Active Star Formation in the N11B Nebula in the Large Magellanic Cloud: A Sequential Star Formation...
18
ACTIVE STAR FORMATION IN THE N11B NEBULA IN THE LARGE MAGELLANIC CLOUD: A SEQUENTIAL STAR FORMATION SCENARIO CONFIRMED 1,2 Rodolfo H. Barba ´ 3 Observatorio Astrono ´ mico La Plata, Paseo del Bosque S/N, B1900 FWA, La Plata, Argentina; [email protected] Mo ´ nica Rubio 4 Departamento de Astronomı ´a, Universidad de Chile, Casilla 36-D, Santiago, Chile; [email protected] Miguel R. Roth Las Campanas Observatory, Observatories of the Carnegie Institution of Washington, Casilla 601, La Serena, Chile; [email protected] and Jorge Garcı ´a Gemini Observatory Southern Operations Center, Association of Universities for Research in Astronomy, Inc., Casilla 603, La Serena, Chile; [email protected] Received 2002 July 29; accepted 2002 December 18 ABSTRACT The second largest H ii region in the Large Magellanic Cloud, N11B has been surveyed in the near-IR. We present JHK s images of the N11B nebula. These images are combined with CO (1 ! 0) emission-line data and with archival New Technology Telescope and Hubble Space Telescope WFPC2 optical images to address the star formation activity of the region. IR photometry of all the IR sources detected is given. We confirm that a second generation of stars is currently forming in the N11B region. Our IR images show the presence of several bright IR sources that appear to be located toward the molecular cloud as seen from the CO emission in the area. Several of these sources show IR colors with young stellar object characteristics, and they are prime candidates to be intermediate-mass Herbig Ae/Be stars. For the first time, an extragalactic methanol maser is directly associated with IR sources embedded in a molecular core. Two IR sources are found at 2 00 (0.5 pc) of the methanol maser reported position. Additionally, we present the association of the N11A compact H ii region to the molecular gas, where we find that the young massive O stars have eroded a cavity in the parental molecular cloud, typical of a champagne flow. The N11 region turns out to be a very good laboratory for studying the interaction of winds, UV radiation, and molecular gas. Several photo- dissociation regions are found. Key words: H ii regions — infrared radiation — ISM: individual (N11) — ISM: molecules — Magellanic Clouds — stars: formation On-line material: color figure 1. INTRODUCTION Giant H ii regions are relatively scarce objects in the Local Group. In these regions, we expect to find a broad spectrum of coeval phenomena related to mas- sive stars. The action of stellar winds from the massive stars and the supernova explosions pushes and destroys the natal molecular cloud, but also helps to trigger the formation of a new generation of massive stars. At present, there is morphological evidence showing that a former massive star generation could produce a new one in the peripheral molecular clouds, but there is no quantitative evidence of how different generations are related in a giant H ii region. This quantitative evi- dence is very hard to obtain, because it requires the characterization of the stellar content embedded in the H ii region and the physical condition of the gas in the molecular cloud. The sequential star formation scenario proposed by Elmegreen & Lada (1977, see also Elmegreen 1998), has a few clear galactic examples where it is possible to see that the direct action of massive stars in the parental molecular cloud could be producing a new generation of stars. Two such regions, the OB Association Ara OB1 (Arnal et al. 1987), and the Carina Nebula (Smith et al. 2000) have been proposed as leading cases in our Galaxy. In general, in a massive star-forming region, we find a cavity of relatively low density ionized gas produced by the action of several hot massive stars together with photodisso- ciation regions (PDR) located on the surfaces of the molecu- lar clouds facing the hot stars. Embedded IR sources and/ or molecular cores could be direct evidence of an emerging new generation of stars. In the Local Group, the formation and evolution of large superbubbles (Oey 1999) is a controversial issue. Evolved superbubbles are suggested to be produced by 1 Based in part on observations with the NASA/ESA Hubble Space Telescope obtained from the archive at the Space Telescope Science Institute, which is operated by the Association of Universities for Research in Astronomy, Inc., under NASA contract NAS 5-26555. 2 Based in part on observations obtained at European Southern Observatory, La Silla, Chile. 3 Member of Carrera del Investigador Cientı ´fico, CONICET, Argentina. 4 Visiting Astronomer, Las Campanas Observatory, Observatories of the Carnegie Institution of Washington, Casilla 601, La Serena, Chile. The Astronomical Journal, 125:1940–1957, 2003 April # 2003. The American Astronomical Society. All rights reserved. Printed in U.S.A. E 1940
Transcript of Active Star Formation in the N11B Nebula in the Large Magellanic Cloud: A Sequential Star Formation...
ACTIVE STAR FORMATION IN THE N11B NEBULA IN THE LARGE MAGELLANIC CLOUD:A SEQUENTIAL STAR FORMATION SCENARIO CONFIRMED1,2
Rodolfo H. Barba3
Observatorio Astronomico La Plata, Paseo del Bosque S/N, B1900 FWA, La Plata, Argentina; [email protected]
Monica Rubio4
Departamento de Astronomıa, Universidad de Chile, Casilla 36-D, Santiago, Chile; [email protected]
Miguel R. Roth
Las Campanas Observatory, Observatories of the Carnegie Institution ofWashington, Casilla 601, La Serena, Chile;[email protected]
and
Jorge Garcıa
Gemini Observatory Southern Operations Center, Association of Universities for Research in Astronomy, Inc.,Casilla 603, La Serena, Chile; [email protected] 2002 July 29; accepted 2002 December 18
ABSTRACT
The second largest H ii region in the Large Magellanic Cloud, N11B has been surveyed in the near-IR. Wepresent JHKs images of the N11B nebula. These images are combined with CO (1 ! 0) emission-line dataand with archival New Technology Telescope andHubble Space TelescopeWFPC2 optical images to addressthe star formation activity of the region. IR photometry of all the IR sources detected is given. We confirmthat a second generation of stars is currently forming in the N11B region. Our IR images show the presenceof several bright IR sources that appear to be located toward the molecular cloud as seen from the COemission in the area. Several of these sources show IR colors with young stellar object characteristics, andthey are prime candidates to be intermediate-mass Herbig Ae/Be stars. For the first time, an extragalacticmethanol maser is directly associated with IR sources embedded in a molecular core. Two IR sources arefound at 200 (0.5 pc) of the methanol maser reported position. Additionally, we present the association of theN11A compact H ii region to the molecular gas, where we find that the young massive O stars have eroded acavity in the parental molecular cloud, typical of a champagne flow. The N11 region turns out to be a verygood laboratory for studying the interaction of winds, UV radiation, and molecular gas. Several photo-dissociation regions are found.
Key words:H ii regions — infrared radiation — ISM: individual (N11) — ISM: molecules —Magellanic Clouds — stars: formation
On-line material: color figure
1. INTRODUCTION
Giant H ii regions are relatively scarce objects in theLocal Group. In these regions, we expect to find abroad spectrum of coeval phenomena related to mas-sive stars. The action of stellar winds from the massivestars and the supernova explosions pushes and destroysthe natal molecular cloud, but also helps to trigger theformation of a new generation of massive stars. Atpresent, there is morphological evidence showing that aformer massive star generation could produce a newone in the peripheral molecular clouds, but there is noquantitative evidence of how different generations are
related in a giant H ii region. This quantitative evi-dence is very hard to obtain, because it requires thecharacterization of the stellar content embedded in theH ii region and the physical condition of the gas inthe molecular cloud.
The sequential star formation scenario proposed byElmegreen & Lada (1977, see also Elmegreen 1998), has afew clear galactic examples where it is possible to see thatthe direct action of massive stars in the parental molecularcloud could be producing a new generation of stars. Twosuch regions, the OB Association Ara OB1 (Arnal et al.1987), and the Carina Nebula (Smith et al. 2000) have beenproposed as leading cases in our Galaxy.
In general, in a massive star-forming region, we find acavity of relatively low density ionized gas produced by theaction of several hot massive stars together with photodisso-ciation regions (PDR) located on the surfaces of the molecu-lar clouds facing the hot stars. Embedded IR sources and/or molecular cores could be direct evidence of an emergingnew generation of stars.
In the Local Group, the formation and evolution oflarge superbubbles (Oey 1999) is a controversial issue.Evolved superbubbles are suggested to be produced by
1 Based in part on observations with the NASA/ESA Hubble SpaceTelescope obtained from the archive at the Space Telescope ScienceInstitute, which is operated by the Association of Universities for Researchin Astronomy, Inc., under NASA contract NAS 5-26555.
2 Based in part on observations obtained at European SouthernObservatory, La Silla, Chile.
3 Member of Carrera del Investigador Cientıfico, CONICET,Argentina.
4 Visiting Astronomer, Las Campanas Observatory, Observatories ofthe Carnegie Institution ofWashington, Casilla 601, La Serena, Chile.
The Astronomical Journal, 125:1940–1957, 2003 April
# 2003. The American Astronomical Society. All rights reserved. Printed in U.S.A.
E
1940
the direct action of supernova explosions in the interstel-lar medium, which produce shells of emitting gas (Wang& Helfand 1991). In younger H ii superbubbles, the mainbright nebular filaments are not shells, but PDR inter-faces between the H ii cavity and the surrounding molec-ular clouds surfaces. An example in an extragalactic envi-ronment is now clearly established: 30 DoradusNebula in the Large Magellanic Cloud (LMC; Rubio etal. 1998; Walborn et al. 1999a and references therein).
The N11 nebular complex (Henize 1956) or DEM34(Davies, Elliot, & Meaburn 1976) is the second largestH ii region in the LMC after 30 Doradus Nebula(Kennicutt & Hodge 1986), lying at the opposite end ofthe LMC bar. The complex consists of a huge bubblesurrounded by nine distinct nebular entities (Rosado etal. 1996). These are easily distinguished in the spectacularH� + [N ii] emission-line image published by Walborn &Parker (1992). The OB association LH9 is located at thecenter of a cavity of about 80 pc � 60 pc (Lucke &Hodge 1970; Parker et al. 1992). This OB association isdominated by HD 32228 (Radcliffe 64, Sk �66 28,Breysacher 9), a massive compact cluster containing aWC4 star of about 3.5 Myr (Walborn et al. 1999b). Sur-rounding LH 9 are several younger OB associationsembedded in dense nebular regions, two of which haveO3 stars among their members: LH 13 in N11C(Heydari-Malayeri et al. 2000) and LH 10 in N11B(Parker et al. 1992). The latter authors propose an evolu-tionary link between the OB associations LH 9 and LH10, where the star formation in LH 10 could have beentriggered by the evolution of massive stars in LH 9. Thissuggestion was based on the different initial mass func-tion slopes found, significantly flatter for LH 10 than forLH 9, and the different apparent ages derived for bothassociations. Walborn & Parker (1992) noticed a remark-able analogy in the structural morphology between N11and 30 Doradus and proposed a two-stage starburst sce-nario to explain the morphological distribution of OBstars in both H ii regions. According to this scenario, aninitial and centrally concentrated burst of stars may trig-ger a second burst in the peripherical molecular cloudsabout 2 � 106 yr later. In N11, this process would be 2million yr older than in 30 Dor.
N11 is a large molecular cloud complex composed of atleast 29 separate molecular clouds (Israel et al. 2002; Israel& de Graauw 1991), directly associated with the ionized gas(Rosado et al. 1996). The CO emission is concentrated indistinctive peaks and correlated with the H� and FIR dustemissions, suggesting that the star formation activity is dis-tributed in the ringlike structure of N11 (Caldwell & Kutner1996).
Thus, the N11 region is a very good candidate for thestudy of the sequential star formation processes and for thedetermination of how different complex elements are relatedin the ongoing star generation embedded in the nebularring.
In this paper, we present new near-infrared images andCO observations of the N11B nebula that show a strikingrelationship between IR sources and the molecular cloud. Inaddition, we compare our observations with optical nebularemission archival images obtained with the New Technol-ogy Telescope (NTT) and the Hubble Space Telescope(HST), yielding further evidence of the ongoing star-forming activity in this region.
2. OBSERVATIONS
2.1. Millimeter
Millimeter observations of N11 were done in the 12CO(1 ! 0) as part of the Swedish-ESO Submillimeter Tele-scope (SEST) Key Programme: ‘‘ CO in the MagellanicClouds ’’ between the years 1988–1994, using the SEST radi-otelescope (ESO, Chile).5 These observations were donewith a FWHP = 4500 resolution (Israel & de Graauw 1991;Israel et al. 2002), and the molecular clouds of the complexwere fully mapped with a 2000 grid spacing. The observationsshowed the presence of 29 individual molecular clouds thatappeared well correlated with H� and FIR peaks. For thiswork, we have selected a subset of the Key Programme COobservations, which include the regions N11A and N11B.The sampled area was 70 � 30 with a grid spacing of 2000
(5 pc at the LMC distance).The data were reduced using the millimeter IRAM soft-
ware package. The spectra were smoothed to a velocityresolution of 0.45 km s�1. Integrated contour maps of theregion were produced and used in the following sections tosuperpose the molecular clouds on the NIR and opticalnebular images.
2.2. Infrared Images
The J, H, and Kshort (Ks) images of the OB associationLH 10 in N11B, centered around the star PGMW 3070,6
were obtained on 1993 January 28, using the near-IRcamera IRCAM, attached to the 2.5 m Du Pont Tele-scope at Las Campanas Observatory (LCO), Chile.IRCAM is equipped with a NICMOS III 256 � 256array (Persson et al. 1992), and the pixel scale was 0>35pixel�1. The seeing during the observations was typicallyof 100 giving an optimum sampling. Nine position tileswith a separation of 3000 were observed in each filter.Each tile was formed of a sequence of five exposures of40 s each, and these were combined to obtain a total on-source exposure time of 800 s in each filter. Sky frameswere taken at 1� to the north of N11B, showing few starsand no extended nebulosities. In each filter, the imageswere median-averaged after subtraction of dark, and sky,and then flat-fielded using IRAF7 routines. Several stan-dard stars extracted from Persson et al. (1998) wereobserved during the night; their images were also dark-subtracted and flat-fielded. All combined images of theLH 10 region were registered with respect to the Ks
image by means of several common stars, and the finalarea covered resulted to be of 11000 � 11000 for each filter.
2.3. Optical
A 120 s exposure time image obtained with EMMIcamera attached to the NTT at the European SouthernObservatory, using the filter No. 589 [O iii], was retrievedfrom the ESO Archive Facility. The image was obtained on1995 December 16 by J. Danziger using a 2K � 2K CCD
5 The Swedish-ESO Submillimeter Telescope (SEST) is operated jointlyby the European Southern Observatory (ESO) and the Swedish ScienceResearch Council (NFR).
6 PGMW star numbers are from Parker et al. 1992.7 IRAF is distributed by the National Optical Astronomy Observatory,
which is operated by AURA, Inc., under cooperative agreement with theNational Science Foundation.
STAR FORMATION IN THE N11B 1941

(scale of 0>266 pixel�1) on very good seeing conditions. Theimage was processed as follows: it was flat-fielded using flatimages obtained during the same day, but due to theunavailability of bias images, the overscan region was usedinstead to remove the bias level. Few cosmic rays weredetected by visual inspection of the image, and these were‘‘ cleaned ’’ by linear interpolation with neighbor pixels.
Archival images obtained with the HST/WFPC2 wereused to investigate the morphological relationships betweenIR sources and stellar objects or gaseous structures in theOB association LH 10. These WFPC2 data sets wereobtained in 1999 May 12 (proposal 6698, principal inves-tigator Y.-H. Chu), using narrowband filters F502N,corresponding to [O iii] 5007 A (data sets U3ME0103Rand U3ME0104R, 1200 s of exposure time) and F656N,corresponding to H� (data sets U3ME0101R andU3ME0102R, 1000 s of exposure time). These images wereextracted from the HST Archive and calibrated using the‘‘ on the fly ’’ calibration pipeline. Additional cosmic-rayrejection, combining, and mosaicking were done usingIRAF/STSDAS software. The data sets are the same asthose reported by Naze et al. (2001).
3. RESULTS
Figure 1 is a false-color image obtained from a combina-tion of J,H, and Ks images as blue, green, and red channels,respectively. Several IR sources are found. These are labeledin yellow numbers in the figure, while those cataloged in theoptical are labeled with white numbers. The image is cen-tered on PGMW 3070, the multiple star core of LH 10 withan O6 V spectral type, showing a cluster of blue stars withrelatively low extinction. In the northwestern corner of theimage, around the O8.5 V star PGMW 3123, a nebular fea-ture appears with several embedded IR sources (shown ingreater detail in Fig. 2). In this area, the WFPC2 and NTTimages (discussed in following sections) show that thisnebulosity is in fact a PDR at the interface between themolecular cloud and the H ii cavity fuelled by the UVphotons produced by the hottest stars in LH 10.
3.1. Photometry of Infrared Sources
Point-spread function (PSF) photometry was performedusing IRAF/DAOPHOT-II software running in a Linuxworkstation. Stars were detected at a 5 � level above the
Fig. 1.—Color composite of J,H, andKs (blue, green, and red channels, respectively) of part of the N11B nebula around PGMW3070. North is up and eastto the left, as in all images in this paper. Numbers greater than 3000 denote optical stars from Parker et al. (1992, PGMW). Smaller numbers (1–184)correspond to RGGB IR sources measured here.
1942 BARBA ET AL. Vol. 125
mean background, and additional stars surrounded bynebulosities were included by eye. Three PSF star candi-dates were selected in each image avoiding nebular andcrowded regions. The PSF was calculated using a penny1function and one lookup table. The final PSF photometrywas made using a 3 pixel aperture (roughly the FWHM ofthe stars), and aperture corrections were estimated using thecurve-of-growth method with the same PSF stars for eachframe. False star detections were minimized by eye inspec-tion of the images, mainly in the nebular region. Objects sus-pected to be false detections were rejected from the finalcatalog. The photometric limits were determined plottingthe star distribution per 0.5 mag bin for each filter, andassuming that the peak of such distributions were magni-tude limits. The peak of the distribution occurred about 1–1.2 mag brighter than the magnitude where the distributionfell to zero. Thus, we estimate that our JHKs catalog is com-plete to J d 17.7,H d 17.3, andKs d 17.0.
Table 1 gives the photometry of all 184 IR sourcesdetected in the field. Running number sources are in column(1) (BRRG numbers), columns (2) and (3) are right ascen-sion and declination (J2000.0), columns (4)–(9) are J, H, Ks
magnitudes and their errors, columns (10) and (11) are J�Hand H�Ks colors, and column (12) contains commentsrelated to the identification of optical counterparts.
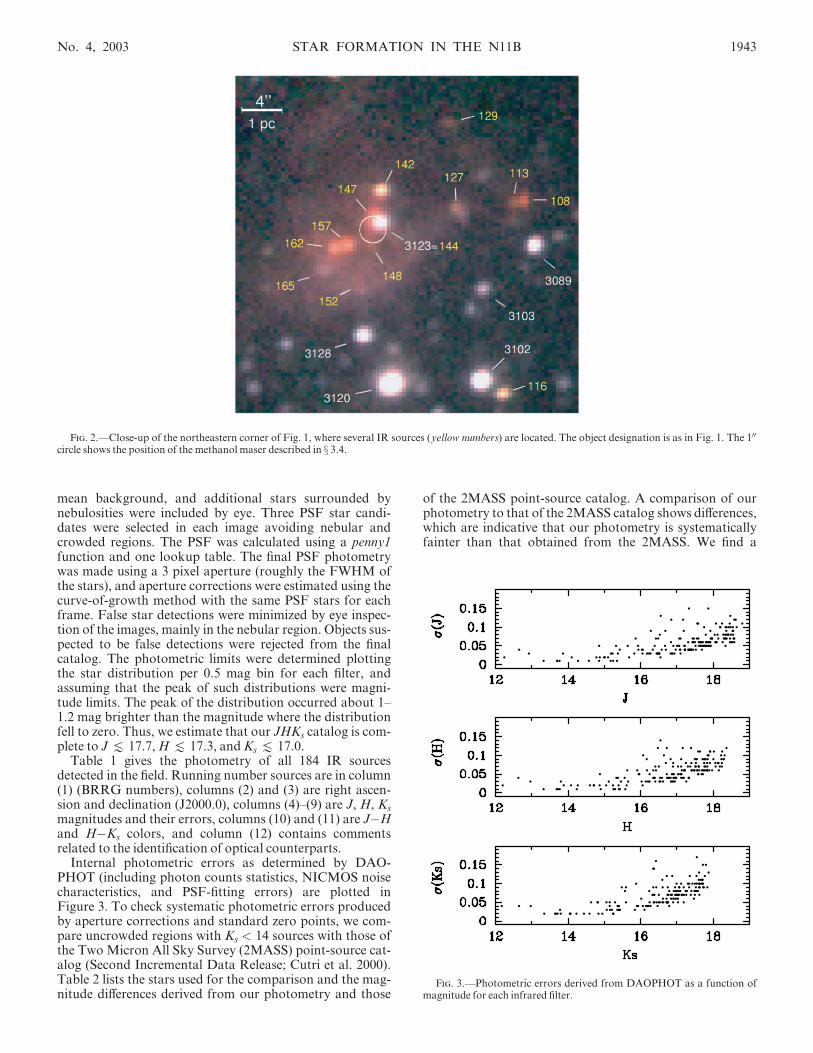
Internal photometric errors as determined by DAO-PHOT (including photon counts statistics, NICMOS noisecharacteristics, and PSF-fitting errors) are plotted inFigure 3. To check systematic photometric errors producedby aperture corrections and standard zero points, we com-pare uncrowded regions with Ks < 14 sources with those ofthe Two Micron All Sky Survey (2MASS) point-source cat-alog (Second Incremental Data Release; Cutri et al. 2000).Table 2 lists the stars used for the comparison and the mag-nitude differences derived from our photometry and those
of the 2MASS point-source catalog. A comparison of ourphotometry to that of the 2MASS catalog shows differences,which are indicative that our photometry is systematicallyfainter than that obtained from the 2MASS. We find a
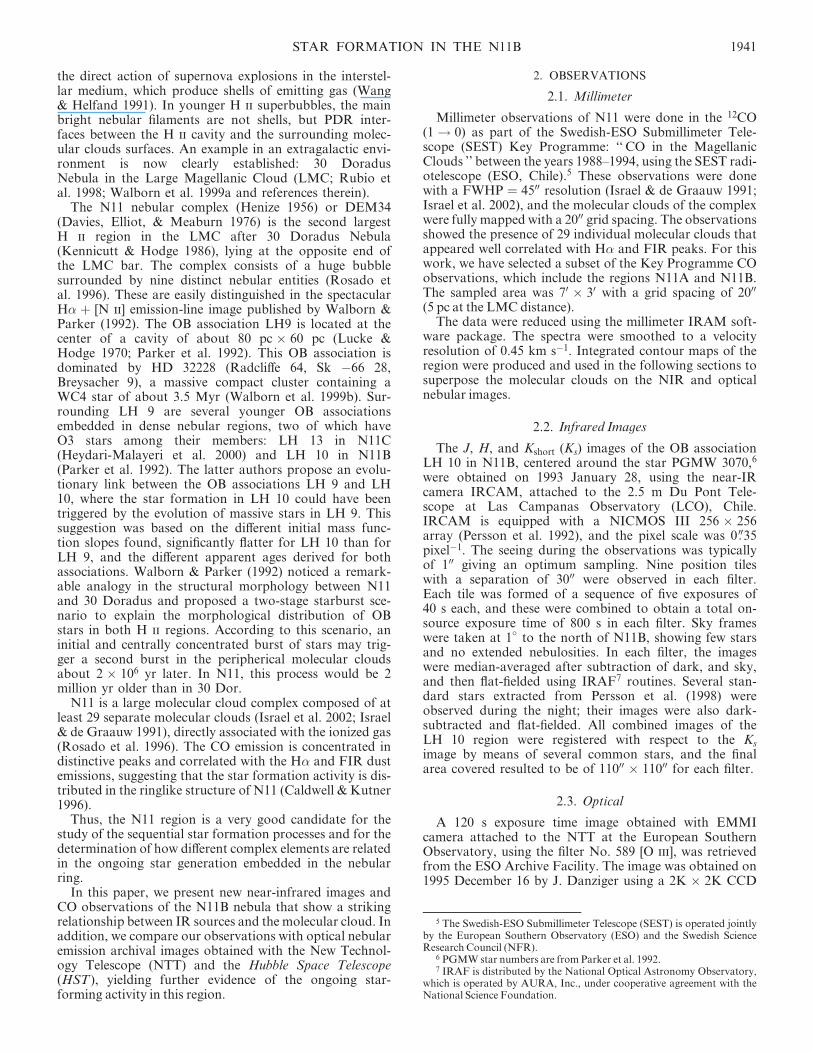
Fig. 2.—Close-up of the northeastern corner of Fig. 1, where several IR sources (yellow numbers) are located. The object designation is as in Fig. 1. The 100
circle shows the position of the methanol maser described in x 3.4.
Fig. 3.—Photometric errors derived from DAOPHOT as a function ofmagnitude for each infrared filter.
No. 4, 2003 STAR FORMATION IN THE N11B 1943
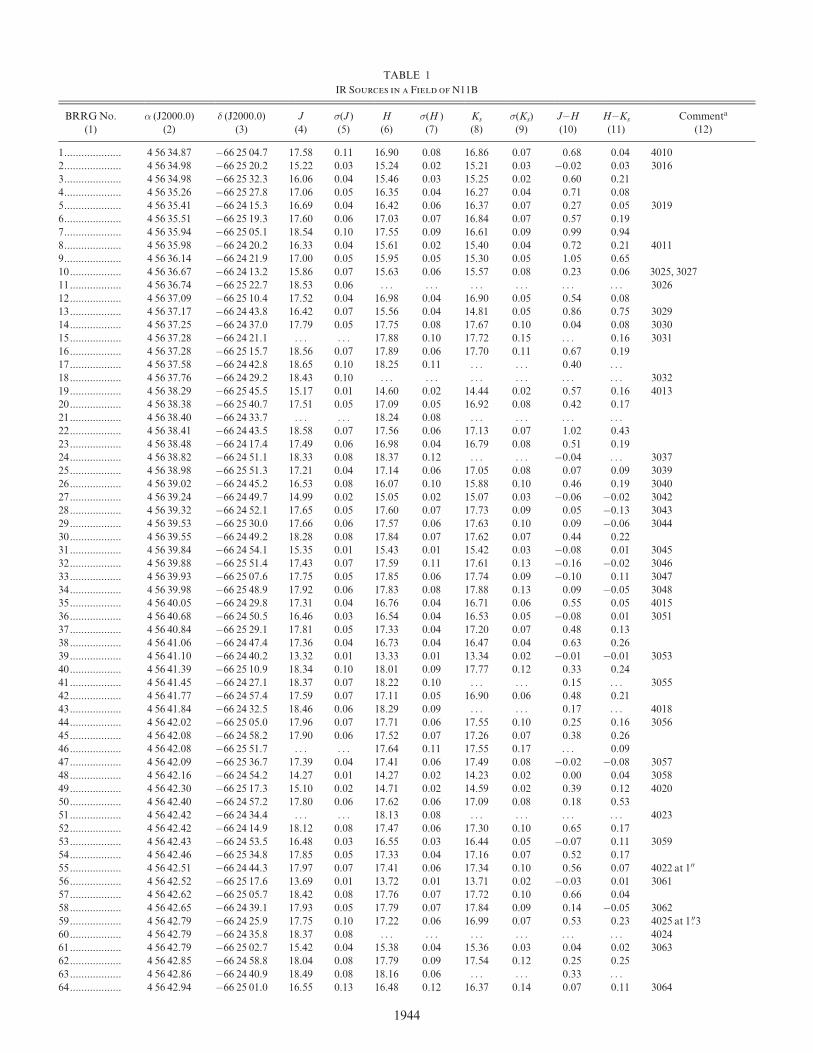
TABLE 1
IR Sources in a Field of N11B
BRRGNo.
(1)
� (J2000.0)
(2)
� (J2000.0)
(3)
J
(4)
�(J )
(5)
H
(6)
�(H )
(7)
Ks
(8)
�(Ks)
(9)
J�H
(10)
H�Ks
(11)
Commenta
(12)
1.................... 4 56 34.87 �66 25 04.7 17.58 0.11 16.90 0.08 16.86 0.07 0.68 0.04 4010
2.................... 4 56 34.98 �66 25 20.2 15.22 0.03 15.24 0.02 15.21 0.03 �0.02 0.03 3016
3.................... 4 56 34.98 �66 25 32.3 16.06 0.04 15.46 0.03 15.25 0.02 0.60 0.21
4.................... 4 56 35.26 �66 25 27.8 17.06 0.05 16.35 0.04 16.27 0.04 0.71 0.08
5.................... 4 56 35.41 �66 24 15.3 16.69 0.04 16.42 0.06 16.37 0.07 0.27 0.05 3019
6.................... 4 56 35.51 �66 25 19.3 17.60 0.06 17.03 0.07 16.84 0.07 0.57 0.19
7.................... 4 56 35.94 �66 25 05.1 18.54 0.10 17.55 0.09 16.61 0.09 0.99 0.94
8.................... 4 56 35.98 �66 24 20.2 16.33 0.04 15.61 0.02 15.40 0.04 0.72 0.21 4011
9.................... 4 56 36.14 �66 24 21.9 17.00 0.05 15.95 0.05 15.30 0.05 1.05 0.65
10.................. 4 56 36.67 �66 24 13.2 15.86 0.07 15.63 0.06 15.57 0.08 0.23 0.06 3025, 3027
11.................. 4 56 36.74 �66 25 22.7 18.53 0.06 . . . . . . . . . . . . . . . . . . 3026
12.................. 4 56 37.09 �66 25 10.4 17.52 0.04 16.98 0.04 16.90 0.05 0.54 0.08
13.................. 4 56 37.17 �66 24 43.8 16.42 0.07 15.56 0.04 14.81 0.05 0.86 0.75 3029
14.................. 4 56 37.25 �66 24 37.0 17.79 0.05 17.75 0.08 17.67 0.10 0.04 0.08 3030
15.................. 4 56 37.28 �66 24 21.1 . . . . . . 17.88 0.10 17.72 0.15 . . . 0.16 3031
16.................. 4 56 37.28 �66 25 15.7 18.56 0.07 17.89 0.06 17.70 0.11 0.67 0.19
17.................. 4 56 37.58 �66 24 42.8 18.65 0.10 18.25 0.11 . . . . . . 0.40 . . .
18.................. 4 56 37.76 �66 24 29.2 18.43 0.10 . . . . . . . . . . . . . . . . . . 3032
19.................. 4 56 38.29 �66 25 45.5 15.17 0.01 14.60 0.02 14.44 0.02 0.57 0.16 4013
20.................. 4 56 38.38 �66 25 40.7 17.51 0.05 17.09 0.05 16.92 0.08 0.42 0.17
21.................. 4 56 38.40 �66 24 33.7 . . . . . . 18.24 0.08 . . . . . . . . . . . .
22.................. 4 56 38.41 �66 24 43.5 18.58 0.07 17.56 0.06 17.13 0.07 1.02 0.43
23.................. 4 56 38.48 �66 24 17.4 17.49 0.06 16.98 0.04 16.79 0.08 0.51 0.19
24.................. 4 56 38.82 �66 24 51.1 18.33 0.08 18.37 0.12 . . . . . . �0.04 . . . 3037
25.................. 4 56 38.98 �66 25 51.3 17.21 0.04 17.14 0.06 17.05 0.08 0.07 0.09 3039
26.................. 4 56 39.02 �66 24 45.2 16.53 0.08 16.07 0.10 15.88 0.10 0.46 0.19 3040
27.................. 4 56 39.24 �66 24 49.7 14.99 0.02 15.05 0.02 15.07 0.03 �0.06 �0.02 3042
28.................. 4 56 39.32 �66 24 52.1 17.65 0.05 17.60 0.07 17.73 0.09 0.05 �0.13 3043
29.................. 4 56 39.53 �66 25 30.0 17.66 0.06 17.57 0.06 17.63 0.10 0.09 �0.06 3044
30.................. 4 56 39.55 �66 24 49.2 18.28 0.08 17.84 0.07 17.62 0.07 0.44 0.22
31.................. 4 56 39.84 �66 24 54.1 15.35 0.01 15.43 0.01 15.42 0.03 �0.08 0.01 3045
32.................. 4 56 39.88 �66 25 51.4 17.43 0.07 17.59 0.11 17.61 0.13 �0.16 �0.02 3046
33.................. 4 56 39.93 �66 25 07.6 17.75 0.05 17.85 0.06 17.74 0.09 �0.10 0.11 3047
34.................. 4 56 39.98 �66 25 48.9 17.92 0.06 17.83 0.08 17.88 0.13 0.09 �0.05 3048
35.................. 4 56 40.05 �66 24 29.8 17.31 0.04 16.76 0.04 16.71 0.06 0.55 0.05 4015
36.................. 4 56 40.68 �66 24 50.5 16.46 0.03 16.54 0.04 16.53 0.05 �0.08 0.01 3051
37.................. 4 56 40.84 �66 25 29.1 17.81 0.05 17.33 0.04 17.20 0.07 0.48 0.13
38.................. 4 56 41.06 �66 24 47.4 17.36 0.04 16.73 0.04 16.47 0.04 0.63 0.26
39.................. 4 56 41.10 �66 24 40.2 13.32 0.01 13.33 0.01 13.34 0.02 �0.01 �0.01 3053
40.................. 4 56 41.39 �66 25 10.9 18.34 0.10 18.01 0.09 17.77 0.12 0.33 0.24
41.................. 4 56 41.45 �66 24 27.1 18.37 0.07 18.22 0.10 . . . . . . 0.15 . . . 3055
42.................. 4 56 41.77 �66 24 57.4 17.59 0.07 17.11 0.05 16.90 0.06 0.48 0.21
43.................. 4 56 41.84 �66 24 32.5 18.46 0.06 18.29 0.09 . . . . . . 0.17 . . . 4018
44.................. 4 56 42.02 �66 25 05.0 17.96 0.07 17.71 0.06 17.55 0.10 0.25 0.16 3056
45.................. 4 56 42.08 �66 24 58.2 17.90 0.06 17.52 0.07 17.26 0.07 0.38 0.26
46.................. 4 56 42.08 �66 25 51.7 . . . . . . 17.64 0.11 17.55 0.17 . . . 0.09
47.................. 4 56 42.09 �66 25 36.7 17.39 0.04 17.41 0.06 17.49 0.08 �0.02 �0.08 3057
48.................. 4 56 42.16 �66 24 54.2 14.27 0.01 14.27 0.02 14.23 0.02 0.00 0.04 3058
49.................. 4 56 42.30 �66 25 17.3 15.10 0.02 14.71 0.02 14.59 0.02 0.39 0.12 4020
50.................. 4 56 42.40 �66 24 57.2 17.80 0.06 17.62 0.06 17.09 0.08 0.18 0.53
51.................. 4 56 42.42 �66 24 34.4 . . . . . . 18.13 0.08 . . . . . . . . . . . . 4023
52.................. 4 56 42.42 �66 24 14.9 18.12 0.08 17.47 0.06 17.30 0.10 0.65 0.17
53.................. 4 56 42.43 �66 24 53.5 16.48 0.03 16.55 0.03 16.44 0.05 �0.07 0.11 3059
54.................. 4 56 42.46 �66 25 34.8 17.85 0.05 17.33 0.04 17.16 0.07 0.52 0.17
55.................. 4 56 42.51 �66 24 44.3 17.97 0.07 17.41 0.06 17.34 0.10 0.56 0.07 4022 at 100
56.................. 4 56 42.52 �66 25 17.6 13.69 0.01 13.72 0.01 13.71 0.02 �0.03 0.01 3061
57.................. 4 56 42.62 �66 25 05.7 18.42 0.08 17.76 0.07 17.72 0.10 0.66 0.04
58.................. 4 56 42.65 �66 24 39.1 17.93 0.05 17.79 0.07 17.84 0.09 0.14 �0.05 3062
59.................. 4 56 42.79 �66 24 25.9 17.75 0.10 17.22 0.06 16.99 0.07 0.53 0.23 4025 at 1>3
60.................. 4 56 42.79 �66 24 35.8 18.37 0.08 . . . . . . . . . . . . . . . . . . 4024
61.................. 4 56 42.79 �66 25 02.7 15.42 0.04 15.38 0.04 15.36 0.03 0.04 0.02 3063
62.................. 4 56 42.85 �66 24 58.8 18.04 0.08 17.79 0.09 17.54 0.12 0.25 0.25
63.................. 4 56 42.86 �66 24 40.9 18.49 0.08 18.16 0.06 . . . . . . 0.33 . . .
64.................. 4 56 42.94 �66 25 01.0 16.55 0.13 16.48 0.12 16.37 0.14 0.07 0.11 3064
1944
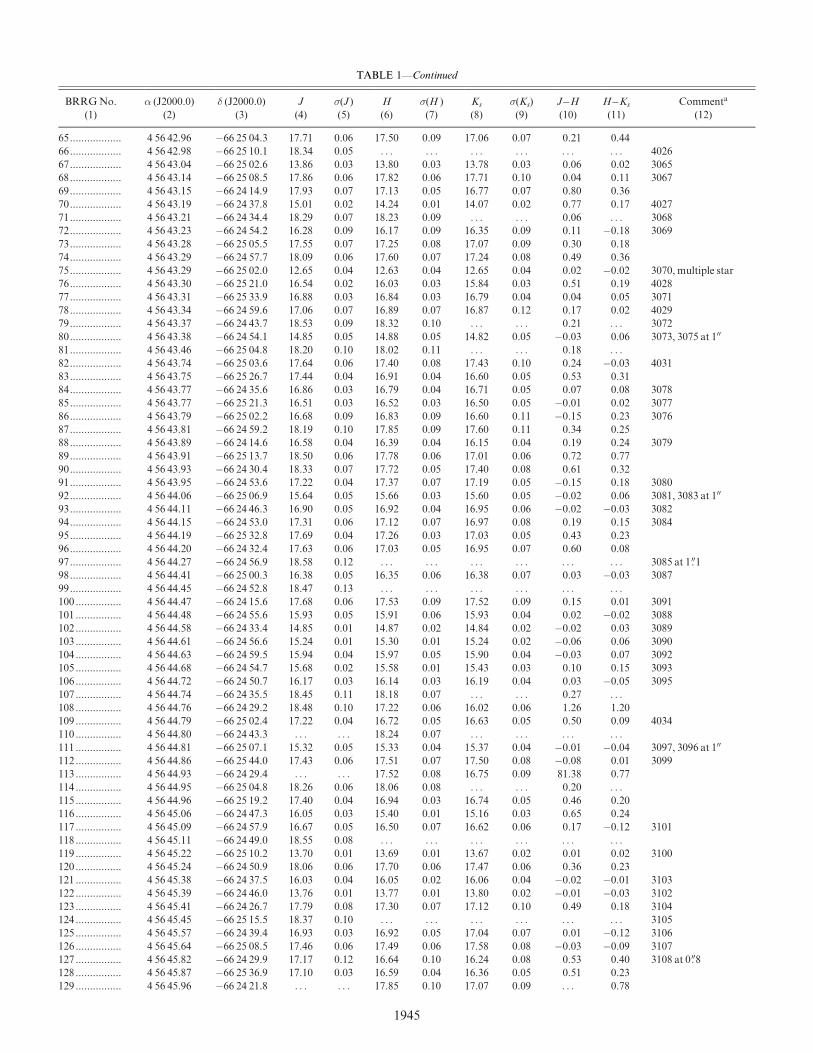
TABLE 1—Continued
BRRGNo.
(1)
� (J2000.0)
(2)
� (J2000.0)
(3)
J
(4)
�(J )
(5)
H
(6)
�(H )
(7)
Ks
(8)
�(Ks)
(9)
J�H
(10)
H�Ks
(11)
Commenta
(12)
65.................. 4 56 42.96 �66 25 04.3 17.71 0.06 17.50 0.09 17.06 0.07 0.21 0.44
66.................. 4 56 42.98 �66 25 10.1 18.34 0.05 . . . . . . . . . . . . . . . . . . 4026
67.................. 4 56 43.04 �66 25 02.6 13.86 0.03 13.80 0.03 13.78 0.03 0.06 0.02 3065
68.................. 4 56 43.14 �66 25 08.5 17.86 0.06 17.82 0.06 17.71 0.10 0.04 0.11 3067
69.................. 4 56 43.15 �66 24 14.9 17.93 0.07 17.13 0.05 16.77 0.07 0.80 0.36
70.................. 4 56 43.19 �66 24 37.8 15.01 0.02 14.24 0.01 14.07 0.02 0.77 0.17 4027
71.................. 4 56 43.21 �66 24 34.4 18.29 0.07 18.23 0.09 . . . . . . 0.06 . . . 3068
72.................. 4 56 43.23 �66 24 54.2 16.28 0.09 16.17 0.09 16.35 0.09 0.11 �0.18 3069
73.................. 4 56 43.28 �66 25 05.5 17.55 0.07 17.25 0.08 17.07 0.09 0.30 0.18
74.................. 4 56 43.29 �66 24 57.7 18.09 0.06 17.60 0.07 17.24 0.08 0.49 0.36
75.................. 4 56 43.29 �66 25 02.0 12.65 0.04 12.63 0.04 12.65 0.04 0.02 �0.02 3070, multiple star
76.................. 4 56 43.30 �66 25 21.0 16.54 0.02 16.03 0.03 15.84 0.03 0.51 0.19 4028
77.................. 4 56 43.31 �66 25 33.9 16.88 0.03 16.84 0.03 16.79 0.04 0.04 0.05 3071
78.................. 4 56 43.34 �66 24 59.6 17.06 0.07 16.89 0.07 16.87 0.12 0.17 0.02 4029
79.................. 4 56 43.37 �66 24 43.7 18.53 0.09 18.32 0.10 . . . . . . 0.21 . . . 3072
80.................. 4 56 43.38 �66 24 54.1 14.85 0.05 14.88 0.05 14.82 0.05 �0.03 0.06 3073, 3075 at 100
81.................. 4 56 43.46 �66 25 04.8 18.20 0.10 18.02 0.11 . . . . . . 0.18 . . .
82.................. 4 56 43.74 �66 25 03.6 17.64 0.06 17.40 0.08 17.43 0.10 0.24 �0.03 4031
83.................. 4 56 43.75 �66 25 26.7 17.44 0.04 16.91 0.04 16.60 0.05 0.53 0.31
84.................. 4 56 43.77 �66 24 35.6 16.86 0.03 16.79 0.04 16.71 0.05 0.07 0.08 3078
85.................. 4 56 43.77 �66 25 21.3 16.51 0.03 16.52 0.03 16.50 0.05 �0.01 0.02 3077
86.................. 4 56 43.79 �66 25 02.2 16.68 0.09 16.83 0.09 16.60 0.11 �0.15 0.23 3076
87.................. 4 56 43.81 �66 24 59.2 18.19 0.10 17.85 0.09 17.60 0.11 0.34 0.25
88.................. 4 56 43.89 �66 24 14.6 16.58 0.04 16.39 0.04 16.15 0.04 0.19 0.24 3079
89.................. 4 56 43.91 �66 25 13.7 18.50 0.06 17.78 0.06 17.01 0.06 0.72 0.77
90.................. 4 56 43.93 �66 24 30.4 18.33 0.07 17.72 0.05 17.40 0.08 0.61 0.32
91.................. 4 56 43.95 �66 24 53.6 17.22 0.04 17.37 0.07 17.19 0.05 �0.15 0.18 3080
92.................. 4 56 44.06 �66 25 06.9 15.64 0.05 15.66 0.03 15.60 0.05 �0.02 0.06 3081, 3083 at 100
93.................. 4 56 44.11 �66 24 46.3 16.90 0.05 16.92 0.04 16.95 0.06 �0.02 �0.03 3082
94.................. 4 56 44.15 �66 24 53.0 17.31 0.06 17.12 0.07 16.97 0.08 0.19 0.15 3084
95.................. 4 56 44.19 �66 25 32.8 17.69 0.04 17.26 0.03 17.03 0.05 0.43 0.23
96.................. 4 56 44.20 �66 24 32.4 17.63 0.06 17.03 0.05 16.95 0.07 0.60 0.08
97.................. 4 56 44.27 �66 24 56.9 18.58 0.12 . . . . . . . . . . . . . . . . . . 3085 at 1>1
98.................. 4 56 44.41 �66 25 00.3 16.38 0.05 16.35 0.06 16.38 0.07 0.03 �0.03 3087
99.................. 4 56 44.45 �66 24 52.8 18.47 0.13 . . . . . . . . . . . . . . . . . .
100 ................ 4 56 44.47 �66 24 15.6 17.68 0.06 17.53 0.09 17.52 0.09 0.15 0.01 3091
101 ................ 4 56 44.48 �66 24 55.6 15.93 0.05 15.91 0.06 15.93 0.04 0.02 �0.02 3088
102 ................ 4 56 44.58 �66 24 33.4 14.85 0.01 14.87 0.02 14.84 0.02 �0.02 0.03 3089
103 ................ 4 56 44.61 �66 24 56.6 15.24 0.01 15.30 0.01 15.24 0.02 �0.06 0.06 3090
104 ................ 4 56 44.63 �66 24 59.5 15.94 0.04 15.97 0.05 15.90 0.04 �0.03 0.07 3092
105 ................ 4 56 44.68 �66 24 54.7 15.68 0.02 15.58 0.01 15.43 0.03 0.10 0.15 3093
106 ................ 4 56 44.72 �66 24 50.7 16.17 0.03 16.14 0.03 16.19 0.04 0.03 �0.05 3095
107 ................ 4 56 44.74 �66 24 35.5 18.45 0.11 18.18 0.07 . . . . . . 0.27 . . .
108 ................ 4 56 44.76 �66 24 29.2 18.48 0.10 17.22 0.06 16.02 0.06 1.26 1.20
109 ................ 4 56 44.79 �66 25 02.4 17.22 0.04 16.72 0.05 16.63 0.05 0.50 0.09 4034
110 ................ 4 56 44.80 �66 24 43.3 . . . . . . 18.24 0.07 . . . . . . . . . . . .
111 ................ 4 56 44.81 �66 25 07.1 15.32 0.05 15.33 0.04 15.37 0.04 �0.01 �0.04 3097, 3096 at 100
112 ................ 4 56 44.86 �66 25 44.0 17.43 0.06 17.51 0.07 17.50 0.08 �0.08 0.01 3099
113 ................ 4 56 44.93 �66 24 29.4 . . . . . . 17.52 0.08 16.75 0.09 81.38 0.77
114 ................ 4 56 44.95 �66 25 04.8 18.26 0.06 18.06 0.08 . . . . . . 0.20 . . .
115 ................ 4 56 44.96 �66 25 19.2 17.40 0.04 16.94 0.03 16.74 0.05 0.46 0.20
116 ................ 4 56 45.06 �66 24 47.3 16.05 0.03 15.40 0.01 15.16 0.03 0.65 0.24
117 ................ 4 56 45.09 �66 24 57.9 16.67 0.05 16.50 0.07 16.62 0.06 0.17 �0.12 3101
118 ................ 4 56 45.11 �66 24 49.0 18.55 0.08 . . . . . . . . . . . . . . . . . .
119 ................ 4 56 45.22 �66 25 10.2 13.70 0.01 13.69 0.01 13.67 0.02 0.01 0.02 3100
120 ................ 4 56 45.24 �66 24 50.9 18.06 0.06 17.70 0.06 17.47 0.06 0.36 0.23
121 ................ 4 56 45.38 �66 24 37.5 16.03 0.04 16.05 0.02 16.06 0.04 �0.02 �0.01 3103
122 ................ 4 56 45.39 �66 24 46.0 13.76 0.01 13.77 0.01 13.80 0.02 �0.01 �0.03 3102
123 ................ 4 56 45.41 �66 24 26.7 17.79 0.08 17.30 0.07 17.12 0.10 0.49 0.18 3104
124 ................ 4 56 45.45 �66 25 15.5 18.37 0.10 . . . . . . . . . . . . . . . . . . 3105
125 ................ 4 56 45.57 �66 24 39.4 16.93 0.03 16.92 0.05 17.04 0.07 0.01 �0.12 3106
126 ................ 4 56 45.64 �66 25 08.5 17.46 0.06 17.49 0.06 17.58 0.08 �0.03 �0.09 3107
127 ................ 4 56 45.82 �66 24 29.9 17.17 0.12 16.64 0.10 16.24 0.08 0.53 0.40 3108 at 0>8
128 ................ 4 56 45.87 �66 25 36.9 17.10 0.03 16.59 0.04 16.36 0.05 0.51 0.23
129 ................ 4 56 45.96 �66 24 21.8 . . . . . . 17.85 0.10 17.07 0.09 . . . 0.78
1945
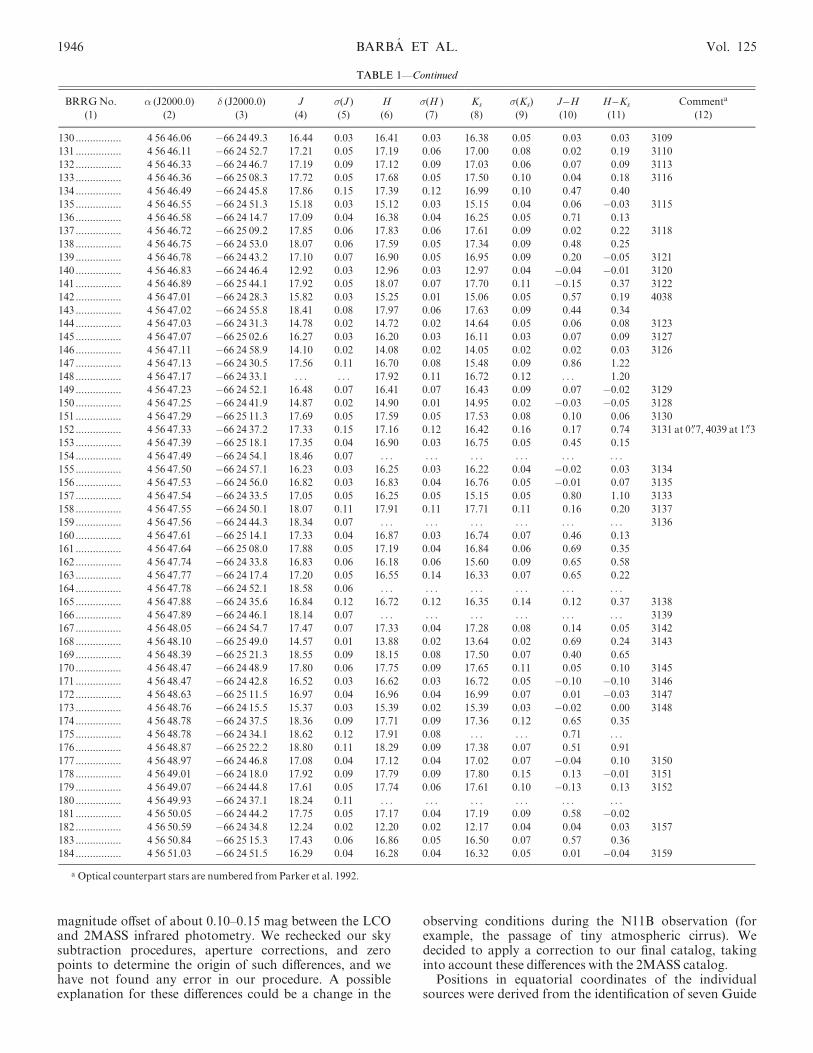
magnitude offset of about 0.10–0.15 mag between the LCOand 2MASS infrared photometry. We rechecked our skysubtraction procedures, aperture corrections, and zeropoints to determine the origin of such differences, and wehave not found any error in our procedure. A possibleexplanation for these differences could be a change in the
observing conditions during the N11B observation (forexample, the passage of tiny atmospheric cirrus). Wedecided to apply a correction to our final catalog, takinginto account these differences with the 2MASS catalog.
Positions in equatorial coordinates of the individualsources were derived from the identification of seven Guide
TABLE 1—Continued
BRRGNo.
(1)
� (J2000.0)
(2)
� (J2000.0)
(3)
J
(4)
�(J )
(5)
H
(6)
�(H )
(7)
Ks
(8)
�(Ks)
(9)
J�H
(10)
H�Ks
(11)
Commenta
(12)
130 ................ 4 56 46.06 �66 24 49.3 16.44 0.03 16.41 0.03 16.38 0.05 0.03 0.03 3109
131 ................ 4 56 46.11 �66 24 52.7 17.21 0.05 17.19 0.06 17.00 0.08 0.02 0.19 3110
132 ................ 4 56 46.33 �66 24 46.7 17.19 0.09 17.12 0.09 17.03 0.06 0.07 0.09 3113
133 ................ 4 56 46.36 �66 25 08.3 17.72 0.05 17.68 0.05 17.50 0.10 0.04 0.18 3116
134 ................ 4 56 46.49 �66 24 45.8 17.86 0.15 17.39 0.12 16.99 0.10 0.47 0.40
135 ................ 4 56 46.55 �66 24 51.3 15.18 0.03 15.12 0.03 15.15 0.04 0.06 �0.03 3115
136 ................ 4 56 46.58 �66 24 14.7 17.09 0.04 16.38 0.04 16.25 0.05 0.71 0.13
137 ................ 4 56 46.72 �66 25 09.2 17.85 0.06 17.83 0.06 17.61 0.09 0.02 0.22 3118
138 ................ 4 56 46.75 �66 24 53.0 18.07 0.06 17.59 0.05 17.34 0.09 0.48 0.25
139 ................ 4 56 46.78 �66 24 43.2 17.10 0.07 16.90 0.05 16.95 0.09 0.20 �0.05 3121
140 ................ 4 56 46.83 �66 24 46.4 12.92 0.03 12.96 0.03 12.97 0.04 �0.04 �0.01 3120
141 ................ 4 56 46.89 �66 25 44.1 17.92 0.05 18.07 0.07 17.70 0.11 �0.15 0.37 3122
142 ................ 4 56 47.01 �66 24 28.3 15.82 0.03 15.25 0.01 15.06 0.05 0.57 0.19 4038
143 ................ 4 56 47.02 �66 24 55.8 18.41 0.08 17.97 0.06 17.63 0.09 0.44 0.34
144 ................ 4 56 47.03 �66 24 31.3 14.78 0.02 14.72 0.02 14.64 0.05 0.06 0.08 3123
145 ................ 4 56 47.07 �66 25 02.6 16.27 0.03 16.20 0.03 16.11 0.03 0.07 0.09 3127
146 ................ 4 56 47.11 �66 24 58.9 14.10 0.02 14.08 0.02 14.05 0.02 0.02 0.03 3126
147 ................ 4 56 47.13 �66 24 30.5 17.56 0.11 16.70 0.08 15.48 0.09 0.86 1.22
148 ................ 4 56 47.17 �66 24 33.1 . . . . . . 17.92 0.11 16.72 0.12 . . . 1.20
149 ................ 4 56 47.23 �66 24 52.1 16.48 0.07 16.41 0.07 16.43 0.09 0.07 �0.02 3129
150 ................ 4 56 47.25 �66 24 41.9 14.87 0.02 14.90 0.01 14.95 0.02 �0.03 �0.05 3128
151 ................ 4 56 47.29 �66 25 11.3 17.69 0.05 17.59 0.05 17.53 0.08 0.10 0.06 3130
152 ................ 4 56 47.33 �66 24 37.2 17.33 0.15 17.16 0.12 16.42 0.16 0.17 0.74 3131 at 0>7, 4039 at 1>3
153 ................ 4 56 47.39 �66 25 18.1 17.35 0.04 16.90 0.03 16.75 0.05 0.45 0.15
154 ................ 4 56 47.49 �66 24 54.1 18.46 0.07 . . . . . . . . . . . . . . . . . .
155 ................ 4 56 47.50 �66 24 57.1 16.23 0.03 16.25 0.03 16.22 0.04 �0.02 0.03 3134
156 ................ 4 56 47.53 �66 24 56.0 16.82 0.03 16.83 0.04 16.76 0.05 �0.01 0.07 3135
157 ................ 4 56 47.54 �66 24 33.5 17.05 0.05 16.25 0.05 15.15 0.05 0.80 1.10 3133
158 ................ 4 56 47.55 �66 24 50.1 18.07 0.11 17.91 0.11 17.71 0.11 0.16 0.20 3137
159 ................ 4 56 47.56 �66 24 44.3 18.34 0.07 . . . . . . . . . . . . . . . . . . 3136
160 ................ 4 56 47.61 �66 25 14.1 17.33 0.04 16.87 0.03 16.74 0.07 0.46 0.13
161 ................ 4 56 47.64 �66 25 08.0 17.88 0.05 17.19 0.04 16.84 0.06 0.69 0.35
162 ................ 4 56 47.74 �66 24 33.8 16.83 0.06 16.18 0.06 15.60 0.09 0.65 0.58
163 ................ 4 56 47.77 �66 24 17.4 17.20 0.05 16.55 0.14 16.33 0.07 0.65 0.22
164 ................ 4 56 47.78 �66 24 52.1 18.58 0.06 . . . . . . . . . . . . . . . . . .
165 ................ 4 56 47.88 �66 24 35.6 16.84 0.12 16.72 0.12 16.35 0.14 0.12 0.37 3138
166 ................ 4 56 47.89 �66 24 46.1 18.14 0.07 . . . . . . . . . . . . . . . . . . 3139
167 ................ 4 56 48.05 �66 24 54.7 17.47 0.07 17.33 0.04 17.28 0.08 0.14 0.05 3142
168 ................ 4 56 48.10 �66 25 49.0 14.57 0.01 13.88 0.02 13.64 0.02 0.69 0.24 3143
169 ................ 4 56 48.39 �66 25 21.3 18.55 0.09 18.15 0.08 17.50 0.07 0.40 0.65
170 ................ 4 56 48.47 �66 24 48.9 17.80 0.06 17.75 0.09 17.65 0.11 0.05 0.10 3145
171 ................ 4 56 48.47 �66 24 42.8 16.52 0.03 16.62 0.03 16.72 0.05 �0.10 �0.10 3146
172 ................ 4 56 48.63 �66 25 11.5 16.97 0.04 16.96 0.04 16.99 0.07 0.01 �0.03 3147
173 ................ 4 56 48.76 �66 24 15.5 15.37 0.03 15.39 0.02 15.39 0.03 �0.02 0.00 3148
174 ................ 4 56 48.78 �66 24 37.5 18.36 0.09 17.71 0.09 17.36 0.12 0.65 0.35
175 ................ 4 56 48.78 �66 24 34.1 18.62 0.12 17.91 0.08 . . . . . . 0.71 . . .
176 ................ 4 56 48.87 �66 25 22.2 18.80 0.11 18.29 0.09 17.38 0.07 0.51 0.91
177 ................ 4 56 48.97 �66 24 46.8 17.08 0.04 17.12 0.04 17.02 0.07 �0.04 0.10 3150
178 ................ 4 56 49.01 �66 24 18.0 17.92 0.09 17.79 0.09 17.80 0.15 0.13 �0.01 3151
179 ................ 4 56 49.07 �66 24 44.8 17.61 0.05 17.74 0.06 17.61 0.10 �0.13 0.13 3152
180 ................ 4 56 49.93 �66 24 37.1 18.24 0.11 . . . . . . . . . . . . . . . . . .181 ................ 4 56 50.05 �66 24 44.2 17.75 0.05 17.17 0.04 17.19 0.09 0.58 �0.02
182 ................ 4 56 50.59 �66 24 34.8 12.24 0.02 12.20 0.02 12.17 0.04 0.04 0.03 3157
183 ................ 4 56 50.84 �66 25 15.3 17.43 0.06 16.86 0.05 16.50 0.07 0.57 0.36
184 ................ 4 56 51.03 �66 24 51.5 16.29 0.04 16.28 0.04 16.32 0.05 0.01 �0.04 3159
a Optical counterpart stars are numbered from Parker et al. 1992.
1946 BARBA ET AL. Vol. 125

Star Catalogue (GSC) stars in the IR images. Positionsderived in this way show systematic differences with thosederived from the default world coordinate system astrome-tric solution in theHST/WFPC2 image headers. This offsetin coordinates is not seen when we compare our positionswith those in other catalogs such as Parker et al. (1992) and2MASS. The offset difference found with theHST images isin the range of the absolute errors expected from the HSTpointing system. Table 3 gives the average offsets and errorsfound on the coordinates between our IR seven stars andthose found in the different catalogs (GSC; Parker et al.1992; 2MASS) and the positions derived from WFPC2images. This offset coordinate difference must be knownwith the best attainable precision since we will compare theposition of a methanol maser with that of detected IRsources and theHST/WFPC2 images (see x 3.4).
3.2. Color-Magnitude and Color-Color Diagrams
Color-magnitude (CMD) and color-color diagrams(Fig. 4) show a clear main-sequence between spectral typesO3 and B0 on the zero-age main sequence (ZAMS; ourlower limit) spread out by low or moderate range of visualabsorption. There are few sources with apparent IR excess(BRRG 7, 89, 147, 148, 157, 152, 169, and 176) and a fewothers that could be O stars with high reddening (AV > 7mag) (BRRG 9, 13, and 162). The absolute IR magnitudesand colors for OB ZAMS stars are adopted from Hanson,Howarth, & Conti (1997).
The interpretation of IR CMDs is not straightforward,since the early ZAMS stars locus is very steep, even steeperthan that of the optical CMDs. Moreover, the first 2 millionyr evolutionary tracks for massive stars are almost constantin color. Therefore, it is extremely difficult to discernbetween a ZAMS and a main-sequence star using onlynear-IR photometric information. Thus, spectroscopicclassification must be done, since an unreddened ZAMSO6.5 V star looks like an unreddened O8 V dwarf star usingNIR broadband photometry.
Parker et al. (1992) classified five stars in LH 10 as ZAMSO stars (O stars with He ii 4686 absorption line beingstronger than any other He ii absorption line). According tothese authors, the stars PGMW 3073, 3102, 3126, 3204, and3264 are roughly coeval with but slightly younger than theother typical ‘‘ non-ZAMS ’’ O stars. Three of these ZAMSstars are found in our survey, namely: PGMW 3073 (O6.5V), 3102 (O7 V), and 3126 (O6.5 V). Only one star, PGMW3073 (Ks = 14.82) showsKsmagnitude compatible with a 06V ZAMS star (Ks = 14.85 for a LMC distance modulus of18.5). The other two stars (PGMW 3102 and PGMW 3126)have Ks magnitudes brighter than PGMW 3073, in particu-lar PGMW 3102 is almost 1 mag brighter in Ks. Their Ks
magnitude would imply a ZAMS O3–O4 star. According tothe calibration of Vacca, Garmany, & Shull (1996), the ab-solute magnitudes for O6.5 V and O7 V stars are �5.0 and�4.9, respectively. So, the optical data for these three stars(MV = �4.3, �5.4, �5.0, for PGMW 3073, 3102, and 3126,respectively) would suggest that the MV, and the spectraltype for PGMW 3126 are in remarkable agreement, thatPGMW 3073 is 0.7 mag underluminous, and that PGMW3102 is 0.5 mag overluminous. The model for ZAMS starspredicts that they could be underluminous, so that couldexplain PGMW 3073. It is possible to invoke differentexplanations to take into account the departure in magni-tudes for those ZAMS stars, but in any case, all of this maybe overinterpretation of the data; in Figure 6 in Vacca et al.(1996), it is clear that the variation ofMV for a given spectralsubtype can be quite large (they state an rms = 0.67 for thedeviation of the data points to the best fit in their calibra-tion). Therefore, the magnitude differences may be intrinsicscatter in the absolute magnitudes. In addition, we need tokeep in mind the intrinsic uncertainty in the spectral classifi-cation derived from spectra with moderate signal-to-noiseratio and nebular contamination.
Another issue in the interpretation of NIR photometricinformation is the effect of differential and internal redden-ing. Sources BRRG 9, 13, and 162 have the colors and mag-nitudes expected for early O stars with high reddening.Different alternative explanations for these kind of sourcescan be suggested. They might be LMC red giants with mod-erate reddening but in a region with a peculiar extinctionlaw, or young stellar objects (YSOs) with intrinsic IR emis-sion whose combined colors place them on the locusexpected for stars with high reddening. We believe that thesecond alternative is the most plausible one. Rubio et al.(1998) reported similar IR sources in 30 Dor, and they dis-cussed the importance of obtaining IR photometry in addi-tional bands, such as L and M, as well as high spatialresolution images and IR spectroscopy.
A direct comparison between the NIR CMDs obtainedfor N11B and the NE nebular filament in 30 Doradus
TABLE 2
Comparison of IR Photometry of Uncrowded Stars in LH 10 with 2MASS Values
2MASS BRRG D(J � J2MASS) D(H � H2MASS) DðKs � Ks2MASSÞ
0456410�662440.............. 39 0.10 0.22 0.13
0456452�662510.............. 119 0.11 0.12 0.14
0456468�662446.............. 140 0.10 0.15 0.14
0456506�662435.............. 182 0.10 0.10 0.18
Mean (�) ...................... 0.10 (0.01) 0.15 (0.05) 0.15 (0.02)
TABLE 3
Comparison of Coordinates of Stars in LH 10
Offset
D�
(s)
D�
(arcsec)
GSC � BRRG................... 0.003 � 0.028 0.02 � 0.21
PGMW � BRRG.............. �0.003 � 0.010 0.22 � 0.05
2MASS � BRRG.............. �0.013 � 0.038 0.02 � 0.22
HST � BRRG................... 0.135 � 0.013 �0.70 � 0.14
Notes.—Comparison of coordinates of stars in LH 10 obtainedin IR images with those values published in GSC, Parker et al.1992, and 2MASS and those derived fromHST/WFPC2 images.
No. 4, 2003 STAR FORMATION IN THE N11B 1947

(Rubio et al. 1998) indicates that sources with the strongIR excess found in the latter are absent in the N11Bregion. In spite of a factor 0.5 smaller area surveyed byRubio et al. (1998) in that filament (7500 � 7500), theyfound six IR sources with Ks < 15 and H�Ks > 1.0. OurNIR survey centered in the LH 10 association does notshow any IR source with characteristics like those foundin 30 Dor. The most extreme IR sources discovered inthis survey, BRRG 147 and BRRG 157, have Ks > 15,and both are found toward the nebulosity where the CO
cloud is located and where a methanol maser has beenreported.
Brandner et al. (2001), using HST/NICMOS images ofthe 30 Dor Nebula, suggested that sources with intrinsic IRexcess J�Ks > 1 and J magnitudes 17 < J < 19 are inter-mediate-mass Herbig Ae/Be candidates. Table 4 lists the IRsources in N11B that meet this criterion. It also lists thesources with H�Ks > 0.5, including stars with interestingmorphological association with the surrounding gas anddust, such as BRRG 26, an embedded source in a compact
Fig. 4.—(Left) Ks vs.H�Ks CMD for the observed field in N11B. The upper ZAMS between O3 V and B1 V, corresponding to a distance modulus of 18.6,is indicated with a solid line. The reddening track for a normal O3 V star is plotted with a dotted line and extends to AV = 20 mag. Numbers are from IRsources in Tables 2 and 3. (Right) J�H vs.H�Ks color-color diagram for the same objects. The main-sequence locus between O3 V andM2 V is indicated witha solid line, while the cool giant branch with a dash line. The reddening tracks for normal O3 V and cool giant stars are plotted as dotted lines, with crossesindicatingAV = 10 and 20mag.
TABLE 4
Candidates Herbig Ae/Be Stars in a Field of N11B
BRRGNo. � (J2000.0) � (J2000.0) J �(J ) J�H �(J�H ) H�Ks �(H�Ks)
7....................... 4 56 35.94 �66 25 05.1 18.54 0.10 0.99 0.14 0.94 0.13
9....................... 4 56 36.14 �66 24 21.9 17.00 0.05 1.05 0.07 0.65 0.07
13..................... 4 56 37.17 �66 24 43.8 16.42 0.07 0.86 0.08 0.75 0.06
26..................... 4 56 39.02 �66 24 45.2 16.53 0.08 0.46 0.13 0.19 0.13
50..................... 4 56 42.40 �66 24 57.2 17.80 0.06 0.18 0.08 0.53 0.10
65..................... 4 56 42.96 �66 25 04.3 17.71 0.06 0.21 0.11 0.44 0.12
89..................... 4 56 43.91 �66 25 13.7 18.50 0.06 0.72 0.08 0.77 0.08
108 ................... 4 56 44.76 �66 24 29.2 18.48 0.10 1.26 0.12 1.20 0.12
113 ................... 4 56 44.93 �66 24 29.4 >18.80 . . . >1.28 . . . 0.77 0.12
129 ................... 4 56 45.96 �66 24 21.8 >18.80 . . . >0.95 . . . 0.78 0.14
147 ................... 4 56 47.13 �66 24 30.5 17.56 0.11 0.86 0.14 1.22 0.12
148 ................... 4 56 47.17 �66 24 33.1 >18.80 . . . >0.88 . . . 1.20 0.14
152 ................... 4 56 47.33 �66 24 37.2 17.33 0.15 0.17 0.19 0.74 0.20
157 ................... 4 56 47.54 �66 24 33.5 17.05 0.05 0.80 0.07 1.10 0.07
162 ................... 4 56 47.74 �66 24 33.8 16.83 0.06 0.65 0.08 0.58 0.11
165 ................... 4 56 47.88 �66 24 35.6 16.84 0.12 0.12 0.17 0.37 0.18
169 ................... 4 56 48.39 �66 25 21.3 18.55 0.09 0.40 0.12 0.65 0.11
176 ................... 4 56 48.87 �66 25 22.2 18.80 0.11 0.51 0.14 0.91 0.12
1948 BARBA ET AL. Vol. 125
nebulosity. Candidates of classical T Tauri stars would haveJ � 20 and Ks � 18 (Brandner et al. 2001) and are thereforebeyond the sensitivity limit reached in our survey.
3.3. Comparison betweenMolecularCO and OpticalNebular Emissions
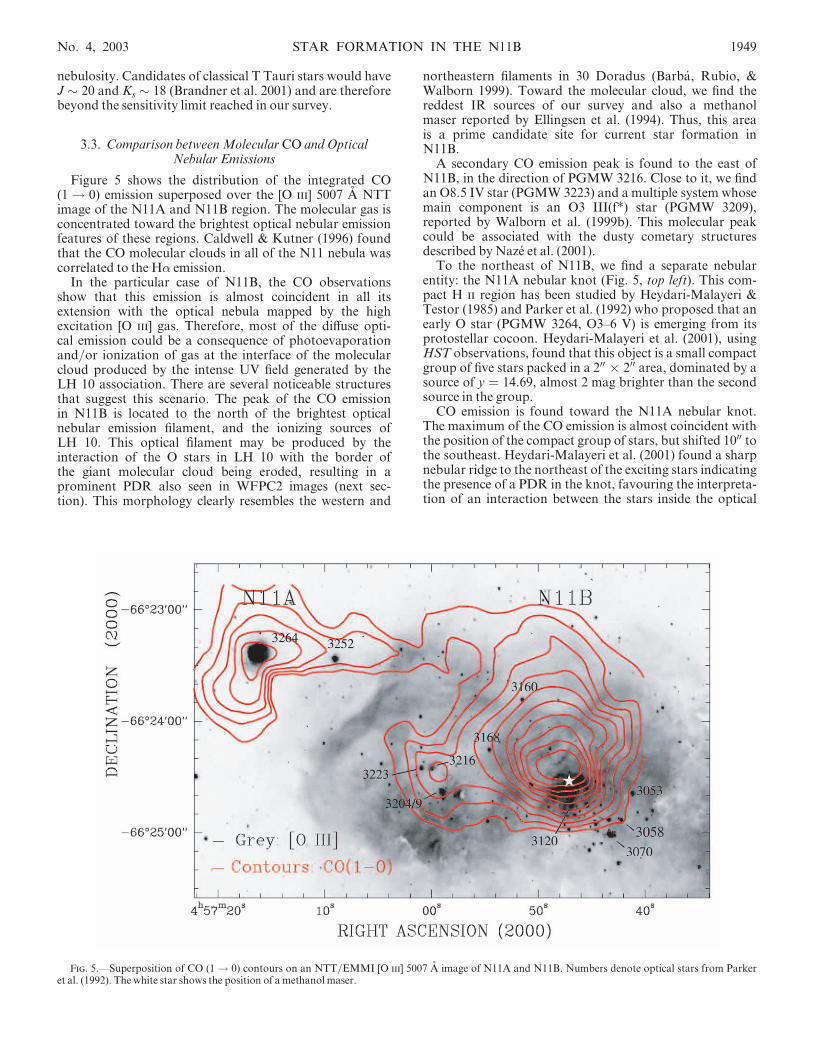
Figure 5 shows the distribution of the integrated CO(1 ! 0) emission superposed over the [O iii] 5007 A NTTimage of the N11A and N11B region. The molecular gas isconcentrated toward the brightest optical nebular emissionfeatures of these regions. Caldwell & Kutner (1996) foundthat the CO molecular clouds in all of the N11 nebula wascorrelated to the H� emission.
In the particular case of N11B, the CO observationsshow that this emission is almost coincident in all itsextension with the optical nebula mapped by the highexcitation [O iii] gas. Therefore, most of the diffuse opti-cal emission could be a consequence of photoevaporationand/or ionization of gas at the interface of the molecularcloud produced by the intense UV field generated by theLH 10 association. There are several noticeable structuresthat suggest this scenario. The peak of the CO emissionin N11B is located to the north of the brightest opticalnebular emission filament, and the ionizing sources ofLH 10. This optical filament may be produced by theinteraction of the O stars in LH 10 with the border ofthe giant molecular cloud being eroded, resulting in aprominent PDR also seen in WFPC2 images (next sec-tion). This morphology clearly resembles the western and
northeastern filaments in 30 Doradus (Barba, Rubio, &Walborn 1999). Toward the molecular cloud, we find thereddest IR sources of our survey and also a methanolmaser reported by Ellingsen et al. (1994). Thus, this areais a prime candidate site for current star formation inN11B.
A secondary CO emission peak is found to the east ofN11B, in the direction of PGMW 3216. Close to it, we findan O8.5 IV star (PGMW 3223) and a multiple system whosemain component is an O3 III(f*) star (PGMW 3209),reported by Walborn et al. (1999b). This molecular peakcould be associated with the dusty cometary structuresdescribed byNaze et al. (2001).
To the northeast of N11B, we find a separate nebularentity: the N11A nebular knot (Fig. 5, top left). This com-pact H ii region has been studied by Heydari-Malayeri &Testor (1985) and Parker et al. (1992) who proposed that anearly O star (PGMW 3264, O3–6 V) is emerging from itsprotostellar cocoon. Heydari-Malayeri et al. (2001), usingHST observations, found that this object is a small compactgroup of five stars packed in a 200 � 200 area, dominated by asource of y = 14.69, almost 2 mag brighter than the secondsource in the group.
CO emission is found toward the N11A nebular knot.The maximum of the CO emission is almost coincident withthe position of the compact group of stars, but shifted 1000 tothe southeast. Heydari-Malayeri et al. (2001) found a sharpnebular ridge to the northeast of the exciting stars indicatingthe presence of a PDR in the knot, favouring the interpreta-tion of an interaction between the stars inside the optical
Fig. 5.—Superposition of CO (1 ! 0) contours on an NTT/EMMI [O iii] 5007 A image of N11A and N11B. Numbers denote optical stars from Parkeret al. (1992). The white star shows the position of a methanol maser.
No. 4, 2003 STAR FORMATION IN THE N11B 1949
knot and the molecular material mapped by the CO emis-sion. The PDR lies on the edge of the molecular regionfacing the exciting stars, similar to the case discussedpreviously for N11B.
It is most interesting to study in detail the PDRs in N11Aand N11B because they might be in a different stage of evolu-tion. In the case of N11A, the optical compact group of starsis visible indicating that the molecular cloud lies behind thestars and that they have evacuated a cavity toward our line ofsight. This conclusion is supported by the fact that the O starhas a relatively low reddening, AV = 0.6, probably due onlyto dust mixed with the ionized gas (Heydari-Malayeri et al.2001). These authors proposed that the nebular morphologyof N11A is a good example of the champagne model(Tenorio-Tagle 1979; Bodenheimer, Tenorio-Tagle, & Yorke1979), in the stage when the newborn stars disrupt the molec-ular cavity. Small nebular emission filaments discovered byHeydari-Malayeri et al. (2001) are located on the southwestborder of the nebular knot and show arcs pointing towardthe direction where the CO emission has a sharp edge, indi-cating an abrupt drop of the molecular gas density. Thismorphology suggests that the compact group of stars couldbe blowing this side of its stellar nursery in a similar morpho-logical picture to that seen toward knot 1 in the 30 DorNebula (Rubio et al. 1998; Walborn et al. 1999a; Walborn,Maız-Apellaniz, & Barba 2002).
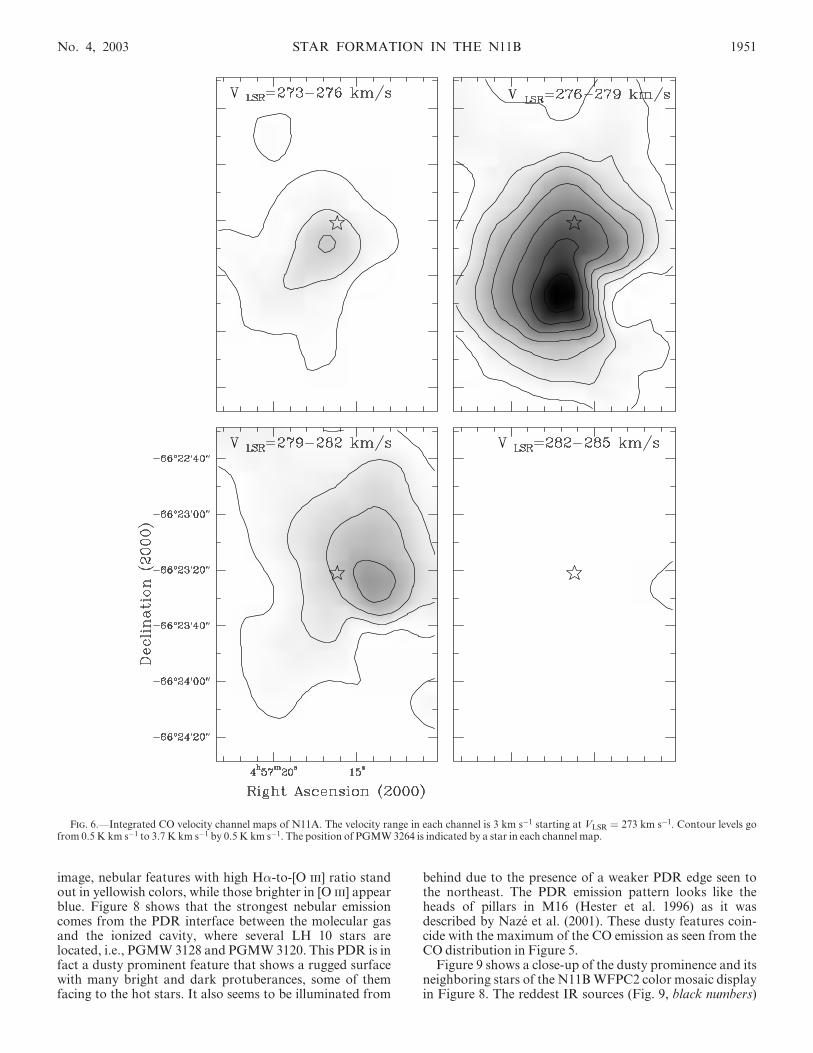
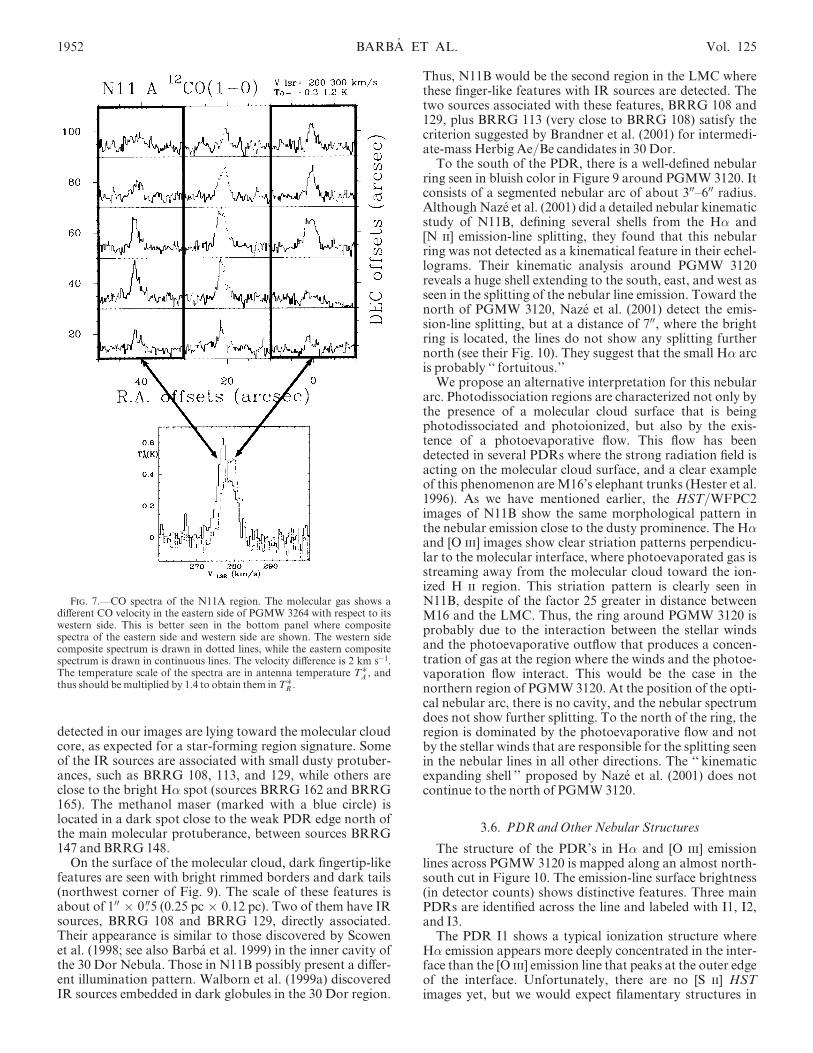
The velocity information of the CO gas supports thisscenario. Figure 6 shows four different velocity integratedchannel maps each with 3 km s�1 range. The position of thecompact group of massive stars is indicated by a star in eachpanel. The CO emission peaks to the south of the stars inthe velocity range VLSR = 276–279 km s�1, while it peaks tothe west at the velocity range VLSR = 279–282 km s�1. As aresult, there is gas spatially concentrated at different veloc-ities. Figure 7 shows the CO spectra around the compactcluster. We have integrated the emission to the east and westof the cluster, as indicated in the figure, and the resultantCO spectra clearly show a velocity separation of 2 km s�1.Thus, the molecular gas is being accelerated, and we seeeither an expanding envelope or the interaction of the clus-ter and the molecular gas that has produced a cavity. Thiscavity is formed in the thinner region of the parental molec-ular cloud. The molecular gas toward this direction has agreater velocity than that toward the densest part of themolecular cloud. We plan to obtain more sensitive andhigher spatial resolution CO (2 ! 1) observations of thisregion.
The CO emission distribution between N11A and N11Bis devoid of molecular gas (Fig. 5). There is a sharp edge inthe molecular cloud west of N11A and then a hugeelongated area of about 30 pc � 10 pc where no molecularemission has been detected. This molecular gas void is coin-cident with the one present in the optical nebular emission.The nebular emission to the east of N11B shows a smoothsurface as seen in the [O iii] gas, suggesting that an energeticevent could have taken place producing the cavity, pressingthe molecular gas toward N11A and mechanically smooth-ing, by some shock interaction, the eastern wall of themolecular cloud N11B. The compression of the molecularcloud in N11A could have favoured the formation of adense core that gave origin to the compact star cluster(PGMW 3264). Alternatively, the energetic event couldhave favoured the gas evacuation around the newbornstars.
Sensitive and better spatially sampled observations of themolecular gas in N11B using the CO (2 ! 1) emission lineare underway. Preliminary results show that the distributionof the molecular gas is similar to the one found in CO(1 ! 0). There seems to be a different CO (2 ! 1)/CO(1 ! 0) ratio toward the peak of N11B (M. Rubio 2002,private communication).
3.4. AMethanolMaser
Methanol (CH3OH) maser emission at 6.67 GHz is one ofthe strongest astrophysical masers, and therefore it has beenpossible to detect it in extragalactic environments. Thismaser emission has been established as a tracer of star-form-ing regions often associated to ultracompact H ii regions inour Galaxy (e.g., Caswell et al. 1995). Three methanol mas-ers were discovered in the LMC, all of them placed in H ii
regions, namely N105a (Sinclair et al. 1992), N11B(Ellingsen et al. 1994), and DEM 52 (Beasley et al. 1996).The methanol maser associated with the N11B nebula is thesecond one in intensity, with a peak flux density of 0.3 Jyand a heliocentric velocity of 301 km s�1 (VLSR = 287). Thecoordinates reported by Ellingsen et al. (1994) for this maserare � = 4h56m47 912, � = �66�24031>8 (J2000.0), and it wasunresolved with a 2>5 beam.
The N11B maser, according to the given radio position, islocated in one of the dusty prominences where our NIRimages show three stellar IR sources inside the 2>5 ATCAbeam (BRRG 144, 147, and 148). Figure 2 shows the maserposition marked by a circle. Only one of these IR sources,BRRG 144, has been identified with an optical stellarsource, PGMW 3123. This star has been classified as a lateO-type star, O8.5 V, with usual stellar IR properties. Its IRmagnitudes are Ks = 14.66, J�H = 0.03, and H�Ks =0.08, with an expected reddening of EB�V = 0.2. This O starprobably belongs to the LH 10 association and is probablynot associated with the maser. The two other IR stellar-likesources are among the reddest sources in the field: BRRG147 (Ks = 15.48, J�H = 0.86, H�K = 1.22) and BRRG148 (Ks = 16.72, J�H > 0.88, H�K = 1.20). They show anintrinsic IR excess and meet the Brandner et al. (2001) crite-rion for intermediate-mass Herbig Ae/Be star candidates(x 3.2). In theMilkyWay, Walsh et al. (1999) did a NIR sur-vey toward a selected sample of methanol maser and/orultracompact H ii regions, and they found that about 50%of the methanol masers have associated NIR counterparts.The IR counterparts were identified not only from coinci-dence in position, but also from the fact that they show thereddest colors in the sample. A similar scenario is foundbetween the association of the IR sources BRRG 147 and148 with the methanol maser in N11B.
3.5. Comparison with NarrowbandWFPC2 Images
Aiming to detect optically wind-blown bubbles in theinterstellar medium of N11B, Naze et al. (2001) obtained aset of WFPC2 images in F502N ([O iii]) and F656N (H�)narrowband filters of such nebula. These images are asuperb set to compare morphological aspects between theionized features, molecular clouds and infrared sourcesdistribution.
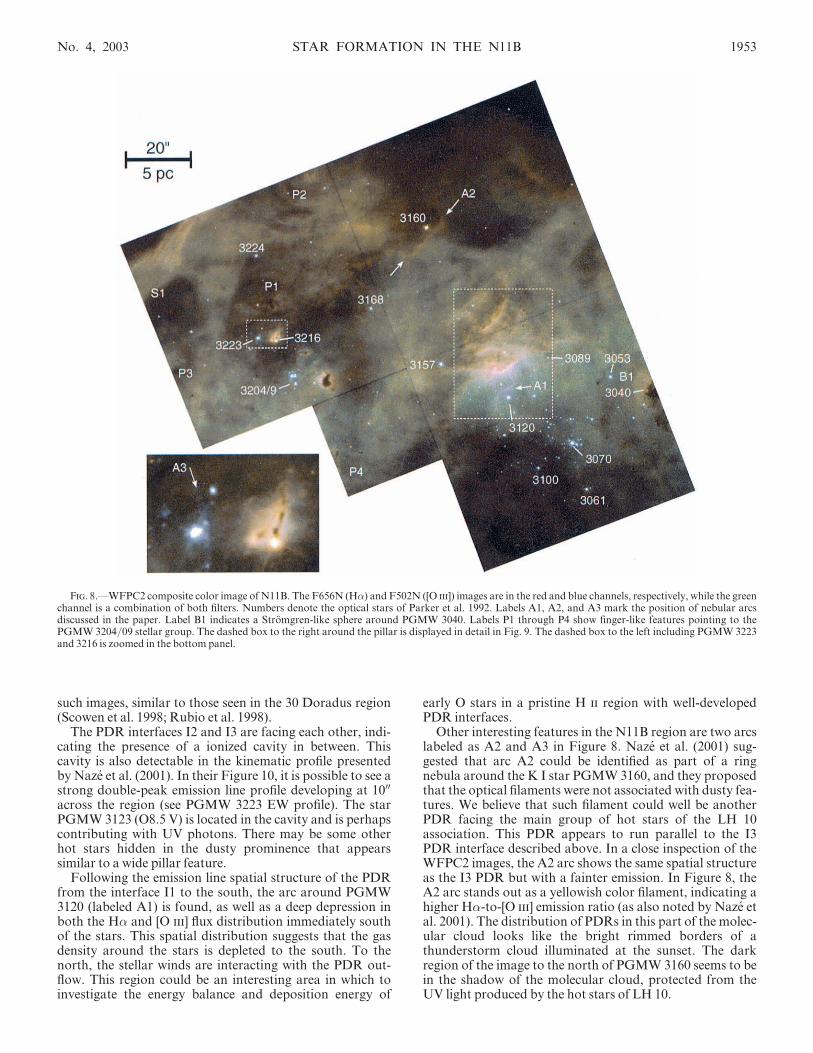
A false-color image (Fig. 8) of N11B was produced bycombining H� (F656N) and [O iii] (F502N) WFPC2mosaics. H�was mapped in red and [O iii] in blue, the greenchannel corresponds to H� and [O iii] together. In this
1950 BARBA ET AL. Vol. 125
image, nebular features with high H�-to-[O iii] ratio standout in yellowish colors, while those brighter in [O iii] appearblue. Figure 8 shows that the strongest nebular emissioncomes from the PDR interface between the molecular gasand the ionized cavity, where several LH 10 stars arelocated, i.e., PGMW3128 and PGMW3120. This PDR is infact a dusty prominent feature that shows a rugged surfacewith many bright and dark protuberances, some of themfacing to the hot stars. It also seems to be illuminated from
behind due to the presence of a weaker PDR edge seen tothe northeast. The PDR emission pattern looks like theheads of pillars in M16 (Hester et al. 1996) as it wasdescribed by Naze et al. (2001). These dusty features coin-cide with the maximum of the CO emission as seen from theCO distribution in Figure 5.
Figure 9 shows a close-up of the dusty prominence and itsneighboring stars of the N11BWFPC2 color mosaic displayin Figure 8. The reddest IR sources (Fig. 9, black numbers)
Fig. 6.—Integrated CO velocity channel maps of N11A. The velocity range in each channel is 3 km s�1 starting at VLSR = 273 km s�1. Contour levels gofrom 0.5 K km s�1 to 3.7 K km s�1 by 0.5 K km s�1. The position of PGMW3264 is indicated by a star in each channel map.
No. 4, 2003 STAR FORMATION IN THE N11B 1951
detected in our images are lying toward the molecular cloudcore, as expected for a star-forming region signature. Someof the IR sources are associated with small dusty protuber-ances, such as BRRG 108, 113, and 129, while others areclose to the bright H� spot (sources BRRG 162 and BRRG165). The methanol maser (marked with a blue circle) islocated in a dark spot close to the weak PDR edge north ofthe main molecular protuberance, between sources BRRG147 and BRRG 148.
On the surface of the molecular cloud, dark fingertip-likefeatures are seen with bright rimmed borders and dark tails(northwest corner of Fig. 9). The scale of these features isabout of 100 � 0>5 (0.25 pc � 0.12 pc). Two of them have IRsources, BRRG 108 and BRRG 129, directly associated.Their appearance is similar to those discovered by Scowenet al. (1998; see also Barba et al. 1999) in the inner cavity ofthe 30 Dor Nebula. Those in N11B possibly present a differ-ent illumination pattern. Walborn et al. (1999a) discoveredIR sources embedded in dark globules in the 30 Dor region.
Thus, N11B would be the second region in the LMC wherethese finger-like features with IR sources are detected. Thetwo sources associated with these features, BRRG 108 and129, plus BRRG 113 (very close to BRRG 108) satisfy thecriterion suggested by Brandner et al. (2001) for intermedi-ate-mass Herbig Ae/Be candidates in 30 Dor.
To the south of the PDR, there is a well-defined nebularring seen in bluish color in Figure 9 around PGMW 3120. Itconsists of a segmented nebular arc of about 300–600 radius.Although Naze et al. (2001) did a detailed nebular kinematicstudy of N11B, defining several shells from the H� and[N ii] emission-line splitting, they found that this nebularring was not detected as a kinematical feature in their echel-lograms. Their kinematic analysis around PGMW 3120reveals a huge shell extending to the south, east, and west asseen in the splitting of the nebular line emission. Toward thenorth of PGMW 3120, Naze et al. (2001) detect the emis-sion-line splitting, but at a distance of 700, where the brightring is located, the lines do not show any splitting furthernorth (see their Fig. 10). They suggest that the small H� arcis probably ‘‘ fortuitous.’’
We propose an alternative interpretation for this nebulararc. Photodissociation regions are characterized not only bythe presence of a molecular cloud surface that is beingphotodissociated and photoionized, but also by the exis-tence of a photoevaporative flow. This flow has beendetected in several PDRs where the strong radiation field isacting on the molecular cloud surface, and a clear exampleof this phenomenon areM16’s elephant trunks (Hester et al.1996). As we have mentioned earlier, the HST/WFPC2images of N11B show the same morphological pattern inthe nebular emission close to the dusty prominence. The H�and [O iii] images show clear striation patterns perpendicu-lar to the molecular interface, where photoevaporated gas isstreaming away from the molecular cloud toward the ion-ized H ii region. This striation pattern is clearly seen inN11B, despite of the factor 25 greater in distance betweenM16 and the LMC. Thus, the ring around PGMW 3120 isprobably due to the interaction between the stellar windsand the photoevaporative outflow that produces a concen-tration of gas at the region where the winds and the photoe-vaporation flow interact. This would be the case in thenorthern region of PGMW3120. At the position of the opti-cal nebular arc, there is no cavity, and the nebular spectrumdoes not show further splitting. To the north of the ring, theregion is dominated by the photoevaporative flow and notby the stellar winds that are responsible for the splitting seenin the nebular lines in all other directions. The ‘‘ kinematicexpanding shell ’’ proposed by Naze et al. (2001) does notcontinue to the north of PGMW3120.
3.6. PDR and Other Nebular Structures
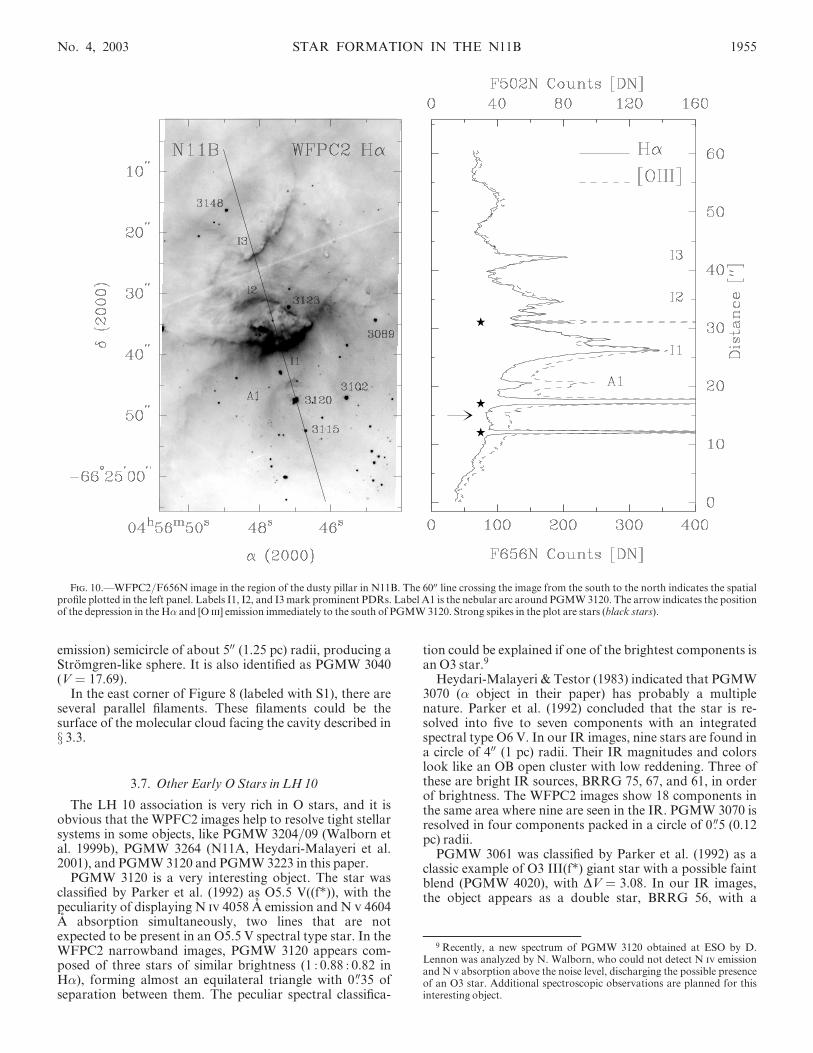
The structure of the PDR’s in H� and [O iii] emissionlines across PGMW 3120 is mapped along an almost north-south cut in Figure 10. The emission-line surface brightness(in detector counts) shows distinctive features. Three mainPDRs are identified across the line and labeled with I1, I2,and I3.
The PDR I1 shows a typical ionization structure whereH� emission appears more deeply concentrated in the inter-face than the [O iii] emission line that peaks at the outer edgeof the interface. Unfortunately, there are no [S ii] HSTimages yet, but we would expect filamentary structures in
Fig. 7.—CO spectra of the N11A region. The molecular gas shows adifferent CO velocity in the eastern side of PGMW 3264 with respect to itswestern side. This is better seen in the bottom panel where compositespectra of the eastern side and western side are shown. The western sidecomposite spectrum is drawn in dotted lines, while the eastern compositespectrum is drawn in continuous lines. The velocity difference is 2 km s�1.The temperature scale of the spectra are in antenna temperature T�
A , andthus should be multiplied by 1.4 to obtain them in T�
R .
1952 BARBA ET AL. Vol. 125
such images, similar to those seen in the 30 Doradus region(Scowen et al. 1998; Rubio et al. 1998).
The PDR interfaces I2 and I3 are facing each other, indi-cating the presence of a ionized cavity in between. Thiscavity is also detectable in the kinematic profile presentedby Naze et al. (2001). In their Figure 10, it is possible to see astrong double-peak emission line profile developing at 1000
across the region (see PGMW 3223 EW profile). The starPGMW3123 (O8.5 V) is located in the cavity and is perhapscontributing with UV photons. There may be some otherhot stars hidden in the dusty prominence that appearssimilar to a wide pillar feature.
Following the emission line spatial structure of the PDRfrom the interface I1 to the south, the arc around PGMW3120 (labeled A1) is found, as well as a deep depression inboth the H� and [O iii] flux distribution immediately southof the stars. This spatial distribution suggests that the gasdensity around the stars is depleted to the south. To thenorth, the stellar winds are interacting with the PDR out-flow. This region could be an interesting area in which toinvestigate the energy balance and deposition energy of
early O stars in a pristine H ii region with well-developedPDR interfaces.
Other interesting features in the N11B region are two arcslabeled as A2 and A3 in Figure 8. Naze et al. (2001) sug-gested that arc A2 could be identified as part of a ringnebula around the K I star PGMW3160, and they proposedthat the optical filaments were not associated with dusty fea-tures. We believe that such filament could well be anotherPDR facing the main group of hot stars of the LH 10association. This PDR appears to run parallel to the I3PDR interface described above. In a close inspection of theWFPC2 images, the A2 arc shows the same spatial structureas the I3 PDR but with a fainter emission. In Figure 8, theA2 arc stands out as a yellowish color filament, indicating ahigher H�-to-[O iii] emission ratio (as also noted by Naze etal. 2001). The distribution of PDRs in this part of the molec-ular cloud looks like the bright rimmed borders of athunderstorm cloud illuminated at the sunset. The darkregion of the image to the north of PGMW 3160 seems to bein the shadow of the molecular cloud, protected from theUV light produced by the hot stars of LH 10.
Fig. 8.—WFPC2 composite color image of N11B. The F656N (H�) and F502N ([O iii]) images are in the red and blue channels, respectively, while the greenchannel is a combination of both filters. Numbers denote the optical stars of Parker et al. 1992. Labels A1, A2, and A3 mark the position of nebular arcsdiscussed in the paper. Label B1 indicates a Stromgren-like sphere around PGMW 3040. Labels P1 through P4 show finger-like features pointing to thePGMW 3204/09 stellar group. The dashed box to the right around the pillar is displayed in detail in Fig. 9. The dashed box to the left including PGMW 3223and 3216 is zoomed in the bottom panel.
No. 4, 2003 STAR FORMATION IN THE N11B 1953

A tiny arc, labeled A3 in the inset of Figure 8, appears justclose to PGMW 32238 an O8.5 V star. The arc is located inbetween the stars and the Y-shaped cometary dust cloudsdescribed by Naze et al. (2001). This arc could be of similarnature as that seen around of PGMW 3120. The outflowpattern seen around the east branch of the Y-shaped cloudsuggests that PGMW3223 could contribute to its photoeva-poration. Naze et al. (2001) identified a star with strong H�emission in the tip of the Y-shaped dust cloud and suggestedthat this star is part of the ongoing star formation in theregion. The star, identified as PGMW 3216, has V = 15.52,B�V = +0.40, U�B = �0.51, and Q = �0.80, indicatingthat it is an obscured hot source. A secondary maximum ofthe CO emission is located in this region (see Fig. 5), favour-ing the scenario of star-forming activity in such place.
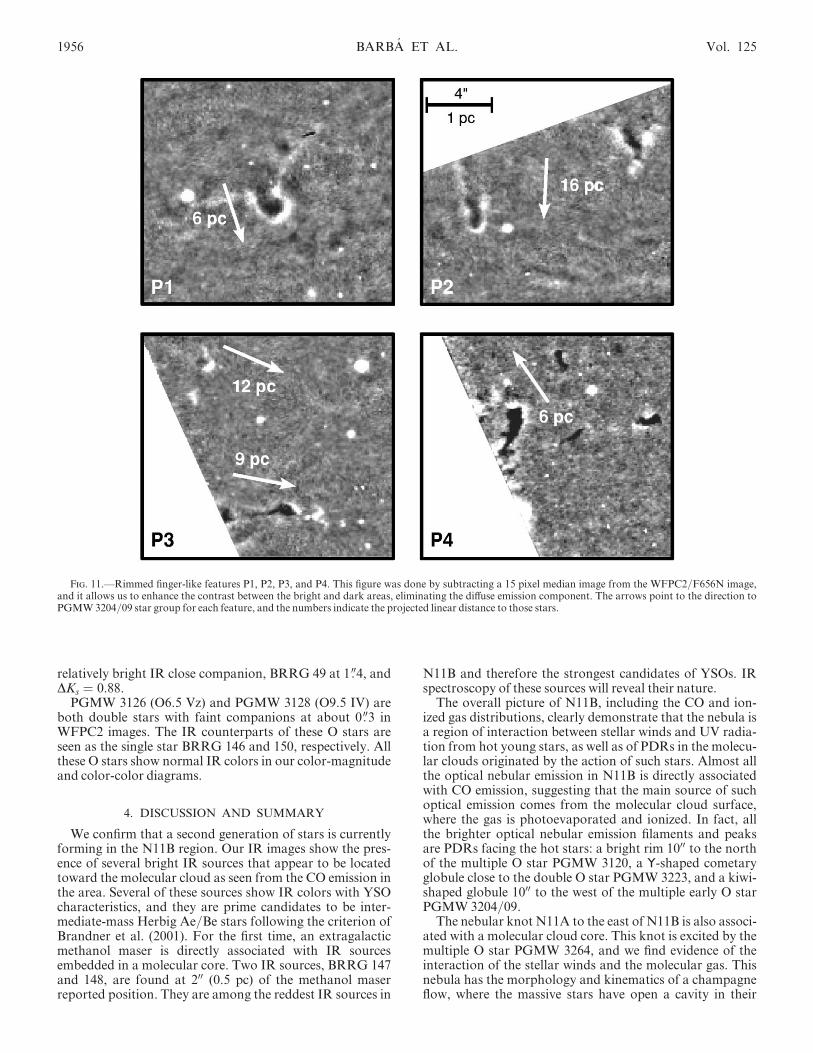
Pointing toward the stars PGMW 3204/09 there are sev-eral dusty clouds, some of them showing PDR interfaces.The kiwi-shaped cloud at 1000 to the west of those stars wasnicely described by Naze et al. (2001). The rimmed finger-
like features with bright tips, labeled P1, P2, P3, and P4 inFigure 8 are shown in Figure 11. They show an illuminatedsurface facing PGMW3204/09 possibly due to the UV radi-ation engraving the molecular cloud as far as 6000 (15 pc)from the stars. This figure was done by subtracting a 15 pix-els median image from the F656N image. This procedureallows us to enhance the contrast between the bright anddark areas, eliminating the diffuse emission component. Thearrows point to the direction to PGMW 3204/09 star groupfor each feature. It also indicates the projected lineardistance to those stars.
There are dusty filamentary structures that do not seemto be directly illuminated by the hot stars, located to thesouth and east of PGMW 3070 (see Fig. 8). The presence ofthese dusty clouds could be relevant for the cluster studies,since they can be responsible for spacial variable extinctionat the scale of few tenths of arcseconds in the LH 10 area.
A very filamentary cloud appears close to the west cornerof the WFPC2 images with an embedded star labeled B1 inFigure 8. This is the BRRG 26 source (Ks = 15.88,J�H = 0.46, and H�Ks = 0.19) in our IR images, whichshows a compact nebulosity. The source is embedded in thetip of the dark pillar, which appears as a yellowish (H�
Fig. 9.—Detail of theWFPC2 composite color image (Fig. 8) around the dusty prominence. Numbers have the samemeaning that in Fig. 1. The ‘‘M ’’ labeldenotes the position of the methanol maser.
8 This star is resolved in two components in WFPC2 images, with anintensity ratio in H� filter of about 1 : 0.6 and a separation of 0>3.
1954 BARBA ET AL. Vol. 125
emission) semicircle of about 500 (1.25 pc) radii, producing aStromgren-like sphere. It is also identified as PGMW 3040(V = 17.69).
In the east corner of Figure 8 (labeled with S1), there areseveral parallel filaments. These filaments could be thesurface of the molecular cloud facing the cavity described inx 3.3.
3.7. Other Early O Stars in LH 10
The LH 10 association is very rich in O stars, and it isobvious that the WPFC2 images help to resolve tight stellarsystems in some objects, like PGMW 3204/09 (Walborn etal. 1999b), PGMW 3264 (N11A, Heydari-Malayeri et al.2001), and PGMW3120 and PGMW3223 in this paper.
PGMW 3120 is a very interesting object. The star wasclassified by Parker et al. (1992) as O5.5 V((f*)), with thepeculiarity of displaying N iv 4058 A emission and N v 4604A absorption simultaneously, two lines that are notexpected to be present in an O5.5 V spectral type star. In theWFPC2 narrowband images, PGMW 3120 appears com-posed of three stars of similar brightness (1 : 0.88 : 0.82 inH�), forming almost an equilateral triangle with 0>35 ofseparation between them. The peculiar spectral classifica-
tion could be explained if one of the brightest components isan O3 star.9
Heydari-Malayeri & Testor (1983) indicated that PGMW3070 (� object in their paper) has probably a multiplenature. Parker et al. (1992) concluded that the star is re-solved into five to seven components with an integratedspectral type O6 V. In our IR images, nine stars are found ina circle of 400 (1 pc) radii. Their IR magnitudes and colorslook like an OB open cluster with low reddening. Three ofthese are bright IR sources, BRRG 75, 67, and 61, in orderof brightness. The WFPC2 images show 18 components inthe same area where nine are seen in the IR. PGMW 3070 isresolved in four components packed in a circle of 0>5 (0.12pc) radii.
PGMW 3061 was classified by Parker et al. (1992) as aclassic example of O3 III(f*) giant star with a possible faintblend (PGMW 4020), with DV = 3.08. In our IR images,the object appears as a double star, BRRG 56, with a
Fig. 10.—WFPC2/F656N image in the region of the dusty pillar in N11B. The 6000 line crossing the image from the south to the north indicates the spatialprofile plotted in the left panel. Labels I1, I2, and I3 mark prominent PDRs. Label A1 is the nebular arc around PGMW3120. The arrow indicates the positionof the depression in the H� and [O iii] emission immediately to the south of PGMW3120. Strong spikes in the plot are stars (black stars).
9 Recently, a new spectrum of PGMW 3120 obtained at ESO by D.Lennon was analyzed by N. Walborn, who could not detect N iv emissionand N v absorption above the noise level, discharging the possible presenceof an O3 star. Additional spectroscopic observations are planned for thisinteresting object.
No. 4, 2003 STAR FORMATION IN THE N11B 1955
relatively bright IR close companion, BRRG 49 at 1>4, andDKs = 0.88.
PGMW 3126 (O6.5 Vz) and PGMW 3128 (O9.5 IV) areboth double stars with faint companions at about 0>3 inWFPC2 images. The IR counterparts of these O stars areseen as the single star BRRG 146 and 150, respectively. Allthese O stars show normal IR colors in our color-magnitudeand color-color diagrams.
4. DISCUSSION AND SUMMARY
We confirm that a second generation of stars is currentlyforming in the N11B region. Our IR images show the pres-ence of several bright IR sources that appear to be locatedtoward the molecular cloud as seen from the CO emission inthe area. Several of these sources show IR colors with YSOcharacteristics, and they are prime candidates to be inter-mediate-mass Herbig Ae/Be stars following the criterion ofBrandner et al. (2001). For the first time, an extragalacticmethanol maser is directly associated with IR sourcesembedded in a molecular core. Two IR sources, BRRG 147and 148, are found at 200 (0.5 pc) of the methanol maserreported position. They are among the reddest IR sources in
N11B and therefore the strongest candidates of YSOs. IRspectroscopy of these sources will reveal their nature.
The overall picture of N11B, including the CO and ion-ized gas distributions, clearly demonstrate that the nebula isa region of interaction between stellar winds and UV radia-tion from hot young stars, as well as of PDRs in the molecu-lar clouds originated by the action of such stars. Almost allthe optical nebular emission in N11B is directly associatedwith CO emission, suggesting that the main source of suchoptical emission comes from the molecular cloud surface,where the gas is photoevaporated and ionized. In fact, allthe brighter optical nebular emission filaments and peaksare PDRs facing the hot stars: a bright rim 1000 to the northof the multiple O star PGMW 3120, a Y-shaped cometaryglobule close to the double O star PGMW 3223, and a kiwi-shaped globule 1000 to the west of the multiple early O starPGMW3204/09.
The nebular knot N11A to the east of N11B is also associ-ated with a molecular cloud core. This knot is excited by themultiple O star PGMW 3264, and we find evidence of theinteraction of the stellar winds and the molecular gas. Thisnebula has the morphology and kinematics of a champagneflow, where the massive stars have open a cavity in their
Fig. 11.—Rimmed finger-like features P1, P2, P3, and P4. This figure was done by subtracting a 15 pixel median image from the WFPC2/F656N image,and it allows us to enhance the contrast between the bright and dark areas, eliminating the diffuse emission component. The arrows point to the direction toPGMW3204/09 star group for each feature, and the numbers indicate the projected linear distance to those stars.
1956 BARBA ET AL. Vol. 125
parental molecular cloud. Future IR data will allow tosearch for IR embedded sources in the region.
Walborn & Parker (1992) proposed that N11 was fewer105 yr older than the 30 Doradus, based on their analysis ofthe relative ages of the stellar content of both giant H ii
regions. In 30 Doradus, a new generation of massive stars iscurrently being formed in the peripherical molecular cloudsapparently due to the energetic activity of the hot massivestellar core R136 (Rubio et al. 1998; Walborn et al. 1999a;Brandner et al. 2001). The stellar content of such newgeneration in 30 Doradus has O stars embedded in compactnebulosities (Walborn et al. 2002 and references therein),with a relative age of about 1–2 Myr younger than the coreR136, characterized by the presence of luminous H-burningWN stars with an age of about 2 Myr. Walborn et al.(1999b) derived an age of about 3.5Myr for the LH 9 associ-ation in the N11 core and less than 1 Myr for PGMW 3209in LH 10. Their results confirm the youth of the LH 10association (also deduced from absence of WR stars) andthat the N11 region is older than 30 Doradus.
Our study supports the idea that N11B is in a later stageof evolution than 30 Doradus. It shows a lack of bright IR
sources compared with the star-forming regions in 30 Dor.Our brightest IR source has K = 15, while several K = 12IR embedded stars were observed in 30 Dor. The IR sourcesin N11B are probably intermediate-mass star candidatesstill embedded in the molecular gas. The O stars have blownaway the molecular material and are disrupting the molecu-lar cloud surface. Thus, we may be witnessing the last stageof the second generation burst in N11B.
M. R. and R. H. B. are supported by the Chilean Centerfor Astrophysics FONDAP No. 15010003. This work wasfunded by FONDECYT (CHILE) through grants 1990881and 7990042. R. H. B. also gratefully acknowledges supportfrom Fundacion Antorchas, Argentina (project No. 13783-5). We wish to thank to the referee Joel Parker for the cour-teous and useful comments that greatly improved the pre-sentation of this paper. This publication makes use of dataproducts from the Two Micron All Sky Survey, which is ajoint project of the University of Massachusetts and theInfrared Processing and Analysis Center, funded bythe National Aeronautics and Space Administration andthe National Science Foundation.
REFERENCES
Arnal, E. M., Cersosimo, J. C., May, J., & Bronfman, L. 1987, A&A, 174,78
Barba, R. H., Walborn, N. R., & Rubio, M. 1999, in Rev. MexicanaAstron. Astrofis. Ser. Conf. 8, Workshop on Hot Stars in Open Clustersof the Galaxy and the Magellanic Clouds, ed. N. I. Morrell, V. S.Niemela, & R. H. Barba (Mexico, D. F.: Inst. Astron. Univ. Nac.AutonomaMexico), 161
Beasley, A. J., Ellingsen, S. P., Claussen, M. J., & Wilcots, E. 1996, ApJ,459, 600
Bodenheimer, P., Tenorio-Tagle, G., &Yorke, H.W. 1979, ApJ, 233, 85Brandner, W., Grebel, E. K., Barba, R. H., Walborn, N. R., &Monetti, A.2001, AJ, 122, 858
Caldwell, D. A., &Kutner,M. L. 1996, ApJ, 472, 611Caswell, J., Vaile, R., Ellingsen, S., Whiteoak, J., & Norris, R. 1995,MNRAS, 272, 96
Cutri, R. M., et al. 2000, Explanatory Supplement to the 2MASS SecondIncremental Data Release (Pasadena: IPAC)
Davies, R. D., Elliot, K. H., &Meaburn, J. 1976,MmRAS, 81, 89Ellingsen, S. P., Whiteoak, J. B., Norris, R. P., Caswell, J. L., & Vaile,R. A. 1994,MNRAS, 269, 1019
Elmegreen, B. G. 1998, in ASPConf. Ser. 148, Origins, ed C. E.Woodward,J.M. Shull, & H. A. Thronson, Jr. (San Francisco: ASP), 150
Elmegreen, B. G., & Lada, C. J. 1977, ApJ, 214, 725Hanson,M.M., Howarth, I. D., & Conti, P. S. 1997, ApJ, 489, 698Henize, K. G. 1956, ApJS, 2, 315Hester, J. J., et al. 1996, AJ, 111, 2349Heydari-Malayeri, M., Charmandaris, V., Deharveng, L., Rosa, M. R.,Schaerer, D., & Zinnecker, H. 2001, A&A, 372, 527
Heydari-Malayeri, M., Royer, P., Rauw, G., & Walborn, N. R. 2000,A&A, 361, 877
Heydari-Malayeri, M., & Testor, G. 1983, A&A, 118, 116———. 1985, A&A, 144, 98Israel, F. P., & de Graauw, Th. 1991, in IAU Symp. 148, The MagellanicClouds, ed. R. Haynes &D.Milne (Dordrecht: Kluwer), 45
Israel, F. P., et al. 2002, A&A, in pressKennicutt, R. C., Jr., &Hodge, P.W. 1986, ApJ, 306, 130Lucke, P. B., &Hodge, P.W. 1970, AJ, 75, 171Naze, Y., Chu, Y.-H., Points, S. D., Danforth, C.W., Rosado,M., & Chen,C.-H. R. 2001, AJ, 122, 921
Oey, M. S. 1999, in IAU Symp. 190, New Views of the Magellanic Clouds,ed. Y.-H. Chu, N. R. Suntzeff, J. E. Hesser, & D. A. Bohlender (SanFrancisco: ASP), 78
Parker, J. Wm., Garmany, C. D., Massey, P., & Walborn, N. R. 1992, AJ,103, 1205
Persson, S. E., Murphy, D. C., Krzeminski, W., Roth, M., & Rieke, M. J.1998, AJ, 116, 2475
Persson, S. E., West, S. C., Carr, D. M., Sivaramakrishnan, A., &Murphy,D. C. 1992, PASP, 104, 204
Rosado, M., Laval, A., Le Coarer, E., Georgelin, Y. P., Amram, P.,Marcelin,M., Goldes, G., &Gach, J. L. 1996, A&A, 308, 588
Rubio, M., Barba, R. H., Walborn, N. R., Probst, R. G., Garcıa, J., &Roth,M. R. 1998, AJ, 116, 1708
Scowen, P. A., et al. 1998, AJ, 116, 163Sinclar, M. W., Carrad, G. J., Caswell, J. L., Norris, R. P., & Whiteoak,J. B. 1992,MNRAS, 256, 33P
Smith, N., Egan, M. P., Carey, S., Price, S. D., Morse, J. A., & Price, P. A.2000, ApJ, 532, L145
Tenorio-Tagle, G. 1979, A&A, 71, 59Vacca,W. D., Garmany, C. D., & Shull, J.M. 1996, ApJ, 460, 914Walborn, N. R., Barba, R. H., Brandner, W., Rubio, M., Grebel, E. K., &Probst, R. G. 1999a, AJ, 117, 225
Walborn, N. R., Drissen, L., Parker, J. Wm., Saha, A., MacKenty, J.W., &White, R. L. 1999b, AJ, 118, 1684
Walborn, N. R.,Maız-Apellaniz, J., & Barba, R. H. 2002, AJ, 124, 1601Walborn, N. R., & Parker, J.Wm. 1992, ApJ, 399, L87Walsh, A. J., Burton, M. G., Hyland, A. R., & Robinson, G. 1999,MNRAS, 309, 905
Wang, Q., &Helfand, D. J. 1991, ApJ, 373, 497
No. 4, 2003 STAR FORMATION IN THE N11B 1957