
THE NUCLEAR GAS DYNAMICS AND STAR FORMATION OF ...
13
THE NUCLEAR GAS DYNAMICS AND STAR FORMATION OF MARKARIAN 231 1 R. I. Davies, L. J. Tacconi, and R. Genzel Max-Planck-Institut fu ¨r extraterrestrische Physik, Postfach 1312, 85741, Garching, Germany Receivv ed 2004 April 15; accepted 2004 June 9 ABSTRACT We report adaptive optics H- and K-band spectroscopy of the inner few arcseconds of the luminous merger/ ultraluminous infrared galaxy (ULIRG)/QSO Mrk 231, at spatial resolutions as small as 0B085. For the first time we have been able to resolve the active star-forming region close to the active galactic nucleus (AGN) using stellar absorption features, finding that its luminosity profile is well represented by an exponential function with a disk scale length 0B18–0B24 (150–200 pc), and implying that the stars exist in a disk rather than a spheroid. The stars in this region are also young (10–100 Myr), and it therefore seems likely that they have formed in situ in the gas disk, which itself resulted from the merger. The value of the stellar velocity dispersion ( 100 km s 1 rather than the usual few times 10 km s 1 in large-scale disks) is a result of the large mass surface density of the disk. The stars in this region have a combined mass of at least 1:6 ; 10 9 M , and account for 25%–40% of the bolometric luminosity of the entire galaxy. At our spatial resolution the stellar light in the core is diluted by more than a factor of 10 even in the H band by continuum emission from hot dust around the AGN. We have detected the 2.12 "m 1–0 S(1) H 2 and 1.64 "m[Fe ii] lines out to radii exceeding 0B5. The kinematics for the two lines are very similar to each other as well as to the stellar kinematics, and broadly consistent with the nearly face-on rotating disk reported in the literature and based on interferometric CO 1–0 and CO 2–1 measurements of the cold gas. However, they suggest a more complex situation in which the inner 0B2–0B3 (200 pc) is warped out of its original disk plane. Such a scenario is supported by the projected shape of the nuclear stellar disk, the major axis of which is significantly offset from the nominal direction, and by the pronounced shift on very small scales in the direction of the radio jet axis, which has been reported in the literature. Subject headin gg s: galaxies: individual (Markarian 231) — galaxies: ISM — galaxies: nuclei — galaxies: Seyfert — galaxies: star clusters — ISM: kinematics and dynamics 1. INTRODUCTION The ultraluminous infrared galaxy (ULIRG) Mrk 231 (UGC 8058, VII Zw 490) has the highest luminosity (L IR 3:2 ; 10 12 L for a distance of 170 Mpc) of the original ULIRG sample of Sanders et al. (1988) from the Bright Galaxy Survey. That this galaxy hosts a powerful active galactic nucleus (AGN) is beyond doubt, as evidenced by the wealth of observations, for example, a compact nuclear radio continuum source with jets (Neff & Ulvestad 1988; Ulvestad et al. 1999a, 1999b; Taylor et al. 1999), broad absorption lines (Smith et al. 1995), and a compact source of variable hard X-ray emission (Gallagher et al. 2002; Braito et al. 2004). Because Mrk 231 has an absolute blue magnitude M B ¼21:7 close to the cutoff of 22.1 for QSOs (Schmidt & Green 1983), it is often clas- sified as one of these. However, it is also sometimes classed as a Seyfert 1, particularly because it has become clear that the AGN is responsible for only a part of the luminosity, and that a significant fraction (1/3 to 2/3) in fact originates in star for- mation (Krabbe et al. 1997; Downes & Solomon 1998; Tacconi et al. 2002). It is exactly this quality—the coexistence in the nucleus of both the star-forming and AGN phenomena with massive luminosities—combined with its relative proximity that make Mrk 231 a key object for investigations of whether, as a class, ULIRGs do (e.g., Sanders et al. 1988; Veilleux et al. 2002) or do not (e.g., Tacconi et al. 2002) evolve into QSOs. The asymmetrical optical morphology and large-scale tidal tails (Hutchings & Neff 1987; Sanders et al. 1987; Canalizo & Stockton 2000) of Mrk 231 are typical of the remnants pre- dicted by models of merger events between equal mass gas- rich spiral galaxies (e.g., Barnes & Hernquist 1992; Mihos 1999). Such models indicate that Mrk 231 is most likely to be such a late-stage merger. The structural and kinematic prop- erties of a sample of similar late-stage ULIRG mergers have been studied by Genzel et al. (2001) to investigate whether they might evolve later into (intermediate mass, L * ) ellipticals; and by Tacconi et al. (2002) to test whether, once rid of their gas and dust shells, they might be the progenitors of QSOs. The total sample consists of 18 ULIRGs, of which eight contain QSO nuclei. Mrk 231 presents a puzzle, since its stellar velocity dispersion of 120 km s 1 is the smallest of the sample (mea- sured in 0B6 slits). A remnant of a merger between massive gas- rich spirals is expected to have a higher velocity dispersion, and indeed the ULIRG sample as a whole has a (logarithmic) av- erage of 185 km s 1 . On the other hand, Mrk 231 appears to be similar to the rest of the sample in having a relaxed stellar population, with V rot =' ¼ 0:2 and an r 1/4 luminosity profile. However, again the effective radius of the extended H- and K-band light in Mrk 231 of 300 pc is the smallest of the sample, which had a (logarithmic) average of 2 kpc. Under the as- sumption that the stellar distribution is spheroidal, Tacconi et al. (2002) calculated the mass within the effective radius (300 pc) to be 6 ; 10 9 M . From the relation between velocity dispersion and black hole mass, they also estimated M BH ¼ 1:3 ; 10 7 M , which would imply an Eddington efficiency of 6. The rather uncomfortable result of a super-Eddington black hole lumi- nosity led them to consider whether the stars might actually lie 1 The near-infrared data presented herein were obtained at the W. M. Keck Observatory, which is operated as a scientific partnership among the California Institute of Technology, the University of California, and the National Aero- nautics and Space Administration. The Observatory was made possible by the generous financial support of the W. M. Keck Foundation. 781 The Astrophysical Journal, 613:781–793, 2004 October 1 # 2004. The American Astronomical Society. All rights reserved. Printed in U.S.A.
-
Upload
khangminh22 -
Category
Documents
-
view
1 -
download
0
Transcript of THE NUCLEAR GAS DYNAMICS AND STAR FORMATION OF ...

THE NUCLEAR GAS DYNAMICS AND STAR FORMATION OF MARKARIAN 2311
R. I. Davies, L. J. Tacconi, and R. Genzel
Max-Planck-Institut fur extraterrestrische Physik, Postfach 1312, 85741, Garching, Germany
Receivved 2004 April 15; accepted 2004 June 9
ABSTRACT
We report adaptive optics H- and K-band spectroscopy of the inner few arcseconds of the luminous merger/ultraluminous infrared galaxy (ULIRG)/QSO Mrk 231, at spatial resolutions as small as 0B085. For the first timewe have been able to resolve the active star-forming region close to the active galactic nucleus (AGN) using stellarabsorption features, finding that its luminosity profile is well represented by an exponential function with a diskscale length 0B18–0B24 (150–200 pc), and implying that the stars exist in a disk rather than a spheroid. The stars inthis region are also young (10–100 Myr), and it therefore seems likely that they have formed in situ in the gasdisk, which itself resulted from the merger. The value of the stellar velocity dispersion (�100 km s�1 rather thanthe usual few times 10 km s�1 in large-scale disks) is a result of the large mass surface density of the disk. The starsin this region have a combined mass of at least 1:6 ;109 M�, and account for 25%–40% of the bolometricluminosity of the entire galaxy. At our spatial resolution the stellar light in the core is diluted by more than a factorof 10 even in the H band by continuum emission from hot dust around the AGN. We have detected the 2.12 �m1–0 S(1) H2 and 1.64 �m [Fe ii] lines out to radii exceeding 0B5. The kinematics for the two lines are very similar toeach other as well as to the stellar kinematics, and broadly consistent with the nearly face-on rotating disk reportedin the literature and based on interferometric CO 1–0 and CO 2–1 measurements of the cold gas. However, theysuggest a more complex situation in which the inner 0B2–0B3 (200 pc) is warped out of its original disk plane. Sucha scenario is supported by the projected shape of the nuclear stellar disk, the major axis of which is significantlyoffset from the nominal direction, and by the pronounced shift on very small scales in the direction of the radio jetaxis, which has been reported in the literature.
Subject headinggs: galaxies: individual (Markarian 231) — galaxies: ISM — galaxies: nuclei — galaxies: Seyfert —galaxies: star clusters — ISM: kinematics and dynamics
1. INTRODUCTION
The ultraluminous infrared galaxy (ULIRG) Mrk 231 (UGC8058, VII Zw 490) has the highest luminosity (LIR � 3:2 ;1012 L� for a distance of 170 Mpc) of the original ULIRGsample of Sanders et al. (1988) from the Bright Galaxy Survey.That this galaxy hosts a powerful active galactic nucleus(AGN) is beyond doubt, as evidenced by the wealth ofobservations, for example, a compact nuclear radio continuumsource with jets (Neff & Ulvestad 1988; Ulvestad et al. 1999a,1999b; Taylor et al. 1999), broad absorption lines (Smith et al.1995), and a compact source of variable hard X-ray emission(Gallagher et al. 2002; Braito et al. 2004). Because Mrk 231has an absolute blue magnitudeMB ¼ �21:7 close to the cutoffof �22.1 for QSOs (Schmidt & Green 1983), it is often clas-sified as one of these. However, it is also sometimes classed asa Seyfert 1, particularly because it has become clear that theAGN is responsible for only a part of the luminosity, and that asignificant fraction (1/3 to 2/3) in fact originates in star for-mation (Krabbe et al. 1997; Downes & Solomon 1998; Tacconiet al. 2002). It is exactly this quality—the coexistence in thenucleus of both the star-forming and AGN phenomena withmassive luminosities—combined with its relative proximitythat make Mrk 231 a key object for investigations of whether,as a class, ULIRGs do (e.g., Sanders et al. 1988; Veilleux et al.2002) or do not (e.g., Tacconi et al. 2002) evolve into QSOs.
The asymmetrical optical morphology and large-scale tidaltails (Hutchings & Neff 1987; Sanders et al. 1987; Canalizo &Stockton 2000) of Mrk 231 are typical of the remnants pre-dicted by models of merger events between equal mass gas-rich spiral galaxies (e.g., Barnes & Hernquist 1992; Mihos1999). Such models indicate that Mrk 231 is most likely to besuch a late-stage merger. The structural and kinematic prop-erties of a sample of similar late-stage ULIRG mergers havebeen studied by Genzel et al. (2001) to investigate whether theymight evolve later into (intermediate mass, L
*) ellipticals; and
by Tacconi et al. (2002) to test whether, once rid of their gas anddust shells, they might be the progenitors of QSOs. The totalsample consists of 18 ULIRGs, of which eight contain QSOnuclei. Mrk 231 presents a puzzle, since its stellar velocitydispersion of 120 km s�1 is the smallest of the sample (mea-sured in 0B6 slits). A remnant of a merger between massive gas-rich spirals is expected to have a higher velocity dispersion, andindeed the ULIRG sample as a whole has a (logarithmic) av-erage of 185 km s�1. On the other hand, Mrk 231 appears to besimilar to the rest of the sample in having a relaxed stellarpopulation, with Vrot=� ¼ 0:2 and an r1/4 luminosity profile.However, again the effective radius of the extended H- andK-band light in Mrk 231 of 300 pc is the smallest of the sample,which had a (logarithmic) average of 2 kpc. Under the as-sumption that the stellar distribution is spheroidal, Tacconi et al.(2002) calculated the mass within the effective radius (300 pc)to be 6 ; 109 M�. From the relation between velocity dispersionand black hole mass, they also estimated MBH ¼ 1:3 ; 107 M�,which would imply an Eddington efficiency of 6. The ratheruncomfortable result of a super-Eddington black hole lumi-nosity led them to consider whether the stars might actually lie
1 The near-infrared data presented herein were obtained at the W. M. KeckObservatory, which is operated as a scientific partnership among the CaliforniaInstitute of Technology, the University of California, and the National Aero-nautics and Space Administration. The Observatory was made possible by thegenerous financial support of the W. M. Keck Foundation.
781
The Astrophysical Journal, 613:781–793, 2004 October 1
# 2004. The American Astronomical Society. All rights reserved. Printed in U.S.A.

in a nearly face-on regularly rotating inner disk, as exhibited bythe cold molecular gas (Bryant & Scoville 1996; Downes &Solomon 1998), since this could also lead to a low value forVrot=�. To address this question in detail and shed light on thenucleus of Mrk 231, we have undertaken near-infrared spec-troscopy using adaptive optics. The aim is to investigate itsstellar luminosity profile, mass, and geometry, and to probe itsnuclear dynamics at high angular resolution in the centralarcsecond.
The paper is arranged as follows. After summarizing theobservations in x 2, we consider the shape and extent of thecontinuum emission in x 3. The radial profile, luminosity, andmass of the nuclear star-forming region is discussed in detail inx 4. In x 5 we turn to the kinematics of the gas and stars, andconstruct a simple planar disk model that can reproduce theircharacteristics. Bringing these results together suggests that thestarburst in the nucleus of Mrk 231 is very young, and so in x 6we appraise other evidence from the literature that this is thecase. Finally, we conclude in x 7.
2. OBSERVATIONS AND DATA REDUCTION
The data were obtained on the night of 2002 May 28 usingNIRC-2, in a partially commissioned shared-risk basis, behindthe adaptive optics (AO) system (Wizinowich et al. 2000) onthe Keck II telescope. NIRC-2 is designed to take full advan-tage of the AO system and has a 1024 ; 1024 Aladdin-3 InSbarray, with a number of grisms and slits for the spectroscopicmode. It is unusual in that, in order to select the requiredwavelength range, the slit and science target are shifted in theAO system’s focal plane rather than tilting the grism.
Spectra were obtained in the H and K bands with the camerain wide-field mode (40 mas pixels) through an 80 mas slit withthe medium-resolution grism, resulting in nominal spectralresolutions of R ¼ 2385 and 2090, respectively. The wave-length coverage is sufficient to include each band entirely in asingle setting. Two position angles (P.A.) were used: �80�
(close to the kinematic major axis) and �25� (reasonably closeto the minor axis, but bisecting the extended 1–0 S(1) emissionseen by Krabbe et al. 1997). The two positions of the slit aredepicted in Figure 1. Individual exposures of 600 s in the Hband and 300 s in the K band were used, nodding the slit aftereach exposure. Total integration times were 40 and 80 minutes.Standard calibrations were performed, including atmosphericstandard stars (using the type G2 V star HD 117845 in the Hband and the F2 star HD 110105 in the K band), arcs, flat fields,and dark frames. The data were reduced using PC-IRAF 2.11.3using standard techniques.
The spatial resolution depended on the AO performance, thereference for which was Mrk 231 itself. Because the seeing wasreasonably good and stable, the wave-front sensor was able torun at a frame rate of 55 Hz with up to 60 counts pixel�1. Forthe K band this resulted in a spatial resolution limited only bythe coarse pixel sampling. The FWHM measured on the nu-cleus of Mrk 231 was 85 mas (close to the 80 mas expected forNyquist sampling). For the H band, both the spatial and tem-poral scales of the atmospheric turbulence are smaller, andhence the AO performance is not so good. The resultingFWHMs measured on the galaxy nucleus were 0B192 and0B160 for the two position angles (�80� and �25�, respec-tively). In x 4 we show that the resolved stellar continuumcontributes relatively little to this, and hence we can take it as areasonable estimate of the spatial resolution.
The resulting FWHM spectral resolution measured fromthe arc lamp lines is 120 km s�1 at 2.2 �m and 164 km s�1 at
1.6 �m. The K-band resolution is rather better than the nominalvalue because of the AO correction, which resulted in a point-spread function (PSF) that had an intrinsic FWHM rather lessthan 2 pixels across. Hence the spectral resolution is limited bythe PSF rather than simply the slit width.Flux calibration for the H-band data could not be performed
using a standard star. Instead we use the H-band point-sourcemagnitude for Mrk 231 of H ¼ 10:09 from the Two Micron AllSky Survey. Extrapolating the continuum profile, assumingazimuthal symmetry, over a filled circular aperture with a di-ameter of 200 (which contains effectively all the flux we havedetected; see Fig. 2) indicates that the flux falling into the slit isa factor of 5.1 less than would be in such an aperture. Thereforewe assign a magnitude of 11.86 to the flux detected in thecentral 200 along the slit. Similarly, the magnitude for a 100
circular aperture is H ¼ 10:19.
3. IMAGING AND CONTINUUM PROFILE
A short sequence of images, totaling 20 s, was taken inthe K band to assess the size of the nucleus of Mrk 231 duringAO wave-front correction. This was measured to be 85 masFWHM, including loss of resolution from undersampling andsubpixel shifting to align the frames. A similar sequence ofimages taken on the standard star, while the AO system wasrunning with the same control parameters (although with 200counts rather than 60, even after dimming the star with a neutraldensity filter), led to the same measurement of the FWHM andan estimate of the Strehl ratio to be �20% in the K band. Thus,although the final images are not diffraction limited, this ispurely a result of the data acquisition procedure, and the nucleusof Mrk 231 is not resolved in the K band on this spatial scale.A second source about 0B19 to the north has been reported
by Lai et al. (1998) who claimed to have seen the same sourcein deconvolved J-, H-, and K-band images. In the K band ithad a relative intensity of a few percent. The AO PSF for theKeck telescope is very complex, and because of pupil rotation
Fig. 1.—Two 0B08 slits at position angles �80� and �25� superimposed onthe 60 mas resolution 1.4 GHz radio continuum map of Carilli et al. (1998).The positive and negative ends of each slit (as referred to in the text) havebeen identified as such. It has been assumed that the slits were centeredexactly on the position of the central radio continuum source ( filled circle).
DAVIES, TACCONI, & GENZEL782 Vol. 613

it was not possible to perform a satisfactory deconvolution ofMrk 231 for our data. The feature is not included in the spec-troscopic data because the slit orientations were such that nei-ther overlapped with the position where it should be. We aretherefore unable to comment on this feature.
The H-band continuum profiles along the slit are shown inthe top panels of Figure 2. At both position angles these havebeen fitted with a combination of a Gaussian and a Moffatfunction. This provides an excellent match to the spatial profilebecause the Gaussian represents both the core of the AO PSFand the bright unresolved point source of the continuum relatedto hot dust around the AGN, while the Moffat represents jointlythe halo of the PSF and the faint extended continuum com-ponent, which has wide shallow wings—at a radial offset of 100,the continuum is �0.5% of its peak intensity. At P.A. �80�, thefit is remarkably good and has an overall FWHM of 0B192.
The Moffat profile has a FWHM of 0B41, consistent with boththe expected size of the halo for the ambient seeing and theeffective radius of the de Vaucouleurs fit to imaging data(Tacconi et al. 2002). It is similar to the broad component at theother position angle and also those measured in the continuumof the K-band spectra. The Gaussian component, representingthe core of the PSF, has a FWHM 0B14. At a P.A. �25
�the
Gaussian component has a slightly smaller width giving anoverall FWHM of 0B160, consistent with a better AO correctionwhile these data were taken. However, there is a residual at anoffset of �0B14 that has a peak intensity 18% of the nucleus.We return to this in the discussion about the CO absorption inthe next section.
It is perhaps surprising that such a feature was not seen in the‘‘PUEO’’ (‘‘Probing the Universe with Enhanced Optics,’’ theCanada-France-Hawaii Telescope adaptive optics bonnette)
Fig. 2.—Spatial profiles of the H-band continuum (top) and 1.62 �m CO 6–3 band head absorption flux (bottom) in the inner 200 of Mrk 231, at P.A.�80�(left) and
P.A.�25� (right). In the top panels, the continuum is overdrawn with a combined Gaussian plus Moffat, which provides a very good fit to the spatial profile. In the topright panel, this reveals a residual at an offset of �0B15. In the bottom panels the three possible models considered in the text are overplotted: blue, a Gaussian; red, ade Vaucouleurs profile; green, an exponential profile. The latter two are convolved (in two dimensions) with a Gaussian to represent the beam. The residual aftersubtracting the exponential profile is also shown in green (dotted line). In the bottom right panel, regardless of which fit is used, the secondary peak at �0B15 can beclearly seen.
NUCLEAR GAS DYNAMICS AND STAR FORMATION OF MRK 231 783No. 2, 2004

images of Lai et al. (1998). However, in the K band wheremuch of their spatial analysis was performed, the relativestrength of this feature would certainly be much less. Assum-ing the AGN component of the continuum emission is hot dustat �1000 K (consistent with the slopes of the H- and K-bandcontinua) and that the feature has a spectrum typical of late-type stars, its strength in the K band relative to the peak wouldbe reduced to only 3%–4%. In Figure 3 we do in fact see aresidual at on offset of about �0B2 in spatial profile of theK-band spectrum at P.A.�25
�with about this relative strength;
but without the much clearer H-band data it would not beconsidered significant. Such a weak feature is not expected to bedetected so close to the nucleus in K-band imaging data withoutprior knowledge or very careful deconvolution techniques.
4. NUCLEAR STAR FORMATION
Under the assumption that the mean stellar type dominat-ing the H-band stellar continuum is the same across the entireregion where stellar absorption features can be seen, the ab-sorption flux (in contrast to the equivalent width) of the ab-sorption features traces the spatial extent of the stellar cluster.We have measured this using the 1.62 �m CO 6–3 band-headabsorption (by comparing the absorption in the range 1.617–1.623 �m with the continuum in the range 1.623–1.629 �m). Ifthere were no hot dust emission associated with the AGN, onewould expect it to be similar to the continuum profile. However,Figure 2 shows that the profile is indeed substantially differentfrom that of the continuum, primarily in not having a strongnarrow peak in the core. This results in a sharp reduction inthe equivalent width of the CO band head to WCOP 0:3 8 atradii smaller than 0B1; at radii in the range 0B1–0B5 (beyondwhich the signal to noise becomes too weak to continue),WCO � 0:7 8 is approximately constant.
4.1. Luminosity and Mass of the Nuclear Star Formation
In late-type giant and supergiant template stars (Meyeret al. 1998) we find that typically WCO � 4 8, as shown inTable 1. Once such stars appear in a cluster, they will dominatethe near-infrared stellar light; in the H band, a K2 I star is about10 times brighter than a O9 I star. Hence, our value for WCO
implies that dilution due to hot dust is a factor of at least 13 in
the core (on scales of 0B1) and still a factor of 5–6 around it(out to �0B5). Since a partially corrected AO PSF has strongextended emission on scales similar to the seeing, much of thedilution on these scales may be due to the halo of the PSF andhence attributable to the AGN rather than being associated withthe underlying and surrounding stellar population. If this is thecase, then in a 200 length of the slit (which includes essentiallyall the near-infrared flux, and for which WCO ¼ 0:5 8) only1/8 of the H-band light originates in star formation. Extrapo-lating to a filled circular 200 aperture, we estimate that approx-imately 20%–25% of the H-band light is stellar. Although thetotal H-band magnitude in this aperture is 10.09, the stellarcontribution is therefore 11.72 mag. A distance modulus of36.15 gives an absolute magnitude for the stellar light ofMH ¼�24:43.We have applied no extinction correction to this value, be-
cause all estimates of the extinction suggest that it is low;optical and near-infrared hydrogen recombination line ratiossuggest it is in the range AV ¼ 2 6 mag (Boksenberg et al.1977; Krabbe et al. 1997), consistent with conclusions that theinner disk of Mrk 231 is close to face-on and hence relativelyunobscured (Downes & Solomon 1998; Carilli et al. 1998).Instead we note that in the following discussion applying anyextinction correction would increase the H-band luminosity,with the result that both the mass and the bolometric luminosity
Fig. 3.—Spatial profiles of the K-band continuum for a short exposure (left), and long exposures (right) for the two position angles. All three are drawn on the samerelative flux density scale. The long exposures resulted in saturation of the core of the PSF. A Gaussian plus Moffat profile (corresponding to the ‘‘core + halo’’ AOPSF as well as the unresolved AGN + extended stellar population of the galaxy) has been fitted to the measurable part of the profile and is shown in gray, together withits residual. A small feature at P.A.�25� can be seen at an offset of about�0B2 with the expected relative strength of 2%; however, without the much clearer feature inthe H-band data this would not be considered significant.
TABLE 1
Late-Type Stellar Parameters
Star
(1)
Stellar Type
(2)
MV
(3)
MH
(4)
Mass
(M�)(5)
WCO
(8)(6)
HR 7479......... G4 I �6.2 �7.9 12 1.3
HR 8465......... K1.5 I �5.9 �8.1 13 4.5
HR 1155......... M2 I �5.6 �9.5 19 5.8
HR 7328......... G9 III +0.8 �1.3 1.1 2.1
HR 8317......... K1 III +0.6 �1.8 1.1 2.7
HR 165........... K3 III +0.3 �2.6 1.2 3.3
HR 4517......... M1 III �0.5 �4.3 1.2 4.2
Note.—Cols. (1)–(2) give the names and types of the stellar templatesfrom Meyer et al. (1998), and col. (6) is the 1.62 �m CO 6–3 equivalent widthmeasured from these; data in cols. (3)–(5) are from Cox (2000).
DAVIES, TACCONI, & GENZEL784 Vol. 613
of the star-forming region would increase, and hence the upperlimit of the permissible age range would decrease.
Whether the stellar light is dominated by active star for-mation or an old population of stars can be determined from itsmass-to-light ratio. Using population synthesis models for MV
and V�H from Starburst99 (Leitherer et al. 1999), one cancalculate the mass of stars for a given age for both instanta-neous and continuous star-forming scenarios (we assume solarmetallicity and a Salpeter initial mass function). Given that thestellar ‘‘cluster’’ (note that for convenience we use the word‘‘cluster’’ for the nuclear star-forming region even though it isnot known whether the stars are distributed continuously orthey actually exist in many compact clusters) is extended overabout 0B40 (see below), equivalent to 330 pc, it seems unlikelythat all the stars were formed in a single instantaneous burst.We therefore consider only continuous star-forming scenarios.The minimum possible mass of the stellar cluster occurs whenlate-type supergiants dominate the H-band continuum, at an
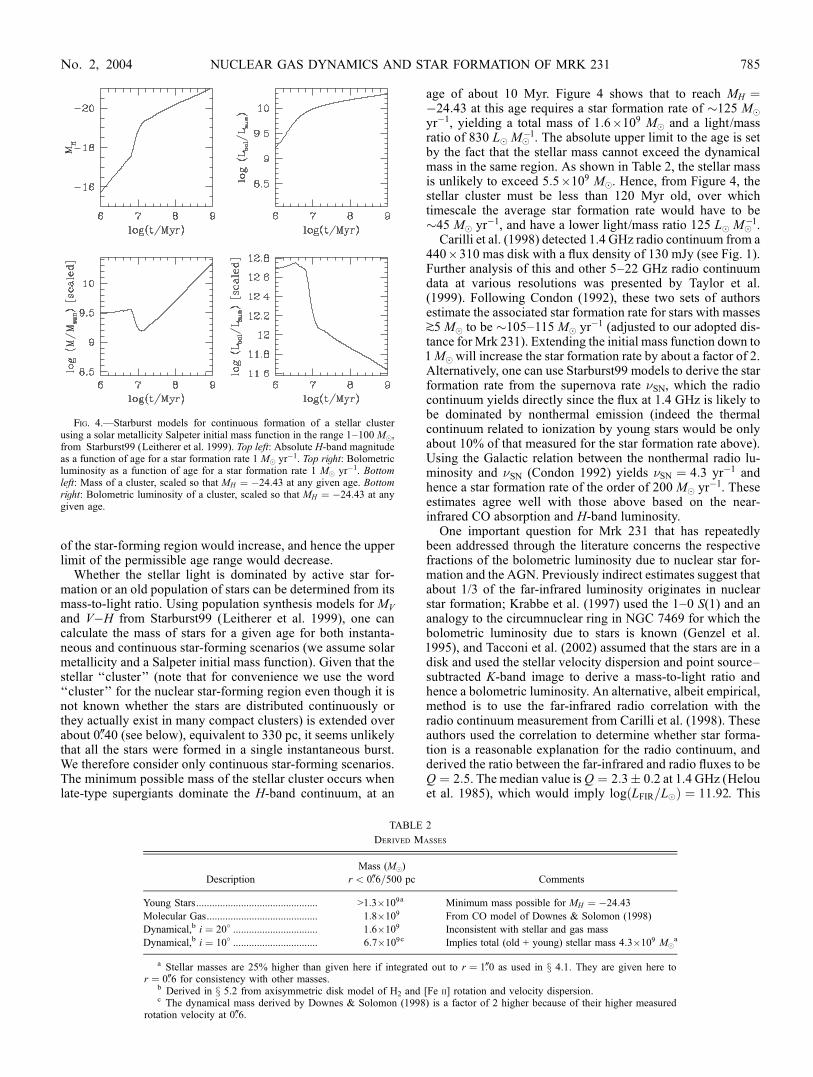
age of about 10 Myr. Figure 4 shows that to reach MH ¼�24:43 at this age requires a star formation rate of �125 M�yr�1, yielding a total mass of 1:6 ;109 M� and a light/massratio of 830 L� M�
�1. The absolute upper limit to the age is setby the fact that the stellar mass cannot exceed the dynamicalmass in the same region. As shown in Table 2, the stellar massis unlikely to exceed 5:5 ; 109 M�. Hence, from Figure 4, thestellar cluster must be less than 120 Myr old, over whichtimescale the average star formation rate would have to be�45 M� yr�1, and have a lower light/mass ratio 125 L� M�
�1.Carilli et al. (1998) detected 1.4 GHz radio continuum from a
440 ; 310 mas disk with a flux density of 130 mJy (see Fig. 1).Further analysis of this and other 5–22 GHz radio continuumdata at various resolutions was presented by Taylor et al.(1999). Following Condon (1992), these two sets of authorsestimate the associated star formation rate for stars with massesk5 M� to be �105–115 M� yr�1 (adjusted to our adopted dis-tance for Mrk 231). Extending the initial mass function down to1M�will increase the star formation rate by about a factor of 2.Alternatively, one can use Starburst99 models to derive the starformation rate from the supernova rate �SN, which the radiocontinuum yields directly since the flux at 1.4 GHz is likely tobe dominated by nonthermal emission (indeed the thermalcontinuum related to ionization by young stars would be onlyabout 10% of that measured for the star formation rate above).Using the Galactic relation between the nonthermal radio lu-minosity and �SN (Condon 1992) yields �SN ¼ 4:3 yr�1 andhence a star formation rate of the order of 200 M� yr�1. Theseestimates agree well with those above based on the near-infrared CO absorption and H-band luminosity.
One important question for Mrk 231 that has repeatedlybeen addressed through the literature concerns the respectivefractions of the bolometric luminosity due to nuclear star for-mation and the AGN. Previously indirect estimates suggest thatabout 1/3 of the far-infrared luminosity originates in nuclearstar formation; Krabbe et al. (1997) used the 1–0 S(1) and ananalogy to the circumnuclear ring in NGC 7469 for which thebolometric luminosity due to stars is known (Genzel et al.1995), and Tacconi et al. (2002) assumed that the stars are in adisk and used the stellar velocity dispersion and point source–subtracted K-band image to derive a mass-to-light ratio andhence a bolometric luminosity. An alternative, albeit empirical,method is to use the far-infrared radio correlation with theradio continuum measurement from Carilli et al. (1998). Theseauthors used the correlation to determine whether star forma-tion is a reasonable explanation for the radio continuum, andderived the ratio between the far-infrared and radio fluxes to beQ ¼ 2:5. The median value isQ ¼ 2:3� 0:2 at 1.4 GHz (Helouet al. 1985), which would imply log LFIR=L�ð Þ ¼ 11:92. This
Fig. 4.—Starburst models for continuous formation of a stellar clusterusing a solar metallicity Salpeter initial mass function in the range 1–100 M�,from Starburst99 (Leitherer et al. 1999). Top left: Absolute H-band magnitudeas a function of age for a star formation rate 1 M� yr�1. Top right: Bolometricluminosity as a function of age for a star formation rate 1 M� yr�1. Bottomleft: Mass of a cluster, scaled so that MH ¼ �24:43 at any given age. Bottomright: Bolometric luminosity of a cluster, scaled so that MH ¼ �24:43 at anygiven age.
TABLE 2
Derived Masses
Description
Mass (M�)
r < 0B6=500 pc Comments
Young Stars.............................................. >1:3 ;109a Minimum mass possible for MH ¼ �24:43
Molecular Gas.......................................... 1:8 ; 109 From CO model of Downes & Solomon (1998)
Dynamical,b i ¼ 20� ................................ 1:6 ; 109 Inconsistent with stellar and gas mass
Dynamical,b i ¼ 10� ................................ 6:7 ; 109c Implies total (old + young) stellar mass 4:3 ; 109 M�a
a Stellar masses are 25% higher than given here if integrated out to r ¼ 1B0 as used in x 4.1. They are given here tor ¼ 0B6 for consistency with other masses.
b Derived in x 5.2 from axisymmetric disk model of H2 and [Fe ii] rotation and velocity dispersion.c The dynamical mass derived by Downes & Solomon (1998) is a factor of 2 higher because of their higher measured
rotation velocity at 0B6.
NUCLEAR GAS DYNAMICS AND STAR FORMATION OF MRK 231 785No. 2, 2004

is about 70% of the observed far-infrared (40–120 �m) lu-minosity of Mrk 231, and about 25% of the 8–1000 �mluminosity.
We are able to use a more direct method, based on theCO 6–3 absorption that arises in the stars themselves. Thelimits on the star formation rate and age we have discussedabove constrain the bolometric luminosity of the cluster tobe log Lbol=L�ð Þ¼ 11:85 12:11 (the lower luminosity corre-sponding to the greater age). The bolometric luminosity ofMrk 231 (taken as the luminosity in the range 8–1000 �m) islog Lbol=L�ð Þ ¼ 12:5 (Lıpari et al. 1994; Tacconi et al. 2002).Hence the star formation within 300 pc of the AGN is respon-sible for 25%–40% of the galaxy’s luminosity. The range wouldreduce considerably if the mass of the stars could be constrainedmore tightly. For this calculation we have assumed that the starformation is continuous. Once it ceases, the bolometric lumi-nosity will fall very fast, and the cluster will fade by an order ofmagnitude over a timescale of up to a few 100 Myr. Repeatingthe same calculation for smaller apertures shows that within 0B5(165 pc, similar to the FWHMof the stellar cluster) of the AGN,stars are still responsible for 15%–30% of Lbol , while within aradius of 0B25 the fraction drops to 10%–15% because many ofthe stars are then excluded.
4.2. Spatial Distribution of the Nuclear Star Formation
We have fitted three analytical functions to the CO absorp-tion profiles out to radii of 1B5 in order to assess how theluminosity (and hence density) of the stellar cluster changeswith radius. At P.A. �25� a small section around the residualpeak seen in the continuum was omitted in order to avoidbiasing the fit. The simplest profile is a Gaussian (blue curvesin bottom panels of Fig. 2). However, the best fits with FWHM0B50 and 0B60 at P.A.’s �80� and �25�, respectively, under-estimate both the core and the wings of the measured profilesand do not yield good matches. It shows definitively that thespatial profile of the stellar cluster has a sharper cusp and broadshallow wings. We therefore consider two further profiles thathave a physical meaning when applied to stellar distributions.
The de Vaucouleurs r1/4 profile provides an empirical matchto the luminosity profile in elliptical galaxies and other spher-oids. The functional form I(r) ¼ Ie exp f�7:67½(r=re)1=4 � 1�ghas been convolved (in two dimensions) with a Gaussian thatrepresents our best estimate of the beam smearing (FWHM0B192 and 0B160 as described in x 3). These provide acceptablefits to the inner part of the profiles, but tend to overestimate thewings at radii beyond 0B5 (red curves in Fig. 2). The derivedeffective radii are also surprisingly large, re ¼ 1B61 and 4B32(1.4 and 3.5 kpc).
The final function is an exponential profile typical of galaxydisks, which has the form I(r) ¼ I0 exp �r=rdð Þ (note that theeffective radius, inside of which half the total luminosity isemitted, is 1.68 times the disk scale length rd). This was alsoconvolved with a Gaussian representing the beam smearing,and provides acceptable fits (green lines in the same figure)over the whole CO profile at both position angles. The re-sulting disk scale lengths are 0B18 and 0B24 (150 and 200 pc),consistent with the size scales over which we have data.
Which of these two profiles best represents the data hasimportant implications on our understanding of the geometryof the nuclear star-forming region: in essence, whether it isspheroidal or a disk. However, it is not immediately clearwhich is correct. Previous measurements of the radial profile ofthe H- and K-band continua (after subtracting a nuclear pointsource) yield very clear signatures of an r1/4 law, but with small
effective radii re ¼ 0B5 and 0B25 (400 and 200 pc), respectively(Tacconi et al. 2002; Lai et al. 1998). In order to reconcile thisresult with our fits above, we consider also the H-band con-tinuum profile from our spectroscopic data, which is shown inFigure 5. To avoid contamination by the AGN component wehave fitted the profile at radii 0B25–2B5, in which region itclearly follows the r1/4 de Vaucouleurs function (dark blueline). The effective radius we derive is re ¼ 0B33 (270 pc),consistent with the 0B5 (400 pc) found by Tacconi et al. (2002).However, if we extrapolate this profile back in toward thenucleus (convolved with our estimate of the PSF as earlier), wefind that it accounts for all of the continuum (cyan line), al-though with some small differences to the observed profile. Yetsince we know that most of the nuclear continuum is associatedwith the AGN rather than stars (e.g., from WCO), this indicatesthat an r1/4 profile with this re cannot extend all the way in tothe nucleus.Figure 5 also shows the profile of the CO absorption flux to
radii of 100 together with the r1/4 fit (red line) and the expo-nential fit (green line) from above. It can be seen that the largere ¼ 1B61 for the former is needed to match the broad shape ofthe profile. However, such a large re is inconsistent with thatderived for the continuum (which at large radii >100 is certainlydominated by stellar light), since it would imply that WCO
increases rapidly and continuously with radius and hencewould require a strong gradient in the stellar population. Inaddition, at radii greater than about 0B5, the fit appears tobegin diverging from the data, although this is close to thenoise limit. Accordingly, we are led to exclude the r1/4 fit tothe CO data. On the other hand, the exponential fit matches
Fig. 5.—Profiles of the H-band continuum (open shapes) and CO 6–3 ab-sorption flux ( filled shapes) plotted as functions of r1/4 for P.A. �80�. Thetriangles and squares represent the two sides of the nucleus along the slit.Contiguous points are joined by dotted lines. Absolute scaling is arbitrary. Thegraph for P.A. �25� is similar, and is not shown. Overplotted are (dark blueline) a de Vaucouleurs fit to the continuum at radii 0B25–2B5, which has beenextrapolated back to the nucleus (cyan line). Also shown are the de Vaucouleurs(red line) and the exponential (green line) fits to the CO profile at radii<100. Notethat the effective radius re defines the region within which half the luminosity ofthe profile originates; the effective radius of the exponential profile is 1.68 timeslarger than the disk scale length rd given.
DAVIES, TACCONI, & GENZEL786 Vol. 613

the CO data well, and does not contradict the continuumprofile.
Our conclusion here is therefore that at radii greater than�100 the continuum traces the luminosity profile of the stellarpopulation, which follows a r1/4 profile. Figure 5 hints thatthere may be a small break in the slope of the profile, and thatat radii larger than �0B8 (600–700 pc) re is slightly larger thanthe value we found above. The result of this would be that atsmaller radii, the r1/4 profile no longer dominates the contin-uum. Instead, as shown by the CO data, the stellar light here isdominated by a bright nuclear population no more than 10–100 Myr old, which is present in a disk and hence has anexponential profile. At very small radii, the continuum tracesthe unresolved hot dust emission associated with the AGN.The fact that the continuum appears to follow a single r1/4 lawat all radii less than 2B5 is an unfortunate coincidence, since ithides the true stellar luminosity profile at small radii. A similarconfiguration is seen in NGC 1068 (Thatte et al. 1997), but inthat case the break between the r1/4 profile and the nuclearexponential star-forming region occurs at a radius of �70 pcand is much clearer.
4.3. An Extranuclear Star Cluster
At P.A. �25� a strong residual is apparent at an offset of�0B17 with a peak intensity of 32% of the central point. Theposition is similar to the residual seen in the continuum.However, this cannot be a peculiarity of the AO correction fortwo reasons: (1) the equivalent width of the CO is more than afactor of 2 higher than that at the nucleus, and (2) the residual ismuch narrower than the main profile; if a scaled replica of themain profile were to be added instead, the residual would be farless distinct and apparent only as an asymmetry. We concludethat this is indeed a real feature, and propose that it may be anunresolved circumnuclear star cluster residing 120–140 pcfrom the AGN. In fact, Figure 1 shows that the 1.4 GHz radiocontinuum (Carilli et al. 1998) also has a subsidiary peak atabout this position, providing additional evidence that it is areal feature.
We estimate that about 1% of the CO absorption in the nu-clear star-forming region originates in this feature. If the starformation here has the same history as discussed above, themass would be of order 2 ;107 M�. While this is a large massfor a single star cluster, it is only a factor of a few greater thanthe most massive clusters seen in the Antennae (Mengel et al.2002) and Henize 2-10 (Vacca et al. 2002), and is entirelyconsistent with the larger cluster masses found in NGC 6745(de Grijs et al. 2003), Arp 220 (Shaya et al. 1994), and NGC7252 (Maraston et al. 2001).
5. KINEMATICS AND MASS
Mrk 231 appears to be a later-stage merger between gas-richspiral galaxies. In a study of 18 late-stage ULIRG mergers,Genzel et al. (2001) and Tacconi et al. (2002) showed char-acteristics of relaxed stellar populations with r1/4 luminosityprofiles and stellar dynamics dominated by dispersion ratherthan rotation. Tacconi et al. showed that although Mrk 231itself is unusual in having a lower than average velocity dis-persion (only 115 km s�1), it still has an r1/4 luminosity profileand a low value of Vrot=� ¼ 0:21� 0:08. The spheroidal massenclosed within the effective radius of 300 pc would then be6 ; 109 M�. In addition, correlations of � with the black holemass would yieldMBH ¼ 1:3 ; 107 M�, which leads to a super-Eddington AGN luminosity. This result led these authors toconsider whether the stars are confined to the same disk that the
molecular gas occupies. In x 4 we have shown that the nuclearstellar population is very young and has an exponential profile.Both of these results tend to support the conclusion that thestars are in a disk. However, before we continue in this vein, weneed to consider whether this is consistent with the stellar dy-namics. The disk properties determined by Downes & Solomon(1998) are an inclination i ¼ 10�, a rotation velocity ofVrot sin i ¼ 60 km s�1 at a radius of 0B6 (500 pc), a dynamicalmass of 12:7 ; 109 M�within the same radius, and a scale height(FWHM) of 23 pc. The actual rotation velocity at 500 pc is then345 km s�1. Using the usual equation for calculating the ve-locity dispersion perpendicular to the disk plane �2 ¼ 2�G�z0,where � is the mass surface density of the disk and z0 is theexponential scale height (for which we approximate z0 ¼ 0:6FWHM), we find a mean value of � ¼ 80 km s�1. Hence,Vrot=� � 4:3, typical of rotationally supported systems. That �is rather larger than one might expect for typical galacticdisks, for which � is a few times 10 to about 100 km s�1
(Bottema 1993), is simply because of the large surface densityof the disk, on average 1:6 ; 104 M� pc�2. It seems thereforethat it may be possible to reproduce a high dispersion and lowrotation velocity from a disk. To test this more thoroughly wehave made a model of an exponential disk having rd ¼ 0B24and other characteristics consistent with those above. We haveconvolved it with seeing of 0B6 and extracted line profilesfrom a 0B6 slit oriented at �80�. Integrating from �0B7 to+0B7 yields a line width of � ¼ 107 km s�1, and the range0B3–0B7 yields Vrot sin i ¼ 35 km s�1. Thus we find an ap-parent Vrot=� ¼ 0:33, consistent with the measurements ofTacconi et al. (2002) and showing that a nearly face-on stellardisk can masquerade as a spheroid if it is sufficiently denseand the details are blurred by seeing. The caveat is that in thiscase the correlation between � and MBH, which is derived fordynamically hot systems, does not apply since most of themotion is in rotation.
5.1. Gas and Stellar Kinematics
The gas dynamics were determined using the 2.12 �m H2
1–0 S(1) and the 1.64 �m [Fe ii] emission lines. The longexposures needed to detect the more extended (i.e., out to radiiof 0B5 or more) line emission resulted in the central few rowsof theK-band spectrum being saturated; because of the subpixelshifting associated with straightening the spectral traces, it isnot possible to use the central 6 rows. In the H band the errorsin the line flux and velocity across the central few rows of thespectrum are too large for these data to be useful. We aretherefore unable to measure the shape of the rotation curvecloser than 0B12 (100 pc) to the nucleus. We have also measuredthe stellar dynamics using the H-band absorption features.However, while these are consistent with the gas dynamics, theerror bars are too large to draw any independent conclusions.
The H2 and [Fe ii] emission line velocity profiles are shownin Figures 6 and 7, respectively (center panels), together withthe flux distribution (top panels) and the velocity dispersion(bottom panels). These parameters were all measured by fittinga Gaussian to the emission line profile in each row of thespectrum. The velocity zero points were calculated as theweighted mean velocity, giving a value close to 12,680 km s�1
in each line and position angle. Uncertainties were calculatedsimultaneously for all three parameters by constructing an11 pixel segment, which had the same statistical noise as theoriginal spectrum (after subtracting the fitted Gaussian), andback to which the fitted Gaussian profile was added. A newGaussian profile was then fitted to the segment, producing
NUCLEAR GAS DYNAMICS AND STAR FORMATION OF MRK 231 787No. 2, 2004

slightly different parameters. The procedure was repeated 1000times, yielding the error bars shown in the figure.
The stellar velocities were measured by cross-correlatingspectra in the range 1.57–1.64 �m (rest frame 1.506–1.574 �m),extracted from each row of the data set, with a K1.5 I templatefromMeyer et al. (1998); repeating the procedure with templatesof different late stellar types gave the same results. A Gaussianwas fitted to the cross-correlation peak. As for the emission lines,the error bars were estimated by measuring the residual noise inthe neighboring 51 pixels, creating a segment with the same sta-tistics towhich the originalGaussianwas added back, and refittingthe result. While this method does not permit the velocity dis-persion to be measured, it does avoid the necessity of deconvo-lution, which can be uncertain and adds significant noise. Thevelocities and their uncertainties are plotted in Figure 8.
It has been shown previously that the cold molecular gas lies ina thin rotating disk (Bryant & Scoville 1996; Downes& Solomon1998; Carilli et al. 1998). Where we have been able to measureboth the H2 and [Fe ii] emission lines, the velocities and dis-persions are remarkably consistent and show a clear rotationalsignature that extends inward to �0B1, as close to the nucleus aswe can measure. Thus it appears that these lines also originate inthe disk structure. The stellar velocities are consistent with thesame rotation, which is to be expected if, as we have argued, thestars lie in the same disk as the gas—a scenario that would befeasible if the stars were recently formed in the gas disk.
As a consistency check on our measurements of the emissionlines, we have calculated an ‘‘effective’’ velocity dispersionfrom our data in a similar aperture to that used by Tacconi et al.
(2002) who, for Mrk 231, summed data at radii 0B3–0B7 eitherside of the nucleus. We have first calculated the mean velocitydifference from one side of the nucleus to the other, and thencombined this in quadrature with the mean velocity dispersionin the same region. At P.A. �80� (close to the kinematic majoraxis, see x 5.2) we find �H2
and �[Fe ii] are both approximately120 km s�1, consistent with the stellar velocity dispersionreported by Tacconi et al. At P.A. �25� (where the rotationalsignature is weaker) we find that �H2
¼ 65 km s�1 and �½Fe ii� ¼85 km s�1, both less than the value given by these authors.Although these results suggest that both the H2 and the [Fe ii]lines trace the kinematic characteristics of a rotationally sup-ported disk in the nucleus of Mrk 231, we consider alsowhether they might be affected by shocks or outflows.The nuclear radio continuum of Mrk 231 has been resolved
into a triple structure oriented north-south and extended over adistance of 0B05 (40 pc) (Neff & Ulvestad 1988; Ulvestad et al.1999a). An additional component 0B1 (90 pc) south of the corewas reported by Taylor et al. (1999). Because the ends of thesestructures are elongated perpendicular to the direction to thecore, they have been interpreted as the working surfaces of jetsfrom the AGN. The core itself has also been resolved on parsecscales, showing two or three components aligned with a moreeast-west orientation (Ulvestad et al. 1999a, 1999b). By anal-ogy with NGC 1068, one might expect these radio jets to beassociated with strong [Fe ii] emission excited at the inter-face between the jet and the interstellar medium (Blietz et al.1994). This may be the case, but it cannot be related to the[Fe ii] emission we have observed, which lies at much greater
Fig. 6.—Spatial profiles for the 2.12 �m H2 1–0 S(1) line at the two position angles. Top panels: Line flux (solid lines) and continuum (dotted lines), normalized tothe same maximum value. Center panels: Velocity curve, with respect to the systemic velocity of 12,680 km s�1. Bottom panels: Velocity dispersion (an approxi-mation to the intrinsic dispersion can be found by quadrature correcting for the instrumental resolution of � ¼ 51 km s�1). The 1 � error bars were calculatedsimultaneously for all three parameters as described in the text. Data are shown for all rows where the spectrum was not saturated and the errors in the flux and velocitywere above specified thresholds. Overdrawn are the velocities and dispersions calculated for our simple mass model with i ¼ 10�, convolved with the appropriatespectral and spatial beam.
DAVIES, TACCONI, & GENZEL788 Vol. 613

distances (more than 100 pc) from the AGN. It therefore seemsunlikely that the extended [Fe ii] has an origin in outflows. Onthe other hand, it is cospatial with the nuclear star-forming re-gion and therefore may instead originate in supernova remnants.A star formation origin for the extremely high optical Fe ii
luminosity of Mrk 231 has already been proposed by Lıpariet al. (1994).
Our confidence in this conclusion is strengthened by thesimilarity of the kinematic signatures of the H2 and [Fe ii] lines,which, again by analogy with NGC 1068, one would not nec-essarily expect to be the case if they were produced in outflowsrather than stellar processes. There are in fact only two placeswhere the emission line kinematics differ significantly. One ofthese is the difference in velocities for small negative offsets atP.A. �80�. The excess in both line fluxes, which is also seen at
an offset of�0B1 along this position angle, may be connected tothis disparate kinematic behavior. The second occurrence is thedifference in dispersions at positive offsets along the same po-sition angle. Here the errors in the dispersion for the [Fe ii] lineare relatively large, and the difference from the H2 dispersions istherefore not highly significant. There is only one remainingunexpected aspect. At P.A. �25
�the velocities show a sym-
metrical decay at increasing radii from ��40 km s�1 to zerowithin 0B3–0B4. This is reminiscent of Keplerian rotation aboutan unresolved mass. However, the decrease in velocity issteeper than r�2, and we discuss it further in x 5.3.
5.2. A Simple Dynamical Model
With only two slit positions, the inclination angle and kine-matic major axis are unconstrained by our data. Instead, we fix
Fig. 8.—Velocity measurements from H-band stellar absorption features for P.A. �80� (left) and �25� (right). Only data for which the error bars were below agiven threshold are included. Overplotted in light gray is our simple mass model with i ¼ 10�, convolved with the appropriate spectral and spatial beam.
Fig. 7.—Spatial profiles for the 1.64 �m [Fe ii] line at the two position angles. Top panels: Line flux (solid lines) and continuum (dotted lines), normalized to thesame maximum value. Center panels: Velocity curve, with respect to the systemic velocity of 12,680 km s�1. Bottom panels: Velocity dispersion (an approximationto the intrinsic dispersion can be found by quadrature correcting for the instrumental resolution of � ¼ 70 km s�1). The 1 � error bars were calculated simultaneouslyfor all three parameters as described in the text. Data are shown for all rows where the spectrum was not saturated and the errors in the flux and velocity were abovespecified thresholds. Overplotted are the velocities and dispersions calculated for our simple mass model with i ¼ 10�, convolved with the appropriate spectral andspatial beam.
NUCLEAR GAS DYNAMICS AND STAR FORMATION OF MRK 231 789No. 2, 2004

them as input parameters to our model using estimates based oninterferometric measurements from the literature of the milli-meter CO emission line and radio continuum. For the kinematicmajor axis, we adopt the value from Downes & Solomon(1998), who used a 0B7 ; 0B5 synthesized beam to measure theproperties of the CO 2–1 line (the highest resolution dataavailable for CO emission). They found the kinematic line ofnodes to be oriented at �90
�(i.e., east-west), similar to that
determined by Bryant & Scoville (1996) in slightly lower res-olution data. For the inclination angle, various estimates exist.Based on the morphology of the nuclear radio continuum,Carilli et al. (1998) estimated i ¼ 45
�. However, we have ar-
gued in x 4 that the elongation in their map is due to additionalmassive star clusters that are not intrinsically part of the nucleardisk. Excluding these makes the remaining emission muchmore symmetrical, suggesting a low inclination angle. Such aconclusion is supported by the K-band AO image in Lai et al.(1998), which has a circular appearance. Downes & Solomon(1998) reported for their CO 2–1 data that in order to reproducethe spectral profile and the symmetrical morphology, to avoidthe gas mass exceeding the dynamical mass, and to be consis-tent with the lack of CO absorption toward the nucleus, theinclination had to be less than 20� from face-on. Additionally,to avoid an excessively high rotation speed (i.e., rather higherthan all other galaxies in their sample), the inclination couldnot be much more face-on than 10�. Because of the dependenceof mass on (sin i)�2, this uncertainty equates to a factor of 4 inthe dynamical mass. We therefore repeat our analysis using thetwo limiting values of 10� and 20�.
To create a model of the mass distribution and kinematics,we have used a method outlined in Tacconi et al. (1994) thathas also successfully been applied to NGC 7469 (Davies et al.2004). We assume that the mass is distributed in a thin disk (seeBryant & Scoville [1996] and Downes & Solomon [1998] forH2 and Carilli et al. [1998] for H i; x 4.2 for the stars), that thegalaxy is inclined by either 10� or 20� at a position angle of90�, and that the disk comprises 3 components: a nuclear stellarcluster with exponential luminosity and mass profile as derivedin x 4, a uniform gas disk as described by Downes & Solomon(1998) (note that these authors also describe a 300 outer disk, butsince we are only interested in radii P0B7, we do not includethis explicitly), and a black hole. A typical rotation curve thatresults from optimizing the masses is shown in Figures 6 and 7.Given that the gas dynamics could be affected by nongravita-tional motions, the model yields a reasonably good represen-tation of the velocities and dispersions for both lines at bothposition angles.
For an inclination of i ¼ 20�our dynamical mass is only
1:6 ; 109 M� within 0B6. This inclination is clearly too high,since it results in a mass that is barely the minimum we haveestimated for the young stars alone based on their luminosityand leaves no room for the gas mass. Including the gas mass of1:8 ; 109 M� of Downes & Solomon (1998) would suggest amaximum inclination of 15
�from face-on. At i ¼ 10
�, the in-
clination preferred by Downes & Solomon, we find theenclosed mass within a radius of 0B6 is 6:7 ; 109 M�. This israther less than the mass determined by them because of thedifferent rotation velocities measured at this radius (but notethat their beam size was �0B6). Our measurements and theirsdiffer by 20 km s�1, which, becauseMrk 231 is close to face-on,corresponds to a factor of 1.5 in the rotation curve and hence afactor of 2 in the derived dynamical mass. The measured ve-locity dispersions are reproduced by imposing a disk thicknessof 15 pc (Gaussian FWHM), similar to that estimated by
Downes& Solomon. The increase in velocity dispersion towardsmaller radii is due to the risingmass surface density of the disk,which is on average 8000 M� pc�2. If we repeat our earlierexperiment of making the same measurements as Tacconi et al.(2002) (i.e., 0B6 seeing, and extracting the velocity and dis-persion over lengths of a 0B6 slit), we find Vrot sin i ¼ 28 km s�1
and � ¼ 67 km s�1. While the former is in good agreement withtheir rotation velocity, the dispersion is somewhat less, indi-cating that there remains some uncertainty about the diskthickness and perhaps also the mass. The black hole mass de-termined by the model for i ¼ 10� is 6 ; 108 M�, similar to themass of stars and gas within a radius of 0B1, indicating that thisis approximately the ‘‘sphere of influence’’ of the black hole(within which it dominates the dynamics). In our data this re-gion is not well resolved, but if one could reach the 0B05 dif-fraction limit of a large telescope by better sampling in theK band or achieving better AO correction (e.g., with a laserguide star) in the H band, one could impose a much strongerconstraint on the black hole mass.
5.3. A Warp in the Inner Disk of Mrk 231?
The velocity profile at P.A.�25�shows a symmetrical decay
at increasing radii from��40 km s�1 to 0 within 0B3–0B4. Thisis reminiscent of Keplerian rotation about a compact mass.However, as the right panel in Figure 9 indicates, the decay is infact faster than r�2 and so cannot be explained by any massdistribution confined to a planar disk. Such a curve can inprinciple be produced by a warp in the inner disk of Mrk 231,which would have the effect of twisting the inner part of the diskto a different inclination and position angle. In x 4.2 we havealready encountered a hint that this may be the case; the ef-fective radius we derive for the exponential profile is signifi-cantly larger at P.A. �25� than at P.A. �80�, opposite to theexpectation if the kinematic major axis lies at about 90�. Al-though the angular scales are small, this can be easily seen inFigure 2. It is not an effect of possible differences in the AOcorrection because the scale sizes and their difference are muchlarger than those of the PSFs (in fact, both results are inde-pendent of which PSF estimate we use). This suggests that, atleast for the stellar disk and unless it is strongly asymmetrical,the major axis lies closer to �25
�than �80
�. While it may be
difficult to warp a stellar disk once it has formed, we are pro-posing that the stars have formed very recently in the gas disk.As a result, it is certainly plausible that the warp occurred in thegas disk before the stars formed.Even combining the kinematic and spatial data, the geom-
etry of a putative warp cannot be constrained. Here, therefore,we consider only an illustrative case that demonstrates thefeasibility of this hypothesis in explaining the observations. Asthe basic starting point, we have taken the same mass distri-bution as derived in the previous section and set the inclinationto be i ¼ 10� with the major axis at �110� (slightly different tothe �90� previously adopted). We define the position angle ofthe warp in the disk plane as measured from an axis in thatplane orthogonal to the major axis (i.e., if the disk major axisruns east-west then, if the disk is deprojected, the positionangle of the warp is measured east of north). At a positionangle of 30
�and for radii <0B2, we tilt the disk out of its plane
by 10�. Beyond this, the tilt declines uniformly with increasingradius until it reaches zero for radii >0B35. The observableeffect of this slight warping of a nearly face-on disk is in fact toshift the major axis of the inner part of the disk more toward�25� without greatly altering the effective inclination. For thisexample, the inner part of the disk would have an effective
DAVIES, TACCONI, & GENZEL790 Vol. 613

inclination of 10� but at a position angle of �50�. Hence, asshown in the right-hand panel of Figure 9, at P.A. �25� thesignature of rotation is seen at small radii but not at large radii.Comparison to Figure 8 suggests that the stellar velocity curvemight also match this model better, again a result that onemight expect if the stars have formed recently in a disk that wasalready warped. Finally, our warp model is also able to re-produce approximately the velocity contours presented byDownes & Solomon (1998) with a 0B6 beam.
We have provided an example of a weak warp that can ex-plain the kinematics we have observed. However, measure-ments of both hydroxyl and the radio continuum provideevidence that there may be much stronger warping occurring inthe nucleus of Mrk 231. The velocity field of the 1.6 GHz OHline emission, observed at a resolution of 30–40 mas over anextent of 100–150 mas by Klockner et al. (2003), has beenmodeled in terms of a thick disk or torus inclined by 56� at aposition angle of 35�. This orientation, on scales of 100 pc, israther different from that on scales of �500 pc traced by themolecular gas, and is indicative of a warp completely consis-tent with, but more pronounced than, that described above. Aswe noted earlier, radio continuum data suggest that there is avery pronounced shift in the direction of the radio jet at radialscales between 1 and 20 pc (Ulvestad et al. 1999a, 1999b).Unless the jets are viewed nearly end-on, this represents asubstantial misalignment of the jet axis. Whether the mis-alignment is due to deflection of the jets as it strikes denseinterstellar medium, or from a twisting of the axis of the centralAGN, it could plausibly be related (whether causally or not) tothe warping of the nuclear disk. Two such possibilities are that(1) the jet impinges on the disk and has caused it to warp, at thesame time changing the direction of the jet, and (2) the spinaxis in the core has changed, perhaps during the later stages ofthe merger as clumps of gas thrown off in the early stages areaccreted, and this is reflected in both the altered jet directionand the kinematics of the disk. The consequence of a warp is tomake modeling of the small-scale kinematics rather morecomplex. However, with the right data it may also make iteasier to measure the dynamical effect of the black hole be-cause for such a low inclination of the disk, small uncertaintiesin either the measured kinematics or the inclination itselfpropagate into very large uncertainties in the true rotationcurve and hence the enclosed mass estimate. A warp will al-most inevitably lead to the inner region having a larger incli-nation, and hence reduce the sensitivity of the derived rotationcurve to uncertainties in these parameters. With the currentdata we are unable to constrain the geometry of the warp andhence are unable to make detailed statements about the blackhole mass. It is expected that with either integral field spec-
troscopy at AO scales or higher resolution interferometric dataat millimeter wavelengths will help to resolve the situation.
6. A YOUNG STARBURST IN Mrk 231
In the previous sections we have presented evidence thatthere is a massive [log Lbol=L�ð Þ � 12:0] young (P120 Myr)starburst occurring in the nucleus of Mrk 231. The stars in-volved in this burst are distributed in the same disk plane oc-cupied by the gas, which is nearly face-on. This evidencesuggests that the H- and K-band stellar light is not tracing starsfrom the progenitor galaxies, which have relaxed into aspheroid during the merger, but instead is dominated by starsthat have formed in situ in the gas disk—which itself hasformed as a result of the merger—and still remain there.
It is important, therefore, to consider whether other obser-vations are consistent with such a scenario. As we mentioned inx 4.1, the radio continuum supports the existence of a youngactive starburst. Here we also look at the important character-istics observed with the Infrared Space Observatory, in par-ticular the mid-infrared emission lines reported in Genzel et al.(1998) and the polycyclic aromatic hydrocarbon (PAH) fea-tures in Rigopoulou et al. (1999).
Rigopoulou et al. (1999) presented measurements of the7.7 �m PAH feature for 62 ULIRGs, comparing them to tem-plates from 23 AGN and 15 starburst and normal galaxies. Theyshowed that AGN and starbursts could be distinguished by theratio of the PAH strength at 7.7 �m to the continuum at 5.9 �m(L=C ); AGN have L=Ch i ¼ 0:4, while starbursts have L=Ch i ¼2:77. Under this classification, Mrk 231 with L=C ¼ 0:3 isclearly an AGN. However, this does not mean that there is nostarburst. The spectrum in Figure 2 of Rigopoulou et al. (1999)clearly shows a strong PAH feature—the low L=C ratio arisessimply because the continuum is also strong. Indeed, compar-ison with the other ‘‘starburst-like’’ ULIRGs in this studyshows that the absolute strength of the PAH feature is consistentwith what one would expect from a massive starburst.
Genzel et al. (1998) did not detect 12.8 �m [Ne ii], a line thatarises in H ii regions and commonly seen in the mid-infraredspectra of starbursts and ULIRGs. Ne + has an ionization po-tential of 21.6 eV, and so is a tracer of the hottest stars. Thelimit of 1:6 ; 10�16 W m�2 is a little lower than the flux thatmight be expected, but on the other hand one cannot rule outthat the true line flux lies within the range of typical values formassive young starbursts. A line that was detected is [Si ii] at34 �m. The ionization potential for Si + is only 8.2 eV, andhence this line arises in H ii regions, at the interface betweenthe ionized and molecular gas. The flux measured was �5 ;10�16 W m�2, again similar to the other ULIRGs. All theULIRGs in this sample had similar fluxes for the two lines, and
Fig. 9.—Velocity curves for the H2 data at the two position angles. Overplotted are a Keplerian r�2 rotation curve (dotted line, right panel), and a simple warpeddisk model for i ¼ 10�, showing that a warp can explain a ‘‘faster than Keplerian’’ decay.
NUCLEAR GAS DYNAMICS AND STAR FORMATION OF MRK 231 791No. 2, 2004

the detection of [Si ii] but nondetection of [Ne ii] at 1/3 theflux level is not an implausible result, particularly given thedifficulty of detecting the lines as a result of the low line-to-continuum ratio. A reanalysis of the data by A. Verma (2004,private communication) suggests that there is a possible �3 �detection of [Ne ii].
One final line of evidence about this is the near- to far-infrared spectral energy distribution (SED). This has beenmodeled in detail by Verma (1999), who found that a combi-nation of a nearly face-on torus model together with a zero-agestarburst was needed to match the 1–1000 �m SED. Althoughthe exact parameters are not uniquely constrained, this generalconclusion was inescapable.
We conclude that the radio continuum, mid-infrared diag-nostics, and SED all support the view that there is vigorousyoung star formation occurring in the nucleus of Mrk 231. Thesuperposition of this starburst and the AGN havemadeMrk 231look similar to a quasar, but at the same time means that it doesnot fit any of the standard correlations. Once the star formationceases and the starburst fades—on timescales of one to a few100 Myr—the galaxy will probably look more like a typicalSeyfert 1.
Evidence for the existence of young nuclear stellar disks in anumber of spiral galaxies has been presented in the literature interms of a drop in the stellar velocity dispersion on small spatialscales. Marquez et al. (2003) measured the�86008Ca ii tripletin five isolated Seyfert spiral galaxies and found a dip in thevelocity dispersion across the central 100–300 for four of them(and a hint of such in the fifth). The drop was accompanied by apossible local increase in the equivalent width of the Ca ii
triplet, indicating the presence of a younger stellar population.A similar effect has been previously reported for three barredgalaxies by Emsellem et al. (2001) using the 2.29 �m CO bandhead. This phenomenon has been modeled by Wozniak et al.(2003) using simulations that include stars, gas, and star for-mation. Their conclusion was that the drop in the line-of-sightstellar velocity dispersion is the kinematic signature of starsformed in a dynamically cold gas disk, which forms as gas isdriven to the nucleus by the bar. Because these stars are young,they outshine the old (dynamically hotter) population in thenucleus. And the effect is enhanced because the high gas den-sity in the very center leads to more efficient cooling, reducingfurther the velocity dispersion of the gas itself and hence also thestars formed from this gas. Thus, although the frequency of suchnuclear disks is unknown, it may be a relatively common phe-nomenon in galaxies where gas is driven to the nucleus, whetherthis be by a bar in a spiral galaxy as for the examples above, orbecause of a merger event as we have seen for Mrk 231.
7. CONCLUSIONS
We have presented AO spectroscopic data of the nearbyultraluminous infrared galaxy and QSO/Seyfert 1 Mrk 231 inthe H and K bands at resolutions as small as 0B085.
1. We have resolved the region of active star formation inthe nucleus of Mrk 231 through the 1.62 �m CO absorption in
late-type stars. The region has a FWHM of 0B35–0B40 (300 pc),and has a spatial profile significantly more cusped and withbroader wings than a Gaussian. It is fit well by an exponentialprofile with disk scale length rd ¼ 0B18 0B24. At larger radii thecontinuum luminosity profile is well represented by an r1/4 law,as one might expect, since during a merger the stars relax into aspheroid, but that this also appears to continue inward is anunfortunate coincidence. The nuclear star-forming region wouldhave a minimum mass of 1:6 ; 109 M� if it is only�10 Myr old(i.e., it has just reached the age when late-type supergiantsdominate the near-infrared stellar continuum), implying a starformation rate of�125M� yr�1. Constraints from the dynamicalmass indicate that its age is unlikely to exceed 120 Myr. It isresponsible for 25%–40% of the galaxy’s entire bolometric lu-minosity, the higher fraction corresponding to the younger agelimit. These results all point to the fact that the stars lie in a diskyrather than spheroidal distribution, and that they are very young.Hence it is likely that they have formed recently in the nearlyface-on molecular gas disk, which is itself a product of themerger that resulted in Mrk 231.2. There is an unresolved extranuclear star cluster �0B15
(120–140 pc) from the nucleus, with a mass of �2 ;107 M�.This is more massive than ‘‘typical’’ young star clusters in star-forming galaxies, but is comparable with the most massiveclusters seen in a few cases.3. The dynamics at radii 0B1–0B7 have been traced using the
2.12 �m 1–0 S(1) H2 and 1.64 �m [Fe ii] emission lines, as wellas the H-band stellar absorption features. The emission lines areextended over the same spatial scales as the stellar CO ab-sorption, which is much greater than the scale of the radio jets,and are therefore likely to originate in stellar processes. Theirkinematics are similar, and in general terms consistent withrotation of a nearly face-on disk. However, a simple dynamicalmodel shows that there are distinct differences. The rotationcurve at a position angle of �25
�shows a rapid decrease in
velocity with radius, faster than r�2. This can be explained ifthere is a warp in the inner 0B2–0B3 (200 pc) of Mrk 231, ahypothesis that appears to be supported by the orientation of themajor axis of the stellar disk, by the pronounced shift on smallscales of the radio jet axis, and by the velocity field of the�150 mas 1.6 GHz OH line emission. Integral field velocitymaps at 0B1 resolution will be needed to constrain the geometryand properties of such a warp.
The authors are grateful for the support of the staff of theKeck Observatory. The authors wish to recognize and ac-knowledge the very significant cultural role and reverence thatthe summit of Mauna Kea has always had within the indig-enous Hawaiian community. We are most fortunate to havethe opportunity to conduct observations from this mountain.We are grateful to A. Verma for looking again at the ISO dataof Mrk 231, and for making her work on its SED availableto us.
REFERENCES
Barnes, J., & Hernquist, L. 1992, ARA&A, 30, 705Blietz, M., Cameron, M., Drapatz, S., Genzel, R., Krabbe, A., van der Werf, P.,Sternberg, A., & Ward, M. 1994, ApJ, 421, 92
Boksenberg, A., Carswell, R., Allen, D., Fosbury, R., Penston,M., & Sargent,W.1977, MNRAS, 178, 451
Bottema, R. 1993, A&A, 275, 16
Braito, V., et al. 2004, Nucl. Phys. B Proc. Suppl., 132, 153Bryant, P., & Scoville, N. 1996, ApJ, 457, 678Canalizo, G., & Stockton, A. 2000, AJ, 120, 1750Carilli, C., Wrobel, J., & Ulvestad, J. 1998, AJ, 115, 928Condon, J. 1992, ARA&A, 30, 575Cox, A., ed. 2000, Allen’s Astrophysical Quantities (New York: Springer)
DAVIES, TACCONI, & GENZEL792 Vol. 613

Davies, R., Tacconi, L., & Genzel, R. 2004, ApJ, 602, 148de Grijs, R., Anders, P., Bastian, N., Lynds, R., Lamers, H., & O’Neil, E. 2003,MNRAS, 343, 1285
Downes, D., & Solomon, P. 1998, ApJ, 507, 615Emsellem, E., Greusard, D., Combes, F., Friedli, D., Leon, S., Pecontal, E., &Wozniak, H. 2001, A&A, 368, 52
Gallagher, S., Brandt, W., Chartas, G., & Garmire, G. 2002, ApJ, 569, 655Genzel, R., Tacconi, L. J., Rigopoulou, D., Lutz, D., & Tecza, M. 2001, ApJ,563, 527
Genzel, R., Weitzel, L., Tacconi-Garman, L. E., Blietz, M., Cameron, M.,Krabbe, A., Lutz, D., & Sternberg, A. 1995, ApJ, 444, 129
Genzel, R., et al. 1998, ApJ, 498, 579Helou, G., Soifer, B., & Rowan-Robinson, M. 1985, ApJ, 298, L7Hutchings, J., & Neff, S. 1987, AJ, 93, 14Klockner, H.-R., Baan, W., & Garrett, M. 2003, Nature, 421, 821Krabbe, A., Colina, L., Thatte, N., & Kroker, H. 1997, ApJ, 476, 98Lai, O., Rouan, D., Rigaut, F., Arsenault, R., & Gendron, E. 1998, A&A,334, 783
Leitherer, C., et al. 1999, ApJS, 123, 3Lıpari, S., Colina, L., & Macchetto, F. 1994, ApJ, 427, 174Maraston, C., Kissler-Patig, M., Brodie, J., Barmby, P., & Huchra, J. 2001,A&A, 370, 176
Marquez, I., Masegosa, J., Durret, F., Gonzalez Delgado, R.,Moles,M.,Maza, J.,Perez, E., & Roth, M. 2003, A&A, 409, 459
Mengel, S., Lehnert, M., Thatte, N., & Genzel, R. 2002, A&A, 383, 137Meyer, M., Edwards, S., Hinkle, K., & Strom, S. 1998, ApJ, 508, 397Mihos, C. 1999, Ap&SS, 266, 195
Neff, S., & Ulvestad, J. 1988, AJ, 96, 841Rigopoulou, D., Spoon, H., Genzel, R., Lutz, D., Moorwood, A., & Tran, Q.1999, AJ, 118, 2625
Sanders, D., Soifer, B., Elias, J., Madore, B., Matthews, K., Neugebauer, G., &Scoville, N. 1988, ApJ, 325, 74
Sanders, D., Young, J., Scoville, N., Soifer, B., & Danielson, G. 1987, ApJ,312, L5
Schmidt, M., & Green, R. 1983, ApJ, 269, 352Shaya, E., Dowling, D., Currie, D., Faber, S., & Groth, E. 1994, AJ, 107, 1675Smith, P., Schmidt, G., Allen, R., & Angel, J. 1995, ApJ, 444, 146Tacconi, L. J., Genzel, R., Blietz, M., Cameron, M., Harris, A., & Madden, S.1994, ApJ, 426, L77
Tacconi, L. J., Genzel, R., Lutz, D., Rigopoulou, D., Baker, A. J., Iserlohe, C.,& Tecza, M. 2002, ApJ, 580, 73
Taylor, G., Silver, C., Ulvestad, J., & Carilli, C. 1999, ApJ, 519, 185Thatte, N., Quirrenbach, A., Genzel, R., Maiolino, R., & Tecza, M. 1997, ApJ,490, 238
Ulvestad, J., Wrobel, J., & Carilli, C. 1999a, ApJ, 516, 127Ulvestad, J., Wrobel, J., Roy, A., Wilson, A., Falcke, H., & Krichbaum, T.1999b, ApJ, 517, L81
Vacca, W., Johnson, K., & Conti, P. 2002, AJ, 123, 772Veilleux, S., Kim, D.-C., & Sanders, D. 2002, ApJS, 143, 315Verma, A. 1999, Ph.D. thesis, Imperial College, LondonWizinowich, P. L., Acton, D. S., Lai, O., Gathright, J., Lupton, W., & Stomski, P. J.2000, Proc. SPIE, 4007, 2
Wozniak, H., Combes, F., Emsellem, E., & Friedli, D. 2003, A&A, 409, 469
NUCLEAR GAS DYNAMICS AND STAR FORMATION OF MRK 231 793No. 2, 2004


![Star (with Answers)[1]](https://static.fdokumen.com/doc/165x107/631e9db04c5c8fb3a00e4680/star-with-answers1.jpg)