EARLY-TYPE GALAXIES AT z ∼ 1.3. III. ON THE DEPENDENCE OF FORMATION EPOCHS AND STAR FORMATION...
27
arXiv:1103.0265v1 [astro-ph.CO] 1 Mar 2011 Early-Type galaxies at z ∼ 1.3. III. On the dependence of Formation Epochs and Star Formation Histories on Stellar Mass and Environment A. Rettura 1,4,5 , S. Mei 2,3 , S.A. Stanford 1 , A. Raichoor 2,3 , S. Moran 4 , B. Holden 6 , P. Rosati 7 , R. Ellis 8 , F. Nakata 9 , M. Nonino 10 , T. Treu 11 , J.P. Blakeslee 12 , R. Demarco 13 , P. Eisenhardt 14 , H.C. Ford 4 , R.A.E. Fosbury 7 , G. Illingworth 6 , M. Huertas-Company 2,3 , M.J. Jee 1 , T. Kodama 15 , M. Postman 16 , M. Tanaka 17 , R.L. White 16 ABSTRACT We study the environmental dependence of stellar population properties at z ∼ 1.3. We derive galaxy properties (stellar masses, ages and star formation his- tories) for samples of massive, red, passive early-type galaxies in two high-redshift 1 Department of Physics, University of California, Davis, CA 95616, USA 2 University of Paris Denis Diderot, 75205 Paris Cedex 13, France 3 GEPI, Observatoire de Paris, Section de Meudon, Meudon Cedex, France 4 Department of Physics and Astronomy, Johns Hopkins University, Baltimore, MD 21218, USA 5 Department of Physics and Astronomy, University of California, Riverside, CA 92521, USA 6 UCO/Lick Observatories, University of California, Santa Cruz, CA 92065, USA 7 European Southern Observatory, 85748, Garching, Germany 8 California Institute of Technology, Pasadena, CA 91125, USA 9 Subaru Telescope, National Astronomical Observatory of Japan, Hilo, HI 96720, USA 10 INAF-Osservatorio Astronomico di Trieste, 34131 Trieste, Italy 11 Department of Physics, University of California, Santa Barbara, CA 93106, USA 12 Herzberg Institute of Astrophysics, National Research Council of Canada, Victoria,BC V9E 2E7, Canada 13 Department of Astronomy, Universidad de Concepcion, Casilla 160-C, Concepcion, Chile 14 Jet Propulsion Laboratory, California Institute of Technology, MS 169-327, Pasadena, CA 91109, USA 15 National Astronomical Observatory of Japan, Mitaka, Tokyo 181-8588, Japan 16 Space Telescope Science Institute, Baltimore, MD 21218, USA 17 Institute for the Physics and Mathematics of the Universe, The University of Tokyo, 5-1-5 Kashiwanoha, Kashiwa-shi, Chiba 277-8583, Japan
Transcript of EARLY-TYPE GALAXIES AT z ∼ 1.3. III. ON THE DEPENDENCE OF FORMATION EPOCHS AND STAR FORMATION...

arX
iv:1
103.
0265
v1 [
astr
o-ph
.CO
] 1
Mar
201
1
Early-Type galaxies at z ∼ 1.3. III. On the dependence of
Formation Epochs and Star Formation Histories on Stellar Mass
and Environment
A. Rettura1,4,5, S. Mei2,3, S.A. Stanford1, A. Raichoor2,3, S. Moran4, B. Holden6, P.
Rosati7, R. Ellis8, F. Nakata9, M. Nonino10, T. Treu11, J.P. Blakeslee12, R. Demarco13, P.
Eisenhardt14, H.C. Ford4, R.A.E. Fosbury7, G. Illingworth6, M. Huertas-Company2,3, M.J.
Jee1, T. Kodama15, M. Postman16, M. Tanaka17, R.L. White16
ABSTRACT
We study the environmental dependence of stellar population properties at
z ∼ 1.3. We derive galaxy properties (stellar masses, ages and star formation his-
tories) for samples of massive, red, passive early-type galaxies in two high-redshift
1Department of Physics, University of California, Davis, CA 95616, USA
2University of Paris Denis Diderot, 75205 Paris Cedex 13, France
3GEPI, Observatoire de Paris, Section de Meudon, Meudon Cedex, France
4Department of Physics and Astronomy, Johns Hopkins University, Baltimore, MD 21218, USA
5Department of Physics and Astronomy, University of California, Riverside, CA 92521, USA
6UCO/Lick Observatories, University of California, Santa Cruz, CA 92065, USA
7European Southern Observatory, 85748, Garching, Germany
8California Institute of Technology, Pasadena, CA 91125, USA
9Subaru Telescope, National Astronomical Observatory of Japan, Hilo, HI 96720, USA
10INAF-Osservatorio Astronomico di Trieste, 34131 Trieste, Italy
11Department of Physics, University of California, Santa Barbara, CA 93106, USA
12Herzberg Institute of Astrophysics, National Research Council of Canada, Victoria,BC V9E 2E7, Canada
13Department of Astronomy, Universidad de Concepcion, Casilla 160-C, Concepcion, Chile
14Jet Propulsion Laboratory, California Institute of Technology, MS 169-327, Pasadena, CA 91109, USA
15National Astronomical Observatory of Japan, Mitaka, Tokyo 181-8588, Japan
16Space Telescope Science Institute, Baltimore, MD 21218, USA
17Institute for the Physics and Mathematics of the Universe, The University of Tokyo, 5-1-5 Kashiwanoha,
Kashiwa-shi, Chiba 277-8583, Japan

– 2 –
clusters, RXJ0849+4452 and RXJ0848+4453 (with redshifts of z = 1.26 and 1.27,
respectively), and compare them with those measured for the RDCS1252.9-2927
cluster at z=1.24 and with those measured for a similarly mass-selected sample
of field contemporaries drawn from the GOODS-South Field. Robust estimates
of the aforementioned parameters have been obtained by comparing a large grid
of composite stellar population models with extensive 8-10 band photometric
coverage, from the rest-frame far-ultraviolet to the infrared. We find no varia-
tions of the overall stellar population properties among the different samples of
cluster early-type galaxies. However, when comparing cluster versus field stellar
population properties we find that, even if the (star formation weighted) ages
are similar and depend only on galaxy mass, the ones in the field do employ
longer timescales to assemble their final mass. We find that, approximately 1
Gyr after the onset of star formation, the majority (75%) of cluster galaxies have
already assembled most (> 80%) of their final mass, while, by the same time,
fewer (35%) field ETGs have. Thus we conclude that while galaxy mass regulates
the timing of galaxy formation, the environment regulates the timescale of their
star formation histories.
Subject headings: galaxies: clusters: individual: RXJ0849+4452, RXJ0848+4453,
RDCS1252.9-2927 — galaxies: high-redshift — galaxies: fundamental parame-
ters — galaxies: evolution — galaxies: formation — galaxies: elliptical — cos-
mology: observations
1. Introduction
Galaxies reside in environments that span a wide range of density. In order to understand
the physical processes that drive their evolution is important to test for systematic differences
between galaxies in various environments. Many authors have shown that population density
plays an important role in determining many galaxy properties, such as star formation
rate, gas content and morphology (Kodama & Bower 2001; Balogh et al. 2002). Several
mechanisms have been proposed by theorists to account for these effects, such as ram pressure
stripping, mergers and tidal effects (Gunn & Gott 1972; Dressler et al. 1997; Moore et al.
1996, 1998, 1999).
More than half of all stars in the local Universe are found in massive spheroids (e.g.,
Bell et al. (2003)). The history of mass assembly and star formation of these Early-Type
Galaxies (ETGs) are among the most actively pursued elements in galaxy evolution studies,
and form the basis for models of massive galaxy formation (Renzini 2006).

– 3 –
Galaxy clusters provide an ideal laboratory to study ETGs, the dominant galaxy population
in clusters, even beyond redshift one. In addition, large field surveys have multiplied in
recent years, extending the baseline over which environmental effects can be studied .
Studies indicate that the most massive ETGs in the field may be amongst the oldest
at any given epoch (Cimatti et al. 2004; Fontana et al. 2004; Saracco et al. 2004; Treu et al.
2005; Juneau et al. 2005; di Serego Alighieri et al. 2005; Pannella et al. 2009). They have
evolved mainly passively since z ∼ 1 and, at least the most massive ones, as slowly as cluster
galaxies (van Dokkum & Franx 1996; Bernardi et al. 1998; Treu et al. 1999; Kochanek et al.
2000; van Dokkum & Franx 2001; Treu et al. 2001; van Dokkum & Stanford 2003; De Propris et al.
2007). Similarly, tight constraints have been placed on the scatter and slope of the color-
magnitude relation (CMR), the Fundamental Plane (FP) (Jørgensen et al. 2006; Treu et al.
2005; van der Wel et al. 2005; di Serego Alighieri et al. 2006; van Dokkum & van der Marel
2007) and Balmer line strengths (Clemens et al. 2006; Sanchez-Blazquez et al. 2006) of the
ETGs populating massive clusters, indicating a very high formation redshift for the ETGs in
clusters as well (Rettura et al. 2006; Eisenhardt et al. 2008; Rettura et al. 2010; Gobat et al.
2008; Mei et al. 2009; Collins et al. 2009; Rosati et al. 2009).
The most distant clusters known to date provide the strongest leverage on model pre-
dictions (Papovich et al. 2010; Tanaka et al. 2010a). Specifically, there is a tight CMR of
ETGs at 0.8 < z < 1.5 (Blakeslee et al. 2003; Blakeslee et al. 2006; Mei et al. 2006a,b;
Lidman et al. 2008; Hilton et al. 2009; Strazzullo et al. 2010), a slowly evolving K-band lu-
minosity function seemingly at odds with hierarchical merging scenarios (Toft et al. 2004;
Strazzullo et al. 2006), and a tight and slowly evolving FP out to z ≈ 1.2 (Holden et al.
2005). The existence of such massive, passively evolving galaxies already at z & 0.8
needs to be reconciled with the evidence for massive (often dusty) star-forming popula-
tions found at z & 2.2 both in the field and in overdense environments (Steidel et al. 2005;
Adelberger et al. 2005; Kodama et al. 2007; Miley & De Breuck 2008; Overzier et al. 2009;
Tanaka et al. 2010b).
Previous studies based on optical and infrared data have placed some constraints on the
star formation histories of ETGs in distant clusters based on the scatter in their CMRs: the
best-fit models yield formation epochs of 2 < zf < 7 (Blakeslee et al. 2003), but a greater
accuracy could not be achieved based on the available rest-frame optical and infrared data
alone. The reason for this is that age-dependent features in galaxy spectra (e.g., the 4000 A
break or the 1.6 µm bump) are too broad or evolve too slowly to be used as adequate age
indicators (Burstein et al. 1988; Tantalo et al. 1996; Maraston 2005; Rettura et al. 2010).
In order to better constrain the formation epoch (zf ) of ETGs we need to probe the much
sharper and fast-evolving rest frame UV-optical colors that will allow us to determine zf with

– 4 –
much greater accuracy than hitherto achieved, enabling us to better constrain the entire SFH
of ETGs1 (see also Fig.2 of Rettura et al. (2010))
In order to provide a key test of the paradigm of an accelerated evolution in the highest
density environments (Diaferio et al. 2001; Thomas et al. 2005), in this work, on the basis
of photometric data available over the rest-frame wavelength range 0.15− 2µm, we compare
stellar masses, ages and inferred star formation histories of ETGs found in three massive X-
ray detected clusters at z ∼ 1.3 (RXJ0849+4452, RXJ0848+4453, RDCS1252.9-2927) with
a sample of field contemporaries drawn from the GOODS South Field.
The structure of this paper is as follows. The description of our datasets, cataloging
and sample selection is described in §2. In §3 we describe our methods in inferring star
formation histories, ages and masses from stellar population analysis. The results of our
study are discussed in §4, while in § 5 we summarize our conclusions.
We assume a ΩΛ = 0.73, Ωm = 0.27 and H0 = 71 km · s−1 · Mpc−1 flat universe
(Spergel et al. 2003), and use magnitudes in the AB system throughout this work.
2. Description of the data
This work is based on data collection programs on the three galaxy clusters at z ∼ 1.3
which are amongst the most extensive spectroscopic and photometric surveys available over
the wavelength range 0.35− 4.5µm. To compare cluster galaxy properties with the field, we
also take advantage of similar-quality archival data available for the GOODS-South Field.
Tab. 1 summarizes the rich and homogeneous dataset employed in this study.
2.1. RX J0849+4452 and RX J0848+4453
The Lynx Supercluster, is the highest redshift supercluster known today (Nakata et al.
2005), with two central X-ray detected galaxy clusters and three spectroscopically confirmed
surrounding groups. This work focuses in particular on the cores of the two main clusters, RX
J0849+4452 (hereafter, Lynx E) and RX J0848+4453 (hereafter, Lynx W), both detected in
the ROSAT Deep Cluster Survey (Rosati et al. 1999) and spectroscopically confirmed at z
= 1.261 (Rosati et al. 1999) and z = 1.273 (Stanford et al. 1997), respectively. Furthermore,
1Note that by z & 1.3 not enough cosmic time has elapsed for HB stars to produce the “UV upturn”
(Yi et al. 1997, 1999).

– 5 –
in two accompanying papers (Raichoor et al. 2011; Mei et al. 2011) we also compare ETGs
stellar population properties in the two cluster cores with those of the ones in the surrounding
groups.
Both Lynx E and Lynx W were observed in the u′ filter with the blue channel of
LRIS on Keck I in two separate epochs. On March 4th, 2003, exposures totaling 260 min
were obtained in conditions that were photometric with 0.8” seeing. A further 240 min was
obtained during the night of March 1st, 2008, with clear skies and a typical seeing of 0.9”. The
two epochs of data were reduced separately using standard IRAF tasks, where we subtracted
the bias level, flat-fielded each exposure using a series of twilight flats obtained on each night,
astrometrically calibrated and aligned each image by comparison to star positions from the
HST GSC2.2 catalog and then refined with a larger number of stellar positions from the
SDSS DR6 catalog. Finally, the images were flux-calibrated, also correcting for atmospheric
extinction, using exposures of various photometric standard stars obtained across a range
of airmasses each night, and then combined. The two sets of images were taken at different
position angles, and so the combined frame has an effective exposure time of 8 hrs 20 min
across much of the field, but a shallower depth at the edges of the field where the frames do
not overlap. The effective resolution in the combined ultraviolet image is 0.95”.
In order to sample the optical-to-infrared wavelength domain, we have obtained data
in the following passbands, R, iF775W , zF850LP , J, Ks, and Spitzer/IRAC channels, 3.6µm
(ch1) and 4.5µm (ch2).
We refer the reader to the companion paper by (Raichoor et al. 2011) for a more detailed
description of the optical and infrared dataset used in this work (see also their Tab.1).
Here we remind that the R-band images were obtained with the Keck/LRIS instrument.
The iF775W and zF850LP -band were observed in the F775W and F850LP filters provided by
the ACS-Wide Field Camera (WFC) on board of the Hubble Space Telescope. We note
that these two observing filters have been purposely chosen to bracket the 4000A-break of a
model elliptical galaxy at z = 1.26− 1.27 (Mei et al. 2006a,b).
The near-infrared imaging data (J,Ks-band) were acquired with the FLAMINGOS instru-
ment available at the Kitt Peak National Observatory (KPNO).
Mid-Infrared imaging was obtained (in two channels at [3.6µm] and [4.5µm]) with the IRAC
camera on board of the Spitzer space telescope.

– 6 –
2.2. RDCS1252.9-2927 and the GOODS-South field.
This work builds on datasets and analyses already performed on ETGs belonging to
the X-ray luminous cluster, RDCS1252.9-2927 (hereafter, CL1252), and to the GOODS-
South field, centered on the so-called Chandra Deep Field South field (hereafter, CDFS), as
reported by Rettura et al. (2010); Gobat et al. (2008).
We refer to the aforementioned papers for more details in the data reduction. Here
we note that the data we have employed for the CL1252 cluster consist of deep imag-
ing in 10 bands: VLT/VIMOS (U), VLT/FORS2 (B, V , R), HST/ACS (iF775W ,zF850lp)
(Blakeslee et al. 2003), VLT/ISAAC (Js,Ks) (Lidman et al. 2004), Spitzer/IRAC (3.6µm,
4.5µm), as well as spectroscopic data taken with VLT/FORS2 and published in Demarco et al.
(2007).
The archival data for the comparison field, the CDFS, comprises deep imaging in 9
bands: VLT/VIMOS (U) (Nonino et al. 2009), HST/ACS (BF435W , VF606W , i775W , zF850LP )
(Giavalisco et al. 2004), VLT/ISAAC, (J ,Ks) (Retzlaff et al. 2010), Spitzer/IRAC (3.6µm,
4.5µm) 2, as well as spectroscopic data taken with the VLT/FORS2 300I grism by the ESO-
GOODS survey3 (Vanzella et al. 2005, 2006, 2008; Balestra et al. 2010) and the K20 survey
(Cimatti et al. 2002).
2.3. Cataloging of observations and samples selection
The resulting datasets for the three clusters and the field have homogeneous depths and
wavelength coverage, allowing the application of similar selection criteria for both samples.
This is a crucial point for stellar population studies, so that we do not have different levels
of systematic biases in the analyses.
The data allow the reconstruction of galaxy spectral energy distributions (SEDs) by
entirely sampling the relevant spectrum range emitted by all the different stellar populations.
For each observing band we produce catalogs from matched aperture photometry, with
an aperture of radius 1.5” and an aperture correction out to 7” radius, as described in
Rettura et al. (2006); Raichoor et al. (2011).
2CDFS imaging is publicly available through the GOODS collaboration web-site:
http://www.stsci.edu/science/goods/.
3Spectroscopic data are publicly available through the web-site:
http://www.eso.org/sci/activities/projects/goods/MasterSpectroscopy.htm.

– 7 –
The availability of 8 to 10 passbands spanning such a large wavelength range enables
the estimate of accurate stellar masses (Rettura et al. 2006), ages and star formation histo-
ries of ETGs (Rettura et al. 2010) and enables us to directly compare galaxy properties of
homogeneously selected samples of ETGs in both environments.
Specifically, we measure stellar population parameters of Lynx E and Lynx W early-type
cluster galaxies and compare them with those found for similarly-selected samples of cluster
and field contemporaries drawn from CL1252 at z = 1.237 and CDFS at z = 1.237± 0.15.
We estimated stellar masses from both Ks band observations and SED fitting . The two
estimates give similar mass limits. The depth of the VLT/ISAAC and KPNO/FLAMINGOS
Ks-band images and the extended multi-wavelength data for all fields allows us, in fact,
to define complete mass-selected samples. The reader is referred to Gobat et al. (2008);
Raichoor et al. (2011) for more details. Here, we note that overall photometric completeness
is obtained if we limit our analysis to stellar masses larger than Mlim = 5 · 1010M⊙4.
A selection of Lynx E, Lynx W and CL1252 passive ETGs along the cluster red sequence
is efficiently provided by a color selection of iF775W − zF850LP > 0.8 (Blakeslee et al. 2003;
Mei et al. 2006a,b, 2009, 2011).
For CL1252, in the spectroscopic sample of Demarco et al. (2007), there are 22 red-sequence
galaxies (iF775W − zF850LP > 0.8) with M∗ > Mlim, of which 18 are classified as passive
ETGs, i.e. without detectable [OII] or other emission lines in their observed spectra. For
Lynx E and Lynx W, in the combined photometric and spectroscopic samples (Mei et al.
2006a; Stanford et al. 1997; Rosati et al. 1999; Stanford et al. 2001; van Dokkum & Stanford
2003; Holden et al. 2011) there are 21 red-sequence galaxies with M∗ > Mlim, of which 17
are classified as passive ETGs. Specifically, there are 10 passive spectroscopically-confirmed
ETGs in Lynx E, and 3 in Lynx W. We remark that, to improve the statistics, we have
also included into the Lynx ETGs sample, 3 photometrically-confirmed members of Lynx E
and 1 photometrically-confirmed member of Lynx W both with iF775W − zF850LP > 0.8 and
M∗ > Mlim, thus resulting in a total sample of 17 Lynx E+W ETGs. It is important to
note that the removal from our sample of these 4 galaxies, whose cluster-membership was
assessed on the basis of a (8-9 band) photometric-redshift only, would not change the main
conclusions of this study.
For the corresponding CDFS sample of field contemporaries, the same criteria yield 27 passive
ETGs in CDFS with FORS2 spectra giving redshift in the range z = 1.237± 0.15 (for more
4Assuming Salpeter Initial Mass Function (IMF), with lower and upper cutoffs, mL = 0.1M⊙ and mU =
100M⊙, respectively. We refer the reader to Rettura et al. (2006); Raichoor et al. (2011) for a discussion on
the dependence of inferred stellar population properties on the actual choice of the IMF.

– 8 –
details see also Gobat et al. (2008); Rettura et al. (2010)).
We also remark that, adopting the classification scheme of Postman et al. (2005), visual
morphological analysis of the HST/ACS images available for all samples indicates that all
our red, passive ETGs also show typical elliptical or lenticular morphology.
As reported in Rettura et al. 2010, we also remind that the spectroscopic follow-up for
CL1252 is more complete at the low-mass end than in CDFS. Thus, our sample of ETGs in
CDFS is likely to be more incomplete at the low-mass end than the CL1252 and Lynx ones.
We will return to this point when discussing our results in Section 4.
3. Data Analysis: derivation of stellar population properties
The data described in the previous section are used to infer fundamental physical prop-
erties of similarly mass-selected samples of early-type galaxies (13 ETGs in the Lynx E, 4 in
Lynx W, 18 in CL1252 and 27 in the CDFS) . Adopting a similar approach to Rettura et al.
(2006, 2010), we derive stellar masses, star formation histories and ages for each ETG in Lynx
E and Lynx W using multi-wavelength PSF-matched aperture photometry from 8 passbands,
from observed u′-band to observed 4.5µm. For each galaxy, we compare the observed SED
with a set of composite stellar populations (hereafter, CSP) templates computed with the
Bruzual & Charlot (2003) models, assuming solar metallicity, Salpeter (1955) Initial Mass
Function (hereafter, IMF) and no dust.
Similarly to Rettura et al. (2006) we checked the effect of dust extinction on the best-fit
stellar masses by including a fourth free parameter, 0.0 < E(B − V ) < 0.4, following the
Cardelli et al. (1989) prescription. Performing the SED fit on 13 Lynx E+W ETGs (all
with complete u′-to-4.5µm coverage) and on 22 CDFS ETGs (all with complete U -to-4.5µm
coverage), we find that in ∼ 50% of the cases E(B − V ) ≤ 0.05 gives the best fit. In the
remaining cases values of E(B − V ) ≤ 0.2 are found and no particular trend with mass nor
environment is found either, hence supporting the validity of the dust-free assumption we
make throughout this work.
For our CSP models, we assume the following grid of exponentially-declining star for-
mation history (SFH) scenarios, Ψ(t, τ):
Ψ(t, τ) = SFR0 · e−t/τ
[
M⊙
yr
]
, (1)
where 0.05 ≤ τ ≤ 5 Gyr, SFR0 is the initial SFR at the onset of star formation, and
– 9 –
t is the time since the onset of star formation5 of the stellar population model formed at a
lookback time T (z) + t, with, e.g., T ≃ 8.67 Gyr at the epoch of observation (z ≃ 1.3).
In determining galaxy model ages, masses and star formation histories from SED fitting,
is important to understand how much our estimates could possibly be affected by “age-
metallicity”6 and “age-SFH” degeneracies. We note that in Rettura et al. (2010) we have
demonstrated that the use of photometric information coming from the rest-frame UV is
crucial to distinguish the different parameters of the stellar population modeling, allowing
us to break the “age-SFH degeneracy”. It is also important to note that the rest-frame UV
remains also largely unaffected by the “age-metallicity” degeneracy, which plagues optical
studies (Worthey 1994).
Furthermore, the reliability, at z > 1, of stellar population parameters inferred in the
rest-frame NIR regime (λobs ∼ 2µm) has long been debated (Maraston 1998) because of the
different implementation of the relevant short-duration thermally pulsating (TP) AGB phase
in the different stellar population synthesis models. However, in Rettura et al. (2006) we
have shown that different stellar population models actually yield overall consistent stellar
masses, within the typical errors, for ETGs at z ∼ 1.0. It is clear that the inferred SFH
(and age) is model-dependent and is generally not a unique solution, however the relative
difference in the underlying stellar population is still significant. In fact, in Rettura et al.
(2010) we have shown that when comparing cluster vs. field τs and ages, the relative dif-
ferences among samples (or lack thereof, as in their Fig. 8) were similar regardless of the
actual stellar population code used, not affecting their conclusions.
Hence, since our study is indeed aimed at constraining the relative difference of galaxy stellar
population parameters in a Cluster vs. Cluster and Cluster vs. Field fashion, we will only
show here the results obtained with the Bruzual & Charlot (2003) models, in order to facil-
itate direct comparison with previous studies in the literature. Note that in Raichoor et al.
(2011) we also present an extensive discussion on systematics due to choice of the stellar
population models at z ∼ 1.3 .
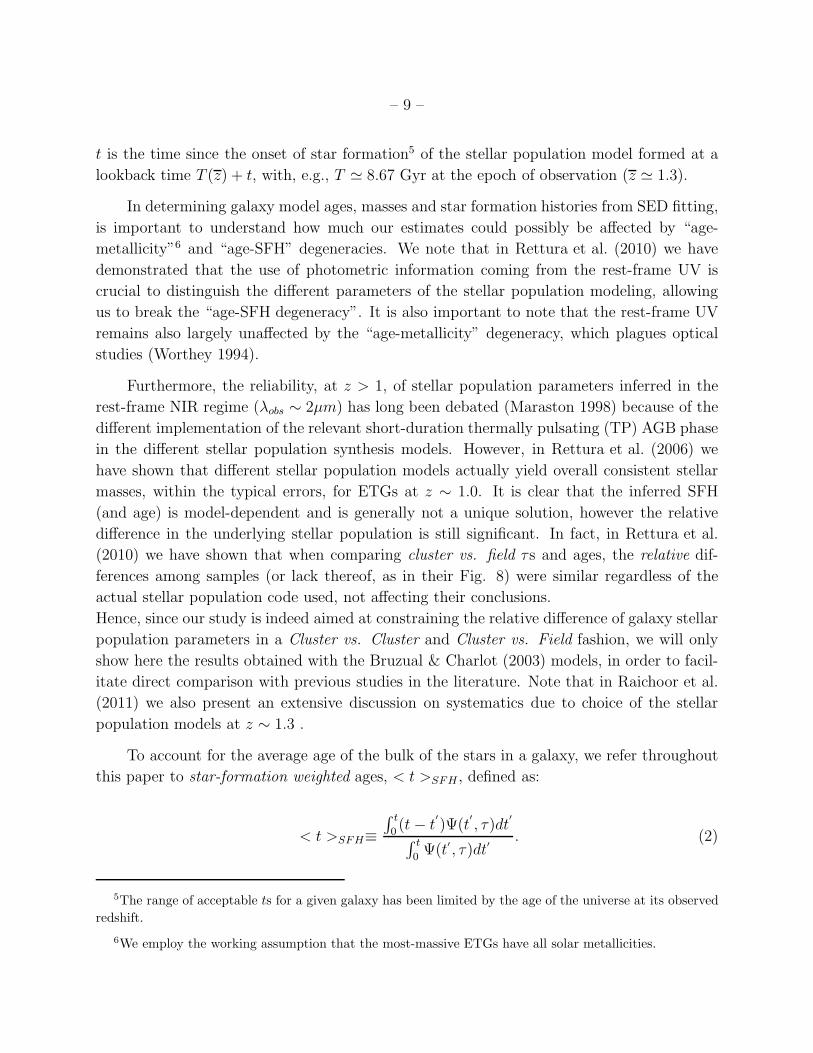
To account for the average age of the bulk of the stars in a galaxy, we refer throughout
this paper to star-formation weighted ages, < t >SFH , defined as:
< t >SFH≡
∫ t
0(t− t
′
)Ψ(t′
, τ)dt′
∫ t
0Ψ(t′ , τ)dt′
. (2)
5The range of acceptable ts for a given galaxy has been limited by the age of the universe at its observed
redshift.
6We employ the working assumption that the most-massive ETGs have all solar metallicities.

– 10 –
Assuming Ψ(t′
, τ) as in Eq. 1 we obtain,
< t >SFH=t− τ + τ · e−
t
τ
1− e−t
τ
, (3)
where t is the time elapsed since the onset of star formation (SF).
By comparing each observed SED with these atlases of synthetic spectra, we construct
a 3D χ2 space spanning a wide range of star formation histories, model ages and stellar
masses. The galaxy mass in stars M∗, the inferred < t >SFH and the τ of the models giving
the lowest χ2 are taken as the best-fit estimates of the galaxy stellar mass, age, and SFH
timescale throughout this work. We note that this procedure results in typical errors for
galaxy ages of ∼ 0.5 Gyr, and for τ of ∼ 0.2 Gyr (Rettura et al. 2010). Typical uncertainties
on the mass determination are about ∼ 40% (i.e., 0.15 dex) (Rettura et al. 2006).
4. Results and Discussion
In the top panel of Fig. 1 we plot the inferred stellar masses as a function of the
U − B rest-frame color for the mass-selected samples of CL1252, Lynx E and Lynx W
ETGs, resulting in a very similar distribution. In the bottom panel of Fig. 1 we show the
rest-frame U − B color - mass diagram of the combined samples of cluster (red circles)
and field (blue circles) ETGs. To have a very simple estimate of the scatter of the color–
mass relation, as derived from the SED fitting, we derive the scatter around the fit using
a Tukey’s biweigth (Press et al. 1992). We simply calculated the uncertainty in the scatter
estimation by bootstrapping on 1,000 simulations. For the Lynx cluster sample, CL1252,
and field galaxies, we obtain a scatter of 0.031 ± 0.010, 0.042 ± 0.010 ,and 0.050 ± 0.008,
respectively. These are intrinsic scatters as predicted from the best SED fitting, and do not
take into account uncertainties in the fitting methods. Field ETGs galaxies are distributed
around the cluster red-sequence, although they seem to show a larger scatter, especially at
lower masses. We will need more statistics and better estimates of uncertainties to draw
a stringent conclusion, since the cluster and field overall scatters could still be consistent
within the uncertainties.
As we apply the method described in section §3, we are able to directly compare the
relative distribution of galaxy stellar population properties for the different samples.
Stellar masses ranges from Mlim to 4 · 1011M⊙ except for three CL1252 bright galaxies and
one galaxy in the field (bottom panel of Fig. 1). We do not find any of the Lynx clusters
ETGs to be more massive than 3 · 1011M⊙ (top panel of Fig. 1).
We want to tests the hypothesis that two samples stellar-mass distributions have the

– 11 –
same median against the hypothesis that they differ at the 5% significance level. The Mann-
Whitney U-Test suggests that the distributions are likely to be similar (median probability
of 44%). We also study the Kolmogorov-Smirnov statistic and associated probability that
the two arrays of data are drawn from the same distribution, yielding a similar result. A
high value (67%) of probability shows that the cumulative distribution function of the cluster
stellar masses is not significantly different from the field one.
As shown in Fig. 2, we also find that all clusters show the same relative distributions
of lookback time since the onset of star formation (T (z) + t, top panel) and stellar mass
assembly timescales, (τ ; bottom panel). In fact both the Mann-Whitney U-Test (median
probability of 10%, 21 %) and the K-S statistics (75%, 91% of probability) also elucidate
that the distributions are very similar.
This lack of cluster-to-cluster variation may well indicate that these three clusters ex-
perienced similar evolutionary processes, resulting in similar stellar population properties
shown by their member ETGs. Since these samples of cluster ETGs are found to be very
similar from a stellar population point-of-view, we can combine them into one sample of 35
ETGs, representative of the Cluster environment at z ∼ 1.3, apt for comparison with the
sample of 27 CDFS ETGs, representative of the Field environment.
Thus we compare the distribution of the star-formation weighted ages (< t >SFH, top
panel of Fig. 3) as a function of stellar mass in both environments. We find the distributions
to be overall very similar, as also shown by the histograms of lookback times since the onset of
star formation (top panel of Fig 4) and by the histograms of the lookback times to < t >SFH
(bottom panel of Fig 4). Note that Mann-Whitney U-Test returns a median probability of
18% and the K-S statistics a 60% of probability that the last two data values are drawn
from the same distribution. These results imply that no significant delay in relative age is
found for ETGs in either environments. Using BC03 models, we find that ∼ 80% of ETGs
have SF-weighted ages in the range 3.5 ± 1.0 Gyr in both cluster and field, in qualitative
agreement with previous CMR studies (Blakeslee et al. 2003; Mei et al. 2006a,b).
In the bottom panel of Fig. 3 we show, for both samples, the dependence of star-
formation weighted ages, < t >SFH, on stellar mass. It is evident that the ages of ETGs
only depends on their mass, i.e. the halo mass in which they reside, which is in agreement
with the so–called downsizing scenario of galaxy formation (Cowie et al. 1996). We note that
this scenario have also been reconciled, with the introduction of various forms of so-called
feedback mechanisms, with the recent versions of semi-analytic models based on ΛCDM
cosmogony (De Lucia et al. 2006; Bower et al. 2006; Menci et al. 2008).
To summarize, we find that cluster galaxy (star formation weighted) ages have the same

– 12 –
relative distribution as their field contemporaries: no significant delay in their formation
epochs is found within the errors (∼ 0.5 Gyr). We remind that this result is in remark-
ably good agreement with the ones derived by van Dokkum & van der Marel (2007) and
di Serego Alighieri et al. (2006) from the evolution of the M/L ratio. However our method
is able to extend this kind of analysis to less massive system than the typical targets of FP
studies at z ∼ 1.
Despite of the fact that cluster and field galaxy formation epochs are found to be
similar, it could still be possible that the timescales of their SFH are significantly different.
As mentioned above, the data have shown that the distributions of cluster and field optical
colors were slightly different. As a function of the stellar mass, cluster galaxies are found to
lie on a very tight red-sequence, while those in the field populate the same color-sequence
with a slightly larger scatter (Fig. 1).
This piece of evidence finds a natural explanation in the framework of our modeling. As
shown in the top-left panel of Fig. 5, as a function of stellar mass, we find that field ETGs
show longer SFH timescales than their cluster contemporaries, which tend to assemble their
mass with the shortest τ at any given mass. In fact the Mann-Whitney U-Test confirms
that the distributions are very likely to be different (median probability of 0.07%). The
Kolmogorov-Smirnov statistic also yields an associated probability that the two distribution
of τs are drawn from the same distribution of just 0.8%.
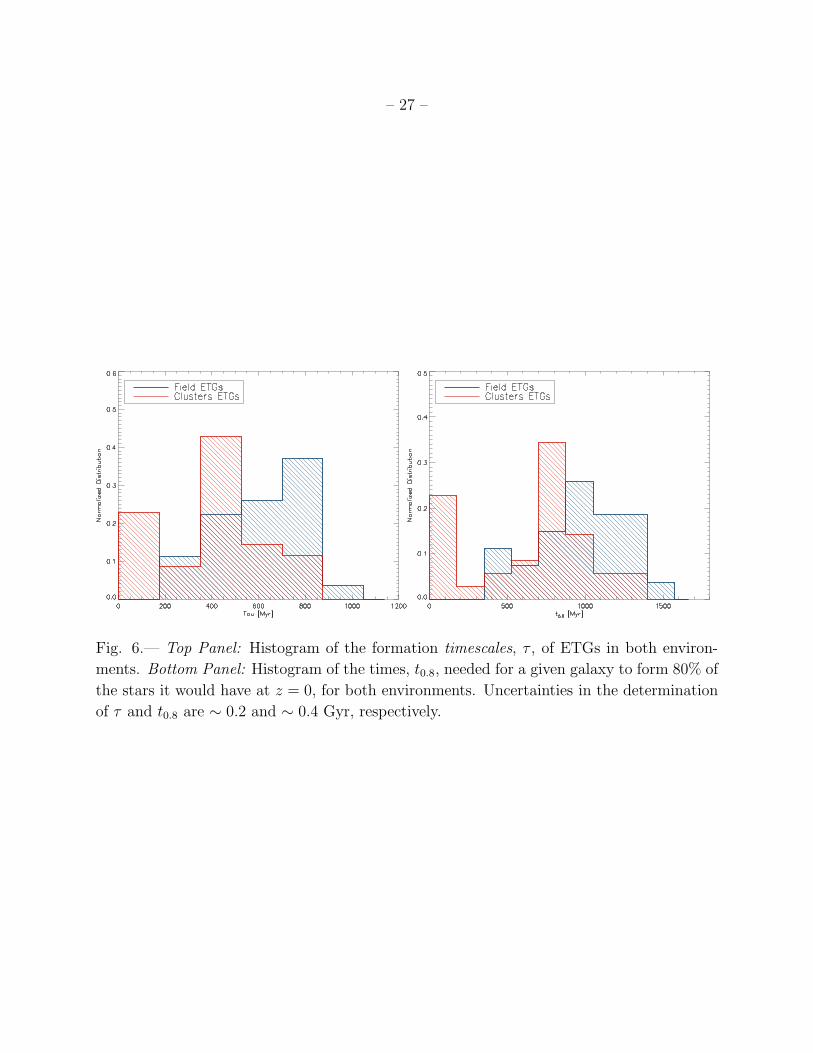
If galaxies continue to form stars following the exponential decay of Eq. 1, we can derive
the time, t0.8 needed to form 80% of the stars they would have at z = 0. As shown by top-
right panel of Fig. 5 and bottom panel of Fig. 6), we find that ∼ 1 Gyr after the onset of
star formation 75% of cluster ETGs have already assembled most of their of their final mass.
By the same time, less than 35% of field ETGs have.
The bottom-left panel of Fig. 5 shows the relative distributions of inferred initial star
formation rate, SFR0, as a function of stellar mass. More than 30% of cluster galaxies
have higher SFR0 and smaller τs than any other field contemporaries, indicating they have
experienced a much more intense star formation at early times than field galaxies. As a result,
at the time of observation, cluster ETG specific star-formation rates, defined as the SFR
divided by the galaxy stellar mass, SSFR, are lower than those of the field ones (bottom-
right panel of Fig. 5). Indeed the Mann-Whitney U-Test confirms that the distributions of
SSFR are likely to be different (median probability of 1.3%). The Kolmogorov-Smirnov
statistic yields an associated probability of 0.5% that the two distribution of τs are drawn
from the same parent distribution.
As summarized by the histograms in Fig. 6, the distributions of τ and t0.8 in clusters

– 13 –
and in the field are found to be very different. These results clearly indicate a dependence
of ETGs star formation histories on the environment, in agreement with previous studies
based on a comparison of a single cluster to the field (Gobat et al. 2008; Rettura et al. 2010;
Menci et al. 2008).
As discussed in Rettura et al. (2010), we recall that our field sample is more deficient
in lower mass objects than the cluster sample because of a less extensive follow-up of spec-
troscopic targets in the field as compared to that in the cluster.
However, even if the field sample were corrected for completeness, this would likely result
in a larger fraction of field ETGs at low mass, which are the ones that we find with longer
τs and t0.8s, higher SSFRs and lower SFR0s. Hence a correction would actually amplify
the difference between the typical mass assembly timescales of the two samples, and so not
affect our conclusions.
5. Conclusions
We have studied the environmental dependence of early-type galaxy stellar population
properties at z ∼ 1.3 based on high-quality, multi-wavelength photometry available in 8-10
passbands from U to [4.5µm]: sampling the entire relevant domain of emission of the different
stellar populations, from rest-frame far-ultraviolet to the infrared.
We have similarly analyzed mass-selected samples of ETGs belonging to the cores of
three massive clusters (RXJ0849+4452 at z=1.261, RXJ0848+4453 at z=1.273, RDCS1252.9-
2927 at z=1.237) and compared their stellar population properties with those measured in
a similarly selected sample of field contemporaries drawn from the GOODS-S survey.
We have derived stellar masses, (star formation weighted) ages, and star formation
histories, parameterized as timescales, τ , from exponentially declining CSP model templates
built with BC03 models for samples of massive (M > 5 · 1010M⊙), passive (no-emission line
in their spectra) ETGs at z≃ 1.3. Apart from a lower level of spectroscopic completeness for
the least massive field galaxies, that we find not to affect our conclusions, our sample has
the advantage of being photometrically complete at our mass limit and having galaxy types
(passive or star-forming members) assigned spectroscopically.
This work extends the analyses performed on a single-cluster by Rettura et al. (2010);
Gobat et al. (2008) to two more clusters at z ∼ 1.3: doubling the size of the cluster ETG
sample.
Hence, on the basis of the new data we are able to affirm that:

– 14 –
• we find no significant difference in the derived stellar population properties of z ∼ 1.3
ETGs belonging to different X-ray luminous clusters (RXJ0849+4452 & RXJ0848+4453,
RDCS1252.9-2927).
Moreover the comparative statistical analysis performed in this work on the extended
dataset corroborates the results obtained in our previous study (Rettura et al. 2010), that
we summarize as follows:
• Field ETGs galaxies are distributed around the cluster ETG red-sequence, although
they seem to show a larger scatter, especially at lower masses. We will need more
statistics and better estimates of uncertainties to draw a more stringent conclusions,
since the cluster and field overall scatters could still be consistent within the uncer-
tainties. However, we remind that the small scatter in cluster environments remains a
challenge for semi-analytical galaxy evolution models (Menci et al. 2008).
• We find no significant delay in the star formation weighted ages of massive ETGs ob-
served in all clusters and in the field at z≃ 1.3.
The age of ETGs increase with galaxy mass in all environments, which is in agree-
ment with the downsizing scenario. The site of active star formation must have
shifted from the most massive to the less massive galaxies as a function of the cos-
mic time. The formation epochs of ETGs only depends on their mass and not on the
environment they live in. This result is in remarkably good agreement with those ob-
tained from the evolution of the M/L ratio (e.g. van Dokkum & van der Marel (2007);
di Serego Alighieri et al. (2006)).
• However, the data show that cluster and field SFHs are significantly different. Field
ETGs best-fit models span a different range of timescales than their cluster contem-
poraries, which are formed with the shortest τ at any given mass. This result is quan-
titatively consistent with the predictions of current galaxy formation models based on
the latest rendition of semi-analytic models (Menci et al. 2008).
• We find that 1 Gyrs after the onset of star formation 75% of cluster ETGs have already
assembled 80% (or more) of their final mass, while, by the same time, less than 35%
of field ETGs have.
• Accordingly, cluster ETGs specific star-formation rates at the time of observation are
found to be smaller than those of the field ones, implying that the last episode of star
formation must have happened more recently in the field than in the cluster.

– 15 –
While cluster and field galaxy observed at z≃ 1.3 form at a similar epoch in a statistical
sense, a high density environment appear to be able to trigger a much more rapid and
homogenous mass assembly event for the ETGs, limiting the range of possible star-formation
processes. In fact, more than 30% of cluster galaxies are found with higher initial SFR0 and
smaller τs than any other field contemporaries, indicating they have experienced much more
intense star formation at early times than field galaxies. In low density environments, this
effect must rapidly fade as ETGs display a much broader range of possible star formation
histories.
A.R. is grateful to Gabriella de Lucia, Raphael Gobat, Roderik Overzier, Maurilio Pan-
nella, Veronica Strazzullo and Loredana Vetere for useful discussions.
ACS was developed under NASA contract NAS 5-32865. This research has been sup-
ported by the NASA HST grant GO-10574.01-A, and Spitzer program 20694. The Space
Telescope Science Institute is operated by AURA Inc., under NASA contract NAS5-26555.
Some of the data presented herein were obtained at the W.M. Keck Observatory, which is op-
erated as a scientific partnership among the California Institute of Technology, the University
of California and the National Aeronautics and Space Administration. The Observatory was
made possible by the generous financial support of the W.M. Keck Foundation. The authors
wish to recognize and acknowledge the very significant cultural role and reverence that the
summit of Mauna Kea has always had within the indigenous Hawaiian community. We are
most fortunate to have the opportunity to conduct observations from this mountain. Some
data were based on observations obtained at the Gemini Observatory, which is operated
by the AURA, Inc., under a cooperative agreement with the NSF on behalf of the Gemini
partnership: the National Science Foundation (United States), the Science and Technology
Facilities Council (United Kingdom), the National Research Council (Canada), CONICYT
(Chile), the Australian Research Council (Australia), Ministerio da Ciencia e Tecnologia
(Brazil) and Ministerio de Ciencia, Tecnologia e Innovacion Productiva (Argentina), Gem-
ini Science Program ID: GN-2006A-Q-78.
REFERENCES
Adelberger, K. L., Steidel, C. C., Pettini, M., Shapley, A. E., Reddy, N. A., & Erb, D. K.
2005, ApJ, 619, 697
Balogh, M. L., et al. 2002, ApJ, 566, 123

– 16 –
Balestra, I., et al. 2010, A&A, 512, A12
Baugh, C. M., Cole, S., & Frenk, C. S. 1996, MNRAS, 283, 1361
Bell, E. F., McIntosh, D. H., Katz, N., & Weinberg, M. D. 2003, ApJS, 149, 289
Bernardi, M., Renzini, A., da Costa, L. N., Wegner, G., Alonso, M. V., Pellegrini, P. S.,
Rite, C., & Willmer, C. N. A. 1998, ApJ, 508, L143
Blakeslee, J. P., Franx, M., Postman, M., et al. 2003, ApJ, 596, L143
Blakeslee, J. P., et al. 2006, ApJ, 644, 30
Bower, R. G., Benson, A. J., Malbon, R., Helly, J. C., Frenk, C. S., Baugh, C. M., Cole, S.,
& Lacey, C. G. 2006, MNRAS, 370, 645
Bruzual, G. & Charlot, S. 2003, MNRAS, 344, 1000
Burstein, D., Bertola, F., Buson, L. M., Faber, S. M., & Lauer, T. R. 1988, ApJ, 328, 440
Cardelli, J. A., Clayton, G. C., & Mathis, J. S. 1989, ApJ, 345, 245
Cimatti, A., Pozzetti, L., Mignoli, M., et al. 2002, A&A, 391, L1
Cimatti, A., Daddi, E., Renzini, A., et al. 2004, Nature, 430, 184
Clemens, M. S., Bressan, A., Nikolic, B., Alexander, P., Annibali, F., & Rampazzo, R. 2006,
MNRAS, 370, 702
Collins, C. A., et al. 2009, Nature, 458, 603
Cowie, L. L., Songaila, A., Hu, E. M., & Cohen, J. G. 1996, AJ, 112, 839
De Lucia, G., Springel, V., White, S. D. M., Croton, D., & Kauffmann, G. 2006, MNRAS,
366, 499
Demarco, R., et al. 2007, ApJ, 663, 164
Diaferio, A., Kauffmann, G., Balogh, M. L., White, S. D. M., Schade, D., & Ellingson, E.
2001, MNRAS, 323, 999
De Propris, R., Stanford, S. A., Eisenhardt, P. R., Holden, B. P., & Rosati, P. 2007, AJ,
133, 2209
di Serego Alighieri, S., Vernet, J., Cimatti, A., et al. 2005, A&A, 442, 125

– 17 –
di Serego Alighieri, S., Lanzoni, B., & Jørgensen, I. 2006, ApJ, 652, L145
Dressler, A., et al. 1997, ApJ, 490, 577
Eisenhardt, P. R. M., et al. 2008, ApJ, 684, 905
Fontana, A., Pozzetti, L., Donnarumma, I., et al. 2004, A&A, 424, 23
Giavalisco, M., Ferguson, H. C., Koekemoer, A. M., et al. 2004, ApJ, 600, L93
Gobat, R., Rosati, P., Strazzullo, V., Rettura, A., Demarco, R., & Nonino, M. 2008, A&A,
submitted
Gunn, J. E., & Gott, J. R. I. 1972, ApJ, 176, 1
Jørgensen, I., Chiboucas, K., Flint, K., Bergmann, M., Barr, J., & Davies, R. 2006, ApJ,
639, L9
Juneau, S., et al. 2005, ApJ, 619, L135
Hilton, M., et al. 2009, ApJ, 697, 436
Holden, B. P., van der Wel, A., Franx, M., et al. 2005, ApJ, 620, L83
Holden, B., et al. 2011, priv. comm.
Kochanek, C. S., et al. 2000, ApJ, 543, 131
Kodama, T., & Bower, R. G. 2001, MNRAS, 321, 18
Kodama, T., Tanaka, I., Kajisawa, M., Kurk, J., Venemans, B., De Breuck, C., Vernet, J.,
& Lidman, C. 2007, MNRAS, 377, 1717
Kurk, J. D., Pentericci, L., Rottgering, H. J. A., & Miley, G. K. 2004, A&A, 428, 793
Lidman, C., Rosati, P., Demarco, R., et al. 2004, A&A, 416, 829
Lidman, C., et al. 2008, A&A, 489, 981
Maraston, C. 1998, MNRAS, 300, 872
Maraston, C. 2005, MNRAS, 362, 799
Mei, S., et al. 2006, ApJ, 644, 759
Mei, S., et al. 2006, ApJ, 639, 81

– 18 –
Mei, S., et al. 2009, ApJ, 690, 42
Mei, S., et al. 2011, submitted
Menci, N., Rosati, P., Gobat, R., Strazzullo, V., Rettura, Mei, S., & Demarco, R. 2008,
ApJ, submitted
Miley, G., & De Breuck, C. 2008, A&A Rev., 15, 67
Moore, B., Katz, N., Lake, G., Dressler, A., & Oemler, A. 1996, Nature, 379, 613
Moore, B., Lake, G., & Katz, N. 1998, ApJ, 495, 139
Moore, B., Ghigna, S., Governato, F., Lake, G., Quinn, T., Stadel, J., & Tozzi, P. 1999,
ApJ, 524, L19
Nakata, F., et al. 2005, MNRAS, 357, 1357
Nonino, M., et al. 2009, ApJS, 183, 244
Overzier, R. A., Shu, X., Zheng, W., Rettura, A. et al. 2009, ApJ, 704, 548
Pannella, M., et al. 2009, ApJ, 701, 787
Papovich, C., et al. 2010, ApJ, 716, 1503
Press, W. H., Teukolsky, S. A., Vetterling, W. T., & Flannery, B. P. 1992, Cambridge:
University Press, —c1992, 2nd ed.,
Renzini, A. 2006, ARA&A, 44, 141
Raichoor, A., et al. 2011, submitted
Rettura, A., et al. 2006, A&A, 458, 717
Rettura, A., et al. 2010, ApJ, 709, 512
Retzlaff, J., et al. & GOODS Team 2010, A&A, 511, A50
Rosati, P., Stanford, S. A., Eisenhardt, P. R., Elston, R., Spinrad, H., Stern, D., & Dey, A.
1999, AJ, 118, 76
Rosati, P., Tozzi, P., Ettori, S., et al. 2004, AJ, 127, 230
Rosati, P., et al. 2009, A&A, 508, 583

– 19 –
Salpeter, E. E. 1955, ApJ, 121, 161
Sanchez-Blazquez, P., Gorgas, J., Cardiel, N., & Gonzalez, J. J. 2006, A&A, 457, 809
Saracco, P., Longhetti, M., Giallongo, E., et al. 2004, A&A, 420, 125
Spergel, D. N., Verde, L., Peiris, H. V., et al. 2003, ApJS, 148, 175
Stanford, S. A., Elston, R., Eisenhardt, P. R., Spinrad, H., Stern, D., & Dey, A. 1997, AJ,
114, 2232
Stanford, S. A., Holden, B., Rosati, P., Tozzi, P., Borgani, S., Eisenhardt, P. R., & Spinrad,
H. 2001, ApJ, 552, 504
Strazzullo, V., et al. 2006, A&A, 450, 909
Strazzullo, V., et al. 2010, arXiv:1009.1423, ApJ, in press
Steidel, C. C., Adelberger, K. L., Shapley, A. E., Erb, D. K., Reddy, N. A., & Pettini, M.
2005, ApJ, 626, 44
Tanaka, M., Finoguenov, A., & Ueda, Y. 2010, ApJ, 716, L152
Tanaka, M., De Breuck, C., Venemans, B., & Kurk, J. 2010, A&A, 518, A18
Tantalo, R., Chiosi, C., Bressan, A., & Fagotto, F. 1996, A&A, 311, 361
Thomas, J., Saglia, R. P., Bender, R., et al. 2005, MNRAS, 360, 1355
Toft, S., Mainieri, V., Rosati, P., Lidman, C., Demarco, R., Nonino, M., & Stanford, S. A.
2004, A&A, 422, 29
Treu, T., Stiavelli, M., Casertano, S., Møller, P., & Bertin, G. 1999, MNRAS, 308, 1037
Treu, T., Stiavelli, M., Bertin, G., Casertano, S., & Møller, P. 2001, MNRAS, 326, 237
Treu, T., Ellis, R. S., Liao, T. X., et al. 2005, ApJ, 633, 174
van der Wel, A., Franx, M., van Dokkum, P. G., Rix, H.-W., Illingworth, G. D., & Rosati,
P. 2005, ApJ, 631, 145
van Dokkum, P. G. & Franx, M. 1996, MNRAS, 281, 985
van Dokkum, P. G., Franx, M., Kelson, D. D., & Illingworth, G. D. 1998, ApJ, 504, L17+
van Dokkum, P. G., & Franx, M. 2001, ApJ, 553, 90

– 20 –
van Dokkum, P. G., & Stanford, S. A. 2003, ApJ, 585, 78
van Dokkum, P. G., & van der Marel, R. P. 2007, ApJ, 655, 30
Vanzella, E., et al. 2005, A&A, 434, 53
Vanzella, E., et al. 2006, A&A, 454, 423
Vanzella, E., et al. 2008, A&A, 478, 83
Worthey, G. 1994, ApJS, 95, 107
Yi, S., Demarque, P., & Oemler, A. J. 1997, ApJ, 486, 201
Yi, S., Lee, Y.-W., Woo, J.-H., Park, J.-H., Demarque, P., & Oemler, A. J. 1999, ApJ, 513,
128
This preprint was prepared with the AAS LATEX macros v5.2.

– 21 –
Table 1: Cluster and Field photometric datasets.
Lynx E Lynx W CL1252 CDFS
Filter (Tel./Instr.) (Tel./Instr.) (Tel./Instr.) (Tel./Instr.)
u’ Keck/LRIS Keck/LRIS V LT/VIMOS (U) V LT/VIMOS (U)
B - - V LT/FORS2 HST/ACS/F435W
V - - V LT/FORS2 HST/ACS/F606W
R Keck/LRIS Keck/LRIS V LT/FORS2 -
iF775W HST/ACS HST/ACS HST/ACS HST/ACS
zF850LP HST/ACS HST/ACS HST/ACS HST/ACS
J KPNO/FLAMINGOS KPNO/FLAMINGOS V LT/ISAAC (Js) V LT/ISAAC
Ks KPNO/FLAMINGOS KPNO/FLAMINGOS V LT/ISAAC V LT/ISAAC
[3.6µm] Spitzer/IRAC Spitzer/IRAC Spitzer/IRAC Spitzer/IRAC
[4.5µm] Spitzer/IRAC Spitzer/IRAC Spitzer/IRAC Spitzer/IRAC

– 22 –
Fig. 1.— Top panel: Rest-frame U − B color-mass diagram of mass-selected samples of
CL1252 (green circles), Lynx E (red circles) and Lynx W (orange circles) passive cluster
ETGs. Uncertainties in the stellar mass are ∼ 0.15 dex. Bottom panel: U − B color - mass
diagram of the combined samples of Cluster (red circles) and Field (blue circles) ETGs. Field
ETGs galaxies are distributed around the cluster red-sequence, although are found with a
larger scatter.

– 23 –
Fig. 2.— Top Panel: Histograms of the lookback times to the onsets of star formation for the
cluster samples. Uncertainties in ages are ∼ 0.5 Gyr. No cluster-to-cluster variation of the
galaxy ages is found. Bottom Panel: Formation timescales, τ , histograms for the different
cluster samples. No cluster-to-cluster variation of the galaxy formation timescales is found.
Uncertainties in stellar masses and τ are ∼ 0.15 dex and ∼ 0.2 Gyr, respectively.

– 24 –
Fig. 3.— Top Panel: The dependence of the star formation weighted ages on the galaxy
mass and environment. No dependence of ages on the environment is found. Bottom Panel:
The dependence of the lookback time to star formation weighted ages on the galaxy mass,
and environment. Uncertainties in stellar masses and ages are ∼ 0.15 dex and ∼ 0.5 Gyr.

– 25 –
Fig. 4.— Histograms of the field (solid blue line) and cluster (solid red line) lookback
times since the onset of star formation (top panel) and of the star formation weighted ages
(bottom panel). No dependence of the ETG ages with the environment. Uncertainties in
age determination are ∼ 0.5 Gyr.

– 26 –
Fig. 5.— Top-left Panel: Formation timescales, τ , of ETG as a function of their stellar
mass and environment. Top-right Panel: As a function of stellar mass and environment, the
diagram of the time, t0.8, needed for a given galaxy to form 80% of the stars it will have at
z = 0. Bottom-left Panel: Dependence of the initial star formation rate, SFR0, of ETGs
as a function of their stellar mass and environment. Bottom-right Panel: Specific SFRs,
SSFR, of ETGs as a function of their stellar mass and environment. The mean error in
stellar age is 0.5 Gyr. Uncertainties in stellar masses, τ and t0.8, are ∼ 0.15 dex, ∼ 0.2 and
∼ 0.4 Gyr, respectively. In all panels, as a function of stellar mass, the median values of the
different cluster (red dashed line) and field (blue dashed line) stellar population parameter
distributions are also indicated.
– 27 –
Fig. 6.— Top Panel: Histogram of the formation timescales, τ , of ETGs in both environ-
ments. Bottom Panel: Histogram of the times, t0.8, needed for a given galaxy to form 80% of
the stars it would have at z = 0, for both environments. Uncertainties in the determination
of τ and t0.8 are ∼ 0.2 and ∼ 0.4 Gyr, respectively.