Evolved Galaxies at z > 1.5 from the Gemini Deep Deep Survey: The Formation Epoch of Massive Stellar...
12
arXiv:astro-ph/0408367v1 19 Aug 2004 Evolved Galaxies at z> 1.5 from the Gemini Deep Deep Survey: The Formation Epoch of Massive Stellar Systems Patrick J. McCarthy 1 , Damien Le Borgne 2 , David Crampton 3 , Hsiao-Wen Chen 5,10 , Roberto G. Abraham 2 , Karl Glazebrook 4 , Sandra Savaglio 4,9 , Raymond G. Carlberg 2 , Ronald O. Marzke 8 , Kathy Roth 6 , Inger Jørgensen 6 , Isobel Hook 7 , Richard Murowinski 3 & Stephanie Juneau 3 ABSTRACT We present spectroscopic evidence from the Gemini Deep Deep Survey (GDDS) for a significant population of color-selected red galaxies at 1.3 <z< 2.2 whose integrated light is dominated by evolved stars. Unlike radio-selected ob- jects, the z> 1.5 old galaxies have a sky density > 0.1 arcmin −2 . Conservative age estimates for 20 galaxies with z> 1.3; 〈z〉 =1.49, give a median age of 1.2 Gyr and 〈z f 〉 =2.4. One quarter of the galaxies have inferred z f > 4. Models restricted to [Fe/H] ≤ 0 give median ages and z f of 2.3 Gyr and 3.3, respec- tively. These galaxies are among the most massive and contribute ∼ 50% of the stellar mass density at 1 <z< 2. The derived ages and most probable 1 Carnegie Observatories, 813 Santa Barbara St, Pasadena, CA 91101, [email protected] 2 Department of Astronomy & Astrophysics, University of Toronto, Toronto ON, M5S 3H8 Canada, [email protected], [email protected], [email protected] 3 NRC Herzberg Institute for Astrophysics, 5071 W. Saanich Rd., Victoria, BC, Canada, [email protected], [email protected], [email protected] 4 Department of Physics & Astronomy, Johns Hopkins University, Baltimore, MD 21218, [email protected], [email protected] 5 Center for Space Sciences, Massachusetts Institute of Technology, 70 Vassar St., Bld. 37, Cambridge, MA 02139, [email protected] 6 Gemini Northern Operations Center, 670 N. A’ohoku Place, Hilo, HI 97620, [email protected], [email protected] 7 UK Gemini Operations Center, Kebble Road, Oxford University, Oxford, OX 3RH, UK, 8 Department of Astronomy and Physics, San Francisco State University, San Francisco, CA, 94132, [email protected] 9 On leave of absence from INAF Osservatorio Astronomico di Roma, Italy 10 Hubble Fellow
-
Upload
independent -
Category
Documents
-
view
9 -
download
0
Transcript of Evolved Galaxies at z > 1.5 from the Gemini Deep Deep Survey: The Formation Epoch of Massive Stellar...

arX
iv:a
stro
-ph/
0408
367v
1 1
9 A
ug 2
004
Evolved Galaxies at z > 1.5 from the Gemini Deep Deep Survey:
The Formation Epoch of Massive Stellar Systems
Patrick J. McCarthy1, Damien Le Borgne2, David Crampton3, Hsiao-Wen Chen5,10,
Roberto G. Abraham2, Karl Glazebrook4, Sandra Savaglio4,9, Raymond G. Carlberg2,
Ronald O. Marzke8, Kathy Roth6, Inger Jørgensen6, Isobel Hook7,
Richard Murowinski3 & Stephanie Juneau3
ABSTRACT
We present spectroscopic evidence from the Gemini Deep Deep Survey
(GDDS) for a significant population of color-selected red galaxies at 1.3 < z < 2.2
whose integrated light is dominated by evolved stars. Unlike radio-selected ob-
jects, the z > 1.5 old galaxies have a sky density > 0.1 arcmin−2. Conservative
age estimates for 20 galaxies with z > 1.3; 〈z〉 = 1.49, give a median age of
1.2 Gyr and 〈zf 〉 = 2.4. One quarter of the galaxies have inferred zf > 4. Models
restricted to [Fe/H] ≤ 0 give median ages and zf of 2.3 Gyr and 3.3, respec-
tively. These galaxies are among the most massive and contribute ∼ 50% of
the stellar mass density at 1 < z < 2. The derived ages and most probable
1Carnegie Observatories, 813 Santa Barbara St, Pasadena, CA 91101, [email protected]
2Department of Astronomy & Astrophysics, University of Toronto, Toronto ON, M5S 3H8 Canada,
[email protected], [email protected], [email protected]
3NRC Herzberg Institute for Astrophysics, 5071 W. Saanich Rd., Victoria, BC, Canada,
[email protected], [email protected], [email protected]
4Department of Physics & Astronomy, Johns Hopkins University, Baltimore, MD 21218, [email protected],
5Center for Space Sciences, Massachusetts Institute of Technology, 70 Vassar St., Bld. 37, Cambridge,
MA 02139, [email protected]
6Gemini Northern Operations Center, 670 N. A’ohoku Place, Hilo, HI 97620, [email protected],
7UK Gemini Operations Center, Kebble Road, Oxford University, Oxford, OX 3RH, UK,
8Department of Astronomy and Physics, San Francisco State University, San Francisco, CA, 94132,
9On leave of absence from INAF Osservatorio Astronomico di Roma, Italy
10Hubble Fellow

– 2 –
star formation histories suggest a high star-formation-rate (∼ 300−500 M⊙yr−1)
phase in the progenitor population. We argue that most of the red galaxies are
not descendants of the typical z ∼ 3 Lyman break galaxies. Galaxies associated
with luminous sub-mm sources have the requisite star formation rates to be the
progenitor population. Our results point toward early and rapid formation for a
significant fraction of present day massive galaxies.
Subject headings: Galaxies: Formation - Galaxies: Evolution - Galaxies: Abun-
dances - Infrared: Galaxies
1. Introduction
Recent surveys have placed significant constraints on galaxy formation models. The
evolving stellar mass density (e.g. Glazebrook et al. 2004, hereafter Paper III; Dickinson et
al. 2003; Rudnick et al. 2004; Fontana et al. 2004) now seems in reasonable accord with
measurements of integrated star formation rates (e.g. Steidel et al. 1999). Interpretation
of these volume-averaged quantities remains difficult, in part because the earliest phases of
galaxy formation are poorly understood. Age determinations for galaxies at intermediate
and high redshift provide an accurate clock for galaxy formation at early times. Application
of this technique has been hampered by the small samples of suitable galaxies at appropri-
ate redshifts, and the difficulty of obtaining reliable age estimates from low signal-to-noise
spectra. Age determinations for the prototypical evolved red galaxy, 53W091, range from
> 3.5 Gyr (Dunlop et al. 1999; Nolan et al. 2001) to as young as 1 − 1.5 Gyr (Bruzual &
Magris 1997; Yi et al. 2000). Visible-light surveys of galaxies at z > 1 are biased against
inclusion of red galaxies and hence are limited in their ability to shed light on the formation
of the oldest and most massive galaxies. Near-IR surveys of galaxies with red optical-to-
IR colors provide the requisite samples of massive galaxies at redshifts that constrain the
formation epoch.
Most spectroscopic studies of the red R−K or I −K population to date (e.g. Cimatti
et al. 2002; Yan et al. 2004), have not revealed signatures of evolved populations at z
> 1.3 due to observational limitations. At higher redshifts the strong signatures of older
stellar populations (e.g., 4000 A break and CaII H&K lines) are beyond the reach of most
CCD-based spectrographs. At z > 2, strong UV resonance lines are redshifted into the
atmospheric passband, allowing identification of UV-bright galaxies. In the intermediate
regime, 1.3 < z < 2, evolved galaxies must be probed with weak photospheric features of
MgII, MgI and FeII.

– 3 –
The red galaxy population 1 (e.g. I − K > 4) is a mix of evolved and reddened star
forming systems. Estimates of the fraction of star forming galaxies in this population range
from 20 - 60% (e.g. Cimatti et al. 2002; Smail et al. 2002; Yan et al. 2004). Although
the z > 2 red J − K selected galaxy population (e.g. Franx et al. 2003) likely contains
evolved objects, those with confirmed redshifts all have strong star formation signatures in
their rest-UV spectra (van Dokkum et al. 2003), possibly due to observational limitations.
Similarly, the massive K-bright galaxies at z ∼ 2 from the GOODS and K20 surveys (Daddi
et al. 2004) have high inferred star formation rates. The Gemini Deep Deep Survey (GDDS:
Abraham et al. 2004, hereafter Paper I), was the first to identify evolved galaxies at z > 1.5
in significant numbers (also see Cimatti et al. 2004).
The GDDS is a spectroscopic study of galaxies in the 1 < z < 2 range within four
separate areas of the Las Campanas IR Survey (McCarthy et al. 2001). Very long exposures,
using the ‘Nod & Shuffle’ sky cancellation technique yielded high quality spectra from which
redshifts could be derived for 272 galaxies with I < 24.5 (Vega). Catalogs, field locations,
mask design, and sample selection are given in Paper I. Twenty GDDS galaxies with z > 1.3
display clear signatures of old stellar populations. In this paper we present spectra of these
galaxies along with preliminary age determinations and consider the implications of these
results for our understanding of the formation of massive galaxies.
2. Quiescent Red Galaxies at z > 1.3
The sample of 20 GDDS galaxies with z > 1.3 with spectra characteristic of old popula-
tions is listed in Table 1. The object designation is given in the first column, followed by the
redshift. Confidence classes and spectral classifications are given in Paper I. High confidence
redshifts were determined for 71% (75/105) of the I −K > 3.5 galaxies and 67% (35/52) of
the I − K > 4 subsample. These two samples span the redshift range from 0.8-2.1. Among
objects with spectroscopic redshifts, 51% of the I − K > 3.5 sample have unambiguous old
stellar components. The redder galaxies (I − K > 4) show an even greater preponderance
for pure-old spectra with 72% having significant old populations. About half of the objects
with I − K > 3.5 and z > 1.3 have old spectra, while 80% of the objects with I − K > 4
and z > 1.3 have old spectral classifications. Thus 50-80% of the z > 1.3 red GDDS sample
show spectra with contributions from old stellar populations. The contribution of old stars
in our z > 1.3 sample is similar to that seen in the z ∼ 1 − 1.3 samples (e.g., Cimatti et al.
2002; Yan et al. 2004).
1A review of the red near-IR selected population can be found in McCarthy (2004).

– 4 –
Fig. 1.— Spectra of evolved GDDS galaxies with z > 1.3. From top to bottom the ob-
jects shown are: GDDS-02-1255, 22-0189, 22-0674, 12-5869, 12-6072, 12-8895, 15-4367,
15-7543,15-5005. This includes all of the galaxies in Table 1 with 1.49 < z < 2.0, plus
GDDS-02-1255 (z = 1.34). The SDSS LRG composite has been overlaid on each spectrum
and an offset has been applied to each, in steps of 10−18 erg s−1 cm−2 A−1. The locations of
the stellar MgII2800 and MgI2852 lines are indicated by the dashed lines.

– 5 –
Fig. 2.— Composite spectra of evolved galaxies with 1.3 < z < 1.4 (in blue, from galaxies
GDDS-12-6131, 02-1255, 12-5836, 15-7972, 22-2587, and 12-8025), and 1.6 < z < 1.9 (in
black, from the five objects listed in Table 1 in this redshift range). Both composite spectra
show strong MgII2800, MgI2852 absorption and broad spectral features due primarily to FeII
absorption. Overlaid in red is a single-burst Bruzual & Charlot (2003) spectral synthesis
model with an age of 2 Gyr, solar abundances, and a Salpeter (1955) IMF cutoff at 120M⊙.

– 6 –
2.1. Individual and Composite Spectra
In Figure 1 we show spectra of 9 z > 1.3 objects with high-confidence redshifts and
spectral classes indicative of old populations from the four GDDS fields. Over-plotted on
these spectra is the SDSS/LRG template (Eisenstein et al. 2003). The evolved GDDS
galaxies form a fairly homogeneous set and are reasonably well matched to the SDSS/LRG
template. The strongest features in the spectra are the MgII2800 doublet and MgI2852.
Numerous weak FeII features blend together to produce a modulated shape to the continuum.
The overall spectral slopes and shapes of the objects with z = 1.6−1.8 are not very different
from those at z = 1.3, although they have somewhat flatter spectral slopes at λ < 2800A.
In Figure 2 we show composite spectra of six galaxies from Table 1 with 1.3 < z < 1.4,
and another composite of the five at 1.6 < z < 1.9. The equivalent widths of the MgII and
MgI lines and overall continuum shapes are quite similar. A spectral synthesis model derived
using Bruzual & Charlot (2003) is shown over-plotted in red in Figure 2. This reddening-
free single-burst simple stellar population model, with an age of 2 Gyr, a Salpeter (1955)
IMF and solar abundances, is the youngest solar-abundance model that fits the data well.
Older models (e.g. ages of 3 − 4 Gyr) fit the far-UV end of the spectrum better than the
2 Gyr model does, but not at a level that allows us to rule out the 2 Gyr model. Younger
models (e.g., 1 Gyr) are bluer than the observed composite spectra. The characteristic ages
derived from the composite spectra are consistent with the results from fits to the spectra
and broad-band energy distributions of individual objects (Sec. 3.1).
Figures 1 and 2 convey the key result presented in this paper: there is a significant
population of color-selected luminous field galaxies at 1.3 < z < 2 with spectra dominated by
old stars. Unlike radio-selected evolved galaxies at z ∼ 1.5 previously reported (e.g. Dunlop
et al. 1996), our objects have a high surface density on the sky (> 0.1 sq. arcmin−2).
3. Model Ages and Formation Redshifts
The existence of massive galaxies at redshifts up to z ∼ 2 with evolved spectra argues
for an early formation episode and strains semi-analytic CDM models (e.g. Cole et al. 2000;
Baugh et al. 2003). The most successful models (Somerville et al. 2004) can produce
sufficiently massive galaxies at early epochs, but still have difficulties in producing red and
old galaxies at z > 1. The critical empirical issue is understanding the age of the stellar
populations, and hence the formation redshifts, in the old red galaxies at the highest redshifts
possible.
We made a preliminary attempt to derive very conservative (i.e. minimum) ages for

– 7 –
the galaxies listed in Table 1 by making use of both the information in the spectra and
B − Ks photometry. For each galaxy, we systematically compared the observed SED with
a set of synthetic spectra computed with PEGASE.2 (Fioc & Rocca-Volmerange 1997) and
constructed a multi-dimensional χ2 surface spanning a wide range of star-formation histories,
ages, extinction (Av) and metallicities.
The observed SED of each galaxy comprises a flux-calibrated GDDS spectrum and a
broad-band spectral energy distribution combined with weights assigned in proportion to the
band-width of the observations. In most cases the spectra and broad-band photometry carry
nearly equal weight. All the models use a Salpeter (1955) IMF with an upper-mass cutoff of
120M⊙. The effects of reddening were modeled by using the Calzetti (1997) extinction law
with Av = 0− 1mag. Instantaneous-burst models with 12 metallicities ranging from 20% to
175% of solar were considered, together with exponentially declining star formation histories
with 10 e-folding times ranging between 0.1 Gyr and 3 Gyr.
From the χ2 surface, a best-fit age, star formation history, metallicity and extinction
were derived. The range of acceptable ages for a given galaxy was limited by the age of the
universe at its observed redshift. Statistical uncertainties on the age were computed from
the set of models satisfying ∆χ2 < 3σ. An extensive description of the underlying models
and our approach to fitting data to these will be given in Le Borgne et al. (in preparation).
3.1. Results
We summarize the results of our age determination analysis using the PEGASE.2 models
in Table 1. In column 6 of Table 1 we list the best-fit ages and the range of acceptable ages.
Bruzual & Charlot (2003) instantaneous-burst models yield best fits with age differences
smaller than 0.2 Gyr. Columns 7 through 11 give the e-folding time, AV, abundance, χ2
value and formation redshift for the best-fitting models, respectively. The reduced χ2 values
exceed unity, in part, because of imperfections in the model spectral libraries. The formation
redshifts are determined from the redshift of observation, the best-fit age and the age of
the Universe in a ΩΛ = 0.7, Ω = 0.3, H0 = 70 km s−1Mpc−1 cosmology. In nearly all
cases the best fits were achieved with either an instantaneous burst or a short e-folding
time exponential burst (< 0.5 Gyr), with a preponderance favoring the instantaneous-burst
models.
The single-burst and exponential model fits generally favor metallicities higher than
50% solar. Super solar metallicities reduced the χ2 values in ∼ 30% of the cases. We
truncated our metallicity search space at [Fe/H]= 0.25. While large values are seen in the

– 8 –
cores of local ellipticals (e.g. Thomas et al. 2003), the large apertures of our spectroscopic
and photometric measurements (10− 20kpc diameter) and the abundance gradients seen in
ellipticals produce luminosity weighted abundances within our apertures that are closer to
solar (see Jørgensen et al. 1997; Arimoto et al. 1997). For the four objects that favor models
with [Fe/H]> 0.15, fits with the metallicity capped at the solar value yield best-fit ages that
are 0.5-1.0 Gyr older than those listed in Table 1.
We have measured the mass-density in high-mass objects and determined the contribu-
tion from the I−K > 3.5 objects using the procedures from Paper III. Adopting a threshold
of 5× 10¹⁰M⊙ (for which our sample is mass-complete over the interval 1.3 < z < 2) we find
that the red objects in this sample contribute 49% of the overall stellar mass density.
The median derived age and formation redshifts are 1.2 Gyr and 2.4, respectively for
our conservative analysis. Nearly 1/3 of the objects (5/20) have inferred zf > 4. Imposing a
minimum collapse time of 3×10⁸ yr moves the median formation redshift from 2.4 to ∼ 3.0.
Limiting the models to [Fe/H] ≤ 0 shifts the inferred median age and zf to 2.3 Gyr and 3.2,
respectively; imposing Av = 0 in addition yields a median zf of 4.0.
4. Discussion
The spectra of the red GDDS galaxies reveal unambiguous evidence for old and metal-
rich galaxies over the full range from 1 < z < 2. Our preliminary, conservative analysis
implies early and rapid formation for a substantial fraction of these. The median z, age, zf ,
and mass for the sample in Table 1 are 1.49, 1.5 Gyr, 2.5, and 1×10¹¹ M⊙, respectively. Our
models strongly favor instantaneous bursts in roughly 50% of the objects and short e-folding
times (e.g. 0.5 Gyr) for the remaining galaxies. More plausible models, those with star
formation extended over one or more dynamical times, produce best-fitting ages that are
typically 1 Gyr larger than those in Table 1, implying < zf >∼ 4 for a substantial fraction
of the galaxies.
Taking the zf in Table 1 as indicative of the onset of star formation, the “median” red
galaxy requires a constant star formation rate of 50 M⊙ yr−1 over the full 1.5 Gyr period
from z = 2.4 to z = 1.5 to produce the required stellar mass. These rates are higher
than that of a typical Lyman Break Galaxy (LBG) at z ∼ 3 (e.g. Shapley et al. 2003).
Constant star formation rate models, however, reproduce neither the colors nor the spectra
of the red galaxies. Star formation with an e-folding time of 3 × 10⁸ yr implies peak SFRs
∼ 300 − 500 M⊙yr−1 at z ∼ 2 − 4 in the most massive galaxies. These high star formation
rates, coupled with the strong clustering of the red galaxy population (e.g. McCarthy et al.

– 9 –
2001) and the differences in stellar mass, suggest that these objects are probably not closely
connected with the z = 3 − 4 Lyman-break galaxy population.
Assembly of the massive GDDS galaxies from many sub-units still requires early, and
short-lived, star formation, although the units could be smaller than the typical 8× 10¹⁰M⊙
of the GDDS galaxies. While star formation in smaller sub-galactic units will proceed with
shorter dynamical times, the best-fitting instantaneous burst (or even τ = 0.1 Gyr) models
imply impressive synchronization in the truncation of star formation among the precursors.
The near-solar metallicities required to fit the strong UV stellar lines and the favored single-
burst models naively argue for a single massive star formation episode (per galaxy) at 2 <
z < 5 as the simplest formation scenario.
It appears that there is a continuous coeval population of massive red galaxies that are
traced, in order of decreasing redshift, by: z > 2 red J − K galaxies, red GDDS galaxies
at z ∼ 1.3 − 2 and the classical “EROs” at 0.9 < z < 1.3 observed in the K20, LCIR and
other surveys. These all point to an early formation epoch for the progenitors of present
day massive galaxies. Our analysis implies high peak star formation rates at z ≥ 2. At
present the only candidates for such rapidly forming massive galaxies at high redshift are
the sub-mm luminous sources. The median redshift (〈z〉 = 2.4) for the bright SCUBA sources
(Chapman et al. 2003) is indistinguishable from our current conservative 〈zf〉 estimate for
the red GDDS galaxies. A significant fraction of the GDDS galaxies, however, appear to
have formation redshifts outside the range of known SCUBA redshifts. The n(z) of the
SCUBA sources, however, has an inferred tail to z > 4 and these may evolve into the red
z > 1.5 population. In summary, the GDDS has revealed a population of evolved galaxies
at z > 1.5 and conservative age estimates yield a modest 〈zf〉 and point to formation of
massive galaxies in episodes of intense star formation.
5. Acknowledgments
This paper is based on observations obtained at the Gemini Observatory, which is op-
erated by AURA Inc., under a cooperative agreement with the NSF on behalf of the Gemini
partnership: the NSF (US), PPARC (UK), NRC (Canada), CONICYT (Chile), ARC (Aus-
tralia), CNPq (Brazil) and CONICET (Argentina). This paper is also based on observations
obtained at the Las Campanas Observatory of the Carnegie Institution of Washington. KG
and SS acknowledge support from the David and Lucille Packard Foundation, RGA acknowl-
edges support from the NSERC.

– 10 –
REFERENCES
Abraham, R. G., et al. 2004, AJ, 127, 2455 (Paper I)
Arimoto, N., Matsushita, K., Ishimaru, Y., Ohashi, T., & Renzini, A. 1997, ApJ, 477,
Baugh, C. M., Benson, A. J., Cole, S., Frenk, C. S., & Lacey, C. 2003, The Mass of Galaxies
at Low and High Redshift, 91
Bruzual, G., Charlot, S., 2003, MNRAS, 344, 1000
Bruzual, G. & Magris, GC 1997, in “The Ultraviolet Universe at Low and High Redshift :
Probing the Progress of Galaxy Evolution” AIP conf. proceedings, 408, 291
Calzetti, D. 1997, AJ, 113, 162.
Chapman, S., C., Blain, A. W., Ivison, R. J., & Smail. I. R. 2003, NATURE, 422, 695
Cimatti, A., et al. 2004, Nature, 430, 184
Cimatti, A., et al. 2002, A&A 381, L68.
Cole, S., Lacey, C. G., Baugh, C. M., & Frenk, C. S. 2000, MNRAS, 319, 168
Daddi, E., et al. 2004, ApJ, 600, 127
Dickinson, M., Papovich, C., Ferguson, H. C., Budavari, T. 2003, ApJ, 587, 25
Dunlop, J., Peacock, J., Spinrad, H., Dey, A., Jimenez, R., Stern, D., Windhorst, R. 1996,
Nature, 381, 581
Eisenstein, D. J., et al. 2003, ApJ, 585, 694.
Fontana, A., et al. 2004, A&A, in press (astro-ph/0405055).
Fioc, M. & Rocca-Volmerange, B. 1997, A&A 326, 95
Franx, M., et al. 2003, ApJ, 587, L79
Glazebrook, K., et al. 2004, Nature, 430, 181 (Paper III)
Jørgensen, I. 1997, MNRAS, 288, 161
McCarthy, P. J. 2004, ARAA, Vol. 42, 477.
McCarthy, P. J., et al. 2001, ApJ, 560, L131.

– 11 –
Nolan, LA; Dunlop, J.S.; Jimenez, R 2001, MNRAS, 323, 385
Rudnick, G., et al. 2003, ApJ, 599, 847.
Salpeter, E. E. 1955, ApJ, 121, 161
Shapley, A., Steidel, C., Pettini, M., Adelberger, K. L., 2003, ApJ, 588, 65
Smail, I; Owen, F N Morrison, G E; Keel, W C; Ivison, RJ; Ledlow, MJ 2002, ApJ, 581, 844
Somerville, R. S. et al. 2004, ApJ, 600, 135
Steidel, C. C., Adelberger, K., Giavalisco, M., Dickinson, M., Pettini, M. 1999, ApJ, 519, 1
van Dokkum, P G, et al. 2003, ApJ, 587, L83
Yan, L., & Thompson, D. 2003, ApJ, 586, 765
Yan, L., Thompson, D., & Soifer, B. T. 2004, AJ in press
Yi, S, Brown, TM, Heap, S., Hubeny, I, Landsman, W, Lanz, T, Sweigart, A 2000, ApJ,
533, 670
This preprint was prepared with the AAS LATEX macros v5.2.
– 12 –
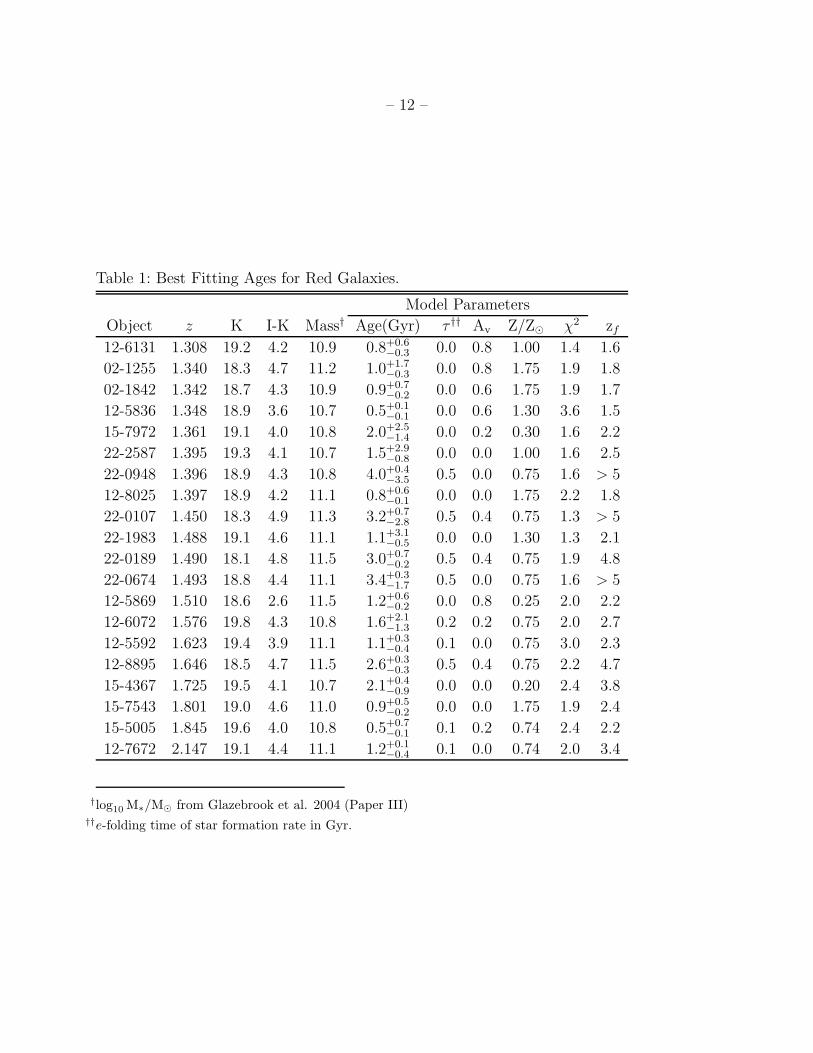
Table 1: Best Fitting Ages for Red Galaxies.
Model Parameters
Object z K I-K Mass† Age(Gyr) τ †† Av Z/Z⊙ χ2 zf
12-6131 1.308 19.2 4.2 10.9 0.8+0.6−0.3 0.0 0.8 1.00 1.4 1.6
02-1255 1.340 18.3 4.7 11.2 1.0+1.7−0.3 0.0 0.8 1.75 1.9 1.8
02-1842 1.342 18.7 4.3 10.9 0.9+0.7−0.2 0.0 0.6 1.75 1.9 1.7
12-5836 1.348 18.9 3.6 10.7 0.5+0.1−0.1 0.0 0.6 1.30 3.6 1.5
15-7972 1.361 19.1 4.0 10.8 2.0+2.5−1.4 0.0 0.2 0.30 1.6 2.2
22-2587 1.395 19.3 4.1 10.7 1.5+2.9−0.8 0.0 0.0 1.00 1.6 2.5
22-0948 1.396 18.9 4.3 10.8 4.0+0.4−3.5 0.5 0.0 0.75 1.6 > 5
12-8025 1.397 18.9 4.2 11.1 0.8+0.6−0.1 0.0 0.0 1.75 2.2 1.8
22-0107 1.450 18.3 4.9 11.3 3.2+0.7−2.8 0.5 0.4 0.75 1.3 > 5
22-1983 1.488 19.1 4.6 11.1 1.1+3.1−0.5 0.0 0.0 1.30 1.3 2.1
22-0189 1.490 18.1 4.8 11.5 3.0+0.7−0.2 0.5 0.4 0.75 1.9 4.8
22-0674 1.493 18.8 4.4 11.1 3.4+0.3−1.7 0.5 0.0 0.75 1.6 > 5
12-5869 1.510 18.6 2.6 11.5 1.2+0.6−0.2 0.0 0.8 0.25 2.0 2.2
12-6072 1.576 19.8 4.3 10.8 1.6+2.1−1.3 0.2 0.2 0.75 2.0 2.7
12-5592 1.623 19.4 3.9 11.1 1.1+0.3−0.4 0.1 0.0 0.75 3.0 2.3
12-8895 1.646 18.5 4.7 11.5 2.6+0.3−0.3 0.5 0.4 0.75 2.2 4.7
15-4367 1.725 19.5 4.1 10.7 2.1+0.4−0.9 0.0 0.0 0.20 2.4 3.8
15-7543 1.801 19.0 4.6 11.0 0.9+0.5−0.2 0.0 0.0 1.75 1.9 2.4
15-5005 1.845 19.6 4.0 10.8 0.5+0.7−0.1 0.1 0.2 0.74 2.4 2.2
12-7672 2.147 19.1 4.4 11.1 1.2+0.1−0.4 0.1 0.0 0.74 2.0 3.4
†log10 M∗/M⊙ from Glazebrook et al. 2004 (Paper III)††e-folding time of star formation rate in Gyr.