A novel simple QSAR model for the prediction of anti-HIV activity using multiple linear regression...
10
Molecular Diversity (2006) 10: 405–414 DOI: 10.1007/s11030-005-9012-2 c Springer 2006 Full-length paper A novel simple QSAR model for the prediction of anti-HIV activity using multiple linear regression analysis Antreas Afantitis 1,4 , Georgia Melagraki 1 , Haralambos Sarimveis 1,∗ , Panayiotis A. Koutentis 2 , John Markopoulos 3 & Olga Igglessi-Markopoulou 1 1 School of Chemical Engineering, National Technical University of Athens, Athens, Greece; 2 Department of Chemistry, University of Cyprus, P.O. Box 20537, 1678 Nicosia, Cyprus; 3 Department of Chemistry, University of Athens, Athens, Greece; 4 Department of ChemoInformatics, NovaMechanics Ltd, Cyprus ( ∗ Author for correspondence, E-mail: [email protected], Tel.: +30-210-7723237, Fax: +30-210-7723138) Received 24 June 2005; Accepted 1 November 2005 Key words: anti-HIV, HEPT derivatives, stepwise regression, MLR, QSAR Summary A quantitative–structure activity relationship was obtained by applying Multiple Linear Regression Analysis to a series of 80 1-[2-hydroxyethoxy-methyl]-6-(phenylthio) thymine (HEPT) derivatives with significant anti-HIV activity. For the selection of the best among 37 different descriptors, the Elimination Selection Stepwise Regression Method (ES-SWR) was utilized. The resulting QSAR model (R 2 CV = 0.8160; S PRESS = 0.5680) proved to be very accurate both in training and predictive stages. Introduction Novel medicines are typically developed using a trial-and- error approach which is costly and time-consuming. The application of quantitative–structure activity relationship (QSAR) methodologies to this problem has the potential to greatly decrease the time and effort required to improve cur- rent medicines in terms of their efficacy or to discover new ones. A successful QSAR model generates statistically signif- icant relationships between chemical structure and biological activity [1]. Human immunodeficiency virus type 1 (HIV-1) is the primary cause of AIDS (acquired immunodeficiency syn- drome), which is one of the main medical and social prob- lems in our epoch. HEPT 1-(2-hydroxyethoxy-methyl)-6- (phenylthio) thymine derivatives (Scheme 1) are the first non nucleoside reverse transcriptase inhibitor (NNRTI) analogues shown to have both potent anti-HIV activity and inhibit HIV-1 at nanomolar concentration [2]. The design of new HEPT derivatives requires a more detailed knowledge of the mech- anism of reverse transcriptase (RT) inhibition by this class of compounds. QSAR is a powerful approach to discern chem- ical properties of compounds that are required for specific biological activity [3, 4]. In the past, numerous attempts have been made to pre- dict the molar concentration of a drug required to achieve 50% protection of MT-4 cells against the cytopathic effect of HIV-1 [5]. Luco et al. [6] used multiple linear regression (MLR) and partial least squares (PLS) methods but no exter- nal data sets were used to validate the models. Subsequently Jalali-Heravi and Parastar [7] used Luco’s MLR model in order to test it with external data and furthermore they intro- duced a new MLR model and a new non-linear model based on artificial neural networks (ANN). Using Principal Com- ponent Analysis (PCA) and 36 derivatives, Alves et al. [8] presented a discussion for the significance of each variable to anti-HIV activity. Bazoui et al. [9] used MLR and ANN computational techniques but no external compounds were used to validate the models. Douali et al. [10–12] introduced a QSAR model using ANNs and a part of Luco’s data set. The predictive ability of the models was tested with the use of leave-one-out (LOO) procedure. Gupta et al. [13] predicted the anti-HIV activity using an eccentric adjacency index. Us- ing a different data set from Luco et al. [6], Gayen et al. [14] presented very good QSAR models based on the MLR technique. In this work we used a data set of 80 HEPT derivatives [6, 7, 10] that has been reported in the literature as reliable. 37 topological and structural descriptors were considered. Among them, the most statistically significant descriptors were selected, using a rigorous variable selection method. The result of this study was the development a new linear QSARs model containing 5 variables. In order to validate the proposed methodology, we used two validation strategies:
Transcript of A novel simple QSAR model for the prediction of anti-HIV activity using multiple linear regression...

Molecular Diversity (2006) 10: 405–414DOI: 10.1007/s11030-005-9012-2 c© Springer 2006
Full-length paper
A novel simple QSAR model for the prediction of anti-HIV activity using multiplelinear regression analysis
Antreas Afantitis1,4, Georgia Melagraki1, Haralambos Sarimveis1,∗, Panayiotis A. Koutentis2,John Markopoulos3 & Olga Igglessi-Markopoulou1
1School of Chemical Engineering, National Technical University of Athens, Athens, Greece; 2Department of Chemistry,University of Cyprus, P.O. Box 20537, 1678 Nicosia, Cyprus; 3Department of Chemistry, University of Athens, Athens,Greece; 4Department of ChemoInformatics, NovaMechanics Ltd, Cyprus
(∗Author for correspondence, E-mail: [email protected], Tel.: +30-210-7723237, Fax: +30-210-7723138)
Received 24 June 2005; Accepted 1 November 2005
Key words: anti-HIV, HEPT derivatives, stepwise regression, MLR, QSAR
Summary
A quantitative–structure activity relationship was obtained by applying Multiple Linear Regression Analysis to a series of 801-[2-hydroxyethoxy-methyl]-6-(phenylthio) thymine (HEPT) derivatives with significant anti-HIV activity. For the selection ofthe best among 37 different descriptors, the Elimination Selection Stepwise Regression Method (ES-SWR) was utilized. Theresulting QSAR model (R2
CV = 0.8160; SPRESS = 0.5680) proved to be very accurate both in training and predictive stages.
Introduction
Novel medicines are typically developed using a trial-and-error approach which is costly and time-consuming. Theapplication of quantitative–structure activity relationship(QSAR) methodologies to this problem has the potential togreatly decrease the time and effort required to improve cur-rent medicines in terms of their efficacy or to discover newones. A successful QSAR model generates statistically signif-icant relationships between chemical structure and biologicalactivity [1].
Human immunodeficiency virus type 1 (HIV-1) is theprimary cause of AIDS (acquired immunodeficiency syn-drome), which is one of the main medical and social prob-lems in our epoch. HEPT 1-(2-hydroxyethoxy-methyl)-6-(phenylthio) thymine derivatives (Scheme 1) are the first nonnucleoside reverse transcriptase inhibitor (NNRTI) analoguesshown to have both potent anti-HIV activity and inhibit HIV-1at nanomolar concentration [2]. The design of new HEPTderivatives requires a more detailed knowledge of the mech-anism of reverse transcriptase (RT) inhibition by this class ofcompounds. QSAR is a powerful approach to discern chem-ical properties of compounds that are required for specificbiological activity [3, 4].
In the past, numerous attempts have been made to pre-dict the molar concentration of a drug required to achieve50% protection of MT-4 cells against the cytopathic effect
of HIV-1 [5]. Luco et al. [6] used multiple linear regression(MLR) and partial least squares (PLS) methods but no exter-nal data sets were used to validate the models. SubsequentlyJalali-Heravi and Parastar [7] used Luco’s MLR model inorder to test it with external data and furthermore they intro-duced a new MLR model and a new non-linear model basedon artificial neural networks (ANN). Using Principal Com-ponent Analysis (PCA) and 36 derivatives, Alves et al. [8]presented a discussion for the significance of each variableto anti-HIV activity. Bazoui et al. [9] used MLR and ANNcomputational techniques but no external compounds wereused to validate the models. Douali et al. [10–12] introduceda QSAR model using ANNs and a part of Luco’s data set.The predictive ability of the models was tested with the use ofleave-one-out (LOO) procedure. Gupta et al. [13] predictedthe anti-HIV activity using an eccentric adjacency index. Us-ing a different data set from Luco et al. [6], Gayen et al.[14] presented very good QSAR models based on the MLRtechnique.
In this work we used a data set of 80 HEPT derivatives[6, 7, 10] that has been reported in the literature as reliable.37 topological and structural descriptors were considered.Among them, the most statistically significant descriptorswere selected, using a rigorous variable selection method.The result of this study was the development a new linearQSARs model containing 5 variables. In order to validate theproposed methodology, we used two validation strategies:

406
Table 1. Topological and structural descriptors
Descriptor ID Description Notation Description Notation
1 Reciprocal of the standard shadow area
shadow on YZ plane
1/S [7] 2 Connectivity index 4χ Np [6]
3 Ratio of the partial charges on the most
positive and the most negative atoms
POS/NEG [7] 4 Molecular Volume Vx [6]
5 Heat of Formation �H f (kcal/mol) [7] 6 Verloop steric parameter B1-3R1 [6]
7 Square of the number of SP3 carbon
atoms on the R2 substituent
(NCSP3-R2)2 [7] 8 Taft steric constant for ortho
substituents
Es-2R1[6]
9 Cub of summation of the positions of R1
on the C-6 aromatic ring constant
(NS-R1)3 [7] 10 Connectivity index ◦�χ (R3) [6]
11 Number of hydroxyl groups on the R3
substituent
NOH-R3 [7] 12 Connectivity (chain) index 6χνch [6]
13 Hansch constant �π (πR1+πR2) [6] 14 Indicator parameter (takes the value 1
or 0 for the presence or absence of a
six membered saturated ring in R3)
Ich-R3 [6]
15 Connectivity level (dividing the value of
the 1χ (R2) index by the number of
atoms involved in their calculus)
1χ N (R2) [6] 16 Indicator parameter (takes the value 1
or 0 for the presence or absence of a
substituent at 4 – position of the C–6
aromatic ring
I-4R1 [6]
17 Molar Refractivity MR 18 Diameter Diam
19 Partition Coefficient (Octanol Water) ClogP 20 Molecular Topological Index TIndx
21 Principal Moment of Inertia Z PMIZ 22 Number of Rotatable Bonds NRBo
23 Principal Moment of Inertia Y PMIY 24 Polar Surface Area PSAr
25 Principal Moment of Inertia X PMIX 26 Radius Rad
27 Connolly Accessible Area SAS 28 Shape attribute ShpA
29 Total Energy TotE 30 Sum of Valence Degrees SVDe
31 LUMO Energy LUMO 32 Total Connectivity TCon
33 HOMO Energy HOMO 34 Total Valence Connectivity TVCon
35 Balaban Index BIndx 36 Wiener Index WIndx
37 Cluster Count ClsC
Y-randomization and external validation using division ofthe entire dataset set into training and test sets.
Materials and methods
Data set
In this QSAR study 80 of the 107 HEPT derivatives of theLuco and Fereti [6] data set were used. The biological activ-ities of these 80 compounds were reported in the same paper[6]. In order to model and predict the specific activity (themolar concentration of a drug required to achieve 50% pro-tection of MT-4 cells against the cytopathic effect of HIV-1),37 physicochemical constants, topological and structural de-scriptors (Table 1) were considered as possible input candi-dates to the model. The first 16 descriptors were collectedfrom the literature [6, 7] and the rest of them were calculatedwith ChemSar which is included in Chemoffice.
The objective of this work was to determinate a subsetof variables which afford the most significant linear QSARmodels linking the structure of these compounds with theiranti-HIV activity.
Stepwise multiple regression
As mentioned in the introduction, the ES-SWR algorithm[15] was used to select the most appropriate descriptors.
Scheme 1. HEPT Derivatives
ES-SWR is a popular stepwise technique which combinesForward Selection (FS-SWR) and Backward Elimination(BE-SWR). It is basically a forward selection approach, butat each step it considers the possibility of deleting a variableas in the backward elimination approach, provided that thenumber of model variables is greater than two. The two basicelements of the ES-SWR method are described next in moredetails.
Forward selection
The variable considered for inclusion at any step is the oneyielding the largest single degree of freedom F-ratio amongthe variables that are eligible for inclusion. The variable isincluded only if this value is larger than a fixed value Fin.Consequently, at each step, the jth variable is added to a k-size
407
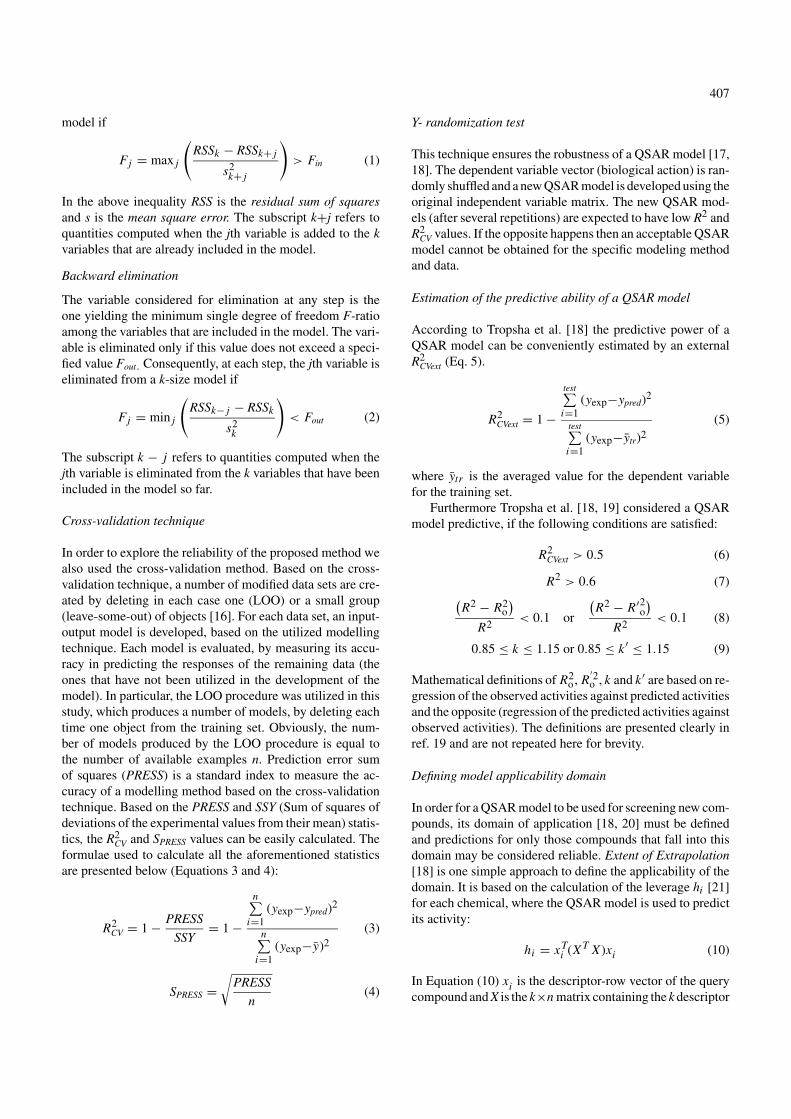
model if
Fj = max j
(RSSk − RSSk+ j
s2k+ j
)> Fin (1)
In the above inequality RSS is the residual sum of squaresand s is the mean square error. The subscript k+j refers toquantities computed when the jth variable is added to the kvariables that are already included in the model.
Backward elimination
The variable considered for elimination at any step is theone yielding the minimum single degree of freedom F-ratioamong the variables that are included in the model. The vari-able is eliminated only if this value does not exceed a speci-fied value Fout. Consequently, at each step, the jth variable iseliminated from a k-size model if
Fj = min j
(RSSk− j − RSSk
s2k
)< Fout (2)
The subscript k − j refers to quantities computed when thejth variable is eliminated from the k variables that have beenincluded in the model so far.
Cross-validation technique
In order to explore the reliability of the proposed method wealso used the cross-validation method. Based on the cross-validation technique, a number of modified data sets are cre-ated by deleting in each case one (LOO) or a small group(leave-some-out) of objects [16]. For each data set, an input-output model is developed, based on the utilized modellingtechnique. Each model is evaluated, by measuring its accu-racy in predicting the responses of the remaining data (theones that have not been utilized in the development of themodel). In particular, the LOO procedure was utilized in thisstudy, which produces a number of models, by deleting eachtime one object from the training set. Obviously, the num-ber of models produced by the LOO procedure is equal tothe number of available examples n. Prediction error sumof squares (PRESS) is a standard index to measure the ac-curacy of a modelling method based on the cross-validationtechnique. Based on the PRESS and SSY (Sum of squares ofdeviations of the experimental values from their mean) statis-tics, the R2
CV and SPRESS values can be easily calculated. Theformulae used to calculate all the aforementioned statisticsare presented below (Equations 3 and 4):
R2CV = 1 − PRESS
SSY= 1 −
n∑i=1
(yexp−ypred)2
n∑i=1
(yexp−y)2
(3)
SPRESS =√
PRESS
n(4)
Y- randomization test
This technique ensures the robustness of a QSAR model [17,18]. The dependent variable vector (biological action) is ran-domly shuffled and a new QSAR model is developed using theoriginal independent variable matrix. The new QSAR mod-els (after several repetitions) are expected to have low R2 andR2
CV values. If the opposite happens then an acceptable QSARmodel cannot be obtained for the specific modeling methodand data.
Estimation of the predictive ability of a QSAR model
According to Tropsha et al. [18] the predictive power of aQSAR model can be conveniently estimated by an externalR2
CVext (Eq. 5).
R2CVext = 1 −
test∑i=1
(yexp−ypred)2
test∑i=1
(yexp−ytr)2
(5)
where ytr is the averaged value for the dependent variablefor the training set.
Furthermore Tropsha et al. [18, 19] considered a QSARmodel predictive, if the following conditions are satisfied:
R2CVext > 0.5 (6)
R2 > 0.6 (7)(R2 − R2
o
)R2
< 0.1 or
(R2 − R′2
o
)R2
< 0.1 (8)
0.85 ≤ k ≤ 1.15 or 0.85 ≤ k′ ≤ 1.15 (9)
Mathematical definitions of R2o, R
′2o , k and k′ are based on re-
gression of the observed activities against predicted activitiesand the opposite (regression of the predicted activities againstobserved activities). The definitions are presented clearly inref. 19 and are not repeated here for brevity.
Defining model applicability domain
In order for a QSAR model to be used for screening new com-pounds, its domain of application [18, 20] must be definedand predictions for only those compounds that fall into thisdomain may be considered reliable. Extent of Extrapolation[18] is one simple approach to define the applicability of thedomain. It is based on the calculation of the leverage hi [21]for each chemical, where the QSAR model is used to predictits activity:
hi = xTi (X T X )xi (10)
In Equation (10) xi is the descriptor-row vector of the querycompound and X is the k×n matrix containing the k descriptor

408
values for each one of the n training compounds. A leveragevalue greater than 3k/n is considered large. It means that thepredicted response is the result of a substantial extrapolationof the model and may not reliable.
Results and discussion
For the selection of the most important descriptors, theaforementioned stepwise multiple regression technique wasused. In order to automate the above procedure, we devel-oped in-house a software that realizes the ES-SWR algo-rithm. More specifically the algorithm was programmed inthe MATLAB programming language and is quite generic,so that it can accept a practically unlimited number ofdescriptors.
The produced MLR models were studied thoroughly asnew descriptors were selected by the aforementioned variableselection method. The most significant descriptor accordingto the ES-SWR algorithm is the connectivity index 4χ N
p fol-
lowed by the connectivity (chain) index 6χ vch, and the num-
ber of hydroxyl groups on the R3 substituent NOH-R3. Theconnectivity index 4χ N
p describes the shape characteristicsof the entire module, which according to Luco et al. [6] isthe most important variable. The connectivity (chain) index6χν
ch encodes information about the number and type of six-membered rings present in the module. NOH-R3 is a simpletopological descriptor and indicates the number of hydroxylgroups on the R3 substituent. The MLR model that consistsof only the three most significant descriptors is already quiteaccurate and attractive as well, since all three descriptors aretopological indices, they are calculated rapidly and have aclear physical meaning.
However, the performance of the MLR model was im-proved substantially, by including the next two most signif-icant descriptors: HOMO energy and Lipophilicity (ClogP).Molecular orbital (MO) surfaces visually represent the var-ious stable electron distributions of a molecule. Accordingto Frontier Orbital Theory, the shapes and symmetries of thehighest-occupied and lowest-unoccupied molecular orbitals(HOMO and LUMO) are crucial in predicting the reactiv-ity of a species and the stereochemical and regiochemicaloutcome of a chemical reaction. All the structures beforethe calculation of the HOMO Energy were fully optimizedusing the AM1 basis set. Lipophilicity is known to be im-portant for absorption, permeability, and in vivo distribu-tion of organic compounds [21, 22] and has been used asa physicochemical descriptor in QSARs with great success[1, 24].
Adding more descriptors to the 5-parameter model, didnot improve significantly the prediction abilities of the mod-els, in terms of R2
CV. For brevity, the remaining analysis willbe focused on the 5-parameter model. Nevertheless, the restof the models can be available to the interested readers. Inorder to avoid internal correlations, we performed a correla-
Table 2. Correlation matrix of the 5 selected descriptors
4χ Np
6χνch NOH-R3 HOMO CLogP
4χ Np 1,00
6χνch 0,428 1,00
NOH-R3 −0,336 −0,373 1,00
HOMO 0,190 −0,103 0,098 1,00
CLogP 0,754 0,612 −0,606 0,028 1,00
tion analysis on the five selected descriptors and the resultsare presented in Table 2. All the values deviate from unityconsiderably so there is no significant correlation betweenthe five independent variables.
The full linear equation for the prediction of the anti-HIVactivity log1/c is the following:
log 1c = 66.30 4χ N
p − 28.80 6χvch − 5.25∗10−1NOH-R3
+ 5.66∗10−1HOMO + 3.49 ∗ 10−1CLogP − 6.98
R2 = 0.841 F = 77.99 RMSE = 0.531 R2CV = 0.816
SPRESS = 0, 568n = 80
(11)
In order to further explore the prediction ability of the selecteddescriptors, the data set of 80 1-[2-hydroxyethoxy-methyl]-6-(phenylthio)thymine (HEPT) derivatives was divided intoa training set of 60 compounds, and a validation set of 20compounds. The selection of the derivatives in the trainingset was made according to the structure and the scale of thebiological action, so that representatives of a wide range ofstructures (in terms of the different substituents, atoms andaction) were included. According to Golbraikh and Tropsha[25] this approach is correct since representative points of thetest set must be close to those of training set and vice versa.The compounds that constituted the training and validationsets are clearly presented in Table 3. The validation examplesare marked with a .
Using the five descriptors, we developed a new MLRequation based on only the 60 training examples.
log 1c = 67.10 4χ N
p − 25.40 6χνch − 5.29∗10−1NOH-R3
+ 6.18∗10−1HOMO + 3.66∗10−1CLogP − 6.81
R2 = 0.838 F = 55.99 RMSE = 0.560 R2CV = 0.804
SPRESS = 0.616 n = 60(12)
This equation was used to predict the HIV-activity for the val-idation examples. The results are presented in the last columnof Table 3 and correspond to an R2 value of 0.904. The resid-ual plot for the predicting set is presented in Figure 1. Theresults illustrated once more that the linear MLR techniquecombined with a successful variable selection procedure areadequate to generate an efficient QSAR model for predictingthe HIV-activity of different compounds.

409
Table 3. Training and test set
A/A R1 R2 R3 X Experimental Values Predicted Values
1 2-Me Me CH2OCH2CH2OH O 4.15 4.999
2 2-NO2 Me CH2OCH2CH2OH O 3.85 4.985
3 2-OMe Me CH2OCH2CH2OH O 4.72 5.327
4 3-Me Me CH2OCH2CH2OH O 5.59 5.201
5a 3-Et Me CH2OCH2CH2OH O 5.57 – 5.234
6 3-t-Bu Me CH2OCH2CH2OH O 4.92 4.822
7 3-CF3 Me CH2OCH2CH2OH O 4.35 4.435
8a 3-F Me CH2OCH2CH2OH O 5.48 – 4.973
9 3-Cl Me CH2OCH2CH2OH O 4.89 5.187
10a 3-Br Me CH2OCH2CH2OH O 5.24 – 5.236
11 3-I Me CH2OCH2CH2OH O 5.00 5.326
12 3-NO2 Me CH2OCH2CH2OH O 4.47 4.179
13 3-OH Me CH2OCH2CH2OH O 4.09 4.720
14 3-OMe Me CH2OCH2CH2OH O 4.66 4.804
15 3,5-Me2 Me CH2OCH2CH2OH O 6.59 6.271
16 3,5-Cl2 Me CH2OCH2CH2OH O 5.89 6.235
17a 3,5-Me2 Me CH2OCH2CH2OH S 6.66 – 6.295
18 3-COOMe Me CH2OCH2CH2OH O 5.10 4.838
19 3-COMe Me CH2OCH2CH2OH O 5.14 4.670
20a 3-CN Me CH2OCH2CH2OH O 5.00 – 4.782
21 H CH2CH=CH2 CH2OCH2CH2OH O 5.60 5.315
22a H Et CH2OCH2CH2OH S 6.96 – 5.742
23 H Pr CH2OCH2CH2OH S 5.00 5.488
24 H i-Pr CH2OCH2CH2OH S 7.23 6.891
25 3,5-Me2 Et CH2OCH2CH2OH S 8.11 7.261
26 3,5-Me2 i-Pr CH2OCH2CH2OH S 8.30 8.379
27a 3,5-Cl2 Et CH2OCH2CH2OH S 7.37 – 7.235
28 H Et CH2OCH2CH2OH O 6.92 5.719
29a H Pr CH2OCH2CH2OH O 5.47 5.465
30 H i-Pr CH2OCH2CH2OH O 7.20 6.863
31 3,5-Me2 Et CH2OCH2CH2OH O 7.89 7.237
32 3,5-Me2 i-Pr CH2OCH2CH2OH O 8.57 8.351
33 3,5-Cl2 Et CH2OCH2CH2OH O 7.85 8.088
34 4-Me Me CH2OCH2CH2OH O 3.66 4.588
35a H Me CH2OCH2CH2OH O 5.15 – 4.632
36 H Me CH2OCH2CH2OH S 6.01 4.654
37 H I CH2OCH2CH2OH O 5.44 4.822
38 H CH=CH2 CH2OCH2CH2OH O 5.69 5.648
39a H CH=CHPh CH2OCH2CH2OH O 5.22 – 5.553
40 H CH2Ph CH2OCH2CH2OH O 4.37 5.629
41 H CH=CPh2 CH2OCH2CH2OH O 6.07 6.386
42 H Me CH2OCH2CH2Me O 5.06 5.114
43a H Me CH2OCH2CH2Ac O 5.17 – 4.491
44 H Me CH2OCH2CH2OCOPh O 5.12 5.754
45 H Me CH2OCH2Me O 6.48 5.876
46 H Me CH2OCH2CH2Cl O 5.82 5.528
47 H Me CH2OCH2CH2N3 O 5.24 – 5.279
48 H Me CH2OCH2CH2F O 5.96 5.476
49 H Me CH2OCH2CH2Me O 5.48 5.822
50 H Me CH2OCH2Ph O 7.06 – 6.522
51 H Et CH2OCH2Me O 7.72 6.828
52 H Et CH2OCH2Me S 7.58 6.848
53 3,5-Me2 Et CH2OCH2Me O 8.24 – 8.366
54 3,5-Me2 Et CH2OCH2Me S 8.30 8.387
55 H Et CH2OCH2Ph O 8.23 7.427
56 3,5-Me2 Et CH2OCH2Ph O 8.55 8.740
57 H Et CH2OCH2Ph S 8.09 – 7.453
58 3,5-Me2 Et CH2OCH2Ph S 8.14 8.766
(Continued to next page)

410
Table 3. Continued
A/A R1 R2 R3 X Experimental Values Predicted Values
59 H i-Pr CH2OCH2Me O 7.99 8.117
60 H i-Pr CH2OCH2Ph O 8.51 – 8.426
61 H i-Pr CH2OCH2Me S 7.89 8.143
62 H i-Pr CH2OCH2Ph S 8.14 8.455
63 H Me CH2OMe O 5.68 6.278
64 H Me CH2OBu O 5.33 5.755
65 H Me Et O 5.66 6.666
66a H Me Bu O 5.92 – 5.748
67 3,5-Cl2 Et CH2OCH2Me S 7.89 8.458
68 H Et CH2O-i-Pr S 6.66 6.437
69a H Et CH2O-c-Hex S 5.79 – 5.755
70 H Et CH2OCH2-c-Hex S 6.45 5.734
71 H Et CH2OCH2C6H4(4-Me) S 7.11 7.094
72 H Et CH2OCH2C6H4(4-Cl) S 7.92 7.118
73a H Et CH2OCH2CH2Ph S 7.04 – 6.985
74 3,5-Cl2 Et CH2OCH2Me S 8.13 8.651
75 H Et CH2O-i-Pr O 6.47 8.159
76 H Et CH2O-c-Hex O 5.40 6.424
78 H Et CH2OCH2CH2Ph O 7.02 5.664
77a H Et CH2OCH2-c-Hex O 6.35 – 5.565
79 H c-Pr CH2OCH2Me S 7.02 7.266
80 H c-Pr CH2OCH2Me O 7.00 7.075
a The test set.
Residuals Plot for Test Set
-1,4
-1,2
-1
-0,8
-0,6
-0,4
-0,2
0
0,2
0,4
0,6
0 5 10 15 20
Test Set
Re
sid
ua
ls
Figure 1. Residuals Plot for Test Set.
The proposed model (Eq. 12) passed all the tests for thepredictive ability (Eqs. 6–9):
R2CVext = 0.827 > 0.5
R2 = 0.904 > 0.6(R2 − R2
0
)R2
= −0.0975 < 0.1
or
(R2 − R′2
0
)R2
= −0.0695 < 0.1
k = 1.0443 and k′ = 0.9543
The model was further validated by applying the Y-randomization. Several random shuffles of the Y vector wereperformed and the results are shown in Table 4. The lowR2 and R2
CV values show that the good results in our origi-nal model are not due to a chance correlation or structuraldependency of the training set.
Finally the extent of extrapolation method was appliedto the compounds that constitute the test set. The leveragesfor all 20 compounds were computed and are presented inTable 5. Two compounds (69 and 77) were found to fallslightly outside from the domain of the model (warning lever-age limit 0.3). Both compounds contain cyclohexyl groups.

411
Table 4. Results of the Y-randomization test
Iteration R2 R2CV
1 0.073 0.00
2 0.045 0.00
3 0.039 0.00
4 0.072 0.00
5 0.047 0.00
6 0.085 0.00
7 0.103 0.00
8 0.073 0.00
9 0.078 0.00
10 0.194 0.00
The proposed model, due to the high predictive ability, cantherefore act as a useful aid to the costly and time consumingexperiments for determining the molar concentration of adrug required to achieve 50% protection of MT-4 cells againstthe cytopathic effect of HIV-1. The model can also be used toscreen existing databases or virtual libraries to identify newpotentially active compounds. In this case, the applicabilitydomain will serve as a valuable tool to filter out “dissimilar”compounds.
We first tried to identify descriptors trends which leadto improved anti-HIV activity through modifications of thedatabase compounds (Vanyur et al., 26) Based on the pro-posed QSAR equation we can make the following remarksregarding the importance of the descriptors and their ef-fects on the anti HIV-activity: As mentioned before, ourstudy agrees with the result of Luco et al. [6] that connec-tivity index 4χ N
p is the most important variable for predict-
ing the anti-HIV activity. As the value of descriptor 4χ Np
increases so does the activity. An opposite effect on theactivity is caused by an increase in the number of ben-zene rings (represented by 6χν
ch), so special care should betaken when increasing the number of benzenes. Furthermore,the QSAR equation (Eq. 12) clearly shows that the pres-ence of –OH group at the R3 position decreases the activ-ity. Finally, anti-HIV activity improves when lipophilicity(CLogP) or the HOMO energy take higher values. LogP andHOMO energy play a crucial role in distinguishing deriva-tives with X=O and those with X=S since all other three de-scriptors cannot recognize the difference between X=O andX=S.
An attempt was made to screen virtual libraries in order toidentify novel potent compounds (Table 6). The introductionof a phenyl substituent at R3 resulted in improved activi-ties, although the leverages approached the limit (0.3) andin several cases exceeded the limit (>0.3) of the domain ofapplicability reducing the confidence of the predicted data.Introduction of an alkyl or alkoxy spacer between the phenylsubstituent and the ring nitrogen at R3 reduced the activi-ties but improved the predictability. A good balance betweenactivity and predictability was found with the introductionof a benzyl group at R3. Furthermore the introduction ofsulfur (X=S) in nearly all cases resulted in better activity
Table 5. Leverages for the test set
Compound Id Leverages
5 0.0554
8 0.0484
10 0.0493
17 0.0516
20 0.0686
22 0.0464
27 0.1491
29 0.0397
35 0.0506
39 0.0731
43 0.1548
47 0.1428
50 0.0521
53 0.0963
57 0.0526
60 0.1655
66 0.0624
69 0.3489
73 0.0639
77 0.3264
than the oxygen (X=O) analogues. Exceptions to the latterwere compounds where alkoxy chains were present at R3,in these cases (A/A 23 to 38, Table 6) there was no signifi-cant difference in activities between the oxygen (X=O) andsulfur (X=S) species. R2 also played an important role inincreasing the activity, (see A/A 13 to 20, Table 6) and thebulky i-Pr group showed better activity than sterically lessdemanding n-Pr, Et and Me substituents. In this case the in-troduction of i-Pr also resulted in a reduced confidence inpredictability since the limits of the domain of applicabil-ity were being approached as the molecular weight of thealkyl group increased. The effect of substitution at R1 wasmore complex to analyse, however some observations can bemade. Firstly mono- or disubstitution with methyl or halo-gen substituents was tolerated by the model whilst hydroxyor amino substituents were not; in particular the dihydroxyand diamino derivatives fell outside the domain of applica-bility (see A/A 73 to 76, Table 6). Secondly disubstitutiongenerally gave better activities but at the expense of pre-dictability. Finally no clear trend as to the preferred site ofsubstitution was evident and may possibly be substituent de-pendant. Several interesting compounds (cf. A/A 20, 42 and80, Table 6) were identified to have good activities (10.22,10.48 and 10.15 respectively) and be comfortably withinthe domain of applicability and these are worthy of furtherstudy.
Conclusion
Our results lead to the conclusion that the anti-HIV activ-ity of the HEPT derivatives can be successfully modelledwith physicochemical constants and structural descriptors.The separation of the data into two independent sets (training

412
Table 6. Virtual screening results
A/A R1 R2 R3 X log (1/IC50) pred Leverages (limit 0.30)
1 3,5-(Cl)2 Et Ph O 9.5820 0.3968
2 3,5-(Cl)2 Et Ph S 10.6013 0.2460
3 2-Me Me Ph O 7.7403 0.1813
4 2-Me Me Ph S 8.5856 0.1048
5 3-Me Me Ph O 7.7632 0.2396
6 3-Me Me Ph S 8.7188 0.1157
7 4-Me Me Ph O 7.1742 0.1347
8 4-Me Me Ph S 8.1109 0.0746
9 3,5 (Me)2 Me Ph O 8.8133 0.3334
10 3,5 (Me)2 Me Ph S 9.7612 0.1868
11 3,5 (Me)2 Et Ph O 9.5406 0.3988
12 3,5 (Me)2 Et Ph S 10.4847 0.2512
13 3,5 (Me)2 Me CH2Ph O 8.4658 0.1107
14 3,5 (Me)2 Me CH2Ph S 8.8250 0.1014
15 3,5 (Me)2 Et CH2Ph O 9.3378 0.1543
16 3,5 (Me)2 Et CH2Ph S 9.6970 0.1488
17 3,5 (Me)2 Pr CH2Ph O 8.9872 0.1095
18 3,5 (Me)2 Pr CH2Ph S 9.3470 0.1912
19 3,5 (Me)2 i-Pr CH2Ph O 9.8526 0.1931
20 3,5 (Me)2 i-Pr CH2Ph S 10.2207 0.2099
21 3,5 (Me)2 i-Pr CH2CH2Ph O 9.8746 0.2174
22 3,5 (Me)2 i-Pr CH2CH2Ph S 10.1117 0.2525
23 3,5 (Me)2 i-Pr OCH2Ph O 9.7923 0.1834
24 3,5 (Me)2 i-Pr OCH2Ph S 9.8080 0.1815
25 3,5 (Me)2 i-Pr OCH2Me O 10.0459 0.2063
26 3,5 (Me)2 i-Pr OCH2Me S 10.0639 0.1936
27 3,5 (Me)2 i-Pr CH2OMe O 10.0277 0.2449
28 3,5 (Me)2 i-Pr CH2OMe S 10.0539 0.2213
29 3,5 (Me)2 i-Pr CH2OEt O 9.6214 0.2026
30 3,5 (Me)2 i-Pr CH2OEt S 9.6490 0.1925
31 3,5 (Me)2 i-Pr CH2OPh O 9.8761 0.2040
32 3,5 (Me)2 i-Pr CH2OPh S 9.9068 0.2035
33 3,5 (Me)2 i-Pr CH2OCH2CH2OH O 8.7066 0.1655
34 3,5 (Me)2 i-Pr CH2OCH2CH2OH S 8.6856 0.1577
35 3,5 (Me)2 i-Pr CH2OCH2CH2OMe O 9.2237 0.1707
36 3,5 (Me)2 i-Pr CH2OCH2CH2OMe S 9.1986 0.1592
37 3,5 (Me)2 Et CH2OEt O 8.7727 0.1885
38 3,5 (Me)2 Et CH2OEt S 8.9276 0.1660
39 4-Ph Et CH2Ph O 8.7020 0.1674
40 4-Ph Et CH2Ph S 9.0633 0.2103
41 4-Ph Et Ph O 9.6316 0.2551
42 4-Ph Et Ph S 10.4771 0.2218
43 2-NH2 i-Pr CH2Ph O 8.1110 0.2869
44 2-NH2 i-Pr CH2Ph S 8.4838 0.1413
45 3-NH2 i-Pr CH2Ph O 8.5363 0.3815
46 3-NH2 i-Pr CH2Ph S 8.9027 0.2169
47 4-NH2 i-Pr CH2Ph O 9.0540 0.4448
48 4-NH2 i-Pr CH2Ph S 9.4257 0.2513
49 2-OH i-Pr CH2Ph O 8.1989 0.1886
50 2-OH i-Pr CH2Ph S 8.5728 0.0987
51 3-OH i-Pr CH2Ph O 8.5031 0.2365
52 3-OH i-Pr CH2Ph S 8.8729 0.1314
53 4-OH i-Pr CH2Ph O 7.9001 0.1590
54 4-OH i-Pr CH2Ph S 8.2718 0.0929
55 2-F i-Pr CH2Ph O 8.5049 0.1162
56 2-F i-Pr CH2Ph S 8.8718 0.1077
57 3-F i-Pr CH2Ph O 8.7381 0.1419
58 3-F i-Pr CH2Ph S 9.1120 0.1213
59 4-F i-Pr CH2Ph O 8.1364 0.0930
60 4-F i-Pr CH2Ph S 8.5090 0.1108
(Continued to next page)

413
Table 6. Continued
A/A R1 R2 R3 X log (1/IC50) pred Leverages (limit 0.30)
61 2-Cl i-Pr CH2Ph O 8.9507 0.1524
62 2-Cl i-Pr CH2Ph S 9.3248 0.1939
63 3-Cl i-Pr CH2Ph O 8.9205 0.1181
64 3-Cl i-Pr CH2Ph S 9.2949 0.1521
65 4-Cl i-Pr CH2Ph O 8.3577 0.0945
66 4-Cl i-Pr CH2Ph S 8.7308 0.1662
67 2-Br i-Pr CH2Ph O 8.8951 0.1267
68 2-Br i-Pr CH2Ph S 9.2652 0.1839
69 3-Br i-Pr CH2Ph O 8.9465 0.1129
70 3-Br i-Pr CH2Ph S 9.3209 0.1616
71 4-Br i-Pr CH2Ph O 8.4096 0.0982
72 4-Br i-Pr CH2Ph S 8.7832 0.1842
73 3,5-(NH2)2 i-Pr CH2Ph O 8.9609 0.8533
74 3,5-(NH2)2 i-Pr CH2Ph S 9.3245 0.5330
75 3,5-(OH)2 i-Pr CH2Ph O 9.0008 0.4640
76 3,5-(OH)2 i-Pr CH2Ph S 9.3676 0.2598
77 3,5-(Br)2 i-Pr CH2Ph O 9.8257 0.1562
78 3,5-(Br)2 i-Pr CH2Ph S 10.2029 0.2571
79 3,5-(Cl)2 i-Pr CH2Ph O 9.7759 0.1523
80 3,5-(Cl)2 i-Pr CH2Ph S 10.1526 0.2236
81 3,5-(F)2 i-Pr CH2Ph O 9.4312 0.1927
82 3,5-(F)2 i-Pr CH2Ph S 9.8067 0.1545
and test) shows that our MLR model can predict external datawith great accuracy. The proposed method, due to the highpredictive ability, is a useful aid to the costly and time con-suming experiments for determining anti-HIV activity. Theproposed models can be used to screen existing databases orvirtual libraries in order to identify novel potent compounds.In this case, the applicability domain will serve as a valu-able tool to filter out “dissimilar” compounds. An attempt inthis direction was carried out. Synthesis of the new proposedmolecules and their biological evaluation will show if thisprocedure can be used as a general rational drug discoverytool.
Acknowledgements
The authors wish to thank Professor Alexander Tropshafor his valuable suggestions that helped to improve thesignificance and rigor of the manuscript. A.A. wishes tothank Cyprus Research Promotion Foundation (Grant No.PENEK/ENISX/0603/05) and A.G. Leventis Foundation forits financial support. G.M. thanks the Empirikion Foundationfor financial support.
References
1. Hansh, C. and Leo, A. Exploring QSAR. Fundamentals and Ap-plications in Chemistry and Biology. American Chemical Society.
Washington, DC, 1995.
2. Miyasaka, T., Tanaka, H., Baba, M., Hayakawa, H., Walker, R.,
Balzarini, J. and Clercq, E. A novel lead for specific anti-HIV-1 agents:
1-[(2-hydroxyethoxy)methyl]-6-(phenylthio)thymine. J. Med. Chem.,
32 (1989) 2507–2509.
3. Hansch, C. and Zhang, L. Bioorg. QSAR of HIV inhibitors. Med. Chem.
Lett., 2 (1992) 1165–1169.
4. Hannongbua, S., Lawtrakul, L. and Limtrakul, J. Structure – ActivityCorrelation Study of HIV-1 Inhibitors. Electron and Molecular Param-eters. J. Comput. – Aided Mol. Des., 10 (1996) 145–152.
5. Tanaka, H., Takashima, H., Ubasawa, M., Sekiya, K., Nitta, I., Baba,
M., Shigeta, Sh., Walker, R.T. De Clercq, E., Miyasaka, T. Synthesisand Antiviral Activity of 6-Benzyl Analogs of 1-[(2-Hydroxyethoxy)-methyl]-6-(phenylthio)thymine (HEPT) as Potent and Selective Anti-HIV-1 Agents. J. Med. Chem., 35 (1992) 4713–4719.
6. Luco, J.M. and Ferreti F.H. QSAR Based on Multiple Linear Regressionand PLS Methods for the Anti-HIV Activity of a Large Group of HEPTDerivatives. J. Chem. Inf. Comput. Sci., 37 (1997) 392–401.
7. Jalali-Heravi., M. and Parastar., F. J. Use of Artificial Neural Networksin a QSAR Study of Anti-HIV Activity for a Large Group of HEPTDerivatives, Chem. Inf. Sci., 40 (2000), 147–154.
8. Alves, C. N., Pinheiro, J. C. Camargo, A. J., Ferreira, M. M. C. and
Silva, A. B. F. A structure – activity relationship study of HEPT – analogcompound with anti – HIV activity. Journal of Molecular Structure
(Theochem), 530 (2000) 39–47.
9. Bazoui, H., Zahouily, M., Boulajaaj, S., Sebti, S. and Zakarya, D.
QSAR for anti-HIV activity of HEPT derivatives. SAR and QSAR in
Environmental Research, 13 (2002) 567–577.
10. Duali, L., Villemin, D. and Cherqaoui, D., Neural Networks : AccurateNonlinear QSAR Model for HEPT Derivatives, J. Chem. Inf. Comput.
Sci., 43 (2003) 1200–1207.
11. Duali, L., Villemin, D. and Cherqaoui, D., Comparative QSAR basedon neural networks for the anti-HIV activity of HEPT derivatives. Curr.
Pharm. Des., 9 (2003) 1817–1826.
12. Duali, L., Villemin, D., Zyad, A. and Cherqaoui, D., Artificial neu-ral networks: non-linear QSAR studies of HEPT derivatives as HIV-1 reserve transcriptase inhibitors. Molecular Diversity, 8 (2004)
1–8.
13. Gupta, S., Singh, M. and Madam, A. K., Predicting anti-HIV activ-ity: computational approach using a novel topological descriptor. J.
Comput. Aided Mol. Des., 15 (2001) 671–678.

414
14. Gayen, S., Debnath, B., Samanta, S. and Jha, T., QSAR study on someanti-HIV HEPT analogues using physicochemical and topological pa-rameters. Bioorganic & Medicinal Chemistry, 12 (2004) 1493–1503.
15. Efroymson, M. A., Multiple Regression Analysis, in: Ralston, A. and
Wilf, H.S. (eds.), Mathematical Methods for Digital Computers, Wiley,
New York, NY, 1960.
16. Osten, D. W. Selection of Oprimal Regression Models via Cross-Validation J. Chemom., 2 (1988) 39–48
17. Wold, S. and Eriksson, L., Statistical Validation of QSAR Results, in:
Van de Waterbeemd, H. (Ed.), Chemometrics Methods in Molecular
Design, VCH Weinheim (Germany), 1995, pp. 309–318.
18. Tropsha, A., Gramatica, P. and Gombar, V. K., The Importance of BeingEarnest: Validation is the Absolute Essential for Successful Applicationand Interpretation of QSPR Models. Quantitative Structure Activity
Relationships, 22 (2003) 1–9.
19. Golbraikh, A. and Tropsha, A. Beware of q2! Journal of Molecular
Graphics and Modelling, 20 (2002) 269–276.
20. Shen, M., Beguin, C., Golbraikh, A., Stables, J., Kohn, H. and Tropsha,
A. Application of Predictive QSAR Models to Database Mining:
Identification and Experimental Validation of Novel AnticonvulsantCompounds. J. Med. Chem., 47 (2004) 2356–2364.
21. Atkinson, A. C., Plots, transformations and regression, Clarendon
Press, Oxford (UK), 1985, p. 282.
22. Gulyaeva, N., Zaslavsky, A., Lechner, P., Chlenov, M., Chait, A.,
Zaslavsky, B. Relative hydrophobicity and lipophilicity of β-blockersand related compounds as measured by aqueous two-phase partition-ing, octanol-buffer partitioning, and HPLC. Eur. J. Pharm. Sci., 17
(2002) 81–93.
23. Walters, W. P., Ajay, Murcko, M. A. Recognizing molecules with drug-like properties. Curr. Opin. Chem. Biol. 3 (1999) 384–387.
24. Devillers, L. (Ed.), Comparative QSAR. Taylor and Francis,
Washington, DC. 1998.
25. Golbraikh, A. and Tropsha, A., Predictive QSAR modeling based ondiversity sampling of experimental datasets for the training and testset selection. Molecular Diversity, 5 (2000) 231–243.
26. Vanyur, R., Heberger, K., Jakus, J., Prediction of Anti-HIV-1 Activityof a Series of Tetrapyrrole Molecules. Journal Chemical Information
Computer Science, 43 (2003) 1829–1836.