Integrating QSAR and read-across for environmental assessment
15
Full Terms & Conditions of access and use can be found at http://www.tandfonline.com/action/journalInformation?journalCode=gsar20 Download by: [Politecnico di Milano Bibl], [Giuseppina Gini] Date: 14 September 2015, At: 06:25 SAR and QSAR in Environmental Research ISSN: 1062-936X (Print) 1029-046X (Online) Journal homepage: http://www.tandfonline.com/loi/gsar20 Integrating QSAR and read-across for environmental assessment E. Benfenati, A. Roncaglioni, M.I. Petoumenou, C.I. Cappelli & G. Gini To cite this article: E. Benfenati, A. Roncaglioni, M.I. Petoumenou, C.I. Cappelli & G. Gini (2015): Integrating QSAR and read-across for environmental assessment, SAR and QSAR in Environmental Research, DOI: 10.1080/1062936X.2015.1078408 To link to this article: http://dx.doi.org/10.1080/1062936X.2015.1078408 Published online: 11 Sep 2015. Submit your article to this journal Article views: 13 View related articles View Crossmark data
Transcript of Integrating QSAR and read-across for environmental assessment

Full Terms & Conditions of access and use can be found athttp://www.tandfonline.com/action/journalInformation?journalCode=gsar20
Download by: [Politecnico di Milano Bibl], [Giuseppina Gini] Date: 14 September 2015, At: 06:25
SAR and QSAR in Environmental Research
ISSN: 1062-936X (Print) 1029-046X (Online) Journal homepage: http://www.tandfonline.com/loi/gsar20
Integrating QSAR and read-across forenvironmental assessment
E. Benfenati, A. Roncaglioni, M.I. Petoumenou, C.I. Cappelli & G. Gini
To cite this article: E. Benfenati, A. Roncaglioni, M.I. Petoumenou, C.I. Cappelli & G. Gini(2015): Integrating QSAR and read-across for environmental assessment, SAR and QSAR inEnvironmental Research, DOI: 10.1080/1062936X.2015.1078408
To link to this article: http://dx.doi.org/10.1080/1062936X.2015.1078408
Published online: 11 Sep 2015.
Submit your article to this journal
Article views: 13
View related articles
View Crossmark data

Integrating QSAR and read-across for environmental assessment$
E. Benfenatia*, A. Roncaglionia, M.I. Petoumenoua, C.I. Cappellia and G. Ginib
aIRCCS - Istituto di Ricerche Farmacologiche Mario Negri, Milano, Italy; bDipartimento di Elettronica,Informazione e Bioingegneria, Politecnico di Milano, Milano, Italy
(Received 22 June 2015; in final form 28 July 2015)
Read-across and QSAR have different traditions and drawbacks. We address here two mainquestions: (1) How do we solve the issue of the subjectivity in the evaluation of data andresults, which may be particularly critical for read-across, but may have a role also for theQSAR assessment? (2) How do we take advantage of the results of both approaches tosupport each other? The QSAR model starts from the training set. The presence of similarchemicals with property values close to that predicted can support the result. The approachin read-across is the opposite. The assessment is focused on the few substances similar tothe target. The data quality of the similar chemicals is fundamental. A risk is poor stan-dardization in the definition of ‘similarity’, because different approaches may be applied.Inspired by the principles of high transparency and reproducibility, a new program forread-across, called ToxRead, has been developed and made freely available (www.toxgate.eu). The output of ToxRead can be compared and integrated with the output of QSAR,within a weight-of-evidence strategy. We discuss the evaluation and integration of ToxReadand QSAR with examples of the assessment of bioconcentration factors of chemicals.
Keywords: read-across; BCF; REACH; QSAR; log P
1. Introduction
The EC regulation Registration, Evaluation, Authorisation and restriction of Chemicals(REACH) (EC Regulation 1907/2006) requires that the registrant assess if alternative methodsare available, to provide valid results. Among the alternative methods, the so-called non-testing methods represent a possibility. Non-testing methods include (quantitative) structure–activity relationship ((Q)SAR) and read-across. However, a main drawback of read-across isthat the evaluation, typically done by the human expert, is quite subjective. The evaluation ofsimilar compound(s) and the reasoning about similarity are often done manually, on the basisof a mental process that is often difficult to replicate.
The issue of chemical-to-chemical similarity is not directly present in the case of QSARmodels. In the case of QSAR models the target chemical is in some way compared with thewhole population of chemicals as the basis of the model, and this is addressed within theso-called applicability domain of the model. Thus, the comparison is done not between onechemical and another, or a few others, as in the read-across case, but with the whole set ofcompounds used for the model.
*Corresponding author. Email: [email protected]$Presented at the 8th International Symposium on Computational Methods in Toxicology and Pharmacology Integrat-ing Internet Resources, CMTPI-2015, June 21–25, 2015, Chios, Greece.
© 2015 Taylor & Francis
SAR and QSAR in Environmental Research, 2015http://dx.doi.org/10.1080/1062936X.2015.1078408
Dow
nloa
ded
by [
Polit
ecni
co d
i Mila
no B
ibl]
, [G
iuse
ppin
a G
ini]
at 0
6:25
14
Sept
embe
r 20
15

However, in QSAR models we should distinguish between models which are statisticallybased, for which the above is true, and SAR models which are based on rules, usually calledstructural alerts. In the latter case, the overall structure of the model is like a collection ofread-across models, with the special situation that rules for similarity are unequivocallydefined by the presence of the structural alert. Thus, if the target chemical has a certain struc-tural alert, it belongs to the family characterized by that alert, and thus it is labelled as toxic.(Within some models there are exception alerts, thus the presence of the exception alert over-rules the toxic effect; this applies, for instance, to the presence of a sulfonic group which cancancel the genotoxic activity of the aromatic amine.) The structural alert is the ontologywhich defines the family, but in some cases the structural alert is supported by one singlechemical, thus this is conceptually very similar to the one-to-one read-across model. This isthe case, for instance, in the rule for genotoxicity of SA_1: Acyl halides [1].
Thus, SAR models have similarities with read-across models. However, the read-acrossapproach is typically not so strictly formalized, and thus different results may be obtainedbased on expert judgment.
Furthermore, several QSAR include tools to visualize the chemicals used to build up themodel. These tools are used to evaluate the reliability of the model; however, they can bealso used for read-across. For example, VEGA and TEST [2,3], a couple of freely availableplatforms for QSAR models, show the most similar compounds to the target chemical, andthis information can be easily used for read-across. These considerations indicate that there isa certain overlap between QSAR and read-across.
In the case of QSAR, the ‘similarity’ is usually addressed with measurements related tothe chemical structure, such as the presence of certain fragments, or using descriptors as donewithin VEGA, TEST and AMBIT [2–4].
However, the way to assess similarity within read-across exceeds the chemical similarity.Annex XI within REACH specifies some other features which may be addressed, such as acommon functional group. Recently the ECHA published a document with a framework toaddress read-across [5]. One of the scenarios described in this document covers the analogueapproach for which the read-across hypothesis is based on different compounds which havethe same type of effect, and the mutagenicity module of ToxRead can be applied to addressthis case. Other scenarios cover the category approach, and the bioconcentration factor (BCF)module of ToxRead can be used for these scenarios.
The multiple choices offer more powerful strategies using read-across, but the drawbackis an increased level of subjectivity. Each expert is guided by his or her past experience;pieces of information may escape her or his knowledge, the weight assigned to each elementof evidence and value may be different, and expressed in a subjective way, such as likely,plausible, reasonable, level of concern, etc. Typically, this evaluation is not associated with aquantitative value, and thus the integration between different results, such as different QSARmodels and read-across, is quite difficult.
Thus, even though examples of integration of results of QSAR and read-across modelshave appeared very recently [6], the way to assess read-across is through manual, individualexpert assessment.
We show here the use of non-testing methods in the case of BCF. BCF has a significantcontribution in environmental assessments of the aquatic compartment [7]. BCF expresses thelikelihood of a chemical to concentrate and consequently accumulate in an organism, increas-ing the risk of adverse effects [8]. REACH requires BCF data, which are usually used withinthe Globally Harmonized System. BCF is typically done using the OECD test No. 305 [9].
2 E. Benfenati et al.
Dow
nloa
ded
by [
Polit
ecni
co d
i Mila
no B
ibl]
, [G
iuse
ppin
a G
ini]
at 0
6:25
14
Sept
embe
r 20
15

The disadvantages of experimental studies for determining the BCF of each chemical arethe high cost and the requirement of hundreds of vertebrate test animals [10]. The duration ofthe test is at least 1 month. Considering the methods used by registrants to address BCF inREACH, this endpoint is one of those with greater use of alternative methods, which haveincreased in comparison with the first evaluation deadline [11]. The most used alternativemethod to deal with BCF was weight of evidence (where also QSAR estimations are some-times nested), followed by read-across (whose use has, however, decreased) and QSAR.
We studied an approach that offers the expert a systematic and reproducible way to anal-yse the reasons for similarity in a guided way, showing data of good quality on similarchemicals. In order to mitigate the subjectivity problems we developed a program for read-across, called ToxRead [12,13]. It has been already described for mutagenicity. Here weextend its use for BCF, and present the integration of its results with QSAR results.
2. Materials and methods
2.1 Experimental BCF data
Data for ToxRead have been derived from the set of compounds available within VEGA[14]. The source of these data has been described in the literature, referring to the VEGAmodels on BCF [15,16]; basically they derive from data considered of good quality, such asthe EURAS database [17], with the addition of further compounds from the literature [8,18].When multiple data for the same compounds were available the arithmetic mean value wasused in the database for the read-across. In total there are 860 chemicals in the databasesupporting the read-across.
2.2 The log P values
The log P values derive from two sources. One source is the experimental data obtained fromthe EPI Suite KOWWIN model [19]. When the experimental value is not available, it iscalculated using the VEGA KOWWIN model [3].
2.3 The algorithm for visualization
The algorithm for the visualization of similar compounds has been adapted from the ToxReadmodel for mutagenicity, with some modifications necessary to deal with a continuous end-point as the BCF rather than a categorical one, as described within the results section. Thealgorithm for measuring similarity is the same used within VEGA [20].
2.4 The rules for BCF
For the BCF endpoint, four sets of rules have been used. The first set of rules already existswithin the CAESAR model of the VEGA platform [3]; these rules, obtained with SARpysoftware [21], specify if a chemical has a high probability of having a low BCF value, despiteits high log P value. The second set is a couple of new rules, also obtained with SARpy,which identify compounds with high log P and BCF values. The third set of rules has beenobtained with the istChemFeat software developed by KODE within the CALEIDOS project[22,23]; istChemFeat identifies if, in a given molecule, there is an atom/fragment, from a listof about 700, representing chemical classes and atom-centred fragments. ToxRead finds if the
SAR and QSAR in Environmental Research 3
Dow
nloa
ded
by [
Polit
ecni
co d
i Mila
no B
ibl]
, [G
iuse
ppin
a G
ini]
at 0
6:25
14
Sept
embe
r 20
15

target chemical has any of these atom-centred fragments, and on this basis it shows theexpected range of BCF value. Thus, families of compounds with the same fragment can beevaluated. In this case, ToxRead indicates if the BCF value of chemicals within a family ishomogeneous, and this family is characterized by its mean value and standard deviation.Finally, the fourth set of rules is related to empirical observation and reasoning, such as thecorrelation among molecular weight, log P and BCF values, which is higher within the rangeof log P values between 2 and 6.
2.5 Using the ToxRead software
The user has to choose the property of interest, in this case BCF. In the current version thereare only two properties. A previous paper discussed the use of the ToxRead software formutagenicity [13]. The chemical structure is introduced as SMILES. The user has to choosethe number of similar chemicals to be shown. This is the only option allowed.
3. Results
3.1 The visualization scheme of ToxRead for BCF
The target chemical is shown as a circle at the centre of the graph. The chemical structure(with the SMILES: O=[N+]([O-])c1c(c(cc(c1Cl)Cl)Cl)) of the target chemical is shown in abox on the right (see Figure 1). The target chemical shown in blue is linked to three other cir-cles, which represent the most similar chemicals, in a number chosen by the user. The typicalnumber is three, but depending on the chemical it may be useful to explore a larger number.
Figure 1. ToxRead screen showing the similar molecules and the rules found in the analysis of themolecule: O=[N+]([O-])c1c(c(cc(c1Cl)Cl)Cl).
4 E. Benfenati et al.
Dow
nloa
ded
by [
Polit
ecni
co d
i Mila
no B
ibl]
, [G
iuse
ppin
a G
ini]
at 0
6:25
14
Sept
embe
r 20
15

Below we provide an example of using different number of similar chemicals. The similarityis measured as described in the material and methods section. This provides only a first levelof evidence. Further information is obtained through the analysis of the rules. The rules areendpoint specific, and allow more insights to be obtained on the likely property value,depending on the endpoints. In other words, the first level of evaluation through chemicalsimilarity is purely on a structural basis, and it is the same approach applied to all properties.It allows a rough assessment of the likely property value, on the basis of property values ofthe most similar compounds. It is conceptually a kind of kNN approach, purely done onchemometric, general features. This approach is suitable in case of poor availability of speci-fic rules, which are endpoint specific, and provides simple information related to similar com-pounds assessed on the general chemical structure.
In addition to this level of information there is a second level of information, which isendpoint specific. The rules are specific features that can be useful for the evaluation of theproperty value of the target compound; the rules are endpoint specific. For BCF the rulesindicate that within the chemical’s structure the software identified a special residue, whichcan be useful for the evaluation of the property value. Associated with each rule there areagain similar chemicals, in this case the ones most similar to the target compound, and inaddition containing the residue at the basis of the rule.
The colours of the rule and of the similar chemicals are associated to a BCF scale, fromred to green, which is reported in the output graph (see Figure 1). Figure 2 summarizes thegraphical symbols used within the BCF module of ToxRead. Circles always represent chemi-cals. The size of the circle is proportional to the similarity of the chemical; the largest is themost similar.
The colour of the circle refers to the same scale of BCF values used for the rules. Yellowmeans that the chemical has a BCF value of about 3, and thus it is close to the 3.3 threshold.Red means a BCF value exceeding the 3.3 threshold, while green means a BCF value farfrom that threshold. Of course different thresholds apply depending on the regulation, and theexact experimental value of the similar chemicals is given by clicking on the circle.
Figure 2. The graphical elements used by ToxRead.
SAR and QSAR in Environmental Research 5
Dow
nloa
ded
by [
Polit
ecni
co d
i Mila
no B
ibl]
, [G
iuse
ppin
a G
ini]
at 0
6:25
14
Sept
embe
r 20
15

Moving the mouse on the circles, if the same chemical appears more than once, thesoftware identifies all the occurrences with a yellow ring around the chemical. Indeed, thesame similar chemical may be similar simply from a chemical point of view, but it may alsocontain one or more of the rules applicable to the target compound, and thus the same chemi-cal may appear several times. For instance, in Figure 1 the chemical with the CAS number18708-70-8 appears three times.
Figure 2 also shows that there are two different symbols for rules. Indeed, some rules,indicated by rectangles, show that the target chemical has a residue that usually is present inchemicals with a certain average BCF value. Again, the colour of the rule represents the BCFvalue of the rule according to the scale. The rules drawn as triangles represent the empiricalset of rules dealing with physico-chemical property values associated to BCF value. A log P/BCF interpolation chart is available for the target molecule and for each rule.
More information is available by clicking on the symbols. Clicking on the rule, the soft-ware shows the average BCF value of chemicals containing that rule, the number of chemi-cals with that rule within the software database, and the standard deviation of the BCF valuesfor the defined family of substances (see Figure 3). For instance, for the rule reported inFigure 3 the software tool indicates that there is an aromatic nitro group, that there are 62
Figure 3. An example of the rules found for the target molecule (upper part of the figure) and the firsttwo of the similar molecules containing the rule (lower part of the figure).
6 E. Benfenati et al.
Dow
nloa
ded
by [
Polit
ecni
co d
i Mila
no B
ibl]
, [G
iuse
ppin
a G
ini]
at 0
6:25
14
Sept
embe
r 20
15

compounds with that rule, and that the average value is 1.43 and the standard deviation is1.09. There is also a button to click, if the user wants to see or download the 100 most simi-lar compounds containing that rule.
Clicking on the similar chemical (circle), the software shows in a box its structure (seeFigure 4), with its experimental values (not only BCF, also other property values are reportedif available). The similarity value is also indicated; it ranges from 1 (identity to the targetcompound) to 0. A good similarity value is higher than 0.85. If the similarity is lower than0.7, there are many atoms and fragments which are different between the target compoundand the similar one.
Clicking on the interpolation chart, a figure reports the most similar molecules with theirlog P value (experimental, if available, otherwise predicted with the VEGA model; if thevalue is experimental the colour of the chemical is dark in the chart) versus their experimentalBCF value (see Figure 5). A dotted vertical line is drawn in correspondence with the log Pvalue of the target compound. The area between the highest and lowest BCF value is white,indicating that the BCF value of the target compound should be within this area. Such a chartcan be useful to evaluate the relationship and the trend between the log P and BCF valuesfor the most similar compounds. There is also a table reporting the log P and BCF values ofthe similar compounds.
3.2 Using the information given by the ToxRead software
The figures of the similar compounds give an example of how the software can help in theassessment based on read-across. In Figure 1 the similar compounds have values ‘green’ or‘yellow’, i.e. close to 3 or lower than 3. There are two rules associated with the target com-pound, and both are ‘green’, indicating that generally this kind of chemical is safe. One rule,rule 1.0, is related to aromatic nitro compounds, and its explanation is shown in Figure 3.Rule 2.0 identifies if there is an atom that can accept H-bonds (N, O, F).
This kind of overview provides the first framework to assess the nature of the target sub-stance. In this case there is no major concern (no ‘red’ rule, no ‘red’ similar compound), butsome chemicals may have a BCF value close to 3. Thus, a closer look at the similar com-pounds allows a more detailed view. This is offered by the graph, as in Figure 5. The targetcompound has an aromatic ring with a nitro group and three chlorine atoms linked to it. The
Figure 4. The three most similar molecules to the target chemical (as in Figure 1).
SAR and QSAR in Environmental Research 7
Dow
nloa
ded
by [
Polit
ecni
co d
i Mila
no B
ibl]
, [G
iuse
ppin
a G
ini]
at 0
6:25
14
Sept
embe
r 20
15

most similar compound has the same kind of substituent groups, only in different positions.The most similar compound has 2.72 log units as experimental BCF value. If we look at theother two most similar compounds, one of them has only two chlorine atoms, while the sec-ond one has four chlorine atoms. Chlorine brings a hydrophobic contribution, and indeed wesee that a BCF of dichloronitrobenzene has the BCF of 1.92 log units, while the tetrachloroanalogue has the BCF of 3.26 log units. If we look at the graph in Figure 5 there is quite anice trend with log P.
Figure 6 shows the same picture analysing a larger number of similar compounds. In thiscase there are more compounds, and the trend with log P is confirmed. The new most similarcompounds now introduced show lower BCF values; indeed, one of them has an aminegroup, which introduces hydrophilicity. The second new similar compound is a phenol, withan expected lower BCF value. The third new similar compound has only one chlorine atom,and as we have already commented this reduces the BCF value, also compared with thedichloro analogue. Thus, the new similar compounds, all of them with a nitro group, confirmthe line of reasoning we had before. The new similar compound confirms the trend, but theirsimilarity is lower, compared with the first ones.
If we further extend our view to a larger set of similar compounds, as shown in Figure 7,we see again a kind of trend, but more noise is present. In this case there are similar chemi-cals which do not contain the nitro group.
3.3 Integrating results from QSAR models
We used the VEGA software, which provides three QSAR models for BCF: one is theMeylan model, as developed within EPI Suite, the second is the CAESAR model [15],
Figure 5. Interpolation chart representing the three most similar molecules to the target molecule as inFigure 1, with their log P versus log BCF values.
8 E. Benfenati et al.
Dow
nloa
ded
by [
Polit
ecni
co d
i Mila
no B
ibl]
, [G
iuse
ppin
a G
ini]
at 0
6:25
14
Sept
embe
r 20
15

and the third is a kNN model. VEGA provides an assessment of the applicability domainin a quantitative manner, through the Applicability Domain Index (ADI), whose valueranges from 1 to 0, and is based on a series of sub-factors. Briefly, the software evaluatesthe similarity of the most similar compounds, and compares the predicted BCF value withthe experimental BCF values of the most similar compounds. Furthermore, it evaluates the
Figure 6. Interpolation chart representing the six most similar molecules, with their log P versus logBCF values.
Figure 7. Interpolation chart representing the 15 most similar molecules, with their log P versus logBCF values.
SAR and QSAR in Environmental Research 9
Dow
nloa
ded
by [
Polit
ecni
co d
i Mila
no B
ibl]
, [G
iuse
ppin
a G
ini]
at 0
6:25
14
Sept
embe
r 20
15
correctness of the predictions of the most similar values. Other checks are done, consider-ing the occurrence of unusual fragments in the molecule, and (for the CAESAR model)perturbing the values of the descriptors, checking if these changes of the descriptor values(up to 10%) provoke a much higher BCF value change. All these checks are used withinthe ADI, and offer a good way to assess the model reliability for the specific chemicaland property.
In our first example the predictions of the three models are in a good agreement: valuesrange from 1.6 to 2.47 log units. The ADI values of the three models are good: they rangefrom 0.7 to 1. Thus, overall the likely BCF value is lower than 3, and is in line with the con-clusions derived from ToxRead. The most similar compound, CAS number 18708-70-8, atrichloronitrobenzene, has a BCF of about 2.7.
Thus, overall, these two parallel approaches, read-across and QSAR, can be used within aweight-of-evidence strategy, and they reinforce each other. This is the ideal situation, becausethe uncertainty of the overall evaluation is reduced, through a consensus process.
3.4 The example of a chemical with more uncertain and conflicting evidences
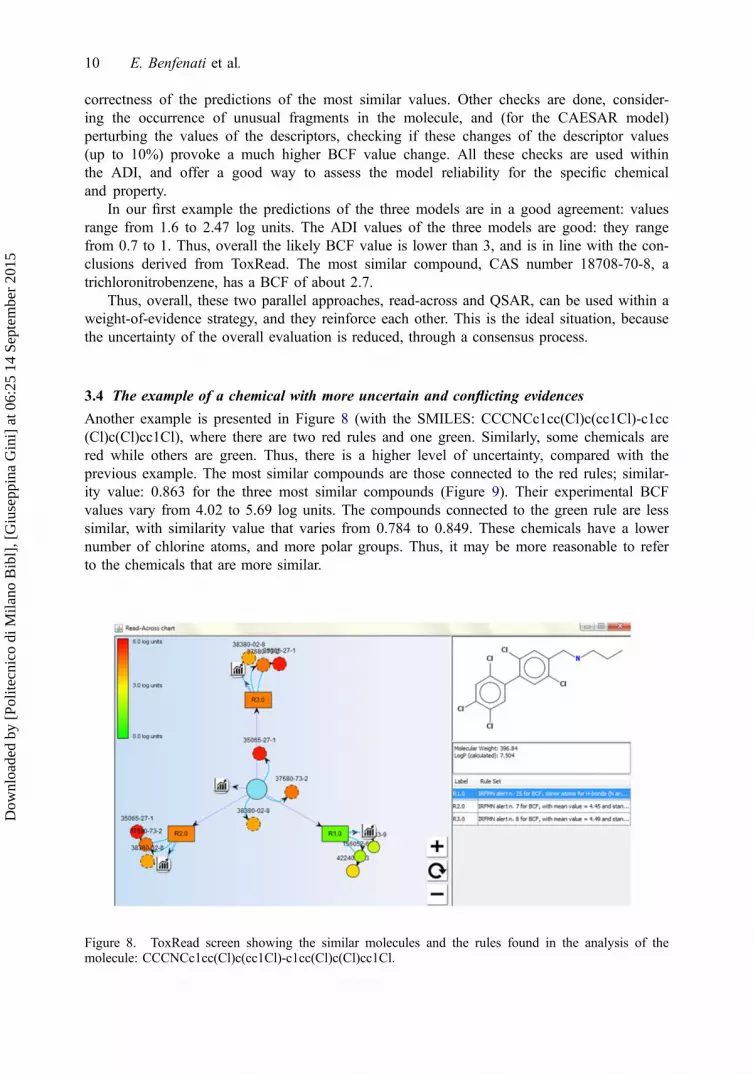
Another example is presented in Figure 8 (with the SMILES: CCCNCc1cc(Cl)c(cc1Cl)-c1cc(Cl)c(Cl)cc1Cl), where there are two red rules and one green. Similarly, some chemicals arered while others are green. Thus, there is a higher level of uncertainty, compared with theprevious example. The most similar compounds are those connected to the red rules; similar-ity value: 0.863 for the three most similar compounds (Figure 9). Their experimental BCFvalues vary from 4.02 to 5.69 log units. The compounds connected to the green rule are lesssimilar, with similarity value that varies from 0.784 to 0.849. These chemicals have a lowernumber of chlorine atoms, and more polar groups. Thus, it may be more reasonable to referto the chemicals that are more similar.
Figure 8. ToxRead screen showing the similar molecules and the rules found in the analysis of themolecule: CCCNCc1cc(Cl)c(cc1Cl)-c1cc(Cl)c(Cl)cc1Cl.
10 E. Benfenati et al.
Dow
nloa
ded
by [
Polit
ecni
co d
i Mila
no B
ibl]
, [G
iuse
ppin
a G
ini]
at 0
6:25
14
Sept
embe
r 20
15

3.5 Integrating read-across and QSAR for the second case study
The three models within VEGA provide values close to or higher than 4, so the prediction isvery bioaccumulative. The ADI of the three models are acceptable. Overall, the main piecesof evidence for each QSAR model indicate that the chemical has a BCF value in the range4–4.5. Combining the overall QSAR results, they support the conclusion that the rule for lowBCF value (Rule 1, related to donor atoms for H-bonds) in this case is overruled by the twoother rules, both associated with the biphenyl structure linked to two chlorine atoms (in dif-ferent positions). The BCF value is probably above 4, but there is a higher level of uncer-tainty, compared with the previous example, for the higher uncertainty associated with theread-across evaluation. In this case the expert may get conflicting results from the read-acrossevaluation provided by ToxRead, but the QSAR model helps in supporting the preference forrules 2 and 3, which indicate the high log P value.
3.6 Discussion
As we have shown, the availability of tools like ToxRead opens the way to a deeper integra-tion between the results of QSAR models and read-across. Thus, ToxRead increases thepossible integration of these two approaches. A first level of integration is the extent of agree-ment between the results. Of course, if there is good agreement, it is easy to get a decision,but problems may arise in the case of conflicting results. In our case the user can easily verifythis possible agreement. What we suggest is to arrive at an assessment on the basis of theQSAR result(s) (each model should be assessed individually, if more than one is available,and then the consistency of the results should be evaluated), separately to obtain a conclusionfor the read-across, and only finally to evaluate the agreement or disagreement between read-across and QSAR(s).
The transparency and documentation offered by VEGA and ToxRead can provide validsupport to integrate the results of the models, evaluating the reliability of individual resultsand thus facilitating the decision in case of conflicting results. We have shown here how toproceed for the read-across case, reasoning about conflicting evidence. The relevance assignedto each result can be established on that basis. This increases the flexibility and robustness ofthe integration of the results of the two approaches. The integration, as we have seen, is not
Figure 9. The three most similar molecules to the target molecule of the Figure 8.
SAR and QSAR in Environmental Research 11
Dow
nloa
ded
by [
Polit
ecni
co d
i Mila
no B
ibl]
, [G
iuse
ppin
a G
ini]
at 0
6:25
14
Sept
embe
r 20
15

the simple mathematical average of different results. Conversely, the chemical information onthe similarity of the chemicals and the presence of specific rules improve the possibility toimprove the overall assessment. The user has presented different pieces of evidence, whichcan help in the process of reasoning (currently the user should save the preferred graph withthe chosen number of similar substances and related information. A future version of Tox-Read will simplify the reporting process). The same rules are shown to all users, which donot select them a priori. The evaluation is based on elements that are automatically shown,and this increases the transparency and reproducibility of the process. Furthermore, the soft-ware is based on parameters that are processed through simple mathematical equations. Thisopens the possibilities to further integration of the results within the same platform, in anautomatic way, which may process and integrate results from QSAR and read-across. This isnot implemented yet, but this objective is greatly facilitated by the fact that each result isbased on parameters, which are produced by the software through quantitative parameters,with a possible use within a unified program.
4. Conclusions
There are more and more cases of read-across done for practical use to register chemicals forregulations such as REACH and the Cosmetics Directive. However, papers discussing the useof read-across are less frequent, and even less frequent are papers on software for read-across.In most cases, human experts perform the evaluation using their personal experience. Thisopens the question of the possible subjectivity of the evaluation.
In order to offer a more systematic way to address read-across, we developed the publiclyavailable tool ToxRead, which has already been downloaded by hundreds of users. Theapproach we adopted offers a general overview of possible reasons of concern, or theexpected behaviour of the target compound, on the basis of a collection of rules. These rulescan be analysed, and the most similar chemicals that are associated with the rules can be seenand evaluated, also through the use of graphs summarizing the different scenarios. In thisway the multiple factors to be evaluated are represented in an overall visual scheme, and theuser should navigate and analyse them, assessing the levels of uncertainty (also through thequantitative similarity scores of the related compounds) and the trend analysis representations;greater care should be given to cases with conflicting elements (similar chemicals or ruleswith large differences in values).
Within ToxRead it is clear that the read-across strategy is endpoint specific, since it refersto specific rules which apply for BCF for instance, as shown here, and is not based on a sim-ple chemical similarity on the related compounds.
QSAR is often criticized as a black-box approach, since it operates at the abstract level ofdescriptors, not always easily related to simple reasoning. ToxRead addresses this kind ofneed, to represent reasons of concern directly related to chemical structures, which are orga-nized according to rules. Combining the two non-testing methods may reciprocally supportthe individual assessment.
ToxRead is based on a diagnostic philosophy, while the QSAR approach is typically prog-nostic. In other words, in the current version of ToxRead no prediction of the property for thetarget compound is attempted. Prediction is left to the QSAR models, which are present forinstance within VEGA (www.vega-qsar.eu).
12 E. Benfenati et al.
Dow
nloa
ded
by [
Polit
ecni
co d
i Mila
no B
ibl]
, [G
iuse
ppin
a G
ini]
at 0
6:25
14
Sept
embe
r 20
15

AcknowledgementsThe authors gratefully acknowledge the financial support of the LIFE+ projects CALEIDOS andPROSIL [23,24].
Disclosure statement
No potential conflict of interest was reported by the authors.
References
[1] R. Benigni, C. Bossa, N.G. Jeliazkova, T.I. Netzeva, and A. Worth, The Benigni/Bossa rulebase formutagenicity and carcinogenicity – A module of Toxtree, EUR-Scientific and Technical ReportSeries, EUR 23241 EN, Office for the Official Publications of the European Communities,Luxembourg, 2008.
[2] VEGA, platform available at http://www.vega-qsar.eu/.[3] TEST, software available at http://www.epa.gov/nrmrl/std/qsar/qsar.html#TEST.[4] AMBIT, Version 2.4.11, 2014; software available at http://ambit.sourceforge.net/.[5] European Chemicals Agency (ECHA), Read-Across Assessment Framework (RAAF), ECHA/PR/
15/07, ECHA, Helsinki, 2015.[6] N. Price and Q. Chaudhry, Application of in silico modelling to estimate toxicity of migrating
substances from food packaging, Food Chem. Toxicol. 71 (2014), pp. 136–141.[7] J.A. Arnot and F.A.P.C. Gobas, A review of bioconcentration factor (BCF) and bioaccumulation
factor (BAF) assessments for organic chemicals in aquatic organisms, Environ. Rev. 14 (2006),pp. 257–297.
[8] M. Pavan, T.I. Netzeva, and A.P. Worth, Review of literature-based quantitative structure-activityrelationship models for bioconcentration, QSAR Comb. Sci. 27 (2008), pp. 21–31.
[9] Organisation for Economic Co-operation and Development (OECD), Guideline for testing ofchemicals, No. 305. Bioaccumulation in fish: Aqueous and dietary exposure, OECD, 2012.
[10] N. Rodriguez-Sanchez, M.T.D. Cronin, A. Lillicrap, J.C. Madden, P. Piechota, and K.E. Tollefsen,Development of a list of reference chemicals for evaluating alternative methods to in vivo fishbioaccumulation tests, Environ. Toxicol. Chem. 33 (2014), pp. 2740–2752.
[11] European Chemicals Agency (ECHA), The Use of Alternatives to Testing on Animals for theREACH Regulation, Second report under Article 117(3) of the REACH Regulation, ECHA,Helsinki, 2014.
[12] ToxRead, software available at http://www.toxgate.eu/.[13] G. Gini, A.M. Franchi, A. Manganaro, A. Golbamaki, and E. Benfenati, ToxRead: A tool to assist
in read across and its use to assess mutagenicity of chemicals, SAR QSAR Environ. Res. 25(2014), pp. 999–1011.
[14] E. Benfenati, A. Manganaro, and G. Gini, VEGA-QSAR: AI inside a platform for predictivetoxicology. Proceedings of the Workshop PAI 2013, 5 December 2013, Turin, Italy, pp. 21–28.
[15] C. Zhao, E. Boriani, A. Chana, A. Roncaglioni, and E. Benfernati, A new hybrid system of QSARmodels for predicting bioconcentration factors (BCF), Chemosphere 73 (2008), pp. 1701–1707.
[16] A. Lombardo, A. Roncaglioni, E. Boriani, C. Milan, and E. Benfenati, Assessment and validationof the CAESAR predictive model for bioconcentration factor (BCF) in fish, Chem. Cent. J. 4(2010), (Suppl 1):S1.
[17] EURAS, database available at http://cefic-lri.org/lri_toolbox/bcf-database/.[18] S. Dimitrov, N. Dimitrova, T. Parkerton, M. Comber, M. Bonnell, and O. Mekenyan, Base-line
model for identifying the bioaccumulation potential of chemicals, SAR QSAR Environ. Res. 16(2005), pp. 531–554.
SAR and QSAR in Environmental Research 13
Dow
nloa
ded
by [
Polit
ecni
co d
i Mila
no B
ibl]
, [G
iuse
ppin
a G
ini]
at 0
6:25
14
Sept
embe
r 20
15
[19] Estimation Programs Interface Suite (EPI Suite) platform, Version 4.11, available at http://www.epa.gov/oppt/exposure/pubs/episuite.htm.
[20] M. Floris, A. Manganaro, O. Nicolotti, R. Medda, G.F. Mangiatordi, and E. Benfenati, Ageneralizable definition of chemical similarity for read-across, J. Cheminform. 6 (2014), p. 39.
[21] T. Ferrari, D. Cattaneo, G. Gini, N.G. Bakhtyari, A. Manganaro, and E. Benfenati, Automaticknowledge extraction from chemical structures: The case of mutagenicity prediction, SAR QSAREnviron. Res. 24 (2013), pp. 365–383.
[22] KODE, available at http://kode-solutions.net/en/index.php.[23] CALEIDOS LIFE+ project, available at http://www.caleidos-life.eu/.[24] PROSIL LIFE+ project, available at http://www.life-prosil.eu/.
14 E. Benfenati et al.
Dow
nloa
ded
by [
Polit
ecni
co d
i Mila
no B
ibl]
, [G
iuse
ppin
a G
ini]
at 0
6:25
14
Sept
embe
r 20
15

![Bles.ppt [Read-Only]](https://static.fdokumen.com/doc/165x107/633bffc7197a6737f10ceddf/blesppt-read-only.jpg)


![08_08_12.html.ppt [Read-Only]](https://static.fdokumen.com/doc/165x107/633217ef5696ca4473030eca/080812htmlppt-read-only.jpg)