
Robust fuzzy mappings for QSAR studies
11
Short communication Robust fuzzy mappings for QSAR studies Mohit Kumar a, * , Kerstin Thurow a , Norbert Stoll b , Regina Stoll c a Center for Life Science Automation, F.-Barnewitz-Street 8, D-18119 Rostock, M.V., Germany b Institute of Automation, University of Rostock, Richard-Wagner-Street 31, D-18119 Rostock, Germany c Institute of Occupational and Social Medicine, University of Rostock, St.-Georg-Street 108, D-18055 Rostock, Germany Received 6 December 2005; received in revised form 9 April 2006; accepted 7 December 2006 Available online 18 January 2007 Abstract This study presents a new robust method of developing quantitative structureeactivity relationship (QSAR) models based on fuzzy mappings. An important issue in QSAR modelling is of robustness, i.e., model should not undergo overtraining and model performance should be least sensitive to the modelling errors associated with the chosen descriptors and structure of the model. We establish robust inputeoutput mappings for QSAR studies based on fuzzy ‘‘if-then’’ rules. The identification of these mappings (i.e. the construction of fuzzy rules) is based on a robust criterion that the maximum possible value of energy-gain from modelling errors to the identification errors is minimum. The robustness of pro- posed approach has been illustrated with simulation studies and QSAR modelling examples. The method of robust fuzzy mappings has been compared with Bayesian regularized neural networks through the QSAR modelling examples of (1) carboquinones’ data set, (2) benzodiazepine data set, and (3) predicting the rate constant for hydroxyl radical tropospheric degradation of 460 heterogeneous organic compounds. Ó 2007 Elsevier Masson SAS. All rights reserved. Keywords: Fuzzy clustering; Fuzzy model identification; QSAR; Bayesian regularized neural networks 1. Introduction The QSAR methods developed by Hansch and Fujita [12] identify relationship between chemical structure of com- pounds and their activity and have been applied to chemistry and drug design [11,18,15]. The QSAR modelling is based on the principle that molecular properties like lipophilicity, shape, and electronic properties modulate the biological activ- ity of the molecule. Mathematically, biological activity is a function of molecular properties’ descriptors: BA ¼ f ðd 1 ; d 2 ; .Þ; where BA is a biological response (e.g. IC 50 , ED 50 , LD 50 ) and d 1 , d 2 , . are mathematical descriptors of molecular properties. The unknown function f is identified using linear methods (e.g. multiple linear regression, partial least-squares) or nonlinear models (e.g. neural networks). During the last years, the appli- cations of neural networks in chemistry and drug design have dramatically increased. A review of the field can be found, e.g., in Refs. [25,33]. Here, we don’t want to discuss the prom- ising role of neural networks in drug lead discovery and devel- opment, rather we address the fundamental problems associated with QSAR analysis. While developing a QSAR model for the design and dis- covery of bioactive agents, we may come across the situation that descriptors don’t accurately capture the molecular proper- ties relevant to the biological activity or the chosen model structure (i.e. number of adjustable model parameters) is not optimal. In such situations, there exist modelling errors. The common problems associated with QSAR modelling can be summarized as follows: (1) For the chosen structure of the model and descriptors, there may exist modelling errors. The commonly used * Corresponding author. Tel.: þ49 381 4949956; fax: þ49 381 4949952. E-mail addresses: [email protected] (M. Kumar), kerstin. [email protected] (K. Thurow), [email protected] (N. Stoll), [email protected] (R. Stoll). 0223-5234/$ - see front matter Ó 2007 Elsevier Masson SAS. All rights reserved. doi:10.1016/j.ejmech.2006.12.017 European Journal of Medicinal Chemistry 42 (2007) 675e685 http://www.elsevier.com/locate/ejmech
-
Upload
independent -
Category
Documents
-
view
2 -
download
0
Transcript of Robust fuzzy mappings for QSAR studies
European Journal of Medicinal Chemistry 42 (2007) 675e685http://www.elsevier.com/locate/ejmech
Short communication
Robust fuzzy mappings for QSAR studies
Mohit Kumar a,*, Kerstin Thurow a, Norbert Stoll b, Regina Stoll c
a Center for Life Science Automation, F.-Barnewitz-Street 8, D-18119 Rostock, M.V., Germanyb Institute of Automation, University of Rostock, Richard-Wagner-Street 31, D-18119 Rostock, Germany
c Institute of Occupational and Social Medicine, University of Rostock, St.-Georg-Street 108, D-18055 Rostock, Germany
Received 6 December 2005; received in revised form 9 April 2006; accepted 7 December 2006
Available online 18 January 2007
Abstract
This study presents a new robust method of developing quantitative structureeactivity relationship (QSAR) models based on fuzzy mappings.An important issue in QSAR modelling is of robustness, i.e., model should not undergo overtraining and model performance should be leastsensitive to the modelling errors associated with the chosen descriptors and structure of the model. We establish robust inputeoutput mappingsfor QSAR studies based on fuzzy ‘‘if-then’’ rules. The identification of these mappings (i.e. the construction of fuzzy rules) is based on a robustcriterion that the maximum possible value of energy-gain from modelling errors to the identification errors is minimum. The robustness of pro-posed approach has been illustrated with simulation studies and QSAR modelling examples. The method of robust fuzzy mappings has beencompared with Bayesian regularized neural networks through the QSAR modelling examples of (1) carboquinones’ data set, (2) benzodiazepinedata set, and (3) predicting the rate constant for hydroxyl radical tropospheric degradation of 460 heterogeneous organic compounds.� 2007 Elsevier Masson SAS. All rights reserved.
Keywords: Fuzzy clustering; Fuzzy model identification; QSAR; Bayesian regularized neural networks
1. Introduction
The QSAR methods developed by Hansch and Fujita [12]identify relationship between chemical structure of com-pounds and their activity and have been applied to chemistryand drug design [11,18,15]. The QSAR modelling is basedon the principle that molecular properties like lipophilicity,shape, and electronic properties modulate the biological activ-ity of the molecule. Mathematically, biological activity isa function of molecular properties’ descriptors:
BA¼ f ðd1;d2;.Þ;
where BA is a biological response (e.g. IC50, ED50, LD50) andd1, d2, . are mathematical descriptors of molecular properties.
* Corresponding author. Tel.: þ49 381 4949956; fax: þ49 381 4949952.
E-mail addresses: [email protected] (M. Kumar), kerstin.
[email protected] (K. Thurow), [email protected] (N. Stoll),
[email protected] (R. Stoll).
0223-5234/$ - see front matter � 2007 Elsevier Masson SAS. All rights reserve
doi:10.1016/j.ejmech.2006.12.017
The unknown function f is identified using linear methods (e.g.multiple linear regression, partial least-squares) or nonlinearmodels (e.g. neural networks). During the last years, the appli-cations of neural networks in chemistry and drug design havedramatically increased. A review of the field can be found,e.g., in Refs. [25,33]. Here, we don’t want to discuss the prom-ising role of neural networks in drug lead discovery and devel-opment, rather we address the fundamental problemsassociated with QSAR analysis.
While developing a QSAR model for the design and dis-covery of bioactive agents, we may come across the situationthat descriptors don’t accurately capture the molecular proper-ties relevant to the biological activity or the chosen modelstructure (i.e. number of adjustable model parameters) is notoptimal. In such situations, there exist modelling errors. Thecommon problems associated with QSAR modelling can besummarized as follows:
(1) For the chosen structure of the model and descriptors,there may exist modelling errors. The commonly used
d.
676 M. Kumar et al. / European Journal of Medicinal Chemistry 42 (2007) 675e685
nonlinear model training algorithms (e.g. gradient-descentbased backpropagation techniques) are not robust towardsmodelling errors.
(2) The model identification process may result in the over-training. This leads to a loss of ability of the identifiedmodel to generalize. Although overtraining can be avoidedby using validation data sets, but the computation effort tocross-validate identified models can result in large valida-tion times for a large and diverse training data set.
To address these issues, the use of Bayesian regularizedneural networks has been suggested in Refs. [6e8]. The con-struction of a QSAR model using inputeoutput data is an ‘‘ill-posed’’ problem and regularization suggested is a generalmethod to convert the model identification problem intoa ‘‘well-posed’’ problem. However, the choice of regulariza-tion parameters is usually not obvious and application depen-dent. Bayesian regularization provides an optimal value ofregularization parameters by applying Bayes’ theorem [24].However, Bayesian regularization considers the model identi-fication problem in a stochastic framework, where assump-tions have been made on the nature of distribution ofsignals. If these assumptions are not met, the identificationperformance may not be optimal. Thus, a robust method forbuilding QSAR models (that does not make any statistical as-sumptions) is required.
Fuzzy inference systems based on fuzzy set theory of Za-deh [35] are considered suitable for dealing with many real-world problems, characterized by complexities, uncertainties,and a lack of knowledge of the governing physical laws. Fuzzylogic provides a conceptual framework for dealing with theproblem of knowledge representation in the environment ofuncertainty and imprecision. The most important applicationof fuzzy set theory is the fuzzy rule-based models, wherethe relationships among system variables are modelled usinglinguistically interpretable rules.
We believe that QSAR studies involve complexities and un-certainties (due to the lack of complete knowledge of underly-ing physical laws), and thus fuzzy rule-based models havemuch to offer in this field. A major difficulty in exploitingthe fuzzy modelling techniques to address the fundamental is-sues of QSAR studies (listed above) is that the robust methodsfor the automatic construction of fuzzy models using data setsprovided by combinatorial chemistry/HTS (high-throughputscreening) are relatively unknown. In literature, various fuzzyidentification techniques have been developed using ad hocapproaches, neural networks, genetic algorithms, clusteringtechniques, and Kalman filtering [1,4,9,13,16,17,23,26e32,34]. Most of the recursive (on-line) fuzzy identificationmethods use gradient-descent based algorithms (such as back-propagation) for the identification of nonlinear fuzzy modelparameters. However, in the presence of data uncertaintiesand modelling errors, gradient-descent based techniques arenot suitable due to their non-robust nature.
Recently, we have started working on robust constructionof fuzzy models in presence of data uncertainties and model-ling errors [20e22]. To design a robust identification method,
a first-principle based approach is to minimize the sensitivityof the identification method towards modelling errors. Thesensitivity of an identification method can be assessed by mea-suring a gain in energy from modelling errors to the identifica-tion errors. That is, a sensitive (non-robust) identificationmethod will result in a higher value of identification errors’energy for a given modelling error energy. Therefore, for de-signing a robust identification method, we try to minimizethe maximum possible value of energy-gain from modellingerrors to the identification errors. The maximum value of en-ergy-gain (that will be minimized) is calculated over all possi-ble finite disturbances without making any statisticalassumptions about the nature of signals. This is what we callas energy-gain bounding approach to model identification.In this article, we will illustrate the development of QSARmodels based on energy-gain bounding approach. It will beshown that energy-gain bounding approach leads to the devel-opment of robust QSAR fuzzy models. The method of QSARmodels’ development using Bayesian regularized neural net-works has been taken as a reference method for comparingthe performance of proposed robust QSAR fuzzy models.
We start with the introduction of clustering based fuzzymappings followed by an energy-gain bounding approach tothe identification of these fuzzy mappings. Afterwards, simu-lation studies and three examples of QSAR studies (concernedwith carboquinones, benzodiazepine, and tropospheric degra-dation data set of volatile organic compounds) have been pre-sented. Finally, the concluding remarks are provided.
2. Theory
2.1. Clustering based fuzzy mappings
We introduce a model that maps the clusters of input pa-rameters’ space into real output values based on some prede-fined fuzzy rules. If input space has been divided into Kdifferent clusters, then the model consists of K fuzzy rules:
If x belongs to a cluster having centre c1 then y¼ a1;«
If x belongs to a cluster having centre cK then y¼ aK;
where x is an input vector, ci is the centre of ith cluster, and thevalues a1, ., aK are real numbers. This type of fuzzy modelwill be characterized by cluster centres (c1, ., cK) and num-bers a1, ., aK. If we define a parameter vector q to character-ize cluster centres and a parameter vector a to characterize thenumbers a1, ., aK, then the model output y to input x couldbe expressed as
y¼ GTðx;qÞa;
where G is a nonlinear function of x and q is a K-dimensionalvector such that ith element of G represents the degree ofmembership of input x to the ith cluster. The exact mathemat-ical details have been given in Appendix A. The identification
677M. Kumar et al. / European Journal of Medicinal Chemistry 42 (2007) 675e685
of above defined fuzzy model means to identify the parametersa and q.
2.2. An energy-gain bounding approach
The aim is to identify fuzzy model parameters (a, q) usinginputeoutput data set fxðjÞ; yðjÞgk
j¼0. Here, x( j ) is the jth-in-dexed input data (i.e. molecular properties’ descriptors) andy( j ) is the corresponding biological response. In the literatureof neural networks and fuzzy modelling, instantaneous-gradi-ent-based algorithms (such as backpropagation) are the mostcommonly used techniques for the identification of nonlinearmodel parameters. In the situation of modelling errors, anyidentification method (e.g. gradient descent) may lead to theerrors in the identification of model parameters. The modellingerrors arise due to the non-optimal choice of either descriptorsor model structure. An ideal identification method is the onethat results in no identification errors, no matter what the mod-elling errors are. However, in practical problems, it is not easyto design an ideal identification method since the modellingerrors’ signals are unknown. Therefore, we are concerned todesign a robust identification method that is least sensitive tothe modelling errors. Our approach to the design of robustidentification method is based on an energy-gain criterion that
maxenergy of identification errors
energy of modelling errors/min:
In other words, the identification method minimizes themaximum possible value of energy-gain from modelling errorsto the identification errors. Such an identification method willguarantee that small modelling errors cannot lead to largeidentification errors. The maximum value of energy-gain(that will be minimized) is calculated over all possible finitedisturbances without making any statistical assumptions aboutthe nature of signals. This is what we call as ‘‘energy-gainbounding approach’’ to fuzzy model identification.
The energy-gain bounding approach to the identification offuzzy model parameters has been studied in Ref. [19]. Here,we present the final results of energy-gain bounding approach.It was shown in Ref. [19] that the identification of fuzzy modelparameters using data set fxðjÞ; yðjÞgk
j¼0 follows by performingfor j¼ 0, ., k, the recursions
qj¼ arg minq
"�yðjÞ�GTðxðjÞ;qÞaj�1
�2
1þmðjÞkGðxðjÞ;qÞk2þðmqðjÞÞ
�1��q�qj�1
��2
#;
ð1Þ
aj ¼ aj�1þmðjÞG
�xðjÞ;qj
��yðjÞ �GT
�xðjÞ;qj
�aj�1
�1þ mðjÞ
��GðxðjÞ;qjÞ��2 ; a�1 ¼ 0;
ð2Þ
where q�1 corresponds to the initial guess of cluster centres,and m( j ), mq( j ) are positive values which reflect the weightagegiven to the data pair (x( j ), y( j )) in the identification of fuzzyparameters. The optimal values of parameters (m( j ), mq( j )),
which result in fast convergence and low misadjustment errorare given as
mðjÞ ¼��bpj
��2
C��GðxðjÞ;qjÞ
��2; mqðjÞ ¼ sq
��bpj
��2
C��GðxðjÞ;qjÞ
��2;
bpj ¼ ubpj�1 þ ð1�uÞyðjÞ �GT
�xðjÞ;qj
�aj�1��GðxðjÞ;qjÞ
��2G�xðjÞ;qj
�;
where sq is a predefined positive constant, u (0<u< 1) isa smoothing factor, and C is a positive constant that shouldbe chosen proportional to the magnitude of modelling errors.
2.3. Simulation studies
The aim of this section is to verify the robustness of energy-gain bounding approach for the fuzzy identification of un-known inputeoutput mappings in presence of disturbance sig-nals. For this purpose assume a training data set of 49 inputeoutput pairs��
x1ðjÞx2ðjÞ
; yðjÞ
j¼0;.;48
;
generated according to
yðjÞ ¼ f ðx1ðjÞ; x2ðjÞÞ þ nj;
f ðx1; x2Þ ¼ ð1� x1x2Þe�ðx1þx2Þ2 � cosð4x1x2Þ þ logð1þ x1x2Þ;
where input points��x1ðjÞx2ðjÞ
j¼0;.;48
are distributed uniformly on two-dimensional space [�0.9,0.9]� [�0.9, 0.9], and nj is a random number chosen froma uniform distribution on the interval [�0.2, 0.2]. The goalis to identify the unknown function f(x1, x2) using a model.Let us try to identify the unknown function f(x1, x2) usingfuzzy mappings based on energy-gain bounding method. Theidentification method (1) and (2) can be implemented usinga GausseNewton based algorithm suggested in Appendix B.Let us choose the number of clusters K equal to 7 that makestotal number of adjustable model parameters equal to 21 (14cluster centres’ parameters and a1, ., a7). The initial guessabout seven different cluster centres is taken as
½c1/c7� ¼��0:9 0 0:9 0 �0:9 0 0:9�0:9 �0:9 �0:9 0 0:9 0:9 0:9
; q�1
¼�cT
1 /cT7
�T:
The identification parameters were chosen as ~m ¼ 2 (for ex-pression (A2)), C¼ 0.05, u¼ 0.99, and sq¼ 0.05. The perfor-mance of the identified model is evaluated by defininggeneralization error as
678 M. Kumar et al. / European Journal of Me
GE¼ 1
100
X100
l¼1
jf ðx1ðlÞ; x2ðlÞÞ �MOðx1ðlÞ; x2ðlÞÞj2;
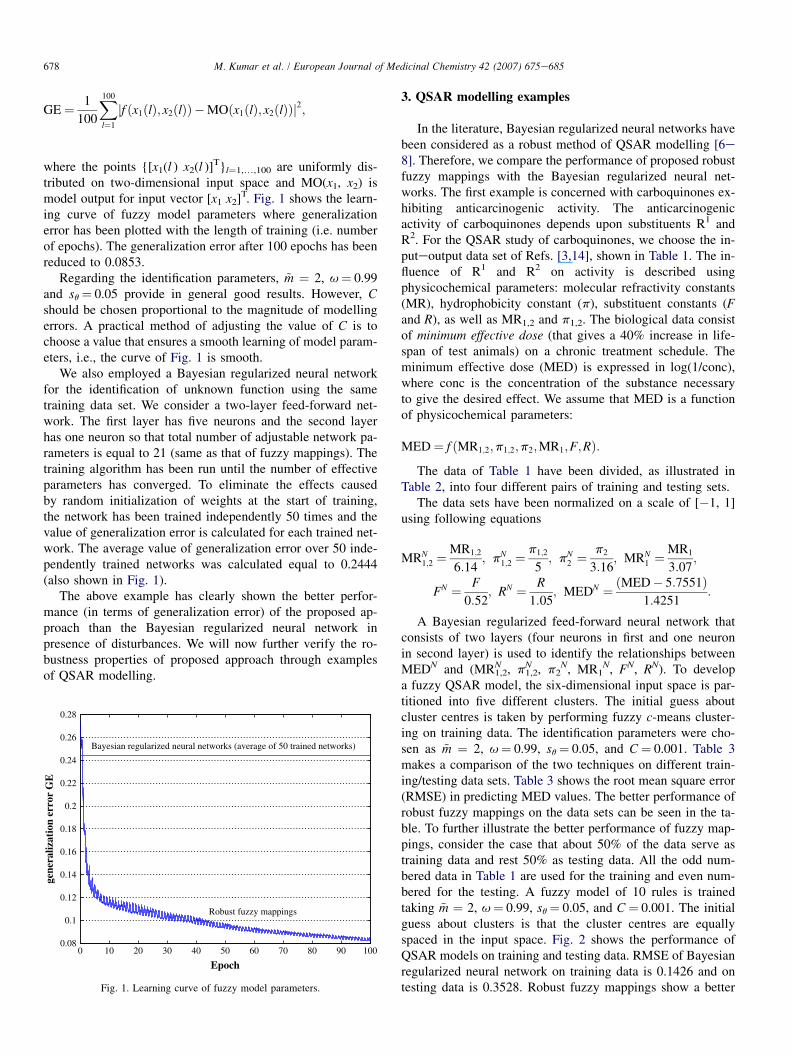
where the points {[x1(l ) x2(l )]T}l¼1,.,100 are uniformly dis-tributed on two-dimensional input space and MO(x1, x2) ismodel output for input vector [x1 x2]T. Fig. 1 shows the learn-ing curve of fuzzy model parameters where generalizationerror has been plotted with the length of training (i.e. numberof epochs). The generalization error after 100 epochs has beenreduced to 0.0853.
Regarding the identification parameters, ~m ¼ 2, u¼ 0.99and sq¼ 0.05 provide in general good results. However, Cshould be chosen proportional to the magnitude of modellingerrors. A practical method of adjusting the value of C is tochoose a value that ensures a smooth learning of model param-eters, i.e., the curve of Fig. 1 is smooth.
We also employed a Bayesian regularized neural networkfor the identification of unknown function using the sametraining data set. We consider a two-layer feed-forward net-work. The first layer has five neurons and the second layerhas one neuron so that total number of adjustable network pa-rameters is equal to 21 (same as that of fuzzy mappings). Thetraining algorithm has been run until the number of effectiveparameters has converged. To eliminate the effects causedby random initialization of weights at the start of training,the network has been trained independently 50 times and thevalue of generalization error is calculated for each trained net-work. The average value of generalization error over 50 inde-pendently trained networks was calculated equal to 0.2444(also shown in Fig. 1).
The above example has clearly shown the better perfor-mance (in terms of generalization error) of the proposed ap-proach than the Bayesian regularized neural network inpresence of disturbances. We will now further verify the ro-bustness properties of proposed approach through examplesof QSAR modelling.
0 10 20 30 40 50 60 70 80 90 1000.08
0.1
0.12
0.14
0.16
0.18
0.2
0.22
0.24
0.26
0.28
Epoch
gene
raliz
atio
n er
ror
GE
Bayesian regularized neural networks (average of 50 trained networks)
Robust fuzzy mappings
Fig. 1. Learning curve of fuzzy model parameters.
3. QSAR modelling examples
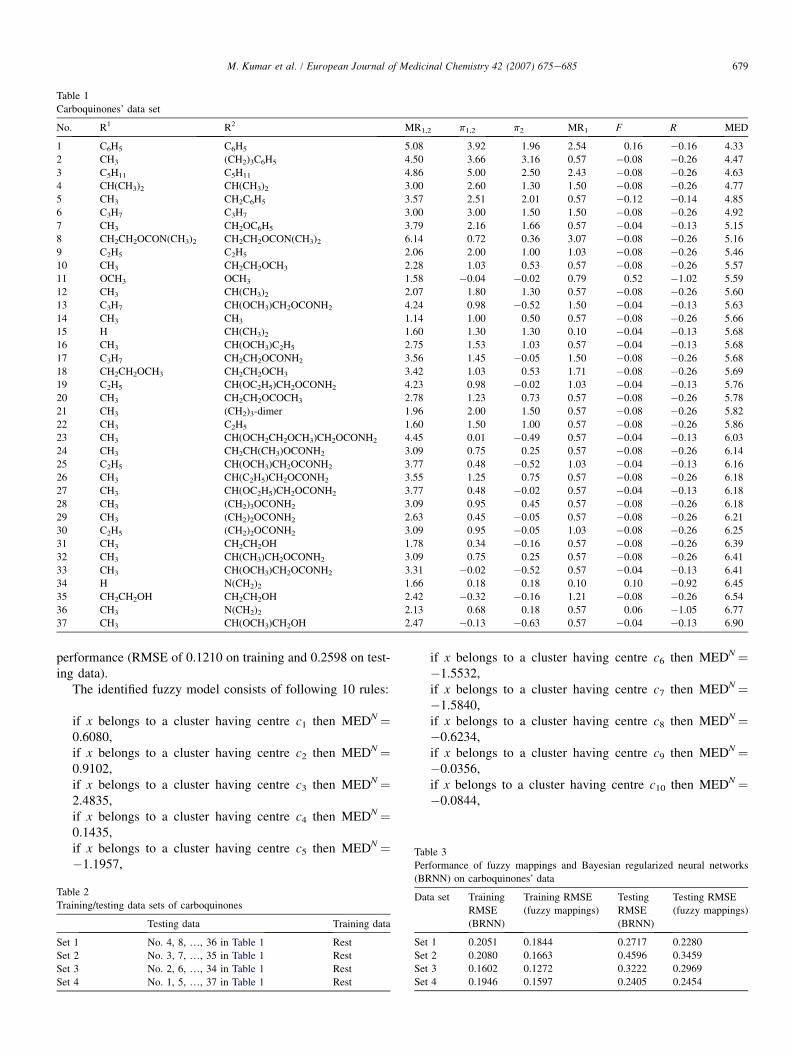
In the literature, Bayesian regularized neural networks havebeen considered as a robust method of QSAR modelling [6e8]. Therefore, we compare the performance of proposed robustfuzzy mappings with the Bayesian regularized neural net-works. The first example is concerned with carboquinones ex-hibiting anticarcinogenic activity. The anticarcinogenicactivity of carboquinones depends upon substituents R1 andR2. For the QSAR study of carboquinones, we choose the in-puteoutput data set of Refs. [3,14], shown in Table 1. The in-fluence of R1 and R2 on activity is described usingphysicochemical parameters: molecular refractivity constants(MR), hydrophobicity constant (p), substituent constants (Fand R), as well as MR1,2 and p1,2. The biological data consistof minimum effective dose (that gives a 40% increase in life-span of test animals) on a chronic treatment schedule. Theminimum effective dose (MED) is expressed in log(1/conc),where conc is the concentration of the substance necessaryto give the desired effect. We assume that MED is a functionof physicochemical parameters:
MED¼ f ðMR1;2;p1;2;p2;MR1;F;RÞ:
The data of Table 1 have been divided, as illustrated inTable 2, into four different pairs of training and testing sets.
The data sets have been normalized on a scale of [�1, 1]using following equations
MRN1;2 ¼
MR1;2
6:14; pN
1;2 ¼p1;2
5; pN
2 ¼p2
3:16; MRN
1 ¼MR1
3:07;
FN ¼ F
0:52; RN ¼ R
1:05; MEDN ¼ ðMED� 5:7551Þ
1:4251:
A Bayesian regularized feed-forward neural network thatconsists of two layers (four neurons in first and one neuronin second layer) is used to identify the relationships betweenMEDN and (MRN
1,2, pN1,2, p2
N, MR1N, FN, RN). To develop
a fuzzy QSAR model, the six-dimensional input space is par-titioned into five different clusters. The initial guess aboutcluster centres is taken by performing fuzzy c-means cluster-ing on training data. The identification parameters were cho-sen as ~m ¼ 2, u¼ 0.99, sq¼ 0.05, and C¼ 0.001. Table 3makes a comparison of the two techniques on different train-ing/testing data sets. Table 3 shows the root mean square error(RMSE) in predicting MED values. The better performance ofrobust fuzzy mappings on the data sets can be seen in the ta-ble. To further illustrate the better performance of fuzzy map-pings, consider the case that about 50% of the data serve astraining data and rest 50% as testing data. All the odd num-bered data in Table 1 are used for the training and even num-bered for the testing. A fuzzy model of 10 rules is trainedtaking ~m ¼ 2, u¼ 0.99, sq¼ 0.05, and C¼ 0.001. The initialguess about clusters is that the cluster centres are equallyspaced in the input space. Fig. 2 shows the performance ofQSAR models on training and testing data. RMSE of Bayesianregularized neural network on training data is 0.1426 and ontesting data is 0.3528. Robust fuzzy mappings show a better
dicinal Chemistry 42 (2007) 675e685
679M. Kumar et al. / European Journal of Medicinal Chemistry 42 (2007) 675e685
Table 1
Carboquinones’ data set
No. R1 R2 MR1,2 p1,2 p2 MR1 F R MED
1 C6H5 C6H5 5.08 3.92 1.96 2.54 0.16 �0.16 4.33
2 CH3 (CH2)3C6H5 4.50 3.66 3.16 0.57 �0.08 �0.26 4.47
3 C5H11 C5H11 4.86 5.00 2.50 2.43 �0.08 �0.26 4.63
4 CH(CH3)2 CH(CH3)2 3.00 2.60 1.30 1.50 �0.08 �0.26 4.77
5 CH3 CH2C6H5 3.57 2.51 2.01 0.57 �0.12 �0.14 4.85
6 C3H7 C3H7 3.00 3.00 1.50 1.50 �0.08 �0.26 4.92
7 CH3 CH2OC6H5 3.79 2.16 1.66 0.57 �0.04 �0.13 5.15
8 CH2CH2OCON(CH3)2 CH2CH2OCON(CH3)2 6.14 0.72 0.36 3.07 �0.08 �0.26 5.16
9 C2H5 C2H5 2.06 2.00 1.00 1.03 �0.08 �0.26 5.46
10 CH3 CH2CH2OCH3 2.28 1.03 0.53 0.57 �0.08 �0.26 5.57
11 OCH3 OCH3 1.58 �0.04 �0.02 0.79 0.52 �1.02 5.59
12 CH3 CH(CH3)2 2.07 1.80 1.30 0.57 �0.08 �0.26 5.60
13 C3H7 CH(OCH3)CH2OCONH2 4.24 0.98 �0.52 1.50 �0.04 �0.13 5.63
14 CH3 CH3 1.14 1.00 0.50 0.57 �0.08 �0.26 5.66
15 H CH(CH3)2 1.60 1.30 1.30 0.10 �0.04 �0.13 5.68
16 CH3 CH(OCH3)C2H5 2.75 1.53 1.03 0.57 �0.04 �0.13 5.68
17 C3H7 CH2CH2OCONH2 3.56 1.45 �0.05 1.50 �0.08 �0.26 5.68
18 CH2CH2OCH3 CH2CH2OCH3 3.42 1.03 0.53 1.71 �0.08 �0.26 5.69
19 C2H5 CH(OC2H5)CH2OCONH2 4.23 0.98 �0.02 1.03 �0.04 �0.13 5.76
20 CH3 CH2CH2OCOCH3 2.78 1.23 0.73 0.57 �0.08 �0.26 5.78
21 CH3 (CH2)3-dimer 1.96 2.00 1.50 0.57 �0.08 �0.26 5.82
22 CH3 C2H5 1.60 1.50 1.00 0.57 �0.08 �0.26 5.86
23 CH3 CH(OCH2CH2OCH3)CH2OCONH2 4.45 0.01 �0.49 0.57 �0.04 �0.13 6.03
24 CH3 CH2CH(CH3)OCONH2 3.09 0.75 0.25 0.57 �0.08 �0.26 6.14
25 C2H5 CH(OCH3)CH2OCONH2 3.77 0.48 �0.52 1.03 �0.04 �0.13 6.16
26 CH3 CH(C2H5)CH2OCONH2 3.55 1.25 0.75 0.57 �0.08 �0.26 6.18
27 CH3 CH(OC2H5)CH2OCONH2 3.77 0.48 �0.02 0.57 �0.04 �0.13 6.18
28 CH3 (CH2)3OCONH2 3.09 0.95 0.45 0.57 �0.08 �0.26 6.18
29 CH3 (CH2)2OCONH2 2.63 0.45 �0.05 0.57 �0.08 �0.26 6.21
30 C2H5 (CH2)2OCONH2 3.09 0.95 �0.05 1.03 �0.08 �0.26 6.25
31 CH3 CH2CH2OH 1.78 0.34 �0.16 0.57 �0.08 �0.26 6.39
32 CH3 CH(CH3)CH2OCONH2 3.09 0.75 0.25 0.57 �0.08 �0.26 6.41
33 CH3 CH(OCH3)CH2OCONH2 3.31 �0.02 �0.52 0.57 �0.04 �0.13 6.41
34 H N(CH2)2 1.66 0.18 0.18 0.10 0.10 �0.92 6.45
35 CH2CH2OH CH2CH2OH 2.42 �0.32 �0.16 1.21 �0.08 �0.26 6.54
36 CH3 N(CH2)2 2.13 0.68 0.18 0.57 0.06 �1.05 6.77
37 CH3 CH(OCH3)CH2OH 2.47 �0.13 �0.63 0.57 �0.04 �0.13 6.90
performance (RMSE of 0.1210 on training and 0.2598 on test-ing data).
The identified fuzzy model consists of following 10 rules:
if x belongs to a cluster having centre c1 then MEDN¼0.6080,if x belongs to a cluster having centre c2 then MEDN¼0.9102,if x belongs to a cluster having centre c3 then MEDN¼2.4835,if x belongs to a cluster having centre c4 then MEDN¼0.1435,if x belongs to a cluster having centre c5 then MEDN¼�1.1957,
Table 2
Training/testing data sets of carboquinones
Testing data Training data
Set 1 No. 4, 8, ., 36 in Table 1 Rest
Set 2 No. 3, 7, ., 35 in Table 1 Rest
Set 3 No. 2, 6, ., 34 in Table 1 Rest
Set 4 No. 1, 5, ., 37 in Table 1 Rest
if x belongs to a cluster having centre c6 then MEDN¼�1.5532,if x belongs to a cluster having centre c7 then MEDN¼�1.5840,if x belongs to a cluster having centre c8 then MEDN¼�0.6234,if x belongs to a cluster having centre c9 then MEDN¼�0.0356,if x belongs to a cluster having centre c10 then MEDN¼�0.0844,
Table 3
Performance of fuzzy mappings and Bayesian regularized neural networks
(BRNN) on carboquinones’ data
Data set Training
RMSE
(BRNN)
Training RMSE
(fuzzy mappings)
Testing
RMSE
(BRNN)
Testing RMSE
(fuzzy mappings)
Set 1 0.2051 0.1844 0.2717 0.2280
Set 2 0.2080 0.1663 0.4596 0.3459
Set 3 0.1602 0.1272 0.3222 0.2969
Set 4 0.1946 0.1597 0.2405 0.2454

680 M. Kumar et al. / European Journal of Medicinal Chemistry 42 (2007) 675e685
where x¼ [MRN1,2 pN
1,2 p2N MR1
N FN RN]T and
c1¼½0:1736 �0:0627 �0:1962 0:0323 �0:2331 �1:0268�T;
c2¼½0:2560 0:0406 �0:0643 0:1354 �0:0813 �0:9299�T;
c3¼½0:2231 �0:0715 �0:1555 0:2250 0:0375 �0:8202�T ;
c4 ¼ ½0:4346 0:2497 0:1976 0:2683 0:1545 �0:6980�T;
c5 ¼ ½0:5276 0:3653 0:2337 0:5358 0:4536 �0:7102�T;
c6 ¼ ½0:6057 0:5292 0:4574 0:5369 0:3695 �0:4676�T;
c7 ¼ ½0:7160 0:5964 0:5558 0:6512 0:5558 �0:4197�T;
c8 ¼ ½0:8120 0:7737 0:7479 0:7687 0:6573 �0:3236�T;
c9 ¼ ½0:8843 0:8627 0:8403 0:8469 0:7602 �0:2396�T;
c10 ¼ ½0:9851 1:0140 0:9941 1:0044 1:0052 �0:1188�T:
The second example deals with the data set of benzodiaze-pines shown in Table 4. The data set has been taken from Refs.[2,3]. It is assumed that anti-pentylenetetrazole effect (ape) isa function of input parameters MR-3, p-3, MR-7, sm-3, F-4,R-4, and I-1. Table 5 illustrates the generation of three pairsof training/testing data sets from the data of Table 4. Pleasenote in Table 5 that about 75% of data in set 1 are training
4 4.5 5 5.5 6 6.5 74
4.5
5
5.5
6
6.5
7
desired output
4 4.5 5 5.5 6 6.5 7
desired output
mod
el o
utpu
t
4
4.5
5
5.5
6
6.5
7
mod
el o
utpu
t
testing data performance
testing data performance
RMSE = 0.1426
RMSE = 0.3528
(a)
Bayesian regularized neural network
Fig. 2. Performance of QSAR m
data, about 66% of data in set 2 are training data, and about50% of data in set 3 are training data. We compare a two-layerfeed-forward Bayesian regularized neural network (five neu-rons in first layer and one neuron in second layer) with a fuzzymodel of six rules. The initial guess about clusters is such thatthe six cluster centres are equally spaced in the input space.The fuzzy model parameters were identified taking ~m ¼ 2,u¼ 0.99, sq¼ 0.05, and C¼ 0.05. Table 6 summarizes theperformance of two methods on the data sets of Table 5.Again, a better performance of robust fuzzy mappings couldbe seen in Table 6.
Finally, consider the problem of predicting the rate constantfor hydroxyl radical tropospheric degradation of 460 volatileorganic compounds considered in Ref. [10]. The data set ofRef. [10] contains hydroxyl radical degradation rate constantsof 460 heterogeneous organic compounds, measured in gasphase at 25 �C and 1 atm. In Ref. [10], QSAR models havebeen developed based on Genetic-algorithm selection of theo-retical molecular descriptors and the data set was split intotraining and test sets using the methods of statistical D-optimalexperimental design and Kohonen artificial neural network.Let us assume that
�log kðOHÞ ¼ f ðHOMO;nX;CIC0;nCaHÞ;
where k(OH) is the hydroxyl radical rate constant, HOMO isthe energy of highest occupied molecular orbital, nX is thenumber of halogen atoms, CIC0 is the complementary infor-mation content index, and nCaH is the number of unsubsti-tuted aromatic carbon (sp2). The data set of Ref. [10], splitinto training and testing using D-optimal algorithm, has beenused to develop QSAR models based on robust fuzzy map-pings and Bayesian regularized neural network. Again, the
4 4.5 5 5.5 6 6.5 7
desired output
4 4.5 5 5.5 6 6.5 7
desired output
4
4.5
5
5.5
6
6.5
7
mod
el o
utpu
t
4
4.5
5
5.5
6
6.5
7
mod
el o
utpu
t
testing data performance
testing data performance
RMSE = 0.1210
RMSE = 0.2598
(b)
Robust fuzzy mappings
odels on carboquinones’ data set.
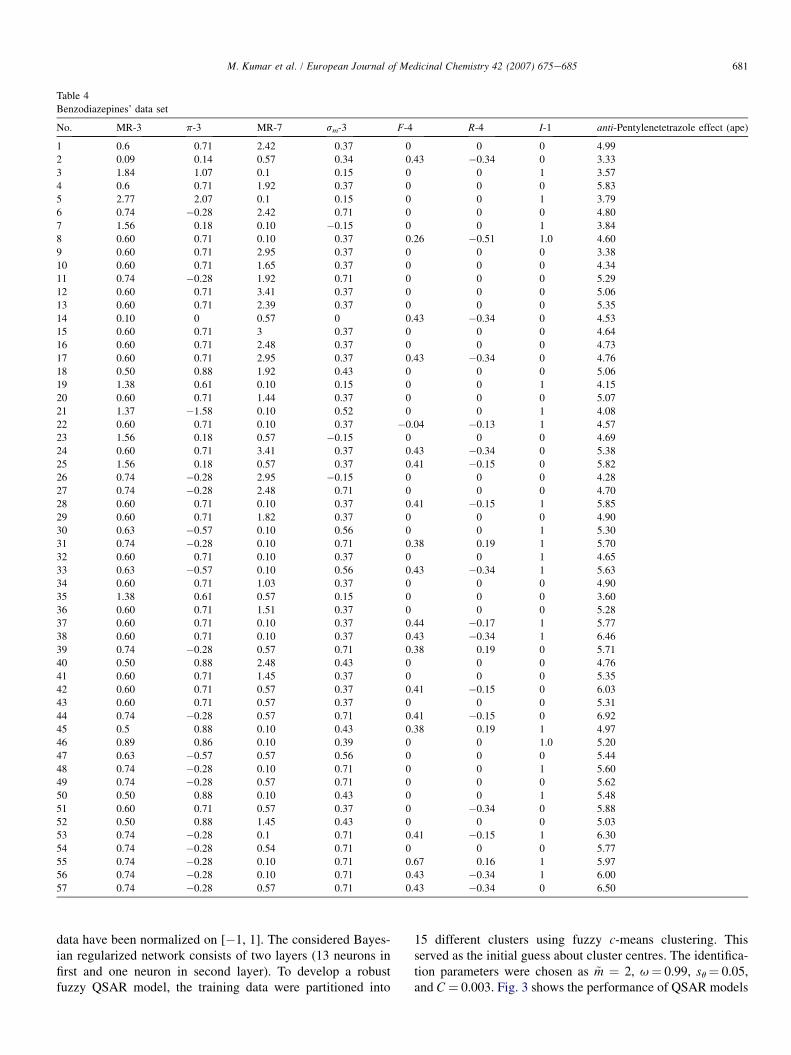
Table 4
Benzodiazepines’ data set
No. MR-3 p-3 MR-7 sm-3 F-4 R-4 I-1 anti-Pentylenetetrazole effect (ape)
1 0.6 0.71 2.42 0.37 0 0 0 4.99
2 0.09 0.14 0.57 0.34 0.43 �0.34 0 3.33
3 1.84 1.07 0.1 0.15 0 0 1 3.57
4 0.6 0.71 1.92 0.37 0 0 0 5.83
5 2.77 2.07 0.1 0.15 0 0 1 3.79
6 0.74 �0.28 2.42 0.71 0 0 0 4.80
7 1.56 0.18 0.10 �0.15 0 0 1 3.84
8 0.60 0.71 0.10 0.37 0.26 �0.51 1.0 4.60
9 0.60 0.71 2.95 0.37 0 0 0 3.38
10 0.60 0.71 1.65 0.37 0 0 0 4.34
11 0.74 �0.28 1.92 0.71 0 0 0 5.29
12 0.60 0.71 3.41 0.37 0 0 0 5.06
13 0.60 0.71 2.39 0.37 0 0 0 5.35
14 0.10 0 0.57 0 0.43 �0.34 0 4.53
15 0.60 0.71 3 0.37 0 0 0 4.64
16 0.60 0.71 2.48 0.37 0 0 0 4.73
17 0.60 0.71 2.95 0.37 0.43 �0.34 0 4.76
18 0.50 0.88 1.92 0.43 0 0 0 5.06
19 1.38 0.61 0.10 0.15 0 0 1 4.15
20 0.60 0.71 1.44 0.37 0 0 0 5.07
21 1.37 �1.58 0.10 0.52 0 0 1 4.08
22 0.60 0.71 0.10 0.37 �0.04 �0.13 1 4.57
23 1.56 0.18 0.57 �0.15 0 0 0 4.69
24 0.60 0.71 3.41 0.37 0.43 �0.34 0 5.38
25 1.56 0.18 0.57 0.37 0.41 �0.15 0 5.82
26 0.74 �0.28 2.95 �0.15 0 0 0 4.28
27 0.74 �0.28 2.48 0.71 0 0 0 4.70
28 0.60 0.71 0.10 0.37 0.41 �0.15 1 5.85
29 0.60 0.71 1.82 0.37 0 0 0 4.90
30 0.63 �0.57 0.10 0.56 0 0 1 5.30
31 0.74 �0.28 0.10 0.71 0.38 0.19 1 5.70
32 0.60 0.71 0.10 0.37 0 0 1 4.65
33 0.63 �0.57 0.10 0.56 0.43 �0.34 1 5.63
34 0.60 0.71 1.03 0.37 0 0 0 4.90
35 1.38 0.61 0.57 0.15 0 0 0 3.60
36 0.60 0.71 1.51 0.37 0 0 0 5.28
37 0.60 0.71 0.10 0.37 0.44 �0.17 1 5.77
38 0.60 0.71 0.10 0.37 0.43 �0.34 1 6.46
39 0.74 �0.28 0.57 0.71 0.38 0.19 0 5.71
40 0.50 0.88 2.48 0.43 0 0 0 4.76
41 0.60 0.71 1.45 0.37 0 0 0 5.35
42 0.60 0.71 0.57 0.37 0.41 �0.15 0 6.03
43 0.60 0.71 0.57 0.37 0 0 0 5.31
44 0.74 �0.28 0.57 0.71 0.41 �0.15 0 6.92
45 0.5 0.88 0.10 0.43 0.38 0.19 1 4.97
46 0.89 0.86 0.10 0.39 0 0 1.0 5.20
47 0.63 �0.57 0.57 0.56 0 0 0 5.44
48 0.74 �0.28 0.10 0.71 0 0 1 5.60
49 0.74 �0.28 0.57 0.71 0 0 0 5.62
50 0.50 0.88 0.10 0.43 0 0 1 5.48
51 0.60 0.71 0.57 0.37 0 �0.34 0 5.88
52 0.50 0.88 1.45 0.43 0 0 0 5.03
53 0.74 �0.28 0.1 0.71 0.41 �0.15 1 6.30
54 0.74 �0.28 0.54 0.71 0 0 0 5.77
55 0.74 �0.28 0.10 0.71 0.67 0.16 1 5.97
56 0.74 �0.28 0.10 0.71 0.43 �0.34 1 6.00
57 0.74 �0.28 0.57 0.71 0.43 �0.34 0 6.50
681M. Kumar et al. / European Journal of Medicinal Chemistry 42 (2007) 675e685
data have been normalized on [�1, 1]. The considered Bayes-ian regularized network consists of two layers (13 neurons infirst and one neuron in second layer). To develop a robustfuzzy QSAR model, the training data were partitioned into
15 different clusters using fuzzy c-means clustering. Thisserved as the initial guess about cluster centres. The identifica-tion parameters were chosen as ~m ¼ 2, u¼ 0.99, sq¼ 0.05,and C¼ 0.003. Fig. 3 shows the performance of QSAR models

682 M. Kumar et al. / European Journal of Medicinal Chemistry 42 (2007) 675e685
to predict the �log k(OH) values. Here, robust fuzzy mappings(having RMSE value equal to 0.4291 on training and 0.3704on testing data) show a slightly better performance than theBayesian network (having RMSE value equal to 0.4472 ontraining and 0.3763 on testing data).
We have seen in different examples of QSAR studies (Figs.2 and 3 and Tables 3 and 6) that robust fuzzy mappings out-perform the Bayesian regularized neural networks.
4. Concluding remarks
This study has presented a new robust method of develop-ing QSAR models using fuzzy mappings. We have addressedthe fundamental issues involved in QSAR studies related tomodelling errors. The robust construction of fuzzy mappingsis based on an energy-gain bounding approach. Simulationstudies and QSAR modelling examples have been providedto illustrate that in presence of modelling errors (a commonproblem in QSAR studies), the proposed robust method offuzzy modelling is more suitable than the Bayesian regular-ized neural networks. This is due to the fact that energy-gainbounding approach mathematically takes into account the is-sue of modelling errors in a sensible manner without makingany assumption about the nature of signals.
Table 5
Training/testing data sets of benzodiazepines
Testing data Training data
Set 1 No. 4, 8, ., 56 in Table 4 Rest
Set 2 No. 3, 6, ., 57 in Table 4 Rest
Set 3 No. 2, 4, ., 56 in Table 4 Rest
Acknowledgements
This study was supported by Bundesministerium fur Bil-dung und Forschung (BMBF), Germany. The troposphericdegradation data set has been taken from http://ecb.jrc.it/.
Appendix A. Mathematical formulation of clusteringbased fuzzy mappings
Let us consider a Sugeno type fuzzy inference systemðFs : X/YÞ, mapping n-dimensional input space(X¼ X1� X2�/� Xn) to one-dimensional real line, consist-ing of K different following rules:
If x belongs to a cluster having centre c1 then y¼ a1;«
If x belongs to a cluster having centre cK then y¼ aK;
where x ˛ Rn is n-dimensional input vector, ci ˛ Rn is the cen-tre of ith cluster, and the values a1, ., aK are real numbers.Let Ai(x) denote a multivariable membership functionAi : X/½0; 1� that represents the degree of membership of
Table 6
Performance of fuzzy mappings and Bayesian regularized neural networks
(BRNN) on benzodiazepines’ data
Data set Training
RMSE
(BRNN)
Training RMSE
(fuzzy mappings)
Testing
RMSE
(BRNN)
Testing RMSE
(fuzzy mappings)
Set 1 0.5721 0.5011 0.5462 0.4500
Set 2 0.5444 0.4451 0.7647 0.7102
Set 3 0.4067 0.4417 0.7695 0.6620
9 10 11 12 13 14 15 169
10
11
12
13
14
15
16training data performance
desired output9 10 11 12 13 14 15 16
desired output
mod
el o
utpu
t
9.5 10 10.5 11 11.5 12 12.5 13 13.5 14 14.59
10
11
12
13
14
15testing data performance
mod
el o
utpu
t
9
10
11
12
13
14
15
16
mod
el o
utpu
t
9
10
11
12
13
14
15
mod
el o
utpu
t
desired output9.5 10 10.5 11 11.5 12 12.5 13 13.5 14 14.5
desired output
training data performance
testing data performance
RMSE = 0.4472
RMSE = 0.3763
(a)
RMSE = 0.4291
RMSE = 0.3704
(b)
Bayesian regularized neural network Robust fuzzy mappings
Fig. 3. Performance of QSAR models to predict the �log k(OH) values.
683M. Kumar et al. / European Journal of Medicinal Chemistry 42 (2007) 675e685
input vector x ˛ X to the ith cluster. The different fuzzy rulescan be aggregated as
FsðxÞ ¼PK
i¼1 aiAiðxÞPKi¼1 AiðxÞ
: ðA1Þ
For the fuzzy partition of input space X into K differentclusters by the method of fuzzy c-means (FCM), the member-ship function Ai(x) must ensure (see, Ref. [5]):
Xx˛X
XK
i¼1
A~mi ðxÞkx� cik2/Minimum;
XK
i¼1
AiðxÞ ¼ 1;
where ~m > 1 is the fuzzifier and k$k denotes the Euclideannorm. The membership function that minimizes above objec-tive function for a given choice of cluster centres fcigK
i¼1 fol-lows as
FCMiðx; c1;.; cKÞ
¼
8>>>><>>>>:
1PK
j¼1
kx� cik2��x� cj
��2
!1=ð~m�1Þfor x ˛ X y�cj
�j¼1;.;K
;
1 for x ¼ ci;
0 for x ˛�
cj
�j¼1;.;K
yfcig:ðA2Þ
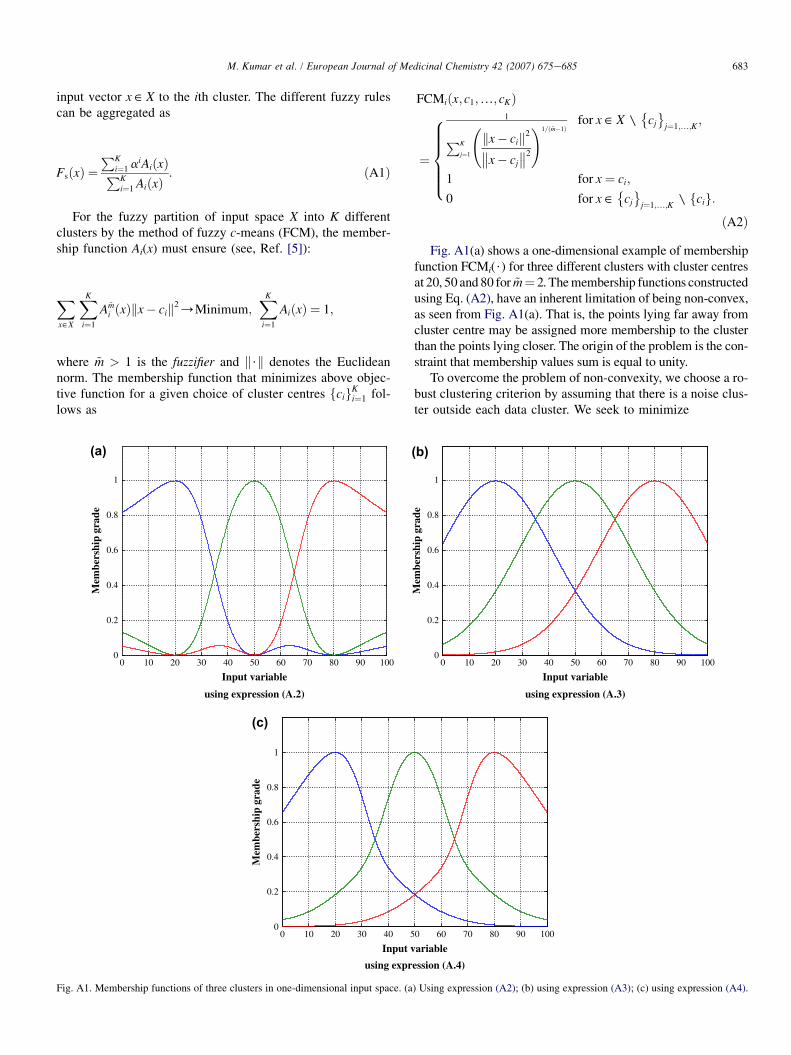
Fig. A1(a) shows a one-dimensional example of membershipfunction FCMi($) for three different clusters with cluster centresat 20, 50 and 80 for ~m¼ 2. The membership functions constructedusing Eq. (A2), have an inherent limitation of being non-convex,as seen from Fig. A1(a). That is, the points lying far away fromcluster centre may be assigned more membership to the clusterthan the points lying closer. The origin of the problem is the con-straint that membership values sum is equal to unity.
To overcome the problem of non-convexity, we choose a ro-bust clustering criterion by assuming that there is a noise clus-ter outside each data cluster. We seek to minimize
0 10 20 30 40 50 60 70 80 90 1000
0.2
0.4
0.6
0.8
1
Input variable
Mem
bers
hip
grad
e
0
0.2
0.4
0.6
0.8
1
Mem
bers
hip
grad
e
(a)
using expression (A.2) using expression (A.3)
0 10 20 30 40 50 60 70 80 90 100
Input variable
(b)
0
0.2
0.4
0.6
0.8
1
Mem
bers
hip
grad
e
using expression (A.4)
0 10 20 30 40 50 60 70 80 90 100
Input variable
(c)
Fig. A1. Membership functions of three clusters in one-dimensional input space. (a) Using expression (A2); (b) using expression (A3); (c) using expression (A4).
684 M. Kumar et al. / European Journal of Medicinal Chemistry 42 (2007) 675e685
JcðAiðxÞ; c1;.; cKÞ ¼Xx˛X
XK
i¼1
�AiðxÞkx� cik2
þf1þAiðxÞlog AiðxÞ �AiðxÞgdi
�;
where the second term in the objective function is intended tobe a noise cluster. The term {1þ Ai(x)log Ai(x)� Ai(x)} maybe interpreted as the degree to which x does not belong tothe ith cluster and thus the membership of x to the noise clus-ter. If the distance of x to the cluster centre ci is greater thanffiffiffiffi
di
p, then the minimization of Jc($) enforces a small value
of Ai(x) and a large value of membership of xi to the noise clus-ter. Therefore, one of the strategy may be to set di equal to thedistance of nearest cluster centre from ci, i.e.,
di ¼minj
��cj � ci
��2:
Setting vJcðAiðxÞ; c1;.; cKÞ=vAiðxÞ ¼ 0, leads to followingexpression for optimal membership function:
RCiðx; c1;.; cKÞ ¼ exp
�kx� cik2
di
!: ðA3Þ
Fig. A1(b) shows the membership functions (A3) for threedifferent clusters with centres at 20, 50 and 80. Although themembership functions shape is convex, but the assignmentof membership values to a cluster is totally independent ofthe location of other cluster centres. As an illustration, con-sider a point 50 (the centre of second cluster) in Fig. A1(b),that has been assigned the membership values more than0.30 to the first and third clusters. This point, however, incase of FCM was assigned zero memberships to the first andthird clusters (that was obviously more natural assignment).
The advantages of both methods can be combined byadopting a mixed clustering criterion. Assume that the mem-bership function Ai has two components A1i and A2i such that
Ai ¼A~m
1i
2þA2i
2;
where A1i, A2i minimizes following constrained objectivefunction:
Xx˛X
XK
i¼1
��A~m
1iðxÞ þA2iðxÞ�kx� cik2þf1þA2iðxÞlog A2iðxÞ
�A2iðxÞgdi
;XK
i¼1
A1iðxÞ¼ 1:
Now, A1i will be given by Eq. (A2) and A2i by Eq. (A3).Thus,
Aiðx; c1;.; cKÞ ¼jFCMiðx; c1;.; cKÞj~m
2þRCiðx; c1;.; cKÞ
2:
ðA4ÞFig. A1(c) shows a one-dimensional example of above
membership function for three clusters (with centres at 20,
50 and 80) for ~m ¼ 2. As seen from Fig. A1(c), expression(A4) provides a compromise between non-convex nature ofEq. (A2) and independent behavior of Eq. (A3) with respectto the location of cluster centres. If we denote
Giðx; c1;.; cKÞ ¼Aiðx; c1;.; cKÞPKi¼1 Aiðx; c1;.; cKÞ
; ðA5Þ
then the output of Sugeno type fuzzy inference system for thisshape of membership functions follows from Eq. (A1) as
FsðxÞ ¼XK
i¼1
aiGiðx; c1;.; cKÞ:
Introduce following notations: a¼ [ai]i¼1,.,K ˛ RK, q ¼½cT
1 ;.; cTK�
T˛RKn, and G(x, q)¼ [Gi(x, q)]i¼1,.,K ˛ RK. Now,the above expression can be rewritten as
Fs
�x�¼ GT
�x;q�a: ðA6Þ
As indicated by above expression, the output of a clusteringbased fuzzy model is linear in consequents a and nonlinear incluster centres q.
Appendix B. A GausseNewton based algorithm
Given inputeoutput data pairs fxðjÞ; yðjÞgNj¼0, to compute
the parameters
qj ¼ arg minq
h½yðjÞ�GTðxðjÞ;qÞaj�1�21þmkGðxðjÞ;qÞk2 þ m�1
q
��q� qj�1
��2i
¼ arg minqkrðqÞk2
; where rðqÞ ¼
24h½yðjÞ�GTðxðjÞ;qÞaj�1�21þmkGðxðjÞ;qÞk2
i1=2
�m�1
q
�1=2�q� qj�1
�35;
aj ¼ aj�1 þmG�xðjÞ;qj
��yðjÞ �GT
�xðjÞ;qj
�aj�1
�1þ m
��GðxðjÞ;qjÞ��2
;
we suggest a GausseNewton based algorithm. The algorithmconsists of following steps:
(1) Choose initial guess about cluster centres q�1, number ofmaximum epochs Emax, a�1¼ 0, epoch count EC¼ 0, anddata index j¼ 0.
(2) If EC< Emax,(a) if j� N,
(i) define
rðqÞ ¼
24h½yðjÞ�GTðxðjÞ;qÞaj�1�21þmkGðxðjÞ;qÞk2
i1=2
�m�1
q
�1=2�q� qj�1
�35
and let s*(q) be the unique solution of following linearleast-squares problem:
s�ðqÞ ¼ arg mins
hkrðqÞ þ r0ðqÞsk2
i;
685M. Kumar et al. / European Journal of Medicinal Chemistry 42 (2007) 675e685
where r0(q) is the Jacobian matrix of vector r with respectto q, determined by the method of finite-differences. The Jaco-bian r0(q) is a full rank matrix, as a result of usingregularization.
(ii) Compute qj¼ qj�1þ s*(qj�1).(iii) Compute
aj ¼ aj�1 þmG�xðjÞ;qj
��yðjÞ �GT
�xðjÞ;qj
�aj�1
�1þ m
��GðxðjÞ;qjÞ��2 :
(iv) j :¼ jþ 1 and go to step 2(a).(b) EC :¼ ECþ 1, a�1 :¼ aN, q�1 :¼ qN, j¼ 0, and go to
step 2.
References
[1] Janos Abonyi, Robert Babuska, Ferenc Szeifert, Modified GatheGeva
fuzzy clustering for identification of TakagieSugeno fuzzy models,
IEEE Trans. Syst. Man Cybern. B (October 2002) 612e621.
[2] T. Aoyama, H. Ichikawa, Obtaining the correlation indices between drug
activity and structural parameters using a neural network, Chem. Pharm.
Bull. 39 (2) (1991) 372e378.
[3] T. Aoyama, Y. Suzuki, H. Ichikawa, Neural networks applied to quanti-
tative structureeactivity relationship (QSAR) analysis, J. Med. Chem. 33
(1990) 2583e2590.
[4] R. Babuska, Fuzzy Modeling for Control, Kluwer Academic Publishers,
Boston, 1998.
[5] J.C. Bezdeck, Pattern Recognition with Fuzzy Objective Function Algo-
rithms, Plenum, New York, 1981.
[6] Frank R. Burden, Martyn G. Ford, David C. Whitley, David A. Winkler,
Use of automatic relevance determination in QSAR studies using Bayes-
ian neural networks, J. Chem. Inf. Comput. Sci. 40 (2000) 1423e1430.
[7] Frank R. Burden, David A. Winkler, New QSAR methods applied to
structureeactivity mapping and combinatorial chemistry, J. Chem. Inf.
Comput. Sci. 39 (1999) 236e242.
[8] Frank R. Burden, David A. Winkler, Robust QSAR models using Bayes-
ian regularized neural networks, J. Med. Chem. 42 (1999) 3183e3187.
[9] A. Gonzalez, R. Perez, Completeness and consistency conditions for
learning fuzzy rules, Fuzzy Set. Syst. 96 (1998) 37e51.
[10] P. Gramatica, P. Pilutti, E. Papa, Validated QSAR prediction of OH tro-
pospheric degradation of VOCs: splitting into trainingetest sets and con-
sensus modeling, J. Chem. Inf. Comput. Sci. 44 (2004) 1794e1802.
[11] Z. Guo, Structureeactivity relationships in medicinal chemistry: devel-
opment of drug candidates from lead compounds, Pharmacochem.
Libr. 23 (1995) 299e320.
[12] C. Hansch, T. Fujita, resep Analysis. A method for the correlation of
biological activity and chemical structure, J. Am. Chem. Soc. 86 (1964)
1616e1626.
[13] F. Herrera, M. Lozano, J.L. Verdegay, Generating fuzzy rules from exam-
ples using genetic algorithms, in: Proceedings of the Fifth International
Conference on Information Processing and Management of Uncertainty
in Knowledge-Based Systems (IPMU’94), Paris, France, July 1994, pp.
675e680.
[14] H. Ichikawa, T. Aoyama, How to see characteristics of structural param-
eters in QSAR analysis: descriptor mapping using neural networks, SAR
QSAR Environ. Res. 1 (1993) 115e130.
[15] R.C. Jackson, Update on computer-aided drug design, Curr. Opin. Bio-
technol. 6 (1995) 646e651.
[16] J.S.R. Jang, C.T. Sun, E. Mizutani, Neuro-Fuzzy and Soft Computing;
a Computational Approach to Learning and Machine Intelligence, Pren-
tice-Hall, Upper Saddle River, 1997.
[17] J.-S. Roger, A.N.F.I.S. Jang, Adaptive-network-based fuzzy inference
systems, IEEE Trans. Syst. Man Cybern. 23 (May 1993) 665e685.
[18] K.L.E. Kaiser, Quantitative structureeactivity relationships in chemistry,
Can. Chem. News 51 (1999).
[19] M. Kumar, N. Stoll, R. Stoll, An energy-gain bounding approach to ro-
bust fuzzy identification, Automatica 42 (5) (May 2006) 711e721.
[20] M. Kumar, R. Stoll, N. Stoll, Robust solution to fuzzy identification prob-
lem with uncertain data by regularization. Fuzzy approximation to phys-
ical fitness with real world medical data: an application, Fuzzy Optim.
Decis. Making 3 (1) (March 2004) 63e82.
[21] M. Kumar, R. Stoll, N. Stoll, A minemax approach to fuzzy clustering,
estimation, and identification, IEEE Trans. Fuzzy Syst. 14 (2) (April
2006).
[22] M. Kumar, R. Stoll, N. Stoll, A robust design criterion for interpretable
fuzzy models with uncertain data, IEEE Trans. Fuzzy Syst. 14 (2) (April
2006).
[23] J. Liska, S.S. Melsheimer, Complete design of fuzzy logic systems using
genetic algorithms, in: Proceedings of the Third IEEE International Con-
ference on Fuzzy Systems, 1994, pp. 1377e1382.
[24] D.J.C. MacKay, Bayesian interpolation, Neural Comput. 4 (1992)
415e447.
[25] D.T. Manallack, D.J. Livingstone, Neural networks in drug discovery:
have they lived up to their promise? Eur. J. Med. Chem. 34 (1999)
195e208.
[26] D. Nauck, R. Kruse. A neuro-fuzzy approach to obtain interpretable
fuzzy systems for function approximation, in: Proceedings of the IEEE
International Conference on Fuzzy Systems 1998 (FUZZ-IEEE’98), An-
chorage, AK, May 1998, pp. 1106e1111.
[27] K. Nozaki, H. Ishibuchi, H. Tanaka, A simple but powerful heuristic
method for generating fuzzy rules from numerical data, Fuzzy Set.
Syst. 86 (1997) 251e270.
[28] J.J. Shan, H.C. Fu, A fuzzy neural network for rule acquiring on fuzzy
control systems, Fuzzy Set. Syst. 71 (1995) 345e357.
[29] D. Simon, Design and rule base reduction of a fuzzy filter for the estima-
tion of motor currents, Int. J. Approx. Reason. 25 (October 2000) 145e
167.
[30] D. Simon, Training fuzzy systems with the extended Kalman filter, Fuzzy
Set. Syst. 132 (December 2002) 189e199.
[31] P. Thrift, Fuzzy logic synthesis with genetic algorithms, in: Proceedings
of the Fourth International Conference on Genetic Algorithms, 1991, pp.
509e513.
[32] L.X. Wang, J.M. Mendel, Generating fuzzy rules by learning from exam-
ples, IEEE Trans. Syst. Man Cybern. 22 (6) (1992) 1414e1427.
[33] David A. Winkler, Neural networks as robust tools in drug lead discovery
and development, Mol. Biotechnol. 27 (2004) 139e167.
[34] S. Wu, M.J. Er, Dynamic fuzzy neural networks e a novel approach to
function approximation, IEEE Trans. Syst. Man Cybern. B 30 (2000)
358e364.
[35] L.A. Zadeh, Outline of a new approach to the analysis of complex sys-
tems and decision processes, IEEE Trans. Syst. Man Cybern. 3 (January
1973) 28e44.