Quantitative Structure Activity Relationships (QSAR) - Covance

Regulatory Toxicology and Pharmacology 71 (2015) 318–330
Contents lists available at ScienceDirect
Regulatory Toxicology and Pharmacology
journal homepage: www.elsevier .com/locate /yr tph
Estimation of the chemical-induced eye injury usinga weight-of-evidence (WoE) battery of 21 artificial neural network(ANN) c-QSAR models (QSAR-21): Part I: Irritation potential q,qq,qqq
http://dx.doi.org/10.1016/j.yrtph.2014.11.0110273-2300/� 2014 Elsevier Inc. All rights reserved.
Abbreviations: 3Rs, refinement, reduction and replacement; AD, applicability domain; ADME, absorption, distribution, metabolism, and excretion; ANN, artificinetwork; ANNE, artificial neural network ensemble; Architecture, particular combination of neurons and inputs in an ANN; CFSAN, Center for Food Safety andNutrition; c-QSAR, classification QSAR; DoA, domain of applicability; ECETOC, The European Center for Ecotoxicology and Toxicology of Chemicals; EEC, European ECommunity; Ensemble, set of ANN QSAR models; EU, European Union; GA, genetic algorithm; GHS, globally harmonized system of classification and labeling of chHBA, number of hydrogen bond acceptors; HBD, number of hydrogen bond donors; IG, input gradient; ITLA, iterative truncated linear analysis; Input, descriptoMatthews’s correlation coefficient; MW, molecular weight; Neuron, ‘‘unit’’ or ‘‘node’’ that sums inputs from a previous layer; NIEHS, National Institute of EnviroHealth Sciences; OECD, Organisation for Economic Co-operation and Development; PolarizM, polarizability in Å3 calculated by Miller’s method; QSAR, quantitative stactivity relationship; r-QSAR, regression QSAR; SPR, structure–property relationship; QSAR-21, a battery of 21 ANN c-QSAR models; REACH, registration, evauthorisation and restriction of chemicals; SMILES, Simplified Molecular Input Line Entry System; S + logP, octanol–water partition coefficient (log P, Simulations PlusTLA, truncated linear analysis; WoE, weight of evidence.
q The work described here was presented in part at the Mid-Atlantic Chapter Society of Cosmetic Chemists (MACSCC) Fall Education Symposium ‘‘Innovating, Evand Regulating: Nanotechnology and Beyond’’ at University of Delaware, Newark, DE 19716, October 8, 2014 (Abstract # 1). This presentation was awarded the MACS‘‘Best Poster’’ Award.qq This work was also presented in part at the 4th Annual FDA Foods and Veterinary Medicine Science and Research Conference ‘‘Food Safety, Veterinary Medicine, Nand Cosmetics Research: Meeting the Challenges of a Global Supply Chain’’ at White Oak, Silver Spring, MD 20993, July 28–29, 2014 (Abstract # 2A-16, July 29, 2qqq This research report is not an official U.S. Food and Drug Administration guidance or policy statement. No official support or endorsement by the U.S. Food aAdministration is intended, nor should it be inferred.⇑ Corresponding author at: OCAC/OFAS, Center for Food Safety and Applied Nutrition, U.S. Food and Drug Administration, 5100 Paint Branch Parkway, College P
20740, United States. Fax: +1 301 436 2973.E-mail address: [email protected] (R.P. Verma).
Rajeshwar P. Verma a,b,⇑, Edwin J. Matthews b
a Office of Cosmetics and Colors, Center for Food Safety and Applied Nutrition, U.S. Food and Drug Administration, 5100 Paint Branch Parkway, College Park, MD 20740, United Statesb Office of Food Additive Safety, Center for Food Safety and Applied Nutrition, U.S. Food and Drug Administration, 5100 Paint Branch Parkway, College Park, MD 20740, United States
a r t i c l e i n f o a b s t r a c t
Article history:Available online 8 December 2014
Keywords:Artificial neural networkc-QSAREye irritationQSAR-21Weight of evidence
Evaluation of potential chemical-induced eye injury through irritation and corrosion is required to ensureoccupational and consumer safety for industrial, household and cosmetic ingredient chemicals. The his-torical method for evaluating eye irritant and corrosion potential of chemicals is the rabbit Draize test.However, the Draize test is controversial and its use is diminishing - the EU 7th Amendment to the Cos-metic Directive (76/768/EEC) and recast Regulation now bans marketing of new cosmetics having animaltesting of their ingredients and requires non-animal alternative tests for safety assessments. Thus, in silicoand/or in vitro tests are advocated. QSAR models for eye irritation have been reported for several small(congeneric) data sets; however, large global models have not been described. This report describesFDA/CFSAN’s development of 21 ANN c-QSAR models (QSAR-21) to predict eye irritation using theADMET Predictor™ program and a diverse training data set of 2928 chemicals. The 21 models had exter-nal (20% test set) and internal validation and average training/verification/test set statistics were: 88/88/85(%) sensitivity and 82/82/82(%) specificity, respectively. The new method utilized multiple artificialneural network (ANN) molecular descriptor selection functionalities to maximize the applicabilitydomain of the battery. The eye irritation models will be used to provide information to fill the critical datagaps for the safety assessment of cosmetic ingredient chemicals.
� 2014 Elsevier Inc. All rights reserved.
al neuralApplied
conomicemicals;rs; MCC,nmentalructure–aluation,model);
aluating,CC 2014
utrition014).nd Drug
ark, MD

R.P. Verma, E.J. Matthews / Regulatory Toxicology and Pharmacology 71 (2015) 318–330 319
1. Introduction
1.1. Background information
The US FDA’s Center for Food Safety and Applied Nutrition(CFSAN) provides regulatory oversight for the safety assessmentof food and color additives using a pre-market review process.However, cosmetic products and their ingredients are subject toa post-market review process. For food additives, ‘‘safety’’ is specif-ically defined as a reasonable certainty that a substance is notharmful under intended conditions of use. For cosmetic productsand ingredients, manufacturers have the responsibility to assurethe ‘‘adequate safety substantiation’’ (FD&C Act 1938, 21 CFR740.10). This investigation was conducted by CFSAN as part of anongoing effort to develop QSAR models to provide scientific infor-mation to support regulatory decisions, and to fill gaps in ourknowledge for data poor chemicals. The goal of the study was todevelop in silico methods that could accurately predict the eye irri-tation (reversible damage) and eye corrosion (irreversible damage)potential of ingredients and contaminants in cosmetic products.Our estimate of the size of the universe of cosmetic ingredientsis over 25,000 substances, and the overwhelming majority of thesechemicals are classified as ‘data-poor’ and the available toxicolog-ical data on these chemicals would not support the regulatorysafety assessment, typically required for products with premarketapproval. This is the first of our two reports, which describes thedevelopment of an in silico method to predict the irritation poten-tial of organic chemicals to the eye; the second report will describean in silico method for predicting eye corrosion potential (Vermaand Matthews, 2014).
The evaluation of potential chemical toxicity to the eye is nec-essary in order to ensure occupational safety for industrial chemi-cals, and consumer safety for products that come in contact withthe eye, e.g., cosmetic products (face creams, mascara, etc.), house-hold products (shampoos, soaps, detergents, etc.), ocular pharma-ceuticals, etc. The anterior surface of the eye is composed ofcornea and conjunctiva tissue which are directly exposed to theair and are highly susceptible to injury by chemicals. Chemicalscan cause loss of vision through corrosivity (corrosion) and irri-tancy (acute/severe irritation) to the eye. The Organization of Eco-nomic Co-operation and Development (OECD) Test Guidelines (TG)and globally harmonized system (GHS) of classification and label-ing of chemicals have defined damage to the eye either by irrita-tion or corrosion. According to them, the eye irritation is definedas ‘‘changes in the eye following the application of a test chemicalto the frontal surface of the eye, which is fully reversible within21 days of the application.’’ In contrast, eye corrosion is definedas ‘‘eye tissue damage, or serious physical decay of vision, follow-ing application of a test chemical to the frontal surface of the eye,which is not fully reversible within 21 days of the application’’. Eyecorrosion is also referred to as an ocular corrosion or serious eyedamage (OECD, 1981; UNECE, 2004).
The historical gold standard method for evaluating the eye irri-tant and corrosion potential of chemicals is the in vivo Draize testthat was developed by John H. Draize, a toxicologist with the U.S.Food and Drug Administration (FDA, Draize et al., 1944). This testhas been primarily used to assess the safety of household productsand cosmetics. The test method involves application of the testchemical to one eye of an albino rabbit and the other eye servesas negative control. The response of the animals is monitored usinga standardized scoring system at different time intervals for up to21 days to measure the full magnitude and reversibility of the ocu-lar injury. The current classification of eye injury through irritationand corrosion is based upon scores in the in vivo Draize test. TheEuropean Union (EU) criterion for the classification of eye irritation
(R36) is based on mean Draize score and on the duration of effectsfor four endpoints: corneal opacity (P2,<3), iris lesion (P1,<1.5),conjunctivae redness (P2.5), and conjunctivae oedema (P2). Incontrast, the EU criterion for the classification of eye corrosion(R41) is based upon the mean Draize score and the duration ofeffect for two endpoints: corneal opacity (P3) and iris lesion(P1.5). In addition, the duration of the study should be sufficient(i.e., 21 days after application of the test chemical) to evaluate fullythe reversibility, or the irreversibility, of the observed effects ofchemicals (Saliner et al., 2006).
Although in vivo Draize test is still considered to be the interna-tional standard assay for assessing the eye irritation potential ofchemicals and formulated products (OECD, 1981), it has been crit-icized for several reasons. It is subject to ethical criticism becausethe test is unusually cruel to rabbits, and thus it represents anunethical, inhumane treatment of animals (Russell and Burch,1959; Wilhelmus, 2001; Tsakovska et al., 2005). This test is alsosubject to two scientific criticisms: (a) significant variability inthe test results can occur due to visual scoring evaluation of thetest and (b) significant differences in physiology and sensitivityto tested substances exist between rabbit and human eyes (Weiland Scala, 1971; Wilhelmus, 2001; Curren and Harbell, 2002;Tsakovska et al., 2005; Cho et al., 2012).
Due to high public concern for the Draize test, the EuropeanEconomic Community (EEC, 1992) and the United Nations Eco-nomic Commission for Europe (UNECE, 2004) have publishedguidelines to minimize the need for the Draize test, and to specif-ically avoid unnecessary animal testing. These guidelines specify apreferred and sequential testing strategy that must be consideredbefore animal testing for the eye corrosion potential of chemicals:(a) all existing historical human and/or animal data of a test chem-ical for their possible eye corrosive potential should be reviewed,(b) chemicals with skin corrosive potential are assumed to be eyecorrosive, (c) chemicals with pH 6 2 and P11.5 are assumed tobe eye corrosive, and (d) the positive output of validated andaccepted quantitative structure–activity relationships (QSARs),structure–activity relationships (SARs), structure–property rela-tionships (SPRs), and in vitro or ex vivo tests for eye/skin corrosionmay be considered as an eye corrosive (EEC, 1992; UNECE, 2004;Saliner and Worth, 2007).
The EEC and UNECE guidelines revising the Draize test, alongwith the ban on testing of cosmetics and their ingredients in ani-mals in the EU (7th Amendment to the Cosmetic Directive; EC,2003), have created an opportunity for the development of alterna-tive in vitro, ex vivo, and in silico test methods to replace the in vivotest. A major research effort has been undertaken to develop andvalidate in vitro methods to replace the Draize test (Balls et al.,1995; Gettings et al., 1996; Spielmann et al., 1996; ILSI TCAAT,1996; Brantom et al., 1997; Bradlaw et al., 1997; Ohno et al.,1999; Louekari, 2004; Takahashi, 2007; Alves et al., 2008; Pintoet al., 2009; Scott et al., 2010; Yang et al., 2010; Scheel et al.,2011; Cho et al., 2012; Verstraelen et al., 2013). Although somein vitro assays exhibited good reproducibility and reliability, thesensitivity and specificity of the individual in vitro test methodswas poor, and no single assay has been accepted as a full regulatoryreplacement for the Draize test (Scott et al., 2010; Scheel et al.,2011). However, in vitro eye irritation tests have a long history ofuse and acceptance by industries (Harbell and Curren, 2001;Curren and Harbell, 2002; Eskes et al., 2005; EC, 2004; NIEHS,2008; Scott et al., 2010).
This part is a global effort to have an acceptable ethical frame-work for conducting scientific experiments using animals, i.e.,reduction, replacement and refinement (3Rs) (Russell and Burch,1959; Wilhelmus, 2001). These include e.g., integrated testingstrategies, high-throughput and high-content testing, modeling

320 R.P. Verma, E.J. Matthews / Regulatory Toxicology and Pharmacology 71 (2015) 318–330
and other in silico approaches, and systems biology, as far as theyare aligned with the 3Rs principles (National Research Council,2007; Schiffelers et al., 2012; Taylor et al., 2014).
1.2. QSARs for eye irritation
Computer-assisted (in silico) prediction methods (SAR, QSAR,grouping and read-across, molecular modeling, etc.) are playingimportant roles for the toxicity assessment of chemicals in orderto fill the critical gaps in toxicological data, i.e., Gap Analysis(Benfenati et al., 2011; EEC, 1992; UNECE, 2004; Saliner andWorth, 2007). Thus, in silico techniques are considered as alterna-tive tests to animal experiments in toxicity testing. The mainobjective of this report is to describe in silico methods for estimat-ing eye irritation potential of organic chemicals. The publishedQSAR models for eye irritation are based on the same set, or subset,of The European Center for Ecotoxicology and Toxicology of Chem-icals (ECETOC) compounds (Sugai et al., 1991; Cronin et al., 1994;Abraham, 1994; Abraham et al., 1998a,b; Kulkarni et al., 2001;Patlewicz et al., 2000; Patlewicz and El-Deredy, 1999). These datasets of Draize eye irritation test contains either congeneric sets ofchemicals or diverse chemical structures (N = 7–54). Further devel-opment of a larger Draize data set, and validation of in silico QSARmodels using a large and diverse data set of eye irritation toxicity,have been recommended (Gallegos-Saliner et al., 2008). There hasalso been a grouping/SAR read across report (Tsakovska et al.,2005) that uses chemical structure property based rules to predictwhether a chemical is a non-irritant/non-corrosive versus an irri-tant/corrosive. A summary of the published in silico studies oneye irritation is provided in the supplementary materials (seeAppendix Table 1).
1.3. Objectives of the investigation
The primary goal of this investigation was to compile a largeand diverse data set for Draize test eye irritation data and to iden-tify the optimal experimental conditions for the development ofhighly predictive, global c-QSAR models used for assessing eye irri-tation of chemicals. The c-QSAR provides an empirical model thatestimates a complex relationship between physicochemical and/or structural properties of an organic molecule and its biologicalactivity/toxicity which is either represented in terms of binaryactivities, e.g., 0 and 1, active versus inactive, or irritation versusnon-irritation.
In this report, we demonstrate a battery of 21 highly predictiveand validated ANN c-QSAR models (QSAR-21) for assessing eyeirritation potential of chemicals using a large and diverse CFSANdata set of 2928 chemicals, ADMET Predictor’s three sensitivityanalyses and ANNE classification functionalities with 20% test setselection from seven different methods. These models will be usedto perform a high throughput screen of data poor cosmetic ingre-dients in order to identify chemicals which are likely to be eyeirritants.
1.4. Significance of ‘the number 21’
The number 21 is due to our QSAR objective to develop highlypredictive 21 ANN c-QSAR models (QSAR-21) for the eye irritationendpoint. The need for 21 models, verses a single model, is toensure the utilization of 100% chemicals both in the 21 trainingpools (training sets and verification sets) and their correspondingtest sets used for external validation of the models. In so doingthe 21 models maximize the cumulative domain of applicability(DoA) of the models in weight of evidence (WoE) predictions.The significance of selecting ‘the number 21’ for the c-QSAR modelsis based on the following facts:
� At least six different methods are required for 20% test set selec-tion to ensure the utilization of 100% chemicals within six dif-ferent test sets and their corresponding six different trainingpools (because the possibility of some common chemicals intwo or more selections), but six different training pools withone sensitivity analysis provide 6 different ANN c-QSAR modelsthat is an even number and may create confusion in the WoEprediction possibly when a tie in the final results. Thus, sevendifferent methods are used for 20% test set selection.� Since one sensitivity analysis provides common descriptors due
to one rank-ordering of the descriptors based on their influenceon the property to be predicted, more than one sensitivity anal-yses are required for various rank-orders of the descriptors.Again the combination of seven different training pools, corre-sponding seven test sets and two different sensitivity analysesprovide 14 different ANN c-QSAR models that is an even num-ber. Thus, three different sensitivity analyses are selected.� The combination of seven different training pools, correspond-
ing seven test sets and three different sensitivity analyses pro-vide a total of 21 different ANN c-QSAR models (QSAR-21).
Thus the ‘number 21’ is highly significant to the primary goal ofour investigation.
2. Materials and methods
2.1. Eye irritation data sources
An eye irritation toxicity data set of 2928 chemicals was col-lected from a wide variety of publicly available sources including:scientific literature (Sugai et al., 1990, 1991; Cronin et al., 1994;Barratt, 1997; Andersen, 1999; Bagley et al., 1999; CIR, 1988,2002, 2012; Cho et al., 2012); material safety data sheets (MSDSs);FDA approved drugs for ophthalmology (www.medilexicon.com/drugs-list/eyes.php); FDA approved cosmetic colors in the eyearea (www.fda.gov/forindustry/coloradditives/coloradditiveinven-tories/ucm115641.htm); Household Products Database (http://hpd.nlm.nih.gov); Hazardous Substances Data Bank (http://toxnet.nlm.nih.gov/cgi-bin/sis/htmlgen?HSDB); and pharmaceutical drugsfrom the Elsevier Pharmapendium Database containing thepreclinical, clinical and post-marketed eye irritant adverse effects(www.pharmapendium.com). The entire data set is available inthe supplementary materials (see Appendix Table 2).
2.2. Classification of eye irritation data set
For the QSAR analysis, the eye irritation activity classification:non-irritant and irritant chemicals to eye were assigned as 0 and1 values, respectively. The non-irritant group of chemicals includedtwo different sets of molecules. The first set was comprised of 351chemicals that had been described as being: non-irritant, slightlyirritant, mild irritant and minimal irritant to eye in the Draize test(including some historical/accepted data). The second set of 1660pharmaceuticals was classified as non-irritant to eye, becausethese drugs did not have significant eye irritation adverse eventsin the Elsevier Pharmapendium database (Ursem et al., 2009).Thus, a total of 2011 (351 + 1660 = 2011) chemicals were classifiedas non-irritant to eye. In contrast, 917 chemicals (described asbeing moderate, strong, acute and severe irritant to eye) wereclassified as irritant to eye based upon the results of the Draizetest (including some historical/accepted data). Therefore theeye irritation data set contained a total of 2928 chemicals(351 + 1660 + 917 = 2928), of which 31.3% of eye irritantchemicals.

R.P. Verma, E.J. Matthews / Regulatory Toxicology and Pharmacology 71 (2015) 318–330 321
2.3. Molecular structures
The present eye irritant data set constitutes a very diverse set ofmolecular structures that includes: high production volume (HPV)chemicals, industrial chemicals, household chemicals, drugs, pesti-cides, cosmetic ingredients, and color additives. Thus, it has a largedomain of applicability (DoA) and coverage of chemical structures,chemical classes, chemical space, physicochemical and structuralproperties. In this investigation, molecular structures were savedas ISIS .mol-files and/or Simplified Molecular Input Line Entry Sys-tem (SMILES) codes. SMILES were copied from ChemIDplusAdvanced (http://chem.sis.nlm.nih.gov/chemidplus), self-written(Weininger, 1988), or generated from MOL-files using the MOSESChemistry Toolbox 1.0.1 software provided by Molecular NetworksInc. (www.molecular-networks.com).
2.4. Software and hardware
In this investigation, the ADMET Predictor™ (version 6.0.0007)was obtained from Simulations Plus, Inc. (www.simulations-plus.-com) through a CFSAN Research Collaboration Agreement (RCA) toconstruct QSAR models. The ADMET Modeler™, a sub-program ofADMET Predictor, provides model-building functionality to createboth types of QSAR models (classification and regression) using acollection of methodologies. This program was run on a Hewlett–Packard Z800 workstation: Intel(R) Xeon(R) CPU E5540 @2.53 GHz, which included 16 GB RAM, and the 64-bit Windows 7Professional operating system.
2.5. Development and validation of artificial neural networkclassification quantitative structure–activity relationship (ANN c-QSAR) models
Construction and validation of ANN c-QSAR models using theADMET Predictor/Modeler required seven different steps.
2.5.1. Data input and calculation/selection of descriptorsADMET Predictor accepts data in which toxicities are linked to
2D molecular structures in a standard ASCII text file (.SMI file)and calculates more than 350 different molecular and atomic-leveldescriptors. In the present investigation, 340 descriptors wereselected after discarding non-numerical descriptors. At this stage,the ADMET Modeler, a sub-program of ADMET Predictor is utilizedto complete the next six steps in order to develop and validate ANNc-QSAR models.
2.5.2. Test set and training pool allocationADMET Modeler utilizes several selection methods for the test
set (called the ‘external data set’), such as, Kohonen Self-OrganizingMap, selecting every nth compound sorted by their measuredproperties, random allocation, manual allocation, and K-meansclustering. The remaining data left behind after the removal ofthe test set is called as the ‘training pool’. The test set is provedto be an essential part of developing a high-quality and predictiveQSAR model because it is never used by the program in the trainingprocess, and used only after the model has been fully trained totest its external predictive accuracy. Thus the use of a large enoughtest set is necessary for the best QSAR modeling. Failure to this, thedeveloped QSAR model may provide unreliable predictions.
2.5.3. Selection of optimal descriptors (inputs)In order to select optimal descriptors, the program’s three differ-
ent methods of sensitivity analysis are used, which includes inputgradient (IG), truncated linear analysis (TLA), and iterative truncatedlinear analysis (ITLA). All three of these descriptor selection methodsuse the same strategy; only those descriptors that have acceptable
variance, adequate representation in the data set, and low correla-tion with other descriptors are retained for model building. Further-more, the best models use the smallest number of descriptors inorder to maximize the applicability domain covered by the modelas well as reduce the chance of overtraining.
TLA is the fastest and default sensitivity analysis method of theprogram that builds a multivariate linear model using all candidatenormalized descriptors and then ranks the descriptors by theirabsolute coefficients. In iterative truncated linear analysis (ITLA),all the descriptors and dependent variable are replaced by theirSpearman ranks across all the observations and then the TLA runto assign the lowest ranking descriptor with a sensitivity of 1.0and removed them from the descriptor pool. TLA is run againand the lowest ranking descriptor is removed from the pool andassigned a sensitivity of 2.0. This process is repeated until all thedescriptors have been removed from the descriptor pool. The sen-sitivity values assigned each descriptor represent the order inwhich they were removed. This method (ITLA) is almost compara-bly as fast as the TLA. On the other hand, a neural network istrained in input gradient (IG) sensitivity analysis using all descrip-tors that are being considered for particular neural network archi-tecture. The average gradients of each descriptor over all trainingdata are then calculated and ranked subsequently with their abso-lute values. The computational time of this method is moderate.
2.5.4. Division of training pool into training and verification setsThe training pool data is automatically divided by the ADMET
Modeler into two separate data sets, the training set and the veri-fication set, using the Kohonen Self-Organizing Map. The trainingand verification sets contain, respectively, about two thirds andone third of the training pool data. In the process of ANN c-QSARmodeling, molecules are exchanged randomly between trainingand verification sets for each candidate neural network in such away that typically trains 165 neural networks for each specifiednumber of descriptors and neurons (i.e., a specified ANNE architec-ture). The best 33 neural networks from the 165 are retained (i.e.,132 are discarded) for the final ANNE architecture and 5 multiplenetworks. Thus the ANNE process produces 165 different partitionsof the training and verification sets for each ANNE architecture ofwhich 33 are chosen for the final ensemble model. As the weightsof the input molecular descriptors are optimized during the train-ing of a single ANN, the training set error decreases continuously.Initially, the verification set error from the same ANN alsodecreases, but at some point during minimization, the verificationset error begins to increase. This inflection point is an indicationthat the model is becoming over-trained. At this point, the trainingprocess is stopped and the coefficients corresponding to the mini-mum verification error are used for the model. This ANN c-QSARtraining technique is known as ‘early stopping’.
2.5.5. Predictive algorithm selectionIn our present investigation, we have used artificial neural net-
work ensemble (ANNE) technique to construct c-QSAR models. Arti-ficial neural networks (ANNs) establish nonlinear correlationbetween molecular and/or structural descriptors of chemicals andtheir biological/toxicological activities. An artificial neural networkis a connected set of mathematical functions that processes eachdescriptor through three layers of neurons (input, hidden and out-put layers; see Fig. 1). An input layer is where each input (descriptor)is multiplied with a coefficient (weight) and that product is sent tothe hidden layer contains neuron. The neuron sums the weighteddescriptors and subtracts a threshold weight as a bias term. Theresulting number is then used by a hyperbolic tangent activationfunction in order to generate the output of each neuron in outputlayer. ADMET Modeler uses Tetko’s associative neural network(ASNN; Tetko, 2002) algorithm with some modifications and consid-

Fig. 1. A simplified sketch for the artificial neural network structure.
322 R.P. Verma, E.J. Matthews / Regulatory Toxicology and Pharmacology 71 (2015) 318–330
ering only one hidden layer of neurons between the inputs and theoutputs. The program utilizes ANNEs, which averaged the outputof collections of ANNs. The prediction from an ensemble is the aver-age predicted values from each separately trained ANNs, all of whichuse the same architecture (ADMET Predictor, 2013).
2.5.6. Development of ANN c-QSAR modelsThe model-building progress can be observed in the ‘Ensemble
Statistics’ Monitor of the program, for which each ensemble dis-plays the combined results of 33 best artificial neural networks(sub-models) using averaging method. The combined resultsinclude the statistics of three different data partitions: trainingset, verification set and test set. The test set statistics of eachensemble is considered as their external validation.
2.5.7. Selection of the best ANN c-QSAR modelsWe have used various statistics, such as, sensitivity, specificity,
false rate, Youden index (Youden, 1950), and Matthews’s correla-tion coefficient (MCC, Matthews, 1975; Baldi et al., 2000) to iden-tify the best ANN c-QSAR models. These statistics were calculatedusing the following formulas:
Sensitivity ð%Þ ¼ TPTP þ FN
� 100
Specificity ð%Þ ¼ TNTN þ FP
� 100
False rate ð%Þ ¼ FP þ FNTP þ FN þ TN þ FP
� 100
Youden index ð%Þ ¼ TPTP þ FN
þ TNTN þ FP
� 1� �
� 100
MCC ð%Þ ¼ TP � TN � FN � FPffiffiffiffiffiffiffiffiffiffiffiffiffiffiffiffiffiffiffiffiffiffiffiffiffiffiffiffiffiffiffiffiffiffiffiffiffiffiffiffiffiffiffiffiffiffiffiffiffiffiffiffiffiffiffiffiffiffiffiffiffiffiffiffiffiffiffiffiffiffiffiffiffiffiffiffiffiffiffiffiffiffiffiðTP þ FNÞðTP þ FPÞðTN þ FNÞðTN þ FPÞ
p � 100
where, TP, TN, FP and FN are the true positive, true negative, falsepositive, and false negative, respectively.
2.6. Availability of experimental data and QSAR models
All the eye irritation data and molecular structures of chemicalswere collected from various publicly available sources (see the Sec-tion 2.1 for references). The entire eye irritant data set are availablein Appendix Table 2. The 21 ANN c-QSAR models (QSAR-21) will bemade available to our RCA collaborator Simulations-Plus for
inclusion in the commercial version of their ADMET Predictorsoftware.
3. Results
3.1. Optimal ADMET Modeler conditions for the development of QSAR-21
In the present study, the following five optimal experimentalconditions of ADMET Modeler were identified and used in the devel-opment of 21 highly predictive ANN c-QSAR models (QSAR-21):
� Test set selection: 20% test set was selected using seven differentmethods: (1) every nth compound sorted by activity, (2) everynth compound sorted by S + logP (hydrophobicity), (3) everynth compound sorted by S + Pcornea (rabbit cornea permeabil-ity), (4) every nth compound sorted by S + Sw (intrinsic watersolubility), (5) every nth compound sorted by S + Sp (solubilityin gastric fluid), (6) every nth compound sorted by RuleOf5(Lipinski RuleOf5), and (7) random.� Molecular descriptor selection: 60 optimal descriptors were
selected from 340 descriptors using three different sensitivityanalyses: (1) truncated linear analysis (TLA), (2) iterative trun-cated linear analysis (ITLA), and (3) input gradient (IG).� ANNE classifications: three different ANNE classification condi-
tions were considered: (1) network neurons: minimum = 1,maximum = 20, step = 1; (2) network descriptors: mini-mum = 2, maximum = 60, step = 2; (3) network training: (a)number of Monte Carlo tries for starting points = 1 and (b) skipnetwork architecture if the number of adjustable weightsexceeds 90% of the data set size.� Binary classifications: three different conditions were used: (1)
averaging method, (2) 50:50 balance between the negativeand positive classes, and (3) minimum specificity = 80%.� Network ensembles: networks per ensemble = 33 and networks
multiple = 5.
The detailed optimal conditions and the model building processfor QSAR-21 are summarized in Fig. 2.
3.2. ANN c-QSAR models (1–21) or QSAR-21 for eye irritation
3.2.1. Statistical performanceThe statistical performance of QSAR-21 is summarized in Table 1.
Although all the ANN c-QSAR models have good statistics, ANN c-QSAR 9 is considered as one of the best models with respect to theirhigh DoA because it is based on only six descriptors (minimum
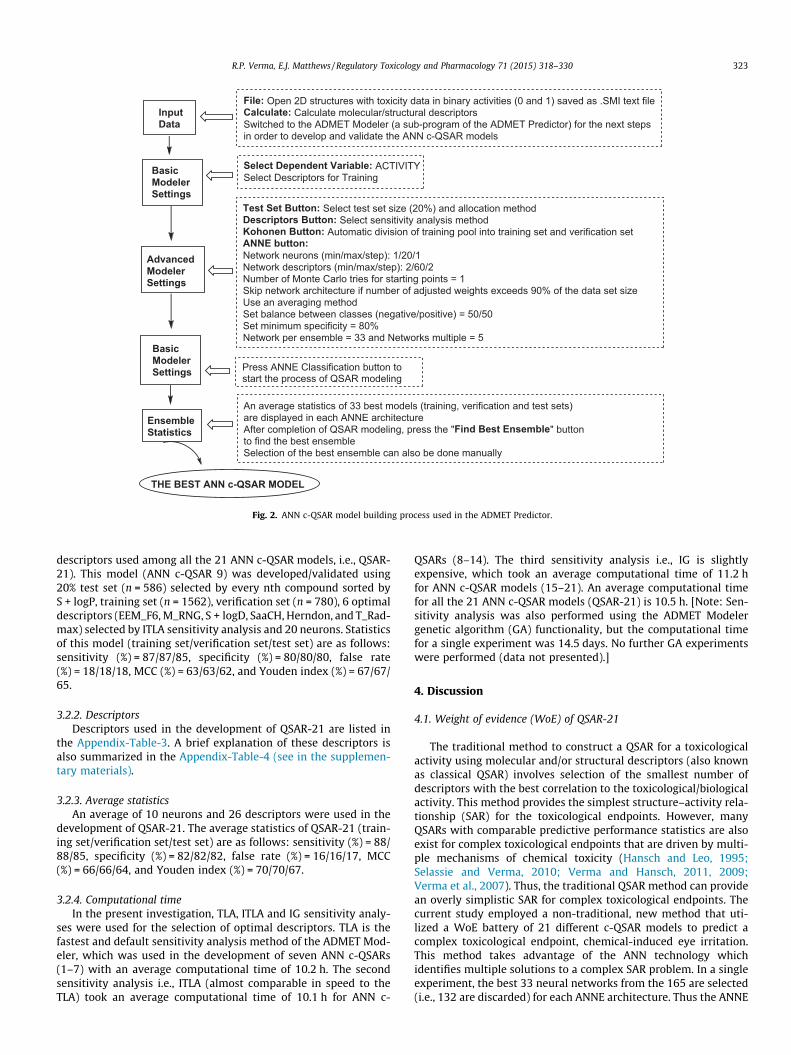
Fig. 2. ANN c-QSAR model building process used in the ADMET Predictor.
R.P. Verma, E.J. Matthews / Regulatory Toxicology and Pharmacology 71 (2015) 318–330 323
descriptors used among all the 21 ANN c-QSAR models, i.e., QSAR-21). This model (ANN c-QSAR 9) was developed/validated using20% test set (n = 586) selected by every nth compound sorted byS + logP, training set (n = 1562), verification set (n = 780), 6 optimaldescriptors (EEM_F6, M_RNG, S + logD, SaaCH, Herndon, and T_Rad-max) selected by ITLA sensitivity analysis and 20 neurons. Statisticsof this model (training set/verification set/test set) are as follows:sensitivity (%) = 87/87/85, specificity (%) = 80/80/80, false rate(%) = 18/18/18, MCC (%) = 63/63/62, and Youden index (%) = 67/67/65.
3.2.2. DescriptorsDescriptors used in the development of QSAR-21 are listed in
the Appendix-Table-3. A brief explanation of these descriptors isalso summarized in the Appendix-Table-4 (see in the supplemen-tary materials).
3.2.3. Average statisticsAn average of 10 neurons and 26 descriptors were used in the
development of QSAR-21. The average statistics of QSAR-21 (train-ing set/verification set/test set) are as follows: sensitivity (%) = 88/88/85, specificity (%) = 82/82/82, false rate (%) = 16/16/17, MCC(%) = 66/66/64, and Youden index (%) = 70/70/67.
3.2.4. Computational timeIn the present investigation, TLA, ITLA and IG sensitivity analy-
ses were used for the selection of optimal descriptors. TLA is thefastest and default sensitivity analysis method of the ADMET Mod-eler, which was used in the development of seven ANN c-QSARs(1–7) with an average computational time of 10.2 h. The secondsensitivity analysis i.e., ITLA (almost comparable in speed to theTLA) took an average computational time of 10.1 h for ANN c-
QSARs (8–14). The third sensitivity analysis i.e., IG is slightlyexpensive, which took an average computational time of 11.2 hfor ANN c-QSAR models (15–21). An average computational timefor all the 21 ANN c-QSAR models (QSAR-21) is 10.5 h. [Note: Sen-sitivity analysis was also performed using the ADMET Modelergenetic algorithm (GA) functionality, but the computational timefor a single experiment was 14.5 days. No further GA experimentswere performed (data not presented).]
4. Discussion
4.1. Weight of evidence (WoE) of QSAR-21
The traditional method to construct a QSAR for a toxicologicalactivity using molecular and/or structural descriptors (also knownas classical QSAR) involves selection of the smallest number ofdescriptors with the best correlation to the toxicological/biologicalactivity. This method provides the simplest structure–activity rela-tionship (SAR) for the toxicological endpoints. However, manyQSARs with comparable predictive performance statistics are alsoexist for complex toxicological endpoints that are driven by multi-ple mechanisms of chemical toxicity (Hansch and Leo, 1995;Selassie and Verma, 2010; Verma and Hansch, 2011, 2009;Verma et al., 2007). Thus, the traditional QSAR method can providean overly simplistic SAR for complex toxicological endpoints. Thecurrent study employed a non-traditional, new method that uti-lized a WoE battery of 21 different c-QSAR models to predict acomplex toxicological endpoint, chemical-induced eye irritation.This method takes advantage of the ANN technology whichidentifies multiple solutions to a complex SAR problem. In a singleexperiment, the best 33 neural networks from the 165 are selected(i.e., 132 are discarded) for each ANNE architecture. Thus the ANNE

Table 1Statistical performance of QSAR-21 models (1–21) developed by selected descriptors using TLA/ITLA/IG sensitivity analyses and externally validated by corresponding 20% test set as selected using different selection methods.
ModelNo.
20% test set selectionmethod
SAmethod
CT(h)
No.N
No.D
Sensitivity (%)Training=verification=ð
test setsÞ
Specificity (%)Training=verification=ð
test setsÞ
False rate (%)Training=verification=ð
test setsÞ
MCC (%)Training=verification=ð
test setsÞ
Youden (%)Training=verification=ð
test setsÞ
1 ENC by activity TLA 11.5 14 24 89/89/86 81/81/79 16/16/19 66/66/61 70/70/652 ENC by S + logP TLA 9.5 17 32 91/91/85 83/83/83 15/15/17 69/69/65 73/73/683 ENC by Pcornea TLA 10.5 2 18 86/86/85 80/80/82 18/18/17 63/63/63 66/66/664 ENC by S + Sw TLA 10.0 14 30 88/88/87 85/85/83 14/14/16 69/69/67 73/73/705 ENC by S + Sp TLA 10.1 3 16 83/83/83 81/81/79 19/19/20 61/61/59 64/64/626 ENC by RuleOf5 TLA 10.1 1 26 87/87/85 80/80/80 18/18/18 64/64/62 67/67/667 Random TLA 10.0 16 22 87/87/80 81/81/81 17/17/20 65/65/59 69/69/618 ENC by activity ITLA 9.9 17 12 88/88/88 81/81/79 17/17/18 65/65/63 69/69/679 ENC by S + logP ITLA 10.0 20 6 87/87/85 80/80/80 18/18/18 63/63/62 67/67/6510 ENC by Pcornea ITLA 9.8 15 22 88/88/88 84/84/85 15/15/14 69/69/70 72/72/7311 ENC by S + Sw ITLA 10.0 19 48 89/89/90 86/86/86 13/13/13 72/72/73 75/75/7612 ENC by S + Sp ITLA 10.4 1 22 87/87/87 80/80/79 18/18/19 63/63/62 67/67/6613 ENC by RuleOf5 ITLA 10.1 5 50 89/89/90 85/85/81 14/14/16 71/71/67 74/74/7114 Random ITLA 10.5 5 20 87/87/81 84/84/84 15/15/17 68/68/63 71/71/6515 ENC by activity IG 11.0 19 14 85/85/82 81/81/81 18/18/19 63/63/60 66/66/6316 ENC by S + logP IG 11.0 16 28 91/91/85 80/80/82 16/16/17 67/67/65 72/72/6717 ENC by Pcornea IG 11.5 7 30 90/90/85 82/82/82 15/15/17 68/68/63 72/72/6718 ENC by S + Sw IG 11.0 7 24 82/82/83 86/86/85 15/15/16 66/66/66 68/68/6819 ENC by S + Sp IG 10.8 14 24 89/89/84 82/82/81 16/16/18 67/67/61 71/71/6420 ENC by RuleOf5 IG 11.2 5 24 88/88/89 83/83/78 16/16/18 67/67/63 71/71/6721 Random IG 12.0 3 50 88/88/83 85/85/82 14/14/18 70/70/62 73/73/65Average – statistics 10.5 10 26 88/88/85 82/82/82 16/16/17 66/66/64 70/70/67
ENC = every nth compound; S + logP = octanol–water partition coefficient (logP), Simulation Plus; S + Pcornea = permeability through rabbit cornea in cm/s � 107, Simulation Plus; S + Sw = native water solubility in mg/mL,Simulation Plus; S + Sp = solubility (mg/mL) in water at user specified pH calculated from pKa, S + IS and S + SF; RuleOf5 = computational filter for oral absorption in human identical to the Lipinski’s ‘‘RuleOf5’’; SA = SensitivityAnalysis; TLA = truncated linear analysis; ITLA = iterative truncated linear analysis; IG = input gradient; CT = computational time; No. N = number of neurons; No. D = number of descriptors; number of compounds (NOC) = 1562(training set) + 780 (verification set) + 586 (test set) = 2928.
324R
.P.Verm
a,E.J.Matthew
s/Regulatory
Toxicologyand
Pharmacology
71(2015)
318–330

Fig. 3. A weight of evidence (WoE) decision tree for the evaluation of results of QSAR-21 eye irritation models.
50.0
60.0
70.0
80.0
90.0
100.0
10 11 12 13 14 15 16 17 18 19 20 21
Perc
enta
ge R
elia
bilit
y in
Pos
itive
Pre
dict
ion
Number of ANN c-QSAR Models Exhibit Positive Prediction
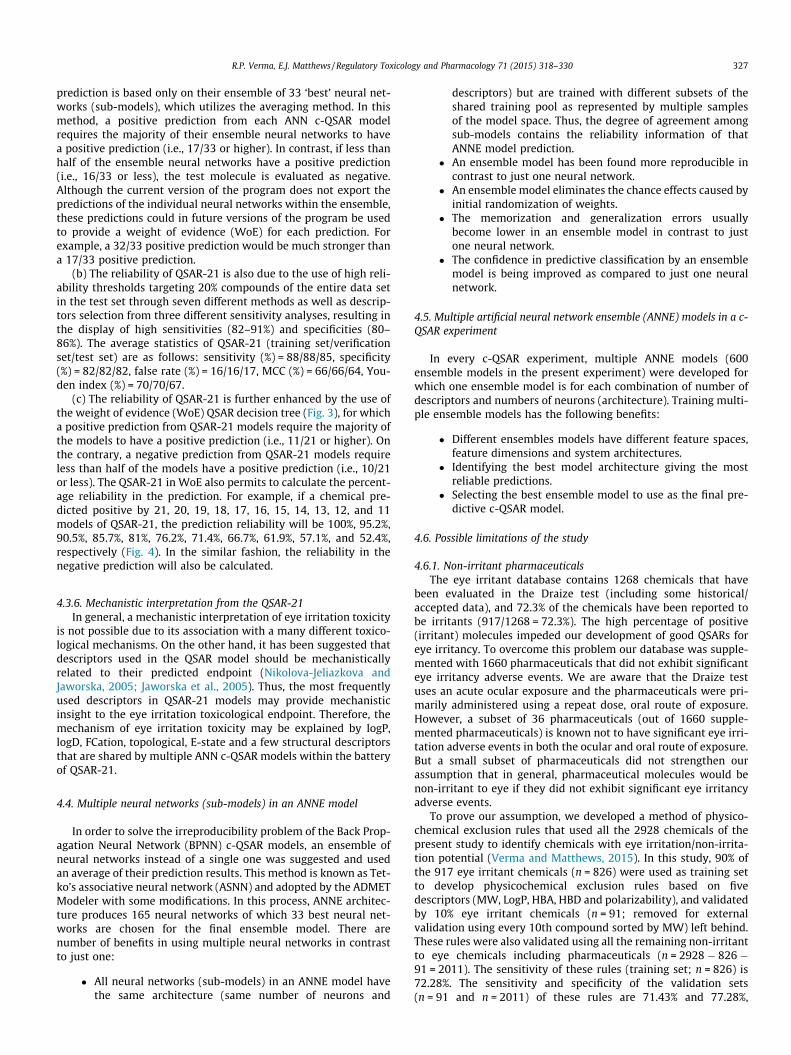
Fig. 4. Reliability in positive prediction by QSAR-21 in weight of evidence (WoE).
R.P. Verma, E.J. Matthews / Regulatory Toxicology and Pharmacology 71 (2015) 318–330 325
process produces 165 different partitions of the training and veri-fication sets for each ANNE architecture of which 33 are chosen forthe final ensemble model. However, if any one of the functional-ities of the ADMET modeler program is changed, an entirely newand different set of neural networks will be automatically gener-ated. Thus, each ANN c-QSAR will have different molecular descrip-tors, and different descriptor weights, as well as different test sets.Therefore the construction of 21 different ANN c-QSARs maximizesthe cumulative applicability domain (AD) of the models, and elim-inates the restrictive DoA problem by selecting only a few molec-ular descriptors in a single QSAR model. Furthermore, thereliability of the prediction is enhanced because the prediction isbased upon the majority rule for a battery of QSAR models(Fig. 3, 11/21 models), all of which have high predictive perfor-mance statistics. Most importantly, the QSAR-21 in WoE providesthe opportunity to calculate reliability in the prediction and thusenhanced the confidence in prediction. The reliability in the posi-tive prediction by QSAR-21 in WoE is demonstrated herein (seeFig. 4), similarly the same will be demonstrated for the negativeprediction. Finally, the present investigation employed a largeeye irritation toxicity data set of 2928 chemicals that maximizesthe detection of eye injury by different mechanisms through theselection of different sets of molecular descriptors in the 21 ANNc-QSAR models.
4.2. Construction of the QSAR-21
This investigation used the ADMET-Modeler’s seven test setselection methods, three sensitivity analyses, and the ANN c-QSARfunctionalities to develop a battery of 21 highly predictive and val-idated ANN c-QSAR models (QSAR-21). The process of c-QSARmodeling began by removing 20% test set using the method of
every nth compound sorted by activity and assigned as test set-1. The remaining 80% chemicals were assigned as training pool-1,which was further divided into training set-1 and verificationset-1. Similarly, we created another six different test sets (testset-2 to 7) and their corresponding training pools (training pool-2 to 7) using six different test set selection methods, including:(1) every nth compound sorted by S + logP, (2) every nthcompound sorted by S + Pcornea, (3) every nth compound sortedby S + Sw, (4) every nth compound sorted by S + Sp, (5) every nth

326 R.P. Verma, E.J. Matthews / Regulatory Toxicology and Pharmacology 71 (2015) 318–330
compound sorted by RuleOf5, and (6) random selection. This pro-cedure ensures that nearly all of the chemicals in the data set wererepresented by both the test sets (test sets-1 to 7) and trainingpools (training pools-1 to 7) in turn of seven different selections.Furthermore, each of the three sensitivity analyses (TLA, ITLA,and IG) gave seven different selection and ranking of descriptorsfor seven different training pools. Thus, a total of 21 different com-binations of training pool-descriptors were developed that yielded21 highly predictive ANN c-QSAR models. All of these c-QSAR mod-els were validated using the corresponding test set of their trainingpool.
In QSAR-21, 17 ANN c-QSARs were developed using 6–30descriptors while 4 ANN c-QSARs were developed using 32–50descriptors (see Table 1). Although ANN c-QSAR 9 is consideredas one of the best models because it uses the fewest number ofdescriptors (only six descriptors), QSAR-21 ensures the utilizationof 100% chemicals in the training pools (training sets andverification sets) as opposed to 80% in the model 9. Thus, thechemical space of the model 9 is only 80% of the chemicals of thedata base as compared to that of 100% in QSAR-21. ThereforeQSAR-21 maximizes the cumulative DoA of the models in WoEprediction and the better choice as compared to a single modelc-QSAR 9.
The three descriptors, e.g., T_Radmax (topological equivalent ofRadMax_3D), hydrophobic parameters (S + logP and S + logD), andFCation (cumulative contribution of purely cationic species to frac-tion ionized at pH 7.4) are the main contributors to the QSAR-21,which are used in 20, 18, and 18 ANN c-QSAR models, respectively.The other important descriptors are structural, topological, and E-state. Each of the three structural descriptors, e.g., M_RNG (indica-tor variable for the presence of ring structures except benzene andits condensed rings e.g., aromatic, hetero-aromatic, and hydrocar-bon rings), Nitrate_-O–NO2 (number of nitrate groups), and Steroid(flag indicating steroid-like fused ring subunit), are used in 14 ANNc-QSARs while Sulfonmd_-SO2–N < (number of sulfonamidegroups) and PriSlfmd_-SO2–NH2 (Number of Primary Sulfonamidegroups) are used in 13 and 9 ANN c-QSAR models, respectively. Thetopological descriptors e.g., T_HydroR (topological equivalent ofHydroR__3D), T_Dipole (topological equivalent of Dipole_3D) andT_Rada (topological equivalent of Rada__3D) are used in 12, 10,and 10 ANN c-QSAR models, respectively. SaaCH (atom-type E-state index for aCHa groups), SaasC (atom-type E-state index for-Caa groups) and SHaaCH (Atom-type hydrogen E-state index foraCHa groups: aromatic carbons) are the three E-state indexdescriptors, which are used in the development of 12, 11 and 9ANN c-QSARs, respectively.
4.3. OECD principles for the validation of QSARs
To facilitate the consideration of a QSAR model for regulatorypurposes, the OECD Member Countries adopted the following fiveprinciples: (a) a defined endpoint; (b) an unambiguous algorithm;(c) a defined domain of applicability (DoA); (d) appropriate mea-sures of goodness-of-fit, robustness and predictivity; and (e) amechanistic interpretation, if possible.
4.3.1. Defined endpointThe defined endpoint for this study is chemical induced toxicity
to the eye that is detected in the in vivo Draize test and character-ized as fully reversible in 21 days, i.e., eye irritation.
4.3.2. Unambiguous algorithmThe ANN QSAR algorithm is described in the materials and
methods (Section 2.5.5).
4.3.3. Domain of applicability (DoA) of the QSAR-21A descriptor-based QSAR model can predict the potential toxic-
ity of almost any organic compound, but the predictive confidencecan vary. The prediction quality of a QSAR model mainly dependsto what extent the tested compounds are represented by structur-ally related compounds in the model, i.e., coverage or DoA. If acompound falls outside the DoA, the reliability of the predictionis uncertain. An approach to determine the DoA of a QSAR modelis to estimate the similarity of the test compound to the com-pounds in the training set, which is however, always descriptordependent. Ideally, the descriptors used for estimation of the appli-cability domain should be mechanistically related to the predictedendpoint (Nikolova-Jeliazkova and Jaworska, 2005; Jaworska et al.,2005).
The ADMET Predictor automatically determines whether a testcompound is within the DoA, or outside the DoA, of the modelby incorporating minimum and maximum values of each descrip-tor in the training set plus a 10% tolerance. Thus, the QSAR modelswith minimal number of descriptors will always have maximumDoA. If a test molecule is outside the DoA of the molecular descrip-tors then the ADMET Predictor evaluates it as outside the DoA andcolor codes (magenta color) the prediction. In the present investi-gation, we developed the following 6, 11 and 4 ANN c-QSAR mod-els using with a range of 6–20, 21–30, and 32–50 descriptors,respectively. The use of fewer descriptors suggests that theQSAR-21 models have high DoA.
4.3.4. Robustness of the QSAR-21The robustness of QSAR-21 models developed by ADMET Mod-
eler was achieved in the following steps: (a) the program first gen-erated 21 different training pool-descriptors combinations as wellas their respective test sets (using seven different test set selectionmethods and three different sensitivity analyses) in order todevelop 21 highly predictive ANN c-QSAR models. The test setswere kept aside and used only to test the predictive accuracy ofthe respective ANN c-QSAR models. (b) The program automaticallydivides the training pool into training and verification sets throughKohonen mapping. The training set is used to minimize the errorfunction of the model as the ANN weights are adjusted, while theerror function for the verification set is monitored to prevent over-training. (c) Molecules in the training and verification sets areexchanged randomly for each candidate neural network in such away that trains typically 165 neural networks for each specifiednumber of descriptors and neurons. In the present QSAR-21 exper-iment, 2–60 descriptors at 2 descriptors intervals (30 steps) and 1–20 neurons at 1 neuron intervals were utilized. Thus, a pool of 600(i.e., 20 � 30 = 600) architectures for each ANN c-QSAR experimentwere established with the statistics of their training, verificationand test sets. Again, each of all 600 architectures represents a poolof 165 neural networks. Thus, the program generated 99,000 (i.e.,20 � 30 � 165 = 99,000) neural networks (sub-models) in orderto select the best architecture for an ANN c-QSAR model. Collec-tively, the program generated 2,079,000 (i.e., 20 � 30 � 165 �21 = 2,079,000) neural networks for the selection of 21 best archi-tectures for QSAR-21. The verification set prevents overtraining ofthe models, and the test set ensures the maximum possible robust-ness of the QSAR-21.
4.3.5. Reliability of the QSAR-21The reliability of QSAR-21 is ascertained as follows: (a) for a
pool of 600 architectures of an ANN c-QSAR experiment, eachANNE architecture retained only the best 33 neural networks outof 165 (i.e., 132 are discarded) and displayed the average statisticsof their training, verification and test sets. The best ANN c-QSARmodel is the ensemble that has the best average statistics of theirtraining, verification and test sets. Thus, the ANN c-QSAR model
R.P. Verma, E.J. Matthews / Regulatory Toxicology and Pharmacology 71 (2015) 318–330 327
prediction is based only on their ensemble of 33 ‘best’ neural net-works (sub-models), which utilizes the averaging method. In thismethod, a positive prediction from each ANN c-QSAR modelrequires the majority of their ensemble neural networks to havea positive prediction (i.e., 17/33 or higher). In contrast, if less thanhalf of the ensemble neural networks have a positive prediction(i.e., 16/33 or less), the test molecule is evaluated as negative.Although the current version of the program does not export thepredictions of the individual neural networks within the ensemble,these predictions could in future versions of the program be usedto provide a weight of evidence (WoE) for each prediction. Forexample, a 32/33 positive prediction would be much stronger thana 17/33 positive prediction.
(b) The reliability of QSAR-21 is also due to the use of high reli-ability thresholds targeting 20% compounds of the entire data setin the test set through seven different methods as well as descrip-tors selection from three different sensitivity analyses, resulting inthe display of high sensitivities (82–91%) and specificities (80–86%). The average statistics of QSAR-21 (training set/verificationset/test set) are as follows: sensitivity (%) = 88/88/85, specificity(%) = 82/82/82, false rate (%) = 16/16/17, MCC (%) = 66/66/64, You-den index (%) = 70/70/67.
(c) The reliability of QSAR-21 is further enhanced by the use ofthe weight of evidence (WoE) QSAR decision tree (Fig. 3), for whicha positive prediction from QSAR-21 models require the majority ofthe models to have a positive prediction (i.e., 11/21 or higher). Onthe contrary, a negative prediction from QSAR-21 models requireless than half of the models have a positive prediction (i.e., 10/21or less). The QSAR-21 in WoE also permits to calculate the percent-age reliability in the prediction. For example, if a chemical pre-dicted positive by 21, 20, 19, 18, 17, 16, 15, 14, 13, 12, and 11models of QSAR-21, the prediction reliability will be 100%, 95.2%,90.5%, 85.7%, 81%, 76.2%, 71.4%, 66.7%, 61.9%, 57.1%, and 52.4%,respectively (Fig. 4). In the similar fashion, the reliability in thenegative prediction will also be calculated.
4.3.6. Mechanistic interpretation from the QSAR-21In general, a mechanistic interpretation of eye irritation toxicity
is not possible due to its association with a many different toxico-logical mechanisms. On the other hand, it has been suggested thatdescriptors used in the QSAR model should be mechanisticallyrelated to their predicted endpoint (Nikolova-Jeliazkova andJaworska, 2005; Jaworska et al., 2005). Thus, the most frequentlyused descriptors in QSAR-21 models may provide mechanisticinsight to the eye irritation toxicological endpoint. Therefore, themechanism of eye irritation toxicity may be explained by logP,logD, FCation, topological, E-state and a few structural descriptorsthat are shared by multiple ANN c-QSAR models within the batteryof QSAR-21.
4.4. Multiple neural networks (sub-models) in an ANNE model
In order to solve the irreproducibility problem of the Back Prop-agation Neural Network (BPNN) c-QSAR models, an ensemble ofneural networks instead of a single one was suggested and usedan average of their prediction results. This method is known as Tet-ko’s associative neural network (ASNN) and adopted by the ADMETModeler with some modifications. In this process, ANNE architec-ture produces 165 neural networks of which 33 best neural net-works are chosen for the final ensemble model. There arenumber of benefits in using multiple neural networks in contrastto just one:
� All neural networks (sub-models) in an ANNE model havethe same architecture (same number of neurons and
descriptors) but are trained with different subsets of theshared training pool as represented by multiple samplesof the model space. Thus, the degree of agreement amongsub-models contains the reliability information of thatANNE model prediction.
� An ensemble model has been found more reproducible incontrast to just one neural network.
� An ensemble model eliminates the chance effects caused byinitial randomization of weights.
� The memorization and generalization errors usuallybecome lower in an ensemble model in contrast to justone neural network.
� The confidence in predictive classification by an ensemblemodel is being improved as compared to just one neuralnetwork.
4.5. Multiple artificial neural network ensemble (ANNE) models in a c-QSAR experiment
In every c-QSAR experiment, multiple ANNE models (600ensemble models in the present experiment) were developed forwhich one ensemble model is for each combination of number ofdescriptors and numbers of neurons (architecture). Training multi-ple ensemble models has the following benefits:
� Different ensembles models have different feature spaces,feature dimensions and system architectures.
� Identifying the best model architecture giving the mostreliable predictions.
� Selecting the best ensemble model to use as the final pre-dictive c-QSAR model.
4.6. Possible limitations of the study
4.6.1. Non-irritant pharmaceuticalsThe eye irritant database contains 1268 chemicals that have
been evaluated in the Draize test (including some historical/accepted data), and 72.3% of the chemicals have been reported tobe irritants (917/1268 = 72.3%). The high percentage of positive(irritant) molecules impeded our development of good QSARs foreye irritancy. To overcome this problem our database was supple-mented with 1660 pharmaceuticals that did not exhibit significanteye irritancy adverse events. We are aware that the Draize testuses an acute ocular exposure and the pharmaceuticals were pri-marily administered using a repeat dose, oral route of exposure.However, a subset of 36 pharmaceuticals (out of 1660 supple-mented pharmaceuticals) is known not to have significant eye irri-tation adverse events in both the ocular and oral route of exposure.But a small subset of pharmaceuticals did not strengthen ourassumption that in general, pharmaceutical molecules would benon-irritant to eye if they did not exhibit significant eye irritancyadverse events.
To prove our assumption, we developed a method of physico-chemical exclusion rules that used all the 2928 chemicals of thepresent study to identify chemicals with eye irritation/non-irrita-tion potential (Verma and Matthews, 2015). In this study, 90% ofthe 917 eye irritant chemicals (n = 826) were used as training setto develop physicochemical exclusion rules based on fivedescriptors (MW, LogP, HBA, HBD and polarizability), and validatedby 10% eye irritant chemicals (n = 91; removed for externalvalidation using every 10th compound sorted by MW) left behind.These rules were also validated using all the remaining non-irritantto eye chemicals including pharmaceuticals (n = 2928 � 826 �91 = 2011). The sensitivity of these rules (training set; n = 826) is72.28%. The sensitivity and specificity of the validation sets(n = 91 and n = 2011) of these rules are 71.43% and 77.28%,

328 R.P. Verma, E.J. Matthews / Regulatory Toxicology and Pharmacology 71 (2015) 318–330
respectively. We also applied these rules separately on the 1660pharmaceuticals alone that did not exhibit significant eye irritancyadverse events and found their specificity is 81.21%.
In our second attempt, we predicted all the 1660 pharmaceuti-cals that did not exhibit significant eye irritancy adverse eventsusing ACD/Percepta program (www.acdlabs.com) to identifychemicals with eye irritation/non-irritation potential. The programpredicted 1652 pharmaceuticals for their possible eye irritation/non-irritation potential and the remaining 8 pharmaceuticals werenot predicted. The specificity of the pharmaceuticals (n = 1652) hasbeen determined as 84.08% by the ACD/Percepta program.
On the basis of the above two experiments, it is a reasonable tosay that in general, pharmaceutical molecules would not be eyeirritants if they did not exhibit significant eye irritancy adverseevents. Thus, we assumed that pharmaceuticals with no significanteye irritancy adverse events would have been classified as inactive(non-irritant, slightly irritant, mild irritant and minimal irritant), ifthey had been tested in the Draize test. This decision gave us anopportunity to create a better eye irritancy database with a lowerpercentage of actives, and thus greatly enhanced the subtractivepower of the QSAR-21 for molecular features that are not associ-ated with chemical-induced eye injury.
4.6.2. Ambiguity of Draize test dataAlthough the rabbit Draize test is the only in vivo test that has
been globally used by various regulatory agencies in order to eval-uate the eye irritation potential of chemicals and formulated prod-ucts (OECD, 1981), it has two major scientific criticisms: (a)significant variability in the test results can occur due to visualscoring evaluation of the test and (b) significant differences inphysiology and sensitivity to tested substances exist between rab-bit and human eyes (Weil and Scala, 1971; Curren and Harbell,2002; Cho et al., 2012). Furthermore, eye irritation data in the pub-lic domain is often described in qualitative terms (e.g., severe,acute, strong, moderate, mild, slightly, and minimal irritants andnon-irritant) and the experimental Draize test scores are not pre-sented. Therefore, we used the activity in binary terms (e.g., 1verses 0 for irritant verses non-irritant) in order to developQSAR-21. Thus the predictions based upon QSAR-21 will alwaysbe in terms of irritant verses non-irritant to eye. However, the highpredictive performance of the QSAR-21 will greatly enhance ourknowledge of eye irritancy for data-poor chemicals.
4.6.3. ADMET Predictor experimental dataThe current version of the ADMET-Predictor program does not
export the predictions of the individual neural networks withinan ensemble model, thus there is no way to assess the WoE of indi-vidual predictions. For example, a positive prediction can be basedupon 17 of 33 through 33 of 33 sub-models, the latter predictionhaving a much higher WoE. However, the predictions for the indi-vidual sub-models exist within the program, and these data couldbe exported in a future version of the program.
The QSAR-21 method described in this paper partially over-comes this limitation of the study and even calculate the reliabilityin the prediction, because the predictions of each the 21 ensemblesof models are exported. For example, if all the 21 models of QSAR-21 predict a chemical as positive, the prediction reliability will be100%. Similarly, if a chemical predicted positive by 20, 19, 18 . . .11models of QSAR-21, the prediction reliability will be 95.2%, 90.5%,85.7% . . .52.4%, respectively (Fig. 4). In the similar fashion, the reli-ability in the negative prediction will also be calculated.
4.7. Possible benefits of QSAR-21
Following are the possible benefits of using QSAR-21 models:
� All chemicals in the data set are likely represented withinthe seven different training pools and their correspondingseven test sets in turn of seven different selections.
� Three different sensitivity analysis (SA) methods selectthree different groups of descriptors for the same trainingpool resulting three different models. Thus, each of the 21models of QSAR-21 is different in respect of theirdescriptors.
� Only one QSAR program is used to develop QSAR-21models.
� Most frequently used descriptors in QSAR-21 models pro-vide mechanistic insight to the toxicological endpoint.
� QSAR-21 maximizes the cumulative DoA, and eliminatesthe restrictive AD problem of individual model.
� QSAR-21 maximizes the predictive ability because itscumulative external validation is raised to the optimummark.
� QSAR-21 enhances the prediction reliability in a WoEapproach.
� QSAR-21 calculates the confidence limit in the prediction(Fig. 4).
4.8. Need for eye irritation QSAR-21
We estimate that there are at least 25,000 different chemicalsused as ingredients in cosmetic products, and based upon our thor-ough search for eye irritancy data, we estimate that less than 1300chemicals have been either evaluated in the Draize test or theirhistorical/accepted data are available. Therefore, 95% of the chem-icals are considered data poor and their potential for eye injury hasnot been experimentally evaluated. Thus, there are many data gapsin our knowledge of chemical-induced eye injury and a need forQSAR-21 estimation of potential eye irritation is great. Further-more, it is unlikely that these data-poor cosmetic ingredients willever be evaluated in the Draize test. The EU 7th Amendment tothe Cosmetic Directive bans the marketing of new cosmetics iftheir ingredients are tested in animal studies. Likewise, the EEC(1992) and UNECE (2004) has published guidelines to minimizethe need for the Draize test, to specifically avoid unnecessary ani-mal testing, and to substitute in vitro and in silico data in place ofin vivo data.
5. Conclusion
The traditional method for evaluation of potential chemical-induced eye injury through irritation and corrosion is the rabbitDraize test; however, this test is ethically controversial, scientifi-cally problematic, and impractical for estimating eye toxicity oflarge numbers of data poor chemicals. The scientific communityhas been challenged to develop and validate QSARs, SARs, SPRs,in vitro and/or ex vivo tests to identify/screen chemical for eye irri-tation and corrosion (EEC, 1992; UNECE, 2004; Saliner and Worth,2007). Previous in silico reports were limited by the molecular sizeand diversity of the training data set, and by QSARs for a limitednumber of congeneric chemical classes. This report describes thedevelopment of a global in silico method that could be used to per-form a high-throughput screen of data poor chemicals for potentialchemical eye irritation. The method involves the use of ANN soft-ware and takes advantage of ANNs that can identify multiple SARsolutions to a complex toxicological problem. The method isexpected to have a very high DoA for cosmetic ingredients becauseof the size and diversity of the training data set, and high predictiveperformance based upon high statistics of external and internalvalidation experiments described herein. The QSAR-21 predictionsin WoE also permit to calculate the reliability in the prediction and

R.P. Verma, E.J. Matthews / Regulatory Toxicology and Pharmacology 71 (2015) 318–330 329
thus provide the confidence in the prediction. Collectively, thisstudy accomplished the major goal of the investigation to develophigh performance QSARs to fill data-gaps of eye injury (eye irrita-tion) and it contributes to the Refinement, Reduction and Replace-ment (3Rs) of animals in the safety assessment process.
6. Funding
One of the authors (Dr. Rajeshwar P. Verma) is grateful to theOffice of Cosmetics and Colors (OCAC) at CFSAN of U.S. Food andDrug Administration (FDA) for financial support through the OakRidge Institute for Science and Education (ORISE) and GoldbeltFalcon.
Acknowledgments
We wish to thank Linda Katz, Patricia Hansen, Nakissa Sadrieh,Stanley Milstein (CFSAN/OCAC), and Dennis Keefe and Mary Ditto(CFSAN/OFAS) for their encouragement and support of our work.We also thank Dr. Mike Lawless of Simulations Plus Inc., Lancaster,CA, for helpful discussions.
Appendix A. Supplementary data
Supplementary data associated with this article can be found, inthe online version, at http://dx.doi.org/10.1016/j.yrtph.2014.11.011.
References
Abraham, M.H., 1994. Scales of solute hydrogen-bonding: their construction andapplication to physicochemical and biochemical processes. Chem. Soc. Rev. 22,73–83.
Abraham, M.H., Kumarsingh, R., Cometto-Muniz, J.E., Cain, W.S., 1998a. Aquantitative structure-activity relationship (QSAR) for a Draize eye irritationdatabase. Toxicol. In Vitro 12, 201–207.
Abraham, M.H., Kumarsingh, R., Cometto-Muniz, J.E., Cain, W.S., 1998b. Draize eyescores and eye irritation thresholds in man can be combined into one QSAR.Olfaction Taste XII 855, 652–656.
ADMET Predictor™ User Manual, March 21, 2013 – Version 6.5, 180–181.Alves, E.N., Presgrave, R.D.F., Presgrave, O.A.F., Sabagh, F.P., de Freitas, J.C.B.R.,
Corrado, A.P., 2008. A reassessment of the in vitro RBC haemolysis assay withdefibrinated sheep blood for the determination of the ocular irritation potentialof cosmetic products: comparison with the in vivo Draize rabbit test. ATLAAltern. Lab. Anim. 36 (3), 275–284.
Andersen, F.A., 1999. Final report on the safety assessment of ascorbyl palmitate,ascorbyl dipalmitate, ascorbyl stearate, erythorbic acid, and sodiumerythorbate. Int. J. Toxicol. 18 (Suppl. 3), 1–26.
Bagley, D.M., Gardner, J.R., Holland, G., Lewis, R.W., Vrijhof, H., Walker, A.P., 1999.Eye irritation: updated reference chemicals data bank. Toxicol. In Vitro 13, 505–510.
Baldi, P., Brunak, S., Chauvin, Y., Andersen, C.A.F., Nielsen, H., 2000. Assessing theaccuracy of prediction algorithms for classification: an overview. Bioinf. Rev. 16,412–424.
Balls, M., Botham, P.A., Bruner, L.H., Spielmann, H., 1995. The EC/HO internationalvalidation study on alternatives to the Draize eye irritation test. Toxicol. In Vitro9, 871–929.
Barratt, M.D., 1997. QSARs for the eye irritation potential of neutral organicchemicals. Toxicol. In Vitro 11, 1–8.
Benfenati, E., Diaza, R.G., Cassano, A., Pardoe, S., Gini, G., Mays, M., Knauf, R., LudgerBenighaus, L., 2011. The acceptance of in silico models for REACH:requirements, barriers, and perspectives. Chem. Cent. J. 5, 58.
Bradlaw, J., Gupta, K., Green, S., Hill, R., Wilcox, N., 1997. Practical application ofnon-whole animal alternatives: summary IRAG workshop on eye irritation.Food Chem. Toxicol. 35, 175–178.
Brantom, P.G., Bruner, L.H., Chamberlain, M., Desilva, O., Dupuis, J., Earl, L.K., Lovell,D.P., Pape, W.J.W., Uttley, M., Bagley, D.M., Baker, F.W., Brachter, M.,Courtellemont, P., Declercq, L., Freeman, S., Steiling, W., Walker, A.P., Carr,G.J., Dami, N., Thomas, G., Harbell, J., Jones, P.A., Pfannenbecker, U., Southee, J.A.,Tcheng, M., Argembeaux, H., Castelli, D., Clothier, R., Esdaile, D.J., Itigaki, H.,Jung, K., Kasai, Y., Kojima, H., Kristen, U., Larnicol, M., Lewis, R.W., Marenus, K.,Moreno, O., Peterson, A., Rasmussen, E.S., Robles, C., Stern, M., 1997. A summaryreport of the COLIPA international validation study on alternatives to the Draizerabbit eye irritation test. Toxicol. In Vitro 11, 141–179.
Cho, S.A., An, S., Lee, E., Shin, K., Cho, J.C., Lee, T.R., 2012. A new cell-based methodfor assessing the eye irritation potential of chemicals: an alternative to theDraize test. Toxicol. Lett. 212, 198–204.
CIR, 1988. Final report on the safety assessment of cetearyl alcohol, cetyl alcohol,isostearyl alcohol, myristyl alcohol, and behenyl alcohol. Int. J. Toxicol. 7, 359–413.
CIR, 2002. Final report on the safety assessment of tocopherol, tocopheryl acetate,tocopheryl linoleate, tocopheryl linoleate/oleate, tocopheryl nicotinate,tocopheryl succinate, dioleyl tocopheryl, methylsilanol, potassium ascorbyltocopheryl phosphate, and tocophersolan. Int. J. Toxicol. 21(Suppl. 3), 51–116.
CIR, 2012. Alkyl esters re-review -supplement book 1: cetyl esters and otherpreviously reviewed alkyl esters. CIR Expert Panel Meeting, March 5–6, 2012.pp.1–310. <http://www.cir-safety.org/sites/default/files/Supplement%20Book%201.pdf>.
Cronin, M.T.D., Basketter, D.A., York, M., 1994. A quantitative structure–activityrelationship (QSAR) investigation of a Draize eye irritation database. Toxicol. InVitro 8, 21–28.
Curren, R.D., Harbell, J.W., 2002. Ocular safety: a silent (in vitro) success story.Altern. Lab. Anim. 30 (Suppl. 2), 69–74.
Draize, J.H., Woodard, G., Calvery, H.O., 1944. Methods for the study of irritation andtoxicity of substances applied topically to the skin and mucous membranes. J.Pharmacol. Exp. Ther. 82, 377–390.
EC, 2003. Directive 2003/15/EC of the European Parliament and of the Council of 27February 2003 amending Council Directive 76/768/EEC on the approximation ofthe laws of the Member States relating to cosmetic products. Official Journal ofthe European Union L66, 26–35.
EC, 2004. Manual of Decisions for Implementation of the 6th and 7th Amendmentsto Directive 67/548/EEC on Dangerous Substances. Updated version of July 2004(EUR 20519). Ispra, Italy: European Chemicals Bureau, European CommissionJRC. Website: <http://ecb.jrc.it/classification-labelling>, p. 189.
European Economic Community (EEC) 1992. Annex V-Methods for thedetermination of toxicity. B.5. Acute toxicity (Eye Irritation). Official Journalof European Communities L383, A 35.
Eskes, C., Bessou, S., Bruner, L., Curren, R., Harbell, J., Jones, P., Kreiling, R., Liebsch,M., McNamee, P., Pape, W., Prinsen, M.K., Seidle, T., Vanparys, P., Worth, A.,Zuang, V., 2005. Eye irritation. Altern. Lab. Anim. 33 (Suppl. 1), 47–81.
Gallegos-Saliner, A., Patlewicz, G., Worth, A.P., 2008. A review of (Q)SAR models forskin and eye irritation and corrosion. QSAR Combut. Sci. 27, 49–59.
Gettings, S.D., Lordo, R.A., Hintze, K.L., Bagley, D.M., Casterton, P.L., Chudkowski, M.,Curren, R.D., Demetrulias, J.L., DiPasquale, L.C., Earl, L.K., Feder, P.I., Galli, C.L.,Glaza, S.M., Gordon, V.C., Janus, J., Kurtz, P.J., Marenus, K.D., Moral, J., Pape,W.J.W., Renskers, K.J., Rheins, L.A., Roddy, M.T., Rozen, M.G., Tedeschi, J.P.,Zyracki, J., 1996. The CTFA evaluation of alternatives program: an evaluation ofin vitro alternatives to the Draize primary eye irritation test. (Phase III)Surfactant-based formulations. Food Chem. Toxicol. 34, 79–117.
Hansch, C., Leo, A., 1995. Exploring QSAR. In: Heller, S.R. (Ed.), Fundamentals andApplications in Chemistry and Biology. American Chemical Society,Washington, DC, pp. 1–588.
Harbell, J., Curren, R., 2001. In vitro methods for the prediction of ocular and dermaltoxicity. In: Derelanko, M.J., Hollinger, M.A. (Eds.), Handbook of Toxicology,second ed. CRC Press, Boco Raton, pp. 835–866.
ILSI Technical Committee on Alternatives to Animal Testing (TCAAT), 1996.Replacing the Draize eye irritation test: Scientific background and researchneeds. J. Toxicol. Cutaneous Ocul. Toxicol. 15, 211–234.
Jaworska, J., Nikolova-Jeliazkova, N., Aldenberg, T., 2005. QSAR applicability domainestimation by projection of the training set in descriptor space: a review. ATLA33, 445–459.
Kulkarni, A., Hopfinger, A.J., Osborne, R., Bruner, L.H., Thompson, E.D., 2001.Prediction of eye irritation from organic chemicals using membrane-interactionQSAR analysis. Toxicol. Sci. 59, 335–345.
Louekari, K., 2004. Status and prospects of in vitro tests in risk assessment. ATLAAltern. Lab. Anim. 32 (4), 431–435.
Matthews, B.W., 1975. Comparison of the predicted and observed secondarystructure of T4 phage lysozyme. Biochim. Biophys. Acta 405, 442–451.
National Research Council, 2007. Toxicity Testing in the 21st Century: A Vision anda Strategy. National Academy Press, Washington, DC.
NIEHS, 2008. News Release: Newly Approved Ocular Safety Methods Reduce AnimalTesting. Available at: <http://www.niehs.nih.gov/news/releases/2008/ocular.cfm>.
Nikolova-Jeliazkova, N., Jaworska, J., 2005. An approach to determining applicabilitydomains for QSAR contribution models: an analysis of SRC KOWWIN. ATLA 33,461–470.
OECD, 1981. OECD Guidelines for Testing of Chemicals; Test Guideline 405, AcuteEye Irritation/Corrosion (Adopted on 12 May 1981, revised on 24 February1987. Updated Guideline, adopted 24 April 2002). OECD (Organization forEconomic Cooperation and Development), Paris, France.
Ohno, Y., Kaneko, T., Inoue, T., Morikawa, Y., Yoshida, T., Fuji, A., Masuda, M., Ohno,T., Hayashi, M., Momma, J., Uchiyama, T., Chiba, K., Ikeda, N., Imanashi, Y.,Itakagaki, H., 1999. Interlaboratory validation of the in vitro eye irritation testsfor cosmetic ingredients. (1) Overview of the validation study and Draize scoresfor the evaluation of the tests. Toxicol. In Vitro 13, 73–98.
Patlewicz, G.Y., El-Deredy, W., 1999. Identification of molecular properties ofcationic surfactants causing eye irritation: a QSAR Bayesian neural networkmodel. In: Proceedings, Predictive Toxicology of Chemicals: Experiences andImpact of AI Tools AAAI Spring Symposium, Menlo Park, CA, USA, March 22–24,pp. 123–127.

330 R.P. Verma, E.J. Matthews / Regulatory Toxicology and Pharmacology 71 (2015) 318–330
Patlewicz, G.Y., Rodford, R.A., Ellis, G., Barratt, M.D., 2000. A QSAR model for the eyeirritation of cationic surfactants. Toxicol In Vitro 14, 79–84.
Pinto, T.J.A., Ikeda, T.I., Miyamaru, L.L., Santa, M.C., Santos, B.R.P., Cruz, A.S., 2009.Cosmetic safety: proposal for the replacement of in vivo (Draize) by in vitro test.Open Toxicol. J. 3, 1–7.
Russell, W.M.S., Burch, R.L., 1959. The Principles of Humane ExperimentalTechnique. Methuen, London.
Saliner, A.G., Worth, A.P., 2007. Testing Strategies for the Prediction of Skin and EyeIrritation and Corrosion for Regulatory Purposes. JRC Technical EUR Report. EUR22881 EN, Luxembourg, Italy: European Commission, Joint Research Centre, pp. 46.
Saliner, A.G., Patlewicz, G., Worth, A.P., 2006. Review of Literature-Based Models forSkin and Eye Irritation and Corrosion. JRC Technical EUR Report. EUR 22320 EN,Ispra, Italy: European Commission, Joint Research Centre, pp. 104.
Scheel, J., Kleber, M., Kreutz, J., Lehringer, E., Mehling, A., Reisinger, K., Steiling, W.,2011. Eye irritation potential: usefulness of the HET-CAM under the globallyharmonized system of classification and labeling of chemicals (GHS). Regul.Toxicol. Pharm. 59, 471–492.
Schiffelers, M.-J.W.A., Blaauboer, B.J., Hendriksen, C.F.M., Bakker, W.E., 2012.Regulatory acceptance and use of 3R models: a multilevel perspective. Altex29, 287–300.
Scott, L., Eskes, C., Hoffmann, S., Adriaens, E., Alepée, N., Bufo, M., Clothier, R.,Facchini, D., Faller, C., Guest, R., Harbell, J., Hartung, T., Kamp, H., Le Varlet, B.,Meloni, M., McNamee, P., Osborne, R., Pape, W., Pfannenbecker, U., Prinsen, M.,Seaman, C., Spielmann, H., Stokes, W., Trouba, K., Van den Berghe, C., VanGoethem, F., Vassallo, M., Vinardell, P., Zuang, V., 2010. A proposed eye irritationtesting strategy to reduce and replace in vivo studies using bottom-up and top-down approaches. Toxicol. In Vitro 24, 1–9.
Selassie, C., Verma, R.P., 2010. History of quantitative structure–activityrelationships. In: Abraham, D.J., Rotella, D.P. (Eds.), Burger’s MedicinalChemistry, Drug Discovery, and Development, vol. 1. John Wiley & Sons Inc,New York, pp. 1–95, seventh ed..
Spielmann, H., Liebsch, M., Kalweit, S., Moldenhauer, F., Wirnsberger, T.,Holzhuetter, H.G., Schneider, B., Glaser, S., Gerner, I., Pape, W.J.W., Kreiling, R.,Krauser, K., Miltenburger, H.G., Steiling, W., Luepke, N.P., Mueller, N., Kreuzer,H., Muermann, P., Spengler, J., Betram-Neis, E., Siegemund, B., Wiebel, F.J., 1996.Results of a validation study in Germany on two in vitro alternatives to theDraize eye irritation test, the HET-CAM test and the 3T3 NRU cytotoxicity test.Altern. Lab. Anim. 24, 741–858.
Sugai, S., Murata, K., Kitagaki, T., Tomita, I., 1990. Studies on eye irritation caused bychemicals in rabbits – 1. A quantitative structure–activity relationshipsapproach to primary eye irritation of chemicals in rabbits. J. Toxicol. Sci. 15,245–262.
Sugai, S., Murata, K., Kitagaki, T., Tomita, I., 1991. Studies on the eye irritationcaused by chemicals in rabbits – II. Structure–activity relationships and in vitroapproach to primary eye irritation of salicylates in rabbits. J. Toxicol. Sci. 16,111–130.
Takahashi, Y., 2007. Usefulness of short time exposure (STE) method for evaluationof eye irritation potential of cosmetic ingredients. Fragrance J. 35 (10), 35–42.
Taylor, K., Stengel, W., Casalegno, C., Andrew, D., 2014. Food for thought. . .
experiences of the REACH testing proposals system to reduce animal testing.Altex 31, 107–128.
Tetko, I.V., 2002. Neural network studies. 4. Introduction to associative neuralnetworks. J. Chem. Inf. Comput. Sci. 42, 717–728.
Tsakovska, I., Netzeva, T., Worth, A.P., 2005. Evaluation of (Q)SARs for the predictionof Eye Irritation/Corrosion potential, Physicochemical exclusion rules. JRCTechnical EUR Report. EUR 21897 EN, Ispra, Italy: European Commission,Joint Research Centre, pp. 38.
United Nations Economic Commission for Europe (UNECE), 2004. GloballyHarmonized System of Classification and Labeling of Chemicals (GHS). Part 3,Health and environmental hazards. Chapter 3.3. Serious eye damage/eyeirritation. <http://www.unece.org/fileadmin/DAM/trans/danger/publi/ghs/ghs_rev00/English/GHS-PART-3e.pdf>.
Ursem, C.J., Kruhlak, N.L., Contrera, J.F., MacLaughlin, P.M., Benz, R.D., Matthews, E.J.,2009. Identification of structure–activity relationships for adverse effects ofpharmaceuticals in humans. Part A: use of FDA post-market reports to create adatabase of hepatobiliary and urinary tract toxicities. Regul. Toxicol. Pharm. 54,1–22.
Verma, R.P., Hansch, C., 2009. Camptothecins: a SAR/QSAR study. Chem. Rev. 109,213–235.
Verma, R.P., Hansch, C., 2011. Use of 13C NMR chemical shifts as QSAR/QSPRdescriptor. Chem. Rev. 111, 2865–2899.
Verma, R.P., Matthews, E.J., 2014. Estimation of the chemical-induced eye injuryusing a weight-of-evidence (WoE) battery of 21 artificial neural network (ANN)c-QSAR models (QSAR-21): Part II: Corrosion potential. Regul. Toxicol. Pharm.71, 331–336.
Verma, R.P., Matthews, E.J., 2015. An in silico expert system for the identification ofeye irritants. (Unpublished results).
Verma, R.P., Hansch, C., Selassie, C.D., 2007. Comparative QSAR studies on PAMPA/modified PAMPA for high throughput profiling of drug absorption potentialwith respect to Caco-2 cells and human intestinal absorption. J. Comput. AidedMol. Des. 21, 3–22.
Verstraelen, S., Jacobs, A., Wever, B.D., Vanparys, P., 2013. Improvement of thebovine corneal opacity and permeability (BCOP) assay as an in vitro alternativeto the Draize rabbit eye irritation test. Toxicol. In Vitro 27, 1298–1311.
Weil, C.S., Scala, R.A., 1971. Study of intra- and interlaboratory variability inthe results of rabbit eye and skin irritation tests. Toxicol. Appl. Pharm. 19,276–360.
Weininger, D., 1988. SMILES, a chemical language and information system. 1.Introduction to methodology and encoding rules. J. Chem. Inf. Comput. Sci. 28,31–36.
Wilhelmus, K.R., 2001. The Draize eye test. Surv. Ophthalmol. 45, 493–515.Yang, Y., Yang, X., Zhang, W., Cai, J., Xue, J., Yang, G., Tan, X., Xie, X., Xiong, X., Huang,
J., Guo, X., 2010. Combined in vitro tests as an alternative to in vivo eyeirritation tests. Altern. Lab. Anim. 38 (4), 303–314.
Youden, W.J., 1950. Index for rating diagnostic tests. Cancer 3, 32–35.
Copyright © 2022 FDOKUMEN