Prediction of aqueous toxicity for heterogeneous phenol derivatives by QSAR
11
Prediction of aqueous toxicity for heterogeneous phenol derivatives by QSAR Pablo R. Duchowicz, Andrew G. Mercader ⁎ , Francisco M. Fernández, Eduardo A. Castro Research Institute of Theoretical and Applied Physical Chemistry (INIFTA), Theoretical Chemistry Division, Faculty of Exact Sciences, Chemistry Department, La Plata National University, Suc.4, C.C. 16, La Plata 1900, Buenos Aires, Argentina Received 25 June 2007; accepted 12 August 2007 Available online 22 August 2007 Abstract We provide QSAR models for the growth inhibition of the ciliated protozoan Tetrahymena pyriformis by 250 mechanistically diverse phenolic compounds. The simultaneous linear regression analysis on 1338 topological, geometrical, and electronic molecular descriptors over 200 molecules leads to a seven-parameter relationship with R = 0.851 and leave more out R l - 60% - o = 0.730, while a model based on flexible descriptors improves to R = 0.880 and R l - 60% - o = 0.812. An external test set of 50 related derivatives demonstrates that both models show good predictive power with rms = 0.418 and rms = 0.352, respectively, comparing fairly well with previously reported Artificial Neural Networks with similar rms. Finally, we employ the best QSAR equation to estimate the unknown aqueous toxicity of 74 structures. © 2007 Elsevier B.V. All rights reserved. Keywords: QSAR studies; Flexible descriptors; Replacement method; Phenol derivatives; Tetrahymena pyriformis; IGC 50 1. Introduction Organic chemicals carrying the structure of phenol have been in production since the 1860s, and include a wide number of applications in various industries such as textile, leather, paper and oil. For example, salicylic acid is used during the production of Aspirin and other pharmaceuticals; chloro- phenols are utilized in Agriculture to manufacture a range of pesticides; alkylphenols are involved in the production of surfactants and detergents; bisphenol A is used to synthesize epoxy resins for paint coatings and mouldings, and in polycarbonate plastics, familiar in CDs and domestic electrical appliances. Despite their great importance, the main drawback of employing phenolic compounds is the resulting pollution both in aquatic and terrestrial ecosystems. Therefore, the accurate estimation of the adverse environmental impact poses great interest in the scientific community, together with a convenient way to regulate their production [1,2]. It is known that performing a toxicological experiment for a given substance is not an easy task as it usually results expensive, requires time and, furthermore, an analysis of such dimension should consider multiple environments and all biological interactions with the living organisms of the ecosystems, data that quite often are not available [3].A generally accepted strategy for overcoming the absence of experimental measurements in complex biological systems is the analysis based on Quantitative Structure–Activity Relation- ships (QSAR) [4], in the present study this analysis will be done on aqueous toxicity of phenol derivatives. An obvious advantage of this sort of studies is to minimize animal testing. The ultimate role of formulating the QSAR is to suggest mathematical models estimating the toxicities by relying on the assumption that these are determined solely by the molecular structures of the phenolic compounds. The structure is therefore translated into the so-called molecular descriptors, describing some relevant feature of the compounds, with mathematical formulae obtained from Chemical Graph Theory, Information Theory, Quantum Mechanics, etc. [5,6]. There exist more than a thousand available descriptors in the literature, and one has to decide how to select those that characterize the property under consideration in the best possible manner. Available online at www.sciencedirect.com Chemometrics and Intelligent Laboratory Systems 90 (2008) 97 – 107 www.elsevier.com/locate/chemolab ⁎ Corresponding author. Fax: +54 221 425 4642. E-mail address: [email protected] (A.G. Mercader). 0169-7439/$ - see front matter © 2007 Elsevier B.V. All rights reserved. doi:10.1016/j.chemolab.2007.08.006
-
Upload
independent -
Category
Documents
-
view
4 -
download
0
Transcript of Prediction of aqueous toxicity for heterogeneous phenol derivatives by QSAR
Available online at www.sciencedirect.com
ory Systems 90 (2008) 97–107www.elsevier.com/locate/chemolab
Chemometrics and Intelligent Laborat
Prediction of aqueous toxicity for heterogeneous phenolderivatives by QSAR
Pablo R. Duchowicz, Andrew G. Mercader ⁎, Francisco M. Fernández, Eduardo A. Castro
Research Institute of Theoretical and Applied Physical Chemistry (INIFTA), Theoretical Chemistry Division, Faculty of Exact Sciences,Chemistry Department, La Plata National University, Suc.4, C.C. 16, La Plata 1900, Buenos Aires, Argentina
Received 25 June 2007; accepted 12 August 2007Available online 22 August 2007
Abstract
We provide QSAR models for the growth inhibition of the ciliated protozoan Tetrahymena pyriformis by 250 mechanistically diverse phenoliccompounds. The simultaneous linear regression analysis on 1338 topological, geometrical, and electronic molecular descriptors over 200molecules leads to a seven-parameter relationship with R=0.851 and leave more out Rl− 60%− o=0.730, while a model based on flexibledescriptors improves to R=0.880 and Rl− 60%− o=0.812. An external test set of 50 related derivatives demonstrates that both models show goodpredictive power with rms=0.418 and rms=0.352, respectively, comparing fairly well with previously reported Artificial Neural Networks withsimilar rms. Finally, we employ the best QSAR equation to estimate the unknown aqueous toxicity of 74 structures.© 2007 Elsevier B.V. All rights reserved.
Keywords: QSAR studies; Flexible descriptors; Replacement method; Phenol derivatives; Tetrahymena pyriformis; IGC50
1. Introduction
Organic chemicals carrying the structure of phenol have beenin production since the 1860s, and include a wide number ofapplications in various industries such as textile, leather, paperand oil. For example, salicylic acid is used during theproduction of Aspirin and other pharmaceuticals; chloro-phenols are utilized in Agriculture to manufacture a range ofpesticides; alkylphenols are involved in the production ofsurfactants and detergents; bisphenol A is used to synthesizeepoxy resins for paint coatings and mouldings, and inpolycarbonate plastics, familiar in CDs and domestic electricalappliances. Despite their great importance, the main drawbackof employing phenolic compounds is the resulting pollutionboth in aquatic and terrestrial ecosystems. Therefore, theaccurate estimation of the adverse environmental impactposes great interest in the scientific community, together witha convenient way to regulate their production [1,2].
⁎ Corresponding author. Fax: +54 221 425 4642.E-mail address: [email protected] (A.G. Mercader).
0169-7439/$ - see front matter © 2007 Elsevier B.V. All rights reserved.doi:10.1016/j.chemolab.2007.08.006
It is known that performing a toxicological experiment for agiven substance is not an easy task as it usually resultsexpensive, requires time and, furthermore, an analysis of suchdimension should consider multiple environments and allbiological interactions with the living organisms of theecosystems, data that quite often are not available [3]. Agenerally accepted strategy for overcoming the absence ofexperimental measurements in complex biological systems isthe analysis based on Quantitative Structure–Activity Relation-ships (QSAR) [4], in the present study this analysis will be doneon aqueous toxicity of phenol derivatives. An obviousadvantage of this sort of studies is to minimize animal testing.The ultimate role of formulating the QSAR is to suggestmathematical models estimating the toxicities by relying on theassumption that these are determined solely by the molecularstructures of the phenolic compounds. The structure is thereforetranslated into the so-called molecular descriptors, describingsome relevant feature of the compounds, with mathematicalformulae obtained from Chemical Graph Theory, InformationTheory, Quantum Mechanics, etc. [5,6]. There exist more than athousand available descriptors in the literature, and one has todecide how to select those that characterize the property underconsideration in the best possible manner.

Table 1Experimental and predicted values for 250 pIGC50
no Compound name pIGC50
Exp. Eq. (4) Eq. (7) ANN [10]
1 4-Hydroxyphenylacetic acid −1.50 −0.42 −0.51 −1.062 3-Hydroxybenzyl alcohol −1.04 −0.41 −0.60 −0.603 4-Carboxyphenol −1.02 −0.40 −0.41 −0.594 3-Hydroxy-4-methoxybenzyl
alcohol−0.99 −0.38 −0.46 −0.73
5 4-Hydroxy-3-methoxybenzylamine
−0.97 −0.26 −0.39 −0.59
6 4-Hydroxyphenethyl alcohol −0.83 −0.52 −0.62 −0.457 3-Carboxyphenol −0.81 −0.25 −0.32 −0.498 4-Hydroxybenzamide −0.78 −0.33 −0.31 −0.409 4-Hydroxy-3-methoxybenzyl
alcohol−0.70 −0.35 −0.47 −0.79
10 2,6-Dimethoxyphenol −0.60 −0.21 −0.38 −0.5011 2,4,6-Tris(dimethylaminomethyl)
phenol−0.52 −0.36 −0.47 −0.04
12 Salicylic acid −0.51 −0.16 −0.27 −0.5413 2-Methoxyphenol −0.51 −0.08 −0.13 −0.3514 5-Methylresorcinol −0.39 0.00 0.06 −0.2515 4-Methylcyanophenol −0.38 0.26 0.25 −0.0916 3-Hydroxyacetophenone −0.38 −0.22 −0.43 0.2817 2-Ethoxyphenol −0.36 −0.08 −0.20 −0.1318 4-Acetylphenol −0.30 −0.31 −0.48 0.3019 3-Ethoxy-4-methoxyphenol −0.30 0.02 −0.06 −0.2120 2-Methylphenol −0.29 0.20 0.11 −0.2621 2-Hydroxybenzamide −0.24 −0.10 −0.19 −0.0222 Phenol −0.21 −0.04 −0.04 −0.1723 4-Methylphenol −0.18 0.03 0.04 0.0024 4-Hydroxy-3-
methoxyphenethylalcohol−0.18 −0.28 −0.36 −0.66
25 3-Acetamidophenol −0.16 0.06 0.07 −0.4126 3-Hydroxy-4-
methoxybenzaldehyde−0.14 0.05 0.02 0.11
27 4-Hydroxy-3-methoxyacetophenone
−0.12 −0.09 −0.19 0.13
28 3,5-Dimethoxyphenol −0.09 −0.33 −0.22 −0.2729 2-Hydroxyethylsalicylate −0.08 0.47 0.14 0.1430 3-Methylphenol −0.06 0.14 0.12 0.0131 Methyl-3-hydroxybenzoate −0.05 0.38 0.22 0.2432 3-Methoxy-4-
hydroxybenzaldehyde−0.03 0.03 −0.01 0.12
33 4-Hydroxy-3-methoxybenzonitrile −0.03 0.10 0.03 0.1634 3-Ethoxy-4-hydroxybenzaldehyde 0.01 0.06 −0.02 0.2235 4-Fluorophenol 0.02 0.40 0.44 0.0836 2-Cyanophenol 0.03 −0.02 −0.01 0.1837 5-Fluoro-2-hydroxyacetophenone 0.04 0.34 0.22 0.7038 2,4-Dimethylphenol 0.07 0.39 0.34 0.1839 2-Hydroxyacetophenone 0.08 −0.14 −0.32 0.5140 2,5-Dimethylphenol 0.08 0.40 0.38 0.2741 Methyl-4-hydroxybenzoate 0.08 0.22 0.08 0.4142 3,5-Dimethylphenol 0.11 0.26 0.27 0.3643 4'-Hydroxypropiophenone 0.12 0.10 0.04 0.6644 2,3-Dimethylphenol 0.12 0.44 0.38 0.1645 3,4-Dimethylphenol 0.12 0.45 0.39 0.1546 2-Ethylphenol 0.16 0.41 0.24 0.2647 Syringaldehyde 0.17 −0.05 −0.05 −0.0648 Salicylhydrazide 0.18 −0.13 −0.21 −0.1249 2-Chlorophenol 0.18 0.64 0.64 0.2650 4-Hydroxy-2-methylacetophenone 0.19 0.13 0.08 0.3751 4-Ethylphenol 0.20 0.22 0.13 0.4352 3-Ethylphenol 0.23 0.36 0.22 0.3353 Salicylaldoxime 0.25 -0.16 0.22 0.3154 2,3,6-Trimethylphenol 0.28 0.75 0.87 0.65
Table 1 (continued)
no Compound name pIGC50
Exp. Eq. (4) Eq. (7) ANN [10]
55 2,4,6-Trimethylphenol 0.28 0.63 0.48 0.6656 2-Hydroxy-5-methylacetophenone 0.31 0.19 0.09 0.6157 2-Bromophenol 0.33 0.75 0.82 0.7558 5-Bromo-2-hydroxybenzyl alcohol 0.34 0.48 0.65 0.2759 2,3,5-Trimethylphenol 0.36 0.77 0.74 0.7560 3-Methoxysalicylaldehyde 0.38 0.03 0.04 0.1061 Salicylhydroxamic acid 0.38 −0.17 −0.25 0.1362 2-Chloro-5-methylphenol 0.39 0.87 0.85 0.8063 4-Allyl-2-methoxyphenol 0.42 0.13 0.07 0.3264 2-Hydroxybenzaldehyde 0.42 0.03 0.09 0.2165 2,6-Difluorophenol 0.47 0.88 0.64 0.6166 Ethyl-3-hydroxybenzoate 0.48 0.37 0.14 0.5167 4-Cyanophenol 0.52 0.00 0.04 0.1968 4-Propyloxyphenol 0.52 0.11 0.20 0.3869 4-Chlorophenol 0.55 0.62 0.70 0.5270 Ethyl-4-hydroxybenzoate 0.57 0.28 0.07 0.7071 5-Methyl-2-nitrophenol 0.59 0.63 0.77 1.2772 2-Bromo-4-methylphenol 0.60 0.90 0.90 1.0673 2,4-Difluorophenol 0.60 1.00 0.97 0.4174 3-Isopropylphenol 0.61 0.56 0.57 0.6175 5-Bromovanillin 0.62 0.73 0.54 0.4676 α,α,α-Trifluoro-4-cresol 0.62 0.21 0.35 0.6777 Methyl-4-methoxysalicylate 0.62 0.44 0.24 0.3478 4-Bromophenol 0.68 0.84 0.96 0.7079 2-Chloro-4,5-dimethylphenol 0.69 1.12 1.08 0.7980 4-Butoxyphenol 0.70 1.26 1.42 0.7881 4-Chloro-2-methylphenol 0.70 0.88 0.89 0.9082 3-tert-Butylphenol 0.73 0.72 0.72 0.9383 2,6-Dichlorophenol 0.73 0.87 0.78 0.7384 2-Methoxy-4-propenyIphenol 0.75 1.00 0.82 0.9685 3-Chloro-5-methoxyphenol 0.76 0.56 0.57 0.4686 4-Chloro-3-methylphenol 0.80 0.83 0.85 0.6487 2-Isopropylphenol 0.80 0.55 0.50 0.5388 2,6-Dichloro-4-fluorophenol 0.80 1.38 1.32 0.8789 4-Iodophenol 0.85 1.20 1.26 1.1090 2,2'-Biphenol 0.88 0.66 0.71 0.2391 4-tert-Butylphenol 0.91 0.60 0.64 0.9792 3,4,5-Trimethylphenol 0.93 0.66 0.64 0.6493 2,2',4,4'-
Tetrahydroxybenzophenone0.96 1.39 1.52 0.97
94 4-sec-Butylphenol 0.98 0.72 0.74 1.1195 3-Hydroxydiphenylamine 1.01 1.30 1.42 0.8196 4-Hydroxybenzophenone 1.02 0.91 1.01 0.8697 2,4-Dichlorophenol 1.04 1.23 1.33 1.3398 2,4,6-Tribromoresorcinol 1.06 1.28 1.15 1.2399 Benzyl-4-hydroxyphenyl ketone 1.07 0.88 0.96 0.75100 4-Chloro-3-ethylphenol 1.08 0.91 0.87 1.22101 2-Phenylphenol 1.09 1.19 1.17 1.19102 2,5-Dichlorophenol 1.13 1.04 1.19 1.41103 3-Chloro-4-fluorophenol 1.13 1.23 1.11 0.67104 3-Bromophenol 1.15 0.91 0.99 0.90105 6-tert-Butyl-2,4-dimethyIphenol 1.16 1.44 1.62 1.07106 4-Chloro-3,5-dirnethyIphenol 1.20 0.82 0.94 0.93107 2-Hydroxybenzophenone 1.23 0.99 0.96 1.15108 4-tert-Pentylphenol 1.23 1.03 1.04 1.43109 4-Bromo-3,5-dimethyIphenol 1.27 0.90 1.07 1.31110 4-Bromo-6-chloro-2-cresol 1.28 1.55 1.72 1.44111 4-Cyclopentylphenol 1.29 2.06 1.34 1.08112 2-tert-Butylphenol 1.29 0.72 1.07 0.81113 2-tert-Butyl-4-methyIphenol 1.30 1.10 1.47 1.13114 2-Hydroxydiphenylmethane 1.31 1.04 1.15 1.22115 Butyl-4-hydroxybenzoate 1.33 1.07 1.01 1.35116 3-PhenyIphenol 1.35 1.21 1.30 1.33
98 P.R. Duchowicz et al. / Chemometrics and Intelligent Laboratory Systems 90 (2008) 97–107

Table 1 (continued)
no Compound name pIGC50
Exp. Eq. (4) Eq. (7) ANN [10]
117 n-Pentyloxyphenol 1.36 0.96 1.15 1.25118 2,4-Dibromophenol 1.40 1.32 1.51 1.74119 2,4,6-Trichlorophenol 1.41 1.36 1.33 1.57120 2-Hydroxy-4-
methoxybenzophenone1.42 1.30 1.33 1.09
121 Isoamyl-4-hydroxybenzoate 1.48 1.39 1.39 1.60122 3,5-Dichlorosalicylaldehyde 1.55 1.23 1.30 1.36123 4-Cyclohexylphenol 1.56 2.52 1.62 1.54124 3,5-Dichlorophenol 1.57 1.11 1.25 1.56125 3,5-Di-tert-butylphenol 1.64 1.70 1.84 2.29126 3,5-Dibromosalicylaldehyde 1.64 1.46 1.50 1.68127 3,4-Dichlorophenol 1.75 1.44 1.37 1.30128 4-Bromo-2,6-dichlorophenol 1.78 1.50 1.69 1.59129 2,6-Di-tert-butyl-4-methylphenol 1.80 2.21 2.42 1.38130 4-Chloro-2-isopropyl-5-
methylphenol1.85 1.50 1.55 1.81
131 2,4,6-Tribromophenol 2.03 1.39 1.47 2.08132 4-Heptyloxyphenol 2.03 1.48 1.63 1.91133 4-tert-Octylphenol 2.10 1.86 1.97 2.17134 4-(4-Bromophenyl)phenol 2.31 2.05 2.13 1.99135 3,5-Diiodosalicylaldehyde 2.34 1.65 1.75 2.22136 2,3,5-Trichlorophenol 2.37 1.37 1.35 1.86137 4-Nonylphenol 2.47 2.46 2.87 2.53138 Nonyl-4-hydroxybenzoate 2.63 2.45 2.66 2.57139 2,4,6-Trinitrophenol −0.16 1.21 1.13 0.33140 3,4-Dinitrophenol 0.27 0.89 1.00 0.64141 2,6-Dinitrophenol 0.54 0.62 0.64 0.35142 2,6-Dichloro-4-nitrophenol 0.63 1.44 1.37 0.62143 2,5-Dinitrophenol 0.95 0.90 1.08 0.82144 2,4-Dinitrophenol 1.08 0.89 1.05 0.48145 2,6-Dinitro-4-cresol 1.23 0.95 0.94 1.29146 4-Bromo-2-fluoro-6-nitrophenol 1.62 1.94 1.74 1.44147 Pentafluorophenol 1.64 2.18 1.95 1.85148 4,6-Dinitro-2-methylphenol 1.72 1.27 1.52 1.24149 2,4-Dichloro-6-nitrophenol 1.75 1.74 1.63 1.41150 Pentachlorophenol 2.05 2.45 2.40 1.94151 2,3,5,6-Tetrachlorophenol 2.22 1.80 1.77 1.48152 Pentabromophenol 2.66 2.54 2.57 2.59153 2,3,4,5-Tetrachlorophenol 2.71 2.42 2.44 2.19154 4-Acetamidophenol −0.82 −0.08 −0.15 −0.57155 3-Aminophenol −0.52 0.07 −0.04 −0.48156 4-Aminophenol −0.08 −0.06 −0.14 0.03157 3-Methylcatechol 0.28 0.20 0.27 −0.18158 2-Amino-4-tert-butylphenol 0.37 0.90 0.97 0.47159 4-Methylcatechol 0.37 0.16 0.13 −0.21160 1,2,4-Trihydroxybenzene 0.44 0.97 0.69 0.81161 Hydroquinone 0.47 0.63 0.48 1.03162 Catechol 0.75 −0.13 0.19 −0.40163 2-Amino-4-chlorophenol 0.78 0.82 0.84 0.27164 1,2,3-Trihydroxybenzene 0.85 -0.11 0.01 -0.52165 2-Aminophenol 0.94 0.10 0.10 0.09166 4-Chlorocatecol 1.06 0.82 1.16 0.45167 Chlorohydroquinone 1.26 1.66 1.35 1.61168 4-Amino-2-cresol 1.31 0.23 0.58 1.39169 2,3-Dimethylhydroquinone 1.41 0.38 0.40 1.49170 4-Amino-2,3-dimethylphenol 1.44 0.61 0.59 0.97171 Bromohydroquinone 1.68 1.71 1.52 1.90172 Tetrachlorocatechol 1.70 1.95 1.95 1.54173 Phenylhydroquinone 2.00 1.35 1.76 1.73174 3,5-Di-tert-butylcatechol 2.11 2.17 2.00 1.87175 Methoxyhydroquinone 2.20 0.99 0.72 0.94176 3-Hydroxy-4-nitrobenzaldehyde 0.27 0.47 0.58 0.89
(continued on next page)
Table 1 (continued)
no Compound name pIGC50
Exp. Eq. (4) Eq. (7) ANN [10]
177 5-Hydroxy-2-nitrobenzaldehyde 0.33 0.41 0.45 0.69178 2-Amino-4-nitrophenol 0.47 0.49 0.41 0.60179 4-Methyl-2-nitrophenol 0.57 0.49 0.41 1.39180 4-Hydroxy-3-nitrobenzaldehyde 0.61 0.47 0.56 0.67181 4-Nitrosophenol 0.65 0.11 0.26 0.13182 2-Nitroresorcinol 0.66 0.32 0.45 0.24183 4-Methyl-3-nitrophenol 0.74 0.62 0.74 1.22184 2-Chloromethyl-4-nitrophenol 0.75 0.65 0.74 0.84185 2-Bromo-2'-hydroxy-5'-
nitroacetanilide0.87 1.18 1.05 1.31
186 4-Amino-2-nitrophenol 0.88 0.49 0.47 1.35187 2-Fluoro-4-nitrophenol 1.07 0.88 0.92 0.71188 5-Fluoro-2-nitrophenol 1.13 1.00 1.07 1.23189 4-Nitrocatechol 1.17 0.41 0.84 0.78190 2-Amino-4-chloro-5-nitrophenol 1.17 1.22 1.31 1.33191 4-Fluoro-2-nitrophenol 1.38 1.01 1.07 1.25192 4-Nitrophenol 1.42 0.28 0.47 0.89193 2-Chloro-4-nitrophenol 1.59 1.14 1.19 0.92194 4-Chloro-6-nitro-3-cresol 1.64 1.34 1.45 1.52195 3-Methyl-4-nitrophenol 1.73 0.67 0.76 1.23196 4-Bromo-2-nitrophenol 1.87 1.37 1.47 1.51197 4-Chloro-2-nitrophenol 2.05 1.24 1.32 1.66198 Tetrabromocatechol 0.98 2.08 2.15 1.75199 Tetramethylhydroquinone 1.28 0.87 0.90 1.13200 Tetrachlorohydroquinone 2.11 2.20 1.82 1.95201 1,3,5-Trihydroxybenzene −1.26 −0.41 −0.28 −0.66202 2-Hydroxybenzylalcohol −0.95 −0.28 −0.64 −0.64203 Resorcinol −0.65 −0.12 −0.07 −0.43204 4-(4-Hydroxyphenyl)-2-butanone −0.50 −0.03 0.05 −0.12205 3-Methoxyphenol −0.33 −0.11 −0.10 −0.30206 Ethyl-4-hydroxy-3-
methoxyphenylacetate−0.23 0.53 0.39 −0.19
207 4-Methoxyphenol −0.14 −0.27 −0.23 −0.28208 3-Cyanophenol −0.06 0.03 0.07 0.26209 4-Ethoxyphenol 0.01 −0.24 −0.21 −0.11210 4-Hydroxypropiophenone 0.05 0.15 0.11 0.59211 3-Hydroxybenzaldehyde 0.09 0.02 0.07 0.20212 4-Chlororesorcinol 0.13 0.77 0.73 0.22213 2-Fluorophenol 0.19 0.56 0.48 0.09214 4-Hydroxybenzaldehyde 0.27 −0.11 −0.04 0.13215 2-Allylphenol 0.33 0.22 0.18 0.23216 3-Fluorophenol 0.38 0.53 0.52 0.13217 4-Isopropylphenol 0.47 0.46 0.46 0.70218 2-Hydroxy-4-
methoxyacetophenone0.55 −0.11 −0.17 0.38
219 3-Methyl-2-nitrophenol 0.61 0.64 0.72 1.18220 4-Propylphenol 0.64 0.50 0.54 0.90221 2-Hydroxy-4,5-
dimethylacetophenone0.71 0.50 0.45 0.81
222 2-Methyl-3-nitrophenol 0.78 0.69 1.14 1.52223 3-Chlorophenol 0.87 0.70 0.74 0.62224 4,6-Dichlororesorcinol 0.97 0.96 1.08 0.86225 4-Benzyloxyphenol 1.04 0.93 1.12 0.58226 3-Iodophenol 1.12 1.19 1.25 1.10227 4-Bromo-2,6-dimethylphenol 1.17 1.06 1.27 0.93228 2,3-Dichlorophenol 1.28 1.34 1.29 0.98229 5-Pentylresorcinol 1.31 1.26 1.46 1.17230 4-Phenylphenol 1.39 1.13 1.24 1.27231 Benzyl-4-hydroxybenzoate 1.55 1.43 1.40 1.16232 4-Hexyloxyphenol 1.64 1.12 1.39 1.61233 4-Hexylresorcinol 1.80 1.70 1.67 1.60234 2,4,5-Trichlorophenol 2.10 1.78 1.82 1.82
(continued on next page)
99P.R. Duchowicz et al. / Chemometrics and Intelligent Laboratory Systems 90 (2008) 97–107

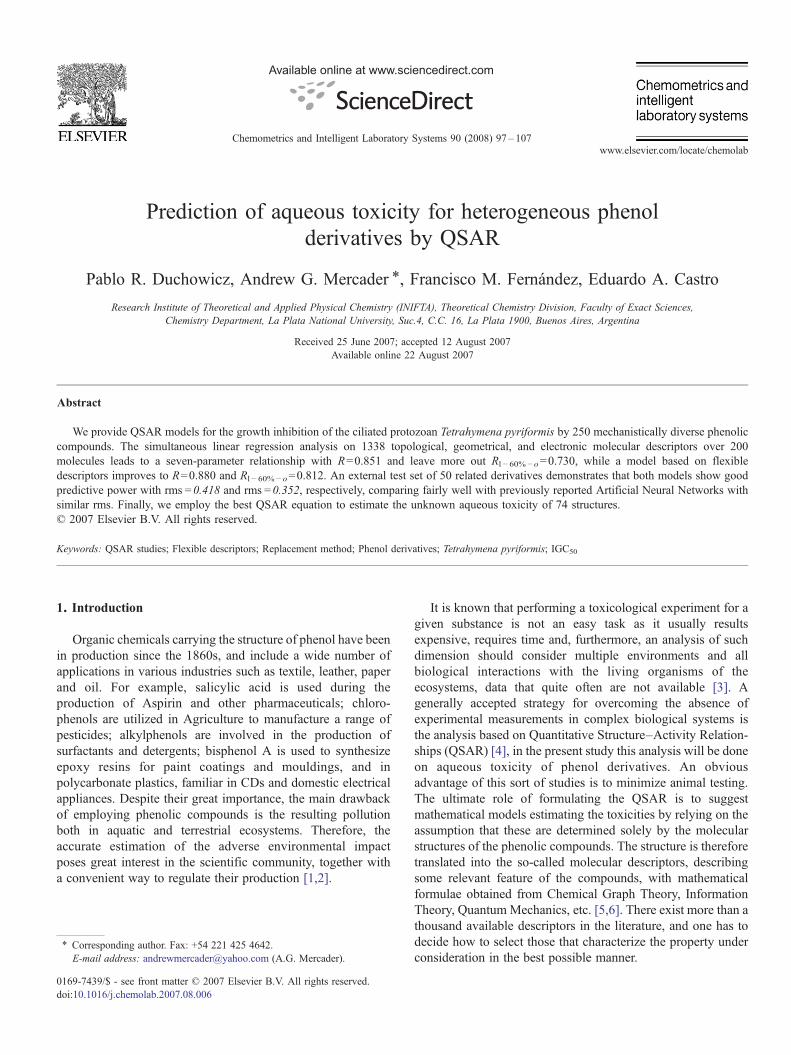
Fig. 1. Histogram for 250 experimental pIGC50 values.
Table 1 (continued)
no Compound name pIGC50
Exp. Eq. (4) Eq. (7) ANN [10]
235 2-Ethylhexyl-4'-hydroxybenzoate 2.51 2.56 2.56 2.45236 2,3-Dinitrophenol 0.46 0.96 1.06 0.56237 2,3,5,6-Tetrafluorophenol 1.17 1.74 1.47 0.96238 2,6-Diiodo-4-nitrophenol 1.71 1.82 1.81 1.58239 3,4,5,6-Tetrabromo-2-cresol 2.57 2.69 2.88 2.54240 2,4-Diaminophenol 0.13 −0.02 −0.19 −0.25241 5-Amino-2-methoxyphenol 0.45 0.00 −0.13 −0.73242 6-Amino-2,4-dimethylphenol 0.89 0.58 0.38 0.28243 Trimethylhydroquinone 1.34 1.86 1.71 0.95244 Methylhydroquinone 1.86 1.20 1.24 1.26245 3-Nitrophenol 0.51 0.43 0.60 1.06246 2-Nitrophenol 0.67 0.53 0.62 0.91247 3-Fluoro-4-nitrophenol 0.94 0.92 1.03 0.97248 2,6-Dibromo-4-nitrophenol 1.36 1.57 1.55 0.93249 4-Nitro-3-(trifluoromethyl)phenol 1.65 0.95 0.95 1.77250 Tetrafluorohydroquinone 1.84 2.20 1.59 2.26
100 P.R. Duchowicz et al. / Chemometrics and Intelligent Laboratory Systems 90 (2008) 97–107
Nowadays, the largest amount of toxicity data tested in thelaboratory by reliable and robust methods is available forthe growth inhibition of the protozoan ciliate Tetrahymenapyriformis [1]. Therefore, these data have been subjected tovarious QSAR analyses [7–9] ranging from simple linear modelsbased on a few number of physicochemical parameters to moresophisticated optimization tools. Cronin et al. in 2002 [7] used thePartial Least Squares (PLS) technique on 108 moleculardescriptors to analyze a large set of 200 heterogeneous phenolsthat simultaneously elicited different modes of toxicologicalaction, such as polar narcotic (N=173), respiratory uncoupler(N=19), pro-electrophile (N=27), soft electrophile (N=27) andpro-redox cycler (N=4). The authors judged the quality of thefinal models with an external test set composed of 50 chemicals.In 2004, Devillers et al. [10] employed the same data set to derivealternative PLS models that improved previous statistical results,supplying also with two three-layer perceptron Artificial NeuralNetwork (ANN) that displayed an even better statistics.
In this paper we propose an alternative QSAR prediction ofaqueous toxicities for the training set-test set of heterogeneousphenol derivatives chosen previously [10]. We explore a greaterpool of structural descriptors including variable definitions ofall classes, of the rigid and flexible type, and resort to therecently developed Replacement Method (RM) [11–14] forperforming the selection of the optimal variable subset.
2. Experimental data and theoretical methods
2.1. Data set
The aqueous toxicities are expressed as pIGC50= log(IGC50
−1), with IGC50 expressing the concentration [mmol l−1]producing a 50% growth inhibition on Tetrahymena pyriformisunder a static regime. The training set is composed by the first200 molecules shown in Table 1, while the remaining 50molecules constitute the external test set. This table alsodisplays the observed and predicted pIGC50 values from theprevious work of Devillers et al. [10]. The histogram for the
complete set of phenols in Fig. 1 shows that the toxicity valuesfollow a normal distribution.
2.2. Molecular descriptors
The structures of the compounds are firstly pre-optimizedwith the Molecular Mechanics Force Field (MM+) procedureincluded in the package Hyperchem 6.03 [15], and the resultinggeometries are further refined by means of the semiempiricalmethod PM3 (Parametric Method-3) using the Polak–Ribierealgorithm and a gradient norm limit of 0.01 kcal/Å.We derived aset D with D=1338 molecular descriptors given by the softwareDragon 5.0 [16], that include Constitutional, Topological,Geometrical, Charge, GETAWAY (GEometry, Topology andAtoms-Weighted AssemblY), WHIM (Weighted Holistic In-variant Molecular descriptors), 3D-MoRSE (3D-MolecularRepresentation of Structure based on Electron diffraction),Molecular Walk Counts, BCUT descriptors, 2D-Autocorrela-tions, Aromaticity Indices, Randic Molecular Profiles, RadialDistribution Functions, Functional Groups, Atom-CentredFragments, Empirical and Properties [17]. Furthermore, 74additional Constitutional variables that take into account thenumber of functional groups and their position in the moleculewere added to the pool, together with four Quantum-Chemicaldescriptors such as molecular dipole moments, total energies,and homo-lumo energies (not provided by the program Dragon).
2.3. Model search
In our calculations we employ the computer system Matlab5.0 [18]. It is our purpose to search the set D, containing Ddescriptors, for an optimal subset d of dVD ones withminimum standard deviation S:
S ¼ 1N � d � 1ð Þ
XNi¼1
res2i ð1Þ
whereN is the number ofmolecules in the training set, and resi theresidual for molecule i (difference between the experimental and

Table 2Linear QSAR models found for 200 phenols
Model Descriptors involved R S FIT Sloo Sl− 60%− o
M1 Mor03p 0.621 0.649 0.620 0.656 0.807M2 RDF020u, Mor03p 0.695 0.597 0.903 0.608 0.770M3 MATS2m, RBF, RDF025u 0.748 0.553 1.191 0.566 0.781M4 ATS2p, RDF020u, C-026, MATS8p 0.770 0.530 1.298 0.553 0.763M5 MATS1m, C-024, C-026, nCOOHPh, H-046 0.820 0.479 1.769 0.494 0.664M6 H-046, RBF, C-026, R3e+, TI2, MATS1m 0.833 0.464 1.857 0.482 0.663M7 H-046, RBF, O-060, nOH1,4, S0K, DISPp, C-026 0.851 0.442 2.024 0.463 0.651M8 H-046, RBF, C-026, TI2, R3e+, R2v+, JGI2, n2,6-P 0.862 0.428 2.087 0.448 0.635M9 MATS1e, nCNPh, C-026, Mor02v, R3e+, R2v+, G(O..O), nRORPh, nOH1,4 0.872 0.414 2.144 0.440 0.710M10 T(O..O), nRORPh, C-026, RDF025u, R3e+, nCNPh, n2,6-P, HATS4u, R2v+, MATS1e 0.881 0.401 2.184 0.430 0.739
The best model found is highlighted.
101P.R. Duchowicz et al. / Chemometrics and Intelligent Laboratory Systems 90 (2008) 97–107
predicted property). More precisely, we want to obtain the globalminimum of S(d) where d is a point in a space of D!/[d!(D−d)!]ones. A full search (FS) of optimal variables is impracticalbecause it requires D!/[d!(D−d)!] linear regressions. Some timeago we proposed the Replacement Method (RM) [11–14] thatproduces linear QSPR–QSAR models that are quite close the FSones with much less computational work. This techniqueapproaches the minimum of S by judiciously taking into accountthe relative errors of the coefficients of the least-squares modelgiven by a set of d descriptors d={X1,X2,…,Xd}. The RM givesmodels with better statistical parameters than the ForwardStepwise Regression procedure [19] and similar ones to themore elaborated Genetics Algorithms [20].
The quality of the final optimized equations obtained via theRM approach is compared by means of two different criteria:the Akaike criterion and the Kubinyi function. Akaike'sinformation criterion (AIC) [23,24] considers the statisticalgoodness of the fit and the number of parameters that have to beestimated to achieve that degree of fit:
AIC ¼XNi¼1
res2i
!N þ d þ 1ð ÞN � d � 1ð Þ2 ð2Þ
Therefore, the model that produces the minimum AIC valueshould be considered potentially the most useful. The Kubinyifunction (FIT) [25,26] closely relates to the Fisher ratio (F), butavoids the main disadvantage of the latter that is too sensitiveto changes in small d values and poorly sensitive to changes inlarge d values. The FIT(d) criterion has a low sensitivity tochanges in small d values and a substantially increasing sen-sitivity for large d values. It is given by
FIT ¼ R dð Þ2 N � d � 1ð ÞN þ d2ð Þ 1� R2ð Þ ð3Þ
where R(d) is the correlation coefficient for a model with ddescriptors. The greater the FIT value the better the linearequation.
The optimal number of molecular descriptors to be includedin the linear regression model (dopt) is deduced from the plot
of FIT vs. d, as the Kubinyi function achieves a maximumvalue (dmax). Therefore, we adopt the following criterion forobtaining dopt:
1. calculate d1 ¼ dmax2
� �þ 1, where [x] denotes the integer partof x.
2. if the slope of FIT at d1 is greater than at d1+1, then dopt=d1,otherwise, dopt=d1+1.
By means of this criterion we expect to obtain a dopt valuethat reflects a “breaking point” beyond which the FIT im-provement is negligible.
The theoretical validation of each linear model is based onthe Leave-More-Out Cross Validation procedure (l−n%−o)[21], with n% representing the number of molecules removedfrom the training set. We considered 5,000,000 cases ofrandom data removal in every l−n%−o. The percentage n%depends simultaneously upon the number of compounds N(one cannot remove many molecules from the training set if asmall sample is analyzed as the normality condition of thefitted data has to be obeyed) and their structural diversity (ifthe molecules are structurally very different, more compoundswould have to be removed from the set for checking thepredictive performance of the model). We chose the value of n%=60% (120 phenols) in Cross Validation in order to properlyvalidate the QSAR equations.
We can improve the predictive performance of linearrelationships with rigid type of numerical variables by meansof a new strategy based on the idea of flexible (optimal)molecular descriptors. This concept was reintroduced by MilanRandic in the 1990s through the definition of the variable vertexconnectivity index [22]. Such adjustable descriptors can beoptimized to make them specific to the property or activityunder consideration, and in this way it is feasible to achieve amodel of better quality that results mathematically simplerthan one given by other approaches such as Artificial NeuralNetworks [10]. However, it has to be mentioned here thatpresent methodology, based on optimization of several para-meters, would always have to be validated with an external testset of compounds, as it is the case of ANN.
There are several ways to construct flexible variables; herewe try linear combinations of rigid molecular descriptors. We

102 P.R. Duchowicz et al. / Chemometrics and Intelligent Laboratory Systems 90 (2008) 97–107
adopted such kind of procedure as it leads to QSPR–QSARmodels that do not loose their predictive power according tothe Leave-More-Out Cross Validation technique. The flexiblevariables consist of linear regression models with dmin=2,…,dopt rigid descriptors that minimizes S on the pool ofvariables. We begin by adding the values of the propertypredicted by each of the calculated dopt−1 linear regressionsto the pool D, thus producing a new pool D' containing
Table 3Symbols for molecular descriptors involved in different proposed models
Molecular descriptor Type Description
Mor03p 3D-MoRSE 3D-MoRSE — signalRDF020u Radial distribution function Radial distribution funMATS2m 2D-Autocorrelations Moran autocorrelationRBF Constitutional Rotatable bond fractioRDF025u Radial distribution function Radial distribution funATS2p 2D-Autocorrelations Broto–Moreau autocoC-026 Atom-centred fragments Number of R–CX–RMATS8p 2D-Autocorrelations Moran autocorrelationMATS1m 2D-autocorrelations Moran autocorrelationC-024 Atom-centred fragments number of R–CH–RnCOOHPh Functional groups number of carboxylicH-046 Atom-centred fragments H attached to C0(sp3)R3e+ GETAWAY R maximal autocorrelTI2 Topological Second Mohar indexO-060 Atom-centred fragments Number of Al–O–Ar/nOH1,4 Constitutional Number of OH substiDISPp Geometrical d COMMA2 value/weDISPv Geometrical d COMMA2 value/weS0K Topological Kier symmetry indexR2v+ GETAWAY R maximal autocorrelJGI2 Galvez topological charge indices Mean topological chan2,6-P Constitutional Number of 2,6-substitMATS1e 2D-autocorrelations Moran autocorrelationnCNPh Functional groups Number of nitriles (arMor02v 3D-MoRSE 3D-MoRSE — signalG(O..O) Geometrical Sum of geometrical dnRORPh Functional groups Number of ethers (aroT(O..O) Topological Sum of topological diHATS4u GETAWAY Leverage-weighted auMW Constitutional Molecular weightlogD Empirical Distribution coefficienABSQon Charge Sum of absolute chargSsOH Electrotopological Electrotopological staLUMO Quantum chemical Energy of the lowest uPneg Charge Negatively charged mMaxHp Charge Largest positive charg4-NH2 Constitutional Number of amino gronCrH2 Functional groups Number of ring seconMor22m 3D-MoRSE 3D-MoRSE — signalnOH2 Constitutional Number of OH substinCH Constitutional Number of CH fragmMor24e 3D-MoRSE 3D-MoRSE — signalTE1 Charge Topographic electroniGATS2e 2D-autocorrelations Geary autocorrelationPW3 Topological Path/walk 3-Randic shC-040 Atom-centred fragments Number of R–C(_X)Rww Topological Reciprocal hyper-detoF1 Flexible M6 from Table 2F2 Flexible M7 from Table 2
a R represents any group linked through carbon. X_O, N, S, P, Se or halogens.b C0(sp3)_carbon atom with formal oxidation number 0 and hybridization sp3. 3
D’=D+dopt−1 variables. Then, the first optimization cycleconsists on calculating the best two-descriptor model, and sothe predicted property with this equation is added to the poolD', leading to a new pool D''. We carry out further opti-mization cycles until the rate of growth of the statisticalparameters of the model diminishes. As the number of opti-mized parameters increase from one cycle to other, thereexists a serious risk of model over-fitting. For this reason, we
03/weighted by atomic polarizabilitiesction — 2.0/unweightedlag-2/weighted by atomic massesnction — 2.5/unweightedrrelation of a topological structure — lag 2/weighted by atomic polarizabilitiesa
lag-8/weighted by atomic polarizabilitieslag-1/weighted by atomic masses
acids (aromatic)with no X attached to next C b
ation of lag 3/weighted by atomic Sanderson electronegativities
Ar–O–Ar/R..O..R/R–O–C_X fragments3
tuting position 1,4 in Arighted by atomic polarizabilitiesighted by atomic volumes
ation of lag 2/weighted by atomic van der Waals volumesrge index of order 2/uted phenolslag-1/weighted by atomic Sanderson electronegativitiesomatic)02/weighted by atomic van der Waals volumesistances between O..Omatic)stances between O..Otocorrelation of lag 4/unweighted
tes on O and Nte index for OH groupnoccupied molecular orbitalolecular surface areae on H atomups in para positiondary C(sp3)22/weighted by atomic massestuting position 2 in Arents24/weighted by atomic Sanderson electronegativitiesc descriptorof lag 2/weighted by atomic Sanderson electronegativitiesape index–X, R–C#X, X – _C_Xur index
Al = aliphatic, Ar = aromatic.

Table 4Correlation matrix for descriptors of Eq. (4) (N_200)
Symbol H-046 RBF O-060 nOH1,4 S0K DISPp C-026
H-046 1 0.342 0.022 0.099 0.094 0.111 0.379RBF 1 0.313 0.002 0.236 0.202 0.301O-060 1 0.038 0.201 0.081 0.196nOH1,4 1 0.137 0.065 0.173S0K 1 0.095 0.256DISPp 1 0.289
103P.R. Duchowicz et al. / Chemometrics and Intelligent Laboratory Systems 90 (2008) 97–107
decided to keep linear regressions containing only twodescriptors as the best model in each optimization cycle.
3. Results and discussion
We first applied the RM algorithm to the training set of 200phenol derivatives in order to find out a suitable model size, inother words, the smallest number of descriptive parameters dopt
Fig. 2. (a) FIT parameter versus number of descriptors (N=200). (b) Predictedby Eq. (4). versus experimental pIGC50. (c) Dispersion plot of the residuals forEq. (4). The dots correspond to the training set and the triangles to the test set.
C-026 1
that should participate in the linear structure-toxicity relation-ship reflecting a predictive ability on the pIGC50 values. Table 2shows the best linear models with 1 through 10 moleculardescriptors, while the specific details of the numerical variablesinvolved throughout the whole article are provided by Table 3.Fig. 2 (a) shows that FIT improves with d up to a maximumvalue at d=10 and, according to the criterion mentioned inSection 2.3, leads to a “breaking point” at dopt=7.
Therefore, the best linear QSAR found is:
pIGC50 ¼ �0:423 F0:2ð Þ þ 0:133 F0:008ð Þ�H � 046� 7:787 F0:7ð Þ � RBFþ0:588 F0:2ð Þ � O� 060þ 0:988 F0:2ð Þ�nOH1; 4þ 0:0428 F0:005ð Þ � S0K þ 0:422 F0:1ð Þ�DISPpþ 0:263 F0:03ð Þ � C � 026
N ¼ 200;R ¼ 0:851; S ¼ 0:442;F ¼ 72;
AIC ¼ 0:212; FIT ¼ 2:024; pb10�4Rloo ¼ 0:835;
Sloo ¼ 0:463;Rl�60k�o ¼ 0:730; Sl�60k�o ¼ 0:651
N ¼ 50;Rval ¼ 0:903; Svat ¼ 0:392
ð4Þ
Here, the absolute errors of the regression coefficients aregiven in parentheses and F is the Fisher ratio, p the significanceof the model, AIC the Akaike's information criterion, loo standsfor the Leave-One-Out Cross Validation technique and val forthe test set parameters.
Table 1 includes the pIGC50 values predicted by Eq. (4) forthe 200 phenols. The plot of predicted vs. experimental toxicitiesshown in Fig. 2 (b) suggests that the 200 training and 50 test setcompounds follow a straight line. The residuals in terms of theexperimental data in Fig. 2 (c) demonstrates that the best mole-cular descriptors given by Eq. (4) lead to predictions that tend tofollow a normal distribution for most of the phenols. This figureincludes three calibration outliers with a residual exceedingthe value 2.5S=1.105: compounds 139 (2,4,6-Trinitrophenol,−1.37), 175 (Methoxyhydroquinone, 1.21), and 192 (4-Nitro-phenol, 1.14); the presence of these outliers may be aconsequence of the selected descriptors. Also, the correlationmatrix in Table 4 reveals that the descriptors of Eq. (4) are notseriously inter-correlated, and thus substantiate the presence ofall the variables in the model. The predictive power of the linearmodel is satisfactory as revealed by its stability upon the in-clusion or exclusion of compounds, as measured by Leave-More-Out parameters Sloo=0.463 and Sl− 60%− o=0.651, and

Table 5Statistical parameters for different QSAR models of pIGC50
Model Descriptors involved R rms training set a Rval rms test set
PLS nOH1,4, logD, MW, ABSQon, SsOH, n2,6-P, LUMO, Pneg, MaxHp, 4-NH2 0.869 0.409 0.871 0.411ANN nOH1,4, logD, MW, ABSQon, n2,6-P, LUMO, Pneg, MaxHp, 4-NH2 0.905 0.351 0.908 0.352Eq. (4) H-046, RBF, O-060, nOH1,4, S0K, DISPp, C-026 0.851 0.433 0.903 0.418Eq. (7) F5, nOH2 0.880 0.392 0.880 0.352M13 G(O..O), GATS2e, C-026, R3e+, O-060, PW3, C-040, n2,6-P, Rww, Mor24e, nOH1,4, DISPv, RBF 0.906 0.349 0.863 0.425a rms: root mean square residual.
104 P.R. Duchowicz et al. / Chemometrics and Intelligent Laboratory Systems 90 (2008) 97–107
especially by means of the root mean square error (rms) in theexternal test set of rms=0.418 and correlation Rval=0.903.
The structural variables appearing in Eq. (4) can be classifiedas follows: (i) three Atom-Centred Fragments: H-046: numberof hydrogens attached to C0(sp3) (carbon atom with formaloxidation number 0 and hybridization sp3) with no X (O, N, S,P, Se or halogens) attached to next C, O-060: number of Al–O–Ar/Ar–O–Ar/R..O..R/R–O–C=X fragments (Al = aliphatic,Ar = aromatic, R = represents any group linked through carbon),C-026: the number of R–CX–R fragments; (ii) two Constitu-tional: RBF: the rotatable bond fraction, nOH1,4: the number ofOH substituting 1,4 position in Ar; (iii) one Topological: S0K:the Kier symmetry index; and (iv) one Geometrical: DISPp: dCOMMA2 (Comparative Molecular Moment Analysis) value/weighted by atomic polarizabilities. Notice that this set ofdescriptors can be easily obtained from the molecular graph orsimply by counting fragments.
Among the more elaborated descriptors of Eq. (4), thegeometrical variable DISPp is a three-dimensional descriptorobtained from moment expansions that do not require molecularsuperposition or alignment for the assignment of molecularsimilarity, and it incorporates information about the magnitudeof the displacement between the molecular centroid (center ofmass) and the polarizability-field center (center of charge) [27].Such kind of descriptor was found valuable for the prediction ofthe electrophoretic mobilities of peptides [28]. The Kiersymmetry index S0K is related to the topological symmetry,and thus represents an entropic factor that measures the disorderin the system. It is known that lower values of S0K lead togreater topological symmetries, and thus to a lower tendency forchanging the molecular freedom. Chemicals with higher valuesof S0K would exhibit higher vapour pressures, as there wouldexist a higher tendency of the compound to escape from con-densed phases [29]. The rotatable bond fraction represents aquotient between the number of rotatable bonds and the totalnumber of bonds of any type in the molecule.
The standardization [19] of the regression coefficients in Eq.(4) allows assigning a greater importance to the moleculardescriptors that exhibit larger absolute standardized coefficients(shown in parentheses):
H � 046 N RBF N S0K N C � 026 N nOH1; 4 N DISPp N OQ060
0:67ð Þ 0:52ð Þ 0:40ð Þ 0:37ð Þ 0:20ð Þ 0:17ð Þ 0:15ð Þ
ð5Þ
It has to be mentioned that all these descriptors havepositive numerical values for the 200 phenols. This rankingestablishes that the structural parameters that contribute mostto the aqueous toxicities are H-046, RBF, S0K, and C-026.Therefore, considering the sign of the regression coefficientsin Eq. (4), it is expected that molecular structures withincreasing values of descriptors H-046, S0K, and C-026 anddecreasing values of RBF would elicit higher predictedpIGC50, taking into account that the remaining descriptorscontribute in a lesser extend to the aqueous toxicities. A greaternumber of hydrogen atoms present in the molecular structure,as reflected by H-046, would increase the number ofelectrostatic interactions in specific reactive sites of theinhibitor. This is also true for the case of the number of R–CX–R fragments: the greater the number of electronegativeatoms in the molecule, the higher the number of polar inter-actions. In summary: Eq. (4) reveals that phenol derivativeswith topologically asymmetric structures, containing a greatnumber of hydrogen and hetero-atoms, and with few rotatablebonds, would tend to be more potent for inhibiting the growthof Tetrahymena pyriformis.
Table 5 summarizes the statistics for the training and testseries in ref. [10] by resorting to a three-component PLS and athree-layer perceptron ANN, and includes the structural para-meters that appeared in those models. There is considerableagreement between Eq. (4) and the linear PLS model, althoughthe latter performs better for both molecular sets. Notice, how-ever, that our model has only 7 descriptors, contrasting with the10 variables of the PLS one. Both linear models share a relevantstructural aspect: the number of OH substituting the 1,4 positionin the aromatic ring, nOH1,4. This indicator was found byDevillers et al to be influential in the description of the aqueoustoxicities, as it accounts for the specific reactivity of somephenol derivatives. Present study confirms that conclusionthrough a simpler methodology based on performing linearregressions through the RM approach.
There are three main procedures for improving thepredictive performance of a given model: (i) selection of afew descriptors from thousands of them through linearregressions; (ii) selection of a few descriptors through somecriteria and optimization of the functional form of theequation; and (iii) selection of a few adjustable descriptorsand optimization of their variable parts. Table 4 reveals thatour best linear QSAR model given by Eq. (4) (case i) isstatistically inferior to the ANN result (case ii), so we decidedto employ flexible descriptors to improve the quality of the

Fig. 3. (a) FIT parameter versus number of optimization cycles (N=200).(b) Predicted by Eq. (7). versus experimental pIGC50. (c) Dispersion plot of theresiduals for Eq. (7). The dots correspond to the training set and the triangles tothe test set.
105P.R. Duchowicz et al. / Chemometrics and Intelligent Laboratory Systems 90 (2008) 97–107
predictions (case iii), and combine these variables with rigidones to perform procedure (i). As it was mentioned in themethodology section, the approach is quite simple and consistsfirstly on defining the flexible functions as the best linearmodels found in Table 2, with dmin =2,…,dopt = 7 rigiddescriptors. Then, the first optimization cycle consists on ad-ding the so calculated six optimal descriptors to the pool Dwith D=1338, leading to a new pool D' possessing D'=1344
variables, and search for the best linear model with d=2, whichresults:
pIGC50 ¼ �0:025 F0:04ð Þ þ 0:658 F0:1ð ÞF1þ0:376 F0:1ð ÞF2
N ¼ 200;R ¼ 0:859; S ¼ 0:426;F ¼ 277;AIC ¼ 0:187;
FIT ¼ 2:716; pb10�4
Rloo ¼ 0:854; Sloo ¼ 0:433;Rl�60k�o ¼ 0:790;
Sl�60k�o ¼ 0:515
ð6Þ
Here, the flexible descriptors F1 and F2 are M6 and M7,respectively, and correspond to the six and seven-parameterlinear models from Table 2. In the second optimization cycle,the new flexible descriptor F3 as defined by Eq. (6) is added toD' leading to a new poolD''withD''=1345 descriptors. A thirdand fourth optimization cycle could also be calculated, and onehas to decide when to stop the iteration. For this purpose, werepresent in Fig. 3 (a) the FIT parameter as a function of thenumber of optimization cycles. It has to be taken into accountthat there exists a serious risk for model over-fitting whenmodelling from one cycle to the next. Therefore, the optimalnumber of cycles should be selected cautiously. Fig. 3 revealsthat after performing four optimization cycles, the best bi-dimensional model is:
pIGC50 ¼ �0:034 F0:04ð Þ þ 1:004 F0:04ð Þ � F5þ0:328 F0:1ð Þ:nOH2
N ¼ 200;R ¼ 0:880;
S ¼ 0:394;F¼ 339;AIC ¼ 0:160; FIT¼3:111; pb10�4
Rloo ¼ 0:876; Sloo ¼ 0:401;Rl�60k�o ¼ 0:812;
Sl�60k�o ¼ 0:487 ð7Þ
with F5 being defined in Table 6. The pIGC50 values predictedby Eq. (7) for the 200 phenols are also given in Table 1. Fig. 3(b) shows the predicted vs. experimental toxicities, whileFig. 3 (c) displays the residuals in terms of the experimentaldata. This figure includes five calibration outliers with aresidual exceeding the value 2.5S=0.985: compounds 1(−0.990), 136 (1.022), 139 (−1.286), 169 (1.010), 175(1.481), and 198 (−1.173). The statistical parameters for thetest set are rms=0.352 and Rval =0.880, and are of similarquality as than those achieved by means of ANN in Table 5.
Our best resulting QSAR model of Eq. (7) is based on atotal set of 13 rigid molecular descriptors. If we now calculatethe best model containing d=13 variables selected from D viaRM, it is found the result denoted as M13 in Table 5. It can beeasily seen that this model that includes too many variablesperforms better in the training set (rms=0.349) but poorer inthe test set (rms=0.425), basically as a main consequenceof model-overfitting. However, the methodology based onflexible descriptors enables the employment of many rigiddescriptors diminishing rms in the training set and, simultaneous-ly, decreasing rms in the test set. We think that present approach

Table 6Definitions for flexible descriptors employed in present analysis
Linear equation involved
F1 ¼ �7:925þ 0:123 � H � 046� 6:692:RBFþ 0:307:C � 026� 7:617:R3eþ þ 0:407:TI2þ 9:316:MATS1m
F4 ¼ �0:011þ 1:027 � F3� 0:197:nCrH2
F5 ¼ 0:00227þ 1:056 � F4� 0:223 � n2; 6� P
106 P.R. Duchowicz et al. / Chemometrics and Intelligent Laboratory Systems 90 (2008) 97–107
based on linear regressions is considerable simpler than ArtificialNeural Networks.
Finally, a practical application of the bestQSARmodel derivedwith Eq. (7) is performed by predicting the aqueous toxicities forsome unmeasured structures. Up to our knowledge, the 74molecular structures listed in Table 7 do not havemeasured valuesof pIGC50. These compounds are proposed by modifying thefunctional groups of some of the phenol derivatives in the data set.
Table 7Predicted pIGC50 for 74 non-measured phenol derivatives
no Compound name Eq. (7) n
1 3,5-Diiodophenol 1.79 32 3,4,5-Triiodophenol 2.47 33 2,3,4,5-Tetraiodophenol 2.90 44 Pentaiodophenol 2.91 45 1,3,5-Triiodophenol 1.81 46 Tetraiodohydroquinone 2.12 47 Triiodo-1,2,4-benzenetriol 1.74 48 Diiodo-1,2,4,5-benzenetetraol 0.46 49 Iodo-1,2,3,4,5-benzenepentaol 0.23 410 3,4-Dihydroxyphenylacetic acid −0.34 411 3,4,5-Trihydroxyphenylacetic acid −0.52 412 2,3,4,5-Tetrahydroxyphenylacetic acid −0.01 413 2,3,4,5,6-Pentahydroxyphenylacetic acid −0.37 514 4-Hydroxybenzene-1,3-biacetic acid −0.43 515 2-Hydroxybenzene-1,3,5-briacetic acid −0.49 516 3-Hydroxyphenylacetic acid −0.44 517 2-Hydroxyphenylacetic acid −0.15 518 1,2,3,5-Tetrahydroxybenzene 0.45 519 Pentahydroxybenzene 0.20 520 Hexahydroxybenzene −0.69 521 3,4-Dihydroxybenzyl alcohol −0.54 522 3,4,5-Trihydroxybenzyl alcohol −0.72 523 2,3,4,5-Tetrahydroxybenzyl alcohol −0.29 624 Pentahydroxybenzyl alcohol −0.59 625 2-Chloro-3,4,5,6-tetrahydroxybenzyl alcohol 0.10 626 2,4-Dichloro-3,5,6-trihydroxybenzyl alcohol 0.80 627 2,4,6-Trichloro-3,5-dihydroxybenzyl alcohol 0.60 628 2,3,4,6-Tetrachloro-5-hydroxybenzyl alcohol 1.40 629 2,3,5,6-Tetrachloro-4-hydroxybenzyl alcohol 1.26 630 4-Hydroxybenzene-1,3-dimethanol −0.83 631 4-Carboxycatechol −0.22 632 1,2,3-Trihydroxy-5-carboxybenzene −0.42 633 1,2,3,4-Tetrahydroxy-5-carboxybenzene 0.07 734 Pentahydroxy-carboxybenzene −0.28 735 2,4-Dicarboxyphenol −0.07 736 2,4,6-Tricarboxyphenol −0.67 737 1,3,5-Tetrahydroxy-2,4,6-tricarboxybenzene −0.99 7
4. Conclusions
The chemical information encoded by the selected set ofdescriptors in the linear QSAR model contributes to the observedaqueous toxicity in a satisfactory extent, enabling to explain atraining set composed of 200 phenol derivatives and an externaltest set with 50 related compounds. The employment of flexiblemolecular descriptors as linear combinations of rigid descriptorsmade possible to achieve better statistical parameters that comparefairly well with others published previously based on three-layerperceptron Artificial Neural Networks and Partial Least Squares.Finally, it has to be emphasized that the new methodologyimproves the linear model results without being necessary tointroduce non-linear sophistications. It is important to notice herethat, although the final models based on flexible descriptors mayinvolve more descriptors of the rigid type than non-linear methodsbased on a few rigid descriptors, this is because the functional formof the model is linear. From the optimization point of view, itresults easier to deal with linear functions.
o Compound name Eq. (7)
8 2-Fluoro-tetrachlorophenol 2.479 2-Bromo-tetrachlorophenol 2.490 2-Iodo-tetrachlorophenol 2.551 3-Bromo-tetrachlorophenol 2.532 4-Bromo-tetrachlorophenol 2.453 3,4-Dibromo-trichlorophenol 2.664 3,4,5-Tribromo-dichlorophenol 2.585 2,3,4,6-Tetrabromo-chlorophenol 2.686 2,3,5,6-Tetrabromo-chlorophenol 2.527 2,3,5,6-Tetrabromo-fluorophenol 2.328 2,3,5,6-Tetrabromo-iodophenol 2.719 Nonyl-3,4-dihydroxybenzoate 2.890 Nonyl-2,4,5-trihydroxybenzoate 3.911 Nonyl-2,3,4,6-tetrahydroxybenzoate 3.812 Nonyl-2,3,4,5,6-pentahydroxybenzoate 3.393 2,4-CH3C8H2OCO-phenol 5.954 2,4,6-CH3C8H2OCO-phenol 7.605 2,5-Dimethyl-3,4,6-tribromophenol 2.376 2,4,5-Trimethyl-3,6-dibromophenol 2.117 2,3,4,5-Tetramethyl-6-dibromophenol 1.848 Pentamethylphenol 1.479 2-Methyl-3,4,5,6-tetrachlorophenol 2.440 2-Methyl-3,5-dibromo-4,6-dichlorophenol 2.621 2-Methyl-3,4,5-tribromo-6-chlorophenol 2.702 2-Methyl-3,4-dibromo-5,6-dichlorophenol 2.643 2-Methyl-3,4-dibromo-5,6-diiodophenol 2.994 2-Methyl-3-bromo-4,5,6-triiodophenol 3.075 2-Methyl-3-bromo-4,5-diiodo-6-chlorophenol 2.936 2-Methyl-3-bromo-4-iodo-5-fluoro-6-chlorophenol 2.657 2-Methyl-3,4-dibromo-5-fluoro-6-chlorophenol 2.478 2-Methyl-3-bromo-4,5,6-trifluorophenol 2.139 2,6-Dimethyl-3-bromo-4,5-difluorophenol 1.930 2,4,6-Trimethyl-3-bromo-5-fluorophenol 2.161 2,4,6-Trimethyl-3-bromo-5-chlorophenol 2.262 2,4,6-Trimethyl-3-fluoro-5-chlorophenol 2.053 2,4,6-Trimethyl-3-iodo-5-chlorophenol 2.354 2,4,6-Trimethyl-3,5-diiodophenol 2.45

107P.R. Duchowicz et al. / Chemometrics and Intelligent Laboratory Systems 90 (2008) 97–107
Acknowledgements
We thank the National Council of Scientific and Techno-logical Research (CONICET) for supporting this work.
References
[1] M.L. Hanson, K.R. Solomon, Environ. Sci. Technol. 36 (2002)3257–3264.
[2] S. Smith, V.J. Furay, P.J. Layiwola, J.A. Menezes-Filho, Chemosphere28 (1994) 825–836.
[3] S.P. Bradbury, Toxicol. Lett. 79 (1995) 229–237.[4] C. Hansch, A. Leo. American Chemical Society, Washington, D. C., 1995.[5] A.R. Katritzky, V.S. Lobanov, M. Karelson, Chem. Soc. Rev. 24 (1995)
279–287.[6] N. Trinajstic. CRC Press, Boca Raton, FL, 1992.[7] M.T.D. Cronin, A.O. Aptula, J.C. Duffy, T.I. Netzeva, P.H. Rowe, I.V.
Valkova, T.W. Schultz, Chemosphere 49 (2002) 1201–1221.[8] J. Damborsky, T.W. Schultz, Chemosphere 34 (1997) 429–446.[9] K. Pirselova, S. Balaz, T.W. Schultz, Arch. Environ. Contam. Toxicol.
30 (1996) 170–177.[10] J. Devillers, SAR QSAR Environ. Res. 15 (2004) 237–249.[11] P.R. Duchowicz, M. Fernández, J. Caballero, E.A. Castro, F.M. Fernández,
Bioorg. Med. Chem. 16 (2006) 5876–5889.[12] A.M. Helguera, P.R. Duchowicz, M.A.C. Pérez, E.A. Castro, M.N.D.S.
Cordeiro, M.P. González, Chemometr. Intell. Lab. 81 (2006) 180–187.
[13] P.R. Duchowicz, E.A. Castro, F.M. Fernández, MATCH Commun. Math.Comput. Chem. 55 (2006) 179–192.
[14] P.R. Duchowicz, M. Fernández, J. Caballero, E.A. Castro, F.M. Fernández,Bioorg. Med. Chem. 16 (2006) 5876–5889.
[15] HYPERCHEM 6.03 (Hypercube)http://www.hyper.com/.[16] DRAGON 5.0 Evaluation Versionhttp://www.disat.unimib.it/chm.[17] R. Todeschini, V. Consonni. Wiley VCH, Weinheim, Germany, 2000.[18] Matlab 5.0 The MathWorks Inc.[19] N.R. Draper, H. Smith. John Wiley&Sons, New York, 1981.[20] S.S. So, M. Karplus, J. Med. Chem. 39 (1996) 1521–1530.[21] D.M. Hawkins, S.C. Basak, D. Mills, J. Chem. Inf. Model. 43 (2003)
579–586.[22] M. Randic, J. Chem. Inf. Model. 31 (1991) 311–320.[23] H. Akaike, in: B.N. Petrov, F. Csáki (Eds.), Second International
Symposium on Information Theory, Akademiai Kiado, Budapest, 1973,pp. 267–281.
[24] H. Akaike, IEEE Trans. Automat. Contr. AC-19 (1974) 716–723.[25] H. Kubinyi, Quant. Struct.-Act. Relatsh. 13 (1994) 393–401.[26] H. Kubinyi, Quant. Struct.-Act. Relatsh. 13 (1994) 285–294.[27] B.D. Silverman, J. Chem. Inf. Model. 40 (2000) 1470–1476.[28] C.J. Metral, G.M. Janini, G.M. Muschik, H.J. Issaq, HRC, J. High Resolut.
Chromatogr. 22 (1999) 373–378.[29] G. Ding, J. Chen, X. Qiao, L. Huang, J. Lin, X. Chen, Chemosphere
62 (2006) 1057–1063.