
Application of 3D-QSAR in the Rational Design of Receptor Ligands and Enzyme Inhibitors
14
Application of 3D-QSAR in the Rational Design of Receptor Ligands and Enzyme Inhibitors by Marco Mor* a ), Silvia Rivara a ), Alessio Lodola a ), Simone Lorenzi a ), Fabrizio Bordi a ), Pier Vincenzo Plazzi a ), Gilberto Spadoni b ), Annalida Bedini b ), Andrea Duranti b ), Andrea Tontini b ), and Giorgio Tarzia b ) a ) Dipartimento Farmaceutico, Universita ¡ degli Studi di Parma, Parco Area delle 27/A, I-43100 Parma (phone: 39 0521 905062 ; fax : 39 0521 905006; e-mail: [email protected]) b ) Istituto di Chimica Farmaceutica e Tossicologica, Universita ¡ degli Studi di Urbino −Carlo Bo×, Piazza del Rinascimento 6, I-61029 Urbino Quantitative structure ± activity relationships (QSARs) are frequently employed in medicinal chemistry projects, both to rationalize structure ± activity relationships (SAR) for known series of compounds and to help in the design of innovative structures endowed with desired pharmacological actions. As a difference from the so-called structure-based drug design tools, they do not require the knowledge of the biological target structure, but are based on the comparison of drug structural features, thus being defined ligand-based drug design tools. In the 3D-QSAR approach, structural descriptors are calculated from molecular models of the ligands, as interaction fields within a three-dimensional (3D) lattice of points surrounding the ligand structure. These descriptors are collected in a large X matrix, which is submitted to multivariate analysis to look for correlations with biological activity. Like for other QSARs, the reliability and usefulness of the correlation models depends on the validity of the assumptions and on the quality of the data. A careful selection of compounds and pharmacological data can improve the application of 3D-QSAR analysis in drug design. Some examples of the application of CoMFA and CoMSIA approaches to the SAR study and design of receptor or enzyme ligands is described, pointing the attention to the fields of melatonin receptor ligands and FAAH inhibitors. Introduction. ± Molecular modeling techniques can be applied to drug design according to two separate paradigms, one focused on the relationships between ligand structure and pharmacological activity, and the other aimed at the understanding of the interactions observed for complexes between a ligand and its binding site [1] . While the first approach attempts to rationalize biological activity in the absence of detailed three-dimensional (3D) structural information about the binding site, the latter requires the knowledge of 3D structures of the therapeutic targets. The rapid increase in available structural information, attributed to the advances in molecular biology to generate target proteins in adequate quantities, and the equally impressive gains in NMR and crystallography to resolve protein structures at atomic level, has stimulated the molecular-modeling community in the development of useful computational tools (e.g. , docking and de novo design software), able to transform the knowledge of the topography of target binding sites into new drugs. Several successful applications of the so-called −structure-based drug design× (SBDD) approach have been recently reported, confirming its usefulness in medicinal chemistry [2] . On the other hand, the traditional −ligand-based drug design× (LBDD) paradigm is the most suitable approach to design new bioactive molecules when the target structure cannot be directly observed, or when its interaction with the drug is so complex that −hidden× structural features, which may not be revealed by the static topography of a protein ± drug complex, can influence CHEMISTRY & BIODIVERSITY ± Vol. 2 (2005) 1438 ¹ 2005 Verlag Helvetica Chimica Acta AG, Z¸rich
Transcript of Application of 3D-QSAR in the Rational Design of Receptor Ligands and Enzyme Inhibitors
Application of 3D-QSAR in the Rational Design of Receptor Ligands andEnzyme Inhibitors
by Marco Mor*a), Silvia Rivaraa), Alessio Lodolaa), Simone Lorenzia), Fabrizio Bordia), Pier VincenzoPlazzia), Gilberto Spadonib), Annalida Bedinib), Andrea Durantib), Andrea Tontinib), and Giorgio Tarziab)
a) Dipartimento Farmaceutico, Universita¡ degli Studi di Parma, Parco Area delle 27/A, I-43100 Parma(phone: �� 390521905062; fax: �� 390521905006; e-mail : [email protected])
b) Istituto di Chimica Farmaceutica e Tossicologica, Universita¡ degli Studi di Urbino −Carlo Bo×,Piazza del Rinascimento 6, I-61029 Urbino
Quantitative structure ± activity relationships (QSARs) are frequently employed in medicinal chemistryprojects, both to rationalize structure ± activity relationships (SAR) for known series of compounds and to helpin the design of innovative structures endowed with desired pharmacological actions. As a difference from theso-called structure-based drug design tools, they do not require the knowledge of the biological target structure,but are based on the comparison of drug structural features, thus being defined ligand-based drug design tools.In the 3D-QSAR approach, structural descriptors are calculated from molecular models of the ligands, asinteraction fields within a three-dimensional (3D) lattice of points surrounding the ligand structure. Thesedescriptors are collected in a large X matrix, which is submitted to multivariate analysis to look for correlationswith biological activity. Like for other QSARs, the reliability and usefulness of the correlation models dependson the validity of the assumptions and on the quality of the data. A careful selection of compounds andpharmacological data can improve the application of 3D-QSAR analysis in drug design. Some examples of theapplication of CoMFA and CoMSIA approaches to the SAR study and design of receptor or enzyme ligands isdescribed, pointing the attention to the fields of melatonin receptor ligands and FAAH inhibitors.
Introduction. ± Molecular modeling techniques can be applied to drug designaccording to two separate paradigms, one focused on the relationships between ligandstructure and pharmacological activity, and the other aimed at the understanding of theinteractions observed for complexes between a ligand and its binding site [1]. While thefirst approach attempts to rationalize biological activity in the absence of detailedthree-dimensional (3D) structural information about the binding site, the latterrequires the knowledge of 3D structures of the therapeutic targets. The rapid increasein available structural information, attributed to the advances in molecular biology togenerate target proteins in adequate quantities, and the equally impressive gains inNMR and crystallography to resolve protein structures at atomic level, has stimulatedthe molecular-modeling community in the development of useful computational tools(e.g., docking and de novo design software), able to transform the knowledge of thetopography of target binding sites into new drugs. Several successful applications of theso-called −structure-based drug design× (SBDD) approach have been recently reported,confirming its usefulness in medicinal chemistry [2]. On the other hand, the traditional−ligand-based drug design× (LBDD) paradigm is the most suitable approach to designnew bioactive molecules when the target structure cannot be directly observed, or whenits interaction with the drug is so complex that −hidden× structural features, which maynot be revealed by the static topography of a protein ± drug complex, can influence
CHEMISTRY & BIODIVERSITY ± Vol. 2 (2005)1438
¹ 2005 Verlag Helvetica Chimica Acta AG, Z¸rich
pharmacological potency at a relevant level. It relies on the notion that compoundswith comparable structural, chemical, and physico-chemical properties should similarlybehave in biological systems. This concept played a central role in favoring theadvancement of the modern medicinal chemistry, and still represents one of the maindriving forces in several drug discovery projects. One of the most frequently employedLBDD method is the Quantitative Structure ± Activity Relationship (QSAR) ap-proach [3]. It consists in the search for empirical functions between measures ofbiological activity (Y), and variables describing structural features or physico-chemicalproperties (X) (e.g., �, MR, and �), that may help in rationalizing the SAR withinseries of homologous compounds [4]. In many cases, QSAR equations allowed tounderstand the fundaments of drug action mechanisms, providing useful insights formedicinal chemistry [5]. Traditional QSAR variables only account for the magnitude ofa particular physical property, but they hardly provide information about the spatialdistribution of such properties in the molecular surroundings. With the advent ofcomputer graphics, algorithms able to calculate vectorial descriptors have beendeveloped, allowing the rationalization of structure ± activity data within a 3Dframework. The possibility to represent molecular properties in a 3D space is evocativeof the supposed ligand ± receptor interaction process and makes intuitive the meaningof the final QSAR models [6].
One of the most popular 3D-QSAR methodology is the Comparative MolecularField Analysis (CoMFA) [7]. This approach, correlating biological differences withchanges in shape and in the intensity of non-covalent interaction fields around themolecules, has been successfully applied in numerous drug-discovery projects, both inthe retrospective analysis and in supporting the design of new active compounds [8].
In a standard CoMFA procedure, a bioactive conformation for each compound in atraining set is chosen, and all the structures are superimposed with rules which dependon the supposed mode of interaction with the target macromolecule, for example,following a previously developed pharmacophore model. The steric and the electro-static fields of these molecules are then calculated as the interaction energies with aprobe atom (generally a pseudo atom having the Van der Waals radius of a C-atom anda unit positive charge) at regularly spaced points of a 3D lattice. The calculated energyvalues are arranged in a very large X matrix, which is then correlated to the Y vector ofpharmacological activity by the partial least-squares (PLS) statistical technique, acorrelative multivariate analysis useful when descriptors are mutually correlated andtheir number exceeds that of the compounds [9]. The dependent variables employedare usually binding affinity values on a log scale (pKi , pIC50), even if other biologicalmeasures can be employed, provided that a continuous relationship with changes instructure can be supposed. The optimum number of latent variables in Projection toLatent Spaces (PLS) analysis is generally selected on the basis of cross-validationresults, thus tuning model complexity at its best predictive power [10]. The final modelis derived using the number of latent variables giving the best q2 value, and the PLSmodel is then back-transformed to a pseudo-multiple regression analysis (MRA)equation, where a pseudo-coefficient is assigned to each variable, representing theeffect on activity of the change in steric or electrostatic field at each lattice point. Theresult is generally presented as a set of contour maps showing favorable andunfavorable steric regions around the molecules, as well as favorable and unfavorable
CHEMISTRY & BIODIVERSITY ± Vol. 2 (2005) 1439

regions for electropositive or electronegative substituents in certain positions.Predictions for a test set (the compounds not included in the analysis) and for othercompounds can be made, either by a qualitative inspection of these contour maps or, ina quantitative manner, by calculating the fields of these molecules and by inserting thegrid values into the PLS model. Evidences have been collected that Lennard ± Jonesand Coulomb potentials implemented in the standard CoMFA are not able toaccurately describe the energetic of the ligand binding process [11]. Entropic influencesare also neglected or insufficiently covered. To include some entropic effects,hydrophobic fields have been developed and implemented in programs like HINT[12], to be employed as additional descriptors in an extended CoMFA analysis.
Further improvements both in the description and intelligibility of 3D-QSARmodels have been reported, such as the recently developed Comparative MolecularSimilarity Indices Analysis (CoMSIA) approach [13]. In this procedure, five differentsimilarity fields (electrostatic, steric, hydrophobic, H-bond donor and H-bond accept-or), selected to cover the commonly accepted major contributions to ligand binding,are calculated using a Gaussian distance function. The slopes of these Gaussianfunctions are not as steep as the traditional Coulomb and Lennard ± Jones potentialsemployed in CoMFA, and thus it is not necessary to make use of artificial cut-off rulesto truncate energies in close proximity of the ligand atoms. As a consequence, CoMSIAgenerates smoother contour maps, with respect to those produced by the traditionalCoMFA protocol, making their structural interpretation easier and more intuitive [11].
Apart from the specific implementation, there are general assumptions that must betaken into account during the development of a 3D-QSAR model. The first importantaspect is that the reported pharmacological effects should be produced by the modeledcompounds and not by their metabolites. Likewise, the conformation, ionic species, andtautomer selected must be mainly responsible for the activity. Moreover, all thecompounds included in the data-set should bind the same binding site at the samebinding points, and the perturbation of the target should be the same for all the ligands.For this reason, receptor agonists and antagonists are generally treated in separate sets.Furthermore, this computational approach presumes that the variation in the biologicalactivity along the series is largely explained by enthalpic processes, or that the entropicterms are comparable for all the data set compounds, even if they can be partiallyaccounted for employing some hydrophobic fields.
There are several potential pitfalls in 3D-QSAR analyses, regarding biological datasources, compound data set composition, and alignment strategy, that may affect thesignificance of the final models [14]. The quality of biological data represents the firstsource of potential errors in all QSARs. The activity of compounds tested by differentresearch groups are often measured employing different pharmacological tests. Forthese reasons, −in-house× pharmacological activities are usually preferred to thosecollected from different literature sources, as inconsistency in the Y data can lead tomeaningless models. On the other hand, this can result in training sets with insufficientstructure modulation, and a compromise has sometimes to be applied, looking for somedata scaling that reduces inconsistencies, such as reporting the potency data as relativeto that of a reference compound. In fact, inadequate structural variation in the trainingset compounds also represents a potential weakness of the 3D-QSAR approach. Thedata set should cover a parameter space in which all the points are evenly distributed,
CHEMISTRY & BIODIVERSITY ± Vol. 2 (2005)1440

and some redundancy (more than one compound with certain features) should beincluded to avoid the possibility that cross-validation is no longer applicable, and thatsingle points, endowed with high leverage, strongly influence the final model. Trainingset compounds should, therefore, be selected on the basis of their shape and chargedistribution to maximize their information content, as generally required byexperimental design. There are several examples of QSAR and 3D-QSAR studiescharacterized by a poor fit of the training set data or by a lack of predictivity for the testset compounds due to the absence of an appropriate series design [14]. This designshould provide uncorrelated variation of steric and electrostatic properties in thedifferent regions of space where the structure of the aligned compounds has beenmodulated, but, while experimental design techniques are easily applied to traditionalQSAR studies with scalar variables, the problem of its application to 3D-QSARanalysis is not straightforward, and still largely unresolved. The alignment strategy isanother crucial point for CoMFA/CoMSIA studies, as it affects the calculated values ofthe fields [15]. The basic idea is to superimpose the molecules in the orientation thatthey are supposed to adopt at the putative binding site. However, a strict alignment rulecannot account for receptor flexibility, and, in some cases, there is not a uniquealignment rule, as very similar compounds can bind to the same binding site in differentarrangements. Pharmacophore analysis is a common strategy to determine thefundamental features of ligand binding, but this procedure provides straightforwardresults only when rigid compounds are employed. At least one highly active andconformationally constrained compound should be present in any data set as it −pre-defines× the distances between the pharmacophoric elements, serving as a template forthe alignment of all the ligands of the data set.
Like all empirical models built by statistical analysis, 3D-QSAR models require aform of validation before being considered reliable. In QSAR, and in 3D-QSAR, theleave-one-out (LOO) cross-validation technique is commonly employed to provide anestimate of the predictive power of the model, called cross-validated correlationcoefficient r2, or simply q2. The q2 value is also considered as a criterion of robustness ofthe model, as its difference from the fitting r2 is larger when the removal of individualcompounds from the training set strongly affects the quality of the model. Manyauthors consider high q2 (e.g., q2� 0.5) as an indicator, or quite as the ultimate proof, ofthe high predictive power of the empirical model. In contrast to such expectation, it hasbeen shown that, in cases where test sets with known values of biological activities wereavailable for prediction, there existed no correlation between LOO cross-validated q2
and correlation coefficient r2 between the predicted and the observed activities for thetest set [16]. A high q2
LOO value should, therefore, be considered as a measure of theinternal consistency of the derived model rather than as a true indicator of theforecasting power. A suitable way to assess the predictivity of a QSAR model could beto divide the available data set into a training set and a test set (containing ca. the 20%of starting compounds) and to predict the activities of the external compounds.However, the huge number of possible test sets derivable from a data set (calculated asC� n!/[k! (n� k)!] where n is the total number of elements and k the number ofelements in the test set; there are 4845 combinations in which four compounds can beextracted from a set of 20) makes this method subject to the casual selection ofcompounds in the test set, and the accuracy of predictions dependent on the level of
CHEMISTRY & BIODIVERSITY ± Vol. 2 (2005) 1441

redundancy within the whole set of compounds. To address the problem of compoundselection, some strategies such as hierarchical clustering, D-optimal and factorialdesign have been applied to assign the compounds to the training or to the data set [17].Another way to judge the reliability of a QSAR model, as opposed to the risk of chancecorrelation, is the randomization of the Y vector, where the biological activity valuesare repetitively scrambled, i.e., randomly ordered y values are submitted to the PLSanalysis with a stable X matrix. A significant risk of chance correlation can be excludedonly if the result from the original order of the y values is significantly better than theresults from the −scrambled× data sets [14]. Even if it can be difficult to accurately assessthe robustness and predictive power of a 3D-QSAR model, simple rules derived fromtraditional QSAR can be applied. Thus, compounds having unique structures stronglyinfluence the model, particularly if they have very high or very low activity, as theattribution of activity variation to their structural features can only be statisticallytested if similar compounds are included in the training set. Moreover, if, in a set ofsimilar compounds, two chemical modifications occur always at the same time, it will beimpossible to understand if one of the two is independently relevant for activity,irrespective of the statistical method employed. Correlation or redundancy in structuralvariables can also lead to model weakness, like in the case where a 3D field (i.e.,electrostatic) is employed in absence of a significant modulation of the chargedistribution within the training set, or where steric and lipophilic fields arecontemporarily applied to study a set of compounds with only lipophilic sub-stituents.
However, apart from the statistic rigor, it should be considered that, in drug designprojects, 3D-QSAR models must give suggestions which could be chemically exploitedin the synthesis of active compounds with non-trivial structures. Our experiencesuggested that the best way to test the predictive ability of 3D-QSAR models is toapply them to the design of new compounds, and that, even if extrapolation generallyprecludes quantitatively accurate predictions, qualitative indications on the structure ±activity trends can still be very useful. Although the potential pitfalls of 3D-QSARsuggest that this tool is particularly suited for retrospective analysis [18], we believethat, if responsibly used, CoMFA and CoMSIA approaches may give valuableindications both in the structural optimization of promising scaffolds and in the designof innovative compounds.
We applied 3D-QSAR analysis to the study of structure ± activity relationships andto the design of new active compounds in the field of receptor ligands, such as histamineH3 antagonists [19] and melatonin MT2 antagonists, and enzyme inhibitors. Someexamples of 3D-QSAR application are further discussed, illustrating the utility of thistechnique in collecting crucial insights within drug-discovery programs. The firstexample describes the development of compounds acting as receptor ligands, which hasled to the design and synthesis of novel melatonin-receptor antagonists; the secondexample reports the application of 3D-QSAR to the development of enzymeinhibitors, in particular of inhibitors of the enzyme fatty acid amide hydrolase(FAAH).
Melatonin Receptor Antagonists. ± Melatonin (�N-acetyl-5-methoxytriptamine;MLT) is a neurohormone primarily secreted by the pineal gland, following a circadian
CHEMISTRY & BIODIVERSITY ± Vol. 2 (2005)1442
rhythm and with the highest concentrations at night. Since its discovery and chemicalcharacterization in 1959 [20], numerous studies have proven its involvement in theregulation of many physiological processes, such as the entrainment of circadian andseasonal rhythms, the modulation of the immune system, as well as the cardiovascularresponses. Melatonin has also evidenced interesting antioxidant properties. Inmammals, MLT binds to two membrane receptors, named MT1 and MT2, andbelonging to the G protein-coupled receptor superfamily [21]. Although the distinctphysiological roles of the MT1 and MT2 receptor subtypes have been deeplyinvestigated, we are still far from a clear and comprehensive knowledge; for thisreason, subtype selective ligands could be very useful as pharmacological tools.Moreover, compounds acting at the MLT receptors have been proposed as potentialagents for the treatment of disrupted circadian rhythms [22].
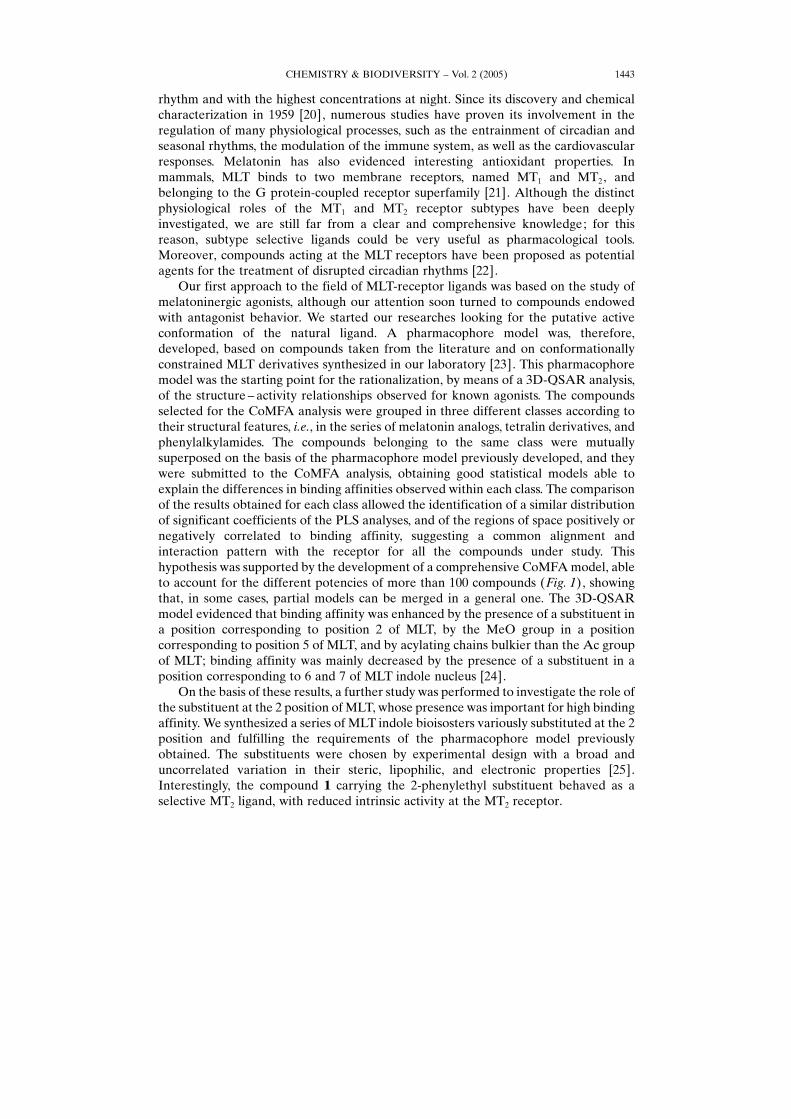
Our first approach to the field of MLT-receptor ligands was based on the study ofmelatoninergic agonists, although our attention soon turned to compounds endowedwith antagonist behavior. We started our researches looking for the putative activeconformation of the natural ligand. A pharmacophore model was, therefore,developed, based on compounds taken from the literature and on conformationallyconstrained MLT derivatives synthesized in our laboratory [23]. This pharmacophoremodel was the starting point for the rationalization, by means of a 3D-QSAR analysis,of the structure ± activity relationships observed for known agonists. The compoundsselected for the CoMFA analysis were grouped in three different classes according totheir structural features, i.e., in the series of melatonin analogs, tetralin derivatives, andphenylalkylamides. The compounds belonging to the same class were mutuallysuperposed on the basis of the pharmacophore model previously developed, and theywere submitted to the CoMFA analysis, obtaining good statistical models able toexplain the differences in binding affinities observed within each class. The comparisonof the results obtained for each class allowed the identification of a similar distributionof significant coefficients of the PLS analyses, and of the regions of space positively ornegatively correlated to binding affinity, suggesting a common alignment andinteraction pattern with the receptor for all the compounds under study. Thishypothesis was supported by the development of a comprehensive CoMFA model, ableto account for the different potencies of more than 100 compounds (Fig. 1), showingthat, in some cases, partial models can be merged in a general one. The 3D-QSARmodel evidenced that binding affinity was enhanced by the presence of a substituent ina position corresponding to position 2 of MLT, by the MeO group in a positioncorresponding to position 5 of MLT, and by acylating chains bulkier than the Ac groupof MLT; binding affinity was mainly decreased by the presence of a substituent in aposition corresponding to 6 and 7 of MLT indole nucleus [24].
On the basis of these results, a further study was performed to investigate the role ofthe substituent at the 2 position of MLT, whose presence was important for high bindingaffinity. We synthesized a series of MLT indole bioisosters variously substituted at the 2position and fulfilling the requirements of the pharmacophore model previouslyobtained. The substituents were chosen by experimental design with a broad anduncorrelated variation in their steric, lipophilic, and electronic properties [25].Interestingly, the compound 1 carrying the 2-phenylethyl substituent behaved as aselective MT2 ligand, with reduced intrinsic activity at the MT2 receptor.
CHEMISTRY & BIODIVERSITY ± Vol. 2 (2005) 1443
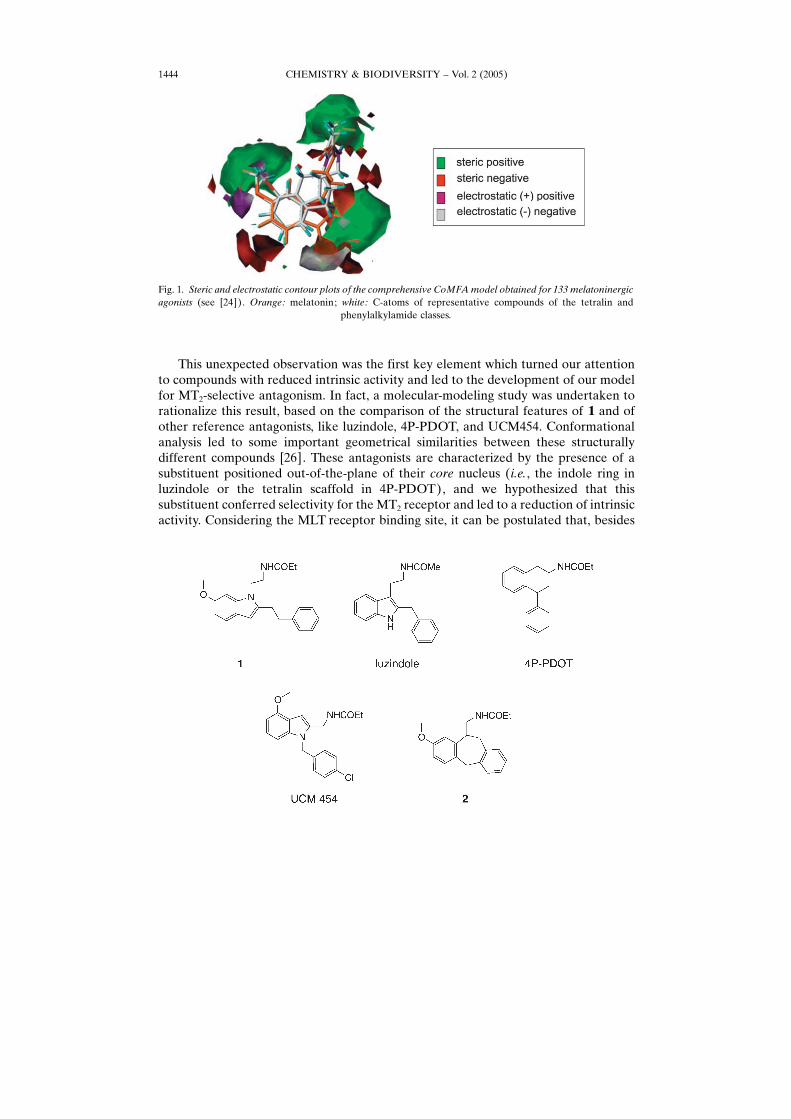
This unexpected observation was the first key element which turned our attentionto compounds with reduced intrinsic activity and led to the development of our modelfor MT2-selective antagonism. In fact, a molecular-modeling study was undertaken torationalize this result, based on the comparison of the structural features of 1 and ofother reference antagonists, like luzindole, 4P-PDOT, and UCM454. Conformationalanalysis led to some important geometrical similarities between these structurallydifferent compounds [26]. These antagonists are characterized by the presence of asubstituent positioned out-of-the-plane of their core nucleus (i.e., the indole ring inluzindole or the tetralin scaffold in 4P-PDOT), and we hypothesized that thissubstituent conferred selectivity for the MT2 receptor and led to a reduction of intrinsicactivity. Considering the MLT receptor binding site, it can be postulated that, besides
CHEMISTRY & BIODIVERSITY ± Vol. 2 (2005)1444
Fig. 1. Steric and electrostatic contour plots of the comprehensive CoMFAmodel obtained for 133 melatoninergicagonists (see [24]). Orange: melatonin; white: C-atoms of representative compounds of the tetralin and
phenylalkylamide classes.
the well known and already characterized lipophilic pocket in correspondence ofposition 2 of the indole nucleus of MLT and common at the two receptor subtypes, theMT2 receptor has an additional lipophilic pocket, positioned out-of-the-plane of theindole ring of MLT and able to accommodate the substituent. The occupancy of thispocket would shift the activity of the compound towards antagonism and conferselectivity for the MT2 receptor; this additional cavity should not be present in the MT1
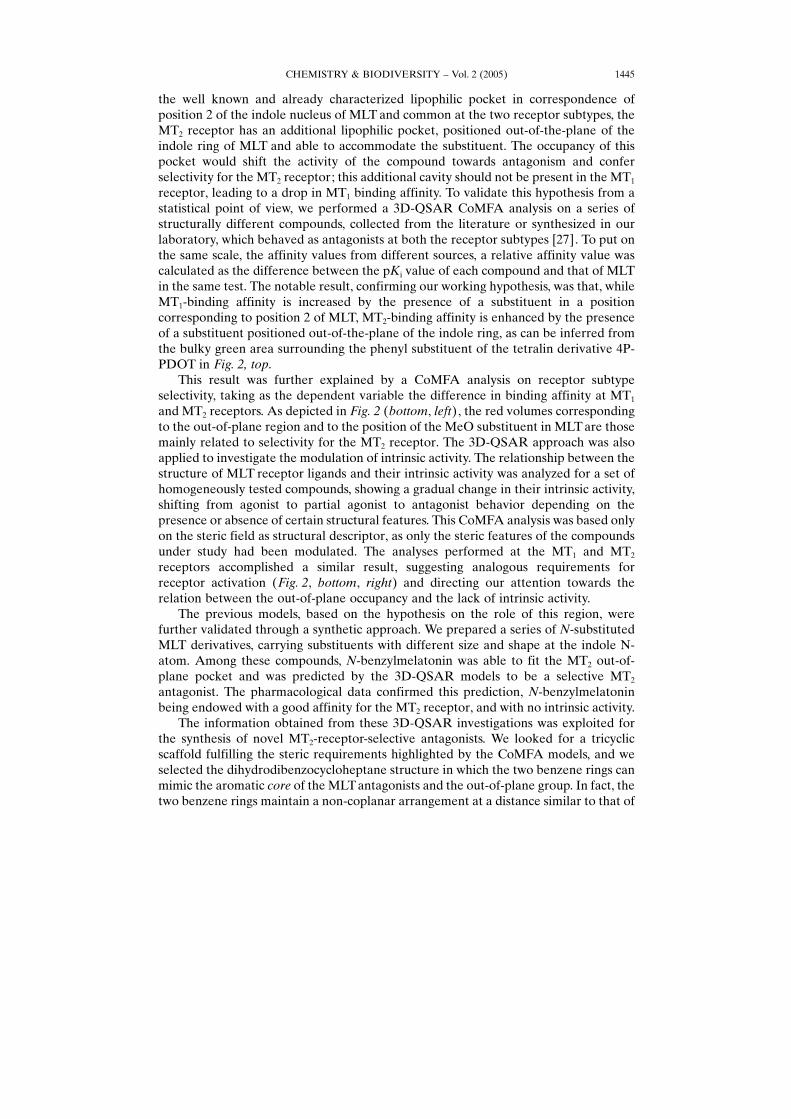
receptor, leading to a drop in MT1 binding affinity. To validate this hypothesis from astatistical point of view, we performed a 3D-QSAR CoMFA analysis on a series ofstructurally different compounds, collected from the literature or synthesized in ourlaboratory, which behaved as antagonists at both the receptor subtypes [27]. To put onthe same scale, the affinity values from different sources, a relative affinity value wascalculated as the difference between the pKi value of each compound and that of MLTin the same test. The notable result, confirming our working hypothesis, was that, whileMT1-binding affinity is increased by the presence of a substituent in a positioncorresponding to position 2 of MLT, MT2-binding affinity is enhanced by the presenceof a substituent positioned out-of-the-plane of the indole ring, as can be inferred fromthe bulky green area surrounding the phenyl substituent of the tetralin derivative 4P-PDOT in Fig. 2, top.
This result was further explained by a CoMFA analysis on receptor subtypeselectivity, taking as the dependent variable the difference in binding affinity at MT1
and MT2 receptors. As depicted in Fig. 2 (bottom, left), the red volumes correspondingto the out-of-plane region and to the position of the MeO substituent in MLTare thosemainly related to selectivity for the MT2 receptor. The 3D-QSAR approach was alsoapplied to investigate the modulation of intrinsic activity. The relationship between thestructure of MLT receptor ligands and their intrinsic activity was analyzed for a set ofhomogeneously tested compounds, showing a gradual change in their intrinsic activity,shifting from agonist to partial agonist to antagonist behavior depending on thepresence or absence of certain structural features. This CoMFA analysis was based onlyon the steric field as structural descriptor, as only the steric features of the compoundsunder study had been modulated. The analyses performed at the MT1 and MT2
receptors accomplished a similar result, suggesting analogous requirements forreceptor activation (Fig. 2, bottom, right) and directing our attention towards therelation between the out-of-plane occupancy and the lack of intrinsic activity.
The previous models, based on the hypothesis on the role of this region, werefurther validated through a synthetic approach. We prepared a series of N-substitutedMLT derivatives, carrying substituents with different size and shape at the indole N-atom. Among these compounds, N-benzylmelatonin was able to fit the MT2 out-of-plane pocket and was predicted by the 3D-QSAR models to be a selective MT2
antagonist. The pharmacological data confirmed this prediction, N-benzylmelatoninbeing endowed with a good affinity for the MT2 receptor, and with no intrinsic activity.
The information obtained from these 3D-QSAR investigations was exploited forthe synthesis of novel MT2-receptor-selective antagonists. We looked for a tricyclicscaffold fulfilling the steric requirements highlighted by the CoMFA models, and weselected the dihydrodibenzocycloheptane structure in which the two benzene rings canmimic the aromatic core of the MLTantagonists and the out-of-plane group. In fact, thetwo benzene rings maintain a non-coplanar arrangement at a distance similar to that of
CHEMISTRY & BIODIVERSITY ± Vol. 2 (2005) 1445
other selective antagonists. An (acylamino)alkyl chain and the MeO substituent wereinserted on the tricyclic scaffold to satisfy the three-dimensional requirements for theselective interaction with the MT2 receptor.
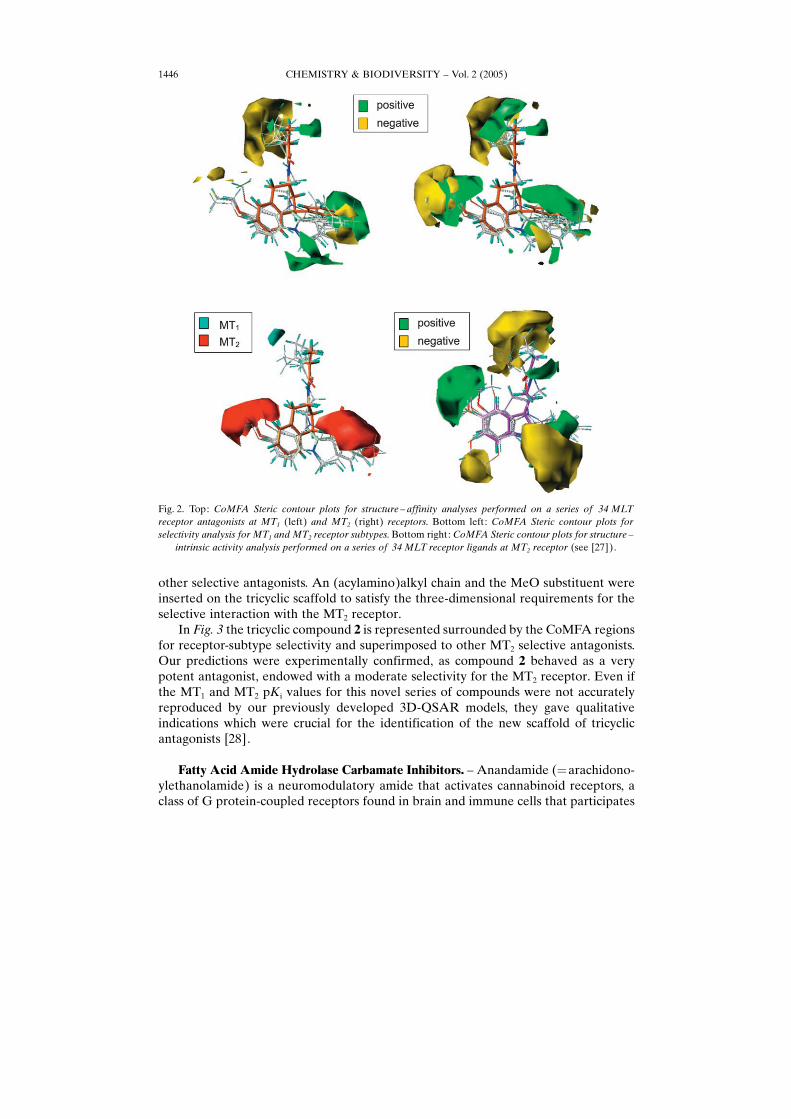
In Fig. 3 the tricyclic compound 2 is represented surrounded by the CoMFA regionsfor receptor-subtype selectivity and superimposed to other MT2 selective antagonists.Our predictions were experimentally confirmed, as compound 2 behaved as a verypotent antagonist, endowed with a moderate selectivity for the MT2 receptor. Even ifthe MT1 and MT2 pKi values for this novel series of compounds were not accuratelyreproduced by our previously developed 3D-QSAR models, they gave qualitativeindications which were crucial for the identification of the new scaffold of tricyclicantagonists [28].
Fatty Acid Amide Hydrolase Carbamate Inhibitors. ± Anandamide (�arachidono-ylethanolamide) is a neuromodulatory amide that activates cannabinoid receptors, aclass of G protein-coupled receptors found in brain and immune cells that participates
CHEMISTRY & BIODIVERSITY ± Vol. 2 (2005)1446
Fig. 2. Top: CoMFA Steric contour plots for structure ± affinity analyses performed on a series of 34 MLTreceptor antagonists at MT1 (left) and MT2 (right) receptors. Bottom left: CoMFA Steric contour plots forselectivity analysis for MT1 and MT2 receptor subtypes. Bottom right: CoMFA Steric contour plots for structure ±
intrinsic activity analysis performed on a series of 34 MLT receptor ligands at MT2 receptor (see [27]).
to the regulation of pain, anxiety, memory, and other physiological functions. Recentobservations have pointed out that new therapeutical approaches can be exploited byenhancing the endogenous level of anandamide [29]. In this light, a promising target isrepresented by the fatty acid amide hydrolase (FAAH) enzyme that has beendemonstrated to terminate the biological effects of several fatty acid amides in vivo.Therefore, the design of potent and selective small-molecule inhibitors of FAAHremains an essential step in the validation of this enzyme as a therapeutic target. Wehave recently developed a series of O-aryl N-alkylcarbamates that inhibits FAAHenzyme with a non-competitive mechanism [30]. It has been speculated that theobserved time-dependent inhibition could be due to a direct reaction between theelectrophilic C-atom of the carbamoyl fragment and the Ser241 OH O-atom, belongingto the Ser-Ser-Lys FAAH catalytic triad. Moreover, a first exploration on the chemicalrequirements of enzyme inhibition has underlined the importance of the O-aryl estergroup, as its replacement with an aliphatic moiety is detrimental for the activity. Thisfindings suggested that the O-aryl ester group could act as a leaving group after thenucleophilic attack of the Ser241 residue on the carbonyl group of the inhibitors,resulting in enzyme carbamoylation. Though direct evidence for this mechanism is stillneeded, the observation that extensive dialysis did not reverse inhibition supported thenotion that these compounds interacted irreversibly with FAAH.
3D-QSAR can be successfully applied also in the field of enzyme inhibition. Even inthe case of active-site directed inhibitors which disrupt the enzymatic catalyticmachinery by its covalent modification, recognition may still play a major role inexplaining the potency differences, at least within a series of compounds endowed witha comparable chemical reactivity. Considering aryl carbamates, a series of inhibitorssharing the same reactivity, we assumed that differences in pIC50 values could belinearly related to steric descriptors.
The comparison of the molecular structures of compounds 3 and 4, two of the mostpotent inhibitors developed in the early phase of the project (IC50 values of 324 and396 n�, resp.), allowed to make a first hypothesis on the shape requirements for the O-substituent.
CHEMISTRY & BIODIVERSITY ± Vol. 2 (2005) 1447
Fig. 3. Left: compound 2 surrounded by the CoMFA regions influencingMLTreceptor subtype selectivity. Right:superposition of 4P-PDOT (orange: C-atoms) , UCM454 (white: C-atoms) , and compound 2 (yellow:
C-atoms).

A systematic conformational analysis of the (benzyloxy)phenyl fragment of 4revealed two families of accessible conformers, mainly differing in the torsion anglearound the O�CH2 bond, with the two phenyl rings in anti- or in gauche-conformation[31]. Apparently, the gauche-conformation of 4 more closely resembled the shape ofthe naphthalenyl derivative 3 when the compounds were superimposed via theircommon carbamate group (Fig. 4). This led us to hypothesize that a bent shape of thecarbamate O-substituent could favor enzyme inhibition, possibly by allowing a greatersteric complementarity between the inhibitor and the active site of the enzyme.
To test this assumption, we conducted a systematic exploration of the stericrequirements of the aromatic O-substituents by synthesizing a series of carbamates inwhich the shape of the O-residue was gradually modified, while maintaining thecyclohexyl substituent on the carbamate N-atom, which provided good potency values.
Starting from the naphthalen-2-yl and phenyl derivatives, a series of compoundswith lipophilic groups potentially able to occupy either a region of space antipodal tothe carbamate group or a region corresponding to the meta-position of the phenyl ringwere prepared. As a result, greater inhibitor potencies were obtained for compoundshaving a bent shape. A 3D-QSAR analysis was undertaken to correlate compoundshape with inhibitor potency after superposition of the carbamate fragments and theO-phenyl rings. To avoid the possibility that single-point errors could affect the finalQSAR model, some redundancy was included in the final data set by synthesizing
CHEMISTRY & BIODIVERSITY ± Vol. 2 (2005)1448
Fig. 4. Superposition of compounds 3 (green: C-atoms)and 4 (white: C-atoms) in its gauche- and anti-conforma-
tions
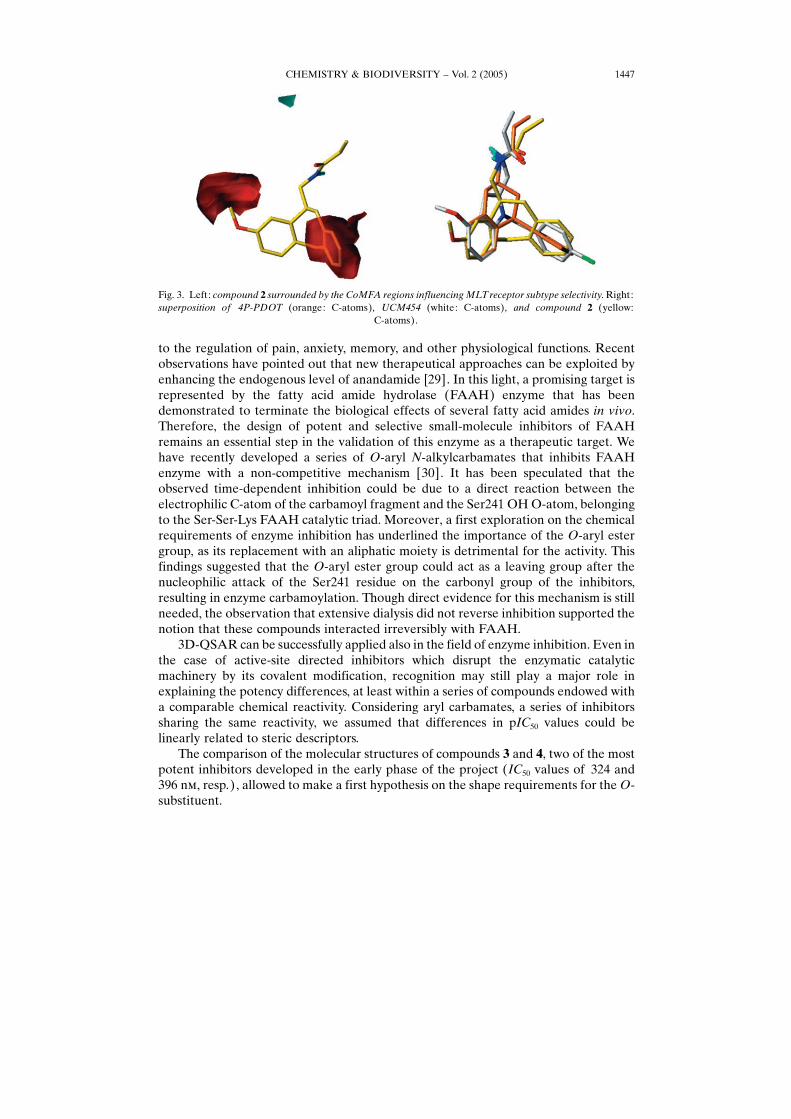
additional compounds. The correlation between molecular shape and FAAH inhibitorpotency was investigated by the CoMSIA method. A PLS model with two latentvariables showed significant descriptive and predictive power (r2� 0.82, q2
LOO � 0.54)for the 14-compound set.
The coefficients of the steric field are depicted in Fig. 5 as isopotential surfaces. Ascan be observed from the green and blue surfaces, corresponding to positive and verypositive coefficients between steric occupancy and potency, the largest and deepestfavorable region was observed for the O-aryl moiety. The positive region correspondsto the second ring of the naphthalenyl nucleus, or to the distal phenyl of a styrylfragment in its (Z)-configuration. It is reasonable to assume the proximity of thisregion to the binding-site surface of FAAH, which would result in an improvement ofsteric and/or lipophilic interactions between the enzyme and the inhibitor. A smallregion with moderately negative coefficients is represented by the yellow surface at thebottom left of Fig. 5, opposite to the point of attachment of the phenyl ring to thecarbamate group. It indicates that longer, straight fragments can be accommodated atthe binding pocket in a less efficient manner than the folded ones. The CoMSIAcoefficients thus supported our hypothesis on the existence of a large cavity with acurved shape in the active site of enzyme, where suitable O-substituents can beaccommodated, so that the interaction of their C�O group with the active serine of theenzyme is facilitated.
The most promising compound, the 1,1�-biphenyl-3-yl derivative URB524, wasselected as a starting point to optimize its inhibitor potency. A two-level experimentaldesign was performed introducing four substituents at the distal phenyl ring in themeta- or in the para-position [32]. The selected substituents represented thecombinations of positive and negative levels for � and � descriptors, and allowed toindependently explore the effect of electronic and lipophilic variation on biologicalactivity, keeping the substituent size relatively constant. As a result, we observed thatthe 3�-methyl and 3�-amino derivatives were as potent as the parent compound, whilethe 3�-carbamoyl derivative (URB597) was by an order of magnitude more potent; onthe contrary, the para substituted compounds were less active than URB524 (Fig. 6).
Fig. 5. Left: representation of CoMSIA contour plots for an explorative set of carbamate FAAH inhibitors.Right: calculated vs. observed pIC50 values for compounds included in the training set (see [31]).
CHEMISTRY & BIODIVERSITY ± Vol. 2 (2005) 1449

This rational design led not only to the identification of a potent FAAH inhibitor(URB597, endowed with an IC50 value of 4 n�), but also to the observation of aninteresting complementarity between the CoMSIA coefficients and the enzyme cavityshape. In fact, the structure of FAAH co-crystallized with a phosphonate inhibitor hadbeen reported after the development of our models [33], and it allowed the docking ofthe 1,1�-biphenyl moiety of URB524 within a bent, lipophilic pocket close to thecatalytic site. It was also possible to identify polar residues potentially able to interactwith the polar substituent of URB597 [32]. This compound revealed promising in vivopharmacological activity in rodents, where it showed anxiolytic effects, furthersupporting FAAH as an interesting target for central nervous system disorders[30] [34].
REFERENCES
[1] G. R. Marshall, D. D. Beusen, in −Burger×s Medicinal Chemistry and Drug Discovery, Vol. 1×, Ed. D. J.Abraham, John Wiley & Sons, Hoboken, 2003, p. 77.
[2] L. W. Hardy, D. J. Abraham, M. K. Safo, in −Burger×s Medicinal Chemistry and Drug Discovery, Vol. 1×, Ed.D. J. Abraham, John Wiley & Sons, Hoboken, 2003, p. 417.
[3] G. E. Kellogg, S. F. Semus, in −Modern Methods of Drug Discovery×, Eds. A. Hillisch, R. Hilgenfeld,Birkh‰user Verlag, Basel, 2003, p. 223.
[4] C. Hansch, A. Leo, −Exploring QSAR. Fundamentals and Applications in Chemistry and Biology×,American Chemical Society, Washington, DC, 1995.
[5] J. G. Topliss, Perspect. Drug Discov. Des. 1993, 1, 258.[6] Y. C. Martin, in −3D QSAR in Drug Design, Vol. 3×, Eds. H. Kubiny, G. Folkers, Y. C. Martin, Kluwer
Academic Publishers, Dordrecht, 1998, p. 3.[7] R. D. Cramer III, D. E. Patterson, J. D. Bunce, J. Am. Chem. Soc. 1998, 110, 5959.[8] K. H. Kim, G. Greco, E. Novellino, in −3D QSAR in Drug Design, Vol. 3×, Eds. H. Kubiny, G. Folkers, Y. C.
Martin, Kluwer Academic Publishers, Dordrecht, 1998, p. 257.[9] S. Wold, A. Ruhe, H. Wold, W. J. Dunn, SIAM J. Sci. Stat. Comput. 1984, 5, 735.
[10] R. D. Cramer III, J. D. Bunce, D. E. Patterson, Quant. Struct.-Act. Relat. 1988, 7, 18.[11] G. Klebe, in −3D QSAR in Drug Design, Vol. 3×, Eds. H. Kubiny, G. Folkers, Y. C. Martin, Kluwer
Academic Publishers, Dordrecht, 1998, p. 87.[12] G. E. Kellogg, S. F. Semus, D. J. Abraham, J. Comput.-Aided Mol. Design 1991, 5, 545.[13] G. Klebe, U. Abraham, T. Mietzner, J. Med. Chem. 1994, 37, 4130.[14] H. Kubinyi, in −The Encyclopedia of Computational Chemistry, Vol. 1×, Eds. P. v. R. Schleyer, N. L. Allinger,
T. Clark, J. Gasteiger, P. A. Kollman, H. F. Schaefer III, P. R. Schreiner, John Wiley & Sons, Chichester,1998, p. 448.
CHEMISTRY & BIODIVERSITY ± Vol. 2 (2005)1450
Fig. 6. Substituents at the distal phenyl ring of URB524, selected to explore the effect of their electronic andlipophilic properties on FAAH inhibitor potency (see [32])

[15] R. T. Kroemer, P. Hecht, S. Guessregen, K. R. Liedl, in −3D QSAR in Drug Design, Vol. 3×, Eds. H. Kubiny,G. Folkers, Y. C. Martin, Kluwer Academic Publishers, Dordrecht, 1998, p. 41.
[16] A. Golbraikh, A. Tropsha, J. Mol. Graph. Model. 2002, 20, 269.[17] A. Tropsha, in −Burger×s Medicinal Chemistry and Drug Discovery, Vol. 1×, Ed. D. J. Abraham, John Wiley
& Sons, Hoboken, 2003, p. 49.[18] A. M. Doweyko, J. Comput.-Aided Mol. Des. 2004, 18, 587.[19] S. Rivara, M. Mor, F. Bordi, C. Silva, V. Zuliani, F. Vacondio, G. Morini, P. V. Plazzi, P.-A. Carrupt, B. Testa,
Drug Design Discov. 2003, 18, 65.[20] A. B. Lerner, J. D. Case, J. Am. Chem. Soc. 1959, 81, 6084.[21] S. M. Reppert, D. R. Weaver, C. Godson, Trends Pharmacol. Sci. 1996, 17, 100.[22] P. Delagrange, J. Atkinson, A. Boutin, L. Casteilla, D. Lesieur, R. Misslin, S. Pellissier, L. Pe¬nicaud, P.
Renard, J. Neuroendocrinol. 2003, 15, 442.[23] G. Spadoni, C. Balsamini, G. Diamantini, B. Di Giacomo, G. Tarzia, M. Mor, P. V. Plazzi, S. Rivara, V.
Lucini, R. Nonno, M. Pannacci, F. Fraschini, B. M. Stankov, J. Med. Chem. 1997, 40, 1990.[24] M. Mor, S. Rivara, C. Silva, F. Bordi, P. V. Plazzi, G. Spadoni, G. Diamantini, C. Balsamini, G. Tarzia, F.
Fraschini, V. Lucini, R. Nonno, B. M. Stankov, J. Med. Chem. 1998, 41, 3831.[25] M. Mor, G. Spadoni, B. Di Giacomo, G. Diamantini, A. Bedini, G. Tarzia, P. V. Plazzi, S. Rivara, R. Nonno,
V. Lucini, M. Pannacci, F. Fraschini, B. M. Stankov, Bioorg. Med. Chem. 2001, 9, 1045.[26] G. Spadoni, C. Balsamini, G. Diamantini, A. Tontini, G. Tarzia, M. Mor, S. Rivara, P. V. Plazzi, R. Nonno, V.
Lucini, M. Pannacci, F. Fraschini, B. M. Stankov, J. Med. Chem. 2001, 44, 2900.[27] S. Rivara, M. Mor, C. Silva, V. Zuliani, F. Vacondio, G. Spadoni, A. Bedini, G. Tarzia, V. Lucini, M.
Pannacci, F. Fraschini, P. V. Plazzi, J. Med. Chem. 2003, 46, 1429.[28] V. Lucini, M. Pannacci, F. Scaglione, F. Fraschini, S. Rivara, M. Mor, F. Bordi, P. V. Plazzi, G. Spadoni, A.
Bedini, G. Piersanti, G. Diamantini, G. Tarzia, J. Med. Chem. 2004, 47, 4202.[29] D. Piomelli, Nat. Rev. Neurosci. 2003, 4, 873.[30] S. Kathuria, S. Gaetani, D. Fegley, F. Valino, A. Duranti, A. Tontini, M. Mor, G. Tarzia, G. La Rana, A.
Calignano, A. Giustino, M. Tattoli, M. Palmery, V. Cuomo, D. Piomelli, Nat. Med. 2003, 9, 76.[31] G. Tarzia, A. Duranti, A. Tontini, G. Piersanti, M. Mor, S. Rivara, P. V. Plazzi, C. Park, S. Kathuria, D.
Piomelli, J. Med. Chem. 2003, 46, 2352.[32] M. Mor, S. Rivara, A. Lodola, P. V. Plazzi, G. Tarzia, A. Duranti, A. Tontini, G. Piersanti, S. Kathuria, D.
Piomelli, J. Med. Chem. 2004, 47, 4998.[33] M. H. Bracey, M. A. Hanson, K. R. Masuda, R. C. Stevens, B. F. Cravatt, Science 2002, 298, 1793.[34] D. Fegley, S. Gaetani, A. Duranti, A. Tontini, M. Mor, G. Tarzia, D. Piomelli, J. Pharmacol. Exp. Ther. 2005,
313, 352.
Received May 16, 2005
CHEMISTRY & BIODIVERSITY ± Vol. 2 (2005) 1451