Digital menu - responsive website - Margarida Yokochi Portfolio
Upload
khangminh22Category
view
0download
0
Robust. R
elevant. Responsive.
Zensar Technologies Ltd Annual Report 2019-20
Robust. Relevant. Responsive.Strengthening Relations. Ensuring Stability.

Happiness is intrinsic to life at RPG. Be it in our product innovations, business challenges, people policies or in our community outreach programmes. Our Vision tenets clearly outline the path we collectively traverse – to be an organisation where dreams are not constrained by fences, and each one of us is encouraged to reach for happiness that is within our grasp.
“hello happiness”, is a bold statement that helps us open our doors to a world of opportunities and possibilities; a statement that signifies our intent to touch and enrich the lives of others, and work collectively towards a common goal that makes each of us rise beyond our limitations.
Established in 1979, the RPG Group is a diversified conglomerate with interests in the areas of infrastructure, tyres, information technology, pharmaceuticals, energy and plantations. Founded by Dr. R P Goenka, the group’s lineage dates back to the early 19th century. Today, the group has several companies in diverse sectors and the most prominent among them being Zensar Technologies, CEAT, KEC International, and RPG Life Sciences. Built on a solid foundation of trust and tradition, the RPG name is synonymous with steady growth and high standards of transparency, ethics and governance.
About RPG Group
hello happiness

Index
Corporate Overview
Notice and Statutory Reports
Financial Statements
Zensar at a Glance ---------------- 2 Key Financial Metrics ------------ 4Strategic Highlights -------------- 5Chairman’s Message ------------- 6CEO’s Message -------------------- 8Board of Directors ----------------- 10Leadership Team ------------------ 11Robust ------------------------------- 12Relevant ----------------------------- 13Responsive -------------------------- 14Testament to Our Commitment 16An Empowered Workforce ------ 18Creating Value Beyond Business ----------------------------- 20Innovate & Thrive in Enterprise 4.0 ----------------------- 22
Notice --------------------------------- 25Board’s Report & Annexures --------------------------- 33
Standalone Financial Statements -------------------------- 119 Consolidated Financial Statements -------------------------- 190
Scan this code with a QR reader app on your smartphones or tablets and know more about us.
To remain relevant and responsive, we are resolutely focused on unveiling opportunities amidst challenges. Underpinned with myriad opportunities for growth and development, challenges are inherent to success. As we tide through unprecedented events, adapting and adjusting to changing norms, we continue to unearth solutions that ensure stability and strengthen relations.
Zensar’s robust attitude and relentless pursuit of delivering groundbreaking digital transformations have helped reinvent strategies that foster intelligent solutions. With an overwhelming need to continuously embrace dynamic yet sustainable solutions, we are establishing unique capabilities to address challenges and ensure long-term transformations.
Resting on innovative and sustainable solutions we endeavour to ensure relevance, creating a favourable eco-system for new-age processes like AI to thrive and succeed. While remaining relevant is the need of the hour, building responsive solutions hold the key to success in an agile and unpredictable environment. As we acknowledge novel challenges and derive exceptional solutions to stay in touch with our partners, we are enthused to elucidate answers that are Robust, Relevant and Responsive.

Zensar at a Glance We are a ‘Living’ digital and technology company, offering reliable and measurable digital solutions that help transform the digital environment of enterprises. We are a part of 3 USD billion RPG Enterprises Group and the 40 USD billion APAX Portfolio Company. Zensar Technologies is one of the very few technology companiesglobally, to be publicly listed on stock exchange(s) for over 56 years.
Who we are
Zensar Technologies, a leading digital solutions and technology services company, continues to deliver excellence and superior customer satisfaction through its diverse service offerings. At a time when organisations are looking for elevated experiences in a digital landscape, our expertise, strong innovation capabilities and credible investment in building digital solutions have helped us emerge as a trusted partner for our customers.
Building on the foundation of digital solutions and technologies, we have today excelled in delivering convenience and efficiency to offer measurable business outcomes. Our approach to Return on Digital ® With New and Exponential Technologies (RoD NeXT), along with the continuous advancement of newer digital offerings that are in sync with our proprietary solutions, have empowered customers across the globe.
In our endeavour to drive digital transformation on a large scale with minimum human intervention, we embarked on the ‘Living AI’ journey to help our clients outperform and be future-ready. In the last few years, a plethora of emerging technologies like Artificial Intelligence (AI) have gained significant prominence with multiple opportunities to deliver value to the end-user. Zensar, has pivoted its next-level growth on the ‘Living AI’ philosophy to provide best-in-class solutions to our customers, enabling them to transform multiple business functions.
Read more about our ‘Living AI’ philosophy on page (13)
Where we operateHeadquartered in Pune (India), Zensar serves leading multinationals and global companies with offices in India, UK, Europe, South Africa and the US.
USA
74.7%
South Africa
10.1%
UK and Europe
15.2%
Operating statistics
9524Employees across all offices as on March 31, 2020
52.4%of the total revenue for FY20
Digital revenues form
10+Countries of presence
280+Active customers
25+Offices across the globe
2 ZENSAR TECHNOLOGIES LTD ANNUAL REPORT 2019-20

What we do
At Zensar, we strive to create a digital eco-system that delivers excellence with digital tools embedded in platforms and processes, and adopted by our people. In our mission to transform customer experiences across industries, domains and technologies, we continue to first implement tools within our eco-system and then take them to our customers. In the process, we learn, adapt and ensure that we deliver a complete suite of end-to-end solutions, integrated to accelerate the digital transformation journey of our clients.
Hi-Tech & Manufacturing
Consumer Services
Banking, Financial Services and Insurance
Our
VisionOur
Values Our
Mission
What drives us
Leaders in business transformation
Customer Centricity Commitment to People and the
Community Continuous Innovation and
Excellence
We will be the best in delivering innovative, industry-focused solutions with measurable business outcomes
Services
Solutions
Customers across sectors
ModernisationDevOps and Agile
AI & Analytics
Smart ADM
Digital Assurance
Wired Autonomous
Cloud
Cloud Applications
Enterprise Applications
Digital Infrastructure
Digital Experience
Management
Digital Operations
Digital Enterprise Security
Digital Workplace Services
Connected Intelligence
Blockchain
ZenCareWired Experience
Intelligent SOC
User First Modern
Workplace
ZenTrust
3CORPORATE OVERVIEWZENSAR AT A GLANCE

Key Financial MetricsRevenue
Revenue by Sector
Quick facts on stakeholder engagement
Revenue per employee (INR Million)
Gross cash (INR Million)
Book value per share (INR)
Digital Revenue as % of total revenue
EBITDA
PAT
(INR Million)
(in %)
Hi-Tech & Manufacturing
2017-18 2017-18 2017-18 2017-182019-20 2019-20 2019-20 2019-20
Banking, Financial Services and Insurance
Consumer Services
Emerging
(INR Million)
(INR Million)
2018-192017-18
2017-18
2017-18
2018-19
2018-19
2019-20
2019-20
2019-20
39,663.3 31,077.4
3,649.3
2,464.8
4,794.4
3,186.5
41,816.8
5,070.6
2,716.1
16.0%
15.4
3.3 53.6
27.7
17.9%
5.0%
CAGR
CAGR
CAGR
38.1
3.4 4,497 74.80
52.4
4.4 7,839 93.77
Integrated digital transformation services that consistently ensure quality
Provide regular and transparent information
Job creation Fair and sustainable
business practices
Support key community development programmes
Make responsive contribution to community interests and needs
Long-term relationships with efficient payment cycle
Area of focus and action points
Customers
Government and Regulatory authorities
Communities
Suppliers and partners
80.3%
3327
INR 53 Million
4717*
Repeat business from existing clients
Gross Headcount added in FY20
Contribution to community development initiatives
Active vendors on-board
Impact in FY20
*as on March 31, 2020
4 ZENSAR TECHNOLOGIES LTD ANNUAL REPORT 2019-20

Strategic Highlights
Sponsored the 2019 edition of the prestigious International Women’s Hackathon, organised by HackerEarth (the world’s largest developer communities)
Hosted first, among many, Conclave Annual Analyst and Advisor Meet in Boston, USA. Eminent analysts and advisors were invited for one-on-one interactions with the leadership team who shared highlights of Zensar's digital journey and customer success stories
Recognised in Gartner Magic Quadrant for Managed Mobility Services, Global, 2019
Sponsored the ISG Automation Summit 2019, New York as a Gold Partner to showcase Zensar's focused approach towards Connected Intelligence Framework
Awarded for ‘Excellence in Leveraging HR Technology’ category and Runners-up in the ‘Excellence in HR Analytics’ category at the SHRM HR Excellence Awards 2019, New Delhi, India
Featured in the ‘100 Best Company’ for Women in 2019
Recognised as a Disruptor on Enterprise Intelligent Automation journey in Avasant’s Intelligent Automation Services RadarViewTM FY20 Report
Launched the Digital Foundation Services (DFS) to help enterprises navigate challenges of the Enterprise 4.0 era
Featured as a Leader in the ISG Provider Lens™ ‘Digital Workplace of the Future’
Started operations in Mexico City, Mexico, to grow and sustain market presence in North America
Keystone Logic, a Zensar Company, sponsored the Manhattan Associates Momentum 2019 Conference as a Gold Partner
Participated in the Adobe Summit EMEA 2019, London, to showcase Zensar's human-centric approach to Digital Transformation
Partnered with Aptos, a recognised market leader in retail technology solutions to deliver next-gen retail innovation
Expanded operations in South Africa with a bigger team and new office
Recognised in Gartner 2019 Magic Quadrant for Data Center Outsourcing and Hybrid Infrastructure Managed Services, North America
Featured in Working Mother & Avtar Best Companies for Women in India and awarded ‘Exemplar of Inclusion’ in the Working Mother & Avtar Most Inclusive Companies in India (MICI)
Winner of the Future of Learning & Development 'Best Learning Strategy of
Report for its capability Managed Services – Workplace Support
Featured as a Leader in the ISG Provider Lens™ Digital Business Solutions and Service Partners U.S. 2019-20 as a Rising Star USA for Digital Product Services Lifecycle Services and Blockchain Services
Zensar's ‘Women in Workplace’, case study has been recognised as
Participated in Nutanix’s annual .'NEXT Americas' conference to showcase the benefits of Zensar's multi-cloud solutions
Sponsored the ISG Digital Business Summit in London to showcase Zensar's human-led experience solutions
Entered into a global partnership with NetApp and Cisco to accelerate application delivery and transition to hybrid cloud with Zensar’s Managed Private Cloud Services
Participated at Oracle OpenWorld 2019 to present Experience Enterprise Intelligence platform
Recognised as an Innovator in Avasant’s Applied Intelligence and Advanced Analytics Services RadarView™ Report
the Year' Award at the 4th Edition L&D Summit and Awards 2019, India
Cynosure, a Zensar Company, sponsored the Guidewire Connections 2019 event as a Gold Partner
the second best in the private sector category at the Best Innovative Practices Awards at United Nations Global Compact (UNGC), New York
Featured as a Leader in the ISG Provider Lens™ Digital Business Solutions and Service Partners U.K 2019-20 as a Rising Star UK for Customer Journey Service Providers
1
2
3
4
Quarter FY20
Quarter FY20
Quarter FY20
Quarter FY20
Apr
Jul
Oct
May
Aug
Nov
Jan
Feb
Mar
Jun
Sep
Dec
5CORPORATE OVERVIEWKEY FINANCIAL METRICS | STRATEGIC HIGHLIGHTS

Chairman’s Message
H. V. GoenkaChairman
In a complex and challenging environment, Zensar’s performance was encouraging thanks to our diversified and resilient business model. We remain passionate about adding value through our customer-centric digital transformation model, strengthened by AI, data analytics and advanced cloud solutions.
Dear Shareholders,
6 ZENSAR TECHNOLOGIES LTD ANNUAL REPORT 2019-20

Our ‘Living AI’ framework sails on successive waves of innovation and is helping enterprises stay ahead of the curve with disruptive customer experience, enabling higher productivity, hyper-personalisation, safety and security.
We are taking this journey forward, with the help of ZenAIR Labs - a dedicated research outfit involved in building AI-led solutions. We continue to gain considerable share of our existing clients with front-line service offerings while adding new clients to our portfolio. We now have 10 clients with revenue size of $10+ Million, as compared to 4 clients three years ago. Our revenues from digital business now comprise 52.4% of the FY20 revenue, up from 38.1% of FY18. More than 100 patents filed in the last 3 years, stand testimony to the talent of our associates, driven by our continuous investments to train and equip them with ever-evolving technology. We have performed at par with the industry in the US and UK region and remained buoyant in the South African market. Most of our platforms, solutions and services were featured in leading advisory and analyst reports including ISG, Avasant, Gartner, Everest and Forrester in 2019-20.
Today we stand witness to an unprecedented human, social and economic crisis caused by the COVID-19 pandemic. While we have acted with urgency, we are preparing for the future with agility and have responded to customers’ requirements with zeal, enthusiasm and priority. I am proud of our 9500+ Zensarians, who have
seamlessly adapted to the work-from-home model, as the world faced uncertainties and vulnerabilities due to this pandemic. Our AI, ML and cloud infrastructure have become more relevant, enabling companies to interact with their customers in real-time with minimal physical presence. With distinguished capabilities and offerings across multiple sectors and geographies, Zensar is well poised to convert the challenges into opportunities that arise as the world adapts to a new normal where technology will be more critical than ever before.
H. V. GoenkaChairman
More than 100 patents filed in the last 3 years, stand testimony to the talent of our associates, driven by our continuous investments to train and equip them with ever-evolving technology.
7CORPORATE OVERVIEWCHAIRMAN’S MESSAGE

Sandeep KishoreManaging Director and Chief Executive Officer
Sandeep KishoreSandeep KishoreManaging Director and Managing Director and Chief Executive Officer
CEO’s Message
Zensar delivered yet another year of positive value creation in FY20, built on the foundation of our strengthened technological know-how, talented associates and a robust balance sheet. Our experience and expertise of operating in diverse geographies, building capabilities and delivering performances have helped us emerge stronger amidst a difficult operating environment.
Dear Shareholders,
As the world was crippled with the coronavirus (COVID-19) pandemic, at Zensar, we proactively took steps to ensure continuity in all perspectives.
8 ZENSAR TECHNOLOGIES LTD ANNUAL REPORT 2019-20

resulted in 24 5M+ per annum clients and 10 10M+ per annum clients.
As we continue to pursue our digital journey, we are enthused to empower our associates, build capabilities, bestow them with decision-making authority, and eventually play a crucial role in balancing our stakeholder interests. An inclusive, supportive and knowledge based environment, endowed with digital tools is a key differentiator for Zensar’s workforce. We are committed to attracting, developing, training and retaining a diverse and inclusive workforce, providing equal opportunities for all. I am proud of our HR team, for policies and practices that earned prestigious awards from global institutions in FY20. These recognitions are testimony to our inclusive and engaging working culture, inculcated across our offices in different geographies.
The strategies formulated to shape the future of Zensar is validated by our healthy performance. Our recent acquisitions have now formed an integral part of the organisation to draw vertical and horizontal synergies across geographies, driving more value for our customers. The acquisition of Cynosure, Foolproof, Keystone Logic and Indigo Slate, have given us the leverage to penetrate deeper into downstream sectors, while also adding to our digital capabilities and enabling a wider market presence with bigger deals.
Our working capital remains robust, where we have reduced our DSO to 87 days as compared to 102 days in 2019. The digital business continues to be a powerful growth-driver, improving efficiency and control of our business model. The improved cash flow will further help us to invest in future opportunities, keeping us a step ahead of the curve.
We recognise our role as a responsive entity, creating value for stakeholders in accordance with changing times. As the world was crippled with the
coronavirus (COVID-19) pandemic, at Zensar we proactively took steps to ensure continuity in all perspectives. ZenTrust and ZenCare played a crucial role in supporting customers who were economically impacted, helping them revive and reset their business continuity plans. At Zensar, 9,500+ Zensarians, across 10+ countries, were safely equipped with the required infrastructure to work from home, ensuring zero disruption of work, while always prioritising their health and well-being. We extended our community services to those that were severely impacted with hunger and job-loss, providing them with sustainable means to survive during the lockdown period.
The economic outlook is expected to remain subdued in the coming fiscal, with the COVID-19 flare-up and broader geo-political issues anticipated to transcend into weaker economic sentiments. However, the post-COVID era would be completely different, initiating the need for new thinking and new methods of articulation. Therefore, a digitally connected world empowered with emerging technologies would be the new normal. Customers across diverse sectors would look forward to immersive and experience-led products to drive business growth. We, at Zensar, stand at a threshold to leverage our capabilities in the digital eco-system, driven by an able management team and our passionate associates to create value for our customers in the long-term.
Sandeep Kishore
Managing Director and Chief Executive Officer
In a dynamic yet challenging business environment, it has become more critical to remain relevant to customers than it was ever before. As we continue to harness emerging technologies, we continue to strengthen our ability to deliver enriching experiences for our customers. Our success of Return on Digital Transformation® With New and Exponential Technologies (RoD NeXT) has delivered significant tangible and visible results for our customers. The digital business now forms more than 52.4% of our total revenue in the last fiscal year, proving our ability to seize opportunities and meet the changing needs of our customers across sectors while remaining agile and innovative.
‘Living AI’ is a testimony to our commitment to evolve and adapt. It also lies at the core of our strategic goals, to identify and capitalise on growing opportunities. AI, as we know, continues to reduce human efforts with accuracy and efficiency. At Zensar, our ‘Living AI’ philosophy rightly leverages the RoD NeXT platform, enabling unmatched experiences every step of the way. Built on the three pivots of Decision AI, Experience AI and Research AI, ‘Living AI’ is our promise to build intelligent operations for our customers, driving automation and enhanced productivity.
We ensure effective usage of AI for our customers, incorporating it into a broader spectrum of strategies to rightly fuse it with people, processes and existing technologies. We continue to focus on growth areas by investing in technologies like AI and cloud infrastructure to create platforms that provide us with actionable outcomes and better results for our customers. This has transpired in the addition of new clients to our portfolio, taking our active clients to 283 in FY20. Our existing customers continue to trust us with our digital and innovative capabilities, as we continue to strengthen our wallet share with them through new offerings that add value to their operations, consistently. Our account mining led focus has
9CORPORATE OVERVIEWCEO’S MESSAGE

Board of Directors
Anant Goenka Non-Executive, Non-Independent Director
Harsh MariwalaNon-Executive, Independent Director
Ben DruskinNon-Executive, Independent Director
Radha Rajappa Additional, Non-Executive, Independent Director
Sandeep KishoreManaging Director and Chief Executive Officer
Shashank SinghNon-Executive, Non-Independent Director
Ketan DalalNon-Executive, Independent Director
Venkatesh KasturiranganNon-Executive, Independent Director
A.T. VaswaniNon-Executive, Independent Director
H. V. GoenkaChairman, Non-Executive, Non-Independent Director
Arvind AgrawalNon-Executive, Independent Director
*as on March 31, 2020.
10 ZENSAR TECHNOLOGIES LTD ANNUAL REPORT 2019-20
Leadership Team
Sandeep KishoreCEO & MD, and Management BoardMember, RPG Enterprises
Harish LalaSenior Vice President and Head, Africa
Malay VermaExecutive Vice President and Global Head, Financial Services
Chaitanya RajebahadurExecutive Vice President and Head, Europe
Venky RamananExecutive Vice President and Head, Hi-Tech & Manufacturing
Navneet KhandelwalSenior Vice President and Chief Financial Officer
Harjott AtriiExecutive Vice President and Head, Cloud and Infrastructure Services
Prameela KaliveChief Operating Officer
Vivek RanjanSenior Vice President and Chief Human Resources Officer
11CORPORATE OVERVIEWBOARD OF DIRECTORS | LEADERSHIP TEAM

RobustCommitted to winning at scale
Our Return on Digital® (RoD) NeXT platform and solutions have been an integral part of our sustained business growth in the recent past. Our continuous efforts, with an effective mining strategy, enabled us to add high-growth, top-tier clients with multiple service deals across our diverse sectoral offerings. With 52.4% of our revenues being derived from digital services in FY 20, we are focused to sustain this growth by winning new deals with our differentiated proposition in digital, AI, human experience and secure cloud and infrastructure services.
The US market continues to be one of the largest contributors to our revenue, as the largest contributor to our revenues, with an increasing demand for disruptive and innovative technologies across insurance, retail, hi-tech and manufacturing and financial services sector. Going ahead, post COVID-19, we see a stable demand-side environment from a strategic point of view, and we shall continue to invest in business to ensure sustained growth
Our revenues from the European market has doubled in the last three years. Zensar remains one of the fastest growing Indian companies in the UK, currently partnering with 5 of
560+TCV Deal (USD in Million)
41Whitepapers published in last one year (April 1, 2019 to March 31, 2020)
283Active clients in FY20
245+ Million revenue generating accounts in FY20 (up from 19 accounts in FY19)
We realise the need to continuously innovate to understand changing customer expectations across diverse businesses and geographies. At Zensar, we continue to create solutions around emerging technologies for our clients while sustaining our growth momentum.
A global enterprise
the top 10 Forbes global organisations headquartered there. We shall continue to be relentless in our pursuit to win large deals and expand our presence in the European region.
We remain a trusted and leading IT services partner in South Africa, the second largest economy in the African continent. Delivering a y-o-y growth of 20.8% in total revenues in FY20, Zensar has proven its excellence across digital disruptive technologies with challenging engagements for multiple clients in the region. With a strong pipeline of orders from leading companies, we expect to sustain market leadership backed by our strong knowledge capabilities that drive localisation efforts.
Numbers that matter
Revenue from top 20 customers
Number of unique patents filed
Number of strategic relationships (alliances)
Continuous YoY Growth
Global headcount
FY17
FY17
FY17
FY17
FY20
FY20
FY20
FY20
55.8%
6
5
8,524
61.3%
23
17
9,524South AfricaEurope USA
12 ZENSAR TECHNOLOGIES LTD ANNUAL REPORT 2019-20

Relevant From Living Digital to ‘Living AI’
At Zensar, we believe it is impossible to drive digital transformation in an environment that is fragmented, replete with disparate solutions, and heavy on human intervention. As a result, we envisioned a workplace where the digital eco-system creates superior value, resulting in a work environment that is at par with personal, living spaces.
As we focus on building an agile and relevant enterprise, designed to digitally transform operations for our clients, we continue to spearhead our digital transformation journey - taking the next step forward.
The technology landscape continues to mature and evolve. As a result, the application of AI technology in enterprises is increasing rapidly. Our adoption of ‘Living AI’ philosophy comes at a time, when there is a need to bridge the gap between possibilities and realities that AI can create for enterprises. A wide spectrum of multi-faceted opportunities that AI presents offer a whole new range of possibilities to connect with consumers, boost employee productivity and unlock new business areas.
Today, we are living in a perfectly conducive era for AI development. Both customers and employees are open to sharing valuable information that can help AI engines learn and apply insights in real-time. To align ourselves with the Living AI philosophy, we have classified AI use cases into three modes:
The starting line introducing AI for point efficiency
Back-end integrations to improve core processes (e.g. AIOps)
30+Use cases developed
20+AI/ML practitioners
20+Patents filed for AI Solutions
Experience AI
Decision AI Sustained investments in AI R&D, an essential part of digital transformation
Research AI
Zensar AIR Labs eco-system and offeringsZensar
Artificial Intelligence Research (AIR) Labs is our innovation powerhouse and the heart of our ‘Living AI’ philosophy with an accelerator enabled AI platform. It offers AI-centric advisory and consulting services to offer customers favourable value additions to businesses. At Zensar AIR Labs, we conceptualise and build AI solutions tailored to our client’s needs using our proprietary platform, accelerators and alliances. Our team of experts consisting of Ph.D. scholars and practicing industry experts in AI, work with clients in different co-innovation engagement models like bespoke development, CoE establishment and professional services.
Computer Vision
Deep Learning
Audio and Speech
Processing
Natural Language Processing
Machine Learning
Multi Agent System
Semantic Web
Predictive and Recommendation
Systems
The starting line introducing AI for
Research AI Zensar AIR Labs
Decision AI
Experience AI
Deep Learning
Data Science
Machine Learning
Natural Language Processing
Cognative Recognition
Hyper - Personalised experiences
Autonomics & Orchestration
Virtual Agent
Natural Interfaces
Dev & Test Automation
Intelligent RPAEnterprise
Bots
Adaptive Application
Facial Recognition
Augmented Reality
Image Processing
AIRLABS
758Bots Launched
Virtual Augmented
13CORPORATE OVERVIEWROBUST | RELEVANT

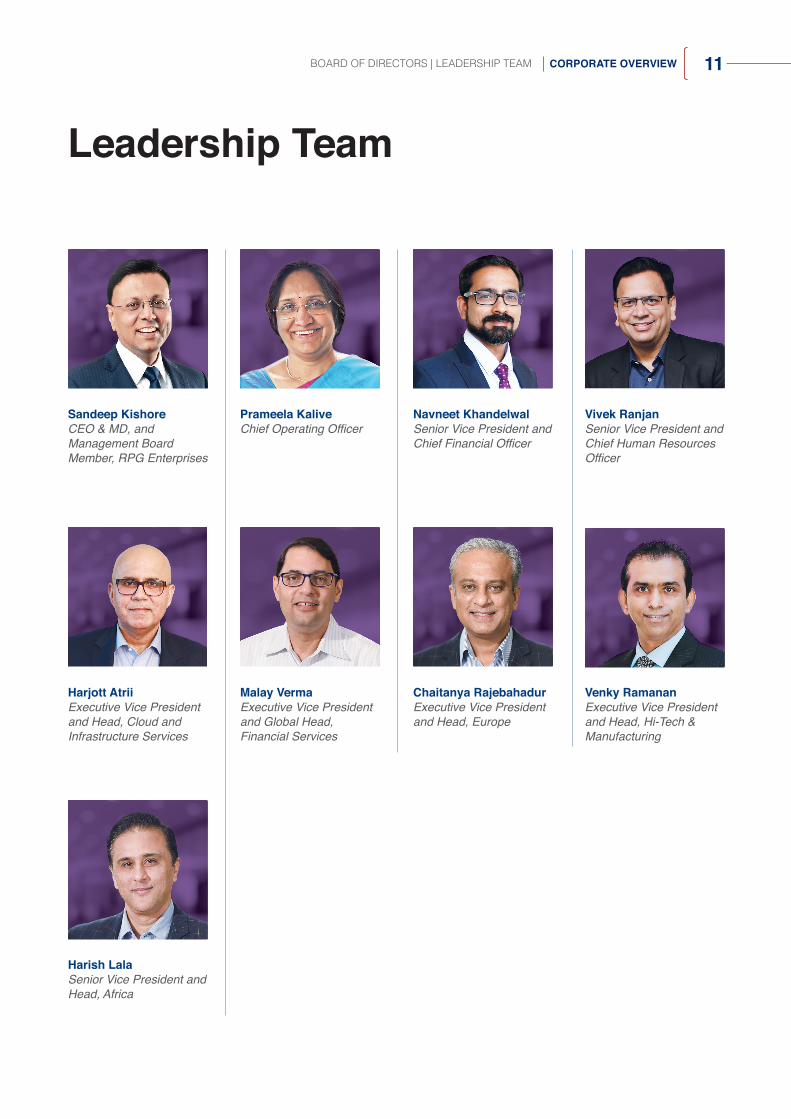
Responsive Delivering rapid responses during critical times
The unprecedented and phenomenal spread of novel COVID-19 disrupted lives, livelihoods and communities worldwide. As a global company with operations, teams and customers present across the world, we worked together to help our stakeholders, prepare and respond to the pandemic.
14 ZENSAR TECHNOLOGIES LTD ANNUAL REPORT 2019-20
At Zensar, we took directives based on our five decades of expertise to reduce the potential impact of COVID-19 on several industries, thereby helping businesses and their people sustain. The introduction of Zensar Enterprise Resiliency Framework (ZERF) helped enterprises mitigate the impact of this exceptional calamity with cost-saving solutions. Under ZERF, we introduced ZenTrust and ZenCare, two rapid responsive services designed to help businesses maintain business continuity and protect productivity at zero consulting fees.
11Webinars conducted
15-20%Optimisation of in-flight and planned project cost
24x7365 days service desk support available
35Whitepapers and blogs introduced on multiple challenges during COVID-19
20-35%
1000 VDIs
Immediate cost reductions
Set up within 72 hours (for critical solutions)
Visible impacts for enterprises adapting to ZenTrust
Our achievements
Scan the QR code to know more about ZERF
ZenTrust
ZenTrust was put together, based on years of experience, to support our customers through a pandemic, which required significant intervention in terms of cost reduction. It was a consulting led approach that potentially addressed the entire applications project portfolio for enterprises, and provided immediate avenues for cost optimisation. The initiative helped to optimise in-flight and planned project costs, ensure business continuity, secure business applications, and digitally enable stakeholders. Our expertise in digital transformation and emerging
With ZenCare, we enabled customers to ramp up their remote workforce instantly and securely, anywhere and against all odds. This delivered the ultimate freedom of choice for businesses to efficiently harness the power of any combination of public cloud or edge data centers to align it with the ‘Distributed Cloud’ strategy across the digital eco-system. Through ZenCare solutions, we have helped organisations retain operational efficiency and regain workforce productivity, while delivering exceptional business experience.
At Zensar we have always prided ourselves on being a 'people first' company. Our Talent at Zensar application is a unique mobile platform created with indigenous AI that enables the HR leadership to seamlessly deliver transformational value to the employees. The tool ensures smooth data recording and helps to effortlessly track an associate’s entry, exit, leaves and other activities. Conversational AI platform has also enabled new associates to connect with others and get more institutional information. Associates are also advised by AI engines to check the internal job market place and aid them to carve their own career paths.
Ensuring safety of associates while sustaining continuity of work
Setting up of central and regional rapid response teams
Sorting of travel and visa
Revision of all policies in light of COVID-19, customised for each geography
24/7 monitoring by Zensar Emergency Response Team (ERT)
'Single click' access to COVID-19 Awareness, Precautions, Symptoms, Myths, etc.
Contact territory specific Zensar ERTs
Regulatory messages, WHO links, all COVID-19 Zensar announcements
Amidst the COVID-19 pandemic, the application was updated on time for Immediate associate support. Some of the updates included:
technologies helped the enterprises adapt to remote working models that demanded the IT systems to be more robust, versatile, secure, user-friendly and scalable.
15RESPONSIVE CORPORATE OVERVIEW

Testament to Our Commitment
Dawie Adlem, Head - Business Change, Sanlam.
“I appreciate Zensar's efforts to keep our projects going. It is good to know we can rely on you during this time”
Avnish Kana, Head of IT Operations, Essar Oil UK Ltd.
“In 32 years of IT industry experience and working in some of the most diverse and stressful organisations; I have had my views changed of Managed Service, Shared Service, Outsourced and Managed Service Partners; Simply by working with you..”
CSPO, US Based Leading Insurance Giant.
“In spite of many obstacles, you did it! We’ve successfully deployed all our offshore resources remotely. Thank you for challenging yourselves in an extraordinary way and for the extra hours and effort you have put into this project during an unprecedented time. We are truly appreciative of your commitment and dedication to the success of this project. We couldn’t do it without you! On behalf of the project leads, thank you!”
Solution Architect, Multinational Independent Investment Bank and Financial Services Company.
“The team is doing a great job in spite of being remote”
Senior Leader IT Operations, A Global Private Independent Investment Management Firm.
“I just wanted to take a moment and thank you all for the dedication and exceptional effort you have displayed the past few weeks. We all have been hurt by the Virus, we are lucky to be able to work and help the people we have come to know and respect. I want to point out exceptional efforts.”
Enterprise Support Manager, UK’s Independent Provider of Private Healthcare.
“Well done team, amazing results in this current situation!”
Director Infrastructure Engineering, US based International Airline.
“I wanted to take a moment and thank you for all of your hard work and dedication through these interesting times. It would be easy for any of us to take our foot off the gas and feel sorry for ourselves but the opposite of that is true – I have seen each and every one of you step up, be more connected than ever and accomplish our tasks while taking on more responsibility. More importantly, you have kept a positive attitude and have truly shown our company spirit”
Managing Director IT (CIO), Multilateral Developmental Investment Bank.
“You have been awesome over the past few weeks, and continue to be so – thank you!”
16 ZENSAR TECHNOLOGIES LTD ANNUAL REPORT 2019-20
Sr. Project Manager, Technology Project Management Office. Customer: Office, US based Insurance Giant.
“I want to thank you for your efforts and great attitude demonstrated during the last months…Together, we have faced several challenges that could seem to be unnoticed, but these are noticed, and we are all grateful for all your efforts. Challenges like the COVID-19, which forced many of us to work from home, but I know that sometimes home has not all the best conditions to work, some places have more noise than other places and make more difficult to focus, etc. Yet, you have delivered, like if you were in the office… I want to thank you, thank your leadership, and ask you to keep the same attitude to face the upcoming challenges and efforts for the remaining work…”
Tax Product Owner , South Africa based Financial Services Giant.
"To our Zensar team (not sure why I'm calling a Zensar team as we now see our selves as A team), thank you for your continuous hard work that you put in and your actual commitment."
Hennie De Villiers, Deputy CEO, Sanlam.
“We see technology playing a key role in how our customers interact with us and make decisions in future. Our company-wide digitisation has accelerated due to Zensar’s proven expertise in automation and digital implementation. We are driven by the need to create compelling experiences for our customers in their interactions with us.”
Ryan Bacher, Managing Director, Netflorist.
“We are fortunate to have a trusted and dynamic partner in Zensar. Our teams have collaborated within the shortest possible time to reengineer our business model to support our customer’s immediate need for essential commodities.”
Christopher Brikkels, Head of IT: Marketing, WFS and Online, Woolworths Information Technology Services.
“Zensar has partnered with Woolworths Online over the last couple of years and is playing an important role during the Covid 19 lockdown period. As many organisations have experienced, the need to change ways of working and deliver innovative solutions during this time was an expressed focus point. Zensar supported Woolworths very well during this period and specifically partnered the IT team on delivering a click and collect solution within 8 days. The teams were committed to the business outcomes and fully understood the importance of meeting our customers at their point of need during this very challenging time that is being felt globally.
We are thankful for the team’s effort and their ongoing commitment to the Woolworths business.”
CIO, Car Rental Major in South Africa.
“It has been a true partnership. This is not just a supplier and customer engagement, we have stuck by each other through both the tough times and the good times, and I think that has added the most significant value.”
Li Mae Ong, Executive Director, Technology Data and Information Management, JLL.
“Broking is fundamental to us here at JLL and to be successful, we need to deliver exemplary internal tools that serve our people and their objectives. Foolproof understand this and the value in developing digital products that support the ambition of our people."
Sam Addeo,Chief Development Officer, Aptos.
“In the last few years, Aptos has doubled the number of customers we serve. There is tremendous demand for our world-class, end-to-end retail software and services as retailers transform their businesses for omnichannel. To meet this demand, and to accelerate innovation, we selected Zensar as a strategic business partner. In Zensar, we see a strong fit in their retail domain expertise, and their capability in co-developing digital-first solutions.”
17TESTAMENT TO OUR COMMITMENT CORPORATE OVERVIEW

An Empowered WorkforceIn an ever-changing industry that demands people with high competence and skills, we make sure to attract and retain the right people to continue delivering on our strategy. At Zensar, our workforce forms an integral part of our values, contributing positively to business sustainability and future growth.
During the year, we took rapid strides towards our business strategy of ‘Living AI’, tapping unmatched possibilities today to create a reality for tomorrow. Underlying the philosophy of digital transformation, we strive to create a workplace that embeds artificial intelligence in our people, processes and platforms. ‘Living AI’ is Zensar’s proprietary strategy that brings together an eco-system where AI is the driving force, bridging disparate solutions and integrating it with human touchpoints.
At Zensar, we worked towards imbibing digital and AI capabilities in the daily lives of employees. Fusing AI into an integrated digital eco-system would not only create a positive impact on the associates, but introduces accountability, transparency, future-readiness and a future-ready HR framework.
Diversity and Inclusion
100%AI driven processes
~88%
~70%
Reduced time for query resolution
Reduction in document management cost
~60%Employee queries resolved within 6 hours
22%Increase in productivity 43%
41%
Career aspirations aligned
Increase in HR Feedback score
67%employees upskilled
Agile Learning
100KQueries resolved
Awards
iInspire award for Best Practices in Gender Diversity in 2019
Zensar’s ‘Women in Workplace’ case study wins at the UN Global Compact’s3rd Best Innovative Practices Awards
Scan this QR code for more details on our prestigious UN Global Compact’s Award
Featured in the 100 Best Company for Women in 2019 ‘Working Mother & Avtar’ Best Companies for Women in India and ‘Exemplar of Inclusion’ in the Working Mother & Avtar Most Inclusive Companies in India (MICI)
Zensar Woman Leader awarded‘Tech Beacon’ in WEQUITY Awards
Participated in McKinsey’s Women in Workplace study in 2019
Impact of Digital HR
Creating sustainable value
We are proud of our inclusive and diverse culture, one of our core values being commitment to people and community. Diversity at Zensar means embracing associates of different gender, age, nationality, backgrounds, experiences and physical ability, supporting them to work together by creating a culture of inclusivity. This includes ensuring equal opportunity to all employees and across all our processes. This includes hiring, promoting and mentoring women in leadership, embracing people with special abilities and from the LGBTQ+ community.
18 ZENSAR TECHNOLOGIES LTD ANNUAL REPORT 2019-20

Nurturing Leadership
Zensarian 5.0 is our leadership framework that articulates the leadership competencies and behaviours required to lead in a dynamic operating space. Our extensive leadership development programmes focus on building right and meaningful abilities within our associates. We have also tied-up with leading B-schools across the globe with e-learning modules for best-in-class learning applications, systems and virtual learning resources.
Continuous Learning
At Zensar, we are committed to creating an environment with optimum learning to ensure quality output. For this, we have focused on multiple learning programmes anchored around technical training and certificate courses. This has led to a significant number of employees getting access to higher quality and personalised learning, specifically catered to their needs and abilities.
138500+ Courses
200+ External certifications completed by our associates on Percipio learning platform from SkillSoft
30,000+ Courses on multiple topics accessed by more than 90% of employees on our upgraded version of ZenLearn platform
Awards
Awards
AwardsTraining snapshot
Scan this QR code to read more about HR Excellence Award
‘Best Learning Strategy for 2019’ Award at the Future of L&D Awards 2019
Skillsoft Innovation Award at 2019 Annual India conference in ‘Creating Impact - in IT Skills’
Winner in the ‘Excellence in Leveraging HR Technology’ category
Runners-up in the ‘Excellence in HR Analytics’ category
Award in ‘Excellence in Technical Learning & Development’ from SIDBI & ASM Group for best practices in driving various technical learning initiatives
‘Best OD Intervention’ Award at the L&D World Summit 2019
‘Best Leadership Development Program’Award at the L&D World Summit 2019
‘Best in Leadership Transformation’ Award at PeopleMatter L&D Awards 2019
* All numbers till March 31, 2020
Annual SHRM HR Excellence Awards 2019, New Delhi, India.
Smart People Analytics
Zensar, with its analytics-led AI propositions, has been able to consolidate and analyse people’s statements on Zensar platforms. Employees can now experience all types of work activities on the platform, on a day-to-day basis, to take data-driven and talent-related decisions instantly. This has empowered the overall strategic workforce planning module and has significantly increased employee engagement.
Taking Charge
Zensar First
Customer Focus
Driving Growth
Meaning and Purpose
Empathy & Inspiration
Zensarian 5.0
Introducing Humané
HUMANé is an enterprise-grade solution to help HR organisations impact employee happiness by augmenting their current systems and processes with a native digital platform. It enriches employee experience across touch points to create higher levels of engagement, greater retention of critical talent, and increase productivity. Driven by AI enabled decision making, experience KPIs and analytics, HUMANé serves as a one-stop solution to meet an extensive array of enterprise HR needs.
19CORPORATE OVERVIEWAN EMPOWERED WORKFORCE
Creating Value Beyond Business We are actively pursuing opportunities to contribute to communities and societies where we operate through multiple engagements. For us, social responsibility means creating a long-term and meaningful impact on the lives of people with our actions.
Engagement areas
All CSR activities at the Company are undertaken through RPG Foundation, which is committed to fulfil CSR activities across all RPG group companies. Zensar’s associates actively participate as volunteers and contribute towards all CSR driven initiatives and programmes.
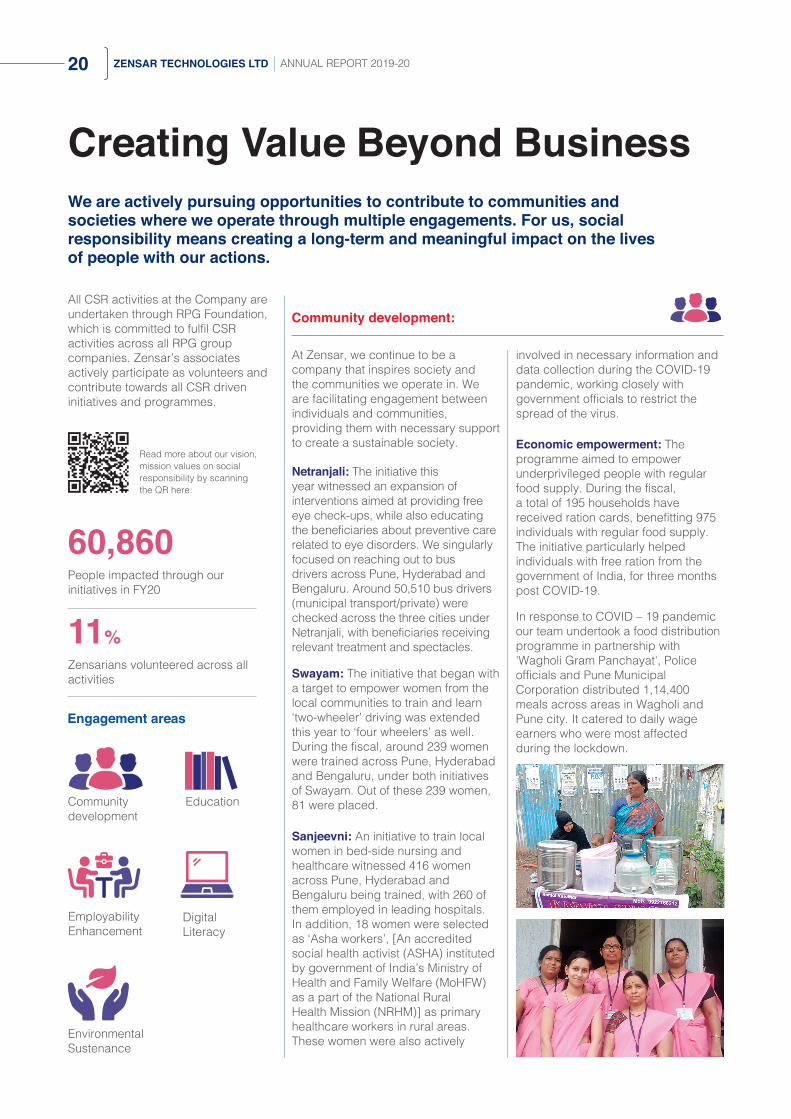
Netranjali: The initiative this year witnessed an expansion of interventions aimed at providing free eye check-ups, while also educating the beneficiaries about preventive care related to eye disorders. We singularly focused on reaching out to bus drivers across Pune, Hyderabad and Bengaluru. Around 50,510 bus drivers (municipal transport/private) were checked across the three cities under Netranjali, with beneficiaries receiving relevant treatment and spectacles.
Swayam: The initiative that began with a target to empower women from the local communities to train and learn ‘two-wheeler’ driving was extended this year to ‘four wheelers’ as well. During the fiscal, around 239 women were trained across Pune, Hyderabad and Bengaluru, under both initiatives of Swayam. Out of these 239 women, 81 were placed.
Sanjeevni: An initiative to train local women in bed-side nursing and healthcare witnessed 416 women across Pune, Hyderabad and Bengaluru being trained, with 260 of them employed in leading hospitals. In addition, 18 women were selected as ‘Asha workers’, [An accredited social health activist (ASHA) instituted by government of India’s Ministry of Health and Family Welfare (MoHFW) as a part of the National Rural Health Mission (NRHM)] as primary healthcare workers in rural areas. These women were also actively
Economic empowerment: The programme aimed to empower underprivileged people with regular food supply. During the fiscal, a total of 195 households have received ration cards, benefitting 975 individuals with regular food supply. The initiative particularly helped individuals with free ration from the government of India, for three months post COVID-19.
In response to COVID – 19 pandemic our team undertook a food distribution programme in partnership with 'Wagholi Gram Panchayat', Police officials and Pune Municipal Corporation distributed 1,14,400 meals across areas in Wagholi and Pune city. It catered to daily wage earners who were most affected during the lockdown.
Read more about our vision, mission values on social responsibility by scanning the QR here:
60,860People impacted through our initiatives in FY20
Community development
Employability Enhancement
Digital Literacy
Environmental Sustenance
Education
11%Zensarians volunteered across all activities
involved in necessary information and data collection during the COVID-19 pandemic, working closely with government officials to restrict the spread of the virus.
Community development:
At Zensar, we continue to be a company that inspires society and the communities we operate in. We are facilitating engagement between individuals and communities, providing them with necessary support to create a sustainable society.
20 ZENSAR TECHNOLOGIES LTD ANNUAL REPORT 2019-20

4,990Students reached out in FY20
~76%Students were offered jobs
Education
Livelihood and skill development programme
Digital literacy
Environmental sustenance
Our drive to ensure socio-economic sustainability, by supporting children within our area of operations, through quality educational programmes.
Vocational Skilling & Entrepreneurship programme: The programme focused on imparting knowledge across educational programmes like financial accounting and skill development programme like air conditioner and mobile repairing, electrical repairing among others. During the year, 32 people in Pune and 25 people in Hyderabad successfully started their businesses through the entrepreneurship programme. Further, 192 individuals were trained in vocational skill development programmes, with 85 of them being offered employment opportunities.
The Employability Skills Development programme: Under this programme around 2,431 students from Tier-3 and Tier-4 engineering colleges received free training on employability, for more than 238 technical, digital and business communication skills. These trainings were conducted by corporate trainers, as per industry standards. After completion of the training, around 76.4% of students were offered jobs.
Digital Skilling: We launched a digital skilling programme, where we plan to train candidates to strengthen their digital skills across marketing, web development, hardware networking and data analytics in Pune, Hyderabad and Bengaluru.
Digital literacy centres: We remain resolute in our efforts to make at least one person from every household digitally empowered. During the year, we trained 1050 people and enabled them to be digitally literate across Hyderabad and Bengaluru.
Since 2012, we have committed to leave a positive environmental impact with the maintenance of the 2 acre Biodiversity Park, developed in partnership with the Pune Municipal Corporation. During the year, more than 5 Biodiversity and Sustainability sessions were conducted to create a focused outreach for the park. A total of about 2287 floral and 79 faunal species were recorded in the park and 2461.5 kg compost was generated within the park. This year we also launched a green skilling programme, wherein we trained 30 candidates, especially women, on becoming urban gardeners who could earn a livelihood through gardening.
We continued to drive IT Education and Udaan English Proficiency across thirteen government schools in Pune and two schools in Hyderabad.
‘Pehlay Akshar’ teachers training programme benefitted about 125 teachers across Bengaluru and
Hyderabad. We also conducted more than 168 ‘Saathi sessions’ – a weekly initiative to train government teachers (coaching session) across Hyderabad and Bengaluru with plans to add Pune in the coming year.
300+Daily visitors at the Zensar Udaan Biodiversity Park
2460+ kgOf compost generated and reused at the park in FY20
21CORPORATE OVERVIEWCREATING VALUE BEYOND BUSINESS

Innovate & Thrive in Enterprise 4.0Zensar Digital Foundation Services: Reference architecture for digital business success
The world is witnessing a massive shift due to convergence of physical, digital and biological systems. This presents a business disruption as well as a business opportunity, which we at Zensar are geared to address
Digital connectivity enabled by advanced and innovative technologies is likely to fundamentally change society. The Enterprise 4.0 model is designed to deliver unmatched human experience and to remain relevant in different cycles of change. Successful enterprises in Enterprise 4.0 will have to understand the disruptions of both demand and supply sides. They will have to continuously innovate to understand the shifting customer expectations – they will also have to be experience-centric, collaborative and AI driven. To be successful in enterprise 4.0, businesses will have to deal with four new realities of disruption – differentiate on experience, develop data enhanced & digitally connected products, adopt digital operating models, and adhere to new digital regulations.
Building a futuristic workplace that manages employee experience
To empower enterprises to deal with their IT realities and to fulfil their digital business aspirations, we at Zensar have come up with Digital Foundation Services (DFS). DFS is the reference architecture for business to successfully meet their aspirations for enterprise 4.0. DFS architecture is built on five foundational capabilities to help our customers be successful, by empowering and enabling their business to run digitally and deliver unique customer experiences. These pillars consist of digital experience management, digital workplace services, digital infrastructure, digital operations and digital skills. With a diverse range of advanced services across various technology areas, DFS is already enabling enterprises to be future-ready and gaining a sustainable competitive advantage.
Managing and monitoring unique customer experience
The five pillars of Zensar’s DFS
Digital Experience Management01
Initiating an invisible infrastructure with secure Cloud services
Digital Infrastructure03
Digital Workplace Services02
Roll out new digital infrastructure on the foundation of existing digital platforms
Digital Operations04
Providing a comprehensive digital and cyber security portfolio for next generation security management
Digital Enterprise Security 05
DFS solutions driving growth
DFS compliments
Analyst Recognitions
Wired Experience Wired Autonomous Cloud User First Modern Workplace Wired Ubiquitous Security
Virtual NOC 1000+ Solution Accelerators Strong Public Cloud Partnerships Experience Lab BEAM
Zensar recognised as an Innovator in Avasant’ s Hybrid Enterprise Cloud Services RadarView™ 2019-20
Zensar recognised as a Leader in ISG Provider Lens™ in Digital Workplace of the Future Quadrant Report for Managed Services – Workplace Support 2019-20, North America
Zensar recognised as a Niche Player in Gartner Magic Quadrant for Data Center Outsourcing and Hybrid Infrastructure Managed Services 2019, North America
Zensar recognised as a Niche Player in Gartner Magic Quadrant for Managed Workplace Services 2020, North America
Zensar recognised as a Niche Player in Gartner Magic Quadrant for Managed Mobility Services 2019, Global
22 ZENSAR TECHNOLOGIES LTD ANNUAL REPORT 2019-20

At Zensar, we continue to drive partnerships and collaborations to importunately stay relevant in a disruptive digital eco-system. Our partnership with leading software and technology providers empower us to remain relevant for our customers with leading technologies and platforms built through innovation.
Our partnerships are an extension of our portfolio offerings and enable our clients to realise true business value with increased productivity, higher efficiencies and cost benefits. Zensar is aligned to the futuristic initiatives of our partners who are leaders in innovative technologies.
Operating across a spectrum of digital eco-system, we co-innovate with our partners across a range of services, creating platforms that steer our customers towards business transformation. Our synchronisation with our partners enables us to deliver the latest digital innovations that meet the present and future business needs of our clients.
Disruptive innovation continues to be key business differentiator, as customer-adaptive methodologies gain prominence in a competitive technology landscape. Our platforms and innovations drive business transformations for our customers, bringing accessible digital technologies within reach and driving business growth. Our holistic capabilities have been acclaimed and recognised by industry leading global analysts and advisors.
We, at Zensar, were extremely humbled and proud to host the team of ISG Inc. (a global technology research and advisory firm) at Zenlabs campus in Pune. As leading sponsors of ‘ISG Digital Innovation Tour 2019’, we were among the few enterprises selected by ISG, enabling us to showcase our capabilities in digital space, advanced analytics, AI and Integrated Command Centre for digital operations.
We set up a dedicated ‘Customer Advisory Board (CAB)’ to seek customer feedback and advice while aligning expectations, outcomes and investments with our customers. Zensar organised the inaugural Customer Advisory Board (CAB) meeting in San Diego in February 2020, where our leadership team interacted with senior level executives representing our customers, enabling exchange of values and ideas for a better tomorrow.
Our alliances
Recognised by industry analysts
Recognised by the industry leaders
Closer to our customers
To know more about our partners and leaders in innovative technologies, please scan the QR code from your smartphone
23CORPORATE OVERVIEWINNOVATE & THRIVE IN ENTERPRISE 4.0

Intentionally left blank
24 ZENSAR TECHNOLOGIES LTD ANNUAL REPORT 2019-20

25NOTICE AND STATUTORY REPORTS
NOTICE

26 ZENSAR TECHNOLOGIES LTD ANNUAL REPORT 2019-20
NOTICE IS HEREBY GIVEN THAT THE FIFTY-SEVENTH ANNUAL GENERAL MEETING OF MEMBERS OF ZENSAR TECHNOLOGIES LIMITED WILL BE HELD ON WEDNESDAY, SEPTEMBER 23, 2020 AT 11.00 A.M. (IST) THROUGH VIDEO CONFERENCING (VC) OR OTHER AUDIO-VISUAL MEANS (OAVM), TO TRANSACT THE FOLLOWING BUSINESS:
ORDINARY BUSINESS:
Item No. 1 – Adoption of Accounts
To receive, consider, approve and adopt:
a) the Audited Standalone Financial Statements of the Company for the Financial Year ended March 31, 2020 together with theReports of the Board of Directors and Auditors thereon; and
b) the Audited Consolidated Financial Statements of the Company for the Financial Year ended March 31, 2020 together with theReports of the Auditors thereon.
Item No. 2 – Confirm payment of Interim Dividend(s)
To confirm payment of Interim Dividends declared during FY 2019-20 viz., the First Interim Dividend at the rate of INR 1.00/- (Rupee One only) per equity share, declared on January 23, 2020 and the Second Interim Dividend at the rate of INR 1.80/- (Rupee One and Eighty Paise Only) per equity share, declared on March 6, 2020.
Item No. 3 – Re - appointment of H. V. Goenka (DIN: 00026726)
To appoint a Director in place of H. V. Goenka, who retires by rotation, in terms of Section 152 of the Companies Act, 2013, and being eligible, offers himself for re-appointment.
SPECIAL BUSINESS:
Item No. 4 – Appointment of Radha Rajappa (DIN: 08530439) as Non-Executive, Independent Director
To appoint Radha Rajappa as a Non-Executive, Independent Director, not liable to retire by rotation. The Members are requested to consider and if thought fit, pass with or without modification(s), the following Resolution as an Ordinary Resolution(s):
“RESOLVED THAT, pursuant to the provisions of Sections 149, 152 and other applicable provisions, if any, of the Companies Act, 2013 (the Act) and the Rules made thereunder, read with Schedule IV to the Act and Securities and Exchange Board of India (Listing Obligations and Disclosure Requirements) Regulations, 2015 and other applicable Regulations (including any statutory modification(s) or re-enactment thereof, for the time being in force), Radha Rajappa (DIN: 08530439) who was appointed as an Additional as well as Non-Executive, Independent Director of the Company, by the Board of Directors, on the recommendation of the Nomination and Remuneration Committee, to hold office for a period of five years from August 6, 2019 up to August 5, 2024, and in respect of whom, the Company has received a notice in writing pursuant to Section 160 of the Act, from a Member proposing her candidature for the office of Directorship of the Company, be and is hereby appointed as a Non-Executive, Independent Director of the Company, not liable to retire by rotation, to hold office till August 5, 2024.
FURTHER RESOLVED THAT, the Board of Directors of the Company (including Committee thereof), Chief Financial Officer and/or Global Finance Controller and/or Head-Treasury, Taxation and Commercials and/or Company Secretary and/or AVP-Finance, and/or, AVP-Business Finance, be and are hereby severally authorised to do all such acts, deeds, matters and things, as may be considered necessary, desirable and/or expedient to give effect to the foregoing resolution(s), including delegation of powers herein, to any of the Directors and/or officers of the Company.”
By Order of the Board of Directors
Gaurav TongiaMumbai, July 23, 2020 Company Secretary
Registered Office: Zensar Knowledge Park, Plot # 4, MIDC, Kharadi,Off Nagar Road, Pune - 411014CIN: L72200PN1963PLC012621
NOTICE
27NOTICE AND STATUTORY REPORTS
NOTES
1. In view of COVID-19 pandemic, the Ministry of Corporate Affairs (MCA), vide its General Circular No. 20/2020 dated May 5, 2020 read with General Circular No. 14/2020 dated April 8, 2020 and General Circular No. 17/2020 dated April 13, 2020 and other applicable circulars issued by the Securities and Exchange Board of India (SEBI), (collectively referred to as “Circulars”), has permitted convening and holding of the Annual General Meeting (AGM) through VC / OAVM, without the physical presence of the Members at AGM venue. Accordingly, the AGM of the Company is being held through VC / OAVM. The venue of the meeting shall be deemed to be the Registered Office of the Company, situated at Zensar Knowledge Park, Plot # 4, MIDC, Kharadi, Off Nagar Road, Pune - 411 014.
2. Pursuant to aforesaid Circulars, the facility for appointment of proxies by the Members will not be available.
3. Institutional / Corporate Shareholders (i.e. other than individuals / HUF, NRI, etc.) are required to send a scanned copy (PDF/JPEG Format) of its Board or governing body Resolution/Authorisation etc., authorising its representative to attend the AGM through VC / OAVM on its behalf and/or to vote through remote e-Voting. The said Resolution/Authorisation should be sent to the Scrutinizer by email through its registered email address to [email protected], with a copy marked to [email protected].
4. The Register of Directors and Key Managerial Personnel and their shareholding, maintained under Section 170 of the Act, and the Register of Contracts or Arrangements in which the directors are interested, maintained under Section 189 of the Act, and the Certificate from Auditors of the Company certifying that the ESOP Schemes of the Company are being implemented in accordance with, the Securities and Exchange Board of India (Share Based Employee Benefits) Regulations, 2014 will be available for electronic inspection by the Members during the AGM. All documents referred to in the Notice will be available for electronic inspection without any fee, upto the date of AGM. Members seeking to inspect such documents can send an email to [email protected].
5. As per Regulation 40 of SEBI (Listing Obligations and Disclosure Requirements) Regulations, 2015 (including any statutory modifications or re-enactments thereof for the time being in force, and other applicable SEBI regulations) (hereinafter referred as ‘SEBI Regulations’), as amended, securities of listed companies can be transferred only in dematerialised form with effect from, April 1, 2019, except in case of request received for transmission or transposition of securities. In view of the same and to eliminate risks associated with physical shares, Members holding shares in physical form are requested to consider converting their holdings to dematerialised form. Members can contact Company’s Registrar and Transfer Agents viz., KFin Technologies Private Limited for assistance in this regard. Members may also refer Frequently Asked Questions (FAQs) on Company’s website https://www.zensar.com/sites/default/files/FAQs%20on%20Demat_0.pdf.
6. In compliance with the aforesaid Circulars, Notice of the AGM along with the Annual Report 2019-20 is being sent only through electronic mode to those Members whose email addresses are registered with the Company/ Depositories. Members may note that the Notice and Annual Report for FY 2019-20 will also be available on Company’s website www.zensar.com, websites of the Stock Exchanges i.e. BSE Limited and National Stock Exchange of India Limited at www.bseindia.com and www.nseindia.com respectively, and on the website of NSDL https://www.evoting.nsdl.com.
7. Members attending the AGM through VC / OAVM shall be counted for the purpose of reckoning the quorum under Section 103 of the Act.
8. Members are requested to address all correspondence, including dividend related matters, and change in address, to the Registrar and Transfer Agent(s) (RTA):
Balaji Reddy S, Manager, KFin Technologies Private Limited, (Formerly Karvy Fintech Private Limited), Unit : Zensar Technologies Limited, Selenium Tower B, Plot 31-32, Financial District, Nanakramguda Serilingampally Mandal, Hyderabad 500 032, India.
9. Members willing to claim dividends that remain unclaimed, are requested to correspond with the RTA. Pursuant to the provisions of the Act and other relevant rules, the Company has transferred dividends, remaining unpaid for seven (7) years to Investors Education and Protection Fund (IEPF). The Members who have not encashed their dividend warrants for the subsequent years, are requested to send their Dividend Warrants for revalidation to the Company or its RTA.
10. Members whose shareholding is in electronic mode, are requested to direct notifications about change of address and updates about bank account details, to their respective Depository Participant(s). Members whose shareholding is in physical mode are requested to opt for the Electronic Clearing System (ECS) mode to receive dividend on time and mitigate risks associated with physical instruments.
11. To support the Green Initiatives taken by MCA, Members are requested to register their e-mail address with the Depository Participant(s)/Company (if not already done), so that all future communication / documents can be sent in electronic mode.

28 ZENSAR TECHNOLOGIES LTD ANNUAL REPORT 2019-20
12. At the Fifty Fourth AGM held on July 19, 2017, the Members approved appointment of M/s Deloitte Haskins and Sells LLP, Chartered Accountants (Registration No. 117366W/W-100018), as Statutory Auditors of the Company, to hold office for a period of five years from the conclusion of that AGM till the conclusion of the Annual General Meeting to be held in the year 2022, subject to ratification of their appointment by Members at every AGM, if so required under the Act. The requirement to place the matter relating to appointment of auditors for ratification by Members at every AGM was done away with by the Companies (Amendment) Act, 2017 with effect from May 7, 2018. Accordingly, no resolution is being proposed for ratification of appointment of Statutory Auditors at the Fifty Seventh AGM.
13. Sridhar Mudaliar (FCS 2664), Partner, SVD & Associates, Company Secretaries and failing him, Sheetal Joshi (FCS 10480), has been appointed as the Scrutiniser to scrutinise the e-Voting process, so as to conduct the same in a fair and transparent manner.
14. The Scrutiniser shall within the prescribed period from the conclusion of the AGM, unblock the votes in the presence of at least two (2) witnesses not in the employment of the Company and make a consolidated Scrutiniser’s Report for the votes cast during the AGM & votes cast through remote e-Voting and submit his report to the Chairman and/or authorised person of the Company, who shall declare the results forthwith.
15. The e-Voting period commences on Sunday, September 20, 2020 (9:00 a.m. IST) and ends on Tuesday, September 22, 2020 (5:00 p.m. IST). During this period, Members holding shares, either in physical or dematerialised form, as on cut-off date, i.e. as on Wednesday, September 16, 2020, may cast their votes electronically. The e-Voting module will be disabled by NSDL thereafter. A Member will not be allowed to vote again on any resolution on which vote has already been cast. The voting rights of Members shall be proportionate to their share of the paid-up equity share capital of the Company as on the cut-off date.
16. Any person who acquires shares of the Company and becomes a Member of the Company after dispatch of Notice and holding shares as of the cut-off date, may obtain the login ID and password by sending a request at [email protected]. However, if he / she is already registered with NSDL for remote e-Voting then he / she can use his / her existing user ID and password for voting.
17. The results declared along with the Scrutiniser’s Report, shall be placed on Company’s website www.zensar.com and on the website of NSDL at www.evoting.nsdl.com and will also be communicated to the BSE Limited and National Stock Exchange of India Limited.
18. The Explanatory Statement as required under Section 102 of the Act is annexed hereto. Further, additional information, inter-alia, pursuant to Regulation 26(4) and 36 of the SEBI Regulations, in respect of the Directors seeking appointment / re-appointment at the AGM, forms part of the Notice and/or Annual Report. The Board of Directors have considered and decided to include the Item No. 4 given above as Special Business in the forthcoming AGM, as the same is unavoidable in nature.
19. Since the AGM will be held through VC / OAVM, the Route Map, proxy form, attendance slip, etc., are not annexed to this Notice.
20. The Company’s Register of Members and Share Transfer Book shall not remain closed, for the purpose of this AGM.
21. The Members of the Company holding equity shares in physical form and who have not registered their e-mail addresses may get their e-mail addresses registered with the RTA, KFin Technologies Private Limited, by sending a mail to [email protected]. Members are requested to provide details such as name, folio number, certificate number, PAN, mobile number and e-mail id and also attach the image of share certificate in PDF or JPEG format.
In respect of demat holdings, for registration of e-mail address, the Members are requested to register the same, with the respective Depository Participant (DP) by following the procedure prescribed by the Depository Participant.
A. INSTRUCTIONS FOR MEMBERS FOR ATTENDING AGM THROUGH VC/OAVM:
How do I vote electronically using NSDL e-Voting system?
Step 1: Log-in to NSDL e-Voting system at https://www.evoting.nsdl.com/
Step 2: Cast your vote electronically on NSDL e-Voting system.
Details on Step 1 is mentioned below:
How to Log-in to NSDL e-Voting website?
1. Visit the e-Voting website of NSDL. Open web browser by typing the URL: https://www.evoting.nsdl.com/ either on a Personal Computer or on a mobile.
2. Once the home page of e-Voting system is launched, click on the icon “Login” which is available under ‘Shareholders’ section.
3. A new screen will open. You will have to enter your User ID, Password and a Verification Code as shown on the screen.
Alternatively, if you are registered for NSDL eservices i.e. IDEAS, you can log-in at https://eservices.nsdl.com/ with your existing IDEAS login. Once you log-in to NSDL eservices after using your log-in credentials, click on e-Voting and you can proceed to Step 2 i.e. Cast your vote electronically.

29NOTICE AND STATUTORY REPORTS
4. Your User ID details are given below:
Manner of holding shares i.e. Demat (NSDL or CDSL) or Physical
Your User ID is:
For Members who hold shares in demat account with NSDL.
8 Character DP ID followed by 8 Digit Client ID
For example if your DP ID is IN300*** and Client ID is 12****** then your user ID is IN300***12******.
For Members who hold shares in demat account with CDSL.
16 Digit Beneficiary ID
For example if your Beneficiary ID is 12************** then your user ID is 12**************
For Members holding shares in Physical Form.
EVEN Number followed by Folio Number registered with the company
For example if folio number is 001*** and EVEN is 101456 then user ID is 101456001***
5. Your password details are given below:
a) If you are already registered for e-Voting, then you can use your existing password to login and cast your vote.
b) If you are using NSDL e-Voting system for the first time, you will need to retrieve the ‘initial password’ which was communicated to you. Once you retrieve your ‘initial password’, you need to enter the ‘initial password’ and the system will ask you to change your password.
c) How to retrieve your ‘initial password’?
(i) If your email ID is registered in your demat account or with the Company, your ‘initial password’ is communicated to you on your email ID. Trace the email sent to you from NSDL. Open the attachment in the email i.e. a pdf file. The password to open the pdf file is your 8 digit client ID for NSDL account, last 8 digits of client ID for CDSL account or folio number for shares held in physical form. The pdf file contains your ‘User ID’ and your ‘initial password’.
(ii) If your email ID is not registered, please follow steps mentioned below in process for those shareholders whose email ids are not registered
6. If you are unable to retrieve or have not received the “Initial password” or have forgotten your password:
a) Click on “Forgot User Details/Password?” (If you are holding shares in your demat account with NSDL or CDSL) option available on www.evoting.nsdl.com.
b) Physical User Reset Password?” (If you are holding shares in physical mode) option available on www.evoting.nsdl.com.
c) If you are still unable to get the password by aforesaid two options, you can send a request at [email protected] mentioning your demat account number/folio number, your PAN, your name and your registered address.
d) Members can also use the OTP (One Time Password) based login for casting the votes on the e-Voting system of NSDL.
7. After entering your password, tick on Agree to “Terms and Conditions” by selecting the check box.
8. Now, click on “Login” button, and Home page of e-Voting will open.
Details on Step 2 is given below:
How to cast your vote electronically on NSDL e-Voting system?
1. After successful login at Step 1, you will be able to see the Home page of e-Voting. Click on e-Voting. Then, click on Active Voting Cycles.
2. After click on Active Voting Cycles, you will be able to see all the companies “EVEN” in which you are holding shares and whose voting cycle is in active status.
3. Select “EVEN” of company for which you wish to cast your vote.
4. Now you are ready for e-Voting as the Voting page opens.
5. Cast your vote by selecting appropriate options i.e. assent or dissent, verify/modify the number of shares for which you wish to cast your vote and click on “Submit” and also “Confirm” when prompted.
6. Upon confirmation, the message “Vote cast successfully” will be displayed.
7. You can also take the printout of the votes cast by you by clicking on the print option on the confirmation page.
8. Once you confirm your vote on the resolution, you will not be allowed to modify your vote.
30 ZENSAR TECHNOLOGIES LTD ANNUAL REPORT 2019-20
General Guidelines for shareholders
1. It is strongly recommended not to share your password with anyone and take utmost care to keep it confidential. Login to the e-Voting website will be disabled upon five unsuccessful attempts. In such an event, you will need to go through the “Forgot User Details/Password?” or “Physical User Reset Password?” option available on www.evoting.nsdl.com to reset the password.
2. In case of any queries, please refer Frequently Asked Questions (FAQs) for Shareholders and e-Voting user manual for Shareholders available at the download section of www.evoting.nsdl.com or call on Toll free No.: 1800-222-990 or send a request to Amit Vishal, Senior Manager, NSDL at the designated e-mail ID: [email protected] or [email protected] or at telephone number +91-99202 64780
Process for those shareholders whose email ids are not registered with the depositories for procuring user id and password and registration of email ids for e-Voting:
1. In case shares are held in physical mode, please provide Folio No., Name of shareholder, scanned copy of the share certificate (front and back), PAN (self-attested scanned copy of PAN card), AADHAR (self-attested scanned copy of Aadhar Card) by email to [email protected].
2. In case shares are held in demat mode, please provide DPID-CLID (16 digit DPID + CLID or 16 digit beneficiary ID), Name, client master or copy of Consolidated Account statement, PAN (self-attested scanned copy of PAN card), AADHAR (self-attested scanned copy of Aadhar Card) to [email protected].
B. INSTRUCTIONS FOR MEMBERS FOR E-VOTING ON THE DAY OF AGM:
1. The procedure for e-Voting on the day of the AGM is same as the instructions mentioned above for remote e-Voting.
2. Only those Members/ shareholders, who will be present at the AGM through VC/OAVM facility and have not yet cast their vote through remote e-Voting and are otherwise not barred from doing so, shall be eligible to vote through e-Voting system at the AGM.
3. Members who have voted through Remote e-Voting will be eligible to attend the AGM. However, they will not be eligible to vote at the AGM.
4. The details of the person who may be contacted for any grievances connected with the facility for e-Voting on the day of the AGM shall be the same person mentioned for Remote e-voting.
C. INSTRUCTIONS FOR MEMBERS FOR ATTENDING AGM THROUGH VC/OAVM:
1. Member will be provided with a facility to attend the AGM through VC/OAVM through the NSDL system. Members may access the same at https://www.evoting.nsdl.com under shareholders/members login by using the remote e-Voting credentials. The link for VC/OAVM will be available in shareholder/members login where the EVEN of Company will be displayed. Please note that the Members who do not have the User ID and Password for e-Voting or have forgotten the User ID and Password may retrieve the same by following the remote e-Voting instructions mentioned in the notice to avoid last minute rush. Further Members can also use the OTP based login for logging into the e-Voting system of NSDL.
2. Members are encouraged to join the Meeting through Laptops for better experience.
3. Members can join the AGM in the VC/OAVM mode 30 minutes before the scheduled commencement time of the Meeting and window for joining the Meeting shall be kept open throughout the meeting.
4. Further, Members will be required to use Internet with good connectivity to facilitate smooth and seamless experience during the meeting.
5. Please note that Members connecting via mobile devices or tablets or through laptop connecting via mobile hotspot may experience audio/video loss due to fluctuation in respective network. It is recommended to use stable Wi-Fi or LAN connection to mitigate such glitches.
6. Shareholders who would like to express their views/ask questions during the AGM may register themselves as a speaker by sending request from their registered E-mail ID, if any, mentioning their name, DP ID and Client ID/ Folio number, PAN and mobile number at [email protected] between 9.00 a.m. (IST) on Thursday, September 17, 2020 and 5.00 p.m. (IST) on Saturday, September 19, 2020. Members who have registered themselves as a speaker, as aforesaid, will only be allowed to express their views/ask questions during the AGM. The Company reserves the right to restrict the number of speakers depending on the availability of time for the AGM.
7. The Members who do not wish to speak during the AGM but have queries, may send the same latest by Saturday, September 19, 2020, mentioning their name, DP ID and Client ID/Folio number, email id, mobile number at [email protected]. The same will be replied to by the Company suitably at the AGM or by email.
8. Members who need assistance before or during the AGM with use of technology, can send a request at [email protected] or use Toll free No. (Helpline): 1800-222-990 or contact:
- Amit Vishal, Senior Manager, NSDL at [email protected] or at telephone number +91-99202 64780; or
- Pallavi Mhatre, Manager, NSDL at [email protected] or at telephone number +91-75066 82281.
9. Further instructions, if any, regarding this AGM and related matters, shall be available on the website of the Company, under investors section.
31NOTICE AND STATUTORY REPORTS
STATEMENT EXPLAINING MATERIAL FACTS PURSUANT TO SECTION 102 OF THE COMPANIES ACT, 2013 (‘THE ACT’)
Item No. 4:
Appointment of Radha Rajappa (DIN: 08530439) as a Non-Executive, Independent Director, not liable to retire by rotation.
Radha Rajappa was appointed as an Additional, Non-Executive, Independent Director of the Company, by the Board of Directors, on the recommendation of Nomination and Remuneration Committee to hold office for a period of five years, from August 6, 2019 to August 5, 2024, subject to approval of Members of the Company.
In view of the above, it is proposed to seek Members’ approval towards appointment of Radha Rajappa as a Non-Executive, Independent Director (hereinafter referred to as “Proposed Director”) inter-alia, under Section 149 and other applicable provisions of the Act, Rules made thereunder and SEBI Regulations not liable to retire by rotation, for the period as mentioned herein.
The Company has received declaration from Radha Rajappa to the effect that she meets the criteria of independence as provided in Section 149(6) of the Act read with the Rules framed thereunder and Regulation 16(1)(b) of SEBI Regulations. In terms of Regulation 25(8) of SEBI Regulations, she has confirmed that she is not aware of any circumstance or situation which exists or may be reasonably anticipated that could impair or impact her ability to discharge her duties.
Accordingly, in the opinion of the Board, Proposed Director fulfils the conditions for her appointment as Independent Director as specified in the Act, Rules made thereunder and SEBI Regulations, and is independent of the Management. It is believed that this appointment will enrich the Board of the Company, as the Proposed Director brings in industry insights, vast domain knowledge and extensive experience.
Brief profile of Radha Rajappa, nature of her expertise in specific functional areas, names of companies in which she holds directorships, membership of Board’s Committees, shareholding in the Company and relationships between directors, inter-se, as stipulated under SEBI Regulations, are given herein and forms part of the Notice. Copy of the draft letter for appointment of Proposed Director, setting out the terms and conditions will be available for inspection by the Members during the AGM.
Accordingly, the Board recommends Ordinary Resolution set out at Item No. 4 of the Notice for approval by the Members of the Company.
Proposed Director and / or her relatives are / may be deemed to be interested in the resolution(s) set out at Item No. 4 of the Notice. Save and except the foregoing, none of the other Directors or Key Managerial Personnel of the Company or their relatives are, in any way, concerned or interested, financially or otherwise, in the resolution(s) as set out at Item No. 4 of the Notice.
By Order of the Board of Directors
Gaurav TongiaMumbai, July 23, 2020 Company Secretary
Registered Office:Zensar Knowledge Park, Plot # 4, MIDC, Kharadi,Off Nagar Road, Pune - 411014CIN: L72200PN1963PLC012621

32 ZENSAR TECHNOLOGIES LTD ANNUAL REPORT 2019-20
DETAILS OF DIRECTOR(S) SEEKING APPOINTMENT / RE-APPOINTMENT
Director(s) seeking appointment/re-appointment
H. V. Goenka Radha Rajappa
Brief profile H. V. Goenka is Chairman of RPG Enterprises, one of the largest industrial groups in India, active in key business segments like tyres, infrastructure, information technology and other diversified segments having an annual turnover of about US $ 4 billion. Born in December 1957, H. V. Goenka is a graduate in Economics and MBA from the International Institute of Management Development (IMD), Lausanne, Switzerland and is now on the Foundation Board of IMD, Lausanne.
H. V. Goenka, a past President of the Indian Merchants’ Chamber, in India, is also a member of the Executive Committee of FICCI and had been the Chairman of Breach Candy Hospital Trust.
Radha Rajappa is an entrepreneurial business leader with more than 29 years of experience in IT industry handling diverse roles of creating, nurturing and leading businesses from start and scaling existing businesses. She has successfully built and passionately led various businesses in Digital Transformation and IT services. Till recently, she was leading Digital and Services business at Microsoft India. Radha was a member of the India Leadership team driving the transformation for customers to the Cloud and Digital world. She has served for 16 years as a key member of the Executive Leadership team at Mindtree.
She was responsible for building and leading the Global Digital Business as the Executive Vice President and established Mindtree as a significant partner for Global clients to “Make Digital Real” for their businesses. She led Mindtree’s move to Industry led vertical focus as the leader for Retail, Consumer Packaged Goods and Manufacturing industry as well as Travel, Transportation and Hospitality. Radha has also served in IBM India in various capacities and in diverse roles encompassing Sales, Marketing and being responsible for various business lines.
Age 62 years 53 years
Date of Appointment September 4, 2001 August 6, 2019
Qualification Graduate in Economics, University of Calcutta; MBA, IMD (Switzerland)
Degree in Electronics and Communications Engineering and an MBA (IIM Bangalore)
Directorship held in other companies
1. CEAT Limited2. Bajaj Electricals Limited3. RPG Life Sciences Limited4. KEC International Limited5. RPG Enterprises Limited6. Spencer International Hotels Limited
NIL
Membership/Chairmanships of Committees of other companies
NIL NIL
For other details like, shareholding, relationship with other Directors / Key Managerial Personnel, skills and expertise, etc., please refer the Corporate Governance report which forms part of this Annual Report. Directorship/Membership/Chairmanship shown herein-above, reckon only listed/public limited companies.

33BOARD’S REPORT NOTICE AND STATUTORY REPORTS
BOARD’S REPORT & ANNEXURES

34 ZENSAR TECHNOLOGIES LTD ANNUAL REPORT 2019-20
Dear Members,
Your Directors are pleased to present 57th Annual Report together with the Audited Financial Statements for the Financial Year ended March 31, 2020.
1. FINANCIAL PERFORMANCE AND STATE OF AFFAIRS
Financial Summary (INR In Lakhs)
ParticularsStandalone Consolidated
FY 2019-20 FY 2018-19 FY 2019-20 FY 2018-19
Income from operations 137,030 137,008 418,168 396,633
Miscellaneous Income 9,093 8,499 8,842 9,268
Total Income 146,123 145,507 427,010 405,901
Profit Before Taxation 30,410 33,351 37,579 44,538
Profit After Taxation 23,104 25,800 27,160 31,865
Proposed Dividend - 4,053 - 4,053
Transfer to General Reserves - 12,000 - 12,000
BOARD’S REPORT
Standalone (INR in Lakhs)
2018-19
2019-20146,123
145,507
23,104
25,800
Total Income Net Profit
Consolidated (INR in Lakhs)
2018-19
2019-20427,010
405,901
27,160
31,865
Total Income Net Profit
Geography (INR in Lakhs)
2019-20
307,02378,208
49,385
2018-19
USA Europe Rest of the world
298,239
56,865
41,529
Business Segment (INR in Lakhs)
2019-20351,518
66,650
2018-19334,692
61,941
Application Management Services
Infrastructure Management Services
Revenue Distribution (Consolidated)

35BOARD’S REPORT NOTICE AND STATUTORY REPORTS
On standalone basis, during FY 2019-20, the Company recorded total income of INR 146,123 Lakhs comprising income from software development and allied services of INR 137,030 Lakhs, and other income of INR 9,093 Lakhs. The Company recorded a net profit of INR 23,104 Lakhs reflecting a decrease of about 10.45% Y-o-Y.
On consolidated basis, the Company has maintained growth with total income of INR 427,010 Lakhs comprising income from Software Development and Allied Services of INR 418,168 Lakhs and other income of INR 8,842 Lakhs. The Consolidated net profit was INR 27,160 Lakhs reflecting decrease of about 14.77% Y-o-Y.
In the preparation of financial statements, no treatment different from that prescribed in Indian Accounting Standards (IND-AS) has been followed.
Dividend
Based on profits during FY 2019-20 and continuing the tradition of rewarding the members, the Company declared dividend(s) as under:
Sr.No.
Dividend declared during FY 2019-20
Dividend per share (INR)
Total Payout(INR Lakhs)
1. 1st Interim Dividend 1.00 2,253.50
2. 2nd Interim Dividend 1.80 4,056.78
The 2nd Interim Dividend was remitted on March 27, 2020, through the approved electronic mode to those shareholders, whose bank account details were available, constituting about 99% of dividend amount. However, in view of nation-wide lockdown announced by the Government of India to contain the spread of COVID-19 disease, dispatch of physical dividend instruments to balance shareholders, is on hold and the arrangements for payment of the same will be made after the normalcy is restored.
The said dividends were declared in accordance with the Dividend Distribution Policy of the Company, formulated pursuant to SEBI Regulations, which is available on website of the Company at https://www.zensar.com/sites/default/files/investor/policies-reports fillings/dividend_destribution_policy.pdf
Investor Education and Protection Fund (IEPF)
Pursuant to the Act and IEPF Authority (Accounting, Audit, Transfer and Refund) Rules, 2016, as amended from time to time, during the year under review, the Company has transferred the following dividend(s) and corresponding shares to IEPF, upon completion of period of seven years:
Date of Declaration
Type of Dividend
Amount of Dividend
transferred (INR)
No. of shares
transferred
July 24, 2012 Final 1,242,832 25,670
January 21, 2013 Interim 1,133,668 69,807
The total amount lying in the Unpaid Dividend Account of the Company up to the year under review and the corresponding shares, which are liable to be transferred to the IEPF, as per records of RTA are as follows:
Sr. No.
FY to which dividend relates
Type of Dividend
Amount lying in the Unpaid
Dividend Account (INR) (as on March
31, 2020)
Due date for transfer to IEPF
1. 2019-20 1st Interim 912,106 March 24, 2027
2. 2018-19 Final 1,768,905 October 5, 2026
Interim 1,079,002 March 22, 2026
3. 2017-18 Final 1,665,524 October 7, 2025
Interim 1,180,230 March 20, 2025
4. 2016-17 Final 2,540,685 September 17, 2024
Interim 1,938,085 March 24, 2024
5. 2015-16 2nd Interim 2,420,775 May 13, 2023
1st Interim 1,682,190 March 20, 2023
6. 2014-15 Final 2,098,850 September 12, 2022
Interim 1,562,603 March 20, 2022
7. 2013-14 Final 1,899,882 September 21, 2021
Interim 1,333,428 March 22, 2021
8. 2012-13 Final 1,412,640 September 14, 2020
Particulars of Loans, Guarantees and Investments pursuant to Section 186 of the Act
Particulars Amount (INR in Lakhs)
Loan(s) Please refer Note No. 6(d) and 37 of Notes to Financial Statements
Guarantee(s) Please refer Note No. 28 of Notes to Financial Statements
Investment(s) Please refer Note No. 6(a) of Notes to Financial Statements
Related Party Transactions
All related party transactions that were entered into during FY 2019-20, were on arm’s length basis and in the ordinary course of business. The requisite approval of the Audit Committee is obtained on periodic basis for the transactions, which are repetitive in nature or otherwise. The actual transactions entered into, pursuant to the approval so granted, are placed periodically, before the Audit Committee.
During FY 2019-20, no materially significant related party transactions were entered into by the Company, that may have potential conflict with the interests of Company, at large. The policy on related party transactions formulated by the Company is available on the website of the Company at https://www.zensar.com/sites/default/files/investor/policies-reports-fillings/Policy%20on%20RPT%20%281%29.PDF.
BOARD’S REPORT (Contd.)

36 ZENSAR TECHNOLOGIES LTD ANNUAL REPORT 2019-20
Further, the Company has not entered in to any material transaction with related parties, during the year under review, which requires reporting in Form AOC-2 in terms of the Act read with Companies (Accounts) Rules, 2014. However, the requisite disclosures under IND-AS form part of Notes to Financial Statements.
Business Update
The information on Company’s affairs and related aspects, is provided under Management Discussion and Analysis Report, which has been prepared, inter-alia, in compliance with Regulation 34 of SEBI Regulations and forms part of this report.
Internal Financial Controls
Details in respect of adequacy of internal financial controls with reference to the Financial Statements are stated in Management Discussion and Analysis Report, which forms part of this Report.
Deposits
During the year under review, the Company has not accepted Deposits under Chapter V of the Act.
Change in the Nature of the Business
During the year under review, there was no change in the nature of the business of the Company or its subsidiaries, pursuant to, inter-alia, Section 134 of the Act and Companies (Accounts) Rules, 2014, as amended from time to time.
Material Changes and Commitments, if any, affecting the Financial Position of the Company
There are no material changes and commitments affecting the financial position of the Company which have occurred between the end of the Financial Year on March 31, 2020 to which the Financial Statements relate and the date of this report.
Significant and Material Orders passed by the Regulators or Courts or Tribunals impacting the Going Concern Status
There are no significant and material orders passed by the Regulators or Courts or Tribunals impacting the going concern status and Company’s operations in future.
Extract of Annual Return
Pursuant to Section 92 of the Act and related rules, the Extract of Annual Return in Form MGT-9 forms part of this report.
Subsidiary Companies
Your Company along with subsidiaries provides digital solutions and technology services globally. As of March 31, 2020, the Company has 24 Subsidiaries as per details set out in Extract of Annual Return, which forms part of this Report.
The highlights of performance of subsidiaries and their contribution to the overall performance of the Company, are included in Form
AOC – 1 forming part of Consolidated Financial Statements section in this Annual Report, in accordance with the provisions, inter-alia, of Section 129 of the Act read with Rule 5 of the Companies (Accounts) Rules, 2014.
Policy for determining material subsidiaries framed by the Company, is available on https://www.zensar.com/sites/default/files/investor/policies-reports-fi l l ings/Policy%20for%20determining%20material%20subsidiaries%20%281%29.pdf.
2. CORPORATE GOVERNANCE
Formal Annual Evaluation of Board and its Committees
Pursuant to provisions of Section 134 of the Act, and Regulation 17 of the SEBI Regulations, the Nomination and Remuneration Committee has laid down criteria for evaluating Board effectiveness by assessing performance of the Board as a whole, performance of individual Director and permanent Committees of the Board, details of which are available in the Corporate Governance Report.
Further, the Nomination and Remuneration Committee had laid down structure for evaluating Board effectiveness and engaged a third-party agency to conduct Board Effectiveness Survey during the year under review. The survey findings and feedbacks were then considered while conducting the requisite evaluations inter-alia under the provisions of the Act and SEBI Regulations.
Directors’ Responsibility Statement
The Directors confirm that:
a) in the preparation of the annual accounts for the Financial Year ended March 31, 2020, the applicable accounting standards had been followed and there were no material departures;
b) the Directors had selected such accounting policies and applied them consistently and made judgments and estimates that are reasonable and prudent so as to give a true and fair view of the state of affairs of the Company at the end of the Financial Year as at March 31, 2020 and of the profit of the Company for that period;
c) the Directors had taken proper and sufficient care for the maintenance of adequate accounting records in accordance with the provisions of this Act for safeguarding the assets of the Company and for preventing and detecting fraud and other irregularities;
d) the Directors had prepared the annual accounts on a going concern basis;
e) the Directors had laid down internal financial controls to be followed by the Company and that such internal financial controls are adequate and were operating effectively.
f) the Directors had devised proper systems to ensure compliance with the provisions of all applicable laws and that such systems were adequate and operating effectively.
BOARD’S REPORT (Contd.)

37BOARD’S REPORT NOTICE AND STATUTORY REPORTS
Director(s) and KMP(s)
Appointment(s) / Re-appointment(s) Resignation(s)
• H. V. Goenka (DIN: 00026726), Non-Executive Director, retires by rotation and being eligible, offers himself for re-appointment. A resolution seeking Members’ approval for his re-appointment forms part of the Notice. The Board recommends his re-appointment.
• Tanuja Randery (DIN: 08014909) and Sudip Nandy (DIN: 07199187), Non-Executive, Independent Directors, tendered their resignations from the Board of the Company, effective May 31, 2019 and August 7, 2019 respectively.
• The Board appointed Radha Rajappa (DIN: 08530439), as an Additional Director, in the capacity of Independent Director, with effect from August 6, 2019 up to August 5, 2024, subject to approval of Members at the 57th Annual General Meeting. The Board is of the opinion that Radha Rajappa holds all the requisite qualities including integrity, expertise, experience and independence to be on the Board of your Company. A resolution seeking Members’ approval for her appointment, forms part of the Notice.
• Both the Directors conveyed that, considering professional commitments, they were unable to devote sufficient time, required of an Independent Director of the Company and therefore willingly tendered the resignation. They further confirmed that there was no other material reason, for their resignation.
• A brief resume of the Director(s) proposed to be appointed at the 57th Annual General Meeting along with, nature of expertise in specific functional areas, names of companies in which they hold directorship(s), membership(s) of the Board’s Committees, shareholding in the Company and relationships with the directors inter-se, forms part of the Notice.
During the year under review, there were no change(s) in the Key Managerial Personnel(s) of the Company.
BOARD’S REPORT (Contd.)
Board of Directors
Audit Committee
Corporate Social Responsibility
Committee
Nomination and Remuneration
Committee
Risk Management Committee
Stakeholders Relationship Committee
Number of Meetings of the Board
During the year under review, 5 (Five) meetings of the Board were held, details of which are set out in the Corporate Governance Report which forms part of this report.
Board Committees
Detailed composition of the following permanent Committees of the Board, number of meetings held during the year under review and other related details, are set out in the Corporate Governance Report which forms part of this report:
The Audit Committee stood reconstituted on May 1, 2019, with the induction of Arvind Agrawal as a member thereof.
With the resignation of Sudip Nandy effective August 7, 2019, the Audit Committee, Nomination and Remuneration Committee and Risk Management Committee stood reconstituted to that extent, at the meeting of Board of Directors, dated August 6, 2019. The Risk Management Committee was also reconstituted by induction of Arvind Agrawal as a member of the said Committee.
Details of terms of reference of the Committees, membership(s) and attendance of members are provided in the Corporate Governance Report. There had been no instances during FY 2019-20 where the Board had not accepted any recommendation of any of the Committees of the Board.
Statement on Declaration of Independent Directors
The Company has received Declaration of Independence from the Independent Directors inter-alia, pursuant to Section 149 of the Act and under SEBI Regulations, confirming and certifying that they have complied with all the requirements of being an Independent Director of the Company, as on the date. The said certificate(s) were taken on record by the Board, at its meeting held on May 14, 2020, after due assessment of the veracity of the same.
Pecuniary Relationship or Transactions of Non-Executive Directors and Disclosures about Remuneration of Directors
All pecuniary relationship or transactions of Non-Executive Directors vis-à-vis the Company, along with criteria for such payments and disclosures on the remuneration of the Directors along with their

38 ZENSAR TECHNOLOGIES LTD ANNUAL REPORT 2019-20
shareholding are disclosed in Corporate Governance Report which forms part of this Report and/or available on the website of the Company, pursuant to relevant regulations.
Inter-Se Relationships between the Directors
There are no relationships between the Directors inter-se, except between Anant Goenka and H. V. Goenka. Anant Goenka, Non-Executive, Non-Independent Director, is son of H. V. Goenka, Chairman.
Risk Management
A detailed report on Risk Management is included in Management Discussion and Analysis Report, which forms part of this report.
Secretarial Standards
Your Company complies with the applicable mandatory Secretarial Standards.
3. HUMAN RESOURCE MANAGEMENT
Disclosure under Sexual Harassment of Women at the Workplace (Prevention, Prohibition and Redressal) Act, 2013
The Company has in place an Internal Complaints Committee and an Anti-Sexual Harassment Policy, inter-alia, in line with the requirements of the Sexual Harassment of Women at Workplace (Prevention, Prohibition and Redressal) Act, 2013 and rules made thereunder to redress all the sexual harassment complaints reported by women employee(s).
BOARD’S REPORT (Contd.)
The following is the summary of complaints received and disposed-off during the year under review:
Number of complaints received 4
Number of complaints disposed off 4
Number of complaints pending 0
Employees Stock Option Plan
The Company currently has three Employees Stock Option Schemes in force, namely, “2002 Employees Stock Option Scheme” (2002 ESOS), “2006 Employees Stock Option Scheme” (2006 ESOS) and Employee Performance Award Unit Plan, 2016 (2016 EPAP) and these schemes are being implemented, as per SEBI Regulations, in this regard.
In FY 2019-20, 22,000 equity shares and 210,050 equity shares were allotted under 2002 ESOS and 2006 ESOS, respectively. No equity shares were allotted under 2016 EPAP.
As required under SEBI (Share Based Employee Benefits) Regulations, 2014, the Auditor’s certificate on the implementation of share-based schemes in accordance with these regulations will be made available at the AGM.
The disclosure pursuant to SEBI (Share Based Employee Benefits) Regulations, 2014 is available on the website of the Company at https://www.zensar.com/investor/financials.
Information pursuant to Section 197 of the Act, read with Rule 5 of the Companies (Appointment and Remuneration of Managerial Personnel) Rules, 2014
1. The ratio of the remuneration of each director to the median remuneration of the employees of the Company excluding Managing Director for the Financial Year.
Please refer Annexure to this Report for details.2. Percentage increase in remuneration of each director, Chief
Financial Officer, Chief Executive Officer, Company Secretary or Manager, if any, in the Financial Year.
3. The percentage increase in the median remuneration of employees.
The percentage increase in the median remuneration in FY 2019-20 of employees on India Payroll was 5.05%.
4. The number of permanent employees on the rolls of Company (in India).
6,943
5. Average percentile increase already made in the salaries of employees other than the managerial personnel in the last Financial Year and its comparison with the percentile increase in the managerial remuneration and justification thereof and point out if there are any exceptional circumstances for increase in the managerial remuneration.
Average percentage increase made in the salaries of the employees other than the managerial personnel in the last Financial Year is 5.96% for India based associates.
Considering nil increment employees, average percentile increase is 45.7 percentile.
The remuneration to employees is as per the remuneration policy of the Company. The percentage increase in the median remuneration of employees has been calculated after excluding Managing Director’s remuneration. Sandeep Kishore, Managing Director and Chief Executive Officer, has not received any directors’ commission during the year from the Company nor from any of its subsidiary(ies). Particulars of employees pursuant to Section 197 of the Act, read with Rule 5 of the Companies (Appointment and Remuneration of Managerial Personnel) Rules, 2014 are annexed with this report.

39BOARD’S REPORT NOTICE AND STATUTORY REPORTS
4. REPORTS AND POLICIES
Corporate Governance
A detailed report on the same for FY 2019-20 along with the practicing Company Secretary’s certification thereon, is provided in the corporate governance section of this report.
Management Discussion and Analysis
A detailed Management Discussion and Analysis Report is annexed to this report.
Business Responsibility Report
As stipulated under the SEBI Regulations, the Business Responsibility Report under Regulation 34(2)(f) forms part of this report and annexed herewith.
Nomination and Remuneration Policy
The Company has a Nomination and Remuneration Policy (Policy) on nomination and remuneration of Directors, Key Managerial Personnel (KMP), Senior Management Personnel (SMP) and other employees, in terms of provisions of the Act and SEBI Regulations, as amended from time to time.
The salient features of the Policy, are:
1. appointment and remuneration of Directors, KMP and SMP.
2. determination of qualifications, positive attributes and independence for appointment of a Director (Executive/ Non-Executive/Independent) and recommendation to the Board matters relating to the remuneration for the Directors, KMP and SMP.
3. formulating the criteria for performance evaluation of all Directors.
4. Board Diversity
The said Policy is available on the website of Company at https://www.zensar.com/sites/default/files/investor/policies-reports-fillings/NRC%20policy%20%281%29.pdf
Vigil Mechanism/Whistle Blower Policy
Pursuant to the Section 177(9) of the Act and Regulation 22 of SEBI Regulations, the Company has established a Vigil Mechanism/Whistle Blower Policy for Directors and employees to report their genuine concerns. The Policy provides for Directors and employees to report concerns about unethical behavior, actual or suspected fraud or violation of Company’s Code of Governance and Ethics. The policy is available on the website of the Company at https://www.zensar.com/sites/default/files/investor/policies- reports-fillings/Whistle-Blower-Policy.pdf
The Company has in place robust measures to safeguard whistle blowers against victimisation. Directors and employees are duly sensitised about mechanisms and guidelines for direct access to the Chairman of the Audit Committee, in appropriate cases.
Further, during FY 2019-20, no personnel has been denied access to the Audit Committee.
5. AUDITORS AND AUDIT REPORTS
Statutory Auditors
M/s. Deloitte Haskins and Sells LLP, the Statutory Auditors of the Company, has been appointed to conduct the audit of the Financial Statements of the Company from FY 2017-18 till FY 2021-22.
Pursuant to the Companies (Amendment) Act, 2017 which came into force on May 7, 2018, appointment of Statutory Auditors is not subject to annual ratification at the Annual General Meeting and accordingly not being placed at the 57th Annual General Meeting for approval of Members.
Further, there was no instance of fraud reported by the Statutory Auditors during FY 2019-20, as required under Section 134 of the Act and rules thereunder.
Secretarial Auditors
Pursuant to the provisions of Section 204 of the Act and the Companies (Appointment and Remuneration of Managerial Personnel) Rules, 2014, the Board had appointed M/s. SVD & Associates, Company Secretaries in Practice, to undertake the Secretarial Audit of the Company. The Report of the Secretarial Audit in Form MR – 3 is annexed herewith.
Further, pursuant to SEBI circular CIR/CFD/CMD1/27/2019 dated February 8, 2019, the Annual Secretarial Compliance Report submitted by M/s SVD & Associates, also forms part of the Board’s Report. The said report(s) does not contain any qualification, reservation or adverse remarks.
The appointment of M/s SVD & Associates, as Secretarial Auditors, continues for FY 2020-21.
Further, during FY 2019-20 and two previous Financial Years, no penalties, strictures were imposed on the Company by stock exchange(s) or SEBI or any statutory authority, on any matter related to capital markets.
Internal Auditors
The Board had appointed Ernst & Young LLP, Pune as Internal Auditors for FY 2019-20 under Section 138 of the Act. The appointment of Ernst & Young LLP, Pune as Internal Auditors continues for FY 2020-21.
Explanations on Qualification, Reservation or Adverse Remark or Disclaimer made by Auditors
There are no qualifications, reservations or adverse remarks made by the Statutory Auditors/Secretarial Auditors in their respective Reports.
6. CORPORATE SOCIAL RESPONSIBILITY (CSR)
The CSR activities at the Company were undertaken through RPG Foundation, which in turn is committed towards undertaking CSR activities across all group companies of RPG. The composition of the CSR Committee of the Company, in accordance with Section 135 of the Act, is covered under the Corporate Governance Report
BOARD’S REPORT (Contd.)

40 ZENSAR TECHNOLOGIES LTD ANNUAL REPORT 2019-20
BOARD’S REPORT (Contd.)
which forms part of this report. A detailed report on CSR activities along with CSR Policy is attached to this report.
The CSR Policy of the Company is available at: https://www.zensar.com/sites/default/files/investor/policies-reports-fillings/CSR%20Policy_Final.pdf
7. CONSERVATION OF ENERGY, TECHNOLOGY ABSORPTION AND FOREIGN EXCHANGE EARNINGS AND OUTGO
The provisions relating to disclosure of details regarding energy consumption, both total and per unit of production, are not applicable as the Company is engaged in the services sector and provides IT and IT related services.
Particulars prescribed under Section 134(3)(m) of the Act, read with the Companies (Accounts) Rules, 2014 in respect of Technology Absorption, Foreign Exchange earnings and outgo as on March 31, 2020 and R & D expenditure during the year are set out as Annexure to this report.
8. OTHER DISCLOSURES
i. The Company is not required to maintain cost records, as specified by the Central Government under section 148 of the Act.
ii. Key initiatives with respect to stakeholder relationship, customer relationship, environment, sustainability, health and safety have been disclosed under respective heads of Corporate Governance Report and Business Responsibility Report.
9. ACKNOWLEDGEMENTS
The Board places on record its appreciation for the contribution of associates at all levels, customers, business and technology partners, vendors, investors, Government Authorities and all other stakeholders towards the performance of the Company during the year under review.
For and on behalf of the Board of Directors
Place: Mumbai H. V. GoenkaDated: July 23, 2020 Chairman
Note: All the Annexures referred in the Board’s Report form an integral part of the same, unless otherwise stated. The entire Annual Report along with the Notice convening the AGM is to be read together.
ANNEXURE(S) TO BOARD’S REPORT
A Form No. MGT-9 : Extract of Annual Return
B Information pursuant to Section 197 read with Rule 5 of the Companies (Appointment and Remuneration of Managerial Personnel) Rules, 2014
C Report on Corporate Governance
D Management Discussion and Analysis Report
E Business Responsibility Report
F Form No. MR-3 : Secretarial Audit Report
G Annual Secretarial Compliance Report
H Annual Report on CSR Activities
I Report on Conservation of Energy, Technological Absorption and Foreign Exchange Earnings and Outgo

41BOARD’S REPORT NOTICE AND STATUTORY REPORTS
Annexure A to the Board’s Report
Form No. MGT-9Extract of Annual Return
As on the Financial Year ended on March 31, 2020[Pursuant to Section 92(3) of the Companies Act, 2013 and Rule 12(1) of the Companies (Management and Administration) Rules, 2014]
I. REGISTRATION AND OTHER DETAILS
i) CIN L72200PN1963PLC012621
ii) Registration date March 29, 1963
iii) Name of the Company Zensar Technologies Limited
iv) Category/Sub category of the Company • Company Limited by Shares• Indian Non-Government Company
v) Address of the Registered office and contact details Zensar Knowledge Park, Plot # 4, MIDC, Kharadi, Off Nagar Road, Pune - 411 014.Tel. No. 020 6605 7500Fax No. 020 6605 7888Email Address: [email protected]
vi) Whether listed company Yes
vii) Name, Address and Contact details of Registrar and Transfer Agent KFin Technologies Private Limited Address: Selenium Tower B, Plot No- 31 & 32, Financial District, Nanakramguda, Hyderabad 500032 Tel. No. 040 6716 2222 Fax No. 040 2300 1153 Email ID: [email protected]
II. PRINCIPAL BUSINESS ACTIVITES OF THE COMPANY:
Sl. No. Name and Description of main products / services NIC Code of the Product/ service
% to total turnover of the Company
1 Software development and allied services 620 99.00%

42 ZENSAR TECHNOLOGIES LTD ANNUAL REPORT 2019-20
III. PARTICULARS OF HOLDING, SUBSIDIARY AND ASSOCIATE COMPANIES
Sr. No.
Name and Country CIN / GLN Holding / Subsidiary / Associate
% of shares
held
Applicable Section
1 Zensar Technologies Inc., USA
Not Applicable Subsidiary
100
2(87)(ii)
2 Professional Access Limited, USA
3 PSI Holding Group Inc., USA
4 Zensar Technologies IM Inc., USA (erstwhile Akibia Inc.)
5 Zensar Technologies IM B.V., Netherlands (erstwhile Akibia B. V.)
6 Aquila Technology Corp., USA
7 Zensar Technologies (Shanghai) Co. Ltd, China
8 Zensar Info Technologies (Singapore) Pte. Ltd., Singapore 1
9 Zensar Technologies (Singapore) Pte. Ltd, Singapore
10 Zensar (South Africa) Proprietary Limited, South Africa
75
11 Zensar (Africa) Holdings Proprietary Limited , South Africa
100
12 Zensar Technologies (UK) Limited, UK
13 Foolproof Limited, UK
14 Knit Limited, UK 1
15 Foolproof (SG) Pte. Limited, Singapore
16 Keystone Logic Inc., USA
17 Cynosure Inc., USA
18 Cynosure APAC Pty. Ltd., Australia 2
19 Indigo Slate Inc., USA
20 Keystone Logic Mexico, S. DE R.L. DE C.V., Mexico
21 Keystone Technologies Mexico, S. DE R.L. DE C.V., Mexico
22 Zensar Technologies Canada Inc, Canada 3
23 Zensar Technologies GmbH, Germany 4
24 Zensar IT Services Limited, India 5 U72900PN2018PLC174305
25 Cynosure Interface Services Private Limited, India U72200KA2014PTC077487
Note: During the year under review:1 The application for liquidation filed.2 The Company was wound up in the month of December, 2019.3 Zensar Technologies Inc., formed this subsidiary in Canada in the month of May, 2019.4 Zensar Technologies (UK) Limited, formed this subsidiary in Germany in the month of January, 2020.5 The Company is under process of voluntary strike-off.
Further during the year, Zensar Technologies IM, Inc. together with PSI Holding Group Inc. transferred its identified business to Zensar Technologies, Inc., by way of slump sale on a going concern basis. PSI Holding Group Inc. distributed the stock of Aquila Technology Corp held by it, to Zensar Technologies, Inc. Aquila Technology Corp., USA is not considered as a subsidiary of PSI within the definition prescribed under IND-AS 110 and hence not consolidated by the Group. Further details, are set out in the Notes to Financial Statements.
Annexure A to the Board’s Report (Contd.)

43BOARD’S REPORT NOTICE AND STATUTORY REPORTS
Annexure A to the Board’s Report (Contd.)
IV)
SH
AR
EH
OLD
ING
PA
TTE
RN
(Equ
ity S
hare
Cap
ital B
reak
up a
s pe
rcen
tage
of T
otal
Equ
ity)
i) C
ateg
ory-
wis
e S
hare
hold
ing
Cat
egor
y of
Sha
reho
lder
sN
o. o
f sha
res
as o
n A
pril
1, 2
019
No.
of s
hare
s as
on
Mar
ch 3
1, 2
020
% c
hang
e du
ring
the
year
Dem
at
Phy
sica
lTo
tal S
hare
s%
of T
otal
S
hare
s*D
emat
P
hysi
cal
Tota
l Sha
res
% o
f Tot
al
Sha
res*
*
A. P
rom
oter
s an
d P
rom
oter
s G
roup
(1) I
ndia
n
a) I
ndiv
idua
l / H
UF
150,
010
-15
0,01
00.
0729
3,70
0-
293,
700
0.13
0.06
b) C
entra
l / S
tate
Gov
ernm
ent(s
)-
--
--
--
--
c) B
odie
s C
orpo
rate
109,
890,
786
-10
9,89
0,78
648
.80
110,
685,
112
-11
0,68
5,11
249
.10
0.30
d) F
inan
cial
Inst
itutio
ns /
Ban
ks-
--
--
--
--
Sub
-tot
al (A
) (1)
:-11
0,04
0,79
6-
110,
040,
796
48.8
711
0,97
8,81
2-
110,
978,
812
49.2
30.
37
(2) F
orei
gn
a) B
odie
s C
orpo
rate
- -
- -
- -
- -
-
b) I
ndiv
idua
l -
- -
- -
- -
- -
s) I
nstit
utio
ns -
- -
- -
- -
- -
d) Q
ualif
ied
Fore
ign
Inve
stor
- -
- -
- -
- -
-
e) A
ny O
ther
s (S
peci
fy)
- -
- -
- -
- -
-
Sub
-tot
al (A
) (2)
:- -
- -
- -
- -
- -
Tota
l hol
ding
for
prom
oter
s(A
) = (A
)(1)
+ (A
)(2)
110,
040,
796
-11
0,04
0,79
648
.87
110,
978,
812
-11
0,97
8,81
249
.23
0.37
B. P
ublic
Sha
reho
ldin
g
1. In
stitu
tions
a) C
entra
l/Sta
te
G
over
nmen
t(s)
--
--
--
--
-
b) F
inan
cial
Inst
itutio
ns /
B
anks
116,
958
5,32
012
2,27
80.
0530
,546
5,07
035
,616
0.02
-0.0
4
c) M
utua
l Fun
ds /
UTI
4,50
9,06
83,
500
4,51
2,56
82.
003,
542,
609
1,00
03,
543,
609
1.57
-0.4
3
*Per
cent
age
com
pute
d ba
sed
on th
e pa
id u
p sh
are
capi
tal a
t the
beg
inni
ng o
f FY
2019
-20
**Pe
rcen
tage
com
pute
d ba
sed
on th
e pa
id u
p sh
are
capi
tal a
t the
end
of F
Y 20
19-2
0

44 ZENSAR TECHNOLOGIES LTD ANNUAL REPORT 2019-20
Cat
egor
y of
Sha
reho
lder
sN
o. o
f sha
res
as o
n A
pril
1, 2
019
No.
of s
hare
s as
on
Mar
ch 3
1, 2
020
% c
hang
e du
ring
the
year
Dem
at
Phy
sica
lTo
tal S
hare
s%
of T
otal
S
hare
s*D
emat
P
hysi
cal
Tota
l Sha
res
% o
f Tot
al
Sha
res*
*
d) V
entu
re C
apita
l Fun
ds-
--
--
--
--
e) I
nsur
ance
Com
pani
es-
2,25
02,
250
--
2,25
02,
250
--
f) F
IIs38
,598
,509
-38
,598
,509
17.1
439
,782
,863
-39
,782
,863
17.6
50.
51
g) F
orei
gn V
entu
re C
apita
l
Inv
esto
rs-
--
--
--
--
h) Q
ualif
ied
Fore
ign
Inve
stor
--
--
--
--
-
i) A
ny O
ther
s (S
peci
fy)
517,
425
-51
7,42
50.
2349
9,84
9-
499,
849
0.22
-0.0
1
j) F
orei
gn P
ortfo
lio In
vest
or-
--
--
--
--
k) A
ltern
ate
Inve
stm
ent F
und
--
--
--
--
-
Sub
Tot
al (B
)(1)
:43
,741
,960
11,0
7043
,753
,030
19.4
343
,855
,867
8,32
043
,864
,187
19.4
60.
03
2. N
on-In
stitu
tions
(a)
Bod
ies
Cor
pora
te2,
307,
900
47,8
102,
355,
710
1.05
1,85
9,52
740
,310
1,89
9,83
70.
84-0
.21
Bod
ies
Cor
pora
te(N
BFC
)55
,810
-55
,810
0.02
17,5
00-
17,5
000.
01-0
.01
(b)
Indi
vidu
als
(i)In
divi
dual
sha
reho
lder
s ho
ldin
g no
min
al s
hare
ca
pita
l upt
o R
s. 1
lakh
12,4
99,5
441,
887,
625
14,3
87,1
696.
3912
,526
,035
1,56
5,65
514
,091
,690
6.25
-0.1
4
(ii)
Indi
vidu
al s
hare
hold
ers
hold
ing
nom
inal
sha
re
capi
tal i
n ex
cess
of R
s 1
lakh
1,23
2,50
4-
1,23
2,50
40.
551,
202,
375
-1,
202,
375
0.53
-0.0
2
(c)
Any
Oth
ers
(Spe
cify
)
(i)Tr
usts
12,7
64-
12,7
640.
014,
250
-4,
250
0.00
0.00
(ii)
Cle
arin
g M
embe
r28
,186
100
28,2
860.
0159
,531
100
59,6
310.
030.
01
(iii)
Non
Res
iden
t Ind
ians
(N
RI)
551,
257
5,29
055
6,54
70.
2544
9,69
8-
449,
698
0.20
-0.0
5
(iv)
Non
Res
iden
t Ind
ians
(R
epat
)-
--
--
5,29
05,
290
--
(v)
Non
Res
iden
t Ind
ians
(N
on R
epat
)38
0,45
450
038
0,95
40.
1735
9,56
850
036
0,06
80.
16-0
.01
(vi)
Fore
ign
Bod
ies
51,5
06,4
70-
51,5
06,4
7022
.87
51,5
06,4
70-
51,5
06,4
7022
.85
-0.0
2
(vii)
IEPF
874,
880
-87
4,88
00.
3997
7,16
2-
977,
162
0.43
0.04
Annexure A to the Board’s Report (Contd.)
*Per
cent
age
com
pute
d ba
sed
on th
e pa
id u
p sh
are
capi
tal a
t the
beg
inni
ng o
f FY
2019
-20
**Pe
rcen
tage
com
pute
d ba
sed
on th
e pa
id u
p sh
are
capi
tal a
t the
end
of F
Y 20
19-2
0

45BOARD’S REPORT NOTICE AND STATUTORY REPORTS
Annexure A to the Board’s Report (Contd.)
Cat
egor
y of
Sha
reho
lder
sN
o. o
f sha
res
as o
n A
pril
1, 2
019
No.
of s
hare
s as
on
Mar
ch 3
1, 2
020
% c
hang
e du
ring
the
year
Dem
at
Phy
sica
lTo
tal S
hare
s%
of T
otal
S
hare
s*D
emat
P
hysi
cal
Tota
l Sha
res
% o
f Tot
al
Sha
res*
*
(d)
Qua
lifie
d Fo
reig
n In
vest
or-
--
--
--
--
(e)
Fore
ign
Port
folio
Inve
stor
--
--
--
--
-
Sub
Tot
al (
B)(
2) :
69,4
49,7
691,
941,
325
71,3
91,0
9431
.70
68,9
62,1
161,
611,
855
70,5
73,9
7131
.31
-0.3
6
Tota
l Pub
lic S
hare
hold
ing
(B)=
(B)(
1) +
(B)(
2)11
3,19
1,72
91,
952,
395
115,
144,
124
51.1
311
2,81
7,98
31,
620,
175
114,
438,
158
50.7
7-0
.33
(C) S
hare
s he
ld b
y C
usto
dian
s an
d ag
ains
t whi
ch
Dep
osito
ry R
ecei
pts
have
be
en is
sued
(a)
Shar
es H
eld
By
Cus
todi
ans
--
--
--
--
-
(i)Pr
omot
er A
nd P
rom
oter
G
roup
--
--
--
--
-
(ii)
Publ
ic-
--
--
--
--
Sub
Tot
al (
C)(
1) :
--
--
--
--
-
(C)=
(C)(
1)-
--
--
--
--
Gra
nd T
otal
(A) +
(B) +
(C)
223,
232,
525
1,95
2,39
522
5,18
4,92
010
0.00
223,
796,
795
1,62
0,17
522
5,41
6,97
010
0.00
-
*Per
cent
age
com
pute
d ba
sed
on th
e pa
id u
p sh
are
capi
tal a
t the
beg
inni
ng o
f FY
2019
-20
**Pe
rcen
tage
com
pute
d ba
sed
on th
e pa
id u
p sh
are
capi
tal a
t the
end
of F
Y 20
19-2
0

46 ZENSAR TECHNOLOGIES LTD ANNUAL REPORT 2019-20ii)
. Sha
reho
ldin
g of
Pro
mot
ers
Sr.
N
o.S
hare
hold
er's
Nam
eS
hare
hold
ing
at th
e be
ginn
ing
of th
e ye
ar
Apr
il 1,
201
9S
hare
hold
ing
at th
e en
d of
the
year
M
arch
31,
202
0%
Cha
nge
in
shar
ehol
ding
du
ring
the
year
No.
of S
hare
s%
of T
otal
S
hare
*%
of S
hare
s P
ledg
ed/
encu
mbe
red
to to
tal s
hare
s
No.
of S
hare
s%
of T
otal
S
hare
**%
of S
hare
s P
ledg
ed/
encu
mbe
red
to to
tal s
hare
s1
Swal
low
Ass
ocia
tes
LLP
60,5
50,9
4026
.89
-60
,586
,344
26.8
8-
-0.0
32
Sum
mit
Secu
ritie
s Li
mite
d24
,680
,535
10.9
6-
24,9
72,4
2711
.08
--0
.01
3In
stan
t Hol
ding
s Li
mite
d 18
,689
,130
8.30
-19
,051
,374
8.45
-0.
494
Sofre
al M
erca
ntra
de P
rivat
e Li
mite
d5,
741,
676
2.55
-5,
846,
462
2.59
-0.
035
Cha
ttarp
ati A
part
men
ts L
LP22
8,50
00.
10-
228,
500
0.10
-0.
006
H. V
. Goe
nka
148,
125
0.07
-14
8,12
50.
07-
0.00
7C
ryst
al In
dia
Tech
Tru
st th
roug
h Tr
uste
e,
H.V
. Goe
nka
1,86
00.
00-
1,86
00.
00-
0.00
8N
ucle
us L
ife T
rust
, thr
ough
Tru
stee
, H
.V. G
oenk
a5
0.00
-5
0.00
-0.
00
9Su
dars
han
Elec
troni
cs a
nd T
V Li
mite
d5
0.00
-5
0.00
-0.
0010
Pris
m E
stat
es T
rust
, thr
ough
Tru
stee
, H
.V. G
oenk
a5
0.00
-5
0.00
-0.
00
11M
onito
r Po
rtfo
lio T
rust
, th
roug
h Tr
uste
e,
H.V
. Goe
nka
50.
00-
50.
00-
0.00
12Se
cura
Indi
a Tr
ust,
thro
ugh
Trus
tee,
H
.V. G
oenk
a5
0.00
-5
0.00
-0.
00
13St
ella
r En
ergy
Tr
ust,
thro
ugh
Trus
tee,
H
.V. G
oenk
a5
0.00
-5
0.00
-0.
00
14R
PG V
entu
res
Lim
ited
00.
00-
143,
650
0.06
-0.
0615
Isha
an G
oenk
a Tr
ust,
thro
ugh
Trus
tee,
H
.V. G
oenk
a0
0.00
-10
0.00
-0.
00
16R
G F
amily
Tru
st, t
hrou
gh T
rust
ee,
Ana
nt G
oekn
a0
0.00
-10
0.00
-0.
00
17AV
G F
amily
Tru
st, t
hrou
gh T
rust
ee,
Ana
nt G
oekn
a0
0.00
-10
0.00
-0.
00
18N
avya
G
oenk
a Tr
ust,
thro
ugh
Trus
tee,
H
.V. G
oenk
a0
0.00
-10
0.00
-0.
00
110,
040,
796
48.8
70.
0011
0,97
8,81
249
.23
0.00
0.37
*Per
cent
age
com
pute
d ba
sed
on th
e pa
id u
p sh
are
capi
tal a
t the
beg
inni
ng o
f FY
2019
-20
**Pe
rcen
tage
com
pute
d ba
sed
on th
e pa
id u
p sh
are
capi
tal a
t the
end
of F
Y 20
19-2
0
Annexure A to the Board’s Report (Contd.)

47BOARD’S REPORT NOTICE AND STATUTORY REPORTS
Annexure A to the Board’s Report (Contd.)
iii) Change in Promoter Shareholding
Sr. No.
Name of the Shareholder
Shareholding at the begginning of the Year
Date Increase/Decrease in share holding
Reason Cumulative Shareholding during the Year / end of
the year
No. of Shares
% of Total Shares*
No. of Shares
% of Total Shares**
1 Swallow Associates LLP
60,550,940 26.89 April 1, 2019 60,550,940 26.89
February 28, 2020
35,404 Market Purchase
60,586,344 26.88
March 31, 2020
60,586,344 26.88
2 Summit Securities Limited
24,680,535 10.96 April 1, 2019 24,680,535 10.96
November 15, 2019
41,232 Market Purchase
24,721,767 10.97
November 22, 2019
77,586 24,799,353 11.01
February 28, 2019
173,074 24,972,427 11.08
March 31, 2020
24,972,427 11.08
3 Instant Holdings Limited
18,689,130 8.30 April 1, 2019 18,689,130 8.30
May 10, 2019
27,663 Market Purchase
18,716,793 8.31
May 17, 2019
4,266 18,721,059 8.31
May 24, 2019
24,217 18,745,276 8.32
February 28, 2020
78,626 18,823,902 8.35
March 6, 2020
18,646 18,842,548 8.36
March 20, 2020
121,826 18,964,374 8.41
March 27, 2020
87,000 19,051,374 8.45
March 31, 2020
19,051,374 8.45
4 Sofreal Mercantrade Private Limited
5,741,676 2.55 April 1, 2019 5,741,676 2.55
September 30, 2019
8,562 Market Purchase
5,750,238 2.55
October 4, 2019
24,116 5,774,354 2.56
February 28, 2020
72,108 5,846,462 2.59
March 31, 2020
5,846,462 2.59
*Percentage computed based on the paid up share capital at the beginning of FY 2019-20**Percentage computed based on the paid up share capital at the end of FY 2019-20

48 ZENSAR TECHNOLOGIES LTD ANNUAL REPORT 2019-20
Annexure A to the Board’s Report (Contd.)
Sr. No.
Name of the Shareholder
Shareholding at the begginning of the Year
Date Increase/Decrease in share holding
Reason Cumulative Shareholding during the Year / end of
the year
No. of Shares
% of Total Shares*
No. of Shares
% of Total Shares**
5 Chattarpati Apartments LLP
228,500 0.10 April 1, 2019 No Change 228,500 0.10
March 31, 2020
228,500 0.10
6 H. V. Goenka 148,125 0.07 April 1, 2019 No Change 148,125 0.07
March 31, 2020
148,125 0.07
7 RPG Ventures Limited
0 0.00 April 1, 2019 0 0.00
November 8, 2019
84,462 Market Purchase
84,462 0.04
November 15, 2019
57,888 142,350 0.06
November 22, 2019
1,300 143,650 0.06
March 31, 2020
143,650 0.06
8 Crystal India Tech Trust,through Trustee, H.V. Goenka
1,860 0.00 April 1, 2019 No Change 1,860 0.00
March 31, 2020
1,860 0.00
9 Ishaan Goenka Trust, through Trustee, H.V. Goenka
0 0.00 April 1, 2019 0 0.00
November 22, 2019
10 Market Purchase
10 0.00
March 31, 2020
10 0.00
10 RG Family Trust, through Trustee, Anant Goekna
0 0.00 April 1, 2019 0 0.00
November 22, 2019
10 Market Purchase
10 0.00
March 31, 2020
10 0.00
11 AVG Family Trust, through Trustee, Anant Goekna
0 0.00 April 1, 2019 0 0.00
June 28, 2019
10 Market Purchase
10 0.00
March 31, 2020
10 0.00
12 Navya Goenka Trust, through Trustee, H.V. Goenka
0 0.00 April 1, 2019 0 0.00
November 22, 2019
10 Market Purchase
10 0.00
March 31, 2020
10 0.00
13 Sudarshan Electronics and TV Limited
5 0.00 April 1, 2019 No Change 5 0.00
March 31, 2020
5 0.00
*Percentage computed based on the paid up share capital at the beginning of FY 2019-20**Percentage computed based on the paid up share capital at the end of FY 2019-20

49BOARD’S REPORT NOTICE AND STATUTORY REPORTS
Annexure A to the Board’s Report (Contd.)
Sr. No.
Name of the Shareholder
Shareholding at the begginning of the Year
Date Increase/Decrease in share holding
Reason Cumulative Shareholding during the Year / end of
the year
No. of Shares
% of Total Shares*
No. of Shares
% of Total Shares**
14 Nucleus Life Trust, through Trustee, H.V. Goenka
5 0.00 April 1, 2019 No Change 5 0.00
March 31, 2020
5 0.00
15 Prism Estates Trust, through Trustee, H.V. Goenka
5 0.00 April 1, 2019 5 0.00
March 31, 2020
5 0.00
16 Monitor Portfolio Trust, through Trustee, H.V. Goenka
5 0.00 April 1, 2019 5 0.00
March 31, 2020
5 0.00
17 Secura India Trust, through Trustee, H.V. Goenka
5 0.00 April 1, 2019 5 0.00
March 31, 2020
5 0.00
18 Stellar Energy Trust, through Trustee, H.V. Goenka
5 0.00 April 1, 2019 5 0.00
March 31, 2020
5 0.00
*Percentage computed based on the paid up share capital at the beginning of FY 2019-20**Percentage computed based on the paid up share capital at the end of FY 2019-20

50 ZENSAR TECHNOLOGIES LTD ANNUAL REPORT 2019-20iv
) Sha
reho
ldin
g P
atte
rn o
f top
ten
Sha
reho
lder
s (o
ther
than
Dir
ecto
rs, P
rom
oter
s an
d H
olde
rs o
f GD
Rs
and
AD
Rs)
:
Sr.
N
o.N
ame
of th
e S
hare
hold
erS
hare
hold
ing
at
the
begi
nnin
g/en
d of
the
year
% o
f tot
al
shar
es*
Dat
eIn
crea
se /
Dec
reas
e in
sh
areh
oldi
ng
Rea
son#
Cum
ulat
ive
Sha
reho
ldin
g
duri
ng th
e Y
ear
Num
ber
of
Sha
res
% o
f tot
al
shar
es**
1M
arin
a H
oldc
o (F
PI)
Lim
ited
51,5
06,4
7022
.87
Mar
ch 3
0, 2
019
NA
51,5
06,4
7022
.87
Mar
ch 3
1, 2
020
51,5
06,4
7022
.85
2A
man
sa H
oldi
ngs
Priv
ate
Lim
ited
13
,096
,412
5.82
Mar
ch 3
0, 2
019
Tran
sfer
13,0
96,4
125.
82
Aug
ust 2
, 201
931
,663
13,1
28,0
755.
83
Aug
ust 3
0, 2
019
5,25
613
,133
,331
5.83
Dec
embe
r 13,
201
913
,719
13,1
47,0
505.
84
Mar
ch 3
1, 2
020
13,1
47,0
505.
83
3H
DFC
Tru
stee
Com
pany
Li
mite
d A
/C -
HD
FC
Chi
ldre
n's
Gif
4,47
1,03
01.
99M
arch
30,
201
94,
471,
030
1.99
May
17,
201
911
,000
4,48
2,03
01.
99
Nov
embe
r 1, 2
019
-936
,165
3,54
5,86
51.
57
Febr
uary
7, 2
020
-9,2
503,
536,
615
1.57
Mar
ch 3
1, 2
020
3,53
6,61
51.
57
4Fi
delit
y A
dvis
or S
erie
s I -
Fi
delit
y A
dvis
or S
mal
l
3,
597,
030
1.60
Mar
ch 3
0, 2
019
3,59
7,03
01.
60
July
5, 2
019
3,50
4,68
77,
101,
717
3.15
July
5, 2
019
-3,5
97,0
303,
504,
687
1.56
July
12,
201
9-1
7,75
73,
486,
930
1.55
Febr
uary
14,
202
0-2
1,92
23,
465,
008
1.54
Febr
uary
21,
202
0-7
,797
3,45
7,21
11.
53
Mar
ch 3
1, 2
020
-5,7
533,
451,
458
1.53
Mar
ch 3
1, 2
020
3,45
1,45
81.
53
5Fi
delit
y Pu
ritan
Tru
st-
Fide
lity
Low
-Pric
ed S
tock
F
3,50
0,00
01.
55M
arch
30,
201
93,
500,
000
1.55
Mar
ch 3
1, 2
020
3,50
0,00
01.
55
6Fi
delit
y In
vest
men
t Tru
st
Fide
lity
Serie
s Em
ergi
ng
1,91
8,41
20.
85M
arch
30,
201
91,
918,
412
0.85
July
26,
201
94,
660
1,92
3,07
20.
85
Aug
ust 2
, 201
918
,727
1,94
1,79
90.
86
Aug
ust 9
, 201
98,
787
1,95
0,58
60.
87
Aug
ust 1
6, 2
019
3,57
01,
954,
156
0.87
Annexure A to the Board’s Report (Contd.)
*Per
cent
age
com
pute
d ba
sed
on th
e pa
id u
p sh
are
capi
tal a
t the
beg
inni
ng o
f FY
2019
-20
**Pe
rcen
tage
at t
he y
ear e
nd, c
ompu
ted
base
d on
the
paid
up
shar
e ca
pita
l at t
he e
nd o
f FY
2019
-20
#As
per i
nfor
mat
ion
prov
ided
by
Reg
istra
r and
Tra
nsfe
r Age
nt

51BOARD’S REPORT NOTICE AND STATUTORY REPORTSS
r.
No.
Nam
e of
the
Sha
reho
lder
Sha
reho
ldin
g at
th
e be
ginn
ing/
end
of th
e ye
ar
% o
f tot
al
shar
es*
Dat
eIn
crea
se /
Dec
reas
e in
sh
areh
oldi
ng
Rea
son#
Cum
ulat
ive
Sha
reho
ldin
g
duri
ng th
e Y
ear
Num
ber
of
Sha
res
% o
f tot
al
shar
es**
Fide
lity
Inve
stm
ent T
rust
Fi
delit
y Se
ries
Emer
ging
(C
ontd
.)
Aug
ust 2
3, 2
019
11,9
58Tr
ansf
er1,
966,
114
0.87
Aug
ust 3
0, 2
019
25,7
681,
991,
882
0.88
Sept
embe
r 6, 2
019
7,69
61,
999,
578
0.89
Sept
embe
r 13,
201
98,
307
2,00
7,88
50.
89
Sept
embe
r 20,
201
912
,300
2,02
0,18
50.
90
Sept
embe
r 27,
201
911
,742
2,03
1,92
70.
90
Sept
embe
r 30,
201
93,
151
2,03
5,07
80.
90
Oct
ober
4, 2
019
4,60
72,
039,
685
0.91
Oct
ober
11,
201
96,
598
2,04
6,28
30.
91
Oct
ober
18,
201
97,
679
2,05
3,96
20.
91
Oct
ober
25,
201
974
,950
2,12
8,91
20.
95
Nov
embe
r 1, 2
019
624,
193
2,75
3,10
51.
22
Nov
embe
r 8, 2
019
23,8
572,
776,
962
1.23
Nov
embe
r 15,
201
919
,604
2,79
6,56
61.
24
Nov
embe
r 22,
201
944
,244
2,84
0,81
01.
26
Nov
embe
r 29,
201
929
,945
2,87
0,75
51.
27
Dec
embe
r 6, 2
019
12,0
962,
882,
851
1.28
Dec
embe
r 13,
201
915
,704
2,89
8,55
51.
29
Dec
embe
r 20,
201
925
,585
2,92
4,14
01.
30
Dec
embe
r 27,
201
914
,654
2,93
8,79
41.
30
Dec
embe
r 31,
201
912
,932
2,95
1,72
61.
31
Janu
ary
3, 2
020
29,1
592,
980,
885
1.32
Janu
ary
10, 2
020
8,90
72,
989,
792
1.33
Febr
uary
21,
202
0-8
7,87
32,
901,
919
1.29
Febr
uary
28,
202
0-1
7,71
22,
884,
207
1.28
Mar
ch 6
, 202
0-1
9,38
72,
864,
820
1.27
Mar
ch 1
3, 2
020
-66,
901
2,79
7,91
91.
24
Mar
ch 2
0, 2
020
-41,
009
2,75
6,91
01.
22
Annexure A to the Board’s Report (Contd.)
*Per
cent
age
com
pute
d ba
sed
on th
e pa
id u
p sh
are
capi
tal a
t the
beg
inni
ng o
f FY
2019
-20
**Pe
rcen
tage
at t
he y
ear e
nd, c
ompu
ted
base
d on
the
paid
up
shar
e ca
pita
l at t
he e
nd o
f FY
2019
-20
#As
per i
nfor
mat
ion
prov
ided
by
Reg
istra
r and
Tra
nsfe
r Age
nt
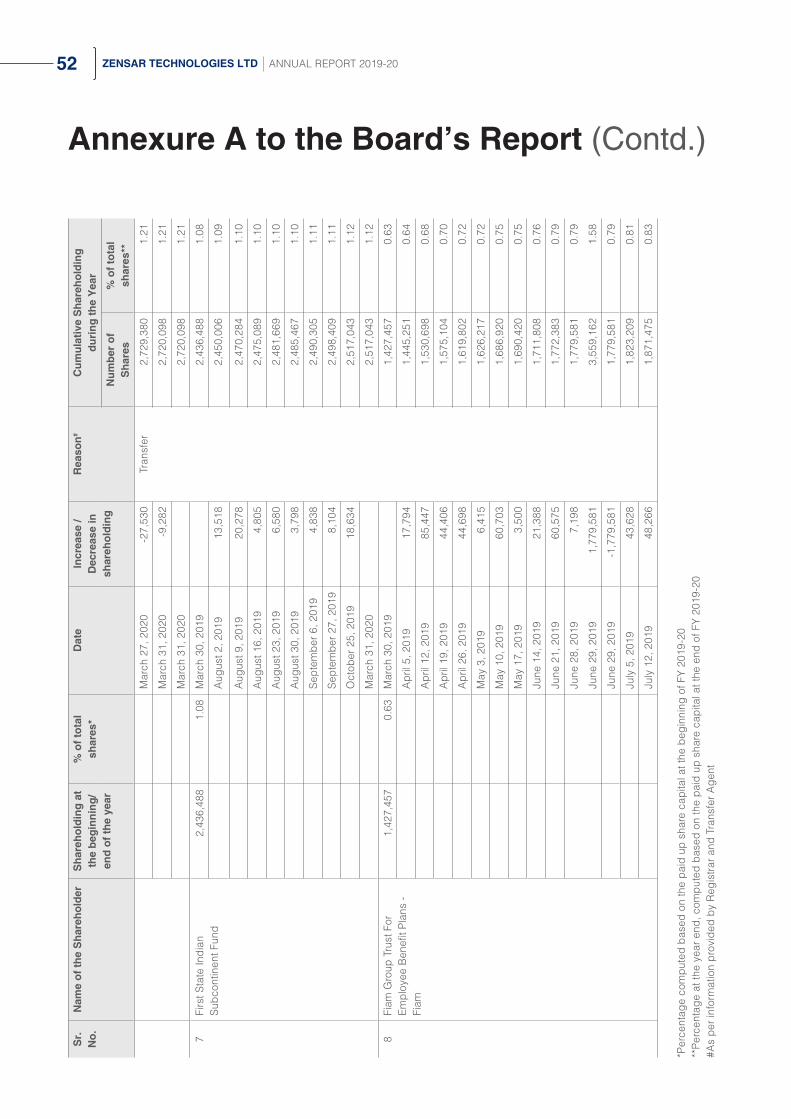
52 ZENSAR TECHNOLOGIES LTD ANNUAL REPORT 2019-20
Annexure A to the Board’s Report (Contd.)
Sr.
N
o.N
ame
of th
e S
hare
hold
erS
hare
hold
ing
at
the
begi
nnin
g/en
d of
the
year
% o
f tot
al
shar
es*
Dat
eIn
crea
se /
Dec
reas
e in
sh
areh
oldi
ng
Rea
son#
Cum
ulat
ive
Sha
reho
ldin
g
duri
ng th
e Y
ear
Num
ber
of
Sha
res
% o
f tot
al
shar
es**
Mar
ch 2
7, 2
020
-27,
530
Tran
sfer
2,72
9,38
01.
21
Mar
ch 3
1, 2
020
-9,2
822,
720,
098
1.21
Mar
ch 3
1, 2
020
2,72
0,09
81.
21
7Fi
rst S
tate
Indi
an
Subc
ontin
ent F
und
2,43
6,48
81.
08M
arch
30,
201
92,
436,
488
1.08
Aug
ust 2
, 201
913
,518
2,45
0,00
61.
09
Aug
ust 9
, 201
920
,278
2,47
0,28
41.
10
Aug
ust 1
6, 2
019
4,80
52,
475,
089
1.10
Aug
ust 2
3, 2
019
6,58
02,
481,
669
1.10
Aug
ust 3
0, 2
019
3,79
82,
485,
467
1.10
Sept
embe
r 6, 2
019
4,83
82,
490,
305
1.11
Sept
embe
r 27,
201
98,
104
2,49
8,40
91.
11
Oct
ober
25,
201
918
,634
2,51
7,04
31.
12
Mar
ch 3
1, 2
020
2,51
7,04
31.
12
8Fi
am G
roup
Tru
st F
or
Empl
oyee
Ben
efit
Plan
s -
Fiam
1,42
7,45
70.
63M
arch
30,
201
91,
427,
457
0.63
Apr
il 5,
201
917
,794
1,44
5,25
10.
64
Apr
il 12
, 201
985
,447
1,53
0,69
80.
68
Apr
il 19
, 201
944
,406
1,57
5,10
40.
70
Apr
il 26
, 201
944
,698
1,61
9,80
20.
72
May
3, 2
019
6,41
51,
626,
217
0.72
May
10,
201
960
,703
1,68
6,92
00.
75
May
17,
201
93,
500
1,69
0,42
00.
75
June
14,
201
921
,388
1,71
1,80
80.
76
June
21,
201
960
,575
1,77
2,38
30.
79
June
28,
201
97,
198
1,77
9,58
10.
79
June
29,
201
91,
779,
581
3,55
9,16
21.
58
June
29,
201
9-1
,779
,581
1,77
9,58
10.
79
July
5, 2
019
43,6
281,
823,
209
0.81
July
12,
201
948
,266
1,87
1,47
50.
83
*Per
cent
age
com
pute
d ba
sed
on th
e pa
id u
p sh
are
capi
tal a
t the
beg
inni
ng o
f FY
2019
-20
**Pe
rcen
tage
at t
he y
ear e
nd, c
ompu
ted
base
d on
the
paid
up
shar
e ca
pita
l at t
he e
nd o
f FY
2019
-20
#As
per i
nfor
mat
ion
prov
ided
by
Reg
istra
r and
Tra
nsfe
r Age
nt

53BOARD’S REPORT NOTICE AND STATUTORY REPORTS
Annexure A to the Board’s Report (Contd.)
Sr.
N
o.N
ame
of th
e S
hare
hold
erS
hare
hold
ing
at
the
begi
nnin
g/en
d of
the
year
% o
f tot
al
shar
es*
Dat
eIn
crea
se /
Dec
reas
e in
sh
areh
oldi
ng
Rea
son#
Cum
ulat
ive
Sha
reho
ldin
g
duri
ng th
e Y
ear
Num
ber
of
Sha
res
% o
f tot
al
shar
es**
Fiam
Gro
up T
rust
For
Em
ploy
ee B
enef
it Pl
ans
- Fi
am (C
ontd
.)
July
19,
201
98,
228
Tran
sfer
1,87
9,70
30.
83
July
26,
201
917
,267
1,89
6,97
00.
84
Aug
ust 2
, 201
94,
582
1,90
1,55
20.
84
Aug
ust 9
, 201
91,
700
1,90
3,25
20.
85
Aug
ust 2
3, 2
019
1,70
01,
904,
952
0.85
Aug
ust 3
0, 2
019
4,20
01,
909,
152
0.85
Sept
embe
r 20,
201
91,
700
1,91
0,85
20.
85
Sept
embe
r 27,
201
95,
100
1,91
5,95
20.
85
Oct
ober
11,
201
91,
700
1,91
7,65
20.
85
Oct
ober
25,
201
918
,100
1,93
5,75
20.
86
Nov
embe
r 1, 2
019
155,
711
2,09
1,46
30.
93
Febr
uary
21,
202
0-6
1,40
02,
030,
063
0.90
Febr
uary
28,
202
0-1
0,30
02,
019,
763
0.90
Mar
ch 6
, 202
0-8
,300
2,01
1,46
30.
89
Mar
ch 1
3, 2
020
-46,
069
1,96
5,39
40.
87
Mar
ch 2
0, 2
020
-23,
500
1,94
1,89
40.
86
Mar
ch 3
1, 2
020
-9,4
001,
932,
494
0.86
Mar
ch 3
1, 2
020
1,93
2,49
40.
86
9Th
e Sc
ottis
h O
rient
al
Smal
ler C
ompa
nies
Tru
stpl
c1,
521,
507
0.68
Mar
ch 3
0, 2
019
1,52
1,50
70.
68
Mar
ch 3
1, 2
020
1,52
1,50
70.
67
10C
aiss
e D
e D
epot
Et
Plac
emen
t Du
Que
bec-
Firs
t St
ate
1,34
8,68
10.
60M
arch
30,
201
91,
348,
681
0.60
Aug
ust 2
, 201
97,
373
1,35
6,05
40.
60
Aug
ust 9
, 201
911
,060
1,36
7,11
40.
61
Aug
ust 1
6, 2
019
2,62
11,
369,
735
0.61
Aug
ust 2
3, 2
019
3,58
81,
373,
323
0.61
Aug
ust 3
0, 2
019
2,07
21,
375,
395
0.61
Sept
embe
r 6, 2
019
2,63
91,
378,
034
0.61
Sept
embe
r 27,
201
94,
420
1,38
2,45
40.
61
Oct
ober
25,
201
910
,163
1,39
2,61
70.
62
Mar
ch 3
1, 2
020
1,39
2,61
70.
62
*Per
cent
age
com
pute
d ba
sed
on th
e pa
id u
p sh
are
capi
tal a
t the
beg
inni
ng o
f FY
2019
-20
**Pe
rcen
tage
at t
he y
ear e
nd, c
ompu
ted
base
d on
the
paid
up
shar
e ca
pita
l at t
he e
nd o
f FY
2019
-20
#As
per i
nfor
mat
ion
prov
ided
by
Reg
istra
r and
Tra
nsfe
r Age
nt
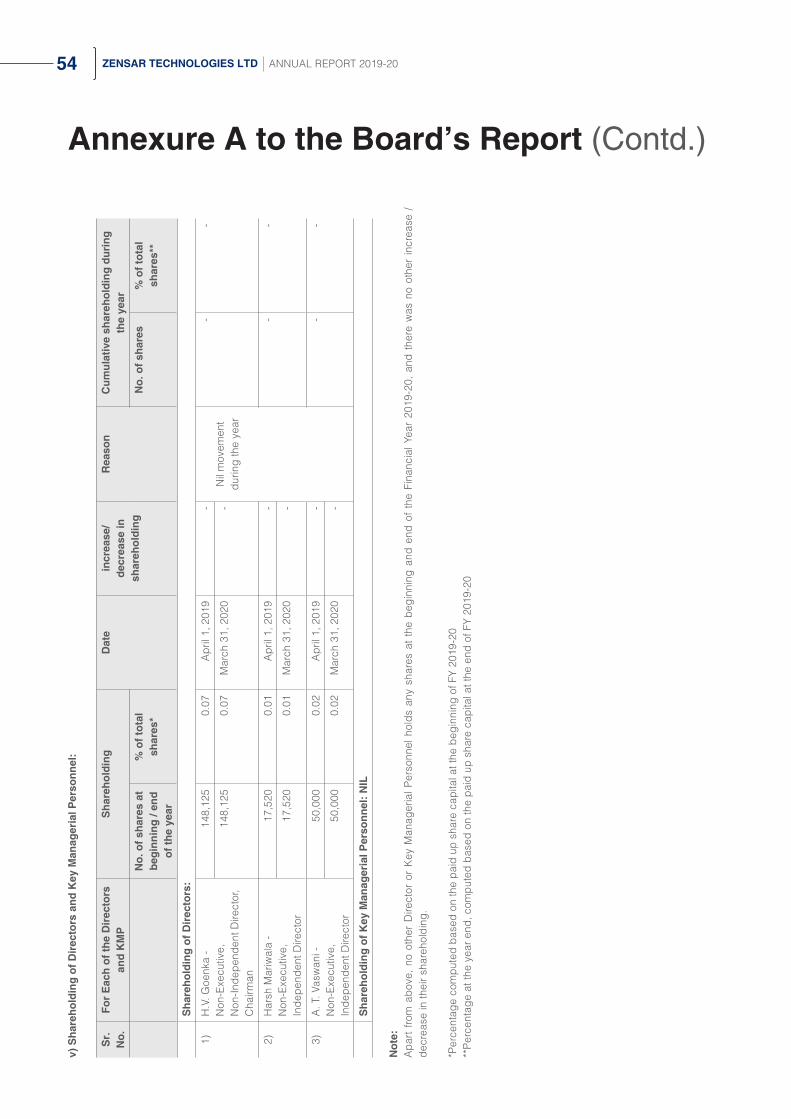
54 ZENSAR TECHNOLOGIES LTD ANNUAL REPORT 2019-20
Annexure A to the Board’s Report (Contd.)
v) S
hare
hold
ing
of D
irec
tors
and
Key
Man
ager
ial P
erso
nnel
:
Sr.
N
o.Fo
r E
ach
of th
e D
irec
tors
an
d K
MP
Sha
reho
ldin
g D
ate
incr
ease
/ de
crea
se in
sh
areh
oldi
ng
Rea
son
Cum
ulat
ive
shar
ehol
ding
dur
ing
the
year
No.
of s
hare
s at
be
ginn
ing
/ end
of
the
year
% o
f tot
al
shar
es*
No.
of s
hare
s %
of t
otal
sh
ares
**
Sha
reho
ldin
g of
Dir
ecto
rs:
1)
H.V
. Goe
nka
- N
on-E
xecu
tive,
N
on-In
depe
nden
t Dire
ctor
, C
hairm
an
148,
125
0.07
Apr
il 1,
201
9-
Nil
mov
emen
t du
ring
the
year
--
148,
125
0.07
Mar
ch 3
1, 2
020
-
2)
Har
sh M
ariw
ala
- N
on-E
xecu
tive,
In
depe
nden
t Dire
ctor
17,5
200.
01A
pril
1, 2
019
--
-
17,5
200.
01M
arch
31,
202
0-
3)
A. T
. Vas
wan
i -
Non
-Exe
cutiv
e,
Inde
pend
ent D
irect
or
50,0
000.
02A
pril
1, 2
019
--
-
50,0
000.
02M
arch
31,
202
0-
Sha
reho
ldin
g of
Key
Man
ager
ial P
erso
nnel
: NIL
Not
e:A
part
fro
m a
bove
, no
oth
er D
irect
or o
r K
ey M
anag
eria
l Per
sonn
el h
olds
any
sha
res
at t
he b
egin
ning
and
end
of
the
Fina
ncia
l Yea
r 20
19-2
0, a
nd t
here
was
no
othe
r in
crea
se /
de
crea
se in
thei
r sha
reho
ldin
g.
*Per
cent
age
com
pute
d ba
sed
on th
e pa
id u
p sh
are
capi
tal a
t the
beg
inni
ng o
f FY
2019
-20
**Pe
rcen
tage
at t
he y
ear e
nd, c
ompu
ted
base
d on
the
paid
up
shar
e ca
pita
l at t
he e
nd o
f FY
2019
-20

55BOARD’S REPORT NOTICE AND STATUTORY REPORTS
Annexure A to the Board’s Report (Contd.)
V) INDEBTEDNESS
Indebtedness of the Company including interest outstanding/accrued but not due for payment (INR in Lakhs)
Indebtedness at the beginning of FY 2019-20 Secured Loans excluding deposits
Unsecured Loans
Deposits Total Indebtedness
i) Principal Amount
ii) Interest due but not paid
iii) Interest accrued but not due
Total (i+ii+iii)
Change in Indebtedness during the Financial Year
* Addition
* Reduction NIL
Net Change
Indebtedness at the end of FY 2019-20
i) Principal Amount
ii) Interest due but not paid
iii) Interest accrued but not due
Total (i+ii+iii)
VI) REMUNERATION OF DIRECTORS AND KEY MANAGERIAL PERSONNEL
A. Remuneration to Sandeep Kishore, Managing Director and Chief Executive Officer/Whole-Time Director
(Amount in INR)
Sr. No.
Particulars of Remuneration Total Amount
1 Gross Salary
a. Salary as per provisions contained in Section 17(1) of the Income-tax Act, 1961 1,422,736
b. Value of perquisites u/s 17(2) Income-tax Act, 1961** -
c. Profits in lieu of salary under section 17(3) Income-tax Act, 1961 -
2 Stock Option -
3 Sweat Equity -
4 Commission: -
- As a % of Profit -
- Others, specify -
5 Others, please specify -
Contribution to PF 170,728
Contribution to Gratuity -
Contribution to Superannuation Fund -
Consolidated Allowances -
Car Perquisite -
Sale of Assets (Perquisites) -
Total (A) 1,593,464
Remuneration Ceiling (Being 5% of the net profit of the Company calculated as per Section 198 of the Act)
147,645,000
Note :*Excludes the value of employee stock options exercised, if any, and provision for compensated absences/Gratuity in respect of separate actuarial valuation reports for key managerial personnel
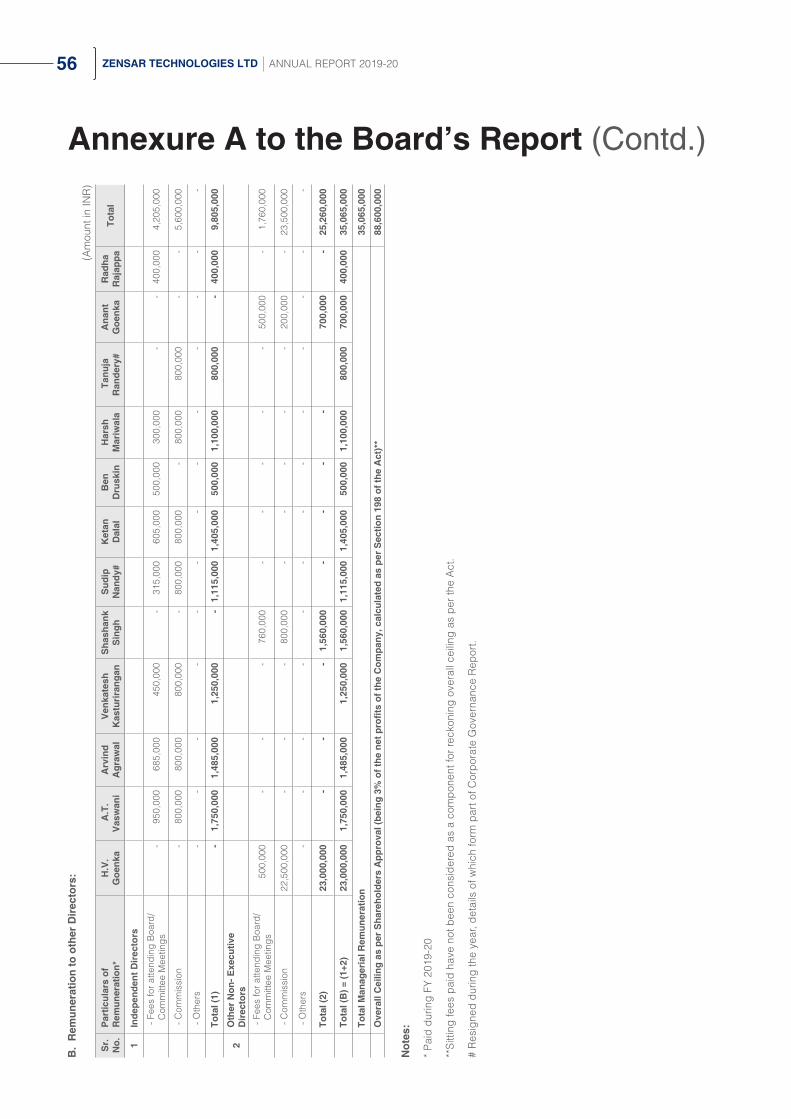
56 ZENSAR TECHNOLOGIES LTD ANNUAL REPORT 2019-20
Annexure A to the Board’s Report (Contd.)
B.
Rem
uner
atio
n to
oth
er D
irec
tors
:
(Am
ount
in IN
R)
Sr.
N
o.P
artic
ular
s of
R
emun
erat
ion*
H.V
. G
oenk
a A
.T.
Vas
wan
iA
rvin
d A
graw
alV
enka
tesh
K
astu
rira
ngan
Sha
shan
k S
ingh
Sud
ip
Nan
dy#
Ket
an
Dal
alB
en
Dru
skin
H
arsh
M
ariw
ala
Tan
uja
Ran
dery
#A
nant
G
oenk
aR
adha
R
ajap
paTo
tal
1In
depe
nden
t Dir
ecto
rs
- Fe
es fo
r atte
ndin
g B
oard
/ C
omm
ittee
Mee
tings
- 9
50,0
00
685
,000
4
50,0
00
- 3
15,0
00
605
,000
5
00,0
00
300,
000
- -
400
,000
4
,205
,000
- C
omm
issi
on -
800,
000
800,
000
800,
000
- 80
0,00
080
0,00
0 -
800,
000
800
,000
-
- 5
,600
,000
- O
ther
s -
- -
- -
- -
- -
- -
- -
Tota
l (1)
- 1
,750
,000
1
,485
,000
1
,250
,000
-
1,11
5,00
0 1,
405,
000
500
,000
1
,100
,000
8
00,0
00
- 4
00,0
00
9,8
05,0
00
2O
ther
Non
- Exe
cutiv
e D
irec
tors
- Fe
es fo
r atte
ndin
g B
oard
/ C
omm
ittee
Mee
tings
500
,000
-
- -
760
,000
-
- -
- -
500
,000
-
1,7
60,0
00
- C
omm
issi
on22
,500
,000
- -
- 80
0,00
0 -
- -
- -
200
,000
-
23,
500,
000
- O
ther
s -
- -
- -
- -
- -
- -
- -
Tota
l (2)
23,0
00,0
00
- -
- 1
,560
,000
-
- -
- 7
00,0
00
- 2
5,26
0,00
0
Tota
l (B
) = (1
+2)
23,0
00,0
00
1,7
50,0
00
1,4
85,0
00
1,2
50,0
00
1,5
60,0
00
1,11
5,00
0 1,
405,
000
500
,000
1
,100
,000
8
00,0
00
700
,000
4
00,0
00
35,
065,
000
Tota
l Man
ager
ial R
emun
erat
ion
35,
065,
000
Ove
rall
Cei
ling
as p
er S
hare
hold
ers
App
rova
l (be
ing
3% o
f the
net
pro
fits
of th
e C
ompa
ny, c
alcu
late
d as
per
Sec
tion
198
of th
e A
ct)*
*88
,600
,000
Not
es:
* Pa
id d
urin
g FY
201
9-20
**Si
tting
fees
pai
d ha
ve n
ot b
een
cons
ider
ed a
s a
com
pone
nt fo
r rec
koni
ng o
vera
ll ce
iling
as
per t
he A
ct.
# R
esig
ned
durin
g th
e ye
ar, d
etai
ls o
f whi
ch fo
rm p
art o
f Cor
pora
te G
over
nanc
e R
epor
t.

57BOARD’S REPORT NOTICE AND STATUTORY REPORTS
C. REMUNERATION TO KEY MANAGERIAL PERSONNEL OTHER THAN MD/MANAGER/WTD
(Amount in INR)
Sr. No.
Particulars of Remuneration Navneet Khandelwal,
Chief Financial Officer
Gaurav Tongia, Company Secretary
Total
1 Gross salary
(a) Salary as per provisions contained in section 17(1) of the Income-tax Act, 1961
15,239,244 5,733,166 20,972,410
(b) Value of perquisites u/s 17(2) Income-tax Act, 1961* - - -
(c) Profits in lieu of salary under section 17(3) Income-tax Act, 1961
- - -
2 Stock Option - - -
3 Sweat Equity - - -
4 Commission - - -
- As % of profit - - -
- Others, specify - - -
5 Others, please specify - - -
Contribution to PF 459,000 197,334 656,334
Total 15,698,244 5,930,500 21,628,744
Note:
*Excludes provision for compensated absences/Gratuity in respect of separate actuarial valuation reports for Key Managerial Personnel.
Further details on remuneration are set out in Notes to Financial Statements.
VII. PENALTIES / PUNISHMENT/ COMPOUNDING OF OFFENCES:
Type Section of the Companies Act
Brief Description Details of Penalty /
Punishment/ Compounding fees imposed
Authority [RD / NCLT
/ COURT]
Appeal made, if any
(give Details)
A. Company
NIL
Penalty
Punishment
Compounding
B. Directors
Penalty
Punishment
Compounding
C. Other Officers in Default
Penalty
Punishment
Compounding
For and on behalf of the Board of Directors
Place: Mumbai H.V. Goenka Date: July 23, 2020 Chairman
Annexure A to the Board’s Report (Contd.)

58 ZENSAR TECHNOLOGIES LTD ANNUAL REPORT 2019-20
REMUNERATION DETAILS OF DIRECTORS AND KMP
Annexure B to the Board’s ReportINFORMATION AS PER RULE 5 OF THE COMPANIES (APPOINTMENT AND REMUNERATION OF MANAGERIAL PERSONNEL) RULES, 2014
Sr. No.
Name of the Director/Key Managerial Personnel
Designation Ratio of remuneration of each director to the
median remuneration of the employees of the Company
% Increase in the remuneration
1. H. V. Goenka Chairman 21.19 15.77
2. Sandeep Kishore2 Managing Director and Chief Executive Officer
1.70 1.94
3. A. T. Vaswani
Director
0.76
14.29
4. Arvind Agrawal 0.76
5. Venkatesh Kasturirangan 0.76
6. Shashank Singh
[Marina Holdco (FPI) Ltd]
0.76
7. Sudip Nandy3 0.76
8. Ketan Dalal 0.33
NA5
9. Ben Druskin -
10. Harsh Mariwala 0.19
11. Tanuja Randery3 0.19
12. Anant Goenka -
13. Radha Rajappa4 -
14. Navneet Khandelwal Chief Financial Officer 15.89 7.76
15. Gaurav Tongia Company Secretary 5.50 17.62
Notes:
1. Median remuneration of the employees is calculated on the basis of remuneration details of permanent employees on India payroll excluding Managing Director.
2. In addition to the above, Sandeep Kishore, Managing Director and Chief Executive Officer, also receives remuneration from subsidiary Company, Zensar Technologies Inc., details of which are as provided in notes to Financial Statements.
3. Tanuja Randery and Sudip Nandy tendered resignation as Directors with effect from May 31, 2019 and August 7, 2019 respectively, and therefore comparable amount of remuneration was not available for determination of percentage increase/decrease in the remuneration.
4. Radha Rajappa was appointed as Additional, Non-Executive, Independent Director with effect from August 6, 2019 and therefore comparable amount of remuneration was not available for determination of percentage increase/decrease in the remuneration.
5. Remuneration received in FY 2018-19 is not comparable with remuneration received, if any, in FY 2017-18 and hence, not stated.
6. Further details are set out in Note No. 35 of Notes to Consolidated Financial Statements.
For and on behalf of the Board of Directors
Place: Mumbai H.V. Goenka Date: July 23, 2020 Chairman

59BOARD’S REPORT NOTICE AND STATUTORY REPORTS
Annexure B to the Board’s Report (Contd.)STATEMENT UNDER SECTION 197 READ WITH RULE 5 OF THE COMPANIES (APPOINTMENT AND REMUNERATION OF MANAGERIAL PERSONNEL) RULES, 2014 FOR THE FINANCIAL YEAR 2019-20
Sr.
No.
Nam
eD
esig
natio
nR
emun
erat
ion
rece
ived
in IN
R
incl
udin
g E
SO
P
perq
usite
val
ue
Qua
lific
atio
nsE
xper
ienc
e (in
yea
rs)
Dat
e of
co
mm
ence
men
t of
em
ploy
men
t w
ith th
e C
ompa
ny
Age
(in
ye
ars)
Last
Em
ploy
men
t he
ld b
efor
e jo
inin
gP
erce
ntag
e of
equ
ity
shar
es h
eld
Whe
ther
any
su
ch e
mpl
oyee
is
rel
ativ
e of
any
D
irec
tor
and
if so
nam
e of
suc
h D
irec
tor
1A
jay
Bha
ndar
i*Ex
ecut
ive
Vice
Pres
iden
t
20,
968,
504
Cha
rter
ed
Acc
ount
ant &
ICW
A
28A
pril
1, 2
004
51Fa
scel
Ltd
.0.
0001
No
2N
avne
et K
hand
elw
alSr
. Vic
e Pr
esid
ent
& C
FO
17,
273,
160
Cha
rter
ed
Acc
ount
ant
20Ja
nuar
y 15
, 201
840
Wip
ro L
td.
-
3Pr
amee
la N
agam
alat
i
Kal
ive
Chi
ef O
pera
ting
Offi
cer (
CO
O)
15,
103,
441
Mas
ter o
f Bus
ines
s
Adm
inis
tratio
n &
ME
32N
ovem
ber 1
7,
2000
54A
then
a C
onsu
lting
Priv
ate
Ltd.
0.04
47
4Vi
vek
Ran
jan
Sr. V
ice
Pres
iden
t
& C
HR
O
15,
056,
306
Mas
ter o
f Bus
ines
s
Adm
inis
tratio
n &
Post
Gra
d. D
iplo
ma
22N
ovem
ber 6
,
2017
47Er
icss
on In
dia
Glo
bal S
ervi
ces
-
5Pr
asad
Mad
hav
Des
hpan
de
Sr. V
ice
Pres
iden
t 1
0,70
4,33
8 M
MS
30Se
ptem
ber 2
,
1986
51M
arsh
alls
0.04
21
6M
adhw
esh
Kris
hnaj
i
Kul
karn
i
Sr. V
ice
Pres
iden
t 1
0,68
7,33
6 B
ache
lor o
f
Engi
neer
ing
25Se
ptem
ber 2
4,
2018
50D
XC T
echn
olog
ies
-
7H
aris
h G
ala*
Exec
utiv
e Vi
ce
Pres
iden
t
10,
572,
132
Mas
ter o
f Bus
ines
s
Adm
inis
tratio
n
33Ju
ne 4
, 201
255
Del
oitte
& T
ouch
e
Ass
uran
ce a
nd
Ente
rpris
e R
isk
Serv
ices
Indi
a Pv
t
Ltd
-
8Sa
njay
Ram
chan
dra
Jam
bhal
e
Vice
Pre
side
nt 8
,951
,147
M
.Tec
h.26
Sept
embe
r 19,
2016
50Ta
ta C
onsu
ltanc
y
Serv
ices
-
9Pu
shpa
l Vim
al K
apad
iaSr
. Vic
e Pr
esid
ent
8,0
20,0
43
Bac
helo
r of
Engi
neer
ing
26Se
ptem
ber 2
0,
1994
46N
A0.
0086
10Vi
kas
Vija
ywar
giya
Vice
Pre
side
nt 7
,982
,556
B
ache
lor o
f
Engi
neer
ing
23N
ovem
ber 1
7,
2014
46Te
ch M
ahin
dra
Ltd.
0.00
56
*Em
ploy
ed fo
r par
t of t
he y
ear
1 R
emun
erat
ion
as s
how
n ab
ove
incl
udes
sal
ary,
allo
wan
ces,
bon
us, C
ompa
ny’s
con
tribu
tion
to th
e pr
ovid
ent f
und,
gra
tuity
and
sup
eran
nuat
ion
fund
and
oth
er p
erqu
isite
va
lue
calc
ulat
ed a
s pe
r Inc
ome
Tax
Rul
es w
here
ver a
pplic
able
.
2 Th
e ab
ove
deta
ils a
re o
nly
of e
mpl
oyee
s ba
sed
in In
dia.
3 Pe
rcen
tage
of e
quity
sha
res
held
by
the
empl
oyee
in th
e C
ompa
ny is
pur
suan
t to
Com
pani
es (A
ppoi
ntm
ent a
nd R
emun
erat
ion
of M
anag
eria
l Per
sonn
el) R
ules
, 201
4.
4 Th
e af
orem
entio
ned
empl
oyee
s ha
ve/h
ad p
erm
anen
t em
ploy
men
t con
tract
s w
ith th
e C
ompa
ny.
For a
nd o
n be
half
of th
e B
oard
of D
irect
ors
Plac
e: M
umba
i H
.V. G
oenk
a D
ate:
Jul
y 23
, 202
0
Cha
irman

60 ZENSAR TECHNOLOGIES LTD ANNUAL REPORT 2019-20
Annexure C to the Board’s Report
Report On Corporate GovernanceCompany’s Corporate Governance Philosophy
Corporate Governance is a set of systems, policies and practices deep-rooted in organisational philosophy to ensure that affairs are being managed in a way which affords accountability, transparency, fairness in all its transactions with stakeholders. The Company believes that good governance practices stem from the culture and mind-set of the organisation. Effective corporate governance is the strong foundation on which commercial enterprises are built and succeed.
Company’s philosophy of Corporate Governance includes:
Shareholders’ Wealth
Maximisation
Timely Disclosures
Strong & Independent
Board
Transparent Accounting
Policies
Upholding Stakeholders
Interests
A report, inter-alia, in line with the requirements of SEBI Regulations for the year ended March 31, 2020 is given below:
1. Board of Directors
A. Size and composition of the Board:
The Company’s Board is characterised by independence, professionalism, transparency in decision making and accountability. It comprises optimum combination of Executive and Non-Executive Directors, each of whom adds value and brings independent, holistic and multifaceted view, in the decision-making process. The Chairman of the Board is a Non-Executive Director.
As on March 31, 2020, the Board comprises of 11 Directors:
Board Composition
7
3
1
Independent Director(s) Non-Executive, Non-Independent Director(s) Executive Director

61BOARD’S REPORT NOTICE AND STATUTORY REPORTS
Annexure C to the Board’s Report (Contd.)
Based on the requisite certifications / affirmations received from respective directors, their directorships and committee memberships are within permissible limits.
Tanuja Randery, (DIN: 08014909) Non-Executive, Independent Director, tendered resignation from the Board of the Company, effective from May 31, 2019. Sudip Nandy (DIN: 07199187) Non-Executive, Independent Director, tendered resignation from the Board of the Company, effective from August 7, 2019. As per details set out in the Board’s Report, the resignations were due to other preoccupations.
Radha Rajappa (DIN: 08530439) was appointed as an Additional Director in the capacity of Non-Executive, Independent Director, effective from August 6, 2019.
Except H. V. Goenka and Anant Goenka, none of the Directors are related to each other.
B. Board Meetings:
The Board of the Company met 5 times during FY 2019-20 as stated below, along with the attendance at the Board Meetings and AGM:
*Appointed w.e.f. August 6, 2019
Composition of the Board and other directorship(s)/membership(s) of Committees held by respective Directors, as on March 31,
2020, are set out below (excluding memberships held in Zensar Technologies Limited, private limited companies, foreign companies
and companies registered under Section 8 of the Act). Memberships/ Chairmanships of only Audit Committee and Stakeholders
Relationship Committee in all public limited companies (excluding Zensar Technologies Limited) are considered (Membership
includes Chairmanship):
Meeting Attendance
Name of DirectorAGM
August 5, 2019
Board Meeting (BM) Dates% of attendance
at BMApril 30, 2019
August 6, 2019
October 21, 2019
January 23, 2020
March 6, 2020
H. V. Goenka 100
Sandeep Kishore 100
A.T. Vaswani 100
Arvind Agrawal 80
Venkatesh Kasturirangan 80
Shashank Singh 100
Ketan Dalal 60
Ben Druskin 100
Harsh Mariwala 60
Anant Goenka 100
Radha Rajappa* NA NA 100
Chairman AbsentPresent in person or through Audio Visual means
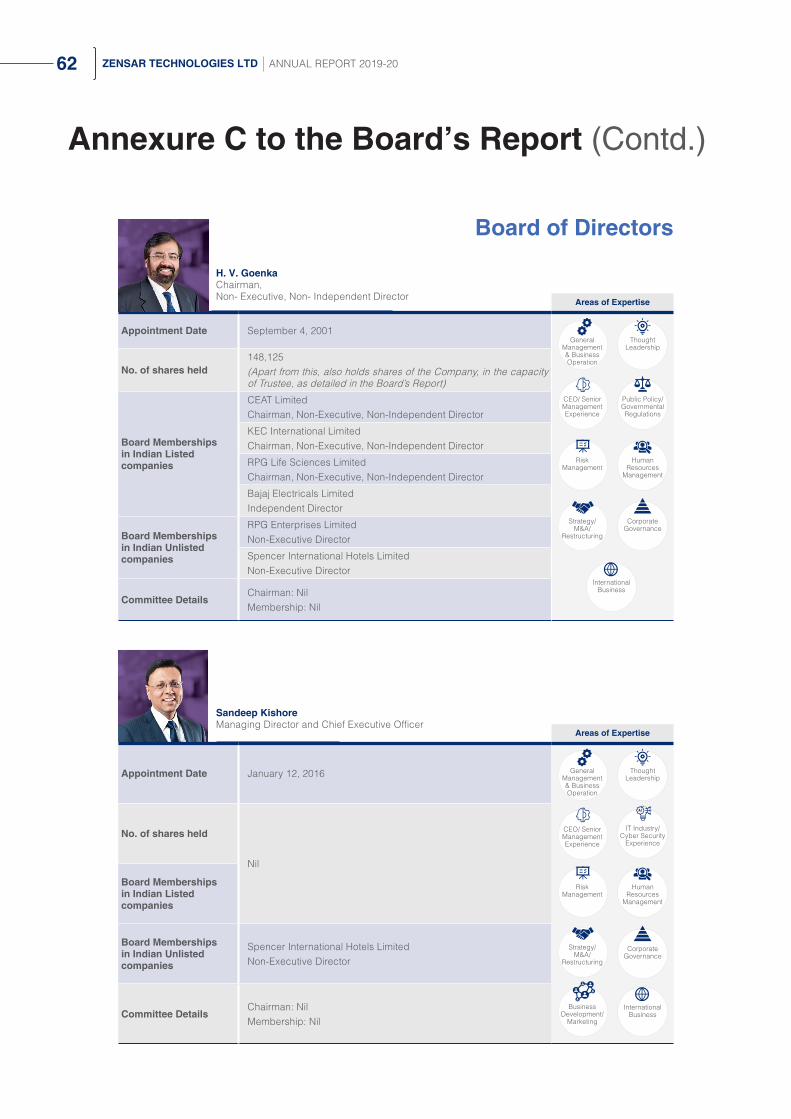
62 ZENSAR TECHNOLOGIES LTD ANNUAL REPORT 2019-20
Annexure C to the Board’s Report (Contd.)
Board of Directors
H. V. GoenkaChairman, Non- Executive, Non- Independent Director Areas of Expertise
Appointment Date September 4, 2001
No. of shares held148,125(Apart from this, also holds shares of the Company, in the capacity of Trustee, as detailed in the Board’s Report)
Board Memberships in Indian Listed companies
CEAT Limited Chairman, Non-Executive, Non-Independent Director
KEC International Limited Chairman, Non-Executive, Non-Independent Director
RPG Life Sciences Limited Chairman, Non-Executive, Non-Independent Director
Bajaj Electricals Limited Independent Director
Board Memberships in Indian Unlisted companies
RPG Enterprises Limited Non-Executive Director
Spencer International Hotels Limited Non-Executive Director
Committee DetailsChairman: NilMembership: Nil
CEO/ Senior Management Experience
Public Policy/ Governmental Regulations
Risk Management
Human Resources
Management
Strategy/ M&A/
Restructuring
Corporate Governance
International Business
General Management & Business Operation
Thought Leadership
Sandeep KishoreManaging Director and Chief Executive Officer
Areas of Expertise
Appointment Date January 12, 2016
No. of shares held
Nil
Board Memberships in Indian Listed companies
Board Memberships in Indian Unlisted companies
Spencer International Hotels Limited Non-Executive Director
Committee DetailsChairman: NilMembership: Nil
General Management & Business Operation
Thought Leadership
CEO/ Senior Management Experience
Risk Management
Strategy/ M&A/
Restructuring
Corporate Governance
International Business
Business Development/
Marketing
Human Resources
Management
IT Industry/ Cyber Security
Experience

63BOARD’S REPORT NOTICE AND STATUTORY REPORTS
Board of Directors
Annexure C to the Board’s Report (Contd.)
A. T. VaswaniNon-Executive, Independent Director Areas of Expertise
Appointment Date April 1, 2015
No. of shares held 50,000
Board Memberships in Indian Listed companies
KEC International Limited Independent Director
Board Memberships in Indian Unlisted companies
Embio Limited Non-Executive, Non-Independent Director
Committee DetailsChairman: 2Membership: 2
General Management & Business Operation
Thought Leadership
CEO/ Senior Management Experience
Risk Management
Strategy/ M&A/
Restructuring
Corporate Governance
IT Industry/ Cyber Security
Experience
Accounting/ Finance/ Legal
Arvind AgrawalNon-Executive, Independent Director Areas of Expertise
Appointment Date May 1, 2019*
No. of shares held
Nil
Board Memberships in Indian Listed companies
Board Memberships in Indian Unlisted companies
Committee DetailsChairman: NilMembership: Nil
*Categorised as Non-Executive, Independent Director w.e.f. May 1, 2019, details thereof form part of Board’s Report.
General Management & Business Operation
Thought Leadership
CEO/ Senior Management Experience
Strategy/ M&A/
Restructuring
Corporate Governance
Human Resources
Management

64 ZENSAR TECHNOLOGIES LTD ANNUAL REPORT 2019-20
Annexure C to the Board’s Report (Contd.)
Board of Directors
Venkatesh KasturiranganNon-Executive, Independent Director Areas of Expertise
Appointment Date April 1, 2015
No. of shares held
NilBoard Memberships in Indian Listed companies
Board Memberships in Indian Unlisted companies
Committee DetailsChairman: NilMembership: Nil
General Management & Business Operation
Thought Leadership
CEO/ Senior Management Experience
Risk Management
Strategy/ M&A/
Restructuring
Human Resources
Management
International Business
Business Development/
Marketing
Shashank SinghNon-Executive, Non-Independent Director Areas of Expertise
Appointment Date October 20, 2015
No. of shares held
Nil
Board Memberships in Indian Listed companies
Board Memberships in Indian Unlisted companies
Shriram City Union Finance LimitedNon-Executive, Non-Independent Director
Committee DetailsChairman: NilMembership: Nil
General Management & Business Operation
Thought Leadership
CEO/ Senior Management Experience
Risk Management
Strategy/ M&A/
Restructuring
Corporate Governance
International Business
Business Development/
Marketing
IT Industry/ Cyber Security
Experience
Accounting/ Finance/ Legal
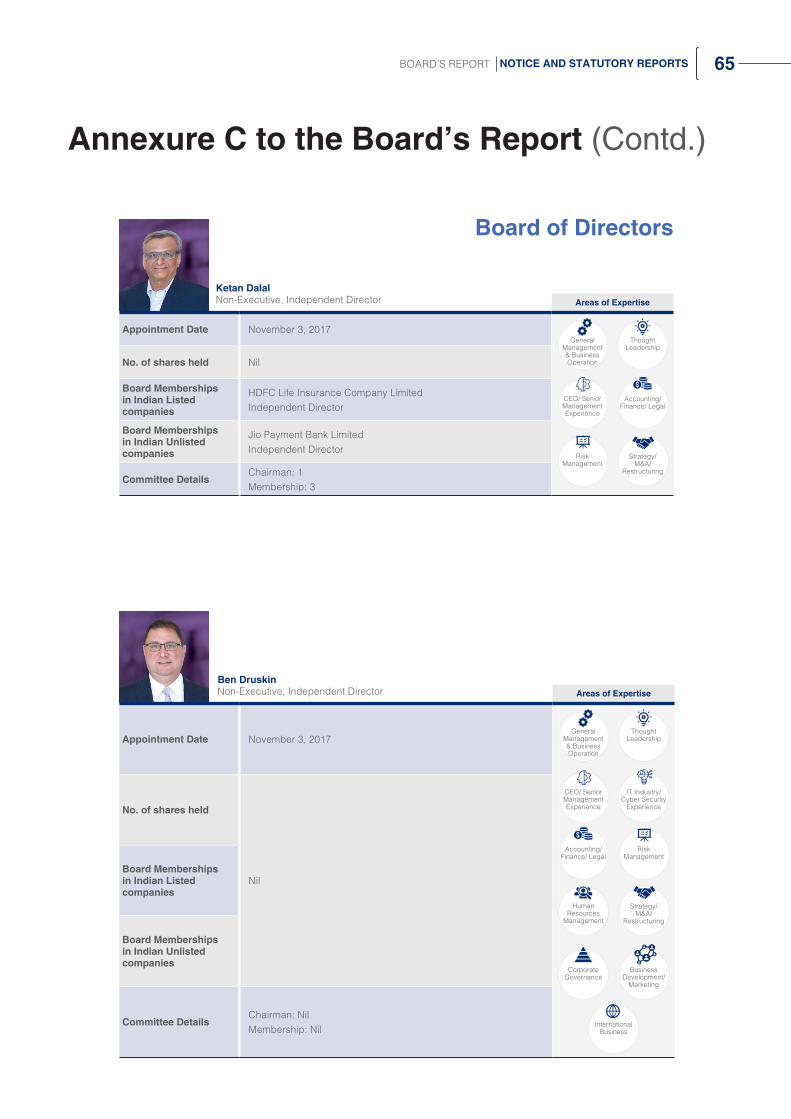
65BOARD’S REPORT NOTICE AND STATUTORY REPORTS
Annexure C to the Board’s Report (Contd.)
Board of Directors
Ketan DalalNon-Executive, Independent Director Areas of Expertise
Appointment Date November 3, 2017
No. of shares held Nil
Board Memberships in Indian Listed companies
HDFC Life Insurance Company Limited Independent Director
Board Memberships in Indian Unlisted companies
Jio Payment Bank Limited Independent Director
Committee DetailsChairman: 1Membership: 3
General Management & Business Operation
Thought Leadership
CEO/ Senior Management Experience
Risk Management
Strategy/ M&A/
Restructuring
Accounting/ Finance/ Legal
Ben DruskinNon-Executive, Independent Director Areas of Expertise
Appointment Date November 3, 2017
No. of shares held
NilBoard Memberships in Indian Listed companies
Board Memberships in Indian Unlisted companies
Committee DetailsChairman: NilMembership: Nil
General Management & Business Operation
Thought Leadership
CEO/ Senior Management Experience
Risk Management
Strategy/ M&A/
Restructuring
Human Resources
Management
International Business
IT Industry/ Cyber Security
Experience
Accounting/ Finance/ Legal
Business Development/
Marketing
Corporate Governance

66 ZENSAR TECHNOLOGIES LTD ANNUAL REPORT 2019-20
Annexure C to the Board’s Report (Contd.)
Board of Directors
Harsh MariwalaNon-Executive, Independent Director Areas of Expertise
Appointment Date January 18, 2018
No. of shares held 17,520
Board Memberships in Indian Listed companies
Marico LimitedChairman and Non-Executive, Non-Independent Director
Kaya Limited Chairman and Managing Director
JSW Steel Limited Independent Director
Thermax Limited Independent Director
Board Memberships in Indian Unlisted companies
Eternis Fine Chemicals Limited Non-Executive Director
Marico Innovation Foundation (Deemed Public Company) Non-Executive, Nominee Director
Marico Consumer Care Limited - Non-Executive, Director
Committee DetailsChairman: NilMembership: 1
CEO/ Senior Management Experience
Public Policy/ Governmental Regulations
Risk Management
Human Resources
Management
Strategy/ M&A/
Restructuring
Corporate Governance
General Management & Business Operation
Thought Leadership
Business Development/
Marketing
Anant GoenkaNon- Executive, Non- Independent Director Areas of Expertise
Appointment Date January 21, 2019
No. of shares heldNil(However, holds shares of the Company, in the capacity of Trustee, as detailed in the Board’s Report)
Board Memberships in Indian Listed companies
CEAT Limited Managing Director
STEL Holdings Limited Non-Executive, Non-Independent Director
Board Memberships in Indian Unlisted companies
Spencer & Company Limited Non-Executive Director
Spencer International Hotels Limited Non-Executive Director
CEAT Specialty Tyres Limited Non-Executive Director
Committee DetailsChairman: NilMembership: Nil
CEO/ Senior Management Experience
Public Policy/ Governmental Regulations
Risk Management
International Business
General Management & Business Operation
Thought Leadership
Strategy/ M&A/
Restructuring
Corporate Governance
Business Development/
Marketing

67BOARD’S REPORT NOTICE AND STATUTORY REPORTS
Annexure C to the Board’s Report (Contd.)
Board of Directors
Radha RajappaAdditional, Non-Executive, Independent Director Areas of Expertise
Appointment Date August 6, 2019
No. of shares held
NilBoard Memberships in Indian Listed companies
Board Memberships in Indian Unlisted companies
Committee DetailsChairman: NilMembership: Nil
General Management & Business Operation
Thought Leadership
CEO/ Senior Management Experience
Risk Management
Strategy/ M&A/
Restructuring
Corporate Governance
International Business
Business Development/
Marketing
IT Industry/ Cyber Security
Experience
The Company believes that the Board should possess the skills, knowledge and experience needed to effectively steer the Company forward. Directors of the Company are appointed, based on their specific skill(s), knowledge and experience, which would help in filling the gap on the Board. The Company believes that it is important to acknowledge that not all Directors will possess each of the skills, but the Board as a whole must possess them. In the table(s) above, the core areas of Skills/Expertise/Competence of individual Board Members, are indicated and it does not necessarily reflect a binary representation.
Independent Directors
Independent Directors play a significant role in the governance processes of the Board and bring diversity in Board’s decision making.
The appointment of Independent Director(s) is carried out in a structured manner in accordance with the provisions of the Act and SEBI Regulations. The Nomination and Remuneration Committee identifies candidates and takes into consideration various factors including the need to diversify and accordingly makes recommendations to the Board.
The Independent Directors are appointed for a term not exceeding five years, at a time, as per the requirements of the Act and SEBI Regulations. In the opinion of the Board, all the Independent Directors, fulfill the prescribed conditions and are independent of the Management.
Information placed before the Board:
Agenda papers along with detailed notes are circulated prior to the meeting(s). Information as required under SEBI Regulations are made available to the Directors from time to time. Further, periodic Compliance Reports / Certificates with respect to applicable laws, are placed before the Board for its review.
The Company did not have any material pecuniary relationship or transactions with its Non-Executive and/or Independent Directors per-se during the year under review, except payment of sitting fees and commission / as disclosed in this report.
Total Independent Directors 7
Male 6
Female 1
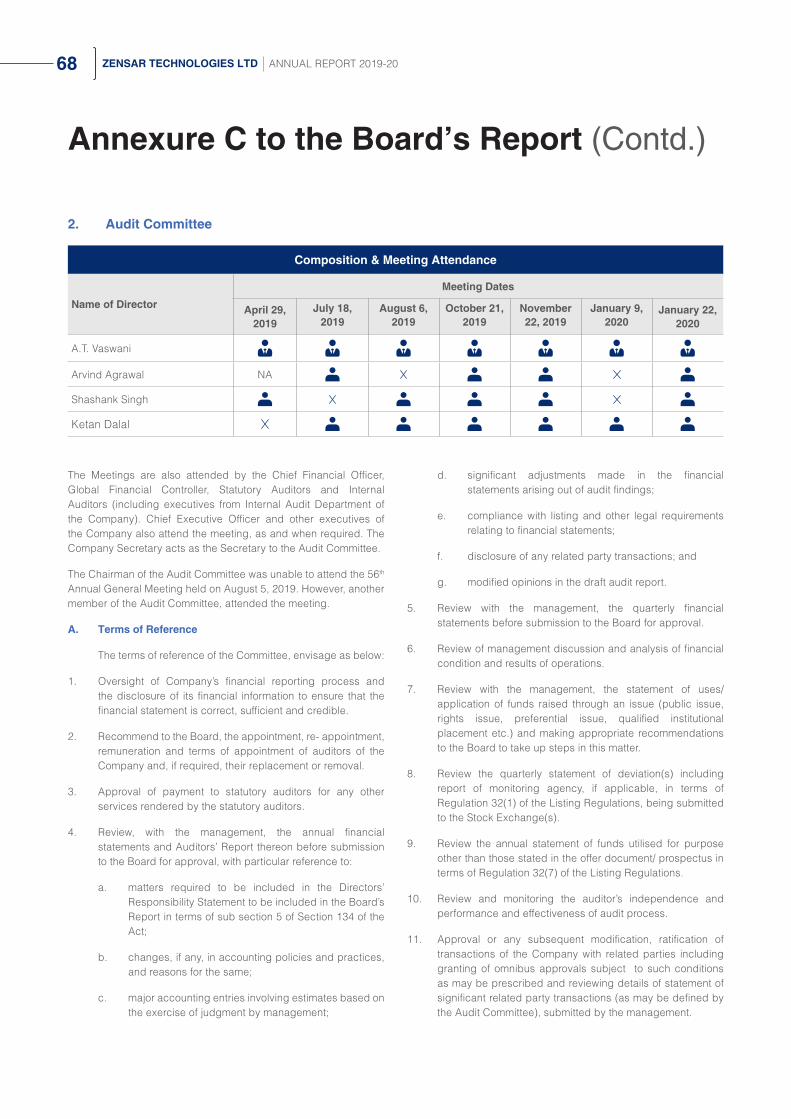
68 ZENSAR TECHNOLOGIES LTD ANNUAL REPORT 2019-20
Annexure C to the Board’s Report (Contd.)
2. Audit Committee
The Meetings are also attended by the Chief Financial Officer, Global Financial Controller, Statutory Auditors and Internal Auditors (including executives from Internal Audit Department of the Company). Chief Executive Officer and other executives of the Company also attend the meeting, as and when required. The Company Secretary acts as the Secretary to the Audit Committee.
The Chairman of the Audit Committee was unable to attend the 56th Annual General Meeting held on August 5, 2019. However, another member of the Audit Committee, attended the meeting.
A. Terms of Reference
The terms of reference of the Committee, envisage as below:
1. Oversight of Company’s financial reporting process and the disclosure of its financial information to ensure that the financial statement is correct, sufficient and credible.
2. Recommend to the Board, the appointment, re- appointment, remuneration and terms of appointment of auditors of the Company and, if required, their replacement or removal.
3. Approval of payment to statutory auditors for any other services rendered by the statutory auditors.
4. Review, with the management, the annual financial statements and Auditors’ Report thereon before submission to the Board for approval, with particular reference to:
a. matters required to be included in the Directors’ Responsibility Statement to be included in the Board’s Report in terms of sub section 5 of Section 134 of the Act;
b. changes, if any, in accounting policies and practices, and reasons for the same;
c. major accounting entries involving estimates based on the exercise of judgment by management;
d. significant adjustments made in the financial statements arising out of audit findings;
e. compliance with listing and other legal requirements relating to financial statements;
f. disclosure of any related party transactions; and
g. modified opinions in the draft audit report.
5. Review with the management, the quarterly financial statements before submission to the Board for approval.
6. Review of management discussion and analysis of financial condition and results of operations.
7. Review with the management, the statement of uses/ application of funds raised through an issue (public issue, rights issue, preferential issue, qualified institutional placement etc.) and making appropriate recommendations to the Board to take up steps in this matter.
8. Review the quarterly statement of deviation(s) including report of monitoring agency, if applicable, in terms of Regulation 32(1) of the Listing Regulations, being submitted to the Stock Exchange(s).
9. Review the annual statement of funds utilised for purpose other than those stated in the offer document/ prospectus in terms of Regulation 32(7) of the Listing Regulations.
10. Review and monitoring the auditor’s independence and performance and effectiveness of audit process.
11. Approval or any subsequent modification, ratification of transactions of the Company with related parties including granting of omnibus approvals subject to such conditions as may be prescribed and reviewing details of statement of significant related party transactions (as may be defined by the Audit Committee), submitted by the management.
Composition & Meeting Attendance
Name of Director
Meeting Dates
April 29, 2019
July 18, 2019
August 6, 2019
October 21, 2019
November 22, 2019
January 9, 2020
January 22, 2020
A.T. Vaswani
Arvind Agrawal NA
Shashank Singh
Ketan Dalal
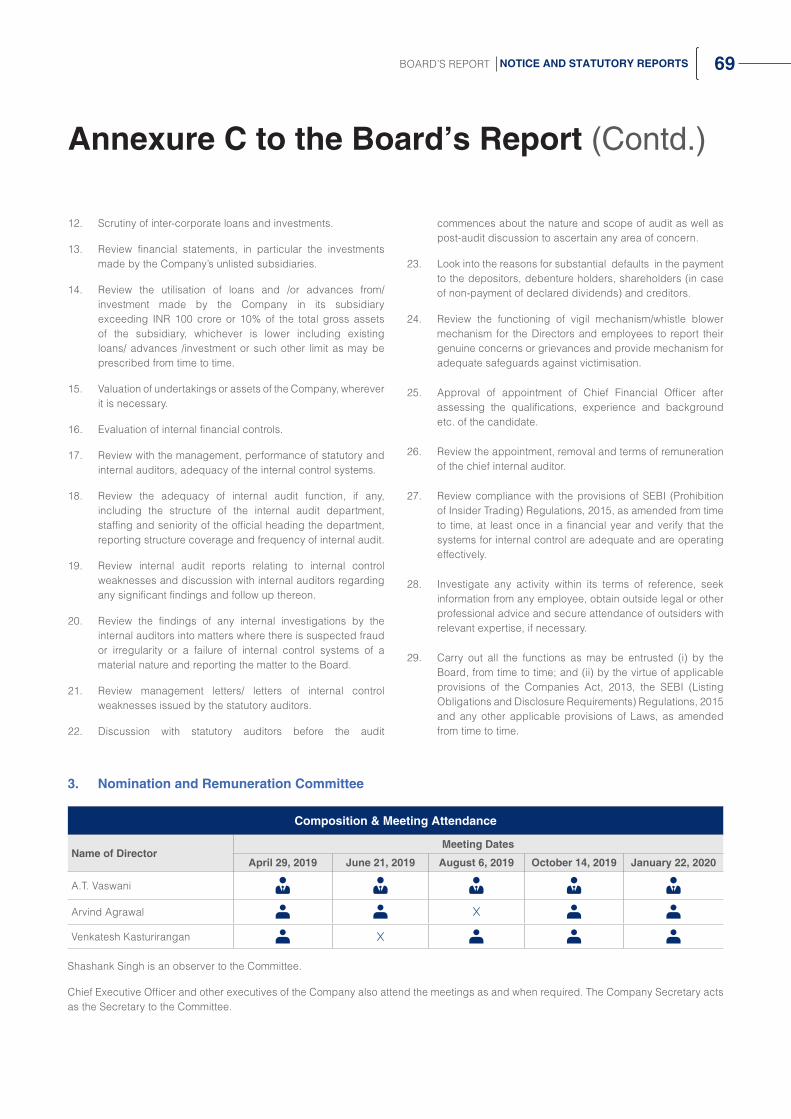
69BOARD’S REPORT NOTICE AND STATUTORY REPORTS
Annexure C to the Board’s Report (Contd.)
12. Scrutiny of inter-corporate loans and investments.
13. Review financial statements, in particular the investments made by the Company’s unlisted subsidiaries.
14. Review the utilisation of loans and /or advances from/ investment made by the Company in its subsidiary exceeding INR 100 crore or 10% of the total gross assets of the subsidiary, whichever is lower including existing loans/ advances /investment or such other limit as may be prescribed from time to time.
15. Valuation of undertakings or assets of the Company, wherever it is necessary.
16. Evaluation of internal financial controls.
17. Review with the management, performance of statutory and internal auditors, adequacy of the internal control systems.
18. Review the adequacy of internal audit function, if any, including the structure of the internal audit department, staffing and seniority of the official heading the department, reporting structure coverage and frequency of internal audit.
19. Review internal audit reports relating to internal control weaknesses and discussion with internal auditors regarding any significant findings and follow up thereon.
20. Review the findings of any internal investigations by the internal auditors into matters where there is suspected fraud or irregularity or a failure of internal control systems of a material nature and reporting the matter to the Board.
21. Review management letters/ letters of internal control weaknesses issued by the statutory auditors.
22. Discussion with statutory auditors before the audit
commences about the nature and scope of audit as well as post-audit discussion to ascertain any area of concern.
23. Look into the reasons for substantial defaults in the payment to the depositors, debenture holders, shareholders (in case of non-payment of declared dividends) and creditors.
24. Review the functioning of vigil mechanism/whistle blower mechanism for the Directors and employees to report their genuine concerns or grievances and provide mechanism for adequate safeguards against victimisation.
25. Approval of appointment of Chief Financial Officer after assessing the qualifications, experience and background etc. of the candidate.
26. Review the appointment, removal and terms of remuneration of the chief internal auditor.
27. Review compliance with the provisions of SEBI (Prohibition of Insider Trading) Regulations, 2015, as amended from time to time, at least once in a financial year and verify that the systems for internal control are adequate and are operating effectively.
28. Investigate any activity within its terms of reference, seek information from any employee, obtain outside legal or other professional advice and secure attendance of outsiders with relevant expertise, if necessary.
29. Carry out all the functions as may be entrusted (i) by the Board, from time to time; and (ii) by the virtue of applicable provisions of the Companies Act, 2013, the SEBI (Listing Obligations and Disclosure Requirements) Regulations, 2015 and any other applicable provisions of Laws, as amended from time to time.
3. Nomination and Remuneration Committee
Shashank Singh is an observer to the Committee.
Chief Executive Officer and other executives of the Company also attend the meetings as and when required. The Company Secretary acts as the Secretary to the Committee.
Composition & Meeting Attendance
Name of DirectorMeeting Dates
April 29, 2019 June 21, 2019 August 6, 2019 October 14, 2019 January 22, 2020
A.T. Vaswani
Arvind Agrawal
Venkatesh Kasturirangan

70 ZENSAR TECHNOLOGIES LTD ANNUAL REPORT 2019-20
Annexure C to the Board’s Report (Contd.)
A. Terms of Reference
The terms of reference of the Committee, envisage as below:
1. Formulate the criteria for determining qualifications, positive attributes and independence of a Director and recommend to the Board of Directors a policy relating to, the remuneration of the Directors, Key Managerial Personnel (KMP), Senior Management Personnel (SMP) and other employees.
2. Recommend to the Board, remuneration payable to Directors, KMPs and SMPs in accordance with the Nomination and Remuneration Policy.
3. Formulate the criteria for effective evaluation of performance of Board of Directors, its Committees, Chairperson and individual Directors (including Independent Directors), to be carried out either by the Board or by NRC or through an independent external agency and review its implementation and compliance.
4. Devise a policy on diversity of Board of Directors.
5. Identify persons who are qualified to become Directors and recommend their appointment to the Board.
6. Opine whether the Director possess the requisite qualification, as required under Section 197(4)(b).
7. Review, appointment and removal of KMPs or SMPs in accordance with the Policy, applicable.
8. Determine whether to extend or continue the term of appointment of the independent Director, based on the report of performance evaluation of Independent Directors.
9. Carry out functions as may be entrusted (i) by the Board of Directors from time to time; and (ii) by the virtue of applicable provisions of the Companies Act, 2013 (iii) the SEBI (Listing Obligations and Disclosure Requirements) Regulations, 2015 and any other applicable provisions of Laws, as may be amended from time to time.
B. Nomination and Remuneration Policy
The policy, inter-alia, on Directors’ appointment and remuneration, including criteria for determining qualifications, positive attributes, independence of a Director and other matters provided under the Act is available on the website of Company at https://www.zensar.com/sites/default/files/investor/policies-reports-fillings/NRC%20policy%20%281%29.pdf
C. Details of remuneration of Directors
1. Details of remuneration to Managing Director
Sandeep Kishore, Managing Director and Chief Executive Officer, is paid remuneration as per the terms recommended by the Nomination and Remuneration Committee, approved by the Board and Members of the Company.
The details of remuneration paid to Sandeep Kishore during FY 2019-20 have been provided in Extract of Annual Return, which forms part of Board’s Report.
As on March 31, 2020, Sandeep Kishore held NIL equity shares of the Company. He holds 1,000,000 Performance Award Units (PAUs) granted under ‘Zensar Technologies Limited – Employee Performance Award Unit Plan 2016 (EPAP 2016). The actual vesting would vary based upon achievement of performance parameters, and may be higher than aforesaid 1,000,000 PAUs, subject to achievement of such parameters.
The key details of service contracts and notice period are as under:
Name Service contract(s) Notice period
Sandeep Kishore,Managing Director and Chief Executive Officer
5 year(s), commencing from January 12, 2016
Six months notice
2. Details of Remuneration to Non-Executive Directors
Non-Executive Directors are paid sitting fees for attending meetings of the Board/ Committee within the limits as prescribed under the Act.
The Nomination and Remuneration Committee (NRC) decides the basis for determining the compensation, to the Non-Executive Directors, including Independent Directors, whether as commission or otherwise. The NRC takes into consideration various factors such as Directors’ participation in Board and Committee meetings during the year under review, other responsibilities undertaken, such as membership(s) or chairmanship(s) of Committees, time spent in carrying out their duties, role and functions as envisaged in Schedule IV of the Act and SEBI Regulations. The Board determines the compensation to Non-Executive Directors within the overall limits permitted by Members.
The Non-Executive Directors are paid sitting fees as below:
Sr. No.
Type of Meeting Sitting fees per meeting / per director (INR)
1 Board Meeting 100,000
2 Audit Committee 50,000
3 Nomination and Remuneration Committee, CSR Committee, Stakeholders Relationship Committee and Risk Management Committee
25,000
4 Banking Committee 5,000

71BOARD’S REPORT NOTICE AND STATUTORY REPORTS
Annexure C to the Board’s Report (Contd.)
The Members of the Company at 55th Annual General Meeting of the Company held on August 8, 2018, approved payment of a sum not exceeding 3% per annum of the net profits of the Company, for the respective financial year, calculated, inter-alia, in accordance with the provisions of Section 198 of the Act as commission to the Non-Executive Directors.
Remuneration to Non-Executive Directors (Amount in INR)
Sr. No.
Name of the Director/Institution Sitting fees paid during FY 2019-20
Commission paid in FY 2019-20 for
FY 2018-19
1 H. V. Goenka 500,000 22,500,000
2 A.T. Vaswani 950,000 800,000
3 Arvind Agrawal 685,000 800,000
4 Venkatesh Kasturirangan 450,000 800,000
5 Sudip Nandy* 315,000 800,000
6 Shashank Singh / Marina Holdco (FPI) Ltd. 760,000 800,000
7 Ketan Dalal 605,000 800,000
8 Ben Druskin 500,000 -
9 Tanuja Randery** - 800,000
10 Harsh Mariwala 300,000 800,000
11 Anant Goenka 500,000 200,000
12 Radha Rajappa# 400,000 -
Total 5,965,000 29,100,000
* Ceased to be a Director, effective from August 7, 2019 ** Ceased to be a Director, effective from May 31, 2019 # Appointed as Director, effective from August 6, 2019
H. V. Goenka, Anant Goenka and Shashank Singh are liable to retire by rotation, whereas details of engagements with Non-Executive, Non-independent Directors are available on the website of the Company.
Performance evaluation of the Board and individual Directors
Pursuant to the provisions of the Act and the SEBI Regulations, the Board has carried out the annual performance evaluation of its own performance, as well as
the evaluation of the working of its Committees respectively. A structured questionnaire considering inputs received from the Directors including independent directors, covering various aspects of Board’s functioning such as adequacy of composition of the Board and its Committees, Board culture, execution and performance of specific duties, obligation and governance etc. is used for the purpose. The evaluation of the performance of individual Directors, including, Independent Directors, was carried out, inter-alia, as per the performance criteria laid down by the Nomination and Remuneration Committee and the relevant regulations.
4. Stakeholders Relationship Committee
The Stakeholders Relationship Committee oversees, redressal of shareholder and investor grievances, transfer/ transmission of shares, issue of duplicate shares, recording dematerialisation / rematerialisation of shares and related matters. The roles and responsibilities of the Committee, are as prescribed under applicable statutes and as stipulated by the Board from time to time.
Composition & Meeting Attendance
Name of DirectorMeeting Dates
June 11, 2019 August 6, 2019 October 3, 2019
A.T. Vaswani
Arvind Agrawal
Sandeep Kishore

72 ZENSAR TECHNOLOGIES LTD ANNUAL REPORT 2019-20
Annexure C to the Board’s Report (Contd.)
A. Terms of Reference
The terms of reference of the Committee, envisage as below:
1. Consider and resolve the grievances of the security holders’, inter-alia consisting of shareholders, debenture-holders, deposit holders, etc. of the Company including complaints related to transfer/transmission of shares, non-receipt of annual report, non receipt of declared dividends, issue of new/duplicate certificates, general meetings etc.
2. Review measures taken for effective exercise of voting rights by shareholders.
3. Review adherence to the service standards adopted by the Company in respect of various services being rendered by the Registrar & Share Transfer Agent.
4. Review various measures and initiatives taken by the Company for reducing the quantum of unclaimed dividends and ensuring timely receipt of dividend warrants/annual reports/statutory notices by the shareholders of the Company.
5. Consider and approve issue of duplicate share certificates in lieu of those lost or destroyed.
6. Approval and rejection of transfer or transmission of shares.
7. Issue of duplicate certificates, Rematerialisation of Share Certificates, and certificates to be issued in accordance with Sub-rule 3 of Rule 6 of the Investor Education and Protection Fund Authority (Accounting, Audit, Transfer and Refund) Rules, 2016, as amended from time to time.
8. Oversee compliances in respect of transfer of unclaimed amounts and shares to and from the Investor Education and Protection Fund.
9. Carry out all the functions as may be entrusted (i) by the Board of Directors from time to time; and (ii) by virtue of applicable provisions of the Companies Act, 2013, the
SEBI (Listing Obligations and Disclosure Requirements) Regulations, 2015 and any other applicable provisions of Laws, as amended from time to time.
Status of shareholders complaints for FY 2019-20 is set out below:
Nature of Complaint FY 2019-20
Received Resolved
Non-receipt of DEMAT rejection documents
0 0
Non-receipt of Share Certificate
46 46
Non-receipt of Share Certificate after Transfer
10 10
Non-receipt of Dividend Warrant
177 177
NSE- Complaints 0 0
SEBI 5 5
Total 238 238
There were no pending complaints as on March 31, 2020.
B. Compliance Officer/Address for Communication
Gaurav Tongia
Company Secretary and Compliance Officer,
Zensar Technologies Limited
Zensar Knowledge Park, Plot # 4, MIDC, Kharadi, Off Nagar Road, Pune - 411 014.
Phone No.: (020) 66074000,
Fax No.: (020) 66074433,
Email: [email protected]
5. Corporate Social Responsibility Committee
Composition & Meeting Attendance
Name of DirectorMeeting Dates
April 26, 2019 October 3, 2019
Arvind Agrawal
A.T. Vaswani
Sandeep Kishore
A. Terms of Reference
The terms of reference of the Committee, envisage as below:
1. Formulate and recommend a Corporate Social Responsibility Policy to the Board.
2. Recommend the amount of expenditure to be incurred on the activities.
3. Institute a transparent monitoring mechanism for
implementation of the CSR projects or programs or
activities undertaken by the Company which would
form a part of CSR Policy.
4. Monitor CSR Policy of the Company.

73BOARD’S REPORT NOTICE AND STATUTORY REPORTS
Annexure C to the Board’s Report (Contd.)
6. Risk Management Committee
Composition & Meeting Attendance
Name of DirectorMeeting Dates
April 29, 2019 October 14, 2019
A.T. Vaswani
Shashank Singh
Ketan Dalal
Venkatesh Kasturirangan
Arvind Agrawal* NA
A. Terms of Reference
The terms of reference of the Committee, envisage as below:
1. Framing, implementing, monitoring and reviewing Risk Management plan, policies, systems and framework of the Company.
2. Validating, evaluating and monitoring key risks including strategic, operational, financial, cyber security and compliance risks.
3. Reviewing the measures taken for risk management and mitigation plan and monitor effectiveness thereof.
4. Carrying out all the functions as is mandated by the Board
from time to time and / or enforced by any statutory notification,
amendment or modification as may be applicable.
Further, the Board, from time to time, constitutes
administrative committee(s), comprising of such number
of directors as it deems fit, for administration / monitoring
certain business matters. Such committees are for specific
purpose only and may get dissolved, once the designated
tasks are completed.
7. Banking Committee
The Board has constituted the Banking Committee and delegated matters, inter-alia, regarding opening and closing of bank accounts in India and abroad, change in signatories to existing bank accounts, review of treasury operations, etc.
Composition & Meeting Attendance
Name of DirectorMeeting Dates
June 11, 2019 October 3, 2019 January 23, 2020 February 20, 2020
A.T. Vaswani
Arvind Agrawal
Sandeep Kishore
A. Terms of Reference
The terms of reference of the Committee, envisage as below:
1. Authorizing opening and closure of all types of Bank Accounts (including EEFC Accounts) in India and Overseas.
2. Authorizing new signatories and / or change, removal of existing authorised signatories in relation to Bank accounts, loans (granted and availed), working capital facilities and all other types of borrowings.
3. Defining / amending signing powers of new / existing authorised signatories in relation to Bank accounts, loans (granted and availed), working capital facilities and all other types of borrowings.
4. Authorizing new signatories and / or change, removal of existing authorised dealers and / or signatories to undertake, book, execute foreign exchange transactions, foreign exchange forward contracts and option derivatives and execute agreements / documents in this regard.
* Appointed w.e.f. August 7, 2019

74 ZENSAR TECHNOLOGIES LTD ANNUAL REPORT 2019-20
Annexure C to the Board’s Report (Contd.)
5. Authorizing new signatories and / or change, removal of existing authorised signatories for making investment of surplus funds within the overall limit specified by the Board and/or its redemption / transfer/sale from time to time.
6. Review of Treasury Operations.
8. Meeting of Independent Directors
The Independent Directors met on April 24, 2020, inter alia, to discuss matters as prescribed under the Act and SEBI Regulations. All the Independent Directors were present at the meeting. No such meeting was held in FY 2019-20 in view of COVID-19 pandemic and the relaxation provided by MCA vide its circular No. 11/2020 dated April 24, 2020.
9. Code of Conduct
The Board of Directors of the Company has laid down a Code of Conduct for Directors and Senior Management Personnel of the Company. This Code of Conduct is available on Company’s website www.zensar.com. The Directors and
Senior Management have affirmed their compliance with the Code of Conduct for FY 2019-20. A declaration from the Managing Director and Chief Executive Officer confirming the above, is annexed to this report, as Annexure I.
10. Familiarisation Program for Independent Directors
Periodic familiarisation sessions are held which provide an opportunity to the Independent Directors to interact with the Senior Officials of the Company and help them to understand Company’s strategy, business model, operations, service and product offerings, markets, organisation structure, finance, human resources etc. Further external experts are also invited to make presentations about business landscape and emerging trends.
The details of the Familiarisation Program are available on Company’s website: https://www.zensar.com/sites/default/files/investor/policies-reports-fillings/FAMILIARISATION%20P R O G R A M M E S % 2 0 F O R % 2 0 I N D E P E N D E N T % 2 0DIRECTORS%20%281%29.pdf
11. Details of previous Annual General Meetings and special resolutions passed at such Annual General Meetings
Particulars Financial Year 2016-17 Financial Year 2017-18 Financial Year 2018-19
Date and Time July 19, 2017 at 12.00 noon August 8, 2018 at 12.00 noon August 5, 2019 at 12:00 noon
Resolution(s)
(a) Adoption of new set of Articles of Association
(a) Alteration of the capital clause of the Memorandum of Association
(a) Re-appointment of A.T. Vaswani (DIN: 00057953) as Non-Executive, Independent Director of the Company, not liable to retire by rotation.
(b) Approval for amendments in Employee Performance Award Unit Plan, 2016 for options granted / to be granted to the employees of the Company.
(b) Re-appointment of Venkatesh Kasturirangan (DIN: 00804896) as Non-Executive Independent Director of the Company, not liable to retire by rotation.
(c) Approval for amendments in Employee Performance Award Unit Plan, 2016 for options granted/to be granted to the employees of the subsidiary(ies) of the Company.
(c) Approval for payment of Commission to Non-Executive Director(s).
(d) Approval for payment of Commission to Non-Executive Directors.
Venue Zensar Knowledge Park, Plot # 4, MIDC, Kharadi, Off Nagar Road, Pune - 411 014.
12. Disclosures
A. Related Party Transactions
All related party transactions that were entered into during the financial year were on arm’s length basis and in the ordinary course of business.
The transactions with the related parties are disclosed, inter-alia, in the Note No. 28 of Notes to Standalone Financial
Statements in compliance with Accounting Standard 18 relating to “Related Party Disclosures” and the Act read with Rules thereunder and SEBI Regulations. The Board has approved a ‘Policy on Related Party Transactions’, web link of which forms part of the Board’s Report.
There are no materially significant related party transactions that may have potential conflict with the interests of the Company at large.

75BOARD’S REPORT NOTICE AND STATUTORY REPORTS
Annexure C to the Board’s Report (Contd.)
B. Statutory Compliance, Penalties and Structures
There were no instances of material non-compliance and no strictures or penalties were imposed on the Company either by SEBI, Stock Exchanges or any statutory authorities on any matter related to capital markets during the last three years.
C. Disclosure relating to Whistle Blower Policy and affirmation that no personnel have been denied access to the Audit Committee
The Board of Directors has adopted Whistle Blower Policy. All associates of the Company are free to approach the Audit Committee of the Company and none of them has been denied access to the Audit Committee during the year under review. The Whistle Blower Policy’s web link forms part of Board’s Report.
D. The details of fees paid to the Statutory Auditors of the Company
The details of total fees for all services paid by the Company and its subsidiaries, on a consolidated basis, to the Statutory Auditor and all entities in the network firm/network entity of which the Statutory Auditor is a part are set out in Note No. 22(b) of Notes to Standalone Financial Statements.
E. Details of compliance with mandatory requirements and adoption of the non-mandatory requirements.
The Company has complied with all mandatory requirements laid down by SEBI Regulations. Specifically, the Company confirms compliance with corporate governance requirements specified in Regulations 17 to 27 and clauses (b) to (i) of sub- regulation (2) of Regulation 46 of the SEBI Regulations.
F. Confirmation by the Board of Directors’ acceptance of recommendation of mandatory committees
The Board confirms that during the year under review, it has accepted all recommendations received from its mandatory committees.
13. Means of Communication
Key disseminations Means
Quarterly, half-yearly and Annual Consolidated Financial Results
Widely circulated newspapers such as Financial Express and Loksatta and/or Company’s website www.zensar.com
Press meets / Analyst’s meets to apprise and disseminate information relating to Company’s working and performance. The transcripts of the same are uploaded on the Company’s website
Official Press releases
Financial Results and presentations made to institutional investors or analysts
Quarterly investor updates
• The investors can contact the Company on the email ID: [email protected].
• Management discussion and analysis forms part of this Annual Report.
• The Company as per Green initiatives undertaken by Ministry of Corporate Affairs, invites Members to register their e-mail addresses with the Company so that all communications / documents including the Notice calling the Annual General Meeting and other General Meeting of the Members along with explanatory statement(s) thereto, Balance Sheets, Board’s Report, Auditor’s Reports etc., can be sent via electronic mode.
14. General Shareholder information
A. Annual General Meeting: The Company is conducting this 57th Annual General Meeting (AGM), through VC/OAVM, pursuant to, inter-alia, the general circular Number 20/2020, issued by the Ministry of Corporate Affairs and circular number SEBI/HO/CFD/CMD1/CIR/P/2020/79 issued by SEBI. The detailed instruction(s) for participation and voting at the meeting are available in the Notice convening the AGM and on the website of the Company, www.zensar.com.
B. Financial Year: April 1 to March 31.
C. Dividend during FY 2019-20:
Sr. No.
Dividend Details
1st Interim Dividend
2nd Interim Dividend
1 Rate of Dividend Declared
INR 1.00 per equity share of INR 2.00 each
INR 1.80 per equity share of INR 2.00 each
2 Date of Declaration
January 23, 2020
March 6, 2020
D. Financial Calendar (tentative and subject to change):
Event Latest by
Financial reporting for the quarter ending September 30, 2020
November 14, 2020
Financial reporting for the quarter ending December 31, 2020
February 14, 2021
Financial reporting for the quarter ending March 31, 2021 alongwith Audited Annual Accounts for FY 2020-21
May 30, 2021
58th Annual General Meeting for the year ending March 31, 2021
September 30, 2021

76 ZENSAR TECHNOLOGIES LTD ANNUAL REPORT 2019-20
Annexure C to the Board’s Report (Contd.)
E. Listing on Stock Exchanges:
The Company’s Equity Shares are listed on the following Stock Exchanges-
a. BSE Limited, Phiroze JeeJeebhoy Towers Dalal Street, Mumbai 400 001 (BSE)
F. Market Price Data(Amount in INR)
Period
BSE Limited National Stock Exchange of India Limited
High Low CloseTotal
Traded Quantity
Sensex High Low CloseTotal
Traded Quantity
Nifty
Apr-19 246.90 223.00 233.80 122,497 39,031.55 248.70 229.55 234.65 1,027,698 11,748.15
May-19 257.00 233.20 250.05 120,769 39,714.20 256.50 235.05 250.00 1,312,414 11,922.80
Jun-19 271.30 245.00 258.25 74,627 39,394.64 271.35 244.45 258.05 1,598,477 11,788.85
Jul-19 260.25 205.00 210.95 40,665 37,481.12 261.00 204.55 210.65 672,810 11,118.00
Aug-19 229.00 204.55 220.05 38,287 37,332.79 230.00 206.00 219.95 488,595 11,023.25
Sep-19 229.80 206.20 219.50 46,297 38,667.33 225.90 206.40 219.30 528,406 11,474.45
Oct-19 222.75 176.50 180.35 800,199 40,129.05 222.95 176.85 178.40 2,157,209 11,877.45
Nov-19 195.00 180.00 186.75 136,845 40,793.81 196.50 179.00 186.60 1,134,312 12,056.05
Dec-19 189.00 167.70 174.95 58,187 41,253.74 188.85 168.10 174.60 770,782 12,168.45
Jan-20 202.40 170.30 170.90 200,878 40,723.49 202.40 170.40 171.20 2,813,109 11,962.10
Feb-20 171.00 135.00 136.70 85,985 38,297.29 171.70 135.05 136.65 1,664,286 11,201.75
Mar-20 141.90 63.70 86.50 116,190 29,468.49 142.50 63.80 88.00 1,611,498 8,597.75
Source – Websites: BSE Ltd. (www.bseindia.com) and The National Stock Exchange of India Ltd. (www.nseindia.com)
The performance chart(s) showing Share Price of the Company in comparison with SENSEX as well as Nifty during FY 2019-20 is as below:
b. National Stock Exchange of India Ltd., Exchange Plaza, 5th Floor, Plot No. C/1, G Block, Bandra – Kurla Complex Bandra (E), Mumbai 400 051 (NSE)
BSE 504067
NSE ZENSARTECH
ISIN in NSDL and CDSL INE520A01027
Listing fees have been paid for FY 2020-21.

77BOARD’S REPORT NOTICE AND STATUTORY REPORTS
Annexure C to the Board’s Report (Contd.)
G. Registrar and Share Transfer Agent (RTA): All shareholders’ correspondence may directly be addressed to the RTA, at the address given below:-
KFin Technologies Private Limited(Formerly Karvy Fintech Private Limited)Address: Selenium Tower B, Plot 31-32,Financial District, Nanakramguda, Serilingampally Mandal, Hyderabad 500 032, India.
The details of the concerned person in KFin Technologies Private Limited are as under:-
Name Telephone no. E-mail ID Fax No.
Balaji Reddy S +91 40 67161571 [email protected] +91 40 23001153
H. Share Transfer System: To expedite the transfer in physical mode, authority has been delegated to Stakeholders Relationship Committee of the Board. However, as per SEBI directive, physical transfer of shares is prohibited with effect from April 1, 2019. During the Financial Year, only those transfer applications have been considered by the Committee that were relodged pursuant to the press release dated March 27, 2019 issued by SEBI. The Committee considers requests for transfers, transmission of shares, issue of duplicate certificates, issue of certificates on split/consolidation/ renewal etc. and the same are processed and delivered, if the documents are complete in all respects. In compliance with the SEBI Regulations, every six months, these processes are certified by a practicing Company Secretary.
I. Distribution Schedule:
No. of Equity Shares held As on March 31, 2020
No. of Shareholders % of Shareholders No. of Shares held % of Shareholding
1- 5,000 26,989 98.20 10,844,066 4.81
5,001 -10,000 250 0.91 1,812,014 0.80
10,001-20,000 120 0.44 1,690,723 0.75
20,001-30,000 34 0.12 833,210 0.37
30,001-40,000 13 0.05 477,640 0.21
40,001-50,000 13 0.05 583,794 0.26
50,001-1,00,000 17 0.06 1,136,279 0.50
1,00,001 & above 48 0.17 208,039,334 92.29
Total 27,484 100 225,416,970 100
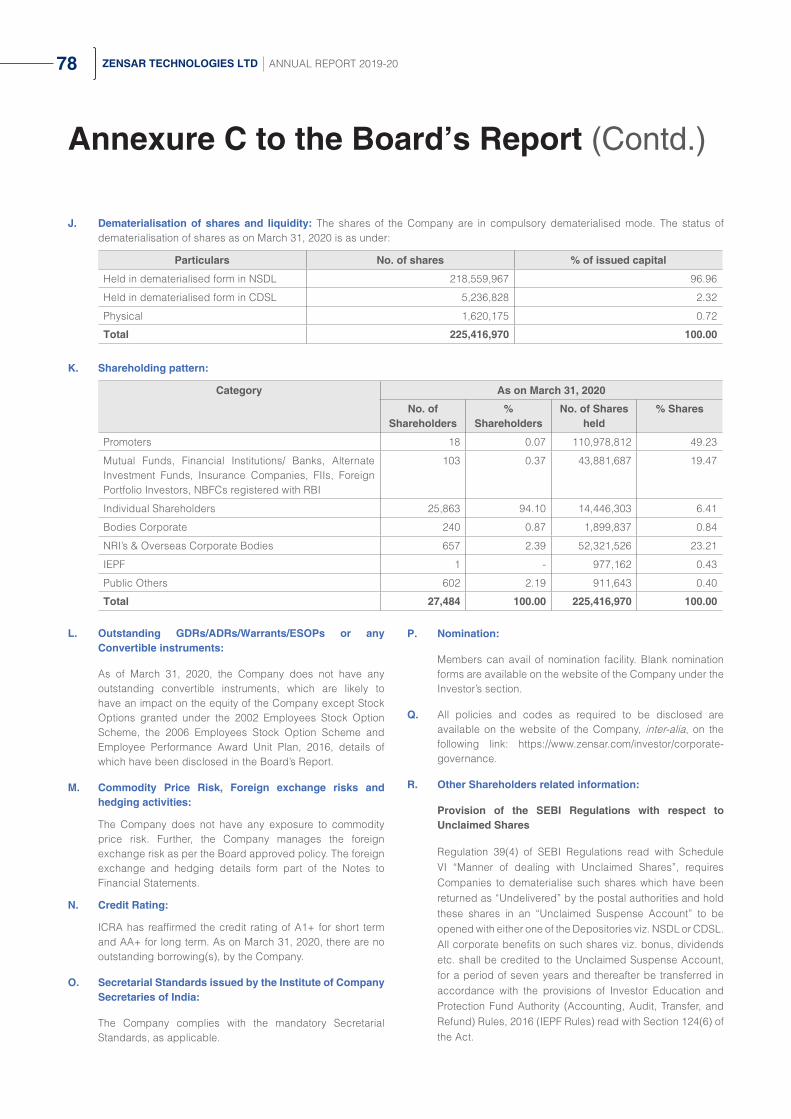
78 ZENSAR TECHNOLOGIES LTD ANNUAL REPORT 2019-20
Annexure C to the Board’s Report (Contd.)
J. Dematerialisation of shares and liquidity: The shares of the Company are in compulsory dematerialised mode. The status of dematerialisation of shares as on March 31, 2020 is as under:
Particulars No. of shares % of issued capital
Held in dematerialised form in NSDL 218,559,967 96.96
Held in dematerialised form in CDSL 5,236,828 2.32
Physical 1,620,175 0.72
Total 225,416,970 100.00
K. Shareholding pattern:
Category As on March 31, 2020
No. of Shareholders
% Shareholders
No. of Shares held
% Shares
Promoters 18 0.07 110,978,812 49.23
Mutual Funds, Financial Institutions/ Banks, Alternate Investment Funds, Insurance Companies, FIIs, Foreign Portfolio Investors, NBFCs registered with RBI
103 0.37 43,881,687 19.47
Individual Shareholders 25,863 94.10 14,446,303 6.41
Bodies Corporate 240 0.87 1,899,837 0.84
NRI’s & Overseas Corporate Bodies 657 2.39 52,321,526 23.21
IEPF 1 - 977,162 0.43
Public Others 602 2.19 911,643 0.40
Total 27,484 100.00 225,416,970 100.00
L. Outstanding GDRs/ADRs/Warrants/ESOPs or any Convertible instruments:
As of March 31, 2020, the Company does not have any outstanding convertible instruments, which are likely to have an impact on the equity of the Company except Stock Options granted under the 2002 Employees Stock Option Scheme, the 2006 Employees Stock Option Scheme and Employee Performance Award Unit Plan, 2016, details of which have been disclosed in the Board’s Report.
M. Commodity Price Risk, Foreign exchange risks and hedging activities:
The Company does not have any exposure to commodity price risk. Further, the Company manages the foreign exchange risk as per the Board approved policy. The foreign exchange and hedging details form part of the Notes to Financial Statements.
N. Credit Rating:
ICRA has reaffirmed the credit rating of A1+ for short term and AA+ for long term. As on March 31, 2020, there are no outstanding borrowing(s), by the Company.
O. Secretarial Standards issued by the Institute of Company Secretaries of India:
The Company complies with the mandatory Secretarial Standards, as applicable.
P. Nomination:
Members can avail of nomination facility. Blank nomination forms are available on the website of the Company under the Investor’s section.
Q. All policies and codes as required to be disclosed are available on the website of the Company, inter-alia, on the following link: https://www.zensar.com/investor/corporate-governance.
R. Other Shareholders related information:
Provision of the SEBI Regulations with respect to Unclaimed Shares
Regulation 39(4) of SEBI Regulations read with Schedule VI “Manner of dealing with Unclaimed Shares”, requires Companies to dematerialise such shares which have been returned as “Undelivered” by the postal authorities and hold these shares in an “Unclaimed Suspense Account” to be opened with either one of the Depositories viz. NSDL or CDSL. All corporate benefits on such shares viz. bonus, dividends etc. shall be credited to the Unclaimed Suspense Account, for a period of seven years and thereafter be transferred in accordance with the provisions of Investor Education and Protection Fund Authority (Accounting, Audit, Transfer, and Refund) Rules, 2016 (IEPF Rules) read with Section 124(6) of the Act.

79BOARD’S REPORT NOTICE AND STATUTORY REPORTS
Annexure C to the Board’s Report (Contd.)
Disclosure with respect to shares lying in suspense account:
Particulars Shareholders Shares
Aggregate number of shareholders and the outstanding shares in the suspense account lying as on April 1, 2019
245 85,635
Number of shareholders who approached the Company for transfer of shares from suspense account during the period 2019-20
1 500
Number of shareholders to whom the shares were transferred from the suspense account during the period 2019-20
59 17,335
Aggregate number of shareholders and the outstanding shares in the suspense account lying as on March 31, 2020
185 67,800
The voting rights on these shares shall remain frozen till the rightful owner claims the shares.
15. Disclosures as per Clause C of Schedule V of SEBI Regulations:
A. Web link for policy for determining ‘material’ subsidiaries:
https://www.zensar.com/sites/default/ f i les/ investor/policies-reports-fillings/Policy%20for%20determining%20material%20subsidiaries%20%281%29.pdf
B. The details of the operational business locations in India are as below:
Sr. No.
Location
1 2nd Floor, Wing 2, Cluster C, Eon Free Zone, S. No. 77, Plot No.1, Kharadi Pune- 411014 Maharashtra
2 4th Floor, Tower B, EON SEZ Phase II, S.No.72/2/1, Kharadi, Pune- 411014 Maharashtra
3 SEZ Unit, 1st Floor, Wing 2 Cluster E, on Free Zone, S. No. 77, Plot No.1, Kharadi Pune- 411014 Maharashtra
4 1st floor in Wing 2 of Cluster C, on Free Zone, S. No. 77, Plot No.1, Kharadi Pune- 411014 Maharashtra
5 Plot # 4, MIDC, Off Nagar Road, Zensar Knowledge Park, Kharadi, Pune 411014, Maharashtra
6 4th & 5th Floor, E-PARK, South Tower, Plot No. 3 /1, Zensar Knowledge Park, MIDC, Kharadi, Pune, Maharashtra
7 101 & 102, 1st Floor, RMZ Ecoworld Campus, RMZ Ecoworld Varthur, Hobli, Bengaluru Rural-560103, Karnataka
8 RMZ Ecoworld, Campus 4C, Unit No.102, 1st Floor, Sarjapur, Devarabeesanahalli, Varthur Hobli, Bengaluru, Rural 560103, Karnataka
9 2nd Floor, Building 11, SEZ Cessna Business Park, Kadubeesanhalli, Varthur Hobli Outer Ring Road, Bengaluru, Urban 560087, Karnataka
10 DLF Cyber City, Part-1st Floor, Block-3, Plot No. 129-132, APHB Colony, Gachibowli, Hyderabad-500019, Telangana
11 DLF Cyber City, Part-9th Floor, Block-3, Plot No.129- 132, APHB Colony, Gachibowli, Hyderabad, 500019, Telangana
12 Part-8th Floor, Block 3, DLF Assets Pvt Ltd, DLF Cyber City, Gachibowli, Serilingampalli Mandal, Hyderabad-500019, Telangana
13 Part-1st Floor, Block 3, DLF Assets Pvt Ltd, DLF Cyber City, Gachibowli, Serilingampalli Mandal, Hyderabad-500019, Telangana
14 Part-1st Floor, Block 3, DLF Assets Pvt Ltd, DLF Cyber City, Gachibowli, Serilingampalli Mandal, Hyderabad-500019, Telangana
C. Disclosures in relation to the Sexual Harassment of Women at Workplace (Prevention, Prohibition and Redressal) Act, 2013 form part of the Board’s Report.
D. A Certificate from a Company Secretary in Practice that none of the Directors on the Board of the Company have been debarred or disqualified from being appointed or continuing as directors of companies by the Board/Ministry of Corporate Affairs or any such statutory authority is annexed with this report as Annexure II.
E. Compliance Certificate from Practicing Company Secretaries regarding compliance of conditions of corporate governance is annexed with this report as Annexure III.

80 ZENSAR TECHNOLOGIES LTD ANNUAL REPORT 2019-20
ANNEXURE I
CODE OF CONDUCT
The Board of Directors of the Company has laid down a Code of Conduct for all Board Members and Senior Management of the Company in terms of provisions of the Securities and Exchange Board of India (Listing Obligations and Disclosure Requirements) Regulations, 2015. The Code of Conduct is uploaded at Company’s Website.
I hereby confirm that the Company has obtained from all members of the Board and Senior Management Personnel, affirmation that they have complied with the Code of Conduct for the FY 2019-20.
Mumbai Sandeep KishoreDate: May 14, 2020 Managing Director and Chief Executive Officer
CEO & CFO CERTIFICATION
We, Sandeep Kishore, Managing Director and Chief Executive Officer and Navneet Khandelwal, Chief Financial Officer of Zensar Technologies Ltd., in terms of Regulation 17(8) of Securities and Exchange Board of India (Listing Obligations and Disclosures requirements) Regulations, 2015, read with Part B of Schedule II, hereby certify to the Board that:
(a) We have reviewed Financial Statements and the Cash Flow Statement for the Financial Year ended March 31, 2020 and that to the best of our knowledge and belief:
(i) these statements do not contain any materially untrue statement or omit any material fact or contain statements that might be misleading;
(ii) these statements together present a true and fair view of the Company’s affairs and are in compliance with existing accounting standards, applicable laws and regulations.
(b) There are, to the best of our knowledge and belief, no transactions entered into by the Company during the year under review which are fraudulent, illegal or violative of the Company’s Code of Conduct.
(c) We accept responsibility for establishing and maintaining internal controls for financial reporting and we have evaluated the effectiveness of internal control systems of the Company pertaining to financial reporting and we have disclosed to the auditors and the Audit Committee, deficiencies in the design or operation of such internal controls, if any, of which we are aware and the steps taken or proposed to be taken to rectify these deficiencies.
(d) We have indicated to the Auditors and the Audit Committee:
(i) significant changes in internal control over financial reporting during the year under review;
(ii) significant changes in accounting policies during the year under review and that the same have been disclosed in the Notes to the Financial Statements; and
(iii) instances of significant fraud of which we have become aware and the involvement therein, if any, of the management or an employee having a significant role in the Company’s internal control system over financial reporting.
Mumbai Sandeep Kishore Navneet KhandelwalDate: May 14, 2020 Managing Director and Chief Executive Officer Chief Financial Officer
Annexure C to the Board’s Report (Contd.)

81BOARD’S REPORT NOTICE AND STATUTORY REPORTS
Annexure C to the Board’s Report (Contd.)
ANNEXURE II
CERTIFICATE OF NON-DISQUALIFICATION OF DIRECTORS
(Pursuant to Regulation 34(3) and Schedule V Para C clause (10)(i) of the SEBI (Listing Obligations and Disclosure Requirements) Regulations, 2015)
To,The Members ofZensar Technologies LimitedZensar Knowledge Park, KharadiPlot No. 4 MIDC, Off Nagar RoadPune- 411014
We have examined the relevant registers, records, forms, returns and disclosures received from the Directors of Zensar Technologies Limited having CIN:L72200PN1963PLC012621 and having registered office at Zensar Knowledge Park, Kharadi, Plot No. 4 MIDC, Off Nagar Road Pune- 411014 (hereinafter referred to as ‘the Company’), produced before us by the Company for the purpose of issuing this Certificate, in accordance with Regulation 34(3) read with Schedule V Para-C Sub clause 10(i) of the Securities Exchange Board of India (Listing Obligations and Disclosure Requirements) Regulations, 2015.
In our opinion and to the best of my/our information and according to the verifications (including Directors Identification Number (DIN) status at the portal www.mca.gov.in) as considered necessary and explanations furnished to us by the Company & its officers, We hereby certify that none of the Directors on the Board of the Company as stated below for the Financial Year ending on 31st March, 2020 have been debarred or disqualified from being appointed or continuing as Directors of companies by the Securities and Exchange Board of India, Ministry of Corporate Affairs, or any such other Statutory Authority.
Sr. No. Name of Director DIN Date of appointment in Company
1 H.V Goenka 00026726 04/09/2001
2 Sandeep Kishore 07393680 12/01/2016
3 A.T. Vaswani 00057953 01/04/2015
4 Arvind Agrawal 00193566 01/05/2019
5 Venkatesh Kasturirangan 00804869 01/04/2015
6 Shashank Singh 02826978 20/10/2015
7 Ketan Dalal 00003236 03/11/2017
8 Ben Druskin 07935711 03/11/2017
9 Harsh Mariwala 00210342 18/01/2018
10 Anant Goenka 02089850 21/01/2019
11 Radha Rajappa 08530439 06/08/2019
Ensuring the eligibility of for the appointment / continuity of every Director on the Board is the responsibility of the management of the Company. Our responsibility is to express an opinion on these based on our verification. This certificate is neither an assurance as to the future viability of the Company nor of the efficiency or effectiveness with which the management has conducted the affairs of the Company.
For SVD & AssociatesCompany Secretaries
Place: Pune S. V. DeulkarDate: May 14, 2020 Partner
FCS No: 1321CP No: 965
UDIN: F001321B000235896

82 ZENSAR TECHNOLOGIES LTD ANNUAL REPORT 2019-20
ANNEXURE III
CERTIFICATE FROM PRACTICING COMPANY SECRETARY ON CORPORATE GOVERNANCE
To,
The Members of Zensar Technologies Limited
We have examined the compliance of conditions of Corporate Governance by Zensar Technologies Limited (hereinafter referred “the Company”), for the year ended on 31st March, 2020 as stipulated in relevant provisions of Securities and Exchange Board of India (Listing Obligations and Disclosures requirements) Regulations, 2015.
The compliance of conditions of Corporate Governance is the responsibility of the management. Our examination was limited to procedures and implementation thereof, adopted by the company for ensuring the compliance of the conditions of the Corporate Governance. It is neither an audit nor an expression of opinion on the financial statements of the Company.
In our opinion and to the best of our information and according to the explanations given to us, we certify that the Company has complied with the conditions of Corporate Governance as stipulated in the above mentioned Listing Regulations, as applicable.
We further state that, this certificate is neither an assurance as to the future viability of the Company nor efficiency or effectiveness with which the management has conducted the affairs of the Company.
For SVD & Associates
Company Secretaries
Date: 14th May, 2020 S. V. DeulkarPlace: Pune Partner
F.C.S. 1321 C.P. No. 965
UDIN-F001321B000235830
Annexure C to the Board’s Report (Contd.)

83BOARD’S REPORT NOTICE AND STATUTORY REPORTS
Annexure D to the Board’s Report
Global Economy
Annual global GDP growth is 2.9% in 20191. The global economy growth was buoyed by positive market sentiment that had been boosted by positive signs from an increase in manufacturing activity and global trade, a broad-based shift toward accommodative monetary policy and diminished fears of a hard Brexit supported by investors’ risk appetite.
Moreover, monetary policy easing continued into the second half of 2019 in several economies. Additionally, due to central bank rate cuts the economy had shown early signs of stabilisation reinforcing financial market sentiment. Equities continued to advance in the large advanced economies over the fall; core sovereign bond yields rose from their September low; and portfolio flows to emerging market economies strengthened, particularly to bond funds.
Review of Key Market Economies
United States: The US economy grew by 2.3% during the year backed by strong consumer spending, spurred by rising wages and household wealth. Business investment is also improved to rebound as several of the factors that weighed on businesses previous year started to abate.2
EURO Area: Euro area registered a growth of 1.2% during the year. The euro area economy has expanded since 2014, helped by accommodative monetary policy, mild expansionary fiscal policy and a recovering global economy. GDP growth is projected to slow somewhat, but to remain strong as compared to recent historic growth rates.3
(Source: IMF World Economic Outlook April 2020)
South Africa: South Africa grew by 0.2% in CY 2019 on the back of reforms introduced by the government. Reforms such as allocation of the telecommunications spectrum, removing barriers to mining investment, and reviewing visa requirements to boost tourism has helped the economy to grow. Household and government consumption expenditure remained a key driver of growth during the year. The economy also experienced a decrease in Inflation to 4.4% in 2019 as compared to 4.7% in 2018. The government is further taking steps to improve investments, revitalizing townships and build industrial parks for driving business growth.
1 OECD Economic Outlook2 https://www.npr.org/2020/01/30/800985774/u-s-economy-slowed-in-2019-to-2-33 https://www.oecd.org/economy/euro-area-and-european-union-economic-snapshot/
Management Discussion and Analysis Report

84 ZENSAR TECHNOLOGIES LTD ANNUAL REPORT 2019-20
Annexure D to the Board’s Report (Contd.)
Outlook
Due to the outbreak of COVID-19 across the world, with uncertainty and debates over exact growth levels in 2020. The adverse effects of this health hazard have been felt across the globe, including the direct disruption of global supply chains, weaker demand for imported goods and services, and regional declines in international tourism and hospitality sector. However, governments around the world are taking immediate, effective and well-resourced public health measures to prevent infection and contagion to implement targeted policies that support health care systems as well as health workers. Supportive macroeconomic policies and bailout packages to several countries by international financial institutions will help restore confidence, aid demand recovery and support economic recovery. However, the economy is expected to contract in the near term but with these measures in place, it is projected to revive in 2021, registering a growth of 5.4%.
Indian Economy Overview
Indian economy is the 5th largest economy in the world in terms of GDP. The economy faced multiple headwinds and grew by 4.2% in FY 2019-20, registering a decline as compared to the previous year. This decline was primarily driven by a mix of both internal as well as external factors such as synchronised global slowdown, plummeting domestic automobile sales, flattening of core sector growth and declining investment in construction and infrastructure. Moreover, due to the recent outbreak of COVID-19, which led to an economy wide lockdown to curtail the spread of the virus, outlook of the Indian economy has been altered. The economy is further expected experience slowdown and is projected to contract by 4.5% in FY 2020-21. However, the government of India and the RBI are continuously working in tandem to revive the economy. Fiscal as well as monetary measures have been introduced and are expected to decelerate this slowdown and will help the economy grow in future. With these measures in place, the economy is expected to register a growth of 6% in FY 2021-22.
Industry Overview
The global technology industry (excl. hardware) stood at US $1.5 trillion, growing at 5.6% Y-o-Y4. The growth was mainly driven by rising demand for services and a shift from traditional services to digital technologies, DevOps and ‘As-a-service’ models. The global sourcing industry reached US $ 213 billion, growing at 7.6% Y-o-Y4. The sourcing market continues to develop, backed by higher growth in BPM services and an uptick in growth for digital and IT services across leading geographies.
The major economies in the Asia Pacific (APAC) region, including China, Japan, India, Australia, and Singapore, have heavily invested in emerging technologies like cloud computing, Artificial Intelligence, 3D printing, SMAC (Social, Mobility, Analytics, and Cloud) and Blockchain technologies. Furthermore, the region also holds a strong competitive advantage over advanced economies owing to its robust and cost-efficient model, trained workforce and flexible regulations and policies.
The Indian IT-BPM industry is estimated to grow at 7.7% in FY2020 to reach US $ 191 billion on a constant currency basis, as the industry is cautiously optimistic about its future prospects3. The growth in this sector is driven by increasing focus on digital transformation, with businesses across the globe expanding their digital capacities and services. In FY2019, the IT-BPM Industry accounts for over 7.9% relative share in India’s GDP and has played a significant role in reducing India’s import bill on IT services4. The industry is estimated to employ 4.36 million people with the addition of 2.05 lakh jobs in FY20204.
The past decade (FY2009-FY2019) saw the industry cross USD 150 billion in revenues (FY2016 being the watershed year) and stood at USD 177 billion in FY2019. Employee addition was close to 2 million people, representing a 1.8X growth over FY2009 levels.
\ \ \ \
(Source: Nasscom Report)
Mega Trends in coming decade (2020-2030)
The decade of 2020-2030 will foresee non-linear transformations, manifesting as global megatrends that will generate opportunities at a rapid speed and scale, necessitating on-time response agility. The mega trends expected to accelerate growth of this sector are:
1. Data Led Economy: Tech-driven economy and mass urbanisation will lead to a rapid growth of technology across the globe. Global data has been doubling every three years and is estimated to reach 175 Zettabytes (ZBs) by 2030. Nearly two-thirds of the data will be machine-to-machine data and out of that, more than one-third will need real-time analysis and decision-making at source. Edge IoT and Edge Analytics shall play a major role in saving data transmission, storage, and post-fact analysis costs.
2. Future of work: With technology playing its part, the future of work will evolve according to changing requirements. The rise of a gig economy is changing the work culture and is opening avenues for remote working. Besides, the future of work will be disrupted with rising automation and machines doing their work effectively without errors and minimal human intervention, through technology-assisted tools.
4 NASSCOM Annual Report on Techade
7.7%
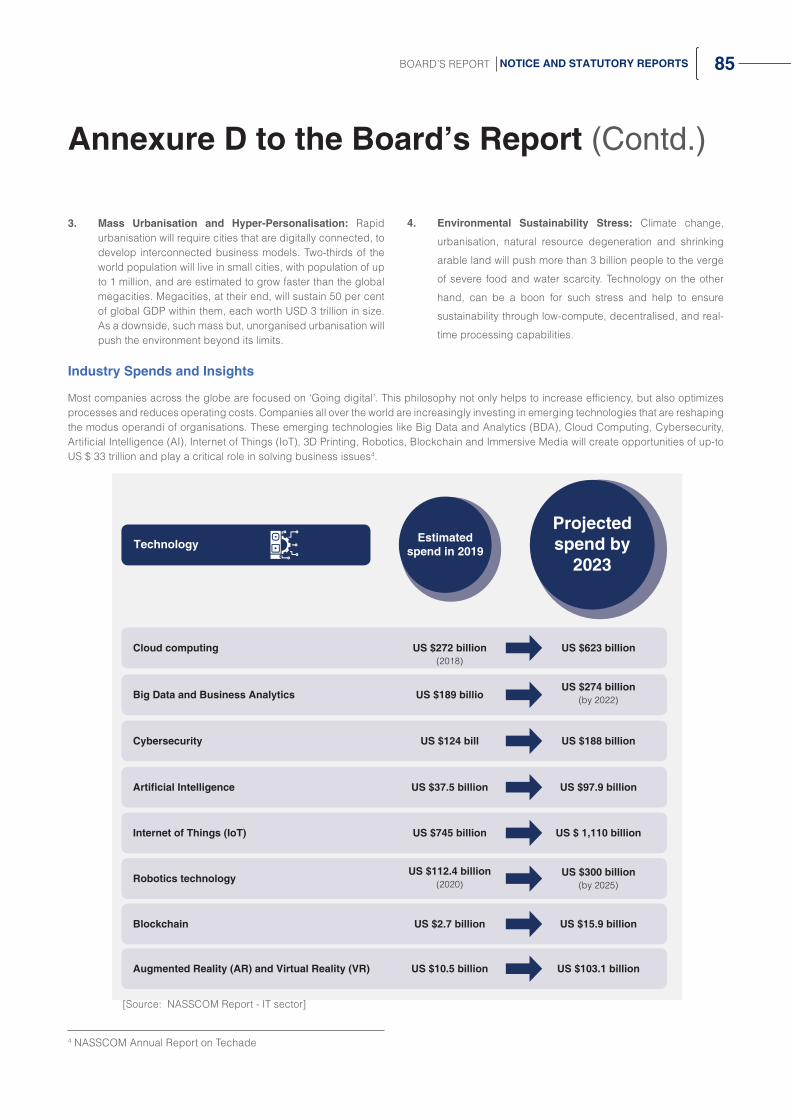
85BOARD’S REPORT NOTICE AND STATUTORY REPORTS
4 NASSCOM Annual Report on Techade
Annexure D to the Board’s Report (Contd.)
3. Mass Urbanisation and Hyper-Personalisation: Rapid urbanisation will require cities that are digitally connected, to develop interconnected business models. Two-thirds of the world population will live in small cities, with population of up to 1 million, and are estimated to grow faster than the global megacities. Megacities, at their end, will sustain 50 per cent of global GDP within them, each worth USD 3 trillion in size. As a downside, such mass but, unorganised urbanisation will push the environment beyond its limits.
4. Environmental Sustainability Stress: Climate change,
urbanisation, natural resource degeneration and shrinking
arable land will push more than 3 billion people to the verge
of severe food and water scarcity. Technology on the other
hand, can be a boon for such stress and help to ensure
sustainability through low-compute, decentralised, and real-
time processing capabilities.
Industry Spends and Insights
Most companies across the globe are focused on ‘Going digital’. This philosophy not only helps to increase efficiency, but also optimizes processes and reduces operating costs. Companies all over the world are increasingly investing in emerging technologies that are reshaping the modus operandi of organisations. These emerging technologies like Big Data and Analytics (BDA), Cloud Computing, Cybersecurity, Artificial Intelligence (AI), Internet of Things (IoT), 3D Printing, Robotics, Blockchain and Immersive Media will create opportunities of up-to US $ 33 trillion and play a critical role in solving business issues4.
Cloud computing
Big Data and Business Analytics
Cybersecurity
Artificial Intelligence
Internet of Things (IoT)
Robotics technology
Blockchain
Augmented Reality (AR) and Virtual Reality (VR)
US $272 billion (2018)
US $189 billio
US $124 bill
US $37.5 billion
US $745 billion
US $112.4 billion (2020)
US $2.7 billion
US $10.5 billion
US $623 billion
US $274 billion (by 2022)
US $188 billion
US $97.9 billion
US $ 1,110 billion
US $300 billion (by 2025)
US $15.9 billion
US $103.1 billion
Technology Estimated spend in 2019
Projected spend by
2023
[Source: NASSCOM Report - IT sector]

86 ZENSAR TECHNOLOGIES LTD ANNUAL REPORT 2019-20
Company Overview
Zensar is a leading digital solutions and technology services company that assists global organisations across industries on their path to Digital success. The Company has a presence across the globe with 25+ offices around the world. Its primary markets comprise of US, UK and South Africa, with Mexico and Germany added in its portfolio recently.
The Company communicates and collaborates with its employees and clients through digital platforms that increase operational productivity, enable smart decision making and enhances customer partnership. The Company thrives on a culture of transparency and openness, with a constant commitment towards people and community.
Analytics Application Transformation
Cloud and Infrastructure
Digital Experience
Enterprise Applications
Testing Unified Digital Commerce
Advanced Analytics
Agile Hybrid IT CRM Oracle Game Testing Digital Commerce Consulting
Analytics Strategy and Consulting
Application Development
Cybersecurity Digital Channels SAP One Touch Testing
Digital Fulfilment
Data Insights DevOps Digital Workplace
Digital Marketing Services
SFDC Outcome Based Testing
Digital Commerce Development
Data Management
Enterprise Architecture
Intelligent Command Center
Experience Services
Pega Alliance Performance Engineering
Managed Commerce Services
Cloud Applications
Third-Party Maintenance Services
Front End Development
Product Testing Sierra - Automated Functional Testing
Connected Intelligence
Unified IT Rush Hour Testing
Sierra - Volume and Performance Testing
Annexure D to the Board’s Report (Contd.)
Smart Application Development and Maintenance (SmartADM)
With the Company’s focus on Return on Digital (RoD), it has widened its scope to strengthen offerings with the launch of SmartADM, a complete suite of Application Services that enable Intelligent Application Services through AI-enabled Cloud Native development, Agile, DevSecOps, Legacy Modernisation, Application Support & Maintenance, Micro-services and API. The Company provides customers with improved efficiencies across automation led processes, zero-risk transition management with integrated application management and increased stability of applications across enterprises. The suite enables enterprises to undergo digital transformation from an environment that is fragmented, replete with incongruent solutions, and rely heavily on human intervention. Going forward, businesses that thrive on Artificial Intelligence solutions will create an impact and drive operations, to successfully move towards a future ready environment.
Augmenting Customer Experience
The Company’s recent acquisitions in key markets of the US and Europe have not only widened its client base, but has also strengthened its service offerings. The synergies derived from these collaborations have helped to create unique customer experiences. With its customer centric approach, the Company offers AI with Experience Design Research (EDR) framework and RPA to enhance customer experience & satisfaction by delivering superior quality services. Backed by its strong track record of innovation and reliable investments in digital solutions, the company is committed to serve its existing client base and leverage its experience to attract potential clients and establish a stronger market presence.

87BOARD’S REPORT NOTICE AND STATUTORY REPORTS
Annexure D to the Board’s Report (Contd.)
Living AI Philosophy
Artificial Intelligence (AI), is already widely used in business applications, including automation, data analytics, and natural language processing. AI, when applied with the layers of experience, can drastically improve prediction & automation, delivering path breaking results to stimulate an organisation’s functionality.
AI applied with Data science and machine learning can help to make decisions in auto mode, for various business operations. AI when collaborated with right tools, helps develop solutions that enable organisations to take better decisions, resulting in maximum Return on Investment (ROI) for companies. AI in research help companies to process data quickly with faster insights and enhanced data protection. IoT and Edge computing in Research AI aids the Company to revolutionize their business, enabling them to take the next leap of progress. The Company has also been mentioned as an “Innovator” in Applied AI and Advanced Analytics service category by RadarviewTM Report in 2019.
Operational Overview
Zensar’s phenomenal journey from a Living Digital company to a Living AI company today, lays the very foundation upon which it delivers technologies and solutions to its partners, offering measurable business outcomes. Zensar’s approach to Return on Digital ® with New and Exceptional Technologies (RoD NeXT), with a continuous focus on newer digital offerings, is in sync with its proprietary solutions that have helped to empower customers across the globe.
In its endeavor to drive digital transformation on a large-scale, with minimum human intervention, the Company embarked on the ‘Living AI’ journey to help its clients outperform and be future ready. Among a plethora of emerging technologies, Artificial Intelligence (AI) has gained significant prominence with multiple opportunities to deliver value to the end-user. The Company has pivoted its next-level growth on the ‘Living AI’ philosophy to deliver best-in-class solutions to its customers, enabling them to transform multiple business functions.
At the beginning of Company’s digital transformation journey, the goal was to create an agile and relevant enterprise focused on creating value through digitally empowered associates. Leveraging the current level of maturity achieved by ‘Living Digital’, the Company
is looking forward to the next phase: ‘Living AI’. It is constantly investing in technology to pursue remarkable outcomes, an effort driven by in-house team at Zenlabs. Taking the technological transformation forward, ZenAIR Labs have a dedicated research team involved in building AI-led solutions. The living AI philosophy compels to provide an AI-enabled digital ecosystem for customers, enabling to utilize AI in three aspects– Experience AI, Decision AI and Research AI.
Zensar’s comprehensive range of digital and technology services and solutions enables its clients to achieve new thresholds of business performance. Zensar, with its experience in delivering excellence and superior client satisfaction, through myriad technology solutions, is uniquely positioned to help its clients surpass challenges and run businesses efficiently, to help in legacy transformation and planning for business expansion and growth in innovative ways.
The Company continues to focus on clients present in Insurance, Retail, Hi-tech, Manufacturing and Financial services sector. Acquisitions in the past have brought synergies in the existing service portfolio, enabling cross-selling and allowing us to acquire larger clients. These acquisitions come with expertise and services that align to the Company’s vision, bringing efficiency, innovation and sustained financial performance on the Board.
The Company is determined to create maximum value for its customers through AI enabled digital transformation engagements in a complex IT environment with highly integrated tools.
Enterprise Risk Management
Zensar has established a robust Enterprise Risk Management program, through which risks are assessed and managed at various levels with a top-down and bottom-up approach covering the enterprise, the business units, the geographies, and the functions. The ERM program covers compliance with applicable government and regulatory requirements, potential risk areas in various economic, social, and industrial environments Zensar operates in.The ERM framework encompasses all the risks that the organisation is facing under different categories, such as Strategic, Operational, Financial, Compliance, and Cyber Security with each of these categories having internal or external dimensions. Systematic and proactive identification of risks and mitigations thereof enable effective and timely decision-making.
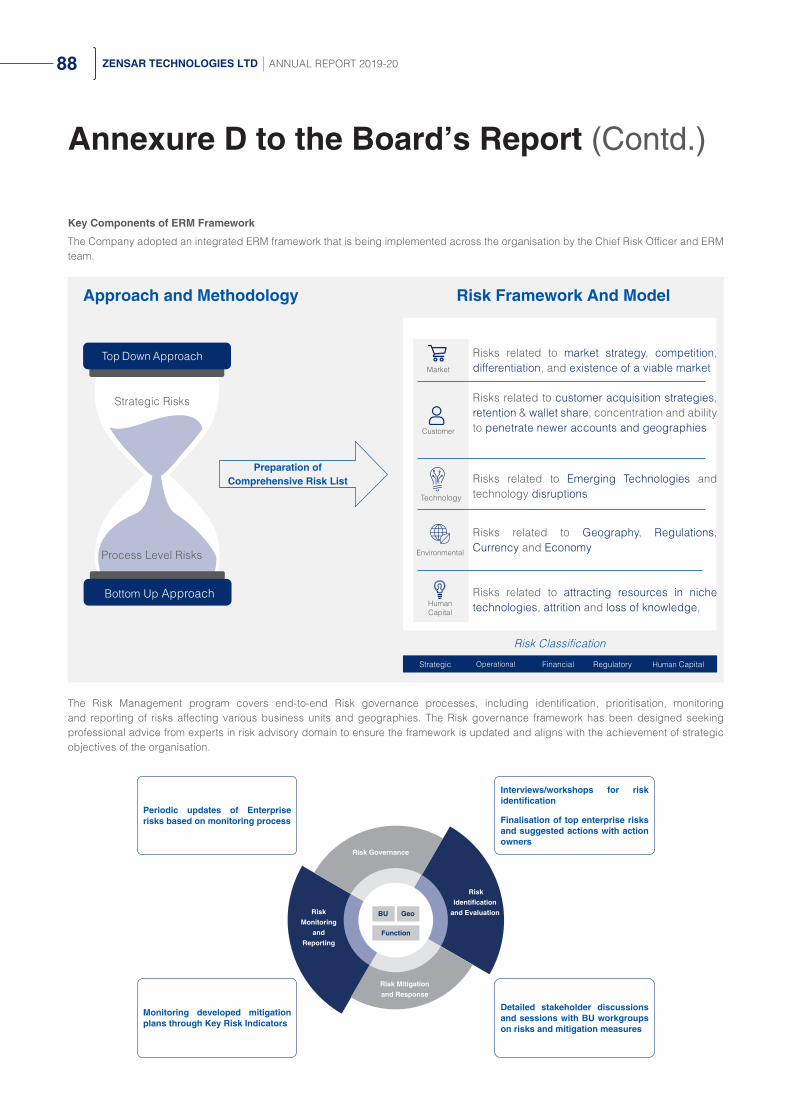
88 ZENSAR TECHNOLOGIES LTD ANNUAL REPORT 2019-20
Key Components of ERM Framework
The Company adopted an integrated ERM framework that is being implemented across the organisation by the Chief Risk Officer and ERM team.
The Risk Management program covers end-to-end Risk governance processes, including identification, prioritisation, monitoring and reporting of risks affecting various business units and geographies. The Risk governance framework has been designed seeking professional advice from experts in risk advisory domain to ensure the framework is updated and aligns with the achievement of strategic objectives of the organisation.
Annexure D to the Board’s Report (Contd.)
Approach and Methodology Risk Framework And Model
Top Down Approach
Bottom Up Approach
Strategic Risks
Process Level Risks
Risks related to market strategy, competition, differentiation, and existence of a viable market
Risks related to customer acquisition strategies, retention & wallet share, concentration and ability to penetrate newer accounts and geographies
Risks related to Emerging Technologies and technology disruptions
Risks related to Geography, Regulations, Currency and Economy
Risks related to attracting resources in niche technologies, attrition and loss of knowledge,
Preparation of Comprehensive Risk List
Market
Customer
Technology
Environmental
Human Capital
Strategic Operational Financial Regulatory Human Capital
Risk Classification
Periodic updates of Enterprise risks based on monitoring process
Monitoring developed mitigation plans through Key Risk Indicators
Interviews/workshops for risk identification
Finalisation of top enterprise risks and suggested actions with action owners
Detailed stakeholder discussions and sessions with BU workgroups on risks and mitigation measures
Risk Governance
Risk Identification
and EvaluationRisk Monitoring
and Reporting
Risk Mitigationand Response
BU Geo
Function

89BOARD’S REPORT NOTICE AND STATUTORY REPORTS
Annexure D to the Board’s Report (Contd.)
Risk Governance
The Company has established a multi-level governance structure to monitor and report risks and risk mitigation activities. The Chief Risk Officer heads the Enterprise Risk Management function, which is responsible for formulation and deployment of risk management policies and procedures. This function provides periodic updates to the Executive Committee and quarterly updates to the Risk Management Committee on risks to key business objectives and their mitigation. It involves working closely with mitigation action owners in deploying mitigation measures and monitoring their effectiveness.
The Risk Council which has been formed with representation across functions and geographies, is responsible for ensuring the robustness, quality, and effectiveness of mitigation measures. It is also responsible for periodically evaluating and reporting impact of the mitigation plans, and identification of emerging risks for assessment and planning.
Risk Champions are responsible for identifying and mitigating the risks for their respective business units, functions, and geographies. They periodically evaluate outcomes of risk mitigation efforts and identify and report any emerging risks in their functions/units.
Enterprise level Risk Register
The ERM function has defined and implemented a multi-layered Risk Register. This includes risks at Organisational level, BU/Function level, and Regional level. The common Risk Register at the Company level is available on the digital platform which provides role-based access, to enable risk-based decision making and reviews.
Risk Categories
Strategy and Strategy Execution: Risks arising out of strategy definition and successful execution of these strategies are covered in this category. For example, risks associated with the choice of the target markets, the Company’s market offerings, and business models. Details of the Company’s strategy are described in other sections of this document.
Operational: Risks arising out of internal and external factors affecting policies, procedures, people, and systems thereby impacting service delivery- for example, risk of business disruption due to natural calamities, and biological warfare/terrorist attacks with physical damage to assets & resources.
Compliance/Regulatory: Risks arising from potential litigations, violations to laws, regulations, and major regulatory/geopolitical changes.
Cyber Security: Risks arising out of potential breach of Company’s network and possible impact on its operations. This includes risks of cyberattacks and data privacy breaches.
COVID-19
In order to effectively respond to the COVID-19 pandemic, Zensar set up a cross-functional core governance team chaired by the Managing Director and Chief Executive Officer, with representation from relevant functions within the organisation, and from global regions through the formation of Emergency Response Teams. The Company has used its in-house digital platform to provide features for Employees to mark themselves, as safe on the platform and seek help from Emergency Response Teams, if needed. All support has been extended to the associates impacted by this pandemic, including those who tested positive for COVID-19. Initiatives were also launched focusing on the overall wellness of associates, including online consultation and Telemedicine services, as well as weekly mindfulness sessions.
To effectively manage the operations during this crisis, the Company triggered its Business Continuity Management program, to ensure service continuity with minimal impact on service deliverables/delivery. With extreme agility the Company enabled 100% Remote Working for its associates across all regions globally, with heightened emphasis on the obligations and responsibilities of Associates when working remotely, and on the Information Security and Data Privacy requirements. It effectively used collaborative tools and digital platforms to ensure no disruption to associates/clients’ engagement.
Travel and immigration related challenges faced by associates were resolved with utmost priority by the Global Mobility and Travel teams, in line with the guidelines issues by the local authorities. While revised policies were rolled out to enable remote working, the Internal Communications Team kept associates constantly informed on the rapidly changing health and safety, travel, and business continuity decisions. Associate learning and development continued to be a focus area with introduction of new modules for Virtual instructor-led VILT sessions.
As a part of its CSR initiative in the communities wherein your Company operates, it has contributed to various COVID-19 relief programs across the regions. A contribution framework was also established for associates to extend their support towards COVID-19 relief efforts.

90 ZENSAR TECHNOLOGIES LTD ANNUAL REPORT 2019-20
Risk Management
During the year, the focus was on strengthening ERM framework across the organisation and institutionalising the risk management
practices. Listed below are some of the key risks, anticipated impact and mitigations:
Key Risk Impact on Organisation Mitigations
Loss of Revenue/Cash flows and Market share, due to gaps in strategy identification and implementation
Dynamically changing business environment and business consumption patterns, changes in client requirement portfolio, necessitates agile strategy identification and deployment. Failure to cope, may result in market share loss and adverse impact on business growth.
• Defined strategy components and measurable KPI’s on real-time basis which help drive course correction.
• Established mechanism for immediate and real time internal and external feedback.
• Strategy for new growth sectors, categories and offerings is reviewed, modified and updated on regular basis.
Risk of loss of revenue and market share due to damage to Company’s reputation
Reputational risk due to ethical behavioural issues, fraudulent activities, and sexual misbehaviour especially by senior management, and misrepresentation of facts due to malicious intention by external entities. Such reputational impact may result in business loss, losing customer trust, and negative impact on talent attraction index.
• Mechanism of identified response team for dealing with such matters.
• Practice of regular and periodic internal communication on business ethics and Code of Conduct.
• Regular ethical/behavioural trainings and global compliance sign-offs.
• Succession plans for all key roles in place and regular reviews thereof.
• Strategy for appropriate communication plan for Media, Analysts, Investors, and Compliance regulators.
Risk of Business disruption due to natural and human-made disasters
Impact on operations of the Company business as well as customer business. Customer technology spending may get affected leading to adverse impact on business growth, uncontrolled peaks in operational costs, if not controlled with agility.
• Process in place for instating an approved Business Continuity Plan(s) for all major natural and people-made disasters.
• Protocols for formation of Regional Emergency Response Teams.
• Periodic training protocols for all/ managerial associates, internal and vendor communications for preparedness and awareness.
• Mechanism for post disaster support to affected associate(s), immediate plan for restoring any losses to physical and/or intellectual property(ies).
• Broad-based business mix and diversification across industry verticals. Company’s offerings and propositions target different stakeholders in the customer organisation, covering discretionary as well as non-discretionary spends.
Impact upon growth objectives due to unsuccessful acquisitions
Acquisition of companies with significant negative cashflow and P&L variation or non-alignment with overall Company strategy and growth outlook can lead to derailment of overall growth objective and business loss.
• Established framework for evaluation of target companies.
• Process of joint creation of integration strategy/roadmap for integrating solutions for Go-to-Market during due diligence phase.
• Well-defined framework for tracking of business metrics vs the objectives of acquisition.
• Course correction, as needed based on defined triggers in the business plan.
Annexure D to the Board’s Report (Contd.)

91BOARD’S REPORT NOTICE AND STATUTORY REPORTS
Annexure D to the Board’s Report (Contd.)
Loss of business and reputation due to violation of data security and privacy (Cybersecurity)
In addition to impact on business operations, violation or security breach could result in reputational damage, penalties, and legal and financial liabilities.
• Continual implementation and maintenance of industry best practices, data security and data privacy management system.
• Detailed program for employee awareness across the organisation on Information Security and Data Privacy requirements.
• Vulnerability Assessment and penetration testing in place for IT infrastructure and applications to strengthen overall cybersecurity posturing.
• Regular implementation of new security solutions to continuously enhance security posture based on security architecture using industry best practices.
Risk associated with geo-political changes including labour and visa regulations.
Fast changing regulatory environments in global market bring operational and resource provisioning challenges. Failure to comply will not only bring penalties and reputational damages but also directly impact business due to inability in timely fulfilment.
• Appropriate measures to reduce exposure in place with the help of experts from professional agencies.
• Strategies to source local talent as required have also been put in place by the Company.
High dependency on certain key customers
With high client concentration, revenue growth may not be sustainable, and a change in customer’s strategy would have a far reaching impact on revenue, margin, and market share.
• Processes in place to monitor customer strategies and align with customer priorities including technological change in customer environment.
• Constant de-risking by soliciting customers from different verticals and geographies.
Risk of regulatory non- compliance in absence of defined framework across geographies
The fast pace of change in the regulatory environment creates operation challenges, and failure to comply, may lead to penalties or revocation of permission to do business in a territory or geography.
• Deployment of global compliance program to monitor compliance and take necessary actions to mitigate risk with assistance from professional experts.
Risk of business obsolescence due to frequent changes in technology and business models
Rapidly evolving technologies and consumption patterns are giving rise to new business models, hence increasing the demand on the Company’s agility to keep pace with the changing customer expectations. Failure to cope may result in loss of market share and impact business growth.
• Investment in building differentiated capabilities on emerging / digital technologies through reskilling, external hiring and regular involvement in events which would help understand market trend.
• Mechanisms to stay aligned to customers’ needs by constantly launching new service lines and technology solutions.
• Customer connect with trust factor - regular customer touchpoints to understand spends and relevance of Company’s digital portfolio for long term and short-term horizon.
• Suitable acquisitions and alliance partner ecosystems to fill the technology skill gaps.

92 ZENSAR TECHNOLOGIES LTD ANNUAL REPORT 2019-20
Annexure D to the Board’s Report (Contd.)
Financial Performance
Zensar’s consistent performance in an otherwise competitive IT sector is a reflection of its ability to continuously create solutions that exceed customer aspirations. A visible and consistent growth in the Company’s digital business has resulted in stable and consistent growth in the past fiscal coupled with its legacy business performance.
(INR in Lakhs)
Particulars FY 2019-20 FY 2018-19Revenue 418,168 396,633
EBITDA 50,706 47,944
Return on net worth 12.6% 16.1%
EPS (Basic) 11.7 13.9
EPS (Diluted) 11.5 13.7
Debtor Turnover 5.4 5.2
Interest coverage ratio 7.2 12.9
Current Ratio 2.0 2.0
Debt Equity ratio 0.2 0.2
Operating Profit Margin 12.1% 12.1%
Net Profit Margin 6.5% 8.0%
Accounting principles consistently used in the preparation of financial statements are also consistently applied to record income and expenditure in individual segments.
Revenue
Revenue for the year ended March 31, 2020 is as under:
BY SEGMENTS (INR in Lakhs)
SEGMENT FY 2019-20 FY 2018-19Application Management Services
351,518 334,692
Infrastructure Management Services
66,650 61,941
Total 418,168 396,633
BY GEOGRAPHY (INR in Lakhs)
Geography FY 2019-20 FY 2018-19United States of America 307,023 298,239
Europe 66,301 56,865
Rest of the World 44,844 41,529
Total 418,168 396,633
Other Income
Other Income comprises dividends from mutual fund investments, interest on bank deposits, profit on sale of investments, net gain on financial assets mandatorily measured at fair value, interest on security deposit, net foreign exchange gain & loss on share buyback liability. Other income during the current year was INR 8,842 Lakhs as against INR 9,268 Lakhs in the previous year.
Share Capital
During the year, Company has allotted total 2,32,050 equity shares fully paid up of INR 2 each. Out of these, 22,000 equity shares were allotted under “2002 Employees Stock Option Scheme” and 2,10,050 numbers of equity shares were allotted under “2006 Employees Stock Option Scheme”.
Reserves And Surplus
The Company’s Reserves and Surplus as on March 31, 2020 were INR 201,118 Lakhs as against INR 187,430 Lakhs in 2018-19. The Company’s Other Reserves as on March 31, 2020 were INR 3,373 Lakhs as against INR 2,302 Lakhs in 2018-19.
Non-Current Borrowings
As of March 31, 2020, Non-current (long-term) borrowings were INR 6,537 Lakhs (Previous year INR 10,221 Lakhs).
The portion of current maturities of long-term loan amounting to INR 4,298 Lakhs (Previous year: INR 4,255 Lakhs) which is payable within twelve months, is shown under Other financial Liabilities.
Current Borrowings
As of March 31, 2020, Current borrowings (Short term) borrowings is INR 22,321. Previous year ended March 31, 2019, it was INR 15,560.
Fixed Assets
During the year there is an addition of INR 6,569 Lakhs in Gross Block of Tangible Fixed Assets and addition of INR 1,969 Lakhs in Gross Block of Intangible Assets.
Return On Capital Employed
The return on capital employed (ROCE) for the year 2019-20 is 19.9%.
Debtors
The position of outstanding debtors was: (INR in Lakhs)
Particulars FY 2019-20 FY 2018-19
Considered Good 66,564 87,621
Considered Doubtful 8,894 10,331
Allowances for Credit losses (8,894) (10,331)
Total Receivables 66,564 87,621
Cash and Bank Balances
The Cash and Bank Balances represent the Company’s balances in banks in India and overseas. The Company also retains funds in the Exchange Earners Foreign Currency (EEFC) account in India, which is mainly used to meet the remittance requirements of the Company’s branches and also for travel purposes. The Company possessed cash and bank balances (India and overseas excluding unpaid dividend) of INR 48,834 Lakhs as on March 31, 2020.

93BOARD’S REPORT NOTICE AND STATUTORY REPORTS
Other Current Assets
Other Current Assets of INR 21,663 Lakhs (Previous Year: INR 32,781 Lakhs) consist mainly of unbilled revenue, prepaid expenses, advances to suppliers and statutory receivables as on March 31, 2020.
Other Current Financial Assets
The Other Current Financial Assets comprise unbilled revenue, foreign exchange forward contracts and security deposits amounting to INR 29,762 Lakhs (Previous Year: INR 26,444 Lakhs) as on March 31, 2020.
Other Current Liabilities
Other Current liabilities amounting to INR 8,485 Lakhs (Previous Year: INR 14,422 Lakhs) represent mainly unearned revenue, employee contributions towards provident & pension fund, statutory taxes.
Tax Expense
The Company’s income-tax expenses is INR 10,419 Lakhs (Previous Year: INR 12,673 Lakhs).
Contingent Liabilities
Contingent Liabilities have been disclosed in Note 31 in the “Consolidated Financial Statement - Notes to the Accounts”.
Accounting principles consistently used in the preparation of financial statements are also consistently applied to record income and expenditure in individual segments.
Human Resources
The Company continues to offer professional development programmes for its employees, emphasizing on skill development and enhancing opportunities for career growth. Its Talent Management practices focus on engaging, developing and retaining the talent pool. With rapid changes in the industry, the Company is geared to make a mark, focusing on its vision, strategy and values:
Vision: Leaders in business transformation.
Mission: We will be the best in delivering innovative industry-focused solutions with measurable business outcomes.
Values: Customer Centricity; Commitment to People and Community and Continuous Innovation and Excellence.
HR Digitalisation
The Company embarked on a journey to make HR 100% digitalised. This has ensured that all HR process are available to associates on handheld devices at all the time. It also provides leaders access to HR metrics to make informed decision.
Organisation and Management Review
OMR is a comprehensive process to review the organisation structure and incumbents of key roles in the structure to ensure alignment to the overall strategy of the Company. This process also includes succession planning of key roles and development planning for Top talent that gets identified through this process.
Employer of Choice
Over the last few years, significant steps have been taken towards making Zensar- an Employer of Choice and thereby measure associate engagement. The Company partnered with Great Place to Work Institute, a globally recognised and widely used platform, to measure associate engagement. The Great Place to Work model measures engagement levels of associates through the levels of Trust, Pride, Respect, Fairness and Camaraderie prevalent in the organisation.
Associate Engagement Framework
It is a framework that identifies the drivers of Associate Engagement in the Company. These drivers work to build a sense of connect between associates and the organisation. Each driver of Associate Engagement is reflected in a list of actions that associates can expect to experience across locations, countries and regions.
Celebrating Diversity
Zensar’s philosophy on Diversity is to Include and Impact: Aligning Business, Diverse Talent and Societal Impact Goals. On this front, the Company decided to focus on one of the biggest challenges of the organisation - to build Leadership Pipeline with Diverse talent.
The diversity program embraces associates of different gender, age, nationality, backgrounds, experiences and physical ability and supports them to work collaboratively by creating a culture of Inclusivity. Diversity in the workplace is a norm and seen as an investment towards building a better business. As an organisation where one of the core values is Commitment to People and Community the diversity program embraces associates of different gender, age, nationality, backgrounds, experiences, physical ability, skill sets, expertise and supports them to work collaboratively by creating a culture of Inclusivity.
Diversity is implemented through the following key initiatives:
• Hiring of diverse workforce
• Developing Women Leadership
• Inroads to People with Special Abilities and LGBTQ+
• ENLIVEN to bring the Women in technology back in careers.
• Women mentoring
• Global Diversity & Inclusion Council
Annexure D to the Board’s Report (Contd.)

94 ZENSAR TECHNOLOGIES LTD ANNUAL REPORT 2019-20
Annexure D to the Board’s Report (Contd.)
Key Achievements
• iInspire award for Best Practices in Gender Diversity in 2019
• Zensar featured in the 100 Best Company for Women in 2019 Working Mother & Avtar Best Companies for Women in India and ‘Exemplar of Inclusion’ in the Working Mother & Avtar Most Inclusive Companies in India (MICI) in 2018 and 2019
• Zensar’s ‘Women in Workplace’ case study won UN Global Compact’s 3rd Best Innovative Practices Awards in March 2020
• Zensar Woman Leader awarded ‘Tech Beacon’ in WEQUITY Awards in February 2020
• Zensar Women leaders invited as speakers in Women In Data Science (WiDS)
• Hosted Round Table in partnership with WILL Forum in February 2020
• Participated McKinsey’s Women in Workplace study in 2019
• Active member is Women In Technology (WiT) Chapters in India and US
• Zensar partnered with WiT and presented RODNext and Gender Inclusion practices on ‘The Demo Day’ in June 2019 No Dot Policy - that ensures there’s no Team without Gender Diversity in the organisation
Cautionary Statement
This Report to the Members is in compliance with the Corporate Governance Standard incorporated inter-alia, in the SEBI Regulations and as such cannot be construed as holding out for any forecasts, projections, expectations, invitations, offers, etc. within the meaning of applicable securities laws and regulations. This Report furnishes information as laid down within the different headings provided under the sub-head Management Discussion and Analysis, inter-alia, to meet the regulatory requirements.
For and on behalf of the Board of Directors
Place: Mumbai H.V. Goenka Date: July 23, 2020 Chairman
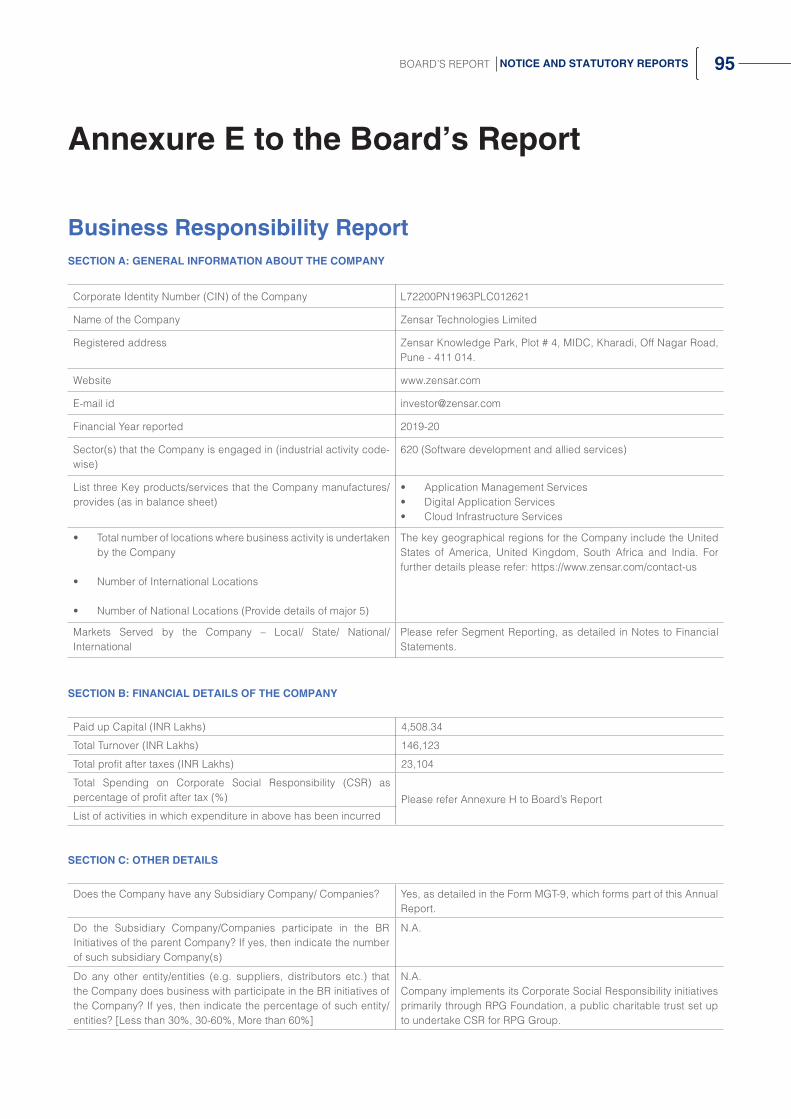
95BOARD’S REPORT NOTICE AND STATUTORY REPORTS
Business Responsibility ReportSECTION A: GENERAL INFORMATION ABOUT THE COMPANY
Corporate Identity Number (CIN) of the Company L72200PN1963PLC012621
Name of the Company Zensar Technologies Limited
Registered address Zensar Knowledge Park, Plot # 4, MIDC, Kharadi, Off Nagar Road, Pune - 411 014.
Website www.zensar.com
E-mail id [email protected]
Financial Year reported 2019-20
Sector(s) that the Company is engaged in (industrial activity code-wise)
620 (Software development and allied services)
List three Key products/services that the Company manufactures/provides (as in balance sheet)
• Application Management Services• Digital Application Services• Cloud Infrastructure Services
• Total number of locations where business activity is undertaken by the Company
• Number of International Locations
• Number of National Locations (Provide details of major 5)
The key geographical regions for the Company include the United States of America, United Kingdom, South Africa and India. For further details please refer: https://www.zensar.com/contact-us
Markets Served by the Company – Local/ State/ National/ International
Please refer Segment Reporting, as detailed in Notes to Financial Statements.
SECTION B: FINANCIAL DETAILS OF THE COMPANY
Paid up Capital (INR Lakhs) 4,508.34
Total Turnover (INR Lakhs) 146,123
Total profit after taxes (INR Lakhs) 23,104
Total Spending on Corporate Social Responsibility (CSR) as percentage of profit after tax (%) Please refer Annexure H to Board’s Report
List of activities in which expenditure in above has been incurred
SECTION C: OTHER DETAILS
Does the Company have any Subsidiary Company/ Companies? Yes, as detailed in the Form MGT-9, which forms part of this Annual Report.
Do the Subsidiary Company/Companies participate in the BR Initiatives of the parent Company? If yes, then indicate the number of such subsidiary Company(s)
N.A.
Do any other entity/entities (e.g. suppliers, distributors etc.) that the Company does business with participate in the BR initiatives of the Company? If yes, then indicate the percentage of such entity/entities? [Less than 30%, 30-60%, More than 60%]
N.A.Company implements its Corporate Social Responsibility initiatives primarily through RPG Foundation, a public charitable trust set up to undertake CSR for RPG Group.
Annexure E to the Board’s Report

96 ZENSAR TECHNOLOGIES LTD ANNUAL REPORT 2019-20
SECTION D: BR INFORMATION
1. Details of Director/ BR Head responsible for BR
S. No. Particulars Details
1 DIN 07393680
2 Name Sandeep Kishore
3 Designation Managing Director and Chief Executive Officer
4 Telephone Number 020-66074000
5 Email ID [email protected]
2. Principle-wise Business Responsibility Policy(ies)
(a) Details of compliance
The National Voluntary Guidelines on Social, Environmental and Economic Responsibilities of Business (NVGs) brought out by the Ministry of Corporate Affairs have adopted nine areas of Business Responsibility, briefly described as under:
P1 Business should conduct and govern themselves with Ethics, Transparency and Accountability.
P2 Businesses should provide goods and services that are safe and contribute to sustainability throughout their life cycle.
P3 Businesses should promote the wellbeing of all employees.
P4 Businesses should respect the interests of, and be responsive towards all stakeholders, especially those who are disadvantaged, vulnerable and marginalised.
P5 Businesses should respect and promote human rights.
P6 Business should respect, protect, and make efforts to restore the environment.
P7 Businesses, when engaged in influencing public and regulatory policy, should do so in a responsible manner.
P8 Businesses should support inclusive growth and equitable development.
P9 Businesses should engage with and provide value to their customers and consumers in a responsible manner.
Annexure E to the Board’s Report (Contd.)

97BOARD’S REPORT NOTICE AND STATUTORY REPORTSP
rinc
iple
N
o.K
ey A
pplic
able
P
olic
yW
eblin
kA
ppro
ved
by B
oard
of
Dir
ecto
rs
of th
e C
ompa
ny
Pol
icy
been
fo
rmul
ated
in
cons
ulta
tion
with
the
rele
vant
st
akeh
olde
rs
Spe
cifie
d co
mm
ittee
of
the
Boa
rd/
Dir
ecto
r/O
ffici
al
to o
vers
ee th
e im
plem
enta
tion
of th
e po
licy
Pol
icy
conf
orm
s to
any
na
tiona
l/in
tern
atio
nal
stan
dard
s
Pol
icy
form
ally
co
mm
unic
ated
to
all
rele
vant
in
tern
al a
nd
exte
rnal
st
akeh
olde
rs
In-h
ouse
st
ruct
ure
to
impl
emen
t th
e po
licy
Gri
evan
ce
redr
essa
l m
echa
nism
re
late
d to
the
polic
y/ p
olic
ies
to a
ddre
ss
stak
ehol
ders
’ gr
ieva
nces
Inde
pend
ent
audi
t/ev
alua
tion
of
the
wor
king
of
this
pol
icy
by a
n in
tern
al
or e
xter
nal
agen
cy
1C
ode
of C
ondu
ctht
tps:
//zen
sar.c
om/in
vest
or/
corp
orat
e-go
vern
ance
?ty
pe=
2&fie
ld_a
nnua
l_ye
ar_t
id=
All&
field
_ann
ual_
quar
ter_
tid=
All
Yes
Whi
stle
Blo
wer
Pol
icy
http
s://z
ensa
r.com
/in
vest
or/c
orpo
rate
-go
vern
ance
?typ
e=3&
field
_an
nual
_yea
r_tid
=A
ll&fie
ld_
annu
al_q
uart
er_t
id=
All
Yes
RPG
Cod
e of
Cor
pora
te
Gov
erna
nce
and
Ethi
cs
Ava
ilabl
e on
intra
net,
for a
ll th
e em
ploy
ees
Yes
2EH
S Po
licy
http
s://z
ensa
r.com
/site
s/de
faul
t/file
s/Q
MS%
20an
d%20
EHSE
n%20
Polic
y%
20an
d%20
Obj
ectiv
es%
20-%
20FY
%20
19-2
0_0.
No
Yes
Qua
lity
Polic
yht
tps:
//zen
sar.c
om/
accr
edita
tions
-and
-ce
rtifi
catio
ns
No
3Fl
exi T
imin
g Po
licy
Ava
ilabl
e on
intra
net,
for a
ll th
e em
ploy
ees
No
Mat
erni
ty P
olic
y
Empl
oyee
Ass
ista
nce
Prog
ram
Pol
icy
Hea
lth &
Saf
ety
Polic
y
Phys
ical
Saf
ety
Polic
y
Empl
oyee
Insu
ranc
e po
licy
Pare
nts
Med
icar
e Po
licy
Ann
ual H
ealth
Che
ck
Up
Preg
nanc
y C
are
Annexure E to the Board’s Report (Contd.)

98 ZENSAR TECHNOLOGIES LTD ANNUAL REPORT 2019-20P
rinc
iple
N
o.K
ey A
pplic
able
P
olic
yW
eblin
kA
ppro
ved
by B
oard
of
Dir
ecto
rs
of th
e C
ompa
ny
Pol
icy
been
fo
rmul
ated
in
cons
ulta
tion
with
the
rele
vant
st
akeh
olde
rs
Spe
cifie
d co
mm
ittee
of
the
Boa
rd/
Dir
ecto
r/O
ffici
al
to o
vers
ee th
e im
plem
enta
tion
of th
e po
licy
Pol
icy
conf
orm
s to
any
na
tiona
l/in
tern
atio
nal
stan
dard
s
Pol
icy
form
ally
co
mm
unic
ated
to
all
rele
vant
in
tern
al a
nd
exte
rnal
st
akeh
olde
rs
In-h
ouse
st
ruct
ure
to
impl
emen
t th
e po
licy
Gri
evan
ce
redr
essa
l m
echa
nism
re
late
d to
the
polic
y/ p
olic
ies
to a
ddre
ss
stak
ehol
ders
’ gr
ieva
nces
Inde
pend
ent
audi
t/ev
alua
tion
of
the
wor
king
of
this
pol
icy
by a
n in
tern
al
or e
xter
nal
agen
cy
4C
SR P
olic
yht
tps:
//ww
w.z
ensa
r.com
/si
tes/
defa
ult/f
iles/
inve
stor
/po
licie
s-re
port
s-fil
lings
/C
SR%
20Po
licy_
Fina
l.pdf
Yes
BB
BEE
initi
ativ
esht
tps:
//ww
w.z
ensa
r.com
/ab
out-u
s/m
edia
/pre
ss-
rele
ase/
zens
ar-k
apel
a-ho
ldin
gs-a
nd-to
mor
row
-trus
t-jo
in-h
ands
-sou
th-a
frica
-pun
e
No
Yes
Div
ersi
ty p
olic
yA
vaila
ble
on in
trane
t, fo
r all
empl
oyee
sN
o
5C
ode
of C
ondu
ctht
tps:
//zen
sar.c
om/
inve
stor
/cor
pora
te-
gove
rnan
ce?t
ype=
2&fie
ld_
annu
al_y
ear_
tid=
All&
field
_an
nual
_qua
rter
_tid
=A
ll
Yes
Whi
stle
Blo
wer
Pol
icy
http
s://z
ensa
r.com
/in
vest
or/c
orpo
rate
-go
vern
ance
?typ
e=3&
field
_an
nual
_yea
r_tid
=A
ll&fie
ld_
annu
al_q
uart
er_t
id=
All
Polic
y an
d pr
actic
es
to c
omba
t Mod
ern
Slav
ery
and
Hum
an
Traf
ficki
ng fo
r Ind
ia
and
UK
regi
ons
http
s://w
ww
.zen
sar.c
om/
site
s/de
faul
t/file
s/in
vest
or/
polic
ies-
repo
rts-
fillin
gs/
Slav
ery%
20St
atem
ent%
2020
19.p
df
No
Yes
6En
viro
nmen
t, En
ergy
, H
ealth
and
Saf
ety
Polic
y
http
s://z
ensa
r.com
/site
s/de
faul
t/file
s/Q
MS%
20an
d%20
EHSE
n%20
Polic
y%20
and%
20O
bjec
tives
%20
-%20
FY%
2019
-20_
0.pd
f
No
7C
ode
of C
ondu
ctht
tps:
//zen
sar.c
om/
inve
stor
/cor
pora
te-
gove
rnan
ce?t
ype=
2&fie
ld_
annu
al_y
ear_
tid=
All&
field
_an
nual
_qua
rter
_tid
=A
ll
Yes
Annexure E to the Board’s Report (Contd.)

99BOARD’S REPORT NOTICE AND STATUTORY REPORTSP
rinc
iple
N
o.K
ey A
pplic
able
P
olic
yW
eblin
kA
ppro
ved
by B
oard
of
Dir
ecto
rs
of th
e C
ompa
ny
Pol
icy
been
fo
rmul
ated
in
cons
ulta
tion
with
the
rele
vant
st
akeh
olde
rs
Spe
cifie
d co
mm
ittee
of
the
Boa
rd/
Dir
ecto
r/O
ffici
al
to o
vers
ee th
e im
plem
enta
tion
of th
e po
licy
Pol
icy
conf
orm
s to
any
na
tiona
l/in
tern
atio
nal
stan
dard
s
Pol
icy
form
ally
co
mm
unic
ated
to
all
rele
vant
in
tern
al a
nd
exte
rnal
st
akeh
olde
rs
In-h
ouse
st
ruct
ure
to
impl
emen
t th
e po
licy
Gri
evan
ce
redr
essa
l m
echa
nism
re
late
d to
the
polic
y/ p
olic
ies
to a
ddre
ss
stak
ehol
ders
’ gr
ieva
nces
Inde
pend
ent
audi
t/ev
alua
tion
of
the
wor
king
of
this
pol
icy
by a
n in
tern
al
or e
xter
nal
agen
cy
8C
SR P
olic
yht
tps:
//ww
w.z
ensa
r.com
/si
tes/
defa
ult/f
iles/
inve
stor
/po
licie
s-re
port
s-fil
lings
/C
SR%
20Po
licy_
Fina
l.pdf
Yes
BB
BEE
initi
ativ
esht
tps:
//ww
w.z
ensa
r.com
/ab
out-u
s/m
edia
/pre
ss-
rele
ase/
zens
ar-k
apel
a-ho
ldin
gs-a
nd-to
mor
row
-trus
t-jo
in-h
ands
-sou
th-a
frica
-pun
No
Yes
Div
ersi
ty p
olic
yA
vaila
ble
on in
trane
t, fo
r all
the
empl
oyee
s N
o
9C
ode
of C
ondu
ctht
tps:
//zen
sar.c
om/
inve
stor
/cor
pora
te-
gove
rnan
ce?t
ype=
2&fie
ld_
annu
al_y
ear_
tid=
All&
field
_an
nual
_qua
rter
_tid
=A
ll
Yes
Qua
lity
Polic
yht
tps:
//zen
sar.c
om/
accr
edita
tions
-and
-ce
rtifi
catio
ns
No
Yes
Annexure E to the Board’s Report (Contd.)

100 ZENSAR TECHNOLOGIES LTD ANNUAL REPORT 2019-20
(b) If answer to the question at serial number 1 against any principle, is ‘No’, please explain why: (Tick up to 2 options)
Sr. No.
Questions P 1 P 2 P 3 P 4 P 5 P 6 P 7 P 8 P 9
1 The Company has not understood the Principles
Not Applicable
2 The Company is not at a stage where it finds itself in a position to formulate and implement the policies on specified principles
3 The Company does not have financial or manpower resources available for the task
4 It is planned to be done within next 6 months
5 It is planned to be done within the next 1 year
6 Any other reason (please specify)
3. Governance related to BR
Sr. No. Particulars Details
1 Indicate the frequency with which the Board of Directors, Committee of the Board or CEO to assess the BR performance of the Company.
An annual review of BR performance is conducted, inter-alia, through adoption of BRR for inclusion in Annual Report.
2 Does the Company publish a BR or a Sustainability Report? What is the hyperlink for viewing this report? How frequently it is published?
The annual BR Report is published, as a part of Annual Report, and made available on the website:https://www.zensar.com/investor/financials.
SECTION E: PRINCIPLE-WISE PERFORMANCE
Principle 1: Ethics, Transparency and Accountability
Sr. No.
Particulars Description
1. Does the policy relating to ethics, bribery and corruption cover only the company? Does it extend to the Group/Joint Ventures/ Suppliers/Contractors/NGOs /Others?
• The Company follows RPG Code of Corporate Governance and Ethics at Group level, to ensure uniformity and integrity in running the business. The said Code extends to the subsidiaries as well.
• In its endeavor to be accountable, the Company has in place an Ethics Committee that is empowered to investigate all matters of suspected violation of ethical standards of the Company.
• Further a dedicated mobile application called ZenPolicies has been put in place, which combines all policies under ethics, transparency and accountability and acts as ready reference for employees.
• The policies are revisited periodically to keep them in sync with emerging business environment. This ready availability of documented policies enforces transparency.
2. How many stakeholder complaints have been received in the past financial year and what percentage was satisfactorily resolved by the management?
• Zensar’s stakeholders include its investors, clients, employees, vendors, government, etc.
• Refer Report on Corporate Governance for data on Investor Complaints received and resolved during the year.
• The Board’s Report sets out relevant details.
Annexure E to the Board’s Report (Contd.)

101BOARD’S REPORT NOTICE AND STATUTORY REPORTS
Annexure E to the Board’s Report (Contd.)
Principle 2: Products Lifecycle Sustainability
Sr. No.
Particulars Description
1. List up to 3 of your products or services whose design has incorporated social or environmental concerns, risks and/or opportunities.
Details are set out in the Corporate Overview and Board Report.
2. For each such product, provide the following details in respect of resource use (energy, water, raw material etc.) per unit of product(optional):
(a) Reduction during sourcing/production/ distribution achieved since the previous year throughout the value chain?
(b) Reduction during usage by consumers (energy, water) has been achieved since the previous year?
Not applicable.
3. Does the company have procedures in place for sustainable sourcing (including transportation)?
NA4. Has the company taken any steps to procure goods and services from local & small producers, including communities surrounding their place of work?
5. Does the company have a mechanism to recycle products and waste? If yes what is the percentage of recycling of products and waste (separately as <5%, 5-10%, >10%).
• Yes, since the business operations of Company include software and software related services, the Company takes cognizance of the social and environmental impact that may be caused due to its operational activities, like: Waste management including e-waste, Energy Management, CSR activities and is certified for ISO 14001:2015 (Environmental Management System), ISO 45001:2018 (Occupational Health and Safety Management System) and ISO 50001:2011 (Energy Management System).
• The above certifications are implemented consistently thus monitoring methodologies are defined and consumption of resources like energy and water are tracked. Reduction in consumption targets in energy at the Company level, is also undertaken and monitored.
Principle 3: Employee’s Well-being:
Sr. No.
Particulars Description
1. Total number of employees 9,524 as on March 31, 2020.
2. Total number of employees hired on temporary/contractual/casual basis
3,345 as on March 31, 2020.
3. Number of permanent women employees 2,742 as on March 31, 2020.
4. Number of permanent employees with disabilities
17 as on March 31, 2020.
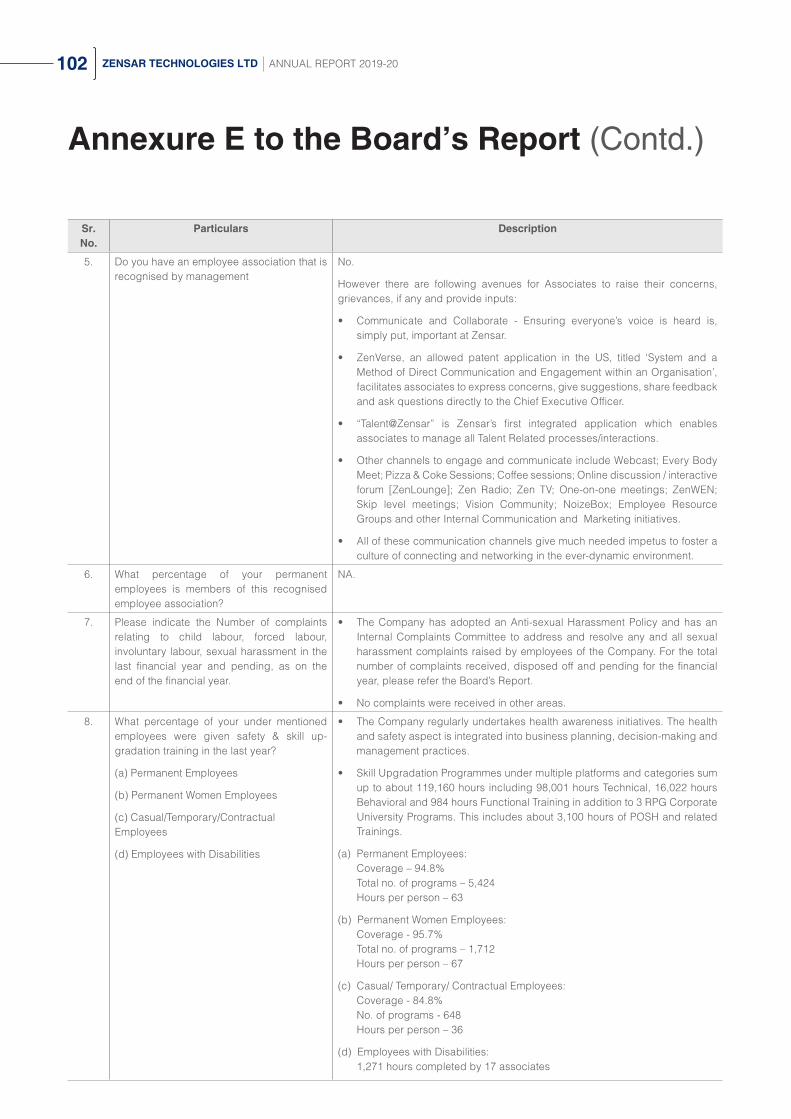
102 ZENSAR TECHNOLOGIES LTD ANNUAL REPORT 2019-20
Annexure E to the Board’s Report (Contd.)
Sr. No.
Particulars Description
5. Do you have an employee association that is recognised by management
No.
However there are following avenues for Associates to raise their concerns, grievances, if any and provide inputs:
• Communicate and Collaborate - Ensuring everyone’s voice is heard is, simply put, important at Zensar.
• ZenVerse, an allowed patent application in the US, titled ‘System and a Method of Direct Communication and Engagement within an Organisation’, facilitates associates to express concerns, give suggestions, share feedback and ask questions directly to the Chief Executive Officer.
• “Talent@Zensar” is Zensar’s first integrated application which enables associates to manage all Talent Related processes/interactions.
• Other channels to engage and communicate include Webcast; Every Body Meet; Pizza & Coke Sessions; Coffee sessions; Online discussion / interactive forum [ZenLounge]; Zen Radio; Zen TV; One-on-one meetings; ZenWEN; Skip level meetings; Vision Community; NoizeBox; Employee Resource Groups and other Internal Communication and Marketing initiatives.
• All of these communication channels give much needed impetus to foster a culture of connecting and networking in the ever-dynamic environment.
6. What percentage of your permanent employees is members of this recognised employee association?
NA.
7. Please indicate the Number of complaints relating to child labour, forced labour, involuntary labour, sexual harassment in the last financial year and pending, as on the end of the financial year.
• The Company has adopted an Anti-sexual Harassment Policy and has an Internal Complaints Committee to address and resolve any and all sexual harassment complaints raised by employees of the Company. For the total number of complaints received, disposed off and pending for the financial year, please refer the Board’s Report.
• No complaints were received in other areas.
8. What percentage of your under mentioned employees were given safety & skill up-gradation training in the last year?
(a) Permanent Employees
(b) Permanent Women Employees
(c) Casual/Temporary/Contractual Employees
(d) Employees with Disabilities
• The Company regularly undertakes health awareness initiatives. The health and safety aspect is integrated into business planning, decision-making and management practices.
• Skill Upgradation Programmes under multiple platforms and categories sum up to about 119,160 hours including 98,001 hours Technical, 16,022 hours Behavioral and 984 hours Functional Training in addition to 3 RPG Corporate University Programs. This includes about 3,100 hours of POSH and related Trainings.
(a) Permanent Employees:Coverage – 94.8%Total no. of programs – 5,424Hours per person – 63
(b) Permanent Women Employees:Coverage - 95.7%Total no. of programs – 1,712Hours per person – 67
(c) Casual/ Temporary/ Contractual Employees:Coverage - 84.8%No. of programs - 648Hours per person – 36
(d) Employees with Disabilities:1,271 hours completed by 17 associates
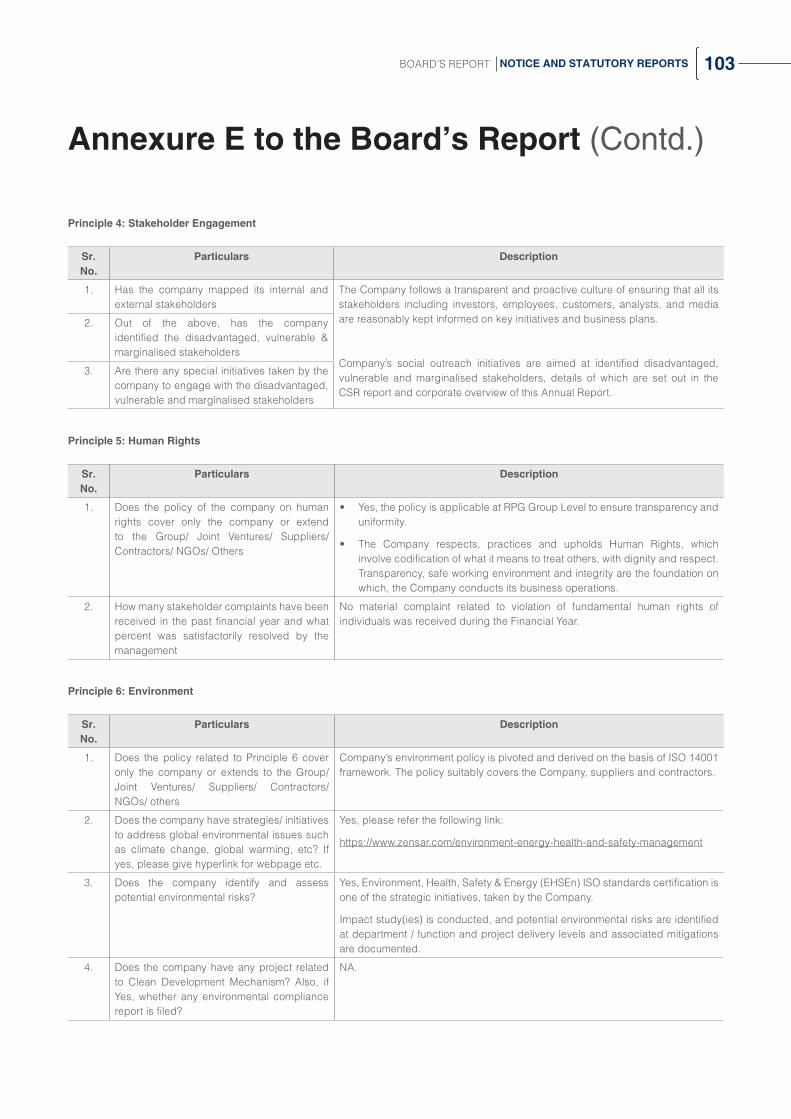
103BOARD’S REPORT NOTICE AND STATUTORY REPORTS
Principle 4: Stakeholder Engagement
Sr. No.
Particulars Description
1. Has the company mapped its internal and external stakeholders
The Company follows a transparent and proactive culture of ensuring that all its stakeholders including investors, employees, customers, analysts, and media are reasonably kept informed on key initiatives and business plans.
Company’s social outreach initiatives are aimed at identified disadvantaged, vulnerable and marginalised stakeholders, details of which are set out in the CSR report and corporate overview of this Annual Report.
2. Out of the above, has the company identified the disadvantaged, vulnerable & marginalised stakeholders
3. Are there any special initiatives taken by the company to engage with the disadvantaged, vulnerable and marginalised stakeholders
Principle 5: Human Rights
Sr. No.
Particulars Description
1. Does the policy of the company on human rights cover only the company or extend to the Group/ Joint Ventures/ Suppliers/ Contractors/ NGOs/ Others
• Yes, the policy is applicable at RPG Group Level to ensure transparency and uniformity.
• The Company respects, practices and upholds Human Rights, which involve codification of what it means to treat others, with dignity and respect. Transparency, safe working environment and integrity are the foundation on which, the Company conducts its business operations.
2. How many stakeholder complaints have been received in the past financial year and what percent was satisfactorily resolved by the management
No material complaint related to violation of fundamental human rights of individuals was received during the Financial Year.
Principle 6: Environment
Sr. No.
Particulars Description
1. Does the policy related to Principle 6 cover only the company or extends to the Group/Joint Ventures/ Suppliers/ Contractors/ NGOs/ others
Company’s environment policy is pivoted and derived on the basis of ISO 14001 framework. The policy suitably covers the Company, suppliers and contractors.
2. Does the company have strategies/ initiatives to address global environmental issues such as climate change, global warming, etc? If yes, please give hyperlink for webpage etc.
Yes, please refer the following link:
https://www.zensar.com/environment-energy-health-and-safety-management
3. Does the company identify and assess potential environmental risks?
Yes, Environment, Health, Safety & Energy (EHSEn) ISO standards certification is one of the strategic initiatives, taken by the Company.
Impact study(ies) is conducted, and potential environmental risks are identified at department / function and project delivery levels and associated mitigations are documented.
4. Does the company have any project related to Clean Development Mechanism? Also, if Yes, whether any environmental compliance report is filed?
NA.
Annexure E to the Board’s Report (Contd.)

104 ZENSAR TECHNOLOGIES LTD ANNUAL REPORT 2019-20
Annexure E to the Board’s Report (Contd.)
5. Has the company undertaken any other initiatives on – clean technology, energy efficiency, renewable energy, etc
Yes.
• Such consumption and conservation data is prominently displayed at conspicuous place(s) within the campus, to further enhance the awareness.
• These efforts helped the Company to achieve power saving of 50,000 units, across all location for FY 2019-20.
• Further details are set out in Annexure I to the Board’s Report.
6. Are the Emissions/Waste generated by the company within the permissible limits given by CPCB/SPCB for the financial year being reported?
Yes, emission & waste generated are well within permissible limits given by SPCB.
7. Number of show cause/ legal notices received from CPCB/SPCB which are pending (i.e. not resolved to satisfaction) as on end of Financial Year.
None.
Principle 7: Policy Advocacy
Sr. No.
Particulars Description
1. Is your company a member of any trade and chamber or association? Name only those major ones that your business deals with.
The Company is well represented in key industry associations like the NASSCOM, MCCIA etc.
2. Have you advocated/lobbied through above associations for the advancement or improvement of public good?
The Company undertakes suitable engagements which help contribute towards the development of Industry and to make a transformational difference to the issues that matter, most to its business, industry and consequently to the country, as a policy and a value norm.
Principle 8: Inclusive Growth
Sr. No.
Particulars Description
1. Does the company have specified programmes/initiatives/projects in pursuit of the policy related to Principle 8?
Yes, the Company has a robust CSR initiative framework, implemented thru RPG Foundation (RPGF), that is aimed at transforming the community, primarily in its areas of operations.
2. Are the programmes/projects undertaken through in-house team/own foundation/external NGO/government structures/any other organisation?
• The CSR activities are primarily managed by RPG Foundation.
• RPGF is set up as a public charitable trust to undertake activities in the field of social welfare and reform, across wide range of areas including education, employability, health, community development etc.
3. Have you done any impact assessment of your initiative?
The Company, through CSR Committee and RPGF, thoroughly reviews and evaluates the initiatives and results on a periodic basis.
4. What is your company’s direct contribution to community development projects- Amount in INR and the details of the projects undertaken.
The relevant details are set out in the CSR report forming part of this Annual Report.

105BOARD’S REPORT NOTICE AND STATUTORY REPORTS
5. Have you taken steps to ensure that this community development initiative is successfully adopted by the community?
• All programs are initiated by carrying out a need-assessment by using ‘human-capacities’ framework – which gauges community needs.
• The programs that are introduced are monitored closely, and community feedback is taken into consideration before continuing with them.
• Interventions are also designed in such a way that their relevance to the community’s social and economic growth are inter-connecting, bringing in elements of ownership.
• There have been many incidences where the programs have built the community’s inter-personal capacities, and programs are also being replicated at relevant scales – individually or at community level.
• The success stories are captured by looking at individual and community transformation in comparison to the principles of the CSR work.
Principle 9: Customer Value
Sr. No.
Particulars Description
1. What percentage of customer complaints/consumer cases are pending as on the end of financial year.
None
2. Does the company display product information on the product label, over and above what is mandated as per local laws?
NA
3. Is there any case filed by any stakeholder against the company regarding unfair trade practices, irresponsible advertising and/or anti-competitive behaviour during the last five years and pending as on end of financial year.
No
Annexure E to the Board’s Report (Contd.)

106 ZENSAR TECHNOLOGIES LTD ANNUAL REPORT 2019-20
4. Did your company carry out any consumer survey/ consumer satisfaction trends?
• Yes, there are following two types of Customer Satisfaction Surveys which are periodically conducted:
1) Continuous Listening (Internal Customer Feedback): This is the project level feedback that is sought by the Quality Excellence Team to ensure that the Company has regular feedback on projects/services delivered, and corrective actions are planned where there are opportunities for improvement.
2) CES (Customer Engagement Survey): This is the Annual survey to capture customer expectations, measure experience, and assess strength of the relationship. This is conducted through a prominent third party agency. This is an in-depth survey providing insights at various levels like Geography/BU/Account categories/ Client seniority levels and provides a rich source of insights leading to actionable outcomes.
• It also serves as a credible, third party feedback on customer delivery framework. The feedback so received are accordingly acted upon so as to work towards consistent and continued improvements.
• All efforts are made towards delivering on customers’ expectations, by adhering to all agreed deliverables. Since Company’s operations span across multiple customer locations in multiple geographies, it is imperative that the Company complies with legal and contractual requirements under relevant local laws.
• To ensure this, the inhouse Legal Team and Contract Excellence Team are regularly updated on various regulations, to ensure that there is requisite awareness.
Note: Unless otherwise stated, this report contains data at global level, wherever required.
For and on behalf of the Board of Directors
Place: Mumbai H.V. Goenka Date: July 23, 2020 Chairman
Annexure E to the Board’s Report (Contd.)
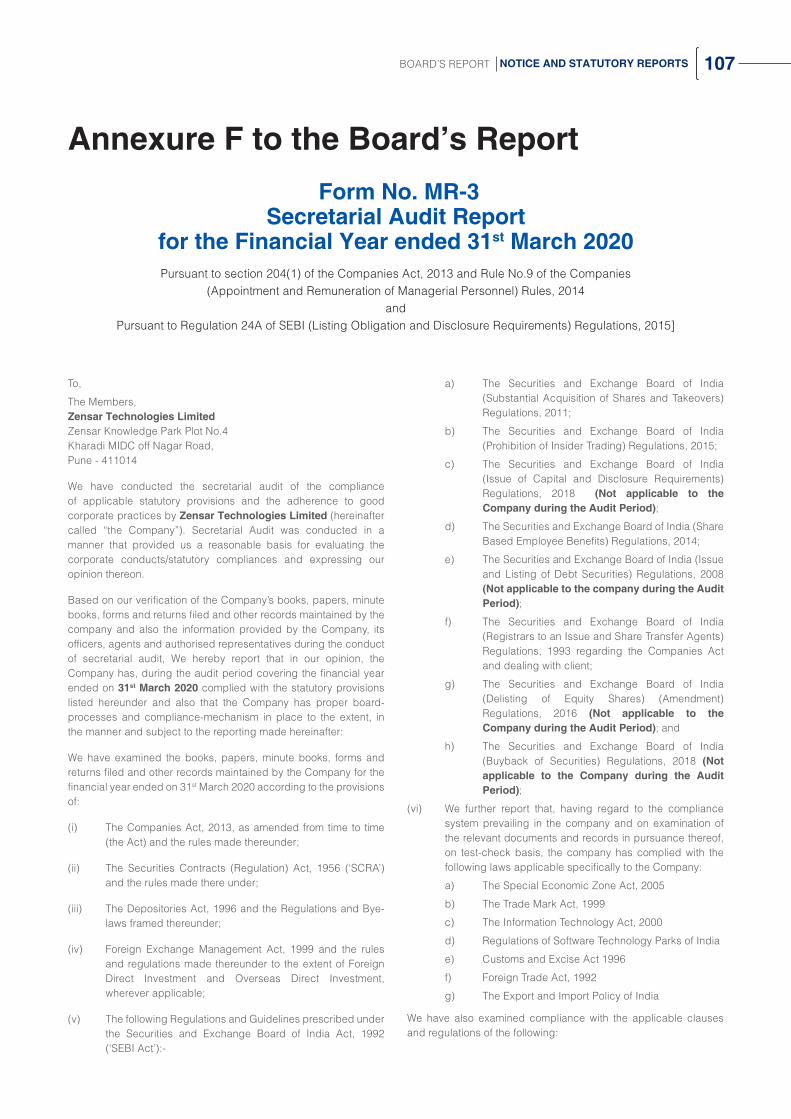
107BOARD’S REPORT NOTICE AND STATUTORY REPORTS
To,
The Members,Zensar Technologies LimitedZensar Knowledge Park Plot No.4Kharadi MIDC off Nagar Road,Pune - 411014
We have conducted the secretarial audit of the compliance of applicable statutory provisions and the adherence to good corporate practices by Zensar Technologies Limited (hereinafter called “the Company”). Secretarial Audit was conducted in a manner that provided us a reasonable basis for evaluating the corporate conducts/statutory compliances and expressing our opinion thereon.
Based on our verification of the Company’s books, papers, minute books, forms and returns filed and other records maintained by the company and also the information provided by the Company, its officers, agents and authorised representatives during the conduct of secretarial audit, We hereby report that in our opinion, the Company has, during the audit period covering the financial year ended on 31st March 2020 complied with the statutory provisions listed hereunder and also that the Company has proper board-processes and compliance-mechanism in place to the extent, in the manner and subject to the reporting made hereinafter:
We have examined the books, papers, minute books, forms and returns filed and other records maintained by the Company for the financial year ended on 31st March 2020 according to the provisions of:
(i) The Companies Act, 2013, as amended from time to time (the Act) and the rules made thereunder;
(ii) The Securities Contracts (Regulation) Act, 1956 (‘SCRA’) and the rules made there under;
(iii) The Depositories Act, 1996 and the Regulations and Bye-laws framed thereunder;
(iv) Foreign Exchange Management Act, 1999 and the rules and regulations made thereunder to the extent of Foreign Direct Investment and Overseas Direct Investment, wherever applicable;
(v) The following Regulations and Guidelines prescribed under the Securities and Exchange Board of India Act, 1992 (‘SEBI Act’):-
a) The Securities and Exchange Board of India (Substantial Acquisition of Shares and Takeovers) Regulations, 2011;
b) The Securities and Exchange Board of India (Prohibition of Insider Trading) Regulations, 2015;
c) The Securities and Exchange Board of India (Issue of Capital and Disclosure Requirements) Regulations, 2018 (Not applicable to the Company during the Audit Period);
d) The Securities and Exchange Board of India (Share Based Employee Benefits) Regulations, 2014;
e) The Securities and Exchange Board of India (Issue and Listing of Debt Securities) Regulations, 2008 (Not applicable to the company during the Audit Period);
f) The Securities and Exchange Board of India (Registrars to an Issue and Share Transfer Agents) Regulations, 1993 regarding the Companies Act and dealing with client;
g) The Securities and Exchange Board of India (Delisting of Equity Shares) (Amendment) Regulations, 2016 (Not applicable to the Company during the Audit Period); and
h) The Securities and Exchange Board of India (Buyback of Securities) Regulations, 2018 (Not applicable to the Company during the Audit Period);
(vi) We further report that, having regard to the compliance system prevailing in the company and on examination of the relevant documents and records in pursuance thereof, on test-check basis, the company has complied with the following laws applicable specifically to the Company:
a) The Special Economic Zone Act, 2005
b) The Trade Mark Act, 1999
c) The Information Technology Act, 2000
d) Regulations of Software Technology Parks of India
e) Customs and Excise Act 1996
f) Foreign Trade Act, 1992
g) The Export and Import Policy of India
We have also examined compliance with the applicable clauses and regulations of the following:
Annexure F to the Board’s Report Form No. MR-3
Secretarial Audit Reportfor the Financial Year ended 31st March 2020Pursuant to section 204(1) of the Companies Act, 2013 and Rule No.9 of the Companies
(Appointment and Remuneration of Managerial Personnel) Rules, 2014 and
Pursuant to Regulation 24A of SEBI (Listing Obligation and Disclosure Requirements) Regulations, 2015]

108 ZENSAR TECHNOLOGIES LTD ANNUAL REPORT 2019-20
(i) Secretarial Standards issued by ‘The Institute of Company Secretaries of India’; and
(ii) The Listing Agreement entered into by the Company with Stock Exchange(s) pursuant to SEBI (Listing Obligations and Disclosure Requirements) Regulations, 2015 including any amendments thereto.
We further report that,
The Board of Directors of the Company is duly constituted with proper balance of Executive Directors, Non-Executive Directors and Independent Directors. The changes in the composition of the Board of Directors that took place during the period under review were carried out in compliance with the provisions of the Act.
Adequate notice is given to all directors to schedule the Board Meetings, agenda and detailed notes on agenda were sent at least seven days in advance and a system exists for seeking and obtaining further information and clarifications on the agenda items before the meeting and for meaningful participation at the meeting. Further, in the incidences where, for the purpose of any Board or Committee Meeting, notice, agenda or notes to agenda are circulated with shorter period of less than seven days, all the Directors including Independent Directors have consented to the shorter period of circulation of the same.
All decisions at Board Meetings and Committee Meetings are carried out unanimously as recorded in the minutes of the meetings of the Board of Directors or Committees of the Board, as the case may be.
We further report that there are adequate systems and processes in the company commensurate with the size and operations of the company to monitor and ensure compliance with applicable laws, rules, regulations and guidelines.
We further report that during the audit period:
1. The company had declared an 2nd Interim Dividend of Rs. 1.80 per equity share of Rs. 2 each for the FY 2019-20 on 6th March, 2020. The company remitted through electronic mode the said interim dividend
Annexure F to the Board’s Report (Contd.)
to all those shareholders whose bank accounts were registered with the company. However, as regards those shareholders who have not updated their respective bank account with the Company or depository participants, the dividend needs to be paid by way of physical warrants and the same could not be paid as the dispatch of the dividend warrants was not possible due to nation-wide lockdown caused by pandemic of Covid-19. Further as per the General Circular no. 20/2020 dated 5th May, 2020 issued by the Ministry of Corporate Affairs, in case the company is unable to pay the dividend to any shareholder by electronic mode, shall upon normalisation of the postal services, dispatch the dividend warrant /cheque to such shareholder by post.
2. A Meeting of Independent Directors, as required under the Act, could not be conducted due to pandemic of Covid-19. As per the General Circular no. 11/2020 dated 24th March, 2020 issued by the Ministry of Corporate Affairs, if the Independent Directors of the company have not been able to hold a meeting, for the financial year 2019-20, the same shall not be viewed as a violation. However, the meeting of such Independent Directors was subsequently held on 24th April, 2020.
For SVD & AssociatesCompany Secretaries
S. V. Deulkar Partner FCS No. 1321Place: Pune C P No. 965Date: May 14, 2020 UDIN: F001321B000235808
Note: This report is to be read with letter of even date by the Secretarial Auditors, which is annexed as Annexure A and forms an integral part of this report.

109BOARD’S REPORT NOTICE AND STATUTORY REPORTS
Annexure F to the Board’s Report (Contd.)
To, (Annexure A)
The Members,
Zensar Technologies Limited
Zensar Knowledge Park Plot No.4
Kharadi MIDC off Nagar Road,
Pune - 411014
Our Secretarial Audit Report of even date is to be read along with this letter.
Management’s Responsibility
1. It is the responsibility of the management of the Company to maintain secretarial records, devise proper systems to ensure compliance with the provisions of all applicable laws and regulations and to ensure that the systems are adequate and operate effectively.
Auditor’s Responsibility
2. Our responsibility is to express an opinion on these secretarial records, standards and procedures followed by the Company with respect to secretarial compliances.
3. We believe that audit evidence and information obtained from the Company’s management is adequate and appropriate for us to provide a basis for our opinion.
4. We have also relied on the documents and evidences provided on email to us, in view of the prevailing Pandemic situation of COVID-19.
5. Wherever required, we have obtained the management’s representation about the compliance of laws, rules and regulations and happening of events, etc.
Disclaimer
6. The Secretarial Audit Report is neither an assurance as to the future viability of the Company nor of the efficacy or effectiveness with which the management has conducted the affairs of the Company.
For SVD & AssociatesCompany Secretaries
S. V. Deulkar Partner FCS No. 1321Place: Pune C P No. 965Date: May 14, 2020 UDIN: F001321B000235808

110 ZENSAR TECHNOLOGIES LTD ANNUAL REPORT 2019-20
To,
The Members,
Zensar Technologies Limited
Zensar Knowledge Park Plot No.4
Kharadi MIDC, Off Nagar Road,
Pune - 411014
We SVD & Associates have examined:
a) all the documents and records made available to us, either physically or by way of email in view of the prevailing Pandemic situation of COVID -19 and explanation provided by Zensar Technologies Limited (“the listed entity”),
b) the filings/ submissions made by the listed entity to the stock exchanges,
c) website of the listed entity,
d) any other document/ filing, as may be relevant, which has been relied upon to make this certification,
for the year ended 31st March, 2020 (“Review Period”) in respect of compliance with the provisions of:
a) the Securities and Exchange Board of India Act, 1992 (“SEBI Act”) and the Regulations, circulars, guidelines issued thereunder; and
b) the Securities Contracts (Regulation) Act, 1956 (“SCRA”), rules made thereunder and the Regulations, circulars, guidelines issued thereunder by the Securities and Exchange Board of India (“SEBI”);
The specific Regulations, whose provisions and the circulars/ guidelines issued thereunder, have been examined, include:-
a) Securities and Exchange Board of India (Listing
Obligations and Disclosure Requirements) Regulations, 2015;
b) The Securities and Exchange Board of India (Issue of Capital and Disclosure Requirements) Regulations, 2018 effective from 09th November, 2018 (Not applicable to the Company during the Review Period);
c) Securities and Exchange Board of India (Substantial Acquisition of Shares and Takeovers) Regulations, 2011;
d) The Securities and Exchange Board of India (Buyback of Securities) Regulations, 2018 effective from 11th September, 2018 (Not applicable to the Company during the Review Period);
e) Securities and Exchange Board of India (Share Based Employee Benefits) Regulations, 2014;
f) Securities and Exchange Board of India (Issue and Listing of Debt Securities) Regulations, 2008; (Not applicable to the Company during the Review Period);
g) Securities and Exchange Board of India (Issue and Listing of Non-Convertible and Redeemable Preference Shares) Regulations,2013; (Not applicable to the Company during the Review Period);
h) Securities and Exchange Board of India (Prohibition of Insider Trading) Regulations, 2015;
i) Securities and Exchange Board of India (Depositories and Participants) Regulations, 2018;
j) The Securities and Exchange Board of India (Registrars to an Issue and Share Transfer Agents) Regulations, 1993 regarding the Companies Act and dealing with client; and circulars/ guidelines issued thereunder;
Annexure G to the Board’s Report
Annual Secretarial Compliance Report of Zensar Technologies Limited for the year ended
31st March, 2020

111BOARD’S REPORT NOTICE AND STATUTORY REPORTS
And based on the above examination, we hereby report that, during the Review Period:
(a) The listed entity has complied with the provisions of the above Regulations and circulars/ guidelines issued there under except in respect of matters specified below:
Sr. No.
Compliance Requirement (Regulations/
circulars/guidelines including specific clause)
DeviationsObservations/
Remarks of the Practicing Company Secretary
1. NIL NIL NIL
(b) The listed entity has maintained proper records under the provisions of the above Regulations and circulars/ guidelines issued there under insofar as it appears from our examination of those records.
(c) The company has suitably included the conditions as mentioned in clause 6(A) and 6(B) of the SEBI circular No. CIR/CFD/CM D1/114/2019 dated October 18, 2019 in the terms of appointment of Statutory Auditor of the company.
(d) The following are the details of actions taken against the listed entity/ its promoters/ directors/ material subsidiaries either by SEBI or by Stock Exchanges(including under the Standard Operating Procedures issued by SEBI through various circulars) under the aforesaid Acts/ Regulations and circulars/ guidelines issued there under:
Sr. No. Action taken by Details of violation
Details of action taken E.g. fines, warning letter, debarment, etc.
Observations/ remarks of the Practicing Company
Secretary, if any
1. NIL NIL NIL NIL
(e) The listed entity has taken the following actions to comply with the observations made in previous reports:
Sr. No.
Observations of the Practicing Company
Secretary in the previous reports
Observations made in the secretarial
compliance report for the year ended. (The years are to be mentioned)
Actions taken by the listed entity,
if any
Comments of the Practicing Company
Secretary on the actions taken by the listed entity
1. Stock exchange intimation of Proceedings of Annual General Meeting (AGM) held on 8th August 2018 are filed with BSE and NSE for about two hours fifty minutes beyond the prescribed timeline as mentioned in regulation 30 read with Schedule III of SEBI (Listing Obligation and Disclosure require-ments) Regulations, 2015.
2018-19 The Company has taken necessary corrective actions to file the proceedings of AGM within the prescribed time lim-its for FY 2019-20.
The actions taken by the Company are satisfactory and the Company has done the filing for the FY 2019-20 within the prescribed time limits.
Annexure G to the Board’s Report (Contd.)

112 ZENSAR TECHNOLOGIES LTD ANNUAL REPORT 2019-20
2. Stock exchange intima-tion of Voting results and Scrutinizer's Report for the AGM held on 8th August 2018 are filed with NSE for about 1 hour beyond the prescribed timeline as per regulation 44 of SEBI (Listing Obligation and Disclosure requirements) Regulations, 2015.
2018-19 The Company has taken necessary corrective actions to submit the vot-ing results of the AGM within the pre-scribed time limits for FY 2019-20
The actions taken by the Company are satisfactory and the Company has done the filing for the FY 2019-20 within the prescribed time limits.
3. Filing of Report on recon-ciliation of share capital audit to Stock Exchange for quarter ended March 31, 2018 has been de-layed for about two days beyond prescribed due date as mentioned in the regulation 55A of Securi-ties and Exchange Board of India(Depositories and Participants) Regulations, 1996.
2018-19 The Company has taken necessary corrective actions to submit the report of reconciliation of share capital within the prescribed time limits for FY 2019-20.
The actions taken by the Company are satisfactory and the Company has done the filing for the FY 2019-20 within the prescribed time limits.
For SVD & AssociatesCompany Secretaries
S. V. Deulkar Partner Place: Pune FCS No. 1321Date: May 14, 2020 C P No. 965
UDIN: F001321B000235874
Annexure G to the Board’s Report (Contd.)

113BOARD’S REPORT NOTICE AND STATUTORY REPORTS
Annexure H to the Board’s ReportAnnual Report on CSR Activities
1 A brief outline of Company’s CSR policy, including overview of projects or programs proposed to be undertaken and a reference to the web-link to the CSR policy and projects or Programs
CSR Policy of the Company is enclosed herewith.
Further details of CSR policy and activities of the Company are hosted on website of the Company on the web-link below: https://www.zensar.com/sites/default/files/investor/policies-reports-fillings/CSR%20Policy_Final.pdf
2 The Composition of the CSR Committee(Pursuant to Section 135 of the Act and the Rules thereunder)
i) Arvind Agrawal, Chairman ii) A. T. Vaswani, Member iii) Sandeep Kishore, Member
3 Average net proflt of the company for last three financial years (INR in Lakhs)
26,403
4 Prescribed CSR Expenditure (2% of the amount as in item 3 above) (INR in Lakhs)
528
5 Details of CSR spent during the financial year (INR in Lakhs)
(a) Total amount to be spent for the financial year 530
(b) Amount unspent, if any Nil
(c) Manner in which the amount spent during the financial year is given below:
(1) (2) (3) (4) (5) (6) (7) (8)Sr. No.
CSR Project or Activity Identified
Sector in which the Project is Covered
Projects or Programs Amount Outlay
(Budget) Project or Program
wise
Amount Spent on Projects or Programs
Cumulative Expenditure
up to the reporting
period
Amount Spent: Direct or through
implementing agency
Local Area or Other
Specify the state and district
where projects or programs were
undertaken
Direct Expenses
Over-heads
1 Contribution to RPG Foundation
Sectors covered under Schedule VII appended to the Act. Brief details of programs are mentioned in Table A below as well as in the Board's Report.
Local Area
Pune, Maharashtra; Hyderabad, Telangana and Bengaluru, Karnataka
528 530 - 530 Entire amount paid by the Company to RPG Foundation, an implementing agency
Total 528 530 - 530
6 CSR Committee hereby states that the implementation and monitoring of CSR Policy, is in compliance with CSR objectives and Policy of the Company.
Place: Mumbai Arvind Agrawal Sandeep KishoreDate: July 23, 2020 Chairman Managing Director and Chief Executive Officer Corporate Social Responsibility Committee
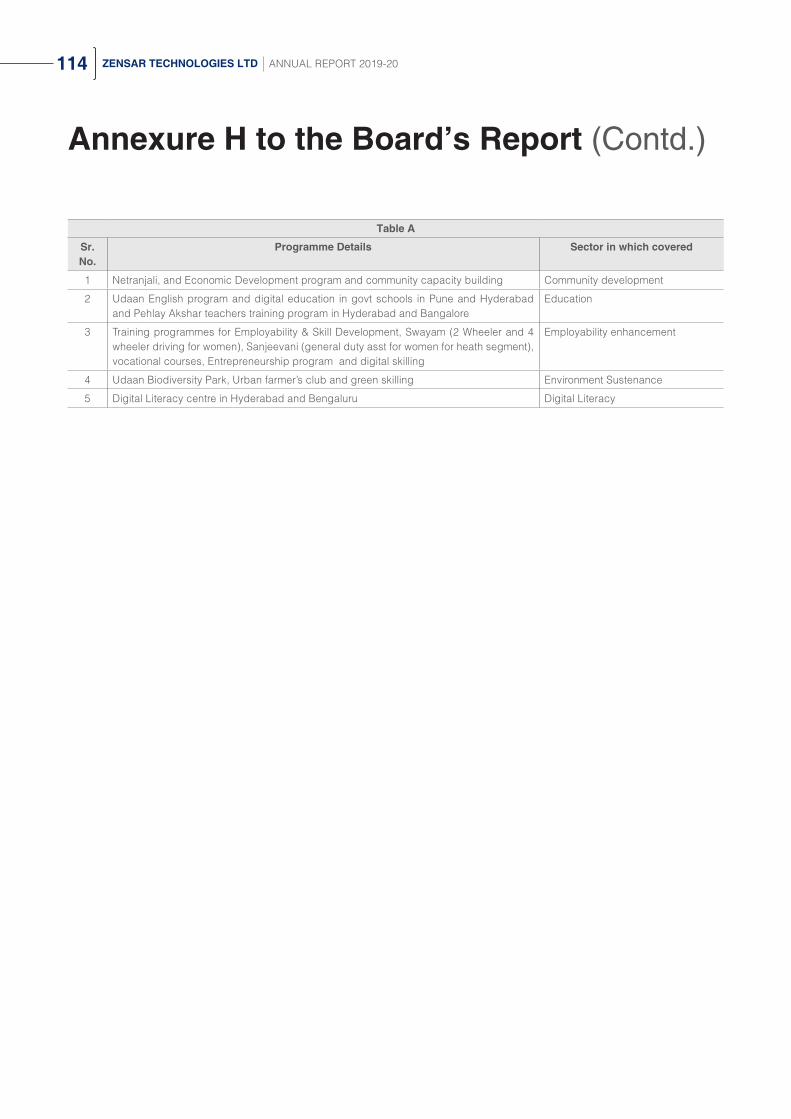
114 ZENSAR TECHNOLOGIES LTD ANNUAL REPORT 2019-20
Annexure H to the Board’s Report (Contd.)
Table A
Sr. No.
Programme Details Sector in which covered
1 Netranjali, and Economic Development program and community capacity building Community development
2 Udaan English program and digital education in govt schools in Pune and Hyderabad and Pehlay Akshar teachers training program in Hyderabad and Bangalore
Education
3 Training programmes for Employability & Skill Development, Swayam (2 Wheeler and 4 wheeler driving for women), Sanjeevani (general duty asst for women for heath segment), vocational courses, Entrepreneurship program and digital skilling
Employability enhancement
4 Udaan Biodiversity Park, Urban farmer’s club and green skilling Environment Sustenance
5 Digital Literacy centre in Hyderabad and Bengaluru Digital Literacy

115BOARD’S REPORT NOTICE AND STATUTORY REPORTS
Annexure I to the Board’s ReportReport on Conservation of Energy, Technological
Absorption and Foreign Exchange Earnings and OutgoParticulars pursuant to Section 134(m) of the Companies Act, 2013 read with the Companies (Accounts) Rules, 2014 and other
sustainability initiatives.
Part A:
CONSERVATION OF ENERGY AND WATER
As a responsible corporate, Zensar believes that it has got accountability in addressing global energy challenges, climate change and environmental sustainability and thus strives to consume energy in an efficient, economical and environment friendly manner throughout all its premises, while:
The key initiatives during FY 2019-20 are briefly stated below:
1. Effective Utilisation of Lighting
• LED lights used in all areas including Offshore Development Centres and common areas in all major campuses and office buildings of Zensar.
• Motion light sensors along with daylight harvesting feature have been installed leading to around 40-50% saving in energy consumption as compared to conventional means and the estimated saving of more than 16,000 KWh of absolute energy consumption and has further helped reduce carbon footprint of about 13tCO2e* (Ton of Carbon Emission), resulting into annual savings of about INR 1.60 Lakhs.
2. Chiller and AHU Operational Performance Improvement
• Effective operation of chillers and AHUs in all major facilities helped the Company to save energy of 1,49,339 KWh during the year and has helped reduce carbon footprint of 126tCO2e* (Ton of Carbon Emission), leading to annual savings of about INR 15 Lakhs.
• VRV, Air & Water-cooled chillers installed across locations consume lesser power than air cooled chillers.
• Energy Star rating Air Conditioners are used in Data centers and hub rooms as backup to floor Air Conditioning system which generally gives 20-30% power efficiency, as against a normal conventional Air-conditioning system.
• Optimal temperature setting is used across various facilities that led to energy savings of 5-7% in line with the commitment to reduce “carbon footprint”.
• A Building Management System (BMS) is used, to control lighting, air-conditioning, CCTV and Fire alarm system from single desk.
• Since 2015, server rationalisation and virtualisation program, lead to decommissioning of old physical servers and replacement with virtualisation technology on fewer numbers of servers with organisation achieving about 50% reduction in energy consumption.
3. Effective utilisation of UPS has led to saving of more than 12,000 KWh of absolute energy consumption during the year and also helped to reduce about 23tCO2e* of carbon footprint, resulting into annual savings of INR 1.20 Lakhs.
4. Voltage optimisation helped save around 10-13% energy consumption during the year. Further the Company practices usage of laptops instead of desktop - more than 60% of systems used, are laptops and thin client, which are more energy efficient. On an average a laptop may peak at a maximum draw of only 60 watts, whereas common desktop may peak around 175 watts.
Promoting energy efficient and environment friendly procurement and designing new infrastructure facilities in environment friendly manner.
Adopting 3-R philosophy (Reduce, Reuse, Recycle) for all types of waste(s) to prevent pollution.
Communicating the Environment, Health, Safety and Energy (EHSEn) policy and objectives to concerned parties.
Setting appropriate policy(ies), objectives and reviewing targets on periodic basis for improvement(s).
Complying with all the environmental, health, safety and energy related regulatory requirements.
CONSERVATION OF ENERGY AND WATER AT ZENSAR

116 ZENSAR TECHNOLOGIES LTD ANNUAL REPORT 2019-20
Annexure I to the Board’s Report (Contd.)
5. Water Conservation
• Ground water recharging technique is used by diverting the roof top and storm water drains into boreholes at various locations.
• Use of automatic sensors for urinals flushing and recycling the waste water saves around 54% of annual water requirement. Aerators have been installed in water taps across locations to reduce water flow and usage.
6. Various other Green Initiatives implemented for environmental protection:
Sewage Treatment
Plant
Gardening and Watering Landscape
Waste Water
Key Green Initiatives
Digital Standees used in place of Flex/
Posters which has helped in reduction of ~1080Sq. ft. Flex
per year
Video Conferencing technologies
preferred over in person travel for
business operations
Single use of plastic is prohibited across
locations
“ZenCommute”, inhouse app is used for controlling and enhancing vehicle occupancy thereby helping in reducing
Carbon footprint
Bio Gas Plant for recycling food waste
and generating biogas for cooking

117BOARD’S REPORT NOTICE AND STATUTORY REPORTS
Annexure I to the Board’s Report (Contd.)
Part B:
TECHNOLOGY ABSORPTION - RESEARCH AND DEVELOPMENT
Innovation driving Next Gen Tech solutions
Zenlabs is a DSIR (Department of Scientific and Research, India) recognised R&D center and innovation hub of Zensar. Company’s innovation strategy is primarily focused on applied R&D surrounding next-gen exponential technologies. The technology focus is two dimensional – Artificial Intelligence (AI) and Blockchain. Zenlabs actively engages in co-innovation initiatives with the clientele, helping ease the adoption of next-gen technologies. The team comprises a rich mix of technology experts, researchers, techno-functional consultants, and domain experts - PhD’s, MTech’s and BTech’s from reputed institutions like IIT/IIIT/NIT, possessing key expertise areas around AI and Blockchain.
Zenlabs has delivered 30+ Proof of Concept / Minimum Viable Product implementations across Retail, Banking, Insurance, and Manufacturing clientele. In FY 2019-20, Zenlabs’ Blockchain practice has successfully delivered an end-to-end productionised blockchain implementation for one of the key international clients.
Zenlabs spearheads the thought leadership initiatives of Zensar. By end of FY2020, Zensar has filed 100+ patents across all geographies and 10+ patents granted including two from USA. Zenlabs have published 25+ whitepapers and 15+ blogs around the latest developments and expert insights in the world of AI and Blockchain. In FY 2019-20 Zensar AI Research Labs has been launched with focus on Artificial Intelligence R&D to develop vertical aligned business solutions powered by AI technologies.
Zenlabs expertise is well recognised in the industry with key Analyst mentions:
• Innovator in Avasant’s Applied AI and Advanced Analytics Services, 2019
• Challenger in Avasant’s Blockchain Services RadarViewTM Report, 2019
• Mentioned in Gartner Market Guide for Blockchain Consulting
• Aspirant in the Everest Blockchain Services PEAK Matrix™ Assessment 2019
Highlights:
1. Zensar AIRLabs
Zensar AIRLab is continuously working in AI applied research to build vertically aligned business solutions for Retail, Banking, Insurance, and Manufacturing clientele.
Some of the Key Solutions/Intellectual Property (IP):
• ZEVA is Zensar Enterprise Virtual Assistant platform developed for organisations to maximise the power of conversational AI (Natural Language Processing) and to improve end user experiences. Zeva has Question Answering system and chatbot capability in-built. It has an omni-channel experience interface and connectors for integration with systems like CRM, databases, ERP, RPA bots.
• Smart Route platform utilizes machine learning and Optical Character Recognition to classify incoming mails into pre-defined categories and smartly route to respective personnel. It helps reduce manual efforts of tracking and routing the customer service mails.
• ZENVAS Zensar Visual Analytics System a platform helps identify user’s age, gender, emotion, and track user movement using vision AI and IP cameras. It helps to understand consumers behavior and extract user analytics.
• Persona Detector platform helps recognize people based on facial features taking camera feed as input. It helps business identify HNI (high net worth individuals) on-premises and surveillance.
• Presence Insight platform identifies the heat map of premises (zones) using IP cameras (video feed).
2. Blockchain
The proprietary blockchain enablement framework ZenSmartBlox is an industry agnostic platform which helps multiple industries like Retail, Banking, Insurance and Manufacturing for adoption of enterprise blockchain solutions. ZenSmartBlox’s acceleration layer acts as an interface with multiple platforms such as Hyperledger, Ethereum, IOTA, Quorum, and Multichain for enterprise solutions.
Key Solutions/IP’s
Deployment Controller Interface Controller
• Helps to spawn the Hyperledger fabric network in a multi-host environment.
• Reduces the time, effort and cost from many weeks to few minutes.
• Automates the complete transfer of data from the existing standard database to the blockchain.
• Maintains the synchronisation between two databases.

118 ZENSAR TECHNOLOGIES LTD ANNUAL REPORT 2019-20
Part C:
Particulars regarding R & D expenditure during the year, are given in Note No. 5 of Notes to Financial Statements.
For and on behalf of the Board of Directors
Place: Mumbai H.V. Goenka Dated: July 23, 2020 Chairman
Annexure I to the Board’s Report (Contd.)
FOREIGN EXCHANGE EARNINGS AND OUTGO
Foreign Exchange Outgo
Foreign Exchange Earnings
8,523
137,168
130,633
3,893
FY 2019-20 FY 2018-19
0 20,000 40,000 60,000 80,000 100,000 120,000 140,000 160,000
(INR in Lakhs)

119BOARD’S REPORT NOTICE AND STATUTORY REPORTS
FINANCIALSTATEMENTSSTANDALONE

120 ZENSAR TECHNOLOGIES LTD ANNUAL REPORT 2019-20
TO THE MEMBERS OF ZENSAR TECHNOLOGIES LIMITED
Report on the Audit of Standalone Financial Statements
Opinion
We have audited the accompanying standalone financial statements of Zensar Technologies Limited (“the Company”), which comprise
the Balance Sheet as at March 31, 2020, and the Statement of Profit
and Loss (including Other Comprehensive Income), the Statement
of Cash Flows and the Statement of Changes in Equity for the year
then ended, and a summary of significant accounting policies and
other explanatory information.
In our opinion and to the best of our information and according
to the explanations given to us, the aforesaid standalone financial
statements give the information required by the Companies Act,
2013 (“the Act”) in the manner so required and give a true and fair
view in conformity with the Indian Accounting Standards prescribed
under section 133 of the Act read with the Companies (Indian
Accounting Standards) Rules, 2015, as amended, (“Ind AS”) and other accounting principles generally accepted in India, of the state of affairs of the Company as at March 31, 2020, and its profit, total comprehensive income, its cash flows and the changes in equity for the year ended on that date.
Independent Auditors’ ReportBasis for Opinion
We conducted our audit of the standalone financial statements in accordance with the Standards on Auditing specified under section 143(10) of the Act (SAs). Our responsibilities under those Standards are further described in the Auditor’s Responsibility for the Audit of the Standalone Financial Statements section of our report. We are independent of the Company in accordance with the Code of Ethics issued by the Institute of Chartered Accountants of India (ICAI) together with the ethical requirements that are relevant to our audit of the standalone financial statements under the provisions of the Act and the Rules made thereunder, and we have fulfilled our other ethical responsibilities in accordance with these requirements and the ICAI’s Code of Ethics. We believe that the audit evidence obtained by us is sufficient and appropriate to provide a basis for our audit opinion on the standalone financial statements.
Key Audit Matters
Key audit matters are those matters that, in our professional judgment, were of most significance in our audit of the standalone financial statements of the current period. These matters were addressed in the context of our audit of the standalone financial statements as a whole, and in forming our opinion thereon, and we do not provide a separate opinion on these matters. We have determined the matters described below to be the key audit matters to be communicated in our report.
Sr. No.
Key Audit Matter Auditors’ Response
1 Determination of Cash Generating Unit (CGU) for impairment testing of goodwill:
As per the requirements of Ind AS 36 – Impairment of Assets, the Company tests the Goodwill acquired in business combination for impairment annually.
As on March 31, 2020, the Company has Goodwill of Rs. 8,402 lakhs which is allocated to CGU as set out in note 33 to the standalone financial statements.
During the year ended on March 31, 2020, the Company has realigned its criteria of CGU determination in line with its integrated global service offerings.
Significant judgment is involved in the determination of CGU and allocation of related goodwill including:
- looking at possible synergies through a combination of service offerings, business units, customers, geographies;
- evaluating the financial performance of the CGU for the purpose of impairment testing of goodwill.
Principal audit procedures performed:
• We evaluated the design of internal controls and their operating effectiveness, relating to testing of impairment of goodwill.
• We gained an understanding of evaluation of identification of CGU and allocation of goodwill to the CGU by management. Specifically we have:
- obtained mapping of the CGU with the business units, customers, service offerings, geographies;
- verified business performance evaluation in respect of the CGU including organization responsibility structure thereof;
- perused how the synergies are expected to materialize by verifying sample of recent business transactions.

121BOARD’S REPORT NOTICE AND STATUTORY REPORTS
Independent Auditors’ Report (Contd.)
2 Allowance for credit losses:
The Company determines the allowance for credit losses based on historical loss experience and collection patterns, adjusted to reflect current and estimated future economic conditions. The Company considered current and anticipated future economic conditions relating to industries the Company deals with and the countries where it operates.
Considering uncertainties due to COVID-19 pandemic, in calculating expected credit loss, the Company has also considered credit reports, subsequent collections, credit term extension requests and other related credit information for its customers to estimate the probability of default in future.
We identified allowance for credit losses as a key audit matter because the Company exercises significant judgment in calculating the expected credit losses because of possible effect from the pandemic relating to COVID-19.
Refer Notes 3(j), 6(c), 6(h) and 26(b) to the standalone financial statements.
Our audit procedures related to the allowance for credit losses for trade receivables and unbilled revenue included the following, among others we tested the effectiveness of controls over:
• management assessment of the allowance for credit losses, including factors taken into account by the management in current and estimated future economic conditions
• relevance of information used in the estimation of probability of default.
• computation of the allowance for credit losses
For a sample of customers:
• We tested the input data such as credit reports, subsequent collections, impact of credit extensions, other credit related information used in estimating the probability of default by comparing them to external and internal sources of information.
• We tested the mathematical accuracy of the credit loss allowances.
Information Other than the Financial Statements and Auditor’s Report Thereon
• The Company’s Board of Directors is responsible for the preparation of the other information. The other information comprises the Board’s Report including its annexures but does not include the standalone financial statements and our auditor’s report thereon. The Board’s Report including its annexures are expected to be made available to us after the date of this auditor’s report.
• Our opinion on the standalone financial statements does not cover the other information and we do not and will not express any form of assurance conclusion thereon.
• In connection with our audit of the standalone financial statements, our responsibility is to read the other information identified above when it becomes available and, in doing so, consider whether the other information is materially inconsistent with the standalone financial statements or our knowledge obtained during the course of our audit or otherwise appears to be materially misstated.
• When we read the Board’s Report including its annexures, if we conclude that there is a material misstatement therein, we are required to communicate the matter to those charged with governance as required under SA 720 ‘The Auditor’s responsibilities Relating to Other Information’.
Management’s Responsibility for the Standalone Financial Statements
The Company’s Board of Directors is responsible for the matters stated in section 134(5) of the Act with respect to the preparation of these standalone financial statements that give a true and fair view of the financial position, financial performance including other comprehensive income, cash flows and changes in equity of the Company in accordance with the Ind AS and other accounting principles generally accepted in India. This responsibility also includes maintenance of adequate accounting records in accordance with the provisions of the Act for safeguarding the assets of the Company and for preventing and detecting frauds and other irregularities; selection and application of appropriate accounting policies; making judgments and estimates that are reasonable and prudent; and design, implementation and maintenance of adequate internal financial controls, that were operating effectively for ensuring the accuracy and completeness of the accounting records, relevant to the preparation and presentation of the standalone financial statements that give a true and fair view and are free from material misstatement, whether due to fraud or error.
In preparing the standalone financial statements, management is responsible for assessing the Company’s ability to continue as a going concern, disclosing, as applicable, matters related to going concern and using the going concern basis of accounting unless management either intends to liquidate the Company or to cease operations, or has no realistic alternative but to do so.

122 ZENSAR TECHNOLOGIES LTD ANNUAL REPORT 2019-20
Those Board of Directors are also responsible for overseeing the Company’s financial reporting process.
Auditors’ Responsibility for the Audit of the Standalone Financial Statements
Our objectives are to obtain reasonable assurance about whether the standalone financial statements as a whole are free from material misstatement, whether due to fraud or error, and to issue an auditor’s report that includes our opinion. Reasonable assurance is a high level of assurance, but is not a guarantee that an audit conducted in accordance with SAs will always detect a material misstatement when it exists. Misstatements can arise from fraud or error and are considered material if, individually or in the aggregate, they could reasonably be expected to influence the economic decisions of users taken on the basis of these standalone financial statements.
As part of an audit in accordance with SAs, we exercise professional judgment and maintain professional skepticism throughout the audit. We also:
• Identify and assess the risks of material misstatement of the standalone financial statements, whether due to fraud or error, design and perform audit procedures responsive to those risks, and obtain audit evidence that is sufficient and appropriate to provide a basis for our opinion. The risk of not detecting a material misstatement resulting from fraud is higher than for one resulting from error, as fraud may involve collusion, forgery, intentional omissions, misrepresentations, or the override of internal control.
• Obtain an understanding of internal financial control relevant to the audit in order to design audit procedures that are appropriate in the circumstances. Under section 143(3)(i) of the Act, we are also responsible for expressing our opinion on whether the Company has adequate internal financial controls system in place and the operating effectiveness of such controls.
• Evaluate the appropriateness of accounting policies used and the reasonableness of accounting estimates and related disclosures made by the management.
• Conclude on the appropriateness of management’s use of the going concern basis of accounting and, based on the audit evidence obtained, whether a material uncertainty exists related to events or conditions that may cast significant doubt on the Company’s ability to continue as a going concern. If we conclude that a material uncertainty exists, we are required to draw attention in our auditor’s report to the related disclosures in the standalone financial statements or, if such disclosures are inadequate, to modify our opinion. Our conclusions are based on the audit evidence obtained up to the date of our auditor’s report. However, future events or conditions may cause the Company to cease to continue as a going concern.
• Evaluate the overall presentation, structure and content of the standalone financial statements, including the disclosures, and whether the standalone financial statements represent the underlying transactions and events in a manner that achieves fair presentation.
Independent Auditors’ Report (Contd.)
Materiality is the magnitude of misstatements in the standalone financial statements that, individually or in aggregate, makes it probable that the economic decisions of a reasonably knowledgeable user of the standalone financial statements may be influenced. We consider quantitative materiality and qualitative factors in (i) planning the scope of our audit work and in evaluating the results of our work; and (ii) to evaluate the effect of any identified misstatements in the standalone financial statements.
We communicate with those charged with governance regarding, among other matters, the planned scope and timing of the audit and significant audit findings, including any significant deficiencies in internal control that we identify during our audit.
We also provide those charged with governance with a statement that we have complied with relevant ethical requirements regarding independence, and to communicate with them all relationships and other matters that may reasonably be thought to bear on our independence, and where applicable, related safeguards.
From the matters communicated with those charged with governance, we determine those matters that were of most significance in the audit of the standalone financial statements of the current period and are therefore the key audit matters. We describe these matters in our auditor’s report unless law or regulation precludes public disclosure about the matter or when, in extremely rare circumstances, we determine that a matter should not be communicated in our report because the adverse consequences of doing so would reasonably be expected to outweigh the public interest benefits of such communication.
Report on Other Legal and Regulatory Requirements
1. As required by Section 143(3) of the Act, based on our audit, we report that:
a) We have sought and obtained all the information and explanations which to the best of our knowledge and belief were necessary for the purposes of our audit.
b) In our opinion, proper books of account as required by law have been kept by the Company so far as it appears from our examination of those books.
c) The Balance Sheet, the Statement of Profit and Loss including Other Comprehensive Income, the Statement of Cash Flows and Statement of Changes in Equity dealt with by this Report are in agreement with the relevant books of account.
d) In our opinion, the aforesaid standalone financial statements comply with the Ind AS specified under Section 133 of the Act.
e) On the basis of the written representations received from the directors of the Company as on March 31, 2020 taken on record by the Board of Directors, none of the directors is disqualified as on March 31, 2020 from being appointed as a director in terms of Section 164(2) of the Act.

123BOARD’S REPORT NOTICE AND STATUTORY REPORTS
f) With respect to the adequacy of the internal financial controls over financial reporting of the Company and the operating effectiveness of such controls, refer to our separate Report in “Annexure A”. Our report expresses an unmodified opinion on the adequacy and operating effectiveness of the Company’s internal financial controls over financial reporting.
g) With respect to the other matters to be included in the Auditor’s Report in accordance with the requirements of section 197(16) of the Act, as amended,
In our opinion and to the best of our information and according to the explanations given to us, the remuneration paid by the Company to its directors during the year is in accordance with the provisions of section 197 of the Act.
h) With respect to the other matters to be included in the Auditors’ Report in accordance with Rule 11 of the Companies (Audit and Auditors) Rules, 2014, as amended, in our opinion and to the best of our information and according to the explanations given to us:
i. The Company has disclosed the impact of pending litigations on its financial position in its standalone financial statements – refer note 29 to the standalone financial statements;
ii. The Company has made provision, as required under the applicable law or accounting standards, for material foreseeable losses, if any, on long-term contracts including derivative contracts;
iii. There has been no delay in transferring amounts, required to be transferred, to the Investor Education and Protection Fund by the Company.
2. As required by the Companies (Auditor’s Report) Order, 2016 (“the Order”) issued by the Central Government in terms of Section 143(11) of the Act, we give in “Annexure B” a statement on the matters specified in paragraphs 3 and 4 of the Order.
For Deloitte Haskins & Sells LLP Chartered Accountants (Firm’s Registration No. 117366W/W-100018) Hemant M. JoshiPlace: Pune PartnerDate: May 14, 2020 (Membership No. 38019)
UDIN:20038019AAAADK9241
Independent Auditors’ Report (Contd.)

124 ZENSAR TECHNOLOGIES LTD ANNUAL REPORT 2019-20
Report on the Internal Financial Controls Over Financial Reporting under Clause (i) of Sub-section 3 of Section 143 of the Act
We have audited the internal financial controls over financial reporting of Zensar Technologies Limited (“the Company”) as of March 31, 2020 in conjunction with our audit of the standalone financial statements of the Company for the year ended on that date.
Management’s Responsibility for Internal Financial Controls
The Company’s management is responsible for establishing and maintaining internal financial controls based on the internal control over financial reporting criteria established by the Company considering the essential components of internal control stated in the Guidance Note on Audit of Internal Financial Controls Over Financial Reporting issued by the Institute of Chartered Accountants of India. These responsibilities include the design, implementation and maintenance of adequate internal financial controls that were operating effectively for ensuring the orderly and efficient conduct of its business, including adherence to company’s policies, the safeguarding of its assets, the prevention and detection of frauds and errors, the accuracy and completeness of the accounting records, and the timely preparation of reliable financial information, as required under the Act.
Auditors’ Responsibility
Our responsibility is to express an opinion on the Company’s internal financial controls over financial reporting of the Company based on our audit. We conducted our audit in accordance with the Guidance Note on Audit of Internal Financial Controls Over Financial Reporting (the “Guidance Note”) issued by the Institute of Chartered Accountants of India and the Standards on Auditing prescribed under Section 143(10) of the Act, to the extent applicable to an audit of internal financial controls. Those Standards and the Guidance Note require that we comply with ethical requirements and plan and perform the audit to obtain reasonable assurance about whether adequate internal financial controls over financial reporting was established and maintained and if such controls operated effectively in all material respects.
Our audit involves performing procedures to obtain audit evidence about the adequacy of the internal financial controls system over financial reporting and their operating effectiveness. Our audit of internal financial controls over financial reporting included obtaining an understanding of internal financial controls over financial reporting, assessing the risk that a material weakness exists, and testing and evaluating the design and operating effectiveness of internal control based on the assessed risk. The procedures selected depend on the auditors’ judgement, including the assessment of the risks of material misstatement of the financial statements, whether due to fraud or error.
We believe that the audit evidence we have obtained is sufficient and appropriate to provide a basis for our audit opinion on
Annexure “A” to the Independent Auditors’ Report(Referred to in paragraph 1(f) under ‘Report on Other Legal and Regulatory Requirements’ section of our report of even date)
the Company’s internal financial controls system over financial reporting.
Meaning of Internal Financial Controls Over Financial Reporting
A company’s internal financial control over financial reporting is a process designed to provide reasonable assurance regarding the reliability of financial reporting and the preparation of financial statements for external purposes in accordance with generally accepted accounting principles. A company’s internal financial control over financial reporting includes those policies and procedures that (1) pertain to the maintenance of records that, in reasonable detail, accurately and fairly reflect the transactions and dispositions of the assets of the company; (2) provide reasonable assurance that transactions are recorded as necessary to permit preparation of financial statements in accordance with generally accepted accounting principles, and that receipts and expenditures of the company are being made only in accordance with authorisations of management and directors of the company; and (3) provide reasonable assurance regarding prevention or timely detection of unauthorised acquisition, use, or disposition of the company’s assets that could have a material effect on the financial statements.
Inherent Limitations of Internal Financial Controls Over Financial Reporting
Because of the inherent limitations of internal financial controls over financial reporting, including the possibility of collusion or improper management override of controls, material misstatements due to error or fraud may occur and not be detected. Also, projections of any evaluation of the internal financial controls over financial reporting to future periods are subject to the risk that the internal financial control over financial reporting may become inadequate because of changes in conditions, or that the degree of compliance with the policies or procedures may deteriorate.
Opinion
In our opinion, to the best of our information and according to the explanations given to us, the Company has, in all material respects, an adequate internal financial controls system over financial reporting and such internal financial controls over financial reporting were operating effectively as at March 31, 2020, based on the criteria for internal financial control over financial reporting established by the Company considering the essential components of internal control stated in the Guidance Note on Audit of Internal Financial Controls Over Financial Reporting issued by the Institute of Chartered Accountants of India.
For Deloitte Haskins & Sells LLP Chartered Accountants (Firm’s Registration No. 117366W/W-100018) Hemant M. JoshiPlace: Pune PartnerDate: May 14, 2020 (Membership No. 38019)
UDIN: 20038019AAAADK9241

125BOARD’S REPORT NOTICE AND STATUTORY REPORTS
(i) In respect of fixed assets:
(a) The Company has maintained proper records showing full particulars, including quantitative details and situation of fixed assets.
(b) The Company has a program of verification of fixed assets to cover all the items in a phased manner over a period of 2 years, which, in our opinion, is reasonable having regard to the size of the Company and the nature of its assets. Pursuant to the program, certain fixed assets were physically verified by the Management during the year. According to the information and explanations given to us, no material discrepancies were noticed on such verification.
(c) According to the information and explanations given to us, the records examined by us and based on the examination of the completion certificate / occupancy certificate / property tax documents provided to us, we report that, the title deeds of buildings are held in the name of the Company as at the balance sheet date.
(ii) The Company does not have any inventory and hence reporting under clause (ii) of the Order is not applicable.
(iii) The Company has not granted any loans, secured or unsecured, to companies, firms, Limited Liability Partnerships or other parties covered in the register maintained under section 189 of the Act.
Annexure “B” to the Independent Auditors’ Report(Referred to in paragraph 2 under ‘Report on Other Legal and Regulatory Requirements’ section of our report of even date)
(iv) In our opinion and according to the information and explanations given to us, the Company has complied with the provisions of Sections 185 and 186 of the Act in respect of grant of loans, making investments and providing guarantees and securities, as applicable.
(v) In our opinion and according to the information and explanations given to us, the Company has not accepted any deposits. Therefore, the provisions of the clause (v) of paragraph 3 of the Order is not applicable to the Company.
(vi) Having regard to the nature of the Company’s business / activities, the maintenance of cost records has not been specified by the Central Government under section 148(1) of the Act. Accordingly reporting under clause (vi) of paragraph 3 of the Order is not applicable.
(vii) According to the information and explanations given to us, in respect of statutory dues:
(a) The Company has generally been regular in depositing undisputed statutory dues, including Provident Fund, Employees’ State Insurance, Income-tax, Goods and Services Tax, Cess and other material statutory dues applicable to it with the appropriate authorities.
(b) There were no undisputed amounts payable in respect of Provident Fund, Employees’ State Insurance, Income-tax, Goods and Services Tax, Cess and other material statutory dues in arrears as at March 31, 2020, for a period of more than six months from the date they became payable.
(c) Details of dues of Income-tax, Value Added Tax and Goods and Services Tax which have not been deposited as on March 31, 2020 on account of disputes are given below:
Name of Statute / Nature of Dues
Forum where dispute is pendingPeriod to which amount relates (Financial Year)
Amount Unpaid*
Amount paid under protest
(Rs. in lakhs)
The Income-Tax Act, 1961
Assessing Officer 2006-07 0# -
Income Tax Appellate Tribunal 2007-08 1 -
Income Tax Appellate Tribunal 2008-09 4 -
Income Tax Appellate Tribunal 2010-11 74 -
Commissioner of Income Tax (Appeals) 2015-16 289 -
Maharashtra Value Added Tax, 2002
Joint Commissioner of Sales Tax (Appeals) 2009-10 54 5
Sales Tax Tribunal 2011-12 70 7
Deputy Commissioner of Sales Tax 2013-14 128 8
Deputy Commissioner of Sales Tax 2014-15 173 9
The Value Added Tax Act, 2005(Telangana Commercial Tax Department)
Deputy Commissioner - Commercial Tax 2015-16 2 -
* Net off amount paid under protest # denotes amount less than Rs. 1 lakh.

126 ZENSAR TECHNOLOGIES LTD ANNUAL REPORT 2019-20
Annexure “B” to the Independent Auditors’ Report (Contd.)
(viii) In our opinion and according to the information and explanations given to us, the Company has not defaulted in the repayment of loans or borrowings to banks. The Company has not taken any loans or borrowings from financial institutions and government or has not issued any debentures.
(ix) The Company has not raised moneys by way of initial public offer or further public offer (including debt instruments) or term loans and hence reporting under clause (ix) of the Order is not applicable.
(x) To the best of our knowledge and according to the information and explanations given to us, no fraud by the Company and no material fraud on the Company by its officers or employees has been noticed or reported during the year.
(xi) In our opinion and according to the information and explanations given to us, the Company has paid / provided managerial remuneration in accordance with the requisite approvals mandated by the provisions of section 197 read with Schedule V to the Act.
(xii) The Company is not a Nidhi Company and hence reporting under clause (xii) of paragraph 3 of the Order is not applicable.
(xiii) In our opinion and according to the information and explanations given to us, the Company is in compliance with Section 177 and 188 of the Act, where applicable, for all
transactions with the related parties and the details of related party transactions have been disclosed in the standalone financial statements etc. as required by the applicable accounting standards.
(xiv) During the year, the Company has not made any preferential allotment or private placement of shares or fully or partly convertible debentures and hence reporting under clause (xiv) of paragraph 3 of the Order is not applicable to the Company.
(xv) In our opinion and according to the information and explanations given to us, during the year the Company has not entered into any non-cash transactions with its directors or directors of its subsidiaries or persons connected with them and hence provisions of section 192 of the Act are not applicable.
(xvi) The Company is not required to be registered under section 45-IA of the Reserve Bank of India Act, 1934.
For Deloitte Haskins & Sells LLP Chartered Accountants (Firm’s Registration No. 117366W/W-100018) Hemant M. JoshiPlace: Pune PartnerDate: May 14, 2020 (Membership No. 38019)
UDIN: 20038019AAAADK9241

127BOARD’S REPORT NOTICE AND STATUTORY REPORTS
Standalone Balance Sheet as at Notes March 31, 2020 March 31, 2019
AssetsNon-current assets(a) Property, plant and equipment 4 10,487 8,126 (b) Right of use assets 2 (c) & 30 23,122 - (c) Capital work-in-progress 5 31 (d) Goodwill 33 8,402 8,402 (e) Other intangible assets 5 3,662 3,603 (f) Intangible assets under development 762 629 (g) Financial assets i. Investments 6 (a) 1,660 6,318 ii. Loans 6 (d) - - iii. Other financial assets 6 (g) 2,759 2,979 (h) Income tax assets (net) 16 (a) 2,434 2,422 (i) Deferred tax assets (net) 7 2,773 3,392 (j) Other non-current assets 8 882 996 Total Non-current assets 56,948 36,898Current assets(a) Financial assets i. Investments 6 (b) 26,704 4,536 ii. Trade receivables 6 (c) 105,569 87,382 iii. Cash and cash equivalents 6 (e) 3,299 12,462 iv. Other balances with banks 6 (f) 2,703 586 v. Other financial assets 6 (h) 6,330 28,022 (b) Other current assets 9 6,273 5,016 Total current assets 150,878 138,004 Total assets 207,826 174,902 Equity and liabilitiesEquity(a) Equity share capital 10 (a) 4,508 4,504 (b) Other equity i. Reserves and surplus 10 (b) 153,358 142,385 ii. Other components of equity 10 (d) (499) 194 Total equity 157,367 147,083 LiabilitiesNon-current liabilities(a) Financial liabilities i. Borrowings 11 (a) - 319 ii. Lease Liabilities 11 (c) 19,369 - (b) Provisions 13 263 209 (c) Employee benefit obligations 14 1,544 1,450 Total non-current liabilities 21,176 1,978 Current liabilities(a) Financial liabilities i. Trade payables 12
- Total outstanding dues of micro and small enterprises 212 - - Total outstanding dues of creditors other than micro and small enterprises 7,841 8,672
ii. Lease liabilities 11 (c) 5,066 - iii. Other financial liabilities 11 (b) 9,643 12,528(b) Employee benefit obligations 14 3,122 1,410 (c) Other current liabilities 15 1,877 1,777 (d) Income tax liabilities (net) 16 (a) 1,522 1,454 Total current liabilities 29,283 25,841 Total liabilities 50,459 27,819 Total equity and liabilities 207,826 174,902
The accompanying notes form an integral part of the standalone financial statementsIn terms of our report attached
For Deloitte Haskins & Sells LLP For and on behalf of the Board of Directors ofChartered Accountants Zensar Technologies Limited(Firm’s registration no: 117366W / W-100018)
Hemant M. Joshi H.V. Goenka Sandeep Kishore Navneet Khandelwal Gaurav TongiaPartner Chairman Managing Director & CEO Chief Financial Officer Company SecretaryMembership No: 38019 (DIN: 00026726) (DIN: 07393680)
Place: Pune Place: Mumbai Date: May 14, 2020 Date: May 14, 2020
Standalone Balance Sheet(All amounts in INR Lakhs, unless otherwise stated)

128 ZENSAR TECHNOLOGIES LTD ANNUAL REPORT 2019-20
Standalone Statement of Profit and Loss for the NotesYear ended
March 31, 2020 Year ended
March 31, 2019
Income(a) Revenue from operations 17 137,030 137,008 (b) Other income (net) 18 9,093 8,499 Total income 146,123 145,507 Expenses(a) Purchase of traded goods 877 1,209 (b) Employee benefits expense 19 80,913 78,949 (c) Subcontracting costs 4,361 3,934 (d) Finance costs 20 2,330 918 (e) Depreciation, amortisation and impairment expense 21 8,138 4,278 (f) Other expenses 22 19,094 22,868 Total expenses 115,713 112,156Profit before tax 30,410 33,351 Tax expense 24(a) Current tax 6,262 8,169 (b) Deferred tax 1,044 (618)Total tax expense 7,306 7,551 Profit for the year 23,104 25,800 Other comprehensive income / (loss)I) (a) Items that will not be reclassified to profit or loss - Remeasurements of defined employee benefit plans 14 (1,374) 159 (b) Income tax relating to items that will not be reclassified to profit or loss 24 480 (48)
(894) 111 II) (a) Items that will be reclassified to profit or loss Effective portion of gain / (loss) on Designated Portion of Hedging Instruments in a Cash Flow Hedge (net)
10 (d) (1,065) 657
(b) Income tax relating to items that will be reclassified to profit or loss 10 (d) 372 (230)(693) 427
Other comprehensive income / (loss) for the year, net of tax (1,587) 538 Total comprehensive income / (loss) for the year 21,517 26,338 Earnings per share - [nominal value per share INR. 2/- ] 32- Basic 10.26 11.46- Diluted 10.12 11.27
Statement of Standalone Profit and Loss(All amounts in INR Lakhs, except earnings per share)
The accompanying notes form an integral part of the standalone financial statementsIn terms of our report attached
For Deloitte Haskins & Sells LLP For and on behalf of the Board of Directors ofChartered Accountants Zensar Technologies Limited(Firm’s registration no: 117366W / W-100018)
Hemant M. Joshi H.V. Goenka Sandeep Kishore Navneet Khandelwal Gaurav TongiaPartner Chairman Managing Director & CEO Chief Financial Officer Company SecretaryMembership No: 38019 (DIN: 00026726) (DIN: 07393680)
Place: Pune Place: Mumbai Date: May 14, 2020 Date: May 14, 2020

129BOARD’S REPORT NOTICE AND STATUTORY REPORTS
Sta
tem
ent o
f Sta
ndal
one
chan
ges
in E
quity
Sha
re C
apita
l(A
ll am
ount
s in
INR
Lak
hs, u
nles
s ot
herw
ise
stat
ed)
Equ
ity s
hare
cap
ital
Bal
ance
as
at A
pril
1, 2
018
Cha
nges
in e
quity
sha
re
capi
tal d
urin
g th
e ye
arB
alan
ce a
s at
Mar
ch 3
1, 2
019
4,49
95
4,50
4
Bal
ance
as
at A
pril
1, 2
019
Cha
nges
in e
quity
sha
re
capi
tal d
urin
g th
e ye
arB
alan
ce a
s at
Mar
ch 3
1, 2
020
4,50
44
4,50
8
Par
ticul
ars
Res
erve
s an
d S
urpl
usO
ther
com
pone
nts
of e
quity
Tota
lC
apita
l re
dem
ptio
n re
serv
e
Sha
re b
ased
pa
ymen
t re
serv
e
Sec
uriti
es
prem
ium
Ret
aine
d ea
rnin
gsG
ener
al
rese
rve
Spe
cial
ec
onom
ic z
one
re-in
vest
men
t re
serv
e
Cas
h flo
w
hedg
ing
rese
rve
Fore
ign
curr
ency
tr
ansl
atio
n re
serv
e
Bal
ance
as
at A
pril
1, 2
018
442
1
,348
2
,378
2
1,82
4 9
4,85
3 1
80
(27)
(206
) 1
20,7
92
Prof
it fo
r the
yea
r -
-
-
25
,800
-
-
-
-
25,8
00
Effe
ctiv
e po
rtio
n of
gai
n / (
loss
) on
Cas
h Fl
ow H
edge
(net
) -
-
-
-
-
-
42
7 -
42
7
Rem
easu
rem
ents
of d
efin
ed e
mpl
oyee
ben
efit
plan
s (n
et o
f tax
) -
-
-
1
11
-
-
-
-
111
Tota
l com
preh
ensi
ve in
com
e fo
r th
e ye
ar -
-
-
2
5,91
1 -
-
4
27
-
26,
338
Tran
sact
ion
with
ow
ners
in th
eir
capa
city
as
owne
rs:
Div
iden
ds p
aid
(incl
udin
g D
ivid
end
Dis
tribu
tion
Tax)
-
-
-
(6,3
33)
-
-
-
-
(6,3
33)
Rec
ogni
tion
of E
mpl
oyee
Sha
re b
ased
pay
men
t exp
ense
-
1,6
47
-
-
-
-
-
-
1,6
47
Tran
sfer
red
from
/ to
Sec
uriti
es p
rem
ium
on
exer
cise
of s
tock
op
tions
-
(58)
58 -
-
-
-
-
-
Rec
eive
d on
exe
rcis
e of
sto
ck o
ptio
ns -
-
13
5 -
-
-
-
-
1
35
Tran
sfer
red
to G
ener
al re
serv
e on
can
cella
tion
of s
tock
opt
ions
-
(88)
-
-
88 -
-
-
-
Tran
sfer
red
to R
etai
ned
earn
ings
-
-
-
180
-
(1
80)
-
-
-
Tran
sfer
red
to G
ener
al re
serv
e -
-
-
(1
2,00
0) 1
2,00
0 -
-
-
-
Tran
sfer
red
to S
peci
al e
cono
mic
zon
e re
-inve
stm
ent r
eser
ve -
-
-
(1
,500
) -
1
,500
-
-
-
Bal
ance
as
at M
arch
31,
201
9 4
42
2,8
49
2,5
71
28,
082
106
,941
1
,500
4
00
(206
) 1
42,5
79
Prof
it fo
r the
yea
r -
-
-
2
3,10
4 -
-
-
-
2
3,10
4

130 ZENSAR TECHNOLOGIES LTD ANNUAL REPORT 2019-20
Par
ticul
ars
Res
erve
s an
d S
urpl
usO
ther
com
pone
nts
of e
quity
Tota
lC
apita
l re
dem
ptio
n re
serv
e
Sha
re b
ased
pa
ymen
t re
serv
e
Sec
uriti
es
prem
ium
Ret
aine
d ea
rnin
gsG
ener
al
rese
rve
Spe
cial
ec
onom
ic z
one
re-in
vest
men
t re
serv
e
Cas
h flo
w
hedg
ing
rese
rve
Fore
ign
curr
ency
tr
ansl
atio
n re
serv
e
Effe
ctiv
e po
rtio
n of
gai
n / (
loss
) on
Cas
h Fl
ow H
edge
(net
) -
-
-
-
-
-
(6
93)
-
(693
)
Rem
easu
rem
ents
of d
efin
ed e
mpl
oyee
ben
efit
plan
s (n
et o
f tax
) -
-
-
(8
94)
-
-
-
-
(894
)
Tota
l com
preh
ensi
ve in
com
e fo
r th
e ye
ar -
-
-
2
2,21
0 -
-
(6
93)
-
21,
517
Tran
sact
ion
with
ow
ners
in th
eir
capa
city
as
owne
rs:
Tran
sitio
n im
pact
of I
nd A
S 11
6 (r
efer
not
e 2(
c))
-
-
-
(97)
-
-
-
-
(97)
Div
iden
ds p
aid
(incl
udin
g D
ivid
end
Dis
tribu
tion
Tax)
-
-
-
(11,
932)
-
-
-
-
(11,
932)
Rec
ogni
tion
of E
mpl
oyee
Sha
re b
ased
pay
men
t exp
ense
-
645
-
-
-
-
-
-
6
45
Tran
sfer
red
from
/ to
Sec
uriti
es p
rem
ium
on
exer
cise
of s
tock
op
tions
-
(94)
94
-
-
-
-
-
-
Rec
eive
d on
exe
rcis
e of
sto
ck o
ptio
ns -
-
1
48
-
-
-
-
-
148
Tran
sfer
red
to G
ener
al re
serv
e on
can
cella
tion
of s
tock
opt
ions
-
-
-
-
-
-
-
-
-
Tran
sfer
red
from
/to G
ener
al re
serv
e/R
etai
ned
earn
ings
-
-
-
1,5
00
-
(1,5
00)
-
-
-
Tran
sfer
red
to S
peci
al e
cono
mic
zon
e re
-inve
stm
ent r
eser
ve -
-
-
(1
,250
) -
1
,250
-
-
-
Bal
ance
as
at M
arch
31,
202
0 4
42
3,4
00
2,8
12
38,
513
106
,941
1
,250
(2
93)
(206
) 1
52,8
59
The
acco
mpa
nyin
g no
tes
form
an
inte
gral
par
t of t
he s
tand
alon
e fin
anci
al s
tate
men
ts
In te
rms
of o
ur re
port
atta
ched
For
Del
oitt
e H
aski
ns &
Sel
ls L
LP
For a
nd o
n be
half
of th
e B
oard
of D
irect
ors
ofC
hart
ered
Acc
ount
ants
Ze
nsar
Tec
hnol
ogie
s Li
mite
d(F
irm’s
regi
stra
tion
no: 1
1736
6W /
W-1
0001
8)
Hem
ant M
. Jos
hi
H.V
. Goe
nka
S
ande
ep K
isho
re
Nav
neet
Kha
ndel
wal
G
aura
v To
ngia
Part
ner
Cha
irman
M
anag
ing
Dire
ctor
& C
EO
Chi
ef F
inan
cial
Offi
cer
Com
pany
Sec
reta
ryM
embe
rshi
p N
o: 3
8019
(D
IN: 0
0026
726)
(D
IN: 0
7393
680)
Plac
e: P
une
Plac
e: M
umba
i D
ate:
May
14,
202
0 D
ate:
May
14,
202
0

131BOARD’S REPORT NOTICE AND STATUTORY REPORTS
ParticularsYear ended
March 31, 2020 Year ended
March 31, 2019
Cash flow from operating activitiesProfit before taxation 30,410 33,351 Adjustments for:Depreciation, amortisation and impairment expenses 8,138 4,278 Employee share based payment expense 119 477 Profit on sale of investments (mutual funds) (1,409) (2,796)Changes in fair value of financial assets/liabilities measured at fair value through profit and loss
283 1,796
Profit on Sale of Business/subsidiaries (Refer Note 36) 51 (2,080)Provision for impairment in the value of investments - 78 Dividend income (2,757) (870)Interest income (262) (317)Finance costs 2,282 875 (Profit) / loss on sale of tangible assets (net) (8) 9 Provision for doubtful debts and advances (net) 1,047 1,103 Adjustment on account of contigent consideration (173) - Bad debts written off - 492 Provisions no longer required and credit balances written back (10) (372)Unrealised exchange gains / (loss) (net) (588) 6,713 1,578 4,251 Operating profit before working capital changes 37,123 37,602 Change in operating assets and liabilities(Increase)/ decrease in other non-current financial assets 6 (860)(Increase)/ decrease in other non-current assets 538 467 (Increase)/ decrease in trade receivables (14,458) (21,197)(Increase)/ decrease in other current financial assets 18,896 (3,935)(Increase)/ decrease in other current assets (1,393) (1,079)Increase/ (decrease) in non-current provisions 54 121 Increase/ (decrease) in non-current employee benefit obligations 93 (45)Increase/ (decrease) in trade payables (647) 90 Increase/ (decrease) in other current financial liabilities (1,610) 2,026 Increase/ (decrease) in current employee benefit obligations 337 185 Increase/ (decrease) in other current liabilities 404 2,220 96 (24,131)Cash generated from operations 39,343 13,471 Income taxes paid (net of refunds) (5,726) (8,210)Net cash inflow from operating activities 33,617 5,261 Cash flow from investing activitiesPurchase of tangible/intangible assets including capital work in progress
(6,767) (3,855)
Payment of Earnout to Subsidiaries (4,988) (3,179)Acquisition of company (Refer Note 35) - (1,270)Proceeds from Sale of Business/subsidiaries 902 -Profit on Sale of Business/subsidiaries (Refer Note 36) - 1,768 Proceeds from sale of tangible/intangible assets 8 40 Fixed Deposits placed (2,434) (350)Fixed Deposits redeemed 354 - Purchase of investments (Mutual Funds) (121,530) (79,121)Sale of investments (Mutual Funds) 105,147 95,202 Sale of Non Convertible Debentures - 814 Interest income received 272 292 Dividend income received 2,757 870 Net cash used in investing activities (26,279) 11,211
Statement of Standalone Cash Flows for year ended March 31, 2020(All amounts in INR Lakhs unless otherwise stated)

132 ZENSAR TECHNOLOGIES LTD ANNUAL REPORT 2019-20
ParticularsYear ended
March 31, 2020 Year ended
March 31, 2019
Cash flow from financing activitiesProceeds from issue of equity shares 152 140 Dividend on equity shares and tax thereon (11,932) (6,333)Interest paid (57) (75)Payment of lease liabilities (Refer note 11(c)) (4,313) - Proceeds from long-term borrowings - - Repayment of long-term borrowings - (290)Proceeds from short-term borrowings 1,376 2,742 Repayment of short-term borrowings (1,418) (2,903)Net cash used in financing activities (16,192) (6,719)Effect of exchange differences on translation of cash and cash equivalents
1 46
Net increase/(decrease) in cash and cash equivalents (8,853) 9,799 Cash and cash equivalents at the beginning of the year 12,152 2,528 Less: Cash transferred during disposal of business (Refer Note 36) - (175)Cash and cash equivalents at the end of the year 3,299 12,152
Notes:
1. The above Standalone Statement of Cash Flows has been prepared under the “Indirect Method” set out in Indian Accounting Standard (Ind AS) 7 on Statement of Cash Flows.
2. Cash and cash equivalents comprise of: Refer Note 6(e)
As at March 31, 2020 As at March 31, 2019Cash on hand 0 2 Funds in transit 26 7,356 Cheques on hand 13 -Balances with Banks:
- In current accounts 2,383 3,156 - Deposits having original maturity of less than three months 877 1,948
Total 3,299 12,462 Less: Book Overdrafts - (310)Total 3,299 12,152
For Deloitte Haskins & Sells LLP For and on behalf of the Board of Directors ofChartered Accountants Zensar Technologies Limited(Firm’s registration no: 117366W / W-100018)
Hemant M. Joshi H.V. Goenka Sandeep Kishore Navneet Khandelwal Gaurav TongiaPartner Chairman Managing Director & CEO Chief Financial Officer Company SecretaryMembership No: 38019 (DIN: 00026726) (DIN: 07393680)
Place: Pune Place: Mumbai Date: May 14, 2020 Date: May 14, 2020
The accompanying notes form an integral part of the standalone financial statementsIn terms of our report attached

Notes to the Standalone Financial Statementsas at and for the year ended March 31, 2020(All amounts in INR Lakhs, unless otherwise stated)
133BOARD’S REPORT NOTICE AND STATUTORY REPORTS
1. Corporate Information
Zensar Technologies Limited (“Company”) is a public limited company incorporated and domiciled in India and has registered office at Zensar Knowledge Park, Plot # 4, MIDC, Kharadi, Off Nagar road, Pune, Maharashtra, India. The Company is listed on BSE Limited and National Stock Exchange of India Limited. Company is engaged in providing a complete range of IT Services and Solutions and company’s industry expertise spans across Manufacturing, Retail, Media, Banking, Insurance, Healthcare and Utilities.
The Financial Statements for the year ended March 31, 2020 were approved by the Board of Directors and authorised for issue on May 14, 2020.
Basis of preparation:
Compliance with Ind AS:
The standalone financial statements (financial statements) comply in all material aspects with Indian Accounting Standards (Ind AS) notified under Section 133 of the Companies Act, 2013 (“the Act”), read together with Rule 3 of the Companies (Indian Accounting Standards) Rules, 2015 as amended from time to time and other relevant provisions of the Act.
i. Historical cost convention:
The financial statements have been prepared on a historical cost basis, except for the following:
- certain financial assets and liabilities (including derivative instruments) which are measured at fair value;
- defined benefit plans - plan assets measured at fair value;
- share- based payments and
- assets and liabilities arising in a business combination
ii. Current versus Non-current classification:
All assets and liabilities have been classified as current or non-current as per the Company’s operating cycle and other criteria set out in the Schedule III to the Companies Act, 2013. Based on the nature of products and services and their realization in cash and cash equivalents, the Company has ascertained its operating cycles as 12 months for the purpose of current and non-current classification of assets and liabilities.
iii. Functional and presentation currency:
Items included in the financial statements are measured using the currency of the primary economic
environment in which the entity operates (‘the functional currency’). The financial statements are prepared in Indian rupee (INR), which is company’s functional and presentation currency.
2. Summary of significant accounting policies
a) Revenue Recognition:
The Company earns revenue primarily from software development, maintenance of software/hardware and related services, and sale of software licenses.
Effective April 1 ,2018, the Company adopted Ind AS 115 “Revenue from Contracts with Customers” using the cumulative catch-up transition method, applied to contracts that were not completed as of April 1, 2018. The effect on adoption of Ind AS 115 was insignificant.
Revenue is recognised only when there is transfer of control of goods or services. At the inception of every contract, transaction price and performance obligations are determined. Transaction price reflect amount of consideration expected to be received in exchange for transferring goods and services plus weighted average estimate of variable consideration i.e. discounts, price concession, rebates etc. Transaction price is allocated to identifiable performance obligations in a manner that depicts exchange for transferring of promised goods and services. Volume discounts are recorded as a reduction of revenue. When the amount of discount varies with the levels of revenue, volume discount is recorded based on estimate of future revenue from the customer.
The Company applies judgement to determine whether each product or services promised to a customer are capable of being distinct, and are distinct in the context of the contract, if not, the promised product or services are combined and accounted as a single performance obligation. The Company allocates the transaction price to separately identifiable performance obligations based on their relative stand-alone selling price. In cases where the Company is unable to determine the stand-alone selling price the company uses expected cost-plus margin approach in estimating the stand-alone selling price.
The billing schedules agreed with customers include periodic performance based payments and / or milestone based progress payments. Invoices are payable within contractually agreed credit period.
i. Time and material contracts:
Revenues and costs relating to time and materials contracts are recognized as the related services are rendered.
Notes to the Standalone Financial Statementsas at and for the year ended March 31, 2020(All amounts in INR Lakhs, unless otherwise stated)
134 ZENSAR TECHNOLOGIES LTD ANNUAL REPORT 2019-20
ii. Fixed- price contracts:
Revenue for fixed-price contracts where performance obligations are satisfied over time is recognised using percentage-of-completion method. In respect of such fixed-price contracts, revenue is recognised using percentage-of-completion method (‘POC method’) of accounting with contract costs/efforts incurred determining the degree of completion of the performance obligation.
Contract assets are recognised when there is excess of revenue earned over billings on contracts. Contract assets are classified as unbilled receivables (only act of invoicing is pending) when there is unconditional right to receive cash, and only passage of time is required, as per contractual terms.
Unearned and deferred revenue (“contract liability”) is recognised when there is billings in excess of revenues.
iii. Sale of licenses:
Revenue from licenses where the customer obtains a “right to use “the licenses is recognized at the time the license is made available to the customer. Revenue from licenses where the customer obtains a “right to access” is recognized over the access period.
b. Income Tax:
Income tax comprises current and deferred tax. Income tax expense is recognized in statement of profit and loss, except when they relate to items that are recognised in other comprehensive income or directly in equity, in which case, the current and deferred tax are also recognised in other comprehensive income or directly in equity, respectively.
i. Current Income Tax:
Current income tax for the current and prior periods are measured at the amount expected to be recovered from or paid to the taxation authorities based on the taxable income for the period. The tax rates and tax laws used to compute the current tax amount are those that are enacted or substantively enacted as at the reporting date and applicable for the period. The current income tax expense for overseas branches has been computed based on the tax laws applicable to each branch in the respective jurisdiction in which it operates.
The Company offsets current tax assets and current tax liabilities, where it has a legally enforceable right to set off the recognized amounts and where it intends either to settle on a net basis, or to realize the asset and liability simultaneously.
ii. Deferred Tax:
Deferred tax is recognized using the balance sheet approach. Deferred tax assets and liabilities are recognized for deductible and taxable temporary differences arising between the tax base of assets and liabilities and their carrying amount in financial statements, except when the deferred income tax arises from the initial recognition of goodwill or an asset or liability in a transaction that is not a business combination and affects neither accounting nor taxable profits or loss at the time of the transaction.
Deferred tax assets are recognized to the extent it is probable that taxable profit will be available against which the deductible temporary differences and the carry forward of unused tax credits and unused tax losses can be utilized.
Deferred tax liabilities are recognized for all taxable temporary differences except in respect of taxable temporary differences associated with investments in subsidiaries and foreign branches where the timing of the reversal of the temporary difference can be controlled and it is probable that the temporary difference will not reverse in the foreseeable future.
The carrying amount of deferred tax assets is reviewed at each reporting date and reduced to the extent that it is no longer probable that sufficient taxable profit will be available to allow all or part of the deferred tax asset to be utilized. Deferred tax assets and liabilities are measured at the tax rates that are expected to apply in the period when the asset is realized or the liability is settled, based on tax rates (and tax laws) that have been enacted or substantively enacted at the reporting date.
The Company offsets deferred tax assets and liabilities, where it has a legally enforceable right to offset current tax assets against current tax liabilities, and they relate to taxes levied by the same taxation authority on either the same taxable entity, or on different taxable entities where there is an intention to settle the current tax liabilities and assets on a net basis or their tax assets and liabilities will be realized simultaneously.
Deferred Tax includes MAT credit, if any and it is recognized as an asset only when and to the extent there is convincing evidence that the Company will pay income tax higher than that computed under MAT, during the period that MAT is permitted to be set off under the Income Tax Act, 1961 for a specified period. Credit on account of MAT is recognized as an asset based on the management’s estimate of its recoverability in the future.
Notes to the Standalone Financial Statementsas at and for the year ended March 31, 2020(All amounts in INR Lakhs, unless otherwise stated)
135BOARD’S REPORT NOTICE AND STATUTORY REPORTS
c) Leases:
A contract is, or contains, a lease if the contract conveys the right to control the use of an identified asset for a period of time in exchange for consideration. The Company assesses whether a contract contains a lease, at inception of a contract. To assess whether a contract conveys the right to control the use of an identified asset, the company assesses whether: (1) the contract involves the use of an identified asset (2) the company has substantially all of the economic benefits from use of the asset through the period of the lease and (3) the company has the right to direct the use of the asset.
Company as a lessee:
At the date of commencement of the lease, the company recognizes a right-of-use asset (“ROU”) and a corresponding lease liability for all lease arrangements in which it is a lessee, except for leases with a term of twelve months or less (short-term leases) and low value leases. For these short-term and low value leases, the Company recognizes the lease payments as an operating expense on a straight-line basis over the term of the lease. Certain lease arrangements include the options to extend or terminate the lease before the end of the lease term. ROU assets and lease liabilities includes these options when it is reasonably certain that they will be exercised. The right-of-use assets are initially recognized at cost, which comprises the initial amount of the lease liability adjusted for any lease payments made at or prior to the commencement date of the lease plus any initial direct costs less any lease incentives. They are subsequently measured at cost less accumulated depreciation and impairment losses.
Right-of-use assets are depreciated from the commencement date on a straight-line basis over the shorter of the lease term or useful life of the underlying asset. Right of use assets are evaluated for recoverability whenever events or changes in circumstances indicate that their carrying amounts may not be recoverable. For the purpose of impairment testing, the recoverable amount (i.e. the higher of the fair value less cost to sell and the value-in-use) is determined on an individual asset basis unless the asset does not generate cashflows that are largely independent of those from other assets. In such cases, the recoverable amount is determined for the Cash Generating Unit (CGU) to which the asset belongs
The lease liability is initially measured at the present value of the future lease payments. The lease payments are discounted using the interest rate implicit in the lease or, if not readily determinable, using the incremental borrowing rates in the country of
domicile of the leases. Lease liabilities are remeasured with a corresponding adjustment to the related right of use asset if the company changes its assessment if whether it will exercise an extension or a termination option.
Lease liability and ROU asset have been separately presented in the Balance Sheet and lease payments have been classified as financing cash flows.
Company as a lessor:
At the inception of the lease the Company classifies each of its leases as either an operating lease or a finance lease. The Company recognises lease payments received under operating leases as income on a straight- line basis over the lease term. In case of a finance lease, finance income is recognised over the lease term based on a pattern reflecting a constant periodic rate of return on the lessor’s net investment in the lease. When the Company is an intermediate lessor it accounts for its interests in the head lease and the sub-lease separately. It assesses the lease classification of a sub-lease with reference to the right-of-use asset arising from the head lease, not with reference to the underlying asset. If a head lease is a short term lease to which the Company applies the exemption described above, then it classifies the sub-lease as an operating lease.
Whenever the terms of the lease transfer substantially all the risks and rewards of ownership to the lessee, the contract is classified as a finance lease.
If an arrangement contains lease and non-lease components, the Company applies Ind AS 115 Revenue to allocate the consideration in the contract.
The Company has taken on lease certain facilities and equipments under lease arrangements. Rental expense for March 31, 2019 was Rs. 3,967 lakhs.
Transition:
Ministry of Corporate Affairs (“MCA”) through Companies (Indian Accounting Standards) Amendment Rules, 2019 and Companies (Indian Accounting Standards) Second Amendment Rules, has notified Ind AS 116 Leases which replaces the existing lease standard, Ind AS 17 leases and other interpretations. Ind AS 116 sets out the principles for the recognition, measurement, presentation and disclosure of leases for both lessees and lessors.
The company has adopted Ind AS 116, effective annual reporting period beginning April 1, 2019 and applied the standard to its leases, retrospectively using the modified retrospective method, with the cumulative effect of initially applying the Standard,

Notes to the Standalone Financial Statementsas at and for the year ended March 31, 2020(All amounts in INR Lakhs, unless otherwise stated)
136 ZENSAR TECHNOLOGIES LTD ANNUAL REPORT 2019-20
recognised on the date of initial application (April 1, 2019). Accordingly, the company has not restated comparative information, instead, the cumulative effect of initially applying this standard has been recognised as an adjustment to the opening balance of retained earnings as on April 1, 2019.
Refer note 2(f) under Significant accounting policies of the Consolidated financial statements in the Annual report of the Group for the year ended March 31, 2019 – Leases, for the policy as per Ind AS 17.
On transition, the Company recognised a lease liability measured at the present value of the remaining lease payments. The right-of-use asset is recognised at its carrying amount as if the standard had been applied since the commencement of the lease, but discounted using the lessee’s incremental borrowing rate as at April 1, 2019. Accordingly, a right-of-use asset of Rs. 13,263 lakhs and lease liability of Rs. 13,412 lakhs has been recognised. The cumulative effect on transition in retained earnings net of taxes is Rs. 97 lakhs. The principle portion of the lease payments have been disclosed under cash flow from financing activities. The lease payments for operating leases as per Ind AS 17 - Leases, were earlier reported under cash flow from operating activities. The weighted average incremental borrowing rate of 9% has been applied to lease liabilities recognised in the balance sheet at the date of initial application.
On application of Ind AS 116, the nature of expenses has changed from lease rent in previous periods to depreciation cost for the right-to-use asset, and finance cost for interest accrued on lease liability.
The difference between the future minimum lease rental commitments towards non-cancellable operating leases and finance leases reported as at March 31, 2019 compared to the lease liability as accounted as at April 1, 2019 is primarily due to inclusion of present value of the lease payments for the cancellable term of the leases, reduction due to discounting of the lease liabilities as per the requirement of Ind AS 116 and exclusion of the commitments for the leases to which the Company has chosen to apply the practical expedient as per the standard.
In respect of leases that were classified as finance leases, applying Ind AS 17, an amount of Rs. 489 lakhs has been reclassified from property, plant and equipment to right-of-use assets. An amount of Rs. 326 lakhs has been reclassified from other current financial liabilities to lease liability - current and an amount of Rs. 319 lakhs have been reclassified from borrowings - non-current to lease liability - non-current.
d) Impairment of assets:
Goodwill and intangible assets that have an indefinite useful life are not subject to amortization and are tested annually for impairment, or more frequently if events or changes in circumstances indicate that they might be impaired. Other assets are tested for impairment whenever events or changes in circumstances indicate that the carrying amount may not be recoverable. An impairment loss is recognized for the amount by which the asset’s carrying amount exceeds its recoverable amount. The recoverable amount is the higher of an asset’s fair value less costs of disposal and value in use. For the purpose of assessing impairment, assets are grouped at the lowest levels for which there are separately identifiable cash inflows which are largely independent of the cash inflows from other assets or group of assets (cash-generating units).
Non-financial assets other than goodwill that suffered an impairment are reviewed for possible reversal of the impairment at the end of each reporting period.
e) Cash and Cash Equivalents:
For the purposes of presentation in the statement of cash flows, cash and cash equivalents include cash on hand, bank balances and demand deposits, other short-term highly liquid investments with original maturities of three months or less that are readily convertible to known amounts of cash and cash equivalents which are subject to insignificant risk of changes in value. Cash and cash equivalents consist of balances with banks which are unrestricted for withdrawal and usage.
f) Investments and other financial assets and liabilities:
i. Classification:
Financial assets and liabilities are recognised when the Company becomes a party to the contractual provisions of the instrument. Financial assets and liabilities are initially measured at fair value. Transaction costs that are directly attributable to the acquisition or issue of financial assets and financial liabilities (other than financial assets and financial liabilities at fair value through profit or loss) are added to or deducted from the fair value measured on initial recognition of financial asset or financial liability.
Financial liabilities are measured at amortised cost using the effective interest method.
The Company derecognises a financial asset only when the contractual rights to the cash flows from the asset expire, or when it transfers the financial asset and substantially all the risks and rewards of

Notes to the Standalone Financial Statementsas at and for the year ended March 31, 2020(All amounts in INR Lakhs, unless otherwise stated)
137BOARD’S REPORT NOTICE AND STATUTORY REPORTS
ownership of the asset to another entity. The Company derecognises financial liabilities when, and only when, the Company’s obligations are discharged, cancelled or have expired.
ii. Initial recognition:
All financial assets are recognised initially at fair value plus, in the case of financial assets not recorded at fair value through profit or loss, transaction costs that are attributable to the acquisition of the financial asset.
iii. Measurement:
Financial assets carried at amortized cost:
A financial asset is subsequently measured at amortized cost if it is held within a business model whose objective is to hold the asset in order to collect contractual cash flows and the contractual terms of the financial asset give rise on specified dates to cash flows that are solely payments of principal and interest on the principal amount outstanding.
Financial assets at fair value through other comprehensive income (FVTOCI):
A financial asset is subsequently measured at fair value through other comprehensive income if it is held within a business model whose objective is achieved by both collecting contractual cash flows and selling financial assets and the contractual terms of the financial asset give rise on specified dates to cash flows that are solely payments of principal and interest on the principal amount outstanding. Further, in cases where the Company has made an irrevocable election based on its business model, for its investments which are classified as equity instruments, the subsequent changes in fair value are recognized in other comprehensive income.
Financial assets at fair value through profit or loss (FVTPL):
A financial asset which is not classified in any of the above categories are subsequently fair valued through profit or loss.
iv. Impairment of financial assets:
The Company assesses at each reporting date whether a financial asset or a group of financial assets is impaired. The Company recognizes loss allowances, in accordance with IND AS 109, using the expected credit loss (ECL) model for the financial assets which are not fair valued through profit or loss. Loss allowance for trade receivables and unbilled revenue with no significant financing component is measured at an amount equal to lifetime ECL. For
all other financial assets, expected credit losses are measured at an amount equal to the 12-month ECL, unless there has been a significant increase in credit risk from initial recognition in which case those are measured at lifetime ECL. The amount of expected credit losses (or reversal) that is required to adjust the loss allowance at the reporting date to the amount that is required to be recognized is recognized as an impairment gain or loss in profit or loss.
v. Interest and Dividend income:
Dividend income is recorded when the right to receive payment is established. Interest income is recognised using the effective interest method.
vi. Investments in subsidiaries:
The Company accounts for its investment in subsidiaries at cost, less impairment losses if any.
g) Derivatives and hedging activities:
The Company designates certain foreign exchange forward, currency options and futures contracts as hedge instruments in respect of foreign exchange risks. These hedges are accounted for as cash flow hedges.
The Company uses hedging instruments that are governed by the policies of the Company which are approved by their respective Board of Directors. The policies provide written principles on the use of such financial derivatives consistent with the risk management strategy of the Company. The Company enters into derivative financial instruments where the counterparty is primarily a bank.
The hedge instruments are designated and documented as hedges at the inception of the contract. The Company determines the existence of an economic relationship between the hedging instrument and hedged item based on the currency, amount and timing of their respective cash flows. The effectiveness of hedge instruments to reduce the risk associated with the exposure being hedged is assessed and measured at inception and on an ongoing basis. If the hedged future cash flows are no longer expected to occur, then the amounts that have been accumulated in other equity are immediately reclassified in net foreign exchange gains/loss in the statement of profit and loss.
For the purpose of hedge accounting, hedges are classified as:
- Fair value hedges when hedging the exposure to changes in the fair value of a recognized asset or liability or an unrecognized firm commitment.
Notes to the Standalone Financial Statementsas at and for the year ended March 31, 2020(All amounts in INR Lakhs, unless otherwise stated)
138 ZENSAR TECHNOLOGIES LTD ANNUAL REPORT 2019-20
- Cash flow hedges when hedging the exposure to variability in cash flows that is either attributable to a particular risk associated with a recognized asset or liability or a highly probable forecast transaction or the foreign currency risk in an unrecognized firm commitment
- Hedges of a net investment in a foreign operation
Subsequent to initial recognition, derivative financial instruments are measured as described below:
Cash flow hedges:
Changes in the fair value of the derivative hedging instrument designated as a cash flow hedge are recognized in other comprehensive income and held in cash flow hedging reserve, net of taxes, a component of equity, to the extent that the hedge is effective. To the extent that the hedge is ineffective, changes in fair value are recognized in the statement of profit and loss and reported within foreign exchange gains/(losses), net within results from operating activities. If the hedging instrument no longer meets the criteria for hedge accounting, then hedge accounting is discontinued prospectively. If the hedging instrument expires or is sold, terminated or exercised, the cumulative gain or loss on the hedging instrument recognized in cash flow hedging reserve till the period the hedge was effective remains in cash flow hedging reserve until the forecasted transaction occurs.
The cumulative gain or loss previously recognized in the cash flow hedging reserve is transferred to the statement of profit and loss upon the occurrence of the related forecasted transaction.
The Company enters into the contracts that are effective as hedges from an economic perspective but may not qualify for hedge accounting. The change in the fair value of such instrument is recognised in the statement of profit and loss.
h) Offsetting financial instruments:
Financial assets and liabilities are offset and the net amount is reported in the balance sheet where there is a legally enforceable right to offset the recognized amounts and there is an intention to settle on a net basis or realize the asset on a net basis or realize the asset and settle the liability simultaneously. The legally enforceable right must not be contingent on future events and must be enforceable in the normal course of business and in the event of default, insolvency or bankruptcy of the Company or the counterparty.
i) Property, plant and equipment:
i. Recognition and measurement:
Property, plant and equipment are measured at cost less accumulated depreciation and impairment losses, if any. Cost includes expenditures directly attributable to the acquisition of the asset. General and specific borrowing costs directly attributable to the construction of a qualifying asset are capitalized as part of the cost.
When parts of an item of property, plant and equipment have different useful lives, they are accounted for as separate items (major components) of property, plant and equipment. Subsequent expenditure relating to property, plant and equipment is capitalized only when it is probable that future economic benefits associated with these will flow to the Company and the cost of the item can be measured reliably.
The carrying amount of any component accounted for as a separate asset is derecognized when replaced.
All other repairs and maintenance costs are charged to profit and loss in the reporting period in which they occur.
An item of Property, Plant & Equipment is derecognised upon disposal or when no future economic benefits are expected to arise from the continued use of the asset. Any gain or loss arising on the disposal or retirement of an item of Property, Plant & Equipment are determined as the difference between the sales proceeds and the carrying amount of the asset and is recognised in the statement of profit or loss.
The cost of property, plant and equipment not available for use before year end date are disclosed under capital work- in-progress and not depreciated.
An asset’s carrying amount is written down immediately to its recoverable amount if the assets or CGU as applicable, carrying amount is greater than its estimated recoverable amount. An impairment loss is recognised in the statement of profit and loss.
ii. Depreciation:
The Company depreciates property, plant and equipment on a straight-line basis as per the useful lives prescribed in Schedule II of the Companies Act 2013, except in respect of the following assets:

Notes to the Standalone Financial Statementsas at and for the year ended March 31, 2020(All amounts in INR Lakhs, unless otherwise stated)
139BOARD’S REPORT NOTICE AND STATUTORY REPORTS
Class of asset
Useful life as per Schedule
II
Useful life as followed by the Company based
on technical evaluation
Networking Equipments and Servers (classified under Data Processing Equipments)
6 years 4 years
Vehicles 8 years 5 years
Electrical Installations and Equipments
10 years 5 years
Assets acquired under leasehold improvements are amortized over the shorter of estimated useful life of the asset or the related lease term.
The assets residual values, useful lives and methods of depreciation are reviewed at each financial year end and adjusted prospectively, if appropriate.
j) Business combinations, Goodwill and Intangible Assets
(i) Business combinations:
Acquisitions of businesses are accounted for using the acquisition method. The consideration transferred in a business combination is measured at fair value, which is calculated as the sum of acquisition date fair values of the assets transferred by the Company, liabilities incurred by the Company to the former owners of the acquiree and the equity interests issued by the Company in exchange for control of the acquiree. Acquisition related costs are generally recognized in profit or loss as incurred.
Intangible assets acquired in business combination are measured at fair value as of the date of acquisition less accumulated amortisation and accumulated impairment, if any.
When the consideration transferred by the Company in a business combination includes assets or liabilities resulting from a contingent arrangement, the contingent consideration is measured at its acquisition date fair value and included as part of the consideration transferred in a business combination. Contingent consideration that is classified as an asset or liability is remeasured at subsequent reporting dates in accordance with Ind AS 109 Financial Instruments or Ind AS 37 Provisions, Contingent Liabilities and Contingent Assets, with the corresponding gain or loss being recognised in profit or loss.
(ii) Goodwill:
Goodwill represents the cost of acquired business as established at the date of acquisition of the business in excess of the acquirer’s interest in the net fair value of the identifiable assets, liabilities and contingent liabilities less accumulated impairment losses, if any. Goodwill is tested for impairment annually or when events or circumstances indicate that the implied fair value of goodwill is less than its carrying amount.
(iii) Intangible assets:
Intangible assets other than acquired in a business combination are measured at cost at the date of acquisition. Following initial recognition, intangible assets are carried at cost less any accumulated amortization and accumulated impairment losses, if any.
Research costs are expensed as incurred.
Internally generated intangible asset arising from development activity is recognized at cost on demonstration of its technical feasibility, the intention and ability of the company to complete, use or sell it, only if, it is probable that the asset would generate future economic benefit and the expenditure attributable to the said assets during its development can be measured reliably.
An item of Intangible assets is derecognised upon disposal or when no future economic benefits are expected to arise from the continued use of the asset. Any gain or loss arising on the disposal or retirement of an item of Intangible assets are determined as the difference between the sales proceeds and the carrying amount of the asset and is recognised in the profit or loss.
Amortization periods and methods for all Intangible Assets, including on business combination:
Intangible assets are amortized on straight line basis over their estimated useful lives which are as follows:
Class of Intangible AssetsUseful life as followed by
the Company
Softwares (acquired) 1-5 years
Softwares (internally generated) 3-5 years
Non-compete agreements 3-5 years
Customer relationship 5-10 years
Customer contracts 1 year
Brand 5 years
The estimated useful life of amortizable intangible assets are reviewed and where appropriate are adjusted, annually.

Notes to the Standalone Financial Statementsas at and for the year ended March 31, 2020(All amounts in INR Lakhs, unless otherwise stated)
140 ZENSAR TECHNOLOGIES LTD ANNUAL REPORT 2019-20
k) Provisions and contingent liabilities:
Provisions are recognized when the Company has a present obligation (legal or constructive) as a result of a past event, it is probable that an outflow of economic benefits will be required to settle the obligation and a reliable estimate can be made of the amount of the obligation.
When some or all of the economic benefits required to settle a provision are expected to be recovered from a third party, the receivable is recognized as an asset, if it is virtually certain that reimbursement will be received and the amount of the receivable can be measured reliably.
When a provision is measured using the cash flows estimated to settle the present obligation, its carrying amount is the present value of those cash flows (when the effect of the time value of money is material).
The Company uses significant judgement to disclose contingent liabilities. Contingent liabilities are disclosed when there is a possible obligation arising from past events, the existence of which will be confirmed only by the occurrence or non-occurrence of one or more uncertain future events not wholly within the control of the Company or a present obligation that arises from past events where it is either not probable that an outflow of resources will be required to settle the obligation or a reliable estimate of the amount cannot be made. Contingent assets are neither recognised nor disclosed in the financial statements.
Provisions for onerous contracts are recognized when the expected benefits to be derived by the Company from a contract are lower than the unavoidable costs of meeting the future obligations under the contract. Provisions for onerous contracts are measured at the present value of lower of the expected net cost of fulfilling the contract and the expected cost of terminating the contract.
l) Employee benefits:
i. Post-employment and pension plans:
The Company participates in various employee benefit plans. Pensions and other post-employment benefits are classified as either defined contribution plans or defined benefit plans. Under a defined contribution plan, the Company’s only obligation is to pay a fixed amount with no obligation to pay further contributions if the fund does not hold sufficient assets to pay all employee benefits. The related actuarial and investment risks fall on the employee. The expenditure for defined contribution plans is recognized as an expense during the period when the employee provides service. Under a defined benefit plan, it is the
Company’s obligation to provide agreed benefits to the employees. The related actuarial and investment risks fall on the Company. The present value of the defined benefit obligations is calculated by an independent actuary using the projected unit credit method.
The Company has the following employee benefit plans:
Provident Fund:
Employees receive benefits from a provident fund, which is a defined benefit plan. The employer and employees each make periodic contributions to the plan. Provident fund contributions are made to a trust administered by the Company. The contributions to the trust managed by the Company are accounted for as a defined benefit plan as the Company is liable for any shortfall, if any with respect to the rate of return based on the government specified minimum rates of return.
The Company’s liability is actuarially determined (using the Projected Unit Credit method) at the end of the year. Actuarial losses/ gains are recognised in the Statement of Profit and Loss in the year in which they arise. The contributions made to the trust are recognised as plan assets. The defined benefit obligation recognised in the balance sheet represents the present value of the defined benefit obligation as reduced by the fair value of plan assets.
Superannuation and family pension funds:
Superannuation plan, a defined contribution scheme is administered by Life Insurance Corporation of India. The Company makes annual contributions based on a specified percentage of each eligible employee’s salary.
The Company has a Defined Contribution Plan for Post-employment benefits for all employees in the form of Family Pension Fund administered by Regional Provident Fund Commissioner.
These contributions to superannuation and family pension funds are classified as defined contribution plans as the Company has no further obligation beyond making the contributions. The Company’s contributions to Defined Contribution Plans are charged to the Statement of Profit and Loss as and when employee provides services.
Gratuity:
The Company provides for gratuity, a defined benefit plan (the “Gratuity Plan”) covering eligible employees in accordance with the Scheme. The Gratuity plan provides for a lump sum payment to eligible employees, at retirement, death, incapacitation or termination of employment based on the last drawn

Notes to the Standalone Financial Statementsas at and for the year ended March 31, 2020(All amounts in INR Lakhs, unless otherwise stated)
141BOARD’S REPORT NOTICE AND STATUTORY REPORTS
salary and years of employment with the Company. The gratuity fund is managed by the Life Insurance Corporation of India (LIC). The Company’s obligation in respect of the gratuity plan, is provided for based on actuarial valuation using the projected unit credit method. The Company recognizes actuarial gains and losses immediately in other comprehensive income, net of taxes.
The retirement benefit obligation recognized in the Balance Sheet represents the present value of the defined benefit obligation as adjusted for unrecognized past service cost, and as reduced by the fair value of scheme assets. Any asset resulting from this calculation is limited to the present value of available refunds and reductions in future contributions to the scheme.
ii. Short-term benefits:
Short-term employee benefit obligations are measured on an undiscounted basis and are recorded as expense as the related services are provided. Liabilities for wages and salaries including the amount expected to be paid under short-term cash bonus or profit sharing plans, expected to be settled wholly within 12 months after the end of the period in which the employees render the related service are recognized if the Company has a present legal or constructive obligation to pay this amount as a result of past service provided by the employee and the obligation can be estimated reliably.
iii. Compensated absences:
The employees of the company are entitled to compensated absences. The employees can carry forward a portion of the unutilized accumulating compensated absences and utilize it in future periods or receive cash at retirement or termination of employment. The company records an obligation for compensated absences in the period in which the employee renders the services that increases this entitlement.
The company’s liability is actuarially determined (using the Projected Unit Credit method) at the end of each year as applicable. Actuarial losses/ gains are recognized in the Statement of Profit and Loss in the year in which they arise.
Accumulated compensated absences, which are expected to be availed or encashed within 12 months from the end of the year are classified under current liabilities and balance under non-current liabilities.
iv. Share-based payments:
Selected employees of the Company receive
remuneration in the form of equity settled instruments, for rendering services over a defined vesting period. The cost of equity-settled transactions is determined by the fair value at the date when the grant is made using an appropriate valuation model.
The cost under employee benefits expense is recognised, together with a corresponding change in Share Based Payment Reserves under Other Equity, over the period in which the performance and/or service conditions are fulfilled. The cumulative expense recognised for equity-settled transactions at each reporting date until the vesting date reflects the extent to which the vesting period has expired and the company’s best estimate of the number of equity instruments that will ultimately vest.
Service and non-market performance conditions are not taken into account when determining the grant date fair value of awards, but the likelihood of the conditions being met is assessed as part of the Company’s best estimate of the number of equity instruments that will ultimately vest.
Market performance conditions are reflected within the grant date fair value. Any other conditions attached to an award, but without an associated service requirement, are considered to be non-vesting conditions. Non-vesting conditions are reflected in the fair value of an award and lead to an immediate expensing of an award unless there are also service and/or performance conditions.
No expense is recognised for awards that do not ultimately vest because non-market performance and/or service conditions have not been met. Where awards include a market or non-vesting condition, the transactions are treated as vested irrespective of whether the market or non-vesting condition is satisfied, provided that all other performance and/or service conditions are satisfied.
When the terms of an equity-settled award are modified, the minimum expense recognised is the expense had the terms had not been modified, if the original terms of the award are met. An additional expense is recognised for any modification that increases the total fair value of the share-based payment transaction or is otherwise beneficial to the employee as measured at the date of modification. Where an award is cancelled by the entity or by the counterparty, any remaining element of the fair value of the award is expensed immediately through profit or loss.
m) Foreign currency transactions
Foreign currency transactions are recorded at exchange rates prevailing on the date of the transaction. Foreign currency denominated monetary

Notes to the Standalone Financial Statementsas at and for the year ended March 31, 2020(All amounts in INR Lakhs, unless otherwise stated)
142 ZENSAR TECHNOLOGIES LTD ANNUAL REPORT 2019-20
assets and liabilities are restated at the exchange rate prevailing on the reporting date and exchange gains and losses arising on settlement and restatement are recognised in the statement of profit and loss. Non-monetary assets and liabilities that are measured in terms of historical cost in foreign currencies are not restated.
Assets and liabilities of entities with functional currency other than the functional currency of the Company have been restated using exchange rates prevailing on the reporting date. Statement of profit and loss of such entities has been restated using weighted average exchange rates. Translation adjustments have been reported as Foreign Currency Translation Reserve in the Statement of Changes in Equity through Other Comprehensive Income.
Goodwill and fair value adjustments arising on the acquisition of a foreign operation are treated as assets and liabilities of the foreign operation and restated at the exchange rate prevailing at the reporting date.
n) Contributed Equity:
Equity shares are classified as equity.
Incremental costs directly attributable to the issue of new shares or options are shown in equity as a deduction, net of tax, from proceeds.
o) Dividends:
Provision is made for the amount of any dividend declared, being appropriately authorized and no longer at the discretion of the entity, on or before the end of the reporting period but not distributed at the end of the reporting period.
p) Earnings per share:
The basic earnings per share is computed by dividing the net profit for the period attributable to equity shareholders by the weighted average number of equity shares outstanding during the period. The number of shares used in computing diluted earnings per share comprises the weighted average shares considered for deriving basic earnings per share and also the weighted average number of equity shares which would have been issued on the conversion of all dilutive potential equity shares. Dilutive potential equity shares are deemed converted as of the beginning of the period unless they have been issued at a later date.
u. Rounding of amounts
All amounts disclosed in the financial statements and notes have been rounded off to nearest lakhs as per the requirement of Schedule III, unless otherwise stated.
3. Critical estimates and judgements
The preparation of the financial statements requires management to make judgements, estimates and assumptions that affect the application of accounting policies and the reported amounts of assets, liabilities, income and expenses. Actual results may differ from those estimates.
The Company has given due consideration of the possible effects that may result from the pandemic relating to COVID-19 on the carrying amounts of receivables, unbilled revenues, goodwill and intangible assets. In assessing the assumptions relating to the possible future uncertainties in the global economic conditions because of this pandemic, the Company, as at the date of approval of these financial statements, has used internal and external sources of information, including credit reports and related information on the expected future performance of the Company. The Company has performed sensitivity analysis on the assumptions used, and based on current estimates, is of the view that the carrying amount of these assets reflect their realisable values. The Company is actively managing its business to respond to its impact. However, there could be an adverse impact on the business, result of operations, financial position and cash flows ; the company believes that the impact is likely to be mitigated by the diversified nature of the company’s clients, including the geographical spread of the company’s operations, and its clientele. The impact of COVID-19 on the Company’s financial statements may differ from that estimated as at the date of approval of these financial statements.
Estimates and underlying assumptions are reviewed on an ongoing basis. Revisions to accounting estimates are recognized in the period in which the estimates are revised and in any future periods affected. In particular, information about significant areas of estimation, uncertainty and critical judgements in applying accounting policies that have the most significant effect on the amounts recognized in the financial statements are included in the following notes:
The areas involving critical estimates and/or judgements are:
a Revenue recognition
The company uses the percentage-of-completion method in accounting for its fixed-price contracts. Use of the percentage-of-completion method requires the company to estimate the efforts or costs expended to date as a proportion of the total efforts or costs to be expended. Efforts or costs expended have been used to measure progress towards completion as there is a direct relationship between input and productivity. Provisions for estimated losses, if any,on uncompleted contracts are recorded in the period in which such losses become probable based on the expected contract estimates at the reporting date.

Notes to the Standalone Financial Statementsas at and for the year ended March 31, 2020(All amounts in INR Lakhs, unless otherwise stated)
143BOARD’S REPORT NOTICE AND STATUTORY REPORTS
b Income taxes
Significant judgements are involved in determining the provision for income taxes, including amount expected to be paid/recovered for uncertain tax positions. The policy for the same has been explained under note 2(b).
c Property, plant and equipment
Property, plant and equipment represent a significant proportion of the asset base of the company. The charge in respect of periodic depreciation is derived after determining an estimate of an asset’s expected useful life and the expected residual value at the end of its life. The useful lives and residual values of company’s assets are determined by management at the time the asset is acquired and reviewed at the end of each reporting period. The lives are based on historical experience with similar assets as well as anticipation of future events, which may impact their life, such as changes in technology. The policy for the same has been explained under note 2(i).
d Impairment of Investments
The Company reviews its carrying value of investments in subsidiaries and other entities annually, or more frequently when there is indication for impairment. If the recoverable amount is less than its carrying amount, the impairment loss is accounted for.
e Provisions
Provision is recognised when the company has a present obligation as a result of past event and it is probable that an outflow of resources will be required to settle the obligation, in respect of which a reliable estimate can be made. These are reviewed at each balance sheet date adjusted to reflect the current best estimates. The policy for the same has been explained under note 2(k).
f Business combinations
In accounting for business combinations, judgement is required in identifying whether an identifiable intangible asset is to be recorded separately from goodwill. Additionally, estimating the acquisition date fair value of the identifiable assets acquired, and liabilities and contingent consideration involves management judgement. These measurements are based on information available at the acquisition date and are based on expectations and assumptions that have been deemed reasonable by management. Changes in these judgements, estimates, and assumptions can materially affect the results of operations.
g Goodwill
Goodwill is tested for impairment at least annually or when events occur or changes in circumstances indicate that the recoverable amount of the cash generating unit is less than its carrying value. The recoverable amount of cash generating units is higher of value-in-use and fair value less cost to sell. The calculation involves use of significant estimates and assumptions which includes turnover and earnings multiples, growth rates and net margins used to calculate projected future cash flows, risk-adjusted discount rate, future economic and market conditions.
h Defined benefit obligation
The cost of the defined benefit plans and the present value of the defined benefit obligation are based on actuarial valuation using the projected unit credit method. An actuarial valuation involves making various assumptions that may differ from actual developments in the future. These include the determination of the discount rate, future salary increases and mortality rates. Due to the complexities involved in the valuation and its long-term nature, a defined benefit obligation is highly sensitive to changes in these assumptions. All assumptions are reviewed at each reporting date. Also refer note 14.
i Employee stock options
The company initially measures the cost of equity-settled transactions with employees using a Black Scholes Options Pricing model to determine the fair value of the liability incurred. Estimating fair value for share-based payment transactions requires determination of the most appropriate valuation model and the performance of the company, which is dependent on the terms and conditions of the grant. This estimate also requires determination of the most appropriate inputs to the valuation model including the expected life of the share option, volatility and dividend yield and making assumptions about them. The assumptions and models used for estimating fair value for share-based payment transactions are disclosed in note 31.
j Allowance for Expected Credit Losses
Considering uncertainties due to COVID-19 pandemic, the Company has reassessed the allowance for credit losses based on historical loss experience adjusted to reflect current and estimated future economic conditions, credit reports, subsequent collections, credit term extension requests from customers and other related credit information, relating to industries the company deals with and the countries where it operates.
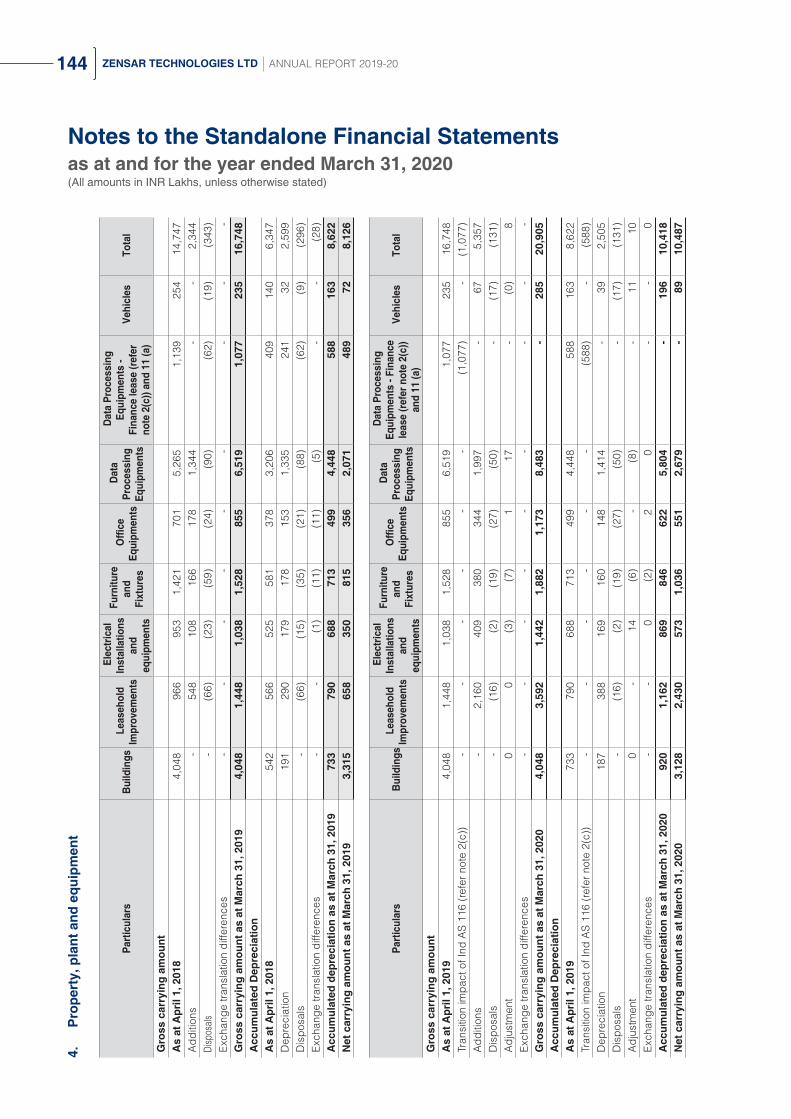
Notes to the Standalone Financial Statementsas at and for the year ended March 31, 2020(All amounts in INR Lakhs, unless otherwise stated)
144 ZENSAR TECHNOLOGIES LTD ANNUAL REPORT 2019-204.
P
rope
rty,
pla
nt a
nd e
quip
men
t
Parti
cula
rs B
uild
ings
L
ease
hold
Im
prov
emen
ts
Ele
ctric
al
Inst
alla
tions
an
d eq
uipm
ents
Fur
nitu
re
and
Fixt
ures
Offi
ce
Equi
pmen
ts
Dat
a Pr
oces
sing
Eq
uipm
ents
Dat
a Pr
oces
sing
Eq
uipm
ents
-
Fina
nce
leas
e (re
fer
note
2(c
)) an
d 11
(a)
Veh
icle
s T
otal
Gro
ss c
arry
ing
amou
ntA
s at
Apr
il 1,
201
8 4
,048
9
66
953
1
,421
7
01
5,2
65
1,1
39
254
1
4,74
7 A
dditi
ons
- 5
48
108
1
66
178
1
,344
-
- 2
,344
Di
spos
als
- (6
6) (2
3) (5
9)(2
4)(9
0) (6
2)(1
9)(3
43)
Exch
ange
tran
slat
ion
diffe
renc
es -
- -
- -
- -
- -
Gro
ss c
arry
ing
amou
nt a
s at
Mar
ch 3
1, 2
019
4,0
48
1,4
48
1,0
38
1,5
28
855
6,5
19
1,07
7 2
35
16,7
48A
ccum
ulat
ed D
epre
ciat
ion
As
at A
pril
1, 2
018
542
5
66
525
5
81
378
3
,206
4
09
140
6
,347
D
epre
ciat
ion
191
2
90
179
1
78
153
1
,335
2
41
32
2,5
99
Dis
posa
ls -
(66)
(15)
(35)
(21)
(88)
(62)
(9)
(296
)Ex
chan
ge tr
ansl
atio
n di
ffere
nces
- -
(1)
(11)
(11)
(5)
- -
(28)
Acc
umul
ated
dep
reci
atio
n as
at M
arch
31,
201
9 7
33
790
6
88
713
4
99
4,4
48
588
1
63
8,62
2N
et c
arry
ing
amou
nt a
s at
Mar
ch 3
1, 2
019
3,3
15
658
3
50
815
3
56
2,07
1 4
89
728,
126
Parti
cula
rs B
uild
ings
L
ease
hold
Im
prov
emen
ts
Ele
ctric
al
Inst
alla
tions
an
d eq
uipm
ents
Fur
nitu
re
and
Fixt
ures
Offi
ce
Equi
pmen
ts
Dat
a Pr
oces
sing
Eq
uipm
ents
Dat
a Pr
oces
sing
Eq
uipm
ents
- Fi
nanc
e le
ase
(refe
r not
e 2(
c))
and
11 (a
)
Veh
icle
s T
otal
Gro
ss c
arry
ing
amou
ntA
s at
Apr
il 1,
201
9 4
,048
1
,448
1
,038
1
,528
8
55
6,5
19
1,0
77
235
1
6,74
8 Tr
ansi
tion
impa
ct o
f Ind
AS
116
(ref
er n
ote
2(c)
) -
- -
- -
- (1
,077
) -
(1,0
77)
Add
ition
s -
2,1
60
409
3
80
344
1
,997
-
67
5,35
7D
ispo
sals
- (1
6) (2
) (1
9) (2
7) (5
0) -
(17)
(131
)A
djus
tmen
t 0
0
(3
) (7
) 1
1
7 -
(0)
8
Exch
ange
tran
slat
ion
diffe
renc
es -
- -
- -
- -
- -
Gro
ss c
arry
ing
amou
nt a
s at
Mar
ch 3
1, 2
020
4,0
48
3,5
92
1,4
42
1,88
21,
173
8,48
3 -
285
20
,905
Acc
umul
ated
Dep
reci
atio
nA
s at
Apr
il 1,
201
9 7
33
790
6
88
713
4
99
4,4
48
588
1
63
8,6
22
Tran
sitio
n im
pact
of I
nd A
S 11
6 (r
efer
not
e 2(
c))
- -
- -
- -
(588
) -
(588
)D
epre
ciat
ion
187
3
88
169
1
60
148
1
,414
-
39
2,50
5D
ispo
sals
- (1
6) (2
) (1
9) (2
7) (5
0) -
(17)
(131
)A
djus
tmen
t 0
-
14
(6)
- (8
) -
11
10
Exch
ange
tran
slat
ion
diffe
renc
es -
- 0
(2
) 2
0
-
- 0
A
ccum
ulat
ed d
epre
ciat
ion
as a
t Mar
ch 3
1, 2
020
920
1,16
286
984
662
25,
804
- 19
610
,418
Net
car
ryin
g am
ount
as
at M
arch
31,
202
0 3
,128
2
,430
5
73
1,03
6 5
51
2,6
79
- 89
10,
487
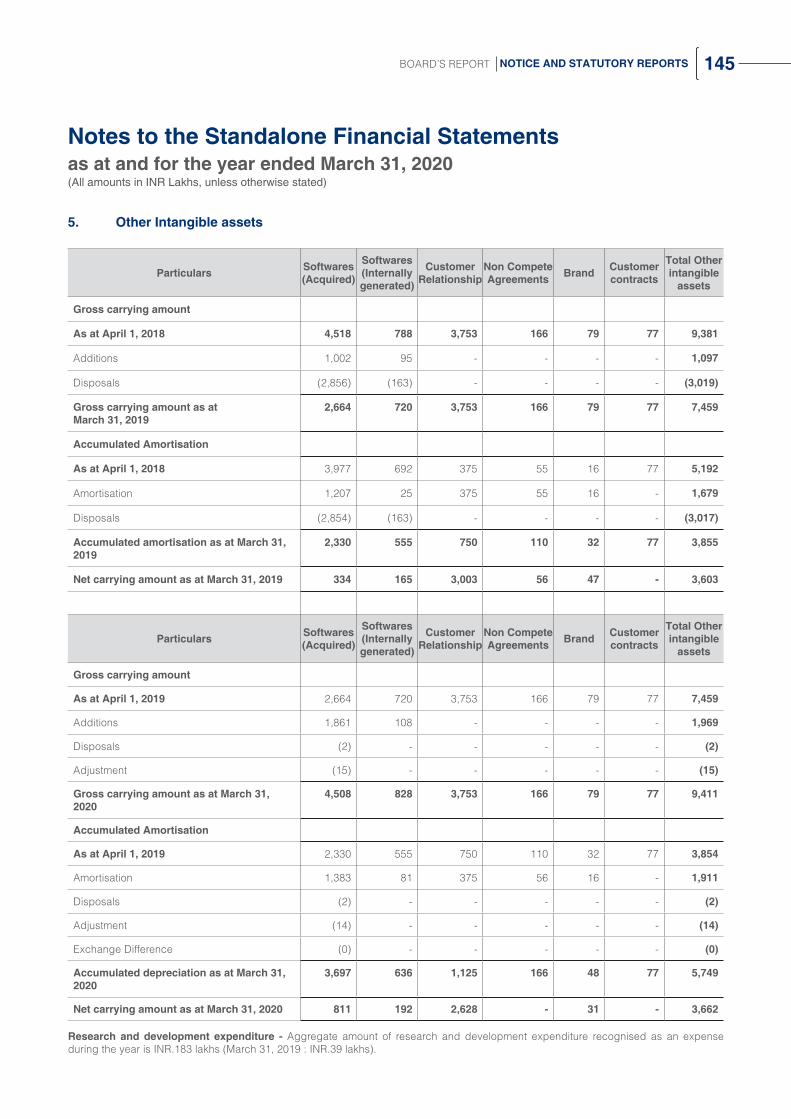
Notes to the Standalone Financial Statementsas at and for the year ended March 31, 2020(All amounts in INR Lakhs, unless otherwise stated)
145BOARD’S REPORT NOTICE AND STATUTORY REPORTS
5. Other Intangible assets
Particulars Softwares (Acquired)
Softwares (Internally generated)
Customer Relationship
Non Compete Agreements Brand Customer
contracts
Total Other intangible
assets
Gross carrying amount
As at April 1, 2018 4,518 788 3,753 166 79 77 9,381
Additions 1,002 95 - - - - 1,097
Disposals (2,856) (163) - - - - (3,019)
Gross carrying amount as at March 31, 2019
2,664 720 3,753 166 79 77 7,459
Accumulated Amortisation
As at April 1, 2018 3,977 692 375 55 16 77 5,192
Amortisation 1,207 25 375 55 16 - 1,679
Disposals (2,854) (163) - - - - (3,017)
Accumulated amortisation as at March 31, 2019
2,330 555 750 110 32 77 3,855
Net carrying amount as at March 31, 2019 334 165 3,003 56 47 - 3,603
Particulars Softwares (Acquired)
Softwares (Internally generated)
Customer Relationship
Non Compete Agreements Brand Customer
contracts
Total Other intangible
assets
Gross carrying amount
As at April 1, 2019 2,664 720 3,753 166 79 77 7,459
Additions 1,861 108 - - - - 1,969
Disposals (2) - - - - - (2)
Adjustment (15) - - - - - (15)
Gross carrying amount as at March 31, 2020
4,508 828 3,753 166 79 77 9,411
Accumulated Amortisation
As at April 1, 2019 2,330 555 750 110 32 77 3,854
Amortisation 1,383 81 375 56 16 - 1,911
Disposals (2) - - - - - (2)
Adjustment (14) - - - - - (14)
Exchange Difference (0) - - - - - (0)
Accumulated depreciation as at March 31, 2020
3,697 636 1,125 166 48 77 5,749
Net carrying amount as at March 31, 2020 811 192 2,628 - 31 - 3,662
Research and development expenditure - Aggregate amount of research and development expenditure recognised as an expense during the year is INR.183 lakhs (March 31, 2019 : INR.39 lakhs).

Notes to the Standalone Financial Statementsas at and for the year ended March 31, 2020(All amounts in INR Lakhs, unless otherwise stated)
146 ZENSAR TECHNOLOGIES LTD ANNUAL REPORT 2019-20
6. Financial assets
6 (a) Investments : Non current
ParticularsAs at
March 31, 2020 As at
March 31, 2019
(i) Investments carried at Fair Value through Other Comprehensive Income (FVOCI)
Investment in equity instruments - Quoted
100 (March 31, 2019 : 100) Equity Shares of INR 10 each fully paid up in CFL Capital Financial Services Limited
0 0
Sub Total 0 0
Investment in equity instruments - Unquoted
100 (March 31, 2019: 100) Equity Shares of INR. 9 (March 31, 2019: INR. 9) each fully paid-up in Spencer & Company Limited
0 0
Sub Total 0 0(ii) Investments carried at cost
Investment in equity instruments of subsidiary companies - Unquoted
Zensar Technologies Inc. 2,00,000 (March 31, 2019: 2,00,000) Shares having an aggregate cost of US$ 10,00,000 (March 31, 2019: US$ 10,00,000)
290 290
Zensar Technologies (Singapore) Pte Limited## 3,00,000 (March 31, 2019: 3,00,000) Equity Shares of SGD 1 each 78 78
Less : Provision for impairment in the value of investments (78) (78)
Zensar Technologies (UK) Limited 50,000 (March 31, 2019: 50,000) Equity Shares of GBP 1 each 39 39
Zensar Technologies (Shanghai) Company Limited @@100% fully paid up equity shares, cost of US$ 10,00,000 (March 31, 2019: US$ 10,00,000)
498 498
Less : Provision for impairment in the value of investments (498) (498)
Zensar (Africa) Holdings Pty Limited100 (March 31, 2019: 100) Shares of an aggregate cost of ZAR 10,00,000 (March 31, 2019: ZAR 10,00,000)
61 61
Cynosure Interface Services Private Limited100,000 (March 31, 2019: 100,000) Equity Shares of Rs.10 each fully paid up (Refer Note 35)
1,270 1,270
Sub Total 1,660 1,660 (iii) Unquoted Investments carried at Fair value through Profit and Loss
(FVTPL)
- Mutual Funds - 4,658
Sub Total - 4,658
Total non current investments 1,660 6,318Aggregate amount of quoted investments & market value thereof - -
Aggregate amount of unquoted investments 2,236 6,894
Aggregate amount of impairment in the value of investments 576 576
## During the previous year ended March 31, 2019 company provided for diminution in value against its investment in Zensar Technologies (Singapore) Pte Limited
@@ Investment in this entity is not denominated in number of shares as per laws of the People’s Republic of China.

Notes to the Standalone Financial Statementsas at and for the year ended March 31, 2020(All amounts in INR Lakhs, unless otherwise stated)
147BOARD’S REPORT NOTICE AND STATUTORY REPORTS
6 (b) Investments : Current
ParticularsAs at
March 31, 2020 As at
March 31, 2019
(i) Unquoted Investments carried at Fair value through Profit and Loss (FVTPL) - Mutual Funds 26,704 4,536
Total 26,704 4,536
Aggregate amount of unquoted investments 26,704 4,536
6 (c) Trade receivables
ParticularsAs at
March 31, 2020 As at
March 31, 2019
(Unsecured, considered good unless otherwise stated)
- Considered good 105,569 87,382
- Credit impaired 4,410 5,895
109,979 93,277
Less: Allowance for credit loss (4,410) (5,895)
Total 105,569 87,382
Notes :
Debts due by directors or other officers of the company or any of them either severally or jointly with any other person or debts due by firms or private companies respectively in which any director is a partner or a director or a member - INR 18 lakhs (March 31, 2019 : INR 32 lakhs) (refer note 28)
6 (d) Loans : Non current
ParticularsAs at
March 31, 2020 As at
March 31, 2019
(Unsecured, considered good unless otherwise stated) Loans to related parties# [Refer note 28]
Considered good - -
Credit impaired 78 78
78 78
Less: Allowance for credit loss (78) (78)
Total - -
# loans provided for their working capital requirements

Notes to the Standalone Financial Statementsas at and for the year ended March 31, 2020(All amounts in INR Lakhs, unless otherwise stated)
148 ZENSAR TECHNOLOGIES LTD ANNUAL REPORT 2019-20
6 (e) Cash and cash equivalents
ParticularsAs at
March 31, 2020 As at
March 31, 2019
Cash on hand 0 2
Funds in transit 26 7,356
Cheques on hand 13 -
Balances with banks :
- In current accounts 2,383 3,156
- Deposits having original maturity of less than three months 877 1,948
Total 3,299 12,462
6 (f) Other balances with banks
ParticularsAs at
March 31, 2020 As at
March 31, 2019
Earmarked Balances with Banks - Unclaimed Dividend 269 232
Deposits having original maturity of more than three months 2,434 354
Total 2,703 586
6 (g) Other financial assets : Non current
ParticularsAs at
March 31, 2020 As at
March 31, 2019
(Unsecured, considered good unless otherwise stated)
Security deposits 1,271 1,597
Amount deposited under protest 1,488 1,382
Interest receivable
Considered good - -
Credit impaired 20 20
Less: Allowance for credit loss (20) (20)
- -
Total 2,759 2,979

Notes to the Standalone Financial Statementsas at and for the year ended March 31, 2020(All amounts in INR Lakhs, unless otherwise stated)
149BOARD’S REPORT NOTICE AND STATUTORY REPORTS
6 (h) Other financial assets : Current
ParticularsAs at
March 31, 2020 As at
March 31, 2019
(Unsecured, considered good unless otherwise stated)
Unbilled revenues
Considered good 1,465 20,260
Credit impaired - 44
1,465 20,304
Less: Allowance for credit loss - (44)
1,465 20,260
Foreign currency derivative assets 1,255 2,885
Security Deposits 177 -
Interest accrued on bank deposits 16 26
Sales consideration receivable (Refer note 36) 22 1,247
Contractually reimbursable expenses (Refer Note 28)
Considered good 3,395 3,604
Credit impaired 151 146
3,546 3,750
Less: Allowance for credit loss (151) (146)
3,395 3,604
Total 6,330 28,022

Notes to the Standalone Financial Statementsas at and for the year ended March 31, 2020(All amounts in INR Lakhs, unless otherwise stated)
150 ZENSAR TECHNOLOGIES LTD ANNUAL REPORT 2019-20
7. Deferred Tax Asset (net)
The components of deferred tax assets and liabilities are as follows:
ParticularsAs at
March 31, 2020 As at
March 31, 2019
The major components of the deferred tax asset are
Depreciation/amortisation of Property, plant and equipment and Intangible assets 544 673
Allowance for credit loss on trade receivables and advances 1,386 1,978
Expenses allowable on payment/exercise basis 653 957
Fair value changes of cash flow hedges 165 -
Others 92 73
2,840 3,681
The major components of the deferred tax liability are
Gain on mutual fund investments mandatorily measured at FVTPL 67 82
Fair value changes of cash flow hedges - 207
67 289
Net deferred tax asset / (liability) 2,773 3,392
(i) Movement in deferred tax assets
Particulars
Depreciation /amortisation of Property, plant and equipment and Intangible
assets
Allowance for credit
loss on trade receivables
and advances
Expenses allowable
on payment / exercise
basis
Tax Losses
Fair value changes of cash flow hedges
Others Total
As at April 1, 2018 514 1,683 991 118 22 42 3,370
(Charged)/credited:
- to statement of profit and loss 159 295 (34) (118) - 31 333
- to other comprehensive income - - - - (22) - (22)
As at March 31, 2019 673 1,978 957 - - 73 3,681
(Charged)/credited:
- Transition impact of Ind AS 116 (refer note 2(c))
- - - - - - -
- to statement of profit and loss (129) (592) (304) - - 19 (1,006)
- to other comprehensive income - - - - 165 - 165
As at March 31, 2020 544 1,386 653 - 165 92 2,840

Notes to the Standalone Financial Statementsas at and for the year ended March 31, 2020(All amounts in INR Lakhs, unless otherwise stated)
151BOARD’S REPORT NOTICE AND STATUTORY REPORTS
(ii) Movement in deferred tax liabilities
ParticularsGain on mutual fund invest-
ments mandatorily measured at FVTPL
Fair value changes of cash flow hedges
Amortisable goodwill
Total
As at April 1, 2018 366 - - 366
(Charged)/credited:
- to statement of profit and loss (284) - - (284)
- to other comprehensive income - 207 - 207
As at March 31, 2019 82 207 - 289
(Charged)/credited:
- to statement of profit and loss (15) - - (15)
- to other comprehensive income - (207) - (207)
As at March 31, 2020 67 - - 67
8 Other non-current assets
ParticularsAs at
March 31, 2020 As at
March 31, 2019
(Unsecured, considered good unless otherwise stated)
Prepaid expenses 808 680
Capital advances 74 316
Total 882 996

Notes to the Standalone Financial Statementsas at and for the year ended March 31, 2020(All amounts in INR Lakhs, unless otherwise stated)
152 ZENSAR TECHNOLOGIES LTD ANNUAL REPORT 2019-20
9 Other current assets
ParticularsAs at
March 31, 2020 As at
March 31, 2019
(Unsecured, considered good unless otherwise stated)
Advances other than capital advances:
- advances to employees 292 307
- advances to suppliers
Considered good 239 247
Credit impaired 118 -
357 247
Less: Allowance for credit loss (118) -
239 247
Unbilled revenues
Considered good 607 97
Credit impaired - -
607 97
Less: Allowance for credit loss - -
607 97
Prepaid expenses 1,010 1,604
Balance with government authorities 4,125 2,761
Others 0 -
Total 6,273 5,016
10 (a) Equity share capital
ParticularsAs at
March 31, 2020 As at
March 31, 2019
Authorised:
23,75,00,000 equity shares of INR. 2 each 4,750 4,750
(23,75,00,000 shares of INR. 2 each at March 31, 2019)
Total 4,750 4,750
Issued, subscribed and Paid up :
225,416,970 equity shares of INR 2 each 4,508 4,504
(225,184,920 shares of INR 2 each at March 31, 2019)
Total 4,508 4,504

Notes to the Standalone Financial Statementsas at and for the year ended March 31, 2020(All amounts in INR Lakhs, unless otherwise stated)
153BOARD’S REPORT NOTICE AND STATUTORY REPORTS
(i) Reconciliation of the shares outstanding as at the beginning and at the end of the year:
ParticularsAs at March 31, 2020 As at March 31, 2019
Nos INR In lakhs Nos INR In lakhs
At the beginning of the year 225,184,920 4,504 44,990,088 4,499
Add: Shares issued on exercise of employee stock options
232,050 4 154,376 5
Add: Conversion on account of share split* - - 180,040,456 -
Outstanding at the end of the year 225,416,970 4,508 225,184,920 4,504
* The shareholder of the company approved the subdivision of Authorised and issued equity share having face value of INR 10/- each into 5 shares of INR 2/- each in their meeting held on August 8, 2018.
(ii) Terms/rights attached to equity shares
The Company has only one class of equity shares having a par value of INR 2 per share. Each holder of equity shares is entitled to one vote per share. The Company declares and pays dividends in Indian rupees. The dividend proposed by the Board of Directors is subject to the approval of the shareholders in the ensuing Annual General Meeting, except in case of Interim Dividend.
In the event of liquidation of the Company, the holder of equity shares will be entitled to receive any of the remaining assets of the Company, after distribution of all preferential amounts. The distribution will be in proportion to the number of equity shares held by the shareholders.
The Shareholders in their general meeting on August 05, 2019 approved the Final dividend for FY 2018-19 of INR 1.80 per equity share. The total outflow of equity dividend and dividend tax thereon amounted to INR 4,628 lakhs including corporate dividend tax of INR 574 lakhs.
The board of directors in their meeting on January 23, 2020 declared the first interim dividend of INR 1.00 per equity share. The total outflow of equity dividend and dividend tax thereon amounted to INR 2,413 lakhs including corporate dividend tax of INR 160 lakhs.
The board of directors in their meeting on March 6, 2020 declared the second interim dividend of INR 1.80 per equity share. The total outflow of equity dividend and dividend tax thereon amounted to INR 4,891 lakhs including corporate dividend tax of INR 834 lakhs.
(iii) Details of shareholders holding more than 5% of the aggregate shares in the company
Name of shareholderAs at March 31, 2020 As at March 31, 2019
% Number of
shares % Number of
shares
Swallow Associates LLP 26.88% 60,586,344 26.89% 60,550,940
Marina Holdco (FPI) Limited 22.85% 51,506,470 22.87% 51,506,470
Summit Securities Limited 11.08% 24,972,427 10.96% 24,680,535
Instant Holdings Limited 8.45% 19,051,374 8.30% 18,689,130
Amansa Holdings Private Limited 5.83% 13,147,050 5.82% 13,096,412
(iv) Aggregate number of bonus shares issued, shares issued for consideration other than cash and shares bought back during the period of five years immediately preceding March 31, 2020 - Nil
(v) For details of Employee Stock Option Plans (ESOP), Refer note 31

Notes to the Standalone Financial Statementsas at and for the year ended March 31, 2020(All amounts in INR Lakhs, unless otherwise stated)
154 ZENSAR TECHNOLOGIES LTD ANNUAL REPORT 2019-20
10 (b) Reserves and surplus
ParticularsAs at
March 31, 2020 As at
March 31, 2019
Capital redemption reserve 442 442
Share based payment reserve 3,400 2,849
Retained earnings 38,513 28,082
Securities premium 2,812 2,571
General reserve 106,941 106,941
Special economic zone re-investment reserve 1,250 1,500
Total reserves and surplus 153,358 142,385

Notes to the Standalone Financial Statementsas at and for the year ended March 31, 2020(All amounts in INR Lakhs, unless otherwise stated)
155BOARD’S REPORT NOTICE AND STATUTORY REPORTS
10 (c) Movement of Reserves and surplus
ParticularsAs at
March 31, 2020 As at
March 31, 2019
Capital redemption reserve
Balance at the beginning and end of the year 442 442
Share based payment reserve
Balance at the beginning of the year 2,849 1,348
Add: Employee Share based payment expense (net) 645 1,647
Less: Transferred to General reserve on cancellation of stock options - 88
Less: Transferred to Securities premium on exercise of stock options 94 58
Balance as at the end of the year 3,400 2,849
Retained earnings
Balance as at the beginning of the year 28,082 21,824
Transition impact of Ind AS 116 (refer note 2(c)) (97) -
Add: Profit for the year 23,104 25,800
Add / (less) items of other comprehensive income recognised directly in retained earnings:
- Remeasurements of defined employee benefit plans (net of tax) (894) 111
Add: Utilisation of Special Economic Zone Re-investment Reserve 1,500 180
Less: Equity Dividends paid (including Dividend Distribution Tax) 11,932 6,333
Less: Transferred to General reserve - 12,000
Less: Transferred to Special Economic Zone Re-investment Reserve 1,250 1,500
Balance as at the end of the year 38,513 28,082
Securities premium
Balance as at the beginning of the year 2,571 2,378
Add: Transferred from share based payment reserve on exercise of stock options
94 58
Add: Received on exercise of stock options 148 135
Balance as at the end of the year 2,812 2,571
General reserve
Balance as at the beginning of the year 106,941 94,853
Add: Transferred from share based payment reserve on cancellation of stock options
- 88
Add : Transferred from Retained earnings - 12,000
Balance as at the end of the year 106,941 106,941
Special Economic Zone Re-investment Reserve
Balance as at the beginning of the year 1,500 180
Add: Transferred from Retained earnings 1,250 1,500
Less: Utilised during the year 1,500 180
Balance as at the end of the year 1,250 1,500
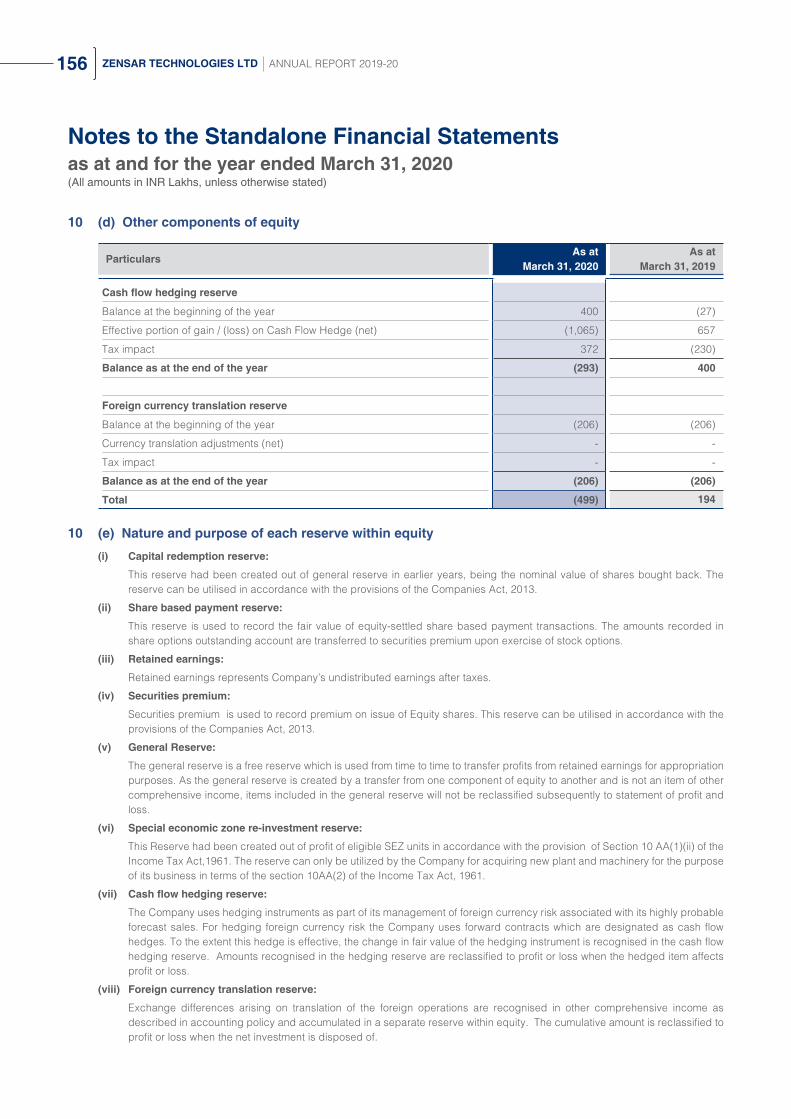
Notes to the Standalone Financial Statementsas at and for the year ended March 31, 2020(All amounts in INR Lakhs, unless otherwise stated)
156 ZENSAR TECHNOLOGIES LTD ANNUAL REPORT 2019-20
10 (d) Other components of equity
ParticularsAs at
March 31, 2020 As at
March 31, 2019
Cash flow hedging reserve
Balance at the beginning of the year 400 (27)
Effective portion of gain / (loss) on Cash Flow Hedge (net) (1,065) 657
Tax impact 372 (230)
Balance as at the end of the year (293) 400
Foreign currency translation reserve
Balance at the beginning of the year (206) (206)
Currency translation adjustments (net) - -
Tax impact - -
Balance as at the end of the year (206) (206)
Total (499) 194
10 (e) Nature and purpose of each reserve within equity
(i) Capital redemption reserve:
This reserve had been created out of general reserve in earlier years, being the nominal value of shares bought back. The reserve can be utilised in accordance with the provisions of the Companies Act, 2013.
(ii) Share based payment reserve:
This reserve is used to record the fair value of equity-settled share based payment transactions. The amounts recorded in share options outstanding account are transferred to securities premium upon exercise of stock options.
(iii) Retained earnings:
Retained earnings represents Company’s undistributed earnings after taxes.
(iv) Securities premium:
Securities premium is used to record premium on issue of Equity shares. This reserve can be utilised in accordance with the provisions of the Companies Act, 2013.
(v) General Reserve:
The general reserve is a free reserve which is used from time to time to transfer profits from retained earnings for appropriation purposes. As the general reserve is created by a transfer from one component of equity to another and is not an item of other comprehensive income, items included in the general reserve will not be reclassified subsequently to statement of profit and loss.
(vi) Special economic zone re-investment reserve:
This Reserve had been created out of profit of eligible SEZ units in accordance with the provision of Section 10 AA(1)(ii) of the Income Tax Act,1961. The reserve can only be utilized by the Company for acquiring new plant and machinery for the purpose of its business in terms of the section 10AA(2) of the Income Tax Act, 1961.
(vii) Cash flow hedging reserve:
The Company uses hedging instruments as part of its management of foreign currency risk associated with its highly probable forecast sales. For hedging foreign currency risk the Company uses forward contracts which are designated as cash flow hedges. To the extent this hedge is effective, the change in fair value of the hedging instrument is recognised in the cash flow hedging reserve. Amounts recognised in the hedging reserve are reclassified to profit or loss when the hedged item affects profit or loss.
(viii) Foreign currency translation reserve:
Exchange differences arising on translation of the foreign operations are recognised in other comprehensive income as described in accounting policy and accumulated in a separate reserve within equity. The cumulative amount is reclassified to profit or loss when the net investment is disposed of.
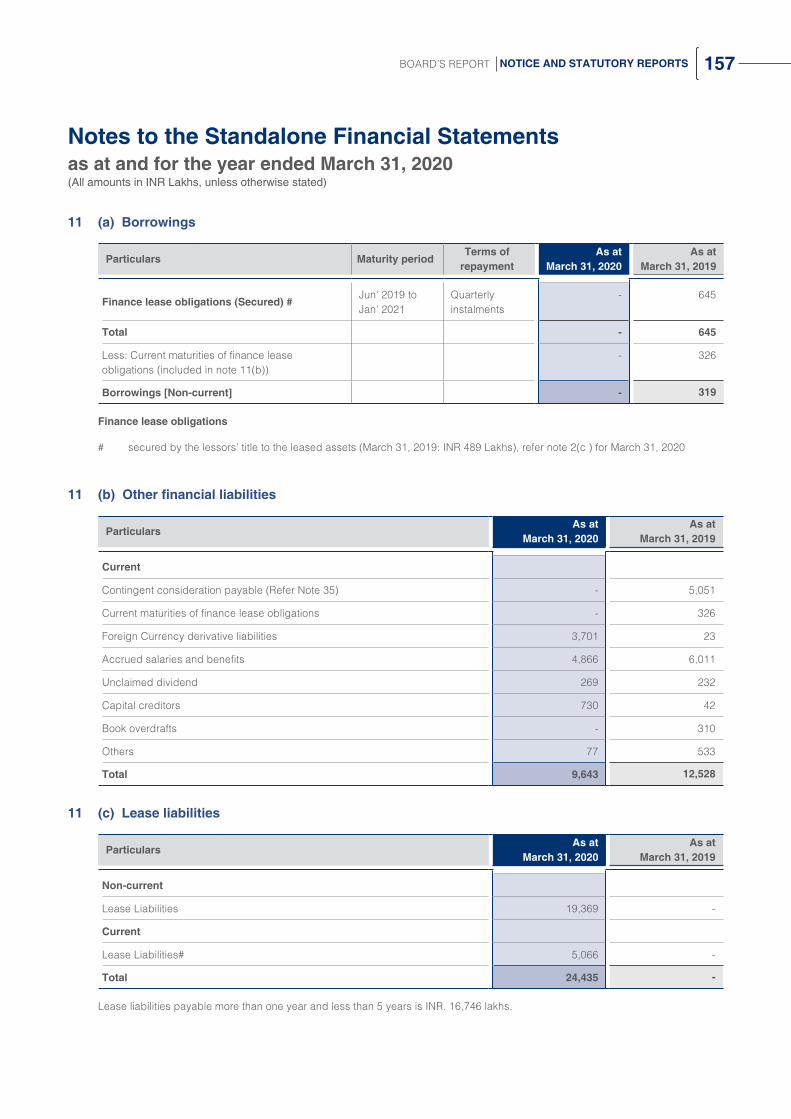
Notes to the Standalone Financial Statementsas at and for the year ended March 31, 2020(All amounts in INR Lakhs, unless otherwise stated)
157BOARD’S REPORT NOTICE AND STATUTORY REPORTS
11 (a) Borrowings
Particulars Maturity periodTerms of
repaymentAs at
March 31, 2020As at
March 31, 2019
Finance lease obligations (Secured) #Jun' 2019 to Jan' 2021
Quarterly instalments
- 645
Total - 645
Less: Current maturities of finance lease obligations (included in note 11(b))
- 326
Borrowings [Non-current] - 319
Finance lease obligations
# secured by the lessors’ title to the leased assets (March 31, 2019: INR 489 Lakhs), refer note 2(c ) for March 31, 2020
11 (b) Other financial liabilities
ParticularsAs at
March 31, 2020 As at
March 31, 2019
Current
Contingent consideration payable (Refer Note 35) - 5,051
Current maturities of finance lease obligations - 326
Foreign Currency derivative liabilities 3,701 23
Accrued salaries and benefits 4,866 6,011
Unclaimed dividend 269 232
Capital creditors 730 42
Book overdrafts - 310
Others 77 533
Total 9,643 12,528
11 (c) Lease liabilities
ParticularsAs at
March 31, 2020 As at
March 31, 2019
Non-current
Lease Liabilities 19,369 -
Current
Lease Liabilities# 5,066 -
Total 24,435 -
Lease liabilities payable more than one year and less than 5 years is INR. 16,746 lakhs.

Notes to the Standalone Financial Statementsas at and for the year ended March 31, 2020(All amounts in INR Lakhs, unless otherwise stated)
158 ZENSAR TECHNOLOGIES LTD ANNUAL REPORT 2019-20
12 Trade payables
ParticularsAs at
March 31, 2020 As at
March 31, 2019
Current
Trade payables 8,053 8,672
Total 8,053 8,672
During the year ended March 31,2020 and 2019, an amount of INR 478 lakhs and INR 66 lakhs respectively was paid beyond the appointed day as defined in the Micro, Small and Medium Enterprises Development Act, 2006.
Interest due and outstanding on the same is INR 8 lakhs. Interest paid INR Nil (previous year INR Nil)
Further in view of the Management, the amount of interest, if any remaining due and payable even in the succeeding years, until such date when the interest dues above are actually paid to the small enterprise, for the purpose of disallowance of a deductible expenditure under section 23 of the Micro, Small and Medium Enterprises Development Act, 2006 is not expected to be material.
This information has been determined to the extent such suppliers have been identified on the basis of information obtained and available with the Company.
13 Provision: Non-current
ParticularsAs at
March 31, 2020 As at
March 31, 2019
Provision for Contingencies 263 209
Total 263 209
(i) Information about individual provisions
It pertains to Lease rentals related litigations. The timing and the amount of cash flows that will arise from this matter will be determined by the Appellate Authorities only on settlement of this case.
(ii) Movements in provisions
Movements in each class of provisions during the financial year, are set out below
ParticularsAs at
March 31, 2020 As at
March 31, 2019
Opening Balance 209 88
Additional provisions accrued 54 121
Unused amounts reversed - -
Amounts used during the year - -
Closing Balance 263 209
14 Employee benefit obligations
ParticularsAs at
March 31, 2020 As at
March 31, 2019
Non current
Provision for compensated absences 1,544 1,450
Total 1,544 1,450
Current
Provision for compensated absences 1,403 1,090
Provision for gratuity (Refer Note (i) below) 1,719 320
Total 3,122 1,410

Notes to the Standalone Financial Statementsas at and for the year ended March 31, 2020(All amounts in INR Lakhs, unless otherwise stated)
159BOARD’S REPORT NOTICE AND STATUTORY REPORTS
(i) Defined benefit plans:
a Gratuity - The company provides for gratuity for employees in accordance with the gratuity scheme of the Company. The amounts recognised in the balance sheet and the movements in the net defined benefit obligation over the year are as follows:
ParticularsPresent value of
obligation Fair value of plan assets
Net liability amount
As at April 1, 2018 8,768 (8,336) 432
Current service cost 1,671 (644) 1,027
Interest expense / (income) 677 - 677
Total amount recognised in statement of profit and loss 2,348 (644) 1,704
Remeasurements
Return on plan assets - 8 8
(Gain) / loss from change in demographic assumptions - - -
(Gain) / loss from change in financial assumptions (33) - (33)
Experience (gains) / losses (134) - (134)
Change in asset ceiling - - -
Total amount recognised in Other Comprehensive Income (167) 8 (159)
Liability Transferred on account of business combinations (62) - (62)
Contributions by the company - (660) (660)
Benefit payments (935) - (935)
As at March 31, 2019 9,952 (9,632) 320
Current service cost 1,889 - 1,889
Interest expense / (income) 772 (747) 25
Total amount recognised in statement of profit and loss 2,661 (747) 1,914
Remeasurements
Return on plan assets - (36) (36)
(Gain) / loss from change in demographic assumptions 172 - 172
(Gain) / loss from change in financial assumptions 1,629 - 1,629
Experience (gains) / losses (391) - (391)
Total amount recognised in Other Comprehensive Income 1,410 (36) 1,374
Liability Transferred Out/Disinvestments (124) - (124)
Contributions by the company - (318) (318)
Benefit payments (1,448) - (1,448)
As at March 31, 2020 12,452 (10,733) 1,719
The net liability disclosed above relates to funded plans. The Company intends to contribute in line with the recommendations of the fund administrator and the actuary.
b The net liability disclosed above relates to funded and unfunded plans are as follows:
Plan typeAs at
March 31, 2020 As at
March 31, 2019
Present value of obligation 12,452 9,952
Fair value of plan assets (10,733) (9,632)
Total liability 1,719 320
c As at March 31, 2020 and March 31, 2019, plan assets were fully invested in insurer managed funds.

Notes to the Standalone Financial Statementsas at and for the year ended March 31, 2020(All amounts in INR Lakhs, unless otherwise stated)
160 ZENSAR TECHNOLOGIES LTD ANNUAL REPORT 2019-20
d Through its defined benefit plans, the company is exposed to number of risks, the most significant of which are detailed below:
Asset Volatility: The Plan liabilities are calculated using a discount rate set with reference to bond yields. If plan assets underperform, this yield will create a deficit. The plan asset investments are in fixed income securities with high grades. These are subject to interest rate risk.
Changes in bond yield: A decrease in bond yields will increase plan liabilities, although this will be partially offset by an increase in the value of the plans’ bond holdings.
The company ensures that the investment positions are managed within an asset-liability matching (ALM) framework that has been developed to achieve long-term investments that are in line with the obligations under the employee benefit plans. Within the framework, the company’s ALM objective is to match assets to the pension obligations by investing in long-term fixed interest securities with maturities that match the benefit payments as they fall due and in the appropriate currency.
The company actively monitors how the duration and the expected yield of the investments are matching the expected cash outflows arising from the employee benefit obligations. The company has not changed the process used to manage its risks from previous periods.
e The Company expects to contribute INR 2,385 Lakhs (March 31, 2019 INR 2,209 lakhs) to the defined benefit plan during the next annual reporting period.
Weighted average duration of the Projected Benefit Obligation is 10 Years (March 31, 2019 - 13 Years)
fEstimated benefit payments from the fund for year ending
As at March 31, 2020
As at March 31, 2019
March 31, 2020 NA 314
March 31, 2021 775 365
March 31, 2022 805 483
March 31, 2023 800 421
March 31, 2024 856 478
March 31, 2025 1,012 NA
Thereafter 4,961 3,768
The expected benefits are based on the same assumptions used to measure the Company’s benefit obligations as of March 31, 2019.
g Provident fund : The company makes contribution towards provident fund which is administered by the trustees. The contributions is accounted for as a defined benefit plan as the Company is liable for any shortfall in the fund assets based on the government specified minimum rates of return. Company has obtained an actuarial valuation of the liability according to which there is no deficit as at the Balance Sheet date. The movement of liability and plan assets is as under:
ga Present Value of Defined Benefit Obligation
ParticularsAs at
March 31, 2020 As at
March 31, 2019
Balance as at the beginning of the year 34,756 29,019
Liability transferred in (Refer note 35) 1,767 1,708
Interest cost 2,911 2,324
Current service cost 2,033 1,711
Employee contribution 3,308 2,915
Benefit paid (4,731) (2,921)
Balance as at the end of the year 40,044 34,756

Notes to the Standalone Financial Statementsas at and for the year ended March 31, 2020(All amounts in INR Lakhs, unless otherwise stated)
161BOARD’S REPORT NOTICE AND STATUTORY REPORTS
gb Fair value of Plan Assets (Restricted to the extent of Present Value of Obligation)
ParticularsAs at
March 31, 2020 As at
March 31, 2019
Balance as at the beginning of the year 35,346 29,377
Expected return on plan assets 2,941 2,499
Contributions by the Company 5,342 4,626
Transfer from other Company 1,767 1,709
Benefit paid (4,731) (2,921)
Actuarial gains/(losses ) (143) 57
Balance as at the end of the year 40,522 35,346
ParticularsAs at
March 31, 2020 As at
March 31, 2019
Assets and liabilities recognised in the balance sheet - -
gd Expenses recognised in the statement of profit and loss
ParticularsYear ended
March 31, 2020 Year ended
March 31, 2019
Current service cost 2,033 1,711 Interest cost 2,911 2,324 Expected return on plan assets (2,941) (2,499)Total expenses recognised in the statement of profit and loss 2,003 1,536
ge The plan assets have been primarily invested as follows :
Category of AssetsAs at
March 31, 2020 As at
March 31, 2019
Central Government of India Assets 6,311 6,119
State Government of India Assets 13,072 10,544
Special Deposits Scheme 253 253
Private Sector Bonds 17,733 16,181
Equity / Mutual Funds 1,315 1,060
Cash and Cash Equivalents 630 71
Others 1,208 1,118
Total 40,522 35,346
gc
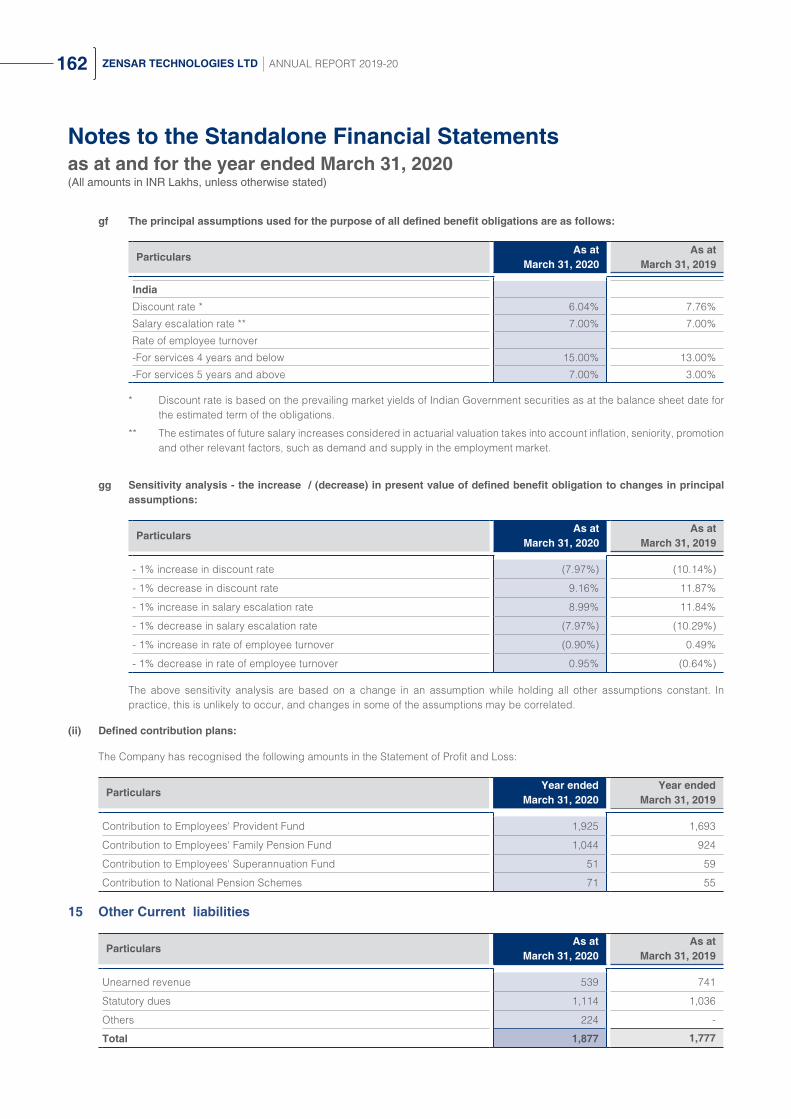
Notes to the Standalone Financial Statementsas at and for the year ended March 31, 2020(All amounts in INR Lakhs, unless otherwise stated)
162 ZENSAR TECHNOLOGIES LTD ANNUAL REPORT 2019-20
gf The principal assumptions used for the purpose of all defined benefit obligations are as follows:
ParticularsAs at
March 31, 2020 As at
March 31, 2019
IndiaDiscount rate * 6.04% 7.76%
Salary escalation rate ** 7.00% 7.00%
Rate of employee turnover
-For services 4 years and below 15.00% 13.00%
-For services 5 years and above 7.00% 3.00%
* Discount rate is based on the prevailing market yields of Indian Government securities as at the balance sheet date for the estimated term of the obligations.
** The estimates of future salary increases considered in actuarial valuation takes into account inflation, seniority, promotion and other relevant factors, such as demand and supply in the employment market.
gg Sensitivity analysis - the increase / (decrease) in present value of defined benefit obligation to changes in principal assumptions:
ParticularsAs at
March 31, 2020 As at
March 31, 2019
- 1% increase in discount rate (7.97%) (10.14%)
- 1% decrease in discount rate 9.16% 11.87%
- 1% increase in salary escalation rate 8.99% 11.84%
- 1% decrease in salary escalation rate (7.97%) (10.29%)
- 1% increase in rate of employee turnover (0.90%) 0.49%
- 1% decrease in rate of employee turnover 0.95% (0.64%)
The above sensitivity analysis are based on a change in an assumption while holding all other assumptions constant. In practice, this is unlikely to occur, and changes in some of the assumptions may be correlated.
(ii) Defined contribution plans:
The Company has recognised the following amounts in the Statement of Profit and Loss:
ParticularsYear ended
March 31, 2020Year ended
March 31, 2019
Contribution to Employees' Provident Fund 1,925 1,693
Contribution to Employees' Family Pension Fund 1,044 924
Contribution to Employees' Superannuation Fund 51 59
Contribution to National Pension Schemes 71 55
15 Other Current liabilities
ParticularsAs at
March 31, 2020 As at
March 31, 2019
Unearned revenue 539 741
Statutory dues 1,114 1,036
Others 224 -
Total 1,877 1,777

Notes to the Standalone Financial Statementsas at and for the year ended March 31, 2020(All amounts in INR Lakhs, unless otherwise stated)
163BOARD’S REPORT NOTICE AND STATUTORY REPORTS
16 (a) Income taxes
ParticularsAs at
March 31, 2020 As at
March 31, 2019
Income tax assets (net) 2,434 2,422
Income tax liabilities (net) (1,522) (1,454)
Net total 912 968
16 (b) Movement The gross movement in the income tax asset / (liability) is as follows:
ParticularsAs at
March 31, 2020 As at
March 31, 2019
Opening Balance 968 975
Income tax paid (net of refunds) 5,726 8,210
Current income tax expense (Refer note 24 (i)) (6,436) (8,293)
Adjustment for current tax of prior periods (Refer note 24 (i)) 174 124
Income tax on other comprehensive income (Refer note 24 (iii)) 480 (48)
Others 0 0
Net total 912 968
17 Revenue from operations
ParticularsYear ended
March 31, 2020Year ended
March 31, 2019
Software development and allied services 136,130 135,908
Sale of licenses, hardware and other equipments 900 1,100
Total 137,030 137,008
18 Other income (net)
ParticularsYear ended
March 31, 2020Year ended
March 31, 2019
Interest Income
- On deposits with banks 95 82
- Others 167 235
Dividend Income (from subsidiaries) 2,757 870
Net gain /(loss) on financial assets mandatorily measured at FVTPL (283) (1,796)
Profit on sale of investments (mutual funds) 1,409 2,796
Foreign exchange gain / (loss) (net) 3,831 2,269
Secondment Fees 670 1,204
Profit /(Loss) on sale of fixed assets (net) 8 (9)
Profit / (Loss) on sale of subsidiaries (Refer note 36) (51) 513
Profit on transfer of customer contracts (Refer note 36) - 1,567
Provisions no longer required and credit balances written back 10 372
Miscellaneous Income 480 396
Total 9,093 8,499
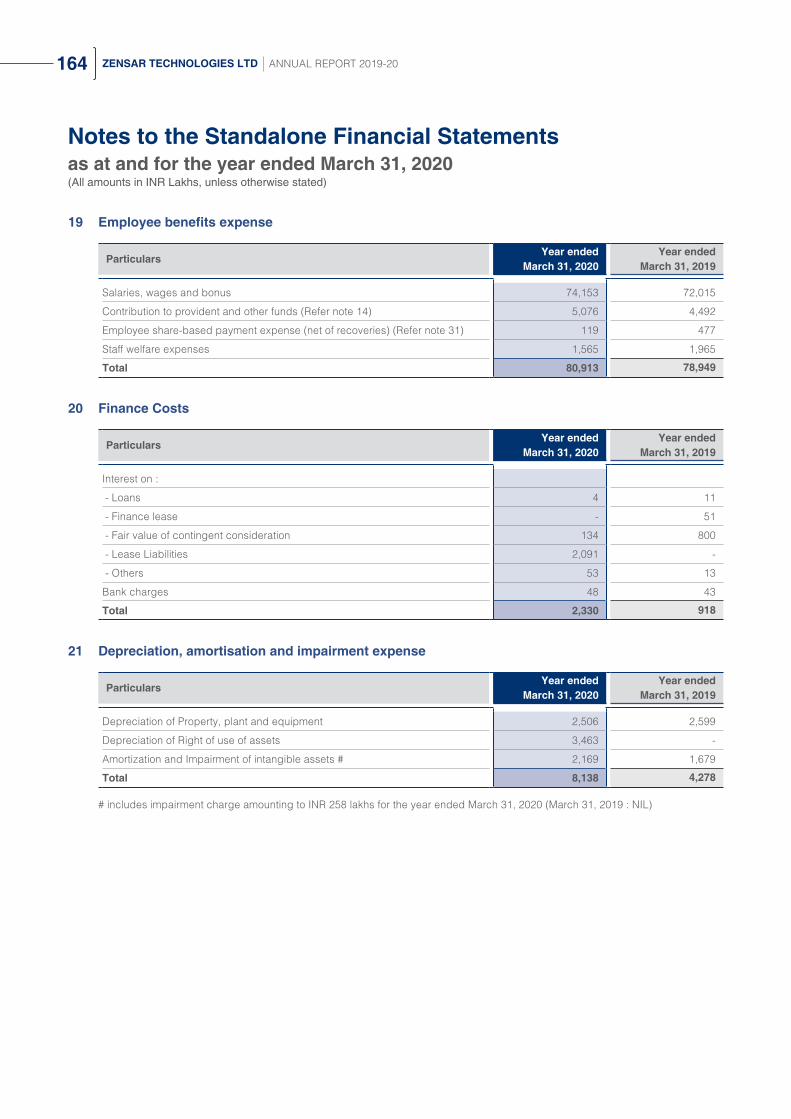
Notes to the Standalone Financial Statementsas at and for the year ended March 31, 2020(All amounts in INR Lakhs, unless otherwise stated)
164 ZENSAR TECHNOLOGIES LTD ANNUAL REPORT 2019-20
19 Employee benefits expense
ParticularsYear ended
March 31, 2020Year ended
March 31, 2019
Salaries, wages and bonus 74,153 72,015
Contribution to provident and other funds (Refer note 14) 5,076 4,492
Employee share-based payment expense (net of recoveries) (Refer note 31) 119 477
Staff welfare expenses 1,565 1,965
Total 80,913 78,949
20 Finance Costs
ParticularsYear ended
March 31, 2020Year ended
March 31, 2019
Interest on :
- Loans 4 11
- Finance lease - 51
- Fair value of contingent consideration 134 800
- Lease Liabilities 2,091 -
- Others 53 13
Bank charges 48 43
Total 2,330 918
21 Depreciation, amortisation and impairment expense
ParticularsYear ended
March 31, 2020Year ended
March 31, 2019
Depreciation of Property, plant and equipment 2,506 2,599
Depreciation of Right of use of assets 3,463 -
Amortization and Impairment of intangible assets # 2,169 1,679
Total 8,138 4,278
# includes impairment charge amounting to INR 258 lakhs for the year ended March 31, 2020 (March 31, 2019 : NIL)

Notes to the Standalone Financial Statementsas at and for the year ended March 31, 2020(All amounts in INR Lakhs, unless otherwise stated)
165BOARD’S REPORT NOTICE AND STATUTORY REPORTS
22 Other expenses
ParticularsYear ended
March 31, 2020Year ended
March 31, 2019
Rent (Refer Note 13) 560 3,967
Rates and taxes 228 256
Electricity and power 1,091 1,105
Travelling and conveyance 3,997 5,320
Recruitment expenses 553 562
Training expenses 474 578
Repairs and maintenance to :
-Building 1,329 1,233
-Electrical Installations and equipments 284 353
-Data Processing Equipments 1,518 1,081
-Others 185 118
Insurance 475 319
Legal and professional charges 3,953 2,911
Payments to auditors (Refer note 22 (b) below) 133 171
Communication expenses 853 952
General Office expenses 668 559
Carriage, freight and octroi - -
Advertisement and publicity 699 489
Expenditure towards Corporate social responsibility (See Note 22 (a)) 530 531
Allowance for doubtful trade receivables and unbilled revenues- Provided during the year 922 1,246
- Bad debts written off 2,051 492
- Less: Reversed during the year 2,617 399
356 1,339 Allowance for doubtful loans and advances- Provided during the year 125 256
- Loans and advances written off - 1,428
- Less: Reversed during the year - 1,428
125 256 Provision for impairment in the value of investments- Provided during the year - 78
- Investments written off - 186
- Less: Reversed during the year - 186
- 78 Miscellaneous expenses 1,083 691
Total 19,094 22,868

Notes to the Standalone Financial Statementsas at and for the year ended March 31, 2020(All amounts in INR Lakhs, unless otherwise stated)
166 ZENSAR TECHNOLOGIES LTD ANNUAL REPORT 2019-20
22 (a) Expenditure towards Corporate social responsibility
ParticularsYear ended
March 31, 2020Year ended
March 31, 2019
Gross amount required to be spent by the Company during the year 528 527
Total 528 527
Amount spent during the year onYear ended
March 31, 2020Year ended
March 31, 2019
a. Construction/ acquisition of any asset - -
b. On purposes other than (a) above 530 531
Total 530 531
22 (b) Details of payments to auditors
ParticularsYear ended
March 31, 2020Year ended
March 31, 2019
As auditors :
- Audit Fee [including quarterly limited reviews] 82 82
In other capacity, in respect of :
- Certification services 10 47 #
- taxation matters 27 20
Reimbursement of expenses 14 22
Total 133 171
# includes Rs. 25 lakhs for services pertaining to 2017-18
23 Revenue from operations
(a) Disaggregate revenue information
The table below presents disaggregated revenues from contracts with customers by geography, offerings and contract-type for each of our business segments. The company believes that this disaggregation best depicts how the nature, amount, timing and uncertainty of our revenues and cash flows are affected by industry, market and other economic factors.
ParticularsVerticals
AMS IMS
Revenue by Geography
- Americas 81,218 10,126
[86,424] [11,506]
- Europe 19,955 3,471
[15,762] [1,939]
- Africa 19,971 810
[18,567] [477]

Notes to the Standalone Financial Statementsas at and for the year ended March 31, 2020(All amounts in INR Lakhs, unless otherwise stated)
167BOARD’S REPORT NOTICE AND STATUTORY REPORTS
ParticularsVerticals
AMS IMS
- Rest of the world 1,352 127
[2,093] [240]
Revenue by Contract Type
- Fixed Price Contracts/Fixed Monthly 6,801 124
[4,417] [915]
- Time and Material 115,695 14,410
[118,429] [13,427]
Figures in brackets are for previous year i.e. March 31, 2019
(b) Trade Receivables and Contract Balances
The company classifies the right to consideration in exchange for deliverables as either receivable or as unbilled revenue.
A receivable is right to consideration that is unconditional upon passage of time. Revenue for time and material contracts are recognised as related service are performed. Revenue for fixed price maintenance contracts is recognised on a straight line basis over the period of contract. Revenue in excess of billing is recorded as unbilled revenue and is classified as a financial asset for these cases as right to consideration is unconditional upon passage of time.
Revenue recognition for fixed price development contracts is based on percentage of completion method. Invoicing to clients is based on milestones as defined in then contract. This would result in timing of revenue recognition being different from the timing of billing the customers. Unbilled revenue for fixed price development contracts is classified as non financial assets as the contractual right to consideration is dependent on completion of contractual milestones.
Invoicing in excess of earnings is classified as unearned revenue.
Trade receivables and unbilled revenues are presented net of impairment in Balance Sheet.
(c) Performance obligations and remaining performance obligations
The remaining performance obligation disclosures provide the aggregate amount of transaction price yet to be recognized as of the end of the reporting period and an explanation as to when company expects to recognize these amounts as revenue. Applying the practical expedients as given in INDAS 115, the company has not disclosed the remaining performance obligations related disclosures where the revenue recognized corresponds directly with the value to customer of the entity’s performance completed to date, typically those contracts where invoicing is on the basis of time and material basis. Remaining performance obligation are subject to change and are affected by several factors, including terminations , changes in the scope of contracts, periodic revalidations, adjustment of revenue that has not materialized and adjustments for currency.
The aggregate value of transaction price allocated to unsatisfied (or partially satisfied) performance obligations is INR 475 lakhs [March 31, 2019: INR 94 lakhs] out of which INR 475 lakhs [March 31, 2019: INR 94 lakhs] is expected to be recognised as revenue in the next year and the balance thereafter. No consideration from contracts with customers is excluded from the amount mentioned above.

Notes to the Standalone Financial Statementsas at and for the year ended March 31, 2020(All amounts in INR Lakhs, unless otherwise stated)
168 ZENSAR TECHNOLOGIES LTD ANNUAL REPORT 2019-20
24 Income tax expense
This note provides Company’s income tax expense and amounts that are recognised directly in equity and how the tax expense is affected by non- assessable and non-deductible items. It also explains significant estimates made in relation to Company’s tax positions.
(i) Breakup of income tax expense:
ParticularsYear ended
March 31, 2020Year ended
March 31, 2019
Income tax expense
Current Tax
Current tax on profits for the year 6,436 8,293
Adjustment for current tax of prior periods (174) (124)
Total current tax expense 6,262 8,169
Deferred tax
Decrease / (increase) in deferred tax assets 1,044 (395)
(Decrease) / increase in deferred tax liabilities - (223)
Total deferred tax expense / (benefit) 1,044 (618)
Income tax expense 7,306 7,551
The company has availed certain tax incentives that the Government of India has provided to the export of software for the units registered under the Special Economic Zones Act 2005 (SEZ). SEZ units which began the provision of services on or after April 1, 2005 are eligible for a deduction of 100 percent of profits or gains derived from the export of services for the first five years from the financial year in which the unit commences the provision of services and 50 percent of such profits or gains for further five years. Upto 50% of such profits or gains is also available for further five years subject to certain Special Economic Zone Re-investment Reserve out of the profit of the eligible SEZ units and utilization of such reserve for acquiring new plant and machinery for the purpose of its business as per the provisions of Income Tax Act, 1961.
(ii) The reconciliation of estimated income tax expense at statutory income tax rate to income tax expense reported in statement of profit and loss is as follows:
ParticularsYear ended
March 31, 2020Year ended
March 31, 2019
Profit before taxes 30,410 33,351
Indian statutory income tax rate 34.94% 34.94%
Computed expected tax expenses 10,626 11,653
Effect of Income exempt from tax (3,560) (3,464)
Effect of non-deductible expenses 454 (217)
Changes in unrecognized deferred tax assets (net) 443 -
Income taxed at higher/(lower) rates (483) (297)
Income tax relating to prior years (174) (124)
Total Income tax expense 7,306 7,551

Notes to the Standalone Financial Statementsas at and for the year ended March 31, 2020(All amounts in INR Lakhs, unless otherwise stated)
169BOARD’S REPORT NOTICE AND STATUTORY REPORTS
(iii) Tax on the amounts recognised directly in OCI:
ParticularsYear ended March 31, 2020 Year ended March 31, 2019
Current tax Deferred tax Current tax Deferred tax
Fair value changes on cash flow hedges - (372) - 230
Remeasurements of post employment benefit obligations (480) - 48 -
Total (480) (372) 48 230
(iv) Changes in tax rate - The applicable Indian statutory tax rate for the financial year 2019-20 and financial year 2018-19 are 34.94% and 34.94% respectively
25 Fair value measurements
Financial instruments by category:
Particulars
As at March 31, 2020 As at March 31, 2019
FVTPL FVOCI
Derivative financial assets /
liabilities
Amortised cost
FVTPL FVOCI
Derivative financial assets /
liabilities
Amortised cost
Financial assets
Investments:
- equity instruments # - - - - - - - -
- mutual funds 26,704 - - - 9,194 - - -
- non-convertible debentures - - - - - - - -
Trade receivables - - - 105,569 - - - 87,382
Cash and cash equivalents - - - 3,299 - - - 12,462
Other balances with bank - - - 2,703 - - - 586
Derivative financial assets - - 1,255 - - - 2,885 -
Security deposits - - - 1,448 - - - 1,598
Unbilled revenues - - - 1465 - - - 20,260
Others - - - 4,921 1,247 - - 5,011
Total financial assets 26,704 - 1,255 119,405 10,441 - 2,885 127,299
Financial liabilities
Borrowings - - - - - - - 645
Trade payables - - - 8,053 - - - 8,672
Capital creditors - - - 730 - - - 42
Accrued salaries and benefits - - - 4,866 - - - 6,011
Derivative financial liabilities - - 3,701 - - - 23 -
Lease liabilities - - - 24,435 - - - -
Contingent consideration - - - - 5,051 - - -
Other financial liabilities - - - 346 - - - 1,075
Total financial liabilities - - 3,701 38,430 5,051 - 23 16,445
# Excludes investments in subsidiaries accounted as per cost model in accordance with Ind AS 27 “Separate Financial Statements”
(i) Fair value hierarchy:
This section explains the judgements and estimates made in determining the fair values of the financial instruments that are
(a) recognised and measured at fair value, and

Notes to the Standalone Financial Statementsas at and for the year ended March 31, 2020(All amounts in INR Lakhs, unless otherwise stated)
170 ZENSAR TECHNOLOGIES LTD ANNUAL REPORT 2019-20
(b) measured at amortised cost and for which fair values are disclosed in the financial statements
To provide an indication about the reliability of the inputs used in determining fair value, the company has classified its financial instruments into three levels prescribed under the accounting standard. An explanation of each level follows underneath the table.
Financial assets and liabilities measured at fair value – As at March 31, 2020
Particulars Level 1 Level 2 Level 3 Total
Financial assets
Financial investments at FVTPL
Mutual funds 26,704 - - 26,704
Financial investments at FVOCI
Equity instruments - - - -
Derivatives designated as hedges
Foreign currency derivative assets - 1,255 - 1,255
Total financial assets 26,704 1,255 - 27,959
Financial liabilities
Contingent consideration - - - -
Foreign currency derivative liabilities - 3,701 - 3,701
Fair value of financial liability - - - -
Total financial liabilities - 3,701 - 3,701
Financial assets and liabilities measured at fair value – As at March 31, 2019
Particulars Level 1 Level 2 Level 3 Total
Financial assets
Financial investments at FVTPL
Mutual funds 9,195 - - 9,195
Sale Consideration receivable - - 1,247 1,247
Financial investments at FVOCI
Equity instruments - - - -
Derivatives designated as hedges
Foreign currency derivative assets - 2,885 - 2,885
Total financial assets 9,195 2,885 1,247 13,327
Financial liabilities
Contingent consideration - - 5,051 5,051
Foreign currency derivative liabilities - 23 - 23
Total financial liability - 23 5,051 5,074
Level 1: Level 1 hierarchy includes financial instruments measured using quoted prices. This includes listed equity instruments and mutual funds that have quoted price. The fair value of all equity instruments (including bonds) which are traded in the stock exchange is valued using the closing price as at the reporting period.
Level 2: Fair value of financial instruments that are not traded in an active market (for example, traded bonds, over the counter derivatives) but is determined using valuation techniques which maximize the use of observable market data and rely as little as possible on entity-specific estimates. If all significant inputs required to fair value an instrument as observable, the instrument is included in level 2.
Level 3: If one or more of the significant inputs is not based on observable data, the instrument is included in level 3. This is the case for unlisted equity securities, contingent consideration and indemnification assets.

Notes to the Standalone Financial Statementsas at and for the year ended March 31, 2020(All amounts in INR Lakhs, unless otherwise stated)
171BOARD’S REPORT NOTICE AND STATUTORY REPORTS
(ii) Fair value measurement using significant Unobservable Inputs (Level 3)
The following table presents changes in level 3 items for the year ended March 31, 2020 and 2019
ParticularsUnlisted Equity
SecuritiesContingent
Consideration
As at April 1, 2018 - 7,197
Paid during the year - 3,179
Fair value gain/(losses) recognized in statement of profit and loss - 800
Foreign Exchange fluctuations – (gains)/losses - 233
As at March 31, 2019 - 5,051
Fair value gain/(losses) recognized in other comprehensive income - -
Fair value gain/(losses) recognized in statement of profit and loss - 134
Addition on business combination - -
Deduction on Payment - (4,988)
Reversal of liability - (173)
Foreign Exchange fluctuations – (gains)/losses - (24)
As at March 31, 2020 - -
(iii) Valuation inputs and relationships to fair value
ParticularsFair value Significant
unobservable inputs
Probability-weighted rangeSensitivityAs at March
31,2020As at March
31,2019As at March
31,2020As at March
31,2019
Contingent consideration
- 5,051
Expected cash outflows
- 5,186
If expected cash flows were 10% lower, the FV would decrease by INR Nil [March 2019 - INR. 506 lakhs]
Discount rate - 16.32%
A change in discount rate by 100bps would increase/decrease the FV by Nil [March 2019 - INR. 7 lakhs]
(iv) Valuation technique used to determine fair value:
The following methods and assumptions were used to estimate the fair value of the level 2 financial instruments included in the above tables:
Derivative instruments: The company enters into foreign currency forward contracts with banks with investment grade credit ratings. These are valued using the forward pricing valuation technique, using present value calculations. The models incorporate various inputs including the credit quality of counterparties and foreign exchange spot and forward rates. As at March 31, 2020, the changes in counterparty credit risk had no material effect on the hedge effectiveness assessment for derivatives designated in hedge relationships.
The main level 3 inputs for contingent consideration - Fair value of contingent consideration is based on management’s assessment of probable consideration payable discounted using weighted average cost of capital.

Notes to the Standalone Financial Statementsas at and for the year ended March 31, 2020(All amounts in INR Lakhs, unless otherwise stated)
172 ZENSAR TECHNOLOGIES LTD ANNUAL REPORT 2019-20
(v) As per Ind AS 107 “Financial Instrument: Disclosure”, fair value disclosures are not required when the carrying amounts reasonably approximate the fair value. Accordingly fair value disclosures have not been made for the following financial instruments: -
1. Trade receivables
2. Cash and cash equivalents
3. Other balances with banks
4. Security deposits
5. Amount deposited under protest
6. Unbilled revenue
7. Other receivables
8. Interest accrued on deposits
9. Borrowings
10. Trade payables
11. Capital creditors
12. Unclaimed dividends
13. Accrued salaries and benefits
14. Book overdrafts
15. Other payables
26 Financial risk management
The Company’s activities expose it to a variety of financial risks: market risk, credit risk and liquidity risk. The Company’s primary focus is to foresee the unpredictability of financial markets and seek to minimize potential adverse effects on its financial performance. The primary market risk to the company is foreign exchange risk. The company uses derivative financial instruments - foreign currency forward contracts to mitigate foreign exchange related risk exposures. Derivatives are used exclusively for hedging purpose and not as trading or speculative instruments. The Company’s exposure to credit risk is influenced mainly by the individual characteristic of each customer and the concentration of risk from the top few customers. The demographics of the customer including the default risk of the industry and country in which the customer operates also has an influence on credit risk assessment.
(a) Market Risk
(i) Foreign currency risk
The Company operates globally and a major portion of the business is transacted in several currencies and consequently the Company is exposed to foreign exchange risk through its sales and services in the United States, South Africa, United Kingdom and elsewhere, and purchases from overseas suppliers in various foreign currencies. The exchange rate between the rupee and foreign currencies has changed substantially in recent years and may fluctuate substantially in the future. Consequently, the results of the Company’s operations are adversely affected as the rupee appreciates/ depreciates against these currencies. The Company evaluates exchange rate exposure arising from these transactions and enters into foreign exchange forward contracts to mitigate the risk of changes in exchange rates on foreign currency exposures. The Company follows established risk management policies, to hedge forecasted cash flows denominated in foreign currency. The Company has designated certain derivative instruments as cash flow hedges to mitigate the foreign exchange exposure of forecasted highly probable cash flows.

Notes to the Standalone Financial Statementsas at and for the year ended March 31, 2020(All amounts in INR Lakhs, unless otherwise stated)
173BOARD’S REPORT NOTICE AND STATUTORY REPORTS
Company’s exposure to foreign currency risk as at March 31, 2020 in INR lakhs is as follows:
Particulars USD GBP ZAROther
currenciesTotal
Financial assets
Cash and cash equivalents 46 - - - 46
[143] [-] [-] [-] [143]
Trade receivables 9,455 1,381 3,248 761 14,845
[4,207] [652] [5,428] [552] [10,839]
Other assets 2,491 807 271 121 3,690
[14,600] [2,953] [1,614] [455] [19,622]
Financial liabilities -
Trade payables 1,970 92 34 67 2,163
[390] [72] [3] [11] [476]
Other liabilities 36 5 508 13 562
[6,413] [5] [2] [98] [6,518]
Figures in brackets are for previous year i.e. as at March 31, 2019
Sensitivity
For the year ended March 31, 2020 and March 31, 2019, every percentage point appreciation/depreciation in the exchange rate would have affected the Company’s operating margins respectively:
- INR/USD by approximately 0.67% and 0.59%,
- INR/GBP by approximately 0.16% and 0.09%,
- INR/ZAR by approximately 0.13% and 0.11%
Sensitivity analysis is computed based on changes in income and expenses, due to every percentage point appreciation/depreciation in the exchange rates.
Derivative financial instruments
The Company holds derivative financial instruments such as foreign exchange forward and Option contracts to mitigate the risk of changes in exchange rates on foreign currency exposures. The counterparty for these contracts is generally a bank. These derivative financial instruments are valued based on quoted prices for similar assets and liabilities in active markets or inputs that are directly or indirectly observable in the marketplace. The foreign exchange forward contracts mature within twelve months from Balance Sheet.
The following table gives details in respect of outstanding foreign exchange contracts:
Particulars
As at March 31, 2020 As at March 31, 2019
Amount of contracts in
lakhs
Fair Value – Gain / (Loss) (INR in lakhs)
Amount of contracts in
lakhs
Fair Value Gain / (Loss) (INR in lakhs)
Derivatives designated as cash flow hedges
Forward Contract
In USD 238 (486) 156 227
In GBP 94 (241) 35 149
In ZAR 950 420 458 168
Total Forwards (307) 544
Option Contracts
In USD 52 (151) 105 69
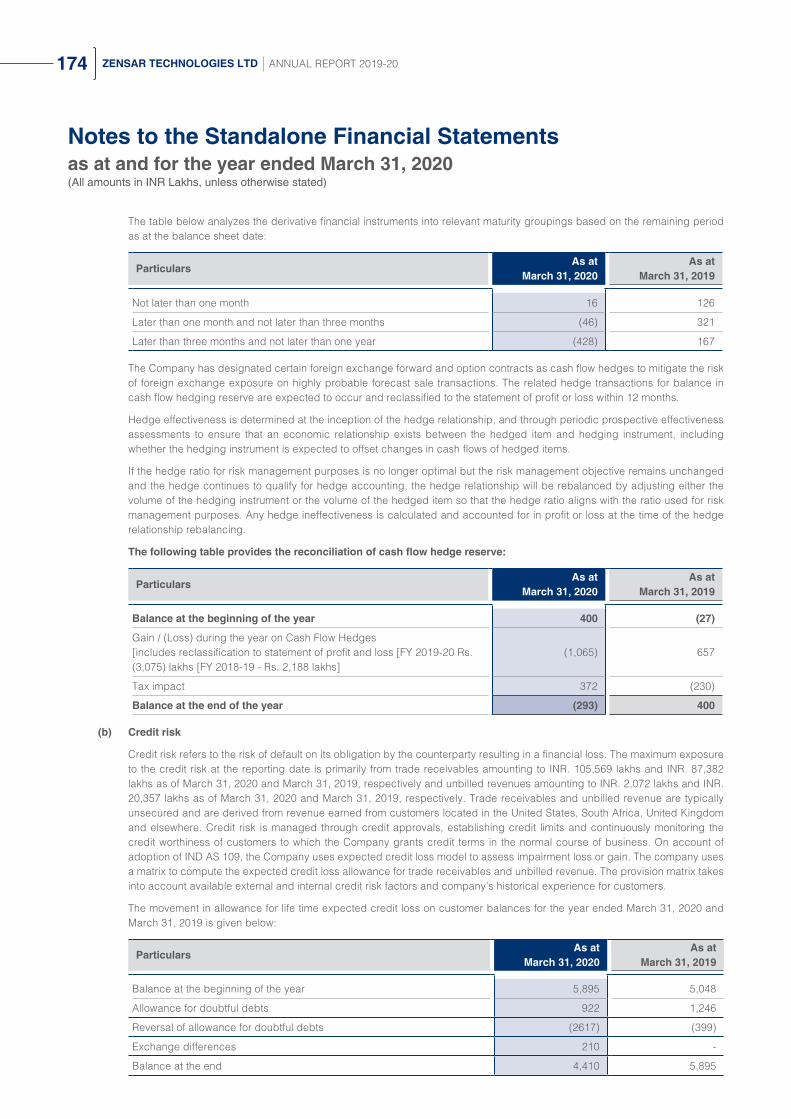
Notes to the Standalone Financial Statementsas at and for the year ended March 31, 2020(All amounts in INR Lakhs, unless otherwise stated)
174 ZENSAR TECHNOLOGIES LTD ANNUAL REPORT 2019-20
The table below analyzes the derivative financial instruments into relevant maturity groupings based on the remaining period as at the balance sheet date:
ParticularsAs at
March 31, 2020As at
March 31, 2019
Not later than one month 16 126
Later than one month and not later than three months (46) 321
Later than three months and not later than one year (428) 167
The Company has designated certain foreign exchange forward and option contracts as cash flow hedges to mitigate the risk of foreign exchange exposure on highly probable forecast sale transactions. The related hedge transactions for balance in cash flow hedging reserve are expected to occur and reclassified to the statement of profit or loss within 12 months.
Hedge effectiveness is determined at the inception of the hedge relationship, and through periodic prospective effectiveness assessments to ensure that an economic relationship exists between the hedged item and hedging instrument, including whether the hedging instrument is expected to offset changes in cash flows of hedged items.
If the hedge ratio for risk management purposes is no longer optimal but the risk management objective remains unchanged and the hedge continues to qualify for hedge accounting, the hedge relationship will be rebalanced by adjusting either the volume of the hedging instrument or the volume of the hedged item so that the hedge ratio aligns with the ratio used for risk management purposes. Any hedge ineffectiveness is calculated and accounted for in profit or loss at the time of the hedge relationship rebalancing.
The following table provides the reconciliation of cash flow hedge reserve:
ParticularsAs at
March 31, 2020As at
March 31, 2019
Balance at the beginning of the year 400 (27)
Gain / (Loss) during the year on Cash Flow Hedges[includes reclassification to statement of profit and loss [FY 2019-20 Rs. (3,075) lakhs [FY 2018-19 - Rs. 2,188 lakhs]
(1,065) 657
Tax impact 372 (230)
Balance at the end of the year (293) 400
(b) Credit risk
Credit risk refers to the risk of default on its obligation by the counterparty resulting in a financial loss. The maximum exposure to the credit risk at the reporting date is primarily from trade receivables amounting to INR. 105,569 lakhs and INR. 87,382 lakhs as of March 31, 2020 and March 31, 2019, respectively and unbilled revenues amounting to INR. 2,072 lakhs and INR. 20,357 lakhs as of March 31, 2020 and March 31, 2019, respectively. Trade receivables and unbilled revenue are typically unsecured and are derived from revenue earned from customers located in the United States, South Africa, United Kingdom and elsewhere. Credit risk is managed through credit approvals, establishing credit limits and continuously monitoring the credit worthiness of customers to which the Company grants credit terms in the normal course of business. On account of adoption of IND AS 109, the Company uses expected credit loss model to assess impairment loss or gain. The company uses a matrix to compute the expected credit loss allowance for trade receivables and unbilled revenue. The provision matrix takes into account available external and internal credit risk factors and company’s historical experience for customers.
The movement in allowance for life time expected credit loss on customer balances for the year ended March 31, 2020 and March 31, 2019 is given below:
ParticularsAs at
March 31, 2020As at
March 31, 2019
Balance at the beginning of the year 5,895 5,048
Allowance for doubtful debts 922 1,246
Reversal of allowance for doubtful debts (2617) (399)
Exchange differences 210 -
Balance at the end 4,410 5,895

Notes to the Standalone Financial Statementsas at and for the year ended March 31, 2020(All amounts in INR Lakhs, unless otherwise stated)
175BOARD’S REPORT NOTICE AND STATUTORY REPORTS
Credit risk on cash and cash equivalents is limited as the Company generally invests in deposits with banks and financial institutions with high credit ratings assigned by international and domestic credit rating agencies. Investments primarily include investment in liquid mutual fund units.
(c) Liquidity risk
Liquidity risk is defined as the risk that the Company will not be able to settle or meet its obligations on time or at a reasonable price. The Company’s corporate treasury department is responsible for liquidity and funding as well as settlement management. In addition, processes and policies related to such risks are overseen by senior management. Management monitors the Company’s net liquidity position through rolling forecasts on the basis of expected cash flows. As of March 31, 2020, cash and cash equivalents are held with major banks and financial institutions.
The table below provides details regarding the remaining contractual maturities of significant financial liabilities at the reporting date. The amounts include estimated interest payments and exclude the impact of netting agreements, if any.
Particulars
As at March 31, 2020
Contractual cash flows
Carrying valueLess than 1
year1-5 years
More than 5 years
Total
Borrowings - - - - -
Trade payables 8,053 8,053 - - 8053
Lease liabilities 24,435 5,066 9,199 10,170 24,435
Other liabilities 9,643 9,643 - - 9,643
Particulars
As at March 31, 2019
Contractual cash flows
Carrying valueLess than 1
year1-5 years
More than 5 years
Total
Borrowings 319 - 319 - 319
Trade payables 8,672 8,672 - - 8,672
Other liabilities 12,528 12,528 - - 12,528
27 Capital management
The Company manages its capital to ensure that it will be able to continue as going concern while maximizing the return to stakeholders through the optimisation of the debt and equity balance. The capital structure of the Company consists of net debt (borrowings as detailed in notes 11 (a) & 11 (b) and 6 (e) offset by cash and bank balances) and total equity of the Company. The Company is not subject to any externally imposed capital requirements. The Company’s risk management committee reviews the capital structure of the Company on an ongoing basis. As part of this review, the committee considers the cost of capital and the risks associated with each class of capital. In order to maintain or adjust the capital structure, the company may adjust the amount of dividends paid to shareholders, return capital to shareholders or issue new shares.
The Company’s capital comprises equity share capital, share premium, retained earnings and other equity attributable to equity holders.
No changes were made in the objectives, policies or processes for managing capital of the Company during the current and previous year.

Notes to the Standalone Financial Statementsas at and for the year ended March 31, 2020(All amounts in INR Lakhs, unless otherwise stated)
176 ZENSAR TECHNOLOGIES LTD ANNUAL REPORT 2019-20
28 Related party disclosures
A List of related parties
(i) List of subsidiaries
Name of Entity Relationship
Zensar Technologies (Singapore) Pte. Limited 100 % subsidiary
Zensar Info Technologies (Singapore) Pte. Limited (refer note (i)) 100 % step down subsidiary
Foolproof (SG) Pte Limited 100 % step down subsidiary
Zensar (Africa) Holdings Proprietary Limited 100 % subsidiary
Zensar (South Africa) Proprietary Limited 75 % step down subsidiary
Zensar Technologies (Shanghai) Company Limited (refer note (ii)) 100 % subsidiary
Zensar Technologies (UK) Limited 100 % subsidiary
Foolproof Limited 100 % step down subsidiary
Knit Limited (refer note (iii)) 100 % step down subsidiary
Zensar Technologies, Inc. 100 % subsidiary
PSI Holding Group, Inc. 100 % step down subsidiary
Zensar Technologies IM, Inc. 100 % step down subsidiary
Keystone Logic Inc. 100 % step down subsidiary
Cynosure Inc (refer note (vi)) 100 % step down subsidiary
Indigo Slate Inc (refer note (ix)) 100 % step down subsidiary
Professional Access Limited 100 % step down subsidiary
Aquila Technology Corporation Refer note (x)
Keystone Logic Mexico, S. DE R.L. DE C.V (refer note (iv)) 100 % step down subsidiary
Keystone Technologies Mexico, S. DE R.L. DE C.V (refer note (iv)) 100 % step down subsidiary
Cynosure APAC Pty Ltd (refer note (viii))
Zensar Technologies IM B.V. 100 % step down subsidiary
Cynosure Interface Services Private Limited (refer note (v)) 100 % subsidiary
Zensar IT Services Limited refer note (xi)
Zensar Information Technologies Limited refer note (xii)
Zensar Software Technologies Limited refer note (xii)
Zensar Technologies (Canada) Inc (refer note (vii)) 100 % step down subsidiary
Zensar Technologies GmbH (refer note (vii)) 100 % step down subsidiary
Notes:
(i) Zensar Info Technologies (Singapore) Pte. Limited has applied for voluntary liquidation during the year ended March 31, 2020.
(ii) Zensar Technologies (Shanghai) Company Limited has applied for voluntary liquidation during the year ended March 31, 2020.
(iii) KNIT Limited has applied for voluntary liquidation during the year ended March 31, 2020.

Notes to the Standalone Financial Statementsas at and for the year ended March 31, 2020(All amounts in INR Lakhs, unless otherwise stated)
177BOARD’S REPORT NOTICE AND STATUTORY REPORTS
(iv) During FY 2018-19, 2 100% subsidiaries in Mexico namely Keystone Logic Mexico, S. DE R.L. DE C.V and Keystone Technologies Mexico, S. DE R.L. DE C.V were incorporated.
(v) Refer Note 35
(vi) The Company, through its subsidiary, Zensar Technologies Inc. entered into Share Purchase Agreement dated March 21, 2018 to acquire 100% equity of Cynosure Inc., a USA based company for purchase consideration of INR. 20,150 lakhs (USD 31 million) payable upfront and balance amount of INR. 18,200 lakhs (USD 28 million) being earn-outs, subject to performance targets over 24 months. The above-mentioned acquisitions have been consummated in April 2018.
(vii) During the year ended March 31, 2020, 100% step down subsidiaries in Canada and Germany namely Zensar Technologies Canada Inc and Zensar Technologies GmbH respectively were incorporated.
(viii) Cynosure APAC Pty Ltd, a step down subsidiary was voluntary liquidated during the year ended March 31, 2020.
(ix) The Company, through its subsidiary, Zensar Technologies Inc. entered into a Share Purchase Agreement dated July 27, 2018 to acquire 100% equity in Indigo Slate, Inc (“Indigo Slate”), a USA based company for purchase consideration of INR. 12,348 lakhs (USD 18 million) payable upfront and deferred consideration of an amount upto INR. 18,522 lakhs (USD 27 million), subject to performance targets over 36 months. The above-mentioned acquisition has been consummated in August 2018.
(x) Aquila Technology Corporation (Aquila) was acquired by Zensar Technologies Inc. as part of the group acquisition of PSI Holding Group Inc (PSI) in 2010. A service agreement between Aquila and a customer of Aquila required independence, separation of its operations and lack of interdependence of Aquila on its related affiliates/parent. Accordingly, this led to loss of control over Aquila for the Group as the Group has no ability to direct the relevant activities of and exercise control over Aquila. Therefore, Aquila is not considered as a subsidiary of PSI within the definition prescribed under Ind AS 110 and hence not consolidated by the Group.
(xi) Zensar IT Services Limited was incorporated in FY 2017-18, but operations were not commenced. Application for voluntary liquidation has been filed.
(xii) Refer note 36
Other related parties with whom transaction have taken place during the current and previous year.
(a) Key Management Personnel
Name Designation
H.V Goenka Chairman
Sandeep KishoreManaging Director and Chief Executive Officer
Navneet Khandelwal Chief Financial Officer
Gaurav Tongia Company Secretary
A.T. Vaswani Non-Executive Director
Arvind Agrawal Non-Executive Director
Venkatesh Kasturirangan Non-Executive Director
Sudip Nandy Non-Executive Director Upto August 7, 2019
Shashank Singh Non-Executive Director
Ben Druskin Non-Executive Director
Ketan Dalal Non-Executive Director
Tanuja Randery Non-Executive Director Upto May 31, 2019
Harsh Mariwala Non-Executive Director
Anant Goenka Non-Executive Director W.e.f January 21, 2019
Radha Rajappa Non-Executive Director W.e.f August 6, 2019

Notes to the Standalone Financial Statementsas at and for the year ended March 31, 2020(All amounts in INR Lakhs, unless otherwise stated)
178 ZENSAR TECHNOLOGIES LTD ANNUAL REPORT 2019-20
(b) Entities where Key management personnel either have significant influence or are members of key management personnel of that entity:
RPG Enterprises
Harrisons Malayalam Limited
KEC International Limited
Raychem RPG Limited
RPG Life Sciences Limited
RPG Art Foundation
CEAT Speciality Tyres Limited
RPG Foundation
CEAT Limited
Rainetree Capital, LLC
Katalyst Advisors LLP
(c) Entities which have the ability to exercise influence / significant influence over the company:
Swallow Associates LLP
Summit Securities Limited
Marina Holdco (FPI) Ltd.
Instant Holdings Limited
Sofreal Mercantrade Private Limited
Other Promoter / Promoter Group entities (shareholding individually less than 1%)
(d) Post employment benefit plans:
Zensar PF Trust
Zensar Gratuity trust
Zensar Superannuation Trust
# refer note 14 for information on transactions with post-retirement plans mentioned above

Notes to the Standalone Financial Statementsas at and for the year ended March 31, 2020(All amounts in INR Lakhs, unless otherwise stated)
179BOARD’S REPORT NOTICE AND STATUTORY REPORTS
B Transactions along with outstanding balances with the related parties:
Sr. No.
Particulars
Transactions during year ended
Amount outstanding as at
March 31, 2020
March 31, 2019
March 31, 2020
March 31, 2019
Receivable / (Payable)
Receivable / (Payable)
A. Revenue from rendering services
(i) Zensar Technologies, Inc. 67,327 64,363 65,037 62,908
(ii) Zensar Technologies (UK) Limited 20,568 15,921 10,904 12,631
(iii) Professional Access Limited 4,001 9,127 3,589 7,202
(iv) Zensar Technologies IM, Inc. 1,597 2,403 1,567 937
(v) Zensar (South Africa) Proprietary Limited 17,415 16,736 10,491 8,542
(vi) RPG Life Sciences Limited 1 25 5 5
(vii) RPG Enterprises 552 363 2 15
(viii) CEAT Limited - - - 3
(ix) Harrisons Malayalam Limited - - 5 5
(x) Zensar Technologies (Singapore) Pte. Limited - 34 - 35
(xi) Zensar Technologies (Shanghai) Company Limited - - 40 40
(xii) Zensar Technologies IM B.V. 161 334 107 340
(xiii) Keystone Logic Inc. 7,138 8,932 5,739 3,802
(xiv) Foolproof Limited 563 946 469 643
(xv) Cynosure Inc. 5,554 2,338 3,763 1,437
(xvi) Indigo Slate Inc. 351 89 29 89
Total - Revenue from rendering services 125,228 121,611 101,747 98,634
B. Subcontracting costs (Purchase of services)
(i) Zensar (South Africa) Proprietary Limited 1,811 894 (2338) (3,936)
(ii) Cynosure Interface Services Private Limited 1,173 757 (112) (53)
(iii) Zensar Technologies IM B.V. 227 227 (505) (257)
(iv) Foolproof Limited 4 58 (63) (58)
(v) Zensar Technologies IM, Inc. (51) 50 (294) (321)
(vi) Professional Access Limited - - - (1)
(vii) Zensar Technologies (UK) Limited - - - (4)
(viii) PSI Holding Group, Inc. - - (1) -
Total - Subcontracting costs (Purchase of services) 3,164 1,986 (3,313) (4,630)
C. Other Income/(Expenses)
(i) Zensar Technologies, Inc. 438 516 377 449
(ii) Zensar Technologies (UK) Limited 377 732 190 367
(iii) Professional Access Limited - 40 - -
(iv) KEC International Limited - - - 0
(v) CEAT Limited 8 8 5 -
(vi) RPG Enterprises (1,995) (1,755) (209) (108)
(vii) Katalyst Advisors LLP (6) - - -
Total - Other Income/(Expenses) (1,178) (459) 363 708

Notes to the Standalone Financial Statementsas at and for the year ended March 31, 2020(All amounts in INR Lakhs, unless otherwise stated)
180 ZENSAR TECHNOLOGIES LTD ANNUAL REPORT 2019-20
Sr. No.
Particulars
Transactions during year ended
Amount outstanding as at
March 31, 2020
March 31, 2019
March 31, 2020
March 31, 2019
Receivable / (Payable)
Receivable / (Payable)
D. Dividend income received(i) Zensar (Africa) Holdings Proprietary Limited 2,557 870 - -
(ii) Cynosure Interface Services Private Limited 200 - - -
Total - Dividend income received 2,757 870 - -
E. Reimbursements to /(by) the company [net]
(i) Zensar Technologies, Inc. 2,398 3,024 1,170 845
(ii) Zensar Technologies (UK) Limited 1,842 2,232 653 1,190
(iii) Zensar Technologies (Singapore) Pte. Limited 1 12 7 8
(iv) Zensar Technologies (Shanghai) Company Limited - - 116 132
(v) Zensar Technologies IM, Inc. 196 153 208 83
(vi) Zensar (South Africa) Proprietary Limited 1262 1,078 393 1,331
(vii) Professional Access Limited 107 186 32 11
(viii) Zensar Information Technologies Limited - 133 - -
(ix) Zensar Software Technologies Limited - 66 - -
(x) Zensar Technologies IM B.V. 42 12 36 8
(xi) Keystone Logic Inc. 144 30 80 29
(xii) Cynosure APAC Pty Ltd - 0 - -
(xiii) Cynosure Inc. 117 15 89 15
(xiv) Cynosure Interface Services Private Limited 34 323 (33) 39
(xv) Indigo Slate Inc. 24 10 31 10
(xvi) Foolproof Limited 53 29 85 31
(xvii) Zensar Technologies (Canada) Inc 3 - 3 -
(xviii) Keystone Logic Mexico, S. DE R.L. DE C.V 14 - 12 -
(xix) Raychem RPG Limited 1 - 1 -
(xx) Harrison Malayalam Limited (1) - - -
(xxi) Sudip Nandy (1) - - -
Total – Reimbursement to /(by) the company [net] 6,236 7,303 2,883 3,732
F Loans granted/ (repaid)
Zensar Technologies (Shanghai) Company Limited - - 78 78
Total - Loans granted/ (repaid) - - 78 78
G Interest income
Zensar Technologies (Shanghai) Company Limited - - 20 20
Total - Interest income - - 20 20
H Investment in Subsidiaries
(i) Zensar Information Technologies Limited - 693 - -
(ii) Zensar Software Technologies Limited - 560 - -
Total - Investment in Subsidiaries - 1,253 - -
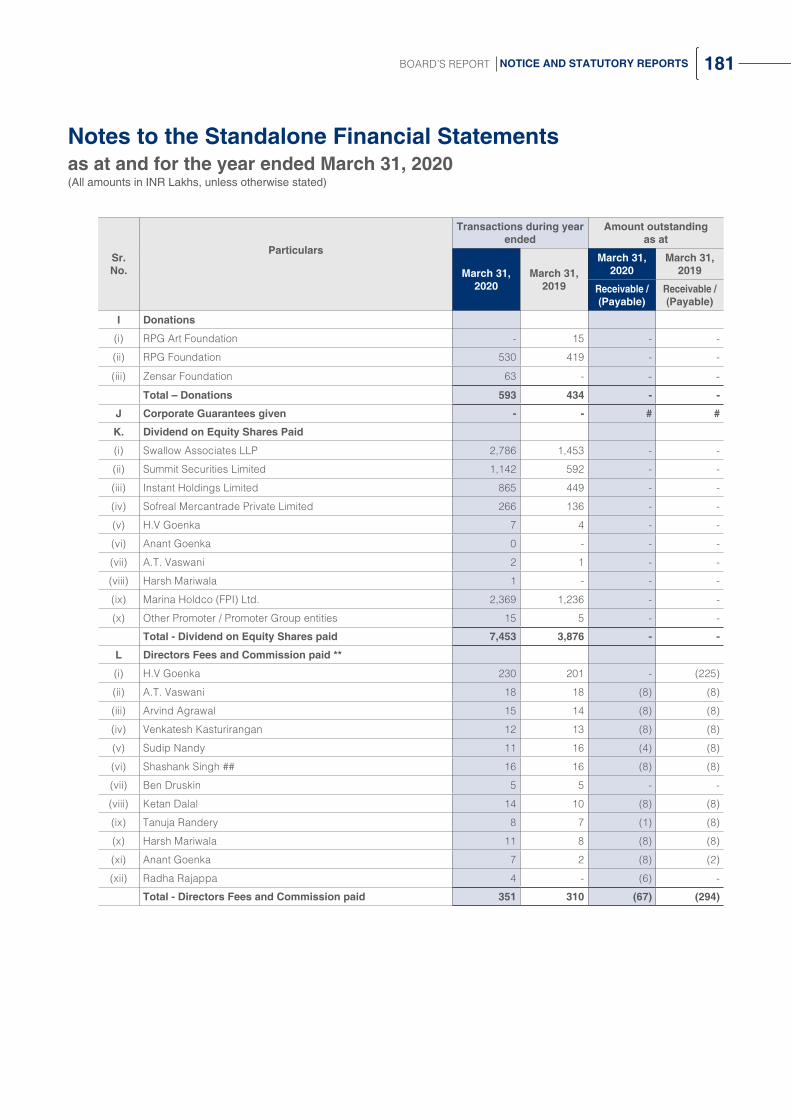
Notes to the Standalone Financial Statementsas at and for the year ended March 31, 2020(All amounts in INR Lakhs, unless otherwise stated)
181BOARD’S REPORT NOTICE AND STATUTORY REPORTS
Sr. No.
Particulars
Transactions during year ended
Amount outstanding as at
March 31, 2020
March 31, 2019
March 31, 2020
March 31, 2019
Receivable / (Payable)
Receivable / (Payable)
I Donations
(i) RPG Art Foundation - 15 - -
(ii) RPG Foundation 530 419 - -
(iii) Zensar Foundation 63 - - -Total – Donations 593 434 - -
J Corporate Guarantees given - - # #
K. Dividend on Equity Shares Paid
(i) Swallow Associates LLP 2,786 1,453 - -
(ii) Summit Securities Limited 1,142 592 - -
(iii) Instant Holdings Limited 865 449 - -
(iv) Sofreal Mercantrade Private Limited 266 136 - -
(v) H.V Goenka 7 4 - -
(vi) Anant Goenka 0 - - -
(vii) A.T. Vaswani 2 1 - -
(viii) Harsh Mariwala 1 - - -
(ix) Marina Holdco (FPI) Ltd. 2,369 1,236 - -
(x) Other Promoter / Promoter Group entities 15 5 - -
Total - Dividend on Equity Shares paid 7,453 3,876 - -
L Directors Fees and Commission paid **
(i) H.V Goenka 230 201 - (225)
(ii) A.T. Vaswani 18 18 (8) (8)
(iii) Arvind Agrawal 15 14 (8) (8)
(iv) Venkatesh Kasturirangan 12 13 (8) (8)
(v) Sudip Nandy 11 16 (4) (8)
(vi) Shashank Singh ## 16 16 (8) (8)
(vii) Ben Druskin 5 5 - -
(viii) Ketan Dalal 14 10 (8) (8)
(ix) Tanuja Randery 8 7 (1) (8)
(x) Harsh Mariwala 11 8 (8) (8)
(xi) Anant Goenka 7 2 (8) (2)
(xii) Radha Rajappa 4 - (6) -
Total - Directors Fees and Commission paid 351 310 (67) (294)

Notes to the Standalone Financial Statementsas at and for the year ended March 31, 2020(All amounts in INR Lakhs, unless otherwise stated)
182 ZENSAR TECHNOLOGIES LTD ANNUAL REPORT 2019-20
Compensation of Key management personnel $ Sandeep Kishore^
Gaurav Tongia
Navneet Khandelwal
Short Term Benefits 14 57 151
[14] [48] [142]
Post-Employment Benefits 2 2 6
[2] [2] [4]
Long-term Employee benefits - - -
[-] [-] [-]
Perquisites value of Employee Stock options - - -
[-] [-] [-]
Total - Compensation of Key management personnel 16 59 157
[16] [50] [146]
Outstanding amounts* - - 100
[-] [-] [51]
Stock Options of Key Management Personnel
Particulars Sandeep Kishore
Gaurav Tongia
Navneet Khandelwal
Opening Balance of options 1,000,000 - 90,000
[125,000] [-] [-]
Options granted - - -
[1,000,000] [-] [90,000]
Options Cancelled @ - - -
[125,000] [-] [-]
Options exercised - - -
[-] [-] [-]
Closing balance of options 1,000,000 - 90,000
[1,000,000] [-] [90,000]
Figures in brackets are for previous year i.e. as at March 31, 2019
$ doesn’t include the provision for Gratuity and compensated absences as these are provided at the company level.
^ Remuneration excludes the remuneration drawn from Zensar Technologies Inc.
@ cancellation of 125000 stock options were on account of voluntary surrender.
* Outstanding is not part of the “Total compensation of Key management personnel”. This includes long term performance-based stock options and incentives
## paid to Marina Holdco (FPI) Limited, which has nominated Shashank Singh on the Board of the Company
# Company has given Corporate Guarantee of USD 36 million to banks for loans availed by a subsidiary of Company.
** Transactions during the year includes Commission disbursed by the Company against previous years approved Commission; Outstanding for the year are the amount accrued as current year Commission.

Notes to the Standalone Financial Statementsas at and for the year ended March 31, 2020(All amounts in INR Lakhs, unless otherwise stated)
183BOARD’S REPORT NOTICE AND STATUTORY REPORTS
29 Contingent liabilities
ParticularsAs at
March 31, 2020As at
March 31, 2019
(a) Income Tax:
Matters decided in favour of the Company by appellate authorities, where the Income Tax Department is in further appeal.
751 986
Matters on which the Company is in appeal 1,863 1,426
(b) Sales Tax / Value Added Tax:
Claims against the Company regarding sales tax against which the Company has preferred appeals.
456 272
(c) Claims against Company regarding service tax against which the Company has preferred appeal
21 11
(d) Claims against the Company not acknowledged as debts 1,652 1,585
(e) Corporate Guarantees given 22,563 24,896
(f) Bank Guarantees 1,837 1,893
30 Disclosures with respect to Capital expenditure and Leases
(a) Capital expenditure contracted but not recognised as liability is as follows:
ParticularsAs at
March 31, 2020As at
March 31, 2019
Property plant and equipments 720 218
Intangible assets 7 56
(b) The details of the right-of-use asset held by the Company are as follows:
ParticularsAdditions
for FY 2019-20As at
March 31, 2020Depreciation charge
for FY 2019-20
Leasehold land - 201 2
Buildings/Office premises 12,604 22,669 3,224
Data Processing Equipments - 252 237
Total 12,604 23,122 3,463
Interest expense on lease liabilities is INR. 2,091 lakhs for year ended March 31, 2020.

Notes to the Standalone Financial Statementsas at and for the year ended March 31, 2020(All amounts in INR Lakhs, unless otherwise stated)
184 ZENSAR TECHNOLOGIES LTD ANNUAL REPORT 2019-20
31 Share based payments
(a) Employee Stock Option Plan, 2002 (2002 ESOP) and Employee Stock Option Plan, 2006 (2006 ESOP)
Under the 2002 ESOP and 2006 ESOP schemes, participants are granted options which vest equally over a period of 5 years from the date of grant. Participation in the plan is at the discretion of the Nomination and Remuneration Committee (NRC) and no individual has a contractual right to participate in the plan or to receive any guaranteed benefits.
- The exercise price is determined based on the market price, being the closing price of the share on the stock exchange with higher trading volume on the day preceding the day of the grant of options. The scheme allows the NRC to set the exercise price at a premium or discount not exceeding 20% on the market price.
- The options remain exercisable for 10 years from the date of vesting and lapse if they remain unexercised during this period.
- Options granted carry no dividend or voting rights. When exercisable, each option is convertible into one equity share.
Stock option activity under the “2002 ESOP” scheme is as follows:
Particulars
2019 - 2020 2018-2019
Number of options
Weighted average exercise price per
option (INR)
Number of options
Weighted average
exercise price per option
(INR)
Outstanding at the beginning of the year 52,335 17.00 105,710 81.96
Granted during the year - - - -
Cancelled during the year 1,750 13.60 8,500 15.97
Exercised during the year 22,000 18.83 40,750 26.94
Lapsed during the year 250 17.60 4,125 -
Outstanding at the end of the year 28,335 15.28 52,335 17.00
Vested and Exercisable at the year end 28,335 - 52,335 -
Stock option activity under the “2006 ESOP” scheme is as follows:
Particulars
2019 - 2020 2018-2019
Number of options
Weighted average exercise price per
option (INR)
Number of options
Weighted average
exercise price per option
(INR)
Outstanding at the beginning of the year 1,089,700 85.00 1,473,900 448.99
Granted during the year - - - -
Cancelled during the year 19,340 117.41 190,470 128.00
Exercised during the year 210,050 70.67 193,730 99.00
Lapsed during the year - - - -
Outstanding at the end of the year 860,310 87.16 1,089,700 85.00
Vested and Exercisable at the year end 800,310 - 918,700 -

Notes to the Standalone Financial Statementsas at and for the year ended March 31, 2020(All amounts in INR Lakhs, unless otherwise stated)
185BOARD’S REPORT NOTICE AND STATUTORY REPORTS
(b) Employee Performance Award Unit Plan, 2016 (EPAU 2016)
Vesting would happen on or after 1 (one) year but not later than 5 (five) years from the date of grant of such PAUs or any other period as may be determined by the Nomination and Remuneration Committee (the Committee) and is subject to achievement of performance targets, set out in the Grant letter and/or the Scheme/prescribed by the Committee.
The exercise price is INR. 2 per unit and all vested units need to be exercised at any time within the period determined by the Committee from time to time, subject to a maximum period of two and half months from the end of calendar year in which vesting happens for the respective PAUs.
Particulars
2019 - 2020 2018-2019
Number of options
Weighted average exercise price per
option (INR)
Number of options
Weighted average
exercise price per option
(INR)
Outstanding at the beginning of the year 3,045,805 2 1,527,525 2
Granted during the year 285,000 2 3,055,805 2
Cancelled during the year 711,805 2 1,537,525 2
Exercised during the year - - - -
Lapsed during the year - - - -
Outstanding at the end of the year 2,619,000 2 3,045,805 2
Vested and Exercisable - - - -
(c ) Share options outstanding at the end of the year have the following expiry dates and exercise prices:
Share based payment scheme Grant yearRange of exercise prices
Expiry yearShare options as at
March 31, 2020 March 31, 2019
2006 ESOP
FY 2006-2009 10 - 30 FY 2022-2024 4,990 2,000
FY 2010-2013 10 - 55 FY 2025-2028 543,470 379,120
FY 2014-2017 50 - 220 FY 2029-2032 311,850 708,580
Weighted average remaining contractual life of options outstanding at the end of the year
6.76 years 7.74 years
2002 ESOP FY 2002-2005 6 - 16 FY 2018-2020 - -
FY 2006-2009 12 - 20 FY 2021-2024 28,335 52,335
Weighted average remaining contractual life of options outstanding at the end of the year
1.23 years 1.77 years
EPAU 2016FY 2016-2017 2 FY 2020-2023 9,000 15,000
FY 2017-2018 2 FY 2021-2023 2,610,000 3,030,805
Weighted average remaining contractual life of options outstanding at the end of the year
1.95 years 2.95 years

Notes to the Standalone Financial Statementsas at and for the year ended March 31, 2020(All amounts in INR Lakhs, unless otherwise stated)
186 ZENSAR TECHNOLOGIES LTD ANNUAL REPORT 2019-20
(d) Fair value of options granted
The fair value of the options at the grant date is determined using Black Scholes Model which takes into account the exercise price, the term of the option, the share price at grant date, expected price volatility of the underlying share, the expected dividend yield and the risk free rate for the term of the option.
(e) The following tables illustrate the model inputs for options granted during the year ended March 31, 2020 and the resulting fair value of the options at the various grant dates:
Employee Performance Award Unit Plan, 2016 (EPAU 2016)
Particulars
Grant date
21-06-2019 29-04-2019
Vest 1 Vest 1
Expected Life (years) * 2.38 2.53
Volatility (%) ** 32.96 33.22
Risk free rate (%) 6.28 6.85
Exercise price (Rs.) 2 2
Dividend yield (%) 3.15 3.46
Fair value per vest 233.93 210
Vest % 100% 100%
Option fair value 233.93 210
* EPAU 2016 scheme allows for a maximum and minimum vesting of 70 % and 40 % on the first vesting date - 36 months after the date of grant and a maximum and minimum cumulative vesting of 220 % and 100 % at the final vesting date- 60 months from the date of grant depending upon the achievement of specified financial parameters. The expected life considered for valuation is based on management’s estimate of the timing and quantum of achievement of the financial parameters between the two specified vesting dates.
** The expected price volatility is based on the historic volatility (based on remaining life of the options), adjusted for any expected changes to future volatility due to publicly available information.
32 Earnings per share
ParticularsYear Ended
March 31, 2020Year Ended
March 31, 2019
Profits attributable to equity shareholders (INR lakhs) 23,104 25,800
Basic Earnings Per Share
Weighted average number of equity shares outstanding during the year (in nos) 225,268,893 225,061,245
Basic EPS (INR) 10.26 11.46
Diluted Earnings Per Share
Weighted average number of equity shares outstanding during the year (in nos) 225,268,893 225,061,245
Effect of dilutive issue of stock options (in nos) 3,117,023 3,784,359
Weighted average number of equity shares outstanding for diluted EPS (in nos) 228,385,916 228,845,604
Diluted EPS (INR) 10.12 11.27

Notes to the Standalone Financial Statementsas at and for the year ended March 31, 2020(All amounts in INR Lakhs, unless otherwise stated)
187BOARD’S REPORT NOTICE AND STATUTORY REPORTS
33 Goodwill
Goodwill is tested for impairment atleast on an annual basis. For the purpose of impairment testing, goodwill is allocated to a Cash Generated Unit (CGU) or group of CGUs expected to benefit from the synergies arising from the business combinations. A CGU is the smallest identifiable group of assets that generates cash inflows that are largely independent of the cash inflows from other assets or group of assets.
Goodwill is allocated to Application management services (AMS) segment.
Goodwill and other Intangible Assets with respect to AMS operating segment acquired through acquisitions is further allocated to identified CGU i.e. Retail Consumer Services.
The carrying amount was computed by allocating the net assets to operating segments for the purpose of impairment testing. The recoverable amount is computed based on value-in-use method using a forecast period of 5 years. The value-in-use of respective CGU is based on the future cash flows using a discount rate range of 9.1% and 1.50% annual revenue growth rate for periods subsequent to the forecast period of 5 years.
Previous year, the CGU’s were predominantly at the entity level and during the year ended on March 31, 2020, the group has realigned its CGUs in line with change in its business environment and synergies available through its integrated global service offerings.
Goodwill movement is given below:
ParticularsAs at
March 31, 2020As at
March 31, 2019
As on March 31, 2019 8,402 8,402
Add: Addition on acquisition - -
Add: Translation difference - -
As on March 31, 2020 8,402 8,402
In respect of above, no impairment was identified as of March 31, 2020 and March 31, 2019 as the recoverable value of the CGUs exceeded the carrying value. Further, an analysis of the calculation’s sensitivity to a change in the key parameters based on reasonably probable assumptions, did not identify any probable scenarios where the CGU’s recoverable amount would fall below its carrying amounts.
Further, due to increase in economic uncertainties due to COVID-19, Company relooked at its sensitivity analysis of the key assumptions used in the projections and basis the current estimates, is of the view that there are no scenarios which warrant impairment of goodwill related to any CGU.
34. Segment information
Segment information has been presented in the Consolidated Financial Statements as permitted by Indian Accounting Standard Ind AS 108, Operating Segments as notified under the Companies (Indian Accounting Standard) Rules, 2015.
35. Business Combination
The Company entered into a Share Purchase Agreement dated March 21, 2018 to acquire 100% equity in Cynosure Interface Solutions Private Limited (Cynosure India), an Indian company for a purchase consideration not exceeding INR. 1300 lakhs, subject to certain conditions, payable upfront. Accordingly, Cynosure India became 100% subsidiary with effect from 1st April 2018.

Notes to the Standalone Financial Statementsas at and for the year ended March 31, 2020(All amounts in INR Lakhs, unless otherwise stated)
188 ZENSAR TECHNOLOGIES LTD ANNUAL REPORT 2019-20
36. Company, during the previous year
• sold 100% of its equity stake in Zensar Information Technologies Limited and Zensar Software Technologies Limited for a sale consideration of INR 485 lakhs and INR 436 lakhs, respectively, receivable upfront and deferred consideration of an amount upto INR 238 lakhs and INR 314 lakhs respectively, subject to realisation of trade receivables over a period of 1 year.
The above-mentioned sale has been consummated in January 2019.
• entered into a business transfer agreement to transfer certain customer contracts and employees related liability for a sale consideration of INR 853 lakhs (USD 1.2 million) receivable upfront and deferred consideration of an amount upto INR 930 lakhs (USD 1.3 million) subject to novation of customer contracts over a period of 6 months.
Accordingly, aggregated gain of Rs. 2,080 lakhs on the above mentioned transactions was recognised under Other income during the year ended March, 31 2019.
37. Disclosure pursuant to Regulation 34(3) of Securities and Exchange Board of India (Listing Obligation and Disclosure requirements) Regulation, 2015.
ParticularsAmount outstanding as at March 31, 2020
Maximum amount outstanding during
the year
To subsidiaries Refer table below
To associates Not Applicable Not Applicable
To firms/companies in which directors are interested (other than subsidiaries/associates mentioned above)
Where there is
No Repayment schedule Not Applicable Not Applicable
Repayment beyond seven years Not Applicable Not Applicable
No Interest Not Applicable Not Applicable
Interest rates below as specified under section 186 of the Act Not Applicable Not Applicable

Notes to the Standalone Financial Statementsas at and for the year ended March 31, 2020(All amounts in INR Lakhs, unless otherwise stated)
189BOARD’S REPORT NOTICE AND STATUTORY REPORTS
Particulars of amount of loans and advances in nature of loans outstanding from subsidiaries as at March 31, 2020
ParticularsBalance as at
March 31, 2020
Maximum amount outstanding during
the year
Zensar Technologies (Shanghai) Company Limited 78 78
[78] [78]
Figures in brackets are for previous year i.e. as at March 31, 2019
There are no loans and advances in the nature of loans as at March 31, 2020 where there is no repayment schedule / repayment beyond seven years.
For and on behalf of the Board of Directors of
Zensar Technologies Limited
H.V. Goenka Sandeep Kishore Chairman Managing Director & CEO DIN: 00026726 DIN: 07393680
Navneet Khandelwal Gaurav Tongia Chief Financial Officer Company Secretary Place: Mumbai Date: May 14, 2020

190 ZENSAR TECHNOLOGIES LTD ANNUAL REPORT 2019-20
FINANCIALSTATEMENTSCONSOLIDATED
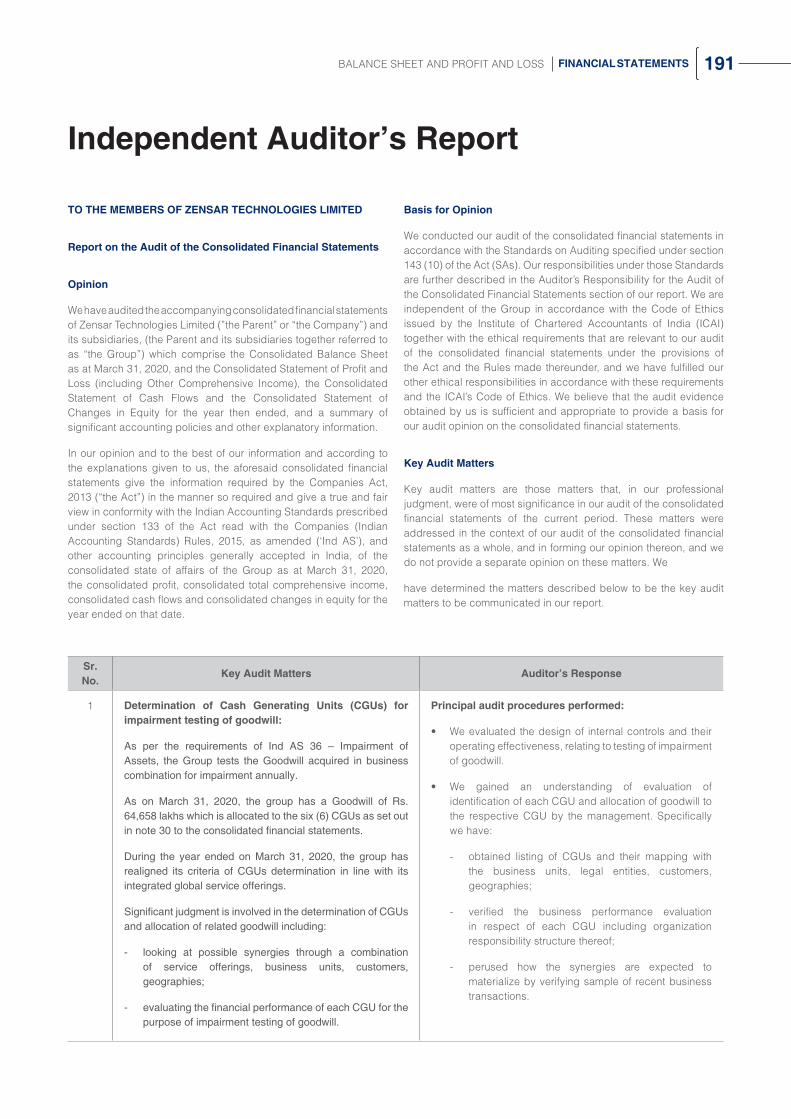
191BALANCE SHEET AND PROFIT AND LOSS FINANCIAL STATEMENTS
TO THE MEMBERS OF ZENSAR TECHNOLOGIES LIMITED
Report on the Audit of the Consolidated Financial Statements
Opinion
We have audited the accompanying consolidated financial statements of Zensar Technologies Limited (”the Parent” or “the Company”) and its subsidiaries, (the Parent and its subsidiaries together referred to as “the Group”) which comprise the Consolidated Balance Sheet as at March 31, 2020, and the Consolidated Statement of Profit and Loss (including Other Comprehensive Income), the Consolidated Statement of Cash Flows and the Consolidated Statement of Changes in Equity for the year then ended, and a summary of significant accounting policies and other explanatory information.
In our opinion and to the best of our information and according to the explanations given to us, the aforesaid consolidated financial statements give the information required by the Companies Act, 2013 (“the Act”) in the manner so required and give a true and fair view in conformity with the Indian Accounting Standards prescribed under section 133 of the Act read with the Companies (Indian Accounting Standards) Rules, 2015, as amended (‘Ind AS’), and other accounting principles generally accepted in India, of the consolidated state of affairs of the Group as at March 31, 2020, the consolidated profit, consolidated total comprehensive income, consolidated cash flows and consolidated changes in equity for the year ended on that date.
Independent Auditor’s Report
Basis for Opinion
We conducted our audit of the consolidated financial statements in accordance with the Standards on Auditing specified under section 143 (10) of the Act (SAs). Our responsibilities under those Standards are further described in the Auditor’s Responsibility for the Audit of the Consolidated Financial Statements section of our report. We are independent of the Group in accordance with the Code of Ethics issued by the Institute of Chartered Accountants of India (ICAI) together with the ethical requirements that are relevant to our audit of the consolidated financial statements under the provisions of the Act and the Rules made thereunder, and we have fulfilled our other ethical responsibilities in accordance with these requirements and the ICAI’s Code of Ethics. We believe that the audit evidence obtained by us is sufficient and appropriate to provide a basis for our audit opinion on the consolidated financial statements.
Key Audit Matters
Key audit matters are those matters that, in our professional judgment, were of most significance in our audit of the consolidated financial statements of the current period. These matters were addressed in the context of our audit of the consolidated financial statements as a whole, and in forming our opinion thereon, and we do not provide a separate opinion on these matters. We
have determined the matters described below to be the key audit matters to be communicated in our report.
Sr. No.
Key Audit Matters Auditor’s Response
1 Determination of Cash Generating Units (CGUs) for impairment testing of goodwill:
As per the requirements of Ind AS 36 – Impairment of Assets, the Group tests the Goodwill acquired in business combination for impairment annually.
As on March 31, 2020, the group has a Goodwill of Rs. 64,658 lakhs which is allocated to the six (6) CGUs as set out in note 30 to the consolidated financial statements.
During the year ended on March 31, 2020, the group has realigned its criteria of CGUs determination in line with its integrated global service offerings.
Significant judgment is involved in the determination of CGUs and allocation of related goodwill including:
- looking at possible synergies through a combination of service offerings, business units, customers, geographies;
- evaluating the financial performance of each CGU for the purpose of impairment testing of goodwill.
Principal audit procedures performed:
• We evaluated the design of internal controls and their operating effectiveness, relating to testing of impairment of goodwill.
• We gained an understanding of evaluation of identification of each CGU and allocation of goodwill to the respective CGU by the management. Specifically we have:
- obtained listing of CGUs and their mapping with the business units, legal entities, customers, geographies;
- verified the business performance evaluation in respect of each CGU including organization responsibility structure thereof;
- perused how the synergies are expected to materialize by verifying sample of recent business transactions.

192 ZENSAR TECHNOLOGIES LTD ANNUAL REPORT 2019-20
Sr. No.
Key Audit Matters Auditors’ Response
2 Impairment testing of CGU:
The Group carries goodwill resulting from business acquisitions. There is a risk that the carrying amount of goodwill is not supported by performance of the CGUs to which goodwill is allocated.
In respect of one of the subsidiaries, the Management has classified it as a separate CGU based on its specific service offerings.
In respect of the aforesaid CGU, any adverse change in the business activities due to internal or external factors such as the financial and economic environment (which includes impact of COVID-19 pandemic) where the Group operates, may have a significant adverse effect on the recoverable amount of goodwill and require the recognition of impairment.
In such a case, it is necessary to reassess the relevance of the assumptions used to determine the CGUs, recoverable amounts and the reasonableness and consistency of the criteria used in the calculation in line with the requirements of Ind AS 36 – Impairment of Assets.
Principal audit procedures performed:
• We evaluated the design of internal controls and their operating effectiveness, relating to testing of impairment of goodwill.
• We evaluated the reasonableness of management’s assumptions by:
- verifying the appropriateness of the model used to calculate value in use;
- using and comparing historical information and rationale for changes in assumptions, if any;
- involving Internal Fair Valuation (IFV) Specialist as per Standard on Auditing (SA) 620- “Using the Work of an Auditor’s Expert” in respect of verification of key valuation assumptions such as weighted average cost of capital (WACC), and terminal growth rate used in calculation of present value of the estimated future cash flows;
- comparing cash flow forecast with the actual performance for past 2 financial years;
- evaluated the underlying key business assumptions in estimating projections including cash flows;
- assessing the sensitivity of the outcome of impairment assessment in response to changes in the key assumptions.
3 Allowance for credit losses:
The Group determines the allowance for credit losses based on historical loss experience and collection patterns, adjusted to reflect current and estimated future economic conditions. The Group considered current and anticipated future economic conditions relating to industries the Group deals with and the countries where it operates.
Considering uncertainties due to COVID-19 pandemic, in calculating expected credit loss, the Group has also considered credit reports, subsequent collections, credit term extension requests and other related credit information for its customers to estimate the probability of default in future.
We identified allowance for credit losses as a key audit matter because the Group exercises significant judgment in calculating the expected credit losses because of possible effect from the pandemic relating to COVID-19.
Refer Notes 3(i), 6(c), 6(g) and 26 (b) to the consolidated financial statements.
Our audit procedures related to the allowance for credit losses for trade receivables and unbilled revenue included the following, among others we tested the effectiveness of controls over:
• management assessment of the allowance for credit losses, including factors taken into account by the management in current and estimated future economic conditions
• relevance of information used in the estimation of probability of default.
• computation of the allowance for credit losses
For a sample of customers:
• We tested the input data such as credit reports, subsequent collections, impact of credit extensions, other credit related information used in estimating the probability of default by comparing them to external and internal sources of information.
• We tested the mathematical accuracy of the credit loss allowances.
Independent Auditor’s Report (Contd.)
Information Other than the Financial Statements and Auditor’s Report Thereon
• The Parent’s Board of Directors is responsible for the preparation of the other information. The other information comprises the Board’s Report including its annexures, but
does not include the consolidated financial statements, standalone financial statements and our auditor’s report thereon. The Board’s Report including its annexures are expected to be made available to us after the date of this auditor’s report.

193BALANCE SHEET AND PROFIT AND LOSS FINANCIAL STATEMENTS
Independent Auditor’s Report (Contd.)
• Our opinion on the consolidated financial statements does not cover the other information and we do not and will not express any form of assurance conclusion thereon.
• In connection with our audit of the consolidated financial statements, our responsibility is to read the other information identified above when it becomes available, in doing so, consider whether the other information is materially inconsistent with the consolidated financial statements or our knowledge obtained during the course of our audit or otherwise appears to be materially misstated.
• When we read the Board’s Report including its annexures, if we conclude that there is a material misstatement therein, we are required to communicate the matter to those charged with governance as required under SA 720 ‘The Auditor’s responsibilities Relating to Other Information’.
Management’s Responsibility for the Consolidated Financial Statements
The Parent’s Board of Directors is responsible for the matters stated in section 134(5) of the Act with respect to the preparation of these consolidated financial statements that give a true and fair view of the consolidated financial position, consolidated financial performance including other comprehensive income, consolidated cash flows and consolidated changes in equity of the Group in accordance with the Ind AS and other accounting principles generally accepted in India. The respective Board of Directors of the companies included in the Group are responsible for maintenance of adequate accounting records in accordance with the provisions of the Act for safeguarding the assets of the Group and for preventing and detecting frauds and other irregularities; selection and application of appropriate accounting policies; making judgments and estimates that are reasonable and prudent; and design, implementation and maintenance of adequate internal financial controls, that were operating effectively for ensuring the accuracy and completeness of the accounting records, relevant to the preparation and presentation of the financial statements that give a true and fair view and are free from material misstatement, whether due to fraud or error, which have been used for the purpose of preparation of the consolidated financial statements by the Directors of the Parent, as aforesaid.
In preparing the consolidated financial statements, the respective Board of Directors of the companies included in the Group are responsible for assessing the ability of the respective entities to continue as a going concern, disclosing, as applicable, matters related to going concern and using the going concern basis of accounting unless the respective Board of Directors either intends to liquidate their respective entities or cease operations, or has no realistic alternative but to do so.
The respective Board of Directors of the companies included in the Group are also responsible for overseeing the financial reporting process of the Group.
Auditor’s Responsibility for the Audit of the Consolidated Financial Statements
Our objectives are to obtain reasonable assurance about whether
the consolidated financial statements as a whole are free from material misstatement, whether due to fraud or error, and to issue an auditor’s report that includes our opinion. Reasonable assurance is a high level of assurance, but is not a guarantee that an audit conducted in accordance with SAs will always detect a material misstatement when it exists. Misstatements can arise from fraud or error and are considered material if, individually or in the aggregate, they could reasonably be expected to influence the economic decisions of users taken on the basis of these consolidated financial statements.
As part of an audit in accordance with SAs, we exercise professional judgment and maintain professional skepticism throughout the audit. We also:
• Identify and assess the risks of material misstatement of the consolidated financial statements, whether due to fraud or error, design and perform audit procedures responsive to those risks, and obtain audit evidence that is sufficient and appropriate to provide a basis for our opinion. The risk of not detecting a material misstatement resulting from fraud is higher than for one resulting from error, as fraud may involve collusion, forgery, intentional omissions, misrepresentations, or the override of internal control.
• Obtain an understanding of internal financial control relevant to the audit in order to design audit procedures that are appropriate in the circumstances. Under section 143(3)(i) of the Act, we are also responsible for expressing our opinion on whether the Parent has adequate internal financial controls system in place and the operating effectiveness of such controls.
• Evaluate the appropriateness of accounting policies used and the reasonableness of accounting estimates and related disclosures made by the management.
• Conclude on the appropriateness of management’s use of the going concern basis of accounting and, based on the audit evidence obtained, whether a material uncertainty exists related to events or conditions that may cast significant doubt on the ability of the Group to continue as a going concern. If we conclude that a material uncertainty exists, we are required to draw attention in our auditor’s report to the related disclosures in the consolidated financial statements or, if such disclosures are inadequate, to modify our opinion. Our conclusions are based on the audit evidence obtained up to the date of our auditor’s report. However, future events or conditions may cause the Group to cease to continue as a going concern.
• Evaluate the overall presentation, structure and content of the consolidated financial statements, including the disclosures, and whether the consolidated financial statements represent the underlying transactions and events in a manner that achieves fair presentation.
• Obtain sufficient appropriate audit evidence regarding the financial information of the entities or business activities within the Group to express an opinion on the consolidated financial statements. We are responsible for the direction,

194 ZENSAR TECHNOLOGIES LTD ANNUAL REPORT 2019-20
Independent Auditor’s Report (Contd.)
supervision and performance of the audit of the financial statements of such entities or business activities included in the consolidated financial statements of which we are the independent auditors.
Materiality is the magnitude of misstatements in the consolidated financial statements that, individually or in aggregate, makes it probable that the economic decisions of a reasonably knowledgeable user of the consolidated financial statements may be influenced. We consider quantitative materiality and qualitative factors in (i) planning the scope of our audit work and in evaluating the results of our work; and (ii) to evaluate the effect of any identified misstatements in the consolidated financial statements.
We communicate with those charged with governance of the Parent and such other entities included in the consolidated financial statements of which we are the independent auditors regarding, among other matters, the planned scope and timing of the audit and significant audit findings, including any significant deficiencies in internal control that we identify during our audit.
We also provide those charged with governance with a statement that we have complied with relevant ethical requirements regarding independence, and to communicate with them all relationships and other matters that may reasonably be thought to bear on our independence, and where applicable, related safeguards.
From the matters communicated with those charged with governance, we determine those matters that were of most significance in the audit of the consolidated financial statements of the current period and are therefore the key audit matters. We describe these matters in our auditor’s report unless law or regulation precludes public disclosure about the matter or when, in extremely rare circumstances, we determine that a matter should not be communicated in our report because the adverse consequences of doing so would reasonably be expected to outweigh the public interest benefits of such communication.
Report on Other Legal and Regulatory Requirements
1. As required by Section 143(3) of the Act, based on our audit we report that:
a) We have sought and obtained all the information and explanations which to the best of our knowledge and belief were necessary for the purposes of our audit of the aforesaid consolidated financial statements.
b) In our opinion, proper books of account as required by law relating to preparation of the aforesaid consolidated financial statements have been kept so far as it appears from our examination of those books.
c) The Consolidated Balance Sheet, the Consolidated Statement of Profit and Loss including Other Comprehensive Income, the Consolidated Statement of Cash Flows and the Consolidated Statement of Changes in Equity dealt with by this Report are in agreement with the relevant books of account maintained for the purpose of preparation of the consolidated financial statements.
d) In our opinion the aforesaid consolidated financial statements comply with the Ind AS specified under Section 133 of the Act.
e) On the basis of the written representations received from the directors of the Company as on March 31, 2020 taken on record by the Board of Directors of the Company and the reports of the statutory auditors of its subsidiary companies incorporated in India, none of the directors of the Group companies incorporated in India is disqualified as on March 31, 2020 from being appointed as a director in terms of Section 164 (2) of the Act.
f) With respect to the adequacy of the internal financial controls over financial reporting and the operating effectiveness of such controls, refer to our separate Report in “Annexure A” which is based on the auditors’ reports of the Parent, subsidiary companies incorporated in India. Our report expresses an unmodified opinion on the adequacy and operating effectiveness of internal financial controls over financial reporting of those companies.
g) With respect to the other matters to be included in the Auditor’s Report in accordance with the requirements of section 197(16) of the Act, as amended,
In our opinion and to the best of our information and according to the explanations given to us, the remuneration paid by the Parent to its directors during the year is in accordance with the provisions of section 197 of the Act.
h) With respect to the other matters to be included in the Auditor’s Report in accordance with Rule 11 of the Companies (Audit and Auditors) Rules, 2014,as amended in our opinion and to the best of our information and according to the explanations given to us:
i) The consolidated financial statements disclose the impact of pending litigations on the consolidated financial position of the Group – refer note 31 to the consolidated financial statements.
ii) Provision has been made in the consolidated financial statements, as required under the applicable law or accounting standards, for material foreseeable losses, if any, on long-term contracts including derivative contracts.
iii) There has been no delay in transferring amounts, required to be transferred, to the Investor Education and Protection Fund by the Parent.
There were no amounts which were required to be transferred to the Investor Education and Protection Fund by the subsidiary company incorporated in India.
For Deloitte Haskins & Sells LLP Chartered Accountants
(Firm’s Registration No. 117366W/W-100018)
Hemant M. JoshiPlace: Pune Partner
Date: May 14, 2020 (Membership No. 38019)
UDIN:20038019AAAADL2271

195BALANCE SHEET AND PROFIT AND LOSS FINANCIAL STATEMENTS
Report on the Internal Financial Controls Over Financial Reporting under Clause (i) of Sub-section 3 of Section 143 of the Act
In conjunction with our audit of the consolidated financial statements of the Zensar Technologies Limited (“the Parent” or “the Company”) as of and for the year ended March 31, 2020, we have audited the internal financial controls over financial reporting of the Parent and its subsidiary companies which are companies incorporated in India, as of that date.
Management’s Responsibility for Internal Financial Controls
The respective Board of Directors of the Parent and its subsidiary companies, which are companies incorporated in India, are responsible for establishing and maintaining internal financial controls based on the internal control over financial reporting criteria established by the respective Companies considering the essential components of internal control stated in the Guidance Note on Audit of Internal Financial Controls Over Financial Reporting issued by the Institute of Chartered Accountants of India (ICAI). These responsibilities include the design, implementation and maintenance of adequate internal financial controls that were operating effectively for ensuring the orderly and efficient conduct of its business, including adherence to the respective company’s policies, the safeguarding of its assets, the prevention and detection of frauds and errors, the accuracy and completeness of the accounting records, and the timely preparation of reliable financial information, as required under the Act.
Auditor’s Responsibility
Our responsibility is to express an opinion on the internal financial controls over financial reporting of the Parent and its subsidiary companies, which are companies incorporated in India, based on our audit. We conducted our audit in accordance with the Guidance Note on Audit of Internal Financial Controls Over Financial Reporting (the “Guidance Note”) issued by the Institute of Chartered Accountants of India and the Standards on Auditing, prescribed under Section 143(10) of the Act, to the extent applicable to an audit of internal financial controls. Those Standards and the Guidance Note require that we comply with ethical requirements and plan and perform the audit to obtain reasonable assurance about whether adequate internal financial controls over financial reporting was established and maintained and if such controls operated effectively in all material respects.
Annexure “A” to the Independent Auditor’s Report(Referred to in paragraph 1 (f) under ‘Report on Other Legal and Regulatory Requirements’ section of our report of even date)
Our audit involves performing procedures to obtain audit evidence about the adequacy of the internal financial controls system over financial reporting and their operating effectiveness. Our audit of internal financial controls over financial reporting included obtaining an understanding of internal financial controls over financial reporting, assessing the risk that a material weakness exists, and testing and evaluating the design and operating effectiveness of internal control based on the assessed risk. The procedures selected depend on the auditor’s judgement, including the assessment of the risks of material misstatement of the financial statements, whether due to fraud or error.
We believe that the audit evidence we have obtained in respect of Parent and its subsidiaries companies, which are companies incorporated in India, is sufficient and appropriate to provide a basis for our audit opinion on the internal financial controls system over financial reporting of the Parent and its subsidiary companies, which are companies incorporated in India.
Meaning of Internal Financial Controls Over Financial Reporting
A company’s internal financial control over financial reporting is a process designed to provide reasonable assurance regarding the reliability of financial reporting and the preparation of financial statements for external purposes in accordance with generally accepted accounting principles. A company’s internal financial control over financial reporting includes those policies and procedures that (1) pertain to the maintenance of records that, in reasonable detail, accurately and fairly reflect the transactions and dispositions of the assets of the company; (2) provide reasonable assurance that transactions are recorded as necessary to permit preparation of financial statements in accordance with generally accepted accounting principles, and that receipts and expenditures of the company are being made only in accordance with authorisations of management and directors of the company; and (3) provide reasonable assurance regarding prevention or timely detection of unauthorised acquisition, use, or disposition of the company’s assets that could have a material effect on the financial statements.
Inherent Limitations of Internal Financial Controls Over Financial Reporting
Because of the inherent limitations of internal financial controls over financial reporting, including the possibility of collusion or improper management override of controls, material misstatements due to

196 ZENSAR TECHNOLOGIES LTD ANNUAL REPORT 2019-20
error or fraud may occur and not be detected. Also, projections of any evaluation of the internal financial controls over financial reporting to future periods are subject to the risk that the internal financial control over financial reporting may become inadequate because of changes in conditions, or that the degree of compliance with the policies or procedures may deteriorate.
Opinion
In our opinion to the best of our information and according to the explanations given to us, the Parent and its subsidiary companies, which are companies incorporated in India, have, in all material respects, an adequate internal financial controls system over financial reporting and such internal financial controls over financial reporting were operating effectively as at March 31, 2020, based
on the criteria for internal financial control over financial reporting established by the respective companies considering the essential components of internal control stated in the Guidance Note on Audit of Internal Financial Controls Over Financial Reporting issued by the Institute of Chartered Accountants of India.
For Deloitte Haskins & Sells LLP Chartered Accountants
(Firm’s Registration No. 117366W/W-100018)
Hemant M. JoshiPlace: Pune Partner
Date: May 14, 2020 (Membership No. 38019)
UDIN: 20038019AAAADL2271
Annexure “A” to the Independent Auditor’s Report (Contd.)

197BALANCE SHEET AND PROFIT AND LOSS FINANCIAL STATEMENTS
Consolidated Balance Sheet(All amounts in INR Lakhs, unless otherwise stated)
The accompanying notes form an integral part of the consolidated financial statements In terms of our report attached
For Deloitte Haskins & Sells LLP For and on behalf of the Board of Directors ofChartered Accountants Zensar Technologies Limited(Firm’s registration no: 117366W / W-100018)
Hemant M. Joshi H.V. Goenka Sandeep Kishore Navneet Khandelwal Gaurav TongiaPartner Chairman Managing Director & CEO Chief Financial Officer Company SecretaryMembership No: 38019 (DIN: 00026726) (DIN: 07393680)
Place: Pune Place: Mumbai Date: May 14, 2020 Date: May 14, 2020
Consolidated Balance Sheet as at Note March 31, 2020 March 31, 2019
AssetsNon-current assets(a) Property, plant and equipment 4 12,940 10,267 (b) Right of use assets 2(c) & 32 32,649 - (c) Capital work-in-progress 180 556 (d) Goodwill 30 64,658 60,310 (e) Other intangible assets 5 22,020 24,411 (f) Intangible assets under development 957 629 (g) Financial assets i. Investments 6(a) 1,142 6,982 ii. Other financial assets 6(f) 6,798 3,262 (h) Income tax assets (net) 17(a) 6,064 3,146 (i) Deferred tax assets (net) 7 4,966 4,468 (j) Other non-current assets 8 1,419 1,125 Total non-current assets 153,793 115,156 Current assets(a) Inventories 9 9,412 9,846 (b) Financial assets i. Investments 6(b) 26,704 4,536 ii. Trade receivables 6(c) 66,564 87,621 iii. Cash and cash equivalents 6(d) 48,834 31,689 iv. Other balances with banks 6(e) 2,823 899 v. Other financial assets 6(g) 29,762 26,444 (c) Other current assets 10 21,663 32,781 Total current assets 205,762 193,816 Total assets 359,555 308,972
Equity and liabilitiesEquity(a) Equity share capital 11(a) 4,508 4,504 (b) Other equity i. Reserves and surplus 11(b) 201,118 187,430 ii. Other components of equity 11(d) 3,373 2,302 Equity attributable to owners of the company 208,999 194,236 Non-controlling interests 29(b) 2,370 1,696 Total equity 211,369 195,932 LiabilitiesNon-current liabilities(a) Financial liabilities i. Borrowings 12(a) 6,537 10,221 ii. Lease liabilities 12(c) 31,293 - iii. Other financial liabilities 12(b) 4,599 6,084 (b) Provisions 14 263 209 (c) Employee benefit obligations 15 1,554 1,457 Total non-current liabilities 44,246 17,971 Current liabilities(a) Financial liabilities i. Borrowings 12(a) 22,321 15,560 ii. Trade payables 13
- Total outstanding dues of micro and small enterprises 212 - - Total outstanding dues of creditors other than micro and small enterprises 26,285 30,095
iii. Lease liabilities 12(c) 10,577 - iv. Other financial liabilities 12(b) 22,825 25,351 (b) Employee benefit obligations 15 8,325 5,692 (c) Other current liabilities 16 8,485 14,422 (d) Income tax liabilities (net) 17(a) 4,910 3,949 Total current liabilities 103,940 95,069 Total liabilities 148,186 113,040 Total equity and liabilities 359,555 308,972

198 ZENSAR TECHNOLOGIES LTD ANNUAL REPORT 2019-20
Consolidated Statement of Profit and Loss (All amounts in INR Lakhs, except earnings per share)
Consolidated Statement of Profit and Loss for the NoteYear ended
March 31, 2020 Year ended
March 31, 2019
Income(a) Revenue from operations 18 418,168 396,633 (b) Other income (net) 19 8,842 9,268 Total income 427,010 405,901 Expenses(a) Purchase of traded goods 15,250 11,538 (b) Consumption of spare parts for computer hardware and maintenance contracts 2,655 3,645 (c) Changes in inventories 434 754 (d) Employee benefits expense 20 234,743 215,258 (e) Subcontracting costs 65,881 66,181 (f) Finance costs 21 6,051 3,729 (g) Depreciation, amortisation and impairment expense 22 15,918 8,944 (h) Other expenses 23 48,499 51,314 Total expenses 389,431 361,363 Profit before tax 37,579 44,538 Tax expense 24(a) Current tax 10,131 14,045 (b) Deferred tax 288 (1,372)Total tax expense 10,419 12,673 Profit for the year 27,160 31,865 Other comprehensive income/(loss)I) (a) Items that will not be reclassified to profit or loss - Remeasurements of defined employee benefit plans 15 (1,374) 159 - Change in fair value of equity instruments 11(d) (1,312) (196) (b) Income tax relating to items that will not be reclassified to profit or loss 24(iii) 480 (7)
(2,206) (44)II) (a) Items that will be reclassified to profit or loss - Effective portion of gain / (loss) on designated portion of hedging instruments in a Cash Flow Hedge (net)
11(d) (1,065) 657
- Exchange differences in translating the financial statements of foreign operations - gain / (loss)
2,887 (24)
(b) Income tax relating to items that will be reclassified to profit or loss 11(d) 560 (230) 2,382 403
Other comprehensive income/(loss) for the year, net of tax 176 359 Total comprehensive income/(loss) for the year 27,336 32,224 Profit for the year attributable to:
- Owners of the Company 26,342 31,359 - Non-controlling interests 818 506
27,160 31,865 Other comprehensive income / (loss) attributable to:
- Owners of the Company 326 534 - Non-controlling interests (150) (175)
176 359 Total comprehensive income attributable to:
- Owners of the Company 26,668 31,893 - Non-controlling interests 668 331
27,336 32,224 Earnings per share [nominal value per share INR 2/-] 33
- Basic 11.69 13.93 - Diluted 11.53 13.70
The accompanying notes form an integral part of the consolidated financial statements In terms of our report attached
For Deloitte Haskins & Sells LLP For and on behalf of the Board of Directors ofChartered Accountants Zensar Technologies Limited(Firm’s registration no: 117366W / W-100018)
Hemant M. Joshi H.V. Goenka Sandeep Kishore Navneet Khandelwal Gaurav TongiaPartner Chairman Managing Director & CEO Chief Financial Officer Company SecretaryMembership No: 38019 (DIN: 00026726) (DIN: 07393680)
Place: Pune Place: Mumbai Date: May 14, 2020 Date: May 14, 2020

199BALANCE SHEET AND PROFIT AND LOSS FINANCIAL STATEMENTS
Con
solid
ated
Sta
tem
ent o
f cha
nges
in e
quity
(A
ll am
ount
s in
INR
Lak
hs, u
nles
s ot
herw
ise
stat
ed)
Equ
ity S
hare
Cap
ital
Bal
ance
as
at A
pril
1, 2
018
Cha
nges
in e
quity
sha
re
capi
tal d
urin
g th
e ye
arB
alan
ce a
s at
M
arch
31,
201
9
4,4
99
5 4
,504
Bal
ance
as
at A
pril
1, 2
019
Cha
nges
in e
quity
sha
re
capi
tal d
urin
g th
e ye
arB
alan
ce a
s at
M
arch
31,
202
0
4,5
04
4 4
,508
Par
ticu
lars
Res
erve
s &
su
rplu
sO
ther
co
mp
on
ents
of
equ
ity
Ow
ners
E
quity
Non
-co
ntro
lling
in
tere
sts
To
tal
Cap
ital
re
dem
pti
on
re
serv
e
Sha
re
base
d pa
ymen
t re
serv
e
Cap
ital
rese
rve
Sec
uri
ties
p
rem
ium
Ret
aine
d ea
rnin
gsG
ener
al
rese
rve
Spe
cial
ec
onom
ic
zone
re-
inve
stm
ent
rese
rve
Cas
h flo
w
hedg
ing
rese
rve
Equ
ity
inve
stm
ent
thro
ugh
OC
I
Fore
ign
curr
ency
tr
ansl
atio
n re
serv
e
Bal
ance
as
at A
pril
1, 2
018
442
1
,348
2
93
2,3
78
61,
017
94,
853
180
(2
7) 7
57
1,1
49
162
,390
1
,365
1
63,7
56
Prof
it fo
r the
yea
r -
-
-
-
3
1,35
9 -
-
-
-
-
3
1,35
9 5
06
31,
865
Effe
ctiv
e po
rtio
n of
gai
n / (
loss
) on
Cas
h Fl
ow
Hed
ge (n
et).
-
-
-
-
-
-
-
427
-
-
4
27
-
427
Cha
nge
in fa
ir va
lue
of e
quity
inst
rum
ents
-
-
-
-
-
-
-
-
(155
) -
(1
55)
-
(155
)
Exch
ange
diff
eren
ces
in tr
ansl
atin
g th
e fin
anci
al s
tate
men
ts o
f for
eign
ope
ratio
ns -
gain
/ (lo
ss) (
net o
f tax
)
-
-
-
-
-
-
-
-
-
151
1
51
(175
) (2
4)
Rem
easu
rem
ents
of d
efin
ed e
mpl
oyee
be
nefit
pla
ns (n
et o
f tax
) -
-
-
-
1
11
-
-
-
-
-
111
-
1
11
Tota
l com
preh
ensi
ve in
com
e fo
r th
e ye
ar -
-
-
-
3
1,47
0 -
-
4
27
(155
) 1
51
31,
893
331
3
2,22
4
Tran
sact
ion
with
ow
ners
in th
eir
capa
city
as
ow
ners
: -
Div
iden
ds p
aid
(incl
udin
g D
ivid
end
Dis
tribu
tion
Tax)
-
-
-
-
(6,3
33)
-
-
-
-
-
(6,3
33)
-
(6,3
33)
Rec
ogni
tion
of E
mpl
oyee
Sha
re b
ased
pa
ymen
t exp
ense
-
1,6
47
-
-
-
-
-
-
-
-
1,6
47
-
1,6
47

200 ZENSAR TECHNOLOGIES LTD ANNUAL REPORT 2019-20
Par
ticu
lars
Res
erve
s &
su
rplu
sO
ther
co
mp
on
ents
of
equ
ity
Ow
ners
E
quity
Non
-co
ntro
lling
in
tere
sts
To
tal
Cap
ital
re
dem
pti
on
re
serv
e
Sha
re
base
d pa
ymen
t re
serv
e
Cap
ital
rese
rve
Sec
uri
ties
p
rem
ium
Ret
aine
d ea
rnin
gsG
ener
al
rese
rve
Spe
cial
ec
onom
ic
zone
re-
inve
stm
ent
rese
rve
Cas
h flo
w
hedg
ing
rese
rve
Equ
ity
inve
stm
ent
thro
ugh
OC
I
Fore
ign
curr
ency
tr
ansl
atio
n re
serv
e
Tran
sfer
red
from
/ to
Sec
uriti
es p
rem
ium
on
exer
cise
of s
tock
opt
ions
-
(58)
-
58
-
-
-
-
-
-
-
-
-
Rec
eive
d on
exe
rcis
e of
sto
ck o
ptio
ns -
-
-
1
35
-
-
-
-
-
-
135
-
1
35
Tran
sfer
red
to G
ener
al re
serv
e on
ca
ncel
latio
n of
sto
ck o
ptio
ns -
(8
8) -
-
-
8
8 -
-
-
-
-
-
-
Tran
sfer
red
to re
tain
ed e
arni
ngs
-
-
-
-
180
-
(1
80)
-
-
-
-
-
-
Tran
sfer
red
to g
ener
al re
serv
e -
-
-
-
(1
2,00
0) 1
2,00
0 -
-
-
-
-
-
-
Tran
sfer
to S
peci
al e
cono
mic
zon
e re
-in
vest
men
t res
erve
-
-
-
-
(1,5
00)
-
1,5
00
-
-
-
-
-
-
Bal
ance
as
at M
arch
31,
201
9 4
42
2,8
49
293
2
,571
7
2,83
4 1
06,9
41
1,5
00
400
6
02
1,3
00
189
,732
1
,696
1
91,4
28
Prof
it fo
r the
yea
r -
-
-
-
2
6,34
2 -
-
-
-
-
2
6,34
2 8
18
27,
160
Effe
ctiv
e po
rtio
n of
gai
n / (
loss
) on
Cas
h Fl
ow
Hed
ge (n
et).
-
-
-
-
-
-
-
(693
) -
-
(6
93)
-
(693
)
Cha
nge
in fa
ir va
lue
of e
quity
inst
rum
ents
-
-
-
-
-
-
-
-
(1,1
24)
-
(1,1
24)
-
(1,1
24)
Exch
ange
diff
eren
ces
in tr
ansl
atin
g th
e fin
anci
al s
tate
men
ts o
f for
eign
ope
ratio
ns -
gain
/ (lo
ss) (
net o
f tax
)
-
-
-
-
-
-
-
-
-
3,0
38
3,0
38
(150
) 2
,888
Rem
easu
rem
ents
of d
efin
ed e
mpl
oyee
be
nefit
pla
ns (n
et o
f tax
) -
-
-
-
(8
94)
-
-
-
-
-
(894
) -
(8
94)
Tota
l com
preh
ensi
ve in
com
e fo
r th
e ye
ar -
-
-
-
2
5,44
8 -
-
(6
93)
(1,1
24)
3,0
38
26,
668
668
2
7,33
6
Tran
sact
ion
with
ow
ners
in th
eir
capa
city
as
ow
ners
:
Tran
sitio
n im
pact
of I
nd A
S 11
6 (r
efer
not
e 2(
c))
-
-
-
-
(579
) -
-
-
-
-
(5
79)
(579
)
Div
iden
ds p
aid
(incl
udin
g D
ivid
end
Dis
tribu
tion
Tax)
-
-
-
-
(11,
974)
-
-
-
-
-
(11,
974)
-
(11,
974)
Rec
ogni
tion
of E
mpl
oyee
Sha
re b
ased
pa
ymen
t exp
ense
-
645
-
-
-
-
-
-
-
-
6
45
-
645

201BALANCE SHEET AND PROFIT AND LOSS FINANCIAL STATEMENTS
Par
ticu
lars
Res
erve
s &
su
rplu
sO
ther
co
mp
on
ents
of
equ
ity
Ow
ners
E
quity
Non
-co
ntro
lling
in
tere
sts
To
tal
Cap
ital
re
dem
pti
on
re
serv
e
Sha
re
base
d pa
ymen
t re
serv
e
Cap
ital
rese
rve
Sec
uri
ties
p
rem
ium
Ret
aine
d ea
rnin
gsG
ener
al
rese
rve
Spe
cial
ec
onom
ic
zone
re-
inve
stm
ent
rese
rve
Cas
h flo
w
hedg
ing
rese
rve
Equ
ity
inve
stm
ent
thro
ugh
OC
I
Fore
ign
curr
ency
tr
ansl
atio
n re
serv
e
Tran
sfer
red
from
/ to
Sec
uriti
es p
rem
ium
on
exer
cise
of s
tock
opt
ions
-
(94)
-
94
-
-
-
-
-
-
-
-
-
Rec
eive
d on
exe
rcis
e of
sto
ck o
ptio
ns -
-
-
1
48
-
-
-
-
-
-
148
-
1
48
Tran
sfer
red
to G
ener
al re
serv
e on
ca
ncel
latio
n of
sto
ck o
ptio
ns -
-
-
-
-
-
-
-
-
-
-
-
-
Tran
sfer
red
from
/to g
ener
al re
serv
e/re
tain
ed
earn
ings
-
-
-
-
1,5
00
-
(1,5
00)
-
-
-
-
-
-
Tran
sfer
to S
peci
al e
cono
mic
zon
e re
-in
vest
men
t res
erve
-
-
-
-
(1,2
50)
-
1,2
50
-
-
-
-
-
-
Min
ority
Adj
ustm
ents
-
-
-
-
-
-
-
-
-
(150
) (1
50)
6
(144
)
Bal
ance
as
at M
arch
31,
202
0 4
42
3,4
00
293
2
,812
8
5,98
0 1
06,9
41
1,2
50
(293
) (5
22)
4,1
88
204
,491
2
,370
2
06,8
61
The
acco
mpa
nyin
g no
tes
form
an
inte
gral
par
t of t
he c
onso
lidat
ed fi
nanc
ial s
tate
men
ts
In te
rms
of o
ur re
port
atta
ched
For
Del
oitt
e H
aski
ns &
Sel
ls L
LP
For a
nd o
n be
half
of th
e B
oard
of D
irect
ors
ofC
hart
ered
Acc
ount
ants
Ze
nsar
Tec
hnol
ogie
s Li
mite
d(F
irm’s
regi
stra
tion
no: 1
1736
6W /
W-1
0001
8)
Hem
ant M
. Jos
hi
H.V
. Goe
nka
S
ande
ep K
isho
re
Nav
neet
Kha
ndel
wal
G
aura
v To
ngia
Part
ner
Cha
irman
M
anag
ing
Dire
ctor
& C
EO
Chi
ef F
inan
cial
Offi
cer
Com
pany
Sec
reta
ryM
embe
rshi
p N
o: 3
8019
(D
IN: 0
0026
726)
(D
IN: 0
7393
680)
Plac
e: P
une
Plac
e: M
umba
i D
ate:
May
14,
202
0 D
ate:
May
14,
202
0

202 ZENSAR TECHNOLOGIES LTD ANNUAL REPORT 2019-20
ParticularsYear ended
March 31, 2020 Year ended
March 31, 2019
Cash flow from operating activitiesProfit before taxation 37,579 44,538
Adjustments for:
Depreciation, amortisation and impairment expense 15,918 8,944
Employee share based payment expense 645 1,652
Profit on sale of investments (mutual funds) (1,409) (2,796)
Change in fair value of equity instruments - (196)
Changes in fair value of financial assets/liabilities measured at fair value through profit and loss
683 2,004
Profit on Sale of Business/subsidiaries (refer note 37) - (1,941)
Adjustment on account of finance lease transactions - -
Interest income (512) (545)
Finance costs 5,167 2,951
(Profit)/Loss on sale of tangible assets (net) (5) 9
Provision for doubtful debts and advances (net) (1,749) 2,368
Bad debts written off 4,357 1,174
Provision no longer required and credit balances written back (2,581) (2,391)
Unrealised exchange (gain) / loss (net) (1,544) 18,970 (83) 11,150
Operating profit before working capital changes 56,549 55,688 Change in operating assets and liabilities(Increase)/ decrease in other non-current financial assets 207 (700)
(Increase)/ decrease in other non-current assets (536) 1,113
(Increase)/ decrease in inventories 434 754
(Increase)/decrease in trade receivables 24,009 (27,566)
(Increase)/decrease in other current financial assets (2,272) 8,100
(Increase)/ decrease in other current assets 11,128 (25,191)
Increase/(decrease) in other non-current financial liabilities 83 (557)
Increase/(decrease) in non-current provisions 54 121
Increase/(decrease) in non-current employee benefit obligations 97 (39)
Increase/(decrease) in trade payables (3,262) 11,482
Increase/ (decrease) in other current financial liabilities (1,705) 4,092
Increase/ (decrease) in current employee benefit obligations 1,259 1,221
Increase/ (decrease) in other current liabilities (5,956) 23,540 948 (26,222)
Cash generated from operations 80,089 29,466 Income taxes paid (net of refunds) (11,467) (13,864)
Net cash inflow from operating activities 68,622 15,602 Cash flow from investing activitiesPurchase of tangible/intangible assets including capital work in progress
(7,818) (5,242)
Payment of Earnout to Subsidiaries (refer note 34) (5,970) (3,179)
Acquisition of Company (refer note 34) - (34,171)
Profit on Sale of Business/subsidiaries (refer note 37) - 1,768
Proceeds from sale of tangible/intangible assets 9 68
Fixed Deposits placed (2,554) (615)
Fixed Deposits redeemed 667 -
Purchase of investments (Mutual Funds) (121,530) (79,121)
Consolidated Statement of Cash Flows for year ended March 31, 2020(All amounts in INR Lakhs, unless otherwise stated)

203BALANCE SHEET AND PROFIT AND LOSS FINANCIAL STATEMENTS
ParticularsYear ended
March 31, 2020 Year ended
March 31, 2019
Sale of investments (Mutual Funds) 105,147 95,202
Sale of Non Convertible Debentures - 814
Interest income received 522 366
Net cash used in investing activities (31,527) (24,110)Cash flow from financing activitiesProceeds from issue of equity shares 152 140
Dividend on equity shares and tax thereon (11,974) (6,333)
Interest paid (1,184) (1,339)
Payment of lease liabilities (refer note 12(c)) (7,817) -
Proceeds from long-term borrowings - 13,067
Repayment of long-term borrowings (4,173) (290)
Proceeds from short-term borrowings 28,237 23,278
Repayment of short-term borrowings (22,920) (8,433)
Net cash used in financing activities (19,679) 20,090 Effect of exchange differences on translation of cash and cash equivalents
39 -
Increase in Cash and Cash Equivalents on Acquisition (refer note 34) - 1,530
Decrease in Cash and Cash Equivalents on disposal of subsidiaries (refer note 37)
- (288)
Net increase/(decrease) in cash and cash equivalents 17,455 12,824 Cash and cash equivalents at the beginning of the year 31,379 18,555
Cash and cash equivalents at the end of the year 48,834 31,379
Notes:
1. The above Consolidated Statement of Cash Flow has been prepared under the “Indirect Method” set out in Indian Accounting Standard (Ind AS) 7 on Statement of Cash Flows.
2. Cash and cash equivalents comprise of: refer note 6(d)
As at March 31, 2020 As at March 31, 2019
Cash on hand 5 5 Funds in transit 26 7,391
Cheques on hand 13 -
Balances with Banks :
- In current accounts 46,953 22,083
- Deposits having original maturity of less than three months 1,837 2,210 Total 48,834 31,689 Less: Book Overdrafts - (310)Total 48,834 31,379
The accompanying notes form an integral part of the consolidated financial statements In terms of our report attached
For Deloitte Haskins & Sells LLP For and on behalf of the Board of Directors ofChartered Accountants Zensar Technologies Limited(Firm’s registration no: 117366W / W-100018)
Hemant M. Joshi H.V. Goenka Sandeep Kishore Navneet Khandelwal Gaurav TongiaPartner Chairman Managing Director & CEO Chief Financial Officer Company SecretaryMembership No: 38019 (DIN: 00026726) (DIN: 07393680)
Place: Pune Place: Mumbai Date: May 14, 2020 Date: May 14, 2020

204 ZENSAR TECHNOLOGIES LTD ANNUAL REPORT 2019-20
1. Corporate Information
Zensar Technologies Limited (“Company”) is a public limited company incorporated and domiciled in India and has registered office at Zensar Knowledge Park, Plot # 4, MIDC, Kharadi, Off Nagar road, Pune, Maharashtra, India. The Company is listed on BSE Limited and National Stock Exchange of India Limited. The Company along with its subsidiaries (together hereinafter referred to as “the Group”) are engaged in providing a complete range of IT Services and Solutions. The Group’s industry expertise spans across Manufacturing, Retail, Media, Banking, Insurance, Healthcare and Utilities.
The Consolidated Financial Statements for the year ended March 31, 2020 were approved by the Board of Directors and authorised for issue on May 14, 2020.
Basis of preparation:
Compliance with Ind AS:
The consolidated financial statements (financial statements) comply in all material aspects with Indian Accounting Standards (Ind AS) notified under Section 133 of the Companies Act, 2013 (“the Act”), read together with Rule 3 of the Companies (Indian Accounting Standards) Rules, 2015 as amended from time to time and other relevant provisions of the Act.
i. Historical cost convention:
The financial statements have been prepared on a historical cost basis, except for the following:
- certain financial assets and liabilities (including derivative instruments) which are measured at fair value;
- defined benefit plans - plan assets measured at fair value;
- share- based payments and
- assets and liabilities arising in a business combination
ii. Current versus Non-current classification:
All assets and liabilities have been classified as current or non-current as per the Group’s operating cycle and other criteria set out in the Schedule III to the Companies Act, 2013. Based on the nature of products and services and their realization in cash and cash equivalents, the Group has ascertained its operating cycles as 12 months for the purpose of current and non-current classification of assets and liabilities.
iii. Principles of consolidation:
The Consolidated Financial Statements comprise the financial statements of Zensar Technologies Limited and its subsidiaries (the Company and its subsidiaries constitute “the Group”). The Company consolidates all entities which are controlled by it.
The Company establishes control when; it has power over the entity, is exposed or has rights to variable returns from its involvement with the entity and has ability to affect the entity’s returns by using its power over the entity. The results of subsidiaries acquired, or sold, during the year are consolidated from the effective date of acquisition and up to the effective date of disposal, as appropriate.
The financial statements of the Group companies are consolidated on a line-by-line basis and intragroup balances, transactions including unrealized gain / loss from such transactions and cash flows are eliminated upon consolidation. These financial statements are prepared by applying uniform accounting policies in use at the Group. Non-controlling interests which represent part of the net profit or loss and net assets of subsidiaries that are not, directly or indirectly, owned or controlled by the company, are excluded.
Changes in the Company’s interests in subsidiaries that do not result in a loss of control are accounted for as equity transactions. The carrying amount of the company’s interests and the non-controlling interests are adjusted to reflect changes in their relative interests in the subsidiaries. Any difference between the amount by which the non-controlling interests are adjusted and the fair value of the consideration paid or received is recognized directly in equity and attributed to owners of the Company
iv. Presentation and Function currency:
Items included in the financial statements of each of Group entities are measured using the currency of the primary economic environment in which the entity operates (‘the functional currency’). The functional currency of the Company and its Indian subsidiaries is Indian Rupee (INR) and these financial statements are prepared in INR which is the presentation currency.
2. Summary of significant accounting policies
a) Revenue Recognition:
The Group earns revenue primarily from software development, maintenance of software/hardware and related services, and sale of software licenses.
Notes accompanying the Consolidated Financial Statementsas at and for the year ended March 31, 2020(All amounts in INR Lakhs, unless otherwise stated)

Notes accompanying the Consolidated Financial Statementsas at and for the year ended March 31, 2020(All amounts in INR Lakhs, unless otherwise stated)
205BALANCE SHEET AND PROFIT AND LOSS FINANCIAL STATEMENTS
Effective April 1, 2018, the Group adopted Ind AS 115 “Revenue from Contracts with Customers” using the cumulative catch-up transition method, applied to contracts that were not completed as of April 1, 2018. The effect on adoption of Ind AS 115 was insignificant.
Revenue is recognised only when there is transfer of control of goods or services. At the inception of every contract, transaction price and performance obligations are determined. Transaction price reflect amount of consideration expected to be received in exchange for transferring goods and services plus weighted average estimate of variable consideration i.e. discounts, price concession, rebates etc. Transaction price is allocated to identifiable performance obligations in a manner that depicts exchange for transferring of promised goods and services. Volume discounts are recorded as a reduction of revenue. When the amount of discount varies with the levels of revenue, volume discount is recorded based on estimate of future revenue from the customer.
The Group applies judgement to determine whether each product or services promised to a customer are capable of being distinct, and are distinct in the context of the contract, if not, the promised product or services are combined and accounted as a single performance obligation. The Group allocates the transaction price to separately identifiable performance obligations based on their relative stand-alone selling price. In cases where the Group is unable to determine the stand-alone selling price the Group uses expected cost-plus margin approach in estimating the stand-alone selling price.
The billing schedules agreed with customers include periodic performance based payments and / or milestone based progress payments. Invoices are payable within contractually agreed credit period.
i. Time and material contracts:
Revenues and costs relating to time and materials contracts are recognized as the related services are rendered.
ii. Fixed- price contracts:
Revenue for fixed-price contracts where performance obligations are satisfied over time is recognised using percentage-of-completion method. In respect of such fixed-price contracts, revenue is recognised using percentage-of-completion method (‘POC method’) of accounting with contract costs/efforts incurred determining the degree of completion of the performance obligation.
Contract assets are recognised when there is excess of revenue earned over billings on contracts. Contract assets are classified as unbilled receivables (only act of invoicing is pending) when there is unconditional right to receive cash, and only passage of time is required, as per contractual terms.
Unearned and deferred revenue (“contract liability”) is recognised when there is billings in excess of revenues.
iii. Sale of licenses:
Revenue from licenses where the customer obtains a “right to use “the licenses is recognized at the time the license is made available to the customer. Revenue from licenses where the customer obtains a “right to access” is recognized over the access period.
b) Income Tax:
Income tax comprises current and deferred tax. Income tax expense is recognized in statement of profit and loss, except when they relate to items that are recognised in other comprehensive income or directly in equity, in which case, the current and deferred tax are also recognised in other comprehensive income or directly in equity, respectively.
i. Current Income Tax:
Current income tax for the current and prior periods are measured at the amount expected to be recovered from or paid to the taxation authorities based on the taxable income for the period. The tax rates and tax laws used to compute the current tax amount are those that are enacted or substantively enacted as at the reporting date and applicable for the period. The current income tax expense for overseas subsidiaries has been computed based on the tax laws applicable to each subsidiary in the respective jurisdiction in which it operates.
The Group offsets current tax assets and current tax liabilities, where it has a legally enforceable right to set off the recognized amounts and where it intends either to settle on a net basis, or to realize the asset and liability simultaneously.
ii. Deferred Tax:
Deferred tax is recognized using the balance sheet approach. Deferred tax assets and liabilities are recognized for deductible and taxable temporary differences arising between the tax base of assets and liabilities and their carrying amount in financial statements, except when the deferred income tax
Notes accompanying the Consolidated Financial Statementsas at and for the year ended March 31, 2020(All amounts in INR Lakhs, unless otherwise stated)
206 ZENSAR TECHNOLOGIES LTD ANNUAL REPORT 2019-20
arises from the initial recognition of goodwill or an asset or liability in a transaction that is not a business combination and affects neither accounting nor taxable profits or loss at the time of the transaction.
Deferred tax assets are recognized to the extent it is probable that taxable profit will be available against which the deductible temporary differences and the carry forward of unused tax credits and unused tax losses can be utilized.
Deferred tax liabilities are recognized for all taxable temporary differences except in respect of taxable temporary differences associated with undistributed earnings of subsidiaries and foreign branches where the timing of the reversal of the temporary difference can be controlled and it is probable that the temporary difference will not reverse in the foreseeable future.
The carrying amount of deferred tax assets is reviewed at each reporting date and reduced to the extent that it is no longer probable that sufficient taxable profit will be available to allow all or part of the deferred tax asset to be utilized. Deferred tax assets and liabilities are measured at the tax rates that are expected to apply in the period when the asset is realized or the liability is settled, based on tax rates (and tax laws) that have been enacted or substantively enacted at the reporting date.
The Group offsets deferred tax assets and liabilities, where it has a legally enforceable right to offset current tax assets against current tax liabilities, and they relate to taxes levied by the same taxation authority on either the same taxable entity, or on different taxable entities where there is an intention to settle the current tax liabilities and assets on a net basis or their tax assets and liabilities will be realized simultaneously.
Deferred Tax includes MAT credit, if any and it is recognized as an asset only when and to the extent there is convincing evidence that the group will pay income tax higher than that computed under MAT, during the period that MAT is permitted to be set off under the Income Tax Act, 1961 for a specified period. Credit on account of MAT is recognized as an asset based on the management’s estimate of its recoverability in the future.
c) Leases:
A contract is, or contains, a lease if the contract conveys the right to control the use of an identified asset for a period of time in exchange for consideration. The group assesses whether a contract contains a lease, at inception of a contract. To assess whether
a contract conveys the right to control the use of an identified asset, the group assesses whether: (1) the contract involves the use of an identified asset (2) the group has substantially all of the economic benefits from use of the asset through the period of the lease and (3) the group has the right to direct the use of the asset.
Group as a lessee:
At the date of commencement of the lease, the Group recognizes a right-of-use asset (“ROU”) and a corresponding lease liability for all lease arrangements in which it is a lessee, except for leases with a term of twelve months or less (short-term leases) and low value leases. For these short-term and low value leases, the Group recognizes the lease payments as an operating expense on a straight-line basis over the term of the lease. Certain lease arrangements include the options to extend or terminate the lease before the end of the lease term. ROU assets and lease liabilities includes these options when it is reasonably certain that they will be exercised. The right-of-use assets are initially recognized at cost, which comprises the initial amount of the lease liability adjusted for any lease payments made at or prior to the commencement date of the lease plus any initial direct costs less any lease incentives. They are subsequently measured at cost less accumulated depreciation and impairment losses.
Right-of-use assets are depreciated from the commencement date on a straight-line basis over the shorter of the lease term or useful life of the underlying asset. Right of use assets are evaluated for recoverability whenever events or changes in circumstances indicate that their carrying amounts may not be recoverable. For the purpose of impairment testing, the recoverable amount (i.e. the higher of the fair value less cost to sell and the value-in-use) is determined on an individual asset basis unless the asset does not generate cashflows that are largely independent of those from other assets. In such cases, the recoverable amount is determined for the Cash Generating Unit (CGU) to which the asset belongs
The lease liability is initially measured at the present value of the future lease payments. The lease payments are discounted using the interest rate implicit in the lease or, if not readily determinable, using the incremental borrowing rates in the country of domicile of the leases. Lease liabilities are remeasured with a corresponding adjustment to the related right of use asset if the Group changes its assessment if whether it will exercise an extension or a termination option.

Notes accompanying the Consolidated Financial Statementsas at and for the year ended March 31, 2020(All amounts in INR Lakhs, unless otherwise stated)
207BALANCE SHEET AND PROFIT AND LOSS FINANCIAL STATEMENTS
Lease liability and ROU asset have been separately presented in the Balance Sheet and lease payments have been classified as financing cash flows
Group as a lessor:
At the inception of the lease the Group classifies each of its leases as either an operating lease or a finance lease. The Group recognises lease payments received under operating leases as income on a straight- line basis over the lease term. In case of a finance lease, finance income is recognised over the lease term based on a pattern reflecting a constant periodic rate of return on the lessor’s net investment in the lease. When the Group is an intermediate lessor it accounts for its interests in the head lease and the sub-lease separately. It assesses the lease classification of a sub-lease with reference to the right-of-use asset arising from the head lease, not with reference to the underlying asset. If a head lease is a short term lease to which the Group applies the exemption described above, then it classifies the sub-lease as an operating lease.
Whenever the terms of the lease transfer substantially all the risks and rewards of ownership to the lessee, the contract is classified as a finance lease.
If an arrangement contains lease and non-lease components, the Group applies Ind AS 115 Revenue to allocate the consideration in the contract.
The Group has taken on lease certain facilities and equipments under lease arrangements. Rental expense for March 31, 2019 was Rs. 8,216 lakhs.
Transition:
Ministry of Corporate Affairs (“MCA”) through Companies (Indian Accounting Standards) Amendment Rules, 2019 and Companies (Indian Accounting Standards) Second Amendment Rules, has notified Ind AS 116 Leases which replaces the existing lease standard, Ind AS 17 leases and other interpretations. Ind AS 116 sets out the principles for the recognition, measurement, presentation and disclosure of leases for both lessees and lessors.
Group has adopted Ind AS 116, effective annual reporting period beginning April 1, 2019 and applied the standard to its leases, retrospectively using the modified retrospective method, with the cumulative effect of initially applying the Standard, recognised on the date of initial application (April 1, 2019). Accordingly, the Group has not restated comparative information, instead, the cumulative effect of initially
applying this standard has been recognised as an adjustment to the opening balance of retained earnings as on April 1, 2019.
Refer note 2(e) under Significant accounting policies of the Consolidated financial statements in the Annual report of the Group for the year ended March 31, 2019 – Leases, for the policy as per Ind AS 17.
On transition, the Group recognised a lease liability measured at the present value of the remaining lease payments. The right-of-use asset is recognised at its carrying amount as if the standard had been applied since the commencement of the lease, but discounted using the lessee’s incremental borrowing rate as at April 1, 2019. Accordingly, a right-of-use asset of Rs. 23,810 lakhs and lease liability of Rs. 24,630 lakhs has been recognised. The cumulative effect on transition in retained earnings net of taxes is Rs. 579 lakhs. The principle portion of the lease payments have been disclosed under cash flow from financing activities. The lease payments for operating leases as per Ind AS 17 - Leases, were earlier reported under cash flow from operating activities. The weighted average incremental borrowing rate of 6.70% has been applied to lease liabilities recognised in the balance sheet at the date of initial application.
On application of Ind AS 116, the nature of expenses has changed from lease rent in previous periods to depreciation cost for the right-to-use asset, and finance cost for interest accrued on lease liability.
The difference between the future minimum lease rental commitments towards non-cancellable operating leases and finance leases reported as at March 31, 2019 compared to the lease liability as accounted as at April 1, 2019 is primarily due to inclusion of present value of the lease payments for the cancellable term of the leases, reduction due to discounting of the lease liabilities as per the requirement of Ind AS 116 and exclusion of the commitments for the leases to which the Group has chosen to apply the practical expedient as per the standard.
In respect of leases that were classified as finance leases, applying Ind AS 17, an amount of Rs. 489 lakhs has been reclassified from property, plant and equipment to right-of-use assets. An amount of Rs. 326 lakhs has been reclassified from other current financial liabilities to lease liability - current and an amount of Rs. 319 lakhs have been reclassified from borrowings - non-current to lease liability - non-current.

Notes accompanying the Consolidated Financial Statementsas at and for the year ended March 31, 2020(All amounts in INR Lakhs, unless otherwise stated)
208 ZENSAR TECHNOLOGIES LTD ANNUAL REPORT 2019-20
d) Foreign Currency Translation:
Foreign currency transactions are recorded at exchange rates prevailing on the date of the transaction. Foreign currency denominated monetary assets and liabilities are restated at the exchange rate prevailing on the reporting date and exchange gains and losses arising on settlement and restatement are recognised in the statement of profit and loss. Non-monetary assets and liabilities that are measured in terms of historical cost in foreign currencies are not restated.
Assets and liabilities of entities with functional currency other than the functional currency of the Group have been translated using exchange rates prevailing on the reporting date. Statement of profit and loss of such entities has been translated using weighted average exchange rates. Translation adjustments have been reported as Foreign Currency Translation Reserve in the Statement of Changes in Equity through Other Comprehensive Income.
Goodwill and fair value adjustments arising on the acquisition of a foreign operation are treated as assets and liabilities of the foreign operation and translated at the exchange rate prevailing at the reporting date.
e) Business Combinations:
Acquisitions of businesses are accounted for using the acquisition method. The consideration transferred in a business combination is measured at fair value, which is calculated as the sum of acquisition date fair values of the assets transferred by the Group, liabilities incurred by the Group to the former owners of the acquiree and the equity interests issued by the Group in exchange for control of the acquiree. Acquisition related costs are generally recognized in profit or loss as incurred.
Goodwill is measured as the excess of the sum of the consideration transferred, the amount of any non-controlling interests in the acquiree, and the fair value of the acquirer’s previously held equity interest in the acquiree (if any) over the net of the acquisition date amounts of the identifiable assets acquired and the liabilities assumed. Goodwill is measured at cost less accumulated impairment losses, if any.
Intangible assets acquired in business combination are measured at fair value as of the date of acquisition less accumulated amortisation and accumulated impairment, if any.
The interest of non-controlling shareholders is initially measured either at fair value or at the non-controlling
interests’ proportionate share of the fair value of the acquiree’s identifiable net assets. The choice of measurement basis is made on an acquisition-by-acquisition basis. Subsequent to acquisition, the carrying amount of non-controlling interests is the amount of those interests at initial recognition plus the non-controlling interests’ share of subsequent changes in equity of subsidiaries.
When the consideration transferred by the group in a business combination includes assets or liabilities resulting from a contingent arrangement, the contingent consideration is measured at its acquisition date fair value and included as part of the consideration transferred in a business combination. Contingent consideration that is classified as an asset or liability is remeasured at subsequent reporting dates in accordance with Ind AS 109 Financial Instruments or Ind AS 37 Provisions, Contingent Liabilities and Contingent Assets, with the corresponding gain or loss being recognised in profit or loss.
f) Impairment of assets:
Goodwill and intangible assets that have an indefinite useful life are not subject to amortization and are tested annually for impairment, or more frequently if events or changes in circumstances indicate that they might be impaired. Other assets are tested for impairment whenever events or changes in circumstances indicate that the carrying amount may not be recoverable. An impairment loss is recognized for the amount by which the asset’s carrying amount exceeds its recoverable amount. The recoverable amount is the higher of an asset’s fair value less costs of disposal and value in use. For the purpose of assessing impairment, assets are grouped at the lowest levels for which there are separately identifiable cash inflows which are largely independent of the cash inflows from other assets or group of assets (cash-generating units).
Non-financial assets other than goodwill that suffered an impairment are reviewed for possible reversal of the impairment at the end of each reporting period.
g) Cash and Cash Equivalents:
For the purposes of presentation in the statement of cash flows, cash and cash equivalents include cash on hand, bank balances and demand deposits, other short-term highly liquid investments with original maturities of three months or less that are readily convertible to known amounts of cash and cash equivalents which are subject to insignificant risk of changes in value. Cash and cash equivalents consist of balances with banks which are unrestricted for withdrawal and usage.

Notes accompanying the Consolidated Financial Statementsas at and for the year ended March 31, 2020(All amounts in INR Lakhs, unless otherwise stated)
209BALANCE SHEET AND PROFIT AND LOSS FINANCIAL STATEMENTS
h) Inventories:
Inventories are valued at lower of cost and net realizable value including necessary provision for obsolescence. Cost is determined using weighted average method. Cost of inventories comprises of all costs of purchase and other costs incurred in bringing the inventories to their present location and condition.
i) Investments and other financial assets and liabilities:
i. Classification:
Financial assets and liabilities are recognised when the Group becomes a party to the contractual provisions of the instrument. Financial assets and liabilities are initially measured at fair value. Transaction costs that are directly attributable to the acquisition or issue of financial assets and financial liabilities (other than financial assets and financial liabilities at fair value through profit or loss) are added to or deducted from the fair value measured on initial recognition of financial asset or financial liability.
Financial liabilities are measured at amortised cost using the effective interest method.
The Group derecognises a financial asset only when the contractual rights to the cash flows from the asset expire, or when it transfers the financial asset and substantially all the risks and rewards of ownership of the asset to another entity. The Group derecognises financial liabilities when, and only when, the Group’s obligations are discharged, cancelled or have expired.
ii. Initial recognition:
All financial assets are recognised initially at fair value plus, in the case of financial assets not recorded at fair value through profit or loss, transaction costs that are attributable to the acquisition of the financial asset.
iii. Measurement:
Financial assets carried at amortized cost:
A financial asset is subsequently measured at amortized cost if it is held within a business model whose objective is to hold the asset in order to collect contractual cash flows and the contractual terms of the financial asset give rise on specified dates to cash flows that are solely payments of principal and interest on the principal amount outstanding.
Financial assets at fair value through other comprehensive income (FVTOCI):
A financial asset is subsequently measured at fair value through other comprehensive income if it is held within a business model whose objective is achieved by both collecting contractual cash flows and selling financial assets and the contractual terms of the financial asset give rise on specified dates to cash flows that are solely payments of principal and interest on the principal amount outstanding. Further, in cases where the Group has made an irrevocable election based on its business model, for its investments which are classified as equity instruments, the subsequent changes in fair value are recognized in other comprehensive income.
Financial assets at fair value through profit or loss (FVTPL):
A financial asset which is not classified in any of the above categories are subsequently fair valued through profit or loss.
iv. Impairment of financial assets:
The Group assesses at each reporting date whether a financial asset or a group of financial assets is impaired. The Group recognizes loss allowances, in accordance with IND AS 109, using the expected credit loss (ECL) model for the financial assets which are not fair valued through profit or loss. Loss allowance for trade receivables and unbilled revenue with no significant financing component is measured at an amount equal to lifetime ECL. For all other financial assets, expected credit losses are measured at an amount equal to the 12-month ECL, unless there has been a significant increase in credit risk from initial recognition in which case those are measured at lifetime ECL. The amount of expected credit losses (or reversal) that is required to adjust the loss allowance at the reporting date to the amount that is required to be recognized is recognized as an impairment gain or loss in profit or loss.
j) Interest and Dividend income:
Dividend income is recorded when the right to receive payment is established. Interest income is recognised using the effective interest method.
k) Derivatives and hedging activities:
The Group designates certain foreign exchange forward, currency options and futures contracts as hedge instruments in respect of foreign exchange risks. These hedges are accounted for as cash flow hedges.

Notes accompanying the Consolidated Financial Statementsas at and for the year ended March 31, 2020(All amounts in INR Lakhs, unless otherwise stated)
210 ZENSAR TECHNOLOGIES LTD ANNUAL REPORT 2019-20
The Group uses hedging instruments that are governed by the policies of the Company and its subsidiaries which are approved by their respective Board of Directors. The policies provide written principles on the use of such financial derivatives consistent with the risk management strategy of the Company and its subsidiaries. The Group enters into derivative financial instruments where the counterparty is primarily a bank.
The hedge instruments are designated and documented as hedges at the inception of the contract. The Group determines the existence of an economic relationship between the hedging instrument and hedged item based on the currency, amount and timing of their respective cash flows. The effectiveness of hedge instruments to reduce the risk associated with the exposure being hedged is assessed and measured at inception and on an ongoing basis. If the hedged future cash flows are no longer expected to occur, then the amounts that have been accumulated in other equity are immediately reclassified in net foreign exchange gains/loss in the statement of profit and loss.
For the purpose of hedge accounting, hedges are classified as:
- Fair value hedges when hedging the exposure to changes in the fair value of a recognized asset or liability or an unrecognized firm commitment.
- Cash flow hedges when hedging the exposure to variability in cash flows that is either attributable to a particular risk associated with a recognized asset or liability or a highly probable forecast transaction or the foreign currency risk in an unrecognized firm commitment
- Hedges of a net investment in a foreign operation
Subsequent to initial recognition, derivative financial instruments are measured as described below:
Cash flow hedges:
Changes in the fair value of the derivative hedging instrument designated as a cash flow hedge are recognized in other comprehensive income and held in cash flow hedging reserve, net of taxes, a component of equity, to the extent that the hedge is effective. To the extent that the hedge is ineffective, changes in fair value are recognized in the statement of profit and loss and reported within foreign exchange gains/(losses), net within results from operating activities. If the hedging instrument no longer meets the criteria
for hedge accounting, then hedge accounting is discontinued prospectively. If the hedging instrument expires or is sold, terminated or exercised, the cumulative gain or loss on the hedging instrument recognized in cash flow hedging reserve till the period the hedge was effective remains in cash flow hedging reserve until the forecasted transaction occurs.
The cumulative gain or loss previously recognized in the cash flow hedging reserve is transferred to the statement of profit and loss upon the occurrence of the related forecasted transaction.
The Group enters into the contracts that are effective as hedges from an economic perspective but may not qualify for hedge accounting. The change in the fair value of such instrument is recognised in the statement of profit and loss.
l) Offsetting financial instruments:
Financial assets and liabilities are offset and the net amount is reported in the balance sheet where there is a legally enforceable right to offset the recognized amounts and there is an intention to settle on a net basis or realize the asset on a net basis or realize the asset and settle the liability simultaneously. The legally enforceable right must not be contingent on future events and must be enforceable in the normal course of business and in the event of default, insolvency or bankruptcy of the Group or the counterparty.
m) Property, plant and equipment:
i. Recognition and measurement:
Property, plant and equipment are measured at cost less accumulated depreciation and impairment losses, if any. Cost includes expenditures directly attributable to the acquisition of the asset. General and specific borrowing costs directly attributable to the construction of a qualifying asset are capitalized as part of the cost.
Freehold land is carried at historical cost.
When parts of an item of property, plant and equipment have different useful lives, they are accounted for as separate items (major components) of property, plant and equipment. Subsequent expenditure relating to property, plant and equipment is capitalized only when it is probable that future economic benefits associated with these will flow to the Group and the cost of the item can be measured reliably.

Notes accompanying the Consolidated Financial Statementsas at and for the year ended March 31, 2020(All amounts in INR Lakhs, unless otherwise stated)
211BALANCE SHEET AND PROFIT AND LOSS FINANCIAL STATEMENTS
The carrying amount of any component accounted for as a separate asset is derecognized when replaced.
All other repairs and maintenance costs are charged to profit and loss in the reporting period in which they occur.
An item of Property, Plant & Equipment is derecognised upon disposal or when no future economic benefits are expected to arise from the continued use of the asset. Any gain or loss arising on the disposal or retirement of an item of Property, Plant & Equipment are determined as the difference between the sales proceeds and the carrying amount of the asset and is recognised in the statement of profit or loss.
The cost of property, plant and equipment not available for use before year end date are disclosed under capital work- in-progress and not depreciated.
An asset’s carrying amount is written down immediately to its recoverable amount if the assets or CGU as applicable, carrying amount is greater than its estimated recoverable amount. An impairment loss is recognised in the statement of profit and loss.
ii. Depreciation:
The Group depreciates property, plant and equipment on a straight-line basis as per the estimated useful lives. The estimated useful lives of property, plant and equipment are as follows:
Class of asset Useful life
Buildings 30 years
Electrical Installations and equipments
5 years
Furniture & fixtures 3-10 years
Office Equipments 3-10 years
Data processing Equipments 3-5 years
Vehicles 5 years
Assets acquired under leasehold improvements are amortized over the shorter of estimated useful life of the asset or the related lease term.
The assets residual values, useful lives and methods of depreciation are reviewed at each financial year end and adjusted prospectively, if appropriate.
n) Intangible Assets:
i. Intangible assets other than acquired in a business combination are measured at cost at the date of acquisition.
Following initial recognition, intangible assets are carried at cost less any accumulated amortization and accumulated impairment losses, if any.
Research costs are expensed as incurred.
Internally generated intangible asset arising from development activity is recognized at cost on demonstration of its technical feasibility, the intention and ability of the Group to complete, use or sell it, only if, it is probable that the asset would generate future economic benefit and the expenditure attributable to the said assets during its development can be measured reliably.
An item of Intangible assets is derecognised upon disposal or when no future economic benefits are expected to arise from the continued use of the asset. Any gain or loss arising on the disposal or retirement of an item of Intangible assets are determined as the difference between the sales proceeds and the carrying amount of the asset and is recognised in the profit or loss.
ii. Amortization periods and methods for all Intangible Assets, including on business combination:
Intangible assets are amortized on straight line basis over their estimated useful lives which are as follows:
Class of Intangible Assets
Useful life as followed by the group
Softwares (acquired) 1-5 years
Softwares (internally generated)
3-5 years
Non-compete agreements
3-5 years
Customer relationship 4-10 years
Customer contracts 1 -3 years
Brand 5 years
The estimated useful life of amortizable intangible assets are reviewed and where appropriate are adjusted, annually.
o) Provisions and contingent liabilities:
Provisions are recognized when the Group has a present obligation (legal or constructive) as a result of a past event, it is probable that an outflow of economic benefits will be required to settle the obligation and a reliable estimate can be made of the amount of the obligation.

Notes accompanying the Consolidated Financial Statementsas at and for the year ended March 31, 2020(All amounts in INR Lakhs, unless otherwise stated)
212 ZENSAR TECHNOLOGIES LTD ANNUAL REPORT 2019-20
When some or all of the economic benefits required to settle a provision are expected to be recovered from a third party, the receivable is recognized as an asset, if it is virtually certain that reimbursement will be received and the amount of the receivable can be measured reliably.
When a provision is measured using the cash flows estimated to settle the present obligation, its carrying amount is the present value of those cash flows (when the effect of the time value of money is material)
The Group uses significant judgement to disclose contingent liabilities. Contingent liabilities are disclosed when there is a possible obligation arising from past events, the existence of which will be confirmed only by the occurrence or non-occurrence of one or more uncertain future events not wholly within the control of the Group or a present obligation that arises from past events where it is either not probable that an outflow of resources will be required to settle the obligation or a reliable estimate of the amount cannot be made. Contingent assets are neither recognised nor disclosed in the financial statements.
Provisions for onerous contracts are recognized when the expected benefits to be derived by the Group from a contract are lower than the unavoidable costs of meeting the future obligations under the contract. Provisions for onerous contracts are measured at the present value of lower of the expected net cost of fulfilling the contract and the expected cost of terminating the contract.
p) Employee benefits:
i. Post-employment and pension plans:
The Group participates in various employee benefit plans. Pensions and other post-employment benefits are classified as either defined contribution plans or defined benefit plans. Under a defined contribution plan, the Group’s only obligation is to pay a fixed amount with no obligation to pay further contributions if the fund does not hold sufficient assets to pay all employee benefits. The related actuarial and investment risks fall on the employee. The expenditure for defined contribution plans is recognized as an expense during the period when the employee provides service. Under a defined benefit plan, it is the Group’s obligation to provide agreed benefits to the employees. The related actuarial and investment risks fall on the Group. The present value of the defined benefit obligations is calculated by an independent actuary using the projected unit credit method.
The Group has the following employee benefit plans:
Provident Fund:
Employees receive benefits from a provident fund, which is a defined benefit plan. The employer and employees each make periodic contributions to the plan. Provident fund contributions are made to a trust administered by the Group. The contributions to the trust managed by the Group are accounted for as a defined benefit plan as the Group is liable for any shortfall, if any with respect to the rate of return based on the government specified minimum rates of return.
The Group’s liability is actuarially determined (using the Projected Unit Credit method) at the end of the year. Actuarial losses/ gains are recognised in the Statement of Profit and Loss in the year in which they arise. The contributions made to the trust are recognised as plan assets. The defined benefit obligation recognised in the balance sheet represents the present value of the defined benefit obligation as reduced by the fair value of plan assets.
Superannuation and family pension fund:
Superannuation plan, a defined contribution scheme is administered by Life Insurance Corporation of India. The Group makes annual contributions based on a specified percentage of each eligible employee’s salary.
The Group has a Defined Contribution Plan for Post-employment benefits for all employees in the form of Family Pension Fund administered by Regional Provident Fund Commissioner.
These contributions to superannuation and family pension funds are classified as defined contribution plans as the Group has no further obligation beyond making the contributions. The Group’s contributions to Defined Contribution Plans are charged to the Statement of Profit and Loss as and when employee provides services.
Gratuity:
The Group provides for gratuity, a defined benefit plan (the “Gratuity Plan”) covering eligible employees in accordance with the Scheme. The Gratuity plan provides for a lump sum payment to eligible employees, at retirement, death, incapacitation or termination of employment based on the last drawn salary and years of employment with the Group. The gratuity fund is managed by the Life Insurance Corporation of India (LIC). The Group’s obligation in respect of the gratuity plan, is provided for based

Notes accompanying the Consolidated Financial Statementsas at and for the year ended March 31, 2020(All amounts in INR Lakhs, unless otherwise stated)
213BALANCE SHEET AND PROFIT AND LOSS FINANCIAL STATEMENTS
on actuarial valuation using the projected unit credit method. The Group recognizes actuarial gains and losses immediately in other comprehensive income, net of taxes.
The retirement benefit obligation recognized in the Balance Sheet represents the present value of the defined benefit obligation as adjusted for unrecognized past service cost, and as reduced by the fair value of scheme assets. Any asset resulting from this calculation is limited to the present value of available refunds and reductions in future contributions to the scheme.
ii. Short-term benefits:
Short-term employee benefit obligations are measured on an undiscounted basis and are recorded as expense as the related services are provided. Liabilities for wages and salaries including the amount expected to be paid under short-term cash bonus or profit sharing plans, expected to be settled wholly within 12 months after the end of the period in which the employees render the related service are recognized if the Group has a present legal or constructive obligation to pay this amount as a result of past service provided by the employee and the obligation can be estimated reliably.
iii. Compensated absences:
The employees of the Group are entitled to compensated absences. The employees can carry forward a portion of the unutilized accumulating compensated absences and utilize it in future periods or receive cash at retirement or termination of employment. The Group records an obligation for compensated absences in the period in which the employee renders the services that increases this entitlement.
The Group’s liability is actuarially determined (using the Projected Unit Credit method) at the end of each year, as applicable. Actuarial losses/ gains are recognized in the Statement of Profit and Loss in the year in which they arise.
Accumulated compensated absences, which are expected to be availed or encashed within 12 months from the end of the year are classified under current liabilities and balance under non-current liabilities.
iv. Share-based payments:
Selected employees of the Group receive remuneration in the form of equity settled instruments, for rendering services over a defined vesting period. The cost of equity-settled transactions is determined by the fair
value at the date when the grant is made using an appropriate valuation model.
The cost under employee benefits expense is recognised, together with a corresponding change in Share Based Payment Reserves under Other Equity, over the period in which the performance and/or service conditions are fulfilled. The cumulative expense recognised for equity-settled transactions at each reporting date until the vesting date reflects the extent to which the vesting period has expired and the Group’s best estimate of the number of equity instruments that will ultimately vest. Service and non-market performance conditions are not taken into account when determining the grant date fair value of awards, but the likelihood of the conditions being met is assessed as part of the Group’s best estimate of the number of equity instruments that will ultimately vest.
Market performance conditions are reflected within the grant date fair value. Any other conditions attached to an award, but without an associated service requirement, are considered to be non-vesting conditions. Non-vesting conditions are reflected in the fair value of an award and lead to an immediate expensing of an award unless there are also service and/or performance conditions.
No expense is recognised for awards that do not ultimately vest because non-market performance and/or service conditions have not been met. Where awards include a market or non-vesting condition, the transactions are treated as vested irrespective of whether the market or non-vesting condition is satisfied, provided that all other performance and/or service conditions are satisfied.
When the terms of an equity-settled award are modified, the minimum expense recognised is the expense had the terms had not been modified, if the original terms of the award are met. An additional expense is recognised for any modification that increases the total fair value of the share-based payment transaction or is otherwise beneficial to the employee as measured at the date of modification. Where an award is cancelled by the entity or by the counterparty, any remaining element of the fair value of the award is expensed immediately through profit or loss.
q) Contributed Equity:
Equity shares are classified as equity.
Incremental costs directly attributable to the issue of new shares or options are shown in equity as a deduction, net of tax, from proceeds.

Notes accompanying the Consolidated Financial Statementsas at and for the year ended March 31, 2020(All amounts in INR Lakhs, unless otherwise stated)
214 ZENSAR TECHNOLOGIES LTD ANNUAL REPORT 2019-20
r) Dividends:
Provision is made for the amount of any dividend declared, being appropriately authorized and no longer at the discretion of the entity, on or before the end of the reporting period but not distributed at the end of the reporting period.
s) Earnings per share:
The basic earnings per share is computed by dividing the net profit for the period attributable to equity shareholders by the weighted average number of equity shares outstanding during the period. The number of shares used in computing diluted earnings per share comprises the weighted average shares considered for deriving basic earnings per share and also the weighted average number of equity shares which would have been issued on the conversion of all dilutive potential equity shares. Dilutive potential equity shares are deemed converted as of the beginning of the period unless they have been issued at a later date.
t) Rounding of amounts:
All amounts disclosed in the financial statements and notes have been rounded off to nearest lakhs as per the requirement of Schedule III, unless otherwise stated.
3. Critical estimates and judgements
The preparation of the financial statements requires management to make judgements, estimates and assumptions that affect the application of accounting policies and the reported amounts of assets, liabilities, income and expenses. Actual results may differ from those estimates.
“The Group has given due consideration of the possible effects that may result from the pandemic relating to COVID-19 on the carrying amounts of receivables, unbilled revenues, goodwill and intangible assets. In assessing the assumptions relating to the possible future uncertainties in the global economic conditions because of this pandemic, the Group, as at the date of approval of these financial statements, has used internal and external sources of information, including credit reports and related information on the expected future performance of the Group. The Group has performed sensitivity analysis on the assumptions used, and based on current estimates, is of the view that the carrying amount of these assets reflect their realisable values. The Group is actively managing its business to respond to its impact. However, there could be an adverse impact on the business, result of operations, financial position and cash flows ; the Group believes
that the impact is likely to be mitigated by the diversified nature of the Group’s clients, including the geographical spread of the Group’s operations, and its clientele. The impact of COVID-19 on the Group’s financial statements may differ from that estimated as at the date of approval of these consolidated financial statements.”
Estimates and underlying assumptions are reviewed on an ongoing basis. Revisions to accounting estimates are recognized in the period in which the estimates are revised and in any future periods affected. In particular, information about significant areas of estimation, uncertainty and critical judgements in applying accounting policies that have the most significant effect on the amounts recognized in the financial statements are included in the following notes:
The areas involving critical estimates and/or judgements are:
a Revenue recognition
The Group uses the percentage-of-completion method in accounting for its fixed-price contracts. Use of the percentage-of-completion method requires the Group to estimate the efforts or costs expended to date as a proportion of the total efforts or costs to be expended. Efforts or costs expended have been used to measure progress towards completion as there is a direct relationship between input and productivity. Provisions for estimated losses, if any,on uncompleted contracts are recorded in the period in which such losses become probable based on the expected contract estimates at the reporting date.
b Income taxes
Significant judgements are involved in determining the provision for income taxes, including amount expected to be paid/recovered for uncertain tax positions. The policy for the same has been explained under note 2(b).
c Property, plant and equipment
Property, plant and equipment represent a significant proportion of the asset base of the Group. The charge in respect of periodic depreciation is derived after determining an estimate of an asset’s expected useful life and the expected residual value at the end of its life. The useful lives and residual values of Group’s assets are determined by management at the time the asset is acquired and reviewed at the end of each reporting period. The lives are based on historical experience with similar assets as well as anticipation of future events, which may impact their life, such as changes in technology. The policy for the same has been explained under note 2(m).

Notes accompanying the Consolidated Financial Statementsas at and for the year ended March 31, 2020(All amounts in INR Lakhs, unless otherwise stated)
215BALANCE SHEET AND PROFIT AND LOSS FINANCIAL STATEMENTS
d Provisions
Provision is recognised when the Group has a present obligation as a result of past event and it is probable that an outflow of resources will be required to settle the obligation, in respect of which a reliable estimate can be made. These are reviewed at each balance sheet date adjusted to reflect the current best estimates. The policy for the same has been explained under note 2(0).
e Business combination
In accounting for business combinations, judgement is required in identifying whether an identifiable intangible asset is to be recorded separately from goodwill. Additionally, estimating the acquisition date fair value of the identifiable assets acquired, and liabilities and contingent consideration involves management judgement. These measurements are based on information available at the acquisition date and are based on expectations and assumptions that have been deemed reasonable by management. Changes in these judgements, estimates, and assumptions can materially affect the results of operations.
f Goodwill
Goodwill is tested for impairment at least annually or when events occur or changes in circumstances indicate that the recoverable amount of the cash generating unit is less than its carrying value. The recoverable amount of cash generating units is higher of value-in-use and fair value less cost to sell. The calculation involves use of significant estimates and assumptions which includes turnover and earnings multiples, growth rates and net margins used to calculate projected future cash flows, risk-adjusted discount rate, future economic and market conditions.
g Defined benefit obligation
The cost of the defined benefit plans and the present
value of the defined benefit obligation are based on actuarial valuation using the projected unit credit method. An actuarial valuation involves making various assumptions that may differ from actual developments in the future. These include the determination of the discount rate, future salary increases and mortality rates. Due to the complexities involved in the valuation and its long-term nature, a defined benefit obligation is highly sensitive to changes in these assumptions. All assumptions are reviewed at each reporting date. Also refer note 15.
h Employee stock options
“The Group initially measures the cost of equity-settled transactions with employees using a Black Scholes Options Pricing model to determine the fair value of the liability incurred. Estimating fair value for share-based payment transactions requires determination of the most appropriate valuation model and the performance of the Group, which is dependent on the terms and conditions of the grant.
This estimate also requires determination of the most appropriate inputs to the valuation model including the expected life of the share option, volatility and dividend yield and making assumptions about them.
The assumptions and models used for estimating fair value for share-based payment transactions are disclosed in note 39.”
i Allowance for Expected Credit Losses
Considering uncertainties due to COVID-19 pandemic, the Group has reassessed the allowance for credit losses based on historical loss experience adjusted to reflect current and estimated future economic conditions, credit reports, subsequent collections, credit term extension requests from customers and other related credit information, relating to industries the company deals with and the countries where it operates.
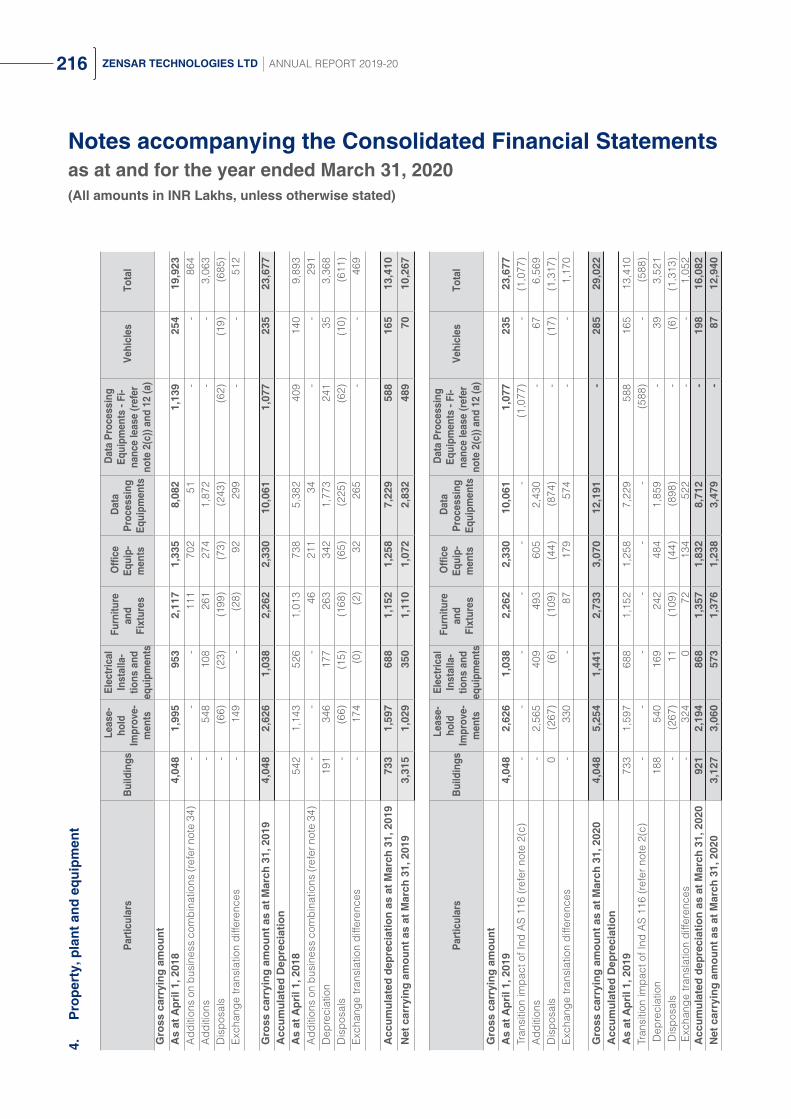
Notes accompanying the Consolidated Financial Statementsas at and for the year ended March 31, 2020(All amounts in INR Lakhs, unless otherwise stated)
216 ZENSAR TECHNOLOGIES LTD ANNUAL REPORT 2019-204.
P
rope
rty,
pla
nt a
nd e
quip
men
t
Parti
cula
rs B
uild
ings
Lea
se-
hold
Im
prov
e-m
ents
Elec
trica
l In
stal
la-
tions
and
eq
uipm
ents
Fur
nitu
re
and
Fi
xtur
es
Offi
ce
Equi
p -m
ents
Dat
a Pr
oces
sing
Eq
uipm
ents
Dat
a Pr
oces
sing
Eq
uipm
ents
- Fi
-na
nce
leas
e (re
fer
note
2(c
)) an
d 12
(a)
Veh
icle
s T
otal
Gro
ss c
arry
ing
amou
ntA
s at
Apr
il 1,
201
8 4
,048
1
,995
9
53
2,1
17
1,3
35
8,0
82
1,1
39
254
1
9,92
3 A
dditi
ons
on b
usin
ess
com
bina
tions
(ref
er n
ote
34)
- -
- 1
11
702
5
1 -
- 8
64
Add
ition
s -
548
1
08
261
2
74
1,8
72
- -
3,0
63
Dis
posa
ls -
(66)
(23)
(199
) (7
3) (2
43)
(62)
(19)
(685
)Ex
chan
ge tr
ansl
atio
n di
ffere
nces
- 1
49
- (2
8) 9
2 2
99
- -
512
Gro
ss c
arry
ing
amou
nt a
s at
Mar
ch 3
1, 2
019
4,0
48
2,6
26
1,0
38
2,2
62
2,3
30
10,
061
1,0
77
235
2
3,67
7 A
ccum
ulat
ed D
epre
ciat
ion
As
at A
pril
1, 2
018
542
1
,143
5
26
1,0
13
738
5
,382
4
09
140
9
,893
A
dditi
ons
on b
usin
ess
com
bina
tions
(ref
er n
ote
34)
- -
- 4
6 2
11
34
- -
291
D
epre
ciat
ion
191
3
46
177
2
63
342
1
,773
2
41
35
3,3
68
Dis
posa
ls -
(66)
(15)
(168
) (6
5) (2
25)
(62)
(10)
(611
)Ex
chan
ge tr
ansl
atio
n di
ffere
nces
- 1
74
(0)
(2)
32
265
-
- 4
69
Acc
umul
ated
dep
reci
atio
n as
at M
arch
31,
201
9 7
33
1,5
97
688
1
,152
1
,258
7
,229
5
88
165
1
3,41
0 N
et c
arry
ing
amou
nt a
s at
Mar
ch 3
1, 2
019
3,3
15
1,0
29
350
1
,110
1
,072
2
,832
4
89
70
10,
267
Parti
cula
rs B
uild
ings
Le
ase-
hold
Im
prov
e -m
ents
Elec
trica
l In
stal
la-
tions
and
eq
uipm
ents
Fur
nitu
re
and
Fi
xtur
es
Offi
ce
Equi
p-m
ents
Dat
a Pr
oces
sing
Eq
uipm
ents
Dat
a Pr
oces
sing
Eq
uipm
ents
- Fi
-na
nce
leas
e (re
fer
note
2(c
)) an
d 12
(a)
Veh
icle
s T
otal
Gro
ss c
arry
ing
amou
ntA
s at
Apr
il 1,
201
9 4
,048
2
,626
1
,038
2
,262
2
,330
1
0,06
1 1
,077
2
35
23,
677
Tran
sitio
n im
pact
of I
nd A
S 11
6 (r
efer
not
e 2(
c) -
- -
- -
- (1
,077
) -
(1,0
77)
Add
ition
s -
2,5
65
409
4
93
605
2
,430
-
67
6,5
69
Dis
posa
ls 0
(2
67)
(6)
(109
) (4
4) (8
74)
- (1
7) (1
,317
)Ex
chan
ge tr
ansl
atio
n di
ffere
nces
- 3
30
- 8
7 1
79
574
-
- 1
,170
Gro
ss c
arry
ing
amou
nt a
s at
Mar
ch 3
1, 2
020
4,0
48
5,2
54
1,4
41
2,7
33
3,0
70
12,
191
- 2
85
29,
022
Acc
umul
ated
Dep
reci
atio
nA
s at
Apr
il 1,
201
9 7
33
1,5
97
688
1
,152
1
,258
7
,229
5
88
165
1
3,41
0 Tr
ansi
tion
impa
ct o
f Ind
AS
116
(ref
er n
ote
2(c)
- -
- -
- -
(588
) -
(588
) D
epre
ciat
ion
188
5
40
169
2
42
484
1
,859
-
39
3,5
21
Dis
posa
ls
- (2
67)
11
(109
) (4
4) (8
98)
- (6
) (1
,313
) E
xcha
nge
trans
latio
n di
ffere
nces
-
324
0
7
2 1
34
522
-
- 1
,052
A
ccum
ulat
ed d
epre
ciat
ion
as a
t Mar
ch 3
1, 2
020
921
2
,194
8
68
1,3
57
1,8
32
8,7
12
- 1
98
16,
082
Net
car
ryin
g am
ount
as
at M
arch
31,
202
0 3
,127
3
,060
5
73
1,3
76
1,2
38
3,4
79
- 8
7 1
2,94
0

Notes accompanying the Consolidated Financial Statementsas at and for the year ended March 31, 2020(All amounts in INR Lakhs, unless otherwise stated)
217BALANCE SHEET AND PROFIT AND LOSS FINANCIAL STATEMENTS
5. Other intangible assets
Particulars Softwares (Acquired)
Softwares (Internally generated)
Customer Relationship
Non Compete
Agreements Brand Customer
contracts
Total Other intangible
assets
Gross carrying amount
As at April 1, 2018 4,747 788 7,963 1,264 852 853 16,467
Additions on business combinations (refer note 34)
1,216 95 - - - - 1,311
Additions - - 18,755 1,115 1,900 - 21,770
Disposals (2,924) (163) - - - - (3,087)
Exchange translation differences 131 - - - - - 131
Gross carrying amount as at March 31, 2019
3,170 720 26,718 2,379 2,752 853 36,592
Accumulated Amortisation
As at April 1, 2018 4,199 692 2,137 1,090 592 853 9,564
Additions on business combinations (refer note 34)
- - - - - - -
Amortisation 1,235 25 3,503 362 449 - 5,574
Disposals (2,921) (163) - - - - (3,084)
Exchange translation differences 128 - - - - - 128
Accumulated amortisation as at March 31, 2019
2,641 554 5,640 1,452 1,041 853 12,181
Net carrying amount as at March 31, 2019 528 165 21,078 927 1,711 0 24,411
Particulars Softwares (Acquired)
Softwares (Internally generated)
Customer Relationship
Non Compete Agreements Brand Customer
contracts
Total Other intangible
assets
Gross carrying amount
As at April 1, 2019 3,170 720 26,718 2,379 2,752 853 36,592
Additions 1,861 108 - - - - 1,969
Disposals (2) - - - - - (2)
Exchange translation differences 98 - 3,369 583 652 - 4,702
Gross carrying amount as at March 31, 2020
5,127 828 30,087 2,962 3,404 853 43,261
Accumulated Amortisation
As at April 1, 2019 2,641 554 5,640 1,452 1,041 853 12,181
Amortisation 1,445 81 4,148 388 449 - 6,511
Disposals (2) - - - - - (2)
Exchange translation differences 93 - 1,493 514 451 - 2,551
Accumulated amortisation as at March 31, 2020
4,177 635 11,281 2,354 1,941 853 21,241
Net carrying amount as at March 31, 2020 950 193 18,806 608 1,463 0 22,020
Research and development expenditure - Aggregate amount of research and development expenditure recognised as an expense during the year is INR 183 lakhs (March 31, 2019 : INR 39 lakhs)

Notes accompanying the Consolidated Financial Statementsas at and for the year ended March 31, 2020(All amounts in INR Lakhs, unless otherwise stated)
218 ZENSAR TECHNOLOGIES LTD ANNUAL REPORT 2019-20
6. Financial assets
6 (a) Investments [Non-current]
ParticularsAs at
31 March, 2020 As at
31 March, 2019
(i) Investment carried at Fair Value through Other Comprehensive Income (FVOCI)
Investment in equity instruments - Quoted
100 (March 31, 2019: 100) Equity Shares of INR 10 each fully paid-up in CFL Capital Financial Services Limited
0 0
Sub Total 0 0
Investments in equity instruments - Unquoted
100 (March 31, 2019: 100) Equity Shares of INR 9 (March 31, 2019: INR 9) each fully paid-up in Spencer & Company Limited
0 0
Sub Total 0 0
Investments in equity instruments of subsidiary companies - Unquoted
1,000 (March 31, 2019: 1,000) Equity Shares of USD 0.01 each of Aquila Technology Corporation (refer note 29)
1,142 2,324
Sub Total 1,142 2,324 (ii) Unquoted Investments carried at Fair value through Profit and Loss
(FVTPL)
- Mutual Funds - 4,658
- Non Convertible Debentures - -
Sub Total - 4,658
Total Non-current Investments 1,142 6,982
Aggregate amount of quoted investments & market value thereof 0 0
Aggregate amount of unquoted investments 1,142 6,982
6 (b) Investments [Current]
ParticularsAs at
31 March, 2020 As at
31 March, 2019
(i) Unquoted Investments carried at Fair value through Profit and Loss (FVTPL) - Mutual Funds
26,704 4,536
Total 26,704 4,536
Aggregate amount of unquoted investments 26,704 4,536

Notes accompanying the Consolidated Financial Statementsas at and for the year ended March 31, 2020(All amounts in INR Lakhs, unless otherwise stated)
219BALANCE SHEET AND PROFIT AND LOSS FINANCIAL STATEMENTS
6 (c) Trade receivables
Particulars As at
31 March, 2020 As at
31 March, 2019
(Unsecured, considered good unless otherwise stated)
Considered good 66,564 87,621
Credit impaired 8,894 10,331
75,458 97,952
Less: Allowance for credit loss (8,894) (10,331)
Total 66,564 87,621
Notes:
Debts due by directors or other officers of the company or any of them either severally or jointly with any other person or debts due by firms or private companies respectively in which any director is a partner or a director or a member - INR 18 lakhs (March 31, 2019 : INR 32 lakhs) (refer note 35)
6 (d) Cash and cash equivalents
ParticularsAs at
31 March, 2020 As at
31 March, 2019
Cash on hand 5 5
Funds in transit 26 7,391
Cheques on hand 13 -
Balances with banks :
- In current accounts 46,953 22,083
- Deposits having original maturity of less than three months 1,837 2,210
Total 48,834 31,689
6 (e) Other balances with banks
ParticularsAs at
31 March, 2020 As at
31 March, 2019
Earmarked Balances with Banks - Unclaimed Dividend 269 232
Deposits having original maturity of more than three months 2,554 667
Total 2,823 899

Notes accompanying the Consolidated Financial Statementsas at and for the year ended March 31, 2020(All amounts in INR Lakhs, unless otherwise stated)
220 ZENSAR TECHNOLOGIES LTD ANNUAL REPORT 2019-20
6 (f) Other financial assets : Non-current
ParticularsAs at
31 March, 2020 As at
31 March, 2019
(Unsecured and considered good unless otherwise stated)
Security deposits
Considered good 1,569 1,880
Credit impaired 5 -
1,574 1,880
Less: Allowance for credit loss (5) -
1,569 1,880
Amount deposited under protest 1,488 1,382
Lease Receivable (refer note 32) 3,741 -
Others - 0
Total 6,798 3,262
6 (g) Other financial assets : Current
ParticularsAs at
31 March, 2020 As at
31 March, 2019
(Unsecured and considered good unless otherwise stated)
Unbilled revenues
Considered good 25,657 22,214
Credit impaired - -
25,657 22,214
Less: Allowance for credit loss - -
25,657 22,214
Foreign currency derivative assets 1,255 2,886
Security deposits 186 68
Lease Receivable (refer note 32) 2,598 -
Interest accrued on bank deposits 20 29
Sales consideration receivable (refer note 37) 22 1,247
Contractually reimbursable expenses (Refer Note 35) 24 -
Total 29,762 26,444

Notes accompanying the Consolidated Financial Statementsas at and for the year ended March 31, 2020(All amounts in INR Lakhs, unless otherwise stated)
221BALANCE SHEET AND PROFIT AND LOSS FINANCIAL STATEMENTS
7. Deferred Tax Asset (net)
The components of deferred tax assets and liabilities are as follows:
ParticularsAs at
31 March, 2020 As at
31 March, 2019
The major components of the deferred tax asset areDepreciation/amortisation of Property, plant and equipment and Intangible assets
1,406 1,630
Allowance for credit loss on trade receivables and advances 2,359 2,416
Expenses allowable on payment/exercise basis 4,477 3,352
Fair value changes of cash flow hedges 163 -
Net operating losses 592 -
Others 50 177
9,047 7,575
The major components of the deferred tax liability areDepreciation/amortisation of Property, plant and equipment and Intangible assets
403 127
Gain on mutual fund investments mandatorily measured at FVTPL 67 82
Fair value changes of cash flow hedges - 207
Investments measured at fair value through OCI - 183
Items allowed on consumption basis 2,677 1,949
Others 934 559
4,081 3,107
Net deferred tax asset / (liability) 4,966 4,468
(i) Movement in deferred tax assets
Particulars
Depreciation/amortisation of
Property, plant and equipment and
Intangible assets
Allowance for credit loss on trade receiv-
ables and advances
Expenses allowable on payment/ex-ercise basis
Fair value changes of cash flow hedges
Net operat-ing losses
Others Total
As at April 1, 2018 1,712 2,287 2,528 22 278 186 7,013
(Charged)/credited:
- to statement of profit and loss (82) 129 824 - (278) (9) 584
- to other comprehensive income - - - (22) - - (22)
As at March 31, 2019 1,630 2,416 3,352 - - 177 7,575
(Charged)/credited:
Transition impact of Ind AS 116 (refer note 2(c))
226 - - - - - 226
- to statement of profit and loss (450) (57) 1,125 (397) 592 (127) 686
- to other comprehensive income - - - 560 - - 560
As at March 31, 2020 1,406 2,359 4,477 163 592 50 9,047

Notes accompanying the Consolidated Financial Statementsas at and for the year ended March 31, 2020(All amounts in INR Lakhs, unless otherwise stated)
222 ZENSAR TECHNOLOGIES LTD ANNUAL REPORT 2019-20
(ii) Movement in deferred tax liabilities
Particulars
Depreciation/amortisation of
Property, plant and equipment and
Intangible assets
Gain on mutual fund investments mandatorily measured at
FVTPL
Fair value changes of cash flow hedges
Invest-ments
measured at fair value
through OCI
Items allowed on consump-tion basis
Others Total
As at April 1, 2018 120 365 - 194 2,193 1,047 3,919
Charged/(credited):
- to statement of profit and loss 7 (283) - - (244) (268) (788)
- to other comprehensive income - - 207 (42) - - 165
Exchange differences - - - 31 - (220) (189)
As at March 31, 2019 127 82 207 183 1,949 559 3,107
(Charged)/credited:
- to statement of profit and loss 276 (15) (207) (183) 728 375 974
- to other comprehensive income - - - - - - -
As at March 31, 2020 403 67 - - 2,677 934 4,081
8 Other non-current assets
ParticularsAs at
31 March, 2020 As at
31 March, 2019
(Unsecured, considered good unless otherwise stated)
Prepaid expenses 1,345 809
Capital advances 74 316
Total 1,419 1,125
9 Inventories
ParticularsAs at
31 March, 2020 As at
31 March, 2019
Spare parts in support of computer hardware maintenance contracts 9,412 9,846
[Goods in transit: INR 399 lakhs (March 31, 2019: INR 205 lakhs)]
Total 9,412 9,846
Amounts recognized in statement of profit or loss:
Write-downs of inventories to net realisable value amounted to INR 1,461 lakhs (March 31, 2019: INR 2,013 lakhs). These were recognised as an expense during the year and included in ‘Changes in inventoriess’ in consolidated statement of profit and loss.

Notes accompanying the Consolidated Financial Statementsas at and for the year ended March 31, 2020(All amounts in INR Lakhs, unless otherwise stated)
223BALANCE SHEET AND PROFIT AND LOSS FINANCIAL STATEMENTS
10 Other Current assets
ParticularsAs at
31 March, 2020 As at
31 March, 2019
Advances other than capital advances:
- advances to employees 554 691
- advances to suppliers
Considered good 1,088 2,647
Credit impaired 118 -
1,206 2,647
Less: Allowance for credit loss (118) -
1,088 2,647
Unbilled revenues
Considered good 13,246 15,445
Credit impaired - -
13,246 15,445
Less: Allowance for credit loss - -
13,246 15,445
Prepaid expenses 2,241 9,451
Balances with government authorities 4,434 3,389
Others 100 1,158
Total 21,663 32,781
11 (a) Equity share capital
ParticularsAs at
31 March, 2020 As at
31 March, 2019
Authorised:
23,75,00,000 equity shares of INR 2 each 4,750 4,750
(23,75,00,000 shares of INR 2 each as at March 31, 2019)
Total 4,750 4,750
Issued, subscribed and Paid up :
22,54,16,970 equity shares of INR 2 each 4,508 4,504
(22,51,84,920 shares of INR 2 each as at March 31, 2019)
Total 4,508 4,504

Notes accompanying the Consolidated Financial Statementsas at and for the year ended March 31, 2020(All amounts in INR Lakhs, unless otherwise stated)
224 ZENSAR TECHNOLOGIES LTD ANNUAL REPORT 2019-20
(i) Reconciliation of the shares outstanding as at the beginning and at the end of the year:
ParticularsAs at 31 March, 2020 As at 31 March, 2019
Nos INR In lakhs Nos INR In lakhs
At the beginning of the year 225,184,920 4,504 44,990,088 4,499
Add:Shares issued on exercise of employee stock options 232,050 4 154,376 5
Add: Conversion on account of share split* - - 180,040,456 -
Outstanding at the end of the year 225,416,970 4,508 225,184,920 4,504
* The shareholder of the company approved the subdivision of Authorised and issued equity share having face value of INR 10/- each into 5 shares of INR 2/- each in their meeting held on August 8, 2018.
(ii) Terms/rights attached to equity shares
The Company has only one class of equity shares having a par value of INR 2 per share. Each holder of equity shares is entitled to one vote per share. The Company declares and pays dividends in Indian rupees. The dividend proposed by the Board of Directors is subject to the approval of the shareholders in the ensuing Annual General Meeting, except in case of Interim Dividend.
In the event of liquidation of the Company, the holder of equity shares will be entitled to receive any of the remaining assets of the Company, after distribution of all preferential amounts. The distribution will be in proportion to the number of equity shares held by the shareholders.
The Shareholders in their general meeting on August 05, 2019 approved the Final dividend for FY 2018-19 of INR 1.80 per equity share. The total outflow of equity dividend and dividend tax thereon amounted to INR 4,628 lakhs including corporate dividend tax of INR 574 lakhs.
The board of directors in their meeting on January 23, 2020 declared the first interim dividend of INR 1.00 per equity share. The total outflow of equity dividend and dividend tax thereon amounted to INR 2,455 lakhs including corporate dividend tax of INR 202 lakhs.
The board of directors in their meeting on March 6, 2020 declared the second interim dividend of INR 1.80 per equity share. The total outflow of equity dividend and dividend tax thereon amounted to INR 4,891 lakhs including corporate dividend tax of INR 834 lakhs.
(iii) Details of shareholders holding more than 5% of the aggregate shares in the company
Name of shareholderAs at 31 March, 2020 As at 31 March, 2019
% Number of shares % Number of shares
Swallow Associates LLP 26.88% 60,586,344 26.89% 60,550,940
Marina Holdco (FPI) Limited 22.85% 51,506,470 22.87% 51,506,470
Summit Securities Limited 11.08% 24,972,427 10.96% 24,680,535
Instant Holdings Limited 8.45% 19,051,374 8.30% 18,689,130
Amansa Holdings Private Limited 5.83% 13,147,050 5.82% 13,096,412
(iv) Aggregate number of bonus shares issued, shares issued for consideration other than cash and shares bought back during the period of five years immediately preceeding March 31, 2020 - Nil
(v) For details of Employee Stock Option Plan (ESOP), refer note 39

Notes accompanying the Consolidated Financial Statementsas at and for the year ended March 31, 2020(All amounts in INR Lakhs, unless otherwise stated)
225BALANCE SHEET AND PROFIT AND LOSS FINANCIAL STATEMENTS
11 (b) Reserves and surplus
ParticularsAs at
31 March, 2020 As at
31 March, 2019
Capital redemption reserve 442 442
Share based payment reserve 3,400 2,849
Retained earnings 85,980 72,834
Capital reserve 293 293
Securities premium 2,812 2,571
General reserve 106,941 106,941
Special economic zone re-investment reserve 1,250 1,500
Total reserves and surplus 201,118 187,430

Notes accompanying the Consolidated Financial Statementsas at and for the year ended March 31, 2020(All amounts in INR Lakhs, unless otherwise stated)
226 ZENSAR TECHNOLOGIES LTD ANNUAL REPORT 2019-20
11 (c) Movement of Reserves and surplus
ParticularsAs at
31 March, 2020 As at
31 March, 2019
Capital redemption reserve
Balance at the beginning and end of the year 442 442
Share based payment reserve
Balance as at the beginning of the year 2,849 1,348
Add: Employee Share based payment expense (net) 645 1,647
Less: Transferred to General reserve on cancellation of stock options - 88
Less: Transferred to Securities premium on exercise of stock options 94 58
Balance as at the end of the year 3,400 2,849
Retained earnings
Balance as at the beginning of the year 72,834 61,017
Transition impact of Ind AS 116 (refer note 2(c)) (579) -
Add: Profit for the year 26,342 31,359 Add / (less) items of other comprehensive income recognised directly in retained earnings:- Remeasurements of defined benefit plans (net of tax) (894) 111
Add: Utilisation of Special Economic Zone Re-investment Reserve 1,500 180
Less: Equity Dividends paid (including Dividend Distribution Tax) 11,974 6,333
Less: Transferred to general reserve - 12,000
Less: Transferred to Special Economic Zone Re-investment Reserve 1,250 1,500
Balance as at the end of the year 85,980 72,834
Capital reserve
Balance at the beginning and end of the year 293 293
Securities premium
Balance as at the beginning of the year 2,571 2,378
Add: Transferred from share based payment reserve on exercise of stock options 94 58
Add: Received on exercise of stock options 148 135
Balance as at the end of the year 2,812 2,571
General reserve
Balance as at the beginning of the year 106,941 94,853 Add: Transferred from share based payment reserve on cancellation of stock options
- 88
Add : Transferred from Retained earnings - 12,000
Balance as at the end of the year 106,941 106,941
Special Economic Zone Re-investment Reserve
Balance as at the beginning of the year 1,500 180
Add: Transferred from retained earnings 1,250 1,500
Less: Utilised during the year 1,500 180
Balance as at the end of the year 1,250 1,500
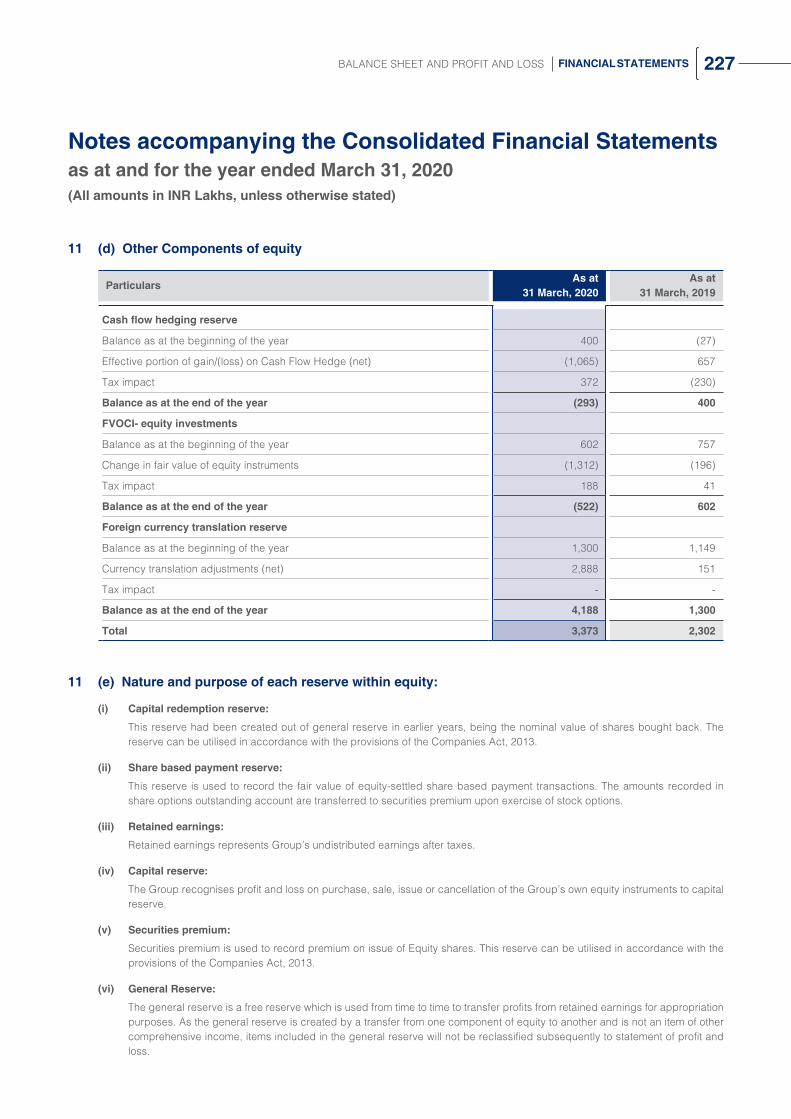
Notes accompanying the Consolidated Financial Statementsas at and for the year ended March 31, 2020(All amounts in INR Lakhs, unless otherwise stated)
227BALANCE SHEET AND PROFIT AND LOSS FINANCIAL STATEMENTS
11 (d) Other Components of equity
ParticularsAs at
31 March, 2020As at
31 March, 2019
Cash flow hedging reserve
Balance as at the beginning of the year 400 (27)
Effective portion of gain/(loss) on Cash Flow Hedge (net) (1,065) 657
Tax impact 372 (230)
Balance as at the end of the year (293) 400
FVOCI- equity investments
Balance as at the beginning of the year 602 757
Change in fair value of equity instruments (1,312) (196)
Tax impact 188 41
Balance as at the end of the year (522) 602
Foreign currency translation reserve
Balance as at the beginning of the year 1,300 1,149
Currency translation adjustments (net) 2,888 151
Tax impact - -
Balance as at the end of the year 4,188 1,300
Total 3,373 2,302
11 (e) Nature and purpose of each reserve within equity:
(i) Capital redemption reserve:
This reserve had been created out of general reserve in earlier years, being the nominal value of shares bought back. The reserve can be utilised in accordance with the provisions of the Companies Act, 2013.
(ii) Share based payment reserve:
This reserve is used to record the fair value of equity-settled share based payment transactions. The amounts recorded in share options outstanding account are transferred to securities premium upon exercise of stock options.
(iii) Retained earnings:
Retained earnings represents Group’s undistributed earnings after taxes.
(iv) Capital reserve:
The Group recognises profit and loss on purchase, sale, issue or cancellation of the Group’s own equity instruments to capital reserve.
(v) Securities premium:
Securities premium is used to record premium on issue of Equity shares. This reserve can be utilised in accordance with the provisions of the Companies Act, 2013.
(vi) General Reserve:
The general reserve is a free reserve which is used from time to time to transfer profits from retained earnings for appropriation purposes. As the general reserve is created by a transfer from one component of equity to another and is not an item of other comprehensive income, items included in the general reserve will not be reclassified subsequently to statement of profit and loss.

Notes accompanying the Consolidated Financial Statementsas at and for the year ended March 31, 2020(All amounts in INR Lakhs, unless otherwise stated)
228 ZENSAR TECHNOLOGIES LTD ANNUAL REPORT 2019-20
(vii) Special economic zone re-investment reserve:
This Reserve had been created out of profit of eligible SEZ units in accordance with the provision of Section 10 AA(1)(ii) of the Income Tax Act,1961. The reserve can only be utilized by the Company for acquiring new plant and machinery for the purpose of its business in terms of the section 10AA(2) of the Income Tax Act, 1961.
(viii) Cash flow hedging reserve:
The Company uses hedging instruments as part of its management of foreign currency risk associated with its highly probable forecast sales. For hedging foreign currency risk, the Company uses forward contracts which are designated as cash flow hedges. To the extent this hedge is effective, the change in fair value of the hedging instrument is recognised in the cash flow hedging reserve. Amounts recognised in the hedging reserve are reclassified to profit or loss when the hedged item affects profit or loss.
(ix) FVOCI- equity investments:
The Company has elected to recognise changes in the fair value of certain investments in equity securities in other comprehensive income. These changes are accumulated within the FVOCI equity instruments reserve within equity. The Company transfers amounts from this reserve to retained earnings when the relevant equity securities are derecognised.
(x) Foreign currency translation reserve:
Exchange differences arising on translation of the foreign operations are recognised in other comprehensive income as described in accounting policy and accumulated in a separate reserve within equity. The cumulative amount is reclassified to profit or loss when the net investment is disposed of.
12 (a) Borrowings
ParticularsMaturity period
Terms of repayment
As at 31 March, 2020
As at 31 March, 2019
Finance lease obligations (Secured) @ Jun' 2019 to Jan' 2021
Quarterly instalments
- 645
From Banks (Secured) # * Sep' 2019 to Sep' 2022
Half yearly instalments
10,835 13,831
Total 10,835 14,476
Less: Current maturities of finance lease obligations (included in note 12(c))
- 326
Less: Current maturities of long term debt (included in note 12(b))
4,298 3,928
Borrowings [Non-current] 6,537 10,221
From Banks (Secured) * Not
Applicable Payable on
Demand 10,593 4,495
From Banks (Secured) # July'2019 Payable within twelve months
from the date of borrowing
11,728 11,065
Borrowings [Current] 22,321 15,560
@ secured by the lessors’ title to the leased assets (March 31, 2019: INR 489 Lakhs), refer note 2(c ) for March 31, 2020
* Present and future right, title, interest and assets of Zensar Technologies Inc, Professional Access Limited, Keystone Logic Inc. & Cynosure Inc.
# Guarantee given by Zensar Technologies Limited

Notes accompanying the Consolidated Financial Statementsas at and for the year ended March 31, 2020(All amounts in INR Lakhs, unless otherwise stated)
229BALANCE SHEET AND PROFIT AND LOSS FINANCIAL STATEMENTS
12 (b) Other financial liabilities
ParticularsAs at
31 March, 2020 As at
31 March, 2019
Non-current
Contingent consideration payable (refer note 34) 3,859 4,157
Accured salaries and benefits 740 384
Fair value of financial liability (refer note 36) - 1,543
Total 4,599 6,084
Current
Contingent consideration payable (refer note 34) 1,833 8,444
Fair value of financial liability (refer note 36) 1,712 -
Current maturities of finance lease obligations - 327
Current maturities of long term debt 4,298 3,928
Foreign Currency derivative liabilities 3,701 23
Accured salaries and benefits 10,053 11,375
Unclaimed dividend 269 232
Capital creditors 730 42
Book overdrafts - 310
Interest accrued on borrowings - 1
Others 229 669
Total 22,825 25,351
12 (c) Lease Liabilities
ParticularsAs at
31 March, 2020 As at
31 March, 2019
Non-current
Lease Liabilities 31,293 -
Current -
Lease Liabilities @ 10,577 -
Total 41,870 -
Lease liabilities payable more than one year and less than 5 years is INR. 29,372 lakhs.
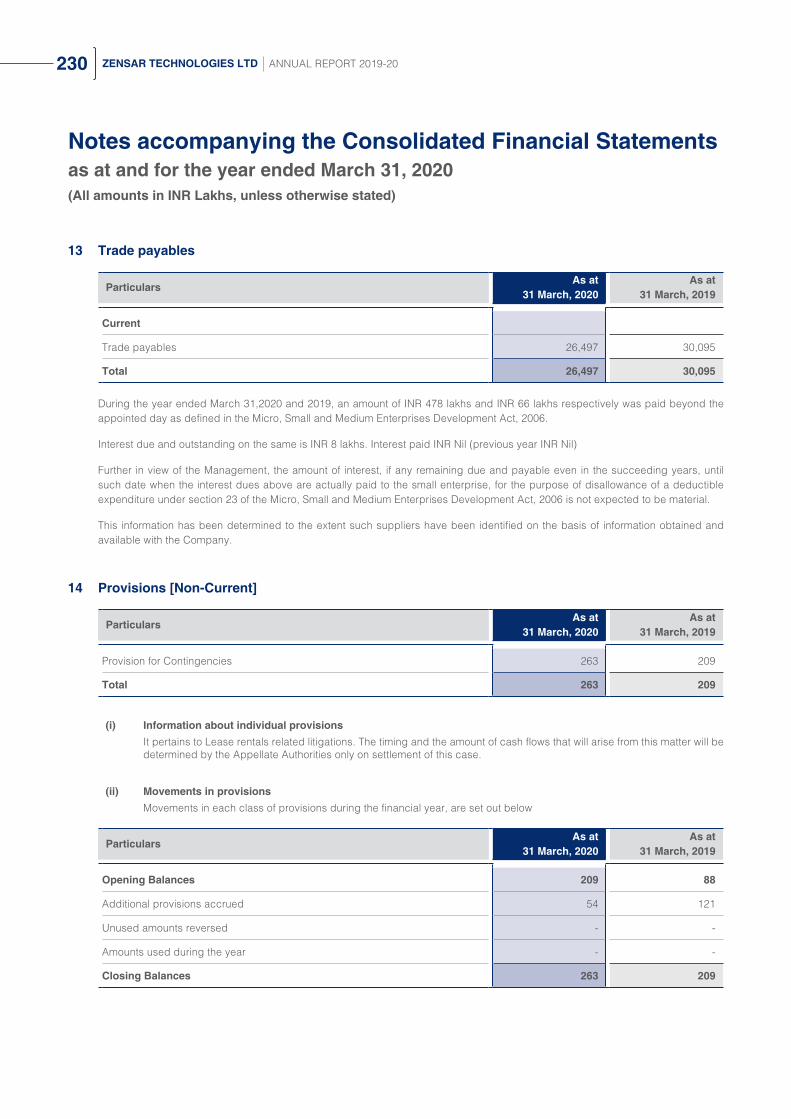
Notes accompanying the Consolidated Financial Statementsas at and for the year ended March 31, 2020(All amounts in INR Lakhs, unless otherwise stated)
230 ZENSAR TECHNOLOGIES LTD ANNUAL REPORT 2019-20
13 Trade payables
ParticularsAs at
31 March, 2020 As at
31 March, 2019
Current
Trade payables 26,497 30,095
Total 26,497 30,095
During the year ended March 31,2020 and 2019, an amount of INR 478 lakhs and INR 66 lakhs respectively was paid beyond the appointed day as defined in the Micro, Small and Medium Enterprises Development Act, 2006.
Interest due and outstanding on the same is INR 8 lakhs. Interest paid INR Nil (previous year INR Nil)
Further in view of the Management, the amount of interest, if any remaining due and payable even in the succeeding years, until such date when the interest dues above are actually paid to the small enterprise, for the purpose of disallowance of a deductible expenditure under section 23 of the Micro, Small and Medium Enterprises Development Act, 2006 is not expected to be material.
This information has been determined to the extent such suppliers have been identified on the basis of information obtained and available with the Company.
14 Provisions [Non-Current]
ParticularsAs at
31 March, 2020 As at
31 March, 2019
Provision for Contingencies 263 209
Total 263 209
(i) Information about individual provisions It pertains to Lease rentals related litigations. The timing and the amount of cash flows that will arise from this matter will be
determined by the Appellate Authorities only on settlement of this case.
(ii) Movements in provisions Movements in each class of provisions during the financial year, are set out below
ParticularsAs at
31 March, 2020 As at
31 March, 2019
Opening Balances 209 88
Additional provisions accrued 54 121
Unused amounts reversed - -
Amounts used during the year - -
Closing Balances 263 209

Notes accompanying the Consolidated Financial Statementsas at and for the year ended March 31, 2020(All amounts in INR Lakhs, unless otherwise stated)
231BALANCE SHEET AND PROFIT AND LOSS FINANCIAL STATEMENTS
15 Employee benefit obligations
ParticularsAs at
31 March, 2020 As at
31 March, 2019
Non-current
Provision for compensated absences 1,554 1,457
Total 1,554 1,457
Current
Provision for compensated absences 6,593 5,368
Provision for gratuity (refer note (i) below) 1,732 324
Total 8,325 5,692

Notes accompanying the Consolidated Financial Statementsas at and for the year ended March 31, 2020(All amounts in INR Lakhs, unless otherwise stated)
232 ZENSAR TECHNOLOGIES LTD ANNUAL REPORT 2019-20
(i) Defined benefit plans:
a Gratuity - The Group provides for gratuity for employees in India in accordance with the gratuity scheme as applicable to the respective entities of the Group. The amounts recognised in the balance sheet and the movements in the net defined benefit obligation over the year are as follows:
Particulars Present value of obligation
Fair value of plan assets
Net liability amount
As at April 1, 2018 8,768 (8,336) 432
Current service cost 1,671 (644) 1,027
Interest expense / (income) 677 - 677
Total amount recognised in statement of profit and loss 2,348 (644) 1,704
Remeasurements
Return on plan assets - 8 8
(Gain) / loss from change in financial assumptions (33) - (33)
Experience (gains) / losses (134) - (134)
Total amount recognised in Other comprehensive income (167) 8 (159)
Liability Transferred Out/Disinvestments (62) - (62)
Contributions by the company - (660) (660)
Benefit payments (935) - (935)
As at March 31, 2019 9,952 (9,632) 320
Current service cost 1,904 - 1,904
Interest expense / (income) 774 (749) 25
Total amount recognised in statement of profit and loss 2,678 (749) 1,929
Remeasurements
Return on plan assets - (36) (36)
(Gain) / loss from change in demographic assumptions 171 - 171
(Gain) / loss from change in financial assumptions 1,635 - 1,635
Experience (gains) / losses (396) - (396)
Total amount recognised in Other comprehensive income 1,410 (36) 1,374
Liability Transferred Out/Disinvestments (124) - (124)
Contributions by the company - (319) (319)
Benefit payments (1,448) - (1,448)
As at March 31, 2020 12,468 (10,736) 1,732
The net liability disclosed above relates to funded plans. The Group intends to contribute in line with the recommendations of the fund administrator and the actuary.
b The net liability disclosed above relates to funded and unfunded plans are as follows:
Plan typeAs at
31 March, 2020 As at
31 March, 2019
Present value of obligation 12,468 9,952
Fair value of plan assets (10,736) (9,632)
Total liability 1,732 320
c As at March 31, 2020 and March 31, 2019, plan assets were primarily invested in insurer managed funds.

Notes accompanying the Consolidated Financial Statementsas at and for the year ended March 31, 2020(All amounts in INR Lakhs, unless otherwise stated)
233BALANCE SHEET AND PROFIT AND LOSS FINANCIAL STATEMENTS
d Through its defined benefit plans, the group is exposed to number of risks, the most significant of which are detailed below:
Asset Volatility: The Plan liabilities are calculated using a discount rate set with reference to bond yields. If plan assets underperform, this yield will create a deficit. The plan asset investments are in fixed income securities with high grades. These are subject to interest rate risk.
Changes in bond yield: A decrease in bond yields will increase plan liabilities, although this will be partially offset by an increase in the value of the plans’ bond holdings.
The group ensures that the investment positions are managed within an asset-liability matching (ALM) framework that has been developed to achieve long-term investments that are in line with the obligations under the employee benefit plans. Within the framework, the group’s ALM objective is to match assets to the pension obligations by investing in long-term fixed interest securities with maturities that match the benefit payments as they fall due and in the appropriate currency. The group actively monitors how the duration and the expected yield of the investments are matching the expected cash outflows arising from the employee benefit obligations. The group has not changed the process used to manage its risks from previous periods.
e The Group expects to contribute INR 2,409 Lakhs (March 31, 2019 INR 2,209 lakhs) to the defined benefit plan during the next annual reporting period.
Weighted average duration of the Projected Benefit Obligation is 10 Years (March 31, 2019 - 13 Years)
fEstimated benefit payments from the fund for year ending
As at 31 March, 2020
As at 31 March, 2019
March 31, 2020 N.A. 314
March 31, 2021 775 365
March 31, 2022 806 483
March 31, 2023 802 421
March 31, 2024 858 478
March 31, 2025 1,014 NA
Thereafter 4,973 3,768
The expected benefits are based on the same assumptions used to measure the Group’s benefit obligations as of March 31, 2019.
g Provident fund : The Group makes contribution towards provident fund which is administered by the trustees. The contributions is accounted for as a defined benefit plan as the Company is liable for any shortfall in the fund assets based on the government specified minimum rates of return. The Group has obtained an actuarial valuation of the liability according to which there is no deficit as at the Balance Sheet date. The movement of liability and plan assets is as under:
ga Present Value of Defined Benefit Obligation
ParticularsAs at
31 March, 2020 As at
31 March, 2019
Balance as at the beginning of the year 34,756 29,019
Liability transferred (refer note 34) 1,767 1,708
Interest cost 2,911 2,324
Current service cost 2,033 1,711
Employee contribution 3,308 2,915
Benefits paid (4,731) (2,921)
Balance as at the end of the year 40,044 34,756

Notes accompanying the Consolidated Financial Statementsas at and for the year ended March 31, 2020(All amounts in INR Lakhs, unless otherwise stated)
234 ZENSAR TECHNOLOGIES LTD ANNUAL REPORT 2019-20
gb Fair value of Plan Assets (Restricted to the extent of Present Value of Obligation)
ParticularsAs at
31 March, 2020 As at
31 March, 2019
Balance as at the beginning of the year 35,346 29,377
Expected return on plan assets 2,941 2,499
Contributions by the Company 5,342 4,626
Transfer from other Company 1,767 1,709
Benefits paid (4,731) (2,921)
Actuarial gains/(losses) (143) 57
Balance as at the end of the year 40,522 35,346
gcParticulars
As at 31 March, 2020
As at 31 March, 2019
Assets and Liabilities recognised in the Balance Sheet - -
gd Expenses recognised in the Statement of Profit and Loss
ParticularsYear ended
31 March, 2020 Year ended
31 March, 2019
Current service cost 2,033 1,711
Interest cost 2,911 2,324
Expected return on plan assets (2,941) (2,499)Total expenses recognised in the statement of profit and loss 2,003 1,536
ge The plan assets have been primarily invested as follows :
Category of AssetsAs at
31 March, 2020 As at
31 March, 2019
Central Government of India Assets 6,311 6,119
State Government of India Assets 13,072 10,544
Special Deposits Scheme 253 253
Private Sector Bonds 17,733 16,181
Equity / Mutual Funds 1,315 1,060
Cash and Cash Equivalents 630 71
Others 1,208 1,118
Total 40,522 35,346

Notes accompanying the Consolidated Financial Statementsas at and for the year ended March 31, 2020(All amounts in INR Lakhs, unless otherwise stated)
235BALANCE SHEET AND PROFIT AND LOSS FINANCIAL STATEMENTS
gf The principal assumptions used for the purpose of all defined benefit obligations are as follows:
ParticularsAs at
31 March, 2020 As at
31 March, 2019
India
Discount Rate * 6.04% 7.76%
Salary Escalation Rate ** 7.00% 7.00%
Rate of Employee Turnover
- For services 4 years and below 15.00% 13.00%
- For services 5 years and above 7.00% 3.00%
* Discount rate is based on the prevailing market yields of Indian Government securities as at the balance sheet date for the estimated term of the obligations.
** The estimates of future salary increases considered in actuarial valuation takes into account inflation, seniority, promotion and other relevant factors, such as demand and supply in the employment market.
gg Sensitivity analysis - the increase / (decrease) in present value of defined benefit obligation to changes in principal assumptions:
ParticularsAs at
31 March, 2020 As at
31 March, 2019
- 1% increase in discount rate (7.97%) (10.14%)
- 1% decrease in discount rate 9.16% 11.87%
- 1% increase in salary escalation rate 8.99% 11.84%
- 1% decrease in salary escalation rate (7.97%) (10.29%)
- 1% increase in rate of employee turnover (0.90%) 0.49%
- 1% decrease in rate of employee turnover 0.95% (0.64%)
The above sensitivity analyses are based on a change in an assumption while holding all other assumptions constant. In practice, this is unlikely to occur, and changes in some of the assumptions may be correlated.
(ii) Defined contribution plans:
The Group has recognised the following amounts in the Statement of Profit and Loss:
ParticularsYear ended
31 March, 2020Year ended
31 March, 2019
Contribution to Employees' Provident Fund 1,960 33
Contribution to Employees' Family Pension Fund 1,474 1,281
Contribution to Employees' Superannuation Fund 51 59
Contribution to Employees' Social Security Fund 5,801 4,080
Contribution to Employees' 401(K) Fund 1,473 1,244
Contribution to Central Provident Fund in Singapore - 75
Contribution to National Insurance of UK 1,705 1,597
Contribution to National Pension Schemes 71 -
Contribution to Medicare Fund 1,424 1,055

Notes accompanying the Consolidated Financial Statementsas at and for the year ended March 31, 2020(All amounts in INR Lakhs, unless otherwise stated)
236 ZENSAR TECHNOLOGIES LTD ANNUAL REPORT 2019-20
16 Other Current liabilities
ParticularsAs at
31 March, 2020 As at
31 March, 2019
Unearned revenue 4,482 9,425
Statutory dues 3,779 4,875
Others 224 122
Total 8,485 14,422
17 (a) Income taxes
ParticularsAs at
31 March, 2020 As at
31 March, 2019
Income tax assets (net) 6,064 3,146
Income tax liabilities (net) (4,910) (3,949)
Net total 1,154 (803)
17 (b) Movement The gross movement in the income tax asset / (liability) is as follows:
ParticularsAs at
31 March, 2020 As at
31 March, 2019
Opening Balance (803) 60
Addition due to acquisition - (499)
Income tax paid (net of refunds) 11,467 13,864
Current income tax expense (refer note 24 (i)) (11,524) (14,279)
Adjustment for current tax of prior periods (refer note 24 (i)) 1,393 234
Income tax on other comprehensive income (refer note 24 (iii)) 480 (48)
Translation difference 71 (135)
Group Relief Tax Aggregation 78 -
Others (8) -
Net total 1,154 (803)
18 Revenue from operations
ParticularsYear ended
31 March, 2020Year ended
31 March, 2019
Software development, its allied services and maintenance services 400,058 387,154
Sale of licenses, hardware and other equipments 18,110 9,478
Total 418,168 396,633

Notes accompanying the Consolidated Financial Statementsas at and for the year ended March 31, 2020(All amounts in INR Lakhs, unless otherwise stated)
237BALANCE SHEET AND PROFIT AND LOSS FINANCIAL STATEMENTS
18 (a) Revenue for year ended March 31, 2020
ParticularsYear ended
31 March, 2020Year ended
31 March, 2019
Software development, its allied services and maintenance services 400,058 387,154
Sale of licenses, hardware and other equipments 18,110 9,478
(b) Disaggregate revenue information
The table below presents disaggregated revenues from contracts with customers by geography, offerings and contract-type for each of our business segments. The company believes that this disaggregation best depicts how the nature, amount, timing and uncertainty of our revenues and cash flows are affected by industry, market and other economic factors.
ParticularsVerticals
AMS IMS
Revenue by Geography
- Americas 255,214 51,809
[242,486] [55,753]
- Europe 54,889 11,412
[52,545] [4,320]
- Africa 40,045 2,109
[33,789] [987]
- Rest of the world 1,371 1,319
[5,872] [881]
Revenue by Contract Type
- Fixed Price Contracts/ Fixed Monthly 203,671 39,669
[190,046] [22,908]
- Time and Material 147,847 26,981
[144,646] [39,033]
Figures in brackets are for previous year i.e. March 31, 2019
(c) Trade Receivables and Contract Balances
The company classifies the right to consideration in exchange for deliverables as either receivable or as unbilled revenue
A receivable is right to consideration that is unconditional upon passage of time. Revenue for time and material contracts are recognised as related service are performed. Revenue for fixed price maintenance contracts is recognised on a straight line basis over the period of contract. Revenue in excess of billing is recorded as unbilled revenue and is classified as a financial asset for these cases as right to consideration is unconditional upon passage of time.
Revenue recognition for fixed price development contracts is based on percentage of completion method. Invoicing to clients is based on milestones as defined in then contract. This would result in timing of revenue recognition being different from the timing of billing the customers. Unbilled revenue for fixed price development contracts is classified as non financial assets as the contractual right to consideration is dependent on completion of contractual milestones.
Invoicing in excess of earnings is classified as unearned revenue.
Trade receivables and unbilled revenues are presented net of impairment in Balance Sheet.

Notes accompanying the Consolidated Financial Statementsas at and for the year ended March 31, 2020(All amounts in INR Lakhs, unless otherwise stated)
238 ZENSAR TECHNOLOGIES LTD ANNUAL REPORT 2019-20
(d) Performance obligations and remaining performance obligations
The remaining performance obligation disclosures provide the aggregate amount of transaction price yet to be recognized as of the end of the reporting period and an explanation as to when company expects to recognize these amounts as revenue. Applying the practical expedients as given in INDAS 115, the company has not disclosed the remaining performance obligations related disclosures where the revenue recognized corresponds directly with the value to customer of the entity’s performance completed to date, typically those contracts where invoicing is on the basis of time and material basis. Remaining performance obligation are subject to change and are affected by several factors, including terminations , changes in the scope of contracts, periodic revalidations, adjustment of revenue that has not materialized and adjustments for currency.
The aggregate value of transaction price allocated to unsatisfied (or partially satisfied) performance obligations is INR 67,751 lakhs [March 31, 2019: INR 59,119 lakhs] out of which INR 39,542 lakhs [March 31, 2019: INR 21,849 lakhs] is expected to be recognised as revenue in the next year and the balance thereafter. No consideration from contracts with customers is excluded from the amount mentioned above.
19 Other income (net)
ParticularsYear ended
31 March, 2020Year ended
31 March, 2019
Interest Income
- On deposits with banks 272 263
- Others 241 282
Net gain /(loss) on financial assets mandatorily measured at FVTPL (283) (1,796)
Profit on sale of investments (mutual funds) 1,409 2,796
Foreign exchange gain / (loss) (net) 4,484 2,899
Fair value of financial liability (refer note 36) (400) (208)
Profit /(Loss) on sale of fixed assets (net) 5 (9)
Profit on Sale of Business (refer note 37) - 1,941
Provisions no longer required and credit balances written back (refer note 38) 2,581 2,391
Miscellaneous Income 533 709
Total 8,842 9,268
20 Employee benefits expense
ParticularsYear ended
31 March, 2020Year ended
31 March, 2019
Salaries, wages and bonus 206,441 192,578
Contribution to provident and other funds (refer note 15) 15,872 12,864
Employee share-based payment expense (refer note 39) 645 1,652
Staff welfare expenses 11,785 8,164
Total 234,743 215,258

Notes accompanying the Consolidated Financial Statementsas at and for the year ended March 31, 2020(All amounts in INR Lakhs, unless otherwise stated)
239BALANCE SHEET AND PROFIT AND LOSS FINANCIAL STATEMENTS
21 Finance Costs
ParticularsYear ended
31 March, 2020Year ended
31 March, 2019
Interest on :
- Loans 1,046 1,275
- Finance lease - 51
- Fair value of contingent consideration 1,133 1,612
- Lease Liablities 2,851 -
- Others 138 13
Bank charges 883 778
Total 6,051 3,729
22 Depreciation, amortisation and impairment expense
ParticularsYear ended
31 March, 2020Year ended
31 March, 2019
Depreciation of Property, plant and equipment 3,521 3,368
Depreciation of Right of use assets 5,628 -
Amortization and Impairment of intangible assets# 6,769 5,576
Total 15,918 8,944
# includes impairment charge amounting to INR 258 lakhs for the year ended March 31, 2020.

Notes accompanying the Consolidated Financial Statementsas at and for the year ended March 31, 2020(All amounts in INR Lakhs, unless otherwise stated)
240 ZENSAR TECHNOLOGIES LTD ANNUAL REPORT 2019-20
23 Other expenses
ParticularsYear ended
31 March, 2020Year ended
31 March, 2019
Rent (refer note 14) 3,113 8,216
Rates and taxes 1,600 1,106
Electricity and power 1,354 1,397
Travelling and conveyance 12,450 12,180
Recruitment expenses 2,061 1,701
Training expenses 857 929
Repairs and maintenance to :
-Building 1,456 1,368
-Electrical Installations and equipments 257 394
-Data Processing Equipments 2,222 1,556
-Others 551 532
Insurance 850 709
Legal and professional charges 9,645 8,879
Communication expenses 2,009 2,337
General Office expenses 769 819
Carriage, freight and octroi 1,484 1,923
Advertisement and publicity 2,147 1,538
Expenditure towards Corporate social responsibility (refer note 23 (a)) 530 531
Allowance for doubtful trade receivables and unbilled revenues
- Provided during the year 3,942 3,716
- Bad debts written off 4,357 1,174
- Less: Reversed during the year (5,863) (1,348)
2,436 3,542
Allowance for doubtful loans and advances
- Provided during the year 172 -
- Loans and advances written off - -
- Less: Reversed during the year - -
172 -
Miscellaneous expenses 2,536 1,657
Total 48,499 51,314

Notes accompanying the Consolidated Financial Statementsas at and for the year ended March 31, 2020(All amounts in INR Lakhs, unless otherwise stated)
241BALANCE SHEET AND PROFIT AND LOSS FINANCIAL STATEMENTS
23 (a) Expenditure towards Corporate social responsibility
ParticularsYear ended
31 March, 2020Year ended
31 March, 2019
Gross amount required to be spent by the Company during the year 528 527
Total 528 527
Amount spent during the yearYear ended
31 March, 2020Year ended
31 March, 2019
a. Construction/ acquisition of any asset - -
b. On purposes other than (a) above 530 531
Total 530 531
24 Income tax expense
This note provides Group’s income tax expense and amounts that are recognised directly in equity and how the tax expense is affected by non- assessable and non-deductible items. It also explains significant estimates made in relation to Group’s tax positions.
(i) Breakup of income tax expense:
ParticularsYear ended
31 March, 2020 Year ended
31 March, 2019
Income tax expense
Current Tax
Current tax on profits for the year 11,524 14,279
Adjustment for current tax of prior periods (1,393) (234)
Current tax expense 10,131 14,045
Deferred tax
Decrease / (increase) in deferred tax assets (686) (584)
(Decrease) / increase in deferred tax liabilities 974 (788)
Deferred tax expense / (benefit) 288 (1,372)
Income tax expense 10,419 12,673
In India, the company has availed certain tax incentives that the Government of India has provided to the export of software for the units registered under the Special Economic Zones Act 2005 (SEZ). SEZ units which began the provision of services on or after April 1, 2005 are eligible for a deduction of 100 percent of profits or gains derived from the export of services for the first five years from the financial year in which the unit commences the provision of services and 50 percent of such profits or gains for further five years. Upto 50% of such profits or gains is also available for further five years subject to certain Special Economic Zone Re-investment Reserve out of the profit of the eligible SEZ units and utilization of such reserve for acquiring new plant and machinery for the purpose of its business as per the provisions of Income Tax Act, 1961.

Notes accompanying the Consolidated Financial Statementsas at and for the year ended March 31, 2020(All amounts in INR Lakhs, unless otherwise stated)
242 ZENSAR TECHNOLOGIES LTD ANNUAL REPORT 2019-20
(ii) The reconciliation of estimated income tax expense at statutory income tax rate to income tax expense reported in statement of profit and loss is as follows:
ParticularsYear ended
31 March, 2020 Year ended
31 March, 2019
Profit before taxes 37,579 44,538
Indian statutory income tax rate 34.94% 34.94%
Computed expected tax expenses 13,130 15,562 Effect of Income exempt from tax (4,464) (3,778)
Effect of non-deductible expenses 448 124
Changes in unrecognized deferred tax assets (net) 442 -
Income taxed at higher/(lower) rates - (581)
Income tax relating to prior years 539 335
Difference in overseas tax rates - (2,424)
Other items 324 3,435
Total Income tax expense 10,419 12,673
(iii) Tax on the amounts recognised directly in OCI:
ParticularsYear ended 31 March, 2020 Year ended 31 March, 2019
Current tax Deferred tax Current tax Deferred tax
Fair value changes on cash flow hedges - (372) - 230
Remeasurements of post-employment benefit obligations (480) - 48 -
Change in fair value of equity instruments (188) - (41)
Total (480) (560) 48 189
(iv) Changes in tax rate - The applicable Indian statutory tax rate for the financial year 2019-20 and financial year 2018-19 are 34.94% and 34.94% respectively
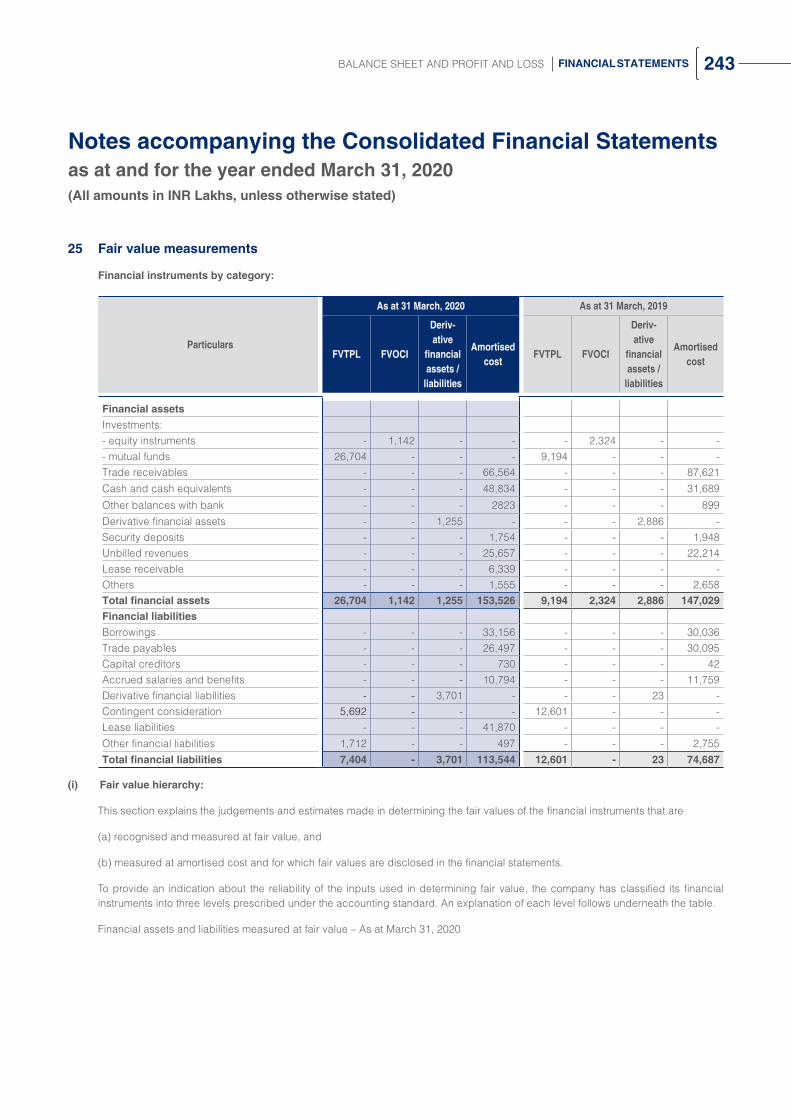
Notes accompanying the Consolidated Financial Statementsas at and for the year ended March 31, 2020(All amounts in INR Lakhs, unless otherwise stated)
243BALANCE SHEET AND PROFIT AND LOSS FINANCIAL STATEMENTS
25 Fair value measurements
Financial instruments by category:
Particulars
As at 31 March, 2020 As at 31 March, 2019
FVTPL FVOCI
Deriv-ative
financial assets /
liabilities
Amortised cost
FVTPL FVOCI
Deriv-ative
financial assets /
liabilities
Amortised cost
Financial assets Investments:- equity instruments - 1,142 - - - 2,324 - -- mutual funds 26,704 - - - 9,194 - - -Trade receivables - - - 66,564 - - - 87,621Cash and cash equivalents - - - 48,834 - - - 31,689
Other balances with bank - - - 2823 - - - 899Derivative financial assets - - 1,255 - - - 2,886 -Security deposits - - - 1,754 - - - 1,948Unbilled revenues - - - 25,657 - - - 22,214Lease receivable - - - 6,339 - - - -Others - - - 1,555 - - - 2,658Total financial assets 26,704 1,142 1,255 153,526 9,194 2,324 2,886 147,029Financial liabilitiesBorrowings - - - 33,156 - - - 30,036Trade payables - - - 26,497 - - - 30,095Capital creditors - - - 730 - - - 42Accrued salaries and benefits - - - 10,794 - - - 11,759Derivative financial liabilities - - 3,701 - - - 23 -Contingent consideration 5,692 - - - 12,601 - - -Lease liabilities - - - 41,870 - - - -Other financial liabilities 1,712 - - 497 - - - 2,755Total financial liabilities 7,404 - 3,701 113,544 12,601 - 23 74,687
(i) Fair value hierarchy:
This section explains the judgements and estimates made in determining the fair values of the financial instruments that are
(a) recognised and measured at fair value, and
(b) measured at amortised cost and for which fair values are disclosed in the financial statements.
To provide an indication about the reliability of the inputs used in determining fair value, the company has classified its financial instruments into three levels prescribed under the accounting standard. An explanation of each level follows underneath the table.
Financial assets and liabilities measured at fair value – As at March 31, 2020

Notes accompanying the Consolidated Financial Statementsas at and for the year ended March 31, 2020(All amounts in INR Lakhs, unless otherwise stated)
244 ZENSAR TECHNOLOGIES LTD ANNUAL REPORT 2019-20
Particulars Level 1 Level 2 Level 3 Total
Financial assets
Financial investments at FVTPL
Mutual funds 26,704 - - 26,704
Financial investments at FVOCI
Equity instruments - - 1,142 1,142
Derivatives designated as hedges
Foreign currency derivative assets - 1,255 - 1,255
Total financial assets 26,704 1,255 1,142 29,101
Financial liabilities
Contingent consideration - - 5,692 5,692
Foreign currency derivative liabilities - 3,701 - 3,701
Fair value of financial liability - 1,712 1,712
Total financial liabilities - 3,701 7,404 11,105
Particulars Level 1 Level 2 Level 3 Total
Financial assets
Financial investments at FVTPL
Mutual funds 9,194 - - 9,194
Financial investments at FVOCI
Equity instruments - - 2,324 2,324
Derivatives designated as hedges
Foreign currency derivative assets - 2,886 - 2,886
Total financial assets 9,194 2,886 2,324 14,404
Financial liabilities
Contingent consideration - - 12,601 12,601
Foreign currency derivative liabilities - 23 - 23
Total financial liabilities - 23 12,601 12,624
Level 1: Level 1 hierarchy includes financial instruments measured using quoted prices. This includes listed equity instruments and mutual funds that have quoted price. The fair value of all equity instruments (including bonds) which are traded in the stock exchange is valued using the closing price as at the reporting period.
Level 2: Fair value of financial instruments that are not traded in an active market (for example, traded bonds, over the counter derivatives) but is determined using valuation techniques which maximize the use of observable market data and rely as little as possible on entity-specific estimates. If all significant inputs required to fair value an instrument as observable, the instrument is included in level 2.
Level 3: If one or more of the significant inputs is not based on observable data, the instrument is included in level 3. This is the case for unlisted equity securities, contingent consideration and indemnification assets.

Notes accompanying the Consolidated Financial Statementsas at and for the year ended March 31, 2020(All amounts in INR Lakhs, unless otherwise stated)
245BALANCE SHEET AND PROFIT AND LOSS FINANCIAL STATEMENTS
(ii) Fair value measurement using significant Unobservable Inputs (Level 3)
The following table presents changes in level 3 items for the year ended March 31, 2020 and 2019
ParticularsUnlisted Equity
SecuritiesFinancial liability
Contingent Consideration
As at April 1, 2018 2,372 1,567 9,821
Fair value gain/(loss) recognized in other comprehensive income (196) - -
Fair value (gain)/loss recognized in statement of profit and loss - 208 (1,612)
Addition on business combination - - 5,811
Paid during the year - - (3,179)
Reversal of liability - - (1,564)
Foreign Exchange fluctuations – (gain)/losses 148 (232) 100
As at March 31, 2019 2,324 1,543 12,601
Fair value gain/(loss) recognized in other comprehensive income (1,312) - -
Fair value (gain)/loss recognized in statement of profit and loss - 400 1,565
Deduction on Payment - - (5,970)
Reversal of liability - - (2,568)
Foreign Exchange fluctuations – (gain)/losses 130 (231) 64
As at March 31, 2020 1,142 1,712 5,692

Notes accompanying the Consolidated Financial Statementsas at and for the year ended March 31, 2020(All amounts in INR Lakhs, unless otherwise stated)
246 ZENSAR TECHNOLOGIES LTD ANNUAL REPORT 2019-20
(iii) Valuation inputs and relationships to fair value
Particulars
Fair value Significant unobserv-able inputs
Probability-weighted range
SensitivityAs at March
31, 2020
As at March
31, 2019
As at March 31, 2020
As at March 31, 2019
Unquoted equity shares
1,142 2,324 Earnings growth rate (CAGR)
2% 10.00% Increasing/decreasing the earnings growth factor by 100bps would increase/decrease the FV by INR. 76 lakhs [March 2019 - INR 166 lakhs]
Risk adjusted discount rate
10.2% 11.37% Increasing/decreasing the discount rate by 100bps would decrease/increase the FV by INR 76 lakhs [March 2019 - INR. 194 lakhs]
Financial liability
1,712 1,543 Risk adjusted discount rate
24.8% 21.7% Increasing/decreasing the discount rate by 100bps would decrease/increase the FV by INR 71 lakhs [March 2019 - INR. 87 lakhs]
Contingent consideration
5,692 12,601 Expected cash outflows
7,642 15,127 If expected cash flows were 10% lower, the FV would decrease by INR 605 lakhs [March 2019 - INR. 1,261 lakhs]
Discount rate
21.80% 7.53% - 21.80%
A change in discount rate by 100bps would increase/decrease the FV by INR 76 lakhs [March 2019 - INR. 90 lakhs]
(iv) Valuation technique used to determine fair value
The following methods and assumptions were used to estimate the fair value of the level 2 financial instruments included in the above tables:
Derivative instruments: The Group enters into foreign currency forward contracts with banks with investment grade credit ratings. These are valued using the forward pricing valuation technique, using present value calculations. The models incorporate various inputs including the credit quality of counterparties and foreign exchange spot and forward rates. As at March 31, 2020, the changes in counterparty credit risk had no material effect on the hedge effectiveness assessment for derivatives designated in hedge relationships.
The main level 3 inputs for above mentioned cases used by the Group are derived and evaluated as follows:
1. Unquoted Equity instruments are valued based on expected cash flows discounted using weighted average cost of capital.
2. Financial liability are valued based on expected cash flows discounted using weighted average cost of capital.
3. Contingent consideration: Fair value of contingent consideration is based on management’s assessment of probable consideration payable discounted using weighted average cost of capital.

Notes accompanying the Consolidated Financial Statementsas at and for the year ended March 31, 2020(All amounts in INR Lakhs, unless otherwise stated)
247BALANCE SHEET AND PROFIT AND LOSS FINANCIAL STATEMENTS
(v) As per Ind AS 107 “Financial Instrument: Disclosure”, fair value disclosures are not required when the carrying amounts reasonably approximate the fair value. Accordingly fair value disclosures have not been made for the following financial instruments:
1. Trade receivables
2. Cash and cash equivalents
3. Other balances with banks
4. Security deposits
5. Amount deposited under protest
6. Unbilled revenue
7. Other receivables
8. Borrowings
9. Trade payables
10. Capital creditors
11. Unclaimed dividends
12. Accrued salaries and benefits
13. Book overdrafts
14. Other payables
26 Financial risk management
The Group’s activities expose it to a variety of financial risks: market risk, credit risk and liquidity risk. The Group’s primary focus is to foresee the unpredictability of financial markets and seek to minimize potential adverse effects on its financial performance. The primary market risk to the Group is foreign exchange risk. The Group uses derivative financial instruments - foreign currency forward contracts to mitigate foreign exchange related risk exposures. Derivatives are used exclusively for hedging purpose and not as trading or speculative instruments. The Group’s exposure to credit risk is influenced mainly by the individual characteristic of each customer and the concentration of risk from the top few customers. The demographics of the customer including the default risk of the industry and country in which the customer operates also has an influence on credit risk assessment.
(a) Market Risk
(i) Foreign currency risk
The Group operates globally and a major portion of the business is transacted in several currencies and consequently the Group is exposed to foreign exchange risk through its sales and services in the United States, South Africa, United Kingdom and elsewhere, and purchases from overseas suppliers in various foreign currencies. The exchange rate between the rupee and foreign currencies has changed substantially in recent years and may fluctuate substantially in the future. Consequently, the results of the Group’s operations are adversely affected as the rupee appreciates/ depreciates against these currencies. The Group evaluates exchange rate exposure arising from these transactions and enters into foreign exchange forward contracts to mitigate the risk of changes in exchange rates on foreign currency exposures. The Group follows established risk management policies, to hedge forecasted cash flows denominated in foreign currency. The Group has designated certain derivative instruments as cash flow hedges to mitigate the foreign exchange exposure of forecasted highly probable cash flows.

Notes accompanying the Consolidated Financial Statementsas at and for the year ended March 31, 2020(All amounts in INR Lakhs, unless otherwise stated)
248 ZENSAR TECHNOLOGIES LTD ANNUAL REPORT 2019-20
Group’s exposure to foreign currency risk as at March 31, 2020 in INR lakhs is as follows:
Particulars USD GBP ZAR EUROther
currenciesTotal
Financial assets
Cash and cash equivalents773
[370]320 [82]
- [-]
731 [146]
- [166]
1,824 [764]
Trade receivables 1,905
[3,887]369
[116]872
[4,319]513
[1,291]438
[741]4,097
[10,354]
Other assets666
[1,548]109
[950]262
[167]577
[370]3
[328]1,617
[3,362]
Financial liabilities
Trade payables2,161 [270]
140 [97]
34 [3]
75 [22]
42 [19]
2,452 [411]
Employee benefit obligations-
[-]66
[19]-
[-]13 [-]
8 [-]
87 [19]
Other liabilities416
[6,669]16
[47]183 [2]
10 [3]
666 [115]
1,291 [6,836]
Figures in brackets are for previous year i.e. as at March 31, 2019
Sensitivity
For the year ended March 31, 2020 and March 31, 2019, every percentage point appreciation/depreciation in the exchange rate would have affected the Company’s operating margins respectively:
- INR/USD by approximately 0.03% and 0.19%,
- INR/GBP by approximately 0.02% and 0.02%,
- INR/ZAR by approximately 0.03% and 0.07%,
- INR/EUR by approximately 0.07% and 0.00%
Sensitivity analysis is computed based on changes in income and expenses, due to every percentage point appreciation/depreciation in the exchange rates.
Derivative financial instruments
The Company holds derivative financial instruments such as foreign exchange forward and Option contracts to mitigate the risk of changes in exchange rates on foreign currency exposures. The counterparty for these contracts is generally a bank. These derivative financial instruments are valued based on quoted prices for similar assets and liabilities in active markets or inputs that are directly or indirectly observable in the marketplace. The foreign exchange forward contracts mature within twelve months from Balance Sheet.

Notes accompanying the Consolidated Financial Statementsas at and for the year ended March 31, 2020(All amounts in INR Lakhs, unless otherwise stated)
249BALANCE SHEET AND PROFIT AND LOSS FINANCIAL STATEMENTS
The following table gives details in respect of outstanding foreign exchange contracts:
Particulars
As at March 31, 2020 As at March 31, 2019
Amount of contracts in
lakhs
Fair Value – Gain / (Loss) (INR in lakhs)
Amount of contracts in
lakhs
Fair Value – Gain / (Loss) (INR in lakhs)
Derivative designated as cash flow hedges
Forward Contract
In USD 238 (486) 156 227
In GBP 94 (241) 35 149
In ZAR 950 420 458 168
Total Forwards (307) 544
Option Contracts
In USD 52 (151) 105 69
The table below analyzes the derivative financial instruments into relevant maturity groupings based on the remaining period as at the balance sheet date:
ParticularsAs at March
31, 2020As at March
31, 2019
Not later than one month 16 126
Later than one month and not later than three months (46) 321
Later than three months and not later than one year (428) 167
The Company has designated certain foreign exchange forward and option contracts as cash flow hedges to mitigate the risk of foreign exchange exposure on highly probable forecast sale transactions. The related hedge transactions for balance in cash flow hedging reserve are expected to occur and reclassified to the statement of profit or loss within 12 months.
Hedge effectiveness is determined at the inception of the hedge relationship, and through periodic prospective effectiveness assessments to ensure that an economic relationship exists between the hedged item and hedging instrument, including whether the hedging instrument is expected to offset changes in cash flows of hedged items.
If the hedge ratio for risk management purposes is no longer optimal but the risk management objective remains unchanged and the hedge continues to qualify for hedge accounting, the hedge relationship will be rebalanced by adjusting either the volume of the hedging instrument or the volume of the hedged item so that the hedge ratio aligns with the ratio used for risk management purposes. Any hedge ineffectiveness is calculated and accounted for in profit or loss at the time of the hedge relationship rebalancing.
The following table provides the reconciliation of cash flow hedge reserve:
ParticularsAs at
31 March, 2020As at
31 March, 2019
Balance at the beginning of the year 400 (27)
Gain / (Loss) during the year on Cash Flow Hedges [includes reclassification to statement of profit and loss [FY 2019-20 Rs. (3,075) lakhs [FY 2018-19 - Rs. 2,188 lakhs]
(1,065) 657
Tax impact 372 (230)
Balance as at the end of the year (293) 400

Notes accompanying the Consolidated Financial Statementsas at and for the year ended March 31, 2020(All amounts in INR Lakhs, unless otherwise stated)
250 ZENSAR TECHNOLOGIES LTD ANNUAL REPORT 2019-20
Interest rate risk exposure
The exposure of the group’s borrowing to interest rate changes are as follows:
ParticularsAs at
31 March, 2020As at
31 March, 2019
Variable rate borrowings (floating rate linked to libor) 33,156 29,391
Fixed rate borrowings - -
Total borrowings 33,156 29,391
Sensitivity
Profit after tax of the Group is sensitive to changes in interest rates, whose impact is given below.
ParticularsIncrease / (Decrease) on profit after tax
For the year ended March 31, 2020
For the year ended March 31, 2019
Interest rates - increase by 50 basis points (50 bps) (122) (147)
Interest rates - decrease by 50 basis points (50 bps) 122 147
(b) Credit risk
Credit risk refers to the risk of default on its obligation by the counterparty resulting in a financial loss. The maximum exposure to the credit risk at the reporting date is primarily from trade receivables amounting to INR. 66,564 lakhs and INR. 87,621 lakhs as of March 31, 2020 and March 31, 2019, respectively and unbilled revenues amounting to INR. 38,903 lakhs and INR. 37,659 lakhs as of March 31, 2020 and March 31, 2019, respectively. Trade receivables and unbilled revenue are typically unsecured and are derived from revenue earned from customers located in the United States, South Africa, United Kingdom and elsewhere. Credit risk is managed through credit approvals, establishing credit limits and continuously monitoring the credit worthiness of customers to which the Group grants credit terms in the normal course of business. On account of adoption of IND AS 109, the Company uses expected credit loss model to assess impairment loss or gain. The company uses a matrix to compute the expected credit loss allowance for trade receivables and unbilled revenue. The provision matrix takes into account available external and internal credit risk factors and company’s historical experience for customers.
The movement in allowance for life time expected credit loss on customer balances for the year ended March 31, 2020 and March 31, 2019 is given below:
ParticularsAs at
31 March, 2020As at
31 March, 2019
Balance at the beginning of the year 10,331 7,781
Allowance for doubtful debts 3,942 3,716
Reversal of allowance for doubtful debts (5,863) (1,348)
Translation differences 484 182
Balance at the end 8,894 10,331
Credit risk on cash and cash equivalents is limited as the Group generally invests in deposits with banks and financial institutions with high credit ratings assigned by international and domestic credit rating agencies. Investments primarily include investment in liquid mutual fund units.

Notes accompanying the Consolidated Financial Statementsas at and for the year ended March 31, 2020(All amounts in INR Lakhs, unless otherwise stated)
251BALANCE SHEET AND PROFIT AND LOSS FINANCIAL STATEMENTS
(c) Liquidity risk
Liquidity risk is defined as the risk that the Group will not be able to settle or meet its obligations on time or at a reasonable price. The Group’s corporate treasury department is responsible for liquidity and funding as well as settlement management. In addition, processes and policies related to such risks are overseen by senior management. Management monitors the Group’s net liquidity position through rolling forecasts on the basis of expected cash flows. As of March 31, 2020, cash and cash equivalents are held with major banks and financial institutions.
The table below provides details regarding the remaining contractual maturities of significant financial liabilities at the reporting date. The amounts include estimated interest payments and exclude the impact of netting agreements, if any.
Particulars
As at March 31, 2020
Contractual cash flows
Carrying valueLess than
1 year1-5 years
More than 5 years
Total
Borrowings 33,156 26,619 6,537 - 33,156
Trade payables 26,497 26,497 - - 26,497
Lease liabilities 41,870 10,577 29,372 1,921 41,870
Other liabilities 23,126 18,527 4,599 - 23,126
Particulars
As at March 31, 2019
Contractual cash flows
Carrying valueLess than
1 year1-5 years
More than 5 years
Total
Borrowings 25,781 15,560 10,221 - 25,781
Trade payables 30,095 30,095 - - 30,095
Other liabilities 31,435 27,278 4,157 - 31,436
27 Capital management
The Company manages its capital to ensure that it will be able to continue as going concern while maximizing the return to stakeholders through the optimisation of the debt and equity balance. The capital structure of the Company consists of net debt (borrowings as detailed in notes 12 (a) & 12 (b) and 6 (d) offset by cash and bank balances) and total equity of the Company. The Company is not subject to any externally imposed capital requirements. The Company’s risk management committee reviews the capital structure of the Company on an ongoing basis. As part of this review, the committee considers the cost of capital and the risks associated with each class of capital. In order to maintain or adjust the capital structure, the company may adjust the amount of dividends paid to shareholders, return capital to shareholders or issue new shares.
The Company’s capital comprises equity share capital, share premium, retained earnings and other equity attributable to equity holders.
No changes were made in the objectives, policies or processes for managing capital of the Company during the current and previous year.
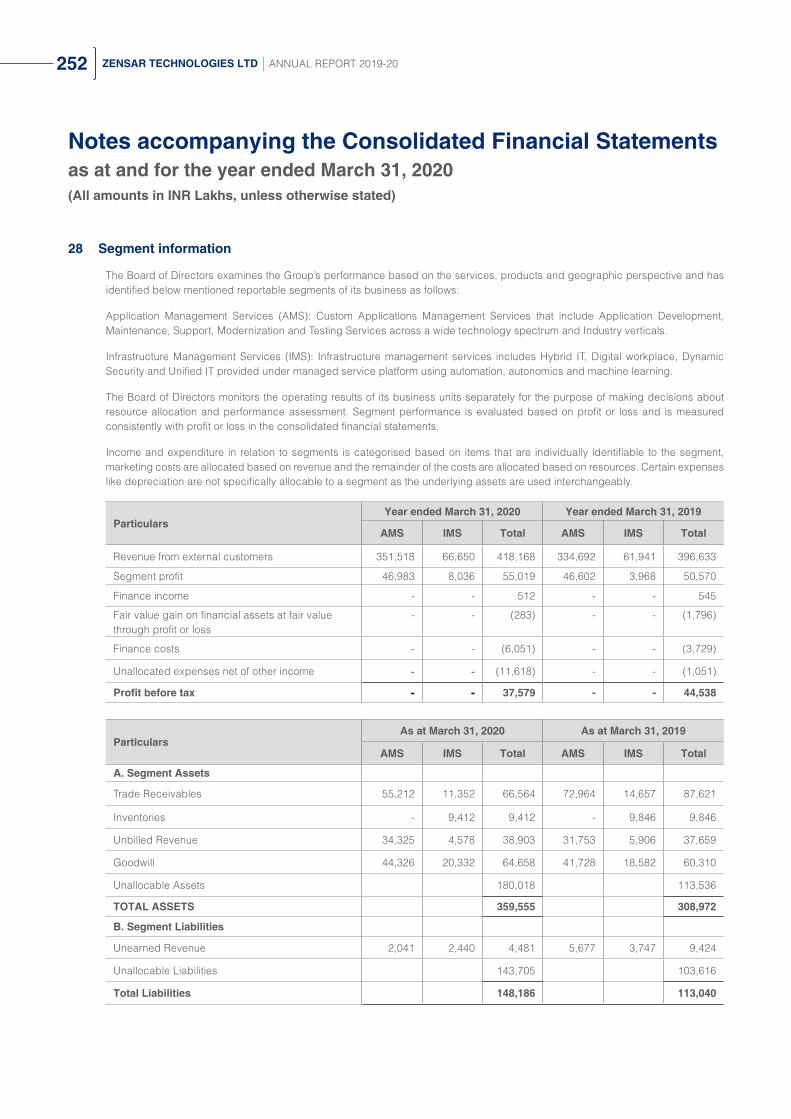
Notes accompanying the Consolidated Financial Statementsas at and for the year ended March 31, 2020(All amounts in INR Lakhs, unless otherwise stated)
252 ZENSAR TECHNOLOGIES LTD ANNUAL REPORT 2019-20
28 Segment information
The Board of Directors examines the Group’s performance based on the services, products and geographic perspective and has identified below mentioned reportable segments of its business as follows:
Application Management Services (AMS): Custom Applications Management Services that include Application Development, Maintenance, Support, Modernization and Testing Services across a wide technology spectrum and Industry verticals.
Infrastructure Management Services (IMS): Infrastructure management services includes Hybrid IT, Digital workplace, Dynamic Security and Unified IT provided under managed service platform using automation, autonomics and machine learning.
The Board of Directors monitors the operating results of its business units separately for the purpose of making decisions about resource allocation and performance assessment. Segment performance is evaluated based on profit or loss and is measured consistently with profit or loss in the consolidated financial statements.
Income and expenditure in relation to segments is categorised based on items that are individually identifiable to the segment, marketing costs are allocated based on revenue and the remainder of the costs are allocated based on resources. Certain expenses like depreciation are not specifically allocable to a segment as the underlying assets are used interchangeably.
ParticularsYear ended March 31, 2020 Year ended March 31, 2019
AMS IMS Total AMS IMS Total
Revenue from external customers 351,518 66,650 418,168 334,692 61,941 396,633
Segment profit 46,983 8,036 55,019 46,602 3,968 50,570
Finance income - - 512 - - 545
Fair value gain on financial assets at fair value through profit or loss
- - (283) - - (1,796)
Finance costs - - (6,051) - - (3,729)
Unallocated expenses net of other income - - (11,618) - - (1,051)
Profit before tax - - 37,579 - - 44,538
ParticularsAs at March 31, 2020 As at March 31, 2019
AMS IMS Total AMS IMS Total
A. Segment Assets
Trade Receivables 55,212 11,352 66,564 72,964 14,657 87,621
Inventories - 9,412 9,412 - 9,846 9,846
Unbilled Revenue 34,325 4,578 38,903 31,753 5,906 37,659
Goodwill 44,326 20,332 64,658 41,728 18,582 60,310
Unallocable Assets 180,018 113,536
TOTAL ASSETS 359,555 308,972
B. Segment Liabilities
Unearned Revenue 2,041 2,440 4,481 5,677 3,747 9,424
Unallocable Liabilities 143,705 103,616
Total Liabilities 148,186 113,040

Notes accompanying the Consolidated Financial Statementsas at and for the year ended March 31, 2020(All amounts in INR Lakhs, unless otherwise stated)
253BALANCE SHEET AND PROFIT AND LOSS FINANCIAL STATEMENTS
Finance income and costs, and fair value gains and losses on financial assets are not allocated to individual segments as the underlying instruments are managed at group basis. Also, Current tax, deferred taxes are not allocated to those segments as they are also managed on a group basis.
Geographical information on revenue and business segment revenue information is collated based on individual customers invoiced or in relation to which the revenue is otherwise recognised.
Revenue from external customersYear ended
31 March, 2020Year ended
31 March, 2019
Americas 307,023 298,137
United Kingdom 66,301 56,850
Rest of the World 44,844 41,646
Total 418,168 396,633
Revenue of INR. 105,879 lakhs (March 31, 2019 INR. 1,00,500 lakhs) are derived from single external customer. These revenues are attributed to the AMS and IMS segment.
Management believes that currently it is not practicable to provide disclosures of assets by geographical location, as meaningful segregation of the available information is onerous.

Notes accompanying the Consolidated Financial Statementsas at and for the year ended March 31, 2020(All amounts in INR Lakhs, unless otherwise stated)
254 ZENSAR TECHNOLOGIES LTD ANNUAL REPORT 2019-20
29 Group Structure
(a) Subsidiaries
Group’s subsidiaries which are considered for consolidation are set below. Unless otherwise stated, they have share capital consisting solely of equity shares that are held directly by the Group, and the proportion of ownership interests held equals the voting rights held by the Group. The country of incorporation or registration is also their principal place of business.
Name of Entity CountryProportion of Ownership interest
As at March 31, 2020
As at March 31, 2019
Zensar Technologies (Singapore) Pte. Limited
Singapore
100 100
Zensar Info Technologies (Singapore) Pte. Limited (refer note (i)) 100 100
Foolproof (SG) Pte Limited 100 100
Zensar (Africa) Holdings Proprietary LimitedSouth Africa
100 100
Zensar (South Africa) Proprietary Limited 75 75
Zensar Technologies (Shanghai) Company Limited (refer note (ii)) China 100 100
Zensar Technologies (UK) Limited
United Kingdom
100 100
Foolproof Limited 100 100
Knit Limited (refer note (iii)) 100 100
Zensar Technologies, Inc.
United States of America
100 100
PSI Holding Group, Inc. 100 100
Zensar Technologies IM, Inc. 100 100
Keystone Logic Inc. 100 100
Cynosure Inc (refer note (v)) 100 100
Indigo Slate Inc (refer note (vi)) 100 100
Professional Access Limited 100 100
Aquila Technology Corp note (ix) note (ix)
Keystone Logic Mexico, S. DE R.L. DE C.V (refer note (iv))Mexico
100 100
Keystone Technologies Mexico, S. DE R.L. DE C.V (refer note (iv)) 100 100
Cynosure APAC Pty Ltd (refer note (viii)) Australia - 100
Zensar Technologies IM B.V. Netherlands 100 100
Cynosure Interface Services Private Limited (refer note (v)) India 100 100
Zensar IT Services Limited India note (x) note (x)
Zensar Technologies (Canada) Inc (refer note (vii)) Canada 100 -
Zensar Technologies GmbH (refer note (vii)) Germany 100 -
Notes:
(i) Zensar Info Technologies (Singapore) Pte. Limited has applied for voluntary liquidation during the year ended March 31, 2020.
(ii) Zensar Technologies (Shanghai) Company Limited has applied for voluntary liquidation during the year ended March 31, 2020.
(iii) KNIT Limited has applied for voluntary liquidation during the year ended March 31, 2020.
(iv) During FY 2018-19, 2 100% subsidiaries in Mexico namely Keystone Logic Mexico, S. DE R.L. DE C.V and Keystone Technologies Mexico, S. DE R.L. DE C.V were incorporated.
(v) Refer Note 34 (a) (i)

Notes accompanying the Consolidated Financial Statementsas at and for the year ended March 31, 2020(All amounts in INR Lakhs, unless otherwise stated)
255BALANCE SHEET AND PROFIT AND LOSS FINANCIAL STATEMENTS
(vi) Refer Note 34 (a) (ii)
(vii) During the year ended March 31, 2020, a 100% subsidiary in Canada and Germany namely Zensar Technologies Canada Inc and Zensar Technologies GmbH respectively were incorporated.
(viii) Cynosure APAC Pty Ltd was voluntary liquidated during the year ended March 31, 2020.
(ix) Aquila Technology Corp (Aquila) was acquired by Zensar Technologies Inc. as part of the group acquisition of PSI Holding Group Inc (PSI) in 2010. A service agreement between Aquila and a customer of Aquila required independence, separation of its operations and lack of interdependence of Aquila on its related affiliates/parent. Accordingly, this led to loss of control over Aquila for the Group as the Group has no ability to direct the relevant activities of and exercise control over Aquila. Therefore, Aquila is not considered as a subsidiary of the group within the definition prescribed under Ind AS 110 and hence not consolidated by the Group.
(x) Zensar IT Services Limited was incorporated in FY 2017-18, but operations were not commenced. Application for voluntary liquidation has been filed.
(b) Non-controlling interests (NCI)
Summarised financial information for Zensar (South Africa) Proprietary Limited, where there is non-controlling interests. The amount disclosed below are before inter-company eliminations
Summarised Balance sheetAs at
31 March, 2020As at
31 March, 2019
Current assets 16,512 14,863
Current liabilities 12,285 13,121
Net current assets 4,227 1,742
Non-current assets 482 2,603
Non-current liabilities 17 -
Net non-current assets 465 2,603
Net assets 4,692 4,345
Accumulated NCI 2,370 1,696
Summarised statement of profit and lossYear ended
31 March, 2020 Year ended
31 March, 2019
Revenue 39,297 30,923
Profit for the year 3,273 2,022
Other comprehensive income (580) 701
Total Comprehensive income 2,693 2,723
Profit allocated to NCI 818 506
Summarised cash flowsYear ended
31 March, 2020 Year ended
31 March, 2019
Net cash inflow/(outflow) 1,009 (671)

Notes accompanying the Consolidated Financial Statementsas at and for the year ended March 31, 2020(All amounts in INR Lakhs, unless otherwise stated)
256 ZENSAR TECHNOLOGIES LTD ANNUAL REPORT 2019-20
30 Goodwill
Goodwill is tested for impairment atleast on an annual basis. For the purpose of impairment testing, goodwill is allocated to a Cash Generated Unit (CGU) or group of CGUs expected to benefit from the synergies arising from the business combinations. A CGU is the smallest identifiable group of assets that generates cash inflows that are largely independent of the cash inflows from other assets or group of assets.
Goodwill has been allocated to the following operating segment:
ParticularsAs at
31 March, 2020As at
31 March, 2019
Infrastructure Management Services (IMS) 20,332 18,582
Application Management Services (AMS) 44,326 41,728
Total 64,658 60,310
Goodwill and other Intangible Assets with respect to IMS and AMS operating segment acquired through acquisitions is further allocated to identified CGU as provided below.
CGU Amount of Goodwill allocated
HiTech and Manufacturing 6,105
Retail Consumer Services 19,361
Cloud and Infrastructure management Services 14,301
Multi-Vendor services 6,020
Financial services 11,784
Foolproof 7,087
The carrying amount was computed by allocating the net assets to operating segments for the purpose of impairment testing. The recoverable amount is computed based on value-in-use method using a forecast period of 5 years. The value-in-use of respective CGU is based on the future cash flows using discount rate range of 8.5-12.8% and 1.50% annual revenue growth rate for periods subsequent to the forecast period of 5 years.
Previous year, the CGU’s were predominantly at the entity level and during the year ended on March 31, 2020, the group has realigned its CGUs in line with change in its business environment and synergies available through its integrated global service offerings.
Goodwill movement is given below:
ParticularsAs at
31 March, 2020As at
31 March, 2019
As on March 31, 2019 60,310 42,234
Add: Addition on acquisition (refer note 34) - 15,820
Add: Translation difference 4,348 2,256
As on March 31, 2020 64,658 60,310 In respect of above, no impairment was identified as of March 31, 2020 and March 31, 2019 as the recoverable value of the CGUs exceeded the carrying value. Further, an analysis of the calculation’s sensitivity to a change in the key parameters based on reasonably probable assumptions, did not identify any probable scenarios where the CGU’s recoverable amount would fall below its carrying amounts.
Further, due to increase in economic uncertainties due to COVID-19, Group relooked at its sensitivity analysis of the key assumptions used in the projections and basis the current estimates, is of the view that there are no scenarios which warrant impairment of goodwill related to any CGU.

Notes accompanying the Consolidated Financial Statementsas at and for the year ended March 31, 2020(All amounts in INR Lakhs, unless otherwise stated)
257BALANCE SHEET AND PROFIT AND LOSS FINANCIAL STATEMENTS
31 Contingent liabilities
ParticularsAs at
31 March, 2020As at
31 March, 2019
(a) Income Tax:
Matters decided in favour of the Company by appellate authorities, where the Income Tax Department is in further appeal
751 986
Matters on which the Company is in appeal 1,863 1,426
(b) Sales Tax / Value Added Tax:
Claims against Group regarding sales tax against which Group has preferred appeals
1,667 272
(c)Claims against Group regarding service tax against which Group has preferred appeal
21 11
(d) Claims against the Company not acknowledged as debts 1,652 1,603
(e) Corporate Guarantees given 22,563 24,896
(f) Bank Guarantees 1,837 1,893
(g) Letter of credit - 111
32 Disclosures with respect to Capital expenditure and Leases
(a) Capital expenditure contracted but not recognised as liability is as follows:
ParticularsAs at
31 March, 2020As at
31 March, 2019
Property plant and equipments 720 218
Intangible assets 7 56
(b) The details of the right-of-use asset held by the Group are as follows:
Particulars Additions for FY 2019-20 As at March 31, 2020 Depreciation charge for FY 2019-20
Leasehold land - 201 2
Buildings/Office premises 13,155 32,196 5,389
Data Processing Equipments - 252 237
Total 13,155 32,649 5,628
Interest expense on lease liabilities is INR. 2,851 lakhs for year ended March 31, 2020.
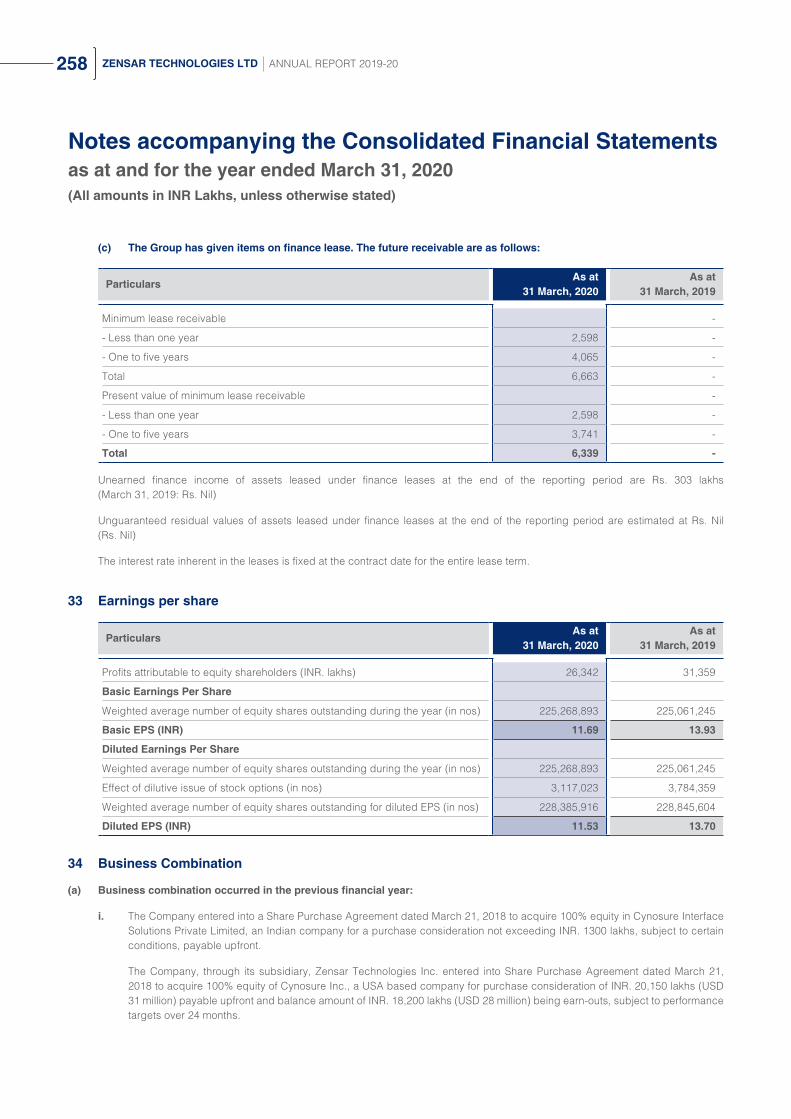
Notes accompanying the Consolidated Financial Statementsas at and for the year ended March 31, 2020(All amounts in INR Lakhs, unless otherwise stated)
258 ZENSAR TECHNOLOGIES LTD ANNUAL REPORT 2019-20
(c) The Group has given items on finance lease. The future receivable are as follows:
ParticularsAs at
31 March, 2020As at
31 March, 2019
Minimum lease receivable -
- Less than one year 2,598 -
- One to five years 4,065 -
Total 6,663 -
Present value of minimum lease receivable -
- Less than one year 2,598 -
- One to five years 3,741 -
Total 6,339 -
Unearned finance income of assets leased under finance leases at the end of the reporting period are Rs. 303 lakhs (March 31, 2019: Rs. Nil)
Unguaranteed residual values of assets leased under finance leases at the end of the reporting period are estimated at Rs. Nil (Rs. Nil)
The interest rate inherent in the leases is fixed at the contract date for the entire lease term.
33 Earnings per share
ParticularsAs at
31 March, 2020As at
31 March, 2019
Profits attributable to equity shareholders (INR. lakhs) 26,342 31,359
Basic Earnings Per Share
Weighted average number of equity shares outstanding during the year (in nos) 225,268,893 225,061,245
Basic EPS (INR) 11.69 13.93
Diluted Earnings Per Share
Weighted average number of equity shares outstanding during the year (in nos) 225,268,893 225,061,245
Effect of dilutive issue of stock options (in nos) 3,117,023 3,784,359
Weighted average number of equity shares outstanding for diluted EPS (in nos) 228,385,916 228,845,604
Diluted EPS (INR) 11.53 13.70
34 Business Combination
(a) Business combination occurred in the previous financial year:
i. The Company entered into a Share Purchase Agreement dated March 21, 2018 to acquire 100% equity in Cynosure Interface Solutions Private Limited, an Indian company for a purchase consideration not exceeding INR. 1300 lakhs, subject to certain conditions, payable upfront.
The Company, through its subsidiary, Zensar Technologies Inc. entered into Share Purchase Agreement dated March 21, 2018 to acquire 100% equity of Cynosure Inc., a USA based company for purchase consideration of INR. 20,150 lakhs (USD 31 million) payable upfront and balance amount of INR. 18,200 lakhs (USD 28 million) being earn-outs, subject to performance targets over 24 months.

Notes accompanying the Consolidated Financial Statementsas at and for the year ended March 31, 2020(All amounts in INR Lakhs, unless otherwise stated)
259BALANCE SHEET AND PROFIT AND LOSS FINANCIAL STATEMENTS
The above-mentioned acquisitions have been consummated in April 2018.
The results for the year ended March 31, 2019 include results of above mentioned acquisitions (Revenue from operations of INR. 17,512 lakhs & Profit before tax of INR. 4,580 lakhs).
Details of purchase consideration, assets and liabilities recognised and goodwill are as follows:
Particulars Fair Value
Cash paid 22,455
Total purchase consideration 22,455
Assets and liabilities recognised as a result of acquisition are as follows:
Intangible asset- Non compete agreements 614
Intangible asset- Customer relationship 7,339
Intangible asset- Brand 1,900
Other net assets 2,317
Net identifiable assets acquired 12,170
Goodwill 10,285
ii. The Company, through its subsidiary, Zensar Technologies Inc. entered into a Share Purchase Agreement dated July 27, 2018 to acquire 100% equity in Indigo Slate, Inc (“Indigo Slate”), a USA based company for purchase consideration of INR. 12,348 lakhs (USD 18 million) payable upfront and deferred consideration of an amount upto INR. 18,522 lakhs (USD 27 million), subject to performance targets over 36 months.
The above-mentioned acquisition has been consummated in August 2018. Also refer note 38 below.
The results for the year ended March 31, 2019 include the results of Indigo Slate (Revenue from operations of INR. 12,189 lakhs & Profit before tax of INR. 2,041 lakhs).
Details of the purchase consideration, assets and liabilities recognised and goodwill are as follows:
Particulars Fair Value
Cash paid 11,716
Contingent consideration 5,811
Total purchase consideration 17,527
Assets and liabilities recognised as a result of acquisition are as follows:
Intangible asset- Non compete agreements 501
Intangible asset- Customer relationship 11,416
Other net assets 75
Net identifiable assets acquired 11,993
Goodwill 5,535
If the above mentioned acquisition was consummated on April 1, 2018, the consolidated revenue from operations for the year ended March 31, 2019 would have been INR. 402,119 lakhs & consolidated profit before tax for the year ended March 31, 2019 would have been INR. 31,762 lakhs.
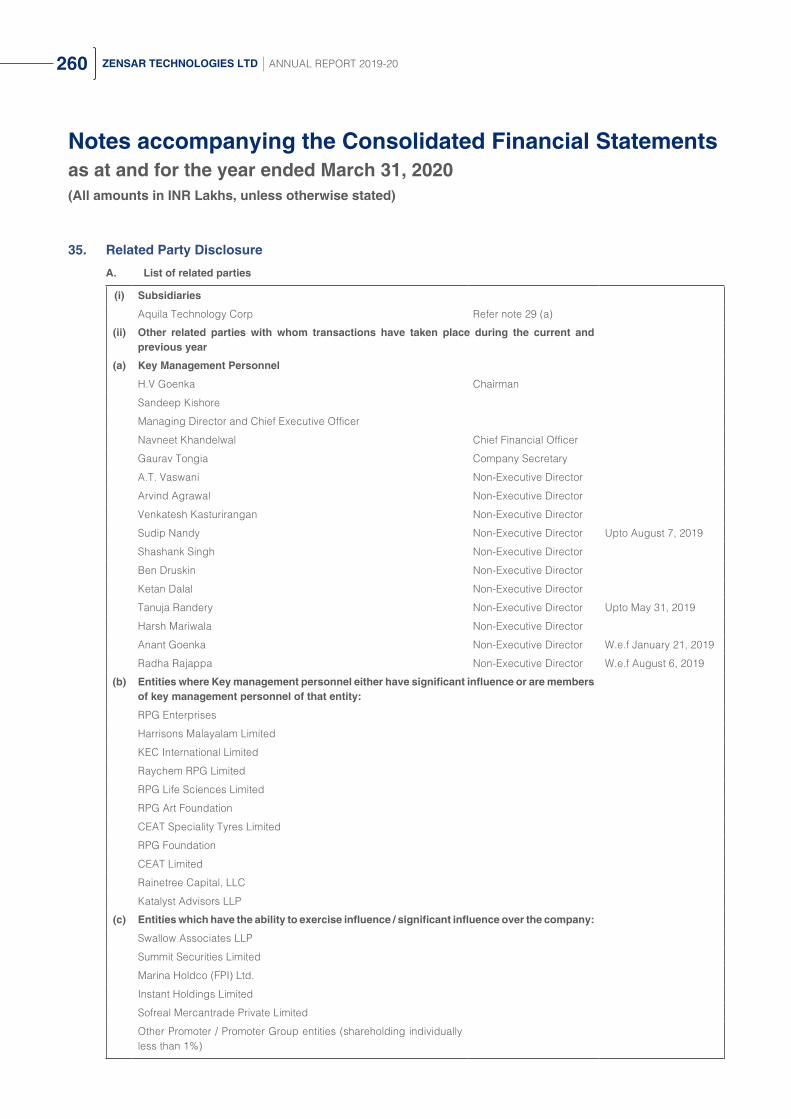
Notes accompanying the Consolidated Financial Statementsas at and for the year ended March 31, 2020(All amounts in INR Lakhs, unless otherwise stated)
260 ZENSAR TECHNOLOGIES LTD ANNUAL REPORT 2019-20
35. Related Party Disclosure
A. List of related parties
(i) Subsidiaries
Aquila Technology Corp Refer note 29 (a)
(ii) Other related parties with whom transactions have taken place during the current and previous year
(a) Key Management Personnel
H.V Goenka Chairman
Sandeep Kishore
Managing Director and Chief Executive Officer
Navneet Khandelwal Chief Financial Officer
Gaurav Tongia Company Secretary
A.T. Vaswani Non-Executive Director
Arvind Agrawal Non-Executive Director
Venkatesh Kasturirangan Non-Executive Director
Sudip Nandy Non-Executive Director Upto August 7, 2019
Shashank Singh Non-Executive Director
Ben Druskin Non-Executive Director
Ketan Dalal Non-Executive Director
Tanuja Randery Non-Executive Director Upto May 31, 2019
Harsh Mariwala Non-Executive Director
Anant Goenka Non-Executive Director W.e.f January 21, 2019
Radha Rajappa Non-Executive Director W.e.f August 6, 2019
(b) Entities where Key management personnel either have significant influence or are members of key management personnel of that entity:
RPG Enterprises
Harrisons Malayalam Limited
KEC International Limited
Raychem RPG Limited
RPG Life Sciences Limited
RPG Art Foundation
CEAT Speciality Tyres Limited
RPG Foundation
CEAT Limited
Rainetree Capital, LLC
Katalyst Advisors LLP
(c) Entities which have the ability to exercise influence / significant influence over the company:
Swallow Associates LLP
Summit Securities Limited
Marina Holdco (FPI) Ltd.
Instant Holdings Limited
Sofreal Mercantrade Private Limited
Other Promoter / Promoter Group entities (shareholding individually less than 1%)

Notes accompanying the Consolidated Financial Statementsas at and for the year ended March 31, 2020(All amounts in INR Lakhs, unless otherwise stated)
261BALANCE SHEET AND PROFIT AND LOSS FINANCIAL STATEMENTS
(d) Post employment benefit plans#:
Zensar PF Trust
Zensar Gratuity trust
Zensar Superannuation Trust
# refer note 15 for information on transactions with post-retirement plans mentioned above
B. Transactions along with outstanding balances with the related parties:
Sr. No. Particulars
Transactions during year ended Amount outstanding as at
March 31, 2020
March 31, 2019
March 31, 2020 Receivable /
(Payable)
March 31, 2019 Receivable /
(Payable)
A. Revenue from rendering services
(i) RPG Life Sciences Limited 1 25 5 5
(ii) RPG Enterprises 552 363 2 15
(iii) CEAT Limited - - - 3
(iv) Harrisons Malayalam Limited - - 5 5
Total - Revenue from rendering services 553 388 12 28
B. Other Income / (expenses)
(i) KEC International Limited - - - 0
(ii) CEAT Limited 8 8 5 -
(iii) RPG Enterprises (1,995) (1,755) (209) (108)
(iv) Katalyst Advisors LLP (6) - - -
(v) Rainetree Capital, LLC 88 - - -
Total - Other Income/ (expenses) (1,905) (1,747) (204) (108)
C. Reimbursements to /(by) the company [net]
(i) Aquila Technology Corp 6 9 24 83
(ii) Raychem RPG Limited 1 - 1 -
(iii) Harrison Malayalam Limited (1) - - -
(iv) Sudip Nandy (1) - - -
(v) Ben Druskin (11) (8) - -
(vi) Venkatesh Kasturirangan (3) (7) - -
Total - Reimbursements to /(by) the company [net] (9) (6) 25 83
D. Dividend on Equity Shares Paid
(i) Swallow Associates LLP 2,786 1,453 - -
(ii) Summit Securities Limited 1,142 592 - -
(iii) Instant Holdings Limited 865 449 - -
(iv) Sofreal Mercantrade Private Limited 266 136 - -
(v) H.V Goenka 7 4 - -
(vi) Anant Goenka 0 - - -

Notes accompanying the Consolidated Financial Statementsas at and for the year ended March 31, 2020(All amounts in INR Lakhs, unless otherwise stated)
262 ZENSAR TECHNOLOGIES LTD ANNUAL REPORT 2019-20
Sr. No. Particulars
Transactions during year ended Amount outstanding as at
March 31, 2020
March 31, 2019
March 31, 2020 Receivable /
(Payable)
March 31, 2019 Receivable /
(Payable)
(vii) A.T. Vaswani 2 1 - -
(viii) Harsh Mariwala 1 - - -
(ix) Marina Holdco (FPI) Ltd. 2,369 1,236 - -
(x) Other Promoter / Promoter Group entities 15 5 - -
Total - Dividend on Equity Shares paid 7,453 3,876 - -
E. Donations
(i) RPG Art Foundation - 15 - -
(ii) RPG Foundation 530 419 - -
(iii) Zensar Foundation 63 -
Total – Donations 593 434 - -
F Directors Fees and Commission paid**
(i) H.V Goenka 230 201 - (225)
(ii) A.T. Vaswani 18 18 (8) (8)
(iii) Arvind Agrawal 15 14 (8) (8)
(iv) Venkatesh Kasturirangan 12 13 (8) (8)
(v) Sudip Nandy 11 16 (4) (8)
(vi) Shashank Singh ## 16 16 (8) (8)
(vii) Ben Druskin 5 5 - -
(viii) Ketan Dalal 14 10 (8) (8)
(ix) Tanuja Randery 8 7 (1) (8)
(x) Harsh Mariwala 11 8 (8) (8)
(xi) Anant Goenka 7 2 (8) (2)
(xii) Radha Rajappa 4 - (6) -
Total - Directors Fees and Commission paid 351 310 (67) (294)
G Compensation of Key management personnel # Sandeep Kishore Gaurav Tongia Navneet Khandelwal
Short Term Benefits 1,000 [961]
57 [48]
151 [142]
Post-Employment Benefits 2 [2]
2 [2]
6 [4]
Long-term Employee benefits - [-]
- [-]
- [-]
Perquisites value of Employee Stock options - [-]
- [-]
- [-]
Total - Compensation of Key management personnel 1,002 [963]
59 [50]
157 [146]
Outstanding amounts * 2,031 [1,778]
- [-]
100 [51]
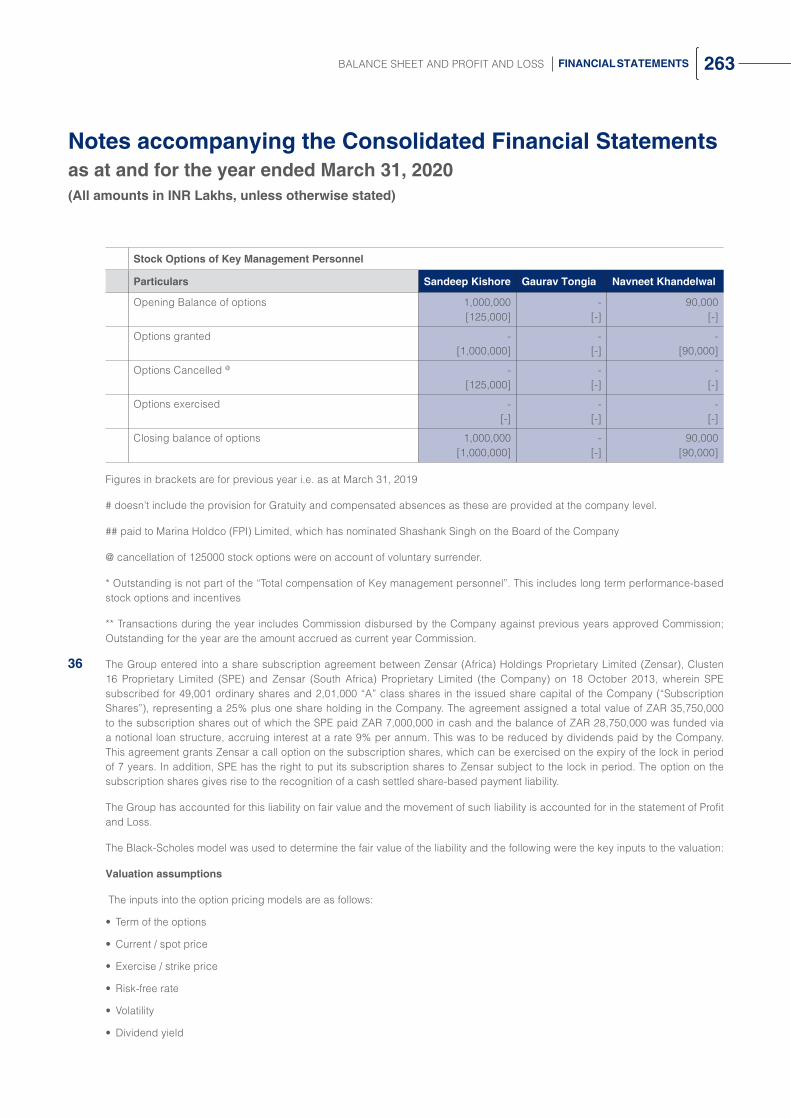
Notes accompanying the Consolidated Financial Statementsas at and for the year ended March 31, 2020(All amounts in INR Lakhs, unless otherwise stated)
263BALANCE SHEET AND PROFIT AND LOSS FINANCIAL STATEMENTS
Stock Options of Key Management Personnel
Particulars Sandeep Kishore Gaurav Tongia Navneet Khandelwal
Opening Balance of options 1,000,000 [125,000]
- [-]
90,000 [-]
Options granted - [1,000,000]
- [-]
- [90,000]
Options Cancelled @ - [125,000]
- [-]
- [-]
Options exercised - [-]
- [-]
- [-]
Closing balance of options 1,000,000 [1,000,000]
- [-]
90,000 [90,000]
Figures in brackets are for previous year i.e. as at March 31, 2019
# doesn’t include the provision for Gratuity and compensated absences as these are provided at the company level.
## paid to Marina Holdco (FPI) Limited, which has nominated Shashank Singh on the Board of the Company
@ cancellation of 125000 stock options were on account of voluntary surrender.
* Outstanding is not part of the “Total compensation of Key management personnel”. This includes long term performance-based stock options and incentives
** Transactions during the year includes Commission disbursed by the Company against previous years approved Commission; Outstanding for the year are the amount accrued as current year Commission.
36 The Group entered into a share subscription agreement between Zensar (Africa) Holdings Proprietary Limited (Zensar), Clusten 16 Proprietary Limited (SPE) and Zensar (South Africa) Proprietary Limited (the Company) on 18 October 2013, wherein SPE subscribed for 49,001 ordinary shares and 2,01,000 “A” class shares in the issued share capital of the Company (“Subscription Shares”), representing a 25% plus one share holding in the Company. The agreement assigned a total value of ZAR 35,750,000 to the subscription shares out of which the SPE paid ZAR 7,000,000 in cash and the balance of ZAR 28,750,000 was funded via a notional loan structure, accruing interest at a rate 9% per annum. This was to be reduced by dividends paid by the Company. This agreement grants Zensar a call option on the subscription shares, which can be exercised on the expiry of the lock in period of 7 years. In addition, SPE has the right to put its subscription shares to Zensar subject to the lock in period. The option on the subscription shares gives rise to the recognition of a cash settled share-based payment liability.
The Group has accounted for this liability on fair value and the movement of such liability is accounted for in the statement of Profit and Loss.
The Black-Scholes model was used to determine the fair value of the liability and the following were the key inputs to the valuation:
Valuation assumptions
The inputs into the option pricing models are as follows:
• Term of the options
• Current / spot price
• Exercise / strike price
• Risk-free rate
• Volatility
• Dividend yield

Notes accompanying the Consolidated Financial Statementsas at and for the year ended March 31, 2020(All amounts in INR Lakhs, unless otherwise stated)
264 ZENSAR TECHNOLOGIES LTD ANNUAL REPORT 2019-20
37 The Group, during the previous year
• sold100%ofitsequitystakeinZensarInformationTechnologiesLimitedandZensarSoftwareTechnologiesLimitedforasale consideration of INR. 485 lakhs and INR. 436 lakhs, respectively, receivable upfront and deferred consideration of an amount upto INR. 265 lakhs and INR. 349 lakhs respectively, subject to realisation of trade receivables over a period of 1 year.
• enteredintoabusinesstransferagreementtotransfercertaincustomercontractsandemployeesrelatedliabilityforasaleconsideration of INR. 853 lakhs (USD 1.2 million) receivable upfront and deferred consideration of an amount upto INR. 930 lakhs (USD 1.3 million) subject to novation of customer contracts over a period of 6 months.
Accordingly, aggregated gain of Rs. 1,941 lakhs on the above mentioned transactions was recognised under Other income during the year ended March, 31 2019.
38 During the current year ended March 31, 2020, Group reversed contingent consideration payable on business combinations consummated in previous year amounting to INR. 2,568 lakhs [USD 3.6 million] based on company’s assessment, being no longer payable. This reversal is accounted under other income.
39 Share based payments
(a) Employee Stock Option Plan, 2002 (2002 ESOP) and Employee Stock Option Plan, 2006 (2006 ESOP)
Under the 2002 ESOP and 2006 ESOP schemes, participants are granted options which vest equally over a period of 5 years from the date of grant. Participation in the plan is at the discretion of the Nomination and Remuneration Committee (NRC) and no individual has a contractual right to participate in the plan or to receive any guaranteed benefits.
- The exercise price is determined based on the market price, being the closing price of the share on the stock exchange with higher trading volume on the day preceding the day of the grant of options. The scheme allows the NRC to set the exercise price at a premium or discount not exceeding 20% on the market price.
- The options remain exercisable for 10 years from the date of vesting and lapse if they remain unexercised during this period.
- Options granted carry no dividend or voting rights. When exercisable, each option is convertible into one equity share.
Stock option activity under the “2002 ESOP” scheme is as follows:
Particulars
2019 - 2020 2018 - 2019
Number of options
Weighted average exercise price per
option (INR.)
Number of options
Weighted average
exercise price per option
(INR)
Outstanding at the beginning of the year 52,335 17.00 105,710 81.96
Granted during the year - - - -
Cancelled during the year 1,750 13.60 8,500 15.97
Exercised during the year 22,000 18.83 40,750 26.94
Lapsed during the year 250 17.60 4,125 -
Outstanding at the end of the year 28,335 15.28 52,335 17.00
Vested and Exercisable at the year end 28,335 - 52,335 -

Notes accompanying the Consolidated Financial Statementsas at and for the year ended March 31, 2020(All amounts in INR Lakhs, unless otherwise stated)
265BALANCE SHEET AND PROFIT AND LOSS FINANCIAL STATEMENTS
Stock option activity under the “2006 ESOP” scheme is as follows:
Particulars
2019 - 2020 2018 - 2019
Number of options
Weighted average exercise price per
option (INR.)
Number of options
Weighted average
exercise price per option
(INR.)
Outstanding at the beginning of the year 1,089,700 85.00 1,473,900 448.99
Granted during the year - - - -
Cancelled during the year 19,340 117.41 190,470 128.00
Exercised during the year 210,050 70.67 193,730 99.00
Lapsed during the year - - - -
Outstanding at the end of the year 860,310 87.16 1,089,700 85.00
Vested and Exercisable at the year end 800,310 - 918,700 -
(b) Employee Performance Award Unit Plan, 2016 (EPAU 2016)
Vesting would happen on or after 1 (one) year but not later than 5 (five) years from the date of grant of such PAUs or any other period as may be determined by the Nomination and Remuneration Committee (the Committee) and is subject to achievement of performance targets, set out in the Grant letter and/or the Scheme/prescribed by the Committee.
The exercise price is INR. 2 per unit and all vested units need to be exercised at any time within the period determined by the Committee from time to time, subject to a maximum period of two and half months from the end of calendar year in which vesting happens for the respective PAUs.
Particulars
2019 - 2020 2018 - 2019
Number of options
Weighted average exercise price per
option (INR.)
Number of options
Weighted average
exercise price per option
(INR.)
Outstanding at the beginning of the year 3,045,805 2 1,527,525 2
Granted during the year 285,000 2 3,055,805 2
Cancelled during the year 711,805 2 1,537,525 2
Exercised during the year - - - -
Lapsed during the year - - - -
Outstanding at the end of the year 2,619,000 2 3,045,805 2
Vested and Exercisable - - - -

Notes accompanying the Consolidated Financial Statementsas at and for the year ended March 31, 2020(All amounts in INR Lakhs, unless otherwise stated)
266 ZENSAR TECHNOLOGIES LTD ANNUAL REPORT 2019-20
(c) Share options outstanding at the end of the year have the following expiry dates and exercise prices:
Share based payment scheme
Grant yearRange of exercise prices
Expiry yearShare options as at
31 March, 2020 31 March, 2019
2006 ESOP
FY 2006-2009 10 - 30 FY 2022-2024 4,990 2,000
FY 2010-2013 10 - 55 FY 2025-2028 543,470 379,120
FY 2014-2017 50 - 220 FY 2029-2032 311,850 708,580
Weighted average remaining contractual life of options outstanding at the end of the year
6.76 years 7.74 years
2002 ESOP FY 2002-2005 6 - 16 FY 2018-2020 - -
FY 2006-2009 12 - 20 FY 2021-2024 28,335 52,335
Weighted average remaining contractual life of options outstanding at the end of the year
1.23 years 1.77 years
EPAU 2016FY 2016-2017 2 FY 2020-2023 9,000 15,000
FY 2017-2018 2 FY 2021-2023 2,610,000 3,030,805
Weighted average remaining contractual life of options outstanding at the end of the year
1.95 years 2.95 years
(d) Fair value of options granted
The fair value of the options at the grant date is determined using Black Scholes Model which takes into account the exercise price, the term of the option, the share price at grant date, expected price volatility of the underlying share, the expected dividend yield and the risk free rate for the term of the option.
(e) The following tables illustrate the model inputs for options granted during the year ended March 31, 2020 and the resulting fair value of the options at the various grant dates:
Employee Performance Award Unit Plan, 2016 (EPAU 2016)
Particulars
Grant date
21-06-2019 29-04-2019
Vest 1 Vest 1
Expected Life (years) * 2.38 2.53
Volatility (%) ** 32.96 33.22
Risk free rate (%) 6.28 6.85
Exercise price (Rs.) 2 2
Dividend yield (%) 3.15 3.46
Fair value per vest 233.93 210
Vest % 100% 100%
Option fair value 233.93 210
* EPAU 2016 scheme allows for a maximum and minimum vesting of 70% and 40% on the first vesting date - 36 months after the date of grant and a maximum and minimum cumulative vesting of 220% and 100% at the final vesting date - 60 months from the date of grant depending upon the achievement of specified financial parameters. The expected life considered for valuation is based on management’s estimate of the timing and quantum of achievement of the financial parameters between the two specified vesting dates.
** The expected price volatility is based on the historic volatility (based on remaining life of the options), adjusted for any expected changes to future volatility due to publicly available information.

Notes accompanying the Consolidated Financial Statementsas at and for the year ended March 31, 2020(All amounts in INR Lakhs, unless otherwise stated)
267BALANCE SHEET AND PROFIT AND LOSS FINANCIAL STATEMENTS
40 Additional information required by Schedule III
Name of the Entity
Net Asset i.e., total assets minus total
liabilitiesShare in profit/(loss)
Share in other comprehensive income/(loss)
Share in total comprehensive income/(loss)
As % of consoli-
dated net assets
Amount
As % of consolidat-ed profit or
loss
Amount
As % of Consolidat-
ed Other OCI
AmountAs % of
Consolidat-ed TCI
Amount
Parent
Zensar Technologies Limited
March 31, 2020 75.3% 157,367 87.7% 23,104 -486.0% (1,587) 80.7% 21,517
March 31, 2019 75.7% 147,083 82.3% 25,800 100.8% 538 82.6% 26,338
Subsidiaries
Zensar Technologies Inc.
March 31, 2020 19.2% 40,175 14.2% 3,735 1054.7% 3,444 26.9% 7,179
March 31, 2019 24.5% 47,496 13.0% 4,085 475.1% 2,538 20.8% 6,623
PSI Holding Group, Inc.
March 31, 2020 0.2% 414 0.0% (1) -32.1% (105) -0.4% (106)
March 31, 2019 1.4% 2,703 0.0% (7) 4.2% 22 0.0% 15
Zensar Technologies IM, Inc
March 31, 2020 10.0% 20,980 48.2% 12,688 418.9% 1,368 52.7% 14,056
March 31, 2019 3.1% 6,101 -9.4% (2,963) 99.5% 531 -7.6% (2,432)
Zensar Technologies IM, B.V.
March 31, 2020 1.2% 2,412 5.5% 1,444 39.1% 128 5.9% 1,572
March 31, 2019 1.0% 1,886 1.6% 492 -17.1% (91) 1.3% 401
Professional Access Limited
March 31, 2020 0.2% 361 1.1% 286 4.2% 14 1.1% 300
March 31, 2019 0.0% 61 -2.3% (725) 20.7% 111 -1.9% (614)
Zensar Technologies (Singapore) Pte Limited
March 31, 2020 0.1% 137 0.4% 103 1.6% 5 0.4% 108
March 31, 2019 0.0% 29 -0.6% (202) 8.5% 46 -0.5% (156)
Zensar Technologies (Shanghai) Company Limited
March 31, 2020 -0.1% (303) -0.3% (70) -3.8% (12) -0.3% (82)
March 31, 2019 -0.1% (223) -0.1% (27) -0.4% (2) -0.1% (29)
Zensar Technologies (UK) Limited
March 31, 2020 13.8% 28,871 22.6% 5,966 293.3% 957 26.0% 6,923
March 31, 2019 11.3% 21,942 21.5% 6,744 -58.3% (312) 20.2% 6,432
Foolproof Limited
March 31, 2020 0.0% (35) -2.5% (657) -1.3% (4) -2.5% (661)
March 31, 2019 0.3% 637 -0.9% (283) 14.0% 75 -0.7% (208)

Notes accompanying the Consolidated Financial Statementsas at and for the year ended March 31, 2020(All amounts in INR Lakhs, unless otherwise stated)
268 ZENSAR TECHNOLOGIES LTD ANNUAL REPORT 2019-20
Name of the Entity
Net Asset i.e., total assets minus total
liabilitiesShare in profit/(loss)
Share in other comprehensive income/(loss)
Share in total comprehensive income/(loss)
As % of consoli-
dated net assets
Amount
As % of consolidat-ed profit or
loss
Amount
As % of Consolidat-
ed Other OCI
AmountAs % of
Consolidat-ed TCI
Amount
Knit Ltd
March 31, 2020 0.0% 0 0.1% 16 -5.9% (19) 0.0% (3)
March 31, 2019 -0.3% (679) -0.1% (24) -11.1% (59) -0.3% (83)
Foolproof (SG) Pte Limited
March 31, 2020 0.1% 156 -0.3% (66) 1.3% 4 -0.2% (62)
March 31, 2019 0.1% 166 0.3% 107 0.4% 2 0.3% 109
Zensar (Africa) holdings (Pty) Limited
March 31, 2020 -0.8% (1,609) 7.3% 1,928 -126.2% (412) 5.7% 1,516
March 31, 2019 -0.6% (1,166) 3.0% 937 38.0% 203 3.6% 1,140
Zensar (South Africa) (Pty) Limited
March 31, 2020 1.1% 2,322 9.3% 2,455 93.9% 307 10.4% 2,762
March 31, 2019 2.2% 4,345 6.4% 2,022 -131.2% (701) 4.1% 1,321
Keystone logic Inc.
March 31, 2020 0.9% 1,910 4.9% 1,296 45.1% 147 5.4% 1,443
March 31, 2019 0.6% 1,178 1.0% 318 17.2% 92 1.3% 410
Zensar Information Technologies Limited
March 31, 2020 0.0% - 0.0% - 0.0% - 0.0% -
March 31, 2019 0.0% - 0.1% 40 0.0% - 0.1% 40
Zensar Software Technologies Limited
March 31, 2020 0.0% - 0.0% - 0.0% - 0.0% -
March 31, 2019 0.0% - 0.4% 115 0.0% - 0.4% 115
Zensar Info Technologies (Singapore) Pte. Limited
March 31, 2020 0.0% - -0.1% (34) -0.4% (1) -0.1% (35)
March 31, 2019 0.0% 35 0.0% (1) 0.0% 0 0.0% (1)
Cynosure APAC Pty. Ltd.
March 31, 2020 0.0% - -0.1% (21) 0.0% - -0.1% (21)
March 31, 2019 0.0% 21 -0.2% (52) 0.0% - -0.2% (52)
Indigo Slate Inc
March 31, 2020 0.1% 162 -5.6% (1,464) 15.2% 49 -5.3% (1,415)
March 31, 2019 0.8% 1,589 5.0% 1,559 -8.1% (43) 4.8% 1,516
Cynosure Inc
March 31, 2020 2.6% 5,350 5.9% 1,544 135.3% 442 7.4% 1,986
March 31, 2019 2.1% 4,089 6.7% 2,113 18.2% 97 6.9% 2,210
Cynosure Interface Services Private Limited
March 31, 2020 0.1% 160 0.3% 70 - - 0.3% 70
March 31, 2019 0.2% 330 0.7% 211 0.0% - 0.7% 211

Notes accompanying the Consolidated Financial Statementsas at and for the year ended March 31, 2020(All amounts in INR Lakhs, unless otherwise stated)
269BALANCE SHEET AND PROFIT AND LOSS FINANCIAL STATEMENTS
Name of the Entity
Net Asset i.e., total assets minus total
liabilitiesShare in profit/(loss)
Share in other comprehensive income/(loss)
Share in total comprehensive income/(loss)
As % of consoli-
dated net assets
Amount
As % of consolidat-ed profit or
loss
Amount
As % of Consolidat-
ed Other OCI
AmountAs % of
Consolidat-ed TCI
Amount
Keystone Logic Mexico, S. DE R.L. DE C.V
March 31, 2020 0.3% 692 2.5% 662 -36.6% (120) 2.0% 542
March 31, 2019 0.1% 150 0.4% 134 -0.2% (1) 0.4% 133
Keystone Technologies Mexico, S. DE R.L. DE C.V
March 31, 2020 0.0% 32 0.0% 10 - (4) 0.0% 6
March 31, 2019 0.0% 26 0.0% 8 0.1% 0 0.0% 8
Zensar IT Services Limited
March 31, 2020 0.0% - 0.0% - 0.0% - 0.0% -
March 31, 2019 0.0% - 0.0% - 0.0% - 0.0% -
Zensar Technologies (Canada) Inc
March 31, 2020 0.0% 48 0.0% 7 - 0 0.0% 7
March 31, 2019 N.A. N.A. N.A. N.A. N.A. N.A. N.A. N.A.
Zensar Technologies GmbH
March 31, 2020 0.0% - 0.0% - - - 0.0% -
March 31, 2019 N.A. N.A. N.A. N.A. N.A. N.A. N.A. N.A.
Adjustments arising out of consolidation
March 31, 2020 -24.2% (50,603) -101.2% (26,659) -1309.3% (4,275) -116.0% (30,934)
March 31, 2019 -22.4% (43,566) -28.8% (9,042) -470.4% (2,512) -36.2% (11,553)
Total
March 31, 2020 100.0% 208,999 100.0% 26,342 100.0% 326 100.0% 26,668
March 31, 2019 100.0% 194,236 100.0% 31,359 100.0% 534 100.0% 31,893
Non controlling Interest
Zensar (South Africa) (Pty) Limited
March 31, 2020 1.1% 2,370 3.0% 818 -85.5% (150) 2.4% 668
March 31, 2019 0.9% 1,696 1.6% 506 -48.7% (175) 1.0% 331
For and on behalf of the Board of Directors of Zensar Technologies Limited
H.V. Goenka Sandeep Kishore Chairman Managing Director and CEO
Navneet Khandelwal Gaurav Tongia Chief Financial Officer Company Secretary
Place: Mumbai Date: May 14, 2020

Notes accompanying the Consolidated Financial Statementsas at and for the year ended March 31, 2020(All amounts in INR Lakhs, unless otherwise stated)
270 ZENSAR TECHNOLOGIES LTD ANNUAL REPORT 2019-20An
nexu
re -
1(F
Y 20
19-2
0)
AO
C -
1
(Pur
suan
t to
first
pro
viso
to s
ub-s
ectio
n (3
) of s
ectio
n 12
9 re
ad w
ith r
ule
5 of
Com
pani
es (A
ccou
nts)
Rul
es, 2
014
Sta
tem
ent c
onta
inin
g sa
lient
feat
ures
of t
he fi
nanc
ial s
tate
men
t of s
ubsi
diar
ies/
asso
ciat
e co
mpa
nies
/join
t ven
ture
s
Par
t “A
”: S
ubsi
diar
ies
(Info
rmat
ion
in re
spec
t of e
ach
subs
idia
ry to
be
pres
ente
d w
ith a
mou
nts
in IN
R L
akhs
)
12
34
56
78
910
1112
1314
15
Nam
e of
the
subs
idia
ry
Repo
rting
pe
riod
for t
he
subs
idia
ry
conc
erne
d
Repo
rting
cur
renc
y an
d Ex
chan
ge ra
te
as o
n th
e la
st d
ate
of th
e re
leva
nt
Fina
ncia
l yea
r in
the
case
of f
orei
gn
Subs
idia
ries
Shar
e ca
pita
l
Re-
serv
es
& su
r-pl
us
Oth
er
com
po-
nent
s of
eq
uity
Tota
l as
sets
Tota
l Li
abili
-tie
s
Inve
st-
men
tsTu
rn-
over
Profi
t be
fore
ta
xa-
tion
Prov
i -si
on fo
r ta
xatio
n
Profi
t af
ter
taxa
-tio
n
Pro-
pose
d Di
vi-
dend
/ Di
vide
nd
Ap-
prov
ed
% o
f sh
are-
hold
ing
1Ze
nsar
Tec
hnol
-og
ies
Inc,
USA
April
201
9 -M
arch
202
0US
D Cl
osin
g Ra
te 7
5.67
290
3
2,95
9 6
,926
21
5,22
6 1
75,0
51
113,
917
196,
965
3,3
66
-369
3
,735
-
100%
2Pr
ofes
siona
l Ac
cess
Lim
ited,
US
A
April
201
9 -M
arch
202
0US
D Cl
osin
g Ra
te 7
5.67
0
240
1
21
5,1
83
4,8
21
- 6
,720
5
96
309
2
86
- 10
0%
3PS
I Hol
ding
G
roup
Inc,
USA
Ap
ril 2
019
-Mar
ch 2
020
USD
Cl
osin
g Ra
te 7
5.67
0
392
2
3 4
46
32
- -
- 1
-1
2
,243
10
0%
4Ze
nsar
Tec
h-no
logi
es IM
Inc,
US
A
April
201
9 -M
arch
202
0US
D Cl
osin
g Ra
te 7
5.67
1
18,
398
2,5
81
48,
290
27,
311
- 2
8,89
7 1
2,52
9 -1
59
12,
688
- 10
0%
5Ze
nsar
Tec
hnol
-og
ies
IM B
.V.,
Neth
erla
nds
April
201
9 -M
arch
202
0EU
R Cl
osin
g Ra
te 8
2.77
11
2,4
14
-13
17,
288
14,
876
- 4
,467
1
,538
9
4 1
,444
-
100%
6Ze
nsar
Tec
hnol
-og
ies
(Sha
ngha
i) Co
. Ltd
, Chi
na **
April
201
9 -M
arch
202
0CN
Y Cl
osin
g Ra
te 1
0.64
505
-7
88
-20
162
4
66
- -
-69
0
-70
- 10
0%
7Ze
nsar
Te
chno
logi
es
(Sin
gapo
re) P
te
Ltd,
Sin
gapo
re
April
201
9 -M
arch
202
0SG
D Cl
osin
g Ra
te 5
3.02
78
-34
92
192
5
5 -
318
1
03
- 1
03
- 10
0%
8Ze
nsar
(Sou
th
Afric
a) P
ropr
i -et
ary
Lim
ited
, So
uth
Afric
a
April
201
9 -M
arch
202
0ZA
R Cl
osin
g Ra
te 4
.23
449
5
,033
-7
90
16,
994
12,
302
- 3
9,29
7 4
,536
1
,263
3
,273
2
,331
75
%

Notes accompanying the Consolidated Financial Statementsas at and for the year ended March 31, 2020(All amounts in INR Lakhs, unless otherwise stated)
271BALANCE SHEET AND PROFIT AND LOSS FINANCIAL STATEMENTS1
23
45
67
89
1011
1213
1415
Nam
e of
the
subs
idia
ry
Repo
rting
pe
riod
for t
he
subs
idia
ry
conc
erne
d
Repo
rting
cur
renc
y an
d Ex
chan
ge ra
te
as o
n th
e la
st d
ate
of th
e re
leva
nt
Fina
ncia
l yea
r in
the
case
of f
orei
gn
Subs
idia
ries
Shar
e ca
pita
l
Re-
serv
es
& su
r-pl
us
Oth
er
com
po-
nent
s of
eq
uity
Tota
l as
sets
Tota
l Li
abili
-tie
s
Inve
st-
men
tsTu
rn-
over
Profi
t be
fore
ta
xa-
tion
Prov
i -si
on fo
r ta
xatio
n
Profi
t af
ter
taxa
-tio
n
Pro-
pose
d Di
vi-
dend
/ Di
vide
nd
Ap-
prov
ed
% o
f sh
are -
hold
ing
9Ze
nsar
(Afri
ca)
Hold
ings
Pro
-pr
ieta
ry L
imite
d,
Sout
h Af
rica
April
201
9 -M
arch
202
0ZA
R Cl
osin
g Ra
te 4
.23
61
-1,9
65
296
1
13
1,7
22
44
- 1
,932
3
1
,928
2
,557
10
0%
10Ze
nsar
Tec
h-no
logi
es (U
K)
Lim
ited,
UK
April
201
9 -M
arch
202
0G
BP
Clos
ing
Rate
93.
50 3
9 2
7,74
5 1
,087
5
1,87
9 2
3,00
8 1
0,08
3 7
0,15
9 7
,445
1
,479
5
,966
-
100%
11Fo
olpr
oof L
td,
UKAp
ril 2
019
-Mar
ch 2
020
GBP
Cl
osin
g Ra
te 9
3.50
1
-100
6
3 6
,310
6
,345
-
8,8
95
-731
-7
4 -6
57
- 10
0%
12Kn
it Lt
d, U
KAp
ril 2
019
-Mar
ch 2
020
GBP
Cl
osin
g Ra
te 9
3.50
1
90
-91
0
-0
- -
16
- 1
6 -
100%
13Fo
olpr
oof (
SG)
Pte.
Ltd
, Sin
ga-
pore
.
April
201
9 -M
arch
202
0SG
D Cl
osin
g Ra
te 5
3.02
25
31
101
1
,053
8
97
- 1
,129
-6
6 0
-6
6 -
100%
14Ke
ysto
ne L
ogic
In
c. U
SAAp
ril 2
019
-Mar
ch 2
020
USD
Cl
osin
g Ra
te 7
5.67
32
1,6
23
255
9
,336
7
,426
-
16,
385
1,2
13
-83
1,2
96
714
10
0%
15Ze
nsar
Info
Te
chno
logi
es
(Sin
gapo
re) P
te
Ltd,
Sin
gapo
re
April
201
9 -M
arch
202
0SG
D Cl
osin
g Ra
te 5
3.02
38
-37
-1
- -
- -
-34
- -3
4 -
100%
16Cy
nosu
re In
c,
USA
April
201
9 -M
arch
202
0US
D
Clos
ing
Rate
75.
67 6
4
,805
5
39
13,
702
8,3
52
- 2
5,65
8 2
,168
6
24
1,5
44
728
10
0%
17Cy
nosu
re
APAC
Pty.
Ltd
, Au
stra
lia
(refe
r not
e 29
(a
))
April
201
9 -D
ecem
ber
2019
AUD
Clos
ing
Rate
46.
07 -
- -
- -
- -
-24
-3
-21
- 10
0%
18Cy
nosu
re In
ter-
face
Ser
vices
Pr
ivate
Ltd
, Ind
ia
April
201
9 -M
arch
202
0IN
R 1
0 1
50
- 3
94
234
-
1,1
73
94
25
70
200
10
0%

Notes accompanying the Consolidated Financial Statementsas at and for the year ended March 31, 2020(All amounts in INR Lakhs, unless otherwise stated)
272 ZENSAR TECHNOLOGIES LTD ANNUAL REPORT 2019-201
23
45
67
89
1011
1213
1415
Nam
e of
the
subs
idia
ry
Repo
rting
pe
riod
for t
he
subs
idia
ry
conc
erne
d
Repo
rting
cur
renc
y an
d Ex
chan
ge ra
te
as o
n th
e la
st d
ate
of th
e re
leva
nt
Fina
ncia
l yea
r in
the
case
of f
orei
gn
Subs
idia
ries
Shar
e ca
pita
l
Re-
serv
es
& su
r-pl
us
Oth
er
com
po-
nent
s of
eq
uity
Tota
l as
sets
Tota
l Li
abili
-tie
s
Inve
st-
men
tsTu
rn-
over
Profi
t be
fore
ta
xa-
tion
Prov
i -si
on fo
r ta
xatio
n
Profi
t af
ter
taxa
-tio
n
Pro-
pose
d Di
vi-
dend
/ Di
vide
nd
Ap-
prov
ed
% o
f sh
are -
hold
ing
19Ke
ysto
ne L
ogic
M
exic
o, S
. DE
R.L.
DE
C.V.
, M
exic
o
April
201
9 -M
arch
202
0M
XN
Clos
ing
Rate
3.1
4 1
7 7
96
-121
1
,291
5
99
- 2
,750
1
,002
3
40
662
-
100%
20Ke
ysto
ne T
ech-
nolo
gies
Mex
ico,
S.
DE
R.L.
DE
C.V.
, Mex
ico
April
201
9 -M
arch
202
0M
XN
Clos
ing
Rate
3.1
4 1
7 1
8 -3
3
35
304
-
810
3
3 2
3 1
0 -
100%
21In
digo
Sla
te In
c.,
USA
April
201
9 -M
arch
202
0US
D
Clos
ing
Rate
75.
67 2
1
54
6
4,1
71
4,0
08
- 1
5,39
1 -1
,828
-3
64
-1,4
64
- 10
0%
22Ze
nsar
IT S
er-
vices
Ltd
, Ind
iaAp
ril 2
019
-Mar
ch 2
020
INR
- -
- -
- -
- -
- -
- 10
0%
23Ze
nsar
Tec
hnol
-og
ies
(Can
ada)
In
c, C
anad
a
May
201
9 -
Mar
ch 2
020
CAD
Clos
ing
Rate
53.
08 4
0 7
0
1
31
84
- 2
40
12
4
7
- 10
0%
24Ze
nsar
Tec
hnol
-og
ies
Gm
bH
Jan
2020
- M
arch
202
0EU
R Cl
osin
g Ra
te 8
2.77
- -
- -
- -
- -
- -
- 10
0%
** Z
ensa
r Tec
hnol
ogie
s (S
hang
hai)
Co. L
td, C
hina
loca
l rep
ortin
g pe
riod
is Ja
nuar
y to
Dec
embe
r. Ho
weve
r for
con
solid
atio
n an
d ab
ove
disc
losu
re, A
pril t
o M
arch
is c
onsid
ered
No
tes
:
1.
Nam
e of
sub
sidia
ry y
et to
com
men
ce o
pera
tions
Ze
nsar
IT S
ervic
es L
td.
Zens
ar T
echn
olog
ies
Gm
bH
2. N
ame
of s
ubsid
iarie
s wh
ich
have
bee
n liq
uida
ted
or s
old
durin
g th
e ye
ar
Cyno
sure
APA
C Pt
y. Lt
d.
3. A
quila
Tec
h Co
rp h
as n
ot b
een
incl
uded
in th
e ab
ove
stat
emen
t (re
fer n
ote
29 (a
))
Part
“B”:
Ass
ocia
tes
and
Join
t Ven
ture
s is
not
app
licab
le to
the
Com
pany
as
the
Gro
up d
oes
not h
ave
any
Asso
ciat
e Co
mpa
nies
and
Joi
nt V
entu
res

Notes accompanying the Consolidated Financial Statementsas at and for the year ended March 31, 2020(All amounts in INR Lakhs, unless otherwise stated)
273BALANCE SHEET AND PROFIT AND LOSS FINANCIAL STATEMENTS(F
Y 2
018-
19)
AO
C -
1(P
ursu
ant t
o fir
st p
rovi
so to
sub
-sec
tion
(3) o
f sec
tion
129
read
with
rul
e 5
of C
ompa
nies
(Acc
ount
s) R
ules
, 201
4S
tate
men
t con
tain
ing
salie
nt fe
atur
es o
f the
fina
ncia
l sta
tem
ent o
f sub
sidi
arie
s/as
soci
ate
com
pani
es/jo
int v
entu
res
Par
t “A
”: S
ubsi
diar
ies
(Info
rmat
ion
in re
spec
t of e
ach
subs
idia
ry to
be
pres
ente
d w
ith a
mou
nts
in IN
R L
akhs
)
12
34
56
78
910
1112
1314
15
Nam
e of
the
subs
idia
ry
Rep
ortin
g pe
riod
fo
r th
e su
bsid
iary
co
ncer
ned
Rep
ortin
g cu
rren
-cy
and
Exc
hang
e ra
te a
s on
the
last
da
te o
f the
rel
evan
t Fi
nanc
ial y
ear
in
the
case
of f
orei
gn
Sub
sidi
arie
s
Sha
re
capi
-ta
l
Re-
serv
es
& s
ur-
plus
Oth
er
com
po-
nent
s of
eq
uity
Tota
l as
sets
Tota
l Li
abili
-tie
s
Inve
st-
men
tsTu
rn-
over
Pro
fit
befo
re
taxa
-tio
n
Pro
vi-
sion
fo
r ta
xa-
tion
Pro
fit
afte
r ta
xatio
n
Pro
-po
sed
Div
i-de
nd
% o
f sh
are-
hold
-in
g
1Ze
nsar
Tec
hnol
o-gi
es In
c, U
SAA
pril
2018
-M
arch
201
9U
SD
Clo
sing
Rat
e 69
.16
290
4
3,61
1 3
,595
18
0,64
8 13
3,15
2 10
3,03
3 17
7,45
1 6
,035
1
,950
4
,085
-
100%
2Pr
ofes
sion
al
Acc
ess
Lim
ited,
U
SA
Apr
il 20
18
-Mar
ch 2
019
USD
C
losi
ng R
ate
69.1
6 0
-4
6 1
07
8,1
71
8,1
10
- 1
5,79
0 -9
46
-221
-7
25
- 10
0%
3PS
I Hol
ding
G
roup
Inc,
USA
A
pril
2018
-M
arch
201
9U
SD
Clo
sing
Rat
e 69
.16
0
250
2
,453
2
,710
7
2
,324
-
-7
- -7
-
100%
4Ze
nsar
Tec
hnol
o-gi
es IM
Inc,
USA
Apr
il 20
18
-Mar
ch 2
019
USD
C
losi
ng R
ate
69.1
6 1
5
,008
1
,093
4
1,64
2 3
5,54
0 -
38,
293
-3,4
41
-478
-2
,963
-
100%
5Ze
nsar
Tec
hnol
-og
ies
IM B
.V.,
Net
herla
nds
Apr
il 20
18
-Mar
ch 2
019
EUR
C
losi
ng R
ate
77.6
7 1
1 1
,934
-5
9 1
4,73
8 1
2,85
2 -
4,4
25
513
2
1 4
92
- 10
0%
6Ze
nsar
Tec
hnol
-og
ies
(Sha
ngha
i) C
o. L
td, C
hina
**
Apr
il 20
18
-Mar
ch 2
019
CN
Y C
losi
ng R
ate
10.2
9 5
05
-720
-8
2
04
427
-
- -2
7 -
-27
- 10
0%
7Ze
nsar
Tec
hnol
o-gi
es (S
inga
pore
) Pt
e Lt
d.
Apr
il 20
18
-Mar
ch 2
019
SGD
C
losi
ng R
ate
51.0
4 7
8 -1
37
88
136
1
07
38
55
-202
-
-202
-
100%
8Ze
nsar
(Sou
th
Afri
ca) P
ropr
i-et
ary
Lim
ited,
So
uth
Afri
ca
Apr
il 20
18
-Mar
ch 2
019
ZAR
C
losi
ng R
ate
4.77
449
4
,106
-2
10
17,
467
13,
122
- 3
0,92
3 2
,784
7
62
2,0
22
- 75
%
9Ze
nsar
(Afri
ca)
Hol
ding
s Pr
o-pr
ieta
ry L
imite
d,
Sout
h A
frica
Apr
il 20
18
-Mar
ch 2
019
ZAR
C
losi
ng R
ate
4.77
61
-1,3
43
116
3
92
1,5
58
44
- 9
40
3
937
-
100%
10Ze
nsar
Tec
h-no
logi
es (U
K)
Lim
ited,
UK
Apr
il 20
18
-Mar
ch 2
019
GB
P C
losi
ng R
ate
90.5
3 3
9 2
1,77
3 1
30
47,
205
25,
263
9,7
62
59,
747
7,9
36
1,1
92
6,7
44
- 10
0%

Notes accompanying the Consolidated Financial Statementsas at and for the year ended March 31, 2020(All amounts in INR Lakhs, unless otherwise stated)
274 ZENSAR TECHNOLOGIES LTD ANNUAL REPORT 2019-201
23
45
67
89
1011
1213
1415
Nam
e of
the
subs
idia
ry
Rep
ortin
g pe
riod
fo
r th
e su
bsid
iary
co
ncer
ned
Rep
ortin
g cu
rren
-cy
and
Exc
hang
e ra
te a
s on
the
last
da
te o
f the
rel
evan
t Fi
nanc
ial y
ear
in
the
case
of f
orei
gn
Sub
sidi
arie
s
Sha
re
capi
-ta
l
Re-
serv
es
& s
ur-
plus
Oth
er
com
po-
nent
s of
eq
uity
Tota
l as
sets
Tota
l Li
abili
-tie
s
Inve
st-
men
tsTu
rn-
over
Pro
fit
befo
re
taxa
-tio
n
Pro
vi-
sion
fo
r ta
xa-
tion
Pro
fit
afte
r ta
xatio
n
Pro
-po
sed
Div
i-de
nd
% o
f sh
are-
hold
-in
g
11Fo
olpr
oof L
td.
UK
Apr
il 20
18
-Mar
ch 2
019
GB
P C
losi
ng R
ate
90.5
3 1
5
61
75
4,2
95
3,6
58
- 9
,259
-3
21
-38
-283
-
100%
12K
nit L
td. U
KA
pril
2018
-M
arch
201
9G
BP
Clo
sing
Rat
e 90
.53
1
-620
-6
0 3
8 7
17
- 1
06
-23
1
-24
- 10
0%
13Fo
olpr
oof (
SG)
Pte.
Ltd
, Sin
ga-
pore
.
Apr
il 20
18
-Mar
ch 2
019
SGD
C
losi
ng R
ate
51.0
4 2
5 1
39
2
845
6
79
- 1
,464
1
17
10
107
-
100%
14K
eyst
one
Logi
c In
c. U
SAA
pril
2018
-M
arch
201
9U
SD
Clo
sing
Rat
e 69
.16
32
1,0
38
108
7
,434
6
,256
-
20,
338
852
5
33
318
-
100%
15Ze
nsar
Info
rma-
tion
Tech
nolo
-gi
es L
td.
Apr
il 20
18
-Jan
uary
20
19
INR
- -
- -
- -
350
5
7 1
7 4
0 -
100%
16Ze
nsar
Sof
twar
e Te
chno
logi
es
Ltd.
Apr
il 20
18
-Jan
uary
20
19
INR
- -
- -
- -
250
1
69
54
115
-
100%
17Ze
nsar
Info
Te
chno
logi
es
(Sin
gapo
re) P
te
Ltd
Apr
il 20
18
-Mar
ch 2
019
SGD
C
losi
ng R
ate
51.0
4 3
8 -3
-0
4
7 1
2 -
- -1
-
-1
- 10
0%
18C
ynos
ure
Inc.
, U
SA
Apr
il 20
18
-Mar
ch 2
019
USD
C
losi
ng R
ate
69.1
6 6
3
,988
9
5 7
,671
3
,582
0
1
7,42
7 2
,805
6
92
2,1
13
- 10
0%
19C
ynos
ure
APA
C
Pty.
Ltd
, Aus
tralia
Apr
il 20
18
-Mar
ch 2
019
AU
D
Clo
sing
Rat
e 49
.02
0
19
2
55
34
- 8
5 -6
4 -1
1 -5
2 -
100%
20C
ynos
ure
Inte
r-fa
ce S
ervi
ces
Priv
ate
Ltd.
Apr
il 20
18
-Mar
ch 2
019
INR
10
320
-
598
2
68
- 1
,342
3
01
90
211
-
100%
21K
eyst
one
Logi
c M
exic
o, S
. DE
R.L
. DE
C.V
., M
exic
o
Jun
2018
-M
arch
201
9M
XN
Clo
sing
Rat
e 3.
57 1
7 1
34
-1
522
3
72
- 4
85
192
5
8 1
34
- 10
0%
22K
eyst
one
Tech
-no
logi
es M
exic
o,
S. D
E R
.L. D
E C
.V.,
Mex
ico
Jun
2018
-M
arch
201
9M
XN
Clo
sing
Rat
e 3.
57 1
7 8
1
3
01
275
-
293
1
2 4
8
-
100%

Notes accompanying the Consolidated Financial Statementsas at and for the year ended March 31, 2020(All amounts in INR Lakhs, unless otherwise stated)
275BALANCE SHEET AND PROFIT AND LOSS FINANCIAL STATEMENTS1
23
45
67
89
1011
1213
1415
Nam
e of
the
subs
idia
ry
Rep
ortin
g pe
riod
fo
r th
e su
bsid
iary
co
ncer
ned
Rep
ortin
g cu
rren
-cy
and
Exc
hang
e ra
te a
s on
the
last
da
te o
f the
rel
evan
t Fi
nanc
ial y
ear
in
the
case
of f
orei
gn
Sub
sidi
arie
s
Sha
re
capi
-ta
l
Re-
serv
es
& s
ur-
plus
Oth
er
com
po-
nent
s of
eq
uity
Tota
l as
sets
Tota
l Li
abili
-tie
s
Inve
st-
men
tsTu
rn-
over
Pro
fit
befo
re
taxa
-tio
n
Pro
vi-
sion
fo
r ta
xa-
tion
Pro
fit
afte
r ta
xatio
n
Pro
-po
sed
Div
i-de
nd
% o
f sh
are-
hold
-in
g
23In
digo
Sla
te In
c.,
USA
Aug
ust 2
018
-Mar
ch 2
019
USD
C
losi
ng R
ate
69.1
6 2
1
,631
-4
4 4
,146
2
,557
-
12,
189
2,0
41
482
1
,559
-
100%
24Ze
nsar
IT s
er-
vice
s Lt
d.A
pril
2018
-M
arch
201
9IN
R -
- -
- -
- -
- -
- -
100%
** Z
ensa
r Tec
hnol
ogie
s (S
hang
hai)
Co.
Ltd
, Chi
na lo
cal r
epor
ting
perio
d is
Jan
uary
to D
ecem
ber.
How
ever
for c
onso
lidat
ion
and
abov
e di
sclo
sure
, Apr
il to
Mar
ch is
con
side
red
Not
es :
1. N
ame
of s
ubsi
diar
y ye
t to
com
men
ce o
pera
tions
Ze
nsar
IT S
ervi
ces
Ltd.
2. N
ame
of s
ubsi
diar
ies
whi
ch h
ave
been
liqu
idat
ed o
r sol
d du
ring
the
year
Ze
nsar
Info
rmat
ion
Tech
nolo
gies
Ltd
.
Zens
ar S
oftw
are
Tech
nolo
gies
Ltd
.
Cyn
osur
e In
c U
K L
td
3. A
quila
Tec
h C
orp
has
not b
een
incl
uded
in th
e ab
ove
stat
emen
t (re
fer n
ote
29 (a
)) P
art “
B”:
Ass
ocia
tes
and
Join
t Ven
ture
s is
not
app
licab
le to
the
Com
pany
as
the
Gro
up d
oes
not h
ave
any
Ass
ocia
te C
ompa
nies
and
Joi
nt V
entu
res

Certain statements in this Annual Report concerning our future prospects may be forward-looking statements which involve a number of underlying identified / non identified risks and uncertainties that could cause actual results to differ materially. This Report and other statements – written and oral – that we periodically make contain forward-looking statements that set out anticipated results based on the management’s plans and assumptions. However the same are subject to risks and uncertainties, including but not limited to, our ability to manage growth; fluctuations in earnings /exchange rates; intense competition in IT services including factors affecting cost advantage; wage increases; ability to attract and retain highly skilled professionals; time and cost overruns on fixed price, fixed-time frame or other contracts; client concentration; restrictions on immigration; our ability to manage international operations; reduced demand for technology in our service offerings; disruptions in telecommunication networks; our ability to successfully complete and integrate acquisitions; liability for damages on our service contracts; withdrawal of governmental fiscal incentives; economic downturn in India, and/or around the world, political instability, legal restrictions on raising capital or acquiring companies; and unauthorised use of intellectual property and general economic conditions affecting the industry.
In addition to the foregoing, global pandemic like COVID-19 may pose an unforeseen, unprecedented, unascertainable and constantly evolving risk(s), inter-alia, to us, our customers, delivery models, vendors, partners, employees, general global operations and may also impact the success of companies in which we have made strategic investments, demand for Company’s offerings and the onshore-offshore-nearshore delivery model.
The results of these assumptions made relying on available internal and external information are the basis for determining the carrying values of certain assets and liabilities. Since the factors underlying these assumptions are subject to change over time, the estimates on which they are based, are also subject to change accordingly. These forward-looking statements represent only the Company’s current intentions, beliefs or expectations, and any forward-looking statement speaks only as of the date on which it was made. The Company assumes no obligation to revise or update any forward-looking statements, whether as a result of new information, future events, or otherwise.
Disclaimer

Zensar Technologies Limited Zensar Knowledge Park, Kharadi, Plot # 4, MIDC, Off Nagar Road, Pune 411014, IndiaTel: +91-(20)6607 4000, 27004000 Fax: +91(20)66074433, www.zensar.com
A Company
Copyright © 2022 FDOKUMEN