
CASE STUDY OF A DEMAND-RESPONSIVE ...
26
CASE STUDY OF A DEMAND-RESPONSIVE TRANSPORTATION SYSTEM H.J. Bauer Transportation Research Department, General Motors Research Laboratories Demand-responsive transportation service (referred to in this paper as D-J for demand- jitney) is essentially a door-to-door public transportation service. A potential system user telephones a central dispatcher indicating a desir e for transportation and informing the operator of his location and desired destination. Through the use of a computer the ability to meet the demand within specific guaranteed waiting and travel times is deter- mined. After the guaranteed conditions are accepted by the customer, a vehicle (which may already be servicing other patrons) is dispatched through an electronic communi- cation link to pick up the new customer. It is intended that the fare for D-J service will be below that of the usual taxicab because the productivity of the vehicles is increased through ride-sharing. Ii was the primary purpose of this study to provide information to aid in decisions re- garding the merit of demand-responsive transportation systems and the need for vehicles specifically designed for D-J transportation systems. The study was also designed to develop improved analytical tools for the objective evaluation of new concepts (modes) of transportation and novel or conventional transportation systems designed to meet specific commwti.ty needs . This case study of a demand-responsive public transportation system has shown the following: 1. Technically the concept is feasible and within the present state of the art; 2. Financially the system, as applied to the rigorous requirements of the case study community, can support itself from the fare box without capital invest- ment subsidy under certain conditions of fare and service level; 3. The political acceptance of the system was limited because the social benefits apply primarily to nonautomobile users, a small percentage in the case study area; 4. The system has sufficient potential social benefits to warrant implementation of demonstration programs; and 5. Engineering design effort should be initiated for a vehicle specifically for demand-responsive service because none of the vehicles currently available is suitable. Many organi zations ha ve studied various aspects of demand-responsive transportation systems. This study differed from the others in several ways. 1. The case study reported here is based on the transportation requirements of a real community. 2. Rather than select a case study city with "ideal" characteristics for D-J , this study sel e ct ed a community based on its repr es n tativeuess of about 100 ci ties in tl1e nation whose population density might lead to a need for a demand-responsive transportation system . Validating the utilit y of D-J for this particular community provided a more meaningful analysis of the potential nationwide merits of the 14
-
Upload
khangminh22 -
Category
Documents
-
view
0 -
download
0
Transcript of CASE STUDY OF A DEMAND-RESPONSIVE ...
CASE STUDY OF A DEMAND-RESPONSIVE ~ TRANSPORTATION SYSTEM
H.J. Bauer Transportation Research Department, General Motors Research Laboratories
Demand-responsive transportation service (referred to in this paper as D-J for demandjitney) is essentially a door-to-door public transportation service. A potential system user telephones a central dispatcher indicating a desire for transportation and informing the operator of his location and desired destination. Through the use of a computer the ability to meet the demand within specific guaranteed waiting and travel times is determined. After the guaranteed conditions are accepted by the customer, a vehicle (which may already be servicing other patrons) is dispatched through an electronic communication link to pick up the new customer. It is intended that the fare for D-J service will be below that of the usual taxicab because the productivity of the vehicles is increased through ride-sharing.
Ii was the primary purpose of this study to provide information to aid in decisions regarding the merit of demand-responsive transportation systems and the need for vehicles specifically designed for D-J transportation systems. The study was also designed to develop improved analytical tools for the objective evaluation of new concepts (modes) of transportation and novel or conventional transportation systems designed to meet specific commwti.ty needs .
This case study of a demand-responsive public transportation system has shown the following:
1. Technically the concept is feasible and within the present state of the art; 2. Financially the system, as applied to the rigorous requirements of the case
study community, can support itself from the fare box without capital investment subsidy under certain conditions of fare and service level;
3. The political acceptance of the system was limited because the social benefits apply primarily to nonautomobile users, a small percentage in the case study area;
4. The system has sufficient potential social benefits to warrant implementation of demonstration programs; and
5. Engineering design effort should be initiated for a vehicle specifically for demand-responsive service because none of the vehicles currently available is suitable.
Many organizations have studied various aspects of demand-responsive transportation systems. This study differed from the others in several ways.
1. The case study reported here is based on the transportation requirements of a real community.
2. Rather than select a case study city with "ideal" characteristics for D-J, this study selected a community based on its repres ntativeuess of about 100 ci ties in tl1e nation whose population density might lead to a need for a demand-responsive transportation system. Validating the utility of D-J for this particular community provided a more meaningful analysis of the potential nationwide merits of the
14
system and, therefore, provided a better nnderstanding of a market for the potential vehicle or equipment or both.
15
3. The study developed and analyzed an entire D-J system including operational and maintenance requirements, operating strategies, overall financial analyses, and potential social-political reactions to D-J implementation.
4. The system design (vehicles, facilities, and operating strategies) was not based merely on the intuitive or professional knowledge of the system designers. Nor was the ridership estimation based on arbitrary percentages of known trips being made in the community at some specific point in time. Both of these (system design and ridership estimation) were based on a series of 3 detailed, personal interviews conducted for the study team by an established, professional marketing and product research firm. The sponsor of the study was not identified in the surveys. The entire D-J system was simulated by computer in order to establish how the system operates nnder a variety of parameters and strategies.
The detailed system design, computer simulation, and findings of the ridership estimation survey provided the basis for a detailed cost analysis of the system nnder various conditions of patronage, fare, and operating guarantees of waiting and travel times. The fiscal posture of the system was determined from the standpoint of the fare box as the sole source of revenue and from that of federal support in terms of two-thirds grants for capital investment.
The basic flow and interactions of the various activities involved in the system study are shown in Figure 1.
THE CASE STUDY CITY
The community that was selected as the case study city is representative, in terms of population density, of a sufficient number of U. S. cities so that a meaningful judgment might be made of the national potential of D-J systems. Further, the use of this community would provide better insight into possible commercial markets for vehicles and equipment related to D-J operations than would the use of an "ideal" city.
The realistic design and evaluation of a transportation system require considerable knowledge of the community for which it is intended. In this study particular attention was paid to the analysis of transportation requirements of the area's residents. Because people's travel patterns and habits are a fnnction of several factors, an analysis was made of socioeconomic characteristics, land use activity systems, and transportation systems in the community with which a D-J system would have to be integrated.
The study area is approximately 6 miles square. Population growth has been rapid. In 1960 the resident population was about 100,000. The city planning department estimates the present population to be near 200,000, with an expected growth by 1980 to approximately 215,000. The net residential density in 1965 was 10,300 persons per square mile. (The overall population density equaled 4,700 persons per square mile.)
Travel data used for the D-J study were based on a regional origin-destination survey conducted in 1965. The population figures used in the D-J study are those for 1965: approximately 175,000.
Some pertinent socioeconomic characteristics of the case study area are given in Table 1. According to the planning commission, the composition of the population is changing. In 1966, more than 60 percent of new "move-in" workers were in white collar occupations. Of this 60 percent, about 45 percent were in technical, professional, and managerial classifications. Incomes and automobile ownership may be expected to rise above those given in Table 1.
Age distributions of the population in a commnnity are also significant for transportation planning. These characteristics are given in Table 2.
The 1965 distribution of land use is given in Table 3. It is estimated that today there are over 52,000 dwelling units in the area, about 6,000 of which are multiple family nnits

16
1965 0 D 1,1P LIil OATA (SOilT FROM A',/ .. ILABU 0.ATA\
0-J FIELD SIA-~ULATION
1}11111111111111 0-J ROUTING AND • D-J SYSTtM ::),•- --' SCHEDULING l----1-.:::• COMPUTU ALOOllTHM - - Slh'ULATJOt ..
TALUS DATA AN.ALVStS
IUUIII 1111111 P
TIANSPOHA TION lltf.SEARCH DEPT. FIELD Sl.aVEY
~ --+--- --1-,.;.• CASE STUDY CIT Y -+--- +-------' : PIOFIU
CASE SIIJDV CITY PLANNING DEPT. OOCUMIN15
i11111l 11111111
ESTIMAn CURRENT TIIP MAKERS 0-J TIIP CHOICE
UTIMA It CUllll:ENT NON TIIP MAKER ,onNTIAL D-J lllP
CHAIIACllRISTICS O~STl0NNA1'I ANALYSIS
DESIGN OUESTIONNAtll ANALYSIS
---n1111111 11111111
YEHICU DE SIGN
COMMAND ANO CONTROl WSTEM DESIGN
FACILITIES DESIGN
Figure 1. Sequence of events of D-J system study.
TO SYSTE~· DEKRIPTION
TO CCWMANO A.ND CONTROL 1vm .. DESIG N
TO SYSTEM SCENARIO
DEWW,INE LP,,'PlfN'ENTATION COSTS
DETEIMINE ACOUlSIHON CAPITAL cons
DlTEIWINE SYSTW Of'ERAHNG com
STANOAIO O PERATING PROCEDUIES

-.. ..
FINANCIAL FEASl81LITY ANALY\IS
1111111111 111111U
:
DETAILED FINOll~GS SL.MNARIZED IN INJ,-mlt(POl!T
0-J SYSTEM SCENARIO
DECISION ON l<IETHOOOLOGY FOR SOC IAL POLITICAL ACCEPTANC[ (VALUATION
CASE sruov FINAL RE,OU
17

-.. 18
TABLE 1
SOCIOECONOMIC CHARACTERISTICS OF CASE STUDY CITY
Characteristic
Family income (median $9,000) Under $3,000 $3,000 to $4,999 $5,000 to $7,999 $8,000 to $9,999 $10,000 to $14,999 $15,000 to $19,999 $20,000 or more
Source: Local 1Y65 survey,
Percent
5.2 6.4
32.5 25.1 24.2
5.1 1.5
Characteristic
Occupation of household heads
White coliar Blue collar
Retired Household automobile
availability None One Two or more
Percent
38 62
7
3 52 45
and 2,000 are mobile homes. The average household size of the community is 3.8 persons. Residential densities vary, ranging from 2 to 8 dwelling units per net residential acre. The community-wide average is 5 units per acre. This distribution is usually classified by urban planners as "medium to low."
There are approximately 1,500 retail and service businesses in the city . Most of these are in the 24 commercial centers relatively evenly distributed through the case study area. There is no clear-cul cenlral business dislrict. In addition, there are 5 regional shopping centers, 4 of which are located within 5 miles of the case study area.
There are 800 industries in the communitv. Most of them emnlov fP.wP.r th:m 100 m•-rsons. The majority of the industry is located along 2 majo°i- cor;id~~s.- Th;~e""~;e more than 55,000 manufacturing jobs in the community.
There are also 98 other significant trip generators. The group includes hospitals, schools and colleges, and branch libraries.
Transportation facilities consist of about 400 miles of residential streets and collector roads, 85 miles of major thoroughfares, and a fixed route-fixed schedule bus system of 6 routes. Neither of the 2 railroads that run through the community provides passenger service originating in the community. Details of the bus transit service in the r.;tu ~,...a o+u.o.n ;n Tr::t.hl a A ............ J ........ "" t::, .. ,, _ ..... &.. .L ""'"" .. "" .&.•
There is 24-hour taxicab service provided by 3 companies operating in the area. The rates are 90 cents for the first mile and 10 cents for each additional % mile.
TABLE 2
POPULATION BY AGE GROUP IN CASE STUDY CITY
Age Group (yrs) Number of Persons Percent of Total
0 to 4 ~ lo 9
10 to 14 15 to 19 20 to 29 30 to 44 45 to 64 65 to 74 75 and over
Total
Source: Local 1965 survey,
25,000 14.2 20,000 14.8 17,000 9.7 12,000 6.8 24,000 13.7 38,000 21.8 26,000 14.9
5,000 2.9 2,000 1.2
175,000 100.00
TABLE 3
LAND USE IN CASE STUDY CITY
Percent of Percent of Land Use Acres Total Area Developed
Land
Re sidential 11,000 49.5 67.7 Commerical 800 3.6 4.9 Industrial 3,000 13.5 18.5 Public and semi-
public 1,300 5.8 8.0 Recreation ~ ~ 0 .9
Total developed 16,240 73.0
Unknown , extractivP-vacant, and agricultural 6,000 27.0
Total 22,240
Source: Local 1965 survev.

19
'!'ABLE 4
TRANSIT SERVICE AND RIDERSHIP
Bus Peak-Hour Normal Hours Days Basic Average
Route Headways Headways of of Farea Weekday (min) (min) Operation Operation (cents) Ridership
10 30 6:40 a.m. to Monday 6:50p.m. through
Saturday 30 2,000 2 24 40 5:00 a. m. to Monday
11:50p.m. through Saturday 30 3,300
3 60 60 7:00 a. m. to Monday 8: 00 p . m . through
Saturday 30 165 4 60 60 6: 00 a . m . to Monday
7:10 p.m . through Saturday 30 1,150
~ 60 60 5:25 a.m. to Monday 7:30 p.m. through
Saturday 35 875 6 30 40 6:00 a.m. to Monday
6:00 p.m. through Friday 25 300
Source: Local published schedules, 1969.
asenior citizens, 10 cents.
The city has a nonpartisan government. An analysis of bond elections, the allocation of funds in municipal budgets, and general policies reflected in capital improvement programs indicate that the community generally concerns itself with adequate police and fire protection, flood control, education, taxes , and low density residential zonings. Transportation, public or private, has not been an issue. Insofar as the social-political response to the possible implementationof a D-J system will be important , this political posture and history become meaningful.
CASE STUDY AREA TRIP-MAKING CHARACTERISTICS
In the design of the D-J system for the case study city, it became necessary to identify who is making what kinds of trips , where in the spatial arrangement of land use activities the trip-makers begin and end their various types of trips, and what the characteristics are of the trips in terms of mode of transportation used, length , and time of day the trips are made. Specifically, it became important to know which, of all the trips made by the residents of the case study community, were trips that might be served by D-J. Second, it was imperative to obtain an estimate of what percentage of these "eligible" trips might be diverted from the mode currently used to make the trip. An eligible trip was defined as a trip that began and ended in the community (internal trip) and that either began or ended at home. All trips associated with school (in a school bus or school car pool) were excluded. In view of the importance of peak-hour demand in the design of a transportation system, it also became necessary to know the temporal distribution of the trips. The data relative to all of the eligible trips were acquired from 3 major sources: origin-destination information from a 1965 survey , land use surveys conducted as part of this study, and a ridership estimation survey conducted for the study team by a professional market research firm. (The latter survey will be discussed under the consideration of ridership estimation.)
A total of 406,000 person trips per day of all types were made by the residents of the case study community as reported in 1965 . Of these, 97 percent were made by automobile. Only 175,000 of the 406,000 trips could be considered eligible for the D-J system. (How many of these would be theoretically diverted to D-J was a problem to be solved later in the study.) The average trip length for all types of internal home-based trips was 11.1 minutes (Table 5). Forty-seven percent of the internal home-based trips were for shopping and personal business purposes . Ninety percent of all eligible trips
20
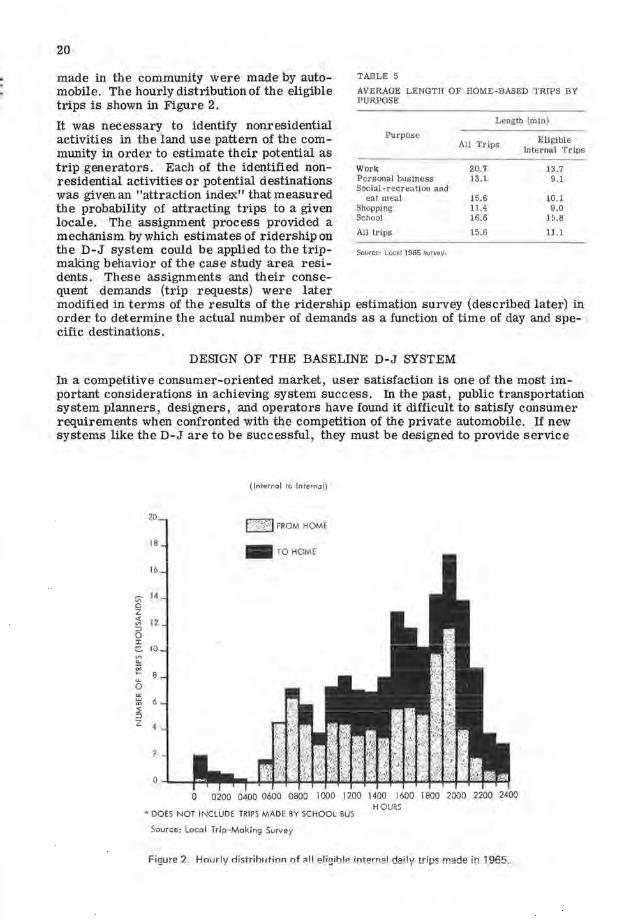
made in the community were made by automobile. The hourly distribution of the eligible trips is shown in Figure 2.
It was necessary to identify nonresidential activities in the land use pattern of the community in order to estimate their potential as trip generators. Each of the identified nonresidential activities or potential destinations was given an "attraction index" that measured the probability of attracting trips to a given locale. The assignment process provided a mechanism by which estimates of ridership on the D-J system could be applied to the tripmaking behavior of the case study area residents. These assignments and their conse-quent demands (trip requests) were later
TABLE 5
AVERAGE LENGTH OF HOME-BASED TRIPS BY PURPOSE
Purpose
Work Personal business Social-recreation and
eat meal Shopping School
All trips
Source: Local 1965 survey.
Length (min)
All Trips
20.7 13.1
15.6 11.4 16.6
15.6
Eli gible Internal Trips
13.7 9.1
10.1 9.0
15.8
11.1
modified in terms of the results of the ridership estimation survey (described later) in order to determine the actual number of demands as a function of time of day and specific destinations.
DESIGN OF THE BASELINE D-J SYSTEM
In a competitive consumer-oriented market, user satisfaction is one of the most important considerations in achieving system success. In the past, public transportation system planners, designers, and operators have found it difficult to satisfy consumer requirements when confronted with the competition of the private automobile. If new systems like the D-J are to be successful , they must be designed to provide service
"' 0 z j; => 0 :c -"' a.. ;;;: I-
0 ; ::;: => z
20
18
16
1~
12
10
8
6
4
7 -
0
(Internal to Internal)
f";'£?! FROM HOME
- TO HOME
0 0200 0400 0600 0800 1000 1200 1400 1600 1800 2000 2200 2400
* DOES NOT INCLUDE TRIPS MADE BY SCHOOL BUS
Source: Local Trip-Making Survey
HOURS
Figure 2. Hourly rfatrihution of ,.11 eli!Jil::>le internal daily trips made ln 1965.

21
and environments that are attractive and competitive within the transportation consumer market. In order to meet this need in transportation system design, a series of attitudinal surveys was developed and administered to about 1,600 residents of the case study area community. The surveys were conducted by a professional and thoroughly experienced market research firm under contract to the investigators.
The market research study sought to achieve 4 specific objectives:
1. To gather information from potential users of the D-J system about their relative preferences for specific system characteristics and specific design solutions being considered for incorporation into the D-J system;
2. To classify the information obtained in terms of the total population sampled and of 8 market subgroups and to analyze these differences;
3. To identify the relative values of various trade-offs and their importance to the potential D-J users ; and
4. To draw specific conclusions about the design of the D-J system from the user's point of view.
The methodology employed in the surveys is derived from the field of experimental psychology . Specifically the method evolved from the branch of experimental psychology called psychophysics (~, 10, Q , 11, 1&) . The 2 methods employed were thos e of pair ed comparisons and semantic scaling. The former was used to establish a scale of preferences for a set of transportation system design characteristics, and the latter was used to determine the "strength" of preferences for particular design solution alternatives to be implemented in the D-J system.
In the paired comparisons technique, each item of the total series is presented to the respondent paired with each other item at least once (e. g. , items A, B, and C are presented as A and B, A and C, and Band C). One item of each pair must be selected in each case. Preference is determined for each item relative t o each other item. The following items were used in this study:
1. Shorter time spent traveling in the vehicle; 2. Shorter time spent waiting to be picked up; 3. Arriving at your destination when you planned to; 4. Ability to adjust the amount of light , air , heat , and sound around you in the
vehicle; 5. More space for storing your packages while traveling; 6. stylish vehicle exterior; 7. Freedom to turn , tilt, or make other adjustments to your seat; 8. Availability of coffee, newspapers, and magazines in the vehicle; 9. Small variation in travel time from one day to the next;
10. More phones available in public places used to call for service; 11. More protection from the weather at public pickup points; 12. More chance of riding in privacy; 13 . More chance of meeting people in the vehicle; 14. More chance of being able to arrange ahead of time to meet and sit with someone
you know; 15. More chance of rearranging the seats inside the vehicle to make talking with
others easier; 16. Lower fare for passengers; 17. Making a trip without changing vehicles; 18. Less time spent walking to a pickup point; 19. Being able to select the time when you will be picked up; 20 . Longer hours of available service; 21. Vehicle whose size and appearance do not detract fro:m the character of the
neighborhood through which it passes; 22 . Calling for service without being delayed; 23 . Being able to talk to, and ask questions of, systems representatives when desired; 24. Easier entry and exit from the vehicle;
22
25. Room for accommodating baby carriages, strollers, and wheelchairs in the vehicle;
26. Assurance of getting a seat; 27. Less chance of meeting with people who may make you feel insecure or uncom-
fortable; 28. More room between you and others in the vehicle; 29. Being able to take a direct route, with fewer turns and detours; 30. Being able to take rides that are pleasant or scenic; 31. More chance of riding with different kinds of people; and 32. Convenient method of paying your fare.
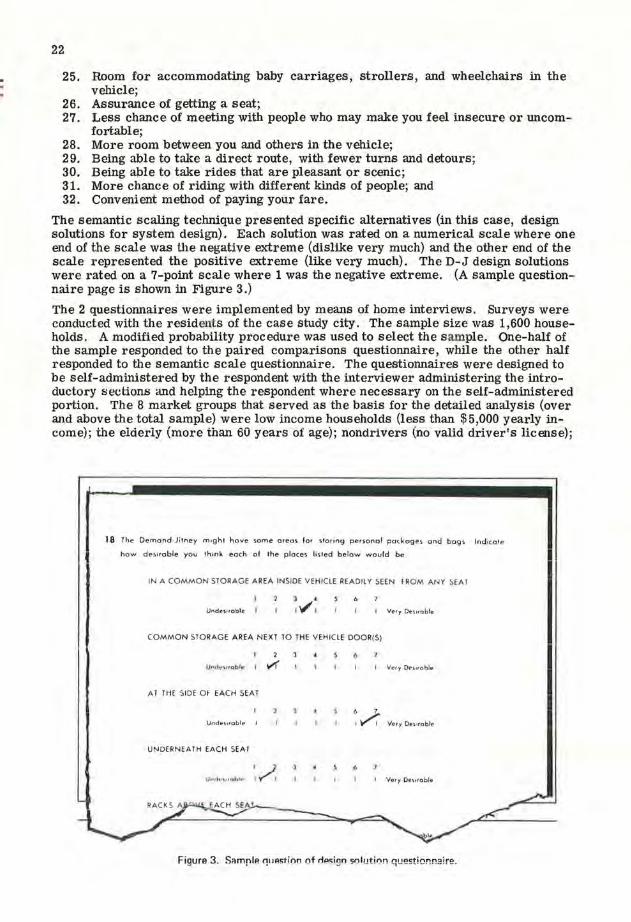
The semantic scaling technique presented specific alternatives (in this case, design solutions for system design). Each solution was rated on a numerical scale where one end of the scale was the negative extreme (dislike very much) and the other end of the scale represented the positive extreme (like very much). The D-J design solutions were rated on a 7-point scale where 1 was the negative extreme. (A sample questionnaire page is shown in Figure 3 .)
The 2 questionnaires were implemented by means of home interviews. Surveys were conducted with the r esidents of the cas e study city. The sample size was 1,600 households. A modified probability procedure was used to select the sample. One-half of the sample responded to the paired comparisons questionnaire, while the other half responded to the semantic scale questionnaire. The questionnaires were designed to be self-administered by the respondent with the interviewer administering the introductory sections and helping the respondent where necessary on the self-administered portion. The 8 market groups that served as the basis for the detailed analysis (over and above the total sample) were low income households (less than $5,000 yearly income); the elderly (more than 60 years of age); nondrivers (no valid driver's license);
18 The Demand-Jitney might hove some areas for storing personal packages and bag s Indicate
how desirable you !hank each of the places listed below would be
IN A COMMON STORAGE AREA INSIDE VEHICLE READILY SEEN FROM ANY SEAT
Undesirable f
) . 1../ '
COMMON STORAGE AREA NEXT TO THE VEHICLE DOOR(S)
2
U"'-dt' 'l.1toblt 1 v,' I Vt!ry Oe1,,rable
Al THE SIDE OF EACH SEAT
Unde1,,roble I
6 7
I ~ Very Oe1,1rable
UNDERNEATH EACH SEAT
Urlodv \11obl .. I Very Oe1 1rable
Figure 3. SrimplP. r111estion of des.ig11 solution questionnaire.

23
the young (under 20 years of age); housewives (females not employed); husband and wife both employed; multicar households (more than one car available); and one-car households (no second car in household). Data for no-car households were not analyzed separately because of the small sample size.
In addition to these basic subgroups, survey data were also examined in terms of 3 different trip purposes: work trips, shopping trips, and school-related trips. Scales were developed relating the responses of each of the subgroups of concern. Correlation coefficients among the various characteristics were also calculated.
The scale representing the responses to the paired comparisons questionnaire for the total sample is shown in Figure 4.
Scale Analysis: Vehicle
If the system is conceived of as serving the population as a whole and not any particular subgroup, the vehicle design should provide for entry-exit configurations that are easier to use than those generally found on current buses. The vehicle should be air conditioned, provide more personal space per passenger than is common in today's transit vehicles, provide for personally controlled microclimate, and have convenient parcel storage areas close to each seat. Less emphasis would be placed on providing for privacy or for a variety of social group seating possibilities or on providing adjustable and movable seats. Vehicle styling, although still an integral component of design, would have to be considered as being shaped by, rather than shaping, the more important requirements mentioned earlier. The exterior design would have to have a clearly understandable, variable identification system so that a specific vehicle could be recognized by passengers. A review of current commercially produced domestic and foreign vans and small buses indicates that a vehicle meeting these needs is not available.
Scale Analysis: Service and Convenience
Insofar as D-J system service characteristics are concerned, arriving at a destination when planned, having a seat during the trip, and not having to transfer during a trip are the 3 most important characteristics as expressed by the survey respondents.
The hours of system operation that seem most desired by the potential users are 9 a.m. to 7 p.m. As might be expected, the respondents strongly prefer being picked up at their doors as opposed to such places as nearest major street or nearest corner. The most accepted waiting times would be between 5 and 20 minutes. Respondents indicated that they would not care to arrive at their destinations more than about 10 minutes earlier than the expected arrival time. The respondents tended to be concerned with what the absolute amount of extra travel time involved in using the D-J system would be rather than how many times longer the trip would take if made by the D-J system rather than by automobile. The demand estimate survey (discussed later) reveals that 2: 1 (D-J:automobile) is the most acceptable ratio. On-board music and beverage availability would not have a significant influence on D-J ridership. The fare payment method preferred was the traditional one of paying with cash and receiving change. The most desirable fare structures were a fixed basic fare, followed closely in preference by a fare based on distance traveled. The data indicate that these are 2 different points of view and not that both are equally preferred by respondents. Examination of the survey data shows that the fare that respondents would be willing to pay is between 40 and 50 cents. The respondents strongly favor discounts to students traveling to and from school, retirees, handicapped, and children accompanied by an adult.
Scale Analysis: Summary
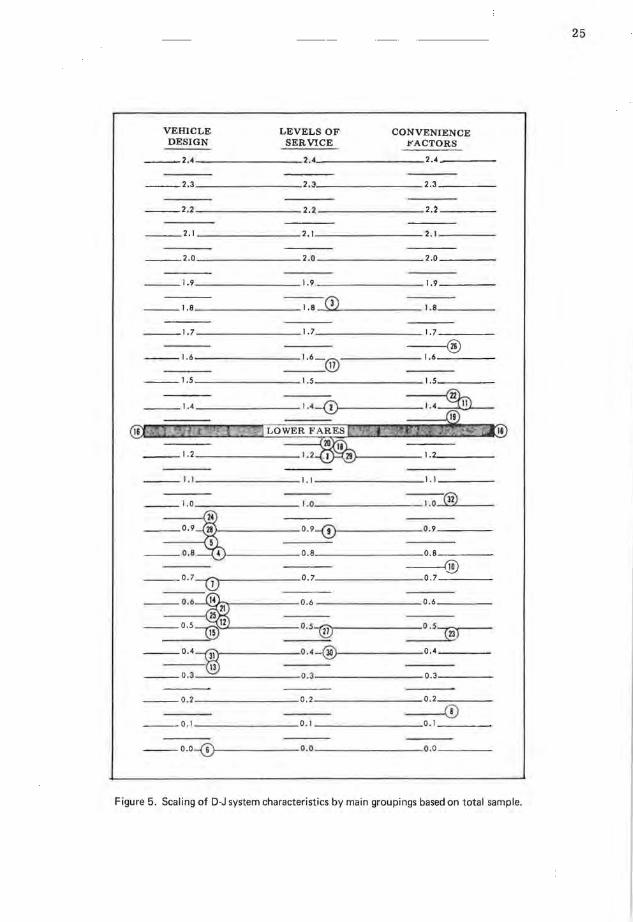
Those D-J system characteristics that may be classified as dealing with levels of service (e.g., arriving when planned) were most important to the potential system users. Characteristics associated with vehicle design were rated as the least important group. stylish vehicle exterior was rated the lowest of any of the 32 items investigated. Items relating to convenience formed a middle group in importance (Fig. 5).

24
PREFERENCE SCALE, TOTAL POPULATION
ARRIVIN G WHEN PLANNED
SHELTERS AT PICK-UP LESS WAIT TIME· CHOOS E PICK-UP TIME
LOWER FARES ::: 3-<-~--+-a~, ~ SHORT TRAVEL TIME • DIRECT ROUTE
::J .,:-+-----+---,
~
EASY FARE PAYING l
1-+-+-+- ~ASY ENTRY/EX IT
LUNU ER SERVICE HOURS LESS WALK TO PICK-UP
p EPENDABLE TRAVEL TIMES • NO CROWDING ON VEHICLE
1-+-+-+- SPACE FOR PACKAGES
f DJUSTABLE AIR, LIGHT AND SOUND
1-+-+-..._ MORE 'PHONES IN PUBLIC PLACES I ADJUSTABLE SEATS
• ABILITY TO MEET FRIENDS ON VEHICLE VEHICLE/NEIGHBORHOOD COMPATIBILITY
1-+-+-+.ROOM FOR BABY STROLLERS, WHEELCHAIRS,ETC , e RIDING IN PRIVACY
• MORE PLEASANT ROUTE •RIDE WITH DIFFERENT KINDS OF PEOPLE
,__,__...____.....,. -C HAN.CE OF MEETING MORE PEOPLE
HYI l~H VFHIC::I F FXTFRIOR
•FORM TALKING GROUPS WHILE RIDING O ASK QUESTIONS OF SYSTEM REP. e AVOID ANNOYING INDIVIDUALS
Figure 4. Scaling of paired comparison preference of total sample regarding D-J system characteristics.
25
VEHICLE LEVELS OF CONVENIENCE DESIGN SERVICE !''ACTORS
---2,4 2.4 2.4
___ 2.3 2.J 2 .3
___ 2.2 2. 2 2.2
___ 2.1 2.1 2.1
___ 2,0 2.0 2.0
___ 1.9 1.9, 1.9
___ l.8 --1.-e - CD l.8
___ 1,7 1.7 1.7
® ---l.6 1,6_® 1.6
17 ___ 1,5
1.5 1.5
___ J.4 ~ II
___ I. I I . I l. l
___ 1.0 1.0 - -1-.0-®
1 0,9--© 0. 9 ___ 0 .9 ~
0.8 0.8 ___ o.a 4
--® __ 0.7-cD 0.7 0.7
_ 0 .6~ 0.6 0.6
__ 0 .5® 0,5-® ~ 15
___ 0.4 =BB 0 .4-@ 0.4
13 ___ o ,3 0 .3 0.3
___ Q, 2 0.2 0.2
© ___ o.J O. J 0 . 1
__ o.o-(D 0.0 o.o
Figure 5. Scaling of D-J system characteristics by main groupings based on total sample.

26
This summary is pertinent to the sample population as a whole. The data were also analyzed in terms of various user groups as noted earlier. Analysis of the subgroups revealed that only 3 of the 8 groups showed major variations from the preferences exhibited by the total sample. The elderly and the low-income respondents attached a greater importance to lower fare than the total population. The elderly were more concerned with convenience in waiting for the vehicle and less concerned with travel and wait time. The low-income group preferred protection from weather over all other characteristics considered. The young, although less concerned with lower fares, demonstrated a higher preference for on-board conveniences such as music and the ability to talk with fellow passengers.
The D-J system characteristics served as the basis for the development of the baseline system that was later presented to respondents in a third survey (discussed later). This survey was designed to provide information regarding the percentage of trips currently being made in the case study city that might be diverted to the D- J system. This base- line system also served as the foundation for the detailed system description used in performing the financial analysis of the D-J system.
COMPUTER SIMULATION STUDIES
The purpose of the computer simulation study of the D-J system was to determine how the system would function under a variety of given parameters and operating strategies. The information derived from the simulation was essential for system performance evaluation and system scaling prior to an actual operating demonstration. Some of the outputs of the simulation were used in the development of the system definition and system cost modeling.
'T'hP. r.ornputer i:iimulation program includes a...ll objective function that makes it possible to ascribe various relative values to a number of community characteristics and customer-oriented service characteristics in order to evaluate their effect on system operation. The community characteristics that were varied were the area (square miles) within the community that would be served by the D-J system, the estimate of the ride demands per hour, and the assumed average velocity (mph) attained by the D-J vehicle. The customer-oriented service characteristics used as simulation inputs included the guaranteed maximum time a customer would have to wait to be picked up after placing a ride request and the guaranteed maximum riding time to the desired destination (D-J trip time to automobile trip time ratio).
The simulation output data were available in 2 forms: computer printouts and graphic (dynamic) displays. Among the data available as permanent record (printout) were the following: number of vehicles required to meet the customer service guarantee at given demand levels and assumed vehicle velocities, total system mileage accumulated for the period of the simulation, mileage accumulated by each vehicle in the system during the simulation, average trip length, average system speed (as distinct from the input average speed), average customer waiting time, average actual trip time, minimum and maximum waiting times for the list of demands during the simulation, and minimum and maximum trip times for the list of trips made during the simulation. The simulation may be stopped at any time during its operation. A "bus table" printout may then be r equested. The table gives the number of ride requests that have been assigned to each vehicle in the system as well as the number of pickups and deliveries that have been made by each vehicle in the system up to the time the simulation was interrupted.
The simulation program is written for a computer that supports graphic ilisplay hardware. This hardware is in the form of a cathode r ay tube (CRT) with a display area of approximately 144 sq in. Inputs to the simulation and intermediate data output requests are made with a light pen to the CRT or an input keyboard or both. During the simulation, the followi1ig graphic displays may be called for: the r oute or tour oi any one of the vehicles as it progresses through the time span of the simulation (any vehicle in the system may be selected for display); the assigned tours of all of the vehicles; and the location of all of the vehicles.
27
A network model of the case study conunw1ity streets and roadways has been developed. It includes approximately 10,000 links and 4,000 nodes. This network model will, in subsequent work, replace the rectilinear x-y coordinate method of determining pointto-point distances in the case study city computer simulation.
RIDERSHIP ESTIMATION
Critical to the analysis of any proposed transportation system is an estimate of the number of people who will use the system (ridership). In the evaluation of the D-J system, 2 classes of information pertaining to ridership were sought from over 1,000 residents of the case study city: qualitative and quantitative. The first of these was to aid in the design of the quantitative questionnaire and to answer questions such as the following: What do residents of the city view as the most important advantages and disadvantages of the system? With reference to both those who would and those who would not use the system, what problems might be anticipated if the D-J system were to be implemented in the community at this time? What communications methods would be most desirable to convince the public to try the system? Toward what market group ought the system to be oriented for maximum citizen benefit? Who ought to own and operate the system? What modifications should be made to the base-line system (as described to respondentis) in order to make the system more attractive to potential users?
Answers to questions such as these were obtained through the use of the traditional, well-accepted market research technique of in-depth group interviews. These interviews, as well as the home interviews used to obtain quantitative estimates of ridership, were conducted by the same market research firm that had previously conducted the attitude survey pertinent to preferences for transportation system characteristics and the survey dealing with specific system design alternatives. As in the previous surveys, the project sponsor was not identified, and members of the study team were intimately involved in the development of the survey instruments and the training of interviewers.
In both surveys (qualitative and quantitative) the respondents, as well as the interviewers, became thoroughly familiar with the various significant aspects of the D-J system as projected for possible use in the case study community. The qualitative interviews were conducted with 5 specific market groups: men who live and work within the community, women who live and work within the community, housewives in the middle-middle socioeconomic class, men and women from households that do not own an automobile, and teen-agers between the ages of 13 and 16 years.
In-Depth Interview Survey
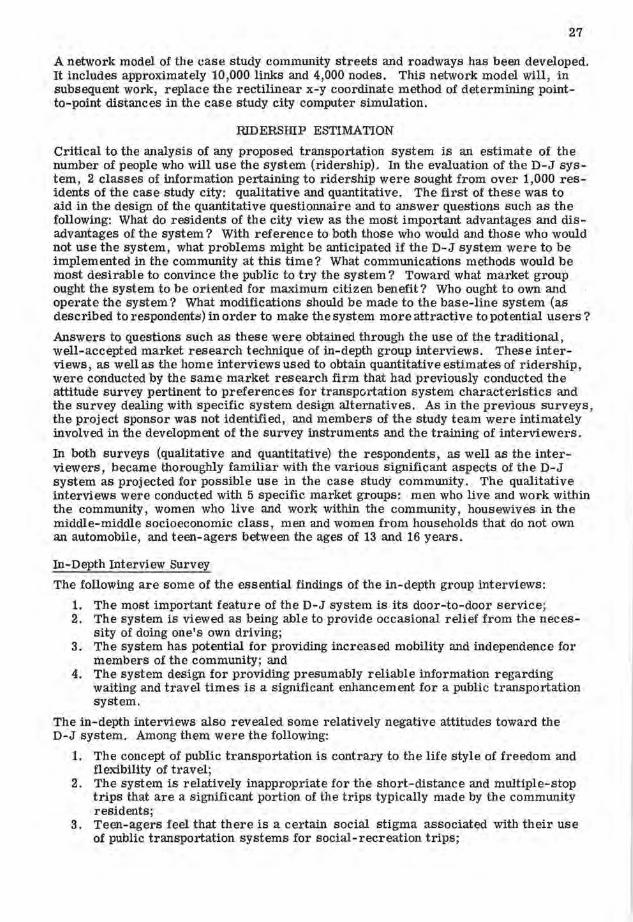
The following are some of the essential findings of the in-depth group interviews:
1. The most important feature of the D-J system is its door-to-door service; 2. The system is viewed as being able to provide occasional relief from the neces
sity of doing one's own driving; 3. The system has potential for providing increased mobility and independence for
members of the community; and 4. The system design for providing presumably reliable information regarding
waiting and travel times is a significant enhancement for a public transportation system.
The in-depth interviews also revealed some relatively negative attitudes toward the D-J system. Among them were the following:
1. The concept of public transportation is contrary to the life style of freedom and flexibility of travel;
2. The system is relatively inappropriate for the short-distance and multiple-stop trips that are a significant portion of the trips typically made by the community residents;
3. Teen-agers feel that there is a certain social stigma associated with their use of public transportation systems for social-recreation trips;

..
28
4. The immediate out- of-pocket cost of using the D-J is generally disproportionate to the perceived out-of-pocket cost of automobile travel; and
5. Some concern was expressed that the implementation of the system might ulti-mately raise taxes in order to support the D-J system.
Home Interview Survey
The qualitative interview technique employed to gather subjective information about D-J potential uses and acceptance also served a second purpose; it facilitated the design of the interviewer-administered questionnaire that was used in the second, and major, data gathering effort for ridership estimation. The point of departure for the group sessions was the questionnaire to be used in the home interviews. Thus, the group sessions served as a pretest for the questionnaire and provided insights into its construction and generated guidelines for its modification prior to use in the field.
Because the measurement of user preferences for the various D-J system characteristics also involved home interviews in the case study city , a procedure to be followed for the quantitative aspects of the ridership estimation, it was important to ensure that no overlap existed between the 2 samples. No individual was to be included in more than one of the attitude surveys. The sample selection technique for the second part of the ridership estimation survey was similar to that used for the other surveys in order to maximize survey compatibility. A quota system was used in determining the sample in order to ensure minimal sample sizes for each type of individual who might be expected to exhibit major differences in attitude toward the use of the D-J system. The quotas and the types of persons are shown in Figure 6.
The questionnaire used for the home interviews for ridership estimation was of the "branch and botLn.ds" type. The interviei.1.r 1.1.1ould begin ,vit..11 a certain set of conditions describing fare rate, for example, and then progress (branch out) according to the response given. The interview would continue until some designated cutoff response {again, this might be a fare level) was given, i.e., a bound was reached, and then the interview was to be shifted to another branch or, depending on the situation, terminated. The questionnaire was interviewer-administered. Some visual aids (drawings and charts) were used to ensure that the respondents understood what was required of them or to serve as memory devices during the 30- to 90-minute interview. These inter-
550 One-Car
Households
2 0 (llousewh·, )
150 (Males) 100
Total Sample: 1,050
Res1><mdenls All Locnlcd in Case Study
Cl,.
100 No-Car
Households
400 Multi-Car
Households
1 0 (Hou~ewi,•es)
100 (Males)
(Females1
~ o Work) 100
(Females Wh o Work ) 100
(Teenagers-Male or Female)
I (Teenagers-Male or Female)
I 100 (Head of Household-Male or Female)
Figure 6 . Types of persons interviewed in the demand estima· tion home interview survev.
views, like those in the previous surveys, were also conducted by the same market research firm.
The base-line D-J system that was developed from the first 2 surveys was presented to the respondents as the D-J for implementation in the surveyed city. The basic parameters that were varied (tested for influence on ridership) were fare charged, maximum waiting time between calling for service and arrival of the vehicle, and ratio of travel time via D-J to travel time for the same trip by private automobile (D-J: automobile ratio). The limits for these parameters were established on the basis of preliminary runs of the system simulation model and earlier surveys. The matrix of the variables resulted in 16 different specific systems. These are given in 'T'ablP. n.
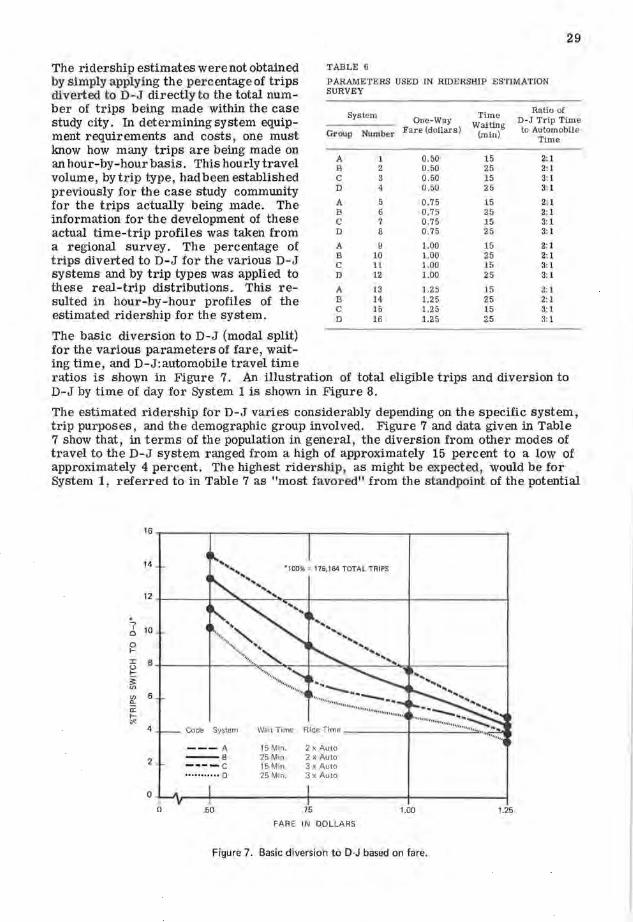
The ridership estimates were not obtained by s imply applying the percentage of trips diverted t o D- J directly to the total number of trips being made within the case study city. In determining system equipment requirements and costs , one must know how many trips are being made on an hour-by-hour basis. This hourly travel volume, by trip type, had been established previously for the case study community for the trips actually being made. The information for the development of these actual time-trip profiles was taken from a regional survey. The percentage of trips diverted to D-J for the various D-J systems and by trip types was applied to these real-trip distributions. This resulted in hour-by-hour profiles of the estimated ridership for the system.
The basic diversion to D-J (modal split) for the various parameters of fare , wait-ing time , and D-J:automobile travel time
29
TABLE 6
PARAMETERS USED IN RIDERSHIP ESTIMATION SURVEY
System One-Way
Group Number Fare (dollars)
A B C D
A B C D
A B C D
A B C D
1 2 3 4
5 6 7 8
9 10 11 12
13 14 15 16
0.50 0.50 0.50 0 .50
0.75 0 .75 0.75 0.75
1.00 1.00 1.00 1.00
1.25 1.25 1.25 1.25
Time Waiting
(min)
15 25 15 25
15 25 15 25
15 25 15 25
15 25 15 25
Ratio of D-J Trip Time to Automobile
Time
2:1 2: 1 3: 1 3: 1
2: 1 2:1 3: 1 3: 1
2: 1 2: 1 3: 1 3: 1
2: 1 2: 1 3: 1 3: 1
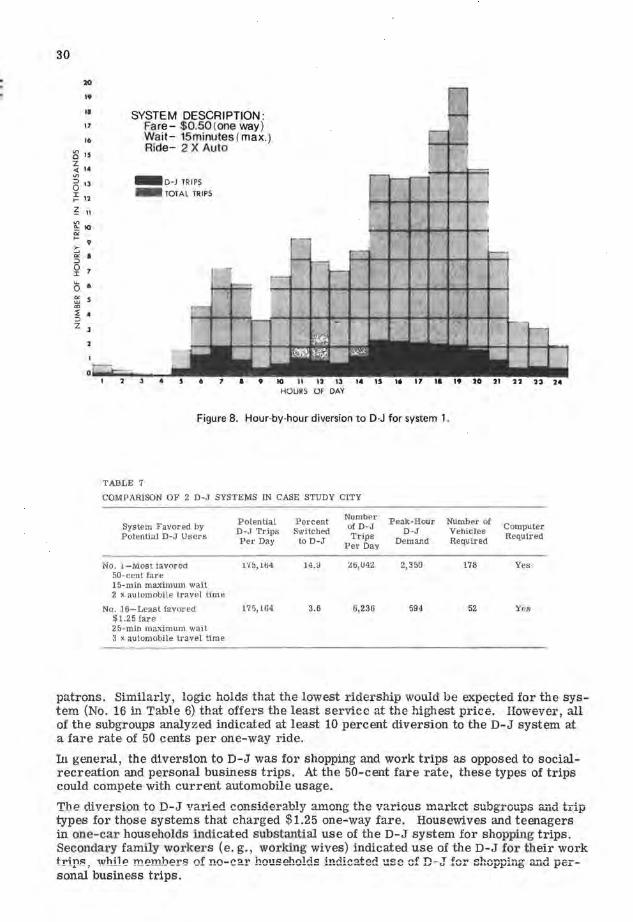
r atios is shown in Figure 7. An illustration of total eligible trips and diversion to D-J by time of day for System 1 is shown in Figure 8.
The estimated ridership for D-J varies considerably depending on the specific system, trip purposes , and the demographic group involved. Figure 7 and data given in Table 7 show that, in terms of the population in general, the diversion from other modes of travel to the D-J system ranged from a high of approximately 15 percent to a low of approximately 4 percent. The highest riders hi p , as might be expected , would be for System 1, referred to in Table 7 as "most favored" from the standpoint of the potential
16
14
12
. 7 10 Cl
0 t-I 8 (.) t-~ "' "' 6 0..
a: t-,,..
4
2
0
0
Code System
--- A ---8 ---- c ........... D
.50
Wait Time
15Min. 25 Min. 15 Min, 25 Min .
.. .. .... ....
2 x Auto 2 x Auto 3 x Auto 3 x Auto
.75
....
FARE IN DOLLARS
.... .... ......
1.00
Figure 7. Basic diversion to D-J based on fare .
1.25
.. 30
20
,. II
17
,,. ~ 1S z <( ,. Vl
6 13
~ 12
~ ,, Vl !!: ,0
~ 9 ::
"' ::, • 0 :c
0 II,
~ s a:,
:; . ::, z 3
SYSTEM DESCRIPTION: Fare- $0.SO (one way) Wait- 15minutes(max.) Ride- 2 X Auto
-D-J TRIPS - TOTAL TRIPS
Figure 8. Hour-by-hour diversion to D-J for system 1.
TABLE 7
COMPARISON OF 2 D-J SYSTEMS IN CASE STUDY CITY
Potential Percent Number Peak-Hour Number of
System Favored by D-J Trips Switched of D-J D-J Vehicles Potential D-J Users Per Day to D-J Trips Demand Required Per Day
No. l-Most tavorect 1·,~, lti4 14.~ 26,U42 2,350 178 50-cent fare 15-min maximum wait 2 x automobile travel time
No. 16-Least favored 175,164 3.6 6, 236 594 52 $1.25 fare 25-min maximum wait 3 • automobile travel time
Computer Required
Yes
Yes
patrons. Similarly, logic holds that the lowest ridership would be expected for ihe system (No. 16 in Table 6) that offers the least service at the high.est price. However, all of the subgroups analyzed indicated at least 10 percent diversion to the D-J system at a fare rate of 50 cents per one-way ride.
In general, the diversion to D-J was for shopping and work trips as opposed to socialrecreation and personal business trips. At the 50-cent fare rate, these types of trips could compete with current automobile usage.
The cliversion to D-J varied considerably among the various market subgroups and trip types for those systems that charged $1.25 one-way fare. Housewives and teenagers in one-car households indicated substantial use of the D-J system for shopping trips. Secondary family workers (e.g. , working wives) indicated use of the D-J for their work trip8
1 while me:m.bers of no-car households indicated use cf D-J for shopping a..Ad per
sonal business trips.
31
It is postulated, on the basis of the data from the quantitative ridership estimate survey , that the demand shown for those systems charging $1.25 fare is directly related to the availability of an automobile. Those persons who do not have access to an automobile or cannot drive (no valid driver's license or infirmity) would use the D-J for the most essential types of trips that they make. At this level of fare ($1.25) the D-J system would complement , rather than compete with or substitute for , the private automobile as a means of transportation.
RIDERSHIP ESTIMATION
The impact of the D-J system in the case study community may, on the basis of the survey data, be viewed as providing a competitive or at least a complementary mode of transportation relative to the private automobile. The usage (competition or complement) depends on the interaction between fare level and trip purpose.
It must be realized that the D-J system if implemented in the case study city would not solve a major transportation requirement simply because there is not a significant public transportation need in this community! It was stated earlier that this city was not an "ideal" community for the application of a D-J system precisely because there is no serious public transportation need in the community. This area, however, representative in terms of population density of more than 100 U.S . communities, would provide a better understanding of a potential product market. It is felt that significant ridership could evolve in a community that did, in fact, have a public transportation problem.
SYSTEM COST STUDY
Previous studies of demand-responsive transportation systems have not included system description and cost studies in sufficient detail to allow policy or marketing decisions. If a D-J system is to be implemented, an accurate financial analysis is crucial to decision-making. This study used the results of the ridership estimation analyses and a detailed system description to assess the financial feasibility of the D-J system as applied to the case study city. The financial feasibility of the system was evaluated in terms of revenues derived from the fare box only and from the standpoint of federal subsidy. (Estimates are based on 1970 dollars.)
The cost study was directed to attain 4 specific objectives: detailed definition of a D-J system structure, identifying all of the essential components required for its operation; development of a cost model that measures accurately system costs and is consistent wit h cu1·rent and projected public transportation system costs; determination of the profitability of the described D-J system as it would be applied and responded to (ridership level) in the case study city; and assessment of the sensitivity of system costs to various parameters.
The cost model for the D-J system was developed in accordance with traditional economic procedures, but it was also specifically tailored to the demand-responsive transportation system concept. The model is applicable to areas other than the case study community with appropriate changes in certain input variables.
The components of the D-J system cost model are functions of several variables that include hourly demand (ridership) , maximum specified waiting time between requesting service and being picked up, maximum specified D-J to automobile travel time ratio , and assumed average speed of the D-J vehicle. The model incorporates manual or computerized routing and scheduling procedures. Costs were estimated on the basis of specific itemized unit costs, amortization periods for capital items, and an interest rate of 10 percent.
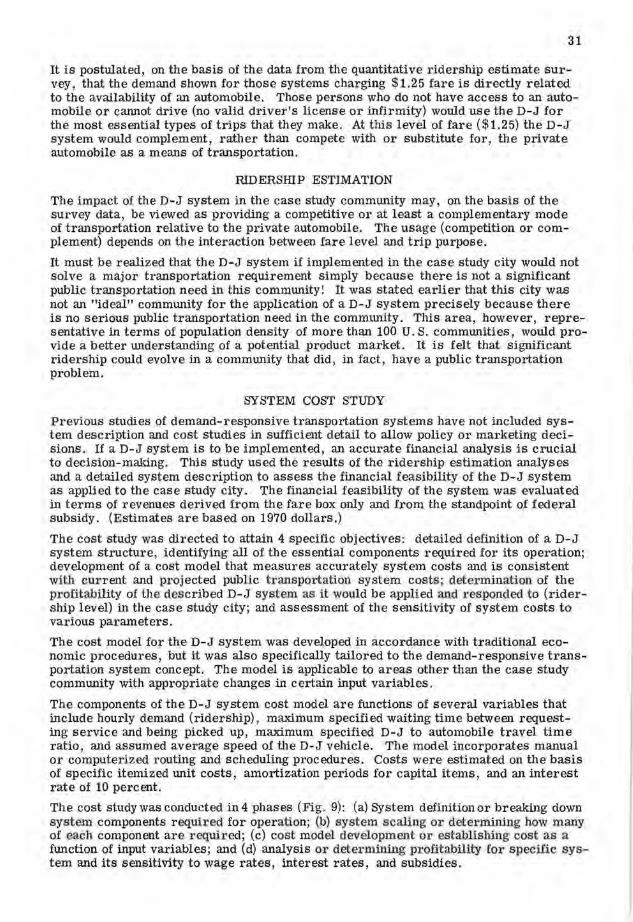
The cost study was conducted in 4 phases (Fig. 9): (a) System definition or breaking down system components r equired for operation; (b) system scaling or determining how many of each component are required; (c) cost model development or establishing cost as a function of input variables; and (d) analysis or dete1·mining pr ofitapility for s pecific system and its sensitivity to wage rates, interest rates, and subsidies.
32
Measurement Of User Preferences
System Definiton
System Simulation
Cost Model
Figure 9. Cost study framework .
Ridership Estimation
Profit Loss Determination
Sensitivity Analysis
The cost estimates for the D-J system took into consideration the length of the operating day and the hourly distribution of ride requests (demand). The inefficiency a transportation system encounters as demand levels vary during an operating day was also considered.
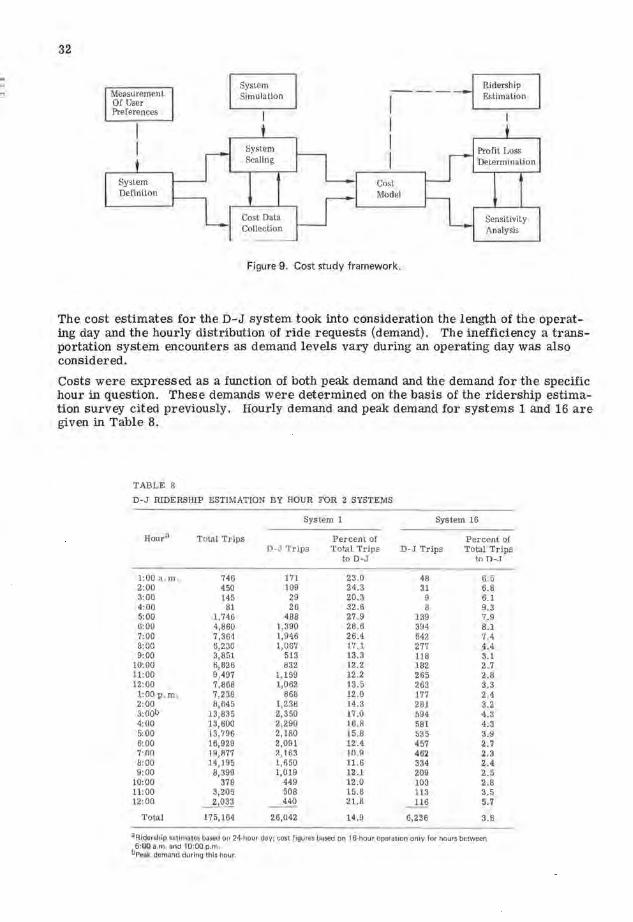
Costs were expressed as a function of both peak demand and the demand for the specific hour in question. These demands were determined on the basis of the ridership estimation survey cited previously. Hourly demand and peak demand for systems 1 and 16 are given in Table 8.
TABLE 8
D-J RIDERSHIP ESTIMATION BY HOUR FOR 2 SYSTEMS
System 1 System 16
Roura Total Trips Percent of Percent of D-J Trips Total Trips D-J Trips Total Trips
to D-J to D-.1
1:00 a . m 746 171 23.0 48 6.5 2:00 450 109 24.3 31 6.8 3:00 145 29 20 .3 9 6.1 4:00 81 26 32.6 8 9.3 5:00 1,746 488 27 .9 139 7.9 6:00 4,860 1,390 28.6 394 8.1 7:00 7,361 1,946 26.4 542 7.4 8:00 6,230 1,067 '" ' 277 4.4 .1.1,.l
9:00 3,851 513 13.3 118 3.1 10:00 6,826 832 12.2 182 2.7 11:00 9,497 1,159 12.2 265 2.8 12:00 7,868 1,062 13.5 263 3.3 1:00p.m , 7,238 868 12.0 177 2.4 2:00 8,645 1,238 14.3 281 3.2 3:00b 13,835 2,350 17 .0 594 4.3 4:00 13,600 2,290 16.8 581 4.3 5:00 13,796 2,180 15.8 535 3.9 6:00 16,929 2,091 12.4 457 2.7 7·00 rn,877 ?., 163 10 ~ 462 2.3 8:00 14,195 1,650 11.6 334 2.4 9:00 8,399 1,019 12.1 209 2.5
10:00 378 449 12.0 103 2.8 11:00 3,205 508 15.8 113 3.5 12:00 ~ 440 21.8 ~ 5.7
Total 175,164 26,042 14.9 6,236 3.6
a Ridership estimates based on 24-hour day; cost figures based on 16-hour operation only for hours between 6:00 a.m. and 10:00 p.m .
bp ~k demand during this hour.
+1 RIDERSHIP IN 1000s
15 20 25
"' g-2+ -----+------tlrli,----'li.,---~ -----1---------i 0.
~ 0_4+------1------t----------,>71:---r--~ --.-- r-------, a: w a.. w -S,+----- +---------+----~"ef';,--- -"1;- --,,t---------i :g ...J
";:::--6+--.-----,.._ ____ __._ _ _,_ ___ -t----..- ~..-.1- .--------, u:: MAltlMUM ~~~~OAU~~ \
~ ~ ~ ~ r•Av[l TIM[ \
a.. -7 " \ ~ === ~ :! so,\ ~ ,, \ ti -a ... ""'"' •. , .... "-ou,v• .. -----;------i----...'--i ~ \
\ so,
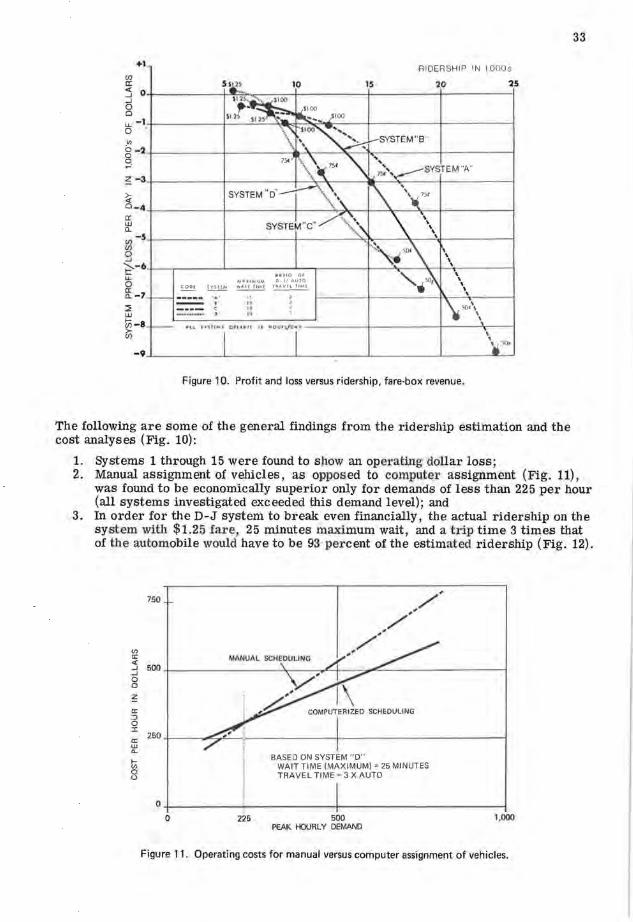
Figure 10. Profit and loss versus ridership, fare-box revenue.
The following are some of the general findings from the ridership estimation and the cost analyses (Fig. 10):
Systems 1 through 15 were found to show an operating dollar loss;
33
1. 2. Manual assignment of vehicles, as opposed to computer assignment (Fig. 11),
was found to be economically superior only for demands of less than 225 per hour (all systems investigated exceeded this demand level) ; and
3. In order for the D-J system to break even financially, the actual ridership on the system with $1.25 fare, 25 minutes maximum wait, and a trip time 3 times that of the automobile would have to be 93 percent of the estimated ridership (Fig. 12).
u, 0:
750
'.3 500 +----------'<--- -r''+- -=~--------- ----i ...J
0 Cl
~ 0: ::J 0 J:
COMPUTERIZED SCHEDULING
o: 250-1-__ ,,...,:;..,e _ _...._ ______ '+---------- ----j w 0..
t; 0 u
BASED ON SYSTEM "D'" WAIT TIME (MAXIMUM) = 25 MINUTES TRAVEL TIME= 3 X AUTO
O;-------,------- -r---------------, ! 0 225 500
PEAK HOURLY DEMAND 1.000
Figure 11. Operating costs for manual versus computer assignment of vehicles.
34
+1
0
!" -1 0 0 0
iii -2
~
~ ·3
a: ~ · 4-
Cl)
~ ·5 ...J
>-; -6 ::; ·7 UJ 1--Cl)
iii ·8
•S l, 25 FARE
5 10 RIDERSHIP( IN 1,000 s)
15 20 25
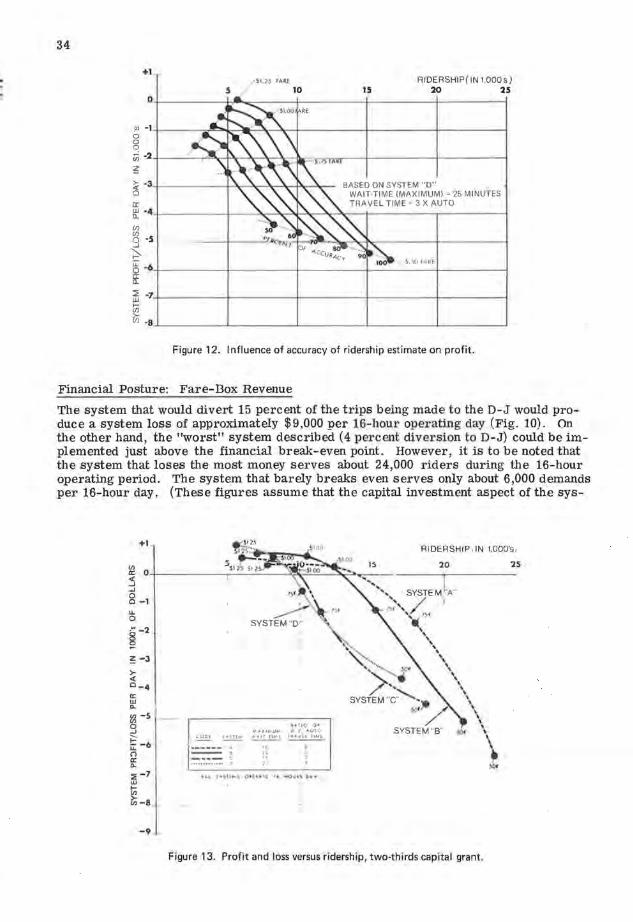
BASED ON SYSTEM "D" WAIT-TIME (MAXIMUM)= 25 MINUTES TRAVEL TIME = 3 X AUTO
S, 50 FARE
Figure 12. Influence of accuracy of ridership estimate on profit.
Financial Posture: Fare-Box Revenue
The system that would divert 15 percent of the trips being made to the D-J would produce a system loss of approximately $9,000 per 16-hour operating day (Fig. 10). On the other hand, the "worst" system described (4 percent diversion to D-J) could be implemented just above the financial break-even point. However, it is to be noted that the system that loses the most money serves about 24,000 riders during the 16-hour operating period. The system that barely breaks even serves only about 6,000 demands per 16-hour day. (These figures assume that the capital investment aspect of the sys-
+1
~ -3
~ 0_4 a:: w "-~ -5 g -e -6 u. n a: "-:,;_-7 w
~ Cl>-8
-91
•• TIO O f O•J' 4UT O
~~ ~·~
-- , -••- C
" " ,1 ,, • U \ '>111¥ \ O f t u tt IA " OU tt O • 'r
I
l!i
RIDERSHIP, IN 1.000's,
:zo
,, SYSTEM).A-
' /. I ,.,, ', '\ 75,t '• \
' ' ', \ ' \
'
SYSTEM"B"
' \ \ ' \ \ ' \ ' ' \
\
\
'
l5
Figure 13. Profit and loss versus ridership, two-thirds capital grant.
35
tem has been geared to handle peak loads, while personnel allocation varies with hourly demand levels.)
Financial Posture: Fare Box Plus Subsidy
If one assumes that the system is instituted under a federal grant for capital investment, both systems 1 and 16 can be made profitable (Fig. 13). However, the fare of tile 15 percent diversion system would have to be raised to just under $1.00 per oneway ride (as opposed to the 50-cent fare). At the $1.00 fare, the system could produce about $500 per day but serve only about 12,000 demands per day. If the fare for this system were to remain at 50 cents, the loss would change from approximately $9,000 to about $6,500 per day. The 4 percent diversion system could, under a capital grant, produce about $1,000 per day and still serve about 6,000 riders per day.
Financial Posture: Wages and Interest Rate
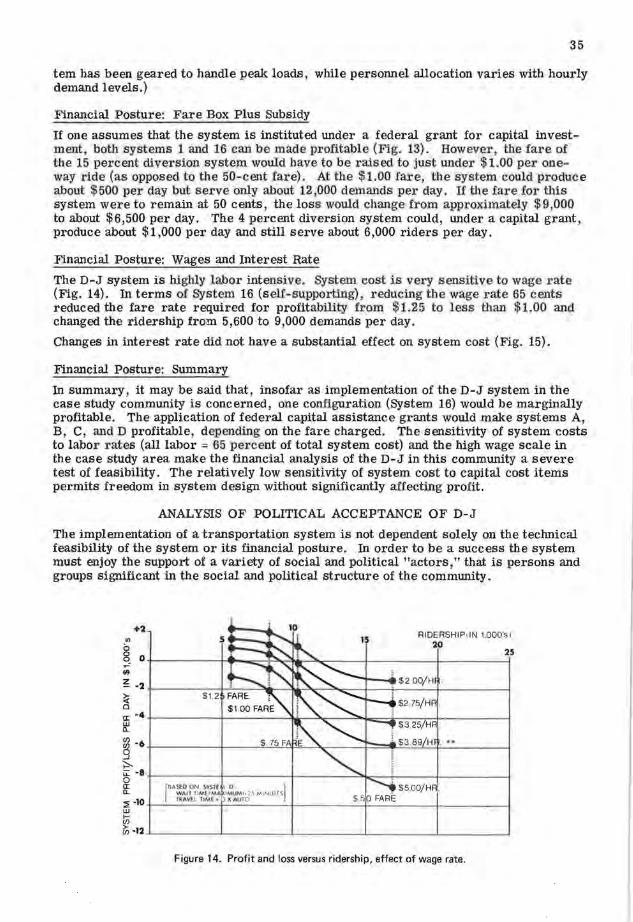
The D-J system is highly labor intensive. System cost is very sensitive to wage rate (Fig. 14). In terms of System 16 (self-supporting) , reducing the wage rate 65 cents reduced the fare rate required for profitability from $1.25 to less than $1.00 and changed the ridership from 5,600 to 9,000 demands per day.
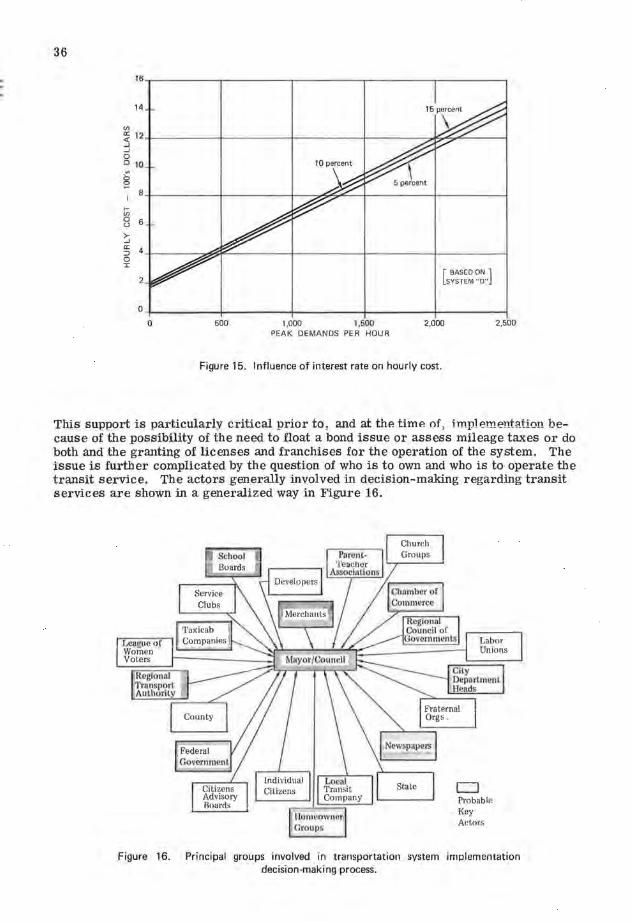
Changes in interest rate did not have a substantial effect on system cost (Fig. 15).
Financial Posture: Summary
In summary, it may be said that, insofar as implementation of the D-J system in the case study community is concerned, one configuration (System 16) would be marginally profitable. The application of federal capital assistance grants would make systems A, B, C, and D profitable, depending on the fare charged. The sensitivity of system costs to labor rates (all labor = 65 percent of total system cost) and the high wage scale in the case study area make the financial analysis of the D-J in this community a severe test of feasibility. The relatively low sensitivity of system cost to capital cost items permits freedom in system design without significantly affecting profit.
ANALYSIS OF POLITICAL ACCEPTANCE OF D-J
The implementation of a transportation system is not dependent solely on the technical feasibility of the system or its financial posture. In order to be a success the system must enjoy the support of a variety of social and political "actors," that is persons and groups significant in the social and political structure of the community.
+2
"' ~ ·2 +--------,--t-'--__;:,--------'l.i.--'~--"'...,...--l---+---1-----~ ~ $1.2 0
ffi.4 +-- ---,----------'1....-~.,-----'-!oc:::::=*:-=--:--,--:----;~----~ a.
~-6 -1-----t----":....:...:a!~:!!:-~.-------+-==~-=:-:::=.:_:;.i.~----l 9 ;:,,.. § ·8t-----t------+----~...,----+----l------l a_ WAH TIM[ f MA lMUM1 •7 5 MINUTES Cl: [BA$.(D ON :S'!'S'{ I O l ~ ·10 +---IR.~_•E_L_lfM_ E_• t-1-X AU_1_0 __ --l-----$·-l------l------l w
~-12 ~----~-----''-------''--- ----'-------'
Figure 14. Profit and loss versus ridership, effect of wage rate.
'"
36
16
14
u,
~ 12 ..J ..J 0 o 10 ~
g 8
f-u, 0 6 (.)
>-..J a: 4 :::)
0 I
2
0
0 500 1,000 1,500 PEAK DEMANDS PER HOUR
[ BASED ON]
SYSTEM "D"
2,000
Figure 15. Influence of interest rate on hourly cost.
2,500
This support is particularly critical prior to , and at the time of; implementation because of the possibility of the need to float a bond issue or assess mileage taxes or do both and the granting of licenses and franchises for the operation of the system. The issue is further complicated by the question of who is to own and who is to operate the transit service. The actors generally involved in decision-making regarding transit services are shown in a generalized way in Figure 16.
CJ
Labor Unions
Probable Key Actors
Figure 16. Principal groups involved in transportation system implementation decision-making process.
37
The purpose of the r esearch into the social-political str ucture of the case study community was t o (a) describe and analyze the r elationships and factors that must be cons idered in designing systems for implementation within a polit ical decision- making framework and (b) specifically analyze the probable political acceptance of the D-J system as proposed for introduction into the case study city.
Two conceptual models were developed and used to assist in the analysis of the probable political response to the D-J system concept in th e case s tudy city: a political r esponse model and a people-resource-environment mod el. The former views the process of introducing a new urban transportation syst,em into a community and that of t rying t o achieve political acceptance for it. The model defines the local political decisionmaking process. The second model is a component of the political response model. It describes the D-J system within a broader social, environmental , and organizational framework. The people-resource-environment model views the system as being used by people within an environmental context.
The data used in the development of the models and in the social-political evaluation of D-J were derived from the following sources: local land use study and interview data file acquired in 1965; case study community data files and published reports on land use, population, and transportation; federal and state guidelines and legislative records relating to public transportation system planning and funding; case study community municipal charters , organization charts, budgets, and annual reports; newspaper accounts of events and issues in the community for the previous 5-year period; interviews with selected individuals both within and outside of the case study community; analysis of attitudinal surveys of consumer preferences conducted as part of other aspects of the D-J system study; in-depth group interviews with selected groups from the case study community; ridership estimates for the D-J system made as an integral part of the overall D-J study; internal reports prepared as part of the overall D-J system study; and selected publications in the field of urban transportation planning, design, and evaluation.
The probable political responses to the implementation of a D-J system in the case study city can be viewed primarily in terms of alternatives to funding arrangements. A D-J system owned and operated privately could gain tentative political approval in the case study community, at least as far as the residents interviewed were concerned. (This is the form preferred by the respondents to the system design questionnaire.) Such a system, while admittedly providing few significant social benefits, would nevertheless require little from the city administration financially or administratively. The "private" system would initially appear innocuous politically.
However, the system is likely to affect the taxicab companies and bus routes (fixed schedule and route) in the community. Thus, it would appear that final political decisions about installation of D-J would have to be preceded by agreements made with the taxicab owners and the operators of the existing transit bus lines.
Funding the D-J system through federal grants obtained by the regional transportation authority could put the case study community into a position of conflict. The community would put few if any of its resources into the D-J system under such an arrangement, but control of the system would reside with the regional authority. This would create ideological as well as practical conflicts. Included among the problems raised would be issues such as fare rates, racial composition of employees, and program and service changes.
The likelihood of the regional group and the case study community coming together on the implementation of D-J is seen as not very promising. The regional group's priorities list (for effort and dollars) places improvement of local transit systems well near the bottom of the list.
A third alternative funding scheme would be to obtain federal grants through local city proposal and request. This posture is seen as an unlikely implementation method. The citywould be required to contribute more than $2 million toward a project that is viewed as providing only marginal community benefits.

38
The D-J system (or any transportation system) in order to gain strong political acceptanc e must seek implementation in a commwlity that has a definite, politically r ecognized need for a new public t r ansportation service. The an.alysis of political is sues and organization of the case s tudy city does not indicate a significant need for the s ystem nor a potential for s ignificant politic.al acceptance.
GENERAL DISCUSSION
Teclmically, the D-J system could be implemented in the case study city. A system with a 50-cent one-way fare, 15-minute maximum waiting time, and a travel time no longer than twice that required to make the trip by automobile would divert to the D- J system about 15 percent of the approximate 175,000 daily , weekday trips made that begin and end in the community. This would result in a peak-hour ride demand of over 2,000 requests and require 178 vehicles if the service guarantees of waiting and travel times are to be met. Routing and scheduling of vehicles would have to be accomplished by comput er , and electronic means have to be used to communicate vehicle assignments.
The interpretation of the fiscal picture must be done with the realization that the computations on which the projections are based are generally the worst conditions. For example, the ridership estimates are based on a community where 90 percent of the trips from which D-J could draw (eligible trips) are currently being made by automobile. In a city where automobile travel is a l esse!r percentage of the trips being made, the trip diversion to D-J, and thus the fiscal picture, could change substantially.
The wage rates used in this study reflect perhaps the highest in the country.
Another factor that could change the fiscal posture of the system is interest rate. Ten percent was used in this analysis. It is not inconceivable that a community desiring to implement a D-J system could obtain much lower interest rates , particularly on a government loan.
All of this discussion has assumed that one system strategy is elected for installation in a given city. In the case study reported here, a single set of parameters was assumed to be universal for all operating hours and days. Such need not be the situation. It would be possible to vary the operating parameters during the vari ous hours of the day or days of the week. All 3 basic factors (fare, waiting time, and trip time) could be modulated in a manne1· to enl1ance the financial status, and the system could be operated, by dynamic changes, to be maximn.lly cost effective at all times of the day and each day of the week. The fares , maximum waiting times , and r iding times could be optimized on the basis of hourly demand changes rather than held at fixed levels for all operating hours for each day of the week.
The D-J system has greater potential than that suggested by the rigorous analysis reported here based on one specific case study city.
ACKNOWLEDGMENTS
This swnmary report is the culmination of the effort of many members of the Transportation Research Department of the General Motors Research Laboratories . The study was planned and organized under the project management of Eugene T . Canty, who guided the work during the major portion of the model building and data gathering phases. Later project management was assigned to Herbert J. Bauer.
REFERENCES
1. Ca.uty , E.T., Sobey, A. J., and Wallace, J.P. New Systems Implementation study. General Motors Research Laborator ies , Feb. 1968.
2. Guilford, J. P. Psychometric Methods , McGr aw-Hill , New York, 1936. 3. Heathington K. W., Miller, J . , Knox, R. R., Hoff, G. C., and Bruggenman, J .M.
Computer Simulation of a Demand-Scheduled Bus System Offering Door-to-Door Service. Paper pr esented at the HRB 47th Annual Meeting, 1968.

39
4. Howson, L. L., and Heathington, K. W. Algorithms for H.outing and Scheduling in Demand-Responsive Transportation Systems. General Motors Research Laboratories, Res. Pub. GMR-944, Jan. 1970.
5. Jones, P. S. Dial-A-Bus. Proc. Symposium on Urban Alternatives, Stanford Research Institute, 1964.
6. The Genie System. In The Metran Study, M.I.T. Press, Cambridge, Mass., 1966. 7. Mosteller, F. Remarks on the Method of Paired Comparisons-The Least Squares
Solution Assuming Equal Standard Deviations and Equal Correlations. Psychometrika, Vol. 16, No. 1, March 1951.
8. Mosteller, F. Remarks on the Method of Paired Comparisons-A Test of Significance for Paired Comparisons When Equal Standard Deviations and Equal Correlations Are Assumed. Psychometrika, Vol. 16, No. 2, June 1951.
9. Mosteller, F. Remarks on the Method of Paired Comparisons-The Effect of an Aberrant Standard Deviation When Equal Standard Deviations and Equal Correlations Are Assumed. Psychometrika, Vol. 16, No. 2, June 1951.
10. Stevens, S.S., ed. Handbook of Experimental Psychology. John Wiley and Sons , New York, 1951.
11. study of Evolutionary Urban Transportation. Westinghouse Air Brake Company, Feb. 1968.
12. Thurstone, L. L. The Measurement of Values. Univ. of Chicago Press, Chicago, 4th impression, 1967.
13. Torgerson, W. S. Theory and Methods of Scaling. John Wiley and Sons, New York, 7th printing, 1967.
14. Vitt, J.E., Bauer, H.J., Canty, E . T., Golob, T. F., and Heathington, K. W. Determining the Importance of User-Related Attributes for a Demand-Responsive Transportation System. General Motors Research Laboratories, Res. Pub. GMR-941, Jan. 1970.
15. Wilson, N. H. M. CARS-Computer Aided Routing Systems. Dept. of Civil Eng., M.I.T., Cambridge, Mass., Res. Rept. R69-12, April 1967.
16. Woodworth, R. S. , and Schlosberg, H. Experimental Psychology. Henry Holt and Company, New York, 1955.