WATER BALANCE, SUPPLY AND DEMAND AND IRRIGATION EFFICIENCY OF INDUS BASIN
Reduction of Non-Revenue Water as a Water Demand Management Tool
Dube Nkosiphile N009 5117L
FINAL YEAR PROJECT:
REDUCTION OF NON REVENUE WATER AS A WATER
DEMAND MANAGEMENT TOOL: A case study of Cowdray
Park in Bulawayo.
FACULTY OF INDUSTRIAL TECHNOLOGY
CIVIL AND WATER ENGINEERING DEPARTMENT
STUDENT : DUBE NKOSIPHILE
STUDENT NUMBER : N0095117L
SUPERVISOR : Dr. M.MAGOMBEYI
MAY 2014

Reduction of Non-Revenue Water as a Water Demand Management Tool
Dube Nkosiphile N009 5117L
FINAL YEAR PROJECT
BY
DUBE NKOSIPHILE
(N009 5117L)
“A PROJECT SUBMITTED TO THE FACULTY OF INDUSTRIAL TECHNOLOGY,
NATIONAL UNIVERSITY OF SCIENCE AND TECHNOLOGY, IN PARTIAL
FULFILMENT OF THE REQUIREMENTS FOR THE DEGREE OF BACHELOR OF
ENGINEERING HONOURS IN THE FIELD OF CIVIL AND WATER ENGINEERING”
DEPARTMEBT OF CIVIL AND WATER ENGINEERING
FACULTY OF INDUSTRIAL TECHNOLOGY
NATIONAL UNIVERSITY OF SCIENCE AND TECHNOLOGY
MAY 2014

Reduction of Non-Revenue Water as a Water Demand Management Tool
i
DECLARATION
I ………………………………………………. Hereby declare to the Registrar of
Examinations at the National University of Science and Technology, that the work
contained in this project is the result of my own original work. With the exception of
such quotations or references that have been attributed to their authors or sources
and that all photographs, sketches, maps, plans, graphs and pictograms were made
by me except where it is acknowledged that someone is the author. To the best of my
knowledge, it has never been submitted before, for any degree or examination in any
University or Institution.
Dated this ……………… day of …………………….in the year ……………………..
Signed by:
Author: ……………………………………..
Dube Nkosiphile
Reduction of Non-Revenue Water as a Water Demand Management Tool
ii
DEDICATIONS
To the Lord God Almighty,
Lorraine, Sthandazile, Sandile and Zoey

Reduction of Non-Revenue Water as a Water Demand Management Tool
iii
ACKNOWLEDGEMENTS
BLESS THE LORD OH MY SOUL AND ALL THAT IS WITHIN ME …… NEVER
FORGET HIS BENEFITS…… (PSA 103 VS 1-5)
I would like to express my most profound gratitude to all the people who made a
contribution to my final year project. Special thanks goes to my Project supervisor
Dr. M.Magombeyi for the support, inspiration, encouragement, motivation, dedication,
comments and greatly helpful corrections. Sincere appreciation also goes to Mrs.K.G
Sibanda, Mr F.M.Nkawu, Sandile S Sibanda, the Directors, Engineers, Technicians
and the Administration staff at City Of Bulawayo who were so kind and warm to work
with as even when they were working under pressure, managed to spare time for me
whenever l made consultations with them. Their assistance is acknowledged with
grateful thanks, without them the academic journey would not have been complete.

Reduction of Non-Revenue Water as a Water Demand Management Tool
iv
ANNOTATIONS
AC Asbestos Cement
AWWA American Water Works Association
CARL Current Annual Real Losses
CoB City of Bulawayo
DMA District Metered Area
ILI Infrastructural Leakage Index
IWA International Water Authority
MNF Minimum Night Flow
MoC Method of Characteristic
NRW Non-Revenue Water
PI Performance Indicator
PRV Pressure Reducing Valve
PVC Polyvinyl Chloride
UARL Unavoidable Annual Real Losses
Reduction of Non-Revenue Water as a Water Demand Management Tool
v
ABSTRACT
Chronic water losses has been the evil that the Bulawayo City Council had to face in
terms of water management over the decades, this may not have mattered much
during an era of assumed plenty. But the rapid growth of Bulawayo’s towns and cities
in particular the development of the high density area of Cowdray Park, has meant
that there is much less water in the urban centres. The loss of an estimated 1.2 million
cubic meters of treated water every year is no longer something that the water utility
can ignore. Reducing these water losses is critical to efficient resource utilization,
efficient utility management and enhanced consumer satisfaction. Wherever active
water loss reduction programs have been initiated and sustained, the gains to
consumers and utilities alike have been significant. Frauendorfer and Liemberger point
out that the costs of improved service delivery are much lower when undertaken
through investments in non-revenue water reduction rather than through investments
in capital projects to augment supply capacities.
The results show that the Non-Revenue Water (NRW) level (for Cowdray Park) is
currently estimated at 50% of the water produced as reported in the Water Balance in
International Water Association(IWA, 1996)Standard Format or 3 861.77m3/day of the
7 704.5m3/day produced by the City of Bulawayo(CoB) . Strategies employed reduced
the Current Annual Real Loss (CARL) from 2 332.8m3/day to 1 555.2m3/day
(Recovering an estimated 777.6m3/day), while the Apparent and Billing Loss (water
that is used but not billed) was reduced from approximately 1528.97m3/day to an
estimated 1443.88m3/day (Recovering an estimated 85.09m3/day).
It was then concluded that these high levels of Non-Revenue Water are a cause for
concern and should be reduced as a matter of urgency so as to effectively manage
water demand. The potential exists to further reduce the Non-Revenue water from the
40% obtained after implementing strategies to a further 10 – 15%. This can be
achieved by adoption of the recommended strategies inclusive of;
Active leak detection methods
Cutting off illegal consumers
Pressure management
Effective asset management
Reduction of Non-Revenue Water as a Water Demand Management Tool
vi
Table of Contents
DECLARATION……………………………………………………………………………...i
DEDICATION…………………………………………………………………………….…..ii
ACKNOWLEDGEMENTS……………………………………………………………….....iii
ANNOTATIONS……………………………………………………………………………..iv
ABSTRACT…………………………………………………………………………………..v
TABLE OF CONTENTS…………………………………………………………………….vi
LIST OF FIGURES……………………………………………………………………….ix
LIST OF TABLES…………………………………………………………………………….x
1. INTRODUCTION……………………………………………………………………1
1.1. Problem statement: Challenge encountered by the City of Bulawayo ........... 1
1.2. Proposed solution for criterion reservoir zone ............................................... 3
1.3. Overall Objective ........................................................................................... 4
1.3.1. Specific objectives .................................................................................. 4
1.3.2. Methodology ........................................................................................... 4
1.4. Expected results ............................................................................................ 6
2. LITERATURE REVIEW ....................................................................................... 8
2.1. Water Conservation and Demand Management ........................................... 8
2.1.1. Water conservation ................................................................................. 8
2.1.2. Demand management ............................................................................ 9
2.2. The integrated Water Resource Management (IWRM). .............................. 11
2.2.1. Components and Definitions of Non-Revenue Water (NRW) ............... 11
2.3. Burst and Background Leaks. ..................................................................... 13
2.4. Water Balance ............................................................................................. 14
2.5. Introduction to BURST AND BACKGROUND ESTIMATE (BABE) CONCEPT
15
2.6. Impacts of NRW: The Vicious and Virtuous circles. .................................... 20
2.7. Strategy for Dealing with Water Losses ...................................................... 21
2.7.1. Calculation of bursts ............................................................................. 27
Reduction of Non-Revenue Water as a Water Demand Management Tool
vii
2.7.2. Pressure correction .............................................................................. 27
3. Study Area ......................................................................................................... 31
3.1. Introduction ................................................................................................. 31
3.2. Water distribution system in Cowdray Park ................................................. 32
3.2.1. Service pipelines .................................................................................. 32
3.2.2. Present water supply situation .............................................................. 33
3.2.3. Existing water supply Water system and Water sources ...................... 34
3.2.4. Short term extensions of the water sources.......................................... 34
3.3. Water Treatment ......................................................................................... 35
3.4. Water delivery facilities ............................................................................... 35
3.5. Reservoirs ................................................................................................... 36
3.6. Pressure Zones ........................................................................................... 37
3.7. Water Meters ............................................................................................... 38
4. METHODOLOGY .............................................................................................. 39
4.1. STUDY DESIGN ......................................................................................... 39
4.1.1. Project Activities ................................................................................... 39
4.1.2. Sources of Data .................................................................................... 39
4.2. Sampling plan ............................................................................................. 40
4.3. Flow measurements .................................................................................... 42
4.4. Pipeline Survey ........................................................................................... 43
4.5. House inspection ......................................................................................... 43
4.6. System inventory ......................................................................................... 44
4.7. Non-Revenue Water calculation .................................................................. 44
4.7.1. Softwares .............................................................................................. 46
4.8. Water Balance ............................................................................................. 51
4.9. Calculation of Real Losses .......................................................................... 54
4.9.1. Leak Simulation .................................................................................... 54
4.9.2. Calculating Real Loss Performance Indicators ..................................... 56
4.10. Data analysis and Strategy implementation ............................................. 59
4.11. Summary of methodology: ....................................................................... 63
5. RESULTS AND DISCUSSION .......................................................................... 65
5.1. Introduction ................................................................................................. 65
5.2. Data logging ................................................................................................ 65
Reduction of Non-Revenue Water as a Water Demand Management Tool
viii
5.3. System input volume (SIV) .......................................................................... 67
5.4. Apparent losses .......................................................................................... 68
5.5. Real losses.................................................................................................. 68
5.6. Water Balance ............................................................................................. 71
5.7. Strategies Implemented .............................................................................. 72
5.8. Infrastructural leakage index (ILI) ................................................................ 72
6. CONCLUSIONS AND RECOMMENDATIONS .................................................. 75
6.1. Introduction ................................................................................................. 75
6.2. Non-revenue water ...................................................................................... 76
6.3. Projections of losses ................................................................................... 76
6.4. Findings ...................................................................................................... 76
6.5. RECOMMENDATIONS ............................................................................... 77
6.5.1. Asset Management ............................................................................... 77
6.5.2. Pressure Management ......................................................................... 79
6.5.3. Active Leak Detection ........................................................................... 80
6.5.4. Efficiency in effecting Repairs ............................................................... 80
6.5.5. Capacity building .................................................................................. 81
6.5.6. Significance of the study ....................................................................... 81
REFERENCES………………………………………………………………81
APPENDICES……………………………………………………………….84
Reduction of Non-Revenue Water as a Water Demand Management Tool
ix
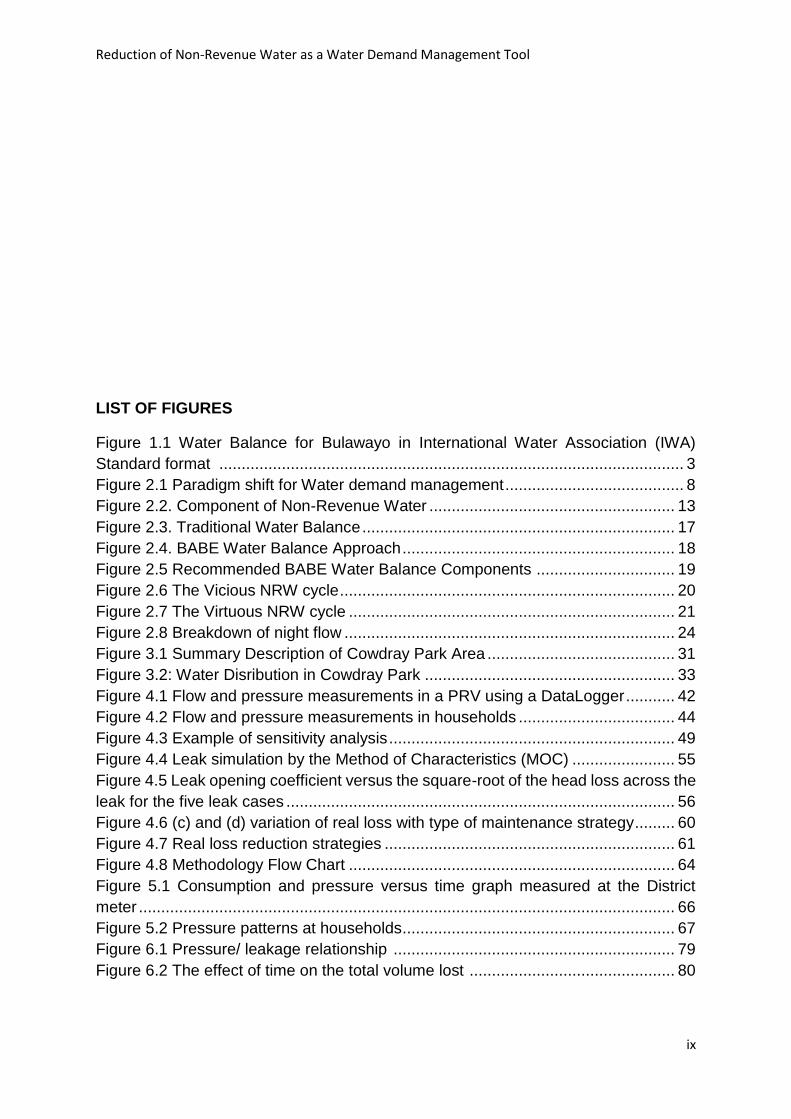
LIST OF FIGURES
Figure 1.1 Water Balance for Bulawayo in International Water Association (IWA)
Standard format ........................................................................................................ 3
Figure 2.1 Paradigm shift for Water demand management ........................................ 8
Figure 2.2. Component of Non-Revenue Water ....................................................... 13
Figure 2.3. Traditional Water Balance ...................................................................... 17
Figure 2.4. BABE Water Balance Approach ............................................................. 18
Figure 2.5 Recommended BABE Water Balance Components ............................... 19
Figure 2.6 The Vicious NRW cycle ........................................................................... 20
Figure 2.7 The Virtuous NRW cycle ......................................................................... 21
Figure 2.8 Breakdown of night flow .......................................................................... 24
Figure 3.1 Summary Description of Cowdray Park Area .......................................... 31
Figure 3.2: Water Disribution in Cowdray Park ........................................................ 33
Figure 4.1 Flow and pressure measurements in a PRV using a DataLogger ........... 42
Figure 4.2 Flow and pressure measurements in households ................................... 44
Figure 4.3 Example of sensitivity analysis ................................................................ 49
Figure 4.4 Leak simulation by the Method of Characteristics (MOC) ....................... 55
Figure 4.5 Leak opening coefficient versus the square-root of the head loss across the
leak for the five leak cases ....................................................................................... 56
Figure 4.6 (c) and (d) variation of real loss with type of maintenance strategy ......... 60
Figure 4.7 Real loss reduction strategies ................................................................. 61
Figure 4.8 Methodology Flow Chart ......................................................................... 64
Figure 5.1 Consumption and pressure versus time graph measured at the District
meter ........................................................................................................................ 66
Figure 5.2 Pressure patterns at households ............................................................. 67
Figure 6.1 Pressure/ leakage relationship ............................................................... 79
Figure 6.2 The effect of time on the total volume lost .............................................. 80
Reduction of Non-Revenue Water as a Water Demand Management Tool
x
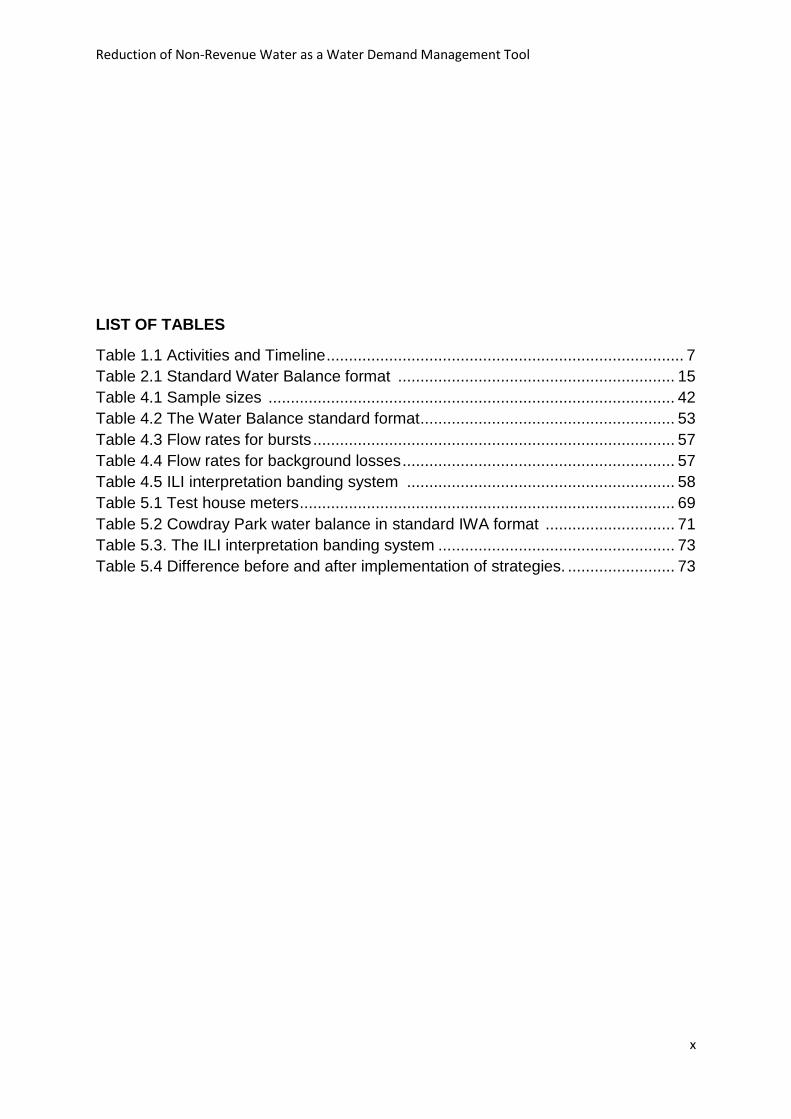
LIST OF TABLES
Table 1.1 Activities and Timeline ................................................................................ 7
Table 2.1 Standard Water Balance format .............................................................. 15
Table 4.1 Sample sizes ........................................................................................... 42
Table 4.2 The Water Balance standard format ......................................................... 53
Table 4.3 Flow rates for bursts ................................................................................. 57
Table 4.4 Flow rates for background losses ............................................................. 57
Table 4.5 ILI interpretation banding system ............................................................ 58
Table 5.1 Test house meters .................................................................................... 69
Table 5.2 Cowdray Park water balance in standard IWA format ............................. 71
Table 5.3. The ILI interpretation banding system ..................................................... 73
Table 5.4 Difference before and after implementation of strategies. ........................ 73
1
1. INTRODUCTION
With the gap closing between water demand and supply for urban areas, which comes
with the increasing human population and associated demand for resources which
require water, especially food we must not limit the solution to supply options only (that
is, to develop the next source of water), but also consider demand-side options, such
as minimising water losses, and influencing demand to more desirable levels through
structural ( for instance, retrofitting of water appliances, recycling and re-use, active or
reactive leak detection and repair), socio-cultural (for example. education and
awareness campaigns, creative and innovative presentation of utility bills), legal (e.g.
restrictions on use) and economic (for example water tariff structure policy that is
pricing) measures. (Asian Development Bank, 2010)
A readily available and applicable solution is the Reduction of Non-Revenue water. -
Revenue Water (NRW) being defined as water that is produced, but “lost” before final
consumption, and hence not billed to the end user of the service. NRW is calculated
using the Top Down approach using the Benchleak method. (www.iwapublishing.com,
undated)
It is in this light that a case study is to be undertaken by the student focusing on
Cowdray Park network; with the area being chosen on the basis of it being a
developing area hence the City of Bulawayo (CoB) has not much data on that area in
terms of Input Volume and billing database. Cowdray Park is prone to illegal
connections, frequent leaks and bursts hence it would be an ideal area to study.(City
of Bulawayo, 2012)
1.1. Problem statement: Challenge encountered by the City of Bulawayo
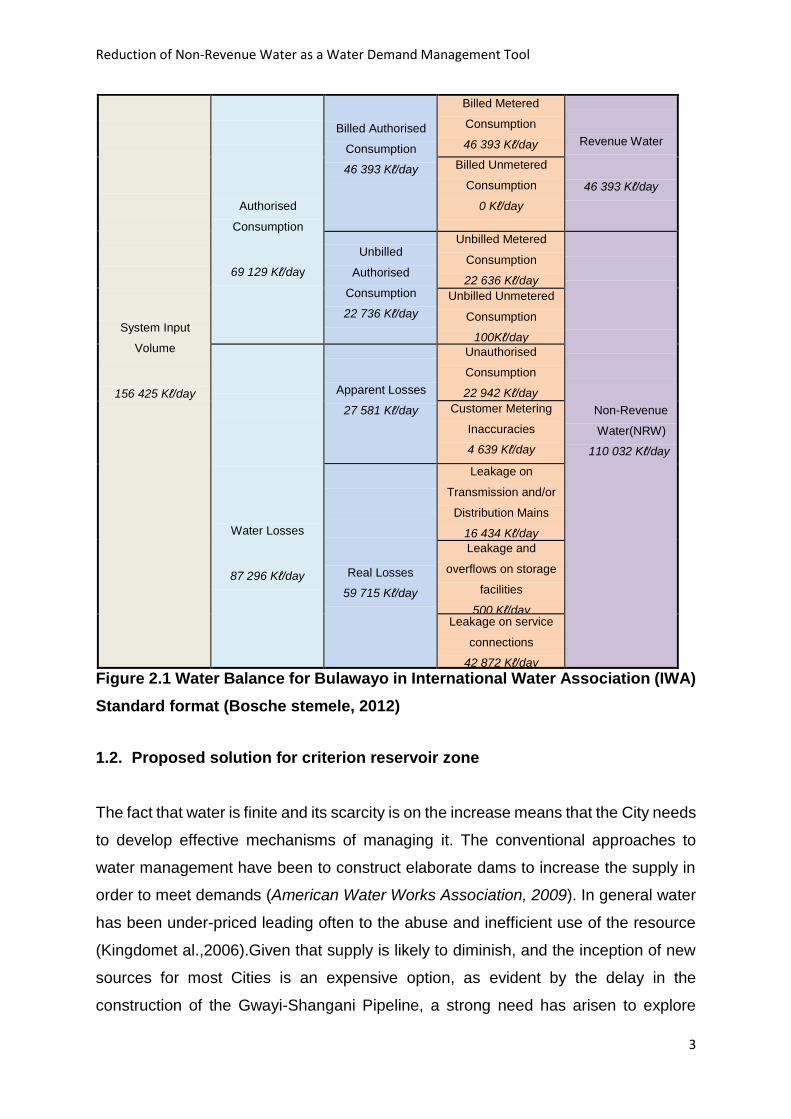
According to the City of Bulawayo (CoB) Master Plan Non-Revenue Water (NRW)
levels at a macro scale (Citywide) is currently estimated at 69% of the water produced
,as reported in the Water Balance in International Water Association(IWA,
Reduction of Non-Revenue Water as a Water Demand Management Tool
2
1996)Standard Format below or 110Mℓ/day of the 156,43Mℓ/day produced by the CoB
(Bosch Stemele,2012). Of this, the potential exists to reduce the Current Annual Real
Loss (CARL) from approximately 59,7Mℓ/day to approximately 20,5Mℓ/day
(Recovering an estimated 39,21Mℓ/day), while the Apparent and Billing Loss (water
that is used but not billed due to under-reading meters, incorrect meter readings etc.)
may be reduced from approximately 50,32M/day to an estimated 22,47Mℓ/day
(Recovering an estimated 27,85Mℓ/day) (target as per City of Bulawayo water and
wastewater master plan). These high levels of Non-Revenue Water are a cause for
concern and should be addressed as a matter of urgency so as to effectively manage
water demand. The City already is water stressed due to prolonged droughts and low
and unreliable rainfall while water scarcity is not too distant in future as evident by
water shedding as a consequence of other dams being decommissioned (City of
Bulawayo, 2012).
Reduction of Non-Revenue Water as a Water Demand Management Tool
3
System Input
Volume
156 425 Kℓ/day
Authorised
Consumption
69 129 Kℓ/day
Billed Authorised
Consumption
46 393 Kℓ/day
Billed Metered
Consumption
46 393 Kℓ/day
Revenue Water
46 393 Kℓ/day
Billed Unmetered
Consumption
0 Kℓ/day
Unbilled
Authorised
Consumption
22 736 Kℓ/day
Unbilled Metered
Consumption
22 636 Kℓ/day
Non-Revenue
Water(NRW)
110 032 Kℓ/day
Unbilled Unmetered
Consumption
100Kℓ/day
Water Losses
87 296 Kℓ/day
Apparent Losses
27 581 Kℓ/day
Unauthorised
Consumption
22 942 Kℓ/day
Customer Metering
Inaccuracies
4 639 Kℓ/day
Real Losses
59 715 Kℓ/day
Leakage on
Transmission and/or
Distribution Mains
16 434 Kℓ/day
Leakage and
overflows on storage
facilities
500 Kℓ/day Leakage on service
connections
42 872 Kℓ/day
Figure 2.1 Water Balance for Bulawayo in International Water Association (IWA)
Standard format (Bosche stemele, 2012)
1.2. Proposed solution for criterion reservoir zone
The fact that water is finite and its scarcity is on the increase means that the City needs
to develop effective mechanisms of managing it. The conventional approaches to
water management have been to construct elaborate dams to increase the supply in
order to meet demands (American Water Works Association, 2009). In general water
has been under-priced leading often to the abuse and inefficient use of the resource
(Kingdomet al.,2006).Given that supply is likely to diminish, and the inception of new
sources for most Cities is an expensive option, as evident by the delay in the
construction of the Gwayi-Shangani Pipeline, a strong need has arisen to explore
Reduction of Non-Revenue Water as a Water Demand Management Tool
4
different water management strategies (Srinivas, 2001). Study will be conducted on
reduction of Non-Revenue Water (NRW) as a tool for Water Demand Management in
the CoB through the hydraulic modelling of the Magwegwe Reservoir Zone, Cowdray
Park Area so that recommendations can be suggested to the City.
1.3. Overall Objective
To quantify the amount and investigate causes of Non-Revenue Water then suggest
reduction mechanisms of Non-Revenue Water.
1.3.1. Specific objectives
The study’s specific objectives are:
1. To quantify the system input volume (SIV).
2. To quantify the amount of Non-Revenue Water (NRW).
3. To construct a water balance for the Cowdray Park Network.
4. To quantify amount of real and apparent losses in the network.
5. To establish location of highest losses in the system.
6. To create consumption billing database.
7. To suggest methods of night flow pressure reduction.
8. To formulate maintenance strategies or plans of the existing network.
1.3.2. Methodology
To efficiently handle data and results database creation for consumers (domestic,
industrial, commercial and fire) will be done and linked to the network layout on
Geographical Information Systems (G.I.S). This data handling method will lead to
effective and efficient execution of objectives. The particular methodology to be
employed includes:

Reduction of Non-Revenue Water as a Water Demand Management Tool
5
Quantify the Input volume into the Cowdray Park Network
Water supply and distribution schematic diagrams will be compiled, with input obtained
from CoB personnel, showing the reservoir pipework layout inclusive of Magwegwe
Reservoir that services Cowdray Park network. The input volume will then be
calculated or derived according to the obtained data and by flow measurement at
specific points that border the Cowdray Park area.
Water Balance
An excel spread sheet software will be created so as to input the SIV, pressure and
losses values obtainable on site, this software will also give the output of the amount
of Non-Revenue water after combining or linking with billing database.
Reduction of Real losses
This loss is most effectively dealt with through pressure management, leak detection
and repair, prudent operation systems and, in extreme cases, infrastructure
replacement.Leak detection will be employed and remedial actions, such as
performance based contracts, Public Private Partnerships (PPPs) and emergency
response teams, will be applied for a period of three months then results will be
analysed against a control area where normal remedial actions, that is the reliance
on the public for leak reporting and use of council deployment for maintenance.
Pressure Management (Rezoning and Optimization)
A high proportion of the reticulation network is operating at above 60m maximum
pressure (Average Zone Pressure has been calculated to be 66m), and leaks appear
to be more prevalent in the high pressure areas. (Engineering Services, 2012).
Pressure management strategies such as introduction of Pressure reducing valves
(PRVs) will be employed after day and night pressure measurements have been
Reduction of Non-Revenue Water as a Water Demand Management Tool
6
assessed.
1.4. Expected results
1. Quantified system input volume (SIV) and Non-Revenue Water (NRW).
2. Constructed water balance for the Cowdray Park Network.
3. Amount of real and apparent losses in the network.
4. Location of highest losses in the system.
5. Maintenance strategies or plans of the existing water supply and
distribution network and applicable strategies for real loss reduction and
water demand management.
6. NRW management software comprising of a billing database linked to
GIS network layout.
7. Strategies that lead to achieving performance indicators standards like
the attainment of an Infrastructure Leakage Index (ILI) value of close to
1, the ILI is defined as the ratio of Current Annual Real Losses (CARL) to
Unavoidable Annual Real Losses (UARL)
Timeline
Activities to be carried out are:
1. Data Collection
2. Data Analysis
3. Formulation of remedial strategies
Reduction of Non-Revenue Water as a Water Demand Management Tool
7
4. Execution of Pilot remedial actions
5. Production of Final Project
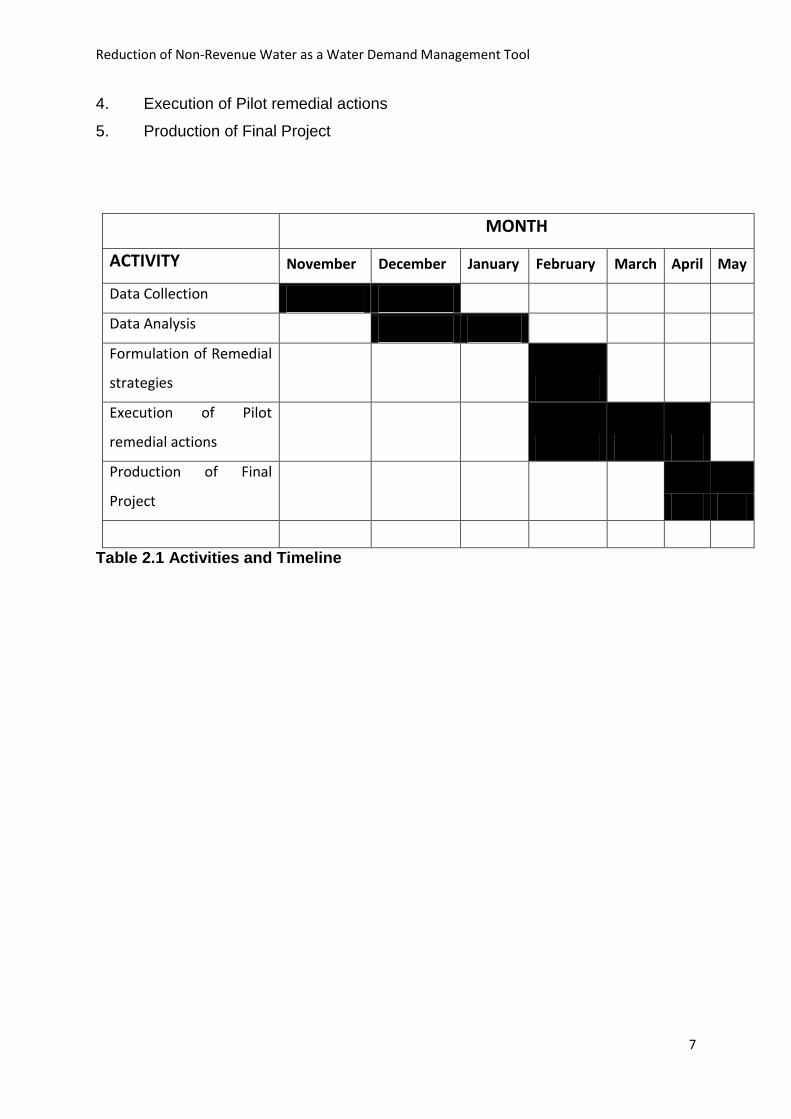
MONTH
ACTIVITY November December January February March April May
Data Collection
Data Analysis
Formulation of Remedial
strategies
Execution of Pilot
remedial actions
Production of Final
Project
Table 2.1 Activities and Timeline
Reduction of Non-Revenue Water as a Water Demand Management Tool
8
2. LITERATURE REVIEW
2.1. Water Conservation and Demand Management
Water conservation and water demand management are often used as synonymous
terms. Although the meaning and implications of these terms is very similar, it is
important to recognise the difference.
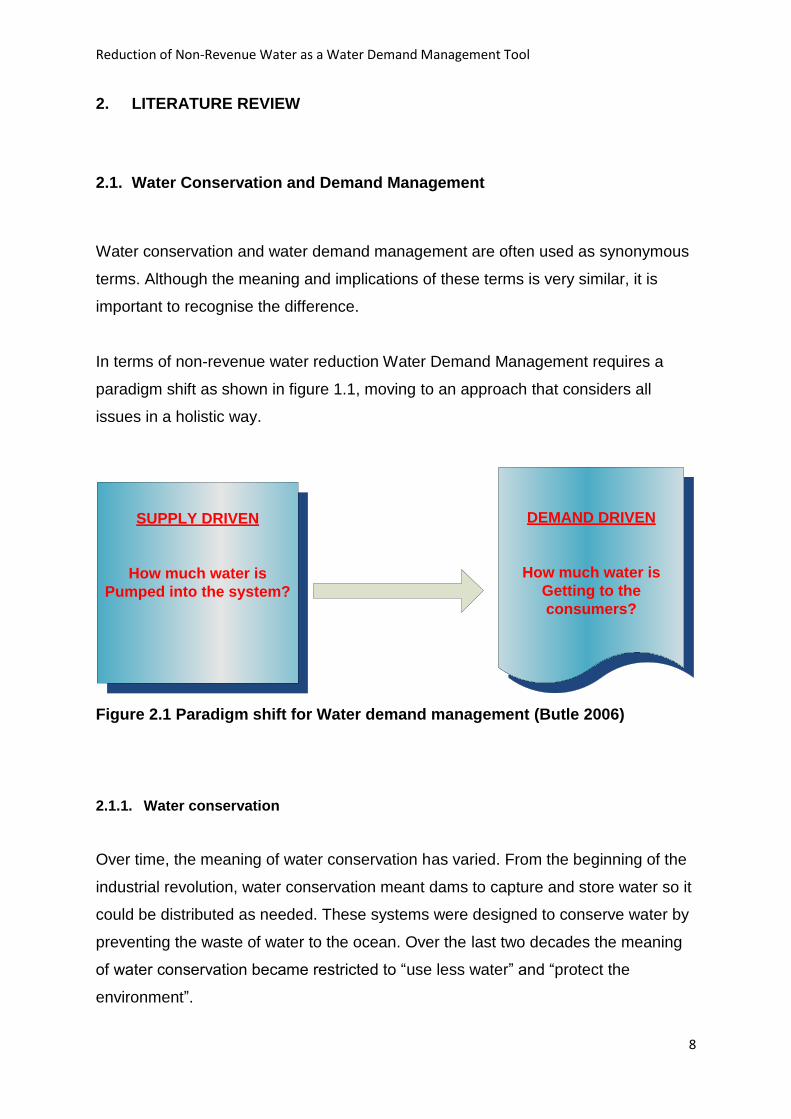
In terms of non-revenue water reduction Water Demand Management requires a
paradigm shift as shown in figure 1.1, moving to an approach that considers all
issues in a holistic way.
SUPPLY DRIVEN
How much water is
Pumped into the system?
DEMAND DRIVEN
How much water is
Getting to the
consumers?
Figure 2.1 Paradigm shift for Water demand management (Butle 2006)
2.1.1. Water conservation
Over time, the meaning of water conservation has varied. From the beginning of the
industrial revolution, water conservation meant dams to capture and store water so it
could be distributed as needed. These systems were designed to conserve water by
preventing the waste of water to the ocean. Over the last two decades the meaning
of water conservation became restricted to “use less water” and “protect the
environment”.
Reduction of Non-Revenue Water as a Water Demand Management Tool
9
Water conservation proposed is: “The minimisation of loss or waste, the
preservation, care and protection of water resources and the efficient and effective
use of water.”
It is important to recognise that water conservation should be both an objective in
water resource management and water services management as well as a strategy.
2.1.2. Demand management
Demand management is defined as: “The adaptation and implementation of a
strategy (policies and initiatives) by a water institution to influence the water demand
and usage of water in order to meet any of the following objectives: economic
efficiency, social development, social equity, environmental protection, sustainability
of water supply and services, and political acceptability.”
Demand management should not be regarded as the objective but rather a strategy
to meet a number of objectives. One reason why the full potential of demand
management is often not recognized is because it is often perceived or understood in
a limited context.
It is common for people to equate demand management only to programs such as
communications campaigns or tariff increases. Demand management should equate
to the development and implementation of strategies and initiatives associated to
managing water usage.
A useful comparison on the philosophy of demand management is a comparison with
the role of marketing in the commercial corporate environment. In the past marketing
in the commercial environment meant simply advertising. Currently marketing has a
much wider meaning which involves understanding the clients and their needs,
understanding the market forces and then deriving a strategy in order to set and
achieve target sales, market share and profits. The principles of demand management
are very similar to that of marketing, where the water supply institutions should set
Reduction of Non-Revenue Water as a Water Demand Management Tool
10
water demand goals and targets by managing the distribution systems and consumer
demands in order to achieve the objectives of economic efficiency, social
development, social equity, affordability and sustainability. The water supply industry
can gain a lot by adopting marketing principles to the demand management strategies.
The scope of Water Conservation (WC)/Demand Management (DM) measures
In Southern Africa due to often complex institutional arrangements particularly in the
provision of water services, it is often difficult to distinguish what measures are
included in demand management and may vary according to which water institution’s
perspective it is viewed from. For example, the perspective of the Department of Water
Affairs and Forestry of South Africa (DWAF) in its role to manage water resources may
only include as demand management those measures that affect the overall
“consumptive” usage of water or the net water abstraction through the water supply
chain. From a Water Board’s perspective demand management will include any
measures that will reduce its total amount of water abstracted from the water source.
This will include measures to reduce losses in the purification process, the bulk
distribution system, the distribution system of the service provider and the
consumption by the end user. From a service provider’s perspective demand
management will only include measures to reduce distribution losses and the
consumption by the end consumer.
For common understanding it is proposed that the scope of demand management is
defined to include the entire water supply chain - from the point of abstraction to the
point of usage. This includes all levels of distribution management and customer
demand management. The conservation measures related to the water resources
and return flow are considered under water resource management and return flow
management respectively.
Reduction of Non-Revenue Water as a Water Demand Management Tool
11
2.2. The integrated Water Resource Management (IWRM).
The IWRM is the idea that instead of the usual sectoral approach to developing and
managing water resources, it is necessary to recognise that river basins are complex
systems, in which use of water for one purpose has important implications for other
uses.
Focusing attention on water basins (a term that includes the upper and lower areas of
the basin as well as the groundwater) enables a systematic approach, considering the
socio-economic, and human dimensions as well as the physical. Classical efficiency
considers water flowing into drains as a “loss.” But because of reuse, from a basin
perspective one person’s wasted drainage water is another’s vital source. While
efficiencies at field level may be low, in the same basin the overall effective efficiency
of a basin may be quite high, and the “real” opportunities to save water by improving
“efficiency” may therefore be limited.
This will be particularly so in the case of “closed” water systems. As population and
economic growth increase the demand for water basins evolve from being “open”
(where unused water is still available for additional uses) to being “closed” (where all
useable flows are captured and distributed). Most water basins in arid areas and many
basins even in non-arid areas are becoming closed basins. This has very important
policy implications, as noted. For example, as upstream uses reduce the quality or
quantity of flows downstream, different users become increasingly interdependent.
Managing this interdependency is an important public function, which few developing
countries are equipped to do. It is very difficult to develop effective institutional
mechanisms to manage water systems, particularly were political or administrative
boundaries do not coincide with watershed boundaries, or where competing partisan
interests are powerful and entrenched.
2.2.1. Components and Definitions of Non-Revenue Water (NRW)
In order to come to better understanding and set the framework for in-depth research
into the current topic, it was necessary to find out the various components and their
definitions as they relate to the topic. Various literatures were identified. But the one
Reduction of Non-Revenue Water as a Water Demand Management Tool
12
which seemed to have dealt with the issue of non-revenue water to a greater extent in
recent times and to which most writers and researchers kept referring to was the
document which has been developed by the International Water Association (IWA)
Water Loss Task Forces for concepts and methodologies for quantifying and
definitions of the components of non-revenue water. Most of the following definitions
are therefore quoted from this document.
Non-Revenue Water (NRW) in a water distribution network, which has been recently
introduced by the IWA instead of Unaccounted For Water (UFW) (Farley and Trow,
2003), is defined as the difference between total inflow to the system and total
metered and authorized un-metered consumptions. NRW is divided into two parts,
apparent and real losses. Apparent losses include human, management and metering
errors and lead to consumption of water without charging. Real losses are some
amount of water which is wasted from the network. Real losses are categorized to
water losses from reported an unreported bursts, background losses, reservoir
leakage and overflow and leakage from valves and pumps. The components of NRW
are determined by a field study with investigation of all properties in the study area
and all the components of water distribution network (such as reservoir, pumps, valves
and pipes).
The main contributors to NRW as depicted in figure 1.2 are thus:
1. Un-billed Authorised Consumption includes water used by the utility for
operational purposes, water used for fire fighting, water used to scour
lines, clean reservoirs, fill lines after repairs. Can also include
unmetered public standpipes, or unbilled services to informal areas, and
water provided for free to certain consumer groups.
2. Apparent or Commercial loss (water that is used but not billed) such as
under-reading meters, incorrect meter readings, data-handling errors,
and theft of water in various forms.
3. Physical or Real loss comprises leakage from all parts of the system
through bursts and leaks and reservoir overflows at the utility’s storage
tanks. These occur as a result of poor operation and maintenance, the
lack of active leakage control, and poor quality of underground assets
and appurtenances. It is “any leakage downstream of a production
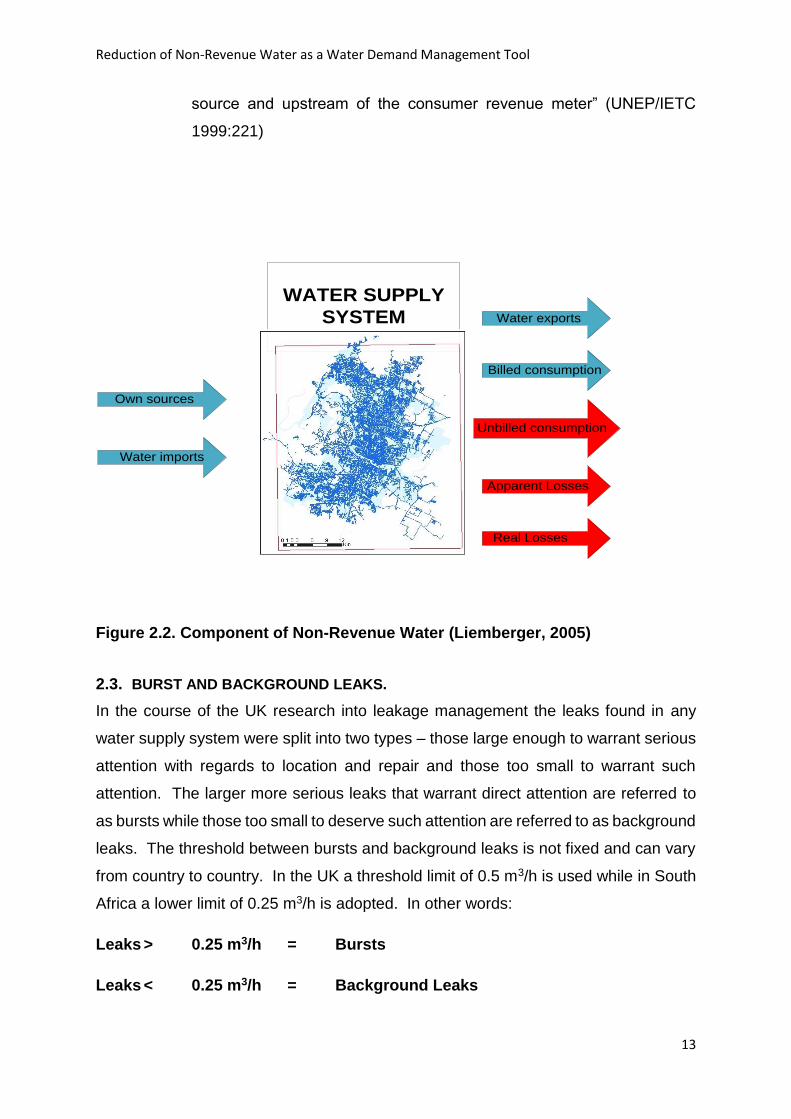
Reduction of Non-Revenue Water as a Water Demand Management Tool
13
source and upstream of the consumer revenue meter” (UNEP/IETC
1999:221)
WATER SUPPLY
SYSTEM
Own sources
Water imports
Water exports
Billed consumption
Unbilled consumption
Apparent Losses
Real Losses
Figure 2.2. Component of Non-Revenue Water (Liemberger, 2005)
2.3. BURST AND BACKGROUND LEAKS.
In the course of the UK research into leakage management the leaks found in any
water supply system were split into two types – those large enough to warrant serious
attention with regards to location and repair and those too small to warrant such
attention. The larger more serious leaks that warrant direct attention are referred to
as bursts while those too small to deserve such attention are referred to as background
leaks. The threshold between bursts and background leaks is not fixed and can vary
from country to country. In the UK a threshold limit of 0.5 m3/h is used while in South
Africa a lower limit of 0.25 m3/h is adopted. In other words:
Leaks > 0.25 m3/h = Bursts
Leaks < 0.25 m3/h = Background Leaks
Reduction of Non-Revenue Water as a Water Demand Management Tool
14
In all water supply systems there are likely to be both bursts and background leaks
since it is not possible to develop a system completely free from leakage.(McKenzie
et al, 2001)
2.4. WATER BALANCE
Only by quantifying NRW and its components, calculating appropriate performance
indicators, and turning volumes of lost water into monetary values, can the NRW
situation be properly understood and the required actions taken.
The first step in reducing NRW is to develop an understanding of the ‘big picture’ of
the water system, which involves establishing a water balance (also called a ‘water
audit’).
The sum of all water quantities that go into the water supply system compared with
the sum of all water quantities that leave the system. ‘Input’ minus ‘output’ should be
equal to zero.
Water losses depict the volume of water lost between the points of supply and the
customer due to various reasons. The components of NRW can be determined by
conducting a water balance. This is based on the measurement or estimation of water
produced, imported, exported, consumed or lost – the calculation should balance. The
water balance calculation provides a guide to how much is lost as leakage from the
network (‘real’ losses), and how much is due to ‘apparent’ or non-physical losses.
Because of the wide diversity of formats and definitions used for water balance
calculations internationally (often within the same country), there has been an urgent
need for a common international terminology. Drawing on the best practice from many
countries, IWA Task Forces on Water Losses and Performance Indicators have
produced an international best practice approach for water balance calculations,
including definitions of its components, and for comparing performance between utility
operators.
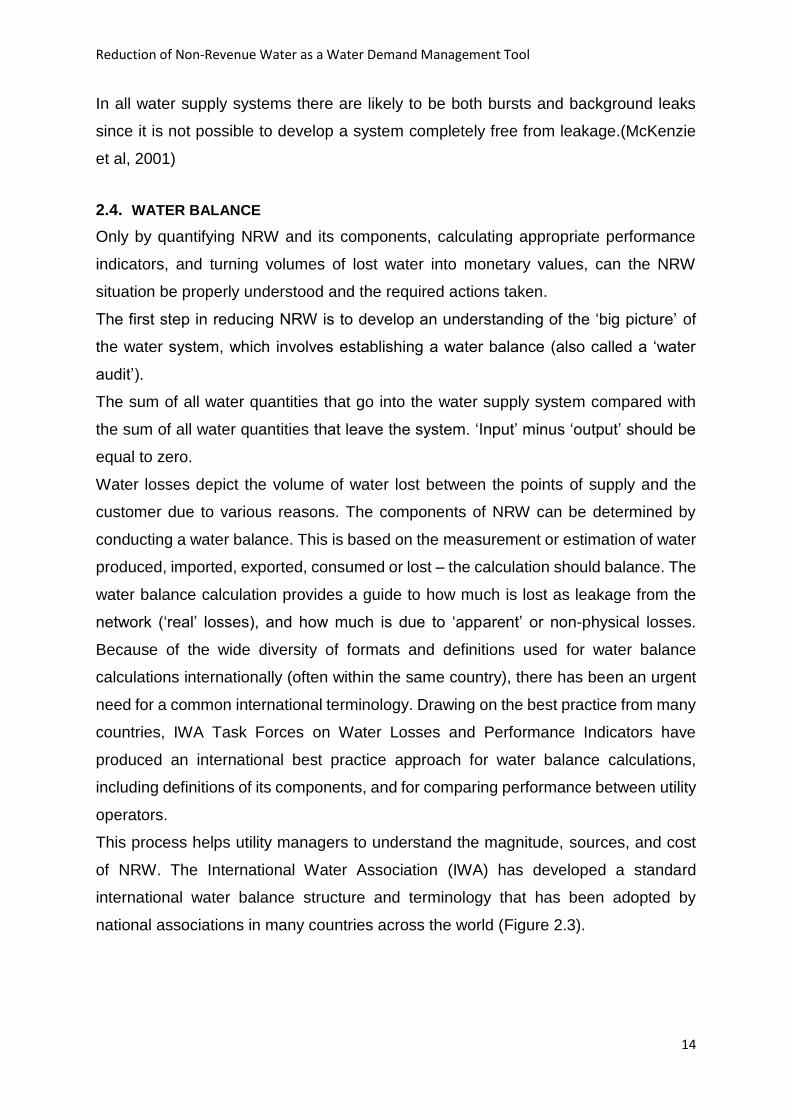
This process helps utility managers to understand the magnitude, sources, and cost
of NRW. The International Water Association (IWA) has developed a standard
international water balance structure and terminology that has been adopted by
national associations in many countries across the world (Figure 2.3).
Reduction of Non-Revenue Water as a Water Demand Management Tool
15
System
Input
Volume
Authorised
Consumption
Billed Authorised
Consumption
Billed Metered
Consumption
Revenue Water
Billed Unmetered
Consumption
Unbilled Authorised
Consumption
Unbilled Metered
Consumption
Non-Revenue
Water(NRW)
Unbilled Unmetered
Consumption
Water Losses
Apparent Losses
Unauthorised
Consumption
Metering
Real Losses
Leakage on
Transmission and/or
Distribution Mains
Leakage and
overflows on storage
facilities
Leakage on service
connections
Table 2.1 Standard Water Balance format (IWA, 2003)
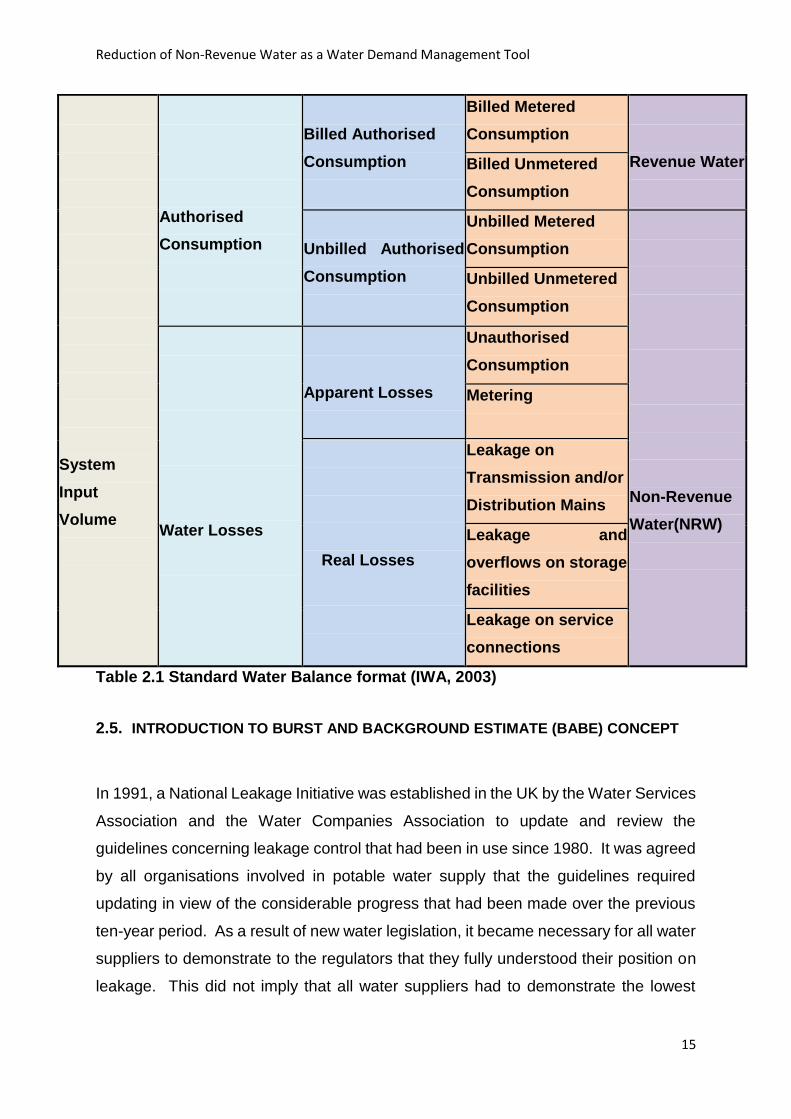
2.5. INTRODUCTION TO BURST AND BACKGROUND ESTIMATE (BABE) CONCEPT
In 1991, a National Leakage Initiative was established in the UK by the Water Services
Association and the Water Companies Association to update and review the
guidelines concerning leakage control that had been in use since 1980. It was agreed
by all organisations involved in potable water supply that the guidelines required
updating in view of the considerable progress that had been made over the previous
ten-year period. As a result of new water legislation, it became necessary for all water
suppliers to demonstrate to the regulators that they fully understood their position on
leakage. This did not imply that all water suppliers had to demonstrate the lowest
Reduction of Non-Revenue Water as a Water Demand Management Tool
16
achievable leakage levels, but simply that they were applying correct and appropriate
economic and resourcing principals. To this end, it was agreed that all water suppliers
would adopt a straightforward and pragmatic approach to leakage levels. This was
achieved through the development of various techniques that became known as the
Burst and Background Estimate (BABE) methodology.(Lambert A, 1994)
The BABE procedures were developed over a period of approximately four years by
a group of specialists selected from several of the major water supply companies
based in England and Wales. The group was instructed to develop a systematic and
pragmatic approach to leakage management that could be applied equally well to all
of the UK water supply utilities. The result of this initiative was a set of nine reports
published by the UK Water Industry (WRc) on the subject of managing leakage. The
nine WRc reports cover the following topics:
Report A: Summary Report, Report B: Reporting Comparative Leakage Performance,
Report C: Setting Economic Leakage Targets, Report D: Estimating Unmeasured
Water Delivered, Report E: Interpreting Measured Night Flows, Report F: Using Night
Flow Data, Report G: Managing Water Pressure, Report H: Dealing with Customers
Leakage, Report J: Leakage Management Techniques, Technology and Training.
The intention of the reports was not to be prescriptive, but to provide a “tool kit” to the
water industry to enable the water supply manager to evaluate leakage levels and to
manage the system.
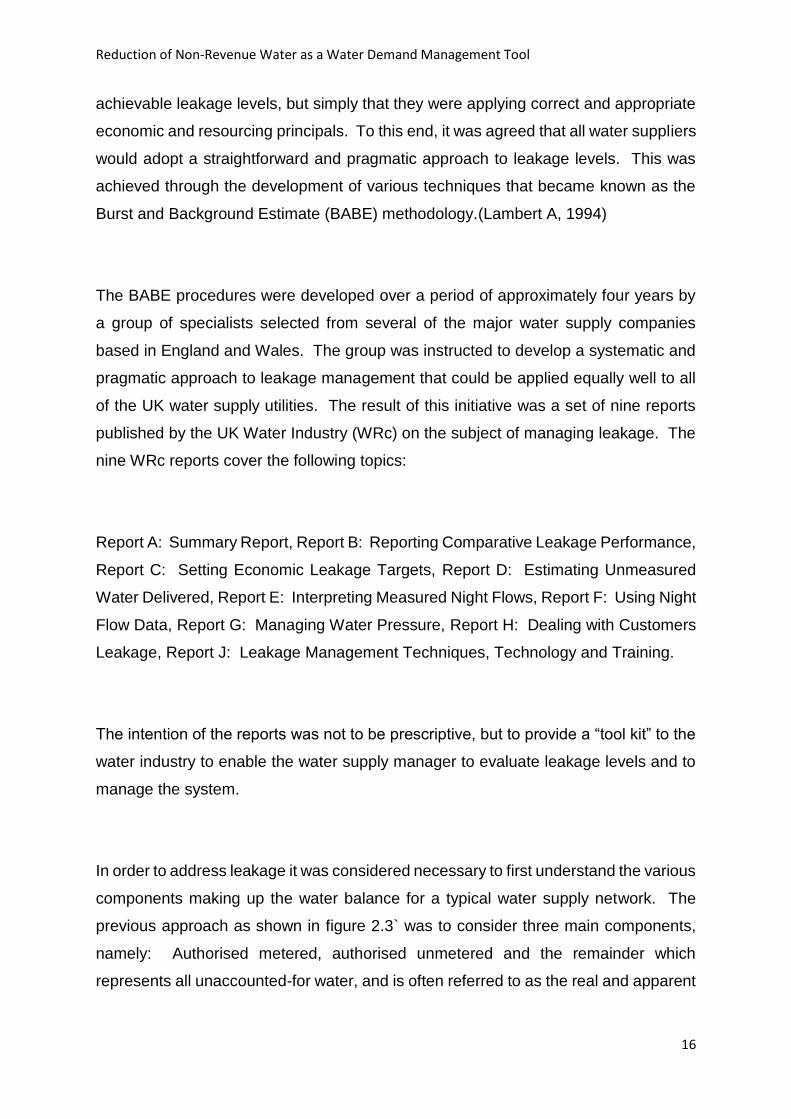
In order to address leakage it was considered necessary to first understand the various
components making up the water balance for a typical water supply network. The
previous approach as shown in figure 2.3` was to consider three main components,
namely: Authorised metered, authorised unmetered and the remainder which
represents all unaccounted-for water, and is often referred to as the real and apparent
Reduction of Non-Revenue Water as a Water Demand Management Tool
17
losses. Further details on real and apparent losses are provided later in this section
and are also shown in figure 2.5.
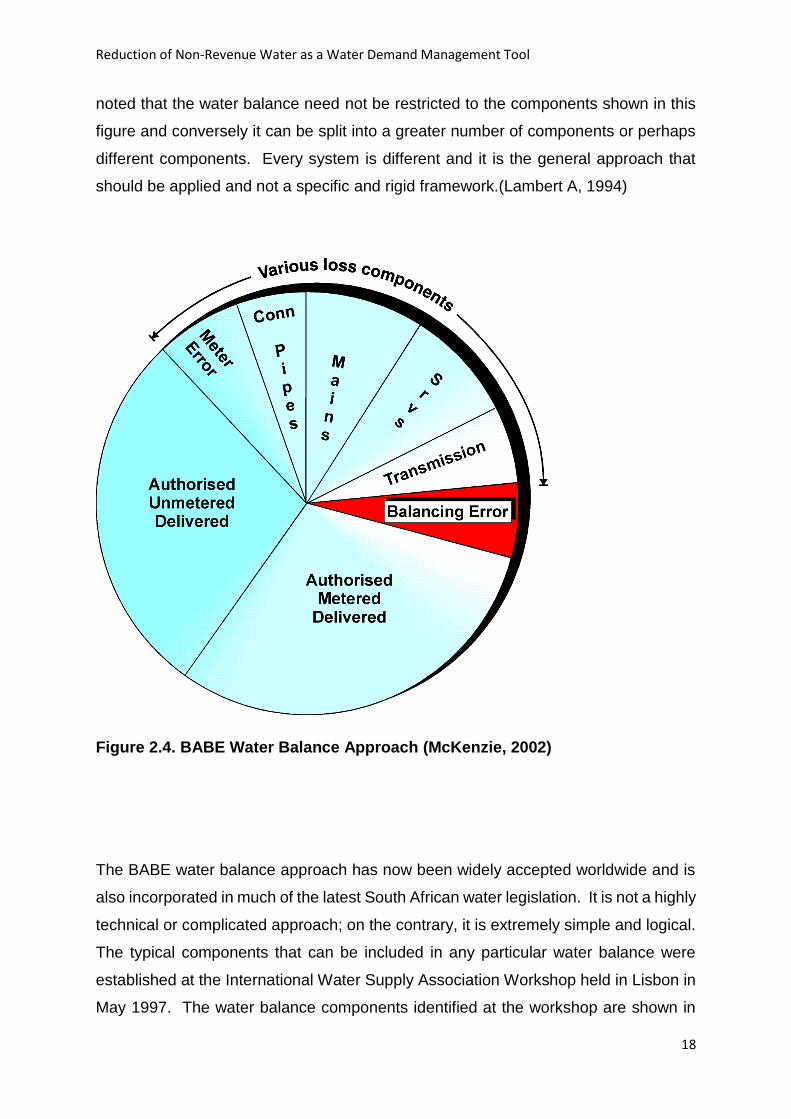
Figure 2.3. Traditional Water Balance (McKenzie, 2002)
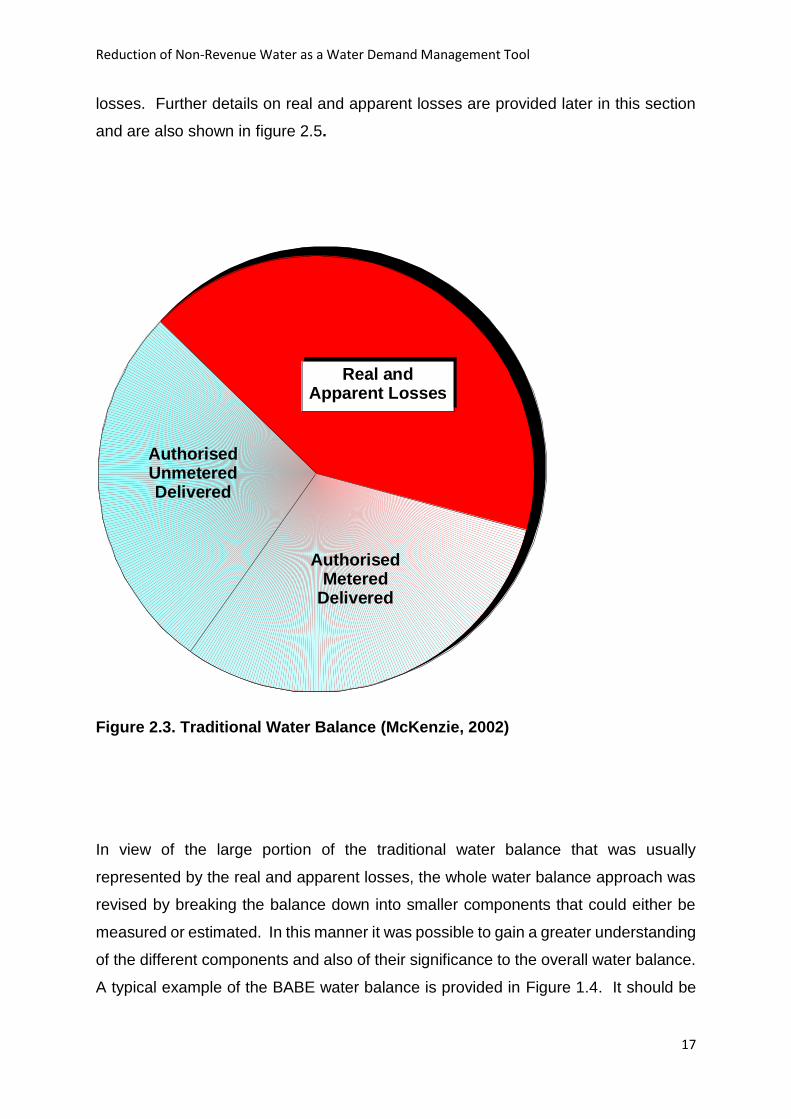
In view of the large portion of the traditional water balance that was usually
represented by the real and apparent losses, the whole water balance approach was
revised by breaking the balance down into smaller components that could either be
measured or estimated. In this manner it was possible to gain a greater understanding
of the different components and also of their significance to the overall water balance.
A typical example of the BABE water balance is provided in Figure 1.4. It should be
AuthorisedUnmeteredDelivered
Authorised Metered
Delivered
Real and Apparent Losses
Reduction of Non-Revenue Water as a Water Demand Management Tool
18
noted that the water balance need not be restricted to the components shown in this
figure and conversely it can be split into a greater number of components or perhaps
different components. Every system is different and it is the general approach that
should be applied and not a specific and rigid framework.(Lambert A, 1994)
Figure 2.4. BABE Water Balance Approach (McKenzie, 2002)
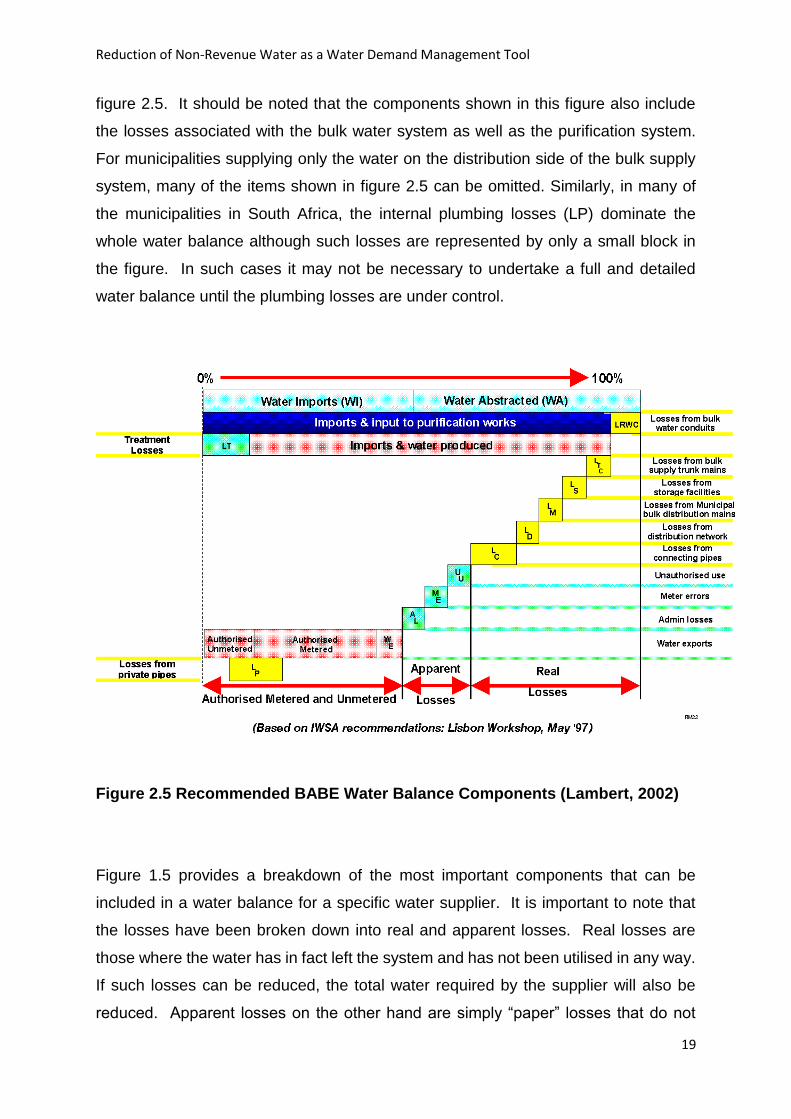
The BABE water balance approach has now been widely accepted worldwide and is
also incorporated in much of the latest South African water legislation. It is not a highly
technical or complicated approach; on the contrary, it is extremely simple and logical.
The typical components that can be included in any particular water balance were
established at the International Water Supply Association Workshop held in Lisbon in
May 1997. The water balance components identified at the workshop are shown in
Reduction of Non-Revenue Water as a Water Demand Management Tool
19
figure 2.5. It should be noted that the components shown in this figure also include
the losses associated with the bulk water system as well as the purification system.
For municipalities supplying only the water on the distribution side of the bulk supply
system, many of the items shown in figure 2.5 can be omitted. Similarly, in many of
the municipalities in South Africa, the internal plumbing losses (LP) dominate the
whole water balance although such losses are represented by only a small block in
the figure. In such cases it may not be necessary to undertake a full and detailed
water balance until the plumbing losses are under control.
Figure 2.5 Recommended BABE Water Balance Components (Lambert, 2002)
Figure 1.5 provides a breakdown of the most important components that can be
included in a water balance for a specific water supplier. It is important to note that
the losses have been broken down into real and apparent losses. Real losses are
those where the water has in fact left the system and has not been utilised in any way.
If such losses can be reduced, the total water required by the supplier will also be
reduced. Apparent losses on the other hand are simply “paper” losses that do not
Reduction of Non-Revenue Water as a Water Demand Management Tool
20
represent a loss from the system. They are usually due to illegal connections, and
meter and billing errors. If such losses are eliminated, the total water required by the
supplier may not change, however, the “unaccounted-for” component in the water
balance will be reduced. In such cases certain other components such as “authorised
metered” or even “authorised unmetered” will increase as the apparent losses are
reduced.(Bhagwan 1995)
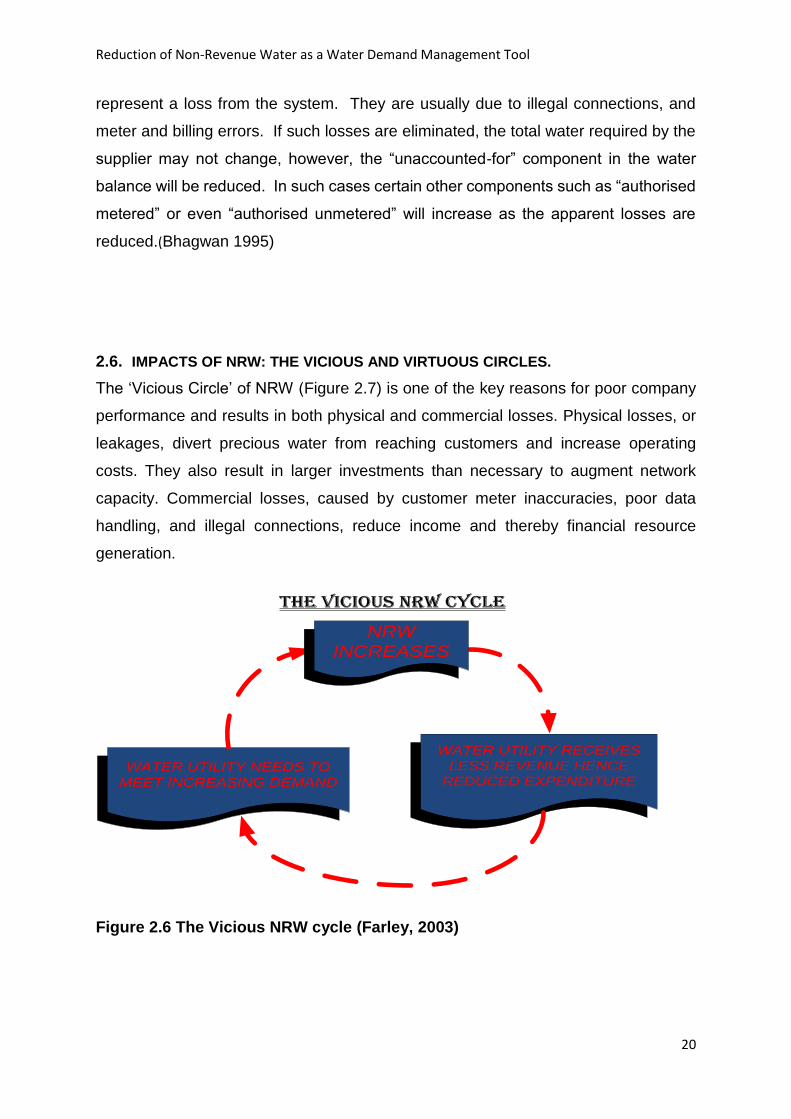
2.6. IMPACTS OF NRW: THE VICIOUS AND VIRTUOUS CIRCLES.
The ‘Vicious Circle’ of NRW (Figure 2.7) is one of the key reasons for poor company
performance and results in both physical and commercial losses. Physical losses, or
leakages, divert precious water from reaching customers and increase operating
costs. They also result in larger investments than necessary to augment network
capacity. Commercial losses, caused by customer meter inaccuracies, poor data
handling, and illegal connections, reduce income and thereby financial resource
generation.
WATER UTILITY NEEDS TO
MEET INCREASING DEMAND
WATER UTILITY RECEIVES
LESS REVENUE HENCE
REDUCED EXPENDITURE
NRW
INCREASES
THE VICIOUS NRW CYCLE
Figure 2.6 The Vicious NRW cycle (Farley, 2003)
Reduction of Non-Revenue Water as a Water Demand Management Tool
21
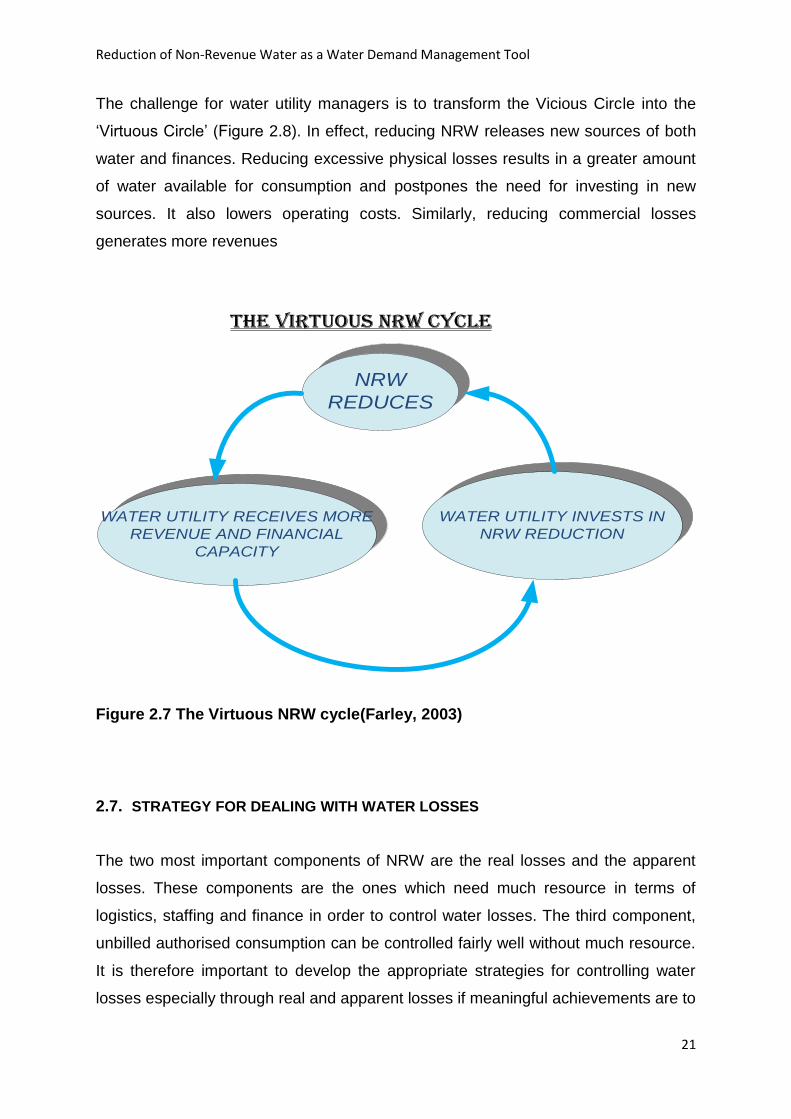
The challenge for water utility managers is to transform the Vicious Circle into the
‘Virtuous Circle’ (Figure 2.8). In effect, reducing NRW releases new sources of both
water and finances. Reducing excessive physical losses results in a greater amount
of water available for consumption and postpones the need for investing in new
sources. It also lowers operating costs. Similarly, reducing commercial losses
generates more revenues
WATER UTILITY RECEIVES MORE
REVENUE AND FINANCIAL
CAPACITY
WATER UTILITY INVESTS IN
NRW REDUCTION
NRW
REDUCES
THE VIRTUOUS NRW CYCLE
Figure 2.7 The Virtuous NRW cycle(Farley, 2003)
2.7. STRATEGY FOR DEALING WITH WATER LOSSES
The two most important components of NRW are the real losses and the apparent
losses. These components are the ones which need much resource in terms of
logistics, staffing and finance in order to control water losses. The third component,
unbilled authorised consumption can be controlled fairly well without much resource.
It is therefore important to develop the appropriate strategies for controlling water
losses especially through real and apparent losses if meaningful achievements are to
Reduction of Non-Revenue Water as a Water Demand Management Tool
22
be made and the outcome would justify the efforts put in. The starting point to deal
with water losses in any water utility, according Butler and Mamon (2006:143), is to
understand the network system of the utility.
Butler and Mamon (2006:143), suggest that certain questions should be posed about
the water utility with regard to the characteristics, the production process, and the
operating practices, and using the available tools and mechanisms within the water
utility to answer these questions form the first step in the right direction to deal with the
prevailing situation.
In the process of trying to answer these questions, better understanding of the network
system of the water utility would now be obtained, which would then form the basis for
the formulation of strategies for dealing with water losses.
Butler and Mamon (2003:143) suggest the following questions:
1. How much water is being lost?
2. Where is it being lost from?
3. Why is it being lost?
A few methodologies have been developed to assess the NRW in water distribution
systems, however most of them just concentrate on the real losses concept, and have
no emphasis on the apparent losses, which is so important in most undeveloped and
developing countries.
As a pioneer, WRc (1980) published the Report 26 in which a methodology to
determine the UFW and leakage was included. After a decade and based on
comprehensive summarizing of many case studies, Report 26 was revised by the UK
Water Industry (1994). As an output, nine reports were published on leakage
management concept. At the same time, some research results were presented to
Leakage 2005 - Conference Proceedings where a Software Tool for Non-Revenue
Water Calculations in Conjunction with Hydraulic and GIS Models was introduced with
new methodologies and terminologies for better understanding of the leakage
components.
Reduction of Non-Revenue Water as a Water Demand Management Tool
23
Lambert (1994) and May (1994) presented the concepts of bursts and background
losses estimation (BABE) and Fixed and Variable Area Discharge (FAVAD),
respectively. These two concepts were applied in many countries to resolve the
problem, regarding real losses and leakage management. Several models have been
developed to evaluate real losses and leakage management schemes, which mostly
investigate the leakage calculation, pressure management, optimal leakage level, etc.
A list of these models can be obtained from Asadiani (2004). Recently a few software
for leakage modelling have been developed which are described as follows.
1. SANFLOW model (Mackenzie, 1999) uses the Minimum Night Flow (MNF)
method based on the inflow measurement at the MNF time. This model suffers
from two major shortcomings. First one is use of estimated values for reported
and unreported bursts and the second one is calculation of the total daily
leakage by multiplying the leakage rate at the MNF time by 24. However, it is
clear that arithmetic average cannot represent the total daily leakage,
realistically.
In this approach, the minimum night flow is considered to consist of three
main components namely:
Normal legitimate night use
Background losses
Burst pipes.
Reduction of Non-Revenue Water as a Water Demand Management Tool
24
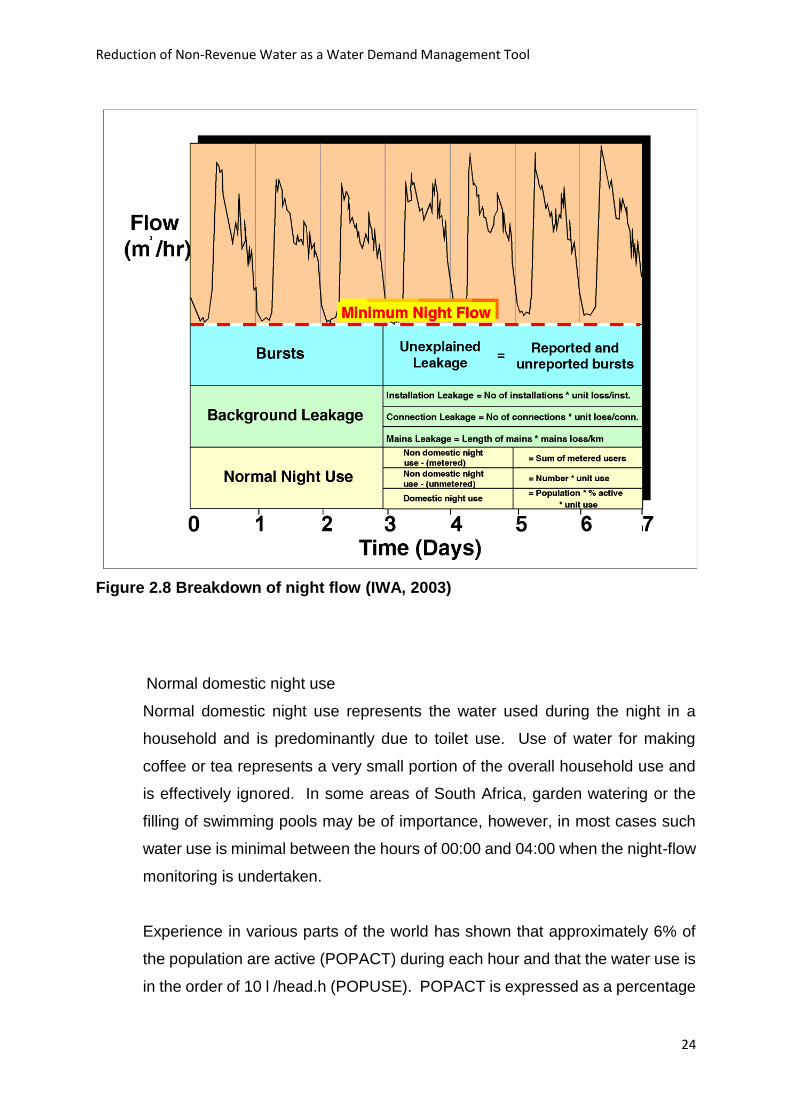
Figure 2.8 Breakdown of night flow (IWA, 2003)
Normal domestic night use
Normal domestic night use represents the water used during the night in a
household and is predominantly due to toilet use. Use of water for making
coffee or tea represents a very small portion of the overall household use and
is effectively ignored. In some areas of South Africa, garden watering or the
filling of swimming pools may be of importance, however, in most cases such
water use is minimal between the hours of 00:00 and 04:00 when the night-flow
monitoring is undertaken.
Experience in various parts of the world has shown that approximately 6% of
the population are active (POPACT) during each hour and that the water use is
in the order of 10 l /head.h (POPUSE). POPACT is expressed as a percentage

Reduction of Non-Revenue Water as a Water Demand Management Tool
25
of the population (POP) and should not be confused with the number of
properties. The value of POPUSE is based on a standard 10 l toilet cistern and
may vary from one country or region to another. The normal household night
use is therefore easily estimated from the product of the active population (i.e.
POPACT * POP) and the average use per hour (POPUSE).
HNORUSE = (POPACT * POP) * POPUSE
From various studies undertaken in different parts of the world it is suggested
that the normal household use is based on either 1.7 l per household per hour
or 0.6 l per person per hour (WRc, Report E).
Background leakage
Background leakage is the cumulative leakage from all relatively small leaks
and seepage that are individually less than 250 l/h at 50 m of pressure. Such
leaks occur from valves, joints, hydrants, stop-taps, meters, dripping taps, toilet
cisterns, roof tanks etc. Individually such leaks are generally uneconomic to
find and repair with the result that background leakage is accepted as a fact of
life within certain limits.
In general, background leakage can be split into three main components
namely:
Background leakage from mains (BLMAIN)
Background leakage from connections (BLCONN)
Background leakage from installations (BLINST)
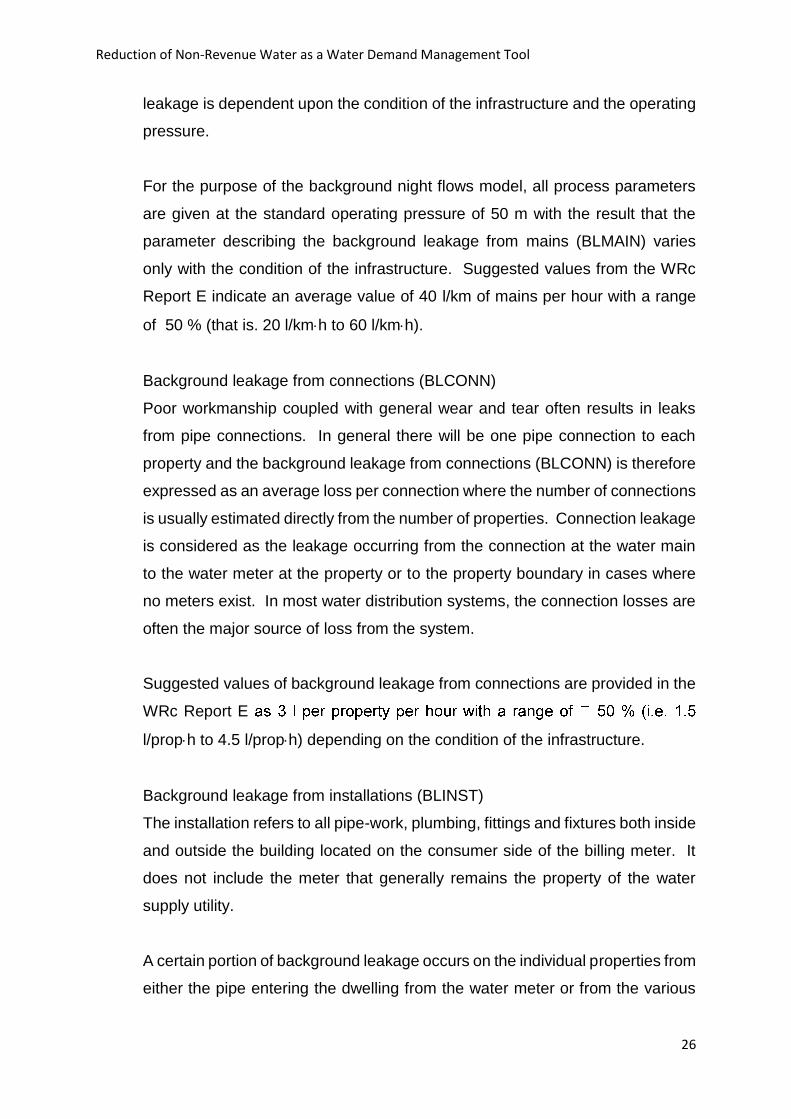
Background leakage from mains (BLMAIN)
There will always be some Background Leakage from any distribution system,
some of which occurs from the water mains. Small leaks often occur at the pipe
joints or from small cracks or holes in the pipes and the magnitude of the
Reduction of Non-Revenue Water as a Water Demand Management Tool
26
leakage is dependent upon the condition of the infrastructure and the operating
pressure.
For the purpose of the background night flows model, all process parameters
are given at the standard operating pressure of 50 m with the result that the
parameter describing the background leakage from mains (BLMAIN) varies
only with the condition of the infrastructure. Suggested values from the WRc
Report E indicate an average value of 40 l/km of mains per hour with a range
of 50 % (that is. 20 l/kmh to 60 l/kmh).
Background leakage from connections (BLCONN)
Poor workmanship coupled with general wear and tear often results in leaks
from pipe connections. In general there will be one pipe connection to each
property and the background leakage from connections (BLCONN) is therefore
expressed as an average loss per connection where the number of connections
is usually estimated directly from the number of properties. Connection leakage
is considered as the leakage occurring from the connection at the water main
to the water meter at the property or to the property boundary in cases where
no meters exist. In most water distribution systems, the connection losses are
often the major source of loss from the system.
Suggested values of background leakage from connections are provided in the
WRc Report E
l/proph to 4.5 l/proph) depending on the condition of the infrastructure.
Background leakage from installations (BLINST)
The installation refers to all pipe-work, plumbing, fittings and fixtures both inside
and outside the building located on the consumer side of the billing meter. It
does not include the meter that generally remains the property of the water
supply utility.
A certain portion of background leakage occurs on the individual properties from
either the pipe entering the dwelling from the water meter or from the various
Reduction of Non-Revenue Water as a Water Demand Management Tool
27
plumbing fittings inside the building. In most cases such leakage will be lower
than that occurring from the mains connection (as discussed in the previous
section). In South Africa, however, there are occasions where the leakage from
the installations is dominant and in fact represents the largest form of leakage
from the system.
Unless more reliable information is available to suggest higher (or lower)
leakage rates, the value recommended in the WRC Report E (Table 4.1) is 1.0
l per property per hour with a range of 50 % (i.e. 0.5 l/proph to 1.5 l/proph)
depending on the condition of the infrastructure. The leakage is usually
assumed to be equally divided between the pipe from the meter to the building
and the internal plumbing fittings.
2.7.1. Calculation of bursts
Having measured or estimated the various components of normal night use and
background night use, the two figures are added together and then subtracted
from the measured minimum night flow. The difference is the unexplained
losses that are attributable to either unreported bursts or to errors in the
assumptions made during the calculation. The possibility of errors in the
assumptions will be dealt with separately and the remainder of this section will
consider the difference to be leakage.
2.7.2. Pressure correction
One of the most important factors influencing leakage is pressure.
Considerable work has been undertaken over the past 10 years in many parts
of the world to establish how leakage from a water distribution system reacts
to pressure.
It is generally accepted that flow from a hole in a pipe will react to pressure in
accordance with normal hydraulic theory that indicates a square root power
relationship between flow and pressure.
Reduction of Non-Revenue Water as a Water Demand Management Tool
28
FlowP2 = FlowP1 x PCF where:
P1 = Pressure 1 (m)
P2 = Pressure 2 (m)
FlowP1 = Flow at pressure P1 (m3/h)
FlowP2 = Flow at pressure P1 (m3/h)
PCF = Pressure correction factor = (P1/P2) POW
pow = power exponent.
This implies that if pressure doubles, the flow will increase by a factor of 1.4
(i.e. PCF = 2 0.5). This has been tested and found to be realistic irrespective of
whether the pipe is above ground or buried. The problem arises because in
many systems the leakage has been found to react by a factor greater than 1.4.
This has caused considerable debate and confusion especially when trying to
establish the likely savings through pressure reduction measures.
Although there are still various opinions concerning the explanation for the
larger than expected influences of pressure on leakage in many systems, at
least one plausible theory has been suggested. In 1997, John May in the UK
first suggested the possibility of fixed area and variable area discharges
(FIVAD). He carried our considerable research on this topic and has found that
systems will react differently to pressure depending upon the type of leak being
considered. If the leak is a corrosion hole for example, the size of the opening
will remain fixed as the pressure in the system changes on a daily cycle. In
such cases, the water lost from the hole will follow the general square root
principle as outlined above. This type of leak is referred to as a fixed area leak.
Reduction of Non-Revenue Water as a Water Demand Management Tool
29
If, however, the leak is due to a leaking joint, the size of the opening may in fact
increase as the pressure increases due to the opening and closing of the joint
with the changing pressure. In such cases the flow of water will increase by
much more than the fixed area leak. Research suggests that in such cases, a
power exponent of 1.5 should be used instead of the 0.5 used for the fixed area
cases. This suggests that if the pressure doubles, the leakage will increase by
a factor of 2.83 (i.e. PCF = 21.5).
In the case of longitudinal leaks, the area of leak may increase both in width as
well as length as is often the case with plastic pipes. In such cases the power
exponent can increase to 2.5. In other words, if the pressure doubles, the flow
through the leak will increase by a factor of 5.6 (i.e. PCF = 2 2.5).
The problem faced by the water distribution engineer is to decide what factor
should be used when estimating the influence of pressure on leakage flow. In
general, it is recommended that a power exponent of 0.5 should be used for all
burst flows since a burst pipe is usually a fixed area discharge. In the case of
the background losses, however, the leaks are likely to be variable area
discharges in which case a larger power exponent should be used. A power
exponent of 1.5 is usually used for the background losses, which is considered
to represent a collection of leaks that have factors of between 0.5 and 2.5. If
all of the pipe work is known to be plastic, a higher value may be appropriate
and conversely, if the pipes are made from cast-iron, a lower value (e.g. 1.0)
should be used.
The influence of the power exponent used in the analysis can be seen in
Table 3.1 where the factors given relate to a basic pressure of 50 m. From
the Table it can be seen that if the pressure is reduced from 50 m to 20 m, the
leakage will decrease to 0.25 of the original value, i.e. a four-fold reduction in
leakage.
2. PRESMAC model (Mackenzie, 2001) is applied for pressure management
purposes. As a disadvantage, this model does not use any hydraulic model and
Reduction of Non-Revenue Water as a Water Demand Management Tool
30
pressure is calculated with some simplifications which lead to high uncertainty
especially in complex networks.
3. ECONOLEAK (Mackenzie and Lambert, 2002) calculates real losses using the
annual water balance method in which, apparent losses are considered as a
percentage of total NRW. Then using the BABE concept, the leakage
components are evaluated. Therefore, it just uses estimated values to calculate
the NRW components.
1. BENCHLEAK model (Mackenzie et al., 2002) was written in an excel
environment to calculate the NRW components using the water balance
method. To resolve the abovementioned weaknesses of the existing leakage
models, this paper aims to develop comprehensive software to evaluate both
apparent and real losses and their components. The model is able to be linked
to hydraulic and GIS models to determine values of nodal and pipe leakage.
The results can be represented in the GIS environmental to perform further
analyses by decision makers
Reduction of Non-Revenue Water as a Water Demand Management Tool
31
3. STUDY AREA
3.1. Introduction
The Cowdray Park high density area that covers an area of 16,5km2 lies in the North
Western part of the City of Bulawayo as depicted in Annexure A; it was developed in
the year 1992 after the need for housing increased in the City. This area was ideal for
study due to the existence of all the parameters required to study Non-Revenue water,
these are inclusive of–
Illegal connections.
Above average, frequent and high rate bursts.
New developments by private developers.
Lack of a complete billing database that then leaves more research to be done.
The description of the area is given according to values obtained from Google earth,
ArcGIS 10.1 and drawings acquired from the Bulawayo City Council. Summary
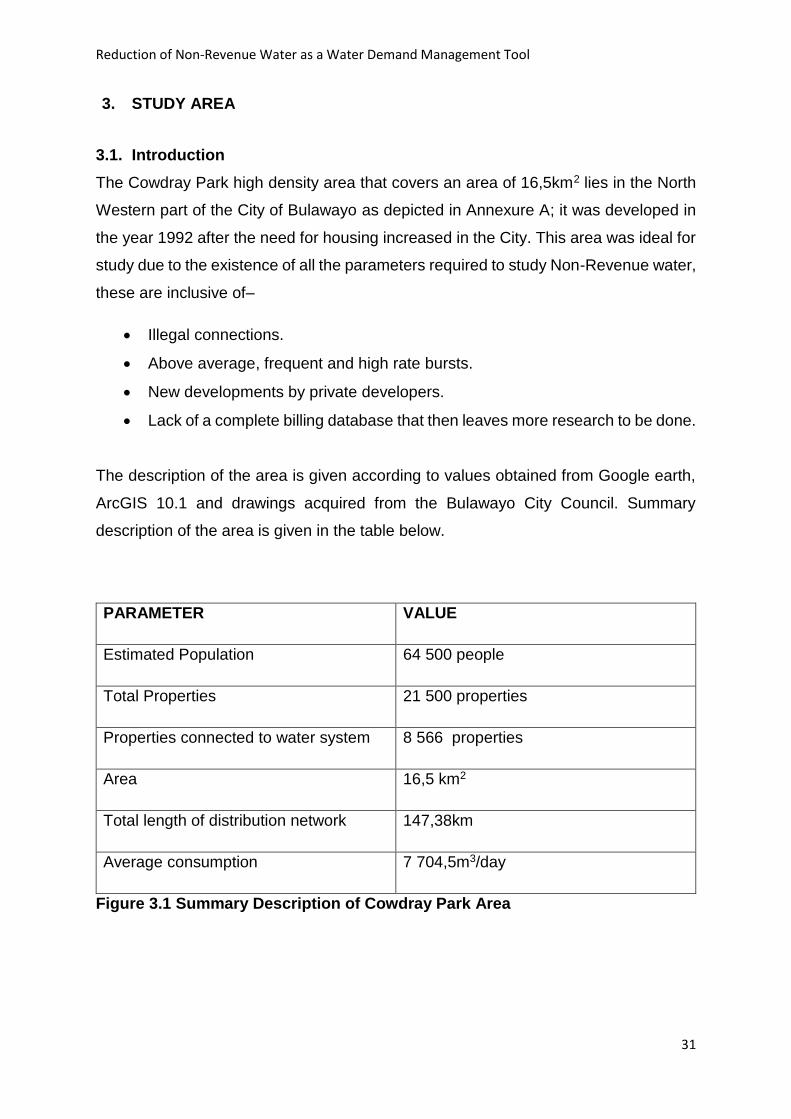
description of the area is given in the table below.
PARAMETER VALUE
Estimated Population 64 500 people
Total Properties 21 500 properties
Properties connected to water system 8 566 properties
Area 16,5 km2
Total length of distribution network 147,38km
Average consumption 7 704,5m3/day
Figure 3.1 Summary Description of Cowdray Park Area
Reduction of Non-Revenue Water as a Water Demand Management Tool
32
3.2. Water distribution system in Cowdray Park
The distribution system (total 147 380 km mains and distribution pipework) consists of
pipes from 50 to 600 mm. 80 % of the pipes are made from Polyvinyl Chloride (PVC)
the remaining pipes are asbestos cement (AC) and steel, both galvanised and bitumen
coated.
The primary distribution system and trunk mains are of diameter 300 – 600 mm. The
primary distribution includes interconnection between the ring mains, which are
located around the area. The system is very complicated and difficult to understand
and operate since it was designed and constructed by numerous Contractors. The
reservoir level at Magwegwe (the supply for Cowdray Park) can be read remotely by
an old system using telephone lines and manually dialling each reservoir, but for this
exercise an insertion meter was used to obtain the reservoir level.
3.2.1. Service pipelines
Consumers are connected to the distribution system through service pipelines.
Domestic meters are fitted on the service pipeline to measure the consumption to each
consumer. The part of the service pipeline from the main distribution pipe to the meter
is the responsibility of Bulawayo City Council. Repair of leaks and replacement of
these service pipelines have to be carried out by BCC. The part of the service pipeline
from the meter to the house installations is private, and the responsibility of the house
owner.
In the high density areas the meter is normally fitted near the house or on the wall of
the house. Council is therefore responsible for the total service pipeline crossing the
private plot to the house, normally 10-18 m.
Reduction of Non-Revenue Water as a Water Demand Management Tool
33
.
3.2.2. Present water supply situation
Due to the precipitation received, the precarious situation for Bulawayo water Supply
has been alleviated. The current volume in the dams is 78 % of the total full capacity
(current dam storage is 306,118,957 m3). This will cover the water demand for
approximately 37 months provided the specific consumption per person does not
increase.
However, there should not be a feeling of complacency. The good rainy season has
given BCC some needed time to implement water conservation measures so
Bulawayo will be better prepared for years with much less rainfall.
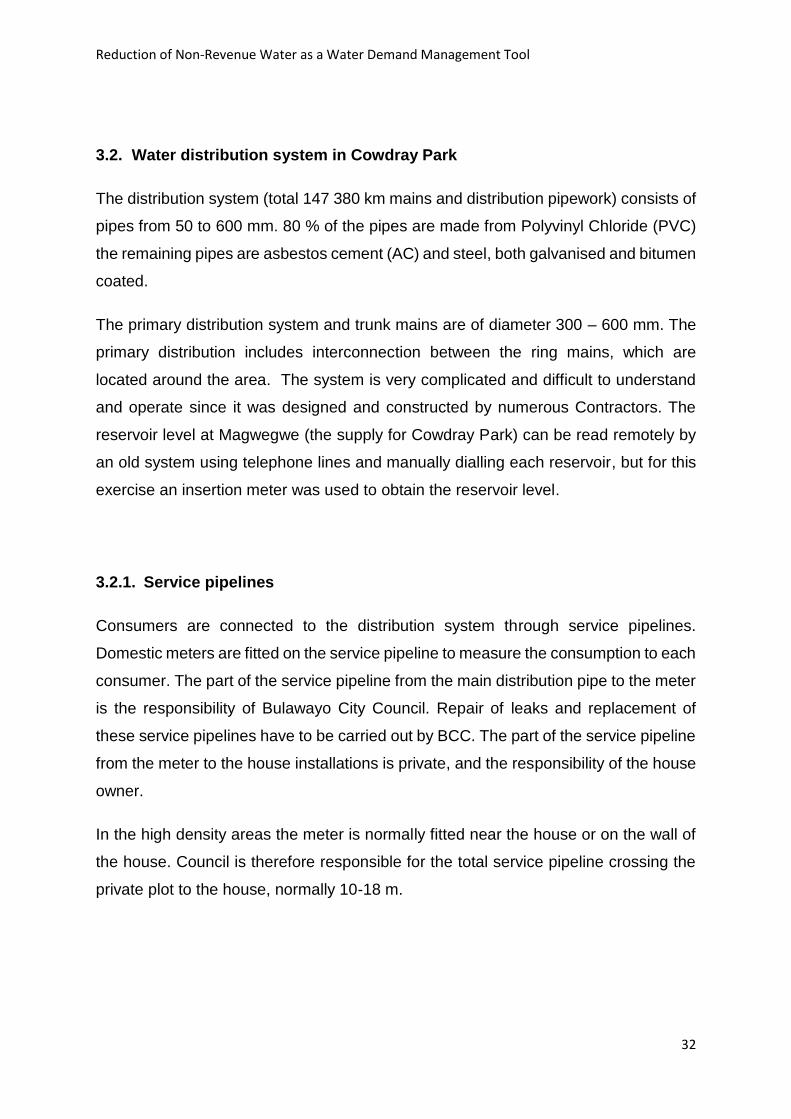
Figure 3.2: Water Disribution in Cowdray Park
Reduction of Non-Revenue Water as a Water Demand Management Tool
34
3.2.3. Existing water supply Water system and Water sources
The water sources in Bulawayo consist of 6 dams at the Southern Catchment and a
groundwater scheme of 68 boreholes commissioned in 1993. Annexure A shows the
Water Sources and the Primary system in Bulawayo.
The present total capacity of Bulawayo’s water supply dams is approximately414
million cubic meters. Traditionally dam yields for raw water abstraction in Zimbabwe
have been based on the 4% yield principle. Effectively by this means that the dam is
assessed to provide an abstraction rate equal to or above the nominated yield for 96
years out of 100.
All of Bulawayo’s water supply dams are in the Southern Water Catchment Area
(Matabeleland South) are characterised by average rainfall of 594 mm per year.
However, the catchment area has experienced repeated droughts the last 25 years
and is therefore relying on the storage capacity of the water.
Nyamandlovu Aquifer-The groundwater supply from the Nyamandlovu aquifer was
established as an emergency drought relief project in 1992 to ease the supply situation
when the water supply sources was on the verge of drying up. Total installed well
capacity at Nyamandlovu is 25,000 m3/d of underground water. However, later
assessment of the aquifer concludes that the abstractions from the current well field
should be restricted to 9000 – 12000 m3 per day to preserve its long term integrity.
3.2.4. Short term extensions of the water sources
The Mtshabezi dam was constructed in 1994, it has been connected to the water
supply system. A pipeline connection from this dam to the Mzingwane pipeline to
Ncema Treatment works exists. This provides an average of 7 000 m3per day in the
stead of the proposed capacity of 17ML.
At the Nyamandlovu aquifer investigations are underway with the aim of extending the
well field to the north west of the current one to bring the production up to the capacity

Reduction of Non-Revenue Water as a Water Demand Management Tool
35
of the Nyamandlovu – Bulawayo pipeline of 26 000 m3 per day. Ten deep boreholes
have been drilled and are being pump tested to determine their safe yields. The
boreholes will be connected to the existing network.
3.3. Water Treatment
The water treatment plants Criterion and Ncema have today an estimated capacity of
respectively 181,000 and 30,000 m3/d, a total of 211.000 m3/d.
Both Ncema and Criterion has a treatment process consisting of:
1. Pre pH correction using lime (rarely used)
2. Flocculation using alum and polyelectrolyte
3. Clarification
4. Rapid sand filters
5. Disinfection by chlorination and chloramination (ammonia)
6. Post pH correction using lime (rarely used)
For additional disinfecting chlorine is added at the reservoirs Tuli, Magwegwe and Rifle
Range.
The water treatment plants are in fairly good condition, but some equipment at Ncema
is out of order.
3.4. Water delivery facilities
Southern Catchment-The Southern Catchment has the following basic delivery
facilities:
1. Treated Water Pumping Main from Ncema Waterworks to Tuli Hill reservoir that
will convey 83,000m3/d.
Reduction of Non-Revenue Water as a Water Demand Management Tool
36
2. Twin Raw Water Pumping Mains from Ncema Dam to Criterion Waterworks;
that will convey 180,000 m3/d.
The delivery facilities are designed normally to convey the average daily flow in a Peak
Week (usually in November). Bulawayo have mitigated this demand in part by
constructing a large raw water reservoir at Criterion Waterworks.
Northern Catchment-The abstracted water from the Nyamandlovu aquifer is pumped
to the Bulawayo water distribution system in two steps, one pumping station at
Rochester near the well field and the next station at Cowdray Park. The capacity of
the water transmission system is 26 000 m3 per day.
A schematic presentation of the existing water delivery facilities including the
reservoirs and the main trunks is showed in Annexure B.
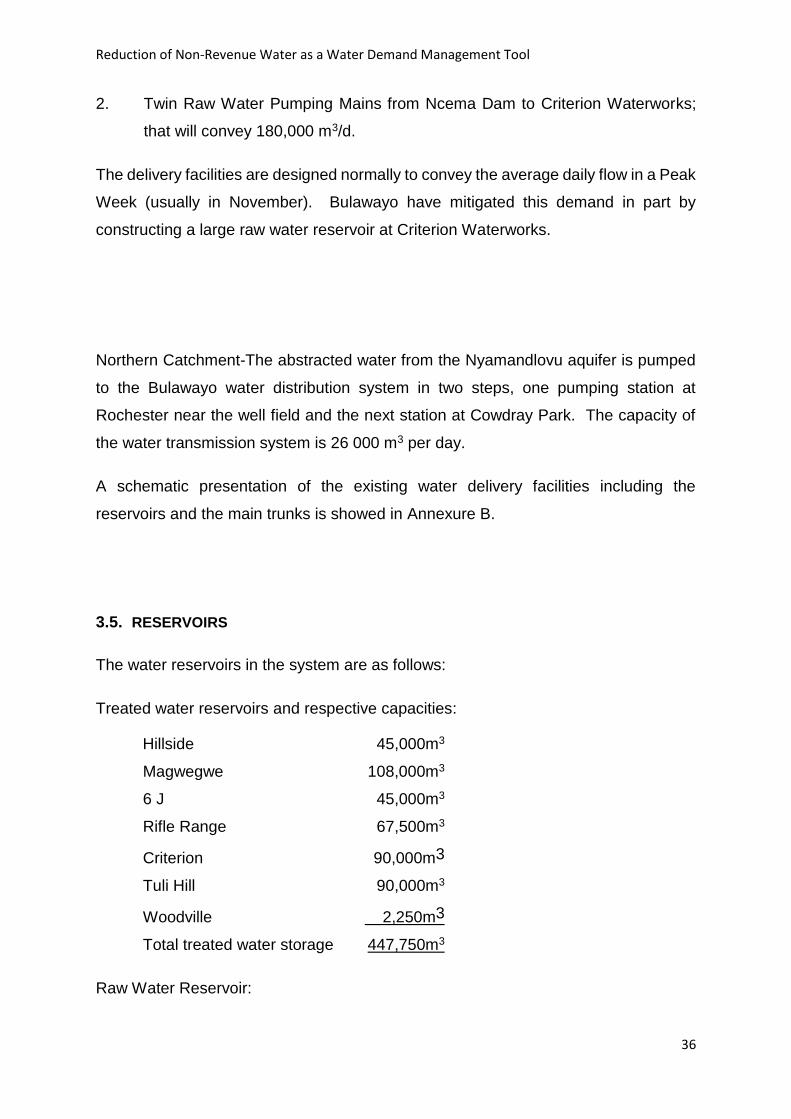
3.5. RESERVOIRS
The water reservoirs in the system are as follows:
Treated water reservoirs and respective capacities:
Hillside 45,000m3
Magwegwe 108,000m3
6 J 45,000m3
Rifle Range 67,500m3
Criterion 90,000m3
Tuli Hill 90,000m3
Woodville 2,250m3
Total treated water storage 447,750m3
Raw Water Reservoir:
Reduction of Non-Revenue Water as a Water Demand Management Tool
37
Criterion- 1,400,000 m3
Reservoirs are required for two primary reasons:
1. To supply excess consumption on peak days compared with supply capacity of
peak week.
2. To provide supply continuity in the event of power failures
Bulawayo has a treated water reservoir storage capacity of 4 –5 days of Treatment
Works Annual Average Daily Consumption. This is more than normal design in similar
systems, and thus regarded as sufficient. The condition of the reservoirs needs to be
checked.
3.6. Pressure Zones
The distribution system for Bulawayo is divided into approximately 30 pressure zones
supplied from the reservoirs and using pressure reducing valves (PRV’s) to set the
pressure in each zone. The pressure reducing valves in the network are of size 100
mm to 400 mm.
In addition there are 8 booster pumping stations serving the high level areas
surrounding the reservoirs. In absence of the hydraulic network model the operational
staff control the pressure zoning in an ad hoc manner.
The pressure zoning is not optimal and a new structured pressure-zoning plan has to
be established early in the work program. The difference in elevation of the supply
areas is 200 m and many zones will be required to maintain pressure at the level of 2
–3 bars in residential areas and 4 –6 bar in the city areas.
The city currently operates passive leakage control although active methods were
employed for the purpose of this project.
The meter readers from the Billing section (City Treasurers Department) read the
meters every month.
Reduction of Non-Revenue Water as a Water Demand Management Tool
38
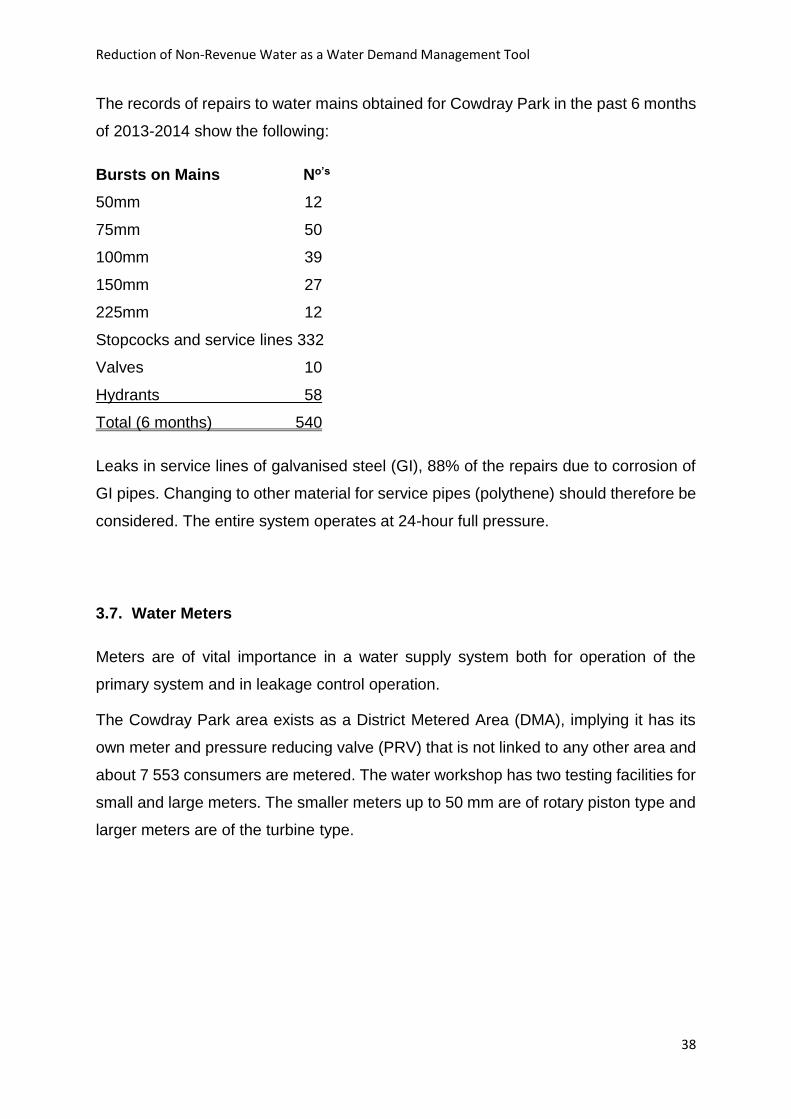
The records of repairs to water mains obtained for Cowdray Park in the past 6 months
of 2013-2014 show the following:
Bursts on Mains No’s
50mm 12
75mm 50
100mm 39
150mm 27
225mm 12
Stopcocks and service lines 332
Valves 10
Hydrants 58
Total (6 months) 540
Leaks in service lines of galvanised steel (GI), 88% of the repairs due to corrosion of
GI pipes. Changing to other material for service pipes (polythene) should therefore be
considered. The entire system operates at 24-hour full pressure.
3.7. Water Meters
Meters are of vital importance in a water supply system both for operation of the
primary system and in leakage control operation.
The Cowdray Park area exists as a District Metered Area (DMA), implying it has its
own meter and pressure reducing valve (PRV) that is not linked to any other area and
about 7 553 consumers are metered. The water workshop has two testing facilities for
small and large meters. The smaller meters up to 50 mm are of rotary piston type and
larger meters are of the turbine type.
Reduction of Non-Revenue Water as a Water Demand Management Tool
39
4. METHODOLOGY
4.1. STUDY DESIGN
The research methodology involves the assessment of the water distribution system
of the Cowdray Park area. This distribution system constitutes the water sources that
supply Cowdray Park and their corresponding conveyance pipelines and
appurtenances associated with this supply network. Various parameters were
quantitatively determined inclusive of pressure, flows and water losses.
4.1.1. Project Activities
The Project’s activities are grouped as follows:-
Desk studies- This involved the collection of primary data on quantity of water
supplied to the area and the billing data (showing the consumption per month
and respective amounts charged) from the local authority’s files and records.
Field studies- This encompassed carrying out interviews with key personnel
involved with running the water distribution system at the Bulawayo City
Council. It included an assessment of the distribution network, obtaining
pressure and flow data utilising the Data Logger (Sensus, undated).
Data Analysis-Quantitative data from the desk studies and field studies is
analysed.
4.1.2. Sources of Data
The data sources for the network layout, study area and information regarding the
losses are:
The Water Branch files containing reports regarding the distribution network
and developments in Cowdray Park
Water books and drawings from BCC.
Documents and reports from the BCC water workshops

Reduction of Non-Revenue Water as a Water Demand Management Tool
40
Various documents and reports prepared by other companies and institutions
on the subject of Non-Revenue Water on and for the City of Bulawayo.
Field Flow and pressure measurements made during the current project
Billing Database from the Billing section of Bulawayo City Council that shows
the total number of households being billed for the water utilised and the
revenue collected therein.
4.2. Sampling plan
One of the goals of the research was to obtain a quantitative analysis of the non-
revenue water brought about by the three NRW contributors (Real and apparent
losses and Unbilled authorised consumption). To meet this objective a sampling plan
was developed. The questions raised in the sampling plan were:
1. From where within the target population should samples be collected
2. What type of samples should be collected
3. How many samples should be analysed
The Cowdray Park area which has a total number of 22 686 units being billed was
divided into 6 sub areas by the method of stratified sampling according to the
Contractors who designed and installed the water reticulation system and these are:
Hawkflight (2 500 units)
Glencoe (1 300 units)
The Government (Garikai/Hlalani Kuhle) (6 050 Units)
Bulawayo Home Seekers Consortium Trust (BHSCT) (3 300 Units)
Bulawayo City Council (8 490 Units)
Other developers (1 046)
These formulated strata were further sampled systematically for more data to be
collected like meter tests, pressure tests and state of connection at individual
connections.
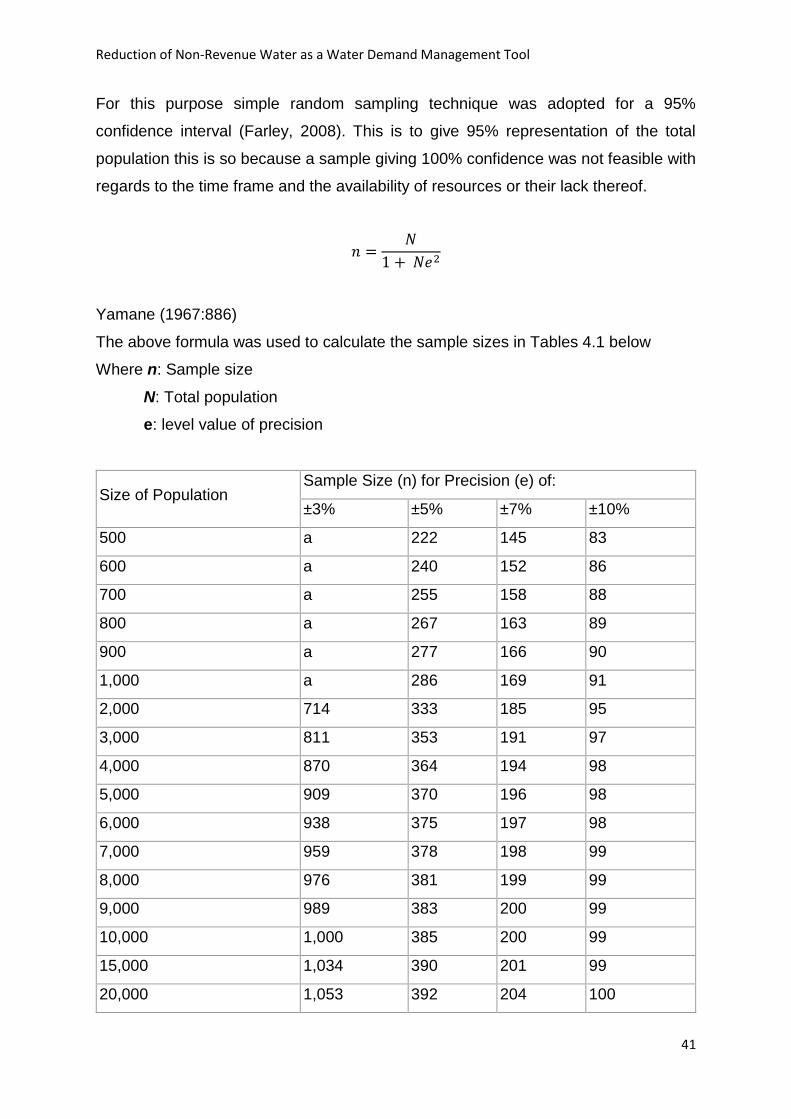
Reduction of Non-Revenue Water as a Water Demand Management Tool
41
For this purpose simple random sampling technique was adopted for a 95%
confidence interval (Farley, 2008). This is to give 95% representation of the total
population this is so because a sample giving 100% confidence was not feasible with
regards to the time frame and the availability of resources or their lack thereof.
𝑛 =𝑁
1 + 𝑁𝑒2
Yamane (1967:886)
The above formula was used to calculate the sample sizes in Tables 4.1 below
Where n: Sample size
N: Total population
e: level value of precision
Size of Population Sample Size (n) for Precision (e) of:
±3% ±5% ±7% ±10%
500 a 222 145 83
600 a 240 152 86
700 a 255 158 88
800 a 267 163 89
900 a 277 166 90
1,000 a 286 169 91
2,000 714 333 185 95
3,000 811 353 191 97
4,000 870 364 194 98
5,000 909 370 196 98
6,000 938 375 197 98
7,000 959 378 198 99
8,000 976 381 199 99
9,000 989 383 200 99
10,000 1,000 385 200 99
15,000 1,034 390 201 99
20,000 1,053 392 204 100
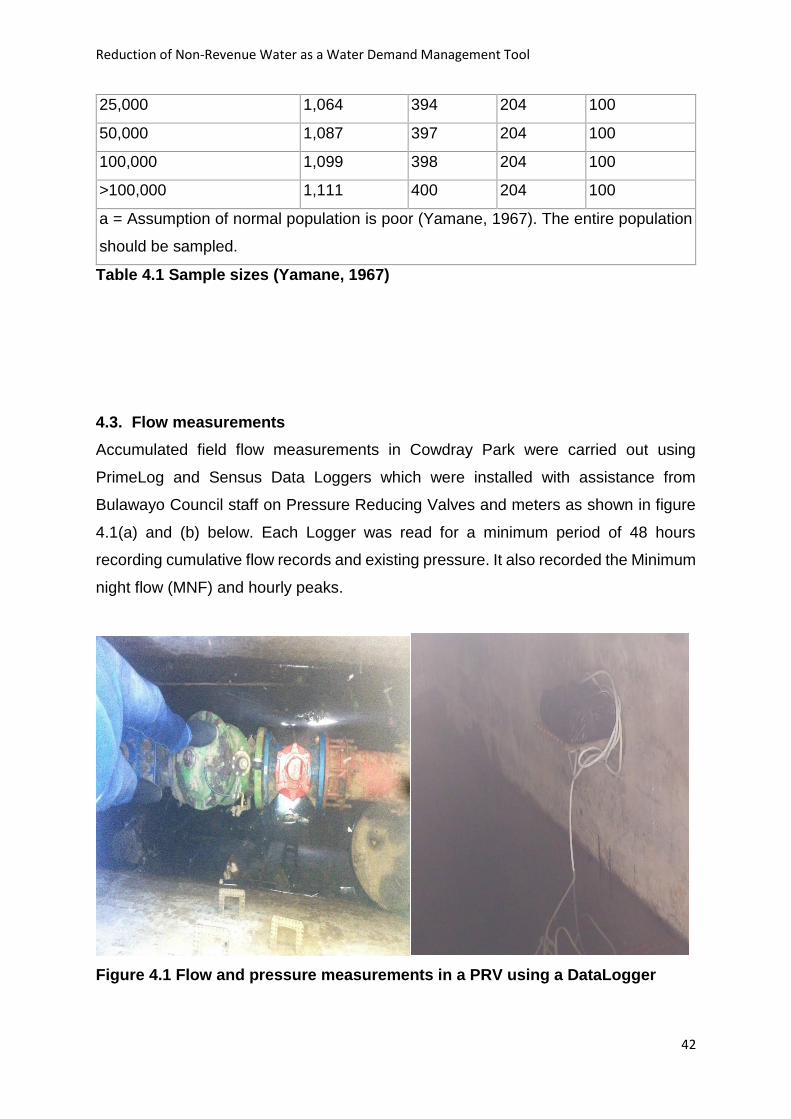
Reduction of Non-Revenue Water as a Water Demand Management Tool
42
25,000 1,064 394 204 100
50,000 1,087 397 204 100
100,000 1,099 398 204 100
>100,000 1,111 400 204 100
a = Assumption of normal population is poor (Yamane, 1967). The entire population
should be sampled.
Table 4.1 Sample sizes (Yamane, 1967)
4.3. Flow measurements
Accumulated field flow measurements in Cowdray Park were carried out using
PrimeLog and Sensus Data Loggers which were installed with assistance from
Bulawayo Council staff on Pressure Reducing Valves and meters as shown in figure
4.1(a) and (b) below. Each Logger was read for a minimum period of 48 hours
recording cumulative flow records and existing pressure. It also recorded the Minimum
night flow (MNF) and hourly peaks.
Figure 4.1 Flow and pressure measurements in a PRV using a DataLogger
Reduction of Non-Revenue Water as a Water Demand Management Tool
43
4.4. Pipeline Survey
Pipeline surveys were carried out and a combination of visual inspection and sounding
of the systems was used to find leaks where flow and pressure measurements
indicated losses. Tasks performed during the pipeline survey:
Inspection of the distribution system for visual leaks
Used listening devices (Farley, 2008) to locate and pinpoint leaks with assistance
from Bulawayo council staff.
Observed leaks were repaired
4.5. House inspection
A door-to-door survey was carried out at selected sampling households, physical
inspection of various installations and leaks and wastage were identified. Wastage
was defined as the case where water is lost due to negligence on the part of the
consumer (leaking taps, open taps, watering etc.)
Tasks performed during inspection included:
Examination of service pipelines for visual leaks by walking along the pipelines.
Inspection of water meters and stopcocks for leaks.
Inspection of household plumbing including water taps for leaks.
Examination of water storage tanks and overhead storage tanks for leaks or
malfunctioning float valves causing overflow of tanks.
Testing water meters using a portable test meter for functionality and accuracy.

Reduction of Non-Revenue Water as a Water Demand Management Tool
44
Figure 4.2 Flow and pressure measurements in households
4.6. System inventory
A system inventory was developed using information from Engineering Services
Department (maps, information from engineers, foremen, plumbers, etc.) and the
billing system in conjunction with field survey work. Data collected includes number
of households, the type, size and length of distribution pipes, number of valves (main
and service), fire hydrants, this data was utilised as input into SANFLOW and Aqualite
softwares to give the amount of Non-Revenue water and its various contributors .
4.7. Non-Revenue Water calculation
Combination of the Top-Down and Bottom-Up approaches were applied with the
utilisation of existing softwares (Farley, 2008)
Top-Down approach starts from the water distribution system input point (since
the Cowdray Park area is a discrete District Metered Area it therefore contains
Reduction of Non-Revenue Water as a Water Demand Management Tool
45
a Pressure Reducing Valve (PRV) and a meter hence flow and pressure were
measured at this point), to the consumer point.
In this approach the System Input Volume was determined then the route of water flow
was traced to the premises that obtain the highest and lowest pressures, respectively.
Leaks and bursts along the route were determined and water lost was quantified by
measuring flow before and after the leak or burst per unit time. This facilitated the
quantification of real losses.
Bottom-Up approach relies on the minimum night flow (MNF). This is because
during the night period the real losses are at their maximum percentages of the
total flow evident by the drop in pressure due to water loss since minimal or no
water is used by the consumer. This approach starts from the consumer
working up to the water distribution system input point by measuring the
pressure at consumer point and input point then asses any pressure reduction
along the network to locate the leaks.
The total households billed were queried utilising the database of domestic and
commercial consumers and their respective amounts paid to the Billing Section
at BCC to facilitate the quantification of apparent losses.
Metering inaccuracies were determined by taking meter readings showing the
amount of water being consumed during the study period by the households
and meter tests to determine the functionality and accuracy of the meters.
Although the whole area was not covered in this respect, appropriate samples
were taken according to the sampling methods articulated later in the chapter.
Utilising the data of households billed for water and revenue obtained from the
billing section, households that use water but are not in the database were
investigated to reveal the illegal connections that relate to the unauthorised
consumption.
Reduction of Non-Revenue Water as a Water Demand Management Tool
46
4.7.1. Softwares
Values from field measurements were taken to be inputs to numerous Water Demand
Management softwares. Softwares utilised include:
Aqualite (Lambert) - creates a water audit for a specific water supply system. The
model was used to create an annual water balance based on the available network
data and the breakdown of the water that can be accounted for by the supplier as
authorised consumption. It provides a selection of performance indicators (ILI and
Financial indicators) which were used to evaluate the levels of leakage as well as the
effectiveness of the management of the system in terms of NRW reduction.
Sanflow (Lambert) -the South African Night Flow Analysis Model assists in the
determination of the level of leakage in a particular District metered area (DMA) from
the analysis of recorded minimum night flows.
Inputs
Column 1 contains a reference name or number for each specific night-flow analysis.
The reference is input to the model through the VARIABLES menu.
Date
This column contains the date for the specific night-flow analysis and is also input
through the VARIABLES form.
Average Zone Night Pressure (AZNP)
This column contains the measured or estimated average zone night pressure in units
of meters for each night-flow analysis. The AZNP is input to the model through the
VARIABLES form.
Measured minimum night flow
Column 4 provides the measured minimum night flow for each night-flow analysis in
units of m3/h. The value is input to the program through the VARIABLES form.
Reduction of Non-Revenue Water as a Water Demand Management Tool
47
Background losses
Column 5 provides the total estimated background loss in units of m3/h for each night-
flow analysis. The breakdown of the background night flow can be examined by
viewing the background loss form – i.e. by clicking on the Background Loss button
(see below for details).
Normal night use
Column 6 provides the total estimated normal night use for each night-flow analysis.
Details of how the figure is calculated can be examined by viewing the Normal Night
Flow form that can be accessed by clicking the Normal Night Use button (see below
for details).
Expected minimum night flow
Column 7 provides details of the expected minimum night flow that is simply the sum
of columns 5 and 6 and represents the night flow that would occur if there are no burst
pipes in the zone.
Excess night flow
Column 8 provides details of the excess night flow in the zone and is simply the
difference between the expected minimum night flow and the measured minimum
night flow. The resulting figure is an indication of the unexplained leakage in the zone
and if a negative value appears, it suggests that there is no serious leakage problem
and that some of the base parameters have been estimated incorrectly.
Equivalent service pipe bursts
Column 9 provides an estimate of how many equivalent service pipe bursts are in the
zone for each night-flow analysis. The pressure is taken into account and this column
enables the different night-flow analyses for the zone to be compared on an equitable
basis since the variability due to operating pressure has been removed from the
calculation.

Reduction of Non-Revenue Water as a Water Demand Management Tool
48
Outputs
Graphs can be produced showing the distribution of the various loss components over
time together with a plot of the equivalent service pipe bursts. Brief reports are also
produced for each night-flow analysis
Sensitivity analysis
Sensitivity analysis has the ability to test the sensitivity of the result to any or all of the
various parameters used in the calculation (McKenzie, 1999) The estimation of the
equivalent service pipe bursts is based on 16 different variables. These 16 variables
are generally estimated from experience, or are selected based on their default values.
In either case there is some uncertainty about the value selected for each variable.
The problem is to identify the magnitude of the uncertainty and to evaluate the
significance on the end result.
In order to quantify the uncertainty of the overall result (i.e. the number of equivalent
service pipe bursts) it is first necessary to estimate the uncertainty associated with
each of the 16 variables. Each variable can be viewed as a random variable with a
particular distribution. A normal distribution would usually be selected; however, in
this case it was decided to use a simple triangular distribution (McKenzie, 1999). The
triangular distribution was selected because it is realistic and practical, since the user
must simply supply three parameters namely:
The lower bound
The upper bound
The best estimate (as supplied through the main program).
In other words, the user must simply provide a lower and upper estimate for each
variable. Such parameters can usually be estimated based on feeling or judgment
and if the user is unsure of a particular variable, a wide range should be specified by
the user to highlight the uncertainty. For ease of use the model selected default upper
and lower bounds based on the best estimate plus and minus 20% respectively.
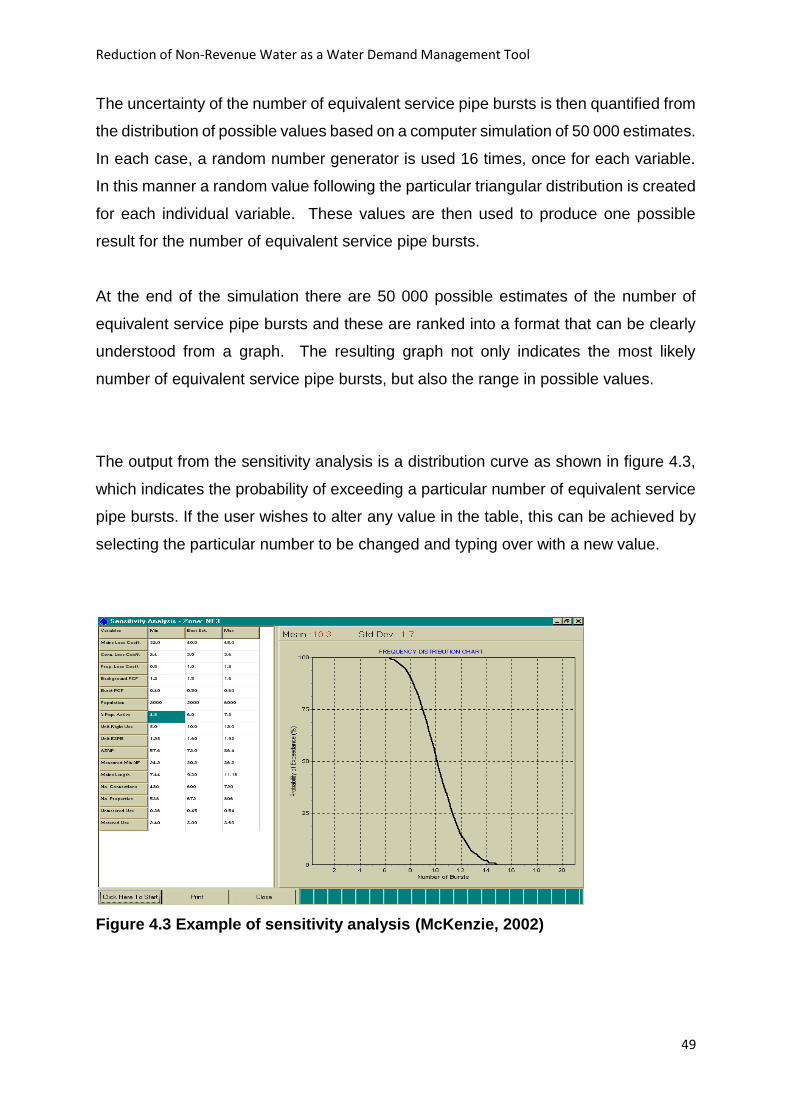
Reduction of Non-Revenue Water as a Water Demand Management Tool
49
The uncertainty of the number of equivalent service pipe bursts is then quantified from
the distribution of possible values based on a computer simulation of 50 000 estimates.
In each case, a random number generator is used 16 times, once for each variable.
In this manner a random value following the particular triangular distribution is created
for each individual variable. These values are then used to produce one possible
result for the number of equivalent service pipe bursts.
At the end of the simulation there are 50 000 possible estimates of the number of
equivalent service pipe bursts and these are ranked into a format that can be clearly
understood from a graph. The resulting graph not only indicates the most likely
number of equivalent service pipe bursts, but also the range in possible values.
The output from the sensitivity analysis is a distribution curve as shown in figure 4.3,
which indicates the probability of exceeding a particular number of equivalent service
pipe bursts. If the user wishes to alter any value in the table, this can be achieved by
selecting the particular number to be changed and typing over with a new value.
Figure 4.3 Example of sensitivity analysis (McKenzie, 2002)
Reduction of Non-Revenue Water as a Water Demand Management Tool
50
The sensitivity analysis was repeated by changing the input values in the table. For
example, the lower estimate of the Average Zone Night Pressure (AZNP) can be
changed from 57.6 m (the default value of 72 – 20%) to 40 m and the upper estimate
changed from 86.4 m to 80.0 m.
CDLwin/PrimeLog - for programming, downloading and evaluating data (for instance,
flow rate and pressure) measured and recorded simultaneously using a Data Logger.
The pressure and flow rate relationship gives a detailed picture of the situation in the
pipeline. If, for example, the water pressure drops without the water meter registering
any flow, there is probably a leak up stream of the meter.
Water Demand Management Scorecard (WDM) (McKenzie, 1999) - for the
assessment of Water distribution systems to ascertain the Status quo of these systems
and evaluate the potential for Water Conservation / Water Demand Management
(WC/WDM) measures be implemented in these systems. The scorecard is to assess
the current situation regarding losses and levels of wastage in all water supply systems
by giving scores to the particular technical and managerial issues in the card. The
initiative provides the mechanism whereby the Water utility can identify areas where
WC/WDM is not being addressed properly to ensure that appropriate measures
are taken to encourage efficient use of water and the elimination of wastage. The
scorecard is based on a number of key issues which all water service providers must
address as part of normal management. Items in the Scorecard are inclusive of:
Development of Standard Water Balance – is there an existent water
balance for the utility that is frequently updated?
Effective Billing System- is the billing system and data management
system effective?
Network (leakage) complaints system-is there a leakage reporting and
data capturing system in place.
Reduction of Non-Revenue Water as a Water Demand Management Tool
51
Billing and metering complaints system-is there a setup that allows
consumers to make complaints with regards to bills and meter reading
they query.
Asset Register for Water Reticulation system-is the network system
properly documented in terms of drawings and network information like
pipe size and length.
Asset management – are Capital, operations and maintenance works
efficient and effective.
Active leakage control-are leaks actively controlled or passive method is
employed.
Pressure management and maintenance of pressure reducing valves-
are pressure zones frequently managed as new developments come up
and are the existing PRV functional and properly maintained.
Regulations and bylaws-are these properly documented and distributed
to all interested parties.
Newspaper and radio articles plus posters and leaflets for distribution to
the public as an awareness method of the implication and consequences
of high levels of Non-revenue water.
4.8. WATER BALANCE
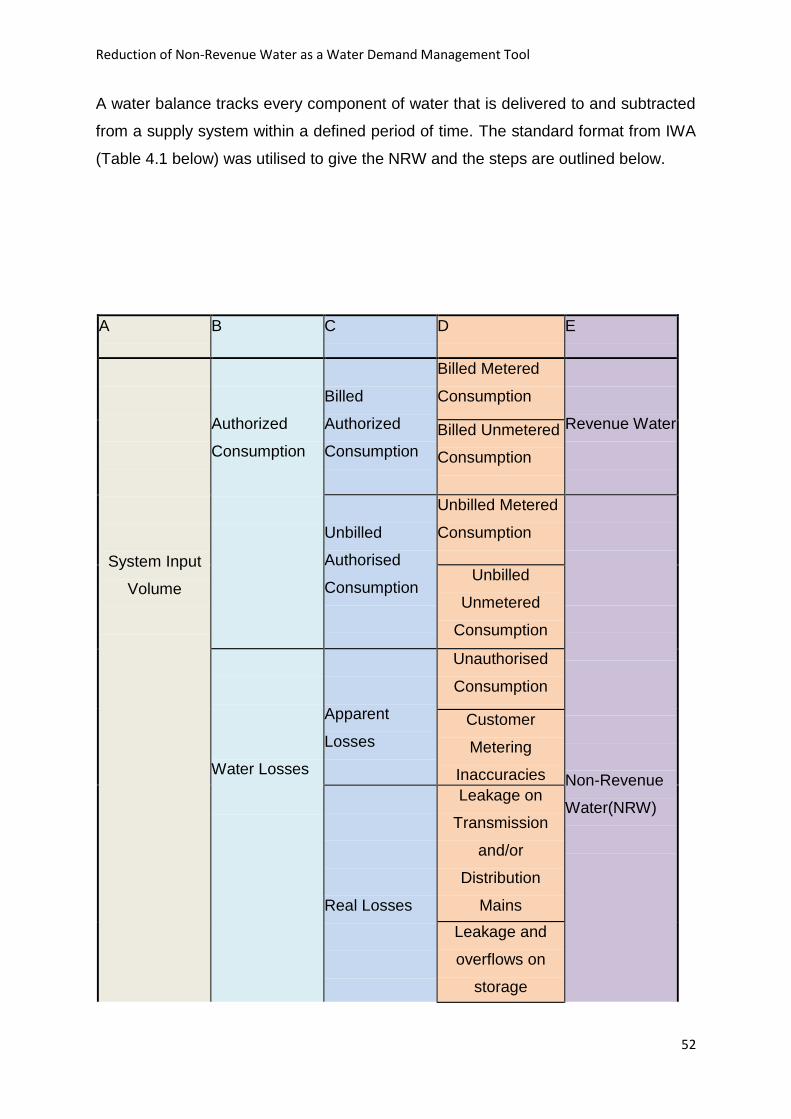
Reduction of Non-Revenue Water as a Water Demand Management Tool
52
A water balance tracks every component of water that is delivered to and subtracted
from a supply system within a defined period of time. The standard format from IWA
(Table 4.1 below) was utilised to give the NRW and the steps are outlined below.
A B C D E
System Input
Volume
Authorized
Consumption
Billed
Authorized
Consumption
Billed Metered
Consumption
Revenue Water
Billed Unmetered
Consumption
Unbilled
Authorised
Consumption
Unbilled Metered
Consumption
Non-Revenue
Water(NRW)
Unbilled
Unmetered
Consumption
Water Losses
Apparent
Losses
Unauthorised
Consumption
Customer
Metering
Inaccuracies
Real Losses
Leakage on
Transmission
and/or
Distribution
Mains
Leakage and
overflows on
storage
facilities
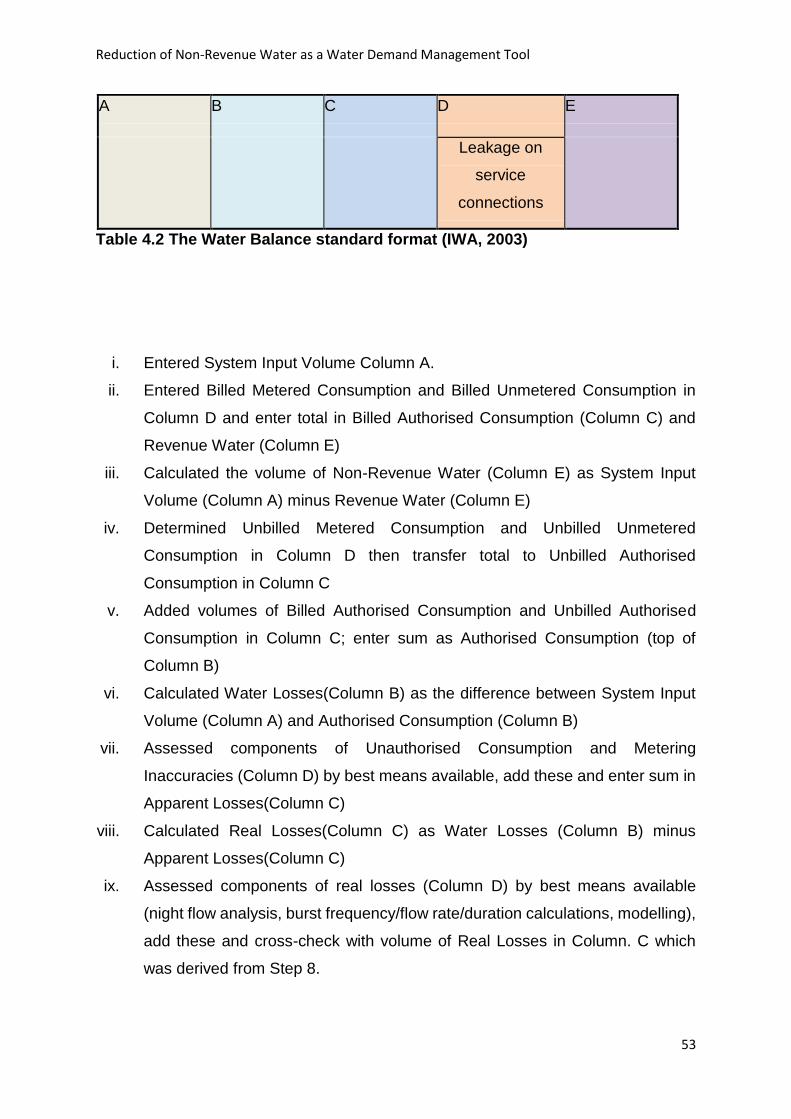
Reduction of Non-Revenue Water as a Water Demand Management Tool
53
A B C D E
Leakage on
service
connections
Table 4.2 The Water Balance standard format (IWA, 2003)
i. Entered System Input Volume Column A.
ii. Entered Billed Metered Consumption and Billed Unmetered Consumption in
Column D and enter total in Billed Authorised Consumption (Column C) and
Revenue Water (Column E)
iii. Calculated the volume of Non-Revenue Water (Column E) as System Input
Volume (Column A) minus Revenue Water (Column E)
iv. Determined Unbilled Metered Consumption and Unbilled Unmetered
Consumption in Column D then transfer total to Unbilled Authorised
Consumption in Column C
v. Added volumes of Billed Authorised Consumption and Unbilled Authorised
Consumption in Column C; enter sum as Authorised Consumption (top of
Column B)
vi. Calculated Water Losses(Column B) as the difference between System Input
Volume (Column A) and Authorised Consumption (Column B)
vii. Assessed components of Unauthorised Consumption and Metering
Inaccuracies (Column D) by best means available, add these and enter sum in
Apparent Losses(Column C)
viii. Calculated Real Losses(Column C) as Water Losses (Column B) minus
Apparent Losses(Column C)
ix. Assessed components of real losses (Column D) by best means available
(night flow analysis, burst frequency/flow rate/duration calculations, modelling),
add these and cross-check with volume of Real Losses in Column. C which
was derived from Step 8.
Reduction of Non-Revenue Water as a Water Demand Management Tool
54
4.9. CALCULATION OF REAL LOSSES
The hydraulic equation for flow rate (L) through a hole of area A subject to pressure P
is;
L = Cd x A x (2gP) 0.5
Cd is a discharge coefficient and g is acceleration due to gravity. The effective area
(Cd x A) can be pressure-dependent for some types of individual leakage path. This
relationship uses the FAVAD (Fixed and Variable Area Discharge) concept and N1
exponent.
4.9.1. Leak Simulation
The method of real-time leak simulation utilised herein is based on the solution of
unsteady pipe flow by the Method of Characteristics (MOC) (Hayase et.al, 1995). The
general leak forms are:
1. Circumferential crack.
2. Loose weldment crack between two pipes.
3. Multiple small cracks
4. Longitudinal long crack
5. Loose union.
Leak is simulated by considering a flow diversion at the desired leak location as shown
in Figure 4.4. However, the leak must be considered at a computational section (NL).
Thus, the continuity equation at the leak location takes the following form:
QP1 − QP2 − qL = 0
Where Qp1 is the discharge just upstream of the leak location;
Qp2 is the discharge just downstream of the leak location and
qL is the leak flow rate.
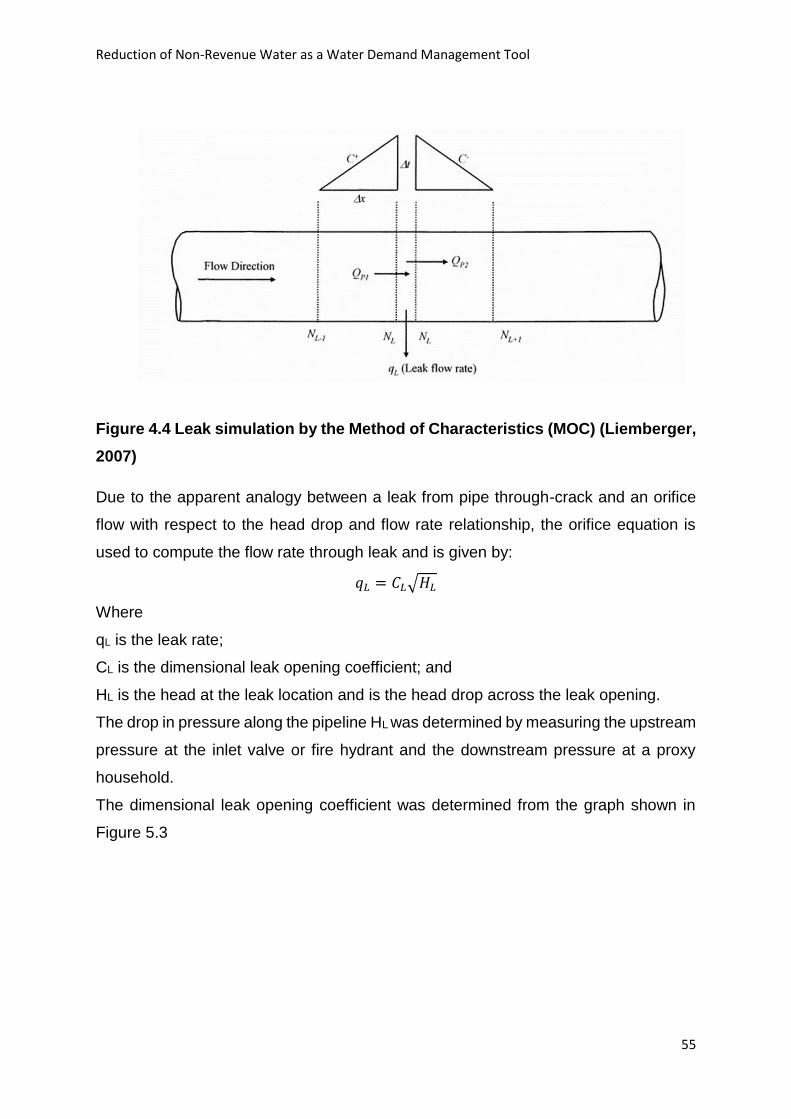
Reduction of Non-Revenue Water as a Water Demand Management Tool
55
Figure 4.4 Leak simulation by the Method of Characteristics (MOC) (Liemberger,
2007)
Due to the apparent analogy between a leak from pipe through-crack and an orifice
flow with respect to the head drop and flow rate relationship, the orifice equation is
used to compute the flow rate through leak and is given by:
𝑞𝐿 = 𝐶𝐿√𝐻𝐿
Where
qL is the leak rate;
CL is the dimensional leak opening coefficient; and
HL is the head at the leak location and is the head drop across the leak opening.
The drop in pressure along the pipeline HL was determined by measuring the upstream
pressure at the inlet valve or fire hydrant and the downstream pressure at a proxy
household.
The dimensional leak opening coefficient was determined from the graph shown in
Figure 5.3
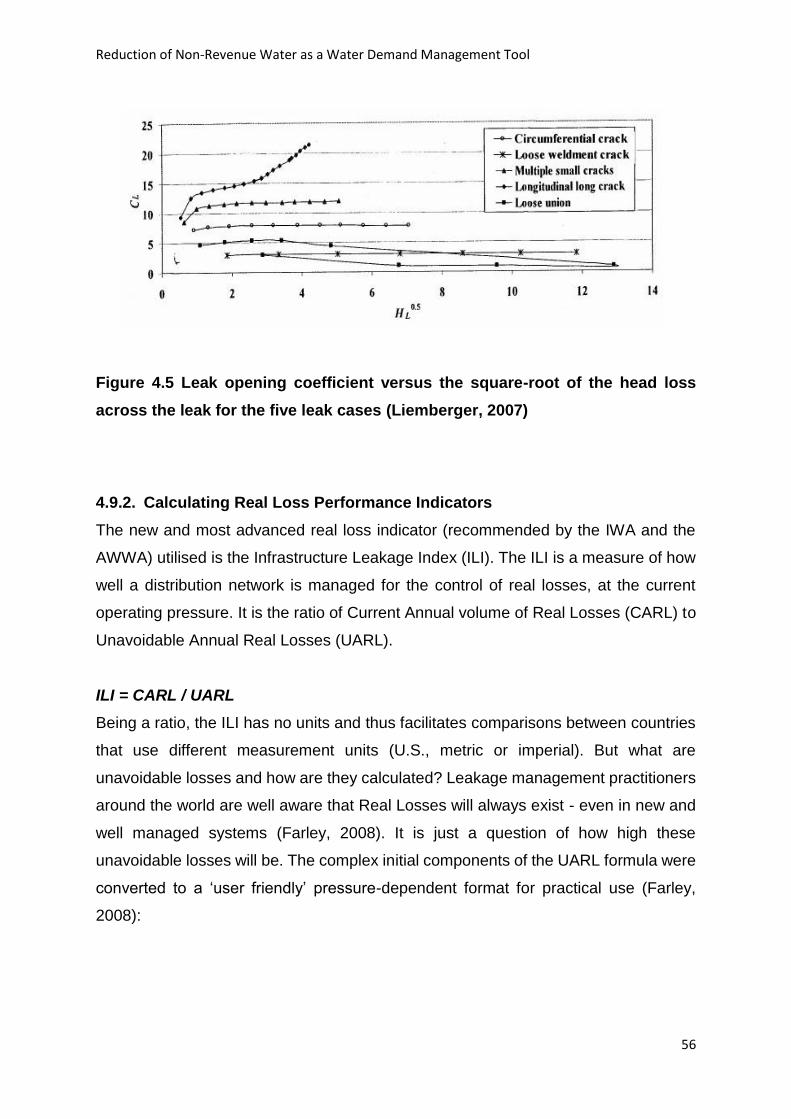
Reduction of Non-Revenue Water as a Water Demand Management Tool
56
Figure 4.5 Leak opening coefficient versus the square-root of the head loss
across the leak for the five leak cases (Liemberger, 2007)
4.9.2. Calculating Real Loss Performance Indicators
The new and most advanced real loss indicator (recommended by the IWA and the
AWWA) utilised is the Infrastructure Leakage Index (ILI). The ILI is a measure of how
well a distribution network is managed for the control of real losses, at the current
operating pressure. It is the ratio of Current Annual volume of Real Losses (CARL) to
Unavoidable Annual Real Losses (UARL).
ILI = CARL / UARL
Being a ratio, the ILI has no units and thus facilitates comparisons between countries
that use different measurement units (U.S., metric or imperial). But what are
unavoidable losses and how are they calculated? Leakage management practitioners
around the world are well aware that Real Losses will always exist - even in new and
well managed systems (Farley, 2008). It is just a question of how high these
unavoidable losses will be. The complex initial components of the UARL formula were
converted to a ‘user friendly’ pressure-dependent format for practical use (Farley,
2008):
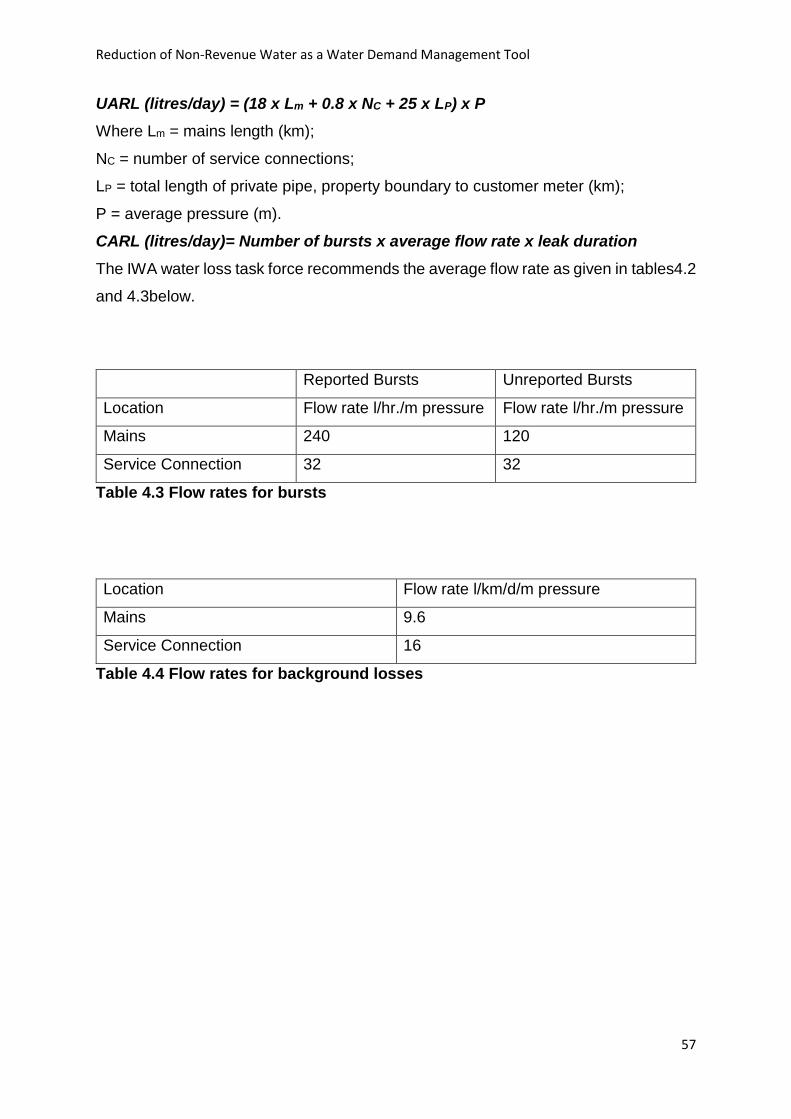
Reduction of Non-Revenue Water as a Water Demand Management Tool
57
UARL (litres/day) = (18 x Lm + 0.8 x NC + 25 x LP) x P
Where Lm = mains length (km);
NC = number of service connections;
LP = total length of private pipe, property boundary to customer meter (km);
P = average pressure (m).
CARL (litres/day)= Number of bursts x average flow rate x leak duration
The IWA water loss task force recommends the average flow rate as given in tables4.2
and 4.3below.
Reported Bursts Unreported Bursts
Location Flow rate l/hr./m pressure Flow rate l/hr./m pressure
Mains 240 120
Service Connection 32 32
Table 4.3 Flow rates for bursts
Location Flow rate l/km/d/m pressure
Mains 9.6
Service Connection 16
Table 4.4 Flow rates for background losses
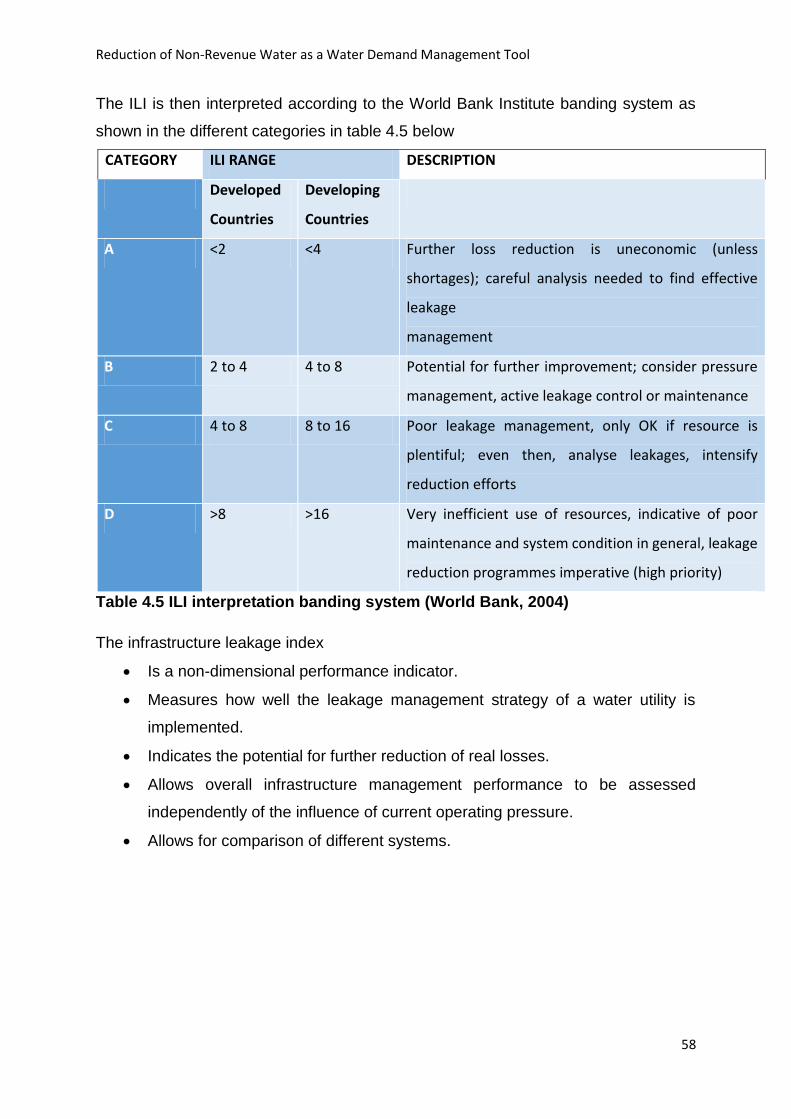
Reduction of Non-Revenue Water as a Water Demand Management Tool
58
The ILI is then interpreted according to the World Bank Institute banding system as
shown in the different categories in table 4.5 below
CATEGORY ILI RANGE DESCRIPTION
Developed
Countries
Developing
Countries
A <2 <4 Further loss reduction is uneconomic (unless
shortages); careful analysis needed to find effective
leakage
management
B 2 to 4 4 to 8 Potential for further improvement; consider pressure
management, active leakage control or maintenance
C 4 to 8 8 to 16 Poor leakage management, only OK if resource is
plentiful; even then, analyse leakages, intensify
reduction efforts
D >8 >16 Very inefficient use of resources, indicative of poor
maintenance and system condition in general, leakage
reduction programmes imperative (high priority)
Table 4.5 ILI interpretation banding system (World Bank, 2004)
The infrastructure leakage index
Is a non-dimensional performance indicator.
Measures how well the leakage management strategy of a water utility is
implemented.
Indicates the potential for further reduction of real losses.
Allows overall infrastructure management performance to be assessed
independently of the influence of current operating pressure.
Allows for comparison of different systems.
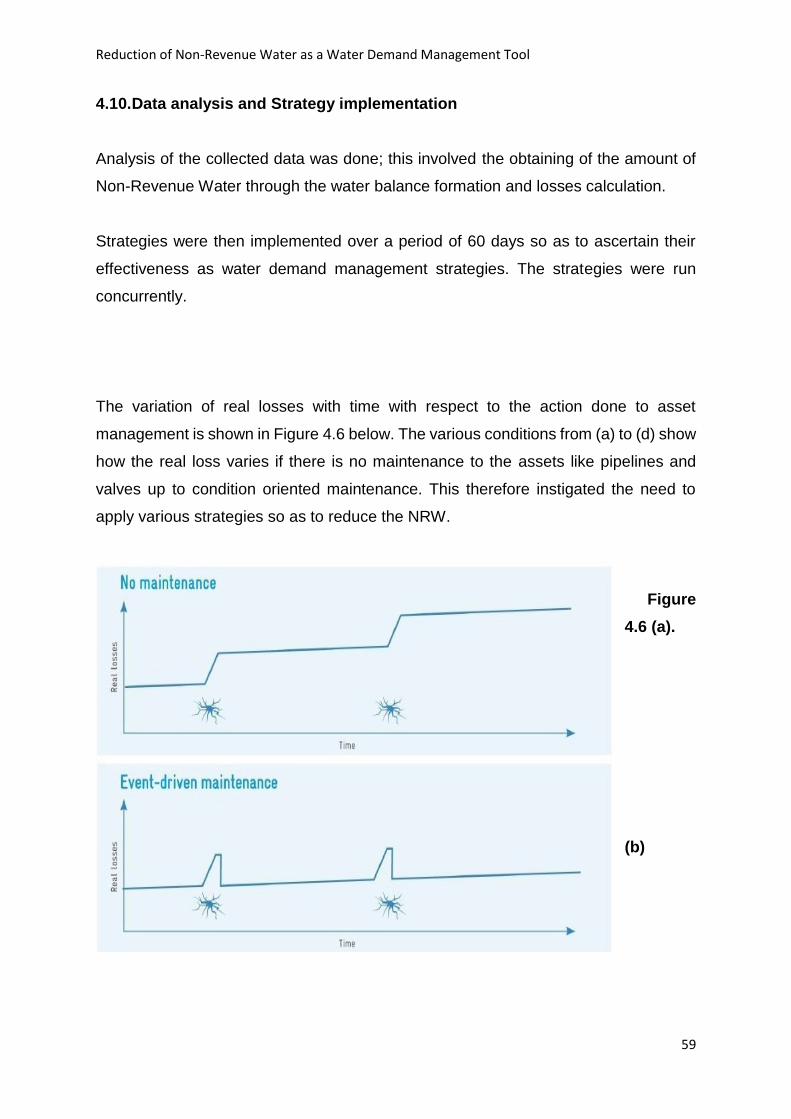
Reduction of Non-Revenue Water as a Water Demand Management Tool
59
4.10. Data analysis and Strategy implementation
Analysis of the collected data was done; this involved the obtaining of the amount of
Non-Revenue Water through the water balance formation and losses calculation.
Strategies were then implemented over a period of 60 days so as to ascertain their
effectiveness as water demand management strategies. The strategies were run
concurrently.
The variation of real losses with time with respect to the action done to asset
management is shown in Figure 4.6 below. The various conditions from (a) to (d) show
how the real loss varies if there is no maintenance to the assets like pipelines and
valves up to condition oriented maintenance. This therefore instigated the need to
apply various strategies so as to reduce the NRW.
Figure
4.6 (a).
(b)
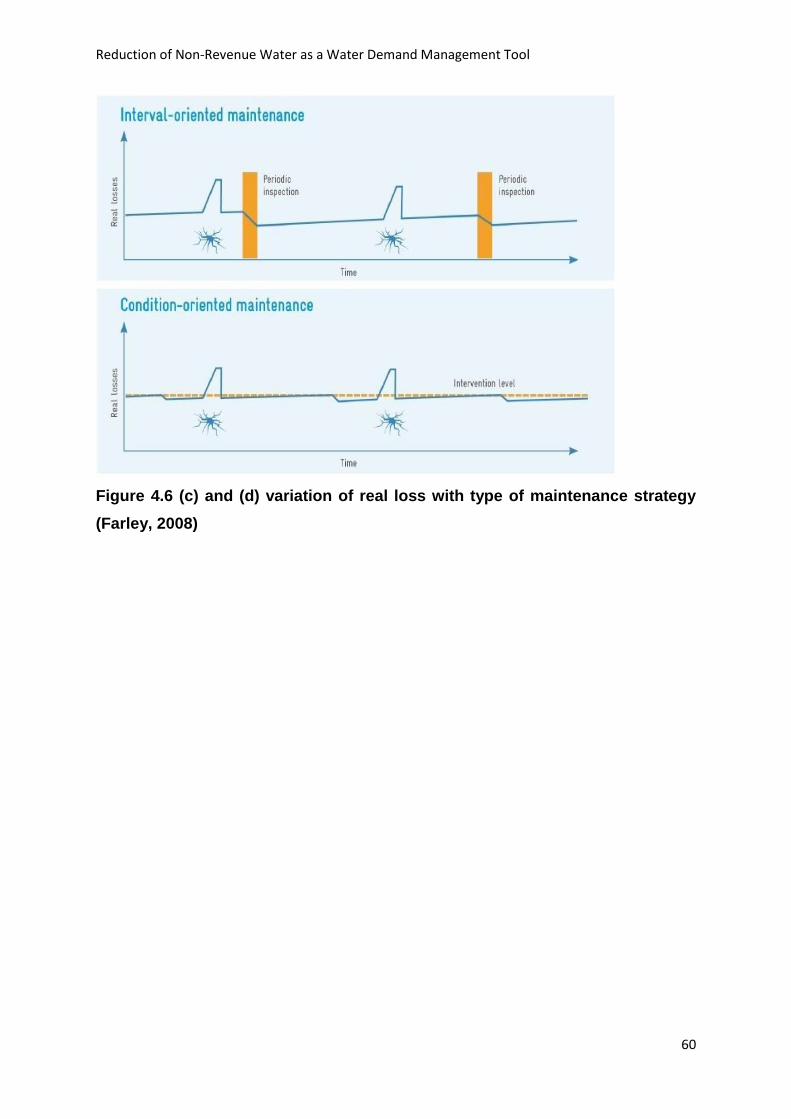
Reduction of Non-Revenue Water as a Water Demand Management Tool
60
Figure 4.6 (c) and (d) variation of real loss with type of maintenance strategy
(Farley, 2008)
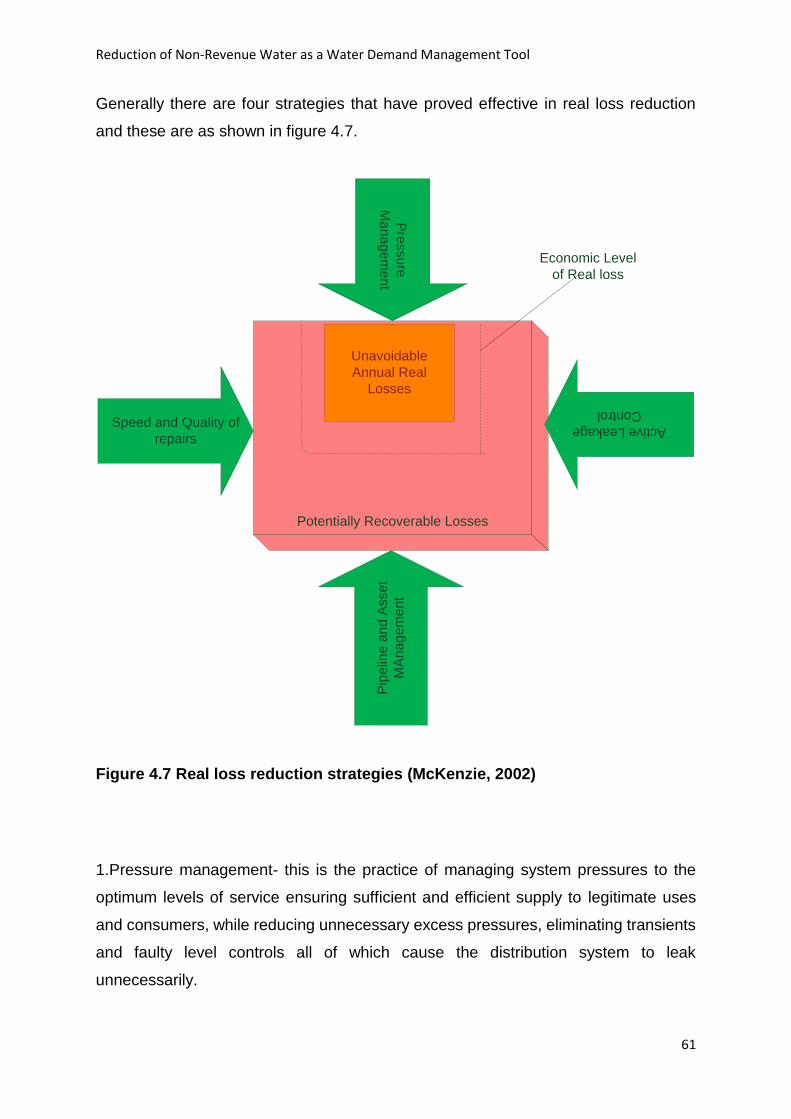
Reduction of Non-Revenue Water as a Water Demand Management Tool
61
Generally there are four strategies that have proved effective in real loss reduction
and these are as shown in figure 4.7.
Unavoidable
Annual Real
Losses
Potentially Recoverable Losses
Speed and Quality of
repairs
Pip
elin
e a
nd
Asse
t
MA
na
ge
me
nt
Pre
ssu
re
Ma
na
ge
me
nt
Active Leakage
Control
Economic Level
of Real loss
Figure 4.7 Real loss reduction strategies (McKenzie, 2002)
1.Pressure management- this is the practice of managing system pressures to the
optimum levels of service ensuring sufficient and efficient supply to legitimate uses
and consumers, while reducing unnecessary excess pressures, eliminating transients
and faulty level controls all of which cause the distribution system to leak
unnecessarily.

Reduction of Non-Revenue Water as a Water Demand Management Tool
62
A compromise however has to be reached so that there may be sufficient pressure to
the furthest and highest point consumer and not much pressure to increase the force
on the pipes which results in bursts.
3. Active leakage control, speed and quality of leak repairs- this articulates the
need for increase in awareness, location and repair time for the leaks. The
passive method relies on reported leaks and this may take longer.
3. Pipeline and Asset management-this involve the selection and installation of the
correct material in a correct manner. The maintenance of the assets is also vital as the
constant monitoring that leads to the decision of whether to replace the assets or repair
the existing ones.
The only strategies that were used are:
1. Step testing, where the District Metered Area (DMA) was sub-divided
into smaller areas by systematic closing of valves usually during the
minimum night flow. The flow data was analysed to see the variation of
consumption with pressure and areas suspected to have leakage are
identified to be followed up by leak location (IWA 2003). Step tests have
the following advantages (Farley and 2003):
Results are immediate; and
Leak location can be done immediately.
2. Active leak detection
3. Apparent loss reduction by
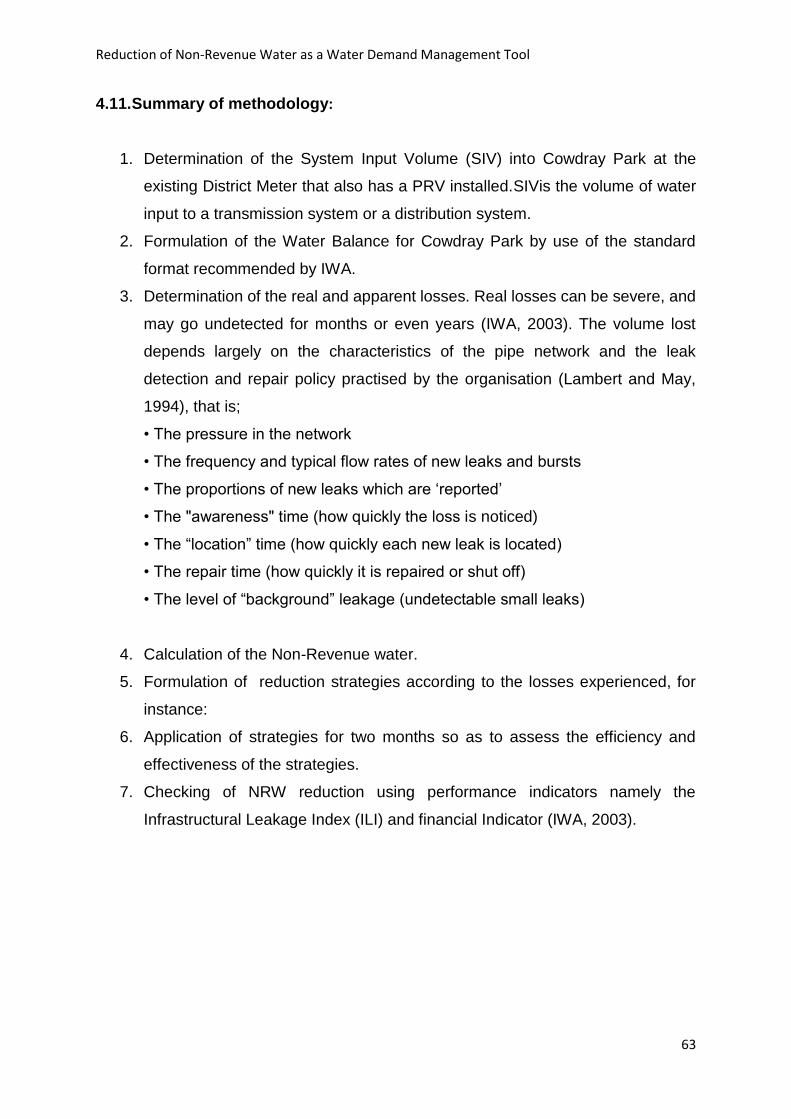
Reduction of Non-Revenue Water as a Water Demand Management Tool
63
4.11. Summary of methodology:
1. Determination of the System Input Volume (SIV) into Cowdray Park at the
existing District Meter that also has a PRV installed.SIVis the volume of water
input to a transmission system or a distribution system.
2. Formulation of the Water Balance for Cowdray Park by use of the standard
format recommended by IWA.
3. Determination of the real and apparent losses. Real losses can be severe, and
may go undetected for months or even years (IWA, 2003). The volume lost
depends largely on the characteristics of the pipe network and the leak
detection and repair policy practised by the organisation (Lambert and May,
1994), that is;
• The pressure in the network
• The frequency and typical flow rates of new leaks and bursts
• The proportions of new leaks which are ‘reported’
• The "awareness" time (how quickly the loss is noticed)
• The “location” time (how quickly each new leak is located)
• The repair time (how quickly it is repaired or shut off)
• The level of “background” leakage (undetectable small leaks)
4. Calculation of the Non-Revenue water.
5. Formulation of reduction strategies according to the losses experienced, for
instance:
6. Application of strategies for two months so as to assess the efficiency and
effectiveness of the strategies.
7. Checking of NRW reduction using performance indicators namely the
Infrastructural Leakage Index (ILI) and financial Indicator (IWA, 2003).
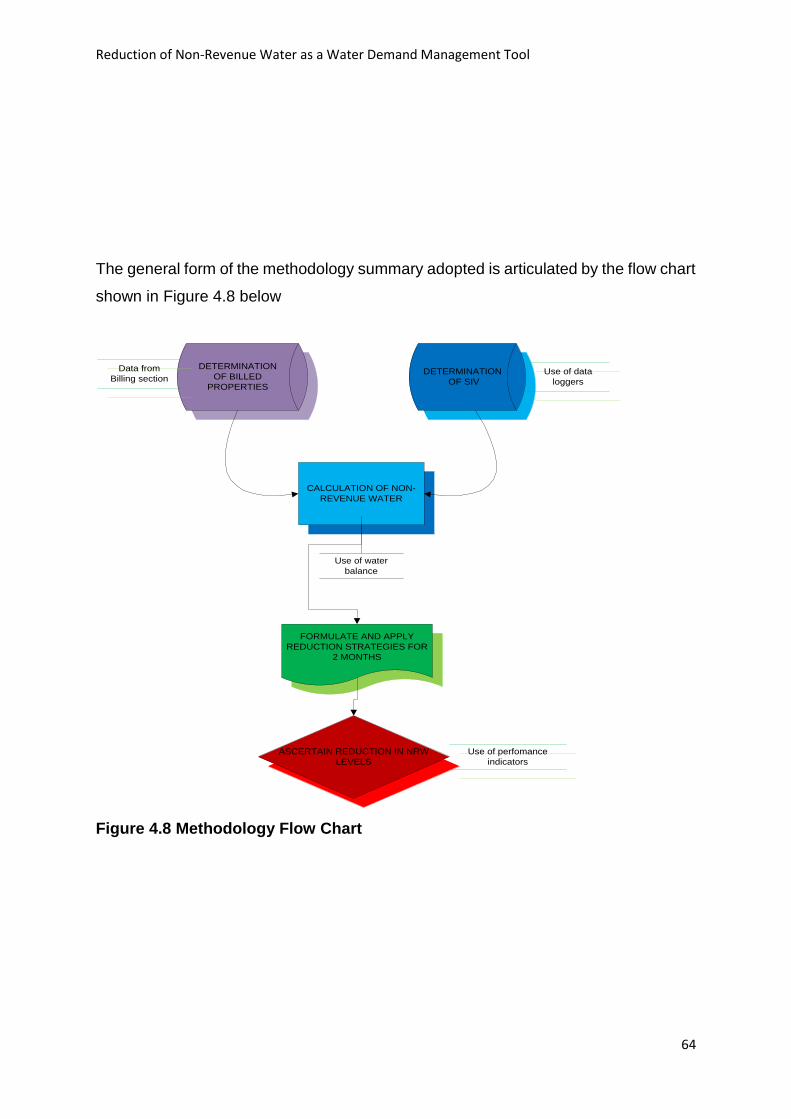
Reduction of Non-Revenue Water as a Water Demand Management Tool
64
The general form of the methodology summary adopted is articulated by the flow chart
shown in Figure 4.8 below
DETERMINATION
OF SIV
DETERMINATION
OF BILLED
PROPERTIES
Use of data
loggers
Data from
Billing section
CALCULATION OF NON-
REVENUE WATER
Use of water
balance
FORMULATE AND APPLY
REDUCTION STRATEGIES FOR
2 MONTHS
ASCERTAIN REDUCTION IN NRW
LEVELS
Use of perfomance
indicators
Figure 4.8 Methodology Flow Chart

Reduction of Non-Revenue Water as a Water Demand Management Tool
65
5. RESULTS AND DISCUSSION
5.1. INTRODUCTION
This chapter serves to achieve the overall objective to this research project. It lays the
analysis for calculating the Non-Revenue water through the water balance and the
various losses involved
The total number of water consumers (subscribers) is 7 553 (Billing data, Appendix
D). Considering an average household size of 4.5 this is equivalent to approximately
34 000 recorded consumers in the City of Bulawayo billing database.
5.2. Data logging
The area was logged and the results downloaded and exported to excel format as in
Annexure C to give the various consumption and pressure patterns. The logging
proved that the consumption is low at night and pressure is consequently high. The
consumption and pressure pattern over the logging period is shown in Figure 5.1, this
depicts that the consumption is low during the period from midnight to about
04.00hours when people wake up. During this period there is a pressure build up in
the pipes as there is no point of exit for the water, pressure increase to a maximum of
65m. This indicates that there is an inverse relationship between pressure and
consumption.
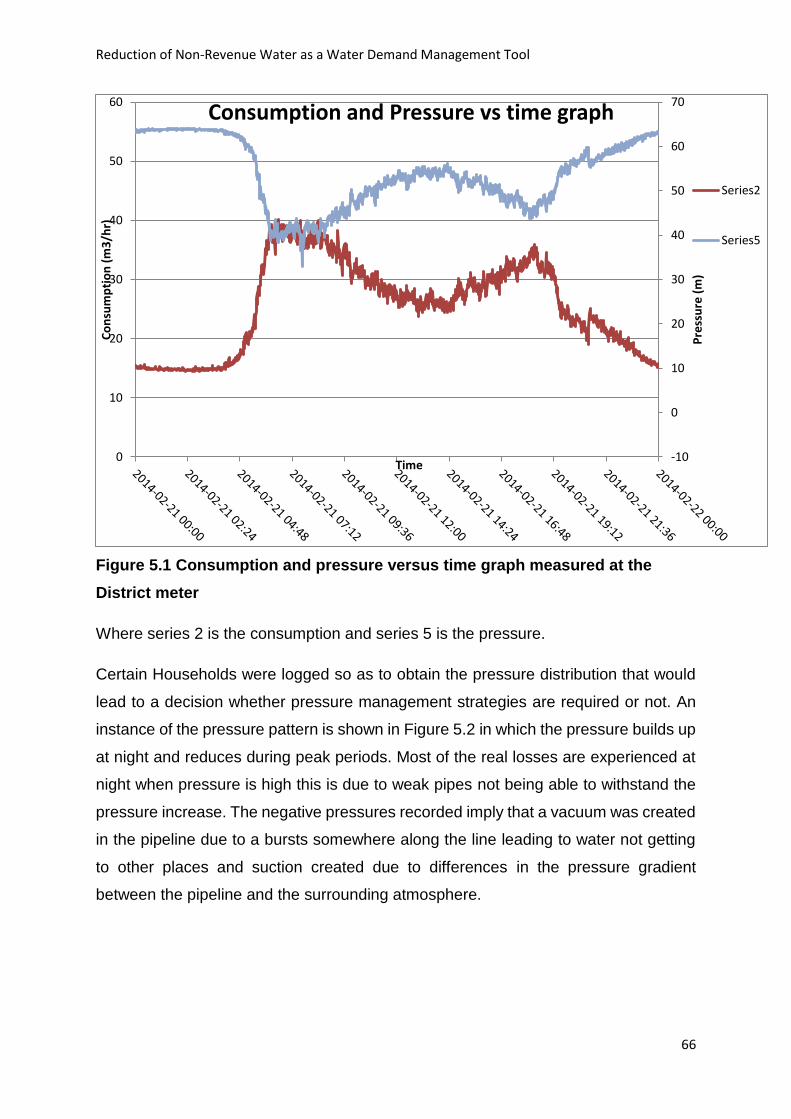
Reduction of Non-Revenue Water as a Water Demand Management Tool
66
Figure 5.1 Consumption and pressure versus time graph measured at the
District meter
Where series 2 is the consumption and series 5 is the pressure.
Certain Households were logged so as to obtain the pressure distribution that would
lead to a decision whether pressure management strategies are required or not. An
instance of the pressure pattern is shown in Figure 5.2 in which the pressure builds up
at night and reduces during peak periods. Most of the real losses are experienced at
night when pressure is high this is due to weak pipes not being able to withstand the
pressure increase. The negative pressures recorded imply that a vacuum was created
in the pipeline due to a bursts somewhere along the line leading to water not getting
to other places and suction created due to differences in the pressure gradient
between the pipeline and the surrounding atmosphere.
-10
0
10
20
30
40
50
60
70
0
10
20
30
40
50
60
Pre
ssu
re (
m)
Co
nsu
mp
tio
n (
m3
/hr)
Time
Consumption and Pressure vs time graph
Series2
Series5
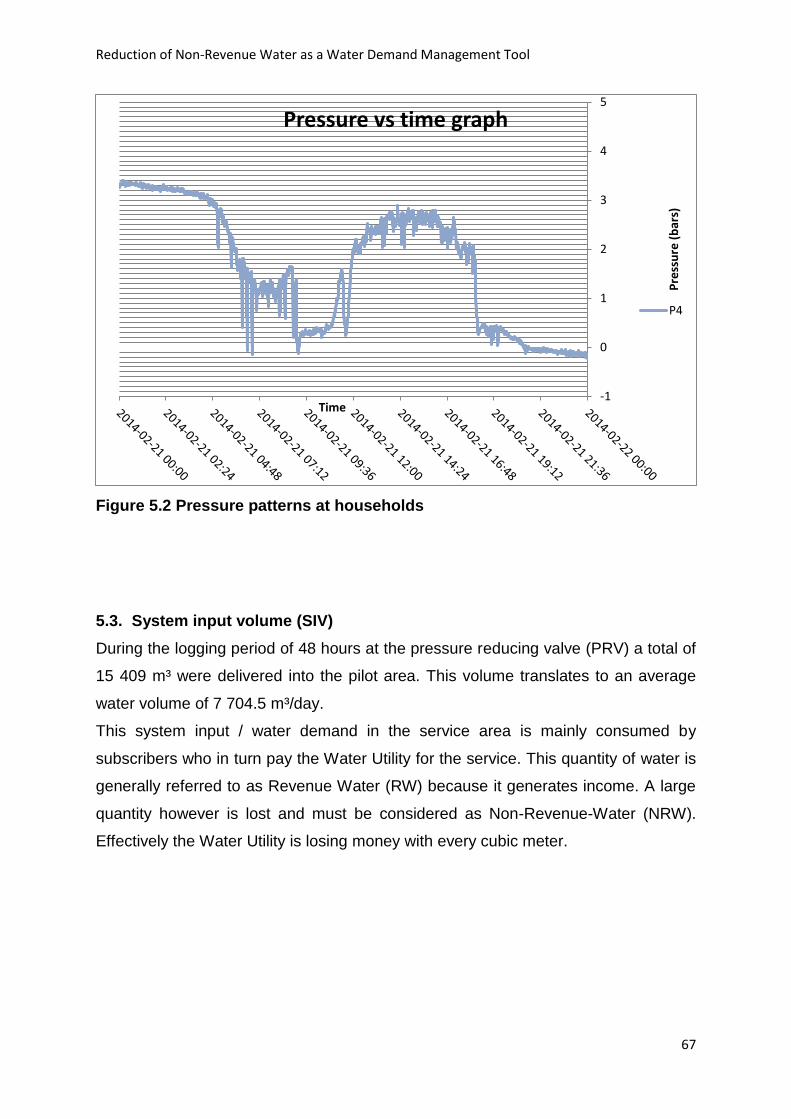
Reduction of Non-Revenue Water as a Water Demand Management Tool
67
Figure 5.2 Pressure patterns at households
5.3. System input volume (SIV)
During the logging period of 48 hours at the pressure reducing valve (PRV) a total of
15 409 m³ were delivered into the pilot area. This volume translates to an average
water volume of 7 704.5 m³/day.
This system input / water demand in the service area is mainly consumed by
subscribers who in turn pay the Water Utility for the service. This quantity of water is
generally referred to as Revenue Water (RW) because it generates income. A large
quantity however is lost and must be considered as Non-Revenue-Water (NRW).
Effectively the Water Utility is losing money with every cubic meter.
-1
0
1
2
3
4
5
Pre
ssu
re (
bar
s)
Time
Pressure vs time graph
P4
Reduction of Non-Revenue Water as a Water Demand Management Tool
68
5.4. Apparent losses
Two undesired types of water consumption are generally described as apparent
losses:
(a) Unauthorized Consumption (or illegal connections) which would be for example a
consumer that benefits from his subscribed neighbour. The customer survey
conducted recently revealed that approximately 10% of the dwellings are not
registered subscribers. Assuming that illegal water users consume the same
amount of water as subscribed customers, results in a daily water loss of
770.45m³/day.
(b) Metering inaccuracies exist with every kind of water meter. Under-reading
volumes (when low flow is not captured) and actual inaccuracies (when the
meter is old and worn) are the main components. Since the water meters in
Cowdray Park are comparatively new a value of 5% of the metered
consumption was reasonably considered, which corresponds with
385.23m³/day.
The bulk water meter was reading uncharacteristic flows or not recording at all
in some instances. The water meter was recently installed by the City of
Bulawayo but intermittent water supplies does lead to meter reading errors.
Success in reduction of non-revenue water can be measured and monitored
with proper flow measurement from both bulk water supply and billing.
5.5. Real losses
Total consumption during the logging period was 7 704.5 m3/d. The minimum night
flow, was recorded at 4.2 ℓ/s (which is 15m3/hr. read of from the graph). Adjusted for
legal night consumption which assumes that 6% of the population is active at night
and utilises 100l/day (Farley, 2008) the leakage in the area at night is 4.2 ℓ/s – 2.4 ℓ/s
= 1.8 ℓ/s.
The net night flow can be converted into a daily leakage of 155.52m3/day.
From the door to door survey, it was found that the average waste at the private
premises to be 8.0 ℓ/day.connection, thus losses in the distribution system was
calculated to be 66.9m3/day for Cowdray Park.

Reduction of Non-Revenue Water as a Water Demand Management Tool
69
The volume of leakage can otherwise be obtained from the Equation 5.1;
Volume of leakage (litres/day) = Number of bursts x average flow rate x leak duration
…Equation 5.1
Number of bursts and leak duration were found from the BCC records as 3 per day
and 3 days respectively, with an average pressure of 45m. The average flow rate is
obtained from the orifice equation or the International Water Association flow rate
recommended tables (IWA, 2003)
Therefore:
Volume of leakage (litres/day) = 3/day x 240 ℓ/hr.m pressure x 72 hrs.
= 2 332800ℓ/day = 2 332.8m3/day
Field measured pressure revealed that the installed PRVs are not regulating the
pressures as expected. It is noted that if the PRVs are not working properly, this may
subject the network to pressure spikes leading to pipe bursts
5.5. House meters
Some house meters in the pilot and control areas were randomly tested using a
portable test meter. Results from these tests are summarised in Table 5.1.
Parameter Value
Number of meters 7553
Tested meters 380
Faulty meters * 74
Discrepancy incl. faulty meters -5.1 %
Discrepancy exc. faulty meters -0.3 %
Average age (year) 7
Table 5.1 Test house meters
* House meter yields 25 % to 100 % lower or higher value than the test meter

Reduction of Non-Revenue Water as a Water Demand Management Tool
70
It was estimated that 30 % of all connections do not have a meter, which corresponds
to Councils own records. All connections with missing or stopped meters are billed
based on an estimated average consumption, hence the consumption figures from the
billing system should be a reasonable estimate of the actual total consumption.
It can be concluded that house meters generally are in good condition with an under-
reading of approximately –1.0 % based on the different monthly readings from
Bulawayo City Council. Faulty meters amounts to approximately 19.5 % of all meters.

Reduction of Non-Revenue Water as a Water Demand Management Tool
71
5.6. Water Balance
The water balance for the Cowdray Park area was determined utilising the value
recorded on the field and those calculated. The SIV was measured on the field, the
real and apparent losses were obtained by a combination field measurements,
documented data from City of Bulawayo and calculations. Figure 5.2 summarises the
water balance and its various components.
System Input
Volume
7 704.5m3/day
Authorized
Consumption
4216.02m3/day
Billed Authorized
Consumption
3 842.73m3/day
Billed Metered
Consumption
3 842.73m3/day
Revenue
Water
3 842.73m3/day
Billed Unmetered
Consumption
0m³/day
Unbilled
Authorised
Consumption
373.29m³/day
Unbilled Metered
Consumption
373.29m³/day
Non-Revenue
Water(NRW)
3 861.77m3/day
Unbilled Unmetered
Consumption
0m³/day
Water Losses
3488.48m3/day
Apparent Losses
1155.68m³/day
Unauthorised
Consumption
770.45m³/day
Customer Metering
Inaccuracies
385.23m³/day
Real Losses
2 332.8m3/day
Leakage on
Transmission and/or
Distribution Mains
2 332.8m3/day
Leakage and overflows
on storage
facilities
Leakage on service
connections
Table 5.2 Cowdray Park water balance in standard IWA format (IWA, 2003)
Reduction of Non-Revenue Water as a Water Demand Management Tool
72
5.7. Strategies Implemented
Visual pipeline survey detected 90 % of the leaks, but sounding proved to be
an effective method of detecting underground leaks. It was noted during the
field investigations, that some of the valve chambers were full of water from
leaking valves and some of the fire hydrants were found leaking.
Cutting off illegal connections realised 70% of the revenue with not much
change in water quantity as the consumers would formalise their connections
in not more than 2 weeks.
5.8. Infrastructural leakage index (ILI)
ILI = CARL / UARL
UARL (litres/day) = (18 x Lm + 0.8 x NC + 25 x LP) x P
Where Lm = mains length (km) = 38.5km
NC = number of service connections = 8 566
LP = total length of private pipe, property boundary to customer meter (km) = 109.3km
P = average pressure (m) = 45m
UARL (litres/day) = (18 x 38.5+ 0.8 x 8566 + 25 x 109.3) x 45
= 462 523.5 l/day = 462.5m3/day
CARL (litres/day) = Number of bursts x average flow rate x leak duration
Volume of leakage (litres/day) = 3/day x 240 l/hr.m pressure x 72 hrs.
= 2 332 800 l/day = 2 332.8m3/day

Reduction of Non-Revenue Water as a Water Demand Management Tool
73
ILI = 𝟐 𝟑𝟑𝟐. 𝟖𝟒𝟔𝟐. 𝟓⁄ = 𝟓. 𝟎𝟒
The ILI value of 5.04 hence according to the ILI interpretation banding system (Table
5.3) there exists potential for further improvement of loss reduction, pressure
management systems should be considered and adopt active leakage control or
maintenance.
There always exists the potential to further reduce the NRW value and this would allow
the Water Utility of Bulawayo saving considerable costs (including energy required for
pumping and chlorine for disinfection). Therefore NRW should be reduced to the
greatest possible extend and values of 10% to 15% may be considered as a maximum
if water is abundant and cheap. Levels below 10% should be envisaged if water
requires a lot of pumping and treatment. However, a better understanding of the
composition of NRW in the service area is required in order to define measures for
reducing NRW.
The Key differences before and after implementing various strategies are summarised
in table 6.2
Parameter Before strategy After Strategy Reduction
S.I.V 7 704.5m3/day 7 704.5m3/day nil
Number of bursts 3/day 3/day nil
Leak duration 72 hrs. 48hrs. 33%
Real Losses 2 332.8m3/day 1 555.2m3/day 33%
Apparent Losses 1528.97m3/day 1443.88m3/day 5%
NRW 3 861.77 m³/day 2 999.08 m³/day 10%
ILI 5.04 1.68 67%
Table 5.4 Difference before and after implementation of strategies.

Reduction of Non-Revenue Water as a Water Demand Management Tool
74
Reduction of Non-Revenue Water as a Water Demand Management Tool
75
6. CONCLUSIONS AND RECOMMENDATIONS
6.1. Introduction
From the analysis and results in chapter five Non-Revenue Water reduction can be
used as water demand management tool this is evident by the amount of water and
revenue saved through implementing just a few strategies, this goes on to represent
that if all strategies are applied and resources directed to Non-Revenue water
reduction then the City can save water and realise revenue. With regards to the
objectives the conclusions are:
6. To quantify the system input volume (SIV) – the SIV was obtained by use of
data logging at the Bulk Meter and was found to be 7 704.5m3/day
7. To quantify the amount of Non-Revenue Water (NRW) – billing data base was
obtained from the billing section and about 7 553 properties were billed to give
the revenue water, the remainder is the Non-Revenue water. Amount was
obtained to be 3 861.77 m³/day and 2 999.08 m³/day before and after
implementation of strategies respectively.
8. To construct a water balance for the Cowdray Park Network- a standard IWA
water balance was constructed using Aqualite, with inputs measured and
some calculated.
9. To quantify amount of real and apparent losses in the network- calculation
were done after field measurements to determine losses and these were
inputs into the water balance
10. To establish location of highest losses in the system – Minimum night flow
analysis and visual leak inspection in conjunction with step testing revealed
the weak points were bursts were frequent and at high rates.
11. To formulate maintenance strategies or plans of the existing network- relevant
strategies were formulated and applied over two months to tests their
efficiency and effectiveness.
Reduction of Non-Revenue Water as a Water Demand Management Tool
76
6.2. Non-revenue water
The most important result for the service area of Cowdray Park is the Non-
Revenue-Water (NRW). In order to obtain the volume of NRW the following
formula was adopted:
Non-Revenue Water (NRW) = System Input – Revenue Water
Considering that the Water Demand (System Input) is 7 704.5 m³/day and that
only 3 842.73 m³/day are consumed (and paid) by subscribers (Revenue Water)
the balance of 3861.77 m³/day is Non-Revenue Water. Based on this, about 50%
of the System Input water was initially lost as Non-Revenue Water in Cowdray
Park this amount was then reduced to 2 999.08m³/day after implementing the
strategies for a period of two months, which is about 40% of the SIV. This is after
using the same calculations as before implementation, by use of the re-measured
data and City of Bulawayo data in Annexure A.
6.3. Projections of losses
The results clearly identified losses on the distribution system as the main
contributor of Non-revenue Water as it contributes 2 332.8m3/day (66.9%). The
losses were found using the minimum night flow (MNF) method and real loss
calculation using volume of leakage (equation 5.1), after allowing for installation
losses at the private premises as these losses/waste are billed through the billing
system and accepted as background leakage (dripping taps etc.).
6.4. Findings
This study of Cowdray Park area, concluded that:.
Losses take place in the distribution system (Leaking valves, hydrants and burst
mains).
In general it seems feasible to reduce losses down to 100 ℓ/h (2.4m3/day). with
introduction of active leakage control.
Reduction of Non-Revenue Water as a Water Demand Management Tool
77
Leak detection: Visual inspection detected most leaks and step-testing proved to
be difficult as most of the valves were buried and had not been regularly
serviced.
Pressure was not stable during the period of measurements, and caused
frequent burst pipes and other leaking spots as valves and hydrants. The
unstable pressure was due to PRV’s not working properly and to incorrect
closure and opening of valves. As an overall finding this emphasis the need of
better pressure control and improved maintenance and operation of valves.
Due to the responsible attitude to water rationing adopted by most residents,
waste is not considered to be a major problem. The household survey
confirmed this to be the case with losses at the household level estimated to be
8.0 ℓ/h (0.19m3/day) and connection.
Utility maps were not up-dated, and reduced the effectiveness of visual
inspection. The exercise showed the need for up-dated maps, to be able to find
leaks for both visual inspection and sounding.
House meters were generally in good condition and those in operation were
under-reading by 1.0 %. However, the study showed that approximate 8 % of
existing meter should be replaced as they are malfunctioning or inaccurate.
These connections were billed uniformly according to average consumption in
the actual area.
6.5. RECOMMENDATIONS
6.5.1. Asset Management
Significant gains in the non-revenue water reduction can be achieved at Cowdray Park
by focusing on asset management. All assets require management of some kind to
ensure optimal performance. Asset management is a key strategy in reducing non-
revenue water as the scope covers the entire water supply cycle from abstraction right
through to water billing and collections.
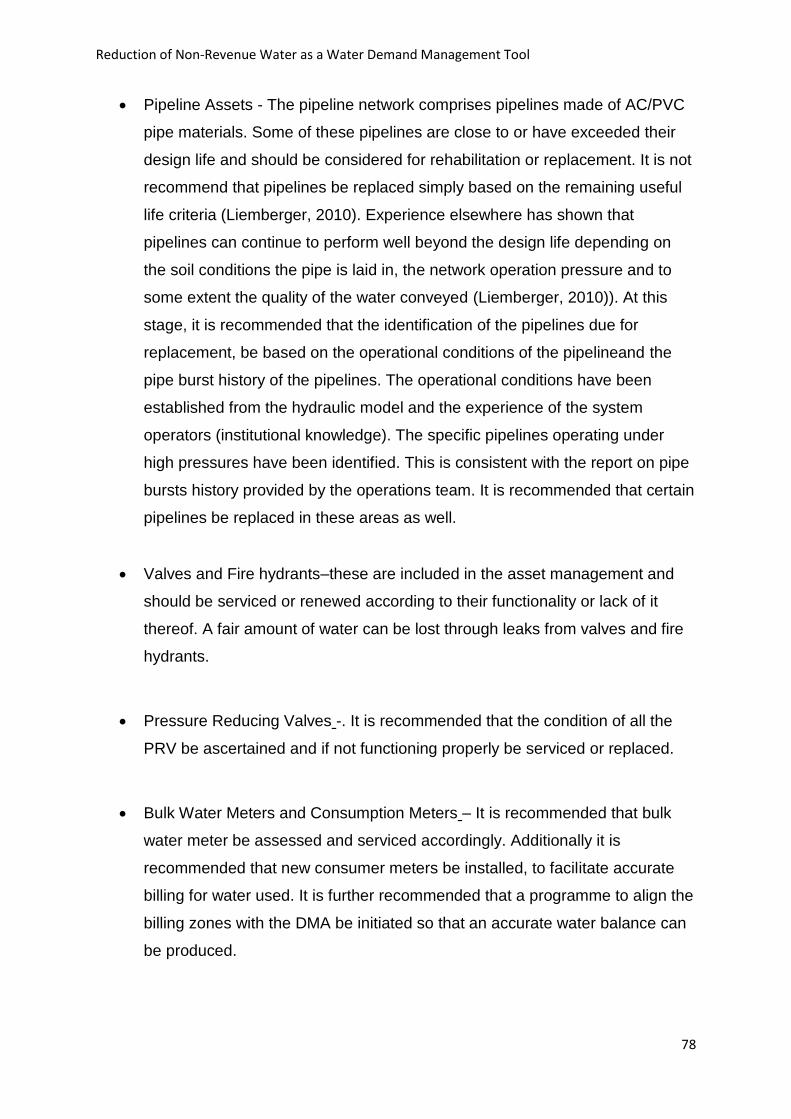
Reduction of Non-Revenue Water as a Water Demand Management Tool
78
Pipeline Assets - The pipeline network comprises pipelines made of AC/PVC
pipe materials. Some of these pipelines are close to or have exceeded their
design life and should be considered for rehabilitation or replacement. It is not
recommend that pipelines be replaced simply based on the remaining useful
life criteria (Liemberger, 2010). Experience elsewhere has shown that
pipelines can continue to perform well beyond the design life depending on
the soil conditions the pipe is laid in, the network operation pressure and to
some extent the quality of the water conveyed (Liemberger, 2010)). At this
stage, it is recommended that the identification of the pipelines due for
replacement, be based on the operational conditions of the pipelineand the
pipe burst history of the pipelines. The operational conditions have been
established from the hydraulic model and the experience of the system
operators (institutional knowledge). The specific pipelines operating under
high pressures have been identified. This is consistent with the report on pipe
bursts history provided by the operations team. It is recommended that certain
pipelines be replaced in these areas as well.
Valves and Fire hydrants–these are included in the asset management and
should be serviced or renewed according to their functionality or lack of it
thereof. A fair amount of water can be lost through leaks from valves and fire
hydrants.
Pressure Reducing Valves -. It is recommended that the condition of all the
PRV be ascertained and if not functioning properly be serviced or replaced.
Bulk Water Meters and Consumption Meters – It is recommended that bulk
water meter be assessed and serviced accordingly. Additionally it is
recommended that new consumer meters be installed, to facilitate accurate
billing for water used. It is further recommended that a programme to align the
billing zones with the DMA be initiated so that an accurate water balance can
be produced.
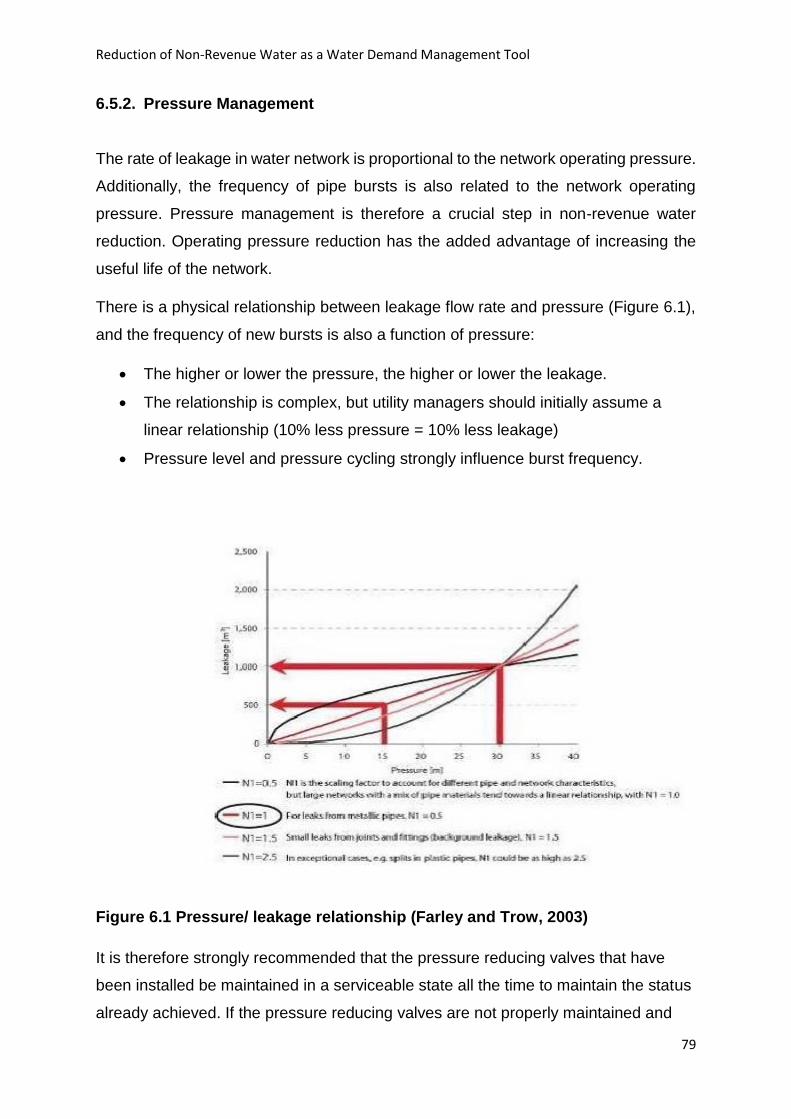
Reduction of Non-Revenue Water as a Water Demand Management Tool
79
6.5.2. Pressure Management
The rate of leakage in water network is proportional to the network operating pressure.
Additionally, the frequency of pipe bursts is also related to the network operating
pressure. Pressure management is therefore a crucial step in non-revenue water
reduction. Operating pressure reduction has the added advantage of increasing the
useful life of the network.
There is a physical relationship between leakage flow rate and pressure (Figure 6.1),
and the frequency of new bursts is also a function of pressure:
The higher or lower the pressure, the higher or lower the leakage.
The relationship is complex, but utility managers should initially assume a
linear relationship (10% less pressure = 10% less leakage)
Pressure level and pressure cycling strongly influence burst frequency.
Figure 6.1 Pressure/ leakage relationship (Farley and Trow, 2003)
It is therefore strongly recommended that the pressure reducing valves that have
been installed be maintained in a serviceable state all the time to maintain the status
already achieved. If the pressure reducing valves are not properly maintained and
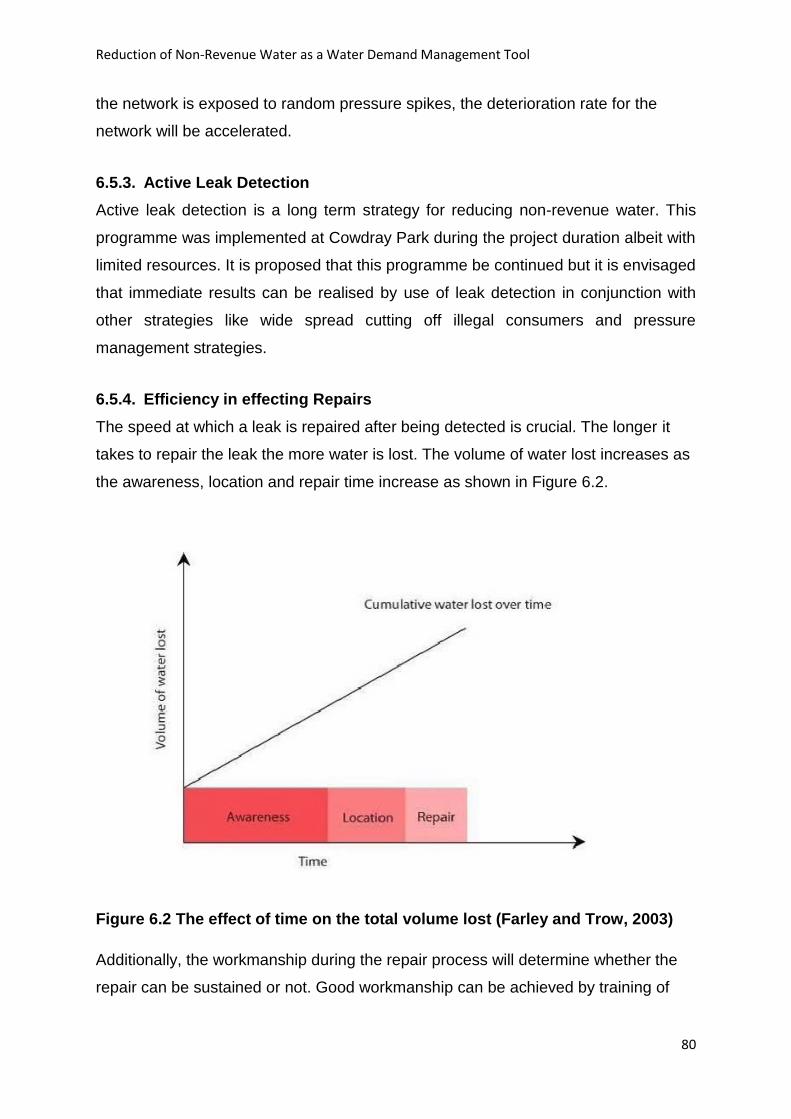
Reduction of Non-Revenue Water as a Water Demand Management Tool
80
the network is exposed to random pressure spikes, the deterioration rate for the
network will be accelerated.
6.5.3. Active Leak Detection
Active leak detection is a long term strategy for reducing non-revenue water. This
programme was implemented at Cowdray Park during the project duration albeit with
limited resources. It is proposed that this programme be continued but it is envisaged
that immediate results can be realised by use of leak detection in conjunction with
other strategies like wide spread cutting off illegal consumers and pressure
management strategies.
6.5.4. Efficiency in effecting Repairs
The speed at which a leak is repaired after being detected is crucial. The longer it
takes to repair the leak the more water is lost. The volume of water lost increases as
the awareness, location and repair time increase as shown in Figure 6.2.
Figure 6.2 The effect of time on the total volume lost (Farley and Trow, 2003)
Additionally, the workmanship during the repair process will determine whether the
repair can be sustained or not. Good workmanship can be achieved by training of

Reduction of Non-Revenue Water as a Water Demand Management Tool
81
the staff operating the network. This considered as a long term objective and may
not result in immediate measurable gains or reduction in non-revenue water.
6.5.5. Capacity building
Successful implementation of the non-revenue water reduction strategies requires a
collective effort from the management and staff from all the departments at the City of
Bulawayo key being the Engineering services and the City Treasurer’s Departments.
Capacity building of Council staff should therefore been targeted at all these levels in
the form of training workshops, on the job training to operations staff and network
hydraulic modelling development.
Resources should also be directed towards monitoring and maintenance of the assets
such as pipeline, valves and meters. This will work towards promoting the Virtuous
cycle. Procurement of new and efficient meters is necessary together with data loggers
to frequently monitor flow and pressure patterns in the system.
6.5.6. Significance of the study
The reduction of Non-Revenue Water in this study has proved that Non-Revenue
water reduction can be applied as a water demand management tool. The universal
slogan of survey states “working from the known to the unknown” and in this instance
the NRW levels were obtained and application of recommended strategies will assist
the water utility to focus on water conservation and realization of revenue at grass
roots.
The 3 861.77 m³/day Non Revenue water translates to a minimum of $3 861.77 lost
per day by the water utility and realisation of this revenue by adopting reduction of
NRW can assist in mobilisation of resources by transforming the Vicious NRW cycle
to the Virtuous cycle.
Reduction of Non-Revenue Water as a Water Demand Management Tool
82
REFERENCES
Alegre, H., et al. (2006). Performance Indicators for Water Supply Services. IWA
Manual of Best Practice. 2nd Edition. IWA Publishing.
American Water Works Association (AWWA) Water Loss Control Committee. (2003).
Applying Worldwide Best Management Practices in Water Loss Control. AWWA.
.
Baumann, D.D., Boland W. John, Haneman, M. (1997). Urban Water Demand
Management and Planning. McGraw-Hill Professional. New York, USA.
Bosche Stemele, (2012).City of Bulawayo Master plan.
Butle, D. and Memon, F. (Eds), (2006). Water Demand Management. IWA: London,
UK.
Farley, M and Trow, S. (2003).Losses in Water Distribution Networks. A Practitioner’s
Guide to Assessment, Monitoring and Control. IWA London, UK.
Fanner, P., J. Thornton, R. Liemberger, and R. Sturm. (2007). Evaluating Water Loss
and Planning Loss Reduction Strategies. AWWA Research Foundation.
Farley, M. and Liemberger, R. (2008) Developing a Non-Revenue Water
Strategy. Part 2: Planning and Implementing the Strategy
Farley, M., G. Wyeth, Z. Ghazali, A. Istandar, and S. Singh. 2008. The Manager’s
NRW Handbook. USAID.
Kingdom, W., R. Liemberger, and P. Marin. 2006. The Challenge of Reducing Non-
Revenue Water (NRW) in Developing Countries – How the Private Sector Can Help:
A Look at Performance-Based Service Contracting. WSS Sector Board Discussion
Paper#8. World Bank.
Reduction of Non-Revenue Water as a Water Demand Management Tool
83
Lambert, A. (2001). What do we know about Pressure: Leakage Relationships in
Water Distribution Systems? IWA Conference.
Lambert, A., T.G. Brown, M. Takizawa, and D. Weimer. (1999). A Review of
Performance Indicators for Real Losses from Water Supply Systems. AQUA.
Lambert, A. and R. McKenzie. (2002). Practical Experience in using the Infrastructure
Leakage Index. Paper to IWA Conference on Leakage Management.
Liemberger, R. and R. McKenzie R. (2005). Accuracy Limitations of the ILI: Is It an
Appropriate Indicator for Developing Countries.
McKenzie, R. Buckle, H. Wegelin, WA, Meyer, N. (2002). Water Demand Management
Cookbook. United Nations and Rand Water.
IWA (2003). Leak detection practices and techniques; a practical approach.
IWA (2005) Leakage reduction conference. Approach to water loss management. By
K.J
IWA (2003). Assessing non-revenue water and its components; a practical approach.
Rizzo, A. (undated) Apparent water Loss Control: Theory and application
Richard Rogers (2008). A review of the June 2007 Non-Revenue water strategy
developed.
Seago, C., R. McKenzie, and R. Liemberger. 2005. International Benchmarking of
Leakage from Water Reticulation Systems. Paper to Leakage 2005 Conference.
South African Bureau of Standards Code of Practice: SABS 0306:(1999). The
management of potable water in distribution systems.
Reduction of Non-Revenue Water as a Water Demand Management Tool
84
Thornton, J., R. Sturm, and G. Kunkel. (2008). Water Loss Control. 2nd edition.
McGraw-Hill Companies: New York, USA.
UNEP/IETC (1999). Innovative Ways of finding water for Cities. Proceedings of the
International Symposium on Efficient Water Use in Urban Areas
UN (1992). Dublin Principle.
UN (2003) Water for People. Water for life.
Vermersch, M. (2005). The reduction and control of UFW.
World Bank (2010). The manager’s non-revenue water handbook for Africa, a guide
to understanding water losses.

Reduction of Non-Revenue Water as a Water Demand Management Tool
85
APPENDICES
Copyright © 2022 FDOKUMEN