Impacts of Climate Change on Water Resources Availability and Agricultural Water Demand in the West...
15
Water Resour Manage (2009) 23:2015–2029 DOI 10.1007/s11269-008-9367-0 Impacts of Climate Change on Water Resources Availability and Agricultural Water Demand in the West Bank Numan Mizyed Received: 2 January 2008 / Accepted: 14 October 2008 / Published online: 31 October 2008 © Springer Science + Business Media B.V. 2008 Abstract Global climate change is predicted as a result of increased concentrations of greenhouse gasses in the atmosphere. It is predicted that climate change will result in increasing temperature by 2 to 6 ◦ C and a possible reduction of precipitation of up to 16% in the Mediterranean basin. In this study, the West Bank is taken as a case study from the Mediterranean basin to evaluate the effects of such climate change on water resources availability and agricultural water demands. Due to the uncertainty in climate change impacts on temperature and precipitation, a number of scenarios for these impacts were assumed within the range of predicted changes. For temperature, three scenarios of 2, 4 and 6 ◦ C increase were assumed. For precip- itation, two scenarios of no change and 16% precipitation reduction were assumed. Based on these scenarios, monthly evapotranspiration and monthly precipitation excess depths were estimated at seven weather stations distributed over the different climatic and geographical areas of the West Bank. GIS spatial analyses showed that the increase in temperature predicted by climate change could potentially increase agricultural water demands by up to 17% and could also result in reducing annual groundwater recharge by up to 21% of existing values. However, the effects of reduced precipitation resulting from climate change are more enormous as a 16% reduction in precipitation could result in reducing annual groundwater recharge in the West Bank by about 30% of existing value. When this effect is combined with a6 ◦ C increase in temperature, the reduction in groundwater recharge could reach 50%. Keywords Climate change · Water resources availability · Agricultural water demand · West Bank · Evapotranspiration · Precipitation · Mediterranean basin · Groundwater · Natural recharge · Precipitation excess N. Mizyed (B ) An-Najah University, Nablus, Palestine e-mail: [email protected]
Transcript of Impacts of Climate Change on Water Resources Availability and Agricultural Water Demand in the West...
Water Resour Manage (2009) 23:2015–2029DOI 10.1007/s11269-008-9367-0
Impacts of Climate Change on Water ResourcesAvailability and Agricultural Water Demandin the West Bank
Numan Mizyed
Received: 2 January 2008 / Accepted: 14 October 2008 /Published online: 31 October 2008© Springer Science + Business Media B.V. 2008
Abstract Global climate change is predicted as a result of increased concentrationsof greenhouse gasses in the atmosphere. It is predicted that climate change will resultin increasing temperature by 2 to 6◦C and a possible reduction of precipitation ofup to 16% in the Mediterranean basin. In this study, the West Bank is taken asa case study from the Mediterranean basin to evaluate the effects of such climatechange on water resources availability and agricultural water demands. Due to theuncertainty in climate change impacts on temperature and precipitation, a numberof scenarios for these impacts were assumed within the range of predicted changes.For temperature, three scenarios of 2, 4 and 6◦C increase were assumed. For precip-itation, two scenarios of no change and 16% precipitation reduction were assumed.Based on these scenarios, monthly evapotranspiration and monthly precipitationexcess depths were estimated at seven weather stations distributed over the differentclimatic and geographical areas of the West Bank. GIS spatial analyses showed thatthe increase in temperature predicted by climate change could potentially increaseagricultural water demands by up to 17% and could also result in reducing annualgroundwater recharge by up to 21% of existing values. However, the effects ofreduced precipitation resulting from climate change are more enormous as a 16%reduction in precipitation could result in reducing annual groundwater recharge inthe West Bank by about 30% of existing value. When this effect is combined witha 6◦C increase in temperature, the reduction in groundwater recharge could reach50%.
Keywords Climate change · Water resources availability · Agricultural waterdemand · West Bank · Evapotranspiration · Precipitation · Mediterranean basin ·Groundwater · Natural recharge · Precipitation excess
N. Mizyed (B)An-Najah University, Nablus, Palestinee-mail: [email protected]

2016 N. Mizyed
Abbreviations
ASCE American Society of Civil EngineersET EvapotranspirationFAO Food and Agriculture OrganizationGIS Geographic information systemsh HourIPCC Intergovernmental Panel on Climate ChangeMCM Million cubic metersMoT Ministry of TransportationP PrecipitationPCBS Palestine Central Bureau of StatisticsPWA Palestine Water Authoritys SecondsWGI Working Group I of the Intergovernmental Panel on Climate Change
1 Introduction
The West Bank, with an area of 5,655 km2 (PCBS 2005), extends for approximately155 km in length and 60 km in width. The West Bank is longitudinally dividedinto three main topographical regions running roughly north–south: the semi-coastalplains in the west, the mountains in the center and the Jordan rift valley in the east.
Groundwater is the main source of water in the West Bank. The annual rechargeof groundwater aquifers in the West Bank is estimated at 688 MCM (PWA 2005). Asthe total population of the West Bank is estimated at 2.3 million (PCBS 2005), theamount of water that could be theoretically made available will be about 300 m3
per capita per year. Due to various restrictions on water use and other politicalconstraints, the amount of water available and consumed by Palestinians in the WestBank is about 146 MCM annually (PCBS 2005). Therefore, the per capita wateravailability in the West Bank is about 63 m3 per year. This makes water scarcityvery severe and any additional reduction on water availability will have severe socio-economic and possibly health impacts on the people.
In the West Bank, agriculture has been playing an important role in the Palestinianeconomy. Agriculture is responsible for employing 18% of the labor force andfor 13% of the gross domestic product in the West Bank (PCBS 2005). Althoughirrigated agriculture utilizes only 5% of the cultivated area of the West Bank (PCBS2005), it contributes about one third of the total agricultural production. However,agriculture also utilizes about 52% of the water resources.
As a result of existing 3 to 4% annual population growth rates and other socio-economic factors, domestic water demands are increasing in the West Bank as wellas in the rest of the Middle East. The increase in water demands and the limitedavailability of water resources are resulting in increasing the water shortages in theregion. The increases in water shortages are yielding to over exploitation of existingwater resources and thus limiting the sustainability of their use. It is also resultingin deteriorating water quality and inducing salinity problems in water resources. Inaddition to depletion of water resources and the deterioration of water quality, theincrease in water shortages could also escalate existing conflicts and tensions in theregion.
Impacts of climate change on water resources in the West Bank 2017
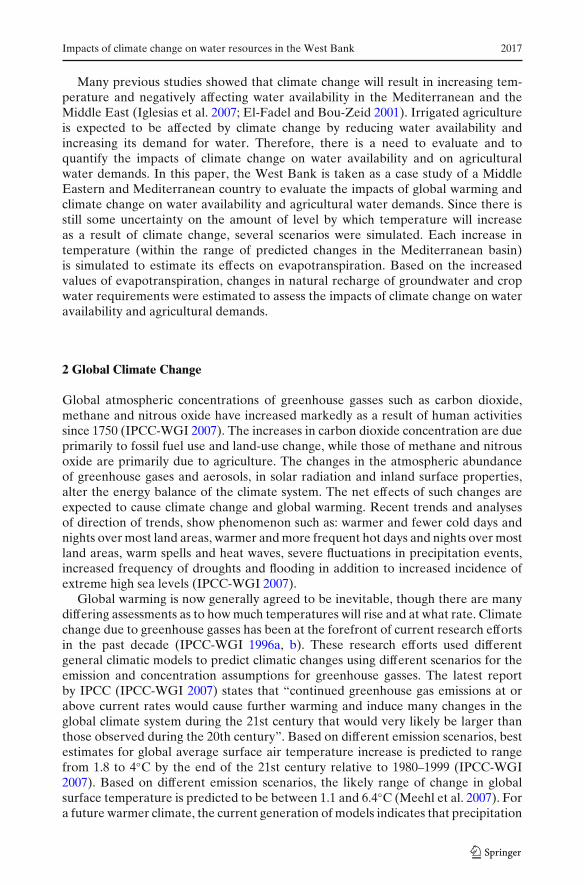
Many previous studies showed that climate change will result in increasing tem-perature and negatively affecting water availability in the Mediterranean and theMiddle East (Iglesias et al. 2007; El-Fadel and Bou-Zeid 2001). Irrigated agricultureis expected to be affected by climate change by reducing water availability andincreasing its demand for water. Therefore, there is a need to evaluate and toquantify the impacts of climate change on water availability and on agriculturalwater demands. In this paper, the West Bank is taken as a case study of a MiddleEastern and Mediterranean country to evaluate the impacts of global warming andclimate change on water availability and agricultural water demands. Since there isstill some uncertainty on the amount of level by which temperature will increaseas a result of climate change, several scenarios were simulated. Each increase intemperature (within the range of predicted changes in the Mediterranean basin)is simulated to estimate its effects on evapotranspiration. Based on the increasedvalues of evapotranspiration, changes in natural recharge of groundwater and cropwater requirements were estimated to assess the impacts of climate change on wateravailability and agricultural demands.
2 Global Climate Change
Global atmospheric concentrations of greenhouse gasses such as carbon dioxide,methane and nitrous oxide have increased markedly as a result of human activitiessince 1750 (IPCC-WGI 2007). The increases in carbon dioxide concentration are dueprimarily to fossil fuel use and land-use change, while those of methane and nitrousoxide are primarily due to agriculture. The changes in the atmospheric abundanceof greenhouse gases and aerosols, in solar radiation and inland surface properties,alter the energy balance of the climate system. The net effects of such changes areexpected to cause climate change and global warming. Recent trends and analysesof direction of trends, show phenomenon such as: warmer and fewer cold days andnights over most land areas, warmer and more frequent hot days and nights over mostland areas, warm spells and heat waves, severe fluctuations in precipitation events,increased frequency of droughts and flooding in addition to increased incidence ofextreme high sea levels (IPCC-WGI 2007).
Global warming is now generally agreed to be inevitable, though there are manydiffering assessments as to how much temperatures will rise and at what rate. Climatechange due to greenhouse gasses has been at the forefront of current research effortsin the past decade (IPCC-WGI 1996a, b). These research efforts used differentgeneral climatic models to predict climatic changes using different scenarios for theemission and concentration assumptions for greenhouse gasses. The latest reportby IPCC (IPCC-WGI 2007) states that “continued greenhouse gas emissions at orabove current rates would cause further warming and induce many changes in theglobal climate system during the 21st century that would very likely be larger thanthose observed during the 20th century”. Based on different emission scenarios, bestestimates for global average surface air temperature increase is predicted to rangefrom 1.8 to 4◦C by the end of the 21st century relative to 1980–1999 (IPCC-WGI2007). Based on different emission scenarios, the likely range of change in globalsurface temperature is predicted to be between 1.1 and 6.4◦C (Meehl et al. 2007). Fora future warmer climate, the current generation of models indicates that precipitation
2018 N. Mizyed
is predicted to increase in the tropical regions and to decrease in the subtropics.Globally averaged mean water vapor, evaporation and precipitation are projectedto increase (Meehl et al. 2007).
3 Climate Change in the Mediterranean Region
The main and most important climate changes in the Mediterranean region are thoserelated to temperature and to precipitation. Although global climate change mightresult in a small increase in global annual precipitation rates, annual precipitationis very likely to decrease (Christensen et al. 2007) in most of the Mediterraneanareas. The most critical months in the Mediterranean related to precipitation arethose months with high precipitation rates which are December, January, andFebruary. In these months, precipitation usually is greater than evapotranspirationand thus recharge of groundwater aquifers usually occurs in these months. Therefore,reduction of rainfall in these months will significantly affect recharge of groundwateraquifers and thus water availability. Table 1 shows projections for temperatureand precipitation response to climate change in the Mediterranean areas. Table 1shows that precipitation is expected to reduce by 6% during December, January andFebruary; this reduction rate could increase to possibly 16%.
In the Mediterranean coast, the median temperature increase lies between 3◦Cand 4◦C, roughly 1.5 times the global mean response (Christensen et al. 2007). Themaximum increase in temperature is expected to be in June, July, and August. Thisincrease is expected to increase crop water demands in these months.
For wind speed, the northward shift in cyclone activity tends to reduce windinessin the Mediterranean areas (Christensen et al. 2007). On the other hand, simulationswith little change in the pressure pattern tend to show only small changes in the meanwind speed. Therefore, wind velocities are not expected to change significantly as aresult of climate change in the Mediterranean basin.
4 Existing Climate in the West Bank
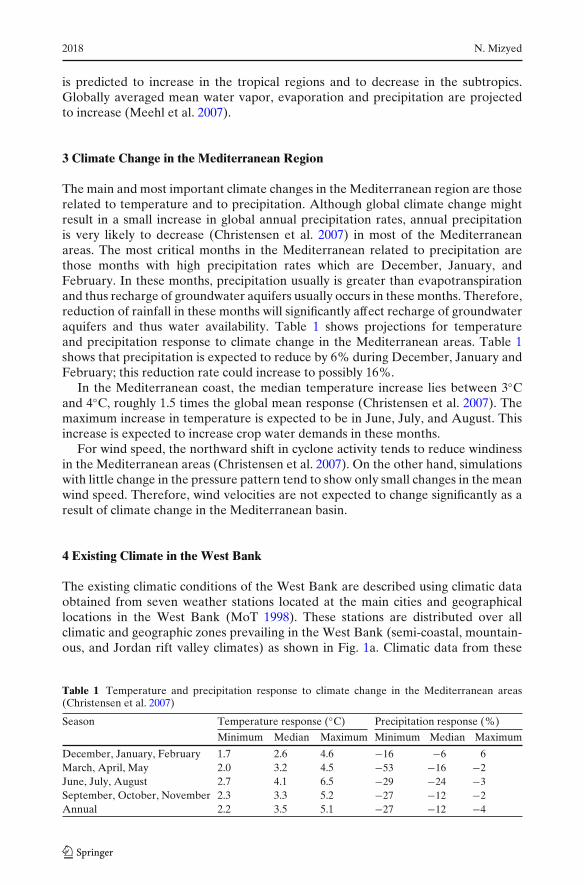
The existing climatic conditions of the West Bank are described using climatic dataobtained from seven weather stations located at the main cities and geographicallocations in the West Bank (MoT 1998). These stations are distributed over allclimatic and geographic zones prevailing in the West Bank (semi-coastal, mountain-ous, and Jordan rift valley climates) as shown in Fig. 1a. Climatic data from these
Table 1 Temperature and precipitation response to climate change in the Mediterranean areas(Christensen et al. 2007)
Season Temperature response (◦C) Precipitation response (%)
Minimum Median Maximum Minimum Median Maximum
December, January, February 1.7 2.6 4.6 −16 −6 6March, April, May 2.0 3.2 4.5 −53 −16 −2June, July, August 2.7 4.1 6.5 −29 −24 −3September, October, November 2.3 3.3 5.2 −27 −12 −2Annual 2.2 3.5 5.1 −27 −12 −4
Impacts of climate change on water resources in the West Bank 2019
0 20 Kilometers
# Weather StationsExisting TemperatureWest Bank Boundary
N
#
#
#
#
#
#
#
19.5
20.
0
20.5
21.0
19.0
18.5
21.5
18.0
17.5
17.0
22.0
16.5
22.5
23.0
23.5
21.0
17.0
17.5
19.0
18 .
5
a b
Fig. 1 a Location of the seven weather climatic stations describing weather conditions in the WestBank. b Spatial distribution of existing annual average temperatures in the West Bank
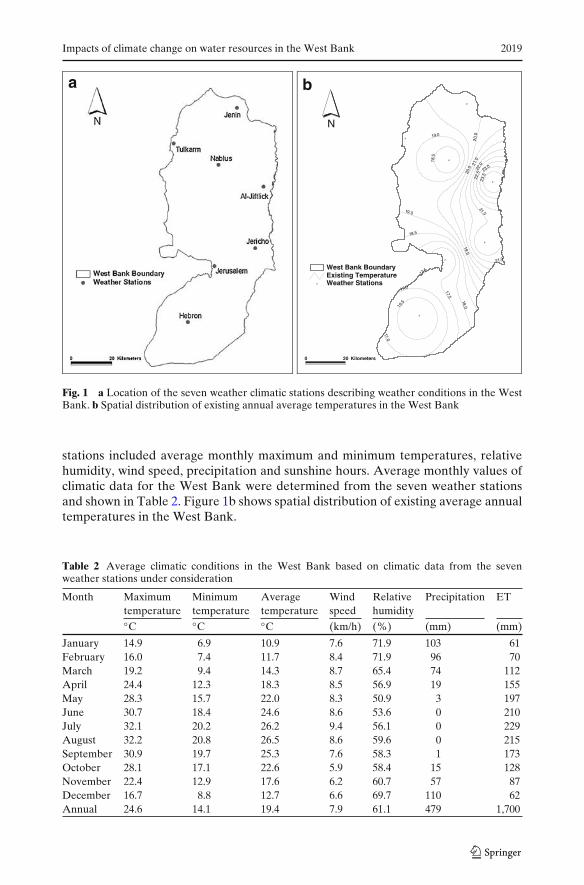
stations included average monthly maximum and minimum temperatures, relativehumidity, wind speed, precipitation and sunshine hours. Average monthly values ofclimatic data for the West Bank were determined from the seven weather stationsand shown in Table 2. Figure 1b shows spatial distribution of existing average annualtemperatures in the West Bank.
Table 2 Average climatic conditions in the West Bank based on climatic data from the sevenweather stations under consideration
Month Maximum Minimum Average Wind Relative Precipitation ETtemperature temperature temperature speed humidity◦C ◦C ◦C (km/h) (%) (mm) (mm)
January 14.9 6.9 10.9 7.6 71.9 103 61February 16.0 7.4 11.7 8.4 71.9 96 70March 19.2 9.4 14.3 8.7 65.4 74 112April 24.4 12.3 18.3 8.5 56.9 19 155May 28.3 15.7 22.0 8.3 50.9 3 197June 30.7 18.4 24.6 8.6 53.6 0 210July 32.1 20.2 26.2 9.4 56.1 0 229August 32.2 20.8 26.5 8.6 59.6 0 215September 30.9 19.7 25.3 7.6 58.3 1 173October 28.1 17.1 22.6 5.9 58.4 15 128November 22.4 12.9 17.6 6.2 60.7 57 87December 16.7 8.8 12.7 6.6 69.7 110 62Annual 24.6 14.1 19.4 7.9 61.1 479 1,700
2020 N. Mizyed
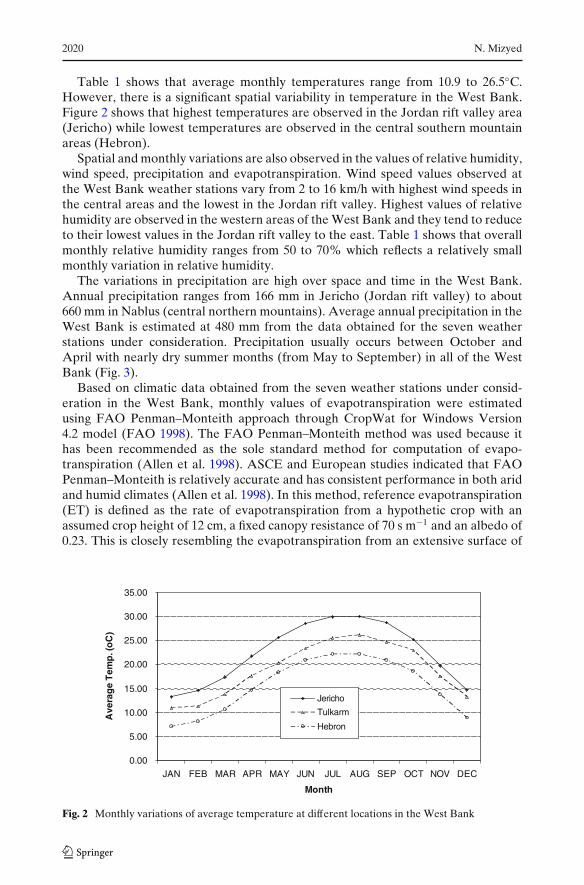
Table 1 shows that average monthly temperatures range from 10.9 to 26.5◦C.However, there is a significant spatial variability in temperature in the West Bank.Figure 2 shows that highest temperatures are observed in the Jordan rift valley area(Jericho) while lowest temperatures are observed in the central southern mountainareas (Hebron).
Spatial and monthly variations are also observed in the values of relative humidity,wind speed, precipitation and evapotranspiration. Wind speed values observed atthe West Bank weather stations vary from 2 to 16 km/h with highest wind speeds inthe central areas and the lowest in the Jordan rift valley. Highest values of relativehumidity are observed in the western areas of the West Bank and they tend to reduceto their lowest values in the Jordan rift valley to the east. Table 1 shows that overallmonthly relative humidity ranges from 50 to 70% which reflects a relatively smallmonthly variation in relative humidity.
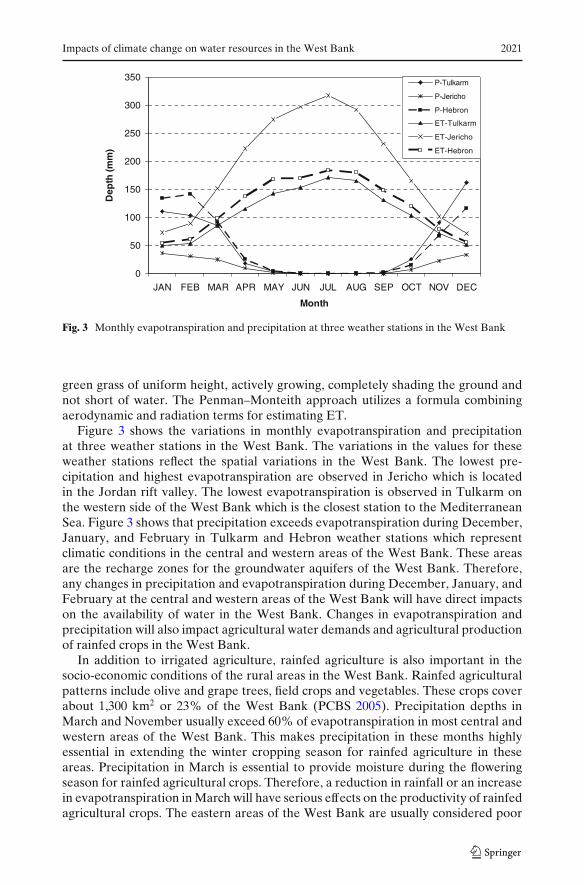
The variations in precipitation are high over space and time in the West Bank.Annual precipitation ranges from 166 mm in Jericho (Jordan rift valley) to about660 mm in Nablus (central northern mountains). Average annual precipitation in theWest Bank is estimated at 480 mm from the data obtained for the seven weatherstations under consideration. Precipitation usually occurs between October andApril with nearly dry summer months (from May to September) in all of the WestBank (Fig. 3).
Based on climatic data obtained from the seven weather stations under consid-eration in the West Bank, monthly values of evapotranspiration were estimatedusing FAO Penman–Monteith approach through CropWat for Windows Version4.2 model (FAO 1998). The FAO Penman–Monteith method was used because ithas been recommended as the sole standard method for computation of evapo-transpiration (Allen et al. 1998). ASCE and European studies indicated that FAOPenman–Monteith is relatively accurate and has consistent performance in both aridand humid climates (Allen et al. 1998). In this method, reference evapotranspiration(ET) is defined as the rate of evapotranspiration from a hypothetic crop with anassumed crop height of 12 cm, a fixed canopy resistance of 70 s m−1 and an albedo of0.23. This is closely resembling the evapotranspiration from an extensive surface of
0.00
5.00
10.00
15.00
20.00
25.00
30.00
35.00
JAN FEB MAR APR MAY JUN JUL AUG SEP OCT NOV DEC
Month
Ave
rag
e T
emp
. (o
C)
Jericho
Tulkarm
Hebron
Fig. 2 Monthly variations of average temperature at different locations in the West Bank
Impacts of climate change on water resources in the West Bank 2021
0
50
100
150
200
250
300
350
JAN FEB MAR APR MAY JUN JUL AUG SEP OCT NOV DEC
Month
Dep
th (m
m)
P-Tulkarm
P-Jericho
P-Hebron
ET-Tulkarm
ET-Jericho
ET-Hebron
Fig. 3 Monthly evapotranspiration and precipitation at three weather stations in the West Bank
green grass of uniform height, actively growing, completely shading the ground andnot short of water. The Penman–Monteith approach utilizes a formula combiningaerodynamic and radiation terms for estimating ET.
Figure 3 shows the variations in monthly evapotranspiration and precipitationat three weather stations in the West Bank. The variations in the values for theseweather stations reflect the spatial variations in the West Bank. The lowest pre-cipitation and highest evapotranspiration are observed in Jericho which is locatedin the Jordan rift valley. The lowest evapotranspiration is observed in Tulkarm onthe western side of the West Bank which is the closest station to the MediterraneanSea. Figure 3 shows that precipitation exceeds evapotranspiration during December,January, and February in Tulkarm and Hebron weather stations which representclimatic conditions in the central and western areas of the West Bank. These areasare the recharge zones for the groundwater aquifers of the West Bank. Therefore,any changes in precipitation and evapotranspiration during December, January, andFebruary at the central and western areas of the West Bank will have direct impactson the availability of water in the West Bank. Changes in evapotranspiration andprecipitation will also impact agricultural water demands and agricultural productionof rainfed crops in the West Bank.
In addition to irrigated agriculture, rainfed agriculture is also important in thesocio-economic conditions of the rural areas in the West Bank. Rainfed agriculturalpatterns include olive and grape trees, field crops and vegetables. These crops coverabout 1,300 km2 or 23% of the West Bank (PCBS 2005). Precipitation depths inMarch and November usually exceed 60% of evapotranspiration in most central andwestern areas of the West Bank. This makes precipitation in these months highlyessential in extending the winter cropping season for rainfed agriculture in theseareas. Precipitation in March is essential to provide moisture during the floweringseason for rainfed agricultural crops. Therefore, a reduction in rainfall or an increasein evapotranspiration in March will have serious effects on the productivity of rainfedagricultural crops. The eastern areas of the West Bank are usually considered poor
2022 N. Mizyed
rainfed agricultural areas or marginal lands because of the small amounts of rainfalloccurring in these areas especially in March. Increasing temperature and reducingprecipitation resulting from climate change could easily yield to extending the areaof marginal lands in the West Bank in addition to reducing available water resources.
5 Simulated Climate Changes
Since the concern of this study was to assess the effects on water availability andwater demands, changes with direct effect on evapotranspiration and precipitationwere considered. Temperature changes for the Mediterranean areas as predictedby different climate models are shown in Table 1. The increase in temperature ispredicted to range from 1.7 to 6.5◦C (Christensen et al. 2007) with small monthlyvariations. Since there is still a lot of uncertainty for climate change, the possibleimpacts of climate change on water resources availability and demand are predictedusing a number of scenarios within the predicted range of temperature and pre-cipitation changes. In this study, three scenarios within the predicted temperaturechanges are modeled. These scenarios are 2, 4, and 6◦C increases in average monthlytemperatures. Although there are small monthly variations in the predicted change,temperature increases were assumed to be uniform as the objective of this study isto assess the range of impacts of such climate change. For precipitation changes, twoscenarios were assumed: one with no changes in monthly precipitation depths andthe second assuming a reduction of 16% in average monthly precipitation depths.The 16% reduction is the maximum predicted reduction in precipitation depths in theMediterranean basin as shown in Table 1 and represents the worse scenario predictedfor climate change effects on precipitation.
Although wind speed, relative humidity and sunshine hours have an effect onevapotranspiration estimation, however predicted changes resulting from climatechange on these variables are small and uncertain (IPCC-WGI 2007). Thus, theeffects of possible changes in wind speed, relative humidity and sunshine hours arenot considered in this study. Based on average values of these climatic parametersand the different scenarios for temperature changes above, monthly evapotranspira-tion depths were estimated using Penman–Monteith approach for the seven climaticstations under consideration in the West Bank.
The monthly evapotranspiration depths for the different weather stations underconsideration were compared with monthly precipitation depths at these stations.The comparison was performed for both existing precipitation depths and the 16%reduced precipitation depths. Based on these comparisons, excess precipitationdepths during winter months were estimated at the different stations. The precip-itation excesses over evapotranspiration represent natural recharge depths for thegroundwater aquifers. Theses depths were added at each station to calculate annualvalues at each station. GIS spatial analyses were performed to estimate spatialaverage effects on the entire West Bank. Changes in annual average natural rechargedepths represent the predicted changes in the groundwater availability from theaquifers. These changes represent changes in the availability of water resources inthe West Bank as a result of climate change.
The changes in monthly and annual evapotranspiration depths at the differentstations represent changes in agricultural water demands. Another important change

Impacts of climate change on water resources in the West Bank 2023
evaluated is the number of months when precipitation exceeds evapotranspiration.This number is highly important in rainfed agriculture as it indicates the feasibility ofplanting crops that depend on rainfall as the only source of water.
6 Results of Simulated Climate Changes
Figure 1b shows existing distribution of average annual temperatures in the WestBank. In addition to the topography, this distribution allows forming three climaticzones in the West Bank. These zones are the Jordan rift valley, the mountainous andthe semi-coastal climatic zones. GIS spatial analyses of average annual temperaturesin the West Bank shows a spatial average of 19.07◦C. Figure 1b shows that a smallincrease in temperature of only 2◦C could expand the climate of the Jordan riftvalley to Jenin in the northern central West Bank. This will be a significant spatialexpansion which will have effects on agricultural crops and cropping patterns there.This effect is also important on the mountainous areas as temperature in the southernmountains around Hebron will be nearly equal to those existing temperatures in thenorthern lower (in height) mountains around Nablus and Jerusalem. Therefore, sucha small change in temperature will probably restrict the plantation and production ofsome current fruit trees requiring low winter temperatures in the Hebron Moun-tains. Figure 1b shows also that an increase of 6◦C in temperature will have thetemperatures of the mountainous areas reaching those of the existing Jordan riftvalley temperatures. As a result of such change, the whole West Bank will have the
0 20 Kilometers
# Weather StationsET (+0)West Bank Boundary
N
#
#
#
#
#
#
#
1500 15501450
1600
1400
1650
1700
1350
1750
1800
1300
1850
1250
1900
195
0
1200
2000
2050
1350
1500 16501450
1400
1300
1550
1600
0 20 Kilometers
# Weather StationsET (+6)West Bank Boundary
N
#
#
#
#
#
#
#
1750
1700
1800
1850
1900
1650
1950
2000
1600
2050
1550
2100
1500
2150
2200
1450
225023
00
1400
2350
1650
20001750
1900
1950
1800
185
0
1700
1850
1600
1550
(a) (b)
Fig. 4 a Spatial distribution of annual evapotranspiration depths (mm) estimated from existingclimatic conditions in the West bank. b Spatial distribution of annual evapotranspiration depths(mm) estimated from 6◦C increase in temperature in the West Bank
2024 N. Mizyed
Jordan rift valley temperatures prevailing instead of the existing three climatic zones.This climate zone will be warm winters and very hot dry summers. Such changes areenormous weather changes and will result in large transformations of weather andagriculture all over the West Bank.
Existing annual evapotranspiration depths in the West Bank show a variationfrom 1,160 mm in the semi-coastal areas to more than 2,000 mm in the Jordan riftvalley. Figure 4a shows the spatial distribution of annual evapotranspiration depthsin the West Bank estimated from existing climatic conditions. Figure 4b shows thespatial distribution of evapotranspiration depths with 6◦C increase in temperature.The increase in evapotranspiration represents increase in irrigation demands.
GIS spatial analyses of evapotranspiration data showed that the increase intemperature predicted by climate change will result in increasing evapotranspirationin the West Bank by 6 to 17%. Therefore, climate change will result in increasingagricultural water demands by up to 17%. It will be possible to plant some crops atearlier times in the season during cooler months to reduce their demand to water toadapt for temperature changes. However, such an option should be evaluated con-sidering availability of water and other environmental and socio-economic conditionsprevailing in the West Bank.
Natural recharge rates were estimated by comparing monthly evapotranspirationwith monthly precipitation considering some losses in precipitation due mainly torunoff. Assuming that these losses remain constant, average natural recharge rates(precipitation excess) are estimated for both existing and future scenarios and shown
0 20 Kilometers
# Weather StationsP-ET (0%/+0)West Bank Boundary
N
#
#
#
#
#
#
#
150140
130
90
120
80
70 60
110
50
100
160
170
180
190
200
40
30
20
210
10
220
220
180
30
180
40
210
160
110
170
20
190
200
50
170
10
0 20 Kilometers
# Weather StationsP-ET (0%/+6)West Bank Boundary
N
#
#
#
#
#
#
#
90
80110
100 70
60
50
40
120130
140
150160
30
20
170
10
180
190
10
140
30
160
170
120
80
130
20
150
120
(a) (b)
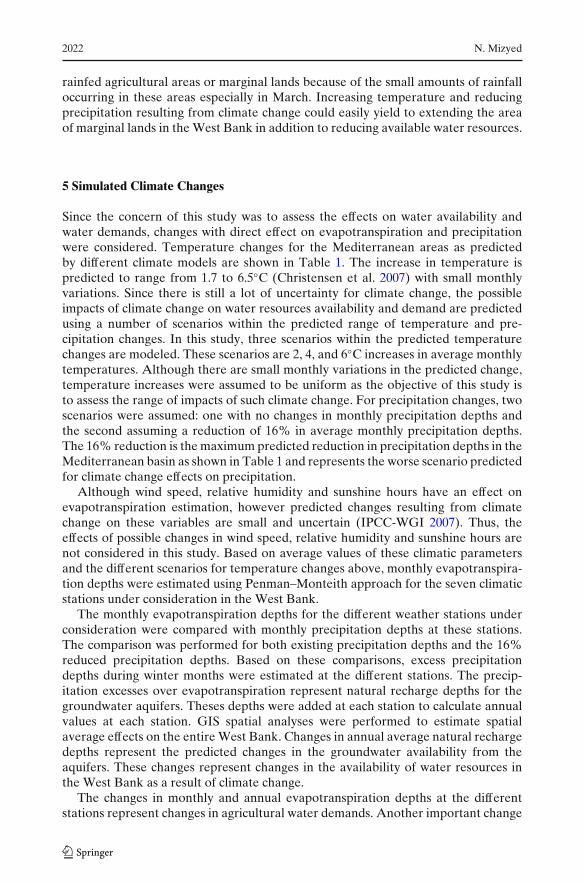
Fig. 5 a Spatial distribution of annual precipitation excess (P-ET) depths estimated from existingclimatic conditions in the West Bank. b Spatial distribution of annual precipitation excess (P-ET)depths estimated from 6◦C increase in temperature in the West Bank

Impacts of climate change on water resources in the West Bank 2025
in Fig. 5a and b. Figure 5b shows the distribution of annual precipitation excess(P-ET) depths with a 6◦C increase in temperature in the West Bank. GIS spatialanalyses showed that the predicted increase in temperature will result in reducingrecharge depths from 7 to 21% assuming no reduction in precipitation. This meansthat natural recharge of groundwater aquifers could reduce by up to 21% as a resultof 6◦C increase in temperature.
Figure 6a shows the distribution of precipitation excess (P-ET) depths withexisting temperatures and a 16% reduction in precipitation. Figure 6b shows thedistribution of precipitation excess depths if the 16% reduction in precipitation iscombined with a 6◦C increase in temperature. GIS spatial analyses showed that apossible 16% reduction in precipitation will have severe effects on recharge ratesof groundwater aquifers and thus on water resources availability in the West Bank.Even with no temperature changes, the reduction in recharge will be about 30%which is much higher than the effect of a 6◦C increase in temperature. If the 16%possible reduction in precipitation is combined with a 6◦C increase in temperature,the reduction in recharge and thus water availability will reach 50%. Such possibilitywill have tremendous effects on water availability, the socio-economics and thepolitics of the West Bank and its neighboring countries which might have similarimpacts. This effect is not going to be unique to the West Bank since Mediterraneanand Middle Eastern countries have similar climatic conditions which could havesimilar effects of climate change.
0 20 Kilometers
# Weather StationsP-ET (-16%/+0)West Bank Boundary
N
#
#
#
#
#
#
#
90
80
70100
60
50 40
110
120
30
130140
20
10
150
160
130
70
150
130
20
120
30
140
110
30
10
0 20 Kilometers
# Weather StationsP-ET (-16%/+6)West Bank Boundary
N
#
#
#
#
#
#
#
60
50
70
40
3080
90
100
20
10
110
120
20
70
110
90
20
40
80
100
70
30
10
110
(a) (b)
Fig. 6 a Spatial distribution of annual precipitation excess (P-ET) depths (mm) estimated fromexisting temperature and 16% reduction in annual precipitation in the West Bank. b Spatialdistribution of annual precipitation excess (P-ET) depths (mm) estimated from 6◦C increase intemperature and a 16% reduction in precipitation in the West Bank
2026 N. Mizyed
Tab
le3
Sum
mar
yof
aver
age
impa
cts
ofin
crea
sein
tem
pera
ture
and
redu
ctio
nin
prec
ipit
atio
non
the
enti
reW
estB
ank
usin
gG
ISsp
atia
lana
lyse
s
Incr
ease
inte
mp
only
Red
ucti
onin
prec
ipit
atio
nan
din
crea
sein
tem
p.
Exi
stin
g2◦
Cin
crea
se4◦
Cin
crea
se6◦
Cin
crea
seE
xist
ing
tem
p.2◦
Cin
crea
se4◦
Cin
crea
se6◦
Cin
crea
se
Ave
rage
tem
p.◦ C
19.0
721
.07
23.0
725
.07
19.0
721
.07
23.0
725
.07
Pre
cipi
tati
on(m
m)
485
485
485
485
408
408
408
408
ET
(mm
)15
2916
1617
0417
9415
2916
1617
0417
94R
echa
rge
(mm
)14
2.3
132.
212
2.2
111.
998
.989
.379
.769
.8C
hang
ein
Pre
cipi
tati
on0.
0%0.
0%0.
0%0.
0%−1
6.0%
−16.
0%−1
6.0%
−16.
0%In
crea
sein
ET
0.0%
5.7%
11.4
%17
.3%
0.0%
5.7%
11.4
%17
.3%
Red
ucti
onin
rech
arge
0.0%
7.1%
14.2
%21
.4%
30.5
%37
.2%
44.0
%50
.9%
Impacts of climate change on water resources in the West Bank 2027
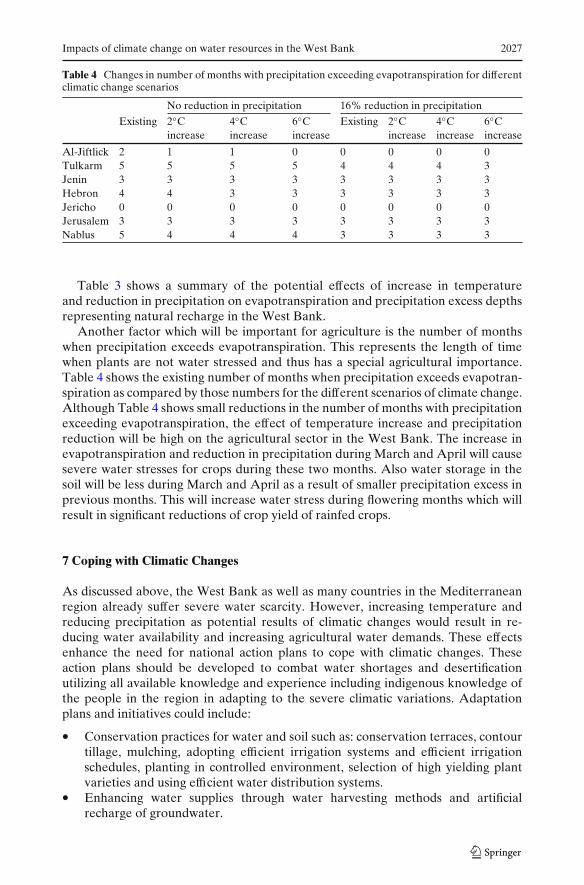
Table 4 Changes in number of months with precipitation exceeding evapotranspiration for differentclimatic change scenarios
No reduction in precipitation 16% reduction in precipitation
Existing 2◦C 4◦C 6◦C Existing 2◦C 4◦C 6◦Cincrease increase increase increase increase increase
Al-Jiftlick 2 1 1 0 0 0 0 0Tulkarm 5 5 5 5 4 4 4 3Jenin 3 3 3 3 3 3 3 3Hebron 4 4 3 3 3 3 3 3Jericho 0 0 0 0 0 0 0 0Jerusalem 3 3 3 3 3 3 3 3Nablus 5 4 4 4 3 3 3 3
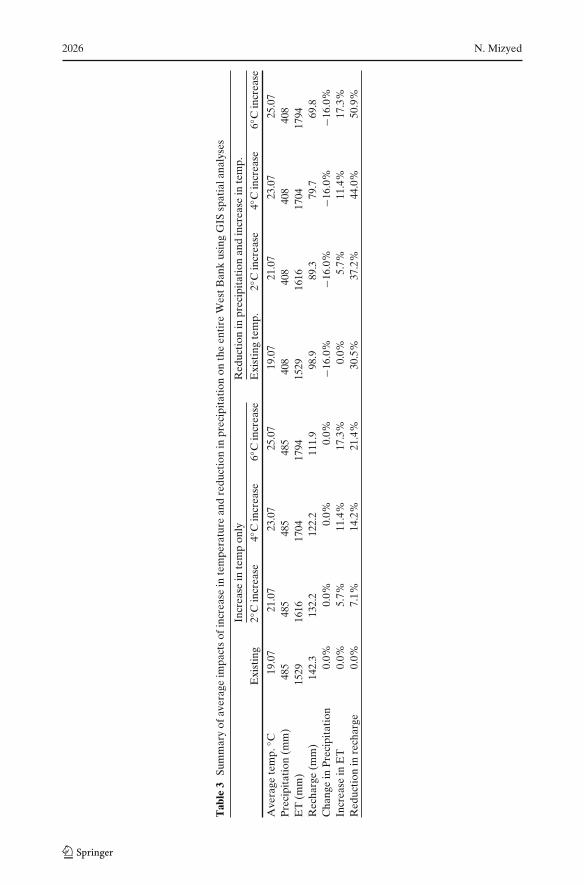
Table 3 shows a summary of the potential effects of increase in temperatureand reduction in precipitation on evapotranspiration and precipitation excess depthsrepresenting natural recharge in the West Bank.
Another factor which will be important for agriculture is the number of monthswhen precipitation exceeds evapotranspiration. This represents the length of timewhen plants are not water stressed and thus has a special agricultural importance.Table 4 shows the existing number of months when precipitation exceeds evapotran-spiration as compared by those numbers for the different scenarios of climate change.Although Table 4 shows small reductions in the number of months with precipitationexceeding evapotranspiration, the effect of temperature increase and precipitationreduction will be high on the agricultural sector in the West Bank. The increase inevapotranspiration and reduction in precipitation during March and April will causesevere water stresses for crops during these two months. Also water storage in thesoil will be less during March and April as a result of smaller precipitation excess inprevious months. This will increase water stress during flowering months which willresult in significant reductions of crop yield of rainfed crops.
7 Coping with Climatic Changes
As discussed above, the West Bank as well as many countries in the Mediterraneanregion already suffer severe water scarcity. However, increasing temperature andreducing precipitation as potential results of climatic changes would result in re-ducing water availability and increasing agricultural water demands. These effectsenhance the need for national action plans to cope with climatic changes. Theseaction plans should be developed to combat water shortages and desertificationutilizing all available knowledge and experience including indigenous knowledge ofthe people in the region in adapting to the severe climatic variations. Adaptationplans and initiatives could include:
• Conservation practices for water and soil such as: conservation terraces, contourtillage, mulching, adopting efficient irrigation systems and efficient irrigationschedules, planting in controlled environment, selection of high yielding plantvarieties and using efficient water distribution systems.
• Enhancing water supplies through water harvesting methods and artificialrecharge of groundwater.

2028 N. Mizyed
• Utilizing non-conventional water sources such as treated wastewater and brack-ish water, desalination of brackish and sea water and rainfall enhancement.
• Evaluating cropping patterns and adopting new patterns considering climaticchanges.
• Regional cooperation on enhancing water supply and food safety issues
8 Conclusions and Recommendations
This study shows that climate change will have severe effects on available waterresources and agricultural water demands in the West Bank. The study shows thatthe predicted increase in temperature could cause an increase in evapotranspirationfrom 6 to 17%. The increase in temperature alone could reduce natural rechargeof groundwater aquifers by 7 to 21%. Therefore, temperature changes could reducewater availability by up to 21% and increase agricultural water demands by up to17%. However, possible changes in precipitation will have more severe effects onwater availability than the increase in temperature. This study shows a possible 16%reduction in precipitation could result in reducing recharge of groundwater aquifersby about 30%. If this effect is combined with an increase of 6◦C in temperature, thereduction in groundwater recharge will reach 50%. Such reduction will have severeeffects on the water availability in the West Bank. It requires more evaluation andanalyses of the possible consequences of climate change especially on precipitation.It also requires adopting national plans to adapt to climate changes.
Although the analyses and evaluation conducted in this study were performed forthe West Bank, the effects of climate change will be also as severe in many MiddleEastern and Mediterranean countries as they have similar climatic conditions. Thisemphasizes the need for regional cooperation in designing and adapting plans to copewith climate change.
References
Allen RG, Pereira LS, Smith M (1998) Crop evapotranspiration—guidelines for computing crop wa-ter requirements—FAO Irrigation and Drainage paper 56. Food and Agriculture Organizationof the United Nations, Rome
Christensen JH, Hewitson B, Busuioc A, Chen A, Gao X, Held I, Jones R, Kolli RK, Kwon W-T,Laprise R, Magaña Rueda V, Mearns L, Menéndez CG, Räisänen J, Rinke A, Sarr A, WhettonP (2007) Regional climate projections. In: Solomon S, Qin D, Manning M, Chen Z, MarquisM, Averyt KB, Tignor M, Miller HL (eds) Climate Change 2007: the physical science basis.Contribution of Working Group I to the Fourth Assessment Report of the IntergovernmentalPanel on Climate Change. Cambridge University Press, Cambridge
El-Fadel M, Bou-Zeid E (2001) Climate change and water resources in the Middle East: vulnerabil-ity, socio-economic impacts, and adaptation. The Fondazione Eni Enrico Mattei Note di LavoroSeries Index: http://www.feem.it/web/activ/_activ.html
FAO (1998) CropWat for Windows version: users guide. Food and Agriculture Organization:http://www.fao.org/nr/water/infores_databases_cropwat.html
Iglesias A, Garrote L, Flores F, Moneo M (2007) Challenges to manage the risk of water and climatechange in the Mediterranean. Water Resour Manage 21:775–788 doi:10.1007/s11269-006-9111-6
Intergovernmental Panel for Climate Change Working Group I (IPCC-WGI) (1996a) Climatechange 1995: the science of climate change. Cambridge University Press, Cambridge
Intergovernmental Panel for Climate Change Working Group I (IPCC-WGI) (1996b) IPCC work-shop on regional climate change projections for impact assessment. Geneva, Switzerland

Impacts of climate change on water resources in the West Bank 2029
Intergovernmental Panel on Climate Change Working Group I (2007) Climate Change 2007: thephysical science basis. Geneva, Switzerland
Meehl GA, Stocker TF, Collins WD, Friedlingstein P, Gaye AT, Gregory JM, Kitoh A, Knutti R,Murphy JM, Noda A, Raper SCB, Watterson IG, Weaver AJ, Zhao Z-C (2007) Global climateprojections. In: Solomon S, Qin D, Manning M, Chen Z, Marquis M, Averyt KB, Tignor M,Miller HL (eds) Climate Change 2007: the physical science basis. Contribution of WorkingGroup I to the Fourth Assessment Report of the Intergovernmental Panel on Climate Change.Cambridge University Press, Cambridge
Ministry of Transport Metrological Office MoT (1998) Palestine Climate Data HandbookPalestinian Central Bureau of Statistics (PCBS) (2005) Statistical Abstract of Palestine No. (6)Palestine Water Authority (PWA) (2005) Volume of renewable water resources in the West Bank
and Gaza Strip during the rainfall season of 2004–2005 (in Arabic)