Global Urban Growth and the Geography of Water Availability, Quality, and Delivery
10
REPORT Global Urban Growth and the Geography of Water Availability, Quality, and Delivery Robert I. McDonald, Ian Douglas, Carmen Revenga, Rebecca Hale, Nancy Grimm, Jenny Gro ¨nwall, Balazs Fekete Received: 21 September 2010 / Revised: 4 March 2011 / Accepted: 5 April 2011 / Published online: 3 May 2011 Abstract Globally, urban growth will add 1.5 billion people to cities by 2030, making the difficult task of urban water provisions even more challenging. In this article, we develop a conceptual framework of urban water provision as composed of three axes: water availability, water qual- ity, and water delivery. For each axis, we calculate quan- titative proxy measures for all cities with more than 50,000 residents, and then briefly discuss the strategies cities are using in response if they are deficient on one of the axes. We show that 523 million people are in cities where water availability may be an issue, 890 million people are in cities where water quality may be an issue, and 1.3 billion people are in cities where water delivery may be an issue. Tapping into groundwater is a widespread response, regardless of the management challenge, with many cities unsustainably using this resource. The strategies used by cities deficient on the water delivery axis are different than for cities deficient on the water quantity or water quality axis, as lack of financial resources pushes cities toward a different and potentially less effective set of strategies. Keywords Aridity index Á Global Rural/Urban Mapping Project Á Gross-domestic product Á Hydrosheds INTRODUCTION For the first time in history, more people live in cities than in rural areas. Cities are expected to add 1.5 billion inhabitants in the next 20 years, particularly in the devel- oping world (UNPD 2007). With this major demographic transition, the challenge of providing fresh, safe drinking water to urban inhabitants takes on global urgency. This challenge is particularly daunting, as most freshwater systems are already stressed (Vo ¨ro ¨smarty et al. 2010), and as urban growth is just one of several major challenges facing humans use of freshwater (Rockstro ¨m and Karlberg 2010). This article analyses the geography of the challenge of urban water provision and the major strategies cities are taking to meet that challenge. Provision of fresh, clean water to urban inhabitants entails three main issues, and cities can be placed along the three corresponding axes. Availability, the absolute amount of surface or groundwater within a region that can be sus- tainably appropriated for urban use, is largely a function of climatic setting. Delivery describes the challenge of pro- viding available water to urban populations, usually via infrastructure such as piped water supplies, dams, canals, and wells. Water quality, the suitability for urban household uses, is the third axis in our framework. Water that is pol- luted either by upstream users or through pollution in situ must be treated and purified before use in urban households. In this article, we conduct a global, quantitative analysis of proxy variables used to estimate water availability, delivery, and quantity (for more analysis of just the water availability axis, see McDonald et al., 2011). We describe the environmental and social factors that are currently most closely associated with poor scores on these three indices. We supplement this global, quantitative analysis with a narrative description of three main management challenges. This narrative section allows us to address issues lacking comprehensive global data, but which are crucial for the delivery of water. Our three main management challenges correspond with poor scores on one of the three dimensions of water provision, and are not mutually exclusive (i.e., one city may face more than one of these challenges): • Arid cities that are faced with very low water availability. Ó Royal Swedish Academy of Sciences 2011 www.kva.se/en 123 AMBIO (2011) 40:437–446 DOI 10.1007/s13280-011-0152-6
Transcript of Global Urban Growth and the Geography of Water Availability, Quality, and Delivery

REPORT
Global Urban Growth and the Geography of Water Availability,Quality, and Delivery
Robert I. McDonald, Ian Douglas, Carmen Revenga, Rebecca Hale,
Nancy Grimm, Jenny Gronwall, Balazs Fekete
Received: 21 September 2010 / Revised: 4 March 2011 / Accepted: 5 April 2011 / Published online: 3 May 2011
Abstract Globally, urban growth will add 1.5 billion
people to cities by 2030, making the difficult task of urban
water provisions even more challenging. In this article, we
develop a conceptual framework of urban water provision
as composed of three axes: water availability, water qual-
ity, and water delivery. For each axis, we calculate quan-
titative proxy measures for all cities with more than 50,000
residents, and then briefly discuss the strategies cities are
using in response if they are deficient on one of the axes.
We show that 523 million people are in cities where water
availability may be an issue, 890 million people are in
cities where water quality may be an issue, and 1.3 billion
people are in cities where water delivery may be an issue.
Tapping into groundwater is a widespread response,
regardless of the management challenge, with many cities
unsustainably using this resource. The strategies used by
cities deficient on the water delivery axis are different than
for cities deficient on the water quantity or water quality
axis, as lack of financial resources pushes cities toward a
different and potentially less effective set of strategies.
Keywords Aridity index �Global Rural/Urban Mapping Project �Gross-domestic product � Hydrosheds
INTRODUCTION
For the first time in history, more people live in cities than
in rural areas. Cities are expected to add 1.5 billion
inhabitants in the next 20 years, particularly in the devel-
oping world (UNPD 2007). With this major demographic
transition, the challenge of providing fresh, safe drinking
water to urban inhabitants takes on global urgency. This
challenge is particularly daunting, as most freshwater
systems are already stressed (Vorosmarty et al. 2010), and
as urban growth is just one of several major challenges
facing humans use of freshwater (Rockstrom and Karlberg
2010). This article analyses the geography of the challenge
of urban water provision and the major strategies cities are
taking to meet that challenge.
Provision of fresh, clean water to urban inhabitants
entails three main issues, and cities can be placed along the
three corresponding axes. Availability, the absolute amount
of surface or groundwater within a region that can be sus-
tainably appropriated for urban use, is largely a function of
climatic setting. Delivery describes the challenge of pro-
viding available water to urban populations, usually via
infrastructure such as piped water supplies, dams, canals,
and wells. Water quality, the suitability for urban household
uses, is the third axis in our framework. Water that is pol-
luted either by upstream users or through pollution in situ
must be treated and purified before use in urban households.
In this article, we conduct a global, quantitative analysis
of proxy variables used to estimate water availability,
delivery, and quantity (for more analysis of just the water
availability axis, see McDonald et al., 2011). We describe
the environmental and social factors that are currently most
closely associated with poor scores on these three indices.
We supplement this global, quantitative analysis with a
narrative description of three main management challenges.
This narrative section allows us to address issues lacking
comprehensive global data, but which are crucial for the
delivery of water. Our three main management challenges
correspond with poor scores on one of the three dimensions
of water provision, and are not mutually exclusive (i.e., one
city may face more than one of these challenges):
• Arid cities that are faced with very low water
availability.
� Royal Swedish Academy of Sciences 2011
www.kva.se/en 123
AMBIO (2011) 40:437–446
DOI 10.1007/s13280-011-0152-6
• Cities that face problems of water quality because of
multiple upstream users.
• Fast-growing cities that lack the resources to deliver
water to their residents.
For each of the three management challenges, we use
scores on our three axes to map where those conditions are
distributed globally and estimate how many cities and
urban residents face each particular challenge. We then
draw upon available literature and more detailed case study
data for a subset of cities to examine how cities responded
to each management challenge, using a narrative approach.
We contrast two broad categories of solutions, those that
focus on increasing water supply, and those that focus on
wise use of existing supply.
MATERIALS AND METHODS
Global Analysis
One goal of our analysis is to provide a quantitative, spa-
tially explicit measure of the three axes of urban water
provision. However, the available global data on water use
and delivery for most cities is rather limited. Accordingly,
we developed proxy measurements that represent these
three axes and seem likely to capture major trends, yet can
be calculated globally. While these proxies are not the
perfect measure of these three axes, they suffice for our
goal of presenting the major geographic trends in urban
water provision.
Our base demographic data on cities was taken from the
Global Rural/Urban Mapping Project (GRUMP 2010),
which consists of three datasets. A point shapefile contains
information on hundreds of thousands of settlements. A
linked grid shows the urban extents of tens of thousands of
cities, based on nighttime light imagery (cf., Sutton et al.
2001; Small et al. 2005; Henderson et al. 2003) and other
areal data. Finally, a population grid shows the population
for both rural and urban areas, based on the urban extents
and census data. Note that the algorithm that defines urban
extents merges contiguous urban and suburban areas into
one urban extent. For this study, we used all cities greater
than 50,000 in population in 2000. This subset of cities
contains 6,730 cities and 2.4 billion urban residents, 84%
of the global urban population (UNPD 2007).
Temperature and precipitation are keys to water avail-
ability. We used UNEP’s aridity index as a proxy measure
of water availability, where the index is the ratio of pre-
cipitation to potential evapotranspiration. Aridity index
data were taken from the Millennium Ecosystem Assess-
ment (MEA 2005), originally created by UNEP/GRID for
the World Atlas on Desertification (UNEP 1997b). One
drawback with this proxy variable is that a city’s score is
determined solely from its local climate, so that a city in an
arid climate able to draw ample water from a major river
would still come out low (i.e. arid) on the aridity axis.
Water quality is often a serious hindrance for urban
water use, yet no global datasets with complete coverage
exist for measures of water quality. The most complete
dataset with information on water quality internationally is
the Water Quality Database of the Global Environmental
Monitoring System (GEMS), which contains information
on thousands of water quality measurements globally
(GEMS and UNEP 2007; GEMS et al. 2008), but infor-
mation would not be available in this dataset for the
majority of the cities in our study area. Our central
assumption in developing this proxy is that water quality is
more likely to be an issue where there are more people
upstream. Previous research has demonstrated significant
and strong correlations between one measure of poor water
quality, nitrate concentrations (NO3-N mg l-1), and pop-
ulation density (Peierls et al. 1991). It appears likely that
other major water quality problems, whether microbial or
chemical in nature (WHO 2008), will be greater in areas
with higher upstream population density. Accordingly, we
calculated the upstream population density (people/ha) for
each city globally, using Hydrosheds (Lehner et al. 2008)
as our digital elevation model and the GRUMP population
grid, which includes both urban and rural populations.
Water delivery issues are extremely challenging to
measure globally in a consistent way because there are no
centralized databases on how cities get their water. Our
central assumption in developing this proxy is that the
greatest delivery problems will be in cities that are fast
growing and have few financial resources. We defined a
delivery axis as the number of new urban residents
expected over the period 2000–2005 divided by the per-
capita GDP. Because city-specific information on popula-
tion growth or economic production is not available for
most cities, we use national-level values for population
growth rate (multiplied by city-specific population in 2000)
and per-capita GDP. Although this estimate is imprecise,
we believe it still captures a useful difference in delivery
capacity between, for example, Phoenix, USA (delivery
axis = 5.0) and Sana’a, Yemen (delivery axis = 146.1).
Management Challenges
Although the global analysis provides a broad-brush pic-
ture of the axes that are associated with the greatest urban
water management challenges, water provision is a local
issue and the responses that cities employ to meet these
challenges are highly dependent on economic, social, and
governance issues. We therefore sought out case studies of
cities that face one or more of a set of management
438 AMBIO (2011) 40:437–446
123� Royal Swedish Academy of Sciences 2011
www.kva.se/en

challenges listed in Table 1. Each management challenge
corresponds to an extreme score on one of our three axes.
Note that management challenges are not mutually exclu-
sive and a city can be, for example, in the ‘‘fast-growing’’
and ‘‘arid’’ categories. Our list of management challenges
is not exhaustive: for particular cities other management
challenges may be important.
This section of the article aims to make quantitative
statements about the number of cities facing each chal-
lenge. This requires dividing our continuous proxy variable
into discrete categories. Water availability was divided
based on the aridity categories used by UNEP (1997b). For
water quality, we based our categories of people/ha on the
analysis of Peierls et al. (1991), which quantified a rela-
tionship between people/ha upstream and the concentration
of NO3, a common water pollutant. We acknowledge that
the specific empirical relationship documented by Peierls
et al. (1991) may not hold in all landscapes, but for the
goals of our narrative section it is a useful rule-of-thumb
for interpreting our proxy variable representing water
quality. Finally, for our water delivery axis we used a
roughly exponential series of breaks (i.e., 0.5, 1, 10, 100),
to span the range of this axis.
Our choice of case study cities was highly opportunistic,
seizing on cities with relevant data. We used the list of
cities with extreme scores on an axis as a guide in our
search, looking for a consistent set of information for each
of our case study cities (Table 2). We also chose cities of
varying wealth, contrasting the response strategies used by
poor cities with those used by rich ones. Similarly, in our
narrative we compare solutions involving building new
public infrastructure with those where private markets or
infrastructure have developed to provide water as well as
with cities that have attempted to restore or strengthen
ecosystem services. Although a brief summary cannot
cover all strategies used, it can give readers an overview of
the major strategies cities and their residents use to respond
to each management challenge.
RESULTS
The Geography of the Three Axes
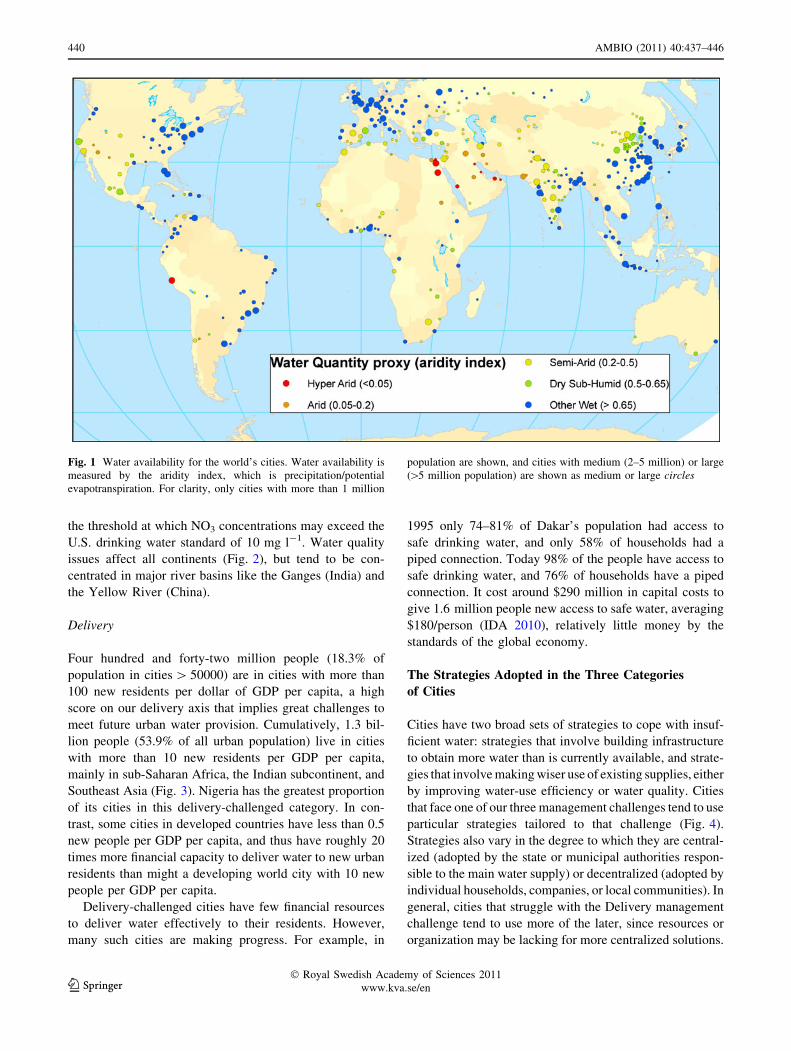
Availability
Seventy-four million people (3.1% of the population of
cities [ 50,000) live in hyperarid climates (aridity
index \ 0.05), and another 97 million (4.0% of urban
population) live in arid climates (aridity index 0.05–0.2).
Cumulatively, 21.7% of urban dwellers, some 523 million,
live in climates that would at least be classified as semiarid
(aridity index \ 0.5). In the developed world these cities
are clustered in the western United States, Australia, and
parts of Spain (Fig. 1). In the developing world, most of
these cities are located in northwestern Mexico, coastal
Peru and Chile, North Africa, the Sahara, Namibia, the
Middle East, and central Asia.
Quality
Fifty-three million people are in cities with an upstream
population density greater than 19 people/ha, the threshold
at which NO3 concentrations may exceed 20 mg l-1 (twice
the United States standard for drinking water), all located
in Africa and Asia. A much larger number, 890 million
(36.9% of population of cities [ 50000), are in cities with
an upstream population density greater than 5.5 people/ha,
Table 1 Management challenges
(1) Cities located in arid and semi-arid regions that potentially suffer from problems of water availability owing to climatic constraints
(2) Fast-growing cities that have limited resources for building infrastructure and other means of delivering water to residents
(3) Cities located along large rivers that have many other water users upstream, leading to poor water quality
Table 2 Information collected from case studies
Name of city cluster
Characteristics of populations involved, including poverty and slum dwellers
Typical sources of water (surface, ground, recycled, etc.)
Types of water shortage experienced (duration of supply, leakage, lack of connections, insufficient flow or groundwater table lowering)
Range of adaptations (private boreholes, commercial water sellers, bottled water, self storage, rooftop collections, fetching from standpipes or
wells or river, desalination, recycling of treated waste water, dual water systems)
Prospects for the future (planned new installations, increased household level adaptation, water saving, leakage reduction, infrastructure
maintenance and renewal)
Ecosystem impacts of present situations
Use of ecosystem services to ameliorate situation (encouraging infiltration, wetland restoration, etc.)
AMBIO (2011) 40:437–446 439
� Royal Swedish Academy of Sciences 2011
www.kva.se/en 123
the threshold at which NO3 concentrations may exceed the
U.S. drinking water standard of 10 mg l-1. Water quality
issues affect all continents (Fig. 2), but tend to be con-
centrated in major river basins like the Ganges (India) and
the Yellow River (China).
Delivery
Four hundred and forty-two million people (18.3% of
population in cities [ 50000) are in cities with more than
100 new residents per dollar of GDP per capita, a high
score on our delivery axis that implies great challenges to
meet future urban water provision. Cumulatively, 1.3 bil-
lion people (53.9% of all urban population) live in cities
with more than 10 new residents per GDP per capita,
mainly in sub-Saharan Africa, the Indian subcontinent, and
Southeast Asia (Fig. 3). Nigeria has the greatest proportion
of its cities in this delivery-challenged category. In con-
trast, some cities in developed countries have less than 0.5
new people per GDP per capita, and thus have roughly 20
times more financial capacity to deliver water to new urban
residents than might a developing world city with 10 new
people per GDP per capita.
Delivery-challenged cities have few financial resources
to deliver water effectively to their residents. However,
many such cities are making progress. For example, in
1995 only 74–81% of Dakar’s population had access to
safe drinking water, and only 58% of households had a
piped connection. Today 98% of the people have access to
safe drinking water, and 76% of households have a piped
connection. It cost around $290 million in capital costs to
give 1.6 million people new access to safe water, averaging
$180/person (IDA 2010), relatively little money by the
standards of the global economy.
The Strategies Adopted in the Three Categories
of Cities
Cities have two broad sets of strategies to cope with insuf-
ficient water: strategies that involve building infrastructure
to obtain more water than is currently available, and strate-
gies that involve making wiser use of existing supplies, either
by improving water-use efficiency or water quality. Cities
that face one of our three management challenges tend to use
particular strategies tailored to that challenge (Fig. 4).
Strategies also vary in the degree to which they are central-
ized (adopted by the state or municipal authorities respon-
sible to the main water supply) or decentralized (adopted by
individual households, companies, or local communities). In
general, cities that struggle with the Delivery management
challenge tend to use more of the later, since resources or
organization may be lacking for more centralized solutions.
Fig. 1 Water availability for the world’s cities. Water availability is
measured by the aridity index, which is precipitation/potential
evapotranspiration. For clarity, only cities with more than 1 million
population are shown, and cities with medium (2–5 million) or large
([5 million population) are shown as medium or large circles
440 AMBIO (2011) 40:437–446
123� Royal Swedish Academy of Sciences 2011
www.kva.se/en

Fig. 2 Water quality for the world’s city. Water quality is measured
as the density of people in upstream contributing areas (people/km2).
For clarity, only cities with more than 1 million population are shown,
and cities with medium (2–5 million) or large ([5 million population)
are shown as medium or large circles
Fig. 3 Water delivery for the world’s city. The ability of a city to
delivery water to its citizens is measured as the number of people
expected divided by per-capita GDP. For clarity, only cities with
more than 1 million population are shown, and cities with medium
(2–5 million) or large ([5 million population) are shown as medium
or large circles
AMBIO (2011) 40:437–446 441
� Royal Swedish Academy of Sciences 2011
www.kva.se/en 123

Strategies to Increase Water Supply
Most cities turn to tapping into groundwater as the solution
of choice to meet urban water needs in all three manage-
ment challenge categories. Groundwater has long been
used as the main supply in arid areas and, in conjunction
with surface water, in large cities located along rivers.
Groundwater use is not only a response to surface water
shortages, but also water pollution and inadequate delivery.
Cairo (Egypt), for example, abstracts about 72% of its
supply from the Nile and 28% from groundwater, in part
due to water quality problems (Shahin 1990).
In cities with inadequate public delivery systems, resi-
dents may install private wells or boreholes to obtain water.
Today in wealthier cities, an abstraction license is required
before water can be taken from an aquifer, but for decades,
drilling a private borehole without any permit requirement
has been a key strategy to overcome an unreliable public
water supply. However, in Delhi, so much groundwater
was being abstracted privately, to overcome issues with
both quality and quantity of municipal supply, that the
Delhi Jal Board, the body that gives borehole approvals,
has to reduce the number of permits for boring tubewells
(Anonymous 2008).
Groundwater use is sustainable if the rate of aquifer
recharge is higher than the rates of withdrawals. However,
for many arid cities, groundwater use far exceeds the low
rates of aquifer recharge and groundwater levels are
dropping. Mexico City has so overused its aquifer that the
ground is subsiding 40 cm/year in some areas (Carrera-
Hernandez and Gaskin 2007). Below Beijing, the water
table has fallen by about 1 m a year since 1980 (Zhang
et al. 2006). Many other fast-growing cities face similar
problems, but globally the extent of this groundwater
mining by cities is unknown. However, if even a significant
fraction of cities in drylands are relying on groundwater
abstraction, then our figures suggest that tens or hundreds
of millions of people may be using their local groundwater
unsustainably. Excess abstraction in Bangkok, for instance,
has caused subsidence, damaging the foundations of valued
ytilauQretaWyrevileDytilibaliavAsixAfokcaL()melborP(
water) (Rapid growth and poverty)
(Many upstream users)
Increasing water supplies
Groundwater
Private boreholes
Long-distance transport
Desalinization
Rainwater harvesting
Local private water selling
Wise use of existing water supplies
Reducing non-accounted for water
Treating water to remove pollutants
Re-use of treated waste water
Dual water systems (grey water)
Land-use changes
Key to symbols Common Occasional Rare
Fig. 4 Frequency of strategies used by cities in response to three major management challenges
442 AMBIO (2011) 40:437–446
123� Royal Swedish Academy of Sciences 2011
www.kva.se/en

historic buildings as well as producing localized flooding
because rainwater gets trapped by changes in surface
topography (Phienwej and Nutalaya 2005). Moreover,
groundwater in many urban and peri-urban areas has been
significantly affected by pollutants, particularly nitrate. For
instance, surveys in India and Africa found that 20–50% of
all wells had nitrate concentrations greater than 50 mg/l
(UNEP, UN Water, and UN Habitat 2010).
Long-distance transport of water by canals or pipes is a
common solution for cities facing the Availability man-
agement challenge, and occurs occasionally in cities facing
the Water Quality challenge. The source of water is
sometimes distant groundwater. The boldest such scheme
is the Great Libyan Man-made River (Kuwairi 2006) which
is abstracting water from ancient aquifers beneath the
Sahara desert that are no longer recharged and carrying it to
cities and farms along the Mediterranean coast.
More frequently, distance surface water sources are
used, sometimes transferring water between river basins
via man-made connections called interbasin transfers.
Many large Indian cities, including Delhi, Mumbai and
Chennai, already rely in part on interbasin transfers (Jain
et al. 2007). China is proceeding with a south-north transfer
(Liu 1998) which will ultimately transfer 45 billion m3
from the Yangtze to farms and cities in the north (Zhang
et al. 2009). Nairobi built the Thika Dam, 60 km from the
city in the 1990s to double the piped water supply to the
city (Syagga and Olima 1996). Lagos is planning a new
pipeline to deliver water from the Oshun River. Interbasin
water transfers continue to expand around the globe.
Interbasin transfers involve multiple trade-offs, often
damaging economic activities and freshwater ecosystems
in the river basin that lost water while often economically
benefiting others in the city capturing the water (Ghassemi
and White 2007).
Reservoir systems which can capture and store seasonal
runoff for year-round use are still a favored response to
availability problems. In areas dependent on snow and gla-
cier melt for water, like the Indus and Ganges, the Yellow
and Yangtze Rivers or the Murray Basin in Australia, res-
ervoirs have been the preferred means to capture water for
urban use. China is planning 59 new reservoirs to collect
water from shrinking glaciers in its western regions (Watts
2009). Many of these reservoir systems store water for use in
distant basins, necessitating long-distance pipelines.
Rainwater harvesting is an ancient technique being
adopted more widely in all three categories of city dis-
cussed in this article. It has the advantage of being
decentralized, requiring low technological knowledge and
relatively inexpensive. Harvested rainwater is primarily
used for purposes other than drinking water, such as
groundwater recharge and irrigation. Legislation requiring
all properties above a certain size to harvest rain water has
been passed in Banglalore, Ahmedabad, Chennia, New
Delhi, Kanpur, Hyderabad and Mumbai. The Bangalore
legislation (City of Bangalore 2009) requires every new
house to have a rainwater harvesting system in order to get
a piped drinking water connection. In the USA, tax
incentives encourage rainwater harvesting in Texas and
Arizona, and in Santa Fe, New Mexico, and Tuscon, Ari-
zona, all new commercial developments are required to use
harvested rainwater for watering their lawns and gardens
(City of Tucson 2008).
Another common strategy employed in most cities in the
developing world is to obtain water from private water
sellers. Private water sellers are typically a more expensive
solution that municipal supply, but emerge wherever
municipal supplies are inadequate or unreliable. Local
private water selling is widespread in Asia, Africa, and
Latin America in all three categories of city discussed here.
In poor cities that suffer from both water quality and water
delivery issues, a two tiered system often develops, where
richer residents can afford to buy clean water from private
vendors while poor residents either endeavor to clean
polluted surface waters or buy ‘‘pure’’ water in plastic
bottles or sachets to drink at a high price from local ven-
dors. In Port-Au-Prince (Haiti), the poor might be spending
20% of their income on water; in Onitsha (Nigeria) during
the dry season 18%; and in Addis Ababa (Ethiopia) 9%
(Bhatia and Falkenmark 1993). Poor people who buy
sachets of water from local vendors face the risk that it may
be of poor quality; cholera outbreaks have been linked to
such water (Hutin et al. 2003). Most households increase
storage, with tanks for the middle class and plastic bottles,
jerry cans, or stone jars for poorer households (Bartlett
2003) but health risks may arise from deterioration in
household storage (Hammad et al. 2008).
Strategies to More Wisely Use Existing Supplies
Leakage can represent a substantial loss from water
delivery systems, and reducing unaccounted for water is a
goal for many water supply systems. In wealthier cities, the
main concern is to reduce leakage from old or damaged
water mains and pipes. In Europe, Malta more than halved
leakage, and the UK cut leakage by about one-third,
between 1995 and 2001 (Lallana 2003). Riyadh was losing
60% of its water through leakage and is reducing that loss
to 20% though increased monitoring of pipe pressures and
flows. However, for cities facing the Delivery management
challenge the problem stems not only from poor mainte-
nance of the system, but also from illegal connections by
residents or by water vendors who fill containers with
water to sell to the poor (Gandy 2006). A much higher
proportion of water in developing countries is unaccounted
for than in developed countries (Kingdom et al. 2006). For
AMBIO (2011) 40:437–446 443
� Royal Swedish Academy of Sciences 2011
www.kva.se/en 123

example, in Lagos, Nigeria, between 40 and 90% of the
piped supply is not accounted for (Global Water Intelli-
gence 2010). In many places, particularly Africa, reduction
of leakage and other losses is possibly a greater priority
than making large new infrastructure development, but
financial resources and government structures are limited
to deal with maintenance issues.
Cities with water quality problems and adequate
resources are able to treat polluted water before distributing
to urban users and regulate sources of pollution (e.g., by
constructing sewage treatment plants). However, most
cities in the developing world and some in the developed
world are currently unable to afford the tens or hundreds of
millions of dollars required for water treatment. Most
major infrastructure improvements in African cities are
usually funded by international aid or loans that pay for
building sewers or complex water treatment plants. This
lack of water treatment is particular important because
many cities in developing countries also lack adequate
sanitation systems. While water use for sanitation is not the
focus of this article, there are obvious connections between
the lack of a sanitation system upstream and serious
drinking water quality problems downstream.
Re-use of treated waste water to increase water use
efficiency is expanding, usually as part of a broader pro-
gram by a city facing the Water Availability management
challenge. In Orange County, California (USA.), sewage
water is treated by microfiltration, reverse osmosis and
ultra-violet light with hydrogen peroxide disinfection
before being used to replenish the groundwater aquifer. In
Barbados, hotel effluent has been treated and used for
landscaping irrigation (UNEP 1997a). In the Yarra Valley
area, Australia, households are required either to use
recycled water for secondary uses (not drinking) or to have
solar water heating or carry out rainwater harvesting to
reduce municipal water use (Kelly 2006).
Some cities have experimented with parallel pipe systems
for potable and non-potable water as a way to decrease
demand for water treatment. Both Gibraltar and Hong Kong
have a second pipe network distributing sea water for
flushing toilets, washing cars and other forms of cleaning
(Chau 1993). Dual systems also exist at the household scale,
particularly for ‘‘grey water’’ from roofs, such as in the
Netherlands (Fernandes et al. 2006), although some projects
have ended due to cross contamination between the grey and
the drinking water (Oesterholt et al. 2007).
Another broad strategy is changing land-use to better
take advantage of available freshwater which can help
cities facing the availability or water quality management
challenges. Depending on the change in land-use, it can
either be a net positive for freshwater biodiversity, if
hydrologic flows are restored, or a net negative, if hydro-
logic flows are further altered.
In arid climates, there are relatively few incentives for
restoring or strengthening the role of natural ecosystems in
water services provision rather than construct new infra-
structure. However, in some cases changes in land man-
agement can save water, as in South Africa’s Working for
Water program where invasive non-native yet water hun-
gry tree species are removed to increase available water.
More commonly, cities simply obtain water that was
allocated for other users, particularly the agricultural sector
or the environment, effectively changing part of a water-
shed’s land-use from agriculture to a less water-intensive
use. For instance, many Colorado farmers have ceased
production and sold their water rights to Denver and other
cities (Kimball 2005).
Since water quality problems for an individual city are
dependent upon upstream uses, land-use changes can also
help improve water quality. Some cities have experimented
with water treatment using natural systems, such as wet-
lands. For instance, in Kampala (Uganda) the Nakivubo
wetlands have been restored to better act as a filter
removing urban wastes before they reach the municipal
water intake (Emerton et al. 1998).
DISCUSSION
Our results show the highly varied geography of urban
water provisioning resulting from the overlay of water
availability, water quality, and water delivery. Different
issues matter in different places, with some unfortunate
cities suffering from two or three of these management
challenges. While perhaps obvious, an appreciation of this
varied geography is important because international policy
discussions often focus on only one of the three axes. For
example, climate change discussions tend to focus on
implications for water availability, ignoring issues of water
quality and delivery which our results suggest affect more
urban dwellers. Moreover, the response to an issue on one
axis, like climate change’s impact on water availability,
will necessarily be governed by the social and economic
situation of the city, and any response will likely also affect
the other two axes. We hope this article motivates a
broader discussion among policymakers of the complex
interplay among the three axes of urban water provision.
Regardless of which management challenge a city faces,
the first response of many cities seems to be increased use of
groundwater. Groundwater use reduces immediate concerns
about water availability and sometimes water quality, and
because groundwater pumping is cheap it is affordable in most
economic contexts. Given this heavy reliance on groundwater,
it is surprising that more global datasets have not augmented
the World Bank’s review (Foster et al. 1998). More infor-
mation is needed about which cities rely on groundwater for
444 AMBIO (2011) 40:437–446
123� Royal Swedish Academy of Sciences 2011
www.kva.se/en

their municipal supply as well as the water budgets and
recharge rates of their aquifers. Without better information on
groundwater use, it is hard to know how many millions of
people are in cities that are essentially mining groundwater in
an unsustainable fashion. If even a fraction of cities facing the
availability management challenge unsustainably pump
groundwater, hundreds of millions of urban dwellers may
have an unsustainable source of drinking water.
A second major trend is the importance of private sector
solutions where local governments cannot meet demand for
clean water. While some of these solutions are comple-
mentary to public strategies (e.g., rainwater harvesting,
household water treatment), others may conflict with public
projects, such as illegal water withdrawals from water
supply systems and the drilling of private boreholes which
can lead to groundwater table declines and land subsidence.
We identified two major categories of strategies that cities
can use, increasing water supply or using existing supply
more wisely. The latter has the potential to be used more
widely than it is currently, and it seems likely to have less of a
negative impact on freshwater ecosystems, already one of the
most damaged habitat types on Earth. However, the scarcity
of information on the use of strategies that seek to use
existing supply more wisely makes it difficult to evaluate the
frequency of such strategies or their cost relative to infra-
structure-based solutions. While renewed interest in envi-
ronmentally friendly solutions to problems of water
provision has resulted in a number of excellent case studies,
most cities do not document the extent to which, for example,
they are dependent for forests or wetlands for water filtration.
In contrast, detailed engineering data is usually available for
infrastructure that increases water supply.
Regardless of whether cities are investing in infra-
structure to increase water supply or trying to use existing
supplies more wisely, it is clear that substantial financial
resources will be required to address these management
challenges in the future. One study estimated that from
2003 to 2025 necessary annual investments would exceed
$180 billion per year (World Panel on Financing Water
Infrastructure 2003). While our study cannot shed light on
the cost of investment, we estimate that a significant
number of people in cities are already facing water provi-
sioning challenges, in the hundreds of millions for water
availability and water delivery and more than a billion for
water quality. Furthermore, our analysis of delivery chal-
lenges suggests that many cities will be unable to finance
water delivery projects themselves, highlighting the need
for substantial international funding. While plenty of pos-
sible solutions to water quantity and quality problems exist,
including some that are relatively less harmful to the
environment, they all take money and time to implement.
For more than a billion people in cities facing water
delivery challenges, both are in short supply.
Acknowledgments The authors were part of an NCEAS Working
Group on urbanization and its effect on the environment. This work
would not have been possible without the GRUMP and Hydrosheds
datasets, and we are grateful for the hard work that went into their
creation.
REFERENCES
Anonymous. 2008. Now, DJB nod must for drilling borewells in city.
The Times of India, December 3.
Bartlett, S. 2003. Water, sanitation and urban children: The need to go
beyond ‘‘improved’’ provision. Environment and Urbanization15(2): 57–70.
Bhatia, R., and M. Falkenmark. 1993. Water resource policies and the
urban poor: Innovative approaches and policy imperatives. In
Water and sanitation currents. Washington, DC: World Bank.
Carrera-Hernandez, J.J., and S.J. Gaskin. 2007. The Basin of Mexico
aquifer system: Regional groundwater level dynamics and
database development. Hydrogeology Journal 15(8): 1577–1590.
Chau, K. 1993. Management of limited water resources in Hong
Kong. Water Resources Development 9(1): 65–73.
City of Bangalore. 2009. The Bangalore waster supply and sewerage
(amendment) Act, Karnataka.
City of Tucson. 2008. Ordinance No. 10597, Tucson, AZ.
Emerton, L., L. Iyango, P. Luwum, and A. Malinga. 1998. Thepresent economic value of Nakivubo urban wetland IUCN—TheWorld Conservation Union. Uganda: Eastern Africa Regional
Office.
Fernandes, T., C. Schout, A. De Roda Husman, A. Eilander, H.
Vennema, and Y. van Duynhoven. 2006. Gastroenteritis associ-
ated with accidental contamination of drinking water with partially
treated water. Epidemiology and Infection 135(5): 818–826.
Foster, S., A. Lawrence, and B. Morris. 1998. Groundwater in urbandevelopment: Assessing management needs and formulatingpolicy strategies. Washington: World Bank.
Gandy, M. 2006. Planning, anti-planning and the infrastructure crisis
facing Metropolitan Lagos. Urban Studies 43: 371–396.
GEMS, and UNEP. 2007. Global drinking water quality indexdevelopment and sensitivity analysis report. Ontario, Canada:
United Nations Environment Programme Global Environmental
Monitoring System, Water Programme Office.
UNEP, GEMS, UNESCO, ERCE, GEMS, and IAP. 2008. Waterquality for ecosystem and human health, 2nd ed. Ontario: United
Nations Environment Programme Global Environmental Mon-
itoring System, Water Programme Office.
Ghassemi, F., and I. White. 2007. Inter-basin water transfer.
Cambridge: Cambridge University Press.
Global Water Intelligence. 2010. Lagos water supply. Global WaterIntelligence 11(6).
GRUMP. 2010. Global rural-urban mapping project. Center for
International Earth Science Information Network (CIESIN),
Columbia University; International Food Policy Research Insti-
tute (IFPRI); The World Bank; and Centro Internacional de
Agricultura Tropical (CIAT). http://sedac.ciesin.columbia.edu/
gpw/.
Hammad, Z.H., A.O. Ali, and H.H. Ahmed. 2008. The quality of
drinking water in storage in Khartoum State. Khartoum MedicalJournal 1(2): 78–80.
Henderson, M., E.T. Yeh, P. Gong, C. Elvidge, and K. Baugh. 2003.
Validation of urban boundaries derived from global night-time
satellite imagery. International Journal of Remote Sensing 24(3):
595–609.
Hutin, Y., S. Luby, and C. Paquet. 2003. A large cholera outbreak in
Kano City, Nigeria: the importance of hand washing with soap
AMBIO (2011) 40:437–446 445
� Royal Swedish Academy of Sciences 2011
www.kva.se/en 123

and the danger of street-vended water. Journal of Water andHealth 1(1): 45–52.
IDA. 2010. Sanitation and water supply: Improving services for thepoor. Washington, DC: International Development Association,
World Bank.
Jain, S.K., P.K. Agarwal, and V.P. Singh. 2007. Hydrology and waterresources of India. Dordrecht: Springer.
Kelly, T. 2006. Using sustainability in urban water planning. Paper
read at SWITCH Workshop on Learning Alliance, Tel Aviv,
Israel.
Kimball, A. 2005. Selling water instead of watermelons: Colorado’s
changing rural economy. Next American City, April.
Kingdom, B., R. Liemberger, and P. Marin. 2006. The challenge ofreducing non-revenue water (NRW) in developing countries.
Washington, DC: World Bank, Energy and Water Department.
Kuwairi, A. 2006. Water mining: the Great-man-made river, Libya.
Proceedings of the Institution of Civil Engineers 159(1): 39–43.
Lallana, C. 2003. Water use efficiency (in cities): Leakage. Copen-
hagen: European Environment Agency.
Lehner, B., K. Verdin, and A. Jarvis. 2008. New global hydrography
derived from spaceborne elevation data. Eos, Transactions,American Geophysical Union 89(10): 93–94.
Liu, C. 1998. Environmental issues and the South-North water
transfer scheme. The China Quarterly 156: 899–910.
McDonald, R. I., P. Green, D. Balk, B. Fekete, C. Revenga, M. Todd,
and M. Montgomery. 2011. Urban growth, climate change, and
freshwater availability. Proceedings of the National Academy ofSciences 108(15): 6312–6317.
MEA. 2005. Ecosystems and human well-being: Desertificationsynthesis. Washington, DC: World Resources Institute.
Oesterholt, F., G. Martijnse, G. Medema, and D. Van Der Kooij.
2007. Health risk assessment of non-potable domestic water
supplies in the Netherlands. Journal of water supply: researchand technology, AQUA 56: 171–179.
Peierls, B.L., N.F. Caraco, M.L. Pace, and J.J. Cole. 1991. Human
influence on river nitrogen. Nature 350(6317): 386–387.
Phienwej, N., and P. Nutalaya. 2005. Subsidence and flooding in
Bangkok. In The physical geography of Southeast Asia, ed.
A. Gupta, 358–378. Oxford: Oxford University Press.
Rockstrom, J., and L. Karlberg. 2010. The quadruple squeeze:
Defining the safe operating space for freshwater use to achieve a
truply gren revolution in the Anthropocene. AMBIO 39:
257–265.
Shahin, M. 1990. Annual flow variations in the Nile River system. In
Hydraulics/Hydrology of Arid Lands, ed. R. H. French. Wash-
ington, DC: American Society of Civil Engineers.
Small, C., F. Pozzi, and C.D. Elvidge. 2005. Spatial analysis of global
urban extent from DMSP-OLS night lights. Remote Sensing ofEnvironment 96(3–4): 277–291.
Sutton, P., D. Roberts, C. Elvidge, and K. Baugh. 2001. Census from
heaven: An estimate of the global human population using night-
time satellite imagery. International Journal of Remote Sensing22(16): 3061–3076.
Syagga, P., and W. Olima. 1996. The impact of compulsory land
acquisition on displaced households: The case of the Third Nairobi
Water Supply Project, Kenya. Habitat International 20: 61–75.
UNEP. 1997a. Source book of alternative techologies for freshwateraugmentation in Latin America and the Caribbean. Nairobi:
United Nations Environmental Program, International Environ-
mental Technology Center.
UNEP. 1997. World atlas of desertification. Nairobi: United Nations
Environmental Programme.
UNEP, UN Water, and UN Habitat. 2010. World water day 2010:Water quality facts and statistics. Nairobi: United NationsEnvironmental Programme.
UNPD. 2007. World urbanization prospects: The 2007 revision. New
York: United Nations Population Division.
Vorosmarty, C.J., P. McIntyre, M.O. Gessner, D. Dudgeon, A.
Prusevich, P. Green, S. Glidden, S.E. Bunn, C.A. Sullivan, C.R.
Liermann, and P.M. Davies. 2010. Global threats to human water
security and river biodiversity. Nature 467: 555–561.
Watts, J. 2009. China plans 59 reservoirs to collect meltwater from its
shrinking glaciers. The Guardian, 2 March.
WHO. 2008. Guidelines for drinking-water quality. Geneva: World
Health Organization.
World Panel on Financing Water Infrastructure. 2003. Financingwater for all. Marseilles: World Water Council.
Zhang, L., and C. Kennedy. 2006. Determination of sustainable yield
in urban groundwater systems: Beijing, China. Journal ofHydrologic Engineering 11(1): 21–28.
Zhang, Q., Z. Xu, Z. Shen, S. Li, and S. Wang. 2009. The Han River
watershed management initiative for the South-to-North water
transfer project (Middle Route) of China. Environmental Mon-itoring and Assessment 148: 369–377.
AUTHOR BIOGRAPHIES
Robert I. McDonald (&) is Vanguard Scientist at The Nature
Conservancy. His research interests include urban growth and its
implications for biodiversity and ecosystem services, energy policy
and its land-use effects, and global agriculture and its impacts on the
environment
Address: Worldwide Office, The Nature Conservancy, 4245 N.
Fairfax Drive, Arlington, VA 22203, USA.
e-mail: [email protected]
Ian Douglas is Emeritus Professor at The University of Manchester.
His work focuses on the geography of access to water, for all kinds of
human uses.
Address: School of Environment and Development, University of
Manchester, Oxford Road, Manchester M13 9PL, UK.
Carmen Revenga is a Senior Scientist at The Nature Conservancy.
Her research focuses on fisheries and freshwater biodiversity.
Address: Worldwide Office, The Nature Conservancy, 4245 N.
Fairfax Drive, Arlington, VA 22203, USA.
Rebecca Hale is a doctoral candidate at Arizona State University.
Her research interests include water use and its ecological implica-
tions in arid systems.
Address: School of Life Sciences, Arizona State University, 1711
South Rural Road, Tempe, AZ 85287, USA.
Nancy Grimm is a Professor at Arizona State University. Dr.
Grimm’s research concerns the structure and function of stream,
riparian, terrestrial, and urban ecosystems in arid lands.
Address: Faculty of Ecology, Evolution, & Environmental Science,
Arizona State University, 1711 South Rural Road, Tempe, AZ 85287,
USA.
Jenny Gronwall is an independent researcher associated with the
Stockholm Resilience Centre. Her work focuses on social equity and
justice in access to water.
Address: 110 Marlyn Lodge, Portsoken St, London E1 8RB, UK.
Balazs Fekete is a Senior Scientist in the CUNY Environmental
Crossroads Initiative. His research interests include global and
regional hydrological modeling.
Address: CUNY Research Foundation, The City College of New
York, 160 Convent Avenue, New York, NY 10031, USA.
446 AMBIO (2011) 40:437–446
123� Royal Swedish Academy of Sciences 2011
www.kva.se/en