The Natural, Human, and Sacred Geography of Classic Maya ...
Upload
khangminh22Category
view
0download
0
Paper 2 (Human Geography)
Topic Title Case Studies/ located examples
4 Changing Cities BirminghamMumbai
5 Global Development India
6A Resource Management and Energy GermanyChina
Name: ___________________________
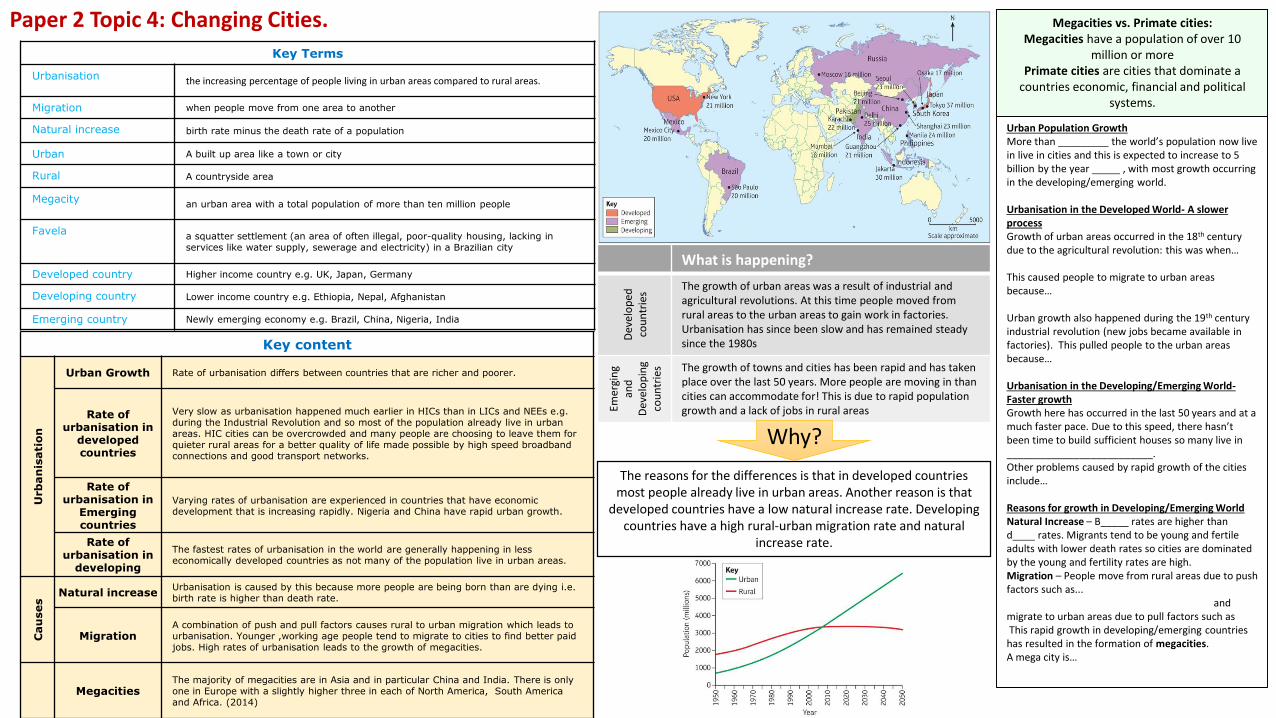
What is happening?
Dev
elo
ped
co
un
trie
s
The growth of urban areas was a result of industrial and agricultural revolutions. At this time people moved from rural areas to the urban areas to gain work in factories. Urbanisation has since been slow and has remained steady since the 1980s
Emer
gin
g an
d
Dev
elo
pin
g co
un
trie
s The growth of towns and cities has been rapid and has taken place over the last 50 years. More people are moving in thancities can accommodate for! This is due to rapid population growth and a lack of jobs in rural areas
The reasons for the differences is that in developed countries most people already live in urban areas. Another reason is that
developed countries have a low natural increase rate. Developing countries have a high rural-urban migration rate and natural
increase rate.
Why?
Megacities vs. Primate cities:Megacities have a population of over 10
million or morePrimate cities are cities that dominate a
countries economic, financial and political systems.
Paper 2 Topic 4: Changing Cities.
Key Terms
Urbanisation the increasing percentage of people living in urban areas compared to rural areas.
Migration when people move from one area to another
Natural increase birth rate minus the death rate of a population
Urban A built up area like a town or city
Rural A countryside area
Megacityan urban area with a total population of more than ten million people
Favelaa squatter settlement (an area of often illegal, poor-quality housing, lacking in services like water supply, sewerage and electricity) in a Brazilian city
Developed country Higher income country e.g. UK, Japan, Germany
Developing country Lower income country e.g. Ethiopia, Nepal, Afghanistan
Emerging country Newly emerging economy e.g. Brazil, China, Nigeria, India
Key content
Urb
an
isati
on
Urban Growth Rate of urbanisation differs between countries that are richer and poorer.
Rate of urbanisation in
developedcountries
Very slow as urbanisation happened much earlier in HICs than in LICs and NEEs e.g. during the Industrial Revolution and so most of the population already live in urban areas. HIC cities can be overcrowded and many people are choosing to leave them for quieter rural areas for a better quality of life made possible by high speed broadband connections and good transport networks.
Rate of urbanisation in
Emergingcountries
Varying rates of urbanisation are experienced in countries that have economic development that is increasing rapidly. Nigeria and China have rapid urban growth.
Rate of urbanisation in
developing
The fastest rates of urbanisation in the world are generally happening in less economically developed countries as not many of the population live in urban areas.
Cau
ses
Natural increaseUrbanisation is caused by this because more people are being born than are dying i.e. birth rate is higher than death rate.
MigrationA combination of push and pull factors causes rural to urban migration which leads tourbanisation. Younger ,working age people tend to migrate to cities to find better paid jobs. High rates of urbanisation leads to the growth of megacities.
MegacitiesThe majority of megacities are in Asia and in particular China and India. There is only one in Europe with a slightly higher three in each of North America, South America and Africa. (2014)
Urban Population GrowthMore than _________ the world’s population now live in live in cities and this is expected to increase to 5 billion by the year _____ , with most growth occurring in the developing/emerging world.
Urbanisation in the Developed World- A slower processGrowth of urban areas occurred in the 18th century due to the agricultural revolution: this was when…
This caused people to migrate to urban areas because…
Urban growth also happened during the 19th century industrial revolution (new jobs became available in factories). This pulled people to the urban areas because…
Urbanisation in the Developing/Emerging World-Faster growthGrowth here has occurred in the last 50 years and at a much faster pace. Due to this speed, there hasn’t been time to build sufficient houses so many live in __________________________.Other problems caused by rapid growth of the cities include…
Reasons for growth in Developing/Emerging WorldNatural Increase – B_____ rates are higher than d____ rates. Migrants tend to be young and fertile adults with lower death rates so cities are dominated by the young and fertility rates are high.Migration – People move from rural areas due to push factors such as...
and migrate to urban areas due to pull factors such as This rapid growth in developing/emerging countries has resulted in the formation of megacities.A mega city is…

UK urbanisation differencesPopulation=
Distribution=
Choropleth=
Density=
Infrastructure
The UK has an uneven population distribution:
This means some areas have…..
Whilst other areas …….
In urban areas there is a __________ population density (lots of people in a smaller area) with a
__________ population density in rural areas. This is due to 4 main reasons:
Physical Factors – The north and west have hilly areas (for example
which are difficult to build on/ provide infrastructure and have poor soils so population density is…
The climate in the north and west is also colder and wetter so…
In the south and east rich soils cause farming communities to grow which also have _______ people
living there because they’re rural areas.
Historical Factors – The industrial revolution caused the growth of urban areas near to coalfields e.g.
B________ and also to ports e.g. L_________ This caused population density in these areas to be…..
Economic Factors – Since the 1950s the UK has focussed on tertiary and quaternary industry which
requires space and good access e.g. Swindon. Tertiary industry supplies a service to people e.g. retail
whilst the quaternary industry involves high levels of education e.g. medical research. Areas of the UK
with higher education /skills and good access now have ________ population densities. For example
__________ has continued to grow due to good access because of the excellent road, rail and airport
links, high skills, a large market and large labour force.
Political Factors – L__________ is the centre of UK government and decision making and so attracts
firms near to the area.
The south east of the UK is close to the EU so it is a convenient location to base businesses, these
businesses increase the population density because…
What is Urbanisation?
This is an increase in the amount of people living in urban areas such as towns or cities. In 2007, the UN announced that for the first time, more than 50 % of the world’s population live in urban
areas.
Where is Urbanisation happening?
Urbanisation is happening all over the word but in developing and emerging countries rates are much faster than
HICs. This is mostly because of the rapid economic growth they are
experiencing.
Causes of Urbanisation
Rural - urban migration (1) The movement of people from rural to urban areas.
Push Pull
• Natural disasters• War and Conflict• Mechanisation
• Drought • Lack of employment
• More Jobs • Better education & healthcare
• Increased quality of life.• Following family members.
Natural Increase (2) When the birth rate exceeds the death rate.
Increase in birth rate (BR) Lower death rate (DR)
• High percentage of population are child-bearing age which leads to high fertility
rate.• Lack of contraception or education about
family planning.
• Higher life expectancy due to better living conditions and diet.
• Improved medical facilities helps lower infant mortality rate.

Key TermsFormal employment Informal employment Urban economies Pre-industrial Post-industrial Industrial Clark-Fisher model Pull factorsPush factorsRural-urban migration Working conditions
Questions1. Explain two differences between formal
and informal employment (4)2. Describe the main differences between
the economies of cities in developing and emerging countries and economies in developed countries (4)
3. Explain why the informal sector creates issues for governments (4)
4. Explain why international and national migration have contributed to the decline of a major city in the developed world (4)
5. Explain two of the pull factors that attract people from other countries to migrate to cities such as London or Birmingham (4)
Formal and informal employment People who work in formal employment usually receive a regular wage and may pay tax on their income. In some countries they may have certain employment rights, such as sick leave or holiday pay. The formal employment sector includes factory workers, office workers, shop keepers and governments. Informal employment activities are not officially recognised by the government. They generally work for themselves e.g. hairdressers. They don’t always pay taxes and have no protection.
Urbanisation is a result of socio-economic processes and change.(migration, national, international, urban economies, type of employment)
The impact of migration on urbanisation—National migration—This is migration that occurs within a country. In 1990, Chongqing in China had a population of 2 million. By 2014, the population was 12.9 million due to large scale internal migration. This was caused by: economic reform in China, the rapid growth of industries after 200, loss of farmland due to urbanisation. Migrants were attracted to the cities due to more opportunities and better services such as healthcare and education.
International migration—This is migration between 2 different countries. In 2001, London had a population of just over 7 million people. In 2011, the population had increased by 14% to 8.1 million. This is largely due to migrants from India, Poland, Ireland, Nigeria and Pakistan. The pull factors that attracted the migrants to London were employment, entertainment and culture, services and UK international transport network. Push factors also encouraged the people to migrate from their country of origin such as lack of jobs, healthcare, standard of living and potentially war.

Key TermsUrbanisationSuburbanisationDe-industrialisation Counter-urbanisationRegeneration CBDAccessibilityAvailabilityPlanning Regulations
Cities change overtime and this is reflected in changing land use(How population, distribution changes overtime, characteristics of urban areas)
Similarities and differences between developed, developing and emerging countries:
• Similarities: Most cities have a CBD, have areas with industrial zones and are spread over a wide area. They have extensive suburbs They have issues with pollution and traffic congestion.
• Differences: The zones of industry and housing are more distinct and separate in developed countries. In developing and emerging countries affluent areas are close to industrial zones or areas of squatter settlements. Most cities in developed countries do not have squatter settlements. Cities in emerging and developing countries have not experienced counter-urbanisation.
The number of people living in a city, where they live within the city and how the city shapes itself all change over time. A city may go through each of the following stages: • Urbanisation—In the most developed countries, such as the UK and USA, urbanisation was linked
to industrialisation. The industrial revolution and services such as railways, roads and a safe water supply attracted workers to the growing towns. As cities become urbanised, more factories were built and growing numbers or rural migrants arrived to fill the jobs that were created.
• Suburbanisation—By the early 20th Century in developed countries, city centres had become noisy, crowded, polluted places. People who could afford to, moved out of the city centre to the new ‘suburbs’ on the edge of the city where land was cheaper and the air was cleaner.
• De-industrialisation— The industry in the city begins to decline. Often this is the result of technological change, failure to invest or competition from other countries (outsourcing).
• Counter-urbanisation—In the 1970s - 1980s, people in the UK, Europe, USA and Japan chose to leave larger towns and cities to move to more rural areas. This led to a pattern of population decline in inner city areas and population growth in small towns and villages. Counter-urbanisation was possible due to increased car ownership and motorway construction, this allowed people to commute to work. Progress in telecommunications and information technology also meant that people could work from home in remote villages.
• Regeneration— Some older cities have started to redevelop their run-down inner-city areas in order to attract people to live close to the amenities of the city centre. New shopping centres, flats, houses and leisure facilities are built to give the city centre a facelift and attract businesses.
Questions1. Define
urbanisation (2)2. Define
regeneration (2)3. Explain how
accessibility and cost influence urban land use (4)
4. Explain some of the main factors that influence land use in a city (4)
Why functional zones form in cities?
The centre of a city is the most accessible part of the city. Most land uses that need access to lots of people, such as shops and offices, must locate near the most accessible part. So there is competition between land uses. This means the rent charges for the city centre are higher, therefore only those who can pay the high rents can afford to locate there. Shops and offices can afford this, other land uses like manufacturing and industry are found further away from the city centre where there is cheaper land.
Land use zonesThe CBD has a range of high-end shops and tall office blocks, together with multi-storey car parks. Close to the CBD are usually the rail and bus terminals, as well as markets (wholesale and retail) and public buildings (town hall). These zones are recognised by the area’s warehouses. Industrial areas are usually further away from the CBD and are recognised by low factory buildings together with old canals and newer dual carriageways. Residential areas have extensive zones of houses with gardens and blocks of flats are away from the CBD.
Factors influencing land use:• Accessibility—Shops & offices need to be accessible to as many people as possible and so are usually found in city centres, which
have good transport links. Sometimes, the edge of the city is most accessible, often by motorway and this has led to the growth of out-of-town shopping centres, which are multi-use.
• Availability– City centres tend to be heavily built up. The availability of land may also affect how land is used. When factories close, the brownfield site may be used for housing, shops and offices.
• Cost– Land in the city centre is often very expensive due to a lack of availability. Some land-uses such as shops and offices, can afford to pay high rents.
• Planning Regulation—Planning also affects land use patterns. Planners try to balance different, often competing for land. The city's authorities often decide how they want a city to look and develop and plan on what type of land use is permitted in certain areas.

The location of the changing city of Birmingham The city of Birmingham developed on a dry point site on a south facing, sandstone ridge overlooking a crossing point of the River Rea. Before the 19th century, Birmingham was a small market town on the Birmingham plateau overshadowed by the surrounding towns of Stafford, Worcester and Warwick.
In the 18th and 19th centuries Birmingham urbanised as it developed its own industries of jewellery, gun making, buttons and brass trade, to create high quality goods. These industries needed skilled labour and small amounts of raw materials in the time before canals were built to carry bulky goods. New estates where built in a hurry in places like Small Heath, Selly Oak and Saltley for people and their children arriving from the countryside.
From the 1830s, Birmingham began to spread rapidly outwards. This was when its situation in the centre of the Birmingham plateau and the middle of the country became so important. First canals and then railwaysconnected Birmingham and other Midlands towns and the rest of the UK, enabling manufacturing to easily source raw materials and reach markets.
Today Birmingham is at the heart of the UK road and rail network. Birmingham is also a major global centre, based on its airport and its reputation as a conference centre.
Case Study of a major* UK city – Birmingham
Birmingham’s Site / Situation / contextSite= Birmingham is located on River Rea on solid sandstone land. This was originally a good site for the location of a settlement because…Situation = Birmingham was surrounded by the forest of Arden, useful for settlers because….. The hilly landscape also gave protection from… Context= The West Midlands, Birmingham is close to nearby towns/cities of W_____________, W_________________ and S_______________.
Birmingham’s stages of urbanisation:1. Urbanisation of Birmingham= Late 1700s to 1900 Birmingham’s population
grew because people were migrating there from rural areas and the high natural increase. In the industrial revolution Birmingham’s population grew rapidly due to lots of pull factors.
Explain why these factors pulled people to Birmingham:• Cadbury Factory opens 1879=• Rail line to Manchester (1837) and to London (1838)=• Birmingham connected to rest of UK by canal network=• Lots of gun and jewellery factories= 2. Suburbanisation of Birmingham= in the early to mid 1900s Birmingham’s suburbs grew 3. Counter urbanisation = In the 1960s-1990s Birmingham’s population declined (fell) = People left the city because parts of it had got really rundown and also because of a lack of jobs due to de-industrialisation. 4. Regeneration and Re-urbanisation of Birmingham 2005 onwards= Birmingham has had A LOT of money spent on it as part of the ‘Big City Plan’ to improve the city. This has helped people to want to live there again.
CBD Inner city Suburbs
Age of buildings
Oldest buildings Old 19th century Newest buildings 1930s – 1960s
Density of buildings
Land here is expensive so density is high, buildings are close together and taller than the rest of the city
Still relatively high density: terraced housing, flats.
Low: semi detached and detached housing
Functions Department stores, offices, theatres, hotels and local government
Few shops, few factories, few churches, limited green space
High quality green spaceLarge number of housing
Land uses Commercial (Retail Offices) A little bit of retail, some manufacturing and some residential
Residential with a few shopsCouncil houses and estates
Environmental quality
High due to areas being redeveloped, some green space
Low High
The structure of Birmingham The central business district is one of the oldest areas of the city, dominated by department stores, specialist and variety goods shops, offices, theatres and hotels. This is the heart of the city and the centre of local government. Many buildings in the CBD are fairly new following redevelopment projects such as the Bullring shopping centre. The quality of the environment in the CBD is quite high with some green space. Because land here is expensive, the building density is high, with buildings both close together and taller than in the rest of the city.
Beyond the CBD are the 19th century inner city areas which were redeveloped in the 1970s into comprehensive development areas (CDAs). Here the buildings are tower blocks of flats or high density terraces/ properties. There are few shops, even fewer factories and a few churches with limited open green space.
By the 1920s as the population of the city increased Birmingham had to expand. The suburbs extend beyond the inner zone and occupy a large part of the city’s area. Some of the suburbs city areas where built in Victorian times, whilst others were built in the 1930s, 50s and 60s. Some are centres of council housing (many of which have been purchased) and others were built as private estates. Here the density of buildings is low, and the land use is mainly housing with a few shops and some good quality green space.
The industrial zones of the city stand out clearly, radiating from the city centre. There are two important zones radiating in an easterly and north-easterly direction. Suburban industrial areas are also significant in the geography of the city and are usually located close to a main road.
By the 1970s counter-urbanisation was boosted by the redevelopment of the city’s inner city areas. Here 5 new CDAs were created by demolishing all the old 19th century terraces and courts. The redevelopment forced people to move out either to estates on the edge of the urban area or to new towns.
On the outskirts of the city is the urban-rural fringe. This is where town meets country. There is a mixture of land uses here, such as housing, golf courses, business parks and airports.
Many people now want to live close to the amenities the CBD offer. New apartments have been built near canals and in converted factories across the city centre. Birmingham is in the process of giving itself a facelift by actively redeveloping parts of its CBD and inner city areas. Older tower blocks have been refurbished and new centres developed like the Mailbox: a mixture of shopping, leisure, offices and apartments.

How has Birmingham’s population, employment and services changed over time?
Urbanisation • In the 18th and 19th century, urbanisation in Birmingham was based on the manufacture of jewellery, guns,
buttons and brass.
• Factory production in the 19th century led to rapid urbanisation.
Suburbanisation • New estates were built in a hurry in places like Small Heath, Selly Oak and Saltley for people and their children
arriving from the countryside.
• As the population of Birmingham increased, Birmingham has to expand and in the 1920s suburbanisation saw
large estates of both council houses and private houses built; mostly semi-detached houses on large areas of
land.
• These estates often lacked shops and clinics. However, they were laid out with wide tree-lined roads and grass
verges (the grassy strips next to pavements) in an attempt to maintain the quality of the environment.
Counter urbanisation
• The redevelopment forced people to move out to either to estates on the edge of the urban area or to new towns like Redditch. This was partly as they could no longer afford the redeveloped properties.
Reurbanisation • Since the 1990s there has been a shift in where some people would like to live- they want to live close to the
amenities the city centre offers.
• New apartments have been built near the canals and converted factories across the city centre as Birmingham is
in the process of giving itself a face lift by actively redeveloping parts of its CBD and inner city areas.
• In the 1970s the inner city areas were redeveloped. Five new CDAs (comprehensive development areas) were
built by demolishing all the old 19th century terraces and courts.
• Older two blocks have been demolished and new centres developed like the Mailbox; a mixture of shopping,
leisure,, offices and apartments.
National migration -reason
Impact on Birmingham
International migration -reason
Impact on Birmingham
Retirement – people decide to leave Birmingham to retire somewhere near the coast in England (example)
+ less pressure on healthcare services in Birmingham+ more housing andinfrastructure freedom- Less spending, can impact economy and growth
Shortage of workers – in the 1950s, UK encouraged migration from India, the Caribbean, Pakistan and Bangladesh to fill jobs (e.g. Textiles and transport)
+ willing to fill less desirable jobs and work for less- Migrants stay and their families come over which can put pressure on resources; increase unemployment, etc.
Job prospects- people often seek better jobs in cities (like Birmingham)
+ more people to fill jobs-More competition- could create job shortages
EU migration - Since 2000, many migrants have come from countries in Eastern Europe for better jobs and living standards
-More competition for jobs- more pressure on resources+ fills labour and less desirable jobs+ people paying taxes to improve economy
Study – Usually involves young people and is temporary or short term
-Using resources (healthcare, etc.) and not necessarily contributing+ can fill up part time/seasonal jobs+ spending money which helps the economy
Flight from conflict –refugees from Syria and Afghanistan
-Large number coming at once makes it difficult to prepare-Increase crime and tension- increases inequality+ filling jobs with shortages
Birmingham’s population compared to the UK average.
The causes of national and international migration
Population characteristics of Birmingham?• Just over 1.1 million people live in
Birmingham. • Since 2004, the population has
increased by almost 100,000 people (this is an average of 0.9% a year).
• There are three key reasons for this: Rising birth rateFalling death rateUK and international migration
• Birmingham is one of the UK’s most diverse cities with 42% of its inhabitants from ethnic groups other than white. 22% of residents were born outside the UK.

How has globalisation and economic change created challenges for Birmingham?
De-industrialisation is the decline of industries in a city.
CAUSES OF DEINDUSTRIALISTION EFFECTS OF DEINDUSTRIALISTION
Globalisation: this is the process by which cities become part of a world market. In Birmingham, this meat that its industries of car motorcycle manufacture suffered badly in the 1970s from imported vehicle from the Japan and western Europe. (Global)
Workers were made redundant.
De-centralisation: the 1970s were also a time of decentralisation in Birmingham when many inner-city areas were redeveloped. Factories were either closed or demolished or they moved out of the city. (Local)
Some factories relocated to the suburbs or to new towns like Redditch.
Technological advances: the development of new technologies associated with metal manufacture were slow to be applied to the older factories in Birmingham. As a result, some firms went out of business because they did not have the new technology which often made goods cheaper. (Global)
It left many brownfield sites with empty factories and warehouses There was some large-scale pollution of the land where former industries such as metal smelting had taken place.
Transport developments: part of the redevelopment of central Birmingham in the 1970s was the construction of an inner ring road. To build the new road, older factories, warehouses and houses had to be demolished. Some of the factories never re-opened and others moved away from Birmingham. (Local)
Factories closed.There was large scale unemployment and the need to retrain many workers.
Inequality in Birmingham How is inequality measured? •The characteristics of different areas of a city can be measured using the Index of Multiple Deprivation (IMD).•The IMD measures 38 different characteristics and splits them into 7 categories: income, employment, health, education, crime, access to services and the living environment.
• 40% of Birmingham’s population live in areas of deprivation.• Deprivation in Birmingham is concentrated in a ring around the
city centre.• The percentage of working-age people with no qualifications in
inner-city Birmingham is double the national average.• Birmingham has the highest level of youth unemployment for
the UK’s major cities (highest in Erdington, lowest in Sutton Coldfield).Why is there inequality in Birmingham?
Social
• There may be some discrimination against newcomers and some racial discrimination, although this is being actively tackled and overcome.
• The large number of people arriving in a short time makes it hard to provide what is needed quickly, for example schools and health services
• Some areas in the inner-city have poorer schools and poorer health provision. • Some of the suburban areas in the south and west have poor living conditions. • Some of the suburban areas in the south and west have poor schools
Economic
• Areas in the inner-city have high unemployment. • Many of the new jobs are only part-time or temporary and do not pay well. • There are few factories, providing few local jobs with the result that people have to travel to find work and this adds to the
expense.• Many migrants are well qualified, for example, as doctors, dentists and lectures, but in the 21st century people with few
qualifications find it harder to find good quality jobs. • Economic chance is so rapid that cities find it hard to keep pace and cities like Birmingham have not had the money to do all
they would wish to in order to reduce the inequality in areas.• Some of the suburban areas in the south and west have high unemployment.
Environmental -including the built
environment)
Older houses in these areas can be damp and hard to heath and this can lead to health issues.
Quality of life is the degree of well-being felt by an individual or group of people in an area. It relates to jobs, wages, food and access to services
Sparkbrook – inner city• Media dubbed area the gun capital of the
UK.• Less green space• Wide range of shops selling produce from
all over the world. • People are not generally unhappy with
their quality of lives. • Some concerns over crime• Some concern over pollution and rubbish
collection.
Sutton Coldfield – suburbs • Relatively low crime rates• Dissatisfaction with rubbish
collection• Lots of green space• Complaints about noise and light
pollution• Wide range of shops• Low air and water pollution
What has caused this pattern of inequality?
Economic change increasing inequality
The economic structure of Birmingham has changed in the last 50 years following the decline of
manufacturing causing unemployment of people with lower skills / secondary sector workers. Higher
skilled-educated workers can live on the outskirts and commute to the centre to work in new jobs in
finance and IT. As a result of this change, new patterns of inequality have occurred across the city. We
can use the index of multiple deprivation to measure poverty in an area. Within Birmingham, the most
deprived areas tend to be in the centre of the city, with claimants of benefits tending to be in the same
area.

Birmingham’s changes in retail and regeneration Retail Change in Birmingham
There has been a massive change in retailing within the city over the past 40 years.
Why has Birmingham’s CBD changed?
• 19th century – People moved away from the city centre to the suburbs as it was noisy and polluted.
• 1879 – Many factories moved away from the city centre to the inner suburbs e.g. Bourneville.
• 1970’s – Shops moved away from the CBD to the suburbs to create retail parks e.g. Merry Hill. This was
built on the site of a former steel works (Round Oak Steel Works) and provided competition for retail in
the city, as a result trade declined. Retail parks are advantageous due to easy access, free parking and a
range of indoor shops.
• Internet shopping – Most recently an increase in computer / smart phone ownership has meant internet
shopping has increased due to its ease and cheapness. Birmingham has combatted this issue through
redevelopment- and offering a ‘day out’ rather than just shops.
THE FIGHT BACK – Birmingham’s CBD Redevelopment.
In the 1980’s the CBD fought back against the out of town developments by:
• Building flagship centres such as ICC and Symphony Hall. Building the new Central Library.
• Making the city centre more pedestrian friendly. Encouraging stores to open until late.
• Adding new attractions such as the Sea Life Centre.
• Redeveloping a previous Royal Mail sorting office into the Mailbox which includes high end stores such as
Harvey Nicholls.
• Building the new Bullring shopping centre in 2003 creating a modern shopping with parking.
• Redeveloping New Street station into Grand Central in 2016 including shopping and restaurants.
• Snow Hill Station was improved.
• The Jewellery Quarter was redeveloped a bit- but it wasn’t successful – this area has high crime rates –
especially burglary and violent crime.
• A new area of growth of the CBD with new offices / retail / restaurants along the Hagley Road such as TGI
Fridays.
• Another new area is where the Birds Custard Factory in Digbeth has been turned into an arts centre and
ICT hub.
Strategy focus Detail
Green transport Birmingham Connected Scheme
Transport network important for economy and society in Birmingham. Building new tram infrastructure & extending tram network.
Also have range of buses, (some gas powered) & network of bus lanes to reduce car transport
Electric charging points throughout city.
CABLED project promotes use of electric vehicles
Cycling: off road routes & round canal network & green spaces. Also on quite roads and main corridors.
Health benefits for cyclists and others as reduces vehicle emissions
Bike North Scheme: learn to ride scheme promotes community involvement
Energy Birmingham District Energy Scheme: Trigeneration of heat, electricity and chilled water to prestigious buildings in town centre
including town hall, council house & new Library. Interconnected areas; benefit businesses as energy, carbon & space saving.
Severn Trent Water: in addition to water & waste removal, generates renewable energy from sewage waste. Process of anaerobic
digestion to produce energy. Based in Minworth, Sutton Coldfield. Contributes energy to National Grid
Northfield Eco Centre: Energy, gardening and food growing. Energy assessment of public and private buildings. Funding for those in
fuel poverty. Plant fruit and nut trees in publically accessible areas; community gardens to teach skills, support public to grow food in
own gardens.
Local Food
Production
Northfield Eco Centre: Energy, gardening and food growing. Plant fruit and nut trees in publically accessible areas; community
gardens to teach skills, support public to grow food in own gardens.
Community 2012 community center opened in Sparkbrook, in an eco-friendly building. It serves around 15 000 local people. It has 3 GP practices,
offers local council services, a library, rooms for community sue ad offices for startup enterprises.
Building Efficiency Zero carbon house: no fossil fuels or new carbon for running house. Generates energy which makes an income as contributes to
national grid.
Very insulated to prevent heat loss
Rainwater filtered and reclaimed
Natural light from above; needs only 1/5 of heat for the houseRecycling Birmingham is still low on this. In 2013 recycling rate for England as 43.5%, but Birmingham was only at 30.1%
Making urban living more sustainable and improving the QofL: Sustainable living in Birmingham
Sustainability or sustainable development is development that meets the needs of the present, without compromising the ability of future generations to meet their own needs
Basic factsSustainable Cities Index tracks progress on sustainability in Britain’s 20 largest cities, ranking them across three areas: environmental performance; quality of life; and future-proofing .
This index includes a wide range of measures such as biodiversity, recycling, health, transport, education, climate change and local food production.In 2010 Birmingham was ranked 15th of 20 – an improvement since 2007 where it was 19th.
Background info on the core-frame model: The CBD consists of an inner core, outer core and frame. Within the inner core department stores and offices can be found. Within the outer core town halls and administration buildings are found as they cannot afford the rent of the inner core. Travel stations tend to be found within the frame. In some areas growth is occurring where old offices are converted to houses (zone of assimilation) where as some areas are retreating due to firms closing down (zone of discard).
Retail - the sale of goods to the public in relatively small quantities for use or consumptionDecentralisation – the movement of people, factories offices and shops away from city centres to suburban and edge of city locationsOut-of-town shopping - Retail facilities located on the edge of cities Internet shopping- form of electronic commerce which allows consumers to directly buy goods or services from a seller over the Internet.

Case Study of a major city in a developing country* or an emerging country – Mumbai, India CASE STUDY—The location and context of Mumbai Megacity –influences, structure, growth &
function(Site, situation, connectivity, structure, functions)
Key TermsSiteSituation Environmental factorsStructureFunction Conurbation
Environmental factors:In the north of Mumbai’s peninsula is the Sanjay Ghandi National Park. This is the world’s largest park in a city (100km²
forest) which attracts 2 million visitors a year. The park has a small population of tigers. It is located on high steep ground preventing urbanisation. Locals believe that it improves the air quality of the city.
Mumbai is India’s biggest city. It has a population of 12.5 million people living within the city limits, which makes it a megacity. • Mumbai’s site explains why people first settled here on a number of islands next to a safe harbour. • Its situation explains why a small fishing village surrounded by mangrove swamps developed into a port city and an
industrial city.• It has a naturally deep harbour, accessible for container ships and it is located on the west coast of India, facing important
regional markets such as the Middle East and international markets in Europe. The docks in Mumbai account for 25% of all India’s international trade. Mumbai is also well connected to the rest of India through extensive road and railway networks. This means people can easily travel to and from Mumbai across India.
Industrial history—Britain was important to Mumbai’s industrial development. • In the 19th Century Britain imported cotton from India. This helped develop rail networks to Mumbai’s port. Britain then
developed textile industries in Mumbai this led to population growth as people come from across the region to work in the factories.
• By the late 20th Century, Mumbai’s textile industries started to decline as did the port. However, other industries started to take its place such as banking. Banking has always been important in Mumbai and is one of the world’s most important financial centres as globalisation connected economies around the world. Many of India’s biggest companies moved their headquarters to Mumbai. Engineering, healthcare, pharmaceutical and IT industries grew fast. ‘Bollywood’, the Hindu-language film industry, also developed in Mumbai. Its importance as an entertainment and media centre makes Mumbai culturally significant in India today.
• Site Problems– By the end of the 20th century, Mumbai’s population was growing very rapidly, fuelled by rural-urban migration. Mumbai could only expand North up its long narrow peninsula making it very crowded and unsanitary. In 1970 a proposal was made to develop a new suburb of Mumbai on the mainland. In 1980-90 the population of the island city of Mumbai declined slightly as New Mumbai expanded rapidly.
How has Mumbai’s structure developed?1. Urban-rural fringe– Mumbai’s urban-rural fringe is hard to locate
because it has spread out into a vast conurbation merging into other towns on the mainland with a population of 22 million people. Rural areas are generally found where the environmental factors around Mumbai mean the land is not suitable for building. For example: Marsh land, the National park area and floodplains.
2. Outer suburbs– This second area of suburbs was developed post-1970s as the settlement developed along the railway lines. This allowed commuters to travel into and out of the city every day. New industrial sectors have now developed along the railway networks as well. New Mumbai was planned as a low density suburb where lower land prices could create a better quality of life, with less congestion for the commuters. Due to the cheap land prices, more space to expand and availability of skilled worker’s industries relocated to New Mumbai from the peninsula.
3. City-Centre—The oldest parts of Mumbai are at the Southern tip of the peninsula. The CBD is located here, centred on the old banking sector of the city. The headquarters of important companies are located here such as Bank of India, Bank of America, Cadbury India, Microsoft India, Tata, Volkswagen and Walt Disney. The old textile mills area has been redeveloped. The housing located here is extremely expensive due to its proximity to the CBD. Retail developments such as shopping malls are also found here. The port is still very economically active, as thousands of people work here and live in slum housing.
4. Inner suburbs– This area was developed to house workers in the old textile mill area. Most of this area is now characterised by squatter settlements and slums such as Dharavi, Asia’s largest slum.
DID YOU KNOW:
• Mumbai is India’s economic powerhouse and a city that is important on a global scale.
• Mumbai generates more than 1/6 of India’s GDP.
• 10% of all India’s industrial jobs are located in Mumbai in a wide range of different industries.
• 40% of India’s exports come from Mumbai and is India’s top location for FDI.
• Mumbai has India’s busiest international airport and India’s 2 largest stock exchanges.
• There are 10 universities and many research centres specialising in IT and engineering.
LocationLargest city in India (emerging country)Site: Number of islands next to a safe harbour. Low lying. Tropical climate (incl. monsoon)Situation: Surrounded by mangrove swamps. Small fishing villages created. Good access to the port and industry could thrive in the naturally deep harbour. Links to coastal oil transportation.Connectivity: Naturally deep harbour. Good access for container ships. Good location for trade with Europe as its on the west coast of India (Suez Canal accessible). Good air connections. Regional: Good railways connecting the outskirts of Mumbai to the centre. National: Good road and rail network connects Mumbai to the port and rest of the country.Global importance: Historically, Mumbai exported cotton. Strong
economy, creative industries. Mumbai generates more than 1/6 of India’s GDP.

CASE STUDY—Mumbai is rapidly growing(Reasons for population growth and how it has affected the pattern of spatial growth and changing urban functions and land use)
Key TermsPopulation density Natural increase Push and pull factors Economic growth
Mumbai’s population has increased by more than 12 times in the last 100 years. After 1970 most of the growth was not in the old island city of Mumbai as this was already too congested. Instead the suburbs grew the most. Population density for the city it is 20,962 people per Km² (one of the highest in the world). This makes living space very expensive and the city very congested. This means people and businesses try to relocate to less congested areas. They generally move along railways and road networks. Some rural-urban migrants have almost nothing, they can’t afford to travel to work or afford rent. This leads to the development of slums, here the population density is very high, however the slums are close places where people can work and accommodation is cheap. Generally, slums are located next to expensive accommodation. Megacity growth in an emerging country such as India is due to two main factors: • National/ international migration - The boom in Mumbai’s population growth from the 1970s onwards was fuelled by migration (mostly
rural– urban migration) from the region and around Mumbai. • Rates of natural increase - From 2001-2011 the population increased by 3.4 million in the conurbation as a whole, around half of this
increase was due to migration into Mumbai and half due to natural increase. In the old city centre, natural increase added 750,000 to the population, however 250,000 moved out during this time. The suburban district population increased by over 1 million people, mostly due to internal migration.
Mumbai’s population growth creates opportunities and challenges
Opportunities• The rise of the service sector— Jobs in manufacturing such as cotton manufacturing
and car production is what encouraged rural-urban migration throughout the 20th century.
• By the 1980s these industries declined and Mumbai’s economy switched to the service sector. Finance and IT services employed the most Mumbaikars. Foreign direct investment due to globalisation meant that IT and finance industries brought in more international migrants to live and work in Mumbai. Other service sector industries developed as well such as taxi driver services, cleaners, hairdressers, mechanics, waiters and street vendors. The main opportunity brought by urban growth is employment, especially for those living in rural regions. Even if the living standards are poor, the opportunities for work are so high it encourages many to move.
• Dharavi industries—Dharavi is located between two major railway lines. It has a population of 1 million people in 1.5km²and is home to 5000 small-scale businesses and 15,000 single-room factories. These businesses provide £350 million per year. This is a result of poor people creating their own opportunities as they cannot afford Mumbai rent outside the slums.
• Infrastructure benefits—Even when people live in slums like Dharavi, megacities provide many services and resources that cannot be found in rural regions. Such as electricity, schools and hospitals. 6million people live in slums in Mumbai (40% of the population). More than 1 million Mumbaikars earn less than £10 a month. However, media companies realise they can still earn profits from poorer people by charging them £1-2 a month for TV access.
Challenges• Rapid expansion—Population growth has occurred faster than services can develop. This has created challenges such as reliable
electricity supplies and adequate water supplies. As well as this it has created huge pollution issues as the government struggles to organise waste disposal. There are an estimated 800 million tonnes of untreated sewage in the river.
• Traffic congestion— There are over 1.8 million cars in Mumbai due to a rapid rise in private cars. Roads are often gridlocked. 90% locals travel by rail rather than car; however, this has strained the railways (8 million travel on the suburban lines each day).
• Housing—Finding affordable housing is extremely hard due to limited space. As the city spreads so does the population and density. There are 2 main types of housing in Mumbai. One type is Chawls (old tenement buildings over 100 years old) They are very overcrowded and aren’t maintained. The second type is Squatter settlements; this is when people put up market huts on land ownedby other people or the government. The poorest people live on the streets, under bridges and on sidewalks. Sometimes it is temporary but for others it’s a way of life. Some business owners try and charge people for sleeping on their pavement. Over 20,000 live this way.
• Living with slums—People live in slum conditions as they can get to work easily and rent is cheaper. However as squatter settlements are not official government or council locations the government doesn't have to provide them with infrastructure or services. This provides many problems such as: lack of adequate water (generally there are stand pipes which only give out water from 5.30am to7.30am), sanitation issues (there are no sewage systems so people defecate in the streets, streams and rivers that run through the settlement. When there is a latrine more than 500 people could share the same toilet at a price). Another issue with a lack of fresh clean water is that families have to clean in the rivers and streams they pollute. A big issue for Mumbaikars is the value of the land as the government and businesses have started clearing squatter settlements for property developments and new businesses. The government wants to provide better services, infrastructure and facilities for locals and businesses. However, when the homes are cleared families are made homeless.
• Working conditions– Most employment is in the informal sector, this means there is no protection for workers. The working conditions are generally very poor with limited light, workspace, breaks, ventilation. Toxic fumes can fill factories; work can be dangerous for little pay.
Push factors
• Difficult rural conditions
• Few services in rural India
• Lack of education and healthcare
• New farming techniques meaning fewer jobs
Pull factors
• Huge range of jobs
• Education opportunities
• Range of healthcare options
• Wages are much higher

Quality of life (QOL)—is measured according to different factors such as wages, how people feel, services. There is no standard way to measure quality of life which can make it difficult to compare cities and countries quality of life. QOL in megacities is generally measured according to: level of air and water pollution, transport congestion rates, access to healthcare and education, crime levels, access to affordable housing, sanitation, quality of government services and income. QOL in Mumbai— Although this city is globally important it lacks a good QOL. Other emerging Asian countries have much better QOL in terms of housing, pollution, healthcare and sanitation. Given Mumbai’s great wealth and FDI its quality of life makes it a difficult place to live and work. There are 3 main problems for Mumbai. Problem 1 is the government is inefficient and bureaucratic which means it takes a long time for infrastructure improvements to be approved. Problem 2 is most of Mumbai’s properties are rent-controlled, meaning there is a limit to how high rents can be. This discourages property owners from improving their residencies and redeveloping. The 3rd problem is corruption. The areas that were meant to be redeveloped into affordable housing such as the old textile mills were sold to property developers who built expensive apartments that only the rich can afford.
Mumbai differences in QOL— Approximately 40% of Mumbai’s population live in squatter settlements, 20% live in Chawls, 10% on the streets and 30% or less who live in apartment buildings, flats or bungalows. Over 60% of the population work in the informalsector, meaning they can only afford to live in Chawls or squatter settlements. Generally, the slums are located next to areas with good QOL. Reasons for differences in QOL—The main reason is due to rapid expansion. Other reasons are that to improve access to affordable housing, more houses will need to be built, however more money can be made by building expensive apartments. A second reason is to improve working conditions in the informal economy new laws and regulations will need to be put into place. Thirdly to improve access to services, the city government would need to incentivise more companies to provide services in poorer areas.Political and economic challenges of managing Mumbai—To improve QOL difficult economic and political decisions have to be made such as whether to clear slums for development, traffic congestion is a huge issue, however it is too expensive to improve and the government gets no taxes from the informal sector, which the government could use to improve QOL however it would be hardto change as locals would feel they are losing money.
CASE STUDY—Quality of life can be improved through different strategies
(Sustainable, Bottom-up, Top-down)
What are sustainable cities?A city that provides a good quality of life for all its residents without using up resources in a way which would mean future generations would have a lower quality of life. In a sustainable city there would be good public transport systems to reduce congestion and improve air quality, waste would be recycled, the residents would be energy efficient so less pollution is made. Everyone would have access to good services such as healthcare and education as well as affordable housing.
Top down strategies to improve quality of lifeThese are big, expensive infrastructure projects generally developed and managed by governments. There would be multi-billion dollar funds city governments can access to pay for the projects. They are known as top down as they are generally imposed on the people by the government.
The Mumbai Monorail
The government decided in 2005 that a mono-rail would be a good solution to traffic congestion. Advantages• Reduces the amount of traffic on the roads making
them safer• Constructed over built up areas without having to
clear any roads/land. • Carries passengers quickly and easily moves around
the landscape• Government created a public-private partnership by
2008 with foreign engineering companies who provided their expertise.
• Tickets are cheap (11 rupees per person –10p),Disadvantages: • Construction began in 2009 with a deadline of 2011 -
only opened in 2014. • The cost of the 1st section was £310 million.• Number of passengers has been lower than
expected - Only 15,000 each day • Mainly used by tourists due to its location away
from the main city.
The Gorai Garbage Site Closure Project
From 1972-2007 over 1200 tonnes of Mumbai’s solid waste was deposited at the Gorai landfill site every day. It was a 20-hectare site in the north of the peninsula which is close to residential areas.
By 2007 the waste was 27m deep and emitting methane. Toxic runoff was leaching into the nearby lake and polluting the local water supply.
In 2007 the supreme court ruled that it must be improved for residents.
The government made a plan and implemented it within 2 years.
The site was reshaped into a hill, lined with material to prevent leaching and planted with grasses to create a 19-hectare park.
Methane capture technology has also been used to generate electricity cheaply for local residents.
In 2014, the site was awarded a prize for sustainable urban development. It was a very expensive project.
Bottom-up strategies to improve quality of lifeOrganisations work with local residents to create community based projects to improve the quality of life for residents. Most of the organisations are non-governmental (NGOs).
Hamara foundation
There is over 200,000 street children in Mumbai that have dropped out of school. Police force them to move from any shelters they have created as some street children steal and take drugs. The Hamarafoundation creates social-work services for these children to help them get an education, improve their health and give them job skills. Between 2013-2014 327 children were supported by the foundation. This foundation also provides vocational training for 16-18 year olds in computing, mechanics and hospitality. The issue is not many children are being helped.
SPARC and community toilet blocks
Government toilet blocks that were provided charged individuals for each use, meaning they were too expensive for most families. The design of the toilets was also very poor, without running water and no employees cleaning them. An Indian NGO called SPARC works with communities to build new toilet blocks that are connected to city sewers and water supplies. Locals help to construct the toilet block and families from the community can purchase monthly permits for 25 rupees (25p) which is much cheaper than the government owned. Once they have a permit they can use the toilets as much as they want. The toilets have electric lights making them safer and separate toilets for children. In 5 years, 800 toilet blocks each with 8 toilets have been created. Although some argue it should be the government’s responsibility to provide toilets not NGOs.
Agora Microfinance India
Squatter settlement residents usually struggle to have a bank account or get loans as they don’t earn enough money. Microfinance is a banking service that helps provide microfinance (small loans—mainly for women) to slum residents to start businesses, improve their homes. There are also education loans available for people who want to take classes. Group loans allow people to take a loan together. Individuals can get a loan of up to £300 with an interest rate of 25%, paid in weekly instalments. Before a loan is given, a guarantor has to agree to pay the company £150 if the loan is not repaid.

Paper 2 Topic 5: GLOBAL DEVELOPMENT 5.1 Definitions of development vary as do attempts to measure it
a. Contrasting ways of defining development, using economic criteria and broader social and political measures.Development is the idea linked to improving the quality of people’s lives.
Quality of life includes: • Physical i.e. diet, water supply and climate• Psychological i.e. happiness, security and freedom• Social i.e. family, education and health• Economic i.e. income, job securityEconomic Development - A measure of a country's wealth and how it is generated (for example agriculture is considered less economically advanced than banking).Social Development - Measures the access the population has to wealth, jobs, education, nutrition, health, leisure and safety.Political Development - The development of the institutions, attitudes, and values that form the political power system of a society. Economic growth and political stability are deeply interconnected
b. Different factors contribute to the human development of a country: economic, social, technological, cultural, as well as food and water security.1. Economic – Move from primary to secondary to tertiary employment for the majority of the
population. This increases the income and GDP for the country. Other factors include; growth rate of the economy, trade surplus/deficit and unemployment rate.
2. Social – Society moves towards a more equal distribution of wealth, with all children attending school and improvements in health care and living conditions. Other factors include; housing quality, opportunities for leisure and recreation.
3. Technological – More machines used by society, both in the work environment on farms but building of factories and in domestic situations. Other factors include; internet access, electrification.
4. Cultural – Women’s place in society is moving towards equality with men i.e. the are given the right to vote. Other factors include; work-life balance, balance between traditional and imported cultures.
5. Food security – The country moves towards being to produce its own food or have the means to trade for food. In 2015, 800m people did not have enough food to lead a healthy, active life. The 3 strands of food security are:
• Availability – sufficient amounts of food being available on a consistent basis• Access – having sufficient resources to obtain appropriate foods for a nutritious diet• Consumption – making appropriate use based on the knowledge of basic nutrition and care6. Water Security – The majority of the population have fresh piped water to their homes. For about 80 countries, 40% of the world’s population, lack access to water. The demand for water is doubling every 20 years and there are issues with water quality and quantity.• More than 840,000 people die each year from water-related diseases• 750m people lack access to safe water i.e. 1 in 9 people• Women and children spend 140m hours a day collecting water.
Reasons for variations in equality across the UK:1. Relief - The South of the UK is flatter – this means urban areas can be more easily built there. The
North and West are more mountainous and therefore it is more difficult to build on and communications / transport routes are more difficult to put in place.
2. Climate - The South and the East have a better climate with less rainfall. This means more people want to live and work there, meaning more income is generated.
3. Natural Resources - The Midlands, North and South Wales were richer in the Industrial Revolution and until the mid-20th century due to coal mining. However, due to a depletion of these resources and governmental decisions, the coal mines are no longer open.
4. Position - The South and East are closer to Europe and so there is more communication and trade. It also attracts more companies and businesses to locate there, meaning there are more jobs.
5. Politics - The Government is based in London, in the South East. This has made this a desirable location for many businesses who want to be close to where the decisions are made.
6. Colonies - In the past the South was more powerful on the global stage as all the decisions made about what happened in the colonies (like Kenya and India) were made in London.
7. Infrastructure - The infrastructure in London is the best in the country. All roads lead to the centre of London and companies who locate there can take advantage of this to trade across the UK and the world.
8. Foreign Investment - Most foreign investment still goes into London, despite efforts by the Government to encourage investment elsewhere (e.g. Honda in Swindon). This means the richest global firms are most likely to provide jobs in London.
c. How development is measured in different ways: Gross Domestic Product (GDP) per capita, the Human Development Index, measuresof inequality and indices of political corruption
1. Gross Domestic Product (GDP) – Total value of goods and services produced within a country in a year. It is often broken up by per capita (divided by the number of people in the country) to take into account the varying population sizes for countries. USA is ranked 1st and Tuvalu is ranked bottom.
2. Human Development Index – Introduced in 1990 and ranges from 0 to 1 (1 = most developed). HDI of Norway is 0.944, compared with Niger with 0.348. It includes 4 key measures:
• Life expectancy at birth• Mean years of schools for adults aged 25 years• Expected years of schooling for children of school-entering age• Gross national income (GNI) per capita (this is similar to GDP but includes overseas income)3. Gini Coefficient – Measures how equal people are within a country or between countries. A country is given a score between 0 and 1 (1= one person has all the income, 0 = same income for everyone). UK = 0.34, compared with Haiti of 0.60.4. Corruption Perceptions Index – Measures the perceived corruption in governments and the public sector. 100 is the perfect score, with 0 showing a very corrupt public sector. Somalia is ranked 174th with a score of 8, compared with Denmark ranked 1st with a score of 92.
Are these effective for measuring development?❑ All measures of development show averages only, so will hid the inequalities within countries i.e. GDP❑ Data does not show everything and are not always accurate e.g. GDP does not include the cash economy.
GLOBAL DEVELOPMENT 5.2 The level of development varies globally
a. Global pattern of development and its unevenness between and within countries, including the UKInequality between countries• The highest GDP per capita is found in N. America, Europe, Australia, New Zealand, Japan, South Korea and Singapore • The lowest GDP per capita is found in Africa and poor Asian countries e.g. Afghanistan and Cambodia • The gap between these rich and poor countries is known as the development gap an it is thought to be increasing Inequality within countries – Named Example: The UK• Gross disposable household wealth (GDHI) shows the following patterns:1. London has the highest GDHI per person in the UK at £21, 446 – 27.7% above the UK average2. Northern Ireland has a GDHI per person of £13,902 – 17.2% below the UK average3. Regional inequality in the UK is the highest in western Europe and is more divided than it was 30 years ago.

GLOBAL DEVELOPMENT 5.2 The level of development varies globally ctd GLOBAL DEVELOPMENT 5.3 A range of strategies has been used to try to address uneven development
b. Factors (physical, historic and economic) that have led to spatial variations in the level of development globally and within the UK.
Physical FactorsClimate• Affects water supply, disease prevalence, drought, flooding• Dictates soil quality and what food (if any) can be grown . If growing food is
difficult, have to pay for fertilisers or import it which also costs money. • Certain diseases thrive in hot climates i.e. malaria – these make people weak and
unable to work.Presence of Natural Resources• Governments use these to create wealth by selling the raw material or products
manufactured from them• Provide people with jobs. They pay tax which can be spent on improving living
standardsGeographical Location (terrain & position in relation to other countries)• Mountainous areas are hard to reach and can be isolated• Countries without a coastline find it hard to trade their good.Natural hazards• Tectonic activity, drought, hurricanes are more likely to occur in some countries
than others. This diverts income to help recover from these events, rather than being used to develop the country.
Historic FactorsAftermath of Colonisation• Countries given political systems, religion, education – which may not suit them• Colonisers took better jobs, raw materials, set up unfair trading schemesGood Governance/Political Stability• If unstable politically or at war, countries do not use wealth gains to develop• Countries looking to invest in other countries will be reluctant to invest in
unstable countriesEconomic Factors
Trade• Trading blocs exist – groups of traders (e.g. EU) – these make it hard for countries
outside the group to trade• Fluctuating market prices of products affect wealth• Countries focusing on selling primary products will make little money as these are
cheap goods.Infrastructure• Developed countries have a good infrastructure and therefore companies invest
in them because goods will be produced and more quickly.Foreign Investment• African is home is 15% of the world’s population and received 5% of the direct
foreign investment.• Europe is home to 7% of the world’s population and received 45% Aid• Donations of money have ‘strings attached’ e.g. connected to trading/rates of
interest• Many countries have to repay millions of pounds a year as interest on loans
a. Impact of uneven development on the quality of life in different parts of the world: access to housing, health, education, employment, technology, and food and water security.
1. Access to housing• People on low incomes have very limited access to adequate housing. • Over 30% of the world’s population live in slums. 2. Health• Investment in health is crucial to development. • Around 6.6 million children under the age of 5 die each year. • About 70% of all HIV/AIDs deaths occur in sub-Saharan Africa – the world’s poorest region• The World Health Organisation (WHO) says that most could be saved if they had access to inexpensive vaccines, clean water and sanitation. 3. Education• More than 775 million people in poor countries cannot read or write. • Those with the least education have the largest families. • Large families are also common where child mortality is high. 4. Employment• The opportunities for employment are much more limited in developing countries where large numbers of people work in labour-intensive agriculture and
the informal sector. • Typical jobs are show-shiners, street food stalls, messengers, which are: generally low paid• Jobs are often temporary and/or part-time in nature; lacking in job security.5. Technology• Reaching a certain level of technology in a country requires investment in the technology itself and people with the necessary skills to operate it efficiently. • Appropriate technology can be better than more advances alternatives as it is generally:❑ Low in energy consumption and cost – appropriate to the local financial and geographical conditions❑ Within the technical capacity of members of the community to operate and maintain themselves❑ Able to use locally sourced materials and spare parts that can be purchased and transported easily.❑ Something that involves the local community at all stages of development.6. Food and water security• Poor countries frequently lack the ability to import food, innovate in agriculture or invest in rural development. • 805 million people around the world were affected by undernourishment. • Water scarcity has been identified as the underlying factor for many of the world’s environmental problems. • Can create serious conflicts between neighbouring countries that share a drainage basin.
a. The range of international strategies (international aid and inter-governmental agreements) that attempt to reduce uneven development.International Aid
Can be used to :• Pay for imports e.g. machinery and oil which are needed for development• Support the accumulation of enough capital to invest in industry and infrastructure• Address a shortage of the skills needed for development.• In 1970, developed countries promised to spend 0.7% of GNP on international aid. In 2013, only 5 countries achieved this.Bilateral Aid – aid that is given from one government to another government e.g. USA gave aid to Europe to rebuilt after WW2. Usually given as apart of attached agreements e.g. India loaned money to Bhutan to built a HEP. India provided the engineers and the technology and will get electricity produced at a cheaper rate than local people in return.Multilateral Aid – Developed countries give money to international organisations such as the World Bank or the United Nations. These organisations then distribute the money in the form of loans to poorer countries.Short-term emergency aidLong-term development aid
GLOBAL DEVELOPMENT 5.4 A range of strategies has been used to try to address uneven development

GLOBAL DEVELOPMENT 5.4 A range of strategies has been used to try to address uneven development GLOBAL DEVELOPMENT 5.5 The level of development of the chosen developing or emerging country is influenced by its location and context in the world
Inter-governmental Agreements1. Debt Relief – Many of the world’s poorer countries struggle to make the annual repayments associated with the
loans that they have been granted. In 1996, the IMF and World Bank organised the HIPC (Heavily Indebted Poor Countries) initiative to reduce the amount owed. It has helped to release some of the countries’ income to be used to improve the lives of their residents.
• By 2015, debt reduction under the HIPC had been approved for 36 countries providing $76 billion in debt relief.2. Trade – Trade agreements such as removing trade barriers can reduce uneven development by helping developing countries to increase trade e.g. opening trade between EU and China.3. Fair Trade – Producers work together to deal directly with retailers in developed countries, receiving fairer conditions and better prices for their goods. × Makes up less than 1% of total world trade4. Foreign Direct Investment – This is when a country invests in a company in a different country, and has some control over what that company does. • Brings in investment• Brings in big brands – widens consumer markets• Foreign companies may be able to pay more = pushes up wages× Big brands can outsell local products× FDI not always reliable – investors can pull out× Lack of regulation can have negative impacts i.e. environmental pollution and industrial accidents.
Difference between top-down (government or transnational corporation (TNC) led) and bottom-up development projects (community led). Their advantages and limitations in the promotion of developmentTop-down development• Happens through governments and TNCs• Large-scale projects that aim at national level or regional-level• Very expensive projects, often funded by international banks• Sophisticated technology that needs exerts to maintain and install.Example: 3 Gorges Dam, China• Supplies 22,500 mw to large cities• Improved trade – allows container ships access• Controls flooding = improved agricultural× 1.4 mill people moved from their homes× Costs $22 billion× Led to extinction of the Yangtze river dolphinBottom-up development• Happens through actions of NGOs working with communities• Local-scale projects that aim to benefit a village• Very cheap and usually funded by the community• Appropriate technology – can be maintained by localsExample: Micro-hydro dams• Practical Aid provides small scale dams to provide energy• Generate 500kw of energy• Provides energy and jobs• Cuts down the need for fuelwood
a. Location and position of the chosen country in its region and globally.• In the Northern hemisphere and located in the continent of Asia• 7th largest country in the world (4.4 million km2)• Southern part of India borders on the Indian Ocean• India shares its boarders with 6 countries including Bangladesh, Nepal and Pakistan• Has 2 islands groups: The Andaman and Nicobar islands and Lakshadweep Islandsb. Broad political, social, cultural and environmental context of the chosen country in its region and globally.
Political Context
Social Context
Cultural Context
Environmental Context
Global Regional
• Member of World Trade organisation, the Commonwealth and the UN
• Second most populated country in the world – 1.3 billion people in 2015
• Seventh largest country in terms of area• Medium level of development – HDI – 0.61
• Largest country in the Indian Subcontinent• Most of India’s population live in six states including
Madhya Pradesh, West Bengal and Andhra Pradesh• Over 20% of the population live in poverty
• Over 20 million Indian diaspora (scattered groups) are located in around 100 countries
• India’s globally –spread population generates income for its economy with money sent back $72 bill in
2015(remittances)
• Population is divided over 29 states – Rajastan = largest and Goa = smallest
• Social ranks known as ‘castes’, assigned at birth, divide India’s society. At the bottom are the ‘untouchables’
and do menial jobs.• Adult literacy is less than 70%
• India has the 3rd largest Muslim population in the world
• India’s film industry ‘Bollywood’, makes 1600 films a year , seen by 2.7 bill
• Was a British Colony until 1947
• Over 80% of India’s population at Hindu• Other religions include Islam, Sikhism and Buddhism
• Climate varies from tropical in the south• Temperate and alpine in the north
• Hosts 3 biodiverse hotspots; western Ghats, Himalayas and the Indo-Burma region
• Experiences two monsoon seasons • North-east monsoon occurs during cooler months• South-west monsoon during the warmer months

GLOBAL DEVELOPMENT 5.5 The level of development of the chosen developing or emerging country is influenced by its location and context in the world
GLOBAL DEVELOPMENT 5.6 The interactions of economic, social and demographic processes influence the development of the chosen developing or emerging country
c. Unevenness of development within the chosen country (core and periphery) and reasons why development does not take place at the same rate across all regions• Rising inequality is an important issue in India. For example, the average (mean) GDP per
capita is $1627.• Bihar has the lowest ranking with $682 and Goa the highest with $4903• The most advanced stated are a group of 4 states and territories in the N-W – Chandigarh,
Delhi, Haryana and the Punjab and a line of states in the west and south – Gujarat, Maharashtra, Goa, Kerala. These two regions are the economic core regions.
• The Periphery is found in the northern and eastern states mainly due to difficult physical environments e.g. Rajasthan (far west, desert), Uttar Pradesh (north, mountainous) and Madhya Pradesh (center, arid plateau)
a. Positive and negative impacts of changes that have occurred in the sectors (primary, secondary, tertiary and quaternary) of the chosen country’s economy.
Key Changes to economic sectors:1. Large reduction in the contribution of agriculture from 37.2% to 14.5% of total GDP → rural-urban migration in search of work and breakdown
of traditional family units.2. Rapid increase in contribution of services from 45.8% to 67.1% → rising air pollution, increased population density in cities and widening
development gap between urban and rural areas.3. Small increase in contribution of manufacturing from 16.9% to 18.4% → Increased employment opportunities and growth of GDP4. Rise in quaternary sector from 0% to 6.1% (included in services %) → Increased investment by TNCs and over 1 million new ICT jobs created.• India has focused on the service sector to fuel its economic growth, particularly software and ICT services - $100 bill in 2014/15.• Global leader in outsourcing due to low-cost labour used to provide ICT services to developed countries.• Tourism sector rapidly growing with 22 million tourists in 2014.• In response, GDP grew slowly in 1950s, with more rapid growth in the 1990s. The economy has grown at a rate of 7%/yr. for the past 20 years.b. Characteristics of international trade and aid and the chosen country’s involvement in both international trade and aidTrade• Until 1990s India was relatively closed off to trade due to high tariffs on imports.• India reduced the barriers to trade to become more integrated into the global economy = large increases in exports and imports.• 2014 India was ranked 19th for exporting merchandise• Ranked 8th for exporting commercial services• Key exports = oil products, gems and jewelry• Key imports = crude oil, gold, silver and electrical goods• Total trade has increased three-fold from 2006 to 2012.Aid• Historically India received large amounts of foreign aid. Shown between 2004-2012 India received more aid than given out.• Aid has declined as the country has developed.• India now sends aid to other countries e.g. Maldives, Nepal, Afghanistan.• 2014/15 India’s foreign aid accounted for $1.3 billion Changing balance between public investment (by government) and private investment (by TNCs and smaller businesses) for the chosen country.Foreign Direct Investment (FDI)• The Indian government is keen to encourage FDI into developing the country’s infrastructure.• FDI rose from $17,800 m in 2005/7 to $34,400m in 2014• 2014/15 main investors were based in Mauritius and Singapore• FDI is dominated by large investments from TNCsPublic Investment • Public investment in education, health and housing. India’s well-educated workforce is important to its ICT sector.• India has been privatising public companies (selling off public companies) attracting more FDI.• Public sector still employs many people but since the 1990s there has been a reduced divide between the public and private sectors
Maharashtra – Core Bihar - Periphery
• Contains Mumbai which is the financial capita of India
Mumbai• Accounts for 7% of India’s GDP and
25% of industrial output• Hosts the Reserve Bank of India and
the two largest stock exchanges• Centre of India’s textile industry but
diversified into chemicals, ICT, publishing.
• 40% of households live in slums• Relatively low unemployment rates –
21 per 1000• Literacy rate = 83%• HDI score = 0.66
• Population over 100 million = most densely populated state (1106km2)
• High fertility rate = 25% growth between 2001 -2011 = large dependant population
• 80% of the population is rural and work in agriculture
• Limited FDI so mostly state employment
• Literacy rate = 63%• HDI score = 0.53
Reasons:1. Economy undeveloped during
colonial times2. Poor governance since independence3. Poor development of infrastructure
i.e. power and irrigation4. Lack of investment in education and
health5. Lack of FDI

GLOBAL DEVELOPMENT 5.6 The interactions of economic, social and demographic processes influence the development of the chosen developing or emerging country
b. How technology and connectivity support development in different parts of the chosen country and for different groups of people.There is still a digital divide , in 2013 61 million broadband connections, but 54% were in just 5 core states
a. Positive and negative social, economic and environmental impacts of rapid development for the chosen country and its people.
India has 2.4% of the world’s land area but 18% of the world’s populationSocial✓ Better access to healthcare = reduced infant mortality rates (135/1000 in 1970s to 42/1000 in 2015)✓ Better jobs and income = reduced poverty✓ Improved community spirit from newly formed groups× Pollution in cities = poor health. Contains 13 out of 20 of the most polluted cities. Air pollution reduces life expectancy by 3.2
years in cities.× Lack of housing = slums and shanty towns (40% of households in Mumbai live in slums)× Men/young people benefit most – women/older people left behind
Economic ✓ Rise in consumerism = strong economy✓ Increase in tourism = jobs and state income✓ Larger workforce× Cost of dealing with environmental and social problems× Cost of installing new infrastructure× Pressure and cost to provide more services
d. Changes in population structure and life expectancy that have occurred in the last 30 years in the chosen country
• Large increase in economically active population = improved economic growth• Proportion of population under 15 have declined• Proportion of the population of 65+ have increased• By 2030, India will be demographically ageing
e. Changing social factors (increased inequality, growing middle class and improved education) in the chosen countryImproved education• 1991 the overall literacy percentage in India is 52.11 as compared to 43.56 ten years ago.• The male literacy 63.86% while the female literacy 39.42%• it is free and compulsory for all children between 6 and 14. India has more than 1.4 million schoolsAge at Marriage• In 1994, the mean age for marriage was estimated to be 23.1 years compared to 17 in 1981. Therefore the
mean age of marriage has been continuously increasingTraditional culture• Poor parents produce children because they need them - 35 million child workers in India.• Families produce many children for sons to combat one’s family’s growing needs, the parents are forced to
keep them out of school to supplement their household income.Food • Food safety practices in agriculture/ improved agricultural practices have lead to fewer famines, allowing
farmers to sustain much larger numbers of people. • Machinery reduces manpower needed to farm while improved fertilizers and pesticides increase crop yields
and reduce crops lost to pests.Health Care • Advances in health care technology and medicine allow fewer individuals to die from injuries and illnesses.Standard of Living and Fertility• As the standard of living increases, better medical care leads to lower infant mortality rates and fertility
medications increase a woman’s chance for pregnancy.Inequality• Low status of women in Indian society is hindering their development. Seen in tribal populations and low
castes• Older people also don’t benefit as much as they haven’t benefited from recent improvements in education
and health = likely to stay in rural areas • Some religious discrimination in poorer, rural areas
1985 2015
Population size 782 million 1.3 billion
Life expectancy 54 years 68 years
Fertility rate 5.2 children 2.3 children
Infant mortality rate 135/100 42/1000
What is it? Benefits? How does it support development?
Biometric identity(all)
Allocates a unique number to every Indian
• Helps to tackle fraud• Crack down on drivers
using false licenses
• Can raise more taxes• Register voters
Swasthya Slate(all – particularly for rural
isolated people)
Mobile platform allowing people to perform health
tests on themselves
• Results received in minutes
• Reduces time required for registering patients• Gives medical
recommendations
• Improves health of the nation = improved economic growth
Smartphones to educate farmers
(primary producers)
SmartAgri – communicates with underground sensors
to provide data on soil moisture, mineral levels
• Benefit 500m small farmers
• Provides crop price updates
• Connects buyers and sellers
• These 500m farmers provide over 50% of the world’s food supply
• Improve productivity = healthly labourers
GLOBAL DEVELOPMENT 5.7 There are positive and negative impacts of rapid development for the people and environment of the chosen developing or emerging country

GLOBAL DEVELOPMENT 5.8 There are positive and negative impacts of rapid development for the people and environment of the chosen developing or emerging country
Exam practice
Environmental✓ Potential to invest in technologies = renewable energy× Logging and land clearance – deforestation× Increased C02 emissions = climate change. India is the 3rd largest emitted of C02 (5.8%) due to
heavy reliance on coal (4/5ths of electricity produced this way). There are still 400m people without electricity.
× More chemicals used in industry/agriculture = water pollution. Less than 1/3rd of sewage in urban areas is treated before flowing into rivers. The Ganges ranks as one of the world’s most polluted rivers.
× Desertification and deforestation = lower biodiversity. Around 68% of India is prone to drought, with the largest areas affected by desertification being Rajasthan and Maharashtra.
b. How the chosen country’s government and people are managing the impacts of its rapid development to improve quality of life and its global status.
Improving quality of life• Smart Cities Mission – Looks to improve equality and quality of life running from 2015 to
2020.• Covers 100 cities and focuses on- Improved sanitation- Health and education- Efficient public transport- Adequate water supply
Developing renewable energy sources- The Intended Nationally Determined Contribution (INDC) focuses on clean energy such as
solar polar (40% by 2030) - Plant more forests to absorb carbon emissions (2.5 to 3 billion tonnes of C02 stored by 2030)- Invest in development programmes in areas vulnerable to climate change e.g. water
resources, coastal regions
Improving global status• Member of G20 and is one of the BRICs nations• Pushing for a permeant seat in the United Nations Security Council• Pushing to be a bigger influence in big organisations such as The World Bank and the World
Trade Organisation.
1. Explain one way of measuring economic inequalities within a country (2)2. Define the term ‘GDP per capita’ (1)3. Define the term development (1)4. State one factor that contributes to increasing human development of a country (1)5. Define the term water security (1)6. Explain one reason why food security contributes to the human development of a country (2)7. Suggest how indices of political corruption might be used to measure development (2)8. Explain how measures of inequality can be used as a measure of development (4)9. Suggest one of the consequences of uneven development (3)10. Describe one impact that uneven global development has on education (2)11. Define the term quality of life (1)12. Suggest why uneven development has an impact on people’s health (2)13. Explain why uneven development has an impact on (i) food and (ii) water security (4)14. Explain what is meant by the term international aid (2)15. Explain two ways international aid can help development (4)16. Define the term bilateral aid (1)17. Explain how top-down development projects help to promote development (4)18. Explain how debt relief can be used as a strategy to reduce uneven global dev (3)19. Describe two ways in which the scale of global inequality can be reduced (4)20. Describe the cultural context of an emerging or developing country (2)21. Explain the impacts of two economic changes in a named developing or emerging country (4)22. Describe the geographical location of an emerging or developing country you have studied (4)23. Describe one environmental context of a developing or emerging country (2)24. Explain the political context of your chosen developing or emerging country (4)25. Explain how changing social factors are having an impact on a developing or emerging country (4)26. Explain why the population structure of an emerging or developing country you have studied has changed (4)27. Explain why life expectancy in a named developing or emerging country has changed over the last 30 years (4)28. Suggest the impacts of (a) a growing middle class and (b) improved education on a developing or emerging country (4)29. Explain how technology has supported development in different parts of a named developing or emerging country (4)30. Explain the meaning of the term geopolitics (2)31. Suggest how development of a developing or emerging country is affected by geopolitics (4)32. Explain how improving connectivity can support development in different parts of a named developing or emerging country (4)33. You have studied a named developing or emerging country. Explain how the government is managing the impacts of rapid
development in order to improve its global status (3)34. Explain how one impact of rapid development is being managed to improve the quality of life in a developing or emerging
country (4)35. Explain two negative environmental impacts of rapid development for a developing or emerging country (4)36. State one positive economic impact of rapid development (1)37. Assess how a developing or emerging country’s government and people are managing the impacts of rapid developing in order
to improve quality of life (8)
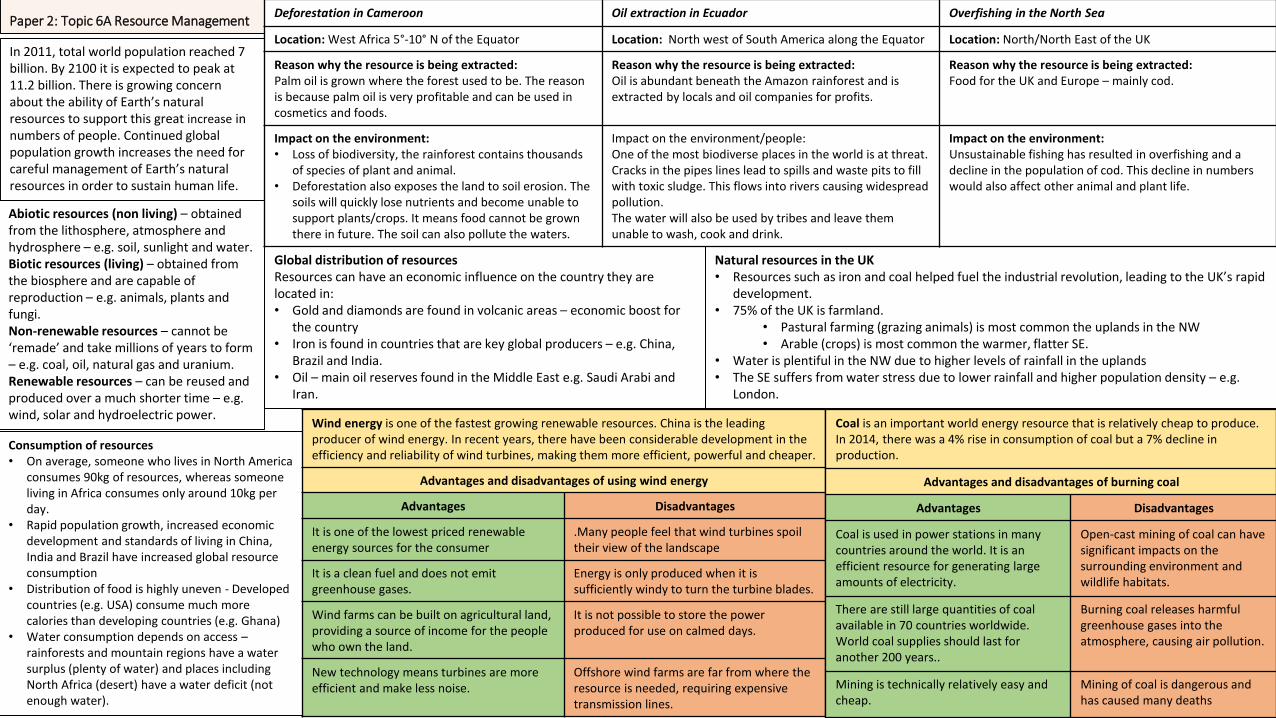
Paper 2: Topic 6A Resource Management
In 2011, total world population reached 7 billion. By 2100 it is expected to peak at 11.2 billion. There is growing concern about the ability of Earth’s natural resources to support this great increase in numbers of people. Continued global population growth increases the need for careful management of Earth’s natural resources in order to sustain human life.
Deforestation in Cameroon Oil extraction in Ecuador Overfishing in the North Sea
Location: West Africa 5°-10° N of the Equator Location: North west of South America along the Equator Location: North/North East of the UK
Reason why the resource is being extracted:Palm oil is grown where the forest used to be. The reason is because palm oil is very profitable and can be used in cosmetics and foods.
Reason why the resource is being extracted:Oil is abundant beneath the Amazon rainforest and is extracted by locals and oil companies for profits.
Reason why the resource is being extracted:Food for the UK and Europe – mainly cod.
Impact on the environment:• Loss of biodiversity, the rainforest contains thousands
of species of plant and animal.• Deforestation also exposes the land to soil erosion. The
soils will quickly lose nutrients and become unable to support plants/crops. It means food cannot be grown there in future. The soil can also pollute the waters.
Impact on the environment/people:One of the most biodiverse places in the world is at threat. Cracks in the pipes lines lead to spills and waste pits to fill with toxic sludge. This flows into rivers causing widespread pollution. The water will also be used by tribes and leave them unable to wash, cook and drink.
Impact on the environment:Unsustainable fishing has resulted in overfishing and a decline in the population of cod. This decline in numbers would also affect other animal and plant life.
Abiotic resources (non living) – obtained from the lithosphere, atmosphere and hydrosphere – e.g. soil, sunlight and water.Biotic resources (living) – obtained from the biosphere and are capable of reproduction – e.g. animals, plants and fungi.Non-renewable resources – cannot be ‘remade’ and take millions of years to form – e.g. coal, oil, natural gas and uranium.Renewable resources – can be reused and produced over a much shorter time – e.g. wind, solar and hydroelectric power.
Global distribution of resourcesResources can have an economic influence on the country they are located in:• Gold and diamonds are found in volcanic areas – economic boost for
the country• Iron is found in countries that are key global producers – e.g. China,
Brazil and India.• Oil – main oil reserves found in the Middle East e.g. Saudi Arabi and
Iran.
Natural resources in the UK• Resources such as iron and coal helped fuel the industrial revolution, leading to the UK’s rapid
development.• 75% of the UK is farmland.
• Pastural farming (grazing animals) is most common the uplands in the NW• Arable (crops) is most common the warmer, flatter SE.
• Water is plentiful in the NW due to higher levels of rainfall in the uplands• The SE suffers from water stress due to lower rainfall and higher population density – e.g.
London.
Consumption of resources• On average, someone who lives in North America
consumes 90kg of resources, whereas someone living in Africa consumes only around 10kg per day.
• Rapid population growth, increased economic development and standards of living in China, India and Brazil have increased global resource consumption
• Distribution of food is highly uneven - Developed countries (e.g. USA) consume much more calories than developing countries (e.g. Ghana)
• Water consumption depends on access –rainforests and mountain regions have a water surplus (plenty of water) and places including North Africa (desert) have a water deficit (not enough water).
Wind energy is one of the fastest growing renewable resources. China is the leading producer of wind energy. In recent years, there have been considerable development in the efficiency and reliability of wind turbines, making them more efficient, powerful and cheaper.
Advantages and disadvantages of using wind energy
Advantages Disadvantages
It is one of the lowest priced renewable energy sources for the consumer
.Many people feel that wind turbines spoil their view of the landscape
It is a clean fuel and does not emit greenhouse gases.
Energy is only produced when it is sufficiently windy to turn the turbine blades.
Wind farms can be built on agricultural land, providing a source of income for the people who own the land.
It is not possible to store the power produced for use on calmed days.
New technology means turbines are more efficient and make less noise.
Offshore wind farms are far from where the resource is needed, requiring expensive transmission lines.
Coal is an important world energy resource that is relatively cheap to produce. In 2014, there was a 4% rise in consumption of coal but a 7% decline in production.
Advantages and disadvantages of burning coal
Advantages Disadvantages
Coal is used in power stations in many countries around the world. It is an efficient resource for generating large amounts of electricity.
Open-cast mining of coal can have significant impacts on the surrounding environment and wildlife habitats.
There are still large quantities of coal available in 70 countries worldwide.World coal supplies should last for another 200 years..
Burning coal releases harmful greenhouse gases into the atmosphere, causing air pollution.
Mining is technically relatively easy and cheap.
Mining of coal is dangerous and has caused many deaths
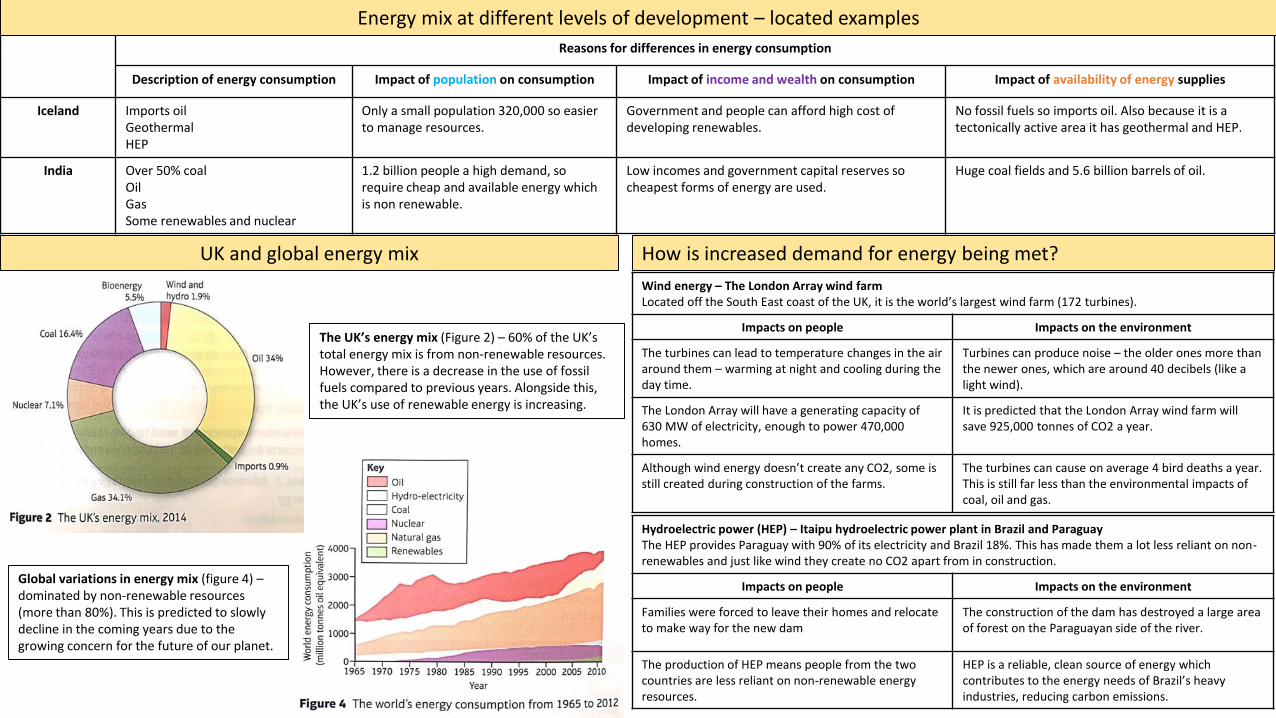
The UK’s energy mix (Figure 2) – 60% of the UK’s total energy mix is from non-renewable resources. However, there is a decrease in the use of fossil fuels compared to previous years. Alongside this, the UK’s use of renewable energy is increasing.
Reasons for differences in energy consumption
Description of energy consumption Impact of population on consumption Impact of income and wealth on consumption Impact of availability of energy supplies
Iceland Imports oilGeothermalHEP
Only a small population 320,000 so easier to manage resources.
Government and people can afford high cost of developing renewables.
No fossil fuels so imports oil. Also because it is a tectonically active area it has geothermal and HEP.
India Over 50% coalOilGasSome renewables and nuclear
1.2 billion people a high demand, so require cheap and available energy which is non renewable.
Low incomes and government capital reserves so cheapest forms of energy are used.
Huge coal fields and 5.6 billion barrels of oil.
How is increased demand for energy being met?
Wind energy – The London Array wind farmLocated off the South East coast of the UK, it is the world’s largest wind farm (172 turbines).
Impacts on people Impacts on the environment
The turbines can lead to temperature changes in the air around them – warming at night and cooling during the day time.
Turbines can produce noise – the older ones more than the newer ones, which are around 40 decibels (like a light wind).
The London Array will have a generating capacity of 630 MW of electricity, enough to power 470,000 homes.
It is predicted that the London Array wind farm will save 925,000 tonnes of CO2 a year.
Although wind energy doesn’t create any CO2, some is still created during construction of the farms.
The turbines can cause on average 4 bird deaths a year. This is still far less than the environmental impacts of coal, oil and gas.
Hydroelectric power (HEP) – Itaipu hydroelectric power plant in Brazil and ParaguayThe HEP provides Paraguay with 90% of its electricity and Brazil 18%. This has made them a lot less reliant on non-renewables and just like wind they create no CO2 apart from in construction.
Impacts on people Impacts on the environment
Families were forced to leave their homes and relocate to make way for the new dam
The construction of the dam has destroyed a large area of forest on the Paraguayan side of the river.
The production of HEP means people from the two countries are less reliant on non-renewable energy resources.
HEP is a reliable, clean source of energy which contributes to the energy needs of Brazil’s heavy industries, reducing carbon emissions.
Global variations in energy mix (figure 4) –dominated by non-renewable resources (more than 80%). This is predicted to slowly decline in the coming years due to the growing concern for the future of our planet.
Energy mix at different levels of development – located examples
UK and global energy mix

Natural gas – FrackingThe process of fracking involves drilling down into shale rock deposits, then injecting water, sand and chemicals into the rock at high pressure, which frees natural shale gas from the rocks.
Impacts on people Impacts on the environment
Fracking has made fuel prices in the USA much cheaper for consumers because the USA has large shale deposits and so the country does not need to import energy from other countries.
Producing and using natural gas releases approximately half the carbon emissions of coal, so it is better for the environment to replace the coal-fired power stations with gas-fired ones.
There is evidence that fracking can be linked with subsidence of homes, as rocks are disturbed deep underground. Fracking has also resulted in gas entering people’s homes – flammable gas coming through the taps, for example!
The chemicals used to release the shale gas may leak into the contaminate groundwater supplies. This could damage ecosystems that rely o the groundwater (and could affect humans who use the water, too).
It is estimated that from 2013 to 2035 the global demand for energy will increase by 37%, driven mainly by rapid population growth in emerging and developing economies. If fossil fuels continue to be used as the same rate, there could be catastrophic impacts on the climate. Therefore, it is essential that renewable energy is used more and there is less energy waste from everyone, including individuals, organisations and governments.
Why do we need to protect our energy resources?
Development of non renewable energy sources
Individuals can track the impact of their personal energy use by measuring their carbon footprint –this looks at their day to day energy use – e.g. using electricity and transport. • Domestic heating - 15% of an individual’s carbon footprint. Heat loss is reduced by installing
cavity-wall insulation, loft insulation and double glazing for windows.• Electricity – 12% of an individuals carbon footprint. Most of this electricity comes from fossil
fuel power stations. This can be reduced by installing solar panels on roofs.• Transport – 10% of an individual’s carbon footprint. This can be reduced by using public
transport, riding a bike or car-pooling (sharing a car with others).
Organisations – large companies such as McDonalds have begun to be more energy efficient. Methods include:• LED lighting instead of neon and filament bulb lighting – saves US$11 million in energy costs• Reusing cooking oil from their restaurants as biodiesel in their delivery lorries• Installing half a million energy-efficient kitchen appliances – saves 500 GW of energy
Governments have pledged to limit global temperature rise to below 2°C at the United Nations summit in Paris in 2015. Developed countries agreed to fund £100 billion to help developing countries convert to renewable energy. For the UK, this involves:• Limiting the amount of greenhouse gases the UK is allowed to emit.• Investing in low-carbon energy technologies and using a larger percentage of renewable energy so that it
produces 80% less carbon in 2050 than 1990.• Reducing the demand for energy with smart meters and other energy-efficient measures for industries,
businesses and individuals.• Public reporting of carbon emissions to allow people to assess their impact on climate change
Oil reserves – the Athabasca tar sands, CanadaThere is an estimated 180 billion barrels of bitumen here, which is refined into petroleum. This was economically viable for years, however due to the rising cost of oil and the development of new extraction technology has resulted in the commercial exploitation of these resources.
Impacts on people Impacts on the environment
Broken pipelines and leaks cause spillages. These are extremely difficult to clean up, leaving humans exposed to harmful chemicals.
Large volumes of water are needed to extract the bitumen from the sands. As much as six barrels of water are needed for each barrel of oil produced.
Extracting the resources and other jobs linked to the production process provide employment for 514000 people across Canada. This is expected to increase to 800,000 jobs by 2028.
Most tar sand extraction is carried out by surface mining, which means vegetation has to be cleared and surface soil and rock removed over a large area, meaning a loss of local habitus.
The energy required to separate the oil from the sand is provided by natural gas-enough to that 3 million Canadian homes.
The refining of bitumen releases 5-15% more CO2 into the air than does the refining of crude oil, there by increasing greenhouse gas emissions

Exam practice
1. Describe the differences between abiotic and biotic resources (3)2. Describe the location of the areas with serious water stress in the UK (2)3. Explain why these areas of the UK experience serious water stress (3)4. Explain how using coal for energy has positive and negative effects on people and the environment (4)5. Explain why energy consumption per person has increased in the last 100 years (4)6. Describe the impacts of continued production and development of wind energy on people and the environment (3)7. Assess the positive and negative environmental impacts of developing shale gas in the UK (8)8. Explain why sustainable energy resource management is important9. Assess the importance of renewable sources of energy for countries at different levels of development (8+4 SPAG)10. Suggest how the development of a renewable energy resource can have both advantages and disadvantages (4)11. For a non-renewable energy resource that you have studied, describe the effects of this resources on people and the environment (3)
Case Study – China, and emerging country
Issues Strategies Impacts
• Largest producer of CO2• 2014 29% of global carbon emissions• 1% of all urban areas considered safe
breathing air• 7/10 most polluted cities
• Government implemented the China Renewable Energy Law – by 2020 to reduce dependency on coal
HEP – The Three Gorges Dam❖ Worlds biggest producer of HEP❖ 98.8 billion kWh❖ Preventing 100 million tonnes C02
Solar power – Gobi Desert➢ Becoming one of the leaders of solar
energy➢ Power 1 million homes ➢ 10 m2 covering
❖ $30 billion – although will pay for itself within 10 years.
❖ 1.4 million people relocated❖ 632 km2 of habitat flooded – although
prevented floods❖ Silt build up prevents nutrients flowing
downstream bad for farmers
➢ Desert habitats destroyed➢ Reduced C02 emissions
Case Study – Germany, and developed country
Issues Strategies Impacts
• Becoming too reliant on nuclear and fearful of Japan’s Fukushima disaster in 2012
• Wants to reduce carbon emissions
Solar power – Bavaria Solarpark❖ 26 hectares of solar
panels and encourage locals and businesses to use them
Wind power➢ Replacing old turbines
and installing new off-shore farms
❖ Aims to reduces CO2 emissions by more than 100,000 tonnesover the next 30 years
❖ 215 million kWh of clean power over 20 years
➢ 6500 MW of 2020➢ Changing mentalities
of the people into using renewable energies
Case studies – Sustainable energy management in an emerging and a developed country
Is this Sustainable? The Three Gorges Dam has massively reduced the coal dependency of China and prevented flooding. However, 1.4 million people were displaced and 632 km2 of habitat was flooded. It is not a totally sustainable project because of the vast scale it was built on.
Is this Sustainable? Germany is becoming more sustainable and foreseeing future issues with nuclear energy. The changing of attitudes the population has been a success and will help Germany remain sustainable in the future.
Copyright © 2022 FDOKUMEN