A critical review of the Mean Measure of Divergence and Mahalanobis Distances using artificial data...
19
A CRITICAL REVIEW OF THE MEAN MEASURE OF DIVERGENCE AND MAHALANOBIS DISTANCES USING ARTIFICIAL DATA AND NEW APPROACHES TO THE ESTIMATION OF BIODISTANCES EMPLOYING NONMETRIC TRAITS Fitch Laboratory, British School at Athens, 52 Souidias Street, 106 76 Athens, GREECE Dr. E. Nikita
Transcript of A critical review of the Mean Measure of Divergence and Mahalanobis Distances using artificial data...

A CRITICAL REVIEW OF THE MEAN
MEASURE OF DIVERGENCE AND
MAHALANOBIS DISTANCES USING
ARTIFICIAL DATA AND NEW
APPROACHES TO THE ESTIMATION OF
BIODISTANCES EMPLOYING
NONMETRIC TRAITS
Fitch Laboratory, British School at Athens,
52 Souidias Street, 106 76 Athens, GREECE Dr. E. Nikita

AIM
Review the two most common distance measures for the calculation of biodistances based on nonmetric traits:
- Mean measure of divergence (MMD)
- Tetrachoric Mahalanobis D2 distance (TMD)
Propose two new approaches for the estimation of biodistances from nonmetric traits:
- Direct application of the Mahalanobis distance to ordinally recorded data (OMD)
- Approximation of the covariances of the Mahalanobis distance by Pearson correlation coefficients (RMD)

DENTAL NONMETRIC TRAITS
Upper incisors –
shovel-shaped
Lower molars –
tuberculum sextum
Upper molars –
Carabelli’s trait
Lower premolars –
Tome’s root

CONTINUOUS VARIATION TURNED
ORDINAL AND THEN BINARY

BIODISTANCE MEASURES IN SKELETAL
ANALYSIS OF NONMETRIC TRAITS
r
i ii nnrMMD
1 21
2
i2i1 }5.0
1
5.0
1){(
1
)(T)(D -1pooled
TTMD 21212 zzzz
)(R)(D -1pooled
TRMD 21212 zzzz
)(C)( 21
-1
21
2 μμμμ pooled
T
OMDD

CORRECTION FOR SMALL SAMPLE SIZES
rnn
nn
gN
rgNDDCorrected
21
2122 1
Mahalanobis-type distances

LIMITATIONS
Highly correlated and nondiagnostic traits
should not be analysed using the MMD
Serious reduction of the data being
analysed
TMD should be used cautiously when the
amount of missing data is large
Problematic in archaeological samples

ADDITIONAL CONSIDERATIONS
How effective are these measures in relation to
the information being lost from a statistical point
of view by the use of binary dichotomies for the
coding of an underlying continuous phenomenon
– the genetic variation that gives rise to the
expression of nonmetric traits?

MATERIALS
Artificial datasets that follow the multivariate normal
distribution of known variance-covariance. Two variance-
covariance matrices were used, one (CT) derived from
cranial data from North African populations, and the other
(DT) from dental data recorded on Cretan EBA samples.
For the transformation of each continuous dataset to a
binary one, the threshold value was the mean value. For the
transformation to four-rank ordinal data, the threshold
values were the first quartile, the median and the third
quartile.
The effect of missing values was examined by using 20%
missing values randomly affecting all traits.

BIODISTANCE COMPARISONS –
POPULATION DATA
DT matrix, (o) MD, (+) TMD, (x) RMD, () OMD,
and () MMD
• TMD tends to coincide
with the MD
• RMD and OMD differ
slightly from the MD
• MMD tends to exhibit
the greatest
divergence from the
remaining measures

BIODISTANCE COMPARISONS –
SAMPLE DATA
o All distances perform
satisfactorily, although the
OMD appears to have the
best performance
o TMD seems to deteriorate
when the number of traits is
large
Correlation coefficients between MD and
OMD (), RMD (o), TMD (+), and MMD (x) for
different datasets without missing values and
with r = 30 (A) and r = 10 (B) traits.
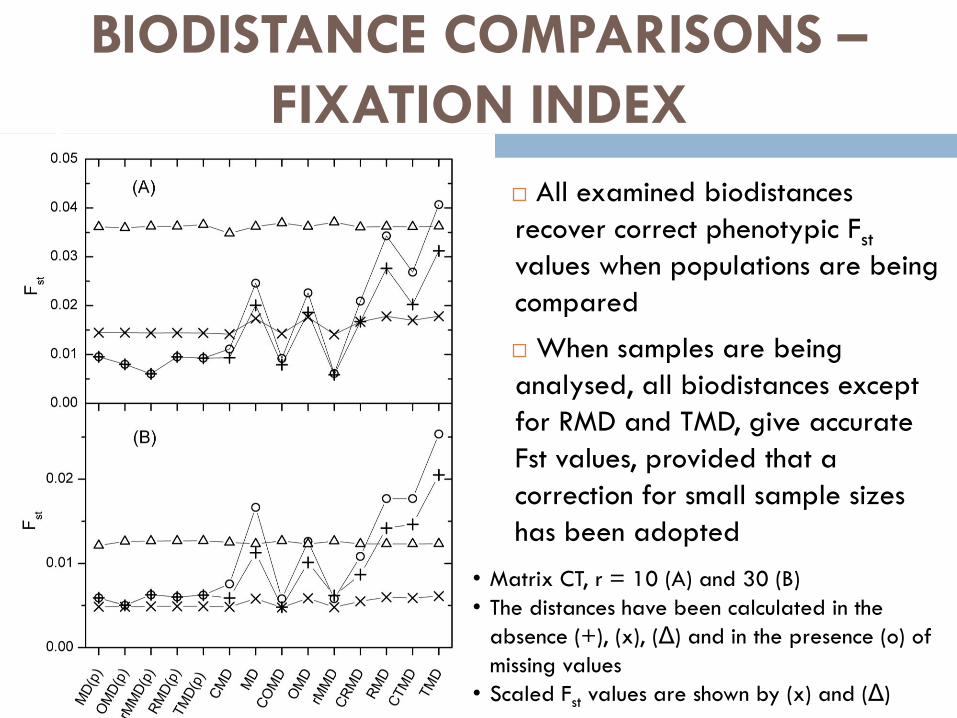
All examined biodistances
recover correct phenotypic Fst
values when populations are being
compared
When samples are being
analysed, all biodistances except
for RMD and TMD, give accurate
Fst values, provided that a
correction for small sample sizes
has been adopted
• Matrix CT, r = 10 (A) and 30 (B)
• The distances have been calculated in the
absence (+), (x), (Δ) and in the presence (o) of
missing values
• Scaled Fst values are shown by (x) and (Δ)
BIODISTANCE COMPARISONS –
FIXATION INDEX

For the assessment of the statistical significance of
the various biodistances, p-values can be calculated
either using permutations or using test statistics,
whenever these are available in the literature.
P-VALUE COMPARISONS
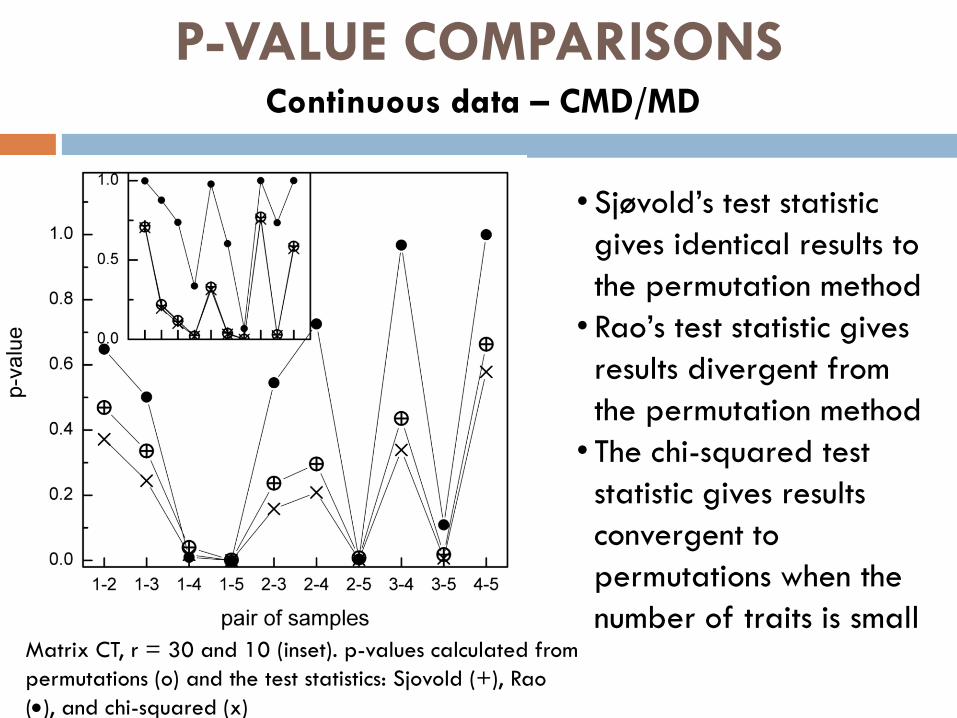
P-VALUE COMPARISONS Continuous data – CMD/MD
• Sjøvold’s test statistic
gives identical results to
the permutation method
• Rao’s test statistic gives
results divergent from
the permutation method
• The chi-squared test
statistic gives results
convergent to
permutations when the
number of traits is small Matrix CT, r = 30 and 10 (inset). p-values calculated from
permutations (o) and the test statistics: Sjovold (+), Rao
(), and chi-squared (x)

Ordinal data – COMD/OMD
• Sjøvold’s test statistic gives results
identical to the permutation method
provided that there are no missing
values
• In the absence of missing values, Rao’s
test statistic and the chi-squared test
statistic yield reliable results when the
number of traits is small
• The presence of missing values affects
the performance of all test statistics
Matrix DT, r = 30 and 10 (inset) without missing values
(A), and with 20% missing values (B). p-values
calculated from permutations (o) and the test statistics:
Sjovold (+), Rao (), and chi-squared (x)
P-VALUE COMPARISONS

Binary data – MMD
Satisfactory convergence
between the p-values
estimated from the test statistic
proposed for MMD and those
of the permutation methods,
regardless of the number of
traits considered or whether or
not missing values are present
P-values using permutations (o) and the test
statistic proposed for MMD () on matrix CT
with r=10 (A) r=30 (B). Insets correspond to
the same datasets with 20% missing values
P-VALUE COMPARISONS
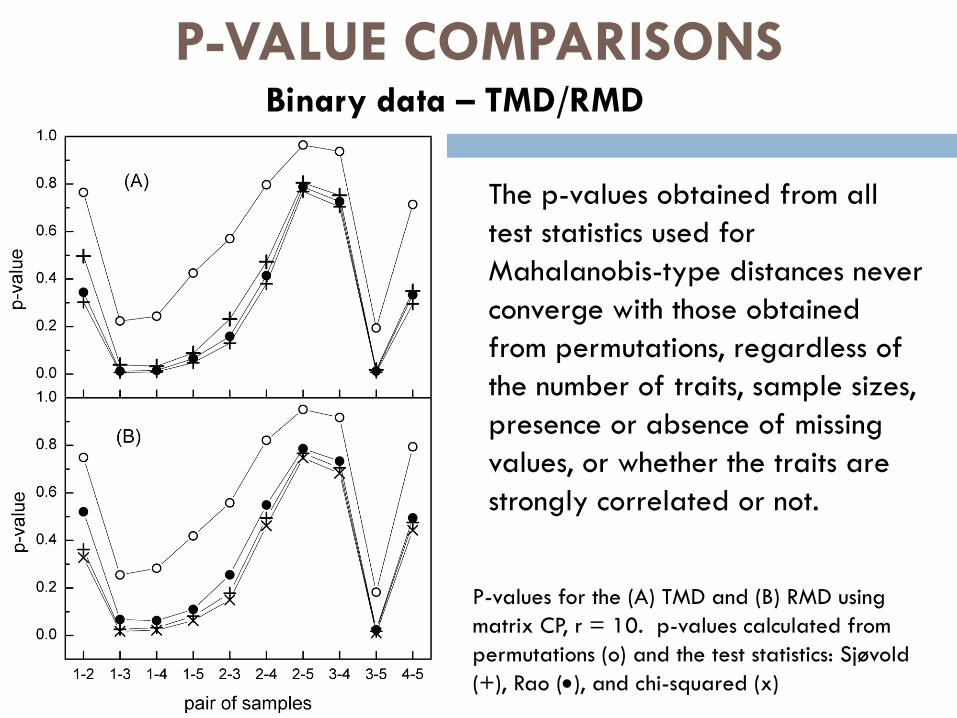
Binary data – TMD/RMD
The p-values obtained from all
test statistics used for
Mahalanobis-type distances never
converge with those obtained
from permutations, regardless of
the number of traits, sample sizes,
presence or absence of missing
values, or whether the traits are
strongly correlated or not.
P-values for the (A) TMD and (B) RMD using
matrix CP, r = 10. p-values calculated from
permutations (o) and the test statistics: Sjøvold
(+), Rao (), and chi-squared (x)
P-VALUE COMPARISONS

CONCLUSIONS
All biodistances give fairly accurate results when the
number of traits is small.
When the number of traits is large, problems arise with
the TMD and RMD, while MMD and COMD are not
affected
COMD exhibits the best performance under all conditions
The presence of missing values does not affect
significantly OMD and MMD, but it may affect TMD when
the number of traits is large.

AKNOWLEDGEMENTS
British School at Athens – Fitch Laboratory
Professor Lyle Konigsberg
Professor Torstein Sjovold
An anonymous reviewer of the AJPA