
A comparison of the various liquid interaction radii derived from experiment and network modelling...
11
Colloids and Surfaces A: Physicochem. Eng. Aspects 251 (2004) 149–159 A comparison of the various liquid interaction radii derived from experiment and network modelling of porous pigmented structures J. Schoelkopf ∗ , P.A.C. Gane, C.J. Ridgway Omya Development AG, CH 4665 Oftringen, Switzerland Received 6 May 2004; accepted 1 September 2004 Abstract Pigment particles, such as calcium carbonate, can be compacted to form tablets without any addition of a binder by the application of high pressure in a die. Using different pressures an array of porosities can be obtained maintaining the pore surface chemical and overall geometric uniformity of the samples [Tappi J. 83 (2000) 77]. These structures can be used to test for a range of liquid interactions. The experimental data measured in this work allow for a unique assessment of the various equivalent hydraulic radii obtained from (i) surface area/porosity correlations, (ii) imbibition, (iii) liquid permeation and (iv) mercury intrusion. It is found that the radii derived from the different liquid interaction methods are dissimilar. The distinct differences are discussed in terms of the specificity of the approaches used in probing the pore structure, highlighting the mechanistic distinction between the intrinsic properties of a porous structure and its interaction with liquid saturation flow, intrusion and imbibition, respectively. The values are also compared with simulations of the structures and their interaction with liquids, using the pore network simulator Pore-Cor. [Pore-Cor is a software package of the Environmental and Fluid Modelling Group, University of Plymouth, PL4 8AA, UK.]. It is shown that the modelling is most representative at low porosity but the restricted pore and throat size range limits the representative modelling of absorption phenomena in structures of higher porosity. The combined data indicate the existence of different pore segregation mechanisms which are proposed to, at least partly, underlie the observed phenomenological dissimilarities seen for these complex porous network structures. © 2004 Elsevier B.V. All rights reserved. Keywords: Pigments; Permeation; Imbibition; BET; Porosity; Hydraulic radius; Porous network modelling 1. Introduction Porosity may be the most significant volumetric descrip- tion of a porous sample, and, in the case of a highly intercon- nected void system, it is easily measurable with a range of saturation methods. Mercury intrusion/extrusion porosime- try is a sophisticated tool that gives a quantitative measure of intruded Laplace radii in relation to applied pressure and is widely used in research and industry. Similarly, absorption can be used to attempt saturation of a structure, providing a derivable porosity associated with saturated pores. Porous structures consisting of consolidated fine particles, mostly of mineral origin, are found in many industrial appli- ∗ Corresponding author. Tel.: +41 62 789 2229, fax: +41 62 789 2397. E-mail address: [email protected] (J. Schoelkopf). cations and in the natural environment around us. The pig- ments used in this study are mainly applied in paper coatings. Most quality printing paper used today is coated with one or more layers of a special pigment, typically a calcium carbon- ate, combined with a synthetic or natural binder system to maintain the integrity of the coating and to fix the particles to the underlying substrate. We developed a technique to produce consolidated parti- cle structures over a range of different porosities, without the need for binder, whilst keeping the surface chemistry and skeletal-defined pore geometry constant; a feature much overlooked when workers have attempted to correlate absorp- tion between samples of different porosities. The samples are made by applying variable compression forces to the pow- der in a specially designed steel die. The resulting range of industrially relevant structures with, unlike many model sys- 0927-7757/$ – see front matter © 2004 Elsevier B.V. All rights reserved. doi:10.1016/j.colsurfa.2004.09.001
-
Upload
independent -
Category
Documents
-
view
1 -
download
0
Transcript of A comparison of the various liquid interaction radii derived from experiment and network modelling...

Colloids and Surfaces A: Physicochem. Eng. Aspects 251 (2004) 149–159
A comparison of the various liquid interaction radii derived fromexperiment and network modelling of porous pigmented structures
J. Schoelkopf∗, P.A.C. Gane, C.J. Ridgway
Omya Development AG, CH 4665 Oftringen, Switzerland
Received 6 May 2004; accepted 1 September 2004
Abstract
Pigment particles, such as calcium carbonate, can be compacted to form tablets without any addition of a binder by the application of highpressure in a die. Using different pressures an array of porosities can be obtained maintaining the pore surface chemical and overall geometricuniformity of the samples [Tappi J. 83 (2000) 77]. These structures can be used to test for a range of liquid interactions. The experimentaldata measured in this work allow for a unique assessment of the various equivalent hydraulic radii obtained from (i) surface area/porosityc liquidi ing the pores saturafl th liquids,u iversity ofP ize rangel xistence ofd ties seen fort©
K
1
tnstiwcd
m
pig-ings.e oron-
m toles
arti-out
istrymuchsorp-s areow-
ge ofys-
0d
orrelations, (ii) imbibition, (iii) liquid permeation and (iv) mercury intrusion. It is found that the radii derived from the differentnteraction methods are dissimilar. The distinct differences are discussed in terms of the specificity of the approaches used in probtructure, highlighting the mechanistic distinction between the intrinsic properties of a porous structure and its interaction with liquidtionow, intrusion and imbibition, respectively. The values are also compared with simulations of the structures and their interaction wising the pore network simulator Pore-Cor. [Pore-Cor is a software package of the Environmental and Fluid Modelling Group, Unlymouth, PL4 8AA, UK.]. It is shown that the modelling is most representative at low porosity but the restricted pore and throat s
imits the representative modelling of absorption phenomena in structures of higher porosity. The combined data indicate the eifferent pore segregation mechanisms which are proposed to, at least partly, underlie the observed phenomenological dissimilari
hese complex porous network structures.2004 Elsevier B.V. All rights reserved.
eywords:Pigments; Permeation; Imbibition; BET; Porosity; Hydraulic radius; Porous network modelling
. Introduction
Porosity may be the most significant volumetric descrip-ion of a porous sample, and, in the case of a highly intercon-ected void system, it is easily measurable with a range ofaturation methods. Mercury intrusion/extrusion porosime-ry is a sophisticated tool that gives a quantitative measure ofntruded Laplace radii in relation to applied pressure and isidely used in research and industry. Similarly, absorptionan be used to attempt saturation of a structure, providing aerivable porosity associated with saturated pores.
Porous structures consisting of consolidated fine particles,ostly of mineral origin, are found in many industrial appli-
∗ Corresponding author. Tel.: +41 62 789 2229, fax: +41 62 789 2397.E-mail address:[email protected] (J. Schoelkopf).
cations and in the natural environment around us. Thements used in this study are mainly applied in paper coatMost quality printing paper used today is coated with onmore layers of a special pigment, typically a calcium carbate, combined with a synthetic or natural binder systemaintain the integrity of the coating and to fix the particto the underlying substrate.
We developed a technique to produce consolidated pcle structures over a range of different porosities, withthe need for binder, whilst keeping the surface chemand skeletal-defined pore geometry constant; a featureoverlooked when workers have attempted to correlate abtion between samples of different porosities. The samplemade by applying variable compression forces to the pder in a specially designed steel die. The resulting ranindustrially relevant structures with, unlike many model s
927-7757/$ – see front matter © 2004 Elsevier B.V. All rights reserved.oi:10.1016/j.colsurfa.2004.09.001

150 J. Schoelkopf et al. / Colloids and Surfaces A: Physicochem. Eng. Aspects 251 (2004) 149–159
tems, a naturally-formed broad size distribution of particles,and hence pores, is seen to contribute a unique series to theliterature upon which consistent studies of liquid imbibition,permeation and intrusion have been made. The experimentalprocedures for liquid imbibition, permeation and intrusioninclude:
• a droplet method using dyes, and subsequent cross-sectional grinding, to determine the macroscopic equilib-rium liquid distribution within the porous network by im-age analysis (data not used in this paper)[1],
• a dynamic supersource imbibition method to investigatethe rate dependence of imbibition on porous structure, liq-uid density, viscosity and surface tension, which samplesdirectly the mass uptake of fluid into the consolidated struc-tures of coating pigment[2],
• an hydrostatic approach for direct measurements of steadystate unidirectional permeability[3],
• and mercury intrusion/extrusion porosimetry, as men-tioned above, for porosity and pore size evaluation. A datacorrection program is applied as will be described in theexperimental section.
The porous structures were then modelled in terms ofan interconnected network using a pore-network simulator,Pore-Cor,2 taking account of the shielding effects, encoun-t de-lm ids ncesc d toi lisedm
of thes rptionB
usedw etert robedb riti-c ntialp h ass fteno dingt ain-i e dif-f ighlys alu-a alsoa fromt
im-bW re-d ellk ale y the
wetting force. There exists a time dependent optimum forflow rate as a function of capillary radius and length[7], liq-uid density and viscosity. The consequence is that pores up toa given diameter in a porous network, this diameter being inturn a function of time, fill very fast while bigger features re-main by-passed and tend to remain unfilled under conditionsof limited supply volumes of fluid, as is the case for examplewith thin applied ink films. This promotes a preferential path-way flow[8]. The existence of unfilled or by-passed pores isalso known from soil science and studies made using micromodels[9]. Inertial flow in a glass capillary was observed byQuere using a high speed camera[10].
With modifications, we applied the Bosanquet equation toform a sequential wetting algorithm for Newtonian fluids inthe pore network simulator to model the imbibition[11] andused a ‘Dinic’ network analysis algorithm[12] in the samesimulator to model the permeability of the network structures.
2. Background for the descriptors
The equations describing liquid flow through porous me-dia contain a driving term, either a wetting force leadingto capillarity and/or an external pressure, which competesagainst a resistance or drag term. Viscous friction is the clas-s ountf liq-u e ofc uid( pro-pG ionso wallb addi-t tingi er-t ousd
cturei lentr d wed rentc
plestc ntedb
x
w heci andθ allso n ofP s isd b-
ered in mercury intrusion porosimetry, which occur inineated pore–throat structures. In earlier practical[1] and
odelling work[4] it could be shown that the broad voize distribution, as encountered in our samples, pronouertain pore-level differentiating properties, mainly relatembibition, as we discuss later, which in the case of idea
onomodal distributions are found to be absent.These data are now compared with measurements
pecific surface area as determined by the nitrogen adsoET method.For all these approaches, descriptive equations are
hich contain some form of phenomenological paramo describe the characteristic radius of the system as py the liquid. This radius is, in many cases, the most cal parameter of a descriptive equation. The other influearameters are normally also difficult to determine, sucurface energy or configuration, and so the radii are overlooked as having any meaningful information regarheir differences. In these studies we have kept the remng phenomenological parameters constant, and so therences encountered in respect to radii are deemed hignificant, such that we can compare them to obtain vble information about the structures themselves, andbout mechanisms and perhaps even artefacts arising
he different liquid interaction methods.In previous studies we reviewed the mechanism of
ibition of pure liquids into coating pigment structures[2].e identified the relevance of inertial flow as physically p
icted by Bosanquet[5] and others, who expanded the wnown Lucas–Washburn[6] equation to contain the inertiffect of the liquid mass which has to be accelerated b
ic drag component. More recent contributions try to accor other dissipation mechanisms like turbulent flow andid flow discontinuity close to the meniscus in the casapillarity. For the regime of liquid displacing another fltypically a gas) as in an imbibition situation, Bosanquetosed inertia as an important additional drag mechanism[5].iven the complexity of the real structures and the limitatf the modelled structures in respect to continuity of sideoundaries, we have focused on the inertial term as the
ional mechanism for retardation in the case of liquid wetmbibition into larger pores, used in combination with inial plug flow wetting of the finest pores, and classical viscissipation.
The parameter we use as a descriptor for the strunteracting with liquid is the respectively derived equivaadius. Each method delivers its own radius descriptor anistinguish them by their subscript according to the diffeonstitutive equations as follows.
The classical Lucas–Washburn equation is the simase for the description of dynamic capillarity, represey a horizontal circular tube of definably small radius,rLW:
2 =(
rLW t
2η
)γLV cosθ (1)
herex is the distance travelled by the liquid front in tapillary, t the time,η the fluid dynamic viscosity,γLV thenterfacial tension, i.e. liquid–vapour interfacial tension,
is the contact angle between the fluid and the solid wf the capillary. The equation is based on a combinatiooiseuille’s law and the Laplace equation. If the radiuerived from Eq.(1) the wetting front position must be o

J. Schoelkopf et al. / Colloids and Surfaces A: Physicochem. Eng. Aspects 251 (2004) 149–159 151
served. This method has some limitations as discussed in theliterature[13]. In the case of a gravimetric experiment, the ab-sorption mass (converted to volume by fluid density) needs tobe translated to remove the contribution from the other forcesin the experiment, as discussed, for example, by Miller et al.[14]. The uptake is then analysed directly as an averaged wet-ting front position, sometimes called a Darcy lengthxDarcy,assuming complete pore filling behind the wetting front
xDarcy = m(t)
ρAφHg(2)
wherem(t) is the mass of liquid absorbed as a function oft,ρ the density,A the area of transplanar uptake andφHg is theporosity found by mercury intrusion.φHg is used in this con-text as a volume term only and is not dependent on shieldingphenomena, i.e. it is independent of pore size and/or geom-etry. It can therefore be assumed to be a universal measureof porosity. Furthermore, it was confirmed to be gravimetri-cally equivalent to liquid (hexadecane) saturation absorption.A plot of x against the square root of time results in a similarpicture as for the imbibed volume per unit areaV(t)/A. Wederive from the experimentally determined Darcy length aradius termrehc based on the LW equation in the form of
rehc =(
V (t))2 2η ≡
(d(V (t)/A)√
)2 2η
w r-i -p tyt g oft iquidf re-l ousL rouss ferentr
ure-d teds esa rop-e osityi ilityk
w -sohv
equivalent radius under the imposed conditions of saturatedflow.
Darcy pioneered the topic of permeability, formulatingthe classical relationship given in Eq.(4). This equation hasbeen widely adopted, and has been further adapted to morecomplex situations such as the recent application to the per-meability of a growing filtercake of particles[17], which issimilarly handled for the permeability of a fibre mat as thebasis of paper making and so been related to further paperstructure parameters.
Among the more popular extensions is the Carman–Kozeny approach[18], often called the “hydraulic radiustheory” [19], linking the fractional void volume in a porousmedium,φ, with its inner specific surface area,s, defined asthe surface area per unit skeletal volume,
rhCK = φ
s(1 − φ)(5)
where rhCK is the hydraulic radius as defined byCarman–Kozeny. Eq.(5) is based on the more general defi-nition expressed in Eq.(6) [20].
rhCK = 2 × void volume of medium
surface area of channels in the medium(6)
The behaviour of a non-wetting fluid, such as mercury (θ >9
sure,
i
r
w -p voids givinga tp
lvingfl iumv -t ncee sizea r allm s ana
3
s ofp driedp froml5
bse-qt rouss imens
AφHg γLV cosθt φHgd t γLV cosθ(3)
here the first term d[V(t)/A]/d√t is the slope of the expe
mental imbibition plot as a function of√t. The most im
ortant drawback using anrehc, which includes a porosierm, is therefore, that it pre-supposes the complete fillinhe available structure from the supersource up to the lront. The use of the gradient function outside the identityation also allows the experimenter to cater for discontinuucas–Washburn behaviour such that discontinuous potructures, for example, banded structures, can have difadii which are experimentally trackable.
Permeation is defined in terms of an external pressriven liquid transport process in an effectively saturaample. Hilfer[15] states that the permeability (sometimlso called conductivity) is the most important physical prty of a porous medium in much the same way as por
s its most important volumetric property. The permeabis expressed using Darcy’s Law[16] Eq.(4),
q = kAP
ηl= r2AP
8ηl
⇒ rehcDarcy=√
q8ηl
APandk = r2
ehcDarcy
8(4)
hereq is the volumetric flow rate (d(V(t))/dt), A the crossectional area of the sample normal to the flow,l the lengthf the sample in the macroscopic flow direction,P theydrostatic pressure drop over the distancel and η theiscosity of the incompressible liquid, andrehcDarcy is the
0 ) penetrating a porous material under an applied press described by the Laplace equation
Hg = −2γLV cosθ
P(7)
hererHg is the defined intrusion radius andP is the aplied pressure. The volume of mercury forced into thepace of the material increases as pressure increasespressure–volume curve. The radius,r50, is defined at tha
ressure at which 50% of the pore volume is intruded.To summarise, we can say that all the equations invo
ow share the Poiseuille assumption of uniform equilibriscous flow. The Bosanquet equation[5] avoids this assumpion only in its early time regime, as discussed later. Oquilibrium flow is reached, within a certain dimensionalnd time, it too shares the Poiseuille approximation. Foeniscus-driven equations, a further common factor issumed constant wettability.
. Materials
The bulk samples used in this work are cubic blockigment. We concentrate here on the use of a sprayredispersed natural ground calcium carbonate derived
imestone with a particle size distribution of 91 wt.% <5m,5 wt.% <2m and 30 wt.% <1m.
The detailed method of powder compaction and suuent sample grinding is described elsewhere[2]. It proved
o give a reproducible and relatively homogeneous potructure. Such homogeneity was required so that spec

152 J. Schoelkopf et al. / Colloids and Surfaces A: Physicochem. Eng. Aspects 251 (2004) 149–159
from the same sample could be used separately for the fluidimbibition, permeation and mercury porosimetry and BETexperiments.
The liquid used for imbibition and permeation was a min-eral oil similar to that used in the formulation of offset print-ing inks, namely a Haltermann PKWF 6/9 af (aromat free)quality, a mixture of aliphatic alkanes. The contact angle ofoil/calcium carbonate,θ, was assumed to be zero followingthe data of Chibowski and Holyz[21,22]. This was also con-firmed by observing the complete spreading of an oil dropleton a freshly ground, dispersant adsorbed (polyacrylate) crys-tal surface of calcite. A deeper discussion of the meaning ofa contact angle in the context of our data follows later.
4. Methods
We go on to compare uniquely data from previous exper-iments with new data as follows. All experimentation in thisstudy was maintained under constant temperature conditionsof 23.0± 1.5C.
The dynamic imbibition of liquids was measured usingan automated microbalance, and a software program was de-veloped interfacing with the balance for data sampling. Toprovide a sufficiently slow and precise approach of the sam-p wasc ve thec lse;d
adect res-s ottlea er FM62 ell isfi bal-a imbi-b ught y per-ft asings n flowo ith au ed byo re-g sentsa thefl ure.
asu arac-t re of
ny,w
land.
mercury was 414 MPa, equivalent to a Laplace throat diam-eter of 0.004m. Small samples were used, each of around1.5 g in weight. The equilibration time at each of the increas-ing applied pressures of mercury was set to 60 s. The mercuryintrusion measurements were corrected for the compressionof mercury, expansion of the glass sample chamber, or ‘pen-etrometer’, and compressibility of the solid phase of the sam-ple by use of the following equation from Gane et al.[24], asincorporated in the software Pore-Comp3:
Vint = Vobs− δVblank +[0.175(V 1
bulk) log10
(1 + P
1820
)]
− V 1bulk(1 − Φ1)
(1 − exp
[P1 − P
Mss
])(8)
whereVint is the volume of intrusion into the sample,Vobstheintruded mercury volume reading,δVblank the change in theblank run volume reading,V 1
bulk the sample bulk volume atatmospheric pressure,P the applied pressure,Φ1 the poros-ity at atmospheric pressure,P1 the atmospheric pressure andMss is the bulk modulus of the solid sample. The volume ofmercury intruded at the maximum pressure, once correctedfor sample compression effects, can be used to calculate theporosity of the sample. The applied pressures can be con-verted to diameters using Eq.(7), and the intruded volumecan be expressed as a percentage assuming that the sample is1 andc es
thod( sur-f aso luatet massa sur-f asd art-P in at2
5
de-s howni
etry( m-b thep cor-r thatt poresr ores,
od-e
le down to the liquid surface, a special sample holderonstructed, and the mass data are normalized to remoontribution of other forces, i.e. mainly the wetting impuetails are given elsewhere[23].
Liquid permeability was determined using a custom mell design and is also described previously elsewhere[3],herefore, only a brief overview is given here. Gas overpure is supplied to the permeating liquid from a nitrogen bnd passes a precision pressure reduction valve (Mess21). A Y-piece connects a digital barometer (Eurolec2 PR05, 0–7000 mbar) to the pressure line. The pressure cxed on a tripod over a micro balance. A PC samples thence data using the same software as developed for theition experimentation and records the flux of liquid thro
he sample. Cycles of measurement were subsequentlormed first with the highest possible pressure (≈7 bar) andhen recorded in descending order of pressure. A decreeries of pressure steps are used to record the permeatiover a reasonable amount of time to achieve a curve wsable gradient. Each step in the recorded curve is causne drop falling into the weighing pan. By making a linearression analysis, a gradient is determined which repreflow rate of mass per unit time. It is clearly visible that
ow is in the necessary steady state at a constant pressA Micromeritics Autopore III mercury porosimeter w
sed to measure the enforced percolation (intrusion) cheristics of the samples. The maximum applied pressu
1 Messer Griesheim GmbH, Futingsweg 34, 47805 Krefeld, Germaorldwide seewww.messergroup.com.
2 Eurolec Instrumentation Ltd., Cluan Enda, Dundalk, Co. Louth, Ire
00% filled at the maximum pressure. The radius usedompared in this study isr50, the radius at which 50% of thample porosity is filled.
Although not undisputed, the nitrogen adsorption meBET) has gained wide acceptance to obtain data for theace area of solids[20]. The condensation isotherm of gnto the surface of the skeletal material is used to eva
he accessible surface area. This is normalised by thend density of the sample to deliver a value for the specific
ace area,s, as used in Eq.(5). The specific surface area wetermined using a Micromeritics Tristar 3000 with Smrep sample preparation, and a degassing time of 30 m50C.
. Discussion of experimental results
The experimental results in the form of the variouscriptor values of radius, as discussed previously, are sn Fig. 1.
It can be seen that the mercury intrusion porosimMIP) derived r50 value is larger than the descriptive iibition and permeation defined radii. As it representsore size following the Laplace equation at the pressureesponding to 50% of intruded volume, it is obvioushis volume-related parameter represents more the largeather than the statistical numerical occurrence of fine p
3 Pore-Comp is a software program of the Environmental and Fluid Mlling Group, University of Plymouth, PL4 8AA, UK.

J. Schoelkopf et al. / Colloids and Surfaces A: Physicochem. Eng. Aspects 251 (2004) 149–159 153
Fig. 1. Comparison of descriptive radii derived from different experimentations.
despite the pore shielding effects associated with the intru-sion method, in which entrance to large pores is shielded byfiner throats. The pore size distributions are themselves ofcourse not Gaussian and resemble more a log-normal distri-bution. Therefore, the use of a simple volume-based medianis not a logical descriptor for liquid interactions. However, itis also not justified to adopt a definition of pore size distribu-tion using mercury intrusion due to the shielding effect. Whatis interesting to note is that ther50 does scale proportionallywith the rehc, i.e. ther50 is a relatively constant multiple ofthe equivalentrehc. This, in turn, is an indication that theshielding throats are themselves likely to be the controllingpore features most associated with the dynamic of absorption,such that mercury intrusion, albeit not an absolute predictor,can be considered a valid qualitative method for predictingrelative absorption radius in comparable structures.
The classical LW basedrehcis at the lower end of the size-scale. The findings suggest that mechanisms of imbibition aredifferent from simple LW behaviour as might be applied if theintrusion radius described the structure. Explanation is givenat least in part via more complex imbibition mechanisms ona pore scale level.
Many studies in the literature describe the jumpwise ad-vance of the liquid front during imbibition, observable, per-haps, with a microscope. An example is the study by Lue lsoK edm tionr ronti , ast is in-e dingi too ated.
Big inter-particle voids can act as reservoirs for these accel-eration events. The application of an equation of imbibitioncontaining an inertial term suggests a preferred pathway flowor effective micro-fingering. This is confirmed by dye solu-tion imbibition which shows that the liquid front does notform a sharp line, but rather a “fuzzy” regime[13] whichextends beyond the point that a saturated porosity behind thewetting front would dictate. The LW equation does not con-sider inertia. It predicts an imbibition which is initially toofast in large pores, and ignores the faster inertial wetting onshort timescales of fine pores. That is why a radius of imbibi-tion gives a much smaller value for the pore radius comparedwith the other descriptors, because reducing the radius is theonly way the LW equation canadjustto the experiment.
To account for the divergence from the LW descriptor,it is typically argued that other parameters are not absolute,but rather become deemed as “effective”, such as the dynamiccontact angle, which may be argued to be larger than the mea-sured static or pseudostatic one. However, this could only bethe case for quasi-steady high velocity regimes. At the startof an impulse-like imbibition event, the contact angle is pro-posed to be∼0. For a range of liquids, contact angles canbe experimentally increased up to 15 in imbibition drivenabsorption. Schoelkopf and others found only a minor contri-bution from this change in wetting angle[13]. Micro-modelsh quidfi flu-e iona elec-t ect top essa ow.L ins chem-
t al. [25,26] who worked with spherical glass beads. Anackstedt et al.[27] have observed this behaviour in etchicro-models. What is obvious is that the jump-wise mo
esults in strong acceleration of that section of the liquid fnvolved in the jump. Therefore, inertia has an influencehe mass of liquid is accelerated (and decelerated). Thrtia has to be considered when modelling the correspon
mbibition dynamic. An important condition for the jumpccur is that enough free liquid is present to be acceler
ave given some insight into the micro-mechanisms of lilms and their transition to meniscus-driven flow. The innce of pre-viscous inertial flow in relation to pore dimensnd the liquid physical parameters, and the resulting s
ivity mechanism, have already been discussed in respore size[23], however, it is also known that the roughnnd microroughness contribute to the discontinuity of flocal temporary pinning of the wetting line may occurome cases caused by local geometrical and/or surface

154 J. Schoelkopf et al. / Colloids and Surfaces A: Physicochem. Eng. Aspects 251 (2004) 149–159
ical features leading to a slip/stick motion or avalanche typemovement.
Further mechanisms complicate imbibition into poroussamples. Toivakka and Nyfors[28] visualised the voids forthe case of spherical particles. The geometrical void struc-ture they presented demonstrates that the throats in packedpigment coating structures are mainly slits or crevices be-tween the closest boundaries of adjacent particles, and poresare formed between the largest distances of adjacent parti-cle centres. For structures formed of crystallite particles likecalcite, triangular shapes of pore cross-section are commonin the lateral directions. There is both theoretical and exper-imental evidence for non-Poiseuille liquid flow in angularpores and their corners[29–31]. It is intuitively obvious thatin a void space with polygonal spatial geometry the actualviscous flow is more complicated (more dissipation) than asimple Poiseuille approximation.
Putting together the findings we have discussed, it is pos-tulated that imbibition into an interparticulate void structurewould behave generally in a progressive multi-step processbeginning with:
• very fast (plug flow) absorption into narrow slits andcrevices without a fully established viscous drag, and
• film flow acting rapidly to coat exposed particles with afilm of subsequently growing thickness.
andt ane ing ap bibi-t
• byniscus
• ime
evena de-s tob lowero influ-e cturep
rivedr -a est tos su-p ver,i rredp res,u ub-s ro-m nve-l enr pre-
ferred pathway flow restricting the size ofrehccompared withrehcDarcyand the subsequent redistribution process during ab-sorption only then takes place via the permeability controlledflow.
The differences between therehcDarcyand ther50 are partlyexplicable in the same way as was argued for therehc term.Additionally, the possibility of air trapped in pore ganglia re-maining after imbibition saturation could lead to an arguablyreduced permeability.
6. Comparison with virtual structures
6.1. Modelling using the pore network simulator
The computer network simulator, Pore-Cor, uses a unitcell with 1000 cubic pores in a three-dimensional 10× 10× 10 array, connected by up to 3000 throats, i.e. up to oneconnected to each cube face depending on the chosen con-nectivity, which can either be cylindrical or double conical[32].
It is clear that the use of cubic pores does not represent theactual geometry of pores found in practice but are present onlyto provide the matching void volume. However, the model isdesigned to represent the mercury intrusion pressure spec-t ctlyb ful-fi us-i onsw redP thep qua-t nth -a thed liseds to beh dente
igh-b lli yc otheri re-f ey ore-a thatt le totT twop tiono kewi e andt axi-m roats ters
These two phenomena are not clearly divisiblehey are accompanied (depending on the liquid) byvaporation—recondensation/adsorption process formrecursor film. Only after these first steps does the im
ion continue by:
a filling of the films into the pore corners and crevicessurface tension to approach a state where a united mecan be formed, thenthe pore fills as a jump with an inertial and a viscous regdepending on the pore dimensions.
In some cases, a range of mechanisms may act to prpore from complete filling. The film flow sequence, as
cribed by Bernadiner[9], leads to air bubbles which tende entrapped in pores. Fast capillaries may by-pass snes so that the air has no way to escape. All thesences have to be seen as factors favouring a finer struarameter than in the LW prediction.
By a similar argument, we see that the permeation-deehcDarcy is larger than therehc, by a factor of∼2. Permetion represents the porous sample in the state closaturation which is equivalent to the final stage of theersource imbibition into a sample of finite size. Howe
mbibition was postulated above to occur with a prefeathway flow at the wetting front, governed by small pop to and including the inertially defined optimum, and sequent liquid redistribution behind the wetting front poting the overall viscous drag. This gives rise to an e
ope curve following a√t function. The difference betwe
ehcDarcyand therehcis therefore proposed to be due to the
t
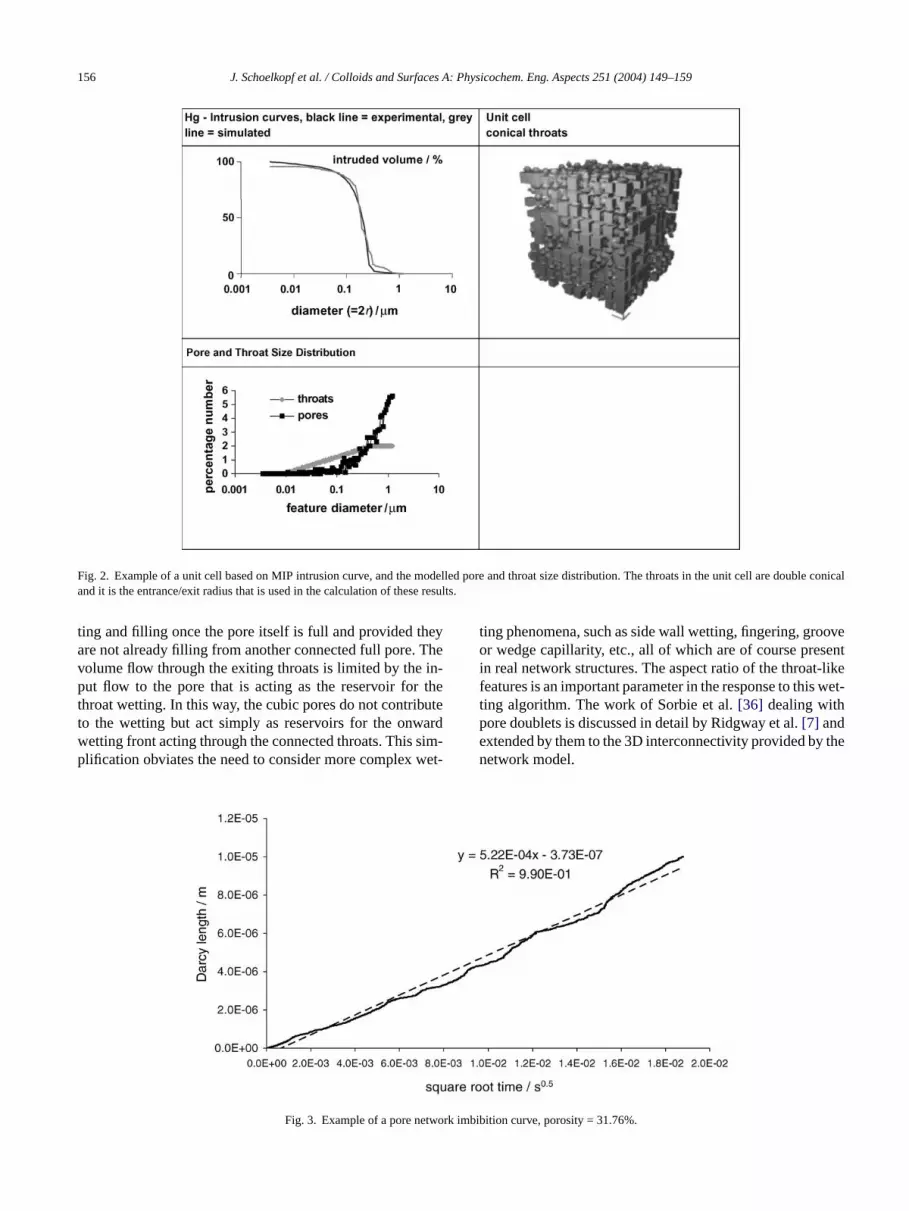
rum in relation to intruded volume. This is achieved direy the interconnecting capillaries, called throats, whichl the intrusion criteria for shielding of the pores whenng mercury, and so it is a valid model for all comparisith mercury data. Furthermore, it is clear from the shaoiseuille relation that it is these throats which controlrimary liquid flow resistance parameters in both the e
ions for imbibition, in which equivalence with experimeas already been shown to be striking[32], and for permetion, as described later. Given the similarity betweenescriptors in the various radii equations and the ideatructure of Pore-Cor, therefore, we consider the modelighly relevant for the elaboration of these radii-depenquations.
The centre of each pore is equally spaced from its neouring pores by the ‘pore row spacing’Q, and each unit ce
s therefore a cube of side length 10Q. Periodic boundaronditions are applied, i.e. each cell is connected to andentical unit cell in each direction. Connectivity, and theore flow, is maintained between adjacent unit cells in thx-,- andz-directions. When modelling real systems, the pnd throat-size distribution of the unit cell is optimised so
he simulated percolation curve fits as closely as possibhe corrected experimental mercury intrusion curve[24,33].he pore and throat size distribution is characterised byarameters, ‘throat skew’ and ‘pore skew’. The distribuf throat sizes is chosen to be log-linear. The throat s
s the percentage number of throats of the smallest sizhe linear distribution between the minimum and the mum size pivots about its mid-point at 1%. A negative th
kew occurs when the linear distribution of throat diame

J. Schoelkopf et al. / Colloids and Surfaces A: Physicochem. Eng. Aspects 251 (2004) 149–159 155
over the logarithmic size range would intercept the percent-age of smallest diameters at a value less than zero. Whenthis occurs the distribution is made horizontal at 0% to bringany unreal negative percentages up to zero, and furthermoremade horizontal at 2% to maintain the total number of throatsat the maximum possible, i.e. 100% of those available. Thepositions of the pores and throats are random, being deter-mined by a pseudo-random number generator. The throatsare randomly positioned within the array and the pores arethen generated to be the size of the largest throat enteringthem. The pore size is initially determined as the size of thelargest throat connecting to that pore. The pore skew thenincreases the sizes of the pores by a constant multiple. How-ever, the pores with the largest sizes are truncated back to thesize of the largest throat, thus giving a peak at the maximumsize.
The percolation characteristics of the network are insen-sitive toQ. Therefore, after convergence of the simulatedenforced mercury percolation (intrusion) to the experimentalintrusion data has been achieved by scanning through val-ues of throat skew and connectivity,Q is adjusted so that theporosity matches the experimental value while ensuring thatno pores overlap. It has been found that it is not normallypossible to represent the overall complexity of the void net-work of a natural sample using the relatively simple geometryo llert sam-p singa rator.T me-t domn ares p ofl llingi -f ndomn com-p n ber s andp lica-t tuals engthc e in-t latives re-
alistic application of the pore shielding algorithm which playsan important role also in the description of permeability.
The parameters for modelling seven of the samples usedin the experimental analysis above are shown inTable 1.
An example of the mercury intrusion curves, unit cell andthe pore and throat size distribution are shown inFig. 2.
6.2. Modelling dynamic imbibition of liquids
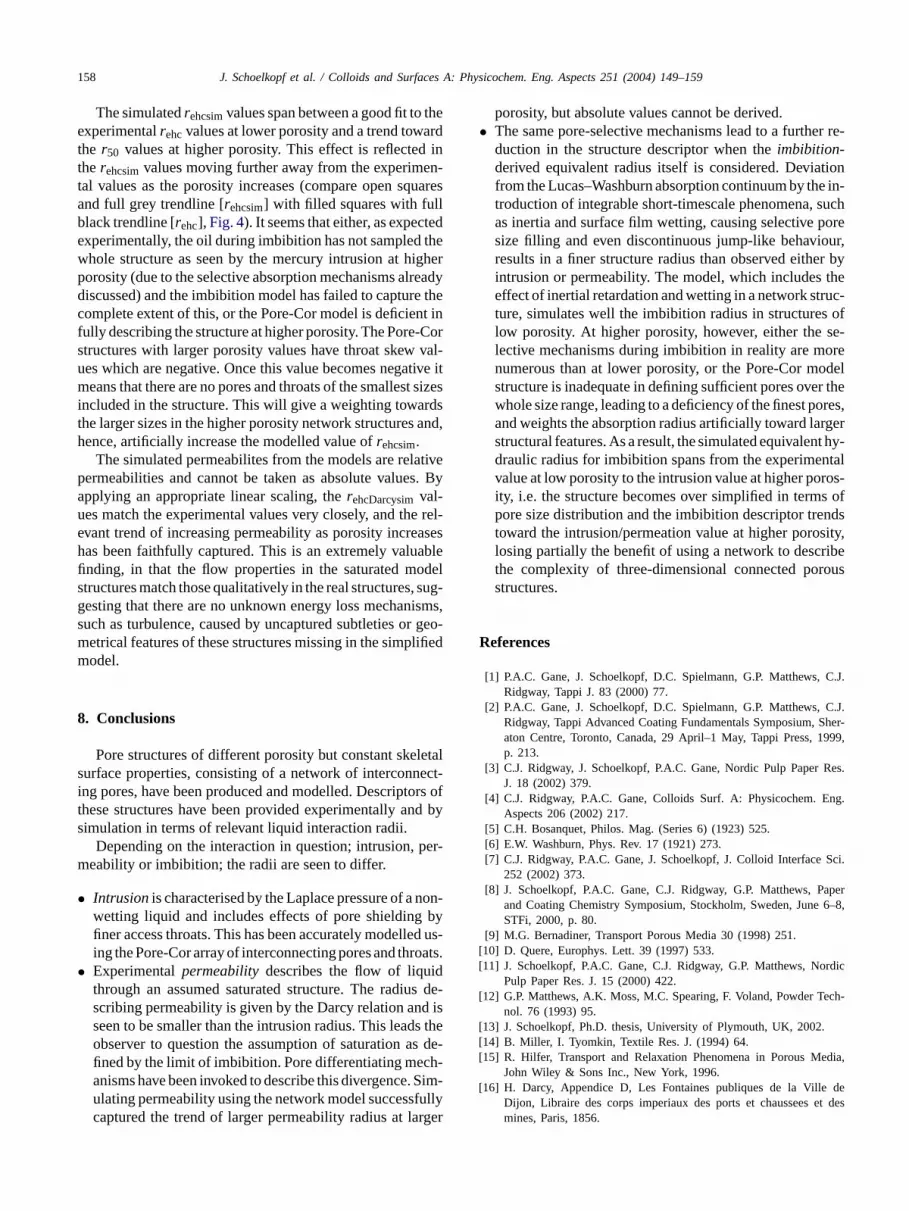
An algorithm incorporating short timescale plug flow andinertial retardation, which initiates a short-lived linear timedependence in the finer pores and effects a slowing of entryinto the larger pores, respectively, together with the longerterm viscous drag component typified in the Lucas–Washburnrelation, was created using a solution of the Bosanquet equa-tion [5,11,32].
The Bosanquet equation is expressed as
d
dt
(πr2ρx
dx
dt
)+ 8πηx
dx
dt= Peπr2 + 2πrγ cosθ (9)
wherex is the distance travelled by the liquid front in thehypothetical horizontal capillary,r the capillary radius,t thetime, ρ the liquid density,η the dynamic viscosity, theliquid–vapour interfacial tension,θ the contact angle andPeis the external pressure.
ec-e nb l oils[t lowv l ef-f tinge truc-t rousm i.e.t ruc-t ont,l x-a
ucht ic offl quete nti-n Thee et-
TP
P skew g
3333222
f a single unit cell. The size of the unit cell is often smahan the representative elementary volume (REV) of thele. Therefore, different unit cells must be generated udifferent seed for the pseudo-random number gene
he model is designed so that different structural paraers in conjunction with the same seed of the pseudo-ranumber generator produce a family of unit cells whichimilar to each other—for example, all may have a grouarge pores in the same region. This aspect of the modes discussed in detail in a recent publication[34]. These diferent stochastic generations use a different pseudo-raumber generator seed, and can either use the originaluter network simulator optimisation parameters or cae-optimised to the experimental data. The parameterrocedure are described in more detail in previous pub
ions[33,35]. As a result it must be recognised that the acize relationships between pores, throats and throat lan be far removed from reality. The model matches thrusion percolation and hence, as we see later, the reample permeability. These are effectively linked via the
able 1ore-Cor parameters
orosity (%) * rmin (m) * rmax (m) Throat skew Pore
7.32 0.002 0.610 −0.5 15.53 0.002 0.610 −0.44 11.76 0.002 0.610 −0.28 10.27 0.002 0.610 −0.13 17.31 0.002 0.610 −0.04 17.11 0.002 0.610 −0.03 14.38 0.002 0.610 0.14 1∗ r equals the entry and exit radii of the double conical throat.
To develop an analytical solution of the equation it is nssary to avoid the discontinuity of initialt = 0 acceleratioy averaging techniques. For, say, water and thin minera
32], the inertial effects occur within the first≤0.1m in aime scale of∼10 ns within each pore element. Denseriscosity fluids have a longer lasting inertial retardationaect. More viscous fluids have a shorter-lived inertial wetffect. The effect in each pore element of the overall s
ure sums to create the macroscopic imbibition of a poedium. Clearly, the long-term dominance of viscosity,
he controlling viscous loss as liquid flows through the stural components that become full behind the wetting freads to an approximate
√t proportionality, as shown for e
mple inFig. 3.The wetting algorithm is applied to the throats only, s
hat they act as simple capillary elements. The dynamow through each throat is determined by the Bosanquation with the boundary condition of mass flow couity. The throats deliver liquid to their connected pore.xiting throat(s) from that pore are allowed to undergo w
Connectivity * r50exp(m) * r50sim (m) Pore row spacin
3.0 0.099 0.093 1.282.8 0.098 0.084 1.273.0 0.078 0.083 1.412.6 0.067 0.062 1.332.6 0.061 0.055 1.412.9 0.056 0.062 1.462.9 0.048 0.053 1.60
156 J. Schoelkopf et al. / Colloids and Surfaces A: Physicochem. Eng. Aspects 251 (2004) 149–159
Fig. 2. Example of a unit cell based on MIP intrusion curve, and the modelled pore and throat size distribution. The throats in the unit cell are double conicaland it is the entrance/exit radius that is used in the calculation of these results.
ting and filling once the pore itself is full and provided theyare not already filling from another connected full pore. Thevolume flow through the exiting throats is limited by the in-put flow to the pore that is acting as the reservoir for thethroat wetting. In this way, the cubic pores do not contributeto the wetting but act simply as reservoirs for the onwardwetting front acting through the connected throats. This sim-plification obviates the need to consider more complex wet-
ting phenomena, such as side wall wetting, fingering, grooveor wedge capillarity, etc., all of which are of course presentin real network structures. The aspect ratio of the throat-likefeatures is an important parameter in the response to this wet-ting algorithm. The work of Sorbie et al.[36] dealing withpore doublets is discussed in detail by Ridgway et al.[7] andextended by them to the 3D interconnectivity provided by thenetwork model.
ork im
Fig. 3. Example of a pore netw bibition curve, porosity = 31.76%.
J. Schoelkopf et al. / Colloids and Surfaces A: Physicochem. Eng. Aspects 251 (2004) 149–159 157
6.3. Modelling liquid permeability
The laminar flow resulting in a parabolic velocity distri-bution within a liquid volumeV, in time t, for a horizontalcircular tube of lengthl, radiusr, containing a fluid of viscos-ity η, flowing under a differential pressureP, is expressedvia the Poiseuille equation, Eq.(10),
d(V (t)/A)
dt= πr4P
8ηl(10)
whereP is the applied pressure difference across the sam-ple. In the Pore-Cor model, the termr4/l corresponds to thevolumetric flow capacity of the modelΞ.
It is assumed that Poiseuille flow occurs across the wholecell:(
dV
dt
)cell
= − π
8ηΩcell
(Ξarcs) Pcell (11)
whereΩcell is an averaging operator over the whole unit cell,operating on the flow capacities of the arcs (Ξarcs) in whichan arc represents a pore–throat–pore pathway between nodessited at the center of each pore[12]. Each arc in the flow net-work is the flow channel between adjacent nodes, positionedat the center of each pore. It generates a term which is relatedto the effective Poiseuillean capacity of the cell for flow int int int es-s cht lfl s. Iti al-g sot nitc net-w rage
of the capacity values over only those channels found to carryflow.
The combination of the Poiseuille equation, Eq.(10), withthe Darcy equation, Eq.(4), results in an expression for theabsolute permeability independent of the pressure gradientimposed on the sample:
k = π
8Ωcell
(Ξarcs)lcell
Acell(12)
7. Results from simulation
The r50sim is taken from the simulated mercury intrusioncurve of the structures. It is the corresponding radius at 50%intruded volume.
Using the same fluid properties as the oil used for the ex-perimental measurements, the imbibition has been simulatedfor the seven modelled structures. A plot of imbibed volumeper unit areaV(t)/A against the square root of time results ina linear graph[23,32,37], as inFig. 3, such that the gradientcan be used in Eq.(3) and a simulated radius,rehcsim, can becalculated.
The permeabilities have also been modelled using the porenetwork simulator for the seven structures. These values fort pli-cc s,m
ows
t isu re, asw re av
F en dat da gressio
he −z-direction (from the top to the bottom face), andhe±x- and±y-direction. Flow, however, is not allowedhe+z-direction, thereby applying an implicit positive prure gradient with respect toz. A network analysis approao this problem supplies a termΩcell(Ξarcs) as the maximaow capacity through the network of pores and throats calculated by means of the ‘Dinic’ network analysisorithm [12]. There is an overall conservation of flow,
hat the entire volume of fluid entering the top of the uell emerges at the bottom, with no build-up through theork. The value obtained, as the maximal flow, is an ave
ig. 4. Overview of experimental (filled data points) and simulated (opround the Carman–Kozeny radius,rhCK (circles.) The lines are linear re
he permeability are in arbitrary units. By using a multiation factor of 40 the simulated Darcy radius,rehcDarcysim,alculated by rearranging Eq.(4) for all seven structureatches very closely to the experimental values.All of the radii, experimental and simulated, are n
hown inFig. 4.The correlation of the simulated intrusion radiir50simwith
he experimentalr50 is partly a given, as the modellingndertaken so as to match the intrusion curve. Therefoe see, the intrusion radii from the simulated curves aery good fit to the experimental values.
a points) radii descriptors, represented logarithmically. All the values are centrens for experimental data (black) and simulated data (grey).
158 J. Schoelkopf et al. / Colloids and Surfaces A: Physicochem. Eng. Aspects 251 (2004) 149–159
The simulatedrehcsimvalues span between a good fit to theexperimentalrehcvalues at lower porosity and a trend towardthe r50 values at higher porosity. This effect is reflected intherehcsimvalues moving further away from the experimen-tal values as the porosity increases (compare open squaresand full grey trendline [rehcsim] with filled squares with fullblack trendline [rehc], Fig. 4). It seems that either, as expectedexperimentally, the oil during imbibition has not sampled thewhole structure as seen by the mercury intrusion at higherporosity (due to the selective absorption mechanisms alreadydiscussed) and the imbibition model has failed to capture thecomplete extent of this, or the Pore-Cor model is deficient infully describing the structure at higher porosity. The Pore-Corstructures with larger porosity values have throat skew val-ues which are negative. Once this value becomes negative itmeans that there are no pores and throats of the smallest sizesincluded in the structure. This will give a weighting towardsthe larger sizes in the higher porosity network structures and,hence, artificially increase the modelled value ofrehcsim.
The simulated permeabilites from the models are relativepermeabilities and cannot be taken as absolute values. Byapplying an appropriate linear scaling, therehcDarcysimval-ues match the experimental values very closely, and the rel-evant trend of increasing permeability as porosity increaseshas been faithfully captured. This is an extremely valuablefi dels , sug-g isms,s r geom lifiedm
8
letals ect-i ors oft nd bys
per-m
• non-by
ed us-oats.
• ds de-d iss thes de-h-Sim-
fullyrger
porosity, but absolute values cannot be derived.• The same pore-selective mechanisms lead to a further re-
duction in the structure descriptor when theimbibition-derived equivalent radius itself is considered. Deviationfrom the Lucas–Washburn absorption continuum by the in-troduction of integrable short-timescale phenomena, suchas inertia and surface film wetting, causing selective poresize filling and even discontinuous jump-like behaviour,results in a finer structure radius than observed either byintrusion or permeability. The model, which includes theeffect of inertial retardation and wetting in a network struc-ture, simulates well the imbibition radius in structures oflow porosity. At higher porosity, however, either the se-lective mechanisms during imbibition in reality are morenumerous than at lower porosity, or the Pore-Cor modelstructure is inadequate in defining sufficient pores over thewhole size range, leading to a deficiency of the finest pores,and weights the absorption radius artificially toward largerstructural features. As a result, the simulated equivalent hy-draulic radius for imbibition spans from the experimentalvalue at low porosity to the intrusion value at higher poros-ity, i.e. the structure becomes over simplified in terms ofpore size distribution and the imbibition descriptor trendstoward the intrusion/permeation value at higher porosity,losing partially the benefit of using a network to describe
rous
R
C.J.
C.J.Sher-999,
Res.
ng.
Sci.
aper6–8,
[[ ordic
[ ech-
[[[ edia,
[ det des
nding, in that the flow properties in the saturated motructures match those qualitatively in the real structuresesting that there are no unknown energy loss mechanuch as turbulence, caused by uncaptured subtleties oetrical features of these structures missing in the simpodel.
. Conclusions
Pore structures of different porosity but constant skeurface properties, consisting of a network of interconnng pores, have been produced and modelled. Descripthese structures have been provided experimentally aimulation in terms of relevant liquid interaction radii.
Depending on the interaction in question; intrusion,eability or imbibition; the radii are seen to differ.
Intrusionis characterised by the Laplace pressure of awetting liquid and includes effects of pore shieldingfiner access throats. This has been accurately modelling the Pore-Cor array of interconnecting pores and thrExperimentalpermeabilitydescribes the flow of liquithrough an assumed saturated structure. The radiuscribing permeability is given by the Darcy relation anseen to be smaller than the intrusion radius. This leadobserver to question the assumption of saturation afined by the limit of imbibition. Pore differentiating mecanisms have been invoked to describe this divergence.ulating permeability using the network model successcaptured the trend of larger permeability radius at la
-
the complexity of three-dimensional connected postructures.
eferences
[1] P.A.C. Gane, J. Schoelkopf, D.C. Spielmann, G.P. Matthews,Ridgway, Tappi J. 83 (2000) 77.
[2] P.A.C. Gane, J. Schoelkopf, D.C. Spielmann, G.P. Matthews,Ridgway, Tappi Advanced Coating Fundamentals Symposium,aton Centre, Toronto, Canada, 29 April–1 May, Tappi Press, 1p. 213.
[3] C.J. Ridgway, J. Schoelkopf, P.A.C. Gane, Nordic Pulp PaperJ. 18 (2002) 379.
[4] C.J. Ridgway, P.A.C. Gane, Colloids Surf. A: Physicochem. EAspects 206 (2002) 217.
[5] C.H. Bosanquet, Philos. Mag. (Series 6) (1923) 525.[6] E.W. Washburn, Phys. Rev. 17 (1921) 273.[7] C.J. Ridgway, P.A.C. Gane, J. Schoelkopf, J. Colloid Interface
252 (2002) 373.[8] J. Schoelkopf, P.A.C. Gane, C.J. Ridgway, G.P. Matthews, P
and Coating Chemistry Symposium, Stockholm, Sweden, JuneSTFi, 2000, p. 80.
[9] M.G. Bernadiner, Transport Porous Media 30 (1998) 251.10] D. Quere, Europhys. Lett. 39 (1997) 533.11] J. Schoelkopf, P.A.C. Gane, C.J. Ridgway, G.P. Matthews, N
Pulp Paper Res. J. 15 (2000) 422.12] G.P. Matthews, A.K. Moss, M.C. Spearing, F. Voland, Powder T
nol. 76 (1993) 95.13] J. Schoelkopf, Ph.D. thesis, University of Plymouth, UK, 2002.14] B. Miller, I. Tyomkin, Textile Res. J. (1994) 64.15] R. Hilfer, Transport and Relaxation Phenomena in Porous M
John Wiley & Sons Inc., New York, 1996.16] H. Darcy, Appendice D, Les Fontaines publiques de la Ville
Dijon, Libraire des corps imperiaux des ports et chaussees emines, Paris, 1856.

J. Schoelkopf et al. / Colloids and Surfaces A: Physicochem. Eng. Aspects 251 (2004) 149–159 159
[17] S. Lohmander, M. Martinez, L. Lason, M. Rigdahl, Advanced Coat-ing Fundamentals Symposium, Toronto, Atlanta, Tappi Press, 1999,p. 46.
[18] P.C. Carman, Transport Relax. Phenomena Porous Media (Lond.) 15(1937) 150.
[19] J. van Brakel, Powder Technol. 11 (1975) 205.[20] F.A.L. Dullien, Porous Media: Fluid Transport and Pore Structure,
Academic Press Inc., New York, 1992.[21] E. Chibowski, L. Holysz, J. Adhesion Sci. Technol. 11 (1997)
1289.[22] L. Holysz, E. Chibowski, J. Colloid Interface Sci. 164 (1994)
245.[23] J. Schoelkopf, C.J. Ridgway, P.A.C. Gane, G.P. Matthews, D.C.
Spielmann, J. Colloid Interface Sci. 227 (2000) 119.[24] P.A.C. Gane, J.P. Kettle, G.P. Matthews, C.J. Ridgway, Ind. Eng.
Chem. Res. 35 (1996) 1753.[25] T.X. Lu, D.R. Nielsen, J.W. Biggar, Water Res. Res. 31 (1995) 11.[26] T.X. Lu, J.W. Biggar, D.R. Nielsen, Water Res. Res. 30 (1994) 3275.
[27] M.A. Knackstedt, T.J. Senden, M.B. Lyne, Paper and Coating Chem-istry Symposium, Stockholm, Sweden, 2000.
[28] M. Toivakka, K. Nyfors, Tappi J. 84 (2001) 49.[29] L.-H. Tang, Y. Tang, J. De Phys. Ii 4 (1994) 881.[30] F.G. Yost, R.R. Rye, J.A. Mann, Acta Mater. 45 (1997) 5337.[31] M.M. Weislogel, S. Lichter, J. Fluid Mech. 373 (1998) 349.[32] C.J. Ridgway, J. Schoelkopf, G.P. Matthews, P.A.C. Gane, P.W.
James, J. Colloid Interface Sci. 239 (2001) 417.[33] G.P. Matthews, C.J. Ridgway, M.C. Spearing, J. Colloid Interface
Sci. 171 (1995) 8.[34] D.M.W. Peat, G.P. Matthews, P.J. Worsfold, S.C. Jarvis, Eur. J. Soil
Sci. 51 (2000) 65.[35] C.J. Ridgway, K. Ridgway, G.P. Matthews, J. Pharm. Pharmacol. 49
(1997) 377.[36] K.S. Sorbie, Y.Z. Wu, S.R. McDougall, J. Colloid Interface Sci. 174
(1995) 289.[37] J. Schoelkopf, P.A.C. Gane, C.J. Ridgway, G.P. Matthews, Colloids
Surf. A: Physicochem. Eng. Aspects 206 (2002) 445.