Porous Alginate Hydrogels: Synthetic Methods for Tailoring the Porous Texture
Upload
khangminh22Category
view
0download
0
Nanocrystallization confined to porous matrices with and without
surface functionalization effects
By
Leia M. Dwyer
Bachelor of Science in Engineering in Chemical Engineering
University of Connecticut, 2013
Master of Science in Chemical Engineering Practice
Massachusetts Institute of Technology, 2015
Submitted to the Department of Chemical Engineering in partial fulfillment of the
requirements for the degree of
Doctor of Philosophy at the
MASSACHUSETTS INSTITUTE OF TECHNOLOGY
June 2018 © Massachusetts Institute of Technology 2018. All rights reserved.
The author hereby grants to MIT permission to reproduce
and to distribute publicly paper and electronic
copies of this thesis document in whole or in part
in any medium now known or hereafter created.
Signature of Author: __________________________________________
Department of Chemical Engineering
May 4th, 2018
Certified by: ______________________________________________
Allan S. Myerson
Professor of the Practice of Chemical Engineering
Thesis Supervisor
Accepted by: ________________________________________________
Patrick S. Doyle
Robert T. Haslam Professor of Chemical Engineering
Chairman, Committee for Graduate Students

1
Nanocrystallization confined to porous matrices with and without
surface functionalization effects
By
Leia M. Dwyer
Submitted to the Chemical Engineering Department on May 4th, 2018, in partial fulfillment of
the requirements for the degree of
Doctor of Philosophy
ABSTRACT
Poorly water-soluble active pharmaceutical ingredients (APIs), which represent a major fraction
of the molecules in drug discovery and development, are a challenge to the pharmaceutical
industry given their low bioavailability. One way to address this issue is to generate nanocrystals
of these APIs. Nanocrystals have a significantly increased surface area to volume ratio as
compared to standard micron-sized crystals, which results in improved solubility and dissolution
rates. There already exist some industrially relevant techniques for producing pharmaceutical
nanocrystals, which typically exploit contact forces and high pressures to bring crystals of a
normal micron range down to the nanocrystal scale. However, these techniques are often plagued
with challenges such as low production rates, high energy input, and issues with stabilization and
control over the final crystalline form produced. Because of this, techniques which produce
nanocrystals in the desired size range from the start are gaining interest.
In this work, crystallization in confinement is used to produce stable pharmaceutical nanocrystals
of a well-controlled size. Rigid, nanoporous silica matrices were used to confine crystallization
volumes to the nanoscale, resulting in the formation of nanocrystals within these pores. The
technique was demonstrated across a wide range of pore sizes, and using several poorly water-
soluble APIs. When the principles were extended to a two-stage continuous crystallizer setup,
the loadings of API in these porous matrices were improved to over 50 weight percent. When
these drug loaded porous silicas were tested in a dissolution rate apparatus, the resulting
dissolution profiles showed dramatic improvements as compared to the dissolution of bulk
micron-sized crystals. In the later stages of this research, porous silica with surface
functionalization was used rather than bare porous matrices. Herein, it was demonstrated that, at
the small pore volumes present in these systems, the surface functionalization from the media
may contribute enough functional group interaction to the solvent-solute system for the solubility
of a dissolved API within these pores to change. Thus, through the combination of surface
functionalization and confinement effects, this work demonstrated nanocrystallization from
undersaturated API solutions using functionalized nanoporous matrices.
Thesis Supervisor:
Allan S. Myerson
Title: Professor of the Practice

2
ACKNOWLEDGEMENTS
I would like to first thank my thesis advisor, Professor Allan S. Myerson. His guidance and
direction on my thesis work as well as personal development has been indispensable. He is kind
and generous with his time and support and I am extremely grateful to have been mentored by
him for my doctoral studies. My other thesis committee members, Professor Bernhardt L. Trout
and Professor William A. Tisdale, deserve my thanks as well. They brought support and helpful
questioning to my work. I have appreciated their input greatly.
Next, I would like to thank all of the members of the Myerson research group who have helped
me and made for a good working environment. In particular, I’d like to thank Dr. Marcus
O’Mahoney who assisted me when I joined the lab and my undergraduate student Luzdary and
collaborator Dr. Lucrèce Nicoud. Next, I thank Jennifer for her friendship as both a lab-mate and
Communication Lab fellow, and for braving conference travel with me. Of course, my
experience in the lab has been critically shaped for the better by the support of my office-mate
Carlos Pons Siepermann, who has been on this journey with me from joining the lab to now
graduating. Not every lab-mate becomes a true friend, but I am lucky to have gone through this
experience with such a supportive, energetic, enthusiastic, and caring individual as Carlos.
I would also like to thank members of the department and MIT at large for helping me establish a
community where I have enjoyed spending my time. The many intramural participants who
joined me on various teams have given me a great sense of camaraderie and fun memories. I’d
like to thank my fellow ChemE Communication Lab members for starting something new
together during this past inaugural year. The MIT Student Art Association ceramics studio has
been a critical component of feeding my creativity and maintaining my sanity during my doctoral
work. I thank Darrell for his mentorship, positive attitude, and constant teaching moments as
well as Jay for keeping the studio lively and fun. I also thank the MIT Recreation community, in
particular Anna, James, and Fen, who have helped me strengthen my mind and body.
I am ever grateful for the support of the many friends I am lucky to have made here. I thank
everyone who joined me on one of my many hiking or camping adventures to get a dose of
nature away from Cambridge, as well as those who adventured in Cambridge during board game
nights. A special thanks goes to Kristen for prioritizing a lunch break every day and for always
being there for me through any problem. Of course, I thank my dear friends who have also been
my roommates for their never-ending support: Brinda, Kathryn, Nikunja, and Sepideh.
Of course I thank my family, my rocks, for their support, realism, delightful eccentricity, and
unconditional love. To Cara, the Carl to my Jimmy. To Garth, finally an older brother to nerd out
with. To my sister Laurel, my first best friend, who will always know my mind like no other. To
my father, Robert, who has made the opportunities I’ve had in life possible and who I know I
need never worry about disappointing. And finally, to my mother, Ellen, my first teacher, for
whom I strive every day to face the world with childlike wonder and cherish life in all its
richness. Without you all, the journey would mean nothing, and I have been lucky.
Leia M. Dwyer

3
TABLE OF CONTENTS
Chapter 1 : Introduction ................................................................................................................ 15
1.1 Introduction to crystallization in confinement ............................................................... 15
1.2 Introduction to surface functionalization effects in crystallization ................................ 19
1.3 Thesis outline ................................................................................................................. 22
Chapter 2 : Confinement effects on properties of pharmaceutical nanocrystals .......................... 26
2.1 Introduction ......................................................................................................................... 26
2.2 Experimental ....................................................................................................................... 28
Materials ............................................................................................................................... 28
Experimental Apparatus........................................................................................................ 28
X-Ray Powder Diffraction Analysis ..................................................................................... 29
Differential Scanning Calorimetry Analysis ......................................................................... 30
Thermogravimetric Analysis ................................................................................................ 30
Solid-state Nuclear Magnetic Resonance Spectroscopy ....................................................... 30
Dissolution testing ................................................................................................................ 31
2.3 Results and discussion ........................................................................................................ 32
Crystal form identification with XRPD ................................................................................ 35
Crystal form identification with ssNMR ............................................................................... 37
Analysis of melting point depression of nanocrystals by DSC ............................................. 38

4
Enhanced dissolution profile for nanocrystalline fenofibrate ............................................... 42
Extension to Aeroperl® porous matrix ................................................................................. 44
2.4 Pore size and shape effects on dissolution rates ................................................................. 46
Understanding dissolution profile factors ............................................................................. 46
Dissolution Profile Modeling ................................................................................................ 49
Experiments to understand transport from a porous matrix.................................................. 52
2.5 Conclusions ......................................................................................................................... 55
2.6 Acknowledgements ............................................................................................................. 56
2.7 Appendix ............................................................................................................................. 57
Chapter 3 : Continuous crystallization in confinement to improve matrix loading ...................... 72
3.1 Introduction ......................................................................................................................... 72
3.2 Experimental ....................................................................................................................... 75
Materials ............................................................................................................................... 75
Experimental apparatus ......................................................................................................... 75
Analytical techniques ............................................................................................................ 79
3.3 Results and discussion ........................................................................................................ 82
Selection of MSMPR operating parameters ......................................................................... 82
Analysis of FEN loading in MSMPR experiments ............................................................... 83
Dissolution profile enhancement .......................................................................................... 86

5
Melting point depression analysis of nanocrystals with DSC .............................................. 87
Crystal form identification with X-Ray powder diffraction (XRPD) ................................... 89
Extension of principle to poorly soluble compounds ........................................................... 90
3.4 Conclusions ......................................................................................................................... 92
3.5 Acknowledgements ............................................................................................................. 93
Chapter 4 : Understanding nanoscale surface functionalization’s role on supersaturation in
crystallizing solutions ................................................................................................................... 94
4.1 Introduction ......................................................................................................................... 94
4.2 Experiments and results ...................................................................................................... 96
Materials for solvent/solute systems ..................................................................................... 96
Production and size control of iron oxide nanoparticles ....................................................... 96
Functionalization of silica-coated nanoparticles ................................................................. 102
Continued testing of functionalized nanoparticles in relevant systems .............................. 105
Initial results indicating effects on heterogeneous nucleation ............................................ 106
Aggregation of nanoparticles and its role in the failure of the intended mechanism ......... 111
4.3 Conclusions ....................................................................................................................... 113
4.4 Acknowledgements ........................................................................................................... 114
Chapter 5 : Surface functionalization in combination with confinement for crystallization from
undersaturated solutions.............................................................................................................. 115
5.1 Introduction ....................................................................................................................... 115

6
5.2 Experimental ..................................................................................................................... 118
Materials ............................................................................................................................. 118
DSC and TGA analysis ....................................................................................................... 118
XRPD analysis .................................................................................................................... 119
Submerged loading experiment .......................................................................................... 119
Column loading experiment ................................................................................................ 120
Capillary crystallization experiment ................................................................................... 122
5.3 Results and discussion ...................................................................................................... 123
Submerged loading experiment .......................................................................................... 123
Column loading experiment ................................................................................................ 126
Capillary crystallization experiment ................................................................................... 135
5.4 Summary and application of the work .............................................................................. 137
Submerged loading experiments ......................................................................................... 137
Column loading experiments .............................................................................................. 138
Capillary crystallization experiments ................................................................................. 138
Proposed extensions of the technology ............................................................................... 139
5.5 Acknowledgements ........................................................................................................... 142
Chapter 6 : Conclusions and recommendations .......................................................................... 143
6.1 Outlook for use of nanoconfinement for crystallization ................................................... 143

7
6.2 Future work on using surface functionalized materials for crystallization in confinement
................................................................................................................................................. 145
Chapter 7 : References ................................................................................................................ 147

8
LIST OF FIGURES
Fig. 1: Organic molecule of interest, fenofibrate (FEN) for API loading in porous silica used for
this study ....................................................................................................................................... 28
Fig. 2: Loading procedure to impregnate porous silica particles with API solution .................... 29
Fig. 3: XRD patterns of bulk fenofibrate presented in (a), fenofibrate loaded on 53 nm CPG in 3
distinct trials in (b), and fenofibrate loaded on three representative pore sizes of CPG in (c) ..... 36
Fig. 4: 13C CP MAS NMR spectra of fenofibrate: molecule (top), bulk drug (middle) and loaded
in 20 CPG (bottom) ....................................................................................................................... 38
Fig. 5: DSC scans of all CPG pore sizes showing single peaks (no surface crystals) with
increasing melting point temperatures. Peaks are separated by color and correspond left to right
to increasing pore sizes 20 to 300 nm. .......................................................................................... 39
Fig. 6: Constant enthalpy-constant surface interaction energy Gibbs-Thomson equation fit to
melting points of fenofibrate nanocrystals confined to porous silica. .......................................... 41
Fig. 7: Enthalpy of fusion of fenofibrate nanocrystals showing a linear relationship with 1/d
across varying CPG pore sizes. ..................................................................................................... 42
Fig. 8 Average dissolution profiles of all CPG-confined fenofibrate nanocrystals showing
enhanced dissolution rates compared to crushed and uncrushed bulk fenofibrate, also shown ... 43
Fig. 9: Comparison of the most enhanced dissolution profile of nanocrystalline fenofibrate in 70
nm CPG compared to bulk crushed fenofibrate ............................................................................ 44

9
Fig. 10: XRPD scans of fenofibrate confined to CPG versus Aeroperl(R) show that it is the same
crystalline form ............................................................................................................................. 45
Fig. 11: Dissolution enhancement profiles showing Aeroperl® outperforming all other porous
matrices ......................................................................................................................................... 46
Fig. 12: Mass transport schematic diagram of nanocrystal dissolution and diffusion from porous
beads ............................................................................................................................................. 48
Fig. 13: Schematic representation of diffusion path length and geometry for basic transport
model of nanocrystal diffusion from within a bead. ..................................................................... 50
Fig. 14: Tortuosity model compared with experimental results for dissolution profiles .............. 51
Fig. 15: Porous supports used for fenofibrate loading: anodic alumnimum oxide (left) and porous
silica (right) ................................................................................................................................... 53
Fig. 16: The results of the dissolution testing of FEN loaded on AAO indicate that the loading
was not confined to the pores, nanocrystals were not produced, and the dissolution profile was
not improved over the bulk form of the drug ................................................................................ 54
Fig. 17: Crystallizer design schematic showing the (a) single-stage design and (b) two-stage
design for improved drug loading ................................................................................................. 78
Fig. 18: Comparison of the MSZW of FEN in ethyl acetate showing a decrease in the width with
the addition of porous silica .......................................................................................................... 83

10
Fig. 19: FEN confined to 35 nm Aeroperl® showing dramatically enhanced dissolution profiles
when compared to the bulk crystals .............................................................................................. 87
Fig. 20: Constant-enthalpy surface interaction energy Gibbs-Thomson equation fit to melting
points of confined nanocrystalline FEN averaged from all MSMPR runs ................................... 89
Fig. 21: XRPD scans of FEN nanocrystals from various runs show crystallinity and consistent
formation of form I ....................................................................................................................... 90
Fig. 22: DSC scans of GSF in porous silica compared to bulk crystals show that the two-pass
loading technique was able to produce confined nanocrystals with no significant surface crystals
....................................................................................................................................................... 92
Fig. 23: Proposed schematic of the technique in the case where the nanoparticles are acting as
antisolvent ..................................................................................................................................... 95
Fig. 24: Proposed schematic of the technique in the case where the nanoparticles are acting as
solvent ........................................................................................................................................... 95
Fig. 25: Size description of synthetic IONPs as measured by DLS............................................ 100
Fig. 26: TEM picture of the iron oxide nanoparticles from Spherotech ..................................... 101
Fig. 27: Scheme of the mechanism of silane deposition on the silica surface ............................ 102
Fig. 28: FTIR spectrum of the silica coated iron oxide nanoparticles functionalized with
hexyltriethoxysilane. As a comparison, the FTIR spectra of the plain nanoparticles and of the

11
silane are also shown. The spectra on the right-hand side of the figure are similar to those on the
left-hand side but with a different scale ...................................................................................... 104
Fig. 29: TGA analysis of the silica coated iron oxide nanoparticles functionalized with hexane
(silane SIH6167.5). ..................................................................................................................... 105
Fig. 30: Experimental data of the solubility of DPH as a function of the volumetric percentage of
heptane (symbols). The black line represents the dilution line upon heptane addition. ............. 108
Fig. 31: Crystallization likelihood at various concentrations of heptane and bare nanoparticles.
Five samples were prepared for each condition 103 ..................................................................... 109
Fig. 32: Crystallization of DPH at 33 % heptane and various concentrations of bare nanoparticles
followed by FBRM. (left) Total number of counts as a function of time. (Right) Chord length
distribution at 1 hour ................................................................................................................... 110
Fig. 33: Pictures of DPH crystals formed at 43 % heptane with 0.25 g/L (left) bare and (right)
decane functionalized nanoparticles 103 ...................................................................................... 111
Fig. 34: FBRM indicates that the nanoparticles are around 20 microns in size, indicating
substantial aggregation 103........................................................................................................... 112
Fig. 35: Images taken with a particle vision ParticleView V19, Mettler Toledo show
nanoparticles before crystallization (left) and in the presence of DPH crystals (right) 103 ......... 112
Fig. 36: Schematic of the column setup for porous matrix loading experiments ....................... 121

12
Fig. 37: DSC scans of porous glass material loaded with a submerged basket from an
undersaturated solution of FEN in ethyl acetate (550 mg/mL). The Zorbax® material shows two
distinct melting points indicating the presence of crystallization in the pores. .......................... 125
Fig. 38: Average FEN loading on functionalized Zorbax® chromatographic media versus parent
solution concentration ................................................................................................................. 126
Fig. 39: Flowthrough concentration of DPH collected as the column was run with CPG shows
little change ................................................................................................................................. 127
Fig. 40: Trace DPH with bulk melting temperature only seen in the CPG powder collected from
the column runs ........................................................................................................................... 127
Fig. 41: Flowthrough concentration of DPH in isopropyl alcohol on runs where the column was
packed with Zorbax® show a significant decrease indicating DPH retention on the column.... 129
Fig. 42: DSC scan of the Zorbax® material collected from the column run showing DPH
confined to the pores of the material........................................................................................... 129
Fig. 43: Flowthrough concentration of solids collected as the column was run with CPG and
impurity shows little change ....................................................................................................... 131
Fig. 44: Flowthrough concentration of solids in isopropyl alcohol on runs where the feed also
contained impurity. The column was packed with Zorbax® and shows a significant decrease in
flowthrough solids concentration indicating DPH retention on the column ............................... 132
13
Fig. 45: DSC scan of the Zorbax® material collected from the column run with impurity in the
feed solution showing DPH confined to the pores of the material ............................................. 132
Fig. 46: XRPD of loaded Zorbax® collected from the column runs in which an impurity was
added to the feed solution. Neither column run's collected Zorbax® shows any trace of the
impurity, showing crystalline DPH only .................................................................................... 134
Fig. 47: XRPD of the solids collected from the flowthrough material on the column from runs in
which an impurity was added to the feed solution. The flowthrough is a clear mix of both DPH
and benzophenone. ...................................................................................................................... 134
Fig. 48: Time series XRPD scans of the API solutions loaded in capillary tubes filled with
Zorbax® media showing crystallization within 1 hour .............................................................. 137

14
LIST OF TABLES
Table 1: Pore sizes, surface areas, and volumes of porous silica used in the study as provided by
producer ........................................................................................................................................ 32
Table 2: Fenofibrate loaded in porous silica particles .................................................................. 33
Table 3: Comparison of bead pore and grain sizes used in API release studies ........................... 49
Table 4: Modeling expressions for release of dissolved API from straight and tortuous pores ... 50
Table 5: Room temperature (25 °C) MSMPR loading summary of FEN wt% in porous silica ... 84
Table 6: Loading results for FEN wt% in porous silica in single-stage MSMPR as a function of
filter temperature ........................................................................................................................... 85
Table 7: Loading results of multi-step procedure for nucleation then growth of crystals to
increase the weight percent loading .............................................................................................. 91
Table 8: Summary of the commercial nanoparticles under investigation ................................... 101

15
Chapter 1 : Introduction
1.1 Introduction to crystallization in confinement
Traditional crystallization of active pharmaceutical ingredients (APIs) in both batch and
continuous crystallization is the main separation and purification process for these ingredients.
The resulting crystal population must be controlled for purity, crystal form, crystal shape, and
particle size, among other properties 1. These parameters have implications for other downstream
processing techniques, such as filtering and drying, as well as the effectiveness of the drug itself
as a medicine 2. Various methods to supply the driving force for crystallization, including
cooling, evaporation, and antisolvent addition, can result in differences in the resulting crystal
population and are therefore controlled to meet target product profiles 3.
A major issue facing the pharmaceutical industry is the processing and development of APIs
which are poorly water-soluble. It has been estimated that up to 40% of pharmaceuticals in the
development phase and up to 70% in the discovery phase are poorly water-soluble molecules 4.
This poses a challenge in the body for uptake of these pharmaceuticals, given that the
bioavailability is directly related to the dissolution rates as well as permeability within the body,
composed of aqueous environments 5.
Nanocrystals of APIs offer a simple physical solution to this issue. Because of their high surface
area to volume ratios, the dissolution behavior of pharmaceutical nanocrystals is much improved
over their bulk crystal counterparts 6. Furthermore, while the saturation solubility of bulk crystals
is fixed for a given molecule in a given solvent at a temperature and pressure, below the micron
range saturation solubility is additionally a function of particle size 7. Pharmaceutical

16
nanocrystals have now become an established topic of interest in the industry, and many
techniques already exist for producing them, some of which are actively used in the processes for
APIs currently on the market.
Broadly, the techniques for producing pharmaceutical nanocrystals may be described as top-
down or bottom-up approaches. Top-down approaches take bulk crystals produced at a larger
size, typically in the micron range, and process them down to the nanoscale range. Methods of
this type include high pressure homogenization and various forms of milling 8. High pressure
homogenization standardly applies a very high pressure to mixture of crystals in solvent 9. Often,
the suspension is passed through a valve or membrane with extremely small slits to result in
shear forces in addition to high pressure. Alternatively, a high pressure stream may be aimed at
physical elements such as blades or plates to produce impact forces, or take advantage of
cavitation within a system 10. High pressure homogenization has been employed in many
different pharmaceutical systems, and typically produces crystals in the range of 50-500 nm.
However, the high pressure in the system may cause changes in the crystal structure in addition
to the crystal size, including a transformation to the amorphous form of the drug. These present
serious issues for a finely controlled pharmaceutical product 5.
Milling is the other approach commonly used to bring crystals from the micron range down to
nanocrystal size, typically resulting in particles not smaller than about 500 nm. In milling
procedures, compression, shear, and impact stresses are imparted to the crystals, typically in a
liquid suspension, through a milling media. This media is a hard and dense material, typically
present in the form of beads 11. Due to the straightforward nature of these technologies, the top-
down approaches are those most commonly used today for pharmaceutical nanocrystal products

17
on the market 12. The most prevalent issue with milling is contamination of the pharmaceutical
product by the milling media or apparatus 8.
Bottom-up approaches instead produce crystals in the desired nanoscale range from the onset at a
molecular level. Some of these techniques are based on solvent evaporation to provide the
driving force for nucleation, including spray-drying, electrospraying, and cryogenic spray
processes 6. In these techniques, the volume of evaporating solution is limited, and thereby
controls the resulting crystal size. This often results in low production volumes for these
techniques 6. Furthermore, the high pressures or low temperatures required in these techniques
renders them quite energy intensive 8. Others use the driving force of antisolvent addition,
namely liquid antisolvent addition and supercritical antisolvent addition. These processes
produce nanocrystals in a similar size range to the top-down approaches, typically around 500
nm, but often result in very broad particle size distributions which is undesirable 13.
An issue with all of the methods discussed above is the stabilization of nanoparticle suspensions.
In all of these methods, the nanocrystals are typically produced and held in a liquid suspension,
often to which surfactants or polymers are added to stabilize the nanocrystals and prevent
aggregation to keep them in the desired size range. This results in another additive to the drug
formulation with potential adverse side effects for some patients 5.
Thus, nanocrystallization in confinement has emerged as a viable method for producing
pharmaceutical nanocrystals from a bottom-up approach that doesn’t require subsequent
stabilization of a nanocrystal suspension. Here, various matrices which can control the
crystallization environment are used. Typically porous in nature, the crystals are made in and
thereby confined to these matrices. Materials which have been used for confinement matrices
18
include ordered mesoporous silica 14–21, controlled pore glass (CPG) 22,23, porous
polycyclohexylethylene and polystyrene (p-PCHE) 22,24, nanostructured lipid carriers 25, fumed
silica 26, and electrospun materials 27. While some of these materials have also been used to
confine the amorphous form of APIs, keeping the API in its crystalline state with associated
polymorphism is more desirable for long term stability of the formulated products 28,29. The
resulting product of a crystal confined to a porous matrix stabilized by the matrix itself has the
advantage of not needing any additional surfactants or polymers to maintain the desired size
distribution. Control over the size of the pores present in the matrices lends itself to control over
the size of the nanocrystalline pharmaceuticals produced.

19
1.2 Introduction to surface functionalization effects in crystallization
Heterogeneous nucleation, the formation of a crystal at a surface, plays a large role in
crystallization processes. This is particularly true in industrial processes where large-scale
crystallizers involve many surfaces such as vessel walls, stirring blades and shafts, and baffles,
making heterogeneous nucleation the major contributor in these processes. However, even in
small-scale research situations, the heterogeneous nucleation of crystals on surfaces such as vial
walls, stir bars, or undesirable particulates is an important factor with respect to the end
crystalline product.
For research purposes, often surface modifications are made to a heterogeneous surface to study
the effects on nucleation and crystal growth. In particular, self-assembled monolayers (SAMs)
have been broadly used to examine the effects of functionalization on promoting or obstructing
crystallization at surfaces. These are surfaces to which surface functional groups have been
chemically added, resulting in an outward-facing functionality or functionalities30. When these
SAMs have been used in crystallization studies, typically the functionalities have been selected
to either promote or suppress crystallization though interactions with the functional groups of
crystallizing molecules, or preferential facial interactions with different crystalline faces of a
particular form 31. Previous studies have shown the use of SAMs as crystallization templates to
have effects on crystal polymorphism, size, morphology, and nucleation rate kinetics 23,32–36. In
these systems, the interaction between the solute, either in molecular or crystalline form, and the
SAM functionality is the basis for selective crystallization.

20
Antisolvent crystallization is one of the most relevant industrial crystallization techniques. In this
method, a solvent in which a solute is poorly soluble, an antisolvent, is added to a solution of
dissolved solute in a highly soluble solvent. The addition of the antisolvent changes the solvent
makeup, and the solubility of the solute in the new solvent system decreases. Thus, the driving
force for nucleation is supplied and crystallization may occur 3,37.
A theory was proposed in our lab and demonstrated in proof-of-concept work that perhaps the
solvent makeup of a system could be changed by the introduction of functional groups through
the addition of surface functionalized nanoparticles 38, building upon well-established SAM
crystallization principles. However this work is different from most studies involving SAMs, in
that here the surface functionality is being used to modify the solution phase of the system, as
opposed to interact with the solute. The motivating thought process behind this work was that the
surface area of an addition of nanoparticles could be so high that the addition could contribute
reasonably to the surface functionality present in the solvent phase of a system, thus changing a
dissolved solute’s saturation solubility. This work was tested in normal, bulk crystallization
experiments with some success, however it was desired to understand how it might extend to
crystallization in confinement as well.
Due to difficulties knowing the exact structure of crystals confined to porous environments as
discussed above, it is unclear how much of a role the surface of the porous confinement media
plays in the crystallization process in confinement. It is likely that crystals form preferentially in
the larger volumes at intersections of pore channels; however, it is also possible that adherence to
the pore walls plays a role in the crystallization in confinement. It may be conjectured that the
heterogeneous effect is potentially quite important, given the small pore sizes, the relative

21
surface area of the walls of the confinement media to the pore volume in a given pore is high.
Understanding how concepts of surface functionalization which apply to crystal nucleation in
these previous studies with nanoparticle addition and SAM surfaces might translate to
crystallization in confinement is an important motivator for some of the investigations carried
out in this thesis.

22
1.3 Thesis outline
This thesis began with the objective of understanding how nanocrystals may be produced in
confinement in a stable, reproducible way and how this may affect their physical properties. We
were particularly interested in how the dissolution rate behavior would change, as this is the
metric most closely aligned with how the drug will behave in the body. As we then gained an
understanding of the role of nanoscale surface functionalization in crystallizing solutions, we
began to investigate how surface functionalization effects could work in combination with
crystallization in confinement.
In Chapter 2, we present a study to crystallize a single pharmaceutical molecule, fenofibrate, in a
range of different pore sizes in porous silica matrices. We found that something fundamentally
lacking from other studies of crystallization in confinement was a systematic investigation across
a broad range of pore sizes. Thus, we obtained and used porous silica of pore sizes from 300 to
12 nm. A basic benchtop procedure was developed for loading parent API solution into these
matrices, and evaporation was used to provide the driving force for crystallization. The resulting
drug-loaded porous silica was subjected to a variety of characterization techniques. It was found
that we achieved reasonable loadings of API in the porous matrices, at about 30 weight percent.
The thermal techniques showed that the melting point behavior of the crystals behaved well
according to a Gibbs-Thomson relationship. The dissolution profiles of the drugs confined to
porous silica had dramatic improvements relative to the bulk crystal dissolution profiles. In
particular, the fenofibrate contained to Aeroperl®, a fumed silica used in the study, had greater
than 80 percent dissolution in just 22 minutes. Differences in the dissolution profiles led to a
further brief investigation into how the dissolution profiles are influenced not just by nanocrystal

23
dissolution but also by transport from the porous matrices, dependent upon pore tortuosity and
grain size of the matrices.
In Chapter 3, we look at the advantages of using a continuous crystallization setup to produce
nanocrystals confined to porous matrices and improve the loadings. Continuous crystallization is
a technique well used in both our lab and industry, as it has advantages in product consistency
and scalability. We designed a single-stage mixed suspension mixed product removal (MSMPR)
crystallizer to load the porous silica matrices used in our previous work with API. We then
extended the principle to a two-stage design, in which the first stage was intended to load the
crystals into the pores. Then, a second stage was added to grow the crystals within the pores
ideally without nucleating additional crystals on the surfaces of the matrices or in solution. We
demonstrated that the two-stage design can improve the loading of API in these matrices
significantly, up to greater than 50 weight percent. The concept to have a second growth stage
after crystals were already nucleated within the pores in a first stage led us to extend the
principle in a benchtop procedure to other poorly water-soluble drugs, griseofulvin and
indomethacin. Ultimately, the poor solubility of these two candidate drugs in many solvents led
to poor loadings in the porous matrices.
Next, we changed the theme of investigation slightly to look at surface functionalized
nanoparticles as additives to crystallization systems. Building on previous results from within the
lab, it was speculated that the addition of surface-functionalized nanoparticles to a solvent
system would add so much resulting functionality due to the high surface area of these particles
that it could substantially change the functional group makeup of the solvent system. Thus, the
solubility of a dissolved solute may change in these systems. Several types of surface-
24
functionalized nanoparticles were investigated in this study: pure gold particles, iron oxide
particles, and silica-coated iron oxide particles. We aimed to achieve a balance of particle size,
permanent surface functionality, and easy separation due to the magnetic nature of the iron oxide
used. Ultimately, however, we found that the achievable size of nanoparticles that had the
desired magnetic and surface functional properties was just too large to be feasible for the
proposed applications. Aggregation of the nanoparticles and an inability to produce them below
200 nm resulted in the required quantity of added nanoparticles to achieve reasonable surface
functionalization addition to the solvent makeup being far too high to be practical.
However, this led us to wonder how we may combine surface functionalization with
crystallization in confinement, to tie together the two somewhat separate avenues of the work
that had been conducted thus far. A chromatographic material, Zorbax® was investigated which
is a porous silica of about 7 nm pore diameter. It has a surface functionalization resulting in C8-
like functionality. We therefore proposed that APIs which showed poor solubility in alkane-type
solvents may be good candidates for testing with this material. We proposed that the addition of
the Zorbax® media would provide the driving force for crystallization because of the unique
combination of the physical confinement in a nanoscale volume with the additional of surface
functional groups. A benchtop, column, and capillary crystallization procedure were investigated
for the crystallization of APIs from undersaturated solutions using Zorbax® functionalized
media. We demonstrate that Zorbax®, through the combined effects of functionalization and
nanoconfinement, was able to provide the required driving force for crystallization in these
systems, resulting in pharmaceutical nanocrystals confined to Zorbax® media.

25
Finally, in Chapter 6, the thesis is concluded with remarks on the research conducted and
recommendations for future studies that build upon the foundations of this work.

26
Chapter 2 : Confinement effects on properties of pharmaceutical
nanocrystals
2.1 Introduction
Pharmaceutical nanocrystals have been targeted as a solution for improving the bioavailability of
poorly water soluble pharmaceuticals 5,39 . Nanocrystals have an increased surface area to
volume ratio compared to their bulk crystal counterparts and can increase dissolution rate
according to the Noyes-Whitney equation 40 and enhance permeability 4. It has also been shown
that the solubility increases with decreasing particle size below a cut-off size of 1-2 μm 41. It is
desirable to produce nanocrystals directly without resorting to other processing steps such as
milling to achieve nanocrystal size while also controlling the polymorphism of the crystal 42.
Several bottom-up methods to produce nanocrystals of a given size in reproducible polymorphs
exist. These include the “hydrosol” method 41, freeze-drying 42, supercritical fluid methods 43,44,
cryogenic spray processes 45, and evaporative precipitation into aqueous solution 46,47. These
processes often produce amorphous material or an undesired polymorphic form. In addition,
control of size distribution and can be difficult to scale up. They can be plagued with low
production rates and typically do not achieve particle sizes below 100 nm 5,8,42,48.
Alternative approaches for producing stable pharmaceutical nanocrystals employ the bottom-up
approach of conducting the crystallization in confinement. Ordered mesoporous silica 14–21,
controlled pore glass (CPG) 22,23, porous polycyclohexylethylene and polystyrene (p-PCHE) 22,24,
nanostructured lipid carriers 25, fumed silica 26, and solutions of active pharmaceutical ingredients

27
(APIs) in electrospun materials 27 have all been used to confine APIs to small volumes 49.
Confining crystals to porous matrices of known size addresses the issue of particle size
distributions, and has been proposed to lead to higher polymorph control through regulation of
nucleation 50 as well as the stabilization of otherwise metastable polymorphs 51. Producing
confined nanocrystals has also been proposed as a way to better understand fundamentals of
polymorph formation, due to the unique surface energy effects of the confined systems 29.
Ha et al. 22 have found a Gibbs-Thomson like relationship between melting point depression and
crystal size in crystals confined to CPG and p-PCHE. They found size-dependent polymorphism
and the potential for polymorph discovery with varying pore size, making particular note of the
interplay between surface energy and volume free energy at the nanoscale. Three pore sizes of
CPG and one size of p-PCHE monolith were studied.
This work aims to explore the crystallization of APIs in rigid nanoporous media over a broad
range of pore sizes, which is lacking in existing studies, allowing a fundamental understanding of
the relationship between pore size, crystallinity and bioavailability. The API fenofibrate (shown
in Fig. 1), which is known in two polymorphic forms, was crystallized over a range of pore sizes
(10 different pore sizes between 12 and 300 nm) of CPG and a porous fumed silica, Aeroperl®.
The drug loadings were determined with thermogravimetric analysis (TGA) and the nanocrystal
melting points and enthalpies of fusion were studied with differential scanning calorimetry
(DSC). Crystallinity was assessed with X-ray powder diffraction (XRPD), while both
polymorphism and degree of crystallinity was studied using solid-state nuclear magnetic
resonance (ssNMR). It is the intent that the porous matrices used be biocompatible excipient

28
media, such that a formulation of the nanocrystalline API could conceivably be as simple as
encapsulated API-loaded matrix.
Fig. 1: Organic molecule of interest, fenofibrate (FEN) for API loading in porous silica used for this
study
2.2 Experimental
Materials
Fenofibrate (FEN) was obtained from Xian Shunyi Bio-chemical Technology Company. Silicon
dioxide (silica) particles of varying pore sizes were obtained from three sources. Controlled pore
glass (CPG) was obtained from Millipore in pore sizes of 300 nm and 70 nm. CPG was also
obtained from Prime Synthesis in pore sizes of 191.4, 151.5, 105.5, 53.7, 38.3, 30.7, 20.2, and
12.7 nm. Colloidal fumed silica which fulfills requirements of Ph. Eur. as well as the USP/NF
(AEROPERL ® 300 Pharma) were obtained from Evonik USA. AEROPERL ® consists of
bead-like mesoporous granules with a pore size of ~35 nm 26.
Experimental Apparatus
Experimental setup is shown in Fig. 2: (1) A small amount (~ 0.25 g) of CPG was placed in a 20
mL scintillation vial, resulting in a CPG bed height of about 0.3 cm and a top surface area of ~

29
3.1 cm2. For this study, the preparation of 0.25 g of CPG to be loaded with drug was plenty for
analytical purposes. (2) The pore volume present in the entire CPG sample was then calculated
based on the given pore volume/gram CPG. A 60% weight/volume solution of fenofibrate in
ethyl acetate was prepared. API solution in equal amount to the pore volume present in the CPG
was then micropipetted over the surface of the CPG in the scintillation vial as uniformly as
possible. (3) Immediately after pipetting, a metal spatula was used to stir the mixture, to wet as
much of the CPG as possible, ceasing only when the mixture appeared dry. The drug-loaded
CPG was then left in a fume hood for an additional 24 hours to continue evaporation of excess
solvent. It is noteworthy that no wash step was required in this method. Samples were prepared
in triplicate for each pore size.
Fig. 2: Loading procedure to impregnate porous silica particles with API solution
X-Ray Powder Diffraction Analysis
X-Ray powder diffraction (XRPD) was performed on all samples using a PANalytical X’Pert
PRO diffractometer at 45 kV with an anode current of 40 mA. The instrument has a PW3050/60
standard resolution goniometer and a PW3373/10 Cu LFF DK241245 X-ray tube. Samples were
placed on a spinner stage in reflection mode. Settings on the incident beam path included: soller

30
slit 0.04 rad, mask fixed 10 mm, programmable divergence slit and fixed 1º anti-scatter slit.
Settings on the diffracted beam path include: soller slit 0.04 rad and programmable anti-scatter
slit. The scan was set as a continuous scan: 2θ angle between 4 and 40 º, step size .0167113 º and
a time per step of 31.115 s.
Differential Scanning Calorimetry Analysis
A Q2000 instrument from TA instruments was utilized for the differential scanning calorimetry
(DSC) analysis. Inert atmosphere environment was maintained in the sample chamber using a
nitrogen gas cylinder set to a flow rate of 50 ml/min. An extra refrigerated cooling system (RCS
40, TA instruments) was used to broaden the available temperature range between -40 and 400
ºC. Tzero ® pans and lids were used with ~5 mg of sample. A heating rate of 10 ºC/min was
applied and the samples were scanned from -20 to 180 ºC. When determining the enthalpy of
fusion for a given sample, the DSC curve was integrated for 30 ºC centered on the melting
temperature of each pore size to capture the entire melting event.
Thermogravimetric Analysis
Thermogravimetric analysis (TGA) was performed on a Q500 instrument from TA instruments
connected with a nitrogen gas cylinder to maintain a flow rate of 25 mL/min to keep the sample
chamber under an inert gas environment. Between 5 and 10 mg of sample were loaded on
platinum sample pans from TA instruments. The samples were allowed to equilibrate at 30 ºC
and then heated at 10 ºC/min to 300 ºC.
Solid-state Nuclear Magnetic Resonance Spectroscopy
Solid-state nuclear magnetic resonance experiments (ssNMR) were conducted on a homebuilt
500 MHz spectrometer (D. Ruben, Francis Bitter Magnet Laboratory (FBML), Massachusetts

31
Institute of Technology). Prepared samples were packed into Revolution NMR (Fort Collins,
USA) 4 mm o.d. (60 μl fill volume) ZrO2 rotors, equipped with Vespel drive and top caps.
Spectra were acquired on a 4 mm Chemagnetics triple resonance (1H/13C/15N) magic-angle
spinning (MAS) probe. 13C natural abundant spectra were acquired using cross-polarization (CP)
52, a recycle delay of 3 seconds, between 16,384 and 65,536 co-added transients and a spinning
frequency of 9,000 ± 3 Hz. The Hartman-Hahn match condition was optimized by setting 1H to
50 kHz (ƔB1/2π), a positive ramp contact pulse for 13C (centered at 58 kHz) and a contact time of
1.5 ms. All data were acquired using two-pulse phase-modulated, TPPM 53 1H decoupling (100
kHz, 1H ƔB1/2π). The magic-angle was adjusted using potassium bromide (KBr) at a spinning
frequency of 5 kHz, (rotational echoes > 11.5 ms). 13C spectra were referenced (and shimmed,
FWHM = 4 Hz) using solid adamantane to 40.49 ppm (high frequency resonance) with respect to
DSS (0 ppm).
Dissolution testing
The dissolution tests were designed following USP standards. Analysis of the percentage of
dissolved API was done using built-in ultraviolet-visible spectroscopy at 286 nm. The
dissolution buffer used was .025 M sodium dodecyl sulfate solution (7.21 grams of powdered
SDS (Sigma Aldrich) was dissolved and brought up to 1000 mL in water). The dissolution
profile of the sample was determined using USP Dissolution Apparatus 2 at 37 ºC. The apparatus
operated at 75 RPM. 900 mL of the buffer solution was allowed to reach the equilibrium
temperature before sample was placed in the apparatus. Enough sample of API-loaded CPG was
added such that the targeted concentration of fenofibrate in solution was 15 μg/mL, within the

32
expected linear range 54. Samples of both uncrushed and crushed bulk fenofibrate were analyzed
as comparison. Samples were acquired for about 29 hours.
2.3 Results and discussion
Fenofibrate was selected as a model API to work with in preliminary studies. It is poorly water
soluble, < 1 mg/mL at 37 ºC 55 , and has two known polymorphs, crystalline form I with a
melting point around 80 ºC and a metastable form II with a melting point around 73 ºC 56,57. The
metastable form has been collected in a sample of amorphous fenofibrate that was heated to
around 40ºC 56. Fenofibrate was chosen for initial studies due to its lack of multiple stable
polymorphs; it is advantageous to first study how a single polymorph changes with varying
crystal size. Table 1 summarizes the sizes of porous media used and the pore volumes as
provided by the supplier.
Table 1: Pore sizes, surface areas, and volumes of porous silica used in the study as provided by
producer
Pore Size (nm) Pore Volume (cc/gram) Producer
300 >1 Millipore
191.4 1.5 Prime Synthesis
151.5 1.2 Prime Synthesis
105.5 1.4 Prime Synthesis
70 >1 Millipore
53.7 1.3 Prime Synthesis
38.3 1.3 Prime Synthesis
30.7 1.11 Prime Synthesis
20.2 1.12 Prime Synthesis
12.7 0.5 Prime Synthesis
Aeroperl (~35) 1.6 Evonik

33
Table 2: Fenofibrate loaded in porous silica particles
Pore size
(nm)
FEN mass loaded
(wt %)
Melting point by
DSC (ºC)
Polymorph by
XRPD
Polymorph
by ssNMR
300 29.4±1.2 79.9±0.1 Form I Form I
191.4 40.0±2.0 79.8±0.5 Form I Form I
151.5 31.5±1.0 79.0±0.2 Form I Form I
105.5 35.7±0.5 78.7±0.2 Form I Form I
70 28.1±0.4 77.7±0.2 Form I Form I
53.7 33.4±0.4 75.2±0.6 Form I Form I
38.3 29.4±0.4 71.8±0.5 Form I Form I
35 28.0±1.7 70.3±0.8 Form I Form I
30.7 29.4±0.7 71.2±0.1 Form I Form I
20.2 26.2±0.8 64.2±0.4 Form I Form I
12.7 16.3±0.6 N/A Amorphous Amorphous
/Form I
All loading data, melting points, and polymorph observations via XRPD and ssNMR are
summarized in Table 2. High drug loadings were achieved via the method of applying the pore
volume of drug solution. In the XRPD samples, there is a large amorphous feature which
disrupts the baseline (to be subtracted) due to the amorphous silica matrix which makes up the
bulk of the sample. NMR is isotope selective and invariant to the substrate that the API is placed
upon offering an approach to probe the degree of crystallinity and identify polymorphs easily
using 13C CP MAS NMR. Overall drug loading is reasonably well correlated to both pore
volume and mean pore size but appears more closely dependent on the nominal pore size.
Fenofibrate in 20 to 300 nm CPG illustrated clean 13C spectra with high crystalline API
formation. DSC and XRPD data indicated an inability to crystallize fenofibrate in the 12 nm
CPG, suggesting an amorphous form (vide infra). In examining the literature, it has been
reported that the pore diameter should be at least 20 times the molecular diameter for
crystallization in confined spaces 58. Fenofibrate has an estimated molecular size of 0.98-1.27 nm

34
54. It is hypothesized that this is the reason why the 12 nm CPG showed no crystalline fenofibrate
in the powder x-ray diffraction results, as it is less than 20 times the diameter of fenofibrate. Ha
et al. found an similar size limit to crystalline versus amorphous stability in porous matrices,
noting that crystallization of the compound ROY was suppressed in 20 nm pores as compared to
30 nm pores when carried out either by evaporation or by melting/cooling 23. We postulate that
under slow crystallization conditions, crystals could be formed in pore sizes under 20 times the
molecular diameter, which would explain the combination of broadened (i.e., amorphous phase)
and narrow (i.e., crystalline) 13C resonance observed in the 12 nm sample (Appendix 2: Figure
IVa).
A major challenge in this work was to produce crystals which are successfully loaded in the
porous matrix, rather than on the external surfaces. DSC was used to determine if surface
crystals were present; in cases where both nanocrystals and surface crystals were formed, there
are two obvious peaks present on the DSC scans corresponding to melting points of the confined
crystals and the surface crystals (Appendix 2: Figure II). Each trial was deemed successful in
producing confined crystals with surface crystals when there was no measurable second peak on
the DSC scans. This conclusion is supported by the work of O’Mahony et al., where SEM
imaging of the surface of drug-loaded nanoporous substrate was used to confirm that crystals
were confined to the pores and that no significant amount of bulk crystals were present on the
surface of the substrate 59. In this study, there was no occurrence of surface crystals that were
nanosized rather than bulk-sized.

35
Crystal form identification with XRPD
With the exception of fenofibrate in 12 nm CPG which showed no crystallinity, all samples
showed the same XRPD peak pattern, both within trials of the same size CPG and across
different sizes of CPG. Fig. 3 (a) is a scan of bulk fenofibrate and Fig. 3 (b) shows the XRPD
scans of a single representative size of 53 nm CPG, across all three trials. It is evident that the
crystal pattern is consistent throughout trials of a given pore size, which was also seen in all
other pore sizes. Fig. 3 (c) shows an overlay of scans from three representative CPG sizes (191,
53, and 70 nm). Crystalline fenofibrate form I has reported theoretical diffractogram main peaks
at 12º (2θ), 14.5º (2θ), 16.2º (2θ), 16.8º (2θ), and 22.4º (2θ) 56. The identity of all samples of
nanocrystalline fenofibrate as form I can be confirmed by matching peaks and the absence of
other peak positions.

36
Fig. 3: XRD patterns of bulk fenofibrate presented in (a), fenofibrate loaded on 53 nm CPG in 3
distinct trials in (b), and fenofibrate loaded on three representative pore sizes of CPG in (c)

37
Crystal form identification with ssNMR
13C CP MAS NMR spectra for all fenofibrate loaded porous silica particles were used to identify
amorphous or crystalline fenofibrate and identify whether the crystalline phase present were
form I or II. All 13C MAS NMR spectra illustrate highly crystalline fenofibrate (form I), with line
widths between 60 and 85 Hz (Appendix 2: Figures IVa-i). Isotropic chemical shift data for silica
particles with pore sizes ranging between 20 and 300 nm revealed identical spectra with no
evidence of structural disorder. The slight decrease in resolution (13C line broadening from 300
to 20 nm) is due to the increase of surface disorder as the nanocrystals become increasingly
smaller (i.e., surface vs nanocrystalline core).
The 13C MAS NMR spectrum of the 12 nm CPG sample is slightly more complex; although the
three well-resolved high frequency 13C resonances indicate form I of fenofibrate, all 13C
resonances were broadened with the aromatic region being most affected (Appendix 2: Figure
IVa). We attribute this broadening to the small pore size causing a high degree of structural
disorder, which often occurs when API’s begin to form an amorphous phase or very small
nanocrystalline formation. This observation agrees with the powder x-ray diffraction data which
exhibits a single broad featureless lump, consistent with the lack of long-range periodic order.
Finally, the poor fenofibrate loading on the 12 nm CPG pore size as determined by the TGA is
reflected by a rather poor signal-to-noise after considerable averaging and comparable sample
mass when ssNMR was performed on this material. The small pore size could retard the ability
of fenofibrate to form nanocrystals as discussed above.

38
Fig. 4: 13C CP MAS NMR spectra of fenofibrate: molecule (top), bulk drug (middle) and loaded in
20 CPG (bottom)
Analysis of melting point depression of nanocrystals by DSC
The melting point of bulk fenofibrate crystals was measured and found to be 81.6 ± 0.2 ºC. Fig.
5 shows an overlay of the DSC scans for representative trials of fenofibrate crystallized in each
CPG pore size. Individual, sharp peaks can be found at decreasing melting point temperatures,
moving left as the CPG pore size decreases. Double peaks were not seen in the trials, indicating
the preparation method was successful inhibiting the formation of any surface crystals.

39
Fig. 5: DSC scans of all CPG pore sizes showing single peaks (no surface crystals) with increasing
melting point temperatures. Peaks are separated by color and correspond left to right to increasing
pore sizes 20 to 300 nm.
It is well known that the Gibbs-Thomson equation can be used to describe the melting point
depression seen in nanocrystals 3. The complete Gibbs-Thomson equation for nanocrystals
confined to pores is as follows:
4( ) cos( )
solid liquid m
m m m
fus solid
MTT T T d
d H
Eq. 1
where 𝑇𝑚 is the bulk melting temperature, 𝑇𝑚(𝑑) is the melting temperature of a confined
crystal with diameter d assumed equal to the pore diameter, M is the molecular mass, 𝜌𝑠𝑜𝑙𝑖𝑑 is
the density of the solid,𝛾𝑠𝑜𝑙𝑖𝑑−𝑙𝑖𝑞𝑢𝑖𝑑 is the surface free energy of the solid-liquid interface, 𝛥𝐻𝑓𝑢𝑠
is the molar enthalpy of fusion, and θ is the contact angle between the wall and crystal. If a
standard contact angle of 180º is assumed, the equation reduces to

40
4( )
solid liquid m
m m m
fus solid
MTT T T d
d H
Eq. 2
At this point, it is evident that if the surface energy interaction term and the enthalpy of fusion,
𝐻𝑓𝑢𝑠, remains constant, there is an expected linear relationship between the melting point and
1/d. Fig. 6 is the plot of 1/d for the fenofibrate in the given range of pore diameters versus the
melting point temperature, taken from the DSC peaks. The data fits a linear trend. If the linear fit
is extrapolated to 1/d = 0, it predicts the melting point of an infinite diameter particle which is
the bulk melting point. The fit predicts a bulk melting point of 81.6 ºC, equal to the measured
bulk melting temperature of 81.6 ºC.
It is clear that the linear Gibbs-Thomson equation wherein the enthalpy of fusion and surface
interaction energies are assumed constant accurately predicts the bulk melting temperature.
However, the enthalpy of fusion was also measured in the DSC experiments, and was determined
to be non-constant. It, too, can be plotted against 1/d, as seen in Fig. 7. It is shown to decrease
linearly with 1/d.
In accordance with a study done by Ha et al. 22 the Young equation to describe the equilibrium
contact angle allows the substitution of (𝛾𝑠𝑜𝑙𝑖𝑑−𝑙𝑖𝑞𝑢𝑖𝑑 cosθ) in the original Eq. 1
with(𝛾𝑠𝑜𝑙𝑖𝑑−𝑠𝑢𝑏𝑠𝑡𝑟𝑎𝑡𝑒 − 𝛾𝑙𝑖𝑞𝑢𝑖𝑑−𝑠𝑢𝑏𝑠𝑡𝑟𝑎𝑡𝑒). This yields the modified equation:
4( )( )
solid substrate liquid substrate m
m m
fus solid
MTT T d
d H
Eq. 3
As nanocrystals size decreases, it is expected that the surface energy of the solid approaches that
of its corresponding liquid. The difference term, (𝛾𝑠𝑜𝑙𝑖𝑑−𝑠𝑢𝑏𝑠𝑡𝑟𝑎𝑡𝑒 − 𝛾𝑙𝑖𝑞𝑢𝑖𝑑−𝑠𝑢𝑏𝑠𝑡𝑟𝑎𝑡𝑒), should

41
therefore decrease and approach zero. The decrease in this term, found in the numerator, likely
offsets the decrease in the enthalpy of fusion term found in the denominator. This would produce
the apparent linear Gibbs-Thomson relationship reflected in the data despite the known change in
enthalpy.
Fig. 6: Constant enthalpy-constant surface interaction energy Gibbs-Thomson equation fit to
melting points of fenofibrate nanocrystals confined to porous silica.

42
Fig. 7: Enthalpy of fusion of fenofibrate nanocrystals showing a linear relationship with 1/d across
varying CPG pore sizes.
Enhanced dissolution profile for nanocrystalline fenofibrate
Dissolution profiles were tested and shown in Fig. 8. The nanocrystalline fenofibrate with the
most enhanced dissolution profile from controlled pore glass confinement occurred in the 70 nm
CPG matrix, shown in detail in Fig. 9. These fenofibrate nanocrystals showed a roughly 7 fold
increase in dissolution rate compared with crushed bulk fenofibrate. They reached >80%
dissolution in 42.5 minutes where crushed bulk fenofibrate reached >80% dissolution in 295.5
minutes. Fenofibrate nanocrystals confined to 20 and 30 nm CPG had profiles which aligned
closely with the crushed bulk profile indicating that, at small pore sizes, diffusional resistance
likely matters to enhancing dissolution rate. Nanocrystals in CPG above 30 nm showed improved
dissolution over the bulk crushed and uncrushed fenofibrate crystals at all time points of the
study. The dissolution profiles can be clustered into two groups based on manufacturer. The 70
nm and 300 nm (Millipore CPG) confined fenofibrate nanocrystals are the most enhanced

43
profiles and show the expected faster dissolution with smaller pore/crystal size. The fenofibrate
nanocrystals confined to the other pore sizes (Prime Synthesis CPG) all have very similar, still
improved, dissolution profiles with no discernible trend by pore size. It is likely that the
differences in pore geometry and tortuosity of the two types of CPG contribute to the differences
in improvement in dissolution rate seen in the study
Fig. 8 Average dissolution profiles of all CPG-confined fenofibrate nanocrystals showing enhanced
dissolution rates compared to crushed and uncrushed bulk fenofibrate, also shown

44
Fig. 9: Comparison of the most enhanced dissolution profile of nanocrystalline fenofibrate in 70 nm
CPG compared to bulk crushed fenofibrate
Extension to Aeroperl® porous matrix
The fumed silica matrix Aeroperl® behaved similarly to the CPG in terms of loading achieved
and depressed melting point. The melting point of the fenofibrate confined to Aeroperl® was
70.3 ± 0.8 °C, compared to the bulk melting temperature of 81.6 ± 0.2 ºC. It had an average
enthalpy of fusion of 55.2 ± 2.5 J/g compared to the bulk enthalpy of fusion of about 71.4 J/g.
While the depressed melting point followed the linear regression extrapolated from all of the data
points collected across different controlled pore glasses, the measured enthalpy of melting for the
fenofibrate confined to Aeroperl® does not lie along the same trend line computed for the
controlled pore glass samples. This is likely due to differences in the surface or shape of the
Aeroperl ® which could affect the enthalpy of fusion of the crystals confined to it. The

45
fenofibrate crystals confined to Aeroperl® showed the same polymorphism and XRPD patterns
as those confined to the CPG media as shown in Fig. 10. The underlying amorphous baseline for
the XRPD scan of the Aeroperl® material is different than that of the CPG simply due to its
difference in grain size and pore structure.
Fig. 10: XRPD scans of fenofibrate confined to CPG versus Aeroperl(R) show that it is the same
crystalline form
Fenofibrate confined to the Aeroperl® behaved dramatically better in dissolution testing than its
counterparts in controlled pore glass. Again, this was likely attributable to differences in the
shape and structure of the pores for Aeroperl®. The nanocrystalline fenofibrate with the fastest
dissolution profile occurred in the AEROPERL ® matrix. It reached ~50% dissolution in ~10
minutes where a control of crushed bulk fenofibrate reached ~50% dissolution in ~100 minutes,
as shown in Fig. 11. The same CPG curves previously discussed are shown as well for
comparison.

46
Fig. 11: Dissolution enhancement profiles showing Aeroperl® outperforming all other porous
matrices
2.4 Pore size and shape effects on dissolution rates
Understanding dissolution profile factors
An outstanding question from previous work was how the shape and material of the matrix
affects the dissolution behavior and possible interactions between the matrix and the confined
nanocrystals. Upon initial examination of the dissolution profiles, no clear trend was observed
between pore size and improvement to dissolution rate. One might assume that the smallest
nanocrystals (20 nm or 30 nm) would dissolve more rapidly than the 300 nm crystals if purely
surface area based dissolution mechanisms were at play. Upon closer look, however, a
generalization can be drawn from the above data that, besides Aeroperl®, the nanocrystals
confined to silica provided by Millipore (300 nm and 70 nm) showed more enhanced dissolution
profiles than those confined to silica obtained from Prime Synthesis (all others). Understanding

47
the contribution of the porosity of the material and pore shape and how this might affect
transport properties of the system was a natural extension of understanding the improvements to
dissolution profiles.
Fig. 12 shows a schematic representation of the combination of dissolution and diffusion effects
at play when considering the final dissolution profile observed for an API released from silica
beads. The dissolution of the nanocrystal embedded in the pores of the bead is actually thought
to be quite fast in terms of the overall time measurements in the system, as the length scale
predicted here is on the 10-1000 nm scale, related to the pore diameter. However the path length
for diffusion is much longer, related to the diameter of the porous bead. The CPG beads used in
this study tended to have grain sizes between 75 and 125 μm. Aeroperl® grain size was even
smaller, at nominally around 30 μm. Thus, the diffusion length from the pore would be expected
to matter greatly. Indeed, a study done on mesoporous silica matrices and the controlled release
of ibuprofen found that “The release process is found to be mainly diffusion controlled, but clear
differences were observed between the studied materials, which we mainly ascribe to differences
in the pore connectivity and pore geometry of the materials, and the aqueous stability of the
matrix.” 60

48
Fig. 12: Mass transport schematic diagram of nanocrystal dissolution and diffusion from porous
beads
Work done in the Doyle Group at MIT has been investigating the effect of bead size in similar
work, looking at the release of APIs from core-shell hydrogels that have a porous network and a
defined grain size 61. They found that lag time release and overall dissolution time was
minimized in smaller hydrogel beads. They found that >80% dissolution in 30 minutes could be
achieved with their hydrogels of about 400 μm in grain size. This is comparable to the best
release profiles seen from our rigid matrices in which >80% dissolution was achieved in 22.5
minutes. While this study’s alginate beads obviously have different pore structures and surface
properties that account for some differences in the release times, it points towards the size and
shape properties of the physical matrix that the nanocrystals are confined to as having a very
important role on the final dissolution profiles. A summary of the pore and grain sizes discussed
here is found in Table 3.

49
Table 3: Comparison of bead pore and grain sizes used in API release studies
Matrix material
(pore size)
Producer Surface area
(m2/gram)
Pore volume
(cc/gram)
Grain size
(diameter)
Alginate bead
(1-2 μm)
Doyle Lab
(MIT)
-- -- 430 μm
Aeroperl
(~35 nm)
Evonik 281 1.6 D50 = 33 μm
CPG
(70 nm)
Millipore 43 1.2 75-125 μm
CPG
(53 nm)
Prime
Synthesis
94 1.3 75-125 μm
Dissolution Profile Modeling
A very basic transport model was made to determine the contribution of tortuosity to the
dissolution rates. A 1987 paper “Hindered transport of large molecules in liquid-filled pores”
was consulted and used to form a simple diffusion model 62. In one case, the pore was modeled
as a straight channel, and in another it was given a sinusoidal path length. A visual of the
proposed path geometries is provided in Fig. 13. Csat indicates the expected saturation
concentration of the API in solution at the nanocrystal interface and CL the concentration at a
given length, L, away from the center of the bead. Csat was found to be 8*10-4 mg/mL for
fenofibrate in the water/SDS mixture which was used for dissolution rate testing, which makes
sense given its extremely poor water solubility 63. The radius of the pore is given by rpore and is
defined by the nominal pore size of the matrices and rsolute is the radius of the solute molecule.
For this case, fenofibrate was used as a model compound for comparison to our experimental
data and the radius was estimated from literature 64.

50
Fig. 13: Schematic representation of diffusion path length and geometry for basic transport model
of nanocrystal diffusion from within a bead.
The estimated diffusivity of fenofibrate in water at room temperature was taken from literature.
A hindrance factor, H, was adapted from this paper to give an effective diffusivity for fenofibrate
in water, to match dissolution rate data. The parameters and expressions used for the model are
summarized in Table 4.
Table 4: Modeling expressions for release of dissolved API from straight and tortuous pores
Straight Pore Tortuous Pore
Deff
= Dwater, 298 K
Deff
= H*Dwater, 298 K
No hindrance factor 𝐻 = 0.984 (1 −𝑟𝑠𝑜𝑙𝑢𝑡𝑒𝑟𝑝𝑜𝑟𝑒
)
92
Path length = L Path length = 𝑎𝑟𝑐𝑙𝑒𝑛𝑔𝑡ℎ(3 sin𝑥) |0
𝐿
𝐿
The solution to the diffusion problem where 𝐶(𝑥, 𝑡) solving for the concentration at a given point
in the x direction away from the surface of the bead at a given time, t, is in the form of an error
function:

51
Eq. 4
This is plotted for fenofibrate in a dissolving water system at a given distance x outside the pore
to compare results with experimental data generated and discussed in the previous section. The
path length of the straight pore L was set equal to the expected radius of the grain size of the
matrix bead. Results are shown in Fig. 14. The distance x was set at 10 μm to be sufficiently far
from the surface of the bead such that a concentration profile would develop that would be
similar to that sampled by the UV spectrometer in the dissolution rate apparatus.
Fig. 14: Tortuosity model compared with experimental results for dissolution profiles
The straight pore model captures the behavior of the Aeroperl® confined fenofibrate dissolution
profile reasonably well, with a similar shape and similar end concentration at about 2 hours. We
know that Aeroperl® had the best dissolution profile of the porous matrices examined, and the
highest surface area. It may be reasonable to assume that its pores are not particularly tortuous.
𝐶(𝑥, 𝑡) = 𝐶𝑠𝑎𝑡 (1 − erf (𝑥
2√𝐷𝑒𝑓𝑓𝑡))

52
However, the model slightly underpredicts in the time between 1000 and 6000 seconds. The
model assumes that the drug is at the center of the bead providing a constant source of solute to
the external system, and must diffuse the entire length out. In fact, some API may be present
throughout various interior points of the bead to the surface and actually have less far to travel.
This may account for the true dissolution profile from Aeroperl® showing slightly higher values
in this range.
The model continues to underpredict for the tortuous pore as compared to the 30 nm pore real
dissolution data. Here, too, the initial behavior is not captured well. There is a lag time for the
tortuous pore model which is not seen for the real data. This is likely explained by the same
phenomenon previously discussed, where some API is present throughout the interior of the
bead, and in fact is likely quite close to the surface at some points. This initial transport of this
material probably prevents a concentration lag from being recorded in the real dissolution
profiles. Overall, the remainder of the curve is underpredicted but the shape is a reasonable
match.
Continued modeling with more advanced parameters could have been performed to better predict
the dissolution profiles seen experimentally. A better model would account for pore wetting,
dissolution of a crystal of solute within the pore as well as diffusion of solute from the pore, and
a distribution of crystals throughout the interior of the bead. A better defined geometry of pores
could improve a model as well, accounting for a pore network with intersections which are at a
juncture of two pores. Further modeling was not continued in this work.
Experiments to understand transport from a porous matrix
As a final experimental step, anodic aluminum oxide (AAO) membranes were purchased from
ACS Material. These membranes possess highly ordered straight pores with a pore aperture of

53
80-100 nm, and a hole depth of 60±10 μm. The pore-to-pore distance is 100-120 nm. This
membrane was wetted with a 60% weight per volume solution of fenofibrate in ethyl acetate and
allowed to evaporate in a similar method to the loading procedure for the porous silica outlined
in this chapter. For comparison, porous CPG of 105.5 nm was loaded as well. A visual of the two
porous supports is shown in Fig. 15. After loading with API, the membranes were subjected to
the standard analytical techniques performed on the porous glass material, of TGA, DSC, and
dissolution testing. The dissolution test in particular was of interest. The straight pores of the
AAO were hypothesized to yield faster dissolution profiles than the tortuous porous network of
CPG.
Fig. 15: Porous supports used for fenofibrate loading: anodic alumnimum oxide (left) and porous
silica (right)
The following graph shows the dissolution profile of fenofibrate confined to porous CPG, in its
bulk form, and the results of the AAO loading indicated above (Fig. 16).

54
Fig. 16: The results of the dissolution testing of FEN loaded on AAO indicate that the loading was
not confined to the pores, nanocrystals were not produced, and the dissolution profile was not
improved over the bulk form of the drug
It is clear from the profile that there is no improvement between the dissolution profile of
fenofibrate loaded on the AAO with the method described above and the bulk fenofibrate. This is
in sharp contrast to the very different and much improved dissolution profile seen for fenofibrate
confined to the nanopores of the CPG. We believe that this is simply a result of not actually
having loaded the fenofibrate into the pores of the AAO. As mentioned previously, the AAO
membrane had pore diameters and lengths comparable to the controlled pore glass used.
However, a critical difference was that the AAO membrane’s pores were not open at both ends.
Thus, we believe the simple drop method used did not wet or penetrate the pores of AAO, and
the fenofibrate crystals formed only at the surface. This would make sense given that their
dissolution essentially behaves as the bulk crystals. In the future, to properly load FEN in an

55
AAO pore, we would likely have to perform the loading under vacuum, to drive the API solution
into the pore since capillary action alone can’t work for the close-ended pore.
We also planned to investigate silica of different grain size but similar pore sizes, however cost
of procurement has proven a hindrance to this investigation. The grain size is not typically finely
controlled in the process of producing the porous glass matrices, so to order or produce sieved
material of different grain sizes would be very costly. Developing a solution to procuring porous
silica in a variety of grain sizes with a single pore size would be an extremely valuable addition
to this work
2.5 Conclusions
We successfully obtained nanocrystalline fenofibrate over a broad range of sizes by using rigid
matrices of porous silica. The results of the study indicate a decreasing melting point and
enthalpy of fusion with decreasing pore size in nanocrystals. The decrease in the enthalpy of
fusion is offset by a simultaneous decrease in the difference between the surface interaction of
the solid-substrate and melt-substrate. This produces seemingly linear behavior in melting point
depression as predicted by the Gibbs-Thomson equation. The dissolution testing showed
enhanced dissolution profiles for the nanocrystalline materials confined to different porous
matrices, with fenofibrate confined in 70 nm CPG from Millipore showing the greatest
improvement in dissolution. Further investigation remains to be done to understand the effect of
pore size, shape, and geometry on the dissolution profiles of APIs confined to porous matrices.
The controlled pore glass matrices used in this study are not currently accepted materials for oral
drug delivery as they do not fulfil requirements of the European Pharmacopeia or the United
States Pharmacopeia and the National Formulary; however, the ability to form nanocrystals

56
across a range of pore sizes in this material suggests the potential to use drug-loaded rigid
matrices of biocompatible materials to serve as an oral dosage forms with enhanced dissolution
ability for poorly water soluble APIs. As a rigid porous material which does meet the USP/NF
guidelines, AEROPERL ® is an attractive matrix for use in simply preparing nanocrystals of
poorly water soluble APIs which could be formulated into capsules with no additional
formulation.
2.6 Acknowledgements
This chapter has been adapted and published as a peer-reviewed journal article. Dwyer LM,
Michaelis VK, O’Mahony M, Griffin RG, Myerson AS. Confined crystallization of fenofibrate
in nanoporous silica. CrystEngComm / RSC. 2015;17(41):7922-7929. doi:10.1039/C5CE01148E.
We thank the Novartis-MIT Center for Continuous Manufacturing for financial support and use
of instrumentation. R.G.G thanks the NIBIB through the National Institutes of Health grant EB-
002026. V.K.M. is grateful to the Natural Sciences and Engineering Research Council of Canada
and the Government of Canada for a Banting Postdoctoral Fellowship. L.M.D. is grateful to Dr.
Samir A. Kulkarni for valuable assistance and discussions.

57
2.7 Appendix
I: Individual DSC Scans: one trial of each pore size shown as a representative
a. 12 nm CPG
b. 20 nm CPG

58
c. 30 nm CPG
d. 38 nm CPG

59
e. 53 nm CPG
f. 70 nm CPG

60
g. 105 nm CPG
h. 151 nm CPG

61
i. 191 nm CPG
j. 300 nm CPG

62
II. DSC Scan of Poor Quality Preparation: scan of a trial wherein bulk and nanosized crystals
were produced in a sample with CPG of 38.3 nm pore size clearly showing two distinct peaks
III. Individual XRPD Scans: one trial of each pore size shown as a representative
a. 12 nm CPG

63
b. 20 nm CPG
c. 30 nm CPG

64
d. 38 nm CPG
e. 53 nm CPG

65
f. 70 nm CPG
g. 105 nm CPG

66
h. 151 nm CPG
i. 191 nm CPG

67
j. 300 nm CPG
IV. Individual ssNMR Spectra: one trial of each pore size shown as a representative
a. 12 nm CPG

68
b. 20 nm CPG
c. 38 nm CPG

69
d. 53 nm CPG
e. 70 nm CPG
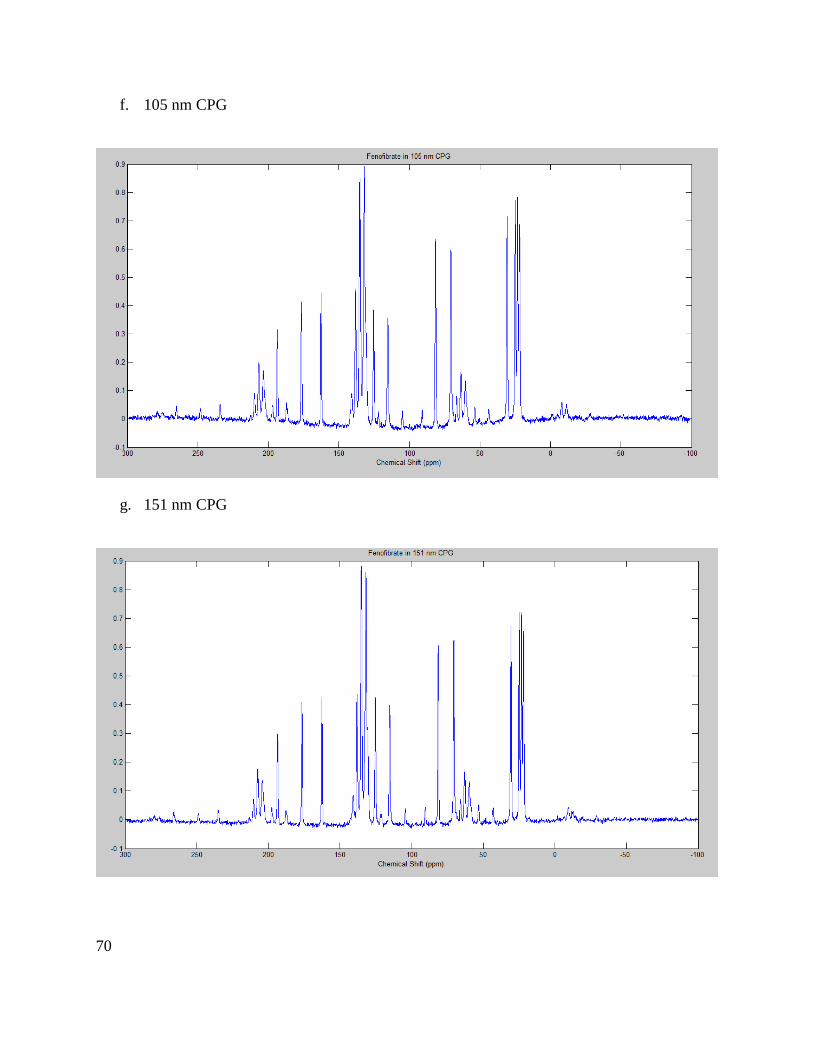
70
f. 105 nm CPG
g. 151 nm CPG

71
h. 191 nm CPG
i. 300 nm CPG

72
Chapter 3 : Continuous crystallization in confinement to improve
matrix loading
3.1 Introduction
The previous work demonstrated that porous matrices could be used effectively for confining an
API and demonstrating a degree of control over the size of nanocrystal formed for improved
release profiles. However, improving the loading of API in a porous matrix was a necessary next
step for allowing this to be a viable candidate for a dosage form to achieve the correct dosing
amounts of drug with a reasonable additional volume of porous matrix for confinement.
The low bioavailability of poorly water soluble active pharmaceutical ingredients (APIs) is a
challenge for API formulation and even selection in the drug discovery phase 65,66. However, as
nearly 90% of drugs in the discovery pipeline have low aqueous solubility 67, finding solutions to
improve the physiochemical properties of these drugs is of high importance 68. Forming
nanocrystals of these APIs is a simple and promising solution to this problem 5. Nanocrystalline
APIs (<1000 nm) have improved surface area to volume ratios compared to bulk crystals,
increasing dissolution rates 40,69, improving solubility 39,41,70, and enhancing permeability 4.
Numerous methodologies exist for producing pharmaceutical nanocrystals in both “top-down”
approaches that control the nanosizing of larger crystals or “bottom-up” technologies which
control the size of the crystal formed directly. These methods include milling 5, high pressure
homogenization 71, hydrosol methods 5,72, freeze-drying 73, supercritical fluid methods 44,45,73, and
evaporative or antisolvent precipitation 46,47,74–76. These methods have associated problems with

73
contamination, high surfactant requirements, complex and energy-intensive procedures,
difficulties controlling particle size distribution and polymorphism, and low production rates 8.
Many of these challenges are addressed with the confined crystallization approach in which
crystallization of the API is restricted to a micro- or nanoporous environment to form
nanocrystals. Of particular interest and widely studied for drug delivery applications are rigid
silica matrices including ordered mesoporous silica with and without surface modifications and
grain size control 14,15,20,77–80, controlled pore glass 19,22,23,81,82, and fumed silica 26 due to the high
degree of control over pore size and inert nature leading to nucleation control and polymorph
stabilization 29,49,51,83 .
While many studies have used porous silica matrices with extremely small pores (<10 nm) to
confine high loadings of the amorphous forms of poorly water soluble drugs to the effect of
dramatically enhanced dissolution profiles 28,84–87 , this study aimed to retain crystallinity of the
drug loaded in porous matrices due to the long-term stability requirements for formulated
pharmaceuticals 41,88. In a previous study, a flow column-based loading process has been
developed to first load the poorly water soluble API ibuprofen into nanoporous silica and then
crystallize the material in the pores through evaporation 59. In this process, a maximum loading
of about 33 wt% ibuprofen in the silica matrix was achieved. The researchers found that high
API solution concentration and high solvent viscosity (within common solvents) were able to
improve the loading achieved in the pores. Rinse volume was also a significant process
parameter, which needed to be adjusted to be low enough to maintain drug loading but high
enough to remove bulk micron sized crystals on the surface of the silica. This important work is

74
a starting point for the development of continuous flow procedures for loading API into porous
silica matrices.
Based on successful multi-stage continuous crystallizer designs in which the second stage and
beyond aim to grow crystals which have nucleated in a first stage 89–92, a two-stage mixed
suspension mixed product removal (MSMPR) crystallizer was proposed to address the challenge
of increasing the loading of API in porous silica. A single-stage MSMPR was employed for the
continuous wetting of porous silica in a variety of pore sizes with a subsequent filtration step
which accomplished the crystallization of fenofibrate (FEN) within the confined pores by either
evaporation or cooling. This was then coupled to a second stage in which the drug-loaded silica
was submerged in a slightly supersaturated FEN solution, allowing for growth of the
nanocrystals within the pores.
Fenofibrate is a BCS Class II drug (low solubility, high permeability) used for lowering
cholesterol and was chosen for its low aqueous solubility of 0.8 μg/mL 93 . It has a molecular
weight of 360.8 g/mol in a structure with an aromatic portion of the molecule containing two
benzyl rings adjacent to an aliphatic region 56. The principle was then applied to a bench-scale
multiple-step impregnation procedure using an even less soluble compound, griseofulvin (GSF),
to demonstrate improved loadings in this system. Samples were analyzed with thermogravimetric
analysis (TGA) to determine loadings, differential scanning calorimetry (DSC) to study their
nanocrystalline nature, and X-ray powder diffraction (XRPD) for form identification. This
methodology was shown to improve drug loading of poorly water soluble compounds, making
drug-loaded biocompatible porous silica a viable dosage form.

75
3.2 Experimental
Materials
Fenofibrate (FEN), griseofulvin (GSF), and indomethacin (IMC) were obtained from Xian
Shunyi Bio-chemical Technology Company. Silicon dioxide (silica) particles of varying pore
sizes were obtained from three sources. Controlled pore glass (CPG) was obtained from
Millipore in a pore size of 300 nm. More than 90% of the particle mass by weight fell within a
120/200 mesh size (75-125 μm). CPG was also obtained from Prime Synthesis in pore sizes of
191.4, 151.5, 105.5, 53.7, and 38.3 nm. All had 100% particle mass with a grain size within a
120/200 mesh. Both the Millipore and Prime Synthesis material were produced from borosilicate
glass. At least 80% of the pores were within 10% of the mean pore diameter in pore size. Finally,
Aeroperl® 300 Pharma, a fumed silica, was obtained from Evonik with a pore size of about 35
nm. These particles had an average grain size of 30 μm. Solvents were purchased at ACS grade
or higher purity from Fisher Scientific.
Experimental apparatus
Single-stage MSMPR
A single-stage MSMPR was used to crystallize fenofibrate in porous silica. A 50 mL round-
bottomed water jacketed reaction vessel with standard dimensions was used with magnetic stir
bar and temperature separately controlled by an external water circulation controller (Thermo
Scientific NESLAB RTE). A solids content within the reactor of 10 mg porous silica/mL API
solution was chosen; the empty reactor was primed with 500 mg silica to meet this value. The
volume contribution of the silica content was deemed negligible. Peristaltic pumps (Masterflex
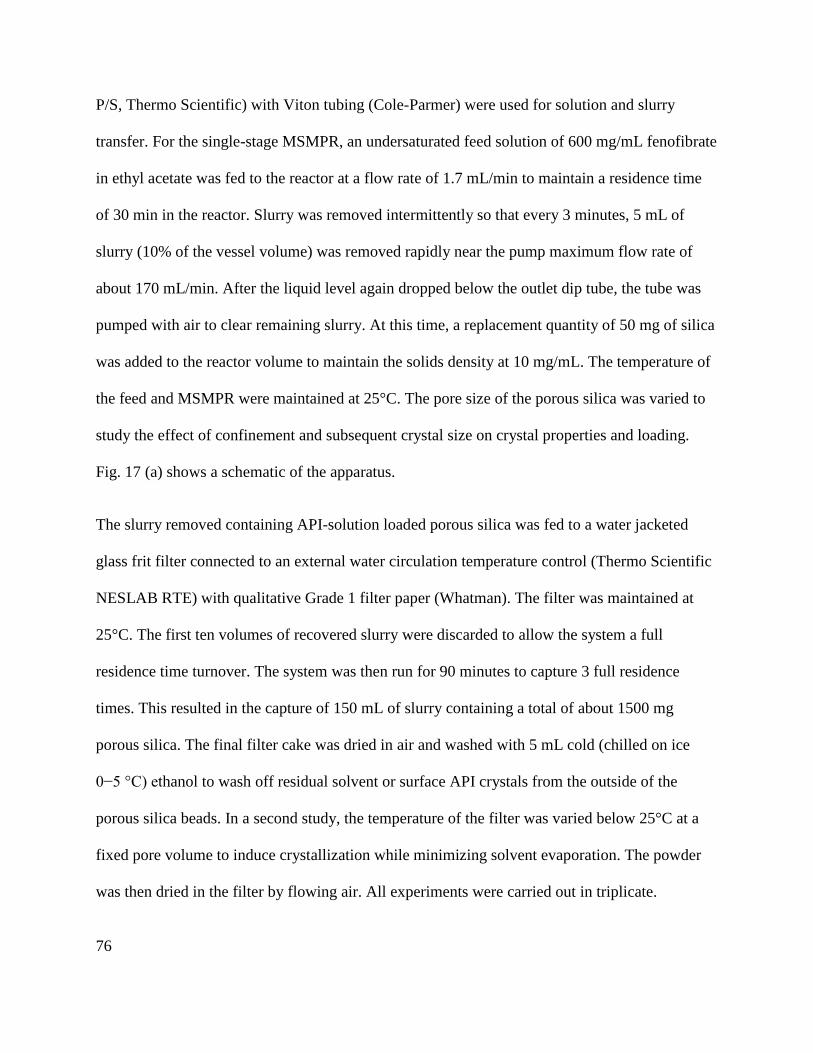
76
P/S, Thermo Scientific) with Viton tubing (Cole-Parmer) were used for solution and slurry
transfer. For the single-stage MSMPR, an undersaturated feed solution of 600 mg/mL fenofibrate
in ethyl acetate was fed to the reactor at a flow rate of 1.7 mL/min to maintain a residence time
of 30 min in the reactor. Slurry was removed intermittently so that every 3 minutes, 5 mL of
slurry (10% of the vessel volume) was removed rapidly near the pump maximum flow rate of
about 170 mL/min. After the liquid level again dropped below the outlet dip tube, the tube was
pumped with air to clear remaining slurry. At this time, a replacement quantity of 50 mg of silica
was added to the reactor volume to maintain the solids density at 10 mg/mL. The temperature of
the feed and MSMPR were maintained at 25°C. The pore size of the porous silica was varied to
study the effect of confinement and subsequent crystal size on crystal properties and loading.
Fig. 17 (a) shows a schematic of the apparatus.
The slurry removed containing API-solution loaded porous silica was fed to a water jacketed
glass frit filter connected to an external water circulation temperature control (Thermo Scientific
NESLAB RTE) with qualitative Grade 1 filter paper (Whatman). The filter was maintained at
25°C. The first ten volumes of recovered slurry were discarded to allow the system a full
residence time turnover. The system was then run for 90 minutes to capture 3 full residence
times. This resulted in the capture of 150 mL of slurry containing a total of about 1500 mg
porous silica. The final filter cake was dried in air and washed with 5 mL cold (chilled on ice
0−5 °C) ethanol to wash off residual solvent or surface API crystals from the outside of the
porous silica beads. In a second study, the temperature of the filter was varied below 25°C at a
fixed pore volume to induce crystallization while minimizing solvent evaporation. The powder
was then dried in the filter by flowing air. All experiments were carried out in triplicate.

77
Two-stage MSMPR
For the two-stage MSMPR, two 50 mL water jacketed reaction vessels were used. The same
peristaltic pumps, tubing, and external water temperature circulators were employed. The first
stage was essentially a replica of the single-stage experiment, with a 600 mg/mL fenofibrate in
ethyl acetate feed with continuously supplied porous silica. The reactor vessel and filter were
held at 25°C with intermittent slurry withdrawals every 3 minutes of 10% of the volume of the
reactor and unloaded porous silica replaced to the vessel at this time. Due to the inability to
continuously harvest the filter cake of API loaded porous silica from the first stage for supply to
the second stage, the second stage was time-decoupled from the first to allow for the buildup of
enough filtered, loaded material from stage one to accumulate to be fed to stage two.
The feed to the second stage was a supersaturated solution of fenofibrate in ethyl acetate at 1080
mg/mL and 1.7 mL/min. The second reactor vessel was primed with 500 mg of stage one API-
loaded silica. The same residence time of 30 min was maintained and the reactor was held at
25°C. The same intermittent withdrawal scheme of 5 mL every 3 minutes was employed. The
silica added to the reactor in 50 mg intervals every three minutes was API loaded silica from
stage one. The slurry was sent to a water jacketed glass frit filter with qualitative Grade 1 filter
paper (Whatman) maintained at 25°C with an external water circulation controller (Thermo
Scientific NESLAB RTE). The samples were washed at each withdrawal with 1 mL cold (chilled
on ice 0−5 °C) ethanol to wash off residual solution and surface crystals. 6 (b) shows a schematic
of the setup. The samples were then dried in the filter by flowing air. Again, the first ten slurry
volumes were discarded. The crystallizer was run for two complete residence times to utilize all

78
of the recovered loaded silica from stage one, resulting in approximately 1000 mg of captured
material at the end of stage two. Experiments were carried out in triplicate.
Fig. 17: Crystallizer design schematic showing the (a) single-stage design and (b) two-stage design
for improved drug loading
Extension of principle to poorly water soluble compounds
Griseofulvin and indomethacin were selected for a bench scale extension of the multiple-stage
MSMPR principle of a first stage to load the pore with an initial crystalline material and a second
stage to grow the crystals in pores. Single, double, and triple-pass loading methods were
employed for each system. In the single loading method, a previously established technique 59
was employed of submerging the particles in a large volume (>250 mL) of undersaturated API
solution using a fine mesh basket. About 1 gram of porous silica particles were immersed in a

79
solution of 30 mg/mL GSF in acetone using a fine mesh basket uncontrolled at room
temperature. The solution was left to wet and enter the silica pores for 20 min before removing
and wicking away excess solution using a paper towel. After the silica particles were removed
from the solution, the particles were rinsed with 2.5 mL of cold ethanol (chilled on ice 0−5 °C).
The rinse was wicked away using a paper towel and the porous silica was removed to dry at
room temperature for approximately 15 hours.
In the double-pass loading method, prepared loaded samples from a single-pass experiment were
then submerged using the fine mesh basket in a large volume very slightly supersaturated
solution of 45 mg/mL GSF in acetone. The samples were held for 5 days held at 25 °C in a
recirculated water bath (Thermo Scientific NESLAB RTE) at 25 °C. The samples were then
removed, solution wicked away, and rinsed with cold ethanol as above before being separated
from any visible bulk crystals and dried at room temperature for about 15 hours. Finally, for the
triple-pass loaded systems, a third submersion step in a slightly more supersaturated GSF
solution of 50 mg/mL was completed for another 5 days, with subsequent identical wash and dry
procedures. The experiments were repeated using IMC solutions in acetone at the same
concentrations for the one-pass, two-pass, and three-pass loading methods. All experiments were
carried out in triplicate.
Analytical techniques
X-Ray powder diffraction
XRPD was performed on all samples using a PANalytical X'Pert PRO diffractometer at 45 kV
with an anode current of 40 mA. The instrument has a PW3050/60 standard resolution

80
goniometer and a PW3373/10 Cu LFF DK241245 X-ray tube. Samples were placed on a spinner
stage in reflection mode. Settings on the incident beam path included: soller slit 0.04 rad, mask
fixed 10 mm, programmable divergence slit and fixed 1° anti-scatter slit. Settings on the
diffracted beam path include: soller slit 0.04 rad and programmable anti-scatter slit. The scan
was set as a continuous scan: 2θ angle between 4 and 40°, step size .0167113° and a time per
step of 31.115 s.
Thermogravimetric analysis
TGA was performed on a Q500 instrument from TA instruments connected with a nitrogen gas
cylinder to maintain a flow rate of 25 mL/min to maintain an inert gas environment in the sample
chamber. Between 5 and 10 mg of sample were loaded on platinum sample pans from TA
Instruments. The samples were allowed to equilibrate at 30 °C and then heated at 10 °C/min to
300 °C.
Differential scanning calorimetry
A Q2000 instrument from TA instruments was used for the DSC analysis. Inert atmosphere
environment was maintained in the sample chamber using a nitrogen gas cylinder set to a flow
rate of 50 ml/min. An extra refrigerated cooling system (RCS 40, TA Instruments) was used to
widen the available temperature range to between −40 and 400 °C. Tzero® pans and lids were
used with ~5 mg of sample. A heating rate of 10 °C/min was applied and the samples were
scanned from −20 to 250 °C. When determining the enthalpy of fusion for a given sample, the
DSC curve was integrated for 30 °C centered on the melting temperature of each pore size to
capture the entire melting event. An exception to this rule was made in samples with a secondary

81
peak present from surface crystals in which case the integration limit was set to exclude the
secondary melting event.
Solubility measurements
The saturation solubility for FEN was measured in ethyl acetate at different concentrations by
adding a known amount of FEN and 1 mL of solvent, respectively, to a 1.5 mL glass vial. The
vials were then placed in a Crystal16 (Avantium), and the heating and cooling rates were set to
0.3 °C/min. The samples were stirred with a controlled stirring speed of 700 rpm using magnetic
stirring bars. The samples were heated with a heating rate of 0.3 °C/min from 5 to 50 °C. The
temperature at which the suspension turned into a clear solution was recorded and assumed to be
the saturation temperature. The clear points generated the solubility curve. After a waiting time
of 30 min at 50°C, the clear solution was cooled to 5 °C with a cooling rate of 0.3 °C/min to
recrystallize the FEN. The cloud point curve was generated as the metastable zone limit (see
Section 3 for discussion).
Dissolution testing
A dissolution test meeting the USP standard for fenofibrate was performed using a USP
Dissolution Apparatus 2 at 37 °C. Built-in ultraviolet-visible spectroscopy was used to determine
percentage of dissolved FEN at 286 nm. The dissolution buffer used was .025 M sodium dodecyl
sulfate solution (Sigma Aldrich). The dissolution apparatus operated at 75 RPM using 900 mL
buffer solution which was allowed to equilibrate at temperature before the addition of drug-
loaded silica. Enough sample of FEN-loaded silica was added such that the targeted

82
concentration of fenofibrate in solution was 15 μg/mL, within the expected linear range. Samples
were acquired for about 29 hours.
3.3 Results and discussion
Poorly water soluble compounds are of interest for confined crystallization work to produce
small crystals with better dissolution ability. In previous studies, FEN nanocrystals confined to
rigid porous silica matrices have been shown to have well-behaved thermal properties and
enhanced dissolution rates 28,40. A single polymorph has been shown to crystallize in pore sizes
from 20-300 nm which is ideal for studying melting point behavior in a simple system 81.
Selection of MSMPR operating parameters
Experiments were conducted on a Crystal 16 apparatus to determine the saturation solubility and
metastable zone width (MSZW) of the FEN systems. The solubility was measured of FEN in
ethyl acetate alone, and with porous silica also present in the vials. Figure 1 clearly shows the
decrease in the metastable zone width with the addition of porous silica. The need to understand
the working MSZW in a confined crystallization procedure is critical in the selection of a
supersaturation level. The feed to stage two of the crystallizer was carefully selected to lie within
the narrowed MSZW resulting from the presence of silica. This feed was designed to be
supersaturated such that the feed could allow growth of the FEN crystals in the crystallizer while
not dissolving the crystals already loaded in the pores. It also needed to be stable enough so as to
not precipitate on its own. Indeed, some crystallizer runs were discarded due to issues with bulk
crystal formation in the second stage. The saturation solubility of FEN in ethyl acetate at room
temperature (25 °C) was found to be approximately 750 mg/mL. The supersaturation selected for

83
the second stage feed was about 1.4, a concentration of 1080 mg/mL. This value was selected to
be well within the MSZW window.
Fig. 18: Comparison of the MSZW of FEN in ethyl acetate showing a decrease in the width with the
addition of porous silica
The experiments were designed to maintain 10% w/v silica in the crystallizers. It is likely that
the crystallizers could be run at much higher than 10% solids density with similar growth and
loading. The low value of 10% was selected to be conservative in the “infinite solution”
approximation for the second stage wherein the mechanics of crystal growth and supersaturation
were being carefully monitored.
Analysis of FEN loading in MSMPR experiments
Table 5 summarizes the loading results from the single- and two-stage MSMPR experiments
held at 25 °C as determined by thermogravimetric analysis (TGA). The theoretical maximum
loading from the first stage of the MSMPR was calculated assuming that all of the fenofibrate

84
contained in the original 600 mg/mL (60% w/v) solution crystallized in the pore and that the pore
volume of the silica was completely filled with solution. The theoretical “filled pore maximum”
theoretical loading was also calculated based on the density of fenofibrate assuming that the
entirely pore volume was filled with crystal 94. This basis is a maximum for comparison;
however, complete filling of the tortuous porous network of the silica would be unlikely.
Table 5: Room temperature (25 °C) MSMPR loading summary of FEN wt% in porous silica
Only runs which did not show bulk crystallization in the vessels were selected for loading
analysis. However, differential scanning calorimetry (DSC) scans did detect the presence of a
small (<10 wt%) amount of surface crystals present on the silica powder in the 38 and 53 nm
samples. This skews the loading data to suggest slightly higher possible loadings for these two
pore sizes. In all pore sizes, the single-stage MSMPR experiments were able to achieve >75% of
the theoretical maximum loading based on the amount of FEN solution expected to have wetted
the pores. The loadings from the two-stage MSMPR were higher than their one-stage counterpart
in all cases, indicating that the crystals confined to the pores in the first stage were then able to
grow within the pores in the second stage. High weight percentage loadings were achieved in all
Pore
size
(nm)
Specific
surface
area
(m2/g)
Pore
vol.
(mL/g)
Theoretical single-
stage max. loading
from FEN soln.
(wt%)
Single-stage
loading
(wt%)
Theoretical
filled pore
max. FEN
loading (wt%)
Two-stage
loading
(wt%)
300 10 1.0 37.5 31.4 ± 1.7 54.1 41.6 ± 1.0
191 30 1.5 47.4 36 ± 1.9 63.9 50.2 ± 1.8
151 31 1.2 41.9 36.1 ± 1.7 58.6 40.2 ± 2.5
105 52 1.4 45.7 36.5 ± 4.2 62.3 54.8 ± 3.7
53 94 1.3 43.8 39.1 ± 1.0 60.5 55.6 ± 2.2
38 138 1.3 43.8 40.3 ± 2.3 60.5 56.1 ± 3.5
35 300 1.6 49.0 - 65.4 56.7 ± 1.6

85
cases. Most notably, due to its large pore volume, the porous silica Aeroperl® was able to be
loaded with FEN to more than 50 wt% loading. While the samples with 38 and 53 nm pores did
show some surface crystals, the relative contribution of surface to confined crystals indicated that
there was still growth of the crystals confined to the pores in the two-stage MSMPR.
The single-stage MSMPR was also run at varying filter temperatures for a single pore size of 191
nm. Rather than allowing the crystallization to occur as a result of evaporation of the solvent and
potentially losing more crystals in the wash step, cooling the solution in the crystal pores was
hypothesized to allow for higher loadings even in the single-stage MSMPR. Table 6 summarizes
the loadings determined by TGA and a description of the DSC scans for the varied temperature
experiment.
Table 6: Loading results for FEN wt% in porous silica in single-stage MSMPR as a function of
filter temperature
Temp
(°C)
Loading (wt%)
Notes from DSC thermogram Trial
1
Trial
2
Trial
3 Avg.
25 36.0 42.3 37.2 38.5 ± 3.5 Single peak, confined crystals
20 27.4 30.3 31.8 29.8 ± 2.2 Single peak, confined crystals
18 50.8 48.7 51.6 50.4 ± 1.5 Single peak, confined crystals
17 61.0 58.9 56.9 58.9 ± 2.1 Single peak, confined crystals
15 64.6 61.0 65.7 63.8 ± 2.5 Two peaks, confined and surface
crystals
For all temperatures but 15°C, the DSC scans showed single peaks at a melting point depression
indicating that the crystals formed were confined to the pores of the silica matrix. There is a
trend of higher loadings with cooler filter temperature. The samples crystallized at 15°C were
shown to have two peaks in the DSC scans corresponding to both confined crystals and crystals

86
on the surface of the porous supports. Previous calculations based on the pore volume and
density of FEN indicated that the theoretical filled pore maximum for FEN entirely occupying
the pore volume for this pore size is 63.9 wt%. The loading values in Trials 1 and 3 at 15°C
further support the interpretation of DSC thermograms indicating that both confined and surface
crystals were present as the measured loading values exceed the theoretical maximum.
Dissolution profile enhancement
The FEN-loaded silica generated from the MSMPR crystallizers was studied in a dissolution
apparatus to generate the dissolution profiles. Fig. 19 shows the dissolution profile of FEN
loaded Aeroperl® from the two-stage MSMPR in contrast with bulk FEN crystals from the
manufacturer. The Aeroperl® dissolution profiles are the most dramatically enhanced, due to a
combination of the small crystal size (35 nm) and also likely diffusion effects from differences in
the tortuosity and porosity between the different silicas used. The nanocrystalline FEN loaded in
Aeroperl® was able to achieve more than 80% dissolution in 22.5 minutes, whereas the bulk
FEN took 656 minutes for the same. The release time for FEN confined to Aeroperl® is the
fastest seen of this API confined to any other form of porous silica 81.

87
Fig. 19: FEN confined to 35 nm Aeroperl® showing dramatically enhanced dissolution profiles
when compared to the bulk crystals
Melting point depression analysis of nanocrystals with DSC
DSC scans were performed on each sample both to confirm that the crystals formed were
confined to the pores and to study the effect of confinement on melting point depression. For the
majority of the silica supports, the DSC scans showed a single, sharp peak at a melting point
below the melting point of bulk FEN (81.6 °C ± 0.2 °C.). This can be interpreted as indicating
the presence of API crystals confined to the pores, without the presence of significant surface
crystals of bulk size on the surface of the porous silica 59,81. A few samples from pore sizes 38
and 53 nm showed two peaks on the DSC scans: a large peak at a temperature below 81.6 °C and
a secondary peak at about 81.6 °C accounting for less than 10% of the total peak area. While this
is interpreted as the presence of some crystals on the surface of the porous silica, the small
relative quantity was accepted and these samples were still used for loading analysis.

88
A basic simplified Gibbs-Thomson analysis was employed to study the effect of confinement on
melting point depression of the nanocrystals produced via the MSMPR methods 24. Eq. 4 relates
the melting point depression to the nanocrystal size:
4( )
solid liquid m
m m m
fus solid
MTT T T d
d H
Eq. 5
where 𝑇𝑚 is the bulk melting temperature, 𝑇𝑚(𝑑) is the melting temperature of a confined crystal
with diameter d assumed equal to the pore diameter, M is the molecular mass, 𝜌𝑠𝑜𝑙𝑖𝑑 is the
density of the solid ,𝛾𝑠𝑜𝑙𝑖𝑑−𝑙𝑖𝑞𝑢𝑖𝑑 is the surface free energy of the solid-liquid interface, and
𝛥𝐻𝑓𝑢𝑠 is the molar enthalpy of fusion.
In previous studies, Eq. 4 has been used to fit melting point data to show that the confined
nanocrystals have the expected predictable linear-fit Gibbs-Thomson melting point depressions,
indicating that a decrease in the surface interaction energy of the nanocrystals with the substrate,
found in the numerator, is balanced by a simultaneous decrease in the enthalpy of fusion of the
nanocrystals, found in the denominator. The melting point data from both the single-stage and
two-stage MSMPR were plotted against the inverse of the pore diameter. Fig. 20 shows that the
confined crystals produced by MSMPRs have the expected melting point depression behavior
with minimal deviation from the theory and minimal error in melting point temperature within a
single pore size. The fit predicts a bulk melting point of 81.9 ºC, very close to the measured bulk
melting temperature of 81.6 ºC.
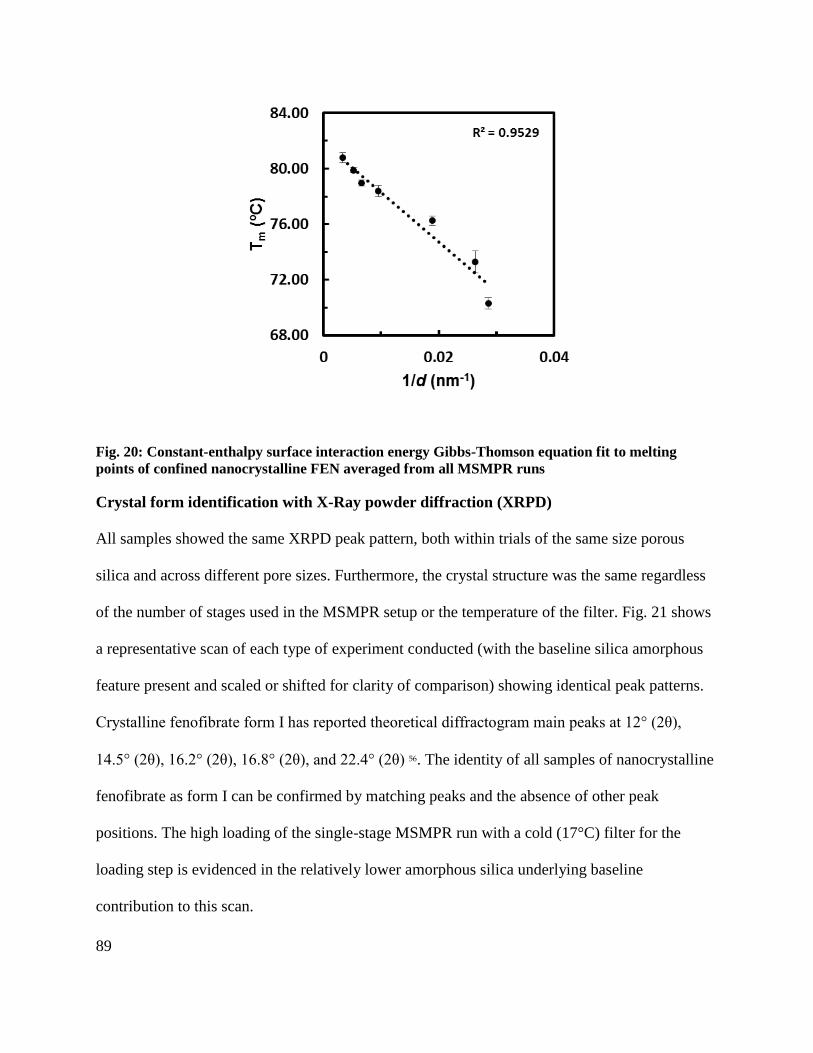
89
Fig. 20: Constant-enthalpy surface interaction energy Gibbs-Thomson equation fit to melting
points of confined nanocrystalline FEN averaged from all MSMPR runs
Crystal form identification with X-Ray powder diffraction (XRPD)
All samples showed the same XRPD peak pattern, both within trials of the same size porous
silica and across different pore sizes. Furthermore, the crystal structure was the same regardless
of the number of stages used in the MSMPR setup or the temperature of the filter. Fig. 21 shows
a representative scan of each type of experiment conducted (with the baseline silica amorphous
feature present and scaled or shifted for clarity of comparison) showing identical peak patterns.
Crystalline fenofibrate form I has reported theoretical diffractogram main peaks at 12° (2θ),
14.5° (2θ), 16.2° (2θ), 16.8° (2θ), and 22.4° (2θ) 56. The identity of all samples of nanocrystalline
fenofibrate as form I can be confirmed by matching peaks and the absence of other peak
positions. The high loading of the single-stage MSMPR run with a cold (17°C) filter for the
loading step is evidenced in the relatively lower amorphous silica underlying baseline
contribution to this scan.

90
Fig. 21: XRPD scans of FEN nanocrystals from various runs show crystallinity and consistent
formation of form I
Extension of principle to poorly soluble compounds
Griseofulvin (GSF) and indomethacin (IMC) were chosen as compounds that are not only poorly
water soluble but which also have low solubilities in most of the FDA Class III solvents as
challenging systems in which to achieve high pore loadings in a nanoporous silica matrix.
Saturation solubility estimates exist for both APIs of about 40 mg/mL in acetone at 25°C 95,96.The
theoretical maximum loading from the single-pass loading method was calculated assuming that
all of the GSF or IMC contained in the original undersaturated solution of 30 mg/mL crystallized
in the pore and that the pore volume of the silica was completely filled with solution. The
theoretical “filled pore maximum” theoretical loading was also calculated assuming that the
entirely pore volume was filled with crystals based on the density of GSF, 1.4 mg/mL 97, and
assumed density of 1.0 mg/mL for a conservative estimate for IMC due to lack of available data.
The experiments were all conducted in Aeroperl® of pore size 35 nm to have the highest pore
volume silica (1.6 mL/g). A previous study 98 used IMC as a model compound to test similar
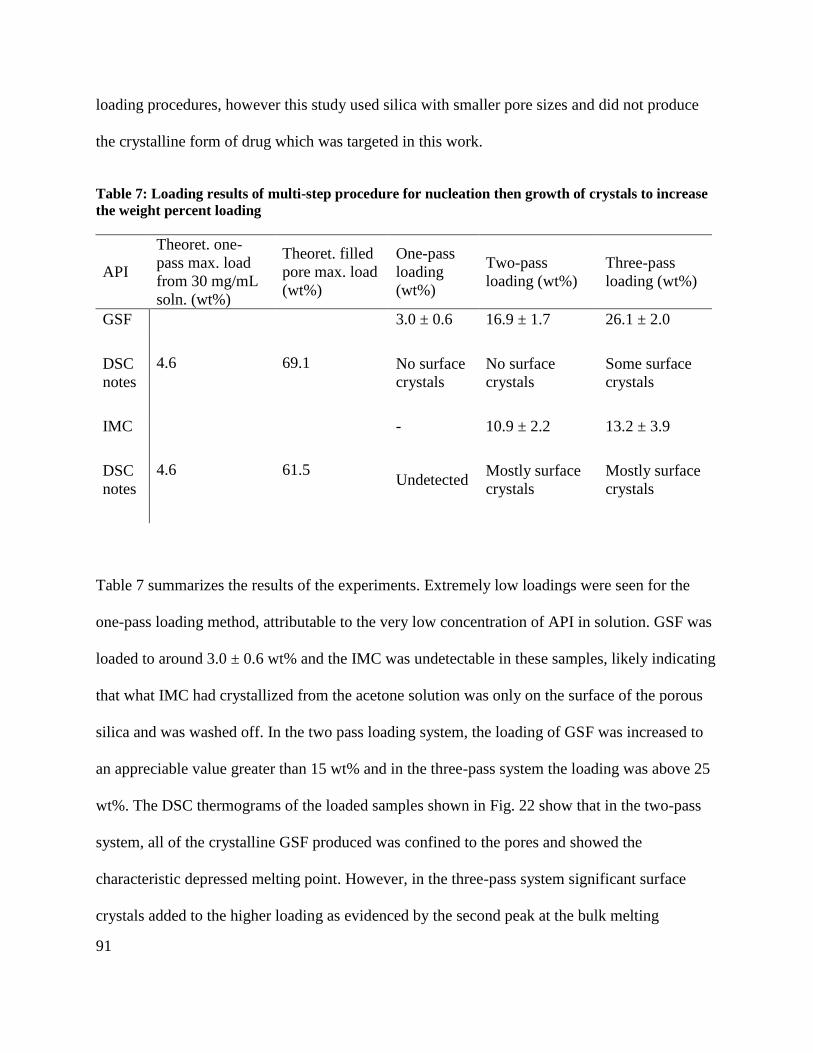
91
loading procedures, however this study used silica with smaller pore sizes and did not produce
the crystalline form of drug which was targeted in this work.
Table 7: Loading results of multi-step procedure for nucleation then growth of crystals to increase
the weight percent loading
API
Theoret. one-
pass max. load
from 30 mg/mL
soln. (wt%)
Theoret. filled
pore max. load
(wt%)
One-pass
loading
(wt%)
Two-pass
loading (wt%)
Three-pass
loading (wt%)
GSF
4.6 69.1
3.0 ± 0.6 16.9 ± 1.7 26.1 ± 2.0
DSC
notes
No surface
crystals
No surface
crystals
Some surface
crystals
IMC
4.6 61.5
- 10.9 ± 2.2 13.2 ± 3.9
DSC
notes Undetected
Mostly surface
crystals
Mostly surface
crystals
Table 7 summarizes the results of the experiments. Extremely low loadings were seen for the
one-pass loading method, attributable to the very low concentration of API in solution. GSF was
loaded to around 3.0 ± 0.6 wt% and the IMC was undetectable in these samples, likely indicating
that what IMC had crystallized from the acetone solution was only on the surface of the porous
silica and was washed off. In the two pass loading system, the loading of GSF was increased to
an appreciable value greater than 15 wt% and in the three-pass system the loading was above 25
wt%. The DSC thermograms of the loaded samples shown in Fig. 22 show that in the two-pass
system, all of the crystalline GSF produced was confined to the pores and showed the
characteristic depressed melting point. However, in the three-pass system significant surface
crystals added to the higher loading as evidenced by the second peak at the bulk melting

92
temperature. With the two and three-pass methods, IMC was detectable in the samples but the
DSC thermograms indicated the majority of the contribution was from bulk crystals on the
surface of the silica or amorphous content and the methodology was unable to produce IMC
nanocrystals confined to the silica pores.
Fig. 22: DSC scans of GSF in porous silica compared to bulk crystals show that the two-pass
loading technique was able to produce confined nanocrystals with no significant surface crystals
3.4 Conclusions
Fenofibrate was successfully loaded into a range of nanoporous silica with varying pore sizes
using a continuous MSMPR methodology. A single-stage MSMPR was shown to reliably wet
the pores for subsequent crystallization by evaporation to yield average nanocrystalline FEN
loadings across pore sizes of 37 wt% at 25 °C. Cooling crystallization was also employed on
wetted porous silica from a single-stage MSMPR to achieve average FEN loadings of 48 wt%.
When the single-stage design was coupled to a second stage crystallizer in which a
supersaturated solution was allowed to grow the nanocrystals which had already been loaded in

93
the pores, loadings increased without substantial contributions from crystals on the surface of the
porous silica. The average two-stage MSMPR loading across pore sizes was 51 wt% at 25 °C.
This was an important improvement in methodology and loading from the previous chapter’s
work. The nanocrystalline FEN produced was the same polymorph across all studies and showed
the expected melting point depression behavior expected from a Gibbs-Thomson relationship. A
benchtop extension of the principle was shown to improve the loading of griseofulvin in porous
silica from just 3.0 wt% to over 15 wt% with no surface crystals, but was unable to load the
poorly water soluble drug indomethacin with appreciable quantities in the pores; indomethacin
showed a strong propensity for crystallization on the surface of the silica related to its nucleation
and growth kinetics. Using a multi-stage MSMPR apparatus to load poorly soluble drugs in silica
matrices has the ability to decouple nanocrystal formation from growth and allow for high drug
loadings for these compounds. In particular, a material used in this study, Aeroperl® 300
Pharma, which not only has the highest pore volume but also meets the USP/NF guidelines, is an
attractive matrix for further pursuit for oral dosage forms.
3.5 Acknowledgements
This chapter has been adapted and published as a peer-reviewed journal article. Dwyer, L.;
Kulkarni, S.; Ruelas, L.; Myerson, A. Two-Stage Crystallizer Design for High Loading of Poorly
Water-Soluble Pharmaceuticals in Porous Silica Matrices. Crystals 2017, 7, 131. We would like
to thank the Novartis-MIT Center for Continuous Manufacturing for financial support and
instrumentation use. L.M.D. is grateful to Carlos Pons Siepermann, Jennifer Moffitt Schall, and
Dr. Marcus O’Mahony for valuable assistance and discussions

94
Chapter 4 : Understanding nanoscale surface functionalization’s
role on supersaturation in crystallizing solutions
4.1 Introduction
Heterogeneous nucleation is the formation of a crystal at a surface, at which the free energy
barrier for nucleation is lower due to the effective surface area energy being lower 3. In industrial
crystallization, surfaces are common, examples including vessel walls, mechanical stirrers, and
even undesirable particulates 99.
Many experimental studies have aimed to look at the effects of surfaces on crystal nucleation, in
particular surfaces which have modifications which may further induce or suppress nucleation
beyond the lowering of the surface energy barrier. In particular, self-assembled monolayers
(SAMs) have been used extensively including in this research group, as surfaces for
heterogeneous nucleation 31–33. SAMs are highly ordered molecular assemblies formed when a
surfactant adsorbs to a solid surface, creating a layer of functional groups oriented outward from
a typically inert surface 34. Using SAMs as surfaces for crystallization has been shown to have
effects on polymorphism35, enantiopurity 36, crystal size 100, and crystal morphology 101.
Within our group, an idea was proposed to use the concept of the surface functionality of SAMs
to act in a different way. It was theorized that if nanoparticles were surface functionalized, they
may provide enough surface area that the interaction of these surface functional groups with the
solvent and solute system in a crystallization would act like an additional solvent or antisolvent,
thereby promoting crystallization or dissolution. In the case of promoting crystallization, for

95
example, the addition of the functionalized nanoparticles would cause the system to become
supersaturated, and thus provide the driving force for crystallization. The types of nanoparticles
used could be exploited for desirable properties including magnetism for easy separation or core-
shell coatings for ease of surface functionalization. A similar concept has been shown in protein
crystallization systems 102. Initial promising results were developed by our group 38 which
prompted a continued study of this methodology presented here. This work was done in close
collaboration with Lucrèce H. Nicoud. Fig. 23 and Fig. 24 summarize the proposed schemes of
how the nanoparticles were thought to interact with solvent/solute systems.
Fig. 23: Proposed schematic of the technique in the case where the nanoparticles are acting as
antisolvent
Fig. 24: Proposed schematic of the technique in the case where the nanoparticles are acting as
solvent

96
4.2 Experiments and results
Materials for solvent/solute systems
All solvents used in this study were purchased at ACS grade or higher purity from Fisher
Scientific. All chemical precursors for iron oxide particle synthesis were purchased at reagent
grade from Sigma-Aldrich. Fenofibrate (FEN) was obtained from Xian Shunyi Bio-chemical
Technology Company. Diphenhydramine hydrochloride (DPH) was purchased from BeanTown
Chemical at a purity ≥ 99%. Silica coated magnetic nanoparticles with a total diameter of 200
nm were purchased from Spherotech Inc (catalog number SIM025-10H). N-decyltriethoxysilane
was purchased from Gelest (catalog number SID2665.0) to perform functionalization of the
silica surface of the nanoparticles with decane.
Production and size control of iron oxide nanoparticles
Over the course of a year, we attempted to continue to investigate the work previously conducted
by Kulkarni in our lab 38. In this work, gold (procured from Spherotech, Inc., Lake Forest, IL) and
iron oxide nanoparticles (synthesized in lab) ranging from 1.8 nm in diameter to >10 nm in
diameter were functionalized with different surface chemistries to behave as antisolvent-like
molecules for a given system. It was later proposed that, similarly, the surfaces could be
functionalized to act as solvents in a system to improve the solubility of a compound of interest.
It was shown that D-mannitol could be crystallized from water using 1.8 nm gold particles
functionalized with 2-mercaptoethanol (Spherotech, Inc.). Fenofibrate was similarly crystallized.
A saturated solution of fenofibrate in ethyl acetate was prepared, and decanoic acid
functionalized iron oxide particles reported to be about 5 nm in diameter were added to solution.
The spontaneous crystallization of fenofibrate was observed within minutes. The iron oxide

97
particles were easily separated from solution with a magnet. It was proposed that the high surface
area of the nanoparticles allowed their functional groups to behave as a traditional liquid addition
to a mixed-solvent system.
These initial successes prompted us to continue to investigate this mode of action, as well as the
reverse mode of action, with solvent-like chemistry to act to improve the solubility of a
compound. This would be most applicable in a recrystallization, where a slurry of API in
antisolvent is made to go into solution again, followed by a subsequent recrystallization, to
remove impurities. However, for both directions of the system, we believed that significant effort
on producing small, well-dispersed nanoparticles of the iron oxide would contribute to the
success of the system, because the gold system with true nanoparticles of <10 nm had the most
promising initial results. We therefore began investigation of a matrix of synthesis conditions to
assess their effect on the nanoparticles produced as well as investigating various procured iron
oxide nanoparticles. We also determined that the thiol functionalization used in the gold
nanoparticles with limited reversibility was likely a good contributor to the success of the
functionalized particles. We therefore investigated silica-coated iron-oxide so that we could do
silane functionalization for a more permanent functionalization than weak surface interactions
directly to the iron oxide surface.
Focusing on size, the previous method employed to produce the iron oxide nanoparticles was
successful at producing the correct form of iron oxide to be magnetic (Fe3O4), however the
particle size was much larger than desired. As measured by dynamic light scattering (DLS), these
particles were in the range of 1000+ nm. The method is summarized here:

98
IONPs were synthesized by chemical co-precipitation method under alkaline
condition and molar ratio between Fe2+ salt and Fe3+ salt was maintained at 1:2. In
order to synthesize 1 g of Fe3O4 particles, 0.86 g of FeCl2_4H2O and 2.35 g of
FeCl3_6H2O were dissolved in 40 mL ultrapure water under N2 atmosphere with
vigorous stirring at speed of 1000 rpm. As the solution was heated to 80 °C, 5 mL
of NH4OH solution was added and the reaction was continued for another 30 min.
The resulting suspension was cooled down to room temperature and washed with
ultrapure water. The product of bare magnetic nanoparticles (IONP) was isolated
from the solvent by magnetic decantation. The IONP’s further washed with water
5 times and separation by magnetic decantation.
In consultation with the literature and members of the Roman lab at MIT, we determined that to
produce the correct size of nanoparticles we would employ a microemulsion method to confine
the reaction volume to micro droplets of aqueous solution in heptane, with a surfactant to
stabilize the emulsion. Several important factors in this synthesis were highlighted and are being
systematically tested to determine a procedure to produce nanoparticles in the size range we
desire (~10 nm), consistently in the correct form (Fe3O4 as opposed to FeO and Fe2O3). These
factors include:
Headspace and atmospheric conditions (air or pure nitrogen)
Vessel size
Heptane/water ratio
Surfactant concentration and type
Iron salt precursor concentration
pH upon addition of base
Heating
Wash, dry, recovery steps

99
The following method was been shown to produce stable magnetic iron oxide nanoparticles at a
size range nearer to the desired size particles, up to about 200 nm. Variations have been
completed wherein the ratio of water to heptane was decreased and the headspace was increased,
both of which produced the wrong form of iron oxide. We also aimed to develop a method in
which a silica shell may be grown on the iron oxide particles, for use in functionalization by
silanes.
A 20 mL scintillation vial is filled with 15 mL heptane and 2 mL Brij, a
commercial surfactant. This is stirred vigorously at 1000 RPM at room
temperature. In a separate vial, 107.4 mg of FeCl2_4H2O and 293.7 mg of
FeCl3_6H2O are dissolved in 5 mL ultrapure water. This is then added to the Brij
and heptane mixture and allowed to stir vigorously to form a reverse
microemulsion with salt contained in the aqueous phase within the larger heptane
phase. After this has stirred for 15 minutes at minimum, 1 mL concentrated
NH4OH was added to the solution. A black precipitate formed immediately,
however the solution was allowed to continue stirring for another 15 minutes.
In the case where we desired to produce bare IONP, the emulsion was broken with the addition
of about 20 mL methanol. The iron oxide nanoparticles were sized directly, after collecting and
washing with water, and after drying and re-suspending. In the case where we desired to coat the
particles with silica, 100 μL Tetraethyl orthosilicate (TEOS) was added. The TEOS partitions
into the water phase and decomposes to silica in the presence of water. This solution was
allowed to stir for 24 hours, at which point the nanoparticles were sampled for sizing.

100
The following diagram summarizes the size of IONP produced with the second method above.
These results are from dynamic light scattering experiments performed on a DynaPro NanoStar
by Wyatt Corporation available at the MIT BioInstrumentation facility. The particles synthesized
by the reverse microemulsion method are nearer to the desired size range but work remains to
produce smaller particles of the correct form and understand the operating parameter effects on
the synthesis.
Fig. 25: Size description of synthetic IONPs as measured by DLS
Besides working on the synthesis of nanoparticles, we also looked for commercial suppliers.
Table 8 summarizes the commercial nanoparticles that were ordered.

101
Table 8: Summary of the commercial nanoparticles under investigation
Particle type Particle size Supplier Comments
Silica nanopowder 5-15 nm Sigma
$ 2/g
We did not manage to properly disperse
those nanoparticles (using vortexing,
sonication, and different solvents)
There are also safety issues related to
such nanopowders.
Iron oxide core
+ silica shell
dispersed in hexane
14 nm
(core 8 nm)
Particle
works
$ 2’000/g
We could not separate these nanoparticles
with a magnet.
Iron oxide core
+ silica shell
dispersed in water
200 nm
(core 160
nm)
Spherotech
$ 600/g
These particles require several minutes to
separate them with a magnet from a 1 mL
solution.
We are currently working with these
nanoparticles to develop our
functionalization protocol.
Iron oxide core
+ silica shell
dispersed in water
40 to 100 nm
Creative
diagnostics
$ 20’000/g
We received samples of these particles.
DLS analysis revealed that the
nanoparticles are larger than expected
(140 to 300 nm), so these nanoparticles
were not used anymore.
Fig. 26 shows a TEM picture of the nanoparticles from Spherotech. The silica shell appears with
a lighter grey than the iron oxide core.
Fig. 26: TEM picture of the iron oxide nanoparticles from Spherotech

102
Functionalization of silica-coated nanoparticles
We aimed at functionalizing silica coated iron oxide nanoparticles with silanes. Fig. 27 shows a
scheme of the functionalization reaction. Several silanes were purchased from Gelest, including
hexyltriethoxysilane, 2-cyanoethyltriethoxyehtylsilane, acetoxyethyltrietoxysilane.
Fig. 27: Scheme of the mechanism of silane deposition on the silica surface

103
We then focused on the functionalization of the commercial 200 nm silica coated iron oxide
nanoparticles with hexyltriethoxysilane. The current protocol goes as follows:
Wash 5 mg of nanoparticles with water and then with anhydrous ethanol. Remove
the solvent with magnetic separation. Prepare a solution with: 95 % w/w
anhydrous ethanol + 5 % w/w water acidified at pH ~4 with acetic acid. Add the
silane to reach a 2 % w/w concentration. Sonicate for 2 min in the bath sonicator.
Add 1 mL of this reaction mixture to the washed nanoparticles and vortex.
Perform the reaction at 25 °C under shaking at 500 rpm for 24 hours. Dry the
nanoparticles for 2 hours in an oven at 90 °C. Wash the nanoparticles with
ethanol. To do so, use the tip sonicator to properly redisperse the nanoparticles.
Remove the solvent with magnetic separation.
The functionalized nanoparticles were analyzed by Fourier-transform infrared spectroscopy
(FTIR) and the results are shown in Fig. 28 with an orange line. As comparison, the FTIR spectra
of the non-functionalized nanoparticles and of the silane are also shown. The small peak small at
around 3000 cm-1 corresponds to the stretching of the C-H bond, which suggests that the
functionalization was successful.

104
Fig. 28: FTIR spectrum of the silica coated iron oxide nanoparticles functionalized with
hexyltriethoxysilane. As a comparison, the FTIR spectra of the plain nanoparticles and of the silane
are also shown. The spectra on the right-hand side of the figure are similar to those on the left-hand
side but with a different scale
The nanoparticles were also analyzed by thermogravimetric analysis (TGA) and the results are
shown in Fig. 29. For both the non-functionalized and functionalized nanoparticles, the mass
decreases when the temperature is increased. Nevertheless, the two signals differ at around
500 °C. These results suggest that the grafted silane represent around 1 % of the mass of the
nanoparticles. However, quantifying accurately the degree of functionalization with FTIR and
TGA reveals quite challenging due to the small mass of grafted silane with respect to the mass of
the nanoparticle.

105
Fig. 29: TGA analysis of the silica coated iron oxide nanoparticles functionalized with hexane
(silane SIH6167.5).
The protocol described above was also applied to 2-cyanoethyltriethoxyehtylsilane,
acetoxyethyltrietoxysilane.
Continued testing of functionalized nanoparticles in relevant systems
The bulk of the results of trying to replicate the initial successes with both the gold nanoparticles
and iron oxide nanoparticles indicate that because we are working with such fine degrees of
changing thermodynamic equilibrium, temperature obviously plays a large role in the
experiments. Through trying to repeat experiments with mercaptoethanol functionalized gold
nanoparticles of 1.8 and 5 nm diameters, whose surface areas should have been quite large
enough to contribute the originally understood effect, we were unable to produce crystallization
from solutions of saturated mannitol dissolved in water, even with the addition of nearly 1:1
parts water and gold nanoparticle slurry. We held these solutions at a constant temperature of
25 °C rather than relying on room temperature to stay constant over the entire laboratory, as it
was done in the preliminary experiments. These solutions never crystallized when held in this
temperature regulated environment. Unfortunately, similar results were shown with the

106
functionalized iron oxide nanoparticles and silica-coated and functionalized iron oxide, which is
unsurprising because the concentration of these particles would allow for even less surface area
than their nanometer gold counterparts. When temperature was properly controlled for, it was
determined that the functionalized particles could not induce crystallization from saturated
solutions.
Initial results indicating effects on heterogeneous nucleation
Cooling crystallization
However, there was some indication that the functionalized nanoparticles promoted faster
nucleation than their unfunctionalized counterparts, or than control experiments in which no
nanoparticles were added. The effect on heterogeneous nucleation was also studied in
diphenhydramine hydrochloride (DPH). We prepared a solution of DPH in isopropanol at 30
mg/mL by heating to about 30°C. All of the DPH dissolved. We determined the saturation
solubility of our samples of DPH in IPA at bath conditions of about 23°C to be around 26
mg/mL. We removed our 30 mg/mL solution from heat and brought it to bath temperature of 23°
at which point we saw no crystallization. We then added around 1.2 mg/mL of iron oxide
nanoparticles functionalized with decanoic acid synthesized in the lab, of about 200 nm in
diameter, and saw crystallization within a minute. We understand that the effect of temperature
would lead to crystallization in this scenario after some time, so we aimed to then compare the
effect of the nanoparticles on nucleation in comparison with cooling crystallization. A solution
of 250 mg/mL DPH in isopropanol was made at 60°C in multiple vials. To one set of vials, 1
mg/mL synthesized iron oxide nanoparticles functionalized with decanoic acid were added, in
another set iron oxide particles with no functionalization were added, and all sets of vials were

107
cooled at 1°C/min from 60°C to 5°C. The vials with the addition of the functionalized iron oxide
nanoparticles crystallized in under 15 minutes, those with non-functionalized particles took
slightly longer averaging 20 minutes, and those with cooling alone took approximately 1 hour. A
magnet easily separated the nanoparticles from the solution leaving the crystals undisturbed at
the bottom of the vial.
Anti-solvent crystallization
After examining the impact of nanoparticles on heterogeneous nucleation in cooling
crystallization experiments, we investigated their effect during anti-solvent crystallization. To do
so, diphenhydramine (DPH) was dissolved in ethanol at a concentration of 300 mg/mL and
heptane was added to reach different levels of supersaturation. The experiments were performed
at 25 °C either in the absence of nanoparticles or in the presence of commercial core-shell
magnetic nanoparticles having a 160 nm iron oxide core and a 20 nm thick silica shell.
Fig. 30 shows experimental data of the solubility of DPH as a function of the volumetric
percentage of heptane in the absence of nanoparticles. The black line represents the dilution line
upon heptane addition starting from a solution at 300 mg/mLEtOH = 277 mg/gTOT. This graph
shows that crystallization is expected to occur at heptane concentrations above approximately
10 % v/vTOT.

108
Fig. 30: Experimental data of the solubility of DPH as a function of the volumetric percentage of
heptane (symbols). The black line represents the dilution line upon heptane addition.
In a first set of experiments, crystallization was investigated at the milliliter scale at various
heptane concentrations above 10 % v/vTOT. Five samples were prepared for each condition and it
was checked after 24 hours of shaking whether crystallization occurred or not. The results are
summarized in Fig. 31. It is seen that in the absence of nanoparticles, most of the samples did not
crystallize after 1 day. In particular, none of the samples below 20 % heptane crystallized. At
heptane concentrations between 25 and 55 %, only some of the samples crystallized and it was
necessary to increase the heptane concentration up to 60 % to observe crystallization in the 5
samples. This shows that kinetic limitations hinder crystal formation at low heptane
concentrations, i.e. in the metastable zone. Interestingly, it was observed that the presence of
bare nanoparticles promotes crystal formation at low supersaturation. Indeed, all the samples
above 33 % heptane crystallized in the presence of nanoparticles.

109
Fig. 31: Crystallization likelihood at various concentrations of heptane and bare nanoparticles. Five
samples were prepared for each condition 103
In a second set of experiments, crystallization was performed in a 100 mL reaction vessel and
was followed by focused beam reflectance measurements (FBRM). The heptane concentration
was set to 33 %, while bare nanoparticles were added in various concentrations varying from 0 to
0.25 g/L. Fig. 32 (left) shows the total number of counts recorded as a function of time. It is seen
that in the absence of nanoparticles, there is a lag time during which no crystals are detected.
After about 30 min, crystallization starts and the number of counts per second rises. When
nanoparticles are added, this lag time disappears and the total number of counts increases, which
suggests that more nanoparticles are formed. Fig. 32 (right) shows the chord length distribution
recorded at 1 hour. In the absence of nanoparticles, the chord length distribution is monomodal
and is centered around 80 μm. When nanoparticles are added, a second peak arises at around 20
μm and its relative contribution increases when increasing the concentration of nanoparticles.

110
Overall, these data show that the presence of nanoparticles promote crystal nucleation and leads
to smaller crystal sizes.
Fig. 32: Crystallization of DPH at 33 % heptane and various concentrations of bare nanoparticles
followed by FBRM. (left) Total number of counts as a function of time. (Right) Chord length
distribution at 1 hour
All the experiments presented above were performed with bare silica coated magnetic
nanoparticles. In a last set of experiments, the impact of surface functionalization was
investigated. To do so, the nanoparticles were functionalized with decane using N-
decyltriethoxysilane. As in the case of the bare nanoparticles, it was found that decane
functionalized nanoparticles promote crystal formation at low heptane concentration. However, it
was observed that the color of the crystals formed in the presence of decane functionalized
nanoparticles is lighter than those formed in the presence of bare nanoparticles, as shown in Fig.
33. This suggests that less nanoparticles are incorporated in the crystal lattice when the
nanoparticles are functionalized with decane.

111
Fig. 33: Pictures of DPH crystals formed at 43 % heptane with 0.25 g/L (left) bare and (right)
decane functionalized nanoparticles 103
To summarize, the major findings of this study are that: a) nanoparticles promote nucleation at
low antisolvent concentrations, i.e. in the metastable zone, b) nanoparticles lead to smaller
crystal sizes, and c) nanoparticle incorporation in the crystal lattice depends on the surface
functionalization.
Aggregation of nanoparticles and its role in the failure of the intended mechanism
Over the course of these experiments and the subsequent work performed by Lucrèce Nicoud in
an EasyMax crystallizer system, it became evident that the nanoparticles were not well dispersed
when used in crystallization systems. In these experiments, non-functionalized silica coated iron
oxide particles from Spherotech of diameter 200 nm were used. The following Fig. 34 shows an
FBRM chord length distribution measurement of one of the crystallizations performed in the
EasyMax, indicating that the nanoparticles were significantly larger than expected. A similar
phenomenon was seen using an imaging probe, a particle vision ParticleView V19 by Mettler-
Toledo which again provided evidence that the nanoparticle aggregates were significant in size,
as seen in Fig. 35.

112
Fig. 34: FBRM indicates that the nanoparticles are around 20 microns in size, indicating
substantial aggregation 103
Fig. 35: Images taken with a particle vision ParticleView V19, Mettler Toledo show nanoparticles
before crystallization (left) and in the presence of DPH crystals (right) 103

113
A simple calculation may be done taking the iron oxide particles which we had worked with
early on as an example. It was calculated that 1 gram of 5 nm IONPs has the same surface area
as 50 grams of 200 nm IONPs. At the nanoscale, even a small difference in diameter translates to
large differences in available surface area. This concept which we initially hoped to exploit as
the basis for why surface functionalization may have allowed the particles to behave as a solvent
addition to the system was inaccessible due to the particle aggregation. Addition of surfactants to
the system to separate the nanoparticles was considered. However the attraction of the system at
the start included the simplicity of the addition of nanoparticles only for ease of separation, as
well as the minimization of additional liquid solvent addition steps.
4.3 Conclusions
From an applicability standpoint, iron oxide particles and their magnetic separation ability are a
better target as a crystallization technology than gold nanoparticles due to the rather prohibitive
cost of gold nanoparticles. However, as a result of this work we discovered that due to synthesis
and aggregation, iron oxide nanoparticles are too large and aggregate too much to behave as a
pure antisolvent. We determined that nanoparticles at reasonable concentrations in the available
size range will not substantially affect solubility. Similar aggregation problems were seen even in
commercial particles with silica shells. However, larger particles that are still in the micron range
represent good targets for studying the effects of functionalized surfaces on heterogeneous
nucleation. In this line of reasoning, it was found that nanoparticles change the heterogeneous
nucleation kinetics and thus impact the crystal size and that functionalized nanoparticles
incorporate differently into the crystal lattice than non-functionalized nanoparticles indicating
that there is an effect on the nucleation behavior.

114
This work prompted continued investigation of the effects that the coated nanoparticles had on
heterogeneous nucleation primarily conducted by Lucrèce Nicoud. This work was later published
as “Heterogeneous Nucleation of Small Molecule Crystals in the Presence of Nanoparticles” in
AIChE Proceedings, 2017 103. Additional investigation into how surface modification might be
used at the nanoscale in conjunction with our knowledge of confinement at the nanoscale is
discussed in the next chapter of this work.
4.4 Acknowledgements
We would like to thank the Novartis-MIT Center for Continuous Manufacturing for financial
support and instrumentation use as well as the DARPA ASKCOS project at MIT for support and
funding. L.M.D. is grateful in particular to Lucrèce Nicoud without whom this work would not
have taken place. We would also like to thank Aaron Garg of the Roman Group at MIT for his
assistance with synthesis.

115
Chapter 5 : Surface functionalization in combination with
confinement for crystallization from undersaturated solutions
5.1 Introduction
This chapter pertains to the crystallization of organic compounds, focusing on active
pharmaceutical ingredients (APIs), from undersaturated solutions through a new combination of
confinement and surface functionalization effects using Zorbax® functionalized
chromatographic media. The technique is demonstrated in several experimental methods, the
most conclusive of which confines the media and API solution to a sealed capillary tube chamber
wherein crystallization is monitored in real time. Discussions of the extension of these principals
to alternative porous matrices and functionalizations may be found in the applications portion of
the chapter.
Crystallization is an important separation and purification technique, especially in the
pharmaceutical industry. The tight regulations on product quality including crystal form, particle
size distribution, crystal shape, purity, and yield require fine control of the crystallization process
104. The crystallization process includes both nucleation and growth, both of which have
implications for the end product of the process. For nucleation to occur, the solution must be
supersaturated, meaning the concentration of solute is greater than the equilibrium concentration
at that given temperature and solvent condition 3. Supersaturated conditions are generated most
often by changing the solvent with the addition of an antisolvent or by cooling the solution. The
addition of heterogeneous surfaces to the crystallization process also changes the dynamics of
nucleation 105.

116
Antisolvent crystallization is particularly common in pharmaceutical processes when the solute
or active pharmaceutical ingredient (API) may be sensitive to changes in temperature 3. A solute
molecule is dissolved in one solvent, typically at ambient temperature. The addition of an
antisolvent to the solution generates supersaturation because the solute is less soluble in this new
anti-solvent. The choice of antisolvent and composition of the solvent/antisolvent mixture can
have implications on crystal size, shape, form, and yield 106–108.
Heterogeneous surfaces can be used to facilitate the formation of crystal nuclei from
supersaturated solutions. These surfaces may include vessel walls or stirring mechanisms, or
seeds of the desired crystal product 99. The activation energy of nucleation is lowered in these
instances due to the addition of the surface site, corresponding to a decrease in the surface area of
the nuclei in classical nucleation theory. Templates whose surface chemistries or geometries
(such as self-assembled monolayers, SAMs) are selected to be favorable for certain solute
crystallizations have been shown to promote nucleation and growth 31,33,35,101. The selection of a
surface chemistry can orient solute molecules in addition to providing a surface site, and thus
lower even further the energy barrier to nucleation.
Crystallization in confinement has been demonstrated as a way to produce stable pharmaceutical
nanocrystals of a controlled size 49,59,81. In this approach, crystallization of the API is restricted to
a micro- or nanoporous environment to form nanocrystals, with contributions to nucleation both
from the confinement of the crystallization volume and heterogeneous surfaces of the pore. This
study combines the effects of crystallization in confinement as well as the principles of
heterogeneous nucleation and surface functionalization to produce nanosized crystals from
undersaturated solutions. Crystallization in pores has been carried out before, however there the

117
driving force was always present due to antisolvent addition, evaporation, or cooling
crystallization as opposed to this unique combined effect of surface functionalization and
confinement.
Zorbax® chromatographic media with C8-like surface groups was used, to mimic the functional
group interaction of alkanes, which tend to be poor solvents for the organic APIs chosen for this
study. We postulate that in the confined volumes of the pores of the matrix, the addition of these
surface groups rendered a change in the solubility of API in solution in these nanoscale volumes,
providing the driving force for nucleation and crystallization. This has been applied to the
crystallization of several small molecule organic compounds. Given that the parent solutions are
undersaturated, when held at a fixed temperature left alone or in the presence of non-
functionalized control silica media which mimics the surface area of the Zorbax® media, the
solutions will not crystallize because there is no driving force for nucleation. However, we
demonstrate that, in several experimental setups, the addition of the functionalized Zorbax®
media induces crystallization. The confined nanoscale volumes of the pores have high surface
areas, and thus the expected contribution of the surface functionalization interaction with the
solvent in this environment is high. We believe the combined surface functionalization and
confinement effect allows for the Zorbax® media to act as an antisolvent, reducing the solubility
of the APIs and causing nucleation and crystallization.

118
5.2 Experimental
Materials
Zorbax® functionalized chromatographic media was obtained from Agilent in bulk packing
form. This is porous silica functionalized with a C8-like group (n-octyldimethylsilane). The
average listed grain size of the beads is 7 μm and the nominal pore size is 7 nm in diameter with
a nominal surface area of 160-180 m2/gram. As a control, unfunctionalized controlled pore glass
(CPG) was purchased from Prime Synthesis (Aston, PA, USA). This is a fumed silica with
controlled pore size of approximately 12 nm. The grain size of this material is about 100 μm.
Acetaminophen (APAP) was purchased from Sigma-Aldrich (BioXtra ≥99.0%, Lot
#SLBR2060V). Aspirin (ASA) and nicotinamide (NIC) were purchased from Sigma Life
Science (USP grade, Lot #MKBQ8444V and ≥99.5%, Lot #BCBF9698V, respectively).
Diphenhydramine hydrochloride (DPH) was purchased from BeanTown Chemical (>99.0%).
Fenofibrate (FEN) was obtained from Xian Shunyi Bio-chemical Technology Company
(Shaanxi, China). Solvents were purchased at ACS grade or higher purity from Fisher Scientific
(Waltham, MA, USA). Benzophenone was purchased from Sigma-Aldrich in ReagentPlus form
at purity ≥99%.
DSC and TGA analysis
Thermogravimetric analysis (TGA) was performed on a Q500 instrument from TA instruments
(Newcastle, DE, USA) connected with a nitrogen gas cylinder to maintain a flow rate of 25
mL/min to maintain an inert gas environment in the sample chamber. Between 5 and 10 mg of

119
sample were loaded on platinum sample pans from TA Instruments. The samples were allowed
to equilibrate at 30 °C and then heated at 10 °C/min to 300 °C.
A Q2000 instrument from TA instruments was used for the differential scanning calorimetry
(DSC) analysis. Inert atmosphere environment was maintained in the sample chamber using a
nitrogen gas cylinder set to a flow rate of 50 mL/min. An extra refrigerated cooling system (RCS
40, TA Instruments) was used to widen the available temperature range to between −40 and
400 °C. Tzero® pans and lids were used with ~5 mg of sample. A heating rate of 10 °C/min was
applied and the samples were scanned from −20 to 200°C.
XRPD analysis
XRPD was performed in a capillary setup using a PANalytical X’Pert PRO (Almelo, the
Netherlands) diffractometer at 45 kV with an anode current of 40 mA. The instrument has a
PW3050/60 standard resolution goniometer and a PW3373/10 Cu LFF DK241245 X-ray tube.
Samples were loaded in capillary tubes (see later section) and aligned on a goniometer capillary
holder in stage capillary spinner mode with a focused point incident beam using a Cu Si focusing
mirror. Settings on the incident beam path included: soller slit 0.04 rad, mask fixed 10 mm,
programmable divergence slit and fixed ½° anti-scatter slit. Settings on the diffracted beam path
include: soller slit 0.04 rad and 1/8°anti-scatter slit. The scan was set as a continuous scan: 2θ
angle between 2° and 90°, step size .0167113° and a time per step of 15.240 seconds.
Submerged loading experiment
In initial experiments, an undersaturated solution of fenofibrate in ethyl acetate was made at
25°C. Fenofibrate is highly soluble in ethyl acetate with a saturation solubility of about 650

120
mg/mL at 25°C, as determined by gravimetric analysis of the filtrate of a stirred slurry. The
undersaturated solution was prepared at 550 mg/mL. One gram of Zorbax® was added to a 20
mL scintillation vial, and 10 mL of the fenofibrate solution was pipetted on top. The vial was
sealed and held for 6 hours at 25°C. A second vial was made in the same way using the control
CPG instead of the Zorbax® material. After the 6 hours, the vials were poured over a paper filter
with vacuum and immediately filtered and rinsed with 5 mL cold ethanol to remove any residual
API solution. The resulting powder was dried and analyzed with DSC and TGA. The
experiments were repeated for initial fenofibrate concentrations in ethyl acetate of 450, 350, and
250 mg/mL. All experiments were repeated in triplicate.
Column loading experiment
A low-pressure glass column was purchased from Bio-Rad Laboratories (Econo-Column®) that
was 1.0 cm in diameter and 10 cm in length with a fill volume of about 8 mL. The column
contained polypropylene end fittings and a porous polymer bed support at the bottom to retain
fine particles. A feed solution bottle was placed in a water bath maintained at 25°C (Thermo
Scientific NESLAB RTE, Waltham, MA, USA). Peristaltic pumps (Masterflex P/S, Thermo
Scientific) with Viton tubing (Cole-Parmer, Vernon Hills, IL, USA) were used for solution
transfer. The column was compatible with isopropyl alcohol at room temperature. A feed
solution of was prepared of diphenhydramine hydrochloride in isopropyl alcohol 25°C at 30
mg/mL. The column was packed with 5 grams of Zorbax®, or CPG for the control case. This
solution was pumped to the column at 1.0 mL/min. The column was run for 60 minutes and the
flowthrough solution was collected. Two mL of solution was collected at time points 0, 20, and
40 minutes, and the total collected volume was sampled at the end of the run at 60 minutes.

121
Gravimetric analysis was used to determine the concentration of DPH in solution. At the end of
the run, the column was flushed with 10 mL of isopropyl alcohol at 0°C followed by air.
Samples of the dried column packing were collected and analyzed with TGA and DSC. Two runs
each of both the Zorbax® and the CPG packing were performed. A schematic of the apparatus is
shown in Fig. 36.
Fig. 36: Schematic of the column setup for porous matrix loading experiments
Additionally, a final experiment was performed in which an impurity was added to the feed
solution sent to the column. All details of the column setup remained identical to those above.
Benzophenone is a known impurity of diphenhydramine hydrochloride. The USP monograph on
the purity of diphenhydramine hydrochloride lists that the known impurity benzophenone must
be present below at an impurity concentration of .0025 mg/mL or no more than 0.4% of DPH. 109

122
It was expected that the column would selectively crystallize the desired crystal, DPH, and the
impurity, benzophenone, would remain in solution and enter the flowthrough.
A feed solution of was prepared of diphenhydramine hydrochloride in isopropyl alcohol 25°C at
(29.5 mg DPH and 0.5 mg benzophenone)/mL. The column was packed with 5 grams of
Zorbax®, or CPG for the control case. This solution was pumped to the column at 1.0 mL/min.
The column was run for 60 minutes and the flowthrough solution was collected. Two mL of
solution was collected at time points 0, 20, and 40 minutes, and the total collected volume was
sampled at the end of the run at 60 minutes. Gravimetric analysis was used to determine the
concentration of solids in solution. At the end of the run, the column was flushed with 10 mL of
isopropyl alcohol at 0°C followed by air. Samples of the dried column packing were collected
and analyzed with TGA and DSC. Two runs each of both the Zorbax® and the CPG packing
were performed.
Capillary crystallization experiment
Slightly undersaturated solutions of several APIs were prepared at 25°C. The saturation
solubilities of these compounds in the chosen solvents were first found by stirring a slurry of the
API in solvent at 25°C for several days, filtering the solution, and performing gravimetric
analysis. These experiments were repeated in triplicate. The saturation solubility of
acetaminophen in water was found to be 15.5 mg/mL. An undersaturated solution of 12.0 mg/mL
was prepared. The saturation solubility of aspirin in isopropyl alcohol was determined to be 90.0
mg/mL. An undersaturated solution of 75.0 mg/mL was prepared. The saturation solubility of
diphenhydramine hydrochloride in isopropyl alcohol was found to be 38.0 mg/mL and an
undersaturated solution of 30.0 mg/mL was prepared. Finally, the saturation solubility of

123
nicotinamide in isopropyl alcohol was found to be 46.5 mg/mL and a solution of 38.0 mg/mL
was prepared.
Glass capillary tubes were purchased from Hampton Research (Aliso Viejo, CA). The tubes were
made of glass #50, with a 1.0 mm OD, wall thickness of 0.01 mm and length of 80 mm. The
capillary tubes were packed with Zorbax® or CPG material by scooping powder into the tip,
placing the capillary in a larger diameter glass pipette, and tapping to allow gravity to act on the
powder to settle. Once packed, the tubes were suctioned at the open end with a 1-mL plastic
syringe, using a small piece of rubber tubing to adapt the fit. The filled capillary was then
immediately dipped into the undersaturated API solutions to allow the solution to fill the tube.
Molten was used to plug the end of the capillary, and the tip was then heated in a Bunsen burner
flame to seal. Additional capillaries were filled with liquid API solution alone.
5.3 Results and discussion
Submerged loading experiment
In previous studies, it was shown that wetting the pores of CPG with an API solution and then
allowing for evaporative crystallization can produce crystals confined to the pores of the silica
matrix. The driving force for crystallization in these instances was the increase in concentration
of the parent solution by evaporation of the solvent. The API solutions which was loaded into
pores in these studies was near saturation, and quickly became supersaturated as evaporation
occurred.
This experiment differed by use of an undersaturated API solution that was never allowed to
evaporate, and thus should have maintained the same undersaturated condition under which no

124
crystal nucleation should have occurred. Any driving force for crystallization would have to stem
from the dynamics of confinement and surface functionalization resulting from the addition of
the porous silica matrices. Additionally, some driving force for crystallization could be expected
in the handling of the material at the end of the experiment. The wash and dry steps were
intended to minimize any crystallization from evaporation of remaining solution. However some
crystallization of the parent solution could have occurred in this step. Indeed, in the control
experiment using unfunctionalized CPG, a trace amount of FEN was detected in the resulting
powder, measuring less than 5 wt% by TGA analysis.
Fig. 37 shows the DSC scan of samples loaded from the 550 mg/mL solution. The samples
loaded onto the Zorbax® material have two distinct melting peaks, one at a depressed melting
point indicative of smaller sized crystals confined to the pores of the material, and one at the bulk
melting temperature. The DSC scan of the control material showed a very small peak at the bulk
FEN melting point, indicating that the crystals formed were of normal micron size and likely
formed on the surface of the porous glass material as a result of the wash and dry steps.

125
Fig. 37: DSC scans of porous glass material loaded with a submerged basket from an
undersaturated solution of FEN in ethyl acetate (550 mg/mL). The Zorbax® material shows two
distinct melting points indicating the presence of crystallization in the pores.
When Zorbax® was used as opposed to unfunctionalized CPG, the average loading as
determined by TGA was significantly higher at an average of 22.4 ± 3.8 wt% for the samples
loaded from solutions of 550 mg/mL FEN in ethyl acetate. The concentration of FEN in the
loading solution was varied over several more undersaturated values, shown in Fig. 38. The
resultant loading of fenofibrate on the collected powders seems to decrease with decreasing
initial API concentration, indicating that this is correlated with the driving force for
crystallization. In combination with the two melting peaks seen in the DSC, this indicated that it
was likely crystallization was occurring as a result of the presence of the functionalized
nanoporous Zorbax® material as opposed to just during the wash and dry steps of the process.
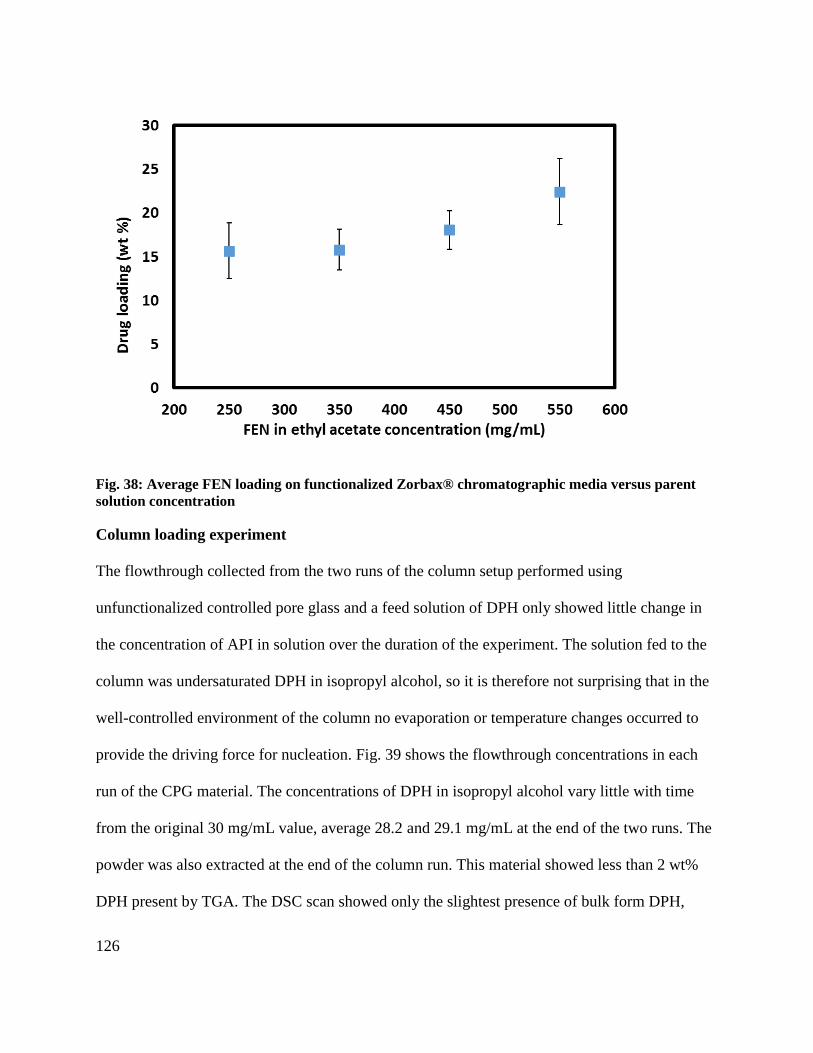
126
Fig. 38: Average FEN loading on functionalized Zorbax® chromatographic media versus parent
solution concentration
Column loading experiment
The flowthrough collected from the two runs of the column setup performed using
unfunctionalized controlled pore glass and a feed solution of DPH only showed little change in
the concentration of API in solution over the duration of the experiment. The solution fed to the
column was undersaturated DPH in isopropyl alcohol, so it is therefore not surprising that in the
well-controlled environment of the column no evaporation or temperature changes occurred to
provide the driving force for nucleation. Fig. 39 shows the flowthrough concentrations in each
run of the CPG material. The concentrations of DPH in isopropyl alcohol vary little with time
from the original 30 mg/mL value, average 28.2 and 29.1 mg/mL at the end of the two runs. The
powder was also extracted at the end of the column run. This material showed less than 2 wt%
DPH present by TGA. The DSC scan showed only the slightest presence of bulk form DPH,

127
likely crystallized on the surface of the porous glass or column during the wash and dry steps
(Fig. 40).
Fig. 39: Flowthrough concentration of DPH collected as the column was run with CPG shows little
change
Fig. 40: Trace DPH with bulk melting temperature only seen in the CPG powder collected from the
column runs

128
When the column runs were performed with Zorbax® chromatographic media, the flowthrough
concentration of DPH in solution changed dramatically over the course of the experiment. Fig.
41 shows the decrease in concentration in the flowthrough, from an initial concentration of 30.0
mg/mL to an average end concentration of 15.9 and 16.0 mg/mL in the two runs, as measured in
the collected pool of flowthrough at the end of the run. The powder was extracted from the
column and analyzed with TGA and DSC. The DSC (Fig. 42) shows a single large peak at a
decreased melting temperature, indicating that the majority of crystals formed in the column are
confined to the pores. The TGA indicated loadings of 14.7 wt% and 15.4 wt% in the two runs. A
significant amount of the DPH in solution was crystallized in the column due to the presence of
the functionalized porous silica media as opposed to the control unfunctionalized silica. A mass
balance may be performed on each of these runs. Of the original 30 mg/mL solution flowed at 1
mL/minute for 60 minutes, the total original API present may be calculated (1800 mg). The
average TGA determined loading for the runs correspond to a yield of 41% and 43%
respectively. We can look at the flowthrough to account for the remainder of the material, and
find that for Run 1 the mass balance summing the loaded and flowthrough API accounts for 94%
of the total material and in Run 2, 96% is accounted for. Considering the fact that the sampling
of the loaded Zorbax® is an average over the entire column and that some API material may
have been trapped in the inlet and outlet apertures, these mass balances are very successfully
closed. While the <50% yields may seem poor at first glance, the flowthrough material may be
easily recycled and passed through another column or the same in a recycle loop, thereby
increasing the expected yield. Furthermore, we believe a primary application here, as indicated
earlier, would be in the purification of APIs. If the API that may interact with the selected
functional groups preferentially crystallizes on the column, we may enrich the flowthrough

129
solution in impurity, and collect purified API in the column. We may then elute the column with
fresh solvent and achieve a high purity API solution dissolved off the column.
Fig. 41: Flowthrough concentration of DPH in isopropyl alcohol on runs where the column was
packed with Zorbax® show a significant decrease indicating DPH retention on the column
Fig. 42: DSC scan of the Zorbax® material collected from the column run showing DPH confined
to the pores of the material

130
The experiments were repeated with an impurity present in the original solution. The feed
solution to the column was formulated to be (29.5 mg DPH and 1 mg benzophenone)/mL in
isopropanol. The flowthrough collected from the two runs of this column setup with impurity
present that were performed using unfunctionalized controlled pore glass showed little change in
the concentration of API in solution over the duration of the experiment. As before, the solution
fed to the column was undersaturated, so it is therefore not surprising that in the well-controlled
environment of the column no evaporation or temperature changes occurred to provide the
driving force for nucleation. Fig. 43 shows the solids flowthrough concentrations in each run of
the CPG material. Because gravimetry alone was used, this concentration is a total solids
concentration as opposed to having information about specifically the composition of DPH and
benzophenone. In the future, HPLC should be used to assess the concentrations of each in the
flowthrough. The concentrations of solids in isopropyl alcohol vary little with time from the
original 30 mg/mL value, average 29.6 and 28.7 mg/mL at the end of the two runs. The powder
was also extracted at the end of the column run. This material showed less than 1.5 wt% solids
present by TGA. Due to time constraints and the lack of change in the flowthrough
concentrations, DSC was not performed on these samples.

131
Fig. 43: Flowthrough concentration of solids collected as the column was run with CPG and
impurity shows little change
When the column runs were performed with Zorbax® chromatographic media and the impurity
solution feed, the flowthrough concentration of solids in solution changed dramatically over the
course of the experiment. Error! Reference source not found. shows the decrease in
oncentration in the flowthrough, from an initial concentration of 30.0 mg/mL solids to an
average end concentration of 17.3 and 13.2 mg/mL solids in the two runs, as measured in the
collected pool of flowthrough at the end of the run. The powder was extracted from the column
and analyzed with TGA and DSC. The DSC (Fig. 44) shows a single large peak at a decreased
melting temperature, indicating that the majority of crystals formed in the column are confined to
the pores. Furthermore, this depressed melting temperature point corresponds well to the point
found in the previous experiment with no impurity present, thereby indicating that the crystals in
the column are DPH only. The TGA indicated loadings of 13.4 wt% and 18.1 wt% in the two
runs.

132
Fig. 44: Flowthrough concentration of solids in isopropyl alcohol on runs where the feed also
contained impurity. The column was packed with Zorbax® and shows a significant decrease in
flowthrough solids concentration indicating DPH retention on the column
Fig. 45: DSC scan of the Zorbax® material collected from the column run with impurity in the feed
solution showing DPH confined to the pores of the material
A significant amount of the DPH in solution was crystallized in the column due to the presence
of the functionalized porous silica media as opposed to the control unfunctionalized silica. A

133
mass balance may be performed on each of these runs. Of the original (29 mg DPH and 1 mg
benzophenone)/mL solution flowed at 1 mL/minute for 60 minutes, the total original API present
may be calculated (1740 mg). The average TGA determined loading for the runs correspond to a
yield of 38% and 51% respectively. The second run is over a 50% yield, which was even better
than the impurity-free runs. The DPH is preferentially crystallized in the porous media over the
impurity, which can even result in this boost in yield.
We can look at the flowthrough to account for the remainder of the material, and find that for
Run 1 the mass balance summing the loaded and flowthrough API accounts for 95% of the total
material and in Run 2, 94% is accounted for. Again, if we consider the fact that the sampling of
the loaded Zorbax®is an average over the entire column and that some crystalline material may
have been trapped in the inlet and outlet apertures, these mass balances are very successfully
closed. To further confirm that the column loaded material contained DPH alone and no
benzophenone, XRPD was performed on the samples. XRD was also performed on the solids
collected from the flowthrough to confirm that this was a mix of DPH and benzophenone.
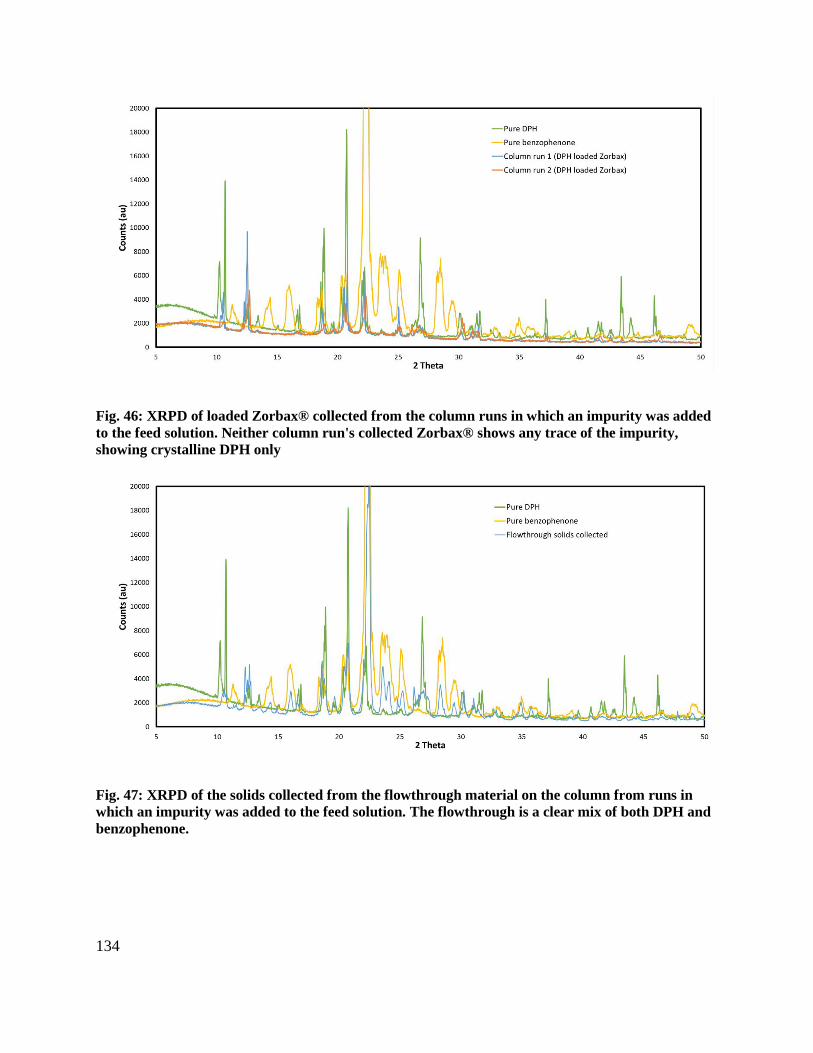
134
Fig. 46: XRPD of loaded Zorbax® collected from the column runs in which an impurity was added
to the feed solution. Neither column run's collected Zorbax® shows any trace of the impurity,
showing crystalline DPH only
Fig. 47: XRPD of the solids collected from the flowthrough material on the column from runs in
which an impurity was added to the feed solution. The flowthrough is a clear mix of both DPH and
benzophenone.

135
These column runs successfully demonstrated that we were able to selectively crystallize DPH
present in a parent solution with impurity on the Zorbax® packed column. We saw the formation
of DPH crystals in the column material without the formation of benzophenone crystals. This
demonstrates what we believe to be a primary application of this technology. If the API that may
interact with the selected functional groups preferentially crystallizes on the column, we may
enrich the flowthrough solution in impurity, and collect purified API in the column. We may
then elute the column with fresh solvent and achieve a high purity API solution dissolved off the
column.
Capillary crystallization experiment
The results of the previous experiments indicated that the presence of the functionalized
Zorbax® material caused crystallization where unfunctionalized CPG did not. However, in both
the submerged loading and column experiments, there was a wash and dry step which would
have potentially caused crystallization of the API from solution due to cooling, evaporative, or
antisolvent crystallization. Indeed we saw trace amounts of API that were attributable to this
cause in the control experiments. To eliminate the question of whether the crystallization seen in
the Zorbax® samples was attributable to the Zorbax® itself, we desired to isolate the system
from these other possible causes of driving force for crystallization and monitor the crystallinity
in a non-invasive way. We isolated the Zorbax® material to a glass capillary tube and loaded it
with the API solution and sealed the tube. The crystallinity was then monitored with XRD. When
the same procedure was carried out with unfunctionalized CPG, no changes were seen in the
XRD over time, with just an amorphous background signal from the silica. This was true for all

136
four API solutions tested. Furthermore, capillaries that were filled with API solution only also
did not crystallize.
In the Zorbax® experiments the four API’s tested all crystallized within the sealed capillary after
loading while being monitored in the XRD machine. All API solutions tested in capillary tubes
filled with Zorbax® functionalized media showed no crystallinity at the initial XRD scan at 0
minutes. In the case of aspirin and nicotinamide, the second XRD run at 20 minutes in to the
experiment showed crystalline form of the compound. The diphenhydramine hydrochloride scan
at 40 minutes showed the first crystallinity and the acetaminophen scan at 60 minutes showed
crystallinity. Samples were held for another 20 minutes after first showing crystallinity to see
that they maintained crystalline API within the sealed capillary. The time series of XRD scans
for each of the compounds discussed is shown in Fig. 48. An artificial offset was placed in the y-
axis so that each scan was visible.

137
Fig. 48: Time series XRPD scans of the API solutions loaded in capillary tubes filled with Zorbax®
media showing crystallization within 1 hour
5.4 Summary and application of the work
The following experiments demonstrated formation of nanoscale crystals from undersaturated
solutions in the presence of Zorbax® chromatographic media.
Submerged loading experiments
1) Zorbax® media is added to an undersaturated API solution and held at constant temperature with no
evaporation of solvent. The media is held for several hours.
2) The media is recovered through filtration followed by a fast 10 mL cold solvent wash, dried, and
analyzed.

138
3) The Zorbax® media is shown to have both surface crystals as well as confined nanocrystals which
were not present in control experiments performed with unfunctionalized silica media, suggesting
that the Zorbax® media allowed for the formation of the nanosized crystals.
Column loading experiments
1) Zorbax® media (5 grams) is held in a 10 mL column and temperature of the solutions is controlled
at 25 °C.
2) Undersaturated API solution is flowed slowly over the column (1 mL/hour) and flowthrough is
collected.
3) Flowthrough analysis demonstrates that in the control experiments performed with unfunctionalized
media, little API is retained on the column. However when the Zorbax® media is used, the
concentration of API in flowthrough solution decreases dramatically.
4) The Zorbax® in the column is analyzed and nanoscale crystals are formed. No nanoscale crystals
are formed when control unfunctionalized media was used.
Capillary crystallization experiments
1) Zorbax® media is packed into 1 mm OD glass capillaries for XRPD.
2) Undersaturated solutions of APIs are prepared. The capillaries are placed under
slight vacuum and filled with API solution.
3) Continuous XRPD is performed on these capillaries to determine crystallinity in live
time.
4) Capillaries packed with functionalized Zorbax® media showed crystallization from
four different undersaturated API solutions within 1 hour, whereas capillaries packed
with control media or API solution alone did not.

139
Proposed extensions of the technology
Crystallization schemes using Zorbax® media
This approach demonstrates a unique combination of confinement and surface functionalization
to cause crystallization in undersaturated solutions. It may be applied to the following
crystallization schemes:
1) Crystallization of APIs: Screening of API crystallization from various solvents with this approach
may be used as an alternative to antisolvent crystallization. It may elucidate differences in nucleation
induction time, polymorphs, or crystal morphologies.
2) Purification of API solutions: The column setup could be particularly advantageous for the
purification of API from solution containing impurities. A solution of this type could pass through a
column loaded with Zorbax® media. The API would crystallize in the column and a solution of
impurities could pass through the column. The API could be harvested with the Zorbax® media, re-
dissolved, and crystallized again with greater purity.
3) Protein crystallization: Protein and large biologic molecule crystallization is typically challenging.
There is a lack of generalized methods, and protein solutions may be dilute. This technique could be
used for crystallization of undersaturated protein solutions for discovery and better understanding of
crystal structure and interaction.
Alternative media
We have demonstrated the combination of the principles of crystallization through surface
functionalization and nanoconfinement. The selection of a functionalized nanoporous media was
critical to the success of these studies. The small pore size contributes to the generation of

140
nanovolumes for crystallization and the surface functionalization is able to alter these
environments due to their small volumes such that the crystallization may occur from
undersaturated parent solutions. Thus, looking at the extension of the technique to other
materials and functionalizations, these critical factors must be considered.
The matrix material itself must be inert to the solvents used in crystallization. Porous silica
represents a natural choice due to its chemically inert nature and ease of production of a variety
of porous silicas. These include controlled pore glass, Vycor ®, Zorbax ®. Other nanoporous
materials that may be inert to solvents used in typical crystallizations include anodic aluminum,
nanoporous zeolites, and nanoporous carbon. The material must be easily functionalized, which
glass may be through a straightforward silane reaction. Optimizing the cost of these materials
versus the surface coverage of functionalization is of key importance. The Zorbax ® material
used in the present study is expensive. Finding cheaper silica alternatives which still possess
good surface coverage but also are more cost effective would be an ideal route forward.
Nanopore size
The ratio of surface functional groups to nanovolume within a pore is critical to the successful
application of these methods. Zorbax® demonstrated success with a pore volume of about 7 nm.
Nanoporous materials typically have best controlled pore volumes at above 1 nm. It has been
demonstrated before that evaporative crystallization in nanopores is successful down to about 20
nm. Thus, for this specific technique of crystallization from undersaturated solutions using the
combined effects of surface functionalization and confinement, we suggest a pore range in
materials between 1 nm and 20 nm.

141
Surface functionalizations
The C8 functionalization was chosen specifically for these experiments because a wide range of
APIs are poorly soluble in alkane solvents such as hexane, heptane, or decane. The
functionalization on the Zorbax® mimicked this poor solubility, and decreased the solubility of
the API in solution in the confinement volumes such that crystallization could occur from an
undersaturated solution. Alternative functionalizations, such as phenyl groups, carboxyl, or –CN
groups already exist for chromatographic media and would be natural choices for a system in
which the desired crystal product is poorly soluble in solvents with functional groups of the
same. For example, a poorly water-soluble compound such as ibuprofen may demonstrate
successful crystallization if a carboxyl functional group on a nanoporous surface were used to
mimic the polar –OH groups present in an aqueous system. Surface functionalizations to
represent the range of solvent types typically available in pharmaceutical solubility studies can
be achieved through easy silane reactions on the surfaces of glass. Available surface groups that
could be made to project from the surface of porous glass matrices through organosilane
chemistry amine, carboxyl, vinyl, or thiol groups effectively spanning a variety of hydrophobic
and hydrophilic functional group types.
The technology discussed here would be highly applicable in the pharmaceutical industry, as fine
control over crystallization of commodity APIs is of interest and these APIs may be both heat
and solvent sensitive. This would also be applicable to chemical products crystallization;
however, the driving force available from the functionalized porous matrices is small and cannot
achieve the yields of a traditional cooling or antisolvent crystallization. Additionally the matrices
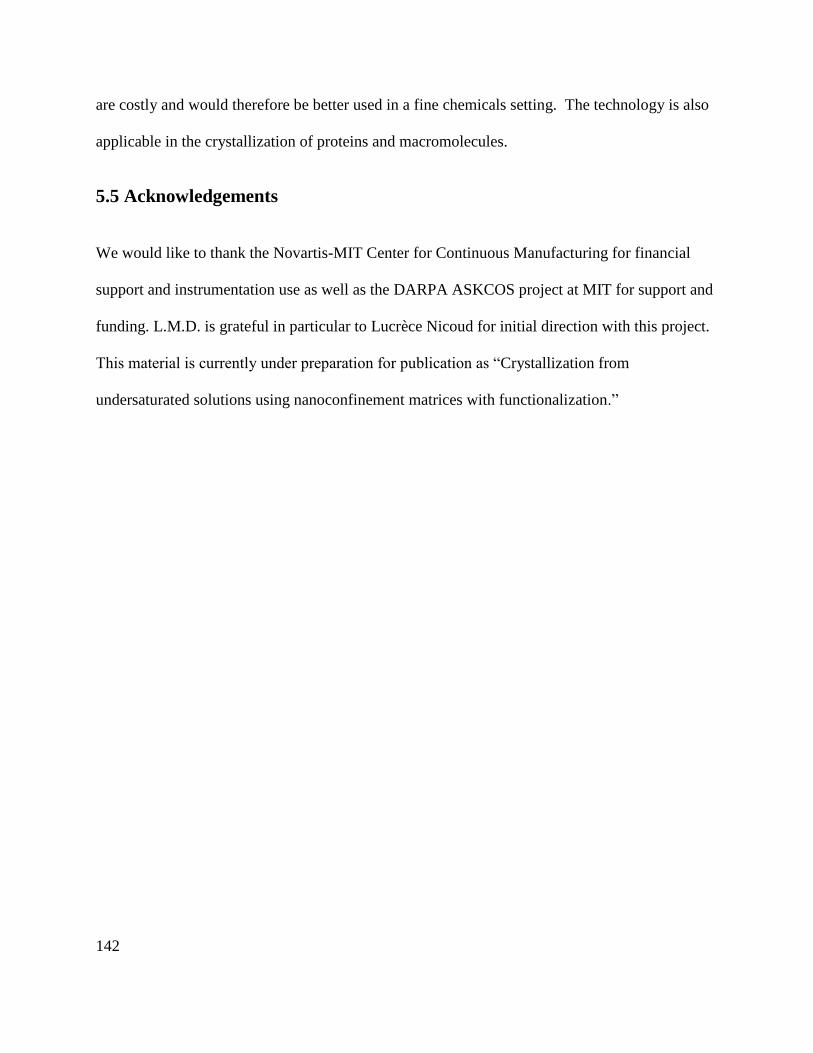
142
are costly and would therefore be better used in a fine chemicals setting. The technology is also
applicable in the crystallization of proteins and macromolecules.
5.5 Acknowledgements
We would like to thank the Novartis-MIT Center for Continuous Manufacturing for financial
support and instrumentation use as well as the DARPA ASKCOS project at MIT for support and
funding. L.M.D. is grateful in particular to Lucrèce Nicoud for initial direction with this project.
This material is currently under preparation for publication as “Crystallization from
undersaturated solutions using nanoconfinement matrices with functionalization.”

143
Chapter 6 : Conclusions and recommendations
6.1 Outlook for use of nanoconfinement for crystallization
The work carried out in this thesis as well as the body of work which it built upon has
successfully demonstrated that rigid porous media is a viable confinement tool for
nanocrystallization. A variety of APIs were successfully loaded into porous matrices in a range
of pore sizes, producing pharmaceutical nanocrystals from 20 nm up through 300 nm. These
nanocrystals showed marked improvements in dissolution profiles as compared to profiles from
standard micron-sized pharmaceutical crystals. The loading of API in these rigid matrices was
further improved from a benchtop procedure to successful loading in a continuous crystallizer, as
well as a consecutive two-stage crystallizer setup for loading and subsequent growth of crystals
within the pores.
These results offer a potentially simple method of drug formulation, wherein a poorly water-
soluble API is loaded in a rigid nanporous matrix and the resulting loaded matrix powder is
encapsulated. This is a much simpler method with fewer stabilizing chemicals than the methods
currently available on the market to produce formulations of nanocrystals relying on top-down
approaches to nanocrystal formation.
Further work to elucidate the size and shape of crystals confined to porous matrices is an
interesting avenue of further research. This work and others assume that the nanocrystals
confined to the matrices are nominally spheres of the same size as the nominal pore size
provided by the matrix. While thermal analysis of melting point depressions do indicate that
crystals of different sizes have formed in matrices with pores of different sizes, the spherical

144
assumption is likely invalid. It neglects standard crystal morphology, where a crystal may be
prompted to grow at a particular face if the energy barrier to do so is lower. Perhaps with crystals
confined to a pore, the energy barrier for growth is lowest if the crystal grows along the length of
the pore, but alternatively it could be more common for larger crystals to form at pore junctions.
Answering questions about the size and shape of confined crystals is an extremely interesting but
challenging topic that deserves further exploration.
Investigations into the grain size of the silica beads could provide information about the
contribution of the transport element of the dissolution enhancement. Conducting dissolution
measurements of silica with the same pore size with different grain sizes could help indicate
whether transport through the bead is causing significant delays in dissolution rate. Improving
modeling capabilities to account for different pore geometries and bead sizes could help explain
experimental results seen in dissolution profiles as well. Advanced models which take into
account dissolution of nanocrystals within pores and subsequent diffusion of the solute to the
surface of the beads are a valuable next step to accompany much of the experimental work which
has been done with nanocrystals in confinement. Such models could also provide insight into
features about these systems which are difficult to know, such as the location of nanocrystals
within porous beads, and the size and shape of these crystals therein.
Ultimately, a technique which would allow for the imaging of nanocrystals confined to these
pores would provide extremely valuable information about the size and shape of crystals formed
by these techniques. Surface microscopy techniques will unfortunately not give the full picture of
crystals confined to the pores. Cross sectioning a porous matrix bead that has been loaded with
API nanocrystals would be ideal for imaging; however, the small grain sizes of the matrices used
makes this less practical. Also the force of cross sectioning a bead may likely damage crystals at

145
the cutting interface. Focused ion beam technology is a potential route forward for this kind of
precise cross sectioning that would not disrupt the embedded crystals.
6.2 Future work on using surface functionalized materials for crystallization
in confinement
The work which resulted from the combination of our investigations with surface functionalized
nanoparticles for addition to bulk solutions for crystallization and the previous work on
crystallization in confinement has been an exciting demonstration of a new concept. The ability
to crystallize within very small pores from undersaturated drug solutions due to the presence of a
surface functionalization in these pores is a previously undemonstrated phenomenon. The surface
functionalization on the porous media support is thought to provide enough interactions in the
small nanovolumes within pores that it may change the saturation solubility of dissolved API.
Due to the relatively high cost of the functionalized media, we believe that this material is best
used in a setup where the confined crystals may then be redissolved, and the functionalized
porous media captured, cleaned, and recycled for use again. The column setup that we showed to
be successful where an impurity was spiked into the parent feed solution and shown to be
enriched in the flowthrough off the column without crystallizing the impurity in the column
demonstrates a useful application of this principle.
Furthermore, it is possible that through a silane surface functionalization, we could functionalize
a more inexpensive rigid porous matrix. It remains to be investigated at what point the pore size
would become too large, such that the surface functionalization could no longer contribute
significantly to the functional groups that the solute molecule would interact with in solution. It

146
is expected through our failed studies using functionalized nanoparticles as additives to solutions
that the tipping point of the pore size needed such that a surface functionalization would
contribute significantly to the solvent makeup actually occurs at a quite small pore size.
Finally, there exists great room for exploration into how this concept may be applied for a
variety of crystallizations. Different surface functionalizations which mimic different
solvent/antisolvent-like groups could be used to crystallize APIs of differing solubilities. In this
work, only one surface functionalization that behaved like an alkane-type solvent was
investigated. Other porous matrices made of materials other than glass may be used provided
they can meet both the nanoconfinement and surface functionalization criteria.

147
Chapter 7 : References
(1) Abu Bakar, M. R.; Nagy, Z. K.; Saleemi, A. N.; Rielly, C. D. The Impact of Direct
Nucleation Control on Crystal Size Distribution in Pharmaceutical Crystallization
Processes. Cryst. Growth Des. 2009, 9 (3), 1378–1384.
(2) Fujiwara, M.; Nagy, Z. K.; Chew, J. W.; Braatz, R. D. First-Principles and Direct Design
Approaches for the Control of Pharmaceutical Crystallization. J. Process Control 2005, 15
(5), 493–504.
(3) Myerson, A. Handbook of Industrial Crystallization; Butterworth-Heinemann, 2002.
(4) Hu, J.; Johnston, D. K. P.; III, D. R. O. W. Nanoparticle Engineering Processes for
Enhancing the Dissolution Rates of Poorly Water Soluble Drugs. Drug Dev. Ind. Pharm.
2004, 30 (3), 233–245.
(5) Shegokar, R.; Müller, R. H. Nanocrystals: Industrially Feasible Multifunctional
Formulation Technology for Poorly Soluble Actives. Int. J. Pharm. 2010, 399 (1–2), 129–
139.
(6) Wang, G. D.; Mallet, F. P.; Ricard, F.; Heng, J. Y. Pharmaceutical Nanocrystals. Curr.
Opin. Chem. Eng. 2012, 1 (2), 102–107.
(7) Buckton, G.; Beezer, A. E. The Relationship between Particle Size and Solubility. Int. J.
Pharm. 1992, 82 (3), R7–R10.
(8) Möschwitzer, J. P. Drug Nanocrystals in the Commercial Pharmaceutical Development
Process. Int. J. Pharm. 2013, 453 (1), 142–156.
(9) Van Eerdenbrugh, B.; Van den Mooter, G.; Augustijns, P. Top-down Production of Drug
Nanocrystals: Nanosuspension Stabilization, Miniaturization and Transformation into
Solid Products. Int. J. Pharm. 2008, 364 (1), 64–75.
(10) Zhang, D.; Tan, T.; Gao, L.; Zhao, W.; Wang, P. Preparation of Azithromycin
Nanosuspensions by High Pressure Homogenization and Its Physicochemical
Characteristics Studies. Drug Dev. Ind. Pharm. 2007, 33 (5), 569–575.
(11) Peltonen, L.; Hirvonen, J. Pharmaceutical Nanocrystals by Nanomilling: Critical Process
Parameters, Particle Fracturing and Stabilization Methods. J. Pharm. Pharmacol. 2010, 62
(11), 1569–1579.
(12) Malamatari, M.; Taylor, K. M. G.; Malamataris, S.; Douroumis, D.; Kachrimanis, K.
Pharmaceutical Nanocrystals: Production by Wet Milling and Applications. Drug Discov.
Today 2018, 23 (3), 534–547.
(13) Khadka, P.; Ro, J.; Kim, H.; Kim, I.; Kim, J. T.; Kim, H.; Cho, J. M.; Yun, G.; Lee, J.
Pharmaceutical Particle Technologies: An Approach to Improve Drug Solubility,
Dissolution and Bioavailability. Asian J. Pharm. Sci. 2014, 9 (6), 304–316.
(14) Qian, K. K.; Bogner, R. H. Application of Mesoporous Silicon Dioxide and Silicate in
Oral Amorphous Drug Delivery Systems. J. Pharm. Sci. 2012, 101 (2), 444–463.
(15) Wang, S. Ordered Mesoporous Materials for Drug Delivery. Microporous Mesoporous
Mater. 2009, 117 (1–2), 1–9.
(16) Hancock, B. C.; Zografi, G. Characteristics and Significance of the Amorphous State in
Pharmaceutical Systems. J. Pharm. Sci. 1997, 86 (1), 1–12.
(17) Willart, J. F.; Descamps, M. Solid State Amorphization of Pharmaceuticals. Mol. Pharm.
2008, 5 (6), 905–920.

148
(18) Yu, L. Amorphous Pharmaceutical Solids: Preparation, Characterization and Stabilization.
Adv. Drug Deliv. Rev. 2001, 48 (1), 27–42.
(19) Jackson, C. L.; McKenna, G. B. Vitrification and Crystallization of Organic Liquids
Confined to Nanoscale Pores. Chem. Mater. 1996, 8 (8), 2128–2137.
(20) Azaïs, T.; Tourné-Péteilh, C.; Aussenac, F.; Baccile, N.; Coelho, C.; Devoisselle, J.-M.;
Babonneau, F. Solid-State NMR Study of Ibuprofen Confined in MCM-41 Material.
Chem. Mater. 2006, 18 (26), 6382–6390.
(21) Azais, T.; Hartmeyer, G.; Quignard, S.; Laurent, G.; Babonneau, F. Solution State NMR
Techniques Applied to Solid State Samples: Characterization of Benzoic Acid Confined in
MCM-41. J. Phys. Chem. C 2010, 114 (19), 8884–8891.
(22) Ha, J.-M.; Hamilton, B. D.; Hillmyer, M. A.; Ward, M. D. Phase Behavior and
Polymorphism of Organic Crystals Confined within Nanoscale Chambers. Cryst. Growth
Des. 2009, 9 (11), 4766–4777.
(23) Ha, J.-M.; Wolf, J. H.; Hillmyer, M. A.; Ward, M. D. Polymorph Selectivity under
Nanoscopic Confinement. J. Am. Chem. Soc. 2004, 126 (11), 3382–3383.
(24) Ha, J.-M.; Hillmyer, M. A.; Ward, M. D. Thermotropic Properties of Organic
Nanocrystals Embedded in Ultrasmall Crystallization Chambers. J. Phys. Chem. B 2005,
109 (4), 1392–1399.
(25) Tran, T. H.; Ramasamy, T.; Truong, D. H.; Choi, H.-G.; Yong, C. S.; Kim, J. O.
Preparation and Characterization of Fenofibrate-Loaded Nanostructured Lipid Carriers for
Oral Bioavailability Enhancement. AAPS PharmSciTech 2014, 15 (6), 1509–1515.
(26) Yang, X.; Ong, T. C.; Michaelis, V. K.; Heng, S.; Huang, J.; Griffin, R. G.; Myerson, A.
S. Formation of Organic Molecular Nanocrystals under Rigid Confinement with Analysis
by Solid State NMR. CrystEngComm 2014, 16 (39), 9345–9352.
(27) Brettmann, B.; Bell, E.; Myerson, A.; Trout, B. Solid-State NMR Characterization of
High-Loading Solid Solutions of API and Excipients Formed by Electrospinning. J.
Pharm. Sci. 2012, 101 (4), 1538–1545.
(28) Ahern, R. J.; Hanrahan, J. P.; Tobin, J. M.; Ryan, K. B.; Crean, A. M. Comparison of
Fenofibrate–mesoporous Silica Drug-Loading Processes for Enhanced Drug Delivery.
Eur. J. Pharm. Sci. 2013, 50 (3–4), 400–409.
(29) Rengarajan, G. T.; Enke, D.; Steinhart, M.; Beiner, M. Size-Dependent Growth of
Polymorphs in Nanopores and Ostwald’s Step Rule of Stages. Phys. Chem. Chem. Phys.
2011, 13 (48), 21367–21374.
(30) Ulman, A. Formation and Structure of Self-Assembled Monolayers. Chem. Rev. 1996, 96
(4), 1533–1554.
(31) Singh, A.; Sung Lee, I.; Kim, K.; S. Myerson, A. Crystal Growth on Self-Assembled
Monolayers. CrystEngComm 2011, 13 (1), 24–32.
(32) Yang, X.; Sarma, B.; Myerson, A. S. Polymorph Control of Micro/Nano-Sized Mefenamic
Acid Crystals on Patterned Self-Assembled Monolayer Islands. Cryst. Growth Des. 2012,
12 (11), 5521–5528.
(33) Kulkarni, S. A.; Weber, C. C.; Myerson, A. S.; ter Horst, J. H. Self-Association during
Heterogeneous Nucleation onto Well-Defined Templates. Langmuir ACS J. Surf. Colloids
2014, 30 (41), 12368–12375.

149
(34) Love, J. C.; Estroff, L. A.; Kriebel, J. K.; Nuzzo, R. G.; Whitesides, G. M. Self-Assembled
Monolayers of Thiolates on Metals as a Form of Nanotechnology. Chem. Rev. 2005, 105
(4), 1103–1169.
(35) Hiremath, R.; Basile, J. A.; Varney, S. W.; Swift, J. A. Controlling Molecular Crystal
Polymorphism with Self-Assembled Monolayer Templates. J. Am. Chem. Soc. 2005, 127
(51), 18321–18327.
(36) Chen, J.; Myerson, A. S. Pasteur Revisited: Chiral Separation by Crystallization on Self-
Assembled Monolayers. CrystEngComm 2012, 14 (24), 8326.
(37) Zhou, G. X.; Fujiwara, M.; Woo, X. Y.; Rusli, E.; Tung, H.-H.; Starbuck, C.; Davidson,
O.; Ge, Z.; Braatz, R. D. Direct Design of Pharmaceutical Antisolvent Crystallization
through Concentration Control. Cryst. Growth Des. 2006, 6 (4), 892–898.
(38) Kulkarni, S. A.; Myerson, A. S. Reversible Control of Solubility Using Functionalized
Nanoparticles. Chem. Commun. 2017, 53 (8), 1429–1432.
(39) Kim, K.; Lee, I. sung; Centrone, A.; Hatton, T. A.; Myerson, A. S. Formation of
Nanosized Organic Molecular Crystals on Engineered Surfaces. J. Am. Chem. Soc. 2009,
131 (51), 18212–18213.
(40) Zuo, B.; Sun, Y.; Li, H.; Liu, X.; Zhai, Y.; Sun, J.; He, Z. Preparation and in Vitro/in Vivo
Evaluation of Fenofibrate Nanocrystals. Int. J. Pharm. 2013, 455 (1–2), 267–275.
(41) Junghanns, J.-U. A. H.; Müller, R. H. Nanocrystal Technology, Drug Delivery and
Clinical Applications. Int. J. Nanomedicine 2008, 3 (3), 295–310.
(42) de Waard, H.; Hinrichs, W. L. J.; Frijlink, H. W. A Novel Bottom–up Process to Produce
Drug Nanocrystals: Controlled Crystallization during Freeze-Drying. J. Controlled
Release 2008, 128 (2), 179–183.
(43) Bleich, J.; Müller, B. W. Production of Drug Loaded Microparticles by the Use of
Supercritical Gases with the Aerosol Solvent Extraction System (ASES) Process. J.
Microencapsul. 1996, 13 (2), 131–139.
(44) Lee, S.; Nam, K.; Kim, M. S.; Jun, S. W.; Park, J.-S.; Woo, J. S.; Hwang, S.-J. Preparation
and Characterization of Solid Dispersions of Itraconazole by Using Aerosol Solvent
Extraction System for Improvement in Drug Solubility and Bioavailability. Arch. Pharm.
Res. 2005, 28 (7), 866–874.
(45) Rogers, T. L.; Johnston, K. P.; III, R. O. W. Solution-Based Particle Formation of
Pharmaceutical Powders by Supercritical or Compressed Fluid Co2 and Cryogenic Spray-
Freezing Technologies. Drug Dev. Ind. Pharm. 2001, 27 (10), 1003–1015.
(46) Sarkari, M.; Brown, J.; Chen, X.; Swinnea, S.; Williams III, R. O.; Johnston, K. P.
Enhanced Drug Dissolution Using Evaporative Precipitation into Aqueous Solution. Int. J.
Pharm. 2002, 243 (1–2), 17–31.
(47) Chen, X.; Young, T. J.; Sarkari, M.; Williams III, R. O.; Johnston, K. P. Preparation of
Cyclosporine A Nanoparticles by Evaporative Precipitation into Aqueous Solution. Int. J.
Pharm. 2002, 242 (1–2), 3–14.
(48) de Waard, H.; Grasmeijer, N.; Hinrichs, W. L. J.; Eissens, A. C.; Pfaffenbach, P. P. F.;
Frijlink, H. W. Preparation of Drug Nanocrystals by Controlled Crystallization:
Application of a 3-Way Nozzle to Prevent Premature Crystallization for Large Scale
Production. Eur. J. Pharm. Sci. 2009, 38 (3), 224–229.
(49) Jiang, Q.; Ward, M. D. Crystallization under Nanoscale Confinement. Chem. Soc. Rev.
2014, 43 (7), 2066–2079.

150
(50) Hilden, J. L.; Reyes, C. E.; Kelm, M. J.; Tan, J. S.; Stowell, J. G.; Morris, K. R. Capillary
Precipitation of a Highly Polymorphic Organic Compound. Cryst. Growth Des. 2003, 3
(6), 921–926.
(51) Beiner, M.; Rengarajan; Pankaj, S.; Enke, D.; Steinhart, M. Manipulating the Crystalline
State of Pharmaceuticals by Nanoconfinement. Nano Lett. 2007, 7 (5), 1381–1385.
(52) Pines, A.; Gibby, M. G.; Waugh, J. S. Proton-Enhanced Nuclear Induction Spectroscopy.
A Method for High-Resolution NMR of Dilute Spins in Solids. J. Chem. Phys. 1972, 56
(4), 1776–1777.
(53) Bennett, A. E.; Rienstra, C. M.; Auger, M.; Lakshmi, K. V.; Griffin, R. G. Heteronuclear
Decoupling in Rotating Solids. J. Chem. Phys. 1995, 103 (16), 6951–6958.
(54) K.S. Rao; Keshar, N. K.; Jena, N.; Rao, M. E.; Patnaik, A. K. Stability Indicating Liquid
Chromatographic Method for the Determination of Fenofibrate and Its Application to
Kinetic Studies. Int. J. Pharm. Sci. Nanotechnol. 2013, 5 (4), 1866–1874.
(55) Bhise, S. D. Effect of Hydroxypropyl β- Cyclodextrin Inclusion Complexation on Solubility
of Fenofibrate; 2011.
(56) Heinz, A.; Gordon, K. C.; McGoverin, C. M.; Rades, T.; Strachan, C. J. Understanding the
Solid-State Forms of Fenofibrate--a Spectroscopic and Computational Study. Eur. J.
Pharm. Biopharm. Off. J. Arbeitsgemeinschaft Pharm. Verfahrenstechnik EV 2009, 71 (1),
100–108.
(57) Henry, R. F.; Zhang, G. Z.; Gao, Y.; Buckner, I. S. Fenofibrate. Acta Crystallogr. Sect. E
Struct. Rep. Online 2003, 59 (5), o699–o700.
(58) Sliwinska-Bartkowiak, M.; Dudziak, G.; Gras, R.; Sikorski, R.; Radhakrishnan, R.;
Gubbins, K. E. Freezing Behavior in Porous Glasses and MCM-41. Colloids Surf.
Physicochem. Eng. Asp. 2001, 187–188, 523–529.
(59) O’Mahony, M.; Leung, A. K.; Ferguson, S.; Trout, B. L.; Myerson, A. S. A Process for
the Formation of Nanocrystals of Active Pharmaceutical Ingredients with Poor Aqueous
Solubility in a Nanoporous Substrate. Org. Process Res. Dev. 2015, 19 (9), 1109–1118.
(60) Andersson, J.; Rosenholm, J.; Areva, S.; Lindén, M. Influences of Material Characteristics
on Ibuprofen Drug Loading and Release Profiles from Ordered Micro- and Mesoporous
Silica Matrices. Chem. Mater. 2004, 16 (21), 4160–4167.
(61) Badruddoza, A. Z. M.; Godfrin, P. D.; Myerson, A. S.; Trout, B. L.; Doyle, P. S. Core–
Shell Composite Hydrogels for Controlled Nanocrystal Formation and Release of
Hydrophobic Active Pharmaceutical Ingredients. Adv. Healthc. Mater. 2016, 5 (15),
1960–1968.
(62) Deen, W. M. Hindered Transport of Large Molecules in Liquid-Filled Pores. AIChE J.
1987, 33 (9), 1409–1425.
(63) Jamzad, S.; Fassihi, R. Role of Surfactant and PH on Dissolution Properties of Fenofibrate
and Glipizide—A Technical Note. AAPS PharmSciTech 2006, 7 (2), E17–E22.
(64) Beck, C.; Dalvi, S. V.; Dave, R. N. Controlled Liquid Antisolvent Precipitation Using a
Rapid Mixing Device. Chem. Eng. Sci. 2010, 65 (21), 5669–5675.
(65) Stegemann, S.; Leveiller, F.; Franchi, D.; de Jong, H.; Lindén, H. When Poor Solubility
Becomes an Issue: From Early Stage to Proof of Concept. Eur. J. Pharm. Sci. Off. J. Eur.
Fed. Pharm. Sci. 2007, 31 (5), 249–261.
(66) Lipinski, C. A. Drug-like Properties and the Causes of Poor Solubility and Poor
Permeability. J. Pharmacol. Toxicol. Methods 2000, 44 (1), 235–249.
151
(67) Kalepu, S.; Nekkanti, V. Insoluble Drug Delivery Strategies: Review of Recent Advances
and Business Prospects. Acta Pharm. Sin. B 2015, 5 (5), 442–453.
(68) Otto, D. P.; Villiers, M. M. de. Physicochemical Principles of Nanosized Drug Delivery
Systems. In Nanotechnology in Drug Delivery; Villiers, M. M. de, Aramwit, P., Kwon, G.
S., Eds.; Biotechnology: Pharmaceutical Aspects; Springer New York, 2009; pp 3–33.
(69) Müller, R. H.; Peters, K. Nanosuspensions for the Formulation of Poorly Soluble Drugs: I.
Preparation by a Size-Reduction Technique. Int. J. Pharm. 1998, 160 (2), 229–237.
(70) Mullin, J. W. 3 - Solutions and Solubility. In Crystallization (Fourth Edition);
Butterworth-Heinemann: Oxford, 2001; pp 86–134.
(71) Keck, C. M.; Müller, R. H. Drug Nanocrystals of Poorly Soluble Drugs Produced by High
Pressure Homogenisation. Eur. J. Pharm. Biopharm. 2006, 62 (1), 3–16.
(72) List, M.; Sucker, H. Hydrosols of Pharmacologically Active Agents and Their
Pharmaceutical Compositions Comprising Them. US5389382 A, February 14, 1995.
(73) de Waard, H.; Grasmeijer, N.; Hinrichs, W. L. J.; De Beer, T.; Frijlink, H. W. A Process
Suitable for Large-Scale Production of Drug Nanocrystals. Pharm. Technol. 2011, 35 (8),
58–62.
(74) Panagiotou, T.; Mesite, S. V.; Fisher, R. J. Production of Norfloxacin Nanosuspensions
Using Microfluidics Reaction Technology through Solvent/Antisolvent Crystallization.
Ind. Eng. Chem. Res. 2009, 48 (4), 1761–1771.
(75) Chan, H.-K.; Kwok, P. C. L. Production Methods for Nanodrug Particles Using the
Bottom-up Approach. Adv. Drug Deliv. Rev. 2011, 63 (6), 406–416.
(76) Khan, S.; Matas, M. de; Zhang, J.; Anwar, J. Nanocrystal Preparation: Low-Energy
Precipitation Method Revisited. Cryst. Growth Des. 2013, 13 (7), 2766–2777.
(77) Thomas, M. J. K.; Slipper, I.; Walunj, A.; Jain, A.; Favretto, M. E.; Kallinteri, P.;
Douroumis, D. Inclusion of Poorly Soluble Drugs in Highly Ordered Mesoporous Silica
Nanoparticles. Int. J. Pharm. 2010, 387 (1–2), 272–277.
(78) Azad, M.; Moreno, J.; Bilgili, E.; Davé, R. Fast Dissolution of Poorly Water Soluble
Drugs from Fluidized Bed Coated Nanocomposites: Impact of Carrier Size. Int. J. Pharm.
2016, 513 (1–2), 319–331.
(79) Geszke-Moritz, M.; Moritz, M. APTES-Modified Mesoporous Silicas as the Carriers for
Poorly Water-Soluble Drug. Modeling of Diflunisal Adsorption and Release. Appl. Surf.
Sci. 2016, 368, 348–359.
(80) Martín, A.; García, R. A.; Karaman, D. S.; Rosenholm, J. M. Polyethyleneimine-
Functionalized Large Pore Ordered Silica Materials for Poorly Water-Soluble Drug
Delivery. J. Mater. Sci. 2014, 49 (3), 1437–1447.
(81) Dwyer, L.; Michaelis, V.; O’Mahony, M.; Griffin, R.; Myerson, A. Confined
Crystallization of Fenofibrate in Nanoporous Silica. CrystEngComm 2015, 17 (41), 7922–
7929.
(82) Sonnenberger, N.; Anders, N.; Golitsyn, Y.; Steinhart, M.; Enke, D.; Saalwächter, K.;
Beiner, M. Pharmaceutical Nanocrystals Confined in Porous Host Systems – Interfacial
Effects and Amorphous Interphases. Chem. Commun. 2016, 52 (24), 4466–4469.
(83) Graubner, G.; Rengarajan, G. T.; Anders, N.; Sonnenberger, N.; Enke, D.; Beiner, M.;
Steinhart, M. Morphology of Porous Hosts Directs Preferred Polymorph Formation and
Influences Kinetics of Solid/Solid Transitions of Confined Pharmaceuticals. Cryst.
Growth Des. 2014, 14 (1), 78–86.

152
(84) Mehanna, M. M.; Motawaa, A. M.; Samaha, M. W. Tadalafil Inclusion in Microporous
Silica as Effective Dissolution Enhancer: Optimization of Loading Procedure and
Molecular State Characterization. J. Pharm. Sci. 2011, 100 (5), 1805–1818.
(85) Van Speybroeck, M.; Barillaro, V.; Thi, T. D.; Mellaerts, R.; Martens, J.; Van Humbeeck,
J.; Vermant, J.; Annaert, P.; Van den Mooter, G.; Augustijns, P. Ordered Mesoporous
Silica Material SBA-15: A Broad-Spectrum Formulation Platform for Poorly Soluble
Drugs. J. Pharm. Sci. 2009, 98 (8), 2648–2658.
(86) Hillerström, A.; Stam, J. van; Andersson, M. Ibuprofen Loading into Mesostructured
Silica Using Liquid Carbon Dioxide as a Solvent. Green Chem. 2009, 11 (5), 662–667.
(87) Zhang, Y.; Zhi, Z.; Jiang, T.; Zhang, J.; Wang, Z.; Wang, S. Spherical Mesoporous Silica
Nanoparticles for Loading and Release of the Poorly Water-Soluble Drug Telmisartan. J.
Controlled Release 2010, 145 (3), 257–263.
(88) Junyaprasert, V. B.; Morakul, B. Nanocrystals for Enhancement of Oral Bioavailability of
Poorly Water-Soluble Drugs. Asian J. Pharm. Sci. 2015, 10 (1), 13–23.
(89) Alvarez, A. J.; Singh, A.; Myerson, A. S. Crystallization of Cyclosporine in a Multistage
Continuous MSMPR Crystallizer. Cryst. Growth Des. 2011, 11 (10), 4392–4400.
(90) Peña, R.; Nagy, Z. K. Process Intensification through Continuous Spherical Crystallization
Using a Two-Stage Mixed Suspension Mixed Product Removal (MSMPR) System. Cryst.
Growth Des. 2015, 15 (9), 4225–4236.
(91) Li, J.; Trout, B. L.; Myerson, A. S. Multistage Continuous Mixed-Suspension, Mixed-
Product Removal (MSMPR) Crystallization with Solids Recycle. Org. Process Res. Dev.
2016, 20 (2), 510–516.
(92) Lai, T.-T. C.; Cornevin, J.; Ferguson, S.; Li, N.; Trout, B. L.; Myerson, A. S. Control of
Polymorphism in Continuous Crystallization via Mixed Suspension Mixed Product
Removal Systems Cascade Design. Cryst. Growth Des. 2015, 15 (7), 3374–3382.
(93) Kawabata, Y.; Wada, K.; Nakatani, M.; Yamada, S.; Onoue, S. Formulation Design for
Poorly Water-Soluble Drugs Based on Biopharmaceutics Classification System: Basic
Approaches and Practical Applications. Int. J. Pharm. 2011, 420 (1), 1–10.
(94) Hong, S.; Shen, S.; Tan, D. C. T.; Ng, W. K.; Liu, X.; Chia, L. S. O.; Irwan, A. W.; Tan,
R.; Nowak, S. A.; Marsh, K.; et al. High Drug Load, Stable, Manufacturable and
Bioavailable Fenofibrate Formulations in Mesoporous Silica: A Comparison of Spray
Drying versus Solvent Impregnation Methods. Drug Deliv. 2016, 23 (1), 316–327.
(95) O’Neil, M. The Merck Index-An Encyclopedia of Chemicals, Drugs, and Biologicals.;
Royal Society of Chemistry: Cambridge, UK, 2013.
(96) Hu, G.; Li, H.; Wang, X.; Zhang, Y. Measurement and Correlation of Griseofulvin
Solubility in Different Solvents at Temperatures from (281.95 to 357.60) K. J. Chem. Eng.
Data 2010, 55 (9), 3969–3971.
(97) Elworthy, P. H.; Lipscomb, F. J. The Effect of Some Non-Ionic Surfactants and a
Polyoxyethylene Glycol on the Dissolution Rate of Griseofulvin. J. Pharm. Pharmacol.
1968, 20 (12), 923–933.
(98) Limnell, T.; Santos, H. A.; Mäkilä, E.; Heikkilä, T.; Salonen, J.; Murzin, D. Y.; Kumar,
N.; Laaksonen, T.; Peltonen, L.; Hirvonen, J. Drug Delivery Formulations of Ordered and
Nonordered Mesoporous Silica: Comparison of Three Drug Loading Methods. J. Pharm.
Sci. 2011, 100 (8), 3294–3306.
(99) Vekilov, P. G. Nucleation. Cryst. Growth Des. 2010, 10 (12), 5007–5019.

153
(100) Lee, A. Y.; Lee, I. S.; Dette, S. S.; Boerner, J.; Myerson, A. S. Crystallization on Confined
Engineered Surfaces: A Method to Control Crystal Size and Generate Different
Polymorphs. J. Am. Chem. Soc. 2005, 127 (43), 14982–14983.
(101) Lee, A. Y.; Ulman, A.; Myerson, A. S. Crystallization of Amino Acids on Self-Assembled
Monolayers of Rigid Thiols on Gold. Langmuir 2002, 18 (15), 5886–5898.
(102) Ko, S.; Kim, H. Y.; Choi, I.; Choe, J. Gold Nanoparticles as Nucleation-Inducing
Reagents for Protein Crystallization. Cryst. Growth Des. 2017, 17 (2), 497–503.
(103) Nicoud, L. H.; Dwyer, L. M.; Myerson, A. S. Heterogeneous Nucleation of Small
Molecule Crystals in the Presence of Nanoparticles. AIChE Proc. 2017.
(104) Rohani, S.; Horne, S.; Murthy, K. Control of Product Quality in Batch Crystallization of
Pharmaceuticals and Fine Chemicals. Part 1: Design of the Crystallization Process and the
Effect of Solvent. Org. Process Res. Dev. 2005, 9 (6), 858–872.
(105) Ganapathy, R.; Sood, A. K. Crystallization: Brought to the Surface. Nat. Phys. 2017, 13
(5), 421–422.
(106) Tierney, T. B.; Rasmuson, Å. C.; Hudson, S. P. Size and Shape Control of Micron-Sized
Salicylic Acid Crystals during Antisolvent Crystallization. Org. Process Res. Dev. 2017,
21 (11), 1732–1740.
(107) Padrela, L.; Zeglinski, J.; Ryan, K. M. Insight into the Role of Additives in Controlling
Polymorphic Outcome: A CO2-Antisolvent Crystallization Process of Carbamazepine.
Cryst. Growth Des. 2017, 17 (9), 4544–4553.
(108) Matsumoto, M.; Ohno, M.; Wada, Y.; Sato, T.; Okada, M.; Hiaki, T. Enhanced Production
of α-Form Indomethacin Using the Antisolvent Crystallization Method Assisted by N2
Fine Bubbles. J. Cryst. Growth 2017, 469, 91–96.
(109) USP Monograph Diphenhydramine Hydrochloride; Official Monographs; United States
Pharmacopeial Convention, 2018; pp 3802–3803.
Copyright © 2022 FDOKUMEN