Geochemical Characterization of Groundwater in the Confined ...
25
Citation: Orecchia, C.; Giambastiani, B.M.S.; Greggio, N.; Campo, B.; Dinelli, E. Geochemical Characterization of Groundwater in the Confined and Unconfined Aquifers of the Northern Italy. Appl. Sci. 2022, 12, 7944. https://doi.org/ 10.3390/app12157944 Academic Editor: Marco Petitta Received: 1 June 2022 Accepted: 20 July 2022 Published: 8 August 2022 Publisher’s Note: MDPI stays neutral with regard to jurisdictional claims in published maps and institutional affil- iations. Copyright: © 2022 by the authors. Licensee MDPI, Basel, Switzerland. This article is an open access article distributed under the terms and conditions of the Creative Commons Attribution (CC BY) license (https:// creativecommons.org/licenses/by/ 4.0/). applied sciences Article Geochemical Characterization of Groundwater in the Confined and Unconfined Aquifers of the Northern Italy Cristina Orecchia, Beatrice M. S. Giambastiani * , Nicolas Greggio , Bruno Campo and Enrico Dinelli BiGeA—Biological, Geological and Environmental Sciences Department, Alma Mater Studiorum, University of Bologna, Via S. Alberto 163, 48123 Ravenna, Italy * Correspondence: [email protected]; Tel.: +39-054-493-7318 Abstract: Having an accurate and easily accessible geochemical database is crucial for a correct groundwater management. Here, for the first time in Italy, chemico-physical data of groundwater collected by different Environmental Protection Agencies during the 2018 were integrated into a single database to assess the geochemical status of a wide and complex aquifer system. Data were assembled, reformatted, corrected, homogenized, and then grouped according to the aquifer type (phreatic, semi- confined, and confined) and the sampling seasons. A total of 3671 validated samples were classified into hydrochemical facies; inorganic N compounds and trace elements were also evaluated. The water were classified mainly as Ca-HCO 3 and Ca-Mg-HCO 3 (90%); locally, Na-HCO 3 , Mg-HCO 3 , Ca-SO 4 , Na-Cl, and Ca-Cl types were detected. In the phreatic aquifers, NO 3 contamination and high concentrations of Na + ,K + , and NH 4 + were found and linked to anthropogenic sources, such as agricultural and livestock activities. Along the Adriatic coast, Na-Cl water confirmed saltwater intrusion phenomena. Landward, evaporitic rocks dissolution, and the upconing of relict marine water explained high EC, Na + ,K + , Cl - , and SO 4 2- concentrations. The dissolution of Fe-Mn oxide- hydroxides coupled with organic carbon oxidation under reducing environment justified high NH 4 + , Fe, Mn, and As recorded in the semi-confined and confined aquifers. Keywords: geochemistry; aquifer; hydrochemical facies; database design; Northern Italy 1. Introduction Despite the increasing investment in the expansion of open water data and the in- credible amount of freely available water data provided by the different environmental agencies and institutions in charge of surface and groundwater monitoring within coun- tries, there are still many obstacles of having available homogeneous and integrated water databases [1,2]. The data quality depends on their own completeness, accuracy, traceability (of dataset creation and updates), contemporaneity, validation, compliance (as with unified metadata standards), and understandability [3]. The availability of long-term water datasets is important to reveal important patterns, which allow trends, cycles, and pollution events to be identified [4]. The benefits ascribed to long-term water quality databases range from scientific advancement, improved gov- ernment and governance (i.e., better transparency, accountability, and decision-making processes), and operational and technical efficiency (i.e., improved services, identification of tempestive solutions). With the enactment of the Italian legislation on water resources (D.Lgs 152/06 and related updates, [5]), in transposition of the Water Framework Directive (WFD, Dir. 2000/60/EC, [6]), monitoring of water bodies is mandatory to assess their environmental quality status. The groundwater monitoring network in Italy is not centralized and all monitoring activities (identification of networks, choice of analytical pools, and monitoring frequencies) and groundwater sample analysis are in charge of each Italian region and the related Regional Agencies for Environmental Protection (ARPAs). The ARPAs are responsible for the quan- titative and qualitative monitoring of surface and groundwater. Sampling procedures, Appl. Sci. 2022, 12, 7944. https://doi.org/10.3390/app12157944 https://www.mdpi.com/journal/applsci
-
Upload
khangminh22 -
Category
Documents
-
view
1 -
download
0
Transcript of Geochemical Characterization of Groundwater in the Confined ...

Citation: Orecchia, C.; Giambastiani,
B.M.S.; Greggio, N.; Campo, B.;
Dinelli, E. Geochemical
Characterization of Groundwater in
the Confined and Unconfined
Aquifers of the Northern Italy. Appl.
Sci. 2022, 12, 7944. https://doi.org/
10.3390/app12157944
Academic Editor: Marco Petitta
Received: 1 June 2022
Accepted: 20 July 2022
Published: 8 August 2022
Publisher’s Note: MDPI stays neutral
with regard to jurisdictional claims in
published maps and institutional affil-
iations.
Copyright: © 2022 by the authors.
Licensee MDPI, Basel, Switzerland.
This article is an open access article
distributed under the terms and
conditions of the Creative Commons
Attribution (CC BY) license (https://
creativecommons.org/licenses/by/
4.0/).
applied sciences
Article
Geochemical Characterization of Groundwater in the Confinedand Unconfined Aquifers of the Northern ItalyCristina Orecchia, Beatrice M. S. Giambastiani * , Nicolas Greggio , Bruno Campo and Enrico Dinelli
BiGeA—Biological, Geological and Environmental Sciences Department, Alma Mater Studiorum,University of Bologna, Via S. Alberto 163, 48123 Ravenna, Italy* Correspondence: [email protected]; Tel.: +39-054-493-7318
Abstract: Having an accurate and easily accessible geochemical database is crucial for a correctgroundwater management. Here, for the first time in Italy, chemico-physical data of groundwatercollected by different Environmental Protection Agencies during the 2018 were integrated into a singledatabase to assess the geochemical status of a wide and complex aquifer system. Data were assembled,reformatted, corrected, homogenized, and then grouped according to the aquifer type (phreatic, semi-confined, and confined) and the sampling seasons. A total of 3671 validated samples were classifiedinto hydrochemical facies; inorganic N compounds and trace elements were also evaluated. Thewater were classified mainly as Ca-HCO3 and Ca-Mg-HCO3 (90%); locally, Na-HCO3, Mg-HCO3,Ca-SO4, Na-Cl, and Ca-Cl types were detected. In the phreatic aquifers, NO3 contamination andhigh concentrations of Na+, K+, and NH4
+ were found and linked to anthropogenic sources, suchas agricultural and livestock activities. Along the Adriatic coast, Na-Cl water confirmed saltwaterintrusion phenomena. Landward, evaporitic rocks dissolution, and the upconing of relict marinewater explained high EC, Na+, K+, Cl−, and SO4
2− concentrations. The dissolution of Fe-Mn oxide-hydroxides coupled with organic carbon oxidation under reducing environment justified high NH4
+,Fe, Mn, and As recorded in the semi-confined and confined aquifers.
Keywords: geochemistry; aquifer; hydrochemical facies; database design; Northern Italy
1. Introduction
Despite the increasing investment in the expansion of open water data and the in-credible amount of freely available water data provided by the different environmentalagencies and institutions in charge of surface and groundwater monitoring within coun-tries, there are still many obstacles of having available homogeneous and integrated waterdatabases [1,2]. The data quality depends on their own completeness, accuracy, traceability(of dataset creation and updates), contemporaneity, validation, compliance (as with unifiedmetadata standards), and understandability [3].
The availability of long-term water datasets is important to reveal important patterns,which allow trends, cycles, and pollution events to be identified [4]. The benefits ascribedto long-term water quality databases range from scientific advancement, improved gov-ernment and governance (i.e., better transparency, accountability, and decision-makingprocesses), and operational and technical efficiency (i.e., improved services, identificationof tempestive solutions).
With the enactment of the Italian legislation on water resources (D.Lgs 152/06 and relatedupdates, [5]), in transposition of the Water Framework Directive (WFD, Dir. 2000/60/EC, [6]),monitoring of water bodies is mandatory to assess their environmental quality status. Thegroundwater monitoring network in Italy is not centralized and all monitoring activities(identification of networks, choice of analytical pools, and monitoring frequencies) andgroundwater sample analysis are in charge of each Italian region and the related RegionalAgencies for Environmental Protection (ARPAs). The ARPAs are responsible for the quan-titative and qualitative monitoring of surface and groundwater. Sampling procedures,
Appl. Sci. 2022, 12, 7944. https://doi.org/10.3390/app12157944 https://www.mdpi.com/journal/applsci

Appl. Sci. 2022, 12, 7944 2 of 25
analysis methods, sampling material to be used are regulated by D.Lgs 152/2006 [5] andanalyses must be performed by accredited laboratories. Data are collected in many waysand by using different protocols; the choice of sampling frequencies and analytical methodsis defined by each region based on the characteristics of the territory, the resources vulnera-bility, pressures, impacts, and the availability of financial resources. Generally, at least twosamplings are carried out per station, one in spring and one in autumn. ARPAs databasesare proposed as usable and accessible tools, whose contents can be freely interrogated anddownloaded. However, data organized in individual databases create the fragmentation ofinformation and so far, a national geochemical database, which can be implemented overttime according to shared rules and standards, does not exist in Italy.
These actions generated and still generate a huge amount of data, which is oftencommented only in relation to water quality standards and relative thresholds, but thatcontains precious additional information that can be extracted. However, some criticalissues arise when working with large heterogeneous datasets collected without sharedprotocols: data harmonization and cleaning, and long revision processes are required.
The Po Plain selected as study area of this work is one of the largest (about 48,000 km2
wide) alluvial plains in Europe and the largest of Italy, and it represents the most importantgroundwater reservoir of the Northern Italy because of its size, the feature of its deposits,and its possibility to recharge. The entire Po Plain and surrounding Alps and Apenninesbelong to five separate administrative entities called Regions; specifically Piedmont, Lom-bardy, Emilia Romagna, Veneto and Friuli-Venezia Giulia that individually manage andmonitor their owned water resources. In this territory coexists some of the most famousand populated cities of Italy (e.g., Milan, Turin, Bologna, Venice, etc.,), huge industrialsettlements, natural areas, and agricultural activities. All of these activities interact andinfluence surface and groundwater quality and quantity.
From a geochemistry point of view, groundwater has spatial differences and are influ-enced by natural geochemical processes, i.e., water–rock interactions, mixing with waterfrom different origins, and human activities [7–9]. Due to the increasing water demand, aswell as the alteration of pluviometric regimes because of climate change, much attention ispaid to groundwater and its pollution around the world, especially in arid and semiaridconditions [10–12]. Although the Po Plain is under temperate climate, annual precipitationprojections for the second part of the century suggest an overall drying for most of theMediterranean basins [13]. In light of this, it is crucial to characterize groundwater qualityand distinguish the effects of natural processes and impacts of anthropogenic activities tobetter understand the regional hydrochemical evolution and improve sustainable waterresource management.
This work aims to integrate 2018 groundwater databases of the Northern ItalianARPAs (Piedmont, Lombardy, Veneto, Friuli-Venezia Giulia, and Emilia-Romagna) intoa single database and assess the geochemical processes in the confined, semi-confined,and phreatic aquifers of the Northern Italy. In addition, this study attempts to build thegroundwater database of the Northern Italy and highlights and discusses the main issuesencountered during the data integration and harmonization processes and investigatesmore in detail some interesting or critical areas in the Po River plain.
2. Material and Methods2.1. Geological Setting
The study area comprises the Po Plain, which represents the surface expression of asyntectonic sedimentary wedge framed between the Alps to the north and the Apenninesto the south (Figure 1) [14]. The Po plain is drained by the Po River, the longest Italian river(652 km) that flows eastward from the western Alps into the Adriatic Sea (Figure 1). The PoRiver drainage basin is about 75,000 km2 [15] and includes about 141 tributaries emergingfrom the surrounding Apenninic and Alpine chains. These tributaries deliver water andsediment to the Po River from south and north, respectively (Figure 1). In the westernsector of the Po drainage basin, including the Western Apennines, Western and Central

Appl. Sci. 2022, 12, 7944 3 of 25
Alps, crystalline-metamorphic and ophiolite complexes crop out extensively (Figure 1).On the other hand, Southern and Eastern Alps are mostly characterized by carbonate(limestone and dolostones) outcrops (Figure 1). The majority of the sediment deliveredby the Apenninic rivers derives from Cretaceous to Pliocene sedimentary successionsdominated by chaotic clays, turbidites (sandstone/marl alternations), and sandstones [16].Important outcrops composed of evaporites (i.e., gypsum) from the Gessoso-SolfiferaFormation are also present in the Apennines [17] (Figure 1).
The Po Plain can be subdivided into minor alluvial sectors as the easternmost Venetian-Friulian Plain (VFP in Figure 1), which was formed by alluvial systems external to the Podrainage basin [18]; the Lombardy-Piedmont Plain (LPP in Figure 1), west of the GardaLake; and the Emilia-Romagna Plain (ERP in Figure 1), south of the Po River (Figure 1).
The Po Basin is filled with Plio-Quaternary sediments, up to 8 km-thick in the maindepocenters south to the Po River, and thin northward [19,20]. Beneath the Venetian plain,thicknesses are about 1 km, and less than 500 m in the Friulian and Lombard areas [21]. Thesedimentary infill is characterized by a shallowing-upward tendency, from Pliocene deep-marine to Quaternary shallow-marine and continental deposits [22,23]. Along the Po Basin,Late Quaternary strata show a vertical cyclic change in fluvial-channel stacking pattern (i.e.,amalgamated fluvial-channel bodies vs. individual fluvial-channel deposits within mud-dominated strata) reflecting the alternation of glacial-interglacial periods during the Middle-Late Pleistocene [24]. Beneath the coastal plains, equivalent glacio-eustatic evidence onthe stratigraphic architecture is documented by the cyclic alternation of vertically-stackedcoastal to marine (interglacial) and continental (glacial) deposits [25–28]. The Holocenesuccession, in the Po coastal plain consists of a transgressive-regressive sedimentary wedgeof coastal to marine sediments overlying fully alluvial Pleistocene deposits [29]. By contrast,the proximal and more superficial portion of the Po Plain is mainly characterized by modernriver courses associated with abandoned fluvial channels and ribbon-shaped fluvial ridges,commonly elevated several meters above the adjacent floodplain [30].
Large alluvial fans, up to 3000 km2, composed of Late Pleistocene fluvioglacial depositscrop out extensively in the VFP and LPP [31,32]. Their piedmont sectors are generallycharacterized by gravel deposits, whereas the distal portion is generally composed offiner-grained materials. Alluvial fans of minor extent are also present in the ERP, close tothe Apenninic margin [33,34]. These alluvial fans mainly consist of amalgamated gravelbodies that thin out toward more distal sectors, where gravels are progressively replacedby fluvial channel sands and floodplain silty-clays [35].
2.2. Hydrogeological Setting
The cyclic alternation of vertically stacked coarse-grained strata (fluvial to coastal)and finer-grained sediments (alluvial to marine), which characterizes the Late Quaternarysuccession of the Po Plain, has important implication from a hydrogeological point ofview [18]. The aquifer system consists of shallow, unconfined aquifers and deeper, semi-confined and confined aquifers. The main aquifer system is mostly unconfined and consistsof coarse-grained sedimentary units, 30 m in thickness and made of amalgamated graveland sand bodies [26,36–38]. Fine-grained (silts and clays) units, with thickness rangingbetween about 5 and 50 m form the main aquiclude and/or aquitards [39–41]. Movingtoward the coastline, some continental alluvial deposits (mostly clay and silt) are laidupon the coarse-grained sedimentary units, making the aquifer locally semi-confined,where recharge and discharge are reduced but can still occur (hydrogeological setting 3in Figure 1). Then, as reported by Martinelli et al. (2018) [42], downwards in the LateQuaternary succession of the Po Plain several confined aquifers are recognized within theentire hydrogeological system.

Appl. Sci. 2022, 12, 7944 4 of 25
Appl. Sci. 2022, 12, x FOR PEER REVIEW 4 of 26
in Figure 1). Then, as reported by Martinelli et al. (2018) [42], downwards in the Late Qua-
ternary succession of the Po Plain several confined aquifers are recognized within the en-
tire hydrogeological system.
Figure 1. Geolithology of the Northern Italy (from Geological map of Italy, 1:500,000 scale, Italian
Geoportal http://www.pcn.minambiente.it/mattm/en/. Accessed on 22 April 2022). The hydrogeo-
logical settings 1–3 are from Martinelli et al. (2018) [42], modified.
Topographically high alluvial fans located at the more proximal locations of the Po
Plain, at the margin of both mountain chains, are characterized by generally high perme-
ability (up to 1–10 × 10−3 m/s of gravel and sand layers). These deposits represent the main
direct recharge area of the entire hydrogeological system, including the deepest aquifers
[31]. Moving toward increasingly lower and more distal portions of the alluvial plains,
coarse-grained sediments are replaced by finer-grained deposits [32,35], with hydraulic
conductivities in the order of 1–10 × 10−5 m/s. Here, the hydrogeological setting is charac-
terized by the presence of multi-layer aquifers with shallow phreatic aquifers that are gen-
erally discontinuous and poorly connected to underlying ones (Figure 1). However, de-
spite their low topographic gradient, relatively high permeability coefficients have been
documented in some areas in the western Po Plain sector [38,42] and in the ERP coast
(“shallow coastal aquifers” in Giambastiani et al., 2013; [43]).
The higher hydraulic gradients are recorded in proximity of the Alpine and Apen-
nine chains, in alluvial fan area (“high plain” in Figure 1). Typical hydraulic gradients of
these areas vary from 8‰ to 10‰ in the westernmost sectors, and from 4‰ to 8‰ in other
portions of the Po Plain such as the VFP [42]. Lower hydraulic gradients (normally rang-
ing from 1‰ to 4‰) characterize the more distal (“low plain” in Figure 1) aquifers along
the Po River. The lowest values, ranging between 0.2 and 1‰, have been reported for the
central-eastern Po Plain [44,45].
Figure 1. Geolithology of the Northern Italy (from Geological map of Italy, 1:500,000 scale, Italian Geo-portal http://www.pcn.minambiente.it/mattm/en/, accessed on 22 April 2022). The hydrogeologicalsettings 1–3 are from Martinelli et al. (2018) [42], modified.
Topographically high alluvial fans located at the more proximal locations of the PoPlain, at the margin of both mountain chains, are characterized by generally high per-meability (up to 1–10 × 10−3 m/s of gravel and sand layers). These deposits representthe main direct recharge area of the entire hydrogeological system, including the deepestaquifers [31]. Moving toward increasingly lower and more distal portions of the alluvialplains, coarse-grained sediments are replaced by finer-grained deposits [32,35], with hy-draulic conductivities in the order of 1–10 × 10−5 m/s. Here, the hydrogeological setting ischaracterized by the presence of multi-layer aquifers with shallow phreatic aquifers thatare generally discontinuous and poorly connected to underlying ones (Figure 1). However,despite their low topographic gradient, relatively high permeability coefficients have beendocumented in some areas in the western Po Plain sector [38,42] and in the ERP coast(“shallow coastal aquifers” in Giambastiani et al., 2013; [43]).
The higher hydraulic gradients are recorded in proximity of the Alpine and Apenninechains, in alluvial fan area (“high plain” in Figure 1). Typical hydraulic gradients of theseareas vary from 8‰ to 10‰ in the westernmost sectors, and from 4‰ to 8‰ in otherportions of the Po Plain such as the VFP [42]. Lower hydraulic gradients (normally rangingfrom 1‰ to 4‰) characterize the more distal (“low plain” in Figure 1) aquifers along thePo River. The lowest values, ranging between 0.2 and 1‰, have been reported for thecentral-eastern Po Plain [44,45].
As the transition from higher to lower alluvial sectors is accompanied by the decreasein the hydraulic gradient and in grain size, this portion of the study area shows theemergence of peculiar lowland springs (fontanili), especially in the Veneto-Friulan plainand in the orographic left of the Po River. The “fontanili line” starts in the most westernpart of the Friuli plain and continues almost continuously to Piedmont; at the foothills of

Appl. Sci. 2022, 12, 7944 5 of 25
the Apennines this phenomenon is much more sporadic and occurs near Piacenza, Parma,Modena and east of Bologna [46–48].
The water level depth in shallow aquifers is highly variable in the Po Plain: minimumvalues of 1–5 m b.g.l. are recorded in the central sectors, whereas it may reach 10 m b.g.l.and up to 50 m b.g.l., close to Apenninic and Alpine margins, respectively. The groundwaterflow in the unconfined aquifers is directed toward the Po River (i.e., oriented N–S in the pre-alpine sector and S–N closer to the Apennines; Figure 1). In the central western sector, theflow is strongly controlled by the draining action of the Po River and its tributaries, whereas,in the eastern sector, the Po River is not in hydraulic connection with groundwater [42].
2.3. Database Design
In Italy the Regional Environmental Protection Agencies (ARPA) are the institutionsin charge of monitoring of the quantity and quality of surface and groundwater bodies,according to European (Directive 2000/60/EC, Water Framework Directive WFD, [6]), andnational directives [5,49,50]. The monitoring of the quantitative state is carried out bymeasuring the piezometric levels with reference to the mean sea level; while the monitoringof the chemical status is based on the analysis of: pollutants subject to quality standards,identified at EU level (Annex III of D.Lgs 30/09, Table 2, [49]); and element subject to thresh-old values, identified at national level (Annex III of D.Lgs 30/09, Table 3, [49]). The decreeprovides indications on minimum sampling frequencies depending on the characteristicsof the water body, the base parameters, and some additional ones to be controlled.
In this study we used the 2018 databases of qualitative and quantitative groundwatermonitoring provided by the ARPAs of Piedmont (hereinafter referred to as PIE), Lombardy(LOM), Veneto (VEN), Friuli-Venezia Giulia (FVG), and Emilia-Romagna (EMR) throughtheir OpenData portals. The databases were integrated with information of samplingstations (well or spring, coordinates, etc.,), related aquifer (phreatic, semi-confined, orconfined), and monitoring depths.
Since each agency provided data according to its own standards (coordinate system,detection limits of analytical protocols, concentration units, and monitoring time interval), agreat effort was dedicated to data homogenization and management to create an operationaldatabase describing the hydrogeochemical characterization of the 2018 groundwater ofthe Po and Venetian-Friulian plains. The inhomogeneities in the dataset depend on thechoices made by each individual ARPAs, especially as regards metals and trace elements,as established in part III D.Lgs 30/09 [49]. Table S1 in Supplementary Material showsthe parameters analyzed by each Region with the relative measurement units. After theverification and cleaning processes, consisting in the eliminations of samples without clearaquifer identification or located in aquifers other than semi-confined, confined, and phreatic(i.e., colluvial and mountainous aquifers), 3671 validated samples, out of the initial 4049,were used for data analysis and map elaborations.
The water samples were analyzed by different laboratories, and therefore had differentdetection limits for the same analyte, both at regional and in some cases even at theprovincial level, as shown in Tables S1 and S2 in Supplementary Material. Another factorthat caused low homogeneity of the final database concerns the different analytical poolanalyzed between regions. Specific electrical conductivity at 20 ◦C (EC), hardness, pH, andtemperature (T) were provided by at least 4 out of 5 agencies. For the other chemical andphysical characteristics, instead, data obtained were fragmentary and incomplete over thewhole considered time period. Concentrations of metals and compounds of environmentalinterest were not homogeneously collected by the agencies; the divergence is justified by thedifferent operational choices adopted by the agencies, as allowed by the relevant legislation(Annex III of the D.Lgs. 30/09 [49]) as shown in Table S2 of Supplementary Material.
Several authors established strategies for using values below detection limit (<D.L.)as valid data [51–53]. However, in the present study the management of these data wasnot done using the proposed methods, because the characteristics of the database were notin line with the conditions set by the authors. The first difference concerns the presence

Appl. Sci. 2022, 12, 7944 6 of 25
of many different D.L. for each analyte, and secondly data population of several analyteswas predominantly composed by values <D.L. The adopted solutions varied accordingto the data considered. For each element, value with the highest number of observationswas identified and all the other different values “<D.L.” were replaced with the half ofthe identified detection limit, according to the methods proposed by Helsel and Hirsch(2002) [51] and Harter (2006) [52].
For metals and compounds of environmental relevance (NO3−, NH4
+), all <D.L. valueswere replaced with a single arbitrary value that was two or more orders of magnitudelower than the minimum value detected by the analyses. This strategy made possible tohighlight and detect on the distribution maps the stations with concentrations below D.L.,although prevented their complete statistical consideration.
2.4. Data Elaboration and Interpretation
After obtaining a homogeneous database, the concentrations of major ions were usedto assess the hydrochemical facies. Distributions of chemical–physical parameters, metals,and compounds of environmental interest were also analyzed and discussed in relation tothe aquifer types. The aquifer type was chosen as discriminating character to assess anydifference in groundwater, since it was one of the most comprehensive and homogeneouscharacteristics provided by all regional datasets. Data were also divided according to thesampling season (spring-summer and autumn-winter considered from now on as “warmseason” and “cold season”, respectively) to assess changes over the year. Analyses werecarried out on 3671 samples distributed as follows:
• 2243 in phreatic aquifers: 1220 for warm season, and 1023 for cold season;• 1149 in confined aquifers: 597 for warm season, and 552 for cold season;• 279 in semi-confined aquifers, equally divided between the two periods.
Considering the difficulty to distinguish between confined and semi-confined aquifersin the complex multilayer hydrogeological setting of the Po Plain (Figure 2), we decidedto treat the data from confined and semi-confined aquifers together both for the statisticalanalysis and the map production.
In order to test for statistically significant differences between warm and cold seasonssub-populations and between different aquifer type, the Kruskal–Wallis nonparametric testwas applied to our database [54,55].
The samples were classified according to the chemical and physical parameters (elec-trical conductivity-EC; water hardness; temperature). Boxplots for all components werecreated to assess the effects of aquifer type. Hydrochemical facies were assessed based onthe concentrations of main dissolved ions using the Langelier–Ludwig diagram [56]. Theratios Na+/K+, Ca2
+/Mg2+, SO4
2−/Cl− were also calculated to distinguish the dominantspecies. The distributions of the associated ion pairs Ca2+-HCO3
−, Na+-Cl− Mg2+-SO42−,
K+-NO3− were defined to assess the origin of the main ions and the lithological effect on
groundwater quality.In order to investigate distributions of metals and compounds of environmental
interest, three criteria of selection were applied:
• The analyses were carried out by at least four regions (Table S1 in Supplementary Material);• The data population had at least 25% of the values > D.L. (Table S2 in Supplementary
Material);• Presence of regulatory limits for the analyte that impose a maximum allowable
concentration.
Based on these criteria, the selected elements were: NO3−, NH4
+, As, Fe, and Mn.Elaboration of all spatial distribution maps of groundwater parameters and compo-
nents were carried out by QGIS software after the merge and conversion into a uniformcoordinate system (WGS84/UTM zone 32N, EPSG: 32632).

Appl. Sci. 2022, 12, 7944 7 of 25Appl. Sci. 2022, 12, x FOR PEER REVIEW 7 of 26
Figure 2. Boxplot of the geochemical parameters grouped according to aquifer type. Figure 2. Boxplot of the geochemical parameters grouped according to aquifer type.

Appl. Sci. 2022, 12, 7944 8 of 25
3. Results and Discussion3.1. Groundwater Dataset
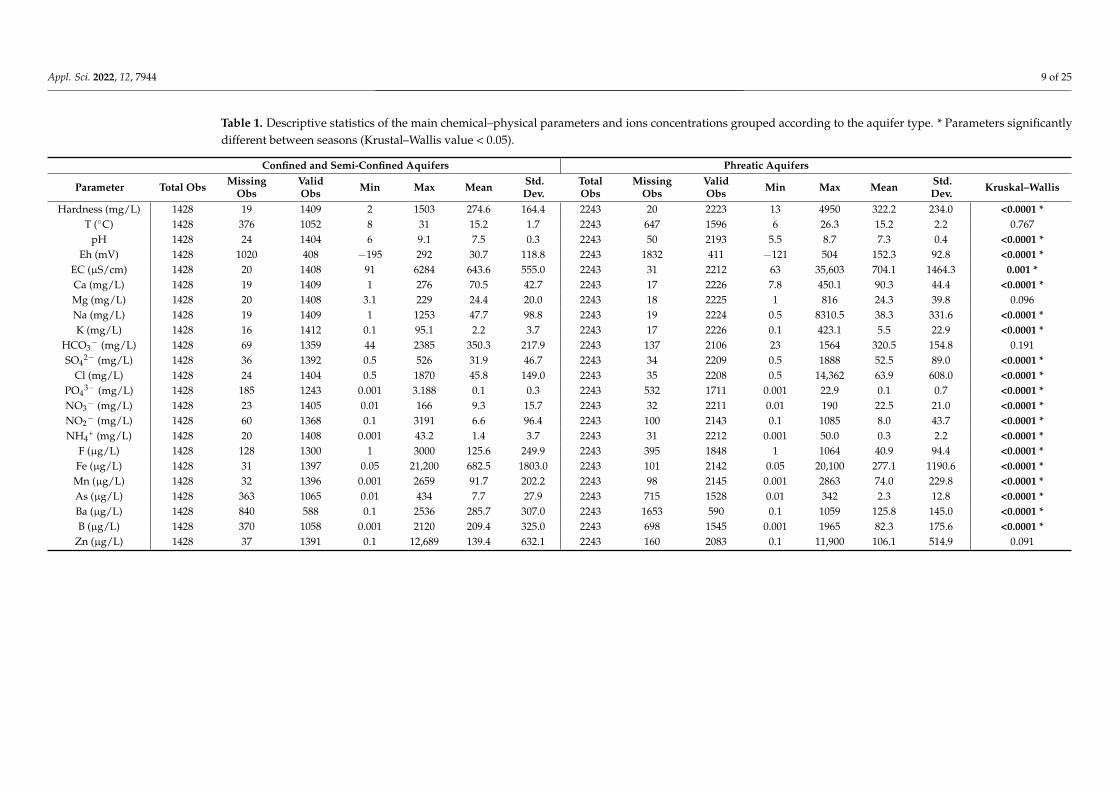
Table 1 shows the main descriptive statistics and Figure 2 the boxplots of all physic-chemical parameters and ions concentrations grouped according to the aquifer type. Forcompleteness, the descriptive statistic of the entire database is reported in Table S1 of theSupplementary Material.
As can be seen in Table 1, the Kruskal–Wallis non-parametric test on the aquifer typesshows a statistically significant differences for most chemical and physical parametersand these will be discussed in the following sections. On the other hand, the same testperformed on warm and cold season datasets (Tables S3 and S4 in Supplementary Material)points out that the only statistically significant differences regard temperature and pH inthe confined and semi-confined aquifers, while Eh and PO4
3− in the phreatic aquifers.Generally, temperature values are slightly higher in the summer season and in the
confined aquifers, as it is expected. Values range between 6.0 ◦C and 31.0 ◦C, with 98%of samples classified as cold water, and 2% as thermal water. As reported in Table S3 inSupplementary Material, the populations analyzed show the same median of 15.0 ◦C, andmost values are between 13.7 ◦C and 16.4 ◦C in line with the Italian patterns of shallowgroundwater temperatures [57]. Anomalous values above 20.0 ◦C were found in all aquifertypes, regardless of the season. The differences found in most of the data are of the orderof 1/10 of a degree, so effects related to seasonality or aquifer type cannot be establishedwith certainty.
The distribution of pH values highlights the presence of an effect due to the type ofaquifer (Table 1). The pH values increase from acidic and neutral condition in the phreaticaquifers to mean value of 7.5 and maximum of 9.1 in the confined aquifers. The median ofthe phreatic aquifers (7.3) is equal to the 25th percentile of the other population.
The recorded values are typical for groundwater; neutral and slightly acid pH valuesare found in the phreatic and shallow aquifers due to the contribution of meteoric water(meltwater and precipitation) that infiltrates and percolates. The pH varies dependingon the composition of rocks and sediments that surround the pathway of the rechargewater infiltrating to the ground and varies depending on the residence time. The longer thecontact time, as in the confined aquifers, the larger the effect of the rock chemistry on thecomposition and on the groundwater pH. Dissolution of carbonate-rich rocks (limestonesand marbles) and silicate weathering result in an increase of pH.
The water of the Po plain have a hardness ranging from 13 mg/L to 4950 mg/L(Table 1). In general, medium hard water prevail (32%), followed by hard water (29%),moderately hard (18%), and soft water (12%). The 7% of the samples analyzed had veryhigh hardness values, exceeding 540 mg/L, which can be easily identified as the outliers inthe distributions (Figure 2). There is a slight effect linked to the type of aquifer analyzing thedifferent populations: in confined and semi-confined aquifers, low and medium hard waterprevail, while in phreatic aquifers medium hard and hard water dominate. In phreaticaquifers located along the coastal areas of the plain, the absolute highest values of over2000 mg/L are recorded. As can be seen in Figure 3a,b, water ranging from very soft tomedium hard are found in PIE and in the western part of the plain. On the contrary, EMRwater tend to be harder, with water from very to extremely hard and values that exceed2000 mg/L along the Ravenna and Ferrara coastal areas, where the highest EC values arerecorded, too (Figure 4). This different in values is related to the higher composition ofcarbonate rocks, sedimentary deposits, and flysch in the Apennine zone compared to themetamorphic rocks that characterize the PIE region, and volcanic rock in the north of VENand FVG (Figure 1).
Appl. Sci. 2022, 12, 7944 9 of 25
Table 1. Descriptive statistics of the main chemical–physical parameters and ions concentrations grouped according to the aquifer type. * Parameters significantlydifferent between seasons (Krustal–Wallis value < 0.05).
Confined and Semi-Confined Aquifers Phreatic Aquifers
Parameter Total Obs MissingObs
ValidObs Min Max Mean Std.
Dev.TotalObs
MissingObs
ValidObs Min Max Mean Std.
Dev. Kruskal–Wallis
Hardness (mg/L) 1428 19 1409 2 1503 274.6 164.4 2243 20 2223 13 4950 322.2 234.0 <0.0001 *T (◦C) 1428 376 1052 8 31 15.2 1.7 2243 647 1596 6 26.3 15.2 2.2 0.767
pH 1428 24 1404 6 9.1 7.5 0.3 2243 50 2193 5.5 8.7 7.3 0.4 <0.0001 *Eh (mV) 1428 1020 408 −195 292 30.7 118.8 2243 1832 411 −121 504 152.3 92.8 <0.0001 *
EC (µS/cm) 1428 20 1408 91 6284 643.6 555.0 2243 31 2212 63 35,603 704.1 1464.3 0.001 *Ca (mg/L) 1428 19 1409 1 276 70.5 42.7 2243 17 2226 7.8 450.1 90.3 44.4 <0.0001 *Mg (mg/L) 1428 20 1408 3.1 229 24.4 20.0 2243 18 2225 1 816 24.3 39.8 0.096Na (mg/L) 1428 19 1409 1 1253 47.7 98.8 2243 19 2224 0.5 8310.5 38.3 331.6 <0.0001 *K (mg/L) 1428 16 1412 0.1 95.1 2.2 3.7 2243 17 2226 0.1 423.1 5.5 22.9 <0.0001 *
HCO3− (mg/L) 1428 69 1359 44 2385 350.3 217.9 2243 137 2106 23 1564 320.5 154.8 0.191
SO42− (mg/L) 1428 36 1392 0.5 526 31.9 46.7 2243 34 2209 0.5 1888 52.5 89.0 <0.0001 *
Cl (mg/L) 1428 24 1404 0.5 1870 45.8 149.0 2243 35 2208 0.5 14,362 63.9 608.0 <0.0001 *PO4
3− (mg/L) 1428 185 1243 0.001 3.188 0.1 0.3 2243 532 1711 0.001 22.9 0.1 0.7 <0.0001 *NO3
− (mg/L) 1428 23 1405 0.01 166 9.3 15.7 2243 32 2211 0.01 190 22.5 21.0 <0.0001 *NO2
− (mg/L) 1428 60 1368 0.1 3191 6.6 96.4 2243 100 2143 0.1 1085 8.0 43.7 <0.0001 *NH4
+ (mg/L) 1428 20 1408 0.001 43.2 1.4 3.7 2243 31 2212 0.001 50.0 0.3 2.2 <0.0001 *F (µg/L) 1428 128 1300 1 3000 125.6 249.9 2243 395 1848 1 1064 40.9 94.4 <0.0001 *Fe (µg/L) 1428 31 1397 0.05 21,200 682.5 1803.0 2243 101 2142 0.05 20,100 277.1 1190.6 <0.0001 *Mn (µg/L) 1428 32 1396 0.001 2659 91.7 202.2 2243 98 2145 0.001 2863 74.0 229.8 <0.0001 *As (µg/L) 1428 363 1065 0.01 434 7.7 27.9 2243 715 1528 0.01 342 2.3 12.8 <0.0001 *Ba (µg/L) 1428 840 588 0.1 2536 285.7 307.0 2243 1653 590 0.1 1059 125.8 145.0 <0.0001 *B (µg/L) 1428 370 1058 0.001 2120 209.4 325.0 2243 698 1545 0.001 1965 82.3 175.6 <0.0001 *
Zn (µg/L) 1428 37 1391 0.1 12,689 139.4 632.1 2243 160 2083 0.1 11,900 106.1 514.9 0.091

Appl. Sci. 2022, 12, 7944 10 of 25Appl. Sci. 2022, 12, x FOR PEER REVIEW 10 of 26
Figure 3. 2018 Hardness distribution in the (a) phreatic, and (b) semi-confined and confined aqui-
fers.
Figure 3. 2018 Hardness distribution in the (a) phreatic, and (b) semi-confined and confined aquifers.

Appl. Sci. 2022, 12, 7944 11 of 25Appl. Sci. 2022, 12, x FOR PEER REVIEW 11 of 26
Figure 4. 2018 EC distribution in the (a) phreatic, and (b) semi-confined and confined aquifers. Figure 4. 2018 EC distribution in the (a) phreatic, and (b) semi-confined and confined aquifers.

Appl. Sci. 2022, 12, 7944 12 of 25
The EC referred to 20 ◦C shows a wide range of variation between 63 µS/cm 35,603 µS/cm(Table 1). The distribution is very non-homogeneous: most of the water are classified asmedium-mineral (85%), 11% as low-mineral and 4% as mineral. In this case there are nodifferences due to seasonality, but the populations of the analyzed aquifers are slightlydifferent from each other (Tables S3 and S4 in the Supplementary Material). Both typesof aquifers have similar EC mean and differ in the interquartile range (Figure 2), which ishigher for the confined aquifers. There are many outliers exceeding 2500 µS/cm (Figure 4).The highest EC values are recorded in the shallow unconfined coastal aquifers alongthe EMR coastal areas, with the maximum value of 35.6 mS/cm in the Comacchio (FE)area. Their origin can be related both to saltwater intrusion and to the presence of relictwater that are well documented in this area [43,57–59]. High values recorded in the EMRApennine zone are due to dissolution of evaporite formations present in that area (Figure 1,Gessoso-Solfifera and Anidriti di Burano formations) [60].
In the confined aquifers (Figure 4b) the highest values are found mainly along the PoRiver course and the EMR coastline, corresponding to extremely hard water shown in Figure 3.
3.2. Hydrochemical Facies and Major Elements
Given that the statistically significant differences in the dataset are between aquifer typesand not between seasons (cfr. the Kruskal–Wallis test results in Table 1 and Tables S3 and S4in Supplementary Material), we decided to only show maps related to the warm season,which consists of the largest dataset.
In all aquifers (Figure 5), Ca-HCO3 is the dominant hydrochemical facies with 85%of water samples. The second most detected facies is Ca/Mg-HCO3 (5%) followed byNa-HCO3 (3%), Mg-HCO3 (2%), Ca-SO4 (1%), Na-Cl (1%), and Ca-Cl (1%), while the remain-ing water are classified as K-HCO3, Ca/Mg-Cl, Mg-Cl, Ca/Mg-SO4, Na-SO4, and Na/K-Cl.
Ca-HCO3 and Ca/Mg-HCO3 water are evenly distributed throughout the studyarea, in line with the characteristics of groundwater present in the aquifers of temperateregions as reported by various authors [42,61–63]. Their origin is due to the dissolution ofcarbonate deposits [64], which are the main minerals constituting the aquifers [14]. Thedistribution of other hydrochemical facies is not homogeneous in the different aquifers andit is conditioned by local effects as following described.
In the phreatic aquifers, the majority of samples are Ca/Mg-HCO3 water, while the secondmost numerous group includes Ca/Mg-Cl/SO4 water as shown in the Langelier–Ludwigdiagram in Figure 5a. The Ca2+ and HCO3
− are the dominant species, while high concentrationsof Mg2+ are detected in PIE, linked to ophiolite outcrops [65], and in the area between Garda Lakeand Veneto-Friulan high plain due to the dissolution of the abundant dolomite deposits [66].
The few water samples classified as Na/K- Cl/SO4 water are in the Emilian hinterland,in the high plain of the border between PIE and LOM, and along the Adriatic coast. In theEmilian hinterland, high concentrations of Na+, K+, and SO4
2− are due to the use of fertiliz-ers that are rich in macro (N, P, and K) and meso elements (Mg, Ca, and S) and are importantin plant nutrition, processes of integration, protection, and development of crops. Close toImola and the border between Reggio-Emilia and Modena, the concentration of sulphatesand calcium increases considerably, due to the local lithologic outcrops rich in Triassicevaporite formations and Messinian gypsum [67]. In the central-western aquifers (PIE andLOM) the effect is due to the interaction between water and evaporitic rocks formed duringthe phases of marine transgression of the Quaternary [42,68,69]. It is not excluded that theincrease in concentrations of Na+, K+, Cl−, and SO4
2− occurring at the border betweenLOM and PIE and in the central portion of the plain along the course of the Po River maybe caused by anthropic activities, such as agriculture or urban wastewater treatment, beingthese phreatic aquifers in an agricultural context. Samples collected close to the low coastalplain of both EMR and VEN are affected by saltwater intrusion phenomena [57,59] andgroundwater salinization due to relict water [43]. EMR coastal shallow aquifers are widelyimpacted by the phenomena of soil and water salinization [8,57,58,70,71], also testified bythe highest EC values of the database, here recorded.

Appl. Sci. 2022, 12, 7944 13 of 25Appl. Sci. 2022, 12, x FOR PEER REVIEW 13 of 26
Figure 5. Distribution of hydrochemical facies in the (a) phreatic, and (b) semi-confined and con-
fined aquifers with related Langelier–Ludwig diagrams. Figure 5. Distribution of hydrochemical facies in the (a) phreatic, and (b) semi-confined and confinedaquifers with related Langelier–Ludwig diagrams.

Appl. Sci. 2022, 12, 7944 14 of 25
The presence of Ca-Cl or Ca/Mg-Cl water detected in the terminal portion of theAlpine chain (PIE, LOM, and EMR), could be due to processes of anaerobic decompositionof organic matter. These stations record high concentrations of HCO3
−, Fe, and Mn, lowconcentration of SO4
2−, and high EC values, all signals testifying processes of organicmatter decomposition [72,73]. Redox values cannot be checked to confirm this hypothesisbecause the parameter is missing in the database. In addition, the dominant activity inthese areas is agriculture, so the high Cl concentrations could also result from irrigationor fertilizer use [74]. A further hypothesis concerns the possibility that in these areastraces of contamination of chlorinated solvent are present as indicated by Vanzetti et al.(2016) [75]. These compounds could release chloride ion into the water when subjectedto decomposition by microorganisms present in aquifers [75]. The Ca/Mg-SO4 waterare limited in confined areas at the foot of the Apennine chain. In such areas, rainwaterinteracting with Triassic and Messinian evaporitic rocks causes dissolution and the releaseof SO4
2− and Ca2+ in groundwater [69].In confined aquifers, 89% of the water samples are classified as Ca/Mg-HCO3, with an
increase of 7% in Na/K-HCO3 water compared to the phreatic aquifers (Figure 5b); whileNa-Cl, Na-SO4, and Ca-MgSO4 water constitute 4% of the total database for semi-confinedand confined aquifers.
In the north-west confined aquifers, the water composition reflects the above phreaticaquifers: Mg2+ and HCO3
− are the dominant ions and their origin is linked to the geologicalcontext [76]. The Mg-HCO3 facies located in the westernmost part of the plain (PIE) isdue to the contribution of ultramafic rocks (Figure 1) and the dissolution of Mg2+. Thesamples have Ca2+/Mg2+ ratio of 1:3, typical of water circulating in serpentinites [76]. Inthis area of the plain, concentrations of Cr and Ni higher than threshold values (50 µg/Lfor Cr, 5 µg/L for CrVI and 20 µg/L for Ni) are found and originate from the ophiolitesand serpentinites outcrops, which constitute a constant natural source of these elementsinto the water [65,77].
The sulfate-rich water are mainly detected in the central EMR area, close to theApennine border but are present also as isolated samples moving towards the coastal area.
Na-HCO3 water are mainly located in the central area of the plain, in EMR. The watercirculation inside the confined aquifers is very slow (less than 10 m/year), while in phreaticaquifers it is between 0.1 and 5.0 m/day [42]. The high residence times allows the cationexchange process in fine sediment between Na+ of marine water and Ca2+ of freshwater asfound in previous studies carried out in EMR and FVG [63,78]. Ionic exchange processesbetween Ca2+ and Na+ are very evident in the central area of the plain, where many Na-HCO3 water samples with extremely high EC are detected [69]. The origin of these water ismost probably linked to the presence of relict marine water, considering the distance fromthe current coastline.
3.3. Trace Elements and Inorganic Nitrogen
Among the selected elements in paragraph 2.2., we present maps of NH4+, Fe, Mn,
and As distributions in phreatic and confined aquifers.Nitrate contamination of Northern Italian aquifers is well documented [79–83], while
less is documented about NH4+ distribution. Nitrate pollution is widespread through
much of the plain (in PIE, EMR, along the Apennine alluvial fans, and in the low LOMplain; cfr. Figure S1 in Supplementary Material). This is connected above all with themassive presence of intensive farming and extensive use of nitrate fertilizers, with thedisposal of stockbreeding waste, and with seepage from the urban sewage systems [42,79].Nitrate pollution reaches its highest levels (also over 100 mg/L) in the areas borderingthe Alps and the Apennines where the hydrogeological structures appear to be the mostvulnerable and land utilization the most intense. The absence of continuous aquitards,especially in the areas of aquifer recharge, allows nitrate leaching from shallow to deepaquifers. Contamination of confined aquifers is extremely localized since, in anaerobiccondition, nitrate is reduced to NH4
+.

Appl. Sci. 2022, 12, 7944 15 of 25
Figure 6 shows NH4+ concentration in the phreatic and confined aquifers. While in
shallow aquifers, most of the water samples (77%) have concentrations <0.10 mg/L, 32%of the samples collected in semi-confined and confined aquifers show values above thelegal limit of 0.5 mg/L, set for water intended for human consumption (D.Lgs. 31/01 [84]).Ammonium in phreatic aquifers is found mainly in lowland areas (Figure 6a). Ammoniumis used as fertilizer, especially in areas of intensive agriculture, such as the lower VEN plain.However, the presence of NH4
+ is also strongly linked to organic matter decomposition pro-cesses, especially in aquifers characterized by the presence of peat and humic layers, such asin VEN, lower LOM and EMR [85,86]. Mastrocicco et al. (2013) [87] has demonstrated thatin the phreatic coastal aquifers of the EMR, NH4
+ is the prevalent nitrogen inorganic speciesin groundwater, and its concentration increases with depth and salinity. Very high NH4
+
concentrations are found in coincidence with peaty sediments of salinized anoxic aquifersand in the low-lying aquitard and are not related to anthropogenic sources. In particular,the elevated NH4
+ concentration derives from mineralization of organic matter present infine sediments deposited in paleo-marsh environments, as supported by the significantcorrelation observed between HCO3
− and NH4+ in the confined aquifers (Figure 7). It is
difficult to certainly establish if water samples exceeding the NH4+ threshold in Figure 6
are due exclusively to anthropic impacts; it is more correct to affirm that farming activitiescause a local intensification of natural NH4
+ background.In confined aquifers, NH4
+ concentrations higher than 0.5 mg/L are found down-stream of the spring line (fontanili), limited to the EMR plain and the lower VEN plain(Figure 6b); in both cases the natural origin is established [85,86].
Moreover, Fe and Mn distributions significantly differ between phreatic and confinedaquifers (Figure 8 and Figure S2 in the Supplementary Material). Dissolved Fe and Mnconcentrations in water are strongly influenced by redox conditions; Fe2+ and Mn2+ aremore soluble in acid or reducing conditions, so higher concentrations are found in reducinggroundwater, typical of deep aquifer; while are precipitated rapidly with increasing pH andEh, forming (hydro)oxides and decreasing Fe and Mn concentration in water. The amountof dissolved Fe also depends on the presence of complexing agents in solution, such as Cl−,F−, SO4
2−, PO43−, and organic matter; while concentration of carbonate, bicarbonate and
sulphate ions affect dissolved Mn due to the formation of complexes.In the phreatic aquifers (Figure 8a), where oxidizing conditions should theoretically be
dominant, 66% and 57% of the samples show Fe and Mn concentration <D.L., respectively.However, most of the remaining samples have values that well exceed the legislativethreshold of 200 µg/L for Fe and 50 µg/L for Mn (D.Lgs 31/01 [84]), sometimes even 1order of magnitude. Most of the samples with high Fe concentrations are located along thePo River, in the lower VEN plain and at the base of the Apennines. The high concentrationsrecorded on the border between PIE and LOM, showing an increase in the warm seasoncompared to the cold period, could be due to the submersion of the paddy fields. This effect,however, has not been documented by local studies, but it is known in the literature [88,89].Paddy fields are reducing environments developing because of the long term presence ofwater flooding the land. Here, the Fe/Mn mineral-rich strata and soil with abundant organicmatter act as sources of Fe and Mn to the groundwater and the reductive environmentin the lower terrain and areas containing water bodies favor Fe and Mn dissolution inthe groundwater. Moreover, NH4
+ generated by the application of N fertilizers duringagricultural activities can promote the reduction of Fe–Mn oxides and cause Fe and Mn tobe released into the water [89].

Appl. Sci. 2022, 12, 7944 16 of 25Appl. Sci. 2022, 12, x FOR PEER REVIEW 16 of 26
Figure 6. NH4+ distribution in the (a) phreatic, and (b) semi-confined and confined aquifers. Figure 6. NH4+ distribution in the (a) phreatic, and (b) semi-confined and confined aquifers.

Appl. Sci. 2022, 12, 7944 17 of 25Appl. Sci. 2022, 12, x FOR PEER REVIEW 17 of 26
Figure 7. Correlation between HCO3− and NH4+ among the confined and semi-confined aquifers.
Moreover, Fe and Mn distributions significantly differ between phreatic and con-
fined aquifers (Figure 8 and Figure S2 in the Supplementary Material). Dissolved Fe and
Mn concentrations in water are strongly influenced by redox conditions; Fe2+ and Mn2+ are
more soluble in acid or reducing conditions, so higher concentrations are found in reduc-
ing groundwater, typical of deep aquifer; while are precipitated rapidly with increasing
pH and Eh, forming (hydro)oxides and decreasing Fe and Mn concentration in water. The
amount of dissolved Fe also depends on the presence of complexing agents in solution,
such as Cl−, F−, SO42−, PO43−, and organic matter; while concentration of carbonate, bicar-
bonate and sulphate ions affect dissolved Mn due to the formation of complexes.
Figure 7. Correlation between HCO3− and NH4
+ among the confined and semi-confined aquifers.
In confined and semi-confined aquifers (Figure 8b) more than 32% and 41% ofsamples have values higher than the Fe and Mn legal thresholds, respectively. Beingthe deep aquifer less affected by anthropogenic activities, these exceedances are due tonatural background [90].
Figure 9 shows As distribution. The mobility of this element in water strongly dependson the oxidation state: the reduced form (As3+) has greater mobility, while the oxidized form(As5+), which is found as oxyanions, tends to be absorbed by Fe-, Al-, and Mn- hydroxidesand, to a lesser extent, by clay minerals and organic matter, favoring precipitation andremoval from solution. In alluvial plains, the reductive dissolution of Fe- and Mn- oxidesand hydroxides, linked to the anaerobic degradation of peat layers, has been identifiedas the main As source from sediment to groundwater [91–94]. The peat was formed inthe meanders abandoned by the rivers and in the water stagnation areas of the mainwatercourses and were buried and incorporated into the stratigraphic sequence by thesubsequent alluvial depositions of the rivers [95].
The As distribution in the aquifers of the Po Valley reflects the NH4+ distribution
(Figure 6). Most of the water samples (75%) have concentrations <L.R., while the majorityof values above legal threshold (10 µg/L) are localized in the semi-confined aquifers, wherethe effect of organic matter degradation could be greater than in deeper confined aquifers.Moreover, Carraro et al. (2015) found the main anomalies at depths between 10 m and 80 mbelow the ground [93].
The anomalous samples are concentrated in the central area, in the lowlands of VEN,LOM and EMR. The presence of extreme values in these areas have been extensivelydocumented by many studies [86,93,96]. It must be noted that some difference is foundcompared to our study. In the phreatic aquifers of the lower VEN plain, high concentrations(>100 µg/L) are mainly located in the province of Rovigo; however, Carraro et al. (2013) [97]detected concentrations higher than 300 µg/L in many wells around the Venetian area,which, according to the authors, represent natural hot-spots. In the EMR confined aquifers,several water samples exceed the background values of 170 µg/L identified by ARPAE [98],with values around 275 µg/L in the provinces of Bologna, Ferrara, and Ravenna.

Appl. Sci. 2022, 12, 7944 18 of 25Appl. Sci. 2022, 12, x FOR PEER REVIEW 18 of 26
Figure 8. Fe distribution in the (a) phreatic, and (b) semi-confined and confined aquifers. Figure 8. Fe distribution in the (a) phreatic, and (b) semi-confined and confined aquifers.

Appl. Sci. 2022, 12, 7944 19 of 25Appl. Sci. 2022, 12, x FOR PEER REVIEW 20 of 26
Figure 9. As distribution in the (a) phreatic, and (b) semi-confined and confined aquifers.
Figure 9. As distribution in the (a) phreatic, and (b) semi-confined and confined aquifers.

Appl. Sci. 2022, 12, 7944 20 of 25
4. Conclusions
For the first time in Italy, this study allowed to integrate in a single and homogeneousdatabase all the freely available geochemical groundwater data separately collected bythe ARPAs of the Northern Italy (Piedmont, Lombardy, Veneto, Friuli-Venezia Giulia,and Emilia-Romagna) during 2018. The developed database permitted to describe thegeochemical processes of a wide and complex aquifers system, providing a complete andunique overview on the natural and anthropic processes characterizing the entire Po plain.
Nevertheless, the study demonstrated that the application of a rigid protocol of datamanagement including data assembling, reformatting, correction, homogenization, andthen grouping into homogeneous aquifer type (phreatic, semi-confined, and confined) al-lowed the comparison of groundwater data originally collected using different managementand analytical protocols.
From the geochemical point of view, mineralization and hardness are higher in theApennine and easter Alpine sectors than in the western Alpine sector due to the prevalenceof carbonate sedimentary rock in the first case, and clasts of crystalline rock in the second.
The phreatic aquifers of Northern Italy are more exposed to contamination phenomenarelated to anthropic activities than confined aquifers, especially in the central area of the Poplain, where agricultural and livestock activities abound. In these contexts, water showhigh values of Na, K, and N, present both in the form of NO3
− and NH4+, which can
be linked to agricultural fertilizers. It is difficult to certainly establish if water samplesexceeding the NH4
+ threshold are due exclusively to anthropic impacts; it is more correctto affirm that farming activities cause a local intensification of natural NH4
+ background.Paddy fields on the border between PIE and LOM seem to be responsible for high Fe andMn concentrations due to local anoxic conditions during the flooded period.
Ongoing saltwater intrusion phenomena are evident in the shallow unconfined coastalaquifers along the EMR coastal areas. At the foot of the Apennine, the dissolution ofevaporite formations is evident and marked by high EC values as well as Ca-SO4 dominantfacies, recorded in shallow and deep water samples.
Throughout the Alps, regardless of the type of aquifer, high concentrations of Mg arefound, the origin of which is identified with the dissolution of ultramafic rocks in PIE, andwith the dissolution of dolomite in the stretches of the plain east of Garda lake in VEN.The presence of Na-Cl water along the Adriatic coast is associated with saltwater intrusionphenomena, while in the hinterland it is more due to the dissolution of evaporitic rocks orthe upwelling of fossil water.
In the confined aquifers of the central plain, the long residence times of groundwaterallow cation exchange processes in fine sediment between Na+ of relict marine water andCa2+, generating Na- HCO3 water with extremely high EC. The negative redox potential,the absence of interaction with oxygenated water, and the dissolution of Fe and Mn oxide-hydroxides testified the mineralization of the abundant organic matter present in finesediments, with consequent increase in NH4
+, Fe, Mn, and also As in deep groundwater.
5. Recommendations
This work highlights the need of structuring a nationally (or even over-national)consistent geochemical database that provides baseline information on the abundance, tem-poral, and spatial variation of chemical elements in groundwater allowing a comprehensiveoverview of the entire groundwater resources that go beyond the regional or nationalborders. For these reasons the outcomes of this study should be used in the future forpaving the road toward a shared analytical protocol between all the stakeholders involvedin groundwater management aiming at developing a long-term groundwater monitoringplan that goes beyond the administrative regions or national borders. The final scope mustbe an integrated and homogeneous monitoring plan able to continuously highlight thestatus of wide and complex aquifer systems, like the one presented in this paper.
This could represent a significant added value to the knowledge that has been achievedover the years, by reducing the organizational and administrative fragmentation of water

Appl. Sci. 2022, 12, 7944 21 of 25
data platforms and local entities, and by bringing significant benefits to the consultationand management processes. However, the process could be quite expensive and timeconsuming because the implementation would require costs in terms of data managementsystems, data repositories and portals, as well as sharing analytical methods, data validationand processing by the different local environmental agencies in charge of the activities(ARPAs) or even between bordering Countries.
The main limits highlighted by this study have been in converting, reformatting,combining, and preserving disparate geochemical data (not homogenous analytical poolsof metals and compounds, different D.L.s and CRSs, lack of metadata, missing data, etc.,)stored in different archives. It is necessary that the environmental data provided by thedifferent local agencies (or bordering Countries) are homogeneous, consistent in samplecollection protocols, analytical methods used, and number of analyzed elements, especiallyregarding trace elements. Long time-series of water quality observations, based on regularcollection and processing, remain critically important for an integrated management ofwater resources.
Supplementary Materials: The following supporting information can be downloaded at: https://www.mdpi.com/article/10.3390/app12157944/s1, Table S1: Parameters monitored in the Re-gions; Table S2: Number of total analyzed water samples and % of data after the validation andcleaning processes; Table S3: Descriptive statistics of the database; Table S4: Comparison betweencold and warm seasons databases for confined and semi-confined aquifers; Table S5: Compari-son between cold and warm seasons database for phreatic aquifers; Figure S1: NO3
− distribution;Figure S2. Mn distribution.
Author Contributions: Conceptualization: B.M.S.G. and E.D.; methodology: C.O. and E.D.; valida-tion, B.M.S.G., N.G. and B.C.; formal analysis: C.O. and E.D.; data curation: B.M.S.G., N.G., B.C. andE.D.; writing—original draft preparation, B.M.S.G. and C.O.; writing—review and editing: B.M.S.G.,N.G., B.C. and E.D.; supervision: E.D. All authors have read and agreed to the published version ofthe manuscript.
Funding: This research received no external funding.
Acknowledgments: The authors would like to thank the Regional Agency for Prevention, Environ-ment and Energy of Piedmont, Lombardy, Veneto, Friuli-Venezia Giulia, and Emilia-Romagna forproviding the datasets and technical support.
Conflicts of Interest: The authors declare no conflict of interest.
References1. Sugg, Z. Social Barriers to Open (Water) Data. WIREs Water 2022, 9, e1564. [CrossRef]2. Qiu, W.; Ma, T.; Wang, Y.; Cheng, J.; Su, C.; Li, J. Review on Status of Groundwater Database and Application Prospect in
Deep-Time Digital Earth Plan. Geosci. Front. 2022, 13, 101383. [CrossRef]3. Vetrò, A.; Canova, L.; Torchiano, M.; Minotas, C.O.; Iemma, R.; Morando, F. Open Data Quality Measurement Framework:
Definition and Application to Open Government Data. Gov. Inf. Q. 2016, 33, 325–337. [CrossRef]4. Burt, T.P.; Howden, N.J.K.; Worrall, F. On the Importance of Very Long-term Water Quality Records. WIREs Water 2014, 1, 41–48.
[CrossRef]5. Normattiva. Decreto Legislativo 3 Aprile 2006, n. 152 Norma in Materia Ambientale. Normattiva. 2006. Available online:
https://www.normattiva.it/uri-res/N2Ls?urn:nir:stato:decreto.legislativo:2006-04-03;152 (accessed on 12 February 2022).6. Water Framework Directive (WFD). 2000, pp. 1–73. Available online: https://eur-lex.europa.eu/legal-content/EN/TXT/?uri=
CELEX:32000L0060 (accessed on 14 February 2022).7. Appelo, C.A.J.; Postma, D. Geochemistry, Groundwater and Pollution; Appelo, C.A.J., Postma, D., Eds.; CRC Press: Boca Raton, FL,
USA, 2004; ISBN 978-0-429-15232-0.8. Greggio, N.; Giambastiani, B.M.S.; Mollema, P.; Laghi, M.; Capo, D.; Gabbianelli, G.; Antonellini, M.; Dinelli, E. Assessment of the
Main Geochemical Processes Affecting Surface Water and Groundwater in a Low-Lying Coastal Area: Implications for WaterManagement. Water 2020, 12, 1720. [CrossRef]
9. Winter, T.C.; Harvey, J.W.; Franke, O.L.; Alley, W.M. Ground Water and Surface Water—A Single Resource; U.S. Geological SurveyCircular 1139; U.S. Geological Survey: Reston, VA, USA, 1998; ISBN 0-607-89339-7.
10. Kharraz, J.E.; El-Sadek, A.; Ghaffour, N.; Mino, E. Water Scarcity and Drought in WANA Countries. Procedia Eng. 2012, 33, 14–29.[CrossRef]

Appl. Sci. 2022, 12, 7944 22 of 25
11. Wu, W.-Y.; Lo, M.-H.; Wada, Y.; Famiglietti, J.S.; Reager, J.T.; Yeh, P.J.-F.; Ducharne, A.; Yang, Z.-L. Divergent Effects of ClimateChange on Future Groundwater Availability in Key Mid-Latitude Aquifers. Nat. Commun. 2020, 11, 3710. [CrossRef]
12. El Osta, M.; Niyazi, B.; Masoud, M. Groundwater Evolution and Vulnerability in Semi-Arid Regions Using Modeling and GISTools for Sustainable Development: Case Study of Wadi Fatimah, Saudi Arabia. Environ. Earth Sci. 2022, 81, 248. [CrossRef]
13. Zittis, G.; Hadjinicolaou, P.; Klangidou, M.; Proestos, Y.; Lelieveld, J. A Multi-Model, Multi-Scenario, and Multi-Domain Analysisof Regional Climate Projections for the Mediterranean. Reg. Environ. Chang. 2019, 19, 2621–2635. [CrossRef]
14. Bruno, L.; Bohacs, K.M.; Campo, B.; Drexler, T.M.; Rossi, V.; Sammartino, I.; Scarponi, D.; Hong, W.; Amorosi, A. Early HoloceneTransgressive Palaeogeography in the Po Coastal Plain (Northern Italy). Sedimentology 2017, 64, 1792–1816. [CrossRef]
15. Dinelli, E.; Lucchini, F. Sediment Supply to the Adriatic Sea Basin from the Italian Rivers: Geochemical Features and Environmen-tal Constraints. G. Geol. 1999, 61, 121–132.
16. Amorosi, A.; Centineo, M.C.; Dinelli, E.; Lucchini, F.; Tateo, F. Geochemical and Mineralogical Variations as Indicators ofProvenance Changes in Late Quaternary Deposits of SE Po Plain. Sediment. Geol. 2002, 151, 273–292. [CrossRef]
17. Lugli, S.; Bassetti, M.A.; Manzi, V.; Barbieri, M.; Longinelli, A.; Roveri, M. The Messinian ‘Vena Del Gesso’ Evaporites Revisited:Characterization of Isotopic Composition and Organic Matter. Geol. Soc. Lond. Spec. Publ. 2007, 285, 179–190. [CrossRef]
18. Castiglioni, G.B. Geomorphology of the Po Plain. Geogr. Fis. E Din. Quat. 1999, 7–20.19. Pieri, M.; Groppi, G. Subsurface Geological Structure of the Po Plain, Italy. Progett. Final. Geodin. 1981, 414, 1–23.20. Picotti, V.; Pazzaglia, F.J. A New Active Tectonic Model for the Construction of the Northern Apennines Mountain Front near
Bologna (Italy): Active construction Apennines front. J. Geophys. Res. 2008, 113, B08412. [CrossRef]21. Bigi, G.; Cosentino, D.; Parotto, M.; Sartori, R.; Scandone, P. CNR Structural Model of Italy. Scale 1:500.000, Sheets I-II-III-IV; Selca
Publisher: Firenze, Italy, 1990.22. Ori, G.G. Continental Depositional Systems of the Quaternary of the Po Plain (Northern Italy). Sediment. Geol. 1993, 83, 1–14.
[CrossRef]23. Ricci Lucchi, F.; Colalongo, M.L.; Cremonini, G.; Gasperi, G.; Iaccarino, S.; Papani, G.; Raffi, I.; Rio, D. Evoluzione Sedimentaria
e Paleogeografica Del Margine Appenninico. In Guida Alla Geologia del Margine Appenninico-Padano, Guide Geologiche Regionali;Cremonini, G., Ricci Lucchi, F., Eds.; Societa Geologiche Italiana: Bologna, Italy, 1982.
24. Amorosi, A.; Pavesi, M.; Ricci Lucchi, M.; Sarti, G.; Piccin, A. Climatic Signature of Cyclic Fluvial Architecture from the Quaternaryof the Central Po Plain, Italy. Sediment. Geol. 2008, 209, 58–68. [CrossRef]
25. Amorosi, A.; Colalongo, M.L.; Fiorini, F.; Fusco, F.; Pasini, G.; Vaiani, S.C.; Sarti, G. Palaeogeographic and Palaeoclimatic Evolutionof the Po Plain from 150-Ky Core Records. Glob. Planet. Chang. 2004, 40, 55–78. [CrossRef]
26. Campo, B.; Bruno, L.; Amorosi, A. Basin-Scale Stratigraphic Correlation of Late Pleistocene-Holocene (MIS 5e-MIS 1) Strata acrossthe Rapidly Subsiding Po Basin (Northern Italy). Quat. Sci. Rev. 2020, 237, 106300. [CrossRef]
27. Massari, F.; Rio, D.; Serandrei Barbero, R.; Asioli, A.; Capraro, L.; Fornaciari, E.; Vergerio, P.P. The Environment of Venice Area inthe Past Two Million Years. Palaeogeogr. Palaeoclimatol. Palaeoecol. 2004, 202, 273–308. [CrossRef]
28. Fontana, A.; Mozzi, P.; Bondesan, A. Late Pleistocene Evolution of the Venetian–Friulian Plain. Rend. Fis. Acc. Lincei 2010,21, 181–196. [CrossRef]
29. Amorosi, A.; Bruno, L.; Campo, B.; Costagli, B.; Dinelli, E.; Hong, W.; Sammartino, I.; Vaiani, S.C. Tracing Clinothem Geometryand Sediment Pathways in the Prograding Holocene Po Delta System through Integrated Core Stratigraphy. Basin Res. 2020,32, 206–215. [CrossRef]
30. Bruno, L.; Piccin, A.; Sammartino, I.; Amorosi, A. Decoupled Geomorphic and Sedimentary Response of Po River and Its AlpineTributaries during the Last Glacial/Post-Glacial Episode. Geomorphology 2018, 317, 184–198. [CrossRef]
31. Fontana, A.; Mozzi, P.; Bondesan, A. Alluvial Megafans in the Venetian–Friulian Plain (North-Eastern Italy): Evidence ofSedimentary and Erosive Phases during Late Pleistocene and Holocene. Quat. Int. 2008, 189, 71–90. [CrossRef]
32. Fontana, A.; Mozzi, P.; Marchetti, M. Alluvial Fans and Megafans along the Southern Side of the Alps. Sediment. Geol. 2014,301, 150–171. [CrossRef]
33. Amorosi, A.; Farina, M.; Severi, P.; Preti, D.; Caporale, L.; Di Dio, G. Genetically Related Alluvial Deposits across Active FaultZones: An Example of Alluvial Fan-Terrace Correlation from the Upper Quaternary of the Southern Po Basin, Italy. Sediment.Geol. 1996, 102, 275–295. [CrossRef]
34. Brandolini, F.; Carrer, F. Assessing the Role of Alluvial Geomorphology for Late-Holocene Settlement Strategies (Po Plain–NItaly) through Point Pattern Analysis. Environ. Archaeol. 2021, 26, 511–525. [CrossRef]
35. Campo, B.; Bohacs, K.M.; Amorosi, A. Late Quaternary Sequence Stratigraphy as a Tool for Groundwater Exploration: Lessonsfrom the Po River Basin (Northern Italy). Bulletin 2020, 104, 681–710. [CrossRef]
36. Amorosi, A.; Pavesi, M. Memorie Descrittive della Carta Geologica d’Italia; ISPRA: Rome, Italy, 2009; pp. 7–20.37. Bersezio, R.; Bini, A.; Felletti, F. Il Quaternario; 2004; pp. 361–378.38. De Luca, D.A.; Lasagna, M.; Debernardi, L. Hydrogeology of the Western Po Plain (Piedmont, NW Italy). J. Maps 2020, 16, 265–273.
[CrossRef]39. Regione Emilia-Romagna. ENI-AGIP Riserve Idriche Sotterranee della Regione Emilia-Romagna; S.EL.CA: Firenze, Italy, 1998.40. Regione Lombardia. ENI-AGIP Geologia Degli Acquiferi Padani della Regione Lombardia; S.EL.CA: Firenze, Italy, 2002.41. Fabbri, P.; Piccinini, L. Assessing Transmissivity from Specific Capacity in an Alluvial Aquifer in the Middle Venetian Plain (NE
Italy). Water Sci. Technol. 2013, 67, 2000–2008. [CrossRef]

Appl. Sci. 2022, 12, 7944 23 of 25
42. Martinelli, G.; Dadomo, A.; De Luca, D.A.; Mazzola, M.; Lasagna, M.; Pennisi, M.; Pilla, G.; Sacchi, E.; Saccon, P. Nitrate Sources,Accumulation and Reduction in Groundwater from Northern Italy: Insights Provided by a Nitrate and Boron Isotopic Database.Appl. Geochem. 2018, 91, 23–35. [CrossRef]
43. Giambastiani, B.M.S.; Colombani, N.; Mastrocicco, M.; Fidelibus, M.D. Characterization of the Lowland Coastal Aquifer ofComacchio (Ferrara, Italy): Hydrology, Hydrochemistry and Evolution of the System. J. Hydrol. 2013, 501, 35–44. [CrossRef]
44. Giambastiani, B.M.; Colombani, N.; Mastrocicco, M. Multilevel characterization of vertical hydraulic gradients, permeability,temperature and salinity in shallow coastal aquifers with low pressure packers. In Proceedings of the 22nd Salt Water IntrusionMeeting: Salt Water Intrusion in Aquifers: Challenges and Perspectives, Cagliari, Italy; 2012; pp. 140–143.
45. Mastrocicco, M.; Giambastiani, B.M.S.; Severi, P.; Colombani, N. The Importance of Data Acquisition Techniques in SaltwaterIntrusion Monitoring. Water Resour. Manag. 2012, 26, 2851–2866. [CrossRef]
46. Vorlicek, P.A.; Antonelli, R.; Fabbri, P.; Rausch, R. Quantitative Hydrogeological Studies of the Treviso Alluvial Plain, NE Italy. Q.J. Eng. Geol. Hydrogeol. 2004, 37, 23–29. [CrossRef]
47. De Luca, D.A.; Destefanis, E.; Forno, M.G.; Lasagna, M.; Masciocco, L. The Genesis and the Hydrogeological Features of the TurinPo Plain Fontanili, Typical Lowland Springs in Northern Italy. Bull. Eng. Geol. Env. 2014, 73, 109–427. [CrossRef]
48. Fumagalli, N.; Senes, G.; Ferrario, P.S.; Toccolini, A. A Minimum Indicator Set for Assessing Fontanili (Lowland Springs) of theLombardy Region in Italy. Eur. Countrys. 2017, 9, 1–16. [CrossRef]
49. D.Lgs 30/09 Attuazione Della Direttiva 2006/118/CE, Relativa Alla Protezione Delle Acque Sotterranee Dall’inquinamento e DalDeterioramento. Off. Gaz. 2009. Available online: https://www.normattiva.it/uri-res/N2Ls?urn:nir:stato:decreto.legislativo:2009-03-16;30 (accessed on 20 February 2022).
50. D.M. 260/10 Regolamento Recante i Criteri Tecnici per La Classificazione Dello Stato Dei Corpi Idrici Superficiali; Ministero Dell’ambientee della Tutela del Territorio e del Mare: Rome, Italy, 2011.
51. Helsel, D.R.; Hirsch, R.M. Statistical Methods in Water Resources. In Techniques of Water-Resources Investigations of the United StatesGeological Survey; Hydrologic Analysis and Interpretation; U.S. Geological Survey: Reston, VA, USA, 2022; Book 4.
52. Harter, T. Nondetects and Data Analysis: Statistics for Censored Environmental Data. Vadose Zone J. 2006, 5, 508–509. [CrossRef]53. Lee, L.; Helsel, D. Statistical Analysis of Water-Quality Data Containing Multiple Detection Limits II: S-Language Software for
Nonparametric Distribution Modeling and Hypothesis Testing. Comput. Geosci. 2007, 33, 696–704. [CrossRef]54. Kruskal, W.H. A Nonparametric Test for the Several Sample Problem. Ann. Math. Statist. 1952, 23, 525–540. [CrossRef]55. Kruskal, W.H.; Wallis, W.A. Use of Ranks in One-Criterion Variance Analysis. J. Am. Stat. Assoc. 1952, 47, 583–621. [CrossRef]56. Langelier, W.F.; Ludwig, H.F. Graphical Methods for Indicating the Mineral Character of Natural Waters. J. Am. Water Work Assoc.
1942, 34, 335–352. [CrossRef]57. Antonellini, M.; Mollema, P.; Giambastiani, B.; Bishop, K.; Caruso, L.; Minchio, A.; Pellegrini, L.; Sabia, M.; Ulazzi, E.; Gabbianelli,
G. Salt Water Intrusion in the Coastal Aquifer of the Southern Po Plain, Italy. Hydrogeol. J. 2008, 16, 1541–1556. [CrossRef]58. Colombani, N.; Mastrocicco, M.; Giambastiani, B.M.S. Predicting Salinization Trends in a Lowland Coastal Aquifer: Comacchio
(Italy). Water Resour. Manag. 2015, 29, 603–618. [CrossRef]59. Giambastiani, B.M.S.; Kidanemariam, A.; Dagnew, A.; Antonellini, M. Evolution of Salinity and Water Table Level of the Phreatic
Coastal Aquifer of the Emilia Romagna Region (Italy). Water 2021, 13, 372. [CrossRef]60. De Waele, J.; Piccini, L.; Columbu, A.; Madonia, G.; Vattano, M.; Calligaris, C.; D’Angeli, I.; Parise, M.; Chiesi, M.; Sivelli, M.; et al.
Evaporite Karst in Italy: A Review. IJS 2017, 46, 137–168. [CrossRef]61. Conti, A.; Sacchi, E.; Chiarle, M.; Martinelli, G.; Zuppi, G.M. Geochemistry of the Formation Waters in the Po Plain (Northern
Italy): An Overview. Appl. Geochem. 2000, 15, 51–65. [CrossRef]62. Pilla, G.; Sacchi, E.; Zuppi, G.; Braga, G.; Ciancetti, G. Hydrochemistry and Isotope Geochemistry as Tools for Groundwater
Hydrodynamic Investigation in Multilayer Aquifers: A Case Study from Lomellina, Po Plain, South-Western Lombardy, Italy.Hydrogeol. J. 2006, 14, 795–808. [CrossRef]
63. Martelli, G.; Granati, C. Hydrochemical general characteristics of the Friuli Plain’s deep aquifers (Northern Italy). Ital. J. Eng.Geol. Environ. 2010, 1, 79–92. [CrossRef]
64. Golubic, S.; Schneider, J. Chapter 2.4 Carbonate Dissolution. In Studies in Environmental Science; Elsevier: Amsterdam, TheNetherlands, 1979; Volume 3, pp. 107–129. ISBN 978-0-444-41745-9.
65. Piana, F.; Fioraso, G.; Irace, A.; Mosca, P.; d’Atri, A.; Barale, L.; Falletti, P.; Monegato, G.; Morelli, M.; Tallone, S.; et al. Geology ofPiemonte Region (NW Italy, Alps–Apennines Interference Zone). J. Maps 2017, 13, 395–405. [CrossRef]
66. Dal Piaz, G.V. The Italian Alps: A journey across two centuries of Alpine geology. The Geology of Italy: Tectonics and life alongplate margins. J. Virtual Explor. 2010, 36, 77–106. [CrossRef]
67. Manzi, V.; Lugli, S.; Lucchi, F.R.; Roveri, M. Deep-Water Clastic Evaporites Deposition in the Messinian Adriatic Foredeep(Northern Apennines, Italy): Did the Mediterranean Ever Dry Out? Sedimentology 2005, 52, 875–902. [CrossRef]
68. Pilla, G.; Sacchi, E.; Gerbert-Gaillard, L.; Zuppi, G.M.; Peloso, G.F.; Ciancetti, G.G. Origine e distribuzione dei nitrati in falda nellaPianura Padana occidentale (Province di Novara, Alessandria e Pavia). Geol. Appl. 2005, 2, 144–150.
69. Martinelli, G.; Chahoud, A.; Dadomo, A.; Fava, A. Isotopic Features of Emilia-Romagna Region (North Italy) Groundwaters:Environmental and Climatological Implications. J. Hydrol. 2014, 519, 1928–1938. [CrossRef]

Appl. Sci. 2022, 12, 7944 24 of 25
70. Mollema, P.N.; Antonellini, M.; Dinelli, E.; Gabbianelli, G.; Greggio, N.; Stuyfzand, P.J. Hydrochemical and Physical ProcessesInfluencing Salinization and Freshening in Mediterranean Low-Lying Coastal Environments. Appl. Geochem. 2013, 34, 207–221.[CrossRef]
71. Mastrocicco, M.; Colombani, N. The Issue of Groundwater Salinization in Coastal Areas of the Mediterranean Region: A Review.Water 2021, 13, 90. [CrossRef]
72. Deng, Y.; Wang, Y.; Ma, T. Isotope and Minor Element Geochemistry of High Arsenic Groundwater from Hangjinhouqi, the HetaoPlain, Inner Mongolia. Appl. Geochem. 2009, 24, 587–599. [CrossRef]
73. Jiang, Y.; Wu, Y.; Groves, C.; Yuan, D.; Kambesis, P. Natural and Anthropogenic Factors Affecting the Groundwater Quality in theNandong Karst Underground River System in Yunan, China. J. Contam. Hydrol. 2009, 109, 49–61. [CrossRef] [PubMed]
74. Huang, G.; Sun, J.; Zhang, Y.; Chen, Z.; Liu, F. Impact of Anthropogenic and Natural Processes on the Evolution of GroundwaterChemistry in a Rapidly Urbanized Coastal Area, South China. Sci. Total Environ. 2013, 463–464, 209–221. [CrossRef]
75. Vanzetti, C.; Gianoglio, N.; Sesia, E. ARPA Piemonte. Studio sulla Contaminazione Diffusa da Solventi Clorurati nelle AcqueSotterranee 2016. Available online: https://www.arpa.piemonte.it/approfondimenti/temi-ambientali/acqua/acque-sotterranee/studio-sulla-contaminazione-diffusa-da-solventi-clorurati-nelle-acque-sotterranee (accessed on 1 March 2022).
76. Margiotta, S.; Mongelli, G.; Summa, V.; Paternoster, M.; Fiore, S. Trace Element Distribution and Cr(VI) Speciation in Ca-HCO3and Mg-HCO3 Spring Waters from the Northern Sector of the Pollino Massif, Southern Italy. J. Geochem. Explor. 2012, 115, 1–12.[CrossRef]
77. Morrison, J.M.; Goldhaber, M.B.; Mills, C.T.; Breit, G.N.; Hooper, R.L.; Holloway, J.M.; Diehl, S.F.; Ranville, J.F. Weathering andTransport of Chromium and Nickel from Serpentinite in the Coast Range Ophiolite to the Sacramento Valley, California, USA.Appl. Geochem. 2015, 61, 72–86. [CrossRef]
78. Chiogna, G.; Skrobanek, P.; Narany, T.S.; Ludwig, R.; Stumpp, C. Effects of the 2017 Drought on Isotopic and GeochemicalGradients in the Adige Catchment, Italy. Sci. Total Environ. 2018, 645, 924–936. [CrossRef]
79. Giuliano, G. Ground Water in the Po Basin: Some Problems Relating to Its Use and Protection. Sci. Total Environ. 1995, 171, 17–27.[CrossRef]
80. Soana, E.; Racchetti, E.; Laini, A.; Bartoli, M.; Viaroli, P. Soil Budget, Net Export, and Potential Sinks of Nitrogen in the LowerOglio River Watershed (Northern Italy). Clean Soil Air Water 2011, 39, 956–965. [CrossRef]
81. Lasagna, M.; De Luca, D.A.; Franchino, E. Nitrate Contamination of Groundwater in the Western Po Plain (Italy): The Effects ofGroundwater and Surface Water Interactions. Environ. Earth Sci. 2016, 75, 240. [CrossRef]
82. Rotiroti, M.; Bonomi, T.; Sacchi, E.; McArthur, J.M.; Stefania, G.A.; Zanotti, C.; Taviani, S.; Patelli, M.; Nava, V.; Soler, V.; et al. TheEffects of Irrigation on Groundwater Quality and Quantity in a Human-Modified Hydro-System: The Oglio River Basin, Po Plain,Northern Italy. Sci. Total Environ. 2019, 672, 342–356. [CrossRef]
83. Viaroli, P.; Soana, E.; Pecora, S.; Laini, A.; Naldi, M.; Fano, E.A.; Nizzoli, D. Space and Time Variations of Watershed N and PBudgets and Their Relationships with Reactive N and P Loadings in a Heavily Impacted River Basin (Po River, Northern Italy).Sci. Total Environ. 2018, 639, 1574–1587. [CrossRef] [PubMed]
84. D.Lgs 31/01 Attuazione Della Direttiva 98/83/CE Relativa Alla Qualità Delle Acque Destinate al Consumo Umano. Off. Gaz.2001. Available online: https://web.camera.it/parlam/leggi/deleghe/01031dl.htm (accessed on 2 March 2022).
85. ARPAV. Le Acque Sotterranee Della Pianura Veneta-I Risultati Del Progetto SAMPAS; ARPAV: Venice, Italy, 2008.86. ARPAE. Valutazione dello Stato delle Acque Sotterranee 2014; ARPAE: Casalecchio Di Reno, Italy, 2018.87. Mastrocicco, M.; Giambastiani, B.M.S.; Colombani, N. Ammonium Occurrence in a Salinized Lowland Coastal Aquifer (Ferrara,
Italy). Hydrol. Processes. 2013, 27, 3495–3501. [CrossRef]88. Azadi, A.; Baghernejad, M.; Gholami, A.; Shakeri, S. Forms and Distribution Pattern of Soil Fe (Iron) and Mn (Manganese) Oxides
Due to Long-Term Rice Cultivation in Fars Province Southern Iran. Commun. Soil Sci. Plant Anal. 2021, 52, 1894–1911. [CrossRef]89. Zhai, Y.; Cao, X.; Xia, X.; Wang, B.; Teng, Y.; Li, X. Elevated Fe and Mn Concentrations in Groundwater in the Songnen Plain,
Northeast China, and the Factors and Mechanisms Involved. Agronomy 2021, 11, 2392. [CrossRef]90. Rotiroti, M.; Fumagalli, L.; Bonomi, T. Come gestire potenziali contaminazioni da As, Fe e Mn nelle acque sotterranee della bassa
Pianura Padana: Una proposta dal caso studio di Cremona. Acque Sotter.-Ital. J. Groundw. 2014, 2, 9–16. [CrossRef]91. Postma, D.; Larsen, F.; Minh Hue, N.T.; Duc, M.T.; Viet, P.H.; Nhan, P.Q.; Jessen, S. Arsenic in Groundwater of the Red River
Floodplain, Vietnam: Controlling Geochemical Processes and Reactive Transport Modeling. Geochim. Cosmochim. Acta 2007,71, 5054–5071. [CrossRef]
92. Guo, H.; Zhang, D.; Wen, D.; Wu, Y.; Ni, P.; Jiang, Y.; Guo, Q.; Li, F.; Zheng, H.; Zhou, Y. Arsenic Mobilization in Aquifersof the Southwest Songnen Basin, P.R. China: Evidences from Chemical and Isotopic Characteristics. Sci. Total Environ. 2014,490, 590–602. [CrossRef]
93. Carraro, A.; Fabbri, P.; Giaretta, A.; Peruzzo, L.; Tateo, F.; Tellini, F. Effects of Redox Conditions on the Control of Arsenic Mobilityin Shallow Alluvial Aquifers on the Venetian Plain (Italy). Sci. Total Environ. 2015, 532, 581–594. [CrossRef] [PubMed]
94. Rotiroti, M.; Jakobsen, R.; Fumagalli, L.; Bonomi, T. Arsenic Release and Attenuation in a Multilayer Aquifer in the Po Plain(Northern Italy): Reactive Transport Modeling. Appl. Geochem. 2015, 63, 599–609. [CrossRef]
95. Miola, A.; Bondesan, A.; Corain, L.; Favaretto, S.; Mozzi, P.; Piovan, S.; Sostizzo, I. Wetlands in the Venetian Po Plain (NortheasternItaly) during the Last Glacial Maximum: Interplay between Vegetation, Hydrology and Sedimentary Environment. Rev. Palaeobot.Palynol. 2006, 141, 53–81. [CrossRef]

Appl. Sci. 2022, 12, 7944 25 of 25
96. Rotiroti, M.; McArthur, J.; Fumagalli, L.; Stefania, G.A.; Sacchi, E.; Bonomi, T. Pollutant Sources in an Arsenic-Affected MultilayerAquifer in the Po Plain of Italy: Implications for Drinking-Water Supply. Sci. Total Environ. 2017, 578, 502–512. [CrossRef]
97. Carraro, A.; Fabbri, P.; Giaretta, A.; Peruzzo, L.; Tateo, F.; Tellini, F. Arsenic Anomalies in Shallow Venetian Plain (Northeast Italy)Groundwater. Environ. Earth Sci 2013, 70, 3067–3084. [CrossRef]
98. ARPAE. Valori di Fondo Naturale di Arsenico Negli Acquiferi Profondi di Pianura per Classificare lo Stato Chimico delle Acque Sotterranee;ARPAE: Casalecchio Di Reno, Italy, 2012.