Porous Alginate Hydrogels: Synthetic Methods for Tailoring the Porous Texture
Upload
independentCategory
view
2download
0
RESEARCH PAPER
A microgrooved membrane based gas–liquid contactor
Jigar M. Jani • Matthias Wessling •
Rob G. H. Lammertink
Received: 5 January 2012 / Accepted: 11 April 2012 / Published online: 9 May 2012
� The Author(s) 2012. This article is published with open access at Springerlink.com
Abstract This research presents an approach for applying
microgrooved membranes for improved gas–liquid con-
tacting. The study involves analysis of the performance of
the microdevice by quantifying the flux enhancement for
different membrane configurations. Two kinds of configu-
rations, continuous and non-continuous grooves, were
investigated. The microgrooves provide shear-free gas–
liquid interfaces, which result in local slip velocity at the
gas–liquid interface. Exploiting this physical phenomenon,
it is possible to reduce mass transport limitations in gas–
liquid contacting. An experimental study using grooved
membranes suggests enhancement in flux up to 20–30 %.
The flux enhancement at higher liquid flow rates is
observed due to a partial shear-free gas–liquid interface.
The performance of the membrane devices decreased with
wetted microgrooves due to the mass transport limitations.
The flow visualization experiments reveal wetting of the
microgrooves at higher liquid flow rates. According to the
numerical and experimental study, we have shown that
microgrooved membranes can be employed to improve
gas–liquid contacting processes.
Keywords Micropatterned membrane � Slip flow �Flux enhancement � Gas–liquid systems
1 Introduction
Microfluidic systems offer a number of advantages such as
enhanced heat and mass transfer intensifying many chem-
ical and biological processes (Hessel et al. 2005; Jensen.
2001; Jahnisch et al. 2004). Numerous studies have been
performed regarding multiphase flows (at micro- and
nanoscale) for important applications in the field of
microfluidic devices (Kreutzer et al. 2005; Heiszwolf et al.
2001; Gervais and Jensen 2006; Shao et al. 2009; Atencia
and Beebe 2004; Squires and Quake 2005). The mass
transfer limitations present in single-phase flow can be
reduced by introducing an additional immiscible fluid.
Such multiphase systems induce recirculation motion in
the liquid stream that enhanced mixing. An important
field of application for these systems considers gas–liquid
contacting/reactions (Gunther and Jensen 2006). For
gas–liquid reactions, often multiphase systems are employed
to achieve fast mixing, lower mass transfer limitations and
better control over reaction conditions (Hessel et al. 2005).
The flow behavior at the microscale is considerably
different than that in macroscopic flows. The fluid flow at
the microscale can be characterized by high surface-
to-volume ratios. Due to their characteristic sub-millimeter
dimensions (50–500 lm) the flow is mainly laminar (Re *1–100) and mixing proceeds via diffusion dominantly.
There have been many attempts to enhance mixing in
the microchannel using active and passive micromixers
(Stroock et al. 2002; Liu et al. 2002; Stone et al. 2004;
Kamholz et al. 1999).
Active mixing can be achieved by creating instabilities
in the flow field (Nguyen and Wu. 2005), pressure fluctu-
ations (Fujii et al. 2003), thermal power (Mao et al. 2002),
electrokinetic forces (Oddy et al. 2001), and ultrasonic
actuation (Yang et al. 2001). Active micromixers have
J. M. Jani � M. Wessling � R. G. H. Lammertink (&)
Soft Matter, Fluidics and Interfaces, MESA? Institute for
Nanotechnology, University of Twente, Enschede, The
Netherlands
e-mail: [email protected]
123
Microfluid Nanofluid (2012) 13:499–509
DOI 10.1007/s10404-012-0987-6
several disadvantages like using external power and com-
plexity in terms of device fabrication, operation and
maintenance. Passive micromixers, on the other hand,
utilize no additional power other than the principle pressure
drop used for the fluid flow. They accomplish mixing due
to formation of flow features induced by geometrical fea-
tures of the microchannel. One approach to achieve passive
mixing is using splitting and recombining which combines
two streams flowing from opposite direction (Bothe et al.
2006). Another way of achieving mixing makes use of
specifically oriented grooves to generate vortices (Stroock
et al. 2002; Bessoth et al. 1999). The twisted microchan-
nels generate curvature induced secondary flows for mixing
(Liu et al. 2002;Austinand Seader. 1973; Jiang et al. 2004
Sudarsan and Ugaz 2005 Howell et al. 2004). All these
configurations aim for simple yet efficient mixing in the
shortest microchannel distance possible.
The flow dynamics along microgrooved superhydro-
phobic surfaces has been studied extensively (Oner and
McCarthy 2000 Torkkeli et al. 2001 Kim and Kim 2002
Bico et al. 2002 Belyaev and Vinogradova 2010; Sbraga-
glia and Prosperetti 2007;Vinogradova and Belyaev 2011).
The frictional resistance offered by such interfaces can be
dramatically reduced. The textured surfaces consist of
microscale alternating grooves or posts. The hydropho-
bicity prevents liquid from wetting the grooves and entraps
air in the cavity. The gas phase exhibits a much lower
viscosity compared to the liquid resulting in interfacial slip
velocities (Vinogradova and Belyaev 2011). There has
been a lot of work performed, experimentally and numer-
ically, on characterizing this drop in drag using micro-
channels with superhydrophobic surfaces (Ou et al. 2007;
Ou and Rothstein 2005). Sbragaglia and Prosperetti (2007)
studied effects of surface deformation caused by pressure
difference along the gas–liquid interface, on wetting of
superhydrophobic surface consisting of grooves. They also
reported a mathematical model that predicts effective slip
length for flow conditions with curved gas–liquid inter-
faces. Maynes et al. (2007) showed experimental and
numerical results for laminar flow through a microchannel
with superhydrophobic surfaces incorporating grooves
aligned parallel to the flow direction. Their numerical
predictions showed that the effective slip length increases
with increasing relative cavity width and depth. Hassell and
Zimmerman (2006) studied numerically the flow through
staggered herringbone micromixer (SHM) to characterize
the effect of grooves on the fluid flow in the channel for Re
ranging 0–15. Belyaev and Vinogradova (2010) derived
equations describing longitudinal and transverse directional
effective slip lengths for various surface slip fractions and
orientations.
There are many examples where membranes can be used
for gas–liquid contacting utilizing porous hydrophobic
membranes (De Jong et al. 2007). Since the gas phase is in
contact with the liquid phase along the device, exchange of
mass between the two phases is possible. Microgrooves
over such membranes gives rise to slip velocities along the
gas–liquid interface (Tsai et al. 2009).
As mentioned above, many attempts have been made to
achieve lower drag over gas–liquid interfaces using dif-
ferent microgrooved designs. Transport of gas into the
liquid using porous membrane microfluidic devices is often
limited by small diffusivities of the species involved. The
use of microgrooves on hydrophobic surface can be an
interesting approach to achieve enhanced transport through
porous walls. Here we describe the concept of microgro-
oved membranes for gas–liquid contacting that allows the
investigation of fluid flow and mass transfer in various
membrane configurations.
2 Experimental
2.1 Membrane fabrication
The microgrooved membranes studied in this work were
fabricated using conventional phase-separation micro-
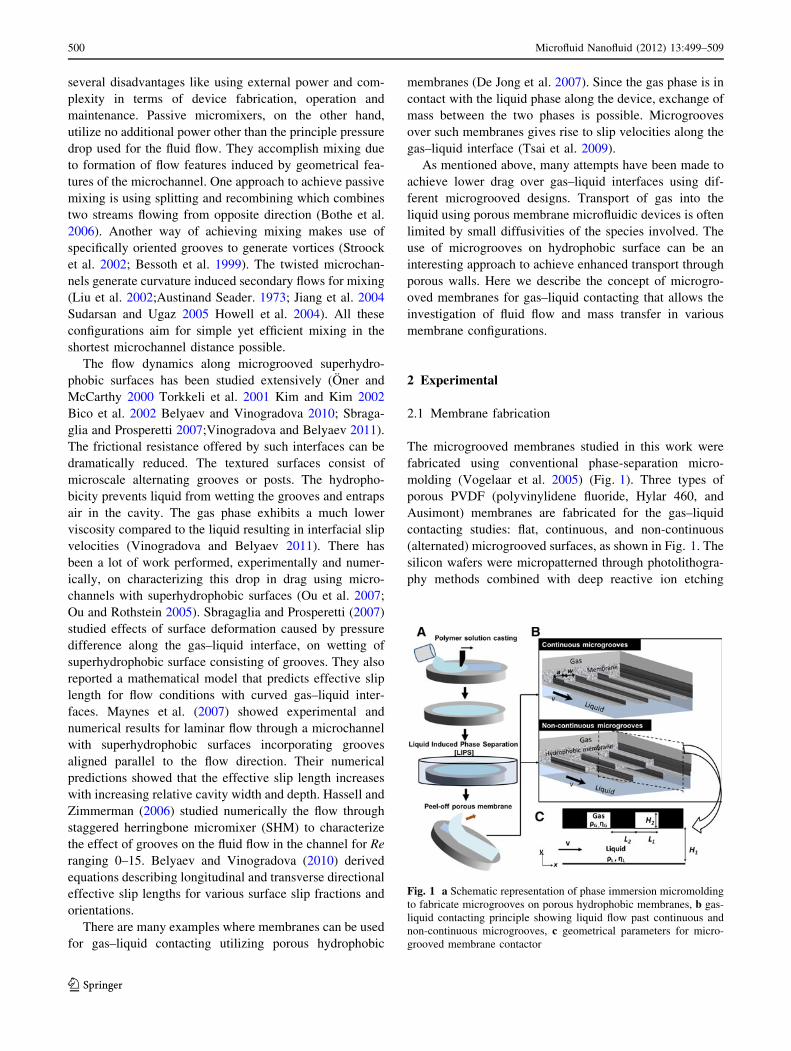
molding (Vogelaar et al. 2005) (Fig. 1). Three types of
porous PVDF (polyvinylidene fluoride, Hylar 460, and
Ausimont) membranes are fabricated for the gas–liquid
contacting studies: flat, continuous, and non-continuous
(alternated) microgrooved surfaces, as shown in Fig. 1. The
silicon wafers were micropatterned through photolithogra-
phy methods combined with deep reactive ion etching
Fig. 1 a Schematic representation of phase immersion micromolding
to fabricate microgrooves on porous hydrophobic membranes, b gas-
liquid contacting principle showing liquid flow past continuous and
non-continuous microgrooves, c geometrical parameters for micro-
grooved membrane contactor
500 Microfluid Nanofluid (2012) 13:499–509
123
(DRIE) in cleanroom facilities. Two types of microgrooves
were obtained on the molds:
– Mold I: Grooves with a width of 25 lm, a height of
40 lm, a spacing of 75 lm and a length of 50 mm.
– Mold II: as Mold I, but the groove is shifted 50 lm to
the side after every 2 mm.
A solution of 20 wt% PVDF in NMP (1-methyl-2-pyr-
rolidinone, 99 % extra pure, Acros) was prepared by
mixing with a mechanical stirrer for 12 h at 70 �C. The
polymer solution was then degassed for about 24 h at room
temperature. Homogeneous and stable polymer solutions
were cast on molds at controlled thicknesses (every
100 lm between 100 and 800 lm). Immediately after
casting, the solution together with the microstructured
mold was immersed in a coagulation bath consisting of
pure ethanol (proanalysis grade, Merck) for 30 min. The
membrane separates from the mold after a few minutes.
The porous membrane was then taped to a glass plate to
prevent it from curling and left to dry in the fume hood
overnight. The porous PVDF membrane replicates the
microgrooves on the mold. Due to shrinkage during phase
separation and drying, the dimensions of the PVDF mi-
crochannels are slightly smaller than those on the mold.
2.2 Device fabrication
The porous membranes were incorporated in a gas–liquid
contacting module consisting of two poly-methyl methac-
rylate (PMMA) plates. In these PMMA plates, separate gas
and liquid microchannels were created with a CNC-mill
(Sherline Inc.). The porous membrane is placed between
these plates separating the gas and liquid channel. The
liquid channel has a width and depth of 1 mm and a length
of 5 cm. The gas channel is made wider and longer on both
sides to assure complete coverage of the liquid channel by
the porous membrane. Polyether ether ketone (PEEK)
tubings (0.75 mm ID) and fittings (0.75 mm ID) from
Upchurch Scientific were used for the connections.
2.3 Gas–liquid contacting in various configurations
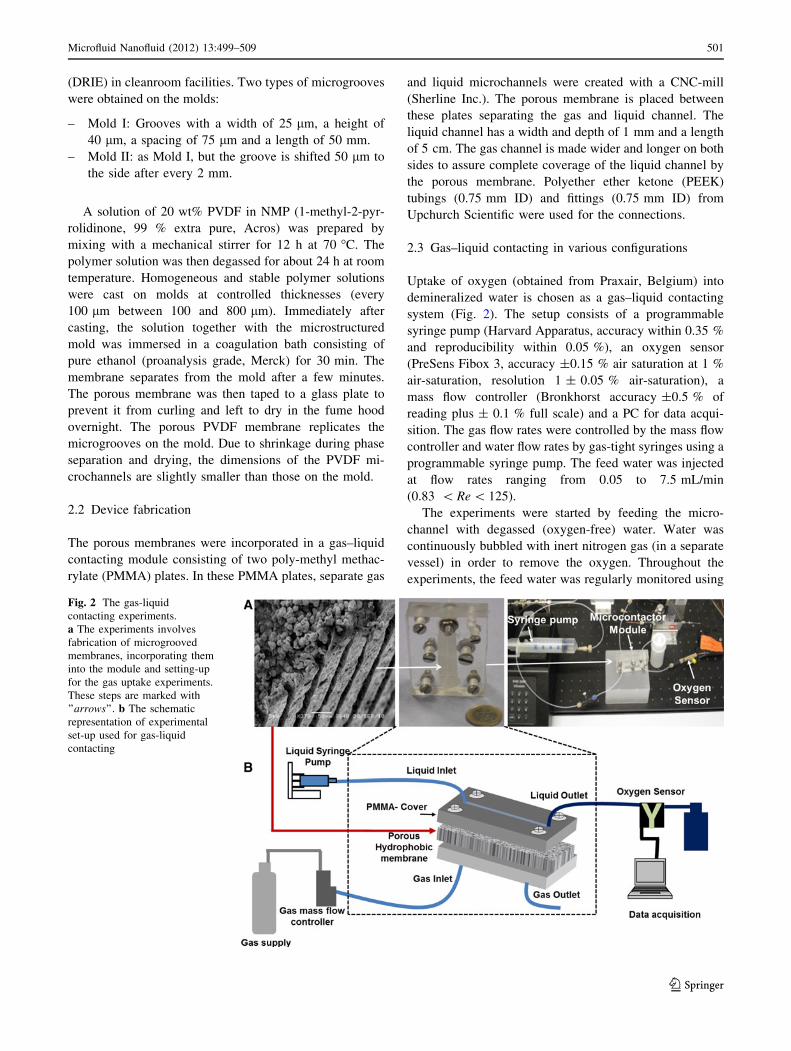
Uptake of oxygen (obtained from Praxair, Belgium) into
demineralized water is chosen as a gas–liquid contacting
system (Fig. 2). The setup consists of a programmable
syringe pump (Harvard Apparatus, accuracy within 0.35 %
and reproducibility within 0.05 %), an oxygen sensor
(PreSens Fibox 3, accuracy ±0.15 % air saturation at 1 %
air-saturation, resolution 1 ± 0.05 % air-saturation), a
mass flow controller (Bronkhorst accuracy ±0.5 % of
reading plus ± 0.1 % full scale) and a PC for data acqui-
sition. The gas flow rates were controlled by the mass flow
controller and water flow rates by gas-tight syringes using a
programmable syringe pump. The feed water was injected
at flow rates ranging from 0.05 to 7.5 mL/min
(0.83 \ Re \ 125).
The experiments were started by feeding the micro-
channel with degassed (oxygen-free) water. Water was
continuously bubbled with inert nitrogen gas (in a separate
vessel) in order to remove the oxygen. Throughout the
experiments, the feed water was regularly monitored using
Fig. 2 The gas-liquid
contacting experiments.
a The experiments involves
fabrication of microgrooved
membranes, incorporating them
into the module and setting-up
for the gas uptake experiments.
These steps are marked with
’’arrows’’. b The schematic
representation of experimental
set-up used for gas-liquid
contacting
Microfluid Nanofluid (2012) 13:499–509 501
123
the oxygen sensor to verify an oxygen-free inlet. To attain
a stable gas–liquid interface during the experiments, the
gas was supplied at a fixed pressure and the liquid flow rate
was gradually increased until bubbles disappeared at the
liquid-side of the microchannel. For higher liquid flow
rates, the gas pressure required to establish a well-defined
interface also increased. The oxygen concentration was
measured for the exiting liquid when steady state was
obtained.
The driving force for oxygen transfer varies with the
axial position in the module. An expression for the overall
oxygen flux at the microchannel outlet, Noi , can be
expressed by,
Nio ¼
ZvxðyÞCðyÞdy
H1Wð1Þ
where, vx(y) and C(y) are liquid flow rate and oxygen
concentration in the liquid, respectively, and Noi represents
outlet flux for corresponding microfluidic module (flat or
microgrooved membrane contactor). Liquid channel height
and width are denoted as H1 and W, respectively. The
experiments were carried out at ambient pressure and
temperature.
2.4 Characterization
The morphology and dimensions of the porous membrane
structures were analyzed by scanning electron microscope
(SEM, JSM 5600LV, JEOL). The porous membranes were
broken in liquid nitrogen for cross-section analysis. The
membrane top surfaces and cross-sections were sputtered
with a 30 nm gold layer (SCD040, Balzers Union).
Contact angles of the porous membrane structures are
measured with an optical contact angle apparatus (OCA 20,
Dataphysics). The water droplet of 5 lL is suspended on
the surface with a speed of 2 lm/s. After initial stabiliza-
tion of the droplet, the contact angle is measured.
An aqueous methylene blue (MB) solution (&200 mg/L)
was prepared and pumped through the liquid inlet for a
minimum time of 5 min, in order to visualize the wetting
behavior. After that, the membranes were taken out and
allowed to dry for 3–4 h and examined by optical micros-
copy (Zeiss Axiovert 40).
2.5 Micro particle image velocimetry
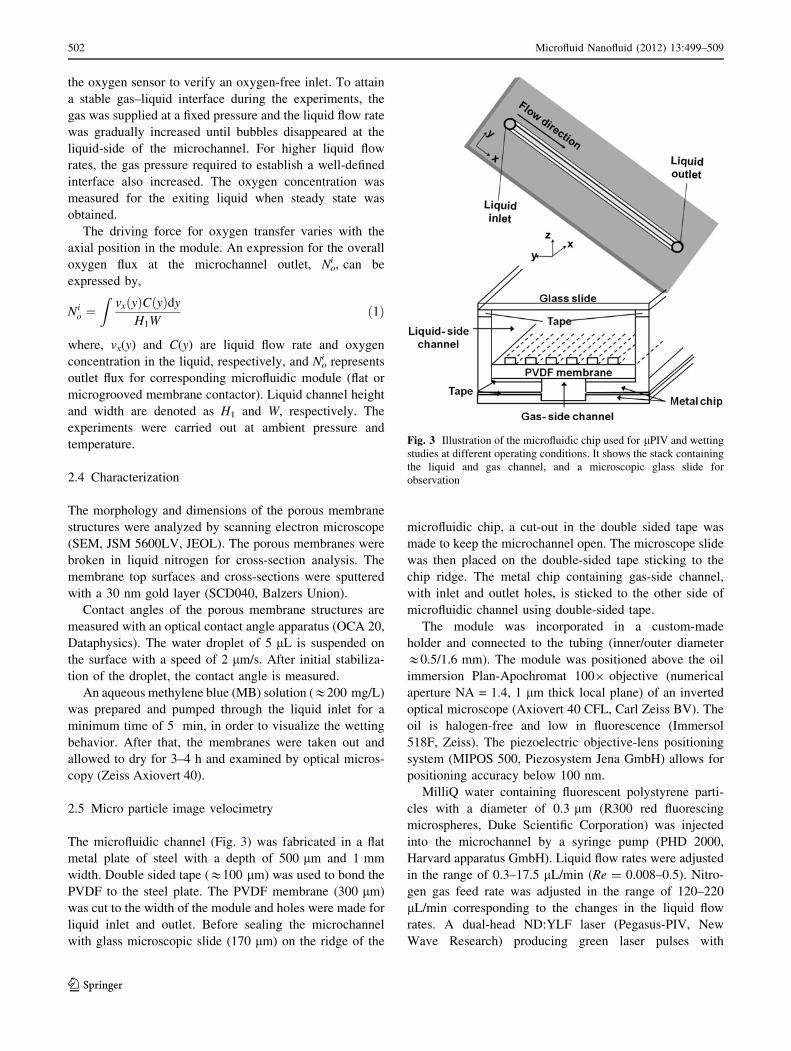
The microfluidic channel (Fig. 3) was fabricated in a flat
metal plate of steel with a depth of 500 lm and 1 mm
width. Double sided tape (&100 lm) was used to bond the
PVDF to the steel plate. The PVDF membrane (300 lm)
was cut to the width of the module and holes were made for
liquid inlet and outlet. Before sealing the microchannel
with glass microscopic slide (170 lm) on the ridge of the
microfluidic chip, a cut-out in the double sided tape was
made to keep the microchannel open. The microscope slide
was then placed on the double-sided tape sticking to the
chip ridge. The metal chip containing gas-side channel,
with inlet and outlet holes, is sticked to the other side of
microfluidic channel using double-sided tape.
The module was incorporated in a custom-made
holder and connected to the tubing (inner/outer diameter
&0.5/1.6 mm). The module was positioned above the oil
immersion Plan-Apochromat 1009 objective (numerical
aperture NA = 1.4, 1 lm thick local plane) of an inverted
optical microscope (Axiovert 40 CFL, Carl Zeiss BV). The
oil is halogen-free and low in fluorescence (Immersol
518F, Zeiss). The piezoelectric objective-lens positioning
system (MIPOS 500, Piezosystem Jena GmbH) allows for
positioning accuracy below 100 nm.
MilliQ water containing fluorescent polystyrene parti-
cles with a diameter of 0.3 lm (R300 red fluorescing
microspheres, Duke Scientific Corporation) was injected
into the microchannel by a syringe pump (PHD 2000,
Harvard apparatus GmbH). Liquid flow rates were adjusted
in the range of 0.3–17.5 lL/min (Re = 0.008–0.5). Nitro-
gen gas feed rate was adjusted in the range of 120–220
lL/min corresponding to the changes in the liquid flow
rates. A dual-head ND:YLF laser (Pegasus-PIV, New
Wave Research) producing green laser pulses with
Fig. 3 Illustration of the microfluidic chip used for lPIV and wetting
studies at different operating conditions. It shows the stack containing
the liquid and gas channel, and a microscopic glass slide for
observation
502 Microfluid Nanofluid (2012) 13:499–509
123
wavelength 527 nm was used to illuminate the particles.
An external pulse delay generator (Model 565, Berkley
Nucleonics Corporation) was used to trigger the laser. The
time between two pulses is typically 6–15 ms depending
on the flow rate. A high-speed charge-coupled device
camera (Sensicam, PCO), fit with a 1/2 or 19 lens adapter,
was used for imaging. The measurement principle includ-
ing a sketch of the set-up was described previously (Pirat
et al. 2008).
After every measurement 200 image pairs were pro-
cessed with DaVis imaging software (version 7.2.2.152,
LaVision). To obtain time-average velocity profiles, a
homemade lPIV post-processing sequence was run in
Matlab R2007b (Pirat et al. 2008).
3 Numerical simulation
The momentum and mass balance equations were solved
simultaneously under steady-state and laminar flow con-
ditions to study hydrodynamics and mass transport.
A three-dimensional model of a straight channel (5 mm
long) was considered for flat and microgrooved mem-
branes. The width of the microgroove and microridge are
denoted as a and w, respectively. For non-continuous
microgrooved membranes, the length and depth of the
groove are denoted as L1 and H2, the liquid microchannel
height is H1 and the distance between two consecutive
grooves (in flow direction) is denoted as L2. For the
numerical simulation, the following properties were con-
sidered: the density (qL and qG) and viscosity (gL and gG) of
the liquid are similar to water and oxygen (1,000 kg m-3,
0.001 Pa s and 1.4 kg m-3, 1 9 10-7 Pa s, respectively), a
maximum concentration of oxygen in water (saturation
point at standard conditions) of 40 mg/L and a diffusion
coefficient of oxygen in water of 1.9 9 10-9 m2 s-1.
In order to obtain a mathematically accurate model, the
following assumption was made:
1. No mass transfer resistance in the membrane.
2. Flat G–L meniscus for non-wetted condition.
3. Any other forces (gravitational and surface tension
forces) are not considered.
The incompressible fluid flow of gas and liquid over a
microgrooved membrane is governed by the Navier–Stokes
equations:
qðv � rÞv ¼ �rPþ gr2v ð2Þ
together with the continuity equation:
r � v ¼ 0 ð3Þ
Here, q is the density, P is the pressure, g is the viscosity
and v is the velocity vector for the respective phases.
The mass balance equation involving convection and
diffusion in the liquid is described as:
Dr2CL ¼ v � rCL ð4Þ
where D is the diffusion coefficient and CL is the oxygen
concentration in water. The relative importance of
diffusion is indicated by the Peclet number, defined as:
Pe ¼ UL
Dð5Þ
where U, L, and D correspond to the velocity, characteristic
length scale, and the diffusion coefficient, respectively. A
fully developed laminar flow profile has been implemented
at the microchannel inlet and the outlet is kept at normal
pressure. There will be zero gas concentration at the
microchannel inlet and convective flux will be implemented
at the outlet boundary. The microchannel walls (solid–
liquid) are ‘‘no-slip’’ boundaries.
vx ¼ vy ¼ 0; for all solid-liquid interfaces ð6Þ
Along the membrane surface (y = H1), both gas–liquid and
liquid–solid interface can apply (depends on continuous or
non-continuous microgrooves). A gas–liquid interface is
described as a shear-free boundary (velocity of gas and
liquid at the interface are equal):
vx ¼ vix;g ¼ vi
x;l ð7Þ
where vx,gi and vx,l
i represents gas and liquid interface
velocity in x-direction, respectively.
Three-dimensional simulations were performed to
investigate the hydrodynamic flow field and mass transport
using finite element modeling (COMSOL Multiphysics).
The model solves the momentum balance equation (incom-
pressible Navier–Stokes) coupled with the mass balance
equation (species convection-diffusion). The numerical
results were obtained after performing mesh size depen-
dency analysis. The size of the grid cells for all the 3D
models in this study resulted in the range of 0.6–5.8 lm
approximately for a mesh density in the range of 37–150
thousand triangular cells (Lagrange type p2,p1) for the total
computational domain. The geometrical dimensions of the
microgrooves are identical to the observed micropattern
dimensions mentioned in Table 1.
Table 1 Dimensions of different features of microgrooved mem-
brane (continuous and non-continuous)
Mold (lm) Membrane (lm) Shrinkage (%)
Groove width 25 24 4
Groove height 40 38 5
Ridge width 75 48 36
Microfluid Nanofluid (2012) 13:499–509 503
123
4 Results and discussion
4.1 Characterization of the porous membrane
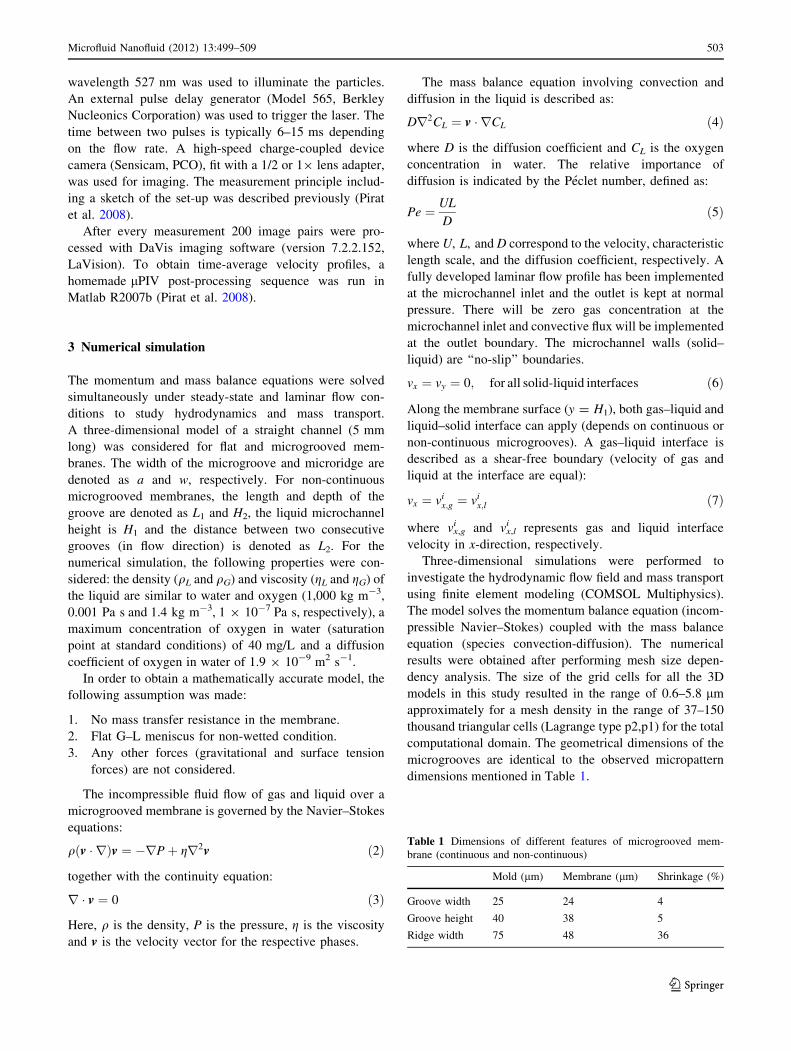
Figure 4 shows the SEM images of the surface and cross-
section of the microgrooved membranes. SEM images of
various structures in PVDF membranes provide insight in
the morphology (i.e., porosity, roughness and porous
structure) and dimensions of the membrane microgrooves.
The features of the mold are very well represented on the
PVDF membranes.
Figure 4a shows the SEM images of flat PVDF mem-
branes in different magnifications. Porous membranes have
narrow pore size distribution with average pore size of
7.4 ± 0.7 lm (obtained from SEM images). The mem-
branes are highly porous and contain inter-connected pores.
The continuous microgrooved membrane is shown in
Fig. 4b, which demonstrates that micropatterns from the
mold are nicely replicated in the membranes. A closer look
at the structures revealed that the distance between the
grooves (50 lm) is slightly smaller than the one on the mold
(75 lm). This is due to the shrinkage during the phase
inversion process (Vogelaar et al. 2005). Table 1 shows the
average values of the dimensions of PVDF membranes.
Compared to Peters (2008), the shrinkage values are
found to be somewhat lower and pores have a more open
structure. Since all conditions were kept the same except
for the coagulation bath (in this work pure ethanol is used
instead of 50:50 wt% water:NMP), the differences in the
membrane structure are attributed to the phase-separation
step. The non-continuous microgrooved membrane can be
seen in Fig. 4c. The dimensions of the non-continuous
microgrooved membranes are similar to the dimensions of
continuous microgrooves.
The water contact angle for the flat membrane was
measured to be 128.2 ± 3.4 �. The measured contact
angles for these PVDF membranes are higher than previous
work from Peters (2008), which is due to the difference in
membrane structure.
4.2 Gas uptake in a membrane microcontactor
Figure 5 presents the outlet oxygen concentration for a
continuously microgrooved membrane for both experiments
Fig. 4 SEM images of the channels in porous PVDF membrane.
a Microporous flat PVDF surface. b Continuous microgrooved PVDF
membrane surface with 24 lm width, 38 lm depth and 48 lm
ridge width. c Non-continuous microgrooved PVDF membrane
surface with 24 lm width, 38 lm depth, 2 mm length and 48 lm
ridge width
504 Microfluid Nanofluid (2012) 13:499–509
123

and simulations (oxygen saturation concentration is 40 mg/L
at 25 �C and 1 bar). For low Re (below 5), the liquid gets
saturated almost completely. The measured oxygen con-
centrations were slightly different compared to the simulated
concentrations at high and low liquid flow rates. These dif-
ferences are due to the experimental error caused by the
oxygen sensor sensitivity.
The measured oxygen uptake when using flat and
microgrooved membranes allow to calculate the flux
enhancement (E):
E ¼ ðNmo � Nf
oÞNf
o
ð8Þ
where Nom and No
f are the outlet flux for microgrooved and
flat membrane, respectively.
The flux enhancement for a continuous microgrooved
membrane compared to a flat membrane is shown in Fig. 6.
The results, both from the numerical model and oxygen
absorption experiments, show higher oxygen absorption for
the microgrooved membrane compared to the flat mem-
brane. It can be seen from the plot that the experimental
flux enhancement increases sharply after Re = 50. This
increase in flux enhancement can be explained due to
enhanced mass transfer caused by an increased gas–liquid
interface velocity (slip condition). The numerical results
also show reasonable agreement with the experimental
observations.
Interestingly, during subsequent decreasing Re experi-
ments, hysteresis was observed. The flux enhancement was
much lower for Re in the range of 50 to 75. The hysteresis
could be explained by wetting of the grooves at higher
Reynolds number. This causes a change in the oxygen
diffusion length and consequently reduces the oxygen mass
transfer rate. The influence of microgroove wetting on the
performance of the membrane module was studied numer-
ically as well (Fig. 6). The numerical simulation results
display a reduced flux enhancement (for Re C 50) due to
wetting of the grooves.
Figure 7 illustrates the flux enhancement for a non-con-
tinuous and a continuous microgrooved membrane. The
enhancement in flux for non-continuous grooves is approx-
imately 20–30 % for Reynolds number higher than 75. Due
to perturbations in the shear-free interface velocity, dis-
placements perpendicular to the flow direction appear. These
Fig. 5 Outlet oxygen concentration against Re for continuous
microgrooved membrane module; experimental values are shown in
symbols and simulation values are shown in line
Fig. 6 Flux enhancement versus Re for continuous microgrooved
membrane module. The values are shown for increasing and
decreasing Reynolds number. The experimental values are shown in
dots and simulation values are shown in line
Fig. 7 Flux enhancement versus Re for continuous and non-contin-
uous microgrooved membrane module. The values are shown for
increasing Reynolds number
Microfluid Nanofluid (2012) 13:499–509 505
123

displacements generate convective flow near the gas
absorbing porous wall, which leads to enhanced gas uptake
compared to a continuously microgrooved membrane.
4.3 Details of the gas-liquid interface
Non-wetted grooves give rise to local slip velocities and to
validate results with analytical model (Philip 1972), we
have to consider two important geometric parameters for
the different configurations: the microgroove width (a) and
microridge width (w). The cavity fraction is represented by
a/d (shown in Fig. 1), where d = a ? w. Philip showed
that for fully developed laminar flow through a parallel-
plate channel and with a vanishing shear-stress at the gas-
liquid interface, the slip-length, b, can be expressed as:
b
d¼ 1
pln
1
cos ad
p2
� �" #
ð9Þ
With Eq. (9), it is possible to quantify slip-length
characteristics with a single curve, which allows
validation of our numerical results for the limiting case
of zero shear-stress at the gas-liquid interface.
The overall shear stress at the gas-liquid interface is
strongly dependent on the ridge and groove widths. The
effective slip length is calculated from the numerical
results and plotted against the microgroove width (Fig. 8).
The analytic solution of Philip given by Eq. (9) is also
presented. The numerical results show very good agree-
ment with the solution from Philip, not surprisingly as both
assume a flat gas-liquid meniscus. However, for high
a/d, there is little deviation (lower values than analytical
model) of slip length from Philip’s formula which can be
due to violation of a perfect slip assumption. This can
further be validated from the previous work of Belyaev and
Vinogradova (Belyaev and Vinogradova, 2010) that shows
decreasing effective slip lengths when local slip becomes
on the order of the groove period.
To investigate the oxygen absorption in water using
different membranes (continuous and non-continuous mi-
crogrooves), numerical simulations were performed at flow
rates ranging from 0.83 \ Re \ 125. The oxygen concen-
tration and fluid flows were investigated to verify our
experimental observations. Two different cases were con-
sidered: wetted and non-wetted under different flow
conditions.
The outlet oxygen concentration vary with the liquid
flow rate due to changes in the Peclet number. Typical
numerical simulation results for continuous microgrooved
membranes, with and without wetting are shown in Fig. 9.
In the wetted microgrooves, the average velocity can be
calculated from the velocity profile and it is required to
determine Pe for various inlet Re. For Re = 0.83 (0.05
lL/min) and 125 (17.5 lL/min), values of Pe are 0.24 and
0.11, respectively, which suggests wetted microgrooves
offer mass transfer resistance to oxygen uptake in water.
Fig. 8 Numerical results showing values of dimensionless slip length
b/d as a function of the dimensionless microgroove width. The results
are compared with the analytical expression for b/d, from literature
(Philip 1972) represented by Eq. (9)
Fig. 9 The numerical
simulations showing
concentration profiles in a
channel with two test cases:
wetted and non-wetted mode
(Re = 25, D = 1.9 9 10-9 m2/s
for 25 lm groove width and
40 lm groove height). The
oxygen concentration in the
microgrooves is shown in
selected inset images
506 Microfluid Nanofluid (2012) 13:499–509
123

4.4 Flow along microgrooved membranes
To investigate the effect of the liquid flow rate on the
membrane microgroove wetting, an aqueous methylene
blue (MB) solution was pumped through the microchannel
for 5 min with increasing flow rates. After every step
change in flow rate, the MB stained membrane was taken
out and observed by optical microscopy (Fig. 10). The
same procedure was followed for decreasing Reynolds
numbers.
As shown in Fig. 10 a and c, the water flowing above the
microgrooves remains in the Cassie-Baxter state for low
flow rates where the differential pressure across the gas-
liquid interface has not reached the wetting pressure.
However, when the differential pressure exceeds the wet-
ting pressure, water penetrates into the grooves (Wenzel
state) (Fig. 10b, d). The observation of water wetting
the grooves explains the hysteresis behavior in flux
enhancement.
Micro-PIV measurements were performed at liquid flow
rates ranging from 0.3-17.5 lL/min (0.008 \ Re \ 0.5).
These conditions resulted in completely non-wetted and
wetted grooves for lower and higher flow rates, respec-
tively. Figures 11a and b show the plots containing infor-
mation about the velocity profiles for two different flow
rates (5 and 17.5 lL/min) at the same observation plane
(5 lm from the micropattern ridge). For low liquid flow
rates (Fig. 11a), the grooves are gas filled and a shear-free
interface is realized giving enhanced liquid velocity.
Fig. 10 Optical microscope
images of the membranes
showing wetting of the grooves.
a Continuous grooves at low
liquid flow rate (Re = 8.30)
showing liquid remaining in the
non-wetted (Cassie-Baxter)
state. b Continuous grooves at
high liquid flow rate (Re =
120.83) showing wetting of the
grooves. c Non-continuous
microgrooved membrane
surface with low liquid flow rate
(Re = 8.30). d Non-continuous
microgrooved membrane
surface with high liquid flow
rate (Re = 120.83) showing
wetting of the grooves
Fig. 11 a MicroPIV results showing one frame visualizing the flow
(5 lL/min) over a microgrooved PVDF membrane surface at a height
z = 5 lm from the microgroove ridge (top) and the time- and space-
averaged velocities in x-direction extracted from this (bottom).
b Particle velocity profile at a flow rate of 17.5 lL/min showing
little difference in water velocity over microgrooves and microridges
(top) and time- and space-averaged velocities (bottom)
Microfluid Nanofluid (2012) 13:499–509 507
123

Figure 11a (bottom) shows the averaged velocity in
x-direction for each position along the y-axis (vx(y)) at a
given height z (5 lm). It displays near zero liquid velocity
above the microgroove ridge and a liquid velocity of
40 lm/s above the gas filled groove.
The velocity of water flowing over wetted microgrooves
(Fig. 11b) is not significantly higher than the velocity of
water flowing over microridges. The completely wetted
membrane surface (Wenzel state) is also observed during the
experiments. The higher averaged liquid velocity (Fig. 11b
bottom) is observed due to the higher liquid flow rate.
5 Conclusions
The main goal of this work was to design a microgrooved
membrane for gas-liquid contacting that was easy to fab-
ricate, efficient and simple. This work presents a system
which can be employed in effective gas-liquid contacting.
By this approach, it is possible to reduce the mass transport
limitations commonly observed in conventional gas-liquid
contacting system. An enhancement in flux up to 20–30 %
has been observed. The liquid flow patterns and wetting
behavior of the porous microgrooved hydrophobic mem-
branes have been analysed experimentally and numerically.
The flux in grooved membrane is enhanced at higher liquid
flow rates due to slip flow at the gas-liquid interface.
However when the microgrooves are wetted the mass
transport decreases. Microgrooved membranes offer a
promising alternative to conventional membranes because
of a significant enhancement in constituent transport. The
experiments also show the limits of the flow regimes
characterized by observing the position of gas-liquid
interface. According to both the numerical simulations and
experimental observations of gas-liquid contacting, we
have shown that it is possible to increase the gas uptake by
merely structuring the membrane surface.
Acknowledgments This work was financially supported by Stich-
ting voor de Technische Wetenschappen (STW, Project 07569) in The
Netherlands. The authors also greatly acknowledge Elif Karatay
(SFI/TNW) for mold preparation and Alvaro Gomez Marin (POF/
TNW) for lPIV analysis and technical support.
Open Access This article is distributed under the terms of the
Creative Commons Attribution License which permits any use, dis-
tribution, and reproduction in any medium, provided the original
author(s) and the source are credited.
References
Atencia J, Beebe D (2004) Controlled microfluidic interfaces. Nat
Biotechnol 437(7059):648–655
Austin L, Seader J (1973) Fully developed viscous flow in coiled
circular pipes. AIChE J 19(1):85–94
Belyaev A, Vinogradova O (2010) Effective slip in pressure-driven
flow past super-hydrophobic stripes. J Fluid Mech 652:
489–499
Bessoth F, deMello A, Manz A (1999) Microstructure for efficient
continuous flow mixing. Anal Commun 36(6):213–215
Bico J, Thiele U, Quere D (2002) Wetting of textured surfaces.
Colloids Surf, A 206(1–3):41–46
Bothe D, Stemich C, Warnecke H (2006) Fluid mixing in a T-shaped
micro-mixer. Chem Eng Sci 61(9):2950–2958
De Jong J, Geerken M, Lammertink R, Wessling M (2007) Porous
microfluidic devices–fabrication and applications. Chem Eng
Technol 30(3):309–315
Fujii T, Sando Y, Higashino K, Fujii Y (2003) A plug and play
microfluidic device. Lab Chip 3(3):193–197
Gervais T, Jensen K (2006) Mass transport and surface reactions in
microfluidic systems. Chem Eng Sci 61(4):1102–1121
Gunther A, Jensen K (2006) Multiphase microfluidics: from flow
characteristics to chemical and materials synthesis. Lab Chip
6(12):1487–1503
Hassell D, Zimmerman W (2006) Investigation of the convective
motion through a staggered herringbone micromixer at low
reynolds number flow. Chem Eng Sci 61(9):2977–2985
Heiszwolf J, Kreutzer M, van den Eijnden M, Kapteijn F, Moulijn J
(2001) Gas-liquid mass transfer of aqueous taylor flow in
monoliths. Catal Today 69(1-4):51–55
Hessel V, Angeli P, Gavriilidis A, Lowe H (2005) Gas-liquid and gas-
liquid-solid microstructured reactors: contacting principles and
applications. Ind Eng Chem Res 44(25):9750–9769
Hessel V, Lowe H, Schonfeld F (2005) Micromixers: a review on
passive and active mixing principles. Chem Eng Sci
60:2479–2501
Howell P, Mott D, Golden J, Ligler F (2004) Design and evaluation of
a Dean vortex-based micromixer. Lab Chip 4:663–669
Jahnisch K, Hessel V, Lowe H, Baerns M (2004) Chemistry in
microstructured reactors. Angew Chem Int Ed 43(4):406–446
Jensen K (2001) Microreaction engineering—is small better. Chem
Eng Sci 56(2):293–303
Jiang F, Drese K, Hardt S, Kupper M, Schonfeld F (2004) Helical
flows and chaotic mixing in curved micro channels. AIChE J
50(9):2297–2305
Kamholz A, Weigl B, Finlayson B, Yager P (1999) Quantitative
analysis of molecular interaction in a microfluidic channel: the
T-sensor. Anal Chem 71(23):5340–5347
Kim J, Kim C (2002) Nanostructured surfaces for dramatic reduction
of flow resistance in droplet-based microfluidics. In: Micro
Electro Mechanical Systems, 2002. The Fifteenth IEEE Interna-
tional Conference on IEEE, pp 479–482
Kreutzer M, Kapteijn F, Moulijn J, Kleijn C, Heiszwolf J (2005)
Inertial and interfacial effects on pressure drop of taylor flow in
capillaries. AIChE J 51(9):2428–2440
Liu R, Stremler M, Sharp K, Olsen M, Santiago J, Adrian R, Aref H,
Beebe D (2002) Passive mixing in a three-dimensional serpen-
tine microchannel. J Microelectromech Syst 9(2):190–197
Mao H, Yang T, Cremer P (2002) A microfluidic device with a linear
temperature gradient for parallel and combinatorial measure-
ments. J Am Chem Soc 124(16):4432–4435
Maynes D, Jeffs K, Woolford B, Webb B (2007) Laminar flow in a
microchannel with hydrophobic surface patterned microribs
oriented parallel to the flow direction. Phys Fluids 19:093,603
Nguyen N, Wu Z (2005) Micromixers-a review. J Micromech
Microeng 15:R1
Oddy M, Santiago J, Mikkelsen J (2001) Electrokinetic instability
micromixing. Anal Chem 73(24):5822–5832
Oner D, McCarthy T (2000) Ultrahydrophobic surfaces. Effects of
topography length scales on wettability. Langmuir 16(20):7777–
7782
508 Microfluid Nanofluid (2012) 13:499–509
123
Ou J, Rothstein J (2005) Direct velocity measurements of the flow
past drag-reducing ultrahydrophobic surfaces. Phys Fluids
17:103–606
Ou J, Moss G, Rothstein J (2007) Enhanced mixing in laminar flows
using ultrahydrophobic surfaces. Phys Rev E 76(1):16–304
Peters A (2008) Micro-patterned interfaces affecting transport
through and along membranes. PhD thesis
Philip J (1972) Flows satisfying mixed no-slip and no-shear
conditions. Zeitschrift fur Angewandte Mathematik und Physik
(ZAMP) 23(3):353–372
Pirat C, Naso A, Van Der Wouden E, Gardeniers J, Lohse D, Van Den
Berg A (2008) Quantification of electrical field-induced flow
reversal in a microchannel. Lab Chip 8(6):945–949
Sbragaglia M, Prosperetti A (2007) A note on the effective slip
properties for microchannel flows with ultrahydrophobic sur-
faces. Phys Fluids 19:043–603
Shao N, Gavriilidis A, Angeli P (2009) Flow regimes for adiabatic
gas-liquid flow in microchannels. Chem Eng Sci 64(11):
2749–2761
Squires T, Quake S (2005) Microfluidics: Fluid physics at the
nanoliter scale. Rev Mod Phys 77(3):977
Stone H, Stroock A, Ajdari A (2004) Engineering flows in small
devices. Annu Rev Fluid Mech 36:381–411
Stroock A, Dertinger S, Ajdari A, Mezic I, Stone H, Whitesides G
(2002) Chaotic mixer for microchannels. Sci Agric 295(5555):647
Sudarsan A, Ugaz V (2005) Fluid mixing in planar spiral micro-
channels. Lab Chip 6(1):74–82
Torkkeli A, Saarilahti J, Haara A, Harma H, Soukka T, Tolonen P
(2001) Electrostatic transportation of water droplets on super-
hydrophobic surfaces. In: Micro Electro Mechanical Systems,
2001 (MEMS 2001). The 14th IEEE International Conference on
IEEE, pp 475–478
Tsai P, Peters A, Pirat C, Wessling M, Lammertink R, Lohse D
(2009) Quantifying effective slip length over micropatterned
hydrophobic surfaces. Phys Fluids 21:112–002
Vinogradova O, Belyaev A (2011) Wetting, roughness and flow
boundary conditions. J Phys: Condens Matter 23:184–104
Vogelaar L, Lammertink R, Barsema J, Nijdam W, Bolhuis-Versteeg
L, Van Rijn C, Wessling M (2005) Phase separation micro-
molding: a new generic approach for microstructuring various
materials. Small Bus Econ 1(6):645–655
Yang Z, Matsumoto S, Goto H, Matsumoto M, Maeda R (2001)
Ultrasonic micromixer for microfluidic systems. Sens Actuators
A Phys 93(3):266–272
Microfluid Nanofluid (2012) 13:499–509 509
123
Copyright © 2022 FDOKUMEN