Development and Characterization of PMMA Based Porous ...
73
1 Development and Characterization of PMMA Based Porous Materials Used for High Pressure Casting of Sanitaryware Ceramics By Yelda ERGÜN A Dissertation Submitted to the Graduate School in Partial Fulfillment of the Requirements for the Degree of MASTER OF SCIENCE Department: Materials Science and Engineering Major: Materials Science and Engineering Izmir Institute of Technology Izmir, Turkey July, 2004
-
Upload
khangminh22 -
Category
Documents
-
view
1 -
download
0
Transcript of Development and Characterization of PMMA Based Porous ...

1
Development and Characterization of PMMA Based
Porous Materials Used for High Pressure Casting of
Sanitaryware Ceramics
By
Yelda ERGÜN
A Dissertation Submitted to the Graduate School in Partial Fulfillment of the
Requirements for the Degree of
MASTER OF SCIENCE
Department: Materials Science and Engineering Major: Materials Science and Engineering
Izmir Institute of Technology Izmir, Turkey
July, 2004

2
We approve the thesis of Yelda ERGÜN Date of Signature
Assoc.Prof.Dr. Metin TANOĞLU
Supervisor
Department of Mechanical Engineering
Prof.Dr. Muhsin ÇİFTÇİOĞLU
Co-Supervisor
Head of Interdisciplinary Material Science
and Engineering Programme
Assoc.Prof.Dr. Mustafa GÜDEN
Department of Mechanical Engineering
Assoc.Prof.Dr. Sacide ALSOY
Department of Chemical Engineering
Assoc.Prof.Dr. Sedat AKKURT

3
Department of Mechanical Engineering

4
ACKNOWLEDGEMENTS
I would like to acknowledge the people who have helped to make this work
possible. My sincere gratitude is first for my thesis advisor Assoc.Prof. Metin Tanoğlu
for his consistent and thoughtful advice, continuous encouragement and help during this
study. I would like to thank to Prof.Dr. Muhsin Çiftçioğlu for his valuable comments
and recommendations.
I acknowledge Ege Vitrifiye Sanitaryware Inc. of Turkey for the financial
support and I wish to specially thank to C. Tokman, C. Dirier, M. Yılmaz and E.
Erdoğan of Ege Vitrifiye Sanitaryware Inc. for their valuable help during my studies. I
also wish to thank to personnel of IZTECH Centre for Material Research for their help
during my material characterization studies.
I am grateful to my friends for assisting me with my research and offering
advice and discussion. Specifically I would like to thank Mehmet Şahin, Emre Kuduğ
and Beyhan Cansever.
Finally, I would like to express my heartfelt gratitude to my parents for their
continuous support and encouragement, which enabled me to overcome difficulties.

5
ABSTRACT
The ceramic whiteware / sanitaryware industry is rapidly undergoing to
implement high-pressure casting techniques for ceramic article production. In high
pressure technique, porous materials with open cell microstructure that allow drainage
of water from the ceramic suspension under applied pressure are needed. In addition, a
relatively high mechanical performance of the porous structure is required to obtain a
long service life from the material under the cycled high pressures. The polymethyl
methacrylate (PMMA) based polymeric porous structures have become the most
suitable type of materials for this purpose because of their short casting periods and
high service lives. The superior service life and performance of these materials are
closely related to their microstructure.
In the present study, PMMA-based porous materials were produced by water-in-
oil emulsion polymerization technique. The porous systems were produced with various
compositions of the constituents in the emulsion and various filler sizes to investigate
the effect of the constituents and the sizes on the microstructure of PMMA-based
materials. The variations on the pore microstructure were related to the performance of
the material. The pore morphology and porosity of the samples was investigated using
optical and scanning electron microscopy techniques (SEM). Water permeability was
measured using a custom made permeability apparatus. The mechanical properties such
as compressive collapse stress and elastic modulus values were determined by
performing mechanical compression tests. It was found that increasing water surfactant
concentration increases the porosity, water permeability and decreases mechanical
properties and reversely increasing the amount of monomer in the emulsion decreases
the porosity, water permeability and increases the mechanical properties. Fracture
toughness values of the materials were measured by using single edge notch three point
bending (SENB) test method. Fracture toughness test results and fracture surface
analysis show that materials are fractured in brittle manner. It was found that lower
concentrations of water and higher concentrations of monomer result in thicker cell
walls and improve the fracture toughness of the material. To investigate the residual
mechanical properties, specimens were subjected to cyclic loadings. After cyclic
loading, increase of elastic modulus with the percentage of 52 and decrease of collapse
stress values were measured.

6
ÖZET
Seramik endüstrisi, seramik ürün elde edebilmek için hızla yüksek basınçlı
döküm tekniğini kullanmaya başlamıştır. Yüksek basınçlı kalıplama tekniğinde mekanik
olarak dayanıklı, açık-hücre gözeneklere sahip ve uygulanan basınç altında su
geçirgenliğine imkan veren malzemelere gerek duyulmaktadır. Bununla birlikte,
gözenekli yapının uygulanan periyodik yüksek basınçlar altında uzun ömürlü olabilmesi
için daha yüksek mekanik performansa sahip olması gerekmektedir. PMMA esaslı
polimerik malzemeler kısa döküm periyotları ve uzun kullanım süreleri dolayısıyla en
uygun malzemeler haline gelmişlerdir. Bu malzemelerin uzun kullanım süreleri ve
performansları malzemenin mikro-yapısıyla yakından ilgilidir. Bu çalışmada PMMA
esaslı açık-hücre gözenekli plastik malzemeler yağ içinde su emülsiyonunun
polimerizasyonu tekniği ile üretilmiştir. PMMA esaslı malzemelerin mikro-yapısı
üzerindeki etkisini incelemek üzere emülsiyon bileşenlerinin çeşitli oranları ve çeşitli
tane boyutlarda dolgu malzemeleri kullanılarak gözenekli malzemeler üretilmiştir.
Gözenek yapısındaki değişim malzemenin performansı ile ilişkilendirilmiştir
Numunelerin gözenek yapısı ve gözeneklilik oranları optik ve taramalı elektron
mikroskobu kullanılarak incelenmiştir. Su geçirgenliği özel tasarlanan bir geçirgenlik
aparatı kullanılarak ölçülmüştür. Malzemenin çökme stresi ve elastik modül gibi
mekanik özellikleri basma testleri düzenlenerek belirlenmiştir. Su ve surfactant
miktarının arttırılması malzemelerin gözeneklilik oranını, su geçirgenliğini arttırmış
mekanik dayanımını azaltmıştır. Bununla birlikte monomer miktarının arttırılması
gözeneklilik oranını, su geçirgenliğini azaltmış ve mekanik dayanımını arttırmıştır.
Malzemelerin kırılma tokluğu değerleri çentikli üç nokta eğme test metodu kullanılarak
ölçülmüştür. Test sonuçları ve kırılma yüzeyi görüntüleri malzemelerin gevreksi
kırıldığını göstermiştir. Düşük su-surfactant ve yüksek monomer konsantrasyonu kalın
hücre duvarlarının oluşumunu sağlamaktadır bu da malzemenin kırılma tokluğunu
arttırmıştır. Kalan mekanik özelliklerinin saptanabilmesi için numuneler periyodik
yükleme testlerine tabi tutulmuştur. Periyodik yüklemenin ardından malzemelerin
elastik modül değerinin 52% oranında arttığı ve çökme stresi değerinin azaldığı
ölçülmüştür.

7
TABLE OF CONTENTS
LIST OF FIGURES
LIST OF TABLES
Chapter 1.INTRODUCTION………………………………………………………..
Chapter 2. PRODUCTION OF SANITARYWARE CERAMICS BY SLIP
CASTING
2.1. Preparation of Raw Materials and Properties of Casting Slip………………
2.2. Traditional Slip Casting……………………………………………………..
2.2.1. Plaster Molds for Traditional Slip Casting………………………….......
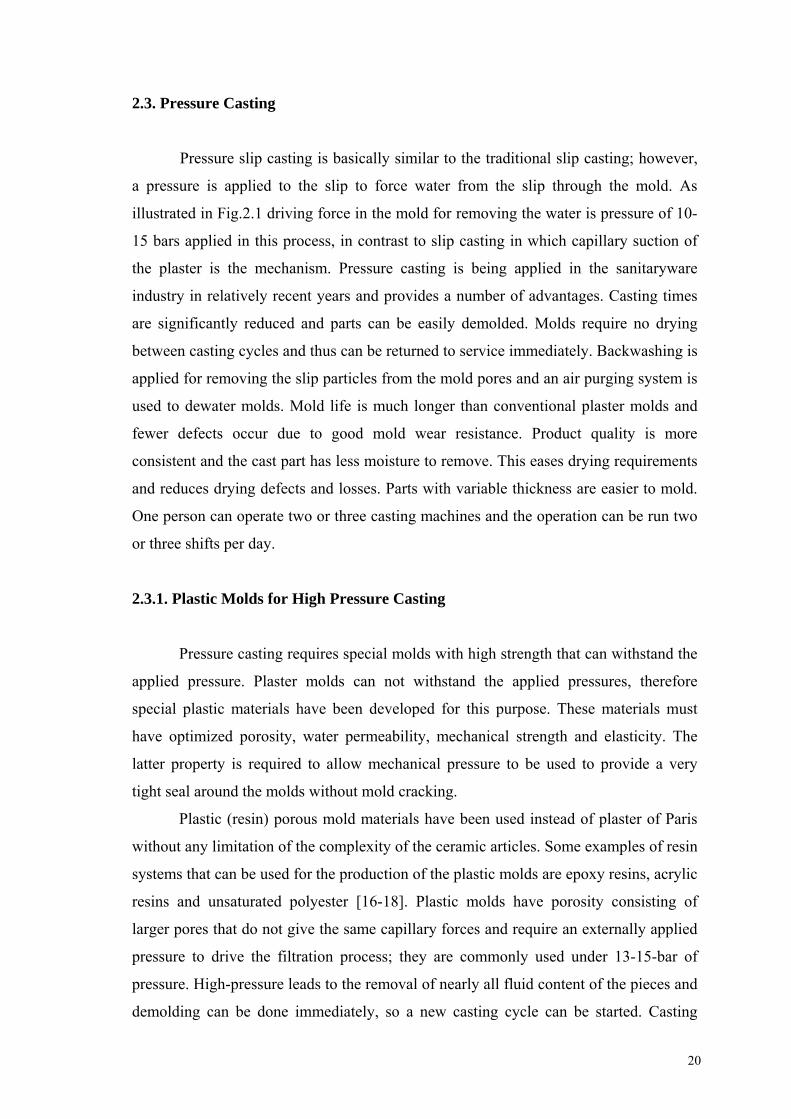
2.3. Pressure Casting……………………………………………………………..
2.3.1. Plastic Molds for High Pressure Casting………………………………..
Chapter 3. EMULSION SYSTEMS
3.1. Production of PMMA Beads by Suspension Polymerization……………….
3.2. Emulsion Polymerization……………………………………………………
3.3. Free Radical Polymerization in the Emulsion……………………………….
Chapter 4. POROUS PLASTIC MATERIALS
4.1. Microstructure of Porous Materials…………………………………………
4.2. Mechanical Behavior of Porous Materials…………………………………..
Chapter 5. EXPERIMENTAL
5.1. Materials……………………………………………………………………..
5.2. Characterization of Materials………………………………………………..
5.2.1. Fourier Transform Infrared Spectroscopy……………………………….
5.2.2. Differential Scanning Calorimetry (DSC).…………………………....
5.2.3. PMMA Beads…………………………………………………………...
5.3. Production of PMMA based Porous Plastic Mold Materials………………..
5.4. Incorporation of Nano Particles into The Emulsion.………………………..
5.4.1. Modification of Clay………………………………………………….....
5.4.2. Production of Porous Plastic Material With Nano Particles…………....
5.5. Characterization of Mold Materials………………………………………..
5.5.1. Microstructure Characterization and Porosity Determination……….....
1
5
6
6
8
8
10
11
12
15
16
24
24
24
27
28
29
30
30
31
32
32

8
5.5.2. Water Permeability Test………………………………………………..
5.5.3. Characterization of Mechanical Properties.………………………….....
5.5.3.1. Compression Test…………………………………………………..
5.5.3.2. Fracture Toughness Measurement………………………………….
5.5.3.3. Determination of Residual Mechanical Properties After Fatigue
Loading………………………………………………………….....
Chapter 6. RESULTS AND DISCUSSION
6.1. Effects of Emulsion Constituent Concentrations on The Properties of
Materials………………………………………………................................
6.1.1. Microstructure…………………………………………….………….....
6.1.2. Porosity and Water Permeability……………………………………….
6.1.3. Mechanical Properties…………………………………………………..
6.2. Effects of Average Particle Size of Filler on The Properties of Plastic
Porous Materials…………………………………………………...………
6.2.1. Microstructure……………………………………………………….....
6.2.2. Porosity and Water Permeability……………………………………….
6.2.3. Mechanical Properties……………………………………………….....
6.3. Effects of Nano Particles on The Properties of Material…………………...
6.4. Deformation Mechanism of the PMMA-Based Plastic Porous Materials….
6.4.1. Collapse Stress and Elastic Modulus…………………………………..
6.4.2. Deformation Mechanism……………………………………………….
6.5. Effects of Variation in Emulsion Constituent Concentrations on The
Fracture Toughness of Material……………………………………………
6.6. Residual Mechanical Properties of Porous Plastic Materials After
Fatigue Loading……………………………………………………………
Chapter 7. CONCLUSION…………………………………………………………..
REFERENCES……………………………………………………………………….
33
33
33
34
35
36
36
38
40
43
43
43
45
45
47
47
50
53
54
57
59

9
LIST OF FIGURES
Figure 2.1. Illustration of slip casting techniques, a) casting with plaster mold, b)
high pressure casting…………………..………………………………
Figure 2.2. Crystal structure of a) kaolin and b) quartz…………………………..
Figure 2.3. SEM micrograph of plaster mold……………………………………..
Figure 2.4. Production by plaster mold……………………………………………
Figure 2.5. Automatic high pressure casting machines……………………………
Figure 3.1. Types of Emulsions…………………………………………………...
Figure 3.2. Illustration of emulsion system….…………………………………….
Figure 3.3. Activation of BPO molecules………………………..………………..
Figure 3.4. Formation of active radical monomer molecule………………………
Figure 3.5. Propagation of the polymerization reaction…………...………………
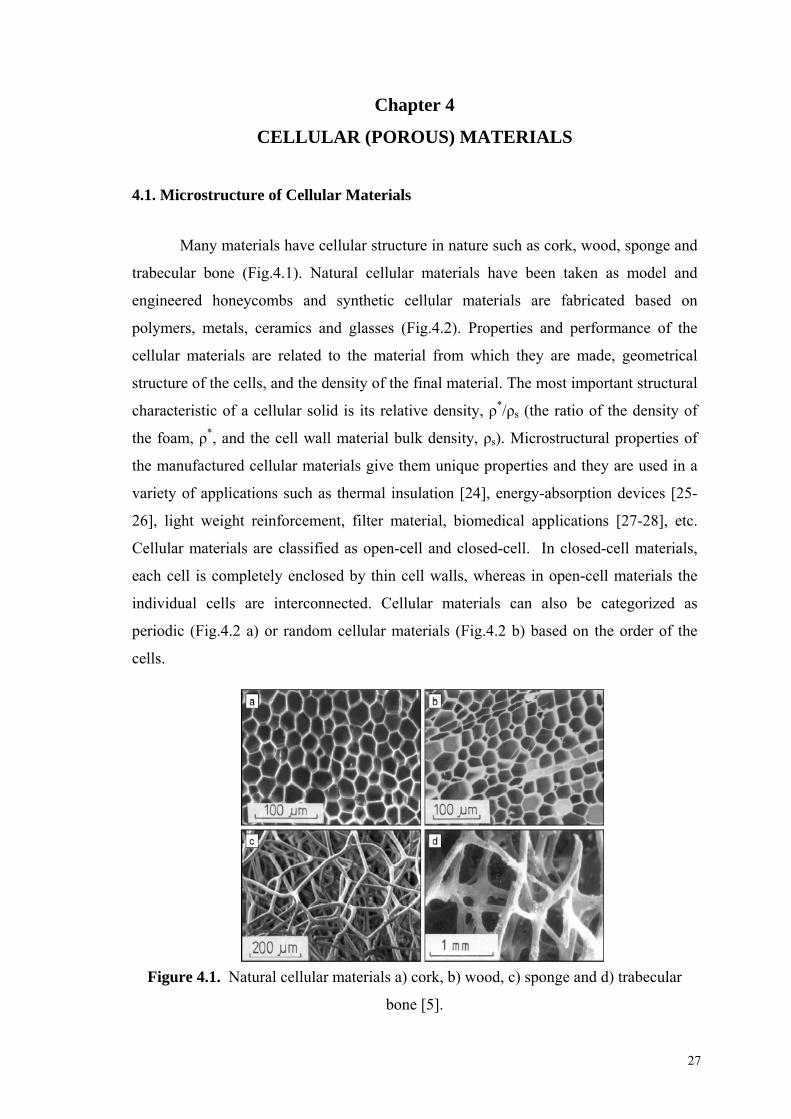
Figure 4.1. Natural cellular materials a) cork, b) wood, c) sponge and d)
trabecular bone…………………………..…………………...………..
Figure 4.2. Manufactured cellular materials a) aluminum honeycomb, b) closed
cell polyethylene foam, c) open-cell nickel foam, d) closed-cell glass
foam, e) open-cell zirconia foam, f) collagen-based scaffold used in
tissue engineering. …...………………………………………………..
Figure 4.3. Compressive stress-strain curves of a) elastomeric, b) elastic-plastic
and c) brittle foam…………..………………………………………....
Figure 4.4. Simple cubic model……………………………………………………
Figure 4.5. Voronoi tessellation…………………………………………………...
Figure 4.6. Boolean models of porous media. (a) overlapping solid sphere, (b)
overlapping spherical pores, (c) overlapping ellipsoidal pores……….
Figure 4.7. Three dimensional Gaussian random field models, (a) single cut, (b)
two cut, (c) open-cell intersection, (d) closed-cell union. ……..……...
Figure 5.1. FT-IR Spectrum of PMMA beads with the average particle size of a)
150 µm and b) 35 µm and c) Methyl Methacrylate monomer.……......
Figure 5.2. FT-IR Spectra of produced PMMA–based porous plastic material.…..
Figure 5.3. DSC profiles of PMMA beads with the average particle size of a) 150
µm and b) 35 µm………………………………………………………
4
5
7
7
9
10
12
12
13
13
15
16
17
18
22
22
22
26
26
27

10
Figure 5.4. DSC profile of Dibenzoyl Peroxide………….………………………..
Figure 5.5. SEM micrographs of PMMA beads with average particle diameter of
157µm…………………………..……………………………………..
Figure 5.6. SEM micrographs of plastized PMMA beads with average particle
diameter of 35µm.………………………………..……………………
Figure 5.7. Crystal structure of montmorillonite……….………………………….
Figure 5.8. Modification steps of clay……………………………………………..
Figure 5.9. Cation exchange process between montmorillonite galleries and
alkylammonium ions……………..……………………………………
Figure 5.10. a) Optical micrograph of the cross section of a specimen, b) the
threshold..…………………………………………………………….
Figure 5.11. Water permeability apparatus………………………………………..
Figure 5.12. Compression test equipment…………………………………………
Figure 6.1. SEM micrographs polished surface of PMMA-based plastics,
produced with various concentrations of surfactant/water. The total
content of water and surfactant in the emulsions are 29, 33, 37 and 40
for a, b, c and d, respectively…………………………………….........
Figure 6.2. Optical polished surface micrographs of PMMA-based plastics,
produced with various concentrations of monomer. The monomer
content in the emulsions are 12.5, 18.3, 19.6 and 20.8 for a, b, c and
d, respectively…………..……………………………………………..
Figure 6.3. Effect of emulsion concentration on the microstructure…….………...
Figure 6.4. Porosity and water permeability constant of the PMMA-based porous
plastics with respect to surfactant and water concentration…………...
Figure 6.5. Porosity and water permeability constant of the PMMA-based porous
plastics with respect to monomer concentration……..………………..
Figure 6.6. Compression stress-strain curve of materials with various surfactant
and water concentration…………………………..……….…………..
Figure 6.7. Collapse stress and elastic modulus of plastic mould samples with
various surfactant and water concentration……………..…………….
Figure 6.8. Compression stress-strain curve of materials with various monomer
concentrations……………….………………………………………...
Figure 6.9. Collapse stress and elastic modulus of plastic mould samples with
28
28
29
30
31
31
32
33
34
37
38
39
40
40
41
42
42

11
various monomer concentrations……..……………………………….
Figure 6.10. Optical images of PMMA-based plastics, produced with various
average particle diameter of PMMA beads. The average particle
diameters are 157, 88 and 22 m for a, b and c respectively………...
Figure 6.11. Porosity and water permeability constants of the PMMA-based
porous plastics with respect to average particle diameter of the
PMMA beads…………………………………………………………
Figure 6.12. Compression stress-strain curve of materials produced with various
average particle diameters of PMMA beads…………………………
Figure 6.13. Collapse stress and elastic modulus of the PMMA-based porous
plastics with respect to average particle diameter of the PMMA
beads…………….................................................................................
Figure 6.14. X-ray Diffraction analysis results of MMT and OMMT .…………...
Figure 6.15. Compression stress-strain behaviors of specimens produced with
additional MMT and OMMT particles.................................................
Figure 6.16. Typical compressive stress-strain response of PMMA-based porous
materials……………………………………………………………...
Figure 6.17. Variation in relative crushing stress as a function of relative
density……………………………………………………………….
Figure 6.18. Variation of relative modulus as a function of relative density……...
Figure 6.19. Comparison of experimental data and predictions of Garboczi and
Roberts……………………………………………………………….
Figure 6.20. Stress-strain curves of porous plastics loaded at the stress levels of
7, 14, 16, 19 MPa…………………………………………………….
Figure 6.21. SEM micrograph of the PMMA based porous plastic that were
exposed to load-unload cycle at the stress level of 7 MPa…………..
Figure 6.22. SEM micrograph of the porous plastics that were exposed to load-
unload cycle at the stress level of 14 MPa…………………………...
Figure 6.23. SEM micrograph of the porous plastics that were exposed to load-
unload cycle at the stress level of 19 MPa…………………………...
Figure 6.24. SEM fracture surface micrograph of the SENB specimens with the
water-surfactant concentrations of (a) 40 and (b) 29 wt.%..................
Figure 6.25. SEM fracture surface micrograph of the SENB specimens with the
43
44
44
45
46
47
47
48
50
50
51
51
52
52
53
55

12
monomer concentrations of (a) 15.5 and (b) 20.8 wt.%.....................
Figure 6.26. Compressive stress-strain responses of materials after 1000 cycle
fatigue loading under the stress values of 6, 7.5, 9 MPa……………..
55
56
LIST OF TABLES
Table 1. Parameters corresponding to the described models…………………….
Table 2. Fracture toughness of materials produced with various water/surfactant
and monomer concentrations…………………………………………...
23
54

13
Chapter 1
INTRODUCTION
Plastic materials have many advantages when compared with metallic and
ceramic materials due to their easy production, shaping and applicability. They became
preferable in many processes such as, in production of ceramic whiteware and
sanitaryware articles with slip casting technique. Porous plastic mold materials have
been replaced with the traditional plaster molds due to their improved properties.
Traditionally, slip casting process for the shaping of ceramic sanitaryware and
whiteware articles has been performed by using plaster molds. This material contains an
open cell structure with a mean pore size of about 1 µm and it operates under the
principle of capillarity and absorbs water from the ceramic slip. Plaster molds are
inexpensive, suitable for machining and operate without external pressure. However,
they exhibit long casting periods (1-2 hours), long drying time and have limited service
life due to their low wear resistance (80-100 maximum cast). Moreover, cast part
contains high amount of water that has to be removed by drying with some additional
cost.
To overcome the limitations of the plaster of Paris and improve the ceramic
article quality and productivity, the trend in the ceramic industry is the utilization of the
high pressure casting process that provides automation. In this technique, a porous mold
material that allows the drainage of water from the slip under high pressures of typically
13-15 bars is needed [1]. The materials with an open cell structure need to provide high
water permeability, high mechanical strength and fatigue performance. These materials
are also expected to keep the integrity of the structure without deformation and allow
the usage of high pressures to provide a tight seal around the mold without cracking
along about 20,000 cycles during expected service life.
Polymeric materials, especially PMMA-based porous materials, became the
most suitable one for this purpose. Using these type of materials, casting and demolding
period can be shortened up to 20 min., molds require no drying between the casting
cycles since air-purging system is used for dewatering and therefore mold can be
returned to the service immediately. Furthermore, casting period can be adjusted by
changing the slip pressure within the limits of the mechanical strength of the mold
material. However, it needs special attention that the service life and performance of

14
plastic mold is closely related to the microstructure and mechanical properties of the
material. Therefore, fundamental understanding of the processing, microstructure and
property relationship in these materials is essential to obtain optimized performance. To
our knowledge, there is very limited work reported in the literature about the subject. In
recent studies, Pique et. al. studied measurement of the fracture toughness of PMMA-
based porous plastic molds and they used fictitious crack model for modeling the
fracture behavior [2]. In addition, the same group has studies on improvement of the
mechanical performance of these materials by addition of reinforcing components such
as clay particles into the plastic structure [3, 4].
In this study, plastic materials with various pore morphologies were produced by
polymerization of water-in-oil emulsions with various compositions of the emulsion
constituents and particle sizes of the PMMA based filler beads. The effects of changing
the compositions and bead sizes on the pore fraction and morphologies were
investigated by SEM and optical microscopy techniques. Also, the relation between the
morphology, water permeability and mechanical properties of the porous materials was
investigated. Measurement of water permeability was done by using a custom made
permeability apparatus. Compressive mechanical testing was performed to obtain the
stress-strain behavior, elastic modulus and collapse stresses and to investigate the
deformation mechanisms of the materials. In the literature, there are some recent studies
related to the prediction of the dependence of mechanical properties on the density of
the cellular materials. Ashby and Gibson used a simple cubic model for periodic, low
density cellular materials to predict their dependence of strength and elastic modulus on
density [5]. The difference between model and experimental data for the randomly
distributed or high density cellular materials showed that the theory of Ashby and
Gibson should be revised for these materials. Roberts and Garboczi have simulated
random cellular materials with wide density ranges by using finite element analysis
(FEA) and developed an analytical equation [6]. Predictions of these two theories were
compared for PMMA based porous materials developed within this study. Fracture
toughness values of the materials were measured based on single edge notch bending
(SENB) test and fracture surfaces were investigated by using SEM to understand the
fracture mechanisms. Deformation of these materials under cycled loading is critical for
their molding applications. For the investigation of the residual mechanical properties
and deformation mechanisms after cyclic loading, specimens were subjected to 1000
cycle loading and then static loadings were performed on the same specimens up to

15
fracture point. It is also known that the contribution of inorganic materials to organic
structures frequently exhibit unexpected improved mechanical properties such as in
PMMA based emulsion systems [4, 7]. To investigate the effect of additional inorganic
reinforcement materials, nanoscale layered clay particles (montmorillonite) was added
to emulsion with and without organical modify cation.

16
Chapter 2
PRODUCTION OF SANITARYWARE CERAMICS BY SLIP
CASTING
Production techniques of traditional ceramics (clay-based ceramics) can be
grouped under three basic headings; dry pressing, plastic forming, and slip casting. Slip
casting is a method for powder based shaping of ceramic articles and has some
advantages, including availability to produce geometrically complex shape articles with
very good material homogeneity due to the slurry properties, such as sanitarywares. It
is a filtration process, in which a powder suspension, usually water based suspension, is
poured into porous mold. Two types of slip casting techniques are used for the shaping;
conventional and pressure slip casting. Most of the ceramic goods are still shaped by
conventional slip casting technique employing plaster molds today, but development
trend is towards high pressure casting with porous polymeric molds [8]. Fig. 2.1. is a
schematic illustration of the casting process and water transport in these techniques
which will be described in detail below.
(a) (b)
Figure. 2.1. Illustration of slip casting techniques, a) casting with plaster mold, b) high
pressure casting
Slip suspension
Depth of absorbed water in plaster mold
Cast layer
Capillaries of plaster mold Water guide tunnel
Open-cell porous plastic mold
Water outlet
Loading of suspension

17
2.1. Preparation of Raw Materials and Properties of Casting Slip
Raw materials used for the production of sanitaryware ceramics are kaolin,
quartz, feldspar and some dispersion additives. A typical batch consists of
approximately 40 to 50 % kaolin (Al2O3 .2SiO2. 2H2O), 20 to 30 % quartz (SiO2), 20 to
30 % feldspar (R2O. Al2O3. 6SiO2) and very low percentage of dispersion additives. Fig.
2.2 shows the crystal structures of kaolin and quartz. To prepare the raw materials for
wet processes, they are suspended in water, crushed and ground until the particle
diameter is reduced. Then, suspension is screened to remove the impurities and
following this step it is homogenized in stirred tanks. The particles in the casting slip
tend to agglomerate, which is called as flocculation. To prevent flocculation, a variety
of chemicals and electrolytes are used to break up these agglomerates. Common
deflocculants used in slips containing clays are sodium silicate, sodium carbonate,
sodium phosphate and some organic substances such as polyacrylates [9].
(a) (b)
Figure 2.2. Crystal structures of a) kaolin and b) quartz [10].
Control of the casting slip is critical and there are a number of slip properties
that are desirable for an optimum process. The casting behavior of ceramic slips
depends strongly on slip`s specific gravity, viscosity and change in viscosity with
respect to time. The viscosity of the slip is a function of the mean particle diameter,
content and the nature of the solids present. Slip should have low viscosity to allow all
parts of the mold to be easily filled and to prevent trapping of air bubbles. The specific
gravity is a simple measurement of the amount of solid suspended in slip. Specific
gravity of the slip should be high enough to shorten casting time, lower the amount of

18
water that must be processed and also increase green density. Cast piece should also
have low drying shrinkage, easy mold release, adequate green strength in the cast layer
to allow easier handling. With regard to raw materials, kaolin influences the rheology
more than feldspar and quartz. In pressure casting, kaolin controls the casting rate and
percentage of kaolin is kept higher in pressure casting slips. The permeability of the
pressure casting slip is usually higher than the conventional slip [11].
2.2. Traditional Slip Casting
Production of ceramic articles by using plaster molds, called as conventional slip
casting, has been introduced on a commercial scale as early as the 18th (1740) century in
England for the production of tableware pieces. Slip casting by using plaster molds has
been used for the production of sanitaryware since the invention of flushing toilets at
the end of the 19th century [12].
2.2.1. Plaster Molds for Traditional Slip Casting
Plaster is made of calcium sulfate hemihydrates CaSO4.0.5H2O. Hemihydrates is
not present in nature, but can be obtained from widely distributed natural products such
as calcium sulfate dihydrate (gypsum rock), CaSO4.2H2O. This natural product contains
some impurities such as clay, chalk, dolomite, silica and metallic oxides. The name
plaster of Paris usually refers to the calcium sulfate hemihydrates obtained from the
purest parts of the natural products and used for molding applications. To produce
hemihydrates from dihydrate, gypsum rock is calcined in order to remove part of the
crystal water from calcium sulfate crystals and then it is ground to obtain a powder with
a suitable particle size distribution. When using plaster as mold material, it has to be
prepared in the form of slurry with water and some additives to modify the properties
according to customer requirements. By mixing the plaster with water, hemihydrates
structure becomes dihydrated.
Excess water in the slurry is eliminated by drying process and the spaces filled
with water generate the porous structure of the hardened plaster mold. During the
settling of the material, interconnecting network of needle and plate-like arrangements

19
Figure 2.3. SEM micrograph of plaster mold [13].
of gypsum crystals is formed as illustrated in Fig 2.3 and this arrangement gives
strength to the mold. In sanitaryware industry, from 68 to 90 parts by weight of water to
100 parts plaster is used [9]. Mold produced with higher plaster ratio has higher
mechanical strength, lower porosity and higher expansion.
Plaster molds operate on the principle of capillarity as shown in Fig.2.1. Water is
absorbed by the mold at its surface and removed from the slip. As a result, a layer of
material is formed with low water content which will be self-supporting when the mold
is removed. After a layer of proper thickness has formed, the remaining slip is drained
from the mold. The formed part is allowed to remain in the mold for additional water
removal by mold absorption and evaporation, until the part has become physically
strong enough to support itself. The mold is taken apart to release the part and it is left
to dry as illustrated in Fig.2.4.
Plaster mold is easily shaped, operate without pressure and relatively
inexpensive as it is produced from natural resources. But, it has several drawbacks.
Casting and drying time of the mold is very long, only one or two casting is available
per a day and also the molds typically have a limited working life, they become useless
after about one hundred castings because of the low resistance to wear [14]. All these
make plaster molds impractical for industrial large-volume operations.
Figure 2.4. Production by plaster mold [15].
20
2.3. Pressure Casting
Pressure slip casting is basically similar to the traditional slip casting; however,
a pressure is applied to the slip to force water from the slip through the mold. As
illustrated in Fig.2.1 driving force in the mold for removing the water is pressure of 10-
15 bars applied in this process, in contrast to slip casting in which capillary suction of
the plaster is the mechanism. Pressure casting is being applied in the sanitaryware
industry in relatively recent years and provides a number of advantages. Casting times
are significantly reduced and parts can be easily demolded. Molds require no drying
between casting cycles and thus can be returned to service immediately. Backwashing is
applied for removing the slip particles from the mold pores and an air purging system is
used to dewater molds. Mold life is much longer than conventional plaster molds and
fewer defects occur due to good mold wear resistance. Product quality is more
consistent and the cast part has less moisture to remove. This eases drying requirements
and reduces drying defects and losses. Parts with variable thickness are easier to mold.
One person can operate two or three casting machines and the operation can be run two
or three shifts per day.
2.3.1. Plastic Molds for High Pressure Casting
Pressure casting requires special molds with high strength that can withstand the
applied pressure. Plaster molds can not withstand the applied pressures, therefore
special plastic materials have been developed for this purpose. These materials must
have optimized porosity, water permeability, mechanical strength and elasticity. The
latter property is required to allow mechanical pressure to be used to provide a very
tight seal around the molds without mold cracking.
Plastic (resin) porous mold materials have been used instead of plaster of Paris
without any limitation of the complexity of the ceramic articles. Some examples of resin
systems that can be used for the production of the plastic molds are epoxy resins, acrylic
resins and unsaturated polyester [16-18]. Plastic molds have porosity consisting of
larger pores that do not give the same capillary forces and require an externally applied
pressure to drive the filtration process; they are commonly used under 13-15-bar of
pressure. High-pressure leads to the removal of nearly all fluid content of the pieces and
demolding can be done immediately, so a new casting cycle can be started. Casting

21
period can be adjusted by changing the slip casting pressure in the limitations of the
mechanical strength of the molds. This technique significantly reduces labour
requirements, however, because of the high pressure and complexity of the
automatically controlled production cycles, it needs design of new machines and this
requires a considerable economic investment. Hence, their use is only meaningful where
the number of output is particularly high and not too much mix product is demanded. In
that case, the technique lowers the overall production costs. Fig 2.5 is an example
showing the automatic high pressure casting machines.
Figure 2.5. Automatic high pressure casting machines [15].

22
Chapter 3
EMULSION SYSTEMS
PMMA based porous materials and PMMA beads that were used in this study
were produced by emulsion and suspension polymerization techniques, respectively.
Suspension and emulsion polymerizations are essentially called as heterogeneous
polymerization systems due to the content of non-solvent liquid, usually water,
immiscible liquid monomer and surfactant. Fig.3.1 illustrates the types of emulsion
systems that are formed by polar and apolar systems. These systems are also called as
water-oil systems because water (polar) and monomer (apolar) phases have tendency to
separate from each other as water and oil phases. For the homogenous distribution of
one phase in the other, surfactants are used. Hydrophobic and hydrophilic ends of the
surfactant molecules catch the monomer and water molecules, respectively, and provide
the formation of homogeneous emulsion.
Figure 3.1. Types of Emulsions
3.1. Production of PMMA Beads by Suspension Polymerization
Polymeric beads are commonly produced by oil in water suspension
polymerization technique. Suspension polymerization was first developed by Hoffman
and Delbruch in 1909 [19] and it was first used for the production of acrylic beads by
Bauer and Lauth`s in 1931 [20]. Suspension polymerization technique involves

23
dispersion of the liquid monomer mass into separate small droplets in a large continuous
mass of a nonsolvent, commonly called as dispersion or suspension medium, by
efficient agitation or using dispersant. Water is invariably used as the suspension
medium for all water insoluble monomers because of many advantages, such as low
cost and non-toxic nature. Water (polar) and monomer (apolar) phases have tendency
to separate from each other as in water and oil phases. Water forms the continuous
phase and monomer phase is distributed in water by using the suitable surfactants (water
in oil). Since polymerization occurs within the monomer droplets, the use of an oil-
soluble initiator, such as benzoyl peroxide (BPO), azobisisobutyronitrile (AIBN), is
required. [21]. Suspension polymerization reactions for the production of polymer beads
were initiated using some other ways, such as ultrasound sources [22]. Each small
polymerizing droplet in the continuous phase behaves as an isolated batch
polymerization reactor. Particle sizes of the produced beads depend on the distribution
of monomer phase in the emulsion and activation of the surfactant.
3.2. Emulsion Polymerization
During the production of PMMA based plastic porous materials, within this
study final mixture consisted of an immiscible water phase dispersed in the monomer
phase and additionally PMMA beads were suspended in the emulsion. This system is
called as water in oil emulsion system. Homogeneity and stability of this system is
provided by surface active agents (surfactant). Surfactant molecules are classified as
ionic or non-ionic depending on whether the head group has a net charge or not. The
ionic surfactants are further classified as cationic or anionic depending on whether the
head group is positively or negatively charged. PEO-PPO block copolymers are
examples of non-ionic surfactants. Non-ionic surfactants are neutral. The head consists
of a small molecular group is the hydrophilic and the long polymer chain is the
hydrophobic part of the nonionic surfactant molecule [23]. In addition to diblock (PEO-
PPO), triblock (PEO-PPO-PEO) copolymers are the other examples of non-ionic
surfactants. There is another class of surfactants, called zwitterionic surfactants, which
has both of an anion and a cation.
Fig.3.2 shows an illustration of the water in oil emulsion system that was used to
produce PMMA based porous materials. Hydrophobic and hydrophilic ends of the PEO-
PPO based surfactant catch monomer and water molecules and hold them together,

24
provide the distribution between the phases. So, the amount of the surface-active agent
determines the level of the dispersion. Dispersion level of the emulsion is critical for the
diameter, shape and distribution of the pores. A high dispersion level may yield
homogeneous distribution of pores with a smaller diameter in the final part. Therefore,
dispersion level is critical to obtain the porous structure with optimum properties.
Figure 3.2. Illustration of emulsion system.
3.3. Free Radical Polymerization in the Emulsion
In the emulsion polymerization of PMMA system, free radical polymerization
reaction takes place by the effect of initiator (BPO) with the contribution of PMMA
beads. Free radical polymerization occurs in three steps; initiation of the reaction with
formation of the first radicals, propagation of the polymerization and termination of the
radicals. This polymerization process starts with the activation of BPO molecules; they
have an ability to fall apart and the pair of electrons in the broken bond separate. Free
active electron try to become stable and double bond between the carbon and oxygen
atoms is broken by the effect of it to form CO2 and radical phenyl molecules (Fig.3.3).
Figure 3.3. Activation of BPO molecules.
Dissolved PMMA bead
Monomer phase
Water droplet
Surfactant molecule

25
The unpaired electron on the phenyl molecule wants to be paired. The carbon-
carbon double bond in a methyl methacrylate monomer has a pair of electrons bonded
with weaker forces and when the unpaired electron comes near and swipe one of them
to pair with it. This new pair of electrons forms a new chemical bond between the
initiator phenyl and carbon atom of the monomer molecule. The other electron which is
not bonded to the initiator forms a new free radical (Fig.3.4).
Figure 3.4. Formation of active radical monomer molecule.
Created active MMA molecule has a strong affinity to react with other monomer
molecule in the same way as the initiator phenyl molecule did. This reaction takes place
over and over again, polymerization reaction is propagated and more monomer
molecules join to the growing chains (Fig.3.5)
Figure 3.5. Propagation of the polymerization reaction.
Termination of the polymer chain can occur in one of three ways. The active
molecule can react with the initiator or with some other impurity that bonds and has no
more open sites for continued bonding. Two active molecules can bond together. Or,
two active sites can come into contact with one and gives up an atom (usually
hydrogen) to the other, so terminating both chains without combining.
Free radical polymerization is an exothermic reaction; released heat and reaction
time depends on the amount of the material that will be produced. After polymerization

26
of the emulsion completed, water molecules find a way and they are removed from the
final product and spaces filled with water droplets in the monomer phase form the pores
of the materials. With the contribution of the PMMA beads and polymerization of the
monomer molecules rigid cell walls are formed.
27
Chapter 4
CELLULAR (POROUS) MATERIALS
4.1. Microstructure of Cellular Materials
Many materials have cellular structure in nature such as cork, wood, sponge and
trabecular bone (Fig.4.1). Natural cellular materials have been taken as model and
engineered honeycombs and synthetic cellular materials are fabricated based on
polymers, metals, ceramics and glasses (Fig.4.2). Properties and performance of the
cellular materials are related to the material from which they are made, geometrical
structure of the cells, and the density of the final material. The most important structural
characteristic of a cellular solid is its relative density, ρ*/ρs (the ratio of the density of
the foam, ρ*, and the cell wall material bulk density, ρs). Microstructural properties of
the manufactured cellular materials give them unique properties and they are used in a
variety of applications such as thermal insulation [24], energy-absorption devices [25-
26], light weight reinforcement, filter material, biomedical applications [27-28], etc.
Cellular materials are classified as open-cell and closed-cell. In closed-cell materials,
each cell is completely enclosed by thin cell walls, whereas in open-cell materials the
individual cells are interconnected. Cellular materials can also be categorized as
periodic (Fig.4.2 a) or random cellular materials (Fig.4.2 b) based on the order of the
cells.
Figure 4.1. Natural cellular materials a) cork, b) wood, c) sponge and d) trabecular
bone [5].

28
Figure 4.2. Manufactured cellular materials a) aluminum honeycomb, b) closed-cell
polyethylene foam, c) open-cell nickel foam, d) closed-cell glass foam, e) open-cell
zirconia foam and f) collagen-based scaffold used in tissue engineering [5].
4.2. Mechanical Behavior of Cellular Materials
The mechanical behavior of a cellular solid is related to the geometrical structure
of the cells and the densities of the raw and final material. Fig. 4.3 a, b and c show the
representative compressive stress-strain curves of elastomeric, elastic-plastic and brittle
foam, respectively [5]. They show linear elasticity at low stresses. Linear elasticity is
controlled by the cell edge bending or cell wall stretching if the material is closed cell.
In the long collapse plateau, deformation of the cells occurs by elastic buckling in
elastomeric foams (rubber for example), by plastically yielding in elastic-plastic
materials (such as a metal) and by brittle crushing in brittle foams (ceramics, glasses).
When the cells are completely collapsed, faces of the cells touch each other and applied
stress compresses the compact solid itself and this results in rapid increase of the stress
values as seen on the densification region of the curves.

29
Figure 4.3. Compressive stress-strain curves of a) elastomeric, b) elastic-plastic and c)
brittle foam [5].

30
Gibson and Ashby investigated the mechanical behavior of cellular materials.
They developed a well-known theory to describe the relationship between the
mechanical properties and the density of the cellular and cell wall materials by using a
simple model and a number of experimental data [5]. Their theory is based on simple
cubic model (Fig.4.4) and generalized equations are given below;
Figure 4.4. Simple cubic model [5].
ss
CE
E1
* (4.1)
n
ss
C
2
(4.2)
Where σ*, σs are the yield strength, * and s are the density, E*, Es are the young
modulus of the porous material and solid cell wall, respectively. C1 and C2 are the
proportionality constants and depend on the structure of the material. The exponents n
and μ take different values for closed and open-cell materials, and for different
deformation mechanisms. Gibson and Ashby have also compared the predictions of the
Equations 4.1 and 4.2 with the experimental data obtained from a number of sources
and found a good fit for regular isotropic materials [5]. For open-cell foams, n=1.5,
whereas for closed-cell foams, n=1. However, the equations given above assume that
deformation occurs primarily by beam bending. This is valid for open-cell foams,
however, closed-cell foams may deform also by wall stretching, beam bending, or
mixtures of the two [5, 29]. Experimentally, it was found that the elastic modulus
changed with the relative density with the power of 1-4 for various structures based on
equation 4.1. [30]. If the material is open cell or the cell walls are much thinner than the
31
cell edges the deformation takes place via edge-bending and E varies quadratically with
the density, (μ=2) [31]. If the cell wall stretching is the dominant deformation behavior,
μ=1. On the other hand, Gibson and Ashby showed that E can also vary cubicly as a
function of density, μ=3, for closed cell materials [32].
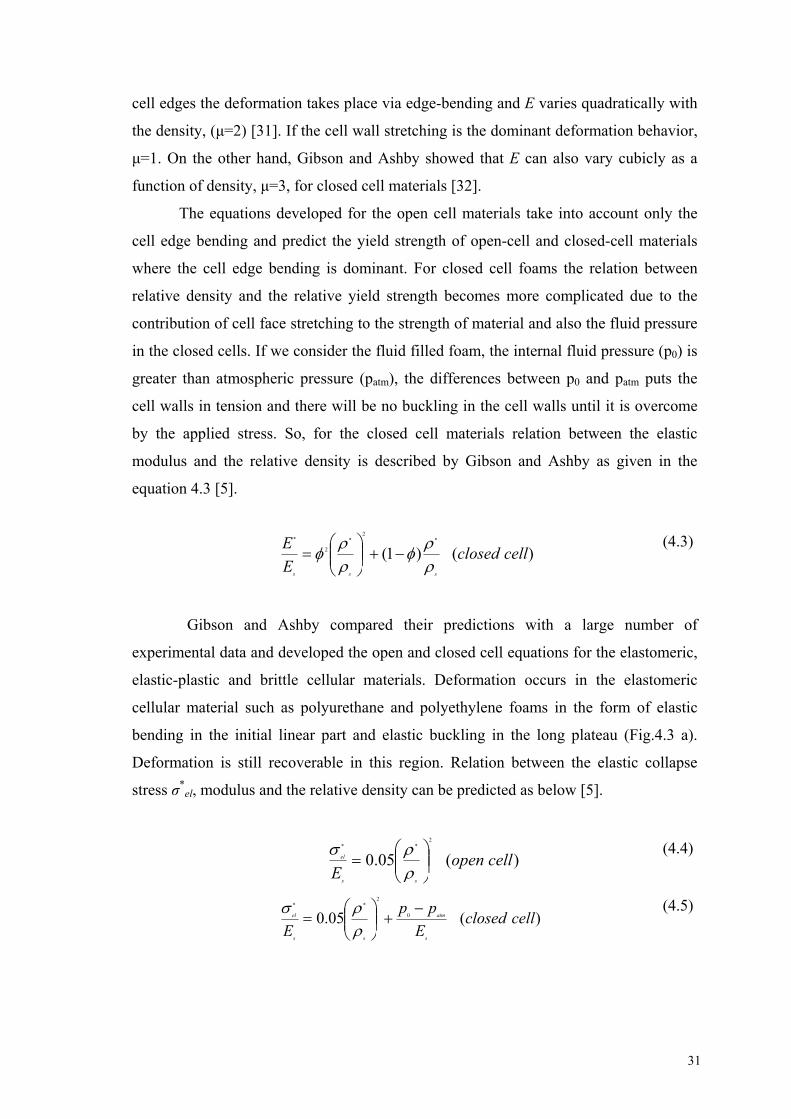
The equations developed for the open cell materials take into account only the
cell edge bending and predict the yield strength of open-cell and closed-cell materials
where the cell edge bending is dominant. For closed cell foams the relation between
relative density and the relative yield strength becomes more complicated due to the
contribution of cell face stretching to the strength of material and also the fluid pressure
in the closed cells. If we consider the fluid filled foam, the internal fluid pressure (p0) is
greater than atmospheric pressure (patm), the differences between p0 and patm puts the
cell walls in tension and there will be no buckling in the cell walls until it is overcome
by the applied stress. So, for the closed cell materials relation between the elastic
modulus and the relative density is described by Gibson and Ashby as given in the
equation 4.3 [5].
)()1(
2
2
*
cellclosedE
E
sss
(4.3)
Gibson and Ashby compared their predictions with a large number of
experimental data and developed the open and closed cell equations for the elastomeric,
elastic-plastic and brittle cellular materials. Deformation occurs in the elastomeric
cellular material such as polyurethane and polyethylene foams in the form of elastic
bending in the initial linear part and elastic buckling in the long plateau (Fig.4.3 a).
Deformation is still recoverable in this region. Relation between the elastic collapse
stress σ*el, modulus and the relative density can be predicted as below [5].
)(05.0
2
cellopenE
ss
el
(4.4)
)(05.0 0
2
cellclosedE
pp
Es
atm
ss
el
(4.5)

32
The elastic-plastic materials such as rigid polymers and metals collapse
plastically when loaded beyond the linear elastic regime. Plastic collapse occurs through
the long deformation plateau (Fig.4.3 b) and material is permanently deformed.
Variations of the strength with density for open and closed cell materials are given as;
)(3.0
2/3
cellopensys
pl
(4.6)
)(13.0 0
2/3
cellclosedpp
ys
atm
ssys
pl
(4.7)
Gibson and Ashby also analyzed crushing of brittle foams, such as ceramics,
glasses and some brittle polymers and developed the relationship between the relative
crushing stress (collapse stress) and relative density of the closed and open cell foams.
According to their analysis the relationship between the relative crushing stress, σ*cr and
density for open and closed cell materials are provided as below;
)(2.0
2/3
cellopensys
cr
(4.8)
)(12.0
2/3
cellclosedssfs
cr
(4.9)
In these equations is in the range of;
1
s
m
The term corresponds to the fraction of the solid present in the cell edges and the
remaining fraction (1-) is in the cell walls in Gibson and Ashby model. The case of
=1 corresponds to an open cell foam with material only in cell edges, lower values of
corresponds to a foam with thicker cell walls and those for closed cell materials with
negligible cell edges are given by =0. The first terms in all these equations developed
for the closed-cell cellular materials describe the contribution of the cell beam bending
to the strength and modulus, respectively, and are identical for both closed and open cell
33
foams. The second term includes the contribution of cell walls stretching, membrane
effect, and does not exist for the case of open cell foams.
The complex dependence of the constants (C1, C2, n and μ for example
described in the general equations 4.1 and 4.2) on microstructure is not known well. At
the cellular scale being open or closed cell, the geometrical arrangement of the cell
elements, e.g. angle of the intersections and the struts and the wall shapes of the cell
such as curvature, cross sectional shape and uniformity have important effects on these
constants. At large scale the geometrical arrangement of the cells is important, if they
are periodic or disordered [33]. Most of the theoretical solutions have been done for
simple three dimensional cell structures with straight struts or walls at low densities
with periodic arrangement. However several recent studies about the cellular materials
indicate that some refinements to earlier models are needed to account for discrepancies
between predictions and experimental measurements of Young’s modulus and
compressive strength. But, for more complex random models, it is necessary to improve
predictions for observation of the mechanical properties of real cellular solids. It was
emphasized by Garboczi and Roberts that there are no exact analytical calculations
available for random materials because it was very difficult to develop sufficiently
accurate model of the microstructure, so that numerical methods become necessary [33].
Nieh et al. used images of aluminum foam and finite element method (FEM) to
predict their modulus values [34]. FEM has been also used by Van der Burg et.al. to
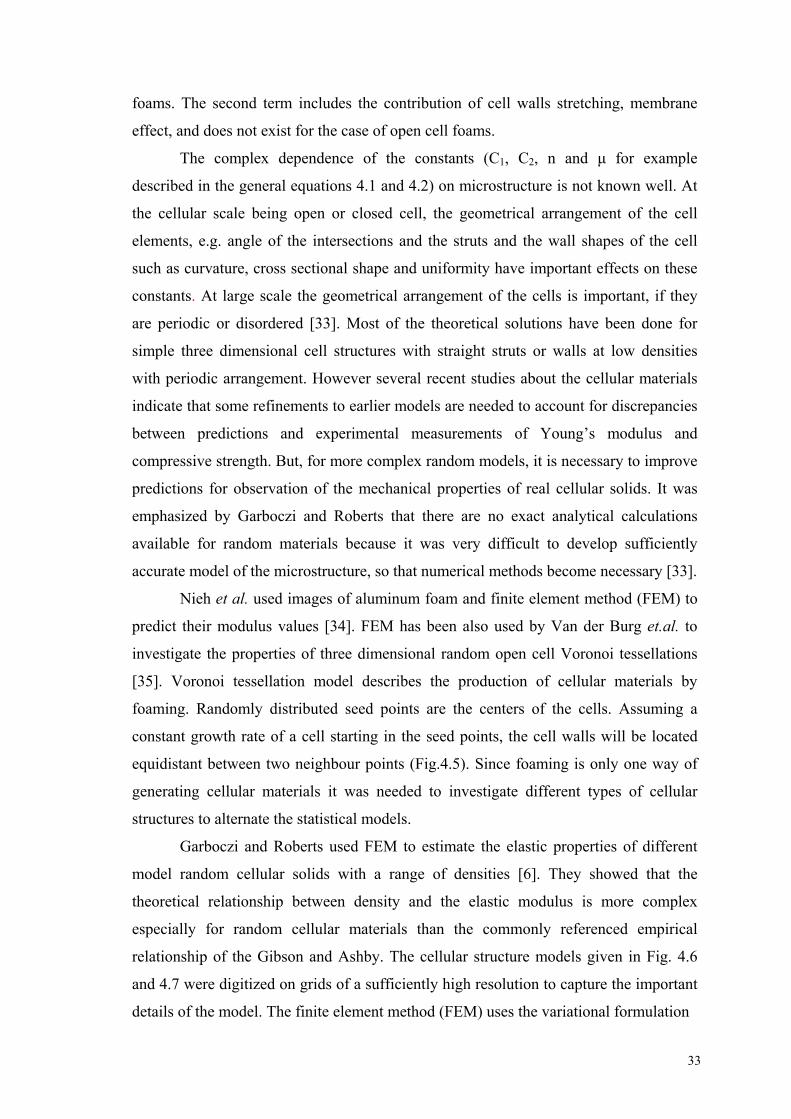
investigate the properties of three dimensional random open cell Voronoi tessellations
[35]. Voronoi tessellation model describes the production of cellular materials by
foaming. Randomly distributed seed points are the centers of the cells. Assuming a
constant growth rate of a cell starting in the seed points, the cell walls will be located
equidistant between two neighbour points (Fig.4.5). Since foaming is only one way of
generating cellular materials it was needed to investigate different types of cellular
structures to alternate the statistical models.
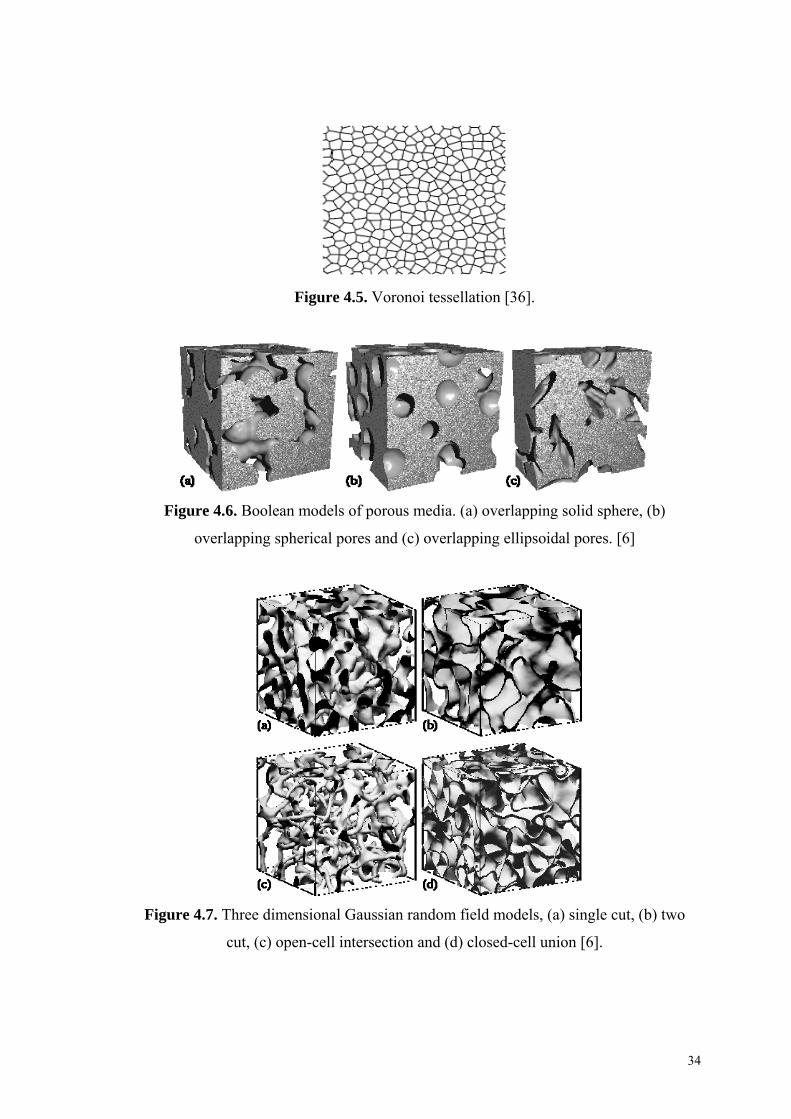
Garboczi and Roberts used FEM to estimate the elastic properties of different
model random cellular solids with a range of densities [6]. They showed that the
theoretical relationship between density and the elastic modulus is more complex
especially for random cellular materials than the commonly referenced empirical
relationship of the Gibson and Ashby. The cellular structure models given in Fig. 4.6
and 4.7 were digitized on grids of a sufficiently high resolution to capture the important
details of the model. The finite element method (FEM) uses the variational formulation
34
Figure 4.5. Voronoi tessellation [36].
Figure 4.6. Boolean models of porous media. (a) overlapping solid sphere, (b)
overlapping spherical pores and (c) overlapping ellipsoidal pores. [6]
Figure 4.7. Three dimensional Gaussian random field models, (a) single cut, (b) two
cut, (c) open-cell intersection and (d) closed-cell union [6].

35
of the linear elastic equations and finds the solution by minimizing the overall elastic
energy of the system. The Young`s Modulus of the system was then determined from
the overall stresses and strains.
They developed equation 4.10 given below which is used for describing the
mechanical properties of materials with high densities and microstructures illustrated in
Fig.4.6 and 4.7. They also determined the constants of the Gibson and Ashby`s simple
model equation, E*/Es=C(ρ*/ρs) for low density material models. In Table.1 constants of
the predicted equations were tabulated.
m
sp
pp
E
E
0
0
*
1 ,
s
p * (4.10)
Table 1. Parameters correspond to the described models. [6]
p<pmax p>pmin
Fig. n C pmax m p0 pmin
4.6 (a) 2.23 0.348 0.50
4.6 (b) 1.65 0.182 0.50
4.6 (c) 2.35 0.202 0.50
4.7 (a) 1.64 0.214 0.30
4.7 (b) 1.58 0.717 0.50 2.09 -0.064 0.10
4.7 (c) 3.15 4.2 0.20 2.15 0.029 0.20
4.7 (d) 1.54 0.694 0.40 2.30 -0.121 0.15
The porous materials developed in this study are PMMA based materials that
have randomly distributed cells with irregular cell shapes and sizes. The predictions of
Roberts and Garboczi for the relation of modulus with density may be more realistic for
these materials. The prepared structures have some similar microstructure developed in
the model with the name of “overlapping solid spheres” shown in Fig. 4.6 (a). The
relative density of the materials is also in the limitations of the models.

36
Chapter 5
EXPERIMENTAL
5.1. Materials
The PMMA based porous plastic mold materials were produced by the
polymerization of water-in-oil emulsion from hardenable composition containing
methyl methacrylate (MMA-C5H8O2, Degussa, Germany), polymethyl methacrylate
beads (PMMA, Keramische Laufen, Germany), dibenzoyl peroxide (BPO-C14H10O4) as
initiator of the polymerization reaction (Peroxid-Chemie GmbH), emulsifier
(Keramische Laufen, Germany) and water. PMMA beads with various average bead
sizes in the range of 22 and 157 µm were used as filler material. To provide the
homogeneity and the stability of the emulsion, water-soluble nonionic surfactant of
ethylene oxide-propylene oxide (EO-PO) block-copolymer was used.
5.2. Characterization of Materials
For the characterization of the emulsion constituents, Fourier Transfer Infrared
Spectroscopy (FT-IR), Differential Scanning Calorimetry (DSC), and Scanning
Electron Microscopy Techniques (SEM) were used.
5.2.1. Fourier Transform Infrared Spectroscopy
FT-IR spectrometer (Shimadzu) was used with the resolution of 2 cm -1 in the
wavenumber range of 400-4600. For the FT-IR analysis of the powder materials, about
0.005 gr sample was mixed with powder KBr to prepare the pellets. For the analysis of
liquid MMA, KBr pellets were prepared and MMA was dropped onto them.
FT-IR spectroscopy is one of the most powerful tools for identifying and
investigating hydrogen bonding in polymers and is used for defining the polymer
systems. Figs.5.1 (a) and (b) show the FT-IR spectrum of the filler PMMA beads with
average particle diameters of 150 µm and 35 µm, respectively. These datas were used to
identify the origin of the beads. In Fig 5.1 (c) FT-IR spectrum of MMA is also given. In
these figures, some characteristic bonds of methyl methacrylic are seen. In the graphs,

37
bonds approximately at 1750, 1280 and 1150 cm-1 corresponding to C=O, C–O and C–
O–C stretching of carboxylic group (O–C=O), respectively are observed. Bands nearly
at 1400 and 1490 cm-1 corresponding to CH3 and CH2 bending and stretching and at
2983 cm-1 are result of the –CH3 stretching. The frequencies at 990 and 750 cm-1 are
assigned to CH2 twisting and bending.
0.05
0.1
0.15
0.2
0.25
500 1000 1500 2000 2500 3000 3500W avenumber (1/cm)
Abs
orba
nce
(a)
0
0.1
0.2
0.3
0.4
500 1000 1500 2000 2500 3000 3500
W avenumber (1/cm)
Abs
orba
nce
(b)

38
0
0.1
0.2
0.3
500 1000 1500 2000 2500 3000 3500Wavenumber (1/cm)
Abs
orba
nce
(c)
Figure 5.1. FT-IR spectra of PMMA beads with the average particle size of a) 150 µm
b) 35 µm and c) methyl methacrylate monomer.
FT-IR spectrum of produced porous plastic materials is given in Fig.5.2, the
characteristic bands of methyl methacrylate can be seen. The peak at nearly 2350 cm-1 is
a result of the moisture content of the material.
0
0.05
0.1
0.15
0.2
500 1000 1500 2000 2500 3000 3500
Wavenumber (1/cm)
Abs
orba
nce
Figure 5.2. FT-IR Spectrum of produced PMMA–based porous plastic materials
39
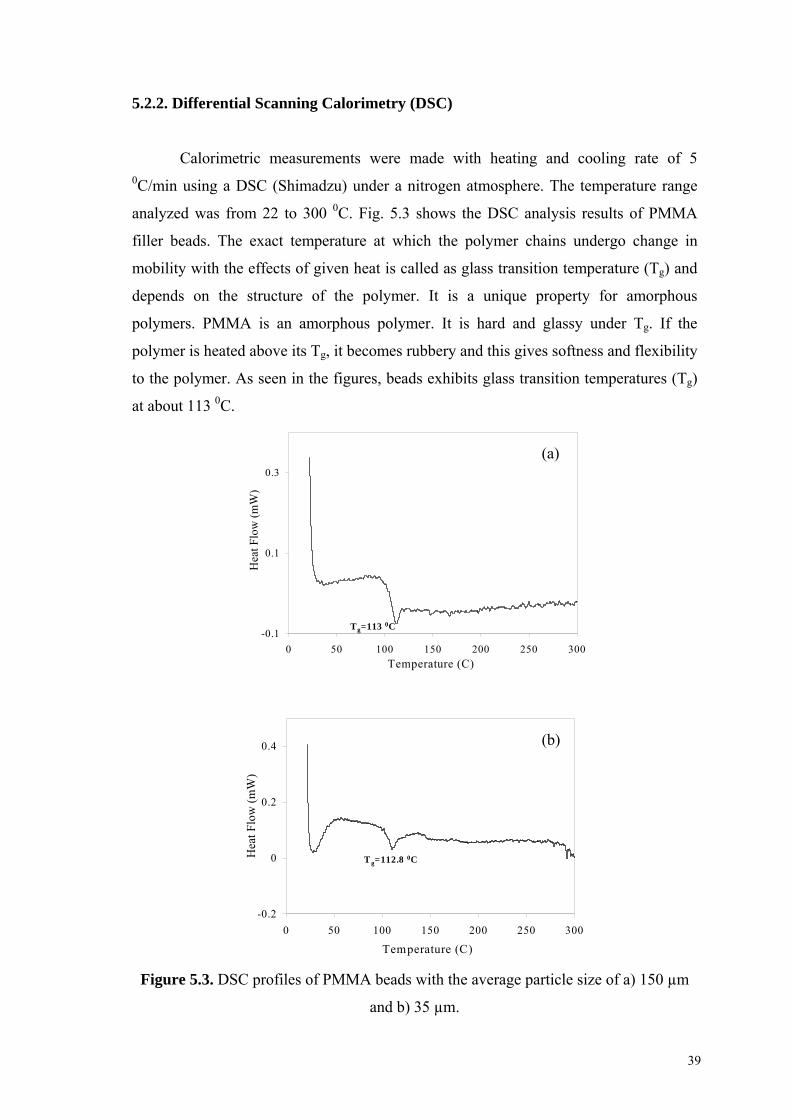
5.2.2. Differential Scanning Calorimetry (DSC)
Calorimetric measurements were made with heating and cooling rate of 5 0C/min using a DSC (Shimadzu) under a nitrogen atmosphere. The temperature range
analyzed was from 22 to 300 0C. Fig. 5.3 shows the DSC analysis results of PMMA
filler beads. The exact temperature at which the polymer chains undergo change in
mobility with the effects of given heat is called as glass transition temperature (Tg) and
depends on the structure of the polymer. It is a unique property for amorphous
polymers. PMMA is an amorphous polymer. It is hard and glassy under Tg. If the
polymer is heated above its Tg, it becomes rubbery and this gives softness and flexibility
to the polymer. As seen in the figures, beads exhibits glass transition temperatures (Tg)
at about 113 0C.
-0.1
0.1
0.3
0 50 100 150 200 250 300
Temperature (C)
Hea
t Flo
w (
mW
)
Tg=113 0C
-0.2
0
0.2
0.4
0 50 100 150 200 250 300
Temperature (C)
Hea
t Flo
w (
mW
)
T g=112.8 0C
Figure 5.3. DSC profiles of PMMA beads with the average particle size of a) 150 µm
and b) 35 µm.
(a)
(b)

40
Fig. 5.4 shows the DSC curve of BPO and it has a crystallization temperature
(Tc) of 58.5 0C and an endothermic melting peak (Tm) at 118.6 0C.
-3
-1
1
3
0 50 100 150 200 250 300T emperature (C)
Hea
t Flo
w (
mW
)
T m=118.6 0C
T c=58.5 0C
Figure 5.4. DSC profile of Dibenzoyl Peroxide (BPO)
5.2.3. PMMA Beads
Fig 5.5 and 5.6 show the SEM images of the filler PMMA beads with the
average particle sizes of 157 µm and 35 µm, respectively. SEM images were used for
the determination of the average particle sizes of the PMMA beads. It was also seen that
there were some dissimilarities on the surfaces of the beads. The surfaces of the PMMA
beads shown in Fig 5.6 have been plastized with dibutyl phatalate to assist the monomer
absorption on the surface.
Figure 5.5. SEM micrographs of PMMA beads with average particle diameter of
157µm
(c)

41
Figure 5.6. SEM micrographs of plastized PMMA beads with average particle diameter
of 35µm.
5.3. Production of PMMA-Based Porous Plastic Mold Materials
In this study, PMMA-based plastic materials were produced by water-in-oil
emulsion polymerization from a hardenable composition that contains water and
monomer phases with the following concentrations. The water phase contained finer
PMMA beads (20-30 wt.%) suspended in the blend of water and the surfactant. During
the preparation of emulsions, water/surfactant ratio was kept constant (1/3) while their
total concentrations varied between 30-40 wt.%. The monomer phase was contained the
coarser beads (15-25 wt.%), dibenzoyl peroxide (0.3-0.5 wt.%) and methyl methacrylate
monomer (15-20 wt.%). Monomer phase was stirred shortly and the blend formed a
viscous solution of polymer in monomer due to the absorption of MMA by PMMA
beads and the dissolution of beads surfaces. These two solutions were mixed together
for very short period of time until the homogeneous emulsion was obtained and then
cast on an epoxy mold with a smooth surface. Final emulsion consists of an immiscible
water phase dispersed in monomer phase and additionally PMMA beads suspended in
the emulsion.
After the polymerization is completed, the cast material is demolded and washed
with tap water to remove remaining monomer and surfactant molecules. The described
technique results in randomly distributed open cell macropore structure with an
irregular morphology.
In addition, to evaluate the compressive properties and density values of the cell
wall material, materials were produced without addition of water and the surfactant to
the emulsion system and PMMA-based plastics, with nearly no porosity were obtained.

42
5.4. Incorporation of Nano Particles into the Emulsion
Addition of filler particles to the polymeric systems may result in improved
properties such as higher mechanical properties of the produced materials. Due to the
importance of mechanical durability of porous mold materials under high pressure, it
was attempted to investigate the mechanical properties of the materials with the
additional reinforcement particles. For this purpose, plastic materials were produced
with additional clay (Na+-montmorillonite (Na+-MMT)), particles. The particles were
purchased from Aldrich.
Fig.5.7 shows the idealized structure for montmorillonite; two tetrahedral sheets
and between them an edge-shared octahedral sheet of either aluminum or magnesium
hydroxide. Isomorphic substitutions in the tetrahedral lattice and the octahedral sheet
cause an excess of negative charges within the montmorillonite layers, which are
naturally balanced by exchangeable inorganic cations, such as Na+ and Ca++. The polar
Si-O groups at the montmorillonite surface impart hydrophilic nature and these results
in affinity of montmorillonite to polar molecules. Clay is needed to be organophilic in
order to disperse in monomer phase (non-polar). Before using in emulsion systems clay
should become organophilic by treatment with suitable modifiers.
Figure 5.7. Crystal structure of montmorillonite. [37]
5.4.1. Modification of Clay
20 gr of Na+-MMT was dispersed in 400 ml deionized water. A solution of
hexadecyltrimethylammonium chloride (CTAC, (CH2)15N(CH3)3+-Cl-, Aldrich - 0,047
mol) and hydrochloric acid (HCl, 0,048 N) in 100 ml deionized water was prepared.

43
These two solutions were mixed and stirred for 1.5 hour at 75 0C (Fig.5.8).
Organophilic MMT was formed by cationic exchange between Na+-MMT galleries and
hexadecyltrimethylammonium chloride in the suspension (Fig.5.9). With the penetration
of alkylammonium ion into the galleries, distance within the galleries increases and by
the affinity of the long hydrophobic polymer chain to non-polar molecules
montmorillonite became organophilic at the end of the modification step. Then the
suspension was filtered and the solid residue was washed with deionised water until no
residual chloride was obtained by using the silver nitrate test. The product was dried in
a fan oven at 70 0C for 24 hours and sieved before usage.
Figure 5.8. Modification steps of clay.
Figure 5.9. Cation exchange process between montmorillonite galleries and
alkylammonium ions.
5.4.2. Production of Porous Plastic Material with Nano Particles
Almost the same procedure described in section was used for the production of
reinforced plastic material. The main difference was that the MMA was mixed with clay
and stirred for 2 hours before using it in the general procedure. To investigate the

44
modification effects of the clay particles, plastic materials were produced with modified
(OMMT) and unmodified (MMT) montmorillonite.
5.5. Characterization of Mold Materials
Produced porous plastic materials were characterized to obtain their
microstructural features, water permeability and mechanical properties.
5.5.1. Microstructure Characterization and Porosity Determination
To investigate the microstructural properties such as pore morphology and
fractions, optical and scanning electron microscopy (SEM) techniques were used.
Specimens were prepared for the microstructure investigations by cold molding,
grinding and polishing. Optical micrographs of the specimens were taken at 50X
magnification from at least seven different regions of the prepared surfaces for each
specimen to obtain the best representative images of the structure to measure the
porosity of the specimens. Thresholds of the optical micrographs were analyzed using
ScionTM image analyzer software. Fig.5.10 is an example showing the optical
micrograph of a specimen and its threshold. The software measures the areas colored
with black and by dividing this value with the total area the areal pore fraction was
determined.
(a) (b)
Figure 5.10. a) Optical micrograph of the cross section of a specimen and b) the
threshold of the same image in (a).
45
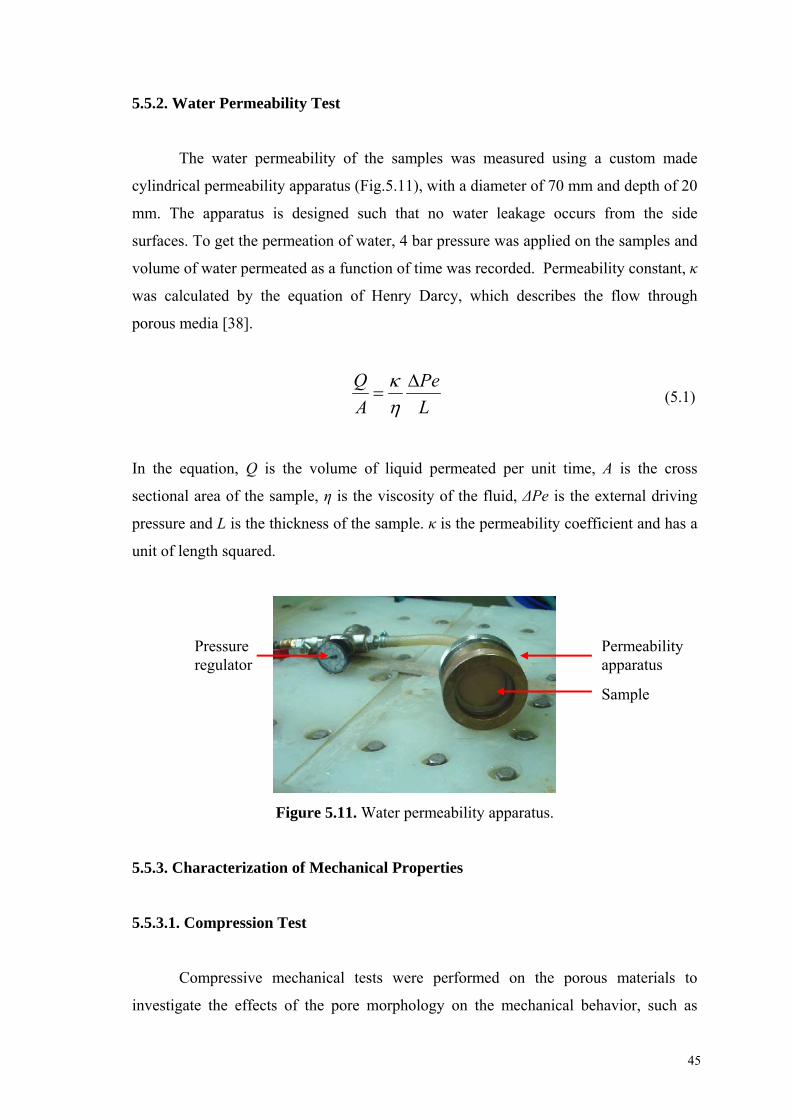
5.5.2. Water Permeability Test
The water permeability of the samples was measured using a custom made
cylindrical permeability apparatus (Fig.5.11), with a diameter of 70 mm and depth of 20
mm. The apparatus is designed such that no water leakage occurs from the side
surfaces. To get the permeation of water, 4 bar pressure was applied on the samples and
volume of water permeated as a function of time was recorded. Permeability constant, κ
was calculated by the equation of Henry Darcy, which describes the flow through
porous media [38].
L
Pe
A
Q
(5.1)
In the equation, Q is the volume of liquid permeated per unit time, A is the cross
sectional area of the sample, η is the viscosity of the fluid, ΔPe is the external driving
pressure and L is the thickness of the sample. κ is the permeability coefficient and has a
unit of length squared.
Figure 5.11. Water permeability apparatus.
5.5.3. Characterization of Mechanical Properties
5.5.3.1. Compression Test
Compressive mechanical tests were performed on the porous materials to
investigate the effects of the pore morphology on the mechanical behavior, such as
Sample
Pressure regulator
Permeability apparatus

46
collapse stress and elastic modulus. Specimens with 15 mm diameter and 20 mm length
were sectioned from lager slabs and all the specimens were dried at 350C for 24 hours
prior to testing. At least five specimens from each set were tested at room temperature
and under a constant crosshead speed of 1.3 mm/min (strain rate of 0.001 s-1), using a
ShimadzuTM universal testing machine (Fig.5.12). Compression test specimens were
also used for density measurements. They were weighted after drying and by dividing
weights to volume, densities of the materials were calculated.
Compressive stress values were calculated by dividing the load values to the
surface area normal to the loading direction and strain values were obtained by dividing
the stroke values with the initial length of the specimen. From the initial linear part of
the compressive stress-strain graph elastic modulus values were calculated. Stress
values at transition point from elastic to plastic deformation region give the collapse
stress of the materials.
Figure 5.12. Compression test equipment
5.5.3.2. Fracture Toughness Measurement
Fracture toughness (Kıc) of PMMA based porous materials were measured
according to ASTM D5045-91, based on single edge notch bend (SENB) specimen
configuration [39]. Specimens with the thickness of 6 mm and width of 12 mm were
prepared by sectioning from larger slabs using a diamond saw. On one edge of the
specimens, a notch was opened by machining with a rotating abrasive disc and a sharp
pre-crack was formed by simply pressing a sharp razor blade into the notched region
[40]. All specimens were dried at 350C for 24 hours and toughness tests were performed
at room temperature. Specimens were tested using the universal test machine with the
crosshead speed of 10 mm/min. Kıc values were calculated based on the following
equation in the units of MPa m1/2.

47
)(2/1 xfBWPK QIC (5.2)
In the equation, PQ, B, W and f(x) are load, specimen thickness, specimen width and a
calibration factor, respectively.
To investigate the fracture mechanism of the produced materials, fracture
surface of the SENB specimens were analyzed by using SEM technique after fracture
tests.
5.5.3.3. Determination of Residual Mechanical Properties after Cyclic Loading
Compressive cyclic loading tests were performed on the plastic materials to
investigate the residual mechanical properties after repeated loading. Specimens with 15
mm diameter and 20 mm length were prepared and all the specimens were dried at 350C
for 24 hours prior to testing. Specimens were repeatedly loaded for 1000 times under
stress values of 9, 7.5 and 6 MPa (75%, 62.5% and 50% of the collapse stress values,
respectively). Tests were performed at room temperature with the stress control
conditions using the universal testing machine. After completion of the cyclic loading,
the specimens were statically loaded to failure, under the same conditions of
compression tests. After 1000 cycle loading, deformations in the structure and the
variation in elastic modulus and collapse stress values were investigated.

48
Chapter 6
RESULTS AND DISCUSSION
6.1. Effects of Emulsion Constituent Concentrations on the Properties of Materials
6.1.1. Microstructure
PMMA-based porous plastics were produced with various concentrations of water-
in-oil emulsion constituents. Fig.6.1 shows the SEM images of the porous materials
processed with varying total weight fraction of water and surfactant in the emulsions
(water/surfactant=1/3). The concentrations of these constituents in the emulsions were
changed in the range of 29-40 wt.%. The results showed that the pore fraction,
morphology and cell connectivity are significantly affected by the total concentrations
of water and surfactant. It was observed that the amount of water in the emulsion is
directly related to the pore fraction and connectivity. As the concentrations of these
constituents are increased, the porosity and cell connectivity increases. The ratio
between the concentrations of liquid constituent (-water/surfactant and monomer-)
defines the formation of the network and also connectivity of the cells. At low
concentrations of the water-surfactant, water droplets are completely enclosed by the oil
phase and larger isolated pores are formed as illustrated in Fig.6.1 (a) Note that the free
radical polymerization reaction occurs in the oil phase between MMA molecules that
are activated by phenyl free radicals, which are a decomposition product of BPO.
Polymerized monomer molecules form the cell walls with the contribution of PMMA
beads. The macropore structure is mainly formed by the water droplets surrounded with
surfactants within the emulsion during the polymerization of the oil phase. So, the
homogeneous distribution of the water droplets and the stabilization of the emulsion
through out the polymerization reaction are very critical for the microstructural
properties of the material. As the polymerization is completed, the water phase is
removed from the structure and open-cell porosity is left behind.
Fig. 6.2 (a) to (d) show the polished surface optical images of the plastic porous
materials produced with various concentrations of monomer. The concentration of
monomer in the emulsions was changed in the range of 12.5-20.8 wt%, respectively.

49
(a) (c)
(b) (d)
Figure 6.1. SEM micrographs polished surface of PMMA-based plastics, produced with
various concentrations of surfactant/water. The total content of water and surfactant in
the emulsions are 29, 33, 37 and 40 for a, b, c and d, respectively
(water/surfactant=1/3).
As indicated in the figure, the pore morphology and cell structures are significantly
affected by the concentrations of monomer. At high concentrations, larger isolated pores
are formed. Additional amount of monomer accumulates around the filler beads and
forms thicker cell walls with nearly no connectivity between the pores (Fig. 6.2 (d)).
Lower concentration of monomer results in the formation of the material with
microstructure that is given in Fig.6.2 (a) with higher connectivity. In this system,
monomer molecules surrounding the PMMA beads form very thin connections between
the beads.
In Fig.6.3 effects of emulsion liquid constituents on the microstructure of the
porous plastic material is summarized by using a concentration diagram.
200 µm200 µm200 µm 200 µm200 µm200 µm
200 µm200 µm200 µm 200 µm200 µm200 µm

50
(a) (b)
(c) (d)
Figure 6.2. Optical polished surface micrographs of PMMA-based plastics, produced
with various concentrations of monomer. The monomer content in the emulsions are
12.5, 18.3, 19.6 and 20.8 for a, b, c and d, respectively.
6.1.2. Porosity and Water Permeability
Fig.6.4 shows the variation of porosity and permeability constant as a function
of total weight fraction of surfactant and water. As seen in this figure, the percentage of
the porosity increases from 34 to 47% as the amount of water-surfactant increase from
29 to 40 wt.%, respectively. As the porosity and effective cell connectivity of the
materials increases, the permeability constant of the specimens increases from 2.1 to 4.3
darcy for the given concentration range.
Increasing in monomer concentration up to a critical point has reverse effect on
porosity and permeability as given in Fig. 6.5. It was found that as the monomer
concentration increases from 12.5 to 19.6 wt%, the porosity is decreased from 46 to
34.5 %. However, the permeability constant is increasing from 2.7 to 3.4 darcy for the
same concentration range. This is due to increased ratio of effective pores which are not
in closed form and take a role in transportation of water.
100 μm100 μm100 μm 100 μm100 μm100 μm
100 μm100 μm100 μm 100 μm100 μm100 μm

51
Figure 6.3. Effect of emulsion constituent concentrations on the microstructure

52
20
30
40
50
60
70
28 30 32 34 36 38 40 42
Surfactant and water wt.%
Por
osit
y (%
)
0
1
2
3
4
5
Per
mea
bili
ty c
onst
ant (
darc
y)
Permeability constant
Porosity
Figure 6.4. Porosity and water permeability constant of the PMMA-based porous
plastics with respect to surfactant and water concentration (w/s=1/3).
0
20
40
60
80
100
12 13 14 15 16 17 18 19 20 21 22
Monomer wt.%
Por
osit
y (%
)
0
1
2
3
4
Per
mea
bili
ty c
onst
ant (
darc
y)
Permeability constantPorosity
Figure 6.5. Porosity and water permeability constant of the PMMA-based porous
plastics with respect to monomer concentration.
6.1.3. Mechanical Properties
Fig. 6.6 shows the compressive stress-strain graphs of the samples produced
with various concentrations of water and surfactants (29 to 40 wt.%). The stress-strain

53
0
10
20
30
40
0 0.1 0.2 0.3 0.4
Strain
Str
ess
(MP
a)
%40
%37
%33
%29
%35
ρ=0.850 g/cm3
ρ=0.747 g/cm3
σc
Figure 6.6. Compression stress-strain curve of materials with various surfactant and
water concentrations (w/s=1/3).
behavior of all the specimens showed linear elasticity up to the collapse stress. The
collapse stress (c) is defined as the point at which deviation is observed in the linear
part of the stress-strain curves. From the slope of the linear elastic region modulus
values were also calculated.
Fig. 6.7 shows the variations in collapse stress and elastic modulus values with
respect to water and surfactant concentrations. As seen in the figure, water and
surfactant content has significant effect on the mechanical properties. It was found that
the collapse stress and elastic modulus values decrease from 24 to 4.9 MPa and from
824 to 224 MPa, respectively, as the concentration of water-surfactant increases from
29 to 40 wt.%. Furthermore, densities of the tested materials change from 0.85 to 0.747
g/cm3 for the given concentration range. As discussed previously, the material with a
high density exhibited short deformation plateau (in region II) in the stress-strain
graphs. This is associated with lower porosity and higher fraction of closed cells. On the
other hand, as shown in Fig.6.6 material with a lower density has longer deformation
plateau and material is completely collapse at high strain values. This is due to higher
fraction of pores with open-cell structure that involves extensive progressive collapse of
the pore network.
In addition to water-surfactant, effect of the MMA on the mechanical properties
was investigated. Fig.6.8 shows the compression stress strain curves of the materials

54
0
10
20
30
40
28 30 32 34 36 38 40
Surfactant and water wt.%
Col
laps
e st
ress
(M
Pa)
0
200
400
600
800
1000
Ela
stic
mod
ulus
(M
Pa)
Collapse stress
Elastic modulus
Figure 6.7. Collapse stress and elastic modulus of plastic mold samples with various
surfactant and water concentration (w/s=1/3).
0
10
20
30
0 0.1 0.2 0.3 0.4
Strain
Str
ess
(MP
a)
%20.8
%18.3
%15.5
%16.9
%14
Figure 6.8. Compression stress-strain curve of materials with various monomer
concentrations.
that were produced with various MMA concentrations. It can be observed from the
figure that when the monomer concentration is under 16 %, the material has very short
plastic deformation plateau and there is no densification, deformation is ended with the
complete collapse of the material.
Fig.6.9 shows the variation of collapse stress and elastic modulus with respect to
monomer concentration. The increase of monomer concentration in the range of 14-
21% resulted in an increase of the collapse stress and modulus values from 8.4 to 19.3
MPa and from 356 to 687 MPa, respectively.

55
0
4
8
12
16
20
13 14 15 16 17 18 19 20 21 22Monomer wt.%
Col
laps
e st
ress
(M
Pa)
0
200
400
600
800
1000
Ela
stic
mod
ulus
(M
Pa)
Collapse stress
Elastic modulus
Figure 6.9. Collapse stress and elastic modulus of plastic mold samples with various
monomer concentrations.
6.2. Effects of Average Particle Size of Fillers on the Properties of Plastic Porous
Materials
6.2.1. Microstructure
In order to investigate the effects of particle size of the PMMA beads on the
microstructure and performance of the porous plastic materials, samples were produced
with various average particle diameters in the range of 22 and 157 m. Figs. 6.10 (a),
(b), (c) show the optical micrographs of the materials produced with the average particle
diameter of 157, 88 and 22 m, respectively. Incorporation of coarser beads results in
formation of larger pores with higher fraction of porosity. Conversely, when finer
particles are added into the emulsion, smaller pores occurs (Fig. 6.10(c)).
6.2.2. Porosity and Water Permeability
Fig. 6.11 shows the porosities and water permeability constants of the porous
samples with various bead diameters. As the PMMA bead diameter increases from 22 to
130 m, the percentage of porosity and hence the permeability values increase from 32
to 45% and from 2.2 to 4.2 darcy, respectively.

56
Figure 6.10. Optical images of PMMA-based plastics, produced with various average
particle diameter of PMMA beads. The average particle diameters were 157, 88 and 22
m for a, b and c, respectively.
0
20
40
60
80
100
0 20 40 60 80 100 120 140
Average bead diameter (micron)
Por
osit
y (%
)
0
1
2
3
4
5
Per
mea
bili
ty c
onst
ant (
darc
y)
Permeability constantPorosity
Figure 6.11. Porosity and water permeability constants of the PMMA-based porous
plastics with respect to average diameter of the PMMA beads.
100 μm100 μm100 μm
a)
100 μm100 μm100 μm
b)
100 μm100 μm100 μm
c)

57
6.2.3. Mechanical Properties
Fig.6.12 shows the compressive stress-strain test results of the materials that
were produced by using PMMA beads with various average bead diameters in the range
of 22-130 μm. Fig. 6.13 shows the variation in collapse stress and elastic modulus
values of the plastic porous materials with respect to average bead size of PMMA. For
the variation of the diameters in this range, collapse stress and modulus values decrease
from 17 to 7.3 MPa and 649 to 350 MPa, respectively. As it was mentioned above,
coarser beads results in formation of larger pores and when the sufficient force for the
collapse of the cell walls is applied, the material is deformed. Also, the bonding
between the adjacent beads become weaker for the materials produced with coarser
beads and this is also associated with the lower collapse stress values.
0
5
10
15
20
25
30
0 0.1 0.2 0.3 0.4
Strain
Stre
ss (
MP
a)
22 μm
35.2 μm
64.4 μm
110 μm
130 μm
157.6 μm
Figure 6.12. Compression stress-strain curve of materials with various average particle
diameters of PMMA beads.
6.3. Effects of Nano Particles on the Properties of Materials
Fig.6.14 shows the X-Ray Diffraction analysis results of MMT and OMMT. As
it can be observed from the figure, the structure of the montmorillonite is significantly
affected from the modification process. Distance between the (001) basal planes
increased from 14.8 Å to 19 Å.

58
0
5
10
15
20
25
20 40 60 80 100 120 140
Average bead diameter (micron)
Col
laps
e st
ress
(M
Pa)
0
200
400
600
800
Ela
stic
mod
ulus
(M
Pa)
Collapse stress
Elastic modulus
Figure 6.13. Collapse stress and elastic modulus of the PMMA-based porous plastics
with respect to average diameter of the PMMA beads.
The results of the performed compression test results on the materials produced
with OMMT and MMT are given in Fig.6.15. Results show that the produced materials
with additional MMT particles have lower elastic modulus and collapse stress values.
Using unmodified clay particles may be resulted in dissolution of particles in water
phase and agglomeration of the particles because of weak wetting by monomer phase.
Produced materials with the 1% of modified clay addition have improved mechanical
properties, i.e.; about 90% increase in collapse stress and 50% increase in elastic
modulus values. However, in the case of modified clay addition 2%, it was observed
that there is no improvement on the mechanical properties. It is also known that amount
of reinforcement addition is critical for the composite systems. In some cases, addition
of reinforcement above the certain limits may decrease the strength of the materials.
Porosity and water permeability of the produced materials with additional clay
particles were also measured and it was seen that addition of reinforcement particles has
no significant effect on these properties.

59
0
40
80
120
160
2 4 6 8 10 122 Theta
Inte
nsit
y
OMMT-d=19Å
MMT-d=14.8Å
Figure 6.14. X-Ray Diffraction analysis results of MMT and OMMT.
0
10
20
30
0.0 0.1 0.2 0.3 0.4Strain
Str
ess
(MP
a)
PMMA + 1% OMMT
PMMA
PMMA + 2% OMMT
PMMA + 2% MMT
Figure 6.15. Compression stress-strain behaviors of specimens produced with
additional MMT and OMMT particles.
6.4. Deformation Mechanism of PMMA-Based Porous Plastic Materials
6.4.1. Collapse Stress and Elastic Modulus
The mechanical performance of the produced material is critical since high
pressure cyclic loadings are applied on these materials during the shaping of ceramic

60
articles. Mechanical behavior of porous materials during mechanical loading is
significantly affected by the pore structure. The typical compressive stress-strain curve
of a PMMA-based porous plastic processed in this study is shown in Fig.6.16. The
graph exhibits three distinct regions, similar to the compressive behavior of elastic
brittle foams described by Gibson and Ashby [5]. The first region is a linear elastic
region that is controlled by cell wall bending and cell face stretching. The second region
is a long deformation plateau with lower rate increasing stress values as compared to
first region. Deformation in this region involves tearing and brittle crushing of the cells,
progressive collapse of the pore network and plastic flow of the structure. This
deformation plateau is generally described with an almost constant stress for open cell
structure materials. With the collapse of the cells, opposing cell walls touch each other
and further stress begins to compress the solid itself, and creates the final region of
densification with a rapidly increasing stress (region III).
0
10
20
30
40
50
0 0.1 0.2 0.3 0.4 0.5 0.6 0.7
Strain
Str
ess
(MP
a)
I IIIII
c
Figure 6.16. Typical compressive stress-strain response of PMMA-based porous
materials
Gibson and Ashby described the second plateau region with nearly constant
stress values for open-cell elastic brittle foams. The increase of stress level in the second
region for the present case may be associated with the presence of a fraction of closed
cells in the structure. Closed-cells cause to increase the contribution of the cell wall
stiffness to the elastic modulus and increase in stress values in plastic deformation

61
plateau. The precise formation of the three region behavior depends on the cell structure
and the density of the material. The material with a high density exhibited short
deformation plateau (in region II) in the stress-strain graphs. As an example, Fig.6.6
shows the compression behavior of porous plastics with various porosity and densities.
The material with a lower density has longer deformation plateau, such that
densification begins at much higher strain values and for specimens with lowest density
there is insignificant densification. This is due to higher fraction of pores with open-cell
structure that involves extensive progressive collapse of the pore network for lower
densities.
The collapse stress vs. density of the produced materials was predicted based on
the analysis of Gibson and Ashby to compare with the experimental values. The
produced materials fracture in brittle manner so the equation 4.9 for brittle materials
were used. The distribution parameter given in Equation 4.3 and 4.9 can be estimated
from the comparison of the experimental data and the predicted values of collapse stress
(brittle-crushing strength) and elastic modulus [41-42]. For the comparison of the
measured and predicted crushing strength of the specimens were normalized to the cell
wall strength (s= 1493.3 MPa) and foam density was normalized to cell wall density
(s=1,124 g/cm3). Note that the cell wall strength and densities were measured based on
the non porous specimens that were made of without addition of water and surfactant.
Fig. 6.17 shows the relation between relative crushing strength and relative density for
the PMMA based porous materials. Straight lines on the plot are the predictions of the
equation using trial values of . Comparisons indicate that the experimental data do not
fit with the prediction of the developed equations of Gibson and Ashby.
Fig. 6.18 shows the variation of relative modulus as a function of relative density
and the straight lines in the plot represent the predictions of the Equation 4.3. The
equation for describing the relation between the relative density and the modulus is not
valid for high density materials. It was obtained that the equations developed from the
simple cubic model are not valid for the irregular cellular, high density materials.
The studied material has randomly distributed cells with irregular cell shapes
similar to the described models given in Fig 4.6. The predictions given by Roberts and
Garboczi which describes the properties of materials with high densities may be more
realistic for the present materials. The constants within the equation were taken for the
models given in Fig.4.6. Fig. 6.19 shows the comparison of the experimental data with

62
0.01
0.1
1
0 1Relative density
Rel
ativ
e cr
ushi
ng s
tres
s
Ø= 1
Ø= 0
Ø= 0.95
Ø= 0.8
Figure 6.17. Variation of relative crushing stress as a function of relative density.
0.01
0.1
1
0.1 1Relative density
Rel
ativ
e m
odul
us
Ø=0
Ø=0.8
Ø=1
Figure 6.18. Variation of relative modulus as a function of relative density.
the predicted results of the Equation 4.10 for these models. As seen in the figure, the
experimental data fits with the curve of the model called as “overlapping solid spheres”
with the constants 348.00p and 23.2m for the case of
minpp and 5.0
minp .
6.4.2. Deformation Mechanism
To investigate deformation mechanism of the porous materials, compression
tests were applied on the specimens at various stress levels below and over the collapse
strength. As seen in the figure, the specimens loaded above the collapse stress of the

63
0
0.2
0.4
0.6
0.8
1
0.4 0.5 0.6 0.7 0.8 0.9 1Relative density
Rel
ativ
e m
odul
us
Experimental results
Prediction of Roberts and Garboczi
m
s
m
p
pp
E
E
0
0
1
23.2m 348.00p
65.1m 182.00p
35.2m 202.00p
Figure 6.19. Comparison of experimental data and predictions of Garboczi and
Roberts.
0
4
8
12
16
20
0 0.05 0.1 0.15
Strain
Str
ess
(MP
a)
7 MPa
14 MPa
16 MPa
19 MPa
Figure 6.20. Stress strain curves of porous plastics loaded at the stress levels
of 7, 14, 16 and 19 MPa.
material ( 12 MPa) some residual deformations occur. The residual deformation is
associated with the failure of the cell structure.
Fig. 6.21 shows the cross section of the specimens unloaded and loaded to 7
MPa without delay. It was observed that there is no apparent deformation in the
structure and material is elastically deformed for the stress values under the collapse
strength.

64
However, for the specimens loaded at slightly over the collapse stress (loaded at
14 MPa), some residual deformations are visible. Cracking and cell bending are
observed especially at thinner region of the cell walls as shown in Fig. 6.22.
(a) (b)
Figure 6.21. SEM micrograph showing the cross section of the PMMA based porous
plastic a) unloaded and b) after loaded at 7 MPa.
Figure 6.22. SEM micrograph of the porous plastics that were exposed to load-unload
cycle at the stress level of 14 MPa.

65
Fig.6.23 shows the cross section of the specimens after loading at 19 MPa stress.
This stress value is in the level of plastic deformation plateau of the material. Under the
compression stress values relatively higher than the collapse stress, cell walls crack and
failure in the brittle form occurs. Brittle fracture propagates through the weak points of
the cells and densification occurs due to collapse of the cells and joining of cell walls. In
Fig. 6.23 at higher magnifications completely collapsed cells are seen.
Figure 6.23. SEM micrograph showing the cross section of the porous plastics after
loading at the stress level of 19 MPa.
6.5. Effects of Emulsion Constituent Concentrations on the Fracture Toughness of
Material
The fracture toughness (Kıc) values of the materials were measured using the
SENB test configuration and are tabulated for varying water-surfactant and monomer
concentrations in Table 2. It was found that Kıc values decrease by 64% as the
concentration of water-surfactant is increased by 38%. In contrast, Kıc values increases
by 104% as the monomer concentration increased by 34%. The results indicate that Kıc
is increasing as the pore fraction is decreasing and cell walls are thickening. Fig. 6.24
shows the fracture surface SEM micrograph of the SENB specimens with 40 and 29
wt.% of water-surfactant, respectively. A high concentration of water-surfactant in the
emulsion resulted in an increase of pore fraction and reduction of the thickness of the
cell walls as can be seen in Fig.6.24 (a). For this case, fracture occurs over a relatively
smaller area by the tear of thinner cell walls. There is no noticeable plastic deformation
on the fracture surfaces. For lower concentration, as shown in Fig. 6.24 (b), the porosity
is lower and thicker cell walls forms where the filler PMMA beads are completely

66
embedded into the monomer phase, dissolved in it and connected very strongly.
Fracture occurs over a larger area and for the extension of the crack a higher surface
energy is required. This may result in improved fracture toughness of the material with
a higher KIC values.
Table 2. Fracture toughness of materials produced with various
water/surfactant and monomer concentrations.
Wt. %
Fracture Toughness,
KIC (MPa m1/2)
Water-Surfactant
29 0.376 0.005
33 0.219 0.041
35 0.187 0.006
37 0.180 0.010
40 0.134 0.026
Monomer (MMA)
15.5 0.158 0.006
18.3 0.246 0.017
19.7 0.274 0.016
20.8 0.322 0.016
On the other hand, an increase in MMA concentration results in a significant
increase of the fracture toughness values due to the formation of a low fraction of pores
and relatively thicker cell walls with higher strength. Fig. 6.25 shows the SEM fracture
surfaces of SENB samples produced with monomer concentrations of 15.5 wt.% and
20.8 wt.%, respectively. Similarly, as the concentration of MMA is increased as in Fig.
6.25 (b), much thicker cell walls form and fracture occurs over a large area [43].
6.6. Residual Mechanical Properties of Porous Plastic Materials after Cyclic
Loading
Structural durability of plastic porous materials that are used as a mold material
and subjected to high pressure cycles is important. To measure the residual mechanical
properties and investigate the deformation mechanisms, cyclic loading experiments
were conducted under compression mode at the maximum load level of 50, 62.5 and 75

67
(a) (b)
Figure 6.24. SEM fracture surface micrograph of the SENB specimens with the water-
surfactant concentrations of a) 40 and b) 29 wt.% (w/s=1/3).
(a) (b)
Figure 6.25. Fracture surface SEM micrograph of the SENB specimens with the
monomer concentrations of a) 15.5 and b) 20.8 wt.%.
of the collapse stress. The cyclic loading was performed for 1000 cycles, and then the
specimens were subjected to static compression testing to measure the residual strength
and modulus of the material. Fig.6.26 shows the comparison of compressive stress
strain responses of the original specimen without cyclic loading and the specimens
loaded at various stress level for 1000 cycles. The results show that the modulus of the
specimen increases by about 52% as compared to un-cycled specimen. This may be
associated with the fatigue of the cell walls and crack initiation and collapse of some
cells during the repeated loading. Due to the collapse of the structure, modulus values
may be increased while the strength is reduced due to the crack formation. Also the
collapse strength values are very close to each other for cycled specimens and it is lower
than the un-cycled one.

68
0
10
20
30
0 0.1 0.2 0.3Strain
Stre
ss (
MP
a)
cycled at 9 M Pa
cycled at 6 M Pa
cycled at 7.5 M Pa
not cycled
Figure 6.26. Compressive stress-strain responses of materials after 1000 cycle loading
under the stress values of 6, 7.5, 9 MPa.

69
Chapter 7
CONCLUSION
PMMA-based open-cell porous materials were produced using various
concentrations of water-in-oil emulsion liquid constituents and PMMA bead sizes. It
was revealed that the porous network is mainly formed by the water droplets surrounded
with surfactants and the cell walls are formed by the polymerized monomer molecules
with the contribution of PMMA beads. To produce an optimized open-cell porous
structure, it is essential to obtain homogeneous distribution of the water droplets with
high connection and the stabilization of the emulsion throughout the polymerization
reaction. It was found that constituent concentrations significantly affect the porosity,
pore morphology, water permeability, collapse stress and elastic modulus of the porous
plastics [44]. Percentage of the porosity increased from 34 to 47%, the permeability
constant of the specimens was increased from 2.1 to 4.3 darcy as the amount of water-
surfactant increased from 29 to 40 wt.%, respectively. Increasing the monomer
concentration has reverse effect on porosity and permeability. Percentage of porosity is
decreasing where the permeability constant of the material is increasing. It was also
found that porosity and permeability values increase as the average particle diameter of
beads used from 22 to 130 m.
Performed mechanical tests showed that the material exhibits the compressive
behavior similar to elastic brittle foams. It was found that the collapse stress and elastic
modulus decrease from 24 to 4.9 MPa and from 824 to 224 MPa, respectively, as the
concentration of water-surfactant increases from 29 to 40 wt.%. Furthermore, densities
of the tested materials change in the range of 0.85 to 0.762 g/cm3 for the given
concentration range. Increasing the monomer concentration was resulted in formation of
thicker cell walls and improved mechanical properties with increasing collapse stress
and modulus. For the increase of average bead diameters from 22 µm to 130 µm
collapse stress and modulus values decrease.
Mechanical compressive test results of the materials were related with the
structural properties of the materials such as relative density based on the predictions of
Ashby-Gibson and Roberts-Garboczi. It was found that the experimental data obtained
from the compressive testing correlates well with the predictions based on Roberts-
Garboczi model for overlapping solid spheres.

70
SENB test results and fracture surface investigations show that the porous
plastic PMMA based materials fracture in brittle manner. It was found that lower
concentrations of water and higher concentrations of monomer result in thicker cell
walls and fracture zone passes through larger area and for the extension of the crack
higher surface energy is required. So this was resulted in improved fracture toughness
of the material with higher KIC values.
Residual strength of the specimens after cyclic loading was investigated and it
was observed that after 1000 cyclic loading all the materials loaded at various stress
levels over and under the collapse stress have permanent deformations. After cyclic
loading, increase of elastic modulus values and decrease of collapse stress values were
measured.
Addition of nano scale montmorillonite particles improves the mechanical
properties of the plastic materials. The specimen produced with the addition of 1 wt. %
of surface modified montmorillonite exhibited 90 and 50% increase of collapse stress
and elastic modulus values, respectively.
In the future studies, addition of nanoscale clay particles to the emulsion system
may be studied and optimum clay concentration may be determined. Also, homogeneity
and stability of the emulsion is very critical for the structure and hence the performance
of the material. So, further studies may be performed to investigate the stability of the
emulsion throughout the polymerization. This is also related with the reaction time and
reaction time can be adjusted by the initiator concentration. So, studies may be
performed to investigate the effects of the initiator concentration and reaction time on
the properties of the materials.

71
REFERENCES
1. V. Mazzanti., The Technology That has Renewed Low Pressure Casting, Process
Engineering, DKG 2002; 79 (1-2): E11-12.
2. E.J. Pique, L.J.M.G. Dortmans, G. de With, Fictitious Crack Modeling of
Polymethyl Methacrylate Porous Material, Material Science and Enginering, 2002,
(A335) 217-227.
3. A. Dortmans, H. Fischer, R.G. Nelissen, Prediction and Improvement of The
Lifetime of Polymer Pressure Casting Molds, Process Engineering DKG 2002; 79
(1-2) :E45-48.
4. A. Dortmans, L.F. Batenburg, T.P.M. Koster, R.G. Nelissen, H. Fischer,
Nanocomposite Materials: From Lab-scale Experiments to Prototypes, e-polymers,
(http://www.e-polymers.org) 2002; (10): 1-10.
5. L.J. Gibson, M.F. Ashby, Cellular Solids, 2nd ed. Cambridge University Press,
Cambridge, UK, 1997.
6. A.P. Roberts, E.J. Garboczi, Computation of The Linear Elastic Properties of
Random Porous Materials With a Wide Variety of Microstructure, Proceeding of
the Royal Society of London A, 458, 1033-1054, 2002.
7. X. Huang, W.J. Brittain, Synthesis and Characterization of PMMA Nanocomposites
by Suspension and Emulsion Polymerization, Macromolecules, 2001, 34, 3255-
3260.
8. J. Teckoe, Synthetic Molds Go Mainstream, www.ceramicindustry.com
9. J.T. Jones, M.F. Berard, Ceramics Industrial Processing and Testing, Iowa State
University Press, Ames, Iowa, 1993.
10. http://unit.aist.go.jp
11. T. Thompson, The Rheology of Ceramic Kaolin’s, International Ceramics, Issue 1,
2000.
12. http://www.asianceramics.com
13. Princeton University: ChE346- Colloidal Consolidation
14. B. Leach, Slurry Solutions for Sanitaryware, www.ceramicindustry.com
15. www.garoll.it
16. United State Patent 5522717
17. British Patent number GB1458203
18. European Patent number EP0516224

72
19. F. Hoffman, K. Delbruch, Patent No.250 690, Germany, 1909.
20. W. Bauer, H. Lauth, Patent No.656 134, Darmstadt, 1931.
21. P.J. Dowding, B. Vincent, Suspension Polymerization to Form Polymer Beads,
Colloids and Surfaces A, 161, 2000, 259-269.
22. D. Blobdeu, M. Bigan, P. Despres, Ultrasound Suspension Polymerization Method
for Preparation of 2-Hydroxyethylmethacrylate Macroporous Copolymers, Reactive
and Functional Polymers, Volume 27, Issue 3, 1995, 163-173
23. T. Liu, C. Burger, B. Chu, Nanofabrication in Polymer Matrices, Progress in
Polymer Science, 28, 2003, 5-26.
24. N.D. Kaushika, K. Sumathy, Solar Transparent Insulation Materials: a Review,
Renewable and Sustainable Energy Reviews, 7 (2003) 317–351
25. A.M. Hayes, A. Wang, B.M. Dempsey, D.L. McDowell, Mechanics of Linear
Cellular Alloys, Mechanics of Materials, 36 (2004) 691–713
26. C. Park, S.R. Nutt, Strain Rate Sensitivity and Defects in Steel Foam, Materials
Science and Engineering A323 (2002) 358–366
27. Arcos D., Ragel C.V., Vallet-RegmH M. Bioactivity in Glass/PMMA Composites
Used as Drug Delivery System, Biomaterials 22 (2001) 701}708.
28. B. Pascuala, M. Gurruchagaa, M.P. Ginebrab, F.J. Gilb, J.A. Planellb, I. Goni,
Influence of The Modification of P/L Ratio on a New Formulation of Acrylic Bone
cement, Biomaterials 20 (1999) 465-474
29. M.J. Silva, L.J. Gibson, The Effects of Non-Periodic Microstructure and Defects on
the Compressive Strength of Two-Dimensional Cellular Solids, International
Journal of Mechanical Science, 39 (1997) 549
30. A.P. Roberts, E.J. Garboczi, Elastic Moduli of Model Random Three Dimensional
Closed Cell Cellular Solids, Acta Materialia, 49, 2001, 189-197.
31. W.E. Warren, A.M. Kraynik, Linear Elastic Behavior of a Low Density Kelvin
Foam With Open Cells, Journal of Applied Mechanics, 64, 787-794.
32. L.J. Gibson, M.F. Ashby, Proceeding of the Royal Society of London A, 1982, 383,
43.
33. A.P. Roberts, E.J. Garboczi, Elastic Properties of Model Random Three
Dimensional Open-Cell Solids, Journal of the Mechanics and Physics of Solids,
2002, 33-55.

73
34. T.G. Nieh, J.H. Kinney, J. Wadsworth, A.J.C. Ladd, Morphology and Elastic
Properties of Aluminum Foams Produced by a Casting Technique, Scripta
Materialia, 38(10), 1487-1494, 1998.
35. M.W.D. Van der Burg, V. Shulmeister, E. Van der Geissen, R. Marissen, On the
Linear Elastic Properties of Regular and Random Open-Cell Foams Models, Journal
of Cellular Plastics, 33, 31-54, 1997.
36. S. Torquato, L.V. Gibiansky, M.J. Silva, L.J. Gibson, Effective Mechanical and
Transport Properties of Cellular Solids, International Journal of Mechanical
Science, 40, (1998), 71-82.
37. E.P. Giannelis, R. Krishnamoorti, E. Manias, Polymer-Silicate Nanocomposites:
Model Systems for Confined Polymers and Polymer Brushes, Advances in Polymer
Science, 138, 1999, 108-147.
38. R.J. Stokes, D.F. Evans, Fundamentals of Interfacial Engineering, Wiley-VCH, New
York, USA, 1997.
39. Standard Test Methods for Plane-Strain Fracture Toughness and Strain Energy
Release Rate of Plastic Materials, American Society for Testing and Materials
(ASTM) D5045-91a.
40. T.L. Anderson, Fracture mechanics; Fundamentals and Application, 2nd ed. CRC
Press, New York, USA, 1995.
41. K.Y.G. McCullough, N.A. Fleck, M.F. Ashby, Uniaxial Stress-Strain Behaviour of
Aluminium Alloy Foams, Acta Materialia, 47 (1999) 8, 2323-2330.
42. C. Park, S.R. Nutt, Anisotropy and Strain Localization in Steel Foam, Material
Science and Engineering A, 299 (2001), 68-74.
43. Y. Ergün, C. Dirier, M. Yılmaz, C. Tokman, M. Tanoğlu, Microstructure-
Performance Relation in PMMA-Based Open-Cell Porous Materials for High
Pressure Ceramic Sanitaryware Casting, Key Engineering Materials, Vols 270-273.
44. Y. Ergün, C. Dirier, M. Tanoğlu, Polymethyl Methacrylate Based Open-Cell Porous
Plastics for High-Pressure Ceramic Casting, Material Science and Engineering.