Processing and characterization of porous Ti2AlC with controlled porosity and pore size
12
Processing and characterization of porous Ti 2 AlC with controlled porosity and pore size Liangfa Hu a , Rogelio Benitez b , Sandip Basu b , Ibrahim Karaman a,b , Miladin Radovic a,b,⇑ a Materials Science and Engineering Program, Texas A&M University, College Station, TX 77843, USA b Department of Mechanical Engineering, Texas A&M University, College Station, TX 77843, USA Received 30 March 2012; received in revised form 22 June 2012; accepted 20 July 2012 Available online 11 September 2012 Abstract In this work, we demonstrate a simple and inexpensive way to fabricate porous Ti 2 AlC, one of the best studied materials from the MAX phase family, with controlled porosity and pore size. This was achieved by using NaCl as the pore former, which was dissolved after cold pressing but before pressureless sintering at 1400 °C. Porous Ti 2 AlC samples with a volume fraction of porosity ranging from 10 to 71 vol.% and different pore size ranges, i.e. 42–83, 77–276 and 167–545 lm, were successfully fabricated. Fabricated samples were systematically characterized to determine their phase composition, morphology and porosity. Room temperature elastic moduli, compressive strength and thermal conductivity were determined as a function of porosity and/or pore size. For comparison, several sam- ples pressureless-sintered without NaCl pore former, or fabricated by spark plasma sintering, were also characterized. The effects of porosity and/or pore size on the room temperature elastic moduli, compressive strength and thermal conductivity of porous Ti 2 AlC are reported and discussed in this work. It follows that porosity can be a useful microstructural parameter to tune mechanical and ther- mal properties of Ti 2 AlC. Published by Elsevier Ltd. on behalf of Acta Materialia Inc. Keywords: MAX phases; Porosity; Elastic moduli; Compressive strength; Thermal conductivity 1. Introduction Ti 2 AlC is one of the most studied compounds out of more than 70 ternary carbides and nitrides with a general formula M n+1 AX n (where n = 1 to 3, M is an early transi- tion metal, A is an A group element and X is C and/or N) that are commonly referred to as MAX phases [1–3]. These ternary compounds are also sometimes termed metallic ceramics [4] because they possess a useful combination of both metallic and ceramic properties. Ti 2 AlC, similar to the rest of the MAX phases, possesses some metal-like properties, i.e. it is readily machinable, thermal-shock- resistant, thermally and electrically conductive, anoma- lously soft (Vickers hardness of 4.5 GPa) [3] and damage tolerant [2]. On the other hand, like ceramics, Ti 2 AlC has a relatively low coefficient of thermal expansion (8.2 10 6 °C 1 ) [3], and it is refractory, elastically stiff (Young’s modulus of 277 GPa [5]) and exceptionally oxida- tion-resistant [6,7]. The combination of both metallic and ceramic properties of Ti 2 AlC and other MAX phases orig- inates partially from the metallic nature of the bonding, and partially from their layered structure. This unique combination makes them promising for many applications such as electrical heating elements [8], gas burner nozzles in corrosive environments, high temperature bearings [9], cladding materials in lead-cooled fast-breeder nuclear reac- tors [10], high temperature electrodes [11], etc. Most of the studies published to date have reported on processing, structure and properties of the Ti 2 AlC and 1359-6454/$36.00 Published by Elsevier Ltd. on behalf of Acta Materialia Inc. http://dx.doi.org/10.1016/j.actamat.2012.07.052 ⇑ Corresponding author at: Materials Science and Engineering Program, Texas A&M University, College Station, TX 77843, USA. Tel.: +1 979 845 5114. E-mail address: [email protected] (M. Radovic). www.elsevier.com/locate/actamat Available online at www.sciencedirect.com Acta Materialia 60 (2012) 6266–6277
Transcript of Processing and characterization of porous Ti2AlC with controlled porosity and pore size

Available online at www.sciencedirect.com
www.elsevier.com/locate/actamat
Acta Materialia 60 (2012) 6266–6277
Processing and characterization of porous Ti2AlCwith controlled porosity and pore size
Liangfa Hu a, Rogelio Benitez b, Sandip Basu b, Ibrahim Karaman a,b,Miladin Radovic a,b,⇑
a Materials Science and Engineering Program, Texas A&M University, College Station, TX 77843, USAb Department of Mechanical Engineering, Texas A&M University, College Station, TX 77843, USA
Received 30 March 2012; received in revised form 22 June 2012; accepted 20 July 2012Available online 11 September 2012
Abstract
In this work, we demonstrate a simple and inexpensive way to fabricate porous Ti2AlC, one of the best studied materials from theMAX phase family, with controlled porosity and pore size. This was achieved by using NaCl as the pore former, which was dissolvedafter cold pressing but before pressureless sintering at 1400 �C. Porous Ti2AlC samples with a volume fraction of porosity ranging from�10 to �71 vol.% and different pore size ranges, i.e. 42–83, 77–276 and 167–545 lm, were successfully fabricated. Fabricated sampleswere systematically characterized to determine their phase composition, morphology and porosity. Room temperature elastic moduli,compressive strength and thermal conductivity were determined as a function of porosity and/or pore size. For comparison, several sam-ples pressureless-sintered without NaCl pore former, or fabricated by spark plasma sintering, were also characterized. The effects ofporosity and/or pore size on the room temperature elastic moduli, compressive strength and thermal conductivity of porous Ti2AlCare reported and discussed in this work. It follows that porosity can be a useful microstructural parameter to tune mechanical and ther-mal properties of Ti2AlC.Published by Elsevier Ltd. on behalf of Acta Materialia Inc.
Keywords: MAX phases; Porosity; Elastic moduli; Compressive strength; Thermal conductivity
1. Introduction
Ti2AlC is one of the most studied compounds out ofmore than 70 ternary carbides and nitrides with a generalformula Mn+1AXn (where n = 1 to 3, M is an early transi-tion metal, A is an A group element and X is C and/or N)that are commonly referred to as MAX phases [1–3]. Theseternary compounds are also sometimes termed metallicceramics [4] because they possess a useful combination ofboth metallic and ceramic properties. Ti2AlC, similar tothe rest of the MAX phases, possesses some metal-likeproperties, i.e. it is readily machinable, thermal-shock-
1359-6454/$36.00 Published by Elsevier Ltd. on behalf of Acta Materialia Inc
http://dx.doi.org/10.1016/j.actamat.2012.07.052
⇑ Corresponding author at: Materials Science and Engineering Program,Texas A&M University, College Station, TX 77843, USA. Tel.: +1 979845 5114.
E-mail address: [email protected] (M. Radovic).
resistant, thermally and electrically conductive, anoma-lously soft (Vickers hardness of 4.5 GPa) [3] and damagetolerant [2]. On the other hand, like ceramics, Ti2AlC hasa relatively low coefficient of thermal expansion(8.2 � 10�6 �C�1) [3], and it is refractory, elastically stiff(Young’s modulus of 277 GPa [5]) and exceptionally oxida-tion-resistant [6,7]. The combination of both metallic andceramic properties of Ti2AlC and other MAX phases orig-inates partially from the metallic nature of the bonding,and partially from their layered structure. This uniquecombination makes them promising for many applicationssuch as electrical heating elements [8], gas burner nozzles incorrosive environments, high temperature bearings [9],cladding materials in lead-cooled fast-breeder nuclear reac-tors [10], high temperature electrodes [11], etc.
Most of the studies published to date have reported onprocessing, structure and properties of the Ti2AlC and
.

L. Hu et al. / Acta Materialia 60 (2012) 6266–6277 6267
the rest of the MAX phases in the compact, fully densestate, with the exception of very few recent studies thatfocused on these materials in the porous state [12–17]. Por-ous MAX phases deserve systematic studies, because con-trol of the porosity and pore size can be used to tailortheir mechanical and functional properties, especiallymechanical damping, as was demonstrated by Fraczkiewiczet al. [12] and Sun et al. [14] for Ti3SiC2, and Zhou et al.[13] for Ti2AlC. Moreover, it has been shown recently thata new class of high-strength MAX phases/Mg compositeswith exceptional mechanical damping can be easily andinexpensively fabricated by metal (Mg) melt infiltrationof porous MAX phases preforms [18–20]. Ti2AlC/nano-crystalline Mg–matrix composite exhibited higher strengthlevels in both tension (350 ± 40 MPa) and compression(700 ± 10 MPa) than other Mg composites, as well asexceptional damping capabilities [18]. Apart from struc-tural applications, porous MAX phases have also beendemonstrated to be potentially good candidate materialsfor substrates for catalytic coatings in gas exhaust catalystdevices [21].
In this limited number of studies, porous MAX phaseswere prepared by using one of two methods: (1) incompletedensification during sintering of MAX phase powders orreaction sintering of elemental powders [12–17], or (2) thereplica template method from the highly dispersed aqueoussuspension using polyurethane sponges as a template [21].Although the first method is simple and straightforward,it does not allow good control over morphology, volumefraction and size of the pores. On the other hand, the sec-ond method allows good control of the pore size and mor-phology, but it is quite complex and time consuming, andcannot be used for processing samples with a low volumefraction of porosity.
In this work, a simple and inexpensive way of fabricat-ing porous Ti2AlC with a controlled volume fraction ofporosity and pore size using NaCl as the pore former isreported. The use of NaCl as the pore former was firstreported by Polonsky and co-workers [22] in the 1960s tofabricate aluminum foams. Since then, this method hasbeen utilized to fabricate open-cell aluminum foams [23–25], shape memory alloy foams [26,27], titanium foams[28] and other porous metals [29,30]. This inspired us toprocess porous Ti2AlC using NaCl powders as the poreformer. NaCl can be easily and completely removed by dis-solving in water after cold pressing but before sintering.Therefore, no reaction between the pore former and theMAX phase is expected, unlike in the case of organic poreformers that can react with the MAX phase powders dur-ing sintering and form binary carbides if they are notburned out completely at lower temperatures [31]. Addi-tionally, NaCl is cheap and commercially available in abroad range of particle sizes, which allows an inexpensiveway to control pore size. The microstructure of porousTi2AlC was systematically characterized, as well as roomtemperature elastic moduli, compressive strength and ther-mal conductivity to elucidate the effect of porosity and pore
size on the thermal and mechanical properties of Ti2AlC.The latter was based on the comparison of different sam-ples pressureless-sintered both with and without usingNaCl pore former, as well as several samples sintered usingspark plasma sintering (SPS). Furthermore, we demon-strate that the developed methodology can be implementedeasily to process the samples with graded porosity, andconsequently functionally graded properties of the MAXphases.
2. Experimental procedures
Ti2AlC powders (Kanthal AB, Sweden) with a particlesize of 45–90 lm or <20 lm were used to process all sam-ples in this study. Fig. 1a shows a field emission scanningelectron microscopy (FE-SEM) image of Ti2AlC powderwith a particle size of 45–90 lm, while the inset in thetop-right corner illustrates the nanolaminated nature ofthe Ti2AlC powders. NaCl powders with particle sizes of45–90 lm, 180–250 lm and 355–500 lm were used as thepore former (Fig. 1b). The Ti2AlC and NaCl powder mix-tures with 0, 20, 40, 60 and 80 vol.% NaCl pore formerwere mixed for 1 h by ball milling and cold pressed in thecylindrical steel die (12.7 mm in diameter) using a pressureof 800 MPa. Green bodies were soaked in water overnightto dissolve the NaCl pore former, and rinsed in water afterthat several times to remove all remaining NaCl. The greenbodies were then pressureless-sintered in flowing argon at1400 �C for 4 h. A Ti2AlC sample with graded porositywas also prepared using this method, but the steel diewas filled in this case with four different layers containing0, 20, 40 and 60 vol.% NaCl pore former. For comparison,some porous samples were prepared by incomplete densifi-cation using spark plasma sintering (SPS25–10, ThermalTechnologies, CA) of Ti2AlC powders in the 1100–1200 �C temperature range under 50–100 MPa for 20 min.
The microstructure of the processed samples was char-acterized using a field emission scanning electron micro-scope (FE-SEM; Quanta 600 FEG, FEI, Oregon, USAor JSM-7500F, JEOL, Tokyo, Japan). Pore size distribu-tion was determined by measuring the size of over 30 poresusing the intercept method, ASTM E112–10, from theSEM images in the four randomly selected locations oneach sample, and calculating the fraction of the pores withthe size in the certain range. The density, overall porosityand open porosity of the sintered samples were determinedby the alcohol immersion method based on Archimedes’principle, as specified in ASTM C20-00 using the followingequations:
q ¼ mdry � qethanol
mwet � msuspended þ mwireð1Þ
P overall ¼ 1� qqtheoretical
� �� 100 ð2Þ
P open ¼mwet � mdry
mwet � msuspended þ mwire� 100 ð3Þ
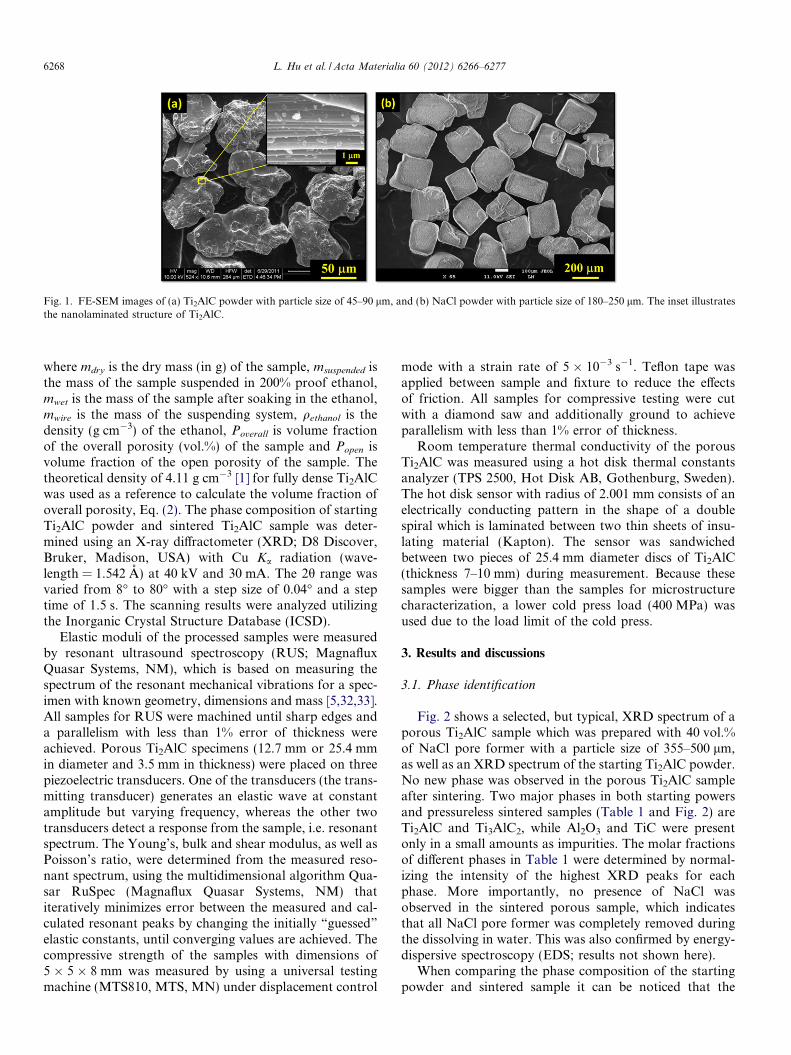
Fig. 1. FE-SEM images of (a) Ti2AlC powder with particle size of 45–90 lm, and (b) NaCl powder with particle size of 180–250 lm. The inset illustratesthe nanolaminated structure of Ti2AlC.
6268 L. Hu et al. / Acta Materialia 60 (2012) 6266–6277
where mdry is the dry mass (in g) of the sample, msuspended isthe mass of the sample suspended in 200% proof ethanol,mwet is the mass of the sample after soaking in the ethanol,mwire is the mass of the suspending system, qethanol is thedensity (g cm�3) of the ethanol, Poverall is volume fractionof the overall porosity (vol.%) of the sample and Popen isvolume fraction of the open porosity of the sample. Thetheoretical density of 4.11 g cm�3 [1] for fully dense Ti2AlCwas used as a reference to calculate the volume fraction ofoverall porosity, Eq. (2). The phase composition of startingTi2AlC powder and sintered Ti2AlC sample was deter-mined using an X-ray diffractometer (XRD; D8 Discover,Bruker, Madison, USA) with Cu Ka radiation (wave-length = 1.542 A) at 40 kV and 30 mA. The 2h range wasvaried from 8� to 80� with a step size of 0.04� and a steptime of 1.5 s. The scanning results were analyzed utilizingthe Inorganic Crystal Structure Database (ICSD).
Elastic moduli of the processed samples were measuredby resonant ultrasound spectroscopy (RUS; MagnafluxQuasar Systems, NM), which is based on measuring thespectrum of the resonant mechanical vibrations for a spec-imen with known geometry, dimensions and mass [5,32,33].All samples for RUS were machined until sharp edges anda parallelism with less than 1% error of thickness wereachieved. Porous Ti2AlC specimens (12.7 mm or 25.4 mmin diameter and 3.5 mm in thickness) were placed on threepiezoelectric transducers. One of the transducers (the trans-mitting transducer) generates an elastic wave at constantamplitude but varying frequency, whereas the other twotransducers detect a response from the sample, i.e. resonantspectrum. The Young’s, bulk and shear modulus, as well asPoisson’s ratio, were determined from the measured reso-nant spectrum, using the multidimensional algorithm Qua-sar RuSpec (Magnaflux Quasar Systems, NM) thatiteratively minimizes error between the measured and cal-culated resonant peaks by changing the initially “guessed”
elastic constants, until converging values are achieved. Thecompressive strength of the samples with dimensions of5 � 5 � 8 mm was measured by using a universal testingmachine (MTS810, MTS, MN) under displacement control
mode with a strain rate of 5 � 10�3 s�1. Teflon tape wasapplied between sample and fixture to reduce the effectsof friction. All samples for compressive testing were cutwith a diamond saw and additionally ground to achieveparallelism with less than 1% error of thickness.
Room temperature thermal conductivity of the porousTi2AlC was measured using a hot disk thermal constantsanalyzer (TPS 2500, Hot Disk AB, Gothenburg, Sweden).The hot disk sensor with radius of 2.001 mm consists of anelectrically conducting pattern in the shape of a doublespiral which is laminated between two thin sheets of insu-lating material (Kapton). The sensor was sandwichedbetween two pieces of 25.4 mm diameter discs of Ti2AlC(thickness 7–10 mm) during measurement. Because thesesamples were bigger than the samples for microstructurecharacterization, a lower cold press load (400 MPa) wasused due to the load limit of the cold press.
3. Results and discussions
3.1. Phase identification
Fig. 2 shows a selected, but typical, XRD spectrum of aporous Ti2AlC sample which was prepared with 40 vol.%of NaCl pore former with a particle size of 355–500 lm,as well as an XRD spectrum of the starting Ti2AlC powder.No new phase was observed in the porous Ti2AlC sampleafter sintering. Two major phases in both starting powersand pressureless sintered samples (Table 1 and Fig. 2) areTi2AlC and Ti3AlC2, while Al2O3 and TiC were presentonly in a small amounts as impurities. The molar fractionsof different phases in Table 1 were determined by normal-izing the intensity of the highest XRD peaks for eachphase. More importantly, no presence of NaCl wasobserved in the sintered porous sample, which indicatesthat all NaCl pore former was completely removed duringthe dissolving in water. This was also confirmed by energy-dispersive spectroscopy (EDS; results not shown here).
When comparing the phase composition of the startingpowder and sintered sample it can be noticed that the

Fig. 2. XRDs of starting Ti2AlC powder and porous Ti2AlC sampleprepared with 40 vol.% of NaCl pore former with 355–500 lm particlesize. The identification of phases was according to the Inorganic CrystalStructure Database (ICSD) collection code 165460 for Ti2AlC, 153266 forTi3AlC2, 10425 for Al2O3 and 44494 for TiC, respectively.
L. Hu et al. / Acta Materialia 60 (2012) 6266–6277 6269
amount of Ti2AlC and TiC decreases, while the amount ofTi3AlC2 increases, during pressureless sintering at 1400 �C.The latter can be explained by the reaction of Ti2AlC withTiC to form Ti3AlC2. However, a decrease of the amountof TiC during sintering is negligible when compared tothe decrease of the amount of Ti2AlC or increase of theamount of Ti3AlC2. Thus, the change in the phase compo-sition must be predominately caused by decomposition ofTi2AlC to Ti3AlC2 according to the following reaction [34]:
2Ti2AlCðsÞ ! Ti3AlC2ðsÞ þ TiAl1�x þ xAlðg or lÞ ð4Þwhere x 6 1. The composition of TiAl1-x in Reaction (4)depends on how much Al is lost to the surroundings [34],with the extreme situation when Al is totally lost as a gas-eous or liquid phase and only pure Ti remains. It is thisreaction that additionally explains the fact that the de-crease of Ti2AlC is almost two times the increase ofTi3AlC2 and that the intensity ratio of Ti2AlC/Ti3AlC2 de-creased 10% from 4.0 to 3.6 (Table 3). In the porous sam-ple, decomposition according to Reaction (4) must be evenmore severe when compared to the fully dense samples, be-cause the high surface area allows faster loss of the Al. Fur-thermore, a total weight loss of �1% was observed aftersintering, which may be attributed to the loss of Al, evenpossibly some Ti, that can both vaporize at high tempera-tures and go to the surroundings. It also follows that theincrease of Al2O3 is not surprising because some of theAl released from this reaction can react with the residualoxygen in the sintering atmosphere and form Al2O3. Both
Table 1Molar fractions of the phases in the starting Ti2AlC powder and porous Ti2AlCeach phase.
Material Molar fraction of phases, %
Ti2AlC Ti3AlC2
Starting Ti2AlC powder 77.0 19.2Porous Ti2AlC sample 74.5 20.7
lost Al and lost Ti may react with oxygen to form oxides.However, the Gibbs free energy of the4Al + 3O2! 2Al2O3 reaction is more negative than thatof the Ti + O2! TiO2 reaction, [35,36], which indicatesthat Al reacts with oxygen more easily than Ti. This mostlikely explains why no TiO2 peaks (but Al2O3 peaks) weredetected by XRD in the porous Ti2AlC sample.
3.2. Characterization of porosity
The porosity was quantitatively characterized by thedetermining values of overall and open porosities of porousTi2AlC samples, as described earlier. Fig. 3 shows the var-iation of overall and open porosities with volume fractionof NaCl pore former for different sizes of the pore formerparticles (i.e. 45–90 lm, 180–250 lm, and 355–500 lm) thatwere used to process porous Ti2AlC samples with 45–90 lm Ti2AlC powders. In all cases, the lowest overallporosity of �9–10 vol.%, with �60% open/overall porosityratio, was measured in the sample pressureless sinteredwithout any NaCl pore former. This porosity is mostlydue to the presence of intergranular pores (closed pores)and channels (open pores) that remained in the structureas a result of incomplete densification during the pressure-less sintering.
Both overall and open porosities generally increase line-arly with increasing volume fraction of NaCl pore former(Fig. 3), and that trend is independent of the particle sizeof the NaCl pore former. The former is particularly obvi-ous in Fig. 3d, where overall porosity of the samples withdifferent amounts of pore former was plotted vs. volumefraction of pore former. This finding cannot be overempha-sized, since it suggests that the size of pore former in gen-eral does not affect shrinkage of Ti2AlC duringdensification/sintering of the porous samples. However,the overall porosity in sintered Ti2AlC is not always lowerthan the volume fraction of pore former added before sin-tering. Fig. 3 clearly shows that the overall porosity of sin-tered samples is larger than the volume fraction of poreformer for samples processed with less than 40 vol.% ofpore former. However, for samples processed with morethan 40 vol.% of pore former, the overall porosity is lowerthan the volume fraction of pore former used in their pro-cessing. This observation suggests that porosity in sinteredsamples is not only a function of the amount of pore for-mer used during processing, but also partially the resultof incomplete sintering of Ti2AlC powder.
Furthermore, Fig. 3 shows that the difference betweenoverall and open porosities generally becomes smaller as
sample as determined by the relative intensity of the highest XRD peaks of
Phase ratio
Al2O3 TiC Ti2AlC/Ti3AlC2
1.3 2.5 4.02.5 2.3 3.6

Fig. 3. Variations of overall and open porosities with volume fraction of NaCl pore former. Particle size of NaCl pore former: (a) 45–90 lm, (b) 180–250 lm, (c) 355–500 lm and (d) comparison of overall porosity in all samples. Insets show the open/overall porosity ratio as a function of volume fractionof NaCl pore former.
Fig. 4. Variation of overall porosity with the starting Ti2AlC particle size:fine powder (<20 lm) and coarse powder (45–90 lm). Both samples wereprocessed using 80 vol.% NaCl pore former (180–250 lm).
6270 L. Hu et al. / Acta Materialia 60 (2012) 6266–6277
the volume fraction of NaCl increases. For example,Fig. 3c shows that the open/overall porosity ratio increasedfrom 0.61, 0.95, 0.96 to 0.99 as the volume fraction of NaClpore former increased from 0, 20, 40 to 60 vol.% (for thesamples processed using NaCl pore former with particlesize of 355–500 lm). It indicates that the number of theconnected pores increases with increasing volume fractionof NaCl pore former. More individual NaCl particles madeit easier for any two individual particles to connect to eachother, leading to more connectivity among pores and mak-ing them open. Fig. 3 also suggests that when the size of thepore former is significantly larger than the powder size(inserts in Fig. 3b and c), almost all pores are intercon-nected when the porosity is above only 20%. However,when the pore former size is comparable to that of thestarting powders, volume fraction of the open porosityincreases more gradually with the amount of pore former.
The results discussed above suggest that even higherporosities, especially open porosity, could be achievedusing this method if the Ti2AlC powder is finer. Fig. 4 dem-onstrates that when starting with the same volume fractionof NaCl pore former, i.e. 80 vol.%, the sample with finerTi2AlC powder (<20 lm particle size) reached 71 vol.%overall porosity, which was the highest porosity achievedvia this processing method and was 13% higher than thecorresponding value of for the sample processed withcoarse Ti2AlC powder (45–90 lm particle size). This result
suggests that the Ti2AlC powder size, in addition to volumefraction and size of NaCl pore former, is another parame-ter that can be used to tailor porosity and pore connectivityin porous Ti2AlC prepared with NaCl pore former.
3.3. Morphology of porous samples and pore size distribution
Fig. 5 shows morphology of the porous Ti2AlC sampleswith different pore sizes but the same volume fraction of

L. Hu et al. / Acta Materialia 60 (2012) 6266–6277 6271
NaCl pore former (60 vol.%). All three samples in Fig. 5a–chad relatively comparable porosities of 56.0, 50.9 and50.6 vol.%, although they were prepared with pore formersizes of 45–90 lm, 180–250 lm and 355–500 lm, respec-tively. Although pores in Fig. 5a appear to be more con-nected than that in both Fig. 5b and c, results shown inFig. 3 clearly demonstrate that that is not the case becauseall three samples have comparable volume fractions ofopen porosity. The fracture surface of the porous Ti2AlCsample in Fig. 5d illustrates even better the typical connec-tivity of Ti2AlC grains and formation of the sintering necksbetween them. The strong network of grains with a well-developed necks is critical to obtain high mechanicalstrength of porous samples (see below). Note that the lam-inated nature of Ti2AlC could be once again clearlyobserved at the walls of the pores, as illustrated in the insetin Fig. 5d.
Fig. 5 also shows that the pore shape became more andmore elliptical with increasing pore size. The ellipticalpores have conjugate in the loading direction, i.e. verticaldirection in Fig. 5, and transverse diameter perpendicularto loading direction during cold pressing. Taking intoaccount that the shape of NaCl pore former particles iscubic-like (Fig. 1b) rather than elliptical, the elliptical
Fig. 5. Morphology of porous Ti2AlC samples after sintering with different porparticle sizes: (a) 45–90 lm, (b) 180–250 lm, (c) 355–500 lm and (d) typical micformer with particle size 180–250 lm). The overall porosity of these samples50.9 vol.%.
shape of the pores is most likely a consequence of the coldpressing because larger NaCl pore former particles deform,and eventually crush and compact easier, in the direction ofcold-press loading. The optical microscopy on the cross-sectional surface of as-pressed samples (not show here)confirmed the latter.
The pore size distributions were quantitatively charac-terized by measuring the pore sizes in the samples shownin Fig. 5, and the results are summarized in Table 2 andFig. 6. Table 2 summarizes the average pore sizes andstandard deviations for each pore size distribution curveshown in Fig. 6. As expected, the average pore sizeincreases from 59 lm, 148 lm to 346 lm with increasingparticle size of NaCl pore former (45–90 lm, 180–250 lmand 355–500 lm). Furthermore, Fig. 6 indicates that thepore size distribution becomes broader with increasingparticle size of NaCl pore former. The authors believethat the increasingly broader particle size range of NaClpore former is the main reason why the pore size rangeincreased significantly. Another reason is that the sam-ples processed from coarser particles have elliptical poreshape, and both transverse and conjugate diameters weretaken into account for pore size measurements, whichbroadened significantly the pore size range. This also
e sizes formed by the addition of 60 vol.% NaCl pore former with differentrostructure of fracture surface at higher magnification (60 vol.% NaCl pore
were comparable: (a) 56.0 vol.%, (b) 50.9 vol.%, (c) 50.6 vol.% and (d)

Table 2Pore sizes of porous Ti2AlC samples with comparable overall porosities. Average pore size and standard deviation were determined from the measured
pore size values as �x ¼ 1N
PNi¼1xi and s ¼
ffiffiffiffiffiffiffiffiffiffiffiffiffiffiffiffiffiffiffiffiffiffiffiffiffiffiffiffiffiffiffi1N
PNi¼1ðxi � �xÞ2
qrespectively, where N is the total number of the pore size values measured from SEM images, xi
is the pore size value and �x is the average pore size value.
Particle size of NaCl (lm) Volume fraction of NaCl (%) Porosity (vol.%) Average pore size (lm) Standard deviation (lm)
45–90 60 56.0 59 11.7180–250 50.9 148 55.5355–500 50.6 346 133.1
Fig. 6. Pore size distribution of porous Ti2AlC with different pore sizesformed by NaCl particles with different particle sizes: 45–90 lm, 180–250 lm and 355–500 lm.
6272 L. Hu et al. / Acta Materialia 60 (2012) 6266–6277
explained that the sample processed from 355–500 lmNaCl pore former would have some measured pore sizeat 550 lm, which is larger than the maximum size ofthe pore former particles.
Fig. 7 illustrates the morphology of porous Ti2AlC sam-ples processed with different volume fractions (0, 20, 40 and60 vol.%) but fixed particle size of 45–90 lm of NaCl poreformer. In this case, after dissolving and sintering, porousTi2AlC samples without processing cracks were obtainedwith a maximum porosity of 56.0 vol.%. As illustrated inFig. 7d, the sample with highest porosity shows intercon-nected pores which are homogeneously dispersed in theTi2AlC matrix. A sample with lower porosity was pro-cessed using no NaCl pore former for comparison(Fig. 7a), i.e. only pressureless sintering of starting Ti2AlCpowders.
3.4. Porous sample with graded porosity
The simple and inexpensive fabrication methoddescribed above was also applied to fabricate a poroussample with graded porosities as shown in Fig. 8. This sam-ple was made by cold pressing and sintering together fourdifferent layers with different volume fraction of NaCl poreformer (i.e. 0 vol.%, 20 vol.%, 40 vol.% and 60 vol.%) inone sample. The importance of having a simple and easymethod for processing Ti2AlC samples with graded poros-ity cannot be overestimated, since it would allow us tofunctionally grade properties of the MAX phases and theircomposites.
3.5. Mechanical properties
The elastic moduli of fully dense and porous Ti2AlCsamples, as determined by RUS, are listed in Table 3.The highest porosity of all tested samples is �35 vol.%.The main reason for not testing even higher porosity sam-ples is that high porosity samples were not only too fragile,but also hard to machine to the shape needed for reliabletesting under RUS, as well in compression. The Young’sand shear moduli were also plotted as functions of porosityin Fig. 9. All relative Young’s and shear moduli values arecompared with Young’s and shear moduli of the fullydense material [37]. Both Young’s and shear moduli vs.porosity data were fitted using the exponential model,Hasselman model and composite spheres model (CSM)using the following equations:
Exponential model [38,39]:
EE0
¼ GG0
¼ e�b�P ð5Þ
Hasselman model [40]:
EE0
¼ GG0
¼ 1� b � P1þ ðb� 1Þ � P ð6Þ
Composite spheres model [41–43]:
EE0
¼ GG0
¼ ð1� P Þ2
1þ b � P ð7Þ
where E0 and G0 are the Young’s and shear moduli of fullydense Ti2AlC, P is the porosity and b is an empirical con-stant. The results of the regression analysis of the experi-mental data in Fig. 9 using all three models, as well thecoefficient of correlation, R2, are listed in Table 4. Notethat the R2 values for all three models are essentially thesame, suggesting that all three models can be used equallywell to describe the change of the elastic moduli of Ti2AlCwith porosity. Nevertheless, most importantly the resultsshown here suggest that the increasing porosity withinthe range of 3–35 vol.% causes a sharp decrease in elasticmoduli, independent of the different morphology of thepores in the samples that were prepared by different meth-ods, i.e. HIPing [5], SPSing and pressureless sintering.Although the pore morphology is different from SPSsamples to pressureless sintered samples, even from pres-sureless sintered sample with NaCl pore former to thosewithout NaCl pore former, the experimental data for differ-ent samples did not scatter significantly, but agreed well

Fig. 7. Morphology of porous Ti2AlC samples with increasing overall porosity: (a) 9.3 vol.%, (b) 23.6 vol.%, (c) 39.3 vol.% and (d) 56.0 vol.%. Samples(b), (c) and (d) were processed from NaCl pore former with the same particle size (45–90 lm).
Fig. 8. Micrograph of the porous Ti2AlC sample with graded porosity.Particle size of the pore former was 180–250 lm. Overall porosity of thissample is 33.2 vol.%.
L. Hu et al. / Acta Materialia 60 (2012) 6266–6277 6273
with the models. Therefore, the decrease of elastic modulipredominately stems from the increasing porosity, regard-less of the processing method and pore morphology.
Results of compressive strength measurements areshown in Fig. 10a and summarized in Table 5. The com-pressive strength of fully dense Ti2AlC prepared by HIPing[44] was used for comparison and its “relative compressivestrength” in Fig. 10a is equal to 1. All tested samples, inde-pendent of the volume fraction of porosity, failed by crack-ing in the direction of approximately 45� relative to theloading direction, as illustrated in Fig. 10b. This observa-tion suggests that even 33 vol.% porous Ti2AlC shows asomewhat graceful failure, and does not crush and frag-ment under compression like typical highly porous ceram-ics. The relative compressive strength of Ti2AlC decreasesdown to 0.3 as the porosity increases to 42 vol.%. However,
unlike common ceramics, i.e. Al2O3, yttria stabilized zirco-nia (YSZ) and Si3N4 [45–47], whose compressive strengthdrops dramatically with increasing porosity, the compres-sive strength of Ti2AlC decreases less rapidly and almostlinearly with increasing porosity (Fig. 10). The reason forthis observation must lie in the kinking and kink band for-mation that are typical deformation mechanisms inTi2AlC, and to a further extent to all MAX phases [1–3].The SEM images of the fracture surfaces shown inFig. 11a–c reveal intensive kinking and delamination ofporous Ti2AlC that dissipated a large amount of mechani-cal energy during crack propagation. Additional evidenceof the exceptional damage tolerance of Ti2AlC could befound in the fact that standard deviations (from 3.9 to16.0%) for compressive strengths are relatively low, forall tested samples independent of the volume fraction ofporosity and pore sizes.
The compressive strength was also investigated as afunction of pore size and loading direction (Fig. 11d–f).Three samples with comparable volume fraction porosity,i.e. 29%, 33% and 33%, but processed using NaCl pore for-mer with different particle sizes (i.e. 45–90 lm, 180–250 lmand 355–500 lm, that consequently result in the differentaverage pore sizes (i.e. 55, 148 and 346 lm, respectively)),were tested and the results are shown in Fig. 11d.Fig. 11d clearly shows that the compressive strengthdecreases due to increasing pore sizes. However, this

Table 3Particle size of starting Ti2AlC powder, pore former size and volume fraction, sintering method, dimensions of testing samples, density q, volume fractionof overall porosity P, shear modulus G, Young’s modulus E, Poisson’s ratio m and bulk modulus B of all tested samples.
Sample Ti2AlCparticle size
Pore former size/volume fraction
Processingmethod
Dimensions(mm)
q (g/cm3) P (vol.%) G (GPa) E (GPa) m B (GPa) Reference
A �25 lm ofgrain size
None HIP U 20.20 � 3.00 4.00 2.7 118.8 277.6 0.169 139.6 [18]
B 45–90 lm None SPS U 19.68 � 5.17 3.76 8.5 95.2 221.9 0.165 110.5 This workC 45–90 lm None SPS U 19.68 � 7.10 3.55 13.6 67.9 158.5 0.167 79.3D 45–90 lm None SPS U 19.67 � 5.94 3.45 16.0 66.0 153.1 0.160 75.1E 45–90 lm None SPS U 19.63 � 7.51 3.41 17.0 57.6 134.2 0.165 66.8F <20 lm and
45–90 lmNone Pressureless
sinteringU 23.99 � 3.45 3.54 13.8 88.3 206.9 0.172 105.2
G 45–90 lm None Pressurelesssintering
U 12.55 � 1.81 2.98 27.5 49.1 116.3 0.184 61.4
H 45–90 lm 180–250 lm,20 vol.%
Pressurelesssintering
15.79 � 15.79 � 7.55 2.69 34.6 40.9 93.8 0.148 44.4
Table 4Empirical constant b and coefficient of correlation R2 from the regressionanalysis of the experiment data and the model values.
Model name Young’s modulus Shear modulus
b R2 b R2
CSM 2.10 0.92 1.80 0.92Hasselman 4.65 0.92 4.35 0.92Exponential 3.95 0.92 3.78 0.92
Fig. 10. (a) Relative compressive strength of Ti2AlC as a function of overallporosity. The loading direction is normal to aligned pore axis. Data pointsare from experiments on an HIP sample (square, green dot) [35] andpressureless sintered samples (round, black dots), listed in Table 4. Alsoincluded are the corresponding data for Al2O3 (dashed blue line) [36] andSi3N4 (dashed red line) [38]. Compression samples after testing: (b) a Ti2AlCsample processed without using NaCl pore former, volume fraction ofoverall porosity = 21%; (c) a Ti2AlC sample processed using 20 vol.% NaClpore former (355–500 lm), volume fraction of overall porosity = 33%.Teflon tape was applied between sample and fixture to reduce the effects offriction. (For interpretation of the references to colour in this figure legend,the reader is referred to the web version of this article.)
Fig. 9. Young’s (a) and shear (b) moduli of Ti2AlC samples as functions of overall porosity. Data points are experimental data determined from the SPSsamples (triangle, green dots), HIP sample (square, purple dot) [5] and pressureless sintered samples (round, blue dots), listed in Table 3. Also included arethe predictions from the CSM model (dashed blue line), Hasselman model (dashed black line) and exponential model (solid red line). (For interpretation ofthe references to colour in this figure legend, the reader is referred to the web version of this article.)
6274 L. Hu et al. / Acta Materialia 60 (2012) 6266–6277
decrease is relatively moderate, �38% for the increase inaverage pore size of over six times, which is also a less rapiddrop what the Griffith criterion [48] predicts, i.e. for thestrength of brittle materials containing pores:
r ¼ ðEc=pcÞ0:5 ð8Þwhere E is the Young’s modulus, c is the surface energy and c
is pore size. This observation is yet another indirect evidenceillustrating the high damage tolerance of porous Ti2AlC.Toinvestigate the effect of pore axis orientation with respect toloading direction, specimens from a sample processed with20 vol.% NaCl pore former (355–500 lm) were machined

Table 5Particle size of starting Ti2AlC powder, pore former size and volume fraction, sintering method, dimensions of testing samples, volume fraction of overallporosity P and compressive strength r of all samples tested for compressive strength.
Sample Ti2AlC particle size Pore former size/volume fraction Processing method Dimensions (mm) P (vol.%) r (MPa) Reference
SA 20–25 lm of grain size None HIP 2 � 2 � 2 Fully dense 540 ± 21 [19]SB <20 lm and 45–90 lm None Pressureless sintering 5 � 5 � 8 16.0 ± 0.6 430 ± 22 This workSC 45–90 lm None Pressureless sintering 5 � 5 � 8 20.8 294SD 45–90 lm 45–90 lm, 20 vol.% Pressureless sintering 5 � 5 � 8 28.9 ± 1.4 208 ± 18SE 45–90 lm 180–250 lm, 20 vol.% Pressureless sintering 5 � 5 � 8 33.2 ± 0.7 168 ± 27SF 45–90 lm 180–250 lm, 40 vol.% Pressureless sintering 5 � 5 � 8 40.8 ± 0.8 149 ± 10SG 45–90 lm 355–500 lm, 20 vol.% Pressureless sintering 5 � 5 � 8 34.0 ± 1.5 188 ± 12
L. Hu et al. / Acta Materialia 60 (2012) 6266–6277 6275
and tested along two loading directions, i.e. normal (r?) andparallel (r==) to the aligned pore axis. The results of testing incompression and a schematic of loading direction vs. alignedpore axis are shown in Fig. 11e and f. The average value ofr== is 45% higher than that of r?, which is consistent withthe results reported in the literature [49] for the samples withsimilar morphology, i.e. unidirectional pore alignment. Asillustrated in Fig. 11f, the effective solid area parallel to thealigned pore axis is larger than that normal to the alignedpore axis, which most likely explains why the value of r==is higher than that of r?. This indicates that the loadingdirection is an additional factor which should be taken intoaccount for the evaluation of compressive strength of theporous Ti2AlC samples with elliptical pores.
3.6. Room temperature thermal conductivity
Results of room temperature thermal conductivity mea-surements are summarized in Fig. 12. The thermal conduc-
Fig. 11. Different magnification FE-SEM images of fracture surface of a com250 lm), volume fraction of overall porosity = 41%: (a)�430, (b)�1100, and (c)�former (the loading direction is normal to aligned pore axis), (e) loading directiousing 20 vol.% NaCl pore former (355–500 lm); and (f) schematic of the loadin
tivity decreases significantly with increasing volumefraction porosity from 34 to 60 vol.%, while it hardlychanges as the particle size of NaCl pore former changesfrom 45–90 lm to 180–250 lm to 355–500 lm. This sug-gests that porosity is an effective parameter for tailoringthermal conductivity, but pore size cannot significantlyaffect the magnitude of thermal conductivity. Fig. 12ashows that the experimental data agrees well with Brugg-eman’s model [50]:
kEff ¼ kMAX ð1� PÞ1:5 ð9Þ
where kEff and kMAX represent the thermal conductivities ofthe porous Ti2AlC and fully dense Ti2AlC, respectively,and P is the volume fraction porosity.
The experimental data were also compared with theoret-ical bounds in Fig. 12b. Hashin and Shtrikman [51] derivedeffective conductivity bounds that were the narrowestbounds for macroscopically homogeneous, isotropic,
pression tested sample processed using 40 vol.% NaCl pore former (180–9000. Compressive strength as a function of (d) the particle size of NaCl poren, i.e. normal (r?) and parallel (r==) to aligned pore axis (sample processedg direction vs. the aligned pore axis. P: volume fraction of overall porosity.
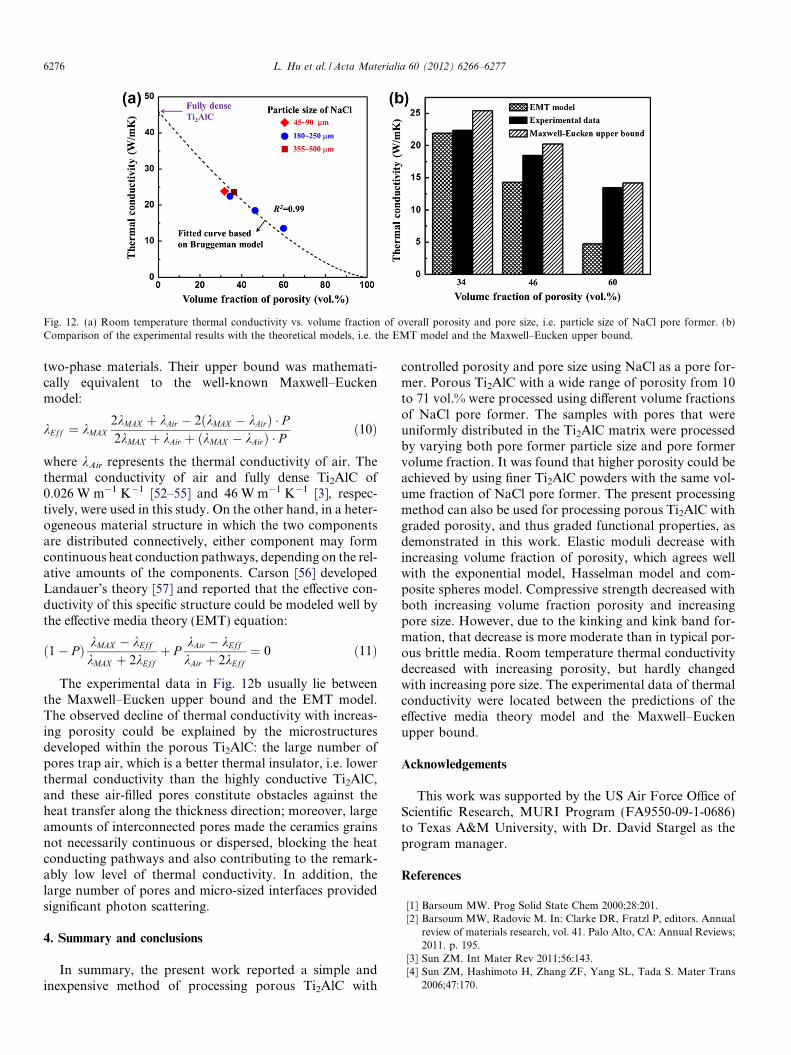
Fig. 12. (a) Room temperature thermal conductivity vs. volume fraction of overall porosity and pore size, i.e. particle size of NaCl pore former. (b)Comparison of the experimental results with the theoretical models, i.e. the EMT model and the Maxwell–Eucken upper bound.
6276 L. Hu et al. / Acta Materialia 60 (2012) 6266–6277
two-phase materials. Their upper bound was mathemati-cally equivalent to the well-known Maxwell–Euckenmodel:
kEff ¼ kMAX2kMAX þ kAir � 2ðkMAX � kAirÞ � P2kMAX þ kAir þ ðkMAX � kAirÞ � P
ð10Þ
where kAir represents the thermal conductivity of air. Thethermal conductivity of air and fully dense Ti2AlC of0.026 W m�1 K�1 [52–55] and 46 W m�1 K�1 [3], respec-tively, were used in this study. On the other hand, in a heter-ogeneous material structure in which the two componentsare distributed connectively, either component may formcontinuous heat conduction pathways, depending on the rel-ative amounts of the components. Carson [56] developedLandauer’s theory [57] and reported that the effective con-ductivity of this specific structure could be modeled well bythe effective media theory (EMT) equation:
ð1� PÞ kMAX � kEff
kMAX þ 2kEffþ P
kAir � kEff
kAir þ 2kEff¼ 0 ð11Þ
The experimental data in Fig. 12b usually lie betweenthe Maxwell–Eucken upper bound and the EMT model.The observed decline of thermal conductivity with increas-ing porosity could be explained by the microstructuresdeveloped within the porous Ti2AlC: the large number ofpores trap air, which is a better thermal insulator, i.e. lowerthermal conductivity than the highly conductive Ti2AlC,and these air-filled pores constitute obstacles against theheat transfer along the thickness direction; moreover, largeamounts of interconnected pores made the ceramics grainsnot necessarily continuous or dispersed, blocking the heatconducting pathways and also contributing to the remark-ably low level of thermal conductivity. In addition, thelarge number of pores and micro-sized interfaces providedsignificant photon scattering.
4. Summary and conclusions
In summary, the present work reported a simple andinexpensive method of processing porous Ti2AlC with
controlled porosity and pore size using NaCl as a pore for-mer. Porous Ti2AlC with a wide range of porosity from 10to 71 vol.% were processed using different volume fractionsof NaCl pore former. The samples with pores that wereuniformly distributed in the Ti2AlC matrix were processedby varying both pore former particle size and pore formervolume fraction. It was found that higher porosity could beachieved by using finer Ti2AlC powders with the same vol-ume fraction of NaCl pore former. The present processingmethod can also be used for processing porous Ti2AlC withgraded porosity, and thus graded functional properties, asdemonstrated in this work. Elastic moduli decrease withincreasing volume fraction of porosity, which agrees wellwith the exponential model, Hasselman model and com-posite spheres model. Compressive strength decreased withboth increasing volume fraction porosity and increasingpore size. However, due to the kinking and kink band for-mation, that decrease is more moderate than in typical por-ous brittle media. Room temperature thermal conductivitydecreased with increasing porosity, but hardly changedwith increasing pore size. The experimental data of thermalconductivity were located between the predictions of theeffective media theory model and the Maxwell–Euckenupper bound.
Acknowledgements
This work was supported by the US Air Force Office ofScientific Research, MURI Program (FA9550-09-1-0686)to Texas A&M University, with Dr. David Stargel as theprogram manager.
References
[1] Barsoum MW. Prog Solid State Chem 2000;28:201.[2] Barsoum MW, Radovic M. In: Clarke DR, Fratzl P, editors. Annual
review of materials research, vol. 41. Palo Alto, CA: Annual Reviews;2011. p. 195.
[3] Sun ZM. Int Mater Rev 2011;56:143.[4] Sun ZM, Hashimoto H, Zhang ZF, Yang SL, Tada S. Mater Trans
2006;47:170.

L. Hu et al. / Acta Materialia 60 (2012) 6266–6277 6277
[5] Radovic M, Barsoum MW, Ganguly A, Zhen T, Finkel P, KalidindiSR, et al. Acta Mater 2006;54:2757.
[6] Basu S, Obando N, Gowdy A, Karaman I, Radovic M. J ElectrochemSoc 2011;159:C90.
[7] Byeon JW, Liu J, Hopkins M, Fischer W, Garimella N, Park KB,et al. Oxid Met 2007;68:97.
[8] Sundberg M, Malmqvist G, Magnusson A, El-Raghy T. Ceram Int2004;30:1899.
[9] Gupta S, Filimonov D, Zaitsev V, Palanisamy T, Barsoum MW.Wear 2008;264:270.
[10] Barnes LA, Rago NLD, Leibowitz L. J Nucl Mater 2008;373:424.[11] Wang XH, Zhou YC. J Mater Sci Technol 2010;26:385.[12] Fraczkiewicz M, Zhou AG, Barsoum MW. Acta Mater 2006;54:5261.[13] Zhou AG, Barsoum MW, Basu S, Kalidindi SR, El-Raghy T. Acta
Mater 2006;54:1631.[14] Sun ZM, Murugaiah A, Zhen T, Zhou A, Barsoum MW. Acta Mater
2005;53:4359.[15] Brodnikovskii NP, Burka MP, Verbilo DG, Demidik AN, Ivanova II,
Koval AY, et al. Powder Metall Met Ceram 2003;42:424.[16] Firstov SA, Pechkovsky EP, Ivanova II, Brodnikovksy NP, Gorban
VF, Demidik AN. High Temp Mater Process 2006;25:47.[17] Firstov SA, Gorban VF, Ivanova II, Pechkovskii EP. Powder Metall
Met Ceram 2010;49:414.[18] Amini S, Ni CY, Barsoum MW. Compos Sci Technol 2009;69:414.[19] Amini S, Barsoum MW. Mater Sci Eng A – Struct Mater Prop
Microstruct Process 2010;527:3707.[20] Kontsos A, Loutas T, Kostopoulos V, Hazeli K, Anasori B, Barsoum
MW. Acta Mater 2011;59:5716.[21] Ziqi S, Ying L, Meishuan L, Yanchun Z. J Am Ceram Soc
2010;93:2591.[22] Polonsky LLS, Markus H. Mod Cast 1961;39.[23] San Marchi C, Mortensen A. Acta Mater 2001;49:3959.[24] Despois JF, Marmottant A, Conde Y, Goodall R, Salvo L, San
Marchi C, et al. In: Umakoshi Y, Fujimoto S, editors. Advancedstructural and functional materials design, proceedings, vol. 512. Zur-ich-Uetikon: TransTech; 2006. p. 281.
[25] Zhao YY, Sun DX. Scripta Mater 2001;44:105.[26] Bansiddhi A, Dunand DC. Acta Biomater 2008;4:1996.[27] Bansiddhi A, Dunand DC. J Mater Res 2009;24:2107.[28] Ye B, Dunand DC. Mater Sci Eng A – Struct Mater Prop Microstruct
Process 2010;528:691.
[29] Pekala RW, Hopper RW. J Mater Sci 1987;22:1840.[30] Fitzgerald TJ, Michaud VJ, Mortensen A. J Mater Sci 1995;30:1037.[31] Radovic M, Lara-Curzio E. J Am Ceram Soc 2004;87:2242.[32] Migliori A, Sarrao JL. Resonant ultrasound spectroscopy: applica-
tions to physics, materials measurements, and nondestructive evalu-ation. New York: John Wiley; 1997.
[33] Radovic M, Lara-Curzio E, Riester L. Mater Sci Eng A – StructMater Prop Microstruct Process 2004;368:56.
[34] Spencer CB, Cordoba JM, Obando N, Sakulich A, Radovic M, OdenM, et al. J Am Ceram Soc 2011;94:3327.
[35] Turkdogan E. Physical chemistry of high-temperature technol-ogy. New York: Academic Press; 1980.
[36] Barin I, Knacke O. Thermochemical properties of inorganic sub-stances. Berlin: Springer-Verlag; 1973.
[37] Sun ZM, Li S, Ahuja R, Schneider JM. Solid State Commun2004;129:589.
[38] Spriggs RM. J Am Ceram Soc 1961;44:628.[39] Knudsen FP. J Am Ceram Soc 1962;45:94.[40] Hasselman DPH. J Am Ceram Soc 1962;45:452.[41] Hashin Z. Elasticity of ceramic systems. Boulder, CO: Westview
Press; 1977.[42] Ramakrishnan N, Arunachalam VS. J Mater Sci 1990;25:3930.[43] Ramakrishnan N, Arunachalam VS. J Am Ceram Soc 1993;76:2745.[44] Barsoum MW, Ali M, El-Raghy T. Metall Mater Trans A – Phys
Metall Mater Sci 2000;31:1857.[45] Rice R. Porosity of ceramics. New York: Marcel Dekker; 1998.[46] Hu LF, Wang CA. Ceram Int 2010;36:1697.[47] Saito S. Fine ceramics. New York: Elsevier; 1988.[48] Griffith A. Philos Trans Roy Soc Lond 1920;A221.[49] Hu LF, Wang CA, Huang Y. J Eur Ceram Soc 2011;31:2915.[50] Bruggeman DAG. Ann Phys Berlin 1935;24:636.[51] Hashin Z, Shtrikman S. J Appl Phys 1962;33:3125.[52] Cao XQ, Vassen R, Stoever D. J Eur Ceram Soc 2004;24:1.[53] Hu LF, Wang CA, Huang Y. J Mater Sci 2010;45:3242.[54] Hu LF, Wang CA, Hu ZJ, Lu S, Sun CC, Huang Y. J Mater Sci
2011;46:623.[55] Hu LF, Wang CA, Huang Y, Sun CC, Lu S, Hu ZJ. J Eur Ceram Soc
2010;30:3389.[56] Carson JK, Lovatt SJ, Tanner DJ, Cleland AC. Int J Heat Mass
Transfer 2005;48:2150.[57] Landauer RJ. Appl Phys 1952;23:779.