Highly ordered self-assembled mesostructured membranes: Porous structure and pore surface coverage
10
Highly ordered self-assembled mesostructured membranes: Porous structure and pore surface coverage Luca Malfatti a , Tongjit Kidchob a , Paolo Falcaro b , Stefano Costacurta a,c , Massimo Piccinini d,e , Mariangela Cestelli Guidi d , Augusto Marcelli d , Anna Corrias f , Maria Francesca Casula f , Heinz Amenitsch g , Plinio Innocenzi a, * a Laboratorio di Scienza dei Materiali e Nanotecnologie, Dipartimento di Architettura e Pianificazione, Universita ` di Sassari, INSTM and Nanoworld Institute, Palazzo Pou Salid, Piazza Duomo 6, 07041 Alghero (Sassari), Italy b Associazione CIVEN – Nano Fabrication Facility, Via delle Industrie 9, 30175 Marghera, Venezia, Italy c Dipartimento di Ingegneria Meccanica, Settore Materiali, Universita ` di Padova, Via Marzolo 9, 35131 Padova, Italy d Laboratori Nazionali di Frascati – INFN, Via E. Fermi 40, 00044 Frascati (Roma), Italy e Dipartimento di Scienze Geologiche, Universita ` Roma Tre, Largo S. Leonardo Murialdo 1, 00146 Rome, Italy f Dipartimento di Scienze Chimiche, Universita ` di Cagliari and INSTM, S.S. 554 bivio per Sestu, 09042 Monserrato (CA), Italy g Institute of Biophysics and Nanosystems Structure Research, Austrian Academy of Sciences, Schmiedlstraße 6, A-8042 Graz, Austria Received 3 November 2006; received in revised form 10 January 2007; accepted 12 January 2007 Available online 26 January 2007 Abstract Highly ordered silica and hybrid organic–inorganic membranes have been obtained through a slow and controlled solvent evapora- tion in the presence of a triblock copolymer as the structure-directing agent. Crack-free mesostructured membranes of large dimensions have been prepared. The mesophase is self-organized into a periodic cubic structure, Im 3m, and consists of macroscopic mesostructured domains that maintain the out-of-plane order throughout the material. After calcination at 350 °C the membranes remain transparent even though they break in fragments of some centimeters. Different techniques have been employed to characterize the mesoporous materials: small angle X-ray scattering (SAXS) using syn- chrotron radiation and transmission electron microscopy to study the porous structure, Fourier transform infrared spectroscopy (FTIR) in vacuum at different partial pressures to investigate the nature of the pore surface. SAXS analysis has been used to map the whole membrane, revealing some differences in the pore organization that can be attributed to a gradient in the evaporation rate. The infrared measurements at different partial pressures have elucidated the mechanism of water adsorption–desorption on the pore surface. The changes of the FTIR spectra with different partial pressure have demonstrated that the pore surface is covered by a layer of molecular water that is hydrogen bonded to silanol species. Ó 2007 Elsevier Inc. All rights reserved. Keywords: Self-assembly; Mesoporous silica; Membrane; FTIR; SAXS 1. Introduction Several types of organized mesoporous materials have been prepared as powders, films, monoliths and mem- branes by a combination of sol–gel chemistry and self- assembly of supramolecular templates [1]. To date, big efforts have been devoted to increase the level of organiza- tion within the materials and to obtain large self-standing membranes [2] and monoliths [3] with an organized mesoporosity. While there are many publications on films and pow- ders, only a few papers deal with mesoporous membranes [4], foams [5] and bulk monoliths [3]. Soler-Illia et al. [2] reported on the preparation of membranes synthesized 1387-1811/$ - see front matter Ó 2007 Elsevier Inc. All rights reserved. doi:10.1016/j.micromeso.2007.01.033 * Corresponding author. Tel.: +39 079 998630; fax: +39 079 9720420. E-mail address: [email protected] (P. Innocenzi). www.elsevier.com/locate/micromeso Microporous and Mesoporous Materials 103 (2007) 113–122
Transcript of Highly ordered self-assembled mesostructured membranes: Porous structure and pore surface coverage
www.elsevier.com/locate/micromeso
Microporous and Mesoporous Materials 103 (2007) 113–122
Highly ordered self-assembled mesostructured membranes:Porous structure and pore surface coverage
Luca Malfatti a, Tongjit Kidchob a, Paolo Falcaro b, Stefano Costacurta a,c,Massimo Piccinini d,e, Mariangela Cestelli Guidi d, Augusto Marcelli d, Anna Corrias f,
Maria Francesca Casula f, Heinz Amenitsch g, Plinio Innocenzi a,*
a Laboratorio di Scienza dei Materiali e Nanotecnologie, Dipartimento di Architettura e Pianificazione, Universita di Sassari, INSTM and
Nanoworld Institute, Palazzo Pou Salid, Piazza Duomo 6, 07041 Alghero (Sassari), Italyb Associazione CIVEN – Nano Fabrication Facility, Via delle Industrie 9, 30175 Marghera, Venezia, Italy
c Dipartimento di Ingegneria Meccanica, Settore Materiali, Universita di Padova, Via Marzolo 9, 35131 Padova, Italyd Laboratori Nazionali di Frascati – INFN, Via E. Fermi 40, 00044 Frascati (Roma), Italy
e Dipartimento di Scienze Geologiche, Universita Roma Tre, Largo S. Leonardo Murialdo 1, 00146 Rome, Italyf Dipartimento di Scienze Chimiche, Universita di Cagliari and INSTM, S.S. 554 bivio per Sestu, 09042 Monserrato (CA), Italy
g Institute of Biophysics and Nanosystems Structure Research, Austrian Academy of Sciences, Schmiedlstraße 6, A-8042 Graz, Austria
Received 3 November 2006; received in revised form 10 January 2007; accepted 12 January 2007Available online 26 January 2007
Abstract
Highly ordered silica and hybrid organic–inorganic membranes have been obtained through a slow and controlled solvent evapora-tion in the presence of a triblock copolymer as the structure-directing agent. Crack-free mesostructured membranes of large dimensionshave been prepared. The mesophase is self-organized into a periodic cubic structure, Im�3m, and consists of macroscopic mesostructureddomains that maintain the out-of-plane order throughout the material. After calcination at 350 �C the membranes remain transparenteven though they break in fragments of some centimeters.
Different techniques have been employed to characterize the mesoporous materials: small angle X-ray scattering (SAXS) using syn-chrotron radiation and transmission electron microscopy to study the porous structure, Fourier transform infrared spectroscopy (FTIR)in vacuum at different partial pressures to investigate the nature of the pore surface. SAXS analysis has been used to map the wholemembrane, revealing some differences in the pore organization that can be attributed to a gradient in the evaporation rate. The infraredmeasurements at different partial pressures have elucidated the mechanism of water adsorption–desorption on the pore surface. Thechanges of the FTIR spectra with different partial pressure have demonstrated that the pore surface is covered by a layer of molecularwater that is hydrogen bonded to silanol species.� 2007 Elsevier Inc. All rights reserved.
Keywords: Self-assembly; Mesoporous silica; Membrane; FTIR; SAXS
1. Introduction
Several types of organized mesoporous materials havebeen prepared as powders, films, monoliths and mem-branes by a combination of sol–gel chemistry and self-
1387-1811/$ - see front matter � 2007 Elsevier Inc. All rights reserved.
doi:10.1016/j.micromeso.2007.01.033
* Corresponding author. Tel.: +39 079 998630; fax: +39 079 9720420.E-mail address: [email protected] (P. Innocenzi).
assembly of supramolecular templates [1]. To date, bigefforts have been devoted to increase the level of organiza-tion within the materials and to obtain large self-standingmembranes [2] and monoliths [3] with an organizedmesoporosity.
While there are many publications on films and pow-ders, only a few papers deal with mesoporous membranes[4], foams [5] and bulk monoliths [3]. Soler-Illia et al. [2]reported on the preparation of membranes synthesized
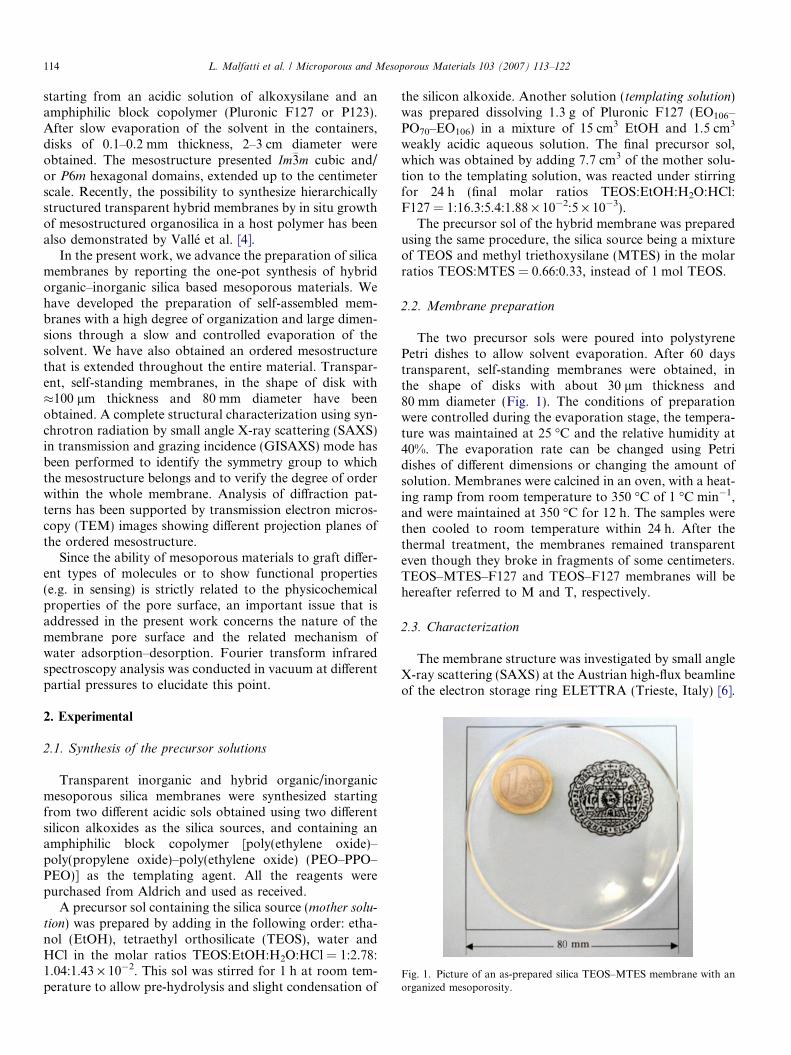
Fig. 1. Picture of an as-prepared silica TEOS–MTES membrane with anorganized mesoporosity.
114 L. Malfatti et al. / Microporous and Mesoporous Materials 103 (2007) 113–122
starting from an acidic solution of alkoxysilane and anamphiphilic block copolymer (Pluronic F127 or P123).After slow evaporation of the solvent in the containers,disks of 0.1–0.2 mm thickness, 2–3 cm diameter wereobtained. The mesostructure presented Im�3m cubic and/or P6m hexagonal domains, extended up to the centimeterscale. Recently, the possibility to synthesize hierarchicallystructured transparent hybrid membranes by in situ growthof mesostructured organosilica in a host polymer has beenalso demonstrated by Valle et al. [4].
In the present work, we advance the preparation of silicamembranes by reporting the one-pot synthesis of hybridorganic–inorganic silica based mesoporous materials. Wehave developed the preparation of self-assembled mem-branes with a high degree of organization and large dimen-sions through a slow and controlled evaporation of thesolvent. We have also obtained an ordered mesostructurethat is extended throughout the entire material. Transpar-ent, self-standing membranes, in the shape of disk with�100 lm thickness and 80 mm diameter have beenobtained. A complete structural characterization using syn-chrotron radiation by small angle X-ray scattering (SAXS)in transmission and grazing incidence (GISAXS) mode hasbeen performed to identify the symmetry group to whichthe mesostructure belongs and to verify the degree of orderwithin the whole membrane. Analysis of diffraction pat-terns has been supported by transmission electron micros-copy (TEM) images showing different projection planes ofthe ordered mesostructure.
Since the ability of mesoporous materials to graft differ-ent types of molecules or to show functional properties(e.g. in sensing) is strictly related to the physicochemicalproperties of the pore surface, an important issue that isaddressed in the present work concerns the nature of themembrane pore surface and the related mechanism ofwater adsorption–desorption. Fourier transform infraredspectroscopy analysis was conducted in vacuum at differentpartial pressures to elucidate this point.
2. Experimental
2.1. Synthesis of the precursor solutions
Transparent inorganic and hybrid organic/inorganicmesoporous silica membranes were synthesized startingfrom two different acidic sols obtained using two differentsilicon alkoxides as the silica sources, and containing anamphiphilic block copolymer [poly(ethylene oxide)–poly(propylene oxide)–poly(ethylene oxide) (PEO–PPO–PEO)] as the templating agent. All the reagents werepurchased from Aldrich and used as received.
A precursor sol containing the silica source (mother solu-
tion) was prepared by adding in the following order: etha-nol (EtOH), tetraethyl orthosilicate (TEOS), water andHCl in the molar ratios TEOS:EtOH:H2O:HCl = 1:2.78:1.04:1.43 · 10�2. This sol was stirred for 1 h at room tem-perature to allow pre-hydrolysis and slight condensation of
the silicon alkoxide. Another solution (templating solution)was prepared dissolving 1.3 g of Pluronic F127 (EO106–PO70–EO106) in a mixture of 15 cm3 EtOH and 1.5 cm3
weakly acidic aqueous solution. The final precursor sol,which was obtained by adding 7.7 cm3 of the mother solu-tion to the templating solution, was reacted under stirringfor 24 h (final molar ratios TEOS:EtOH:H2O:HCl:F127 = 1:16.3:5.4:1.88 · 10�2:5 · 10�3).
The precursor sol of the hybrid membrane was preparedusing the same procedure, the silica source being a mixtureof TEOS and methyl triethoxysilane (MTES) in the molarratios TEOS:MTES = 0.66:0.33, instead of 1 mol TEOS.
2.2. Membrane preparation
The two precursor sols were poured into polystyrenePetri dishes to allow solvent evaporation. After 60 daystransparent, self-standing membranes were obtained, inthe shape of disks with about 30 lm thickness and80 mm diameter (Fig. 1). The conditions of preparationwere controlled during the evaporation stage, the tempera-ture was maintained at 25 �C and the relative humidity at40%. The evaporation rate can be changed using Petridishes of different dimensions or changing the amount ofsolution. Membranes were calcined in an oven, with a heat-ing ramp from room temperature to 350 �C of 1 �C min�1,and were maintained at 350 �C for 12 h. The samples werethen cooled to room temperature within 24 h. After thethermal treatment, the membranes remained transparenteven though they broke in fragments of some centimeters.TEOS–MTES–F127 and TEOS–F127 membranes will behereafter referred to M and T, respectively.
2.3. Characterization
The membrane structure was investigated by small angleX-ray scattering (SAXS) at the Austrian high-flux beamlineof the electron storage ring ELETTRA (Trieste, Italy) [6].
L. Malfatti et al. / Microporous and Mesoporous Materials 103 (2007) 113–122 115
The angle of incidence of the beam (wavelength 1.54 A)was set either to 90� (transmission mode) or slightly abovethe critical angle (grazing incidence mode or GISAXS).Two-dimensional diffraction patterns were recorded witha CCD detector (Photonic Science). Data analysis was per-formed, with the FIT2D application (A.P. Hammersley/ESRF) [7], on images acquired with different expositiontimes in order to obtain the d-spacings of the ordered mes-ostructure with good precision for both low-order andhigh-order diffraction spots. The images were correctedfor flat field spacial distortion and fluctuation of primaryintensity using FIT2D.
TEM images were obtained in bright field mode on aJEOL 200CX microscope equipped with a tungsten cath-ode operating at 200 kV. Samples were prepared evaporat-ing on a carbon-coated copper grid one drop of asuspension obtained by sonicating the finely ground mem-brane in n-octane.
Infrared (IR) analysis was performed at synchrotroninfrared beamline (SINBAD) [8] at the Laboratori Nazio-nali (Frascati, Italy) of the Istituto Nazionale di FisicaNucleare (INFN) using a Bruker Equinox 55 with a con-ventional Globar source customized to operate in a vac-uum chamber. To investigate the desorption kinetics ofchemical moieties physically adsorbed on the pore surface,the spectrophotometer was equipped to work in vacuumdown to 10�2 mbar. The measure was done at different par-tial pressures in transmission mode using the interferome-ter working in the range 500–6000 cm�1 and at aresolution of 4 cm�1. A MCT detector (1 mm2 size) cooledwith liquid nitrogen and a KBr beam splitter were used. 2Dinfrared analysis was performed using Bruker Opus 5.5Software. The baseline was calculated by rubberband cor-rection using 64 points. A Gaussian peak fitting procedurewas applied to the FTIR spectra (OriginLab Origin Soft-ware), the quality of the fitting was evaluated on the basis
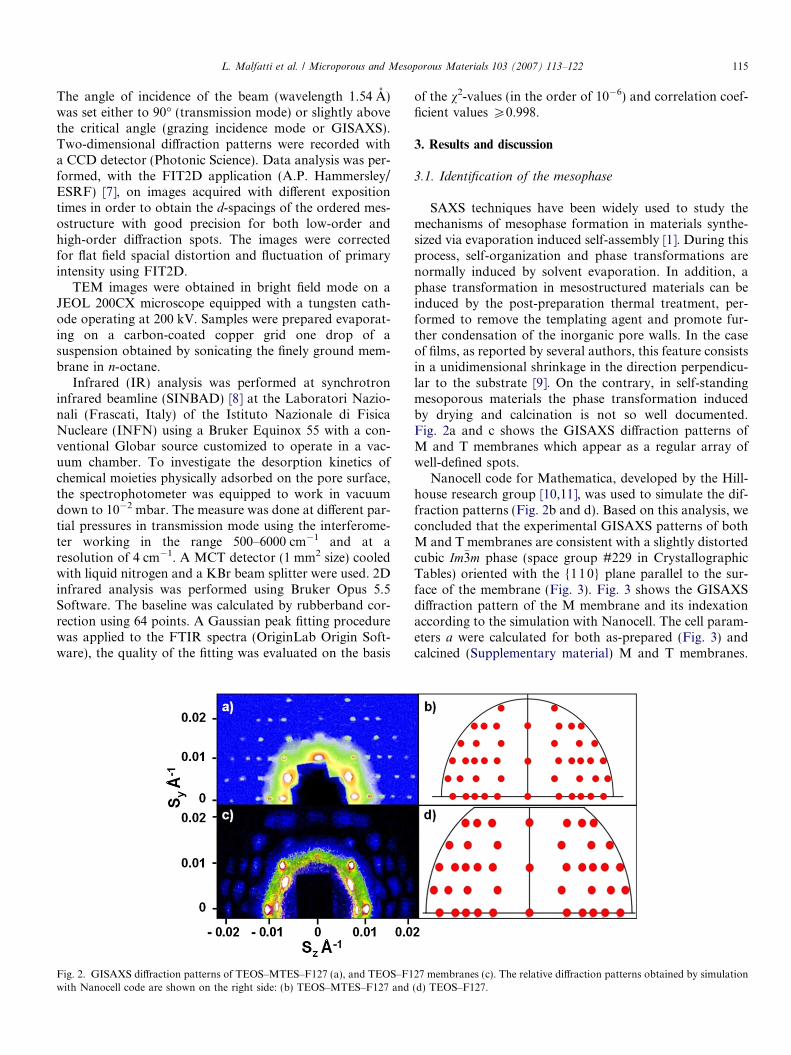
Fig. 2. GISAXS diffraction patterns of TEOS–MTES–F127 (a), and TEOS–F1with Nanocell code are shown on the right side: (b) TEOS–MTES–F127 and
of the v2-values (in the order of 10�6) and correlation coef-ficient values P0.998.
3. Results and discussion
3.1. Identification of the mesophase
SAXS techniques have been widely used to study themechanisms of mesophase formation in materials synthe-sized via evaporation induced self-assembly [1]. During thisprocess, self-organization and phase transformations arenormally induced by solvent evaporation. In addition, aphase transformation in mesostructured materials can beinduced by the post-preparation thermal treatment, per-formed to remove the templating agent and promote fur-ther condensation of the inorganic pore walls. In the caseof films, as reported by several authors, this feature consistsin a unidimensional shrinkage in the direction perpendicu-lar to the substrate [9]. On the contrary, in self-standingmesoporous materials the phase transformation inducedby drying and calcination is not so well documented.Fig. 2a and c shows the GISAXS diffraction patterns ofM and T membranes which appear as a regular array ofwell-defined spots.
Nanocell code for Mathematica, developed by the Hill-house research group [10,11], was used to simulate the dif-fraction patterns (Fig. 2b and d). Based on this analysis, weconcluded that the experimental GISAXS patterns of bothM and T membranes are consistent with a slightly distortedcubic Im�3m phase (space group #229 in CrystallographicTables) oriented with the {110} plane parallel to the sur-face of the membrane (Fig. 3). Fig. 3 shows the GISAXSdiffraction pattern of the M membrane and its indexationaccording to the simulation with Nanocell. The cell param-eters a were calculated for both as-prepared (Fig. 3) andcalcined (Supplementary material) M and T membranes.
27 membranes (c). The relative diffraction patterns obtained by simulation(d) TEOS–F127.
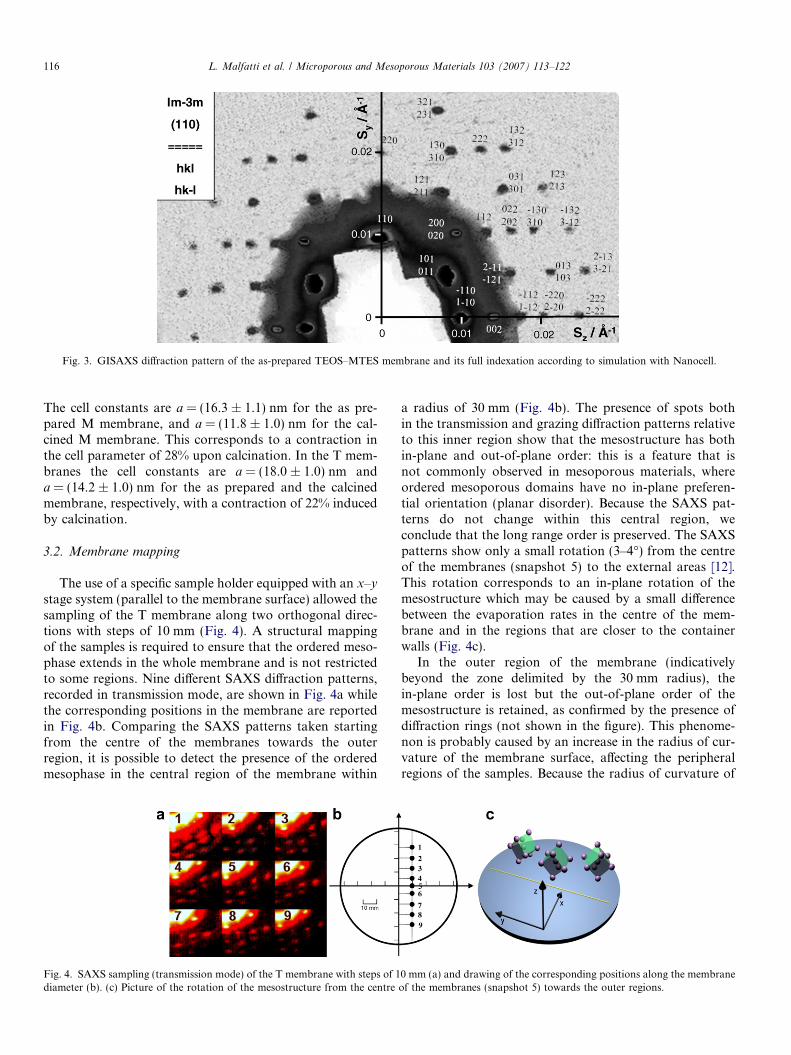
Fig. 3. GISAXS diffraction pattern of the as-prepared TEOS–MTES membrane and its full indexation according to simulation with Nanocell.
116 L. Malfatti et al. / Microporous and Mesoporous Materials 103 (2007) 113–122
The cell constants are a = (16.3 ± 1.1) nm for the as pre-pared M membrane, and a = (11.8 ± 1.0) nm for the cal-cined M membrane. This corresponds to a contraction inthe cell parameter of 28% upon calcination. In the T mem-branes the cell constants are a = (18.0 ± 1.0) nm anda = (14.2 ± 1.0) nm for the as prepared and the calcinedmembrane, respectively, with a contraction of 22% inducedby calcination.
3.2. Membrane mapping
The use of a specific sample holder equipped with an x–y
stage system (parallel to the membrane surface) allowed thesampling of the T membrane along two orthogonal direc-tions with steps of 10 mm (Fig. 4). A structural mappingof the samples is required to ensure that the ordered meso-phase extends in the whole membrane and is not restrictedto some regions. Nine different SAXS diffraction patterns,recorded in transmission mode, are shown in Fig. 4a whilethe corresponding positions in the membrane are reportedin Fig. 4b. Comparing the SAXS patterns taken startingfrom the centre of the membranes towards the outerregion, it is possible to detect the presence of the orderedmesophase in the central region of the membrane within
Fig. 4. SAXS sampling (transmission mode) of the T membrane with steps of 1diameter (b). (c) Picture of the rotation of the mesostructure from the centre
a radius of 30 mm (Fig. 4b). The presence of spots bothin the transmission and grazing diffraction patterns relativeto this inner region show that the mesostructure has bothin-plane and out-of-plane order: this is a feature that isnot commonly observed in mesoporous materials, whereordered mesoporous domains have no in-plane preferen-tial orientation (planar disorder). Because the SAXS pat-terns do not change within this central region, weconclude that the long range order is preserved. The SAXSpatterns show only a small rotation (3–4�) from the centreof the membranes (snapshot 5) to the external areas [12].This rotation corresponds to an in-plane rotation of themesostructure which may be caused by a small differencebetween the evaporation rates in the centre of the mem-brane and in the regions that are closer to the containerwalls (Fig. 4c).
In the outer region of the membrane (indicativelybeyond the zone delimited by the 30 mm radius), thein-plane order is lost but the out-of-plane order of themesostructure is retained, as confirmed by the presence ofdiffraction rings (not shown in the figure). This phenome-non is probably caused by an increase in the radius of cur-vature of the membrane surface, affecting the peripheralregions of the samples. Because the radius of curvature of
0 mm (a) and drawing of the corresponding positions along the membraneof the membranes (snapshot 5) towards the outer regions.
L. Malfatti et al. / Microporous and Mesoporous Materials 103 (2007) 113–122 117
the air-sample interface is smaller in the region closer to theedge of the container than in the central region, the thick-ness rises from 30 lm in the membrane centre to 48 lm atthe edges. As already reported [13], the self-organization ofmicelles starts from the interfaces (we assume this as a rea-sonable hypothesis based on the literature even if we haveonly a direct experimental evidence in the present system),therefore the smaller radius of curvature can determine agradient in the evaporation rate of solvent and, in turn,the loss of order.
3.3. TEM characterization
TEM images were collected to support the informationprovided by SAXS data. Bright field TEM images for T
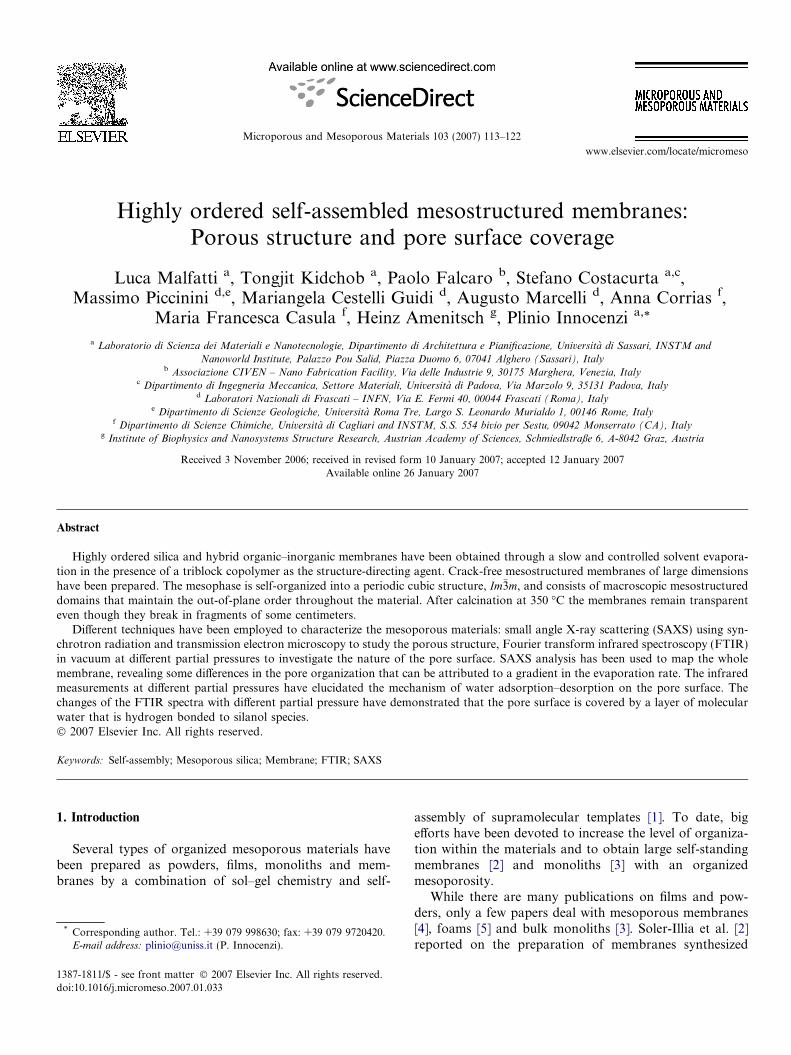
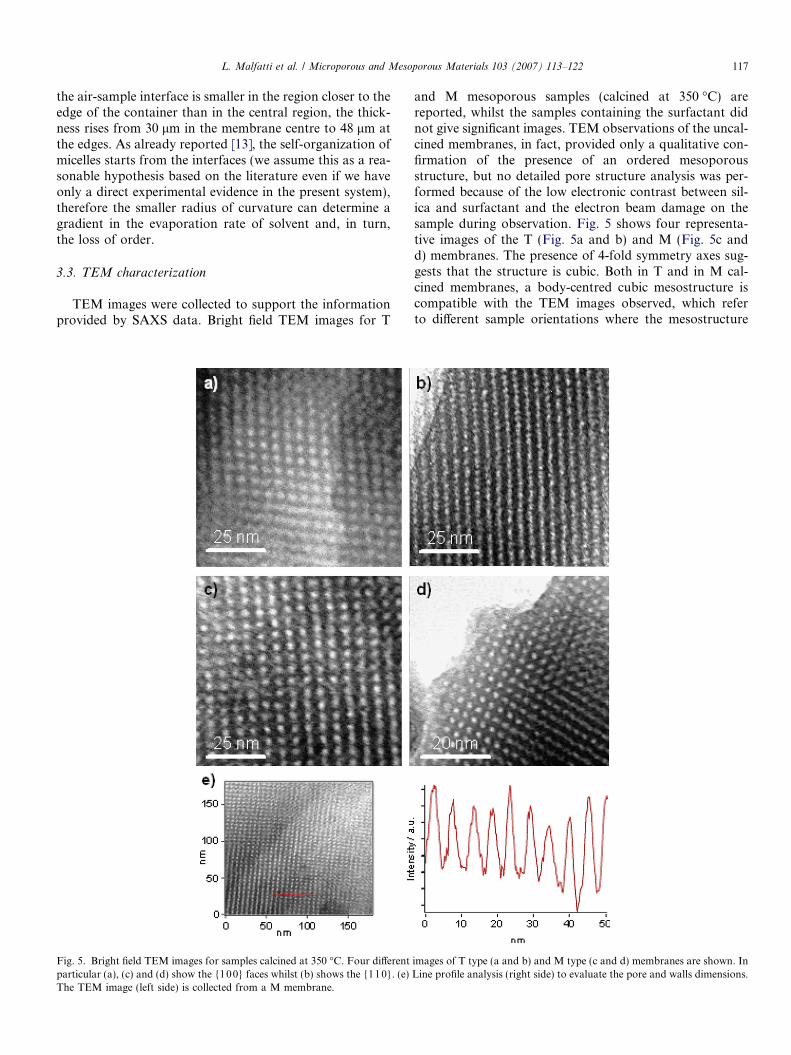
Fig. 5. Bright field TEM images for samples calcined at 350 �C. Four differentparticular (a), (c) and (d) show the {100} faces whilst (b) shows the {110}. (e)The TEM image (left side) is collected from a M membrane.
and M mesoporous samples (calcined at 350 �C) arereported, whilst the samples containing the surfactant didnot give significant images. TEM observations of the uncal-cined membranes, in fact, provided only a qualitative con-firmation of the presence of an ordered mesoporousstructure, but no detailed pore structure analysis was per-formed because of the low electronic contrast between sil-ica and surfactant and the electron beam damage on thesample during observation. Fig. 5 shows four representa-tive images of the T (Fig. 5a and b) and M (Fig. 5c andd) membranes. The presence of 4-fold symmetry axes sug-gests that the structure is cubic. Both in T and in M cal-cined membranes, a body-centred cubic mesostructure iscompatible with the TEM images observed, which referto different sample orientations where the mesostructure
images of T type (a and b) and M type (c and d) membranes are shown. InLine profile analysis (right side) to evaluate the pore and walls dimensions.
3800 3600 3400 3200 3000 28000
20
40
60
80
100
120
0.5 mbar 0.3 mbar 0.2 mbar 0.06 mbar 0.03 mbar 0.01 mbar 0.005 mbar 0.001 mbarA
bsor
banc
e
Wavenumber / cm-1
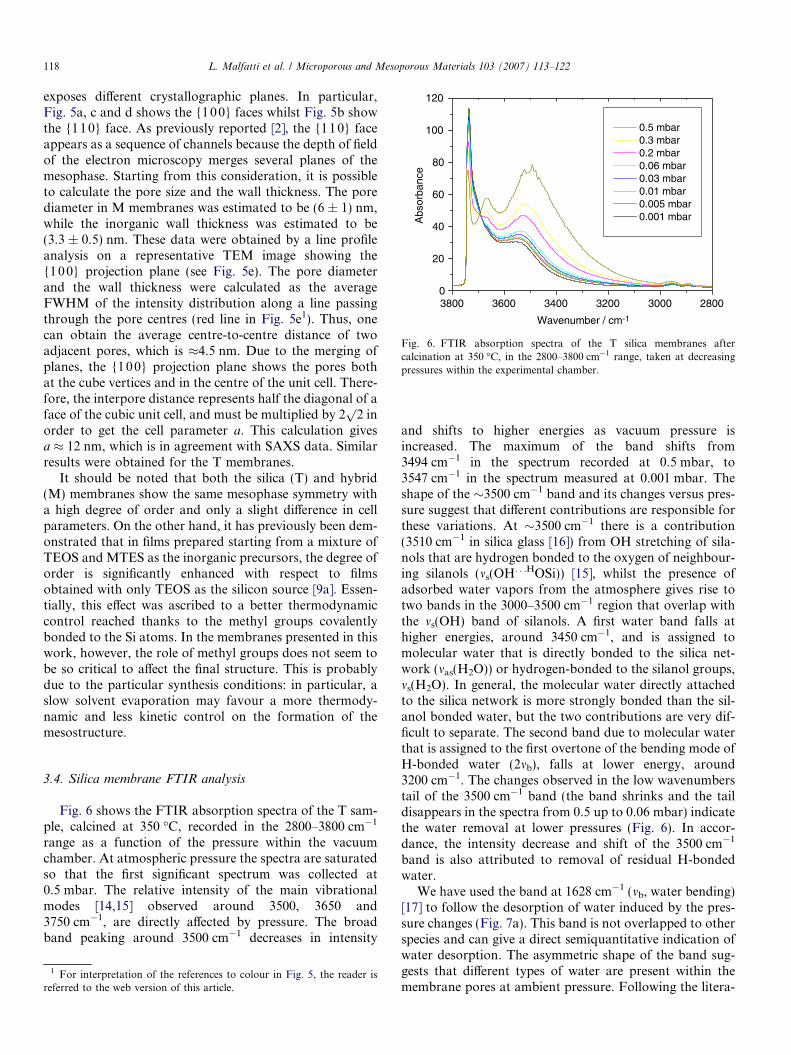
ig. 6. FTIR absorption spectra of the T silica membranes afteralcination at 350 �C, in the 2800–3800 cm�1 range, taken at decreasingressures within the experimental chamber.
118 L. Malfatti et al. / Microporous and Mesoporous Materials 103 (2007) 113–122
exposes different crystallographic planes. In particular,Fig. 5a, c and d shows the {100} faces whilst Fig. 5b showthe {110} face. As previously reported [2], the {110} faceappears as a sequence of channels because the depth of fieldof the electron microscopy merges several planes of themesophase. Starting from this consideration, it is possibleto calculate the pore size and the wall thickness. The porediameter in M membranes was estimated to be (6 ± 1) nm,while the inorganic wall thickness was estimated to be(3.3 ± 0.5) nm. These data were obtained by a line profileanalysis on a representative TEM image showing the{10 0} projection plane (see Fig. 5e). The pore diameterand the wall thickness were calculated as the averageFWHM of the intensity distribution along a line passingthrough the pore centres (red line in Fig. 5e1). Thus, onecan obtain the average centre-to-centre distance of twoadjacent pores, which is �4.5 nm. Due to the merging ofplanes, the {100} projection plane shows the pores bothat the cube vertices and in the centre of the unit cell. There-fore, the interpore distance represents half the diagonal of aface of the cubic unit cell, and must be multiplied by 2
p2 in
order to get the cell parameter a. This calculation givesa � 12 nm, which is in agreement with SAXS data. Similarresults were obtained for the T membranes.
It should be noted that both the silica (T) and hybrid(M) membranes show the same mesophase symmetry witha high degree of order and only a slight difference in cellparameters. On the other hand, it has previously been dem-onstrated that in films prepared starting from a mixture ofTEOS and MTES as the inorganic precursors, the degree oforder is significantly enhanced with respect to filmsobtained with only TEOS as the silicon source [9a]. Essen-tially, this effect was ascribed to a better thermodynamiccontrol reached thanks to the methyl groups covalentlybonded to the Si atoms. In the membranes presented in thiswork, however, the role of methyl groups does not seem tobe so critical to affect the final structure. This is probablydue to the particular synthesis conditions: in particular, aslow solvent evaporation may favour a more thermody-namic and less kinetic control on the formation of themesostructure.
3.4. Silica membrane FTIR analysis
Fig. 6 shows the FTIR absorption spectra of the T sam-ple, calcined at 350 �C, recorded in the 2800–3800 cm�1
range as a function of the pressure within the vacuumchamber. At atmospheric pressure the spectra are saturatedso that the first significant spectrum was collected at0.5 mbar. The relative intensity of the main vibrationalmodes [14,15] observed around 3500, 3650 and3750 cm�1, are directly affected by pressure. The broadband peaking around 3500 cm�1 decreases in intensity
1 For interpretation of the references to colour in Fig. 5, the reader isreferred to the web version of this article.
Fcp
and shifts to higher energies as vacuum pressure isincreased. The maximum of the band shifts from3494 cm�1 in the spectrum recorded at 0.5 mbar, to3547 cm�1 in the spectrum measured at 0.001 mbar. Theshape of the �3500 cm�1 band and its changes versus pres-sure suggest that different contributions are responsible forthese variations. At �3500 cm�1 there is a contribution(3510 cm�1 in silica glass [16]) from OH stretching of sila-nols that are hydrogen bonded to the oxygen of neighbour-ing silanols (ms(OH. . .HOSi)) [15], whilst the presence ofadsorbed water vapors from the atmosphere gives rise totwo bands in the 3000–3500 cm�1 region that overlap withthe ms(OH) band of silanols. A first water band falls athigher energies, around 3450 cm�1, and is assigned tomolecular water that is directly bonded to the silica net-work (mas(H2O)) or hydrogen-bonded to the silanol groups,ms(H2O). In general, the molecular water directly attachedto the silica network is more strongly bonded than the sil-anol bonded water, but the two contributions are very dif-ficult to separate. The second band due to molecular waterthat is assigned to the first overtone of the bending mode ofH-bonded water (2mb), falls at lower energy, around3200 cm�1. The changes observed in the low wavenumberstail of the 3500 cm�1 band (the band shrinks and the taildisappears in the spectra from 0.5 up to 0.06 mbar) indicatethe water removal at lower pressures (Fig. 6). In accor-dance, the intensity decrease and shift of the 3500 cm�1
band is also attributed to removal of residual H-bondedwater.
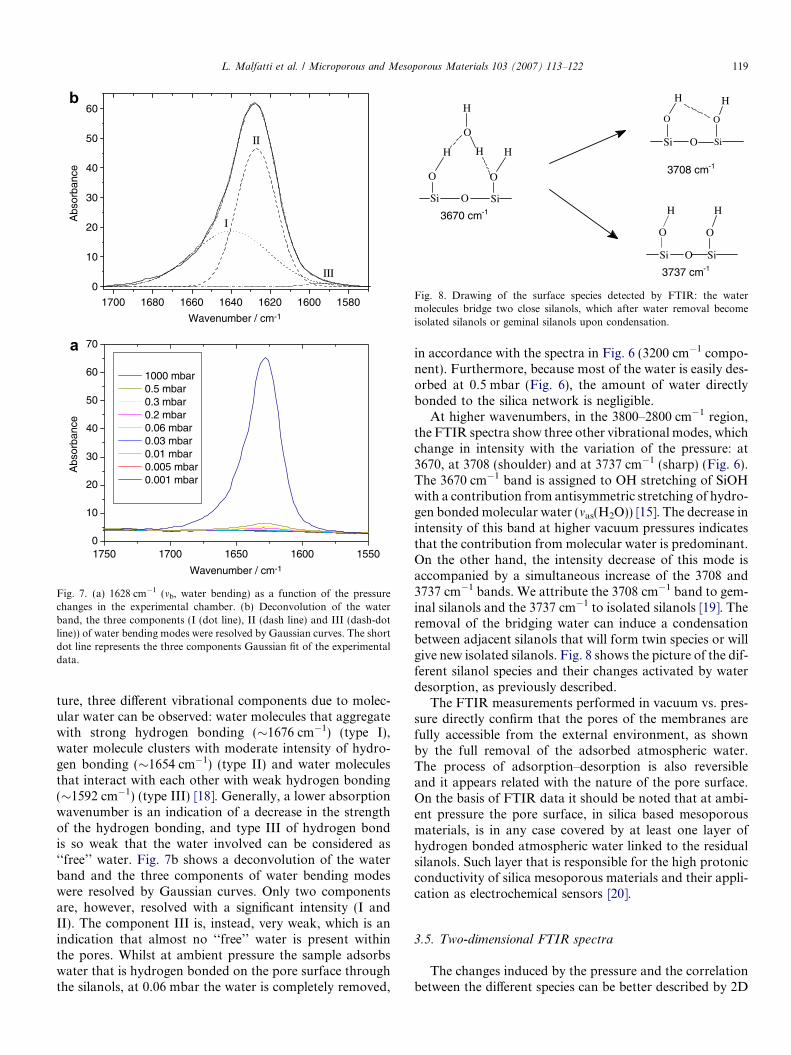
We have used the band at 1628 cm�1 (mb, water bending)[17] to follow the desorption of water induced by the pres-sure changes (Fig. 7a). This band is not overlapped to otherspecies and can give a direct semiquantitative indication ofwater desorption. The asymmetric shape of the band sug-gests that different types of water are present within themembrane pores at ambient pressure. Following the litera-
1700 1680 1660 1640 1620 1600 1580
0
10
20
30
40
50
60
I
II
III
Abs
orba
nce
Wavenumber / cm-1
1750 1700 1650 1600 15500
10
20
30
40
50
60
70
Abs
orba
nce
Wavenumber / cm-1
1000 mbar 0.5 mbar 0.3 mbar 0.2 mbar 0.06 mbar 0.03 mbar 0.01 mbar 0.005 mbar 0.001 mbar
Fig. 7. (a) 1628 cm�1 (mb, water bending) as a function of the pressurechanges in the experimental chamber. (b) Deconvolution of the waterband, the three components (I (dot line), II (dash line) and III (dash-dotline)) of water bending modes were resolved by Gaussian curves. The shortdot line represents the three components Gaussian fit of the experimentaldata.
Si O Si
H
OO
H
Si O Si
O
H
O
H
H
Si O Si
H
O
3670 cm-1
3708 cm-1
3737 cm-1
O
H
O
H
Fig. 8. Drawing of the surface species detected by FTIR: the watermolecules bridge two close silanols, which after water removal becomeisolated silanols or geminal silanols upon condensation.
L. Malfatti et al. / Microporous and Mesoporous Materials 103 (2007) 113–122 119
ture, three different vibrational components due to molec-ular water can be observed: water molecules that aggregatewith strong hydrogen bonding (�1676 cm�1) (type I),water molecule clusters with moderate intensity of hydro-gen bonding (�1654 cm�1) (type II) and water moleculesthat interact with each other with weak hydrogen bonding(�1592 cm�1) (type III) [18]. Generally, a lower absorptionwavenumber is an indication of a decrease in the strengthof the hydrogen bonding, and type III of hydrogen bondis so weak that the water involved can be considered as‘‘free’’ water. Fig. 7b shows a deconvolution of the waterband and the three components of water bending modeswere resolved by Gaussian curves. Only two componentsare, however, resolved with a significant intensity (I andII). The component III is, instead, very weak, which is anindication that almost no ‘‘free’’ water is present withinthe pores. Whilst at ambient pressure the sample adsorbswater that is hydrogen bonded on the pore surface throughthe silanols, at 0.06 mbar the water is completely removed,
in accordance with the spectra in Fig. 6 (3200 cm�1 compo-nent). Furthermore, because most of the water is easily des-orbed at 0.5 mbar (Fig. 6), the amount of water directlybonded to the silica network is negligible.
At higher wavenumbers, in the 3800–2800 cm�1 region,the FTIR spectra show three other vibrational modes, whichchange in intensity with the variation of the pressure: at3670, at 3708 (shoulder) and at 3737 cm�1 (sharp) (Fig. 6).The 3670 cm�1 band is assigned to OH stretching of SiOHwith a contribution from antisymmetric stretching of hydro-gen bonded molecular water (mas(H2O)) [15]. The decrease inintensity of this band at higher vacuum pressures indicatesthat the contribution from molecular water is predominant.On the other hand, the intensity decrease of this mode isaccompanied by a simultaneous increase of the 3708 and3737 cm�1 bands. We attribute the 3708 cm�1 band to gem-inal silanols and the 3737 cm�1 to isolated silanols [19]. Theremoval of the bridging water can induce a condensationbetween adjacent silanols that will form twin species or willgive new isolated silanols. Fig. 8 shows the picture of the dif-ferent silanol species and their changes activated by waterdesorption, as previously described.
The FTIR measurements performed in vacuum vs. pres-sure directly confirm that the pores of the membranes arefully accessible from the external environment, as shownby the full removal of the adsorbed atmospheric water.The process of adsorption–desorption is also reversibleand it appears related with the nature of the pore surface.On the basis of FTIR data it should be noted that at ambi-ent pressure the pore surface, in silica based mesoporousmaterials, is in any case covered by at least one layer ofhydrogen bonded atmospheric water linked to the residualsilanols. Such layer that is responsible for the high protonicconductivity of silica mesoporous materials and their appli-cation as electrochemical sensors [20].
3.5. Two-dimensional FTIR spectra
The changes induced by the pressure and the correlationbetween the different species can be better described by 2D

Fig. 9. Schematic contour map of the synchronous 2D FTIR correlation spectrum of the T sample. A colour scale is used to indicate the intensity changes.
3800 3600 3400 3200 3000 28001
2
3
4
5
Abs
orba
nce
1000 mbar 300 mbar 200 mbar 100 mbar 50 mbar 25 mbar 10 mbar 1 mbar
120 L. Malfatti et al. / Microporous and Mesoporous Materials 103 (2007) 113–122
FTIR data analysis [21] (Fig. 9). 2D infrared spectroscopyhas been applied to investigate the synchronous changes inthe 3000-3800 cm�1 region induced by change of partialpressure. Fig. 9 shows the schematic contour map of thesynchronous 2D FTIR correlation spectrum of the T sam-ple. A colour scale is used to indicate the intensitychanges.2 Four distinct autopeaks of different intensitiesare observed in the diagonal from right top to left bottomof the contour map, at the wavenumbers around 3500,3650, 3710 and 3740 cm�1. The autopeaks correspond tothe region of the spectrum that show intensity variationsinduced by the change of the external variable, which inthis case is pressure (from 0.5 mbar down to 0.001 mbar).The autopeaks are all positive, whilst the cross-peaks canbe either positive or negative. Four correlation squares,joining pairs of cross-peaks located at the opposite sidesof the diagonal line can be drawn, indicating the existenceof coherent changes of spectral intensities with partial pres-sure. In particular, correlation squares (CS) between theautopeaks at 3500 and 3650 cm�1 (CS1), at 3650 and3740 cm�1(CS2), at 3500 and 3740 cm�1(CS3) and 3500and 3710 cm�1 (CS4) can be built. The correlation squaresindicate a related origin of the spectral intensity changes bythe pressure change on the membranes. Whilst the signs inthe CS1 between the autopeaks at 3500 and 3650 cm�1 andthe relative cross-peaks are all positive, in the other corre-lation squares (CS2 and CS3) the signs of the autopeaks arealways positive and the signs of the cross-peaks always neg-ative. The signs of the species in the CSs indicate that thereduction of the partial pressure is directly correlated with
2 For interpretation of the references to colour in Fig. 9, the reader isreferred to the web version of this article.
a decrease of hydrogen bonded water, which leads to theappearance of isolated Si–OH (CS3) or geminal silanols(CS4). The positive sign observed in both cross-peaksand autopeaks in CS1 indicate that the two species at3500 and 3650 cm�1 show intensity changes with partialpressure in the same direction. They decrease or increasein intensity in accordance and this is a good support tothe assignment of their origin to hydrogen bonded water.
3.6. Hybrid membrane FTIR analysis
The FTIR spectra of hybrid M membranes show a trendsimilar to that observed in the T membranes, but with some
Wavenumber / cm-1
Fig. 10. FTIR absorption spectra of the hybrid membrane, M, aftercalcination at 350 �C, in the 2800–3800 cm�1 range, at decreasingpressures.

L. Malfatti et al. / Microporous and Mesoporous Materials 103 (2007) 113–122 121
important differences. Fig. 10 shows the FTIR absorptionspectra of the hybrid membrane after calcination at350 �C, in the 2800–3800 cm�1 range vs. pressure. The cal-cination temperature is effective in removing the surfactant,but at this temperature the methyl groups are not removedfrom the mesoporous membrane. The thermal treatmenttemperature (350 �C) has been selected to allow surfactantremoving without degradation of the methyl species (seeour previous works on methyltriethoxysilane derived films[9a,22]). In addition, the different behaviour with respect towater adsorption can also give a clue about the location ofthe hydrophobic methyl groups since the spectra are notsaturated at ambient pressure, and at 300 mbar all thetraces of residual adsorbed atmospheric water(�3200 cm�1 band) are removed. This suggests that mostpore surface be covered by methyl groups [23] which makethe pore surface of the M membranes partially hydropho-bic. Thus, in M membranes a weaker signal is observedfor adsorbed water, as opposed to T membranes whereadsorbed water may even cause saturation of the FTIRspectra. This supports the fact that after removal of resid-ual water no other changes on the pore surface can beobserved and that isolated silanols do not react with eachother.
4. Conclusions
Highly ordered membranes (cubic Im�3m) of large dimen-sions have been synthesized via evaporation induced self-assembly. Crack-free silica and hybrid organic–inorganicsilica membranes with a diameter up to 80 mm have beenobtained through a slow and controlled evaporation ofthe solvent. In-plane and out-of-plane order has been dem-onstrated for the central region of the membrane, whilst inthe region closer to the edge the in-plane order is lost. Aftercalcination at 350 �C the membranes remained transparentmaintaining a good homogeneity and order of the porousstructure, as confirmed by TEM observations. No signifi-cant difference is observed in the porous structure of themembranes obtained by the two silica precursors.
SAXS analysis has allowed us to correlate in detail theporous structure with the evaporation induced process inthe membranes. The difference in evaporation rate fromthe centre of the membrane to the outer regions is respon-sible for a slight rotation (�3�) of pore axis. TEM observa-tions also support the mesophase identification performedby SAXS analysis.
The nature of the membrane surface and the adsorp-tion–desorption behaviour of water has been clarified byFTIR analysis, performed in vacuum at different partialpressures. In silica membranes the pores are saturated bythe adsorbed water, on the contrary in hybrid membranesthe hydrophobic methyl groups highly reduce the presenceof water. At low pressures most of the water within thepores is removed, and this has enlightened the nature ofthe pore surface. The residual water is mainly bridging
close silanols, after its removal the pore surface appearsformed of isolated Si–OH groups.
Acknowledgments
FIRB Italian projects are acknowledged for finan-cial support (FIRB Contract No. RBNE01P4JF,RBNE033KMA).
Appendix A. Supplementary data
SAXS pattern with indexation of the M membrane aftercalcination at 350 �C. Supplementary data associated withthis article can be found, in the online version, at doi:10.1016/j.micromeso.2007.01.033.
References
[1] (a) S. Forster, M. Antonietti, Adv. Mater. 10 (1998) 195;(b) C.J. Brinker, Y. Lu, A. Sellinger, H. Fan, Adv. Mater. 11 (1999)579;(c) G.J. de A.A. Soler-Illia, C. Sanchez, B. Lebeau, J. Patarin, Chem.Rev. 102 (2002) 4093;(d) G.J. de A.A. Soler-Illia, P. Innocenzi, Chem. Eur. J. 12 (2006)4478.
[2] G.J. de A.A. Soler-Illia, E.L. Crepaldi, D. Grosso, D. Durand, C.Sanchez, Chem. Commun. (2002) 2298.
[3] (a) N.A. Melosh, P. Davidson, B.F. Chmelka, J. Am. Chem. Soc. 122(2000) 823;(b) N.A. Melosh, P. Lipic, F.A. Bates, F. Wudl, G.D. Stucky, B.F.Chmelka, Macromolecules 32 (1999) 4332;(c) J.H. Smatt, S. Schunk, M. Linden, Chem. Mater. 15 (2003) 2354.
[4] K. Valle, P. Belleville, F. Pereira, C. Sanchez, Nat. Mater. 5 (2006)107.
[5] K. Suzuki, K. Ikari, H. Imai, J. Mater. Chem. 13 (2003) 1812.[6] H. Amenitsch, M. Rappolt, M. Kriechbaum, H. Mio, P. Laggner, S.J.
Bernstorff, J. Synchrotron Radiat. 5 (1998) 506.[7] Website: http://www.esrf.fr/computing/scientific/FIT2D/ (accessed
November 2006).[8] M. Cestelli Guidi, M. Piccinini, A. Marcelli, A. Nucara, P. Calvani,
E. Burattini, J. Opt. Soc. Am. A 22 (2005) 2810.[9] (a) P. Falcaro, S. Costacurta, G. Mattei, H. Amenitsch, A. Marcelli,
M.C. Guidi, M. Piccinini, A. Nucara, L. Malfatti, T. Kidchob, P.Innocenzi, J. Am. Chem. Soc. 127 (2005) 3838;(b) P. Innocenzi, L. Malfatti, T. Kidchob, P. Falcaro, S. Costacurta,M. Guglielmi, G. Mattei, H. Amenitsch, J. Synchrotron Radiat. 12(2005) 734;(c) P. Falcaro, D. Grosso, H. Amenitsch, P. Innocenzi, J. Phys.Chem. B 108 (2004) 10942;(d) D. Grosso, A.R. Balkenende, P.A. Albouy, A. Ayral, H.Amenitsch, F. Babonneau, Chem. Mater. 13 (2001) 1848.
[10] M.P. Tate, V.N. Urade, J.D. Kowalski, T. Wei, B.D. Hamilton, B.W.Eggiman, H.W. Hillhouse, J. Phys. Chem. B 110 (2006) 9882.
[11] Website: http://cobweb.ecn.purdue.edu/~hgroup/ (accessed Novem-ber 2006).
[12] The rotation of the whole SAXS pattern, from the snapshots 5–1 and5–9, can be visualized taking as reference the central snapshot 5.
[13] S. Besson, T. Gacoin, C. Jacquiod, C. Ricolleau, D. Babonneau, J.-P.Boilot, J. Mater. Chem. 10 (2000) 1331.
[14] P. Innocenzi, J. Non-Cryst. Solids 316 (2003) 309.[15] K.M. Davis, M. Tomozawa, J. Non-Cryst. Solids 201 (1996) 177.[16] G.E. Walrafen, S.R. Samanta, J. Chem. Phys. 69 (1978) 493.[17] J.G. Bayly, V.B. Kartha, W.H. Stevens, Infrared Phys. 3 (1963) 211.[18] Y. Shen, P. Wu, J. Phys. Chem. B 107 (2003) 4224.

122 L. Malfatti et al. / Microporous and Mesoporous Materials 103 (2007) 113–122
[19] P. Innocenzi, P. Falcaro, D. Grosso, F. Babonneau, J. Phys. Chem. B107 (2003) 711.
[20] (a) P. Innocenzi, P. Falcaro, J. Mio Bertolo, A. Bearzotti, H.Amenitsch, J. Non-Cryst. Solids 351 (2005) 1980;(b) P. Falcaro, J. Mio Bertolo, P. Innocenzi, H. Amenitsch, A.Bearzotti, J. Sol-Gel Sci. Technol. 32 (2004) 107;(c) A. Bearzotti, J. Mio Bertolo, P. Innocenzi, P. Falcaro, E.Traversa, J. Eur. Ceram. Soc. 24 (2004) 1969;(d) J. Mio Bertolo, A. Bearzotti, P. Falcaro, E. Traversa, P.Innocenzi, Sensor Lett. 1 (2003) 64;(e) P. Innocenzi, A. Martucci, M. Guglielmi, A. Bearzotti, E.Traversa, J.C. Pivin, J. Eur. Ceram. Soc. 21 (2001) 1985;
(f) P. Innocenzi, A. Martucci, M. Guglielmi, A. Bearzotti, E.Traversa, Sens. Act. B 76 (2001) 299.
[21] (a) I. Noda, Appl. Spectrosc. 47 (1993) 1329;(b) I. Noda, A.E. Dowrey, C. Marcott, G.M. Story, Y. Ozaki, Appl.Spectrosc. A 54 (2000) 296;(c) I. Noda, Y. Ozaki, Two-Dimensional Correlation Spectroscopy –Applications in Vibrational and Optical Spectroscopy, Wiley, NewYork, 2004.
[22] P. Innocenzi, M.O. Abdirashid, M. Guglielmi, J. Sol-Gel Sci.Technol. 3 (1994) 47.
[23] R.E. Galindo, A. Van Veen, H. Schut, S.W.H. Eijt, C.V. Falub, A.R.Balkenende, F.K. De Theije, Mater. Eng. B 102 (2003) 403.