Pore Scale Visualization of Drainage in 3D Porous Media by ...
11
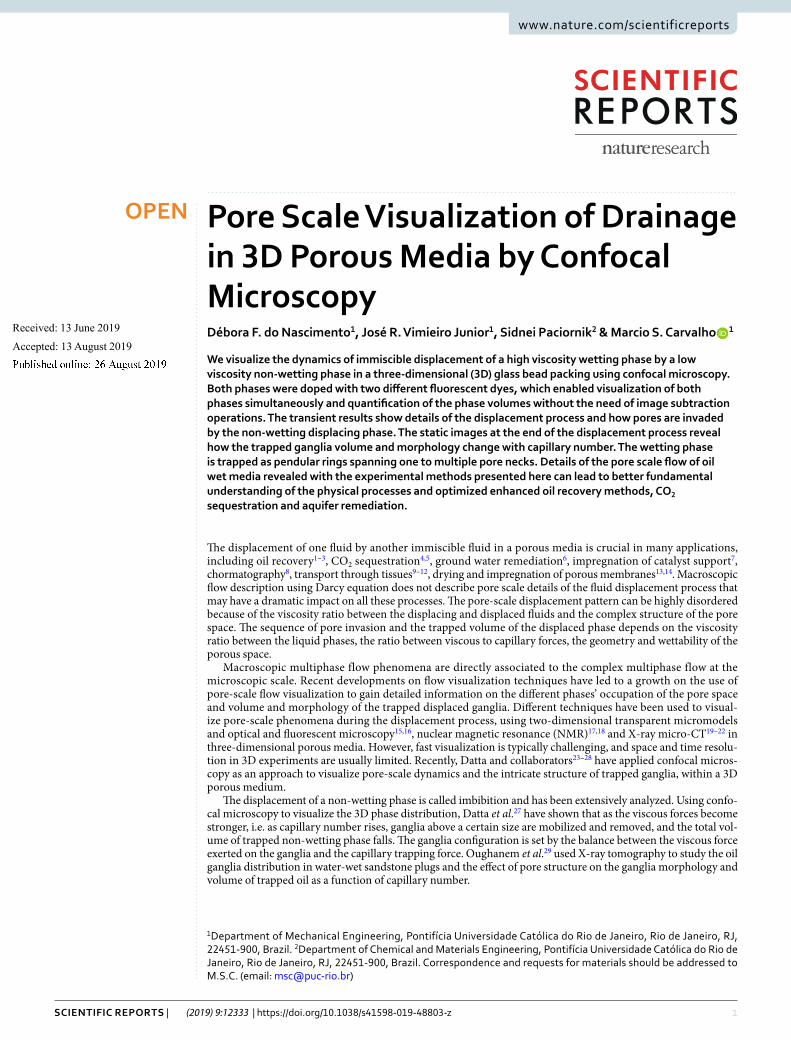
1 SCIENTIFIC REPORTS | (2019) 9:12333 | https://doi.org/10.1038/s41598-019-48803-z www.nature.com/scientificreports Pore Scale Visualization of Drainage in 3D Porous Media by Confocal Microscopy Débora F. do Nascimento 1 , José R. Vimieiro Junior 1 , Sidnei Paciornik 2 & Marcio S. Carvalho 1 We visualize the dynamics of immiscible displacement of a high viscosity wetting phase by a low viscosity non-wetting phase in a three-dimensional (3D) glass bead packing using confocal microscopy. Both phases were doped with two different fluorescent dyes, which enabled visualization of both phases simultaneously and quantification of the phase volumes without the need of image subtraction operations. The transient results show details of the displacement process and how pores are invaded by the non-wetting displacing phase. The static images at the end of the displacement process reveal how the trapped ganglia volume and morphology change with capillary number. The wetting phase is trapped as pendular rings spanning one to multiple pore necks. Details of the pore scale flow of oil wet media revealed with the experimental methods presented here can lead to better fundamental understanding of the physical processes and optimized enhanced oil recovery methods, CO 2 sequestration and aquifer remediation. e displacement of one fluid by another immiscible fluid in a porous media is crucial in many applications, including oil recovery 1–3 , CO 2 sequestration 4,5 , ground water remediation 6 , impregnation of catalyst support 7 , chormatography 8 , transport through tissues 9–12 , drying and impregnation of porous membranes 13,14 . Macroscopic flow description using Darcy equation does not describe pore scale details of the fluid displacement process that may have a dramatic impact on all these processes. e pore-scale displacement pattern can be highly disordered because of the viscosity ratio between the displacing and displaced fluids and the complex structure of the pore space. e sequence of pore invasion and the trapped volume of the displaced phase depends on the viscosity ratio between the liquid phases, the ratio between viscous to capillary forces, the geometry and wettability of the porous space. Macroscopic multiphase flow phenomena are directly associated to the complex multiphase flow at the microscopic scale. Recent developments on flow visualization techniques have led to a growth on the use of pore-scale flow visualization to gain detailed information on the different phases’ occupation of the pore space and volume and morphology of the trapped displaced ganglia. Different techniques have been used to visual- ize pore-scale phenomena during the displacement process, using two-dimensional transparent micromodels and optical and fluorescent microscopy 15,16 , nuclear magnetic resonance (NMR) 17,18 and X-ray micro-CT 19–22 in three-dimensional porous media. However, fast visualization is typically challenging, and space and time resolu- tion in 3D experiments are usually limited. Recently, Datta and collaborators 23–28 have applied confocal micros- copy as an approach to visualize pore-scale dynamics and the intricate structure of trapped ganglia, within a 3D porous medium. e displacement of a non-wetting phase is called imbibition and has been extensively analyzed. Using confo- cal microscopy to visualize the 3D phase distribution, Datta et al. 27 have shown that as the viscous forces become stronger, i.e. as capillary number rises, ganglia above a certain size are mobilized and removed, and the total vol- ume of trapped non-wetting phase falls. e ganglia configuration is set by the balance between the viscous force exerted on the ganglia and the capillary trapping force. Oughanem et al. 29 used X-ray tomography to study the oil ganglia distribution in water-wet sandstone plugs and the effect of pore structure on the ganglia morphology and volume of trapped oil as a function of capillary number. 1 Department of Mechanical Engineering, Pontifícia Universidade Católica do Rio de Janeiro, Rio de Janeiro, RJ, 22451-900, Brazil. 2 Department of Chemical and Materials Engineering, Pontifícia Universidade Católica do Rio de Janeiro, Rio de Janeiro, RJ, 22451-900, Brazil. Correspondence and requests for materials should be addressed to M.S.C. (email: [email protected]) Received: 13 June 2019 Accepted: 13 August 2019 Published: xx xx xxxx OPEN
-
Upload
khangminh22 -
Category
Documents
-
view
6 -
download
0
Transcript of Pore Scale Visualization of Drainage in 3D Porous Media by ...
1Scientific RepoRtS | (2019) 9:12333 | https://doi.org/10.1038/s41598-019-48803-z
www.nature.com/scientificreports
pore Scale Visualization of Drainage in 3D Porous Media by Confocal MicroscopyDébora F. do nascimento1, José R. Vimieiro Junior1, Sidnei paciornik2 & Marcio S. carvalho 1
We visualize the dynamics of immiscible displacement of a high viscosity wetting phase by a low viscosity non-wetting phase in a three-dimensional (3D) glass bead packing using confocal microscopy. Both phases were doped with two different fluorescent dyes, which enabled visualization of both phases simultaneously and quantification of the phase volumes without the need of image subtraction operations. The transient results show details of the displacement process and how pores are invaded by the non-wetting displacing phase. The static images at the end of the displacement process reveal how the trapped ganglia volume and morphology change with capillary number. The wetting phase is trapped as pendular rings spanning one to multiple pore necks. Details of the pore scale flow of oil wet media revealed with the experimental methods presented here can lead to better fundamental understanding of the physical processes and optimized enhanced oil recovery methods, CO2 sequestration and aquifer remediation.
The displacement of one fluid by another immiscible fluid in a porous media is crucial in many applications, including oil recovery1–3, CO2 sequestration4,5, ground water remediation6, impregnation of catalyst support7, chormatography8, transport through tissues9–12, drying and impregnation of porous membranes13,14. Macroscopic flow description using Darcy equation does not describe pore scale details of the fluid displacement process that may have a dramatic impact on all these processes. The pore-scale displacement pattern can be highly disordered because of the viscosity ratio between the displacing and displaced fluids and the complex structure of the pore space. The sequence of pore invasion and the trapped volume of the displaced phase depends on the viscosity ratio between the liquid phases, the ratio between viscous to capillary forces, the geometry and wettability of the porous space.
Macroscopic multiphase flow phenomena are directly associated to the complex multiphase flow at the microscopic scale. Recent developments on flow visualization techniques have led to a growth on the use of pore-scale flow visualization to gain detailed information on the different phases’ occupation of the pore space and volume and morphology of the trapped displaced ganglia. Different techniques have been used to visual-ize pore-scale phenomena during the displacement process, using two-dimensional transparent micromodels and optical and fluorescent microscopy15,16, nuclear magnetic resonance (NMR)17,18 and X-ray micro-CT19–22 in three-dimensional porous media. However, fast visualization is typically challenging, and space and time resolu-tion in 3D experiments are usually limited. Recently, Datta and collaborators23–28 have applied confocal micros-copy as an approach to visualize pore-scale dynamics and the intricate structure of trapped ganglia, within a 3D porous medium.
The displacement of a non-wetting phase is called imbibition and has been extensively analyzed. Using confo-cal microscopy to visualize the 3D phase distribution, Datta et al.27 have shown that as the viscous forces become stronger, i.e. as capillary number rises, ganglia above a certain size are mobilized and removed, and the total vol-ume of trapped non-wetting phase falls. The ganglia configuration is set by the balance between the viscous force exerted on the ganglia and the capillary trapping force. Oughanem et al.29 used X-ray tomography to study the oil ganglia distribution in water-wet sandstone plugs and the effect of pore structure on the ganglia morphology and volume of trapped oil as a function of capillary number.
1Department of Mechanical Engineering, Pontifícia Universidade Católica do Rio de Janeiro, Rio de Janeiro, RJ, 22451-900, Brazil. 2Department of Chemical and Materials Engineering, Pontifícia Universidade Católica do Rio de Janeiro, Rio de Janeiro, RJ, 22451-900, Brazil. Correspondence and requests for materials should be addressed to M.S.C. (email: [email protected])
Received: 13 June 2019
Accepted: 13 August 2019
Published: xx xx xxxx
open
2Scientific RepoRtS | (2019) 9:12333 | https://doi.org/10.1038/s41598-019-48803-z
www.nature.com/scientificreportswww.nature.com/scientificreports/
Despite being extremely relevant in oil recovery, since most oil reservoirs are not purely water-wet and display mixed-wetting conditions associated to the sorption of surface-active components in the oil to the rock surface, the displacement of the wetting phase, called drainage, is not as well understood as imbibition. The fluid displace-ment dynamics in drainage is remarkably different from imbibition. To displace a wetting phase from a pore, the pressure in the invading non-wetting phase has to be above a threshold capillary pressure, which is a function of the interfacial tension between the phases and the pore geometry. The wall wettability has a dramatic impact on the efficiency of the displacement process in oil recovery processes. Avendaño et al.30 compared the sequence of events that occur in oil displacement processes in water-wet and oil-wet 2D porous media micromodel to show that, at low capillary number, the remaining oil volume was larger in water wet media. The results agree with the core flooding experiments of Jadhunandan and Morrow31 and the capillary network model of Zhao et al.32. Iglauer et al.1 studied the size distribution of trapped oil ganglia in oil- and water-wet sandstone using X-ray tomography. They showed that the oil ganglia had a flatter, sheet-like configuration in the oil-wet media while they were more spherical in the water-wet case. In the oil-wet sandstone, the trapped oil ganglia were mostly located adjacent to the walls and in smaller pores, leading to a smaller volume of trapped oil. Details of the dynamics of the liquid displacement and morphology of the trapped ganglia are still not clear.
Here, we use fast confocal microscopy to visualize the dynamics of the fluid displacement flow during drain-age. We doped both the wetting, displaced phase and the non-wetting, invading phase, with different fluorescent dyes, which enabled the visualization of both phases simultaneously inside the pore space. The ganglia size dis-tribution and detailed information about morphology of the trapped wetting phase within a three-dimensional porous media is quantified as a function of flow conditions.
Results and DiscussionFigure 1 shows the 3D rendering of the displacement process dynamics in an 0.581 × 0.581 × 0.400 mm3 volume of the porous media. As mentioned before, because the fluorescent dyes used in both phases emit at different wave lengths, it was possible to visualize both phases simultaneously. The wetting displaced phase is shown in yellow and the non-wetting invading liquid is shown in blue in Fig. 1 and in the Supplementary Videos 1 and 2. The sequential images were acquired every 10 seconds. Figure 1a,b show, respectively, both phases together and only the non-wetting fluid, in blue. The flow rate imposed at this particular case was Q = 0.027 mL/h, which cor-responded to a capillary number of Ca = 1 × 10⁻⁶.
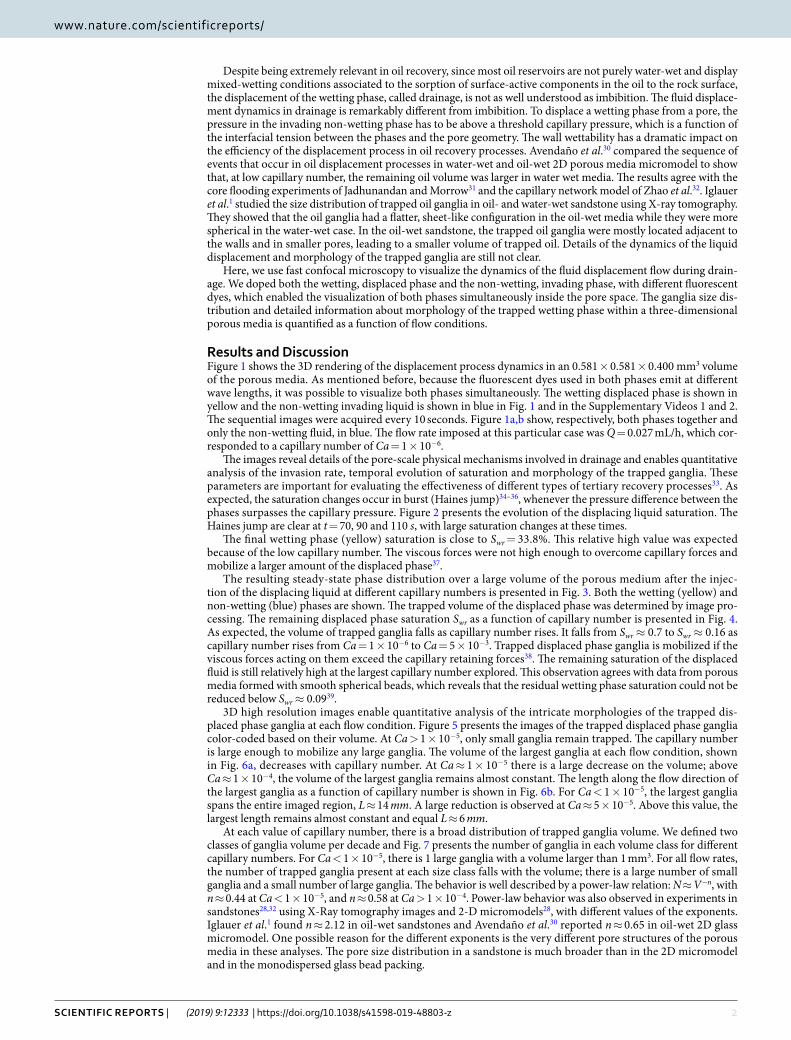
The images reveal details of the pore-scale physical mechanisms involved in drainage and enables quantitative analysis of the invasion rate, temporal evolution of saturation and morphology of the trapped ganglia. These parameters are important for evaluating the effectiveness of different types of tertiary recovery processes33. As expected, the saturation changes occur in burst (Haines jump)34–36, whenever the pressure difference between the phases surpasses the capillary pressure. Figure 2 presents the evolution of the displacing liquid saturation. The Haines jump are clear at t = 70, 90 and 110 s, with large saturation changes at these times.
The final wetting phase (yellow) saturation is close to Swr = 33.8%. This relative high value was expected because of the low capillary number. The viscous forces were not high enough to overcome capillary forces and mobilize a larger amount of the displaced phase37.
The resulting steady-state phase distribution over a large volume of the porous medium after the injec-tion of the displacing liquid at different capillary numbers is presented in Fig. 3. Both the wetting (yellow) and non-wetting (blue) phases are shown. The trapped volume of the displaced phase was determined by image pro-cessing. The remaining displaced phase saturation Swr as a function of capillary number is presented in Fig. 4. As expected, the volume of trapped ganglia falls as capillary number rises. It falls from Swr ≈ 0.7 to Swr ≈ 0.16 as capillary number rises from Ca = 1 × 10⁻⁶ to Ca = 5 × 10⁻³. Trapped displaced phase ganglia is mobilized if the viscous forces acting on them exceed the capillary retaining forces38. The remaining saturation of the displaced fluid is still relatively high at the largest capillary number explored. This observation agrees with data from porous media formed with smooth spherical beads, which reveals that the residual wetting phase saturation could not be reduced below Swr ≈ 0.0939.
3D high resolution images enable quantitative analysis of the intricate morphologies of the trapped dis-placed phase ganglia at each flow condition. Figure 5 presents the images of the trapped displaced phase ganglia color-coded based on their volume. At Ca > 1 × 10⁻⁵, only small ganglia remain trapped. The capillary number is large enough to mobilize any large ganglia. The volume of the largest ganglia at each flow condition, shown in Fig. 6a, decreases with capillary number. At Ca ≈ 1 × 10⁻⁵ there is a large decrease on the volume; above Ca ≈ 1 × 10⁻⁴, the volume of the largest ganglia remains almost constant. The length along the flow direction of the largest ganglia as a function of capillary number is shown in Fig. 6b. For Ca < 1 × 10⁻⁵, the largest ganglia spans the entire imaged region, L ≈ 14 mm. A large reduction is observed at Ca ≈ 5 × 10⁻⁵. Above this value, the largest length remains almost constant and equal L ≈ 6 mm.
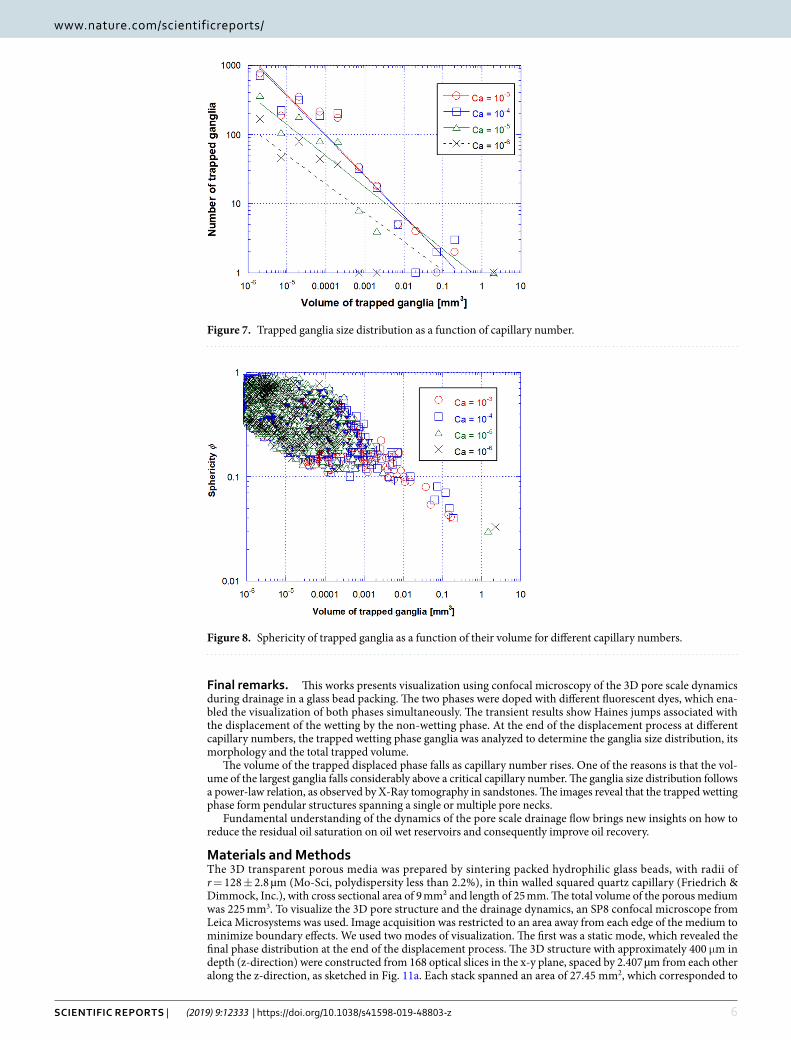
At each value of capillary number, there is a broad distribution of trapped ganglia volume. We defined two classes of ganglia volume per decade and Fig. 7 presents the number of ganglia in each volume class for different capillary numbers. For Ca < 1 × 10⁻⁵, there is 1 large ganglia with a volume larger than 1 mm3. For all flow rates, the number of trapped ganglia present at each size class falls with the volume; there is a large number of small ganglia and a small number of large ganglia. The behavior is well described by a power-law relation: N ≈ V−n, with n ≈ 0.44 at Ca < 1 × 10⁻⁵, and n ≈ 0.58 at Ca > 1 × 10⁻⁴. Power-law behavior was also observed in experiments in sandstones28,32 using X-Ray tomography images and 2-D micromodels28, with different values of the exponents. Iglauer et al.1 found n ≈ 2.12 in oil-wet sandstones and Avendaño et al.30 reported n ≈ 0.65 in oil-wet 2D glass micromodel. One possible reason for the different exponents is the very different pore structures of the porous media in these analyses. The pore size distribution in a sandstone is much broader than in the 2D micromodel and in the monodispersed glass bead packing.

3Scientific RepoRtS | (2019) 9:12333 | https://doi.org/10.1038/s41598-019-48803-z
www.nature.com/scientificreportswww.nature.com/scientificreports/
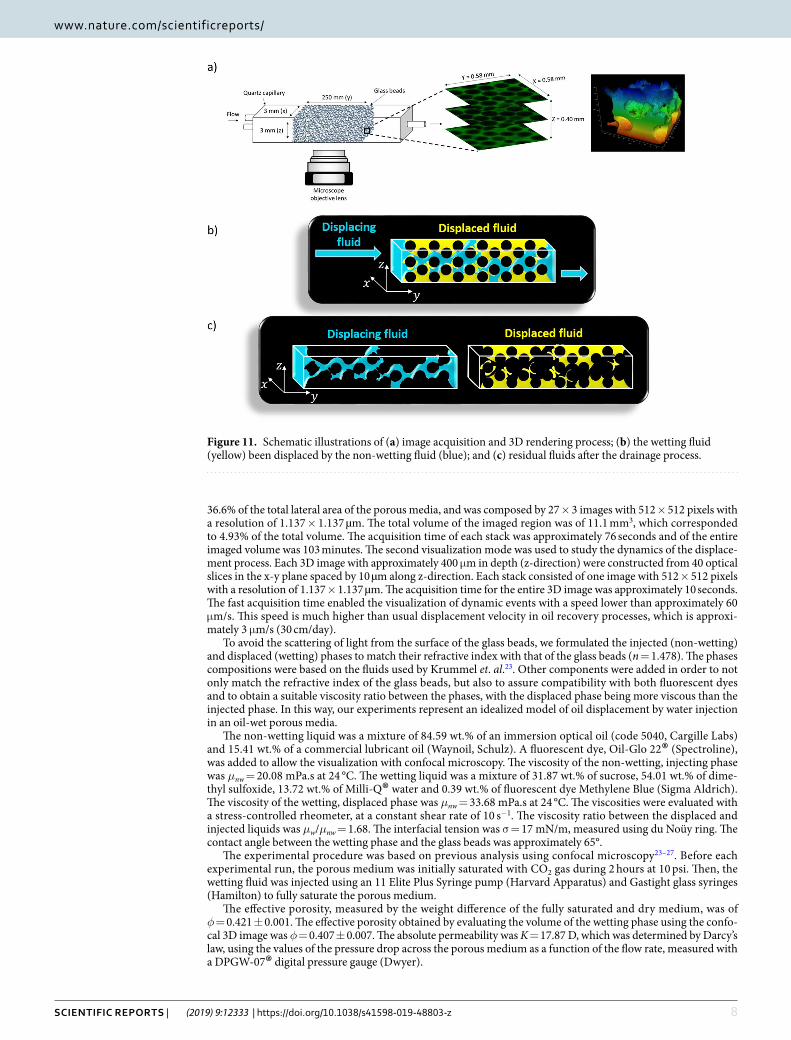
In order to study the shape of the trapped ganglia, we plot in Fig. 8 the sphericity ϕ of each individual ganglion
as a function of its volume for different capillary numbers. Sphericity, defined as φ π= ( )V A6 /p p12
23 (Vp and Ap are
the volume and surface area of the ganglion), measures how closely the shape of an object approaches a sphere. By definition, the sphericity of a sphere is φ = 1 In general, the sphericity of a trapped ganglion falls as its volume becomes larger, indicating that the large ganglia have a relatively high surface area, with φ < 0.1 for ganglia with volume lower than Vp ≈ 0.01 mm3, and with a shape far from spherical. This result agrees with Iglauer et al.’s20 finding. They reported that the oil ganglia in an oil-wet sandstone had a flatter, sheet-like configuration while they
Figure 1. 3D rendering images showing the dynamic behavior of drainage. (a) Showing both the displaced wetting (yellow) and displacing non-wetting (blue) phases and (b) showing only the non-wetting liquid.
4Scientific RepoRtS | (2019) 9:12333 | https://doi.org/10.1038/s41598-019-48803-z
www.nature.com/scientificreportswww.nature.com/scientificreports/
were more spherical in the water-wet case. The dispersion of the sphericity value increases as the ganglia volume falls. The shape of the very small ganglia approaches that of a sphere with values of sphericity close to 1.
Since the wetting phase preferentially wets the glass beads, the majority of the trapped fluid formed pendular rings40, as shown in Fig. 9. These are small volumes of fluid forming axisymmetric liquid bridges with interfaces
Figure 2. Evolution of the non-wetting invading phase saturation showing Haines jump.
Figure 3. Rendering of 3D images acquired at steady state after the injection of the displacing fluid at different capillary numbers, which contemplates both phases: wetting (yellow) and non-wetting (blue) fluids.

5Scientific RepoRtS | (2019) 9:12333 | https://doi.org/10.1038/s41598-019-48803-z
www.nature.com/scientificreportswww.nature.com/scientificreports/
(meniscus) between two or more axisymmetric solids41. These individually isolated segments of fluid surrounding the bead-to-bead contact points are shown in Fig. 9. The images were obtained at Ca = 5 × 10⁻³ and represent different positions in the porous media after drainage is completed. They show examples of structures spanning one, three and multiple pore-necks. The high-resolution 3D confocal images allowed visualization of these pen-dular structures.
Pendular rings were analyzed previously only by numerical simulation, and experimentally by X-ray com-puted micro-tomography and synchrotron40,42–47. Figure 10 shows the same images of Fig. 9 with the trapped wetting phase color-coded by their volume. The volume is proportional to the number of pore necks that the gan-glion spans. The orange and yellow structures (large volumes) of Fig. 10 span more than 4 bead-to-bead contacts.
Figure 4. Saturation of the displaced phase as a function of the capillary number.
Figure 5. Volume of trapped displaced phase ganglia as a function of capillary number.
6Scientific RepoRtS | (2019) 9:12333 | https://doi.org/10.1038/s41598-019-48803-z
www.nature.com/scientificreportswww.nature.com/scientificreports/
Final remarks. This works presents visualization using confocal microscopy of the 3D pore scale dynamics during drainage in a glass bead packing. The two phases were doped with different fluorescent dyes, which ena-bled the visualization of both phases simultaneously. The transient results show Haines jumps associated with the displacement of the wetting by the non-wetting phase. At the end of the displacement process at different capillary numbers, the trapped wetting phase ganglia was analyzed to determine the ganglia size distribution, its morphology and the total trapped volume.
The volume of the trapped displaced phase falls as capillary number rises. One of the reasons is that the vol-ume of the largest ganglia falls considerably above a critical capillary number. The ganglia size distribution follows a power-law relation, as observed by X-Ray tomography in sandstones. The images reveal that the trapped wetting phase form pendular structures spanning a single or multiple pore necks.
Fundamental understanding of the dynamics of the pore scale drainage flow brings new insights on how to reduce the residual oil saturation on oil wet reservoirs and consequently improve oil recovery.
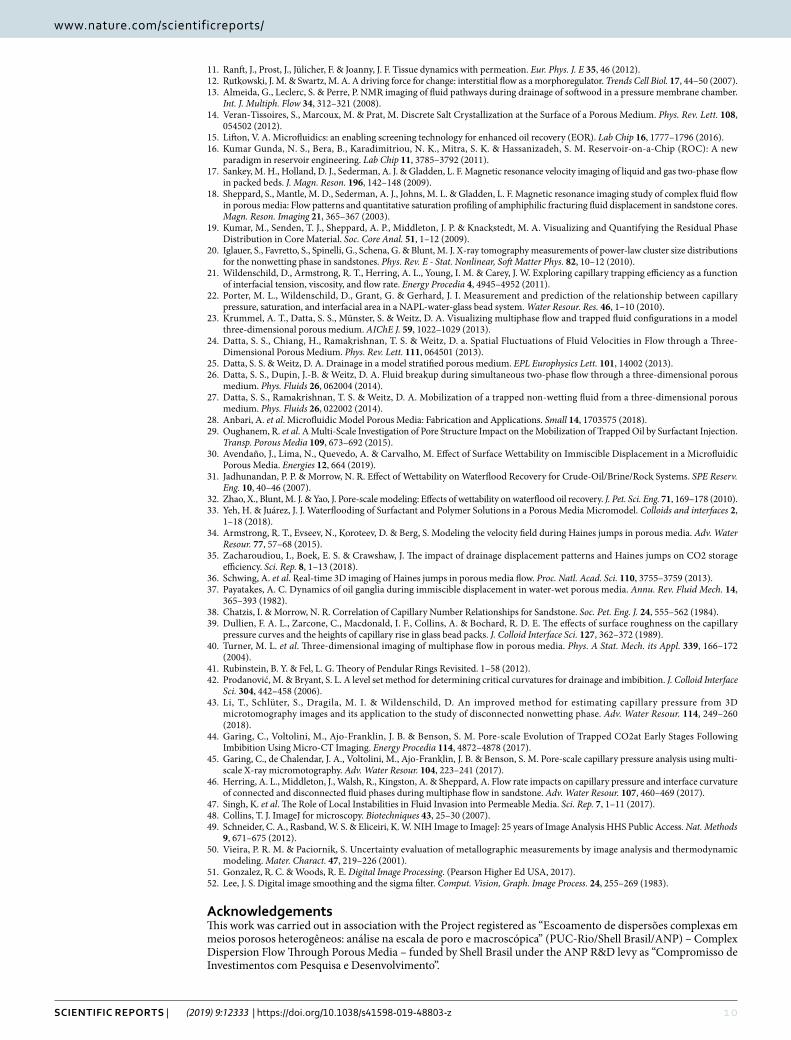
Materials and MethodsThe 3D transparent porous media was prepared by sintering packed hydrophilic glass beads, with radii of r = 128 ± 2.8 µm (Mo-Sci, polydispersity less than 2.2%), in thin walled squared quartz capillary (Friedrich & Dimmock, Inc.), with cross sectional area of 9 mm² and length of 25 mm. The total volume of the porous medium was 225 mm3. To visualize the 3D pore structure and the drainage dynamics, an SP8 confocal microscope from Leica Microsystems was used. Image acquisition was restricted to an area away from each edge of the medium to minimize boundary effects. We used two modes of visualization. The first was a static mode, which revealed the final phase distribution at the end of the displacement process. The 3D structure with approximately 400 μm in depth (z-direction) were constructed from 168 optical slices in the x-y plane, spaced by 2.407 µm from each other along the z-direction, as sketched in Fig. 11a. Each stack spanned an area of 27.45 mm2, which corresponded to
Figure 7. Trapped ganglia size distribution as a function of capillary number.
Figure 8. Sphericity of trapped ganglia as a function of their volume for different capillary numbers.

7Scientific RepoRtS | (2019) 9:12333 | https://doi.org/10.1038/s41598-019-48803-z
www.nature.com/scientificreportswww.nature.com/scientificreports/
Figure 9. 3D images showing both the displacing non-wetting (blue) and displaced wetting (yellow) phases in four different positions along the porous media to exemplify different ganglia morphology. The trapped ganglia are in the form of pendular rings, spanning one, three and multiple pore necks.
Figure 10. 3D processed images with ganglia volume colored according to the scale bar.
8Scientific RepoRtS | (2019) 9:12333 | https://doi.org/10.1038/s41598-019-48803-z
www.nature.com/scientificreportswww.nature.com/scientificreports/
36.6% of the total lateral area of the porous media, and was composed by 27 × 3 images with 512 × 512 pixels with a resolution of 1.137 × 1.137 µm. The total volume of the imaged region was of 11.1 mm3, which corresponded to 4.93% of the total volume. The acquisition time of each stack was approximately 76 seconds and of the entire imaged volume was 103 minutes. The second visualization mode was used to study the dynamics of the displace-ment process. Each 3D image with approximately 400 μm in depth (z-direction) were constructed from 40 optical slices in the x-y plane spaced by 10 µm along z-direction. Each stack consisted of one image with 512 × 512 pixels with a resolution of 1.137 × 1.137 µm. The acquisition time for the entire 3D image was approximately 10 seconds. The fast acquisition time enabled the visualization of dynamic events with a speed lower than approximately 60 μm/s. This speed is much higher than usual displacement velocity in oil recovery processes, which is approxi-mately 3 μm/s (30 cm/day).
To avoid the scattering of light from the surface of the glass beads, we formulated the injected (non-wetting) and displaced (wetting) phases to match their refractive index with that of the glass beads (n = 1.478). The phases compositions were based on the fluids used by Krummel et. al.23. Other components were added in order to not only match the refractive index of the glass beads, but also to assure compatibility with both fluorescent dyes and to obtain a suitable viscosity ratio between the phases, with the displaced phase being more viscous than the injected phase. In this way, our experiments represent an idealized model of oil displacement by water injection in an oil-wet porous media.
The non-wetting liquid was a mixture of 84.59 wt.% of an immersion optical oil (code 5040, Cargille Labs) and 15.41 wt.% of a commercial lubricant oil (Waynoil, Schulz). A fluorescent dye, Oil-Glo 22® (Spectroline), was added to allow the visualization with confocal microscopy. The viscosity of the non-wetting, injecting phase was μnw = 20.08 mPa.s at 24 °C. The wetting liquid was a mixture of 31.87 wt.% of sucrose, 54.01 wt.% of dime-thyl sulfoxide, 13.72 wt.% of Milli-Q® water and 0.39 wt.% of fluorescent dye Methylene Blue (Sigma Aldrich). The viscosity of the wetting, displaced phase was μnw = 33.68 mPa.s at 24 °C. The viscosities were evaluated with a stress-controlled rheometer, at a constant shear rate of 10 s−1. The viscosity ratio between the displaced and injected liquids was μw/μnw = 1.68. The interfacial tension was σ = 17 mN/m, measured using du Noüy ring. The contact angle between the wetting phase and the glass beads was approximately 65°.
The experimental procedure was based on previous analysis using confocal microscopy23–27. Before each experimental run, the porous medium was initially saturated with CO2 gas during 2 hours at 10 psi. Then, the wetting fluid was injected using an 11 Elite Plus Syringe pump (Harvard Apparatus) and Gastight glass syringes (Hamilton) to fully saturate the porous medium.
The effective porosity, measured by the weight difference of the fully saturated and dry medium, was of φ = 0.421 ± 0.001. The effective porosity obtained by evaluating the volume of the wetting phase using the confo-cal 3D image was φ = 0.407 ± 0.007. The absolute permeability was K = 17.87 D, which was determined by Darcy’s law, using the values of the pressure drop across the porous medium as a function of the flow rate, measured with a DPGW-07® digital pressure gauge (Dwyer).
Figure 11. Schematic illustrations of (a) image acquisition and 3D rendering process; (b) the wetting fluid (yellow) been displaced by the non-wetting fluid (blue); and (c) residual fluids after the drainage process.

9Scientific RepoRtS | (2019) 9:12333 | https://doi.org/10.1038/s41598-019-48803-z
www.nature.com/scientificreportswww.nature.com/scientificreports/
The non-wetting, displacing phase (blue in Fig. 11b,c) was injected at different flow rates, varying from Qinj = 0.027 to Qinj = 137.15 mL/h, leading to a capillary number range of Ca ≡ μnwQinj/Aσ = 10−6 to 5 × 10⁻³. At each condition, the dynamics of drainage was observed and the phase distribution at the end of the injection process was measured, as sketched in Fig. 11b,c. Since both phases were fluorescent at different wavelengths, we could visualize the distribution of each phase without the need of the image subtraction operation used in previ-ous works23–25,27, which compromises the accuracy of the analysis.
The 3D images were processed to extract numerical attributes and quantitative analysis using the software FIJI/ImageJ®, which is a Java-based image processing program developed at the National Institutes of Health (NIH) and the Laboratory for Optical and Computational Instrumentation (LOCI, University of Wisconsin)48,49, and Dragonfly® (ORS)50.
A FIJI macro was prepared to process all images in the volume. The sequence of operations is illustrated in Fig. 12 for two representative slices, one at the bottom wall and another at 192 µm depth. The latter shows much lower contrast. The first step involved histogram equalization51 to make different image layers have similar brightness and contrast. This was critical for the segmentation step, as described in the following. Then, noise was reduced with the so-called Sigma filter52, which is an edge preserving low-pass filter. Finally, the fluids were automatically discriminated, layer by layer, using the segmentation Otsu´s method. Here, the similarity of the intensity histograms achieved by the equalization step was critical to allow accurate segmentation in all layers without the need for manual adjustments.
References 1. Iglauer, S., Fernø, M. A., Shearing, P. & Blunt, M. J. Comparison of residual oil cluster size distribution, morphology and saturation
in oil-wet and water-wet sandstone. J. Colloid Interface Sci. 375, 187–192 (2012). 2. Homsy, G. Viscous Fingering In Porous Media. Annu. Rev. Fluid Mech. 19, 271–311 (1987). 3. Lenormand, R., Zarcone, C. & Sarr, A. Mechanisms of the displacement of one fluid by another in a network of capillary ducts. J.
Fluid Mech. 135, 337–353 (1983). 4. Plug, W.-J. & Bruining, J. Capillary pressure for the sand–CO2–water system under various pressure conditions. Application to CO2
sequestration. Adv. Water Resour. 30, 2339–2353 (2007). 5. Shukla, R., Ranjith, P., Haque, A. & Choi, X. A review of studies on CO2 sequestration and caprock integrity. Fuel 89, 2651–2664
(2010). 6. Cvetkovic, V. & Dagan, G. Reactive transport and immiscible flow in geological media. II. Applications. Proc. R. Soc. London. Ser. A
Math. Phys. Eng. Sci. 452, 303–328 (1996). 7. Fortunato, R., Afonso, C. A. M., Reis, M. A. M. & Crespo, J. G. Supported liquid membranes using ionic liquids: study of stability and
transport mechanisms. J. Memb. Sci. 242, 197–209 (2004). 8. Calvin Giddings, J. Dynamics of Chromatography Principles and Theory., https://doi.org/10.1201/9781315275871 (CRC Press, 2017). 9. Heinemann, S., Rössler, S., Lemm, M., Ruhnow, M. & Nies, B. Properties of injectable ready-to-use calcium phosphate cement based
on water-immiscible liquid. Acta Biomater. 9, 6199–6207 (2013). 10. Khaled, A.-R. A. & Vafai, K. The role of porous media in modeling flow and heat transfer in biological tissues. Int. J. Heat Mass
Transf. 46, 4989–5003 (2003).
Figure 12. Image processing sequence for two representative slices. Top 4: Slice 1, at the bottom wall. Bottom 4: Slice 80, 192 µm depth. (a,e) Original images. (b,f) After histogram equalization. (c,g) After noise reduction with Sigma filter. (d,h) After segmentation with the Otsu method.
1 0Scientific RepoRtS | (2019) 9:12333 | https://doi.org/10.1038/s41598-019-48803-z
www.nature.com/scientificreportswww.nature.com/scientificreports/
11. Ranft, J., Prost, J., Jülicher, F. & Joanny, J. F. Tissue dynamics with permeation. Eur. Phys. J. E 35, 46 (2012). 12. Rutkowski, J. M. & Swartz, M. A. A driving force for change: interstitial flow as a morphoregulator. Trends Cell Biol. 17, 44–50 (2007). 13. Almeida, G., Leclerc, S. & Perre, P. NMR imaging of fluid pathways during drainage of softwood in a pressure membrane chamber.
Int. J. Multiph. Flow 34, 312–321 (2008). 14. Veran-Tissoires, S., Marcoux, M. & Prat, M. Discrete Salt Crystallization at the Surface of a Porous Medium. Phys. Rev. Lett. 108,
054502 (2012). 15. Lifton, V. A. Microfluidics: an enabling screening technology for enhanced oil recovery (EOR). Lab Chip 16, 1777–1796 (2016). 16. Kumar Gunda, N. S., Bera, B., Karadimitriou, N. K., Mitra, S. K. & Hassanizadeh, S. M. Reservoir-on-a-Chip (ROC): A new
paradigm in reservoir engineering. Lab Chip 11, 3785–3792 (2011). 17. Sankey, M. H., Holland, D. J., Sederman, A. J. & Gladden, L. F. Magnetic resonance velocity imaging of liquid and gas two-phase flow
in packed beds. J. Magn. Reson. 196, 142–148 (2009). 18. Sheppard, S., Mantle, M. D., Sederman, A. J., Johns, M. L. & Gladden, L. F. Magnetic resonance imaging study of complex fluid flow
in porous media: Flow patterns and quantitative saturation profiling of amphiphilic fracturing fluid displacement in sandstone cores. Magn. Reson. Imaging 21, 365–367 (2003).
19. Kumar, M., Senden, T. J., Sheppard, A. P., Middleton, J. P. & Knackstedt, M. A. Visualizing and Quantifying the Residual Phase Distribution in Core Material. Soc. Core Anal. 51, 1–12 (2009).
20. Iglauer, S., Favretto, S., Spinelli, G., Schena, G. & Blunt, M. J. X-ray tomography measurements of power-law cluster size distributions for the nonwetting phase in sandstones. Phys. Rev. E - Stat. Nonlinear, Soft Matter Phys. 82, 10–12 (2010).
21. Wildenschild, D., Armstrong, R. T., Herring, A. L., Young, I. M. & Carey, J. W. Exploring capillary trapping efficiency as a function of interfacial tension, viscosity, and flow rate. Energy Procedia 4, 4945–4952 (2011).
22. Porter, M. L., Wildenschild, D., Grant, G. & Gerhard, J. I. Measurement and prediction of the relationship between capillary pressure, saturation, and interfacial area in a NAPL-water-glass bead system. Water Resour. Res. 46, 1–10 (2010).
23. Krummel, A. T., Datta, S. S., Münster, S. & Weitz, D. A. Visualizing multiphase flow and trapped fluid configurations in a model three-dimensional porous medium. AIChE J. 59, 1022–1029 (2013).
24. Datta, S. S., Chiang, H., Ramakrishnan, T. S. & Weitz, D. a. Spatial Fluctuations of Fluid Velocities in Flow through a Three-Dimensional Porous Medium. Phys. Rev. Lett. 111, 064501 (2013).
25. Datta, S. S. & Weitz, D. A. Drainage in a model stratified porous medium. EPL Europhysics Lett. 101, 14002 (2013). 26. Datta, S. S., Dupin, J.-B. & Weitz, D. A. Fluid breakup during simultaneous two-phase flow through a three-dimensional porous
medium. Phys. Fluids 26, 062004 (2014). 27. Datta, S. S., Ramakrishnan, T. S. & Weitz, D. A. Mobilization of a trapped non-wetting fluid from a three-dimensional porous
medium. Phys. Fluids 26, 022002 (2014). 28. Anbari, A. et al. Microfluidic Model Porous Media: Fabrication and Applications. Small 14, 1703575 (2018). 29. Oughanem, R. et al. A Multi-Scale Investigation of Pore Structure Impact on the Mobilization of Trapped Oil by Surfactant Injection.
Transp. Porous Media 109, 673–692 (2015). 30. Avendaño, J., Lima, N., Quevedo, A. & Carvalho, M. Effect of Surface Wettability on Immiscible Displacement in a Microfluidic
Porous Media. Energies 12, 664 (2019). 31. Jadhunandan, P. P. & Morrow, N. R. Effect of Wettability on Waterflood Recovery for Crude-Oil/Brine/Rock Systems. SPE Reserv.
Eng. 10, 40–46 (2007). 32. Zhao, X., Blunt, M. J. & Yao, J. Pore-scale modeling: Effects of wettability on waterflood oil recovery. J. Pet. Sci. Eng. 71, 169–178 (2010). 33. Yeh, H. & Juárez, J. J. Waterflooding of Surfactant and Polymer Solutions in a Porous Media Micromodel. Colloids and interfaces 2,
1–18 (2018). 34. Armstrong, R. T., Evseev, N., Koroteev, D. & Berg, S. Modeling the velocity field during Haines jumps in porous media. Adv. Water
Resour. 77, 57–68 (2015). 35. Zacharoudiou, I., Boek, E. S. & Crawshaw, J. The impact of drainage displacement patterns and Haines jumps on CO2 storage
efficiency. Sci. Rep. 8, 1–13 (2018). 36. Schwing, A. et al. Real-time 3D imaging of Haines jumps in porous media flow. Proc. Natl. Acad. Sci. 110, 3755–3759 (2013). 37. Payatakes, A. C. Dynamics of oil ganglia during immiscible displacement in water-wet porous media. Annu. Rev. Fluid Mech. 14,
365–393 (1982). 38. Chatzis, I. & Morrow, N. R. Correlation of Capillary Number Relationships for Sandstone. Soc. Pet. Eng. J. 24, 555–562 (1984). 39. Dullien, F. A. L., Zarcone, C., Macdonald, I. F., Collins, A. & Bochard, R. D. E. The effects of surface roughness on the capillary
pressure curves and the heights of capillary rise in glass bead packs. J. Colloid Interface Sci. 127, 362–372 (1989). 40. Turner, M. L. et al. Three-dimensional imaging of multiphase flow in porous media. Phys. A Stat. Mech. its Appl. 339, 166–172
(2004). 41. Rubinstein, B. Y. & Fel, L. G. Theory of Pendular Rings Revisited. 1–58 (2012). 42. Prodanović, M. & Bryant, S. L. A level set method for determining critical curvatures for drainage and imbibition. J. Colloid Interface
Sci. 304, 442–458 (2006). 43. Li, T., Schlüter, S., Dragila, M. I. & Wildenschild, D. An improved method for estimating capillary pressure from 3D
microtomography images and its application to the study of disconnected nonwetting phase. Adv. Water Resour. 114, 249–260 (2018).
44. Garing, C., Voltolini, M., Ajo-Franklin, J. B. & Benson, S. M. Pore-scale Evolution of Trapped CO2at Early Stages Following Imbibition Using Micro-CT Imaging. Energy Procedia 114, 4872–4878 (2017).
45. Garing, C., de Chalendar, J. A., Voltolini, M., Ajo-Franklin, J. B. & Benson, S. M. Pore-scale capillary pressure analysis using multi-scale X-ray micromotography. Adv. Water Resour. 104, 223–241 (2017).
46. Herring, A. L., Middleton, J., Walsh, R., Kingston, A. & Sheppard, A. Flow rate impacts on capillary pressure and interface curvature of connected and disconnected fluid phases during multiphase flow in sandstone. Adv. Water Resour. 107, 460–469 (2017).
47. Singh, K. et al. The Role of Local Instabilities in Fluid Invasion into Permeable Media. Sci. Rep. 7, 1–11 (2017). 48. Collins, T. J. ImageJ for microscopy. Biotechniques 43, 25–30 (2007). 49. Schneider, C. A., Rasband, W. S. & Eliceiri, K. W. NIH Image to ImageJ: 25 years of Image Analysis HHS Public Access. Nat. Methods
9, 671–675 (2012). 50. Vieira, P. R. M. & Paciornik, S. Uncertainty evaluation of metallographic measurements by image analysis and thermodynamic
modeling. Mater. Charact. 47, 219–226 (2001). 51. Gonzalez, R. C. & Woods, R. E. Digital Image Processing. (Pearson Higher Ed USA, 2017). 52. Lee, J. S. Digital image smoothing and the sigma filter. Comput. Vision, Graph. Image Process. 24, 255–269 (1983).
AcknowledgementsThis work was carried out in association with the Project registered as “Escoamento de dispersões complexas em meios porosos heterogêneos: análise na escala de poro e macroscópica” (PUC-Rio/Shell Brasil/ANP) – Complex Dispersion Flow Through Porous Media – funded by Shell Brasil under the ANP R&D levy as “Compromisso de Investimentos com Pesquisa e Desenvolvimento”.

1 1Scientific RepoRtS | (2019) 9:12333 | https://doi.org/10.1038/s41598-019-48803-z
www.nature.com/scientificreportswww.nature.com/scientificreports/
Author ContributionsM.S.C. planned the project and experiments. D.F.N. and J.R.V. performed the experiments. D.F.N. and S.P. performed the image analyses. All the authors contributed to the data analysis and the discussions. D.F.N. and M.S.C. wrote the first draft of the manuscript. All the authors read and commented the final manuscript before submission.
Additional InformationSupplementary information accompanies this paper at https://doi.org/10.1038/s41598-019-48803-z.Competing Interests: The authors declare no competing interests.Publisher’s note: Springer Nature remains neutral with regard to jurisdictional claims in published maps and institutional affiliations.
Open Access This article is licensed under a Creative Commons Attribution 4.0 International License, which permits use, sharing, adaptation, distribution and reproduction in any medium or
format, as long as you give appropriate credit to the original author(s) and the source, provide a link to the Cre-ative Commons license, and indicate if changes were made. The images or other third party material in this article are included in the article’s Creative Commons license, unless indicated otherwise in a credit line to the material. If material is not included in the article’s Creative Commons license and your intended use is not per-mitted by statutory regulation or exceeds the permitted use, you will need to obtain permission directly from the copyright holder. To view a copy of this license, visit http://creativecommons.org/licenses/by/4.0/. © The Author(s) 2019