Evaluation, using EIS, of anticorrosive paints pigmented with zinc phosphate
18
EVALUATION OF ANTICORROSIVE PAINTS PIGMENTED WITH ZINC PHOSPHATE USING EIS. L.S. Hernández, G. García, C. López*, B. del Amo** and R. Romagnoli** Institute of Metallurgy, UASLP, Av. Sierra Leona Nº 550, 78210 San Luis Potosí, México. *Corrosion Program, U.A. Campeche, Av. Agustín Melgar s/n, 24030 Campeche, México. **Cidepint, Research and Development Center for Paint Technology, 52 entre 121 y 122, 1900 La Plata, Argentina. ABSTRACT Searching alternatives to the toxic traditional pigments, Electrochemical Impedance Spectroscopy (EIS) was used to study the influence of zinc phosphate content and of the pigment volume concentration (PVC) to critical pigment volume concentration (CPVC) ratio on the anticorrosive properties of two series of vinyl primers. Salt fog, humidity chamber and adhesion tests were also carried out. Results from EIS and traditional lab tests showed that paints containing 25% of zinc phosphate by weight and PVC/CPVC ( ) ratio of 0.8-0.9 achieved the best anticorrosive performance. In general, for these vinyl primers, the corrosion protective properties have not been affected greatly by the ratios. Key Words: ecological pigments, A.C. impedance, zinc phosphate, vinyl resins, anticorrosive primers, salt fog and humidity chamber tests. INTRODUCTION Due to their excellent inhibiting corrosion properties, both red lead and hexavalent chromate based pigments have been added to organic coatings since long time ago. In spite of their widely recognised toxicity and legal restrictions imposed on their use, they cannot be thoroughly eliminated of the formulations even though there is a raising trend to diminished their contents in anticorrosive paints used for industrial maintenance. Regardless of the many efforts that have been made to replace these toxic pigments, the substitute compounds that have been proposed only in a few cases have become so effective, as it has been claimed (1-4); accordingly, its use has not generalised. It is perhaps a measure of the efficiency
-
Upload
independent -
Category
Documents
-
view
0 -
download
0
Transcript of Evaluation, using EIS, of anticorrosive paints pigmented with zinc phosphate

EVALUATION OF ANTICORROSIVE PAINTS PIGMENTED WITH ZINCPHOSPHATE USING EIS.
L.S. Hernández, G. García, C. López*, B. del Amo** and R.Romagnoli**
Institute of Metallurgy, UASLP, Av. Sierra Leona Nº 550, 78210San Luis Potosí, México.
*Corrosion Program, U.A. Campeche, Av. Agustín Melgar s/n,24030 Campeche, México.
**Cidepint, Research and Development Center for PaintTechnology, 52 entre 121 y 122, 1900 La Plata, Argentina.
ABSTRACT
Searching alternatives to the toxic traditional pigments,Electrochemical Impedance Spectroscopy (EIS) was used to studythe influence of zinc phosphate content and of the pigmentvolume concentration (PVC) to critical pigment volumeconcentration (CPVC) ratio on the anticorrosive properties oftwo series of vinyl primers. Salt fog, humidity chamber andadhesion tests were also carried out. Results from EIS andtraditional lab tests showed that paints containing 25% of zincphosphate by weight and PVC/CPVC () ratio of 0.8-0.9 achievedthe best anticorrosive performance. In general, for these vinylprimers, the corrosion protective properties have not beenaffected greatly by the ratios.
Key Words: ecological pigments, A.C. impedance, zinc phosphate,vinyl resins, anticorrosive primers, salt fog and humiditychamber tests.
INTRODUCTION
Due to their excellent inhibiting corrosion properties,both red lead and hexavalent chromate based pigments have beenadded to organic coatings since long time ago. In spite oftheir widely recognised toxicity and legal restrictions imposedon their use, they cannot be thoroughly eliminated of theformulations even though there is a raising trend to diminishedtheir contents in anticorrosive paints used for industrialmaintenance. Regardless of the many efforts that have been madeto replace these toxic pigments, the substitute compounds thathave been proposed only in a few cases have become soeffective, as it has been claimed (1-4); accordingly, its usehas not generalised. It is perhaps a measure of the efficiency

of these traditional pigments that they still maintainapproximately 50% of the US market in 1990 (5).
One of these substitutes that has often been employed forthe formulation of environmentally compatible anticorrosivepriming compositions is zinc phosphate (ZP) (1-5). Itsanticorrosive mechanism is not still fully understood.According to a recent review (6): “the protective action of ZPresults from phosphatization of the metal substrate and theformation of complex substances with binder components. Thesesubstances react with corrosion products to yield a layer thatadheres strongly to the substrate. More recent studies,sustained that the protective action is due to the formation ofan iron oxyhydroxides film on the steel. Besides, it wouldinvolve the polarisation of cathodic areas by the formation ofsparingly soluble basic salts that adhere to the surface. Thesesalts may contain the phosphate anion. The low solubility of ZPand its extremely coarse crystalline structure could affect theformation of the protective layer.”
ZP is able to be used with all types of binders. Whenadded to resins it improves both the drying and the adhesion tothe metal substrate (7). However, very different experimentalresults were obtained with this pigment: accelerated tests gavebad results but outdoor long exposure tests were encouraging(6). Therefore, new phosphate based pigments have beendeveloped to replace it. One of these modifications ismicronised ZP. Micronised ZP has acquired increasingsignificance since it disperses better, sediments less and itscontent in the paint formulation may be reduced. This isprobably due to the smaller particle size and the surfacechanges produced during the micronisation process.
An excellent starting point to appraise the usefulness ofsubstitutes of toxic anticorrosive pigments, for controllingpaint properties, is to control the relationship of the pigmentvolume concentration (PVC) to the critical pigment volumeconcentration (CPVC). The correct placement of PVC with respectto the CPVC of the paint system, is an essential considerationin designing coatings of all kinds (8). Because most of theimportant physical properties, including gloss, hidingefficiency (opacity), permeability, flexibility andscrubbability, most of the mechanical properties, many of theoptical (except colour), and many of the electrical propertiesof a paint film are dependent on the ratio PVC/CPVC, named by

Bierwagen and Hay (9) as the reduced pigment volumeconcentration represented by the Greek letter lambda ().
During the last years, electrochemical impedancespectroscopy (EIS) has proved its value in the evaluation ofthe performance and degradation of coated metals in contactwith electrolyte solutions. EIS is very useful because itprovides the possibility of investigating systems with a highresistance owing to their dielectric properties, and moreover,it is also possible to detect the start of the corrosionprocess at a very early stage and to derive the corrosionprotective mechanism of active pigments (10). A large number ofimpedance studies of painted metals under permanent immersionconditions have been published. According to Feliu and co-workers (11), values representative of the impedance parametersof the metal/paint system and their changes with time providevaluable information on system degradation and a quantitativeway of making performance comparisons of different paintsystems.
The purpose of this work was to compare the protectivecapacity of two series of anticorrosive primers pigmented withdifferent contents of micronised ZP. As binder, two vinylresins were employed: VAGD resin, a partially hydrolysed vinylchloride - vinyl acetate copolymer, which adheres on a washprimer; and VMCC resin, a carboxyl modified terpolymer, thatcan be directly applied on steel. The performance of both paintseries was assessed through EIS combined with adhesion, saltspray and humidity chamber tests.
EXPERIMENTAL
Composition and Paint Preparation.
As anticorrosive pigment micronised ZP was used. Itsmorphological characteristics were determined in a previouspaper (12,13). Paints were prepared with 8, 16 and 25% ofmicronised ZP of total pigment content by weight at ratios of0.8, 0.9 and 1.1. Although it is not usual to employ = 1.1,in anticorrosive paints, this ratio was included to asses theanticorrosive pigment performance with a minimum contributionof the binder barrier effect. Paints were formulated fromsimilar pigment mixtures including ferric oxide and barite.These pigments do not have anticorrosive properties rathertheir role was to provide hiding power in the case of ferric

oxide, and to act as inert extender for barite. Theexperimental formulations are shown in Table 1.
Two homologous series of anticorrosive primers wereprepared using two commercial grade vinyl resins: the firstseries, identified as 1-9, included VAGD resin, a partiallyhydrolysed vinyl chloride - vinyl acetate copolymer; and theother, identified as 1V-9V series, was made with VMCC resin, acarboxyl modified vinyl chloride terpolymer. Vinyl resins mostwidely used in coatings are vinyl chloride - vinyl acetatecopolymers that can be modified, as in this case, withhydroxyls to improve the compatibility of the copolymer withother resins such as epoxies and alkyds; or with maleic acid toenhance the adhesion to the substrate (14). Changing the vinylchloride - vinyl acetate ratio and polymerisation degreediverse vinyl polymers with different properties can beobtained. Vinyl acetate concentration has influence in thecopolymer solubility whereas a high vinyl chloride contentproduces films of low permeability and high water and chemicalagents resistance.
It was used a solvent mixture containing methyl isobutylketone, xylene and butyl acetate at a ratio 10/20/70 by weight.Tricresyl phosphate was added as plasticizer, being the vinylresin/plasticizer ratio 4/1 by weight. The paint manufacturewas carried out in laboratory using a ball mill of 3.3 litrejar capacity. First, the resin in solution was added and thenthe pigment dispersion took place for 24 hr (15).
Preparation of Samples.
The 15 X 7.5 X 0.2 cm specimens used as metallic substratewere cut from SAE 1010 steel plates. The surface (initial gradeA) was sandblasted to Swedish Standard SIS 05 59 00/67 Sa 2 ½and then vapour degreased with toluene. Paint series 1-9 (withVAGD resin) were brush applied over specimens previously coatedwith a wash primer (SSPC-PT 3-64 specification); while paintseries 1V-9V were brush applied directly over the bare steel.The average dry film thickness was determined as 60 ± 5 µm withthe aid of an electromagnetic gauge, using a bare sanded plateand standards of known thickness as reference. Samples thusprepared were kept in the laboratory atmosphere for 24 hrbefore the beginning of the tests.
Laboratory Tests.

Electrochemical impedance spectroscopy. The impedancemeasurements were carried out at ambient temperature with athree electrode arrangement and at the rest potential of thecoated sample. The surface area of painted samples (9.1 cm2)exposed to the electrolyte (a 3% NaCl solution, pH = 7.0) wasconfined by means of a short piece of glass tubing attached tothe coated steel surface using a silicon rubber adhesive. Oneach specimen two cylindrical tubes were fixed. The cellcontained a graphite electrode, as the counterelectrode and asaturated calomel electrode (SCE) as reference. Impedancespectra were collected in the potentiostatic mode, by using aSchlumberger 1250 frequency response analyser (FRA) operatedunder microcomputer control. The FRA was connected to theelectrochemical cell through a PAR 273 potentiostat. Asinusoidal signal of 10 mV was applied over a frequency rangefrom 100 kHz to 1 mHz. Impedance measurements were made for allpaints after different exposure times in the electrolyte up to576 hr.
Salt spray (fog) testing (ASTM B 117-90). Before the test,a cross scratch penetrating through the coating was made in allspecimens, following ASTM D 1654-92 standard, in order toevaluate the protection provided in the presence of a paintfilm failure. Test was made in triplicate determining the meanvalue of data. Oxidation grade was assessed according to ASTM D610-85 standard after 500 hours exposition.
Humidity chamber (ASTM D 2247-87). Another sample batchsimilar to the former, was placed in a humidity chamber (100%relative humidity and 38 1 C) for 500 hours. Blisteringgrade was assessed according ASTM D 714-87 standard.
Adhesion (ASTM D 4541-89). The pull-off test was carriedout in triplicate using an Elcometer 106 portable device.
RESULTS AND DISCUSSION
Figure 1 shows the impedance spectra obtained from thecoated electrodes after 1 hr immersion in the sodium chloridesolution. Reproducible data were obtained from the two cells oneach coated steel specimen. The Bode plots of the 1V-9V paintseries show two characteristic segments. The high frequencystraight line region, representing a capacitive behaviour has aslope close to unity indicating that the modulus Z is inverselyrelated to . At lower frequencies, the straight line bends soas to become a line approximately parallel to the abscissaaxis; the impedance is independent of frequency, indicating a |

Z| resistive value. 9V, 3V, 7V and 6V paints (except 7V paint,all with 25% of ZP) showed a gradual transition from capacitiveto resistive behaviour and total coating resistance values (Rf)at the lowest frequencies around to 109 .cm2. Throughout thetext Rf will indicates the Bode plots extreme values consideredas total coating resistance, since eventually, they willrepresent the sum of coating resistance, charge transferresistance and solution resistance. The complex plane plots ofthese 4 paints depicted an incomplete semicircle which containsinformation on the coating properties and suggests that theelectrolyte has started to permeate through the coating, figure2. The corresponding electrical equivalent circuit is a Randlessimple circuit (16-19), a combination in series of the solutionresistance with a parallel arrangement containing the ionicresistance (Ri) and the coating capacitance (Cp). Conversely,4V, 8V, 5V and 1V paints showed a relatively sharp capacitive-resistive transition and Rf values progressively low, between107 and 105 .cm2. The complex plane plots for these paintsdepicted a complete semicircle at high frequencies and only aportion of a second semicircle at the lowest frequencies,figure 3. The corresponding electrical equivalent circuit hadtwo time constants (16-19) indicating that the electrolyte haspermeated through the coating and that the oxidation andreduction electrochemical processes have started to happen inthe coating/steel interface. So the high frequency timeconstant would be the result of the coating capacitance (Cp)and ionic resistance (Ri) interaction while the low frequencyrelaxation time would be given by the charge transferresistance (Rt) and the double layer capacitance (Cd) (20).
The value of 105 .cm2 is a border between both paintseries. All Rf values for the 1-9 series are lower than 105
.cm2, ranging from 8.9 x 10⁴ to 6.9 x 10³ .cm2 for 4 and 3paints, respectively, what caused an overlap in the Rf valuesand in the whole spectrum range. These low resistance valuesindicate that the coatings possessed inherent porosity and thata substantial amount of electrolyte had penetrated the pores inthe coating (16). The lack of linearity of the high-frequencysegment of some spectra has been associated with a continuousstate of change of the coated steel samples due to electrolyteuptake (21). Besides, this paint series showed another responsemodel as long as the coating capacitance-resistance transitionwas shifted to higher frequencies (i.e. > 104 Hz). The complexplane plots also showed 2 poorly defined semicircles and muchlesser Z imaginary and Z real values, figure 4, than thosemeasured for the 4V-1V paints.

The impedance spectra after 576 hr immersion are shown infigure 5. In order to make interpretation easier some spectraof 1V-9V paint series were omitted. Even so, the spectra and Rfvalues of both paint series are overlapped. Rf values range arefrom 2.8 X 10⁴ to 1.7 X 10³ .cm2 for 9V and 7 paintsrespectively. This suggests that the electrolyte havepenetrated the coatings and corrosion of the metallic substratehave taken place extensively. It also indicates that theorganic coatings were no longer acting as a protective layer.The decrease of resistance, throughout the frequency rangestudied, with increasing time of immersion, suggests that wateringress was uniform throughout the coating and not localised(16). These assertions were verified by inspecting theimmersion zones. Highest Rf values paints (3V, 6V, 9V), showedless rust, blisters only in some areas of the immersion zonebut not any burst; while in the rest of the paints, althoughsome had less number of blisters like paint 5, blisters were onwhole the immersion zone and some of them were burst, withabundant rust around them. This inspection was performed with alow magnification stereoscope.
It can be seen, in figure 5, that only 4 paints, includedthe three paints of 1V-9V series with 25% of ZP, showed thecoating capacitive-resistive transition in the plot`s frequencyrange; while for the other paints this transition was shiftedtoward even higher frequencies (22). At lower frequencies, allpaints responses bent upward showing a linear increase in log |Z| as log f decreases. This additional low frequency componentof the impedance spectra has been identified like the onset ofsubstrate corrosion, however, in this plot it represents theWarburg impedance (diffusion tail) as consequence of adiffusion controlled corrosion process at the paint/steelinterface. Figure 6 proved the appearance of this kind ofimpedance for 1V paint, after 576 hr immersion. The highest Rfvalues paints (9V, 3V, 6V) showed a poorly defined semicirclefollowed by the diffusion tail, while the 1-9 paint seriesdepicted the diffusion tail alone, as it was already observedafter 24 hr. The shape of the diagrams did not change from thistime to the end of the immersion time, only the Z imaginary andZ real values became progressively low.
As for the low Rf values showed in figure 5 for 1V-9Vpaint series after 1 hr immersion, the specimens with thehighest Rf values decreased about five orders of magnitudeafter 576 hr exposure, indicating an increasing ionic

conductivity for the coatings and lower protective propertiesas a result of electrolyte penetration (figure 7). On thecontrary, for 1-9 paint series the decrease was of about oneorder of magnitude or less, the values were very low after only1 hr immersion and stayed at this low range during the wholetest period, as can be seen in figure 8. It is worth notingthat the evolution of the corrosion potential (Ecorr) showed abehaviour very similar to that of Rf, i.e., initially 1-9 paintseries Ecorr values were between 376 and 628 mV/SCE. TheEcorr values far from 650 mV/SCE, the known free corrosionpotential of uncoated steel under equivalent environmentalconditions, shifted rapidly and continuously in the negativedirection, reaching a value near to 650 mV/SCE in only 72 hrand remained in this range until the 576 hr test period. On theother hand, Ecorr values for 1V-9V paint series, at thebeginning ranged from 85 to 358 mV/SCE growing slowly to thenegative side and notwithstanding at 576 hr all Ecorr valueswere equal to the steel free corrosion potential, except 3Vpaint Ecorr ( 566 mV/SCE).
The associated increase in capacitance as function oftime, as consequence of the electrolyte penetration into thecoating, is difficult to assess due to the uncertainty ofcalculated capacitance values, this is due to the higher degreeof deterioration shown by most of the paints scarcely after 24hr of immersion (figs. 7 and 8). Practically, paint filmcapacitance can be calculated only on paint films that have nottoo much damaged. Several researchers have determined paintcapacitance after very long exposure times, on badly damagedfilms, and/or at lower frequencies (21,23), so, what theyreally have determined is the double layer capacitance.Actually, in order to continue measuring the capacitance of adeteriorated paint it would be necessary to use much higherfrequencies than those permitted by the measuring equipmentused (24).
Sometimes it is possible to calculate the paintcapacitance if previously the ionic resistance has beendetermined as the length of the chord enclosed by the points atwhich the high frequency semicircle cuts the real axis, in acomplex plane diagram. However, as noted earlier, only paintswith 25% of ZP showed this high frequency semicircle up to 576hr. The plot of capacitance for the above mentioned paints asfunction of time showed a trend of continuous increase ofcapacitance after immersion. It was not observed a capacitancestabilisation period (constant value) after some hours,

indicating a continuous electrolyte uptake. This behaviour issimilar to that depicted by a coated electrode with anartificial intentional defect (19).
From the showed EIS results, it is apparent that the onlymechanism that shared in the metallic substrate protection wasa barrier effect, although it was noticed the high porosity of1-9 paint series just at the beginning of the immersion and theincreasing porosity of the 1V-9V paint series as function oftime. Chemical protection by build-up of solid compoundsplugging the coating pores was not present; and theelectrochemical mechanism which involves the build-up ofpermanently passive conditions at the metal surface washindered by chloride ions action forming soluble ion complexesof iron which may diffuse away and are converted to insolublerust products (11). The exact nature of the pores in theorganic primers is not clear: the pores could be macroscopicflaws created during the application or curing process, or theycould be microscopic defects and tortuosity associated withamorphous polymer tangles, or even flaws due to poor attachmentof pigment particles to the resin (25).
The damage of both paint series may be increased by thefact that tricresyl phosphate is a highly hydrolisablesubstance due to its high polarity (26). As result of this, thefilm became very permeable to water, oxygen and ions,increasing the conductivity of the interface solution andfacilitating the cathodic reaction of oxygen ionisation,complementary of the metallic dissolution process.
With regard to the effect of the ratio on the paintsperformance, figure 9 shows Rf values plotted against suchratio at 1 and 576 hr immersion, for the 1V-9V paint series. Itcan be clearly seen that at 1 hr immersion, the lines for thethree contents of ZP went up as the ratio increased from 0.9to 1.1. The behaviour for the paints with 8% of ZP is astraight line. After the 576 hr test period, the paints with25% of ZP continued showing the highest Rf values, including 9Vpaint with a = 1.1. In contrast, the other two paints withthe same ratio depicted the lowest Rf values even thoughthese were very similar to the values of the other paints. Aminimum for 6V paint with a = 0.9 can be seen at both testperiods. For the 1-9 paint series, the Rf values were alreadylow at 1 hr immersion and diminished further after 576 hrimmersion, as can be seen in figure 10.

The good results yielded by 9V paint, with = 1.1, arein disagreement with the results that could be expected andwith those reported by Skerry et al (22). In alkyd primerscontaining either zinc chromate or barium metaborate asinhibitors, they found that the Rf values sharply diminishedwhen the ratio changed from 0.8 to 1.1 ( from 109 to 104
.cm2) and the paints with = 1.1 quickly deteriorated respectto paints with 1.0. So far, it is unknown the why of thisamazing behaviour with = 1.1, considering that, when 1.0,there are void spaces in the film with part of the pigmentparticles not in contact with the binder (9). It could be dueto the small particle size of the micronised ZP and itsinteraction with the more acid resin (VMCC). By successivediminishing of the particle size, the active area has beenincreased in such way that its anticorrosive action become moreeffective.
As for the micronised ZP content, a 25% of it showed thehighest Rf values. Leblanc et al (2) claimed that the ZPprotective action clearly increases as does the concentration,being in some cases, better than that of the zinc chromate.They obtained the best results with a PVC of 40%, although theydid not report the paints ratios they used. They mention thatdamage at the paints cuts was much lower and that paint filmsshowed excellent adhesion to the substrate.
The results obtained in the salt spray chamber and in thehumidity chamber, both after 500 hr of testing, are shown intable 2. In the salt spray test none of the paints depictedblistering during the test. The anticorrosive protectionachieved with the VMCC resin was more efficient than thatobtained with the VAGD resin and this increased with higher ZPcontents. It can be seen again, that paints with 25% ofmicronised ZP and ratios of 0.8-0.9 depicted the smallestoxidation grade. So, 3V and 6V paints showed the bestanticorrosive performance. 9V paint also showed a goodanticorrosive performance, but not as good as that in theimpedance test. A similar trend was observed with paints nº 3,6 and 9 although the protection capacity was smaller.
After a 500 hr exposure in the humidity chamber, theblister grade for paints 6 to 9, in both paint series, was thesame: only a few small blisters (8F). For the other paints, theamount of blisters by unit area increased when the ratiodiminished. It was observed a little better behaviour of paintsnº 3, with 25% of micronised ZP, respect to paints nº 1 and 2.
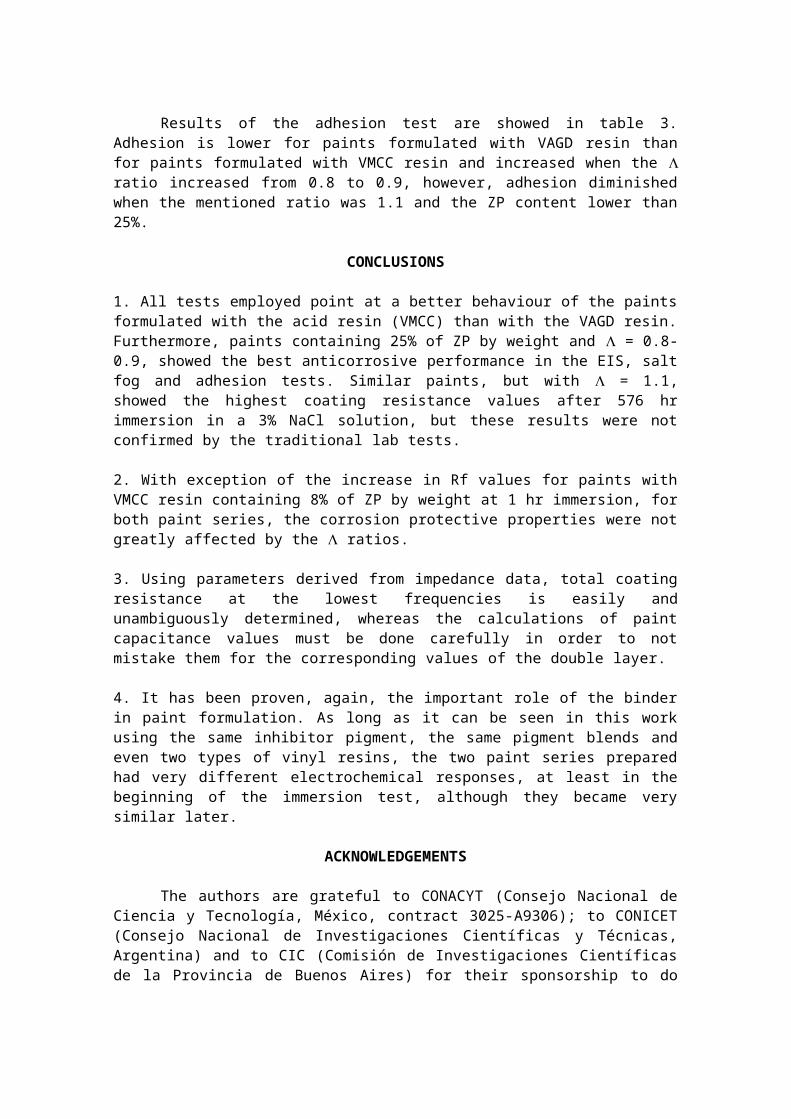
Results of the adhesion test are showed in table 3.Adhesion is lower for paints formulated with VAGD resin thanfor paints formulated with VMCC resin and increased when the ratio increased from 0.8 to 0.9, however, adhesion diminishedwhen the mentioned ratio was 1.1 and the ZP content lower than25%.
CONCLUSIONS
1. All tests employed point at a better behaviour of the paintsformulated with the acid resin (VMCC) than with the VAGD resin.Furthermore, paints containing 25% of ZP by weight and = 0.8-0.9, showed the best anticorrosive performance in the EIS, saltfog and adhesion tests. Similar paints, but with = 1.1,showed the highest coating resistance values after 576 hrimmersion in a 3% NaCl solution, but these results were notconfirmed by the traditional lab tests.
2. With exception of the increase in Rf values for paints withVMCC resin containing 8% of ZP by weight at 1 hr immersion, forboth paint series, the corrosion protective properties were notgreatly affected by the ratios.
3. Using parameters derived from impedance data, total coatingresistance at the lowest frequencies is easily andunambiguously determined, whereas the calculations of paintcapacitance values must be done carefully in order to notmistake them for the corresponding values of the double layer.
4. It has been proven, again, the important role of the binderin paint formulation. As long as it can be seen in this workusing the same inhibitor pigment, the same pigment blends andeven two types of vinyl resins, the two paint series preparedhad very different electrochemical responses, at least in thebeginning of the immersion test, although they became verysimilar later.
ACKNOWLEDGEMENTS
The authors are grateful to CONACYT (Consejo Nacional deCiencia y Tecnología, México, contract 3025-A9306); to CONICET(Consejo Nacional de Investigaciones Científicas y Técnicas,Argentina) and to CIC (Comisión de Investigaciones Científicasde la Provincia de Buenos Aires) for their sponsorship to do

this research. They wish to thank J. M. Miranda for assistancein preparation of the manuscript.
REFERENCES
1. Goldie, B. P. F., JOCCA, 70(9), 257-267, 1988. 2. Leblanc, O., Llovensà, X. and Martorell, C., “Un estudiosobre la eficacia de los pigmentos anticorrosivos”, Colores Hispania, S.A.,Barcelona, 1981. 3. Koskiniemi, M., S. and Conti, W., J., Pinturas y AcabadosIndustriales, 38(229), 28-31, 1996. 4. Escudero, J., Rev. Iber. Corros. y Prot., 15(3), 43-46, 1984. 5. Hare., C., H., “Protective Coatings. Fundamentals ofChemistry and Composition”, Technology Publishing Company, Pittsburgh, Pennsylvania,1994, p 343. 6. Romagnoli, R. and Vetere, V., F., CIDEPINT-Anales, 249-264,1994. 7. Meyer, G., Farbe+Lack, 71(2), 113-118, 1965. 8. ibid 5, p6. 9. Bierwagen, G., P. and Hay, T., K., Prog. Org. Coat., (3), 281-303, 1975.10. Rammelt, U. and Reinhard G., Prog. Org. Coat., (24), 309-322,1994.11. Feliu, S., Morcillo, M. and Feliu Jr., S., Surface CoatingsInter., 78(8), 338-341, 1995.12. Romagnoli, R. and Vetere, V., F., Corrosion Reviews, 13(1), 45-64, 1995.13. Hacticox Hispafos, pigmentos anticorrosivos no tóxicos yeficaces. Especificación técnica, Colores Hispania, S.A., Argentina, 1995.14. ibid 5, p85.15. Giúdice, C., Benítez, J. C. and Rascio, V., JOCCA, 63 (3),151, 1980.16. Lin, C., Nguyen, T. and McKnight, M. E., Prog. Org. Coat.,(20), 169-186, 1992.17. Feliu, S., Galván, J. C. and Morcillo, M., Corros. Sci.,30(10), 989-998, 1990.18. Tsai, C. H. and Mansfeld, F., Corrosion, 49(9), 726-737,1993.19. Deflorian, F., Miskovic-Stankovic, V. B., Bonora, P. L. andFedrizzi, L., Corrosion, 50(6), 438-446, 1994.

20. Cavalcanti, E., Ferraz, O. and Di Sarli, A.R., Prog. Org.Coat., (23), 185-200, 1993.21. Chen, C-T. and Skerry, B. S.,Corrosion, 47(8), 598-611, 1991.22. Skerry, B. S., Chen, C-T. and Ray, C. J., J. Coat. Tech.,64(806), 77-86, 1992.23. McIntyre, J. F. and Hang, L., Corrosion, 50(1), 26-38, 1994.24. Feliu, S., private communication, October 1996.25. Cohen, S. M., J. Coat. Tech., 68 (859), 73-81, 1996.26. Di Sarli, A. R., Schwiderke, E. E. and Podestá, J. J., JOCCA, 73(1), 18-23, 1990.
Log frequency (Hz)
Log Impedance
1
3
5
7
9
11
-4 -2 0 2 4 6
SERIES 1V-9V
SERIES 1-9
123456789
( ohms.cm2 )
1V
3V
4V
5V
6V7V
9V
8V
4
3
PAINT SERIES 1-9
Figure 1. Electrochemical impedance spectra after 1 hr immersion in a 3 % NaCl solution for steel electrodes coated with paints containing micronized ZP in VMCC vinyl resin (1V - 9V) or in VAGD vinyl resin (1 - 9).

Z real
- Z imaginary
0
2e7
4e7
6e7
8e7
1e8
1.2e8
0 4e7 8e7 1.2e8 1.6e8 2e8 2.4e8
(ohms.cm
2 )
( ohms.cm 2)Figure 2. Example of complex plane plot for paints with thehighest Rf values. 3V paint after 1 hr immersion in a 3 % NaCl solution.
Z real
-Z imaginary
0
40000
80000
120000
160000
0 100000 200000 300000 400000 500000 600000
(ohms.cm
2 )
( ohms.cm 2)
Figure 3. Example of complex plane plot for paints with middle Rf values. 5V paint after 1 hr immersion in a 3 % NaCl solution.

Z real
-Z imaginary
0
4000
8000
12000
16000
20000
24000
0 20000 40000 60000 80000
(ohms.cm
2 )
(ohms.cm 2)Figure 4. Example of complex plane plot for 1 - 9 paint series, lowest Rf values. 4 paint after 1 hr immersion in a3 % NaCl solution.
Log frequency (Hz)
Log Impedance
1.2
1.8
2.4
3
3.6
4.2
4.8
-4 -2 0 2 4 6
1V3V5V6V9V
123456789
(ohms.cm
2 ) 9V3V
6V
7
Figure 5. Electrochemical impedance spectra after 576 hr immersion in a 3 % NaCl solution for steel electrodes coated with paints containing micronized ZP in VMMC vinyl resin (1V - 9V) or in VAGD vinyl resin (1 - 9).

Z real
-Z imaginary
0
400
800
1200
1600
2000
2400
2800
0 400 800 1200 1600 2000 2400 2800
(omhs.cm
2 )
(omhs.cm 2)
Figure 6. Appearance of Warburg impedance for 1V paint after 576 hr immersion in a 3 % NaCl solution.
Immersion time (hours)
Log coating resistance
2
3
4
5
6
7
8
9
10
1 10 100 1000
9V3V7V
4V
5V1V
8V
6V
1V3V4V5V6V7V8V9V
(ohms.cm
2 )
Figure 7. Variation of Rf values as function of time for 1V- 9 V paint series.

Immersion time (hours)
Log coating resistance
3
3.5
4
4.5
5
5.5
1 10 100 1000
1
4
5
6
3
2
8
7
(ohms.cm
2 )
9
123456789
Figure 8. Variation of Rf values as function of time for 1 - 9 paint series.
Log coating resistance
1
2
3
4
5
6
7
8
9
10
0.6 0.7 0.8 0.9 1 1.1 1.2
(omhs.cm
2 )
3V 6V
9V
1V
4V
7V
5V 8V
3V 6V 9V
5V
8V7V1V
4V
1HOUR
576 HOURS
8 % ZP16 % ZP25 % ZP

Figure 9. Coating resistance vs ratios for the 1V - 9V paint series after 1 and 576 hr immersion testing.
a)
Log coating resistance
1
1.5
2
2.5
3
3.5
4
4.5
5
5.5
6
0.7 0.8 0.9 1 1.1 1.2
1
23
4
56
78
8 % ZP16 % ZP25 % ZP
(ohms.cm
2 )
9
b)
Log coating resistance
1
1.5
2
2.5
3
3.5
4
4.5
5
5.5
6
0.7 0.8 0.9 1 1.1 1.2
1
23
4
5
6
7
8
8% ZP16% ZP25% ZP
(ohms.cm
2 )
9
Figure 10. Coating resistance vs ratios for the 1 - 9 paint series after a) 1 hr and b) 576 hr immersion testing.