Basing Grange, Old Basing and Lychpit, Hampshire: Chemical Analysis of Excavated Window Glass
Upload
independentCategory
view
6download
0
This article appeared in a journal published by Elsevier. The attachedcopy is furnished to the author for internal non-commercial researchand education use, including for instruction at the authors institution
and sharing with colleagues.
Other uses, including reproduction and distribution, or selling orlicensing copies, or posting to personal, institutional or third party
websites are prohibited.
In most cases authors are permitted to post their version of thearticle (e.g. in Word or Tex form) to their personal website orinstitutional repository. Authors requiring further information
regarding Elsevier’s archiving and manuscript policies areencouraged to visit:
http://www.elsevier.com/copyright

Author's personal copy
Plastic radii and longitudinal deformation profiles of tunnels excavatedin strain-softening rock masses
Leandro R. Alejano a,⇑, Alfonso Rodríguez-Dono a, María Veiga b,1
a Department of Natural Resources and Environmental Engineering, University of Vigo, Spainb Itasca Consultants AB, Stockholm, Sweden
a r t i c l e i n f o
Article history:Received 1 September 2011Received in revised form 2 December 2011Accepted 7 February 2012Available online 31 March 2012
Keywords:Convergence confinement methodTunnelStrain-softening rock massLongitudinal deformation profile
a b s t r a c t
We describe techniques to estimate plastic radii and longitudinal deformation profiles of tunnels exca-vated in rock masses. The longitudinal deformation profile, a graph that relates a fictitious internal pres-sure to the distance to the tunnel face, is necessary to assess adequate distance to the face for the purposeof installing support. Traditional application of this method usually relies on an elastic representation ofthe longitudinal deformation profile. A more realistic approach has been proposed recently that accountsfor the elastoplastic nature of rock masses. It is based, however, on assuming elastic–perfectly plastic rockmass behaviour, an assumption which is more or less realistic, but only for low quality rock masses with ageological strength index (GSI) below 35. We extend this approach to the case of strain-softening rockmasses representing a wider range of rock masses (25 < GSI < 75). Based on studying various numericaltechniques to estimate these curves, we propose a simplified approximate equation of the plastic radiusof a tunnel excavated in a strain-softening rock mass, which can be combined with existing longitudinaldeformation profile estimation techniques to analytically obtain a more realistic approach to calculatinglongitudinal deformation profiles for strain-softening rock masses.
� 2012 Elsevier Ltd. All rights reserved.
1. Introduction
The convergence-confinement method is an approach to ana-lysing stress–strain problems in tunnels that provides a general al-beit simplified estimate of the nature of the interplay between therock mass and support installed at a distance from the face. Whenthe support is installed close to the tunnel face, it does not carrythe full load to which it will be subjected once the tunnel facehas moved. The face itself carries a significant portion of the loadof its surroundings (Carranza-Torres and Fairhurst, 2000).
The three basic components of the convergence-confinementmethod are the ground reaction curve (GRC), the support character-istic curve (SCC) and the longitudinal deformation profile (LDP). TheLDP is a graphical representation of radial displacement (tunnelwall deformation) versus distance to the tunnel face for an unsup-ported tunnel section, behind and ahead of the tunnel face, alongthe tunnel axis. An accurate description of the LDP is needed to esti-mate optimal distance of the support from the face. The LDP and theGRC both strictly depend on the characteristics of the rock mass tobe excavated, whereas the SCC and support distance from the facehave to be designed bearing in mind the particular needs of the sec-tion to be excavated.
Starting from the 1970s, different rigorous solutions to accu-rately calculating GRCs have been proposed for different types ofrock behaviour models, including elastic–perfectly plastic (EPP)materials (Panet, 1995; Duncan Fama, 1993; Carranza-Torres andFairhurst, 1999; Carranza-Torres, 1998), elastic-brittle (EB) materi-als (Carranza-Torres, 1998; 2004) and strain-softening (SS) materi-als (Alonso et al., 2003; Guan et al., 2007; Park et al. 2008; Lee andPietruszczak, 2008; Wang et al., 2010). It is also possible to useplane-strain 2D numerical models in which mesh dependencycan be observed in particular circumstances. However, since thisarticle is restricted to the stable basic solutions for tunnels, bifur-cation and strain localisation (Varas et al., 2005) are not addressed.As has been demonstrated by the authors elsewhere (Alejano et al.,2009), rock mass response will differ depending on the behaviourmodel selected.
In the early years of application of the convergence-confine-ment method, the LDP was usually calculated elastically. In-placemeasurements (Chern et al., 1998), however, showed that this elas-tic approach was inaccurate, especially in large deformation condi-tions. Recently, Vlachopoulos and Diederichs (2009) have proposeda robust formulation, based on a number of numerical models, toestimate the LDP according to the significant influence of the ulti-mate plastic radius, shown to play a definitive role in the develop-ment and shape of the LDP.
Vlachopoulos and Diederichs (2009) considered that materialsin rock masses that had attained maximum strength are able to
0886-7798/$ - see front matter � 2012 Elsevier Ltd. All rights reserved.doi:10.1016/j.tust.2012.02.017
⇑ Corresponding author. Tel.: +34 986 812374; fax: +34 986 811924.E-mail address: [email protected] (L.R. Alejano).
1 Formerly of the University of Vigo, Spain.
Tunnelling and Underground Space Technology 30 (2012) 169–182
Contents lists available at SciVerse ScienceDirect
Tunnelling and Underground Space Technology
journal homepage: www.elsevier .com/ locate/ tust
Author's personal copy
retain the stress level for further deformation; in other words,these are EPP rock masses. This behaviour model, however, doesnot seem to properly model the behaviour of average to goodquality rock masses, which are considered to exhibit SS behaviour(Hoek and Brown, 1997). The plastic zone around excavationstends to be larger for SS rock masses compared to EPP rock masses.For this reason we focus, in this study, on extending the Vlachopo-ulos and Diederichs (2009) approach to SS behaviour.
Sole application of the GSI is largely questionable as a rock masscharacterisation method, so we highly recommend further studiesfor particular tunnelling applications: RQD, RMR, Q, discontinuitydata collection and detailed geological and hydrogeological stud-ies. Nonetheless, the GSI system is convenient within the scopeof our study, as it reflects general rock mass quality (joint densityand joint strength behaviour) in a simple way and so enables us toeasily assign a concrete behaviour model to the rock mass and esti-mate its parameters.
2. State of the art
2.1. Approaches to tunnel design, rock mass behaviour models andparameter estimates
Thanks to intensive research in recent decades into the differentinstability mechanisms observed in underground excavations,nowadays we have a reasonable picture of how rock masses be-have around underground excavations.
Empirical methods, such as rock mass rating (RMR) (Bieniawski,1976; Bieniawski, 1989), Q (Barton et al., 1974; Barton and Grims-tad, 1994) and the geological strength index (GSI) (Hoek, 1999;Hoek and Marinos, 2000), are grounded in a database of real exca-vations. These methods are recommended as an interesting start-ing point for the design and excavation of tunnels. Manyexcavations worldwide are based solely on empirical methods,which usually work well if applied by experienced personnel.These approaches account for the different instability mechanismsobserved in practice from an empirical perspective, whether theseare structurally controlled or stress–strain related.
As might be expected, a relevant role is played by the disconti-nuities occurring in the rock mass, so this need to be studied in de-tail to identify structurally controlled instabilities. This is done bymeans of a survey and statistical interpretation of joints, estimatesof relevant joint sets and their properties and estimates of the sta-bility of rock wedges or blocks using classical techniques or blocktheory. If necessary, an appropriate support and reinforcement sys-tem is designed (Hoek and Brown, 1980; Hoek et al., 1995; Good-man and Shi, 1985; Rocscience, 2005).
However, the stress–strain behaviour of the rock mass may alsoplay a non-negligible role, sometimes governing rock mass re-sponse when a deep underground excavation is made. Hoek andBrown (1997) suggested that this behaviour varies according tothe quality of the rock mass, proposing that brittle behaviour prop-erly represents the behaviour of good to very good quality rockmasses (GSI > 70). Diederichs and Martin (2010) established thelimits of situations where this behaviour could be expected onthe basis of the GSI and the ratio between intact uniaxial compres-sive strength (UCSi) and tensile strength (T). This complex behav-iour, which usually occurs in deep tunnels and mines in hardrock and may result in brittle failure and spalling, is beyond thescope of this paper, but has been studied in detail by variousauthors, for instance, Diederichs (2003) and Kaiser et al. (2000).
EPP behaviour seems to accommodate reasonably wellthe behaviour of low quality rock masses (GSI < 25). From amathematical perspective, this behaviour, where peak and residualfailure criteria are the same, is relatively easy to work with. Hence,
the earliest convergence-confinement methods (Panet, 1995;Carranza-Torres and Fairhurst, 1999; Vlachopoulos and Diederichs,2009) and numerical behaviour models were based on perfectplasticity.
Finally, average quality rock masses (25 < GSI < 75) present SSbehaviour (Hoek and Brown, 1997). Limiting cases of SS behaviourare EPP and simple EB behaviour, which can also be accommodatedwithin general SS behaviour. Brittle behaviour and, particularly,spalling instabilities have been shown to be particularly complex,so they cannot be included in an elastoplastic theory governingSS behaviour. Following Diederichs and Martin (2010), the upperlimits for which this SS behaviour can reasonably well representrock mass behaviour are as follows: GSI > 80 for rocks with a ratioof UCSi/T < 15 (more or less soft rocks) and GSI = 65 for rocks with aratio of UCSi/T > 15 (more or less hard rocks).
Even if it were clear that the SS behaviour of average qualityrock masses could be reasonably accommodated within the gen-eral elastoplastic theory, it is still not easy to obtain representativevalues for all the parameters needed to simulate this behaviour,including peak and residual failure criteria—for instance, peakand residual cohesion and friction for the Mohr–Coulomb failurecriterion (cp, up, cr and ur) or unconfined compressive strengthand peak and residual m and s for the Hoek–Brown failure criterion(rci, mp, sp, ap, mr, sr and ar). These parameters also include elasticproperties, namely elastic Young’s modulus E and Poisson’s ratiom, and post-failure deformation parameters such as the drop mod-ulus M and dilatancy w.
Obtaining a reasonably accurate estimate of all these parame-ters for SS rock masses is not a simple matter, even with the helpfultools developed in recent years (Hoek and Brown, 1997; Crowderand Bawden, 2006; Cai et al., 2004; Cai et al., 2007). A general ap-proach recently proposed in Alejano et al. (2010) and based onexisting references and experience can be considered as a reason-able guess or an initial approach that should be fine-tuned on acase-by-case basis. This is the approach we use to estimate the in-put parameters for the models in this study.
It is worth noting that actual rock mass behaviour is very com-plex, including as it does, non-elastic pre-failure deformation anddilation, variable dilatancy, pressure sensitivity and time-depen-dent effects, to name just a few factors. The approach describedhere therefore attempts to deal with the most relevant featuresof stress–strain behaviour for average quality rock masses in tun-nel excavations but is not suitable for resolving certain non-stan-dard behaviour problems, such as creep, slaking, etc.
The difficulties associated with estimating a large number ofparameters and the complex mathematics involved in solving thedifferential equations associated with SS behaviour have contrib-uted to the fact that application of the convergence-confinementmethod to SS rock masses has to date been limited. A rigorous ap-proach to obtaining the GRC of a tunnel excavated in SS materialwas initially proposed by Alonso et al. (2003) and was followedby other numerical formulations (Guan et al., 2007; Park et al.,2008; Lee and Pietruszczak, 2008; Wang et al., 2010). However,as Carranza-Torres and Fairhurst (2000) have pointed out, the con-vergence-confinement method cannot be rigorously applied if theLDP cannot be computed. Serious errors may be made when simu-lating tunnels in poor quality rock masses using LDPs correspond-ing to the elastic case, as the support would be placed too far fromthe face to control tunnel deformation.
Fig. 1 shows how, if one analyses the behaviour of a tunnel in anSS rock mass considering the elastic or EPP versions of the LDP, thedeformations prior to lining installation will be higher or muchhigher than in practice (if the rock mass behaviour is SS). Thereforethe analysis will result in lower stress loads in the lining than inpractice (if the rock mass behaviour is SS), when they might evenbe large enough to damage or crack the lining. This error could lead
170 L.R. Alejano et al. / Tunnelling and Underground Space Technology 30 (2012) 169–182

Author's personal copy
to undesirable tunnelling errors and results. Such errors have beendetected, for instance, in the early stages of the construction of theYacambú-Quibor tunnel (Hoek et al., 2008) and in squeezing tun-nels in Europe (Barla, 2009).
It is important to point out that SS behaviour may or may notlead to squeezing, depending on the stress level and rock massstrength encountered.
The type of problems caused by this inaccuracy in LDP calcula-tions may also lead to face instability and subsequent tunnel prob-lems. Unsuccessful tunnels with face instability problems ledLunardi to propose an approach called analysis of controlled defor-mation in rocks and soils as a tunnelling construction method(Lunardi, 2000). This method relies on measurements made ofthe deformation observed in the tunnel face as indicative valuesof the stability of the excavation. Preliminary numerical resultsfrom tests performed by us suggest that face deformation is closelyrelated to final deformation in the spring-line and to the supportdistance from the face. Therefore, a more detailed and realisticknowledge of LDP is likely to improve understanding of stress–strain behaviour in advancing tunnels.
As pointed out by Cai et al. (2004) or as can be derived from theformulation to obtain the plastic radius around tunnels in EPP andEB materials, the plastic radius around a tunnel depends on therock mass behaviour type (EPP, SS or EB) and parameters, and sois likely to vary the corresponding LDP. The main aim of our re-search was to develop an estimation technique for calculating LDPsfor SS rock masses. Other recent approaches have been proposed toestimate LDPs for different types of complex rock mass behaviour(Sofianos, 2003; Pilgerstörfer and Schubert, 2009).
2.2. Previous approaches to calculating the LDP
Different modes for computing LDPs have been proposed, rang-ing from elastic approaches (Panet, 1995; Unlu and Gercek, 2003)to plastic approaches needing experimental parameters (Panetand Guenot, 1982) and empirical approaches based on measure-
ments (Chern et al., 1998). New approaches have recently beenproposed, based on data fitting in 3D numerical models (Pilgerstör-fer and Schubert, 2009) and 2D axisymmetric models (Vlachopou-los and Diederichs, 2009). In these last two cases, the models wererun for EPP rock masses. The Vlachopoulos and Diederichs ap-proach has the advantage that the LDP can be obtained from tunnelgeometry and the normalised plastic radius, as follows:
u� ¼ uumax
¼ u�0 � eX� for X� < 0 ðin the rock massÞ ð1Þ
u� ¼ 1� ð1� u�0Þ � e�3X�2R� for X� P 0 ðin the tunnelÞ ð2Þ
where
u0
umax¼ 1
3e�0;15R� ð3Þ
and where R� is the normalised plastic radius or the ratio betweenthe plastic radius Rpl and the tunnel radius Rt and where X� is thedistance to the face normalised with the tunnel radius. R� can alsobe obtained by means of theoretical formulae, as explained below.
If an elastically derived equation is used to calculate an LDP andthe result is implemented in the convergence-confinement meth-od, the recommended timing of support installation will be errone-ous and highly non-conservative in terms of stress in the supportsystem. In other words, a lower stress level than would occur inpractice will result from the analysis. However, the predicteddeformation will be larger than would occur in practice, whichcould lead to support for the face when it is not, in fact, necessary(in this case the approach is conservative). If a generic empiricalformula (Chern et al., 1998) is used, the apparent factor of safetywill be closer to reality but still non-conservative. If the recentlydeveloped plastic approach by Vlachopoulos and Diederichs(2009) is used, the factor of safety is smaller and closer to realitythan in the previous cases, resulting in support installed furtherfrom the tunnel face than in the previous cases, but still inaccurate.
2.3. Estimating the plastic radius for tunnels excavated in differenttypes of materials
2.3.1. EPP rock masses obeying the Mohr–Coulomb failure criterionThe plastic radius for EPP rock masses can be calculated using
analytical approaches. Thus, for the Mohr–Coulomb failure crite-rion, the so-called normalised plastic radius R� can be estimatedas (Carranza-Torres, 1998):
Rpl
Rt¼ R�EPP�MC ¼
~r0 � 1� ~qu=ð1� KpÞ~pi � ~qu=ð1� KpÞ
� � 1Kp�1
ð4Þ
where the following notation is used to normalise the stress andstrength parameters:
~r ¼ rr0 � p�i
where p�i ¼2r0 � qu
Kp þ 1ð5Þ
where ro is the field stress and qu and Kp refer to the unconfinedcompressive strength and the passive earth pressure of the mate-rial, respectively. These parameters depend on cohesion and frictionvalues as follows:
Kp ¼1þ sin /1� sin /
and qu ¼ 2cffiffiffiffiffiffiKp
qð6Þ
The ultimate plastic radius is the radius after full relaxation, soit corresponds to a null value for internal pressure pi and thereforefor ~pi ¼ 0.
Fig. 1. Application of the convergence-confinement method to a tunnel: standardgraphsobtained.Groundreactioncurve(GRC);longitudinaldeformationprofiles(LDP):elastic, elastic–perfectly plastic (EPP) and strain-softening (SS) cases; support charac-teristic curves (SCC) for all cases. Based onVlachopoulos and Diederichs (2009).
L.R. Alejano et al. / Tunnelling and Underground Space Technology 30 (2012) 169–182 171

Author's personal copy
2.3.2. EB rock masses obeying the Mohr–Coulomb failure criterionThe extent of the plastic radius for EB rock masses can also be
calculated using analytical approaches, this time taking into ac-count peak and residual strength values. For the Mohr–Coulombfailure criterion therefore, the normalised plastic radius, that is,the ratio between the plastic radius and the tunnel radius can beestimated as (Carranza-Torres, 1998):
Rpl
Rt¼ R�EB�MC ¼
~r0 � 1� ~q0u=ð1� K 0pÞ~pi � ~q0u=ð1� K 0pÞ
" # 1K0p�1
ð7Þ
where stress notation as per Eq. (5) is used, but now qu and Kp refersto cohesion and friction peak values as in Eq. (6) and q0u and K 0p referto residual values, as follows:
K 0p ¼1þ sin /r
1� sin /rand q0u ¼ 2cr
ffiffiffiffiffiffiK 0p
qð8Þ
The ultimate plastic radius is the radius after full relaxation,corresponding to a null value for internal pressure pi and thereforefor ~pi ¼ 0.
Eqs. (4) and (8) can be used to obtain the plastic radius of a tun-nel excavated in an EPP and in an EB material. The plastic radius ina SS material falls between these two values.
2.3.3. EPP rock masses obeying the Hoek–Brown failure criterionIf using the Hoek–Brown failure criterion, the normalised plas-
tic radius R� can be estimated for parameter a = 0.5 as (Carranza-Torres and Fairhurst, 2000):Rpl
Rt¼ R�EPP�HB ¼ exp 2
ffiffiffiffiffiffiPcr
i
q�
ffiffiffiffiPi
p� �� �ð9Þ
This expression can also be estimated for a – 0.5 but results donot vary significantly so these expressions are kept for the sake ofsimplicity.
The following notation is used to normalise stress and strengthparameters:
Pi ¼pi
mrciþ s
m2 S0 ¼r0
mrciþ s
m2 ð10Þ
where ro is the field stress, rci refers to the unconfined compressivestrength and m and s refer to the Hoek–Brown parameters of thematerial. Pcr
i , the scaled critical internal pressure at which plasticdeformation starts, can be computed according to:
Pcri ¼
1�ffiffiffiffiffiffiffiffiffiffiffiffiffiffiffiffiffiffiffi1þ 16S0p
4
� �2
ð11Þ
The ultimate plastic radius is the radius after full relaxation,corresponding to a null value for internal pressure pi and thereforefor Pi = s/m2.
2.3.4. EB rock masses obeying the Hoek–Brown failure criterionThe extent of the plastic radius for EB rock masses obeying the
Hoek–Brown failure criterion can also be calculated used analytical ap-proaches, this time taking into account peak and residual strength val-ues. The peak values are mp and sp and the residual values are mr and sr.The approach described below corresponds to the case whereap = ar = 0.5, for the sake of simplicity and since no significant differ-ences are observed for other values. This simplification produces smallbut insignificant differences in the plastic radius obtained. The norma-lised plastic radius can thus be estimated as (Carranza-Torres, 2004):
Rpl
Rt¼ R�EB�HB ¼ exp 2
ffiffiffiffiffiffiffiePcri
q�
ffiffiffiffiffiePi
q� �� �ð12Þ
where the following expressions are used to compute the parame-ters in Eq. (12):
ePi ¼pi
mrrciþ sr
m2r
and ePcri ¼
pcri
mrrciþ sr
m2r
ð13Þ
where the value for pcri is derived from the following expression:
pcri ¼ Pcr
i �sp
m2p
" #mprci ð14Þ
An exact value for Pcri , estimated according to Eq. (11), can only
be found when ap = ar = 0.5. Once pcri is known, the parameters in
Eq. (13) can be computed and the plastic radius can be estimatedaccording to Eq. (12).
For the general case when ap – ar – 0.5, peak and residualstrength values must be taken into account. The peak values arenow mp, sp and ap and the residual values are mr, sr and ar. The nor-malised plastic radius can thus be computed as (Carranza-Torres,2004):
Rpl
Rt¼ R�EB�HB ¼ exp
ePcr1�ar
i � eP1�ari
ð1� arÞ~l
" #ð15Þ
where the following expressions are used to compute the parame-ters in Eq. (12):
ePi¼pi
mð1�arÞ=arr rci
þ sr
m1=arr
ePcri ¼
pcri
mð1�ar Þ=arr rci
þ sr
m1=arr
and l¼mð2ar�1Þ=arr
ð16Þ
where the value for pcri is derived from the following expression:
pcri ¼ Pcr
i �sp
m1=app
" #mð1�apÞ=ap
p rci ð17Þ
Numerical methods, such as the Newton–Raphson method, arenow needed to approximate the exact value for Pcr
i (Carranza-Torres,2004). An approximate approach is to estimate Pcr
i as if ap = ar = 0.5,according to Eq. (11). Once pcr
i is obtained according to Eq. (17), thevalues in Eq. (16) are calculated and the plastic radius is computedaccording to Eq. (15). Note that if one equals mp = mr, sp = sr andap = ar in Eqs. (15)–(17), the plastic radius for EPP rock masses forthe general case in which a – 0.5 can be obtained.
3. Estimating the plastic radius of a tunnel excavated in an SSmaterial
We have shown that it is possible to analytically calculate theplastic radius around a tunnel excavated in an EPP or an EB rockmass using the Mohr–Coulomb or Hoek–Brown failure criteria.For the case of SS rock masses it is clear that the plastic radius mustbe larger than that for the EPP case but smaller than that for the EBcase (Fig. 2).
The SS plastic radius will be closer to the EB radius for a very stiffdrop modulus (GSI > 75) and especially when critical pressure is rel-atively large compared to field stress, whereas the SS plastic radiuswill be closer to the EPP radius for a very mild drop modulus(GSI < 30) and especially when critical pressure is small relative tofield stress, while still remaining positive. Note that for some tun-nels, mainly those excavated to a shallow depth in hard rock masses,the redistributed stresses are smaller than those required for failure;therefore the surroundings of the tunnels are elastic, that is, criticalpressure is negative. The methodology proposed by Alonso et al.(2003), was used to estimate the SS plastic radius of 400 tunnels rep-resenting standard average conditions and then a further 660 tun-nels representing more severe squeezing conditions.
The statistical study of the 400 tunnels departed from the histo-grams depicted in Fig. 3. Since the results for these rock masses donot properly represent poor or squeezing conditions, it was decidedto analyse another 660 tunnels for combinations of the followingparameters: GSI values of 25, 30, 35, 40, 45, 50, 55, 60, 65, 70 and75; rc values of 10, 20, 35 and 50 MPa; m values of 5, 7 and 10; depth
172 L.R. Alejano et al. / Tunnelling and Underground Space Technology 30 (2012) 169–182

Author's personal copy
values of 1000, 1250, 1500, 1750 and 2000 m; and a density value of2600 kg/m3. Since this second series consisted of very deep tunnelsin low strength rock masses, squeezing conditions are representedin many of them. The two series together represent over a thousandrock masses and it was possible to estimate the plastic radius foraround 800 of them (some remained elastic so the plastic radius con-cept was not applicable).
These rock masses were characterised as Mohr–Coulomb SSmaterial on the basis of the indicated data and following the ap-proach described in Alejano et al. (2010). Values for the elastic,peak and residual strength and post-failure parameters were com-puted. In this case the residual GSI was estimated from the originalGSI value according to:
GSIr ¼ 17:25 � e0:0107�GSI ð18Þ
This equation is proposed by the authors in the light of theirown estimates and the results obtained by Cai et al. (2007). Notethat it is an approximate estimate.
The corresponding plastic radii were rigorously calculated fol-lowing the procedure described in Alonso et al. (2003) by means ofa code written in MATLAB which implements the solution for theground reaction curve and plastic radius of a tunnel excavated in astrain-softening material. A special subroutine has been set up torun a large number of calculations. As an example, EPP, EB and SSplastic radii for rock masses of GSI = 25 and m = 5, of GSI = 45 andm = 10 and of GSI = 65 and m = 10 are presented in Fig. 4, in relationto the ratio of uniaxial compressive strength to field stress (rcm/ro).As can be observed, the gap between the EPP radius and the EB radiuscan be significant (note the logarithmic nature of this representa-tion), especially for high quality rock masses. As commented above,the SS plastic radius always falls between EPP and EB values,approaching the brittle case as the quality of the rock mass increases.
After analysing a number of possibilities we chose a reasonablyaccurate way to estimate the SS plastic radius, starting with the gra-phic representation depicted in Fig. 5, where the values for qu=p�i arecontrasted with the difference between the normalised SS and theEPP radii raised to the power of Kp + 1, that is, ðR�SS � R�EPPÞ
Kpþ1, withR�EPP derived from Eq. (4). This graphical data indicates rather straighttrends in the logarithmic representation of constant GSI and m val-ues, so it was possible to fit potential equations to the trend lines.
This enabled us to estimate the plastic radius of a tunnel exca-vated in an SS rock mass as:
R�SS ¼ R�EPP þ DR�SS�EPP ð19Þ
where R�SS is the plastic radius of the SS rock mass, R�EPP is the plasticradius of the corresponding EPP rock mass (that is, using the peakparameters of the SS rock mass obtained according to Eqs. (4) and(9) for the Mohr–Coulomb and Hoek–Brown criteria, respectively)and where DR�SS�EPP is an estimate of the difference between R�SS
and R�EPP . In the case of perfect elastoplasticity, occurring in our casefor GSI < 20, this increment tends to zero. After carefully interpret-ing the results depicted in Fig. 5 and including various minimum
Fig. 2. Differing plastic zones (plastic radius) depending the behaviour of the rockmass—elastic–perfectly plastic (EPP), elastic brittle (EB) and strain-softening (SS)—where the tunnel is excavated.
Fig. 3. Histograms of the significant parameters for the first series of 400 rock masses and tunnels selected to perform a statistical study of the plastic radii of tunnelsexcavated in strain-softening rock masses.
L.R. Alejano et al. / Tunnelling and Underground Space Technology 30 (2012) 169–182 173

Author's personal copy
square fit processes, it was possible to provide an estimate of DR�SS�EPP according to:
DR�SS�EPP ¼qup�
i
ð0:0244 �GSI�0:53Þ � 1� m50
� � ! �1ð1þKp Þð0:0018�GSIþ0:0783Þ
for 30<GSI<75
ð20Þ
This expression, developed for the Mohr–Coulomb case, enablesthe plastic radius to be obtained for the SS case starting from thestandard Mohr–Coulomb parameters qu and Kp, and GSI, m (for in-tact rock) and ro. This formula applies to rock masses with SSbehaviour, characterised as per Alejano et al. (2010). Since this for-mulation was obtained after various statistical fits, a very accuratevalue should not be expected. However, in 85% of the studied casesthe error was under 15%, indicating the approach to be a reason-able one, from a practical perspective, for estimating LDPs for tun-nels. Fig. 6 depicts the results of this approach in terms R�SS, asobtained from Eqs. (19) and (20) and as obtained numerically fol-lowing the rigorous approach of Alonso et al. (2003).
4. Estimating the LDP for tunnels excavated in EPP rock masses
Below we describe and compare various approaches to estimat-ing LDPs for different tunnels excavated in EPP rock masses. We
first reproduce the results of a series of tunnel models studied byVlachopoulos and Diederichs (2009) by means of axisymmetricsimulations performed with Phase2 code (Rocscience, 2009) basedon the finite element method. The same models were then set upand run under FLAC2D code (Itasca, 2008) with Neumann bound-ary conditions (applied stress). A comparison of results revealedvery good agreement for both approaches. Finally, numerical LDPsfor the same series of tunnels were obtained using FLAC3D code(Itasca, 2007) with Dirichlet boundary conditions (fixed displace-ment). To check the quality of our models we compared the resultsfor different modelling techniques and the results obtained usingthe proposed formulation of Eqs. (1) and (2).
4.1. Comparison of analytical and numerical approaches to calculatingthe LDP
Tunnels measuring 5 m in diameter and 1100 m deep, as pro-posed by Vlachopoulos and Diederichs (2009), were selected andmodelled. A set of rock masses of increasing quality was chosento perform the simulations. A rock type with rci = 35 MPa andmi = 7 was assumed along with increasing GSI values simulatingincreasing quality rock masses. The rock masses were consideredto be EPP and the Hoek–Brown failure criterion was used. Thematerial parameters (Table 1) were obtained following the ap-proach by Hoek et al. (2002), implemented in the ROCLAB code(Rocscience, 2003). The extent of the plastic region in relation tothe tunnel radius, as obtained from the models by Vlachopoulosand Diederichs (2009) and as computed according to Carranza-Tor-res and Fairhurst (2000) is included in Table 2.
For Phase2D (Rocsience, 2009) models, Vlachopoulos andDiederichs (2009) recommendations were followed. The discre-tised area was 40 m � 100 m. Mesh size was gradually reducedtowards the tunnel zone. A symmetry axis was set for y = 0.The tunnel was presented as a rectangle of length 52.5 m, insuch a way that 21 rounds of length 2.5 m could be performedin the model. The normal displacements were fixed in the sym-metry axis and on the left-hand-side of the model. Normal pres-sure of 28 MPa was applied to the remaining boundaries of themodel.
For FLAC2D (Itasca, 2008) models, the same axisymmetricconfiguration was used. A slightly larger discretised area of70 m � 100 m was selected, due to the stiffer spatial discretisa-tion capabilities of FLAC2D (Fig. 7a). The normal displacementswere fixed in the symmetry axis and at the bottom part of themodel. Normal pressure of 28 MPa was applied to the remainingboundaries of the model. The tunnel geometry was the same asthat for Phase2D and the tunnel excavation process was alsomodelled round by round.
Fig. 4. Diagram of elastic–perfectly plastic (EPP), elastic brittle (EB) and strain-softening (SS) plastic radii for rock masses of GSI = 25 and m = 5, of GSI = 45 andm = 10 and of GSI = 65 and m = 10, in relation to the ratio of uniaxial compressivestrength to field stress (rcm/ro).
Fig. 5. Representation of plastic radii for a large number of rock masses analysed interms of qu=pi� vs. ðDR�SS�EPPÞ
ðKpþ1Þ . Different colours indicate different GSI values anddifferent shapes refer to different m values. Note that the trends are not perfectlystraight, so the statistical fit is not highly accurate.
Fig. 6. Comparison of the strain softening (SS) plastic radii (vertical axis) obtainedusing a rigorous numerical procedure (Alonso et al., 2003) and the plastic radiiestimated using Eqs. (19) and (20).
174 L.R. Alejano et al. / Tunnelling and Underground Space Technology 30 (2012) 169–182

Author's personal copy
A mesh comprehending one fourth of the model was used forFLAC3D (Fig. 7b) in order to control computing time. The discre-tised area was 60 m � 60 m � 60 m and mesh size was graduallyreduced towards the tunnel zone. The normal displacements werefixed at zero for all the boundaries of the model except the tunnelsurface. Dirichlet boundary conditions were therefore applied.Homogeneous pressure of 28 MPa was initialised in the discretisa-tion area within these boundaries. A 50-m tunnel was excavated in25 rounds. Since Neuman-type and Dirichlet-type boundary condi-tions were used in the FLAC2D and the FLAC3D approaches, respec-tively, slightly larger displacement and extension of the plasticzone could be expected in the 2D approaches.
Fig. 8 shows, for the different quality rock masses analysedand for materials from Table 1, the results of the LDPs obtainedaccording to Phase2 (Rocscience, 2009), FLAC2D (Itasca, 2008),FLAC3D (Itasca, 2007) and Eqs. (1) and (2), with the plastic ra-dius obtained as per Vlachopoulos and Diederichs (2009). Thegraphs illustrate that all the methods yielded similar values;hence, we can feel confident in the different approaches forthese tunnels excavated in rock masses, obeying the Hoek–Brown criterion and behaving in an EPP manner. This also con-firms the usefulness of the Vlachopoulos and Diederichs ap-proach. It is also interesting to note that these LDPs for EPProck masses can be easily calculated by means of the analyticalapproach proposed by Vlachopoulos and Diederichs (2009) (Eqs.(1)–(3)), once the plastic radius is computed as suggested byCarranza-Torres and Fairhurst (2000) (Eqs. (9)–(11)).
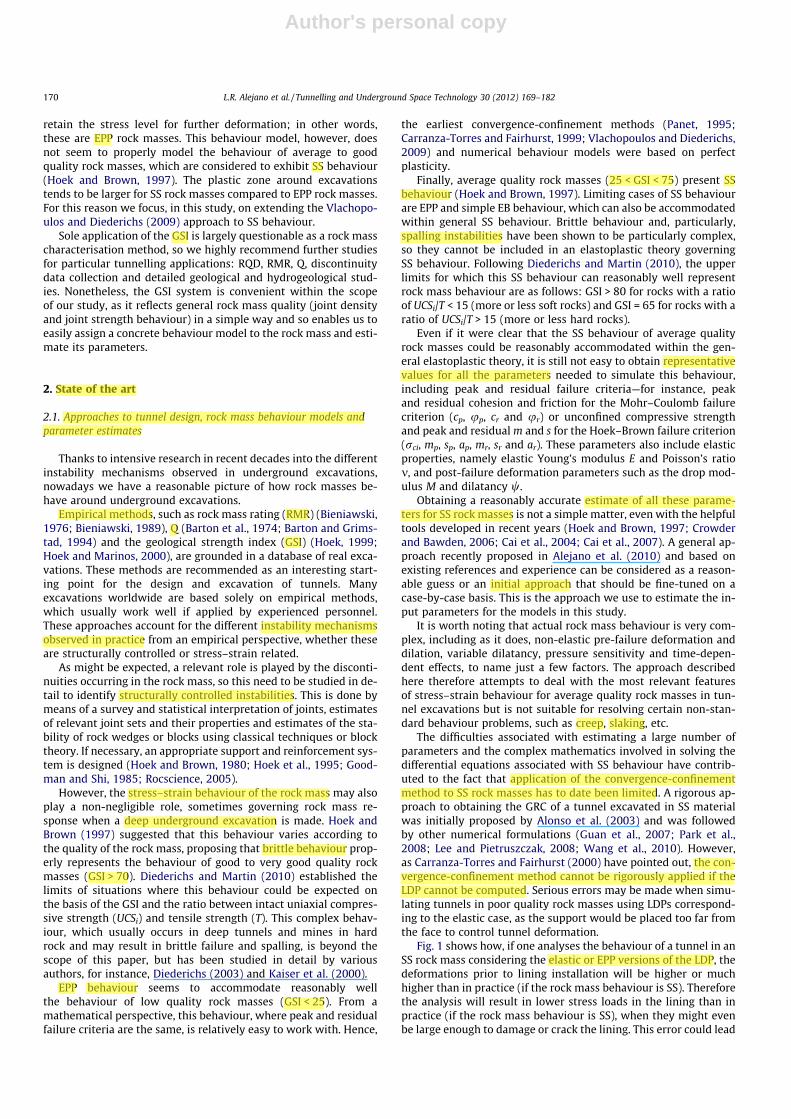
Fig. 9 illustrates the influence of the selected failure criteria—Mohr–Coulomb or Hoek–Brown—on the LDPs obtained for the ser-ies of rock masses studied, showing how only small differencesderiving from the selection of the failure criteria arise in themodels. For high quality rock masses in the range 60 < GSI < 75,the fit between the Mohr–Coulomb and the Hoek–Brown modelswas very good, whereas small differences arose for average qualityrock masses in the range 40 < GSI < 50, with these differencesbecoming significant for low quality rock masses in the range25 < GSI < 30.
Table 1Rock mass parameters for longitudinal displacement profile analysis using Phase2, as proposed by Vlachopoulos and Diederichs (2009).
A1 B1 C1 D1 E1 F1
Specific weight (kN/m3) 26 26 26 26 26 26Depth (m) 1100 1100 1100 1100 1100 1100Diameter (m) 5 5 5 5 5 5GSI 25 35 45 48 60 74mi 7 7 7 7 7 7r0 (MPa) 28 28 28 28 28 28rci (MPa) 35 35 35 50 75 100m 0.481 0.687 0.982 1.093 1.680 2.766s 0.0002 0.0007 0.0022 0.0031 0.0117 0.0536a 0.531 0.516 0.508 0.507 0.503 0.501E (MPa) 1150 2183 4305 7500 11 215 27 647m 0.25 0.25 0.25 0.25 0.25 0.25R� (V&D, 2009) 7.5 5.1 3.5 2.3 1.5 1.2R� (C-T&F, 2000) 7.92 5.15 3.60 2.50 1.56 1.17
Table 2Hoek–Brown strain-softening rock mass parameters.
A2 B2 C2 D2 E2
GSIpeak 75 60 50 40 25GSIres 40 35 30 27 –mpeak 2.87 1.68 1.17 0.821 0.481speak 0.0622 0,0110 0.0039 0,0013 0,0002mres 0821 0.687 0.575 0.516 –sres 0.0013 0.0007 0.0004 0.0003 –E (GPa) 36.5 15.4 8.66 4.87 2.05eps (def.)a 0.00054 0.00311 0.0144 0.0595 Infinity
a FLAC3D plastic parameter.
Fig. 7. Meshes used for the numerical modelling. (a) Mesh used for the FLAC2D models. (b) Example of a tunnel modelled in FLAC3D to analyse longitudinal deformationprofiles (LDP). The clearer tone indicates the plastic zone around the tunnel.
L.R. Alejano et al. / Tunnelling and Underground Space Technology 30 (2012) 169–182 175
Author's personal copy
4.2. Comparison of analytical and numerical approaches to calculatingplastic radii
The plastic radii around tunnels excavated in EPP rock masseswere also computed according to theoretical expressions for theMohr–Coulomb (Eqs. (4)–(6)) and Hoek–Brown (Eqs. (9)–(11)) fail-ure criterion approaches and were compared with the numericalestimates (Fig. 10).
Fig. 10a shows the Mohr–Coulomb plastic radii (Rpl/RT) obtainedtheoretically (Carranza-Torres, 1998) and according to variousnumerical models (Phase 2D, FLAC2D and FLAC3D). A rather goodfit is observed, even if it seems that scattering tends to increasefor lower quality rock masses. Fig. 10b shows the Hoek–Brownplastic radii obtained by means of an approximate theoretical for-mulation (Carranza-Torres and Fairhurst, 2000) and according tothe previously mentioned approaches. Again a rather good fitis observed, with the same comment regarding lower quality rock
Fig. 8. Comparative longitudinal deformation profiles (LDP) for different rock masses A1-F1 according to Phase2, FLAC2D, FLAC3D and Vlachopoulos and Diederichs (2009).
Fig. 9. Comparative FLAC 2D longitudinal deformation profiles (LDP) for different rock masses A1–F1 according to the Mohr–Coulomb (MC) and Hoek–Brown (HB) failurecriteria.
176 L.R. Alejano et al. / Tunnelling and Underground Space Technology 30 (2012) 169–182

Author's personal copy
masses. Fig. 10c shows a comparison of the theoretical Mohr–Cou-lomb and Hoek–Brown approaches, with somewhat larger Hoek–Brown plastic radii, particularly for low quality rock masses.
It should be remembered, however, as explained in the introduc-tion, that the EPP behaviour model seems to more or less accuratelyrepresent the behaviour of low quality rock masses and is thereforeonly proposed for rock masses in the range 25 < GSI < 35. For rockmasses with higher GSI values, an SS approach is considered moresuitable and rigorous.
The results above indicate that the approach developed by Vlach-opoulos and Diederichs (2009) is a simple and efficient method forobtaining the LDP of a tunnel excavated in an EPP rock mass. Accord-ingly, combination of Eqs. (1)–(3) with the value of the plastic ra-dius—obtained by means of Eqs. (4)–(6) for the Mohr–Coulombcase and Eqs. (9)–(11) for the Hoek–Brown case—is a reliable wayto represent LDPs for tunnels excavated in EPP rock masses.
5. Numerical calculation of LDPs in SS rock masses
In this section we analyse how SS behaviour affects LDPs in tun-nels. Following Vlachopoulos and Diederichs (2009), several FLAC
models were used to tunnel a series of rock masses of decreasingrock mass quality. To highlight differences, the models reflectedvery deep tunnels excavated in low strength rock. The rock masseswere the same as those referred to in a previous publication (Alej-ano et al., 2010), except that the tunnels were deepened from600 m to 1500 m. The rock masses were formed of a weak intactrock, with mi = 7 and rci = 35 MPa. The tunnels were 5 m in diam-eter and the depth of 1500 m implied a field stress of 37.5 MPa.Rock specific weight was 25 kN/m3 and the Poisson’s ratio was0.25. Simulations were run using both Hoek–Brown parameters(Table 2) and Mohr–Coulomb parameters (Table 3). The rockmasses were characterised following a procedure developed bythe authors (Alejano et al., 2010) with the help of RocLab, a free-ware program for analysing rock shear strength according to theHoek–Brown failure criterion (Rocscience, 2003). Using these tech-niques, the equivalent Hoek–Brown and Mohr–Coulomb strengthparameters were obtained as presented in Tables 2 and 3, respec-tively. The elastic modulus was that referring to the characterisa-tion of the 600-m deep tunnels.
The Hoek–Brown SS rock mass model, as implemented in bothFLAC2D and FLAC3D codes, had an associated flow rule adapted tothe failure criterion; hence, dilatancy could not be explicitly in-cluded. However, the Mohr–Coulomb models were run to analysethe role of dilatancy in LDPs. Including dilatancy in a numericalmodel requires use of a suitable model, so the FLAC code was usedas it has a strain hardening/softening Mohr–Coulomb model thatincludes dilatancy. No dilatancy was considered for the Hoek–Brown case. All the models were run for both the Hoek–Brownand Mohr–Coulomb cases and similar results were obtained(graphs representing results for both will be presented below).
As in the previous section, referring to EPP rock masses, Neu-mann boundary conditions were used for the FLAC2D models, thatis, stresses were fixed at some model boundaries; meanwhile,Dirichlet boundary conditions were used for the FLAC3D models,that is, all boundary displacement was fixed (except in the exca-vated tunnel surface), and the field stress was initialised in the en-tire discretised area. As was anticipated, similarly to the EPP cases,the displacements indicated by the FLAC2D models were slightlylarger than those predicted by the FLAC3D models—a differencewe attribute to the boundary conditions.
5.1. Comparison of analytical and numerical approaches to calculatingLDPs
The LPDs obeying the Mohr–Coulomb failure criterion were ob-tained numerically for the EPP case (without considering the resid-ual parameters) and the SS case. In the case of the E2 rock mass, weconsidered only the EPP approach, since this is the behaviour ex-pected for poor quality rock masses; since the results are identicalto those for the EPP case, they are not reproduced again. Fig. 11compares the LDPs for SS and EPP behaviours for the remainingcases (A2 to D2) and rock masses obeying Mohr–Coulomb failurecriterion as obtained from FLAC2D models. The numerically
Fig. 10. Plastic radii for different rock masses (A1–F1) according to differentmodelling techniques (Phase2, FLAC2D, FLAC3D) and analytical techniques (Car-ranza-Torres, 1998; Carranza-Torres and Fairhurst, 2000). (a) Numerical andanalytical results for the Mohr–Coulomb (MC) failure criterion. (b) Numerical andanalytical results for the Hoek–Brown (HB) failure criterion. (c) Analytical resultsfor the MC and HB failure criteria.
Table 3Mohr–Coulomb strain-softening rock mass parameters.
A2 B2 C2 D2
GSIpeak 75 60 50 40GSIres 40 35 30 27/peak (�) 29.52 25.68 23.13 20.64cpeak (MPa) 3.637 2.673 2.242 1.878/res (�) 20.64 19.42 18.21 17.49cres (MPa) 1.878 1.707 1.536 1.432wpeak (�) = wres (�) 7.38 4.49 2.89 1.55eps (def.)a 0.00054 0.00311 0.0144 0.0595
a FLAC3D plastic parameter.
L.R. Alejano et al. / Tunnelling and Underground Space Technology 30 (2012) 169–182 177

Author's personal copy
obtained LDPs are presented together with the LDPs estimated fol-lowing Vlachopoulos and Diederichs (2009), based on plastic radiiderived from the FLAC2D models. As can be observed, provided theplastic radius is known, the Vlachopoulos and Diederichs approachis also satisfactory when considering SS models.
These results also suggest that there are significant differences inLDPs for tunnels considered to have EPP or SS behaviour. It is thereforeimportant to note that SS behaviour plays a role in the shape of LDPsand, hence, in the design and installation of support and reinforcement.
Fig. 12 depicts the same approach as Fig. 11 for the case of theFLAC3D models and rock masses obeying the Hoek–Brown failurecriterion, with basically the same considerations applying. Notethat, for this case, and probably due to the boundary conditions ap-plied, smaller displacements than in the FLAC2D case are pro-duced. The variation in displacement is somewhat more markedfor SS rock masses than for EPP materials. Actual displacementsare considered to lie somewhere between FLAC2D and FLAC3Ddisplacements.
Fig. 11. FLAC2D numerical model of Mohr–Coulomb material results for axisymmetric models of a tunnel excavated in rock masses A2, B2, C2 and D2, considering elastic–perfectly plastic (EPP) behaviour (numerical squares and analytical solid line) and strain-softening (SS) behaviour (numerical rhombus and analytical dots). Analyticalapproach by Vlachopoulos and Diederichs (2009) based on the numerical plastic radius.
Fig. 12. FLAC3D numerical model of Hoek–Brown material results for axisymmetric models of a tunnel excavated in rock masses A2, B2, C2 and D2, considering elastic–perfectly plastic (EPP) behaviour (numerical squares and analytical solid line) and strain-softening (SS) behaviour (numerical rhombus and analytical dots). Analyticalapproach by Vlachopoulos and Diederichs (2009) based on the numerical plastic radius.
178 L.R. Alejano et al. / Tunnelling and Underground Space Technology 30 (2012) 169–182

Author's personal copy
Fig. 13 shows the same numerical results as Fig. 12 for FLAC3DHoek–Brown models, but in this case the Vlachopoulos and Diede-richs (2009) approach was an estimate based on the SS plastic ra-dius estimated as per our Eqs. (19) and (20). The analytical LDPestimates were quite satisfactory, with displacements roughlyequal to those for the numerical FLAC3D and, therefore, probablyquite close to actual values.
It should be emphasised that the difference between the LDPscalculated for EPP rock masses and for SS rock masses grows asthe GSI increases. The difference is negligible for lower quality rockmasses (20 < GSI < 35), more relevant for average quality rockmasses (40 < GSI < 50) and quite significant for good quality rockmasses (60 < GSI < 75). Excavating tunnels in good quality rockmasses does not usually produce significant stress–strain relatedproblems, unless the tunnel is very deep, in which case error canbe avoided using this SS approach.
5.2. Comparison of analytical and numerical approaches to estimatingplastic radii
The plastic radii around the tunnels excavated for the purposeof considering EPP and SS rock masses were computed accordingto theoretical or approximated expressions. Plastic radius valuesobtained under various circumstances and using various tech-niques are listed in Table 4. The theoretically obtained values werecompared with the numerically estimated values shown in Fig. 14.
Fig. 14a shows the EPP Mohr–Coulomb and Hoek–Brown plasticradii ðR�EPPÞ obtained theoretically (Carranza-Torres, 1998; Car-ranza-Torres and Fairhurst, 2000) and using numerical FLAC2Dand FLAC3D models. A rather good fit can be observed, even if,due to higher field stress than in the cases described in Section 4.2,FLAC3D tends to underestimate the plastic radius value in a moremarked way. It can also be observed that scattering tends to in-crease for lower quality rock masses.
Fig. 14b shows the SS Mohr–Coulomb and the Hoek–Brownplastic radii (R�SS) obtained using Eqs. (19) and (20) and numericalFLAC2D and FLAC3D models and based on the simplified numerical
approach of Alonso et al. (2003). Fig. 14b show a reasonable fit.We attribute the differences between theoretical and approxi-mated expressions and numerical approaches to the boundaryconditions selected, the extent of discretised areas and meshsizes. The observed differences are typically smaller than thoseassociated with errors in the characterisation and heterogeneityof the rock mass.
Fig. 14c compares the theoretical EPP, EB and SS Mohr–Coulomband Hoek–Brown approaches. It can be observed that the ap-proaches coincide for both Mohr–Coulomb and Hoek–Brown fail-ure criteria for low quality rock masses (GSI = 25, E2). Alsoclearly evident is the fact that larger plastic radii tend to be yieldedfor the Hoek–Brown criteria compared to the Mohr–Coulomb crite-ria in EPP rock masses. Conversely, for the case of high quality rockmasses (GSI = 75), the EB and SS approaches basically coincide forboth the Mohr–Coulomb and Hoek–Brown cases, since actualbehaviour is considered to be EB.
Fig. 13. FLAC3D numerical model of Hoek–Brown material results for axisymmetric models of a tunnel excavated in rock masses A2, B2, C2 and D2, considering elastic–perfectly plastic (EPP) behaviour (numerical squares and analytical solid line) and strain-softening (SS) behaviour (numerical rhombus and analytical dots). Analyticalapproach by Vlachopoulos and Diederichs (2009) based on the analytical plastic radius obtained according to Eqs. (19) and (20).
Table 4Strain-softening plastic radius for different circumstances.
A2 B2 C2 D2 E2
GSI 75 60 50 40 25EPP MC Flac2D 1.65 2.63 3.38 4.69 10.36
Flac3D 1.84 2.60 3.36 4.64 8.80Theor. (CC) 1.90 2.63 3.44 4.80 9.94
HB Flac2D 1.81 2.81 3.80 5.71 12.10Flac3D 1.88 2.64 3.68 5.20 8.88Theor. (CC) 1.93 2.86 3.95 5.77 11.80
SS MC Flac2D 3.59 4.46 5.44 6.55 10.36Flac3D 3.20 4.20 5.20 6.20 8.80Appr. Eqs. (19) and (20) 3.35 4.86 6.11 7.25 10.05Alonso et al. (2003) 3.42 4.63 5.40 6.50 9.94
HB Flac2D 4.01 4.94 5.98 7.47 12.10Flac3D 3.36 4.40 5.20 6.40 8.88Appr. Eqs. (19) and (20) 3.39 5.09 6.62 8.22 11.91
L.R. Alejano et al. / Tunnelling and Underground Space Technology 30 (2012) 169–182 179

Author's personal copy
5.3. Analysis of dilatancy considered as a constant
We also analysed the role of constant dilatancy in LDPs, run-ning the models for each rock mass and considering dilatancyvalues of 0�, /p/8 and /p/4. The results obtained show that,whereas standard LDPs vary due to the differing maximum con-vergence values, the normalised LDPs are practically the same.This indicates that a change in dilatancy within expected rangesdoes not influence LDPs in a significant manner. For the sake ofbrevity, only the standard and normalised LDPs for case C2 aredescribed (Fig. 15), since this case is representative of whatwould be expected of SS rock mass. Similar results were ob-tained for the other rock masses.
5.4. Final considerations
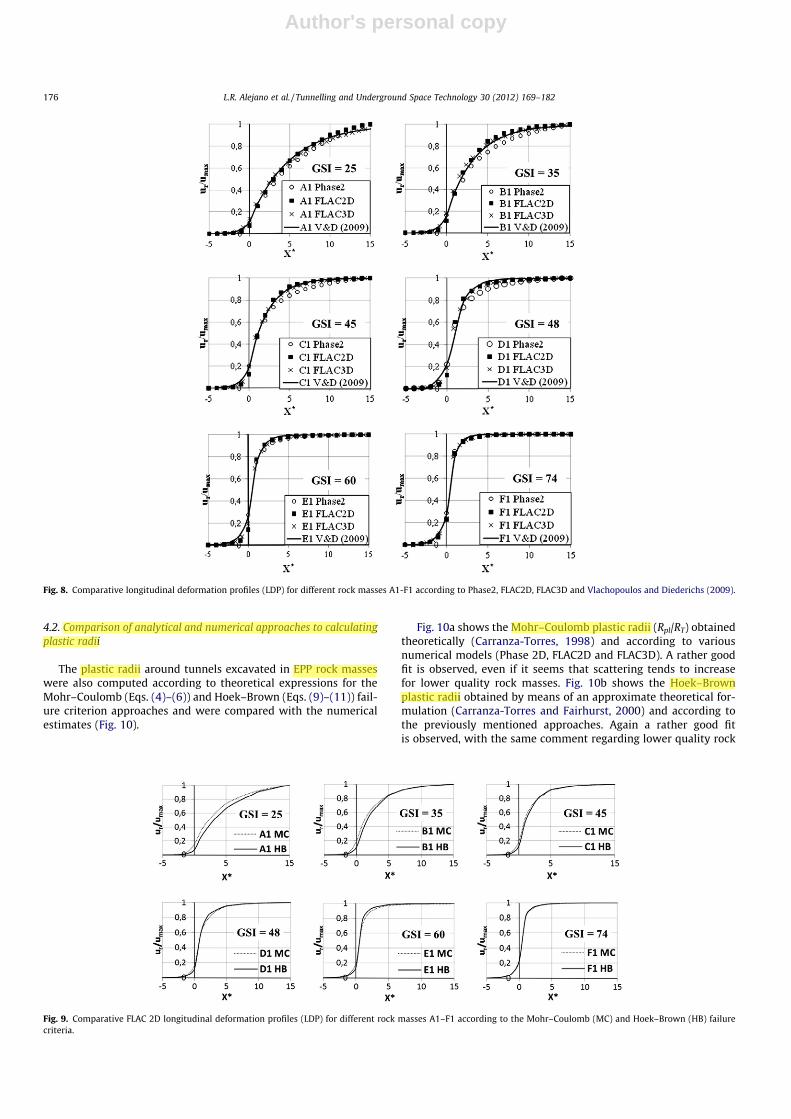
As a final consideration we propose using SS LDPs in applyingthe convergence-confinement method in average to high qualityrock masses. The rock mass can be characterised following Hoekand Brown (1997) and Alejano et al. (2010); the LDPs can be ob-tained according to Vlachopoulos and Diederichs (2009); the plas-tic radius can be obtained using the estimation proposed here (Eqs.(19) and (20)); and the GRC can be estimated according to any ofthe more or less simplified but rigorous numerical approaches pro-posed in the bibliography (Alonso et al., 2003; Guan et al., 2007;Park et al. 2008; Lee and Pietruszczak, 2008; Wang et al., 2010).This proposal relies on the fact that, as shown in Fig. 16, the useof an LDP based on EPP behaviour when dealing with rock masseswith SS behaviour underestimates displacement when support orreinforcement is installed, leading to inappropriate and potentiallyinaccurate designs.
Note that, even for a stable tunnel face, such inaccuracies mayresult in higher closure rates and a loss of rock strength. For in-stance, in some tunnels in very deformable rock, support must beinstalled early on in order to ensure a safe working environmentat the face; however, it is preferable to delay full reinforcementto prevent an unacceptable build-up of internal loads due to highclosure rates near the face. Premature installation of the final liningbased on an EPP approach to estimating LDP (Fig. 16) could resultin buckling of the primary support system, expansion of the plasticzone and an increase in final closure (Hoek et al., 2008).
6. Conclusions
Some of the limitations of the convergence-confinement meth-od relate to the knowledge of actual rock behaviour. One such issueis the correct definition of post-failure behaviour in the rock mass,
Fig. 14. Plastic radius for elastic–perfectly plastic (EPP), strain-softening (SS) andelastic brittle (EB) rock masses A2-E2 according to different modelling techniques(FLAC2D and FLAC3D) and analytical techniques (Carranza-Torres, 1998; Carranza-Torres and Fairhurst, 2000; Carranza-Torres, 2004; this text). (a) Numerical andanalytical results for EPP rock masses under Mohr–Coulomb (MC) and Hoek–Brown(HB) criteria. (b) Numerical and analytical results for SS rock masses under Mohr–Coulomb and Hoek–Brown criteria. (c) Analytical results for EPP, SS and EB underthe MC criterion (Carranza-Torres, 1998; this text) and the HB criterion (Carranza-Torres and Fairhurst, 2000; Carranza-Torres, 2004; this text).
Fig. 15. Comparison of the standard (convergence in mm) and normalised (relativeconvergence) longitudinal deformation profiles (LDP) for the tunnel in rock mass C2for different dilatancy angles in the expected range.
180 L.R. Alejano et al. / Tunnelling and Underground Space Technology 30 (2012) 169–182
Author's personal copy
which has a bearing on rock mass behaviour in the plastic zone.Once post-failure behaviour is defined, it is still necessary to ade-quately characterise SS rock masses. And once all the rock massparameters are known, suitable tools are needed to provide reli-able designs.
With the aim of reliably estimating appropriate timing forsupport installation, it is of paramount importance for designpurposes to establish the longitudinal closure or displacementprofile for the tunnel. Failure to use the appropriate LDP canproduce significant errors in calculating the correct installationdistance from the face for tunnel support systems. Such errorsare likely to produce failure or problems with temporary supportsystems. Previous LDP functions are not particularly well suitedfor tunnel analysis in average quality rock masses at moderateto great depth.
Based on a number of numerical studies, we have extended pre-vious approaches to estimating the LDPs for tunnels excavated inEPP material to the case of SS material representing a wider rangeof rock masses (25 < GSI < 75). Our simplified approximate equa-tion for the plastic radius of a tunnel excavated in a SS rock massanalytically obtains a more realistic LDP calculation for tunnelsexcavated in average quality rock masses.
Acknowledgements
The authors thank the Spanish Ministry of Science and Technol-ogy for financial support awarded, under Contract Reference Num-ber BIA2009-09673, to the project entitled ‘Studies of undergroundexcavations in rock masses’, which funded developments in thispaper. Ailish M.J. Maher provided assistance with English usagein a version of the manuscript.
Appendix A. Supplementary data
Supplementary data associated with this article can be found, inthe online version, at doi:10.1016/j.tust.2012.02.017.
References
Alejano, L.R., Alonso, E., Rodriguez-Dono, A., Fernández-Manín, G., 2010. Applicationof the convergence-confinement method to tunnels in rock masses exhibitingHoek–Brown strain-softening behaviour. Int. J. Rock Mech. Min. Sci. 47 (1), 150–160.
Alejano, L.R., Rodriguez-Dono, A., Alonso, E., Fernández-Manín, G., 2009. Ground reactioncurves for tunnels excavated in different quality rock masses showing several typesof post-failure behaviour. Tunn. Undergr. Sp. Technol. 24 (6), 689–705.
Alonso, E., Alejano, L.R., Varas, F., Fdez.Manin, G., Carranza-Torres, C., 2003. Groundreaction curves for rock masses exhibiting strain-softening behaviour. Int. J.Num. Anal. Meth. Geomech. 27, 1153–1185.
Barla, G., 2009. Innovative tunnelling construction method to cope with squeezingat Saint Martin La Porte Access Adit. In: Vrkjan (Ed.), Rock Engineering inDifficult condition, Proc. Eurock 2009. Catvat, Croatia. Taylord & Francis,London, pp. 15–24.
Barton, N., Grimstad, E., 1994. The Q-system following 20 years of application inNATM support selection. In: 43rd Colloquy on Geomechanics, Salzburg. Felsbau1994, 6/94, pp. 428–436.
Barton, N.R., Lien, R., Lunde, J., 1974. Engineering classification of rock masses forthe design of tunnel support. Rock Mech. 6 (4), 189–239.
Bieniawski, Z.T., 1976. Rock mass classification in rock engineering. In: Proceedings,Symposium on Exploration for Rock Engineering, Johannesburg, vol. 1, pp. 97–106.
Bieniawski, Z.T., 1989. Engineering Rock Mass Classifications. Wiley, New York.Cai, M., Kaiser, P.K., Tasakab, Y., Minamic, M., 2007. Determination of residual
strength parameters of jointed rock masses using the GSI system. Int. J. RockMech. Min. Sci. 44 (2), 247–265.
Cai, M., Kaiser, P.K., Uno, H., Tasaka, Y., Minamic, M., 2004. Estimation of rock massdeformation modulus and strength of jointed rock masses using the GSI system.Int. J. Rock Mech. Min. Sci. 41 (1), 3–19.
Carranza-Torres, C., 1998. Self Similarity Analysis of the Elastoplastic Response ofUnderground Openings in Rock and Effects of Practical Variables, Ph.D. Thesis.University of Minnesota, USA.
Carranza-Torres, C., Fairhurst, C., 1999. The elasto-plastic response of undergroundexcavations in rock masses that satisfy the Hoek–Brown failure criterion. Int. J.Rock Mech. Min. Sci. 36 (6), 777–809.
Carranza-Torres, C., Fairhurst, C., 2000. Application of convergence-confinementmethod of tunnel design to rock masses that satisfy the Hoek–Brown failurecriterion. Tunn. Undergr. Sp. Technol. 15 (2), 187–213.
Carranza-Torres, C., 2004. Elasto-plastic solution of tunnel problems using thegeneralized form of the Hoek–Brown failure criterion. In: Hudson, J.A., Xia-Ting,F. (Eds.), Proceedings of ISRM SINOROCK2004 Symposium, China. Int. J. RockMech. Min. Sci., 480–481.
Chern, J.C., Shiao, F.Y., Yu, C.W., 1998. An empirical safety criterion for tunnelconstruction. In: Proc. Regional Symposium on Sedimentary Rock Engineering.Taipei, Taiwan. Balkema, pp. 222–227.
Crowder, J.J., Bawden, W.F., 2006. The Estimation of Post-Peak Rock MassProperties: Numerical Back Analysis Calibrated using In Situ InstrumentationData. Rocnews, 2006. <http://www.rocscience.com/library/rocnews>.
Diederichs, M.S., 2003. Rock fracture and collapse under low confinementconditions. Rock Mech. Rock Eng. 36 (5), 339–381.
Diederichs, M.S., Martin, C.D., 2010. Measurement of spalling parameters fromlaboratory testing. In: Zhao, J., Labiouse, V. (Eds.), Proc. EUROCK 2010. RockMechanics in Civil and Environmental Engineering, Lausanne, Switzerland, 15-18 June 2010. CRC Press, Boca Raton, pp. 323–326.
Duncan Fama, M.E., 1993. Numerical modelling of yield zones in weak rock. In:Hudson, J. (Ed.), Comprehensive Rock Engineering 1993, vol. II. Pergamon Press,Oxford, pp. 49–75.
Goodman, R.E., Shi, G., 1985. Block Theory and Its Application to Rock. Prentice-Hall,Englewood Cliffs, NJ, USA.
Guan, Z., Jiang, Y., Tanabasi, Y., 2007. Ground reaction analyses in conventionaltunnelling excavation. Tunn. Undergr. Sp. Technol. 22 (2), 230–237.
Hoek, E., Kaiser, P.K., Bawden, W.F., 1995. Support of Underground Excavations inHard Rock 1995. Balkema, Rotterdam, Holland.
Hoek, E., Carranza-Torres, C., Corkum B., 2002. Hoek–Brown failure criterion—2002edition. In: Proceedings of the NARMS-TAC2002, Toronto, Canada, vol. 1, pp.267–273.
Hoek, E., Carranza-Torres, C., Diederichs, M., Corkum, B., 2008. The 2008 Kerstenlecture integration of geotechnical and structural design in tunnelling. In: 56thAnnual Geotechnical Engineering Conference, 2008. University of Minnesota,USA.
Hoek, E., 1999. Practical Rock Engineering. <http://www.rocscience.com>.Hoek, E., Brown, E.T., 1997. Practical estimates of rock mass strength. Int. J. Rock
Mech. Min. Sci. 34 (8), 1165–1186.Hoek, E., Brown, E.T., 1980. Underground Excavations in Rock. Chapman & Hall,
London.Hoek, E., Marinos, P., 2000. Predicting tunnel squeezing problems in weak
heterogeneous rock masses. Tunnels Tunnelling Int.Itasca, 2007. FLAC3D Version 3. Fast Lagrangian Analysis of Continua, 3D Version.
Minneapolis, Minnesota, USA. <http://www.itascacg.com>.Itasca, 2008. FLAC Version 5. Fast Lagrangian Analysis of Continua. 2D Version.
Minneapolis, Minnesota, USA. <http://www.itascacg.com>.
Fig. 16. Application of the convergence-confinement method to a tunnel. Typicalgraphs obtained of the ground reaction curve (GRC) and support characteristiccurve (SCC) below and longitudinal deformation profiles (LDP) above. Blackindicates the elastic–perfectly plastic (EPP) approach and grey indicates thestrain-softening (SS) approach. Note that although the tunnel would be correctlystabilised in the EPP case, in the SS case, the lining would be unable to withstandthe ground load.
L.R. Alejano et al. / Tunnelling and Underground Space Technology 30 (2012) 169–182 181

Author's personal copy
Kaiser, P.K., Diederichs, M.S., Martin, D., Sharpe, J., Steiner, W., 2000. Undergroundworks in hard rock tunnelling and mining. In: Proceedings, GeoEng 2000,Melbourne. Technomic Publishing. Lancaster, Australia. pp. 841–926.
Lee, Y.-K., Pietruszczak, S., 2008. A new numerical procedure for elasto-plasticanalysis of a circular opening excavated in a strain-softening rock mass. Tunn.Undergr. Sp. Technol. 23 (4), 588–599.
Lunardi, P., 2000. The design and construction of tunnels using the approach basedon the analysis of controlled deformation in rocks and soils ADECO-RS approach2000. Tunnels Tunnelling Int. Special supplement, 11.
Panet, M., Guenot, A., 1982 Analysis of convergence behind the face of a tunnel. In:Proceedings International Symposium Tunnelling’82. IMM, London, pp. 197–204.
Panet, M., 1995. Le calcul des tunnels par la méthode des curves convergence-confinement. Presses de l’Êcole Nationale des Ponts et Chaussées, Paris, France.
Park, K.H., Tontavanich, P., Lee, J.-G., 2008. A simple procedure for ground responsecurve of circular tunnel in elastic-strain softening rock masses. Tunn. Undergr.Sp. Technol. 23 (1), 151–159.
Pilgerstörfer, T., Schubert, W., 2009. Forward prediction of spatial displacementdevelopment. Rock Engineering in difficult ground conditions – soft rocks inKarst. Vrkljan, I. EUROCK’2009. Catvat, Croatia. Taylord & Francis. London.
Rocscience, 2009. Phase-2D. Rocscience Inc., Toronto, Canada.Rocscience, 2003. RocLab. Rocscience Inc., Toronto, Canada. <http://www.rocscience.
com>.Rocscience, 2005. Unwedge. Rocscience Inc., Toronto, Canada.Sofianos, A.I., 2003. Tunnelling Mohr–Coulomb strength parameters for rock masses
satisfying the generalized Hoek–Brown failure criterion. Int. J. Rock Mech. Min.Sci. 40 (3), 435–440.
Unlu, T., Gercek, H., 2003. Effect of Poisson’s ratio on the normalized radialdisplacements occurring around the face of a circular tunnel. Tunn. Undergr. Sp.Technol. 18, 547–553.
Varas, F., Alonso, E., Alejano, L.R., Fdez-Manin, G., 2005. Study of bifurcation in theproblem of unloading a circular excavation in a strain-softening material. Tunn.Undergr. Sp. Technol. 20 (3), 311–322.
Vlachopoulos, N., Diederichs, M.S., 2009. Improved longitudinal displacementprofiles for convergence confinement analysis of deep tunnels. Rock Mech.Rock Eng. 42 (1), 131–146.
Wang, S., Yin, X., Tang, H., Ge, X., 2010. A new approach for analyzing circular tunnelin strain-softening rock masses. Int. J. Rock Mech. Min. Sci. 47 (1), 170–178.
182 L.R. Alejano et al. / Tunnelling and Underground Space Technology 30 (2012) 169–182
Copyright © 2022 FDOKUMEN