19820008620.pdf - NASA Technical Reports Server
285
N O T I C E THIS DOCUMENT HAS BEEN REPRODUCED FROM MICROFICHE. ALTHOUGH IT IS RECOGNIZED THAT CERTAIN PORTIONS ARE ILLEGIBLE, IT IS BEING RELEASED IN THE INTEREST OF MAKING AVAILABLE AS MUCH INFORMATION AS POSSIBLE
-
Upload
khangminh22 -
Category
Documents
-
view
0 -
download
0
Transcript of 19820008620.pdf - NASA Technical Reports Server

N O T I C E
THIS DOCUMENT HAS BEEN REPRODUCED FROM MICROFICHE. ALTHOUGH IT IS RECOGNIZED THAT
CERTAIN PORTIONS ARE ILLEGIBLE, IT IS BEING RELEASED IN THE INTEREST OF MAKING AVAILABLE AS MUCH
INFORMATION AS POSSIBLE

DOE/NASA/0197-1NASA CR-165287
a ^rnational Market Assessmentu Stand-Alone Photovoltaic
Power Systems for CottageIndustry Applications
(NASA-CR- 165287) INTERNATICNAL MARKET N82-16494
ASSESSMENT OF STAND-ALCNE PHOTOVOLTAIC POWBESYSTEMS FOR CO'T'TAGE INDUSTRY APPLICATICNSFinal Report (YIT 8esearch Inst.) 290 p Uaclas
HC A 13/MF A01 CSCL JOB G3/4 4 08859
Therese M. PhilippiTIT Research Institute
November 1381
Prepared forNational Aeronautics and Space AdministrationLewis Research CenterUnder Contract DEN 3-197
forU.S. DEPARTMENT OF ENERGYConservation and Renewable EnergyDivision of Photovoltaic Energy Systems
International Market Assessmelof Stand-Alone PhotovoltaicPower Systems for CottageIndustry Applications
Therese M. PhilippiIIT ResePrch InstituteChicago, Illinois 60616
November 1981
Prepared forNational Aeronautics and Space AdrninistraLewis Research CenterCleveland, Ohio 44135Under Contract DEN 3-197
forU,S: DEPARTMENT OF ENERGYConservation and Renewable EnergyDivision of Photovoltaic Energy SystemsWashington, D,C. 20545Under Interagency Agreement DE-AI01-79ET20485

ACKNOWL EDGEMENTS
We wish to express our thanks to DNR, Inc., Associates in Rural
Development, Inc., and Mr. Robert J. Lapen for providing their
technical and international expertise in support of this study,
t
i

t
iTABLE OF CONTENTS
Section Page
EXECUTIVE SUMMARY vi
1. INTRODUCTION 1
2. NATURE OF COTTAGE INDUSTRY IN LESS DEVELOPED COUNTRIES 3
2.1 Sub-lllohara Africa 4
2.2 Latin America 9
2.2.1 Andes 102.2.2 Brazil 132.2.3 Central America and the Caribbean 172.2.4 Mexico 19
i 2.3 Morocco 24
j 2.4 The Philippines 26
3. THE "POTENTIAL" MARKET FOR SMALL, DECENTRALIZED ELECTRICPOWER SOURCES IN COTTAGE INDUSTRY APPLICATIONS 31
4. COMPETITIVE ANALYSIS OF STAND-ALONE PHOTOVOLTAIC SYSTEMS1 AND DIESEL DRIVEN GENERATOP S 43
4.1 The Private Purchase 43
4.2 'The Government Purchase 544.3 Appropriate Technology 564.4 The Strategic Implications for the Small Manufacturer 57
4.5 The Strategic= implications for the Importing Country 60 E'
5. CONCLUSIONS 63 g",
6. BIBLIOGRAPHY 70
APPENDIX A - The Philippines
B - Mexico
! C - Morocco
f
D - Brazil
E - Economics of Photovoltaic and Diesel Genertor Sets
F - Cash Flow Analysis
I
LIST OF EXHIBITS
ft 2e
I Cumulative Market Size As A Function of Source Capacity ix
II Breakeven Cost Required for Photovoltaics To Be CompetitiveWith Diesel Generators xii
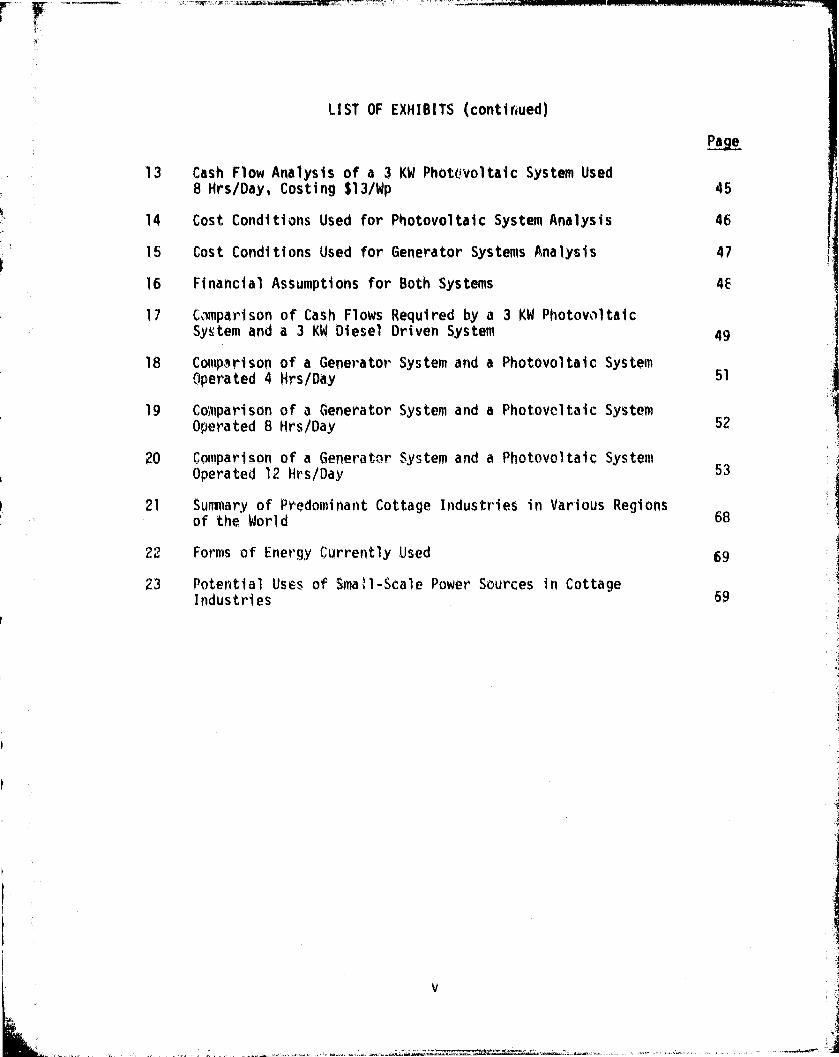
III Comparison of A Generator System and A Photovoltaic SystemOperated 8 Hrs/Day xiii
IV Forms of Energy Currently Used xvi
V Suiiviiary of Predominant Cottage Industries in Various Regionsof The World xvii
VI Potential Uses of Small-Scale Power Sources in CottageIndustries xx
1 Sources of Finance for Initial Investments by SmallEnterprises in Some African Countries 7
2 Industrial Classification in the Philippines 27
3 Potential Market for Photovoltaic Systems in Cottage IndustryAppl i ca ti ons 32
4 Countries Studied in Detail 33
5 Employment in Fundamental Industries as A Percent of TotalRural Industrial 'E'mployment 34
6 Suiaiiary - Cottage Industries and Energy Intensities 35
7 Rural Industrial Employment in the Non-Industrialized,Non-Centrally Planned World by Fundamental Industry 37
8 Energy Consumption per Employee and Establishment loadsby Fundamental Industry 38
9 Rural Industrial Power by Fundamental Industry 39
10 Rural Industrial Power by Fundamental Industry 40
11 Power and Energy Requirements of Household Appliances andFarm Equipment in Con>mon Use 42
12 Cash Fiw Analysis of 3 KW Diesel Generator Used 8 Hrs/Day 44
iv
LIST OF EXHIBITS (conti6ued)
Page
13 Cash Flow Analysis of a 3 KW Photovoltaic System Used8 Hrs/Day, Costing $13/Wp 45
14 Cost Conditions Used for Photovoltaic System Analysis 46
15 Cost Conditions Used for Generator Systems Analysis 47
16 Financial Assumptions for Both Systems 4F
17 Comparison of Cash Flows Required by a 3 KW PhotovoltaicSystem and a 3 KW Diesel Driven System 49
18 Comparison of a Generator System and a Photovoltaic SystemOperated 4 Hrs/Day 51
19 Comparison of a Generator System and a Photovoltaic. SystemOperated 8 Hrs/Day 52
20 Comparison of a Generator 'System and a Photovoltaic SystemOperated 12 Hrs/ pay 53
p 21 Summary of Predominant Cottage Industries in Various Regionsof the World 68
22 Forms of Energy Currently Used 69
23 Potential Uses of Small-Scale Power Sources in CottageIndustries 69
i
t
v

PRECEDING PACE BLANK NOT Pi6MED
EXECUTIVE SUMMARY
This study was sponsored by the NASA-Lewis Research Center 0 support
of the Photovoltaic Technology Development and Application Program that
NASA manages for the U. S. Department of Energy (DOE).
Purpose
The purpose of this study is to assess the international market for
small-scale, stand-alone photovoltaic systems for applications in cottage
industries. For this study, cottage industries are defined as small rural
manufacturers, employing less than 50 people, producing consumer and simple
products. It was known that stand-alone photovoltaic systems are not cost
competitive with grid generated electricity. Therefore, the study focused
on rural areas of non-industrialized countries, where commercial power is
not available. Countries with centrally planned economies were not viewed
as a viable market for U.S. exports and were also excluded.
The underlying motivation for this study was two-fold. Primarily, it
was believed that applying electricity to rural cottage industry production
would help raise the standard of living for the rural sector by increasing
employment and providing supplementary income. It was also the intention
to promote the widespread usage of photovoltaic power systems.
Approach
The project approach was to initially establish the existence of a
"potential" market, to examine the economic advantages of a photovoltaic
system as compared to alternative means of supplying electric power, toquantify the electric power needs of typical cottage industries, and toidentify countries which appeared to represent early market opportunities
for rural, small-scale decentralized sources of electric power. This
portion of the study was done based on information obtained from secondarysources within the U.S.
It was the original intent of the study to look at systems 15 kilowatt
peak (KW p ) and smaller. For an industry operating 8 hours a day, this would
represent only 6.76 kilowatts capacity (KWW It was found that the electric
vii

M ;
I power requirements of typical cottage industries ranged from 750 watts (W)
to over 90 kilowatts (KW) in capacity. Therefore, systems of capacities ask
large as 100 KW were considered.
This approach also considers the DOE price reduction goals through
1986 which are expected to bring the photovoltaic system price from $13 /14p
to $6/W P*
Statistical data on cottage industries is extremely limited, especiallyin developing nations. Many cottage industries exist outside the formal
I
economy and few are registered legal businesses. However, they are deeply
entrenched within the culture and rural economy of a country and are recog-
nized as such. Therefore, it was necessary to take an in-depth took at
how photovoltaics could "fit" in the cottage industry sector of specific
j developing countries.
Four countries were selected for this in -depth analysis -- thePhilippines, Mexico, Morocco and Brazil. In-country field investigations
were made in the Philippines and Mexico. Studies were made of Morocco and
Brazil based on U.S. available secondary and expert sources. Detailed
reports of these studies can be found in Appendixes A, B, C and D of this
report.
" Potential" Market
The "potential" market is a theoretical estimate of the gross demand
for small-scale decentralized sources of electric power for rural cottage
industry applications in non-industrialized countries, with non-centrallyplanned economies. The underlying assumptions are that the rural producer
desires electricity and that the purchaser can afford it. Factors considered
in determining the "potential" market include: rural population, importance
of manufacturing and cottage industry to the economy, the number of people
engaged in fundamental industries and the power consumption of typical
cottage industries. It was also considered that: some rural industriesare electrified or soon to be electrified by a grid network, in some areas
hydro or wind power may be more appropriate, and some rural areas will haveinsufficient solar radiation for effectively utilizing photovoltaics. The
remainder of the market is assumed to be the potential market for stand-alone
viii
5
v*^v u
>
4j X
P-if
a
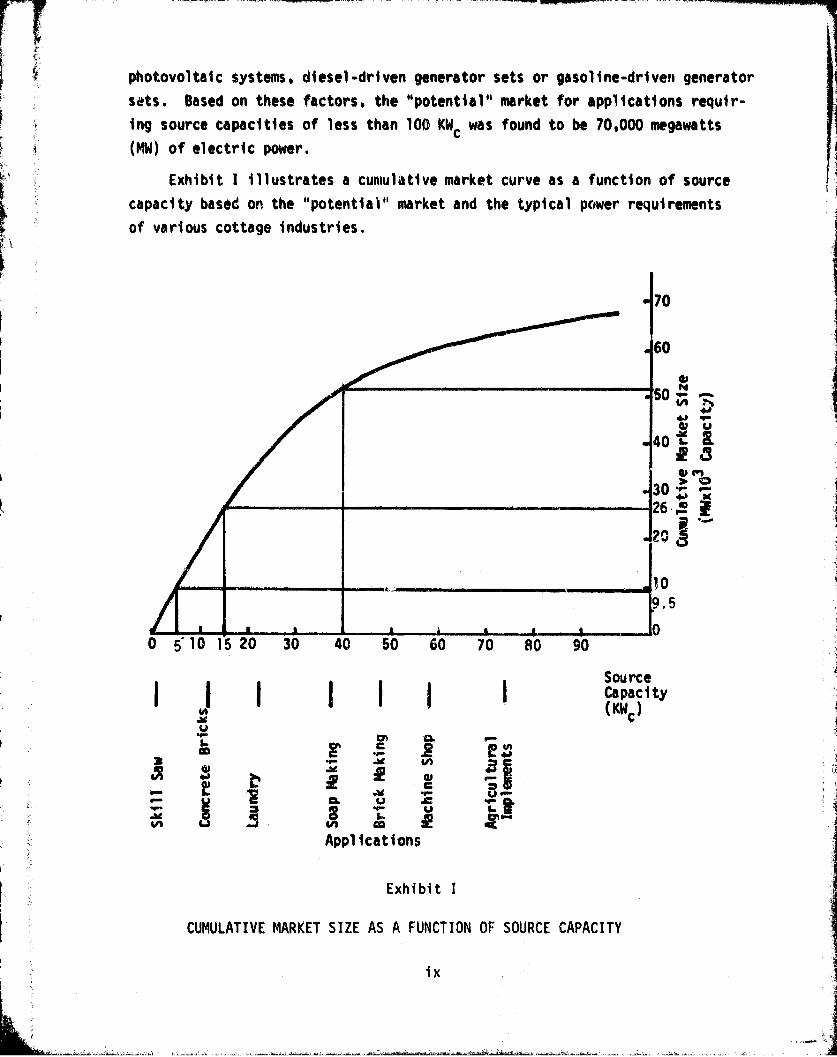
photovoltaic systems, diesel-driven generator sets or gasoline-driven generator
sets. used on these factors, the "potential" market for applications requir-
ing source capacities of less than 100 KW c was found to be 70,000 megawatts
(MW) of electric power.
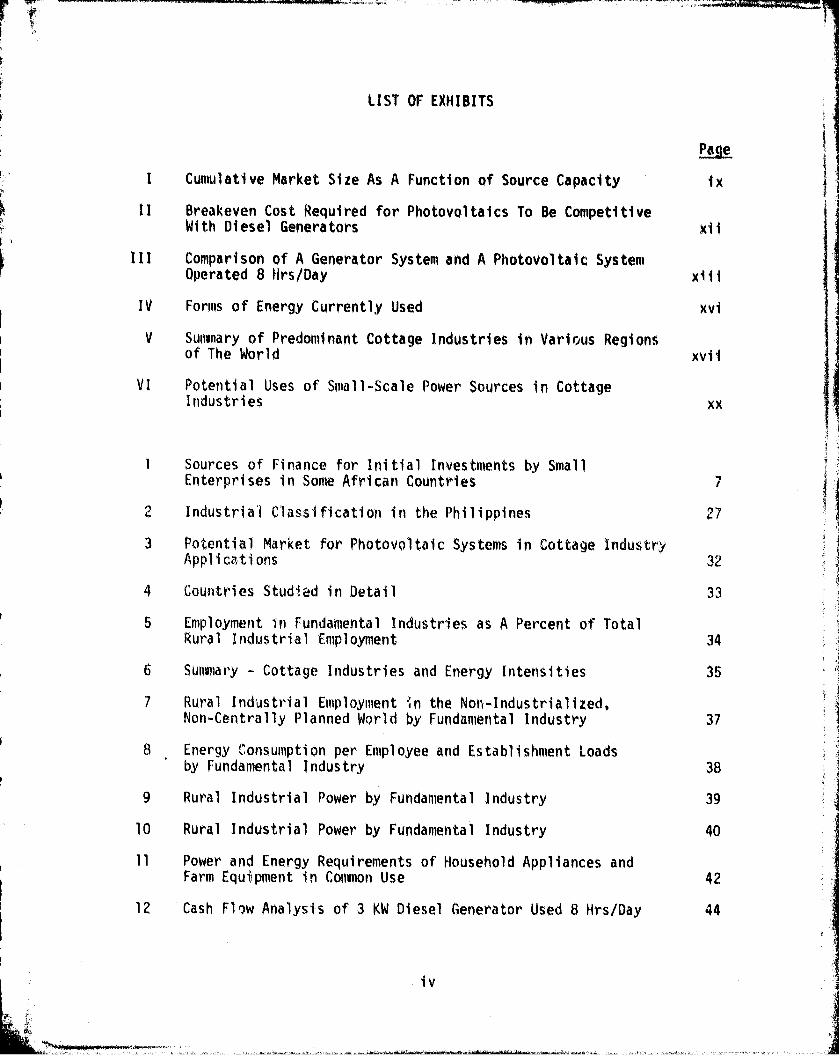
Exhibit I illustrates a cumulative market curve as a function of source
capacity based on the "potential" market and the typical power requirements
of various cottage industries.
Ij
SourceCapacity(KWc)
U
nn e0
w
w^ a+
CL u
4A
Applications
Exhibit I
CUMULATIVE MARKET SIZE AS A FUNCTION OF SOURCE CAPACITY
ix

The exhibit illustrates that, for powering industries that use 5 KWc
or less, the potential market is 9.5 MW. For those using 15 KW c or less the
potential is 26 MW and for those using 40 KW, or less the market is 52 MW.
Ob ectives
After estimating the theoretical "potential" market for rural power,
the next course of action was to determine the feasibility of attaining thatpotential or, in other words, to determine the "real" market for photovoltaicsystems.
The most significant factors which will determine the "real" marketfor stand-alone photovoltaic systems in cottage industry applications are:
1. Is the system affordable to the purchaser?
2. Does the system demonstrate itself to be the best option for the
purchaser over his current power source or the available
alternatives?
3: Will the system be accepted and utilized by the end-user?
To answer these questions the study addressed the following objectives:
- Determine the 6 teak-even price at which photovoltaics are as
economical a choice as alternative electr'.r power sources.
- Determine the life-cycle cost of a photovoltaic system versus
its alternative.
- Determine the cash flow requirements associated with the purchase.
- Identify those countries which appear to be representative markets
for small, decentralized power sources in cottage industryapplications.
Characterize rural cottage industries in terms of processesused, products, assets, available means of financing, marketingchannels, size and raw materials.
- Characterize the rural cottage industry producer.
- Establish the role of cottage industry within both the ruraland national economy.
- Establish the electric power needs of typical cottage industries.
- Identify the purchaser.
x
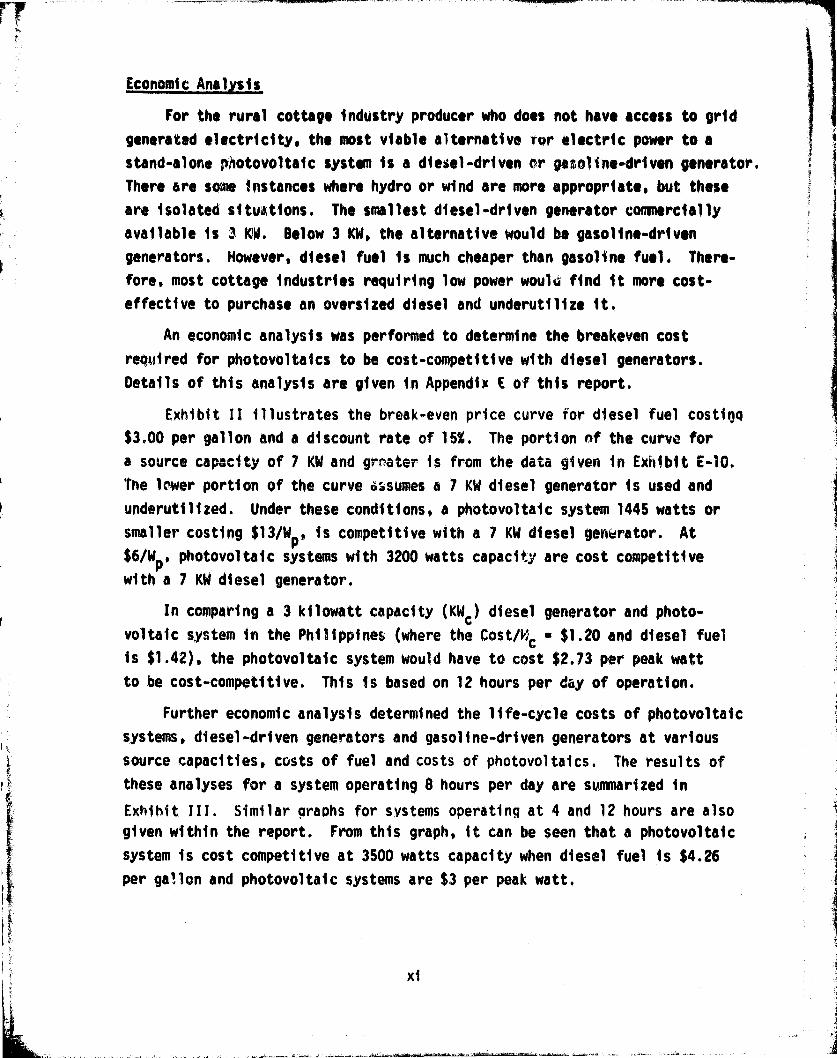
Economic Analysis
For the rural cottage industry producer who does not have access to grid
generated electricity, the most viable alternative ror electric power to a
stand-alone photovoltaic system is a diesel-driven or gasoline-driven generator.
There are some instances where hydro or wind are more appropriate * but these
are isolated situations. The smallest diesel-driven generator commercially
available is 3 KW. Below 3 KW, the alternative would be gasoline-driven
generators. However, diesel fuel is much cheaper than gasoline fuel. There-
fore, most cottage industries requiring low power wouli^ find it more cost-
effective to purchase an oversized diesel and underutilize it.
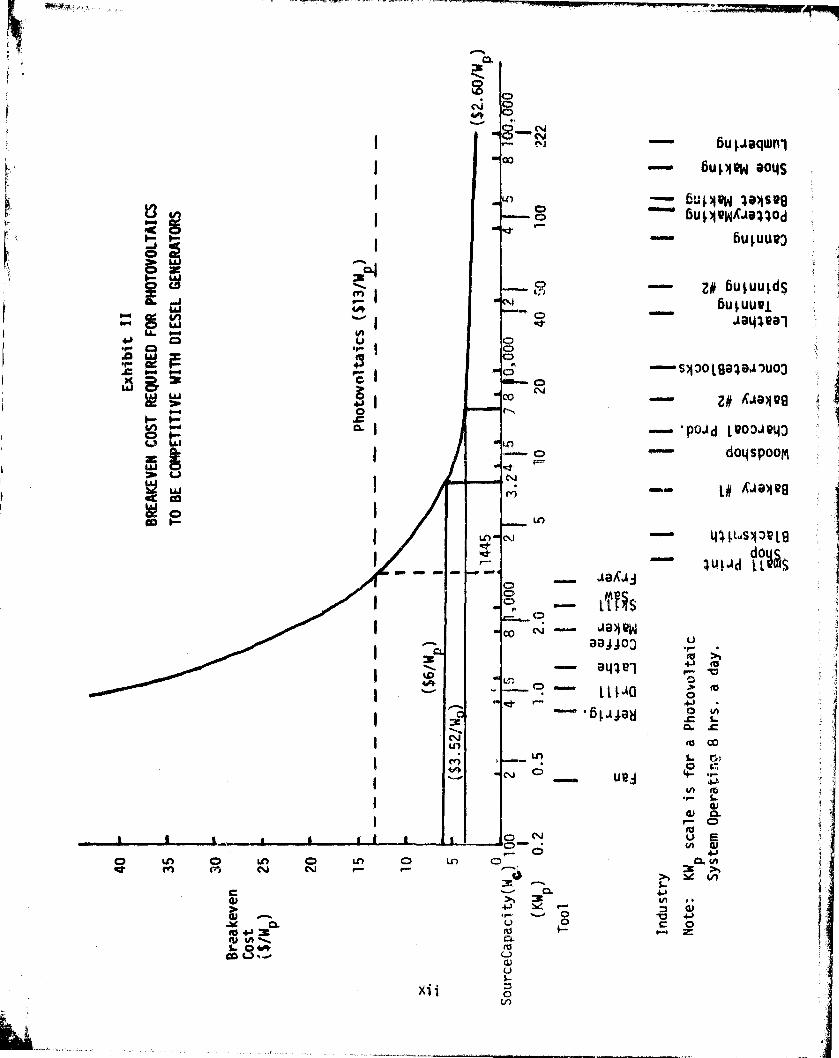
An economic analysis was performed to determine the breakeven cost
required for photovoltaics to be cost-competitive with diesel generators.
Details of this analysis are given in Appendix E of this report.
Exhibit II illustrates the break -even price curve for diesel fuel costing
$3.00 per gallon and a discount rate of 15%. The portion of the curve for
a source capacity of 7 KW and greater -is from the data given in Exhibit E-10.
The lower portion of the curve a &asumes a 7 KW diesel generator is used and
underutilized. Under these conditions, a photovoltaic system 1445 watts or
smaller costing $13/Wp , is competitive with a 7 KW diesel generator. At
$6/Wp, photovoltaic systems with 3200 watts capacity are cost competitive
with a 7 KW diesel generator.
In comparing a 3 kilowatt capacity (KW c ) diesel generator and photo-
voltaic system in the Philippines (where the Cost/Kc . $1.20 and diesel fuel
is $1.42), the photovoltaic system would have to cost $2.73 per peak watt
to be cost-competitive. This is based on 12 hours per day of operation.
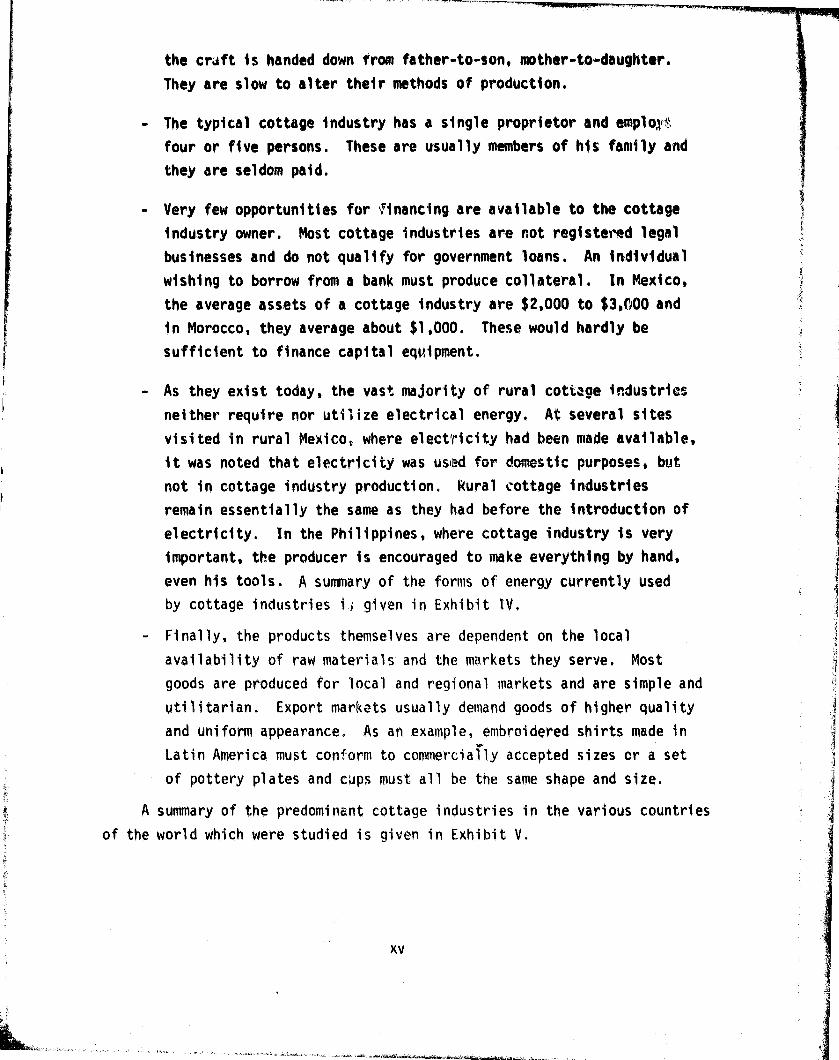
Further economic analysis determined the life -cycle costs of photovoltaic
systems, diesel -driven generators and gasoline -driven generators at various
source capacities, costs of fuel and costs of photovoltaics. The results of
these analyses for a system operating 8 hours per day are summarized in
Exhibit III. Similar gra phs for systems operating at 4 and 12 hours are also
given within the report. From this graph, it can be seen that a photovoltaic
system is cost competitive at 3500 watts capacity when diesel fuel is $4.26
per ga'lon and photovoltaic systems are $3 per peak watt.
t
xi
0-%a.
C)
- 04R.Vl6u ljaqwnl
oa6uiMVW 004S
LO
Cw 6u EJQWOCAOIIOdad
6utUU93
Z# 6utuuLdsC-4 6upu9i
15130 LGOIOA!)UOJ
co
C:)C"i
r.'PO.Ad LI?O:) -A e43
d04SPOOM
cli1#
LO C'J 4 4 [ LA 1:)e L 9vt do
luPd MASAOX.Aj
LTNS
0 00 N r.r Jal 9W
aajjoo
041 LI
L L PO
6 ^.A JaHCL
(c CO
CDURA 4-
CD
C:)C%J u(A
CL 4A>1
tl
u(a
U
u
0V)
o Lin CD Ln 0 Ln CD LOM C.-P C*4 C%j
cQ)
CL.
S. OM00 L.) ^ -o
xi i

6
k
ORIGINAL PAGE IGr POOR QUALITY
..v !^ W o! A I .V O VI W !^ W V/ O n1 N
^Ra^^ed p^ s3^eM)o peon •-,`--
1 ^
c P
O Y
MW
O
I`
I
E 1$
iL0
i >N
6$
d da^
9S,
cF-
® dM/£4O r
w X£,,,
IV
Via`XZ^
^ LL
auai.An
1/9 Rcz r
e
Q
WON
Nr. w
'Q mR
Vm
in
F
^x•0101 n }0 9% C P1 N
PYM
O
A
-- rtk
"
" 44L I
•} r^^ ter...... ,w ^.i+..`it ! 1 ^l l,i
h17^A
0^• ^ i 1i , if
I
'^1w '1'.". ..Mr
R A^i'p1.
w I..er A
'
."^ '
.a.. n•.s
I.. P MIyr
' 0 '
N
.kt• a ,^ Y' ^^.wt. ^ "n /awl
, ^ r I II +^4
Ll !
0 ► ^'I'' j r ) a 1; , ;.,^. ^,+ j ► { i
II^1 ^^ , I ^^. ^I „_ 0 ^ it q
Ti
it
:r
l
f i_
^^';
I,
^,; I,
► ; II ,j^^ ^^ ; .TI ^^^j ^ ' ^,]) 4 1 1 ^ ^(^ ^ ^ ,^;. I^'
a ^' 'il ` i ► ' ill i 1 Ib f I Ii i ► , If ► ^ ; 1
(
i' Y 1 1
I ;, ^^
CD
dCA
1. ^, lli^ II,I^ I,^ Ili;', l l
►
i
(^
^
jua.^.Anir
iT
_^I .- ^1 I^ ^ I ^ lI t
^'I^
r^
I
?.i
IIiI1'^i
}'
Ilil
,
I1 •^Im
l
^
lI,I
^^t
I ^' ' IIII
l;
rI
.^.HL
'I , <<^
1
.j
•r
El ,
a
(11
1 ,,
..
,_
I,i Illif i _.. ! I I I I I. n , i: I
O Pr
CD8Cr
xiii
w 4•r
w 4►
W
M
to W
o ^w V •^
u iw.^J Oo

To further illustrate, at $1.42 r gallon diesel fuel in the Philippines
Is very close to world market price. If the price were to increase by 24.6%
a year, for five years, it would then be three times the current price or
$4.26. If, in five years, the system price for photovoltaics came down to
$6/Wp . it would still be more economical to use a diesel generator.
Characteristics of Rural Cottage Industries
Although each culture is unique, many general characteristics of rural
cottage industries can be seen throughout the world. This study took an
in-depth look at cottage industries in Sub-Sahara Africa, Morocco, the
Philippines and Latin America, including the Andes, Brazil, Mexico, Central
America and the Caribbean. From these, the following observations were drawn.
Countries at a very early stage of industrial development, as in
Sub-Sahara Africa, have a bimodal industrial distribution. There
are large, modern urban industries and the small and artisan,
sector. Large scale industries are highly energy intensive, while
the small, artisan sector is largely dependent on hand or mechanical
labor. As these industries grow and develop, there will be a need
for power, but at present familiarity with the use of electrical
equipment is not widespread.
- Countries in which all segments of industry (artisan, small, medium
and large scale) are developed will be more likely to apply an
electric power source to their rural cottage industries. The
Philippines, Brovil and Mexico would be included in this category.
- For many producers, cottage industry is a part -time or seasonal
activity. Seldom do people consider themselves as a potter or
weaver, but rather as a homemaker or fa^iner.
- Cottage industry production is frequently the only source of income
to the producer to supplement a subsistent farm production.
Cottage industry producers learn their craft either through apprentice-
ship or formal training. Formal training would usually be through
government extension service or missionaries. How,,;; r, in most cases,
xiv
the crift is handed down from father-to-son, mother-to-daughter.
They are slow to alter their methods of production.
- The typical cottage industry has a single proprietor and emplo3lt
four or five persons. These are usually members of his family and
they are seldom paid.
- Very few opportunities for,Financing are available to the cottage
industry owner. Most cottage industries are not registered legal
businesses and do not qualify for government loans. An individual
wishing to borrow from a bank must produce collateral. In Mexico,
the average assets of a cottage industry are $2,000 to $3,()00 and
in Morocco, they average about $1,000. These would hardly be
sufficient to finance capital equipment.
- As they exist today, the vast majority of rural cotta ge industries
neither require nor utilize electrical energy. At several sites
visited in rural Mexico, where electricity had been made available,
it was noted that electricity was used for domestic purposes, but
not in cottage industry production. Rural cottage industriesremain essentially the same as they had before the introduction ofelectricity. In the Philippines, where cottage industry is very
important, the producer is encouraged to make everything by hand,
even his tools. A summary of the forms of energy currently used
by cottage industries i; given in Exhibit IV.
- Finally, the products themselves are dependent on the local
availability of raw materials and the markets they serve. Most
goods are produced for local and regional markets and are simple and
utilitarian. Export markets usually demand goods of higher quality
and uniform appearance. As an example, embroidered shirts made in
Latin America must conform to commercially accepted sizes or a set
of pottery plates and cups must all be the same shape and size.
A summary of the predominant cottage industries in the various countries
of the world which were studied is given in Exhibit V.
xv
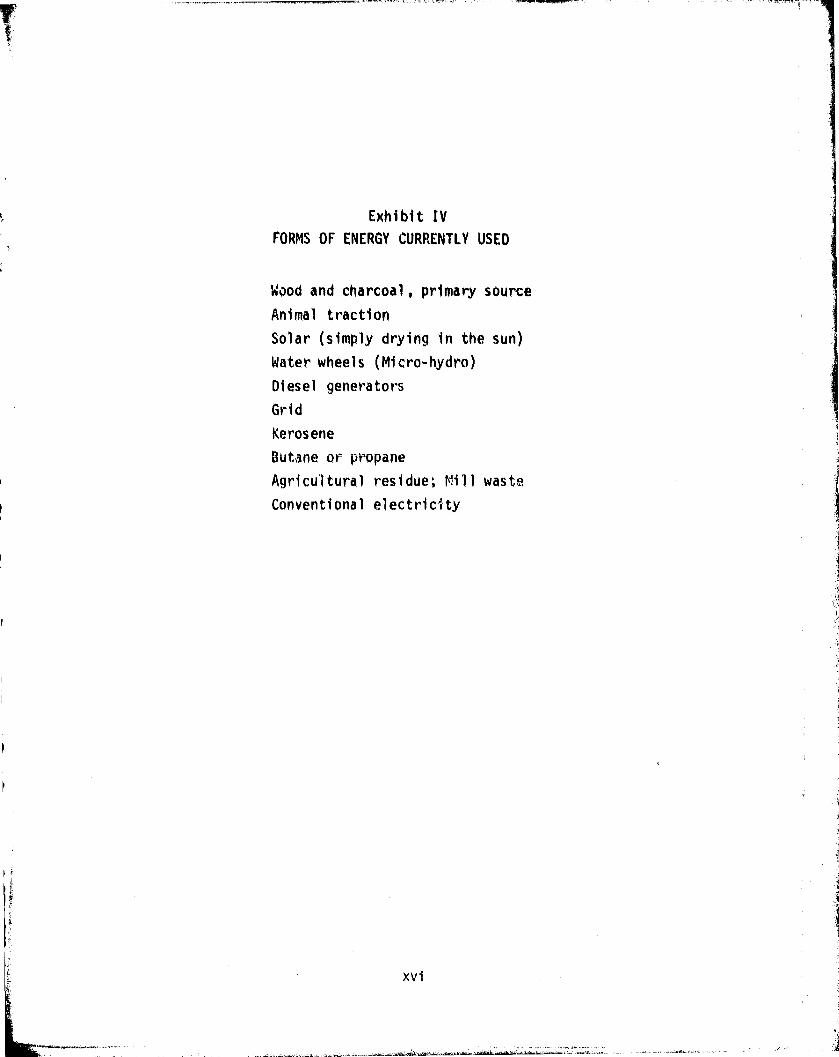
Exhibit IVFORMS OF ENERGY CURRENTLY USED
Food and charcoal, primary sourceAnimal tractionSolar (simply drying in the sun)Water wheels (Micro-hydro)Diesel generatorsGridKeroseneButane or propaneAgricultural residue; Neill wasteConventional electricity
xvi

cLi C
4 Ad
w 1
L O C wC N N C1 L 4- Im
C C ^^ r0 w C 01_ •r r •r OJ L CL r- C+1 rn to .be C1r— u o -he •^•.- c u L C 4- t ro •at
O O COL(atm C ^ •L 4A 41
.c 4J ro rd ui r• in r- C u 4)u t C9 t 10 ea) r > >yr- •r •r' rR7 C1 C u C C 4J G. O O L. L. -r-r- •r •r ^y 3 •r O O 4J "0 G..0 4Jco J g W u IL
wM OO CO •r-M ww wfLil •r u
4-► 4/ •o L0) b °O aJ co U-
RyE
w
LCL a
yr •rC36
O
6-4 •r r••• •rF-1 C x r- 41 L
R — 9 u R wU. Al
v '> Ad 4J
s cu^ a
o vlJ COC •F- CO ^d 4► -r-
L.
c C V 4J O 4-I D0-•4 N r •r )d gMg^^ •>K dJ }? L 0 w L rO
O O ti Z ccN
CD V ^^
1^ C1 O L N uN G4J L O L•^ -r ♦•r w 3'i
U 1ra ^ O wIx aQ 3v 0. c IY
Z W41
^• 41
NW
X 1LLJ N w
O wo az u
Cm awi uW J C •r •r d0 6-4 •^ L E
1-4i0 ^ L O C
O CD 3 co V LL-
2E
^-'S C,^ C >, >, LC r- • r L L O 4J
LLJ W •> Q J ^C Gl Cr•M o 6 °or-^v ro
LL Q 3 N m r-j 3 coOw L
•rw w ^
1t
P c Na1 •fl E 'N ^ C! r C1 M O L
•^L.L awi c awi a •E >, c 0)
Q d r •r O •r E L" 4! +J r-C^ •r > r L •r C 1 C d •r u
Vd' O X w to _u r0 r w (a L3Q 3 F m cc CD 3 z 40. m
r cb
L
xvii

^.
k
Purchaser
The primary purchaser of stand-alone photovoltaic systems in cottage
industry applications will clearly be from the government sector. The
principal reason being money. Photovoltaic systems are initially capital
intensive and require iuiig-term usage to be economical, if at all.
Considering the characteristics of typical cottage industries, it is
highly unlikely that a rural cottage industry would have the financial
means necessary to support such a purchase.
Conclusions
Based on the nature of rural cottage industries in developing nations
and the economic analyses of this study, the near term market for photo-
voltaics in rural cottage industries appears to be limited to demonstration
projects and pilot programs.
The two major reasons supporting this conclusion are: (1) Stand-alone
photovoltaic systems, at a system cost of $6%Wp to $13%Wp are not the mosteconomical means of providing small, decentralized sources of electric
power for cottage industry applications, and (2) cottage industries are
not a high priority for development.
It i , the usual objective of a developing nation to make a positive
impact on the standard of living for the greatest number of its people. The
highest priorities in a government's developmental plan will be food produc-
tion, the provision of safe drinking water and medical facilities.
Once the basic necessities have been filled, the next level of priorities
is to provide education and infrastructure. Schools, educational television,
communication systems and highways would be the next facilities and services
provided.
Cottage industry production beyond the needs of a village requires skilled
producers, adequate supplies of raw materials and a marketing infrastructure
for the goods produced.
A country having attained this stage of development would then begin to
consider developing the rural economy either to provide goods regionally or
to create an export trade. Also, skilled labor creates a need for employment
xvi ii
and cottage industry production tends to be tabor-intensive. Funding
for projects to develop cottage industries and train labor is usually low.
Mexico. which has one of the most ambitious plans in this area has committed$27.4 million to electrifying 4,705 small rural industries. This gives an
average of $5,834 per industry.
Finally, consider what effects the application of electric power couldhave on rural cottage industries. Basically there are three effects:
- Production of more goods
Production of goods with a higher value-added
- Better utilization of labor
Production of more goods is desirable only if there is a demand in themarketplace. Usually this situation is limited to export-oriented producers.Most cottage industries produce simple goods for local and regional markets
and their production levels are in balance with the rural economy. It is
unlikely that this producer will want to produce more goods, since thismay actually reduce the price obtained for his goods. Roads, transportation,
storage and intermediaries must all be present. For many isolated rural
industries an adequate supply of raw materials may also be a problem.
Another effect is to produce a more profitable product. Production of
goods with a higher value-added is a good rationale for adapting electricity
to manufacturing and there have been many successful cases demonstrated.
This is especially true in the furniture and woodworking industries. The
maJor drawback is, again, there must be a demand in the marketplace for
higher value-added goods. Another problem is maintaining the integrity of
the product. The value of many cottage industry products lies in their
visible manual craftsmanship and cultural expression. This is especially
true for clothing, carved goods and painted goods. In an export market,
hand-made goods also enjoy considerably lower tariffs and duties than
machine-made goods.
xix

The third effect of applying electricity is better utilization of
lab',, r. The purpose is to free the laborer from tedious, low-value manual
tasks to either produce a more valuable product or use his or her time in
a more profitable manner. However, this frequently requires a total
program of education and facilities. Unemployment is a major problem in
many countries and, often, underemployment of labor rather than
introducing powered equipment is preferable.
An opportunity that may exist for stand-alone power sources is in the
extraction, tra l .,)ortation, storage and processing of raw materials used
in cottage industry applications. Semifinishing processes, finishing
processes and finishing accessories are also segments of cottage industry
that could easily utilize stand-alone, decentralized power sources.Exhibit VI contains a list of potential uses and their relative applications.
Exhibit VI
POTENTIAL USES OF SMALL-SCALE POWER SOURCES IN COTTAGE INDUSTRIES
Use (Equipment) Application
- lighting - general usage
- mixers for the extraction - potteryand mixing of clay cooking vessels
- grinders construction material
- centrifuges - cornmeal grinding
- lathes, bandsaws - fishmeal grinding
circular saws, - jewelry makingsandersgrinders - religious articles
- lathes - furniture and wood products
soldering irons construction materials
buffers - metalworkingpolishers
y,
xx
k_'_'__. _ ._
INTERNATIONAL ASSESSMENT OF STAND-ALONE PHOTOVOLTAIC
POWER SYSTEMS FOR COTTAGE INDUSTRY APPLICATIONS
1. INTRODUCTION
The purpose of this study was to assess the international market for
small-scale, stand-alone photovoltaic energy systems with respect to the
energy needs and resources available to cottage industry applications.
Stand-alone photovoltaic systems are not cost-competitive with grid generated
electric power. Therefore, they have their greatest utility in rural areas
where commercial power is not available. Therefore, the study focused on
the rural cottage industry sector of non-industrialized countries with non-
centrally planned economies. Throughout the world, cottage industry has
many meanings and usually encompasses both artisan and small-scale industries.
For this study, cottage industries are defined as small rural manufacturers
employing less than 50 people, producing consumer and simple products.
The original intent of the study was to examine industries which would
utilize a maximum power supply of 15 kilowatts peak (KW p ). A 15 KWp system
can supply 5 kilowatts capacity (KWd of constant power over a 12 hour period,
or 6.75 KWc of power over an 8 hour period. However, the energy needs of
typical cottage industries were found to range from 750 watts capacity to
over 90 kilowatts capacity. Therefore, in order to derive a better under-
standing of cottage industry needs the economic portion of the study con-
sidered systems as large as 100 KW c,
Initially a preliminary assessment of the worldwide market identified
countries for further study that would be representative of cottage industries
throughout the world. This assessment was based only on data and information
available in the United States.
The methodology used to make a preliminary assessment of the market was
to (1) estimate the "potential" market for photovoltaics, (2) examine the
economics of photovoltaic systems in relation to their most viable competitor --
diesel driven generators, and (3) assess values of photovoltaics other than
economics by examining the strategic implications of introduction of photo-
voltaics for the small businessman and for the importing country.
7
1

Fourteen countries which appeared to have a healthy cottage industry
sector were profiled. At least three developing countries were chosen from
each of the four regions of the world. For each country, consideration was
given to the extent of rural electrification, the importance of cottage
industry, and the potential of stand-alone power systems within the current
government policies for energy, industry and the general economy. The 14
countries which appeared representative of world cottage industry producers
are:
Central and South America
ArgentinaBrazilMexico
Mediterranean an,; Middle East
EgyptSpain
. GreeceMorocco
Sub-Sahara Africa
Kenya• Cameroon• Nigeria
Southeast Asia
IndiaRepublic of KoreaPhilippinesMalaysia
From these 14 countries, four were selected for in-depth study. They
include the Philippines, Mexico, Brazil and Morocco. In-country field
investigations were made in the Philippines and Mexico. Studies of Brazil
and Morocco were made based on information from expert sources in the Q.J.S.
Detailed reports of these studies are given in Appendixes A, B. C and D.
Statistical data on rural cottage industries is extremely limited.
In most parts of the developing world, rural cottage industries are not
2
2
perceived as such, but rather are regarded as a part-time activity of
families and farmers. Frequently, they function outside the formal economy
and rarely will they be registered legal entities. An exception to this
may be in Asian cottage industries, but, even here, data is incomplete.
Hence, for the purpose of this study, emphasis has been placed on the
analysis 0 the qualitative application of stand-alone photovoltaic systems
in cottage industries, rather than a statistical evaluation of the numbers
of industries and establishments that could utilize the technology.
2. NATURE OF COTTAGE INDUSTRY IN LESS DEVELOPED COUNTPIES
In order to determine the market potential of an electric power source
for use in cottage industry, it is necessary to gain an understanding of
cottage industries as they exist in the developing regions of the world.
The major factors to be considered are the processes used by cottage indus-
tries, how energy is utilized, how easily the producer could apply photovoltaic
systems and the overall fit of cottage industry in the rural economy. It is
also important to consider, to some degree, what effect the introduction of
electricity would have on the production and marketing of cottage industry
goods.
The following sections probe this objective by examining the nature of
cottage industry in Sub-Sahara Africa, regions of Latin America, Morocco and
the Philippines.

2.1 Sub-Sahara Africa
With the exception of South Africa and the People's Republic of the
Congo, Sub-Saahara Africa consists of primarily agrarian economies with at
least 50 percent of the labor force of each country employed in agriculture.
As characteristic of countries at an early stage of industrial development,
African nations tend to exhibit a bimodal distribution of industry. This
is a "stage of industrialization in which a large number of small craft-
based enterprises r;.oexist with a limited number of large scale, foreign or
state-owned firms."' The absence: of small factories and medium-size enter-
prises is obvious. In Africa, small and artisan enterprises which employ
less than 50 workers account for 95 percent of those employed in manufactur-
ing. Within the small and artisan sector there are two factions. The
traditional crafts are rural, the modern small industries are urban. A
community is considered rural if it has a population of less than 20,000
people.
African cottage industry as an economic entity is just. beginning to
emerge with the majority of firms still belonging to the informal economy.
Most small-scale industries, especially urban, are less than 15 years old.
Characteristic of countries which have been under colonial rule, a signifi-
cant expansion in the number of cottage industries can be seen, beginning
with each country's independence. However, these industries are those
which require very low technical skills. The goods produced are simple and
frequently unfinished or inferior. This appears acceptable to the local,
low-income markets they serve, but goods sold in the formal economy are
produced by formally trained artisans.
Tailoring, furniture making, carpentry and vehicle repair are primarily
urban industries. In the rural sector, there is a definite linkage between
agriculture and small-scale industry. Agricultural processing and agricultural
implements predominate, although weaving, mat making and pottery are also
significant. Most of the agricultural processing involves grain milling,
1 John M Page, Jr., Small Enterprises in African Development: A Survey,World Bank Staffing Paper No. 363, . P. 4.
xi
4

E
especially rice mills. Oil seed processing is also important. Rural black-
smithing represents an estimated ovie percent of the agricultural output. The
major activities are tool repair and the production of machetes, hoes, knives
and axes. The goods are not of high quality and lack standardization.
Cottage industry, for the rural producer, tends to be a part-time
activity with two -thirds of his time being spent farming. The business has
a household nature and either relies heavily on family labor or is a singleworker, sole proprietorshi lp enterprise. With the exception of Ghana, cottage
industry is primarily a male occupation. The incidence of wage employment in
small -scale industries increases with the size of populations and is usually
urban. Cottage industry producers, in general, earn larger incomes than
solely agricultural producers.
African cottage industries, both urban and rural, produce simple consumer
goods for local markets. Goods are commonly produced on demand for individual
customers and marketing is through personal contact between the producer and
the customer. One rea3un for this is tie shortage of working capital which
plagues most small-scale enterprises. However, pra0ziction on demand also
contributes to the lack of quality control and standardization.
In Sub-Sahara Africa, skills are learned through an apprenticeship
program. This applies to both the technical skills of the manufacturing
process and the skills of business ownership. West and East Africa exhibit
distinct methods for teaching cottage industry production. West African
apprenticeship programs are large, extremely organized and traditionally
oriented. East African programs have been formulated more recently and are
less structured. All, however, utilize on-the -job training. Few cottage
industry producers have formal education or training and a large percentagelack basic literacy and numerical skills. In the urban sector, less than
15 percent of the business owners have received school training.
The typical produce! , is a "craftsmen, entrepreneur technically proficient
in the manufacturing process, but without extensive training in financialmanagement or business organization." 2 Formal education or vocational train-
ing have a high opportunity cost. Once basic technical skill has been acquired,
2 John M. Page, Jr., IBID. P. 29
5
most artisans prefer to begin generating income, rather than advance their
capabilities. Training and education are not readily available ncr easily
accessible. Most vocational schools are academically oriented and have high
entrance requirements. Also, they are usually located in large cities, making
them physically out of reach for the rural entrepreneur.
The tack of basic business skills in organization and management severely
hinders rural cottage industries. Became it serves as a symbol of social
status, most tend to hold excessive stocks of goods and raw materials. Raw
materials are poorly stored and results in considerable spoilage and waste.
Inapplicable. unused capital equipment is another status related problem.
Production improvements for workshops could be made in the inefficient
layout of machinery. Poor maintenance of tools and equipment is a major
problem as well as obtaining production inputs and spare pants which are
imported. Small enterprises are usually the last to get delivery on im-
ported goods and do not enjoy the duty and license advantages of larger firms.
Most African small-scale enterprises are unregistered businesses. The
two main reasons are to avoid taxes and a general inability to cope with the
bureaucracy. Compliance with health and safety regulations is also a problem
for small business and discourages legal registration. Again there exists
some distinction here between regions. Registration requirements for West
African nations are relatively uniform throughout the country. Registration
of small firms usually means greater government assistance to them. In
East African nations, registration of business is usually done at the local
level so that requirements, fees and enforcement policy vary.
The major drawback to non-registration for a small business, is the lack
of available financing. Insufficient working capi't;al is considered the big-
gest constraint for small-scale and artisanal enterprises. Part of the prob-
lem is that the business must extend credit to its purchasers, but must pay
cash to its suppliers. This, coupled with generally poor management, creates
a major cash flow problem. Exhibit 1 shows the results of several surveys
taken to identify so rces of capital for small African businesses. Personal
savings is, by far, the qreatest source of money.
1
6
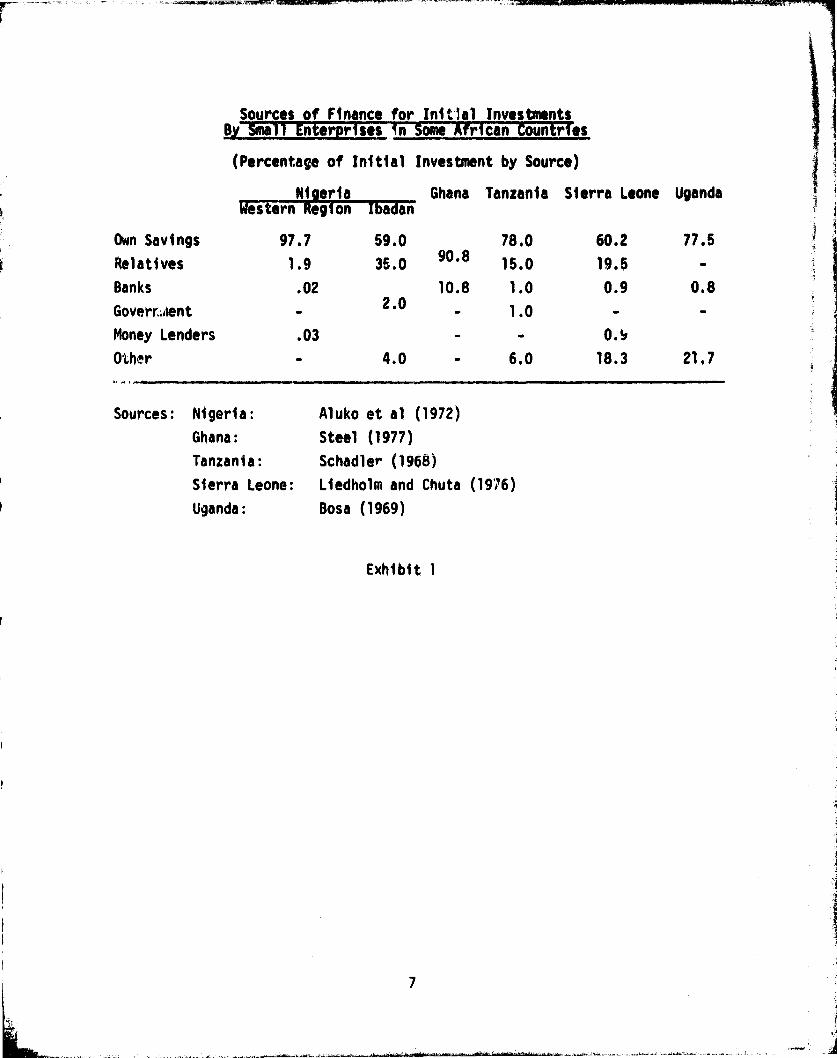
Sources of Finance for Initial Investmentsn 5 rE se n ome r can oun r es
(Percentage of Initial Investment by Source)
Nigeria Ghana Tanzania Sierra Leone Ugandawesterneeggi-on sedan
Own Savings 97.7 59.0 78.0 60.2 77.5
Relatives 1.9 35.0 90.815.0 19.5 -
Banks .02 10.8 1.0 0.9 0.8
Gove:rr..nent - 2.0 - 1.0 - -
Money Lenders .03 - - 0.p
Oth r - 4.0 - 6.0 18.3 21.7
6
Sources: Nigeria:
Ghana:
Tanzania:
Sierra Leone:
Uganda:
Aluko et al (1977)
Steel (1977)
Schadler (1968)
Liedholm and Chuta (1976)
Bosa (1969)
Exhibit 1
7
Public and commercial banks are rarely a source of capital and
government development agencies are Just beginning to finance small
business. Government policies, while encouraging cottage industry,
usually favor funding for large-scale, modern enterprises and large loans.
Private banks will make loans to small businesses, but the cost of borrowed
capital for the small business is much higher than for the large borrower.
This, however, is a real cost and reflects the greater risk associated withsmall business and the high administrative costs of processing small loans.
It is anticipated that the demand for cGttege industry goods will
increase with incomes and the overall development of each country. However,imported goods may be favored over African goods because of the desire for
finished quality. Many countries also anticipate a demand for traditional
and cultural goods for export and tourist markets.
There will be a need for better technical processes and equipment,
such as electrified tools, looms, ovens and similar products, but this is
not an immediate need. The biggest problem presently is the lack of educa-
tion, especially in finance and business management. Although there is
considerable effort being made in African rural iridustrial development, it
is insufficient to support the widespread introduction of a small-scale
decentralized electric power source into the cottage industry sector.
i

2.2 Latin America
The cottage industry sector of a country is deeply entrenched in the
history and culture of its people. Culture is the root of a society from which
stems its attitudes towards commerce, labor and production. The first step in
analyzing an international market is to perceive the attitudes and behavior of
the potential end-user.
In Latin America, two distinct cultural influences predominate. The
upper and middle classes .end to be of Spanish-Portuguese descent, while the
lower classes and less developed population is largely the indigenous Indian
population. The Spanish and Portuguese, considered manual labor degrading;
hence, they have historically viewed cottage industry as a lower-class
occupation, reserved for the poor. Cottage industry goods were perceived as
inferior, while machine-made European goods were the preferred choice. In
the last W years, as many countries have begun to adopt nationalistic
industrial policies, this attitude is beginning to show signs of change.
Also, improved rural incomes and development of infrastructure are bringing
about a deeper appreciation of rural cottage industries.
Among the indigenous Indian populations, the cottage industry producer
enjoys a considerable amount of respect, but few people consider themselves
as such. Even though cottage industry production may be the sole source of
income for a rural dweller, he or she will still call themselves farmers or
housewives. Nevertheless, cottage industry is very important to the
informal economy of rural Latin America.
This section will consider the nature of cottage industry in the Andes,
Brazil, Central America and the Caribbean and Mexico. A more detailed
discussion of Brazil and Mexico is given in the Appendix of this report.
9

7.2.1 Andes
The Andes mountains form a distinct rural region in South America which
includes Bolivia, Peru, Ecuador and Northern Ch11e. 1 The lifestyle of these
Andean people is closely tied to their physical environment. Sheltered fertile
valleys and rugged mountains form the Andean region. Agriculture and ranch
herding are the primary occupations of most people, but all members of a family
will never be engaged in the same work. For example, one may be a farmer, one
a herder, one a pottery maker. This is to ensure against unemployment and loss
of income to the family. Even farming is done vertically a;n varied. That is,
a farmer will plant at various altitudes anI not only in one area.
The culture of the rural people in this region is highly indigenous, dating
back to the Incas. The power of the community and local government still exists
today. The community consists of a highly structured organization. This gray
encompass several villages or there may be more than one community within a
single village. This is because the male population may go off to farm in
another area or altitude, but they still belong to their original community. The
community leadership, the Elu, dictates all tasks and chores and decides who will
produce what. This ensures employment and provides for all the diversified
needs of the community.
In the Andean countries, weaving is, by far, the greatest employer in
cottage industry and blankets, clothing and carryalls are the principle products.
In Ecuador, they weave cotton, sheep wool and orlon. In Bolivia, Peru and Northern
Chile they use alpaca and some llama. This industry is so important to the in-
formal economy that Bolivia and Peru each have a federal Ministry of Wool.
Pottery, wood products, bakeries and basketry are also important, but not to
the extent of weaving. Jewelry making is important because of its high monetary
value. Peruvian cottage industries work in silver, while Bolivians produce tin
and pewterware.
In the Andean countries, the commercial intermediary is an integral component
of the rural infrastructure. The commercial intermediary Is a rural entrepreneur
who finances, organizes and markets the products of cottage industries. He will
Nor te: Columbia and Venezuela are also members of the Andean Pact Group,.,whereas Chile is not. However, Columbian and Venezuelan cottage industriesare not described here.
10
either finance raw materials through credit or distribute piecework. Piecework
is especially common in the clothing industry where women do embroidery and
handwork rather than cutting and assembly. In very remote areas, the interme-
diary is usually from, the community or a nearby town. In larger rural communities,
with populations of over 3,000, he is usually a self-made businessman from the
middle or upper class or the local clergyman.
The priest or missionary is very important in Latin America and exerts a
tremendous influence on the people. A missionary or padre will set up a total
community facility in a larger, but rural oriented city, that provides equip-
ment, materials, warehousing and whatever is necessary for supplying and
marketing cottage industries. He will then form a network of producers in
the nearby rural areas within a radius of 00-100 km. Occasionally, there willbe some industry already there, but usually a teacher is brought in and the
processes and techniques used are introduced. For example, a common strategy
is for the priest to organize a mother's club in the rural community. He
then brings in a sewing teacher and the local sewin g circle evolves into an
industry. The goods are usually marketed within the formal economy and are
produced for export or tourist trade.
Many view the commercial intermediary as all of rural artisans.,
however, the intermediary must provide credit to the producer, supply the raw
materials and market the goods. A product may go through several intermediaries
before it is actually exported and each step in the chain increases the cost.
Also, the product then must compete with industrial produced goods, as in thesewing industry, as well as other foreign producers. There is also a risk
associated with being an interymediar,y since most cottage industries are non-registered businesses and occasionally operate illegally. Illegal businesses
may be found in areas where raw materials are extremely scarce and privatelyowned or federally controlled; Ali example may be forestry or fishing relatedi ndus tri es
Ill rural informal sector the goods produced are utilitarian and
cultural. The informal sector is that which is outside the monetary economy.
Here, goods are frequently bartered and prices are often set by the local leader,
the Flu. The nlajor ty of cottage industry producers are employed in this sector.
Their articles and designs are intended for the informal market and they have a
s
11

functional purpose, usually religious. Not every city or village will have
cottage industry, but where it is found it is usually the sole source of income
for the producer combined with a subsistence agriculture. Cottage industry
is an essential contributor to the informal economy and balances agricultural
production.
The processes used are traditional and usually learned by apprenticeship.
Since their techniques are so closely tied to their lifestyles, it is very
difficult to introduce new technology. One example is in spinning wool. The
women of the Andes Use a portable spinning device called a Rueca. The spinning
wheel will never replace .a Rcuca, because the portable device allows them to do
the herding and spin their wool at the same time.
The principal sources of energy for rural, Andean cottage industries are
wood, charcoal, hydro power and diesel generators. Wood and charcoal are used
by bakeries which produce empanadas, the daily staple. Empanadas are like a
turnover which are filled with meat or fish. They are made fresh each morning.
Grinding mills are run on animal traction or hydro power. In and near
the mountains they make good use of water wheels for operating mills. Other
food processing industries use wood and charcoal or diesel.
Diesel generators are used quite extensively throughout the Andean region.
In Bolivia and Peru, fuel is so highly subsidized that, in 1977, diesel fuel
was retaining below the world market price. Even so, the cost and operation
of diesels is considered extremely expensive, especially in the E1 Beni region
of Bolivia.
Since the people are so deeply entrenched in their cultural patterns, the
introduction of any new technology would be difficult and lengthy. It is doubt-
ful that weaving and pottery would adapt to electricity since these industries
are so closely integrated with everyday activities. There may be some potential
in wood-working and jewelry making, but a great deal of training would be
necessary.
T
12
2.2.2 Brazil
Brazil is a semi-industrialized nation with all levels of industry present
ranging from singular home producers to major multinational corporations.
Cottage industry in Brazil is fairly well developed in both the urban and
interior sectors. Brazilians do not talk about the rural sector, but ra+her
refer to it as the interior. Thirty-nine percent of the population or 48,500,000people live in interior Brazil.
The majority of rural cottage industry activity is in Northeast Brazil.
The Northeast is a distinct geographical region which comprises "the Brazilian
Bulge". This area is the most economically deprived, is overpopulated and
frequently is subject to drought.
The goods produced in Brazil, as in most of Latin America, tend to be
functional and reflect the culture and traditions of the people. Weaving is,by far, the most important cottage industry, followed by bakeries, ceramics
or pottery and food processing: Again, these are industries which providenecessary goods. Hammocks and blankets are extremely important products withenti-re towns engaged in hamriiock making. Printshops, brickmaking, timemaking
and tilemaking are also readily seen, as well as popular crafts, such as toys
and dolls.
Blacksmithing, 'tight engineering, mechanical shops, metalworking, cutlery
and hunting rifles are important cottage industries, but these are usually foundcloser to urban centers. Shoemaking is also becoming an urban industry. More
and more interior Brazilians are wearing oriental rubber thongs and t'cdemand for locally produced shoes is declining.
Of the processes used, some are traditional, but many have been introducedby an intermediary, missionaries or, frequently, by one charismatic individual.
The cottage industry producer learns his craft either through an apprentice-ship or an intermediary. Apprenticeship is usually to a family relation, butthe strong direct transfer of a family profession as seen in Mexico and Moroccodoes not prevail in Brazil.
In the interior sector, there are several types of intermediaries includ-
ing commercial, government and upper class.
13

Commercial intermediaries in Brazil function essentially the same as in
the Andean region. One difference is that the Brazilian intermediary is begin-
ning to reorganize cottage industries and do more actual development of cottage
industries.
Government extension programs are frequently found where a commercial
intermediary has already existed. Their purpose is usually to provide a more
efficient means of marketing goods and organizing producers. Overall, most proj-
ects are not much more successful than using a commercial intermediary. The
problems of infrastructure are the same and there is little improvement of
wages for the producer. Since government projects are evaluated on the volume
of goods sold, there is no incentive to produce a more valuable product. The
advantages a government intermediary does have for the artisan are in the intro-
duction of new designs and in the technical assistance which a government exten-
sionist can provide.
The upper class intermediary is either a non-profit organization or a
financial entrepreneur. Both are based in large cities and seek to provide
alternative outlets for the cottage industry producer to market his wares. They
will also seek to improve production by bringing in new equipment and instruc-
tors for the interior artisan. Some are very successful and fairly large com-
mercial enterprises. The upper class intermediary, however, encounters the same
problems as government intermediaries in dealing with the interior infrastruc-
ture and do not really provide much more of a market.
The type'of intermediary he or she deals with makes little difference to
the interior producer. Essentially, he or she lives a day-to-day, hand-to-
mouth existence. The artisan is still paid on a piecework basis and prices
are set by the intermediary.
Because of the predominant Catholic population in Brazil, the padre or
missionary is often a very important intermediary. As in the Andes and Mexico,
he will organize the people, teach them a craft and then find markets for
products. A prime example of this is in the Carira region of Cenra in'
Northeast Brazil. Cottage industry was first introduced there by a mystical
padre named Cicero. From its simple artisan beginning, this region is now a
strong center of small, artisan and medium-scale industry.
14
Cottage industry is extremely important to the interior economy, especi-
ally in Northeastern Brazil. Here, if agriculture is the primary activity, it
is usually at a subsistent level and cottage industry provides the sole source
of income. Typically, cottage industry will provide are interior family with
enough coffee, sugar and approximately two meters of cloth per person per year.
As in the Andes, not every village will have a cottage industry, but, with-
in a region, one can find the entire spectrum of necessary cottage industry
goods. in many small villages, there will be only one industry which is based
on either the geography of the village or the available raw materials. Eventu-
ally,all the products will make their way to one marketplace.
Basically, Brazilian goods are produced for local and regional markets.
Those produced for only local consumption are usually seasonal goods or a part-
time occupation. Most Brazilian cottage industry goods are produced for sale
in the formal economic sector by persons engaged full-time in that industry.
Even for a housewife, it is not uncommon to see household chores turned over
to the children and the mother working full-time at a trade such as pottery-
making or embroidery. It has been found that communities which have a strong
base in cottage industry have a greater ability to economically survive natural
disasters, such as drought. This can be seen, especially, in the very dry
regions of Northeastern Brazil.
There is a tremendous amount of internal commerce in Brazil. Goods pro-
duced in the interior of Northeast Brazil will flow into a large marketing
network and, through informal channels, end up in the large marketplaces of
STo Paulo and Rio de Janeiro. Internal trade is an important factor in the
narrowing of income disparity between the interior and urban sectors. It also
provides an educational awareness of urban lifestyle to the interior population.
That is, they have an understanding of electricity, mechanical equipment, com-
munication and transportation equipment and sanitary facilities. Most Brazilians
that own mechanical equipment such as generators, trucks or bandsaws have
little trouble maintaining and repairing it. The biggest problem in the inter-
ior is obtaining spare parts, especially goods which are imported and have
import quotas.
15
Evidence of the interior Brazilians ingenuity can be seen in their use
of scrap material in cottage industries. Frequently, the scrap material will
have been generated by a highly energy intensive process, but the interior
craftsperson uses little or no electricity in recycling the material into a
useful product. For example, cutlery is made from used files and rasps, gun
barrels are fashioned from used car axles and old tires provide rubber for
planters and insect guards.
The primary source of energy for cottage industry is wood and charcoal.
Ceramics and pottery use both wood and charcoal, but brickmaking, limemaking,
bakeries and food processing primarily use wood. Bakeries are an extremely
important industry since they produce the daily staple, french bread. Food
industries use wood to make farina, guava paste, banana paste and for process-
ing crude sugar and dried fruits. Wood is very expensive and not too readily
available, especially in Northeast Brazil.
Animal traction is another important energy source for transporting raw
materials and finished products and running grinding mills for rice and sugar
production. Coconut shell is frequently burned for ceramic-making instead of
the usual wood or charcoal.
Diesel generators are used extensively in Brazil, but mainly in major
cities as backup to the grid. There are some places in Brazil where an
entire town will be electrified by diesel. The population of such a town
would range between 1,000 and 3,000 people. More frequently, only parts of
a town will have grid-connected electricity while the rest uses diesel genera-
tors. Many times the only use made of the diesel generator is to run the loud-
speaker. In Brazil, every town has a loudspeaker which broadcasts music, news
and political rhetoric. The loudspeaker operates continuously, all day, every
day.
Agricultural applications of diesel generators are usually seen on large
farms and ranches owned by the upper class. These people may live on their
farms a large part of the time and desire the same electrical conveniences as
in the city. Diesels are also used for processing cacan, coffee and Brazil
nuts. Occasionally, diesel will be used for cottage industry when a share-
cropper can draw off the estate's generator to run a small appliance, such as
a grinder.
16
The Brazilian government recognizes the economic importance of cottage
industry and actively supports its development. The government is, character-
istically, a long-term planner, and beginning with a study done in 1458, several
assistance programs have been set up specifically to help "micro" industries.
These programs are not only government sponsored, but private projects and irixed
government and private programs also exist. The government also has a consis-
tent cooperative program for rural areas which focuses on forming legal business
entities. At present, there are approximately sixty of these co-ops in North-
eastern Brazil.
The Bank of Brazil slates 70% of its loanable funds to be consistent with
government policy for national priority programs. Development of small and
artisan industry would be among those priorities. Priority programs are
reviewed and changed annually. Last year there were 65 programs for which the
bank established 22 different rates. Special rates are given to small and
artisan industries and very special rates are given to the North and Northeastern
Regions. Small and artisan industries are defined based on their sales volume
in cruzieros or rather, standard capita` units. Standard capital units are
adjusted monthly zo reflect inflation. Rates for agriculture are based on
yield of crop per land area, stressing the importance of productivity in Brazil
Regardless of the special rate given to interior development, inflation is
running at 100% and the bank ;s allowed only 15% loan expansion per year. Hence,
money is very expensive and very tight with little or no opportunity for the
small borrower.
2.2.3 Central America and the Caribbean
Central America and the Caribbean are Comprised of middle income
countries which earn the majority of their Gross Domestic Product in services.
Haiti is the one notable exception, being a low-income country and an agrarian
economy. Cottage industry is not highly visible in the formal economy, but it
is important to the informal economy.
17

The populations of Central American countries are largely indigenous.
Hence, the processes they use for cottage industry and their products are
traditional and culturally oriented. Many of the designs and patterns used
will tell a story or signify who the designer is. Styles f)f clothing
produced also reflect the culture of the people. Weaving and rush reed
Products are the most predominant industries, but pottery and wood-working
are also significant.
As in many other countries, most small businessmen lack skills in
management. Inefficient use of production time and poor shop layout are
common problems. Production is on a small-scale level, employing four to five
persons. Since most cottage industries are family shops and produce
individually, productivity is not high. Another result is that cottage
industry products lack standbMdization, especially in clothing production.
Because of the deep seeded culture and tradition of their products,
Central Americans are slow to alter their methods and adapt to changing
markets.
Caribbean cottage industry is somewhat unique because of their geographic
location. Raw materials are scarce and most of the islands lack the indigenous
cultures of Central America. Some goods are produced for tourists, but most
production is for local markets.
Another problem in both Central America and the Caribbean is the monetary
structure which, in many crises, 'is tied to the U.S. dollar. Even though the
producer is earning a low income in his economy, he is not cost competitive
with Asian-produced goods. One example can be seen in the Dominican Republic.
In the early 1970's, a commercial intermediary organized 250 cottage industries
together to produce braided rush reed mats and rugs. The product was a copy
of one produced in the Philippines and was intended for sale in the international
market.
The Caribbean product was more expensive than the Philippine, but of
superior quality. At that time, the Chinese entered the market with an equal
product at a lower price. The Philippines quickly adapted and met the competi-
tion, but the Caribbean produced product was soon squeezed out of the market.
18

r
Energy is a major problem for Contra? America and the Caribbean. Trinidad
and Tobago is at exception. It is a net oil exporter with significant potential
f for further exploration. The remaining countries,, however, import over 75% of
their oil for commercial demand. Even Guatemala, which is an oil producer, must
import over 75% to meet its commercial demand.
The primary energy source for cottage industry is wood and charcoal.
However, wood is in rapidly diminishing supply not only as a fuel source, but
as a raw material for cottage industry production. Haiti already has a serious
deforestation problem and by the year 2000, Honduras and E1 Salvador will also.
Several organizations are investigating the feasibility of renewable
energy sources throughout Central America and the Caribbean. Solar cookers,
biogas, wind and solar dryers appear to be the most promising. Biogas systems
are emerging as a potential energy source for rural industry. Ragaraie,s of
the technology, experience shows that a tremendous amount of technical assistance
and training is necessary to implement a new process. Energy systems will
certainly be no exception.
2.2.4 Mexico
Mexico is a rapidly developing country experiencing tremendous economic
growth. Fifty-seven percent of the labor force is engaged either in
services or in industry other than manufacturing. Another 8.8% is engaged
in manufacturing and 34% is in agriculture. Overpopulation, urban migration
and unemployment are major problems. The population is 66 million with an
average annual growth rate of 2.8% and an urban migration rate of 4.5%. In
1980, 33% of the population was rural compared to 49% in 1960. A rural
community is one having less than 10,000 people. Officially, 10% of the
labor force is unemployed, but an estimated 45% have no regular jobs.0)
The industrial sector is well developed in all stages of large-scale,
medium-scale, small-scale and artisan enterprises.
(1) "Survey: Mexico," World Business Weekly, 29 June 1981, p. 29.
i
19

Rural Mexican cottage industry would fall under the category of small-
scale and artisan enterprises. Small-scale industries are those which
employ less than 25 people and have a net worth of 50,000 to 7 million pesos
(U.S. $2,173 to $300,0000 1) Artisan enterprises are those which employ
five to six people and have a net worth of less than 50,000 pesos (U.S.$2,173).
There are over 41,000 registered artisans and nearly 70,000 small businesses.
According to the National Fund for Handicraft Promotion (F'ONART), an
estimated 1.2 million heads of households are engaged in full -time cottage
industries and employ an average of five workers per establishment. This
gives a total of six million people employed in cottage industry, or nearly
10% of the total population. However, the majority of workers participate
on a part-time or seasonal basis. This 1s especially true for women, who
work at cottage industry production between household activities.
Cottage industries are either culturally oriented or based on available
raw materials. Industries which are culturally oriented produce festival and
ceremonial accessories. Usually, one village will produce goods for the
entire region. A village having a festival products industry would make
musical instruments, fireworks, ex-votive offerings, pinatas and
similar products. A village engaged in making ceremonial accessories would
produce masks, canes, dolls and items used in folk dances. Religious and folk
festivals are considered a social and cultural obligation and purchases for
such events are frequently the single largest expenditure a family will make
at any given time over the year.
Most cottage industries are based on the raw materials available within
the region. In Mexico, these include clay,.basic minerals, animal fibers,
vegetable fibers, wood and, to a lesser extent, metals. The major industries
that are raw material based include lumbering, pottery, copper forging,
silversmithing, furniture making, fishmeal production, grain milling, tanning
and tilemaking. Rural bakeries are not as important in Mexico as in the
Andes and Brazil since the people eat tortillas which they usually bake
themselves.
(1) Based on 23 pesos per dollar.
20
The use of many raw materials is controlled by the government and, as in
the Andes, there are quite a few illegal cottage industries. The authorities
tolerate this to some extent as long as the effe,-t is negligible.
The goods produced by Mexican cottage industries are primarily utilitarian
and produced for local and regional consumers. Products made by potters include
vessels for storing food and water for cooking and tableware. Weaving
industries use wool primarily and produce clothing and blankets, 3asket
industries produce mats, ornaments, straw figures, hats and, more importantly,
shelter construction and baskets for harvesting, transporting and storing
field crops. Woodworking is an important industry. Its products include
spoons, scoops, tools, ox yokes, handles, bowls, crates, statuary, furniture
and carpentry products, such as doors and window frames. Grinding mills are
a basic utilitarian industry. They produce mainly cornmeal and fishmeal.
Simple and utilitarian goods are made in the rural sector for local and
regional purchases. A rural cottage industry region is usually found around
a moderately sized city which will have a large central popular market.
Examples can be seen in cities such as Uruapan, Morelia, Quiroga, Patacuaro
and Oaxaca. The central city market is an important trading and distribution
center. It serves not only as an outlet for rural products, but also as a
source of urban produced supplies. The principal products being supplied
to the rural region are those made by blacksmiths, tanneries and confection
industries. They include products such as metal spurs, stirrups and bits,
hardware, leather shoe stirrups, machetes, rope, saddles and drygoods.
Mexico has an unique system of production in which there is a chain of
value adding processes from village to village. This can best be understood
through an example. A copper pitcher may have its origin in a very remote
village. Originally it is a piece of barely formed metal which is sold to
another village. The metal workers there will pound it out into a normal
spouted shape. It is then sold to another village closer to the city where
it is polished and cleaned. It will then go to an urban or fringe-urban
artisan who adds a handle and sells it in the central market.. A similar
case can be seen in furniture. Rurally produced cha i rs are very crude, but
21
they are channeled from village to village with each place adding more detail
until finally a well-crafted product reaches the urban market. This system
is quite unique. Frequently, the entire cottage industry sector of a village
will specialize in that village's phase of production.
The typical rural cottage industry will either be in the home or in a
small shop. The owner is the manager and usually the principal worker. The
establishment is a sole proprietorship. Common production facilities are
not shared. The production facility is usually rudimentary and serves only
as basic shelter. Characteristically, the shop layout is very inefficient
and the comfort and safety of the workers are seldom considered,
Few, if any, production needs, such as tools, are purchased outside the
community. Rural cottage industry production is cyclic in direct relation
with the agricultural cycle and the seasonal availablity of raw materials is
an important consideration for the rural entrepreneur.
The technology of production in rural Mexico is traditional, with many of
the processes used dating back to Pre-Colonial times. As in many other parts
of Latin America, the technology of the processes tised tends to be introduced
rather than evolved.
The origin of Mexican _:ottage industry processes falls into three groups.
The first is the pure Indian Craftsman who yeses the same techniques as did
his or her Aztec ancestors as in Chiapas. The second group uses those pro-
cesses which were introduced Ly Spanish guilds when feudal land systems
flourished as in Puebla. The third group is those settled and developed by
the clergy. These regions tend to have strong cottage sectors and the
artisans of these regions tend to be more entrepreneurial. Evidence of this
can be seen in the region of Michoacan where the techniques used today were
introduced by Bishop Don Vasco de Quiroga.
The family unit is very important to the rural Mexican and contributes
to the preservation of tr,tiditio ► ial processes. Unfortunately, it also servesas a barrier to new technology. The skills of a craft are handed down from
father to son, mother to daughter. Occasionally, a new producer will learn
his or her craft through an extended family membei, such as a cousin or uncle.
Other social factors could also be a barrier to new technology as in
the distinction between male and female tasks. For example, pottery in
one village may be a male occupation and in another, female. However, men
I 22
L

and women would not be potters in the same village. Weaving is done byboth men and women, but both do not use the same technique. Women use the
tedious backstrap loom, while the more comfortable and efficient colonial
upright loom is strictly used by men only.
As in other Latin American countries, although it is meager, cottage
s°
industry is frequently the sole source of income to the producer. The majority
of cottage industries are non-registered, informal businesses that have no
legal identity. The average assets of a rural cottage industry range between2,000 and 3,000 U.S. dollars and all earrings are viewed as personal income.
The workers are usually members of the family and are seldom paid. The primaryobjective of the rural producer is not necessarily to increase his income, but
to provide employment ''or as many members of his family as possible.
According to 1977 estimates, in villages with populations of less than2,500, less than 21% of households had a total family income which equalledthe minimum wage of 123 pesos per day (U.S. $5.35). Furthermore, 45% ofthe house!wlds derived, from all sources, a total income below one-half of
the minimum wage or 51.5 pesos (U.S, $2.67).(1)
There is no hard, reliable data on the exact income derived from cottage
industry, but, at full employment levels, a typical producer earns an estimated
25 to 50 pesos per day or 1 to 2 U.S. dollars. The highly productive industries
served by FONART earn a family income of 450 to 1500 pesos per month or 1 to
3 U.S. dollars per day. However, the average for the total rural sector would
be much lower and, lower still, in highly remote regions.
Opportunities for financing rural cottage industry are extremely limited.
Options include commercial banks, FOGAIN (Fund for the Guaranty and Development
of Small and Medium Industry), a patron, the Rural Development Bank, a coopera-
tive purchase and the Fund for Artisans (FONART). Commercial banks and FOGAIN
will work only with registered businesses, which most cottage industries are not.
Short-term commercial loans are for up to one year at 30% annual interest. Long-
term loans are for seven to eight years with a fluctuating interest rate. The
current rate is 32%. The Rural Development'Bank finances only government sponsored
projects and the Fund for Artisans has very little money. The most feasible
alternative for the rural producer is to fired a wealthy patron or for several
families to purchase capital equipment together. A cooperative purchase would
not favor photovoltaics. It would be more reasonable to purchase a large
generator system and have several industries utilize it simultaneously.
Source; Ministry of Programming and Budget, Mexico
23
2.3 Morocco
Morocco's cottage industry sector is one of the oldest and most
established in the world. It offers two broad categories of products. The
first is handicrafts and the second is utilitarian products. Handicrafts
primarily serve the tourist trade and expnrt markets. Utilitarian goods
serve domestic consumption both at or near the production site as well as
in other regions of the country.
Traditionally, Morocco has had an established reputation as a tourist
attraction and source for quality handicraft products. These prodcts include
primarily rugs, baskets, blankets, robes, pottery, leather goods, and metal-
ware. Handicrafts are tied closely to the cultural and artistic heritage of
the population, with its strong Arabic and Berber influence.
Production of handicrafts is divided between the urban and rural sectors.Handicraft production in Morocco is highly concentrated and found principally
in the urban centers. The urban sector has ready access to export market
distribution, and a greater tendency to adopt equipment which will increase
production. The rural sector for handicraft production is, to a greater
extent a part-time, seasonal occupation for agricultural workers. Also, in
the rural sector, there is a greater dependence on traditional community
open markets for selling products.
Both the urban and rural haniicraft operations are more likely to be
characterized by full production of a product. at one site. There is still
a greater emphasis on traditional, hand production processes using simple
tools as opposed to use of modern tools and automation. The government
recognizes the importance to the tourist and export trade of maintaininghigh quality in its handicraft products. It encourages training programs
which combine the best of hand craftmanship with tools that offer greater
life and utility. The supply of handicraft products, particularly in the
rural areas, is quite readily able to serve demand. Thus, there is little
incentive to substantially increase production.
Those employed in the handicraft sector are generally less educated and
have lower standards of living thin those employed in other sectors,
24

particularly in the urban areas. Each handicraft occupation position represents
an average $1,000 of annual income. Women and men both participate in making
handicrafts, though women appear to play a greater role in the carpet making
field. Selling in the marketplace is strictly male.
Utilitarian products also represent a significant portion of the cottage
industry sector. For the most part, they serve the agriculture sector and,
to some extent, other urban-based sectors of the economy. Primary utilitarian
products are foodstuffs, textiles, metal, and leather. The major food groups
indigenous to Morocco which are processed and consumed locally include grain,
citrus fruits, and vegetables.
Cottage industries which serve the tourist trade have traditionally
received the attention and support of the government. However, in the rural
sector there are no agencies for special development and extension services
are very weak.
Cottage industry growth is tied inextricably to the agrarian economy
of most of the rural population. In poorer (generally less irrigated)agriculture regions the economic growth is noticeably less than in more
productive regions. Handicraft production is less dependent on local
economies than it is on tourist volume.
Only slightly greater than 10% of the rural areas are electrified,
representing approximately by of the population. Much of the rural power
needs are met by stvategically located diesel generators that serve one or
more communities. For the most part, cottage industries utilize little
energy. The primary use is in lighting; and secondary uses consist of
powering saws and other basic implements.
25
FrW
I
2.4 The Philippines
The Philippines is a capital-poor country with no high value export
such as oil or gold. Fifty-two percent of the population is of employable
age (15-64) and 83% of the people over age ten are literate. The country is
said to have one of the most literate and skillful populations in Southeast
Asia. Ironically, for the most part, labor force is underemployed.
Industrial activity in the Philippines can be broken down into four
basic categories. These categories arse Large Scale Industry (LSI), Medium
Scale .Industry (MSI), Small Scale Industry (SSI), and Cottage Industry (CI).
The criteria used by the Philippine government to place an establishment
in one of these categories is shown in Exhibit 2 . For the purpose of this
study, the establishments of most interest are those classified as Cottage
industries and those at the lower end of the SSI category.
In 1975, it was e7,timated that there were 71,084 SSI establishments
and 7,698 CI establishments. These establishment-s accounted for 98.6%
of the industrial establishments officially 'registered with the Philippine
government. Experts feel that the real number of cottage and small indus-
tries is much larger than that registered. It should also be notw'' that
68,738 of the SSI establishments were in the smallest sub-sector, 5-19 workers.
While accounting fir 98.6% of the industrial establishments, SSI and
CI account for less than 50% of the industrial employment, less than 25%
of the total industrial production. The general tendency is for productivity
and wages to decline with decreasing scale. The reasons given for this are
many, but generally tend to be under capitalization and poor management.
The goods typically produced by the cottage and small scale industry
in the Philippines tend to have a high labor content, are relatively
abundant, and have a wide variance in quality. As a result, the producers
and distributors of these goods are finding increasingly stiff competition
in both the international and domestic marketplace competing against other
developing countries and newly industrialized countries.
26
NOEL
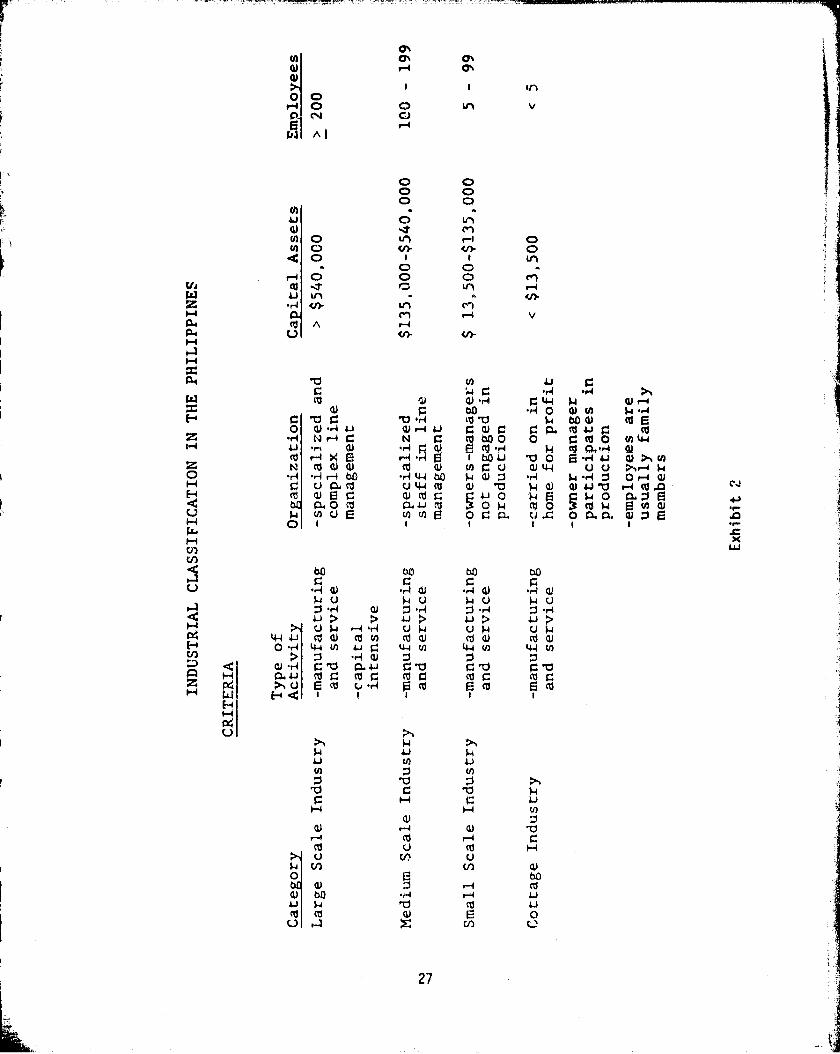
esN 0% C%a) r-1 d^a)
1 1 1!'1O OH O 0 kn vC► N O
W^ ^ I r- 1
O OO OO ONdl O 1r1Gl -.T cnV) O u1 r1 ON 0 t/)^ t? Od p 1 1 cry0 ar•1 o O O c`'1
ca -It Ln41 Ln
Z •r1 cn u1 c^)CV) r-d v
W cd n r-+a+ U v} v,Hawx
coeuo^ v •U)v r. •H o H4
H Ir fu G b •rl W Ta p GO N cd Eo Q) •r1 tj a! r-1 A.1 G v p G a cd u 0 cd
Z •H N ra O N 0 cd 600 O O cd O V) Wt-4 1J •ry a) •r1 f: a) E! CO -A 14 M @+ •rt a)co r-1 >4 E r-1 •'d 0 1 u0 u b O a -A Aj w >% VI
2 N cd a) a) cd a) 0 G u (U W U U ?. r-1 WO •r4 -H r-I CO •rl W bO F4 a) O •H $4 •rl O O r-4 a)u a cd U w cd v v N a) ar u v r-1 cd ,GE-+ ve0
wocda)ctGa^cd ^
41 o pE N o90$ ass
Enu^ o^^t0 poVCL
roox Oaa.
Ina)v^8o
w
co aci an ao
U •r4 Q) •r4 aJ -,4 a) •rr44 a)
aU p r-1 •rl u p u H u p
w " cd a cd (n cd a) cd a) cd alH O -r1 W cA ♦J G W N W V) W N
zQ n^ r4 Gv a" 9 b Gb G•vH a 41 cd G of G cd q cd G cd G
u= co a -H E ca 6 co Ei coF 1
W HHH
U
lJ Cl) 41
to O cnO b ^ T
ro ^ •a a^H H cn
Q) Oa) r-1 a) b
r-d cd r-1 Gcd U cd NU U
^ u] cn vO b0
9) w r-1 lei1.1 }^ b cd lJ
U r-7 ^., Cn 0C-.
cL!
+J
.c
sxw
27
In recent years the increase in the price of oil has caused havoc in
the Philippine Economy. Prier to 1977, over 90% of the energy used in the
Philippines was supplied by imported oil. Unable to diversify to other
energy sources, th( Philippines was forced to import increasing quantities
of oil at increasing prices. At the same time, the country was experiencin
a decline in prices for its commodity exports such as copper, sugar, and
coconut. This was an experience similar to many other developing countries.
Fortunately, the country is largely self-sufficient in food.
This "energy crisis" and the resulting deficits in the country's current
and trade accounts, for the most part shape the country's current development
plans and energy plans. In capsule form these plans are:
Industrial Development Plan - The government encourages and supports
investments and industries which will employ large numbers of people, earn
foreign exchange, reduce the need for imports, and not disrupt the domestic
markets. 'The government welcomes and encourages foreign investment which
will support these goals; and it is pursuing its own programs such as the
development of a copper smelter, aluminum smelter, etc., which will c'harige
and improve the industrial base of the country.
Energy Program - The government is pursuing a very aggressive program
that will reduce imported oil to 509 of the energy demand of the Philippines
by 1985. This will largely be done by diversifying to other sources of
energy such as geothermal and hydroelectric and by developing the country's
reserves of oil and coal„
The Philippine government recognizes and is well aware of the close
dependence between industrial development and energy consumption. For this
reason, the government is trying to-electrify the country by 1985. The
aim of this electrification program is fourfold:
1. Provide infrastructure in rural areas which will encourage
industrial development and lead to the growth of employment
opportunities.
2. Enhance the well being of the people in rural areas.
28
3. Reduce the migration to the overpopulated urban areas by improving
employment opportunities and the quality of life in the rural areas.
4. Distribute the benefits of geothermal and hydroelectric power to
other areas of the country and reduce their use of oil for electric
power generation.
Obviously, the country has a very complete and comprehensive development
program and strategy. This program will take time and there will be occasional
setbacks, such as blackouts.
It can be seen that the role and emphasis on cottage and small scale
industries in this plan is low. The reasons should be rather obvious. By
their very nature, cottage and small scale industries tend to have low
capital requirements. This, combined with the small impact that they could
have on the under-employment and trade deficits of the country are the
reasons why the government has left the development of the cottage and small
scale industry sector to the guiles of the small entrepreneur. It is felt
that this sector does not need the direct resources and attention of the
government as much as other areas.
For human and social reasons, the government has not totally ignored
this area, and there are sections of the government specifically established
to aid and assist small scale and cottage industries. The emphasis and
funding of these governmental agencies is low and they do not do much more
than assist in establishing marketing channels and providing some technology
transfers. These services, however, are second rate compared to those
offered by some of the private, profit motivated distributors of cottage
industry and small scale industrial goods.
It is felt that cottage industry and small scale industry goods have
the value they have and receive the tariff free treatment they do from other
countries because of their handmade nature. As a result, no technological
improvements or introductions will be made into the process which will
affect the (hand finishing. As a result, improvements will only be allowed
and encouraged in the pre-processing steps. These steps such as the process-
ing of logs or the mixing of clay are possible applications for stand-alone
photovoltaic systems.
i^
29
E4
The Philippine enterpreneur is a highly motivated, creative, and
innovativ-* individual. This is a skill that is honed from years of coping-
with scarcity. He must make tools and equipmert function and operate when
most others would discard them. However, he is a highly risk adverse
.x
individual not willing to try new products or processes because their
failure could severely impact both him and his family. Therefore,he is
almost forced to stick to tried and proven methods and procedures. As a
result, while he is able to keep a small motor running well beyond its
normal life, in operations beyond its original design, he may not be
anxious to try a new power source.
It is this environment with which photovoltaic energy systems will have
to compete, both on a performance and economic basis, with other sources of
power. These could include animal and human power, gasoline and diesel
driven power, and grid supplied electricity. The government hRs explicitly
said that it does not feel that photovoltaic systems are competitive with
these other systems now, nor do they feel that they are as close to
competitiveness as other sources of power such as biomass and dendro thermal.
For this reason, and because of the high risks involved in the development
of photovoltaics, the government has left their development to the private
sector.
With no government assistance, photovoltaics must compete with the
government's electrification program and with well established maintenance
and distribution channels for diesel and gasoline driven engines. This,
combined with the large initial up-front cost in a country where capital
is scarce are formidable obstacles for photovoltaics to overcome in the
Philippines.
30
6

11-7-1
3. THE "POTENTIAL" MARKET FOR SMALL, DECENTRALIZED ELECTRIC POWER
SOURCES IN COTTAGE INDUSTRY APPLICATIONS
The "potential" market is a theoretical estimate of the gross demand
for small -scale decentralized sources of electric power for rural cottage
industry applications in non-industrialized countries, with non-centrally
planned economies.
To estimate the "potential" market for stand-alone photovoltaic systems,
it was assumed that the rural population of the non-industrialized, non-
centrally planned countries desired electrical power and could afford it.
The value assessment of stand-alone photovoltaic systems was studied sepa-
rately from the "potential" market. As illustrated in Exhibit 3 the
"potential" market for small, decentralized power sources in rural cottage
industry applications is estimated to be 70,000 MW. To arrive at this
estimate, 14 countries were studied in detail, and the results from these
countries were used to characterize the market in the non-industrialized,
non-centrally planned world. The 14 countries studied are shown in Exhibit 4.
Given these 14 countries, the rural industrial employment in fundamental
industries as a percent of total rural industrial employment was estimated
for each country. These eztiwates are shown in Exhibit 5.
The industries chosen as fundamental were considered as such because
the 32 typical cottage industries given in Exhibit 6 would be classified
under these industrial classes using Standard Industrial Classification (SIC)
codes. It can be seen that the cottage industries listed in Exhibit 6
and the fundamental industries listed in Exhibit 5 are basic to everyday
life. It was therefore assumed that employment proportions for these
industries in the total country could be applied to the rural areas. There
are possibly some variations due to the differences in the scale of industry
and location of raw materials for fundamental industrial employment For the
total country compared to rural areas, but these are probably minor.
The total rural industrial employment was estimated based on the
percent of population that is rural, the percent which is of employable age
and the percent employed in agriculture, industry and services. The rural
industrial employment as a percent of rural population was then determined.
31
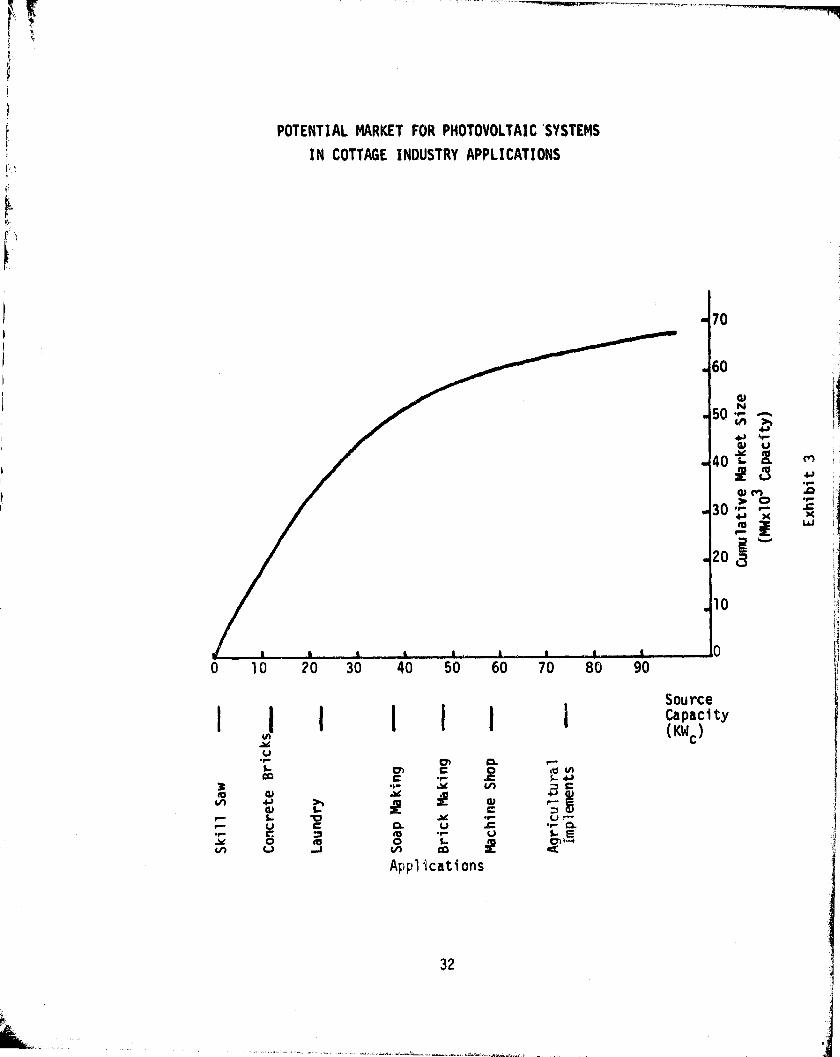
aNM1 ^ }
4j +ra uL
a eh.r
•r
N K Wr-
3
POTENTIAL MARKET FOR PHOTOVOLTAIC`SYSTEMS
IN COTTAGE INDUSTRY APPLICATIONS
0 10 20 30 40 50 60 70
Acv.r.L
D1 a rco C •^
+- .a6 N ^ C
knN L C
•^ c.U c a v cG •t v o„yc ego o
N e..) J N CG dApplications
80 90
SourceCapacity
( KWd
32
.J

COUNTRIES STUDIED IN DETAIL
Central b South America
Argentina
Mexico
Brazil
Mediterranean b Middle East
Egypt
Spain
Greece
Morocco
Sub - Sahara Africa
Kenya
Cameroon
Nigeria
Southeast Asia
India
Korea, Rep. of
Philippines
Malaysia
Exhi bi t 4
33
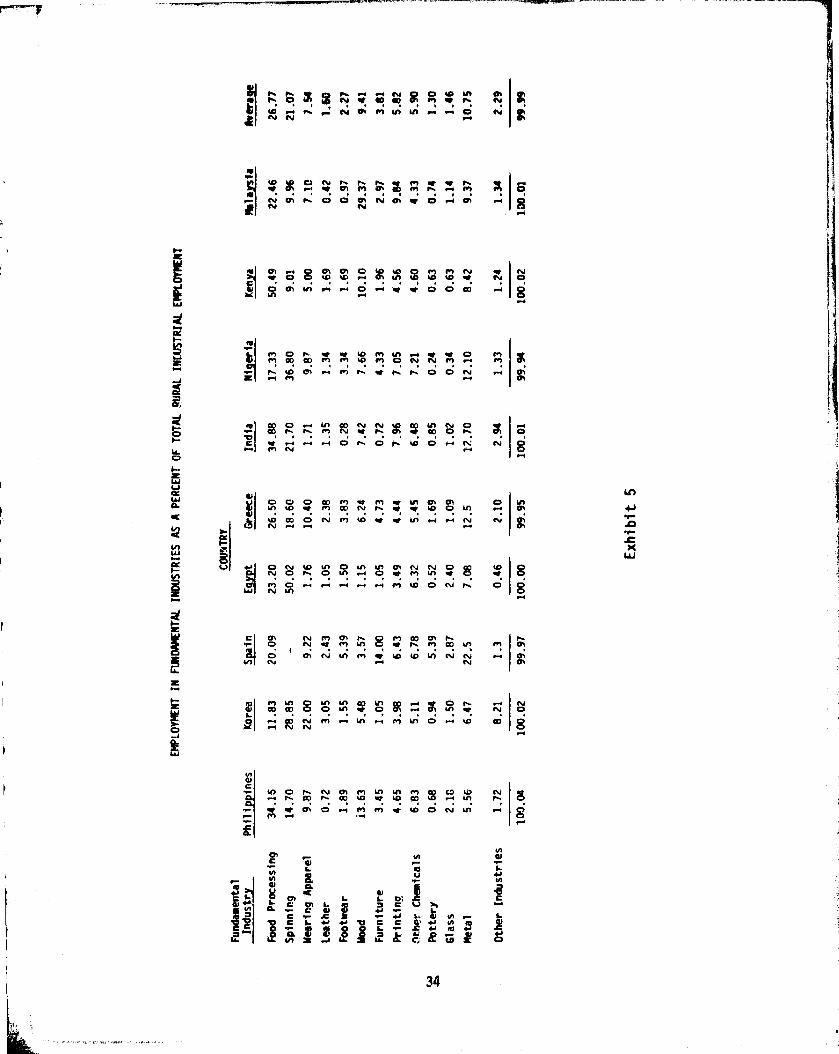
W
CIG
J
0H4.O
WuWa
H
CD-I
t
A ^ O Y $ N /v b 2 9 M y h NN N h ^.. N CM M {A Ifl w r+ ^ N O^
Ar ^p ►wr O^ ^i r Ohl Ph'f C11 ^ M n .~-^ M ^ O
r N OI h O O N N 01 ♦ O ^+ Of .+ Or/
S ,Q-/ MCy^ • C9 ^C1 W Q1 1n 10 ^ ♦ N I O
in 0 F, P~9 1a0 en U10 .Orli O 00 e! O N N M Men
r 00 ^ ^ M N A r 000 O ^ Oi Oe►. M N
.4 .-1 O h O ^ w O V-4 c%-: N 8.-n
ar^O1n O10 O♦ COM MW VN Mh •r 1n^f M^O 01O 1- O 0►1 01
•^•1O N P'1 ^D • ^► In ti r+ H N 01
YN Of
V +^ O N 1D in O 0 In Of N N O f0 8N O 1^ O In N O ♦ M ll' l►Q N ~ ~ -4 •4 M to O N h col OW N Y1
,-/
e C11 N M CR 'A M 00 CH h hO N f M Y'1 8 V h M O 0 M 01O { C1/ N 1f1 M • 10 ^O Ln N N '-1 CN
V1 N ^I N O
p` ,."R -OR Oin 4n O 0 O "id O. 01 U01 ^ N( O
1r " N N M — in " M 1n O " w 00 O
Ln
tW I
dC
r w O h N C11 M In IA M ^^77 C0 ^O N ^1yy.r h O h 0 10 YtT 10 OQ 10 1-/ M) h Or' ^t 01 O ^-1 M M ♦ ^O O N In w1 C7M •-1 y O
O ^e d ^ yam.rL U
r. ^4 r YI
ILp
nj •+ L. r CL. W N e _
1^ N s`'el a
9 e r L r ►. in pL^
e e L M 4+ Q e e ^^ 4j in Ap 1°
,.r r L r M e0 ++gin° sa j
+' b c 8 0
34
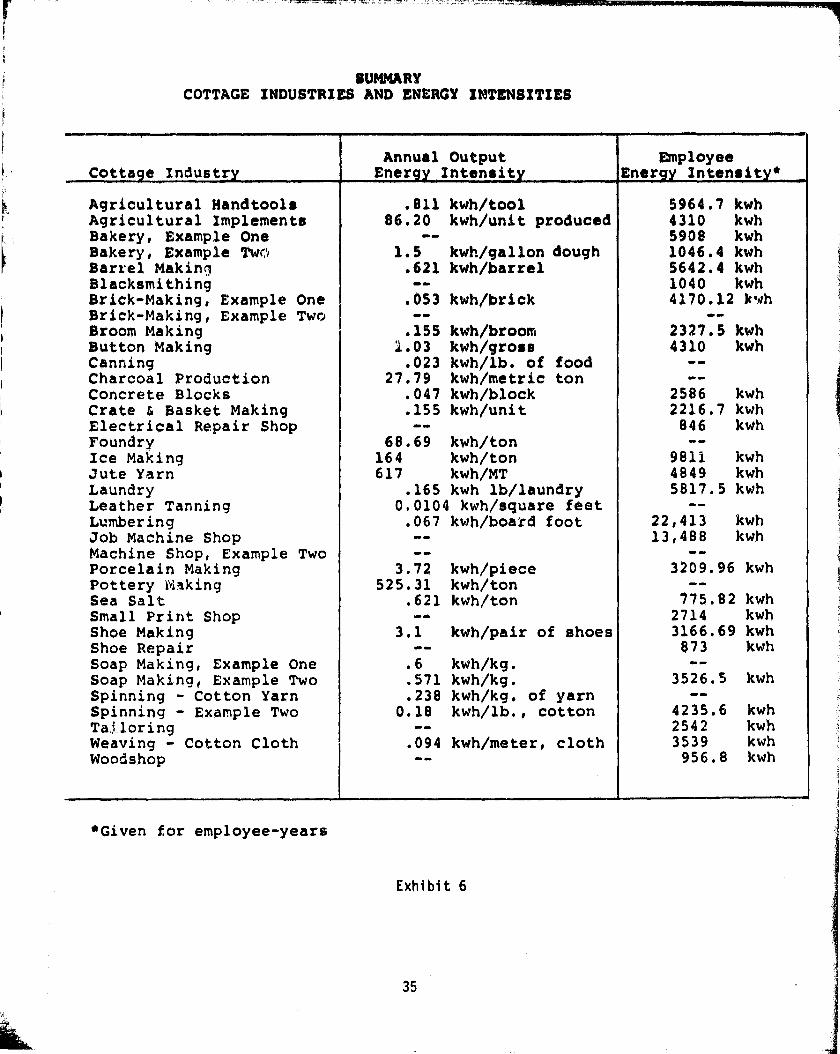
SUMMARYCOTTAGE INDUSTRIES AND LNtRGY INTENSITIES
Cottage IndustryAnnualEnergy
OutputIntensity
EmployeeEnergy Intensity*
Agricultural Handtools .611 kwh/tool 5964.7 kwhAgricultural Implements 86.20 kwh/unit produced 4310 kwhBakery, Example One -- 5906 kwhBakery, Example Twca 1.5 kwh/gallon dough 1046.4 kwhBarrel Making .621 kwh/barrel 5642.4 kwhBlacksmithing -- 1040 kwhBrick-Making, Example One .053 kwh/brick 4170.12 kwhBrick-Making, Example Two -- --Broom Making .155 kwh/broom 2327.5 kwhButton Making 1.03 kwh/gross 4310 kwhCanning .023 kwh/lb. of food --Charcoal Production 27.79 kwh/metric ton --Concrete Blocks .047 kwh/block 2586 kwhCrate b Basket Making .155 kwh/unit 2216.7 kwhElectrical Repair Shop -- 846 kwhFoundry 68.69 kwh/ton --Ice Making 164 kwh/ton 9811 kwhJute Yarn 617 kwh/MT 4849 kwhLaundry .165 kwh lb/laundry 5817.5 kwhLeather Tanning 0,0104 kwh/square feet --Lumbering .067 kwh/board foot 22,413 kwhJob Machine Shop -- 13,488 kwhMachine Shop, Example Two -- --Porcelain Making 3.72 kwh/piece 3209.96 kwhPottery 1h,aking 525.31 kwh/ton --Sea Salt .621 kwh/ton 775.82 kwhSmall Print Shop -- 2714 kwhShoe Making 3.1 kwh/pair of shoes 3166.69 kwhShoe Repair -- 873 kwhSoap Making, Example One .6 kwh/kg. --Soap Making, Example Two .571 kwh/kg. 3526.5 kwhSpinning - Cotton Yarn .238 kwh/kg. of yarn --Spinning - Example Two 0.18 kwh/lb., cotton 4235.6 kwhTalloring -- 2542 kwhWeaving - Cotton Cloth .094 kwh/metes, cloth 3539 kwhWoodshop -- 956.8 kwh
*Given for employee-years
Exhibit 6
35
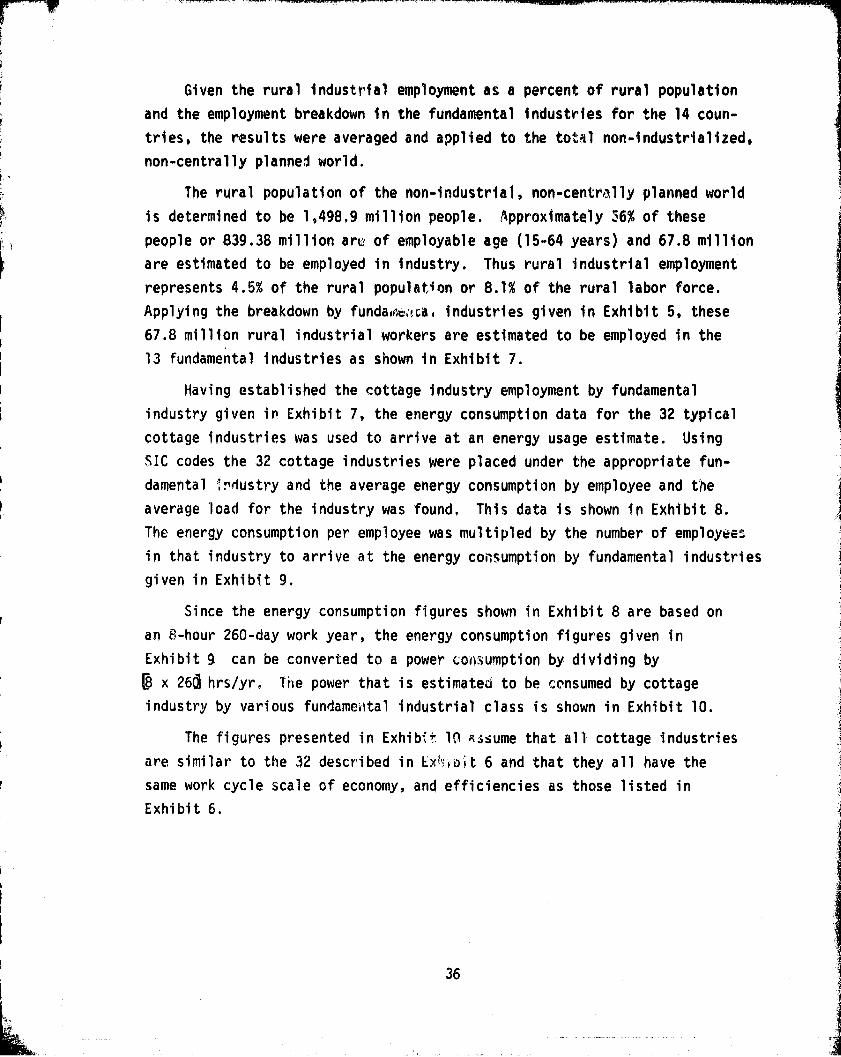
{4
Y
Given the rural industrial employment as a percent of rural population
and the employment breakdown in the fundamental industries for the 14 coun-
tries, the results were averaged and applied to the to`al non.-industrialized,
non-centrally planned world.
The rural population of the non-industrial, non-centrally planned world
is determined to be 1,498.9 million people. Approximately 56% of these
people or 839.38 million are of employable age (15-64 years) and 67.8 million
are estimated to be employed in industry. Thus rural industrial employment
represents 4.5% of the rural population or 8.1% of the rural labor force.
Applying the breakdown by fundao&,sca. industries given in Exhibit 5, these
67.8 million rural industrial workers are estimated to be employed in the
13 fundamental industries as shown in Exhibit 7.
Having established the cottage industry employment by fundamental
industry given in Exhibit 7, the energy consumption data for the 32 typical
cottage industries was used to arrive at an energy usage estimate. Using
SIC codes the 32 cottage industries were placed under the appropriate fun-
damental Industry and the average energy consumption by employee and the
average load for the industry was found. This data is shown in Exhibit 8.
The energy consumption per employee was multipled by the number of employees
in that industry to arrive at the energy consumption by fundamental industries
given in Exhibit 9.
Since the energy consumption figures shown in Exhibit 8 are based on
an 8-hour 260-day work year, the energy consumption figures given in
Exhibit 9 can be converted to a power consumption by dividing by
[8 x 26d hrs/yr, Tise power that is estimated to be consumed by cottage
industry by various fundamclital industrial class is shown in Exhibit 10.
The figures presented in Exhibit 11 Assume that all cottage industries
are similar to the 32 described in Ex^^iol t 6 and that they all have the
same work cycle scale of economy, and efficiencies as those listed in
Exhibit 6.
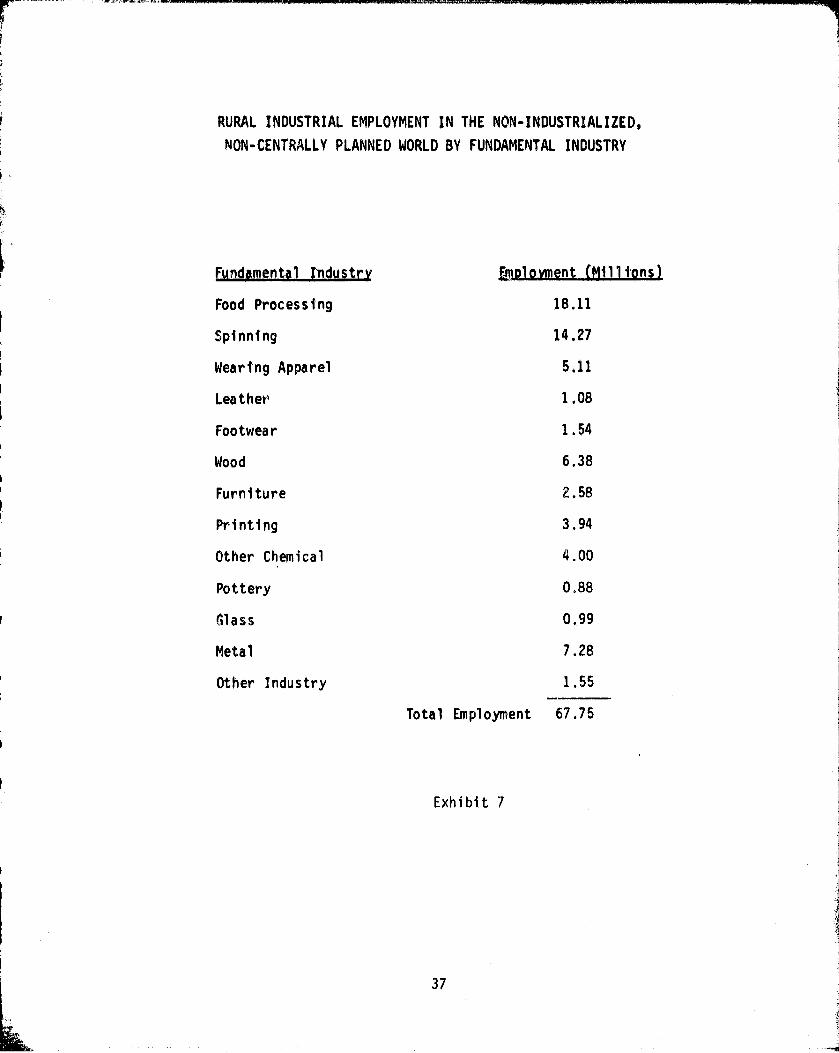
RURAL INDUSTRIAL EMPLOYMENT IN THE NON-INDUSTRIALIZED,
NON-CENTRALLY PLANNED WORLD BY FUNDAMENTAL INDUSTRY
r
Fundamental Tndustry gplovment (Mill ions)
Food Processing 18.11
Spinning 14.27
Wearing Apparel 5.11
Leather 1.08
Footwear 1.54
Wood 6.38
Furniture 2.58
Printing 3.94
Other Chemical 4.00
Pottery 0.88
Class 0.99
Metal 7.28
Other Industry 1.55
Total Employment 67.75
Exhibit 7
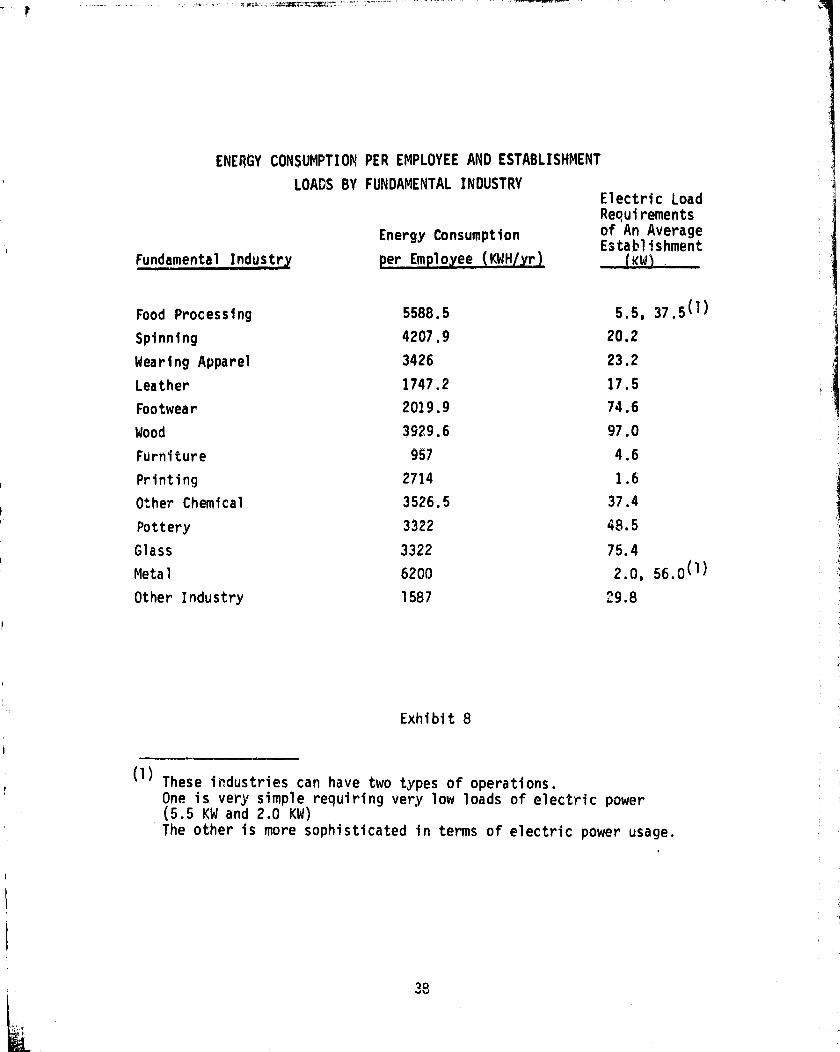
ENERGY CONSUMPTION PER EMPLOYEE AND ESTABLISHMENT
LOADS BY FUNDAMENTAL INDUSTRYElectric LoadRequirements
Energy Consumption of An AverageEstablishment
Fundamental Industry per Employee (KWH/yr) (KW) .
Food Processing 5588.5 5.5, 37.5(1)
Spinning 4207.9 20.2
Wearing Apparel 3426 23.2
Leather 1747.2 17.5
Footwear 2019.9 74.6
Wood 3929.6 97.0
Furniture 957 4.6
Printing 2714 1.6
Other Chemical 3526.5 37.4
Pottery 3322 48.5
Glass 3322 75.4
Metal 6200 2.0, 56.0(1)
Other Industry 1587 29.8
Exhibit 8
(l) These industries can have two types of operations.One is very simple requiring very low loads of electric power(5.5 KW and 2.0 KW)The other is more sophisticated in terms of electric power usage.
30w
k
I

RURAL JNDUSYRIAL ENERGY CONSUMPTION
BY FUNDAMENTAL INDUSTRY
Energy ConsumptionFundamental Industry (KWH/veer) x 10'
Food Processing 101,375.4
Spinning 60,046.7
Wearing Apparel 17,506.9
Leather 1,887.0
Footwear 3,110.7
Wood 25,070.9
Furniture 2,469.1
Printing 1U,693.2
Other Chemical 14,106.0
Pottery 2,923.4
Glass 3,288.8
Metal 45,136.0
Other Industry 2,459.9
Total* 290,073.7
Exhibit 9
* The per capita electrical energy consumption in the U.S. was 10,060 KWH/yearin 1978. So the energy that could be consumed by rural industry in non-industrial, non-centrally planned countries is about the same as the energyconsumed by 13% of the U.S, population.
39
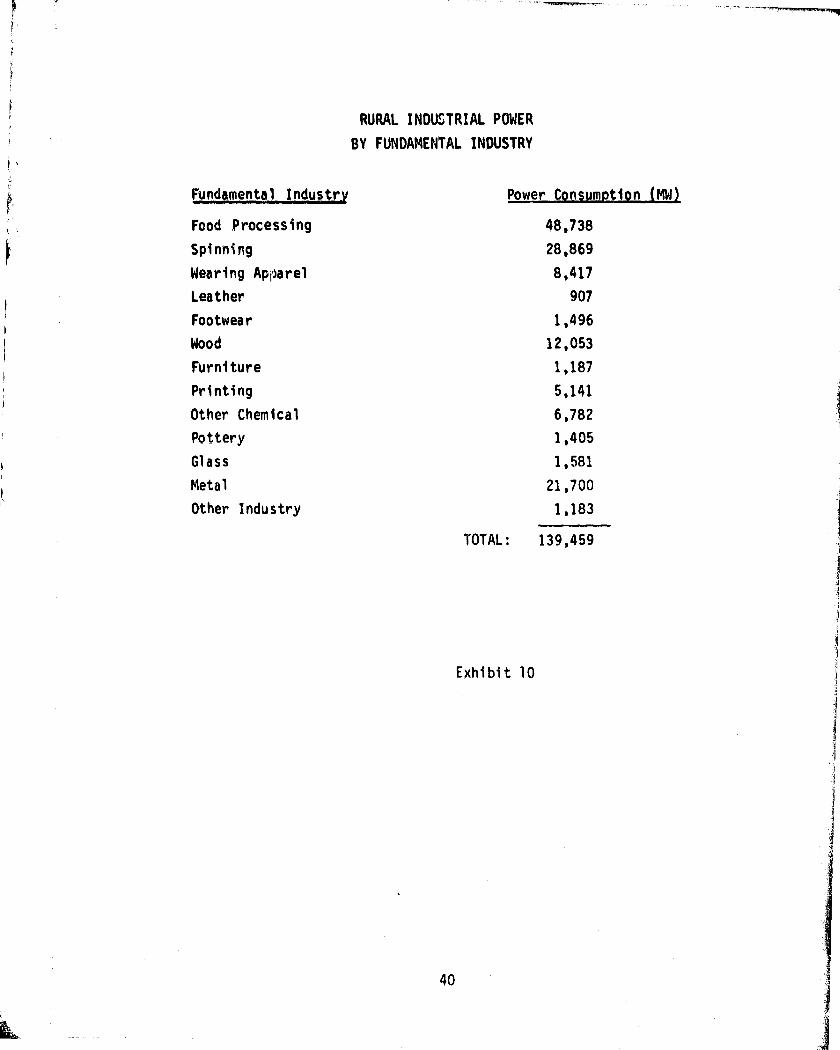
RURAL INDUSTRIAL POWER
BY FUNDAMENTAL INDUSTRY
Fundamental Industr
Power Consumption (MW)
Food .Processing
48,738
Spinning
28,869
Wearing Apparel
8,417
Leather
907
Footwear
1,496
Wood
12,053
Furniture
1,187
Printing
5,141
Other Chemical
6,782
Pottery
1,405
Glass
1,581
Metal
21,700
Other Industry 1,183
TOTAL:
139,459
Exhibit 10
40
'i
41k
The power consumption figures by industry given in Exhibit 10 were
divided by two to account for cases where the rural area is electrified or
about to be 0 ectrified by an electrical grid, other forms of electrical
power such as hydro cr wind might be more appropriate, or there is not
enough solar insolation to permit the consideration of photovoltaics. The
remaining market was assumed to be the market for either photovoltaics or
diesel driven generators.
Given the "potential" market for photovoltaic systems or diesel
generators by fundamental industry (Exhibit 10) and the typical power
requirement for an establishment within that industry (Exhibit 8), the
cumulative "potential" market as a function of source capacity was found.
This was shown in Exhibit 3. From Exhibit 3, it can be seen that the
total market for power sources below 40 KW of capacity is 52,000 MW.
Implicit within this "potential" market estimate is the assumption that
manufacturers do not form cooperatives to buy power capacity beyond the
capacity being considered. For example, two users of 30 Us each could
cooperate and buy a 60 KW system, however the market estimate presented
assumes that each buys a 30 KW system if the market for 40 KW and less
systems is being considered. On the other hand, two users of 20 KW who
cooperate to buy a 40 KW system would be included within the 40 KW and
less market estimate.
Placing these estimates in perspective, 140,000 MW (the total power
consumption of rural industry) for 67.8 million employees suggests that the
average rural industrial consumption per employee is 2,065 watts for his
immediate tools and support services. As a basis of comparison, the typical
power and energy requirements for appliances and equipment are shown in
Exhibit 11. From this information, it appears that the estimates previously
developed are reasonable.
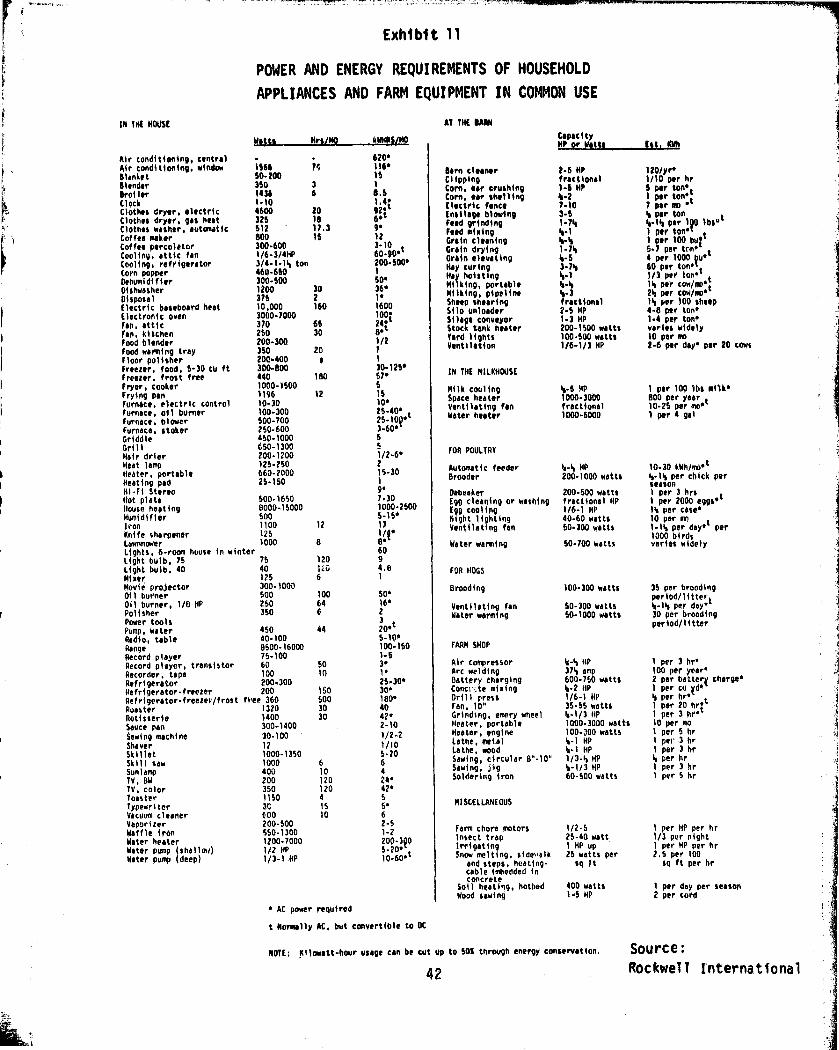
Exhibit 11
POWER AND ENERGY REQUIREMENTS OF HOUSEHOLD
APPLIANCES AND FARM EQUIPMENT IN COMMON USE
IN THE HOUSE
Watts Mrs M0 k"S/MO
Air conditioning, central 620•
Air conditioning, window 1566 74 1160'
elsnket 50.200 15
elender 350 3 1
eroi1:1 1436 6 8.5
Clock 1.10 1,N92•tClothes dryer, electric 4600 20
18 6•tClothes dryer, gas heat 325
Clothes washer, automatic 512 1713 g•Coffee maker 800 15 12
Coffee percolator 300.600 3.1060.90•tCooling, attic fan 1/6.3/4HP
Cooling, refrigerator 3/4.1.14 ton 200.5001
Corn popper 460.650 1
Dehumidifier 300.500 50•
Dishwasher 1200 30 36•
Disposal 37S 2 It
Electric baseboard heat 10,000 160 1600
Electronic oven 3000.1000 100•
Fan, attic 370 65 20
ran, kitchen 250 30 B•
Food blender 200-300 1/2
food worming tray 350 20 7
Floor polisher 200.400 a 1Freezer, food, 5 . 30 cu ft 300-800 30-125•Freezer, frost free 440 180 $7•Fryer, cooker 1000-1500 SFrying pan 1196 12 15Furnace, electric control 10.30 10•Furnace, oil burner 100-300 25-40• tfurnace, blower 500-700 25-10Q1
Furnace, stoker 150.600 3.606
Griddle 450.1000 5Grill 650-1300 5Nair drier 200.1200 1/2-61Nest lamp 125.150 2Neater, portable 660-2000 15-30
Heating pad 2S-ISO 1
0141 Stereo g•Hot plate $00.1650 7.30House heating 8000.15000 1000.2500Humidifier 500 5.15•
Iron 1100 12 13Knife sharpener 125 1/Q•Lawmnower 1000 6 D•Lights, 6-room huuse in winter 60Light bulb, 75 75 120 9
Light bulb, 40 40 lie 4,8
Miser 1 25 6 1
Movie projector 300-1000
Oil burner 500 100 50•
Oil burner, 1/0 HP 250 64 16•
Polisher 350 6 2
Power tools 3
Pump, water 450 44 20•t
Radio, table 40-100 5.10°
Range 8500-16000 100-150
Record player 75-100 1-5
Record player, transistor 60 50 3•
Recorder, ta pe 100 10 1•
Refrigerator 200.300 2S-30•
Refrigerator-freezer 100 150 30•
Refrigerator-freezen ,/frost fPee 360 500 180•
Roaster 1320 30 40
Rotisserie 1400 30 42•
Sauce Pon 300-1400 2-10
Sewing machine 30.100 1/2-2
Shaver 12 1/10
Skillet 1000-1350 5-20
Skill taw 1000 6 6
Sunlamp 400 10 4
TV, BW 200 120 24•
TV, color 350 120 42•
Toaster iI50 a 5
Typewriter 3C 15 5•
Vacuum cleaner COO 10 6Vaporizer 200.500 2-5Waffle iron SSO-1300 1-2Water heater 1200-7000 200.3Q0Water pump shalimi) 112 HP S-20•Water pump deep) 1/3-1 HP 10.60•t
AT THE IIANN
IN THE MILNHOUSE
Milk cooling 4-5 HP 1 per 100 Ibs milk•
Space heater 1000-3000 800 per year t
Ventilating fan fractional 10.25 per mot
Water heater 1000-5000 1 per 4 gal
FOR POULTRY
Automatic feeder 4-4 Hp 10-30 kWh/moat
Brooder 200-1000 watts 4-14 per chick perseason
Debeaker 200-500 watts
fractional HP
1 per 3 hrst1 2000Egg cleaning or washing
Egg cooling 116-1 HP
per eggs*
14 per case*
Night lighting 40.60 watts 10 per rn
Ventilating fan 50-300 watts 1-14 per day* per
1000 birdsWater warning 50-700 watts varies widely
FOR HOGS
Brooding 100-300 watts 36 per brooding
period/litter
Ventilating fan 60-300 watts 4.14 per days
Water warming 50-1000 watts 30 per brooding
period/litter
FARM SHOP
Air compressor 4-4 HP 1 per 3 hr,
Arc welding 3N amp 100 per year*
Battery charging 600.750 watts 2 per battery charge*
Concr,te mixing 4.2 lip 1 per cu yd•
Drill press 1/6-1 HP 4 Per hr*20Fan, 10" 35.55 watts 1per hrLt
1 3 hr•Grinding, emery wheel
floater, portable
4-1/3 HP
1000-3000 watts
per
10 per mo
Heater, engine 100.300 watts i per 5 hr
Lathe, metal 4.1 Hp Ile" 3 hr
Lathe, wood 4-I HP 1 per 3 hr
Sawing, circular 6"-10" 1/3-4 HP 4 per hr
Sawing, ,fig 4-1/3 NP 1 per 3 hr
Soldering iron 60-500 watts 1 per 5 hr
MISCELLANEOUS
Farm chore motors 1/2.5 1per HP per hr
Insect trap 25.40 watt 1/3 per night
Irrigating 1 NP up 1 per HP per hr
Snow melting, side"aik 25 watts per 1,5 per 100
and steps, heating- sq ft sq ft per hrcable imbedded inconcrete
Soil heating, hotbed 400 watts 1 per day per season
Wood sawing 1.5 NP 2 per cord
Capacitylip or Watts Est, IOIh
earn cleaner 2-5 HP 1201yr•Clipping fractional 1/10 per hrCorn, ear crushing 1-6 Hp 5 per ton•
1 per ton•tCorn, ear shelling 4- 2Electric fence 7-10 1 per no •tEnsilage blowing 3.5 4 r ton
yIp per Ibs•tFeed grinding 1-74 1?0
Feed mixing 4-1 1 per ton'1 100Grain cleaning 4-4 per but
6.7 ton•tGrain drying 1-14 per
Grain elevating 4-5 4"" 1000 ^u•t
Ray curing 3-74 60 per ton•ton •tHay hoisting
portable4.14.4
i/3 par
14 cowJi .tMilking, per24 per tow/nm•tMilking, pi pel i ne 4- 3
Sheep sheering fractional 14 per 100 sheepSilo unloads 2-5 HP 4.8 per ton,Shape conveyor 1.3 HP 1-4 per ton,Stock tank heater 200.1500 watts varies widelyYard llghts 100-600 watts 10 per moVentilation 1/6-1/3 HP 2-6 per day per 20 cows
• AC power required
t Norm Ily AC, but convertible to OC
NOTE; Kilowatt-hour usage can be cut up to SOS through energy conservation Source:
42
Rockwell International
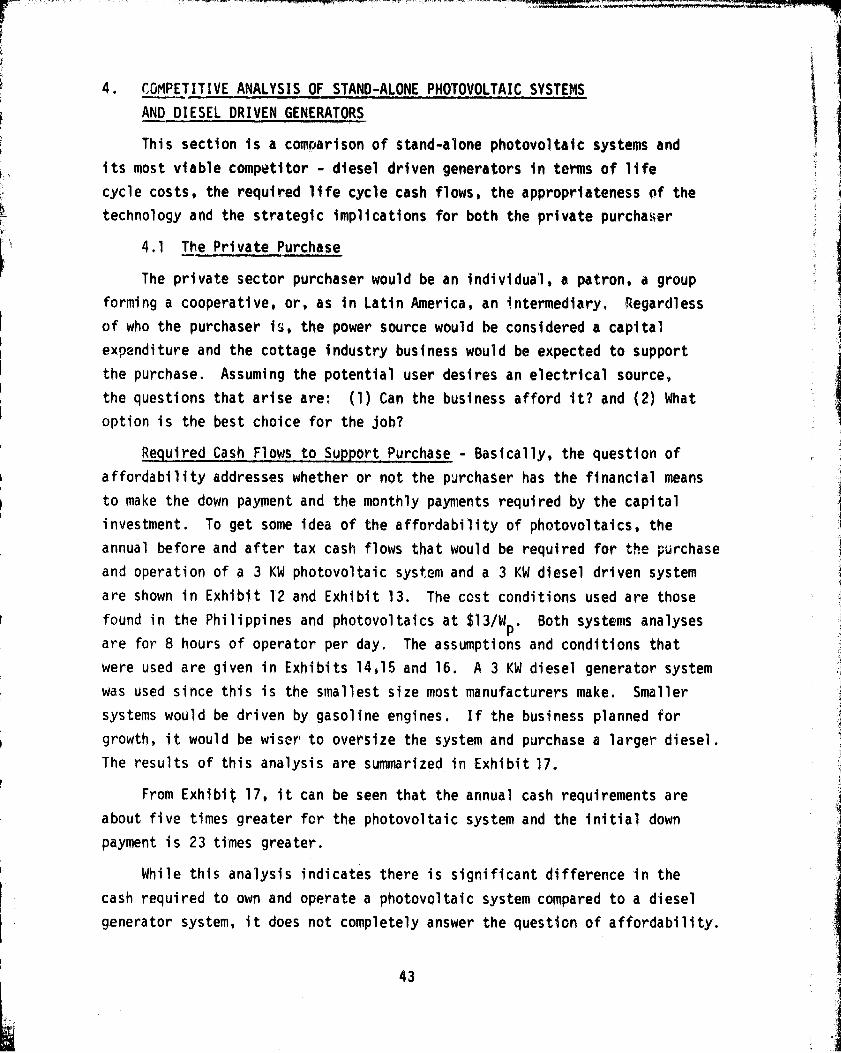
xr
t
4. COMPETITIVE ANALYSIS OF STAND-ALONE PHOTOVOLTAIC SYSTEMS
AND DIESEL DRIVEN GENERATORS
This section is a comparison of stand-alone photovoltaic systems and
its most viable competitor - diesel driven generators in terms of life
cycle costs, the required life cycle cash flows, the appropriateness of the
technology and the strategic implications for both the private purchaser
4.1 The Private Purchase
The private sector purchaser would be an individual, a patron, a group
forming a cooperative, or, as in Latin America, an intermediary. Regardless
of who the purchaser is, the power source would be considered a capital
expenditure and the cottage industry business would be expected to support
the purchase. Assuming the potential user desires an electrical source,
the questions that arise are: (1) Can 'the business afford it? and (2) What
option is the best choice for the job?
Required Cash Flows to Support Purchase - Basicaily, the question of
affordability addresses whether or not the purchaser has the financial means
to make the down payment and the monthly payments required by the capital
investment. To get some idea of the affordability of photovoltaics, the
annual before and after tax cash flows that would be required for the purchase
and operation of a 3 KW photovoltaic system and a 3 KW diesel driven system
are shown in Exhibit 12 and Exhibit 13. The cost conditions used are those
found in the Philippines and photovoltaics at $13/W P*
Both systems analyses
are for 8 hours of operator per day. The assumptions and conditions that
were used are given in Exhibits 14,15 and 16. A 3 KW diesel generator system
was used since this is the smallest size most manufacturers make. Smaller
systems would be driven by gasoline engines. If the business planned for
growth, it would be wiser to oversize the system and purchase a larger diesel.
The results of this analysis are summarized in Exhibit 17.
From Exhibit 17, it can be seen that the annual cash requirements are
about five times greater for the photovoltaic system and the initial down
payment is 23 times greater.
While this analysis indicates there is significant difference in the
cash required to own and operate a photovoltaic system compared to a diesel
generator system, it does not completely answer the question of affordability.
43

(o +JSLW aoL ^
00 p
4- N
c `°L•rO +i Ctor-L c Ca n vC d VI
C7 n it/f ^ Id,
N+JO La 3e o
o6q^°om o ^
•r a ♦rVI ^ V1r 00
• u tc a t ,vro(a++ vcu 4-r E O ra
+)4Jas+JVI VI V) •r
>1 O aLn
N U •r•r G1 Gl N.Cttt
F-
N
co
wN
0QWZW
WN_W
0
YM
0N►•rNY
Z<t
0LLxNv
1i'acoMco
40i.
00
41
OvN
w
4-
NbMR741
L
4-
4-0
a_1r•'
4J
aLqa1—
41
KW
`G
foeo
73 ol i; --oll Olin
eo
„r
G..o^ a^ Aid^rAa ^^J,,yJ
^'^G f^ ^ aV oSi , ^t ill sV ^i ^1 J
l .•._rAers_rw_nyraL.•^^r^wn^.e•rLr^^•^^Q161 w.^ay .n .•^e:• .q ^.y .^itiwww ir it •i w^w•q
..1..w....q.q •.1 Aw ..•..1n r•n r H w•A •n
^^^^ •P: f^: ii: ^fi: 03: : N` ^ ^fi`Ii`:^:
^Aa^! ^tVM^i;;^t^:ay^d=•'tilc?^ieiQ^in'16e^^'
44

6-1d1
A
c
CL
1.. N
rd00
S- cdEi )
14-)/i Lw Nr Q1
m CL
L/0 Ca-0-) 0 aO vi O> In 4j -o+-1 41 0
.r- :a Ja -I^e roro(cc Q !fT
L M V)
4- W MLC1 w
4A 4-11O
^ U tM m 131 0C CL N tom 10 •P- U
U V1dl P°tEEerl
4J 4J jCA V) 0 •^P >)>c
V) V) •P•ut•^ 4) Cif d)ttt.^
a3Mr-
t.D
H-+
f7v
t^C<
a1-Mw
LL1h-Uls.lh
V
JC^aC)
C1.
3Ne
Md
U-C)
0-4
V)
JZ
3CC7
LL
zt/1QU
G^J,
It
^rG.t1?F
V a
Leo Imm - Co N-
11tlfmo;N
fi sm N.ir.tg0 °.y^ . ='n.vo ^d'
`tom •,I* d* Oct. 04 hN^0 M^ChhhMlgk9101010hIf9^G 491fl dP^'i to
ly ^J179hdh*0000110 -NCtJ-MCI—;*Co
h&`!
y'^A h;O nOh ftD:COOL^ - M 0^ra SQC4CM 9::ooC^N^'d°O+M^cnMO+oo®CN4+0^^'^"'N'N C7tUNNR9 C IO 04 94 k^4/1G^
^ •4 '^ 'NleTCTA + crin CV^dIGNCOdUW Uy Od.h
'%^^0^ONNCtiNNd"^'Q^C^S'lM+f'^C`^C9NCJQ.^N+^
J NNNNNL7Cri, MCOC9MMMMc"! S'lCOMClt'aN N N N N v^ l0 ^D 10 ^D 10 ^6 ^: ID ^O ^O ^D
Gy H....,. .........,...,.,...,... ---
7
1 1..i ..., r- yr .^ A ^ in. — - Md ..1 !^ .•. '/ •1 A rl A ..1ePaaa^ ©ooc0000000eoon!.. ..1 .•1 E.M H e^ ... .!. O.I t.1. A ri M^ f•. W ... A .Ir ^ ^
^s o Q•©o .c000©ne. oo .00000AJ Ifs 6"7 L, 4'1110 0 lfj 1.9 im ifs 0 l.'9 M Ll0L in L?
C"^MC7MC^c^c'^r^6`^c^JM4^Mt'^M09InMM
dJAlv ®^©+^o©o^®a^^0000®ono
(^^ N N N
7' Ili lfJ L? 4'1 V7 V7 IA !19 ItJ In N 47 4!^ L7 l:'a L7 L'3 4"> iAtrlC'^MMC^MM^AMC9C^NaC" C9t`'!C'^Mt9LhC!9
f^
7
^' ®®®®,ti®tea®aoeaea®©ee^o®o®
d^-RV C9d16^!>OhL^A^-------
N^oC'1
u,r.
C^
P+,
er
M4)
L:
.r.
sX
0
LL1
4-
r
ror^
X
S-4)wCu
4-04)
rRI
C4)V1d)Ld.
01-
45

COST CONDITIONS USED FOR PHOTOVOLTAIC SYSTEM ANALYSIS
Photovoltaic System
Assumptions
For every peak system watt, there is 4.5 Watt-hr of usable
power per day
. Primary batteries replaced every 1,800 cycle.
. Battery discharge is 20% and cost $100/kW-Hr.
. Maintenance $350/yr.
k
Exhibit 14
46
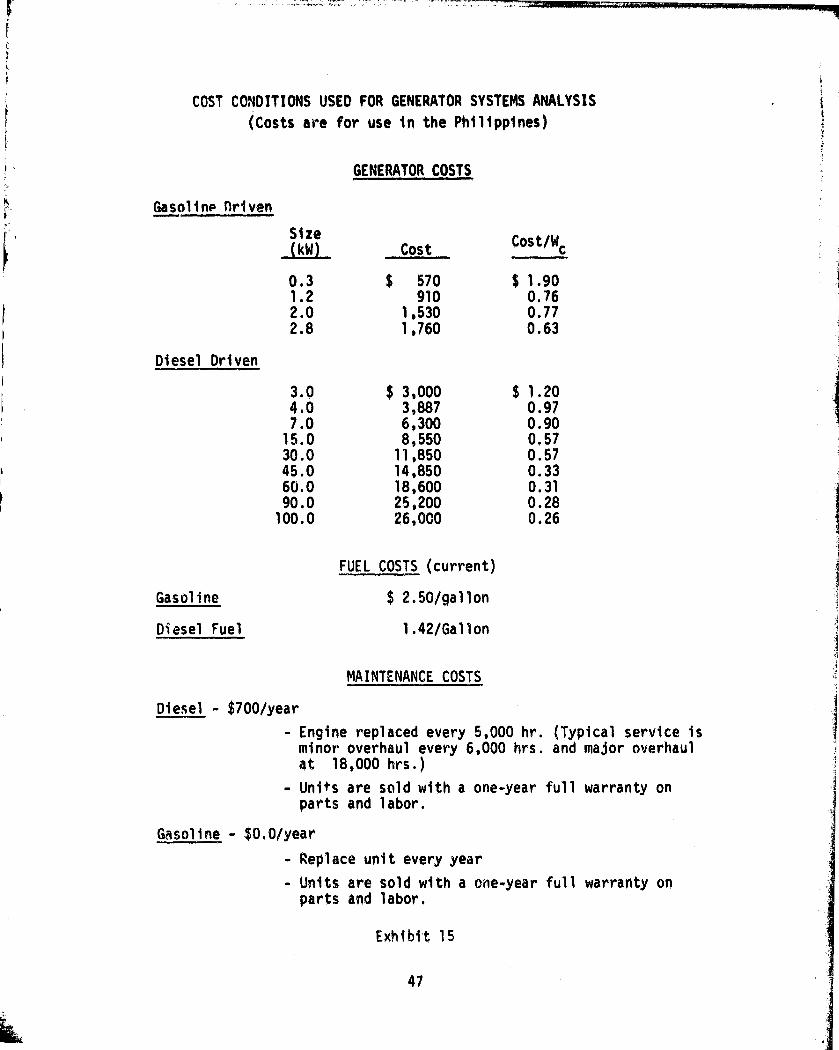
µ COST CONDITIONS USED FOR GENERATOR SYSTEMS ANALYSIS(Costs are for use in the Philippines)
GENERATOR COSTS
Gasol i nP nri ven
Size Cost/WkW Cost c
0.3 $ 570 $ 1.90
1.2 910 0.76
2.0 1,530 0.77i 2.8 1,760 0.63
Diesel Driven !
3.0 $ 3,000 $ 1.20
4.0 3,887 0.97
7.0 6,300 0.90
15.0 8,550 0.57
30.0 11,850 0.57
45.0 14,850 0.33
60.0 18,600 0.31
90.0 25,200 0.28
100.0 76,000 0.26
FUEL COSTS (current)
Gasoline
$ 2.50/gallon
Diesel Fuel
1.42/Gallon
MAINTENANCE COSTS
Diesel - $700/year
- Engine replaced every 5,000 hr. (Typical service isminor overhaul every 6,000 hrs. and major overhaulat 18,000 hrs.)
- Units are sold with a one-year full warranty onparts and labor.
Gasoline - $0.0/year
- Replace unit every year
- Units are sold with a one-year full warranty onparts and labor.
Exhibit 15
47
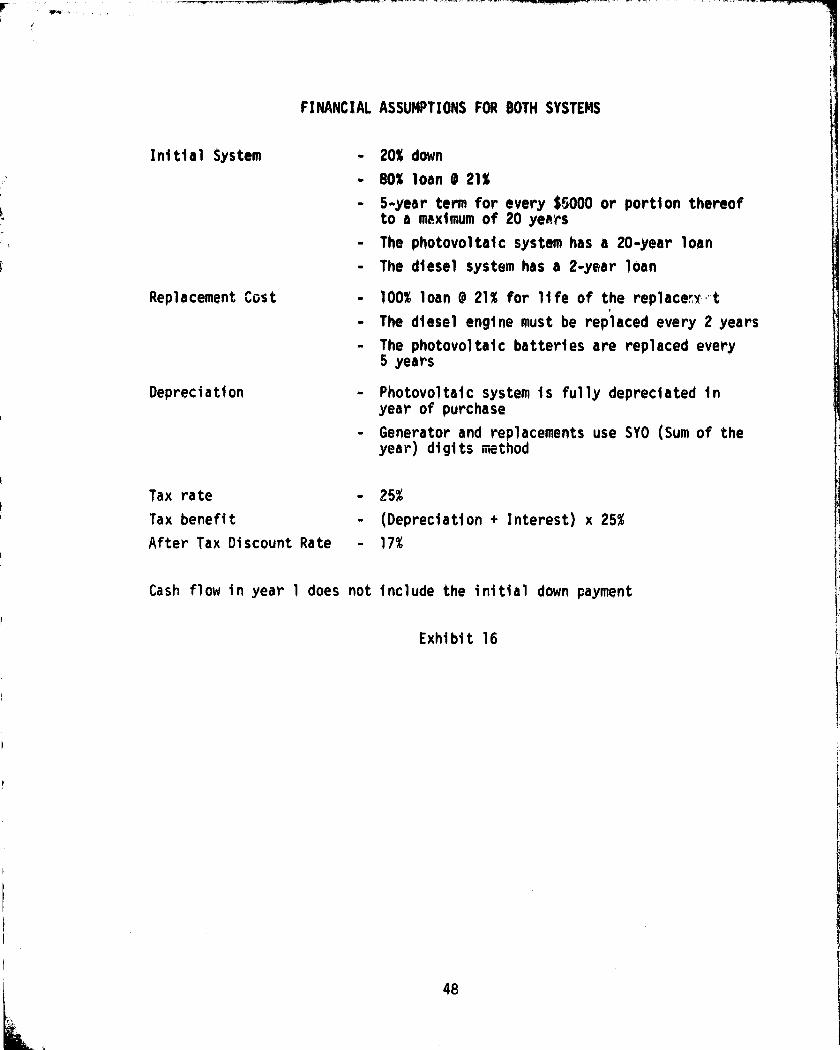
FINANCIAL ASSUMPTIONS FOR BOTH SYSTEMS
Initial System - 20% down
- 80% loan @ 21%
- 5-year term for every $5000 or portion thereofto a maximum of 20 years
The photovoltaic system has a 20-year loan
- The diesel system has a 2-year loan
Replacement Cost - 100% loan @ 21% for life of the replacerx.,t
- The diesel engine must be replaced every 2 years
- The photovoltaic batteries are replaced every5 years
Depreciation - Photovoltaic system is fully depreciated inyear of purchase
Generator and replacements use SYO (Sum of theyear) digits method
Tax rate - 25%
Tax benefit - (Depreciation + Interest) x 25%
After Tax Discount Rate - 17%
Cash flow in year 1 does not include the initial down payment
Exhibit 16
48
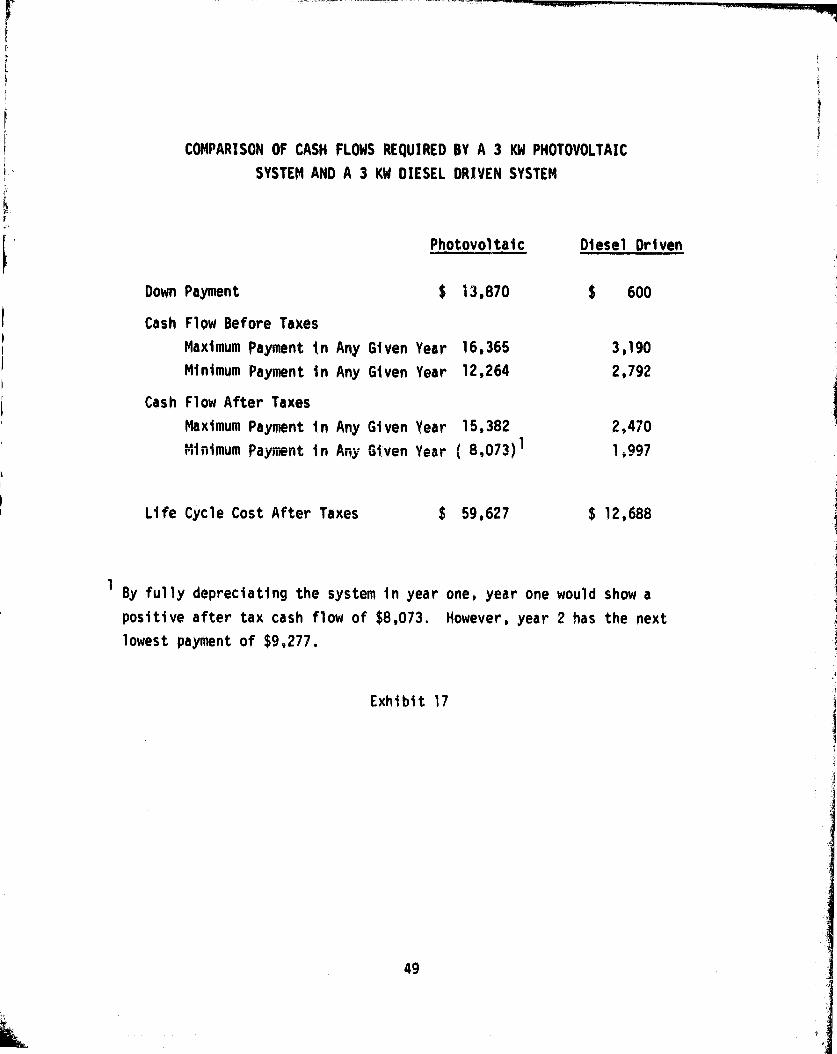
COMPARISON OF CASH FLOWS REQUIRED BY A 3 KW PHOTOVOLTAIC
SYSTEM AND A 3 KW DIESEL DRIVEN SYSTEM
i
t
f
Photovoltaic
Down Payment $ 13,870
Cash Flow Before Taxes
Maximum Payment in Any Given Year 16,365
Minimum Payment in Any Given Year 12,264
Cash Flow After Taxes
Maximum Payment in Any Given Year 15,382
Minimum Payment in Any Given Year ( 8,073)1
Life Cycle Cost After Taxes $ 59,627
Diesel Driven
$ 600
3,190
2,792
2,470
1,997
$ 12,688
1 By fully depreciating the system in year one, year one would show a
positive after tax cash flow of $8,073. However, year 2 has the next
lowest payment of $9,277.
Exhibit 17
49
The question that remains is, Now many rural cottage industries in
developing nations, which use 3 KW of power could afford $16,000 per year
over and above the other costs and expenses of doing business? In Mexico,
the average assets of a rural cottage industry range between $2000 and
$3000 and in Morocco the average annual income of a handicraft producer is
$1000. To generate this large of a cash flow, the business would have to
approach the category of small-scale manufacturing. However, the energy
requirements of a small scale manufacturer would also be greater.
Assuming there are some cottage industries that could support the
required cash flows, the next question is which system will the potential
buyer choose.
The "best" choice will again vary from case to case. The deciding
factor could be delivery time, serviceability, low maintenance, special
features, but, in general, the system demonstrating the greatest economic
value will be the one chosen. This is especially true if the system will
be financed by a third party such as a bank or development agency.
Life Cycle Costing of Competitive Power Systems - To establish the
economic value of each option, the cash flows required by competing systems
must be compared by a time value method. In other words, how much more
should be spent today to save in the future, or how much should be saved
today if more must be spent in the future. The "life cycle cost" method
or discounted cash flow method is the accepted means for making this
comparison.
Life cycle cost is the sum of the costs of a system discounted over a
period of time. Costs considered here are for a 20-year operating period
and include the following:
- fuel costs
- financing costs
- maintenance costs
- initial system costs
- cost of replacing the system or parts of it.
The results of calculating life cycle costs for a photovoltaic system and
a diesel generator system in the Philippines are shown in Exhibits 18, 19,
and 20. The cost assumptions used for the analysis are given in Exhibits 14,
15 and 16.
50

d0
V)
s
0W(`4G'WCLO
WHN
N
Ua-^
d
C £ ^$
0 6$
R 9$ '.d N a
dM/£$0
x£.1
x
N Q1 G. I o-Zb ^.,LA- :^ua,a and..
C)H44-
Go
DC ^WZ
"'
&nWC:7 a
dLL.
m
O
O N
NfYda
Qt
UP
m
N
OD
+jv r-
4 1 C1 Z
V ' W
CD
CD u
°o ut
J et
OOO
Or-
I I. (,I ,I
..III
IIfilli,
::,A,r-ilell,pl
il"lil91
11 111111°
11 Lil.; fl'^ II ; I
!
L.— I Il
III
1'1
►I
1!;,, VIII
;Iiii 1
I,(_^I' I Il ,ji ^l li i
l iti lii l ! ' i l i11:
I.1{I h^
k IIIit 1 ^I, ^ >L! p rl,li^ j I
= i' I w I . , ,
^^ I c I'i'j'iIj
'i'I^ihi(1 I^
(„i1,11^ III 11 Ii II I
i!lilI I I I
^^
n,,
i. i i l^,
I,li^jl il, IIl
I i .II .1
Ij ^ I i III ^^IIII, I (
! a^! S.7 II l o ll I
I)
'
^I' ' ^ ' i i I ' ''! ' III 1 1 1 - '1;jll i'11 1^ III ! I i c I ^Iu ! ^ ',•
I
1p4A t
I
" t' '1 ' ; j iI 'I
-
—
.w
q I TI
;,I I -1. I. I II
111 III' lu;
^ ' I
1
ill'i,,
tl III' ; i I ! { I,I la II I
I HF1 i ll P 11 III11 I I•
I I1 1 U1 '
I
li
..I
I
i I
I^ !
I!^I^ I
I^
' I
I
1 I
^
-II
t i
I '!li
II11 I
I^ I
'!i
i^'
!;I
I'
^{III,
III ; I1
'!' I, I I r l
^'
1 "!I
i7 tI`!^ r
i1
1i I ! i I i!11 j ,
I'..jlI i . I lj!'h'i:;!^ 1
II'III I'll ^
! Ii 1 j I' I
1I ^tll , ' ^I 'III
Ilji ^J ^^' ^,
^
I
I
I' I
I ^ 1
I'" !^I;I^I!III,II11' ^i Ir ^l' li i' ",Irt
! 1 ' I^'''
I,{ II `jlll^^^,,
1: _1111 I^^^ LI.'
Ir i ,i!I
11i l ' t
I^{ I t!II^1
^
^ li I I I
1
I
I
II ^ '' it
i, l I l.. I II I I;II'ili IN,It; ..1 ! .^
Lp ;'I u I I. T^"
^' x £n r;11 -' t 4J I i. l,' rlt 1 -I,
`II
r
11;1 Ir i
I
rrIT.I.
1,
1111 Pil l . 1,
fx
r p
^7 Z$
4ua,a,anjiil! I - ,:' I i lIl II ti I lil i I {
I t,, , 1 ^ r Yit I, : ^ I rf f I I. ii-
^ Ii ^' ^n
_1 , I, it t l i -
R-T-I I I
^1 I'f •I lu _
1 ; TII 1 -
tfl
I.I'n
t II _ l I 1^^;'I lip
.1
It,I; 1I. II !^' p i1 I i^ ; II it ^ I III I i ,II. I ^ 11I L i) ..I 1^ 1_. .hl I • hl. I I ! I I ^ IIn V M N i01mn%P H1 'W M NV
O0
r=
00
00r-
51
0NI'..- - W rr ^ - nV
CD
(^ 4pedeo s4leM)
C) pe0l
r-
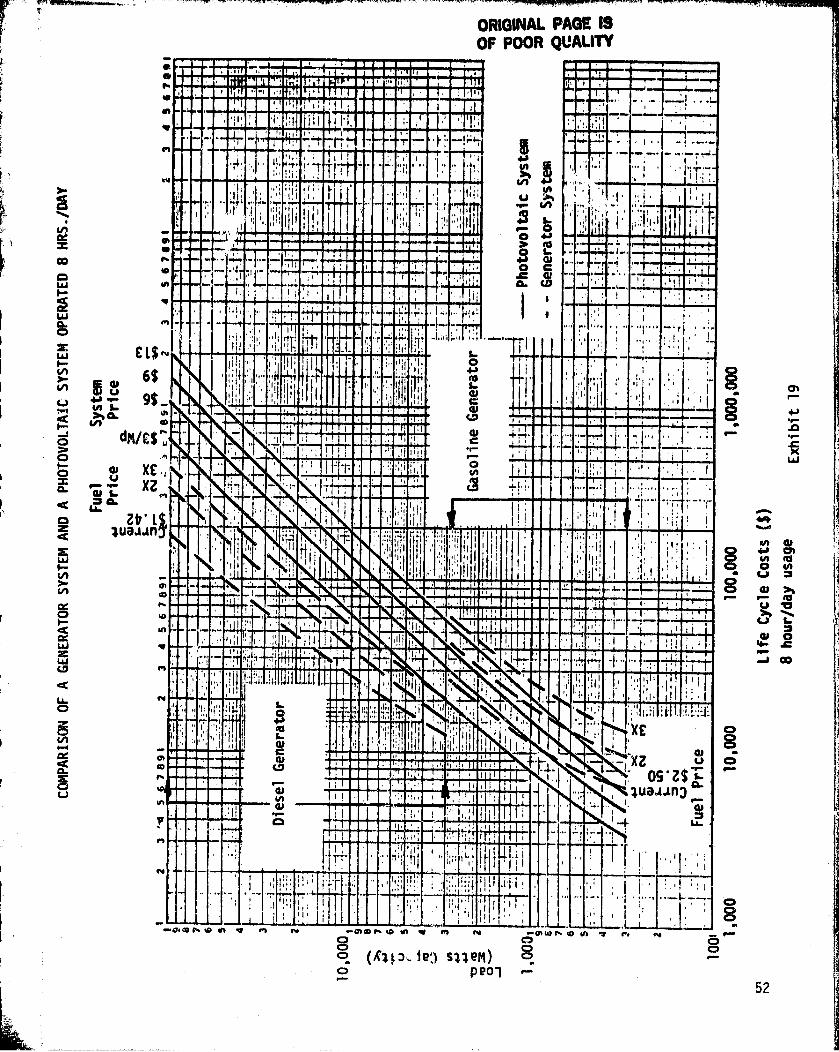
ELI
61
y 99
Ndm/£4
u MXi
Z4°IZuajjr
O O 1^l1
^ ^ b
V L
^_ t
J (A
0AP
oS
w
s
a
i
II 1 Y.+, ,•f it (,
•Ili
!I li (n1
; ^'
•i i^ ^I Iii y A
,^ I ifJill :1
!1i I .T.I.'f i, ^ i I
., ! ; I 1 ' t.
C6 177
rt
I ' i, I Ir^' ! ^'_I. L )I.
„!iI (
I^
I
^
, it 'jii ,4J I
,111 ^'' I d ! ' I ^ :' 'I^ ''' ' ,I ' 1
^, '^ 'lj 'I' •, ,
'V. , I IF_ 71lN
I 1 - _
S. •I I'^^I .Ire 11 1 I^ ^ ^
11 ^)
i/ J,Iii+ dl^ I
I Il.(^ I lliiil^^i i (I ^ !^ , I ,I, li I
'I '^Ii n i I^ I^i
1 '•1• +,^ I I I I
_ ' 'I I ', ^ I .I I I.-
^I l ,
,•.^.: i
I -. 1 -,. ^^
, ^ I tm,
NN;
'1( I
I lil ! .I i^^ l .j;:l I I III
^ 1 I
121
I „IIIl^'I•,I•.i.s,li^,.^.- I-,, ,. "ilil^I •i: I '%
1, ` ,Il(.''I,'^l,il! '^(
.a•
,iI^
lII^N .!
tt,H, ,,' "'
iI 'I I +i^ : h i l l 'il ! it 1 !I I iwwwl^l
7
w I I^,,I I' i I
!` luaAan^
11,' I I
,
I
^-
4.11I I, 4J
® , 1P
! '
Tr+ •^ l ' ^^r Dili
i ' • [ IPoll I I
T" ^^^ ^• ! !;.
• i ll ; -^ ^1
,
'^.^
^ r^ ' f I1• ' ^I, If s .^ ^
ORIGINAL RA®L IROF POOR QUALITY
CD
C (41pAe) silent)o peol
Am u. n ^p n B r.
qwe
Q
Qs
2CA
DW
CLWOz
knNV
0csCL
4c
0z4
WI>—NN
O
WzWCD
400.-r
cca
V
52

m
oW
m'F- to
toi W
a VII O
V 6 i n14JN a,-- 9$
J dM/£$
o
o,m
vXE r
a XZLnW-
Zb•l$Za
NI W
rNN
m
I F--ccn^o
WZ
^
WO o
IQ
m'.
O
ZO
N
I
Qr O
°^
U
ON40
sxW
0
°OnO
g
IbO (A
Ow O V ^
O 4) M
t^O
4) t4-•r NJ r-
41U
dr O
OI O^ w
N
m
14
m
N
ORIGINAL PAGE ISOF POOR QUALITY
amP
ha
N
x
Pw•Q^ W P ^O N ^ m N w_ch m n W N +Y m N •• oleo P ID In V m N
C) Ojp(^vde3 Sjj eM) opeon
O r-
J°0C w
O rO
53

Shown in these exhibits are the life cycle costs of owning and operating
a system for 4, 8, and 12 hours per day at current fuel prices, two times
current, and three times current with photovoltaic systems costing $13, $9,
$6, and $3 per peak watt (Wp).
From these exhibits, it can be seen that, at current fuel prices and
at photovoltaic system prices of $13/Wp , photovoltaics compete favorably
with conventional diesel or gasoline driven generators only when very small
amounts of power are required. As fuel prices increase and photovoltaic
system prices decrease, the range in which the systems are competitive
increases, but the competitive range still remains relatively narrow. This
demonstrates the scale of economy advantage that diesel generator systems
have over photovoltaic systems. The cost per Watt-Hr of energy decreases
more rapidly for diesel systems than for photovoltaic systems. Therefore,
it is to the advantage of users to form cooperatives whenever possible, to
achieve these economies of scale.
Cash flow analyses for various sized systems and the development of
life cycle cost equations for comparative purposes are presented in Appendix E
and Appendix F. These two appendixes present a reasonable cost`^ I ng model for
anyone cansidering investment in high initial cost systems.
4.2 The Go vernm,,nt Purchase
From the discussion of Section 2, we have seen that throughout the world,
the majority of rural cottage industry producers, with no access to electricity,
exist at a level barely above subsistence. Frequently these enterprises
exist outside the formal economy and are the only source of income to the
producer. They function to provide the producer with basic utilitarian
goods, supplemental food and about the equivalent of two meters of cloth per
person per year. A cottage industry with capital resources would be a rare
exception. Therefore, in non-industrialized countries, the purchaser of a
power source for cottage industry applications will, most probably, be the
government.
Assuming a government intends to provide electricity to cottage industry
and can afford it, the government will have several basic concerns regarding
the purchased They include:
54
- Protecting domestic industry
- Minimizing trade deficits
- Providing for the most people with the resources theyhave available
- Choosing the system which is the most economical, overall.
The first condition limiting a purchase is whether parts of the power
system are produced domestically or abroad. If a suitable portion of the
system is produced domestically, there is an increased opportunity for it
to penetrate the market.
The next issue to be considered is minimizing the potential for a trade
deficit. The purchasing country will seek to minimize imports; however, if
the product imported will substantially increase exports, the purchase may
be warranted.
It is the objective of any developing nation to raise the standard of
living of as many people as possible. Therefore a government will strive
to allocate available resources to its best advantage.
The final consideration is the optimum investment choice considering
intangibles such as social benefits. The system chosen should be an
appropriate technology and in balance with the rural economy. Other factors
would include cultural acceptance of the product, technical adaptability,
maintenance, service, flexibility of the product and the ecological impact.
These factors are highly qualitative and vary from site to site.
The factor of greatest importance is which system is cost-effective in
providing electricity. The decision in most cases would be based on an
analysis of "life cycle costing." The government purchaser will usually
consider the best alternative over the long-term and will probably have the
capital resources to afford a longer term payback. An example of life
cycle costing for a photovoltaic system and a diesel generator system has
been given in Section 4.1. Taxes would not be considered in a government
evaluation. (In the example given in Section 4.1, deleting the tax factor
would not significantly change the evaluation.)
The example given in Section 4.1 is a "financial" analysis based on
cost conditions prevailig within the country. Many governments would also
55
consider an "economic" analysis which would evaluate the opportunity costs
of the market on an international basis. This analysis considers fuel at
world market prices and costs in world currency dollars. However, the
relevancy of ths- "economic" analysis method depends on the overall resource
base of the country and world trade position.
4.3 Appropriate Technology
In introducing electricity to the cottage industry sector, some
industries, such as wood-working, will adapt readily. Others, such as pottery
and weaving, would require a great deal of extension service assistance and
training. Recent trends in foreign development policies have stressed that
new technology introduced in the rural sector be "appropriate technology".
In other words, it should be in harmony with the rural society. For cottage
industry, an "appropriate" process should liberate the artisan from labor
activities which are low income producers and redirect his or her efforts to
processes which will generate greater income. In altering the processes
used, such as using electrified tools, care must be taken to preserve the
unique quality of the product. The final product must remain semi-artisanal
rather than semi-industrialized, yet there must be a visibly higher value in
the product made by the new process or improved technology.
The utilization of any energy source for a rural development project
would require that it be of an appropriate technology. In Mexico, renewable
energy technologies must conform to the criteria established by the Institute
for Electric Studies to evaluate projects for integrated energy systems for
rural communities. They require that the technology be:
- low cost
- utilize local rural materials and labor for installation
- labor intensive, providing utilization of local labor
- maintainable by the local community
- simple in design and flexible for adaptation under widely diverseconditions
- modular in order to increase capacity as required
- compatible with the local culture and customs
- compatible with the social and economic needs of the groups usingthe technology
- based upon local environments and ecological systems with minimaladverse impact upon these systems.
56

Although the exact criteria and local interpretations vary, the essence
of what is an appropriate energy source remains the same. In the ruralsector of less developed countries, power systems should be simple,,locally
maintainable, provide more use of local labor and be socially acceptable.
4.4 The Strategic Implications for the Small Manufacturer
In order to assess the market for photovoltaic systems in cottage
industry applications, it is necessary to go beyond the pure economic
numbers of the decision. This is done by assessing the non-economic
value of photovoltaic systems by considering their strategic implicationsfor the small manufacturer and for the importing country.
The strategic implications of photovoltaics for the small manufacturer
can be assessed by relating the advantages and disadvantages of a photo-
voltaic system and diesel generator to the needs and desires of the user.
In this way the non-economic value of photovoltaics may be discovered.
The characteristics of a photovoltaic system and diesel generator system
are summarized below and categorized as either an advantage or disadvantage.
This categorization is usually done by advocates of photovoltaic systems and
therefore represents their perception. What must actually be determined is
how the characteristics of these two stand-alone power systems will be
perceived and valued by the end user.
A
r
Photovoltaic System
- Advantages
No fuel required
Low maintenance
Benign environmental impact
Modularity
- Disadvantages
High initial cost
Diesel Generator System
- Advantages
Low initial cost
Compact
Transportable
Decreasing marginal cost
Requires large land area - disadvantages
Technical complexity Fuel required
Rapidly changing technology Noise and air pollution
Appliance adaptability Maintenance required
57

Assuming that a small manufacturer in the non-industrial, non-centrally
planned world would think similarly to a small manufacturer in this country,
his main concerns will be:
- Ability to Pay/Cost of Capital - A small manufacturer has a limited
amount of investment dollars:. He wants the greatest impact for the fewest
dollars, and must constantly tradeoff between present costs Pnd future
benefits.
- Operational Flexibility - The small manufacturer wants to be able
to adjust his expenses to his business revenues. If sales are down, he
reduces production and reduces his total variable costs. These are the
costs that vary directly with production level such as labor, materials,
and fuel. The cost of plant and machinery is a fixed cost and is indepen-dent of production level. Controlling operational flexibility is veryimportant to the small manufacturer and is one of the factors that determineshis ability to weather bad times.
The small manufacturer also wants a plant that can change to conditions.
He wants to be able to grow and change or augment his product line if
opportunities are present. Therefore he does not want to invest in
inflexible equipment.
- Financiai Flexibility - Financial flexibility is the ability of thesmall manufacturer to raise money when he needs it. If the small business-
man has unlimited resources, this is no problem. However, this is seldomthe case. The small manufacturer will usually have to go to a local lenderfor additional debt, and if the business already has a large debt out-
standing, the lender will be extremely reluctant to loan more money.
Additional borrowing becomes more risky and consequently more expensive.
- Control The concept of control is related to the small manufacturer's
flexibility. He wants to be able to control the costs of his inputs. For
example, if the small manufacturer is buying an input supplied by only one
supplier, that supplier controls its cost and the manufacturer must pay
the supplier's price if there is no substitute. On the other hand, if the
input is a commodity item, he can go to an alternate supplier.
i'
58

- Timin - Timing is a very important element in the competitive
strategy of a small manufacturer. If a manufacturer buys equipment just
before a technological breakthrough affects that equipment, he is at a
competitive disadvantage with his competitors because he has obsolete
equipment which cannot be easily sold, and he has probably expended his
investment dollars. With rapidly changing technologies, therefore,
timing is a crucial element of competitiveness.
Having explained some of the concerns of the small manufacturer, it
must now be determined how the characteristics of the photovoltai{t system
might be perceived by the small manufacturer to determine if ther,a is any
value over and beyond the economic values considered in the pre0 ous section.
Photovoltaic System
- High Initial Cost - The initial cost of the photovoltaic system
required for various cottage industries was indicated in Sections 3.1 and
3.2. It can be seen that in most cases the cost of the photovoltaic system
is many times the cost of other equipment. It is probably unlikely that
the small manufacturer would have the ability to pay for the system in
these cases and would eliminate any financial flexibility in the business
if he did buy the system..
- No Fuel Required - This would eliminate the need for the small
manufacturer to buy fuel, the price of which he has no control over.
However, he is trading off buying fuel with a large initial investment.
Fuel purchases will follow his production maintaining operational flexibility,
but the large initial investment results in a fixed cost reducing his
operational flexibility and financial flexibility.
Requires Large Land Area - Not only must the small manufacturer pay
for this land, but he must maintain it and protect it. It also exposes
him to more risks such as damage due to storm or accident..
- Low Maintenance/Technical Complexity - While the maintenance required
under normal circumstances is extremely low for photovoltaic systems, the
small manufacturer will consider a "what if" situation. If the system
should fa,' the technical complexity means that he will not be able to fix
it and spare parts are beyond his control.
3
59

- Rapidly Changing Technology The ,price of photovoltaic systems is
projected to decrease substantially. If this is the case, why should he
buy the system now with a very high initial cost? Would he not be better
off to buy a diesel generator now and fuel it with diesel fuel while fuel
is still relatively cheap and then buy the system in the future at a
lower cost? For example, modules cost approximately $10.00 per W now
and are projected to cost $7.80 in two years. This would represent a
savings of $7.20 per W if purchase is delayed. For a 15 KW p system, this
saving totals $108,000.
- Modularity - Modularity is claimed to be a positive factor for
photovoltaics in that the system can be expanded to meet the needs of the
user. However, the marginal cost of each additional unit of photovoltaic
capacity is the same while marginal cost decreases for the diesel generator.
As a result, if growth is expected the diesel generator would be preferred
due to decreasing costs and shorter lifetimes resulting in greater flexibility.
- Benign Environmental Impact - This will be of little value to the
small manufacturer. Environmental impact is a social cost which he may be
concerned about, but only after all other concerns are satisfied.
- Appliance Adaptability - If special tools can only be used along
with the photovoltaic system, the small manufacturer will be limited in
his choice of tools and manufacturers. He loses both control and flexibility.
.Based on the analysis above, a stand-alone photovoltaic system does not
appear to be the answer to the electrical power needs of the small manufac-
turer. An electrical grid is probably the best solution since the small
manufacturer is not in the business to generate power, but only to use it.
If the grid option is not availab"le, photovoltaics would be attractive
under limited conditions, however a diesel generator would appear to be a
wiser choice for most small manufacturers..
4.5 The Strategic Implica tions for the Importing Country
So far we have examined the decision of the small rural manufacturer,
assuming minimal interference from the government. It is possible that the
government could establish policies and incentives which would make the
decision to buy photovoltaic systems more attractive. To understand why
this can be done, it is necessary to understanI the strategic implications
for the importing country.
T
60
i
A typical country in the none-industrial, non -centrally planned world
which would import photovoltaic systems is trying to improve the welfare
of its people. To do this in today's world, the country must produce the
goods it requires domestically, or produce goods to sell in the inter-
national market to earn the foreign exchange it needs to buy the goods it
requires from other nations. To achieve this situation, the only strategy
that the country can follow for an extended period of time is to limitimports to essential items and items required for industry formation.The country must develop industries within its means that can sell goods
internationally or replace imports. It is now important to determine how
photovoltaics may fit within this strategy.
The idea behind selling photovoltaics internationally for cottage
industry applications is to;
A. Lessen the dependence of the importing country on non-renewable oil.
B. Provide a Source of electrical power in remote areas of the countryto improve industrial production and the life of the people.
The escalating price of oil has caused havoc on the economics of many
developing countries. They were forced to buy this essential product at
higher prices and to fund their purchases through deficit spending. As a
result many of the developing countries are over-extended in debt, and have
a very great desire to reduce their import of oil. Photovoltaics will
reduce this dependence on oil.
Photovoltaics, however, represents an imporv,. of much greater value
than oil unless the country produces the system domestically. The question
is whether the production of photovoltaic systems and their applications
fits within the industrial development strategy of the country.
Photovoltaics can be broken down into modules, storage, structural
support, and controls. The modules are a high technology component
requiring significant investment in equipment and people. As a result,
it is unlikely Viat a developing country could develop this industry
domestically. The storage is usually lead acid batteries and the struc-
tural support is simple steel structures. Both of these products are
technically simple and would seem to be an industry within the capabilities
61
of most developing nations. There is some question ar, to how these products
fit into the industrial development strategy of the country,,whether the
country may achieve a comparative advantage in these or an auxiliary product,
and what the conditions in the international market for these products or
the auxiliary product may be.
The application of photovoltaics and its fit within the industrial
development strategy of the country is the next area of concern. For the
purpose of this report, the application of photovoltaics is limited to
rural cottage industries or rural small manufacturers. It has been a
strategy in some countries to promote cottage industries because, typically
they require little capital investment, employ a significant number of
people and produce basic essential products. Photovoltaics and the capital
they require may change this outlook towards cottage industries if they
were to be adapted.
The strategic implications of photovoltaics for the small manufacturer
have already been discusser;. it was concluded that were the manufacturer
given an independent choice between photovo%:'ics and a disel generator,
the diesel generator would most likely be Chosen. The question is whether
the importing country wishes to push this decision the other way. This
can be done either through a tax policy or through direct subsidies. If
direct subsidy is used the cost/benefit for the country must be considered.
It would appear that more manufacturers could be supplied with more power
if diesel generators were to be supplied than if photovoltaic systems were
bought.
62
eY
iL
5. CONCLUSIONS
T;he near term market for photovoltaics in rural cottage industries in
the nor-industrialized, non-centrally planned world, is estimated to be
70,w0 MW. However, further in-depth study has revealed that this "potential"
appears nonobtainable within the next 10 years. Furthermore, the near term
market for photovoltaics in rural cottage industry applications appears to
be limited to demonstration projects and pilot programs.
Several major factors contribute to this conclusion;
1) Photovoltaic (PV) systems demonstrate their greatest utility in
highly remote sites where fuel, transportation and maintenance costs are
excessive. For this situation to exist, there would also be a definite lack
of physical and marketing infrastructure, both of which are necessary to
support a thriving cottage industry trade.
2) PV systems in the range of $6/W p to $13/Wp are not the most cost-
effective means of supplying power to rural cottage industries. An exception
would be very remote, isolated sites, but the likelihood of these cottage
industriew being electrified is negligible.
3) PV systems do not use indigenous resources, nor do they create
more employment than other alternative products. In many countries the use
of diesel generator sets is encouraged, since maintenance of these systems
creates employment.
4) The introduction of electricity, especially photovoltaics, may
require extensive training. The peripheral equipment of a PV system (controls,
inverters, regulators) all require careful monitoring. In general, an under-
standing of these systems is beyond a peasant's comprehension.
5) The technology of photovoltaics is not fully developed. Many
countries are aware of the potential of photovoltaics as a rural energy
source. However, those who would serioi,isly consider it perceive significant
technical advances and cost reductions forthcoming. Therefore, the y will
delay their purchases until the technology is more fully developed.
Furthermore, in marketing small-scale decentralized power systems for
cottage industry applications two distinct situations emerge. One is the
demand for only a general power source. Tree other is a demand for a total
63
R
1pk
system. A general power source would have its greatest markets in countriessuch as the Philippines and Brazil. However, in Mexico or Sub-Sahara Africa,
the preferred product would be turnkey systems. Turnkey PV systems packaged
with cottage industry appliances, such as lathes and saws, are not available >'
in the marketplace at present.
6) Most cottage industries in non-industrialized countries do not use
t
decentralized electric power sources for production. It was found that
even in the Philippines and Brazil, where diesel generators are usedextensively, they were not widely used for producing cottage industry goods.
7) Electrification of cottage industry is not a high priority fordevelopment. People fulfill their ;seeds in a hierarchy with physiological
needs being primary. Food, shelter, clothing and freedom from disease are
considered minimal for subsistence. For many countries of the world,particularly the very low-income countries, overpopulation and inadequate
natural resources create a constant struggle to provide even these basic
minimal needs.
It is the usual objective of a developing nation to make a positive
impact on the standard of living for the greatest number of its people.The highest priorities in a government's developmental plan will be foodproduction, the provision of safe drinking water and medical facilities.
Once the basic necessities have been filled, the next level of
priorities is to provide education and infrastructure. Schools, educational
television, communication systems and highways would be the next facilitiesand services provided.
Cottage industry production beyoncl the needs of a village requiresskilled producers, adequate s.upplifes of raw materials and a marketing
infrastructure for the goods produced,
A country having attained this stage of development would then begin
to consider developing the rural economy either to provide goods regionally
or to create an export trade.. Also, ,s pilled labor creates a need for
employment and cottage, industry productirm tends to be labor-intensive.
For rural electrification of cottage industries tc be a significantdevelopment issue, the country woulit he at least middle-income and possibly
tripper mi ;' -income
64

Li
8) Finally, consider the effects of utilizing electricity. Basically,
the application of electricity to cottage industry production could have
three effects:
- Production of more goods
- Production of goods with a higher value-added
Better utilization of labor.
In most rural industries production of more goods is not a high priority
and, if so, it is usually an export oriented producer. More goods are desirable
only if there is the demand in the marketplace. Cottage industries that servelocal and regional markets would be unlikely to want to produce more goods,
since this may actually reduce ti p price obtained for their goods. It also
requires an accompanying infrastructure for marketing those goods. Roads,
transportation, storage and intermediaries must all be present. For many iso-
lated rural industries an adequate supply of raw materials may also be a problem,
Production of goods with a higher value-added is a good rationale for
adapting electricity to manufacturing and there have been many successful cases
demonstrated. This is especially true in the furniture and woodworking indus-
tries. The major drawback is, again, there must be a demand in the marketplace
for higher value-added goods. Another problem, as stated previously, is main-
taining the integrity of the product. The value of many cottage industry prod-
ULts lies in their visible manual craftsmanship and cultural expression: This
is especially true for clothing, carved goods and painted goods. In an export
market, hand irLde goods also enjoy considerably lower tariffs and duties than
machine-made goods.
The third effect of applyin g electricity is better utilization OiF labor.
The purpose i.s to free the laborer from tedious, low-value manual tasks to
either produce a mare valuable product or use his or her time in a more profit-
able manner. However, this frequently requires a total program of -education.
An additi -oval result of this study was to recognize some aspects of
cottage industry production which could utilize stand-alone sources of
electric power. This does not mean that these applications are a market for
photovoltaics, but that they are potential applications.
65
p
k
t
One case where the application of stand-alone power sources could be
considered as appropriate technology is in the extraction, transportation,
storage and processing of raw materials used in cottage industry production.
This specific group of activities are characterized as being heavily labor
intensive, yet extremely low income generating activities. In some cottage
industries these processes are viewed as domestic duties of the household and
are not considered as costs attributable to the cottage industry production.
Frequently these processes are not even detectable in the final product.
Improved methods of raw material preparation represent, an opportunity
for existing industries as well as for new industries in the rural sector,
This also represents an area where modern, high technology has success-
fully penetrated the rural cottage industry market, not necessarily because
it has been appropriate, but because it was the only alternative to tradi-
tional methods. In many cases, high technology material processing has been
incompatible with rural cottage industry production and has had a negative
impact on the quality and value of traditional production. As rural cottage
industries develop, however, the need for appropriate rural processing of
raw materials for cottage industry production will become the major challenge
for Lppropriate technology applications.
Semifinishing processes, finishing processes and finishing accessories
are also cases where the application of electricity to cottage industry may
be considered an appropriate technology. An excellent example of electricity
applied to a semifinishing process can be seen in the village of Cuanajo,
Mexico. Here, electricity was used to power circular saws in furniture making.
A table leg, sawed by hand from a log requiring many hours of labor, is indis-
tinguishable from a table leg sawed by circular saw in a few minutes. The
value of the Cuanajo artisan's work was not their skill with a hand saw, but
their skill with a malle"t and chisel in providing the^sculptured designs which
decorate their finished work.
Many rural produced goods are poorly finished or sold unfinished because
the artisan has neither the time nor the tools to produce a finished product.
Finishing accessories such as buttons, drawer pulls, fasteners and similar
products are also lacking. Here, simplification of early process stages would
again allow tithe artisan to concentrate on producing a more valuable product.
However, this may also require some initial training of new skills.
66

fi
Exhibit 21 is a summary of predominant cottage industries In various A
regions of the world. Forms of energy currently used by cottage industries
are given in Exhibit 22 and potential uses of small amounts of electric
power are given in Exhibit 23.
67
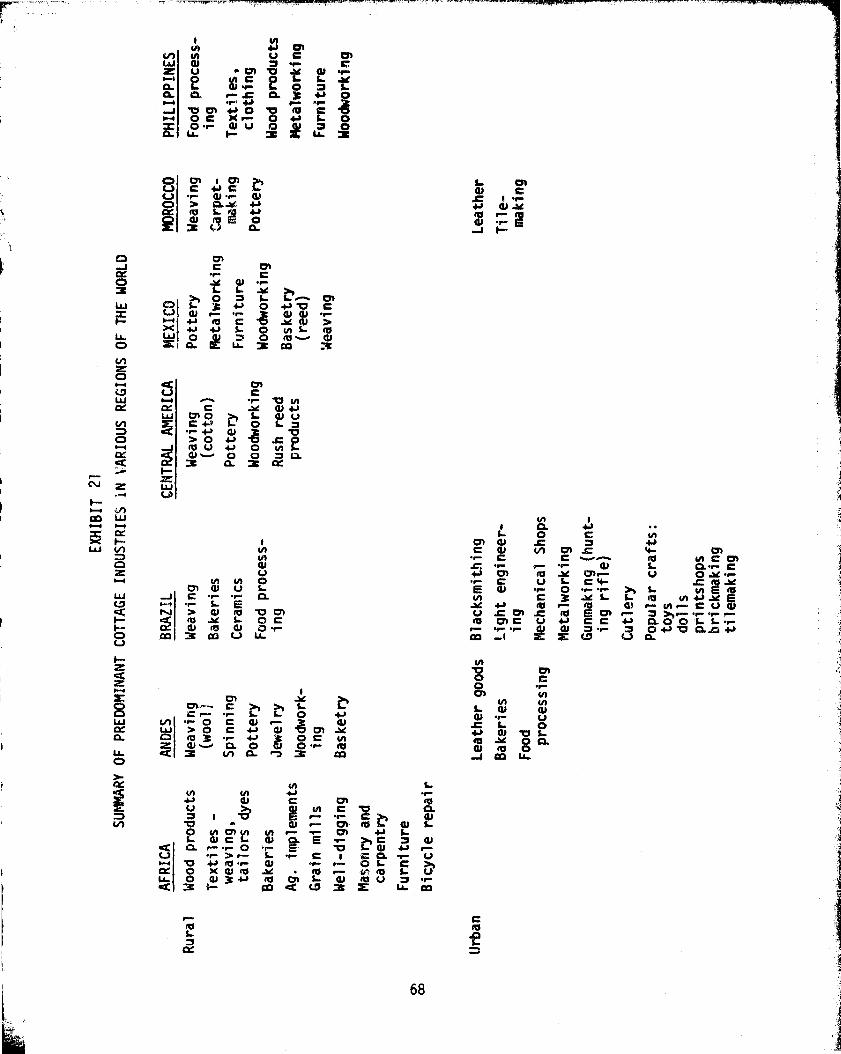
N 11 d }1L O C N
C N N 01 s w Q►•^ C C ^^.0 •r r •r O L a - r-C41 m
LC V C IF- = YE O •.- O •r- • r- >^ L f0I
N.G 41 C0 $r Y LM LCf a N► .4-A Y Er- 1n r-- c u (iJu t 471 = m E CT r > >a r- •,- •^ r°to fT C u 4-1 C C ++ a 0 0 L L •.-r-
•r- •^ k0 +J V IL.M 4J
to W
N^ D1O CO •.-C1
N 4A
•^N V
4J Ol V L
J fn U-
m•C C
•.C- 2 O O Lr .#-4 3
^%+ O C K r0-Is
E '00q^
IQ C CN f.."CJ •r- N •r- ddO > a.V, +1
rO L /4 +^ss 3 4^i E 0..
O Q1J C M
L +',1 O +)V CWCOJr~. b •C .9 N •>i
O19C i•1 -P L O to L to
O "^ d U. 3 Inv
O-+ Q Q1i^ V _ C
0-4cc C Y N 4J
C^N "EW L L4j IV X00
pu•(O UJ ^ O t^/1 L0Q 3 Ir
N Z LLJ
F-
fn W
W N Vf^ WZ u►-i
Lcm 4) uW J C •r• •r- G.¢ e114 > 4Li b V o1h cC 4) to ^ U •^
co 3 ca U ti
HZQZ
d fT C >^ LC ++IC r-- •r L L O38J
0r W > O C 4, v 'Cf]. D (0 ^'. •r i•1 O C toW Q 3v N a 3•^ mO
cz N Li 41 C 01 •t0u
> > 1 •O ^ r r f.°•. >^ ON T7 ^ IU r-- f,1 rr9 L^ W Lv c ^' N ^ C
L.1- E aQ O- r- •r- O r- •C 4) 4•1 rV •^ > r- L •r C 1 C d •r- ur-r 'C3 .1 b •r- AJ •r•4 r- O L C
cz O X 4) b Y b r- 0 r0 L CADU. O N 3 41 b (M L. N to u O •r-Q 3 3- m Q W m E LA- m
r- CLa O
i
68
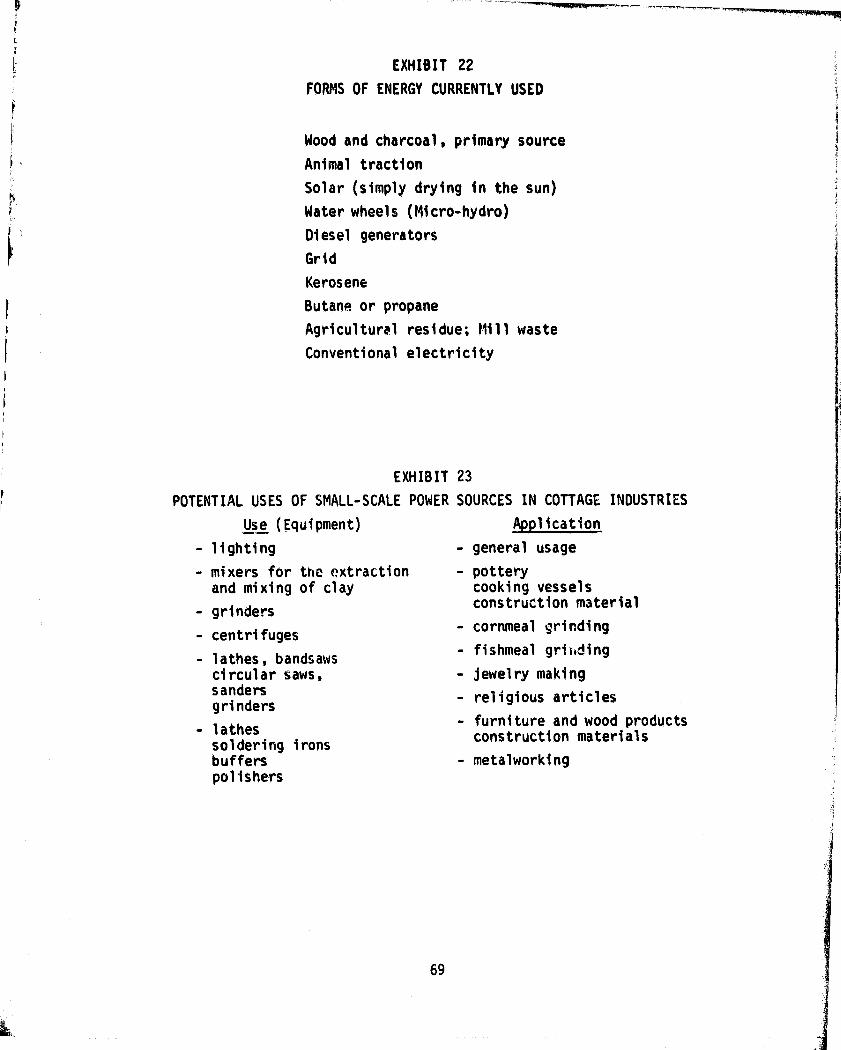
EXHIBIT 22
FORMS OF ENERGY CURRENTLY USED
Wood and charcoal, primary source
Animal traction
Solar (simply drying in the sun)
Water wheels (Micro-hydro)
Diesel generators
Grid
Kerosene
Butane or propane
Agricultural residue; Mill waste
Conventional electricity
EXHIBIT 23
POTENTIAL USES OF SMALL-SCALE POWER SOURCES IN COTTAGE INDUSTRIES
Use (Equipment) Application
- Lighting - general usage
- mixers for the extraction - potteryand mixing of clay cooking vessels
- grindersconstruction material
- centrifuges- cornmeal grinding
- lathes, bandsaws- fishmeal grinding
circular saws, - jewelry makingsanders - religious articlesgrinders
- lathes- furniture and wood products
soldering ironsconstruction materials
buffers - metalworkingpolishers
69
6. BIBLIOGMPHY
"Alcohol Fuels Hit a Rocky Road", World Business Weems, July 6, 1981, P. 16
Allio, Rob J., and Pennington, Malcolm W. Corporate Planning, Techniquesand Applications. New York: AMACOM, 1979
American Embassy, Brasilia, Alternate Enemy Technologies: Production and Useof Alcohol in Brazil. U.S. Dept. of Statee r^ gram, ` J an. 2, I980-
"Annual Report 1979", Furnas ( Electrobras, Centrais Electricas Brasilieras,S.A.) Rio de Janeiro, Braz il
Araujo, Jose Theodoro Alvesde. Investments in Brazil - Basic Legal Aspects,Brazil, Minas Gerais: The IndustrialDevelopment ns to a of -Mfna^s Gerais,May, 1979
Bautista, R. and John H. Power & Associates, Industrial Promotioti Policiesin the Ph^ii l l i i^ne s , ( Philippines: Phi1ippine nst tuiFf r Devel opmentStudies), 1979.
Board of Investments, The Investment and Export Incentives Acts, (Manila,Philippines: Government rinting 6ffice), 1978.
"Brazil Solar Energy Country Notebook", PRC Energy Analysis Company, Virginia:March 21, 1979
"Brazil, The Energy Crunch", Latin America Daily Po st Speci al EnergySupplement, 1979
"The Brazilian Economy: 1979", Americ an Chamber of Commerce for Brazil
"Brazilian News Briefs", The American Chamber of Commerce for BrazilSao Paulo: April 28, 198
-_ . _ _ _ ... ._ ..__.
The Brazilian Nuclear Program. Federative Republic of Brazil, 1977
Business Latin America. Business International Corporation New York:Fetir'ua ry 20,
"Business Outlook Abroad: Mexico", Business America, April 6, 1981
"Businessmen Guide Brazilian Economy", Visao, Nov. 17, 1980
Cals, Ceasar. The Brazilian Energetic Policy. Minister of Mines andEnergy. Fed Rep.o^Braz
_ ._
Comision Federal de Electricidad, "National Electric Sector", Mexico: 1979.NEA 1979 Annual Report. (Manila, Philippines: National Electrification
Administration), 1979.
70
Comision Federal de Electricidad. Plan National de Eyectrificacion Rural1979-1982. Mex. City, Mexico.
"Credito Para Empresas Medias a Pequenas," Banas, 1977
Darrow, Ken and Pam, Rick. Appropriate Technology Sourcebook. Volunteers inAsia Publication. June, 197 - ^"-
De Ocampo, N.J., "DBP Schedule of Interest Rates, Fees, and Other Charges,"(Manila: Development Bank of the Philippines), February 14, 1980.
Development Bank of the Philippines, 1979 Annual Report.
"Development of a Decision-Making Model for Energy R & D". (Philippines:Center for Nonconventional Energy Development).
Pakistan Basic Facts 1974-75, Pakistan, Islamabad; Government of Pakistan, 1975
The Econom : 1980 Summary and Preview of 1981. Info Brazil, Center of^'razilian studies, Vol. Z, No. 3. rFe_Fr_uary,_1981).
Economy of Greece 1976-78. Greece: Chronopoulos, Vassiliades 6 Co. withHellenews, October, 1978.
Editors of Fortune, Businessmen Around The Globe, Pennsylvania: Ginigen/Stackpole, 1965
Foster, George M., Tzintzuntzan: Mexican Peasants in _A Chanq_ing World,Boston: Little, Brown and Co.,
Greece: A Portrait, Athens: Research and Publicity Center, KEDR LTD,November 1979.
Guerrero & Torres., Primer on Doing business in the Philippines, 1980,(Makati, Metro Manila:, Republic of the pp nes
Harlow, Carol S. Philipp i ne Energy Issues. (Prepared for the U.S.A.I.D. AsiaBureau Conference, Energy, -Env ronme-n and Forestry, Nov. 12-16, 1979 Manila.)
Handbook of Statistics, 1978. New Delhi, India: Association of IndianEngi neeri ng n us ry, Jan. 1979.
"Helping Small Business Attain Greater Productivity", Brazilian Business,April, 1978. -^
71

Hershey, Robert D. Jr., "Gasohol's Market Share Is Meager 1t-21Y, in U.S.", NewYork Times, Oct. 13, 1980
Hoge, Warren, "Effort Spurred by Loss of Iraq Oil Supplies". New York Times,October 13, 1980
Hull, Galen. Strategies for Development for the Rural Enter rise DevelopmentProject . in the Lastern Region ORD of pper VoTfa. Partnership forrF oducti-VTty.
International Economic Report of the President. U.S. Government Printingoffice Was-M-9-ton, D.C., January, 1977—`
International Labor 0^ganization, Sharing in Development: A Programme_ ofE.,mp10 my ent, Equi ty and Growth for'the`Philipp n s,e neva:ICO, 1974,-
International Monetary Fund, Bureau of Statistics, International FinancialStatistics, English, Vol. XXXIII, No. 7, Washington, D.C.: Tnfe—rnitionalMonetary Fund, July 1980.
International Monetary Fund, World Economic Outlook, Washington, D.C.; May 1980.
International Trade Guide,Chicago: International Banking Group, Harris TrustF - av ngs Bank, Jan. 978.
"Invpstigacion on Energia Solar" PNUD - UNESCO: Dec. 1978
Investment Guide - Morocco. Citibank - Maghreb, Morocco.
Investments in Brazil, Basic Legal Aspects, Institute de DesenvolvimentoI ndustrial-"cle Mi s Gerais — nt dii . Bra:z T 1975
Investment Opportunities in the Philippines, (Manila, Philippines: Board ofnves en s), -September 1980.
Jhirad, David J. Brazilian Trie Report. National Center for Analysis ofEnergy Systems, BrookkFaven -Nanal Laboratory, December, 1980.
Kidder, Tracy, "The Future of the Photovoltaic Cell", The Atlantic Monthly,June, 1980, p. 68-76.
Kinkead, Gwen "Trouble in D.K." Fortune April 120, 1981 (Brazil)
Knight, Petert., et al. Brazil: Human Resources Special Re ort. A World BankCountry Study. Latir, Amer-Tca and-the Caribbean Regional office, The WorldBank. Washington, D.C., Oct. 1979.
72
Lima, Sergio E. Moreira. Coo erative Alcohol Seminar. Brazilian EmbassyEnergy Office, December 19W.
Lima, Sergio E. Moreira. Use of Alcohol as a Fuel in Brazil. BrazilianEmbassy Energy Office: Septe^er; T9'$6 '
Lof, George 0.; Duffie, John A.; Smith, Clayton 0.; World Distribution ofSolar Radiation, University of Wisconsin: Solar Energy L Fo aFory,'^y W-6.
Manibag, F. R. Patterns of Energy Utilization in Philippine_ Village: Sources,End -Uses and Corr- a on^fina ses rai"eport prepared f-o-r the Internatr6ndlnergy Agency, OECD i-nd to the ockefeller Foundation), December 1979.
Market Research Summary: . Energy and Power Generation Systems (Prepared for`AWIVA" x'86" , mar canro uct:s Ex'h'fbion n MarcMar 980, Manila,Republic of the Philippines).
Martin, Everett G., "Argentina Is Pushing Firms to Modernize, But Many FearImports May Swamp Them", The Wall Street Journal, July 30, 1980, p. 36.
de Mendoga, Antonio Aureliano Chaves. The Brazilian Energy Question.Brasilia: 1980``
Instituto Mexicado de Comercio Exterior. Mexico, 1980. Mexico: 1981.
"Mexicco, Flush with Oil, Remembers Rural Poor," The New York Times,September 21, 1980.
"Mexico Manufacturing Sector: Situation Prospects and Policies" World BankCountry Study, March, 1979. '-
"Mexico Spends Billions to Foster Growth Outside Bursting Capital", The Wall_Street Journal, January 20, 1981.
Ministry of Economy, Argentine Economic Development, April, 1976 - June 1979,ICfr toArgentine Republic, Buenos es: fiecn ca 3n resor- a. 1979 ^
"Monthly Information Review", Banque Marocaine du Commerce Exterieur, January/February 1981, November/December 1980, Ju'iy/August 1980.
Moskow, Michael H., Strategic Planning in Business and Government, New York:Committee for Economfic--Te-ve i opment, 1978.
Murray, Charles A. A Behavioral Study of Rural Modernization: Social andEconomic Changes in Thai ages, New oork:Praeger_ub5#fs e' rs, 1977
73

ppines.
National Census and Statistics Office: Monthly Bulletin of Statistics April1980 ( Manila: NEDA), 1980
National Economic Development Authority. Five Year Philippine DevelopmentPlan, 1978-82. (Manila, Philippines), Sep e—m er 1977.
National Economic Development Authority. Long-Term Phil ippi ne Devel opmmentPlan Up to the Year 2000. (Manila, Philippines), September 1977.
National Economic and Development Authority. 1979 Philippine StatisticalYearbook. (Manila, The Philippines: NEDA) 1979.
National Foreign Assessment Center, C.I.A, Handbook of Economic Statistics
^^1p/9778 A Research Aid, U.S. Governme6 c Pri ntfin" ce, as. tng on, ,
Uc Y.
National Statistical Service of Greece, Statistical Yearbook of Greece 1978,Greece, Athens: 1978.^^
"0 Drama das Pequenas a Medias Empresas Negocios en Exame, Nov. a, 1977.
Overview of Small- and Medium - Sale Industries ( SMI) in the Phili ppines.Research epar enInstitute or ma tale In au r es. uezon^ y- MetroManila: University of the Philippines, April, 1980.
Pacific Northwest Laborator E^^xppo__r^^tPotential for Photovoltaic S stems,prepared for U.S. Dept. of Energ y Asst. Sec. -orconservation avid SolarApplications, Office of Solar Applications, April, 19790
Patil, P., et al. Solar Energy Commercialization in India, Malaysia,Philippines and Sin a ore TPrepar r by Systems onsu tams,nc .
Palmedo, Philip F., et al, Energy Needs, Uses and Resources in DevelopingCountries, prepared for U.S. Agency for MY. Development RDA/TAB -
with the U.S. Dept. of Energy, New York, Upton: Policy Analysis Div.Natl. Center for Analysis of Energy Systems Brookhaven Natl. Laboratory Assoc.Univ., Inc. March, 1978.
Petroleo, Bralileiro S.A., Brazil and Petrobra's. Social CommunicationService, 1980.
74
Petroleo, Bralileiro S. A., Brazil and Petrobra's. Social ConwvnicationService, 1980..
^Phhi^llippppines Investment Guide. Citibank, Financial Planning and ManagementDivision. Manila, pp nes: June, 1978
Phhiil^ippine Yearbook 1979. (Manila, Republic of the Philippines: NationalEconomic^ an eve opmen Authority), 1980.
III Plano Nacional de Desenvolvimento - 1980-85. Republica Federative doBrazil ep em e-r 77—
Policy Strategies for the International Marketing of Photovoltaics, Finalen'^"orts, es-T and--I RePor prepared by TIT Research Institute, Chicago,Illinois for Jet Propulsion Laboratory, California Institute of Technologyunder Contract No. 955463, (August, 1979).
PD(;P, 1979 Annual Report, (Philippines: Private Development Corporation of thePhilippines).
PDCP Long-Term Financing, (Philippines: Private Development Corporation of thePhi Ii-ppi nes . --
"Questions & Answers on Foreign Investments in the Philippines," (Philippines:Board of Investments), June 1980.
"Renewable Energy Sources for the World's Poor: A Review of CurrentInternational Development Assistance Programs." Solar Energy ResearchInstitute. Colorado: October, 1,979.
Rodrigues, Eduardo Celestino. Crise Ener ecettica. Editoras llnidas Ltda.Sao Paulo, Brazil, Nov, 1979.
Rosenblum, Bifano, Hein, and Ratajczak. Photovoltaic Power Systems for RuralAreas of Developing Countries. NASA Technical Memorandum 79097 presented itInterregional Symposium on Solar Energy for Development, Tokyo, Japan(February, 1979).
Shetty, M. C., Small-Scale and Household Industries in a Developing Economy,Bombay; P.S. Jayas ngiie,^As ia Pub. House. 196
and Demonstration of Small-Scalert Report, _NDP Pro ect X77878-04,
Sir William Haicrow and Partners. TestiSolar-Powered PumRinq Systems: Stake—cEon onn: rld Bank. Dec. 1
75

Smith, Douglas V. "Small Scale Energy Activities in India and BangladeiTrip Report - March 17-31, 1977 and April 3-1+4 0 1977. Energy LaboratorWorking Paper, Massachusetts Institute of Technology: August 31, 1977.
"Solar Electric Generator Systems: Principles of Operation and DesignConcepts." Solar Power Corp, Woburn, Massachusetts.
Solar Engineering Group. Definitional Mission on Solar Fnarnw Annl4eAt .r... ...Brazil ( for Trade and Development rogram, in ernati onal Developmentoff'operation Agency Washington, D.C.). Princeton, New Jersey, Aug. 1980.
Staley, E., Morse, R. Modern Small Industry For Developing Countries, New York:McGraw-Hill Series in n .evelopmen ,
Steiner, George A., Stratnic Planning, London: The Free Press, 1979.
Sullivan b Claycombe, Fundamentals of Forecasting, Reston Pub. Co., Inc.Reston, VA, Prentice-He1T 1977
Systems Consult*nts, Inc., Overview of Energy Programs/Solarn
aer ►► ^^Commercialization Status In ec a Countries, U.S.S.Gover- ment WntingOffi ce, Washington, O. C., Dec. 1978.
"Technological Progk°um on Ethanol" Ministry of Industry and Commerce, Brazil:1978 m
Ten Year Energy Program, 1979 -1988, ( Manila, Philippines: Ministry of Energy),
Usmani, I. H,, "Characteristics of a Typical Village in the Solar Belt of theDeveloping Countries of Asia, Africa and Latin America, Proceeding of theSemi-annual Photovoltaic Review", U.S. D.O.E., Washington, D.C., Nov. 8, 1978.
U.S. Congress. House. Report to the Committee on Science and Technology.OversiVht of EnerqX Development in Africa and the Middle East, 96th Congret^s,n "sess ,April .
U.S. Congress, Office of Technology Assessment, "Chapter X-Energy ConversionWith Photovoltaics", Application of Solar Technology to Today's Energy Needs,Vol. 1, Washington, D.C.: U.S. Govt. Printing Office, June 1978.
76
U.S. Department Of Commerce, International Trade Administration. "MarketingMexico", U.S. Govt. Printing Office Washington: May, 1981.
U.S. Department of Energy. A Guide to U.S. Solar Energy _S s tem for.International Applications ov. f.'"-P"ri n ti'ng Offi'ceWala s + ng on Vim'.: MayTwo. _._
Picker, Ray, "Crisis in Cairo", The Wall_ Street Journal, Aug. 22, 1980, p. 32
Walton, J. D., Jr., A State of The Art Survey of Solar Powered IrrigationPumps Solar Cookers awn ^ro^1'^ odTurn oves or use n sub- a ara rrca.eorg a Tns^i'teho ogy.Georg ia: January. 197B. For AT" DTriyyahInstitute of Geneva, Switzerland.
Weiss, Charles and Pak, Simon. Developing Country Applications of Photovol-taic Cells, Science and Tech nolog—Kepor e s, No.aasshington, 0.*-C^. -The World bank, 1976.
Weiss, Charles, Solar Photovoltaic Cells In Developing Countries, Science AndTechnology Report'3er, aaxis ington D.C.: The or an ,oA-'w. 1976.
Westfield, James D. and Mellby, Eric D. K., "Solar and Wind Power For a RuralTunisian Village and Surrounding Agricultural Uses." Presented at the 7thEnergy Technology Conference, March 24-26, 1990, Washington, D.C.
"Why Brazil Believes It is on The Right Economic Track," World Business Weekly,November 3, 1980.
"Will Argentina's New Competitiveness Survive?" Business Week, July 21, 1980,
PP • 78-84.
The World Bank. World Development Refit, 1979, New York: Oxford UniversityPress, 1979.
Yambot, Efren. Philippine Almanac & Handbook of Facts 1975. Phil. AlmanacPrinters, Inc.`'
SERIES
Price, Waterhouse and Company.International Information Guide Series.
Country-USA: Ernst & Whitney International Series
Foreign Area Studies, The American University, Area Handbook SeriesU.S. Government Printing Office, Wash. D.C.
4
77
Touche Ross International Business StudiesU.S. Dept. of Commerce, Overseas Business Reports,, U.S. Government PrintingOffice; Washington, D.C.
U.S. Dept. of Commerce, Foreign Economic Trends, U.S. !Government PrintingOffice; Washington, D.C.
U.S. Dept. of Energy, Solar Energy Commercialization for African Countries,U.S. Govt. Printing Office, wasn. D.C.T97F.
WORLD BANK STAFF WORKING PAPERS
Chenery, Hollis B., "The Changing Composition of Developing Country Exports",No. 314. Washington, D.C., January 1979.
Choksi, Armean, "State Intervention in the Industrialization of DevelrpingCountries: Selected Issues", No. 341. Washington, D.C., July 1979.
Fallen - Bailey, D. G. and Byer, T.A., "Energy Optinns and Policy Issues inDeveloping Countries", No. 360. Washington, D.C., August 1979.
Hughart, David, "Prospects for Traditional and Non-Conventional Energy Sourcesin Developing Countries", No. 346. Washington, D.C., July 1979.
Jallade, Jean-Pierre, "Basic Education and Income Inequality in Brazil: TheLong-Term View", No. 268. Washington, D.C,, 1977.
Keesing, Donald, "Trade Policy for Developing Countries", No. 363 Washington,D.C., August 1979.
Page, John M. Jr., "Small Enterpriser, in African Development: A Survey", No.363. Washington, D.C. 1979.
Wolf, Martin, "Adjustment Policies and Problems in Developed Countries", No.349. Washington, D.C., August 1979.
IFS.
bin p,.

A. THE PHILIPPINES
PREFACE
This report presents the findings of an in-depth market assessmentof stand-alone photovoltaic energy systems for small industrial applicationsin the Philippines. Information to support this study was collectedin the Philippines between October 25th and November 19th, 1 0900. A list
of organizations contacted during this period is given at the end ofAppendix A.
r
A-i

1. THE COUNTRY AND ITS PEOPLE
The Philippines is an archipelago consisting of 7107 islands scattered
over an area of about 300,000 square miles. Of the 7107 islands, only
1000 are populated, and only 462 are a square mile or larger. In 1979,
population was estimated to be 46 million people, with 8 million people or
17% of the population living in the Metro Manila area. The populations of
the ten most populous areas are shown in Exhibit Al. The country is under-
going a rapid urbanization movement with 36% of the population being urban
in 1980 compared with 30% in 1960. This represents an annual growth rate
of over 3.6% for urban areas compered to an annual population growth of
approximately 2.8% for the country as d whole.
The Climate is tropical, having only two seasons, wet and dry. The
dry season extends from March to June and the remainder of the year has
heavy rainfall. Typhoons are prevalent from June to December, with one
exception, the island of Mindanao is rarely subject to tropical dep,ressioos.Seismic disturbances are frequent throughout the islands. The average annual
hours of sunshine range from 1800 - 2200 hours. Quezon City has an annual
mean solar radia'.+ion of 383 Langleys per day..
The country has sixt y ine natural harbors and innumerable rivers, bays
and lakes. These provide irrigation, transportation, hydro-electric ;power
and cont ribute to the fishing industry.
The 1978 GNP of the P'hi'lippines was $23.2 billion,representing a per
capita income of $500. The average annual real growth of GDP was 5.6%
between 1960 - 1978 and real per capita GNP grew 2.6% during the same period,
Inflation averaged 5.8% from 1960 - 1970 and 13.4% from 1970 - 1978.
Agriculture contributes ?q% to the GDP, industry 35% and services 36%. Of
the 35% contributed by industry, 25% of the GDP is from manufacturing.
Hence, the economic importance of manufacturing can be clearly seen.
The delineation of wealth in the Philippines is sharp. The majority
of the population is i;v-ing at the subsistence level with 53.9% of the
total household income going to the top 20% of households.
s
A-1
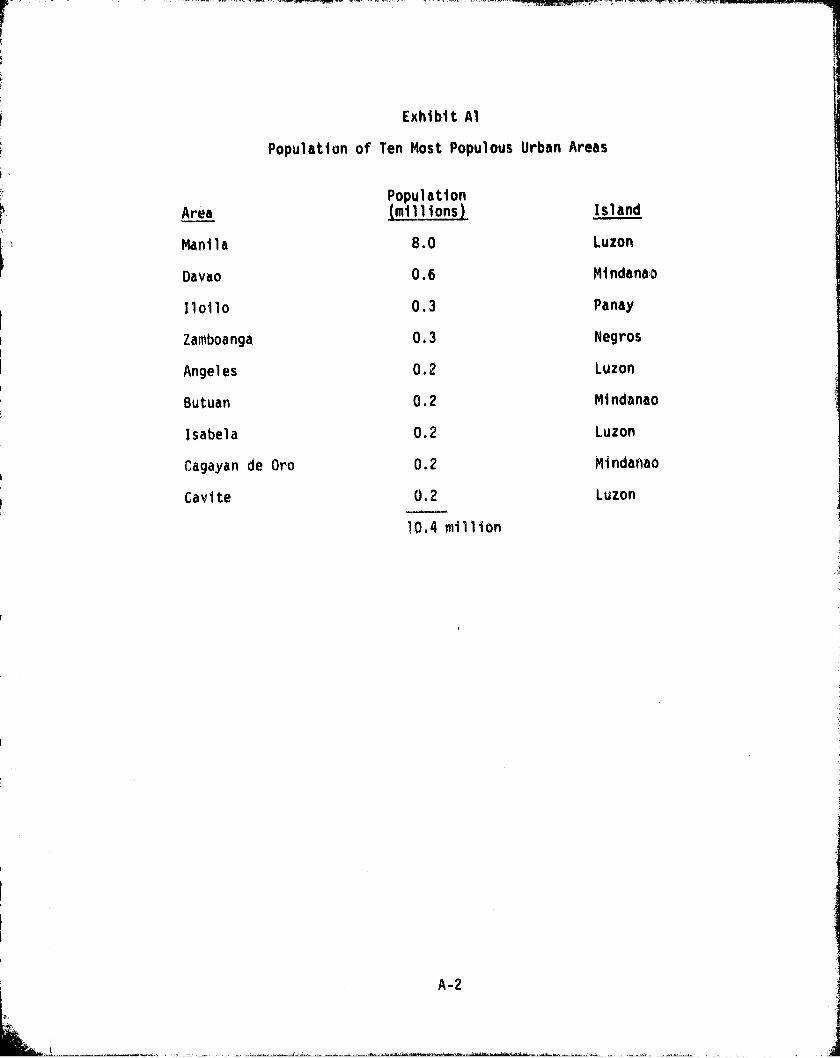
Exhibit Al
Population of Ten Most Populous Urban Areas
Population(millions). Island
8.0 Luzon
0.6 Mindanao
0.3 Panay
0.3 Negros
0.2 Luzon
0.2 Mindanao
0.2 Luzon
0.2 Mindanao
0.2 Luzon
Area
Manila
Davao
Iloilo
Zamboanga
Angeles
Butuan
Isabela
Cagayan de Oro
Cavite
10.4 million
A-2
s.

The Philippines is said to have one of the most skillful and literate
populations in Southeast Asia with 83% of the population over age ten able
to read and write, The goverv;ment encourages schooling and offers free
elementary education to all. The Philippines has a young population with
57% of the population under age 20, and the median age being 17 in 1977.
52% of the population is of employable rage (15-64 years),and the labor
breakdown is shown in Exhibit A2.
Exhibit A2
Labor Breakdown
Type of Labor
Agriculture, forestry, fishing
Manufacturing
Commerce
Government and Services
Transport, storage, communication
Construction
Other
Percent of Labor Force
60%
12`X
10.5`,
10.5%
3.5'%
3'%
0.5%
The country is rich in both mineral and biological resources. Fifty-three
percent of the land is forested, providing major industries in timber, lumber
and veneer. The Philippines is basically an agricultural state, being the
world's largest producer of coconuts and the third in copra production. Rice,
sugar, fish and orchids are also major products. The country is unique in
production of abaca, also known as Manila hemp.
The Philippines is also rich in mineral resources. Gold, iron, copper,
zinc, lead, chromium, cement, salt, asbestos, granite,pearls and shells are
all found in quantity. This abundance of natural resources provides a good
supply of raw materials for p ottage industries.
A-3
THE PHILIPPINE CULTURE
Within the Philippine culture, the most important underlying values
are family and a sense of mutual social respect and pride. The Philippine
extended family includes not only blood relatives, but also "compadres" -
sponsors at a child's baptism and wedding who assume familial responsibili-
ties for that, child. The family is the basic unit of society. It offers
its members tremendous support and security. Whereas Americans draw strength
from being able to act independently. Filipinos find security in interdepen-
dence coming from within the family group, where family members are
responsible for one another. Wealthy family members, and those in positions
of power are expected to assist less fortunate family members. Major
decisions are rarely reached independently, and generally, the decision
reflects the consensus of the family. Likewise, family obligations take
precedence over one's civic responsibility, obligations to an employer, or
one`s own personal preferences.
,lust as Filipinos are interdependent within the family unit, they are
interdependent in society as well. Interdependence is fostered through a
series of "debt of gratitude" or "reciprocity" relationships. It is a network
of favors asked, and favors repaid. The favor may be as direct as finding
someone employment, or it may mean performing duties a Westerner would con-
sider "his job". A Filipino is under an obligation to repay these favors
in whichever way he can.. An individual is "charged" according to his ability
to pay. (While a poor employee may never be able to repay a large loan, she
can, for example, volunteer her services in preparing for a family celebration).
A Filipino is honored to be asked a favor. On the other hand, he is not
ashamed to ask for a favor in return.
Smooth social interaction is a most important Philippine value. Filipinos
believe that relationships, whether with a store clerk, a business associate,
or a family member, should not have open conflict. In a Filipino organization,
it is as important to preserve good relationships as it is to get the jobdone. The indivi,_ 1 who gets along best with his co-workers, is as apt tobe rewarded as the one who does the best work. To compliment someone's skill
at social interaction is , the highest compliment that one can give.
A-4

IF The last point of note is that the Filipinos have a tremendous senseof pride. A Filipino is expected to be sensitive to the feelings of others,
so that the self-esteem of others is not hurt. A Filipino will go to great
lengths to avoid causing others shame or embarrassment, because he is so
r sensitive to embarrassment himself,
2.1 The Industrial Sector
The Industrial Sector in the Philippines is broken down into four
categories, Large Scale Industry (L5I), Medium Scale Industry (MSI), Small
Scale Industry, (SSI), and Cottage Industry (CI). The criteria used to
place an establishment in one of these categories is number of employees,
value of total assets, organization, and type of activity. The definition
of each category is shown in Exhibit A3.
2.2 Establishments
In 1975, 79,889 industrial establishments were registered with the
Philippine government. The breakdown of these establishments between Large
Scale, Medium Scale, Small Scale, and Cottage Industry is shown in Exhibit A4.
It can be seen that small scale industry and cottage industry account for
the largest number of establishments, 78,782 establishments or 98.6% of
registered establishments. Of those establishments considered small scale,
96.7% or 68,738 establishments belonged to the smallest subsector, 5-19 workers.
It should be noted that, as in most non-industrialized nations, a large
number of cottage industry establishments are thought to be operating that
are not registered with the government. As a result, the real number of
cottage industry establishments is most likely greater than the 7,698 regis-
tered. It was not possible to estimate the real number of cottage industry
establishments.
C.3 Employment
In 1975, 754,128 workers were employed by the registered industrial
establishments. The breakdown of these workers -.jy type of establishment
is shown in Exhibit A5. Of the 754,128 workers, 357,869 or 47.5% were
employed by small scale and cottage industries,. Therefore, while small
scale and cottage industry accounted for 98.6% of the registered industrial
establishments, they accounted for only 47.5% of the employment.
A-5

O^y O^ ON
a ^ ^r in
O aV-4 Q A v
eV O.a
W ^I
A Oi
q OA ON
♦J O N
VIP OQ
A VY
^O Ovi b q Ln r-1W u Ln N-,4 ^/? 1n en
r-1 Va kV nN U vY to
aHx
w u (0) •r4 c44 W •^ d r^i
•v4 °d°ro.04
t°4 41ago•n epG (V .4 u U ►-4 u G to C C Q rtt u C
•r4 N r4 C N C m MO O C M O Noe
Q m F-- 4 -4 •P4 1 OA 1J "d O •r4 W 4) >,. Vlz N ri C) 4) m N eq C u N 44 U U .•fir-a 14♦J Q •r4 •r1 r-d Op •r# 4.1 W 1 01 :3 -P4 M r) O O P-4 G)•r/ F-1 C u m C3 U 44 M 4) 'a w U Qa tJ V r4 0 .0
-O` 4
H r3 w E G w m c tJ 0 w 8 w O MO EO R.Or7 e3. uO .•Oka ro0 Rf$4 BTU
oy E ca U.c Oaa w g
wcn
on to ao ao
u •G C1 •G 4) • U •r4 0)"Z u• r f 4)y P4 0 -o-4 ;j •4
N 4e^
> U r- •e • u $4 U w de! fww u r a CO a (o (U ro w W WO r4 44 CA uc wU) 14.4 (4 wtO)
cn > O •ra V O O OO ^'
HC) e4O. ^.►
•qN G
LJR1 G
"C7G
G bRi C
G bE m u M RI R1 ni
i
L+1 f> uFI 1
N ',
Ad
V:I
as u >,,l,J t11 u
C ►-+ C u10 0-4 N
U O4) r-1 U 'U
I u m ►Gi> u cn uO N N ONO
+U-► fr-4
b uri
V a N U
A-6
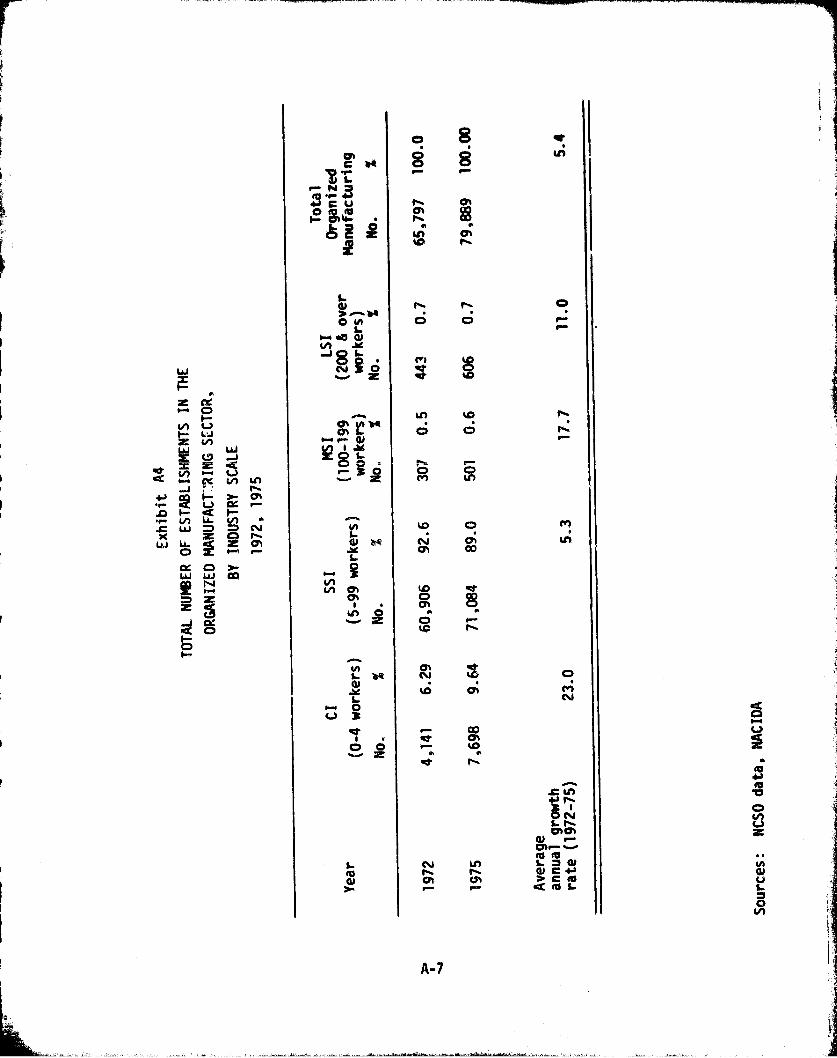
e W4
W
iE
Z !^CQ1--Lug1N-
Z V9Wz Q
'^ ► i CK N lC1..J P.
Ch
.G h Q H•^ V1 11 N
Wx Q p-
4.J aQ C1LOA.
WLAJ ccN
ip
0
La.-.beowL•.. *a 4)N a6JO L
cli C;
Ch VQON
0.0 n!
^O
L
aai^Z
IA
GJ
L
d/1H
LW
H^V
O O
Lr®N
m
P-. f*^%
0 0
1f'f 1D
C1 O
M
w OCo
wOw^^
C •
A
W
Ch1\V
W
r^ Co
w w
Q r.
CV Ln
Chr P
0r
r
Il'f
0
lV
,C W)
1N
01chO ^
f0 f0W C i,> C 10d O L
^yV
eO
OV
O
VZ
NQJ
OON
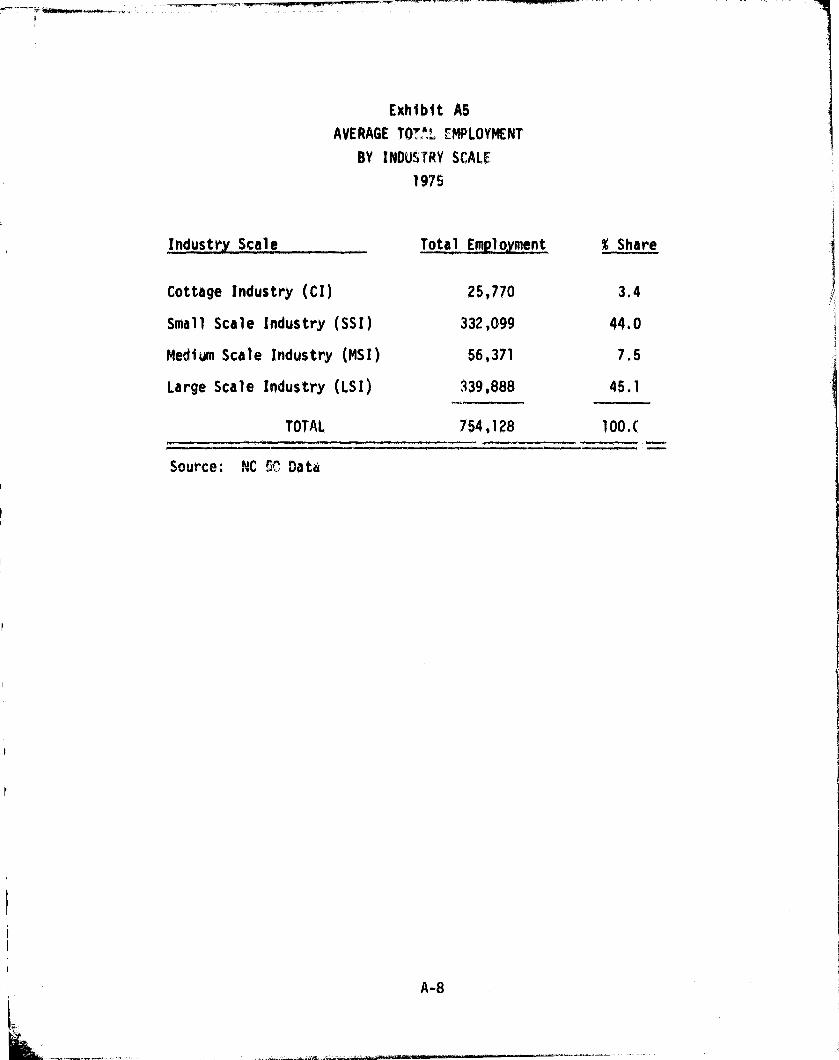
Exhibit AS
AVERAGE 107,"- EMPLOYMENT
BY INDUSTRY SCALE
19`15
Industry Scale Total EMplo my ent % Share
Cottage Industry (CI) 25,770 3.4
Small Scale Industry (SST) 332,099 44.0
Medium Scale Industry (MSI) 56,371 7.5
Large Scale Industry (LSI) 339,888 45,1
TOTAL 754,128 100. (
Source: NC 9^ Data
A-8

F" T
2,4 Wages and Salaries
The average wages and salaries of paid workers in the Large Scale, Small
Scale, ind Medium Scale Industry categories are shown in Exhibit A6. Informa-
tion about Cottage Industry was not available. It can be seen that the
average wage is highest for Large Scale Industry and lowest for Small ScaleIndustry. While Small Scale Industry accounts for 89% of registered indus-
trial establishments, and 44% of employment, it accounts for less than24% of all industrial wages.
Exhibit A6
Average Annual Wages And Salaries
By Industry Scale
1975
Average
ofgWa es & Salaries Salariesnuales
Number Per
Paid Workers WorkerSc -al o
Value(000) 1d ($US) % OUS)
SS1 233.0 37 .0
96,554 23.4 414
MS 1
56.4 9.0
39,676 9.6 703
Total SNI 239.4 46.0 136,230 33.0 470
LSZ 339.6 54.0 276,405 67.0 814
TOTAL 629.0 100.0 412.635 100.0 655
A-9
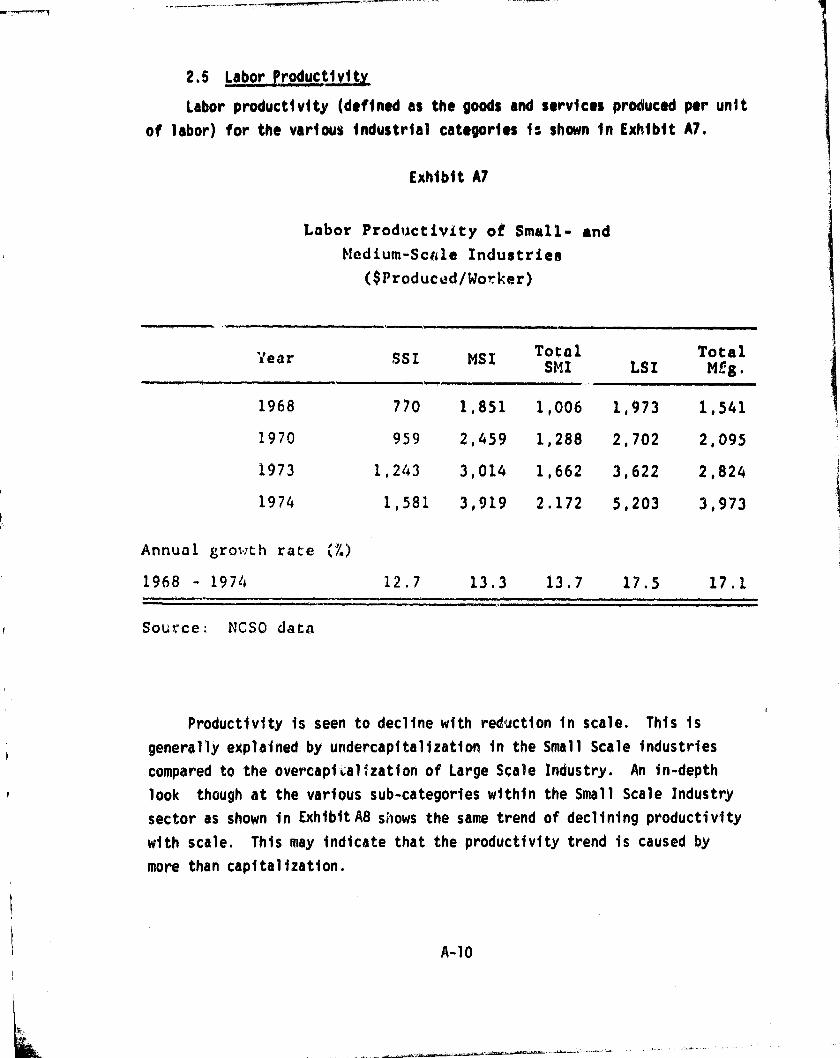
2.5 labor IroducAlvity
Labor productivity (defined as the goods and services prOluced per unitof labor) for the various industrial categories is shown in Exhibit A7.
Exhibit A7
Labor Productivity of Small- andMedium-Scale Industries
01'roduced/Worker)
Year .SSI MS1 TotalSMI LSI
TotalMfg.
1968 770 1,851 1,006 1,973 1,541
1970 959 2,459 1,288 2,702 2,095
1973 1,243 3,014 1,662 3,622 2,824
1974 1,581 3,919 2.172 5,203 3,973
Annual growth race
1968 - 1974 12.7 13.3 13.7 17.5 17.1
Source: NCSO data
Productivity is seen to decline with reduction in scale. This is
generally explained by undercapitaliaation in the Small Scale industriescompared to the overcapitalization of Large Scale Industry. An in-depth
look though at the various sub-categories within the Small Scale Industrysector as shown in Exhibit A8 snows the same trend of declining productivity
with scale. This may indicate that the productivity trend is caused by
more than capitalization.

Exhibit A8
Labor Productivity by SSI Subsectors
($ Produced/Worker)
No. of Workers in SSI Subsector
Year 5 - 19 20 - 49 50 - 99 'Total__ SSI
1968 500 946 1,149 770
1970 581 1,108 1,664 959
1973 581 1,649 2,;095 1,243
1974 608 2,054 2,905 11581
Average annualgrowth rate. (%)(1968 - 74) 3.3 13.8 16..7 12.7
Source: NCSO data
A-11
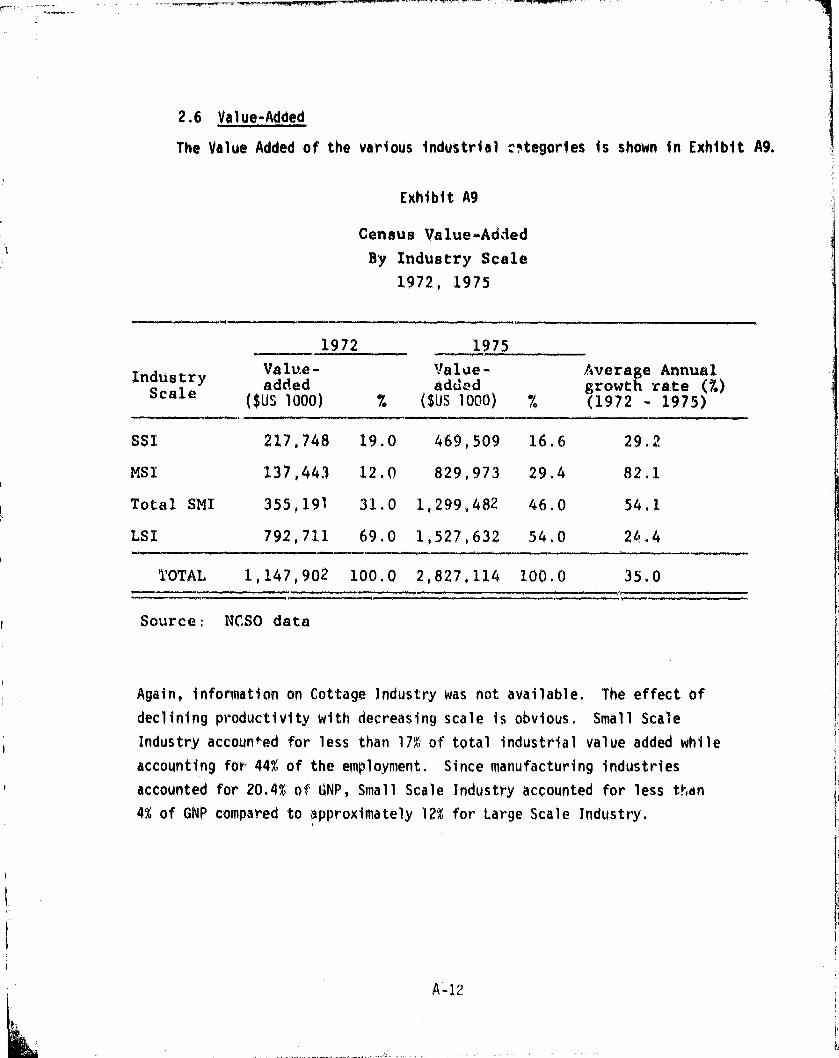
2.6 Value-Added
The Value Added of the various industrial ^tegories is shown in Exhibit A9.
Exhibit A9
Census Value-Added
By Industry Scale
1972, 1975
1972 1975
Valve- Value- Average AnnualIndustr y added added growth rate (%)
($US 1000) % ($Us 1000) `/4(1972 - 1975)
SST 217,748 1910 469,509 16.6 29.2
MS1 137,443 12.0 829,973 29.4 82,1
Total SMI 355,191 31.0 1,299,482 46.0 54.1
LSI 792,711 69.0 1,527,632 54.0 24..4
TOTAL 1,147,902 100.0 2,827,114 100.0 35,0
Source: NCSO data
Again, information on Cottage Industry was not available. The effect of
declining productivity with decreasing scale is obvious. Small Scale
Industry accounted for less than 17% of total industrial value added while
accounting for 44% of the employment. Since manufacturing industries
accounted for 20.4% of GNP, Small Scale Industry accounted for less than
4% of GNP compared to ,approximately 12% for Large Scale Industry.
A-12

2.7 Distribution Py Industry
In 1975, wearing apparel manufacturing (excluding footwear) had the
largest number of establishments (37.85% of the total SSI establishments)
followed closely by food manufacturing at 36.23%. These two industries
combined account for around three-fourths (74.07%) of all SSI. As can be
seen from Exhibit A l a the light industries such as the food, textiles and
wood products industries had overwhelmingly large numbers of establishments
compered with such industries as metal products, machinery and chemicals,
whose shares in the total number of establishments were comparatively very
small.
The cottage industry sector as shown in Exhibit Allis dominated by
Embroidery, Woodcraft, Metalcraft, and Leathercraft. These four product
types accounted for 53% of the cottage industry establishments and 53% of
the cottage industry employment in 1978.
2.8 Distribution^bb Regan
As of 1975, 65..5; and 79.9% of the total number of establishments in
SSI and MSI, respectively were concentrated in Luzon. Particularly in
Metro Manila and Southern Tagalog where the concentration of SST establish-
ments was as high a^ 32.4%. This is due to the well-organized physica'I and
institutional infrastrti44ure in Manila and its surrounding areas, and the
concentration of business and other economic activities benefiting from the
regions' external economics. The same pattern was marred in MST where
65.1% of the total medium-scale establishments were concentrated in
Metro Manila and Southern Tagalog. Exhibit Al2 shows the geographical
distribution of organized industry.
A-13
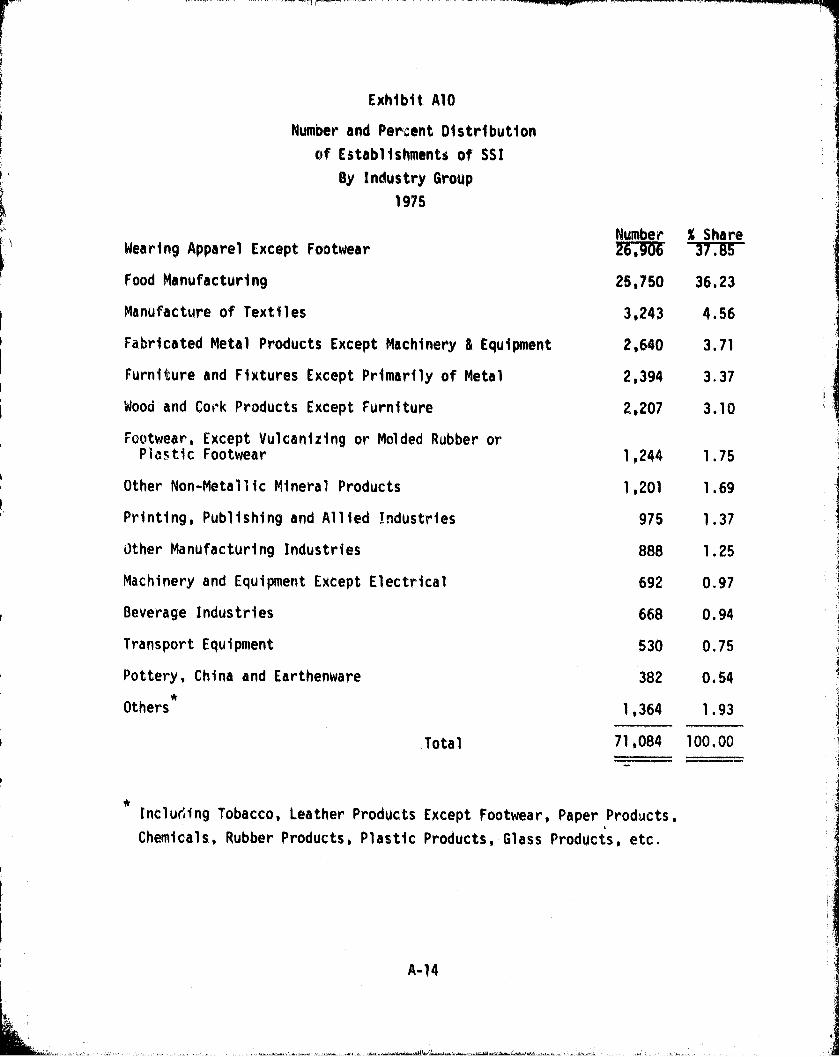
T^'
q
I^7I7f
Exhibit, A10
Number and Percent Distribution
of Establishments of SSI
By Indlustry Group
1975
Number % ShareWearing Apparel Except Footwear 266, 737 Tr
Food Manufacturing 25,750 36.23
i Manufacture of Textiles 3,243 4.56
Fabricated Metal Products Except Machinery & Equipment 2,640 3.71
Furniture and Fixtures Except Primarily of MetalI
2,394 3 37
Wood and Cork Products Except Furniture 2,207 3.10
Footwear, Except Vulcanizing or Molded Rubber orPa-,,tic Footwear 1,244 1.75
Other Non-Metallic Mineral Products 1,201 1.69
Printing, Publishing and Allied industries 975 1.37
Other Manufacturing Industries 888 1.25
Machinery and Equipment Except Electrical 692 0.97
Beverage Industries 668 0.94
Transport Equipment 530 0.75
Pottery, China and Earthenware 382 0.54
Others 1,364 1.93
Total 71,084 100.00
Inclining Tobacco, Leather Products Except Footwear, Paper Products,
Chemicals, Rubber Products, Plastic Products, Glass Products, etc.
A-14
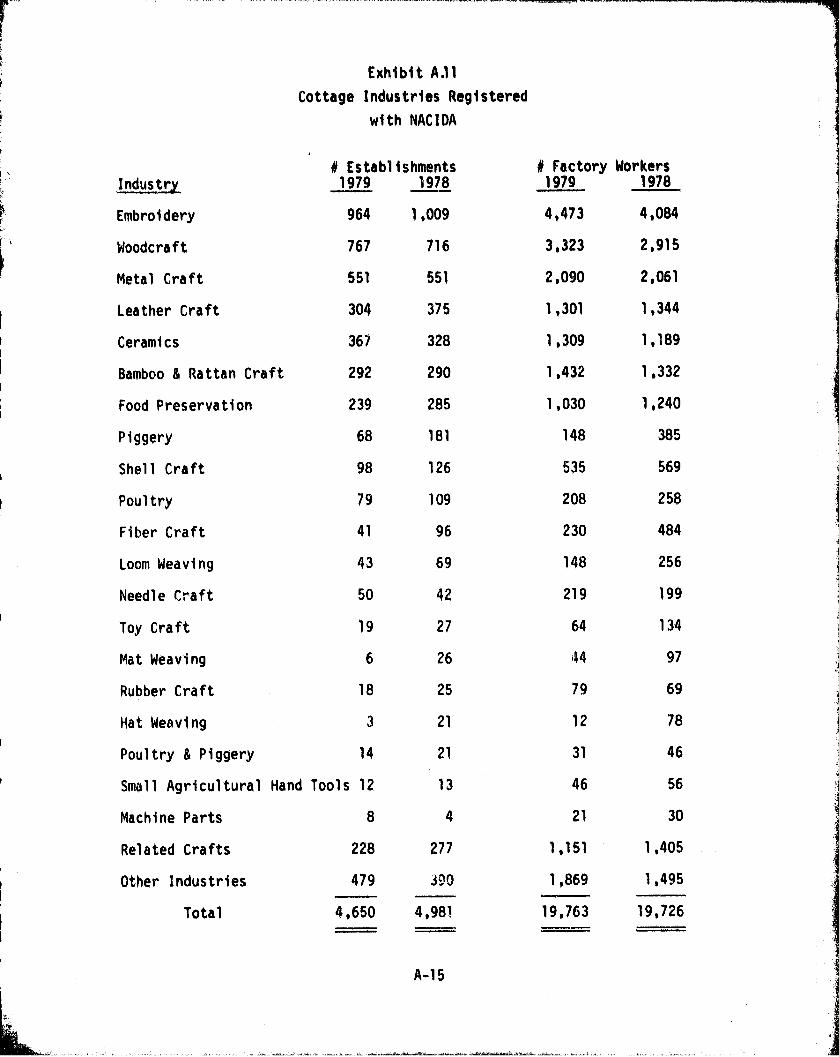
N Factory Workers1979 1978
4,473 4,084
3,323 2,915
2,090 21061
1,301 1,344
1,309 1,189
1,432 1,332
1,030 1,240
148 385
535 569
208 258
230 484
148 256
219 199
64 134
+i4 97
79 69
12 78
31 46
46 56
21 30
1,151 1,405
1,869 1,495
19,763 19,726
iExhibit AJI
Cottage Industries Registered
with NACIDA
# EstablishmentsIndustry 1979 1978
Embroidery 964 11009
Woodcraft 767 716
Metal Craft 551 551
Leather Craft 304 375
Ceramics 367 328
Bamboo & Rattan Craft 292 290
Food Preservation 239 285
Piggery 68 181
Shell Craft 98 126
Poultry 79 109
Fiber Craft 41 96
Loom Weaving 43 69
Needle Craft 50 42
Toy Craft 19 27
Mat Weaving 6 26
Rubber Craft 18 25
Hat Weaving 3 21
Poultry & Piggery 14 21
Small Agricultural Hand Tools 12 13
Machine Parts 8 4
Related Crafts 228 277
Other Industries 479 390
Total 4,650 4,981
A-15

WO••0uwNto
cc.
U
C ^
}bD
^aU
C ^'M td •.v C
+j O " t-^d
WC
y ^t: C4! ,C
♦Jrn
Ww0c.N.D
{U. 117 t- %}r to in M .r tD O tvi in N .-d eM Oit
.•r NO••+I
V^ C••t
Of•^
Mrl
t. O N t tC^ t'7 OO
Nw
N00
tot-
coN
C).•1
OCD
oft-
.-+M
WNN r7
f7 Nc,••117 m 117 M• 1n M W O t"- N in V •-+ t 1 t^ O M V' ad
z (`= t^! [^•-1
C! 1t7 to Q' N
Uco co in O n7 co co a' w N t- co cn O
od
NP+ V' N
Ow w t- N M N C;
Oo
III
..
l^.
P-4
O•-1 era n
Ntot- ll? CV
toa7'
In Pr d+ n O N to
Z M^ N .ter p
tD
G
^' O O 00 CJ) N C.) 4'; N ^" `Y O 0 coo
ON tr M to tc
1f7to 0,; • 1 V'j ..^
1r t O
to b~O
ON
InP+
c7N
toC;1
.-r Or1 .-a
Mr- t- O
Nco 5)
ON to
^+ fL1 C- ^}+ cn TV N t!) CD M ll) N N c1! O
NO•-r
er O.-1
MPI
M.-4
t` Q) 17 M N t^ tD M O
iO
I r1In
NCJ
MN
coo-i
coN
In!I+
(.7e±+
Ifat()
C)W
f'1M
WW
G-v-1
CNto
NM
Wcoa In M tl+ V' C:) CV In C1 PV t4 N O M V/ O
^' I" M t" M t7? to tD M N ^Pt M sr ,N .-^
^ O ^ to ^
O
G
Om
0^
O
C lod
O *O+ CA O TGO
a r. NGO
4
N
T
C C .r
v a 0,
•°94
ej
t. c. c. c.to y o to ^, 4)
da
U0
tih C }d 44U C cn N ++ G rJ
tn° u w tno U HI ^ 1 1 1 1 i 1 I ^ ! I ^ 1
1 ^ ^ 1 1
T
O
uz
E014w
TU
ciU
0
A-16
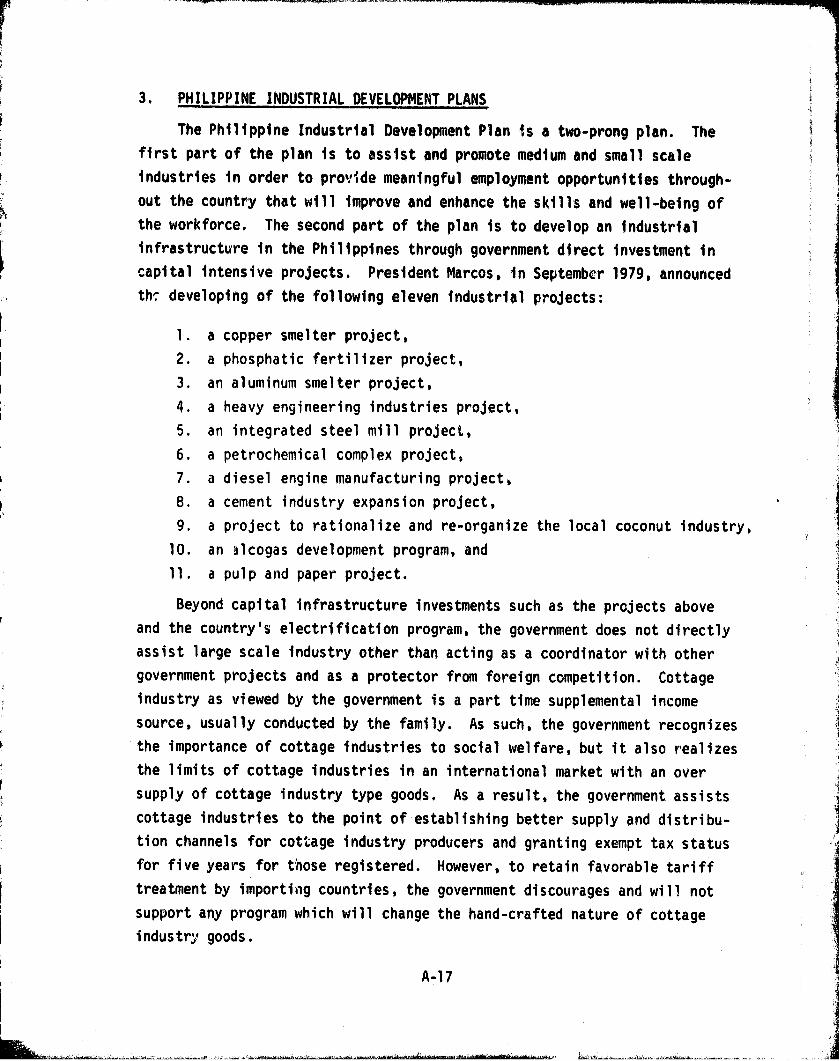
3. PHILIPPINE INDUSTRIAL DEVELOPMENT PLANS
The Philippine Industrial Development Plan is a two-prong plan. The
first part of the plan is to assist and promote medium and small scale
industries in order to provide meaningful employment opportunities through-
out the country that will improve and enhance the skills and well-being of
the workforce. The second part of the plan is to develop an industrial
infrastructure in the Philippines through government direct investment in
capital intensive projects. President Marcos, in September 1979, announced
the developing of the following eleven industrial projects:
1. a copper smelter project,
2. a phosphatic fertilizer project,
3. an aluminum smelter project,
4. a heavy engineering industries project,
5. an integrated steel mill project,
b. a petrochemical complex project,
7. a diesel engine manufacturing project,
8. a cement industry expansion project,
9. a project to rationalize and re-organize the local coconut industry,
10. an alcogas development program, and
11. a pulp and paper project.
Beyond capital infrastructure investments such as the projects above
and the country's electrification program, the government does not directly
assist large scale industry other than acting as a coordinator with other
government projects and as a protector from foreign competition. Cottage
industry as viewed by the government is a part time supplemental income
source, usually conducted by the family. As such, the government recognizes
the importance of cottage industries to social welfare, but it also realizes
the limits of cottage industries in an international market with an over
supply of cottage industry type goods. As a result, the government assists
cottage industries to the point of establishing better supply and distribu-
tion channels for cottage industry producers and granting exempt tax status
for five years for t'nose registered. However, to retain favorable tariff
treatment by importing countries, the government discourages and will not
support any program which will change the hand-crafted nature of cottage
industryy goods.
A-17
i

3.1 Role of Small and Medium Scale Industries
The Ministry of Industry has instituted a program for the promotion
and development of small and medium industries (SMI) separate from its
program of growth and expansion of large-scale industries. This program is
principally concerned with technical assistance for existing and potential
small business entrepreneurs, to encourage their investments in SMI projects
and to guide the growth of SMI projects to success. The development of
small and medium-scale industries has the following objectives:
to help provide non-farming Jobs in rural areas and arrestmigration to the urban centers from the countryside.
to use traditional skills and indigenous resources that large-scaleindustries cannot use due to their small quantity and non-uniformquality.
Toward the attainment of these objectives, the 1978-1982 Five-Year
Development Plan of the Philippines includes industrial policies providing
greater access to institutional finance, intermediate technology and
marketing schemes for the SMI sector.
The current assistance programs for SMI is coordinated by the Commission
on Small and Medium Industries (CSMI) of the Ministry of Industry, which
is composed of 11 government agencies. The CSMI was created in June 1974,
to develop and execute an effective and comprehensive national program to
accelerate the development of SMI. Its primary function is to integrate and
coordinate the activities of the member-agencies which are
1. Central Bank of the Philippines (CBP)
2. Development Bank of the Philippines (DBP)
3. Ministry of Agriculture (MA)
4. Ministry of Local Government and Community Development (M LGCD)
5. Ministry of Industry/Bureau of Small and Medium Industries (MI/BSMI)
6. Ministry of Natural Resources (MNR)
7. Ministry of Trade (MT)
8. National Economics and Development Authority (NEDA)
9. National Manpower and Youth Council (NMYC)
10. National Science Development Board (NSDB)
11. University of the Philippines Institute for Small-Scale Industries(UPISSI)
A-18
I'
r
The details of the development plans are provided at the end of this
chapter. The majority of the effort appears to be in the provlsiop of
managerial and technical assistance and financing up to a maximum of` $135,000 for plant equipment and working capital. The loans tend to be
A
of medium length terms, five-years, and to be below market rates. These
programs are designed to increase employment in manufacturing in rural
areas, provide for the transfer of idle agricultural resources to productive
use, and to increase real per capita income in the rural areas.
Studies have shown that of 166 small scale firms studied between 19721979, 28.9% vent bankrupt or di g -,n tinued operations. Similarly, of 273
firms studied between 1972 - 1975, 25.6% went bankrupt or discontinued
operations. The reasons given for bankruptcies and discontinued operations
include:
Management Weaknesses
poor and inadequate records
- poor financial management
money in fixed assets and no working capital
- poor organization
- poor production control
- poor training
- poor marketing
- poor decision making
Worldwide Economic Conditions
- recession
- stiff competition
Nigh Costs and Lack of Raw Materials
These difficulties, besides leading to bankruptcy, are also cause forthe poor productivity and profitability of the small scale industry
demonstrated in previous exhibits. It was noted that small scale industry
employs the second highest number of workers, pays the lowest wages, and
has the lowest productivity rate.
These problems are the prime concerns of the Commission on Small and
Medium Industries (CSMI) in trying to assist small and medium scale industry.
A-19
CSMI'S SMALL AND MEDIUM INDUSTRY DEVELOPMENT PROGRAM
In accordance with the CSMI's Countryside Development Program, member-
agencies are grouped to form functional working teams. The following programs
were outlined by the Commission in September 1978:
Enterprise Project Development
- Medium and Small Industries Coordinated Action Program (MASICAP),MI. MASICAP is a field project promotion organization witharound 50 teams ccnsisting of three young college graduates perteam spread throughout the country assisting entrepreneurs inpreparing feasibility studies and coordinating directly withfinancing institutions. In the past four years of its operations,over 4,000 SMI enterprise projects have been assisted, of whichnearly 2,000 have been established and are in operation.
- Metro Manila Barangay Industrial Development Program (MMBIDP),MI. The program aims to promote the establishment of smallcooperative industries in depressed Metro Manila barangays, thus,tapping idle or underemployed manpower resources and stimulatingincome-generating economic activities in the community.
- Agri-business Development Center (ADC), MA. For agro-industrialdevelopment of the countryside, the ADC's encourage the establish-ment of agri-business enterprises and render assistance andextensive information dissemination on modern agricultural technology.
- Fisheries Program in the Countryside, MNR. The program promotesthe maintenance of fishery resources all over the country inoptimum productive condition and accelerates the development ofthe fishing industry.
- ESCAP Industrialization Project in Non-Metropolitan Areas. Thefirst phase of this project aims to identify specific growth centersin non-metropolitan areas of the country and the study of pilotindustry projects which will create significant forward and backwardlinkages in generating socio-economic benefits to the selectedrural areas. The CSMI and its Regional Councils will undertake asecond phase to implement the identified enterprise projects.
Entrepreneurial Development
Entrepreneurship Development Program (EDP), UP ISSI. The programseeks to stimulate self-employment for potential entrepreneursand to provide employment opportunities for others. Its coverageincludes motivational development, management skills training,feasibility study and project preparation, and Philippineentrepreneurship characteristics
A-20
Innovative Financing Assistance Programs
1),_Dev1ment Bs o, f tbg Philippings (DREJ. The DB provides majorfinancing assistance to SMI projects in rural areas and in export-oriented activities. It offers loans at terms more favorable thanthose given to large-scale industries. Its countryside financingprogram is pursued in support of the overall national SMI developmentprogram through its 41 branches, 13 sub-branches and 14 agenciesthroughout the country servicing SMI loan applications. The DBP SMIFinancing Scheme has the following features:
a) Lending Program for Small and Medium Scale Industries
The target market for this loan package is small and mediumscale industries in the rural areas. The loans are intendedfor the acquisition, construction, or improvement of fixedassets (such as plant sites, buildings, machinery and equipment)and for use as working capital. As a rule, small scale indus-tries can borrow loans of from $13,500 to $135,000, whilemedium scale industries can acquire loans ranging from $135,000to $305,000.
b) Home Industries Financing Program
Beneficiaries of this program are cottage industries fullyowned by Filipino nationals. The assets of these cottageindustries after having obtained the loan should be below$13,500. Priority is given to firms in rural areas. Fundsobtained under this program could be used for the purchase,construction, or improvement of fixed assets and/or as workingcapital.
c) DBP-MSSD Financing Program for Rural Home Industries
This program aims to assist the Ministry of Social Servicesand Development (MSSD) in complementing the second phase ofits Self-Employed Assistance Program (SEAP) to uplift theliving standard of below minimum level income families.
2) Private Development lorRoratjon of the Philippines (PDCP). PDCP isa private institution engaged in the financing of small and mediumscale industry projects. Under its Small and Medium Term LendingProgram, PDCP offers 1114 following types of loans:
a) Facility Loan Package
This package finances the acquisition of machinery andequipment and of land to be used as plant site. The amountthat can be secured from this package ranges from $6,750 to$135,000. A four-year amortization period is required aftera one-year grace period.
A-21
b) The Working Capital Loan Package
This package is provided for permanent working capitalloan requirements of SMIs. The value of loans that can beacquired ranges from $6,750 to $27,000.
Both types of loans are available simultaneously as long asthe total amount secured does not exceed $135,000. Preferenceis given to firms in priority investment areas, which includeindustries which are export oriented, import substituting,utilizing locally produced raw materials, labor intensive, andAncillary.
3) Industrial Guarantee and Loan Fund (IGLF). IGLF is a governmentfinancial nst tut on whose function Is to extend financial assistanceand credit guarantee to small and medium scale industries. Thefollowing are the types of IGLF's loan programs for SMIs:
a) Special Time Deposit/Guarantee Program
IRM
Under this program, IGLF lendsinstitutions, upon their request,time deposits for loans to SMIs.for funds, tht IGLF makes its ownproposals. Under this prog-am, Iithe total value of the loa;i.
to accredited financialfunds in the form of specialIn the granting of requestsevaluation of the projectX F guarantees u^ to 60% of
b) Loan Guarantee Program
Under this program, IGLF guarantees up to 80% of loans madet^ SMIs by accredited financial institutions. The latter canthemselves process and approve the loans without having to sendthe applications to the IGLF for approval.
4) Philippine National Bank. The PNB provides loans for SMI to financetheir working capitalrequirements and export activities.
5) Financing of Export-Oriented Firms: To support the thrust towardsthe promotion an eve opment o non-traditional exports, the CentralBank initiated several credit relaxation measures to encourageincreased financial assistance of banking institutions to SMI.
In addition to the programs outlined above, there are a number of
other technical and consultancy services offered by the government. These
are explained in detail below.
o Consultancy Services
1) Small Busines s Advi sor Center SBAC MI. There are 12 SBACregional centers spread out invarious parts of the country. SBACprovides managerial and technical consultancy services to smallbusiness establishments to improve their productivity, efficiencyand profitability.
A-22
2) Trade Assistance Center (TAC), MT. Marketing Services by the TACprovide research an- Information -onion on market channe;s, trade oppor-tunities and sales promotion for SMI. There are 13 regionalcenters all over the country.
3) TechnoloU Services. These are provided to SMI throughout thecountry through thi CSMI delivery systems which tap the technologyresources of various government institutions, such as NSDB, DesignCenter Philippines, Fooe Terminal, Inc., and other specializedindustrial institutions.
4) Project Padrino, MI. The CSMI and the BSMI have organized a groupof—volunteer management experts in Metro Manila and have made theirservices available to client enterprises in the regions. At present,40 volunteer experts from professional associations are available ona need-call basis.
o Regional Project Promotion
1) Subcontracting Promotion Pro ram CSMI & TAC. CSMI's ManufacturersSubcontra—cting Development Office an AC's Regional Sub-contracting Development Offices (RSDO) provide the means forcontractors to locate subcontractors, and for subcontractors to beidentified as to their capabilities.
2) Collective Marketing Schemes MT. The. program seeks to organizeSMI producers In various regions into marketing associations andcorporations so they can gain economic advantage in collectivepurchasing and selling operations.
3) Exhort Development Prt4gram Board of Investment. The BOI conductsIts regu— Tar course on "How toGet Started Tn-xports" for prospectiveentrepreneurs who would like to know the mechanics of the exportbusiness and holds its product development clinics where businessmencan `ring their products for evaluation as to their competitivenessin the international market.
4) Batasang Pambansa. In support to CSMI's program, Batasang PambansaNo. n Act to Promote Invests,(fonts in Less Developed Areas) wasrecently passed to promote investments in "less developed areas" ofthe country and accelerate the dispersal of industries in thecountryside.
o Technical Assistance Projects
1) Local Study Mission, Development Academ of the Philippines. Theprof ect Is organized to expose selected small businessmen from therural areas to modern processes and techniques and better systems ofoperation being used by their advanced counterparts in the urbancenters. It is also expected to create possible business tie-upsand subcontract arrangements between large and small-scale firms.
P-a T
A-23
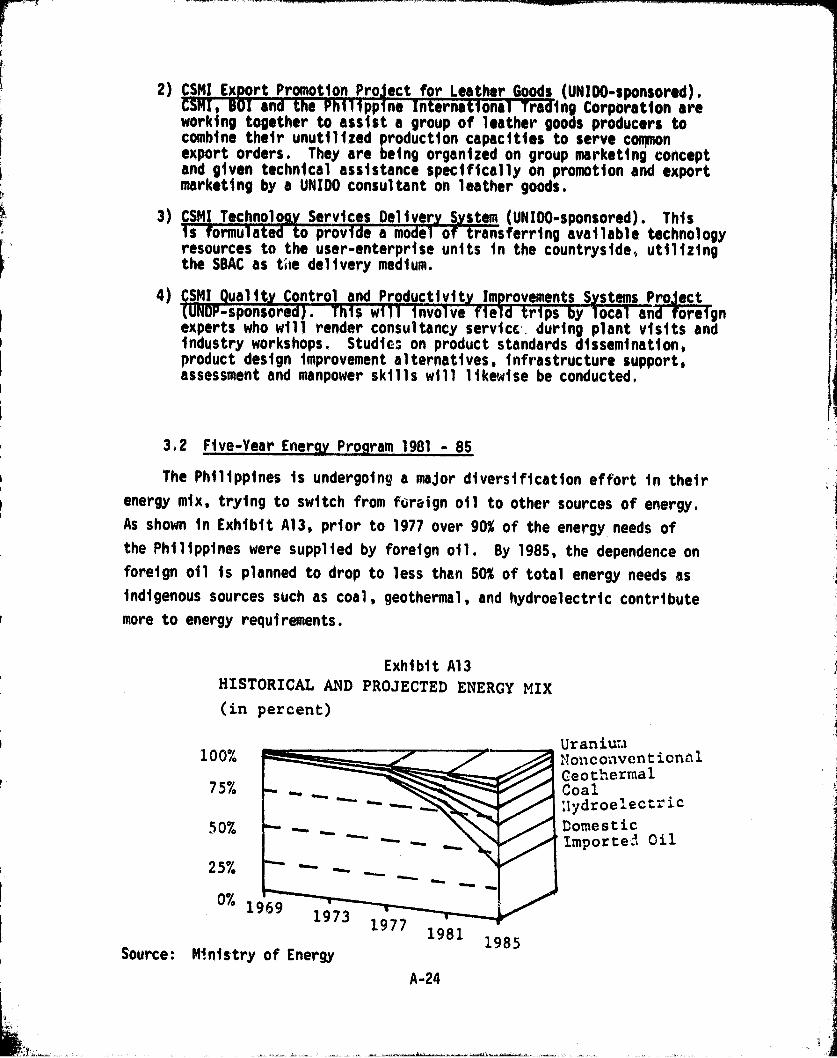
2) CSMI Export Promotion Pro ect for Leather Goods (UNIDO•sponsored).G5M1 9 301 and the Phili pp no International Tr"aa ing Corporation areworking together to assist a group of leather goods producers tocombine their unutilized production capacities to serve comymonexport orders. They are being organized on group marketing conceptand given technical assistance specifically on promotion and exportmarketing by a UNIDO consultant on leather goods.
3) CSMI Technology Services Deliver S stem (UNIDO-sponsored). ThisIs formulated to provide a model of ransferring available technologyresources to the user-enterprise units in the countryside, utilizingthe SBAC as toe delivery medium.
4)tunur-sponsoreal. inns wiii invoive r1e10 trips oy iocai an® roreignexperts who will render consultancy service, during plant visits andindustry workshops. Studio on product standards dissemination,product design improvement alternatives, infrastructure support,assessment and manpower skills will likewise be conducted.
3.2 Five-Year Energy Program 1981 - 85
The Philippines is undergoing a major diversification effort in their
energy mix, trying to switch from foreign oil to other sources of energy.
As shown in Exhibit A13, prior to 1977 over 90% of the energy needs of
the Philippines were supplied by foreign oil. By 1985, the dependence on
foreign oil is planned to drop to less than 50 % of total energy needs as
indigenous sources such as coal, geothermal, and hydroelectric contribute
more to energy requirements.
Exhibit A13
HISTORICAL AND PROJECTED ENERGY MIX
(in percent)
100%
75%
50%
25/.^ O
O
0% 19691973
1977 198119$5
Source: Ministry of Energy
Uraniu-nNonconventionzlCeothermalCoalnydroelectr isDomesticImporte' Cif
A-24

Electrical power generation in the Philippines accounts for approximately
33% of all energy consumption. The remaining energy is consumed by transpor-
tation and industrial process heat. By 1985, it is expected that electrical
power generation will account for 40% of total energy consumption as industry
grows from 41.88 million barrels of oil equivalent (MMBOE) energy consumption
in 1981 to 63.51 MMBOE energy consumption in 1985. Together with residential
consumption growing from 3.03 MMBOE in 1981 to 18.05 MMBOE in 1985. there
sectors account for the fastest growing electrical energy users. The
energy source mix and sectored consumption mix are shown in Exhibits A14
and A15.
Exhibit A14
NATIONAL ENIiHGY SOURCE M1X(1n million harrels-of-oil equivalent, MAtnor)
Voltrlm , Perrent t'ol71trrr' 1 1 1ercent VoRtnie Percent
flowerIlydro 6,62 7,.21 7,26 7.42 17,08 12,78
Geothermal 3,114 4.19 5,34 5,46 16,34 12.22
Coal 0,42 0,46 111$ 1118 8,38 6127
Dilldiesel 19,39 21.13 19.50 19.93 7,02 5,25
Nuclear -- - - - 2.81 2,10
Nonconventional - -- 0,04 0,09 1.37 1,02
Subtotal 30,27 32,99 33,34 34,08 53.00 L9, 54
No p tpo we eOil 6032 06.39 63,16 61,55 66.44 49,70
Coal 0,52 0,57 1.17 1120 9155 ► 7,14Nonconventional 0.05 0,05 0,17 0117 4.71 3,52
Subtotal 01.49 67.01 64,50 65,92 80,70 60,36
Total commercialenergy 91,76 I oO,t"1ll 97.84 1001 00 133,70 100,00
54.94Oil shard 80,31 87.52 82,66 84,50 73,46
Total indigenous 16,51 1744 22,48 22,97 65,37 48,89
Per capita 1190 2,00 2.47
Nonenergy con-sumption' 1 3,10 1 3.40 3,70
Memo total' • 94,86 101.24 137,40
'Nonenergy consumption refers to petroleum only,"Memo total is the sum of total commercial energy and nonenergy consumption,
_t
Source: Ministry of Energy
A-75

!00%- 970 Mmnof
faux - 133,70mms s
Exhibit A15
PROACTEO ENERGY CONSUMPTION; SECTORAL MIXIIn mutton ba► rmltivI-oll equivalent, waci I
V_
The policy of the Philippines towards non-conventional energy sources
is clear and explicitly stated in their publications. The Philippines has
been severely impacted by the energy crisis and they are looking at all
possible alternatives. However, the country has neither the money nor the
resources to engage in research or invest in high risk energy alternatives.
For this reason, they show a very small energy contribution from non-
conventional sources and these are mini-hydro, dendro-thermal, and biogas
sources.
The non-conventional energy sources that the Philippines is considering
and their attitude towards them is shown in Exhibit A16. Here it can be
seen that photovoltaic systems must compete against a large number of alter-
native systems, many of which can be remote and small scale and some of
which the Philippines views as either being economically viable now or in
the near future. Given this attitude, that photovoltaics are not now
economically viable or close to viability, the Philippine Government has
left the development of photovoltaics to the private sector.
A-26

Exhibit A16
Nonconveni Tonalenergy tecinnologies
Direct solar• Water heating'• Process--steam generation• Refrigeration• Air conditioning• Distillation• Drying of crops, lumber, etc."• Water pumping• Electricity generation
— photovoltaic cells— solar-thermal conversion-- ocean •thernial energy conversion (OTC-C)
Wind• Water pumping*• Electricity generation
Small hydroo Rural electrification/irrigation'
Biomasso Furl alcohol*O Drying of crops, lumber, etc,'o Process—steam generation*o Biogas generationo Pyrolytic production of charcoal, gas, oilo Electricity generation
dcndro thermalwaste thermal"producer gas systems
Hot springso Drying of crops, foodstuffs, lumber'q Absorption refrigerationo Electricity generation by organic Rankincengines
Waste heato Cogenerationo Air conditioning• Drying of crops, lumber, etc,• Motive-power generation• Steam generation
'Presently econvrr ► ically aiablr orclose to viability
Source: Ministry of Energy
A-27
I
t
3.3 Electrical Generation and Distribution in the Philippines
To better understand the role photovoltaics may play in the Philippines,
it is important to understand how electricity is generated and distributed.
This responsibility is split. The generation of electricity is the respon-
sibility of the National Power Company while the distribution of energy is
the responsibility of the National Electrification Administration.
The primary role of the National Power Company is the generation of
large amounts of electrical power and its transmission to large industrial
users or to electrical cooperatives for distribution..
The current chairman of the National Power Company is also the Minister
of Energy and the Deputy Minister of Energy is also the president of the
National Power Company. The Center for Non-conventional Energy, the
government body apparently most responsible for the adaptation of photo-
voltaic systems is also under the Ministry of Energy. The organizational
structure is shown in Exhibit A17. This organization could have a very
important bearing on the attitude toward photovoltaics. From the organiza-
tion chart it can be seen that the head of the Center for Nonconventional
Energy reports to the Assistant Secretary. Given this reporting relationship
and the interests of the Minister and Deputy Minister, it may be inferred
that the Ministry of Energy is pt°imarily concerned with the generation of
large amounts of power and small non-conventional sources may not be a high
priority.
The National Electrification Administration on the other hand, is
responsible for the distribution of electrical power through electrical
cooperatives and the development of self-generating cooperatives where
transmission from a NPC generation station is not practical. The National
Electrification Administration is directly under the Office of the President.
The goal of the National Electrification Administration is to have the
Philippines electrified during the first half of the 80s. Exhibit A18 shows
the status of implementation. The National Electrification Administration
executes its plans through independent electrical cooperatives. However,
the electrical cooperatives are controlled by the National Electrification
Administration through attractive financing terms, the selection of
management, and technical assi5tdnce.
A-28

ORIGINAL PAGE 1sOF POOR QUALITY
Y
Big
- g
g^g =_ w
o
W
+ f M
C l
s 3
2 .'Q.^rou id
F
t
E
ceasuz0
Q z
41CDa
r 9.
W WzW
LA-CD
tYhN•-rZIAN
^41{
r s Jill
It 4 fI
IIII >^ a
WillI ^ ,^rcrr^^^
I
I
I
I
j^I $}$tX £ g y
A
I...
^ > ^ oo: r^if 31^
sal
I +^ ^ W s
I ^ 1
I F'I
II
I
u
^^ t^ ^rBrg
OI N u >V>=NN fryO i G
1 ^ 1 1 —^ C 1 1
I ommm S^iCr' y^C^bCOS^OCC ooC
^ ^ g }qg^^^
=^^
$8g
aL
^ o^ }yygryy^ lip^^itO J ^
IP
tj W h ► 0^
Vpp^y'
I ^_-__ _ _ ____. - I 1
J_.__.J__
A-29
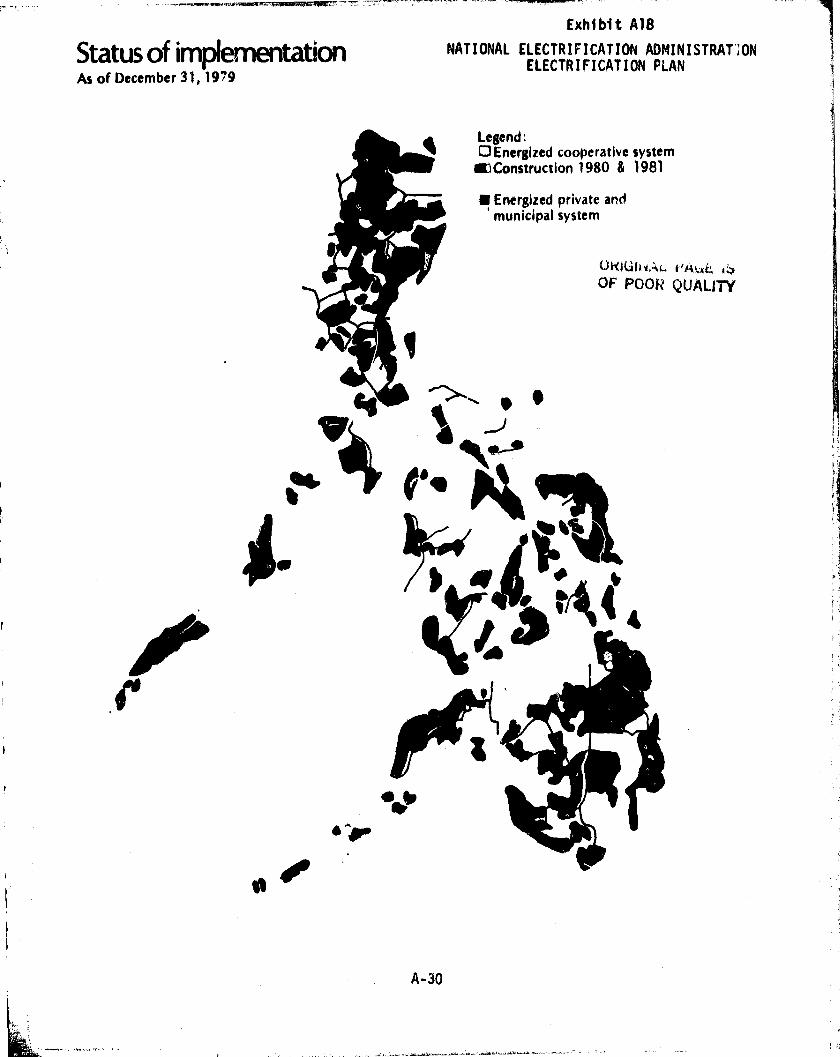
Legend:O Energized cooperative system
WConstruction 1980 & 1981
n Energized private and` municipal system
ORKAI'dA .. 1`r ,t1uj ^OF POOR QUALITY
• to
A A% Of44
Status of implementationAs of December 31, 1979
Exhibit A18NATIONAL ELECTRIFICATION ADMINI5TRAT'ON
ELECTRIFICATION PLAN
0
A-30

Electrical Cooperatives are basically of two types, self-generating
and connected. There are 111 cooperatives in the country. Of these 49
generate their own power and 62 buy power from the National Power Company.
The main source of self -generated power is diesel, but there are specific
directions to develop dendro-thermal and mini -hydro resources. The
smallest generating plant the National Electrification Administration will
consider is around 200 kW.
From the breakdown of responsibilities between the National Electrification
Administration and the National Power Company and its close relation to the
Ministry of Energy, it would appear that the development of Non-Conventional
Energy would be the responsibility of the National Electrification
Administration since non -conventional energy sources would need to be
recommended and financed by them for adaptation . in self generating cooperatives.
However, because of the manner of operating at the National Electrification
Administration, i.e., through electrical cooperatives, the Center for Non-
Conventional Energy may not fit appropriately.
This division of responsibility and interests may be a potential
problem for the development of non-conventional energy source including
photovoltaics.
A-31
^r
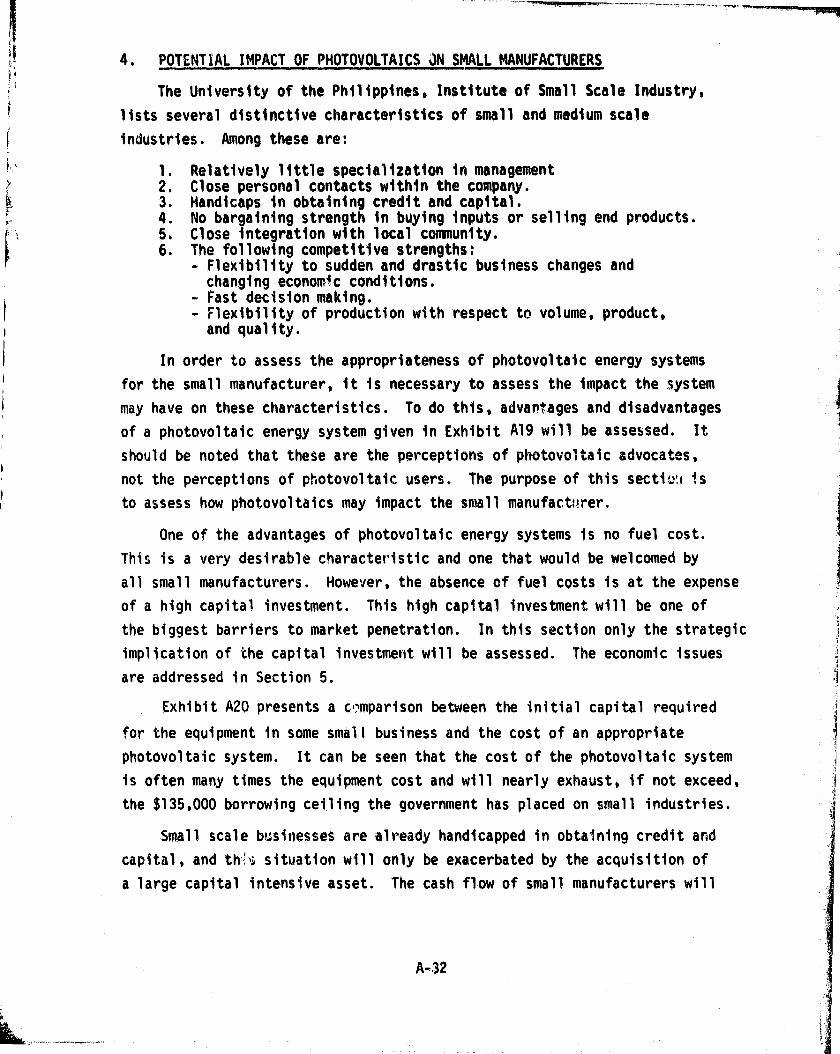
4. POTENTIAL IMPACT OF PHOTOVOLTAICS JN SNALL MANUFACTURERS
The University of the Philippines, Institute of Small Scale Industry,
lists several distinctive characteristics of small and medium scale
industries. Among these are:
1. Relatively little specialization in management2. Close personal contacts within the company.3. Handicaps in obtaining credit and capital.4. No bargaining strength in buying inputs or selling end products.5. Close integration with local community.6. The following competitive strengths:
Flexibility to sudden and drastic business changes andchanging economic conditions.
- Fast decision making.Flexibility of production with respect to volume, product,and quality.
In order to assess the appropriateness of photovoltaic energy systems
for the small manufacturer, it is necessary to assess the impact the system
may have on these characteristics. To do this, advantages and disadvantages
of a photovoltaic energy system given in Exhibit A19 will be assessed. It
should be noted that these are the perceptions of photovoltaic advocates,
not the perceptions of photovoltaic users. The purpose of this secti .e is
to assess how photovoltaics may impact the small manufact;?rer.
One of the advantages of photovoltaic energy systems is no fuel cost.
This is a very desirable characteristic and one that would be welcomed by
all small manufacturers. However, the absence of fuel costs is at the expense
of a high capital investment. This high capital investment will be one of
the biggest barriers to market penetration. In this section only the strategic
implication of the capital investment will be assessed. The economic issues
are addressed in Section 5.
Exhibit A20 presents a c-^mparison between the initial capital required
for the equipment in some small business and the cost of an appropriate
photovoltaic system. It can be seen that the cost of the photovoltaic system
is often many times the equipment cost and will nearly exhaust, if not exceed,
the $135,000 borrowing ceiling the government has placed on small industries.
Small scale businesses are already handicapped in obtaining credit and
capital, and th' situation will only be exacerbated by the acquisition of
a large capital intensive asset. The cash flow of small manufacturers will
A-32
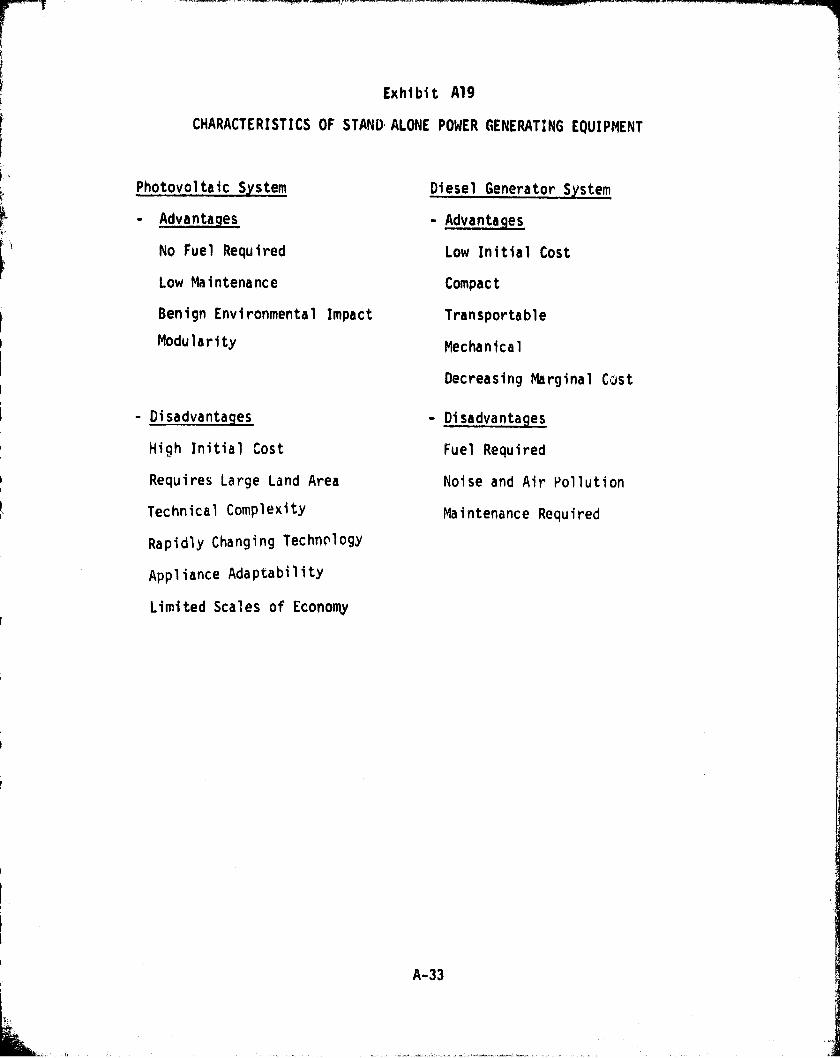
Exhibit A19
CHARACTERISTICS OF STAND-ALONE POWER GENERATING EQUIPMENT
f'
Photovoltaic System
Advantages
No Fuel Required
Low Maintenance
Benign Environmental Impact
Modularity
- Disadvantages
High Initial Cost
Requires Large Land Area
Technical Complexity
Rapidly Changing Technology
Appliance Adaptability
Limited Scales of Economy
Diesel Generator System
- Advantages
Low Initial Cost
Compact
Transportable
Mechanical
Decreasing Marginal Cost
- Disadvantages
Fuel Required
Noise and Air Pollution
Maintenance Required
A-33
11L
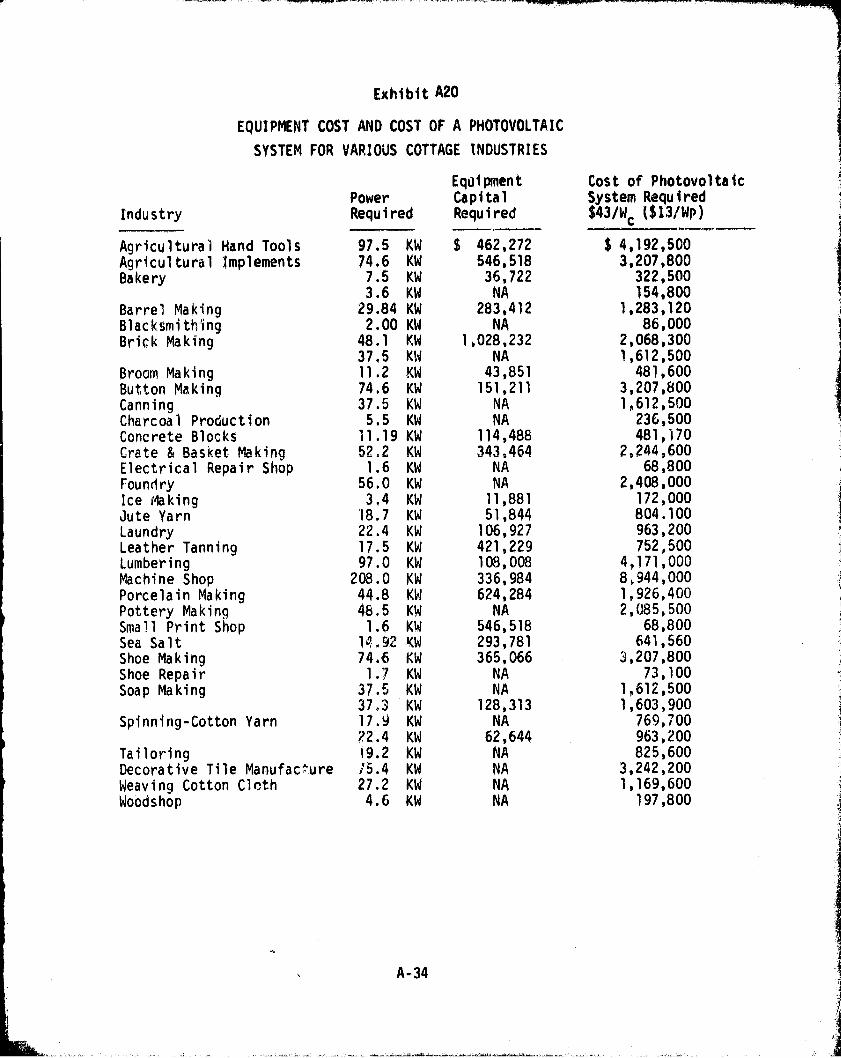
Exhibit A20
EQUIPMENT COST AND COST OF A PHOTOVOLTAIC
SYSTEM FOR VARIOUS COTTAGE INDUSTRIES
Industry
Agricultural Nand ToolsAgricultural ImplementsBakery
Barrel MakingBlac.ksmithingBrick Making
Broom MakingButton MakingCanningCharcoal ProductionConcrete BlocksCrate & Basket MakingElectrical Repair ShopFoundryIce MakingJute YarnLaundryLeather TanningLumberingMachine ShopPorcelain MakingPottery MakingSmall Print ShopSea SaltShoe MakingShoe RepairSoap Making
Spinning-Cotton Yarn
TailoringDecorative Tile ManufactureWeaving Cotton ClothWoodshop
PowerRequired
97.574.67.53.6
29.842.00
48.137.511.274.637.55.511.1952.21.6
56.03.4
18.722.417.597.0
208.044.848.51.6
1a,9.274.61.7
37.537.317.9?2.419.215.427.24.6
EquipmentCapitalRequired
$ 462,272546,51836,722NA
283,412NA
1,028,232NA
43,851151,211
NANA
114,488343,464
NANA11,88151,844106,927421,229108,008336,984624,284
NA546,518293,781365,066
NANA
128,313NA
62,644NANANANA
Cost of PhotovoltaicSystem Required$43/Wc ($13/WP)
$ 4,192,5003,207,800
322,500154,800
1,283,12086,000
2,068,3001,612,500481,600
3,207,8001,612,500236,500481,170
2,244,60068,800
2,408,000172,000804.100963,200752,500
4,171,0008,944,0001.926,4002,085,500
68,800641,560
:x,207,80073,100
1,612,5001,603,900
769,700963,200825,600
3,242,2001,169,600
197,800
A-34
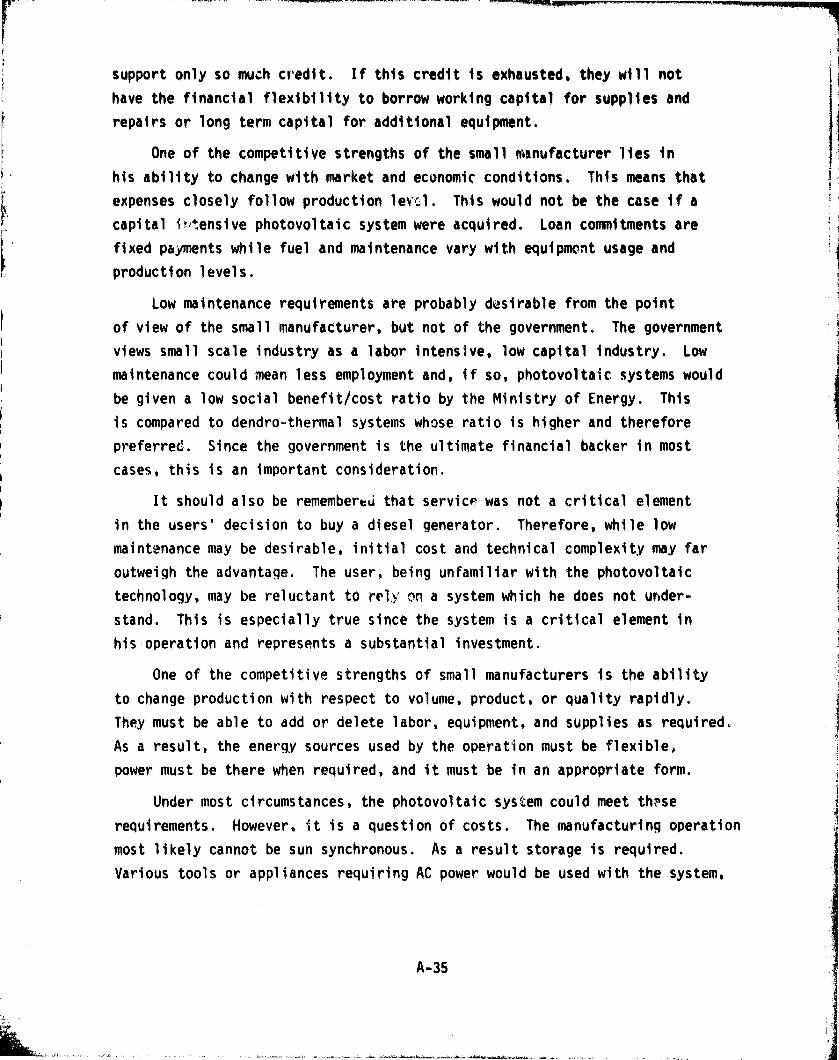
r support only so much credit. If this credit is exhausted, they will not
t
have the financial flexibility to borrow working capital for supplies and
repairs or long term capital for additional equipment.
E One of the competitive strengths of the small manufacturer lies in
his ability to change with market and economic conditions. This means thatexpenses closely follow production levr;l. This would not be the case if acapital intensive photovoltaic system were acquired. Loan commitments are
fixed p&yments while fuel and maintenance vary with equipmont usage and
production levels.
Low maintenance requirements are probably desirable from the point
of view of the small manufacturer, but not of the government. The government
views small scale industry as a labor intensive, low capital industry. Low
maintenance could mean less employment and, if so, photovoltaic systems would
be given a low social benefit/cost ratio by the Ministry of Energy. This
is compared to dendro-thermal systems whose ratio is higher and therefore
preferred. Since the government is the ultimate financial backer in most
cases, this is an important consideration.
It should also be remembereu that service was not a critical element
in the users' decision to buy a diesel generator. Therefore, while low
maintenance may be desirable, initial cost and technical complexity may far
outweigh the advantage. The user, being unfamiliar with the photovoltaictechnology, may be reluctant to rely on a system which he does not under-
stand. This is especially true since the system is a critical element in
his operation and represents a substantial investment.
One of the competitive strengths of small manufacturers is the ability
to change production with respect to volume, product, or quality rapidly.
They must be able to add or delete labor, equipment, and supplies as required.
As a result, the energy sources used by the operation must be flexible,
power must be there when required, and it must be in an appropriate form.
Under most circumstances, the photovoltaic system could meet th.pse
requirements. However, it is a question of costs. The manufacturing operation
most likely cannot be sun synchronous. As a result storage is required.
Various tools or appliances requiring AC power would be used with the system,
A-35
r
i
therefore,an inverter is necessary. IF operations expand or contract, power
requirements will change. Photovoltaic systems are long life systems with
no apparent scales of economy. As a result, capacity additions are costly
and deletions are difficult. Thus, while modularity may appear to be an
advantage, when system life and economies of scale are considered, this
advantage must be questioned.
Another market barrier to photovoltaic systems is the rapidly changing
technology. Since the system is long lived and costly, the purchaser must
be prepared to live with the system for a long time. With the rapidly
changing technology and the expected price reductions, anyone who buys the
system today may not be able to compete with his neighbor who buys the system
five years from now. Substantial price reductions are expected, as a result
the competitor will be able to buy a system at a much lower price while the
:First time buyer is still paying off his debt. Timing, is crucial, and it
is not always best to be first.
Photovoltaic systems also require a large land area. A typical 40 Wp
panel occupies an area of 13.2 in. x 47.2 in. Lois means that a 15 kWp system
would occupy 1,622.5 sq. ft. or 0.04 acres for modules. The small manufacturer
must have the rights to such an area, and maintain and protect it..
Besides considering just the apparent advantages and disadvantages of
photovoltaic systems, it is important to consider the possible sociological
impact as well. As was noted, the small manufacturer has a very close
integration with the local community, and the effect of a very expensive and
obvious photovoltaic system on this community integration must be considered,
Will the manufacturer be considered a rich industrialist exploiting the workers,
or will he be considered an ingenious innovator concerned about the petroleum
crisis and the environmental impact of air and noise pollution.
Given these considerations, a photovoltaic system does not appear to be
the best power choice for the small manufacturer. It represents a backward
integration move into power production which he most likely would prefer not
to take, especially given the country's electrification plans. The photovoltaic
option also has implications that could severely impact the competitive strengths
of i small business.
A-36

5. COMPETITIVE ENERGY SYSTEMS
To assess the market for photovoltaic energy systems, it is necessary
to understand the present competition, diesel driven and gasoline driven
generators and multi-purpose engines. The competition in this market is
fierce. there is no local manufacturer of internal combustion engines for
use with generators, but firms from all over the world are represented by
local distributorships and dealers.
It is estimated that 5,050 generator sets were sold in 1979 and
3,777 in 1978. The breakdown by size is given in Exhibit A21.
Exhibit A21
Generator Sets Sold in The Philippines
UnitsSize 1979
0 - 1.5 kW 2100
1.5 - 2.5 kW 1475
2.5 - 3.5 kW 630
5 - 100 kW 254
100 - 300 kW 338
300 - 600 kW 169
600 & Above 84
5,050
It has been estimated that 75 - 90% of these systems, with most estimates
tending to the higher range, were sold as backup units. Only 10 - 25% were
used as the prime source of power. The location in which most of the systems
were to be used are:
Urban 67%
Rural 20%
OEM 13%
The prime user for the smaller systems were contractors and small
businesses such as banks and stores needing backup. The larger units were
sold primarily to plants and factories and to large high rise buildings
A-37
-1

for backup. Distributors felt that the country's electrification program
helped their sales. It appears that once electricity becomes available,
people become dependent on it. Also, the country has undergone a major
construction program and industrial development program creating the need
for reliable electrical power.
The distributors who sell the gasoline driven gei.arators also distribute
multi-purpose engines. It is estimated that approximately 150,000 of these
units were sold in 1979. The breakdown by size is given in Exhibit A22.
Exhibit A22
Multi-Purpose Gas Driven Engines Sold
Size Units Sold (1971)
2.5 - 8 Hp 42,700
10 Hp 2,300
14 Hp 25,000
16 Hp 100It is estimated that of the 150,000 multi-purpose engines sold in the
Philippines in 1979, approximately 112,000 units were bought by fishermen. Fishermen
predominantly buy the higher horsepower engines for use in their crafts.
Farmers and construction contractors are estimated to have purchased 32,000
and 5,000 units respectively. These users typically buy the lower horsepower
units.
The distribution channels for diesel driven generators, gasoline driven
generators, and multi-purpose engines are wide and varied. There are several
full line dealerships which carry a full line of products. That is, they
carry small, medium, and 'large engines and generators. They tend to carry
the product of several manufacturers, but only one manufacturer's product in
a certain range. For example, they will carry manufacturer A's small
generator, but manufacturer B's medium generator.. They do not receive much
assistance from the manufacturer and their t-%sic goal and interest appears
to be to sell the product. As a result, there is not much emphasis on
service or parts availability and these are provided only to meet competition.
A-38
These dealerships are to be contrasted with the larger distributorships.
The larger distributorship tends to be the exclusive distributor of one
manufacturer's product. As a result, the product line is limited. Howevero
they do receive manufacturer assistance and are more concerned about service
and parts availability.
r The larger size diesel generator market, 60 - 300 kW, appears to be
`
dominated by two of these large distributorships. Both are distributors
of earth moving equipment and the diesel generator market is of
secondary interest to them. However, because of the use of diesel engines
in both applications, there is synergism and they are able to maintain a
large service network and parts supply. One distributor felt C,,at their
emphasis on parts and service was one of their keys to success in the
marketplace. For this reason, to maintain control, they owned and operated
all outlets. They appeared to have a strong desire to provide good service
and planned to remain in the market foe the long term rather than to take
quick profits.
The distribution of small gas liie driven generators and multi-purpose
engines is not as clear. This market appears to be more fragmented with
the long time dominant leader being threatened. Again in this market, there
is the presence of both exclusive distributorship and multi-product dealer-
ships. However, because of the nature of the product, the exclusive
distributors are willing to sell to dealers who will retail the product
in competition with the distributor. The distributors need these dealers
'to market the product, but while requiring certain standards for service
and parts, do not rely on dealers to perform this function entirely. These
distributors, while selling generators and multi-purpose engines also sell
such products as motorcycles and pumps. Therefore, while generators and
multi-purpose engines may not be their prime product, there is a synergism
similar to ,'hat meitioned before. This allows these dealerships to maintain
roving service and training people in the field to enhance their long term
market prospects. These distributors are also taking a long term view of
remaining in the market.
A-39
d
'd
S
6. PHOTOVOLTAICS IN THE PHILIPPINES
For the past three years, Robert Puckett, first as president of Natural
Energy systems and now as president of International Solar has been trying to
sell photovoltaic systems to both the private sector and to the government.
He was born and raised in the Philippines, is the grandson of the former
vice president, and has family and friends in business. He has advertised
extensively in magazines and newspapers,(snme of his advertisements are
shown in Exhibits A23 and A24), and has held press conferences and has tried
to get all the publicity he can. He offers both parts and systems along with
consultinC and installation services. Despite his many efforts, he has not been
able to sell enough product to keep his exclusive distributorship.
Mr. Puckett attributes his marketing problems in the Philippines to cost
and lack o' awareness. He has tried to improve awareness by working with the
government to establish demonstration projects and by advertising and press.
Demonstration projects have been offered by both the U.N. and ARCO-Solar, but
the Philippine Government turned these down because of future contingencies.
In the case of one project, the Philippine Government could experiment with
a lOkW village power system for a year at no cost. If the system we•e
acceptable, the Philippines would pay $100,000 for it and agree to buy more
systems in the future. If the system were not acceptable they could return
it at no cost. This offer was rejected.
The German Government and AEG Telefunken are presently working with the
Philippine Government to build and demonstrate a, village power system. This
deal is apparently at no cost and has no future commitments. It is awaiting
site selection and bureaucratic proceedings.
People who are aware of and knowledgeable about photovoltaics are
familiar with the DOE price goals. These goals however do not encourage
someone to buy the system now and many people are taking a wait and see
attitude.
A-40
NL I
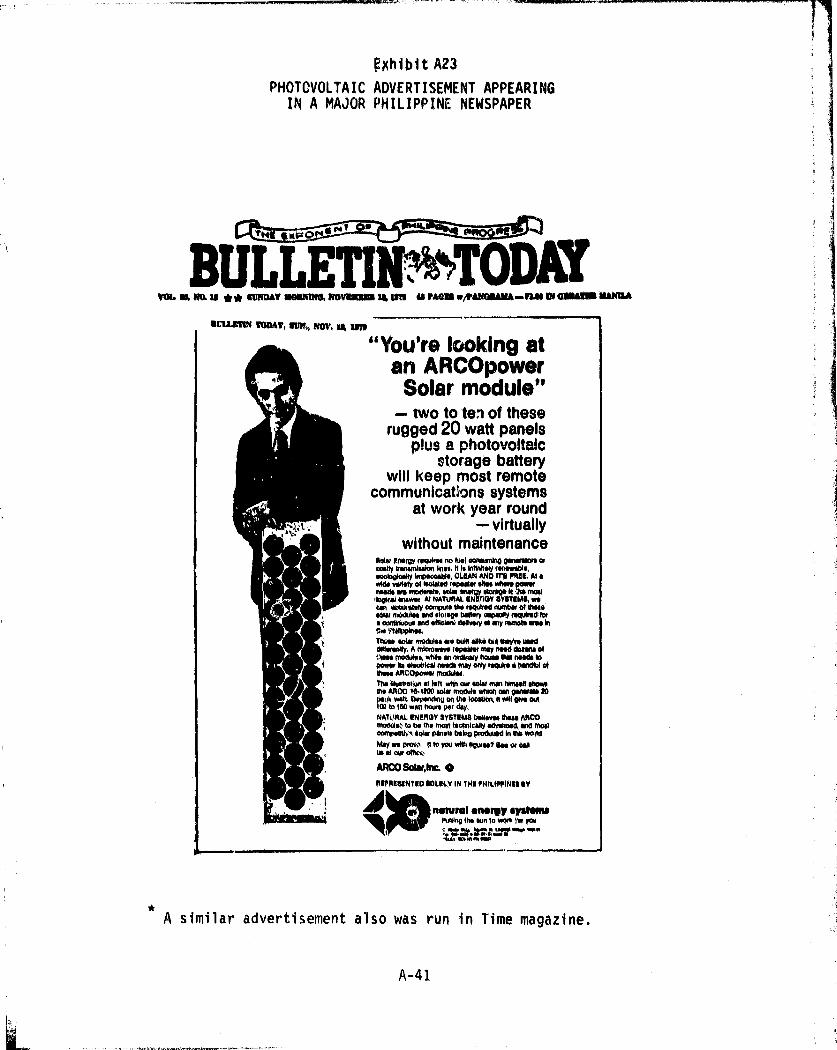
fshibit A23
PHOTOVOLTAIC ADVERTISEMENT APPEARINGIN A MAJOR PHILIPPINE NEWSPAPER
rrH i ri 0.a^
BULLETINT-vtNTODAYvm a tau ** I ll Y Mam w eaNt1 mu-n n w animm omaut
OBid,RM "Mir, am,,, "V.. 1a4 U"
"You're looking atan ARCOpower
Soler module"— two to ten of these
rugged 20 watt panelsplus a photovoltaic
storage batterywill keep most remote
communications systemsat work year round
— virtuallywithout maintenance
11o1e+ lerr+oy rsoulree to 1,U:1
eoinneareYrp o«uramr. ruooa6y hmtuulat Nn 7 hMNrty rmewaWe;enoWoMy WOUNW., CUM AND ITS FRIM, At .wft V*1" of ladled repa" GNU Mwsrye to meets", WE No t, ttnpe it mat+kv" emwt, At NATURAL IN WAY SYSTSMS, weam wmraettq oontpur dr mitred manbt of Sraealt moduln and loupe 00" oaPNIV tsprdrsd fora awffin ow and .Mel" dstety M my rsnrh tM inSs" rNwh*ft,Tlraee WIN modutee r.130 a%* Out tlrynt oadOftWIl f, A mitorowe.e tpes"rIMy rrsd dum olMen mo"*, WNW m man" hwae MUd made toPmm 6 eleotr"aces" rrtry only M Wr s hw du of
wt maddeY.two AROopo Ttw Nwwauon at 40 veldt of Witt; ttrm hwaa IeOMoN ARCO 16,1200 wtr module WN0 am QWWft to
r* welt aepend toit on me Won, h WIN "*A
f00 to 160 watt hour pot dryNAVRAL ENtROY RYSTUNIS Oellem Gras Mt0moWQ to a" revel teeKtlwlty .WWW4 and MOarm ",q sohu pants Oelnp prodraesd N Or woAdmly we WOO M to you wWt "W"? Us or amUs at our OWL,
ARCO sOlKh'tc. 0
RIVANUNTtD SOUCY IN TNt NIIL"INU BY
Idne Uml .Mtoy .y mm1 no towor% ;4 you
'r 1.V1.ff.r1.^1:.i yB*1-1-I mYft it
A similar advertisement also was run in Time magazine.
A-41

Exhibit A24
PHOTOVOLTAIC ADVERTISEMENT APPEARINGIN A MAJOR PHILIPPINE NEWSPAPER
Suelneee Clay Monday, October 29.1979
o^RL'A_
Ever wondered csnaceshins haveSolar photovoltaic Cells have been used In space since 1958 onVanguard TV-4, Since then, Telster, Apollo, Intelsat-IVA andseveral other space vehicles have used the sun as a aaurce ofelectric power. Power to run its environmental, communicationsand guidance control systems, Just Imagine, If a space4Dhiphad to be plugged to an electrical outlet on earth, It would havean extension cord thousands and thousands of miles long)Today, solar technology is ready to power your home orbusiness needs, And here In the Philippines, Natural EnergySystems, a bright, down-to-earth company with powerful ideasis ready to put the sun to work for you, We have various solarsystems and devices that can light up your home or office. Coolyour place. Heat your water, And even entertain youl Plug Intothe sun, See or call us today,
natural energy systemsPutting the Sun to work for you.C. Rivllla Bldg„ Aguirre St, Legaspl Village, MakatlTel. 518.4435089 . 97 .51 local 20TELEX; SOLA1- PN 83621
A-42

r- ,
7. FOREIGN INVESTMENT IN THE PHILIPPINES
Foreign investment in the Philippines is welcomed and encouraged to
the extent that the business is in keeping with the plans and policies of
the Philippine Governme ►,t, is not in conflict with existing Filipino businesses
and is not in restraint of trade. The Philippine policy on foreign investment
is summiarizefd in Exhibit A25.
Setting up a business in the Philippines requires application and
registration with several government bodies. These include the Board of
Investment, the Central Bank, the Securities and Exchange Commission, the
Bureau of Customs, National Housing Authority, Export Processing Zone
Authority, Bureau of Commerce, Bureau of Internal Revenue, National PollutionControl Commission and local authorities. To assist foreign businessmen in
establishing a business an assistance team for foreign investments was created
in the Board of Investments. This government help along with assistance
from privite sources such as ar„couviting firms, consultants, and lawyers, ishighly recommended.
The manufacture of photovoltaic energy systems in the Philippines is
considered a preferred pioneer industry. This means thcl. the business will
receive the incentives of a preferred pioneer enterprise which include
protection from government competition and foreign dumping, along with tax
and tariff incentives. Unlike a preferred non-pioneer industry, though, it
can also be 100% foreign owned for at least 30 years. In addition, thepreferred pioneer industry will receive post-operative tariff protection not
to exceed 50`X, of the dutiable value on the importation of products similar to
those manufactured and a scheduled exemption from all taxes under the National
Internal Revenue Code except income tar,. This appears to be a very attractive
incentive package.
Financing of a business and tiie repatriation of profits and ,investments
is governed by the Central Bank of the Philippines. The roles depend uponthe amount of domestic borrowing, amount of foreign investment, a;d extentof product exr-reed. li'he rules are established to encourage exports and
foreign capital investment and borrowing, and go as far as regulating debt/equity ratios if domestic peso borrowing is desired.
! A-43
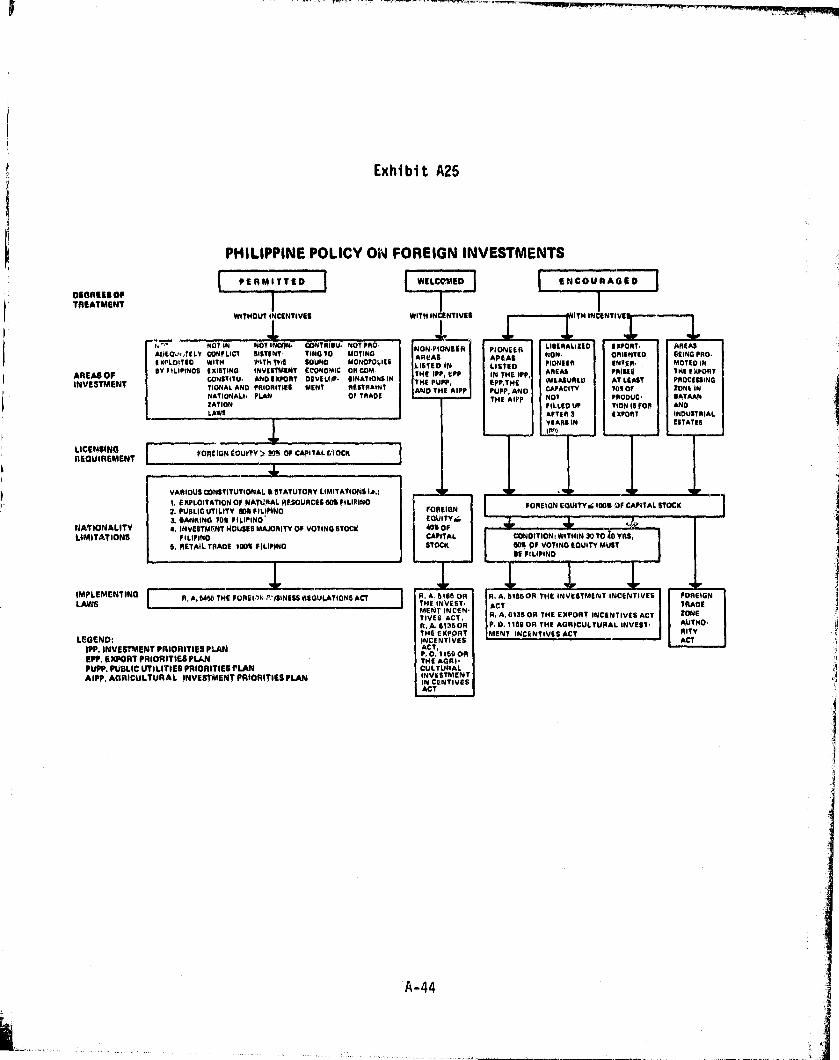
Exhibit A25
PHILIPPINE POLICY OW FOREIGN INVESTMENTS
PERMITTED I I WELCOMED I ENCOURAGED
090REEB OFTREATMENT
WITHOUT
AiltWi,tELY OON ► UCT SI/flNf TING TO u'-OTING99PLOITIC WITH WITH TINE SOUND MONOPOLIES
AREAS OFBYIILIPINOS EXISTING INVESTMENT ECONOMIC ORCOM
INVESTMENTCONPITU, ANDEXFORT DEVELIIP• BINATIONS INTIONAL AND PRIORITIES MENT RESTRAINTNATIONAU , PLAN Q ► TMOEZATIONLAWS
WITH
VON-PIONEER PIONEER LISERALIZfO EXPORT• AREASAREAS AREAS NON ORIENTED 6EINGFRO,
LISTED IN LISTED PIONEEP fNTtR, MUTED IN
THE IPP, EPP IN THE IPP, AREAS PRISSS THE E XFORTTHE PUPP, EpP,THE (MtASUREO AT LEAST PROCESSING
AND THE AIPP PUPP, AND CAPACITY 701 OF ZONE IN
THE AIPP NOT FRODUC, BATAAN
I to UP TION IS FOR ANDAFTER S EXPORT INDUSTRIALYEARS IN ESTATES
LICENMN13REQUIREMENT
I FOREIGN EQUITY ? 3"OF CAPITAL MOCK I
' VARIOUS CONSTITUTIONAL &STATUTORY LIMITATIONS IA„ ♦ ^►EXPLOITATION OF NATURAL RESOURCES 601 FILIPINO FOREIGN EOUITY610DS OF CAPITAL STOCK
Z. PUBLIC UTILITY SOS FILIPINO fORE1GNFEGUITY48. BANKING 70% FILIPINO
NATIONALITY 6, INVESTM[NT HOUSES MAJORITY OF VOTINGSTOCK 108 OFLIMITATIONS FILIPINO CAPITAL CONDITIONt WITHIN 30TO10YRS.
6, RETAIL TRADE 100% FILIPINO STOCK BOB OF VOTING EQUITY MUSTOf FILIPINO
IMPLEMENTING R, A, b184 THE FORE0C M')SINESS 66OULATIONS ACT R, A. 8186 OR A. 6186OR THE INVESTMENT INCENTIVES FOREIGNLAWS THE INVEST- ACT TRADE
MENTINCEN •TIVES ACT,
JR,
R. A,019BOR THE EXPORT INCENTIVES ACT ZONE
R, A. 61360A P. O, 1169 OR THE AGRICULTURAL INVEST, AUTHO-
THE EXPORT MENT INCENTIVES ACT PITYLEGEND: INCENTIVES ACT
IPP. INVESTMENT PRIORITIES PLAN ACT,EPP. EXPORT PRIORITIES PLAN P. 11x9
THEE ISO
PUPP. PUBLIC UTILITIES PRIORITIES PLAN CULTURALAIPP, AGRICULTURAL INVESTMENT PRIORITIES PLAN INVESTMENT
INCENTIVESACT
A-44

Mr. Deo AcupanNorkis Tr-iding Company11 Calbay. ►g Corner LibertadMandaluyongManila, Philippines
Mr. Constantino AguilarGeneral ManagerPolygon Argo-Industrial Corp.1197 E. de Los Santos AvenueQuezon CityMetro Manila, Philippines
Mr. Jose C.F. AlladoDirector, Financial ServicesTechnology Resource CenterMinistry of Human SettlementTRC Building, Buendia Avenue,MakatiMetro Manila, Philippines
Philippine Key Contacts
Dr. Jose A, AzerconEnergy & Information Technology401 Exechem BuildingSalcado & Herrera StreetsLogaspi VillageMakatiMetro Manila, Philippines
Dr. S.I. BhuiyanDepartment of Irrigation & WaterAgricultural Economics DepartmentInternational Rice Research InstituteP.C. Box 933Main .1a, Philippines
Dr. C.W. Bockhop, HeadAgricultural Engineering Department
Ext. International Rice Research InstituteP.O. Box 933Manila, Philippines
Mr. Emmanual 0. Almonte Mr. Felipe BuenflorHead Coordinator ForesterBureau of Small & Medium Industry Ministry of Natural Resources5th Floor Quezon CityIndustry & Investment Building Manila, Philippines385 Buendia Avenue, Ext.Makati Mr. Arnold CaoiliMetre Manila, Philippines Assistant Secretary
Ministry of Natural ResourcesMr. Arthur M. Alvendia Quezon CityDirector Genera. Manila, PhilippinesTechnology Resource CenterMinistry of Human Settlement Mr. Rufo Colayco, Principal
TRC Building, Buendia Avenue, Ext. SGV & CompanyMakati SGV Development CenterMetro Manila, Philippines 105 De LaRosa
Makati
Mr. Dorotee Antonio Manila, Philippines
ForesterMinistry of Natural Resources Mr. John Crance, Chief
Quezon City Fisheries Division
Manila, Philippines USAID/ManilaAPO
Mr. Romeo V. Aquino, Director San Francisco, California 96528
Regional OfficeMinistry of Agriculture Mr. Bobby M. Criaostomo
Region IV Sales EngineerIloilo City, Philippines Usiphil
BueY-,dia AvenueMakati, Philippines
A-45h;.
{
a
4k
k
Engineering Corp.
Mr. Lino T. DatuSales ManagerAlpha Machinery b1167 Paisong Tama,Makati
Mr. B.G. Gertes
Managing DirectorCinter for Appropriate TechnologyMetro Manila, Philippines
Manila, Philippines
Dr. Bart DuffAgricul tural EconomistAgricultural Engineering Dept.International Rice Research InstituteP.O. Box 9?) "Manila, Pl,klippines
Mr. Ral^ a EdwardsAgriculture DivisionUSAID /ManilaAPOSan Francisco, California 96528
Mr. Lawrence ErvinSenior Energy AdvisorUSAID /ManilaAPO
San Francisco, California 96528
Mr. Hector L. FajardoA. Soriano CorporationA. Soriano BuildingPaseo de RoxasMakatiManila, Philippines
Mr. James FerraraCatepillar Tractors,Philippines, Inc.2123 Pariaso StreetDas Marinas VillageManila, Philippines
Mrs. Consuelo E. GomezForecasts and Estimates SecretaryDe Los Santos Building582 Quezon AvenueQuezon CityManila, Philippines
Mrs. Nelia T. GonzalasAssistant SecretaryRepublic of the PhilippinesMinistry of AgricultureQuezon City 3008Manila, Philippines
Mr. Bruce GrahamConsultantDe Los Santos Building582 Quezon AvenueQuezon CityMania, Philippines
Dr. Perfecto K. GuerreroScience AttacheEmbe, ssy of the Philippines1617 Massachusetts Ave., NWWashington, D.C. 20036
Mr. S. GutiarezzAssistant DirectorEquipment Management GroupNIA BuildingNational Government CenterE. De Los Santos AvenueQuezon City, Philippines
Mr. Jerry FranciscoMinistry of EnergyPNOC Building, RoomMakati AvenueManila, Philippines
Mr. Everit HendricksAgriculture Division
1104 USAID/ManilaAPOSan Francisco, California 96528
Mr. Arthur GamillaSenior Industrial EngineerNational Grains AuthorityRepublic of the PhilippinesQuezon CityManila, Philippines
Dr. Robert W. HerdtAgricultural EconomistInternational Rice Research InstituteP.O. Box 933Manila, Philippines
A-46

Dading HizonExecutive Vice-PresidentV R Corporete Management and
Development IncorporatedCommandV R J Building1643 Dian StreetMakatiMetro Manila, Philippines
Dr. Fufino H. IbarraSolar Energy DivisionCenter for Nonconventional
DevelopmentDilimanQuezon CityManila, Philippines
Dr. Tirso J, JaramandreePresidentJaramandre Industries, Inc.88 Rizal Street, LaPazIliolo City, Philippines 5901
Mr. Vincente JaymePresident, PDCPPDCP BuildingAyalg BoulevardMakatiMetro Manila, Philippine4
Miss JimenezInformation OfficerBoard of InvestmentsIndustries and Investments Bldg.Buendia Avenue, Ext,MakatiManila, Philippines
Dr. Aida Librero, DirectorSocio-Economic Research DivisionPCARR, Los BanosLaguna, Philippines
Dr. Amado Maglinao, DirectorFarm, Resources 8 SystemsPCARR, Los BanosLaguna, Philippines
Mr. Jaunito B. MatigAssistant Director for Conservationand Aquatic Resources
860 Quezon AvenueQuezon CityManila, Philippines
Emil B. Mascardo, Jr.Sales ManagerCummins Diesel Sales 6 ServiceCorporation of the Philippines2nd Floor, Park View Building112 Gamboa StreetLegaspi VillageMakatiMetro Manila, Philippines
I. Bill Obligacion, Jr.Oriental MachineriesP.O. Box 640GreenhillsMetro Manila, Philippines
Mr. Hermingildo MagsuciRegional Director
Energy Bureau of Fisheries & Aquatic ResourcesRegion VIIloilo City, Philippines
Mr. Mark R. Johnson Mrs. Christina PabloDevelopment Load Officer Manager, Regional OfficeUSAID/Manila Development Bank of the PhilippinesAPO Iloilo City, PhilippinesSan Francisco, California 96528
Mr. M. PasquelDr. Rayaldo Lantin, Dean Development AdministrationInstitute of Agricultural Engineering National Cottage IndustriesU.P. at Los Banos Pacific Bank Buildi}g, RamonLaguna, Philippines Magsaysay Boulevard, Santa Mesa
Metro Manila, PhilippinesMr. Y. G. LeePresident and General ManagerMotorola,, Philippines Inc.Boraheco Building, KM17West Derica Road, SouthSuperhighway, ParanaqueMetro Manila, Philippines
A-47
k
Dr. B.M. SaliniAssociate Agricultural Engineering
and BeadDepartment of Irrigation & Waterranagement
International Rice Research InstituteP.O. box 933Manila, Philippines
Dr. D.C. Salita, ChairmanNRC of the PhilippinesUniversity of the Philippines (UP)DilimanQuezon CityManila, Philippines
Dlemente San Augustin, Esq.Manager, Marketing Tntel.ligenceInternational Harvester, Philippines, Inc.744 Romual,dez AvenueManila, Philippines
Dr. Vic SandovalEnergy & Information Technology Corp.401 Exechem BuildingSalcado and Herrera StreetsLegaspi VillageMakatiMetro Manila, Philippines
Dr. Aldwyn C. SantosTechnical Assessment DivisionCenter for Nonvonventional EnergyDevelopment
DilimanQuezon CityManila, Philippines
Mrs, Zenaida A. SantusDeputy Administrator for
Engineering and MaterialsNational Electrification Administration1050 Quezon AvenueQuezon CityManila, Philippines
Mr. Herminigildo SaycoGovernor, Board of InvestmentsIndustry and Investments BuildingBuendia Avenue, Ext.MakatiManila, Philippines
Mr. Robert PuckettThe International Solar Corp.C. Rivilia BuildingAguirre StreetMakati, Philippines
Mr. Gil G. Puyat, Jr.PresidentEastern Seaboard Insurance Co., Inc.Manila Bank BuildingMakatiMetro Manila, Philippines
Mr. Tom RanadaInstitute of Small Scale IndustriesUP Diliman, Quezon CityManila, Philippines
Dr. Jose A. Remula, DirectorResearch and DevelopmentFSDC2nd Floor Rudgen BuildingShaw BoulevardPasigMetro Manila, Philippines
Mr. Francisco G. RentutarDirectorBureau of Agricultural Ext.DilimanQuezon CityMetro Manila, Philippines
Dr. Jim RiessElectrical Engineer-GeneralNEA Advisory Services TeamStanley Consultantsc/o NEA1050 Quezon Boulevard, Ext.Quezon CityManila, Philippines
Dr. Gil Rodgigues, Jr.Economic Research DivisionDe Los Santos Building582 Quezon AvenueQuezon CityManila, Philippines
A-48

.ia. Tom SchlinkerFinance AdvisorU.S. Embassy/ManilaAPOSan Francisco, California 96528
Mr. Curtis StoneEconomic Advisor, EnergyU.S. Embassy/ManilaAPOSan Francisco, California 96528
Ms. Daisy Ann F. TabtabPlanning Servt,isMinistry of EnergyPNOC Building, Room 1104Makati AvenueManila, Philippines
Dr. Quiuttn TanHead CoordinatorBureau of Small & Medium Industries5th Floor, Int `,istry & Investment Bldg.385 Buendia Avenue, Ext.MakatiMetro Manila, Philippines
Mr. Dick TaylerTIME MagazineB&S Investment & Development Corp.151 Paseo de RoxasMakatiManila, Philippines
Dr. E.M. Taylor, DirectorInstitute of Small Scale IndustriesUniversity of the PhilippinesE. Virata HallUP Campus, DilimanQuezon City, Philippines
Dr. Alberto R. TeganoActing ManagerDevelopment Bank of the PhilippinesMakatiMetro Manila, Philippines
Dr. Ernesto N. Terrado, Ph.D.Administrator, Ministry of EnergyCenter for Nonconventional Energy
DevelopmentPNPC Merrit RoadFt. Bonifacio, MakatiManila, Philippines
Mr. J. Marsh ThomsonExecutive Vice PresidentAmerican Chamber of Commerce of
the Philippines, Inc.2nd Floor Corinthian PlazaPaseo de RoxaeMakatiMetro Manila, Philippines
Ms. Piedad F. ThozaSenior Research AssistantInstitute of Small Scale IndustriesUniversity of the Philippines, DilimanQuezon CityManila, Philippines
Mr. Edilberto A. UichancoSenior Vice-President1200 E. De Los Santos AvenueQuezon CityManila, Philippines
Mr. Mauricio R. ValdezChief of DivisionIndustrial Services & Development Div.National Grains AuthorityRepublic of the PhilippinesQuezon CityManila, Philippines
Sergio C. ValenzuelaOperations Manager, Mariwasa, Inc.Mi-Aurora Branch, Mariwasa Bldg.717 Aurora Blvd.Quezon CityManila, Philippines
Mr. Herman J.J. Van EngelenProfessor, Department of PhysicsUniversity of San CarlosCebu, Philippines
Mr. Stephen P. WadeDeputy SEA Regional ManagerP.O. Box 1995, MCCMakati, Philippines
Mr. James Young;ales EngineerUsiphilBuendia AvenueMakati, Philippines
A-49

I.
B. MEXICO

PREFACE
This report is an in-depth study of Mexico and its potential for using
stand-alone photovoltaic systems in cottage industry applications. Thestudy was performed based on information obtained in an in-country visitMarch 16 to March 27, 1981. The areas visited included the Federal Districtof Mexico, the State of Morelos and the State of Michoacan. A list of
organizations contacted is given at the end of this section.
The information contained in this report describes the physical,
cultural and economic environment, as well as government policy on industrial
and rural development,, energy, rural electrification, a discussion of Mexican
cottage industry, the status of photovoltaics in Mexico, an estimate of
the potential for its application (excluding market barriers and constraints)
and a summary of the site visits of rural cottage industry.
B-i
41
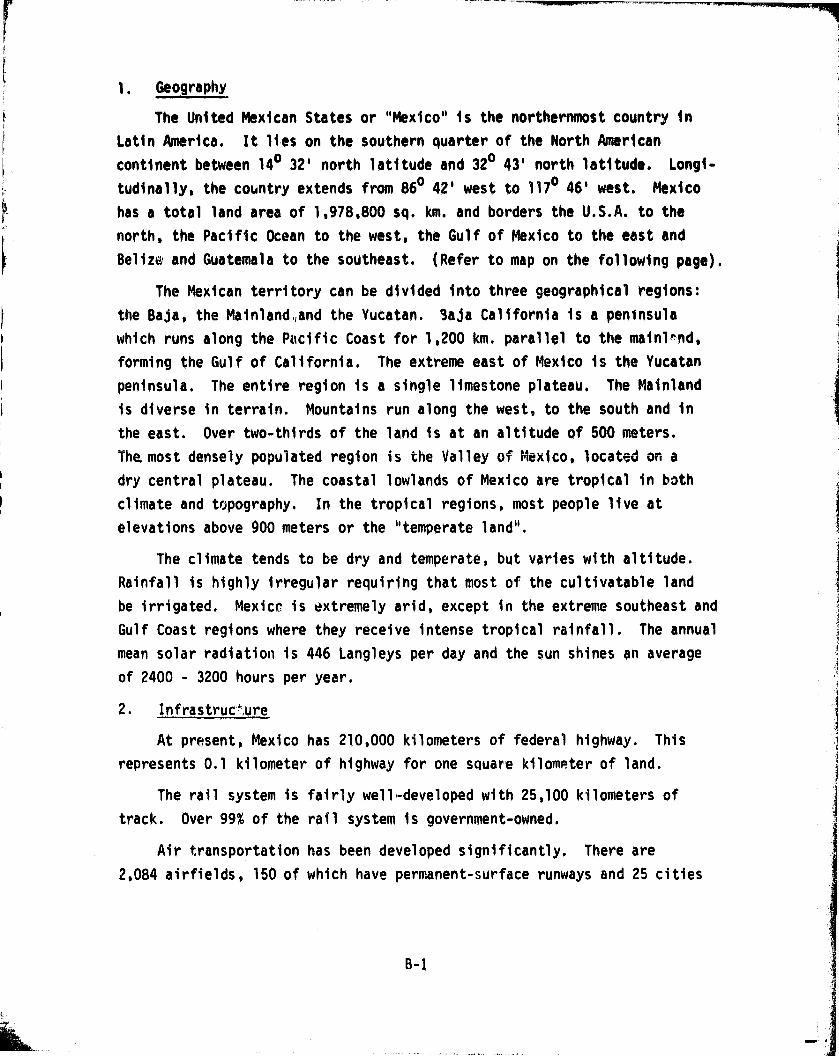
Pt
41. Geography
The United Mexican States or "Mexico" is the northernmost country in
Latin America. It lies on the southern quarter of the North American
continent between 140 32' north latitude and 320 43' north latitude. Longi-
tudinally, the country extends from 860 42' west to 1170 46' west. Mexico
has a total land area of 1,978,800 sq. km . and borders the U.S.A. to the
north, the Pacific Ocean to the west, the Gulf of Mexico to the east and
Belize and Guatemala to the southeast. (Refer to map on the following page).
The Mexican territory can be divided into three geographical regions:
the Baja, the Mainland.,and the Yucatan. 9aJa California is a peninsula
which runs along the Pacific Coast for 1,200 km. parallel to the mainlrnd,
forming the Gulf of California. The extreme east of Mexico is the Yucatan
peninsula. The entire region is a single limestone plateau. The Mainland
is diverse in terrain. Mountains run along the west, to the south and in
the east. Over two-thirds of the land is at an altitude of 500 meters.
The most densely populated region is the Valley of Mexico, located on a
dry central plateau. The coastal lowlands of Mexico are tropical in both
climate and topography. In the tropical regions, most people live at
elevations above 900 meters or the "temperate land".
The climate tends to be dry and temperate, but varies with altitude.
Rainfall is highly irregular requiring that most of the cultivatable land
be irrigated. Mexicr is extremely arid, except in the extreme southeast and
Gulf Coast regions where they receive intense tropical rainfall. The annual
mean solar radiation is 446 Langleys per day and the sun shines an average
of 2400 - 3200 hours per year.
2. Infrastruc',ure
At present, Mexico has 210,000 kilometers of federal highway. This
represents 0.1 kilometer of highway for one square kilometer of land.
The rail system is fairly well-developed with 25,100 kilometers of
track. Over 99% of the rail system is government-owned.
Air transportation has been developed significantly. There are
2,084 airfields, 150 of which have permanent-surface runways and 25 cities
B-1

a
I Lo
'^• :;:G37 v>
,,,,,r..;3'I',i •} • 011Se
.. y:::• r.
•M1
}ti
^^;;r:;^} is y' : '''•'^,;:i'h:;}'Jh:
:f•u
Z^-.¢...•Q tj1.r•
Qc:i;i^• Q
iir i• Oy, V
N5 r. wV
•rr
^^
;^ ••j^ C
r'
e^
O S S VO
qg Oi.^ O e aF'f9 •. •;W C N Ln 3e• • ui O
iO ^i E s
110
ia •.ae • •.y
MI e w 0./' 4 CO
.e^ • ro Oo•
crp:. •^
IA0
O g
do
u
1111• ••'••,'::•,
^sQi''^ifi!`^^^^¢'.• = lL aft ° $ C e 8 0
00-N Jill IS
H P •)010 ,
N NV AN 1V PI IUD N$tM'I Mf
P v s3^'ft3g =,+te
a LZZ4 [it s b^n p -0 ^
' a, O ••1 N i9 °1MA • Of 1p P O 3^1 M► • ff ID
-
19
O
is
Y
91
0I
B-2

with international airports. The two largest airlines are Mexicana de Aviacion
and Aeromexico, S.A. Two O.S. airlines, American and United, also serve Mexico.
The telecommunications system is well-developed and a segment to which
the government has a strong commitment to further improve. Telephone service
is a government enterprise, Telefonas de Mexico, S.A. (TEIMEX). There are,
at present, aver 4.4 million telephones installed. Mexico has one Atlantic
Ocean satellite ground station, 574 A.M. stations, 109 F.M. stations and
163 television stations.
Distribution systems seem well-,stablished and do not represent a large
barrier to business in the rural sector. Transportation cosh vary, but
they also do not appear to be a major inhibitor of rural business.
3. Natural Resources
Mexico is the world's largest producer of silver, has large reserves
of copper and gold, and is among the world leaders in producing lead, zinc
and sulphur. Fluorspars, manganese, salt, uranium, iron ore, coal and natural
gas are also important resources. Indigenous gems include opals, amethysts,
turquoise, agates and onyx.
At present, Mexico's most important natural resource is oil, in which
it currently ranks 4th in world production and 5th in world hydrocarbon
reserves.l
Agricultural resources for export include coffee, cotton, cattle, sugar,
shrimp, tomatoes and fruit. Fish are an important resource and a significant
Mexican industry.
Forty percent of the land can be used for pasture, 12% is cropland and
22% is forested.
4. Population
The population of Mexico is 66,114,000 with an average annual growth
rate of 2.6%. In 1980, the urban sector accounted for 67% of the population,
leaving 33% as rural. The average annual growth rate of the urban population
1 Chemical Week, May 27, 1981, p. 31
B-3

is 4.5%. There are three major cities: Mexico City (13.2 million people),
Guadalajara (2.3 million), and Monterrey (1.9 million). There are thirteenmore cities with populations over 300,000. They are: Ciudad Juarez, Puebla,
Tijuana, Chihuahua, Mexicali, Cuernavaca, San Luis Potosf, Veracruz,,Hermosillo, Culiacan, Torreon, Lean and Mcfrida.l
The structure of the population is as follows:2
Age Range (yrs.)
% of the Population
0 - 15
48
16 30
25
31 - 50
17
50 and over
10
5. Education
Education is extremely important to Mexicans and is regarded as the major
instrument to achieving the goals of the Revolution of 1910. The desire for
an education is a large cause of urban migration by people seeking better
educational opportunities in the city. Although education is free and
compulsory for the first nine years, many children in the rural areas do notattend school. The adult literacy rate is estimated at 75%.
6. Labor
The Mexican labor force numbers 18 million, with 34% in agriculture,
25% in industry and 41% engaged in services. Unemployment is currently at
10% and 40% of the labor force is considered underemployed. The government
estimates that 700,000 new jobs are needed each year. The labor force in
Mexico City is easily trainable for both skilled and semiskilled jobs.Outside of Mexico City, the labor force, for the most part, is unskilled.
For white collar positions, there is a surplus of qualified workers.However, there is an unfilled demand for top-level executive personnel'.
1 IMCE 1980
2 1977, Sec. de Prog.y Presupuesto
8-4

Religion has had a strong influence in Mexico and 97% of the people
are Roman Catholic. Traditional Christianity prevails in the northern4
states and in major urban areas,. In tmmost rural areas, especially the
s
Yucatan and peripheral populated regions, religion is a fusion of Christianity
and preconquest indigenous practices. Indians do not distinguish between
religion and culture. Although they have adopted many of the symbols of
Christianity, especially saints, they reject Monotheism because it is in
conflict with their beliefs of afterlife.
Saints, however, are very important. Every village and region will
have patron saints which are honored by shrines, pilgrimages and fiestas.
The most common religious symbol is the cross. The cross is believed to
protect the faithful from fear, thievery, and similar evils. Failure to
pay one's spiritual obligations is believed to cause disease, crop failure,
and other such tragedies.
8. Society
One of the most stable and important institutions of Mexican society
is the family. The nuclear family consists of parents and unmarried children,
but extends the family by ritual kinship. Family relationships play a key
role in rural-urban migration. The urban migrant will frequently get
his first job through his family and usually settles near extended family
members, but still retains ties with rural relatives.
The family functions as a basic ec l!)nomic unit and rural male-female
roles reflect the economy. Female activities center in the household and
include child-rearing, domestic duties and productior of domestic goods,
such as pottery and clothing. Male activities include crafts, agriculture
and commerce. At peak agricultural times, women also work the fields. In
some areas, as in Oaxaca, men are engaged only in agriculture, while women
tend the marketplace. Interestingly, Oaxaca is renowned for its pottery.
As a result of the strong family unit, cultural values, behavior and
skills are strictly 'transmitted from father-to-son, mother-to-daughter.
Even though an individual's status and security originates in the
family, Mexican society allows for considerable vertical social mobility.
Through education, the peasant becomes a laborer, the laborer a professional.
8-5
Mexicans are extremely proud of their heritage and they strive for
social reform. Most artistic and intellectual works focus on social
issues rather than universal ideology.
Spanish is the official language and is spoken by everyone. English
is understood by most business personnel. Some remote villages still speak
Indian dialects, but this is very rare.
9. Government
Mexico is a Federal democratic republic comprised of 31 states and a
Federal District. The present constitution was adopted in 1911 and divides
the federal government into three branches: executive, legislative and
Judiciary. The legislative branch is a bicameral national congress, elected
by universal adult suffrage. The Senate has 64 members (two from each state
and the Federal District) who serve -. six-year term. The Chamber of Deputies
consists of congressmen elected for 11nrt p-year terms. Each state has at
least two deputies and any pol_ititial Party that polls over 1.51% of the total
vote may seat five of its candidates as "party deputies". The number varies
with voting percentages. The maximum number of deputies would be 258.
The judicial authority is administered through the Supreme Court of
Justice and a system of federal and state courts. The supreme court has
four chambers: civil, criminal, administrative and labor.
The superior power of the government lies in the executive branch and
is vested in the president, who is elected for a six-year term. The president
can be elected for only one term. This office is currently held by Jose Lopez
Portillo until 1982. The government is administered through sixteen ministries,
two departments and several autonomous agencies, which operate with their
own funds subject only to the presidential authority. The ministries having
the greatest influence on the adoption of photovoltaics for cottage industry
woul , ' be the Secretary for Patrimony and Industrial Development, the Secretary
for Industry and Commerce and the Secretary for Public Works. Also among
prr , 'dential powers is the tax courts and public education at the primary and
secondary levels.
B-6

Each individual state has its own constitution and elects 1t6 own
governor and chamber of deputies. However, the president has the right to
remove any governor for a broad variety of reasons. The Governor of the
Federal District is appointed by the President.
10. Economy
The Mexican economy is experiencing dynamic growth. In 1980, for the
third consecutive year, the annual growth rate was over T. However, since
World War II, Mexico has maintained an average economic growth rate of 6%.
The 1980 current account deficit did i;crease to $6.5 billion (U.S.), but
this is mainly due to $4.8 billion (U.S.) in payments for financial services.
Foreign exchange reserves are up by $1.15 billion (U.S.) due to a net
inflow to capital accounts.
Factors which had the greatest impact on the Mexican economy in 1980 were:
- higher international interest rates
- an increase in value-added of ,ii-uond industries
- a favorable international market for precious metals
- decreased tourism
- decreased border transactions
- low increase in productivity.
The investment climate is good, Both public sector and private fixed
investments were at a record high in 1980. In the industrial sectors, strong
real growth was seen in petroleum, petrochemicals and construction. Even
agriculture, an historically slow performer, was up also.
Mexico"s goals for economic expansion are extremely ambitious. A
long term economic growth rate of 8% annually and self-sufficiency in food
production by 1982 are foremost. The present administration is committed
to improving the balance of international payments, reducing the rate of
inflation (which is currently near 30%), and increasing employment. Private
investment that encourages employment receives considerable incentives.
Government deficits are quite high, but controls on government expenditures
are improving the situation.
B-7

The Mexican monetary unit is the peso (PS). There are one hundred
centavos to a peso. The exchange rate varies, but averages at 23 pesos perI dollar. The official exchange rate as of July 29, 1981 was 24.6 pesos to
one U.S. dollar.
The average minimum wage in 1979 was U.S.. $4.65 per day in the urban
areas and U.S. $4.23 per day in the rural areas.
B-8

11. Industry
The major industries are transportation equipment,, mining; basic metals
and related products; textiles and clothing; processing of food, beverages,
and tobacco; chemicals; and petroleum related industries. The oil and petro-
chemical industry (PEMEX) is a government-owned monopoly. The gove rnment has
large interests in several other major industrie+ as well. Manufacturing,
however, is predominantly private. The manufacturing sector contributes 28%
of the G.D.P. with a total industrial contribution of 36%.
Mexican industry is well developed in each of the four sectors (large,
medium, small-scale and artisan). In 1980, by definition,
- Large" scale industries are those employing more than 250persons and having a net worth of at least 60 millionpesos (U.S„ $2,600,000).
- Medium-scale industries are those employing 26 to 250persons having a net worth of 7 million to 60 millionpesos (U.S. $300,000 to $2,600,000).
- Small-scale industries are those emplo;., ing less than 25persons and having a net worth of 50,u00 to 7 millionpesos (U.S. $2,173 to $300,000).
- Artisans are those industries which employ five to sixpeople and have a net worth of less than 50,000 pesos(U.S. $2,173).
Small and medium size industry (SMI) is a vital component of the Mexican
economy, accounting for 45% of production and 60% of employment. SMIs are
present 'in nearly all sectors of industry, especially in food processing and
garment mal. ing.
Basel on size, small industries account for 58% of all manufacturing
enterprises and 18% of the total number employed In manufacturing. Small
industries have an average of four employees and fixed assets per employee
of $1,772 (U.S.)1
Medium industries represent only 6.5% of all manufacturers, but employ
37% of the manufacturing labor force. The average number of employees is
75 and average fixed assets per employee are $5,429 (U.S.).
1 Exchange Rate: U.S. $1.00 - 23 pesos.
•!
B-9
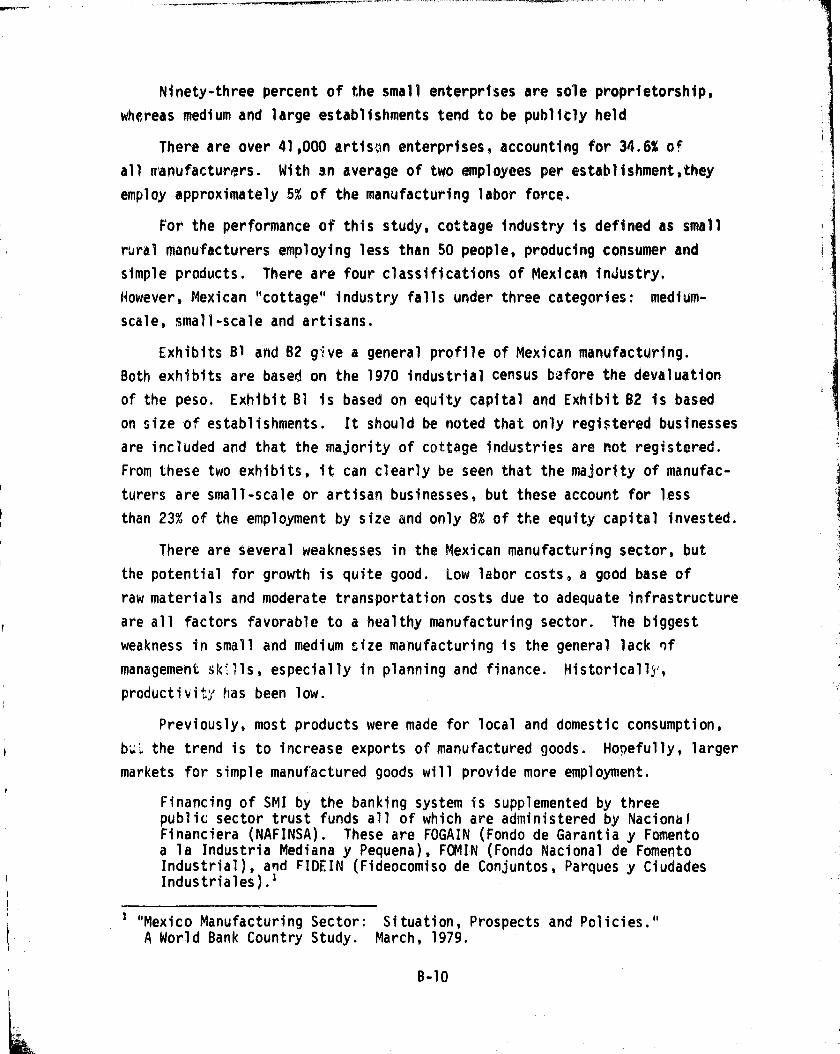
Ninety-three percent of the small enterprises are sole proprietorship,
whereas medium and large establishments tend to be publicly held.
There are over 41,000 artisan enterprises, accounting for 34.6% of
all nanufacture rs. With an average of two employees per establishment,they
employ approximately 5% of the manufacturing labor force.
For the performance of this study, cottage industry is defined as small
rural manufacturers employing less than 50 people, producing consumer and
simple products. There are four classifications of Mexican industry.
However, Mexican "cottage" 'industry falls under three categories: medium-
scale, small-scale and artisans.
Exhibits 69 and 62 give a general profile of Mexican manufacturing.
Both exhibits are based on the 1970 industrial census before the devaluation
of the peso. Exhibit Bl is based on equity capital and Exhibit 62 is based
on size of establishments. It should be noted that only registered businesses
are included and that the majority of cottage industries are not registered.
From these two exhibits, it can clearly be seen that the majority of manufac-
turers are small-scale or artisan businesses, but these account for less
than 23% of the employment by size and only 8% of the equity capital invested.
There are several weaknesses in the Mexican manufacturing sector, but
the potential for growth is quite good. Low labor costs, a good base of
raw materials and moderate transportation costs due to adequate infrastructure
are all factors favorable to a healthy manufacturing sector. The biggest
weakness in small and medium size manufacturing is the general lack 9f
management sk "Ils, especially in planning and finance. Historically,productivit has been low.
Previously, most products were made for local and domestic consumption,
the trend is to increase exports of manufactured goods. Hopefully, larger
markets for simple manufactured goods will provide more employment.
Financing of SMI by the banking system is supplemented by threepublic sector trust funds all of which are administered by NacionalFinanciera (NAFINSA). These are FOGAIN (Fondo de Garantia y Fomentoa la Industria Mediana y Pequena), FOMIN (Fondo Nacional de FomentoIndustrial), and FIDEIN (Fideocomiso de Conjuntos, Parques y CiudadesIndustriales).'
' "Mexico Manufacturing Sector: Situation, Prospects and Policies."A World Bank Country Study. March, 1979.
B-10
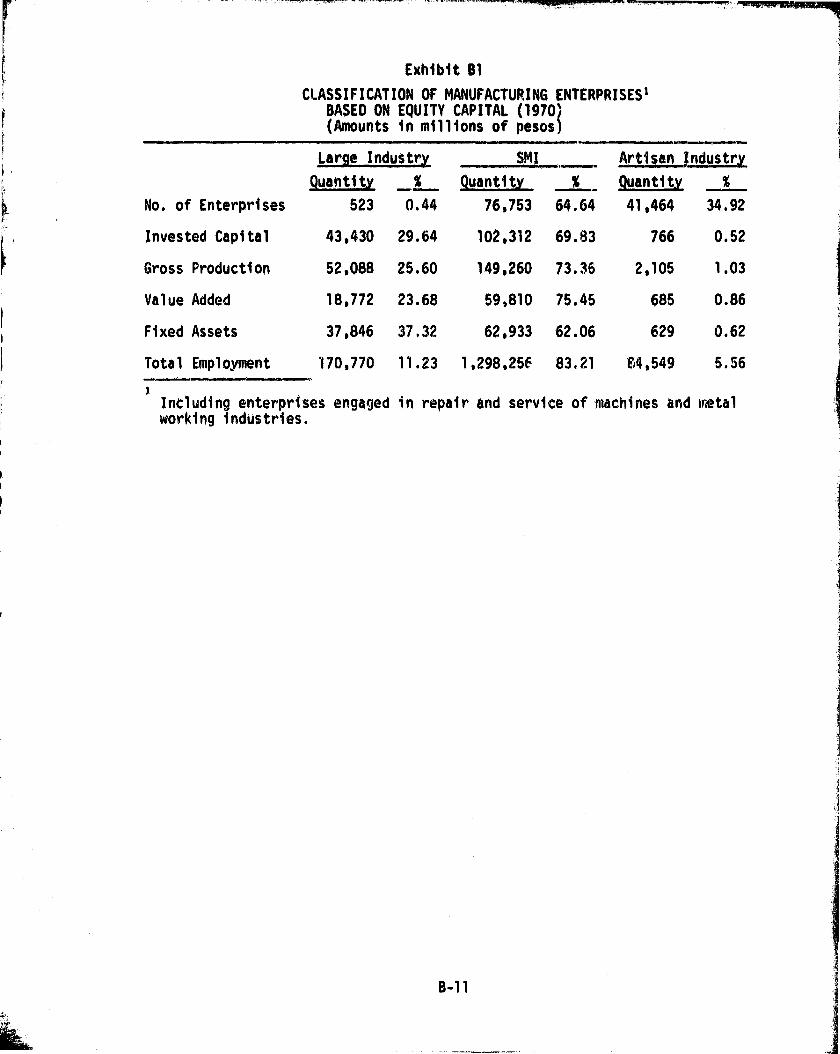
Exhibit B1
s CLASSIFICATION OF MANUFACTURING ENTERPRISES1BASED ON EQUITY
f (AmountsCAPITAL (1970
in millions of pesos
Large Indust SMI ,^. Artisan Industryuantit _ x uantlt % _ uantit
No. of Enterprises 523 0.44 76,753 64.64 41,464 34.92
_ Invested Capital 43,430 29.64 102,312 69.83 766
i
0.52
Gross Production 52,088 25.60 149,260 73.36 2,105 1.03
Value Added 18,772 23.68 59,810 75.45 685 0.86
Fixed Assets 37,846 37.32 62,933 62.06 629 0.62
^I Total Employment 170,770 11.23 1,298,256 83.21 04,549 5.56
1Including enterprises engaged in repair and service of machines and metalworking industries.
B-11
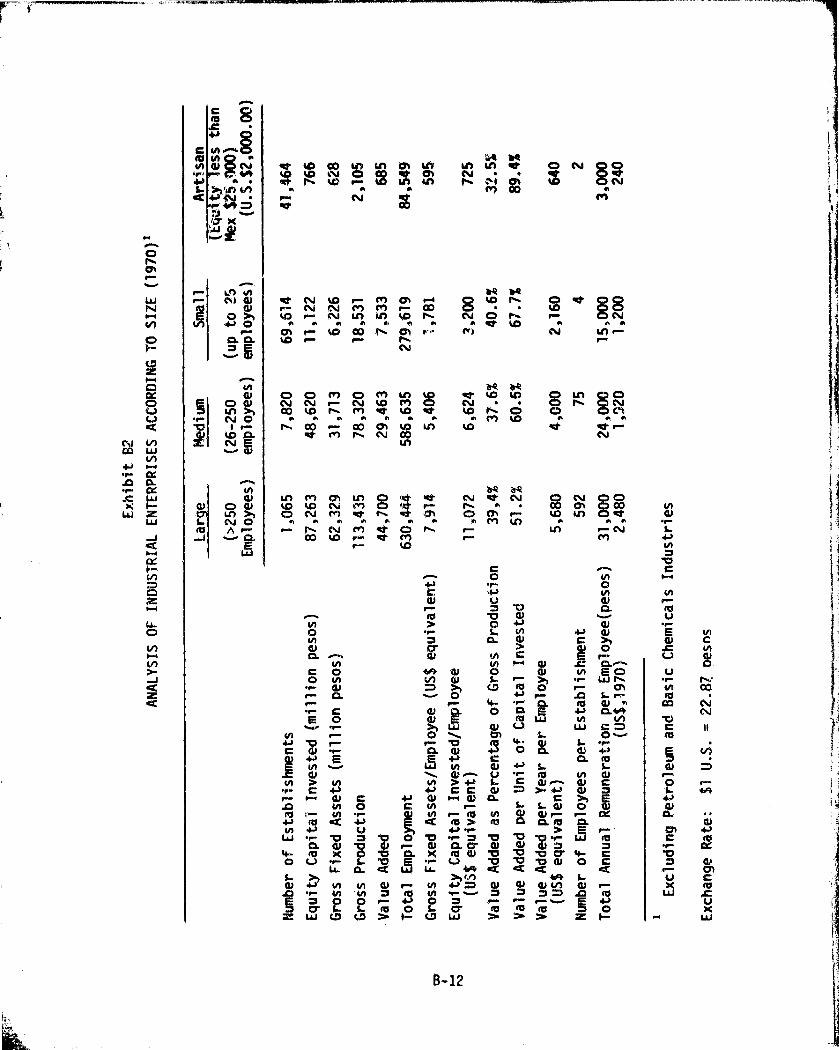
4
c ^Ire
c W+-^^w
d Mr»
Nr 401, 0
^s x1.1 w
y^ saof W 00 In 6n M Ln Ln 161 of Q N
qw1gn 1L1 ^tL^ oi l O► O N
w w w en 00 wr N Mv
r Ln ^r- ON 0 4!
^ Or^-naa F
Qi
u►4)
^ ^ ►•r N O'C 1 r
AT N 5
M^
41
1U. 0 4)L N O-ree - a
19
O
CTr-v
WN
N
O
HD
C^d
6i1 W
$8 h-1
•r LYC UJx F-LLi W
Jcc►-rIxa-1n
n
U.coN
N
J
Z
4A
4r
LO
Vc
wrreu
v
u.4A
toCID
L'ci0
41C^.
C)C
V9r-u
L
tocN
rWoo.
NN
AI
1/b
a
4k4J
cre
uxw
o " *4rte- hN9 N M M rte- co 8 ^ w 8
r N 1n kd') tc i^ N O o•-• r Nw w q w w n w w ^ ^ w a w
C3^ r 10 00 LO r-W r-- r- h r-,
N
^p i!•Q 3Q pp ©N N r N m M O N O r ONCO ^ ^ c ^ m ^ t0 Poo O O OO C8q q q q q w q q 1h t^ w q w
h CO r 00 M a Ln tD d at rst f n N n N
1k a'Q1n M m LO O kw Ole N if N Ca N O OtD 6A N ") O f*
r.- n 00 01 O 00
O 4V (Y) ef' tl. ^ Im O 0q
^-- w 11'1 O Qq P. q q q q q q M 1n q q qr n N 4h Rt O ^ r 1n r N
0o to .- cr ^ r- Mr— kc
c --^v , O of4 •r OC. +j IAre u w
a.a
A41 •0(U
c ACr
CL (A c w
t-r i-^.CA w Qa .c Cs.
c0 (AA vim) 4rei L r A 'H L5n•r 4! O ^ cs O r mr- Cl O 41 r- .0 L r-
r C 4/ r
O •r0C36 4J VI M 1NE O
>1 Al V U.1 C Ow r O \ C) 4• 4) O a.
c w or- Cl W ^ O G. 1 M1oloj
A E t5 ++ 0) a reJA ^ V1 0) 41 S L
u •rto > to W > 4J L c (Ui-. C
.--n-e 4J c +1 0) ►w 40 CS. ctBEIN O c v9 r L- L 4) C
M
N ru— • r re (A 4! 4) r- r- (Z4-1 !4^ 4 41 ^ ^S F ->- M 0 (26> CL r
W •r 'C O'C O "0 •r 7 'v 'fl 'a reC]. (U a 4) r- 4) C1 C' w 11J N O C
4- 10 X O 'a fS )C re 0) '0 T7 '0 Cr 4- r-0 U 4i CL I.L. 4A,Q K Q 4 cJ O ^
r4J d•1 N H 40 r N = W 4J 41 N 4! r
•r N (A C re w •r C O .0 reO O O r- 40 O 3 r- r r- ... 4.1
w cm c ::w h CLD W >- > >. 2C ►A-
B-12
FOGAIN is the largest organization and a viable opportunity for small
enterprises. FOMIN and FIDEIN have less resources and most of their
transactions are with medium and large industries.
Based on our in-country research, the cottage industry that would be a
potential user of photovoltaics is rural, located in a community of more
than 30 persons, is located more than seven miles from a power distribution
line, employs less than 25 people and has a total net worth of $2,000 (U.S.)
to $3,000. Therefore, all artisans and some small-scale industries would be
considered in this study.
The decision to enter a market must take into account the local business
environment for the seller, as well as the purchaser. Therefore, it is
important to note some of the intrinsic cW ,acteristics of Mexican business.
In 1960, Mexico adopted a protectionist policy -- the "Mexicanization program."
The motivation for this is to ensure that the Mexican people will participate
and benefit in their own development. The policy is designed to develop
capabilities within Mexico for greater economic independence. Basically,
the policy says that if an acceptable substitute can be manufactured in
Mexico, the product cannot be imported and the majority of a company's control
must be Mexican. Compliance with this policy is insured by requiring importlicenses, permits and levying tariffs. However, if a venture or product can
demonstrate that it is good for the general welfare of the people, the policy
is flexible and terms are negotiable.
Characteristically, Mexican business investors favor low-risk ventureswith short-term returns on investments. The usual payback for a Mexicank4isiness is a 45% to 50% return within one year. The average industrial
return is 35% to 40%. This is not unrealistic considering short-term moneyis at 30% and long-term is at 32%. Also, many investors are apprehensive of
long-term investments, such as a photovoltaic distributorship, before the
installation of the new administration in the summer of 1982.
Mexican industry tends to be highly concentrated in terms of control
and there are approximately 550 parastatal government entities. Chambers of
Commerce are very strong in Mexico and all registered busim.,,:ti ps must belong
to at least one, The chamber serves a dual purpose, as a surveilling device
for the government and as a lobbying and development device for its members.
B-13
:a
12. Government Policy on Industrial Development
Energy is perceived as Mexico's lever for development and the National
Plan for Industrial Development is very closely integrated with the National
Energy Program. Each is interdependent upon the other. The National
Industrial Development Plan covers the period from 1979 to 1982, but it
also includes long-term goals from 1982 to 1990. However, Mexico's sexennial
political cycle does not insure continuity of policy beyond 1982.
The Industrial Development Plan has three underlying m^+ivations:
- to eliminate unemployment and underemployment
- to consolidate the bases for a development process capable ofbeing self-supporting
- to guarantee at least minimum well-being to the whole population
To achieve the goals of the Plan, financial incentives are provided for
investment in industries which either provide employment, improve the
balance of payments, enhance industrial decentralization or develop specific
geographic areas.
For encouraging incentives, the country is divided into three economic
zones. New industrial activity in Zone I receives the greatest incentives.
Zone I locations are principally those related to the national distribution
network for natural gas and oil. It includes the industrial parts of
Coatzacoalcos, Tampico, Salina Cruz, and Lazaro Cardenas as well as the
corridor of land between Quer4taro and Ledn. Industries which build in
these areas receive substantial discounts on industrial energy supplies
and tax credits.
Zone II includes municipalities that are considered a priority for
development by the individual state. These also receive considerable tax
benefits for new industry.
Zone III consists of the Valley of Mexico, the Toluca Valley, Puebla
and Tlaxcala. This is divided into two areas: the central area which is
of controlled growth and within which no expansion or new investment is
encouraged, and another (a belt around this regulated space). known as the
area of consolidation, which includes all the capital cities of the states
surrounding the Federal District ( Toluca, Cuernavaca, Puebla, Tlaxcala
and Pachuca).
B-14
k
^i

The industrialization plan is flexible, but each incentive has a
targeted result. In the small business sector (those with assets of less
than $500,000), a liberal 25% investment tax credit is given for expansion
or new industry outside Mexico City. The desired result is the creation
of labor-intensive plants along the U.S.-Mexican border and the sea coasts.
These locations are ideally situated for export oriented industries, thereby
improving the balance of payments and creating employment away from the
urban areas. The major thrust of industrial development is, however,
related to and in support of the energy sector.
13. Rural Development
Mexican rural development programs strongly reflect the goals of the
National Industrial Development Plan. They stress social services, food
production, employment and availability of basic consumer goods. A major
sub-sector of the industrialization plan is the Mexican Food System. The
goals of this program are to make Mexico self-sufficient in food production
and to improve the diet of lower income groups.
Another issue addressed in the industrial plan is the manufacturing of
basic consumer goods at relatively low prices. Increased production of
simple basic consumer goods in the rural sector provides employment and
helps to offset the impact of inflation on lower income groups.
The Mexican government is very aware of the needs and importance of
its rural inhabitants. Under President Apez Portillo, eleven governmentorganizations which dealt with rural development were brought together under
one new organization - COPLAMAR. The purpose for this restructuring was 1;o
form a total iiii. grated approach to improving living conditions and to ease
poverty in the rural sector. COPLAMAR provides the fit,ances and direction,
while using other agencies to actually execute its programs. The most
prominant of these agencies is PIDER (program of public investments for
rural development). The proposed budget for COPLAMAR is more than
U.S.$4 billion over the next three years.
The rural population of Mexico is widely dispersed,both socially and
geographically, with many people being nomads and migrants. COPLAMAR's
s
B-15
strategy is to bring the isolated population together into stable communities.
To achieve this, they intend to provide them access to medical facilities,
regular food supplies and potable water. The agency also plans to build
15,000 miles of feeder roads to provide infrastructure for bringing these
people together. In 1980, the commitment to the Human Settlement Program
was 1.4% of the total federal budget.
By September 1980, the agency 1had built over 2100 rural medical units,
each capable of treating 5000 people, and 41 new hospitals in economically
depressed rural regions. Further plans include a project to build 200 large
food storage areas to serve as distribution centers for over 6000 villages.
Among other programs are a project to bring potable water to 15 million
people, another to bui'd 37 boarding schools for children from remote regions
and a project to create 300,000 new jobs in agriculture and reforestation.
In keeping with their total integrated approach, frequently light
industry will also be introduced to a new settlement to provide employment
and income. However, development of small-scale industry is not as ;high
of a priority as food and medicine and therefore would follow the provisirin
of these services.
It should be kept in mind that the lifestyle of the rural Mexicali is
deeply imbedded in his heritage and family and that change must come slowly
and without coiflict with the Mexican culture. Mexicans are a proud and
independent people. This is why participation of the local community is
so important in rural development. If the people feel they have contributed
and earned these improvements, they will utilize and maintain them.
B-16
14. Government Policy on Energy
In the management of energy, Mexico is a long-range planner. The
current national energy program sets concrete objectives to 1990, yet
maintains a horizon of reference for the year 2000. Mexico is extremely
wealthy in energy resources and, at present, its proven hydrocarbon
reserves rank it fifth in the world. The country also has large reserves
in uranium, hydropower, coal and geothermal energy.
The primary objectives of the national energy program are to ensure
an adequate supply of energy and generating capacity to support Mexican
industry, to utilize energy commodities to support an overall,balanced,
economic development and, for the very long term, to diversify their
primary sources of energy.
The strategy for achieving their objectives is two-fold. One pathway
is to stress management of their existing renewable and non-renewable
resources. Mexico, like many energy-rich countries, s considered energy
inefficient. This is illustrated by their high rate of energy consumption
per unit of Gross Domestic Product. Conservation of energy in transporta-
tion and industry could represent significant savings of valuable resources.
The other course of action is to observe world-wide technical developments
in energy production and remain scientifically at the forefront of those
technical developments. The country is currently paying very close attention
to world-wide developments in nuclear, geothermal, biomass and solar energy.
Being a key factor in Mexican economic developrment, the National Energy
Program is closely integrated with the purposes and policies of the National
Program of Employment, the Mexican Food System, and the National Plan of
Urban Development.
The program focuses on the role of energy in three areas: industrialization,
regional development and the foreign sector.
In the area of industrialization, development will be in vertical integration
of the petroleum industry and in energy intensive industries. As mentioned
in the industrial plan, there are considerable financial incentives for new
industries in regions related to energy resources, especially Chiapas and
B-17

Tabasco. Industries that are strongly encouraged include refining.
petroleum processing, and production of heavy machinery used by the energy
industry.
Politically; vertical integration of the energy business is an excellent
strategy. Currently, the largest purchaser*. of Mexico's energy commodities
are also the primary suppliers of its equipment,as well as the
o ijor processors of gas and petroleum. Develop-Ing their own capacity in
These segments will give Mexico a considerably better strategic position
in world-wide marketing of oil and natural gas.
Because of its abundant indigenous energy resources. Mexico also
perceives itself as having a competitive edge in energy intensive industries,
especially steel and transportation equipment. Utilization of their own
resources for developing these industries is an important part of the total
energy plan.
In the regional development faction of the energy plan, the goal is
to develop positive industrial centers near or along the route of energy
centers. The extraction, production and processing of hydrocarbons is
making a tremendous impact on the economy of the regions where it is located.
To avoid a "boom" and "bust" economic situation, the government is seeking
to control the amount of hydrocarbons that can be taken from a region and
to promote other industrial activity to complement energy production. The
government is also concerned with providing infrastructure, social services
and environmental protection to these areas.
The energy plan has five objectives in relation to the foreign sector.
They are:
1) Once internal demand is met, to export hydrocarbons in
balance with foreign imports.
2) To obtain a higher value added for energy exports
3) To use energy exports to diversity Mexico's foreign trade partners
4) To use energy export receipts to develop a world position in the
capital and manufactured goods market
5) To cooperate with other countries in the development of oil supply
and in the search and exploitation of local sources of energy.
B-18
E..

Controlled levels and desinations of hydrocarbon exports will be the
chief instrument for achieving these objectives.
0-19
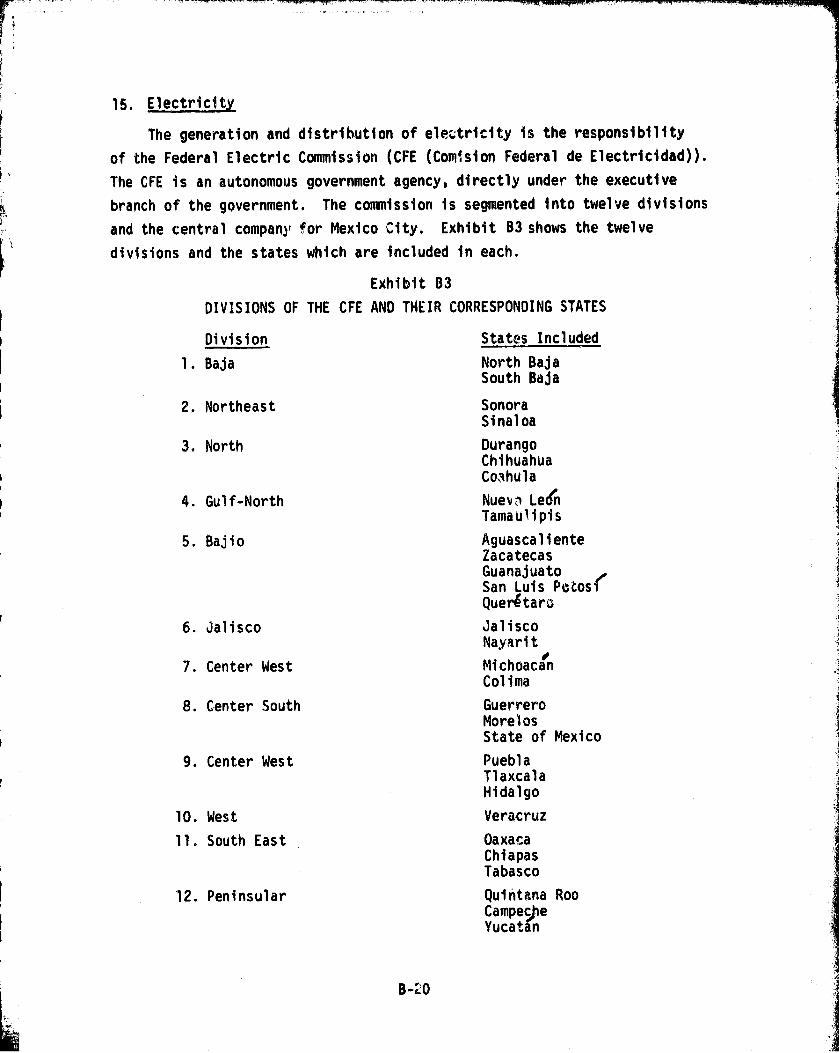
15. Electricity
The generation and distribution of electricity is the responsibility
of the Federal Electric Commission (CFE (Comision Federal de Electricidad)).
The CFE is an autonomous government agency, directly under the executive
branch of the government. The commission is segmented into twelve divisions
and the central company for Mexico City. Exhibit B3 shows the twelve
divisions and the states which are included in each.
Exhibit B3
DIVISIONS OF THE CFE AND THEIR CORRESPONDING STATES
Division States Included
1. Baja North BajaSouth Baja
2. Northeast SonoraSinaloa
3. North DurangoChihuahuaCoahula
4. Gulf-North Nueva Led'nTamaulipis
5. Bajio AguascalienteZacatecasGuanajuato
Potosi'San LuisQuer6taro
6. Jalisco JaliscoNay:ari t
7. Center West MichoacanColima
8. Center South GuerreroMorelosState of Mexico
9. Center West PueblaTlaxcalaHidalgo
10. West Veracruz
11. South East OaxacaChiapasTabasco
'12. Peninsular Quintana RooCampecpeYucatan
r
''[ r
X
^a
B-`0

The Baja region and the Yucatan peninsula each hove separate systems.
The remainder of the country is interconnected into a South System and a
North System. At present, Mexico's interconnected source capacity is
60% thermal power, 35% hydro power and the remainder is supplied by diesel
stations and geothermal plants. Exhibit B4 gives a detailed breakdown of
capacity by source and region.
Exhibit 64 A
CAPACITY IN OPERATION AS OF DECEMBER 31, 1979
(in KW)
Hydroelectric Thermoelectric TOTAL
Combined Internal GeothermalSteam Cycle Turbonas Combustion Electric TOTAL
TOTAL NATIONAL 5,218,517 6,716,375 720,000 1,259,170 733,488 150,000 14,297,550
National Electric System 5,217,017 6,135,375 720,000 1,143,170 48,152 13,263,714
Northern InterconnectedSystem 358,700 1.791,000 240,000 531,620 12,480 2,933,800
Northwest Area 327,200 811,000 106,370 1,244,570
North Area 323,000 240,000 288,250 12.480 863,730
Northeast Area 31,500 657,000 137.000 825,500
Southern InterconnectedSystem 4,858,317 4.344,375 480.000 611,550 35,672 10,329,914
Central Area 1,998,726 2,196,800 431,170 4,626,696
Western Area 320,191 992,875 82,780 17.602 1,413,448
Eastern Area 2,539,400 1,154,700 480,000 97.600 18,070 4,289,770
TiJuana - Mexicali 307,000 74,000 150,000 531,000
Peninsular 199,000 42,000 18,350 259,350
Small Independent Systems 1,500 75,000 166,986 243,486
Source; CfE of Mexico
B-21
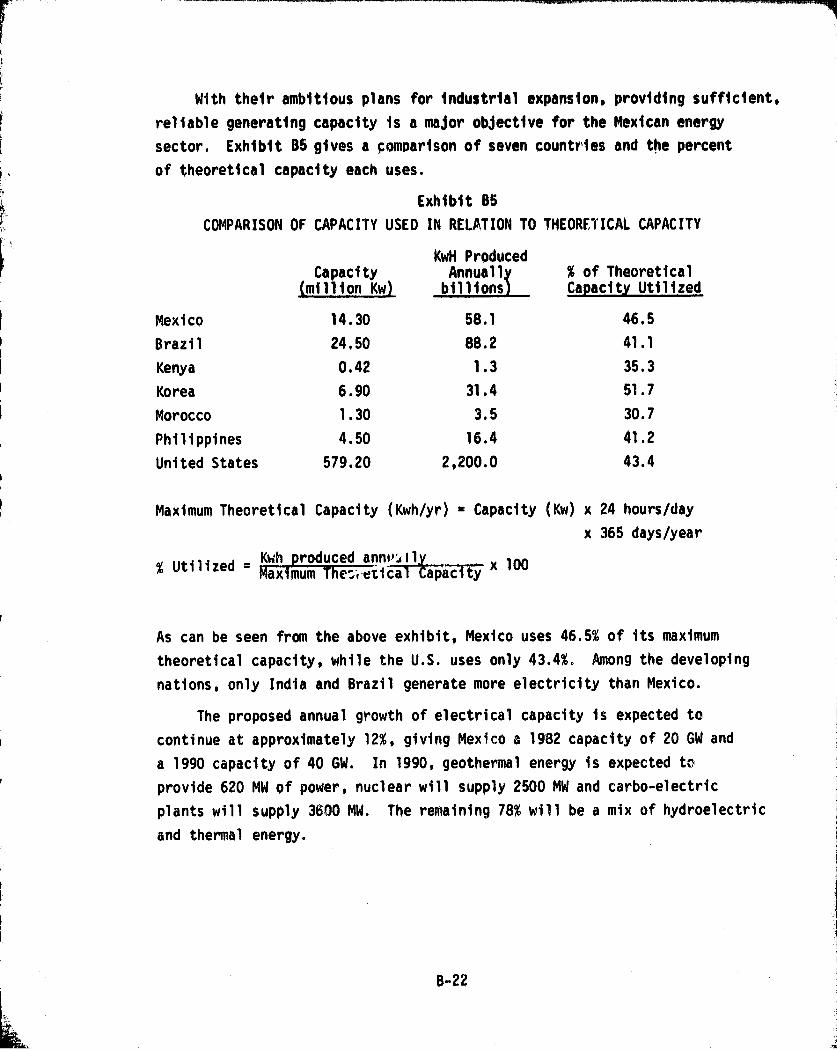
With their ambitious plans for industrial expansion, providing sufficient,
reliable generating capacity is a major objective for the Mexican energy
sector. Exhibit 65 gives a pom parison of seven countries and the percent
of theoretical capacity each uses.
+ Exhibit 65
COMPARISON OF CAPACITY USED IN RELATION TO THEORETICAL CAPACITY
KwH ProducedCapacity Annuall % of Theoretical
(million Kw) billions Capacity Utilized
Mexico 14.30 58.1 46.5
Brazil 24.50 88.2 41.1
Kenya 0 . 42 1.3 35.3
Korea 6.90 31.4 51.71
Morocco 1.30 3.5 30.7
Philippines 4.50 16.4 41.2 I
United States 579.20 2,200.0 43.4
Maximum Theoretical Capacity ( Kwh/yr) - Capacity (Kw) x 24 hours/day
x 365 days/year
% Utilized - Kcwh_p_roduced annv 11Y x 100Maximum Tier et i c a Hapa i ty
As can be seen from the above exhibit, Mexico uses 46.5% of its maximum
theoretical capacity, while the U.S. uses only 43.4%. Among the developing
nations, only India and Brazil generate more electricity than Mexico.
The proposed annual growth of electrical capacity is expected to
continue at approximately 12%, giving Mexico a 1982 capacity of 20 GW and
a 1990 capacity of 40 GW. In 1990, geothermal energy is expected to
provide 620 MW of power, nuclear will supply 2500 MW and carbo-electric
plants will supply 3600 MW. The remaining 78% will be a mix of hydroelectric
and thermal energy,
B-22

The CFE serves 20,434 towns and 85% of the total population has access
to electricity. This is not to say that they all use it. At present 61%
of the population consumes 98% of the energy for domestic purposes, the
next 11% of the population consumes 2% and 28% of the population either
has no access or does not use electricity at all. As would be expected,
the consumption of electricity reflects and rises with income levels.
Exhibit B6 gives a breakdown, by division, of the number of towns with
service, the number of users, and the total amount of energy purchased.
Exhibit B6
NUMBER OF TOWNS SERVED, NUMBER OF USERS, AND QUANTITY
OF ELECTRIC ENERGY SOLD BY DIVISION
Number of Number ofTowns with Users Energy Sold
Division Service x 1000 (million Kwh)
Baja California 219 295 1,761
Northeast 1,459 466 3,308
North 1,815 706 4,946
Northern Gulf 1,276 724 5,344
Bajio 3,204 820 4,124
Jalisco 1,267 725 2,795
Central West 1,450 462 1.,500
Central South 2,372 525 1,174
Central East 1,848 496 2,218
East 2,106 630 5,223
Southeast 2,231 477 1,155
Peninsular 650 265 870
CLFC (in liquidation) 537 2,510 14,779
TOTAL 20,434 9,101 49,197
B= 3

I'
I
The cost of electricity in Mexico varies widely. There are twelve
different rate categories based on the purpose for usage and the wattage
used. Exhibit B7 designates the various categories, the quantity of energy
sold in each category and the number of users in each category.
Exhibit 67
ELECTRIC ENERGY SOLD AND NUMBER OF USERS BY RATE CATEGORY (1979)
ElectricEnergy Sold Number of Users
Rate Category Imillion Kwh xl000Z
1. Domestic 4,896 5,068
1A. Domestic - regions withvery hot summers 4,314 7,779
2. General Usage u^ to 40 Kw 3,677 1,107
3. General Usage greater than40 Kw 1,325 11
4. Cornmeal Mills 202 33
5. Public Lighting 1,537 22
' 6. Potable Water Pumps 1,808 11
7. Temporary Usage 92 8
8. General High Tension 15,692 28
9. Agricultural Irrigation 3,328 34
10. High Tension 297 24
11. High Tension for Mining 1,235 307
12. General Usage, 5MW or more,at 66 KU or more 10,594 94
TOTAL 49,197 9,101
One of the objectives of the tariff policy is to safeguard the
purchasing power of the low-income consumer and to provide reasonable
protection to Mexican manufacturers. Small scale and artisan industries
would be included in rate number 10, of to .tension papa teventa.
B-24
16. Rural Electrification
In 1979, the population of Mexico was estimated to be 65.4 million.
Of these, 10 million people or 32% of the rural population did not have
access to electricity. In an effort to bring electricity to a greater
proportion of the rural population, a total of 9,621.5 million pesos
($418 million (U.S)) has been committed to rural electrification.
The task of electrifying rural Mexico is the responsibility of the CFE
and the agency maintains a rural electrification oYfice in Each of the
31 states. The decision to electrify an area is made by a committee within
each Mate. Each committee consists of the constitutional governor, a
representative of CFE and one or two members of the state government. Each
state has its own developmental plan. The locutions chosen for electrifica-
tion are selected on the basis of fit within that plan.
The current National Rural Electrification Plan of Mexico covers the
period from 1979 through 1982. In analyzing the need for electricity and
the population served, the plan excludes the Federal District, bA does
consider the remainder of the State of Mexico. By definition, a rural
community is one having a population of less than ten thousand people.
Within the overall plan, there are three programs:
- Electrification of Population Centers
- Electrification of Public Services
- Electrification for Production.
The objective of the program for centers of population is to provide
electricity to a larger number of persons in rural villages and fringe-
urban communities.
The prog-am for public services is a`^med at providing rural communities
with electricity for basic services and the standard necessities of life.
Things included would be lighting for training schools, medical attention
units and pumps for potable water.
The third program, Electrification for Production,is concerned wih
increasing agricultural production and creating employment. Included here
would be electrification of irrigation pumps, agroindustries and all types
of production that will utilize more manual labor. Electrification of
cottage industries would fall in this category.
B-25

l
1
The goals of the program were set based on an analysis of the demand.
Three criteria were considered:. socioeconomics, technical considerations
and investment requirements. The purpose of the socioeconomic criteria
is to select those areas for electrification that will demonstrate the
maximum social and productive impact. The technical criteria considers th*
feasibility of improving the load factor and foreseeing the growth and
development of the overall network. The third criteria, investment, require-
ments, seeks a rational financial investment to maximize usage of resources
with the least cost incurred.
Exhibit RV illustrates the structure of demand for electricity by
population, number of rural communities without access to electricity and
the number of persons living in those communities.
Exhibit 08
STRUCTURE OF R 1 4RAL DEMAND FOR ELECTRICITY
Number ofRange of Number of Rural Communities
Population Rural Communities Without Electricity
1 to 30 39,71357,176
31 to 99 16,006
100 !,D 249 16,582 13,101
250 to 499 12,150 6,667
500 to 999 7,384 2,618
1000 to 2499 4,073 548
2500 to 10 4 000 1,544 15
TOTAL 98,909 78,668
Number ofNumber of Rural Inhabitants
Rural Inhabitants Without Electricity
696,2431,786,311
1,010,626
3,212,258 2,492,759
4,857,809 2,690.631
5,696,437 2,063,046
6,920.598 1,015,229
9,039,417 89,;624
31,512,830 10,058,158
B-26
Based on an analysis of the domand, the plan segments rural Mexico
into three zonts: Electrified, Saturation and Integration. The ^clectrified
zone is bil areas which are already electrified. The Saturation zone includes
those areas within seven miles of an existing distribution line and represent
the best conditions technically and economically. This area would be electri-
fied first within each state's schedule. The remainder of the rural sector is
in the Integration zone. Areas in this gone would be electrified for two
reasons. One is if there are a large number of potential users who, through
specific projects, will cause significant growth of the network. The second
is whqre a socioeconomic analysis can justify the installation of electricity.
In cases where there is Justifiable demand, but the site is beyond seven
miles of a distribution line, an alternative power source is used. The
choice is usually a diesel generator system. However, CFE tries to ovoid
equipment alternative to the grid, since it prefers to control and maintain
operation of its own equipment. If an alternative to the grid is used, CFE
establishes and trains a committee from the town itself to care for the
facility.
It is assumed that stand-alone photovoltaic systems would have no
viable potential in areas which are readily accessible to the grid either
presently or in the future. Legally, in areas where the grid network
is available they could be used only as emergency back-up systems.
Economically, stand-alone photovoltaic systems are not cost competitive
with grid generated electricity. Therefore, potential usage would be
restricted to areas designated to he in the Integration zone.
Exhibit B9 illustrates the number of non-electrified rural communities
by each state. It also breaks out the number of rural communities of less
than thirty residents and more than thirty residents. No communities of
less than thirty inhau €ants are being considered for electrification.
Characteristically, communities of less than thirty people consist of
transient nomadic people, who do not represent a stable group. Exhibit B9
also indicates the number of communities in each state which are in the
Saturation zone and the number in the Integration zone.
B-27
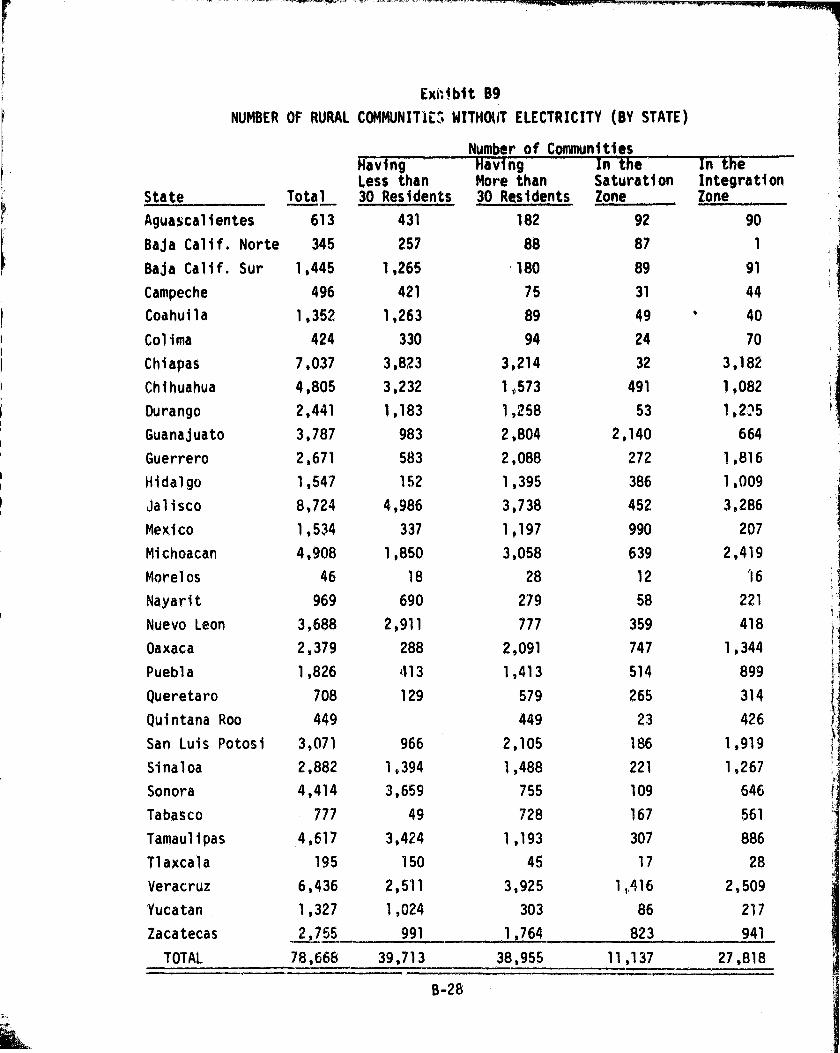
Ex0 bit B9
NUMBER OF RURAL COMMUNITIC► WITHOUT ELECTRICITY (BY STATE)
Number of CommunitiesHaving Having In the In theLess than More than Saturation Integration
State Tota l 30 Residents 30 Residents Zone Zone
Aguascalientes 613 431 182 92 90
Baja Calif. Norte 345 257 88 87 1
Baja Calif. Sur 1,445 1,265 180 89 91
Campeche 496 421 75 31 44
Coahuila 1,352 1,263 89 49 40
Colima 424 330 94 24 70
Chiapas 7,037 3,823 3,214 32 3,182
Chihuahua 4,805 3,232 1,,573 491 1,082
Durango 2,441 1,183 1,258 53 1,25
Guanajuato 3,787 983 2,804 2,140 664
Guerrero 2,671 583 2,088 272 1,816
Hidalgo 1,547 152 1,395 386 11009
Jalisco 8,724 4,986 3,738 452 3,286
Mexico 1,534 337 1,197 990 207
Michoacan 4,908 1,850 3,058 639 2,419
Morelos 46 18 28 12 '16
Nayarit 969 690 279 58 221
Nuevo Leon 3,688 2,911 777 359 418
Oaxaca 2,379 288 2,091 747 1,344
Puebla 1,826 413 1,413 514 899
Queretaro 708 129 579 265 314
Quintana Roo 449 449 23 426
San Luis Potosi 3,071 966 2,105 186 1,919
Sinaloa 2,882 1,394 1,488 221 1,267
Sonora 4,414 3,659 755 109 646
Tabasco 777 49 728 167 561Tamaulipas 4,617 3,424 1,193 307 886
Tlaxcala 195 150 45 17 28
Veracruz 6,436 2,511 3,925 11,416 2,509
Yucatan 1,327 1,024 303 86 217
Zacatecas 2,7 55 991 _1,764 823 941
TOTAL 78,668 39,713 38,955 11,137 27,818
B-28
In addition to the classification of Saturated or Integrated zone,
each stae is further categorized by the number of locations, within eachstate, that will be electrified in the near, medium, and long term.
Exhibit B10 illustrates the proposed schedule for electrifying each state.The communities which appear to represent the best opportunities for stand-alone photovoltaics would be those in the integration zone of statesscheduled for electrification in the medium and long term. These statesare illustrated in Exhibits Bll and B12 (maps). However, those communitiesin near term integration zones can also be regarded as potential opportunities.
Government efforts in the electrification of rural cottage industries
are included in the CFE program -- Electrification for Production. Theobjectives of this program are: to increase the profitability of rural
products, attain self- sufficiency in basic foods and increase rural employ-ment. The program is divided into two sectors. One, is Agricultural
Irrigation Wells and the other subsector is Rural Industries.
The total budget for the Electrification for Production Program is2,246.2 million pesos ($98 million U.S.). The agricultural irrigation phase
represents approximately 72% of the investment and will provide ',645 watering
units to irrigate 270,400 hectares of land..
The subprogram for electrification of rural industries will serve 4,705
industries and provide employment for 117,000 people. The plan calls for
1,014 industries to be electrified in 1979 with 865 kilometers of line. The
remaining 3691 industries will be electrified in the period of 1980 to 1982,
using 3008 kilometers of line. The cost is $6,000 (U.S.) per kilometer.
Four agencies will be responsible for executing the program. They
include PIDER, CONASUPO, the Secretary of Tourism and the Department of
Fisheries. The total budget for this subprogram is approximately 631 million
pesos ($27.4 million U.S.). Distributed among 4,705 industries, this gives
an average of $5,834 (U.S.) per industry. Exhibit B13 gives a summary of the
agencies involvod, the number of industries they will affect, and the
approximate amount that will be invested.
B-29

I .
EXHIBIT BID
SCHEDULE FOR ELECTRIFICATION BY STATE
(No. of Towns)
Near Term M
brie nt. oneT..
Aguascalientes 92 90
SajaCalif,Norte 87 1
BajaCalif.Sur 89 91
Campeche 31 44
Coahuila 49 40
Colima 24 70
Morelos 12 16
Nayarit 58 221
T1a,xcala 17 28
Yucatan 86 217
Nuevo Leon 359 4118
Queretaro 265 314
Quintana Roo 23 426
Sonora 109 646
Tabasco 167 561
Chihuahua 491 1082
Durango 53 1205
Hidalgo 386 1009
Mexico 990 207
Puebla 514 899
5i na 1 coa 221 1267
Tamaulipas 307 886
Zacatecas 823 941
Chiapas 32 3182
Guanajuato 2140 664
Guerrero 272 1816
Michoacan. 639 2419
Oaxaca 747 1344
SanL.ouis Potosi 186 1919
The States of Jalisco (37'8) and Veracruz (3925) are to be electrified in the
vary long term.
8-30
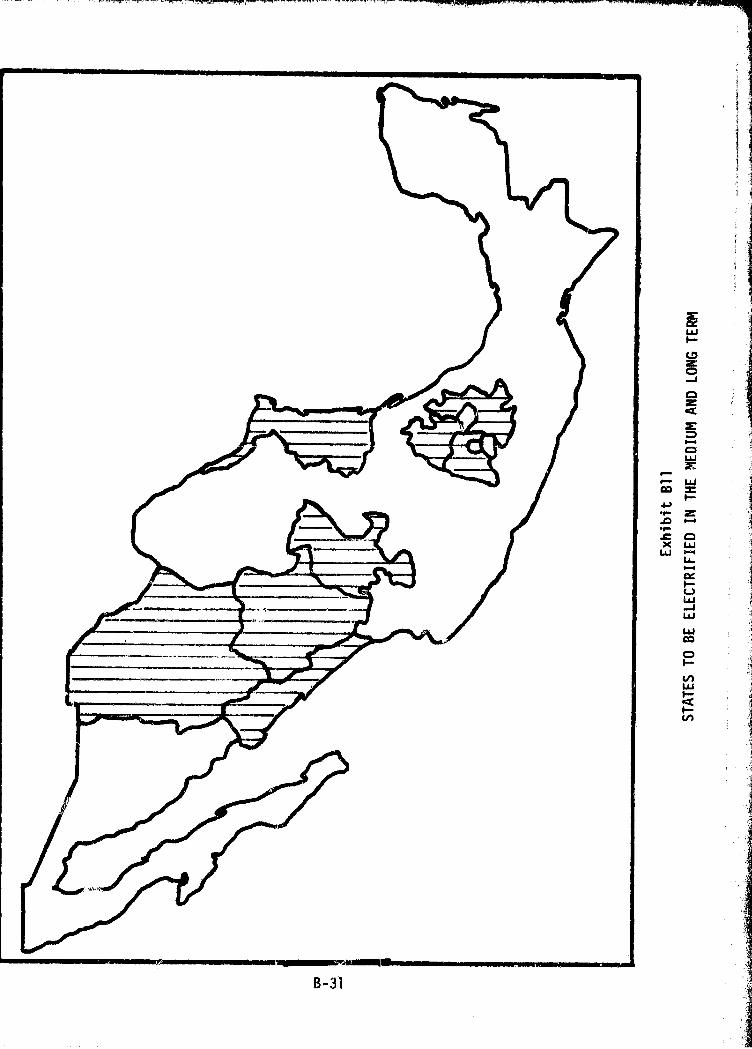
9WF--t3OJAZa
►rOW
rr- Wm =
F-•r Z
cmx WW wL1..
WJ4JujcoOF-HWF°QHN
B-31
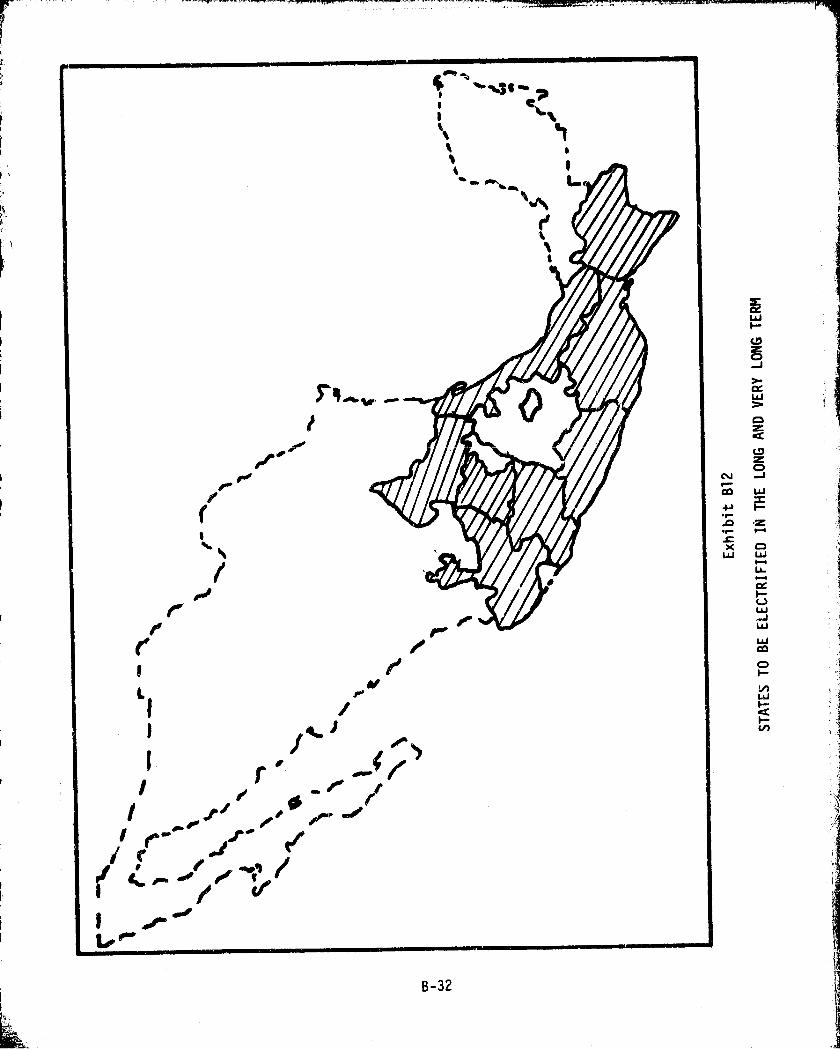
iVr-
co
sxW
1e`
aWF-
G.7ZOJ
aW}
0zac^zO
W
•Z
0W6..rLL
aUW—iLid
WCID
O
Lon
F-
LUaw
I^„ f
A'o
1
1
PrS 1-0
L'i I11 ,,
Moe
r
B-32

Exhibit B13
SUMMARY OF AGENCIES AND COMMITMENTS TO ELECTRIFICATION OF RURAL INDUSTRY
(1979 - 1982)
Tnune+man+
Number of Number of (ThousandsAge Industries Employees U.S.Dollars)
SPP
PFish Industry 1,205 30,125
ID
Rural Industry 3,030 75,750 26,000
ER
Tourist Development 366 9,150
Secretary of Tourism
1
17 405 235,000
Department of Fisheries 31 775 865,000
CONASUPO 56 845 261,000
TOTAL 4,705 117,050 27,361
' 11 Industries in Guerrero, 6 in Veracruz
Exhibit B14 gives a breakdown of the program budget for each state.
An examole of a government-sponsored rural industry is a current project
through PIDER to develop a clothing assembly business in Guerrero. The
factory will make baseball caps and employ about 100 women. The total
investment is 13 million pesos ($565,000 U.S.) This includes all plant
facilities, supplies and 60 to 80 sewing machines. The energy source had
not been chosen yet, but is anticipated to be a diesel generator, eventhough the plant site is within seven miles of an electric grid line.
B-33

wF) •T1-4 r L
to N OOet Oef 000CV CA Linn r%00 M t001K8et%000 0000 r eh0MOhOONM M 0001 ^Ot r Nrrrrr rrMhrrrr r- 01Mr-rN Vr MgeMt1'f0► J.,P^r•-NM r-r rGO CDC «-+CL
= WO F-LA-
FQ- wr• Z N eco O 10O Orr tDfe rrt0M01 01Ln tp t0 M01N r r tn NO et ONO1 tPfet01 00 in4-1 H u 0 to 01 Co O et I^ t0 CA 00 1n M et M M M t^ M N r d tC N (30 M r? et P^ 0
r r ^••r Q Q 4J r r r r r r r r r N r r-.A ^ =Z.0 U- OXLU OC G7
!- WV = fTW C wJ >- •r- 4J ON t0 M et tD to et t0 00 M m 0110 N to N M ON O M to N O t0 N et n f^ t0W m L. M 0 M Intr. MM 00001 to"CO et WMM to t0tllNetrrCA tnet0l Mtn0
O) C et MM Mr VQLn NM rr N Mln MrNM%c r•NLn M toO b
3^
QaYc.7O
t tCL 4J 4J
L ^ •rZ N fll O
O 44 +1O CO
C w w Y- O w aO b b •r •r- C +•1 O •r w
b N d O r r N f0 b N O L /0 r w 10 Or -1 •r t O to to 4-/10 t C O C O U > > O w t0 r to •r U w L•r ^- f0 0) u t-) •r O /0 u 10 U f0 fC U L •rf M O O 10 4-/ 10 U > N 10 t}) f0CN 7 0 3 J C L r L QJ 4-1 w 4-J E w O U f0 r U r r OJ U w -f 4J 06 L V+1 L > f0 .G b b 1a 1d 10 O C f0 b •r •^ .0 10 r LC b • .0 X 1p CC 10 L-
iu L.M O 4).0 1X04J O 1E0 C :J •1n0 •M M •rr-- O •= U(a f0 O 10 •rr-- N = - > > r-- l'T fC0 1U0N fJ Z f- V O co 00 2 N N V Cr F-- >- V r'3 E 9 t7 2 2 z CL Cr F- c•, V) N V f.7 O
r
LL O 4/
CDC •:vi W dV NC AOJ $ in to.,- 1r0 f0
O S t t C L V L L L t U•r 4J 11 4-1 •r 4-) b iJ 4J 41 1J f0
dO V toDC v Z m V V Z
toO
et
to
koco
laOf•-
w0w41 ac
wC 00001 ChM %0r qr040 0► t0Met r1-- r- N et rrP-to WeM NO► tf'f Nr"Nw O_ tDr 0000 1' r 000Q Le;CNt0 0 tnEP O01 OO CtC4W; %O NN MN ^ N
^pt0
^y..M C;
p^..M^>r f ^ 0 t0 t0^ et CA et Net f^ et t0 N OMOONNtoN
C rE
N
NN
wa,9LAC9 Oet tn ^ CDWN vs0%toet 0.O P\ f, cttOetMetf\ 00 000 M t0N
r40 N ^ Nf-fN et e Nt et fn N MNet N N Nett) M M00toNr- r NN Mwt^W
O
r
B-34

i
i
17. Mexican Cottage Industry
The key to successfully doing business in Mexico is to understand the
cultural environment of the Mexican people. The Mexican today is characteris-
tically, patriotic and proud and the spirit of reformation prevails. The
influence of the Aztec civilization still remains, but the arts tend to
depict social issues rather than the spiritual.
17.1 Historical Background
Cottage industries tend to reflect the material culture of a people.
Mexiro has one of the most highly developed cottage industry sectors in the
world with many unique characteristics. In order to fully appreciate Mexican
cottage industry as it exists today, one must consider its origins and the
historical background in which it developed. There are, basically, three
distinct periods: pre-Colombian, colonial and post-revolutionary.
The roots of Mexican culture began in the Mayan civilization of the
fourth century. The Mayans were a highly advanced civilization whose demise
remains a mystery today. They were followed by the Toltecs who settled the
Valley of Mexico, present day Mexico City, and then by the Chicimec peoples.
In the twelfth century, the Aztecs conquered the Valley of Mexico and formed
an empire. `the Aztecs were a highly developed civilization. They practiced
trade, had a thriving economy and a deep appreciation of the arts. They
were highly skilled at weaving, crafting gold and silver, and sculpture.
Even today Aztec figures and designs are eA,ily distinguishable. Religionwas also an important part of the Aztec life. They worshiped many gods,
were ritualistic and practiced human sacrifice.
A turning point in Mexican history is April, 1519 when the Spanish
explorer, Hernan Cortes, landed at Veracruz. By 1522, Cortes had conquered
the Aztecs and instituted the Spanish baronial land grant system, thereby
creating individual fiefdoms for his fellow conquistadores.
Two important changes then occurred. One was the concentration and
relocation of the Indian population to serve as feudal labor. The other
was the migration of the Spaniards toward the southern region of
Coatzacoalcos and to the north in search of gold. Hence, settlements
B-35
began as mining camps and grew to market centers. At this point a social
stratification began to emerge. The highest class was the Iberian-born,
then the native-born "Criollas" of Spanish descent. The next class was the
I "Mestizo" or those of mixed Spanish and Indian blood. Then came the pure
F
blooded Indian. The lowest class was the Negro, imported to work as slaves.
These separations of class, coupled with the Spanish attitude of manual
labor symbolizing servility, was an important factor in the evolution of
.Mexican cottage industry.i g y
A third major instrument for resettlement was through the establishment
of Jesuit and Franciscan missions.
During the 11th century, the Roman Catholic Church was the wealthiest
corporation in Mexico, especially the Jesuit sector. They became the major
financial lending agency and, through foreclosures, obtained nearly fifty
percent of the land by the late 1800s. More importantly, the Jesuits
introduced new technology and organization among the Indians in both
agricultural production and manufacturing. One notable example is that of
Bishop Don Vasco de Quiroga who developed a strong cottage industry sector
based on the existing Indian culture in the State of Michoacan. Even
today, this region has the largest concentration and the widest variety of
cottage industries in Mexico.
In general, cottage industry processes in those regions settled by the
clergy are quite distinct from those used by either the feudal trained labor
or the pure Indian craftsmen. To a careful observer, the distinction is
also visible in the final product.
The traditional Indian craftsman uses the same techniques and processes
as did his ancestors in pre-Col ymbian times. Today, these techniques are
still used in the States of Chiapas, Oaxaca and Guerrero.
The Spanish bureaucratic system also had a strong influence on the
evolution of cottage industry. The Spanish ruled Mexico through a viceroy,
provincial governors and judicial magistrates or mayors. These were all
Iberian born. However, each town or city had a council of native-born
Mexicans. The council was an oligarchy who survived using graft and
nepotism. It was through the town councils that the European guild system
was instituted. This meant that if a craftsman was not a member of a guild,
B-36

he was barred from the craft. The guild system greatly hindered the
development of cottage industry and stifled the processes which were
indigenous to the people. In regions where the guild system flourished,the characteristics of the cottage industries mirror those used in Spain
during the pre-Columbian period. A good example of this can be seen in
the pottery industry of Puebla.
The campaign for Mexican independence began in the early 1800s.
Discontent among the people arose in two forms: social and economic. One
faction was the democratic idealists who sought social reform from the
feudal landlords. The other was the Mexican elite who sought independence
from colonial Spanish government and the Spanish mercantile monopolies.
In 1808, upon Napoleon's occupation of Spain, the Mexican Indians rose up
against the ruling Spanish class. It took another hundred years of reforma-
tion, culminated in the Revolution of 1910, to rid Mexico of the Spanish
bureaucracy. In 1917, the Mexican Constitution was adopted and still
provides the framework for today's government.
Out of the revolution rose the "Mestizo Spirit". The post-revolutionary
government sought to give the Mexican a sense of national identity through
the glorification of their Indian ancestry. Social stratification was
changed in that, those of mixed blood were considered racially superior and
the overall standard of living was raised through organized labor, agrarian
reform and public education. From this spirit comes the extraordinary sense
of patriotism and Mexican pride which is characteristic of the people today.
Rural development has been a goal for fifty years and will continue to be
a high priority of the Mexican government.
The revolution had a tremendous impact on cottage industry, as well,
because it encouraged production and development of Mexican handicrafts
and folk art goods. Prior to the revolution Mexican cottage industries
had produced only utilitarian goods for rural and rural-oriented communities.
In the post-revolutionary period, national pride created a greater market
for products indigenous to the Mexican culture. The development of handi-
craft and folk art industries was further sparked by an impressive and
influential handicraft exhibit held in Mexico City in 1921. The response
B-37
V
of the urban upper classes marked an important stop in bringing national
and international recognition of the cultural and socioeconomic importance
of rural cottage industry.
In other parts of Latin America, such recognition did not take place
until the mid-1950s. The early recognition of Mexico as a handicraft
producer was extremely important to its entering tourist and export
► ^ markets.
17.2 Contemporary Cottage Industry
As is true the world over, the rural cottage industries of Mexico
both respond to and reflect the needs of the rural cultura and population.
Where the needs and culture of the people have remained traditional, the
cottage industries have also remained unchanged. In areas where high
technology and methods of intensive agriculture have bfian applied, cottage
industries have adapted to meet the changing needs.
Cottage industries are either culturally oriented or based on available
raw materials. Industries which are culturally oriented produce festival
and ceremonial accessories. Usually, one village will produce goods for
the entire region. A village having a festival products industry would
make musical instruments, fireworks, ex-votive offerings, piwatas and similar
products. A village engaged in making ceremonial accessories would produce
masks, canes, dolls and items used in folk dances. Religious and folk
festivals are considered a social and cultural obligation and purchases for
such events are frequently the single largest expenditure a family will
make at any given time over the year.
Most cottage industries are based on the raw materials available within
the region. In Mexico, these include C*Imay, basic minerals, animal fibers,
vegetable fibers, wood and, to a lesser extent, metals. The major industries
that are raw material based include lumbering, pottery, copper forging,
silversmithing, furniture making, fishmeal production, grain milling, tanning
and tilemaking.
The use of many raw materials is controlled by the government and there
are quite a few " illegal cottage industries". The authorities tolerate this
B-38
i^
to some extent as long as the effect is negligible. An example is cutting
one tree a month to support local housing construction versus 15 trees a
month to support a smell scale lumber mill.
The goods produced by Mexican cottage industries are primarily
utilitarian and produced for local and regional consumers. The most prevalent
cottage industry,in both rural and urban Mexico,is pottery making, which
employs the largest number of artisans.
Pottery making utilizes a vast number of methods and technologies of
both hispanic and indigenous origins. Most of contemporary rural cottage
industry combines elements of both Hispano-Moorish and indigenous influence,
giving Mexican cottage industry and its products a distinctive national
character. In the urban production centers, pottery making applies such
contemporary techniques as high temperature gas and electric kilns and
electric potter's wheels. However, within the rural regions traditional
technologies still predominate. Products made by potters include vessels
for storing food and water and tableware.
Weaving is the second most predominant cottage industry in rural Mexico.
It, too, uses only traditional technologies. Wool is the usual raw material.
Weavers produce clothing and blankets. Basket industries produce mats,
ornaments, straw figures, hats and, more importantly, shelter contruction
and baskets for harvesting, transporting and storing field crops. Wood-
working is an important industry. Its products include spoons, scoops,
tools, ox yokes, handles, bowls, crates, statuary, furniture and carpentry
products, such as doors and window frames. Grinding mills are a basic
utilitarian industry. They produce mainly cornmeal and fishmeal.
Simple and utilitarian goods are made in the rural sector for local
and regional purchasers. A rural cottage industry region is usually found
around a moderately sized city which will have a large central popular
market. Examples can be seen in cities such as Uruapan, Morelia, Quiroga,
Patzcuaro and Oaxaca. The central city market is an important trading and
distribution center. It serves not only as an outlet for rural products,
but also as a source of urban produced supplies. The principal products
B-39

being supplied to the rural region are those made by blacksmiths, tanneries
and confection industries. They include products such as metal spurs,
stirrups and bits, hardware, leather shoe stirrups, machetes, rope, saddlesand drygoods.
Mexico has a unique system of production ,in which there is a chain of
value adding processes from village to village. This can best be under-
stood through an example. A copper pitcher may have its origin in a veryremote village. Originally, it is a piece of barely formed metal which is
sold to another village, The metal workers there will pound it out into a
normal spouted shape. It is then sold to another village, closer to the
city, where it is polished and cleaned. It will then go to an wrban or
fringe-urban artisan who adds a handle and sells it in the central market.
A similar case can be seen in furniture. Rurally produced chain-s are very
crude, but they are channeled from village to village with each place adding
more detail until finally a well-crafted product reaches the urban market.
This system is quite unique. Frequently, the entire cottage industry sector
of a village will specialize in that village's pose of production.
Through this chain of production, rural Mexican industry has found a
means to simulate factory assembly production. It has been an important
factor in competing with goods from Asia in the international market.
Unfortunately, this system of production also presents a significant barrier
to adopting new technology. By introducing a new method or technology early
in the chain the effect would be felt in several villages. It is highly
likely that by helping the originating industries, actual unemployment could
be created for those further down the cycle.
The typical rural cottage industry will either be in the home or in a
small shop. The owner is the manager and usually the principal worker. The
establishment is a sole proprietorship. Common production facilities are
not shared. The production facility is usually rudimentary and serves only
as basic shelter. Characteristically, the shop layout is very inefficient
and the comfort and safety of the workers are seldom considered.
Few, if any production needs, such as tools, are purchased outside the
community. Rural cottage industry production is cyclic in direct relation
B-40

w4th the agricultural cycle and the seasonal avaitrbility of raw materials
Is an important consideration for the rural entrepreneur.
17.3 Fit With The Rural Economy
According to the National Fund for Handicraft Promotion (FONART), an
estimated 1.2 million heads of households are engaged in full-time cottage
industries and employ an average of five workers per establishment. This
gives a total of .six million people employed in cottage industry, or nearly
10% of the total population. However, the majority of workers participate
on a part-time or seasonal basis. This is especially true for women, who
work at cottage industry production between household activities.
There is no hard, reliable data on the exact income derived from
cottage industry, but, at full employment levels, a typical producer earns
an estimated 25 to 50 pesos per day or 1 to 2 U.S. dollars. The highly
productive industries served by FONART earn a family income of 450 to 1500
pesos per month or i to 3 U.S. dollars per day. However, the average for
the total rural sector would be much iwer, and, lower still, in highly
remote regions.
According to 1977 estimates, in villages with populations of less than
2,500, less than 21% of households had a total family income which equalled
the minimum wage of 123 pesos per day (U.S, $5.35). Furthermore, 45% of
the households derived, from all sources, a total income below one-half
of the minimum wage or 61.5 pesos (U.S. $2.67)„(1)
While rural cottage industry is insignificant in terms of GNP or balance
of trade payments, it plays an increasingly important social and economic
role at the +tillage and regional level with important implications at the
national level.
For the fifty percent of the farm population that is either landless
or underemployed, cottage industry production offers the only alternative
to migrant employment: For the many subsistence farmers, cottage industry
provides the only incomie t o meet their needs for purchasing food not produced
on the farm plot, clothing, and the mean, to meet the expenses of cultural
obliqations.
Source. M"nist,;Vof Programming and Budget, Mexico
r—
B -41
The average assets of a rural cottage industry range between 2000 and
3000 U.S. dollars and all earnings are viewed as personal income. Theworkers are usually members of the family and are seldom paid. The primary
objective of the rural producer is not necessarily to increase his income,
but to provide employment for as many members of his family as possible.
Cottage industry production, unlike many types of large scale rural
industry, does not create more Jobs in the metropolitan centers than within
the rural region itself, thus cottage industry development provides a viable
deterent to migration. As demonstrated in the case of Puerto Rico .wring
the 1950s, many industries which are implanted into the rural region
actually encourage immigratior, into the larger cities. Cottage industry in
rural Mexico is playing a small, yet important role towards achievement of
national goals to deter immigration to the already overcrowded urban
centers of Mexico.
Cottage industry also plays an important role in establishing the
linkages with government institutions which enable the fostering of further
development within the village. Much of the infrastructure anI public
services projects which have been implemented over the years have been
directly related to existing cottage industry or the potential for cottage
industry production.
If a rural producer is entrepreneurial and wishes to expand or modernize
his business, the opportunities for borrowing capital are very limited.
Options would include commercial banks, FOGAIN (Fund for she Guaranty and
Development of Small and Medium Industry, a patron, the Rural Development
Bank, a cooperative purchase and the Fund for Artisans. Commercial banks
and FOGAIN will work only with registered businesses, which most cottage
industries are not. Short-term commercial loans are for up to one year at
30% annual interest. Long-term leans are for seven to eight years with a
fluctuating interest rate. The current rate is 32%. The Rural Development
Bank finances only government sponsored projects and the Fund for Artisans
has very little money. The most feasible alternative for the rural producer
is to find a wealthy patron or for several families to purchase capital
equipment together.
B-42
I;
However, in adapting a view technology, the question of affordability
goes beyond capital financing. In the city, a rural immigrant "earns as
he learns" a new skill through on the Job training. To learn a new skill
or apply new processes and equipment to rural production, the artisan would
have to dirupt production long enough to master the new technology. In
many cases, this could represent a sacrifice of the total annual family
income. This is a cost that no rural artisan can afford and a disruption
0 supply that the local region could III adapt to.
18. Government Interest In Solar/Photovoltaics
To quote directly from the Mexican National Energy Plan,
It is necessary to guarantee a trustworthy and economical supply ofelectric energy in rural areas. It will allow increasing farming andanimal husbandry production by increasing the water pumping capacityfor irrigation, encouraging the development of small industries andcommercial establishments, increasing, therefore, the Job possibilitiesin those areas. In the same way it will help satisfy minimum standardsof well-being of groups up ;o now marginal, by extending electricalservice to isolated communities. The attainment of these objectivessupposes rationalizing the programs of rural electrification andgiving them greater support, in accordance with the directives of theMexican Food System.
With the technological characteristics of the modern electrical systems,a greater degree of decentralization is needed. Very often tothe reduced quantity in local consumptions, it is not economic%+' , t)extend the national distribution networks to isolated communities.Therefore, the programs must be directed to the application of tech-nologies on a small scale, s°aita,ble for the countryside. This meansmaking a greater effort of developing, adapting and publicizing thosetechnologic!-s. Among them the Installation of electric, micro-centersand making use of solar energy for heating water for domestic usesand for production, as well as for drying farm and animal produce,stand out.
From this, it can be clearly seen that the Mexican government is highly
aware of the potentials for solar energy in rural electrification. However,
the plan also clearly sta gs that the widespread use of solar energy, in
any form, is for the long term. Long term is interpreted to be beyond 1990.
For whe near and medium term, "its contribution to the energy balance will
be nominal." (1)
(1) Mexican National Energy Program, paragraph 122; November, 1980.
B-43

In keeping with their strategy to observe the world-wide technical
development in energy and to remain at the forefront of those technologies,
Mexico is exerting a considerable effort in the research and development
of solar energy, although the work is somewhat fragmented between academic
and public works agencies. To a large extent, they look to solar work in
the U.S. as a base for their own development.
18.1 A cademic Sector
Solar research work is done by the academic sector. The principal
institutes are CONACYT (National Council for Science and Technology), IPN
(National Polytechnic University), UNAM ( National Autonomous University of
Mexico), Monterey Technical University, and IIE ( Institute of Electric
Research).
The IIE_ functions similar'iy to the Electric Power Research Institute
in the U . S. Funding for the IIE comes from CFE and federal government.
The Institute has a staff of 16 working in solar energy. Eight are in
biogas and wind research and eight are in power plants, central receivers
and photovoltaics. Their interest in photovoltaics is for rural electri-
fication. Currently, all t-,eir work with photovoltaics is in system
analysis and central receiver power stations. Projects proposed that would
utilize only solar sources for electrifying rural communities have not been
funded.
Photovoltaics are not considered the best choice for rural electrification
because:
1) They do not increase the use of local labor for operation andinstallation.
2) Electrical problems are beyond the average rural dweller's skill.
3) They are not the most cost-effective means of providing electricity.
CONACYT is the national science council for Mexico. Their solar
mission is to maintain scientific awareness of sola r technology and its
potential applications. The total 1980 budget for solar research is
$4 million (U.S.), over 90% of which is slated foi photovoltaic research.
The Council feels, of all forms of solar energy, photovoltaics is the most
promising, but nct within the next ten years.
B-44
,•• .^*::rend,y^,,Wh^u`tSiNC`^v^nm,xa,.sy.:ro-w c .............
-.- ,.. e,- y _.. ,. „^+.—..,.^T-a'Tm^.r^'.. -m^5pr^s+SS.:IIR +ns^.-r*/e?B'F*P+"!^'
amx,. ..#, ^ t , i. .z ...
Rer ,mtly, the agency ;performed a cost-benefit analysis of alternative
energy systems for powering agricultural irrigation pumps. The alternatives
considered were: grid extension, photovoltaics, wind, diesel generators,
and gas generators. Diesel generators v,ere the optimum choice.
Regarding the rural cottage industry actor, especially remote locations,
the Council has several studies that show that introducing electricity has
no significant impact.
The I?N is concerned with basic research of photovol taic cell production.
It is their desire to develop a domestic cell production capability in
Mexico. All of the work, to date, has been at a pilot and laboratory
level. The Institute has applied to the Federal Government for funds to
build a photovoltaic cell factory capable of 60 Kw per day. Their strategy
for obtaining funds has been 'to stress nationalism and independence from
foreign business in Mexico..
Many sources feel it is unlikely that the project will be fully funded.
Nevertheless, the production capability and technology is still being
developed.
18.2 Public Work Sector
The development and implementation of solar energy is delegated to the
various agencies for public works. The principal agencies involved are
SAHOP (Secretary of Human Settlements and Public Works), DIGAASES (General
Management for Saline Water and Solar Energy Development) COPLAMAR and
PIDER. Other agencies that have some involvement in electrifying rural
cottage industries are FONART, CFF and the Mexican Development Foundation.
CFE uses grid extension or, in very rare cases, diese l generators. They
do not, at present, use solar. FONART and the Mexican Development
Foundation are interested in the potentials of photovoltaics, but do not
have any plans to utilize it in the next two years. These agencies also
have very little funds available and would require that an energy supply
be an appropriate technology.
PIDER would be the agency most likely to fund a project for rural
electrification. They would also provide the necessary technical and
B-45

B-46
educational support for implementing a rural development project. At
present, they ha ys only one project to utilize solar energy and it provides
domestic hot water to a residence. In choosing equipment for the rural
sector, cost and upkeep are the criteria. The product must be the most
cost-effective, easily maintainable and provide good, long-term service.
The primary interest in photovoltaics lies with the Ministry of
Education. In a period of three to four years, the Ministry hopes to
buy 50,000 package systems to provide basic needs for rural villages with
populations of 500 or less. These packages include lighting for a
hospital, a telex or radio-telephone and an educational television. The
estimatkR l cost of these systems would be PS $70,000 to PS $100,000
(U.S. $1143 to $4,348).
The energy source would be either photovoltaics or wind. Wind is
appropriate in many areas of Mexico, especially in the coastal regions.
These systems would probably have 'Lo be imported in order to obtain the
quality ;necessary.
Photovoltaics would be obtained from the optimum source. Because of
the large volume, a price break would be expected.
The financing of these purchases would be through an international
source, such as UNESCO, who would grant a low rate (preferential rate)
for a long-term.
Other government projects under consideration include a project to
insta'i1 1000 rural telephone stations and another project to build
64 ports, 80 km apart starting at Baja, California. Photovoltaics could
be the potential energy source in either of these projects.
It should be noted that these are long term proposals that may not be
acted upon in the next federal administration,
t
. m a, _ ....... __. .

19. Photovoltaics - Current Commercial Activities
The photovoltaic industry of Mexico is at the beginning stage of its
development. Currently, there are seven photovoltaic manufacturers
represented. They include:
- Solar Power, Distributed by Productos de Lorain de Mexico
- Applied Solar Eriergy, Distributed by SOLVIMEX- S/,larex, Represented through Electrotec-nica Medica
- Philips, Formerly represented by Grupa del Sol, S.C.
- Motorola
- Arco-Solar, Represented through PRECENCO
- A. E. G. Telefunken
The majority of these companies have been in the Mexican market for one
to two years and, at present, none can be considered a clear market leader.
Although each company has adopted a unique penetration strategy, several
generalities and market characteristics can be seen.
First, consider the actual photovoltaic: product. Reliability of the
cells and strength of the panel itself are absolutely essential and can
serve: as a competitive strength for some manufacturers. Another important
factor is the quanti' that can be supplied within a desired time. If a
decision were made to use photovoltaics, fcr a major development program, the
quantity of cells that could be supplied in a reasonable time period would
be a k y factor for the government agency in choosing thc, photovoltaic
supplier. Another significant characteristic of the Mexican market is its
preference for turnkey systems and total photovoltaic packages. It is
reasonable to assume that this same preference would be seen in serving the
cottage industry sector.
The Mexican government is perceived as the primary market. Hence, the
point of sale will be Mexico City and the purchaser will be extremely
knowledgeable of the product. The rural private sector is considered a
potential second-ry market. Sales would be through one of several rural
distribution networks already established which sell light industrialequipment and hardware.
B-47
The form of business strategy most businesses have taken is in three
phases. Phase one is to direct import through an agent or subsidiary who
also provides the necessary peripheral equipment, such as inverters,
batteries and control devices. The second phase of their strategy is to
assemble the panel in Mexico. The third phase is the actual production of
cells in Mexico, although this will require approval of the government.
Sales strategies range from mere response to requests for quotations
to holding seminars and participating in trade shows. Brand name identity
is important, especially since the purctt.aier is usual v well-informed.
Cost is a major factor and strong p,,-ice competition can be anticipated.
Any large purchaser will expect a significant price break for quantity.
Companies which sell total systems and peripheral equipment have greater
flexibility for price negotiation and the type and size of equipment used.
Transportation cost may also impact the price and a company's production
strategy.
Import fees and taxes can represent a significant portion of the cost.
Photovoltaic cells, unmounted, are registered as Brussels Tariff Number
85.21 A-12. The tariff rate is ten percent. If the cells i,re. mounted, they
are considered an apparatus and the tariff will vary according to the intended
usage. In either case, there is an additional ten to fifteen percent fee
for custom rights and another ten percent IVA (value added tax). If the
r^at.e were 10/10/10, this would add an additional 33% to the selling prices.
At present, the primary market for photovoltaics is in the field of
telecommunications, especially microwave repeater systems. Also included
are rural television, rural telephones, maritime signals, navigational aids
and railroad signals. A viable market can also be seen in cathodic protection.
Here the customer would be PEMEX, the national petroleum company. Social
service packages, water pumps for irrigation and solar toys may also have
future potential. Fisheries have been suggested, but thermal collectors
have been demonstrated to be cheaper.
B-48

20. The Potential Market
As illustrated in Exhibit, B8, according to CFE, 10,058,158 rural
inhabitants living in "x, ,668 locations have no access to electricity. Of
these 39,713 have populations of less than 30 people. These are usually
migrant people and are not considered a stable community. It is also highly
unlikely that an established, stable cottage industry would be found in this
sector. These communities are not being considered for electrification
within the national plan and are unlikely to be a market for stand-alone
photovoltaic systems. This leaves a remainder of 38,955 rural communities
with a population of more than 30 persons.
As previously mentioned, CFE has classified all communities into one
of three zones: electrified, saturated or integrated, A community in the
electrified zone is one already served by CFE. The saturated zone is com-
prised of communities which are near the existing network lines and represent
the best technical and economic conditions for extending the grid network.
Obviously, these zones would not be a potential market for stand-alone
photovoltaic systems. The remaining areas are in t. , ' integration zone. These
would be the last areas to be electrified within each state's respective
schedule. The potential for stand -alone photovoltaics would lie in communi-ties in the integration zone. Of the 38,955 rural communities with 30 ormore persons, 27,818 are in the integration zone and 11,137 are in the
saturation zone.
In oree, ,.o determine the population this represents, it is assumedthat all communities of 500 or more are in the saturation zone, or 3,181 com-
munities with a total population of 3,167,899. This leaves 35,774 communities
with a population range of 30 to 399 residents. The total population for
this sector is 6,194,016. Assuming the population number in each zone of
this range to be normally distributed, 27,818 communities are 78% of the
communities or a population of 4,830,000. Refer to Exhibit 815.
B-49
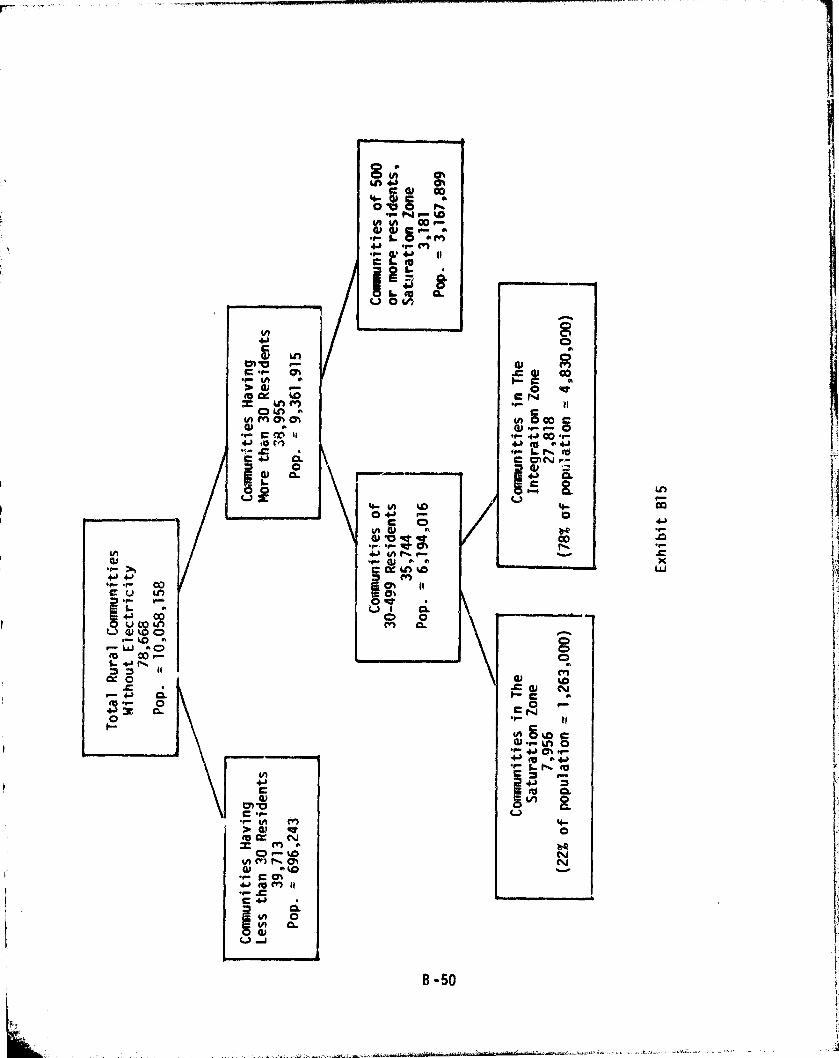
84Ln41 a coo,09•... w towco—
VVL
v o^
IAidc(La
vlMC -r-
IA a
tw wz Ln MoU')0 M M M
•r C !b ^^
+^ •O M•'tom
Co
0I-V jp
$n
4AidC
C•r Vt M> 41 ofcc GC N
PO r- 10
(A M ^ Im4! w 1O
•r- C Oli•)w1'1 ii•r .0C
QN L^ aV J
0
W i
Co.V v
c N•r H
^•^0•r d, 00 •r^► fp aidC C) N
41 CLCM-0
4-
0
trQ0nv
80
aron
c Nc10 r
'r tl
Ln 0i•► M -r-
44
A/Y
U4-0
NNv
4!
4J 4J'r •r W
G E.! td^
r• 1C00
'"-
^ 11cc o^^ a
.o •- oo 3t d.
H
4- w 10
c ow 4! n
id of P^ r-+p. 4) a n^^ 11
v ^i a
cn a°
Ln
mi,
rX
W
B-50
^ L"
FONART estimates that 10% of the general population is engaged in
cottage industry with approximately five employees per industry. Therefore,
the number of potential cottage industries would be
4,830,000 residents x 10% n 483,000 persons engaged in rural cottaa industry(with no access to electricity;
483,000 + 5 employees- 96,600 industriesi ndustry
If the energy requirement of the average cottage industry is taken to be
1.5 horsepower (hp), this is equivalent to 2KWp per industry.
1.5 hp x 745 watts - 1118 watts x 8 hrs - 8940 watt-hrs_dip' ^'ay day
1 Wp produces 4,5 watt-hrs.Fa y-
8940 watt-hr 4.5 - 1987 Wp or 2 KWp per i ndustry
Of the 96,600 cottage industries with no access to the electric power network,
assume that 25% could utilize electric power. Therefore,
96,600 x 25% - 24,150 potential industries
24,150 potential industries x 2 KWp per industry - 48,300 Up or 48.3 MW of
photovoltaics
The quantity 48.3 MW represents the totr.i potential application of
photovoltaics in the remote, rural cottage, industry sector. However, in
penetrating any market there are barriers and constraints to be considered,
as well as an appreciation of the competitive product.
8-51

21. Summary of the Site Visits to the State of Michoacan
The mountain and lake region of the State of Michoacan was selected
for site visits for this study because it presented an opportunity to observe
a large variety of cottage industries which are typical to many rural regions
in Mexico. Michoacan also allowed the observation of cottage industries
under a variety of conditions within both private and institutional structures
as related to cottage industry at both the regional and local level.
The rural population of Mexico is widely dispersed and, in general,
neither the high concentration of cottage industry nor the ease of accessi-
bility to the sites visited are typical of rural Mexico. A more typical
region is the State of Chiapas which represents 11% of non-electrified ruralMexico. However, during an eight day field investigation of potential
applications for Stand-Alone Photovoltaic Systems by the CIEA-IPN, the
expedition failed to observe a single cottage industry.
Michoacan offered two viewpoints. the non-electrified potential usersand the impact on cottage industry after electrification. It was essential
for the field trip to gather broad observations in order oot to exclude
potentials which might exisi; within non-electrified Mexico. In addition
it was important to view the impact on ,Ottage industry after electrification
and also the relationships between non-electrified and electrified rural areas.
The major irindings of the field investigation were:
Zl' Confirmation of the inadequacies in, and highly misleading natureof official data available on rural industries in general and specificallyconcerning the non-electrified rural areas. The industrial census of 1975,
for example, would have one believe that less than 50,000 cottage industries
exist in all Mexico as compared to unofficial estimates of 1.5 to 2 millionsuch industries. In the specific case of Santa Clara del Cobre, the indus-
trial census lists this urban center of 25,000 inhabitants as possessing one
fruit crate factory employing over 400 workers. Such a factory is listed
according to the census as a large-scale industry. A site vi.-it to Santa
Clara del Cobre revealed that no such large-scale factory exists, but ratherapproximately 400 small cottage industries were producing fruit crates on an
individual small scale. Interviews with State and regional authorities
B-52
m
confirmed that this practice of grouping small cottage industries to appear
as one large industry was common practice, although such methodology is not
apparent to the casual observer of official data. It was further revealed
that the census rarely went beyond small urban centers and that almost no
reliable statistics are gathered in the rural area even for what is
referred to as the rural industries census.
The most accurate information was found to be provided by those
institutions and branches of institutions which maintained direct linkages
with the rural area. These organizations, however, rarely publi,h their
't unofficial estimates which generally provide a more realistic view of
cottage industry in rural Mexico than official statistics.
(2) Rural electrification does not stimulate adoption of electrical
technology by traditional cottage industry. This fact, which is known to
be true in most regions of the world and assumed to be true in Mexico, was
confirmed for all traditional cottage industries observed on the field trip
and by interviews with leading authorities on traditional cottage industry.
Observations were made of non-traditional and modern cottage industry
adapting electrical technologies. However, all such cases were observed
within urban centers of populations over 10,000 inhabitants or in specific
fringe urban industries with their basic linkages to urban rather Than rural
community needs.
(3) Photovoltaics do not represent a substitute alternative ta,, diesel
generators. It was observed and confirmed through interviews that diesel
generators are not commonly utilized by rural cottage industry„ but rather
that they are employed as a source of backup energy supply by industries
located within the electrical grid.. Generators are utilized by some fringe
urban industry, agro-industry and, very occasionally cottage industry, but
not to any significant extent within non-electrified rural villages of
under 2500 inhabitants. This finding is considered to be country-specific
to Mexico due to official definitions of "rural" and the extent of the rural
electrification grid in Mexico.
(4) Observation of the highly sophisticated linkages between rural and
urban cottage industry processes: The impact of Hispanic culture on cottage
industry entrepreneurship results not only in the tendancy for cottage
r-
industry to be organized as a family enterprise, but also as a very
independent and self-sufficient enterprise which resists cooperative
production ventures. Often in order to maintain the indepemdence of the
productive unit or in order to fuirther its best interests, specialization
in a cooperative production process may occur. This is not considered to
be unusual in other Latin American countries, but the degree of sophistica-
tion of this system, as observed in Michoacan, had not been anticipated.
Especially in the wood products industry, it was found to be quite common
for a network of individual cotta9v industries to specialize in one specific
process in the chain of processes leading to the production of a specific
final product. This network of cottage industries was found to stretch from
village to village in the rural area and then to a series of urban cottage
industries where the product was finally finished and marketed. This
finding could point to potential application of electrification of the rural
industry in cases where the next higher link in the process chain currently
utilizes or might adapt electrical technologies. In other words, electric
technologies may 'transfer bask along the process chain from more advanced
urban cottag*4 industries to the less advanced rural cottage iridustries.
Exhibit B16 is a summary of the sites visited and their related
industries.
B-5a

Town
MORELIA
QUIROGA
TZIN TZUN TZAN
PATZCUARO
Exhibit B16
SITES VISITED IN THE STATE OF MICHOACAN
Population, Tuspes of Industry Connents
- Various Seat of State Government
50 0000 Wood Products, Furniture Market Center
6,000 Pottery, Wheat Straw Electrified, but UsedProducts, Furniture Only for Lighting
50,000- Wool, Lacquerware, Extension of Other Rural60,000 Furniture, Weaving Industries
25,000 Copper Products, ElectrifiedFruit Crate Parts,Fine Furniture
100 Pottery, Straw Products lion-Electrified -
VILLA ESCALANTE ORSANTA CLARA
VILLA LAZARO CARDFNAS
TOCUARO
350 Ceremonial Accessories
PATAMBICHO 1,500 Sandstone Ornaments
TINGAMBATO 81000 Crate Manufacturing,Meal Grinder, Carpentry
IHUATZIU 3,000 Tuli (Rush Reed)Products
SAN ASRIA 20000 Fishmeal
URUAPAN Large City Terraao Manufacturer
Immigrants from TainTxun Ttan
Electrified, but Usedfor Lights Only
Electrified, but They►Sse No Electricity inIndustry
Electrified
Fisihing ►►illage,Electrified, but UsedOnly for Lights
Non-Electrified (but OnLine) Used Diesel forEquipment and Lights
Electrified, FringeUrban „"Industry
B-55
J.

r-
LIST OF ORGANIZATIONS C014TACTED IN MEXICO CITY
AMERICAN CHAMBER OF COMMERCE OF MEXICOLucerne 78, 30 FloorMexico 6, D. F. 905/566-08-66
Lic. John Bruton, Executive Vice-PresidentLic. Jesus Rosales B., Subdirecte-e of Commercial InformationEster HovocampRosio Sponholtz
BANAMEXMarro 21 30 piso
i* n Schwedel
BANCOMER
Roger Johnston
905/585-0066
CALENTA DORES SOLARES DE MORELIA S.A.(Private flat plate solar heater manufacturing)Morelia, Michoacan 3-0968
Lic, Ignacio Torres, President
CIEA-IPN CENTRO DE INVESTIGACION Y DE ESTUDIOS AVANZADOS DELINSTITUTO POLITECNICO NACIONAL(Center of Research and Advactced Studies of the National Polytechnical Institute)Apartaoo Postal 14740Mexico 14, D. F. 754-0200 ext. 189 or 207
Dr. Juan Luis Del Valle, Principal Researcher
COMISION FEDERAL DE ELECTRICIDAD (Federal Electricity Commission)rerencia de DistribucionRio Rodano No. 14-3er PisoMexico 5, D. F. (905) 553-65-96 - 553-71-31
Ing, Jorge Gutierrez Vera, General ManagerSr. Navaraez, 17 Elba, Mexico 5, D. F.Jose Luis Aburto Avila - Leibnitz 14, 3er Piso,Mexico 5, D.F. 011
CONACYTConseJo National de Ciencia y TecnoloisNational Council for Science b TechnologyInsurgentes Sur 1677Mexico 20, D.F. 905/524-09-87
Dr. Ignacio Gutierrez Arce, Adjunct Director of Technical DevelopmentUbg, Agystub Sabcgez Vazqyez, Chief
ext. 2030
525 553 70617133 x 2767
B-56
DIGAASESuiRECCION GENERAL DE APPROVECHAMIENTO DE AGUAS SALINAS Y
ENERGIA SOLARGeneral Management for Saline Water & Solar Energy Develop.
Bulevar Pipila No. 1Tecamachalco Presa San JoaquinMexico 10, D. F. 011 525 589-0166
Javier Ibarra Herrera, Director General
ESCUELA ARTESANAL DE SANTA CLARA DEL COME(Vocational Craft School of Santa Clard del Cobre)Santa Clara del Cobre, SN. Michoacan
Sr. Jesus F. Perez Ornelas, Copper Master (Federal)
ESCUELA NACIONAL DE ARTESANIAS(National School of Crafts)
Casa del Artesono,Morelia, Michoacan
Sr. Raul Arrollo, Capuca Group Manager
FAIRBANKS-MORSE ( Manufacturio)1338 Cuauhtemoc 2 0 pisoMexico 13, D. F. 905/559-12-33
Lic. Marico GasqueInc. Enrique Vega
FDM - FUNDACION DE DESARROLLO MEXICANOMexican Development Foundation)venida Ejersito Nacional 599 - 12 piso Mexico 5, P. F. 531-8518
Lic. Humberto Marrero, Executive Director
FOGAINNational Financiera, S. A.Fondo de garantia y fomento a la industria mediana y pequanaDinaira rca No. 84, 2 0 pisoMexico 6, D. F. 905 592-02-99
Lic.. Rafael Molina Zaldivar, General Credit Manager
Lic. Eutimio Tobsr, Director - Portal Matamores 70, Morelia, Michoacan2.-1841
FONARTE - FONDO NACIONAL PARA EL FOMENTO DE LAS ARTESANIAS(National Fund for Fostering Cottage Industry)Avenuda Patriotism 691Mexico 19, D. F. Mexico 563-8840
Lic. Alberto Dias de Cossio G.':;°P)ajal, Technical Director
B-57
f
GRUPO DEL SOL, S. C.Costa 209Colonia Las AguilosMexico 20, D. F.
Roberto J. Martin
IGSAPaseo de la Reforma 5287Mexico 10, D. F.
Sr. Orazca, General Sales Manager
INSTITUTO DE INVESTIGOCIONES ELECTRICASInterior Internado Palmira, A Postal 475Cuernavaca, MorelosMexico
905/511-8050
4-21-71 Telex: 0178351
M. en C. Ana MartinezDr. Eduardo Gleason Garcia, InvestigadorDr. Pablo Mulas del bozo, Director do la Division
INTERMARK DE MEXICO, S. A DE C. U.Fuente de pegaso no. 34Lamas de TecamachdcoMexico 10, D. F. 905/294-13-33
Patrick F. Kavanagh, Dir. General , President
INSTITUTO DE INVESTIGACIONES ELECTRICAS (IIE)Interior Internado PalmiraApartado Postal Num. 475Cuernavaca, Mor. - Mexico
Dpto Fuentes no ConvencionalesDiv. Fuentes de Energia 4-13-51 Directo
6 4-14-33, 4-21-47 ext. 31
Or, Eduardo Gleason Garcis, InvestigadorDr. Pablo Mulas del Poxo, Director de la Division
NAFINSA PIN - NATIONAL FINANCERA S. A. - PROGRAMA DE APOYOINTEGRAL A LA INDUSTRIA PEQUENA Y MEDIANA(National Finance S. A. - Program of Integrated Support to Small & Medium industry)Portal Matamores 70, Morelia, Michoacan 2-1835
Ing, Humberto Gonzalez Ramirez, Industrial Extensionist
PIDERIzazaga 38, 20 piso
905/585-5077 ext. 249
Srta Kim ConroyLic. Guillermo Saenz
B-58

SAHOPSECRETARIA DE ASENTAMIENTOS HUMANOS Y OBRAS PUBLICASBoulevard Pipila No. 1TecamachalcoMexico 10, D. F. 905/589-40-11
Lic. Jose Fco. Rios Coello, Subdirector of Studies and Programs
SECRETARIA DE FOMENTO INDUSTRIAL(State Secretary of Industrial Development)Avenida Lazaro Cardenas 1677-3 pisoMorelia, Michoacan 24800
Dr. Alberto Alcara Iatimirano, Chief Economist
SECRETARIA DE FOMENTO RURAL(State Secretary of Rural Development)Guilermo Preto 57Morelia, Michoacan
Ing. Tomas Torres Mdgana, Director of Agroindustry
SECRETARIA DE PROGAMACION Y PRESUPUESTO(State Secretary of Planning and Budget)PolacioMorelia, Michoacan 2-4446
Information Desk Officer
SECRETARIA DE PATRIMONICO Y FOMENTO INDUSTRIAL (SPFI)Insurgentes sur 552 80 piso
Mexico 7, D. F. 905/564-8000General directorate of foreign investment & technology transfer
Lic. Hector Hernandez Vinas, Chief -Dept. of Statistical Analysis 584-83-38Lic. Abreu Abreu, 26 Hermosilla 50 piso Mexico 7. D. F.
SECRETARIAT OF COMMERCEDirector General of Control of Foreign TradeCuauhtemoc No. 80Planta Baja 578-8029
V. A. Mawr^o Antonio Guzman Orozco, Chief, Dept. of "orientacion y dificion"
SOLVIMEX, S. A.Paseo de la Reforma 5287Mexico 10, D. F.A.D. 82-011
Rosanna Aldarao, Administrator of SalesMario Sanchez Miles
905.510-35-88 Tx 1776360
570-04-25
B-59
W
TOUCHE ROSS INTL.Galaz, Carstens, fhavero, Yamazaki y Cia.Lagrange 103Mexico 10, 0. F.
Lic. Javier Labrador
TRADEMEX IMPORTACION - EXPORTACIONPaseo de la Reforma 95-601Mexico 4, D. F.
In San Diego
Ing. Alejandro Portillo de la LamaIng. Jose Lasa
U.S. TRADE CENTERApartado PostalM-2805Mexico City 1, D. F.
James L. Blow, Director
905/395-0455 ext 147 Telex 1771621 ATRIME
535-6047714-421-6338
905/573-1659
B-60

C. 'MOROCCO
PREFACE
This report is a profile of Morocco in the context of photovoltaic
systems, with a specific focus on cottage industry applications. Unlike
the companion reports on the Philippines and Mexico, this study was made
on the basis of secondary information only and without travel to the country.
This clearly limits the depth and breadth of information which can be
evaluated relevant to photovoltaic systems and cottage industries. It also
removes the possibility of recommending key individuals and organizations,
whose interest and awareness of photovoltaics and U.S. manufacturers would
have otherwise been stimulated through personal contact by the study team.
At the same time, this report intentionally does not elaborate in great
detail on all of the issues which would influence a market development or
joint venture investment in Morocco (such as "Moroccanization", tax incen-
tives, tax requirements). These issues are well documented in the list of
references included in this report.
Despite the somewhat limited utility of secondary research, it is
valuable in achieving the broader objectives of the program, to develop this
profile of Morocco. Each country is unique in terms of business infrastruc-
ture, cotta ge industries, and the potential for photovoltaic systems.
Nevertheless, each major region of the world also represents a unique set
of conditions and potentials. As a result of prior analysis and review, it
has been determined that Morocco offers a reasonable focus for evaluating
the problems and opportunities for photovoltaic systems applications to
cottage industries in the North Africa/Mideast region.
1. OVERVIEW
The Kingdom of Morocco is located at the northwestern edge of Africa,
in an area frequently referred to as the Maghrib. The 490,200 sq. km of land
borders Algeria, Western Sahara, the Mediterranean Sea and the Atlantic Ocean.
The Strait of Gibraltar separates the country from Spain and provides the
gateway to the Mediterranean. Refer to the map on the following page.
tr
F;
C-1
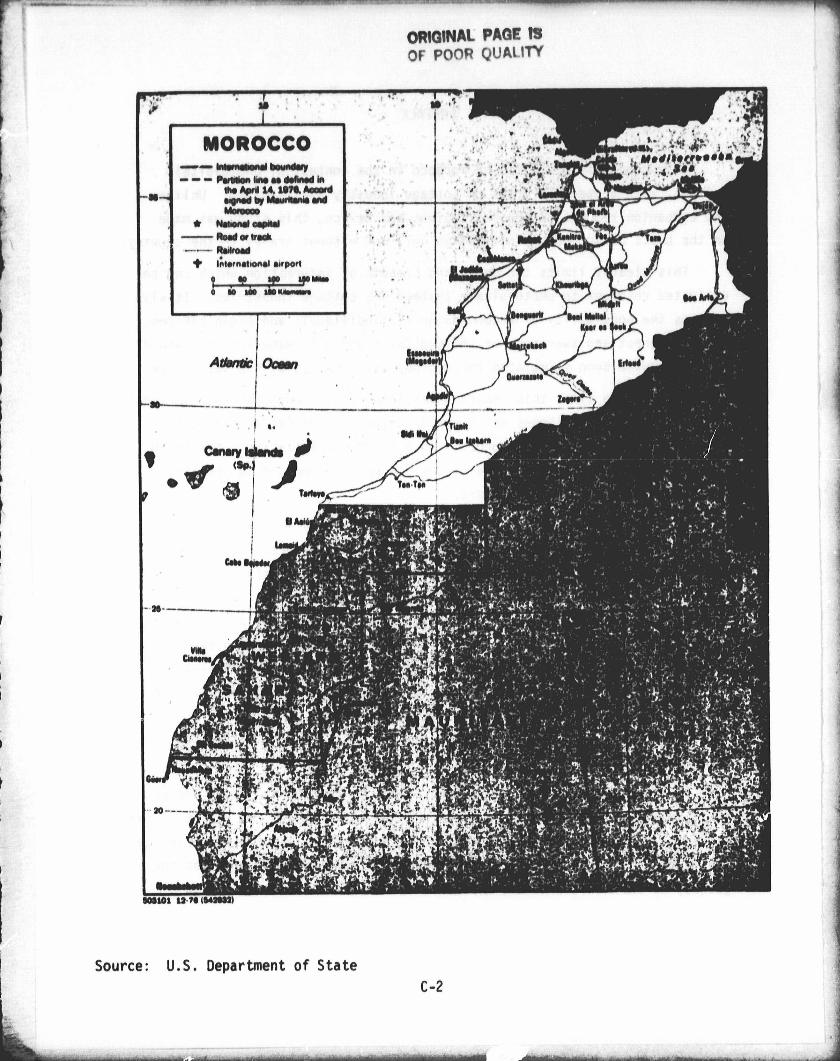
Department of State
ORIGINAL PAGE ISOF POOR QUALITY
C-2
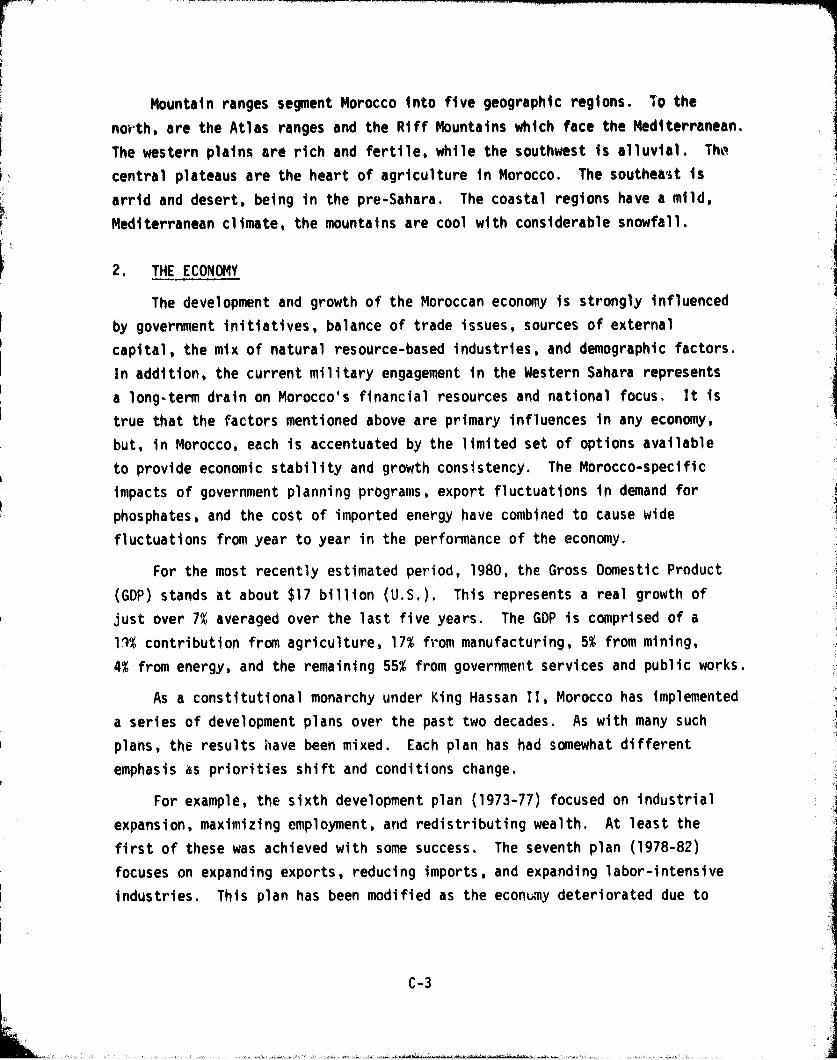
r
t;.6
Mountain ranges segment Morocco into five geographic regions. To thei
north, are the Atlas ranges and the Riff Mountains which face the Mediterranean.
The western plains are rich and fertile, while the southwest is alluvial. The
I.
central plateaus are the heart of agriculture in Morocco. The southeast is
arrid and desert, being in the pre-Sahara. The coastal regions have a mild,
Mediterranean climate, the mountains are cool with considerable snowfall.
2. THE ECONOMY
The development and growth of the Moroccan economy is strongly influenced
by government initiatives, balance of trade issues, sources of external
capital, the mix of natural resource-based industries, and demographic factors.
In addition, the current military engagement in the Western Sahara represents
a long-term drain on Morocco's financial resources and national focus. It is
true that the factors mentioned above are primary influences in any economy,
but, in Morocco, each is accentuated by the limited set of options available
to provide economic stability and growth consistency. The Morocco-specific
impacts of government planning programs, export fluctuations in demand for
phosphates, and the cost of imported energy have combined to cause wide
fluctuations from year to year in the performance of the economy.
For the most recently estimated period, 1980, the Gross Domestic Product
(GDP) stands at about $17 billion (U.S.). This represents a real growth of
just over 7% averaged over the last five years. The GDP is comprised of a
19% contribution from agriculture, 17% from manufacturing, 5% from mining,
4% from energy, and the remaining 55% from government services and public works.
As a constitutional monarchy under King Hassan II, Morocco has implemented
a series of development plans over the past two decades. As with many such
plans, the results have been mixed. Each plan has had somewhat different
emphasis as priorities shift and conditions change.
For example, the sixth development plan (1973-77) focused on industrial
expansion, maximizing employment, and redistributing wealth. At least the
first of these was achieved with some success. The seventh plan (1978-82)
focuses on expanding exports, reducing imports, and expanding labor-intensive
industries. This plan has been modified as the econLhny deteriorated due to
C-3
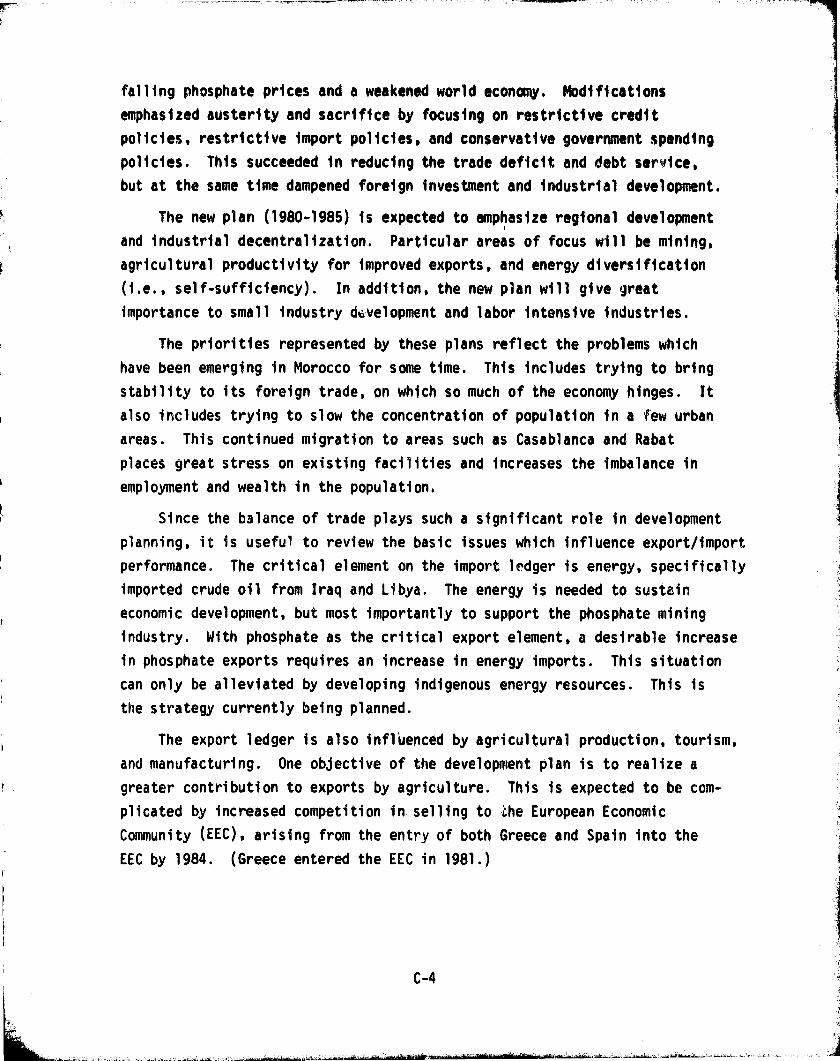
falling phosphate prices and a weakened world economy. Modificationsemphasized austerity and sacrifice by focusing on restrictive credit
policies, restrictive import policies, and conservative government spending
policies. This succeeded in reducing the trade deficit and debt service,but at the same time dampened foreign investment and industrial development.
The new plan (1980-1985) is expected to emphasize regional development
and industrial decentralization. Particular areas of focus will be mining,
agricultural productivity for improved exports, and energy diversification
(i.e., self-sufficiency). In addition, the new plan will give great
importance to small industry development and labor intensive industries.
The priorities represented by these plans reflect the problems which
have been emerging in Morocco for some time. This includes trying to bringstability to its foreign trade, on which so much of the economy hinges. It
also includes trying to slow the concentration of population in a few urbanareas. This continued migration to areas such as Casablanca and Rabat
places great stress on existing facilities and increases the imbalance in
employment and wealth in the population.
Since the balance of trade plays such a significant rote in development
planning, it is useful to review the basic issues which influence export/import
performance. The critical element on the import ledger is energy, specificallyimported crude oil from Iraq and Libya. The energy is needed to sustain
economic development, but most importantly to support the phosphate mining
industry. With phosphate as the critical export element, a desirable increase
in phosphate exports requires an increase in energy imports. This situation
can only be alleviated by developing indigenous energy resources. This is
the strategy currently being planned.
The export ledger is also influenced by agricultural production, tourism,
and manufacturing. One objective of the development plan is to realize a
greater contribution to exports by agriculture. This is expected to be com-
plicated by increased competition in selling to the European Economic
Community (EEC), arising from the entry of both Greece and Spain into the
EEC by 1984. (Greece entered the EEC in 1981.)
C-4

A second broad objective is to displace imported manufactured goods
through a greater emphasis on local manufacturing. This has tempered the
"Morrocanization" policy by encouraging foreign firms to establish manufacturing
facilities in Morocco, whether for sale to the Moroccan market or for export
from Morocco. Extra investment incentives are offered for establishing
facilities in the less developed regions. This will be further encouraged
by investing in development of the infrastructure (roads, telecommunications,
electric power) to better serve the less developed areas.
Morocco is in the fortunate position of being granted a $1.1 billion
stand-by credit for three years by the International Monetary Fund. This
is intended to help cover the balance of payment deficits. At the same time,
Morocco has been given $3 discounts on every barrel of oil purchased from
Iraq, which supplies most of Mororrr's oil. Financing for such purposes has
also been generous. It is also expected that Morocco will be assisted in
its rural electrification efforts throu^h the participation of the World Bank.
3. INDUSTRIAL PRODUCTION
The Moroccan economy, as mentioned previously, is supported by four major
industries: agriculture, minerals, manufacturing, and tourism. The first
three sectors in particular play a critical role in improving the livelihood
of the population, and in providing the opportunity for improving the export
performance of the Country. The major characteristics and forces of change
for the three sectors are described in the following paragraphs.
3.1 Agriculture
Agriculture and related activities support more than 50% of the working
population, about 2.5 million people. Approximately one-third of domestic
requirements are satisfied by current agricultural production. The remaining
two-thirds, primarily in the form of wheat and sugar, is imported.
Fish, fruit, vegetables, grain and wool are the primary agricultural
resources. Twelve percent of the land is forested and represents a significant
industry, wholly owned by the state. Production of vegetables, citrus fruits,
and fish contribute 33% to the export trade of Morocco. Much of this is
C-5l
t

I_17`
derived from modern farms which represLl:nt the most productive agricultural
real estate. The output capacity of the millions of small traditional farms +''
is only sufficient to serve local, indigenous food needs.
Moroccan government and rural development planners (e.g., at the World
Bank) recognize that the agriculture production potential is considerably
underdeveloped. Through investment in irrigation projects,and training
programs, the stability and level of production are expected to be enhanced.
This will help to further improve the export trade and reduce dependence on
imports as well. Examples of the types of agricultural operations in Morocco
include 8000 small flour mills, 8000 commercial vegetable farms, and 150 small
fish canneries.
3.2 Minerals
The most significant mineral resource in Morocco is phosphate. Deposits
of this mineral in Morocco are estimated at three-fourths of the world
reserves. The phosphate rock mining industry employs approximately 21,000
people. Iron ore, anthracite, copper, zinc and lead are also present in
substantial quantities. Phosphate offers the potential of providing Morocco
with long term economic leverage in world markets. Short tern supply/demand
conditions, however, do not provide an encouraging balance of trade situation.
This situation is exacerbated by the increasingly high cost of and demand
for crude oil imports.
3.3 Manufacturing
Manufacturing in Morocco, as in most countries of this region, is
characterized by both large modern operations and small-scale traditional
artisan, handicraft, and other activities. Manufacturing employs about
20% of the labor force. Modern operations employ about 250,000 and represent
60% of production by value. Traditional operations employ as many as
150,000 and represent 40% of production by value.
The primary manufacturing sectors are food and beverage processing,
textiles, metal processing, and chemicals. Products most likely to be
produced by rural, small-scale manufacturers include rugs, pottery, cork,
light metal objects, bricks, glassware, leather goods, wrought iron, and
mosaic tile. The small manufacturers employ between 10 and 50 people and
have assets less than $1,250,000.
C-6
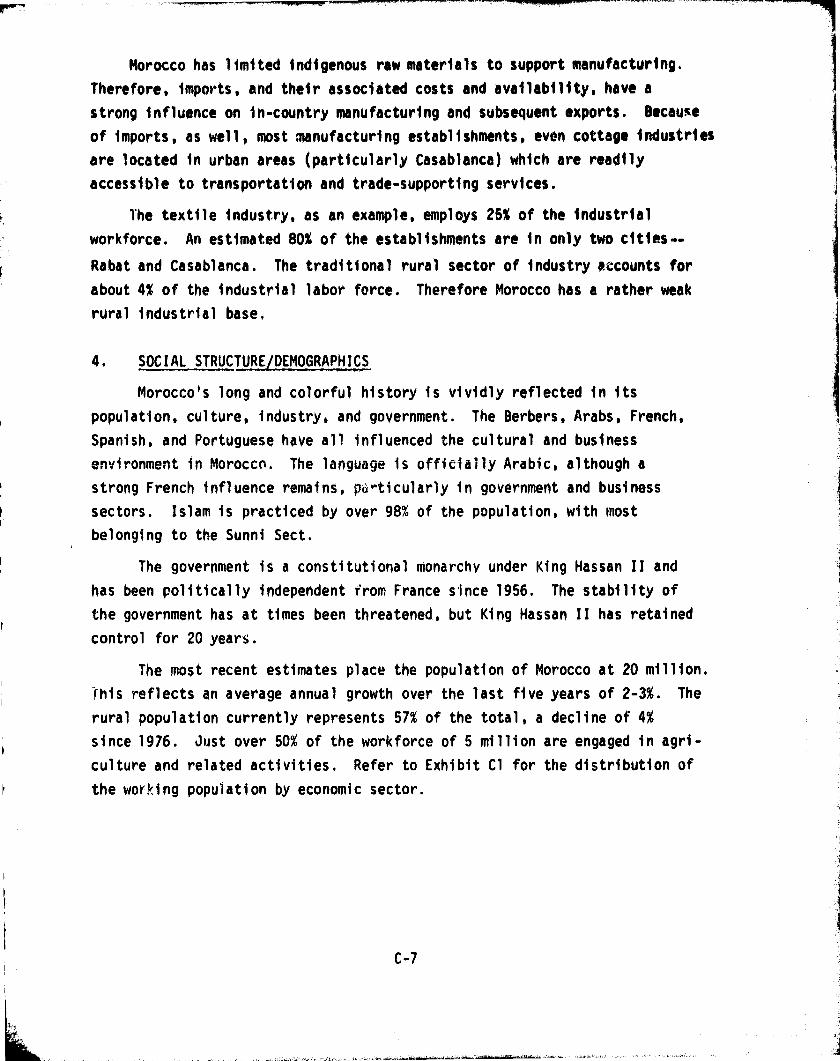
Morocco has limited indigenous raw materials to support manufacturing.
Therefore, imports, and their associated costs and availability, have a
strong influence on in-country manufacturing and subsequent exports. Because
of imports, as welt, most ;manufacturing establishments, even cottage industries.
are located in urban areas (particularly Casablanca) which are readily
accessible to transportation and trade-supporting services.
The textile industry, as an example, employs 25% of the industrial
workforce. An estimated 80% of the establishments are in only two cities.-
Rabat and Casablanca. The traditional rural sector of industry accounts for
about 4% of the industrial labor force. Therefore Morocco has a rather weak
rural industrial base.
4. SOCIAL STRUCTURE/DEMOGRAPHICS
Morocco's long and colorful history is vividly reflected in its
population, culture, industry, and government. The Berbers, Arabs, French,
Spanish, and Portuguese have all influenced the cultural and business
environment in Morocco. The language is officially Arabic, although a
strong French influence remains, ,pa rticularly in government and business
sectors. Islam is practiced by over 98% of the population, with most
belonging to the Sunni Sect.
The government is a constitutional monarchv under King Hassan II and
has been politically independent from France since 1956. The stability of
the government has at times been threatened, but King Hassan I1 has retained
control for 20 years.
The most recent estimates place the population of Morocco at 20 million.
p his reflects an average annual growth over the last five years of 2-3%. The
rural population currently represents 57% of the total, a decline of 4%
since 1976. Just over 50% of the workforce of 5 million are engaged in agri-
culture and related activities. Refer to Exhibit Cl for the distribution of
the working population by economic sector.
C-7

Exhibit Cl
DISTRIBUTION OF ECONOMICALLY ACTIVE POPULATION BY ECONOMIC SECTOR. 1071
ttyb,«. traw ar..S VA" $MW .r aw ►..rr Mid own tit rowel
Apiculture, forestry, bua*% and a i"s ......1111, 604,0473 416,731 671,441 2,661 1,9"'080 60.0WON WA guano* ..................................... 3,461 39,091 674 104 44,640 111m.nuiwtuvins .... ....................... "1 111,1111, 124.086 214.136 SAIS 6,466 306.E 0.3Elwirwity, gas, and water ,,.............I ............... 871 01046 in 171 101010 0.3CoMtruction ...................... ... ............1.,..,,.... 16,301 136,306 2,761 1,113 171,668 4.3Wbolt"sale and retell trade, nuaumb,
and boteb 1111.1.1_11 "_ ........................... 103.124 71,701 14,610 111111 210.022 7,3Tnumport, stump, amd wmmuniawom ............... 16,088 711400 1,017 630 100,415 1.3Fkundnl, krauranue, real estate, ad f
t"ine" services 11 1 1,,,,,,,,,,,,,,,,,,,,,,,,,,,,,,,, , 1,807 1,661 03 31 6,601 011Community, soeW, and penonal servim ...,,.,.,., 34,667 446,624 10,008 1,371 60i,711 1216Astivitins rt dequetely devr6ef ,,,,.,,.,..,,,.,.,., 10.632 66,173 6,638 63.710 166.412 3.0usempt"W ... .... .... . . ... ..... .. .......... 343,000 6.6`
'MAL ....................................... ........ 1.336,%3 11484,601 WOW 411,640' 3,660,616 100.0so
°rom & no add to WJ, aarw r bras ` sr..Source; Bead on k&wmad m bom Ynrbo k of Labour ltatUNw. ION. Gomm 1076, p, 61,
Source: "Morocco w A Country Study", The American University, 1978.
The population of Morocco is becoming increasingly concentrated in the
urban coastal areas (e.g., Casablanca and Rabat) and in spectific regions of
Morocco (e.g., center and northwest). Refer to Exhibit C2 on the following
page.
This has % fluenced government planning, economic development, balance-
of-trade, and distribution of wealth. Urban concentration has increased for
several reasons. The manufacturing sector (including many handicraft
industries) is dependent on the import of raw materials into such port
cities as Casablanca and Rabat. A large proportion of handicraft production
is also located in urban areas to serve the tourist and export trade. The
infrastructure has naturally become more developed in response to this
concentration, which in turn has amplified the difference between urban and
rural development and wealth.
The rural areas have remained relatively underdeveloped. The rural
population is agriculture-oriented, with most of the small-scale agricultural
production serving local consumption (as opposed to export consumption).
Handicraft and artisan activities offer supplementary income for the rural
population during the off-season.
i
C -8
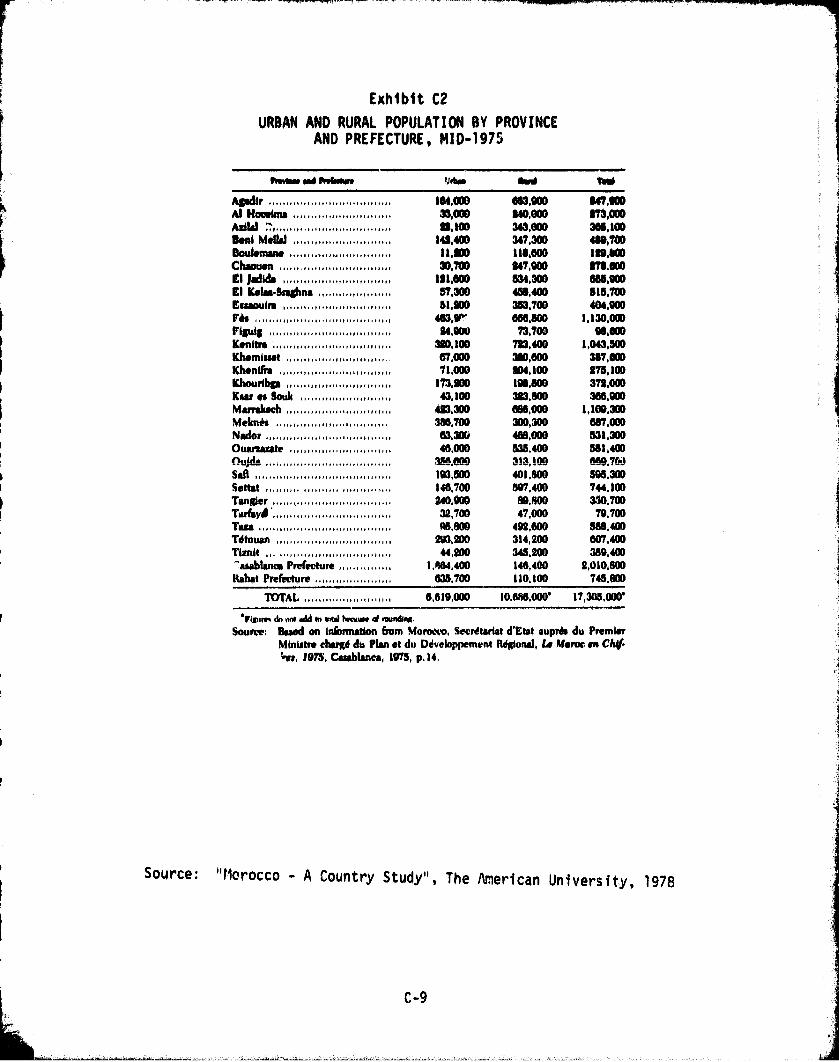
Exhibit C2
URBAN AND RURAL POPULATION BY PROVINCEAND PREFECTURE, MID-1975
tAwei - OW pleblo s Mms &W Ofd
Avdir ................................... 164,000 MAN 2471900Al H=Wme ............................ 33.OW AMAIN 173,0010AdW ^1,,..„u•.,nn+n.,,,. u,..xa.n 96.100 943,000 1.100o nl M01W ............................ 142.400 947,300 4W.=owlemwe ..........., .,,,,,,,,,,,,,,, 11,1100 116,600 199,1 0Chown ................................ 30,7W 247,900 276.600M isdide ,,,,,,,,,,,,,,,,,,,,,,,,, 1211600 231.3011 MAWEI IGrlaaSr#Aeu ,,,,,,,,,,,,,,,,,,,,, 87.300 MAN 815.700Ewouire ............................... 811900 363,700 401.9!10Fb..... .................... .......... .... 463,, - M.sw 1,130.000Fib ................................... 24,900 73,700 96,600
300.100 'x.400 1.063,500Khemiwet ...................... 67,600 920,600 367,600Khenih ...... ......................... 71,000 204,100 278,10DKhouribp ... ... ............ .......,,.„ 173.200 196.600 372.000Ksu es Sauk .......................... 43,100 323.600 3661900MarrakecA ,,,,,,,,,,,,,,,,,,,,,,,,,,,,,, 423,300 686.000 1.109.30DMekn►s ................................ 386.700 900,900 667,000Nador ,,,,,,,,,,,,,,,,,,,,,,,,,,,,,,,,,,, 63,900 466,000 531,300Ouarsarate ,,,,,,,,,,,,,,,,,,,,,,,,,,,,, 46,000 838,400 881,400OMok 1111.1-11-1111- 356,640 313,100 669.700San ,,,,,,,,,,,,,,,,,,,,,,,,,,,,,,,,,,,,,,, 1931600 401,600 898,300Settat .................... .............. 146.700 597,400 744.100Tangler .................................. 240,000 69,400 930,700Tarfiy,f * .................................. 32,700 47,000 79,700Tazr ,,,,,,,,,,,,,,,,,,,,,,,,,,,,,,,,,,,,,, 95,600 492.600 866,400Tdtouan „,,,,,,,,,,,,,,,,,,,,,,,,,,,,,,, 293,200 914,200 607.400Tlsnit ,,,,,,,,,,,,,,,,,,,,,,,,,,,,,,,,,,, 44,200 348.000 389.400'asablanoa Prefidure ,,,,,,,,,,,,,,, 1,564,400 146,400 $,010,500
HAW Prefaeture ...................... 695.700 110.100 745.600
TOTAL ......................... 6,619,000 10,686,000' 17,905,000'
Ot ivim do wo add In mW twoum d mund"na.
Source; Based on h6nnalion bam %foroevo, Secrdtarist d'Etat suprrls du PremierMinistre chargd du Plan et du Ddveloppement Migionel. 4e Meroc on Chi
Ges. 1975. CasaManea. 1975. p. 14,
Source: "Morocco - A Country Study", The American University, 1978
C-9
rI
The government has been attempting to encourage decentralization of
economic production. Ideally, this will improve the distribution of wealth
by placing greater emphasis on the development of the rural and small-scale
urban infrastructure. This includes developing the electric power grid and
increasing the irrigation capacity (hence the yield) of the available land.
It is hoped that this will at least stabilize the current population, improve
the productivity of existing operations, and ultimately encourage appropriate
industries to locate in the smaller urban areas.
5, BUSINESS INFRASTRUCTURE
The infrastructure efficiently doing business in Morocco is still
In the development stages. The Government of Morocco recognizes that much
has to be done to provide a network of ports, reads, railroads, utilities,
and communication systems which will attract new industries and encourage
greater development in outlying regions. This section is intended to offer
a summary assessment of the key factors which define the infrastructure.
In addition to those mentioned above, we will briefly consider the labor
force, education, housing, financing, channels of distribution, investment
requirements, and incentives.
The Moroccan government continues to invest in the expansion and
improvement of existing transport facilities, as well as in new facilities.
Part of the objective is to reduce the burden on existing facilities
serving Casablanca and Rabat, and to encourage greater decentralization of
industry. Thus new ports, new roads, new railroads as well as new power
generation plants and communications stations are intended to not only
improve service to existing industrial plants, but also ehr-nurage new
business centers in the currently less populated areas. The communications
system is adequate, though much could be done to make it more reliable for
business use.
The optimistic goals of these development projects must be tempered
by the reality of an economically depressed time period. While in the long
term Morocco will assuredly make considerable progress in improving its
infrastructure,as in most planned economies, this is likely to take longer
than formal plans generally recognize. At the same time, Morocco's ports
and transportation network is regarded as the best available in Africa.
C-IA
The labor force consists of approximately five million men and women.
Specific information regarding industry sectoral distribution and geographical
distribution of the population were presented in a previous section. Regard-
ing housing, there is a recognized shortage which it is hoped will be
alleviated by the construction of about 40,000 dwellings per year. The
World Bank has provided assistance in this area. Education is regarded as
a key ingredient in raising the standard of living, and some emphasis is
being placed on expanding facilities for primary and secondary schools as
well ,s universities. But the adult literacy rate remains at about 28%.
There is an established financing and credit system in Morocco, led by
the Banque du Maroc, the official government bank. There are also 15
private commercial banks. Major U.S. banks include Citibank and Continental
Illinois. Foreign owned banks must be at least 50 percent owned by Moroccan
interests according to Moroccanization requirements. There are,as well,
specialized credit institutions. For example, Banque Nationale pour le
Development Economique (BNDE) provides financing for private manufacturing,
while Caisse Nationale du Credit Agricole (CNCA) provides financing for
agriculture.
Reflecting the dichotomy of traditionao and modern industr y in
Morocco, there are also traditional and modern distribution and sales
channels. The traditional sector, serving local sales and consumption, is
represented by about 1000 weekly markets. Bargaining is the ke,,v ingredient.
Those who frequent the markets are self-sufficient farmers or vi!iagers
(roughly two-thirds of the population) who purchase very few imported
products.
The modern sales and distribution sector has been strongly influenced
by Moroccanization -- a government program for assuring that Moroccan
interests are represented in commercial and light industry. The government
itself controls the marketing of goods considered critical to the economy:
fruits, vegetables, handicrafts, fish, phosphate, etc. Casablanca remains
the center, the entry point for goods to be distributed throughout Morocco
by private, family-owned wholesale and retail operations.
C-11

As mentioned previously, Moroccan investment requirements demand that
for most service and manufacturing industries 50% of the ownership must be
Moroccan. Such firms also must have a Moroccan chairman and a majority
of Moroccans on the board of directors. Exa ,iples of such industries include
automobile and tractor assembly, chemical products, steel, tanning, and
textile activities.
At the same time there are specific incentives to encourage investment
in Morocco. This includes exoneration from customs duties on imported
capital goods, 2% rebate on individual long term loans from BLADE and CIH,
partial or total exoneration from income tax for up to ten years, and
guaranteed transfer of dividends and repatriation of foreign capital
I
invested in case of sale or liquidation. In addition, there are special
incentives for establishing plants or offices in the outlying areas which
are targets of economic development.
6. ENERGY
Morocco's energy resources are limited. Currently, Morocco satisfies
80% of its energy needs through crude oil imports. The remainder is con-
tributed by coal, gas, and hydroelectric power. Energy resources which
have been unexploited to-date consist of off-shore oil, oil shale,
additional hydroelectric power, phcsphate-based uranium, and renewable
energy. The renewable energy resource includes biomass and solar insolation.
Exhibits C3 A C4 on the following pages provide an energy resource profile
of Morocco.
Near-term demand for energy is expected to be satisfied by continued
import of petroleum, domestic coal and hydroelectric resources. In the
long-term, coal, oil shale, and hydroelectric power will dominate, as well
as a new commitment to nuclear power beyond 1990.
Renewable energy is viewed as a supplement or special application
resource (e.g., desalination) for Morocco -- not as a major energy reserve..
The newly established solar energy center at Marrakesh is the focal point
for such developments. Working with this center is the U.S. Agency for
International Development, in order to study the energy prospects for
Morocco, and identify energy projects of interest to both the U.S. and
Morocco.
C-12
L^x^

Exhibit C3
ENERGY RESOURCE PROFILE OF MOROCCO
1979 STATISTICS
^ed11 MY..P^GI1.^l1976 1979 Y ch+nr
Net electric energy (million kw/h),.,., 4,100.0 4,500,0 + 9,8of which ;- thermal 2,707,0 2,943.0 + 8.7- hydraulic., ............... 1,393,0 1,556.5 + 11,7
Anthracitz (1,000 tons)., ... ,,,,. 720,0 710,0 - 1.4Crude petroleumoil (1,000 tons},,,,,,, 24,3 18,6 - 23,5Natural gas (million m3),,,,,,,,,,,,,,, 84,5 75.0 - 7.8
P$QD'^Sim1 ^.BEE1NF12 !^ c '`^ P@(IOIKI^
198 1979 - • % change
Petrol (1,000 m3).,. .... ...... 19815 210,6 + 6,0High gradspetrol (1,000 m3),.,,,,. .... , 330.9 399,9 + 20,8Gas oil (1,000 m3 ... ... 842,7 1,424,9 + 69,1Kerosene (1,000 m3) 85,0 89,4 + 5,1Jet fuel (1:000 m3 18.$,6 309,0 + 66,4Fuel oil (1,000 tons) .................. 1,265.9 1,864.3 + 47.2Butane (1,000 tons),,,,,,,,,,,,,,,,,,,, 61.5 153,7 + 149,9Propane (1,000 tons),,,,,,,,,,,,,,,,,,, 8,4 26,5 + 215,4
TOTAL REFINED PETROLEUM (1,000 tons),, 2,747,0 4,440,2 + 61,6
^LSLN?PTlC1.1 SY .2W
1978 1979 ^ c, hange
Anthracite (1,000 tons) „ 770,6 602,8 - 21,8Hydroelectricity (million kw/h),,,,,,,, 1,423,2 1,590,0 + 11,7Fuel oil (1,000 tons),,,,,,,,,,,,,,,,,, 1,417,2 1,740,0 + 22,8Gas oil (1,000 m3),,,,,,,,,,,,,,,,,,,,, 1,229,9 1,558,3 + 26,7Petrol (1,000 m3),,,,,,,,,,,,,,,,,,,,,, 5341 585,9 + 9,7
Kerosene (1,000 m3), 75,2 81,2 + 8.0
Natural gas (1,000 m3),,,,,,,,,,,,,,,,, 81,4 75,0 - 1,9
1 9 7 9
Tons DH 1,000
Coal, agglomerates, and coke,,,,....... 39,177 19,739Crude petroleum oil .................... 4,541,618 2,436,876
Petrol . 6,080 '9,595
Kerosene,. ................. 199 136
Gas oils and fuel oils ................. 48,062 50,602Lubricating oils ....................... 54,176 63,481Petroleum gases and other hydrocarbons, 133,897 125,411
Parraffin wax- „ 14,855 23,008
Bituminous products.. 491 995
Other energy products .................. 22,508 39,493
TOTAL....... 4,861,063 2,769,336
Sources ; Direction de la Statistique, Office des Changes, Office National doI'Electricitl, Charbonnages Nord Africains, SAMIR, S,C,P.
Source:. Banque Marocaine du Coemerce Exterieur
C-13

1 9 7 4 1 9 7 5 1 9 7 6 1 9 7 7 1 9 7 8TOTAL % TOTAL % TOTAL Y TOTAL % TOTAL %
344 11 431 13 469 13 434 11 459 112.517 77 2,640 77 2,927 79 3.176 79 3.331 79
62 2 54 2 60 1 66 1 62 1330 10 273 8 270 7 359 9 368 9
3,251 100 3,398 100 3.276 100 4.037 100 4.220 10C
325 44 412 55 449 57 414 48 432 49
83 11 70 9 67 9 86 10 85 10330 45 273 36 270 34 359 42 368 41738 100 755 100 786 100 659 100 885 100
2,514 2.643 2.940 3,178 3.335
77
78
79 79 79
THE ENERGY BALANCEa
(Thousands of petrolequivalent tons)
COMSUMPTION
Coal,,,,,,,,,,,,,,,,,,,,,,
Petroleum products'!.,.,,,
Natural gas ...............
Hydroelectricity.......,..
Total...............
DOMESTIC PRODUCTIONAnthracite,,,,,,,,,,,,,,,,Crude oil and natural gas,
Hydroelectricity,,,,,,,,,.
Total,.,_,.,......,,
DEFICITPercent of total consump-tion...,..,,.
*excluding lubricants, asphalt
CONSUMPTION OF ENERGY
1974 1971 1972 1973 1974 1975 1976 1977 1978
Petroleum products;
Light products (1,000 m3)
petrol ....................... 206.8 20019 19119 194,3 199,3 18919 192.0 206.1 201.3
high grade petrol.,,..,...... 21519 243,5 279,8 310,5 270,4 302.7 321.3 330.7 332,7
kerosene ..................... 91,9 94,6 96.2 91,1 92,0 90,4 93,3 85,1 75,2
gas oil ...................... 556.9 594,6 649,1 734,2 798.7 930.9 1,095.9 1,200.0 1,229,9
Heavy products (1000 t) :
- fuel oil ...................... 547.7 605.5 638.8 839,3 988.8 1,006,7 1.158.8 1,249.6 1,417,2
Liquefied gas (1000 t)
butane ....................... 72.3 86,0 103,5 116,0 134,0 157.8 1793 201,7 227,2
propane ...................... 5,4 6,7 6.5 8,9 9,0 9,9 11,6 13.6 13.4
Electricity (million kw/h),......, 1,794,2 1,953,9 2,158,7 2,420,0 2 9 600,0 2,667.4 2,995,4 '3,331,7 3,639,1
Coal (1000 t) :
*anthracite „ 441,3 372,1 569,9 582.3 573,2 127.4 792,2 739,3 770.5
*imported coal,,,,,,,,,,,,,,,, 63.8 $6.7 58,2 24,5 29,2 27.8 29,8 31.0 41.5
Sources : Ministt/re de 14- ig a e t s mines.
Office national de 11Electricitf
ELECTRIC ENERGYINSTALLED CAPALTTP-Ar TRE_END OF 1978 ADDITIONAL CAPACITY
inlc7-owe sIII • HYDRAULIC PLANTS COMPLETED IN 1979 AND 1980 160,000
1 HYDRAULIC PLANTS .......................... 448.790 ued el Makhazine... 33 vuu
purer. .1.10= Al Massira „ 126,000
Bin el Ouidane ................. .. 135,600IV - THERMAL PLANTS NEARING COMPLETION
Daourat. 17,000 ens ra.. .. "
300.000Mansour ed Dahbi 10,000
Mohammedia .......... ...........
600,000Mohammed el Khamis „ ,,....., ..... 23.200 " " "
El Kansera.. 14,200
Houlay Youssef ............................. 24,000Fez amont .................................. 1,200
Fez aval. .,,........ 1.890
idriss 1st,. 40,000
Imfout 31,200 INVESTMENT CARRIED OUT IN THEKasba Zidania. 7,120 7
Lalla Takerkoust „ 8,800 n thousands of tr amsSi Sald.Mahchou .................. 20,800
6,400 D, N. E. 1.363,515Bou Areg Other plants 14,380 Coal (C.N,A,)..... 165,060
Petroleum exploration.,... I ............... 519,253
11 -THERMAL PLANTS 569 769 of which by :
era a ........... .................. ........ Tb5;d'6 I B.R,P,M ................... .,,....... 343.472
Casablanca..,. ........ ...... 152,000 , Private enterprisirs.. 175,781
Kenitra ................... 75,000 Refining and distribution of
Tangier,,.,. 46,400 petroleum products- ,,,,,,,,,,,,,,,,,,,,,1,149,000
Agadir ............................. ...... 40.000 Refining......,..................... 858,000
Distribution ........................ 291,000Sidi Kacem. 22,700 Exploration and studies (oil shale;....... 22,540Terruan..... 40,000 Energy studies 375Oujda..,....
11669Other plants.., TOTAL .......................4,888.936
Source Direction de le statistiQue source L97680 Three-ye a r-plan
Source: Banque Marocaine du Commerce ExterieurC-14
In 1977, the national grid served all major cities, 70% of the small
towns and 11% of the rural areas. The first stage of a 15-year rural
electrification program was scheduled for 1980 with an $85 million budgeted
cost. The first stage will take four years to electrify 220 villages in
17 rural provinces. The long-term goal is to connect 1,800 villages with
the national grid. Currently rural power needs are served through about
400 generator sets which serve small communities.
Over 90% of the electric energy produced in Morocco is controlled by
the government through the Office National de VElectricite (ONE). Nearly
half of this electric power is consumed by industry -- the phosphate industry
in particular. Electricity costs approximately $0.08 per kilowatt hour,
while gasoline costs about !iO.60 per liter.
7. COTTAGE INDUSTRIES
The cottage industry sector in Morocco reflects many of the same
fundamental activities which characterize traditional industries in other
developing countries throughout the world. Small, non-grid connected
enterprises in Morocco represent two main activities. First, they support
the local economies - which are primarily agriculture-ba<;ed - by offering
tools, utensils, pottery and other basic, utilitarian products, as well as
by processing the agricultural products for local consumption. Second,
these enterprises, which consist for the most pP.,°t of farmers and their
families, supply the handicraft products which serve the export market.
They use this work to keep themselves employed during thc, off-season. (Many
additional handicraft businesses are located in the cities, near the export
facilities and tourist sites.)
The major product categories which serve the utilitarian needs of the
local economies are: foodstuffs, textiles, metal, and leather. The
product categories which serve the export and tourist trade for the most
part consist of: rugs, baskets, blankets, robes, pottery, leather goods,
and metalware. In nearly every case there is a modern industrial counterpart,
most likely located in or near the large cities, which produces similar
products. With regard to handicrafts, the current challenge in both the
traditional and modern sectors is to maintain the quality and product
C-I5
consistency which exporters and tourists have come to expect. Training ofartisans to assure production consistency is in fact one of the programswhich the government has been supporting.
As examples of the types of small -scale operations which serve mostlylocal needs, there are,in Morocco,8000 small flour mills, 150 small fish
canneries (although these do serve the export market), and 160 small textile
factories. As mentioned previously, small-scale industry represents three-
fourths of the total industrial employment and 40 % of production by value.
In addition, there are an estimated 250,000 artisans producing handicrafts.
This includes both urban and rural craftsmen.
Small-scale industry has had, at least until recently, a limited access
to financing credit and government programs. The primary source for long-term
financing for industrial projects (and these are mostly large-scale projects)
is through BNDC, the national economic development bank. Short and medium
term financing for industrial development is through the 15 commercial
banks. Most credit applications are short term, indicating that the
capital requirements are needed more to sustain current operations (i.e.,
raw material, consumables, utilities, etc.) rather than invest in plant
and equipment.
8. POTENTIAL FOR PHOTOVOLTAICS IN COTTAGE INDUSTRIES
Renewable energy is a new factor in economic planning by the government
of Morocco. This is a direct consequence of the rise in petroleum imports
and prices which have contributed to a deteriorated balance of trade. As
a result; the government is planning for greater long term energy self-
sufficiency by developing to the maximum its indigenous energy resources.
The greatest proportion is expected to be contributed by coal, oil shale,
and nuclear power. But the government has also specifically indicated that
renewable energy will also receive attention. It is the nature and extent
of this attention which appears crucial in exploring the opportunities for
photovoltaics in various applications. There is currently very little
research or application activity in photovoltaics in Morocco. While a
center for renewable energy has been established, it is still too early to
expect any specific commitment or results regarding use of photovoltaics.
i, :,..,
C-16
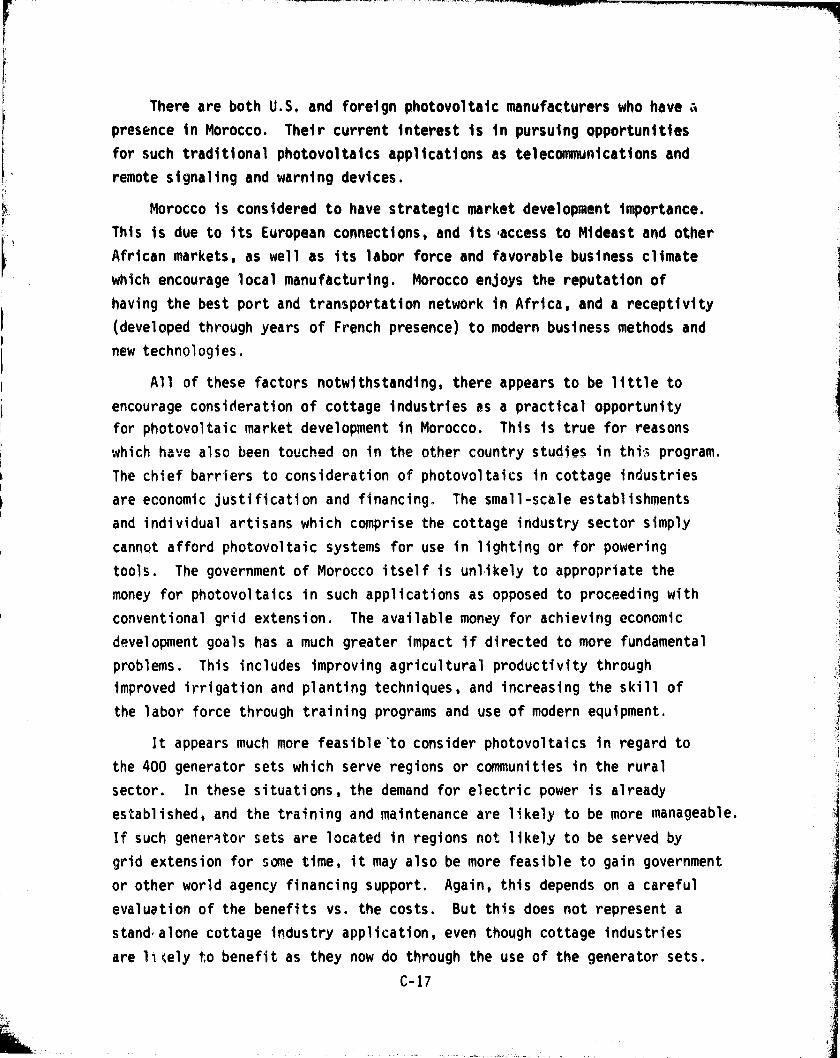
There are both U.S. and foreign photovoltaic manufacturers who have a
presence in Morocco. Their current interest is in pursuing opportunities
for such traditional photovoltaics applications as telecommunications and
remote signaling and warning devices.
Morocco is considered to have strategic market development importance.r
This is due to its European connections, and its-access to Mideast and other
African markets, as well as its labor force and favorable business climate
which encourage local manufacturing. Morocco enjoys the reputation of
having the best port and transportation network in Africa, and a receptivity
P(developed through years of French presence) to modern business methods and
new technologies.
All of these factors notwithstanding, there appears to be little to
encourage consideration of cottage industries as a practical opportunity
for photovoltaic market development in Morocco. This is true for reasons
which have also been touched on in the other country studies in this program.
The chief barriers to consideration of photovoltaics in cottage industries
are economic justification and financing. The small-scale establishments
and individual artisans which comprise the cottage industry sector simply
cannot afford photovoltaic systems for use in lighting or for powering
tools. The government of Morocco itself is unlikely to appropriate the
money for photovoltaics in such applications as opposed to proceeding with
conventional grid extension. The available money for achieving economic
development goals has a much greater impact if directed to more fundamental
problems. This includes improving agricultural productivity through
improved irrigation and planting techniques, and increasing the skill of
the labor force through training programs and use of modern equipment.
It appears much more feasible`to consider photovoltaics in regard to
the 400 generator sets which serve regions or communities in the rural
sector. In these situations, the demand for electric power is already
established, and the training and maintenance are likely to be more manageable.
If such generator sets are located in regions not likely to be served by
grid extension for some time, it may also be more feasible to gain government
or other world agency financing support. Again, this depends on a careful
evaluation of the benefits vs. the costs. But this does not represent a
stand alone cottage industry application, even though cottage industries
are 1l W y to benefit as they now do through the use of the generator sets.
C-17

The government of Morocco has also established several training centers
throughout Morocco for development of artisan skills and introduction to
new techniques and equipment. It is conceivable that as an awareness
mechanism such training centers could be equipped with appropriate photo-
voltaic systems. This would provide the cottage industry sector with an
opportunity to see how photovoltaics could serve them. It would also
provide photovoltaic suppliers with an initial demonstration and market
test "vehicle" for exploring application possibilities. Again, the financing
will more than likely come through either the government or such organizations
as the World Bank.
C-18

D. BRAZIL
PREFACE
This report is a brief discussion of Brazil including its demographic
factors, government policies, enemy resources and energy plans which would
affect the Brazilian market for stand-alone photovoltaic systems in cottage
industry applications.
The information collected to support this report is from secondary
domestic sources only and, hence, represents a general overview of the
Brazilian market.
D-i

E
1. GEOGRAPHY
Brazil is the fifth largest country in the world, covering a total
land mass of 8,521,100 sq. km . The country covers halt of South America
and borders each of its countries with the exception of Chile and Ecuador.
Nearly 7500 km of Brazil's coast borders the Atlantic Ocean (Refer to the
map on the following page). There are five geographic regions. The North
region lies entirely in the Amazon Basin. The Northeast region comprises
"the Brazilian bulge." This area is the most economically deprived, is
overpopulated, and frequently is subject to drought. The Southeast region
rovers only 11% of the land, but has 80% of the financial capital, 85% of
the industrial production And employs 70% of the industrial workers. The
South region is characterized by its coffee estates, cattle ranches and
coal deposits. The Central-West is sparsely populated and is regarded as
the new agricultural frontier.
The river system is one of the most extensive in the world with
50,000 km of navigable inland waterways. Principal rivers include the
Amazon, Parana, Paraguay, and the SO Francisco.
There are three climatic zones -- tropical, subtropical and temperate.
The average annual sunshine ranges from 1400 to 3200 hours and the average
mean solar radiation is 411 Langley's per day.
2. POPULATION
Brazil's population is presently estimated at 124.4 million, being the
sixth most populous nation in the world. It accounts for 35% of the total
population of Latin America and is presently growing at a rate of approximately
2.8% a year. Population density within Brazil averages 33 inhabitants per
square mile, varying from three inhabitants per square mile in the north and
Amazon region to 129 per square mile in the southeast.
3. GOVERNMENT
The Brazilian government is presently under military rule and has been
since the revolution of April 1964. Since the revolution, Brazil's presidents
have been selected by Armed forces high command and formally elected by an
electoral college similar to presidential elections in the U.S. The president
d-1
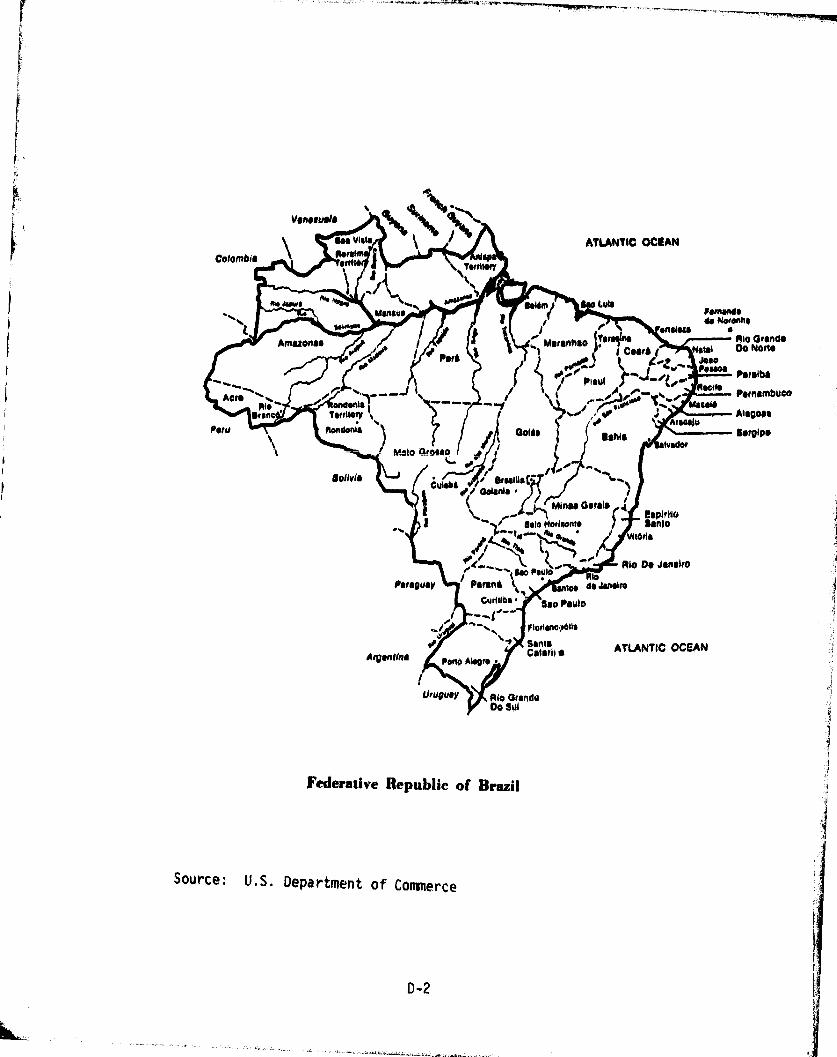
ATLANTIC OCEAN
Psmandoto Note"$
11110 Grand#
tN Do Norteoso
ow'= Paraibaselh Pernambuco
Alagoas
Sergipe
i Psu^ Rio D# Janeiro0
da Janalro
Sao Paulo
► lorismi, tills
SameCrirrir a ATLANTIC OCEAN
Rio GrandeCo Sul
Federative Republie of Brazil
Source: U.S. Department of Commerce
D-2
and vice-president are elected for five-year terms, and the electoral college
is comprised of members of the national congress and delegates chosen by
state assemblies. Under Brazil's constitution it is mandatory for all
persons of legal age to vote in elections.
The last Brazilian presidential election was in March of 1979, at which
time General Joso Baptista de Oliveria Figueiredo was elected by the Brazilian
electoral college and is publicly committed lead Brazil toward greater
democracy.
Factors that are important to a modern Brazil are advocacy of pluralism
or federalism, personalism, economic regionalism, a relative absence of
violent conflict, ethnic harmony, and widespread influence of the Roman
Catholic Church. These factors all have deep roots in the 450-year history
of Brazil.
4. ECONOMY
a
i
Inflation has been a major
Major reforms within the governs
Brazilian Cruzeiro, contributed
rate until 1973. The inflation
in 1974, mainly due to the 1970
foreign oil.
problem in Brazil since the late 1950s.
nent, along with the re-evaluation of the
to a steady decline in the annual inflation
rate increased from 15.7% in 1973 to 34.5%
oil crisis and Brazil's dependence on
On June, 30, 1979 Brazil's foreign debt was U.S. $46.5 billion, an
increase from 12 to 13% per annum representing almost a half billion dollar
increase in interest rates. In 1979, Brazil paid U.S. $4.9 billion in
interest fees and U.S. $2.9 million in net terms. The GDP for 1979 was
U.S. $213 billion. This represents a 6.4% growth in constant Cruzeiros. The
1980 GDP was U.S. $237 billion with a real growth of only 6.5%. The 1979
per capita income was U.S. $1780.
Inflation has accelerated steadily until August 1980, peaking at 109%
before turning down to 104%. This was the highest in Brazil's history. At
the same period wholesale prices increased 120% among construction materials
and cost-of-living index, which is measured by the Rio de Janeiro cost-of-
living index. Public service cost increased some 122% as previously controlled
prices were adjusted upward.
D-3
Brazilian imports of oil, which supply about 80% of the country's
petroleum needs, hit an all time high of 1.1 million barrels per day (bpd)
in the first half of 1980. The average amount of oil consumed is presently
1.1 million bpd with Brazil only producing a predicted 350,000 bpd and a
possible 150,000 bpd as based upon discoveries not yet made. However,
Brazil is attempting to reduce the amount of imported oil by producing
alcohol fuel. In 1980 an estimated 4.1 billion liters of alcohol fuel was
produced.
Since March 1979, emphasis has been placed on agriculture. Agricultural
programs are aimed at achieving self-efficiency in basic foodstuffs and
generating increased foreign exchange earnings through expanding the volume
of resources for the alcohol fuel program.
Through August 1980 the 'foreign trade deficit alone was U.S. $2.5 billion,
some 78% above the equal period in 1979. In 1979, the total annual trade
deficit was U.S. $2.7 billion. Oil imports continues to be the principle
feature of Brazil's balance of trade. Total imports in oil for 1980 was
about $24 billion, a 30% increase over 1979.
In the first eight months of 1980, the value of exports increased 31%.
However. commodity exports in 1979 experienced sluggish expansion, and the
trend carried over into 1980.
Brazil borrowed some U.S. $12 billion in foreign loans in 1979. Exports
of industrial goods continues to increase at a slow rate, however, the import
costs of petroleum and the need to import great amounts of capital goods
to expand industry are still major problems.
For the remainder of 1981 and into 1982, foreign investment in Brazil
should continue, even with growth in Sao Paulo being restricted by the
government. Joint ventures between foreign companies and Brazilian manufac-
turers are being given high priority in those areas where technology
requirements are high.
D-4
5. CULTURAL ENVIRONMENT
5.1 Lan ua e
The national language of Brazil is Portuguese and is spoken by more
South Americans than is Spanish. The Brazilian takes pride in his national
language and seeks new ways to express himself, inventing colorful phrases.
Therefore, Portuguese spoken in Brazil often differs from that taught in
schools. Names of businesses and even foreign agricultural colonies must
be in Portuguese.
5.2 Education
In 1971 legislation was enacted to reform the primary and intermediate
scnool system. As a direct result the adult literacy rate is an estimated
76%. Enrollment in basic education, as a whole increased to 85% or
18.6 million by 1974, while the population of children within the age of
7-14 y,-ars was 21.7 million.
Secondary education enrollment, grades 9-12, grew to an estimated
two million students in 1974. At the same time higher education enrollment
stood at almost one million in 1975, with an additional 36,000 enrolled
in graduate programs.
The new program was designed to reduce the number of grade repetitions
and dropouts. The program called for a revision of the curriculum and
greater flexibility. Under the 1967 Constitution, a 1971 law requires that
no less than eight years of basic education be mandatory for all children
between the ages of seven and fourteen. Within the restructuring of the
school system, these eight years are to be followed by a program designed
to provide skills needed for immediate employment or continue on to a
higher education.
By geographic regions, attendance in primary and middle schools is
highest in the Southeast and South. The Northeast has been regarded as an
educationally deprived area.
Approximately one half of the students completing primary classes go
on to middle level schools. This is due to the lack of schools to attend
in the case of most rural children and to extreme crowding of urban facilities.
D-5
x
Many teachers are unqualified and a large portion of these at the middle level
have positions within industry and teach part-time. Enrollments in institu-
tions of higher education remains highly concentrated. Gaining admission to
an institution of higher education is extremely difficult because of requiredk,
entrance examinations. Many students find it necessary to take a one-year
preparatory course one or more times.
Teachers in Brazil must be Brazilian citizens and over the age of
eighteen. Rules concerning their qualifications, rights and responsibilities
are laid down by state governments, which operate most of the schools at
the primary and middle levels.
In 1970 there were almost 440,000 teachers in the primary program plus
25,000 in the supplementary program. Two-thirds were in urban localities
with only about 10% being fully qualified professors. Nearly one-half of
the remainder had not completed the lower middle school cycle of normal
school. In rural areas, many teachers have no more than a primary education.
5.3 Religion
Brazil 'is the largest Roman Catholic country 'in the world. An estimated
93% of the population are baptized church members. The Roman Catholic Church
provided the first systematic medical services in Brazil and missionary
priests were responsible for establishing some of the first schools in
rural areas. A direct result of Roman Catholic influence is the existence
of a real sep;^ration of church and state with religion and other spiritual
movements practicing with complete freedom.
The clergy has been very active in organizing urban and rural organizations
such as labor unions, student groups, businessmen's associations, and Catholic
Action volunteers groups. Student volunteers in urban squatter settlements
and in countrysides worked with the clergy in an effort to make peasants and
workers aware of their rights as citizens in an effort to improve relations
between the people, industry and the Brazilian Government.
The military government under President General Erenesto Geisel, elected
in 1974, recognized the churches influence and publicly acknowledged the
influence of the Catholic Church with Brazil's government. The church con-
tinues today in its efforts to help the people take a leavening role for
the construction of a better Brazil and world.
D-6
^x

5.4 Social_Organizatinn
Social relatives, kinsmen, accept a great deal of responsibility. Young
boys may visit an uncle for the first time and remain several years. During
this period he is treated as one of the family;receiving food, shelter and
an education. Godparents may be called upon to house a godson while he
attends school in an urban center. Rural peasants who migrate to the cities
in search of work can be followed by kin. Those remaining at home help
finance the trip, with relatives in the city expected to help the newcumer
find work, and support him while looking for work as well as sharing their
often orie room dwcl l ing.
Those who own their own businesses often place their own kin in positions
of trust. The owner has an obligation to provide a job for a relative within
the relative's limits.
Family loyalties also extend into politics in well-established rural
towns more than in urban areas. Family support is of great importance to the
local politician, with his election dependent more upon his relatives than
his platform. Officials often owe favors to their supporters and are expected
to secure appointments for them. Failure by the politician to carry out his
obligations to his 7amily is severely critized.
6. INFRASTRUCTURE (HIGHWAYS, RAILROADS, PORTS AND TELEPHONES)
Since colonial times transportation from populated coastal areas to
the interior of Brazil has been a problem. The usual means of commuting
were along the lengthy coastline, on the rivers of the Amazon Basin in the
north, the Sao Francisco River system running in a north-south direction,
and the Parana-Paruguay River system in the South.
When roads, and later railroads were built, they were developed in a
pattern running from the interior to the various ports on the coast. In
the early 1970s, about 70 percent of all freight and 90 percent of all
passengers moved on highways. 'There are approximately 1.7 million kilometers
of roadways in Brazil today moving 95 percent of passenger and 75 percent of
cargo transportation. Railroads for the most part are confined to the coastal
areas and run inland for short distances only.. The furthest line running
D-7

k
inland is from the coast to Brasilia, the Federal District. Interconnection
of the various rail lines is made difficult due to the fact that the various
track gauges differ. The interconnections exist only in the vicinity of
Rio de Janeiro and Sao Paulo. Travel to neighboring Argentina and Uruguay
is also hampered by the differences in track gauges. In late 1973, the first
Atlantic-to-Pacific train was capable of running from Santos, Brazil to
Antofa astj Chile.
Brazil's rail system presently consists of approximately 31,000 kilometers
of track and is made up of eight companies. Since the beginning of the
petroleum crisis of 1974, the railroads have received priority attention from
the Government. The Brazilian railroad system is almost entirely operated
by Government-owned enterprises. In 1977, of the eight railroad companies,
the three largest were controlled by the Federal Government.
Brazil's railroad system is presently in dire need of maintenance. The
two Government-owned railway ccmpanes, which control 96 percent of the
nation's track, are presently in a critical financial state. The large
investments necessary to bring the rail system up to the needed efficiency
will impede the rail system from playing an important role in Brazil's
overall transportation system.
Brazil's port facilities are maturing into efficient and competitive
forces in international waters. Consisting of nearly 1040 merchant ships
having a capacity of 5.5 million dead weight tons, 51 percent of Brazil's
international trade is shipped by Brazilian flag vessels. There are some
250 sea and inland ports; however, in 1977 only 30 possessed mechanical handling
equipment and adequate stora ge facilities to accommodate international freight
lines. Despite the small number of ports possessing mechanical handling equip-
ment, some 143 million tons of overseas freight was moved in 1977. Another
54 million tons were moved at inland ports.
In 1977 the Brazilian telephone network censisted of 4.5 million
installed telephones serving some 3300 municipalities. Approximately 90%
of the telephone network is installed and operated by government-owned
telephone companies. During 1977, some 688,006 new installations took place.
D-8

Direct distance dialing was made available in 1977 to all 21 Brazilian
states and some 533 municipalities. International dialing is possible to the
United States, Canada, and ten other countries from Rio de Janeiro, Curitiba
and 150 other Brazilian cities.
In 1980 Telex was installed in over 200 cities with the number of
terminals exceeding 36,000. Between 1977 and 1978 some $125 million was
invested into expanding the Brazilian telecommunications telex services.
Telecommunicacoes Brasileiras S.A., the largest telephGne subsidiary
in Brazil, estimates that by 1982 some 7.1 million telephones, and 62,000
telex terminals will have been installed.
7. ENERGY RESOURCES
Brazil is one of the few countries having six natural resources
available for energy needs. The resources are petroleum, gas, wood, coal,
uranium, and hydro. Brazil, despite its resources still has a critical
energy problem, specifically liquid fuel. Present energy sources are inade-
quate to meet the needs of the country.,, The only abundant means of energy
in Brazil are hydroelectric for electric power, and resources for alcohol
production to replace petroleum.
Many contributing factors make up Brazil's energy problem. Heading
the list are oil production and transportation needs. Dependency on foreign
oil to the extent of 80% results in high transportation costs. Need for
technology and energy related equipment has deprived areas of electrical
energy for decades. High sulfur content and low energy rating of coal
reserves makes use of coal inefficient. High inflation rate and large trade
deficit has discouraged imports and slowed the advancement of electrical
energy to rural areas.
Wood was Brazil's greatest source of energy before the 1950s, especially
in rural areas and small towns. Wood was used for both small industry and
domestic uses. Firewood, together with cane thrash and charcoal accounted
for more than 50% of energy consumption. In 1970, with the modernization
of Brazil, and low price`, wood only accounted for about 30% of the energy
balance.
D-9
L
The oil crisis brought about a renewed interest in wood which could
become an alternate source for the substitution of oil by-products. The
renewed interest is brought about through the application of advanced
technologies, higher yield patterns and the rational utilization of forest
resources. As part of a pilot experiment, wood is being used for the
production of alcohol. Wood charcoal i also being used for iron and steel
metallurgy. However. only 50% of the iron and steel metallurgy using
charcoal can be met using new reforestation practices..
Dependence upon foreign oil accounts for some 80% of Brazil's
petroleum needs, or 1.1 million barrels per day. Forty-five percent of
Brazil's primary energy is derived from petroleum. Imported oil represents,
as of August 1980, 40% of all imports at a cost of U.S. $6 billion and is
estimated to cost U.S. $11 billion by year end, a 61% increase over 1979.
The first six months oil import was approximately 171 million barrels.
Transportation is presently the prime energy user. Until the world
oil crisis in the 1970s, much of Brazil's transportation effort was in the
development and expansion of their highway system. Prior to the 1970s, themajority of travel and transportation of goods was done by highway. Highway
travel at that time was more economical than the money required to maintain
and update Brazil's rail system.
The majority of Brazil's electrical service is hydroelectric and,
until the Rural Electrification Program for 1976 to 1978, electrical service
existed only in highly populated urban areas. Between 1976 and 1978
$230 million was invested to increase the number of farms having electrical
service to 350,000, an increase of 83,000 farms with distribution lines
in all of Brazil's 21 states.
In 1979 another $75 million was spent to serve an additional 22,500
homes. Almost all of this additional coverage was accomplished by extension
of electric power lines. Yet, it is estimated that only 8% of Brazil's
4.5 million rural communities have electricity. Another possible 10,000farmers, remote from the grid, use small gasoline or diesel generators for
their electric power.
D-10

Thermoelectric generation is une;;onomical,even with Brazil's coal
reserve in excess of 3 billion tons and 600 million barrels of oil shale
reserves. Only a small percentage of Brazil's coal from Santa Catarina
can be utilized in core furnaces.
Brazil's coal reserve is characteristically bituminous, high in ash
content, low in heat value and highly sulfurous. The added costs of
refining the coal, along with the processes necessary to utilize the
600 million barrels of oil ;Shale, and the fact that 90% of all natural gas
wells, an estimated 25 billion cubic feet in 1973, are in Northeast Bahia,
makes production of these energy sources cost prohibitive.
The number of diesel-powered stand-by generators installed by
individuals during the 1970s is inadequate to meet today's need of
uninterrupted supply of electrical energy. Stand-^y generators are mainly
used by industry, hospitals, businesses, airports and other institutions.
The actual number of these generators is unknown, however, it is knuwn
that the actual number is far below requirements. Several hospitals do
not have emergency generators for critical areas, even though existing
legislation makes such equipment compulsory.
Hydroelectric and nuclear power generation are, therefore, the most
extensive means of producing Brazil's electric power. Installed generating
capacity is estimated to be growing at 12% annually throughout the 1972-82
period. Emphasis is on hydroelectric power which will account for an
estimated 85'4; of the total power generated in 1982 as compared to 92% in
1979. The total annual dollar investment since 1978 has been in the range
of U.S. $500 million.
Brazil has made a heavy commitment to nuclear power for the generation
of electrical energy. The first nuclear power plant was completed in 1979
and was obtained from the United States. The move toward nuclear power
over hydroelectric was to help meet the demands for electrical energy in
the industrialized southeast region. It its estimated that by 1990, a major
portion of Brazil's hydroelectric potential in the southeast region will have
been harnessed. In all, nine nuclear power plants were planned. However,
opposition to nuclear power , plants does exist because of the cost of tech-
nology and equipment that must be imported. It now appears that only three
D-11

of the nine nuclear power facilities will be completed. The second and
third facilities, Angra II and III, are being obtained from Germany. The
two German facilities will only utilize about 50% Brazilian equipment and,
at present, only site preparations have begun on Angra II which is scheduled
for completion in 1987. The site for Angra III has yet to be approved by
the Brazilian Nuclear Energy Commission. All three plants will be located
in the State of Rio de Janeiro.
7.1 Energy Plans
To help reduce imports, between 1970 and 1977 Brazil initiated research
on solar and geothermal energy sources of energy. However, formal support
for such projects by the government controlled electric company, Electrobras,
has been minimal.
In addition, thermoelectric plants have been receiving considerable
attention throughout the 1970s in the Sa`3 Paulo metropolitan area. Solid
waste will be utilized as fuel with the first plant, with an estimated
capacity of 150 MW, expected to be in operation in 1982.
Nine hydroelectric plants are also under construction to serve 16
townships in the State of Amazonas and 51 townships in the northeast using
water reservoirs. A larger hydroelectric plant, $o billion Itaipu, is
being built on the Brazil-Paraguay border with a projected 12,600 MW
capacity. The plant is slated to be on line in 1983 and reach full capacity
by 1988.
Extensive research and construction for the production of alcoholfuel has taken place. The Petrobras Curvelo Alcohol Plant can produce20 million liters per year of alcohol from 370 tons per day of manioc. The
plant will also yield, as by-products: 10,000 tons per year of carbon
dioxide, for fire extinguishers, dry ice and cold storage of food; and
5000 tons per year of solid manioc residues for use as animal feed. In
1980, total production for all alcohol plants was 4.1 billion liters of
alcohol with an anticipated volume of 14 billion liters being produced
in 1985.
Under the National Alcohol Plan (PNA), alcohol derived from sugar is
mixed with gasoline on a 1:4 ratio. Production is presently underwa; for
D-12

WMAWROMM
G. vehicles that operate on 100% alcohol. Present plans were for some
h 200,000 new cars and 50,000 converted to be using alcohol fuel only in
1980.
Disregarding the cost of solar energy, research continues. An
energy group at the University of Campinas (Unicamp) was formed in 1975to develop alternative forms of energy. Areas under study are waterheating and electrical energy which is being financed by the government
funding agency - FINEP (Financing of Studies and Projects). In September
1979, solar energy was being researched for alternative forms of energy.
I
The technology for solar, water heating has been completely developed in
Brazil. Research is still being conducted for the generation of electricityutilizing solar sources. Brazilian physicists are developing solar energy
as a source of heat for water, to produce industrial vapor, and direct con-
version into electrical energy. Electrical generation is expected to be
Via ble in Brazil in 1982 and could represent 10 to 25% of Brazil's electrical
need by the year 2000. Financing by the Brazilian government for solar
research in 1979 came from part of the U.S. $1.2 billion special energy fund
created to study alternative energy sources. Some sponsorship was also
received from West Germany and France for the development of photovoltaic
power.
In the City of Sad Paulo, more than 600 houses are fitted with solar
panels to heat water and generate electricity. There are presently
10,000 square meters of solar panels in use in Brazil. The average cost
of a solar collector is U.S. $800 sold by a Brazilian company, FAST, W`A ch
has exported a solar collector to Paraguay and expect, to soon export
solar collectors to Peru and Bolivia.
7.2 Control of Energy
Brazil's electric utility system is operated by over 40 federal and
state-owned utilities and about 20 privately owned companies.
At the federal government level, ELECTROBRAS is responsible far planning,
financing and coordinating the national electric power system, including
generation, transmission, and distribution of electricity. A major port+on
of their administrative and operational responsibilities are delegated to
four major subsidiaries, whose principle role is to build and operate the
D-13
major nine power plants, and regional transmission grids. These four
companies are: Furnas Centrais Electricas S.A. (FURNAS); Cia Hidroelectric
do Sul Francisco (CHESI); Centrais Electricas do Sul do Brasil S.A.
(ELECTROSUL); and Centrais Eltricas do 'Norte do Brasil S.A. (EILE`PRONORTE).
The state-owned utility companies are also regulated by the four regional
ELETROBRAS subsidiaries. Furnas is also responsible for Brazil's first
nuclear power plant.
Petroleum production and the production of oil substitutes, alcohol
and biogas, is governed by Petrobras, a state-controlled Brazilian petroleum
company. Petrobras is the largest corporation in Brazil and a law decree
of 1953 gave the company a monopoly over prospecting for and developing
petroleum and other fluid hydrocarbons and natural gas. Seventy-five
percent of the capital stock of PETROBRAS is held by the federal government,
eight percent by general public and the balance by the state government,
8. IMPORT OF TECHNOLOGY
Import duties have increased on approximately 1500 items as well as
a 15% tax on foreign exchange transactions. Foreign financing, ranging
from 180 days to eight years, is required for imports exceeding $100,000
for most transactions now paid for in cash. Imports are expected to be
very selective and limited to: high technology items, items not produced
in Brazil, and items that Brazil will later export.
Prior to any technology imported by a Brazil firm, approval must be
obtained by the National Institute of Industrial Property (INPI) and the
Central Bank of Brazil. All controls of the transfer of technology,
including selectivity and payment, are under the authority of the Ministry
of Industry and Commerce through the INRI. The Central Bank of Brazil
has final approval authority over contracts which involve remittances
abroad. Following approval by INPI, the Central bank must then issue a
Certificate of Registration before the local recipient of the technology
can remit payments.
The INPI often refuses to approve payment of technical assistance fees
where the recipient has affiliation with a multinational company. Even
if approved the recipient is not allowed to report the paid fees as a tax
D-14

f
deduction. This holds true even if the receiver is controlled directly or
indirectly by the supplying company, a.g., a multinational and its
Brazilian subsidiary.
Even when payments for visiting technicians are approved, the INPI
will often agree to pay only a small percentage of the total costs. This
leaves the remainder to be negotiated between the Brazilian company and
the technician. There is also no technical assistance payments for the
transfer of technology related to projects. Fees payable for technical
assistance varies from one to five percent of the net sales of the locally
manufactured product being sold. Technical assistance must have also been
applied to that product. The percentage received depends upon the
importance of the product to the Brazilian economy.
All imports must be registered with the foreign trade department of
the Central Bank (CACEX). Import duties vary from 25 to 60% on most goods
and as high as 205% on others. All imports can be purchased directly by
the private sector, however, both state and federal approval is required.
At the present time, some solar products are easy to import because of no
competition. However, once a Brazilian company becomes established in the
manufacturing of a product, either for export or use within Brazil, further
imports of that product becomes difficult. In the instance of solar energy
or photovoltaics, once Brazil successfully manufactures its own panels,
foreign companies would have to switch to individual components, for
example, just the wafers or other supportive equipment.
At the present time the U.S. Department of Commerce estimates that there
are about 50 companies manufacturing solar energy related products in
Brazil, Solarex being the largest. Solarex is working in Brazil on a joint
venture with the Brazilian Government to establish the manufacturing of
solar related products in that country. Economic conditions have also had
a negative effect on imports to Brazil.
NORTHEAST BRAZIL
The Northeast section of Brazil, which accounts for an estimated 19.6%
of the total land, 37.5% of the housing, and 38.9% of the population is an
-15

extremely poor area. The region
populated urban centers along the
of the region. The urban centers
of the total population of Brazil
Brazil is widely dispersed with a
five inhabitants per kilometer.
can be segmented between the highly
Eastern Coast and the interior portion
account for 17.4 mfi 0 on people or 14%
The interior population of Northeast
population density ranging from one to
In this region, sources of electric power are very limited. Many
rural communities are located more than 15 kilometers from electric powergrids, making grid extension extremely costly. Hydraulic energy and wind-
fall power are also in short supply. The Northeast region is extremely
arid and the average wind velocity is only 50% of that required to make
windmills economic and efficient.
Internal combustion generators are capable of providing needed energy
in a few areas near large towns, however the transportation of fuel, lack
of spare parts and repair facilities preclude their adoption in outer
rural areas. The cost of a generator, fuel and maintenance could amount
to U.S. $1000 per annum to opera-te.
There is a large hydroelectric plant under construction in the Northeast
which is scheduled for completion in 1983. When completed the new plant
will only help provide the needs of those in the populated urban and nearby
rural areas. The high cost per inhabitant in outlying rural areas appears
to be the main obstacle. Few electric grid lines do exist throughout the
vast rural area of the Northeast. However, rintil Brazil can establish a
steady economy, those living over 10 KM from the main electricalpower
lines, in low inhabitant areas, will remain without electric power.
D-16
:i 5

r
APPENDIX E
ECONOMICS OF PHOTOVOLTAIC AND DIESEL GENERATOR SETS
In order to assess the economic advantage or disadvantage of photovol
systems in cottage industry applications, the photovoltaic system must be
compared with its product substitute, the diesel generator.. The parameters
of these stand-alone power systems used for this assessment are given in
Exhibit E1.
Exhibit E1
STAND ALONE POWER SOURCE PARAMETERS
Photovoltaic Systems:
Costs: $10/Wp Balance of System-^ $13/Wp System
$ 3/Wp Modules
OperatingConditions - 1 Wp produces 4.5 WH/day
- Battery & Inverter Losses Z 20%
-► $131Wp or $43/WcDiesel Generator Systems
Cape J ty Cost Cost/WC
7 KW $ 6.000 $0.86/Wc
11 KW 7,000 0.64
15 KW 8,000 0.53
30 KW 10,000 0.33
45 KW 13,000 0.29
50 KW 14,000 0.28
60 KW 16,000 0.27
75 KW 18,000 0.24
90 KW 19,500 0.22
Fuel Consumption 8.45 x 10 -5 gallons/Wc-hr
0.37 gallons/Wc-yr (4380 hrs/yr)
E-1
The cost of a photovoltaic system was assumed to be:
Module Cost $3/Wp (Peak Watt)
Balance of System $10/Wp
The $3/Wp Module Cost is the ARCO Solar estimate for 1983 and the $10/Wp
Balance of System Cost is the medium range of current Balance of System
Estimates of $6 - 13 Wp.
Given these estimates, it is necessary to convert the photovoltaic
cost based upon peak watts to cost based on capacity watts. In a good
site, 1 Wp of n`• ' ultaic modules will generate about 4.5 WH of energy
per day. Assuming battery and inverter losses of 20%, this leaves 3.6 WH
of energy 1 p"'t for consumption. Assuming that the power load is even
throughout a 12-hour day, it is found that for every 1 Wp of system there
is .30 capacity watts of power. As a result, if the photovoltaic system
cost is $13/Wp, it costs $43/Wc. This was determined by the following formula:
4.5 Wh/day x 20% loss = 3.6 Wh/day
3.6 Wh/day ; No. of hrs. of operation : Conversion Factor
Cost per Wp -r Conversion Factor = Cost per We
Because of the modularity of the photovoltaic system, this cost of
$43/Wc remains constant even with increasing capacity size of the photovoltaic
system. With diesel generators on the other hand, there is some economy of
scale as the cost per We of the generator system decreases with size. A
comparison of the system cost is shown in Exhibit E2.
As can be seen from Exhibit E2, the initial system cost between
photovoltaic systems and diesel generator systems are drastically different.
However, in maki^c , -a,i economic design between these two systems, the
life cycle cost of Ua systems must be considered. This is the discounted
cost of operatinq and maintaining the system over the desired lifetime.
For the purpose of this study, the lifetime is assumed to be 20 years.
E-2
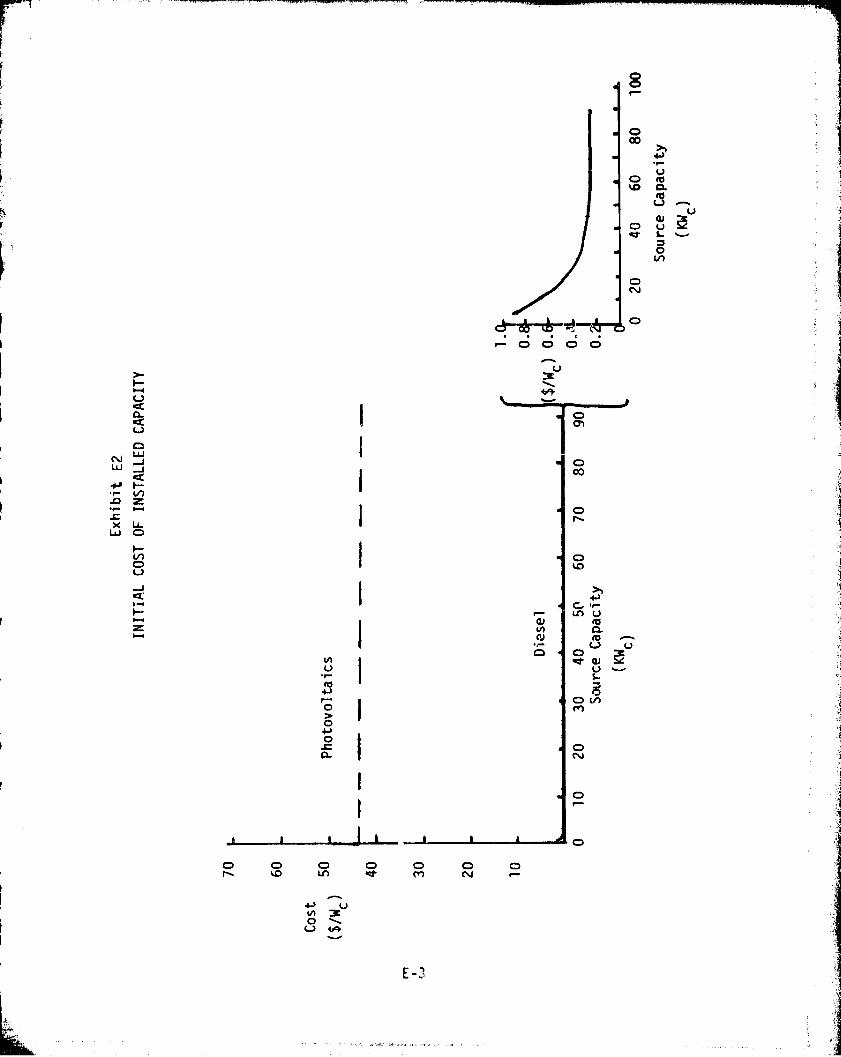
A
I
I
I
II
u^ro
u
oOOtCL
O O O Oh 10 In
4-` uV) 3OfJ VR
H
c.^Q
QVcm
NWWJJQ
V)
Lx tiw O
NOva--C
F--
Z
uO ^^u a
ua u Sicct L
ON
ON
O
r- O O O O
u3
CD
lJ1 ^
Oco
Oh
Ot0
G rr— In u41 ^OCl0 0
uL
CD Nr^
ON
Or
O
O O OM N r--
E-3
For the diesel generator set, the costs to be considered over this
time period are:
I. The initial system cost and installation cost
2. Fuel cost
3. Maintenance cost
4. Diesel engine replacement every 5000 hrs.
For the photovoltaic system, the costs to be considered over this
time period are:
1. The initial system cost and installation cost
2. Maintenance cost
3. Battery replacement every 1800 cycles.
To make an estimate of the life cycle cost, it was assumed that the
system would power a constant load 12 hours a day for 365 days a year. Taxes,
credits and subsidies would vary by country and have been ignored for the
purposes of this report. Also, these would not be considered if the system
is a government purchase.
Diesel Generator life Cycle Cost
Initial System Cost
- Equipment Cost - See Exhibit E1.
- Installation Cost - $900
Fuel Cos t
- A diesel generator will consume approximately .37 gal/Wc-yearof fuel under the assumed load pattern
Using the formula:
Present value ofan annual cost = i (1 - - 1 + X)x for 20 years. (1+0
where i is the discount rate
The life cycle cost of fuel is:
Wx F .37 + ic T— (1 - (l +---Y-)
where F = cost of fuel per gallon
i = discount rate
We = capacity of generator in Watts
E-4
11^t!i`•

Maintenance Cost
Maintenance Cost on a diesel generator is claimed to be $700/yr. Over
the life of the ;4enerator, the discounted value of this cost is:
Discounted Maintenance Cost n 700 (1 - . I -)(1+i)
Replacement Cost
The lifetime of a diesel generator is approximately 5000 hrs. of operation
before the engine needs to be overhauled. If the generator operates fc,r 12 hours
a day 365 days a year, it receives 4380 hours of operation per year. As a
result, it will be assumed that the diesel engine will be replaced every year.
The diesel engine is approximately 60% of the initial system cost. The life
cycle cost of replacement is:
Life cycle _ .60 (Initial sy s tems c ost 1replacement cost - i
(1 - ____ O )
(1+i)
Combining the results above, the life cycle cost of the diesel generator
when initial system cost is We x CWst and CWst
is the system cost per We is:
c c
Life Cycle Cost of Diesel Generator (LCCDG)
(W c x
Cos tl r 0 6 (1 _ 1 +
1 + ^ 11+____`20
( 1 +1)
( i)
0)
(1 i)
For i =5% LCCDG = We ( 7.48 Cost—t- + 4.98xF) + 8,724V_
'
10% LCCDG = We (6.11 CCo^st + 3.52xF) + 5,959
c
15% LCCDG = We (4.76 C + 2.69xF) + 4,382W-
20% LCCDG = We (3.92 C
+ 2.17xF) + 3,409V_-
E-5
The life cycle cost of a diesel generator for various fuel costs at
various capacities at different discount rates Is shown in Exhibit E3. For
a photovoltaic system to be competitive, the life cycle cost of the photo-
voltaic system must be less than that of the diesel generator.
E-6
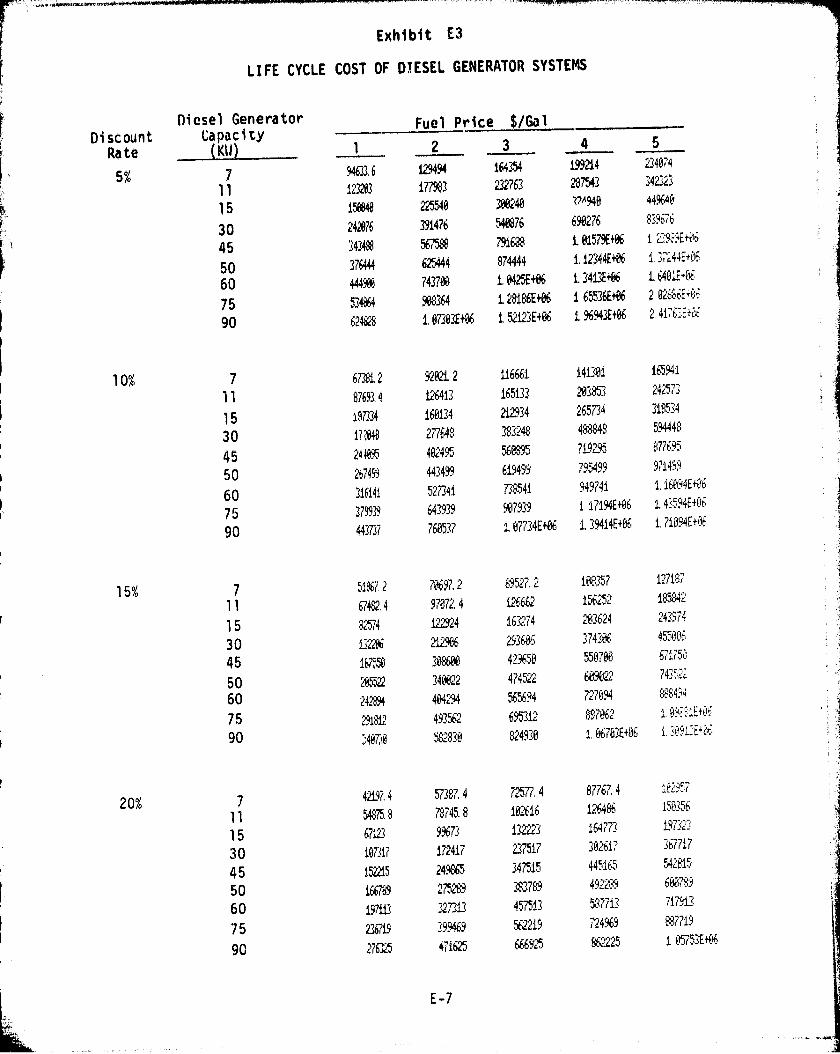
Exhibit E3
LIFE CYCLE COST OF DIESEL GENERATOR SYSTEMS
Diesel Generator Fuel Price $/GalDiscount Capacity 2 3 4 5
Rate (W 1
5% 7 WE 6 1 494 164354 !99214 234@74
11 123203 177983 232763 287543 34&
15 550840 225540 300240 27'`948 44960
30 242876 391476 X876 690276 839676
45 343488 567588 7916,88 1.01579E+06 i 2 .;EQ0'
50 376444 625444 874444 1.12344E+866 17244Et@6
60 4449NN 743700 1. @425E+©6 13413E+06 16401E+E!E
75 534864 9N8364 i 28186E+86 i 65536E+06 2 @2686E,r
90 624828 1.@7303E+06 1, 552123E+@6 i 96943E+06 2.417 636+ks
10% 7 673812 92@212 116661 141381 165941
11 87693.4 116413 165133 213853 242573
15 07334 160134 21'034 265734 318534
30 17 ?048 277648 ?83248 488,848 5.44448
45 24 W, 402495 56@895 719?95 877695
50 267499 443499 615499 795499 97149r^
60 316141 527341 M941 949741 1.16@94E+1'6
75 379939 643939 907939 1 :i NE+N6 143`-94F6"
90 443737 760537 1.07734E+06 139414E+06 171094E++:^6
15% 7 51867.2 70697.2 89527.2 08357 127187
11 67482.4 97072.4 126662 156252 185842
15 8,574 1229224 16=k74 203624 243974
30 137206 212906 293606 3743@6 4550@6
45 187 1 '.k" 429650 5507061 67175
50 20,522 3022 474522 609022 7435'2
60 242894 4M294 565694 727094 8864'4
75 231812 493.562 69,532 897062' 1. !{:at'- E+^t
90 :407,21+ 552830 824930 1. @67833 416 1 'k!'a1 Ej^ir
7 42-47.4 57387.4 725,77, 4 87767.4 1NY17
20%11 54875.8 78745.8 IM16 12'6486 150356
15 67123 99673 B 223 164773 19732?
30 107317 172417 237517 302617 367°717
45 152215 24`.+865 347515 4451C°+ 542815
50 i66789 275<V 383789 49:2289 60078'a
60 197W 327313 45(513 587713 71M3
75 236549 399461 562219 724969 887719
90 2763`05 471625 666925 8 25 1 675--'14
E-7

Photovoltaic System Life Cycle Cost
Initial System Cost
- Equipment Cost - $43.00/Wc
Maintenance Cost
- Assumed to be $700 per year, equivalent to the diesel generatormaintenance cost.
Replacement Cost
- The batteries usually mist be replaced after 1800 cycles assuming
20% depth of discharge. Assuming that the batteries are cycled 365 times a
year. They must be replaced every five years. The cost of the batteries
is approximately:
We x 12 - where We is the capacity of the system and
batteries are assumed to cost $100 per KwH. Battery Replacement
cost is then given by:
Battery Replacement Cost = 6.00 x We ( +5 —I-^ 0 + ^)
(1 + 1) (1+0 (1+^)
Combining the results above, the life cycle cost of the photovoltaic system is:
For i =
Life Cycle Cost ofPhotovoltaic System
(LCCPV) = We (43 + (1+i) +( 6+^ ) +(l+ ) + 7- 0 - 1+
-- )
5% LCCPV = 44.20 We + 8,724
10% LCCPV = 43.72 We + 5,959
15% t.CCPV = 43.42 We + 4,382
20% LCCPV = 43 .25 We + 3,409
E-8

These results are compared with results for diesel generators in
Exhibits E4, E5, E6, and E7. It can be seen that at the current time for
systems above 7 KWC the photovoltaic system is uneconomical. To find theconditions necessary for breakeven, the LCCDG is set equal to LCCPV.
DiscountRa to
Cost
5% 44.20 : 8.48 Of + 4.98xF
Cost + 3.52xFC
15% 43.42 = 4.76 C- - + 2.69xF
c
20% 43.25 = 3.92 C- - + 2.17xF
c
The fuel price at which photovoltaic systems would be competitive is
found by:
DiscountRate
5 % F = 44.20 - 8.48 Co s t /Wc
10% F = 43.72 - 6.11 Cost/Wc
43.42 - 4.76 Cost/Wc
20% F = 43.25 - 3.92 Cost/Wc
.17
These results are shown in Exhibit E8.
10% 43.72 = 6.11
E-9
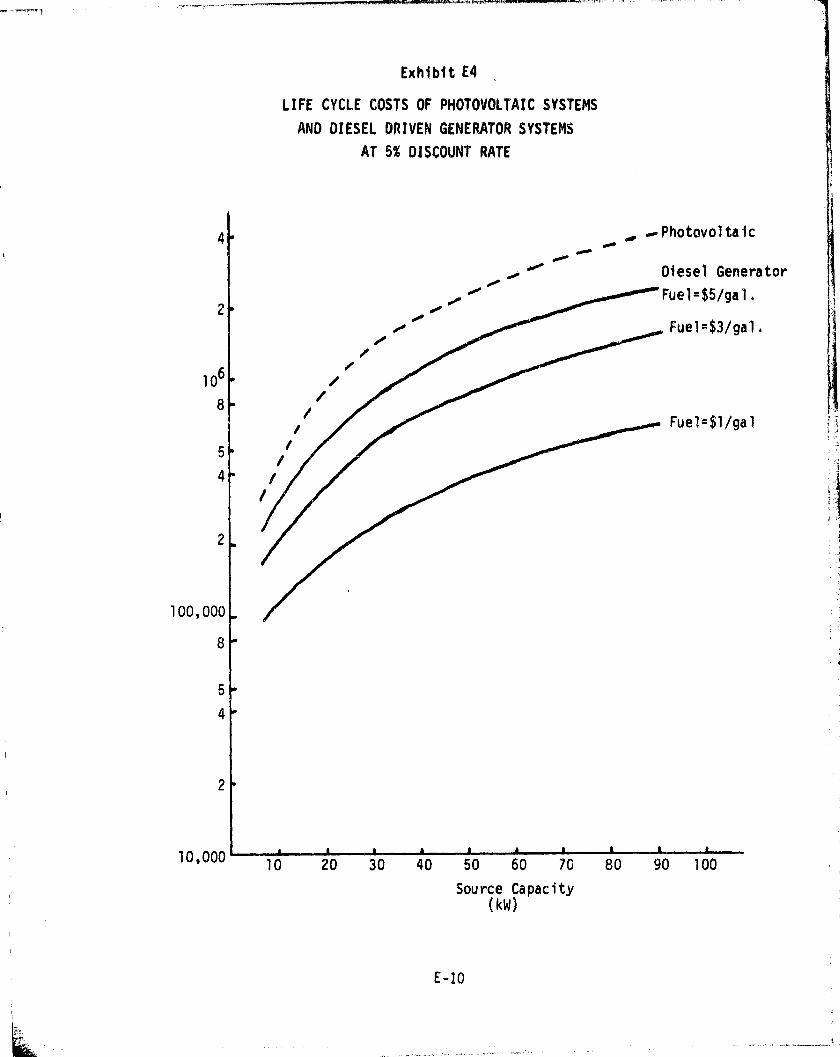
.r Photovoltaica rsr Diesel Generator
.0p Fuel-$5/gal.sa ^ Fue1-$3 /gal.
4
2
rFuel=$1/gal
100,000
8
5
4
2
10
8
5
4
2
_I
Exhibit E4
LIFE CYCLE COSTS OF PHOTOVOLTAIC SYSTEMS
AND DIESEL DRIVEN GENERATOR SYSTEMS
AT 5% DISCOUNT RATE
10,00010 20 30 40 50 60 70 80 90 100
Source Capacity(kw)
E-10

Exhibit E5
LIFE CYCLE COSTS OF PHOTOVOLTAIC SYSTEMS
AND DIESEL DRIVEN GENERATOR SYSTEMS
AT 10% DISCOUNT RATE
p,
5
4
Life Cycle 106Cost
8
5
4
2
100,000
8
4
Photovoltaic0010
i 3
Diesel Generator
^ Vii Fuel-$5/gal.
Fue1=$3/ga1.
Fuel =$1/gal.
2
10,00030 40 50 60 70 80 90 1
Source Capacity(kW)
E-11
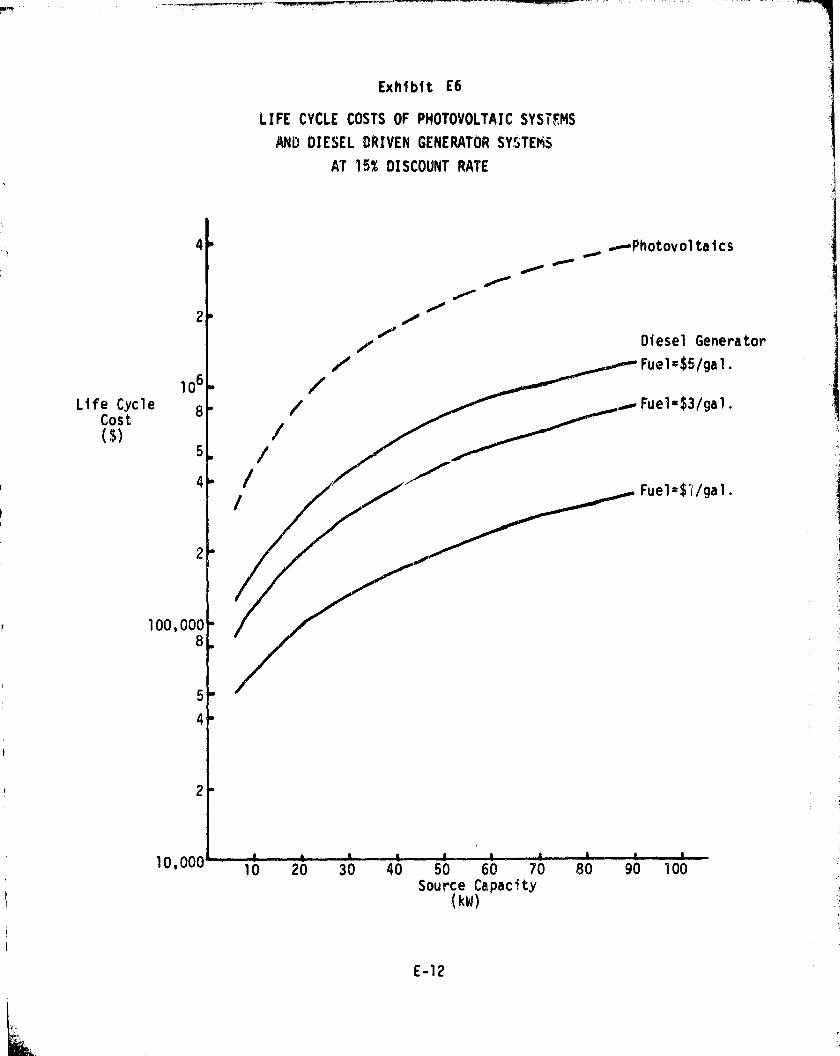
Exhibit E6
LIFE CYCLE COSTS OF PHOTOVOLTAIC SYSTEMS
AND DIESEL DRIVEN GENERATOR SYSTEMS
AT 16% DISCOUNT RATE
4
2
106
Life Cycle 8Cost
t$)5
4
2
100,0008
5
4
Photovoltaics
r/ Diesel Generator
,3 ^-- Fuel m $5/ga 1.
Fu el = $3/gal .
eFuel-$I/gal.
2
10,000 80 90 10010 20 30 40 50 60 70Source Capacity
(kW)
E-12

Exhibit E7
LIFE CYCLE COSTS OF PHOTOVOLTAIC SYSTEMS
AND DIESEL DRIVEN GENERATOR SYSTEMS
AT 20% DISCOUNT RATE
4 .Photovoltaic
rr '^
2/
'00 Generator
Fuel-$5/gal .
00
Fuel=$3/gal.
Fuel=$1/gal.
106
8
Life Cycle
5Cost
4
2
100,00
8
5
4
2
10, 0 80 90 100
Source Capacity(W)
E-13
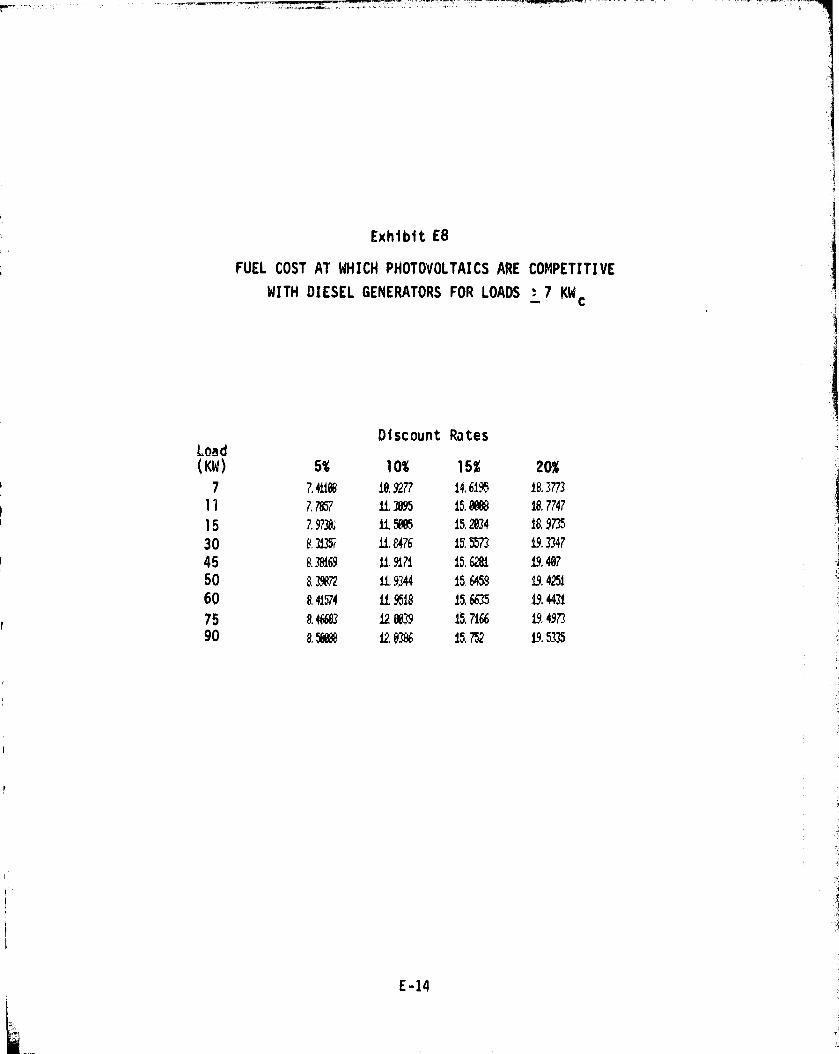
Exhibit E8
FUEL COST AT WHICH PHOTO'VOLTAICS ARE COMPETITIVE
WITH DIESEL GENERATORS FOR LOADS ? 7 KWc
Discount RatesLoad(KW) 5% 10% 15% 20%
7 7.41188 18, 9277 14,6195 18.377311 7.7857 113895 15.00 18.7747
15 7.9738 ii. 5885 15.2834 19735
30 8.315( 11.8476 i5 5573 19.3347
45 8.38169 119171 15.62Ri 19.48750 & 39877 li. 9344 15.6458 19.425160 941574 li 9518 15, 6635 19.4431
75 8.46683 12 8839 15,7166 19.497390 8, 58888 120386 15,752 19.5335
E-14
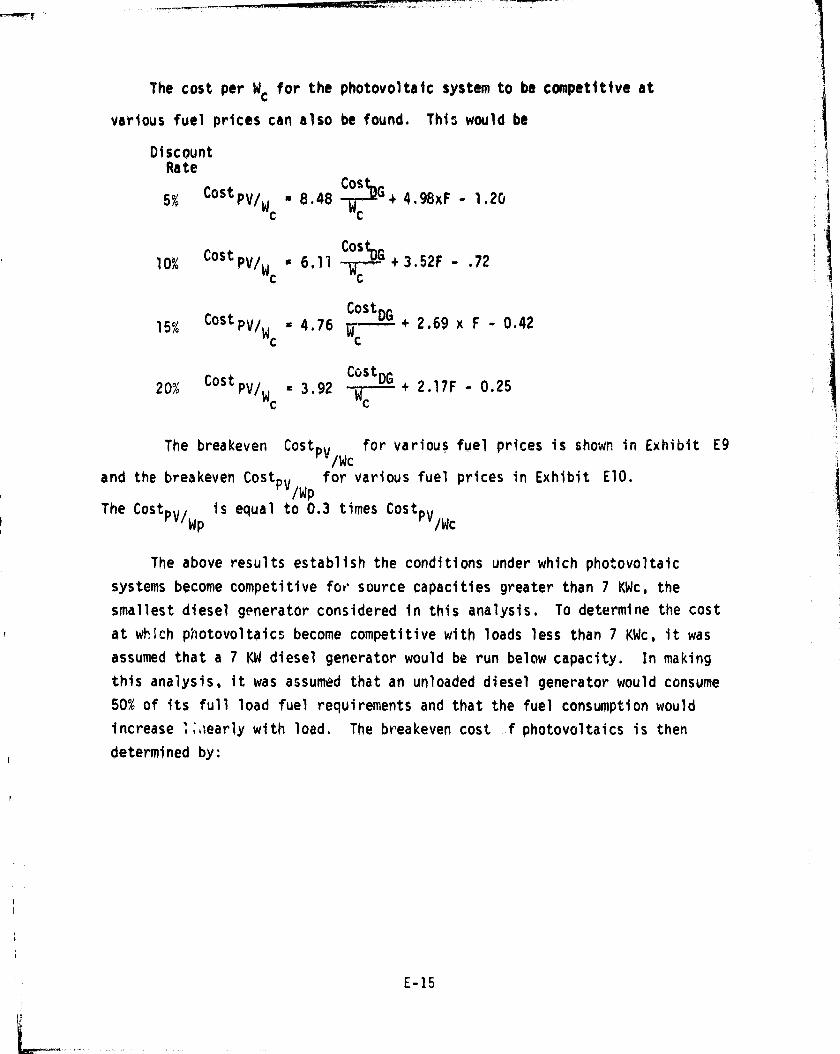
The cost per We for the photovoltaic system to be competitive at
various fuel prices can also be found. This would be
DiscountRa to
5 Cost PU/W 8.48 COS
G 4.98xF - 1.2Gc c
10% Cost PV/ W e 6.11 Cos-^ + 3.52E - .72c c
CostCostDG
151 PV/ = 4.76 W + 2.69 x F - 0.42
c c
Cust
20%Cost PV/W a 3.92 W DG + 2.17F - 0.25C
c
The breakeven Cost., for various fuel prices is shown in Exhibit E9/Wc
and the breakeven Cost PVrWp
for various fuel prices in Exhibit E10.
The Cost PV/ is equal to 0.3 times Cost PVWP /Wc
systems become competitive far• source capacities greater than 7 KWc, the
smallest diesel generator considered in this analysis. To determine the cost
at which ph otovoltaics become competitive with loads less than 7 KWc, it was
assumed that a 7 KW diesel generator would be run below capacity. In making
this analysis, it was assumed that an unloaded diesel generator would consume
50% of its full load fuel requirements and that the fuel consumption would
increase $;,aearly with load. The breakeven cost f photovoltaics is then
determined by:
E-15
hm.
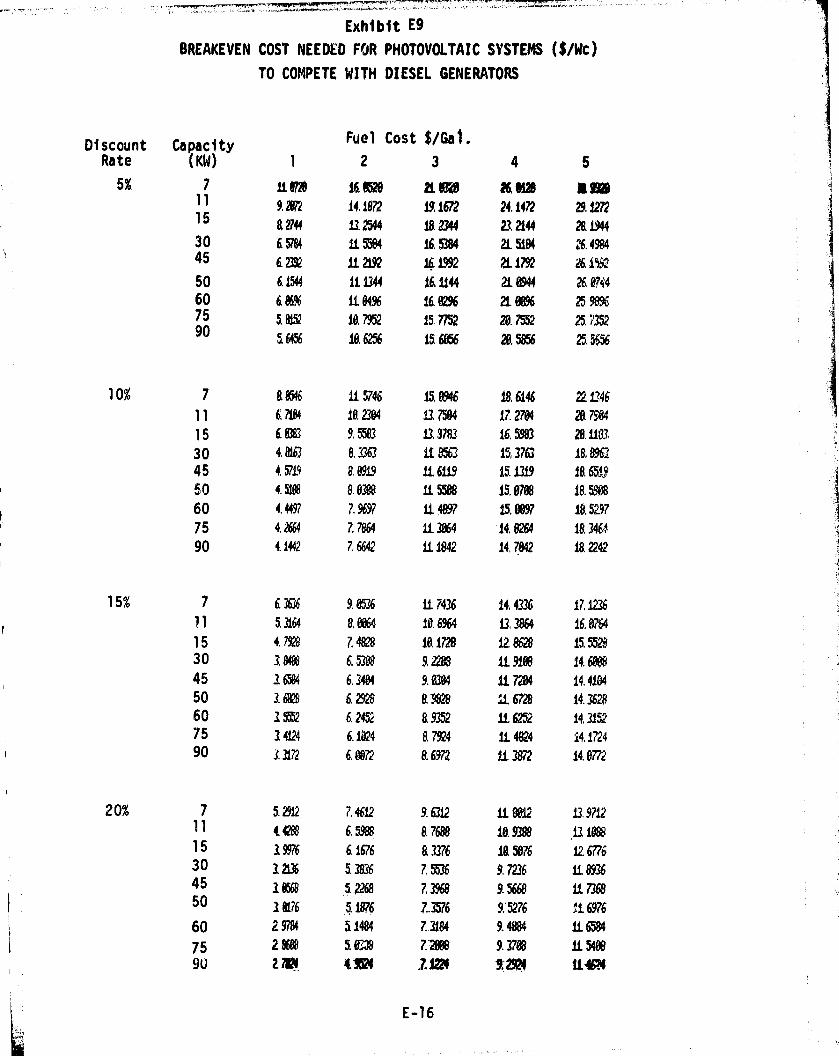
Exhibit E9
DREAKEVEN COST NEEDED FOR PHOTOVOLTAIC SYSTEMS ($1Wc)
TO COMPETE WITH DIESEL GENERATORS
Discount Capacity Fuel Cost $/Gal.
Rate (KW) 1 2 3 4 5
5% 7 11. ra 16 w 21.4lI B 16 so lain 11 9, 2872 14.1812 !91672 24.1472 29.127215 8 2744 8,2544 2 2344 2-12144 28194430 65784 11. 55$4 16.5384 21. 5184 26.4984
45 6 zm 11. 2192 16.1992 2L1792 26 i550 61544 111344 161144 21. elm 26,074460 6 Bpi It 8496 1606 21. N% 25.%%75 5 am !8.7952 15.7752 28.7552 25 M290 g 6456 18.6256 Ism 20,50 2556%
10% 7 88546 115746 15.8946 IR 6146 22134611 6 7184 18 2384 13.7584 17.2784 28 798415 6 m 9, 5583 13.9783 16.5983 20. 1183,30 4.8163 8.3363 it 8563 .15.3763 18.896345 4 5719 8, 8919 1i. 6119 15139 18 651950 4.514 8.83N it 5m 15.8788 18.5060 4.4497 7.9697 ii e'7 15.8897 18.521775 4, 2664 7.7864 A 3864 14, 8264 18 3464,90 41442 7.6642 it 1842 14 7842 192242
15% 7 6.36 6 9.8536 11.7436 14.4336 17.1236
i 11 53164 8.8864 18.6964 113864 16.876415 4.7928 Z 4828 181728 1280 15 X2830 3.8488 6,50 9.2288 11. 9188 14.6845 3 6584 6.3484 9.8384 ii 7284 14.418450 16B 6.2928 8 ?4128 A 6m it 362860 152 6.2452 8 9352 11.6252 14.315275 14124 6.1024 8 7924 tt 4824 44.1724
i 90 3.3172 6.8872 8.6972 it 3872 14.8772
20% 7 5.29!2 7.4612 9.6312 11 X12 i3, 971111 4X88 6.5988 8.7686 18.9388 13188815 1996 61676 8 3376 ifl 5876 12 677630 3 m 53836 7.5536 9.7236 11893645 3 w X68.5 73968 9.50 tt 736950 16176 51876 7.3576 9'5276 116976
j 60 2979 11484 7.3184 9.4884 1t 6584
` 75 2 8688 5 08 7.2888 9.3788 11548690 2 7 !1 4W4 .l.la 1-2'J21 11.4p
E-16
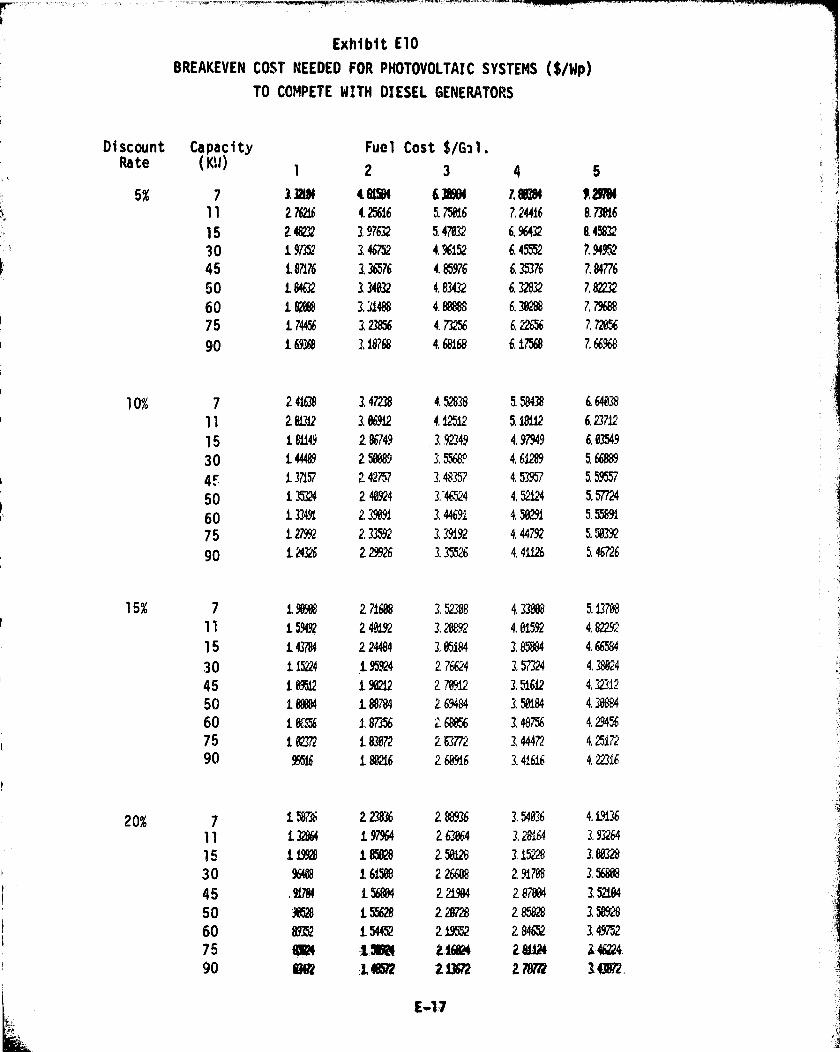
10/
15%
7
15
30
4F
50
60
75
90
7
11
15
30
45
50
60
75
90
20%
711
15
30
45
50
60
75
90
i,I
Exhibit E10
GREAKEVEN COST NEEDED FOR PHOTOVOLTAIC SYSTEMS ($/Wp)
TO COMPETE WITH DIESEL GENERATORS
Discount Capacity Fuel Cost $/Gal.Rate ( KU) 1 2 3 4 5
5% 7 l ay 418M i Im 188381 91 7918!
11 2 M6 4.25616 5.758!6 7, 24416 8.73Bi6
15 2 48232 3, 07632 5.47832 6.96432 945832
30 19'1352 3 46752 4.96152 6.45552 7, 94952
45 187176 136576 4.85976 6.35376 7.84776
50 L 84632 134032 4.83432 6.32832 7.82232
60 L 82888 3.1!488 4.88888 6, 38288 7.79688
75 174456 12346 4.73256 6.226% 7.72856
90 169368 3. 18768 4,068 6. i756B 766_-68
^f
ejrt
i24108 147138 4.52838
2 6312 106912 4.12512
i Bii49 2 86749 3,92349
144489 2 588B9 3. W.
137157 2 427 57 3,48357
135324 2 48924 1'46524
i 33491 2 39691 3,4469-1
127992 2.33592 3.39192
124326 2 29926 3.35526
i 98989 2710 3. M-9
L 59492 2 48191 3.28892
143784 224484 3.15184
115214 195924 276624i 89512 i 962!2 2.70512i 88884 188784 2 69484
i 8x596 1, 87356 2.656i 81;71 183872 2 63712
99516 1=6 2 68916
5,58438 6.6038
5, i81i2 623712
4,97949 6 83549
4.61289 5,6m
4.5395 5,595F
4, 52114 5,57724
4.58291 5, 55891
4.44792 5.58392
4,41Z 5.46726
4,330 5.13788
4.01592 4, 821.-1
3, 854 4.684
3 57324 4,38@,24
3,R612 4,32-112
3. 50184 4 38884
3.48756 4,29456
-1, 44472 4 25172
3.41616 4,12316
i 587% 2 23B36 288936 3.54836 4. V06
i WA 197964 2 OKA 3.28164 3.932164
i 19928 i 8582,8 2500 3.15228 188328
%w 16W 2 26608 291708 1 56
.91704 156884 2 am 2870 152184
WA 150 2 207a 2 85818 3.56928
89351 154452 2 !9552 284652 149732
w 13!181'! t !6824 2 81124 i 46224.
OR .i. 4115T1 2 W2 2 Am 1402;
E47
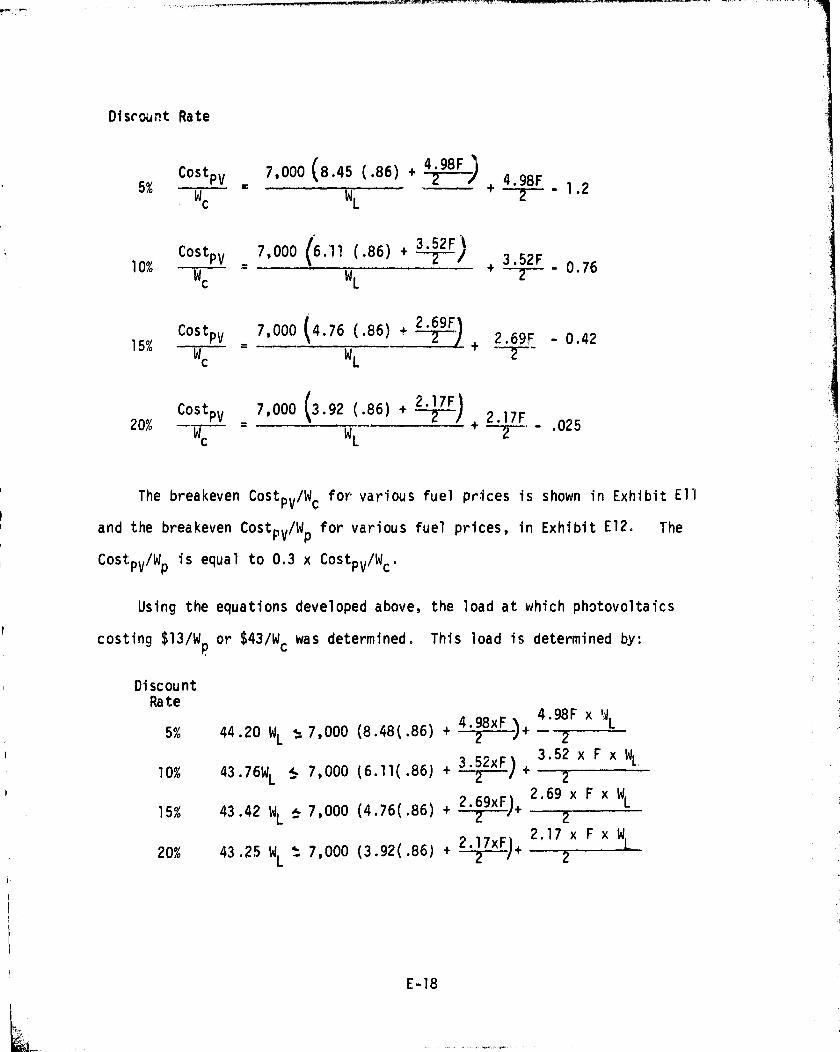
Discount Rate
5%CostPV
6 7,000 8.45 (.86) + 4-^--)
+ 4.98F _ 1.2
We L —
CostPV - 7,000 (6.11(.86) +3.52F10% W - W + — 2-- - 0.76
c L
Cost
7,000 (4.76 (.86) + ^2--^6-9.^F%15 % P V + 2.69F - 0.42W e WL
CostPV - 7,000 3.92 (.86) + 2-^—, + 2.17F.20
We WL -- --- .025
The breakeven Cost PV/Wc for various fuel prices is shown in Exhibit Ell
and the breakeven Cost PV/Wp for various fuel prices, in Exhibit E12. The
CostPV /Wp is equal to 0.3 x CostPV/Wc'
Using the equations developed above, the load at which photovoltaics
costing $13/W p or $43/Wc was determined. This load is determined by:
DiscountRa to
4 98xF \ 4.98F x '4L
5% 44.20 WL 7,000 (8.48(.86) + 4--)+ -^-----3 52x 3.52 x F x WL
10% 43.76WL 7,000 ( 6.11( .86) + = 2—) + --T
2 69xF2.69 x F x WL
15% 43 .42 WL 7,000 (4.76(.86) + —--^+ —217xF^ 2.17x FxWL
20% 43.25 WL = 7,000 ( 3.92 (.86) + —4-- + --------
E-18
LL
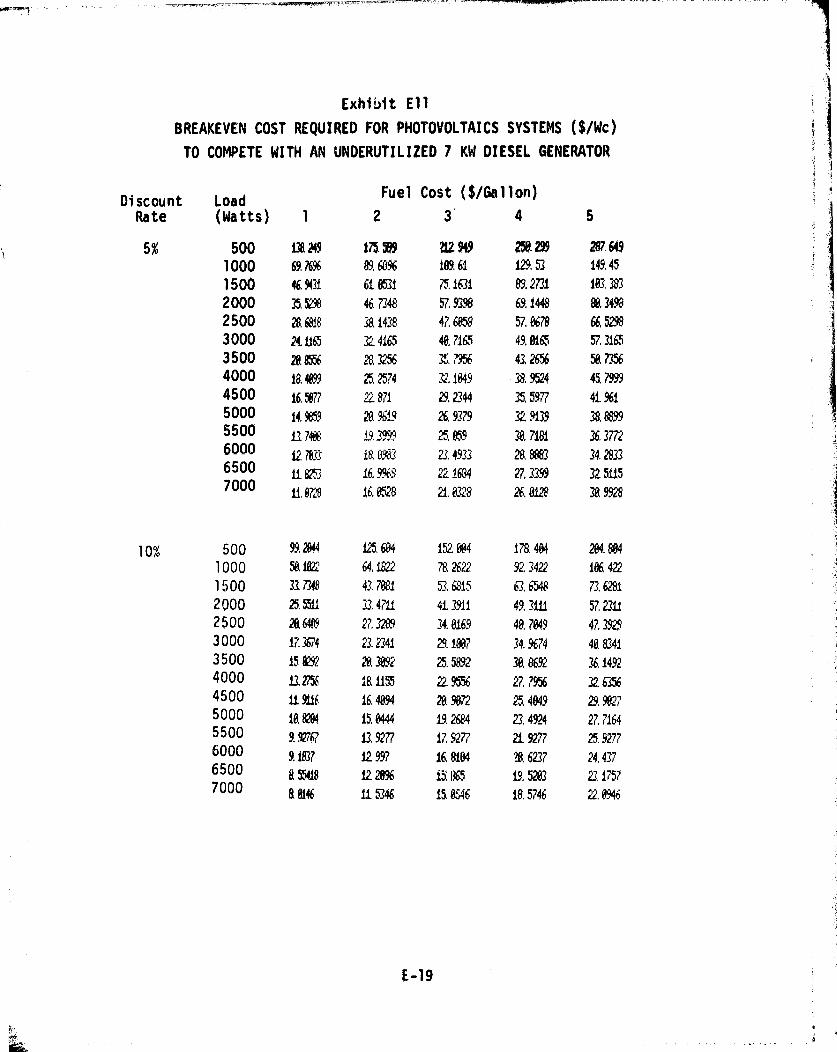
Exhibit Ell
BREAKEVEN COST REQUIRED FOR PHOTOVOLTAICS SYSTEMS ($IWO
TO COMPETE WITH AN UNDERUTILIZED 1 KW DIESEL GENERATOR
f
Fuel Cost ( $/Gallon)Discount Load
Rate (Watts) 1 2 3' 4 5
5% 500 138, 249 115.599 212 %9 2%299 287,6491000 69.1696 89,6a% in 61 0.53 149.45
1500 46.9431 610531 7,5.1631 89.2731 103, 383
2000 35.52% 46.7348 57,9398 69.1448 8a 3498
2500 78.6818 38,1438 47, 6058 57.6678 66.529`93000 24. U65 324165 40,7165 49.0165 57,310
3 500 2a ON 2a 3256 z 7956 43,26% 58.7356
4000 18. 48.99 25.2574 32.1049 138. 9524 45.7999
4500 16.5877 22.871 2.244 35,5977 41961
5000 i4. W 28.96±-9 26,9379 32 9139 3a K995500 13.1488 +931Q99 25,059 30.7181 36, 37726000 12 rs3 i8. M3 23,49-33 2a 8883 34.28336500
118253 16.9963 2216`-94 27-7399 32 51151000
u. @0 1h 8528 a. 0328 26. &N 38.9928
10% 500 9y 2844 125.604 152.004 178.404 204,804
1000 50.1022 64,1822 78.2622 92.3422 106,422
1.500 317348 43.7881 26815 63.6548 73.6281
2000 25.5511 33.4711 4139ii 49.3111 57,2311
2500 20 W. 27,3289 34.0169 40,1049 47, 3929
3000 173P 23.2_741 29,1007 34.9674 40.8341
3 500 15 N292 2a 02 25.5 2 30.8692 36.1492
4000 13. BY 181155 22.9556 27.7956 32.63%4500 it 9iif 16.4094 20.9072 25 4049 29.90275000 10.8284 15.0444 19.2684 23,4924 27.71645500 9 RV67 i3 9271 17.9277 21.9277 25-92776000 9,1837 12 997 16.8104 V. 6237 24.43376500 a 5418 122096 ii, 10 19.5203 2.17571000 a 9146 115346 15.8~;46 18.5746 22, 0446
E-19
rte_
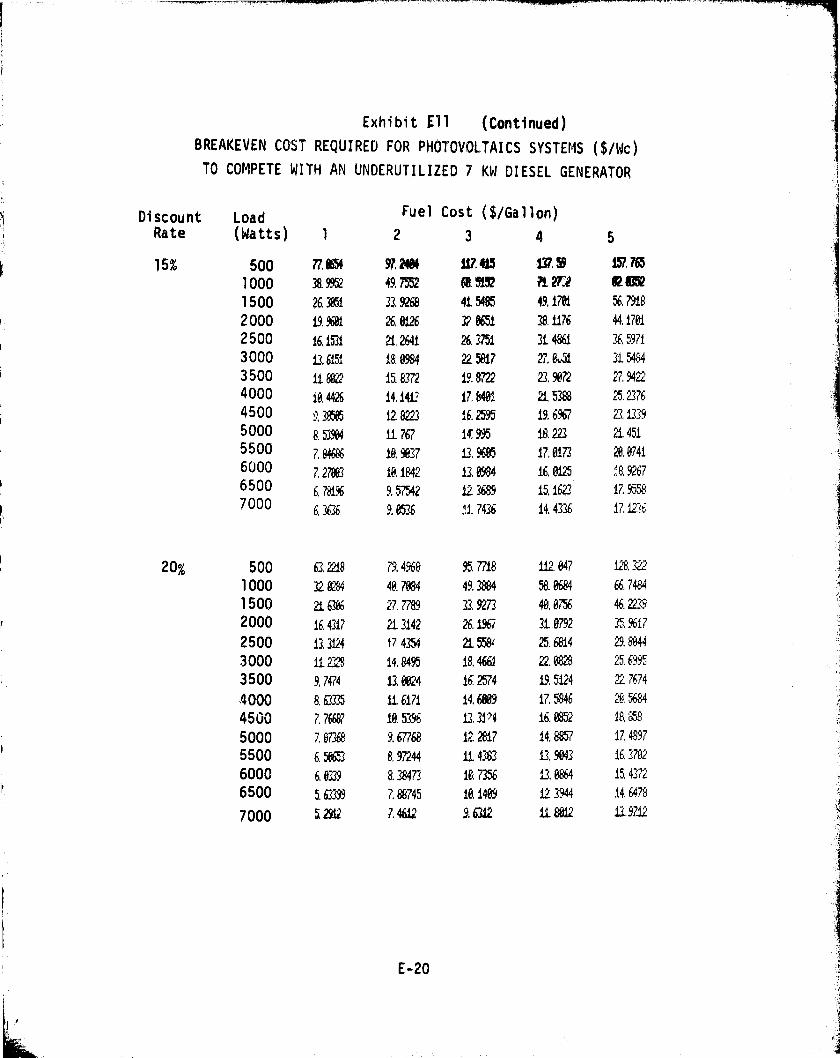
Exhibit .Ell (Continued)
BREAKEVEN COST REQUIRED FOR PHOTOVOLTAICS SYSTEMS ($/Wc)
TO COMPETE WITH AN UNDERUTILIZED 7 KW DIESEL GENERATOR
1 Discount Load Fuel Cost ($/Gallon)
Rate (Watts) 1 2 3 4 5
15% 500 77.0 97.2181 !17.415 13"1.59 15/.763
1000 38.9952 49.7552 t. 3152 A 2?rg 02 w
1500 26.385! 33.9268 415485 49,1781 56.7918
2000 19.9681 26, M 32001 38.1176 44,178i
2500 16,10 21,2641 26.3751 3i 4861 36, 5971
3000 13.6151 18.8984 2'1.5817 27.851 315494
3 500 ft 8822 15,8372 i9, 8722 23.9072 27.9422
4000 i8 4426 14,141 17, MR 215388 25.23764500 ;, 3M 12 822"5 !6.2595 19.6.967 23. 095000 8, N4 ii 767 14: 995 18.223 214515500 7.84685 18, 9037 L. 9685 17.8173 28,07416000 7.27883 18,1842 13.8984 16, M . "8.9267
' 6500 6.78196 9.57542 12 3689 15,1623 17.95587000 6,3636 9.8536 17436 14,4336 17.0:,
20% 500 63.2218 7y 4968 95.7718 112847 1a. W
1000 32 m 40.7884 49.3884 58.8684 66.7484
1500 2163006 27.7789 33.92n 40.8756 46. &?9
2000 16.4317 213142 26.1%-1 318792 35.9%17
2500 13.3124 17 4354 215581 25, 6884 29.8844
3000 11.2"'8 14.8495 18.4661 22 00 25.6995
3500 9.7474 13.8824 16.2574 19.5124 217674
4000 8.63335 116171 14, 6889 17.5846 'It 5684
4500 7.76687 19.53% DAN 16, 8852 18,19
5000 7, 67368 9.67768 12 2817 14, 8857 17.48`37
5500 6.5865 8, 97244 114383 13.9043 16.3782
6000 & 8339 8.38473 iR, 7356 13.88%4 15, 4372
6 500 5.099 7.88745 10.1489 12 3944 14,6478
7000 a 2912 7.45!2 96312 i1 Z2 13.9712
E-20
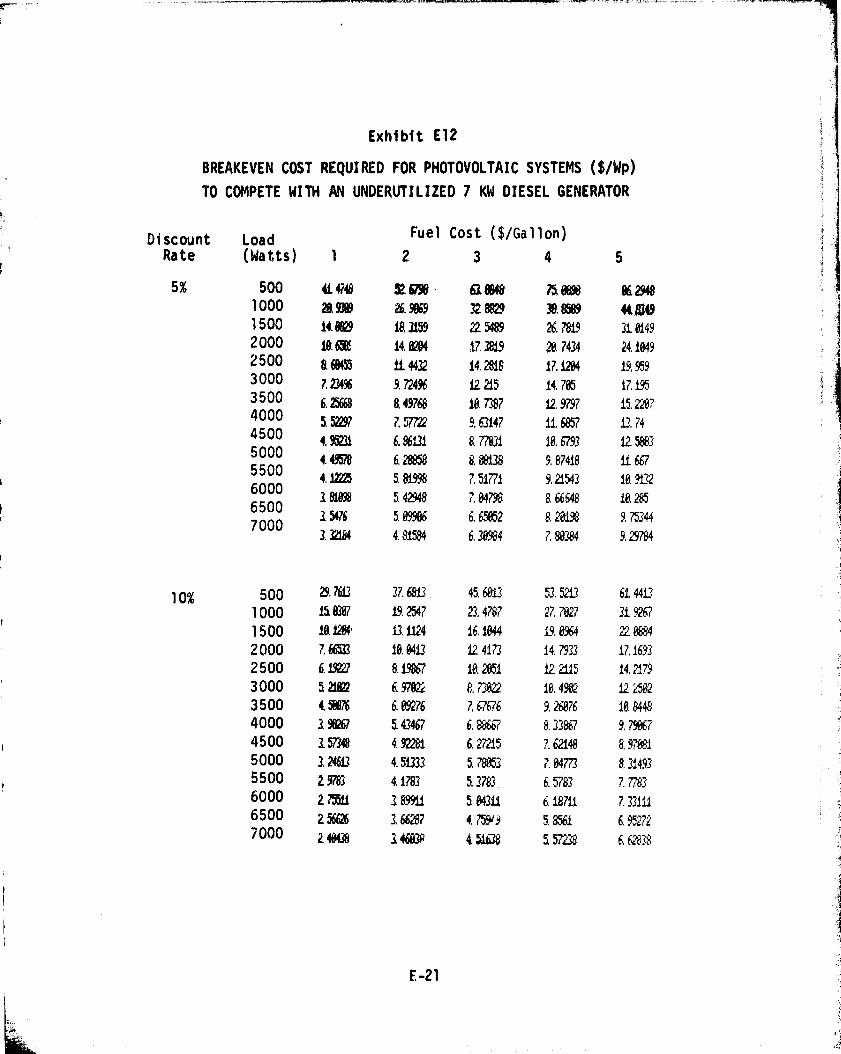
Exhibit E12
RREAKEVEN COST REQUIRED FOR PHOTOVOLTAIC SYSTEMS ($/Wp)
TO COMPETE WITH AN UNDERUTILIZED 7 KW DIESEL GENERATOR
Discount LoadFuel Cost ($/Gallon)
Rate (Watts) 1 2 3 4 5
5% 500 414746 V. 698 la 8848 Fa 8a98 8fi 29481000 28; 9349 X6.9869 3280 38. w 44M
1500 14.80 !a 3159 2250 26.7819 318149
2000 law 14, 8284 17.3819 28.7434 24.18492 500 a m 1t 4432 14.2818 17.1244 19.9593 000 7.234% 9.72496 12 215 14.785 171953 500 6.25658 a 49768 1,8.7387 129797 15, 22974000 g 5N 7, 57722 9.63147 11.6857 13.744500 t 9sm E 86131 R 77631 18.6793 12 58835000 4.49578 6.28858 8.88138 9.87418 11.6675500
4 I= 5 81998 751771 9, 21543 18, 906000
3 5.42948 7.847.98 8.66648 18.2856500
7 00015" 5.89 6 6.65k62 91,41% 9.75344132181 4.81584 6.38984 7,80384 9.29784
10% 500 29 7613 37.6813. 45.6813 53.520 61440
1000 1567 V. 2547 214787 27.7827 319267
1500 la 1281. 13.1124 16.1844 A 8964 22M
2000 7.660 18.8413 12 4173 14.7933 17.16932500 6.192`'7 S. !9867 18. ml i2 2115 14, 21793 000 52M fi 978 8.7:4 2 10.4902 12 k1w3500 459876 6.89276 767676 9.26876 18.84484000 196261 a 43467 6,38667 8.338e7 9.790674500 157,348 4, 92281 6.27215 7.62148 8, 9715000 3.29613 4.51333 5.78653 7.84773 8, 324935500 2 9783 4.1783 5 3783. 6.5783 7.71,836000 2l 189911 5:84311 6.18711 7.331116500 2 593 3.66287 4.759/9 5.8561 6, 952727 000 240438 1460 42638 fi 57',M 6.038
9--°
E-21
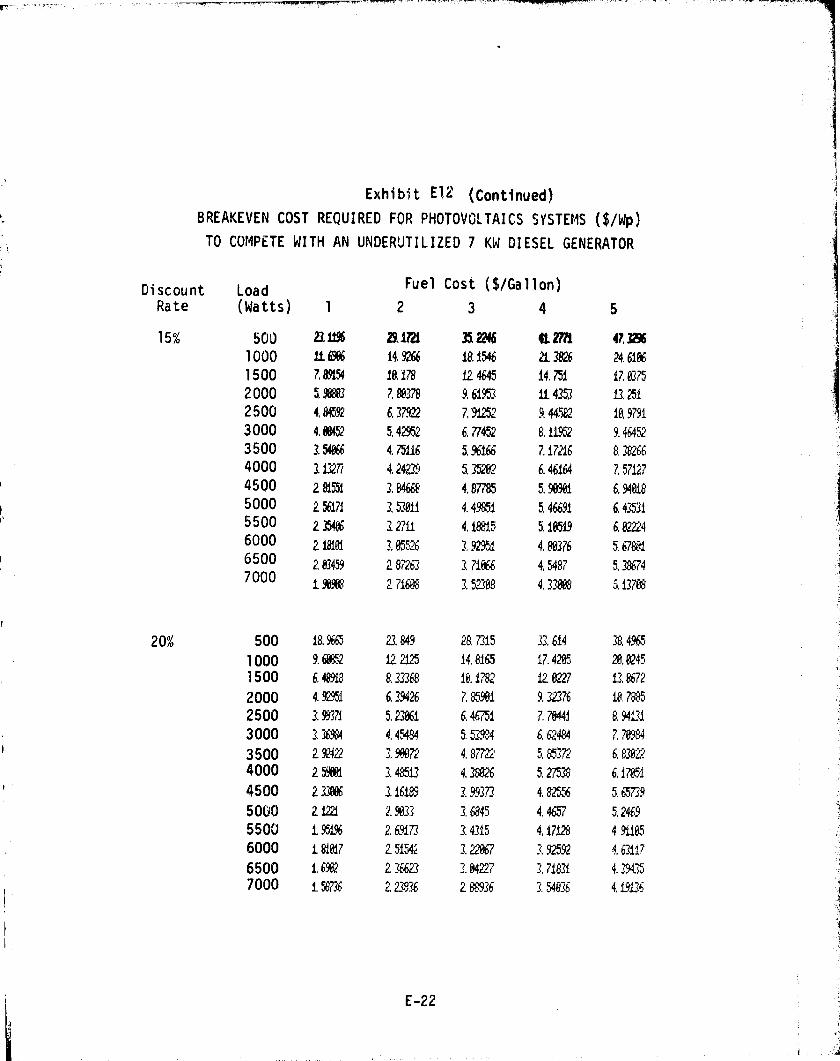
1
Exhibit E12 (Continued)
BREAKEVEN COST REQUIRED FOR PHOTOVOLTAICS SYSTEMS ( $/Wp)
TO COMPETE WITH AN UNDERUTILIZED 7 KW DIESEL GENERATOR
Discount LoadFuel Cost ($/Gallon)
Rate (Watts) 1 2 3 4 5
15% 500 22 im 2910 3a 2216 4t 2?h 47.06
1000 it 69@6 A 9266 181546 2t 3826 24.6106
1500 7.89!54 18.178 12 4645 14.751 17.6375
2000 5 98883 7.88378 9.6M A 4357 13,251
250U 4, 84592 6, 37922 Z902 9.44.582 16.9791
3000 4.89452 5.42952 6, 77452 8,11952 9.46452
3 500 3.54866 4.75116 5.96166 7,17216 8 XX6
4000 107r 4,2402 535202 6.46164 7.5712,'
4500 29152 3, 84668 4.87785 5.9@901 6.94818
5000 2 560 3,53@11 4, 401 5.46691 6,435315500 2 35466 33.2711 4, !8815 5.10519 6. @22246000 2 !8161 3.05526 3.92951 4,80376 5.678016500 20345.9 2 87263 3.71066 4.5487 5.3747 000
190968 2 716138 3.52-A 4.3.868 5. 0708
20% 500 18,90 23.849 28.7315 33.614 38,4965
1000 9.6m 220 14, 8165 17.4295 20.0245
1500 6.48918 8.33368 ih.IIV 12.0227 13.8672
2000 4.9295! 6.3942E 7. X9@1 9.32.376 10,7885
2500 199371 5.23061 6.46751 7, 76441 8.941.1
3 000 3.36984 4,45W 5.539'.4 6.62484 7.70984
3 500 292422 19067'2 4.87722 5 85372 6, 83@'x)
4000 2 596@1 3.48513 4.3£b26 5.27538 6,17851
4500 23M 116189 199373 4, 825~56 5.65739
50UO 212c1'1 2.9@33 3.6m,9 4.4657 5.2469
550U 1951% 2 6-9173 3.4315 4,17128 4.91105
6000 181017 2 51.°°42 -122067 3.92592 4.017
6500 16902 2360 3.04227 3, 71831 4.39435
7000 1 ga 2 23836 288936 3.54636 4.19136
E-22

or:
DiscountRa to
5%W 51,049.6 + 17 430 F aL - 44-Z _Z:
f
10 WL < 3^-743. +^6'F
a
15% WL < 28 655.2 + 9,415 F1.35 Fi
20% WS
23 598.4 + 7,595 F
The result of this analysis is shown in Exhibit E13. In looking at
these numbers it must be remembered that the photovoltaic system is economic
only if the load always remains below the loa4 determined by the equations
above. If any load growth above those determined is anticipated in the
near future, it would be more economical to buy the diesel generator system.
E-2.3
h

Exhibit E13
POWER LOADS UNDER WHICH IT WOULD BE MORE ECONOMICAL TO GUY A
PHOTOVOLTAIC SYSTEM THAN UNDERUTILIZE A 7 KW DIESEL GENERATOR*
Discount Rate 1 2 3 4 5
5% 16418 Wx, 45 2813, 49 ?527.15 4365 2. 74
10% 1176.21 1521,91 M K 2346,29 281?. 35
15% 964.0, i16G 14 1445.27 1.744.22 2865.18
20% 119.0 944.446 it* 17 07.98 .1628. 93
It was assumed that the diesel generater under no load would
consume 50% of its full load fuel consumption, and that the
fuel consumption would increase linearly with load.
E-24
APPENDIX F
CASH FLOW ANALYSIS
This appendix presents the cash flow analysis for a diesel and gas
driven generator system compared to a photovoltaic system. The conditions
user! in this analysis are current conditions fnd diesel fuel costs of
$1.42/gallon and gasoline $2.50/gallon. The photovoltaic system costs
$13/Wp. This is some of the data used to generate Exhibits 11, 12 and
13 of this report. Sample analyses are give;~ for 1200 W c , 2000 We and
4000 We systems.
F-1

LIFE CYCLE COST OF GAS GENERATOR AND PHOTOVOLTAIC ENERGY SYSTEM
Gas Generator
Capacity Load Hours of Operation(Watts) 4 hrs da 8 hrs da 12 hrs da
300 4,714 6,452 81191
1200 8,925 13,100 17,275
2000 13,089 18,193 23,298
2800 17,878 26,567 35,262
Photovoltaicsystem
300 4,504 7,405 10,364
1200 13,192 24,744 36,371
2000 20,868 40,247 59,627
2800 28,619 55,751 82,882
F-2

m
LIFE CYCLE COST OF A PHOTOVOLTAIC ENERGY SYSTEM
PhotovoltaicSystem
Capacity Load Hours of Operation
(Watts) 4 hrs da 8 hrs/day 12 hrs/day
3,000 30,557 59,621 88,696
4,000 40,247 79,006 '179765
7,000 69,316 137,145 20,1,973
15,000 146,834 292,181 437,527
30,000 292,181 582,873 873,566
45,000 437,527 873,566 1,309,604
60,000 582,873 1,164,258 1,745,643
90,000 873,566 1,745,643 2,617,721
100,000 970,463 1,939,438 2,908,413
F-3

r-- _ .
LIFE CYCLE COSTS OF A DIESEL GENERATOR SYSTEM
DieselGenerator
Capacity Load Hours of Operation(Watts) 4 hrs da 8 hrs/day 12 hralday
3 0 000 8,725 12,688 18,770
4,000 10,502 15,708 23,659
7,000 15,512 24,278 37,489
15,000 23,458 38,848 60,238
30,000 36,197 62,864 97,258
45,000 50,488 89.255 138,331
60 0 000 64,780 115,647 179,403
90,000 92,199 166,648 258,508
100,000 99,527 180,878 2'30,149
F-4

1200 WATT GASOLINE DRIVEN GENERATOR - $910.00
Annual Costs Hours o_ f Operation
4 hrs da 8 hrs da 12.hrsfday
Fuel $ 989.04 $ 1,978.08 $ 2,967.12
Maintenance 0 0 0
Replace 910.00 910.00 910.00
CFBF 1,899.04 2,888.08 3,877.12
Finance 0 0 0
CFAF 1,899.04 2,888,08 3,877.12
Taxes 474.76 722.02 969.28
CFAT 1,424.28 2,166.06 2,907.84
Present Value $8,925.00 $13,100.00 $17,275.00
Key: CFBF - Cash Flow Before Financing
CFAF - Cash Flow After Financing
CFAT - Cash Flow After Taxes
F-5

2000 WATT GASOLINE DRIVEN GENERATOR - $1,530
Annual Costs Hours of Operationration
4 hrs/day 8 hrs da 12 hrs.1day
Fuel $ 1,209.00 $ 2,418.00 $ 3,627.00
Maintenance 0 0 0
Replace 1,530.00 1,530.00 1,530.00
CFBF 2,739.00 3,948..00 5,157.00
Finance 0 0 0
CFAF 2;739.00 3,948.00 5,157.00
Taxes 685.O,J 987.00 1,289.00
CFAT 2,054.00 2,961.00 3,868.00
Present Value: $13,089.00 $18,193.00 $23,298.00

7MIS , IS 700 AWALY19, 11S, FOR X PHOTOVOL7W'IIC SBY5173%I'!.,7ME 6iVSWA CAPAC IMY IS , 11200.00 NC FOR 41.00 BR . PER DAY..7®E 8YS7T IN S-1ME , Is , 1068., MP AND COSTS , 0 lease;..ME WIMIIAL CASH COST 115 , 01 2776'.,MONEY I& BORROWED AT N RAW OF- 0.2,11.,IMF; TAX RAW IIS, 0.25!.
YA FUEL NNIQIT REPLACE CFBF, F-IN RA'NCE- CFAY TIMS, CFAT PRIM APREC.11 0.1 3130.1 0'.. 3501.1 24741.. 282141. , 41114111.. -• 18.17:. , 11111041.23' 108794 672r 0.- 350.. o.- 350. • 2+4741.. 28241.. 6641. , 2:116'11.. 1109621.47:3 0.1 36161:.. 0. , 350. • 24741.- 28241.- 655'.. 2:170., 107910.9141 0 , 0041 0.1 3501., 0... 350.1 247141, 28241.. 6441. 21811.. 110583.39i 01.00•3! 0.1 350:.. 0:. 350.. 247141. , 28241. , 6'30:. , 2;119141.. 10332. 25! 0.006' 0. , 350.1 2141011. 350.. 13293!. , 3645;.. 914111.. 271041., 1124128.87' 800.11717! 0.. 350., 0.. 350.. 32.95'., 364413:.. 86'3!.. 2780.. 1117441.88 640..13:a 0.- 350.. 0:. 350.1 3295!.. 36451. , 7811.. 2863.. 109:17:. 25' 480..10:91 0. . 3513•. 0.- 350. , 3295!. , 36'45'.. 6891.. 2956'.. 9046 1 .811 320.07!
10 0.- 350.. 0. 350.. 3295:.. 36415'.. 511M. , 3060.. 87041.07: 160.03:1111 0- 330.. 24011.. 350.. 32951.. 3645'.. , 7941. , 28511.. 9638.37: 800.1171191: 0.. 380.. 0.. 350.1 3295;., 3643!.. 68T., 2957.. 8368.37 640.,1010 0.1 3510`. • 0.. 350. 32951. , 3645'.. 367:.. 30713.. 68311.67: 480..101141 0.- 35!0.. 0.1 350... 3293T., 3645:.. 4291.. 32,16:. • 41972;.26' 320.071.15; 0.1 350.. 0.. 350... 3295'.. 3643!. , 2714. 33741.- 2722..38 160.0316' 0.- ?54. - 241011-- 3501.. 8211., 111711.. 411141.. 71371., 24100.52: 800.17;17; 0., 3;60'., 0.. 350., 82.11.. 111731.. 357.. B13.. 20841.22: 640.,113l8 0.. 3t'^0'.. C0'.. 350., 82:11.. 1117:11., 2971., 87141., 171011.5!0 480..101191 0.1 3150. , 0.. 350.. 82.11., 111711.. 233'... 938.. 1238.4111 320.07:20: 0.. 35\1.1 O:.. 350., 82:11.. 111731. 11641. , 1007E.. 678.07: 1601. 03
IME PRESENT VALUE OY .A'FTER TAX- CASH FLOWS , D.ISCOUNWD AT 0..170 IS- 01 113193..82:.
7WI1S IS 7111E ARALYS-IS- FOR N PHOTOVOLMNIC SY1^`MI;WE SWIM?; CAPACITY IS 2000.00 VC FOR 4..00 illt . PEii . D'A'Y!.M, slys-7 vif S l IZE IS . 1779.. WP AND COSTS, Q 23:124..THE IN' MIlA'L CASIT COST IS , 01 41625!..MONEY IS- BOAROY-410 AT A RATE OF' , 0.2,11. .THE TAX RWM I R 0.26:.
Yli FUEL AIATINIT REP LAIC E CI: BF- FIN-ANCE CFAY 7% MAT PR IN , DIE,11 O.. 350:. 0`.. 3510.. 3973.. 4323., 6846. -25313.. 16499i. 79i 23'1241..11112: 01• 350. 0'... 35(0.. 3973., 4323.. 11055!. 32691., 184112:.011 01.0.0'19 0.1 350'. 0... 350.. 39"i 3'.. 41323.. 1049i. 527141.. 16305:. 80' 0.100'4! 0.1 350:. 0'.. 3541... 3973.1 4323., 110421. 32811.. 18177:.29! 0.00:5! 0.1 3501. 0:., 35'0., 3973'.. 4023.. 110341. 3289!., 1802,11.7!91 01.006: 0.. 350. 40011.. 350.. 5340.. 56910.. 11366. 41123'., 2118341..14 16333.5107 : 0- 350:. co., 3:50!. , 5340:.. 56910. , 114111`.! I. 42294. 21079433 11066'.808 0.1 350. 0'.. 350:.. 5540. , 56910.. 1347. 434141., 20166.02: 800 ..1109' 0.. 350. 0.1 350'.. 5340., 5690.. 1022;. 41468., 19060.92; 533.40
1 P) 0.. 350. 0:., 35:0. 5340:.. 56910.. 1031. 4605!.. 17723.75'. 2x6.6'.701111 0.- 35101. 40011.. 3540:.. 5340:.. 5690.. 114177. 421141.. 20106:. 27
'11333 50
112; 0.- 350. 0.. 35:0.. 5340.. 3690.1 11352,. 4f'39;-, 1IB9118.63 11066'.130113 0.- 36.0. 0'... 330.1. 5340:.. 3690.1 12141. 40117.71.. 17636'. 271 800.1101141 0.. 3510. 0.. 350., 5"340.. 56910.. 1106'11. 46291.. 1131991.93 533.40113! 0.1 350. 0... 350.. 5340:.. 516910+.1 89111. 4800•.. 1149 , 044.5' °.66'..70'116' 0.1 350. 40011.. 350., 5340_. 36!90.. 1124'?;. 4M149,.. 15.'624 'i. 671 16333.,510171 0., 350. 0:.. 350'.- 5"340'.. 56'91€1., 1051. 415241., 163565.86 1066'.80Ili: 0.1 350'. 0.1 350.. F~;40:.. 86910., 869:. 482:11., 1110741.76' 800.1019; 0.. 3510. 0... 350.. 5340.. 86910., 645'.. 50416'.. 8060.49; 533.4.020 0.. 350. 0.. 350.1 5340.. 56910.. 3861. 53041.. 414113.23 266'.:70.
M; PRESENT VALUE OP AMER TAX CASH FLOWS, DISCOUNTED AT O.-IM IS- 01 20-967.6:11.
F-7
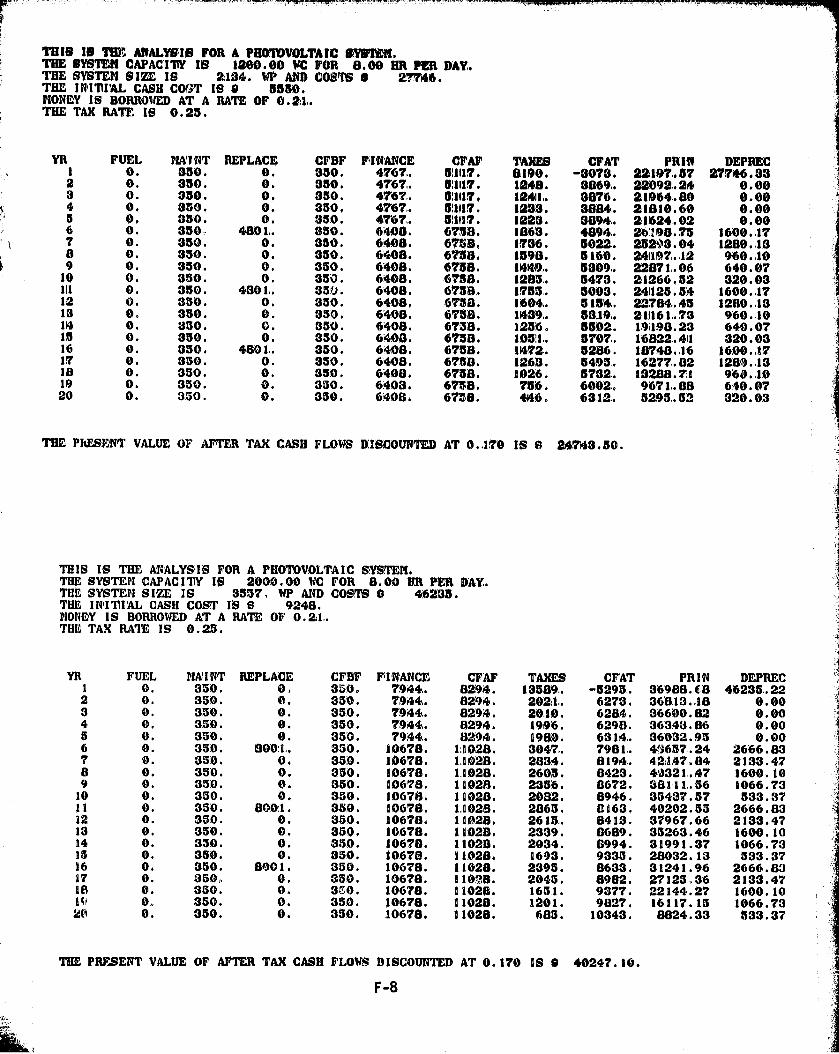
77118 19 71: ANALYSIS FOR A PBWMVOLTAIC 9,YWMN.TIM SY87Eff CAPAC'17W 16 1200.010 VC FOR 8.00 HR PER DAY.THE SYSTEM SIM, 18 2134e. WP AND COSTS A 27746.THE IRITI"AL CASH COW IS it 6530.MONEY IS BORROWED AT A RAISE OF 0.21.THE TAX RATE IS 0.23..
YR FUEL MNIVT REPLACE CFRF F-IINANCE CFAF TAME MAT PR141 DEPRRC1 0. 330. 0. 360. 4767.. 53117. 81190. -3073. 22-1197..57 27746.332 0. 350. 0. 350. 4767. 51117. 1248. 3869.. 22092.24 0.003 O. 350. O. 350. 4767.. 53117. 112411.. 3876. 2:1!964,.80 0.0104 0. 350. 0. 350. 4767. 51117. 1233. 388.4. 2:1010.60 0.005 0. 350. 0. 350. 4-76T. 511117. 1223. 3894. 2;1624.02 0.006 0. 350, 480.1.. 350. 6408. 6788. 1863. 4894. 26'2198..75 16100.177 0. 350. 0. 350. 6408. 6758, 1736. 5022. 25203.04 1280..138 0. 330. 0. 350. 6408. 6738. 1590. 5160. 2411197,.,12 960. 409 0. 350. 0. 350. 6408. 6758. 1149491. 5309,. 22871,.06 640.0710 0. 350. 0. 350. 6408. 6758. 1293.. 5479. 2:1266.52 320.03111 0. 350. 4801. 330. 6408. 6138,, 175%. 5003. 241125.514 11600.,1712 0. 350. 0. 350. 6408. 67318. 1604. 51514.. 2784..45 12110.4313 0. 350. 0. 330. 6408. 6758. 114391. 53119.. 24116L.73 960.4014 0. 3130. 0. 350. 6408. 6739. 1256. 5502. 119198.23 640.0715 0. 350. 0. 350. 61403. 6758. 10511. 5707.. 16822.411 320.0316 0. 350, 4801. 350. 6408. 6758. 11472. 5296. 187148..16 1600.4717 0. 330. 0. 350. 6408. 6758. 1263. 5495.. 16277..02 12819.,1318 0. 330. 0. 350. 6408. 6758. 1026. 5732. 13288.71 960.11019 0. 350. 0. 330. 6403. 6759. 756. 6002.. 9671,.88 640.0720 0. 330. 0. 350. 6408. 6758. 4148. 63.12.. 5293..52 320.03
THE PkESE'NT VALUE OF AFTER TAX CASH FLOWS DISCOUNTED AT 0.470 IS 8 247143.50.
THIS IS THE AVALYS;IS FOR A PHOTOVOLTAIC SYSTEM.THE SYSTEM CAPAC'.ITY IS 2000.00 WC FOR 8.00 Mt PER DAY.THESYSTEM SIZE IS 3537, WP AND COSTS O 46235.THE INITIAL CASH COST IS 8 9248.MONEY IS BORROWED AT A RATE OF 0.2,1,.THE TAX RATE IS 0.23..
YR FUEL PININT REPLACE CFBF FINANCE CF'AF TAXES CF'AT PRIN DEPREC1 0. 330. 0 , 350. 7944. 82914. 13589.. -5293.. 36988.68 46235,.222 0. 330. 0. 350.. 7944.. 8294. 2021. 6273. 36813.48 0.003 0. 350. 0. 350. 7941. 8294. 20.10. 6284. 36600.82 0.004 0. 380. 0. 350. 79144,. 8294. 1996. 6298. 36343.86 0.008 0. 350. 0. 350. 7944,. 8294. 1980. 63.14,. 36032.93 0.006 0. 330. 80011.. 330. 10678. 1:1028. 3047.. 7981,. 43657..24 2666.837 0. 330. 0. 330. 10678. 1.11029. 2834. 8194. 4 2.1 f47.. 84 2133.4.78 0. 380. 0. 330. 10678. 1.1028. 2603. 8423. 411321.47 1600.109 0. 350. 0. 350. 10678. 11028. 2336. 8672.. 36,111..56 1066.7310 0. 380. 0. 350. 10670. 11028. 2082. 8946. 33437.57 533.3711 0. 380. 800:1. 350. 10678. 1.1028. 2863. 8163. 40202.55 2666.8312 0. 380. 0. 380. 10678. 11028, 2615.. 8413. 37967.66 2133.4713 0. 330. 0. 380. 10678. 11029, 2339. 0689. 35263.46 1600.1014 0. 330. 0. 350. 106781. 11028. 2034. 8994. 31991.37 1066.7315 0. 350. 0. 350. 10678. 11028. 1693. 9333. 28032.13 333.3716 0. 350. 8901. 330. 10678. 11028. 2395. 8633. 31241.96 2666.8317 0. 330. 0. 350. 10678. 110-18. 2043. 8982. 27123,36 2133.47Is 0. 380. 0. 3w0. 10678. 11028. 163.1. 9377. 22144.27 1600.10191 0. 350. 0. 350. 10678. 11028. 1201. 9827. 16117.13 1066.7320 0. $50. 0. 350. 10678. 11028. 683. 10343. 8824.33 533.37
THE" PRESENT VALUE OF AFTER TAX CASH FLOWS DISCOUNTED AT 0.170 IS 9 40247.10.
F-8
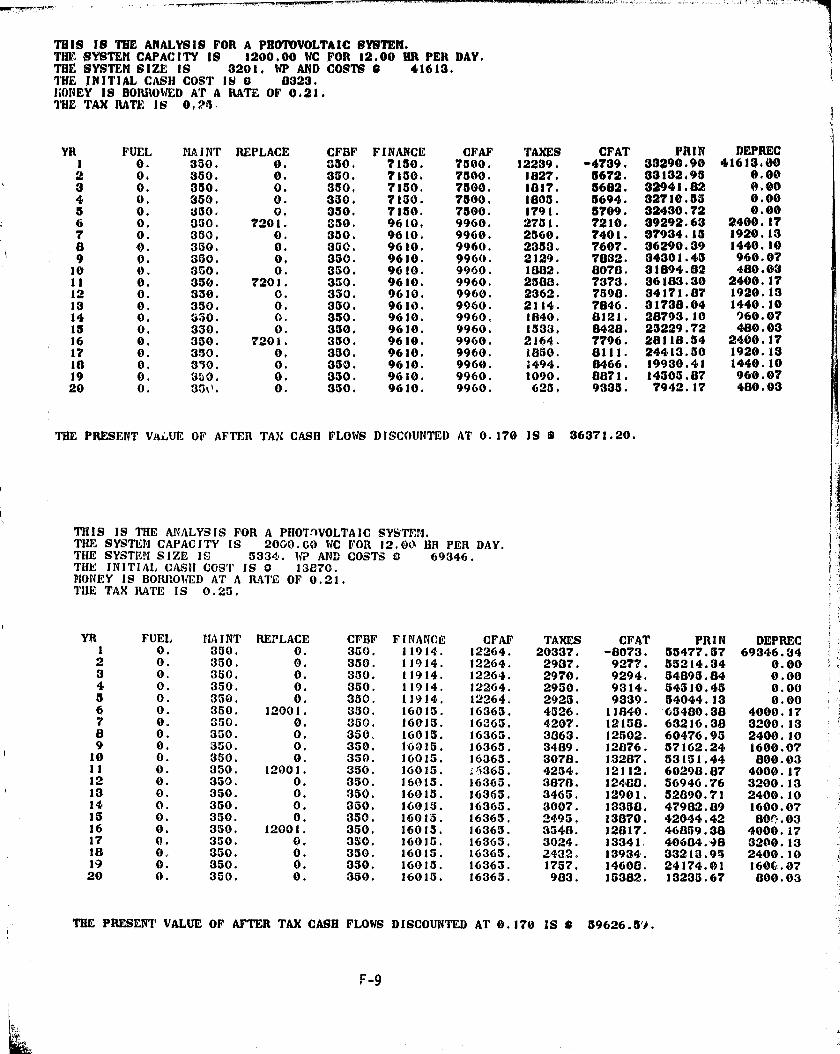
THIS IS THE ANALYSIS FOR A PHOTOVOLTAIC SYSTEM.THF. SYSTEMCAPACITY IS 1200.00 VC FOR 12.00 HR PER DAY.THE SYSTEM SIZE IS 3201. WP AND COSTS 0 41613.THE INITIAL CASH COST IS 0 8323.CONEY IS BORROWED AT A RATE OF 0.21.THE TAX RATE IS O.P3.
YR FUEL MAINT REPLACE CFBF FINANCE CFAF TAXES CFAT PRIM DEPREC1 0. 350. 0. 350. 7150. 7500. 12239. -4739. 33290.90 41613.002 0. 350. 0. 350. 7150. 7500. 1827. 5672. 33132.95 0.003 0. 350. 0. 350. 7150. 7500. 1817. 5682. 32941.82 0.004 0. 350. 0. 330. 7130. 7500. 1803. 5694. 32710.53 0.005 0. 330. 0. 350. 7150. 7500. 1791. 57094 32430.72 0.006 0. 350. 7201. 330. 9610, 9960. 2751. 7210. 39292.63 2400.177 0. 350. 0. 350. 9610. 9960. 2560. 7401. 37934.13 1920.138 0. 350. 0. 350. 9610. 9960. 2353. 7607. 36290.39 1440.109 0. 350. 0. 350. 9610. 9960. 2129. 7832. 34301.43 960.0710 0. 350. 0. 350. 9610. 9960. 1832. 8078. 31894.82 480.0311 0. 330. 7201. 350. 9610. 9960. 2503. 7373. 36183.30 2400.1712 0. 330. 0. 330. 9610. 9960. 2362. 7598. 34171.87 1920.1313 0. 350. 0. 350. 9610. 9960. 2114. 7846. 31738.04 1440.1014 0. 350. 0. 350. 9610. 9960. 1840. 8121. 28793.10 760.0715 0. 350. 0. 330. 9610. 9960. 1333, 8428. 23229.72 480.0316 0. 350. 7201. 330. 9610. 9960. 2164. 7796. 28116.54 2400.1717 0. 350. 0. 330. 9610. 9960. 1850. 8111. 24413.50 1920.13l8 0. 330. 0. 33.3. 9610. 9960. 1494. 8466. 19930.41 1440.1019 0. 340. 0. 330. 9610. 9960. 1090. 8871. 14303.87 960.0720 0. 350. 0. 330. 9610. 9960. 623. 9335. 7942.17 480.03
THE PRESENT VALUE OF AFTER TAX CASH FLOWS DISCOUNTED AT 0.170 IS 0 36371.20.
THIS IS THE ANALYSIS FOR A PHOTOVOLTAIC SYSTE".THE SYSTEM CAPACITY 1S 2000.60 WC FOR 12.00 HR PER DAY.THE SYSTEM SIZE IC 5334. IN? AND COSTS 0 69346.THE INITIAL CASH COST IS 0 13870.MONEY IS BORllOI;ED AT A RATE OF 0.21.THE TAX RATE IS 0.25.
YR FUEL PAINT REPLACE CFBF FINANCE CFAF TAXES CFAT PRIM DEPREC1 0. 350. 0. 350. 11914. 12264. 20337. -8073. 55477.57 69346.342 0. 350. 0. 350. 11914. 12264. 2987. 9277. 55214.34 0.003 0. 350. 0. 350. 11914. 12264. 2970. 9294. 54895.84 0.004 0. 350. 0. 350. 11914. 12264. 2950. 9314. 54310.45 0.005 0. 350. 0. 350. 11914, 12264. 2923. 9339. 54044.13 0.006 0. 350. 12001. 330. 16015. 16363. 4326. 110140. 65480.38 4000.177 0. 350. 0. 350. 16013. 16363. 4207. 12158. 63216.38 3200.138 0. 350. 0. 350, 16013. 16365. 3863. 12502. 60476.95 2400.109 0. 350. 0. 350. 16015. 16365. 3489. 12876. 57162.24 1600.0710 0. 350. 0. 350. 16015. 16365. 3078. 13287. 53131.44 800.0311 0. 350. 12001. 350. 16015. 16365. 4254. 12112. 60298.87 4000.1712 0. 350. 0. 350. 16015. 16365. 3878. 12480. 56946.76 3200.1313 0. 350. 0. 350. 16015. 16363. 3465. 12901. 52690.71 2400.1014 0. 350. 0. 350. 16013. 16363. 3007. 13358. 47982.89 1600.0715 0. 350. 0. 350. 16015. 16363. 2493. 13870. 42044.42 80!'.0316 0. 350. 12001. 350. 16013. 16363. 3548. 12817. 46859.38 4000.1717 0. 350. 0. 330. 16015. 16365. 3024. 13341, 40684.48 3200.1318 0, 350. 0. 350. 16015. 16365. 2432. 13934. 33213.95 2400.1019 0. 350. 0. 350. 16015. 16365. 1757. 14608. 24174.01 160G.0720 0. 350. 0. 350. 16015. 16365. 963. 15382. 13233.67 800.03
THE PRESENT VALUE OF AFTER TAX CASH FLOWS DISCOUNTED AT 0.170 IS S 59626.54.
F-9
I
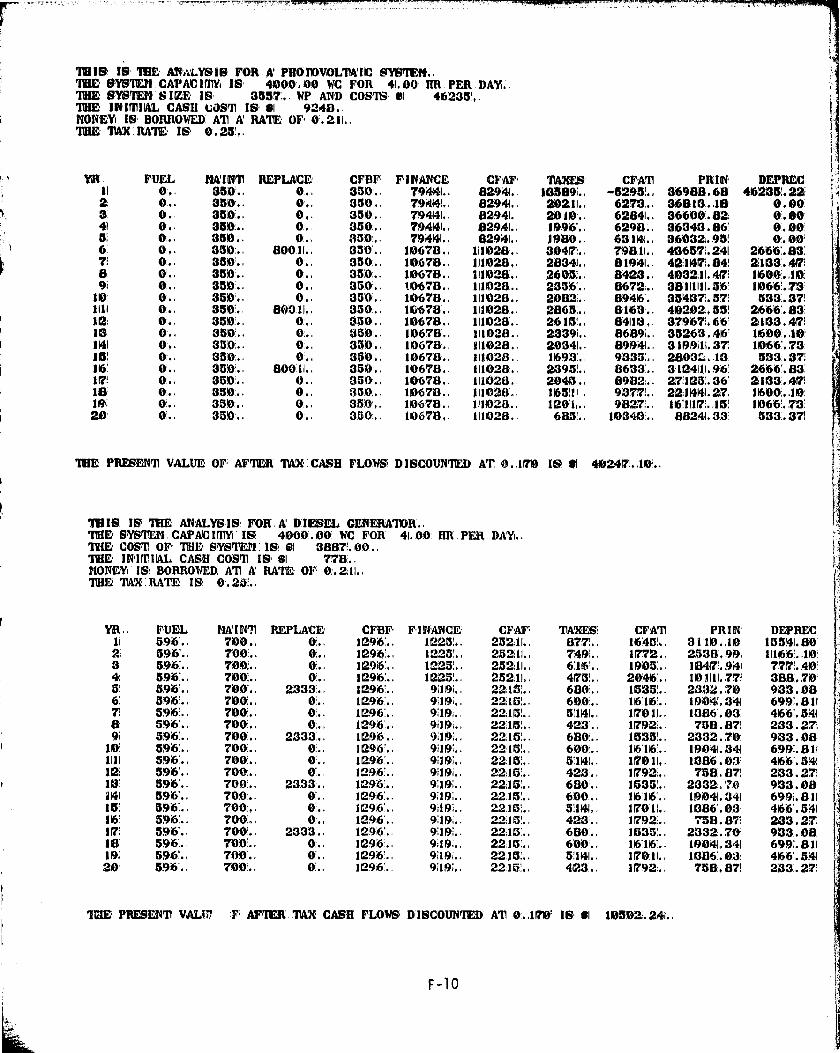
IM I D IS, 78E• Alt LYS• I0 FOR X PHO lI0VOLTN I C S ►YBTE14.7M SYS7EM.CAPACIMVi IS, 41000.00 WC FOR 41.00 HR PER,DA'Y^..741E SYSTEM S I1 M. IR 3557.. WP AND COSMS3 01 46235!..THE- INIMBAL CASH COST IS, 01 9248..MONEYS IS BORROWED: AT A RAW- OF , 0.2,11..741E TAX, RM IS- 0.251.,
Yin FUEL MA'INTI REPLACE CFBV F• IIVANCE CFAY 7V171F.S, CFATI PRII , DEPREC.11 0.1 350.1 0-, 3501. , 794141.. 829141.. 10589i., -5'2951.. 36968.60 4162135!. 22:2: 0... 3510'.1 01.. 350.1 794+41.. 02941.- 20211.. 6273... 36010-16 0.00:3 0.1 350.- 0- 350.. 79441.. 82941.- 20110'.. 62841.. 366100:. 82, 0'. 0041 0. , 350:. , 0. , 350:.. 79441.. 82941. , 11996°.. 6298.. 36340.86' 0. 005! 0.. 3150.. 0.. 3510:.. 794141.. 82.941.. 11980.. 631141., 36032.95! 0:.00'6: 0- 350:.. 80011.- 330'. , 10678.. 1111028. , 304171.. 79811., 406571.241 2666. 83:7! 0.. 3501.. 0.. 350.. 10678,.. 111028.. 28341.. 811941.. 42447 84! 2103'. 47!8 0.1 350:.. 0:., 350'.. 10678. , 111028. , 26!0`5!.. 8423.. 41032:11.47 1 11606-10:9i 0.1 31110.. 0.. 350. , 10678.. 1111028.. 2356'.. 8672;.. 38111111.86' 1066'. 73
110' 0.. 350.1 0',., 350.. 10678., 111028.. 21082.. 89146. 35407.57 533:.371111 0.1 350'. 60011.1 350., 110678.. 111028., 28651.. 81163.. 40202.551 2666.83:162; 0'.. 350.'.. 0.. I.M .. 10678.. 111028.. 2615'.. , 841141.. 37967'. 66' 21433.47!113 0., 350.. 0:.. 350- - 10678. , 1111028.. 2339i. , 86894, 35263.416 7 1600-19) ; .1141 0.. 3510.1 0.1 3150. , 10678.. 1111028.. 20341. , 89941. , 3199'11. 37 11066'.73:IS! 0'.. 350:. , 0'.. 350. , 10678.. 111028. 11693'.. 93313'.. 2803L..16 533.3716' 01.- 35!0'. , 800:11.1 3501:.. 10678.. 111028.. 2395%. 8633:.. 31124111.96. 2666'.83:17 0:. , 350:. , 0... 350.. 110678.. 111028.. 2045.. 8982,.. 271051.36' 2:133.47'11® 0.. 350.. 0.. 350:.. 10670. , 1111028.. 1165111 , 90377.. 22:114141.27, 116110.1101191 0'.. 35D.- 0:.. 3510.. 110678.. 111!028.. 120'1.. , 9827:.. 16'.11171..15! 11066'. 73.20' 0.. 350.. 0.. 350:.. 1106713., 1111028., 6851.. 110314431.. 88241.33: 533:.37!
7111E PRESENT VALUE 07 AFTER . TAX-:CASHCAS33 FLOWSi DISCOUNTED AT 0:..17101 IS- 01 41024171..10. ,
7616 IS; 741E ANALYGIB FORA' DIESEL GENERATIOR.,'ME SYSTEM . CAPAC IMYi ' I Si 41000 . 001. WC FOR . 41.00: IM . PEJ . DA'Yi.:741E COS71 OF' 741E SYS ►IEM: 1S- 01 3887:.00:..ME- INIMIlAL CASH COST ISi SI 778..MONEY:' ISM BORROWED AT A RATE• OF: 0.211.,741E 71AX . RATE IS! 0'.20!..
YR. . FUEL MA' IFIn REPLACE CFBF, F; IN'ANCE CFAT 71A'3"Si CFATI PRIN DEPREC'.11 596'. , 700'. • 0!. , 1296'.. 11225!.. 252:11. , 877.. 11646'.. 311110..110 1 15541.802: 596'.. 700... 0;.' 11296%. 122M., 25211. , 749i.. 1772,. , 2538.99i 111166.403: 5916'.. 700... 01. 1296'.. 122S., 252:11.. 616'.. 119:051., 11147.9141 777.40: .41 596'.. 700!.. 0'.. , 1296.. 1225!. , 2!52:11. , 4173!. , 20:416'. , 141 1111..77! 388,:.70,5! 596'. 7:00:.. 2333:.. 112916`.. 9:194. 224M., 680:.. 1535!.. 2:3 3?r;. 70' 933:.08.6' 596.. 700:.. 0:.,1 1296:.. 919:1. 2215!., 60:0'.. 116:16'.. 1194141.341 69!9;. 81171 5!96'.. , 7100!. 01.. 1296'.. 9419;.. 22113!.. 53141.. 17011.. 14386:.103: 466'. 541
9165'.. 700:.. 0:. 1296'.. 949:..' 2215!.. 42.'3:.. 1790. - 7583.871 233:. 279i 596'.. 700r:., 2333:.. 1296.. 94W., 2248:1.. 6130`.. 151351.. 23'32.70' 933:. 08
10 596. , 700:.. 0:.. 1296. , 9i19:.. 22143!. M. 600'.. 116'116'.. 119041.341 699;.8111111 596:., 700.. 0.. 1296'.. 91191.. 22115!.. 5 .1141.. 1x10'11.. 1086.0`1 4166:.5:41112: 5196'.. 700:.. 0`... 12916" 919i.. 2215'... 423:.. 17'92;. , 758.87! 233.271I4#: 596:.. 7100:.. 2333`. , 11296.. 949:.. 22;15'!.. 689:.. 153:'. , 2332:. '.'10 933..081141 596'.. 7100:.. 0'. 1296'... 9:19i.. 22.15'... 6100' .. 116'116". 119041.341 699i.811133! 596'.. 790-- 01.
. .1296.1 949'.. 22,15'.. 141141, . 170-11., 14386'. 03: 4166'. 541
116. 5916'.. 700. , 0. 1296'.. 9:19.. 22:15!. , 423'.. 1792:.. 7518.87! 233.2717" 596'.. 7100'. , 2333. , 12916'.. 9119!.. 22,16:.. 680:.. 15351.. 2332:.70- 933:.08:11B: 5196:., 700'... 0;., 1296. , 91191.. 22:16:. , 600:.. 116'.1 V. 1194)41„ 341 69948' 11119: 5196'. , 700.'.. 0:.. 1296'.. 91191.. 22.161.. 5:1141.. 171011. , 14386'.0'3: 4166'. 514120 596:.. 7100'.. 0'., 129:6.. 91191., 22:15!.. 423:.. 1792:.. 750..87! 233.27
IME- PRESEWTi VAI.M .F• AFTER . IMX- CASH FLOWS; DISCOUNTED AT 0..17!0` 18; 01 110:102: . 241.,
F-10

TOIS 18 THE ANALYSIS FOR A PHOTOVOLTAIC SYSTEM.THE SYSTEM CAPACITY 18 4000.08 WC FOR 8.00 OR PER DAY.THE SYSTEM SIZE I6 7112. WP AND COSTS 8 92457.THE INITIAL CASH COST IS 0 18492.MONEY IS BORROWED AT A RATE OF 0.21.THE TAX RATE IS 0.25.
YR FUEL MAINT REPLACE CFBF FINANCE CFAF TAXES CFAT PRIN DEPREC1 0. 350. 0. 350. 15884. 16234. 27086. -10851: 73966.46 92457.452 0. 350. 0. 350. 15884. 16234. 3953. 12282. 73615.51 0.003 0. 350. 0. 350. 15064. 16234. 3931. 12304: 73190.85 0.004 0. 350. 0. 350. 15884. 16234. 3904. 12331. 72677.02 0.005 0. 350. 0. 350. 15884. 16234. 3871, 123641 72053.29 0.006 0. 350. 16001. 350. 21353. 21703. 6005. 15698; 87303.49 5333.507 0. 350. 0. 350. 21353. 21703. 5580. 16123. 84284.90 4266.808 0. 350. 0. 350. 21353. 21703. 5121. 16582. 80632.41 3200.109 Q. 350. 0. 350. 21353. 21703. 4623. 17080: 76212.89 2133.4010 0. 350. 0. 350, 21353. 21703. 4075. 17628. 70865.27 1066.7011 0. 350. 16001. 350. 21353. 21703. 5642. 16061. 80395.16 5333.5012 0., 350. 0. 360. 21353. 21703. 5141. 16562: 75925.81 4266.8013 0. 350. 0. 350. 21353. 21703. 4590. 17113. 70517.91 3200.1014 0. 350. 0. 350. 21353. 21703. 3980. 17723. 63974.34 2133.4015 0. 350. 0. 350. 21353. 2!703. 3298. 18405. 56056.63 1066.7016 0. 3310. 16001. 350. 21353. 21703. 47111. 17001, 62476.70 5333.5017 0. 350. 0. 350. 213113. 21703. 4003. 17700.' 54244.49 4266.80l8 0. 350. 0. 350. 21353, 21703. 3213. 18490. 44283.51 3200.1019 0. 350. 0. 380. 21353. 21703. 2313. 19389: 32230.72 2133.4020 0. 350. 0. 350. 21353. 21703. 1281. 20422; 17646.85 1066.70
111E PRESENT VALUE OF AFTER TAX CASH FLOWS DISCOUNTED AT 0.170 IS 8 79006.10.
THIC9 IBS TBE ANALYS'IIS, FOR X DIESEL GENERATOR..THE' SYSTEM CAPAC I rJT IS, 41000.00 WC FOR . 11.00 HR P'ER . DA'Yi. .TIM" COSH OF' TIIE SYS'IEEM. IS, 01 3887!.00..THE IN'I(."iiUAZ, CASH COST IS- 01 7713..MONEY: IS , BORROWED AT N RATE- OF' 01. 211.,IM- 'M'}C RAIM, IIS , 0'.231!..
YR. FUEL MNINT REPLACE CFBF 1ri T RANCE Cr"AF, TAXES; CFATI PRIM DEPREC'11 111198.. 700!.. 0:., 11698.. zk611., 39591.. 1286.'.. 2673:. 3:11110'.,18! 259i11.33:2; 11198.. 7100.'.. 0`. 11398. , 20.6'11.. 3959i.. 888:.1 307!11. , 17021.821 1295'.. 6713^ 111198.. 7110.. 2333. , 11898.. 1546'.. 344141. , 98(1'.. , 2456. , 2332;. 70 1. 11555!..11341 111198.. 7100!. , 0,.. 1898.. 11.1'.416'.. 3414141., 73.71.. 27013. 11277:..16 777.575! 111198.. 700'., 2333'.. 1698... 15:.46'.. 344141., 986:., 245B., 23321..710` 11355!.,1136! 111198.. 7100.. 0:.' 1699.1 15!46., 3414141., 737:.. 2700.'; 1(277, .16 777. 57!7i 111198.. 700.. 2333'.. 1698,1 115416'.. 341441.. 986'., 21458.:. 2332:.70' 1355!.,1018: 111198.1 700;., 'a;.. 16913:. , 1646'.. 3414141.. 737.. 2701L. 112771..18 777:. 8719; 1111981. 700`.' 2333:.. 1,698.1 1046%. 3414141.. 986.. 2450., 2332.76 113!55!..1D:10 111198... 7100., 0.. 1698.1 1546'.. 3414141. , 737' . , 27108;:. 1@77. ,16 777!. 57!1111 111198.. 7100.. 23:33:.. 1698:. , 15416'.. 3414141. , 986 :. , 2458.. 23:32;. 710: 11555!. ,13:12; 11198.. 700.. 0!. , 16913'.. 1546'.. 3414141.. 7371., 2701L ; 12771..16' 7771.57!lo: 111198.. 790;.. 2333., 1698.. 16'46. , 3414141. , 956:. 2458. , 2332,. 70 1555!..1031141 111198.. 7100... 0:., 1698:.. 164416'.. 3414141. , 737:4. 27108'. , 11277 1..16 777. 5715! 111198., 7100... 2333:.. 1698.. 1846:.. 3414141., 986., 2458:. 23321.70 1855;.,103:16' 111198.. 700.. 0:.. 1890:.. 15416..1 34441.. 737'... 27108 12'77:. J8. 7771.87.111: 111198'. , 710(1'.. 2333.. 11898. , 15'.416;.. 3414141.. 986'. , 2458. , 2332;.70! 1555!..103:In 111198... 7100`.. o.. 1698.. 15146'.. 3414141.. 7371. , 27108: , 127! -I B'. 777:.57!119; 111198.. 700.. 2333'.. 16`p8 .. 15416'.. 3414141., 986'.. 2458.. 2332.70 : 1555'..10320 111198.. 700... 0:.. 1698.. 13146.. 3414141., 737:.. 2708.. 1(2,77..18 7!77`;.$7'
THE' PRESENT VALUE, OF- AFTER TAX: CASH FLOW& DISCOUNTED AT 0.1110 16 , 81 15707.917'..
F-11
Lill
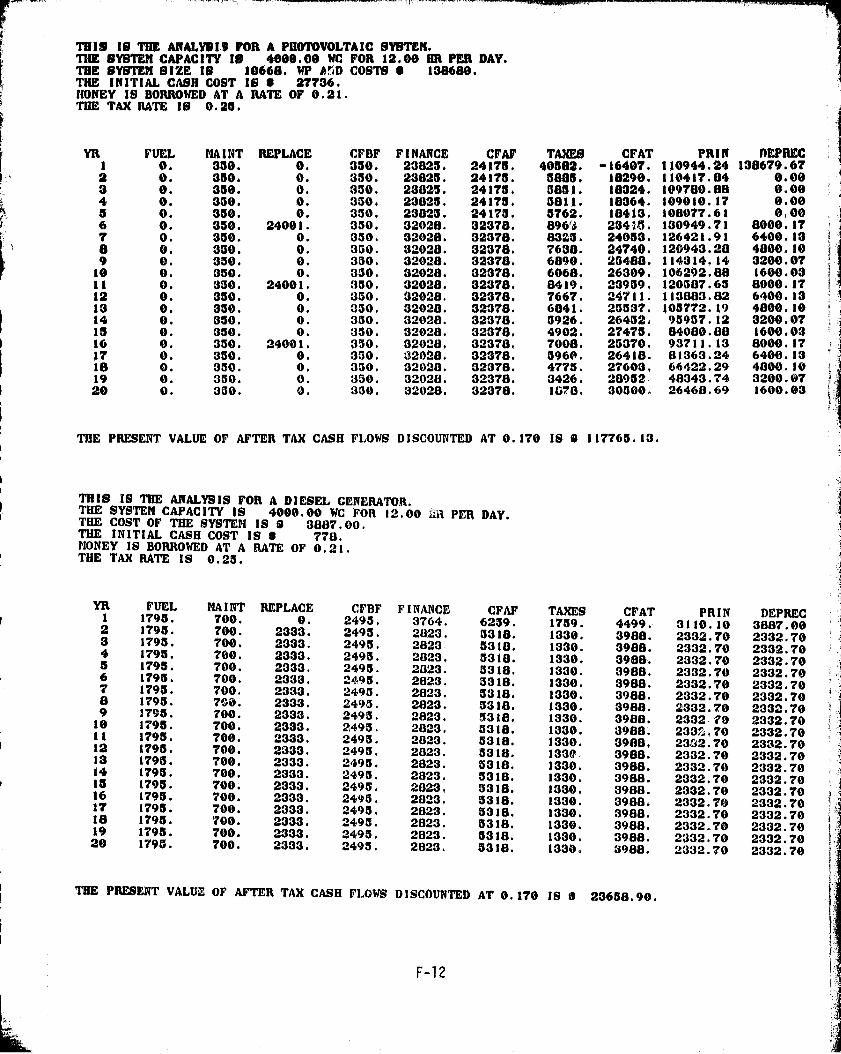
THIS 1 S THE ANALYB S FOR A PHOTOVOLTAIC SYS'T'EM.THE SYSTEM CAPACITY IN 4000.00 WC FOR 12.00 HR PER DAY.THE SYSTEM SIZE IS 10668. WP Ann COSTS 6 136680.THE INITIAL CASH COST IS 0 27736.HONEY IS BORROWED AT A RATE OF 0.21.THE TAX RATE IS 0.25.
YR FUEL MAINT REPLACE CFBF FINANCE CFAF TAXES CFAT PRIX REPREC1 0. 350. 0. 350. 23825. 24175. 40582. -16407. 110944.24 138679.672 0. 350. 0. 350. 23825. 24175. 5885. 18290. 110417.84 0.003 0. 350. 0. 350. 23823. 24175. 5851. 18324. 109780.88 0.004 0. 350. 0. 350. 23625. 24175. 3811. 18364. 109010.17 0.005 0. 350. 0. 350. 23825. 24175. 5762. 18413. 108077.61 01-006 0. $50. 24001. 350. 32028. 32378. 8963 23418. 130949.71 8000.177 0. 350. 0. 350. 32028. 32378. 8325. 24053. 126421.91 6400.138 0. 330. 0. 350. 32028. 32378. 7638. 24740. 120943.28 4800.109 0. 350. 0. 330. 32028. 32378. 6890. 25488. 114314.14 3200.0710 0. 350. 0. 350. 32028. 32378. 6068. 26309. 106292.88 1600.0311 0. 330. 24001. 350. 32028. 32378. 8419. 23959. 120587.65 8000.1712 0. 350. 0. 330. 32028. 32378. 7667. 24711. 113883.82 6400.1313 0. 350. 0. 330. 32028. 32378, 6841. 25537. 105772.19 4800.1014 0. 350. 0. 330. 32028. 32378. 3926. 26452. 95957.12 3200.0715 0. 350. 0. 330. 32028. 32378. 4902. 27475. 84080.88 1600.0316 0. 330. 24001. 330. 32028. 32378. 7008. 23370. 93711.13 8000.1717 0. 350. 0. 350. 32028. 32378. 5960. 26418. 81363.24 6400.1318 O. 330. 0. 330. 32028. 32378. 4775. 27603. 66422.29 4800.1019 0. 330. 0. 350. 32028. 32378. 3426. 28952 48343.74 3200.0720 0. 330. 0. 330. 32028. 32378. 1678. 30300. 26468.69 1600.03
THE PRESENT VALUE OF AFTER TAX CASH FLOWS DISCOUNTED AT 0.170 IS 9 117765.13.
THIS IS THE ANALYSIS FOR A DIESEL GENERATOR.THE SYSTEM CAPACITY IS4000.00 WC FOR 12.00 ai PER DAY.THE COST OF THE SYSTEM IS 9 3887.00.THE INITIAL CASH COST IS 0 778.PIONEY IS BORROWED AT A RATE OF 0.21.THE TAX RATE IS 0.25.
YR FUEL MAINT REPLACE CFBF FINANCE CFAF TAXES CFAT PRIM DEPREC12
1795.1795.
700.700.
0.2333.
2495.2495.
3764.2823.
6259.3318.
1759. 4499. 3110.10 3687.003 1795. 700. 2333. 2495. 2823 5318.
1330.1330.
3988.3988.
2332.702332.70
2332.702332.704
51795. 700. 2333. 2493. 2823. 3318. 1330. 3988. 2332.70 2332.70
61795. 700. 2333. 2495. 2823. 3318. 1330. 3988. 2332.70 2332.70
71795.1795.
700.700,
2333.2333.
2495.2493.
2823.2823.
3318.5318.
1330. 3988. 2332.70 2332.708 1795. 700. 2333. 2493. 2823. 5318.
1330.1330.
3988.3988.
2332.702332.70
2332.702332.709
101795.1795.
700.700.
2333.2333.
2495.2495.
2823. 3318. 1330. 3988. 2332-?0 2332.7011 1795. 700. 2333. 2493.
2823.2823.
3318.5318.
1330.1330.
3988.3988.
233%.7023s2.70
2332.702332.7012
131795.1795.
700.700.
2333.2333.
2495.2495.
2823.2823.
5318. 1330, 3988. 2332.70 2332.7014 1795. 700. 2333. 2493. 2823.
5318.5318.
1330.1330.
3988.3988.
2332.702332.70
2332.702332.7015
161795. 700. 2333. 2495. 2823. 3318. 1330. 3988. 2332.70 2332.70
171795.1795.
700.700.
2333.2333.
24+5.2495.
2823. 5318. 1330. 3988. 2332.70 2332.7018 1795. 700. 2333. 2495.
2823.2823.
5318.5318.
1330.1330.
3988.3988.
2332.702332.70
2332.702332.7019
201795.1795.
700.700.
2333.2333.
2495. 2823. 5318. 1330. 3988. 2332.70 2332.702495. 2823. 5318. 1330. 3988. 2332.70 2332.70
THE PRESENT VALUi OF AFTER TAX CASH FLOWS DISCOUNTED AT 0.170 IS 9 23658.90.
F-12