Wavelength dispersion of Verdet constants in chalcogenide glasses for magneto-optical waveguide...
7
Wavelength dispersion of Verdet constants in chalcogenide glasses for magneto-optical waveguide devices Yinlan Ruan a,b, * , Ruth A. Jarvis b , Andrei V. Rode b , Steve Madden a,b , Barry Luther-Davies a,b a Centre for Ultra-high-bandwidth Devices for Optical Systems, The Australian National University, Canberra ACT 0200, Australia b Laser Physics Centre, The Australian National University, Canberra ACT 0200, Australia Received 1 January 2005; received in revised form 16 March 2005; accepted 21 March 2005 Abstract The wavelength dispersion of the Verdet constants of bulk As–S, As–Se–S, Ge–As–Se and Ga–La–S-based chalco- genide glasses has been investigated at wavelengths between 675 and 1550 nm. Ge 33 As 12 Se 55 was found to have the highest Verdet constant, 0.0485 min/G.cm at 1550 nm, 30 times that of silica. The high Verdet constant of Ge 33 As 12 Se 55 is related to its smaller band gap energy compared with the other glasses. Further improvement of the Verdet constants of the Ge–Se-based chalcogenide glasses by engineering their compositions could make them promising materials for integrated magneto-optical devices. Ó 2005 Elsevier B.V. All rights reserved. PACS: 85.70.S Keywords: Verdet constant; Chalcogenide glasses; Faraday rotation; Dispersion 1. Introduction An increasing number of optical and laser de- vices require protection from back-reflected beams. This has an increased interest in new mag- neto-optic materials that can be used to make opti- cal isolators based, for example, on the Faraday effect – the non-reciprocal rotation of the plane of polarisation of light when it passes through a transparent material in an external magnetic field. For bulk devices, magnetic garnet materials pro- duce very large specific rotation and have been used widely in the fabrication of isolators in opti- cal fibre networks. The move towards integration of active and passive optoelectronic devices to make photonic ‘‘chips’’ is now motivating research 0030-4018/$ - see front matter Ó 2005 Elsevier B.V. All rights reserved. doi:10.1016/j.optcom.2005.03.037 * Corresponding author. Tel.: +61-2-61254079; fax: +61-2- 61250029. E-mail address: [email protected] (Y. Ruan). Optics Communications 252 (2005) 39–45 www.elsevier.com/locate/optcom
-
Upload
independent -
Category
Documents
-
view
3 -
download
0
Transcript of Wavelength dispersion of Verdet constants in chalcogenide glasses for magneto-optical waveguide...
Optics Communications 252 (2005) 39–45
www.elsevier.com/locate/optcom
Wavelength dispersion of Verdet constants inchalcogenide glasses for magneto-optical waveguide devices
Yinlan Ruan a,b,*, Ruth A. Jarvis b, Andrei V. Rode b, Steve Madden a,b,Barry Luther-Davies a,b
a Centre for Ultra-high-bandwidth Devices for Optical Systems, The Australian National University, Canberra ACT 0200, Australiab Laser Physics Centre, The Australian National University, Canberra ACT 0200, Australia
Received 1 January 2005; received in revised form 16 March 2005; accepted 21 March 2005
Abstract
The wavelength dispersion of the Verdet constants of bulk As–S, As–Se–S, Ge–As–Se and Ga–La–S-based chalco-
genide glasses has been investigated at wavelengths between 675 and 1550 nm. Ge33As12Se55 was found to have the
highest Verdet constant, 0.0485 min/G.cm at 1550 nm, 30 times that of silica. The high Verdet constant of Ge33As12Se55is related to its smaller band gap energy compared with the other glasses. Further improvement of the Verdet constants
of the Ge–Se-based chalcogenide glasses by engineering their compositions could make them promising materials for
integrated magneto-optical devices.
� 2005 Elsevier B.V. All rights reserved.
PACS: 85.70.S
Keywords: Verdet constant; Chalcogenide glasses; Faraday rotation; Dispersion
1. Introduction
An increasing number of optical and laser de-
vices require protection from back-reflectedbeams. This has an increased interest in new mag-
neto-optic materials that can be used to make opti-
0030-4018/$ - see front matter � 2005 Elsevier B.V. All rights reserv
doi:10.1016/j.optcom.2005.03.037
* Corresponding author. Tel.: +61-2-61254079; fax: +61-2-
61250029.
E-mail address: [email protected] (Y. Ruan).
cal isolators based, for example, on the Faraday
effect – the non-reciprocal rotation of the plane
of polarisation of light when it passes through a
transparent material in an external magnetic field.For bulk devices, magnetic garnet materials pro-
duce very large specific rotation and have been
used widely in the fabrication of isolators in opti-
cal fibre networks. The move towards integration
of active and passive optoelectronic devices to
make photonic ‘‘chips’’ is now motivating research
ed.

40 Y. Ruan et al. / Optics Communications 252 (2005) 39–45
into magneto-optical waveguide devices that allow
the fabrication of waveguide isolators or
circulators.
Attempts to directly deposit and pattern crys-
talline magnetic garnet films onto semiconductorsubstrates suffer from lattice mismatch or
growth-induced magnetic anisotropy [1]. This re-
sults in modal birefringence – a large difference be-
tween the refractive indices of the TE and TM
guided modes. High modal birefringence is a prob-
lem because it produces oscillation of the principal
axis of polarisation, rather than a linear increase of
the rotation angle of linearly polarised light withdistance, making it impossible to obtain the re-
quired Faraday rotation of 45� for an optical iso-
lator. Overcoming these effects greatly increases
the complexity of the fabrication.
An alternative to garnet films is to use amor-
phous glass films that, in principle, can have
very low birefringence. However, the commonly
used amorphous films used for integrated opticaldevices have too low magneto-optic activity.
Presently, there is growing interest in amorphous
chalcogenide glasses for use in integrated optics
because their high non-linear refractive indices
at infrared wavelengths suggest that they can
be used to make chips capable of all-optical pro-
cessing. Their high linear refractive indices and
relatively strong dispersion in the infra-red alsoindicates that they should also have relatively
high Verdet constants [2]. Previous investigations
of the Faraday effect in chalcogenide glasses
have been made by Qiu et al. [3] involving some
As–S based glasses studied at several wave-
lengths in the visible region of the spectrum
but well away from the wavelengths of interest
for integrated optics applications. Measurementsof magneto-optical rotation in gallium lantha-
num sulphur (Ga28La12S42O18) glasses were also
performed by Pedroso et al. [4] at 543 nm, for
which the Verdet constant was found to be as
high as 0.2 min/G.cm.
To explore the interesting possibilities presented
by chalcogenide films for integrated magneto-opti-
cal devices, we report here measurements of thedispersion of the Faraday rotation of several chal-
cogenide glasses at visible and near-infrared
wavelengths.
2. Theoretical background: the Faraday effect and
the wavelength dependence of the Verdet constant
Linearly polarised light with a given plane of
polarisation can be represented as a superpositionof right and left circularly polarised light with a
specific phase difference. The refractive indices,
n+ and n�, for the right-hand and the left-hand cir-
cularly polarised waves, respectively, are equiva-
lent in the absence of a magnetic field. When the
linearly polarised light passes through a diamag-
netic material, parallel to the direction of the
applied magnetic field H, n+ and n� diverge, caus-ing the two polarisations to propagate with differ-
ent velocities and phases. As a consequence, the
plane of the polarisation of the linearly polarised
light rotates through the angle macroscopically
described by Zvezdin and Kotov [5]
h ¼ xcðnþ � n�ÞL ¼ VHL; ð1Þ
where x is the angular frequency of light, c is light
speed, L is the length of the light path in the med-
ium, and V is known as the Verdet constant.
The mechanism for the Faraday effect can be
explained by the magnetic-field-induced Larmor
precession of electron orbits. Instead of one ei-gen-frequency of the electrons (x), two arise, cor-
responding to the right-hand and the left-hand
circular oscillations when there is a magnetic field
in the medium. The difference between the reso-
nance frequencies x+ and x� results in a displace-
ment of n+(x) and n�(x) relative to each other on
the frequency scale:
n�ðxÞ � nðxÞ � dndx
eH2mc
; ð2Þ
where e and m are the electron charge and mass,
respectively, and n(x) is the refractive index ofthe material in the absence of the field H. Substitu-
tion of Eq. (2) into (1) yields the well-known Bec-
querel formula:
V ¼ e2mc2
kdndk
; ð3Þ
where k = 2pc/x is the wavelength of the light. Eq.
(3) indicates that the Verdet constant is linearly pro-
portional to the dispersion dn/dk of the material.

Y. Ruan et al. / Optics Communications 252 (2005) 39–45 41
However, the dispersion of the refractive index is
theoretically related to the electronic absorption
spectrum through the Wemple equation based on
the single electronic oscillator model in the region
from UV to near-infrared as [2]
n2 � 1 ¼ Ed � E0
E20 � E2
; ð4Þ
where n is the refractive index, E the photon en-
ergy, E0 the average electronic energy gap, andEd the electronic oscillator strength. Larger refrac-
tive index arises from smaller E0 and/or large Ed
and results in a larger dispersion throughout the
glass system.
3. Experiments
Six different chalcogenide glasses, As40S60(As2S3), As40S45Se15, As24S38Se38, Ge33As12Se55(AMTIR-1), Ga27La13S41O19 (GLSO), and Ga28-La12S60 (GLS) were investigated. Silica was also
characterised for comparison. The bulk samples
were obtained from three different sources: bulk
As2S3 and AMTIR-1 were obtained from Amor-
phous Materials Inc. (Garland, Tx); the As–Se–Ssamples were prepared at CREOL at the Univer-
sity of Central Florida; and the GLS samples were
prepared in-house using the process described in
[6].
Thin films of As2S3, Ge33As12Se55, As40S45Se15and As24S38Se38, were prepared from bulk samples
using the Ultra-Fast Pulsed Laser Deposition
(UFPLD) technique developed at the AustralianNational University [7,8]. UFPLD uses short, ps
or sub-ps, low energy (�0.1 to 10 lJ) pulses at
MHz-range repetition rate. UFPLD produces high
quality films free from contamination with partic-
ulates suitable for waveguide fabrication. How-
ever, the surface layer of the target is ablated
with moderately high kinetic energy which densi-
fies the resulting films and this results in some dif-ferences between the deposited films and bulk
glasses as mentioned below.
To deposit films for these experiments, a fre-
quency doubled mode-locked Nd:YAG laser pro-
ducing 6–7 W average power (70–80 nJ/pulse) at
532 nm, was directed at the bulk glass targets, at
a repetition rate of 76 MHz [7]. The beam was
focused to a 30 lm spot onto the bulk glass target,
inside a vacuum chamber (base pressure <
10�6 Torr), to produce an ablated plume which
was deposited on the 100-mm substrate positioned�20 cm from the target. The substrate wafer was
rotated to ensure good (±5%) thickness uniformity
of the film. The substrates used were either pure
silicon or silicon wafers oxidized with a 2.4 lm sil-
ica layer to act as a buffer layer for waveguiding.
The refractive index n and extinction coefficient
k of the chalcogenide films were measured in the
wavelength range from 450 to 1650 nm using acommercial SCI FilmTek 4000 wafer mapper.
The FilmTek system is based on spectrophotome-
try of the samples, using reflection fringes from the
film at two different angles (normal to the surface,
0� and 70�) to model the refractive index and thick-
ness of the films according to a Lorentz–Tauc dis-
persion model. This technique also determines the
value of the optical band gap energy, below whichthe absorption is assumed to be zero. The FilmTek
4000 provides n and k data across the full wave-
length range of the measurement from which the
dispersion can be calculated.
Absorption spectra of polished bulk samples
were measured using a Cary 5000 UV–Vis spectro-
photometer. From the absorption data, the optical
band gap, Eg, could also be determined using theTauc and Menth [9] method by plotting the func-
tion (aht)1/2 versus ht, where a is the absorption
coefficient (cm�1) and ht is the photon energy
(eV). By fitting a straight line to the data, the inter-
cept at a = 0 determines the energy of the band gap.
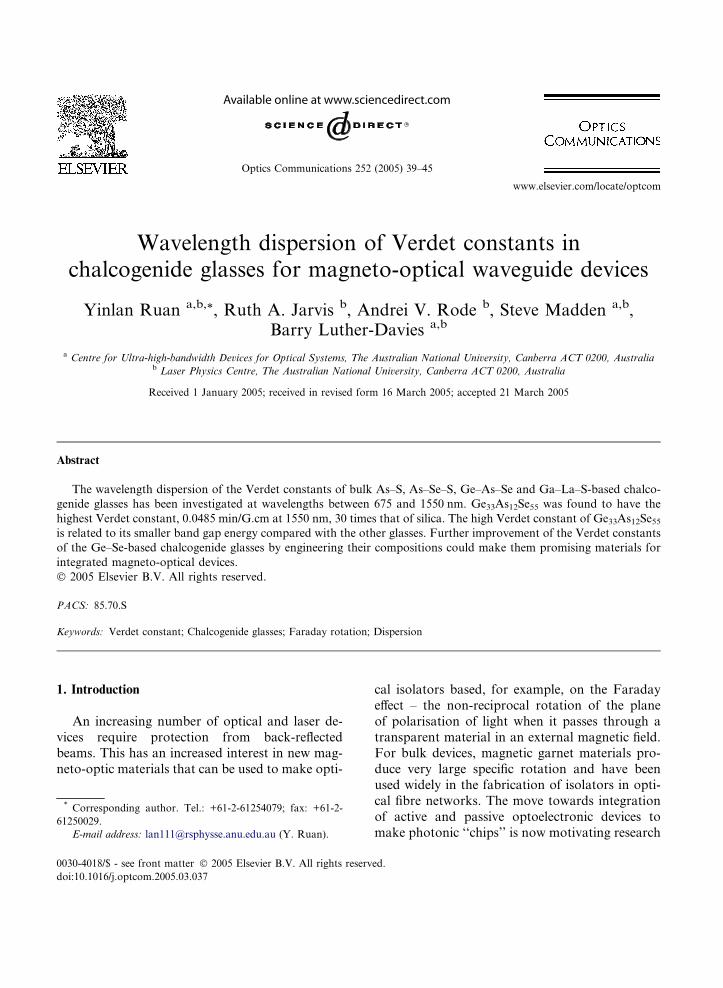
The system used to measure the Faraday rota-
tion of chalcogenide glasses is shown in Fig. 1. A
solenoid was driven at 30 Hz to give a maximummagnetic field of 460 G in the centre of the sole-
noid, where the polished glass samples were
placed. The magnetic field was calibrated by using
a sample of silica glass whose Verdet constant was
taken as 0.01352 at 632.8 nm at room temperature
[10]. The polarisation rotation of the input beam
was determined with high sensitivity with the aid
of a lock-in amplifier. Laser diode sources usedhad wavelengths of 675, 780, 1064, 1310 and
1550 nm. The measurement sequence was repeated
to confirm reproducibility.
0.00
0.01
0.02
(αhν
)1/2
hν (eV)1.7 1.8 1.9 2.0 2.1 2.2 2.3
Fig. 3. Tauc plot for As2S3.
Solenoid
LIA
LD
Sample
AC PowerSupply (30 Hz)
AnalyzerPD Polariser
Fig. 1. Experimental setup for measuring magneto-optic rota-
tion. PD, photodetector; LD, laser diode; LIA, lock-in
amplifier.
42 Y. Ruan et al. / Optics Communications 252 (2005) 39–45
4. Results
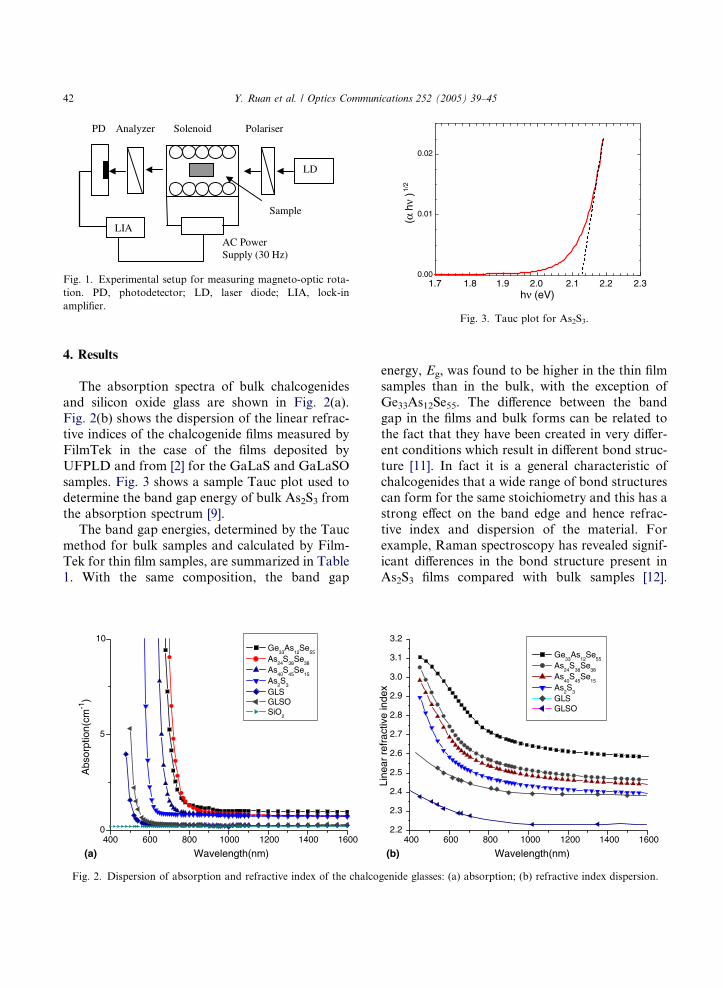
The absorption spectra of bulk chalcogenides
and silicon oxide glass are shown in Fig. 2(a).
Fig. 2(b) shows the dispersion of the linear refrac-tive indices of the chalcogenide films measured by
FilmTek in the case of the films deposited by
UFPLD and from [2] for the GaLaS and GaLaSO
samples. Fig. 3 shows a sample Tauc plot used to
determine the band gap energy of bulk As2S3 from
the absorption spectrum [9].
The band gap energies, determined by the Tauc
method for bulk samples and calculated by Film-Tek for thin film samples, are summarized in Table
1. With the same composition, the band gap
0
5
10
Abs
orpt
ion(
cm-1
)
Ge33
As12
Se55
As24
S38
Se38
As40
S45
Se15
As2S
3
GLS GLSO SiO
2
400 600 800 1000 1200 1400 1600
Wavelength(nm)(a)
Fig. 2. Dispersion of absorption and refractive index of the chalco
energy, Eg, was found to be higher in the thin film
samples than in the bulk, with the exception of
Ge33As12Se55. The difference between the band
gap in the films and bulk forms can be related to
the fact that they have been created in very differ-
ent conditions which result in different bond struc-
ture [11]. In fact it is a general characteristic of
chalcogenides that a wide range of bond structurescan form for the same stoichiometry and this has a
strong effect on the band edge and hence refrac-
tive index and dispersion of the material. For
example, Raman spectroscopy has revealed signif-
icant differences in the bond structure present in
As2S3 films compared with bulk samples [12].
400 600 800 1000 1200 1400 16002.2
2.3
2.4
2.5
2.6
2.7
2.8
2.9
3.0
3.1
3.2
Line
ar r
efra
ctiv
e in
dex
Wavelength(nm)
Ge33
As12
Se55
As24
S38
Se38
As40
S45
Se15
As2S
3
GLS GLSO
(b)
genide glasses: (a) absorption; (b) refractive index dispersion.
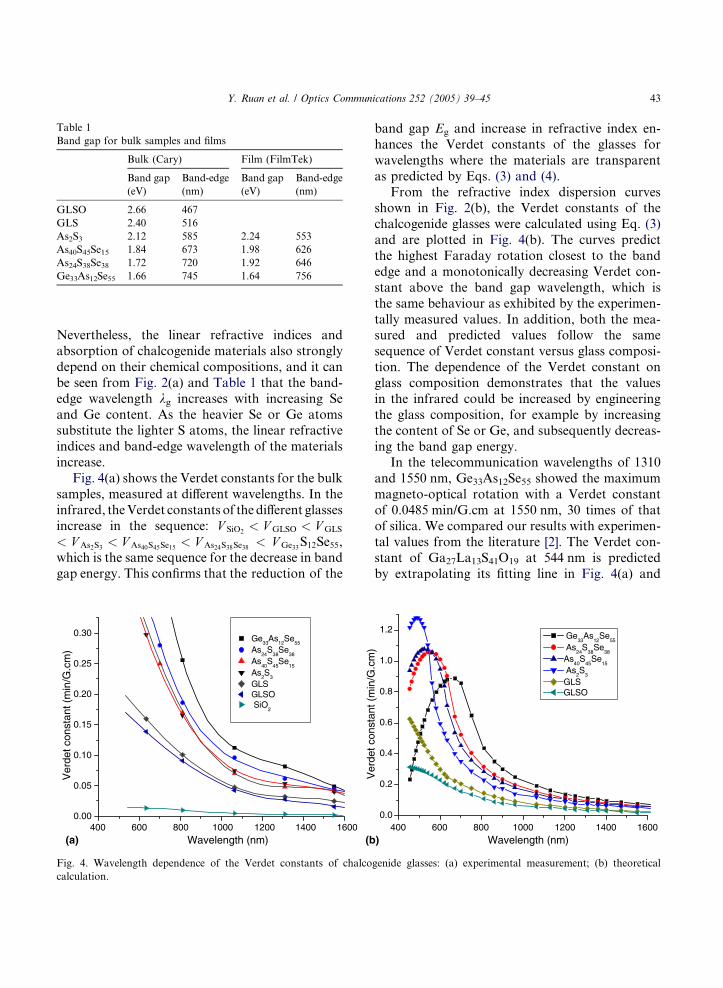
Table 1
Band gap for bulk samples and films
Bulk (Cary) Film (FilmTek)
Band gap
(eV)
Band-edge
(nm)
Band gap
(eV)
Band-edge
(nm)
GLSO 2.66 467
GLS 2.40 516
As2S3 2.12 585 2.24 553
As40S45Se15 1.84 673 1.98 626
As24S38Se38 1.72 720 1.92 646
Ge33As12Se55 1.66 745 1.64 756
Y. Ruan et al. / Optics Communications 252 (2005) 39–45 43
Nevertheless, the linear refractive indices and
absorption of chalcogenide materials also strongly
depend on their chemical compositions, and it can
be seen from Fig. 2(a) and Table 1 that the band-
edge wavelength kg increases with increasing Se
and Ge content. As the heavier Se or Ge atomssubstitute the lighter S atoms, the linear refractive
indices and band-edge wavelength of the materials
increase.
Fig. 4(a) shows the Verdet constants for the bulk
samples, measured at different wavelengths. In the
infrared, theVerdet constants of the different glasses
increase in the sequence: V SiO2< V GLSO < V GLS
< V As2S3 < V As40S45Se15 < V As24S38Se38 < V Ge33S12Se55,which is the same sequence for the decrease in band
gap energy. This confirms that the reduction of the
0.00
0.05
0.10
0.15
0.20
0.25
0.30
Ver
det c
onst
ant (
min
/G.c
m)
Ge33
As12
Se55
As24
S38
Se38
As40
S45
Se15
As2S
3
GLSGLSO SiO
2
400 600 800 1000 1200 1400 1600Wavelength (nm)(a) (b
Fig. 4. Wavelength dependence of the Verdet constants of chalco
calculation.
band gap Eg and increase in refractive index en-
hances the Verdet constants of the glasses for
wavelengths where the materials are transparent
as predicted by Eqs. (3) and (4).
From the refractive index dispersion curvesshown in Fig. 2(b), the Verdet constants of the
chalcogenide glasses were calculated using Eq. (3)
and are plotted in Fig. 4(b). The curves predict
the highest Faraday rotation closest to the band
edge and a monotonically decreasing Verdet con-
stant above the band gap wavelength, which is
the same behaviour as exhibited by the experimen-
tally measured values. In addition, both the mea-sured and predicted values follow the same
sequence of Verdet constant versus glass composi-
tion. The dependence of the Verdet constant on
glass composition demonstrates that the values
in the infrared could be increased by engineering
the glass composition, for example by increasing
the content of Se or Ge, and subsequently decreas-
ing the band gap energy.In the telecommunication wavelengths of 1310
and 1550 nm, Ge33As12Se55 showed the maximum
magneto-optical rotation with a Verdet constant
of 0.0485 min/G.cm at 1550 nm, 30 times of that
of silica. We compared our results with experimen-
tal values from the literature [2]. The Verdet con-
stant of Ga27La13S41O19 at 544 nm is predicted
by extrapolating its fitting line in Fig. 4(a) and
400 600 800 1000 1200 1400 16000.0
0.2
0.4
0.6
0.8
1.0
1.2
Ver
det c
onst
ant (
min
/G.c
m)
Wavelength (nm)
Ge33
As12
Se55
As24
S38
Se38
As40
S45
Se15
As2S
3
GLSGLSO
)
genide glasses: (a) experimental measurement; (b) theoretical
400 600 800 1000 1200 1400 1600
0.0
0.2
0.4
0.6
0.8
1.0
1.2
1.4
Ver
det c
onst
ant (
min
/G.c
m)
Wavelength (nm)
Theoretical Experimental
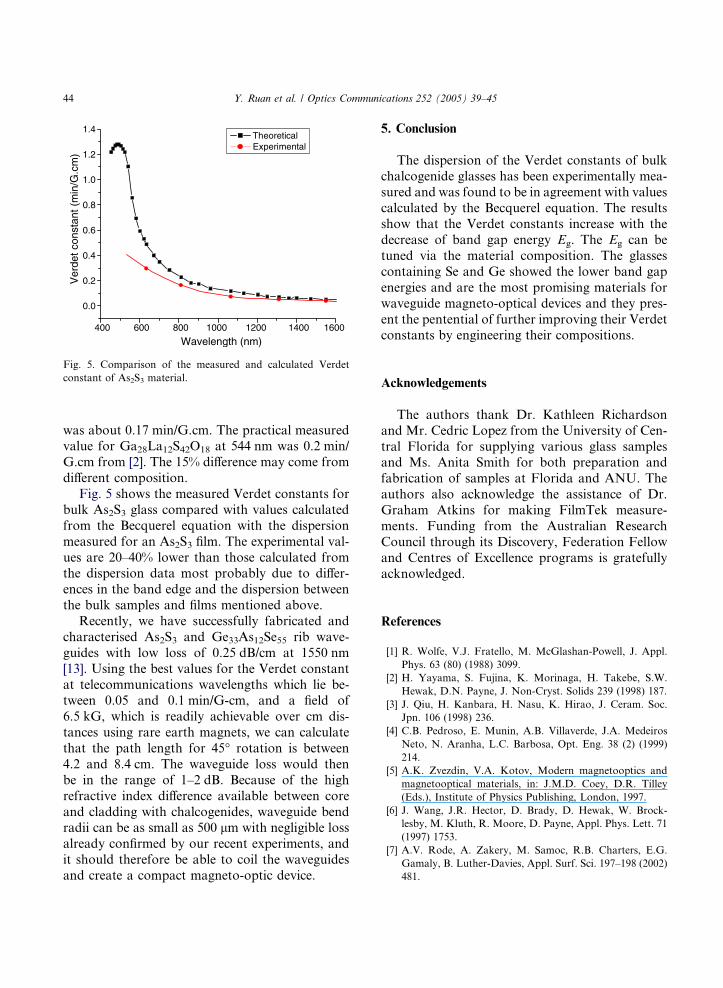
Fig. 5. Comparison of the measured and calculated Verdet
constant of As2S3 material.
44 Y. Ruan et al. / Optics Communications 252 (2005) 39–45
was about 0.17 min/G.cm. The practical measuredvalue for Ga28La12S42O18 at 544 nm was 0.2 min/
G.cm from [2]. The 15% difference may come from
different composition.
Fig. 5 shows the measured Verdet constants for
bulk As2S3 glass compared with values calculated
from the Becquerel equation with the dispersion
measured for an As2S3 film. The experimental val-
ues are 20–40% lower than those calculated fromthe dispersion data most probably due to differ-
ences in the band edge and the dispersion between
the bulk samples and films mentioned above.
Recently, we have successfully fabricated and
characterised As2S3 and Ge33As12Se55 rib wave-
guides with low loss of 0.25 dB/cm at 1550 nm
[13]. Using the best values for the Verdet constant
at telecommunications wavelengths which lie be-tween 0.05 and 0.1 min/G-cm, and a field of
6.5 kG, which is readily achievable over cm dis-
tances using rare earth magnets, we can calculate
that the path length for 45� rotation is between
4.2 and 8.4 cm. The waveguide loss would then
be in the range of 1–2 dB. Because of the high
refractive index difference available between core
and cladding with chalcogenides, waveguide bendradii can be as small as 500 lm with negligible loss
already confirmed by our recent experiments, and
it should therefore be able to coil the waveguides
and create a compact magneto-optic device.
5. Conclusion
The dispersion of the Verdet constants of bulk
chalcogenide glasses has been experimentally mea-
sured and was found to be in agreement with valuescalculated by the Becquerel equation. The results
show that the Verdet constants increase with the
decrease of band gap energy Eg. The Eg can be
tuned via the material composition. The glasses
containing Se and Ge showed the lower band gap
energies and are the most promising materials for
waveguide magneto-optical devices and they pres-
ent the pentential of further improving their Verdetconstants by engineering their compositions.
Acknowledgements
The authors thank Dr. Kathleen Richardson
and Mr. Cedric Lopez from the University of Cen-
tral Florida for supplying various glass samplesand Ms. Anita Smith for both preparation and
fabrication of samples at Florida and ANU. The
authors also acknowledge the assistance of Dr.
Graham Atkins for making FilmTek measure-
ments. Funding from the Australian Research
Council through its Discovery, Federation Fellow
and Centres of Excellence programs is gratefully
acknowledged.
References
[1] R. Wolfe, V.J. Fratello, M. McGlashan-Powell, J. Appl.
Phys. 63 (80) (1988) 3099.
[2] H. Yayama, S. Fujina, K. Morinaga, H. Takebe, S.W.
Hewak, D.N. Payne, J. Non-Cryst. Solids 239 (1998) 187.
[3] J. Qiu, H. Kanbara, H. Nasu, K. Hirao, J. Ceram. Soc.
Jpn. 106 (1998) 236.
[4] C.B. Pedroso, E. Munin, A.B. Villaverde, J.A. Medeiros
Neto, N. Aranha, L.C. Barbosa, Opt. Eng. 38 (2) (1999)
214.
[5] A.K. Zvezdin, V.A. Kotov, Modern magnetooptics and
magnetooptical materials, in: J.M.D. Coey, D.R. Tilley
(Eds.), Institute of Physics Publishing, London, 1997.
[6] J. Wang, J.R. Hector, D. Brady, D. Hewak, W. Brock-
lesby, M. Kluth, R. Moore, D. Payne, Appl. Phys. Lett. 71
(1997) 1753.
[7] A.V. Rode, A. Zakery, M. Samoc, R.B. Charters, E.G.
Gamaly, B. Luther-Davies, Appl. Surf. Sci. 197–198 (2002)
481.
Y. Ruan et al. / Optics Communications 252 (2005) 39–45 45
[8] A. Zakery, Y. Ruan, A.V. Rode, M. Samoc, B. Luther-
Davies, J. Opt. Soc. Am. B 20 (2003) 1844.
[9] J. Tauc, A. Menth, J. Non-Cryst. Solids 8–10 (1972) 569.
[10] C.Z. Tan, J. Arndt, Physica B 233 (1997) 1.
[11] D. Arsova, J. Phys. Chem. Solids 57 (1996) 1279.
[12] A. Schulte, C. Rivero, K. Richardson, K. Turcotte, V.
Hamel, A. Villeneuve, T. Galstian, R. Vallee, Opt. Com-
mun. 198 (2001) 125.
[13] Y. Ruan, W. Li, R. Jarvis, N. Madsen, A. Rode, B.
Luther-Davies, Opt. Exp. 12 (2004) 5140.