Water productivity improvements in Indian Agriculture: potentials, constraints and prospects
369
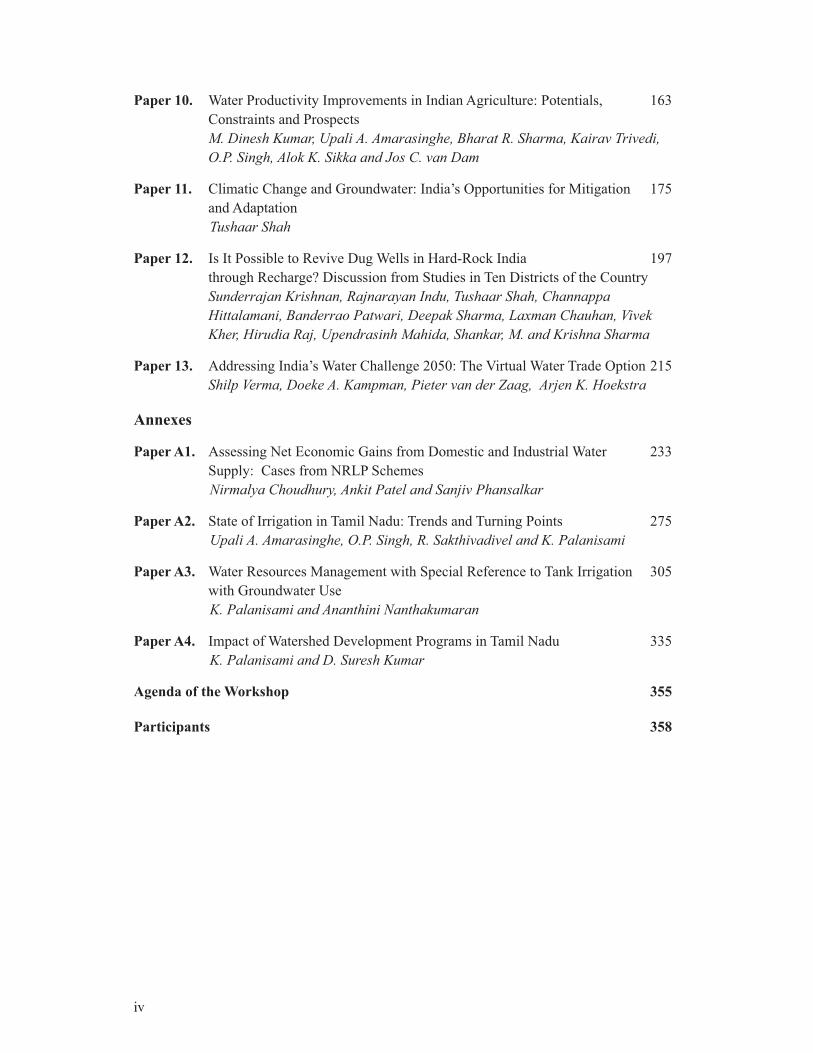
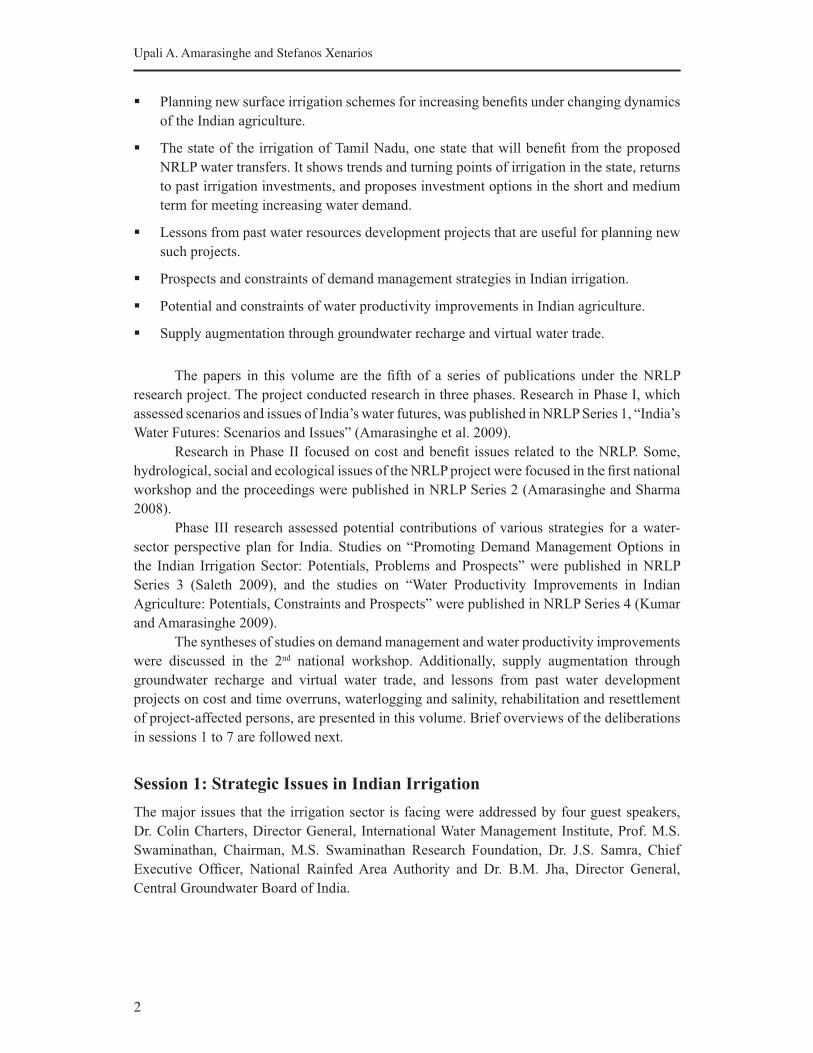
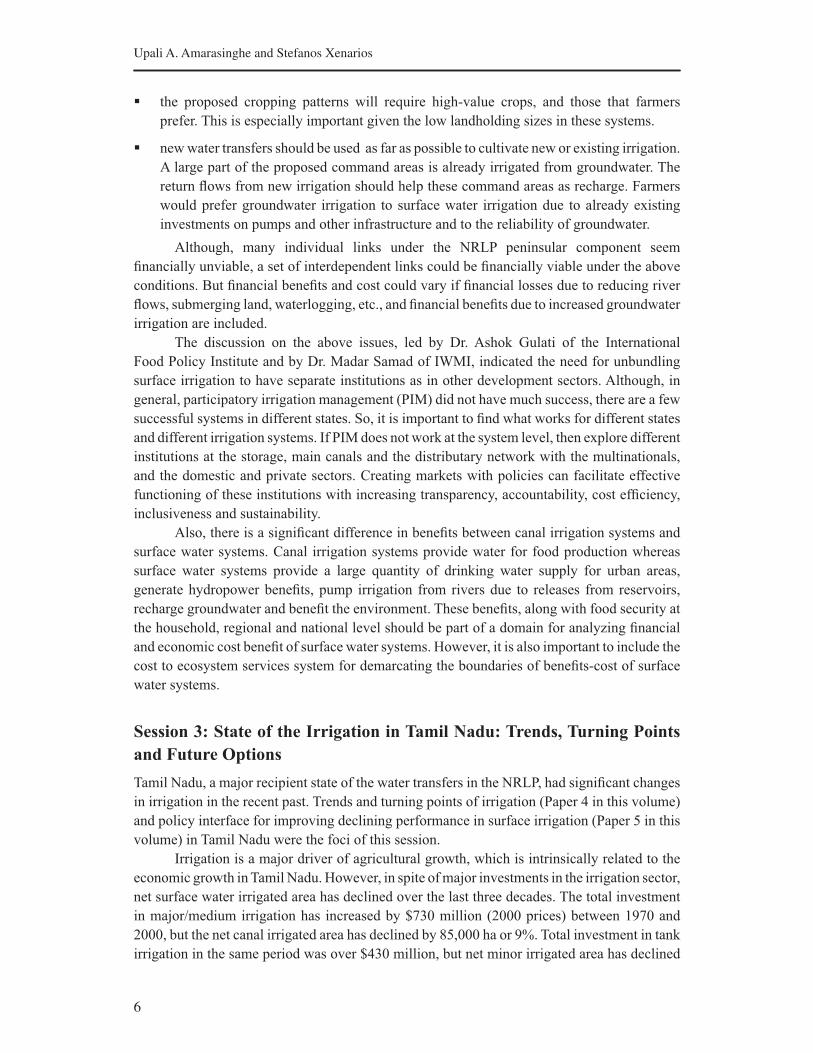
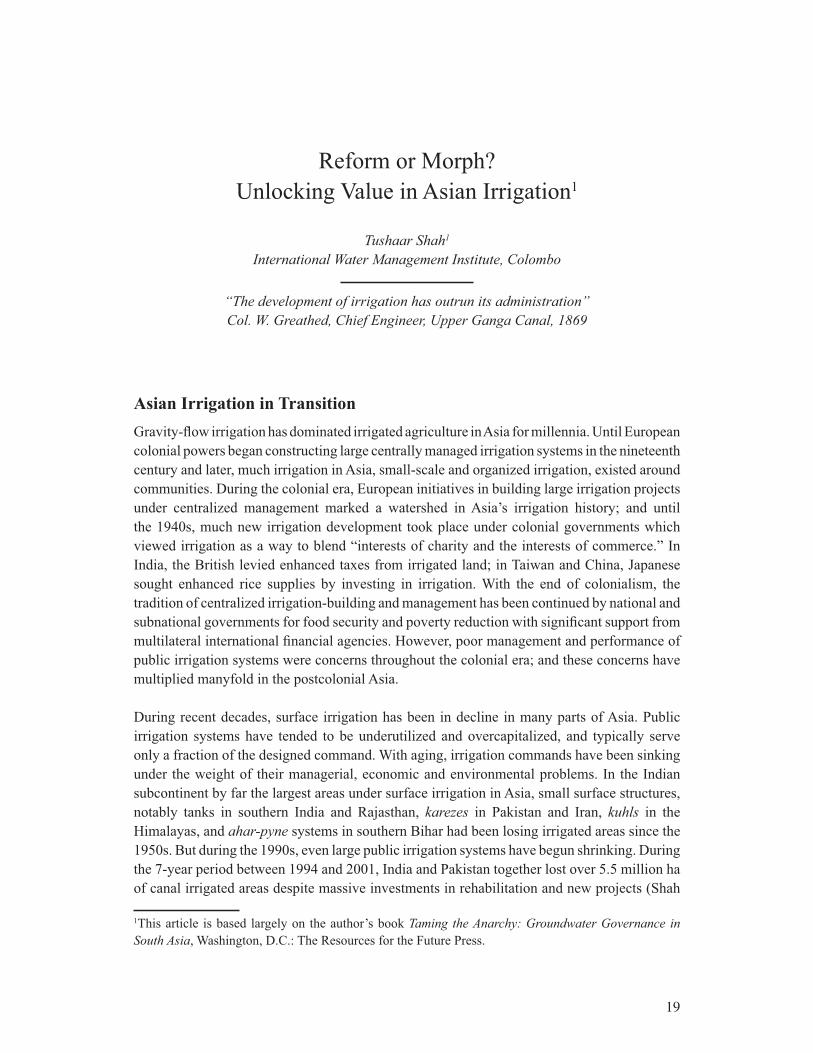
Strategic Analyses of the National River Linking Project (NRLP) of India Series 5 Proceedings of the Second National Workshop on Strategic Issues in Indian Irrigation 0 6 12 18 24 30 36 42 0 10 20 30 40 50 60 1960 1970 1980 1990 2000 Net irrigated area (million ha) (billion US$, in 2000 prices) Expenditure Trends of public expenditure in major and medium irrigation and net irrigated area under different sources in India Expenditure Tanks Canals Groundwater PROCEEDINGS
-
Upload
independent -
Category
Documents
-
view
0 -
download
0
Transcript of Water productivity improvements in Indian Agriculture: potentials, constraints and prospects

Strategic Analyses of the National
River Linking Project (NRLP) of India
Series 5
Proceedings of the Second National Workshop on
Strategic Issues in Indian Irrigation
0
6
12
18
24
30
36
42
0
10
20
30
40
50
60
1960 1970 1980 1990 2000
Ne
t ir
rig
ate
d a
rea
(mill
ion
ha)
(bill
ion
US
$, in
20
00
pri
ce
s)
Exp
en
ditu
re
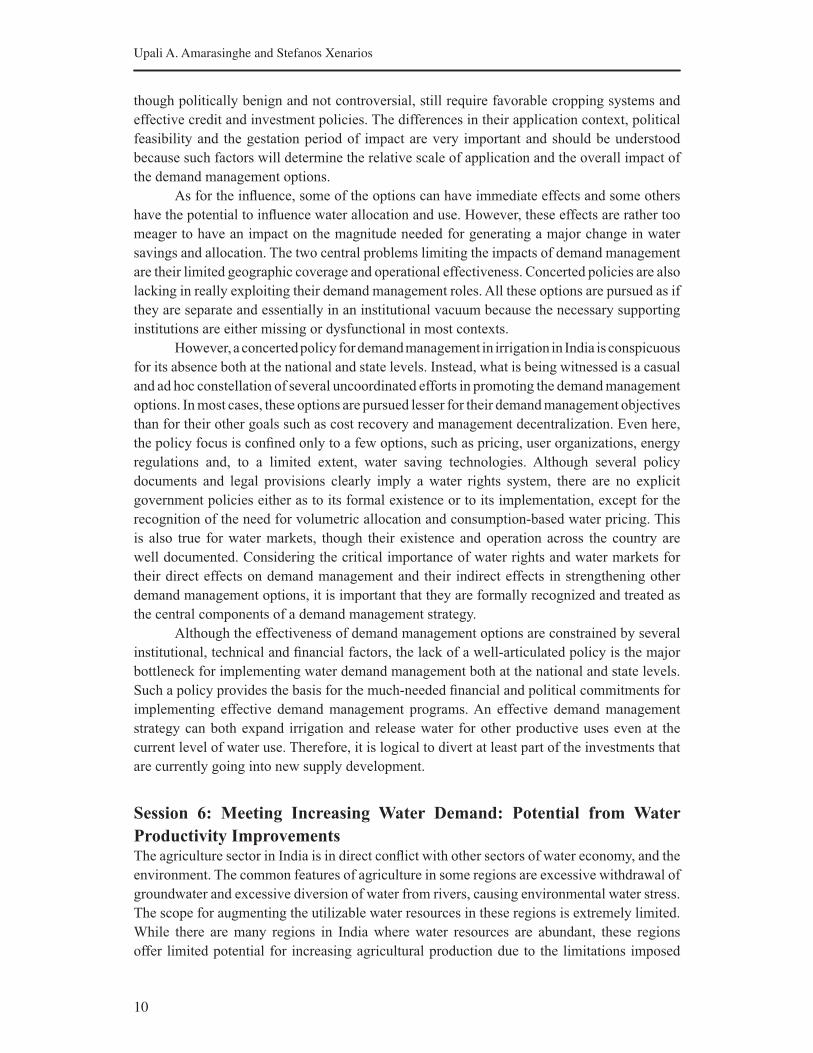
Trends of public expenditure in major and medium irrigation and net irrigated area under different sources in India
Expenditure Tanks Canals Groundwater
PROCEEDINGS
Strategic Analyses of the National River
Linking Project (NRLP) of India
Series 5
Proceedings of the Second National Workshop on
Strategic Issues in Indian Irrigation
International Water Management Institute
INTERNATIONAL WATER MANAGEMENT INSTITUTE
International Water Management Institute (IWMI). 2009. Strategic Analyses of the National
River Linking Project (NRLP) of India Series 5. Proceedings of the Second National Workshop
on Strategic Issues in Indian Irrigation, New Delhi, India, 8-9 April 2009. Colombo, Sri
Lanka: International Water Management Institute. 367p. doi: 10.3910/2010.202
/ irrigation management / institutional reform / surface irrigation / river basin management
/ water transfer / investment / irrigation schemes / policy / irrigation programs / water users
associations / groundwater management / groundwater recharge / water supply / drinking
water / watershed management / crops / Tamil Nadu / Rajasthan / India /
ISBN 978-92-9090-719-0
Copyright © 2009, by IWMI. All rights reserved.
Cover: Public expenditure data are from the Central Water Commission, Ministry of Water
Resources, Government of India (accessible via cwc.gov.in/main/webpages/statistics.html).
Net irrigated areas under different sources are from the Ministry of Agriculture, Government
of India (accessible via the dacnet.nic.in/eands/).
Please direct inquiries and comments to: [email protected]
iii
Contents
Acknowledgements v
Preface vii
Paper 1. Strategic Issues in Indian Irrigation: Overview of the Proceedings 1
Upali A. Amarasinghe and Stefanos Xenarios
Paper 2. Reform or Morph? Unlocking Value in Asian Irrigation. 19
Tushaar Shah
Paper 3. Cost and Benefits of the National River Linking Project: An Analysis of 29
Peninsular Links
Upali A. Amarasinghe and R. Srinivasulu
Paper 4. State of Irrigation in Tamil Nadu: Investments and Returns 53
Upali A. Amarasinghe, K. Palanisami, O.P. Singh and R. Sakthivadivel
Paper 5. Policy Interfacing and Irrigation Development in Tamil Nadu 83
K. Palanisami, Upali A. Amarasinghe and R. Sakthivadivel
Paper 6. Institutional Vacuum in Sardar-Sarovar Project: Framing 95
‘Rules-of-the-Game’
Jayesh Talati and Tushaar Shah
Paper 7. Groundwater Externalities of Large Surface Irrigation Transfers: 107
Lessons from Indira Gandhi Nahar Pariyojana, Rajasthan, India
Bharat R. Sharma, K.V.G.K. Rao and Govind Sharma
Paper 8. Managing Rehabilitation and Resettlement of the Involuntarily 123
Displaced Population: Lessons from Selected Hydro Projects
Madar Samad, Zhankana Shah, Sridhar Acharyulu and Shreedhar Acharya
Paper 9. Promoting Demand Management in Irrigation in India: Policy Options 139
and Institutional Requirements
Rathinasamy Maria Saleth, Upali A. Amarasinghe, V. Ratna Reddy,
K. Palanisami, R.P.S. Malik, A. Narayanamoorthy, Vishal Narain and
M. Venkata Reddy
iv
Paper 10. Water Productivity Improvements in Indian Agriculture: Potentials, 163
Constraints and Prospects
M. Dinesh Kumar, Upali A. Amarasinghe, Bharat R. Sharma, Kairav Trivedi,
O.P. Singh, Alok K. Sikka and Jos C. van Dam
Paper 11. Climatic Change and Groundwater: India’s Opportunities for Mitigation 175
and Adaptation
Tushaar Shah
Paper 12. Is It Possible to Revive Dug Wells in Hard-Rock India 197
through Recharge? Discussion from Studies in Ten Districts of the Country
Sunderrajan Krishnan, Rajnarayan Indu, Tushaar Shah, Channappa
Hittalamani, Banderrao Patwari, Deepak Sharma, Laxman Chauhan, Vivek
Kher, Hirudia Raj, Upendrasinh Mahida, Shankar, M. and Krishna Sharma
Paper 13. Addressing India’s Water Challenge 2050: The Virtual Water Trade Option 215
Shilp Verma, Doeke A. Kampman, Pieter van der Zaag, Arjen K. Hoekstra
Annexes
Paper A1. Assessing Net Economic Gains from Domestic and Industrial Water 233
Supply: Cases from NRLP Schemes
Nirmalya Choudhury, Ankit Patel and Sanjiv Phansalkar
Paper A2. State of Irrigation in Tamil Nadu: Trends and Turning Points 275
Upali A. Amarasinghe, O.P. Singh, R. Sakthivadivel and K. Palanisami
Paper A3. Water Resources Management with Special Reference to Tank Irrigation 305
with Groundwater Use
K. Palanisami and Ananthini Nanthakumaran
Paper A4. Impact of Watershed Development Programs in Tamil Nadu 335
K. Palanisami and D. Suresh Kumar
Agenda of the Workshop 355
Participants 358
v
Acknowledgements
This volume of papers is the fifth and last in a series of publications under the IWMI-CPWF
research on “Strategic Analyses of India’s National River Linking Project.” The project team
would like to thank the authors of the respective chapters for their thoughtful contributions
to the research presented in the workshop and reported in this volume. We are grateful to Dr.
Colin Chartres, Prof. M.S. Swaminathan, Dr. J.S. Samra and Dr. B.M. Jha for delivering the
keynote addresses in the workshop and to Dr. Ashok Gulati, Dr. M.Samad, Prof. Kanchan
Chopra, Mr. Anil D. Mohile, Prof. A. Narayanamoorthy, Mr. Himanshu Thakker, Dr. L.
Venkatachalam, Mr. S. Gopalakrishnan and Dr. Alok Sikka for their useful contributions by
chairing or critiquing different sessions of the workshop.
The project team also appreciates the guidance of the project advisory committee— the
Chairman Prof. M.S. Swaminathan and others including Professors Yoginder K Alagh, Vijay
S. Vyas, Kanchan Chopra, Vandana Shiva and Frank R. Rijsberman, Messrs Anil D. Mohile,
S. Gopalakrsinan and Deep Joshi, and Drs. Peter McCornick and Tushaar Shah.
This research project has benefited immensely from the intellectual leadership of
Dr. Tushaar Shah, and the contributions of many other researchers at IWMI and in various
government departments, universities and local organizations. We are grateful to all of them.
Finally, we express our sincere thanks to Mr. Kingsley Kurukulasuriya, Editor; Ms.
Pavithra Amunugama, Workflow Coordinator of the Publishing Unit, IWMI and Ms. Mala
Ranawake, Administrative Officer, Research Division, IWMI for general coordination and
logistical support; and all other IWMI and CPWF staff who helped in the various stages of this
workshop and the project bringing them to a successful completion.
Research in this book is part of the project no. 48, “Strategic
Analyses of India’s National River-Linking Project (NRLP)” of
the CGIAR Challenge Program on Water and Food (CPWF).
National Rainfed Area Authority, New Delhi
Banaras Hindu University, Varanesi, Uttar Pradesh
The Madras Institute of Development Studies, Chennai
Agro Economic Research Centre, Delhi University, Delhi
Project
Partners
vi
Centre for Rural Development, Alagappa University, Karaikudi,
Tamil Nadu
Faculty of Environmental Sciences, Wageningen University and
Research Centre, Wageningen
School of Public Policy and Governance, Management
Development Institute, Gurgaon, Haryana
NALSAR University of Law, Hyderabad
Livelihoods and Natural Resource Management Institute,
Hyderabad
Indwa Technologies, Hyderabad, Andhra Pradesh
Consulting Engineering Services (I), Pvt. Ltd., Bangalore
Institute for Resource Analysis and Policy, Hyderabad
INREM Foundation, Anand, Gujarat, India
IWMI-TATA Water Policy Program, Hyderabad
vii
Preface
In 2005, the International Water Management Institute (IWMI) and the Challenge Program
on Water and Food (CPWF) started a 3-year research study on “Strategic Analyses of India’s
River Linking Project.” The primary focus of the research project was to inform the public and
the policy planners of a balanced analysis of the benefits and costs of the different components
of the National River Linking Project (NRLP). The project also conducted various research
on experiences of past water development projects which can benefit new water transfers such
as NRLP, and on major strategic issues in the Indian irrigation sector that require immediate
attention.
The second national workshop of the project, held at the India Habitat Centre in New
Delhi during April 8-9, presented the results of the studies on lessons that can be transferred
from past to future water development projects, and strategic issues that require immediate
attention for meeting India’s increasing water demand.
This compendium of papers, the fifth and last of a series of publications under the IWMI-
CPWF research project, includes the summary of keynote speeches and the deliberations in
different sessions and the papers presented at the second national workshop.
Upali A. Amarasinghe
Project Leader
IWMI New Delhi Office

1
Strategic Issues in Indian Irrigation:
Overview of the Proceedings
Upali A. Amarasinghe and Stefanos Xenarios
Introduction
India’s National River Linking Project (NRLP), if implemented in its entirety, will form a
gigantic water grid that South Asia has never witnessed in the history of its water development.
However, from the outset, the proposed NRLP plan was a bone of contention among the civil
society, academia, environmental community, policy planners and politicians (Alagh et al.
2006). For opponents its economic benefits will not be sufficiently higher vis-à-vis its social
and environmental cost. For its proponents, it is the savior of the pending water crisis in India
(NWDA 2009). However, many of the discourses on NRLP lacked sufficient analytical rigor in
assessing cost and benefits. And importantly there was very little attention to what determinants
are ailing the existing surface irrigation systems leading to their poor performance, and what
lessons can be learnt from these for new water development projects. Also, amidst the intense
debate on social cost and benefits of the NRLP, many other important issues that require
immediate attention for meeting India’s water needs have been pushed into the background.
The research project, The Strategic Analyses of National River Linking of India of the
International Water Management Institute (IWMI), Colombo, under the aegis of the Challenge
Program for Water and Food (CPWF 2005), tried to address these twin challenges. It tried to
fill the void created by the analytical rigor in the NRLP debate and to better informs the public
on the pros and cons of the NRLP and the lessons to be learnt from the existing water supply
systems. It also raises many strategic issues and challenges in Indian irrigation that require
immediate attention.
The second national workshop of the NRLP research project, held at the India Habitat
Centre in New Delhi, on April 8-9, 2009, mainly focused on strategic issues of Indian irrigation
that require immediate attention. The issues highlighted at the workshop contribute to a cluster
of short- to long-term strategies for a perspective plan for the Indian water sector. This paper
provides an overview of the proceedings of the second workshop. It includes a description of
the deliberations on:
§ International and local perspectives on strategic issues facing the water sector, especially
the irrigation sector.
2
Upali A. Amarasinghe and Stefanos Xenarios
§ Planning new surface irrigation schemes for increasing benefits under changing dynamics
of the Indian agriculture.
§ The state of the irrigation of Tamil Nadu, one state that will benefit from the proposed
NRLP water transfers. It shows trends and turning points of irrigation in the state, returns
to past irrigation investments, and proposes investment options in the short and medium
term for meeting increasing water demand.
§ Lessons from past water resources development projects that are useful for planning new
such projects.
§ Prospects and constraints of demand management strategies in Indian irrigation.
§ Potential and constraints of water productivity improvements in Indian agriculture.
§ Supply augmentation through groundwater recharge and virtual water trade.
The papers in this volume are the fifth of a series of publications under the NRLP
research project. The project conducted research in three phases. Research in Phase I, which
assessed scenarios and issues of India’s water futures, was published in NRLP Series 1, “India’s
Water Futures: Scenarios and Issues” (Amarasinghe et al. 2009).
Research in Phase II focused on cost and benefit issues related to the NRLP. Some,
hydrological, social and ecological issues of the NRLP project were focused in the first national
workshop and the proceedings were published in NRLP Series 2 (Amarasinghe and Sharma
2008).
Phase III research assessed potential contributions of various strategies for a water-
sector perspective plan for India. Studies on “Promoting Demand Management Options in
the Indian Irrigation Sector: Potentials, Problems and Prospects” were published in NRLP
Series 3 (Saleth 2009), and the studies on “Water Productivity Improvements in Indian
Agriculture: Potentials, Constraints and Prospects” were published in NRLP Series 4 (Kumar
and Amarasinghe 2009).
The syntheses of studies on demand management and water productivity improvements
were discussed in the 2nd national workshop. Additionally, supply augmentation through
groundwater recharge and virtual water trade, and lessons from past water development
projects on cost and time overruns, waterlogging and salinity, rehabilitation and resettlement
of project-affected persons, are presented in this volume. Brief overviews of the deliberations
in sessions 1 to 7 are followed next.
Session 1: Strategic Issues in Indian Irrigation
The major issues that the irrigation sector is facing were addressed by four guest speakers,
Dr. Colin Charters, Director General, International Water Management Institute, Prof. M.S.
Swaminathan, Chairman, M.S. Swaminathan Research Foundation, Dr. J.S. Samra, Chief
Executive Officer, National Rainfed Area Authority and Dr. B.M. Jha, Director General,
Central Groundwater Board of India.
3
Strategic Issues in Indian Irrigation: Overview of the Proceedings
Issues across the globe
Dr. Colin Charter’s keynote speech focused on pressing global issues influencing water-food
dimensions at present. Globally, many poor and hungry people live in regions where access
to water is a constraint for increasing food production. In semiarid to arid tropics, about 800
million people are undernourished. Many river basins are already experiencing physical
water scarcities while many others are facing economic water scarcities. Large numbers
of river basins have low minimum river flows and consequently have high environmental
stress. At present, more than one-third of the worlds’ population live in river basins with high
environmental water stress.
Yet, major demand drivers of water for food are also changing, resulting in rapidly
increasing water needs. Consumption patterns are changing, mainly towards diets consisting of
more non-cereals and animal products. Changing dietary patterns have significant implications
on water demand. While a person needs about 2-5 liters/day, and a household needs 200-
500 liters/day, it takes 2,000-5,000 liters/kg of evapotranspiration (ET) for producing grain to
5,000-15,000 liters/kg of ET, mainly from feed products, for producing animal products, such
as meat, milk, etc..
The water demand, especially for blue water, of industrial and domestic sectors is
increasing, and the demand for biofuel production will increase manifold in the next 20 to 30
years. A major part of biofuel water demand, especially in water-scarce regions, will have to
be from irrigation (85% and 65% in India and China, respectivly versus 17% and 8% in the US
and Brazil, respectively).
Climate change impacts on water availability are real, and they are already affecting
some regions. Rainfall and runoff have decreased significantly in some regions, while the
reduction in runoff is comparatively higher than that of rainfall. Implications of such reduction
on already water-stressed basins, especially in developing countries, could be catastrophic.
In fact, many countries are facing water crises. But these crises can be averted if the
countries do things differently. Some high potential strategies for water-scarce countries include
increasing water productivity, turning wastewater to a valuable resource and increasing virtual
water trade with few trade barriers. Additionally, various types of storage options, including
large to small dams to subsurface storage, clearly need rethinking.
Many countries with low per capita storage require increasing storage to cope with
droughts and impacts due to climate change. These countries need large investments, a message
that needs to be communicated to politicians and policymakers with added significance.
Hydropower industry also needs large dams. But the dams need to be built and managed
efficiently for irrigation and for other multiple water uses while reducing environmental damage
and ensuring minimum river flows. There are many other options to large dams. Medium-
scale reservoirs, village ponds, groundwater recharge and water harvesting can augment water
significantly. However, all options need to be evaluated for assessing potential gains and losses
under different conditions.
Reforming water governance is essential for demand management to be successful.
While protecting the poor, water rights, valuation of water and pricing, water markets, policies
and institutional reforms, equitable and gender sensitive management systems need to be in
place for effective functioning of supply and demand management systems.
4
Upali A. Amarasinghe and Stefanos Xenarios
Issues in India
Prof. M. S. Swaminathan highlighted strategic issues of irrigation in India. He noted that water
planning for supply augmentation for a national water security system requires integrating of
five sources of water: rainwater, river water, groundwater, wastewater and seawater.
§ Rainwater is the greatest asset at hand. The most important step for supply augmentation
in India today is rainwater harvesting. The national rural employment guarantee program
(NREGP) plays a major role in water harvesting and watershed development programs.
These programs can be made more effective by empowering the Panchayat Raj institutions,
which are responsible for implementing NREGP, to use the unskilled labor of the poor
people as productively as possible. Rewarding these institutions/NREGP for conducting
better programs could be an incentive for contributing to a water security system.
§ River water, a part of the river linking project, is also important. However, there are many
conflicts in water sharing between neighboring nations and between states at present.
India requires many non-judiciary conflict resolution organizations, such as the Key-
Stone centre in the Colorado River in the USA. These centers can resolve many conflicts
and have win-win situations for all parties in the conflict without relying on long-delayed
judicial processes.
§ Groundwater is the most dominant water use at present. It contributes most to both
receding and rising water tables in many regions. Managing this resource is the most
important short- to long-term water management challenge.
§ Wastewater recycling is gradually increasing in metropolitan areas. This is an important
source not only for raising fodder and other crops but for breeding fish. Industries can be
made to give back the water by proper methods of recycling.
§ Seawater is useful for agro-aqua-farming, including agroforestry and aquaculture. Given
India’s 7,500 km shore line, this aspect of using seawater productively requires more
consideration.
Linking of rivers could be one option for easing the water stress in some locations
where the links are economically viable and environmentally sustainable. However, as of
now, the Himalayan component presents a large number of political problems and may not
be feasible in the short term. The peninsular links are feasible to the extent that the political
control of designing, planning and implementing is within India. The new government could
takes up these as priority issues.
While supply-side solutions are essential, demand management strategies also have
significant potential to address water problems in many locations. Policy formulation for
effective functioning of demand management strategies requires increased emphasis. Within
this, it is important to increase more crops and more income from water, and create more
opportunities in rain-fed areas. Some experiments, under the Farmer Participatory Program in
rain-fed areas show yield increase in the range of 200-300%. These can reduce the additional
demand for large surface storages.
According to Dr. Samra, rain-fed agriculture has a great potential for improving the
livelihoods of the poor. Data indicate that 78% of the Indian agriculture is linked to markets.
The other 22% is subsistence agriculture, mainly in the rain-fed areas. Many of the poor also
live in rain-fed areas, but most of the virtual water trade is occurring from low- to high-rainfall
5
Strategic Issues in Indian Irrigation: Overview of the Proceedings
areas. This is a paradoxical situation of virtual water trade, in particular for India. Reversing the
trends of virtual water trade within the country could solve many water and poverty problems.
Most of the water-intensive crops, such as rice, sugarcane, banana and aquaculture should, as
far as possible, be in high rainfall areas and be exported to low-rainfall areas. These forms of
high-value agriculture can constitute an attractive proposition for the eastern regions, which
are reeling with a high incidence of rural poverty.
Dr. Jha highlighted the criticality of groundwater irrigation in India’s food and livelihood
security. Groundwater is the source for more than 60% of the irrigation at present. But many
regions are fast depleting their resources due to overabstraction. The Government of India has
a national master plan for increasing groundwater recharge, which includes recharging from
millions of dug wells dotting the rural landscape in India.
Session 2: Benefits of Irrigation Water Transfers
The changing face of irrigation (Paper 2 by Tushaar Shah), and the financial benefit-cost of
proposed irrigation water transfers in the NRLP (Paper 3 by Amarasinghe and Srinivasulu)
were the foci of this session.
According to Shah, the face of Indian irrigation is rapidly changing. India has spent
over Rs 1,000 billion ($22 billion in 2000 prices) on surface irrigation since 1991. But net area
under surface irrigation has declined by 24%. Since 1970, Tamil Nadu and Andhra Pradesh,
two major water-recipient states of the NRLP, have spent over $5 billion in canal irrigation,
but have lost close to 500,000 ha of net irrigated area under major/medium schemes. Since
1990, net area under groundwater irrigation area has increased by 26%. This was mainly due
to private investments. Groundwater irrigation is widespread, both in and outside the canal
command have areas, although overexploitation is threatening irrigated agriculture in many
regions. Many factors contribute to this changing face of irrigation. They include
§ pressure of decreasing landholding sizes and large number of smallholders,
§ increasing demand for year-round on-demand water supply for increasing income from
small landholdings,
§ inefficient institutions providing irrigation services and unreliable water supply in canal
irrigation,
§ differences of existing and proposed conditions supporting surface irrigation, including
the nature of both the state and agrarian society,
§ changes in agricultural demography, and
§ adoption of new irrigation technology.
These factors, thus pose a major question on the viability of large surface irrigation
systems such as those proposed in the NRLP.
Amarasinghe and Srinivasulu (Paper 3 in this volume) assessed the financial viability of
water transfers in the peninsular links in the proposed NRLP. This study shows that proposed
surface irrigation through the river linking program can be financially viable if the planners
appreciate the changing face of irrigation and then adapt to these changes. In order to avoid the
same fate and issues as that facing surface irrigation at present, many factors need rethinking
in the current river linking proposal. Two of the major factors of influence include that
6
Upali A. Amarasinghe and Stefanos Xenarios
§ the proposed cropping patterns will require high-value crops, and those that farmers
prefer. This is especially important given the low landholding sizes in these systems.
§ new water transfers should be used as far as possible to cultivate new or existing irrigation.
A large part of the proposed command areas is already irrigated from groundwater. The
return flows from new irrigation should help these command areas as recharge. Farmers
would prefer groundwater irrigation to surface water irrigation due to already existing
investments on pumps and other infrastructure and to the reliability of groundwater.
Although, many individual links under the NRLP peninsular component seem
financially unviable, a set of interdependent links could be financially viable under the above
conditions. But financial benefits and cost could vary if financial losses due to reducing river
flows, submerging land, waterlogging, etc., and financial benefits due to increased groundwater
irrigation are included.
The discussion on the above issues, led by Dr. Ashok Gulati of the International
Food Policy Institute and by Dr. Madar Samad of IWMI, indicated the need for unbundling
surface irrigation to have separate institutions as in other development sectors. Although, in
general, participatory irrigation management (PIM) did not have much success, there are a few
successful systems in different states. So, it is important to find what works for different states
and different irrigation systems. If PIM does not work at the system level, then explore different
institutions at the storage, main canals and the distributary network with the multinationals,
and the domestic and private sectors. Creating markets with policies can facilitate effective
functioning of these institutions with increasing transparency, accountability, cost efficiency,
inclusiveness and sustainability.
Also, there is a significant difference in benefits between canal irrigation systems and
surface water systems. Canal irrigation systems provide water for food production whereas
surface water systems provide a large quantity of drinking water supply for urban areas,
generate hydropower benefits, pump irrigation from rivers due to releases from reservoirs,
recharge groundwater and benefit the environment. These benefits, along with food security at
the household, regional and national level should be part of a domain for analyzing financial
and economic cost benefit of surface water systems. However, it is also important to include the
cost to ecosystem services system for demarcating the boundaries of benefits-cost of surface
water systems.
Session 3: State of the Irrigation in Tamil Nadu: Trends, Turning Points
and Future Options
Tamil Nadu, a major recipient state of the water transfers in the NRLP, had significant changes
in irrigation in the recent past. Trends and turning points of irrigation (Paper 4 in this volume)
and policy interface for improving declining performance in surface irrigation (Paper 5 in this
volume) in Tamil Nadu were the foci of this session.
Irrigation is a major driver of agricultural growth, which is intrinsically related to the
economic growth in Tamil Nadu. However, in spite of major investments in the irrigation sector,
net surface water irrigated area has declined over the last three decades. The total investment
in major/medium irrigation has increased by $730 million (2000 prices) between 1970 and
2000, but the net canal irrigated area has declined by 85,000 ha or 9%. Total investment in tank
irrigation in the same period was over $430 million, but net minor irrigated area has declined
7
Strategic Issues in Indian Irrigation: Overview of the Proceedings
by 450,000 ha or about 50%. However, with private investment, net groundwater irrigated area
has increased by about 500,000 ha. Although the contribution of groundwater has increased
substantially, many regions in the state are facing acute groundwater depletion. In fact, 85% of
the groundwater resources in the state are already withdrawn at present.
To overcome water woes, Tamil Nadu requires sharper policy focus on short- to
medium-term irrigation investments. Some policy recommendations include:
§ recharging groundwater in intensive well irrigation regions,
§ conserving soil and water in tank irrigation regions,
§ combining five to six micro-watersheds to form macro-meso watersheds within a zone of
influence of 400 m,
§ converting tanks, with less than 40% supply capacity, to percolation tanks and increase
groundwater irrigation in the command area by introducing one well per 2 ha in well-only
irrigation situation; one well per 4 ha in well-cum-tank irrigation situation, and one well
per 10 ha in tank-only irrigated areas,
§ increasing wells in surface water irrigation systems and reworking system operation
plans,
§ increasing investment in watercourse improvements in major reservoir systems,
§ increasing investments in main systems in tank irrigation systems, and
§ investing in secondary and main system management for increasing demand
management.
The discussion of the above issues, led by Eng. A.D. Mohile, former Chairman of the
Central Water Commission of India, noted that water transfers of the NRLP can be used within
a network of interlinking of rivers within the state, although water received through NRLP may
be too low to address all water problems in the state. Moreover, successful implementation of
the above recommendations, however, requires a comprehensive water accounting analysis
assessing the impact of increase in groundwater in the canal and tank irrigation commands.
Session 4: Lessons from Past Water Transfer Projects
Many existing water development projects, which India has implemented in recent decades,
have a plethora of issues that can benefit planning and implementing new water transfer
projects. In this session, Thalati and Shah (Paper 6) focused on project implementation issues
in the Sarda-Sarovar project; Sharma et al. (Paper 7) addressed waterlogging and salinization
issues in the Indira Gandhi Nehar Paryojana (IGNP) project in Rajasthan, and Samad et al.
(Paper 8) highlighted resettlement and rehabilitation issues in the Sarda-Sarovar and Ujjini
projects.
The Sarda-Sarovar project suffers from many issues due to inadequate details in the
planning and implementation (Paper 6). Hydrologically, it suffers from lower inflow to the
reservoir than expected. The project planners had not envisaged large-scale groundwater
abstractions in the upstream of the reservoir. Hence, the inflow to the reservoir is already
17-30% lower than planned, and will further reduce with increasing upstream development.
Significant cost and time overruns were also major issues. The Government of Gujarat has
already overspent more than Rs 130 billion (in 1987/88 prices) in the construction of the
8
Upali A. Amarasinghe and Stefanos Xenarios
project. Yet, only 0.1 million ha (Mha) of the 1.8 Mha of planned area are irrigated; only 200
MW of the planned 1,460 MW hydropower generation are realized; and only 35 and 1,500
of the 135 and 8,215 towns and cities, respectively, have received water supply to date. If the
project is to be completed as planned it requires at least another Rs 2,000 billion. The failure
of the planned institutional model largely contributed time and cost overruns. The expectation
that farmers and water user associations would voluntarily provide land and also build
watercourses and field channels, has never materialized. Instead, farmers divert a significant
part of the water to far-away lands from the main and branch canals by lifting to upland areas
and siphoning to lowland areas through underground pipes. Such innovations are not common
in surface irrigation projects, but can impact significantly in reducing problems related to land
acquisition for distributaries and watercourses, and water distribution to tail-end areas in the
project.
A large part of IGNP projects suffers from waterlogging and salinity (Paper 7). A
considerable lag period between water availability and water utilization in the command areas
was a major cause for waterlogging. For example, in Phase II of the IGNP project, the available
water supply is adequate to irrigate 0.925 million ha of croplands, but the distributary network
is sufficient to irrigate only 0.144 million ha. Moreover, inadequate attention to the existing
hard pan, which is only less than 10 meters from the surface, exacerbated the situation. In fact,
in the IGNP, the hard pan with less than 10 m depth covers more than 33% of the flow irrigated
area and 76% of the lift irrigated area. Inadequate drainage was a major issue in the IGNP.
Resettlement and rehabilitation are major issues facing implementers of any water
development project. The studies on Sarda-Sarovar and Ujjini projects however show that
there is an initial distress and fall of standard of living. But many of the displaced persons have
restored their livelihoods to the original level in 4-6 years, although the level of restoration
and benefits vary spatially. Those displaced in Maharashtra and Madya Pradesh in the Sarda-
Sarovar are worse-off than those in Gujarat.
The major conclusions from the discussion of this session, led by Mr. Himanshu Thakkar
were:
§ Hydrological modeling should incorporate the groundwater irrigation already taking
place and expected to come up in the future in the command area and in the upstream
of reservoirs, and should assess drainage requirements with regard to the existing
hydrogeological conditions and the command area development.
§ Be cognizant of the existing modes of water delivery systems at the watercourses, and the
farm and field levels in planning new systems .
§ The pump and pipe system of water delivery could reduce water and land wastage through
watercourses and field channels.
§ Piped water delivery system, possibly at or below the distributary canals, can also increase
reliability and reduce wastage. But such systems should have a mechanism in place not to
deprive water to the tail enders to increase the equity.
§ Create institutions for appropriate water delivery management at the branch/distributary
canal level.
§ Prepare proper command area development plans, optimum water delivery plans and
adequate drainage structures.
9
Strategic Issues in Indian Irrigation: Overview of the Proceedings
§ Develop distributaries, watercourse and field-level distribution systems quickly to reduce
the gap of water availability for irrigation and water utilization, thereby increasing
consumptive water use and reducing waterlogging.
§ There should be active engagement to reduce not only the initial risk but also the impact
of impoverishments after resettlement.
Session 5: Meeting Increasing Water Demand: Potential from Demand
Management Strategies
The growing gap between the demand and supply in Indian irrigation is a serious concern for
policy planners. While, supply-side solutions based on new augmentation, such as NRLP, are
essential in some contexts, they cannot be the exclusive basis for irrigation sector strategies.
Many demand management strategies will help reduce the gap. Paper 9 presented the synthesis
of six studies of various demand management strategies in the Indian irrigation sector (Saleth
2009). These strategies include water pricing, formal and informal water markets, water rights
and entitlement systems, energy-based water regulations such as power tariff and supply
manipulations, water saving technologies such as drip and sprinklers, crop choices and farm
practices, and user- and community-based organizations.
The major focus of these studies was to asses the present status of these options in
the irrigation management strategy in India. It includes the extent of their application, their
effectiveness in influencing water use decisions at the farm level, presence of policies in
promoting them at the national and state levels, cases of success and best practices in demand
management, and what lessons there are for policy in upscaling them. What are the bottlenecks
and constraints for promoting them on a wider scale, particularly within the irrigation sector?
What are the present potentials and future prospects for these options as an effective means
for improving water use efficiency and water saving, which are sufficient enough to expand
irrigation or to reallocate water to nonagricultural uses and sectors?
The focus and coverage show that some demand management options are context-
specific. For instance, water pricing as a tool is largely applicable to canal regions, whereas
the options involving energy regulations—involving both supply and price manipulations—is
largely applicable in groundwater irrigation. The latter may also be relevant in canal regions to
the extent where water lifting is involved. Water markets and water saving technologies also
occur predominantly in the groundwater irrigation regions. But, the options involving water
rights and user organizations are relevant in both canal and groundwater regions. Similarly,
some of the options have more direct and immediate impacts on water demand, while others
have an indirect and gradual effect and, that too, depending on a host of other factors. For
instance, water rights and water saving technologies have a more direct effect on water
demand, and the options involving user organizations and energy regulations have only an
indirect effect.
The demand management options also differ considerably in terms of the scope for
adoption and implementation, especially from a political-economy perspective. Among the
options, water rights system is the most difficult one followed by water pricing reforms and
energy regulations, but those involving water markets and user organizations are relatively easier
to adopt, though their implementation can still remain difficult. Water saving technologies,
10
Upali A. Amarasinghe and Stefanos Xenarios
though politically benign and not controversial, still require favorable cropping systems and
effective credit and investment policies. The differences in their application context, political
feasibility and the gestation period of impact are very important and should be understood
because such factors will determine the relative scale of application and the overall impact of
the demand management options.
As for the influence, some of the options can have immediate effects and some others
have the potential to influence water allocation and use. However, these effects are rather too
meager to have an impact on the magnitude needed for generating a major change in water
savings and allocation. The two central problems limiting the impacts of demand management
are their limited geographic coverage and operational effectiveness. Concerted policies are also
lacking in really exploiting their demand management roles. All these options are pursued as if
they are separate and essentially in an institutional vacuum because the necessary supporting
institutions are either missing or dysfunctional in most contexts.
However, a concerted policy for demand management in irrigation in India is conspicuous
for its absence both at the national and state levels. Instead, what is being witnessed is a casual
and ad hoc constellation of several uncoordinated efforts in promoting the demand management
options. In most cases, these options are pursued lesser for their demand management objectives
than for their other goals such as cost recovery and management decentralization. Even here,
the policy focus is confined only to a few options, such as pricing, user organizations, energy
regulations and, to a limited extent, water saving technologies. Although several policy
documents and legal provisions clearly imply a water rights system, there are no explicit
government policies either as to its formal existence or to its implementation, except for the
recognition of the need for volumetric allocation and consumption-based water pricing. This
is also true for water markets, though their existence and operation across the country are
well documented. Considering the critical importance of water rights and water markets for
their direct effects on demand management and their indirect effects in strengthening other
demand management options, it is important that they are formally recognized and treated as
the central components of a demand management strategy.
Although the effectiveness of demand management options are constrained by several
institutional, technical and financial factors, the lack of a well-articulated policy is the major
bottleneck for implementing water demand management both at the national and state levels.
Such a policy provides the basis for the much-needed financial and political commitments for
implementing effective demand management programs. An effective demand management
strategy can both expand irrigation and release water for other productive uses even at the
current level of water use. Therefore, it is logical to divert at least part of the investments that
are currently going into new supply development.
Session 6: Meeting Increasing Water Demand: Potential from Water
Productivity ImprovementsThe agriculture sector in India is in direct conflict with other sectors of water economy, and the
environment. The common features of agriculture in some regions are excessive withdrawal of
groundwater and excessive diversion of water from rivers, causing environmental water stress.
The scope for augmenting the utilizable water resources in these regions is extremely limited.
While there are many regions in India where water resources are abundant, these regions
offer limited potential for increasing agricultural production due to the limitations imposed
11
Strategic Issues in Indian Irrigation: Overview of the Proceedings
by land and ecological constraints. Moreover, productivity of water use is very low in India
for major crops in terms of the amount of biomass produced per unit of water depleted in crop
production. So, improving water productivity (WP) in agriculture, wherever possible, holds
the key to not only sustaining agricultural production and rural livelihoods but also making
more water available for other sectors including the environment. Paper 10 presents a synthesis
of several studies covering various aspects of WP and their potential improvements in India
(Kumar and Amarasinghe 2009). These studies include quality and reliability of water supply
affecting WP, strategies of WP improvements at different scales, potential WP productivity
improvements in food grains, WP in dairying and in different agricultural systems including
multiple uses, and taking the concept of WP beyond more crop per drop to more value per drop
and its implications for the agriculture sector in India.
Improving water productivity in agriculture can bring about many positive outcomes.
In some regions, WP improvement would result in increased crop production with no increase
in consumptive use of water, while in some others it would result in reduced use of surface
water or groundwater draft. Both outcomes would protect the environment. On the other hand,
there are certain regions in India where yields are very poor as the crops are purely rain-fed in
spite of having a sufficient amount of unutilized water resources. Augmenting water resources
and increasing irrigation in such regions can result in enhanced yield and income returns,
as well as improvements in water productivity. Such strategies have the potential to reduce
poverty in these regions.
Opportunities
There are several opportunities for improving the water productivity of crops in India. They
include:
§ providing full irrigation to meet the full crop evapotranspirative demand or providing
supplemental irrigation in critical periods of crop growth for the rain-fed crops for
increasing the crop yield,
§ replacing long-duration food crops with higher water use efficiency by short-duration
ones with low efficiency; and growing crops in regions where their yields are higher due
to climatic advantages (high solar radiation and temperature, for instance), better soil-
nutrient regimes or lower ET demand,
§ Practicing deficit irrigation in areas where yield is large and consumptive water use is very
high,
§ improving the quality and reliability of irrigation water,
§ managing irrigation for certain crops by controlling or increasing allocation to the said
crops,
§ adopting high-yielding varieties without increasing the crop consumptive use,
§ Bridging the yield gap by providing optimal dosage of nutrients such as artificial irrigation
and fertilizing; and improving farming systems with changes in crop and livestock
compositions.
12
Upali A. Amarasinghe and Stefanos Xenarios
Food crops such as paddy and wheat dominate cropping patterns in many irrigated
districts in eastern India. The yields of these food crops are significantly lower than the
maximum attainable under similar conditions. There are 202 districts in the country which fall
under the category of medium consumptive use of water for irrigated crops (300-425 mm),
but with high yield gaps. Improved agronomic inputs (high-yielding varieties and better use of
fertilizers and pesticides) can significantly raise the yields. This will have a positive impact on
water productivity though it is not a concern for farmers in this water-abundant region of India.
While there are districts in central India, where better use of fertilizers would help enhance
crop yields, these areas also require an optimum dosage of irrigation also to achieve higher
crop yields.
There are many irrigated areas in western India with large potential for water productivity
improvements through water delivery control, improving quality and reliability of irrigation
water supplies, and use of micro-irrigation systems. Water productivity in irrigated crops could
be enhanced significantly through deficit consumptive water use through deficit irrigation.
This could be a key strategy in water delivery control in 251 districts. These districts already
have a very high yield per unit of land and receive intensive irrigation.
Most of India’s “so called” rain-fed areas are in central India and the peninsular region.
There are 208 districts with low (below 300 mm) average consumptive use of water for food
grain production. These districts have large areas under rain-fed course grains like pulses such
as green gram and black gram. These crops give very low grain yields, resulting in low WP.
Supplementing full irrigation can boost both yield and WP significantly in the rain-fed areas of
these districts.
Constraints
In spite of large opportunities, there are many constraints for increasing water productivity
too. They include:
§ constraints induced by land availability,
§ food security concerns and regional economic growth. Cereals such as rice and wheat are
important for food security of India but have low water efficiency, compared to cash crops
such as cotton, castor and groundnut which have high water use efficiency,
§ existing institutional and policy frameworks in improving water productivity for irrigated
crops. For instance, in many situations, improvement in water productivity in kg/ET or
Rs/ET does not convert into better returns for the farmers due to inefficient pricing of
water and electricity. The policy constraints concern the pricing of water used in canal
irrigation and electricity used in well irrigation, whereas the institutional constraint comes
from the lack of well-defined water rights for both surface water and groundwater. Both
aspects leave minimum incentives for farmers to invest in measures for improving crop
water productivity as such measures do not lead to improved income in most situations,
§ lack of knowledge and wherewithal to adopt technologies and practices to improve water
productivity in agriculture, especially in the communities dependent on rain-fed crops,
§ lack of credit required to invest in water harvesting systems for supplementary irrigation
for rain-fed crops and economic viability issues.
13
Strategic Issues in Indian Irrigation: Overview of the Proceedings
In a nutshell, while there seem to be great opportunities for improving water productivity
in agriculture the extent to which these can be achieved depends on the scale at which the
above-mentioned constraints operate.
Some of the policy and institutional interventions are as follows:
§ improving the quality of irrigation water supplies from canal systems, including the
provision for intermediate storage systems like the diggies in Rajasthan,
§ improving the quality of power supply in agriculture in regions that have intensive
groundwater irrigation and improving electricity infrastructure in rural areas of eastern
India,
§ providing targeted subsidies for micro-irrigation systems in regions where their use results
in major social benefits,
§ investing in rainwater harvesting for supplementary irrigation in rain-fed districts, and
§ rainwater harvesting and irrigation infrastructure for supplemental or full irrigation would
significantly enhance crop yields in many, and water productivity in some, rain-fed areas.
This would be a medium-term measure.
Session 7: Meeting Increasing Water Demand: Augmenting Water Supply
through Artificial Groundwater Recharge
Shah (Paper 11) and Sunderrajan et al. (Paper 12) assessed opportunities and constraints of the
groundwater recharge master plan and recharge through dug-well programs in India.
For many centuries, surface storages and gravity flow have been the main source of
irrigation for Indian agriculture. However, over the last four decades, while surface water
irrigation has been gradually declining, groundwater irrigation through small private tube wells
has been flourishing. Groundwater is contributing to about two-thirds of the gross irrigated area,
but this contribution could be even more if all the conjunctive water use areas are also accounted
for. Contrary to what most claim, groundwater irrigation has spread everywhere, even outside
canal command areas where recharge from surface return-flows could not have reached. As a
result of this boom, a significant part of India’s agricultural production and rural livelihoods
depend on groundwater irrigation. This boom is also a threat due to overexploitation. Thus
sustaining groundwater irrigation is essential for a country like India, because groundwater
irrigation, a) gives large spatially distributed social benefits by spreading to vast rural areas
that surface irrigation generally has not reached and cannot reach, especially benefiting the
large number of smallholders in Indian agriculture, b) is more efficient in irrigating crops, thus
allowing better application of agricultural inputs and crop intensification and diversification,
resulting in higher yields and an income per unit land than in canal command areas, c) is a
better mechanism for drought proofing, and enhances the importance of mitigating impacts due
to climate change. For sustainable groundwater irrigation, India needs to make more artificial
recharge in many locations and better managements of aquifer storages.
India’s National Master Plan for Groundwater Recharge proposes augmenting the water
resources annually by another 38 billion m3. The program, costing Rs 2,450 billion ($6 billion
at the January 2008 exchange rate), proposes many recharge structures including percolation
tanks, check dams, cement plugs and nala bunds, gabian structures akin to check dams, village
14
Upali A. Amarasinghe and Stefanos Xenarios
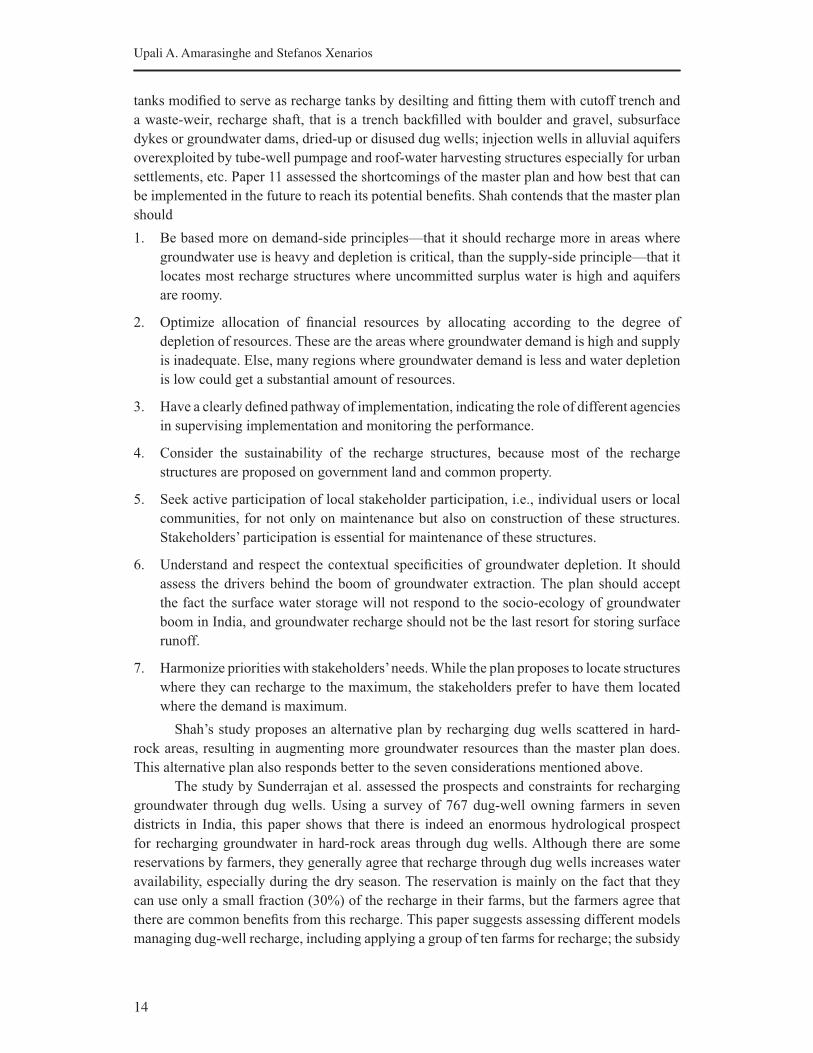
tanks modified to serve as recharge tanks by desilting and fitting them with cutoff trench and
a waste-weir, recharge shaft, that is a trench backfilled with boulder and gravel, subsurface
dykes or groundwater dams, dried-up or disused dug wells; injection wells in alluvial aquifers
overexploited by tube-well pumpage and roof-water harvesting structures especially for urban
settlements, etc. Paper 11 assessed the shortcomings of the master plan and how best that can
be implemented in the future to reach its potential benefits. Shah contends that the master plan
should
1. Be based more on demand-side principles—that it should recharge more in areas where
groundwater use is heavy and depletion is critical, than the supply-side principle—that it
locates most recharge structures where uncommitted surplus water is high and aquifers
are roomy.
2. Optimize allocation of financial resources by allocating according to the degree of
depletion of resources. These are the areas where groundwater demand is high and supply
is inadequate. Else, many regions where groundwater demand is less and water depletion
is low could get a substantial amount of resources.
3. Have a clearly defined pathway of implementation, indicating the role of different agencies
in supervising implementation and monitoring the performance.
4. Consider the sustainability of the recharge structures, because most of the recharge
structures are proposed on government land and common property.
5. Seek active participation of local stakeholder participation, i.e., individual users or local
communities, for not only on maintenance but also on construction of these structures.
Stakeholders’ participation is essential for maintenance of these structures.
6. Understand and respect the contextual specificities of groundwater depletion. It should
assess the drivers behind the boom of groundwater extraction. The plan should accept
the fact the surface water storage will not respond to the socio-ecology of groundwater
boom in India, and groundwater recharge should not be the last resort for storing surface
runoff.
7. Harmonize priorities with stakeholders’ needs. While the plan proposes to locate structures
where they can recharge to the maximum, the stakeholders prefer to have them located
where the demand is maximum.
Shah’s study proposes an alternative plan by recharging dug wells scattered in hard-
rock areas, resulting in augmenting more groundwater resources than the master plan does.
This alternative plan also responds better to the seven considerations mentioned above.
The study by Sunderrajan et al. assessed the prospects and constraints for recharging
groundwater through dug wells. Using a survey of 767 dug-well owning farmers in seven
districts in India, this paper shows that there is indeed an enormous hydrological prospect
for recharging groundwater in hard-rock areas through dug wells. Although there are some
reservations by farmers, they generally agree that recharge through dug wells increases water
availability, especially during the dry season. The reservation is mainly on the fact that they
can use only a small fraction (30%) of the recharge in their farms, but the farmers agree that
there are common benefits from this recharge. This paper suggests assessing different models
managing dug-well recharge, including applying a group of ten farms for recharge; the subsidy
15
Strategic Issues in Indian Irrigation: Overview of the Proceedings
for constructing structures is transferred to farmers in April or May, as most of the farmers
unanimously prefer; promote local businesses around recharge structures, such as to harness
the experience of well drillers, who also operate during the same summer months.
Virtual Water Trade
The virtual water trade concept suggest that water-rich countries should produce and export
water-intensive commodities (which indirectly carry embedded water needed for producing
them) to water-scarce countries, thereby enabling the latter to divert their precious water
resources to alternative, higher-productivity uses. The study by Verma et al. (2008) quantifies
and critically analyzes interstate virtual water flows in India in the context of a large interbasin
transfer plan of the Government of India.
This analysis shows that the amount of virtual water traded between states is more or
less equivalent to the water transfers of 178 Bm3 proposed in the NRLP. Much of the water
trade is from water-stressed to water-surplus states at present. In fact, the existing virtual
water trade between states exacerbates water scarcities in some states. The existing pattern
of interstate virtual water trade is influenced by non-water factors such as “per capita gross
cropped area” and “access to secured markets.”
This study suggests that in order to comprehensively understand virtual water trade,
non-water factors of production need to be taken into consideration. This includes some
changes to food procurement and input subsidy policies.
Conclusion
Increasing reliance of groundwater and declining area under surface irrigation are the
prominent recent trends in Indian irrigation. Given this changing face of irrigation, many
issues in groundwater and surface irrigation require immediate attention.
Recharging groundwater is an immediate requirement for sustaining the present
groundwater economy and for distributing irrigation benefits to a larger part of the population.
Empowering local institutions on watershed development programs, combining several
micro-watersheds within a radius of 400 m with meso-watersheds for development, recharging
groundwater through millions of dug wells, converting small tanks to percolation ponds,
increasing groundwater irrigation tank commands, and changing irrigation scheduling in canal
commands to increase conjunctive water use are some measures for sustaining groundwater
irrigation.
Water productivity improvements could significantly reduce the requirement for
additional water development. Increasing crop yield by providing supplemental irrigation
in major rain-fed districts with low consumptive water use (below 325 mm), reducing the
yield gap in many irrigated areas without increasing the total consumptive water use (325-
475 mm), deficit irrigation to provide deficit consumptive water use in irrigation districts
with large consumptive water use (more than 450 mm), and increasing multiple water uses
in water-abundant rain-fed areas are some strategies towards increasing water productivity in
agriculture.
Demand management strategies can reduce the widening gap between supply and
needs. If implemented with stronger policy backing, water pricing, formal and informal water
markets, water rights and entitlement systems, energy-based water regulations, water saving
16
Upali A. Amarasinghe and Stefanos Xenarios
technologies, and user and community-based organizations would go a long way towards
reducing this gap.
Virtual water trade can ease the stress in water-scarce regions, and provide livelihood
opportunities and reduce poverty in the eastern regions. However, proper policy and institutional
and infrastructural facilities are necessary to change cropping patterns in different regions to
make virtual water a win-win proposition for all regions.
New surface water development projects, including water transfers between rivers as
in the NRLP, may become necessary for meeting water demand in some regions. However,
planning of such projects should give due consideration to local hydrological, economic and
social trends and conditions. Planners should introduce innovative water distribution networks
to reduce water and land wastages in watercourses and field channels. They should also set
up water allocation institutions that are transparent and accountable to the end users. Proper
markets and policies are preconditions for effective functioning of these institutions.
17
Strategic Issues in Indian Irrigation: Overview of the Proceedings
References
Alagh, Y.K.; Pangare, G.; Gujja, B. eds. 2006. Interlinking of rivers in India. Overview and Ken-Betwa Link.
New Delhi, India: Academic Foundation.
Amarasinghe, U.A.; Sharma, B., eds. 2008. National River Linking Project- Analyses of hydrological, social
and ecological issues. Strategic Analysis of National River Linking Project of India. Series 2. Colombo,
Sri Lanka: International Water Management Institute.
Amarasinghe, U. A.; Shah, T.; Malik, R.P.S., eds. 2009. India’s water future: Scenarios and issues. Strategic
Analyses of National River Linking Project of India. Series 1. Colombo, Sri Lanka: International Water
Management Institute.
Saleth, R.M., ed. 2009. Water sector perspective plan for India: Potential contributions from demand
management in irrigation. Strategic Analyses of National River Linking Project of India. Series 3.
Colombo, Sri Lanka: International Water Management Institute.
CPWF (Challenge Program on Water and Food). 2005. Strategic analysis of India’s River Linking Project. The
Project Proposal. www.cpwf.org
Kumar, M.D.; Amarasinghe, U.A., eds. 2009. Improving water productivity in India: Potential, prospects and
constraints. Strategic Analyses of the National River Linking Project (NRLP) of India, Series 4. Sri Lanka:
International Water Management Institute
NWDA (National Water Development Agency). 2009. The Inter basin water transfers: The need. Accessible
via www.nwda.gov.in
Verma, V. K.; Ampman, D.A.; Zaag, P.; Van D.; Hoekstra, A.Y. 2008. Going against the flow. A critical analysis
of virtual water trade in the context of India’s National River Linking Project. Value of Water Research
Report Series No. 31. Delft, Netherlands: UNESCO-IHE, Institute of Water Education.

19
Reform or Morph?
Unlocking Value in Asian Irrigation1
Tushaar Shah1
International Water Management Institute, Colombo
“The development of irrigation has outrun its administration”
Col. W. Greathed, Chief Engineer, Upper Ganga Canal, 1869
Asian Irrigation in Transition
Gravity-flow irrigation has dominated irrigated agriculture in Asia for millennia. Until European
colonial powers began constructing large centrally managed irrigation systems in the nineteenth
century and later, much irrigation in Asia, small-scale and organized irrigation, existed around
communities. During the colonial era, European initiatives in building large irrigation projects
under centralized management marked a watershed in Asia’s irrigation history; and until
the 1940s, much new irrigation development took place under colonial governments which
viewed irrigation as a way to blend “interests of charity and the interests of commerce.” In
India, the British levied enhanced taxes from irrigated land; in Taiwan and China, Japanese
sought enhanced rice supplies by investing in irrigation. With the end of colonialism, the
tradition of centralized irrigation-building and management has been continued by national and
subnational governments for food security and poverty reduction with significant support from
multilateral international financial agencies. However, poor management and performance of
public irrigation systems were concerns throughout the colonial era; and these concerns have
multiplied manyfold in the postcolonial Asia.
During recent decades, surface irrigation has been in decline in many parts of Asia. Public
irrigation systems have tended to be underutilized and overcapitalized, and typically serve
only a fraction of the designed command. With aging, irrigation commands have been sinking
under the weight of their managerial, economic and environmental problems. In the Indian
subcontinent by far the largest areas under surface irrigation in Asia, small surface structures,
notably tanks in southern India and Rajasthan, karezes in Pakistan and Iran, kuhls in the
Himalayas, and ahar-pyne systems in southern Bihar had been losing irrigated areas since the
1950s. But during the 1990s, even large public irrigation systems have begun shrinking. During
the 7-year period between 1994 and 2001, India and Pakistan together lost over 5.5 million ha
of canal irrigated areas despite massive investments in rehabilitation and new projects (Shah
1This article is based largely on the author’s book Taming the Anarchy: Groundwater Governance in
South Asia, Washington, D.C.: The Resources for the Future Press.
20
Tushaar Shah
2008). In Central and Southeast Asia, figures are not as dismal; but the present performance
and future sustainability of irrigation projects have remained a matter of growing concern.
Institutional Reforms in Surface Irrigation
In recent years, researchers, NGOs, donors and governments have sought to reverse this
declining trend through institutional reforms-in the form of Participatory Irrigation Management
(PIM) or Irrigation Management Transfer (IMT) to farmer associations. This idea itself derives
from the variety of farmer-managed irrigation systems (FMIS) that proliferated-and can still
be found-in Asia. As with all complex socio-technical systems, to work well, these systems
required, generated, and nurtured a ‘culture of irrigation.’ So central was this culture to
shaping the social lives of irrigators that anthropologist Robert Hunt called such groupings
‘irrigation communities.’ With large gravity-flow systems constructed by the state, system
design and centralized operation acquired greater significance. But despite caution from the
likes of Hunt and sociologist Walter Coward, it has been widely assumed that catalyzing and
nurturing vibrant irrigation communities-water user associations-in command areas can help
large irrigation systems function as well as traditional FMIS did. This assumption is now
proving far-fetched.
For centuries, the feasibility of catalyzing a viable irrigation community determined the
size of irrigation systems. Unsurprising, then, most FMIS were small-scale systems that could
be sustained over centuries by local irrigation communities-often with cooperation aided by
coercion from local authority structures. These survived and thrived as long as they met three
ongoing challenges facing all multiuser irrigation systems:
Rule enforcement: Rules were enforced to keep in check the anarchy endemic to these
systems by punishing deviations such as water thefts, vandalism and violation of distribution
norms. Anarchy-control ensured efficient and equitable provision of irrigation service and
helped maximize ‘member-value’ but required deft system-management backed by authority.
Regular maintenance: There was regular maintenance to counter the atrophy endemic
to irrigation systems due to gradual disfigurement, arrested only by constant investment in their
maintenance and upkeep. Atrophy-control ensured physical sustainability of the systems—
which sometimes lasted for centuries—but required ruthless collection of irrigation service
fees, often in the form of labor.
Upgradation: Systems were upgraded to minimize the noise by adapting the system to
changing service-expectations of irrigators as changes in farming systems modified irrigation
demands. The control of noise-the gap between the service system is capable of delivering and
the service irrigators’ demand at a point in time-is minimized by constant upgradation to meet
changing irrigation demand patterns. Until some decades ago, noise-control was not much of
an issue in Asian irrigation. However, during recent decades, with household farming systems
in the throes of massive change, noise-control has become a critical driver of irrigation system
performance.
Clearly, authority-constituted endogenously within the irrigation community or provided
from outside-was always central to sustained control of anarchy and atrophy. Large systems
were therefore built and managed effectively only when external authority could enforce rules,
21
Unlocking Value in Asian Irrigation
and secure resources and labor for maintenance and repair. The colonial state had the necessary
authority as well as the incentive to keep anarchy and atrophy in check. In many parts of Asia,
the post-colonial state has neither. Moreover, noise was never as important a performance-
depressant in Asian irrigation systems as it is today, what with farmers expecting on-demand
irrigation year-round to support intensification and diversification of their subsistence farming.
In this sense, decline in community and public irrigation systems is a reflection of larger
changes underway in the Asian state and society.
Changing Socio-Technical Foundations of Asian Irrigation
Table 1 summarizes a broad-brush selection of socio-technical conditions that prevailed during
precolonial, colonial and postcolonial eras in many Asian countries. The hypothesis is that
particular forms of irrigation organizations we find in these eras were in sync with the socio-
technical fundamentals of those times. Irrigation communities thrived during precolonial
times when (a) there was no alternative to sustained collective action in developing irrigation,
(b) strong local authority structures, such as Zamindars in Mughal India, promoted—even
coerced—collective action to enhance land revenue through irrigation and (c) exit from
farming was difficult.
Similarly, in the colonial times, large-scale irrigation systems kept anarchy, atrophy
and noise in check because (a) land revenue was the chief source of government income, and
enhancing it was the chief motive behind irrigation investments; (b) the state had a deep agrarian
presence and used its authority to extract ‘irrigation surplus’ and impose discipline in irrigation
commands; and (c) farmers had practical alternatives not as subsistence farming livelihoods
or as gravity flow irrigation. These socio-technical conditions created an ‘institutional lock-in’
which ensured that public irrigation systems performed in terms of criteria relevant to their
managers in those times.
Postcolonial Asian societies are confronted with a wholly new array of socio-technical
conditions in which neither irrigation communities nor disciplined command areas are able to
thrive. The welfare state’s revenue interests in agriculture are minimal; the prime motive for
irrigation investments is food security and poverty reduction, and not maximizing government
income. Governments have neither the presence and authority nor the will to even collect
minimal irrigation fees needed to maintain systems. So, agrarian economies are in the throes
of massive change. Farmers can—and do—exit from agriculture with greater ease than ever
before. Growing population pressure has made smallholder farming unviable except when they
can intensify land use and diversify to high-value crops for growing urban and export markets.
Finally, gravity flow irrigation systems are hit by the mass availability of small pumps, pipes
and boring technologies that have made the ‘irrigation community’ redundant; these have
also made the irrigators impervious to the anarchy, atrophy and noise in surface systems, and
therefore reduced surface systems’ stake in their performance.

22
Tushaar Shah
Table 1. Socio-technical context of surface irrigation in different eras.
Precolonial
(adaptive irrigation)
Colonial
(constructive
imperialism)
Postcolonial
(atomistic irrigation)
Unit of
irrigation
organization
Irrigation
community
Centrally managed
irrigation systemIndividual farmer
Nature of the
state
Strong local
authority; state and
people lived off
the land; forced
labor; maximizing
land revenue chief
motive for irrigation
investments.
Strong local authority;
land taxes key source
of state income; forced
labor; maximizing land
revenue and export to
home-markets chief
motive for irrigation
investments; state used
irrigation for exportable
crops.
Weak state and
weaker local
authority; land
taxes insignificant;
poverty reduction,
food security and
donor funding key
motives for irrigation
investments; forced
labor impossible;
electoral politics
interfere with orderly
management.
Nature of
agrarian
society
No private property
in land. Subsistence
farming, high taxes
and poor access to
capital and market
key constraints to
growth; escape from
farming difficult;
most command area
farmers grow rice.
No property rights
in land. Subsistence
farming and high taxes;
access to capital and
market key constraints
to growth; escape
from farming difficult;
tenurial insecurity; most
command area farmers
grow uniform crops,
mostly rice.
Ownership or secure
land use rights for
farmers; subsistence
plus high-value
crops for markets;
growing opportunities
for off-farm
livelihoods; intensive
diversification of
land use; command
areas witness a wide
variety of crops
grown, with different
irrigation scheduling
requirements.

23
Unlocking Value in Asian Irrigation
Demographics Abundant land
going begging for
cultivation; irrigable
land used by feudal
lords to attract
tenants.
Abundant land going
begging for cultivation;
irrigable land used by
feudal lords to attract
tenants.
Population explosion
after 1950 and
slow pace of
industrialization
promoted
ghettoization of
agriculture in South
and Southeast Asia
and China.
State of
irrigation
technology
Lifting of water as
well as its transport
highly labor-
intensive and costly.
Lifting of water as well
as its transport highly
labor-intensive and
costly.
Small mechanical
pumps, cheap boring
rigs, and low-cost
rubber/PVC pipes
drastically reduce
cost and difficulty
of lifting and
transporting water
from surface water
and groundwater.
Rise of Atomistic Irrigation
Shrinking of surface irrigation does not mean irrigation areas of Asia are declining overall.
In fact, they are not. Old community and government-managed systems are rapidly giving
way to a new atomistic mode of irrigation in which millions of smallholders are creating their
own mini irrigation systems and scavenge water at will using mechanical pumps, wells and
rubber/PVC pipes. The rise of this new water-scavenging irrigation economy is most visible
in South Asia and North China plains; here pump irrigation has begun dominating not only
dryland areas but also irrigated areas where public and community irrigation ruled the roost
until around the 1960s. In India, for example, even as governments keep investing in large,
centrally managed surface irrigation projects, over 60% of irrigated areas are today under
atomistic pump irrigation. Farmers in India, Pakistan, Bangladesh and Nepal have created
more irrigation under this atomistic mode in the past 30 years than governments and colonial
powers had created 200 years earlier. During the 1950s and 60s, Mao’s China built massive
irrigation systems to water North China plains; but today, the region irrigates mostly with
small pumps and boreholes.
The same trend is now also evident in rice economies of Southeast Asia home to
gravity flow irrigation communities for a long time. In Sri Lanka, known for its centuries-
old tank irrigation of rice paddies, farmers were unfamiliar with irrigation pumps until the
1980s but were using some 106,000 by 2000 to scavenge water from whatever source-wells,
tanks, streams-to irrigate dry-season rice and vegetables. By 1999, Vietnamese farmers had
pressed into service more than 800,000 diesel pumps; and in Thailand, farmers increased
24
Tushaar Shah
their pumps from 500,000 in 1985 to more than 3 million in 1999. And the trend was just
picking up; Francois Molle found that between 1995 and 1999 alone, Vietnamese farmers had
purchased 300,000 irrigation pumps, and Thai farmers had added a million. Between 1998
and 2002, Indonesian farmers increased their pumps from 1.17 million to 2.17 million. In the
Philippines, David Dawe noted that “approximately 23 percent of rice farms now use pumps
to access water, either from sub-soil reservoirs, drainage canals, or natural creeks and rivers.”
Observers have been struck by the pace of spread of pump irrigation in Southeast Asia.
In the Chao Phraya Delta of Thailand, 80% of farmers were said to have at least one pump,
and in Thailand’s Mae Klong project, the World Bank has estimated that in the early 1990s,
a million pumps were drawing water from canals, drains, ditches and ponds to irrigate dry-
season crops. Regarding the Makhamtao-Uthong canal system in Chao Phraya, Facon wrote:
“Use of groundwater for irrigation has exploded during the last five years. It is reported that
28,000 tubewells (sic) are in use in the region … All the farmers interviewed during the field
visit reported having individual pumping equipment used to pump from any possible source
of water.” The irrigation scene in Asia resembles a palimpsest, with layers of old systems
of irrigation getting removed to make room for the next one of atomistic, water-scavenging
irrigation.
The boom in water-scavenging irrigation is supported by the rapid rise of the Chinese
pump industry, which has pared the cost as well as the weight of their diesel pumps to a fraction
of their competitors’ products. The Chinese export some 4 million diesel pumps annually, at
a pump per hectare, and these are adding around 4 million ha of atomistic irrigation every
year, mostly in South and Southeast Asia. What atomistic irrigation is able to do, that the
community and public surface irrigation are unable to match, is help farmers control the noise
endemic to surface irrigation systems. Hard-pressed by shrinking landholdings and energized
by growing markets for high-value farm products, Asia’s smallholders are intensifying as well
as diversifying their farming systems; this requires on-demand irrigation year-round. Atomistic
irrigation is responding to that call. It is making the farmer immune to the anarchy, atrophy and
noise in surface systems, and reducing surface systems’ stake in countering them.
The ascent of atomistic irrigation is at different stages in different parts of Asia just as the
socio-technical fundamentals. In South Asia and North China plains, it is peaking, threatening
the relevance of irrigation communities and public irrigation itself. In Southeast Asia, it is at
the early stages but it is already making the control of anarchy and atrophy in surface irrigation
a challenge. In Central Asia, the jury is out; well irrigation is rising, especially for backyard
garden irrigation, but from a small base.
Reform or Morph?
In the midst of these changing socio-technical fundamentals, Asia’s surface irrigation enterprise
is up against some hard questions. Everywhere, PIM/IMT is being tried as the panacea. But can
PIM/IMT help restore control of anarchy and atrophy in irrigation systems? Can institutional
reforms ensure financial and physical sustainability? Can these help improve rehabilitation of
Asia’s surface irrigation systems? The evidence from some decades of experiments is far from
encouraging; by far the most celebrated experiments-catalyzed, sustained and micro-managed
by NGOs with the help of unreplicable quality and scale of resources and donor support-report
only modest gains in terms of performance and sustainability, leading researchers to demand
‘reform of reforms.’

25
Unlocking Value in Asian Irrigation
Low, uncollected irrigation service fees, growing deferred maintenance, rampant
anarchy and inequity in water distribution in Asian surface irrigation systems are symptoms of
a larger malaise that PIM/IMT seems unable to address. Unlocking value from Asia’s public
irrigation capital demands a nuanced exploration of the farmer-system interplay in the context
of today’s socio-technical fundamentals which differ across Asia. Table 2 presents a first-cut
view of the socio-technical environment in which irrigation systems function in Central Asia,
South Asia, Southeast Asia and China. Institutional reforms of the PIM/IMT kind appear to
have best prospects in Central Asia especially if integrated in the estate-mode of irrigated
agriculture that European colonial powers popularized in Africa. In China, the model of
contracting out distributaries to incentivized contractors seems to have produced better results
compared to PIM; and this model needs to be improvised and built upon. The authority and
backing of the Village Party Leader seems essential for such privatization to work; and for that
reason, this model is unlikely to work in South Asia and Southeast Asia. In Southeast Asia, the
key may lie in upgrading and modernizing rice irrigation systems to support dry-season rice
cultivation as well as diversification of farming systems.
The situation in South Asia suggests that instead of institutional reforms, surface
irrigation systems here themselves need to morph to fit in to today’s socio-technical context.
For millennia, irrigation systems were ‘supply-driven.’ They offered a certain volume of water
at certain times with a certain dependability and farmers had no option but to adapt their
farming systems to these; they adapted because doing so was better than rain-fed farming.
Atomistic irrigation—offering water-on-demand year-round—has turned South Asian
irrigation increasingly ‘demand-driven,’ giving a whole new meaning to the term ‘irrigation
management.’ With the option of ‘exit’ available, farmers in command areas are now reluctant
to exercise ‘voice’ through PIM/IMT, refusing to give their loyalty to an irrigation regime that
cannot provide them irrigation on-demand year-round.
Table 2. Socio-technical environment of Asia’s surface irrigation systems.
Central Asia South AsiaSoutheast
AsiaChina
1. State’s revenue
interest in irrigation
agriculture
High Low Low Low
2. State’s capacity to
enforce discipline in
irrigation systems
Some to high Low Low High
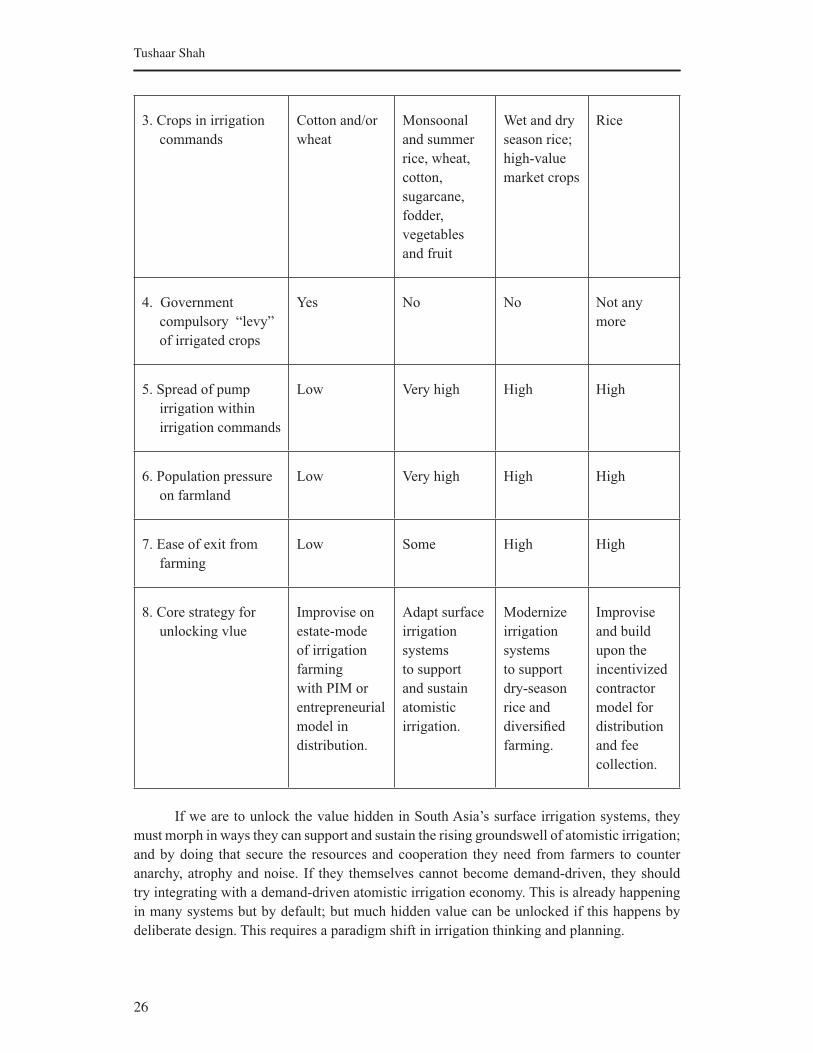
26
Tushaar Shah
3. Crops in irrigation
commands
Cotton and/or
wheat
Monsoonal
and summer
rice, wheat,
cotton,
sugarcane,
fodder,
vegetables
and fruit
Wet and dry
season rice;
high-value
market crops
Rice
4. Government
compulsory “levy”
of irrigated crops
Yes No No Not any
more
5. Spread of pump
irrigation within
irrigation commands
Low Very high High High
6. Population pressure
on farmland
Low Very high High High
7. Ease of exit from
farming
Low Some High High
8. Core strategy for
unlocking vlue
Improvise on
estate-mode
of irrigation
farming
with PIM or
entrepreneurial
model in
distribution.
Adapt surface
irrigation
systems
to support
and sustain
atomistic
irrigation.
Modernize
irrigation
systems
to support
dry-season
rice and
diversified
farming.
Improvise
and build
upon the
incentivized
contractor
model for
distribution
and fee
collection.
If we are to unlock the value hidden in South Asia’s surface irrigation systems, they
must morph in ways they can support and sustain the rising groundswell of atomistic irrigation;
and by doing that secure the resources and cooperation they need from farmers to counter
anarchy, atrophy and noise. If they themselves cannot become demand-driven, they should
try integrating with a demand-driven atomistic irrigation economy. This is already happening
in many systems but by default; but much hidden value can be unlocked if this happens by
deliberate design. This requires a paradigm shift in irrigation thinking and planning.

27
Unlocking Value in Asian Irrigation
Reference
Shah, Tushaar. 2008. Taming the anarchy: Groundwater governance in South Asia. Washington, D.C.: The
RFF Press.


29
Cost and Benefits of the National River Linking Project:
An Analysis of Peninsular LinksUpali A. Amarasinghe1 and R. Srinivasulu2
1Senior Researcher, International Water Management Institute, New Delhi2PhD student, Jawaharlal Nehru University, New Delhi
Abstract
Water, a critical component of food, livelihood and economic security, has always received
a central place in India’s investment portfolios. The investment in water transfers of the
National River Linking Project (NRLP) is one of the biggest proposed in recent times. When
and if completed, the NRLP forms a gigantic water grid covering most of South Asia. It
envisages transferring 174 billion cubic meters (Bm3) of water across 34 river links and will
cost about US$120 billion (2000 prices). The proposed plan has aroused a large interest in
recent public discourses. Hydrological feasibility, financial viability and social cost are the
issues that dominate these public dalogues. This paper analyzes the cost and benefits of eight
river links in the peninsular component, which include the main subcomponent of linking
rivers of Mahanadi, Godavari, Pennar and Cauvery. Irrigation is the main beneficiary in this
component and, en route, these links or canals account for 85% of the total water transfers to
irrigation and domestic and industrial sectors in the command areas. However, our analyses
show mixed results of financial viability of individual links. The main reason for this is low net
value-added benefits from additional irrigation over and above the existing level of cropping
and irrigation patterns. The proposed cropping patterns of these links generate much less net
value-added benefits than the existing cropping and irrigation patterns. To make these links
financially viable, they need to include high-value cropping patterns that, at least, generate as
much benefit per unit area as fruits and vegetables.
Although some individual links show less than desirable net benefits, taken together the
Mahanadi-Godavari-Pennar-Cauvery subcomponent gives a higher internal rate of return of
14% compared to a discount rate of 12%, and a high benefit-cost ratio of 1.3. However, many
unknown factors or unavailable information in this analysis can alter the estimates of financial
benefits and costs.
Introduction
The importance of access to water in India’s national food security is well recognized.
Access to irrigation was a critical determinant for the success of the green revolution, which
transformed India’s chronic food deficits in the 1960s to a state of food self-sufficiency in the
1970s. The effect of irrigation on productivity growth, as a direct input and as catalyst for other
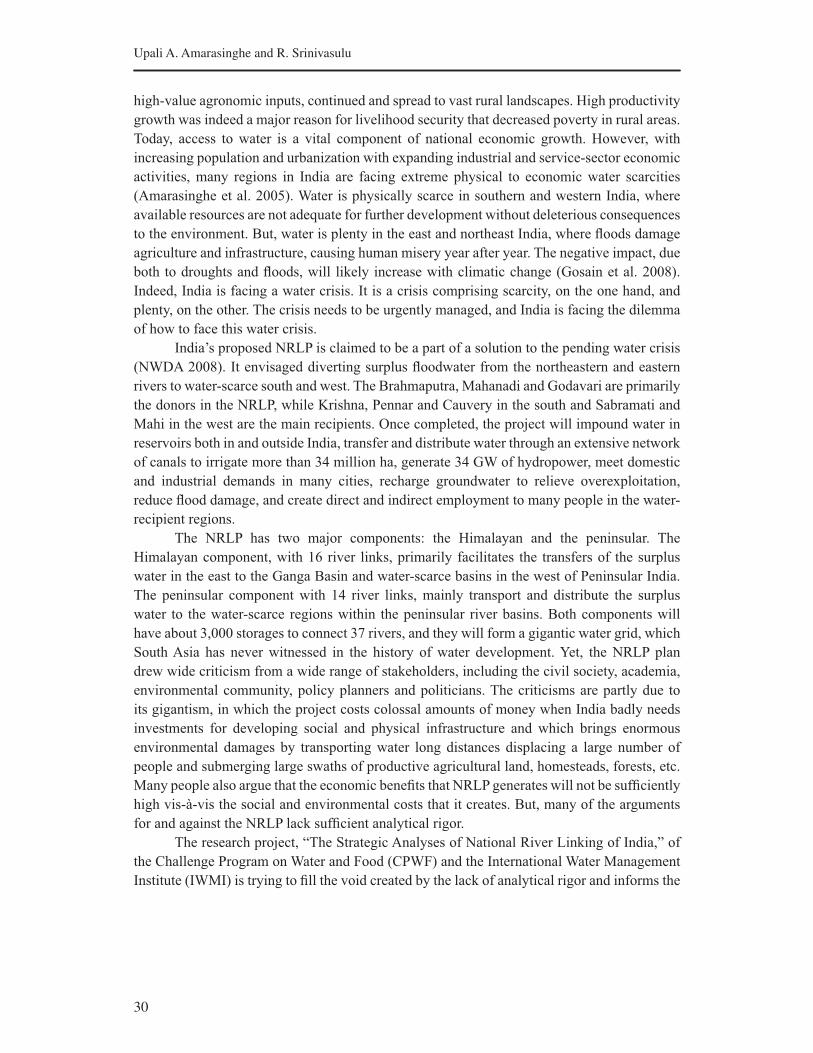
30
Upali A. Amarasinghe and R. Srinivasulu
high-value agronomic inputs, continued and spread to vast rural landscapes. High productivity
growth was indeed a major reason for livelihood security that decreased poverty in rural areas.
Today, access to water is a vital component of national economic growth. However, with
increasing population and urbanization with expanding industrial and service-sector economic
activities, many regions in India are facing extreme physical to economic water scarcities
(Amarasinghe et al. 2005). Water is physically scarce in southern and western India, where
available resources are not adequate for further development without deleterious consequences
to the environment. But, water is plenty in the east and northeast India, where floods damage
agriculture and infrastructure, causing human misery year after year. The negative impact, due
both to droughts and floods, will likely increase with climatic change (Gosain et al. 2008).
Indeed, India is facing a water crisis. It is a crisis comprising scarcity, on the one hand, and
plenty, on the other. The crisis needs to be urgently managed, and India is facing the dilemma
of how to face this water crisis.
India’s proposed NRLP is claimed to be a part of a solution to the pending water crisis
(NWDA 2008). It envisaged diverting surplus floodwater from the northeastern and eastern
rivers to water-scarce south and west. The Brahmaputra, Mahanadi and Godavari are primarily
the donors in the NRLP, while Krishna, Pennar and Cauvery in the south and Sabramati and
Mahi in the west are the main recipients. Once completed, the project will impound water in
reservoirs both in and outside India, transfer and distribute water through an extensive network
of canals to irrigate more than 34 million ha, generate 34 GW of hydropower, meet domestic
and industrial demands in many cities, recharge groundwater to relieve overexploitation,
reduce flood damage, and create direct and indirect employment to many people in the water-
recipient regions.
The NRLP has two major components: the Himalayan and the peninsular. The
Himalayan component, with 16 river links, primarily facilitates the transfers of the surplus
water in the east to the Ganga Basin and water-scarce basins in the west of Peninsular India.
The peninsular component with 14 river links, mainly transport and distribute the surplus
water to the water-scarce regions within the peninsular river basins. Both components will
have about 3,000 storages to connect 37 rivers, and they will form a gigantic water grid, which
South Asia has never witnessed in the history of water development. Yet, the NRLP plan
drew wide criticism from a wide range of stakeholders, including the civil society, academia,
environmental community, policy planners and politicians. The criticisms are partly due to
its gigantism, in which the project costs colossal amounts of money when India badly needs
investments for developing social and physical infrastructure and which brings enormous
environmental damages by transporting water long distances displacing a large number of
people and submerging large swaths of productive agricultural land, homesteads, forests, etc.
Many people also argue that the economic benefits that NRLP generates will not be sufficiently
high vis-à-vis the social and environmental costs that it creates. But, many of the arguments
for and against the NRLP lack sufficient analytical rigor.
The research project, “The Strategic Analyses of National River Linking of India,” of
the Challenge Program on Water and Food (CPWF) and the International Water Management
Institute (IWMI) is trying to fill the void created by the lack of analytical rigor and informs the

31
Cost and Benefits of the National River Linking Project: An Analysis of Peninsular Links
public better of the discourse on NRLP (CPWF 2005). The project also raises many strategic
issues regarding the state of the water sector that India needs addressing for preventing a
pending water crisis with or without the NRLP.
A water development project generally originates from a water futures assessment.
The major source for NRLP was the scenario’s assessment of the National Commission of
Integrated Water Resources Assessment (NCIWRD 1999). But, the drivers, both exogenous
and endogenous, of water demand and supply are changing rapidly. The publication “India’s
Water Futures: Scenarios and Issues” (Amarasinghe et al. 2009), discusses scenarios and
issues that emanate from this fast-changing status of drivers. India has a large rural population
with agriculture-dependent livelihoods. Meeting livelihood security of the rural masses and
food security at the national level is the foremost priority of policy planners. As a result, many
large water development projects have been proposed and implemented to date. However, the
proposed NRLP is such a gigantic water grid that India and, for that matter, the whole of South
Asia have never dreamt of implementing before. Thus, issues embedded in the NRLP are
many, requiring more attention than previous water development projects. In the proceedings
of the national workshop “Social, Hydrological and Environmental Issues of the National
River Linking Project” (Amarasinghe and Sharma 2008) many issues related to the NRLP
project are discussed.
This paper assesses the financial benefits and costs of some of the proposed peninsular
links. The primary focus of the assessment is on irrigation benefits. Of all water transfers of
the NRLP, irrigation is the major beneficiary. The benefit analysis in this paper focuses on
the changes of India’s irrigation landscape since the project proposal came into existence.
Thus, we develop scenarios of benefit streams on the level of irrigation that could already be
in the proposed command areas. After a brief introduction of the domain of analysis in the
next section, we explain the methodology in detail in the section on methodology of benefit
assessment. Then follows the section on the benefit and cost scenarios of the links in the
study. Lasr, we conclude the paper with a discussion of issues arising out of this analysis for
consideration for further analyses.
Links in the Study
This study assesses financial benefits of eight links in the peninsular component (Figure 1)
that connect Mahanadi, Godavari, Pennar and Cauvery river basins. These include Link 1
connecting Mahanadi and Godavari, Links 2, 3 and 4 connecting Godavari and Krishna,
Link 7 connecting Krishna and Pennar1, Link 8 connecting Pennar-Palar-Cauvery and Link 9
connecting Cauvery to Vaigai and Gundai subbasins in Tamil Nadu. The full implementation
of these links is largely dependent on water transfers between one another. Water transfer
from Mahanadi to Godavari facilitates water transfer from Godavari to Krishna that, in turn,
facilitates water transfer to Pennar, and then to Cauvery. Additionally, we include the link
connecting Pamba to Achankvoil-Vaipar, transferring surplus water from Kerala to Tamil
Nadu.
1Links 5 and 6 were not considered for this analysis. Water transfers through these links from Krishna
to Pennar are only substitutes for the water transfers from Krishna to Pennar from the Nagarjunasagr-
Pennar links.

32
Upali A. Amarasinghe and R. Srinivasulu
Figure 1. River links in the peninsular component.
PROPOSED INTERBASIN WA TER TRANSFER LINKS,
PENINSULAR COMPONENT
ANDAMAN AND NICOBAR
1. Mahanadi (Manibhadra) - Gadavari (Dowlaiswaram)*2. Godavari (Inchampalli) - Krishna (Nagarjunasarar)*3.4.
6.
Godavari (Inchampalli) - Krishna (Pulichintala)*Godavari (Polavaram) - Krishna (Vijayawada)*
5. Krishna (Almatti) - Pennar*Krishna (Srisailam) - Pennar*
7. Krishna (Nagarjunasagar) - Pennar (Somasila)*8. Pennar (Somasila - Palar - Couvery (Grand Anicut)*
9. Cauvery (Kattalai) - Vaigai - Gundar*10. Ken - Betwa*11. Parbati - Kalisindh - Chambal*12. Par - Tapi - Narmada*13. Damanganga - Pinjal*
16. Pamba - Achankovil - Vaippar* * Feasibility reports completed
14. Bedti - Varda 15. Netravati - Hemavati
Links in the analysis include:
• The uppermost link of the peninsular component links Mahanadi (Manibhadra) and
Godavari (Dowlaiswaram) rivers. The primary objective of this link is to transfer
surplus water of the Mahanadi Basin. While doing so, en route, this link provides water
for irrigation, domestic purposes and industries and meets the water demands of the
downstream from Dowlaiswaram in the Godavari Basin. The latter is only a substitute
for the water transfers from Godavari to the Krishna Basin via three links upstream of
Dowlaiswaram.
• Godavari (Inchampalli)-Krishna (Nagarjunasagar) is the uppermost link originating from
the Godavari Basin and, en route, this link also supplies water for irrigation, domestic
and industrial purposes, and then transfers water from Krishna to the Pennar Basin at
Nagarjunasagar.
33
Cost and Benefits of the National River Linking Project: An Analysis of Peninsular Links
• Godavari (Inchampalli)-Krishna (Pulichintala) is the middle link originating from the
Godavari Basin and, en route, this water provides only for irrigation and domestic and
industrial purposes.
• Godavari (Polavaram)-Krishna (Vijayawada) is the lowermost link from the Godavari
Basin. The primary objective of this link is to facilitate water transfer from Krishna to
Pennar by way of substituting the water demand of Krishna below Vijayawada. This link
also has major provisions for irrigation, and domestic and industrial purposes en route
from the canal command.
• Krishna (Nagarjunasagar)-Pennar (Somasila) Link, one among the three links originating
from Krishna to Pennar, provides water en route for irrigation and domestic and industrial
purposes, and facilitates water transfer from the Pennar to the Cauvery Basin.
• Pennar (Somasila)-Palar-Cauvery Link, facilitating transfer of water received from
Krishna to the Cauvery Basin,
• Cauvery (Kattalai)-Vaigai-Gundai Link, which transfers water from smaller basins of
Cauvery. This link also provides water for irrigation and the domestic and industrial
sectors.
• The last link in the study transfers water from Pamba to Achankvoil-Vaipar subbasins for
irrigation, which is an independent component in the peninsular basins.
The eight links considered in this analysis transfer 61 Bm3 of water, accounting for 35%
of the total water transfers in NRLP and, en route, these canals provide 18.3 Bm3 irrigation to
2.9 million ha (Mha) of culturable land and meet 3 Bm3 of domestic and industrial needs.
En route, the command areas cut across 33 districts and include 0.256 Mha of croplands
in six districts in Orissa, 1.4 Mha of nine districts in Andhra Pradesh, and 0.823 Mha of 17
districts in Tamil Nadu (Table 1).
According to feasibility reports prepared by the National Water Development Agency
(NWDA 2008a-f), the total cost of supplying water to en-route commands of eight links is
US$6,257 million (Table 2), which is 41% of the total cost. This is only the apportioned cost
of water supply to en-route commands. For example, Mahanadi-Godavari diverts water not
only for the en-route command but also for Godavari Delta. The latter is a substitution for
the diversions from the upstream location in Godavari to the Krishna Basin. It also generates
hydropower to be used outside the en-route canal. The total cost of the project is US$3.9
billion, of which the en-route command accounts for only 35%.
The total cost estimate of the eight links is US$15 billion, which is only 12% of the cost
estimate of the whole NRLP project.
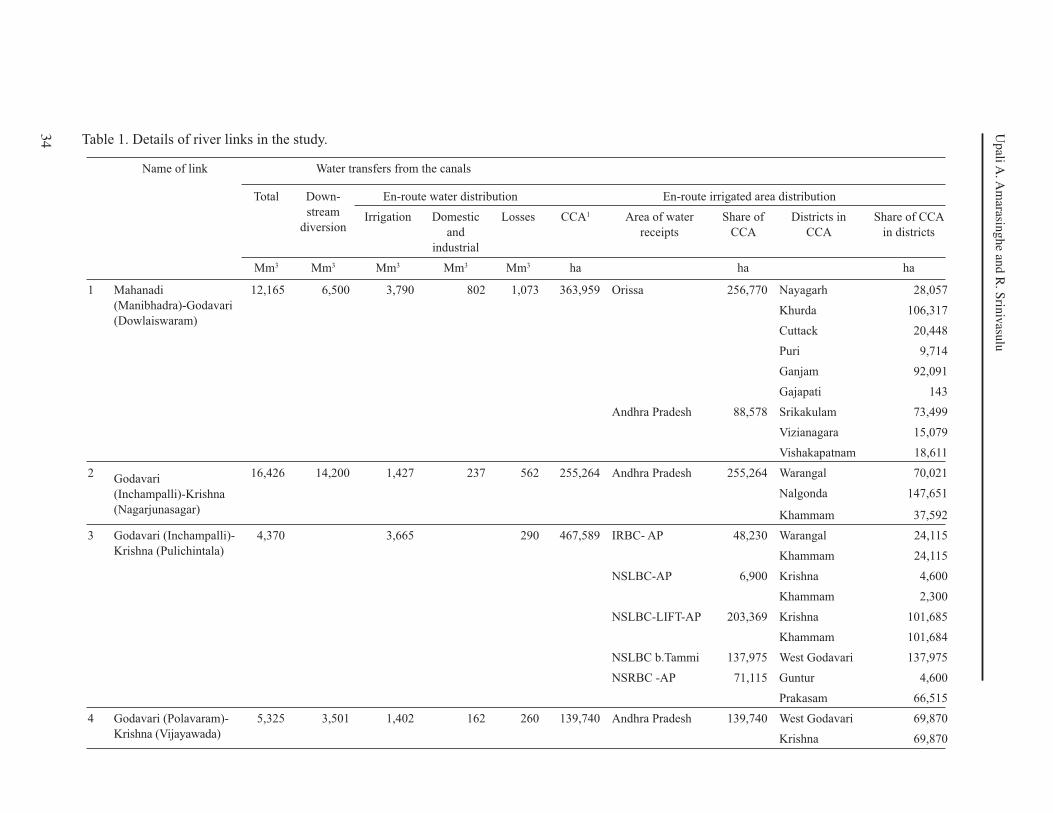
34
Upali A
. Am
arasinghe an
d R
. Srin
ivasu
lu
Table 1. Details of river links in the study.
Name of link Water transfers from the canals
Total Down-
stream
diversion
En-route water distribution En-route irrigated area distribution
Irrigation Domestic
and
industrial
Losses CCA1 Area of water
receipts
Share of
CCA
Districts in
CCA
Share of CCA
in districts
Mm3 Mm3 Mm3 Mm3 Mm3 ha ha ha
1 Mahanadi
(Manibhadra)-Godavari
(Dowlaiswaram)
12,165 6,500 3,790 802 1,073 363,959 Orissa 256,770 Nayagarh 28,057
Khurda 106,317
Cuttack 20,448
Puri 9,714
Ganjam 92,091
Gajapati 143
Andhra Pradesh 88,578 Srikakulam 73,499
Vizianagara 15,079
Vishakapatnam 18,611
2 Godavari
(Inchampalli)-Krishna
(Nagarjunasagar)
16,426 14,200 1,427 237 562 255,264 Andhra Pradesh 255,264 Warangal 70,021
Nalgonda 147,651
Khammam 37,592
3 Godavari (Inchampalli)-
Krishna (Pulichintala)
4,370 3,665 290 467,589 IRBC- AP 48,230 Warangal 24,115
Khammam 24,115
NSLBC-AP 6,900 Krishna 4,600
Khammam 2,300
NSLBC-LIFT-AP 203,369 Krishna 101,685
Khammam 101,684
NSLBC b.Tammi 137,975 West Godavari 137,975
NSRBC -AP 71,115 Guntur 4,600
Prakasam 66,515
4 Godavari (Polavaram)-
Krishna (Vijayawada)
5,325 3,501 1,402 162 260 139,740 Andhra Pradesh 139,740 West Godavari 69,870
Krishna 69,870
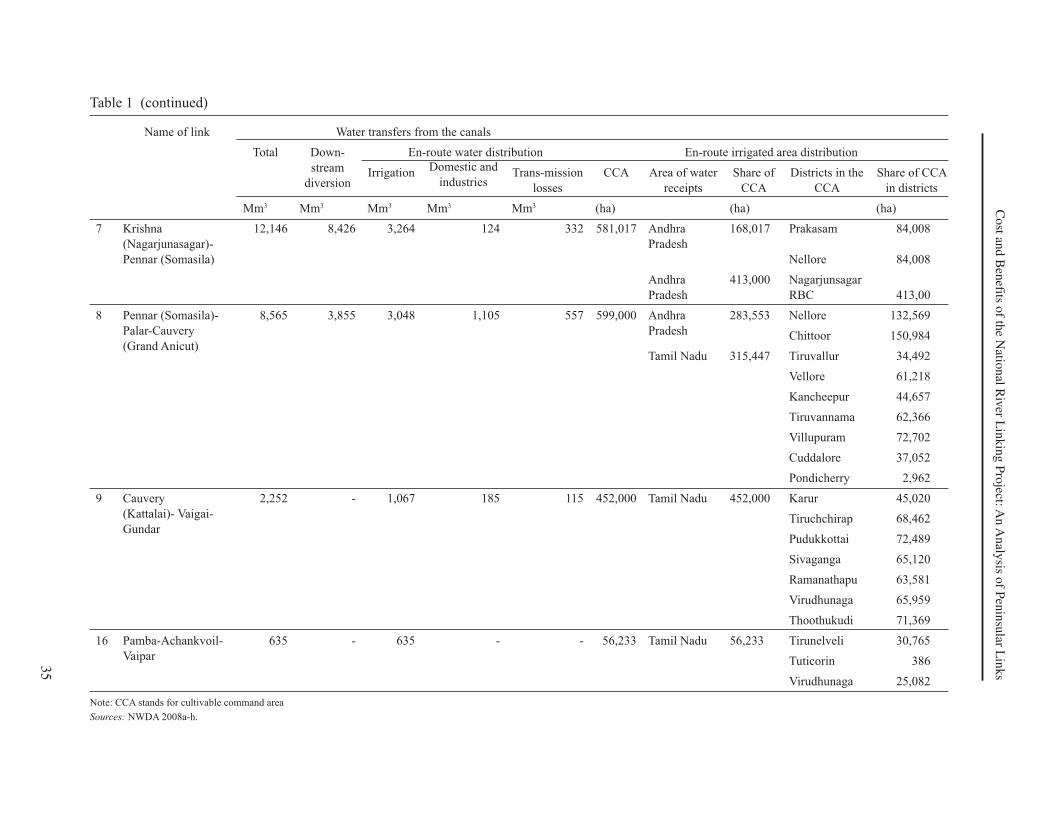
35
Cost an
d B
enefits o
f the N
ation
al Riv
er Lin
kin
g P
roject: A
n A
naly
sis of P
enin
sular L
ink
s
Table 1 (continued)
Name of link Water transfers from the canals
Total Down-
stream
diversion
En-route water distribution En-route irrigated area distribution
IrrigationDomestic and
industries Trans-mission
losses
CCA Area of water
receipts
Share of
CCA
Districts in the
CCA
Share of CCA
in districts
Mm3 Mm3 Mm3 Mm3 Mm3 (ha) (ha) (ha)
7 Krishna
(Nagarjunasagar)-
Pennar (Somasila)
12,146 8,426 3,264 124 332 581,017 Andhra
Pradesh
168,017 Prakasam 84,008
Nellore 84,008
Andhra
Pradesh
413,000 Nagarjunsagar
RBC 413,00
8 Pennar (Somasila)-
Palar-Cauvery
(Grand Anicut)
8,565 3,855 3,048 1,105 557 599,000 Andhra
Pradesh
283,553 Nellore 132,569
Chittoor 150,984
Tamil Nadu 315,447 Tiruvallur 34,492
Vellore 61,218
Kancheepur 44,657
Tiruvannama 62,366
Villupuram 72,702
Cuddalore 37,052
Pondicherry 2,962
9 Cauvery
(Kattalai)- Vaigai-
Gundar
2,252 - 1,067 185 115 452,000 Tamil Nadu 452,000 Karur 45,020
Tiruchchirap 68,462
Pudukkottai 72,489
Sivaganga 65,120
Ramanathapu 63,581
Virudhunaga 65,959
Thoothukudi 71,369
16 Pamba-Achankvoil-
Vaipar
635 - 635 - - 56,233 Tamil Nadu 56,233 Tirunelveli 30,765
Tuticorin 386
Virudhunaga 25,082
Note: CCA stands for cultivable command area
Sources: NWDA 2008a-h.
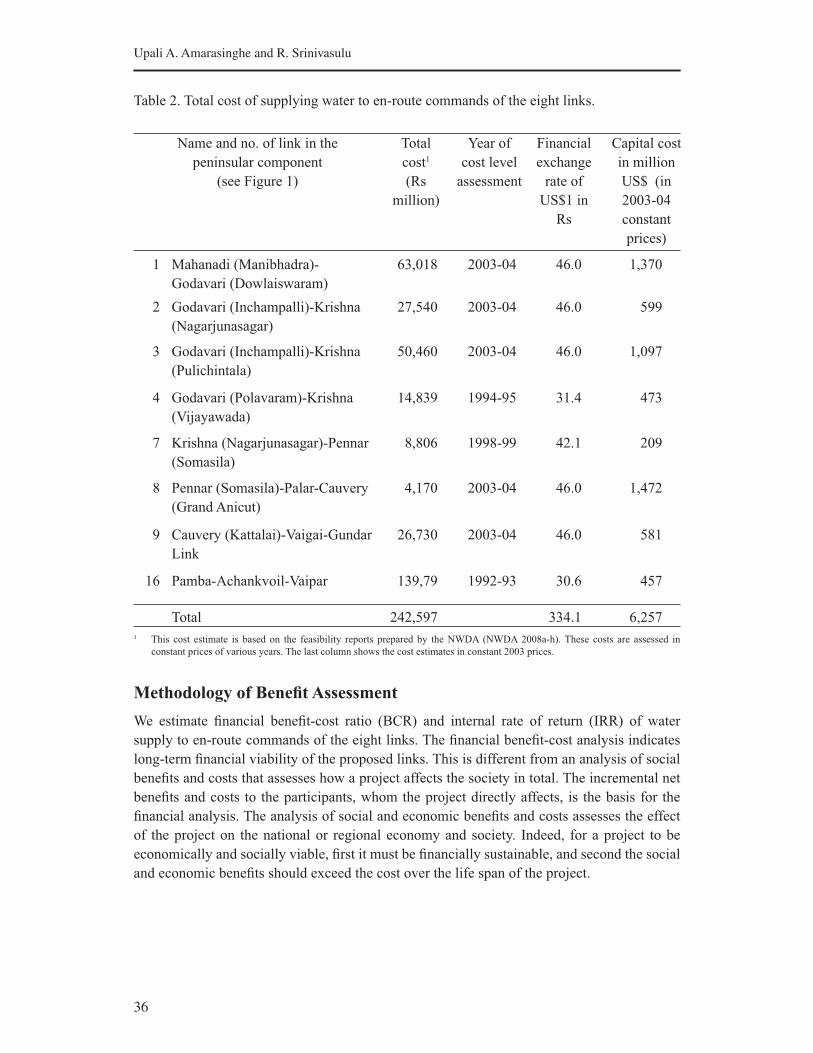
36
Upali A. Amarasinghe and R. Srinivasulu
Table 2. Total cost of supplying water to en-route commands of the eight links.
Name and no. of link in the
peninsular component
(see Figure 1)
Total
cost1
(Rs
million)
Year of
cost level
assessment
Financial
exchange
rate of
US$1 in
Rs
Capital cost
in million
US$ (in
2003-04
constant
prices)
1 Mahanadi (Manibhadra)-
Godavari (Dowlaiswaram)
63,018 2003-04 46.0 1,370
2 Godavari (Inchampalli)-Krishna
(Nagarjunasagar)
27,540 2003-04 46.0 599
3 Godavari (Inchampalli)-Krishna
(Pulichintala)
50,460 2003-04 46.0 1,097
4 Godavari (Polavaram)-Krishna
(Vijayawada)
14,839 1994-95 31.4 473
7 Krishna (Nagarjunasagar)-Pennar
(Somasila)
8,806 1998-99 42.1 209
8 Pennar (Somasila)-Palar-Cauvery
(Grand Anicut)
4,170 2003-04 46.0 1,472
9 Cauvery (Kattalai)-Vaigai-Gundar
Link
26,730 2003-04 46.0 581
16 Pamba-Achankvoil-Vaipar 139,79 1992-93 30.6 457
Total 242,597 334.1 6,257
1 This cost estimate is based on the feasibility reports prepared by the NWDA (NWDA 2008a-h). These costs are assessed in
constant prices of various years. The last column shows the cost estimates in constant 2003 prices.
Methodology of Benefit Assessment
We estimate financial benefit-cost ratio (BCR) and internal rate of return (IRR) of water
supply to en-route commands of the eight links. The financial benefit-cost analysis indicates
long-term financial viability of the proposed links. This is different from an analysis of social
benefits and costs that assesses how a project affects the society in total. The incremental net
benefits and costs to the participants, whom the project directly affects, is the basis for the
financial analysis. The analysis of social and economic benefits and costs assesses the effect
of the project on the national or regional economy and society. Indeed, for a project to be
economically and socially viable, first it must be financially sustainable, and second the social
and economic benefits should exceed the cost over the life span of the project.
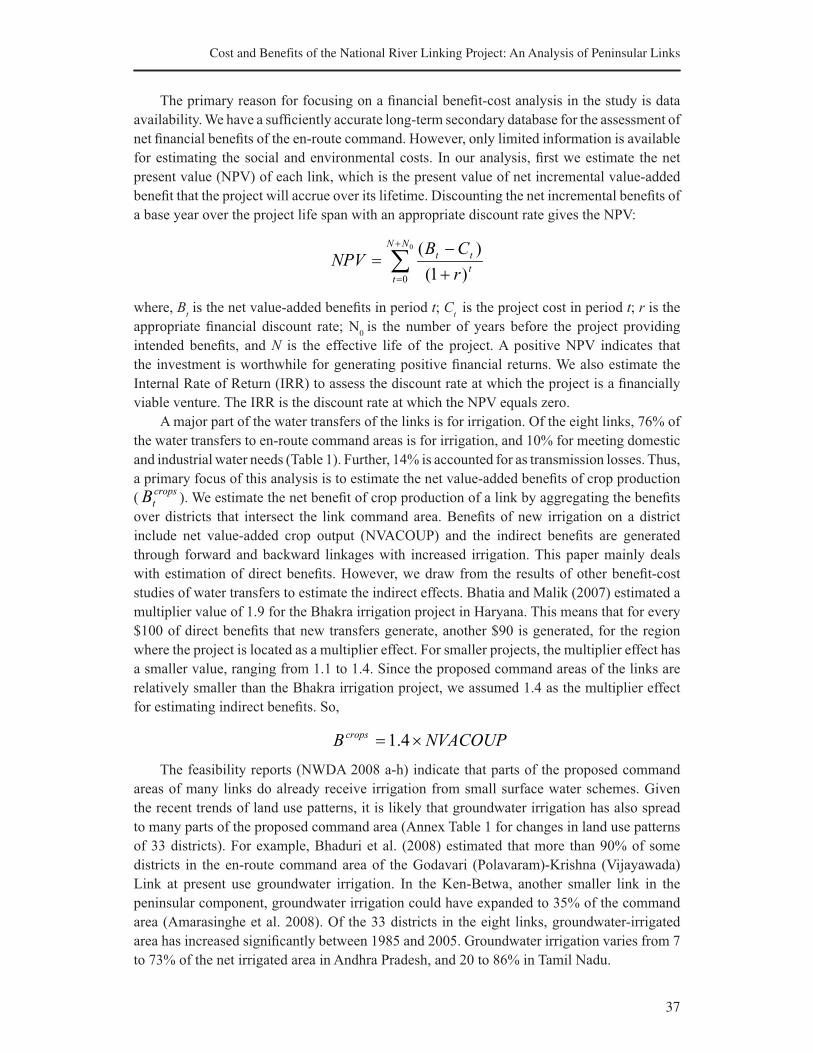
37
Cost and Benefits of the National River Linking Project: An Analysis of Peninsular Links
The primary reason for focusing on a financial benefit-cost analysis in the study is data
availability. We have a sufficiently accurate long-term secondary database for the assessment of
net financial benefits of the en-route command. However, only limited information is available
for estimating the social and environmental costs. In our analysis, first we estimate the net
present value (NPV) of each link, which is the present value of net incremental value-added
benefit that the project will accrue over its lifetime. Discounting the net incremental benefits of
a base year over the project life span with an appropriate discount rate gives the NPV:
∑+
= +
−=
0
0 )1(
)(NN
tt
tt
r
CBNPV
where, Bt is the net value-added benefits in period t; C
t is the project cost in period t; r is the
appropriate financial discount rate; N0
is the number of years before the project providing
intended benefits, and N is the effective life of the project. A positive NPV indicates that
the investment is worthwhile for generating positive financial returns. We also estimate the
Internal Rate of Return (IRR) to assess the discount rate at which the project is a financially
viable venture. The IRR is the discount rate at which the NPV equals zero.
A major part of the water transfers of the links is for irrigation. Of the eight links, 76% of
the water transfers to en-route command areas is for irrigation, and 10% for meeting domestic
and industrial water needs (Table 1). Further, 14% is accounted for as transmission losses. Thus,
a primary focus of this analysis is to estimate the net value-added benefits of crop production
(crops
tB ). We estimate the net benefit of crop production of a link by aggregating the benefits
over districts that intersect the link command area. Benefits of new irrigation on a district
include net value-added crop output (NVACOUP) and the indirect benefits are generated
through forward and backward linkages with increased irrigation. This paper mainly deals
with estimation of direct benefits. However, we draw from the results of other benefit-cost
studies of water transfers to estimate the indirect effects. Bhatia and Malik (2007) estimated a
multiplier value of 1.9 for the Bhakra irrigation project in Haryana. This means that for every
$100 of direct benefits that new transfers generate, another $90 is generated, for the region
where the project is located as a multiplier effect. For smaller projects, the multiplier effect has
a smaller value, ranging from 1.1 to 1.4. Since the proposed command areas of the links are
relatively smaller than the Bhakra irrigation project, we assumed 1.4 as the multiplier effect
for estimating indirect benefits. So,
NVACOUPB crops ×= 4.1
The feasibility reports (NWDA 2008 a-h) indicate that parts of the proposed command
areas of many links do already receive irrigation from small surface water schemes. Given
the recent trends of land use patterns, it is likely that groundwater irrigation has also spread
to many parts of the proposed command area (Annex Table 1 for changes in land use patterns
of 33 districts). For example, Bhaduri et al. (2008) estimated that more than 90% of some
districts in the en-route command area of the Godavari (Polavaram)-Krishna (Vijayawada)
Link at present use groundwater irrigation. In the Ken-Betwa, another smaller link in the
peninsular component, groundwater irrigation could have expanded to 35% of the command
area (Amarasinghe et al. 2008). Of the 33 districts in the eight links, groundwater-irrigated
area has increased significantly between 1985 and 2005. Groundwater irrigation varies from 7
to 73% of the net irrigated area in Andhra Pradesh, and 20 to 86% in Tamil Nadu.
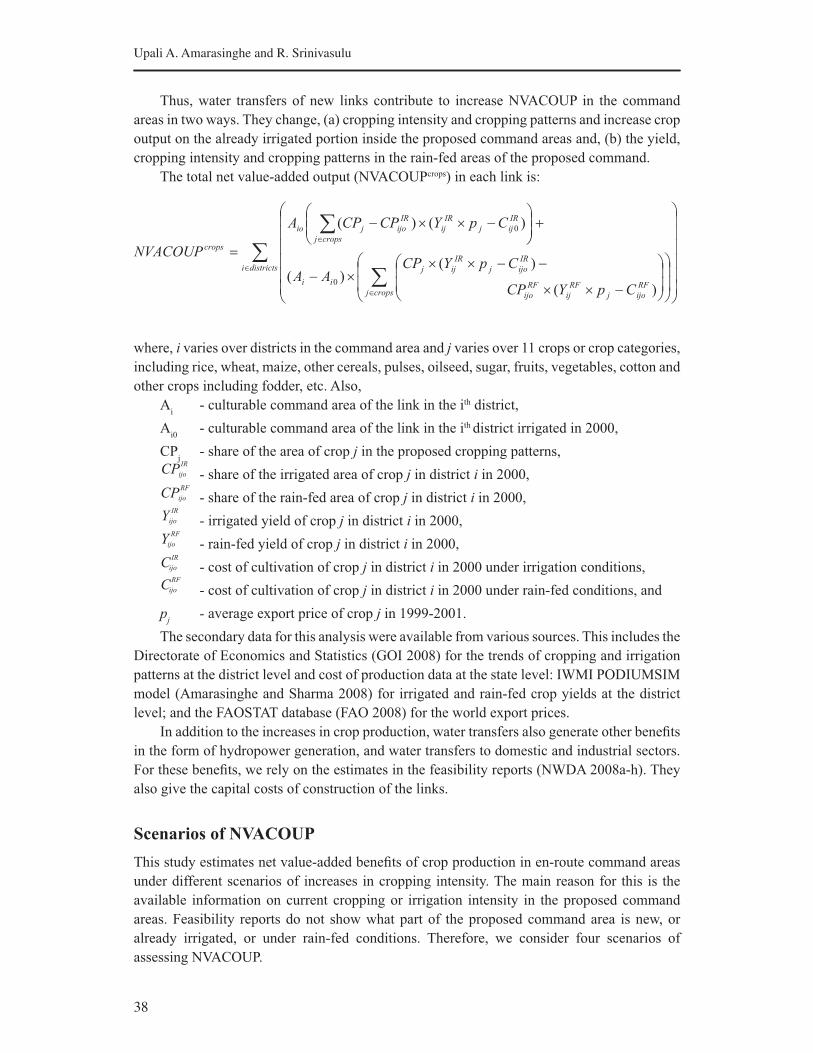
38
Upali A. Amarasinghe and R. Srinivasulu
Thus, water transfers of new links contribute to increase NVACOUP in the command
areas in two ways. They change, (a) cropping intensity and cropping patterns and increase crop
output on the already irrigated portion inside the proposed command areas and, (b) the yield,
cropping intensity and cropping patterns in the rain-fed areas of the proposed command.
The total net value-added output (NVACOUPcrops) in each link is:
where, i varies over districts in the command area and j varies over 11 crops or crop categories,
including rice, wheat, maize, other cereals, pulses, oilseed, sugar, fruits, vegetables, cotton and
other crops including fodder, etc. Also,
Ai - culturable command area of the link in the ith district,
Ai0 - culturable command area of the link in the ith district irrigated in 2000,
CPj - share of the area of crop j in the proposed cropping patterns,
- share of the irrigated area of crop j in district i in 2000,
- share of the rain-fed area of crop j in district i in 2000,
- irrigated yield of crop j in district i in 2000,
- rain-fed yield of crop j in district i in 2000,
- cost of cultivation of crop j in district i in 2000 under irrigation conditions,
- cost of cultivation of crop j in district i in 2000 under rain-fed conditions, and
pj
- average export price of crop j in 1999-2001.
The secondary data for this analysis were available from various sources. This includes the
Directorate of Economics and Statistics (GOI 2008) for the trends of cropping and irrigation
patterns at the district level and cost of production data at the state level: IWMI PODIUMSIM
model (Amarasinghe and Sharma 2008) for irrigated and rain-fed crop yields at the district
level; and the FAOSTAT database (FAO 2008) for the world export prices.
In addition to the increases in crop production, water transfers also generate other benefits
in the form of hydropower generation, and water transfers to domestic and industrial sectors.
For these benefits, we rely on the estimates in the feasibility reports (NWDA 2008a-h). They
also give the capital costs of construction of the links.
Scenarios of NVACOUP
This study estimates net value-added benefits of crop production in en-route command areas
under different scenarios of increases in cropping intensity. The main reason for this is the
available information on current cropping or irrigation intensity in the proposed command
areas. Feasibility reports do not show what part of the proposed command area is new, or
already irrigated, or under rain-fed conditions. Therefore, we consider four scenarios of
assessing NVACOUP.
districtsi
cropsjRF
ijoj
RF
ij
RF
ijo
IR
ijoj
IR
ijj
ii
cropsj
IR
ijj
IR
ij
IR
ijojio
crops
CpYCP
CpYCPAA
CpYCPCPA
NVACOUP
)(
)()(
)()(
0
0
39
Cost and Benefits of the National River Linking Project: An Analysis of Peninsular Links
Scenario I assumes that the proposed command area is a completely new addition to
the crop production base. Essentially, this means no crop production exists at present on the
proposed command area, and hence Aio=0, and
=0. Obviously, this scenario would give
the highest crop production benefits with new water transfers.
Scenario II assumes that the proposed command area is completely under rain-fed
cultivation at present, indicating only Aio=0. Additionally, we assume that the share of crop
area in the command area at present is the same as the share of crop area in the respective
districts under rain-fed condition.
Scenario III assumes that maximum cropping intensity in the command areas at present
is the minimum of the existing and the proposed command areas. This scenario assumes that
maximum annual cropped area at present within the proposed command area is the cropped
area proposed under full irrigation.
• For example, the current cropping intensity in districts covering the Mahanadi-Godavari
en-route command area is 152% (Table 3). But we assume the current cropping intensity
as only 131%, which is the same as the proposed cropping intensity under full irrigation.
Only, 57% of that area is irrigated at present.
• In the districts covering Godavari (Inchampalli)-Krishna (Pulichintala) Link command,
the current cropping intensity is 140%. But the proposed irrigation intensity is only
110%. So, in Scenario III we assume only 110% existing cropping intensity for Godavari
(Inchampalli)-Krishna (Pulichintala) Link command.
Scenario IV assumes that irrigation is already available for a part of the command area.
Also, the share of crop area in the command area under irrigated and rain-fed conditions at
present is the same as that of the districts intersecting the command (Table 3). For example, the
current cropping and irrigation intensities in the command area of Mahanadi-Godavari Link
are assumed to be the same as those of the districts covering the command areas. In this case,
the current cropping and irrigation intensities are 157 and 47%, respectively. However, the
proposed irrigation intensity in the command area is 137%. This allows a part of the command
area to be rain-fed even after water transfers; and the irrigation intensity in the Mahanadi-
Godavari Link is 20% of the culturable command.
In all these scenarios, we assume the following in NVACOUP estimation:
• Feasibility reports show that a significant part of the command area is allocated for crops
other than the 10 crops or crop categories mentioned above. We use the maximum of net
value-added in the 10 crops to estimate the net benefits of other crops. In most links, this
is the net value-added benefits of fruits and vegetables (Annex Table 2).
• The secondary data of cost of crop production under irrigation and rain-fed conditions
at the district level are not available for this analysis. Depending on the availability of
data and estimation constraints, we use a regression analysis of the state-level data from
2001 to 2004 to estimate the cost of production. The dependent variable of the regression
analysis is the cost of production per ha and the independent variable is the percentage of
irrigated area of crops. Additionally, a dummy variable captures other differences between
states. In sugarcane, the total area is almost completely irrigated in most states. Therefore,
we use the cost of production of irrigated sugarcane in Andhra Pradesh for the current
analysis (these items of information are given in Annex Table 2).
40
Upali A. Amarasinghe and R. Srinivasulu
Benefits and Costs
As expected, Scenario I, with no crop production before water transfers, has the highest
NVACOUP, generating $1,898/ha of gross crop area (GCA) of all links (Table 4). Scenario II,
with only one-season of rain-fed crop before water transfers, has the next highest NVACOUP,
i.e., $1,040/ha.
• In Scenario II, all canals, except those in the Godavari (Inchampalli)-Krishna
(Nagarjunasagar) Link, have positive net benefits. The negative benefits in these canals
are mainly due to small differences in yields under irrigated and rain-fed areas at present
and changes in proposed cropping patterns. The proposed cropping patterns in the
Godavari (Inchampalli)-Krishna (Nagarjunasagar) Link do not have rice or other crops,
which dominate the cropping patterns at present. Thus, in spite of increase in area under
fruits and vegetables, with the highest net benefit/ha of different crops at present, the
decreases in rice and other crops in the proposed cropping patterns have decreased the
total NVACOUP.
• If the proposed cropping pattern is the same as that existing at present, then the NVACOUP
increases from a negative 262/ha to a positive 2,093/ha.
Scenario III has the next best NVACOUP, i.e., $613/ha. This scenario still generates
negative benefits in the Godavari (Inchampalli)-Krishna (Nagarjunasagar) Link, due to changes
in cropping patterns. If the proposed cropping pattern is similar to that existing at present, then
NVACOUP in this link changes from a negative $719/ha to a positive $411 /ha.
Scenario IV has the lowest benefits, i.e., $279/ha. Three out of the eight links under
this scenario have negative value-added benefits. This is again mainly due to differences in
cropping patterns. If the proposed cropping pattern is similar to that existing at present, then
NVACOUP of the Godavari (Inchampalli)-Krishna (Nagarjunasagar) Link will increase from
a negative $860/ha to a positive $134/ha.
This shows that the selection of a proper high-value cropping pattern, even after
irrigation transfers, should be a necessary condition for the links to generate positive net
benefits. Any drastic changes from the present cropping patterns, especially from fruits/
vegetables and other high-value crops would not yield any crop production benefits in the
proposed command areas. At present, fruits, vegetables, rice and sugarcane provide the highest
value-added net benefit per ha of all crops (Table 2). For crop production to generate positive
net benefits, the proposed cropping patterns should include a higher percentage of high-value
crops. This is more important in the command areas, where yields of irrigated crops are not
significantly higher than those of rain-fed crops.
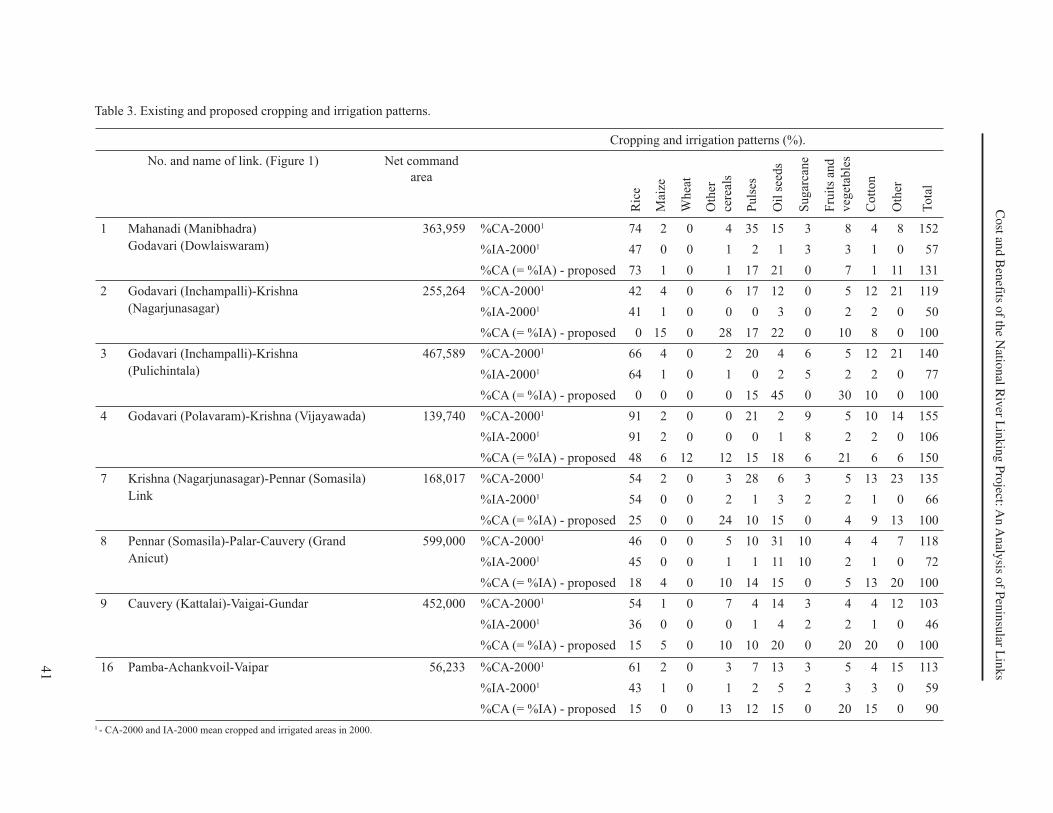
41
Cost an
d B
enefits o
f the N
ation
al Riv
er Lin
kin
g P
roject: A
n A
naly
sis of P
enin
sular L
ink
s
Table 3. Existing and proposed cropping and irrigation patterns.
Cropping and irrigation patterns (%).
No. and name of link. (Figure 1) Net command
area
Ric
e
Mai
ze
Wh
eat
Oth
er
cere
als
Pu
lses
Oil
see
ds
Su
gar
can
e
Fru
its
and
veg
etab
les
Cott
on
Oth
er
To
tal
1 Mahanadi (Manibhadra)
Godavari (Dowlaiswaram)
363,959 %CA-20001 74 2 0 4 35 15 3 8 4 8 152
%IA-20001 47 0 0 1 2 1 3 3 1 0 57
%CA (= %IA) - proposed 73 1 0 1 17 21 0 7 1 11 131
2 Godavari (Inchampalli)-Krishna
(Nagarjunasagar)
255,264 %CA-20001 42 4 0 6 17 12 0 5 12 21 119
%IA-20001 41 1 0 0 0 3 0 2 2 0 50
%CA (= %IA) - proposed 0 15 0 28 17 22 0 10 8 0 100
3 Godavari (Inchampalli)-Krishna
(Pulichintala)
467,589 %CA-20001 66 4 0 2 20 4 6 5 12 21 140
%IA-20001 64 1 0 1 0 2 5 2 2 0 77
%CA (= %IA) - proposed 0 0 0 0 15 45 0 30 10 0 100
4 Godavari (Polavaram)-Krishna (Vijayawada) 139,740 %CA-20001 91 2 0 0 21 2 9 5 10 14 155
%IA-20001 91 2 0 0 0 1 8 2 2 0 106
%CA (= %IA) - proposed 48 6 12 12 15 18 6 21 6 6 150
7 Krishna (Nagarjunasagar)-Pennar (Somasila)
Link
168,017 %CA-20001 54 2 0 3 28 6 3 5 13 23 135
%IA-20001 54 0 0 2 1 3 2 2 1 0 66
%CA (= %IA) - proposed 25 0 0 24 10 15 0 4 9 13 100
8 Pennar (Somasila)-Palar-Cauvery (Grand
Anicut)
599,000 %CA-20001 46 0 0 5 10 31 10 4 4 7 118
%IA-20001 45 0 0 1 1 11 10 2 1 0 72
%CA (= %IA) - proposed 18 4 0 10 14 15 0 5 13 20 100
9 Cauvery (Kattalai)-Vaigai-Gundar 452,000 %CA-20001 54 1 0 7 4 14 3 4 4 12 103
%IA-20001 36 0 0 0 1 4 2 2 1 0 46
%CA (= %IA) - proposed 15 5 0 10 10 20 0 20 20 0 100
16 Pamba-Achankvoil-Vaipar 56,233 %CA-20001 61 2 0 3 7 13 3 5 4 15 113
%IA-20001 43 1 0 1 2 5 2 3 3 0 59
%CA (= %IA) - proposed 15 0 0 13 12 15 0 20 15 0 90
1 - CA-2000 and IA-2000 mean cropped and irrigated areas in 2000.

42
Upali A
. Am
arasinghe an
d R
. Srin
ivasu
lu
Table 4. Net value of crop output before and after water transfers.
Name and no. of link (Figure 1)
Net value of crop output per ha of gross cropped area ($/ha in 2000 prices)
Scenario I Scenario II Scenario III Scenario IV
Before After Change Before After Change Before After Change Before After Change
1 Mahanadi-Godavari 0 948 948 622 948 326 668 948 280 703 864 161
2 Godavari–Krishna
(Nagarjunasagar)
0 972 972 1,233 972 -261 1,681 972 -709 1,677 870 -807
3 Godavari-Krishna (Pulichintala) 0 2,792 2,792 1,125 2,792 1,667 1,672 2,792 1,120 1,651 2,114 463
4 Godavari-Krishna (Vijayawada) 0 1,874 1,874 697 1,874 1,177 1,357 1,874 517 1,360 1,834 474
7 Krishna (Nagar.)-Pennar (Somasila) 0 1,748 1,748 1,069 1,748 678 1,662 1,748 85 1,764 1,399 -365
8 Pennar (Somasila)-Palar-Cauvery 0 2,398 2,398 518 2,398 1,880 1,094 2,398 1,304 1,097 2,085 988
9 Cauvery (Kattalai)-Vaigai-Gundar 0 1,895 1,895 1,026 1,895 869 1,416 1,895 479 1,421 1,851 429
16 Pamba-Achankvoil-Vaipar 0 1,943 1,943 944 1,943 999 1,567 1,943 375 1,600 1,624 24
All links 0 1,898 1,898 869 1,898 1,028 1,297 1,898 601 1,320 1,654 335
43
Cost and Benefits of the National River Linking Project: An Analysis of Peninsular Links
Net Present Value (NPV) and Internal Rate of Return (IRR)
In estimating NPV and IRR, we assumed a 12% annual discount rate, a 10-year construction
period, project life span of 50 years and 10% of the capital cost as operation and maintenance
costs. Total net value-added benefits of water transfers include:
• Net value-added benefits of crop production due to irrigation water transfers.
• Benefits of domestic and industrial2 water transfers.
• Hydropower generation.3
• Indirect benefits of water supply assessed through a multiplier value, which we have taken
as 1.4.
The net value-added benefit of a link is 1.4 times the net value-added crop output and
domestic, industrial and hydropower benefits. The data show the percentage share of water
supply and contribution to net value-added benefits by the irrigation, domestic and industrial
sectors (Table 5). Clearly, a major part of the water deliveries is for irrigation. Of the eight
links in this study, 85% of the water deliveries is for the irrigation sector, and 8 and 7%
for domestic and industrial sectors, respectively. The contribution to net value-added benefits
varies with existing extent of cropped and irrigated area. Scenario I has the highest contribution
of irrigation to net value-added benefits. This contribution decreases from 88 to 62% from
Scenarios I and IV.
The NPV, IRR and BCR of different links are given in Table 5. The results indicate the
following:
• Under Scenario 1, all links except the Pamba-Achankvoil-Vaipar Link, have a significantly
high IRR (16-39%) and BCR (1.3-6.9), showing that investments in the en-route canal
command are financially viable. However, financial viability decreases with the assumption
on existing cropped and irrigated areas in the proposed commands.
• If the en-route command at present has only rain-fed cropping (Scenario 2), then all links,
except the Godavari (Inchampalli)-Krishna (Nagarjunasagar) and Pamba-Achankvoil-
Vaipar links are financially viable. The proposed cropping pattern is the major reason for
financial nonviability. If this link also has a high-value cropping pattern it can also be a
financially viable option. If the proposed cropping patters are similar to those existing
now, the BCR and IRR of the Godavari (Inchampalli)-Krishna (Nagarjunasagar) Link
under Scenario 2 increase between 2.0 and 20%.
• A major part of the proposed command areas in all links already has some cropped area,
and within that some irrigation. Scenarios III and IV correspond to these conditions.
Under these scenarios, the IRR of all links, except the Godavari (Inchampalli)-Krishna
(Nagarjunasagar), Krishna (Nagarjunasagar)-Pennar (Somasila) and Pamba-Achankvoil-
Vaipar links, are more than the discount rate and BCR is more than 1, indicating that they
will be financially viable investments with the projected benefit streams.
2Benefits of domestic and industrial supply of all links are assessed at 5.00 and 14.50 Rs/m3, respectively,
of water deliveries, the rate used for assessing Godavari (Inchampalli)-Krishna (Nagarjunsagar) Links. 3Hydropower benefit is assessed at 1.67 per unit of kWh, the prevailing average rate per unit in Andhra
Pradesh (NCAER 2009).

44
Upali A. Amarasinghe and R. Srinivasulu
• These links whose proposed cropping patterns are quite different from those existing now
have low irrigation benefits, low NPV and lower IRR and BCR. If the proposed cropping
patters are similar to those existing now, the IRR and BCR of the Godavari (Inchampalli)-
Krishna (Nagarjunasagar) Link under Scenario III increases to 14 and 1.1%, respectively.
But the net benefits under Scenario IV still do not exceed the cost (BCR=0.7). With high-
value cropping patterns, the Krishna (Nagarjunasagar)-Pennar (Somasila) Link can also
generate large net benefits, high IRR and BCR.
Thus, it is clear from the analysis that projected benefits of individual links depend on
the extents of cropping and irrigation that exist at present and the proposed cropping patterns
in en-route command areas. If the proposed cropping patterns have substantial high-value crop
areas, which at least give the net benefits as in fruits and vegetables, new investments on water
supply in individual link commands are financially viable.
However, water transfers between links in the Mahanadi-Godavari-Pennar-Cauvery
subcomponent are dependent on one another. Thus, it is more appropriate to assess benefits
and costs for the whole component than for the individual links. When all links are considered
together, the net value-added benefits still exceed the cost. The IRR and BCR are significantly
higher than the discount rate (12 %) and 1 respectively, under Scenarios I and II; 19 and
1.7%, respectively, under Scenario III, and 15 and 1.3%, respectively, under Scenario IV. This
shows that with proper cropping patterns, the aggregate net benefits of en-route commands in
the Mahanadi-Godavari-Pennar-Cauvery component exceed the cost, and the investments are
financially viable.
Does this mean that the subcomponent of linking Mahanadi, Godavari, Pennar and
Krishna as a whole, is a financially viable investment? This is a difficult question to answer
from the above results due to many reasons. We discuss these issues next.
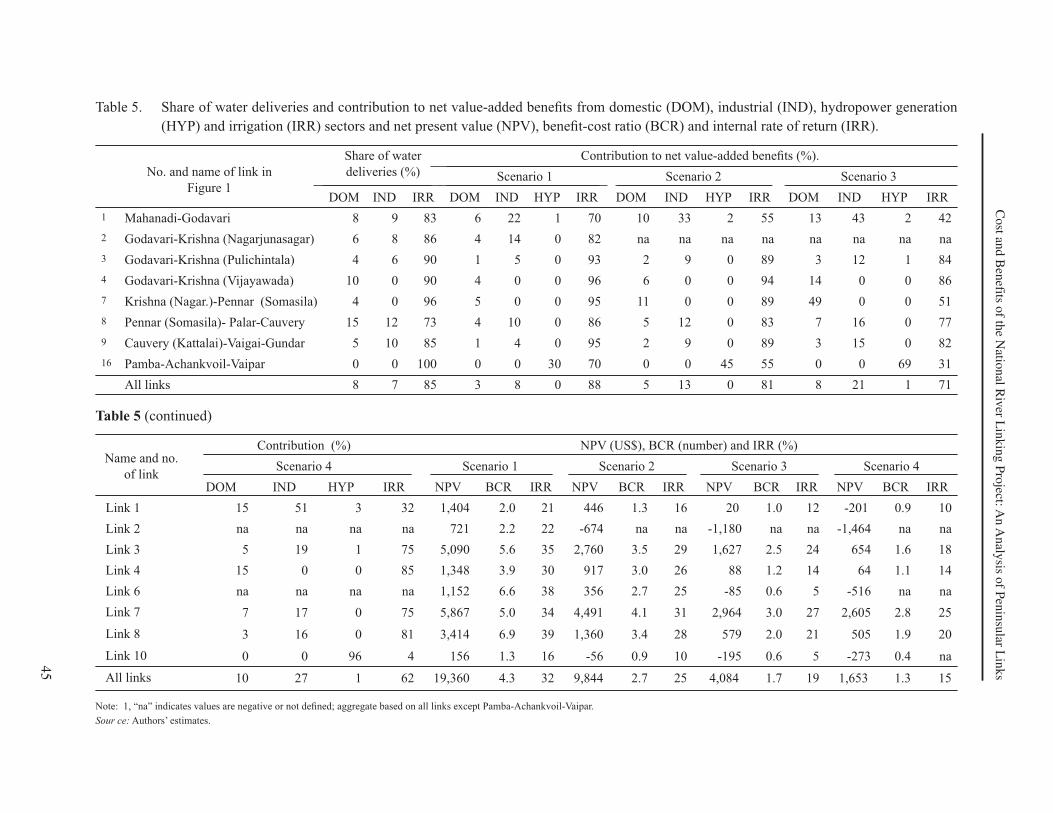
45
Cost an
d B
enefits o
f the N
ation
al Riv
er Lin
kin
g P
roject: A
n A
naly
sis of P
enin
sular L
ink
s
Table 5. Share of water deliveries and contribution to net value-added benefits from domestic (DOM), industrial (IND), hydropower generation
(HYP) and irrigation (IRR) sectors and net present value (NPV), benefit-cost ratio (BCR) and internal rate of return (IRR).
No. and name of link in
Figure 1
Share of water
deliveries (%)
Contribution to net value-added benefits (%).
Scenario 1 Scenario 2 Scenario 3
DOM IND IRR DOM IND HYP IRR DOM IND HYP IRR DOM IND HYP IRR
1 Mahanadi-Godavari 8 9 83 6 22 1 70 10 33 2 55 13 43 2 42
2 Godavari-Krishna (Nagarjunasagar) 6 8 86 4 14 0 82 na na na na na na na na
3 Godavari-Krishna (Pulichintala) 4 6 90 1 5 0 93 2 9 0 89 3 12 1 84
4 Godavari-Krishna (Vijayawada) 10 0 90 4 0 0 96 6 0 0 94 14 0 0 86
7 Krishna (Nagar.)-Pennar (Somasila) 4 0 96 5 0 0 95 11 0 0 89 49 0 0 51
8 Pennar (Somasila)- Palar-Cauvery 15 12 73 4 10 0 86 5 12 0 83 7 16 0 77
9 Cauvery (Kattalai)-Vaigai-Gundar 5 10 85 1 4 0 95 2 9 0 89 3 15 0 82
16 Pamba-Achankvoil-Vaipar 0 0 100 0 0 30 70 0 0 45 55 0 0 69 31
All links 8 7 85 3 8 0 88 5 13 0 81 8 21 1 71
Table 5 (continued)
Name and no.
of link
Contribution (%) NPV (US$), BCR (number) and IRR (%)
Scenario 4 Scenario 1 Scenario 2 Scenario 3 Scenario 4
DOM IND HYP IRR NPV BCR IRR NPV BCR IRR NPV BCR IRR NPV BCR IRR
Link 1 15 51 3 32 1,404 2.0 21 446 1.3 16 20 1.0 12 -201 0.9 10
Link 2 na na na na 721 2.2 22 -674 na na -1,180 na na -1,464 na na
Link 3 5 19 1 75 5,090 5.6 35 2,760 3.5 29 1,627 2.5 24 654 1.6 18
Link 4 15 0 0 85 1,348 3.9 30 917 3.0 26 88 1.2 14 64 1.1 14
Link 6 na na na na 1,152 6.6 38 356 2.7 25 -85 0.6 5 -516 na na
Link 7 7 17 0 75 5,867 5.0 34 4,491 4.1 31 2,964 3.0 27 2,605 2.8 25
Link 8 3 16 0 81 3,414 6.9 39 1,360 3.4 28 579 2.0 21 505 1.9 20
Link 10 0 0 96 4 156 1.3 16 -56 0.9 10 -195 0.6 5 -273 0.4 na
All links 10 27 1 62 19,360 4.3 32 9,844 2.7 25 4,084 1.7 19 1,653 1.3 15
Note: 1, “na” indicates values are negative or not defined; aggregate based on all links except Pamba-Achankvoil-Vaipar.
Sour ce: Authors’ estimates.
46
Upali A. Amarasinghe and R. Srinivasulu
Discussion and Conclusion
We discuss a few issues here that arise from our analysis of benefits and costs or from lack of
detailed information on the proposed links.
• According to the NRLP plan, a substantial part of the proposed water transfers in the
Mahanadi-Godavari-Pennar-Cauvery subcomponent is only a substitute for the water
transfers out of the upstream of river basins. For example, 6,500 Mm3 of water transfers
in the Mahanadi-Godavari Link are allocated to meet the demand downstream of the
Godavari River. If not for water transfers to Krishna from the upstream of Godavari, the
above quantity for downstream use would anyway be available from the surplus water of
Godavari. Since this quantity is only a substitution, what additional net output would this
generate and account for the project benefits? A similar situation is applicable for the water
transfers to the Krishna Delta through the Godavari (Polavaram)-Krishna (Vijayawada)
Link, which amounts to another 3,500 Mm3.
The water transfers of these two links as substitution is 10,000 Mm3, and this
volume would be more than half the water delivered to en-route command areas. An
important question here is whether the net value-added benefits from the water transfers
as substitution are more than the value transfers can generate if they are new transfers to
a region. Theoretically, this cannot generate any net value-added benefits in Godavari as
it is a water-surplus basin. However, the water transfers to the Krishna Delta could add
value as it is a water-scarce basin. However, it is not clear from the feasibility reports how
this allocation would be used in the Krishna Delta.
If the total capital cost of the Mahanadi-Godavari Link is added to the cost
component, the IRR of all links under Scenarios III and IV will decrease to 13 and 10%,
respectively.
• It is not completely clear whether the water transfers from Brahmaputra to Mahanadi
basins through the Himalayan Links are necessary for the fully operational Mahanadi-
Godavari-Krishna-Pennar subcomponent. If they are, then a part of the capital cost of the
Himalayan Links should also be included in the peninsular subcomponent in this analysis.
Therefore, the capital cost estimates of the links used in this study could be substantially
lower, and hence the estimates of IRR and BCR could be higher. For instance, the Manas-
Sankosch-Tista-Ganga, Ganga-Damodar-Subernarekha, and Subernarekha-Mahandi links
in the Himalayan component facilitating water transfers from Brahmaputra to Mahanadi
cost about US$19 billion. In fact, the total cost of these three links is 30% more than the
total cost of the eight links in this study, and 200% more than the cost of water transfers
to eight en-route link commands. Thus, adding a portion of the Himalayan component
capital cost could very much escalate the total cost used in this analysis. Under such a
scenario, the BCR and ICR will decrease drastically.
• A substantial part of the irrigation deliveries and the transmission losses in canals
contribute to groundwater recharge. This recharge could help expand groundwater below
the command areas and links. In this study, the extent of groundwater irrigation that will
originate from this groundwater recharge and the resulting benefits are not clear. If these
are known, it is certainly an indirect contribution for the benefit streams, and with regional
multipliers the net value-added could be much higher. If we include these benefits, the
BCR and IRR of the subcomponent could increase.
47
Cost and Benefits of the National River Linking Project: An Analysis of Peninsular Links
• The new reservoirs and canals will submerge large parts of forest and agricultural land
and displace populations. Forests contribute to livelihoods of many people, especially the
tribal population living there. They are the majority who will be displaced due to water
transfers. The flora and fauna of the submerged lands were means of income for many
people. This analysis has not considered the financial losses due to the submergence of
lands, displacement of people and environmental impacts on the riverine environment.
Such financial losses can decrease the net value-added benefits, reducing IRR and BCR.
• New reservoirs impound large quantities of water and affect the river flows downstream.
Vladimir et al. (2008) show that many peninsular river basins could be perceived to have
more surpluses than what they actually have. If these perceived surpluses are impounded
and transferred out of the basin, they could badly affect river flows downstream. River
flows in the downstream support the livelihoods of many people, especially in terms of
inland navigation, fishing, tourism, etc. Thus, impounding could financially affect riverine
populations directly and others indirectly. If these financial losses are included, IRR and
BCR could decrease.
Our analysis indicates that if new water transfers only bring new lands into cultivation,
the benefits are immense. Also, if water transfers are only used for irrigating the existing rain-
fed lands, the net value-added benefits could still exceed costs by several factors. However,
in reality this is not the case. The proposed command areas for irrigation in many river links
already have some cropped areas and, in some cases, irrigated areas too. The financial viability
of these links depends on the proposed cropping patterns. They require irrigating substantially
high-value crops such as vegetables and fruits. The IRR and BCRs of links depend on many
factors other than net value-added benefits of irrigation, domestic and industrial sectors in
the en-route command areas and hydropower generation. These include hydrological factors
related to groundwater recharge and benefits; environmental factors due to area submergence
and loss of river flows, and social factors due to displacement, resettlement and rehabilitation
of project-affected people. They need to be considered for a proper financial and social benefit-
cost analysis framework.

48
Upali A. Amarasinghe and R. Srinivasulu
Annex
Table 1. Changes in net irrigated area as a % of net sown area, and net groundwater irrigated area
as % of net irrigated area in Andhra Pradesh and Tamil Nadu.
State and district
Net irrigated area - % of net sown areaNet groundwater irrigated area -
% of net irrigated area
19
71
19
75
19
80
19
85
19
90
19
95
20
00
20
05
19
71
19
75
19
80
19
85
19
90
19
95
20
00
20
05
Adilabad 5 6 7 8 10 12 15 16 11 12 15 19 29 44 42 59
Anantapur 13 15 14 14 15 14 14 11 38 45 48 56 59 68 71 70
Chittoor 31 31 30 29 32 34 40 39 45 48 59 62 65 71 82 69
Cuddapah 26 30 29 27 31 31 36 34 48 46 57 60 62 72 79 71
East Godavari 63 64 65 64 62 63 65 65 4 7 7 11 10 17 20 21
Guntur 48 50 54 57 58 54 59 59 2 4 4 4 6 9 11 15
Karimnagar 22 29 32 40 60 68 69 76 47 46 50 46 52 66 62 56
Khammam 16 20 21 30 39 40 42 42 14 10 18 15 21 26 29 37
Krishna 64 66 66 72 72 68 68 66 6 6 7 7 8 11 12 16
Kurnool 10 10 12 13 17 18 20 22 9 11 13 15 26 40 47 46
Mahabubnagar 9 13 14 10 19 17 20 23 28 29 37 58 55 79 81 70
Medak 15 20 22 23 31 27 30 29 22 27 42 48 54 77 87 80
Nalgonda 20 28 27 27 35 38 40 46 18 18 26 25 37 47 53 53
Nellore 62 64 69 74 81 82 76 77 16 21 26 30 28 32 37 36
Nizamabad 34 46 47 49 59 59 67 70 12 12 19 22 37 67 68 72
Prakasam 19 23 25 28 33 34 36 29 32 28 26 23 27 33 37 24
Rangareddy 13 13 14 13 22 18 26 22 56 54 67 72 75 88 90 93
Srikakulam 57 55 55 60 57 56 58 54 2 2 1 7 4 8 8 7
Visakhapatnam 34 33 36 37 39 36 33 31 8 5 3 5 11 14 11 14
Vizianagampuram 41 40 40 42 43 43 41 39 4 2 1 6 9 10 11 7
Warangal 21 27 27 37 55 60 59 69 27 24 36 54 58 70 75 73
West Godavari 75 77 77 81 81 82 82 83 16 17 20 21 25 34 37 39
Chengaianna 72 76 81 82 73 81 86 85 18 28 37 48 50 53 52 61
Coimbatore 36 40 47 42 41 47 55 52 50 55 56 56 50 55 59 56
Kanyakumari 40 34 35 35 34 35 36 35 1 1 1 5 5 5 6 6
Madurai 34 33 43 38 42 47 49 46 41 49 52 53 55 61 64 69
North Arcot\
Ambedkar 50 48 46 48 39 50 56 56 49 52 65 66 86 70 78 80
Ramanthapuram 37 40 41 37 40 41 47 43 15 17 19 25 26 26 28 26
Salem 22 21 27 22 27 32 37 53 66 73 76 74 80 83 82 86
South Arcot 50 57 59 51 50 55 63 90 34 45 53 50 65 67 67 70
Tanjavur 83 84 83 84 84 78 88 65 2 2 2 3 8 5 3 7
The Nilgris 1 0 1 1 1 1 2 2 0 30 15 22 6 7 6 6
Tiruchirapalli 31 31 39 33 34 36 46 54 30 30 35 37 40 51 57 67
Tirunelveli 34 33 40 37 39 44 44 41 39 41 39 43 39 42 44 44
Note: Highlighted rows are districts that include en-route command areas in this study.
An
dh
ra P
rad
esh
Tam
il N
adu
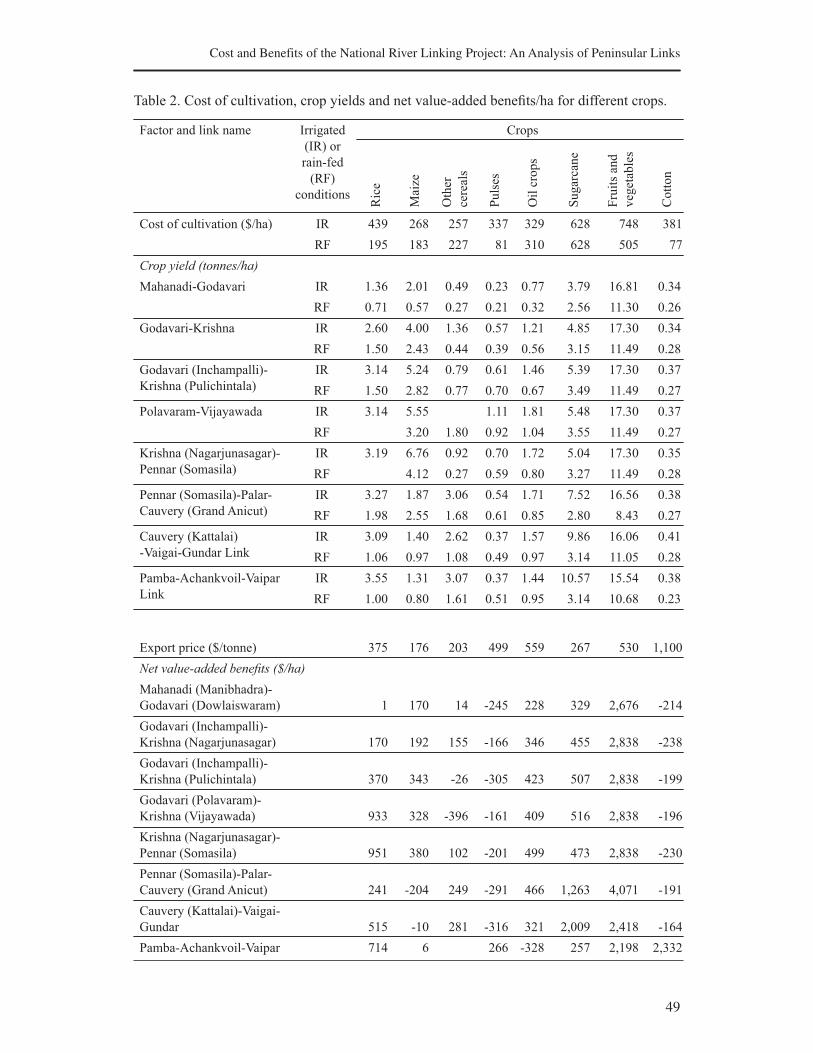
49
Cost and Benefits of the National River Linking Project: An Analysis of Peninsular Links
Table 2. Cost of cultivation, crop yields and net value-added benefits/ha for different crops.
Factor and link name Irrigated
(IR) or
rain-fed
(RF)
conditions
Crops
Ric
e
Mai
ze
Oth
er
cere
als
Pu
lses
Oil
cro
ps
Su
gar
can
e
Fru
its
and
veg
etab
les
Co
tto
n
Cost of cultivation ($/ha) IR 439 268 257 337 329 628 748 381
RF 195 183 227 81 310 628 505 77
Crop yield (tonnes/ha)
Mahanadi-Godavari IR 1.36 2.01 0.49 0.23 0.77 3.79 16.81 0.34
RF 0.71 0.57 0.27 0.21 0.32 2.56 11.30 0.26
Godavari-Krishna IR 2.60 4.00 1.36 0.57 1.21 4.85 17.30 0.34
RF 1.50 2.43 0.44 0.39 0.56 3.15 11.49 0.28
Godavari (Inchampalli)-
Krishna (Pulichintala)
IR 3.14 5.24 0.79 0.61 1.46 5.39 17.30 0.37
RF 1.50 2.82 0.77 0.70 0.67 3.49 11.49 0.27
Polavaram-Vijayawada IR 3.14 5.55 1.11 1.81 5.48 17.30 0.37
RF 3.20 1.80 0.92 1.04 3.55 11.49 0.27
Krishna (Nagarjunasagar)-
Pennar (Somasila)
IR 3.19 6.76 0.92 0.70 1.72 5.04 17.30 0.35
RF 4.12 0.27 0.59 0.80 3.27 11.49 0.28
Pennar (Somasila)-Palar-
Cauvery (Grand Anicut)
IR 3.27 1.87 3.06 0.54 1.71 7.52 16.56 0.38
RF 1.98 2.55 1.68 0.61 0.85 2.80 8.43 0.27
Cauvery (Kattalai)
-Vaigai-Gundar Link
IR 3.09 1.40 2.62 0.37 1.57 9.86 16.06 0.41
RF 1.06 0.97 1.08 0.49 0.97 3.14 11.05 0.28
Pamba-Achankvoil-Vaipar
Link
IR 3.55 1.31 3.07 0.37 1.44 10.57 15.54 0.38
RF 1.00 0.80 1.61 0.51 0.95 3.14 10.68 0.23
Export price ($/tonne) 375 176 203 499 559 267 530 1,100
Net value-added benefits ($/ha)
Mahanadi (Manibhadra)-
Godavari (Dowlaiswaram) 1 170 14 -245 228 329 2,676 -214
Godavari (Inchampalli)-
Krishna (Nagarjunasagar) 170 192 155 -166 346 455 2,838 -238
Godavari (Inchampalli)-
Krishna (Pulichintala) 370 343 -26 -305 423 507 2,838 -199
Godavari (Polavaram)-
Krishna (Vijayawada) 933 328 -396 -161 409 516 2,838 -196
Krishna (Nagarjunasagar)-
Pennar (Somasila) 951 380 102 -201 499 473 2,838 -230
Pennar (Somasila)-Palar-
Cauvery (Grand Anicut) 241 -204 249 -291 466 1,263 4,071 -191
Cauvery (Kattalai)-Vaigai-
Gundar 515 -10 281 -316 321 2,009 2,418 -164
Pamba-Achankvoil-Vaipar 714 6 266 -328 257 2,198 2,332
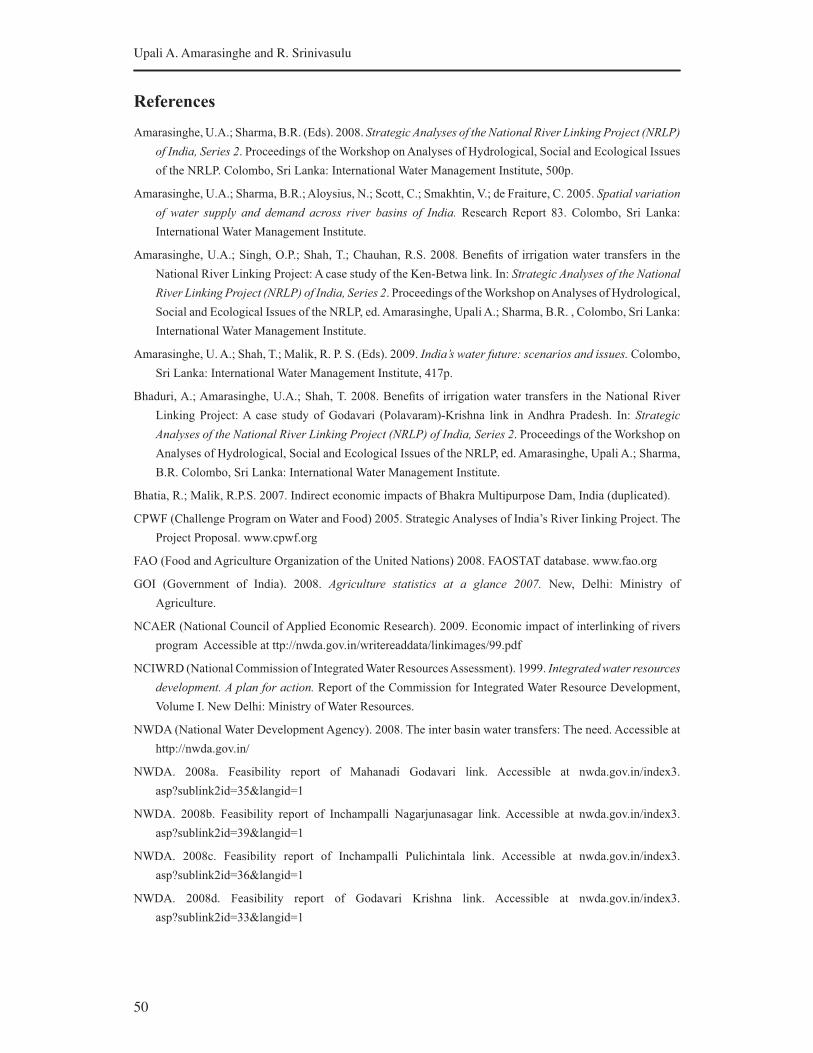
50
Upali A. Amarasinghe and R. Srinivasulu
References
Amarasinghe, U.A.; Sharma, B.R. (Eds). 2008. Strategic Analyses of the National River Linking Project (NRLP)
of India, Series 2. Proceedings of the Workshop on Analyses of Hydrological, Social and Ecological Issues
of the NRLP. Colombo, Sri Lanka: International Water Management Institute, 500p.
Amarasinghe, U.A.; Sharma, B.R.; Aloysius, N.; Scott, C.; Smakhtin, V.; de Fraiture, C. 2005. Spatial variation
of water supply and demand across river basins of India. Research Report 83. Colombo, Sri Lanka:
International Water Management Institute.
Amarasinghe, U.A.; Singh, O.P.; Shah, T.; Chauhan, R.S. 2008. Benefits of irrigation water transfers in the
National River Linking Project: A case study of the Ken-Betwa link. In: Strategic Analyses of the National
River Linking Project (NRLP) of India, Series 2. Proceedings of the Workshop on Analyses of Hydrological,
Social and Ecological Issues of the NRLP, ed. Amarasinghe, Upali A.; Sharma, B.R. , Colombo, Sri Lanka:
International Water Management Institute.
Amarasinghe, U. A.; Shah, T.; Malik, R. P. S. (Eds). 2009. India’s water future: scenarios and issues. Colombo,
Sri Lanka: International Water Management Institute, 417p.
Bhaduri, A.; Amarasinghe, U.A.; Shah, T. 2008. Benefits of irrigation water transfers in the National River
Linking Project: A case study of Godavari (Polavaram)-Krishna link in Andhra Pradesh. In: Strategic
Analyses of the National River Linking Project (NRLP) of India, Series 2. Proceedings of the Workshop on
Analyses of Hydrological, Social and Ecological Issues of the NRLP, ed. Amarasinghe, Upali A.; Sharma,
B.R. Colombo, Sri Lanka: International Water Management Institute.
Bhatia, R.; Malik, R.P.S. 2007. Indirect economic impacts of Bhakra Multipurpose Dam, India (duplicated).
CPWF (Challenge Program on Water and Food) 2005. Strategic Analyses of India’s River Iinking Project. The
Project Proposal. www.cpwf.org
FAO (Food and Agriculture Organization of the United Nations) 2008. FAOSTAT database. www.fao.org
GOI (Government of India). 2008. Agriculture statistics at a glance 2007. New, Delhi: Ministry of
Agriculture.
NCAER (National Council of Applied Economic Research). 2009. Economic impact of interlinking of rivers
program Accessible at ttp://nwda.gov.in/writereaddata/linkimages/99.pdf
NCIWRD (National Commission of Integrated Water Resources Assessment). 1999. Integrated water resources
development. A plan for action. Report of the Commission for Integrated Water Resource Development,
Volume I. New Delhi: Ministry of Water Resources.
NWDA (National Water Development Agency). 2008. The inter basin water transfers: The need. Accessible at
http://nwda.gov.in/
NWDA. 2008a. Feasibility report of Mahanadi Godavari link. Accessible at nwda.gov.in/index3.
asp?sublink2id=35&langid=1
NWDA. 2008b. Feasibility report of Inchampalli Nagarjunasagar link. Accessible at nwda.gov.in/index3.
asp?sublink2id=39&langid=1
NWDA. 2008c. Feasibility report of Inchampalli Pulichintala link. Accessible at nwda.gov.in/index3.
asp?sublink2id=36&langid=1
NWDA. 2008d. Feasibility report of Godavari Krishna link. Accessible at nwda.gov.in/index3.
asp?sublink2id=33&langid=1
51
Cost and Benefits of the National River Linking Project: An Analysis of Peninsular Links
NWDA. 2008e. Feasibility report of Nagarjunasagar Somasila link. Accessible at nwda.gov.in/index3.
asp?sublink2id=44&langid=1
NWDA. 2008f. Feasibility report of Pennar Palar Cauvery link. Accessible at nwda.gov.in/index3.
asp?sublink2id=45&langid=1
NWDA. 2008g. Feasibility report of Cauvery Vaigi Gundar link. Accessible at nwda.gov.in/index3.
asp?sublink2id=46&langid=1
NWDA. 2008h. Feasibility report of Pamba Achankovil Vaippar link. Accessible at nwda.gov.in/index3.
asp?sublink2id=47&langid=1
Smakhtin, Vladimir; Gamage, N.; Bharati, L. 2007. Hydrological and environmental issues of interbasin water
transfers in India: A case of the Krishna River Basin. IWMI Research Report 120. Colombo, Sri Lanka:
International Water Management Institute.

53
State of Irrigation in Tamil Nadu:
Investments and Returns
Upali A. Amarasinghe,1 K. Palanisami,1 O.P. Singh2 and R. Sakthivadivel3 1International Water Management Institute, India Office.
2Banaras Hindu University, Varanasi, India.3Consultant, Tamil Nadu (Former Fellow, International Water Management Institute).
Introduction
Development of land infrastructure for agriculture in monsoonal Asia had three major phases
of growth (Kikuchi et al. 2002). Bringing new land under cultivation for increasing agricultural
output dominated the first phase. However, the cost of opening up new land increased gradually
due to limitations of suitable arable land and constraints for developing them for agricultural
activities. The response to this cost increase was development of irrigation on existing lands,
which dominated the investments in the second phase. With increasing unit cost of new
irrigation development, water management for agriculture became dominant in the third phase.
At present, investments in the agriculture sector in Tamil Nadu are in the third phase, where
improving the performance of existing irrigation facilities is the primary concern.
Trends in irrigation development show that the State of Tamil Nadu as a whole has
already reached its irrigated potential. Most of the utilizable surface water resources for
canal irrigation are stored in 64 large and medium, and 11 small reservoirs (GoTN 2007).
Conventional potential developed with the available surface water resources in major and
medium systems has reached a peak of about 1.5 million ha (Mha) in the 1970s (GoI 2006).
More than 39,202 tanks support tank irrigation whose potential was reached long before 1970.
The potential utilization of groundwater is more than 85% of the available resources (CGWB
2006). In fact, many regions in Tamil Nadu are experiencing severe groundwater depletion at
present. Thus, maintaining the existing infrastructure and managing the distribution of surface
water and abstraction of groundwater constitute the major focus in recent policy interventions
and investment patterns (GoTN 2003).
However, in spite of significant investments in operation, maintenance and water
management, especially in major, medium and tank irrigation sectors, the area under surface
water irrigation has been decreasing in recent years. Moreover, in spite of vastly overexploited
groundwater resources, private investments in groundwater development are increasing, albeit
at a reduced pace (Amarasinghe et al. 2009).
This paper assesses recent trends in public and private investments, and their returns
to agricultural production in Tamil Nadu. Such knowledge, with increasing water scarcities
and demand, would be important to aid future investment decisions. First, we show the
54
Upali A. Amarasinghe, K. Palanisami, O.P. Singh and R. Sakthivadivel
trends of public and private investments in the irrigation sector of Tamil Nadu since 1970.
Next, we assess the contribution from different growth and investment patterns in irrigation
to the state crop output. Third, we assess irrigation demand at present and potential water
management improvements for meeting future demand. Finally, we conclude the paper with
recommendations for investments in the irrigation sector to improve agricultural productivity
and production.
Trends of Investments in Irrigation
Public investments, mainly on major, medium and minor irrigation schemes, meet the cost
of new construction and rehabilitation, recurrent expenditure on operation and maintenance
(O&M) and staff salaries and benefits. Major and medium irrigation reservoirs include schemes
with commands over 10,000 ha and between 2,000 and 10,000 ha, respectively. Minor irrigation
involves tanks; surface flow irrigation, which involves diversion from a stream or storage in
a community-owned small tank or pond; and surface lift irrigation schemes, in which water is
lifted from a stream or river into irrigation channels due to topographic constraints for direct
surface flow irrigation.
Private investments are mainly in dug wells and in shallow and deep tube wells. Dug
wells are open wells with a depth up to the water-bearing stratum. Shallow tube wells tap
groundwater from the porous zones with a depth not exceeding 6-70 meters (m) and would,
generally, operate about 6-8 hours and yield 100-300 m3 per day during the irrigation season.
Deep tube wells in general have a depth more than 100 m, discharge 100-200 m3/hour, and
can have 15 times more annual output than shallow wells. But the output is not sustainable
(CGWB 2006; Palanisami et al. 2008).
Data on plan-wise investments in Tamil Nadu on major, medium and minor irrigation
schemes were collected from various government publications for the study (GoTN 2007)
Public Investments in Major and Medium Irrigation Schemes
Public investments in major, medium and minor irrigation schemes from the first Five-
Year Plan (1951-1956) to the tenth Five-Year Plan (2002-2007) are shown in Figure 1.1 The
investments in major and medium irrigation schemes show three different periods. First, the
investments gradually increased to a peak in mid-1980, up to the sixth Plan. Almost all new
constructions ended by that time. Since then, the investments have declined, along with net
irrigated area, until the late 1990s. A major investment again in the eighth Plan has reversed
and perhaps stabilized the declining trend in major/medium irrigation scheme areas.
1This includes annual plans between 1967/68 and 1968/69, 1978/79 and 1980/81, and 1990/91 to
1996/97.
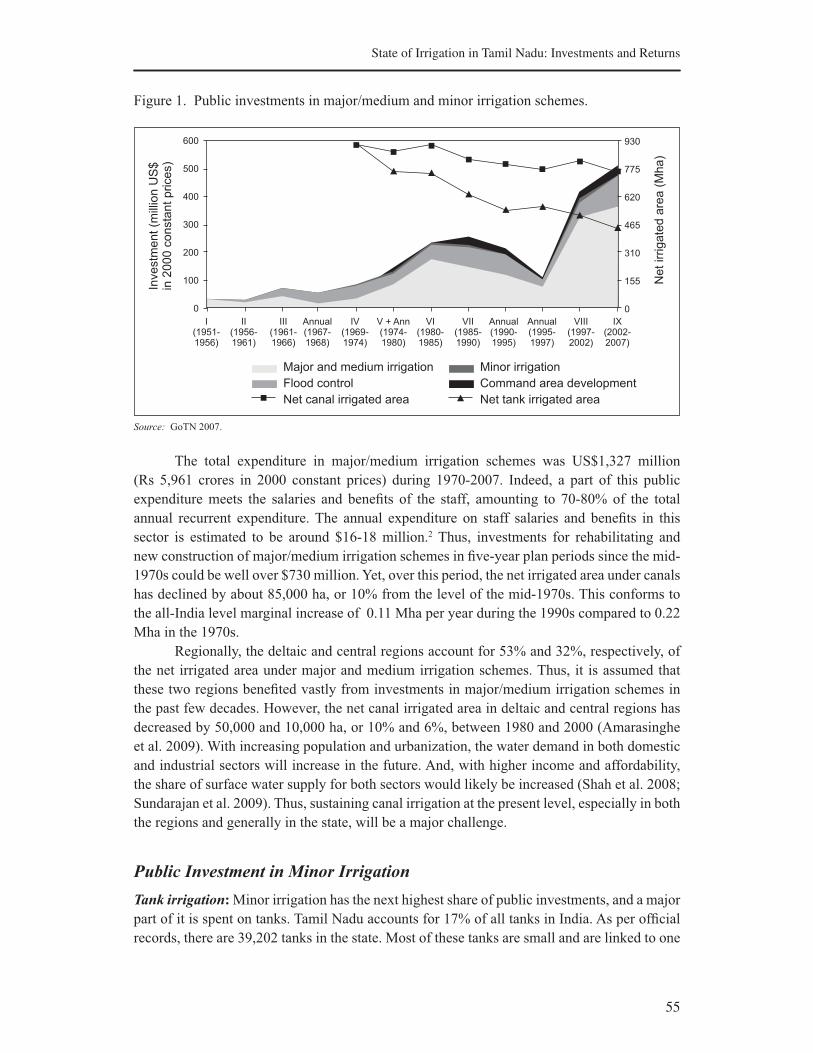
55
State of Irrigation in Tamil Nadu: Investments and Returns
Figure 1. Public investments in major/medium and minor irrigation schemes.
Source: GoTN 2007.
The total expenditure in major/medium irrigation schemes was US$1,327 million
(Rs 5,961 crores in 2000 constant prices) during 1970-2007. Indeed, a part of this public
expenditure meets the salaries and benefits of the staff, amounting to 70-80% of the total
annual recurrent expenditure. The annual expenditure on staff salaries and benefits in this
sector is estimated to be around $16-18 million.2 Thus, investments for rehabilitating and
new construction of major/medium irrigation schemes in five-year plan periods since the mid-
1970s could be well over $730 million. Yet, over this period, the net irrigated area under canals
has declined by about 85,000 ha, or 10% from the level of the mid-1970s. This conforms to
the all-India level marginal increase of 0.11 Mha per year during the 1990s compared to 0.22
Mha in the 1970s.
Regionally, the deltaic and central regions account for 53% and 32%, respectively, of
the net irrigated area under major and medium irrigation schemes. Thus, it is assumed that
these two regions benefited vastly from investments in major/medium irrigation schemes in
the past few decades. However, the net canal irrigated area in deltaic and central regions has
decreased by 50,000 and 10,000 ha, or 10% and 6%, between 1980 and 2000 (Amarasinghe
et al. 2009). With increasing population and urbanization, the water demand in both domestic
and industrial sectors will increase in the future. And, with higher income and affordability,
the share of surface water supply for both sectors would likely be increased (Shah et al. 2008;
Sundarajan et al. 2009). Thus, sustaining canal irrigation at the present level, especially in both
the regions and generally in the state, will be a major challenge.
Public Investment in Minor Irrigation
Tank irrigation: Minor irrigation has the next highest share of public investments, and a major
part of it is spent on tanks. Tamil Nadu accounts for 17% of all tanks in India. As per official
records, there are 39,202 tanks in the state. Most of these tanks are small and are linked to one
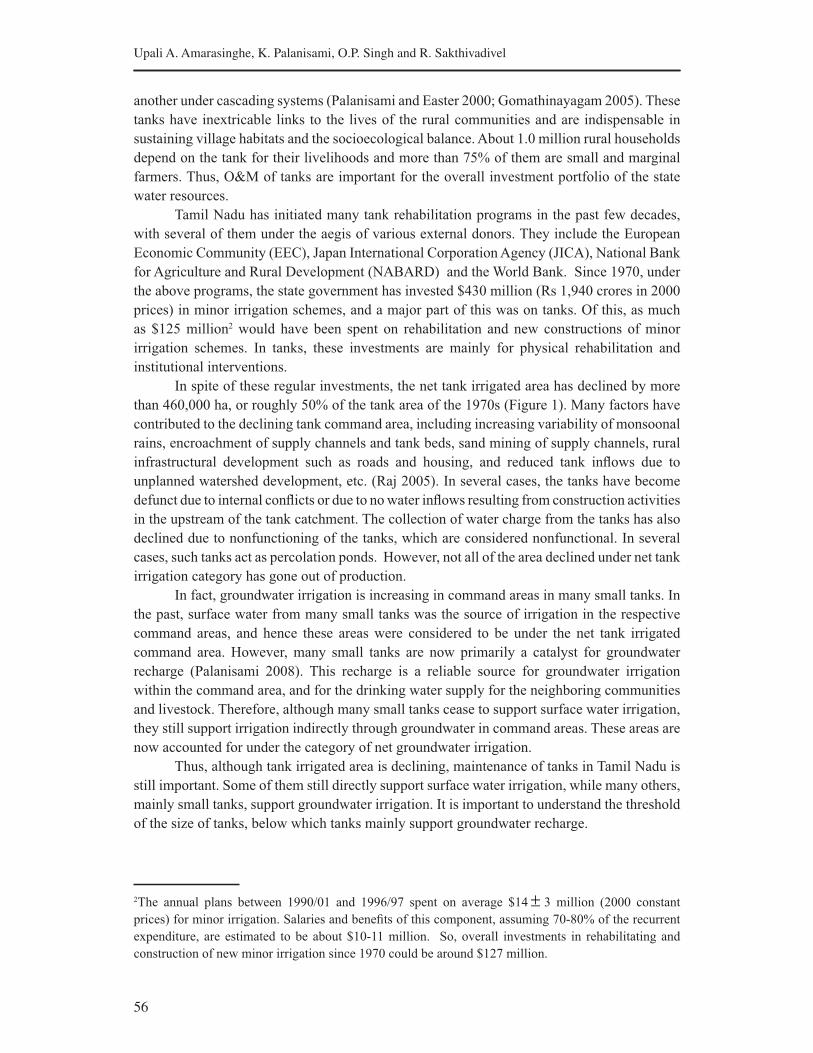
56
Upali A. Amarasinghe, K. Palanisami, O.P. Singh and R. Sakthivadivel
another under cascading systems (Palanisami and Easter 2000; Gomathinayagam 2005). These
tanks have inextricable links to the lives of the rural communities and are indispensable in
sustaining village habitats and the socioecological balance. About 1.0 million rural households
depend on the tank for their livelihoods and more than 75% of them are small and marginal
farmers. Thus, O&M of tanks are important for the overall investment portfolio of the state
water resources.
Tamil Nadu has initiated many tank rehabilitation programs in the past few decades,
with several of them under the aegis of various external donors. They include the European
Economic Community (EEC), Japan International Corporation Agency (JICA), National Bank
for Agriculture and Rural Development (NABARD) and the World Bank. Since 1970, under
the above programs, the state government has invested $430 million (Rs 1,940 crores in 2000
prices) in minor irrigation schemes, and a major part of this was on tanks. Of this, as much
as $125 million2 would have been spent on rehabilitation and new constructions of minor
irrigation schemes. In tanks, these investments are mainly for physical rehabilitation and
institutional interventions.
In spite of these regular investments, the net tank irrigated area has declined by more
than 460,000 ha, or roughly 50% of the tank area of the 1970s (Figure 1). Many factors have
contributed to the declining tank command area, including increasing variability of monsoonal
rains, encroachment of supply channels and tank beds, sand mining of supply channels, rural
infrastructural development such as roads and housing, and reduced tank inflows due to
unplanned watershed development, etc. (Raj 2005). In several cases, the tanks have become
defunct due to internal conflicts or due to no water inflows resulting from construction activities
in the upstream of the tank catchment. The collection of water charge from the tanks has also
declined due to nonfunctioning of the tanks, which are considered nonfunctional. In several
cases, such tanks act as percolation ponds. However, not all of the area declined under net tank
irrigation category has gone out of production.
In fact, groundwater irrigation is increasing in command areas in many small tanks. In
the past, surface water from many small tanks was the source of irrigation in the respective
command areas, and hence these areas were considered to be under the net tank irrigated
command area. However, many small tanks are now primarily a catalyst for groundwater
recharge (Palanisami 2008). This recharge is a reliable source for groundwater irrigation
within the command area, and for the drinking water supply for the neighboring communities
and livestock. Therefore, although many small tanks cease to support surface water irrigation,
they still support irrigation indirectly through groundwater in command areas. These areas are
now accounted for under the category of net groundwater irrigation.
Thus, although tank irrigated area is declining, maintenance of tanks in Tamil Nadu is
still important. Some of them still directly support surface water irrigation, while many others,
mainly small tanks, support groundwater irrigation. It is important to understand the threshold
of the size of tanks, below which tanks mainly support groundwater recharge.
2The annual plans between 1990/01 and 1996/97 spent on average $14 ± 3 million (2000 constant
prices) for minor irrigation. Salaries and benefits of this component, assuming 70-80% of the recurrent
expenditure, are estimated to be about $10-11 million. So, overall investments in rehabilitating and
construction of new minor irrigation since 1970 could be around $127 million.
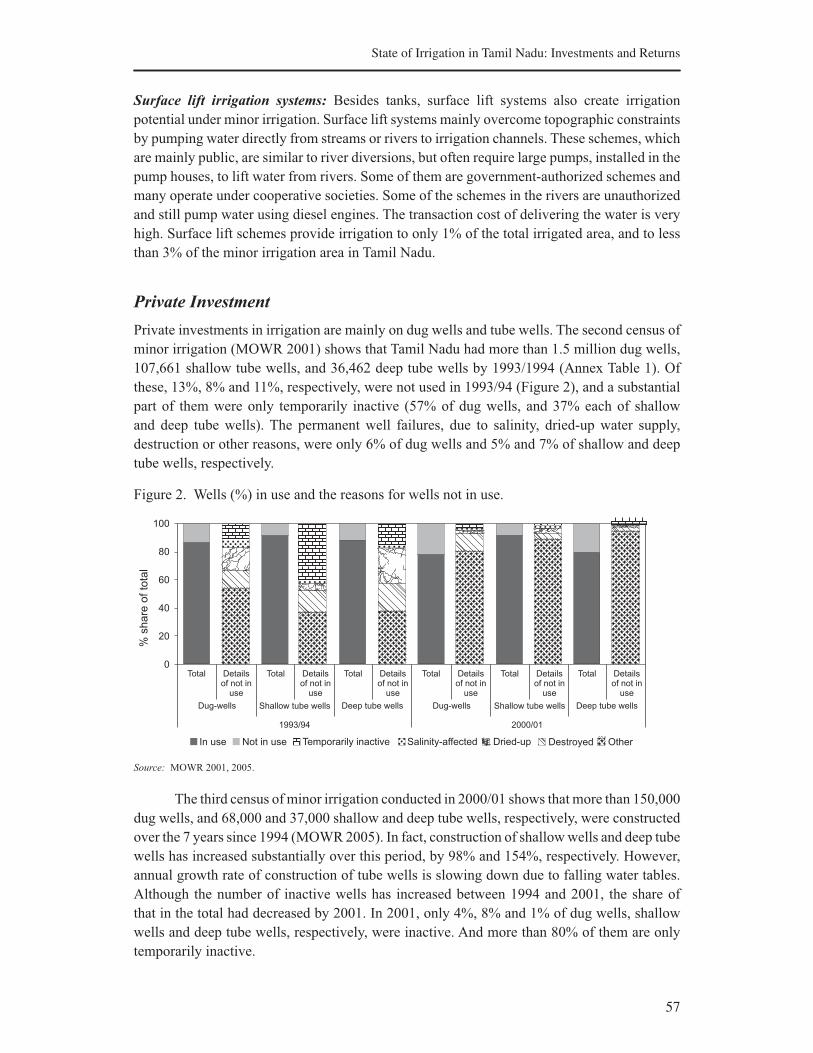
57
State of Irrigation in Tamil Nadu: Investments and Returns
Surface lift irrigation systems: Besides tanks, surface lift systems also create irrigation
potential under minor irrigation. Surface lift systems mainly overcome topographic constraints
by pumping water directly from streams or rivers to irrigation channels. These schemes, which
are mainly public, are similar to river diversions, but often require large pumps, installed in the
pump houses, to lift water from rivers. Some of them are government-authorized schemes and
many operate under cooperative societies. Some of the schemes in the rivers are unauthorized
and still pump water using diesel engines. The transaction cost of delivering the water is very
high. Surface lift schemes provide irrigation to only 1% of the total irrigated area, and to less
than 3% of the minor irrigation area in Tamil Nadu.
Private Investment
Private investments in irrigation are mainly on dug wells and tube wells. The second census of
minor irrigation (MOWR 2001) shows that Tamil Nadu had more than 1.5 million dug wells,
107,661 shallow tube wells, and 36,462 deep tube wells by 1993/1994 (Annex Table 1). Of
these, 13%, 8% and 11%, respectively, were not used in 1993/94 (Figure 2), and a substantial
part of them were only temporarily inactive (57% of dug wells, and 37% each of shallow
and deep tube wells). The permanent well failures, due to salinity, dried-up water supply,
destruction or other reasons, were only 6% of dug wells and 5% and 7% of shallow and deep
tube wells, respectively.
Figure 2. Wells (%) in use and the reasons for wells not in use.
Source: MOWR 2001, 2005.
The third census of minor irrigation conducted in 2000/01 shows that more than 150,000
dug wells, and 68,000 and 37,000 shallow and deep tube wells, respectively, were constructed
over the 7 years since 1994 (MOWR 2005). In fact, construction of shallow wells and deep tube
wells has increased substantially over this period, by 98% and 154%, respectively. However,
annual growth rate of construction of tube wells is slowing down due to falling water tables.
Although the number of inactive wells has increased between 1994 and 2001, the share of
that in the total had decreased by 2001. In 2001, only 4%, 8% and 1% of dug wells, shallow
wells and deep tube wells, respectively, were inactive. And more than 80% of them are only
temporarily inactive.

58
Upali A. Amarasinghe, K. Palanisami, O.P. Singh and R. Sakthivadivel
Due to extensive groundwater abstraction, the growth of dug-well construction has slowed
down considerably in all regions. The central and southeast coastal regions have two-thirds of
the dug wells, which had been constructed by 2000, followed by the north region with 17%
(Table 1).
The growth rate of the construction of shallow tube wells has decreased in all regions
except the north. But, the north region only accounts for a small share (less than 1%) of
shallow tube wells. More than 85% of shallow tube wells are concentrated in the southeast
coastal and deltaic regions, while the central region accounts for another 10%.
The construction of deep tube wells, however, has continued in most regions. The central
region accounts for 46% of deep tube wells, followed by deltaic, north and southeast coastal
regions with 18%, 14% and 10%, respectively. The growth rate of the construction of tube
wells has decreased in the central and deltaic regions, while there are annual fluctuations in
the growth rate in other regions.
No estimates of private investments, except the data on the number of wells, are available
in official records. We estimate private investments in groundwater development3 using
the following assumptions. The construction of each dug well, shallow tube well and deep
tube well costs4 Rs 30,000, 50,000 and 100,000 (in 2000 prices; $1.00=Rs 44.94 in 2000),
respectively. We also use the number of dug wells and tube wells per ha of net irrigated area
(Table 1) in 1993 to estimate the total number of tube wells prior to 1993. Figure 2 shows these
cost estimates along with data on the growth of net irrigated area.
Figure 2. Private investments in dug wells and tube wells.
Sources: Investments are authors’ estimates. Area is from GoTN 2007.
3Investment in electricity was a major driver of groundwater expansion in the state. By 1970, the peak
demand of the state was 1,000 Mw. The demand has increased by 10 times to about 6,290 MW by 2000.
Ideally, the part of the electricity consumption in the agriculture sector needs to be considered in the total
investments in this sector. 4Indeed, the cost of construction varies between regions and also with other parameters such as depth,
type of bore, etc. As these items of information for different regions are not available for this analysis; we
use the same average cost per well in all regions for estimating the total construction cost.
0
200
400
600
800
1,000
1,200
1,400
1970 1975 1980 1985 1990 1995 2000
Inve
stm
en
ts
(mill
ion
$ in
20
00
pri
ce
s)
0
200
400
600
800
1,000
1,200
1,400
Ne
t ir
rig
ate
d a
rea
(1,0
00
ha
)
Dug wells Tube wells Dug wells Tube wells
59
State of Irrigation in Tamil Nadu: Investments and Returns
Investments in dug wells:
§ A large part of the construction of dug wells occurred prior to 1970. The aggregate
investment in dug wells between 1970 and 2000 was about $357 million, which was
only half of the total investment in dug-well construction before 1970 and 40% of the
combined public investments (minus salaries and benefits) in major/medium and minor
irrigation schemes since 1970.
§ There has been a sharp decline in investments in dug wells in the last decade, accounting
for only $66 million between 1994 and 1996, and only $16 million in the next 4 years.
• Regionally, central and northeast coastal regions account for 35% and 31%, respectively,
of the dug wells constructed between 1970 and 200 while the north and southeastern
coastal regions accounted for 17% and 12%, respectively.
Investments in tube wells:
• Most of the constructions in tube wells started after 1970. The total investment in tube
wells between 1970 and 2000 was about $202 million, which was about ten times the
investments before 1970, and only about 11% of the public investments in major, medium
and minor irrigation schemes after 1980.
• About half the investments were on deep tube wells, and more than 60% of that were in
the 1990s.
• Although, the investments in tube wells are increasing, the rate of growth is slowing
down. This is especially true in the northeast coastal and deltaic regions, where more than
80% of groundwater resources are already utilized. Investments on tube wells in the north
region show no signs of abating, although this region, as a whole, has overexploited its
available resources.
• About 39% of shallow tube wells and 17% of deep tube wells were in the deltaic region,
although this region only accounts for 8% of the net irrigated area under tube wells in
Tamil Nadu. In fact, filter point wells account for about 69% of the wells in the deltaic
region. This indicates that many of these wells in the deltaic region provide the necessary
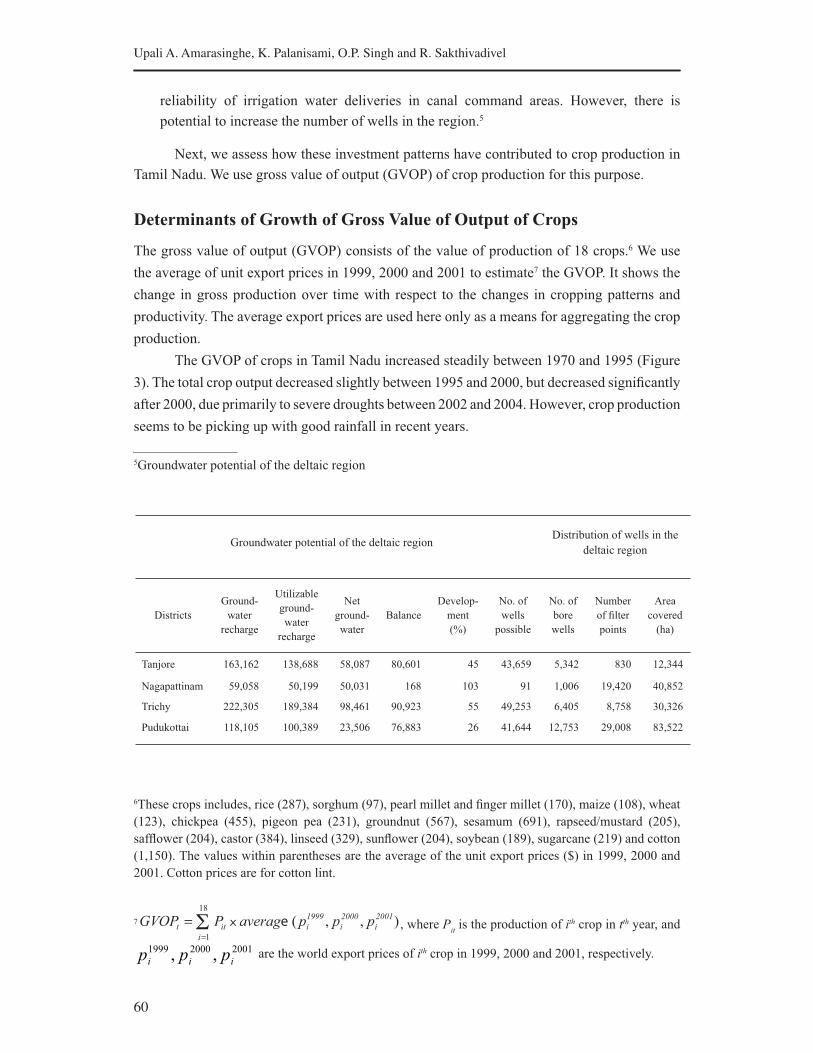
60
Upali A. Amarasinghe, K. Palanisami, O.P. Singh and R. Sakthivadivel
reliability of irrigation water deliveries in canal command areas. However, there is
potential to increase the number of wells in the region.5
Next, we assess how these investment patterns have contributed to crop production in
Tamil Nadu. We use gross value of output (GVOP) of crop production for this purpose.
Determinants of Growth of Gross Value of Output of Crops
The gross value of output (GVOP) consists of the value of production of 18 crops.6 We use
the average of unit export prices in 1999, 2000 and 2001 to estimate7 the GVOP. It shows the
change in gross production over time with respect to the changes in cropping patterns and
productivity. The average export prices are used here only as a means for aggregating the crop
production.
The GVOP of crops in Tamil Nadu increased steadily between 1970 and 1995 (Figure
3). The total crop output decreased slightly between 1995 and 2000, but decreased significantly
after 2000, due primarily to severe droughts between 2002 and 2004. However, crop production
seems to be picking up with good rainfall in recent years.
5Groundwater potential of the deltaic region
Groundwater potential of the deltaic regionDistribution of wells in the
deltaic region
Districts
Ground-
water
recharge
Utilizable
ground-
water
recharge
Net
ground-
water
Balance
Develop-
ment
(%)
No. of
wells
possible
No. of
bore
wells
Number
of filter
points
Area
covered
(ha)
Tanjore 163,162 138,688 58,087 80,601 45 43,659 5,342 830 12,344
Nagapattinam 59,058 50,199 50,031 168 103 91 1,006 19,420 40,852
Trichy 222,305 189,384 98,461 90,923 55 49,253 6,405 8,758 30,326
Pudukottai 118,105 100,389 23,506 76,883 26 41,644 12,753 29,008 83,522
6These crops includes, rice (287), sorghum (97), pearl millet and finger millet (170), maize (108), wheat
(123), chickpea (455), pigeon pea (231), groundnut (567), sesamum (691), rapseed/mustard (205),
safflower (204), castor (384), linseed (329), sunflower (204), soybean (189), sugarcane (219) and cotton
(1,150). The values within parentheses are the average of the unit export prices ($) in 1999, 2000 and
2001. Cotton prices are for cotton lint.
7
18
1
200120001999 ),,(i
iiiitt pppaverageP xGVOP , where Pit is the production of ith crop in tth year, and
200120001999 ,, iii ppp are the world export prices of ith crop in 1999, 2000 and 2001, respectively.

61
State of Irrigation in Tamil Nadu: Investments and Returns
Figure 3. Share of gross value of output (GVOP) by major crops.
Share
(%
)100
80
60
40
20
0
4,000
3,500
3,000
2,500
2,000
1,500
1,000
500
0
GO
UP
(mill
ion $
)
1970 1975 1980 1985 1990 1995 2000 2005
Rice Groundnut Sugarcane
Cotton Other crops GOUP
Source: Authors’ estimates.
Four crops, rice, sugarcane, groundnut and cotton, contribute to 95% of the crop
output. The share of rice in gross crop production has decreased from 56% to 46% from
1970 to 2005 , while that of sugarcane has increased from 9% to 23%, and that of cotton has
increased slightly from 3% to 6%. Among the other crops, maize had a major increase in crop
production, accounting for only 1% in 1971 to 26% by 2005 of the gross output of other crops.
In fact, maize production has increased by 16 times over this period to cater to the growing
feed demand for livestock, especially for poultry.
Contribution from Irrigation to Crop Output in Tamil Nadu
The contribution from irrigation to crop productivity growth in India is well recognized.
Irrigation is the key input that explains the vast differences of crop yields in neighboring
irrigated and rain-fed areas (Huzzain 2005). With its ability to control water application,
groundwater irrigation can have significantly higher crop yields than in other irrigated fields
(Dhawan 1998; Kumar et al. 2008).
We estimate the contributions of different sources of water inputs, in terms of net
irrigated and rain-fed areas, to crop output growth in Tamil Nadu between 1970 and 2000.
The contribution from irrigation is further subdivided into different sources of irrigation, such
as net irrigated area under canals, tanks, tube wells and dug wells. Along with irrigation,
application of many other agronomic inputs, which has increased over time, has contributed
to the growth of crop productivity. The information on total fertilizer use and area under high-
yielding varieties (HYVs) of rice area is available for this analysis. Cropping intensity and
crop diversification affect gross value of output. We estimate these effects in irrigated and rain-
fed areas through aggregate indices (see Amarasinghe et al. 2009 for a detailed discussion).
The use of many nonagronomic inputs, such as machines, transport, etc., also contributes to
productivity growth. Increase in road infrastructure, which acts as a trigger for increasing
many nonagronomic inputs, is available for this analysis. We estimate the contributions of
different factors to gross value of output growth using a series of recursive panel regressions.
The panels, consist of data in 10 districts over 31 years (1970-2000) and include
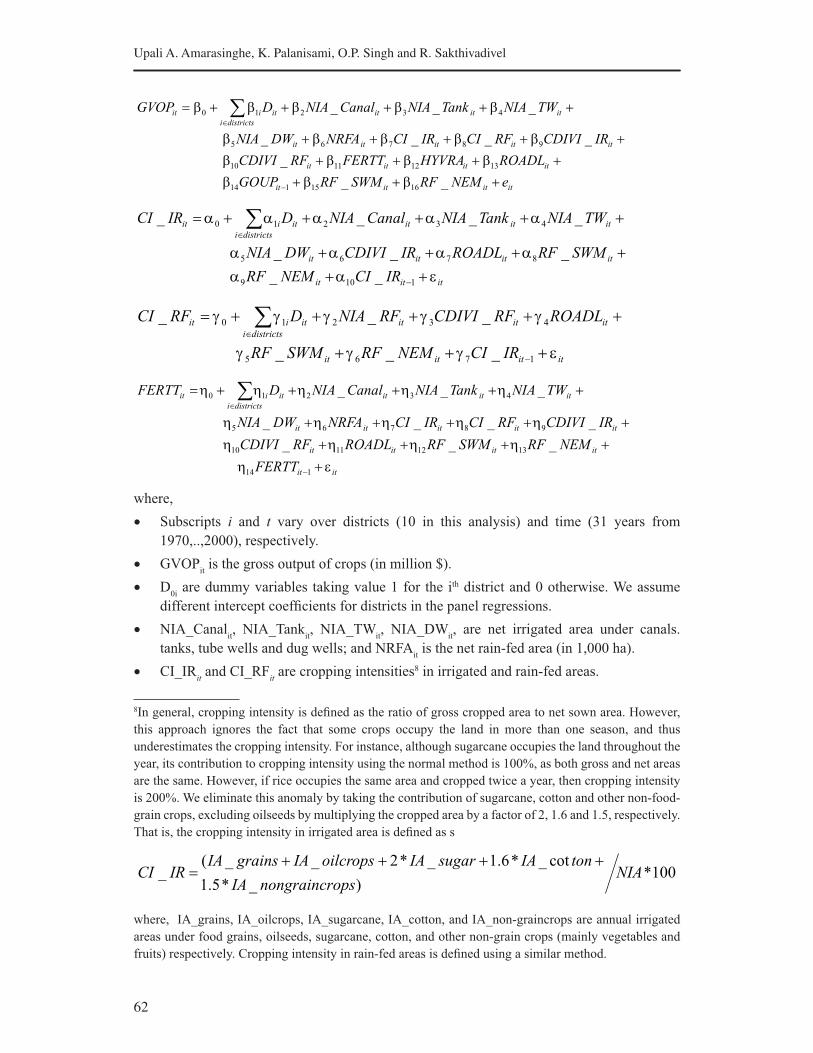
62
Upali A. Amarasinghe, K. Palanisami, O.P. Singh and R. Sakthivadivel
where,
• Subscripts i and t vary over districts (10 in this analysis) and time (31 years from
1970,..,2000), respectively.
• GVOPit is the gross output of crops (in million $).
• D0i are dummy variables taking value 1 for the ith district and 0 otherwise. We assume
different intercept coefficients for districts in the panel regressions.
• NIA_Canalit, NIA_Tank
it, NIA_TW
it, NIA_DW
it, are net irrigated area under canals.
tanks, tube wells and dug wells; and NRFAit is the net rain-fed area (in 1,000 ha).
• CI_IRit and CI_RF
it are cropping intensities8 in irrigated and rain-fed areas.
8In general, cropping intensity is defined as the ratio of gross cropped area to net sown area. However,
this approach ignores the fact that some crops occupy the land in more than one season, and thus
underestimates the cropping intensity. For instance, although sugarcane occupies the land throughout the
year, its contribution to cropping intensity using the normal method is 100%, as both gross and net areas
are the same. However, if rice occupies the same area and cropped twice a year, then cropping intensity
is 200%. We eliminate this anomaly by taking the contribution of sugarcane, cotton and other non-food-
grain crops, excluding oilseeds by multiplying the cropped area by a factor of 2, 1.6 and 1.5, respectively.
That is, the cropping intensity in irrigated area is defined as s
where, IA_grains, IA_oilcrops, IA_sugarcane, IA_cotton, and IA_non-graincrops are annual irrigated
areas under food grains, oilseeds, sugarcane, cotton, and other non-grain crops (mainly vegetables and
fruits) respectively. Cropping intensity in rain-fed areas is defined using a similar method.
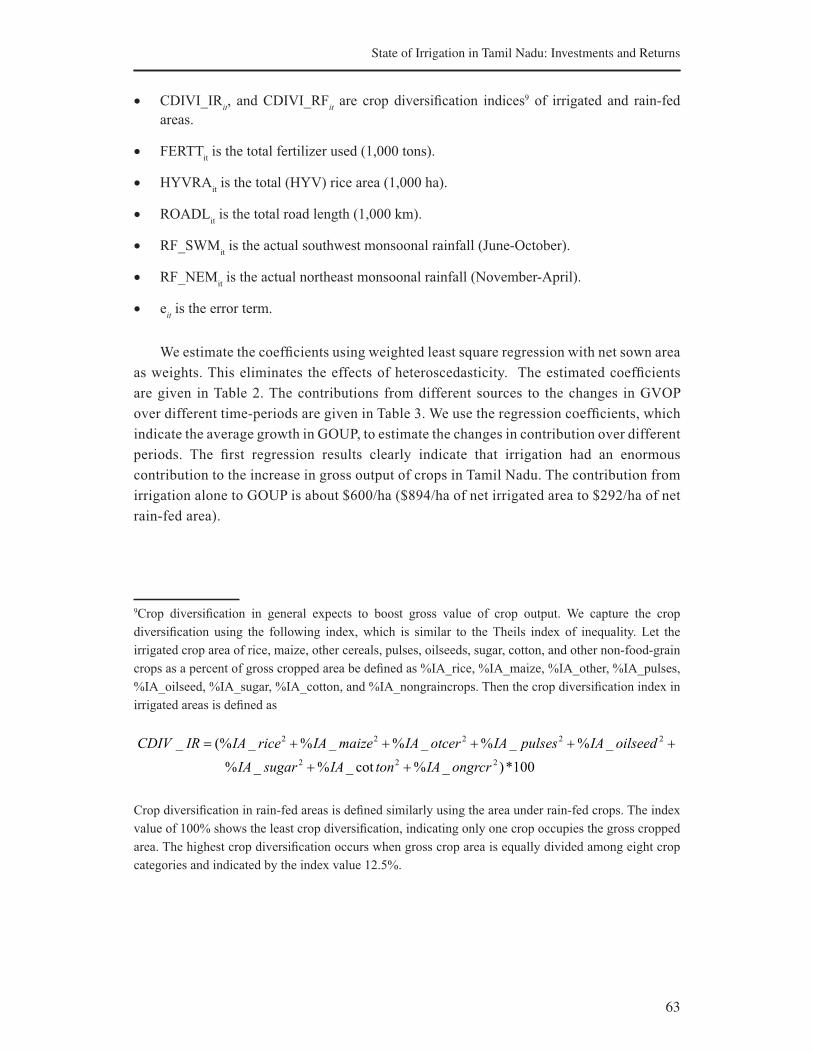
63
State of Irrigation in Tamil Nadu: Investments and Returns
• CDIVI_IRit, and CDIVI_RF
it are crop diversification indices9 of irrigated and rain-fed
areas.
• FERTTit is the total fertilizer used (1,000 tons).
• HYVRAit is the total (HYV) rice area (1,000 ha).
• ROADLit is the total road length (1,000 km).
• RF_SWMit is the actual southwest monsoonal rainfall (June-October).
• RF_NEMit is the actual northeast monsoonal rainfall (November-April).
• eit is the error term.
We estimate the coefficients using weighted least square regression with net sown area
as weights. This eliminates the effects of heteroscedasticity. The estimated coefficients
are given in Table 2. The contributions from different sources to the changes in GVOP
over different time-periods are given in Table 3. We use the regression coefficients, which
indicate the average growth in GOUP, to estimate the changes in contribution over different
periods. The first regression results clearly indicate that irrigation had an enormous
contribution to the increase in gross output of crops in Tamil Nadu. The contribution from
irrigation alone to GOUP is about $600/ha ($894/ha of net irrigated area to $292/ha of net
rain-fed area).
9Crop diversification in general expects to boost gross value of crop output. We capture the crop
diversification using the following index, which is similar to the Theils index of inequality. Let the
irrigated crop area of rice, maize, other cereals, pulses, oilseeds, sugar, cotton, and other non-food-grain
crops as a percent of gross cropped area be defined as %IA_rice, %IA_maize, %IA_other, %IA_pulses,
%IA_oilseed, %IA_sugar, %IA_cotton, and %IA_nongraincrops. Then the crop diversification index in
irrigated areas is defined as
Crop diversification in rain-fed areas is defined similarly using the area under rain-fed crops. The index
value of 100% shows the least crop diversification, indicating only one crop occupies the gross cropped
area. The highest crop diversification occurs when gross crop area is equally divided among eight crop
categories and indicated by the index value 12.5%.
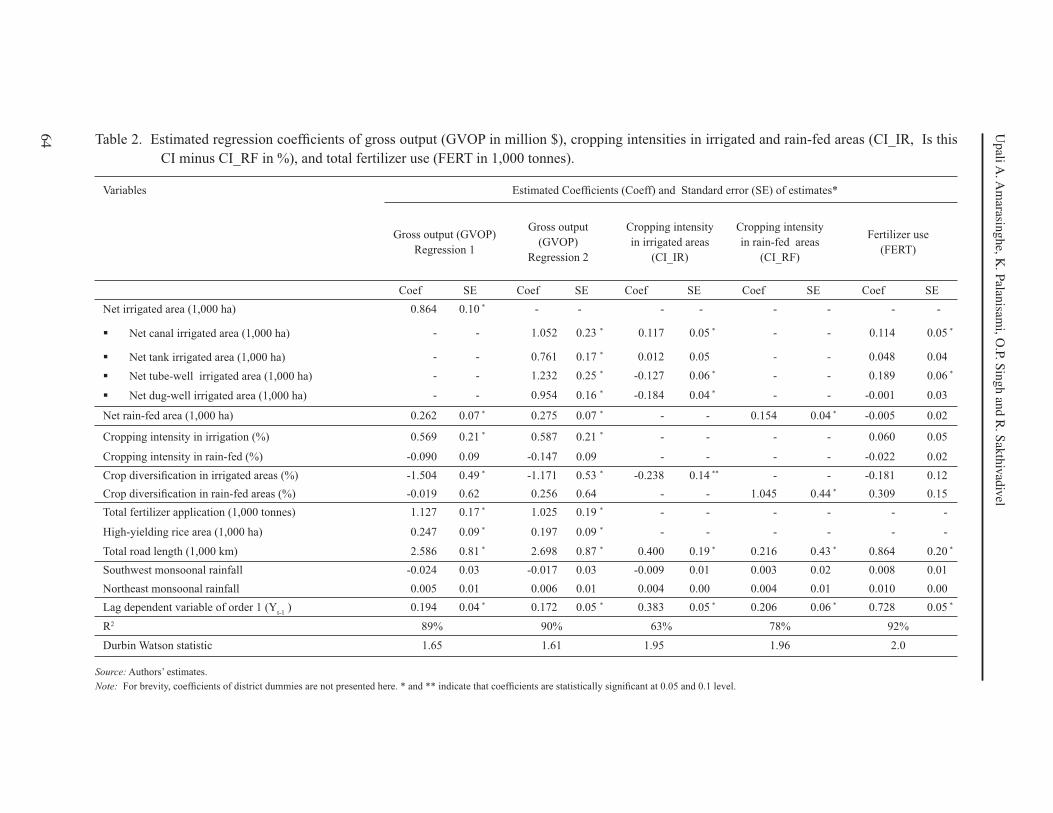
64
Upali A
. Am
arasinghe, K
. Palan
isami, O
.P. Sin
gh
and
R. S
akth
ivad
ivel
Table 2. Estimated regression coefficients of gross output (GVOP in million $), cropping intensities in irrigated and rain-fed areas (CI_IR, Is this
CI minus CI_RF in %), and total fertilizer use (FERT in 1,000 tonnes).
Variables Estimated Coefficients (Coeff) and Standard error (SE) of estimates*
Gross output (GVOP)
Regression 1
Gross output
(GVOP)
Regression 2
Cropping intensity
in irrigated areas
(CI_IR)
Cropping intensity
in rain-fed areas
(CI_RF)
Fertilizer use
(FERT)
Coef SE Coef SE Coef SE Coef SE Coef SE
Net irrigated area (1,000 ha) 0.864 0.10 * - - - - - - - -
§ Net canal irrigated area (1,000 ha) - - 1.052 0.23 * 0.117 0.05 * - - 0.114 0.05 *
§ Net tank irrigated area (1,000 ha) - - 0.761 0.17 * 0.012 0.05 - - 0.048 0.04
§ Net tube-well irrigated area (1,000 ha) - - 1.232 0.25 * -0.127 0.06 * - - 0.189 0.06 *
§ Net dug-well irrigated area (1,000 ha) - - 0.954 0.16 * -0.184 0.04 * - - -0.001 0.03
Net rain-fed area (1,000 ha) 0.262 0.07 * 0.275 0.07 * - - 0.154 0.04 * -0.005 0.02
Cropping intensity in irrigation (%) 0.569 0.21 * 0.587 0.21 * - - - - 0.060 0.05
Cropping intensity in rain-fed (%) -0.090 0.09 -0.147 0.09 - - - - -0.022 0.02
Crop diversification in irrigated areas (%) -1.504 0.49 * -1.171 0.53 * -0.238 0.14 ** - - -0.181 0.12
Crop diversification in rain-fed areas (%) -0.019 0.62 0.256 0.64 - - 1.045 0.44 * 0.309 0.15
Total fertilizer application (1,000 tonnes) 1.127 0.17 * 1.025 0.19 * - - - - - -
High-yielding rice area (1,000 ha) 0.247 0.09 * 0.197 0.09 * - - - - - -
Total road length (1,000 km) 2.586 0.81 * 2.698 0.87 * 0.400 0.19 * 0.216 0.43 * 0.864 0.20 *
Southwest monsoonal rainfall -0.024 0.03 -0.017 0.03 -0.009 0.01 0.003 0.02 0.008 0.01
Northeast monsoonal rainfall 0.005 0.01 0.006 0.01 0.004 0.00 0.004 0.01 0.010 0.00
Lag dependent variable of order 1 (Yt-1
) 0.194 0.04 * 0.172 0.05 * 0.383 0.05 * 0.206 0.06 * 0.728 0.05 *
R2 89% 90% 63% 78% 92%
Durbin Watson statistic 1.65 1.61 1.95 1.96 2.0
Source: Authors’ estimates.
Note: For brevity, coefficients of district dummies are not presented here. * and ** indicate that coefficients are statistically significant at 0.05 and 0.1 level.
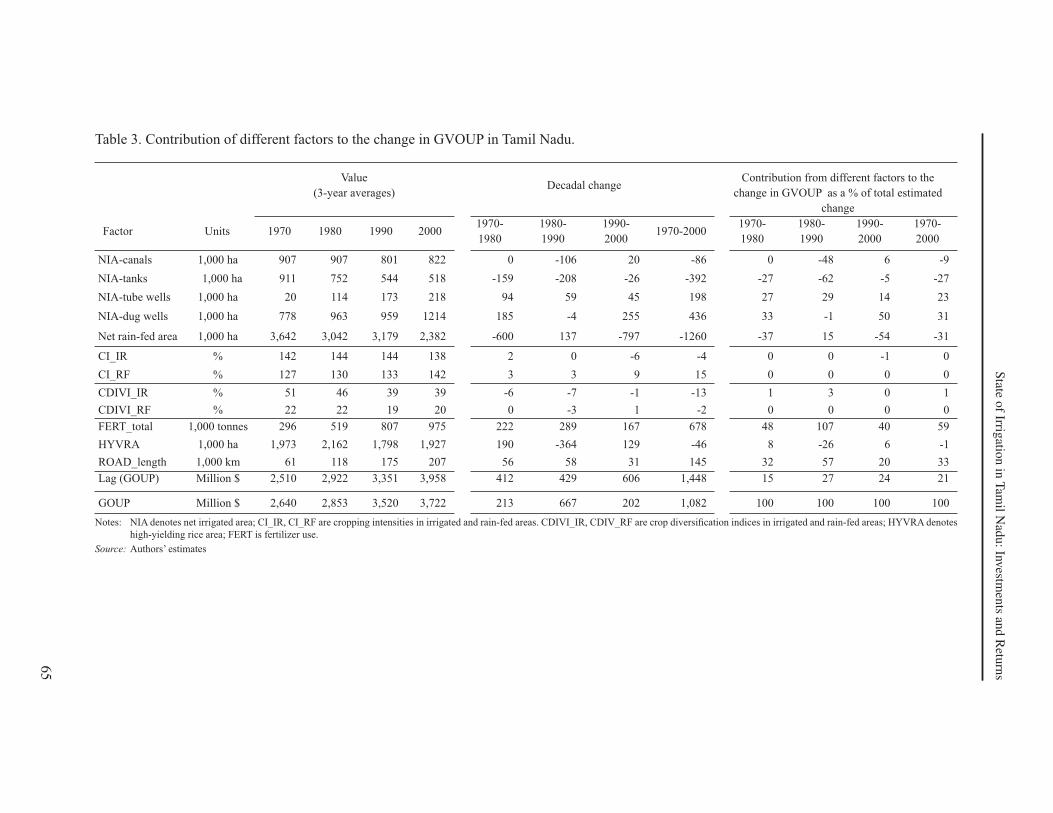
65
State o
f Irrigatio
n in
Tam
il Nad
u: In
vestm
ents an
d R
eturn
s
Table 3. Contribution of different factors to the change in GVOUP in Tamil Nadu.
Value
(3-year averages)Decadal change
Contribution from different factors to the
change in GVOUP as a % of total estimated
change
Factor Units 1970 1980 1990 20001970-
1980
1980-
1990
1990-
20001970-2000
1970-
1980
1980-
1990
1990-
2000
1970-
2000
NIA-canals 1,000 ha 907 907 801 822 0 -106 20 -86 0 -48 6 -9
NIA-tanks 1,000 ha 911 752 544 518 -159 -208 -26 -392 -27 -62 -5 -27
NIA-tube wells 1,000 ha 20 114 173 218 94 59 45 198 27 29 14 23
NIA-dug wells 1,000 ha 778 963 959 1214 185 -4 255 436 33 -1 50 31
Net rain-fed area 1,000 ha 3,642 3,042 3,179 2,382 -600 137 -797 -1260 -37 15 -54 -31
CI_IR % 142 144 144 138 2 0 -6 -4 0 0 -1 0
CI_RF % 127 130 133 142 3 3 9 15 0 0 0 0
CDIVI_IR % 51 46 39 39 -6 -7 -1 -13 1 3 0 1
CDIVI_RF % 22 22 19 20 0 -3 1 -2 0 0 0 0
FERT_total 1,000 tonnes 296 519 807 975 222 289 167 678 48 107 40 59
HYVRA 1,000 ha 1,973 2,162 1,798 1,927 190 -364 129 -46 8 -26 6 -1
ROAD_length 1,000 km 61 118 175 207 56 58 31 145 32 57 20 33
Lag (GOUP) Million $ 2,510 2,922 3,351 3,958 412 429 606 1,448 15 27 24 21
GOUP Million $ 2,640 2,853 3,520 3,722 213 667 202 1,082 100 100 100 100
Notes: NIA denotes net irrigated area; CI_IR, CI_RF are cropping intensities in irrigated and rain-fed areas. CDIVI_IR, CDIV_RF are crop diversification indices in irrigated and rain-fed areas; HYVRA denotes
high-yielding rice area; FERT is fertilizer use.
Source: Authors’ estimates
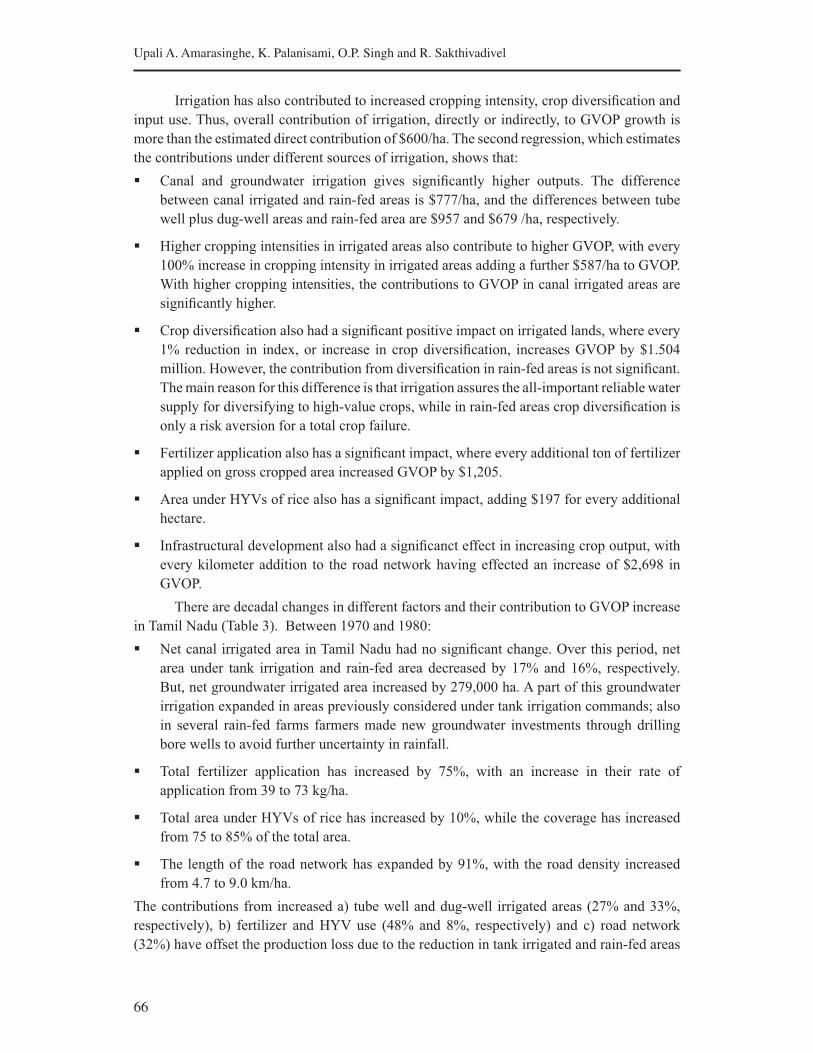
66
Upali A. Amarasinghe, K. Palanisami, O.P. Singh and R. Sakthivadivel
Irrigation has also contributed to increased cropping intensity, crop diversification and
input use. Thus, overall contribution of irrigation, directly or indirectly, to GVOP growth is
more than the estimated direct contribution of $600/ha. The second regression, which estimates
the contributions under different sources of irrigation, shows that:
§ Canal and groundwater irrigation gives significantly higher outputs. The difference
between canal irrigated and rain-fed areas is $777/ha, and the differences between tube
well plus dug-well areas and rain-fed area are $957 and $679 /ha, respectively.
§ Higher cropping intensities in irrigated areas also contribute to higher GVOP, with every
100% increase in cropping intensity in irrigated areas adding a further $587/ha to GVOP.
With higher cropping intensities, the contributions to GVOP in canal irrigated areas are
significantly higher.
§ Crop diversification also had a significant positive impact on irrigated lands, where every
1% reduction in index, or increase in crop diversification, increases GVOP by $1.504
million. However, the contribution from diversification in rain-fed areas is not significant.
The main reason for this difference is that irrigation assures the all-important reliable water
supply for diversifying to high-value crops, while in rain-fed areas crop diversification is
only a risk aversion for a total crop failure.
§ Fertilizer application also has a significant impact, where every additional ton of fertilizer
applied on gross cropped area increased GVOP by $1,205.
§ Area under HYVs of rice also has a significant impact, adding $197 for every additional
hectare.
§ Infrastructural development also had a significanct effect in increasing crop output, with
every kilometer addition to the road network having effected an increase of $2,698 in
GVOP.
There are decadal changes in different factors and their contribution to GVOP increase
in Tamil Nadu (Table 3). Between 1970 and 1980:
§ Net canal irrigated area in Tamil Nadu had no significant change. Over this period, net
area under tank irrigation and rain-fed area decreased by 17% and 16%, respectively.
But, net groundwater irrigated area increased by 279,000 ha. A part of this groundwater
irrigation expanded in areas previously considered under tank irrigation commands; also
in several rain-fed farms farmers made new groundwater investments through drilling
bore wells to avoid further uncertainty in rainfall.
§ Total fertilizer application has increased by 75%, with an increase in their rate of
application from 39 to 73 kg/ha.
§ Total area under HYVs of rice has increased by 10%, while the coverage has increased
from 75 to 85% of the total area.
§ The length of the road network has expanded by 91%, with the road density increased
from 4.7 to 9.0 km/ha.
The contributions from increased a) tube well and dug-well irrigated areas (27% and 33%,
respectively), b) fertilizer and HYV use (48% and 8%, respectively) and c) road network
(32%) have offset the production loss due to the reduction in tank irrigated and rain-fed areas
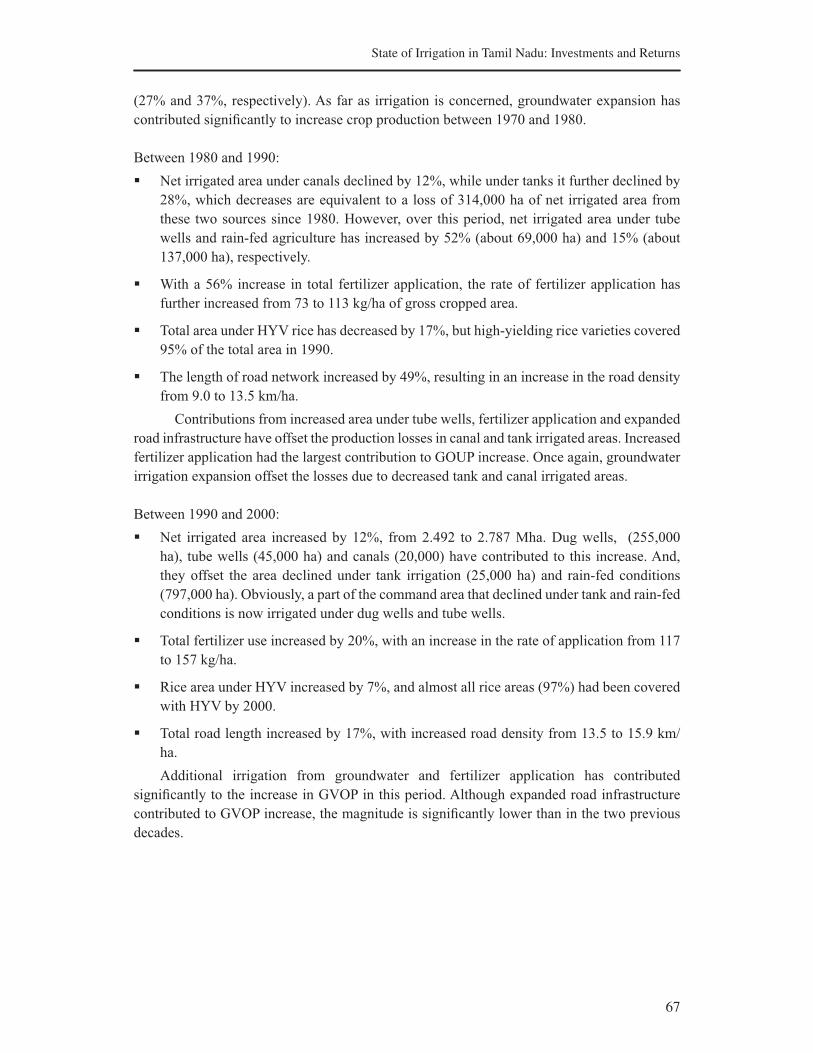
67
State of Irrigation in Tamil Nadu: Investments and Returns
(27% and 37%, respectively). As far as irrigation is concerned, groundwater expansion has
contributed significantly to increase crop production between 1970 and 1980.
Between 1980 and 1990:
§ Net irrigated area under canals declined by 12%, while under tanks it further declined by
28%, which decreases are equivalent to a loss of 314,000 ha of net irrigated area from
these two sources since 1980. However, over this period, net irrigated area under tube
wells and rain-fed agriculture has increased by 52% (about 69,000 ha) and 15% (about
137,000 ha), respectively.
§ With a 56% increase in total fertilizer application, the rate of fertilizer application has
further increased from 73 to 113 kg/ha of gross cropped area.
§ Total area under HYV rice has decreased by 17%, but high-yielding rice varieties covered
95% of the total area in 1990.
§ The length of road network increased by 49%, resulting in an increase in the road density
from 9.0 to 13.5 km/ha.
Contributions from increased area under tube wells, fertilizer application and expanded
road infrastructure have offset the production losses in canal and tank irrigated areas. Increased
fertilizer application had the largest contribution to GOUP increase. Once again, groundwater
irrigation expansion offset the losses due to decreased tank and canal irrigated areas.
Between 1990 and 2000:
§ Net irrigated area increased by 12%, from 2.492 to 2.787 Mha. Dug wells, (255,000
ha), tube wells (45,000 ha) and canals (20,000) have contributed to this increase. And,
they offset the area declined under tank irrigation (25,000 ha) and rain-fed conditions
(797,000 ha). Obviously, a part of the command area that declined under tank and rain-fed
conditions is now irrigated under dug wells and tube wells.
§ Total fertilizer use increased by 20%, with an increase in the rate of application from 117
to 157 kg/ha.
§ Rice area under HYV increased by 7%, and almost all rice areas (97%) had been covered
with HYV by 2000.
§ Total road length increased by 17%, with increased road density from 13.5 to 15.9 km/
ha.
Additional irrigation from groundwater and fertilizer application has contributed
significantly to the increase in GVOP in this period. Although expanded road infrastructure
contributed to GVOP increase, the magnitude is significantly lower than in the two previous
decades.
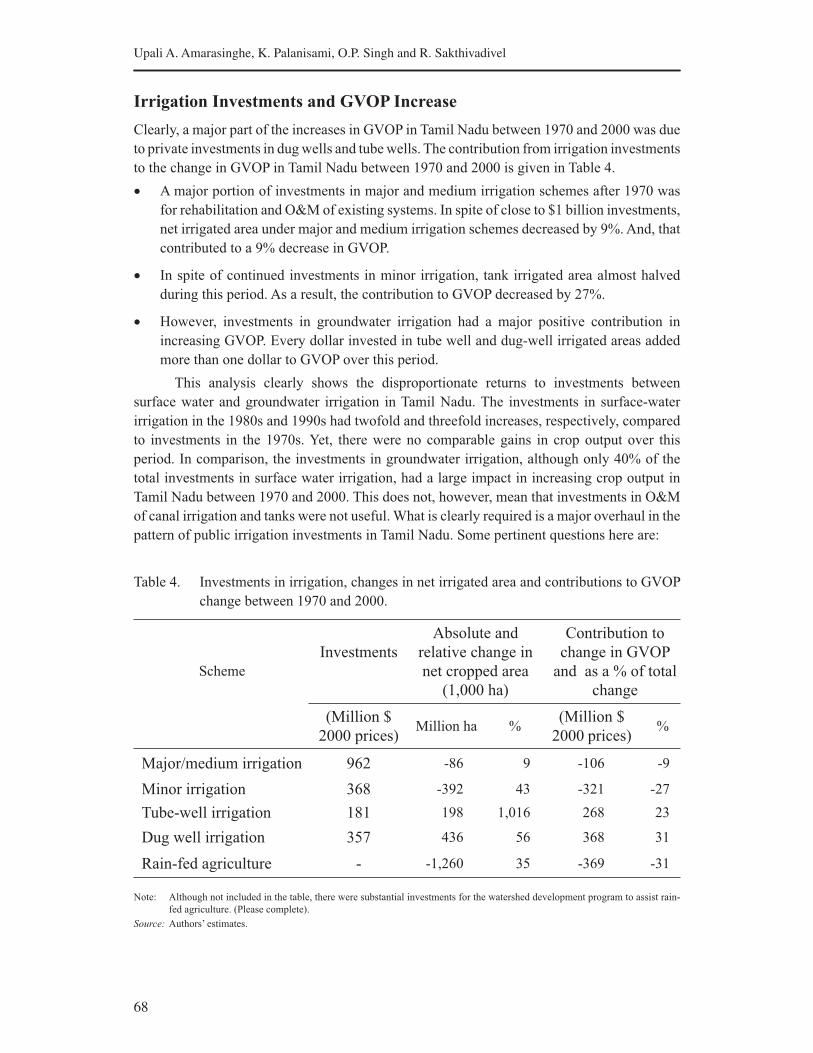
68
Upali A. Amarasinghe, K. Palanisami, O.P. Singh and R. Sakthivadivel
Irrigation Investments and GVOP Increase
Clearly, a major part of the increases in GVOP in Tamil Nadu between 1970 and 2000 was due
to private investments in dug wells and tube wells. The contribution from irrigation investments
to the change in GVOP in Tamil Nadu between 1970 and 2000 is given in Table 4.
• A major portion of investments in major and medium irrigation schemes after 1970 was
for rehabilitation and O&M of existing systems. In spite of close to $1 billion investments,
net irrigated area under major and medium irrigation schemes decreased by 9%. And, that
contributed to a 9% decrease in GVOP.
• In spite of continued investments in minor irrigation, tank irrigated area almost halved
during this period. As a result, the contribution to GVOP decreased by 27%.
• However, investments in groundwater irrigation had a major positive contribution in
increasing GVOP. Every dollar invested in tube well and dug-well irrigated areas added
more than one dollar to GVOP over this period.
This analysis clearly shows the disproportionate returns to investments between
surface water and groundwater irrigation in Tamil Nadu. The investments in surface-water
irrigation in the 1980s and 1990s had twofold and threefold increases, respectively, compared
to investments in the 1970s. Yet, there were no comparable gains in crop output over this
period. In comparison, the investments in groundwater irrigation, although only 40% of the
total investments in surface water irrigation, had a large impact in increasing crop output in
Tamil Nadu between 1970 and 2000. This does not, however, mean that investments in O&M
of canal irrigation and tanks were not useful. What is clearly required is a major overhaul in the
pattern of public irrigation investments in Tamil Nadu. Some pertinent questions here are:
Table 4. Investments in irrigation, changes in net irrigated area and contributions to GVOP
change between 1970 and 2000.
Scheme
Investments
Absolute and
relative change in
net cropped area
(1,000 ha)
Contribution to
change in GVOP
and as a % of total
change
(Million $
2000 prices)Million ha %
(Million $
2000 prices)%
Major/medium irrigation 962 -86 9 -106 -9
Minor irrigation 368 -392 43 -321 -27
Tube-well irrigation 181 198 1,016 268 23
Dug well irrigation 357 436 56 368 31
Rain-fed agriculture - -1,260 35 -369 -31
Note: Although not included in the table, there were substantial investments for the watershed development program to assist rain-
fed agriculture. (Please complete).
Source: Authors’ estimates.
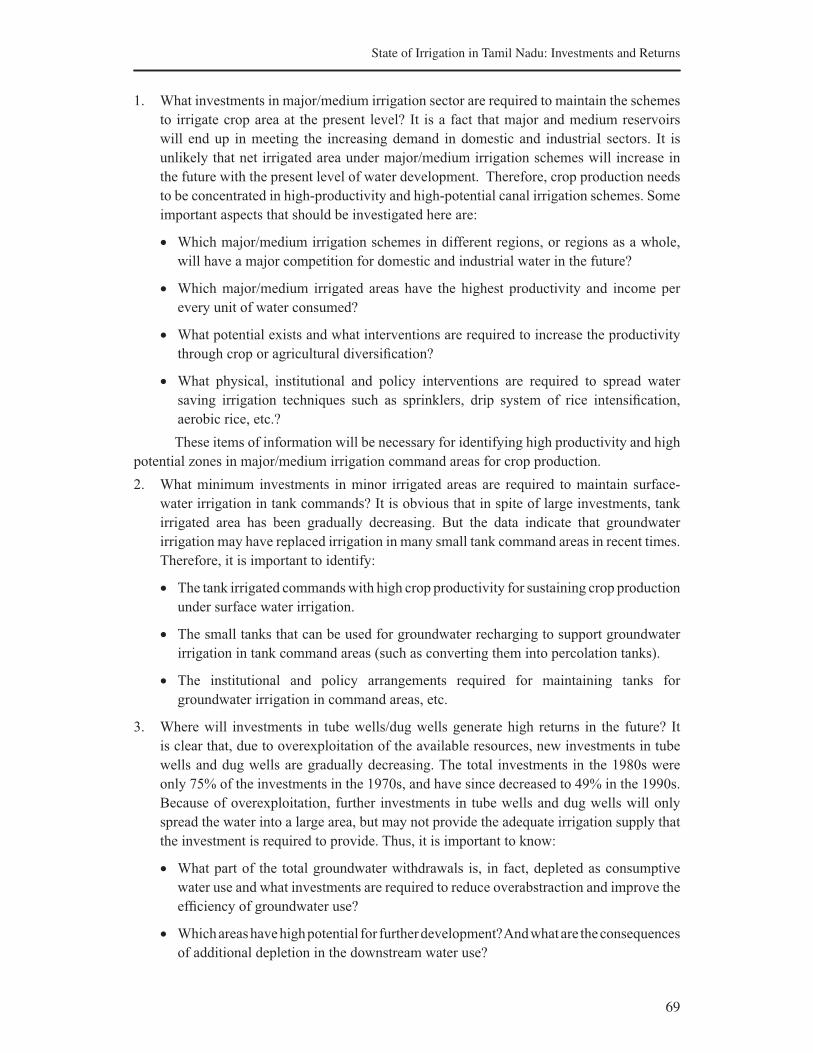
69
State of Irrigation in Tamil Nadu: Investments and Returns
1. What investments in major/medium irrigation sector are required to maintain the schemes
to irrigate crop area at the present level? It is a fact that major and medium reservoirs
will end up in meeting the increasing demand in domestic and industrial sectors. It is
unlikely that net irrigated area under major/medium irrigation schemes will increase in
the future with the present level of water development. Therefore, crop production needs
to be concentrated in high-productivity and high-potential canal irrigation schemes. Some
important aspects that should be investigated here are:
• Which major/medium irrigation schemes in different regions, or regions as a whole,
will have a major competition for domestic and industrial water in the future?
• Which major/medium irrigated areas have the highest productivity and income per
every unit of water consumed?
• What potential exists and what interventions are required to increase the productivity
through crop or agricultural diversification?
• What physical, institutional and policy interventions are required to spread water
saving irrigation techniques such as sprinklers, drip system of rice intensification,
aerobic rice, etc.?
These items of information will be necessary for identifying high productivity and high
potential zones in major/medium irrigation command areas for crop production.
2. What minimum investments in minor irrigated areas are required to maintain surface-
water irrigation in tank commands? It is obvious that in spite of large investments, tank
irrigated area has been gradually decreasing. But the data indicate that groundwater
irrigation may have replaced irrigation in many small tank command areas in recent times.
Therefore, it is important to identify:
• The tank irrigated commands with high crop productivity for sustaining crop production
under surface water irrigation.
• The small tanks that can be used for groundwater recharging to support groundwater
irrigation in tank command areas (such as converting them into percolation tanks).
• The institutional and policy arrangements required for maintaining tanks for
groundwater irrigation in command areas, etc.
3. Where will investments in tube wells/dug wells generate high returns in the future? It
is clear that, due to overexploitation of the available resources, new investments in tube
wells and dug wells are gradually decreasing. The total investments in the 1980s were
only 75% of the investments in the 1970s, and have since decreased to 49% in the 1990s.
Because of overexploitation, further investments in tube wells and dug wells will only
spread the water into a large area, but may not provide the adequate irrigation supply that
the investment is required to provide. Thus, it is important to know:
• What part of the total groundwater withdrawals is, in fact, depleted as consumptive
water use and what investments are required to reduce overabstraction and improve the
efficiency of groundwater use?
• Which areas have high potential for further development? And what are the consequences
of additional depletion in the downstream water use?
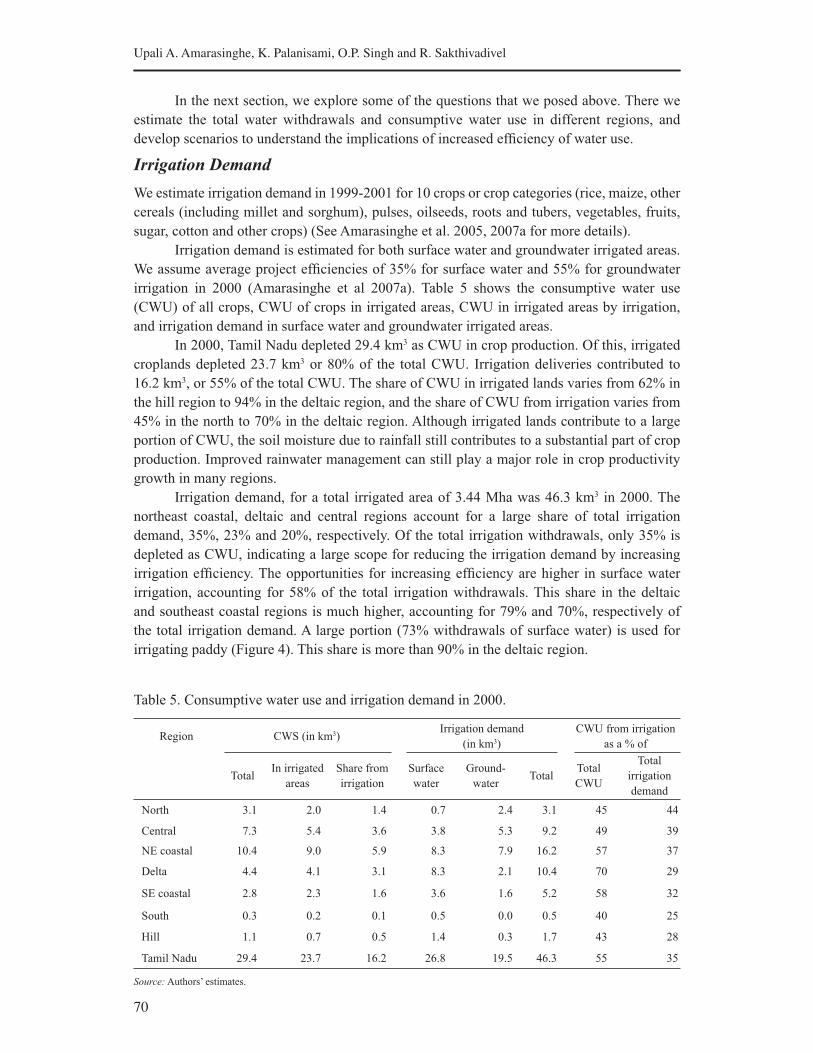
70
Upali A. Amarasinghe, K. Palanisami, O.P. Singh and R. Sakthivadivel
In the next section, we explore some of the questions that we posed above. There we
estimate the total water withdrawals and consumptive water use in different regions, and
develop scenarios to understand the implications of increased efficiency of water use.
Irrigation Demand
We estimate irrigation demand in 1999-2001 for 10 crops or crop categories (rice, maize, other
cereals (including millet and sorghum), pulses, oilseeds, roots and tubers, vegetables, fruits,
sugar, cotton and other crops) (See Amarasinghe et al. 2005, 2007a for more details).
Irrigation demand is estimated for both surface water and groundwater irrigated areas.
We assume average project efficiencies of 35% for surface water and 55% for groundwater
irrigation in 2000 (Amarasinghe et al 2007a). Table 5 shows the consumptive water use
(CWU) of all crops, CWU of crops in irrigated areas, CWU in irrigated areas by irrigation,
and irrigation demand in surface water and groundwater irrigated areas.
In 2000, Tamil Nadu depleted 29.4 km3 as CWU in crop production. Of this, irrigated
croplands depleted 23.7 km3 or 80% of the total CWU. Irrigation deliveries contributed to
16.2 km3, or 55% of the total CWU. The share of CWU in irrigated lands varies from 62% in
the hill region to 94% in the deltaic region, and the share of CWU from irrigation varies from
45% in the north to 70% in the deltaic region. Although irrigated lands contribute to a large
portion of CWU, the soil moisture due to rainfall still contributes to a substantial part of crop
production. Improved rainwater management can still play a major role in crop productivity
growth in many regions.
Irrigation demand, for a total irrigated area of 3.44 Mha was 46.3 km3 in 2000. The
northeast coastal, deltaic and central regions account for a large share of total irrigation
demand, 35%, 23% and 20%, respectively. Of the total irrigation withdrawals, only 35% is
depleted as CWU, indicating a large scope for reducing the irrigation demand by increasing
irrigation efficiency. The opportunities for increasing efficiency are higher in surface water
irrigation, accounting for 58% of the total irrigation withdrawals. This share in the deltaic
and southeast coastal regions is much higher, accounting for 79% and 70%, respectively of
the total irrigation demand. A large portion (73% withdrawals of surface water) is used for
irrigating paddy (Figure 4). This share is more than 90% in the deltaic region.
Table 5. Consumptive water use and irrigation demand in 2000.
Region CWS (in km3)Irrigation demand
(in km3)
CWU from irrigation
as a % of
TotalIn irrigated
areas
Share from
irrigation
Surface
water
Ground-
waterTotal
Total
CWU
Total
irrigation
demand
North 3.1 2.0 1.4 0.7 2.4 3.1 45 44
Central 7.3 5.4 3.6 3.8 5.3 9.2 49 39
NE coastal 10.4 9.0 5.9 8.3 7.9 16.2 57 37
Delta 4.4 4.1 3.1 8.3 2.1 10.4 70 29
SE coastal 2.8 2.3 1.6 3.6 1.6 5.2 58 32
South 0.3 0.2 0.1 0.5 0.0 0.5 40 25
Hill 1.1 0.7 0.5 1.4 0.3 1.7 43 28
Tamil Nadu 29.4 23.7 16.2 26.8 19.5 46.3 55 35
Source: Authors’ estimates.
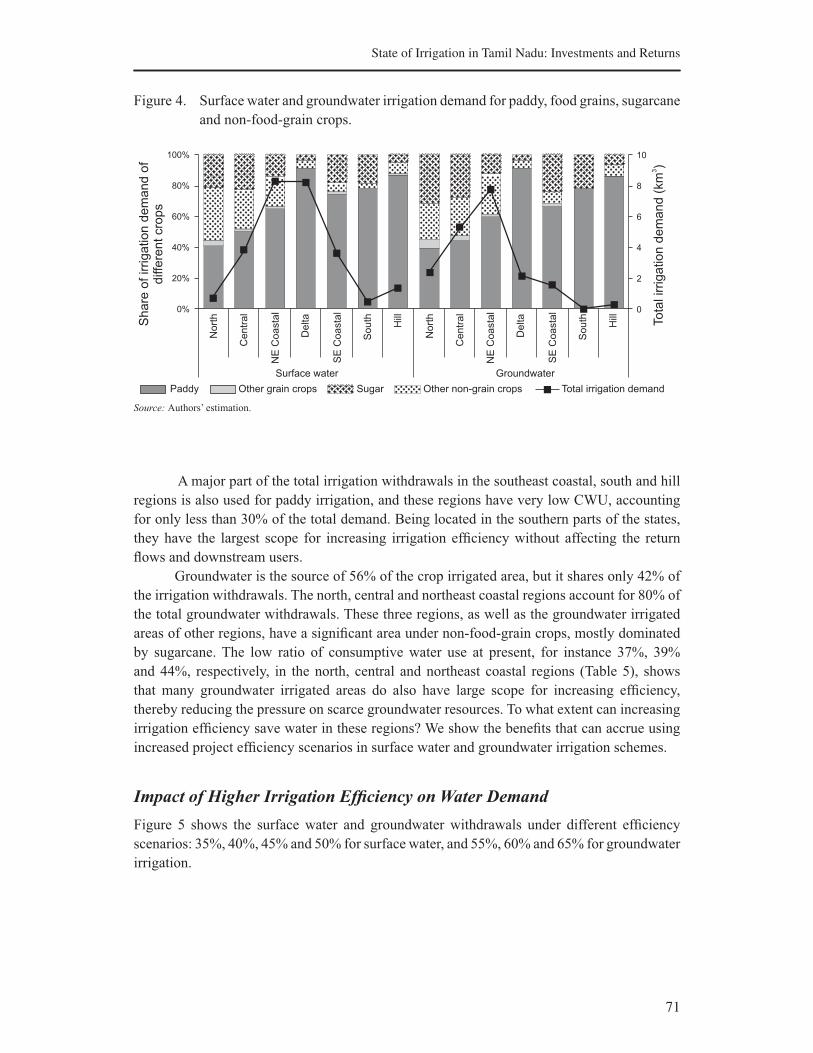
71
State of Irrigation in Tamil Nadu: Investments and Returns
Figure 4. Surface water and groundwater irrigation demand for paddy, food grains, sugarcane
and non-food-grain crops.
Source: Authors’ estimation.
A major part of the total irrigation withdrawals in the southeast coastal, south and hill
regions is also used for paddy irrigation, and these regions have very low CWU, accounting
for only less than 30% of the total demand. Being located in the southern parts of the states,
they have the largest scope for increasing irrigation efficiency without affecting the return
flows and downstream users.
Groundwater is the source of 56% of the crop irrigated area, but it shares only 42% of
the irrigation withdrawals. The north, central and northeast coastal regions account for 80% of
the total groundwater withdrawals. These three regions, as well as the groundwater irrigated
areas of other regions, have a significant area under non-food-grain crops, mostly dominated
by sugarcane. The low ratio of consumptive water use at present, for instance 37%, 39%
and 44%, respectively, in the north, central and northeast coastal regions (Table 5), shows
that many groundwater irrigated areas do also have large scope for increasing efficiency,
thereby reducing the pressure on scarce groundwater resources. To what extent can increasing
irrigation efficiency save water in these regions? We show the benefits that can accrue using
increased project efficiency scenarios in surface water and groundwater irrigation schemes.
Impact of Higher Irrigation Efficiency on Water Demand
Figure 5 shows the surface water and groundwater withdrawals under different efficiency
scenarios: 35%, 40%, 45% and 50% for surface water, and 55%, 60% and 65% for groundwater
irrigation.
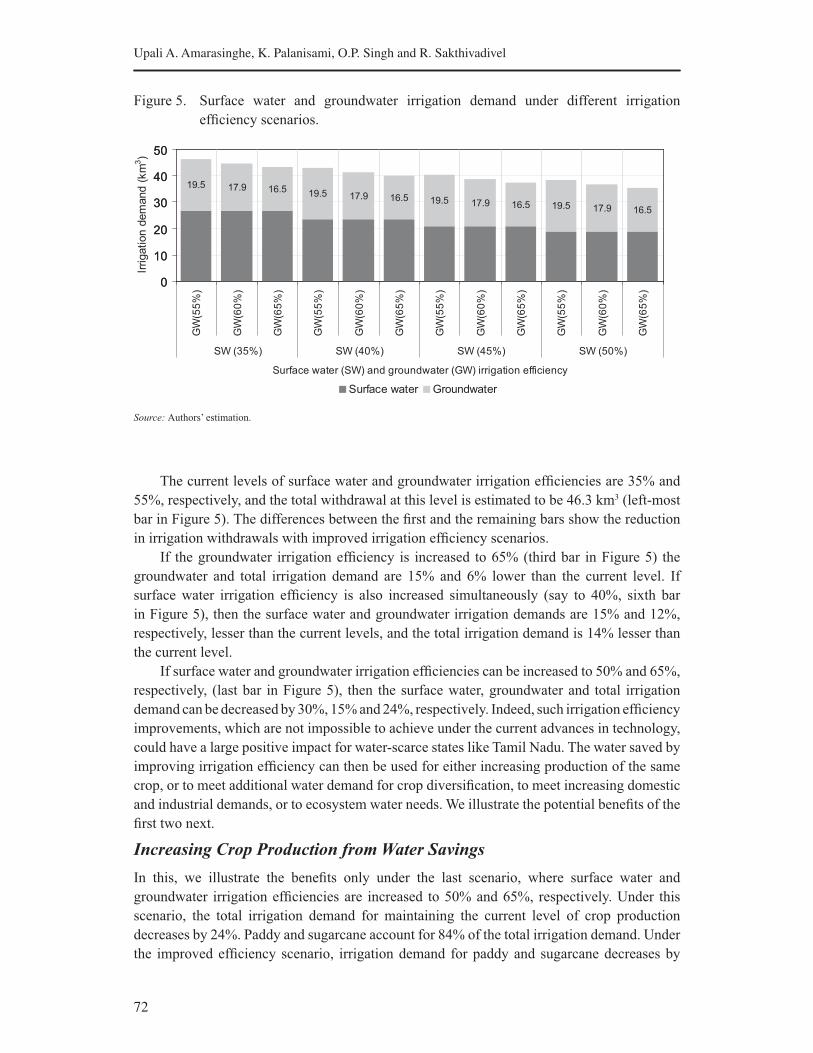
72
Upali A. Amarasinghe, K. Palanisami, O.P. Singh and R. Sakthivadivel
Figure 5. Surface water and groundwater irrigation demand under different irrigation
efficiency scenarios.
Source: Authors’ estimation.
The current levels of surface water and groundwater irrigation efficiencies are 35% and
55%, respectively, and the total withdrawal at this level is estimated to be 46.3 km3 (left-most
bar in Figure 5). The differences between the first and the remaining bars show the reduction
in irrigation withdrawals with improved irrigation efficiency scenarios.
If the groundwater irrigation efficiency is increased to 65% (third bar in Figure 5) the
groundwater and total irrigation demand are 15% and 6% lower than the current level. If
surface water irrigation efficiency is also increased simultaneously (say to 40%, sixth bar
in Figure 5), then the surface water and groundwater irrigation demands are 15% and 12%,
respectively, lesser than the current levels, and the total irrigation demand is 14% lesser than
the current level.
If surface water and groundwater irrigation efficiencies can be increased to 50% and 65%,
respectively, (last bar in Figure 5), then the surface water, groundwater and total irrigation
demand can be decreased by 30%, 15% and 24%, respectively. Indeed, such irrigation efficiency
improvements, which are not impossible to achieve under the current advances in technology,
could have a large positive impact for water-scarce states like Tamil Nadu. The water saved by
improving irrigation efficiency can then be used for either increasing production of the same
crop, or to meet additional water demand for crop diversification, to meet increasing domestic
and industrial demands, or to ecosystem water needs. We illustrate the potential benefits of the
first two next.
Increasing Crop Production from Water Savings
In this, we illustrate the benefits only under the last scenario, where surface water and
groundwater irrigation efficiencies are increased to 50% and 65%, respectively. Under this
scenario, the total irrigation demand for maintaining the current level of crop production
decreases by 24%. Paddy and sugarcane account for 84% of the total irrigation demand. Under
the improved efficiency scenario, irrigation demand for paddy and sugarcane decreases by
26.8 26.8 26.8 23.4 23.4 23.4 20.8 20.8 20.8 18.7 18.7 18.7
0
10
20
30
40
50
Surface water (SW) and groundwater (GW) irrigation efficiency
Irrigation d
em
and (
km
3)
Surface water Groundwater
19.5 17.9 16.5 19.5 17.9 16.5 19.5 17.9 16.5 19.5 17.9 16.5
0
10
20
30
40
50
GW
(55
%)
GW
(60
%)
GW
(65
%)
GW
(55
%)
GW
(60
%)
GW
(65
%)
GW
(55
%)
GW
(60
%)
GW
(65
%)
GW
(55
%)
GW
(60
%)
GW
(65
%)
SW (35%) SW (40%) SW (45%) SW (50%)
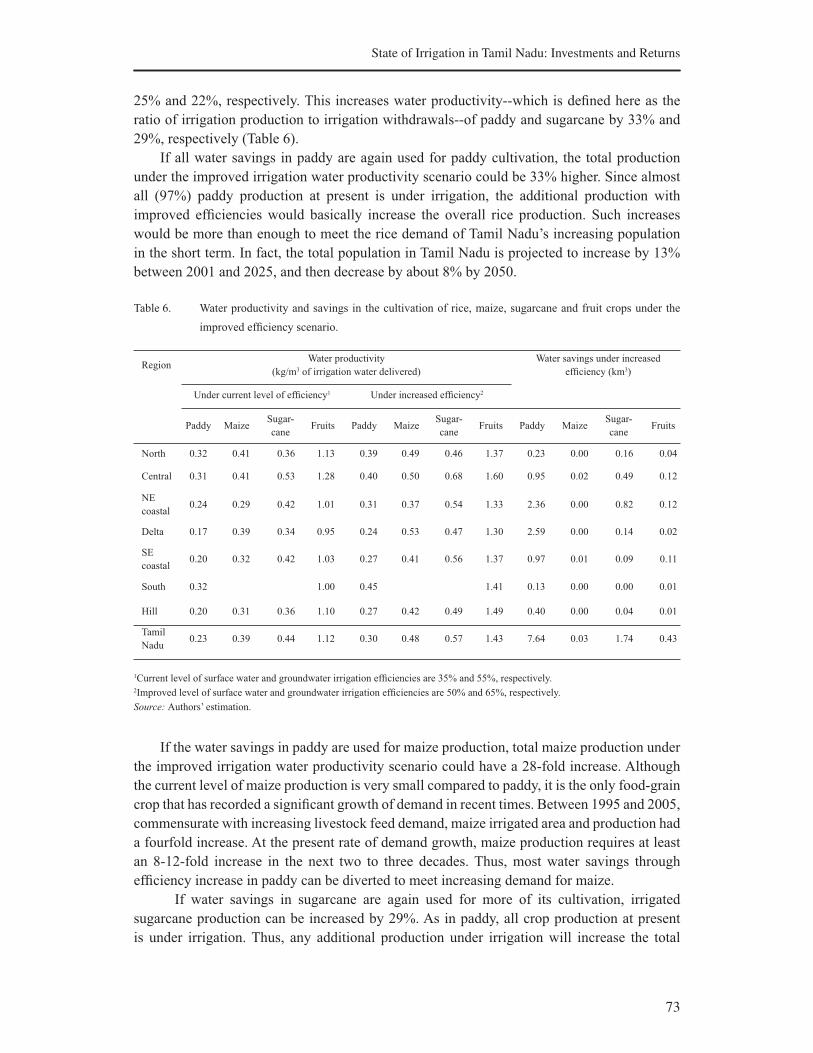
73
State of Irrigation in Tamil Nadu: Investments and Returns
25% and 22%, respectively. This increases water productivity--which is defined here as the
ratio of irrigation production to irrigation withdrawals--of paddy and sugarcane by 33% and
29%, respectively (Table 6).
If all water savings in paddy are again used for paddy cultivation, the total production
under the improved irrigation water productivity scenario could be 33% higher. Since almost
all (97%) paddy production at present is under irrigation, the additional production with
improved efficiencies would basically increase the overall rice production. Such increases
would be more than enough to meet the rice demand of Tamil Nadu’s increasing population
in the short term. In fact, the total population in Tamil Nadu is projected to increase by 13%
between 2001 and 2025, and then decrease by about 8% by 2050.
Table 6. Water productivity and savings in the cultivation of rice, maize, sugarcane and fruit crops under the
improved efficiency scenario.
RegionWater productivity
(kg/m3 of irrigation water delivered)
Water savings under increased
efficiency (km3)
Under current level of efficiency1 Under increased efficiency2
Paddy MaizeSugar-
caneFruits Paddy Maize
Sugar-
caneFruits Paddy Maize
Sugar-
caneFruits
North 0.32 0.41 0.36 1.13 0.39 0.49 0.46 1.37 0.23 0.00 0.16 0.04
Central 0.31 0.41 0.53 1.28 0.40 0.50 0.68 1.60 0.95 0.02 0.49 0.12
NE
coastal0.24 0.29 0.42 1.01 0.31 0.37 0.54 1.33 2.36 0.00 0.82 0.12
Delta 0.17 0.39 0.34 0.95 0.24 0.53 0.47 1.30 2.59 0.00 0.14 0.02
SE
coastal0.20 0.32 0.42 1.03 0.27 0.41 0.56 1.37 0.97 0.01 0.09 0.11
South 0.32 1.00 0.45 1.41 0.13 0.00 0.00 0.01
Hill 0.20 0.31 0.36 1.10 0.27 0.42 0.49 1.49 0.40 0.00 0.04 0.01
Tamil
Nadu0.23 0.39 0.44 1.12 0.30 0.48 0.57 1.43 7.64 0.03 1.74 0.43
1Current level of surface water and groundwater irrigation efficiencies are 35% and 55%, respectively.2Improved level of surface water and groundwater irrigation efficiencies are 50% and 65%, respectively.
Source: Authors’ estimation.
If the water savings in paddy are used for maize production, total maize production under
the improved irrigation water productivity scenario could have a 28-fold increase. Although
the current level of maize production is very small compared to paddy, it is the only food-grain
crop that has recorded a significant growth of demand in recent times. Between 1995 and 2005,
commensurate with increasing livestock feed demand, maize irrigated area and production had
a fourfold increase. At the present rate of demand growth, maize production requires at least
an 8-12-fold increase in the next two to three decades. Thus, most water savings through
efficiency increase in paddy can be diverted to meet increasing demand for maize.
If water savings in sugarcane are again used for more of its cultivation, irrigated
sugarcane production can be increased by 29%. As in paddy, all crop production at present
is under irrigation. Thus, any additional production under irrigation will increase the total
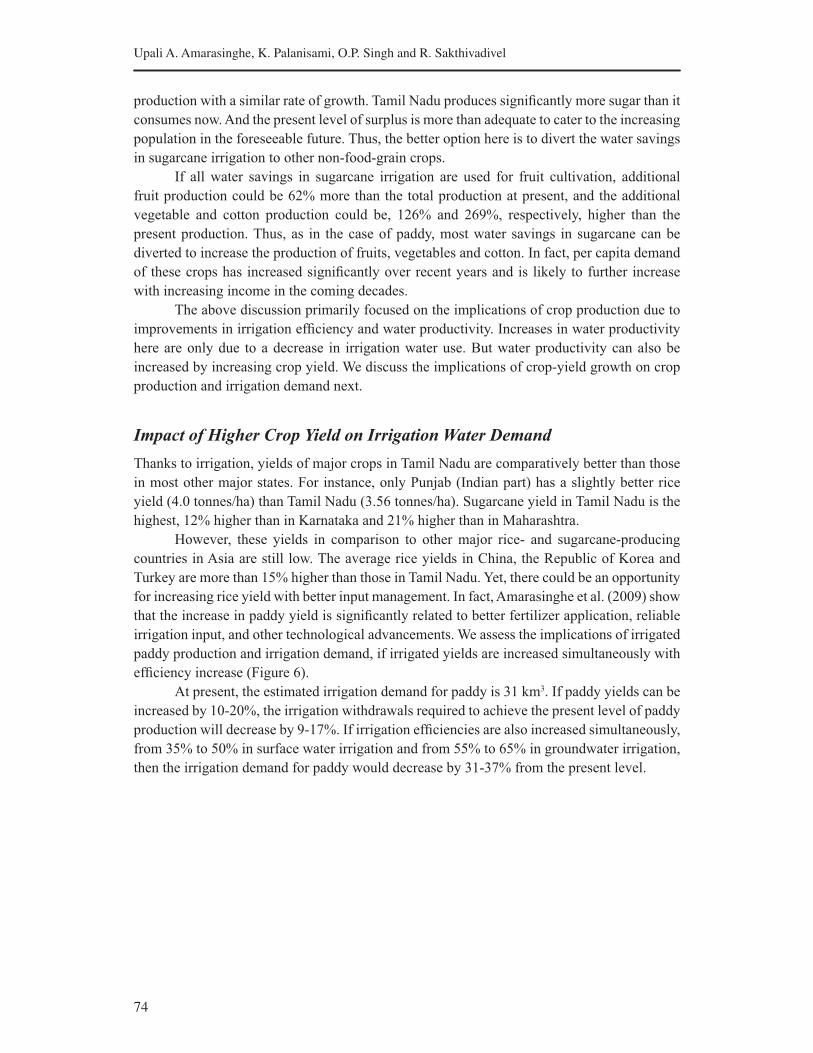
74
Upali A. Amarasinghe, K. Palanisami, O.P. Singh and R. Sakthivadivel
production with a similar rate of growth. Tamil Nadu produces significantly more sugar than it
consumes now. And the present level of surplus is more than adequate to cater to the increasing
population in the foreseeable future. Thus, the better option here is to divert the water savings
in sugarcane irrigation to other non-food-grain crops.
If all water savings in sugarcane irrigation are used for fruit cultivation, additional
fruit production could be 62% more than the total production at present, and the additional
vegetable and cotton production could be, 126% and 269%, respectively, higher than the
present production. Thus, as in the case of paddy, most water savings in sugarcane can be
diverted to increase the production of fruits, vegetables and cotton. In fact, per capita demand
of these crops has increased significantly over recent years and is likely to further increase
with increasing income in the coming decades.
The above discussion primarily focused on the implications of crop production due to
improvements in irrigation efficiency and water productivity. Increases in water productivity
here are only due to a decrease in irrigation water use. But water productivity can also be
increased by increasing crop yield. We discuss the implications of crop-yield growth on crop
production and irrigation demand next.
Impact of Higher Crop Yield on Irrigation Water Demand
Thanks to irrigation, yields of major crops in Tamil Nadu are comparatively better than those
in most other major states. For instance, only Punjab (Indian part) has a slightly better rice
yield (4.0 tonnes/ha) than Tamil Nadu (3.56 tonnes/ha). Sugarcane yield in Tamil Nadu is the
highest, 12% higher than in Karnataka and 21% higher than in Maharashtra.
However, these yields in comparison to other major rice- and sugarcane-producing
countries in Asia are still low. The average rice yields in China, the Republic of Korea and
Turkey are more than 15% higher than those in Tamil Nadu. Yet, there could be an opportunity
for increasing rice yield with better input management. In fact, Amarasinghe et al. (2009) show
that the increase in paddy yield is significantly related to better fertilizer application, reliable
irrigation input, and other technological advancements. We assess the implications of irrigated
paddy production and irrigation demand, if irrigated yields are increased simultaneously with
efficiency increase (Figure 6).
At present, the estimated irrigation demand for paddy is 31 km3. If paddy yields can be
increased by 10-20%, the irrigation withdrawals required to achieve the present level of paddy
production will decrease by 9-17%. If irrigation efficiencies are also increased simultaneously,
from 35% to 50% in surface water irrigation and from 55% to 65% in groundwater irrigation,
then the irrigation demand for paddy would decrease by 31-37% from the present level.
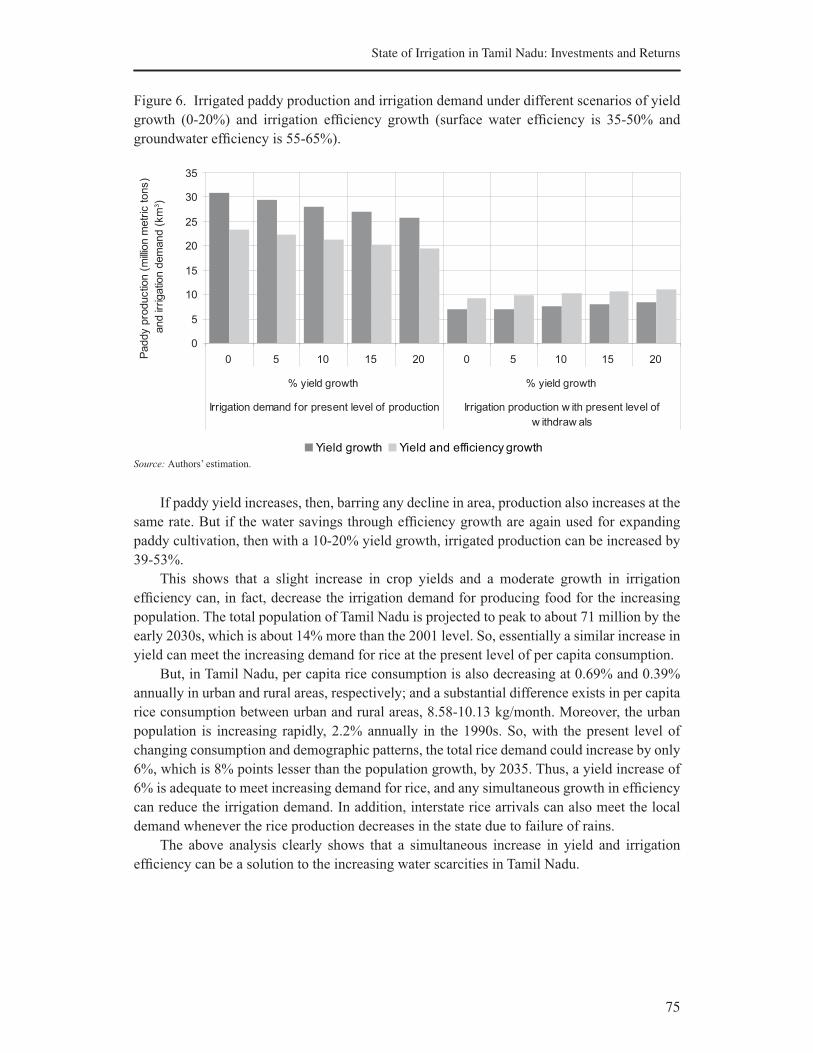
75
State of Irrigation in Tamil Nadu: Investments and Returns
Figure 6. Irrigated paddy production and irrigation demand under different scenarios of yield
growth (0-20%) and irrigation efficiency growth (surface water efficiency is 35-50% and
groundwater efficiency is 55-65%).
Source: Authors’ estimation.
If paddy yield increases, then, barring any decline in area, production also increases at the
same rate. But if the water savings through efficiency growth are again used for expanding
paddy cultivation, then with a 10-20% yield growth, irrigated production can be increased by
39-53%.
This shows that a slight increase in crop yields and a moderate growth in irrigation
efficiency can, in fact, decrease the irrigation demand for producing food for the increasing
population. The total population of Tamil Nadu is projected to peak to about 71 million by the
early 2030s, which is about 14% more than the 2001 level. So, essentially a similar increase in
yield can meet the increasing demand for rice at the present level of per capita consumption.
But, in Tamil Nadu, per capita rice consumption is also decreasing at 0.69% and 0.39%
annually in urban and rural areas, respectively; and a substantial difference exists in per capita
rice consumption between urban and rural areas, 8.58-10.13 kg/month. Moreover, the urban
population is increasing rapidly, 2.2% annually in the 1990s. So, with the present level of
changing consumption and demographic patterns, the total rice demand could increase by only
6%, which is 8% points lesser than the population growth, by 2035. Thus, a yield increase of
6% is adequate to meet increasing demand for rice, and any simultaneous growth in efficiency
can reduce the irrigation demand. In addition, interstate rice arrivals can also meet the local
demand whenever the rice production decreases in the state due to failure of rains.
The above analysis clearly shows that a simultaneous increase in yield and irrigation
efficiency can be a solution to the increasing water scarcities in Tamil Nadu.
0
5
10
15
20
25
30
35
0 5 10 15 20 0 5 10 15 20
% yield growth % yield growth
Irrigation demand for present level of production Irrigation production w ith present level of
w ithdraw als
Paddy p
roductio
n (
millio
n m
etr
ic tons)
and ir
rigatio
n d
em
and (
km
3)
Yield growth Yield and efficiency growth
76
Upali A. Amarasinghe, K. Palanisami, O.P. Singh and R. Sakthivadivel
Discussion and Conclusion
This analysis shows that major, medium and minor irrigation sectors in Tamil Nadu are not
contributing to crop production growth exactly as the investments in these sectors are supposed
to generate. Irrigation investments in these three sectors since 1970 have been primarily for
rehabilitation and O&M of existing schemes, which could be well over $1 billion. In spite of
these investments, net surface-water irrigated area has declined between 1970 and 2000 by
10% in canal irrigation commands, and most notably by 50% in the tank irrigation commands.
This indeed is a significant reduction, considering that 70% of the net irrigated area in the
1970s was under canals and tanks.
However, there is a strong possibility that not all the net area that declined from canal
and tank irrigation has disappeared totally from crop production. A large part of the command
area that was surface-water irrigated previously is now groundwater irrigated. This is more
prevalent in command areas of small tanks, which are now acting as artificial groundwater
recharge structures. Groundwater recharge is a source for reliable irrigation in a large part of
surface water command areas, providing the much-needed domestic water supply for rural
communities and livestock. Between 1970 and 2000, net groundwater irrigated area increased
by 0.646 Mha compared to 1.719 Mha of area that declined under canal and tank irrigation
and rain-fed agriculture. Over the same period, total investment in groundwater (dug wells and
tube wells) irrigation development, which is mainly private, increased by $560 million. This is
only a little over half the public investments on surface-water irrigation schemes. Indeed, our
estimate of investments in groundwater does not reflect the public investments in generating
power, where the agriculture sector has enjoyed free electricity in Tamil Nadu since 1989
(Palanisami 2002).
In spite of the differences in investment patterns, it is clear that groundwater irrigation
had a significant contribution for crop output increase. Between 1970 and 2000, the estimated
contribution of groundwater irrigation alone to crop output increase is about $636 million.
In comparison, production losses due to area decline in surface-water irrigation and rain-fed
sectors are estimated to be over $795 million. Groundwater irrigation, not only as a reliable
irrigation input by itself but also as a catalyst for other inputs such as fertilizers, has contributed
to this production growth. In fact, contribution of increased fertilizer application to crop output
growth was over $695 million.
Groundwater irrigation could also have a significant impact on irrigation water use. In
2000, groundwater was the source for 56% of the 3.444 Mha gross irrigated area in Tamil Nadu.
But, groundwater contributed to only 46% of the 46.3 km3 of total irrigation withdrawals. A
10% increase in groundwater efficiency, from the present level of 50%, would reduce total
groundwater demand by 15% and total irrigation demand by 6%. The Government of India has
estimated that by increasing water use efficiency by 10% , it is possible to add an additional 14
Mha under irrigation (MoWR 2007). In the first place, such reductions would be a direct and
enormous relief for groundwater-overexploited regions. Second, it can save the much-needed
energy for other sectors, which the agriculture sector uses freely at present. If groundwater
recharge from reservoirs and tanks can be effectively used for groundwater irrigation in
command areas, it can improve crop productivity, increase efficiency, and save water for other
sectors where demand increases with increasing population and economic activities
Increasing efficiency in surface-water irrigation is another way of meeting increasing
water needs of the nonagriculture sectors. At present, surface-water irrigation is estimated to
77
State of Irrigation in Tamil Nadu: Investments and Returns
operate at 35% efficiency, and meets 58% of the total irrigation demand. A modest increase in
surface-water irrigation efficiency, say by 15%, could reduce total irrigation demand by about
8.0 km3. This saving, which is significantly more than the combined demand of 6.3 km3 of the
domestic and industrial sectors at present can meet the projected additional demand of 7.2 km3
of these sectors by 2050 (Authors’ estimates based on PODIUMSIM model; Amarasinghe et al.
2005, 2008). However, the impact of such improvements in surface-water irrigation efficiency
on groundwater recharge and groundwater irrigation downstream needs better understanding
Another option is to use water savings through efficiency increases for increasing crop
production. Improvements of surface water and groundwater irrigation efficiencies to 50%
and 65%, respectively, from the present level of 35% and 50%, respectively, could reduce
the irrigation demand by 24%. If water savings in paddy are again used for increasing paddy
cultivation, additional rice production would be significantly more than the total additional
demand for the increasing population. A similar production increase is possible for sugarcane,
the most water-consuming crop in the state. In fact, only a part of water savings is adequate for
irrigating other crops, such as fruits and vegetables for food and maize for livestock feeding.
The demand for these crops is increasing with changing food consumption patterns.
Increasing crop yields on existing land can make additional irrigation demand less. For
example, with the changing consumption patterns, total rice demand will increase anywhere
between 6% and 14%. The latter is the growth of population of Tamil Nadu, when it reaches
its maximum in the mid-2030s. Similar increases in crop yield on existing land would be
sufficient to meet additional food demand without additional irrigation.
The future investments in irrigation in Tamil Nadu indeed require some rethinking.
Investments in surface water irrigation would perhaps require new direction. Investments on
O&M and rehabilitations of major and medium irrigation schemes are still required. More
specifically, tertiary system improvements are needed for effective water control by the farmers
(Palanisami et al. 2008). But investments should promote a different mode of irrigation within
the command areas with a view to increase efficiency. This can include a properly managed
conjunctive water use plan to utilize groundwater recharge in command areas, or intermediate
storage tanks in a farm or in a group of farms for increasing on-farm water use (Amarasinghe et
al. 2008). The latter can be a vehicle for spreading micro-irrigation in surface water irrigation
commands.
Investments in tank irrigation require a completely new approach. Rehabilitation of
tanks is still important, but the type of rehabilitation depends on whether tanks supply water for
surface-water or conjunctive irrigation or whether the tanks recharge groundwater to facilitate
complete groundwater irrigation in command areas. The threshold for selecting tanks only for
groundwater recharge depends on its interconnectedness with other tanks in cascade systems
and extents of water use in the neighboring communities, number of fillings and hydrogeology.
Further research is required for selecting these thresholds. Selective tank modernization
with needed interventions is recommended as against the package of modernization, which
incorporates all components of tank systems (Palanisami and Easter 2000).
Groundwater irrigation is an important part of the irrigation landscape in Tamil Nadu,
but overexploitation threatens its sustainability. Thus, public investment should facilitate
groundwater recharge to augment water supply. Watershed development in overexploited
regions for artificial recharge through dug wells needs to be taken up (Shah 2009). The state
should explore policies and action plans for reducing groundwater overabstraction. As such
78
Upali A. Amarasinghe, K. Palanisami, O.P. Singh and R. Sakthivadivel
about 19,330 micro-watersheds are delineated for interventions in the state and about 4,500
watersheds have been covered under the watershed programs. Increase in the water table due
to watershed programs was ranging from 1 to 3 meters depending on the regions (Palanisami
et al. 2009). Policy initiatives of pricing electricity, however, unpopular politically, can have
an immediate impact, or providing separate reliable electricity supply for agriculture, such as
Jothigram in Gujarat (Shah and Verma 2008) could be another option.
Irrigation investments should promote water saving techniques, such as drip and
sprinklers, for reducing overabstraction. So far, Tamil Nadu has less than 20% irrigated area
under drip and sprinkler irrigation. But water saving techniques can expand to a substantially
more crop area (Narayanamoorthy 2009). Large-scale adoption of drip and sprinklers would
not only save water but also improve irrigation efficiency and increase productivity.
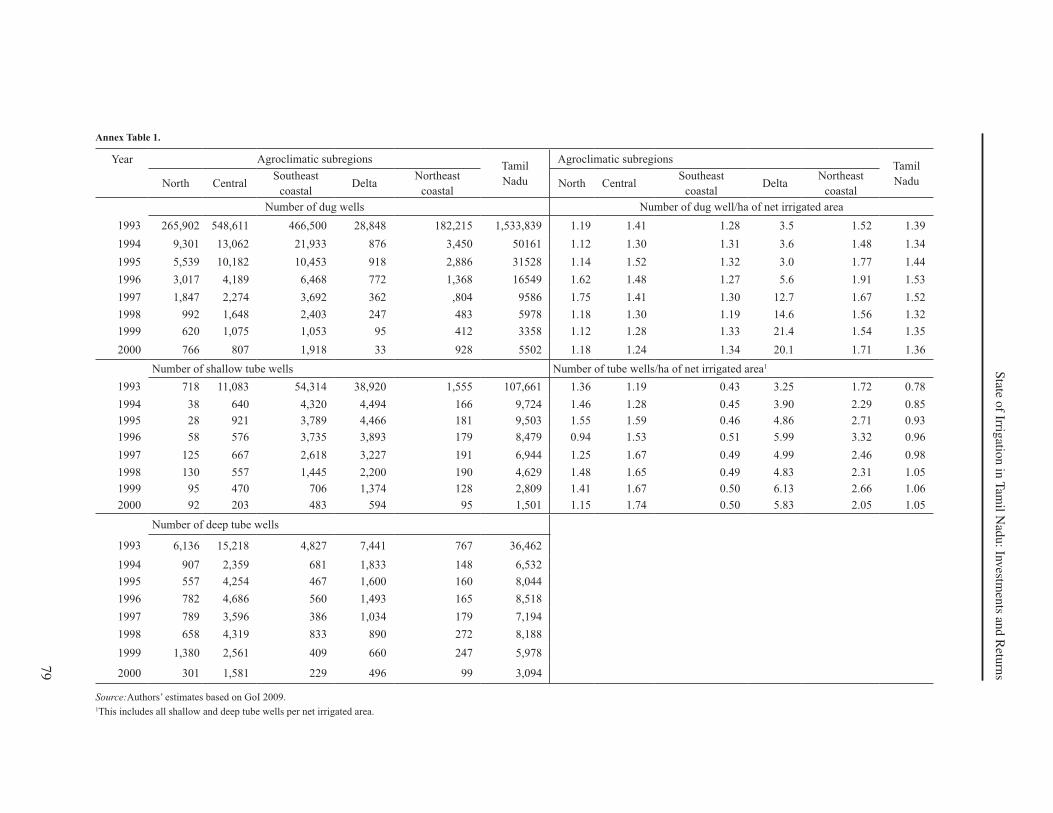
79
State o
f Irrigatio
n in
Tam
il Nad
u: In
vestm
ents an
d R
eturn
s
Annex Table 1.
Year Agroclimatic subregionsTamil
Nadu
Agroclimatic subregionsTamil
NaduNorth CentralSoutheast
coastalDelta
Northeast
coastalNorth Central
Southeast
coastalDelta
Northeast
coastal
Number of dug wells Number of dug well/ha of net irrigated area
1993 265,902 548,611 466,500 28,848 182,215 1,533,839 1.19 1.41 1.28 3.5 1.52 1.39
1994 9,301 13,062 21,933 876 3,450 50161 1.12 1.30 1.31 3.6 1.48 1.34
1995 5,539 10,182 10,453 918 2,886 31528 1.14 1.52 1.32 3.0 1.77 1.44
1996 3,017 4,189 6,468 772 1,368 16549 1.62 1.48 1.27 5.6 1.91 1.53
1997 1,847 2,274 3,692 362 ,804 9586 1.75 1.41 1.30 12.7 1.67 1.52
1998 992 1,648 2,403 247 483 5978 1.18 1.30 1.19 14.6 1.56 1.32
1999 620 1,075 1,053 95 412 3358 1.12 1.28 1.33 21.4 1.54 1.35
2000 766 807 1,918 33 928 5502 1.18 1.24 1.34 20.1 1.71 1.36
Number of shallow tube wells Number of tube wells/ha of net irrigated area1
1993 718 11,083 54,314 38,920 1,555 107,661 1.36 1.19 0.43 3.25 1.72 0.78
1994 38 640 4,320 4,494 166 9,724 1.46 1.28 0.45 3.90 2.29 0.85
1995 28 921 3,789 4,466 181 9,503 1.55 1.59 0.46 4.86 2.71 0.93
1996 58 576 3,735 3,893 179 8,479 0.94 1.53 0.51 5.99 3.32 0.96
1997 125 667 2,618 3,227 191 6,944 1.25 1.67 0.49 4.99 2.46 0.98
1998 130 557 1,445 2,200 190 4,629 1.48 1.65 0.49 4.83 2.31 1.05
1999 95 470 706 1,374 128 2,809 1.41 1.67 0.50 6.13 2.66 1.06
2000 92 203 483 594 95 1,501 1.15 1.74 0.50 5.83 2.05 1.05
Number of deep tube wells
1993 6,136 15,218 4,827 7,441 767 36,462
1994 907 2,359 681 1,833 148 6,532
1995 557 4,254 467 1,600 160 8,044
1996 782 4,686 560 1,493 165 8,518
1997 789 3,596 386 1,034 179 7,194
1998 658 4,319 833 890 272 8,188
1999 1,380 2,561 409 660 247 5,978
2000 301 1,581 229 496 99 3,094
Source:Authors’ estimates based on GoI 2009. 1This includes all shallow and deep tube wells per net irrigated area.

80
Upali A. Amarasinghe, K. Palanisami, O.P. Singh and R. Sakthivadivel
References
Amarasinghe, U. A.; Sharma, B. R.; Aloysius, N.; Scott, C.; Smakhtin, V.; de Fraiture, C. 2005. Spatial
variation of water supply and demand across river basins of India. Research Report 83. Colombo, Sri
Lanka: International Water Management Institute.
Amarasinghe, U. A.; Shah, T.; Turral, H.; Anand, B. 2007a. India’s water futures to 2025-2050: Business as
usual scenario and deviations. IWMI Research Report 123. Colombo, Sri Lanka: International Water
Management Institute.
Amarasinghe, U. A.; Shah, T.; Singh, O. 2007b. Changing consumption patterns: Implications for food and
water demand in India. IWMI Research Report 119. Colombo, Sri Lanka: International Water Management
Institute.
Amarasinghe, U.A.; Singh, O.P.; Sakthivadivel, R.; Palanisami, K. 2009. State of the irrigation in Tamil Nadu:
Trend and turning points. Draft prepared for the IWMI-CPWF project on “Strategic Analyses of India’s
National River Linking project.
CGWB (Central Ground Water Board). 2006. Dynamic groundwater resources of India (Accessed on March
2004). cgwb.gov.in/documents/DGWR2004.pdf.
Dhawan, B.D. 1988. Irrigation in India’s agricultural development: Productivity, stability, equity. Delhi:
Institute of Economic Growth and Saga Publications.
Gomathinayagam, P. 2005. Two decades of tank rehabilitation in India: Evaluating sustainability of
rehabilitation. In: Annual partners’ meet. Aannd, Gujarat: IWMI-Tata Water Policy Programme.
GoI (Government of India). 2006. Plan-wise position of irrigation potential created and utilized. wrmin.nic.in/
writereaddata/mainlinkFile/File413.pdf. Government of India, New Delhi.
GoI. 2009. Reports of minor irrigation census in 1993/94 and 2000/01. Accessible via cgwb.gov.in
GoTN (Government of Tamil Nadu). 2003. Report on the expert committee on development and management
of water resources of Tamilnadu. Volume 1. Chennai: Water Resources Organization.
GoTN. 2007. Irrigation policy note for the year 2008-2009. Public Works Department. Chennai
Hussain, I. 2005. Pro-poor intervention strategies in irrigated agriculture in Asia. Poverty in irrigated
agriculture: Issues, options and guidelines. Bangladesh, China, India, Indonesia, Pakistan, Vietnam.
Colombo, Sri Lanka: International Water Management Institute
Kikuchi, K.; Barker, R.; Weligamage, P.; Samad, M. 2002. Irrigation sector in Sri Lanka. Recent trends and
the development path ahead. Research Report 62. Colombo, Sri Lanka: International Water Management
Institute.
Kumar, M.D.; Singh, O.P.; Sharma, B.R. 2009b. Water saving and yield enhancing micro-irrigation technologies:
How far can they contribute to water productivity in Indian agriculture. In: India’s water future: Scenarios
and issues. Strategic Analyses of National River Linking Project of India. Series 2, ed. Amarasinghe, Upali
A.; Shah, Tushaar; Malik, R.P.S.. Colombo, Sri Lanka: International Water Management Institute.
MOWR (Ministry of Water Resources). 2001. Report on census of minor irrigation schemes 1993-94. mowr.
gov.in/micensus/mi1census/defauld.htm. Government of India, New Delhi.
MOWR. 2005. 3rd Census of minor irrigation schemes 2000-01. mowr.gov.in/micensus/mi3census/index.htm.
Government of India, New Delhi.
MOWR. 2007. More crop and income per drop. Project outline. New Delhi.
81
State of Irrigation in Tamil Nadu: Investments and Returns
Narayanamoorthy. 2009. Drip and sprinkler irrigation in India: Benefits, potential and future directions. In:
India’s water future: Scenarios and issues, ed. Amarasinghe, U. A.; Shah, T.; Malik, R. P. S. Colombo, Sri
Lanka. International Water Management Institute, 417p.
Palanisami, K. 1997. Productivity per unit of water in different irrigation sources. Chennai: State Planning
Commission Report.
Palanisami, K. 2002. Techno-economic feasibility of groundwater over-exploitation in Tamil Nadu. In: Annual
partners’ meet. Aannd, Gujarat: IWMI-Tata Water Policy Programme.
Palanisami, K. 2008. Water resource management with special reference to tank irrigation with groundwater
use. A draft prepared for the IWMI-CPWF project on “Strategic Analyses of India’s National River Linking
Project.”
Palanisami, K.; Easter, K.W. 2000. Tank irrigation in the 21st century - What next? New Delhi: Discovery
Publishing House.
Palanisami, K.; Kumar, D. S. 2009. Impact of watershed development programs in Tamil Nadu . A draft
prepared for the IWMI-CPWF project on “Strategic Analyses of India’s National River Linking Project.”
Palanisami, K.; Amarasinghe, U.; Sakthivadivel, R. 2008. Tamilnadu: Irrigation sector policy recommendations.
Paper presented to the State Planning Commission, Government of Tamilnadu, Chennai.
Raj, A. B. S. 2005. Declining trend in tank irrigated area: Is there a way to arrest? In: Annual partners’ meet.
Anand, Gujarat: IWMI-Tata Water Policy Programme.
Shah, T. 2009. An assessment of India’s groundwater recharge master plan. A draft prepared for the IWMI-
CPWF project on “Strategic Analyses of India’s National River Linking Project.”
Shah, T.; Verma, S. 2008. Real-time co-management of electricity and groundwater: An assessment of Gujarat’s
pioneering Jyotirgram scheme. Economic and Political Weekly 43(7): 59-66.
Shah, T.; Amarasinghe, U. A.; McCornick, P. G. 2008. India’s river linking project: The state of the debate. In:
National River Linking Project-Analysis of hydrological, social and ecological issues. Strategic Analyses
of National River Linking Project of India. Series 2. ed. Sharma, Bharat R.;Amarasinghe, Upali A..
Colombo, Sri Lanka: International Water Management Institute
Sundarrajan, K.; Patel, A.; Raychoudhury, T.; Purohit, C. 2009. Groundwater exploitation in India,
Environmental impacts and limits to further exploitation for irrigation. In: India’s water future: Scenarios
and issues. Strategic Analyses of National River Linking Project of India. Series 2, ed. Amarasinghe, Upali
A.; Malik, R.P.S. Colombo, Sri Lanka: International Water Management Institute.

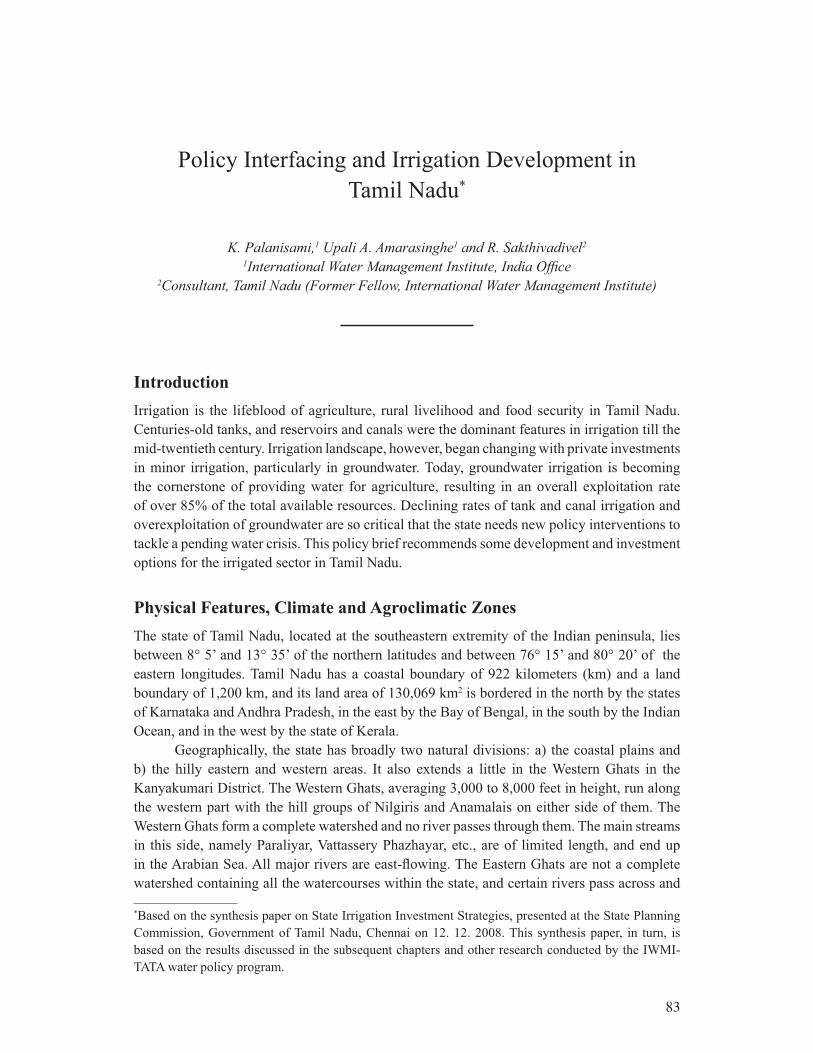
83
Policy Interfacing and Irrigation Development in
Tamil Nadu*
K. Palanisami,1 Upali A. Amarasinghe1 and R. Sakthivadivel2
1International Water Management Institute, India Office2Consultant, Tamil Nadu (Former Fellow, International Water Management Institute)
Introduction
Irrigation is the lifeblood of agriculture, rural livelihood and food security in Tamil Nadu.
Centuries-old tanks, and reservoirs and canals were the dominant features in irrigation till the
mid-twentieth century. Irrigation landscape, however, began changing with private investments
in minor irrigation, particularly in groundwater. Today, groundwater irrigation is becoming
the cornerstone of providing water for agriculture, resulting in an overall exploitation rate
of over 85% of the total available resources. Declining rates of tank and canal irrigation and
overexploitation of groundwater are so critical that the state needs new policy interventions to
tackle a pending water crisis. This policy brief recommends some development and investment
options for the irrigated sector in Tamil Nadu.
Physical Features, Climate and Agroclimatic Zones
The state of Tamil Nadu, located at the southeastern extremity of the Indian peninsula, lies
between 8° 5’ and 13° 35’ of the northern latitudes and between 76° 15’ and 80° 20’ of the
eastern longitudes. Tamil Nadu has a coastal boundary of 922 kilometers (km) and a land
boundary of 1,200 km, and its land area of 130,069 km2 is bordered in the north by the states
of Karnataka and Andhra Pradesh, in the east by the Bay of Bengal, in the south by the Indian
Ocean, and in the west by the state of Kerala.
Geographically, the state has broadly two natural divisions: a) the coastal plains and
b) the hilly eastern and western areas. It also extends a little in the Western Ghats in the
Kanyakumari District. The Western Ghats, averaging 3,000 to 8,000 feet in height, run along
the western part with the hill groups of Nilgiris and Anamalais on either side of them. The
Western Ghats form a complete watershed and no river passes through them. The main streams
in this side, namely Paraliyar, Vattassery Phazhayar, etc., are of limited length, and end up
in the Arabian Sea. All major rivers are east-flowing. The Eastern Ghats are not a complete
watershed containing all the watercourses within the state, and certain rivers pass across and
*Based on the synthesis paper on State Irrigation Investment Strategies, presented at the State Planning
Commission, Government of Tamil Nadu, Chennai on 12. 12. 2008. This synthesis paper, in turn, is
based on the results discussed in the subsequent chapters and other research conducted by the IWMI-
TATA water policy program.

84
K. Palanisami, Upali A. Amarasinghe and R. Sakthivadivel
beyond, notable among them being the Cauvery River, which is one of the main rivers. The
tributaries of the Cauvery are Bhavani, Amaravathi and Noyyal. The other main rivers are
Vaigai, Tamaraparani, Palar, Ponniyar and Vellar.
The climate of Tamil Nadu is basically tropical. Due to its proximity to the sea, the
summer is less warm and the winter is less cold than other parts of Peninsular India. The
maximum daily temperature rarely exceeds 40 °C and the minimum seldom falls below 15 °C.
Both southwest and northeast monsoons influence rainfall in the state.
Based on rainfall distribution, soil characteristics and other physical, ecological
and social characteristics, Tamil Nadu is classified into seven agroclimatic zones, namely
northeastern, northwestern, western, Cauvery Delta, southern, high rainfall and hilly zones.
The climate and the agroclimatic zones influence the water availability and use in different
regions, in particular in the irrigated areas.
Trends of Irrigation in Tamil Nadu: 1971-2006
Net Sown Area
The net sown area in Tamil Nadu has had three distinct trend patterns over the last three-and-a-
half decades (Figure 1). Overall, the total net sown area has declined by 25%, or 1.5 million ha
(Mha), from 6.3 Mha in 1971 to 4.8 Mha in 2005. In the 1970s, the net sown area decreased at
an annual rate of 0.77%. The declining trend stopped in the early 1980s, and remained steady
until the mid-1990s. It started declining again at 2.1% annually after 1995.
Figure 1. Net sown and irrigated area in Tamil Nadu.
0.0
1.0
2.0
3.0
4.0
5.0
6.0
7.0
1965 1970 1975 1980 1985 1990 1995 2000 2005 2010
Are
a (
mha)
Net irrigated area Net sown area

85
Policy Interfacing and Irrigation Development in Tamil Nadu
Net Irrigated Area
No significant trend in net irrigated area exists over the same period (1971 to 2005). However,
with declining net sown area, the share of net irrigated area steadily increased from 42% in
1970 to 56% in 2005.
Contribution to Net Irrigation Area
The area under different sources of irrigation has changed drastically during the last three-
and–a-half decades (Figure 2). Canals and tanks were the main sources of irrigation in the
1970s and 1980s, contributing to two-thirds of the total net irrigated area. But groundwater has
dominated irrigation since the mid-1990s, and contributed to more than half the net irrigated
area in 2005.
Figure 2. Land-use patterns in Tamil Nadu.
Canal Irrigation
Canal irrigation contributed to 34% of the total net irrigated area in the early 1970s. More
than 140,000 ha were lost from the total net irrigated area under canals, and the current canal
irrigated area accounts for 29% of the total net irrigated area in 2005.
Tank Irrigation
Tank irrigation contributed to more than one-third of the total net irrigated area in 1971, and
had lost more than half of its net irrigated area by 2005. Although rainfall explains a significant
part of the annual variation in tank irrigated area, there has been a consistent declining trend
in tank irrigated area over the last few decades. Today, tank irrigated areas are only 17% of the
total net irrigated area.
Groundwater Irrigation
Groundwater irrigation contributed only 30% to the net irrigated area in 1971. This share had
increased to 54% by 2005. Groundwater expansion shows different growth patterns. First,
it has replaced the area lost under surface irrigation, especially that under tank commands.
35%
34%
1%
1%
29%
Canal Tanks Tube wells Other wells Other sources
1971 1980 1990 2000 2005
33%
27%
4%
1%
35% 32%
22%7%
1%
38% 29%
19%
8%
43%
1%
29%
17%
12%
42%
0%
86
K. Palanisami, Upali A. Amarasinghe and R. Sakthivadivel
Second, it has spread well outside surface water command areas. Third, groundwater irrigation,
especially through dug wells, seemed to be unsustainable in many regions. Dug wells were
the main contributors to the growth of groundwater irrigation before the late 1990s. However,
this contribution has been decreasing in recent years. Fourth, it is clear that reliance on tube
wells in groundwater irrigation is increasing. In 1991, tube wells contributed to only 2% of
groundwater irrigation. But this share had increased to 23% by 2005.
Gross Irrigated Area
Gross irrigated area has had a slight declining trend since the 1990s. This is primarily due to
declining irrigation intensity. The irrigation intensity decreased from 130% in 1990 to 112%
in 2005.
Given the trend in the irrigated area under different sources of irrigation, it is important
to provide appropriate strategies to sustain the irrigation sector. Even though a vast array of
recommendations is available through several research studies, the following measures could
be considered and action initiated to manage the supply-demand gap in Tamil Nadu. The
measures are grouped under “Policy Interventions” as follows:
Policy Interventions
Given the projection for 2050, the total water resources of the state including the potential
interbasin transfers will be about 46,540 million cubic meters (Mm3) compared to the total
demand of 57,725 Mm3 (i.e., agricultural demand of 49,978 and nonagricultural demand of
7,747 Mm3). The projected supply-demand gap will be 11,185 Mm3 (24%) (GoTN 2003).
The gap will be further widened if the agreed interbasin transfers cannot be implemented
and also if rainfall variability increases. Hence, it is important to address the needed policy
interventions that may help bridge this gap for which the following are suggested.
Policy Interventions in Well Irrigation
The level of groundwater exploitation has been increasing over the years (Table 1). The number
of critical blocks increased from 10.8% in 1987 to 46.2% in 1998.
Table 1. Level of groundwater extraction in Tamil Nadu.
Year of
assessment
Total no. of
blocks
Categorization of blocks (No.)
Critical Semi-critical Safe
1987 378 41 86 251
1992 384 89 86 200
1998 385 178 70 137
Extraction level: critical = 90-100%; semi-critical = 70-90%; safe = <70%.
Source: Director of Agriculture 2006.
In the case of electricity consumption in Tamil Nadu, out of the total pump sets (9.04 million),
about 51.5% are accounted for by 5 HP electricity, followed by 7-10 HP pump sets (23.8%),
87
Policy Interfacing and Irrigation Development in Tamil Nadu
indicating the need for protecting these regions from well failure due to overexploitation.
Hence, it is important to identify appropriate strategies to manage the groundwater resources
in the state.
Impact of Watershed Program
The watershed program has been implemented by different project implementing agencies,
concentrating mainly on soil and water conservation and development of the rain-fed area.
So far, about 4,000 micro-watersheds have been treated out of 19,240 in the state. As such,
they account for about 10% of the area under rain-fed conditions and 1% of the area under
wastelands. One of the major interventions is recharging the groundwater. According to
the research studies conducted, rise in water levels varies from 3 to 7 m over the seasons
(Palanisami and Sureshkumar 2005). On the basis of analysis of 358 watersheds, the following
recommendations have been made.
Recommendations
§ Intensify watershed developmental activities, especially in overexploited and critical
blocks on a priority basis so that dysfunctionality of wells will be minimized. The
abandoned wells should also be used for groundwater recharge.
§ Water saving techniques, such as drip and sprinkler irrigation methods, should be
introduced to all the commercial crops, and all the extension officers should be trained
who, in turn, can train the farmers in the installation and maintenance of the systems. In
addition, capacity building programs at the village level should be initiated to benefit all
the farmers in the villages.
§ A watershed program with recharging options should be implemented in areas with rainfall
ranges of 700-1,000 mm/year.
§ In tank-intensive regions, the focus of the program should be on soil and water conservation
while in well-intensive regions, the focus should be on groundwater recharge.
§ Combining five to six micro-watersheds will enhance the benefits of watershed
programs.
§ Wells in a zone of influence of 400 m (from the upstream of the water storage structures)
should be accounted for while planning the water harvesting structures.
§ Agricultural and livestock activities should be combined in all the watershed programs.
§ A decision support system (DSS) incorporating the above options can be developed for
each district and this DSS should be used for planning the watershed programs.
§ Guidelines for post-project management of watershed programs should be developed for
better management of watersheds.
Policy Interventions in Tank IrrigationTank irrigation systems in South India are centuries-old and they account for over 30%
of the total irrigated area. According to the records, there are about 39,200 tanks in Tamil
Nadu with varying sizes and types. Most of the tanks are mainly used to irrigate the rice
crop from September to December. Several constraints limit the productivity of these tanks.
Tank siltation, foreshore encroachment and poor maintenance of structures are major above-

88
K. Palanisami, Upali A. Amarasinghe and R. Sakthivadivel
outlet problems; absence of water user associations (WUAs), a poor distribution system and
inadequate groundwater supplies for supplemental irrigation are major below-outlet problems
(Palanisami 2005). In three out of 10 years, the tanks get adequate storage (Table 2).
Table 2. Tank irrigation in Tamil Nadu in a 10-year period.
Tank storage Storage level (%) Probability1
Surplus > 100 0.1
Full 70-100 0.2
Deficit 50-70 0.5
Very low <50 0.21Based on 46 years’ rainfall data.
Even though the number of tanks is about 39,200, it is not known how many are still
functioning. The results of the study had indicated that in less-tank-intensive regions, about
64% of Public Works Department (PWD) tanks and 76% of the Panchayat Union (PU) tanks
are defunct. In tank-intensive regions, about 2.6% of PWD tanks and 1.2% of PU tanks are
defunct, showing that there is still a potential to make the tanks a better investment entity
(Table 3).
Table 3. Tanks in Tamil Nadu: Functioning and defunct tanks.
Region/Tank type Number of tanks Mean command Area (ha)
PU PWD PU PWD
Tank-intensive districts
Total tanks counted 2,064 487Functioning tanks 2,039 474 12.67 105.2 (%) 98.8 97.4Defunct tanks 25 13 15.81 74.81
(%) 1.2 2.6
Less-tank-intensive districts
Total tanks counted 67 90
Functioning tanks 16 32 22.48 79.75
(%) 23.9 35.6
Defunct tanks 51 58 18.16 99.46
(%) 76.1 64.4
Conversion of Tanks to Percolation Ponds
As rainfall has been varying much over the years, several tanks are functioning as percolation
ponds, recharging the wells in the tank command. A partial budget was worked out using a 15-
tank sample in the southern districts with the aim of comparing the financial gains and losses
by cultivating paddy and sugarcane crops. Normally, a farmer with a command area under a
tank with well conditions and having 2 ha land prefers to cultivate 1 ha each of paddy and
sugarcane. The same farmer in the tank-only situation could cultivate only paddy in the 2 ha.
Farmers with wells would be able to get a net income of about Rs 49,000/ha compared to those
in other categories (Table 4).
89
Policy Interfacing and Irrigation Development in Tamil Nadu
Table 4. Value of production in tanks (using data from 15 tanks in southern Tamil Nadu).
TypologyTotal value of
production (Rs)
Total
income
(Rs/ha)
Additional
income
(Rs/ha)
Cost of
cultivation
(Rs/ha)
Net
income
(Rs/ha)
Additional
net income
(Rs/ha)
Tanks 2,344,490 28,343 0 17,589 10,754 0
Tank+ wells 13,049,154 71,406 43,063 38,719 32,687 21,933
Wells 2,656,928 106,582 78,238 57,505 49,076 38,322
Tank Sluice Rotation and Optimum Well Pumping
Currently, the tank sluices are continuously open and the tank water is exhausted within 6-8
weeks of the release of tank water. Hence, to keep the tank water available for a longer period
and for wells to get recharged, tank sluices can be rotated alternately. By doing so, the tank
water can be sustained for 10-12 weeks and groundwater supplementation assured to all
farmers.
Well owners maximize profits from water sales when the water level is about 5 meters
from the surface and this corresponds to about 5.6 hours of pumping per day from the well.
Under these conditions, output of well water can best be increased by having farmers install
more wells with increased competition. With more wells, the demand for water from each
individual well will fall, resulting in a lower price for well water. According to a detailed
survey, the number of wells can be increased by 25% in many tank command areas.
Tank Modernization and Its Impact
Tank modernization is one of the key strategies being recommended in all the policy
documents. Even though tanks have been modernized through different programs in a small
scale, a major program was implemented from 1984-85 to 1994-95, with financial aid from
the European Economic Community (EEC). In the first phase (1984-91), 150 nonsystem tanks
with a command area of 100-200 ha were selected for modernization with a financial outlay of
Rs 450 million. In the second phase (1989-1995), an additional 230 tanks were included and
in the same period, considered as Phase II extension, 269 tanks were included at a financial
outlay of Rs 500 million. The approximate cost per hectare was Rs 21,000. The project was
expected to save about 20% of water over the present use, thus permitting the expansion of
cultivation by about 9,000 ha (PWD 1986).
There is no significant difference in the performance between modernized and non-
modernized tanks in the region except marginal improvements in terms of water availability
in tanks, reduction in encroachment, siltation, presence of WUAs and area covered by
wells (Table 5). Since the EEC program was adopted, the package of modernization had the
same modernization strategies for all tanks irrespective of their physical conditions. Hence,
it is important to identify appropriate selective modernization strategies. Different tank
modernization strategies have been examined which include sluice modification, provision of
additional wells, sluice management and sluice rotation (Palanisami and Easter 2000).
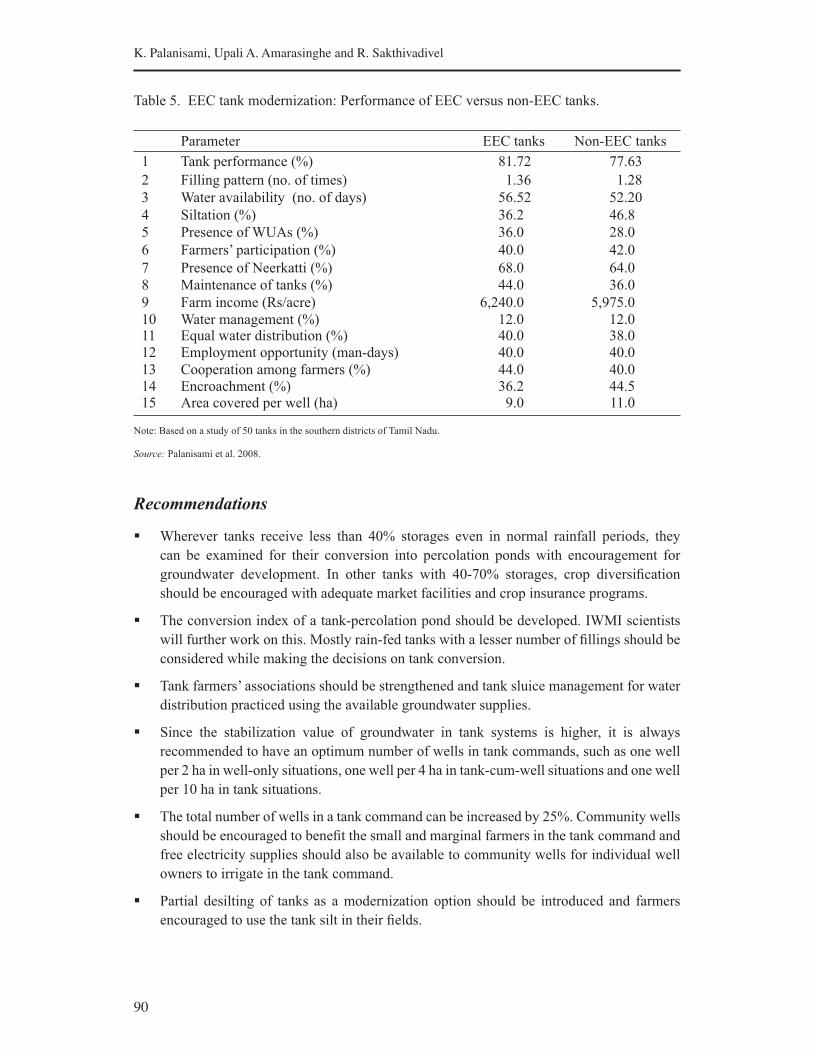
90
K. Palanisami, Upali A. Amarasinghe and R. Sakthivadivel
Table 5. EEC tank modernization: Performance of EEC versus non-EEC tanks.
Parameter EEC tanks Non-EEC tanks
1 Tank performance (%) 81.72 77.63
2 Filling pattern (no. of times) 1.36 1.28
3 Water availability (no. of days) 56.52 52.20
4 Siltation (%) 36.2 46.8
5 Presence of WUAs (%) 36.0 28.0
6 Farmers’ participation (%) 40.0 42.0
7 Presence of Neerkatti (%) 68.0 64.0
8 Maintenance of tanks (%) 44.0 36.0
9 Farm income (Rs/acre) 6,240.0 5,975.010 Water management (%) 12.0 12.011 Equal water distribution (%) 40.0 38.012 Employment opportunity (man-days) 40.0 40.0
13 Cooperation among farmers (%) 44.0 40.014 Encroachment (%) 36.2 44.515 Area covered per well (ha) 9.0 11.0
Note: Based on a study of 50 tanks in the southern districts of Tamil Nadu.
Source: Palanisami et al. 2008.
Recommendations
§ Wherever tanks receive less than 40% storages even in normal rainfall periods, they
can be examined for their conversion into percolation ponds with encouragement for
groundwater development. In other tanks with 40-70% storages, crop diversification
should be encouraged with adequate market facilities and crop insurance programs.
§ The conversion index of a tank-percolation pond should be developed. IWMI scientists
will further work on this. Mostly rain-fed tanks with a lesser number of fillings should be
considered while making the decisions on tank conversion.
§ Tank farmers’ associations should be strengthened and tank sluice management for water
distribution practiced using the available groundwater supplies.
§ Since the stabilization value of groundwater in tank systems is higher, it is always
recommended to have an optimum number of wells in tank commands, such as one well
per 2 ha in well-only situations, one well per 4 ha in tank-cum-well situations and one well
per 10 ha in tank situations.
§ The total number of wells in a tank command can be increased by 25%. Community wells
should be encouraged to benefit the small and marginal farmers in the tank command and
free electricity supplies should also be available to community wells for individual well
owners to irrigate in the tank command.
§ Partial desilting of tanks as a modernization option should be introduced and farmers
encouraged to use the tank silt in their fields.
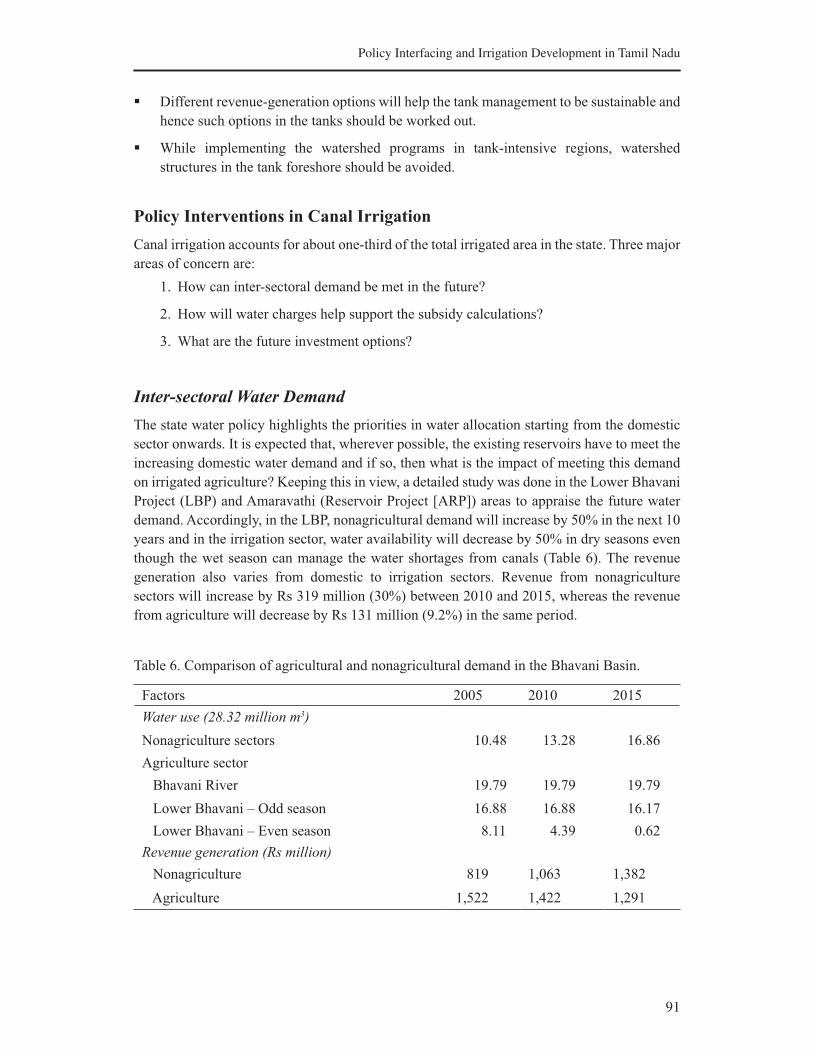
91
Policy Interfacing and Irrigation Development in Tamil Nadu
§ Different revenue-generation options will help the tank management to be sustainable and
hence such options in the tanks should be worked out.
§ While implementing the watershed programs in tank-intensive regions, watershed
structures in the tank foreshore should be avoided.
Policy Interventions in Canal Irrigation
Canal irrigation accounts for about one-third of the total irrigated area in the state. Three major
areas of concern are:
1. How can inter-sectoral demand be met in the future?
2. How will water charges help support the subsidy calculations?
3. What are the future investment options?
Inter-sectoral Water Demand
The state water policy highlights the priorities in water allocation starting from the domestic
sector onwards. It is expected that, wherever possible, the existing reservoirs have to meet the
increasing domestic water demand and if so, then what is the impact of meeting this demand
on irrigated agriculture? Keeping this in view, a detailed study was done in the Lower Bhavani
Project (LBP) and Amaravathi (Reservoir Project [ARP]) areas to appraise the future water
demand. Accordingly, in the LBP, nonagricultural demand will increase by 50% in the next 10
years and in the irrigation sector, water availability will decrease by 50% in dry seasons even
though the wet season can manage the water shortages from canals (Table 6). The revenue
generation also varies from domestic to irrigation sectors. Revenue from nonagriculture
sectors will increase by Rs 319 million (30%) between 2010 and 2015, whereas the revenue
from agriculture will decrease by Rs 131 million (9.2%) in the same period.
Table 6. Comparison of agricultural and nonagricultural demand in the Bhavani Basin.
Factors 2005 2010 2015
Water use (28.32 million m3)
Nonagriculture sectors 10.48 13.28 16.86
Agriculture sector
Bhavani River 19.79 19.79 19.79
Lower Bhavani – Odd season 16.88 16.88 16.17
Lower Bhavani – Even season 8.11 4.39 0.62
Revenue generation (Rs million)
Nonagriculture 819 1,063 1,382
Agriculture 1,522 1,422 1,291
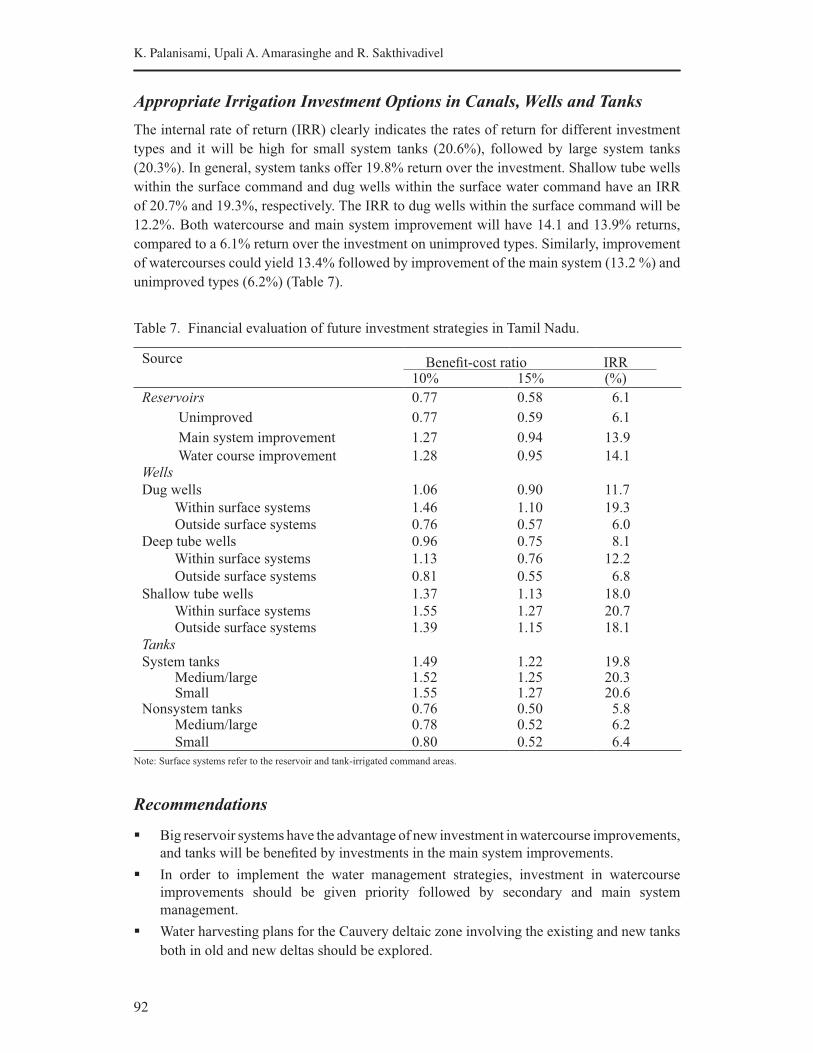
92
K. Palanisami, Upali A. Amarasinghe and R. Sakthivadivel
Appropriate Irrigation Investment Options in Canals, Wells and Tanks
The internal rate of return (IRR) clearly indicates the rates of return for different investment
types and it will be high for small system tanks (20.6%), followed by large system tanks
(20.3%). In general, system tanks offer 19.8% return over the investment. Shallow tube wells
within the surface command and dug wells within the surface water command have an IRR
of 20.7% and 19.3%, respectively. The IRR to dug wells within the surface command will be
12.2%. Both watercourse and main system improvement will have 14.1 and 13.9% returns,
compared to a 6.1% return over the investment on unimproved types. Similarly, improvement
of watercourses could yield 13.4% followed by improvement of the main system (13.2 %) and
unimproved types (6.2%) (Table 7).
Table 7. Financial evaluation of future investment strategies in Tamil Nadu.
Source
10% 15% (%)
Reservoirs 0.77 0.58 6.1
Unimproved 0.77 0.59 6.1
Main system improvement 1.27 0.94 13.9
Water course improvement 1.28 0.95 14.1Wells
Dug wells 1.06 0.90 11.7
Within surface systems 1.46 1.10 19.3 Outside surface systems 0.76 0.57 6.0Deep tube wells 0.96 0.75 8.1
Within surface systems 1.13 0.76 12.2
Outside surface systems 0.81 0.55 6.8
Shallow tube wells 1.37 1.13 18.0
Within surface systems 1.55 1.27 20.7 Outside surface systems 1.39 1.15 18.1Tanks
System tanks 1.49 1.22 19.8 Medium/large 1.52 1.25 20.3 Small 1.55 1.27 20.6Nonsystem tanks 0.76 0.50 5.8 Medium/large 0.78 0.52 6.2
Small 0.80 0.52 6.4
Note: Surface systems refer to the reservoir and tank-irrigated command areas.
Recommendations
§ Big reservoir systems have the advantage of new investment in watercourse improvements,
and tanks will be benefited by investments in the main system improvements.
§ In order to implement the water management strategies, investment in watercourse
improvements should be given priority followed by secondary and main system
management.
§ Water harvesting plans for the Cauvery deltaic zone involving the existing and new tanks
both in old and new deltas should be explored.
Benefit-cost ratio IRR
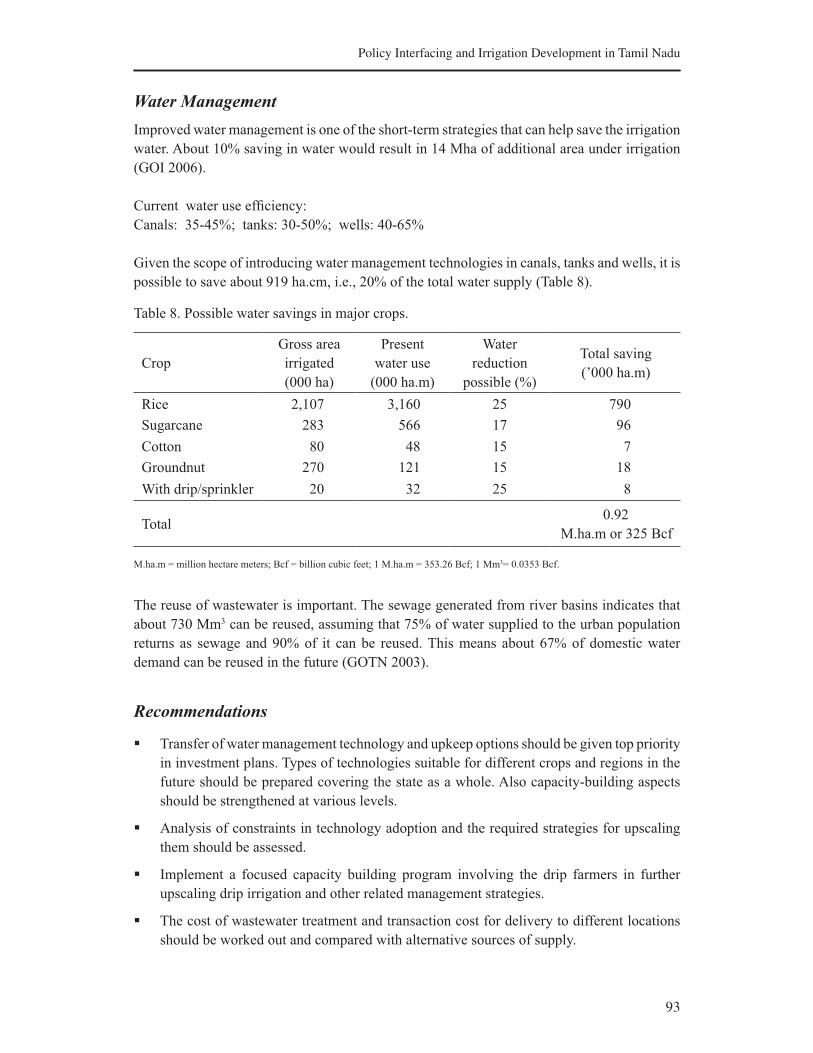
93
Policy Interfacing and Irrigation Development in Tamil Nadu
Water Management
Improved water management is one of the short-term strategies that can help save the irrigation
water. About 10% saving in water would result in 14 Mha of additional area under irrigation
(GOI 2006).
Current water use efficiency:
Canals: 35-45%; tanks: 30-50%; wells: 40-65%
Given the scope of introducing water management technologies in canals, tanks and wells, it is
possible to save about 919 ha.cm, i.e., 20% of the total water supply (Table 8).
Table 8. Possible water savings in major crops.
Crop
Gross area
irrigated
(000 ha)
Present
water use
(000 ha.m)
Water
reduction
possible (%)
Total saving
(’000 ha.m)
Rice 2,107 3,160 25 790
Sugarcane 283 566 17 96
Cotton 80 48 15 7
Groundnut 270 121 15 18
With drip/sprinkler 20 32 25 8
Total0.92
M.ha.m or 325 Bcf
M.ha.m = million hectare meters; Bcf = billion cubic feet; 1 M.ha.m = 353.26 Bcf; 1 Mm3= 0.0353 Bcf.
The reuse of wastewater is important. The sewage generated from river basins indicates that
about 730 Mm3 can be reused, assuming that 75% of water supplied to the urban population
returns as sewage and 90% of it can be reused. This means about 67% of domestic water
demand can be reused in the future (GOTN 2003).
Recommendations
§ Transfer of water management technology and upkeep options should be given top priority
in investment plans. Types of technologies suitable for different crops and regions in the
future should be prepared covering the state as a whole. Also capacity-building aspects
should be strengthened at various levels.
§ Analysis of constraints in technology adoption and the required strategies for upscaling
them should be assessed.
§ Implement a focused capacity building program involving the drip farmers in further
upscaling drip irrigation and other related management strategies.
§ The cost of wastewater treatment and transaction cost for delivery to different locations
should be worked out and compared with alternative sources of supply.
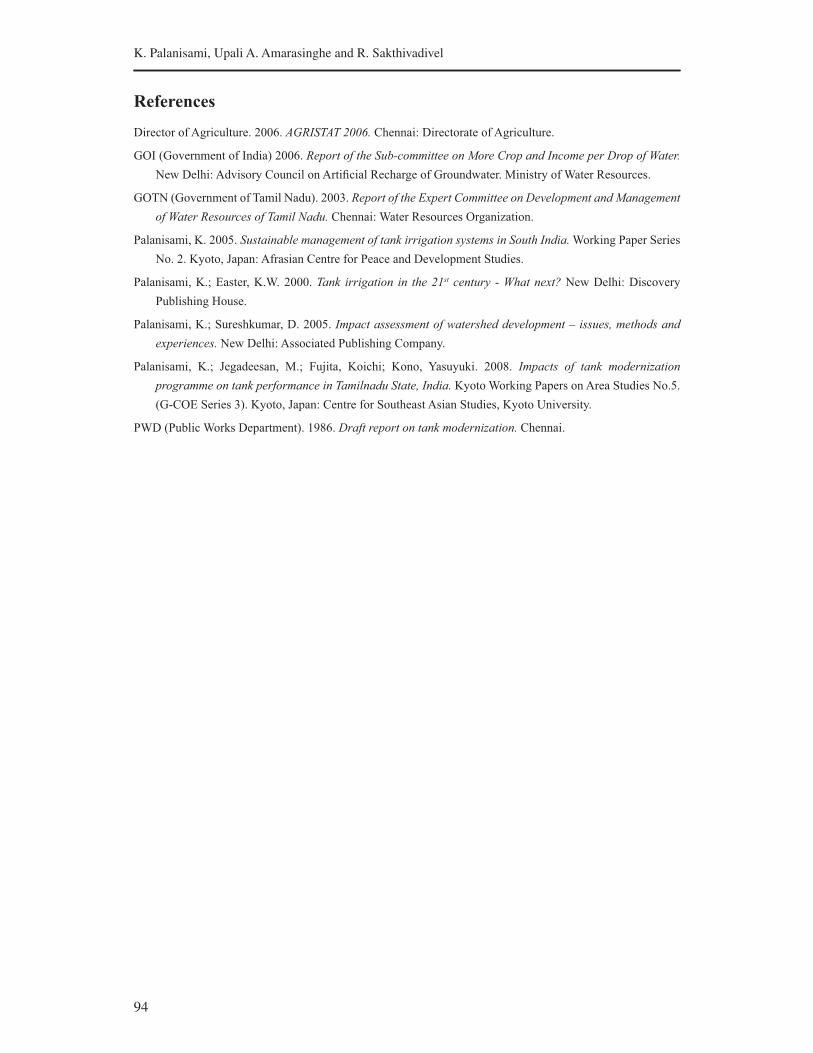
94
K. Palanisami, Upali A. Amarasinghe and R. Sakthivadivel
References
Director of Agriculture. 2006. AGRISTAT 2006. Chennai: Directorate of Agriculture.
GOI (Government of India) 2006. Report of the Sub-committee on More Crop and Income per Drop of Water.
New Delhi: Advisory Council on Artificial Recharge of Groundwater. Ministry of Water Resources.
GOTN (Government of Tamil Nadu). 2003. Report of the Expert Committee on Development and Management
of Water Resources of Tamil Nadu. Chennai: Water Resources Organization.
Palanisami, K. 2005. Sustainable management of tank irrigation systems in South India. Working Paper Series
No. 2. Kyoto, Japan: Afrasian Centre for Peace and Development Studies.
Palanisami, K.; Easter, K.W. 2000. Tank irrigation in the 21st century - What next? New Delhi: Discovery
Publishing House.
Palanisami, K.; Sureshkumar, D. 2005. Impact assessment of watershed development – issues, methods and
experiences. New Delhi: Associated Publishing Company.
Palanisami, K.; Jegadeesan, M.; Fujita, Koichi; Kono, Yasuyuki. 2008. Impacts of tank modernization
programme on tank performance in Tamilnadu State, India. Kyoto Working Papers on Area Studies No.5.
(G-COE Series 3). Kyoto, Japan: Centre for Southeast Asian Studies, Kyoto University.
PWD (Public Works Department). 1986. Draft report on tank modernization. Chennai.
95
Institutional Vacuum in Sardar-Sarovar Project: Framing
‘Rules-of-the-Game’
Jayesh Talati and Tushaar Shah
Anand 388001, India
Abstract
Few large irrigation projects in India have been as elaborately planned as the Sardar-Sarovar
Project (SSP), incorporating as it did the lessons of decades of irrigation project design and
management. The project was to blaze a new trail in farmer-participatory irrigation project
design and management with water user associations (WUAs) building their own distribution
systems. However, as it unfolds, the institutional reality of the project is seen to be vastly
different from its plans. If SSP is to chart a different course from scores of earlier large irrigation
projects, it must invent and put into place new rules of the irrigation management game.
Backdrop
With 30 years in planning, over 15 years in construction and some Rs 1,500 billion of investment
later, the saga of SSP’s vision is now ready to unfold. When fully commissioned, the project
will use 5,600 km of main and branch canals and 66,000 km of distribution networks (including
distributaries and minors) to deliver 9.8 km3 of irrigation water to 1.8 million hectares (Mha)
of land. Besides, SSP is also expected to boost the rural and urban drinking water needs of the
state and also help recharge groundwater aquifers in intensively groundwater-irrigated areas
of North Gujarat and Saurashtra. If all these targets are fully or even substantially met, SSP
will indeed prove to be the lifeline of Gujarat. And this will happen if its operational strategy,
i.e., key assumptions made during the planning phase about its manner of operation, holds.
The operational strategy of SSP was to be put to test in rabi (October to March) 2002. The key
elements of this strategy are:
1. The project will create distribution infrastructure such that each village has one or more
pucca (lined) minors depending upon its culturable command area (CCA); the distribution
system below the minor, including lined sub-minors, delivering water to 40-60 ha chaks
(small command areas), and field channels further down to serve 5-8 ha sub-chaks, will
be created by the irrigation community; the thinking was presumably that, by involving
the irrigation community in the design and creation of distribution infrastructure below
the minor, the project would not only invite genuine partnership with the community but
also provide an organizing logic for the WUA.
96
Jayesh Talati and Tushaar Shah
2. The irrigation community in each minor (serving a Village Service Area [VSA]) will form
a WUA whose responsibility will be to: (a) mobilize community labor and resources to
create the water distribution system below the minor; (b) arrange orderly distribution of
irrigation water within the command; (c) ensure future maintenance and upkeep of the
distribution system below the minor while the canal infrastructure up to the minor level
is maintained and operated by the SSP; (d) collect water fees at Rs 157/irrigation/ha, of
which Rs 7 would go back to the WUA as a subsidy to meet administrative expenses.
The idea was that participatory irrigation management (PIM) in the SSP starts at the
beginning, rather than come up midstream when system managers have taken all crucial
design decisions.
3. The project will provide only 21 inches of irrigation requirement in five irrigations turns
during rabi; no summer irrigation was envisaged, nor was it envisaged that Narmada
water would be used to raise perennial, water-intensive crops like sugarcane and banana;
the SSP planners’ idea was to cover large areas through extensive irrigation rather than
supporting a small, intensively irrigated command. The logic of rationing water was to
stem at the outset the propensity for early command areas at the head of the system to
form the habit of practicing water-intensive agriculture.
4. The SSP’s primary responsibility was to be the upkeep of the infrastructure up to the
minor level, and timely delivery of water on a volumetric basis to each VSA through
the WUA which would collect and aggregate indents from individual farmers in the
command. That done, it was expected that the WUAs would take over the responsibility of
water distribution with the VSA. The SSP would not consider water indents by individual
farmers unless these are routed through the WUA. This was expected to result in division
of O&M responsibility and costs in which the project takes the responsibility of those
parts of O&M that require technical and engineering competence of a high order whereas
WUAs will operate and maintain local infrastructure within the VSA where the knowledge
of local conditions is critical.
5. The system is planned for sophisticated, computerized water control from control rooms
strewn along branches and distributaries throughout the command; while the control rooms
are ready, the water control infrastructure will take a long time to install and commission.
As a result, for several years, volumetric water control will be operated manually, if at all.
The basic idea is to introduce volumetric delivery and charge at all levels from the very
beginning
As visions and strategies go, the early years of the operation of the SSP will be critical;
they will decide whether the project will run according to the original vision outlined above,
or by a new evolutionary operational framework even superior to the original vision, or regress
into an operational mode in which the SSP will follow in the footsteps of other major irrigation
projects, where achievements on all counts have fallen far short of expectations.
Running-in
The SSP is now poised at that crucial juncture. Like a new engine being run in, the SSP too
is getting ready to be ‘run in.’ Starting in rabi 2002, SSP has begun to release irrigation to
some 80,000 ha of its command in Narmada, Bharuch and Vadodara districts where canal
97
Institutional Vacuum in Sardar-Sarovar Project: Framing ÂRules-of-the-GameÊ
and distribution infrastructure up to the minor level is fully or partially ready. While the full
reservoir capacity is likely to be created once the dam height is raised to 135 m, it will take
10-15 years before the canal network gets constructed to cover the entire command area of
the project. Until then, SSP will gradually evolve, adding new areas in its irrigated command
every year. In this process of evolution, the experience of these formative years will prove
decisive in three ways: (a) system managers as well as users’ behavior and practices in the first
years will take the shape of habits, which will be difficult and painful to change later; (b) the
behavior, practices and habits allowed to form in the early parts of the command will define
the norms, rules, behavior and habits in new areas being brought under the command as the
project evolves; and (c) early years will decide whether the actual operational framework of
the project is faithful to the original vision or whether it is superior to, comparable with or
inferior to it.
Members of the SSP field staff have already done some amount of WUA organizing
work in the 800 villages encompassing the first year command of 80,000 ha. Typically, a
group of 11 leading, forward-looking farmers, generally representing all or most of the chaks
constituting the command area in each minor (sometimes, more than one minor) are formed
into a management committee of the WUA who also act as promoters, with one of the members
nominated as (often cajoled to become) the president. Over 800 WUAs have been registered
as cooperatives under the Co-operative Act. However, registering WUAs as cooperatives is
quite different from catalyzing functional WUAs that begin to undertake all the tasks they
are expected to perform. The critical challenge facing the SSP is to activate and energize the
800 odd minor-level WUAs so that they begin to play the role envisaged for them by the SSP
vision.
Impressions from Fieldwork
During late 2002, IWMI-Tata researchers worked together with the field staff and engineers of
the SSP to develop a firsthand assessment of the preparedness of the irrigation communities
to receive and utilize Narmada water for irrigation. Some 40 villages in different parts of the
command were covered. Subsequently, IWMI-Tata Program continued with field surveys and
studies in these villages. The objectives of this field research were:
1. To develop a quick situation analysis of the conditions in each village covered including
the size of the farmlands, number of irrigators, socioeconomic structure, cropping pattern,
existing irrigation sources, farm productivity, etc.
2. To assess the preparedness of the irrigation groups to receive Narmada water and arrange
for their orderly distribution.
3. To assess the level of user comfort with the SSP water pricing (which is higher compared
to government water pricing in all other surface irrigation systems) and the mode of
collection of water fees and their reimbursement to the SSP.
4. To understand the general state of the WUA, its internal dynamics, public awareness
about its existence, functions and future role.
5. To develop an assessment of the likelihood of the role of the SSP vision, outlined earlier,
being played out in reality; and to develop a prognosis of what might happen if it does
not.

98
Jayesh Talati and Tushaar Shah
The general situation in the 40 villages covered by our fieldwork was highly variable.
Some villages near the Kevadia Colony, near the head of the system, have had a small
area irrigated by Narmada water on a trial basis; some more area in the Bharuch District
too received some surface irrigation from small and medium irrigation projects, such as the
Deo project. Barring these small patches, the entire area commanded in this first phase has
never seen canal irrigation before. However, we found that even villages which had some
canal irrigation experience had no experience of farmer management of water distribution.
In Devalia and Madhodar minors, where the sub-minors too were constructed by the SSP
Nigam under a pilot project, WUAs were formed some 3 years back and were supposed to
manage water distribution and water fee collection. However, in reality, the water rotation
roster is given to them by the Nigam officials and the WUA has done little of its own rule-
making work. Moreover, whereas in Mahi and Ukai-Kakrapar commands we found vibrant
farmer organizations (FOs) like dairy and sugar cooperatives, the villages we visited in the
SSP command had virtually no experience in successful FOs at the local level. If anything,
people had bitter memories of all manner of cooperatives that had either swindled them or
become defunct.
Groundwater irrigation was fairly well developed in some parts but absent in other
areas, such as in Bharuch. Tank irrigation—by gravity flow and through lift irrigation with
diesel pumps and rubber pipes—however was found to be common. Near Jambusar, where
large tracts suffer from primary salinity, agriculture has been underdeveloped and careful
application of surface irrigation can boost the economy. Unlike the command areas of Ukai-
Kakrapar, Mahi and other canal systems, where the Patidaar cast population dominates the
farming population, in the 40 villages we visited, the Kshatriya cast dominates the farming,
and these are not as well known as Patidaars for their agrarian entrepreneurship. While we
found stray cases of Saurashtra Patel cast population having acquired land and settled in
the command area, there seemed no evidence of large-scale “strategic” land acquisition by
enterprising farmers from outside the command as yet. In general, we found Kshatriya (Jadejas,
Darbars, etc.), Parmars and Prajapati cast populations and a spattering of Harijans and tribals
in most of the villages. Some of the villages in the Bharuch District have mixed Hindu and
Muslim populations. Compared to the Mahi command area in the Kheda District, for instance,
the villages we visited were agriculturally far more backward; and onset of irrigation will no
doubt perk up the rural economy of this region in 3-5 years. Our surmise was that each of the
80,000 ha would produce at least Rs 8-10,000 in incremental value-added, thanks to Narmada
irrigation (direct irrigation plus more productive well irrigation); and the cost of Narmada
irrigation will be less than 10% of this increased value-added from farmland.
All the villages visited had taken some action to form WUAs under prompting from SSP
field staff. However, almost everywhere, what we found were only Management Committees
(MCs) with a president-designate. A few MCs had already had a general body meeting but none
had actually begun enrolling irrigators as formal members of WUAs. A subsequent IWMI-Tata
study (Talati and Liebrand 2003) showed that less than 3% of the farmers benefiting from
Narmada water had paid their WUA membership fees. The study which surveyed farmers in
12 villages of the SSP command also found that while most farmers know the MC members,
62.5% did not know “the purpose of forming a WUA;” 50% did not know “about the meeting
in which a WUA was formed;” 82% know nothing about the bylaws of the WUA and none

99
Institutional Vacuum in Sardar-Sarovar Project: Framing ÂRules-of-the-GameÊ
know about the rules and regulations of the WUA. Expectedly, no WUA performed any of
the three essential tasks they are expected to perform: indenting collation and water allocation,
orderly distribution of water and collection of water charges.
The SSP’s pricing and other policies too have been evolving only recently; and these
had not been fully communicated to all the MCs as yet. There was also some confusion
amongst MCs about the bylaws and specific clauses contained in them. Within the SSP staff
too, there was a lack of clarity about how the report of the Government of Gujarat’s Taskforce
on PIM would affect the SSP WUAs. All in all, at the time of our fieldwork, there were great
confusion and ambiguity about the design of WUAs, the bylaws, specific role of WUAs, and
the pattern of interaction between irrigators and WUAs and between WUAs and the SSP. Later
field studies suggest there has not been any major improvement in this condition since then.
We had expected to find some work initiated at the village level on creating the water
distribution system below the minor by irrigation communities. However, in none of the 40
villages was there any move in this direction. On the contrary, we found significant resistance
to the idea; in many villages, MC members categorically told us that sub-minors and field
channels will never get built unless the government does it. There was some ambiguity about
what the government/SSP will do to help; engineers accompanying us had told MCs that the
government had recently taken the decision to acquire land for building sub-minors. Some
MCs felt this would be welcome. The general impression the field staff gave farmers was
that sub-minors to the chak level must be lined; and farmers seemed daunted by the cost of
lining.
In any case, from our interaction with 40 village communities, we understood it is very
unlikely that irrigation communities will construct sub-minors and field channels in a hurry,
if at all. Half-hearted statements and rumors that the government might after all take over the
responsibility of building distribution systems within VSAs have further reduced the chances
that irrigation communities would take any initiative in this direction (Thomas 2004).A detailed
case study of social dynamics in two chaks of the SSP command suggested that farmers do
engage in primitive forms of fragmented collective action in building watercourses within
small portions of the chaks; but conflicts amongst subgroups hinder or frustrate such efforts.
It also does not help when this informal fragmented private and collective action results in the
design of watercourses which are very different from the standardized design evolved by the
SSP planners who are therefore not sympathetic to such uncoordinated attempts by groups of
irrigators trying to secure access to Narmada irrigation (Thomas 2004). But the SSP-designed
distribution systems are unlikely to get implemented for a long time to come, if ever.
What seems far more likely is that tiny areas adjoining the minors will be flow-irrigated,
but a lot more area will be irrigated by lifting water from canals through diesel pumps and
rubber pipes. Even farmers who can irrigate by gravity flow often prefer lifting water and
conveying it through rubber pipes to avoid conflict with upstream farmers and to better control
the flow (Thomas 2004). This mode of irrigation from canals, drains and tanks is already quite
popular in many parts. Almost every village we visited had 10-20 diesel pump renters who
also provide up to 1,000-1,500 feet of rubber pipes. Conveying lifted water 1-1.5 km using
rubber pipes is quite common in the area. Therefore, rather than investing money and labor in
building field channels and sub-minors, farmers will very likely use lift irrigation on a large
scale. In many villages we covered, we found that farmers were already preparing to invest in
diesel pump sets and pipes. Once they see water in the minors, very likely 5-10,000 new diesel
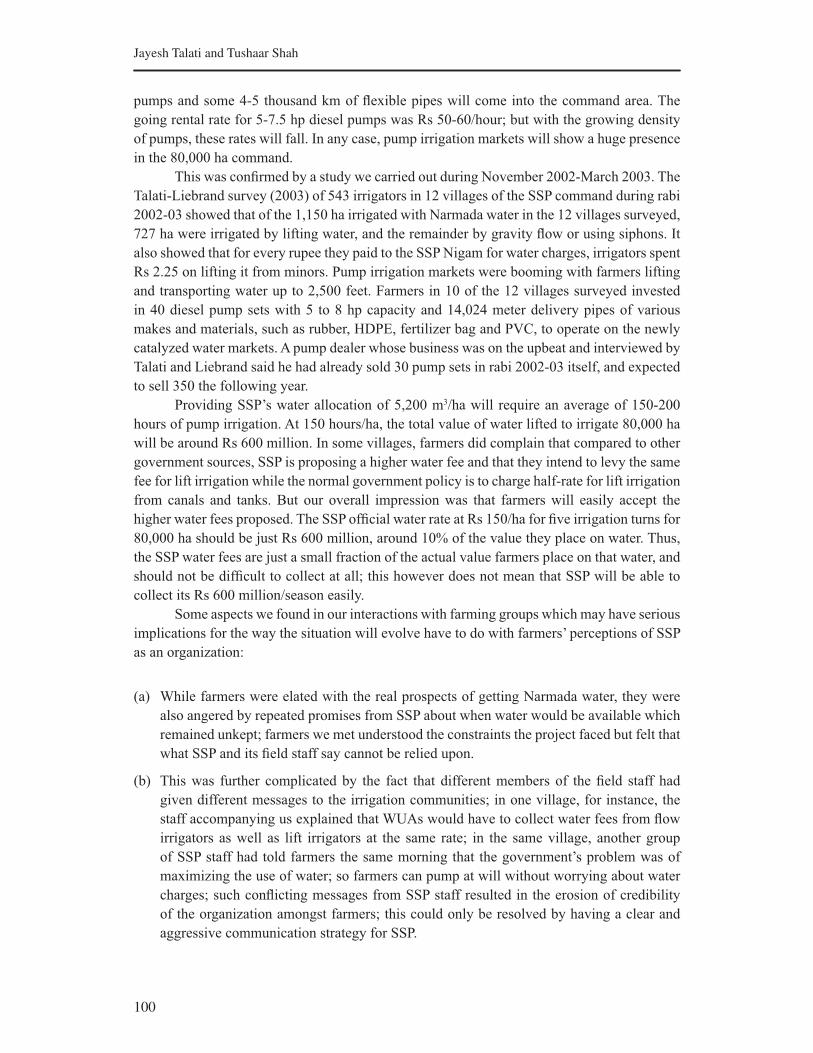
100
Jayesh Talati and Tushaar Shah
pumps and some 4-5 thousand km of flexible pipes will come into the command area. The
going rental rate for 5-7.5 hp diesel pumps was Rs 50-60/hour; but with the growing density
of pumps, these rates will fall. In any case, pump irrigation markets will show a huge presence
in the 80,000 ha command.
This was confirmed by a study we carried out during November 2002-March 2003. The
Talati-Liebrand survey (2003) of 543 irrigators in 12 villages of the SSP command during rabi
2002-03 showed that of the 1,150 ha irrigated with Narmada water in the 12 villages surveyed,
727 ha were irrigated by lifting water, and the remainder by gravity flow or using siphons. It
also showed that for every rupee they paid to the SSP Nigam for water charges, irrigators spent
Rs 2.25 on lifting it from minors. Pump irrigation markets were booming with farmers lifting
and transporting water up to 2,500 feet. Farmers in 10 of the 12 villages surveyed invested
in 40 diesel pump sets with 5 to 8 hp capacity and 14,024 meter delivery pipes of various
makes and materials, such as rubber, HDPE, fertilizer bag and PVC, to operate on the newly
catalyzed water markets. A pump dealer whose business was on the upbeat and interviewed by
Talati and Liebrand said he had already sold 30 pump sets in rabi 2002-03 itself, and expected
to sell 350 the following year.
Providing SSP’s water allocation of 5,200 m3/ha will require an average of 150-200
hours of pump irrigation. At 150 hours/ha, the total value of water lifted to irrigate 80,000 ha
will be around Rs 600 million. In some villages, farmers did complain that compared to other
government sources, SSP is proposing a higher water fee and that they intend to levy the same
fee for lift irrigation while the normal government policy is to charge half-rate for lift irrigation
from canals and tanks. But our overall impression was that farmers will easily accept the
higher water fees proposed. The SSP official water rate at Rs 150/ha for five irrigation turns for
80,000 ha should be just Rs 600 million, around 10% of the value they place on water. Thus,
the SSP water fees are just a small fraction of the actual value farmers place on that water, and
should not be difficult to collect at all; this however does not mean that SSP will be able to
collect its Rs 600 million/season easily.
Some aspects we found in our interactions with farming groups which may have serious
implications for the way the situation will evolve have to do with farmers’ perceptions of SSP
as an organization:
(a) While farmers were elated with the real prospects of getting Narmada water, they were
also angered by repeated promises from SSP about when water would be available which
remained unkept; farmers we met understood the constraints the project faced but felt that
what SSP and its field staff say cannot be relied upon.
(b) This was further complicated by the fact that different members of the field staff had
given different messages to the irrigation communities; in one village, for instance, the
staff accompanying us explained that WUAs would have to collect water fees from flow
irrigators as well as lift irrigators at the same rate; in the same village, another group
of SSP staff had told farmers the same morning that the government’s problem was of
maximizing the use of water; so farmers can pump at will without worrying about water
charges; such conflicting messages from SSP staff resulted in the erosion of credibility
of the organization amongst farmers; this could only be resolved by having a clear and
aggressive communication strategy for SSP.
101
Institutional Vacuum in Sardar-Sarovar Project: Framing ÂRules-of-the-GameÊ
(c) Often in good faith and almost casually, SSP field staff had liberally made commitments to
irrigation communities to fix their specific local problems; in some villages, farmers came
with complaints that some of their lands were waterlogged; in one village, the community
wanted the bed of the minor raised so they could use siphons; in several, they wanted the
SSP Nigam to provide water to fill their tanks; in some villages, where the paddy crop was
burning because of moisture stress, farmers wanted Narmada water released immediately
to save the paddy crop. Field staff accompanying us agreed so solve all their problems
or at least to look into them. However, irrigators as well as SSP staff were certain that
most of these commitments would not be kept, often because it is very difficult, or even
impossible, to solve each individual farmer’s problem in such a large system. Yet, farmers
will not forget these commitments and will use them as a stick to beat the SSP with.
(d) One idea that was deeply ingrained in the minds of farmers is that SSP’s need to release
water into the system is greater and stronger than farmers’ need to use the water; allowing
this impression to continue must further erode SSP’s capability to establish an orderly
institutional arrangement for irrigation.
(e) Similarly, farmers and MCs we met assigned no seriousness or urgency to SSP’s insistence
on the operating practices it intends to pursue; for example, most farmers did not believe
that water indents will not be honored unless they are made through WUAs; that WUAs
which do not make an indent will not get water; that WUAs which do not pay their dues
will be refused water for the next irrigation; that lift irrigation will actually be charged
at the same rate as flow irrigation. It seemed to us that farmers take the SSP and the
government so lightly that they were totally nonchalant about SSP’s new water policy,
which they did believe would be vigorously implemented.
Assessment
Overall, based on a brief stint of fieldwork during 2003 and follow-up studies later, our assessment
is that it is unlikely the overall vision of the SSP for irrigation management will be played out
for several seasons to come. Farmers are certainly not ready; but we think that even the SSP is
not quite ready to implement its strategy. For example, even now, neither farmers nor field staff
know where to obtain forms for indenting water. Field staff have not thought about what course
of action is to be adopted in villages which have minors but which have not submitted their water
indents, or if farmers begin to lift water en masse without submitting the indent.
It is unlikely that even in the long run, irrigation communities and WUAs will build
below-the-minor distribution systems of the kind the SSP expects them to build.1 Most villages
will prefer instead to use lift irrigation and rubber pipes to distribute water. This means that
there will be no planned, orderly water distribution by the WUAs. Instead, pump irrigation
markets will proliferate. From the viewpoint of both water use efficiency and economical use
1In building distribution systems within Village Service Areas, one problem farmers face is of high
capital cost of pucca sub-minors; but the other is of acquiring land for sub-minors, which they feel only
the government can do. There is some thinking in the government now about Sardar-Sarovar Narmada
Nigam Limited acquiring the land for sub-minors and farmers contributing funds to build the distribution
system. However, there is no clarity on the issue; in the meanwhile, lift irrigation from SSP canals has
been going apace
102
Jayesh Talati and Tushaar Shah
of water, this arrangement would in some ways be even superior to the sub-minors and field
channels envisaged by the SSP. Pipes will minimize seepage; and farmers paying Rs 50-60/
hour for lift irrigation will strive to minimize wasteful use of water. Therefore, in our judgment,
a distribution system based on private pump irrigation markets may not be necessarily bad
and may even result in better use of the 21-inch irrigation requirement under SSP plans of
provision.
Two bothersome issues about this are the use of energy and equitable distribution of
water. Pump-irrigation-based distribution will mean avoidable use of 150-200 liters of fuel/
ha; and it will be useful to examine if improved water use efficiency justifies this substantial
incremental cost. A detailed and proper analysis of private, community and social-cost
benefit issues involved in choosing between lift-based and gravity-based distribution systems
is strongly indicated. The key gain from the former is that it will not require setting aside
farmland for sub-minors and field channels which may cost Rs 0.4-0.5 million per minor,
especially if land is acquired after irrigation arrives as will be the case in these parts of the
Narmada command. The SSP has already been estimating the cost of a fairly good distribution
system at around Rs 1-1.2 million/village, and a good part of it will require regular, annual
maintenance. Contrast this with 50 7.5 hp pumps and 50 km of flexi pipes with a total capital
investment of around Rs 1-1.25 million to distribute water over 500 ha. The annual fuel cost
at 150 liters/ha would be Rs 1.5 million. So in opting for lift-based pump irrigation markets
over constructing a gravity-flow distribution system, a village irrigation community is paying
around Rs 1.5 million/year (plus the annual wear and tear, and replacement costs of pumps and
pipes) to save two costs: (a) farmland, labor and other material needed to build channels and
(b) transaction cost of organizing to build a common-property distribution system.
Gravity irrigation systems have their own equity issues between head- and tail-reach
farmers. In a lift-irrigation-based water distribution system that may soon dominate the SSP
command, equity issues will take a different spin in which topography will play an important
part. Depending on the location of their farms in relation to the minor, and the topography of
the area, different farmers will have differential access to canal irrigation. Lands adjoining the
minor will get plentiful gravity flow; their owners will be the most privileged class.2 Owners
of lands who can get canal water by using siphons too will be privileged because they will
not have to spend on lifting. Owners of fields further away and/or higher than the minor will
be forced to lift; and those who are too resource-poor to own their own pumps and pipes
will spend the most for irrigation. Since the lift involved is low, perhaps, it would be useful
to promote low-lift diesel-operated and even manual and bullock-operated pumps for water
distribution.
What might be the role of WUAs and PIM in the Narmada context, if distribution of
water below the minor will be done by private lift irrigation suppliers? In our view, it would be
considerably more limited than would be the case under gravity flow distribution. Indeed, the
principal role the WUA would now be expected to play is collecting water fees from irrigators
and indenting water on behalf of them from the SSP.
2However, a deeper probe suggests that lowlands near minors may also face the problem of unwanted
leakages, flooding and waterlogging, and their owners may not always and necessarily be better-off
compared to owners of distant lands and uplands that require lift irrigation (Thomas 2004).
103
Institutional Vacuum in Sardar-Sarovar Project: Framing ÂRules-of-the-GameÊ
Immediate Priorities
In the immediate future, SSP can do little either to strengthen WUAs by capacity-building
work or to encourage irrigation communities to build distribution infrastructure since there is
no time to do either. In the medium to the long run, however, it should keep making efforts
to do both. What it can do now, however, is important and can profoundly affect the way the
project’s O&M evolve over the coming years. Some of these are listed below:
1. Indents for irrigation water: The best and quickest way of energizing WUAs into
functional bodies is for the SSP to ensure water indents are accepted only through WUAs;
and that no farmer who has not submitted an indent through a WUA is allowed to use
irrigation from the minor, either by gravity or by lift. In order that this happens, prior to
each irrigation season, SSP needs to move fast, make indent forms available to WUA MCs
and get them to complete these forms and submit them in a campaign mode.
2. Advance collection of water fees: This can be another measure that will energize WUAs.
Although a widely used practice in Gujarat and elsewhere is to collect irrigation fees after
irrigation is over, we believe that is the prime reason behind the low collection ratio. The
SSP’s current policy offers WUAs a 10% discount for advance payment. However, in our
view, this gives irrigation communities scope to avoid having to organize now; MCs will
take a pro-active attitude because they can wait until after the season is over to approach
members for dues. This opportunity should not be given. Instead, the SSP should ask
all those WUAs which want irrigation water to pay their water fees in advance. Doing
this will mean that MCs will have to call the general body meeting, and will have to ask
irrigators to pay up the water fees, which is the first step to catalyzing effective WUAs.
3. Announce an irrigation schedule and adhere to it strictly and at all cost: At present there
is so much uncertainty and fluidity in the thinking of farmers as well as SSP field staff
that nobody can say for sure when the first irrigation will be released, and how water
will move around the system. In this situation, WUAs would find it difficult to even
complete their indents. The SSP should finalize an irrigation schedule as soon as possible
and widely disseminate it. It should clearly state which minors will be run at full supply
during which weeks, the total number of weeks when water would be provided and so on
so that farmers can plan their cropping patterns and schedules. Once these schedules are
announced, they should be adhered to strictly. Doing this will enable MCs to call general
body meetings and start collecting water fees in advance.
4. Establish rules of the game: The key task to be performed at this stage is to establish the
rules of the game by which SSP will operate. Farmers now see SSP as a government body
that would look after everything. SSP needs to break out of this mould and establish a fair
business relationship with the users. This requires that its organization treats farmers as
customers, like all good businesses and utilities do; at the same time, it needs to ensure
that basic rules of the game of the business are adhered to by both parties. So SSP should
provide a specified quantity of water along a specified schedule to irrigation communities
which have indented water and paid for it in advance; but those communities that have not
indented or not paid must be prevented from using Narmada water, no matter what. If this
rule is not enforced in the first year, chances are that it will never be.
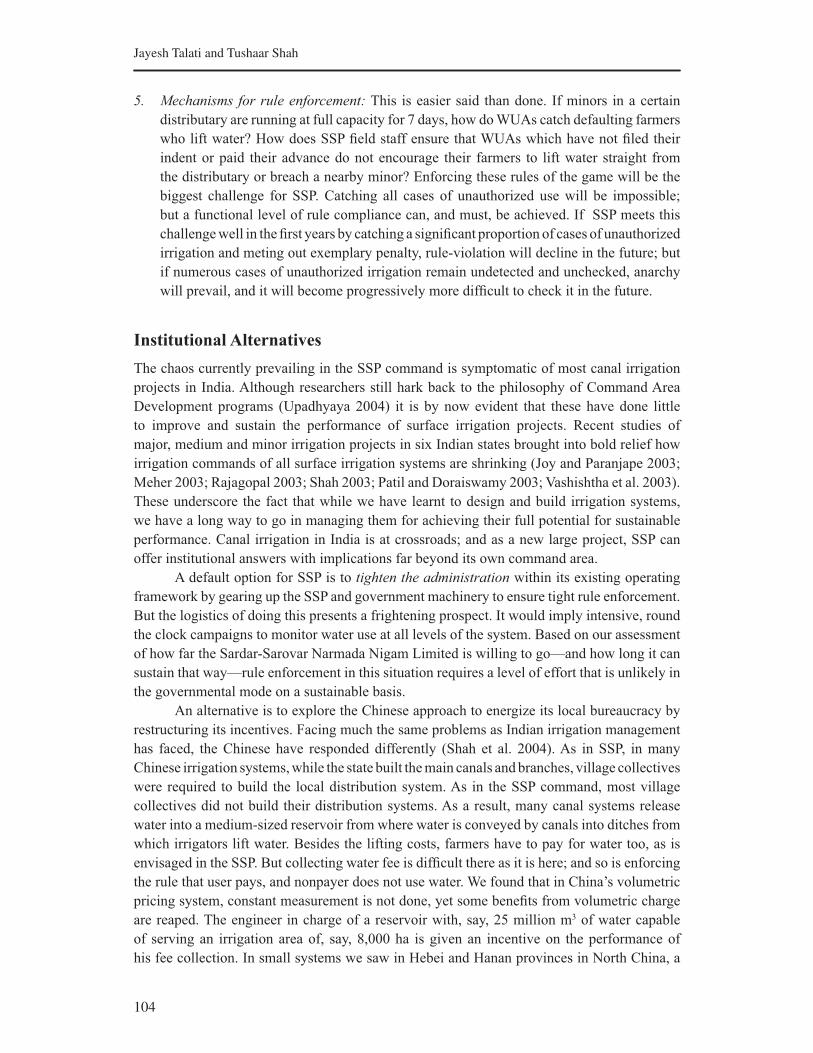
104
Jayesh Talati and Tushaar Shah
5. Mechanisms for rule enforcement: This is easier said than done. If minors in a certain
distributary are running at full capacity for 7 days, how do WUAs catch defaulting farmers
who lift water? How does SSP field staff ensure that WUAs which have not filed their
indent or paid their advance do not encourage their farmers to lift water straight from
the distributary or breach a nearby minor? Enforcing these rules of the game will be the
biggest challenge for SSP. Catching all cases of unauthorized use will be impossible;
but a functional level of rule compliance can, and must, be achieved. If SSP meets this
challenge well in the first years by catching a significant proportion of cases of unauthorized
irrigation and meting out exemplary penalty, rule-violation will decline in the future; but
if numerous cases of unauthorized irrigation remain undetected and unchecked, anarchy
will prevail, and it will become progressively more difficult to check it in the future.
Institutional Alternatives
The chaos currently prevailing in the SSP command is symptomatic of most canal irrigation
projects in India. Although researchers still hark back to the philosophy of Command Area
Development programs (Upadhyaya 2004) it is by now evident that these have done little
to improve and sustain the performance of surface irrigation projects. Recent studies of
major, medium and minor irrigation projects in six Indian states brought into bold relief how
irrigation commands of all surface irrigation systems are shrinking (Joy and Paranjape 2003;
Meher 2003; Rajagopal 2003; Shah 2003; Patil and Doraiswamy 2003; Vashishtha et al. 2003).
These underscore the fact that while we have learnt to design and build irrigation systems,
we have a long way to go in managing them for achieving their full potential for sustainable
performance. Canal irrigation in India is at crossroads; and as a new large project, SSP can
offer institutional answers with implications far beyond its own command area.
A default option for SSP is to tighten the administration within its existing operating
framework by gearing up the SSP and government machinery to ensure tight rule enforcement.
But the logistics of doing this presents a frightening prospect. It would imply intensive, round
the clock campaigns to monitor water use at all levels of the system. Based on our assessment
of how far the Sardar-Sarovar Narmada Nigam Limited is willing to go—and how long it can
sustain that way—rule enforcement in this situation requires a level of effort that is unlikely in
the governmental mode on a sustainable basis.
An alternative is to explore the Chinese approach to energize its local bureaucracy by
restructuring its incentives. Facing much the same problems as Indian irrigation management
has faced, the Chinese have responded differently (Shah et al. 2004). As in SSP, in many
Chinese irrigation systems, while the state built the main canals and branches, village collectives
were required to build the local distribution system. As in the SSP command, most village
collectives did not build their distribution systems. As a result, many canal systems release
water into a medium-sized reservoir from where water is conveyed by canals into ditches from
which irrigators lift water. Besides the lifting costs, farmers have to pay for water too, as is
envisaged in the SSP. But collecting water fee is difficult there as it is here; and so is enforcing
the rule that user pays, and nonpayer does not use water. We found that in China’s volumetric
pricing system, constant measurement is not done, yet some benefits from volumetric charge
are reaped. The engineer in charge of a reservoir with, say, 25 million m3 of water capable
of serving an irrigation area of, say, 8,000 ha is given an incentive on the performance of
his fee collection. In small systems we saw in Hebei and Hanan provinces in North China, a
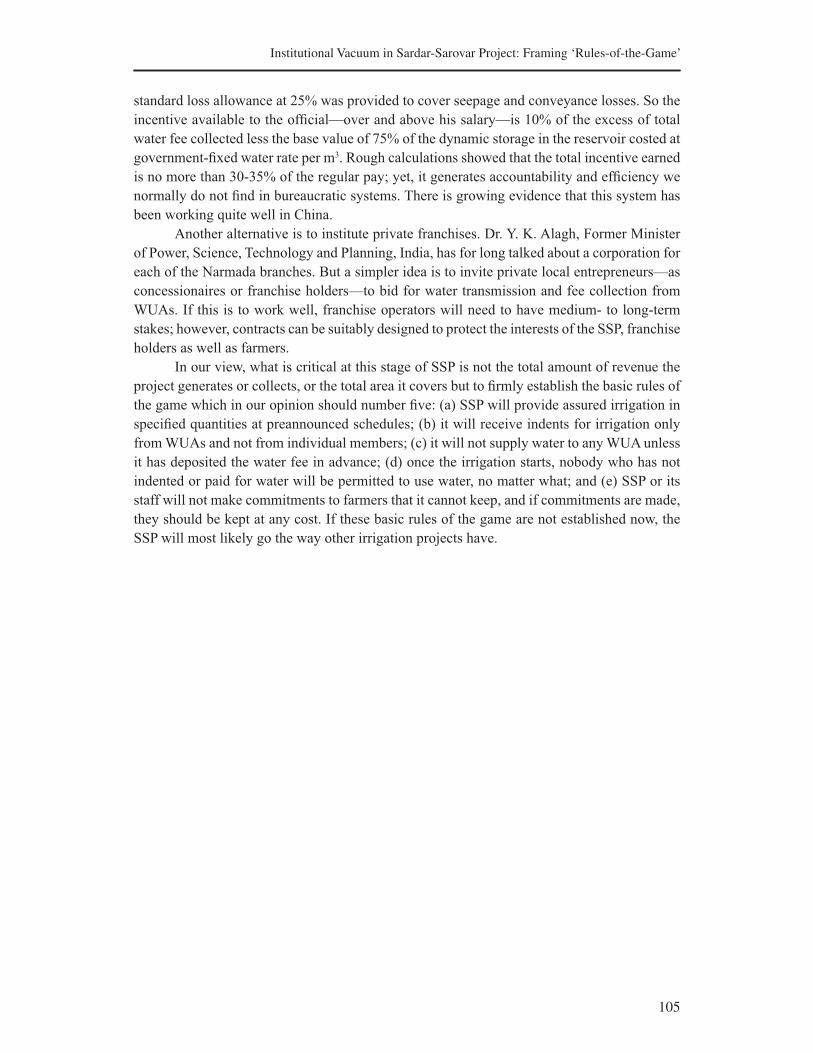
105
Institutional Vacuum in Sardar-Sarovar Project: Framing ÂRules-of-the-GameÊ
standard loss allowance at 25% was provided to cover seepage and conveyance losses. So the
incentive available to the official—over and above his salary—is 10% of the excess of total
water fee collected less the base value of 75% of the dynamic storage in the reservoir costed at
government-fixed water rate per m3. Rough calculations showed that the total incentive earned
is no more than 30-35% of the regular pay; yet, it generates accountability and efficiency we
normally do not find in bureaucratic systems. There is growing evidence that this system has
been working quite well in China.
Another alternative is to institute private franchises. Dr. Y. K. Alagh, Former Minister
of Power, Science, Technology and Planning, India, has for long talked about a corporation for
each of the Narmada branches. But a simpler idea is to invite private local entrepreneurs—as
concessionaires or franchise holders—to bid for water transmission and fee collection from
WUAs. If this is to work well, franchise operators will need to have medium- to long-term
stakes; however, contracts can be suitably designed to protect the interests of the SSP, franchise
holders as well as farmers.
In our view, what is critical at this stage of SSP is not the total amount of revenue the
project generates or collects, or the total area it covers but to firmly establish the basic rules of
the game which in our opinion should number five: (a) SSP will provide assured irrigation in
specified quantities at preannounced schedules; (b) it will receive indents for irrigation only
from WUAs and not from individual members; (c) it will not supply water to any WUA unless
it has deposited the water fee in advance; (d) once the irrigation starts, nobody who has not
indented or paid for water will be permitted to use water, no matter what; and (e) SSP or its
staff will not make commitments to farmers that it cannot keep, and if commitments are made,
they should be kept at any cost. If these basic rules of the game are not established now, the
SSP will most likely go the way other irrigation projects have.
106
Jayesh Talati and Tushaar Shah
References
Joy, K J; Paranjape, Suhas. 2003. Tail-enders and other deprived in canal irrigation systems: Maharashtra. Paper
for The National Workshop on “Tail-enders and Other Deprived in Canal Irrigation Systems” organized by
Development Support Centre at Ahmedabad during November 28-29, 2003.
Meher, Rajkishore. 2003. Tail-enders and others deprived in canal irrigation systems: Orissa, Paper for The
National Workshop on “Tail-enders and Other Deprived in Canal Irrigation Systems” organized by
Development Support Centre at Ahmedabad during November 28-29, 2003
Patil, S.K.; Doraiswamy, R. 2003. Tail-enders and others deprived in canal irrigation systems: Karnataka. Paper
for The National Workshop on “Tail-enders and Others Deprived in Canal Irrigation Systems” organized
by Development Support Centre at Ahmedabad during November 28-29, 2003.
Rajagopal, A. 2003. Tail-enders and others deprived in canal irrigation systems: Tamilnadu. Paper for The
National Workshop on “Tail-enders and Others Deprived in Canal Irrigation Systems” organized by
Development Support Centre at Ahmedabad during November 28-29, 2003.
Shah, Anil. 2003. Tail-enders and others deprived in canal irrigation systems: Gujarat. Paper for The National
Workshop on “Tail-enders and Others Deprived in Canal Irrigation Systems” organized by Development
Support Centre at Ahmedabad during November 28-29, 2003.
Shah, Tushaar; Giordano, Mark; Wang, Jinxia. 2004. Water institutions in a dynamic economy: What is China
doing differently from India? Anand: IWMI-Tata Water Policy Program. (Duplicated).
Talati, Jayesh; Liebrand, J. 2003. Evolving institutions for irrigation management in Sardar Sarovar Project
command. Anand, IWMI-Tata Program. (Duplicated).
Thomas, Vincent. 2004. Villagers’ responses to the Narmada water supply. Anand: IWMI-Tata Water Policy
Program. (Duplicated).
Upadhyaya, Himanshu. 2004. Narmada project: Concerns over command area environment. Economic and
Political Weekly XXXIX, No 19, May 8.
Vashishtha, Prem; Deva, Vikram; Kumar, Yogesh. 2003. Tail-enders and others deprived in canal irrigation
systems: Haryana. Paper for the National Workshop on “Tail-enders and Others Deprived in Canal
Irrigation Systems” organized by Development Support Centre at Ahmedabad during November 28-29,
2003.
107
Groundwater Externalities of Large Surface
Irrigation Transfers:
Lessons from Indira Gandhi Nahar Pariyojana,
Rajasthan, India
Bharat R. Sharma,1 K.V.G.K. Rao2 and Govind Sharma3
1 International Water Management Institute, New Delhi Office, India ([email protected]).2 Indwa Technologies Pvt. Ltd., Punjagutta, Hyderabad, India.
3 Command Area Development & Water Use Department,
Government of Rajasthan, Jaipur, India.
Introduction
Indira Gandhi Nahar Pariyojana (IGNP) was among the first group of large surface water
transfer projects taken up in the country aiming to transform the wastelands of Thar Desert in
Rajasthan into agriculturally productive zones along with improvement of afforestation and
environment, development and protection of livestock/animal health, human rehabilitation
and settlement, and economic growth of the poor people of the desert. The project had
laudable objectives of “drought proofing, provision of drinking water, industrial and irrigation
facilities, creation of employment opportunities, settlement of human population of thinly
populated desert areasi; improvement of fodder, forage and agriculture facilities, check spread
of desert area and improve ecosystem through large-scale afforestation, develop road network
and provide requisite opportunities for overall economic development” (IGNB 2002). Over
the years, some of these objectives have been adequately met. At the same time, this large
transfer of surface water from alluvial plains to a desert region with no natural drainage and
over 250 km away leads to a massive spread of waterlogging and salinity, inundation of vast
land depressions and adjoining habitations, roads and public property and fast spread of water-
induced animal and human diseases. IGNP presents a great lesson to water infrastructural
planners and managers on how inadequacies in planning and operation of large surface irrigation
transfers can create negative groundwater externalities of unforeseen magnitude which fail to
be tackled by normal quickfix solutions. This paper, a part of the Strategic Analyses of the
National River Linking Project, attempts to diagnose and analyze this problem, and drawing
lessons from the past failed-interventions offers a certain viable strategy for IGNP and other
large future projects of surface water transfers elsewhere.
108
Bharat R. Sharma, K.V.G.K. Rao and Govind Sharma
IGNP-The Project
IGNP is a large water infrastructural project designed for transferring 9.36 Bm3 (7.59 milion
acre feet) of Rajasthan’s share agreed under the Indus Water Treaty (1960)/and Inter-State
Water Agreement (1981). The water from the Harike Barrage in Punjab is transferred to the
western desert region of Rajasthan through a 200 km long feeder canal. The system is designed
to irrigate 2.5 Mha of Thar Desert through an extensive network of a more than 9,000 km
length of distribution system and 450 km length of main canals. Irrgation in IGNP is developed
in stages popularly known as Stage-I and Stage-II. The IGNP Stage-I consists of a head feeder
reach of 204 km offtaking from the Harike Barrage, a 189 km main canal and a 3,454 km
long distribution system with a culturable command area (CCA) of 541,000 ha. The IGNP
Stage-II, commencing with a 189 km main canal, consists of the lower reaches of the project
comprising a 256 km long main canal and a 5,606 km long distribution system with a CCA of
1,319,000 ha.
The canal network is lined and able to bring large quantities of water to irrigate an
extensive area of what was a low-value desert. Land brought into the scheme is allotted to
persons applying for land, with a carefully developed system of prioritization of applications
to identify the most deserving applicants. Each allotment is 25 bighas (6.32 ha) in area. The
applicants with the highest priority are from the region being developed; nevertheless, there
have been extensive population shifts into the project area to take advantage of the potential
created. Stage-I started receiving irrigation since October 1961 and Stage-II is still under
construction.
By 2004-05, 559,000 ha irrigation potential was created under Stage I and 510,000
ha under Stage II. Irrigation potential is deemed to be created only when watercourses are
constructed, and water is provided through outlets for a murabba of 6.32 ha. Irrigation potential
created and utilized for some selected years for Stage-I and Stage-II of IGNP is given in Table
1. The development activities of the command area for the IGNP command, which included,
among others, the construction of lined watercourses to the outlets, land leveling and shaping
and soil conservation, started in 1974.
Table 1. Progressive development of irrigation potential created and utilized under Stage-I
and Stage-II of IGNP.
YearStage-I Stage-II
Through canal Through watercourse Utilized Through canal Through watercourse Utilized
Area
opend
(lakh
ha)
Potential
created
(with
110%
irrigation
intensity)
Area
covered
(lakh
ha)
Irrigation
potential
created
(110%)
Area
opend
(lakh
ha)
Potential
created
(with
110%
irrigation
intensity)
Area
covered
(lakh
ha)
Irrigation
potential
created
(110%)
74-75 2.86 3.15 0 0 2.58 - - - - -
81-82 4.86 5.35 2.07 2.28 4.02 0.35 0.28 0 0 0
88-89 5.22 5.74 4.08 4.49 5.53 1.45 1.16 0.3 0.24 0.12
95-96 5.31 5.84 4.42 4.86 6.64 5.09 4.07 2.85 2.28 1.37
2000-
015.42 5.96 4.69 5.16 6.28 7.55 6.04 5.13 4.1 2.08
2004-
055.46 6.01 5.08 5.59 6.88 9.26 7.41 6.37 5.1 1.44
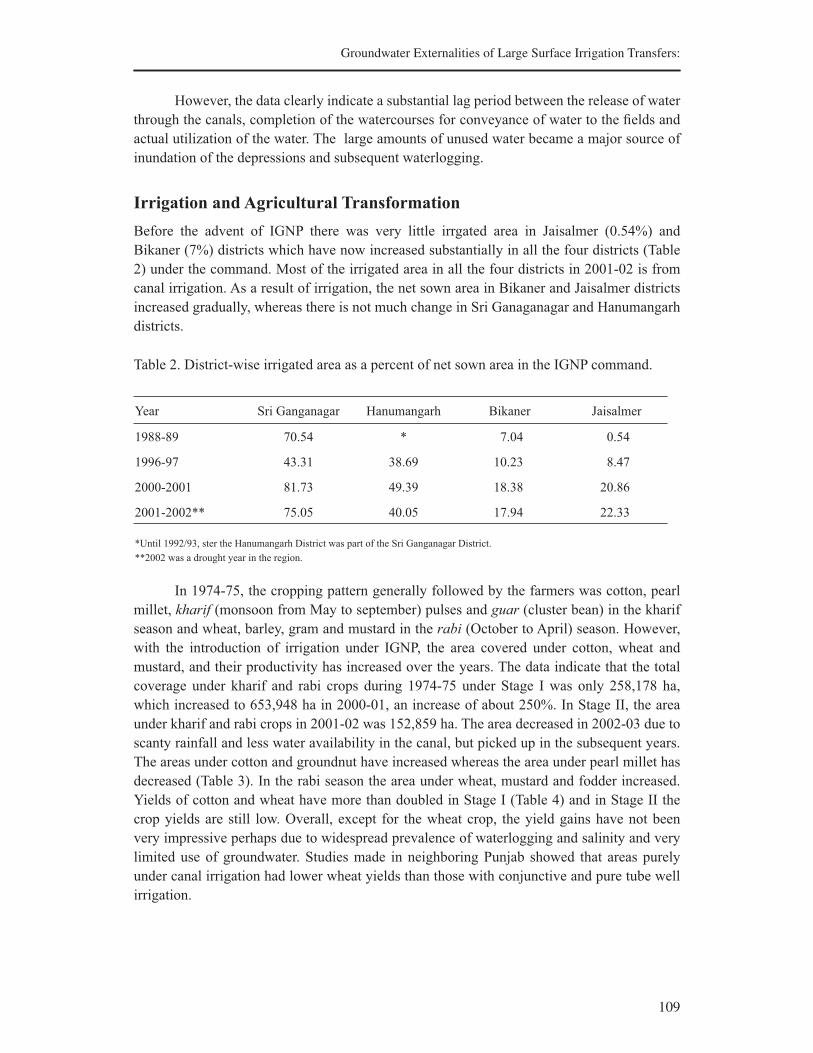
109
Groundwater Externalities of Large Surface Irrigation Transfers:
However, the data clearly indicate a substantial lag period between the release of water
through the canals, completion of the watercourses for conveyance of water to the fields and
actual utilization of the water. The large amounts of unused water became a major source of
inundation of the depressions and subsequent waterlogging.
Irrigation and Agricultural Transformation
Before the advent of IGNP there was very little irrgated area in Jaisalmer (0.54%) and
Bikaner (7%) districts which have now increased substantially in all the four districts (Table
2) under the command. Most of the irrigated area in all the four districts in 2001-02 is from
canal irrigation. As a result of irrigation, the net sown area in Bikaner and Jaisalmer districts
increased gradually, whereas there is not much change in Sri Ganaganagar and Hanumangarh
districts.
Table 2. District-wise irrigated area as a percent of net sown area in the IGNP command.
Year Sri Ganganagar Hanumangarh Bikaner Jaisalmer
1988-89 70.54 * 7.04 0.54
1996-97 43.31 38.69 10.23 8.47
2000-2001 81.73 49.39 18.38 20.86
2001-2002** 75.05 40.05 17.94 22.33
*Until 1992/93, ster the Hanumangarh District was part of the Sri Ganganagar District.
**2002 was a drought year in the region.
In 1974-75, the cropping pattern generally followed by the farmers was cotton, pearl
millet, kharif (monsoon from May to september) pulses and guar (cluster bean) in the kharif
season and wheat, barley, gram and mustard in the rabi (October to April) season. However,
with the introduction of irrigation under IGNP, the area covered under cotton, wheat and
mustard, and their productivity has increased over the years. The data indicate that the total
coverage under kharif and rabi crops during 1974-75 under Stage I was only 258,178 ha,
which increased to 653,948 ha in 2000-01, an increase of about 250%. In Stage II, the area
under kharif and rabi crops in 2001-02 was 152,859 ha. The area decreased in 2002-03 due to
scanty rainfall and less water availability in the canal, but picked up in the subsequent years.
The areas under cotton and groundnut have increased whereas the area under pearl millet has
decreased (Table 3). In the rabi season the area under wheat, mustard and fodder increased.
Yields of cotton and wheat have more than doubled in Stage I (Table 4) and in Stage II the
crop yields are still low. Overall, except for the wheat crop, the yield gains have not been
very impressive perhaps due to widespread prevalence of waterlogging and salinity and very
limited use of groundwater. Studies made in neighboring Punjab showed that areas purely
under canal irrigation had lower wheat yields than those with conjunctive and pure tube well
irrigation.
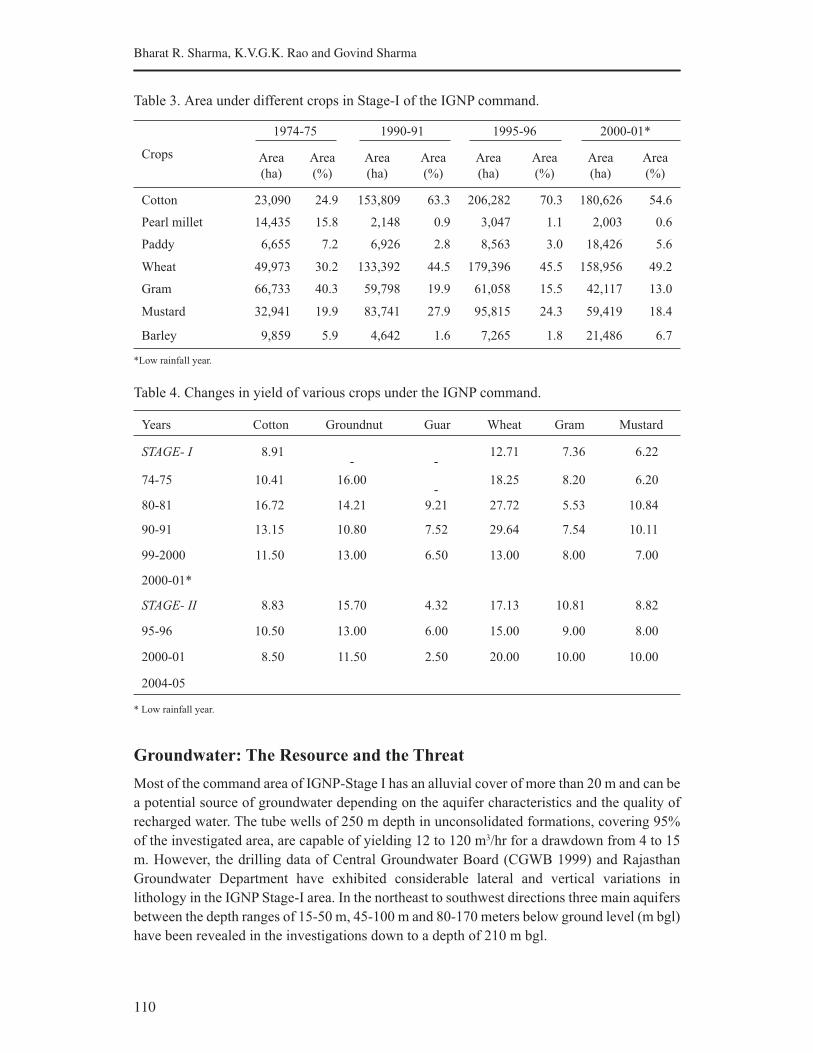
110
Bharat R. Sharma, K.V.G.K. Rao and Govind Sharma
Table 3. Area under different crops in Stage-I of the IGNP command.
Crops
1974-75 1990-91 1995-96 2000-01*
Area
(ha)
Area
(%)
Area
(ha)
Area
(%)
Area
(ha)
Area
(%)
Area
(ha)
Area
(%)
Cotton 23,090 24.9 153,809 63.3 206,282 70.3 180,626 54.6
Pearl millet 14,435 15.8 2,148 0.9 3,047 1.1 2,003 0.6
Paddy 6,655 7.2 6,926 2.8 8,563 3.0 18,426 5.6
Wheat 49,973 30.2 133,392 44.5 179,396 45.5 158,956 49.2
Gram 66,733 40.3 59,798 19.9 61,058 15.5 42,117 13.0
Mustard 32,941 19.9 83,741 27.9 95,815 24.3 59,419 18.4
Barley 9,859 5.9 4,642 1.6 7,265 1.8 21,486 6.7
*Low rainfall year.
Table 4. Changes in yield of various crops under the IGNP command.
Years Cotton Groundnut Guar Wheat Gram Mustard
STAGE- I 8.91
-
-12.71 7.36 6.22
74-75 10.41 16.00
-18.25 8.20 6.20
80-81 16.72 14.21 9.21 27.72 5.53 10.84
90-91 13.15 10.80 7.52 29.64 7.54 10.11
99-2000 11.50 13.00 6.50 13.00 8.00 7.00
2000-01*
STAGE- II 8.83 15.70 4.32 17.13 10.81 8.82
95-96 10.50 13.00 6.00 15.00 9.00 8.00
2000-01 8.50 11.50 2.50 20.00 10.00 10.00
2004-05
* Low rainfall year.
Groundwater: The Resource and the Threat
Most of the command area of IGNP-Stage I has an alluvial cover of more than 20 m and can be
a potential source of groundwater depending on the aquifer characteristics and the quality of
recharged water. The tube wells of 250 m depth in unconsolidated formations, covering 95%
of the investigated area, are capable of yielding 12 to 120 m3/hr for a drawdown from 4 to 15
m. However, the drilling data of Central Groundwater Board (CGWB 1999) and Rajasthan
Groundwater Department have exhibited considerable lateral and vertical variations in
lithology in the IGNP Stage-I area. In the northeast to southwest directions three main aquifers
between the depth ranges of 15-50 m, 45-100 m and 80-170 meters below ground level (m bgl)
have been revealed in the investigations down to a depth of 210 m bgl.
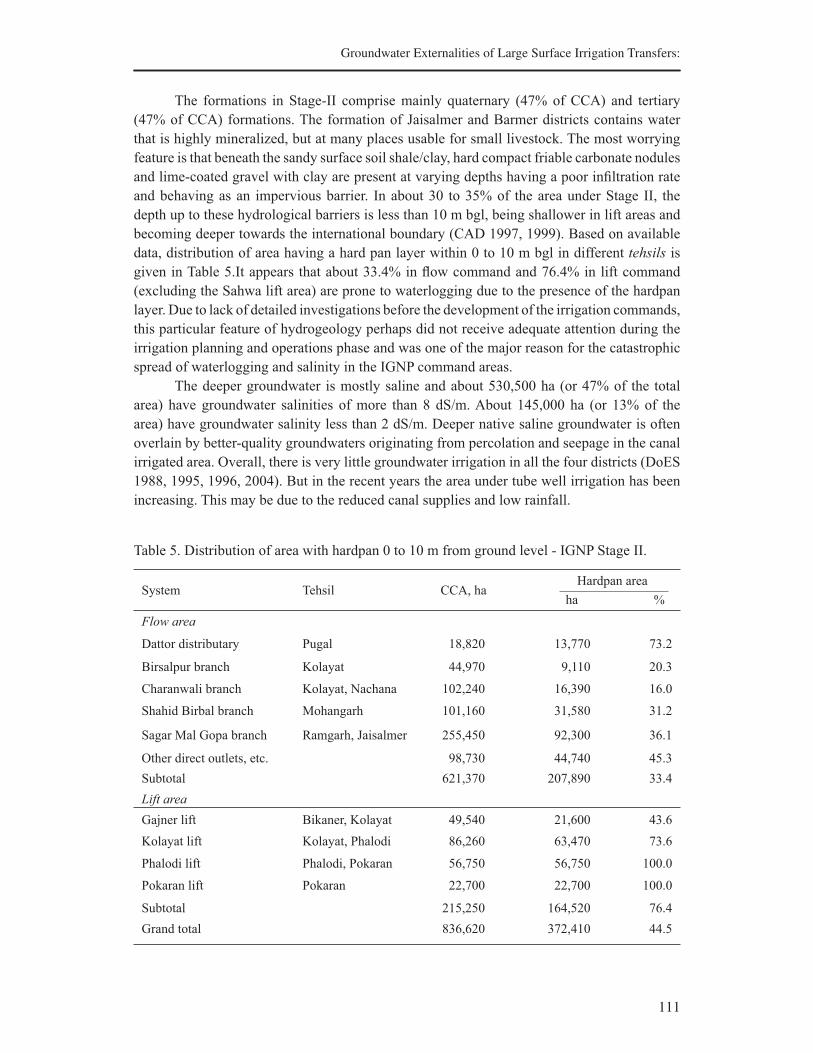
111
Groundwater Externalities of Large Surface Irrigation Transfers:
The formations in Stage-II comprise mainly quaternary (47% of CCA) and tertiary
(47% of CCA) formations. The formation of Jaisalmer and Barmer districts contains water
that is highly mineralized, but at many places usable for small livestock. The most worrying
feature is that beneath the sandy surface soil shale/clay, hard compact friable carbonate nodules
and lime-coated gravel with clay are present at varying depths having a poor infiltration rate
and behaving as an impervious barrier. In about 30 to 35% of the area under Stage II, the
depth up to these hydrological barriers is less than 10 m bgl, being shallower in lift areas and
becoming deeper towards the international boundary (CAD 1997, 1999). Based on available
data, distribution of area having a hard pan layer within 0 to 10 m bgl in different tehsils is
given in Table 5.It appears that about 33.4% in flow command and 76.4% in lift command
(excluding the Sahwa lift area) are prone to waterlogging due to the presence of the hardpan
layer. Due to lack of detailed investigations before the development of the irrigation commands,
this particular feature of hydrogeology perhaps did not receive adequate attention during the
irrigation planning and operations phase and was one of the major reason for the catastrophic
spread of waterlogging and salinity in the IGNP command areas.
The deeper groundwater is mostly saline and about 530,500 ha (or 47% of the total
area) have groundwater salinities of more than 8 dS/m. About 145,000 ha (or 13% of the
area) have groundwater salinity less than 2 dS/m. Deeper native saline groundwater is often
overlain by better-quality groundwaters originating from percolation and seepage in the canal
irrigated area. Overall, there is very little groundwater irrigation in all the four districts (DoES
1988, 1995, 1996, 2004). But in the recent years the area under tube well irrigation has been
increasing. This may be due to the reduced canal supplies and low rainfall.
Table 5. Distribution of area with hardpan 0 to 10 m from ground level - IGNP Stage II.
System Tehsil CCA, ha Hardpan area
ha %
Flow area
Dattor distributary Pugal 18,820 13,770 73.2
Birsalpur branch Kolayat 44,970 9,110 20.3
Charanwali branch Kolayat, Nachana 102,240 16,390 16.0
Shahid Birbal branch Mohangarh 101,160 31,580 31.2
Sagar Mal Gopa branch Ramgarh, Jaisalmer 255,450 92,300 36.1
Other direct outlets, etc. 98,730 44,740 45.3
Subtotal 621,370 207,890 33.4
Lift area
Gajner lift Bikaner, Kolayat 49,540 21,600 43.6
Kolayat lift Kolayat, Phalodi 86,260 63,470 73.6
Phalodi lift Phalodi, Pokaran 56,750 56,750 100.0
Pokaran lift Pokaran 22,700 22,700 100.0
Subtotal 215,250 164,520 76.4
Grand total 836,620 372,410 44.5
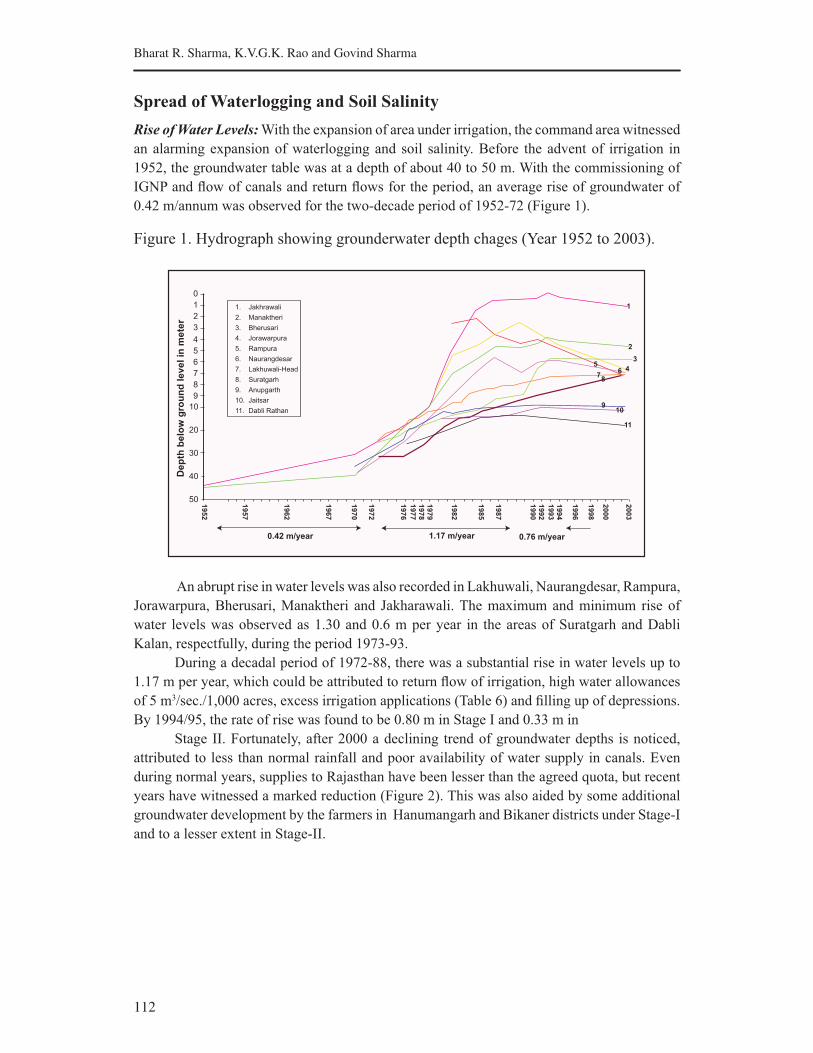
112
Bharat R. Sharma, K.V.G.K. Rao and Govind Sharma
Spread of Waterlogging and Soil Salinity
Rise of Water Levels: With the expansion of area under irrigation, the command area witnessed
an alarming expansion of waterlogging and soil salinity. Before the advent of irrigation in
1952, the groundwater table was at a depth of about 40 to 50 m. With the commissioning of
IGNP and flow of canals and return flows for the period, an average rise of groundwater of
0.42 m/annum was observed for the two-decade period of 1952-72 (Figure 1).
Figure 1. Hydrograph showing grounderwater depth chages (Year 1952 to 2003).
An abrupt rise in water levels was also recorded in Lakhuwali, Naurangdesar, Rampura,
Jorawarpura, Bherusari, Manaktheri and Jakharawali. The maximum and minimum rise of
water levels was observed as 1.30 and 0.6 m per year in the areas of Suratgarh and Dabli
Kalan, respectfully, during the period 1973-93.
During a decadal period of 1972-88, there was a substantial rise in water levels up to
1.17 m per year, which could be attributed to return flow of irrigation, high water allowances
of 5 m3/sec./1,000 acres, excess irrigation applications (Table 6) and filling up of depressions.
By 1994/95, the rate of rise was found to be 0.80 m in Stage I and 0.33 m in
Stage II. Fortunately, after 2000 a declining trend of groundwater depths is noticed,
attributed to less than normal rainfall and poor availability of water supply in canals. Even
during normal years, supplies to Rajasthan have been lesser than the agreed quota, but recent
years have witnessed a marked reduction (Figure 2). This was also aided by some additional
groundwater development by the farmers in Hanumangarh and Bikaner districts under Stage-I
and to a lesser extent in Stage-II.
0
1
2
3
4
5
6
7
8
9
0.42 m/year 1.17 m/year 0.76 m/year
10
20
30
40
50
De
pth
be
low
gro
un
d l
ev
el
in m
ete
r
1
2
3
45
67
8
910
11
20
03
20
00
19
98
19
96
19
94
19
93
19
92
19
90
19
87
19
85
19
82
19
79
19
78
19
77
19
76
19
72
19
70
19
67
19
62
19
57
19
52
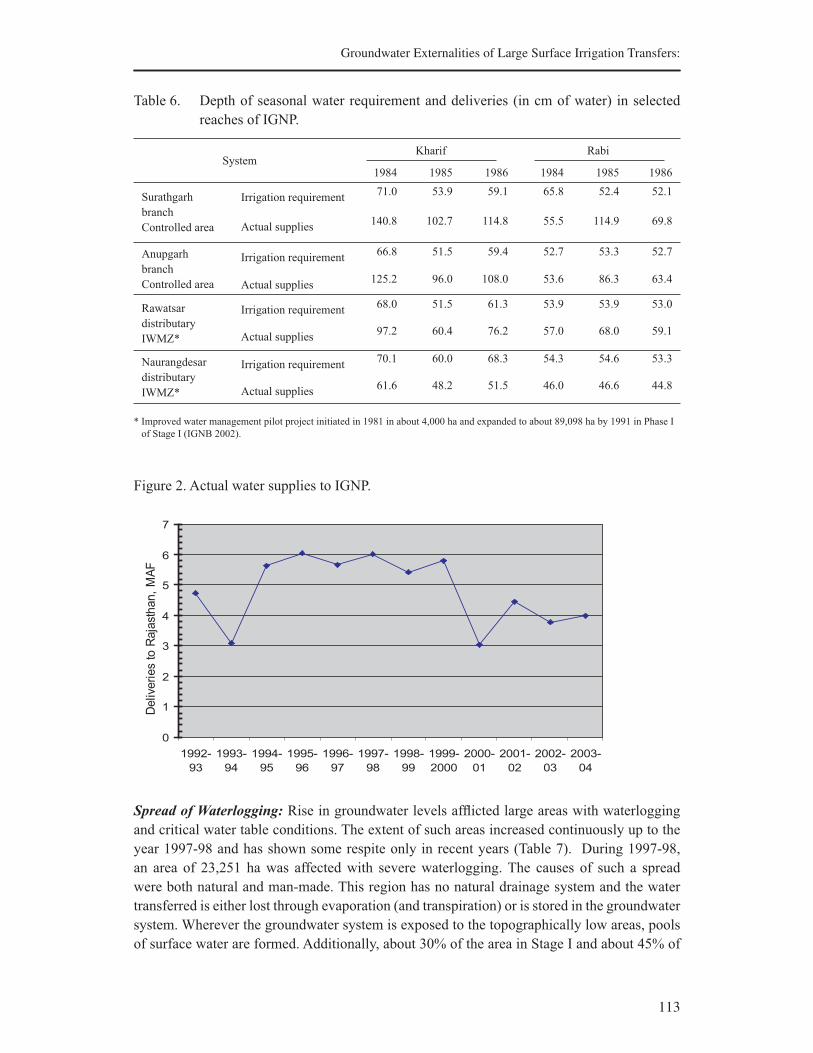
113
Groundwater Externalities of Large Surface Irrigation Transfers:
Table 6. Depth of seasonal water requirement and deliveries (in cm of water) in selected
reaches of IGNP.
SystemKharif Rabi
1984 1985 1986 1984 1985 1986
Surathgarh
branch
Controlled area
71.0 53.9 59.1 65.8 52.4 52.1
140.8 102.7 114.8 55.5 114.9 69.8
Anupgarh
branch
Controlled area
66.8 51.5 59.4 52.7 53.3 52.7
125.2 96.0 108.0 53.6 86.3 63.4
Rawatsar
distributary
IWMZ*
68.0 51.5 61.3 53.9 53.9 53.0
97.2 60.4 76.2 57.0 68.0 59.1
Naurangdesar
distributary
IWMZ*
70.1 60.0 68.3 54.3 54.6 53.3
61.6 48.2 51.5 46.0 46.6 44.8
* Improved water management pilot project initiated in 1981 in about 4,000 ha and expanded to about 89,098 ha by 1991 in Phase I
of Stage I (IGNB 2002).
Figure 2. Actual water supplies to IGNP.
Spread of Waterlogging: Rise in groundwater levels afflicted large areas with waterlogging
and critical water table conditions. The extent of such areas increased continuously up to the
year 1997-98 and has shown some respite only in recent years (Table 7). During 1997-98,
an area of 23,251 ha was affected with severe waterlogging. The causes of such a spread
were both natural and man-made. This region has no natural drainage system and the water
transferred is either lost through evaporation (and transpiration) or is stored in the groundwater
system. Wherever the groundwater system is exposed to the topographically low areas, pools
of surface water are formed. Additionally, about 30% of the area in Stage I and about 45% of
Irrigation requirement
Actual supplies
Irrigation requirement
Actual supplies
Irrigation requirement
Actual supplies
Irrigation requirement
Actual supplies
0
1
2
3
4
5
6
7
1992-
93
1993-
94
1994-
95
1995-
96
1996-
97
1997-
98
1998-
99
1999-
2000
2000-
01
2001-
02
2002-
03
2003-
04
Delive
ries
to R
aja
sth
an
, M
AF
114
Bharat R. Sharma, K.V.G.K. Rao and Govind Sharma
the area in Stage II have hydrological barriers in the form of gypsum, clay and kankar layers
which appear in the shallow region of less than 10 m in most of the area causing buildup of
perched water tables.
Table 7. Development of waterlogging (area in ha) in the IGNP command.
Category 1992-93 1997-98 2000-01 2003-04
Potentially sensitive area
(water table within 1.5 to 6.0 m) 202,960 328,123 237,337 195,000
Critical area
(water table within 1.0 to 1.5 m)22,000 32,552 15,654 9,576
Waterlogged area
(water table within 0.0 to 1.0 m) 13,750 23,251 13,041 2,535
All categories 238,710 383,926 266,032 207,111
Besides the natural causes, several management and operational practices have also
exacerbated the situation:
i. Ghaggar river floodwater stored in depressions contributed substantially to groundwater
recharge in the neighboring areas.
ii. Several inter-dunal low-lying areas filled up with canal water to meet requirements during
construction remained unused.
iii. Very high water allowance of 5.23 cusec/1,000 acres in Stage I caused high seepage losses
from unlined watercorses/field channels and return flows.
iv. Uncontrolled high discharge direct outlets from the main canal and branches caused
flooding of large areas.
v. Absence of gates and controls on minors and watercourses caused flooding of low areas
during low/no irrigation requirements.
Impact of Waterlogging
Rise of the water table closer to the surface and inundation of the low-lying areas have caused
submegence of agricultural lands and village common lands, submergence of the villages/
habitations, damages to road communication and public utilities and constraints in the choice
of crops and loss of production. The damages have taken place extensively in several areas and
about 4,000 ha of agriculture, village common lands and government lands have been partly
or completely submerged resulting in complete loss of the assets. Waterlogging conditions
have resulted in the submergence of 22 villages due to exposure of the hydrostatic line of the
groundwater and leakages and return flows from the irrigation system. The main pockets of
submerged lands are shown in Table 8. Several of the marooned villages (Rangmahal, Samnala
Quarter, Manaktheri, Baropal, Jakharawali, Bherusari, Rawatsar, Dabli Kalan, Dabli Khurd,
Lunio ki Dhani, Ghandheli, 13/15 SPD, Kalalon ki Dhani, Jowrapura, etc.) had to be shifted to
higher elevations at huge public costs and distress. Large sections of the road systems also got
submeged and required repeated raising of road levels. Several schools, hospitals, and other
public service utilities also got submeged affecting the society as a whole.
115
Groundwater Externalities of Large Surface Irrigation Transfers:
Table 8. Pockets of submerged lands in the IGNP command (ha).
1. Manaktheri-Baropal-Jakharawali-Bherusari, Kalalon Wali Dhani 2,500
2. Dabli Khurd and Dabli Kalan 500
3. Lunio ki Dhani 55
4. Masitawali head and head reaches of Naurangdesar 33
5. Rawatsar, Gandheli, Dasuwali, 2,3 RWD, 34 RWD 650
6. Nachana 50
Loss to Agricultural Production: By the end of year 1997-98, a total CCA of 514,000 ha in
Stage I, which is around 56% of the total area, had become potentially sensitive to waterlogging
(CAD, 2004, 2005, 2007b). In Stage II, out of 182,000 ha utilized for irrigation about 23,000
ha (about 13%) had become potentially sensitive to waterlogging. Some waterlogged areas
have completely gone out of cultivation, where the water table is either above the ground
surface or very close to the surface. Waterlogged areas have also gone out of cultivation due to
salinization. Waterlogging seriously constrains the choice of crops, enhances expenditure on
farm operations and strongly affects the growth and yield of crops.
To have a better understanding of the existing cropping patterns, sources of irrigation,
yield levels and net returns of the farmers in the command, a survey of 253 farmers (184
farmers in Stage I and 69 farmers in Stage II) cultivating an area of 1,241 ha was undertaken
during 2007. Salient findings from the farm survey were:
i. More than 50% of the irrigated area in Stage I had water tables within sensitive zones
during the late nineties. About 10% of the soil surveyed in the command showed high
salinity conditions. It is, therefore, necessary to safeguard the gains of IGNP in terms
of increased cropped area and production, socioeconomic life of the settled farmers and
public utilities from the vagaries of waterlogging and soil salinity. Primary data collected
by IWMI (IWMI 2007) showed that 98% of farmers depend only on agriculture for family
income and livelihoods. Most of the farmers are marginal to medium with an average
cultivated area of 5.58 ha per farm family. Only about 14.6% are large farmers.
ii. Canal irrigation (96.4%) remains the major source of irrigation. However, in recent years
farmers have shown good interest in tube well irrigation as 44% of the surveyed farmers
also owned tube wells. In the early 1990s, the major source of irrigation in these districts
was only canal water. The average depth of tube wells is about 38 m indicating that tube
wells are shallow and mostly tapping freshwater lenses floating on parent saline water.
The average pump set capacity is about 9.0 hp, cost of installation is about INR 51,000
and operation and maintenance (O&M) cost is high at INR 1189/ha as almost all the tube
wells are diesel-operated.
iii. The cropping intensity in IGNP is 130% with 149% under Stage I and 110% under Stage
II. About 31% in kharif and 30% in rabi have remained fallow mainly due to deficit canal
supplies. In Stage I only about 20% remained fallow against 44% fallow lands in Stage
II, mainly due to deficit water supplies for Stage II and more groundwater availability in
Stage I. Cultivation in about 4.4% of the area has been abandoned due to waterlogging
and salinity - about 5.7% area in Stage I and 2.4% in Stage II.
116
Bharat R. Sharma, K.V.G.K. Rao and Govind Sharma
iv. Cotton occupied the largest area (55%) in the kharif season followed by cluster bean
(29%) and oil seeds (7%) in Stage I. In the same season, water-deficit farmers in Stage
II mainly cultivated cluster bean (64%), groundnut (17%) and cotton (8%). During rabi,
wheat (64%) and mustard (26%) were the main crops under Stage I as compared to barley
(37%), mustard (29%) and gram (24%) under Stage II. So the farmers in Stage II cultivate
the crops having minimum water requirements during both seasons.
v. The average crop yields in the command were somewhat comparable to the average yields
of the state with variations of 1.7 t/ha cotton in Hanumangarh and 0.7 t/ha in Lunkaransar.
Similarly, wheat yields varied from 0.4 to 3.4 t/ha with an average yield of 2.3 t/ha in
Stage I and 2.0 t/ha in Stage II. The data did not support a good impact of source of
irrigation on crop yields.
vi. Waterlogging (28% of respondents) and soil salinity (26% of respondents) are major
problems in IGNP with a lot of area submerged under pools of water, cultivation of some
areas abandoned and other lands producing much less than crop potential yields. The
farmers reported that, on average, the additional expenditure due to waterlogging and soil
salinity on practices like field preparation, enhanced seed rate and fertilizer applications is
to the tune of Rs 1,095/ha. With the problem of waterlogging and soil salinity, the average
cotton crop yields are low at 13 quintal/ha (q/ha) compared to about 15 q/ha in normal
soils under Stage I. The same is the case with cluster bean, wheat, mustard and gram. In
fact, the reduction in gram yields due to waterlogging and soil salinity is about 50%.
vii. The cropping pattern of cotton and wheat gives an average net return of about INR 25,000/
ha/year. The net return from the gram crop is about INR 8,000/ha. In the case of areas
affected by waterlogging and soil salinity the net returns are lower by about 25% in the
case of cotton and by 46% in the case of the wheat crop.
With about 56% of the command having some degree of waterlogging problems, the loss
to agricultural economy, with the increased crop production expenses and reduced crop yields,
is huge. The problem is also causing extensive social costs as a result of submerged villages
and the road network and migration of farmers from affected areas to new areas.
Interventions Attempted
Several ameliorative interventions have been attempted on a pilot scale to mitigate waterlogging
and salinity in the IGNP command. These interventions, mainly biophysical in nature, included
reduction in water allowance and drainage pilots for surface drainage, subsurface drainge, tube
well drainage, skimming wells and bio-drainage (CAD 2007a). Most of the interventions faced
operational, managemental, finanacial and institutional challenges and could not be upscaled
for wider adoption in the command.
117
Groundwater Externalities of Large Surface Irrigation Transfers:
i. The CAD-installed vertical drainage systems faced considerable problems in terms
of infrastructural arrangements for operation, availability of electricity, and a shared
institution and have been put under operation for a short period of 2 to 3 years with
periodical interruptions in pump operations. Though the results indicated that, to some
extent, groundwater levels can be controlled, these projects have been discontinued due
to huge costs involved.
ii. Installation of the subsurface drainage shows its beneficial effects in reclaiming
waterlogged saline soils in a short span of 2 to 3 years in several subsurface drainage
projects in the country (HOPP 2001). The subsurface drainage projects installed in IGNP
also showed similar improvements. However, the technology is new to the area. The pilot
projects need to be operated and monitored for evaluating the impacts and the effects on
society and environment including the options for disposal of drainage effluent, which
is a major challenge. The costs involved are huge (Rs 30,000 to 40,000/ha) and can be
implemented only inder a state-sponsored program.
iii. Attempts were also made to decongest the large surfce water pondages. The experince
showed that pumping for dewatering the stagnated water bodies is not a one-time activity,
but it has to be a perennial one. Further, the cost of pumping of water is also very high.
It has been concluded that dewatering through pumping operations would not be an
economically viable proposition. Moreover, it is very likely that the decrease in standing
water levels achieved by pumping will be nullified with inflows during the seasonal rains
and irrigation spills.
iv. Bio-drainage with eucalyptus species was also attempted along small stretches of the
canals. The experiences were good only along certain patches where the plants survived
but failed due to continuous water stagnation. The bio-plantations may be used in certain
waterlogged wastelands with suitable species and management practices. It has very
limited success for controlling waterlogging of the agricultural lands.
v. However, the farmers are taking up tube well irrigation increasingly (especially under
Stage I) and the adverse impact of fluctuating canal supplies on cropping intensity could
be mitigated to some extent by adopting large-scale conjunctive use. The spread is slow
due to higher costs and nonavailability of electricity to run the tube wells. Diesel-operated
medium/deep tube wells are less cost-effective.
Moreover, most of these scientific interventions were top-down with limited participation
of the communities and setting up of effective institutions for asset ownership, O&M and
cost and benefit sharing mechanisms. As such, these had limited acceptance and had to be
abandoned after the initial enthusiasm for implementation subsided and ground realities were
sincerely appreciated.
Strategy for Groundwater Management
Provision of canals, the distribution system and the application of surface water to such a large
area, besides providing direct irrigation benefits, also assists in modification of the groundwater
regime. Such groundwater externalities may be both positive in the form of additional recharge
118
Bharat R. Sharma, K.V.G.K. Rao and Govind Sharma
and improvements in the water table in a water-stressed area and negative through creation of
waterlogging, water-quality problems and soil salinity in previously water-congested pockets.
The planning for integrated use of canal and groundwater will mot likely alleviate some of these
problems and improve water use efficiency and productivity. Attempts have been made earlier
in planning conjunctive use of groundwater and canal supplies for Haryana (Tyagi 2006) and
for Punjab (Sondhi and Kaushal 2006) using simulation modeling techniques. Some studies
have also been made in IGNP for projecting the problems of waterlogging and soil salinity and
evaluating various options for problem amelioration (ORG 1996, 1999; NIH 1996).
From the experiences of IGNP and experiences elsewhere, it is certain that there are no
global solutions to problems of such unprecedented magnitude. It is proposed that according
to the extent of the problem, the affected areas may be broadly divided into the following three
categories and appropriate measures implemented both on short- and long-term bases.
i. Converting water-ponded areas as wetlands: As the IGNP command has no natural
and man-made drainage, the inundated areas may be designated as wetlands and used
as receiving bodies for the irrigation return flows and surface and subsurface drainage
effluents. These wetlands can also be put for economic use like freshwater and saline
water fisheries according to the water quality. The alternative plan of transferring such
poor-quality water through a dedicated canal to the Arabian sea requires large investments
and cooperation of the neighboring country.
ii. Enhancing tube well development in waterlogged areas: Areas afflicted with the
waterlogging problem may be ameliorated, among others, through appropriate groundwater
management practices. A large portion of the command has developed freshwater layers
closer to the surface and below, and conjunctive use of canal water and groundwater in
this area will result in controlling of the groundwater table. The installation and operation
of tube wells by the government have not produced encouraging results. The increasing
installation of private tube wells and successful use of groundwater for irrigation by the
farmers in the last few canal supply deficit years have shown that the conjunctive use of
canal water and groundwater is viable in the IGNP command. However, the results of the
conjunctive use on the control of the water table will not be visible in a short time. Long-
term planning is required in promoting conjunctive use of canal water and groundwater,
which involves :
a. Institutional support for delineating the aquifers suitable for tube well installation and
identifying appropriate technologies for well construction to avoid rising of saline
water.
b. Canal supply management practices for providing reduced irrigation allowance on
warabandi and subsidies and policy support.
c. Priority in energization of the tube wells in the IGNP command can be one of the
supports from the government that will encourage the farmers to opt for tube well
irrigation.
iii. Subsurface drainage for saline-waterlogged areas: The areas with soil salinity associated
with saline groundwater require subsurface drainage to leach out salts and maintain a
favorable salt balance in the root zone. The pilot projects on subsurface drainage have
119
Groundwater Externalities of Large Surface Irrigation Transfers:
shown that salinity in the root zones can be quickly reduced when the cropping intensity
will increase and crop yield will be more than double. However, this technology requires
the participation of a group of farmers having contiguous land parcels and also issues like
disposal/reuse of drainage effluent need to be addressed before embarking on large-scale
adoption. The already installed successful pilots on subsurface drainage (SSD) systems
may be operated and monitored for deriving experience on these issues. Besides the
technical operation of the infrastructure, establishing an effective drainage farmer group/
association is crucial for its long-term sustainability.
Conclusions and Recommendations
Transfer of large amounts surface irrigation water through an elaborate water conveyance
and distribution infrastructure under IGNP helped India to make use of its share of the Sutlej
river water as established under the Indus Water Treaty. Availability of water in this dry area
helped tremendously in the expansion in cropped/irrigated area and a substantial change in
agricultural land productivity, improved socioeconomic conditions, and in the general well-
being of the local poor and immigrant communities, and greening of the desert area. The
advent of irrigation has resulted in rapid changes in the hydrologic regime and groundwater
conditions. During the past about four decades, the groundwater levels have risen by more
than 1.0 m per year and more than 50% of the command area now has groundwater levels
in sensitive zones (> 6.0 m bgl). Substantial areas have gone out of cultivation due to water
stagnation/inundation, waterlogging and soil salinity. A considerable loss to the agro-economy
is being incurred due to constraints in the choice of crops, higher costs of cultivation and low
crop yields caused by waterlogging and soil salinity. Several of the ad-hoc technical measures
implemented in the form of pilot projects on the hot-spots have met with little success and
acceptance by the farming communities and have been either abandoned or operated on a
lower scale. The recent spurt in the development of private tube wells, especially under Stage
I of IGNP, caused by deficit canal water supplies as a whole to the IGNP and also opening up
of areas under Stage II of the command, have shown a positive impact through lowering of
water tables and better crop yields.
The waterlogging and soil salinity areas of IGNP require interinstitutional cooperation
and action plans with irrigation, groundwater, agriculture and other concerned departments,
CAD and other research and development institutions, local NGOs and farmer bodies to
develop and implement short- and long-term plans of groundwater management strategy and
other innovative ideas. Among the strategies this paper suggests dividing the affected areas
into three broad categories and introducing appropriate interventions. These include i) water-
ponded areas―treat them as wetlands and use appropriate economic activities such as saline
water fisheries, ii) waterlogged areas―enhance tubewell irrigation in waterlogged areas and
provide policy and institutional support on technology, management of canal water supply and
energy provision, and iii) saline groundwater affected areas―provide subsurface drainage for
leaching out the salt and create a favorable soil-balance condition at the root zone.

120
Bharat R. Sharma, K.V.G.K. Rao and Govind Sharma
The planning, development, implementation and operation of the large and long-
distance surface irrigation water transfer and distribution infrastructure under the IGNP have
provided several important lessons of enormous cost for all those involved in improving the
welfare of people and ensuring food security through large-scale land- and water-centric
interventions. Professionals with their defined areas of expertise will draw lessons so as to
sharpen the future line of thinking and action. But one thing is certain, which is that all future
water infrastructural plans elsewhere and especially those envisaged under the National River
Linking Project of India must ensure that while achieving the highest positive impacts the
present and future negative externalities must remain at a minimum.
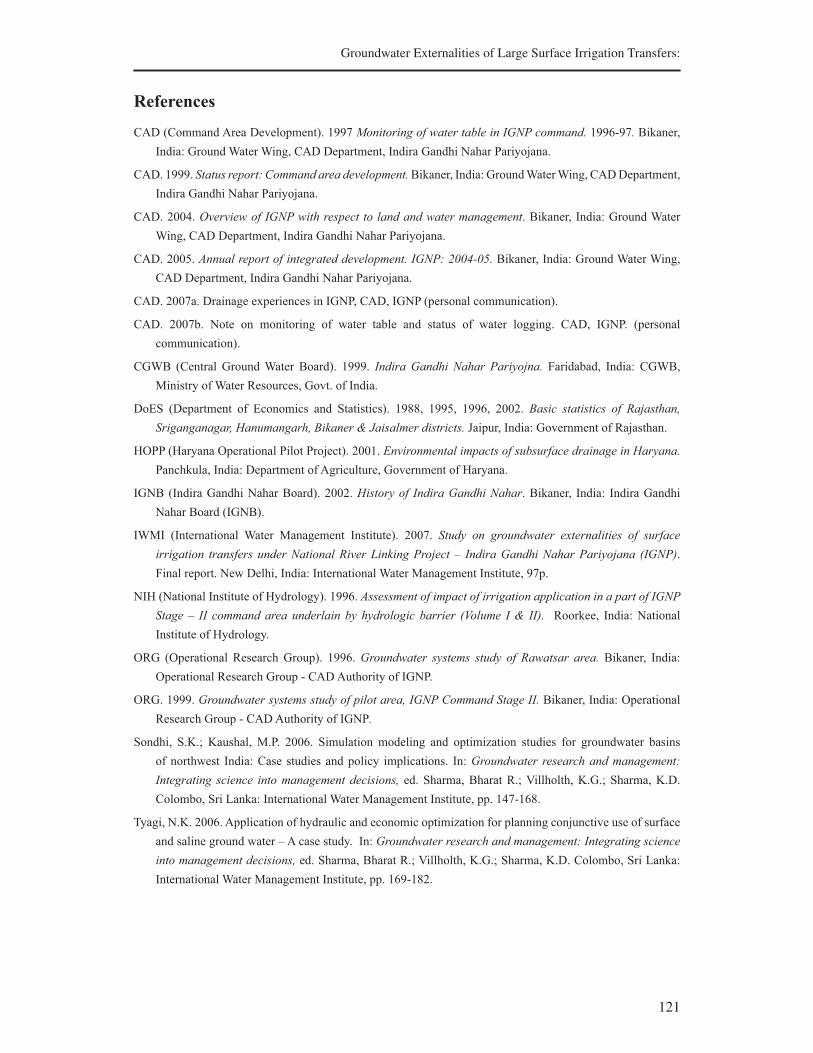
121
Groundwater Externalities of Large Surface Irrigation Transfers:
References
CAD (Command Area Development). 1997 Monitoring of water table in IGNP command. 1996-97. Bikaner,
India: Ground Water Wing, CAD Department, Indira Gandhi Nahar Pariyojana.
CAD. 1999. Status report: Command area development. Bikaner, India: Ground Water Wing, CAD Department,
Indira Gandhi Nahar Pariyojana.
CAD. 2004. Overview of IGNP with respect to land and water management. Bikaner, India: Ground Water
Wing, CAD Department, Indira Gandhi Nahar Pariyojana.
CAD. 2005. Annual report of integrated development. IGNP: 2004-05. Bikaner, India: Ground Water Wing,
CAD Department, Indira Gandhi Nahar Pariyojana.
CAD. 2007a. Drainage experiences in IGNP, CAD, IGNP (personal communication).
CAD. 2007b. Note on monitoring of water table and status of water logging. CAD, IGNP. (personal
communication).
CGWB (Central Ground Water Board). 1999. Indira Gandhi Nahar Pariyojna. Faridabad, India: CGWB,
Ministry of Water Resources, Govt. of India.
DoES (Department of Economics and Statistics). 1988, 1995, 1996, 2002. Basic statistics of Rajasthan,
Sriganganagar, Hanumangarh, Bikaner & Jaisalmer districts. Jaipur, India: Government of Rajasthan.
HOPP (Haryana Operational Pilot Project). 2001. Environmental impacts of subsurface drainage in Haryana.
Panchkula, India: Department of Agriculture, Government of Haryana.
IGNB (Indira Gandhi Nahar Board). 2002. History of Indira Gandhi Nahar. Bikaner, India: Indira Gandhi
Nahar Board (IGNB).
IWMI (International Water Management Institute). 2007. Study on groundwater externalities of surface
irrigation transfers under National River Linking Project – Indira Gandhi Nahar Pariyojana (IGNP).
Final report. New Delhi, India: International Water Management Institute, 97p.
NIH (National Institute of Hydrology). 1996. Assessment of impact of irrigation application in a part of IGNP
Stage – II command area underlain by hydrologic barrier (Volume I & II). Roorkee, India: National
Institute of Hydrology.
ORG (Operational Research Group). 1996. Groundwater systems study of Rawatsar area. Bikaner, India:
Operational Research Group - CAD Authority of IGNP.
ORG. 1999. Groundwater systems study of pilot area, IGNP Command Stage II. Bikaner, India: Operational
Research Group - CAD Authority of IGNP.
Sondhi, S.K.; Kaushal, M.P. 2006. Simulation modeling and optimization studies for groundwater basins
of northwest India: Case studies and policy implications. In: Groundwater research and management:
Integrating science into management decisions, ed. Sharma, Bharat R.; Villholth, K.G.; Sharma, K.D.
Colombo, Sri Lanka: International Water Management Institute, pp. 147-168.
Tyagi, N.K. 2006. Application of hydraulic and economic optimization for planning conjunctive use of surface
and saline ground water – A case study. In: Groundwater research and management: Integrating science
into management decisions, ed. Sharma, Bharat R.; Villholth, K.G.; Sharma, K.D. Colombo, Sri Lanka:
International Water Management Institute, pp. 169-182.


123
Managing Rehabilitation and Resettlement of the
Involuntarily Displaced Population: Lessons
from Selected Hydro Projects in India
Madar Samad, Zhankana Shah, Sridhar Acharyulu and Shreedhar Acharya1
Introduction
Despite the vast national and international experiences in, and the existence of several guidelines
on, managing involuntarily displaced persons (IDPs), resettlement and rehabilitation (R&R)
of displaced populations continue to be a difficult problem. Involuntary displacement not
only puts the affected people at serious risk of impoverishment but also reverses the entire
poverty reduction efforts. The establishment of dams for irrigation and hydropower are often
associated with large-scale displacement of rural communities.2 In India in particular, public
controversies and civil society concerns about IDPs are intenser than in many other developing
countries. This is understandable. India is the third largest dam-building country in the world
with some 4,290 dams and, possibly, it has the largest number of development-induced IDPs
in the world.3 There are no authentic statistics about the number of IDPs. Estimates based
on the number of dams constructed since Independence indicate that as many as 21 to 33
million persons are likely to have been displaced (Fernandes 2000: 277; Mander et al. 1999: 5)
These estimates do not include persons displaced by canals, or by the construction of colonies
or other infrastructure. Neither do they include those who have been subjected to multiple
displacements (Rangachari 2000: 116-117).4 According to Human Rights Watch, indigenous
peoples, known as Adivasis or Scheduled Tribes suffer from high rates of displacement. They
make up 8% of the total population but constitute 55% of IDPs (Human Rights Watch 2006).
Statistics related to the National River Linking Project suggest that around 0.5 million people
will be displaced due to peninsular links alone and millions in other river-link areas.
Empirical evidence accumulated over the years has shown that, in most cases,
displacement has resulted in deprivations and severe impoverishments. In India, agitations
by the civil organizations such the Narmada Bachao Andolan (NBA) and debates relating
1Madar Samad, Zhankana Shah, and Shreedhar Acharya are from the International Water Management
Institute while Sridhar Acharyulu is from the NALSAR, Hyderabad.
2Among the projects involving displacement funded by the World Bank, large dams account for 63% of
displacement (WCD 2000: 104).
3According to the WCD, India accounts for 9% of the world’s share of dams (WCD 2000: 373).
4A recent estimate by Fernandez (2008) concludes that between 1947 and 2000 about 60 million people
had been displaced or deprived of their livelihoods due to development projects.
124
Madar Samad, Zhankana Shah, Sridhar Acharyulu and Shreedhar Acharya
to the Sardar-Sarovar Project clearly point to such outcomes. It is argued that rehabilitation
and resettlement of people already affected by the project are lagging behind and is deficient
in terms of conformity to international policies and standards, and procedures, and to the
decisions of India’s own Narmada Tribunal, resulting in “considerable hardships and injustice”
to many IDPs (Ramasamy Iyer 2006). The Hindu newspaper of 17 April reports that “A Brief
Note on the Assessment of Resettlement and Rehabilitation (R & R) Sites and Submergence of
Villages of the Sardar Sarovar Project” prepared by a group of ministers noted that many of
the current R&R practices are not in accordance with the Supreme Court Decisions (The Hindu
2006). Controversies surrounding the Sardar-Sarovar Project are just a case in point. There are
many other water resources development sites where similar controversies prevail. Under the
National River Linking Project over half a million people are estimated to be displaced in the
peninsular links alone. Many of these studies focus on the short-term consequences of forced
displacement and denounce their flaws and impoverishing effects. In contrast, relatively little
research has been conducted on the longer-term impacts of relocating communities in newly
developed relocation sites with potentially better socioeconomic and physical infrastructure,
improved access to support services and enhanced opportunities for improving their livelihoods
creating benefits in the longer term that compensate for losses incurred in the short term. The
present paper examines long-term impacts of relocation of IDPs in selected water resources
development projects in India.
Scope, Objectives and Hypotheses
The present study is limited to an assessment of how the socioeconomic status of IDPs has
changed over time. The study examines the long-term trajectories of the displaced communities
and identifies factors that play a major role in rejuvenating or constraining their livelihoods
in the long run. The focus shifts from reporting displacement traumas to understanding
impoverishments and predicting trends that would shed light on how impoverishment risks
can be preempted and mitigated in the resettlement and rehabilitation programs. As Thayer
Scudder (n.d.) points out there is a clear need for more longitudinal studies of resettled
communities because the effects of resettlement carry over to one or two generations.
The focus of this paper is limited to assessing the change over time in the living
standards of project-affected people (PAP). The key research question addressed is, has the
R&R program enabled the majority of PAP to restore and improve their living standards, or
are they more impoverished than before? A related question in cases of positive outcomes is
how long did the PAP take to improve their living standards? The principal hypotheses tested
are:
a) Adverse short-term impacts of displacement are compensated for by the longer-term
benefits generated from enhanced socioeconomic opportunities created in the newly
developed relocation sites.
b) With recent refinements in policies and procedures in resettlement and rehabilitation
management, short-term adverse effects can be largely arrested, and some even fully
prevented, while others are considerably mitigated, and livelihoods of displaced
communities restored faster.
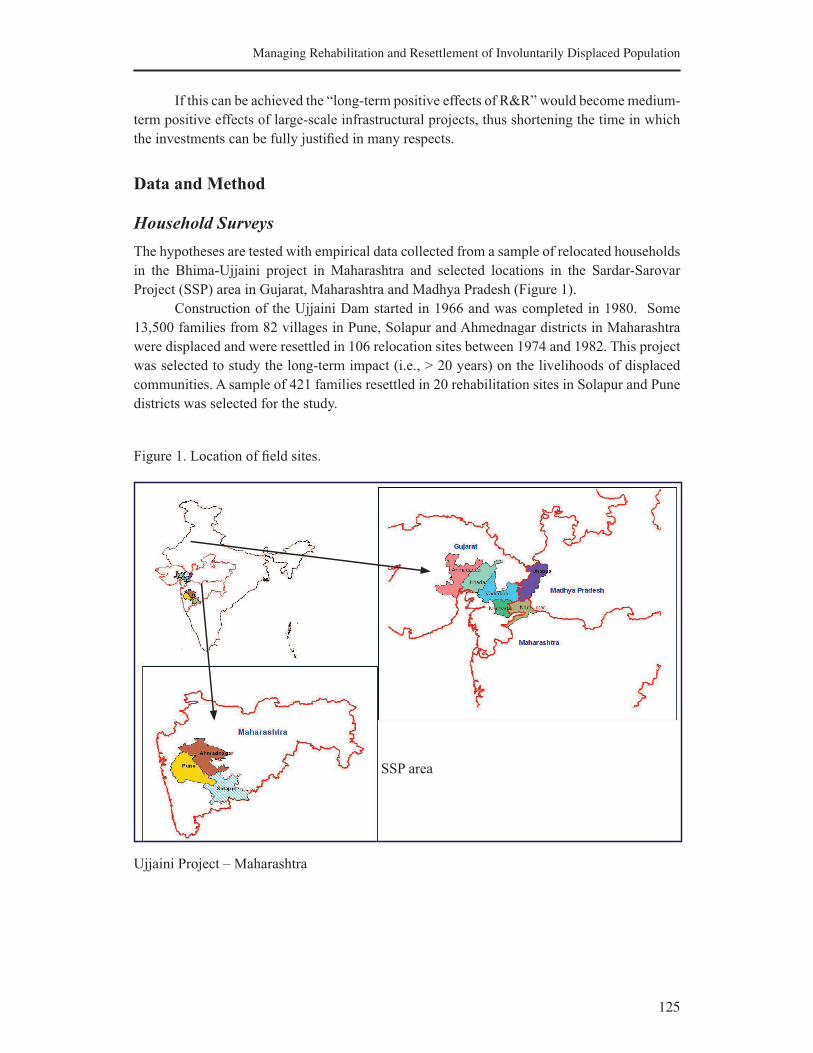
125
Managing Rehabilitation and Resettlement of Involuntarily Displaced Population
If this can be achieved the “long-term positive effects of R&R” would become medium-
term positive effects of large-scale infrastructural projects, thus shortening the time in which
the investments can be fully justified in many respects.
Data and Method
Household Surveys
The hypotheses are tested with empirical data collected from a sample of relocated households
in the Bhima-Ujjaini project in Maharashtra and selected locations in the Sardar-Sarovar
Project (SSP) area in Gujarat, Maharashtra and Madhya Pradesh (Figure 1).
Construction of the Ujjaini Dam started in 1966 and was completed in 1980. Some
13,500 families from 82 villages in Pune, Solapur and Ahmednagar districts in Maharashtra
were displaced and were resettled in 106 relocation sites between 1974 and 1982. This project
was selected to study the long-term impact (i.e., > 20 years) on the livelihoods of displaced
communities. A sample of 421 families resettled in 20 rehabilitation sites in Solapur and Pune
districts was selected for the study.
Figure 1. Location of field sites.
SSP area
Ujjaini Project – Maharashtra

126
Madar Samad, Zhankana Shah, Sridhar Acharyulu and Shreedhar Acharya
The SSP is probably the world’s most controversial and widely discussed development
project. At the current height of 121.92 m, the dam has affected 32,600 families from 300
villages in the states of Gujarat (4,726 families of 91 villages), Madhya Pradesh (24,421
families of 177 villages) and Maharashtra (3,452 families of 32 villages). A sample of 954
displaced households from the three states was selected for the study. The sample consisted of
404 families resettled in 31 rehabilitation sites in Vadodara, Narmada, Kheda and Ahmedabad
districts in Gujarat. The Maharashtra sample consisted of 154 households from the Nandurbar
district. A sample of 376 households from three districts in Madhya Pradeesh (Barwani, Dhar,
Khargone) was chosen for the study. The sample was stratified on the basis of households
resettled between 0-5 years, and 5-10 years, and more than 10 years after displacement.
In India, planning and implementing programs for resettlement and rehabilitation of
families displaced by infrastructural development projects are the responsibility of the state
governments. The households from three states benefiting from the SSP were selected with
the aim of comparing the impact of affected by the same project (SSP) but are resettled and
rehabilitated under the R&R programs of three different states.
Analysis of Litigations and Submissions to the Grievance Redressal
Authority
Litigations filed before the district courts by IDPs were analyzed. A sample of 480 judgments
relating to 1,762 litigations filed in the Sholapur District Court, Maharashtra by persons
displaced by the Ujjaini Dam project in Maharashtra was analyzed. In addition, summary
information on petitions filed by IDPs in the SSP area to the Grievance Redressal Authority
(GRA) was also analyzed. The analysis of litigations and petitions to GRC was motivated
on the assertion that such information provides a more accurate account of the concerns and
difficulties of IDPs than those captured by household questionnaire surveys.
Salient Characteristics of Resettled families
Bhima-Ujjaini Project
Eighty two villages from three districts in Maharashtra were affected by the construction of
the dam. According to official statistics, some 13,580 families were affected by the project
(Center for Social Sciences 1994). The displaced families were resettled in 106 relocation
sites. Official records claim that the process of resettlement that commenced in 1974/75
was completed in 1981/82. At the time of displacement, 58% were agricultural households,
30% employed as agricultural laborers and the rest classified as “engaged in services” and
“self-employed.” Following displacement, the number employed as agricultural laborers has
reportedly increased significantly (Center for Social Sciences 1994). Of the surveyed families,
49% belonged to the backward castes–16% belonged to the scheduled castes, 20% to the
scheduled tribes and 13% to other backward castes.
Sardar-Sarovar Project
There are no precise estimates of the number of people affected by SSP. Early estimates
indicated that the SS Dam would affect some 7,000–10,000 families. Estimates that are more
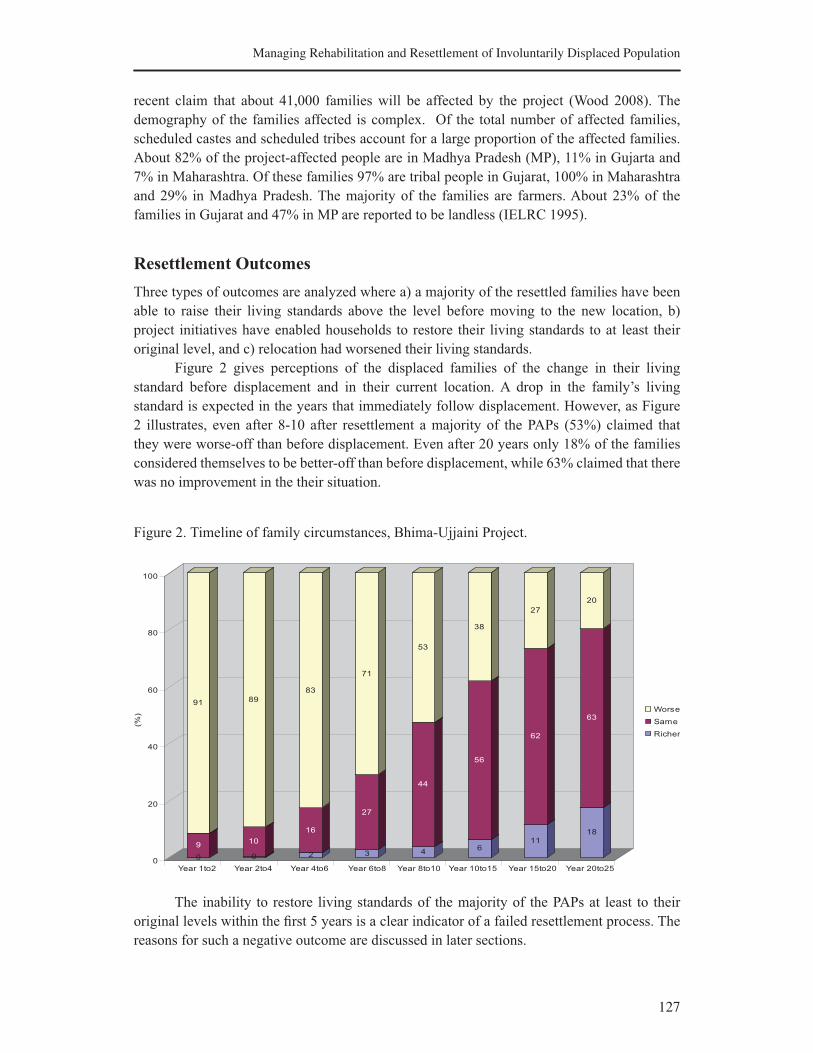
127
Managing Rehabilitation and Resettlement of Involuntarily Displaced Population
recent claim that about 41,000 families will be affected by the project (Wood 2008). The
demography of the families affected is complex. Of the total number of affected families,
scheduled castes and scheduled tribes account for a large proportion of the affected families.
About 82% of the project-affected people are in Madhya Pradesh (MP), 11% in Gujarta and
7% in Maharashtra. Of these families 97% are tribal people in Gujarat, 100% in Maharashtra
and 29% in Madhya Pradesh. The majority of the families are farmers. About 23% of the
families in Gujarat and 47% in MP are reported to be landless (IELRC 1995).
Resettlement Outcomes
Three types of outcomes are analyzed where a) a majority of the resettled families have been
able to raise their living standards above the level before moving to the new location, b)
project initiatives have enabled households to restore their living standards to at least their
original level, and c) relocation had worsened their living standards.
Figure 2 gives perceptions of the displaced families of the change in their living
standard before displacement and in their current location. A drop in the family’s living
standard is expected in the years that immediately follow displacement. However, as Figure
2 illustrates, even after 8-10 after resettlement a majority of the PAPs (53%) claimed that
they were worse-off than before displacement. Even after 20 years only 18% of the families
considered themselves to be better-off than before displacement, while 63% claimed that there
was no improvement in the their situation.
Figure 2. Timeline of family circumstances, Bhima-Ujjaini Project.
The inability to restore living standards of the majority of the PAPs at least to their
original levels within the first 5 years is a clear indicator of a failed resettlement process. The
reasons for such a negative outcome are discussed in later sections.
0
9
91
0
10
89
2
16
83
3
27
71
4
44
53
6
56
38
11
62
27
18
63
20
0
20
40
60
80
100
Worse
Same
Richer
Year 1to2 Year 2to4 Year 4to6 Year 6to8 Year 8to10 Year 10to15 Year 15to20 Year 20to25
(%)

128
Madar Samad, Zhankana Shah, Sridhar Acharyulu and Shreedhar Acharya
During the questionnaire survey conducted in the SSP project area PAPs were asked
to assess how their family circumstances had changed over time from the year they were
displaced to the present. The assessment was made on a scale of +5 to -5 with 0 signifying the
living standard at the time of displacement. A rating of +5 indicates a substantial enhancement
in the living standard and a rating of -5 a substantial decline. A rating in between these extremes
indicates different levels of enhancement or decline in the living standards of the PAPs.
Figures 3a to 3c give PAP’s perceptions of changes in family circumstances over time.
As Figure 3a demonstrates 59% of the PAPs in Gujarat claimed that they had restored (8%)
or enhanced (51%) their standard of living within a period 4-6 years since resettlement. It is
also noteworthy that 22% of the Gujarat PAPs claimed to have improved their living standards
within the first 2 years. The Gujarat survey results also show that 86% of the PAPs have
improved their family circumstances within 10-15 years since displacement from their original
villages.
Figure 3a. Timeline of family circumstances, SSP Gujarat.
Figure 3b. Timeline of family circumstances, SSP Maharashtra.
60
26
27
20
12
1
1
23
41
28
23
1321
3
12
33
29
7
25
6
311
2
13
30
3
27
24
10
6
2
3
6
3
35
19
12
9
7
2
11
34
12
11
11
0
10
20
30
40
50
60
70
80
90
100
Year 1-2 Year 2-4 Year 4-6 Year 6-8 Year 8-10 Year 10-15
5
4
3
2
1
0
-1
-2
-3
-4
-5
(%)
3
6
18
11
35
4
20
2
4
9
18
27
6
25
9
2
1
6
12
22
8
30
17
4
12
9
12
6
35
24
9
2
2
5
8
7
32
20
19
6
1
4
4
5
28
23
22
12
1
1
2
6
5
19
25
21
17
2
0
20
40
60
80
100
Year 1-2 Year 2-4 Year 4-6 Year 6-8 Year 8-10 Year 10-15 Year 15-20
5
4
3
2
1
0
-1
-2
-3
-4
-5
(%)
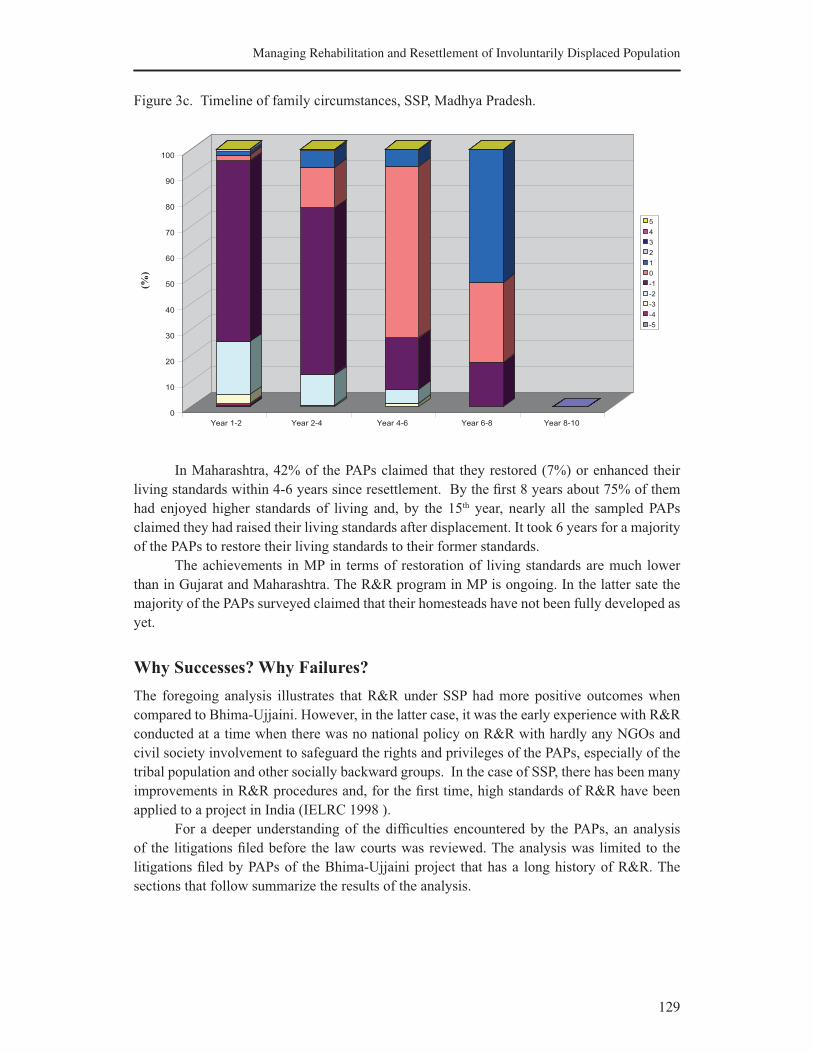
129
Managing Rehabilitation and Resettlement of Involuntarily Displaced Population
Figure 3c. Timeline of family circumstances, SSP, Madhya Pradesh.
In Maharashtra, 42% of the PAPs claimed that they restored (7%) or enhanced their
living standards within 4-6 years since resettlement. By the first 8 years about 75% of them
had enjoyed higher standards of living and, by the 15th year, nearly all the sampled PAPs
claimed they had raised their living standards after displacement. It took 6 years for a majority
of the PAPs to restore their living standards to their former standards.
The achievements in MP in terms of restoration of living standards are much lower
than in Gujarat and Maharashtra. The R&R program in MP is ongoing. In the latter sate the
majority of the PAPs surveyed claimed that their homesteads have not been fully developed as
yet.
Why Successes? Why Failures?
The foregoing analysis illustrates that R&R under SSP had more positive outcomes when
compared to Bhima-Ujjaini. However, in the latter case, it was the early experience with R&R
conducted at a time when there was no national policy on R&R with hardly any NGOs and
civil society involvement to safeguard the rights and privileges of the PAPs, especially of the
tribal population and other socially backward groups. In the case of SSP, there has been many
improvements in R&R procedures and, for the first time, high standards of R&R have been
applied to a project in India (IELRC 1998 ).
For a deeper understanding of the difficulties encountered by the PAPs, an analysis
of the litigations filed before the law courts was reviewed. The analysis was limited to the
litigations filed by PAPs of the Bhima-Ujjaini project that has a long history of R&R. The
sections that follow summarize the results of the analysis.
0
10
20
30
40
50
60
70
80
90
100
Year 1-2 Year 2-4 Year 4-6 Year 6-8 Year 8-10
5
4
3
2
1
0
-1
-2
-3
-4
-5
(%)
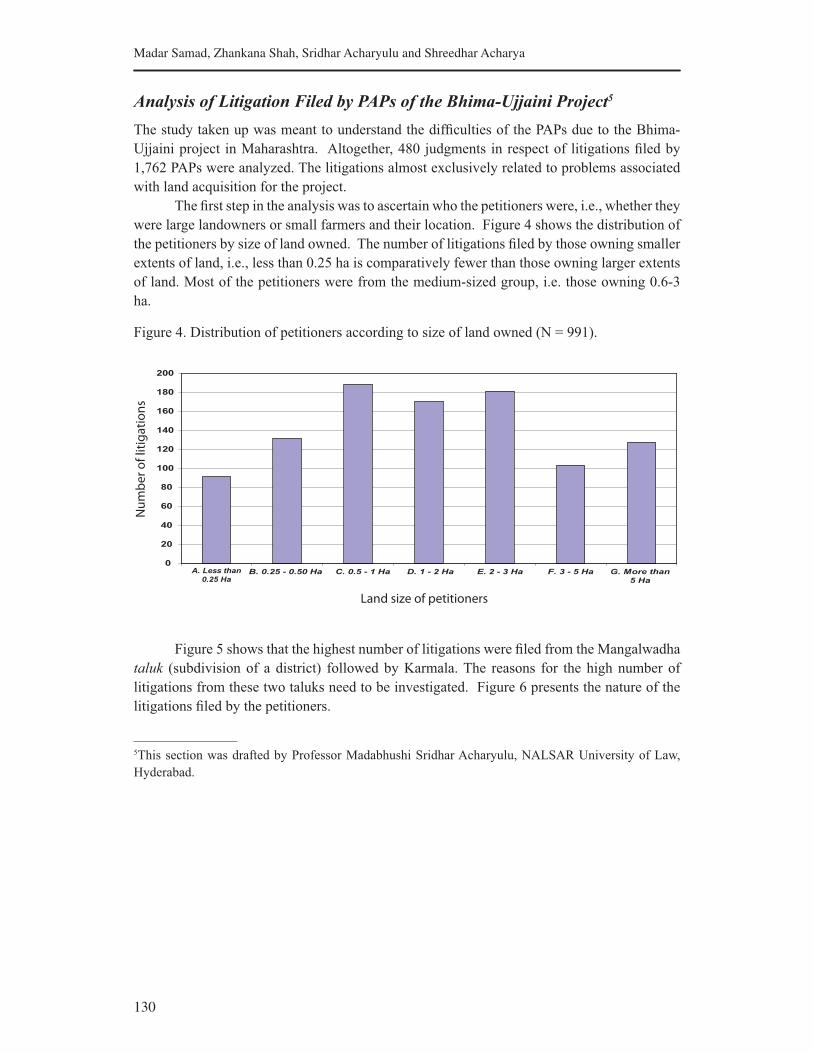
130
Madar Samad, Zhankana Shah, Sridhar Acharyulu and Shreedhar Acharya
Analysis of Litigation Filed by PAPs of the Bhima-Ujjaini Project5
The study taken up was meant to understand the difficulties of the PAPs due to the Bhima-
Ujjaini project in Maharashtra. Altogether, 480 judgments in respect of litigations filed by
1,762 PAPs were analyzed. The litigations almost exclusively related to problems associated
with land acquisition for the project.
The first step in the analysis was to ascertain who the petitioners were, i.e., whether they
were large landowners or small farmers and their location. Figure 4 shows the distribution of
the petitioners by size of land owned. The number of litigations filed by those owning smaller
extents of land, i.e., less than 0.25 ha is comparatively fewer than those owning larger extents
of land. Most of the petitioners were from the medium-sized group, i.e. those owning 0.6-3
ha.
Figure 4. Distribution of petitioners according to size of land owned (N = 991).
Figure 5 shows that the highest number of litigations were filed from the Mangalwadha
taluk (subdivision of a district) followed by Karmala. The reasons for the high number of
litigations from these two taluks need to be investigated. Figure 6 presents the nature of the
litigations filed by the petitioners.
5This section was drafted by Professor Madabhushi Sridhar Acharyulu, NALSAR University of Law,
Hyderabad.
0
20
40
60
80
100
120
140
160
180
200
B. 0.25 - 0.50 Ha C. 0.5 - 1 Ha D. 1 - 2 Ha E. 2 - 3 Ha F. 3 - 5 Ha G. More than
5 Ha
Land size of petitioners
Nu
mb
er
of
liti
ga
tio
ns
A. Less than
0.25 Ha
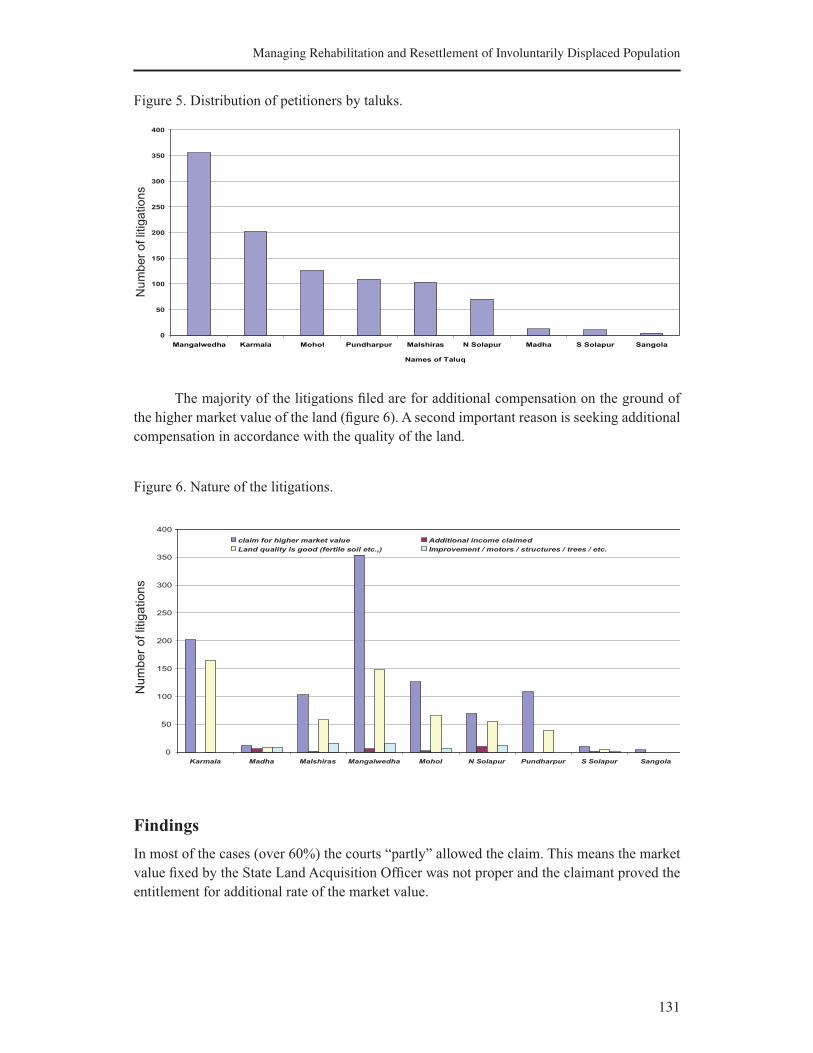
131
Managing Rehabilitation and Resettlement of Involuntarily Displaced Population
Figure 5. Distribution of petitioners by taluks.
The majority of the litigations filed are for additional compensation on the ground of
the higher market value of the land (figure 6). A second important reason is seeking additional
compensation in accordance with the quality of the land.
Figure 6. Nature of the litigations.
Findings
In most of the cases (over 60%) the courts “partly” allowed the claim. This means the market
value fixed by the State Land Acquisition Officer was not proper and the claimant proved the
entitlement for additional rate of the market value.
0
50
100
150
200
250
300
350
400
Mangalwedha Karmala Mohol Pundharpur Malshiras N Solapur Madha S Solapur Sangola
Names of Taluq
Num
ber
of lit
igations
0
50
100
150
200
250
300
350
400
Karmala Madha Malshiras Mangalwedha Mohol N Solapur Pundharpur S Solapur Sangola
claim for higher market value Additional income claimed
Land quality is good (fertile soil etc.,) Improvement / motors / structures / trees / etc.
Nu
mb
er
of
litig
atio
ns
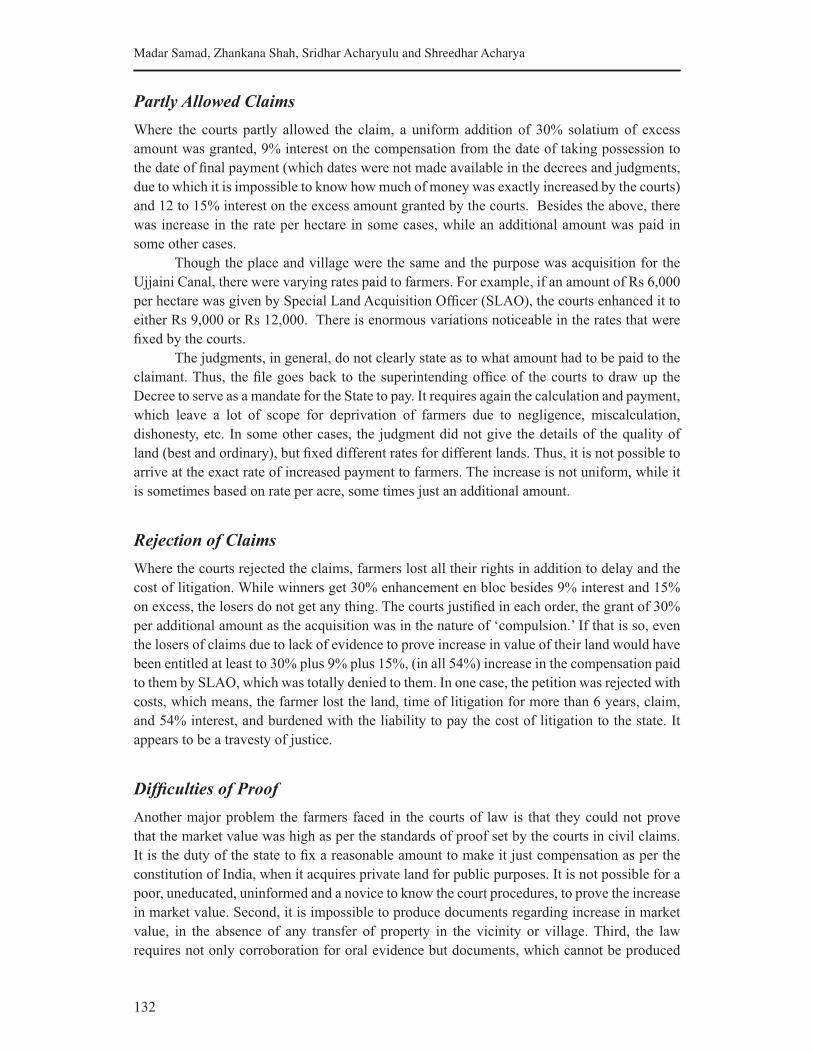
132
Madar Samad, Zhankana Shah, Sridhar Acharyulu and Shreedhar Acharya
Partly Allowed Claims
Where the courts partly allowed the claim, a uniform addition of 30% solatium of excess
amount was granted, 9% interest on the compensation from the date of taking possession to
the date of final payment (which dates were not made available in the decrees and judgments,
due to which it is impossible to know how much of money was exactly increased by the courts)
and 12 to 15% interest on the excess amount granted by the courts. Besides the above, there
was increase in the rate per hectare in some cases, while an additional amount was paid in
some other cases.
Though the place and village were the same and the purpose was acquisition for the
Ujjaini Canal, there were varying rates paid to farmers. For example, if an amount of Rs 6,000
per hectare was given by Special Land Acquisition Officer (SLAO), the courts enhanced it to
either Rs 9,000 or Rs 12,000. There is enormous variations noticeable in the rates that were
fixed by the courts.
The judgments, in general, do not clearly state as to what amount had to be paid to the
claimant. Thus, the file goes back to the superintending office of the courts to draw up the
Decree to serve as a mandate for the State to pay. It requires again the calculation and payment,
which leave a lot of scope for deprivation of farmers due to negligence, miscalculation,
dishonesty, etc. In some other cases, the judgment did not give the details of the quality of
land (best and ordinary), but fixed different rates for different lands. Thus, it is not possible to
arrive at the exact rate of increased payment to farmers. The increase is not uniform, while it
is sometimes based on rate per acre, some times just an additional amount.
Rejection of Claims
Where the courts rejected the claims, farmers lost all their rights in addition to delay and the
cost of litigation. While winners get 30% enhancement en bloc besides 9% interest and 15%
on excess, the losers do not get any thing. The courts justified in each order, the grant of 30%
per additional amount as the acquisition was in the nature of ‘compulsion.’ If that is so, even
the losers of claims due to lack of evidence to prove increase in value of their land would have
been entitled at least to 30% plus 9% plus 15%, (in all 54%) increase in the compensation paid
to them by SLAO, which was totally denied to them. In one case, the petition was rejected with
costs, which means, the farmer lost the land, time of litigation for more than 6 years, claim,
and 54% interest, and burdened with the liability to pay the cost of litigation to the state. It
appears to be a travesty of justice.
Difficulties of Proof
Another major problem the farmers faced in the courts of law is that they could not prove
that the market value was high as per the standards of proof set by the courts in civil claims.
It is the duty of the state to fix a reasonable amount to make it just compensation as per the
constitution of India, when it acquires private land for public purposes. It is not possible for a
poor, uneducated, uninformed and a novice to know the court procedures, to prove the increase
in market value. Second, it is impossible to produce documents regarding increase in market
value, in the absence of any transfer of property in the vicinity or village. Third, the law
requires not only corroboration for oral evidence but documents, which cannot be produced

133
Managing Rehabilitation and Resettlement of Involuntarily Displaced Population
by a farmer. Because of this, the courts either rejected the claims or partly allowed the claims
and only in a few cases was there a total acceptance of claims.
The courts chose to give very elaborate technical and evidentiary reasons to reject the
claims fully or partly. The farmers had to lose because of:
a. Wrongful and arbitrary fixation of low rates by the SLAO.
b. Lack of evidence of increase in market value.
c. Lack of sales transactions in the past in the village or the vicinity.
d. Technical rejection of the total claim.
e. Lack of understanding of the plight of farmers by the lower judiciary.
f. Technical rule adherence of the judiciary, depriving the farmers whose claims were
rejected while a 54% common increase was allowed to all of those where the claim was
partly allowed.
Gross Injustice in Rejected Cases
In most of the cases rejected by the courts, the farmers were made to pay costs to the government
for “bringing unnecessary claims.” It is very unreasonable and not justified at all. Their failure
in proving the enhanced value is due to several technical reasons. If one takes the overall
conclusion of the cases the farmers’ dissatisfaction was upheld and the fact that they were paid
lesser amounts was proved. In such cases, how were the farmers penalized for bringing an
action against the state for just compensation?
The major reason for rejecting the claims is the lack of proof of the market value. As
there was no sale transaction in a particular area, it was difficult for the poor farmer to produce
evidence for the assumed market value. It is such a situation that unless there is a sale, there
is no document to establish the value. In the absence of sale the value could not be proved.
Though it has its own market value, the simple fact of absence of a transaction deprived
several of the farmers of their real worth of the property that was lost. In many cases, the courts
did not take into account the loss of future gains, which unfortunately was not claimed by any
applicant. The fact that the land was the livelihood was totally neglected by the applicants
because of their lack of awareness, and even by their lawyers, may be because of negligence
or inefficiency. It is so unfortunate in no case out of 480 that went to the courts, was the issue
of land as livelihood either mentioned or discussed. At the end, the courts did not find any
material before them to enhance the compensation to adequate levels. Around 252 farmers
could not get anything in spite of their struggle in litigation as their cases were not accepted.
In most of the cases where they lost, their poverty made them to lose. Because they
could not utilize the land by adding water sources or raising some structures or planting profit-
yielding gardens, etc., they could not enhance the value of the land.
The fight in courts of law appears to be very unproductive and the time and money
spent on the litigation is comparatively very high in relation to the raise in compensation
yielded. In one case it took 23 years just for one step of litigation wherein 13 parties together
gained an increase of just Rs 4,873 more than what was given by the SLAO. In another case,
one applicant got just Rs 1,508 after 22 years’ long litigation. Most of the cases were rejected

134
Madar Samad, Zhankana Shah, Sridhar Acharyulu and Shreedhar Acharya
after 10 or 15 years of hearing. While just 23 cases were completed within 1 year, 339 cases
were disposed of within 2 to 7 years while 120 cases took more than 8 years for disposal.
When the SLAO fixes the amount of compensation in the beginning itself, the villagers
of the Sholapur District would have had no need to come to courts of law for enhancement.
It is because of the inefficiency or negligence of SLAO that the farmers were either paid less
or driven to courts of law, while they were deprived of their right to just compensation within
a reasonable time frame. This fact is well established through the observations of the judicial
officers that the compensation fixed by the SALO was inadequate and unreasonable. The
inefficiency of SLAO was amply proved as it was only in two out of 480 cases that the courts
found the compensation as adequate. Though there were a number of rejections and dismissals
they were based on the lack of evidence and not because of the adequacy of compensation
fixed by SLAO.
Who Has to Calculate the Just Compensation?
It is the duty of the state, which compulsorily acquired the land of the farmer to provide just
compensation. This is the constitutional principle. Then how can the courts impose the burden
on the farmer who has neither education, nor means to know the real value of his land?
There is a lot of difference between a civil case where compensation is demanded for
a violation of right, necessitating the claimant to prove what loss he had suffered, and a civil
case where land was compulsorily acquired. In the latter case it is the responsibility of the state
to calculate and give just compensation; it is not possible for the farmers to prove the exact rate
of compensation. The courts also could not help the farmers to get just compensation because
of their habitual technical approach resulting in procedural injustice. The courts should have
not insisted on cent per cent evidence for establishing claims.
Where the farmers wanted the enhanced value of land to be taken into account, the
courts just increased a little amount, because they could not believe the claims as they were
not supported by any documents. The courts generally did not look into the point that it was
not possible for farmers to prove the value of their land, quality of their land and annual returns
with documents.
There are some more aspects that need to be considered with reference to just
compensation which is beyond the comprehension of land acquisition law, land acquisition
officers, and the courts caught in the cobweb of procedural tangles, which are as follows:
1. The Ujjaini Canal has improved the value of the land, prospects of productivity of land in
the vicinity. But some farmers lost their total land while others lost part of their own land.
Neither SLAO nor the courts have taken into account the prospective increase in value of
land, its productivity while fixing and adjudicating on the rate of the land.
2. While some farmers lost the land for the Ujjaini Canal, other farmers gained as their
livelihood was strengthened, economy was improved and market value increased. If they
proposed to sell the land after Ujjaini Canal started irrigating their lands, they would
have got more than a hundredfold increase in the market value, which factor was never
considered regarding farmers who lost the land.
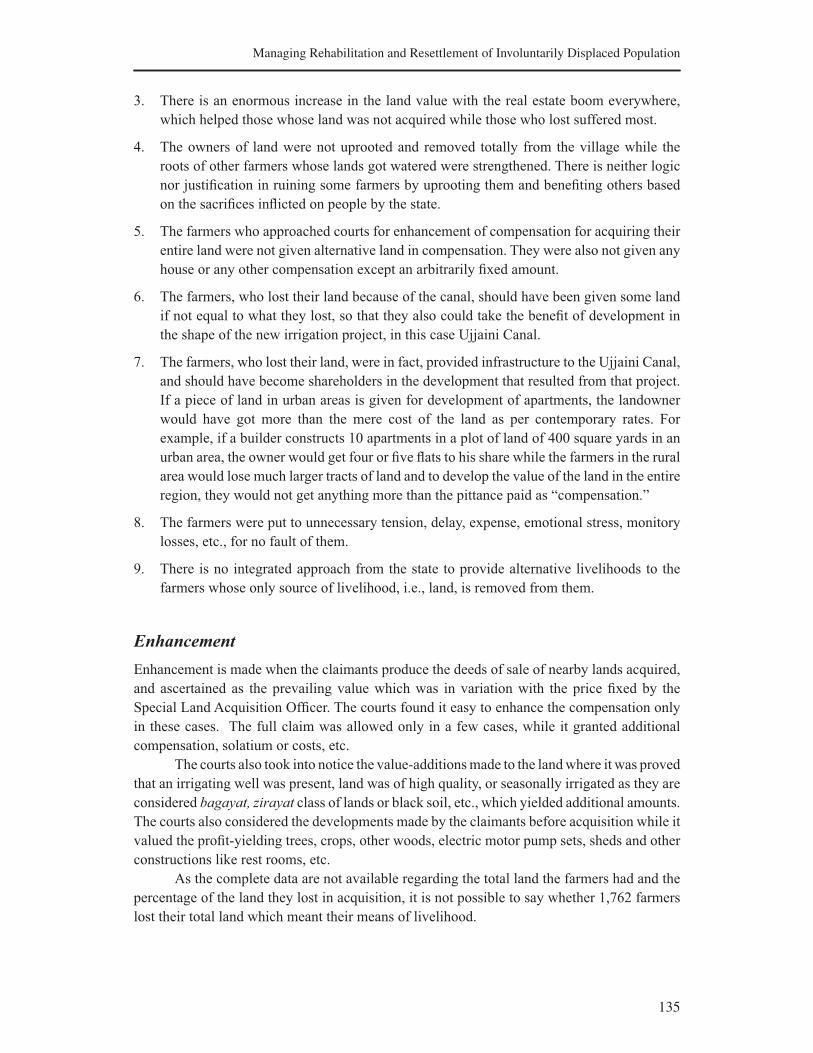
135
Managing Rehabilitation and Resettlement of Involuntarily Displaced Population
3. There is an enormous increase in the land value with the real estate boom everywhere,
which helped those whose land was not acquired while those who lost suffered most.
4. The owners of land were not uprooted and removed totally from the village while the
roots of other farmers whose lands got watered were strengthened. There is neither logic
nor justification in ruining some farmers by uprooting them and benefiting others based
on the sacrifices inflicted on people by the state.
5. The farmers who approached courts for enhancement of compensation for acquiring their
entire land were not given alternative land in compensation. They were also not given any
house or any other compensation except an arbitrarily fixed amount.
6. The farmers, who lost their land because of the canal, should have been given some land
if not equal to what they lost, so that they also could take the benefit of development in
the shape of the new irrigation project, in this case Ujjaini Canal.
7. The farmers, who lost their land, were in fact, provided infrastructure to the Ujjaini Canal,
and should have become shareholders in the development that resulted from that project.
If a piece of land in urban areas is given for development of apartments, the landowner
would have got more than the mere cost of the land as per contemporary rates. For
example, if a builder constructs 10 apartments in a plot of land of 400 square yards in an
urban area, the owner would get four or five flats to his share while the farmers in the rural
area would lose much larger tracts of land and to develop the value of the land in the entire
region, they would not get anything more than the pittance paid as “compensation.”
8. The farmers were put to unnecessary tension, delay, expense, emotional stress, monitory
losses, etc., for no fault of them.
9. There is no integrated approach from the state to provide alternative livelihoods to the
farmers whose only source of livelihood, i.e., land, is removed from them.
Enhancement
Enhancement is made when the claimants produce the deeds of sale of nearby lands acquired,
and ascertained as the prevailing value which was in variation with the price fixed by the
Special Land Acquisition Officer. The courts found it easy to enhance the compensation only
in these cases. The full claim was allowed only in a few cases, while it granted additional
compensation, solatium or costs, etc.
The courts also took into notice the value-additions made to the land where it was proved
that an irrigating well was present, land was of high quality, or seasonally irrigated as they are
considered bagayat, zirayat class of lands or black soil, etc., which yielded additional amounts.
The courts also considered the developments made by the claimants before acquisition while it
valued the profit-yielding trees, crops, other woods, electric motor pump sets, sheds and other
constructions like rest rooms, etc.
As the complete data are not available regarding the total land the farmers had and the
percentage of the land they lost in acquisition, it is not possible to say whether 1,762 farmers
lost their total land which meant their means of livelihood.
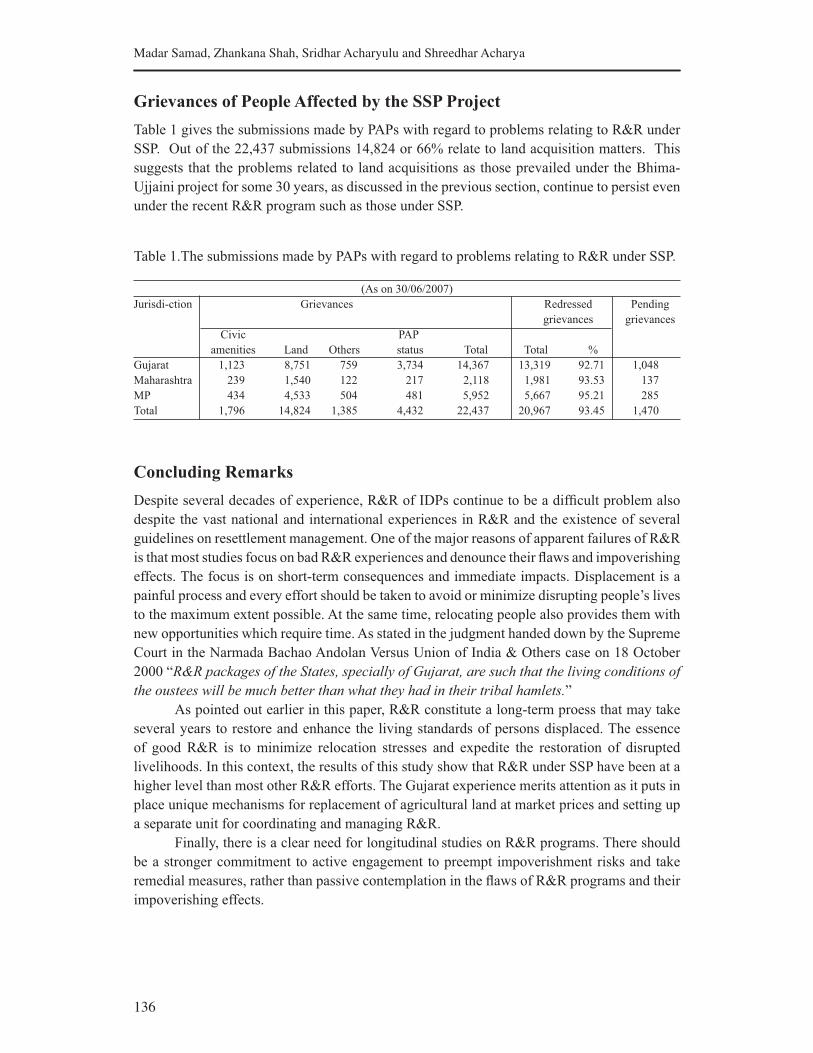
136
Madar Samad, Zhankana Shah, Sridhar Acharyulu and Shreedhar Acharya
Grievances of People Affected by the SSP Project
Table 1 gives the submissions made by PAPs with regard to problems relating to R&R under
SSP. Out of the 22,437 submissions 14,824 or 66% relate to land acquisition matters. This
suggests that the problems related to land acquisitions as those prevailed under the Bhima-
Ujjaini project for some 30 years, as discussed in the previous section, continue to persist even
under the recent R&R program such as those under SSP.
Table 1.The submissions made by PAPs with regard to problems relating to R&R under SSP.
(As on 30/06/2007)
Jurisdi-ction Grievances Redressed Pending
grievances grievances
Civic PAP
amenities Land Others status Total Total %
Gujarat 1,123 8,751 759 3,734 14,367 13,319 92.71 1,048
Maharashtra 239 1,540 122 217 2,118 1,981 93.53 137
MP 434 4,533 504 481 5,952 5,667 95.21 285
Total 1,796 14,824 1,385 4,432 22,437 20,967 93.45 1,470
Concluding Remarks
Despite several decades of experience, R&R of IDPs continue to be a difficult problem also
despite the vast national and international experiences in R&R and the existence of several
guidelines on resettlement management. One of the major reasons of apparent failures of R&R
is that most studies focus on bad R&R experiences and denounce their flaws and impoverishing
effects. The focus is on short-term consequences and immediate impacts. Displacement is a
painful process and every effort should be taken to avoid or minimize disrupting people’s lives
to the maximum extent possible. At the same time, relocating people also provides them with
new opportunities which require time. As stated in the judgment handed down by the Supreme
Court in the Narmada Bachao Andolan Versus Union of India & Others case on 18 October
2000 “R&R packages of the States, specially of Gujarat, are such that the living conditions of
the oustees will be much better than what they had in their tribal hamlets.”
As pointed out earlier in this paper, R&R constitute a long-term proess that may take
several years to restore and enhance the living standards of persons displaced. The essence
of good R&R is to minimize relocation stresses and expedite the restoration of disrupted
livelihoods. In this context, the results of this study show that R&R under SSP have been at a
higher level than most other R&R efforts. The Gujarat experience merits attention as it puts in
place unique mechanisms for replacement of agricultural land at market prices and setting up
a separate unit for coordinating and managing R&R.
Finally, there is a clear need for longitudinal studies on R&R programs. There should
be a stronger commitment to active engagement to preempt impoverishment risks and take
remedial measures, rather than passive contemplation in the flaws of R&R programs and their
impoverishing effects.
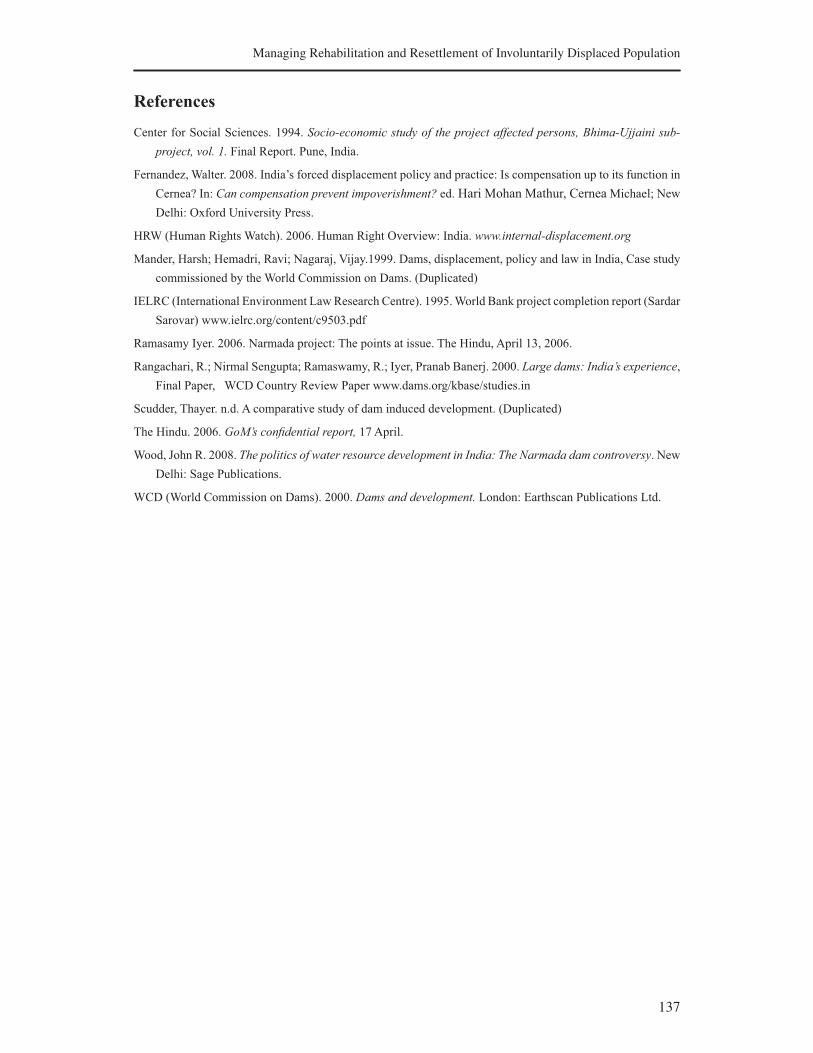
137
Managing Rehabilitation and Resettlement of Involuntarily Displaced Population
References
Center for Social Sciences. 1994. Socio-economic study of the project affected persons, Bhima-Ujjaini sub-
project, vol. 1. Final Report. Pune, India.
Fernandez, Walter. 2008. India’s forced displacement policy and practice: Is compensation up to its function in
Cernea? In: Can compensation prevent impoverishment? ed. Hari Mohan Mathur, Cernea Michael; New
Delhi: Oxford University Press.
HRW (Human Rights Watch). 2006. Human Right Overview: India. www.internal-displacement.org
Mander, Harsh; Hemadri, Ravi; Nagaraj, Vijay.1999. Dams, displacement, policy and law in India, Case study
commissioned by the World Commission on Dams. (Duplicated)
IELRC (International Environment Law Research Centre). 1995. World Bank project completion report (Sardar
Sarovar) www.ielrc.org/content/c9503.pdf
Ramasamy Iyer. 2006. Narmada project: The points at issue. The Hindu, April 13, 2006.
Rangachari, R.; Nirmal Sengupta; Ramaswamy, R.; Iyer, Pranab Banerj. 2000. Large dams: India’s experience,
Final Paper, WCD Country Review Paper www.dams.org/kbase/studies.in
Scudder, Thayer. n.d. A comparative study of dam induced development. (Duplicated)
The Hindu. 2006. GoM’s confidential report, 17 April.
Wood, John R. 2008. The politics of water resource development in India: The Narmada dam controversy. New
Delhi: Sage Publications.
WCD (World Commission on Dams). 2000. Dams and development. London: Earthscan Publications Ltd.

139
Promoting Demand Management in Irrigation in India:
Policy Options and Institutional Requirements
Rathinasamy Maria Saleth, Upali A. Amarasinghe, V. Ratna Reddy, K. Palanisami,
R.P.S. Malik, A. Narayanamoorthy, Vishal Narain and M. Venkata Reddy1
Introduction
The symptoms of an ever-growing gap between water supply and demand, already visible
in a few regions around the country, are soon expected to assume national proportions and
become a permanent feature of the Indian water economy. While water demand is growing
fast due to population growth and economic expansion, water supply is not growing at the
same rate due to constraints in expanding supply and also due to the ultimate physical limit
for supply expansion. Although water resources developed at present, i.e., 644 billion cubic
meters (Bm3), constitute only 57% of the ultimate utilizable potential (1,122 Bm3), augmenting
supply beyond this level is going to be increasingly constrained by investment bottlenecks,
environmental concerns, and political and legal snags. In this respect, the country’s ability
to meet the increasing water demand in the next few decades will be a major challenge.
According to the Ministry of Water Resources (2000), the total demand is projected to increase
to 694-710 Bm3 by 2010 to 784-850 Bm3 by 2025 and to 973-1,180 Bm3 by 2050. A recent
analysis of water demand and supply scenarios, which accounts for the major changes in the
key drivers of water demand and supply, also confirms this demand trend (Amarasinghe et al.
2007a). Particularly, this study projects that under the ‘business-as-usual’ water use patterns,
nine basins amounting to over four-fifths of the total water use in India, will face physical
water scarcity by 2050.
From a larger perspective, water scarcity of this magnitude will constrain the ability of
the country in meeting the increasing food, livelihood, and water supply needs of an increasing
population. Such an inability for a monsoon-dependent and rural-based economy such as
India is likely to have devastating social, economic, and political consequences unless water
demand is managed through well-designed and implemented policies for improving water use
efficiency and productivity, particularly in the irrigation sector, which accounts for the most
water consumption. As the scenario facing the Indian water economy is rather grave, any
1Rathinasamy Maria Saleth, Madras School of Development Studies, Chennai; Upali A. Amarasinghe,
IWMI, New Delhi; Centre for Economic and Social Studies, Hyderabad; V. Ratna Reddy, K. Palanisami,
IWMI, Hyderabad; R.P.S. Malik, Agro-economic Centre, Delhi University, Delhi; A. Narayanamoorthy,
Centre for Rural Development, Alagappa University, Karaikudi, Tamil Nadu; Vishal Narain, School of
Public Policy and Governance, Management Development Institute, Gurgaon, Haryana; and M. Venkata
Reddy, Consulting Engineering Services(I) Pvt. Ltd., Banglore.
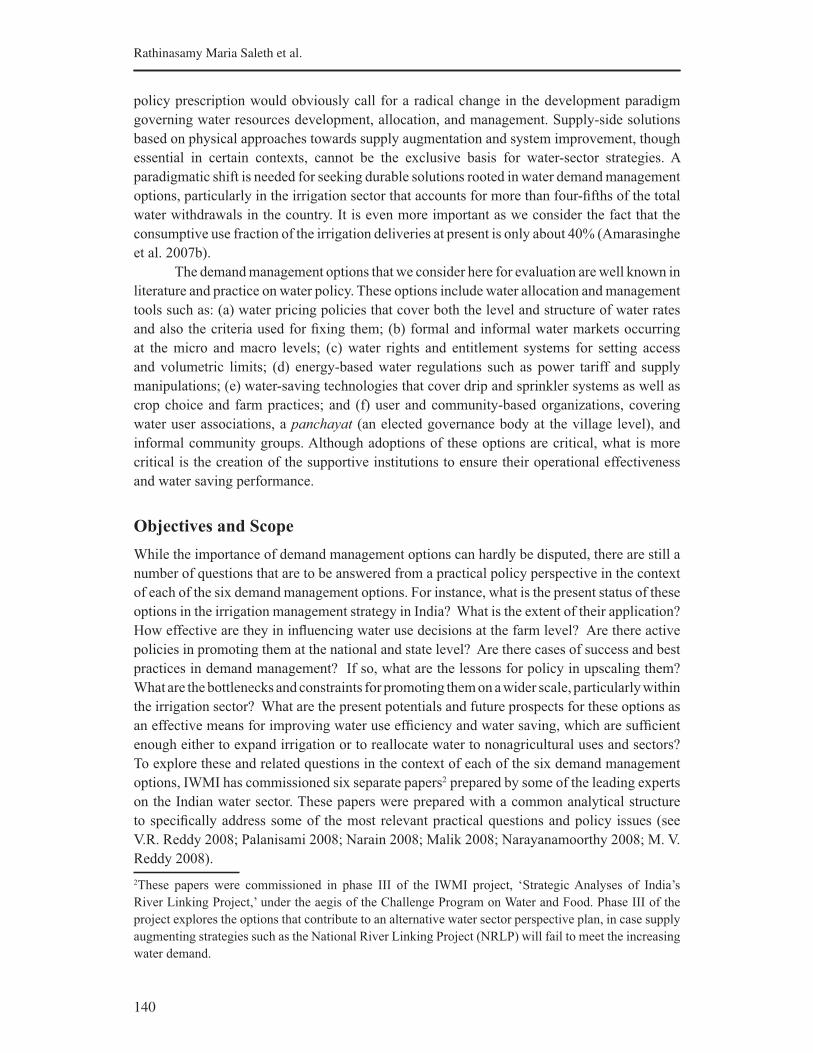
140
Rathinasamy Maria Saleth et al.
policy prescription would obviously call for a radical change in the development paradigm
governing water resources development, allocation, and management. Supply-side solutions
based on physical approaches towards supply augmentation and system improvement, though
essential in certain contexts, cannot be the exclusive basis for water-sector strategies. A
paradigmatic shift is needed for seeking durable solutions rooted in water demand management
options, particularly in the irrigation sector that accounts for more than four-fifths of the total
water withdrawals in the country. It is even more important as we consider the fact that the
consumptive use fraction of the irrigation deliveries at present is only about 40% (Amarasinghe
et al. 2007b).
The demand management options that we consider here for evaluation are well known in
literature and practice on water policy. These options include water allocation and management
tools such as: (a) water pricing policies that cover both the level and structure of water rates
and also the criteria used for fixing them; (b) formal and informal water markets occurring
at the micro and macro levels; (c) water rights and entitlement systems for setting access
and volumetric limits; (d) energy-based water regulations such as power tariff and supply
manipulations; (e) water-saving technologies that cover drip and sprinkler systems as well as
crop choice and farm practices; and (f) user and community-based organizations, covering
water user associations, a panchayat (an elected governance body at the village level), and
informal community groups. Although adoptions of these options are critical, what is more
critical is the creation of the supportive institutions to ensure their operational effectiveness
and water saving performance.
Objectives and Scope
While the importance of demand management options can hardly be disputed, there are still a
number of questions that are to be answered from a practical policy perspective in the context
of each of the six demand management options. For instance, what is the present status of these
options in the irrigation management strategy in India? What is the extent of their application?
How effective are they in influencing water use decisions at the farm level? Are there active
policies in promoting them at the national and state level? Are there cases of success and best
practices in demand management? If so, what are the lessons for policy in upscaling them?
What are the bottlenecks and constraints for promoting them on a wider scale, particularly within
the irrigation sector? What are the present potentials and future prospects for these options as
an effective means for improving water use efficiency and water saving, which are sufficient
enough either to expand irrigation or to reallocate water to nonagricultural uses and sectors?
To explore these and related questions in the context of each of the six demand management
options, IWMI has commissioned six separate papers21 prepared by some of the leading experts
on the Indian water sector. These papers were prepared with a common analytical structure
to specifically address some of the most relevant practical questions and policy issues (see
V.R. Reddy 2008; Palanisami 2008; Narain 2008; Malik 2008; Narayanamoorthy 2008; M. V.
Reddy 2008).
2These papers were commissioned in phase III of the IWMI project, ‘Strategic Analyses of India’s
River Linking Project,’ under the aegis of the Challenge Program on Water and Food. Phase III of the
project explores the options that contribute to an alternative water sector perspective plan, in case supply
augmenting strategies such as the National River Linking Project (NRLP) will fail to meet the increasing
water demand.
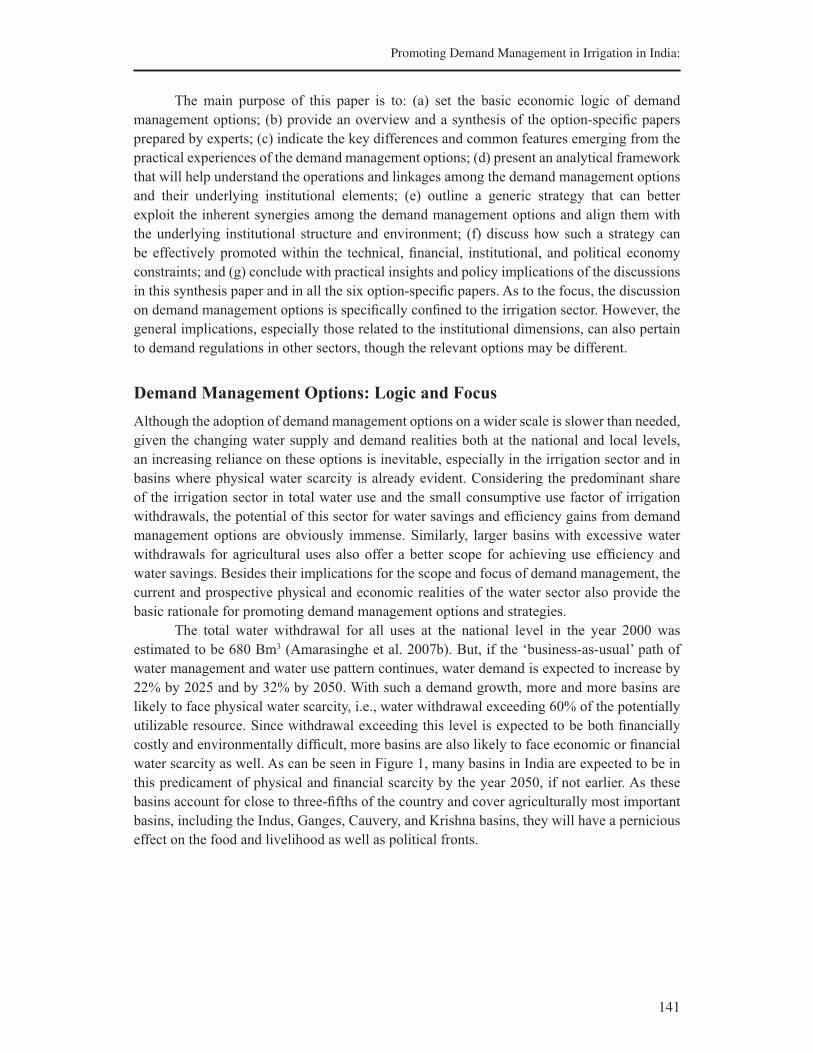
141
Promoting Demand Management in Irrigation in India:
The main purpose of this paper is to: (a) set the basic economic logic of demand
management options; (b) provide an overview and a synthesis of the option-specific papers
prepared by experts; (c) indicate the key differences and common features emerging from the
practical experiences of the demand management options; (d) present an analytical framework
that will help understand the operations and linkages among the demand management options
and their underlying institutional elements; (e) outline a generic strategy that can better
exploit the inherent synergies among the demand management options and align them with
the underlying institutional structure and environment; (f) discuss how such a strategy can
be effectively promoted within the technical, financial, institutional, and political economy
constraints; and (g) conclude with practical insights and policy implications of the discussions
in this synthesis paper and in all the six option-specific papers. As to the focus, the discussion
on demand management options is specifically confined to the irrigation sector. However, the
general implications, especially those related to the institutional dimensions, can also pertain
to demand regulations in other sectors, though the relevant options may be different.
Demand Management Options: Logic and Focus
Although the adoption of demand management options on a wider scale is slower than needed,
given the changing water supply and demand realities both at the national and local levels,
an increasing reliance on these options is inevitable, especially in the irrigation sector and in
basins where physical water scarcity is already evident. Considering the predominant share
of the irrigation sector in total water use and the small consumptive use factor of irrigation
withdrawals, the potential of this sector for water savings and efficiency gains from demand
management options are obviously immense. Similarly, larger basins with excessive water
withdrawals for agricultural uses also offer a better scope for achieving use efficiency and
water savings. Besides their implications for the scope and focus of demand management, the
current and prospective physical and economic realities of the water sector also provide the
basic rationale for promoting demand management options and strategies.
The total water withdrawal for all uses at the national level in the year 2000 was
estimated to be 680 Bm3 (Amarasinghe et al. 2007b). But, if the ‘business-as-usual’ path of
water management and water use pattern continues, water demand is expected to increase by
22% by 2025 and by 32% by 2050. With such a demand growth, more and more basins are
likely to face physical water scarcity, i.e., water withdrawal exceeding 60% of the potentially
utilizable resource. Since withdrawal exceeding this level is expected to be both financially
costly and environmentally difficult, more basins are also likely to face economic or financial
water scarcity as well. As can be seen in Figure 1, many basins in India are expected to be in
this predicament of physical and financial scarcity by the year 2050, if not earlier. As these
basins account for close to three-fifths of the country and cover agriculturally most important
basins, including the Indus, Ganges, Cauvery, and Krishna basins, they will have a pernicious
effect on the food and livelihood as well as political fronts.
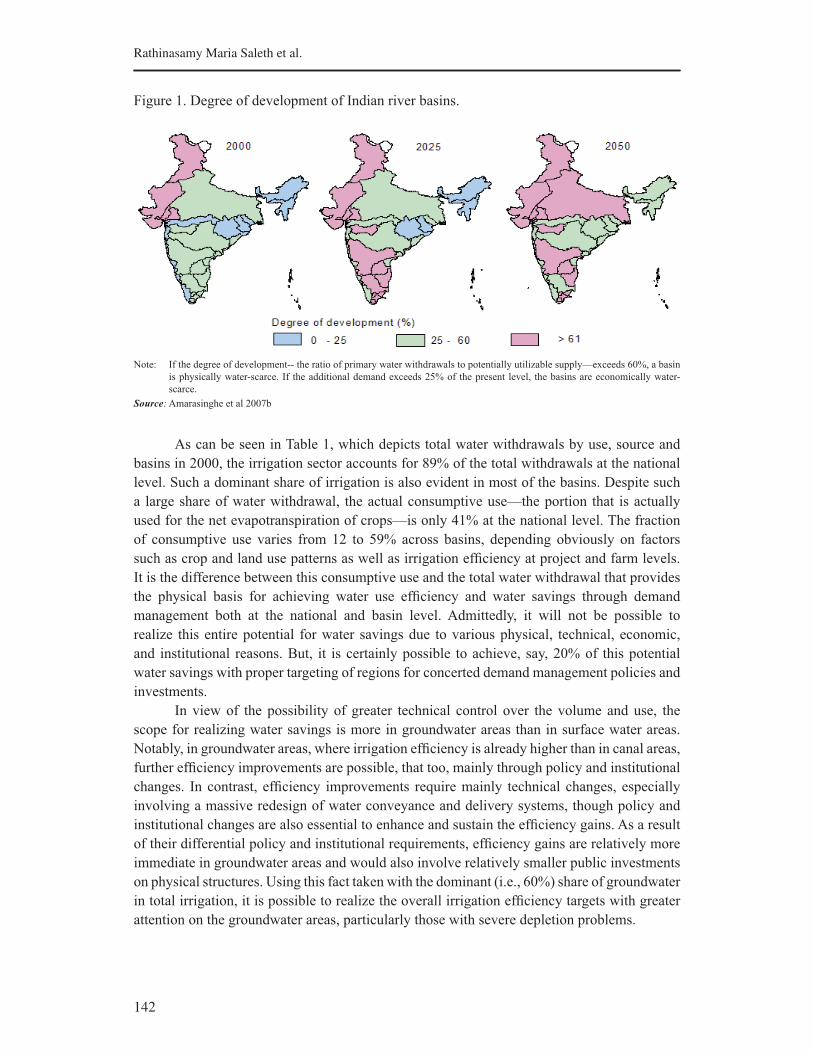
142
Rathinasamy Maria Saleth et al.
Figure 1. Degree of development of Indian river basins.
Note: If the degree of development-- the ratio of primary water withdrawals to potentially utilizable supply—exceeds 60%, a basin
is physically water-scarce. If the additional demand exceeds 25% of the present level, the basins are economically water-
scarce.
Source: Amarasinghe et al 2007b
As can be seen in Table 1, which depicts total water withdrawals by use, source and
basins in 2000, the irrigation sector accounts for 89% of the total withdrawals at the national
level. Such a dominant share of irrigation is also evident in most of the basins. Despite such
a large share of water withdrawal, the actual consumptive use—the portion that is actually
used for the net evapotranspiration of crops—is only 41% at the national level. The fraction
of consumptive use varies from 12 to 59% across basins, depending obviously on factors
such as crop and land use patterns as well as irrigation efficiency at project and farm levels.
It is the difference between this consumptive use and the total water withdrawal that provides
the physical basis for achieving water use efficiency and water savings through demand
management both at the national and basin level. Admittedly, it will not be possible to
realize this entire potential for water savings due to various physical, technical, economic,
and institutional reasons. But, it is certainly possible to achieve, say, 20% of this potential
water savings with proper targeting of regions for concerted demand management policies and
investments.
In view of the possibility of greater technical control over the volume and use, the
scope for realizing water savings is more in groundwater areas than in surface water areas.
Notably, in groundwater areas, where irrigation efficiency is already higher than in canal areas,
further efficiency improvements are possible, that too, mainly through policy and institutional
changes. In contrast, efficiency improvements require mainly technical changes, especially
involving a massive redesign of water conveyance and delivery systems, though policy and
institutional changes are also essential to enhance and sustain the efficiency gains. As a result
of their differential policy and institutional requirements, efficiency gains are relatively more
immediate in groundwater areas and would also involve relatively smaller public investments
on physical structures. Using this fact taken with the dominant (i.e., 60%) share of groundwater
in total irrigation, it is possible to realize the overall irrigation efficiency targets with greater
attention on the groundwater areas, particularly those with severe depletion problems.

143
Promoting Demand Management in Irrigation in India:
Table 1. Water withdrawal by use, source and basins, 2000.
River basins
Water withdrawalNET3 as
% of
irrigation
withdrawal
Gross irrigated areaGround-
water
abstrac-
tion ratio4
Total1
As % of
potentially
utilizable
resources2
Share of
irrigationTotal
Ground-
water
share
Bm3 % % % Mha % %
Indus 98 135 96 37 11.6 58 67
Ganga 285 68 90 41 36.5 69 56
Brahmaputra 6 12 67 14 0.4 14 4
Barak 3 29 76 12 0.3 6 4
Subarnarekha 3 35 81 24 0.4 46 36
Brahmani-Baitarani 6 28 88 24 0.7 28 21
Mahanadi 21 32 92 24 2.2 20 13
Godavari 44 37 85 46 4.3 59 40
Krishna 55 66 89 45 5.2 44 48
Pennar 8 66 90 47 0.7 65 61
Cauvery 22 70 85 39 1.9 48 43
Tapi 9 41 81 55 0.8 80 59Narmada 13 30 90 46 1.5 61 42Mahi 6 89 86 43 0.5 55 44Sabarmati 7 136 86 53 0.9 83 100
WFR15 29 112 88 59 3.2 89 132
WRF25 14 26 52 34 0.9 40 22
EFR15 20 63 92 35 1.9 26 17
EFR25 33 95 86 37 2.2 54 46
All basins 684 61 89 41 75.9 61 48
Source: Amarasinghe et al. 2007b.
Notes: 1Total includes withdrawals for irrigation, domestic and industrial sectors. 2Figures more than 100% also include recycling. 3NET is the net evapotranspiration of all irrigated crops. 4It relates total groundwater withdrawals to the total groundwater availability through natural recharge and return flows . 5WFR1 comprises west-flowing rivers of Kutch, Saurashtra and Luni; WFR2 comprises west-flowing rivers from Tapi to
Kanayakumari; EFR1 comprises east-flowing rivers between Mahanadi and Pennar, and EFR2 comprises east-flowing rivers
between Pennar and Kanyakumari.
Besides their immediate impacts on agricultural productivity, improvements in
irrigation efficiency will also have a direct effect on the irrigation water demand and, hence,
on the water savings necessary for meeting urban and environmental needs. As can be seen
in Figure 2, if the overall irrigation efficiency in canal regions can be raised from the current
level of 40 to 50% and in the groundwater regions from the present level of 60 to 80%, the
future irrigation demand, even with the larger irrigated area, will not exceed the present level
of agricultural water withdrawals. But, if the surface irrigation efficiency is increased by an
additional 10%, i.e., to 60%, while keeping groundwater irrigation efficiency at 80%, there
will be a reduction in irrigation demand to the tune of 43 Bm3 (Amarasinghe et al. 2007b). If it
is possible to raise groundwater irrigation efficiency by an additional 5%, i.e., 85%, then, the
total reduction in irrigation demand can be as high as 63 Bm3. Notably, this reduced irrigation
demand or irrigation water savings are close to the total nonirrigation demand in 2000, i.e.,
79 Bm3. In a sense, this represents the true magnitude of the potential for water savings that
exists in the agriculture sector at present. This potential can be realized gradually through
the implementation of demand management strategies involving the judicious application of
options such as water pricing, water markets, water rights, energy regulations, water saving
technologies and user associations.
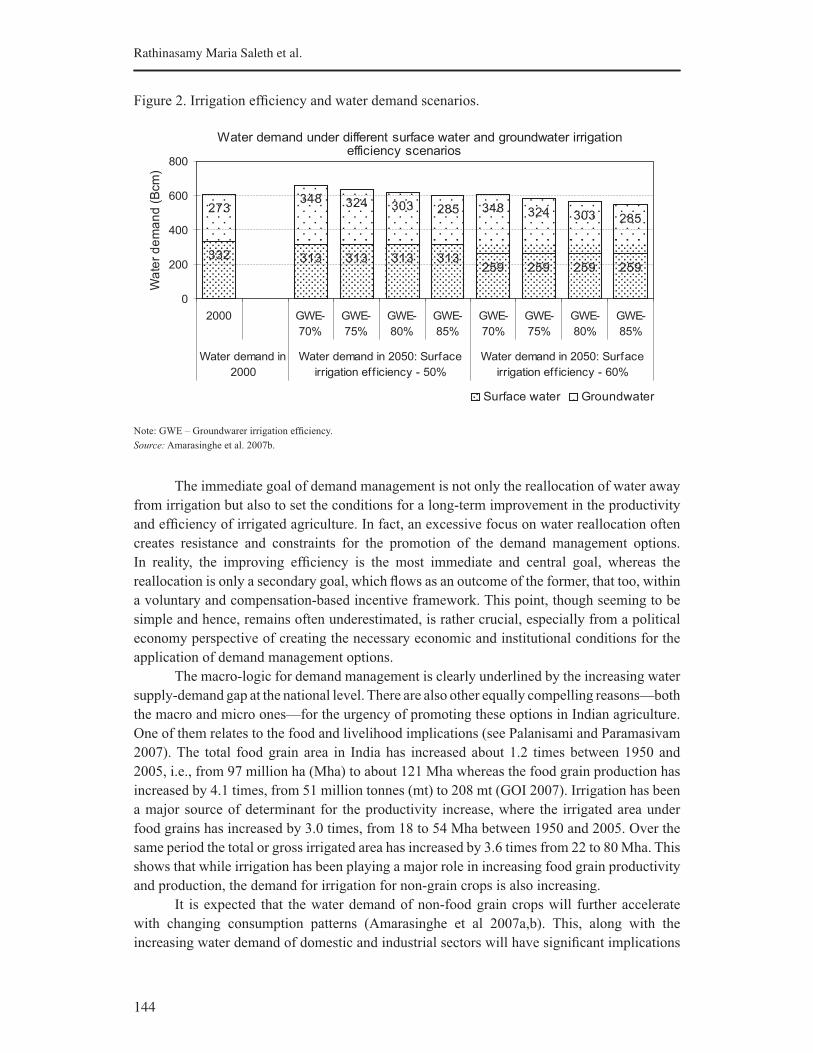
144
Rathinasamy Maria Saleth et al.
Figure 2. Irrigation efficiency and water demand scenarios.
Note: GWE – Groundwarer irrigation efficiency.
Source: Amarasinghe et al. 2007b.
The immediate goal of demand management is not only the reallocation of water away
from irrigation but also to set the conditions for a long-term improvement in the productivity
and efficiency of irrigated agriculture. In fact, an excessive focus on water reallocation often
creates resistance and constraints for the promotion of the demand management options.
In reality, the improving efficiency is the most immediate and central goal, whereas the
reallocation is only a secondary goal, which flows as an outcome of the former, that too, within
a voluntary and compensation-based incentive framework. This point, though seeming to be
simple and hence, remains often underestimated, is rather crucial, especially from a political
economy perspective of creating the necessary economic and institutional conditions for the
application of demand management options.
The macro-logic for demand management is clearly underlined by the increasing water
supply-demand gap at the national level. There are also other equally compelling reasons—both
the macro and micro ones—for the urgency of promoting these options in Indian agriculture.
One of them relates to the food and livelihood implications (see Palanisami and Paramasivam
2007). The total food grain area in India has increased about 1.2 times between 1950 and
2005, i.e., from 97 million ha (Mha) to about 121 Mha whereas the food grain production has
increased by 4.1 times, from 51 million tonnes (mt) to 208 mt (GOI 2007). Irrigation has been
a major source of determinant for the productivity increase, where the irrigated area under
food grains has increased by 3.0 times, from 18 to 54 Mha between 1950 and 2005. Over the
same period the total or gross irrigated area has increased by 3.6 times from 22 to 80 Mha. This
shows that while irrigation has been playing a major role in increasing food grain productivity
and production, the demand for irrigation for non-grain crops is also increasing.
It is expected that the water demand of non-food grain crops will further accelerate
with changing consumption patterns (Amarasinghe et al 2007a,b). This, along with the
increasing water demand of domestic and industrial sectors will have significant implications
Water demand under different surface water and groundwater irrigation efficiency scenarios
313 313 313 313259 259 259 259
273 324 303 285 348 324 303 285
0
200
400
600
800
2000 GWE-
70%
GWE-
75%
GWE-
80%
GWE-
85%
GWE-
70%
GWE-
75%
GWE-
80%
GWE-
85%
Water demand in
2000
Water demand in 2050: Surface
irrigation eff iciency - 50%
Water demand in 2050: Surface
irrigation eff iciency - 60%
Wa
ter
de
ma
nd
(B
cm
)
Surface water Groundwater
348
332
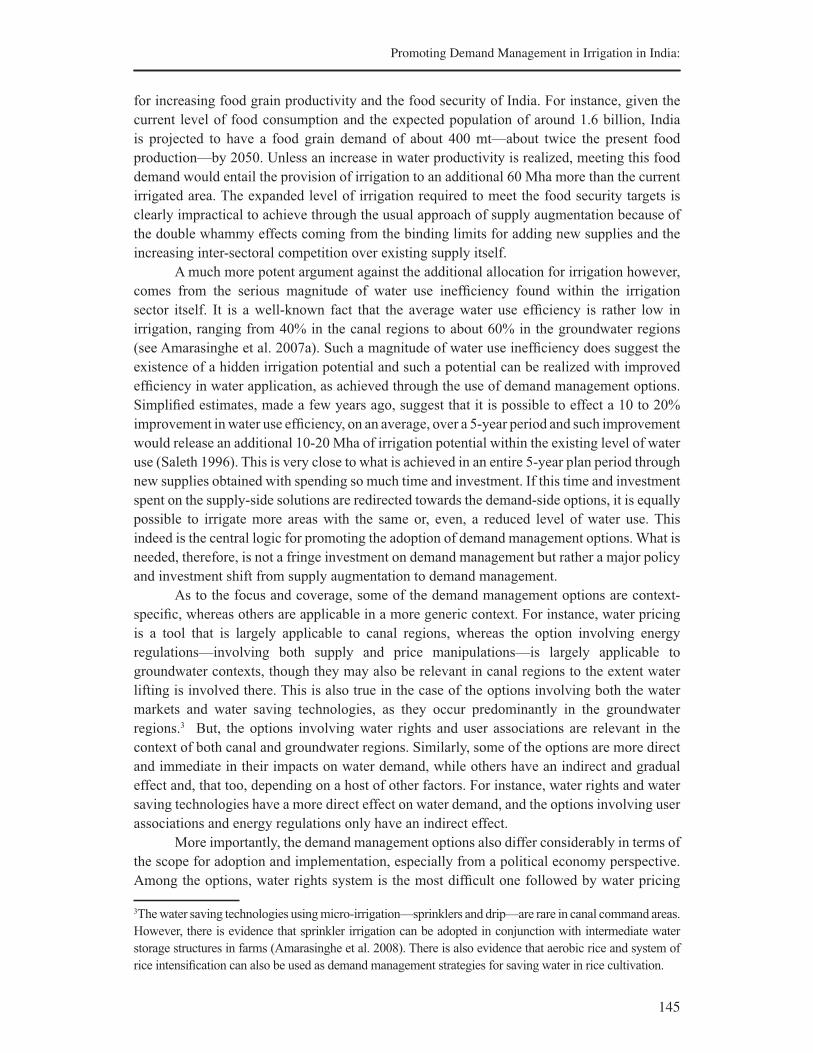
145
Promoting Demand Management in Irrigation in India:
for increasing food grain productivity and the food security of India. For instance, given the
current level of food consumption and the expected population of around 1.6 billion, India
is projected to have a food grain demand of about 400 mt—about twice the present food
production—by 2050. Unless an increase in water productivity is realized, meeting this food
demand would entail the provision of irrigation to an additional 60 Mha more than the current
irrigated area. The expanded level of irrigation required to meet the food security targets is
clearly impractical to achieve through the usual approach of supply augmentation because of
the double whammy effects coming from the binding limits for adding new supplies and the
increasing inter-sectoral competition over existing supply itself.
A much more potent argument against the additional allocation for irrigation however,
comes from the serious magnitude of water use inefficiency found within the irrigation
sector itself. It is a well-known fact that the average water use efficiency is rather low in
irrigation, ranging from 40% in the canal regions to about 60% in the groundwater regions
(see Amarasinghe et al. 2007a). Such a magnitude of water use inefficiency does suggest the
existence of a hidden irrigation potential and such a potential can be realized with improved
efficiency in water application, as achieved through the use of demand management options.
Simplified estimates, made a few years ago, suggest that it is possible to effect a 10 to 20%
improvement in water use efficiency, on an average, over a 5-year period and such improvement
would release an additional 10-20 Mha of irrigation potential within the existing level of water
use (Saleth 1996). This is very close to what is achieved in an entire 5-year plan period through
new supplies obtained with spending so much time and investment. If this time and investment
spent on the supply-side solutions are redirected towards the demand-side options, it is equally
possible to irrigate more areas with the same or, even, a reduced level of water use. This
indeed is the central logic for promoting the adoption of demand management options. What is
needed, therefore, is not a fringe investment on demand management but rather a major policy
and investment shift from supply augmentation to demand management.
As to the focus and coverage, some of the demand management options are context-
specific, whereas others are applicable in a more generic context. For instance, water pricing
is a tool that is largely applicable to canal regions, whereas the option involving energy
regulations—involving both supply and price manipulations—is largely applicable to
groundwater contexts, though they may also be relevant in canal regions to the extent water
lifting is involved there. This is also true in the case of the options involving both the water
markets and water saving technologies, as they occur predominantly in the groundwater
regions.32 But, the options involving water rights and user associations are relevant in the
context of both canal and groundwater regions. Similarly, some of the options are more direct
and immediate in their impacts on water demand, while others have an indirect and gradual
effect and, that too, depending on a host of other factors. For instance, water rights and water
saving technologies have a more direct effect on water demand, and the options involving user
associations and energy regulations only have an indirect effect.
More importantly, the demand management options also differ considerably in terms of
the scope for adoption and implementation, especially from a political economy perspective.
Among the options, water rights system is the most difficult one followed by water pricing
3The water saving technologies using micro-irrigation—sprinklers and drip—are rare in canal command areas.
However, there is evidence that sprinkler irrigation can be adopted in conjunction with intermediate water
storage structures in farms (Amarasinghe et al. 2008). There is also evidence that aerobic rice and system of
rice intensification can also be used as demand management strategies for saving water in rice cultivation.
146
Rathinasamy Maria Saleth et al.
reforms and energy regulations, but those involving water markets and user associations are
relatively easier to adopt, though their implementation can still remain difficult. Water saving
technologies, though politically benign and not controversial, still require favorable cropping
systems and effective credit and investment policies. The differences in their application
context, political feasibility and the gestation period of impact are very important and should
be understood because such factors will determine the relative scale of application and the
overall impact of the demand management options.
Demand Management Options in India: An Overview and Synthesis
Before developing the analytical framework that sheds light on the strategic and institutional
dimensions as well as the dynamics and impact paths of demand management, it is useful to
provide an overview and synthesis of the six demand management options (V.R. Reddy 2008;
Palanisami 2008; Narain 2008; Malik 2008; Narayanamoorthy 2008; M.V. Reddy 2008). Since
these papers provide a comprehensive evaluation of the present status and effectiveness of the
individual demand management options in the particular context of the irrigation sector, an
overview of them can be helpful both to highlight the main issues and challenges and to explore
the possible avenues for enhancing the individual and joint coverage and demand management
performance. With this point in mind, let us provide a quick overview and synthesis of the
potential, present status, problems and prospects of individual options as presented in each of
the option-specific papers.
Water Pricing
V.R. Reddy (2008), in his most comprehensive review of water pricing as a demand management
option, concludes that the ability of water pricing to influence water use in India is severely
constrained both by the nature and level of water rates and by the lack of effective institutional
and technical conditions. Although successive Irrigation Commissions have recommended
to base water rates on benefits or gross revenues rather than on simple provision costs, the
prevailing rates in most states are tuned more to cost recovery than to income or benefits.
Even this cost focus is also restricted to operation and maintenance (O&M) costs, and in most
states the water rates were able to cover no more than 20% of these costs. Notably, V.R. Reddy
(2008) argues that such lower rates are more to do with technical and political factors than
with issues on willingness to pay, as the case of farmers willing to pay more, especially with
an improved supply and service quality, is well documented across the states.
Besides the lower level, the nature and structure of water rates also make them
ineffective both in their cost recovery and allocation roles. Since water rates are charged in
terms of area, crop and season (or combinations thereof), they fail to create enough incentive
for water use efficiency. While water rates in groundwater areas are relatively higher, they are
also related to average pump costs rather than to water productivity or economic value (see
V.R. Reddy 2008, Table 3). Under this condition, it is far-fetched to expect the present water
pricing policy to play the much needed economic role of water allocation. Based on a careful
review of both water pricing literature and actual experience in India and abroad, V.R. Reddy
(2008) argues that water pricing policy can be an effective tool to manage demand, if it is
designed within a marginal cost principle, volumetric allocation and block or tier structure.
Besides the design aspects, he has also elaborated on supportive institutional conditions such
147
Promoting Demand Management in Irrigation in India:
as the user associations, locally managed water rights, water markets and system redesigns to
improve conveyance and delivery.
Although Indian experience shows that water pricing is largely ineffective in
influencing water use, there are interesting examples, which, in fact, show the importance
of the necessary technical and institutional conditions. While water pricing has not been that
effective, its effectiveness can be enhanced with the proper level and structuring of water rates.
For instance, in Israel, marginal cost pricing followed within either the block rate structure
or the tier rate system has been successful in reducing water consumption by 7%. Similarly,
pricing policy, when combined with supply regulations either directly or through water rights,
can also be very effective. For instance, the Krishna Delta farmers in Andhra Pradesh received
40% less than the normal supply during the drought of 2001-2004. Interestingly, they have not
only managed well with this lower supply but also reported a 20% improvement in the yield
(V.R. Reddy 2008). Although this case shows the efficiency and water saving benefits of an
accidental supply reduction during drought, it does demonstrate the potential of direct supply
regulations in canal regions. The experience in cases such as Australia and California in the
US shows that the effectiveness of water pricing in demand management can be attributed to
the supporting institutions such as volumetric allocation, water rights and water markets.
Water Markets
In his critical review and evaluation, Palanisami (2008) highlights both the opportunities and
challenges involved in using prevailing water markets as a demand management option in
irrigation. He has compiled extensive empirical evidence on the efficiency and equity roles of
water markets both in the groundwater and tank regions. But, at the same time, he also notes
the negative social and resource effects due to the monopoly tendencies and groundwater
depletion. While there is scope for considerable net positive effects of water markets on water
use efficiency, he reckons it to be rather small for two major reasons. First, although water
markets are observed widely, the areas they cover or influence are small and they occur mostly
in groundwater regions mainly on a sporadic basis. The estimated area served or influenced by
water markets varies widely in a range of 15 to 50% of the total irrigated area in the country. But,
given their seasonal character, transitory nature and concentration in a few regions, the actual
area affected by water markets is likely to be close to the lower bound of this range. Second,
since these markets operate without any volumetric limits or other regulatory framework, there
is only very little incentive for increasing water use efficiency or water saving. Although water
rates vary across markets, the dominant practice of fixing them, based mainly on pumping and
other operational costs, reduces their role in reflecting the scarcity of water.
Due to the size, coverage and nature of functioning, the ability of water markets to
perform their economic and efficiency roles is considerably limited in the Indian context. On
the other hand, there is evidence for the increasing depletion and economic loss of production
due to groundwater mining. In the case of inter-sectoral water markets around peri-urban areas,
where water is moved directly from irrigation to urban water supply, there can be serious
livelihood issues when urban migration is low and urban-based livelihoods do not increase
concurrently in the long run. Moreover, as Palanisami (2008) argues, this problem is not due to
water markets per se but due to the technical and institutional conditions in which they operate.
Specifically, he mentions the absence of volume-based water rights, spatial issues limiting
148
Rathinasamy Maria Saleth et al.
competition and regulatory framework, including energy supply and pricing regulations
and community involvement in local water withdrawal decisions. One can also add here the
distorting role of land tenure that tends to link water control with landownership, especially
when there are no volume-based water rights. Similarly, the absence of spacing out of wells
and depth regulations also leads to the crowding of wells in agriculturally productive regions.
The successful cases of water markets in countries such as the US, Australia and Chile are
provided to underline the importance of supporting institutions such as volumetric allocation,
water rights and water regulations to protect equity and environment.
Water Rights
Against a detailed conceptual and legal analysis of water rights within a new institutional
economics framework, Narain (2008) evaluates the potential and prospects for its utility and
applicability as an option for managing irrigation demand. For water rights to be effective and
enduring as an institutional system for managing water, in general, and irrigation, in particular,
he suggests the necessity of converting the abstract notion into an operationally applicable
practical tool with a clear delineation and quantification of the volume of water. This is not
going to be easy in view of the understandable legal, technical, institutional, and political
challenges. But, at the same time, there are also considerable potentials for creating a volume-
based water rights system as there are growing compulsions from the emerging water demand-
supply realities and the attendant water-based conflicts at various levels. The arguments also
make it clear that the costs and difficulties involved in establishing a water rights system can be
more than offset by the potential, but definite, long-term benefits for the society. Considering
the existing legal and institutional potentials and the emerging realities on the resource and
technology sides, the development of water rights system will not be as difficult or costly as it
is made out to be in current public discourse. In fact, water rights systems of various forms are
already in operation both at the macro and micro levels in India.
Based on the review of the literature, legal and policy documents and field-level
perspective of water rights, Narain (2008) concludes that while there is a clear need and
basis for establishing water rights systems it will, however, be unrealistic to contemplate
a single form of water rights systems applicable to all contexts. Diverse forms of water
rights are needed to suit the location and context-specific realities, though there are
common principles of equity, legal pluralism and negotiation. Besides the lease-based
water rights issued by government in the Gangetic deltaic regions and the macro-level
rights implicit in sectoral priorities, there are also semi-legal and informal rights linked
to land such as the groundwater rights—based on the legal principle of easement, and
canal water rights—based on the location-related principle of fixed-tenure (Saleth
2007). But, the most important ones, which are socially recognized, locally managed,
and operating on a larger scale, especially in the northwestern and eastern states are
the water rights based on time (as in warabandi system) and on volume (as in Shejpali
system).43 Narain (2008) provides field evidence for their role in facilitating negotiation, water
allocation and use efficiency.
4Notably, both the time and volume-based water rights are linked to farm size, as they are determined in
proportion to land owned or operated. But, there are instances such as the Pani Panchayat system, where
even landless persons also have a water share, which they can sell. In this case, the shares are based not
on land but on family size (see Saleth 1996)
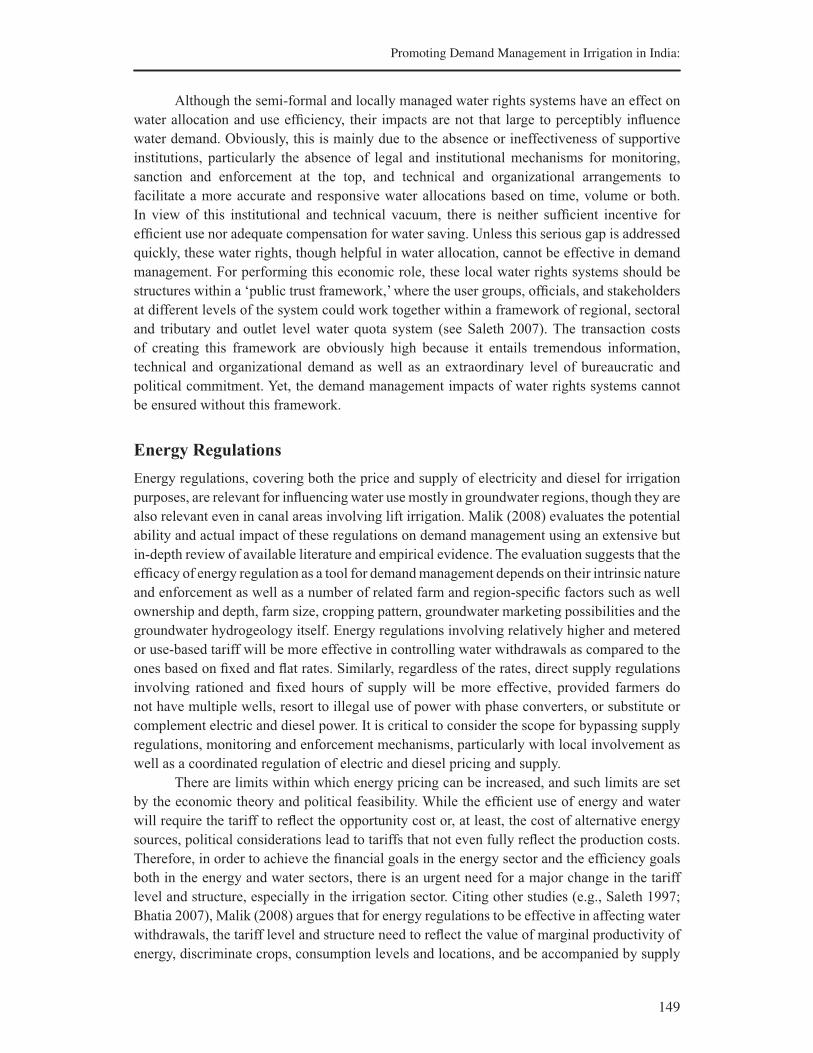
149
Promoting Demand Management in Irrigation in India:
Although the semi-formal and locally managed water rights systems have an effect on
water allocation and use efficiency, their impacts are not that large to perceptibly influence
water demand. Obviously, this is mainly due to the absence or ineffectiveness of supportive
institutions, particularly the absence of legal and institutional mechanisms for monitoring,
sanction and enforcement at the top, and technical and organizational arrangements to
facilitate a more accurate and responsive water allocations based on time, volume or both.
In view of this institutional and technical vacuum, there is neither sufficient incentive for
efficient use nor adequate compensation for water saving. Unless this serious gap is addressed
quickly, these water rights, though helpful in water allocation, cannot be effective in demand
management. For performing this economic role, these local water rights systems should be
structures within a ‘public trust framework,’ where the user groups, officials, and stakeholders
at different levels of the system could work together within a framework of regional, sectoral
and tributary and outlet level water quota system (see Saleth 2007). The transaction costs
of creating this framework are obviously high because it entails tremendous information,
technical and organizational demand as well as an extraordinary level of bureaucratic and
political commitment. Yet, the demand management impacts of water rights systems cannot
be ensured without this framework.
Energy Regulations
Energy regulations, covering both the price and supply of electricity and diesel for irrigation
purposes, are relevant for influencing water use mostly in groundwater regions, though they are
also relevant even in canal areas involving lift irrigation. Malik (2008) evaluates the potential
ability and actual impact of these regulations on demand management using an extensive but
in-depth review of available literature and empirical evidence. The evaluation suggests that the
efficacy of energy regulation as a tool for demand management depends on their intrinsic nature
and enforcement as well as a number of related farm and region-specific factors such as well
ownership and depth, farm size, cropping pattern, groundwater marketing possibilities and the
groundwater hydrogeology itself. Energy regulations involving relatively higher and metered
or use-based tariff will be more effective in controlling water withdrawals as compared to the
ones based on fixed and flat rates. Similarly, regardless of the rates, direct supply regulations
involving rationed and fixed hours of supply will be more effective, provided farmers do
not have multiple wells, resort to illegal use of power with phase converters, or substitute or
complement electric and diesel power. It is critical to consider the scope for bypassing supply
regulations, monitoring and enforcement mechanisms, particularly with local involvement as
well as a coordinated regulation of electric and diesel pricing and supply.
There are limits within which energy pricing can be increased, and such limits are set
by the economic theory and political feasibility. While the efficient use of energy and water
will require the tariff to reflect the opportunity cost or, at least, the cost of alternative energy
sources, political considerations lead to tariffs that not even fully reflect the production costs.
Therefore, in order to achieve the financial goals in the energy sector and the efficiency goals
both in the energy and water sectors, there is an urgent need for a major change in the tariff
level and structure, especially in the irrigation sector. Citing other studies (e.g., Saleth 1997;
Bhatia 2007), Malik (2008) argues that for energy regulations to be effective in affecting water
withdrawals, the tariff level and structure need to reflect the value of marginal productivity of
energy, discriminate crops, consumption levels and locations, and be accompanied by supply
150
Rathinasamy Maria Saleth et al.
rationing. But, changes in the power tariff level and structure, though critical, are not sufficient
given the critical roles played by institutional and technical conditions involved not only in the
transmission and distribution of energy for agricultural uses, but also in determining the access
to groundwater itself.
Energy regulations do have the potential to influence water withdrawal and irrigation
demand and also to improve the efficiency and financial viability of the energy sector itself.
But, these roles cannot be expected to be automatic under the current conditions of tariff
level and structure, bureaucratic management and unregulated groundwater access conditions.
There is a need for major reforms both in power and water sectors. Malik (2008) outlines
some key components of these reforms. First, considering the practical limits to which power
rates can be raised and also the difficulties for them to effectively influence water withdrawal
directly, it is reasonable to use them mainly to achieve the financial goals. Second, the policy of
metered rates varying with consumption and crops has to be combined with supply regulations
so as to directly influence water withdrawal. Third, the successful experiences in China and
US and also in the piloted experiment in Gujarat suggest that the state electricity boards have
to bulk distribute power to local organizations such as a panchayat (an elected governance
body at the village level) and rural electricity cooperatives for them to retail power among
users and collect charges. Finally, besides these changes related to the power sector, there
are also changes needed in the water sector, especially the strict enforcement of spacing and
depth regulations as well as the whole host of institutional and technical aspects related to
establishment of legally sanctioned but locally enforced and managed volumetric water rights.
When these conditions are created, energy regulations can be a powerful tool within an overall
strategy of irrigation demand management.
Water Saving Technologies
The water saving technologies cover not only the methods related to water application (drip,
sprinkler and micro-irrigation) but also those related to crop choice and farming practices.
Unlike other demand management options, this option has a direct and immediate effect on
water consumption and irrigation demand. Having reviewed the available evidence on the
extent and impact of water saving technologies, Narayanamoorthy (2008) shows that these
technologies can raise water use efficiency to the level of 60% (sprinkler) and 90% (drip) in
irrigation. Besides the obvious savings in water that may depend on the extent the saved water
is available for use elsewhere, these irrigation methods also provide additional savings in terms
of energy and labor costs. Empirical studies in India establish that these irrigation technologies
save 48 to 67% of water, 44 to 67% of energy costs, and 29 to 60% of labor costs. Overall,
private benefit-cost ratio, which depends on the value of water productivity and the underlying
role of crop prices, is impressive, ranging from 1.41 for coconut to 13.35 for crops such as
grapes. In view of these economic and productivity benefits, these technologies remain highly
viable in a range of crops from sugarcane, banana and grapes to even field crops such as wheat
and bajra (Narayanamoorthy 1997; Kumar et al. 2004). Since these technologies are scale-
neutral, they are also beneficial to farmers even with less than one hectare (Narayanamoorthy
2006). Notably, much more than the private benefits are the social benefits in terms of water
savings and input use efficiency (see Dhawan 2000).
151
Promoting Demand Management in Irrigation in India:
Unfortunately, despite the enormous scope and the impressive performance in terms
of both private and social benefits, the spread of water application technologies is rather slow
and their application is largely confined to a few states and crops. For instance, the total area
under drip irrigation is not more than 500,000 to 600,000 ha. Over 85% of this area is also
confined to the groundwater-dependent hard-rock states, i.e., Maharashtra, Karnataka, Tamil
Nadu and Andhra Pradesh. Although the technical and economic viability of this irrigation
method is established, as many as 80 crops, more than four-fifths of the current application is
restricted to vegetable and horticultural crops, including mango and citrus. Notably, coconut,
banana and grape together account for approximately half the area under drip irrigation. The
issue of low level of application and extent of coverage also applies equally to other water
saving technologies related to the selection of water conserving crops and farm practices, such
as crop spacing, use of plastics and deficit irrigation. The common reason for this low level
of adoption is the absence of binding incentives, which emerge not just from the expected
benefits of adoption but also from the resource-based compulsions reflecting the real scarcity
value of water. Under conditions of unregulated water withdrawals, the latter never enters into
the irrigation use decision of farmers.
While it is true that the water saving technologies have the most direct and immediate
impacts on irrigation demand, the major problem is that these impacts are limited mainly due
to the limited extent of their application and the limited environment within which they are
operating at present. Narayanamoorthy (2008) elaborates, then, the policy measures needed
both to expand their coverage and to improve the supportive institutional arrangements. One
of the main problems with irrigation technologies such as drips and sprinklers relates to the
need for high initial investment. Although state subsidy can be helpful, this is not the only
factor in view of the role of other factors such as extension and the need for the involvement
of the technology firms as well as other actors such as the sugar factories in the targeting and
active promotion of adoption. In this respect, besides the subsidy directed to farmers, it is also
necessary to extend tax relief or other incentives for the technology firms and sugar factories.
Equally, if not more important, however, is the need for other direct and indirect regulation on
the water resource side such as water rights and energy regulations that will reflect the scarcity
value of water to the farmers. Field studies reveal that the availability of cheap canal water and
unregulated groundwater supply do not provide the farmers with the much needed economic
compulsion for adopting the drip irrigation technologies. At the same time, adjustments in farm
price and input policies are needed to bolster water conserving crops and farming practices.
User Associations and Community Organizations
User associations as well as community organizations play a major role in water allocation and
demand management in the irrigation sector. They cover both the formal ones such as water
user associations (WUAs) and panchayats as well as the implicit and informal ones such as
those in Shejpali and Pani Panchayats systems, including those promoted by NGOs and other
stakeholders in rural areas. Although the general attention is focused mainly on WUAs and
canal irrigation contexts, other organizations and their roles in groundwater irrigation and
energy distribution are also equally important. However, a careful evaluation of the WUAs,
which are created and promoted under various forms of irrigation management transfer
programs in the canal regions of many states, can provide an indication of the overall status
and ability of user associations and community organizations in demand management, either
152
Rathinasamy Maria Saleth et al.
directly or indirectly in terms of facilitating other options. M.V. Reddy (2008) has made such
an assessment based on a critical review of the available literature and field evidence on the
status, problems and prospects of WUAs, particularly in the canal irrigation sector.
As in the case of other options, the two most important factors that will determine
the extent of demand management impacts of user associations are their area coverage and
their design and effectiveness. Despite the user participation policy being promoted since the
command area development programs of the 1960s and the user associations being currently
promoted actively in almost all states in India, the number of formal WUAs created so far and
the extent of area under their influence remain extremely low. According to Palanisami and
Paramasivam (2007), the total number of formal WUAs in the country is only about 15,000
and the area they cover is not more than about 500,000 ha. Obviously, these figures do not
cover the 800 WUAs created in Rajasthan and also many informal and implicit water-related
organizations involved in the Shejpali, Pani Panchayats and warabandi operating in parts of
Maharashtra, Orissa, Punjab and Haryana. While the warabandi system covers most canal
areas in Punjab and Haryana, there are no clear estimates for the number and area coverage of
the other informal systems, especially for Maharashtra. However, according to the estimates
for Orissa, there were 13,284 Pani Panchayats covering a total area of over 800,000 ha in
2002 (V.R. Reddy 2008). Even risking a rough estimate, the total areas under the Shejpali and
warabandi systems cannot be more than 3 to 4 million ha, representing only a fraction of the
total canal irrigated area in India.
Much more serious than the low area coverage are the weak design and operational
effectiveness of the user associations. In view of their central institutional role, user associations
and community organizations are where the whole effort to promote demand management
strategy is to begin first. Unfortunately, these organizations, especially the WUAs, as they
exist today, are designed more to focus on the limited roles of local maintenance, cost recovery
and water distribution rather than on the broad and long-term roles of being the organizational
basis for developing higher levels of economic and institutional functions. As a result, the
ability of WUAs to influence real water allocation and demand management is considerably
limited. This does not, however, deny their positive roles in cost recovery, system maintenance
and service quality in some contexts. In this respect, it is also important to note that the current
policy of Maharashtra to introduce bulk water rights at the sectoral and tributary levels and
involve local user associations to retail water is likely to strengthen the kind of institutional
role needed for demand management.
Similarly, one cannot also deny the effective role of informal organizations, which
are well documented by M.V. Reddy (2008), V.R. Reddy (2008) and Narain (2008) in the
context of different states. Although their impacts are highly location-specific and also
confined only to a few regional pockets, the key for policy makers is to learn the social and
resource-related incentives behind these success cases and try to replicate them in the case of
formal organizations. While having democratic elections and improving farmers’ participation
are important, much more important and challenging are the policy and institutional aspects
of creating effective incentive systems for collective action. In this respect, the creation of
volumetric water rights and volume-based water pricing, for instance, can create the necessary
incentives for collective action and water use efficiency. This is an interesting case of structural
linkages among the demand management options, where the effectiveness of user associations
depends on other institutional options such as water rights and pricing that, in turn, depends on
the effectiveness of the organizational aspects.

153
Promoting Demand Management in Irrigation in India:
Demand Management: Analytics of Institutions and Impacts
The central message of the review of demand management options is rather clear. Although
some of the options have immediate effects and some others have the potential to influence
water allocation and use, these effects are rather too meager to have an impact of the magnitude
needed for generating a major change in water savings and allocation. The two central
problems limiting the impacts of demand management are their limited geographic coverage
and operational effectiveness. Concerted policies are also lacking in really exploiting their
demand management roles. All these options are pursued as if they are separate and essentially
in an institutional vacuum because the necessary supporting institutions are either missing or
dysfunctional in most contexts. To see why the demand management options are effective
and to know how their effectiveness and performance can be improved, we can develop an
analytical framework capturing the linkages and dynamics among these options and their
underlying institutional structure.
Although the demand management options appear to have important differences in
terms of the nature, mechanics and the gestation period of their impacts, there are fundamentally
important operational and institutional linkages among them. Operationally, these options
are not independent but linked due to their mutual influences on each other. Similarly, there
are also intrinsic linkages among the institutions that support each of these options. A clear
understanding of these operational and institutional linkages is so vital not only for designing
an integrated strategy for demand management but also for determining its effectiveness and
impacts on water management and economic goals. For this purpose, we can use Figure 3
depicting the analytics as well as the institutional ecology of demand management options and
their joint impact on sectoral and economic goals.
Before proceeding, it is instructive to note a few key aspects of Figure 3. First, the
institutions and their linkages noted for each of the options are not exhaustive but only illustrative
to highlight some of the most important and immediate ones among them. This also applies to
the effects or impact pathways identified both in the sectoral and macro-economic contexts.
Second, since the institutions and their linkages together form the ‘institutional ecology’ of
demand management, Figure 3 does capture the ‘institutional structure.’ But, the ‘institutional
environment’ of demand management, as defined by the joint role of hydrological, demographic,
social, economic and political factors, though not a role of hydrological, demographic, social,
economic and political factors, and though not explicitly specified, actually operate beneath
Figure 3 and, hence, will have major effects on the entire system presented therein. From
the perspective of the demand management strategy, the elements defining the institutional
environment are the exogenous factors, whereas the elements forming the institutional structure
are the endogenous factors.
Despite its limited coverage, Figure 3 is able to place irrigation demand management
in the strategic context of water and agricultural institutions as well as in the larger context
of water management and economic goals. As can be seen, there are five analytically distinct
but operationally linked segments. The first segment shows the sequential linkages among
demand management options, where the options that form the necessary conditions for other
options and those having the most intense linkages with others are shown. The next segment
captures the joint effects of these options on the irrigation sector, where the water savings
effected through an improved irrigation efficiency lead to expanded irrigation with existing
supply and/or increased water savings. The third segment shows the sectoral and economy-
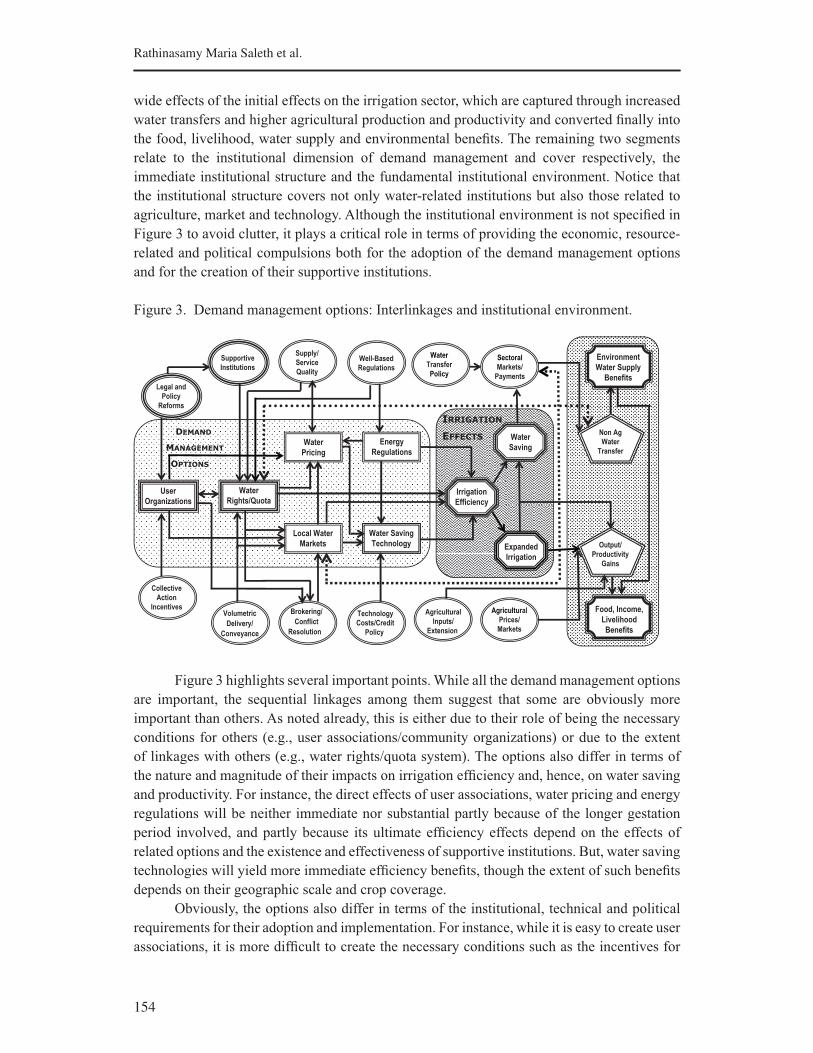
154
Rathinasamy Maria Saleth et al.
wide effects of the initial effects on the irrigation sector, which are captured through increased
water transfers and higher agricultural production and productivity and converted finally into
the food, livelihood, water supply and environmental benefits. The remaining two segments
relate to the institutional dimension of demand management and cover respectively, the
immediate institutional structure and the fundamental institutional environment. Notice that
the institutional structure covers not only water-related institutions but also those related to
agriculture, market and technology. Although the institutional environment is not specified in
Figure 3 to avoid clutter, it plays a critical role in terms of providing the economic, resource-
related and political compulsions both for the adoption of the demand management options
and for the creation of their supportive institutions.
Figure 3. Demand management options: Interlinkages and institutional environment.
IRRIGATION
EFFECTS DEMAND
MANAGEMENT
OPTIONS
Local Water
Markets
User
Organizations
Water
Pricing
Technology
Costs/Credit
Policy
Supportive
Institutions
Supply/
Service
Quality
Legal and
Policy
Reforms
Collective
Action
IncentivesBrokering/
Conflict
Resolution
Expanded
Irrigation
Output/
Productivity
Gains
Agricultural
Prices/
Markets
Volumetric
Delivery/
Conveyance
Agricultural
Inputs/
Extension
Food, Income,
Livelihood
Benefits
Non Ag
Water
Transfer
Environment
Water Supply
Benefits
Sectoral
Markets/
Payments
Water
Transfer
Policy
Well-Based
Regulations
Water
Rights/Quota
Water Saving
Technology
Water
Saving
Irrigation
Efficiency
Energy
Regulations
Figure 3 highlights several important points. While all the demand management options
are important, the sequential linkages among them suggest that some are obviously more
important than others. As noted already, this is either due to their role of being the necessary
conditions for others (e.g., user associations/community organizations) or due to the extent
of linkages with others (e.g., water rights/quota system). The options also differ in terms of
the nature and magnitude of their impacts on irrigation efficiency and, hence, on water saving
and productivity. For instance, the direct effects of user associations, water pricing and energy
regulations will be neither immediate nor substantial partly because of the longer gestation
period involved, and partly because its ultimate efficiency effects depend on the effects of
related options and the existence and effectiveness of supportive institutions. But, water saving
technologies will yield more immediate efficiency benefits, though the extent of such benefits
depends on their geographic scale and crop coverage.
Obviously, the options also differ in terms of the institutional, technical and political
requirements for their adoption and implementation. For instance, while it is easy to create user
associations, it is more difficult to create the necessary conditions such as the incentives for
155
Promoting Demand Management in Irrigation in India:
collective action and the establishment of the volumetric delivery, and water quota and loss-
free conveyance systems. Thus, the ability of an option to manage depends not only on how
efficiently it is designed and implemented but also on how well it is aligned with other options
and how effective the supportive institutional and technical conditions are. This fact highlights
another strategic feature of the options. Considering the fact that institutions, including water
institutions, are defined by the interactive roles of legal, policy and organizational aspects
(Bromley 1989; Saleth and Dinar 2004), all options, except water saving technology, are also
institutions in themselves. In this sense, the linkages among user associations, water rights,
water markets, water pricing and energy regulations are actually part of the larger institutional
setting of demand management. Major institutional issues are involved both in terms of the
functional linkages among the options as well as in terms of the structural linkages within the
supportive institutional structure.
It is also clear from Figure 3 that the institutional structure for demand management
covers not only the institutions directly related to individual options but also those related
to farm input and extension delivery systems, agricultural markets and price and investment
policies. Responsive input and extension systems, favorable market and price conditions
and well-planned investments in volumetric delivery systems and user associations are
vital for the performance of demand management options. Since these sectoral and macro-
economic policies affect the returns of farm-level water saving initiatives, they determine the
level of economic incentives and technical scope for the adoption and extension of demand
management options. Demand management options cannot operate effectively in the absence
of supportive institutions. In the absence of these sectoral and macro policy measures the
institutions cannot do that either. But, unfortunately, the way the demand management options
are operating at present suggests that there is a clear disconnection between these options and
their institutional and policy environment. Indeed this is the epicenter of all problems related
to the poor performance of demand management options at present in India.
From an impact perspective, it is clear that the overall performance of a demand
management strategy depends on the way it is designed and implemented. In this context,
the strategy has to exploit well the functional and structural linkages among the options and
also benefit from the synergies of the sectoral and macro-economic policies. For instance, the
efficiency and equity benefits of water markets can be increased manyfold when such markets
operate with a volumetric water rights system and are supported by effective user associations.
There are also second-round institutions that can emerge through the interface among water
rights, water markets and local organizations. They relate not only to the conflict-resolution
roles of user associations and community-based organizations but also to the water brokering
and water-delivery-related technical activities of other private agencies that are expected
to thrive under mature institutional conditions. Likewise, water pricing policy can be more
effective, not only in cost recovery but also in influencing water use, if it is combined with
volumetric delivery, use-based allocation structures and improved system performance and
service quality. Similar results can be expected also with other options, when they are aligned
with other options and supported well with relevant institutional and technical conditions.
The ultimate impact of demand management can be measured in terms of the nature
and scale of water savings obtained within the irrigation sector. Even when water savings are
substantial, the social impact can still be low, unless the saved water is properly reallocated
either within agriculture or to other sectors. The economic and welfare impacts of such
reallocation can be enhanced with additional but higher-level institutional and policy aspects
156
Rathinasamy Maria Saleth et al.
such as sectoral water markets and agricultural input and price policies. Thus, the final impact
of demand management options within irrigation depends not only on the scale and gestation
period of their sectoral impacts but also on the facilitative roles of macro-level institutional
and policy aspects. Besides the issues of scale and gestation period, there is also another major
issue related to the inevitability of vast uncertainties both in the full implementation and in the
expected benefits of demand management options.
Towards a Demand Management Strategy
The overview of the current status and performance of the demand management options,
particularly in light of the analytics of the institutional ecology and impact of demand
management presented in Figure 3 makes it clear what the missing elements in the current
policy in this respect are. To be real, a concerted policy for demand management in irrigation
is conspicuous by its absence both at the national and state levels. Instead, what is being
witnessed is a casual and ad hoc constellation of several uncoordinated efforts in promoting
the demand management options. In most cases, these options are pursued lesser for
their demand management objectives than for their other goals such as cost recovery and
management decentralization. Even here, the policy focus is confined only to a few options
such as pricing, user associations and energy regulations and, to a limited extent, water saving
technologies. Although several policy documents and legal provisions clearly imply a water
rights system, there are no explicit government policies either as to its formal existence or
to its implementation, except for the recognition of the need for volumetric allocation and
consumption-based water pricing. This is also true for water markets, though their existence
and operation across the country are well documented. Considering the critical importance
of water rights and water markets for their direct effects on demand management and their
indirect effects in strengthening other demand management options, it is important that they
are formally recognized and treated as the central components of a demand management
strategy.
As we contrast the present status of demand management policy and the ideal demand
management approach evident in Figure 3, we can identify several key points useful for the
design and implementation of a well-coordinated and more effective demand management
strategy. The functions, linkages and the institutional character of the demand management
options clearly underline the need for the strategy to treat these options as an interrelated
configuration functioning within an institutional environment, characterized by the overall
legal, policy and organizational factors. Since the changing economic, technological and
resource conditions will tend to alter the political and institutional prospects for demand
management, it is important to align the policy for it to benefit from the potential synergies
from the institutional environment as well. Given such an overall character and thrust of the
strategy, the next step is to create technical conditions and strengthen the institutions—both
formal and informal ones. The technical conditions include, for instance, the modernization
of the water delivery system, introduction of volumetric allocation and installation of water
and energy meters. Similarly, the institutional conditions will include, among others, the
public trust framework for the joint management of users, officials, state, and communities,
the creation of a separate but an embedded structure of sectoral, regional, and user level water
rights within the overall supply limits at the respective levels, conflict resolution mechanisms
and incentives for collective action.
157
Promoting Demand Management in Irrigation in India:
The institutional and policy requirements for demand management identified above
are varied and wide ranging. Considering their extent and coverage, what is needed is nothing
short of some fundamental changes in the existing institutional arrangements built around the
supply-oriented paradigm of water governance. This fact clearly underlines the logical link
between the implementation of the demand management strategy and the necessity of broad
water-sector reforms. Indeed, demand management forms the spearhead around which water-
sector reforms are to be planned and implemented. While the strategic and institutional logic
of designing a demand-managed strategy in itself as part of a larger program of water sector
reforms is clear, its implementation is certainly not easy and quick. But, neither the stupendous
nature of the task nor the heavy economic and political costs involved in transacting such a
change in the current context can be a source for alarm or complacency.
There are well-tested reform, design and implementation principles that can assist
policymakers in overcoming the technical, financial and political economy constraints and,
thereby, effectively negotiating the demand management strategy and the institutional reforms.
The reform, design and implementation principles are simple yet powerful when used carefully
within a well-planned program and time frame. These principles relate to the prioritization,
sequencing and packaging of institutional and technical components based on impact, costs
and feasibility considerations. Besides these design-related principles, there are also principles
related to implementation, which cover strategic aspects such as timing, coverage and scale.
As can be seen, these principles essentially try to exploit the basic features of institutions such
as path dependency, functional linkages and institutional ecology, in addition to the inherent
synergies and feedback that institutions receive from the larger physical, socioeconomic and
political environment. The theoretical rationale and the institutional basis for these principles
are explained by Saleth and Dinar (2004, 2005), and how they have been applied in the practical
context of reforms in selected countries and regions are discussed by Saleth and Dinar (2006).
Here, we can briefly discuss how these design and implementation principles can be used
for the planning and implementation of the demand management strategy and its underlying
institutional reforms with minimum transaction costs and maximum effectiveness.
As can be seen in Figure 3, there are sequential linkages among the demand management
options as well as among the institutions. For instance, we have seen user associations remain
as the basis for the operation of water rights, water markets and water pricing (and also for
energy regulations). Similarly, water rights are critical for the effective functioning of water
markets and could also provide the incentives for the application of water saving technologies
and improve the effectiveness of even energy regulations. Clearly, since the user associations
are the foundation for the emergence and operation of other institutions and do not involve
much political opposition, they should receive top priority from the long-term perspective.
But, in the short term, the promotion of water saving technologies with the immediate and
direct impact should receive priority. Since the establishment of a water rights system involves
major legal, technical and political challenges, the focus here should be in creating some of the
basic conditions for its emergence, such as the modernization of the water delivery systems
and introduction of a volumetric allocation. Along with their roles in facilitating the eventual
introduction of a water rights system, these conditions will also have direct roles in improving
the effectiveness of water pricing. Besides these ways of sequencing and prioritizing demand
management options and their institutional components, there are also instances for packaging
programs such as the system modernization to be combined with management transfer and
improved supply reliability and service quality to be accompanied by higher water rates.
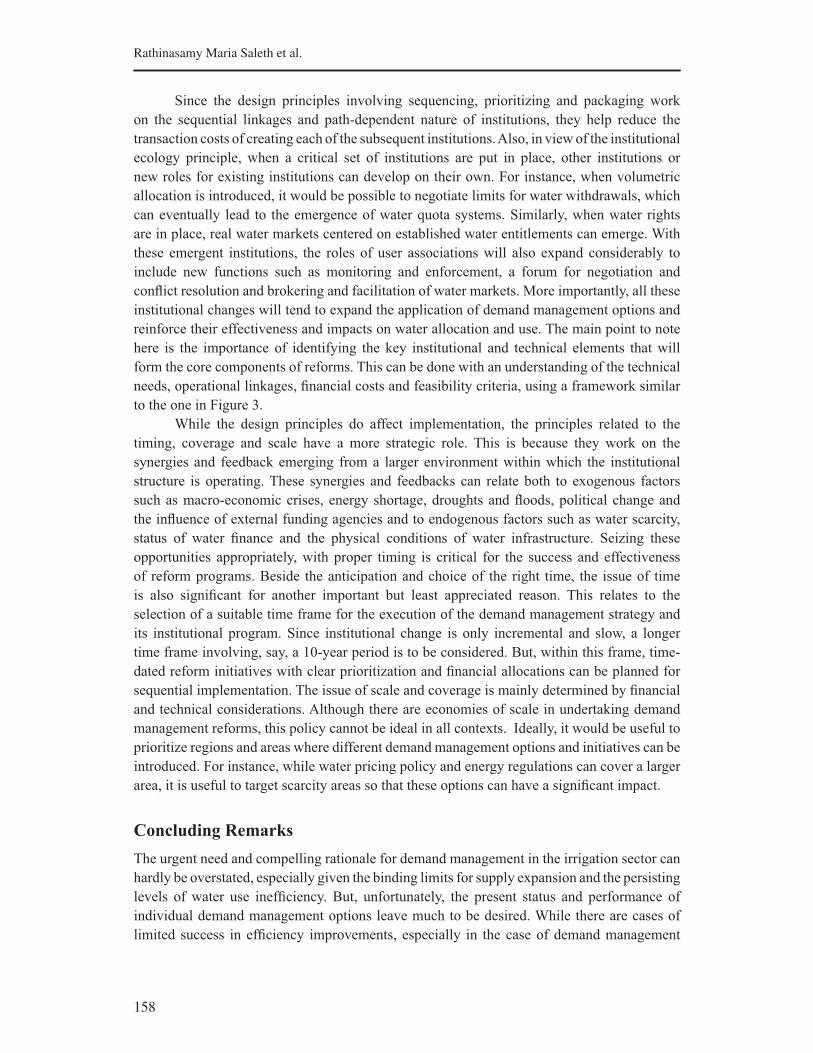
158
Rathinasamy Maria Saleth et al.
Since the design principles involving sequencing, prioritizing and packaging work
on the sequential linkages and path-dependent nature of institutions, they help reduce the
transaction costs of creating each of the subsequent institutions. Also, in view of the institutional
ecology principle, when a critical set of institutions are put in place, other institutions or
new roles for existing institutions can develop on their own. For instance, when volumetric
allocation is introduced, it would be possible to negotiate limits for water withdrawals, which
can eventually lead to the emergence of water quota systems. Similarly, when water rights
are in place, real water markets centered on established water entitlements can emerge. With
these emergent institutions, the roles of user associations will also expand considerably to
include new functions such as monitoring and enforcement, a forum for negotiation and
conflict resolution and brokering and facilitation of water markets. More importantly, all these
institutional changes will tend to expand the application of demand management options and
reinforce their effectiveness and impacts on water allocation and use. The main point to note
here is the importance of identifying the key institutional and technical elements that will
form the core components of reforms. This can be done with an understanding of the technical
needs, operational linkages, financial costs and feasibility criteria, using a framework similar
to the one in Figure 3.
While the design principles do affect implementation, the principles related to the
timing, coverage and scale have a more strategic role. This is because they work on the
synergies and feedback emerging from a larger environment within which the institutional
structure is operating. These synergies and feedbacks can relate both to exogenous factors
such as macro-economic crises, energy shortage, droughts and floods, political change and
the influence of external funding agencies and to endogenous factors such as water scarcity,
status of water finance and the physical conditions of water infrastructure. Seizing these
opportunities appropriately, with proper timing is critical for the success and effectiveness
of reform programs. Beside the anticipation and choice of the right time, the issue of time
is also significant for another important but least appreciated reason. This relates to the
selection of a suitable time frame for the execution of the demand management strategy and
its institutional program. Since institutional change is only incremental and slow, a longer
time frame involving, say, a 10-year period is to be considered. But, within this frame, time-
dated reform initiatives with clear prioritization and financial allocations can be planned for
sequential implementation. The issue of scale and coverage is mainly determined by financial
and technical considerations. Although there are economies of scale in undertaking demand
management reforms, this policy cannot be ideal in all contexts. Ideally, it would be useful to
prioritize regions and areas where different demand management options and initiatives can be
introduced. For instance, while water pricing policy and energy regulations can cover a larger
area, it is useful to target scarcity areas so that these options can have a significant impact.
Concluding Remarks
The urgent need and compelling rationale for demand management in the irrigation sector can
hardly be overstated, especially given the binding limits for supply expansion and the persisting
levels of water use inefficiency. But, unfortunately, the present status and performance of
individual demand management options leave much to be desired. While there are cases of
limited success in efficiency improvements, especially in the case of demand management
159
Promoting Demand Management in Irrigation in India:
options such as user associations, water saving technologies and water markets, they are too
few to have the magnitude of efficiency and water saving benefits that are needed at present.
The overview of the performance of demand management options clearly shows how their
extent and effectiveness are constrained by several institutional, technical and financial factors.
But, a much more serious issue is the absence of a clearly articulated policy for water demand
management both at the national and state levels, even though demand management has been
very much in policy discourse for a long period. Even though there are policies for promoting
user associations, water saving technologies, water pricing or energy regulations, they are
implemented mostly in an ad hoc or partial manner.
The formulation of a demand management policy cannot be considered as a ceremonial
need because it is the policy statement that provides the basis for the much-needed financial
and political commitments for implementing demand management programs. Such a policy
can also represent a formal shift from the outdated supply-oriented paradigm that has
governed water development, allocation, use and management so far. Since an effective
demand management strategy can both expand irrigation and also release water for other
productive uses even at the current level of water use, it is logical to divert, at least part of
the investments that are currently going into new supply development. Although some of the
demand management initiatives have a long gestation period, this may not be as high as that
associated with new water development projects, especially considering the delay caused by
environmental problems and interstate water conflicts. Besides the direct returns from demand
management investments, there are also long-term effects since demand management options
and their institutions can enhance the efficiency and sustainability benefits not only in the
irrigation sector but also in the water economy as a whole.
An analytical framework similar to the one presented in Figure 3 can help understand the
analytics and dynamics of impacts of a demand management strategy. As we have shown, this
framework provides considerable insights on the operational linkages among the options and
functional linkages in the underlying institutions. A demand management strategy delineated
in the light of these linkages, formulated within a more realistic time frame and implemented
with the design and implementation principles can be more practical and effective in achieving
the efficiency and water saving goals within the irrigation sector. Broadly, this strategy
involves a sequencing, prioritization and packaging of demand management tools and also
their institutions. Similarly, the principles involving the issues of timing, scale and coverage
can also be used for planning the implementation of the demand management strategy. While
implementing the strategy, areas and regions can also be prioritized in terms of their relative
feasibility and also the available financial resources for investment on demand management.
The central idea is to achieve immediate efficiency benefits as much as possible while gradually
paving the way for institutional and technical foundation for similar benefits in the long term.
The approach of gradual, sequential and consistent implementation of demand management
strategy within a well-planned time frame is likely to neutralize possible resistance, minimize
transaction costs and maximize long-term impacts.
While India has to go a long way in formulating and implementing a demand
management strategy as discussed here, one cannot be that pessimistic given the recent trends
of institutional changes observed in India (see Saleth 2004). Although the observed changes are
slow, partial and inadequate, their direction and thrust are on the desired lines. Several states
have raised the water rates and there has also been a gradual and steady improvement in cost
160
Rathinasamy Maria Saleth et al.
recovery. The issues of volumetric allocation and water entitlements have also been receiving
increasing public and policy attention in recent years. In Maharashtra, the policy of volumetric
allocation on a bulk basis has been introduced. Many policies that were once considered as
anathema, such as water markets, privatization and de-bureaucratization are already a reality
in India’s water sector. There are also constant pressures from factors both endogenous
and exogenous to the water sector (e.g., the physical limits for supply augmentation, food
security compulsions, water supply challenges and energy issues) for further changes in water
policies and institutions. Since the path dependency properties of institutions will ensure that
it is costlier to return to the status quo than to continue to proceed with the reform path, the
institutional environment is going to favor the formulation and implementation of the demand
management strategy sooner than later. Obviously, there is a clear policy demand for more
research-based studies for exploring still further the design and implementation properties of
irrigation demand management strategy.
161
Promoting Demand Management in Irrigation in India:
References
Amarasinghe, U.A.; Shah, T.; Turral, H.; Anand, B.K. 2007a. India’s water futures to 2025-2050: Business-
as-usual scenario and deviations. Research Report 123. Colombo, Sri Lanka: International Water
Management Institute.
Amarasinghe, U.A.; Shah, T.; Singh, O.P. 2007b. Changing consumption patterns: Implications on food and
water demand in India. Research Report 119. Colombo, Sri Lanka: International Water Management
Institute.
Bhatia, R. 2007. Water and energy interactions in India. In: Handbook of water resources in India, ed. Briscoe,
John; Malik, R.P.S.. New Delhi, India: The World Bank and Oxford University Press.
Bromley, D.W. 1989. Economic interests and institutions: The conceptual foundations of public policy. New
York: Basil Blackwell.
Dhawan, B.D. 2000. Drip irrigation in India. New Delhi, India: Commonwealth Publishers.
Government of India (GOI). 2007. Agricultural statistics at a glance 2007. New Delhi: Directorate of Economic
and Statistics, Ministry of Agriculture.
Kumar, D.M.; Singh, K.; Singh, O. P.; Shiyani, R.L. 2004. A study of water-saving and energy-saving micro
irrigation technologies in Gujarat. Research Report 2. Anand, India: India Natural Resource Economics
and Management Foundation.
Malik, R.P.S. 2008. Energy regulations as a demand management option: Potentials, problems, and prospects.
Colombo, Sri Lanka: International Water Management Institute (computer script).
Ministry of Water Resources. 2000. Annual Report-1999-2000. New Delhi, India: Government of India.
Narain, V. 2008. Water rights system as a demand management option: Potentials, problems, and prospects.
Colombo, Sri Lanka: International Water Management Institute (computer script).
Narayanamoorthy, A. 1997. Economic viability of drip irrigation: An empirical analysis from Maharashtra.
Indian Journal of Agricultural Economics 52 (4): 728-739.
Narayanamoorthy, A. 2006. Economics of drip irrigation in sugar cane cultivation: An empirical analysis. In:
Managing water resources: Policies, institutions, and technologies, ed. Ratna Reddy, V.; Mahendra Dev,
S. New Delhi, India: Oxford University Press.
Narayanamoorthy, N. 2008. Water saving technologies as a demand management option: Potentials, problems,
and prospects. Colombo, Sri Lanka: International Water Management Institute (computer script).
Palanisami, K. 2008. Water markets as a demand management option: Potentials, problems, and prospects.
Colombo, Sri Lanka: International Water Management Institute (computer script).
Palanisami, K.; Paramasivam, P. 2000. Participatory irrigation management (PIM): Lessons from water users
associations for Tamil Nadu. Centre for Agriculture and Rural Development Studies. Coimbatore, India:
Tamil Nadu Agricultural University.
Palanisami, K.; Paramasivam, P. 2007. Irrigation sector in India: Trends, issues, and prospects. Coimbatore,
India: Tamil Nadu Agricultural University (computer script), 32p.
Reddy, M. V. 2008. User organizations as a demand management option: Potentials, problems, and prospects.
Colombo, Sri Lanka: International Water Management Institute (computer script).
Reddy, V. R. 2008. Water pricing as a demand management option: Potentials, problems, and prospects.
Colombo, Sri Lanka: International Water Management Institute (computer script).
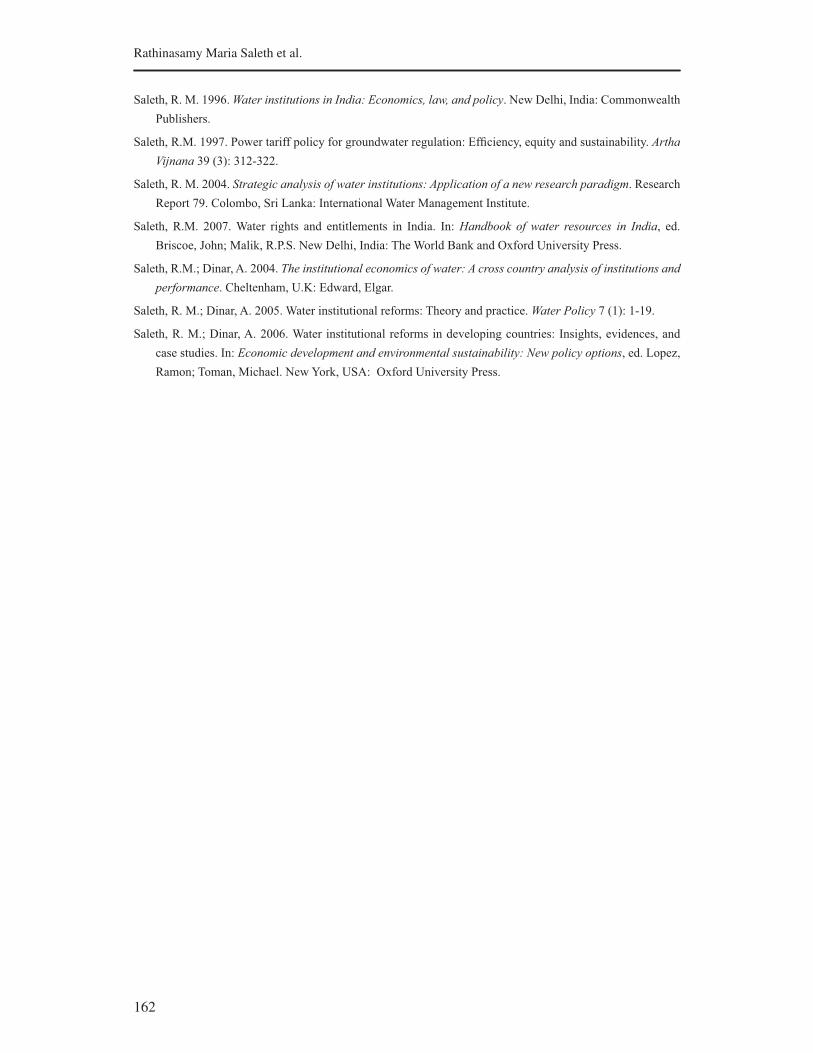
162
Rathinasamy Maria Saleth et al.
Saleth, R. M. 1996. Water institutions in India: Economics, law, and policy. New Delhi, India: Commonwealth
Publishers.
Saleth, R.M. 1997. Power tariff policy for groundwater regulation: Efficiency, equity and sustainability. Artha
Vijnana 39 (3): 312-322.
Saleth, R. M. 2004. Strategic analysis of water institutions: Application of a new research paradigm. Research
Report 79. Colombo, Sri Lanka: International Water Management Institute.
Saleth, R.M. 2007. Water rights and entitlements in India. In: Handbook of water resources in India, ed.
Briscoe, John; Malik, R.P.S. New Delhi, India: The World Bank and Oxford University Press.
Saleth, R.M.; Dinar, A. 2004. The institutional economics of water: A cross country analysis of institutions and
performance. Cheltenham, U.K: Edward, Elgar.
Saleth, R. M.; Dinar, A. 2005. Water institutional reforms: Theory and practice. Water Policy 7 (1): 1-19.
Saleth, R. M.; Dinar, A. 2006. Water institutional reforms in developing countries: Insights, evidences, and
case studies. In: Economic development and environmental sustainability: New policy options, ed. Lopez,
Ramon; Toman, Michael. New York, USA: Oxford University Press.
163
Water Productivity Improvements in Indian Agriculture:
Potentials, Constraints and Prospects
M. Dinesh Kumar, Upali A. Amarasinghe, Bharat R. Sharma, Kairav Trivedi,
O.P. Singh, Alok K. Sikka and Jos C. van Dam1
Introduction
India is still an agrarian country although the structure of the economy is gradually changing.
Industrialization and urbanization set off in the 1990s resulted in a greater contribution from
the manufacturing and service sectors to the national economic output. Today, the agriculture
sector contributes to only 17% of the gross domestic product (GDP), yet nearly 70% of
the country’s population live in rural areas and the majority of this proportion depends on
agriculture-related economic activities for their livelihoods. Projections show that it would
take another five decades before the population starts stabilizing (Visaria and Visaria 1995).
Hence, sustaining agricultural production, particularly the production of food grains in tune
with population growth and changing consumption patterns, is an important task, which is
not only essential for feeding the growing population for a large country like India but also
important for supporting livelihoods and reducing the poverty of India’s large rural population21
(Chaturvedi 2000). Moreover, water demand in nonagricultural sectors, including that for the
environment, is increasing and many regions in the country are facing severe water stress
(Amarasinghe et al. 2005, 2008a). Thus, efforts to manage water efficiently in the agriculture
sector and produce more crop and value per drop are gaining momentum now more than ever
before.
Agriculture continues to account for a major share of the water demand in India
(Amarasinghe et al. 2008a). The southwest monsoon provides a major part of India’s annual
1M. Dinesh Kumar and Kairav Trivedi, Institute for Resources and Analyses and Policy, Hyderabad;
Upali A. Amarasinghe and Bharat R. Sharma, IWMI, New Delhi; O.P. Singh, Dept. of Agricultural
Economics; Banaras Hindu University, Varanasi; Alok K. Sikka, National Rainfed Area Authority,
New Delhi; Jos C. van Dam; Faculty of Environmental Sciences, Wageningen University and Research
Centre, Wageningen.
2Several studies in the past have indicated that agricultural growth, especially growth in food grain
production positively impacted on reducing rural poverty (Hazzle and Haggblade 1991; Rao 1994;
Ghosh 1996; Desai and Namboodri 1998). Rural poverty has correlated with relative food prices, which
is affected by fluctuations in food supply (Ravallion 1998; Dev and Ajit 1998).
164
M. Dinesh Kumar et al.
rainfall, and the quantum varies widely across space (GoI 1999). In most places, growing
crops require an artificial provision of water during the non-monsoonal seasons and in some
places even during the monsoon. In fact, only one-third of the agricultural production in the
country comes from rain-fed areas, which account for two-thirds of the croplands. As per
official projections, a major share of the future growth in India’s agricultural production would
have to come from increasing cropping intensity, and bringing rain-fed areas under irrigated
production, rather than expanding the net cultivated area (GoI 2002), all of which would
require irrigation water.2
The extent of net additional irrigation at the aggregate level would depend heavily on
three aspects. The first two aspects—the extent of growth needed in agricultural production,
particularly production of food grains; and the extent to which we can increase the productivity of
water use in agriculture are well recognized and researched. However, the third aspect, how and
where those improvements in water productivity (WP) are going to occur are less recognized.
But, the last aspect on WP improvements is extremely important. It is a false notion
that raising the production of a particular crop by a certain degree, by increasing WP, would
compensate for the increase in future water demand for raising the production of a particular
crop by the same degree. Several situations explain this false notion.
1. A region can get all its production from rain-fed crops. In such a case, it is quite possible
that the productivity improvement comes from an increase in yield of crops in a rain-fed
area, through supplementary irrigation. WP gains through supplementary irrigation would
only help us take some of the rain-fed areas out of cultivation, thereby freeing some of
the agricultural land for other uses. However, most of the water used up by rain-fed crops,
i.e., soil moisture, in these rain-fed lands cannot be reallocated to irrigate crops or for any
other use. Thus, it will not reduce the need for diverted water.
2. The sum of the extent of water resource augmentation for irrigation in different regions
could be more than the required net increase in irrigation water supply at the aggregate
level. For instance, a region could have great scope for WP improvement through
reduction in consumptive use of water for irrigation. But these regions may not have much
additional land, such as Punjab or Haryana. Such gains in WP will not reduce the need
for additional water supply in another region that has additional arable land to produce
food. Nevertheless, it would only free up some of the water resources in the first region
for reallocating to the environment or to another sector of use.
3. If WP (kg/evapotranspiration) improvements can come from supplementary irrigation of
rain-fed crops in one region, such as certain parts of central India or in the Godavari basin
in Peninsular India, which has low levels of water resources development, then it would
still require a lot of additional water. This additional water, however, can be at the expense
of water availability of another region with fully developed water resources for intensive
irrigation. The latter, by reducing its irrigated area or improving the productivity in its
region by shifting to water-efficient non-food crops, parts with its water for the benefit of
the former region.
4. If reduced consumptive water use in irrigated crop production can improve WP, then
this would lower the need for increased irrigation only if additional land is available for
2However, this does not mean that growth in production from rain-fed areas is not possible without
large irrigation infrastructure. Sharma et al. (2009) showed that small supplementary irrigation in critical
periods of water stress can significantly increase productivity in rain-fed lands.
165
Water Productivity Improvements in Indian Agriculture: Potentials, Constraints and Prospects
cultivation in the same area to achieve a greater crop output with the saved quantum of
water. If the improvement comes from an increased use of fertilizers in certain regions,
which also brings about crop yield improvements, then this would mean there would be a
reduced need for augmenting irrigation.
All of the above-mentioned hypothetical situations actually exist in India. So, in
the ultimate analysis, it would appear that the benefit of WP improvement cannot be fully
translated into an equivalent reduction in the requirement for developing additional water
resources, although significant reductions could still be possible. However, the outcomes
of WP improvement would be multiple. It increases the streamflows in some areas; reduces
pressure on groundwater in some other areas; boosts productivity and production freeing up
rain-fed land in yet some other areas with a consequent increase in streamflows from the river
catchments owing to change in land use hydrology. All these are important for the country. So
improving WP in agriculture is an important component of a water-sector perspective plan. A
water-perspective plan for water resources for India should indicate:
§ How the demand for water will increase in different sectors, including the environment,
and in different regions.
§ How much of the additional demand for water can be managed through improvements
in WP in different competitive sectors of water use in different regions.
§ What kind of interventions would be required for improving productivity of water
use and at what scale (supplementary irrigation, controlled water allocation, micro-
irrigation, conservation technologies, etc.).
§ How much of this gets translated into real reduction in irrigation water demands in every
region where it matters, or does it actually increase water demand in some regions.
§ What should be the increase in utilizable water supplies in different regions. And what
should be the aggregate increase in water supplies, after considering interregional
reallocation of the freed-up resource.
This book explores the potential interventions for WP improvement in Indian agriculture,
the scale of adoption of these interventions and their potential impacts on future agricultural
water demand.
The papers in this book are the results of various research activities conducted in Phase
III of the project on ‘Strategic Analyses of National River Linking Project’ (NRLP) of India
(CPWF 2005). Phase I and II of the NRLP project assessed ‘India’s Water Futures: Scenarios
and Issues’ (Amarasinghe et al. 2009) and ‘Social, Hydrological and Environmental Cost and
Benefits of the River Linking Project’ (Amarasinghe and Sharma 2008), respectively. Phase III
studies explored various options to interlinking of rivers, which can contribute to an alternative
water-sector perspective plan for India. As part of this, Saleth (2009) explored the potential
and prospects for, and constraints in, promoting demand management strategies in the Indian
irrigation sector. The chapters in this book assess potential and prospects for, and constraints
in, promoting WP improvements in the Indian agriculture sector. They provide fresh empirical
analyses based on primary data across India on crop inputs and outputs and also district-level
secondary data on crop production, crop yields and agro-meteorology. They cover both rain-
fed areas and irrigated areas. In addition to field crops, the analysis also included dairying
under composite farming systems.
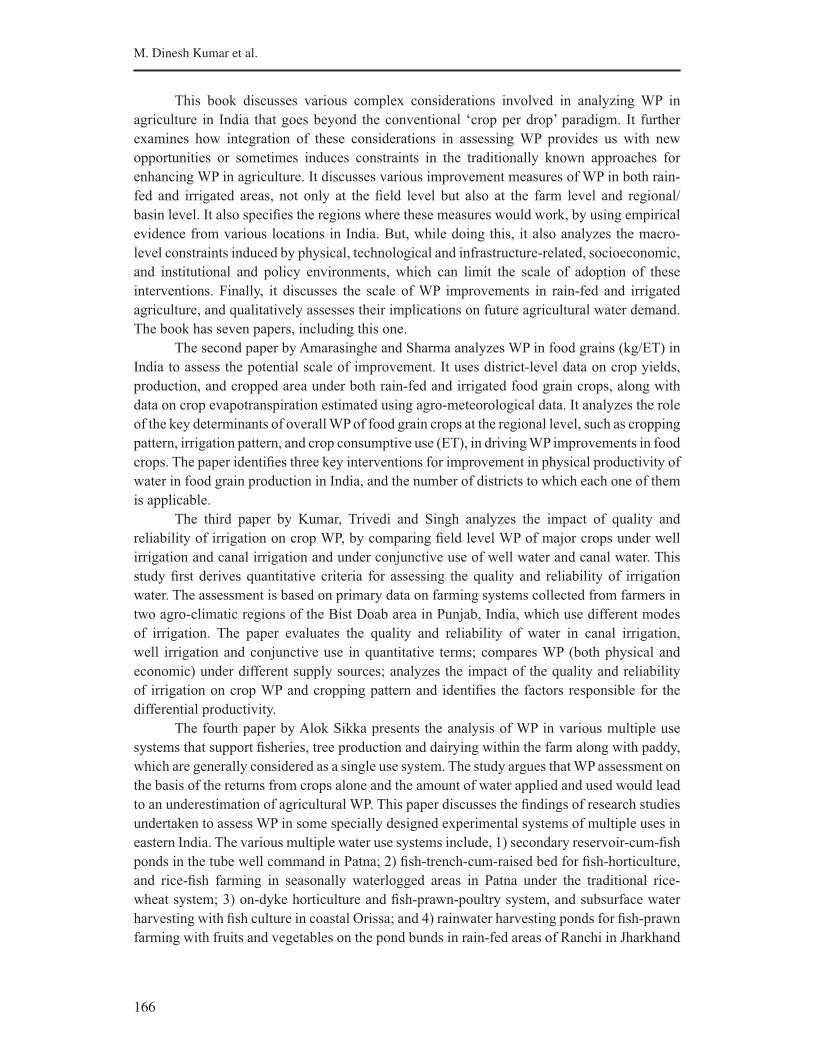
166
M. Dinesh Kumar et al.
This book discusses various complex considerations involved in analyzing WP in
agriculture in India that goes beyond the conventional ‘crop per drop’ paradigm. It further
examines how integration of these considerations in assessing WP provides us with new
opportunities or sometimes induces constraints in the traditionally known approaches for
enhancing WP in agriculture. It discusses various improvement measures of WP in both rain-
fed and irrigated areas, not only at the field level but also at the farm level and regional/
basin level. It also specifies the regions where these measures would work, by using empirical
evidence from various locations in India. But, while doing this, it also analyzes the macro-
level constraints induced by physical, technological and infrastructure-related, socioeconomic,
and institutional and policy environments, which can limit the scale of adoption of these
interventions. Finally, it discusses the scale of WP improvements in rain-fed and irrigated
agriculture, and qualitatively assesses their implications on future agricultural water demand.
The book has seven papers, including this one.
The second paper by Amarasinghe and Sharma analyzes WP in food grains (kg/ET) in
India to assess the potential scale of improvement. It uses district-level data on crop yields,
production, and cropped area under both rain-fed and irrigated food grain crops, along with
data on crop evapotranspiration estimated using agro-meteorological data. It analyzes the role
of the key determinants of overall WP of food grain crops at the regional level, such as cropping
pattern, irrigation pattern, and crop consumptive use (ET), in driving WP improvements in food
crops. The paper identifies three key interventions for improvement in physical productivity of
water in food grain production in India, and the number of districts to which each one of them
is applicable.
The third paper by Kumar, Trivedi and Singh analyzes the impact of quality and
reliability of irrigation on crop WP, by comparing field level WP of major crops under well
irrigation and canal irrigation and under conjunctive use of well water and canal water. This
study first derives quantitative criteria for assessing the quality and reliability of irrigation
water. The assessment is based on primary data on farming systems collected from farmers in
two agro-climatic regions of the Bist Doab area in Punjab, India, which use different modes
of irrigation. The paper evaluates the quality and reliability of water in canal irrigation,
well irrigation and conjunctive use in quantitative terms; compares WP (both physical and
economic) under different supply sources; analyzes the impact of the quality and reliability
of irrigation on crop WP and cropping pattern and identifies the factors responsible for the
differential productivity.
The fourth paper by Alok Sikka presents the analysis of WP in various multiple use
systems that support fisheries, tree production and dairying within the farm along with paddy,
which are generally considered as a single use system. The study argues that WP assessment on
the basis of the returns from crops alone and the amount of water applied and used would lead
to an underestimation of agricultural WP. This paper discusses the findings of research studies
undertaken to assess WP in some specially designed experimental systems of multiple uses in
eastern India. The various multiple water use systems include, 1) secondary reservoir-cum-fish
ponds in the tube well command in Patna; 2) fish-trench-cum-raised bed for fish-horticulture,
and rice-fish farming in seasonally waterlogged areas in Patna under the traditional rice-
wheat system; 3) on-dyke horticulture and fish-prawn-poultry system, and subsurface water
harvesting with fish culture in coastal Orissa; and 4) rainwater harvesting ponds for fish-prawn
farming with fruits and vegetables on the pond bunds in rain-fed areas of Ranchi in Jharkhand
167
Water Productivity Improvements in Indian Agriculture: Potentials, Constraints and Prospects
in the central plateau. This paper also discusses the impacts of introducing different production
systems such as fish, prawn, horticulture and poultry in rice-wheat system on agricultural WP.
Furthermore, it includes an analysis of impact of conservation technologies, viz., zero tillage-
bed planting and drip irrigation on crop WP in wheat and banana, respectively.
The fifth paper by Singh and Kumar examines the factors determining water intensity
of dairy farming other than climate. For this, it synthesizes empirical data available from two
locations in India, viz., northern Gujarat, western Punjab, both representing semiarid climatic
conditions. But, the two regions are markedly different in terms of the nature of dairy farming.
The first one is commercial dairying, which is intensive and depends heavily on irrigated fodder
crops. In the second case, dairy heavily depends on by-products from crops. This paper presents
the data on feed, fodder and water inputs in dairy production, expenditure on livestock keeping,
milk yields, and WP in dairying for different categories of livestock. This study shows that
dairy production is highly water-intensive when it is commercial, and is still water-intensive
but more efficient when it is part of mixed farming. It also shows that the nature of trade-offs
involved in maximizing agricultural WP under the two situations are different. Furthermore,
an empirical analysis from Kerala, which is a subhumid area, demonstrates the impact of
climatic change on the water intensity of dairy production. It shows that milk production is
highly water-efficient in regions like Kerala, but the lack of availability of sufficient arable
land becomes a constraint to intensive milk production.
The sixth paper by Kumar and van Dam discusses the various determinants for
analyzing WP in Indian agriculture that are markedly different from those used in the west.
It also identifies some major gaps in WP research and the key drivers of change in WP. The
main arguments are 1) in developing economies like India the objective of WP research
should also be to maximize net return per unit of water and aggregate returns for the farmer,
rather than merely enhancing ‘crop per drop;’ 2) the determinant for analyzing the impact
of efficient irrigation technologies on the basin-level WP and water saving should be the
consumed fraction (CF) rather than evapotranspiration; 3) in closed basins, determinants for
analyzing basin-level WP improvement through water harvesting and conservation should be
incremental economic returns and opportunity costs; 4) at the field level, the reliability of
irrigation water and changing water allocation could be the key drivers of change in WP,
whereas at the farm level, changes in the crop mix and farming system could be key drivers
of change. In composite farming systems, measures to enhance WP should be based on farm-
level analyses. At the regional level, concerns of food security, employment and market risks
can reduce the ability to significantly improve WP in agriculture.
The seventh paper by Kumar further discusses potential, prospects and constraints for
improving agricultural WP in India. It first discusses the various considerations in analyzing
WP in India. Some of them are: ‘scale of analyses,’ i.e., field to farm to region or field to system
to river basins; objective of WP assessment; food security; and regional economic growth
and environmental sustainability. It then discusses how integration of these considerations in
analyzing WP changes the way we assess agricultural WP improvements. While new windows
of opportunity for WP improvement are created, it also creates some new limits. For instance,
taking the basin as a unit for WP enhancement measures leaves us with the opportunity for
improving WP using the climatic advantage, as within the same basin, climate often varies
remarkably. It then summarizes various interventions for WP enhancement in rain-fed and
irrigated agriculture, which are discussed in various papers. This is followed by a discussion
168
M. Dinesh Kumar et al.
of various macro-constraints in enhancing agricultural WP in rain-fed agriculture that are
social, economic and financial in nature. In the case of irrigated agriculture, the constraints
are physical, technological and infrastructural, institutional, and market- and policy-related.
Finally, the scale at which various WP improvement measures could be adopted in India and
their potential impact on future growth in agricultural water demand is assessed.
Why Is WP Improvement in Agriculture Crucial for India?
Many of India’s agriculturally prosperous regions are water-scarce, where the natural endowment
of water is poor (Amarasinghe et al. 2005), while the demand for water in agriculture alone far
exceeds the utilizable renewable water resources (Kumar et al. 2008b). The common features
of these regions are excessive withdrawal of groundwater and excessive diversion of water
from rivers, which cause environmental water stress. Agriculture is the major user of water in
these regions, particularly for irrigated crops, with very high per capita water use in irrigation
(Kumar et al. 2008c). Agriculture is in direct conflict with other sectors of the water economy
and environment. The scope for augmenting the utilizable water resources in these regions is
extremely limited. While there are many regions in India where water resources are abundant,
most of them have limited potential for increasing agricultural production due to the limitations
imposed by land and ecological constraints. So, improving WP in agriculture, wherever
possible, holds the key not only to sustaining agricultural production and rural livelihoods but
also to making more water available for other sectors including the environment.
The world over, agriculture has very low water use efficiency when compared to
manufacturing (Xie et al. 1993; Turner et al. 2004), and the situation is no different in India.
Agriculture continues to be the largest user of diverted water in the country (Amarasinghe et
al. 2008a; GOI 1999). Moreover, productivity of water use in India is very low for major crops
in terms of the amount of biomass produced per unit of water depleted in crop production. The
reasons are many.
First, India has some of the lowest yields in cereal crops viz., wheat and rice
(Amarasinghe and Sharma, paper 2, this book). They consume large quantities of irrigation
water in aggregate terms (Amarasinghe et al. 2005), compared to what is biologically possible
to consume by these crops for a given variety, in the given temperature and solar radiation The
factors responsible for this could be lack of irrigation, deficit irrigation or excessive irrigation,
or lack of soil-nutrient management through optimal dosage of fertilizers and micro-nutrients,
poor on-farm water management or farm management. Furthermore, what is biologically
possible may not be economically viable or in other words optimal. It is particularly true in
areas where the soils are degraded with poor micro- and macro-nutrients, which demands
application of huge quantities of nutrients to achieve the maximum yield. The latter increases
the input costs, reducing the net income. Also, many crops are grown in regions where the
climate is not fully favorable for realizing good yields.
Second, irrigation water use efficiencies are poor in India (GOI 1999) due to inefficient
irrigation practices or unfavorable soil conditions. Flood irrigation, level border irrigation and,
to an extent, furrow irrigation are generally practiced by Indian farmers for agricultural crops.
The adoption of water-efficient irrigation technologies has been by and large very poor to date.
One example of an unfavorable soil condition is the practice of growing irrigated paddy in
light soils. Excessive deep percolation would require frequent watering of the crop to keep the
169
Water Productivity Improvements in Indian Agriculture: Potentials, Constraints and Prospects
ponding of water in the field. Another important issue is the adoption of short-duration food
crops, which are inherently inefficient in water use in terms of amount of grain yield per unit of
water consumed (ET), but survive on rains, in vast regions of India, owing to lack of irrigation
facilities.
Improving WP in agriculture can bring about many positive outcomes. While in some
regions WP improvement would result in increased crop production with no increase in
consumptive use of water, in some others it would result in reduced use of surface water or
groundwater draft. Both would protect the environment. On the other hand, there are certain
regions in India where yields are very poor as the crops are purely rain-fed in spite of having
a sufficient amount of unutilized water resources. Augmenting water resources and increasing
irrigation in such regions can result in enhanced yield and income returns, as well as water
productivity improvements. Hence, such strategies have the potential to reduce poverty in
these regions.
Opportunities and Constraints for WP Improvements
As various papers included in this book show, there are several opportunities for improving
the WP of crops. They include
§ providing irrigation to crops that are currently rain-fed so as to meet the full crop
evapotranspirative demand for realizing the yield potential (Amarasinghe and Sharma,
paper 2, this book);
§ adopting long-duration food crops, which have higher water use efficiency, and replacing
short-duration ones, which have low efficiency, again possible through the availability of
irrigation water (Amarasinghe and Sharma, paper 2, this book);
§ growing certain crops in regions where their yields are higher due to climatic advantages
(high solar radiation and temperature for instance), better soil nutrient regimes or lower
ET demand (high humidity for instance)—(Abdulleev and Molden 2004; Loomis and
Connor 1996);
§ improving quality and reliability of irrigation water (Kumar, Trivedi and Singh, paper
3, this book; Palanisami et al. 2008); managing irrigation for certain crops, which could
mean controlling allocation or increasing allocation to the said crops (Kumar and van
Dam, paper 6, this book);
§ adopting high-yielding varieties without increasing the crop consumptive use (Amarasinghe
and Sharma, paper 2, this book);
§ providing optimal dosage of nutrients, such as artificial fertilizier, and improving farming
systems with changes in crop and livestock compositions (Singh and Kumar, paper 5;
Kumar and van Dam, paper 6, this book).
But, there are constraints to improving WP for irrigated crops induced by land
availability (Amarasinghe and Sharma, paper 2, this book; Singh and Kumar, paper 5, this
book), food security concerning regional economic growth (Kumar and van Dam, paper 6,
this book) and existing institutional and policy frameworks. For instance, in many situations,
improvement in WP in kg/ET or Rs/ET does not guarantee better returns for the farmers due to
inefficient pricing of water and electricity, and absence of well-defined property rights in water
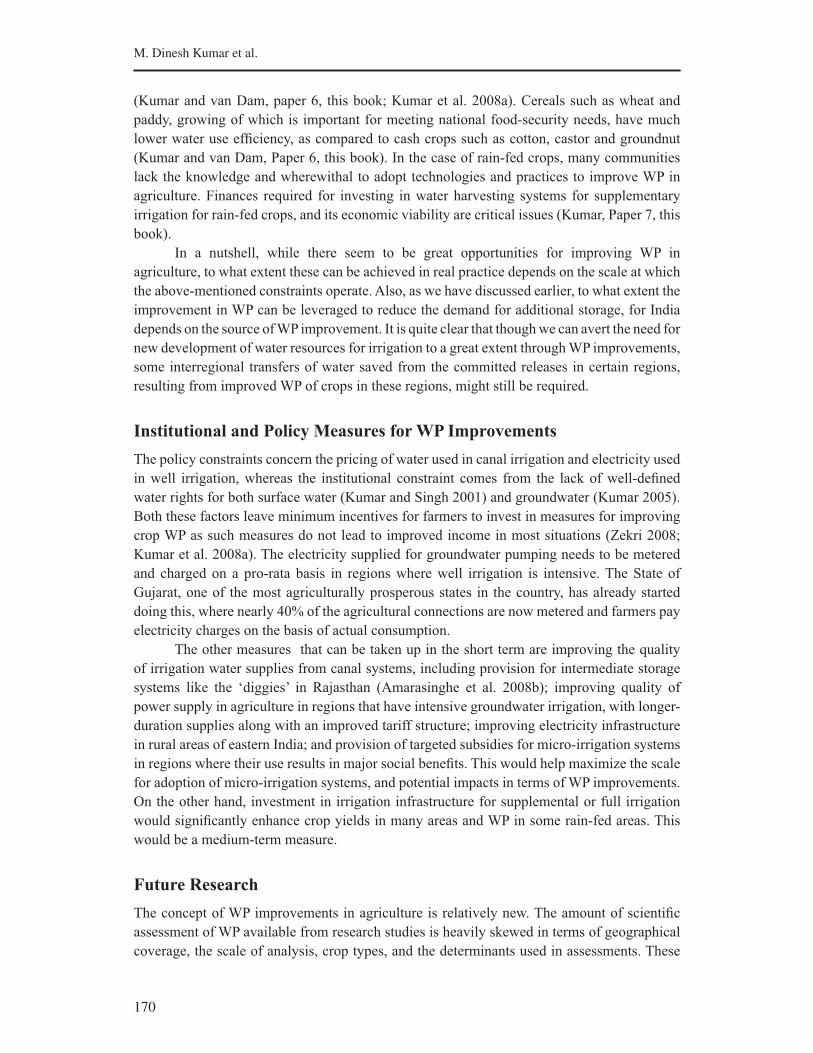
170
M. Dinesh Kumar et al.
(Kumar and van Dam, paper 6, this book; Kumar et al. 2008a). Cereals such as wheat and
paddy, growing of which is important for meeting national food-security needs, have much
lower water use efficiency, as compared to cash crops such as cotton, castor and groundnut
(Kumar and van Dam, Paper 6, this book). In the case of rain-fed crops, many communities
lack the knowledge and wherewithal to adopt technologies and practices to improve WP in
agriculture. Finances required for investing in water harvesting systems for supplementary
irrigation for rain-fed crops, and its economic viability are critical issues (Kumar, Paper 7, this
book).
In a nutshell, while there seem to be great opportunities for improving WP in
agriculture, to what extent these can be achieved in real practice depends on the scale at which
the above-mentioned constraints operate. Also, as we have discussed earlier, to what extent the
improvement in WP can be leveraged to reduce the demand for additional storage, for India
depends on the source of WP improvement. It is quite clear that though we can avert the need for
new development of water resources for irrigation to a great extent through WP improvements,
some interregional transfers of water saved from the committed releases in certain regions,
resulting from improved WP of crops in these regions, might still be required.
Institutional and Policy Measures for WP Improvements
The policy constraints concern the pricing of water used in canal irrigation and electricity used
in well irrigation, whereas the institutional constraint comes from the lack of well-defined
water rights for both surface water (Kumar and Singh 2001) and groundwater (Kumar 2005).
Both these factors leave minimum incentives for farmers to invest in measures for improving
crop WP as such measures do not lead to improved income in most situations (Zekri 2008;
Kumar et al. 2008a). The electricity supplied for groundwater pumping needs to be metered
and charged on a pro-rata basis in regions where well irrigation is intensive. The State of
Gujarat, one of the most agriculturally prosperous states in the country, has already started
doing this, where nearly 40% of the agricultural connections are now metered and farmers pay
electricity charges on the basis of actual consumption.
The other measures that can be taken up in the short term are improving the quality
of irrigation water supplies from canal systems, including provision for intermediate storage
systems like the ‘diggies’ in Rajasthan (Amarasinghe et al. 2008b); improving quality of
power supply in agriculture in regions that have intensive groundwater irrigation, with longer-
duration supplies along with an improved tariff structure; improving electricity infrastructure
in rural areas of eastern India; and provision of targeted subsidies for micro-irrigation systems
in regions where their use results in major social benefits. This would help maximize the scale
for adoption of micro-irrigation systems, and potential impacts in terms of WP improvements.
On the other hand, investment in irrigation infrastructure for supplemental or full irrigation
would significantly enhance crop yields in many areas and WP in some rain-fed areas. This
would be a medium-term measure.
Future Research
The concept of WP improvements in agriculture is relatively new. The amount of scientific
assessment of WP available from research studies is heavily skewed in terms of geographical
coverage, the scale of analysis, crop types, and the determinants used in assessments. These
171
Water Productivity Improvements in Indian Agriculture: Potentials, Constraints and Prospects
assessments mainly covered wheat, paddy and maize among food grain crops; and cotton
among cash crops. Most of the assessments, which are for developed countries in the west, look
at biomass output per unit of water depleted or applied and are done at the field scale looking
at individual crops (Zwart and Bastiaanssen 2004; Kumar and van Dam 2008). There are quite
a few unknowns in the field of WP, which can hinder making the right kind of policy decisions
for managing water demand in agriculture that does not cause any undesirable consequences
for the farming communities and society. Next, we discuss a few of these unknowns that
require further research.
1. The possible trade-off between improving WP of individual crops and the entire farm level
needs to be better understood under different socioeconomic environments. For instance,
while shift from irrigated paddy and wheat to water-efficient fruits and vegetables might
help achieve higher crop WP, it might affect the output of milk from the farm, thereby
affecting the WP of the farming system as dairying under ‘mixed farming’ conditions was
found to be highly water productive (Kumar and van Dam 2008). The unknown here is the
overall value of WP in dairying under different farming conditions (Rs/m3). Also, the risk
involved in cultivation of some of the vegetables and fruits, is very high when compared
to dairy farming and paddy cultivation. This is one reason why many farmers prefer to
adopt the wheat-paddy system, which involves the least agronomical and market risk.
2. There is very little useful research available that can be used to estimate the WP (both
physical and economic) of many perennial fruit crops. The most crucial piece of
information needed here is the amount of water consumed annually by the crop (ET)
with increase in age of the plant, the change in yield over the years, and the irrigation
water requirements in different years under different agro-climatic conditions. The issue
of water consumption by tree crops is quite complex. While many trees consume large
quantities of water, depending on the foliage, a good portion of this water comes from
deep soil strata. In deep water table areas, the moisture held up in the ‘vadoze zone’
(hygroscopic water), which is not available for recharge or consumption by smaller plants,
would provide this water. Hence, the impact of the trees on the actual water balance needs
better understanding.
3. The possible trade-offs between improving agricultural WP of an individual farm and
an entire region needs more assessment. For instance, the introduction of certain cash
crops might help raise the field- and farm-level WP, thereby benefiting the farmers who
adopt it. But, extensive adoption of these crops by a large number of farmers in a region
might result in increased market risk, resulting from over-production and price crash.
The research question is, what should be the optimum level of adoption of such crops in
different regions to save water as well as to sustain farm economy?
4. The general perception is that micro-irrigation (MI) systems help raise the WP of crops
and that there is sufficient analytical work now available, to show that the extent of real
water saving possible with MI is a function of the soil, climate, geohydrology, and type
of technology used (Kumar et al. 2008a,). But, unfortunately, change in the quantity of
water applied after adoption of the technology is often perceived as reduction in water
use. When researchers proceed with their analyses of physical and economic impacts
of MI systems using such assumptions, it leads to false policy prescriptions. Most of
the available research on water saving and WP impacts of MI systems is based on the
172
M. Dinesh Kumar et al.
estimation of change in applied water. What is important is to know how the consumptive
fraction changes under different climates, soils, water table conditions, and how it affects
different crops.
5. The WP and income improvements that are possible through the conversion of single
use systems into multiple use systems under different multiple use combinations require
better understanding. This is a very crucial area for research because there appears to be
several limitations to maximizing WP and income returns through the conventional route
in many regions due to physical, technological, financial and climatic constraints. For
instance, in the wetlands of cold/hot and subhumid areas, paddy is a dominant crop. It
is difficult to shift from paddy to high-valued crops here. The reasons are many. Paddy
is not amenable to micro-irrigation systems. Wetlands are not suitable for growing fruits
and vegetables. At the same time, if the same land is also used for growing fish or shrimp,
the returns could be enhanced significantly. Also, growing tree crops might enhance the
returns. The biggest research challenge would be proper accounting of the water used in
farms that helps assess the marginal productivity of various farming systems such as tree
crops, field crops, duck-rearing and fishery.
Conclusions
With increasing water scarcities, WP enhancement in agriculture is not only relevant, but also
very crucial in meeting future water demands of the agriculture and other sectors. There are
several constraints in enhancing WP in agriculture. But, there are several opportunities too.
However, the constraints can be reduced and the opportunities enhanced through appropriate
institutional and policy interventions. WP improvement would definitely reduce the need for
future investments in the new development of water resources in some regions. But, due to
regional variations of water supply and use, the extent of reduction in demand for additional
water for meeting future needs will not be the same as the scale of aggregate savings of
water achieved by enhancing WP. However, it might result in more water being available for
environmental uses or reallocation to other sectors in some regions wich were earlier used for
growing crops.
The other outcomes of WP improvement are: reduced poverty due to rise in farm income
in the agriculturally backward regions; reduced environmental stresses caused by excessive
pumping of groundwater or diversion of water from streams/rivers; and better availability
of water from basins for allocation to environmental uses or freeing up of a large amount of
cultivated land under rain-fed production, resulting in increased streamflow generation from
catchments. They all help meet the future water demand of different water use sectors. In fact,
WP improvements in agriculture can be a major component in a water-sector perspective plan
in India.
173
Water Productivity Improvements in Indian Agriculture: Potentials, Constraints and Prospects
References
Abdullev, I.; Molden, D. 2004. Spatial and temporal variability of WP in the Syr Darya Basin, Central Asia.
Water Resources Research Vol. 40, W08S02.
Amarasinghe, U. A.; Sharma, B.R.; Aloysius, N.; Scott, C.; Smakhtin, V.; de Fraiture, C. 2005. Spatial variation
in water supply and demand across river basins of India. IWMI Research Report 83. Colombo, Sri Lanka:
International Water Management Institute.
Amarasinghe, U.A.; Sharma, B., eds. 2008. National River Linking Project-Analysis of hydrological, social
and ecological issues. Strategic Analyses of National River Linking Project of India. Series 1. Colombo,
Sri Lanka: International Water Management Institute.
Amarasinghe, U.A.; Shah, T.; McCornick, P. 2008a. Seeking calm waters: Exploring policy options for India’s
water future. Natural Resource Forum 32 (4): 305-315.
Amarasinghe, U.A.; Bhaduri, A.; Singh, O.P.; Ojha, A.; Anand, B.K. 2008b. Cost and benefits of intermediate
water storage structures: Case study of diggies in Rajasthan. Proceedings of the CGIAR Challenge
Program on Water and Food and 2nd International Forum on Water and Food. Addis Ababa, Ethiopia,
November 10-14 2008. Volume III (pp. 79-82).
Amarasinghe, U. A.; Shah, T.; Malik, R.P.S., Eds. 2009. India’s water future: Scenarios and issues. Colombo,
Sri Lanka: International Water Management Institute.
Chaturvedi, M. C. 2000. Water for food and rural development, developing countries. Water International 25
(1): 40-53.
CPWF (Challenge Program on Water and Food). Strategic Analyses of India’s River Linking Project. The
Project Proposal. www.cpwf.org
Desai, B. M.; Namboodri, N. V. 1998. Policy strategy and instruments for alleviating rural poverty. Economic
and Political Weekly 33: 2669-2674.
Dev, S. Mahendra.; Ajit, R. 1998. Rising food prices and rural poverty: Going beyond correlation. Economic
and Political Weekly 33: 2529-2536.
Ghosh, M. 1996. Agricultural development and rural poverty in India. Indian Journal of Agricultural Economics
51: 374-380.
GoI (Government of India). 1999. Integrated water resource development: A plan for action. Report of the
National Commission on Integrated Water Resources Development-Volume I. New Delhi: Government
of India.
GoI. 2002. India’s planning experience. New Delhi: Planning Commission.
Hazzle, P. B.; Haggblade, S. 1991. Rural urban growth linkages in India. Indian Journal of Agricultural
Economics 46: 515-529.
Kumar, M. D. 2005. Impact of energy prices and volumetric water allocation regime on groundwater demand
management: Analysis from western India. Energy Policy 33 (1).
Kumar, M. D.; Singh, O.P. 2001. Market instruments for demand management in the face of growing scarcity
and overuse of water in Gujarat, India. Water Policy 5 (3): 86-102.
Kumar, M. D.; van Dam, J. 2008. Improving WP in agriculture in developing economies: In search of new
avenues. Proceeding of the 7th Annual Partners’ Meet of the IWMI-Tata Water Policy Research Program,
IWMI South Asia Regional Program, ICRISAT Campus, Patancheru, 2-4 April, 2008.

174
M. Dinesh Kumar et al.
Kumar, M. D.; Turral, H.; Sharma, B.; Amarasinghe, U.; Singh, O.P. 2008a. Water saving and yield enhancing
micro-irrigation technologies: When do they become best bet technologies? Proceeding of the 7th Annual
Partners’ Meet of the IWMI-Tata Water Policy Research Program, IWMI South Asia Regional Program,
ICRISAT Campus, Patancheru, 2-4 April, 2008.
Kumar, M. D.; Patel, A.; Ravindranath, R.; Singh, O.P. 2008b. Chasing a mirage: Water harvesting and artificial
recharge in naturally water-scarce regions. Economic and Political Weekly 43 (35): 61-71.
Kumar, M. D.; Sivamohan, M.V.K.; Narayanamoorthy, A. 2008c. Irrigation water management for food security
and sustainable agriculture: The forgotten realities. Paper presented at the International Conference on
Food Security, Greenpeace, New Delhi, 24 October, 2008.
Loomis, R. S.; Connor, D. J. 1996. Crop ecology: Productivity and management in agricultural systems.
Cambridge, New York and Australia: Cambridge University Press.
Palanisami, K.; Senthilvel, S.; Ramesh, T. 2008. WP at different scales under canal, tank and well irrigation
systems. In: India’s water future: Scenarios and issues, ed. Amarasinghe, U.A.; Shah, T.; Malik, R. P. S.
Colombo, Sri Lanka: International Water Management Institute.
Rao, C. H. Hanumantha. 1994. Agricultural growth, rural poverty and ecological degradation in India. New
Delhi: Oxford University Press.
Ravallion, M. 1998. Reforms, food prices and poverty in India. Economic and Political Weekly 33: 29-30.
Saleth, R. M., ed. 2009. Promoting demand management in irrigation in India: Policy options and institutional
requirements. Colombo, Sri Lanka: International Water Management Institute.
Sharma, B.; Rao, K.V.; Vittal, K.P.R. 2009. Converting rain into grain: Opportunities for realizing the potential
of rain-fed agriculture in India. In: India’s water future: Scenarios and issues, ed. Amarasinghe, U.A.;
Shah, T.; Malik, R. P. S. Colombo, Sri Lanka: International Water Management Institute.
Turner, K.; Georgiou, S.; Clark, R.; Brouwer, R. 2004. Economic valuation of water resources in agriculture:
From the sectoral to a functional perspective of natural resource management. FAO Water Report 27.
Rome: Food and Agriculture Organization of the United Nations.
Visaria, L.; Visaria, P. 1995. Prospective population growth and policies for India. Working Paper 75.
Ahmedabad: Gujarat Institute of Development Research.
Xie, M.; Kuffner, U.; Le Moigne, G. 1993. Using water efficiently, technological options. Technical Paper 205.
Washington, D.C.: World Bank.
Zekri, S. L. 2008. Using economic incentives and regulations to reduce seawater intrusion in the Batinah
coastal area of Oman. Agricultural Water Management 95 (3), March.
Zwart, S. J.; Bastiaanssen, W.G.M. 2004. Review of measured crop WP values for irrigated wheat, rice, cotton
and maize. Agricultural Water Management 69 (2004): 115-133.
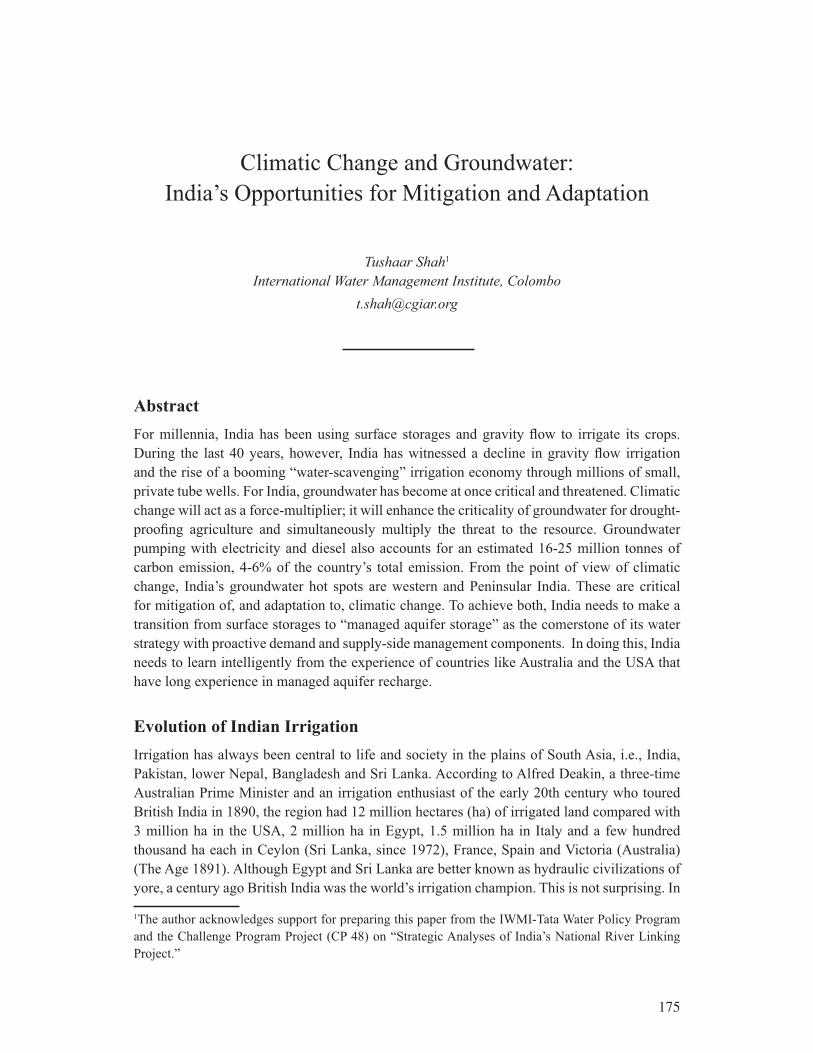
175
Climatic Change and Groundwater:
India’s Opportunities for Mitigation and Adaptation
Tushaar Shah1
International Water Management Institute, Colombo
Abstract
For millennia, India has been using surface storages and gravity flow to irrigate its crops.
During the last 40 years, however, India has witnessed a decline in gravity flow irrigation
and the rise of a booming “water-scavenging” irrigation economy through millions of small,
private tube wells. For India, groundwater has become at once critical and threatened. Climatic
change will act as a force-multiplier; it will enhance the criticality of groundwater for drought-
proofing agriculture and simultaneously multiply the threat to the resource. Groundwater
pumping with electricity and diesel also accounts for an estimated 16-25 million tonnes of
carbon emission, 4-6% of the country’s total emission. From the point of view of climatic
change, India’s groundwater hot spots are western and Peninsular India. These are critical
for mitigation of, and adaptation to, climatic change. To achieve both, India needs to make a
transition from surface storages to “managed aquifer storage” as the comerstone of its water
strategy with proactive demand and supply-side management components. In doing this, India
needs to learn intelligently from the experience of countries like Australia and the USA that
have long experience in managed aquifer recharge.
Evolution of Indian Irrigation
Irrigation has always been central to life and society in the plains of South Asia, i.e., India,
Pakistan, lower Nepal, Bangladesh and Sri Lanka. According to Alfred Deakin, a three-time
Australian Prime Minister and an irrigation enthusiast of the early 20th century who toured
British India in 1890, the region had 12 million hectares (ha) of irrigated land compared with
3 million ha in the USA, 2 million ha in Egypt, 1.5 million ha in Italy and a few hundred
thousand ha each in Ceylon (Sri Lanka, since 1972), France, Spain and Victoria (Australia)
(The Age 1891). Although Egypt and Sri Lanka are better known as hydraulic civilizations of
yore, a century ago British India was the world’s irrigation champion. This is not surprising. In
1The author acknowledges support for preparing this paper from the IWMI-Tata Water Policy Program
and the Challenge Program Project (CP 48) on “Strategic Analyses of India’s National River Linking
Project.”
176
Tushaar Shah
a normal year, India receives 4,000 km3 of rainfall precipitation, large by any standard; but a
large part of it falls in eastern India. Moreover, almost all of it is received within 100 hours of
torrential downpour, making storage and irrigation critical for the survival of agrarian societies.
Considering that parts of India, chiefly the Indo-Gangetic Basin, were densely populated and
intensively cultivated more than even 2,000 years ago suggests that water-managed agriculture
has been the bedrock of civilization in this part of the world. However, the technology of water-
managed agriculture has undergone profound changes over the millennia. Three distinct eras
of irrigation evolution can be identified according to the technology used and the institutions
it has spawned:
Era of Adaptive Irrigation
From time immemorial to the early 1800s, farming communities adapted their agrarian lives to
the hydrology of river basins. There are records of numerous, often gigantic, irrigation systems
constructed by kings and managed by specialized bureaucracies. This induced historians like
Karl Wittfogel (1957) to famously claim that irrigation drove state-formation in oriental
societies like India’s; and the administrative requirements of managing large, state-run systems
were at the root of the rise of despotic authority in these societies during a period when many
countries in Europe had well-entrenched republican institutions. However, the sum total of
the evidence suggests that, at least in today’s South Asia, farming communities and local
overlords, rather than the monolithic state, were key irrigation players in Mughal India and
earlier. Diverting and managing monsoonal flood water to support riverine agriculture was the
dominant mode in northern India and Pakistan with sandy alluvial aquifers; and using them to
fill up countless small reservoirs was the standard procedure in hard-rock parts of Peninsular
India (Shah 2008a).
Era of Canal Construction
Around 1810, the British East India Company began changing this adaptive irrigation regime
by undertaking gigantic projects that reconfigured river basins. The Indus canals transformed
northwestern (British) India from a pastoral region to an intensively cultivated terrain. Large
canal projects were also undertaken in the south of India. In ambitious irrigation projects, the
colonial rulers combined the “interests of charity and the interests of commerce” (Whitcombe
2005). The state and centralized irrigation bureaucracies replaced village communities and
local landlords as key players in the new regime. Civil engineering began dominating water
planning, construction and management, and continued to do so even after India gained
independence and remains predominant today. The colonial era left India and Pakistan with
some of the world’s largest gravity flow irrigation systems, complete with a highly centralized,
bureaucratic irrigation management regime.
Era of Atomistic Irrigation
The colonial irrigation strategy however created pockets of agrarian prosperity in canal
commands which even as recently as 2,000 encompassed no more than 15% of India’s farming
areas. However, India has experienced an explosion in agricultural population since 1960;

177
Climatic Change and Groundwater: IndiaÊs Opportunities for Mitigation and Adaptation
and the land:man ratio declined from over 0.4 ha/person in 1900 to less than 0.1 ha/person
in 2000. The peasants around the country felt the need to secure a means of irrigation that
could permit intensification and diversification of land use. At this time the availability of
small mechanical pumps and boring rigs provided a technological breakthrough. Beginning
in 1970, this combination of circumstances catalyzed a groundwater revolution all over South
Asia. This was a wholly new phenomenon that the water establishment was unfamiliar with.
Northwestern India had seen some well-irrigation even during colonial times; however,
irrigation of field crops with groundwater was wholly new to humid eastern India and hard-
rock Peninsular India. In India, the number of irrigation wells equipped with diesel or electric
pumps increased from 150,000 in 1950 to nearly 19 million by 2000. Around 1960, India was
a relatively minor user of groundwater in agriculture compared to USA and Spain; by 2000,
the country had emerged as the global champion in groundwater irrigation, pumping around
220-230 billion m3/year, i.e., over twice the amount the USA had pumped as the chart in Figure
1 shows.
Figure 1. Growth in agricultural groundwater use in selected countries during 1940-2010.
Source: Author’s estimates based on various sources.
The policy making regarding India’s water is yet to fully factor in this epochal
transformation in the way its farmers water their crops; and governments keep investing
billions of dollars on new surface water reservoirs and canal networks even as the existing
ones have begun falling into disuse. Evidence gathered around 2007 suggests that since 1990,
central and state governments in India have invested over US$20 billion in building new, and
rehabilitating existing, surface irrigation systems; however, the net area served by surface
structures, small and large, has actually declined by over 3 million ha (Shah 2008a; Thakkar
and Chandra 2007). In contrast, net area served by groundwater has been steadily rising. Small
farmers looking for opportunities to intensify and diversify their agriculture need year-round
on-demand irrigation more frequently. Altough tanks and canal systems are unable to meet this
need groundwater wells are able to do so. Groundwater wells are also a better insurance against
0
50
100
150
200
250
300
1940 1950 1960 1970 1980 1990 2000 2010
km
2/y
ear
Western Europe SpainUnited States
Mexico China India
Pakistan Bangladesh Sri Lanka
Vietnam Ghana South Africa
Tunisia

178
Tushaar Shah
a drought than tanks and canal systems. As a result, since 1990, Indian irrigation has been
transformed from a centrally-managed surface irrigation regime to an atomistically managed
water-scavenging irrigation regime involving tens of millions of pump owners who divert
surface water and groundwater at will. Even as groundwater irrigation helped South Asia’s
smallholders survive, myriad environmental impacts have followed as a result of unmanaged
overexploitation of the resource. The key consequences of intensification of groundwater use
in agriculture in different parts of the subcontinent are given in Table 1.
Table 1. Key consequences of intensification of groundwater use in agriculture in different
parts of the subcontinet.
Hydrogeological
settings
Socioeconomic and management challenges
Resource-
depletion
Optimizing
conjunctive use
Secondary
salinization
Natural
groundwater
quality
concerns
A. Major
alluvial
plains
A.1. Arid ●● ●● ●●● ●
A.2. Humid ● ●●● ●●
B. Coastal plains ●● ● ●●● ●
C. Intermontane valleys ● ●● ● ●
D. Hard-rock areas ●●● ● ● ●●●
Note: The number of dots suggests the scale and severity of a challenge.
Groundwater Management Challenges in Different Areas of India
This transformation and the socioecological threats it implied necessitated a totally new
policy response from governments and water planners. The meteoric rise of the atomistic
groundwater economy demanded bold new thinking and a resource allocation strategy to
evolve a groundwater management regime with practical supply- and demand-side strategies.
However, steeped in colonial irrigation thinking, Indian water planners still keep spending
billions of dollars on the canal irrigation technology that farmers throughout India have been
roundly rejecting. If canals are ending up as groundwater recharge structures by default, the
question is whether it would not be more effective to do so by design.
Even as India’s groundwater irrigation economy remains pretty much ungoverned,
climatic change will present new challenges and uncertainties, and demand new responses
from the region’s water planners. The rise of the booming groundwater economy and the
decline in surface irrigation necessitate a totally new understanding of the operating system
of India’s water economy and how best it can mitigate as well as adapt to the hydro-climatic
change.

179
Climatic Change and Groundwater: IndiaÊs Opportunities for Mitigation and Adaptation
India’s Hydro-Climatic Future
Climatic change is expected to significantly alter India’s hydro-climatic regime over the
twenty-first century. It is widely agreed that the Indo-Gangetic Basin will experience
increased water availability from snowmelt up to around 2030 but face gradual reductions
thereafter. Parts of the Indo-Gangetic Basin may also receive less rain than in the past; but
the rest of India is likely to benefit from greater precipitation. According to IPCC (2001),
most of the Indian land mass below the Ganges Plain is likely to experience a 0.5-1 degree
rise in average temperature during 2020-2029 and a 3.5-4.5 degree rise in 2090-2099. Many
parts of Peninsular India, especially Western Ghats will experience a 5-10% increase in total
precipitation (IPCC 2001);2 however, this increase will be accompanied by greater temporal
variability. Throughout the subcontinent, it is expected that ‘very wet days’ will contribute
more and more to total precipitation suggesting that more of India’s precipitation may be
received in fewer than 100 hours of hailstorms—and half in less than 30 hours— as has been
the case during recent decades. This would mean higher precipitation intensity and a larger
number of dry days in a year.3 Increased frequency of extremely wet rainy seasons (Gosain
and Rao 2007) will also mean increased runoff. According to Milly et al. (2008), compared to
1900-1970, most of India will experience a 5-20% increase in annual runoff during 2041-60.
All in all, India should expect to receive more of its water through rain than through snow,
get used to snowmelt occurring faster and earlier, cope with less soil moisture in summer and
higher crop ET demand as a consequence.
For Indian agriculture, hydro-climatic change will mean the following:
• Kharif (monsoon from May to September) season crops will experience heightened risk
of floods as well as droughts.
• Rabi (from October to April) and especially summer crops will experience enhanced ET
needing larger, more frequent irrigation.
• Surface water storages—large and small—will benefit from increased runoff but will
also suffer increased evaporation from large open surfaces of reservoirs and open canal
networks as a result of higher mean temperature.
• Irrigating the same area through canals will necessitate larger reservoir storage; more
frequent droughts will also mean greater need for multiyear reservoir storage capacity of
which India has very little at present.
2In some ways, this may reflect a continuation of some past trends. Based on analyses of rainfall data over
the 1872-2005 period, Basishtha et al. (2007) identified a secular decline in rainfall in North India barring
Punjab, Haryana, West Rajasthan, Saurashtra and an increase in rainfall in southern India. 3By analyzing a daily rainfall data set, Goswami et al. (2006) have shown a rising trend in the frequency
of heavy rain events and a significant decrease in the frequency of moderate events over central India
from 1951 to 2000.
180
Tushaar Shah
From these and other points of view, managing groundwater storage will acquire greater
significance for India than ever before. However, besides groundwater demand, climatic
change is expected to affect groundwater supply too in direct and myriad ways.
Impact of Climatic Change Impacts on Groundwater
To the extent that climatic change results in spatial and temporal changes in precipitation, it
will significantly influence natural recharge. Moreover, since a good deal of natural recharge
occurs in areas with vegetative cover, such as forests, changing ET rates resulting from rising
temperatures may reduce infiltration rates from natural precipitation thus reducing recharge.
Recharge responds strongly to the temporal pattern of precipitation as well as to soil cover
and soil properties. In the African context, Carter (2007) has argued that replacing natural
vegetation by crops can increase natural recharge by up to a factor of 10. If climatic change
results in changes in natural vegetation in forests or savanna, these too may influence natural
recharge; however, the direction of net effect will depend upon the pattern of changes in the
vegetative cover. Simulation models developed by Australian scientists have shown that
changes in temperatures and rainfall influence growth rates and leaf size of plants that affect
groundwater recharge. The direction of change is conditioned by the context: in some areas,
the vegetation response to climatic change would cause the average recharge to decrease,
but in other areas, recharge to groundwater would more than double. Changing river flows
in response to changing mean precipitation and its variability, rising sea levels, and changing
temperatures will all influence natural recharge rates (Kundzewich and Doll 2007).4
We know little about how exactly rainfall patterns will change; but increased temporal
variability seems guaranteed. This will mean intense and large rainfall events in short monsoons
followed by long dry spells. All evidence we have suggests that groundwater recharge
through natural infiltration occurs only beyond a threshold level of precipitation; however,
it also suggests not only that runoff increases with precipitation but the runoff coefficient
(i.e., runoff/precipitation) itself increases with increased rainfall intensity (or precipitation per
rainfall event). Higher variability in precipitation may thus negatively impact natural recharge
in general. The net impact on a given location will depend upon whether it experiences greater
or smaller total precipitation as a result of climatic change.
The Indo-Gangetic aquifer system has been getting heavy recharge from the Himalayan
snowmelt. As snowmelt-based runoff increases during the coming decades, their contribution
to potential recharge may increase; however, a great deal of this may end up as “rejected
recharge” and enhance river flows and intensify the flood proneness of eastern India and
Bangladesh. As the snowmelt-based runoff begins declining, one should expect decline in
runoff as well as in groundwater recharge in this vast basin.5
A major interplay of climatic change and groundwater will be witnessed in coastal
areas. Using the records of coastal tide gauges in the north Indian Ocean for more than 40
years, Unnikrishnan and Shankar (2007) have estimated a rise in sea level between 1.06 and
1.75 mm per year, con sistent with 1-2 mm per year global sea-level rise esti mates of IPCC.
4www.gwclim.org/presentations/plenary/kundzewicz.pdf 5Data monitored on the Himalayan glaciers present a confusing picture. They indicate recession of some
gla ciers in recent years, but the trend is not consistent across the entire mountain chain.
181
Climatic Change and Groundwater: IndiaÊs Opportunities for Mitigation and Adaptation
Rising sea levels will threaten coastal aquifers. Many of India’s coastal aquifers are already
experiencing salinity ingress. This problem is particularly acute in the Saurashtra Coast in
Gujarat and the Minjur aquifer in Tamil Nadu. In coastal West Bengal, Sundarban is threatened
by saline intrusion overland, affecting its aquifers. The precarious balance between freshwater
aquifers and seawater will come under growing stress as sea levels rise. According to the
Ghyben-Herzberg relation, a 1 foot rise in sea level decreases the depth of the freshwater-
seawater interface by 40 times as much (Kundzewich and Doll 2007). Coastal aquifers are thus
likely to face serious threats from rise in the sea level induced by climatic change.
Some scientists suggest climatic change may alter physical characteristics of aquifers
themselves.6 Higher CO2 concentrations in the atmosphere, they argue, may influence carbonate
dissolution and promote the formation of crest that, in turn, may negatively affect infiltration
properties of the topsoil. Others have argued the opposite. From experimental data, some
scientists have claimed that elevated atmospheric CO2 levels may affect plants, the vadose
zone and groundwater in ways that may hasten infiltration from precipitation by up to 119% in
the Mediterranean climate and up to 500% in the subtropical climate.7
Rethinking Storage
The response of aquifers to droughts and climatic fluctuations is much slower than that to
surface storages; as a result, compared to surface storages, aquifers act as a more resilient
buffer during dry spells, especially when they have large storages. This is why India has
experienced explosive growth in groundwater demand during recent decades; and this is also
why groundwater demand will expand further in the wake of climatic change. For millennia,
groundwater wells have been the principal weapon Indian farmers have used to cope with
droughts (Shah 2008a). This is evident from the fact that digging of wells has tended to peak
during drought years. This trend continues even today and will likely increase with heightened
hydro-climatic variability. All in all, while we can predict with confidence that climatic change
will enhance the demand for groundwater in agricultural and other uses, there is no clarity on
whether climatic change will enhance or reduce natural groundwater recharge in net terms
under the business-as-usual (BAU) scenario.
For millennia, India has relied on building surface storages and gravity-flow irrigation to
water crops. With the groundwater boom, India’s irrigation economy has been fundamentally
transformed, bringing into question its age-old emphasis on surface structures. Climatic
change raises new questions about continued reliance on surface storage and transport of
water to agriculture, and demands that India fundamentally rethink its storage strategy. Table
2 compares four storage alternatives India faces along a dozen criteria using a ten-point scale
that assigns up to five ‘
’ signs for positives (benefits) and up to five ‘ ’ signs for the negatives
(costs, disbenefits). The four alternatives compared are:
• The first, advocated by environmental and civil society groups, emphasizes numerous
small decentralized storages close to the point of use and with short canals. India’s age-old
6Aquifers are also of interest to researchers on climate for other reasons. Growing literature on Carbon
Capture and Storage (CCS) and Geological Sequestration hints at opportunities that aquifers—especially
saline and otherwise unusable—offer themselves as “carbon storehouses.” This paper, focusing on
climatic change-groundwater-agriculture interaction, does not deal with these aspects.7www.sciencedaily.com/releases/2007/10/071006091012.htm
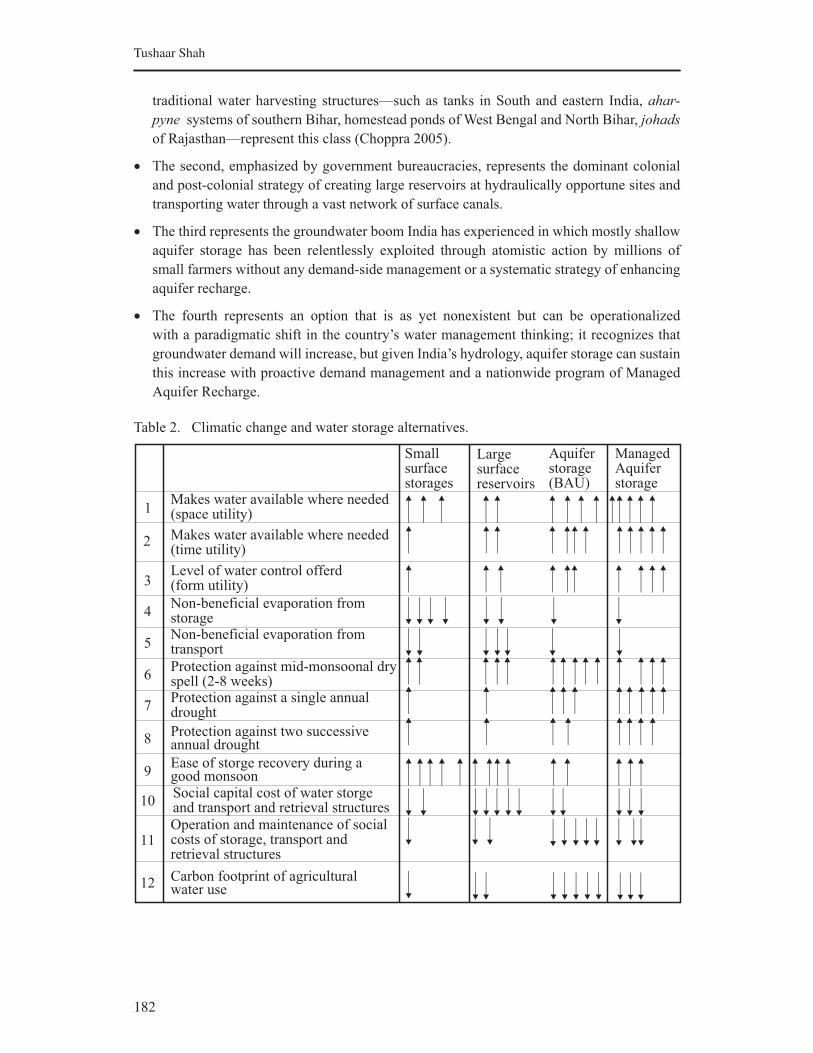
182
Tushaar Shah
traditional water harvesting structures—such as tanks in South and eastern India, ahar-
pyne systems of southern Bihar, homestead ponds of West Bengal and North Bihar, johads
of Rajasthan—represent this class (Choppra 2005).
• The second, emphasized by government bureaucracies, represents the dominant colonial
and post-colonial strategy of creating large reservoirs at hydraulically opportune sites and
transporting water through a vast network of surface canals.
• The third represents the groundwater boom India has experienced in which mostly shallow
aquifer storage has been relentlessly exploited through atomistic action by millions of
small farmers without any demand-side management or a systematic strategy of enhancing
aquifer recharge.
• The fourth represents an option that is as yet nonexistent but can be operationalized
with a paradigmatic shift in the country’s water management thinking; it recognizes that
groundwater demand will increase, but given India’s hydrology, aquifer storage can sustain
this increase with proactive demand management and a nationwide program of Managed
Aquifer Recharge.
Table 2. Climatic change and water storage alternatives.
Smallsurfacestorages
Largesurfacereservoirs
Aquiferstorage(BAU)
ManagedAquiferstorage
Makes water available where needed(space utility)
Non-beneficial evaporation fromstorageNon-beneficial evaporation fromtransport
Protection against mid-monsoonal dryspell (2-8 weeks)Protection against a single annualdrought
Protection against two successiveannual drought
Ease of storge recovery during agood monsoon
Carbon footprint of agriculturalwater use
Operation and maintenance of socialcosts of storage, transport andretrieval structures
Social capital cost of water storgeand transport and retrieval structures
Makes water available where needed(time utility)
Level of water control offerd(form utility)
1
2
3
4
5
6
7
8
9
10
11
12
183
Climatic Change and Groundwater: IndiaÊs Opportunities for Mitigation and Adaptation
Rows 4, 5, 10, 11 and 12 in Table 2 include costs or disadvantages of different storage
structures; the rest are benefits/positives. Of the benefits and costs, some, like operating costs
(row 11) and quality of access (rows 1, 2 and 3) are private in nature and drive the choices of
individual farmers. Others are “public” (or social) in nature; for instance, the carbon-footprint
of alternative storage systems may not directly influence individual farmer decisions but they
have to be factored into the national calculus.
Since the 1970s, high scores of groundwater irrigation on space, time and form utility
(rows 1, 2 and 3) have driven India’s groundwater boom. Also important has been the resilience
of groundwater against dry spells and droughts (rows 6, 7 and 8). Surface storages have fared
poorly on these counts. These benefits will become more valuable as climatic change heightens
the hydrological variability. From the society’s viewpoint, aquifer storage has the advantage
of minimum non-beneficial evaporation (rows 4 and 5); for a mostly semiarid country, where
surface reservoirs can lose 3 meters or more of their storage every year simply through pan-
evaporation; this is no mean gain. The major social disadvantages of heavy dependence on
groundwater are: (a) aquifers are slow to recharge; and hard rock aquifers that underlie 65%
of India have limited storage; (b) while gravity flow irrigation from canals needs little or no
energy, groundwater irrigation is energy-intensive; and (c) since the bulk of the energy used
in pumping groundwater uses diesel or electricity generated with coal, India’s transition from
flow irrigation to pump irrigation has created a massive carbon footprint.
Carbon Footprint of India’s Groundwater Economy
Transformation of Indian irrigation from gravity-flow to lift has made it highly energy-
intensive; but the arithmetic of computing the carbon footprint of this economy is fraught with
widely divergent estimates. Around 2000, Indian farmers lifted some 150 km3 of groundwater
using electric pump sets and around 80 km3 using diesel pump sets. Lifting 1,000 m3 of
water to a height of 1 meter uses up 2.73 kWh of energy without friction losses and at peak
efficiency (Nelson and Robertson 2008, personal communication). Indian electric irrigation
pumps probably operate at 40% efficiency; moreover, transmission and distribution losses in
delivering power to pump sets are of the order of 25% or higher. This implies that electricity
actually used to lift 1,000 m3/m in India is of the order of 9.1 kWh. If we assume that a
representative electric pump lifts water to a dynamic head of 20 meters, then lifting 150 km3
of groundwater requires 27.3 billion kWh of electricity. This estimate is highly sensitive to the
assumption about the dynamic head over which a representative electric pump set lifts water.
Taking a value of 40 meters yields an electricity consumption value of 55 billion kWh.
Using India’s 2001 Minor Irrigation Census data on groundwater irrigated area8 and
the energy consumed in agriculture (Planning Commission 2007, annexure 2.4)9 combined
with some assumptions, Rao (2008, personal communication) estimated total electricity
consumption in groundwater irrigation at 87 billion kWh. Another indirect estimate is provided
from numbers circulating in the electricity industry. The total power generation in India is
around 560 billion kWh; and many observers suggest that power used by irrigation pumps may
be around 15% of the total generation (Planning Commission 2007), giving a total agricultural
consumption of around 84 billion kWh. However, this means that either the transmission and
8 wrmin.nic.in/micensus/mi3census/reports/integrated/integrated_report.htm9 planningcommission.nic.in/reports/genrep/rep_grndwat.pdf
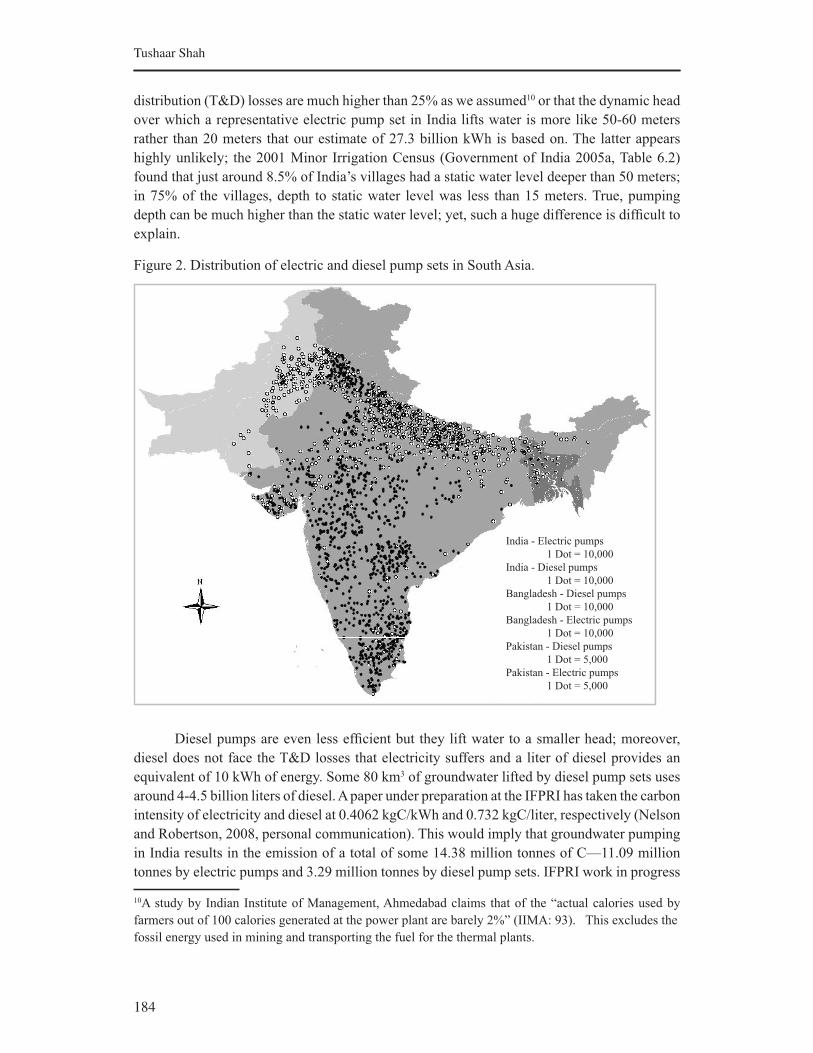
184
Tushaar Shah
distribution (T&D) losses are much higher than 25% as we assumed10 or that the dynamic head
over which a representative electric pump set in India lifts water is more like 50-60 meters
rather than 20 meters that our estimate of 27.3 billion kWh is based on. The latter appears
highly unlikely; the 2001 Minor Irrigation Census (Government of India 2005a, Table 6.2)
found that just around 8.5% of India’s villages had a static water level deeper than 50 meters;
in 75% of the villages, depth to static water level was less than 15 meters. True, pumping
depth can be much higher than the static water level; yet, such a huge difference is difficult to
explain.
Figure 2. Distribution of electric and diesel pump sets in South Asia.
Diesel pumps are even less efficient but they lift water to a smaller head; moreover,
diesel does not face the T&D losses that electricity suffers and a liter of diesel provides an
equivalent of 10 kWh of energy. Some 80 km3 of groundwater lifted by diesel pump sets uses
around 4-4.5 billion liters of diesel. A paper under preparation at the IFPRI has taken the carbon
intensity of electricity and diesel at 0.4062 kgC/kWh and 0.732 kgC/liter, respectively (Nelson
and Robertson, 2008, personal communication). This would imply that groundwater pumping
in India results in the emission of a total of some 14.38 million tonnes of C—11.09 million
tonnes by electric pumps and 3.29 million tonnes by diesel pump sets. IFPRI work in progress
10A study by Indian Institute of Management, Ahmedabad claims that of the “actual calories used by
farmers out of 100 calories generated at the power plant are barely 2%” (IIMA: 93). This excludes the
fossil energy used in mining and transporting the fuel for the thermal plants.
India - Electric pumps
1 Dot = 10,000
India - Diesel pumps
1 Dot = 10,000
Bangladesh - Diesel pumps
1 Dot = 10,000
Bangladesh - Electric pumps
1 Dot = 10,000
Pakistan - Diesel pumps
1 Dot = 5,000
Pakistan - Electric pumps
1 Dot = 5,000

185
Climatic Change and Groundwater: IndiaÊs Opportunities for Mitigation and Adaptation
tentatively estimates the C-emission from groundwater irrigation to be higher at 16 million
tonnes, roughly 4% of India’s total C-emissions.
Two interesting aspects of the carbon footprint of India’s groundwater economy are
that: (a) lifting 1,000 m3/m using electricity emits 5.5 times more C than using diesel; and
diesel pumps are concentrated in eastern India with rich alluvial aquifers; (b) C-emission of
groundwater irrigation is highly sensitive to the dynamic head over which groundwater is
lifted because, first, higher head leads to higher energy use and C-emission; second, beyond a
depth of 10-15 meters, diesel pumps become extremely inefficient forcing irrigators to switch
to electricity which has a larger C-footprint anyway. Figure 2 shows that most of India’s diesel
pumps are concentrated in eastern India and her electric pumps, in western and Peninsular
India. Table 4 presents this distribution for all of groundwater-irrigating South Asia, i.e. India,
Pakistan, Bangladesh and the Nepal terai region. Indeed, as the calculations made by J. Rao
in Table 4 show, 96% of India’s electricity use in groundwater pumping is concentrated in
11 states of western and Pzzh eninsular India. Even amongst these, the biggest C-culprits are
states like Karnataka, Tamil Nadu, Andhra Pradesh and Gujarat which have large areas under
deep tube well irrigation. Deep tube wells have a huge C-footprint; according to preliminary
calculations of IFPRI, India’s deep tube wells irrigate only 4.1 million ha of the 31 million ha
under electric pump set irrigation; but these account for nearly two-thirds of C-emission from
groundwater pumping with electric pump sets.
Table 3. Geographic distribution of electric and diesel irrigation pumps in South Asia.
Number of
irrigation pumps
(million)
Diesel
(%)
Electric
(%)
Pakistan 0.93
Bangladesh 1.18
Eastern India: Assam, West Bengal, Bihar, Orissa,
Jharkhand, Uttar Pradesh, Uttarakhand, West Bengal5.09
Western and southern India: Andhra Pradesh, Gujarat,
Haryana, Karnataka, Kerala, Madhya Pradesh, Maharashtra,
Punjab, Rajasthan, Tamil Nadu
11.69
Sources: 1. Values for Pakistan are from Pakistan Agricultural Machinery Census 2004.
2. Values for Bangladesh are from Mandal 2006.
3. Values for Indian states are from the third Minor Irrigation Census 2000-01 (Government of India 2005a).
89.6
96.7
84.0
19.4
10.4
3.3
16.0
80.6
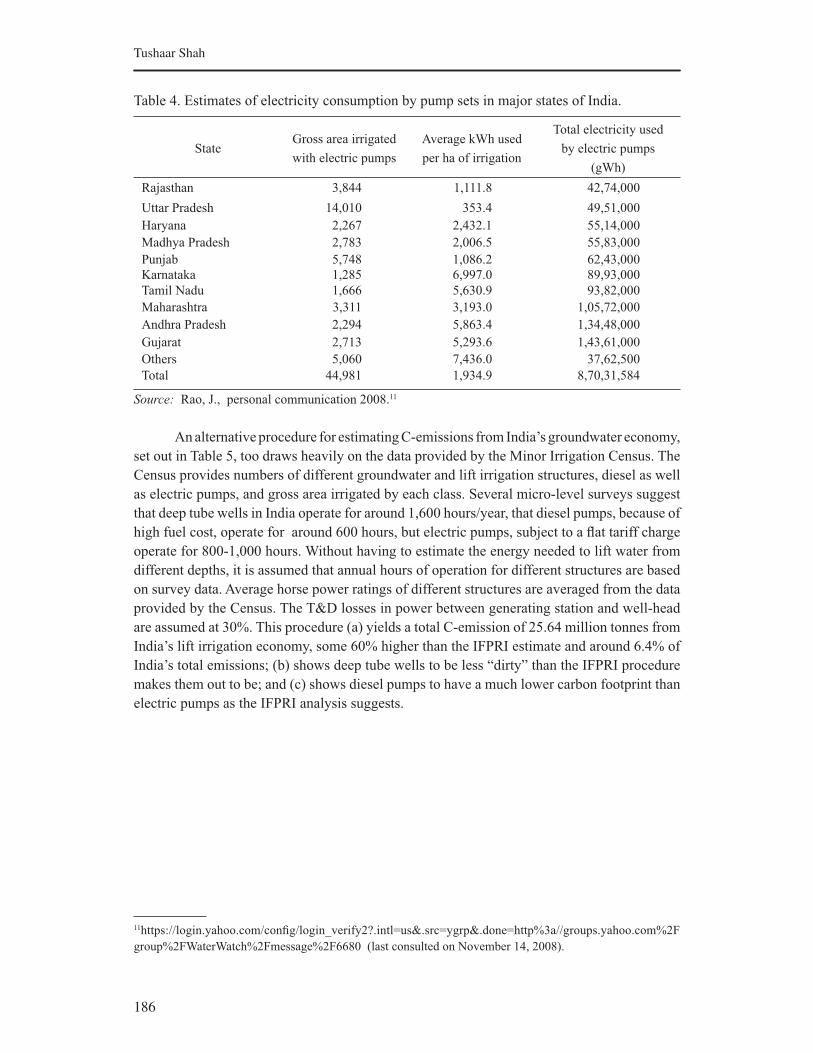
186
Tushaar Shah
Table 4. Estimates of electricity consumption by pump sets in major states of India.
StateGross area irrigated
with electric pumps
Average kWh used
per ha of irrigation
Total electricity used
by electric pumps
(gWh)
Rajasthan 3,844 1,111.8 42,74,000
Uttar Pradesh 14,010 353.4 49,51,000
Haryana 2,267 2,432.1 55,14,000
Madhya Pradesh 2,783 2,006.5 55,83,000
Punjab 5,748 1,086.2 62,43,000Karnataka 1,285 6,997.0 89,93,000
Tamil Nadu 1,666 5,630.9 93,82,000
Maharashtra 3,311 3,193.0 1,05,72,000
Andhra Pradesh 2,294 5,863.4 1,34,48,000
Gujarat 2,713 5,293.6 1,43,61,000
Others 5,060 7,436.0 37,62,500
Total 44,981 1,934.9 8,70,31,584
Source: Rao, J., personal communication 2008.11
An alternative procedure for estimating C-emissions from India’s groundwater economy,
set out in Table 5, too draws heavily on the data provided by the Minor Irrigation Census. The
Census provides numbers of different groundwater and lift irrigation structures, diesel as well
as electric pumps, and gross area irrigated by each class. Several micro-level surveys suggest
that deep tube wells in India operate for around 1,600 hours/year, that diesel pumps, because of
high fuel cost, operate for around 600 hours, but electric pumps, subject to a flat tariff charge
operate for 800-1,000 hours. Without having to estimate the energy needed to lift water from
different depths, it is assumed that annual hours of operation for different structures are based
on survey data. Average horse power ratings of different structures are averaged from the data
provided by the Census. The T&D losses in power between generating station and well-head
are assumed at 30%. This procedure (a) yields a total C-emission of 25.64 million tonnes from
India’s lift irrigation economy, some 60% higher than the IFPRI estimate and around 6.4% of
India’s total emissions; (b) shows deep tube wells to be less “dirty” than the IFPRI procedure
makes them out to be; and (c) shows diesel pumps to have a much lower carbon footprint than
electric pumps as the IFPRI analysis suggests.
11https://login.yahoo.com/config/login_verify2?.intl=us&.src=ygrp&.done=http%3a//groups.yahoo.com%2F
group%2FWaterWatch%2Fmessage%2F6680 (last consulted on November 14, 2008).
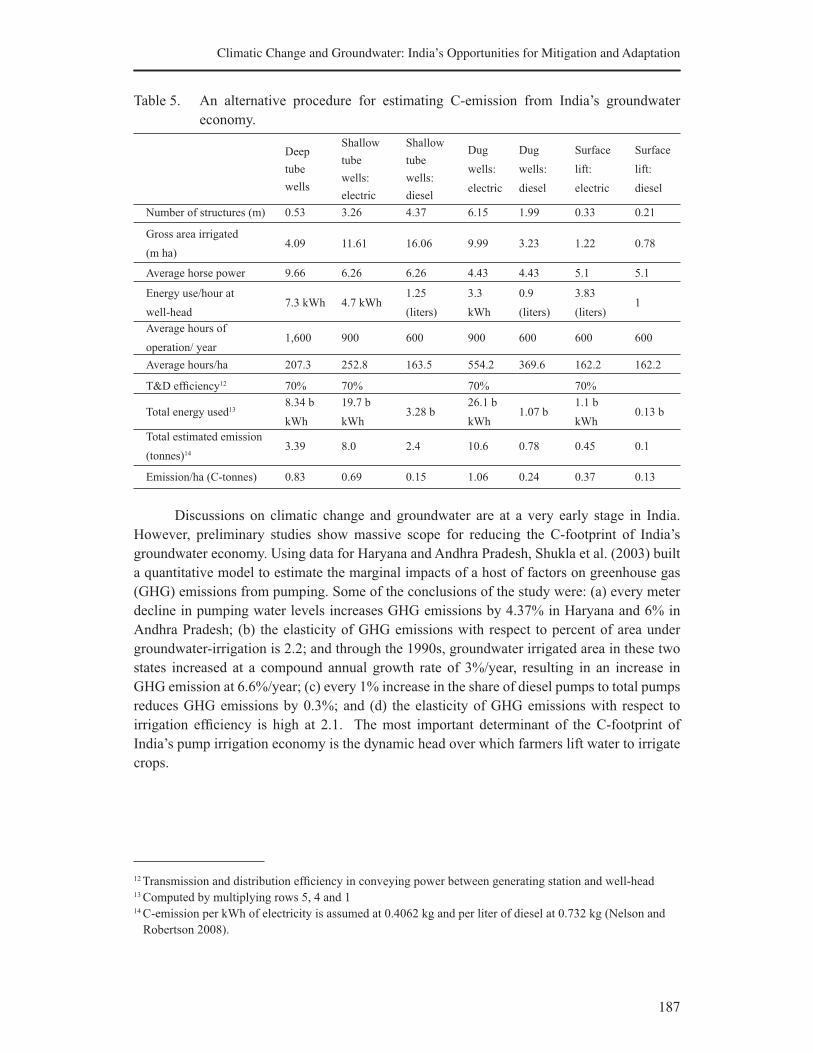
187
Climatic Change and Groundwater: IndiaÊs Opportunities for Mitigation and Adaptation
Table 5. An alternative procedure for estimating C-emission from India’s groundwater
economy.
Deep
tube
wells
Shallow
tube
wells:
electric
Shallow
tube
wells:
diesel
Dug
wells:
electric
Dug
wells:
diesel
Surface
lift:
electric
Surface
lift:
diesel
Number of structures (m) 0.53 3.26 4.37 6.15 1.99 0.33 0.21
Gross area irrigated
(m ha)4.09 11.61 16.06 9.99 3.23 1.22 0.78
Average horse power 9.66 6.26 6.26 4.43 4.43 5.1 5.1
Energy use/hour at
well-head7.3 kWh 4.7 kWh
1.25
(liters)
3.3
kWh
0.9
(liters)
3.83
(liters)1
Average hours of
operation/ year1,600 900 600 900 600 600 600
Average hours/ha 207.3 252.8 163.5 554.2 369.6 162.2 162.2
T&D efficiency12 70% 70% 70% 70%
Total energy used138.34 b
kWh
19.7 b
kWh3.28 b
26.1 b
kWh1.07 b
1.1 b
kWh0.13 b
Total estimated emission
(tonnes)143.39 8.0 2.4 10.6 0.78 0.45 0.1
Emission/ha (C-tonnes) 0.83 0.69 0.15 1.06 0.24 0.37 0.13
Discussions on climatic change and groundwater are at a very early stage in India.
However, preliminary studies show massive scope for reducing the C-footprint of India’s
groundwater economy. Using data for Haryana and Andhra Pradesh, Shukla et al. (2003) built
a quantitative model to estimate the marginal impacts of a host of factors on greenhouse gas
(GHG) emissions from pumping. Some of the conclusions of the study were: (a) every meter
decline in pumping water levels increases GHG emissions by 4.37% in Haryana and 6% in
Andhra Pradesh; (b) the elasticity of GHG emissions with respect to percent of area under
groundwater-irrigation is 2.2; and through the 1990s, groundwater irrigated area in these two
states increased at a compound annual growth rate of 3%/year, resulting in an increase in
GHG emission at 6.6%/year; (c) every 1% increase in the share of diesel pumps to total pumps
reduces GHG emissions by 0.3%; and (d) the elasticity of GHG emissions with respect to
irrigation efficiency is high at 2.1. The most important determinant of the C-footprint of
India’s pump irrigation economy is the dynamic head over which farmers lift water to irrigate
crops.
12 Transmission and distribution efficiency in conveying power between generating station and well-head13 Computed by multiplying rows 5, 4 and 114 C-emission per kWh of electricity is assumed at 0.4062 kg and per liter of diesel at 0.732 kg (Nelson and
Robertson 2008).
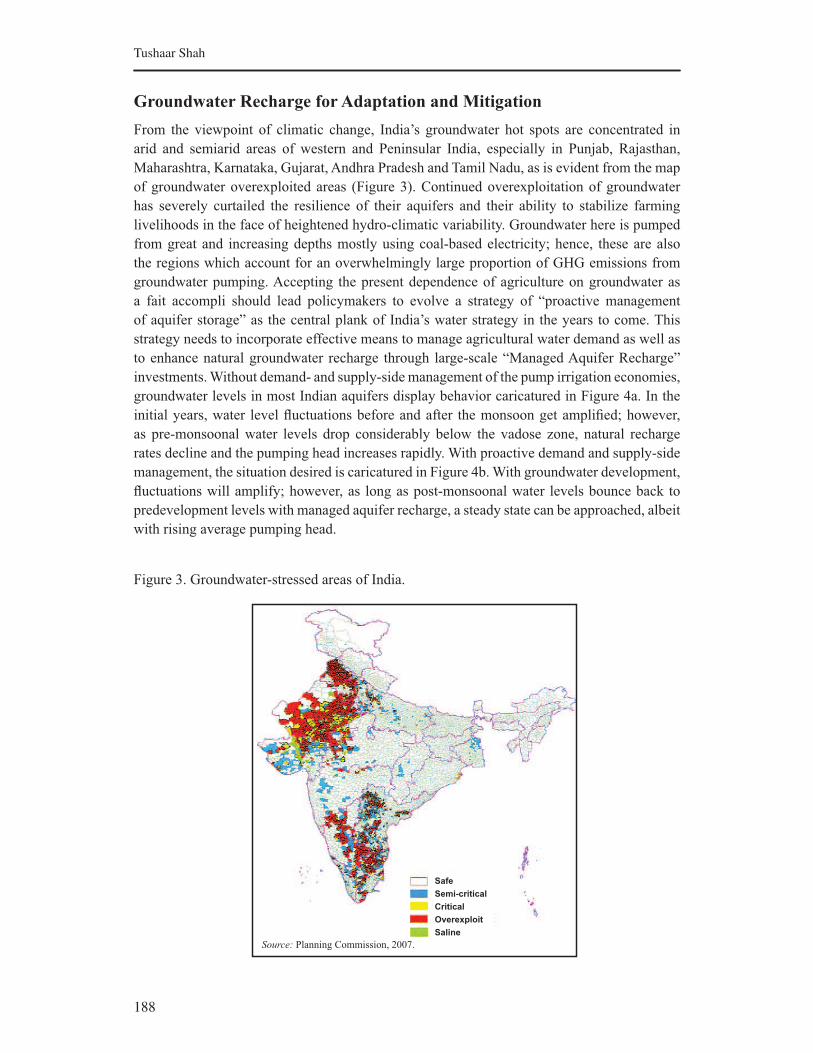
188
Tushaar Shah
Groundwater Recharge for Adaptation and Mitigation
From the viewpoint of climatic change, India’s groundwater hot spots are concentrated in
arid and semiarid areas of western and Peninsular India, especially in Punjab, Rajasthan,
Maharashtra, Karnataka, Gujarat, Andhra Pradesh and Tamil Nadu, as is evident from the map
of groundwater overexploited areas (Figure 3). Continued overexploitation of groundwater
has severely curtailed the resilience of their aquifers and their ability to stabilize farming
livelihoods in the face of heightened hydro-climatic variability. Groundwater here is pumped
from great and increasing depths mostly using coal-based electricity; hence, these are also
the regions which account for an overwhelmingly large proportion of GHG emissions from
groundwater pumping. Accepting the present dependence of agriculture on groundwater as
a fait accompli should lead policymakers to evolve a strategy of “proactive management
of aquifer storage” as the central plank of India’s water strategy in the years to come. This
strategy needs to incorporate effective means to manage agricultural water demand as well as
to enhance natural groundwater recharge through large-scale “Managed Aquifer Recharge”
investments. Without demand- and supply-side management of the pump irrigation economies,
groundwater levels in most Indian aquifers display behavior caricatured in Figure 4a. In the
initial years, water level fluctuations before and after the monsoon get amplified; however,
as pre-monsoonal water levels drop considerably below the vadose zone, natural recharge
rates decline and the pumping head increases rapidly. With proactive demand and supply-side
management, the situation desired is caricatured in Figure 4b. With groundwater development,
fluctuations will amplify; however, as long as post-monsoonal water levels bounce back to
predevelopment levels with managed aquifer recharge, a steady state can be approached, albeit
with rising average pumping head.
Figure 3. Groundwater-stressed areas of India.
Source: Planning Commission, 2007.
Safe
Semi-critical
Critical
Overexploit
Saline
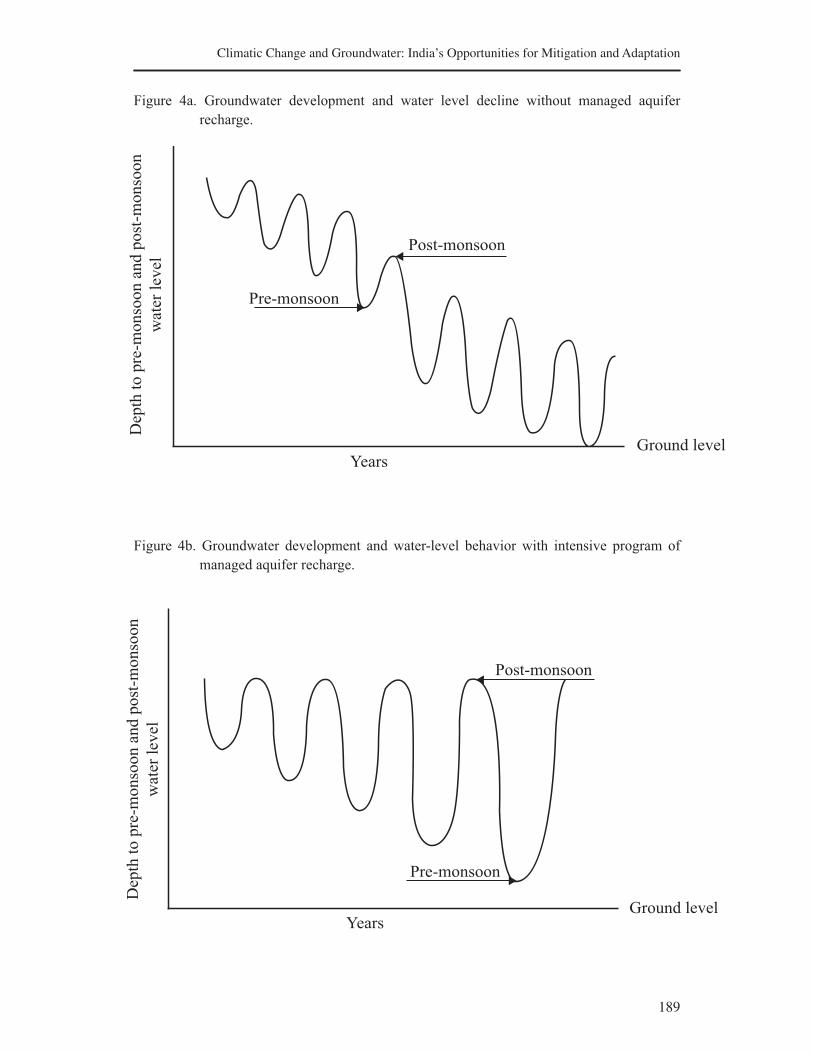
189
Climatic Change and Groundwater: IndiaÊs Opportunities for Mitigation and Adaptation
Figure 4a. Groundwater development and water level decline without managed aquifer
recharge.
Figure 4b. Groundwater development and water-level behavior with intensive program of
managed aquifer recharge.
Pre-monsoon
Dep
th t
o p
re-m
on
soo
n a
nd
po
st-m
on
soo
n
wate
r le
vel
Post-monsoon
Ground levelYears
Pre-monsoon
Post-monsoon
Depth
to p
re-m
onso
on a
nd p
ost
-monso
on
wate
r le
vel
Ground levelYears
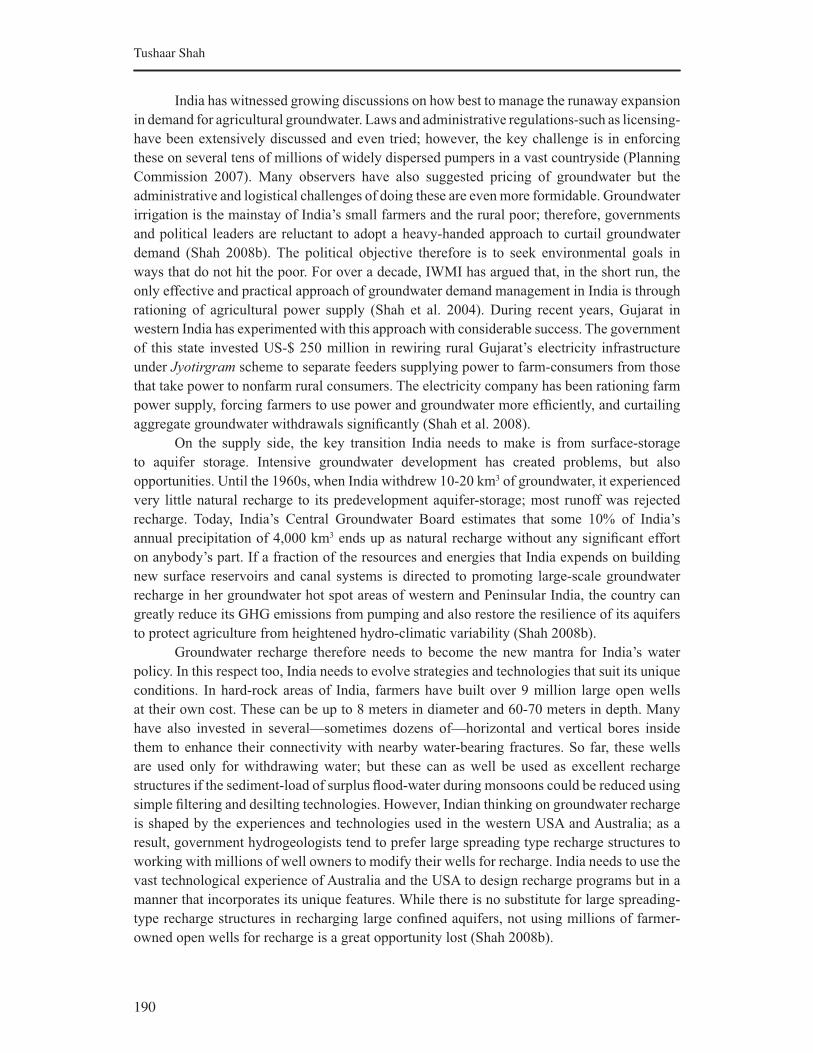
190
Tushaar Shah
India has witnessed growing discussions on how best to manage the runaway expansion
in demand for agricultural groundwater. Laws and administrative regulations-such as licensing-
have been extensively discussed and even tried; however, the key challenge is in enforcing
these on several tens of millions of widely dispersed pumpers in a vast countryside (Planning
Commission 2007). Many observers have also suggested pricing of groundwater but the
administrative and logistical challenges of doing these are even more formidable. Groundwater
irrigation is the mainstay of India’s small farmers and the rural poor; therefore, governments
and political leaders are reluctant to adopt a heavy-handed approach to curtail groundwater
demand (Shah 2008b). The political objective therefore is to seek environmental goals in
ways that do not hit the poor. For over a decade, IWMI has argued that, in the short run, the
only effective and practical approach of groundwater demand management in India is through
rationing of agricultural power supply (Shah et al. 2004). During recent years, Gujarat in
western India has experimented with this approach with considerable success. The government
of this state invested US-$ 250 million in rewiring rural Gujarat’s electricity infrastructure
under Jyotirgram scheme to separate feeders supplying power to farm-consumers from those
that take power to nonfarm rural consumers. The electricity company has been rationing farm
power supply, forcing farmers to use power and groundwater more efficiently, and curtailing
aggregate groundwater withdrawals significantly (Shah et al. 2008).
On the supply side, the key transition India needs to make is from surface-storage
to aquifer storage. Intensive groundwater development has created problems, but also
opportunities. Until the 1960s, when India withdrew 10-20 km3 of groundwater, it experienced
very little natural recharge to its predevelopment aquifer-storage; most runoff was rejected
recharge. Today, India’s Central Groundwater Board estimates that some 10% of India’s
annual precipitation of 4,000 km3 ends up as natural recharge without any significant effort
on anybody’s part. If a fraction of the resources and energies that India expends on building
new surface reservoirs and canal systems is directed to promoting large-scale groundwater
recharge in her groundwater hot spot areas of western and Peninsular India, the country can
greatly reduce its GHG emissions from pumping and also restore the resilience of its aquifers
to protect agriculture from heightened hydro-climatic variability (Shah 2008b).
Groundwater recharge therefore needs to become the new mantra for India’s water
policy. In this respect too, India needs to evolve strategies and technologies that suit its unique
conditions. In hard-rock areas of India, farmers have built over 9 million large open wells
at their own cost. These can be up to 8 meters in diameter and 60-70 meters in depth. Many
have also invested in several—sometimes dozens of—horizontal and vertical bores inside
them to enhance their connectivity with nearby water-bearing fractures. So far, these wells
are used only for withdrawing water; but these can as well be used as excellent recharge
structures if the sediment-load of surplus flood-water during monsoons could be reduced using
simple filtering and desilting technologies. However, Indian thinking on groundwater recharge
is shaped by the experiences and technologies used in the western USA and Australia; as a
result, government hydrogeologists tend to prefer large spreading type recharge structures to
working with millions of well owners to modify their wells for recharge. India needs to use the
vast technological experience of Australia and the USA to design recharge programs but in a
manner that incorporates its unique features. While there is no substitute for large spreading-
type recharge structures in recharging large confined aquifers, not using millions of farmer-
owned open wells for recharge is a great opportunity lost (Shah 2008b).
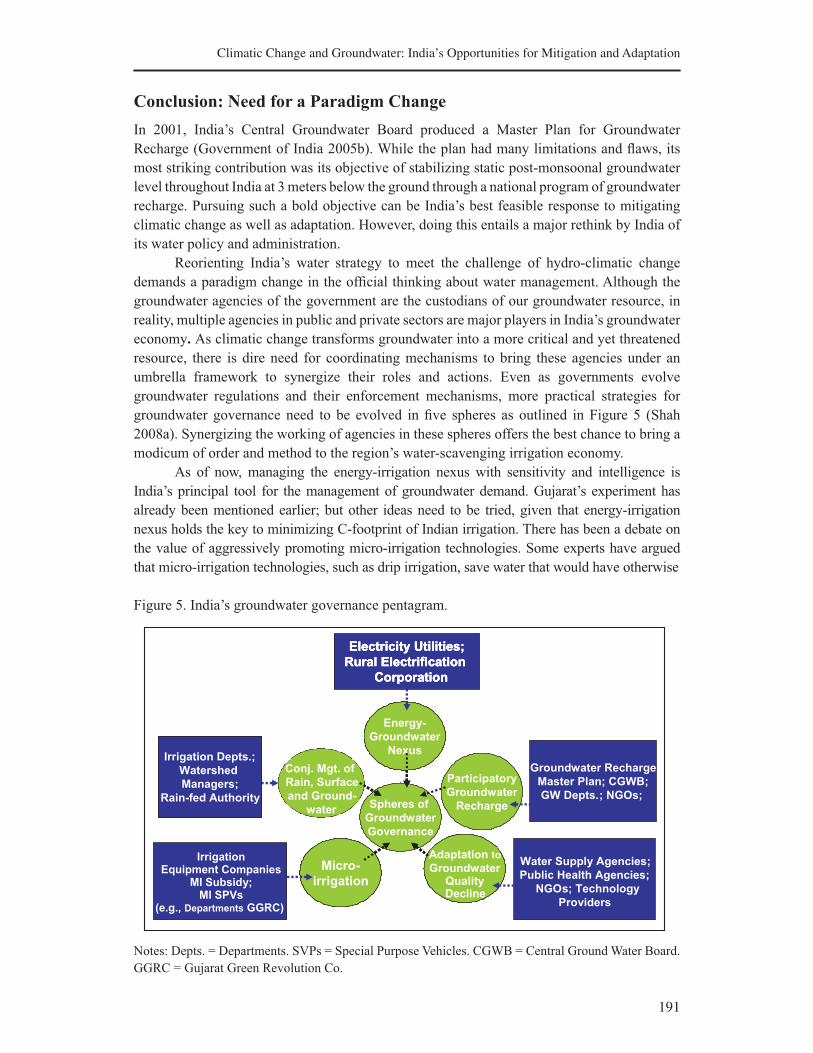
191
Climatic Change and Groundwater: IndiaÊs Opportunities for Mitigation and Adaptation
Conclusion: Need for a Paradigm Change
In 2001, India’s Central Groundwater Board produced a Master Plan for Groundwater
Recharge (Government of India 2005b). While the plan had many limitations and flaws, its
most striking contribution was its objective of stabilizing static post-monsoonal groundwater
level throughout India at 3 meters below the ground through a national program of groundwater
recharge. Pursuing such a bold objective can be India’s best feasible response to mitigating
climatic change as well as adaptation. However, doing this entails a major rethink by India of
its water policy and administration.
Reorienting India’s water strategy to meet the challenge of hydro-climatic change
demands a paradigm change in the official thinking about water management. Although the
groundwater agencies of the government are the custodians of our groundwater resource, in
reality, multiple agencies in public and private sectors are major players in India’s groundwater
economy. As climatic change transforms groundwater into a more critical and yet threatened
resource, there is dire need for coordinating mechanisms to bring these agencies under an
umbrella framework to synergize their roles and actions. Even as governments evolve
groundwater regulations and their enforcement mechanisms, more practical strategies for
groundwater governance need to be evolved in five spheres as outlined in Figure 5 (Shah
2008a). Synergizing the working of agencies in these spheres offers the best chance to bring a
modicum of order and method to the region’s water-scavenging irrigation economy.
As of now, managing the energy-irrigation nexus with sensitivity and intelligence is
India’s principal tool for the management of groundwater demand. Gujarat’s experiment has
already been mentioned earlier; but other ideas need to be tried, given that energy-irrigation
nexus holds the key to minimizing C-footprint of Indian irrigation. There has been a debate on
the value of aggressively promoting micro-irrigation technologies. Some experts have argued
that micro-irrigation technologies, such as drip irrigation, save water that would have otherwise
Figure 5. India’s groundwater governance pentagram.
Spheres of
Groundwater
Governance
Participatory
Groundwater
Recharge
Adaptation to
Groundwater
Quality
decline
Micro-
irrigation
Conj. Mgt. of
Rain, surface
And ground
water
Energy-
Groundwater
Nexus
Electricity Utilities;
Rural Electrification
Corporation
Irrigation Deptts;
Watershed
Managers;
Rainfed Authority
Groundwater Recharge
Master Plan; CGWB;
GW Depts.; NGOs;
Water Supply Agencies;
Public Health Agencies;
NGOs; Technology
Providers
Spheres of
Groundwater
Governance
Participatory
Groundwater
Recharge
Adaptation to
Groundwater
Quality
decline
Micro-
irrigation
Conj. Mgt. of
Rain, surface
And ground
water
Energy-
Groundwater
Nexus
Electricity Utilities;
Rural Electrification
Corporation
Irrigation Deptts;
Watershed
Managers;
Rainfed Authority
Adaptation to
GroundwaterQualityDecline
Micro-
irrigation
Conj. Mgt. of
Rain, Surface
and Ground-
water
Energy-
Groundwater
Nexus
Electricity Utilities;
Rural Electrification
Corporation
Irrigation Depts.;
Watershed
Managers;
Rain-fed Authority
IrrigationEquipment Companies
MI Subsidy;MI SPVs
(e.g., Departments GGRC)
Notes: Depts. = Departments. SVPs = Special Purpose Vehicles. CGWB = Central Ground Water Board.
GGRC = Gujarat Green Revolution Co.
192
Tushaar Shah
returned to the aquifer for later use. However, in the context of climatic change, micro-irrigation
is important for energy savings even more than water savings. Indeed, in the context of climatic
change, water management structures and strategies need to achieve joint maximization of
water productivity as well as energy efficiency.
In hard-rock India, together with intelligent management of the energy-irrigation
nexus, mass-based decentralized groundwater recharge offers a major short-run supply-side
opportunity. Public agencies are likely to attract maximum farmer participation in any program
that augments on-demand water availability around farming areas. Experience also shows that
engaging in groundwater recharge is often the first step for communities to evolve norms for
local, community-based demand management.
In alluvial aquifer areas, conjunctive management of rain, surface water and
groundwater is the big hitherto underexploited opportunity for supply-side management.
Massive investments being planned for rehabilitating, modernizing and extending gravity-flow
irrigation from large and small reservoirs need a major rethink in India. In view of the threat of
climatic change, India needs to rethink our storage technology itself. Over the past 40 years,
India’s land mass has been turned into a huge underground reservoir, more productive, efficient
and valuable to farmers than surface reservoirs. For millennia, it could capture and store little
rainwater because in its predevelopment phase it had little unused storage. The pump irrigation
revolution has created 230-250 km3 of new, more efficient storage in the subcontinent. Like
surface reservoirs, aquifer storage is good in some places and not so good in others. To the
farmers, this reservoir is more valuable than surface reservoirs because they have direct access
to it and can obtain water on demand. Therefore, they are far more likely to collaborate in
managing this reservoir if it responds to their recharge pull (Shah 2008 forthcoming).
In mainstream irrigation thinking, groundwater recharge is viewed as a by-product
of flow irrigation, but in today’s India, this equation needs rethinking. Increasingly, the
country’s 250 odd km3 of surface storage make economic sense only for sustaining on-demand
groundwater irrigation in extended command areas. A cubic meter of recharged well water,
available on demand, is valued many times more than a cubic meter of water in surface storage.
Farmers’ new-found interest in local water bodies throughout semiarid Peninsular India
reflects the value of groundwater recharge. This is evident in South Indian tank communities
that are converting irrigation tanks into percolation tanks, and in Saurashtra and Kutch, where
a new norm intended to maximize groundwater recharge forbids irrigation from small surface
reservoirs so that recharge gets maximized.
In some areas of India with massive evaporation losses from reservoirs and canals but
with high rates of infiltration and percolation, the big hope for surface irrigation systems—
small and large—may be to reinvent them to enhance and stabilize groundwater aquifers
that offer water supply close to points of use, permitting frequent and flexible just-in-time
irrigation of diverse crops. Already, many canal irrigation systems create value not through
flow irrigation but by supporting well irrigation by default through farmers investing in tube
wells in command areas. But canal systems need to be redesigned for maximizing recharge
over a larger area than the command. While farmers are doing their bit, the management of
the system itself tends to be totally antithetical to optimal system-wide conjunctive use (Shah
1993). Management of surface systems is clearly in dire need of reinvention.
193
Climatic Change and Groundwater: IndiaÊs Opportunities for Mitigation and Adaptation
Surface systems in water-stressed regions of western India need to be remodeled to
mimic the on-demand nature of groundwater irrigation. In Rajasthan’s Indira Gandhi Canal, the
government is subsidizing farmers to make farm ponds, to be filled by the canal once a month
and then used to supply water on demand. Gujarat is following suit through a new program of
supporting farmers in command areas to build on-farm storage from which they can irrigate on
demand. Integrating large canal irrigation projects in the groundwater irrigation economy may
support the case for rethinking their modernization in ways previously unimagined. Replacing
lined canals with buried perforated pipes connected to irrigation wells or farm and village
ponds, thus creating recharge paths along the way, may be a more efficient way of using
surface storage than flow irrigation.
There is a new groundswell of enthusiasm for pipes rather than for open channels to
transport water. The use of pipes for water transport is also valued for at least two other benefits:
first, saving scarce farmland otherwise used for watercourses and field channels, and second,
micro-irrigation. In the Sardar-Sarovar Project in Gujarat the major water user associations
refused to build water distribution systems because of land scarcity. In an agrarian economy
with already high population pressure on farmland, flexible pipes for water distribution make
more sense than surface channels, and buried pipes are even better. Pipes also support micro-
irrigation technologies. This is what explains a boom in the use of plastics in many parts of
Indian agriculture. And if China’s experience is any guide, this boom will continue to generate
water as well as energy savings.
By far the most critical response to hydro-climatic change in India’s water sector
demands exploring synergies from a variety of players for a nationwide groundwater recharge
program. Evolving a groundwater recharge strategy appropriate to India needs to begin
with an appreciation of the variety of actors that can contribute through different kinds of
recharge structures as suggested in the following table. Public agencies with strong science
and engineering capabilities need to play a major role in constructing and managing large
recharge structures. However in India, an intelligent strategy can also involve millions of
farmers and householders—and thousands of their communities—each of whom can
contribute small volumes to recharge dynamic groundwater. When we approach the problem
thus, new strategic avenues present themselves. India’s water policy has so far tended to focus
on what governments and government agencies can do. Now, it needs to target networks of
players, each with distinct capabilities and limitations. If groundwater recharge is to be a major
response to hydro-climatic change, the country needs to evolve and work with an integrated
groundwater recharge strategy with roles and space for various players to contribute.
194
Tushaar Shah
References
Carter, R.C. 2007. Climate, population and groundwater in Africa. In: International conference on groundwater
and climate in Africa, held at Kampala, Uganda, during 24-28 June 2008.
Choppra, K. 2005. The raining nature. www.boloji.com/environment/31a.htm, accessed on November 10,
2008.
Gosain, A.K.; Rao, S. 2007. Impact assessment of climate change on water resources of two river systems in
India. Jalvigyan Sameeksha 22: 21.
Government of India. 2005a. Report on third Census of Minor Irrigation Schemes (2000–01). New Delhi:
Minor Irrigation Division, Ministry of Water Resources, Government of India.
Government of India. 2005b. Master plan for artificial recharge to groundwater in India. New Delhi, India:
Central Groundwater Board, Ministry of Water Resources, Government of India.
IPCC (Intergovernmental Panel on Climate Change). 2001. Climate change: Impacts, adaptation and
vulnerability. Third Assessment Report of Intergovernmental Panel on Climate Change, IPCC. Cambridge,
UK: Cambridge University Press.
Kundzewich, Z.W.; Doll, P. 2007. Will groundwater ease freshwater stress under climate change? In:
International conference on groundwater and climate in Africa, held at Kampala, Uganda, during 24-28
June 2008.
Mandal, M. A. S. 2006. Groundwater irrigation issues and research experience in Bangladesh. In: International
workshop on groundwater governance in Asia (IIT, Roorkee, November).
Milly, P. C. D.; Betancourt, J.; Falkenmark, M.; Hirsch, R.M.; Kundzewicz, Z.W.; Lettenmaier, D.P.; Stouffer,
R.J. 2008. Stationarity is dead: Wither water management? Science 319 (5863): 573-574.
Nelson, G.C.; Roberson, R. 2008. Personal communication.
Pakistan Agricultural Machinery Census 2004. Accessible via www.statpak.gov.pk/depts/aco/publications/
agricultural-machinery-census2004/amc2004.html
Planning Commission. 2007. Report of the Expert Group to Review the Issue of Groundwater Ownership in the
Country. New Delhi: Planning Commission, Government of India.
Rao, J. 2008. Personal communication.
Shah, T. 1993. Groundwater markets and irrigation development: Political economy and practical policy.
Mumbai: Oxford University Press.
Shah, T. 2008a. Taming the anarchy? Groundwater governance in South Asia. Washington, D.C.: Resource
for the Future.
Shah, T. 2008b. India’s master plan for groundwater recharge: An assessment and some suggestions for
revision. Economic and Political Weekly (in press).
Shah, T.; Scott, C.; Kishore, A.; Sharma, A. 2004. Energy-irrigation nexus in South Asia: Improving groundwater
conservation and power sector viability. Research Report 70. Colombo, Sri Lanka: International Water
Management Institute.
Shukla, P.R.; Nair, R.; Kapshe, M.; Garg, A.; Balasubramaniam, S.; Menon, D.; Sharma, K.K. 2003.
Development and climate: An assessment for India. A report submitted to UCCEE, Denmark, by the
Indian Institute of Management, Ahmadabad: (www.developmentfirst.org/india/report/fullreport.pdf).
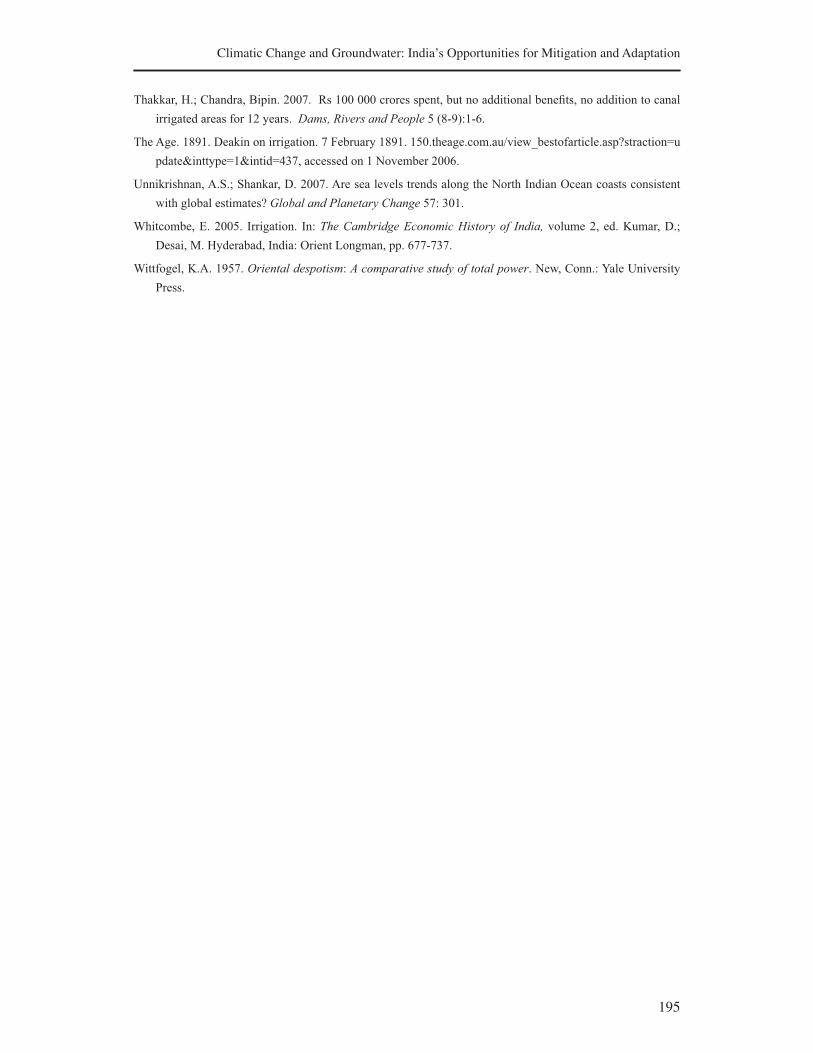
195
Climatic Change and Groundwater: IndiaÊs Opportunities for Mitigation and Adaptation
Thakkar, H.; Chandra, Bipin. 2007. Rs 100 000 crores spent, but no additional benefits, no addition to canal
irrigated areas for 12 years. Dams, Rivers and People 5 (8-9):1-6.
The Age. 1891. Deakin on irrigation. 7 February 1891. 150.theage.com.au/view_bestofarticle.asp?straction=u
pdate&inttype=1&intid=437, accessed on 1 November 2006.
Unnikrishnan, A.S.; Shankar, D. 2007. Are sea levels trends along the North Indian Ocean coasts consistent
with global estimates? Global and Planetary Change 57: 301.
Whitcombe, E. 2005. Irrigation. In: The Cambridge Economic History of India, volume 2, ed. Kumar, D.;
Desai, M. Hyderabad, India: Orient Longman, pp. 677-737.
Wittfogel, K.A. 1957. Oriental despotism: A comparative study of total power. New, Conn.: Yale University
Press.

197
Is It Possible to Revive Dug Wells in Hard-Rock India
through Recharge?
Discussion from Studies in Ten Districts of the Country
Sunderrajan Krishnan, Rajnarayan Indu, Tushaar Shah, Channappa Hittalamani, Banderrao
Patwari, Deepak Sharma, Laxman Chauhan, Vivek Kher, Hirudia Raj, Upendrasinh Mahida,
Shankar, M. and Krishna Sharma1
Abstract
Groundwater exploitation in hard-rock India is leading to high distress amongst farmers.
Various water conservation schemes have been tried and piloted, but no idea has scaled up
to the national level. An idea of revitalizing groundwater use, individual as it is, and if still
individual-based, could possibly succeed. Recharging through dug wells is one such thought.
After mass movements in Saurashtra in the mid-1990s, no effort has been made to promote
the idea nationally, till now. The current national program on artificial recharge of dug wells
hopes to do so. But this idea can succeed only if farmers see any value in it and try to make
it successful. A survey of 767 farmers owning dug wells in 10 districts of India shows that
there is immense potential in, yet constraints to, dug-well recharge. A comparison of dug-well
recharge with the average annual natural recharge over hard-rock areas of 116 mm shows that
there is almost an equal potential in recharging groundwater irrigated areas through dug wells.
Surveyed farmers also expect a great increase in water availability, especially during the dry
seasons. However, farmers are wary of this recharged water flowing across to their neighbors.
They expect to gain around 30% from their recharged water, but agree that there would be a
common gain by recharging groundwater together with their neighbors. The farmers’ estimated
cost of Rs 10,000 for the recharge structures is not such a big constraint, nor is siltation, for
which they suggest numerous innovative solutions. Managing dug-well recharge locally is
critical. Should it become mandatory for farmers to apply in groups of 10, as our sampled
farmers suggest? Should the national program be structured such that farmers are transferred
the subsidy and they can construct the structures in April or May as they unanimously prefer
to do? Instead, should the policy be to promote local businesses around recharge, so as to
harness the experience of well drillers, who also operate during the same summer months?
1Sunderrajan Krishnan, Rajnarayan Indu: INREM Foundation, Anand, Gujarat; Tushaar Shah:
International Water Management Institute, Anand, Gujarat; Channappa Hittalamani: Navachetana Rural
Development Society, Gadag; Banderrao Patwari: SCOPE, Dharwad; Deepak Sharma, GATE, Jhabua;
Laxman Chauhan: SAVARAJ, Rajkot; Vivek Kher: Nagpur; Hirudia Ra, Hyderabad; Upendrasinh
Mahida, Anand Shankar, M: DHVANI, Dharmapuri; and Krishna Sharma, PEDO, Dungarpur.
198
Sunderrajan et al.
More such tuning is needed over implementation of the dug-well recharge program to create
demand from farmers, catalyze enterprises locally around recharge and establish monitoring
programs to measure the benefits from the first upcoming season in 2009 over lakhs of recharge
structures.
Introduction
The existence of individual farm-based irrigation facilities has been one important reason for
the increase in irrigated areas in India for the past 3-4 decades. Whether the water for this
irrigation comes from a reservoir or from the ground beneath, the farmers are at ease when
they do not have to depend on a faraway control for irrigating their fields. This facility however
comes with its drawbacks. On the one hand, it gives the farmers the luxury of adjusting their
times towards their field activities and, on the other, it also puts the entire onus of assuring
water availability to the farmers. This was fine in the initial years of groundwater development,
but not so now. The boom, peak and burst of the groundwater revolution are now well known.
The farmers, especially in the hard-rock regions are desperate. After expectations that arose
from rising incomes due to groundwater-based irrigation, they now face prospects of even
more investment, greater risk and uncertain yield (NIH 1999). This crisis has led to distress
and agony in the farmer community, who wish, but without hope, towards some strategy to
salvage their irrigation infrastructure (Janakarajan 1999).
Spreading canals all across this landscape is not a viable option given numerous physical
and economic constraints. Debates often travel towards local options for water capture and on
that front, numerous efforts have been initiated. But unlike the development of groundwater
irrigation as an individual effort, these local efforts at water conservation have been primarily
community efforts requiring collective action by a group of people. Hard as it is to sustain
such efforts, much energy often goes towards bringing about such community action. Is there
any individual alternative by the farmers themselves that can help in water conservation and
sustaining the groundwater-based irrigation?
The Central government has initiated the national program for artificial recharge through
dug wells in primarily hard-rock districts of the country which also experience a high stage
of groundwater exploitation. It is anticipated, over different phases, to utilize several million
wells (aimed at 4.55 million) as recharge structures (Shah 2008; Mohandas and Gupta 2009).
Most of these wells are located on private land owned by farmers. The recharging of these
private wells is being coordinated by state-wide implementation structures that differ from one
state to another. Currently, i.e., early 2009, the two states that have gone on an overdrive for
this program are Tamil Nadu and Gujarat. Other states are in earlier stages of organizing the
implementation structures, identifying beneficiaries and going ahead with execution. By the
monsoon of 2009, a few lakhs of wells would be covered by this program. The monsoon will
provide us with pointers for testing this idea and its future potential.
The final end point and, in fact, the most crucial point in this entire structure is the well-
owning farmers. Once a recharge structure is attached to a farmer’s well, utilizing this facility
to perform recharge or enhancing and maintaining it in the future rest mainly with the farmers.
199
Is It Possible to Revive Dug Wells in Hard-Rock India through Recharge?
What do the farmers think of such a mode of doing recharge with their wells? Do they feel
there is a significant potential benefit to themselves (and others) by such recharging? Do the
farmers have other models and ideas to contribute?
Should such questions have preceded the implementation of the national program
itself? Currently, the program is structured so that there is identification of farmers, transfer of
funds and expectation that farmers would construct recharge structures. There is less thinking
on how village-level implementation should proceed and what support will be available to the
farmers during and after construction of recharge structures.
In the past, success of such mass ventures by the farmers has proceeded only due to
innovation by farmers themselves. The Saurashtra well recharge movement, which later on
provided a base for community action on the check dam movement, succeeded because of a
massive communication program by civil society groups that highlighted the need for water
conservation amidst several years of drought. Farmers, charged by the idea went ahead and
invested their own money and effort towards constructing recharge structures for their wells.
Even today, much experience gained from these experiments in the mid-1990s is helping the
farmers in Saurashtra to acquire higher yield of water in different ways (e.g., through horizontal
bores, etc.).
If an idea such as having distributed recharge of dug wells across the country needs
to succeed, it needs to start from the farmers’ need and thinking, and channeling it in this
direction. For that, it is first essential to know what the farmers think about this idea and how
much benefit they would accrue from it.
Worldwide, the need for enhancing recharge to groundwater started being felt on a large
scale in the early twentieth century (Todd 2004), and especially in the US, various experiments
have been carried out continuously for many decades. These experiments have established
different ways of doing recharge – basin-spreading, stream channeling, well recharging, etc.
California in the western US has been a pioneer in artificial recharging. Most of recharging
in California takes place through basin-spreading in areas such as the Santa Clara aquifer.
There are also well-recharging experiments conducted in the coastal areas to prevent ingress of
saline water into freshwater aquifers. The source water for recharge is not only through rainfall
runoff but also through imported water supplied by canals as in the case of the Santa Clara
aquifer. Interestingly, 2,000 wells in a Basaltic aquifer have been used for recharge in southern
Idaho Snake Plains aquifer where the fractured rock provides ample space for recharge. These
experiments from the US have given some estimates on recharge rates after experience over
several decades. Todd reports some of these recharge rates that generally hover around a few
thousand cubic meters per day but with high variation from 200 m3/day to 50,000 m3/day.
In the Indian context, water harvesting and the concept of groundwater recharge are
deep-rooted in cultural practices (Rosin 1993). Today, many NGOs, private consultants and
farmers have been trying out different types of well-recharging efforts. The technologies are
highly varied with much action on the ground. However, to have millions of farmers take up
recharging on their dug wells requires a massive participation from the farmers themselves.
This study has been designed to gauge how farmers themselves perceive the value of their
dug wells, if they see recharging as an effort worth enough and how they see the possible
benefits from recharging. The purpose is to provide constructive inputs to current efforts in this
direction.
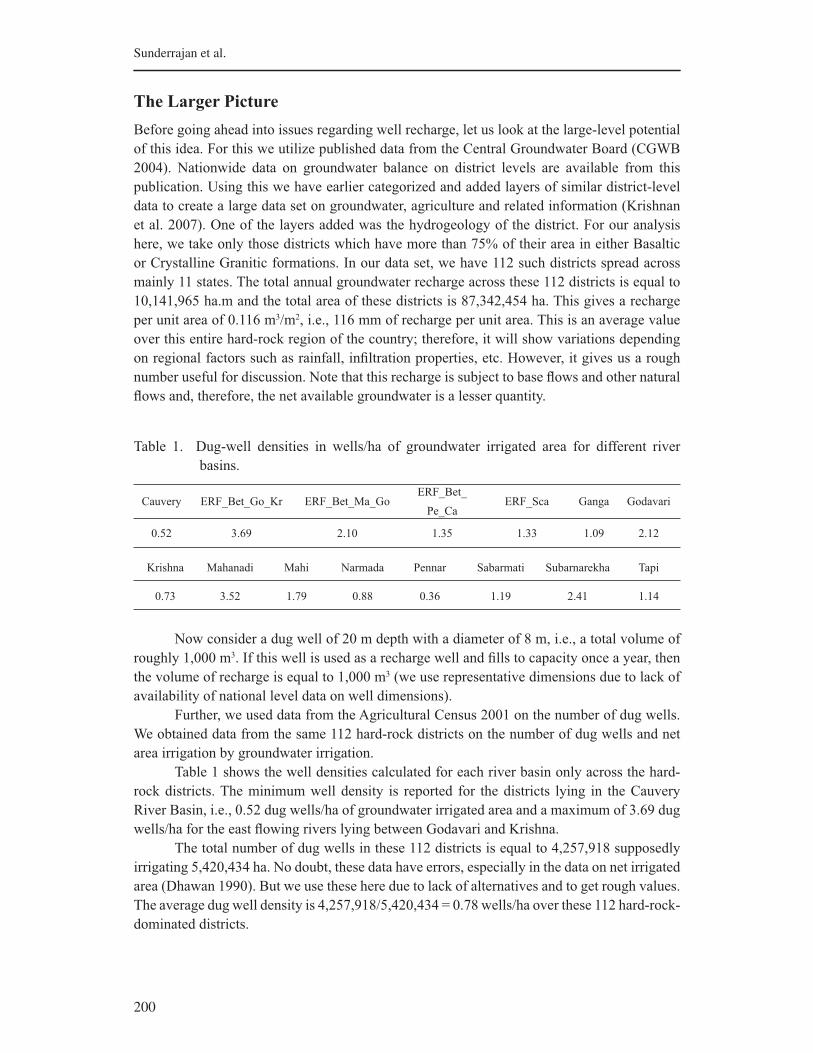
200
Sunderrajan et al.
The Larger Picture
Before going ahead into issues regarding well recharge, let us look at the large-level potential
of this idea. For this we utilize published data from the Central Groundwater Board (CGWB
2004). Nationwide data on groundwater balance on district levels are available from this
publication. Using this we have earlier categorized and added layers of similar district-level
data to create a large data set on groundwater, agriculture and related information (Krishnan
et al. 2007). One of the layers added was the hydrogeology of the district. For our analysis
here, we take only those districts which have more than 75% of their area in either Basaltic
or Crystalline Granitic formations. In our data set, we have 112 such districts spread across
mainly 11 states. The total annual groundwater recharge across these 112 districts is equal to
10,141,965 ha.m and the total area of these districts is 87,342,454 ha. This gives a recharge
per unit area of 0.116 m3/m2, i.e., 116 mm of recharge per unit area. This is an average value
over this entire hard-rock region of the country; therefore, it will show variations depending
on regional factors such as rainfall, infiltration properties, etc. However, it gives us a rough
number useful for discussion. Note that this recharge is subject to base flows and other natural
flows and, therefore, the net available groundwater is a lesser quantity.
Table 1. Dug-well densities in wells/ha of groundwater irrigated area for different river
basins.
Cauvery ERF_Bet_Go_Kr ERF_Bet_Ma_GoERF_Bet_
Pe_CaERF_Sca Ganga Godavari
0.52 3.69 2.10 1.35 1.33 1.09 2.12
Krishna Mahanadi Mahi Narmada Pennar Sabarmati Subarnarekha Tapi
0.73 3.52 1.79 0.88 0.36 1.19 2.41 1.14
Now consider a dug well of 20 m depth with a diameter of 8 m, i.e., a total volume of
roughly 1,000 m3. If this well is used as a recharge well and fills to capacity once a year, then
the volume of recharge is equal to 1,000 m3 (we use representative dimensions due to lack of
availability of national level data on well dimensions).
Further, we used data from the Agricultural Census 2001 on the number of dug wells.
We obtained data from the same 112 hard-rock districts on the number of dug wells and net
area irrigation by groundwater irrigation.
Table 1 shows the well densities calculated for each river basin only across the hard-
rock districts. The minimum well density is reported for the districts lying in the Cauvery
River Basin, i.e., 0.52 dug wells/ha of groundwater irrigated area and a maximum of 3.69 dug
wells/ha for the east flowing rivers lying between Godavari and Krishna.
The total number of dug wells in these 112 districts is equal to 4,257,918 supposedly
irrigating 5,420,434 ha. No doubt, these data have errors, especially in the data on net irrigated
area (Dhawan 1990). But we use these here due to lack of alternatives and to get rough values.
The average dug well density is 4,257,918/5,420,434 = 0.78 wells/ha over these 112 hard-rock-
dominated districts.
201
Is It Possible to Revive Dug Wells in Hard-Rock India through Recharge?
The effective recharge per unit area of this dug well is therefore as follows:
Recharge per unit area = Recharge from single well * well density
That is, 1,000 m3 * 0.78/10,000 m2 = 0.078 m, i.e., 78 mm, i.e., 67% of the current recharge.
But what are the assumptions here? We are assuming that this 1,000 m3 of recharge
would have otherwise flowed downstream without recharging into any downstream aquifer.
We are assuming that the net base flows or natural flows from recharged water would be the
same as before so that there is an increase in water availability with this additional recharge.
Also assumed here is that it is possible to recharge using dug wells during storm events, in
spite of any water-level increase (by a Hortonian or Dunne mechanism;2 a hydrologic way of
putting a common sense question: “How would water recharge from wells during rains when
water level rises so much close to the surface?”), a point which is countered by some observers
especially in the hard-rock areas (Kumar et al 2008).
Also assumed are the quality of water recharged through the dug well which if silt-
loaded could reduce infiltration through the well. In short, if all these assumptions are valid,
we have a potentially powerful idea of using dug wells for recharging the aquifers and
augmentation of current recharge by a significant amount. That is, of course, if a lot of wells
do such recharging.
Debates Surrounding Dug-well recharge
Discussions surrounding such a distributed mode of groundwater recharge through dug wells
center on some key issues:
1. Is there surplus runoff available for recharge through dug wells? Would this water recharge
into the aquifer downstream through ponds, etc.?
2. Considering that this recharge water also carries silt load (and agrochemicals) would the
pore spaces close to the well get choked?
3. Would we ever have a mass number of recharge wells in place to achieve a significant
increase in water availability?
4. During monsoons, when recharged water already saturates the low specific yield aquifers
is there more space left at all?
2There are two main theories explaining surface runoff in catchments. The classical Hortonian mechanism
propagated by Horton describes runoff as the excess water beyond the infiltration capacity of the soil
(Horton 1945). The infiltration capacity reduces with rainfall and after a sufficient time, it is limited by
the vertical hydraulic conductivity of the soil. In this conceptualization, if the rainfall rate is above this
infiltration limit, runoff occurs. The classical theory of runoff considers this mechanism to be uniform
over the landscape and the varying runoff patterns are explained by the variations in precipitation and in
local soil conditions. However, such conditions were observed to be true mainly in semiarid catchments
with a deep water table. In field conditions, this theory failed to explain phenomena such as pockets of
runoff generation from local depressions and from hollows. An alternative mechanism was proposed
by Thomas Dunne in the 1970s according to whom runoff occurs when locally the water table rises to
the surface (Dunne and Black 1970). Such locations are generally depressions and topographic hollows
that are recipients of subsurface flows. In such locations, the water table is locally at the surface and any
precipitation has to flow as surface runoff. These two mechanisms: infiltration excess overland flow and
the saturated overland flow together explain most types of surface runoff observed in small catchments
that finally lead onto larger streams and rivers.
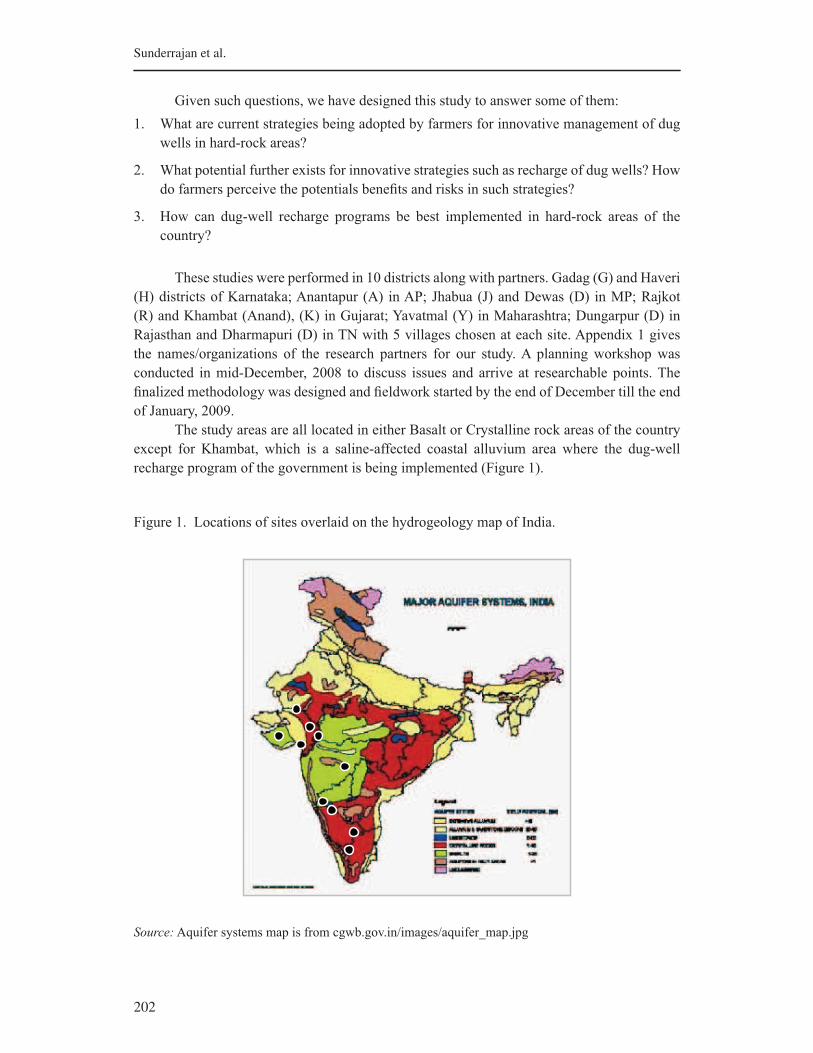
202
Sunderrajan et al.
Given such questions, we have designed this study to answer some of them:
1. What are current strategies being adopted by farmers for innovative management of dug
wells in hard-rock areas?
2. What potential further exists for innovative strategies such as recharge of dug wells? How
do farmers perceive the potentials benefits and risks in such strategies?
3. How can dug-well recharge programs be best implemented in hard-rock areas of the
country?
These studies were performed in 10 districts along with partners. Gadag (G) and Haveri
(H) districts of Karnataka; Anantapur (A) in AP; Jhabua (J) and Dewas (D) in MP; Rajkot
(R) and Khambat (Anand), (K) in Gujarat; Yavatmal (Y) in Maharashtra; Dungarpur (D) in
Rajasthan and Dharmapuri (D) in TN with 5 villages chosen at each site. Appendix 1 gives
the names/organizations of the research partners for our study. A planning workshop was
conducted in mid-December, 2008 to discuss issues and arrive at researchable points. The
finalized methodology was designed and fieldwork started by the end of December till the end
of January, 2009.
The study areas are all located in either Basalt or Crystalline rock areas of the country
except for Khambat, which is a saline-affected coastal alluvium area where the dug-well
recharge program of the government is being implemented (Figure 1).
Figure 1. Locations of sites overlaid on the hydrogeology map of India.
Source: Aquifer systems map is from cgwb.gov.in/images/aquifer_map.jpg
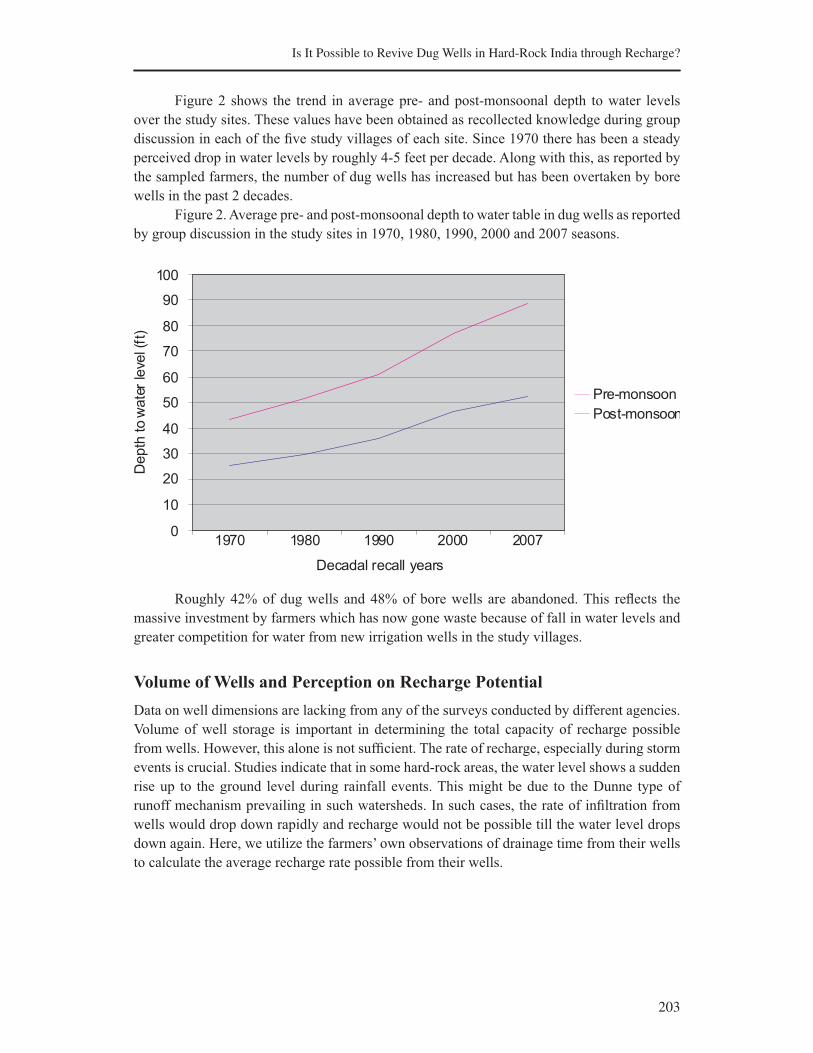
203
Is It Possible to Revive Dug Wells in Hard-Rock India through Recharge?
Figure 2 shows the trend in average pre- and post-monsoonal depth to water levels
over the study sites. These values have been obtained as recollected knowledge during group
discussion in each of the five study villages of each site. Since 1970 there has been a steady
perceived drop in water levels by roughly 4-5 feet per decade. Along with this, as reported by
the sampled farmers, the number of dug wells has increased but has been overtaken by bore
wells in the past 2 decades.
Figure 2. Average pre- and post-monsoonal depth to water table in dug wells as reported
by group discussion in the study sites in 1970, 1980, 1990, 2000 and 2007 seasons.
Roughly 42% of dug wells and 48% of bore wells are abandoned. This reflects the
massive investment by farmers which has now gone waste because of fall in water levels and
greater competition for water from new irrigation wells in the study villages.
Volume of Wells and Perception on Recharge Potential
Data on well dimensions are lacking from any of the surveys conducted by different agencies.
Volume of well storage is important in determining the total capacity of recharge possible
from wells. However, this alone is not sufficient. The rate of recharge, especially during storm
events is crucial. Studies indicate that in some hard-rock areas, the water level shows a sudden
rise up to the ground level during rainfall events. This might be due to the Dunne type of
runoff mechanism prevailing in such watersheds. In such cases, the rate of infiltration from
wells would drop down rapidly and recharge would not be possible till the water level drops
down again. Here, we utilize the farmers’ own observations of drainage time from their wells
to calculate the average recharge rate possible from their wells.
0
10
20
30
40
50
60
70
80
90
100
1970 1980 1990 2000 2007
Decadal recall years
Pre-monsoon
Post-monsoon
Depth
to
wate
r le
vel (
ft)
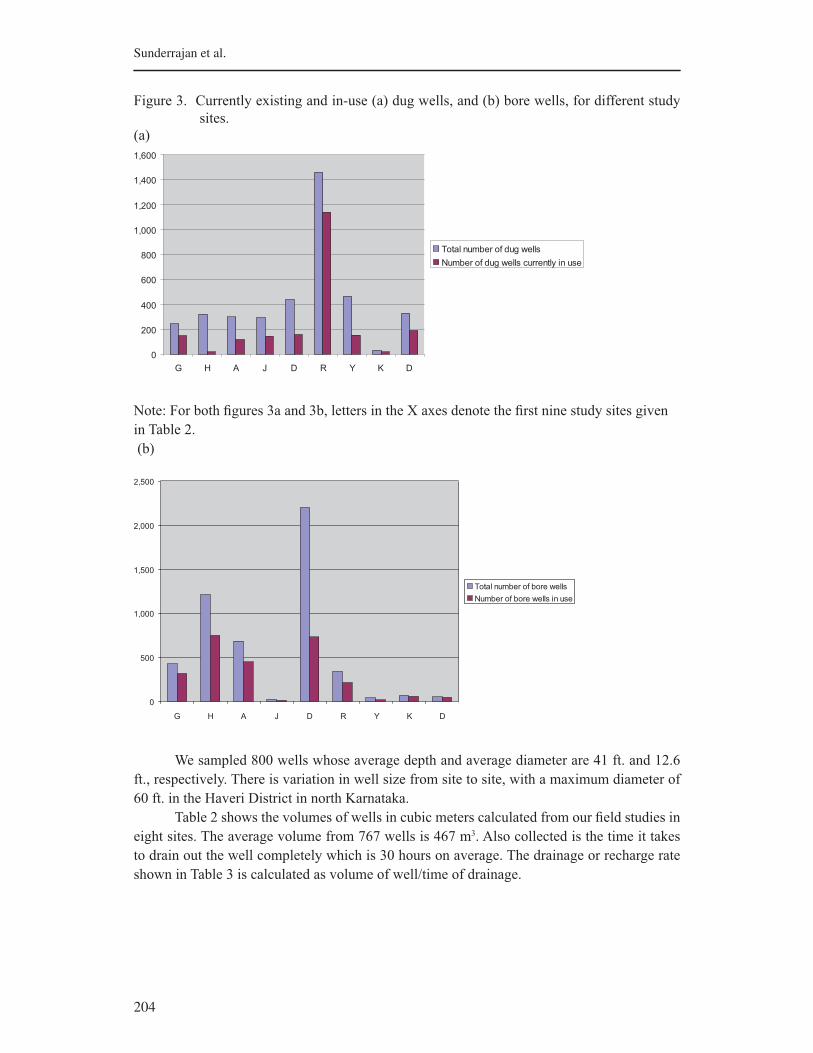
204
Sunderrajan et al.
Figure 3. Currently existing and in-use (a) dug wells, and (b) bore wells, for different study
sites.(a)
Note: For both figures 3a and 3b, letters in the X axes denote the first nine study sites given
in Table 2.
(b)
We sampled 800 wells whose average depth and average diameter are 41 ft. and 12.6
ft., respectively. There is variation in well size from site to site, with a maximum diameter of
60 ft. in the Haveri District in north Karnataka.
Table 2 shows the volumes of wells in cubic meters calculated from our field studies in
eight sites. The average volume from 767 wells is 467 m3. Also collected is the time it takes
to drain out the well completely which is 30 hours on average. The drainage or recharge rate
shown in Table 3 is calculated as volume of well/time of drainage.
0
200
400
600
800
1,000
1,200
1,400
1,600
G H A J D R Y K D
Total number of dug wells
Number of dug wells currently in use
0
500
1,000
1,500
2,000
2,500
G H A J D R Y K D
Total number of bore wells
Number of bore wells in use
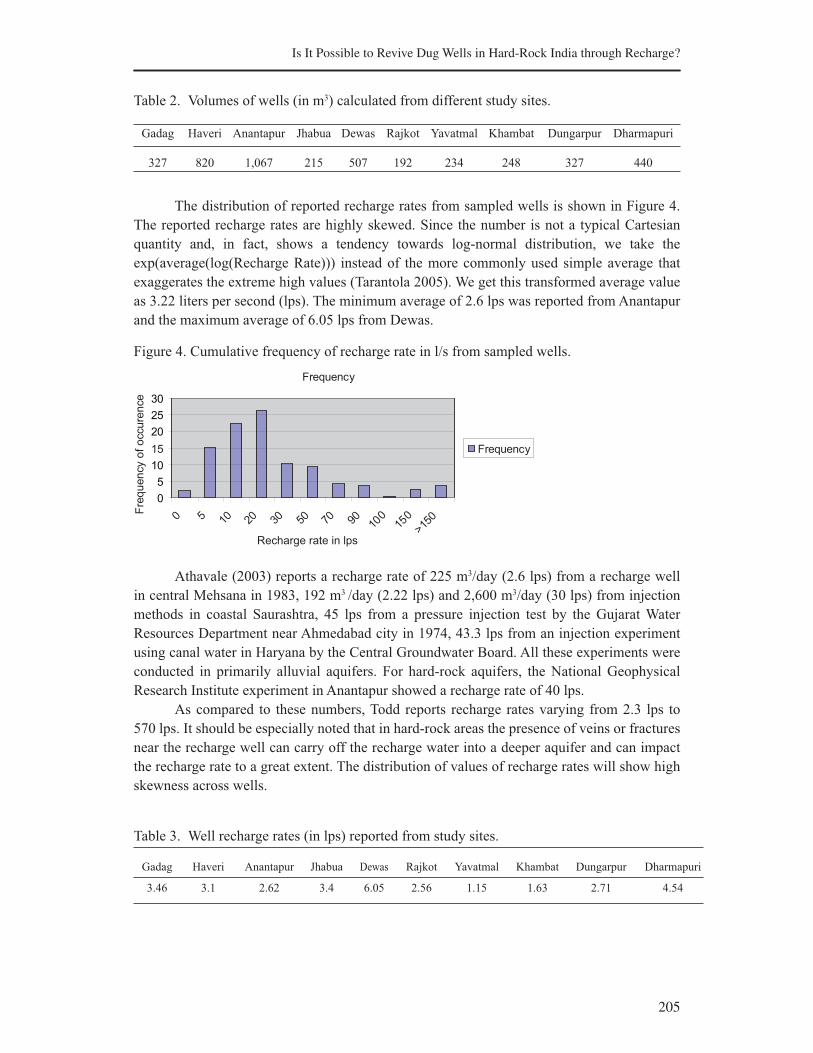
205
Is It Possible to Revive Dug Wells in Hard-Rock India through Recharge?
Table 2. Volumes of wells (in m3) calculated from different study sites.
Gadag Haveri Anantapur Jhabua Dewas Rajkot Yavatmal Khambat Dungarpur Dharmapuri
327 820 1,067 215 507 192 234 248 327 440
The distribution of reported recharge rates from sampled wells is shown in Figure 4.
The reported recharge rates are highly skewed. Since the number is not a typical Cartesian
quantity and, in fact, shows a tendency towards log-normal distribution, we take the
exp(average(log(Recharge Rate))) instead of the more commonly used simple average that
exaggerates the extreme high values (Tarantola 2005). We get this transformed average value
as 3.22 liters per second (lps). The minimum average of 2.6 lps was reported from Anantapur
and the maximum average of 6.05 lps from Dewas.
Figure 4. Cumulative frequency of recharge rate in l/s from sampled wells.
Athavale (2003) reports a recharge rate of 225 m3/day (2.6 lps) from a recharge well
in central Mehsana in 1983, 192 m3 /day (2.22 lps) and 2,600 m3/day (30 lps) from injection
methods in coastal Saurashtra, 45 lps from a pressure injection test by the Gujarat Water
Resources Department near Ahmedabad city in 1974, 43.3 lps from an injection experiment
using canal water in Haryana by the Central Groundwater Board. All these experiments were
conducted in primarily alluvial aquifers. For hard-rock aquifers, the National Geophysical
Research Institute experiment in Anantapur showed a recharge rate of 40 lps.
As compared to these numbers, Todd reports recharge rates varying from 2.3 lps to
570 lps. It should be especially noted that in hard-rock areas the presence of veins or fractures
near the recharge well can carry off the recharge water into a deeper aquifer and can impact
the recharge rate to a great extent. The distribution of values of recharge rates will show high
skewness across wells.
Table 3. Well recharge rates (in lps) reported from study sites.
Gadag Haveri Anantapur Jhabua Dewas Rajkot Yavatmal Khambat Dungarpur Dharmapuri
3.46 3.1 2.62 3.4 6.05 2.56 1.15 1.63 2.71 4.54
0
5
10
15
20
25
30
0 5 10 20 30 50 70 90 100
150
>150
Frequency
Recharge rate in lps
Fre
qu
en
cy o
f o
ccu
ren
ce
Frequency

206
Sunderrajan et al.
Next we also collect data on the number of times farmers perceive their wells to fill up
during the monsoon if recharged. This is a purely estimated quantity since farmers have not
yet experienced such recharge.
Table 4. Expected number of times wells would drain out with recharged water annually
Gadag Haveri Anantapur Jhabua Dewas Rajkot Yavatmal Khambat Dungarpur Dharmapuri
0.63 0.715 7.78 3.58 2.5 2.89 1.61 0.96 3.1 2.8
The average number of times of recharge is 2.83. Using the volumes of wells and the
number of expected times of recharge, we compute the expected volume of recharge as well
volume * expected number of times of recharge.
Table 5. Expected volume of recharge from dug wells (in m3) annually.
Gadag Haveri Anantapur Jhabua Dewas Rajkot Yavatmal Khambat Dungarpur Dharmapuri
198.27 561.75 8,578 876.73 1,361.93 559.47 363.37 233.403 1,030.18 1,112.17
The average recharge volume of wells is 1,591.62 m3. Using this average recharge
capacity of the dug well in our initial calculation on potential of such recharge, the result
is: 1,591.62 m3 * 0.78 / 10,000 m2 = 0.124 m, i.e., 124 mm, which come to 7% more than
the average current recharge calculated previously as 116 mm. This is a really significant
number; in other words, the average recharge over groundwater irrigated hard-rock areas can
be increased by over 100%, but as mentioned in the earlier parts of the paper, we can make this
statement over several assumptions.
For the 112 districts, if there are 4.25 million wells recharged, then we will have, the
following results: Total recharge = 4.25 million * 1,000 m3, i.e., 4.25 billion m3 of recharge.
Altogether 101 billion m3 of recharge are occurring annually over these 112
districts (CGWB 2004), i.e., a net increase of around 4% over this total groundwater
recharge. Considering only the groundwater irrigated areas in these districts, we have
a total of 9.99 m3 of recharge occurring now. So we have a potential net increase of 42%.
Next, Figure 5 shows the number of farmers in our sample of 900 who perceive water to
be available in their wells in a particular month with and without recharge. On average, there
is a 36% increase in the number of wells which are expected to increase water availability with
recharge. This increase is more in the dry seasons than in the wet seasons. It reflects more the
need that people wish with the recharge, and less with what would actually happen.
What is sure from these expected potential benefits of recharge is that there is a demand
from farmers for such an option. The numbers reported here are perceptions and results of a
survey and are therefore not to be taken as actual figures. However, in the face of lack of such
information, this is the best we have, at the least indicating the farmers’ potential hope with
dug-well recharging.

207
Is It Possible to Revive Dug Wells in Hard-Rock India through Recharge?
Figure 5. Number of farmers reporting water availability in their dug wells currently and
with recharge
The question now is what are the constraints to going ahead for recharge? Why are
farmers not implementing recharge structures by themselves when they come to know about
them? As compared to the cost of enhancements to the well, such as deepening and boring,
the cost of constructing a recharge structure is not too high. If the farmers feel that this would
be beneficial, they would have gone ahead by themselves. So, what prevents them from doing
so?
Constraints to Implementing Recharging of Dug Wells by Farmers
One constraint to farmers adopting dug-well recharge is their perception about whether the
recharged water would be available to them for pumping. Naturally, if there are conduits for
water to flow across to other nearby wells, they would be disinclined to recharge. This was
evident from our survey. Moreover, if there are deeper wells nearby, one would be less inclined
to recharge.
Our sample of 767 farmers feel, on average, that their water yield reduces by 16%
on average and the level of their well water goes down by 4 ft. when their neighbors pump
from their wells. Therefore, there is always this perception of sharing a common aquifer; this
perception is carried over to recharging too.
Except for one, all sites see a greater expectation of loss of water to neighbors rather
than gain from neighbors by recharging. In general, there is no reason to expect this over a
reasonably large data set, but here we see a common trend (except for the first site) of greater
expectation of loss. This is a sure impediment to recharge. Unless the neighbors also recharge,
the present farmers would not take much effort towards recharging.
There is wide variation over the well construction and estimated costs of well recharge
structure which average to around Rs 10,000, i.e., Rs. 6.28/m3 of annual recharge (from previous
calculation of average recharge = 1,591.62 m3/well). That itself is a significant investment
since the returns from recharging are not as directly evident as those from, say, well deepening.
There is always the risk that the water that is being recharged would not be available to oneself.
Further, around 60% of the sampled farmers report that the water collection points in or near
their farms lie above (in terms of elevation) their wells. This means that either they use a field
channel or more surely, make arrangement for underground boring to transmit water to their
0
100
200
300
400
500
600
700
800
J F M A M J J A S O N D
Months of year
No. of fa
rme
rs r
eport
ing w
ate
r
ava
ilabili
tyNumber of farmers
reporting water
availability currently
Number of farmers
expecting water
availability with
recharge
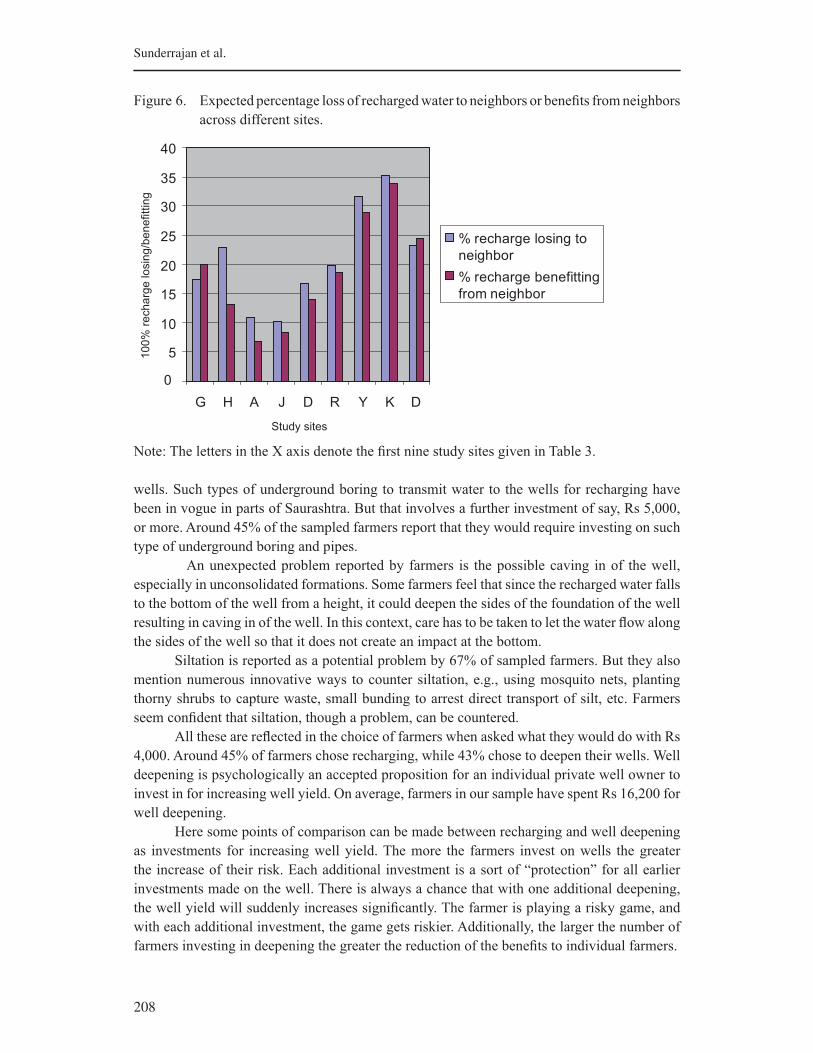
208
Sunderrajan et al.
Figure 6. Expected percentage loss of recharged water to neighbors or benefits from neighbors
across different sites.
Note: The letters in the X axis denote the first nine study sites given in Table 3.
wells. Such types of underground boring to transmit water to the wells for recharging have
been in vogue in parts of Saurashtra. But that involves a further investment of say, Rs 5,000,
or more. Around 45% of the sampled farmers report that they would require investing on such
type of underground boring and pipes.
An unexpected problem reported by farmers is the possible caving in of the well,
especially in unconsolidated formations. Some farmers feel that since the recharged water falls
to the bottom of the well from a height, it could deepen the sides of the foundation of the well
resulting in caving in of the well. In this context, care has to be taken to let the water flow along
the sides of the well so that it does not create an impact at the bottom.
Siltation is reported as a potential problem by 67% of sampled farmers. But they also
mention numerous innovative ways to counter siltation, e.g., using mosquito nets, planting
thorny shrubs to capture waste, small bunding to arrest direct transport of silt, etc. Farmers
seem confident that siltation, though a problem, can be countered.
All these are reflected in the choice of farmers when asked what they would do with Rs
4,000. Around 45% of farmers chose recharging, while 43% chose to deepen their wells. Well
deepening is psychologically an accepted proposition for an individual private well owner to
invest in for increasing well yield. On average, farmers in our sample have spent Rs 16,200 for
well deepening.
Here some points of comparison can be made between recharging and well deepening
as investments for increasing well yield. The more the farmers invest on wells the greater
the increase of their risk. Each additional investment is a sort of “protection” for all earlier
investments made on the well. There is always a chance that with one additional deepening,
the well yield will suddenly increases significantly. The farmer is playing a risky game, and
with each additional investment, the game gets riskier. Additionally, the larger the number of
farmers investing in deepening the greater the reduction of the benefits to individual farmers.
Study sites
10
0%
re
ch
arg
e lo
sin
g/b
en
efitt
ing
0
5
10
15
20
25
30
35
40
G H A J D R Y K D
% recharge losing to
neighbor
% recharge benefitting
from neighbor
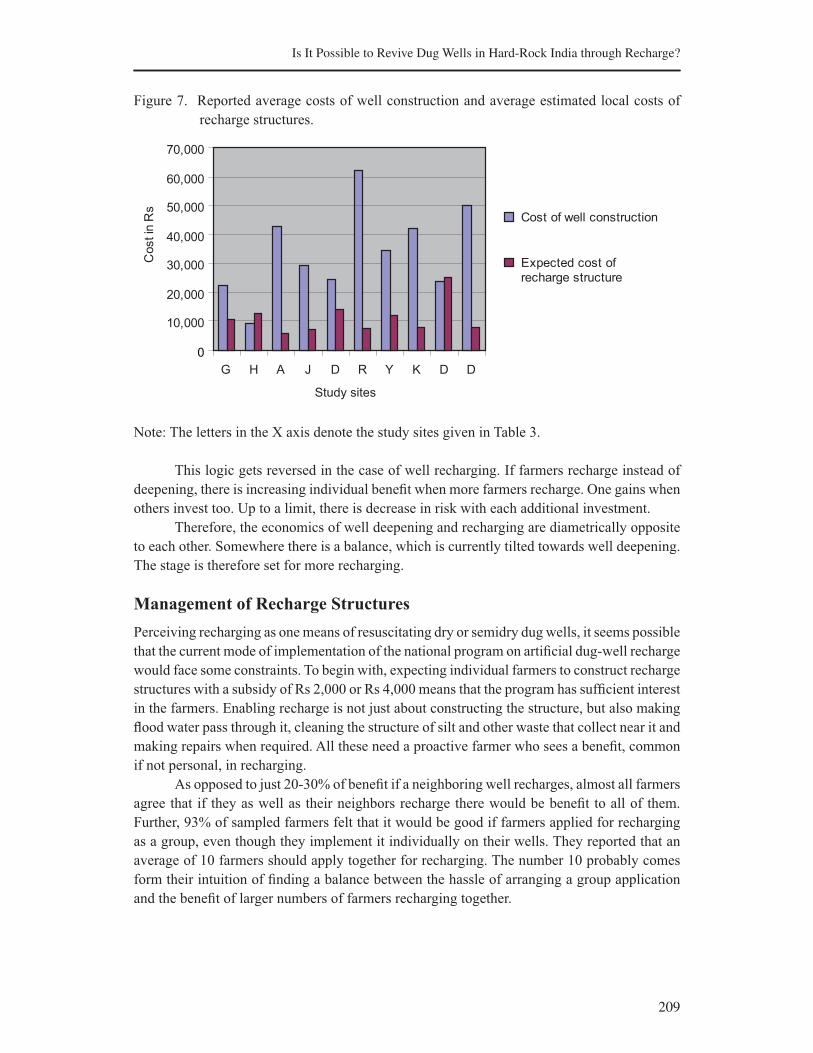
209
Is It Possible to Revive Dug Wells in Hard-Rock India through Recharge?
Figure 7. Reported average costs of well construction and average estimated local costs of
recharge structures.
Note: The letters in the X axis denote the study sites given in Table 3.
This logic gets reversed in the case of well recharging. If farmers recharge instead of
deepening, there is increasing individual benefit when more farmers recharge. One gains when
others invest too. Up to a limit, there is decrease in risk with each additional investment.
Therefore, the economics of well deepening and recharging are diametrically opposite
to each other. Somewhere there is a balance, which is currently tilted towards well deepening.
The stage is therefore set for more recharging.
Management of Recharge Structures
Perceiving recharging as one means of resuscitating dry or semidry dug wells, it seems possible
that the current mode of implementation of the national program on artificial dug-well recharge
would face some constraints. To begin with, expecting individual farmers to construct recharge
structures with a subsidy of Rs 2,000 or Rs 4,000 means that the program has sufficient interest
in the farmers. Enabling recharge is not just about constructing the structure, but also making
flood water pass through it, cleaning the structure of silt and other waste that collect near it and
making repairs when required. All these need a proactive farmer who sees a benefit, common
if not personal, in recharging.
As opposed to just 20-30% of benefit if a neighboring well recharges, almost all farmers
agree that if they as well as their neighbors recharge there would be benefit to all of them.
Further, 93% of sampled farmers felt that it would be good if farmers applied for recharging
as a group, even though they implement it individually on their wells. They reported that an
average of 10 farmers should apply together for recharging. The number 10 probably comes
form their intuition of finding a balance between the hassle of arranging a group application
and the benefit of larger numbers of farmers recharging together.
0
10,000
20,000
30,000
40,000
50,000
60,000
70,000
G H A J D R Y K D D
Study sites
Cost in
Rs
Cost of well construction
Expected cost of
recharge structure
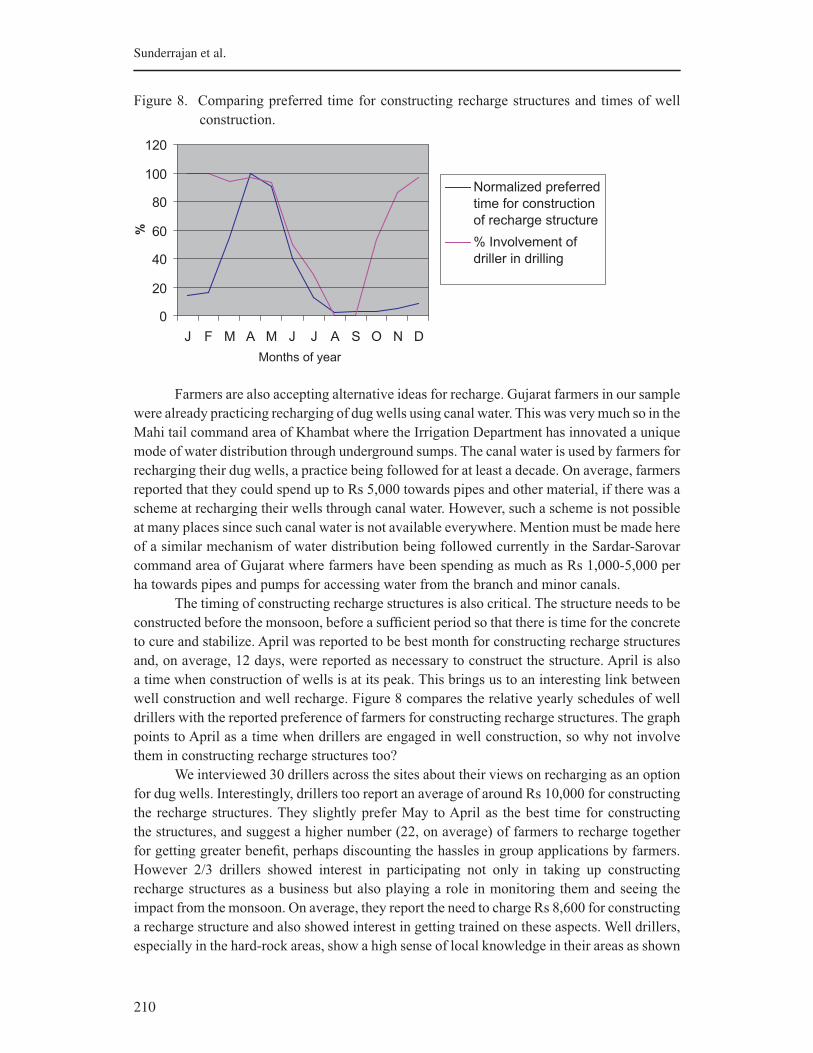
210
Sunderrajan et al.
Figure 8. Comparing preferred time for constructing recharge structures and times of well
construction.
Farmers are also accepting alternative ideas for recharge. Gujarat farmers in our sample
were already practicing recharging of dug wells using canal water. This was very much so in the
Mahi tail command area of Khambat where the Irrigation Department has innovated a unique
mode of water distribution through underground sumps. The canal water is used by farmers for
recharging their dug wells, a practice being followed for at least a decade. On average, farmers
reported that they could spend up to Rs 5,000 towards pipes and other material, if there was a
scheme at recharging their wells through canal water. However, such a scheme is not possible
at many places since such canal water is not available everywhere. Mention must be made here
of a similar mechanism of water distribution being followed currently in the Sardar-Sarovar
command area of Gujarat where farmers have been spending as much as Rs 1,000-5,000 per
ha towards pipes and pumps for accessing water from the branch and minor canals.
The timing of constructing recharge structures is also critical. The structure needs to be
constructed before the monsoon, before a sufficient period so that there is time for the concrete
to cure and stabilize. April was reported to be best month for constructing recharge structures
and, on average, 12 days, were reported as necessary to construct the structure. April is also
a time when construction of wells is at its peak. This brings us to an interesting link between
well construction and well recharge. Figure 8 compares the relative yearly schedules of well
drillers with the reported preference of farmers for constructing recharge structures. The graph
points to April as a time when drillers are engaged in well construction, so why not involve
them in constructing recharge structures too?
We interviewed 30 drillers across the sites about their views on recharging as an option
for dug wells. Interestingly, drillers too report an average of around Rs 10,000 for constructing
the recharge structures. They slightly prefer May to April as the best time for constructing
the structures, and suggest a higher number (22, on average) of farmers to recharge together
for getting greater benefit, perhaps discounting the hassles in group applications by farmers.
However 2/3 drillers showed interest in participating not only in taking up constructing
recharge structures as a business but also playing a role in monitoring them and seeing the
impact from the monsoon. On average, they report the need to charge Rs 8,600 for constructing
a recharge structure and also showed interest in getting trained on these aspects. Well drillers,
especially in the hard-rock areas, show a high sense of local knowledge in their areas as shown
0
20
40
60
80
100
120
J F M A M J J A S O N D
Months of year
%
Normalized preferred
time for construction
of recharge structure
% Involvement of
driller in drilling
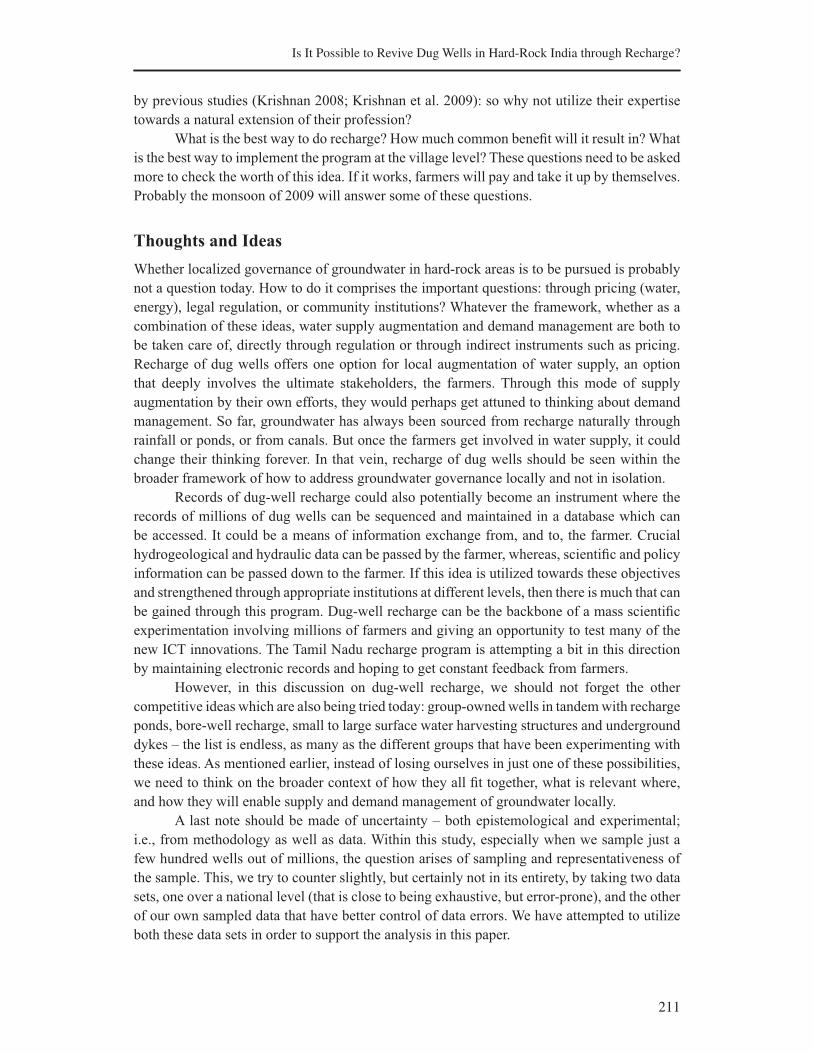
211
Is It Possible to Revive Dug Wells in Hard-Rock India through Recharge?
by previous studies (Krishnan 2008; Krishnan et al. 2009): so why not utilize their expertise
towards a natural extension of their profession?
What is the best way to do recharge? How much common benefit will it result in? What
is the best way to implement the program at the village level? These questions need to be asked
more to check the worth of this idea. If it works, farmers will pay and take it up by themselves.
Probably the monsoon of 2009 will answer some of these questions.
Thoughts and Ideas
Whether localized governance of groundwater in hard-rock areas is to be pursued is probably
not a question today. How to do it comprises the important questions: through pricing (water,
energy), legal regulation, or community institutions? Whatever the framework, whether as a
combination of these ideas, water supply augmentation and demand management are both to
be taken care of, directly through regulation or through indirect instruments such as pricing.
Recharge of dug wells offers one option for local augmentation of water supply, an option
that deeply involves the ultimate stakeholders, the farmers. Through this mode of supply
augmentation by their own efforts, they would perhaps get attuned to thinking about demand
management. So far, groundwater has always been sourced from recharge naturally through
rainfall or ponds, or from canals. But once the farmers get involved in water supply, it could
change their thinking forever. In that vein, recharge of dug wells should be seen within the
broader framework of how to address groundwater governance locally and not in isolation.
Records of dug-well recharge could also potentially become an instrument where the
records of millions of dug wells can be sequenced and maintained in a database which can
be accessed. It could be a means of information exchange from, and to, the farmer. Crucial
hydrogeological and hydraulic data can be passed by the farmer, whereas, scientific and policy
information can be passed down to the farmer. If this idea is utilized towards these objectives
and strengthened through appropriate institutions at different levels, then there is much that can
be gained through this program. Dug-well recharge can be the backbone of a mass scientific
experimentation involving millions of farmers and giving an opportunity to test many of the
new ICT innovations. The Tamil Nadu recharge program is attempting a bit in this direction
by maintaining electronic records and hoping to get constant feedback from farmers.
However, in this discussion on dug-well recharge, we should not forget the other
competitive ideas which are also being tried today: group-owned wells in tandem with recharge
ponds, bore-well recharge, small to large surface water harvesting structures and underground
dykes – the list is endless, as many as the different groups that have been experimenting with
these ideas. As mentioned earlier, instead of losing ourselves in just one of these possibilities,
we need to think on the broader context of how they all fit together, what is relevant where,
and how they will enable supply and demand management of groundwater locally.
A last note should be made of uncertainty – both epistemological and experimental;
i.e., from methodology as well as data. Within this study, especially when we sample just a
few hundred wells out of millions, the question arises of sampling and representativeness of
the sample. This, we try to counter slightly, but certainly not in its entirety, by taking two data
sets, one over a national level (that is close to being exhaustive, but error-prone), and the other
of our own sampled data that have better control of data errors. We have attempted to utilize
both these data sets in order to support the analysis in this paper.

212
Sunderrajan et al.
The next question on uncertainty and perhaps more important is on methodology.
Looking at the physical context, a unit of aquifer of watershed and a time scale observation of
a few seasons are essential to make any statement of reasonable accuracy. In hard-rock areas,
especially, there have been research groups which have worked on a single 1 km2 plot of fractured
rock for decades in arid Arizona to finally conclude very high uncertainty. Here, we have relied
on localized farmers’ and well drillers’ knowledge gathered through years of observation, but
who have had no scientific training. As such, it is subject to opinions, perceptions and biases as
opposed to the more objective, repeatable and potentially error-minimizable nature of scientific
data. Neither is one a substitute for the other, only complementary. We have therefore, tried
to refer to scientific studies and utilize them as much as possible. Any additions on that front
would be valuable.
Appendix 1. Research partners for the study.
Site Research partner
Gadag Navchetana Rural Dev Society
Haveri SCOPE
Anantapur Hirudia Raj
Jhabua GATE
Dewas GATE
Rajkot SAVARAJ
Yavatmal Vivek Kher
Khambat INREM, Upen Mahida
Dungarpur PEDO

213
Addressing IndiaÊs Water Challenge 2050: The Virtual Water Trade Option
References
Athavale, R. N. 2003. Water harvesting and sustainable supply in India. Centre for Environment Education
(CEE), Ahmedabad: Rawat Publications.
Central Ground Water Board (CGWB). 2004. Dynamic groundwater resources of India. Accessible via cgwb.
gov.in/documents/DGWR2004.pdf
Dhawan, B. D. 1990. How reliable are groundwater estimates? Economic and Political Weekly 19:1073-1078
(May).
Dunne, T.; Black, R.D. 1970. An experimental investigation of runoff production in permeable soils. Water
Resources Research 6: 478-490.
Horton, R. E. 1945. Erosional development of streams and their drainage basins; hydrophysical approach to
quantitative morphology. Bulletin of the Geological Society of America 56: 275-370.
Janakarajan, S. 1999. Conflicts over the invisible resource: Is there a way out? In: Rethinking the mosaic:
Investigations into local water management, ed. Moench, M.; Elizabeth Caspari; Ajay Dixit. USA: NWCF
and ISET.
Krishnan, S.; Raychoudhary, T.; Purohit, C.; Patel, A. 2007. Environmental impacts of groundwater
intensification in India, in IWMI-NRLP Studies Report
Krishnan, S. 2008. Duel between duals: Basaltic hydrogeology of a village in hard rock Saurashtra. Proceedings
of Annual Partner’s Meet, IWMI-Tata Water Policy Programme, Hyderabad.
Krishnan, S.; Islam, A.; Machiwal, D.; Sena, D. R.; Villholth, K. 2009. The living wisdom: Local well
driller knowledge on groundwater hydrology: Inferences from studies across Indo-Gangetic Basin. In:
Groundwater governance in the Indo-Gangetic and Yellow river basins: Realities and challenges, ed.
Mukherji, A.; Villholth, K.G.; Sharma, B.R.; Wang,.J. (in press). IAH-Selected Papers Series. Netherlands:
CRC/Balkema Press; (formerly Taylor and Francis Publishers).
Kumar, D.; Patel, A.; Ravindranath, R; Singh, O.P. 2008. Chasing a mirage: Water harvesting and artificial
recharge. Naturally Water-Scarce Regions 43 (35): 41-49 (August 30-September 05, 2008).
Mohandas, M.; Gupta, N. 2009. Evolving effective implementation protocol of Government of India’s dug-well
recharge programme. Management Trainee Segment Report. Anand, Gujarat, India: Institute of Rural
Management at Anand.
NIH (National Institute of Hydrology). 1999. Hydrological problems of hard rock region. Accessible via www.
nih.ernet.in/belgaum/Studies.html
Rosin, T. 1993. The tradition of groundwater irrigation in northwestern India. Human Ecology 21(1): 51-86.
Shah, T. 2008. India’s master plan for groundwater recharge: An assessment and some 41 suggestions for
revision. EPW 43 (51): 41-49. (December 20-26, 2008).
Tarantola, A. 2005. Inverse problem theory and model parameter estimation. Philadelphia,, USA: Society of
Industrial and Applied Mathematics.
Todd, D.K. 2004. Groundwater hydrology. New York, USA: Wiley.


215
Addressing India’s Water Challenge 2050:
The Virtual Water Trade Option1
Shilp Verma,2, a, b, c Doeke A. Kampman,d Pieter van der Zaag,a, c Arjen K. Hoekstra d
a Department of Management and Institutions, UNESCO-IHE Institute for Water Education,
Westvest 7, 2611 AX, Delft, The Netherlands.
b International Water Management Institute, c/o INREM Foundation, Besides Smruti
Apartments, Behind IRMA Gate, Anand 388001, Gujarat, India.
c Water Resources Section, Delft University of Technology, Delft, The Netherlands.
d Department of Water Engineering and Management, University of Twente, Enschede, The
Netherlands.
Food Security and Water Transfers
The Government of India, on directions from the Supreme Court in 2002 and advice from
the National Water Development Agency (NWDA), proposed an estimated US$120 billion
National River Linking Project (NRLP) which envisages linking 37 Himalayan and Peninsular
rivers (Figure 1; NCIWRD 1999). Doing this will form a gigantic South Asian water grid which
will annually handle 178×109 m3/yr of interbasin water transfer; build 12,500 km of canals;
generate 34 gigawatts of hydropower; add 35 million hectares (Mha) to India’s irrigated areas;
and generate inland navigation benefits (IWMI 2003; NWDA 2006; Gupta and van der Zaag
2007).
The prime motivation behind this grand plan is India’s growing concern about the need
to produce additional food for its large and rapidly increasing population. The NWDA cites
that India will require about 450 million tonnes of food grains per annum to feed a population
of 1.5 billion in the year 2050 (NCIWRD 1999) and to meet this requirement, it needs to
expand its irrigation potential to 160 Mha, which is 20 Mha more than the total irrigation
potential without NRLP. This follows India’s long-standing, unwritten policy of food self-
sufficiency.
1An earlier version of this paper was invited as a keynote presentation at the Stockholm World Water
Week, 2009.
2Corresponding author, Department of Management and Institutions, UNESCO-IHE Institute for Water
Education, P.O. Box 3015, 2601 DA Delft, The Netherlands. Tel.: +31 (0) 15 215 18 97. s.verma@
unesco-ihe.org
216
Shilp Verma, Doeke A. Kampman, Pieter van der Zaag and Arjen K. Hoekstra
Figure 1. India’s proposed National River Linking Project (NRLP), with the Himalayan
component (left) and the Peninsular component (right).
Source: Reproduced from NCIWRD 1999.
Considering that large parts of the Ganga-Brahmaputra-Meghna Basin face recurring
floods and a number of western and peninsular states face severe droughts, the NWDA (2006)
contends that “one of the most effective ways to increase the irrigation potential for increasing
the food grain production, mitigate floods and droughts and reduce regional imbalance in the
availability of water is the Inter Basin Water Transfer (IBWT) from the surplus rivers to deficit
areas.
However, representatives from civil society, the media and academia have strongly
criticized the plan (Iyer 2002; Vombatkere 2003; Vaidyanathan 2003; Bandyopadhyay
and Perveen 2004; Patkar 2004). Besides voicing concerns about the potential negative
environmental impacts of the mega-project, critics have argued that the decision to go ahead
with the plan has been hasty. They argue that NRLP is only one of the alternatives to ensure
India’s food and water security and alternative—local, cheaper and greener—options should
have been given more serious consideration. A number of alternatives have been suggested
including decentralized water harvesting and artificial recharge of aquifers, improving the

217
Addressing IndiaÊs Water Challenge 2050: The Virtual Water Trade Option
productivity of agriculture in water-scarce regions (which, it is claimed, continue to waste
precious water resources), improving the efficiency of India’s public irrigation systems through
involvement of stakeholders in the management of irrigation, and using virtual water trade,
instead of physical water transfers, to tackle the high spatial variation in water availability
across the country.
While a number of these options seem plausible, all of them require further scientific
exploration and study before any one of them (or a combination of several of them) can form
a feasible answer to India’s impending and formidable water crisis. While the Government of
India has failed to share with the public its detailed studies and plans for the proposed interbasin
transfers, the opponents of NRLP also do not have a studied program of action to present. The
lack of such analyses has led to a polarized and opinionated debate which is preventing the
nation from forming a scientific opinion about NRLP and its various alternatives (Verma and
Phansalkar 2007).
One of the alternatives to NRLP that has been discussed is virtual water trade within
the country. Proponents of this alternative have argued that instead of physically transferring
large quantities of water from the flood-prone east to the water-scarce west and south, it would
be desirable to transfer virtual water in the form of food grains. This paper explores the factors
that influence interstate virtual water trade in India; provides a preliminary assessment of the
potential of virtual water trade to act as an alternative to the proposed IBWT; and assesses
policy options for promoting and enhancing water-saving trade within the country.
Virtual Water Trade and International Trade Theories
The term ‘virtual water’ was introduced by Professor Tony Allan (1993, 1994) referring to
the volume of water needed to produce agricultural commodities. The same concept has
differently been referred to as ‘embedded water’ (Allan 2003), ‘exogenous water’ (Haddadin
2003) or ‘ultraviolet’ water (Savenije 2004). When a commodity (or service) is traded, the
buyer essentially imports (virtual) water used in the production of the commodity. In the
context of international (food) trade, this concept has been applied with a view to optimize
the flow of commodities considering the water endowments of nations. Using the principles
of international trade, it suggests that water-rich countries should produce and export water-
intensive commodities (which indirectly carry embedded water needed for producing them) to
water-scarce countries, thereby enabling the latter to divert their precious water resources to
alternative, higher productivity uses.
The concept was later expanded to include other commodities and services (Allan 1998;
Hoekstra 2003). Several researchers (Hoekstra and Hung 2002; Hoekstra 2003; Chapagain
and Hoekstra 2003; Oki et al. 2003; Renault 2003; Zimmer and Renault 2003; De Fraiture
et al. 2004; Chapagain et al. 2005; Chapagain 2006; Hoekstra and Chapagain 2007a,b) have
investigated the role that international trade in virtual water can play in attaining global water
saving and in ensuring food security in regions facing acute physical and economic water
scarcity, especially in the Middle East, North Africa region and southern Africa.
Chapagain and Hoekstra (2004) employed the concept of ‘water footprint’ to compute
nations’ dependence on virtual water in the global trade system. Hoekstra and Hung (2002,
2005) quantified the scale and extent of virtual water crop trade globally while Chapagain and
Hoekstra (2003) developed the methodology for similar calculations in the context of trade in

218
Shilp Verma, Doeke A. Kampman, Pieter van der Zaag and Arjen K. Hoekstra
livestock and livestock products. The two results were then combined to get a comprehensive
picture of the total agricultural virtual water trade (Hoekstra and Chapagain 2007a, b). Global
water saving from this trade was estimated to be about 455 giga cubic meters (Gm3) per annum
(Oki et al. 2003; Oki and Kanae 2004). However, policy conclusions from these results were
suitably moderated by De Fraiture et al. (2004) who noted that global water savings are caused
as a result of productivity differences between importing and exporting countries and are only
an unintended by-product of international trade in agricultural commodities. Following the
same logic, it is also possible to argue that virtual water trade can lead to wastage of water in
the situation where countries with low water productivity export virtual water to high water
productivity regions.
While a lot has been said about the scope, benefits and limitations of virtual water trade
between countries, studies on virtual water movement within countries are, at best, sparse. As
mentioned above, for countries such as India and China, it might be misleading to account
for them as single entities. This is because even within these huge countries, there are wide
disparities in water endowments. In addition, they demand special attention since they are big
players in the international food trade, as the percentage of their domestic consumption trade
is negligible and both countries are close to food self-sufficiency (De Fraiture et al. 2004).
Further, virtual water trade within countries like India sidesteps the debate around food self-
sufficiency—which is often used to negate any suggestion of letting the virtual water trade
logic to influence India’s food trade policies.
Ma and others (Ma 2004; Ma et al. 2006) quantified the virtual water trade within China
in the backdrop of the south-north transfer project. The study found that north China exports
52×109 m3/yr of virtual water to south China, a volume which is more than the maximum
proposed water transfer volume along three routes (38–43×109 m3/yr) in the south-north
Transfer Project. The study therefore concludes that if the “perverse” direction of virtual water
trade in China can be reversed, it can act as a better alternative to physical transfer of water
across basins. It is with a similar logic that the idea of interstate virtual water trade in India is
being proposed as an alternative to NRLP.
The Economic Logic behind Virtual Water Trade
Theory of Comparative Advantage
Hoekstra (2003) referring to Wichelns (2001) observed that “the economic argument behind
virtual water trade is that, according to international trade theory, nations should export
products in which they possess a relative or comparative advantage in production, while they
should import products in which they possess a comparative disadvantage.” Thus the logic of
virtual water trade follows Ricardo’s theory of comparative advantage which focuses on trade
based on differences in production technologies and factor endowments. It states that each
country should specialize in the production of such goods and services and export them to other
countries and that in the production of these each country enjoys a comparative advantage by
virtue of its factor endowments.
219
Addressing IndiaÊs Water Challenge 2050: The Virtual Water Trade Option
Heckscher–Ohlin (H–O) Model of International Trade
The direction and patterns of virtual water trade should be predictable and in agreement with
the Heckscher-Ohlin (H-O) model of trade. Developed by Eli Heckscher and Bertil Ohlin,
the Heckscher-Ohlin (H-O) model builds on Ricardo’s theory to predict patterns of trade and
production based on the factor endowments of trading entities. Broadly, the model states that
countries (or regions) will export products that require high quantities of abundant resources
and import products that require high quantities of scarce resources. Thus, a capital-rich (and
relatively labor-scarce) country would be expected to export capital-intensive products and
import labor-intensive products or services and vice versa (IESC 2007; Antras 2007; Davis
2007). In the context of virtual water trade, this translates to water-rich regions exporting
water-intensive products and vice versa.
Leontief Paradox
However, even in trade of goods and services, the H-O model has been found wanting in terms
of empirical evidence to support its logic. In 1954, Prof. W.W. Leontief attempted to test the
H-O model by studying trade patterns between countries. To his surprise, he found that the US,
perhaps the most capital-abundant country in the world, exported labor-intensive commodities
and imported capital-intensive commodities. This was seen to be in contradiction to the H-O
model and came to be known as the Leontief paradox.
Linder Effect
Several economists have, ever since, tried to resolve this paradox. In 1961, Staffan Burenstam
Linder proposed the Linder hypothesis as a possible resolution to the Leontief paradox. Linder
argued that demand, rather than comparative advantage, is the key determinant of trade.
According to him, countries (or entities) with similar demands will develop similar industries,
irrespective of factor endowments; and that these countries would then trade with each other
in similar but differentiated goods. For example, both the US and Germany are capital-rich
economies with significant demand for capital goods such as cars. Rather than one country
dominating the car industry (by virtue of factor-endowment based comparative advantage),
both countries produce and trade different brands of cars between them. This Linder effect has
also been observed in other subsequent examinations. However, it does not account for the
entire pattern of world trade (see Linder 1961; Bergstrand 1990).
New Trade Theory
Similarly, proponents of the New Trade Theory (Paul Krugman, Robert Solow and others) argue
that factors other than endowments determine trade. New trade theorists base international
trade on imperfect competition and economies of scale—both of which are realistic but
assumed away in the H-O model. Gains from increasing returns to scale at the entity level
are understood intuitively but gains from industry-level scale economies (external economies
of scale) often get ignored. Such gains are particularly important in the case of agriculture
where the scale of production of an individual farmer is very small compared to the size
of the market. However, several factors such as agricultural extension services, specialized
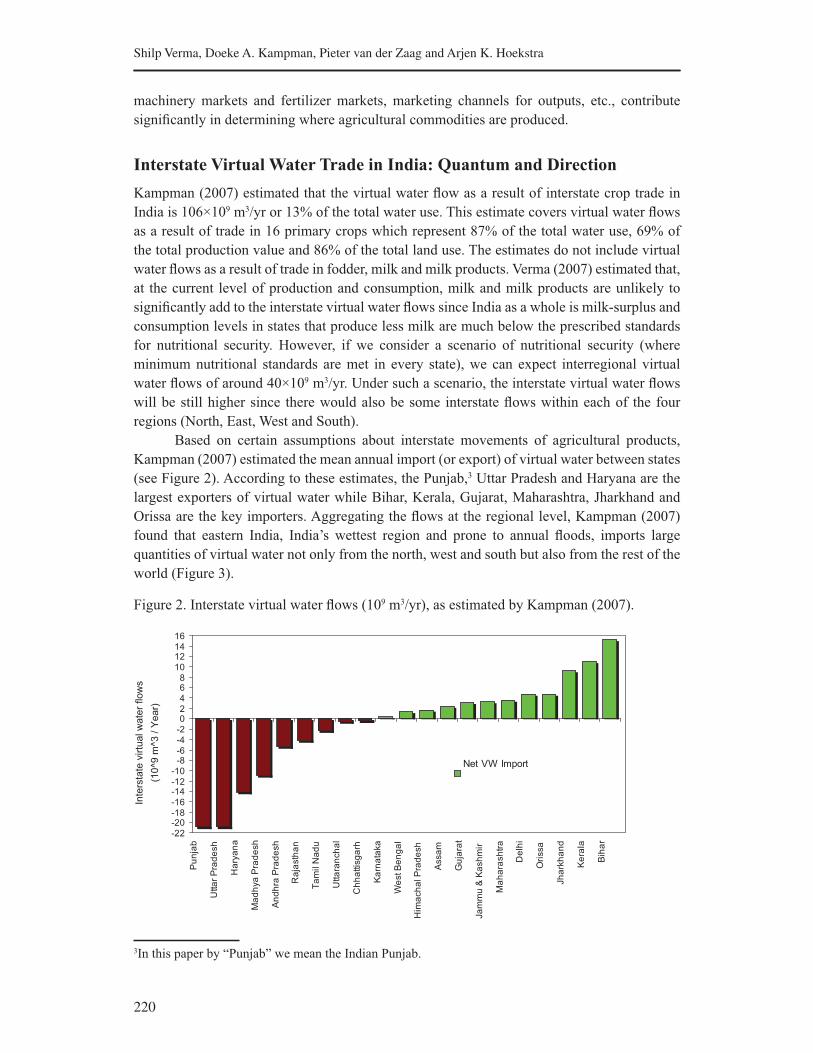
220
Shilp Verma, Doeke A. Kampman, Pieter van der Zaag and Arjen K. Hoekstra
machinery markets and fertilizer markets, marketing channels for outputs, etc., contribute
significantly in determining where agricultural commodities are produced.
Interstate Virtual Water Trade in India: Quantum and Direction
Kampman (2007) estimated that the virtual water flow as a result of interstate crop trade in
India is 106×109 m3/yr or 13% of the total water use. This estimate covers virtual water flows
as a result of trade in 16 primary crops which represent 87% of the total water use, 69% of
the total production value and 86% of the total land use. The estimates do not include virtual
water flows as a result of trade in fodder, milk and milk products. Verma (2007) estimated that,
at the current level of production and consumption, milk and milk products are unlikely to
significantly add to the interstate virtual water flows since India as a whole is milk-surplus and
consumption levels in states that produce less milk are much below the prescribed standards
for nutritional security. However, if we consider a scenario of nutritional security (where
minimum nutritional standards are met in every state), we can expect interregional virtual
water flows of around 40×109 m3/yr. Under such a scenario, the interstate virtual water flows
will be still higher since there would also be some interstate flows within each of the four
regions (North, East, West and South).
Based on certain assumptions about interstate movements of agricultural products,
Kampman (2007) estimated the mean annual import (or export) of virtual water between states
(see Figure 2). According to these estimates, the Punjab,3 Uttar Pradesh and Haryana are the
largest exporters of virtual water while Bihar, Kerala, Gujarat, Maharashtra, Jharkhand and
Orissa are the key importers. Aggregating the flows at the regional level, Kampman (2007)
found that eastern India, India’s wettest region and prone to annual floods, imports large
quantities of virtual water not only from the north, west and south but also from the rest of the
world (Figure 3).
Figure 2. Interstate virtual water flows (109 m3/yr), as estimated by Kampman (2007).
3In this paper by “Punjab” we mean the Indian Punjab.
-22-20-18-16-14-12-10
-8-6-4-202468
10121416
Pu
nja
b
Utta
r P
rad
esh
Ha
rya
na
Ma
dh
ya
Pra
de
sh
An
dh
ra P
rad
esh
Ra
jasth
an
Ta
mil N
ad
u
Utta
ran
ch
al
Ch
ha
ttis
ga
rh
Ka
rna
taka
We
st B
en
ga
l
Him
ach
al P
rad
esh
Assa
m
Gu
jara
t
Ja
mm
u &
Ka
sh
mir
Ma
ha
rash
tra
De
lhi
Ori
ssa
Jh
ark
ha
nd
Ke
rala
Bih
ar
Net VW Import
Inte
rsta
te v
irtu
al w
ate
r flo
ws
(10
^9 m
^3 /
Ye
ar)
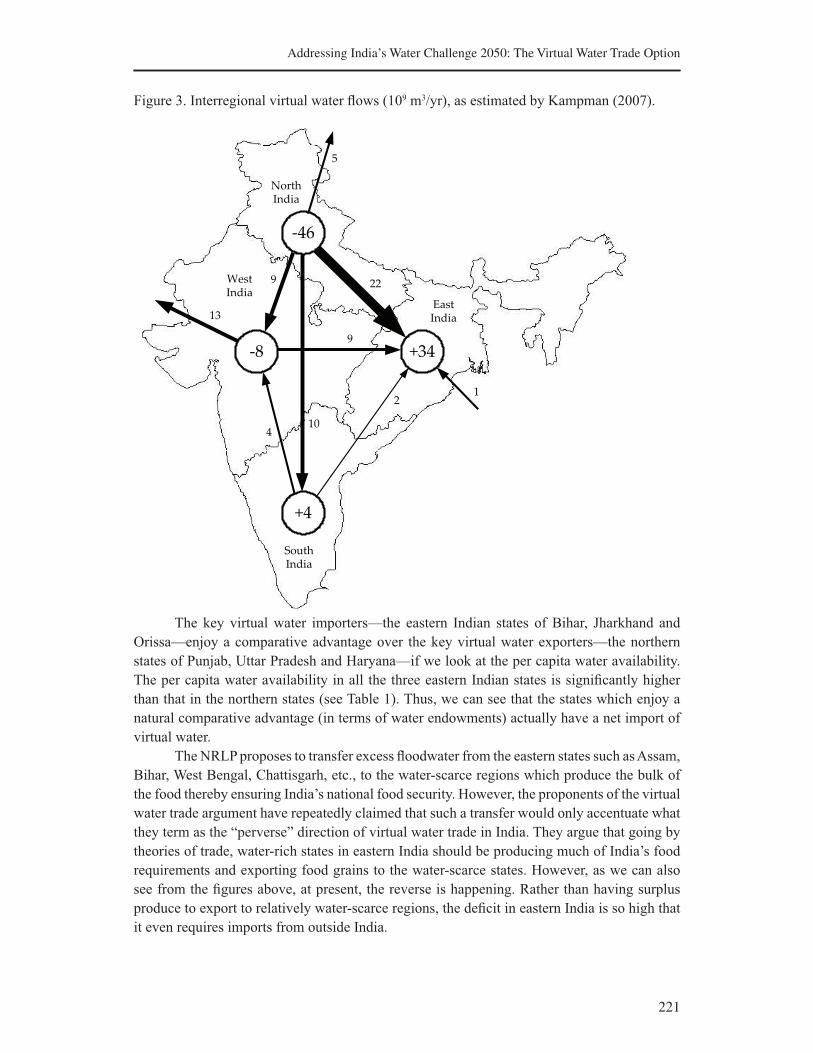
221
Addressing IndiaÊs Water Challenge 2050: The Virtual Water Trade Option
Figure 3. Interregional virtual water flows (109 m3/yr), as estimated by Kampman (2007).
9
4
2
9
22
10
+4
-8 +34
-46
1
13
5
North
India
South
India
East
India
West
India
The key virtual water importers—the eastern Indian states of Bihar, Jharkhand and
Orissa—enjoy a comparative advantage over the key virtual water exporters—the northern
states of Punjab, Uttar Pradesh and Haryana—if we look at the per capita water availability.
The per capita water availability in all the three eastern Indian states is significantly higher
than that in the northern states (see Table 1). Thus, we can see that the states which enjoy a
natural comparative advantage (in terms of water endowments) actually have a net import of
virtual water.
The NRLP proposes to transfer excess floodwater from the eastern states such as Assam,
Bihar, West Bengal, Chattisgarh, etc., to the water-scarce regions which produce the bulk of
the food thereby ensuring India’s national food security. However, the proponents of the virtual
water trade argument have repeatedly claimed that such a transfer would only accentuate what
they term as the “perverse” direction of virtual water trade in India. They argue that going by
theories of trade, water-rich states in eastern India should be producing much of India’s food
requirements and exporting food grains to the water-scarce states. However, as we can also
see from the figures above, at present, the reverse is happening. Rather than having surplus
produce to export to relatively water-scarce regions, the deficit in eastern India is so high that
it even requires imports from outside India.
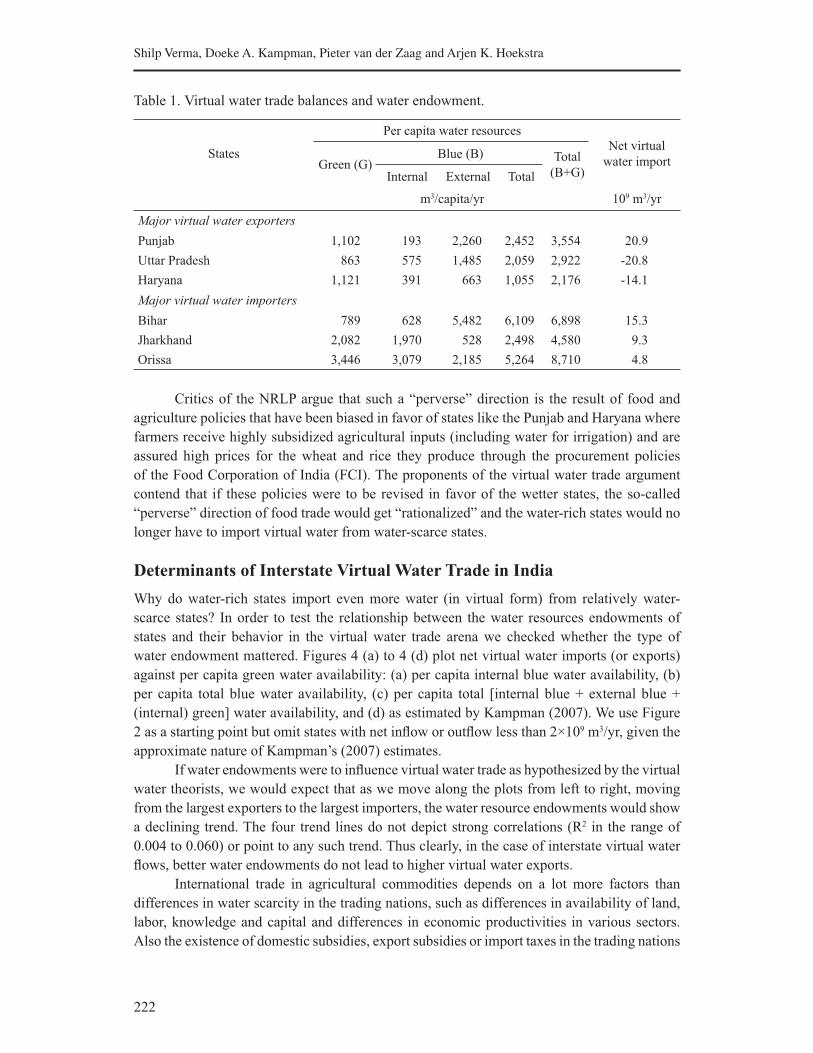
222
Shilp Verma, Doeke A. Kampman, Pieter van der Zaag and Arjen K. Hoekstra
Table 1. Virtual water trade balances and water endowment.
States
Per capita water resourcesNet virtual
water importGreen (G)Blue (B) Total
(B+G)Internal External Total
m3/capita/yr 109 m3/yr
Major virtual water exporters
Punjab 1,102 193 2,260 2,452 3,554 20.9
Uttar Pradesh 863 575 1,485 2,059 2,922 -20.8
Haryana 1,121 391 663 1,055 2,176 -14.1
Major virtual water importers
Bihar 789 628 5,482 6,109 6,898 15.3
Jharkhand 2,082 1,970 528 2,498 4,580 9.3
Orissa 3,446 3,079 2,185 5,264 8,710 4.8
Critics of the NRLP argue that such a “perverse” direction is the result of food and
agriculture policies that have been biased in favor of states like the Punjab and Haryana where
farmers receive highly subsidized agricultural inputs (including water for irrigation) and are
assured high prices for the wheat and rice they produce through the procurement policies
of the Food Corporation of India (FCI). The proponents of the virtual water trade argument
contend that if these policies were to be revised in favor of the wetter states, the so-called
“perverse” direction of food trade would get “rationalized” and the water-rich states would no
longer have to import virtual water from water-scarce states.
Determinants of Interstate Virtual Water Trade in India
Why do water-rich states import even more water (in virtual form) from relatively water-
scarce states? In order to test the relationship between the water resources endowments of
states and their behavior in the virtual water trade arena we checked whether the type of
water endowment mattered. Figures 4 (a) to 4 (d) plot net virtual water imports (or exports)
against per capita green water availability: (a) per capita internal blue water availability, (b)
per capita total blue water availability, (c) per capita total [internal blue + external blue +
(internal) green] water availability, and (d) as estimated by Kampman (2007). We use Figure
2 as a starting point but omit states with net inflow or outflow less than 2×10⁹ m3/yr, given the
approximate nature of Kampman’s (2007) estimates.
If water endowments were to influence virtual water trade as hypothesized by the virtual
water theorists, we would expect that as we move along the plots from left to right, moving
from the largest exporters to the largest importers, the water resource endowments would show
a declining trend. The four trend lines do not depict strong correlations (R2 in the range of
0.004 to 0.060) or point to any such trend. Thus clearly, in the case of interstate virtual water
flows, better water endowments do not lead to higher virtual water exports.
International trade in agricultural commodities depends on a lot more factors than
differences in water scarcity in the trading nations, such as differences in availability of land,
labor, knowledge and capital and differences in economic productivities in various sectors.
Also the existence of domestic subsidies, export subsidies or import taxes in the trading nations
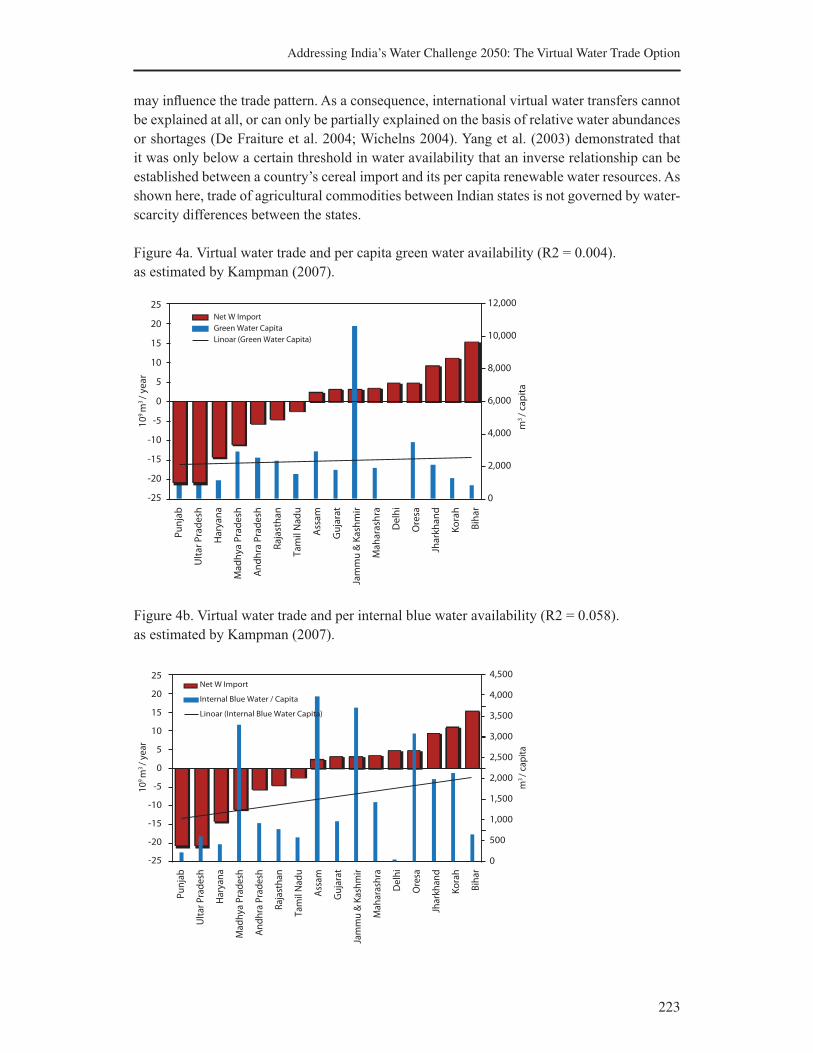
223
Addressing IndiaÊs Water Challenge 2050: The Virtual Water Trade Option
may influence the trade pattern. As a consequence, international virtual water transfers cannot
be explained at all, or can only be partially explained on the basis of relative water abundances
or shortages (De Fraiture et al. 2004; Wichelns 2004). Yang et al. (2003) demonstrated that
it was only below a certain threshold in water availability that an inverse relationship can be
established between a country’s cereal import and its per capita renewable water resources. As
shown here, trade of agricultural commodities between Indian states is not governed by water-
scarcity differences between the states.
Figure 4a. Virtual water trade and per capita green water availability (R2 = 0.004).
as estimated by Kampman (2007).
25
20
15
10
5
0
-5
-10
-15
-20
-25
12,000
10,000
8,000
6,000
4,000
2,000
0
10
9 m
3 /
ye
ar
m3
/ ca
pit
a
Pu
nja
b
Ult
ar
Pra
de
sh
Ha
rya
na
Ma
dh
ya
Pra
de
sh
An
dh
ra P
rad
esh
Ra
jast
ha
n
Ta
mil
Na
du
Ass
am
Gu
jara
t
Jam
mu
& K
ash
mir
Ma
ha
rash
ra
De
lhi
Ore
sa
Jha
rkh
an
d
Ko
rah
Bih
ar
Net W Import
Green Water Capita
Linoar (Green Water Capita)
Figure 4b. Virtual water trade and per internal blue water availability (R2 = 0.058).
as estimated by Kampman (2007).
25
20
15
10
5
0
-5
-10
-15
-20
-25
4,500
4,000
3,500
3,000
2,500
2,000
1,500
1,000
500
0
10
9 m
3 /
year
m3
/ ca
pit
a
Pu
nja
b
Ult
ar P
rad
esh
Har
yan
a
Mad
hya
Pra
de
sh
An
dh
ra P
rad
esh
Raj
asth
an
Tam
il N
adu
Ass
am
Gu
jara
t
Jam
mu
& K
ash
mir
Mah
aras
hra
De
lhi
Ore
sa
Jhar
khan
d
Ko
rah
Bih
ar
Net W Import
Internal Blue Water / Capita
Linoar (Internal Blue Water Capita)
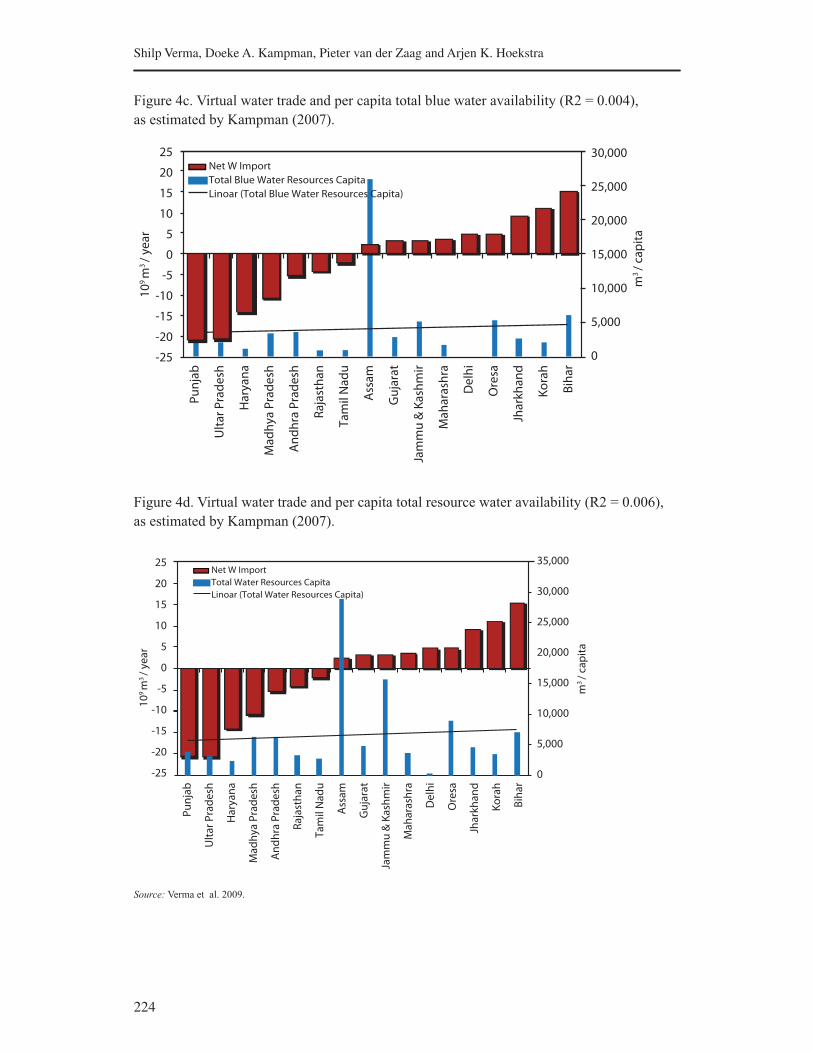
224
Shilp Verma, Doeke A. Kampman, Pieter van der Zaag and Arjen K. Hoekstra
Figure 4c. Virtual water trade and per capita total blue water availability (R2 = 0.004),
as estimated by Kampman (2007).
10
9 m
3 /
ye
ar
m3
/ ca
pit
a
Pu
nja
b
Ult
ar
Pra
de
sh
Ha
rya
na
Ma
dh
ya
Pra
de
sh
An
dh
ra P
rad
esh
Ra
jast
ha
n
Ta
mil
Na
du
Ass
am
Gu
jara
t
Jam
mu
& K
ash
mir
Ma
ha
rash
ra
De
lhi
Ore
sa
Jha
rkh
an
d
Ko
rah
Bih
ar
25
20
15
10
5
0
-5
-10
-15
-20
-25
30,000
25,000
20,000
15,000
10,000
5,000
0
Net W Import
Total Blue Water Resources Capita
Linoar (Total Blue Water Resources Capita)
Figure 4d. Virtual water trade and per capita total resource water availability (R2 = 0.006),
as estimated by Kampman (2007).
10
9 m
3 /
ye
ar
m3
/ ca
pit
a
Pu
nja
b
Ult
ar
Pra
de
sh
Ha
rya
na
Ma
dh
ya
Pra
de
sh
An
dh
ra P
rad
esh
Ra
jast
ha
n
Ta
mil
Na
du
Ass
am
Gu
jara
t
Jam
mu
& K
ash
mir
Ma
ha
rash
ra
De
lhi
Ore
sa
Jha
rkh
an
d
Ko
rah
Bih
ar
25
20
15
10
5
0
-5
-10
-15
-20
-25
35,000
30,000
25,000
20,000
15,000
10,000
5,000
0
Net W Import
Total Water Resources Capita
Linoar (Total Water Resources Capita)
Source: Verma et al. 2009.
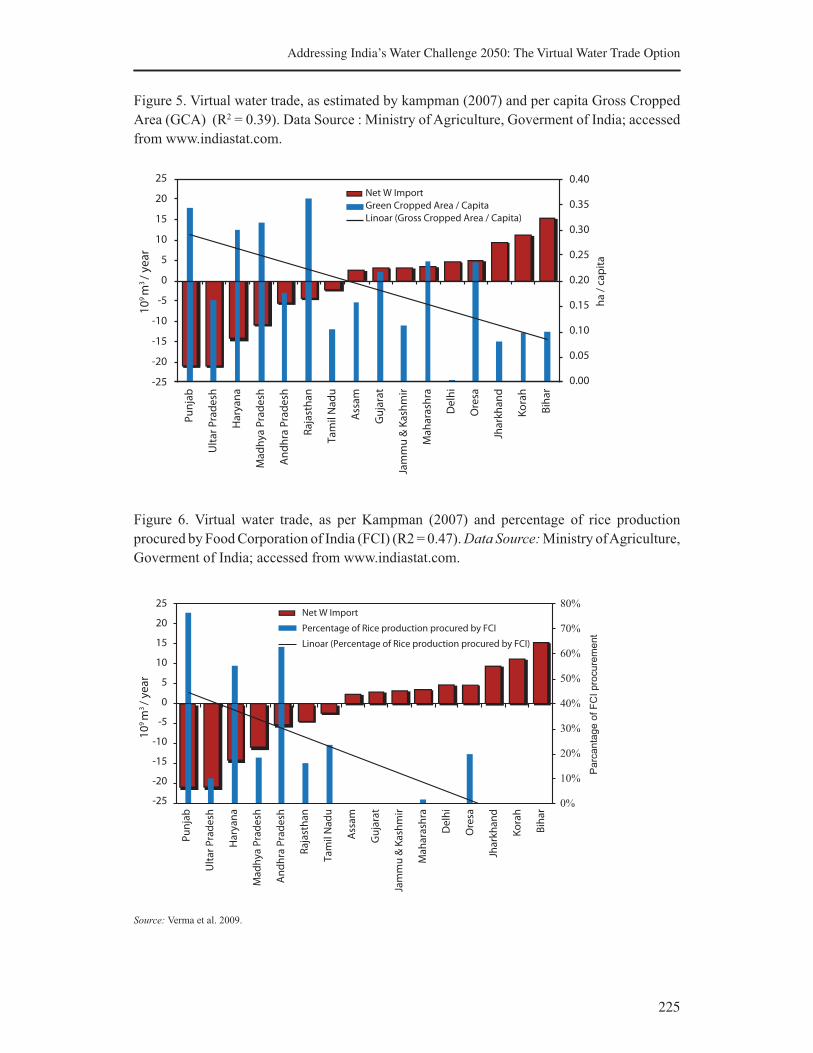
225
Addressing IndiaÊs Water Challenge 2050: The Virtual Water Trade Option
Figure 5. Virtual water trade, as estimated by kampman (2007) and per capita Gross Cropped
Area (GCA) (R2 = 0.39). Data Source : Ministry of Agriculture, Goverment of India; accessed
from www.indiastat.com.
25
20
15
10
5
0
-5
-10
-15
-20
-25
0.40
0.35
0.30
0.25
0.20
0.15
0.10
0.05
0.00
Net W Import
Green Cropped Area / Capita
Linoar (Gross Cropped Area / Capita)
Pu
nja
b
Ult
ar
Pra
de
sh
Ha
rya
na
Ma
dh
ya
Pra
de
sh
An
dh
ra P
rad
esh
Ra
jast
ha
n
Ta
mil
Na
du
Ass
am
Gu
jara
t
Jam
mu
& K
ash
mir
Ma
ha
rash
ra
De
lhi
Ore
sa
Jha
rkh
an
d
Ko
rah
Bih
ar
10
9 m
3 /
ye
ar
ha
/ c
ap
ita
Figure 6. Virtual water trade, as per Kampman (2007) and percentage of rice production
procured by Food Corporation of India (FCI) (R2 = 0.47). Data Source: Ministry of Agriculture,
Goverment of India; accessed from www.indiastat.com.
25
20
15
10
5
0
-5
-10
-15
-20
-25
Net W Import
Percentage of Rice production procured by FCI
Linoar (Percentage of Rice production procured by FCI)
Pu
nja
b
Ult
ar
Pra
de
sh
Ha
rya
na
Ma
dh
ya P
rad
esh
An
dh
ra P
rad
esh
Ra
jast
ha
n
Ta
mil
Na
du
Ass
am
Gu
jara
t
Jam
mu
& K
ash
mir
Ma
ha
rash
ra
De
lhi
Ore
sa
Jha
rkh
an
d
Ko
rah
Bih
ar
10
9 m
3 /
ye
ar
80%
70%
60%
50%
40%
30%
20%
10%
0%
Parc
anta
ge o
f F
CI pro
cure
ment
Source: Verma et al. 2009.
226
Shilp Verma, Doeke A. Kampman, Pieter van der Zaag and Arjen K. Hoekstra
If it is not water endowment that determines the direction of virtual water flow, then
what does? In a recent paper analyzing data for 146 countries across the globe, Kumar and
Singh (2005) have argued that a country’s virtual water surplus or deficit is not determined by
its water situation. They concluded that no correlation exists between relative water availability
in a country and virtual water trade or the volume of water embedded in the food and food
products traded. Several water-rich countries including Japan, Portugal and Indonesia have
recorded high net virtual water imports.
Further analysis of 131 countries in the same paper showed that “access to arable land”
can be a key driver of virtual water trade. We test this “access to arable land” hypothesis
using per capita gross cropped area data for the Indian states (Figure 5). As can be seen from
Figure 5, per capita gross cropped area does seem to assert a strong influence on net virtual
water exports. The correlation coefficient (R2 = 0.39) is much higher than that related to water
endowment.
In our analysis of high food exports from the northern Indian states, it was suggested
that “access to secure markets” could be a key determinant of why the Punjab continues to
produce food grains. We therefore also test “access to secure markets” across virtual water
importing and exporting states by using the proxy variable of ‘percentage of rice production
procured by the Food Corporation of India’ (Figure 6). We find that this percentage correlates
well with net virtual water exports (R2 = 0.47). Thus we see that while the correlation between
water endowments and virtual water surplus/deficit is very weak, access to arable land and
access to secure markets are much more strongly correlated with virtual water exports.
Discussion: Why H-O Does Not Work for H2O?
If the H-O model of international trade was able to explain the quantum and direction of trade,
we would have expected water endowments to be strongly and positively correlated with a
region’s virtual water exports. However, our estimates of interstate virtual water trade clearly
do not match with such a pattern. One of the reasons for this could be the method Kampman
(2007) applied for estimating interstate trade. Kampman assumed that trade (import or export)
is equal to the difference between production and consumption within a state. Thus, only
surplus states export and only deficit states import. Such an estimation procedure implicitly
assumes that all traded agricultural goods are undifferentiated commodities. But we know that
products such as basmati rice, branded dairy products and other differentiated (or branded)
agricultural commodities negate this assumption. However, in comparison to the total volume
of virtual water traded, the proportion of virtual water embedded in branded products is
perhaps small.
Another reason that the H-O model fails to apply is that it requires pre-trade resource
prices to be in relation to resource endowments. In the case of water, this does not happen,
especially at the farm level. Farmers in water-rich states such as Bihar face a much steeper
price for using water for irrigation compared to water-scarce states like the Punjab. This can
be attributed to the public policy biases in favor of regions such as the Punjab. Thus while a
region might be facing physical water scarcity, the farmers do not face any economic scarcity
while the reverse is true for wetter regions.
Thus, though intuitively appealing as a concept, the idea of using virtual water as a
tool for water saving, or as an alternative to physical water transfers, has limited applicability
227
Addressing IndiaÊs Water Challenge 2050: The Virtual Water Trade Option
in the current scenario. Virtual water trade theorists have often implicitly and erroneously
assumed that water-abundant countries (or regions) necessarily enjoy comparative advantage
in the production of water-intensive commodities. The patterns of interstate virtual water trade
in India and global food trade trends discussed by De Fraiture et al. (2004) show that water
endowments alone are unable to explain the direction and magnitude of trade. The Leontief
paradox holds as much in the case of virtual water trade as it does for other goods. The implicit
assumption behind measuring every commodity by its virtual water content is that water is
the most critical and scarcest resource input. However, this assumption does not always hold.
There are several key inputs that go into the production of food and these other ‘factors of
production’ might tilt the balance of decisions against the logic of virtual water which dictates
water saving as the sole criterion.
Thus, the H-O model will work to efficiently allocate water resources if and only if they
constitute the most critical resource in the production process. If, on the other hand, another
resource such as land becomes the critical constraint, efficient allocation will optimize land
use and not water use. By importing food grains from a land-rich state, a land-scarce region
is economizing on its land use. Following the virtual water trade logic, this can be termed as
virtual land trade (see Würtenberger et al. 2006). A land-scarce region (such as Bihar) would
import crops from regions where land productivity is higher (for instance, the Punjab). In order
to produce the same amount of food as in the Punjab, Bihar would have to employ more land
than Punjab (Aggarwal et al. 2000). If, and as long as, land is the critical constraining resource,
Bihar would like to economize on its land use, even at the cost of inefficient or incomplete
utilization of its abundant water resources.
Conclusions and Implications for India’s River Linking Project
The mean annual interstate virtual water trade in India has been estimated to be 106×109 m3/
yr for the years 1997–2001 (Kampman 2007). While these estimates are neither precise nor
comprehensive (for instance, Kampman’s estimates do not include virtual water trade through
trade in milk and milk products), they do illustrate that the quantum of interstate virtual water
trade is comparable to the proposed interbasin water transfers proposed by the Government of
India under the NRLP (178×109 m3/yr). Significantly, the estimates also show that the direction
of virtual water trade runs opposite to the proposed physical transfers. While physical water
transfers are proposed from ‘surplus’ to ‘deficit’ basins, interstate virtual water flows move
from water-scarce to water-rich regions.
The existing pattern of virtual water trade is exacerbating scarcities in already water-
scarce regions and our analysis has shown that rather than being dictated by water endowments,
trade patterns are influenced by factors such as per capita availability of arable land and, more
importantly, by biases in food and agriculture policies of the Government of India as indicated
by the FCI’s procurement patterns. Given that the desperation of the 1960s and 1970s with
respect to national food security no longer persists, there is a strong case for reversing this
trend through changes in food procurement and input subsidy policies.
According to international trade theory, there are five basic reasons why trade takes place
between two entities: (1) differences in technological abilities, as explained by the Ricardian
model of comparative advantage; (2) differences in resource endowments, as explained by the
H-O model; (3) differences in demand, which partly explain trade between surplus entities, as
explained by the Linder effect; (4) existence of economies of scale, as enumerated by the new
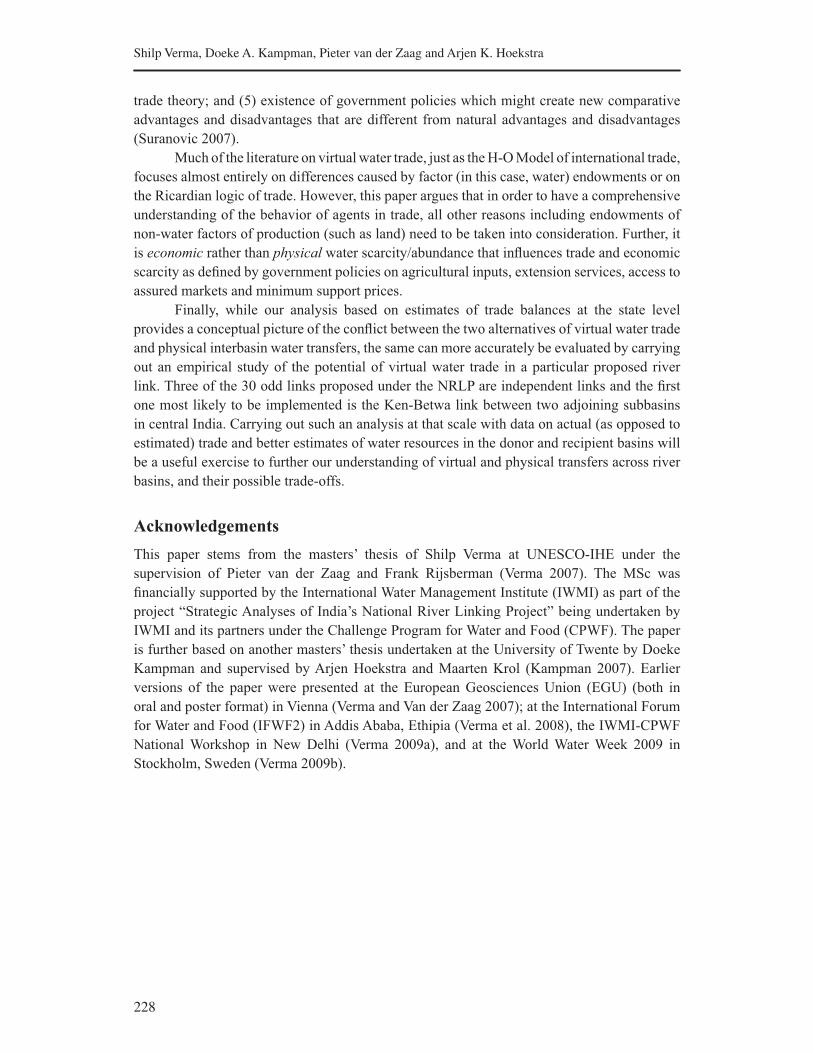
228
Shilp Verma, Doeke A. Kampman, Pieter van der Zaag and Arjen K. Hoekstra
trade theory; and (5) existence of government policies which might create new comparative
advantages and disadvantages that are different from natural advantages and disadvantages
(Suranovic 2007).
Much of the literature on virtual water trade, just as the H-O Model of international trade,
focuses almost entirely on differences caused by factor (in this case, water) endowments or on
the Ricardian logic of trade. However, this paper argues that in order to have a comprehensive
understanding of the behavior of agents in trade, all other reasons including endowments of
non-water factors of production (such as land) need to be taken into consideration. Further, it
is economic rather than physical water scarcity/abundance that influences trade and economic
scarcity as defined by government policies on agricultural inputs, extension services, access to
assured markets and minimum support prices.
Finally, while our analysis based on estimates of trade balances at the state level
provides a conceptual picture of the conflict between the two alternatives of virtual water trade
and physical interbasin water transfers, the same can more accurately be evaluated by carrying
out an empirical study of the potential of virtual water trade in a particular proposed river
link. Three of the 30 odd links proposed under the NRLP are independent links and the first
one most likely to be implemented is the Ken-Betwa link between two adjoining subbasins
in central India. Carrying out such an analysis at that scale with data on actual (as opposed to
estimated) trade and better estimates of water resources in the donor and recipient basins will
be a useful exercise to further our understanding of virtual and physical transfers across river
basins, and their possible trade-offs.
Acknowledgements
This paper stems from the masters’ thesis of Shilp Verma at UNESCO-IHE under the
supervision of Pieter van der Zaag and Frank Rijsberman (Verma 2007). The MSc was
financially supported by the International Water Management Institute (IWMI) as part of the
project “Strategic Analyses of India’s National River Linking Project” being undertaken by
IWMI and its partners under the Challenge Program for Water and Food (CPWF). The paper
is further based on another masters’ thesis undertaken at the University of Twente by Doeke
Kampman and supervised by Arjen Hoekstra and Maarten Krol (Kampman 2007). Earlier
versions of the paper were presented at the European Geosciences Union (EGU) (both in
oral and poster format) in Vienna (Verma and Van der Zaag 2007); at the International Forum
for Water and Food (IFWF2) in Addis Ababa, Ethipia (Verma et al. 2008), the IWMI-CPWF
National Workshop in New Delhi (Verma 2009a), and at the World Water Week 2009 in
Stockholm, Sweden (Verma 2009b).
229
Addressing IndiaÊs Water Challenge 2050: The Virtual Water Trade Option
References
Aggarwal, P.K.; Talukdar, K.K.; Mall, R.K. 2000. Potential yields of rice-wheat system in the Indo-Gangetic
plains of India. Rice-Wheat Consortium Paper Series 10. New Delhi, India: Rice-Wheat Consortium for
the Indo-Gangetic Plains p.16.
Allan, J.A. 1993. Fortunately there are substitutes for water otherwise our hydro-political futures would be
impossible. In: Priorities for water resources allocation and management, ed. ODA, London: Overseas
Development Administration pp. 13-26.
Allan, J.A. 1994. Overall perspectives on countries and regions. In: Water in the Arab World: Perspectives and
prognoses, ed. Rogers, P.; Lydon, P. Cambridge, Massachusetts: Harvard University Press, pp.65-100.
Allan, J.A. 1998. Virtual water: A strategic resource, global solutions to regional deficits. Groundwater 36 (4):
545-546.
Allan, J.A. 2003. Virtual water - the water, food, and trade nexus: Useful concept or misleading metaphor?
Water International 28 (1): 106-113.
Antras, P. 2007. Lecture notes on international economics I. MIT 14.581 (graduate), Spring 2007. Cambridge,
MA: Massachusetts Institute of Technology (MIT). Available online (last accessed in May 2007) stellar.
mit.edu/S/course/14/sp07/14.581/materials.html
Bandyopadhyay, J.; Perveen, S. 2004. The doubtful science of interlinking. India Together, February. Available
online (last accessed on 7 October 2006). www.indiatogether.org/2004/feb/envbadsci-p1.htm
Bergstrand, J. H. 1990. The Heckscher-Ohlin-Samuelson model, the Linder hypothesis and the determinants of
bilateral intra-industry trade. Economic Journal 100 (403): 1216-1229.
Chapagain, A.K. 2006. Globalisation of water: Opportunities and threats of virtual water trade. PhD
dissertation, UNESCO-IHE, TU Delft, University of Twente. The Netherlands: A.A. Balkema Publishers.
Chapagain, A.K.; Hoekstra, A.Y. 2003. Virtual water flows between nations in relation to trade in livestock and
livestock products. Value of Water Research Report Series # 13. Delft, the Netherlands: UNESCO-IHE.
Chapagain, A.K.; Hoekstra, A.Y. 2004. Water footprint of nations. Value of Water Research Report Series # 16.
The Netherlands: UNESCO-IHE, Delft.
Chapagain, A.K.; Hoekstra, A.Y.; Savenije, H.H.G. 2005. Saving water through global trade. Value of Water
Research Report Series # 17. Delft, the Netherlands: UNESCO-IHE.
Davis, D.R. 2007. Notes on competitive trade theory. Lecture notes from Columbia University, New York.
Available online www.columbia.edu/~drd28/Text.pdf (last accessed in May 2007).
De Fraiture, C.; Cai, X.; Amarasinghe, U.; Rosegrant, M.; Molden, D. 2004. Does international cereal trade
save water? The impact of virtual water trade on global water use. Comprehensive Assessment Research
Report 4. Colombo, Sri Lanka: Comprehensive Assessment Secretariat.
Gupta, J.; Van der Zaag, P. 2007. Interbasin water transfers and integrated water resources management: Where
engineering, science and politics interlock. Physics and Chemistry of the Earth 33: 28-40.
Haddadin, M.J. 2003. Exogenous water: A conduit to globalization of water resources. In: Virtual water trade:
Proceedings of the International expert meeting on virtual water trade, ed. Hoekstra, A.Y. Value of Water
Research Report Series # 12. Delft, the Netherlands: UNESCO-IHE.
Hoekstra, A.Y. 2003. Virtual water: An introduction. In: Virtual water trade: Proceedings of the International
expert meeting on virtual water trade, ed. Hoekstra, A.Y. Value of Water Research Report Series # 12.
Delft, the Netherlands: UNESCO-IHE.
230
Shilp Verma, Doeke A. Kampman, Pieter van der Zaag and Arjen K. Hoekstra
Hoekstra, A.Y.; Chapagain, A.K. 2007a. Globalization of water: Sharing the planet’s freshwater resources.
Oxford, UK: Blackwell Publishing.
Hoekstra, A.Y.; Chapagain, A.K. 2007b. Water footprints of nations: Water use by people as a function of their
consumption pattern. Water Resources Management 21(1): 35-48.
Hoekstra, A.Y.; Hung, P.Q. 2002. Virtual water trade: A quantification of virtual water flows between nations
in relation to international crop trade. Value of Water Research Report Series # 11. Delft, the Netherlands:
UNESCO-IHE.
Hoekstra, A.Y.; Hung, P.Q. 2005. Globalisation of water resources: International virtual water flows in relation
to crop trade. Global Environmental Change 15 (1) : 45-56.
IESC (International Economics Study Center). 2007. Website of the International Economics Study Center
(IESC) (last accessed in May 2007). internationalecon.com/Trade/T-toc.php.
IWMI (International Water Management Institute). 2003. Strategic Analyses of India’s National River Linking
Project (NRLP). Proposal submitted to the CGIAR Challenge Program on Water and Food. Available
online (last accessed on 9 October 2006).
Iyer, R. 2002. Linking rivers: Vision or mirage. Frontline 19 (25), December 7. Available online (last accessed
on 8 October 2006). www.frontlineonnet.com/fl1925/stories/20021220001504900.htm
Kampman, D.A. 2007. Water footprint of India: A study on water use in relation to the consumption of
agricultural goods in the Indian states. Masters’ thesis. Enschede: University of Twente.
Kumar, M.D.; Singh, O.P. 2005. Virtual water in global food and water policy making: Is there a need for
rethinking? Water Resources Management 19: 759-789.
Linder, S.B. 1961. An essay on trade and transformation. Stockholm: Almqvist and Wiksell.
Ma, J. 2004. Assessment of virtual water trade as a tool in achieving food security in China. MS thesis. Delft,
the Netherlands: UNESCO-IHE.
Ma, J.; Hoekstra, A.Y.; Wang, H.; Chapagain, A.K.; Wang, D. 2006. Virtual versus real water transfers within
China. Phil. Trans. R. Soc. B, 361: 835-842.
NCIWRD (National Commission for Integrated Water Resource Development). 1999. Integrated water
resource development: A plan for action. Report of the National Commission for Integrated Water Resource
Development (NCIWRD). Volume I. Government of India: Ministry of Water Resources.
NWDA (National Water Development Agency). 2006. Inter basin water transfer: The need. National
Water Development Agency. Available online (last accessed on 7 October 2006). nwda.gov.in/index2.
asp?sublinkid=46&langid=1
Oki, T.; Kanae, S. 2004. Virtual water trade and world water resources. Water Science & Technology 49 (7):
203-209.
Oki, T.; Sato, M.; Kawamura, A.; Miyake, M.; Kanae, S.; Musiake, K. 2003. Virtual water trade to Japan and in
the world. In: Virtual water trade: Proceedings of the International expert meeting on virtual water trade,
ed. Hoekstra, A.Y. Value of Water Research Report Series # 12. Delft, the Netherlands: UNESCO-IHE.
Patkar, M. 2004. River linking: A millennium folly? India: National Alliance of Peoples’ Movements (NAPM)
and Initiative, 131p.
Renault, D. 2003. Value of virtual water for food: Principles and features. In: Virtual water trade: Proceedings
of the International expert meeting on virtual water trade, ed. Hoekstra, A.Y. Value of Water Research
Report Series # 12. Delft, the Netherlands: UNESCO-IHE.
231
Addressing IndiaÊs Water Challenge 2050: The Virtual Water Trade Option
Savenije, H.H.G. 2004. The role of green water in food production in sub-Saharan Africa. Article prepared for
the Food and Agriculture Organization of the United Nations (FAO). Available online (last accessed on 7
October 2006). www.wcainfonet.org/cds_upload/documents/1352.Role_of_green_water.pdf
Suranovic, S.M. 2007. International trade theory and policy. Online textbook on International Trade (last
accessed in April 2007), International Economics Study Center. internationalecon.com/Trade/tradehome.
php
Vaidyanathan, A. 2003. Interlinking of peninsular rivers: A critique. Economic and Political Weekly, July 5,
pp. 2865-2871.
Verma, S. 2007. Can H-O work for H2O? Interstate virtual water trade as an alternative to inter basin water
transfers in India. MSc thesis. Delft: Institute for Water Education, UNESCO-IHE.
Verma, S. 2009a. Addressing India’s water challenge 2050: the virtual water trade option. Paper presented at
“Strategic Issues in Indian Irrigation”, National Workshop: International Water Management Institute and
Challenge Program for Water and Food Project on “ Strategic Analyses of India’s National River Linking
Project,” New Delhi, Apr 7-8.
Verma, S. 2009b. Securing India’s water future 2050: Can domestic virtual water trade play a role? Keynote
address, “Securing access to water-related goods through trade.” Selected for publication in “The Best of
World Water Week 2009.” Stockholm World Water Week, 16-22 August.
Verma, S.; Phansalkar, S. 2007. India’s water future 2050: Potential deviations from ‘business-as-usual’.
International Journal of Rural Management. Sage Publications.
Verma, S.; Van der Zaag, P. 2007. Virtual water trade and India’s water future 2050. Paper presented at the
EGU General Assembly, session “Water resources assessment with special focus on developing countries”.
Vienna, 18 April. Geophysical Research Abstracts Vol. 9, No. 05601
Verma, S.; Kampman, D.A.; Van der Zaag, P.; Hoekstra, A.Y. 2008. Going against the flow: A critical analysis
of inter-state virtual water trade in the context of India’s National River Linking Program. Paper presented
at the International Forum on Water and Food (IFWF2), Addis Ababa, Ethiopia, Nov 10-14.
Vombatkere, S.G. 2003. Interlinking: Salvation or folly? India Together, February. Available online (last
accessed on 7 October 2006). www.indiatogether.org/environment/water/wtrsgvintlink.htm
Wichelns, D. 2001. The role of ‘virtual water’ in efforts to achieve food security and other national goals, with
an example from Egypt. Agricultural Water Management 49: 131-151.
Wichelns, D. 2004. The policy relevance of virtual water can be enhanced by considering comparative
advantages. Agricultural Water Management 66(1): 49-63.
Würtenberger, L.; Koellner, T.; Binder, C.R. 2006. Virtual land use and agricultural trade: Estimating
environmental and socio-economic impacts. Ecological Economics 57: 679–697.
Yang, H.; Reichert, P.; Abbaspour, K.C.; Zehnder, A.J.B. 2003. A water resources threshold and its implications
for food security. In: Virtual water trade: Proceedings of the International Expert Meeting on Virtual
Water Trade, ed. A.Y. Hoekstra. Value of Water Research Report Series No. 12. Delft: UNESCO-IHE, pp.
111-117.
Zimmer, D.; Renault, D. 2003. Virtual water in food production and global trade: Review of methodological
issues and preliminary results. In: Virtual water trade: Proceedings of the International expert meeting on
virtual water trade, ed. Hoekstra, A.Y. Value of Water Research Report Series # 12. Delft, the Netherlands:
UNESCO-IHE.

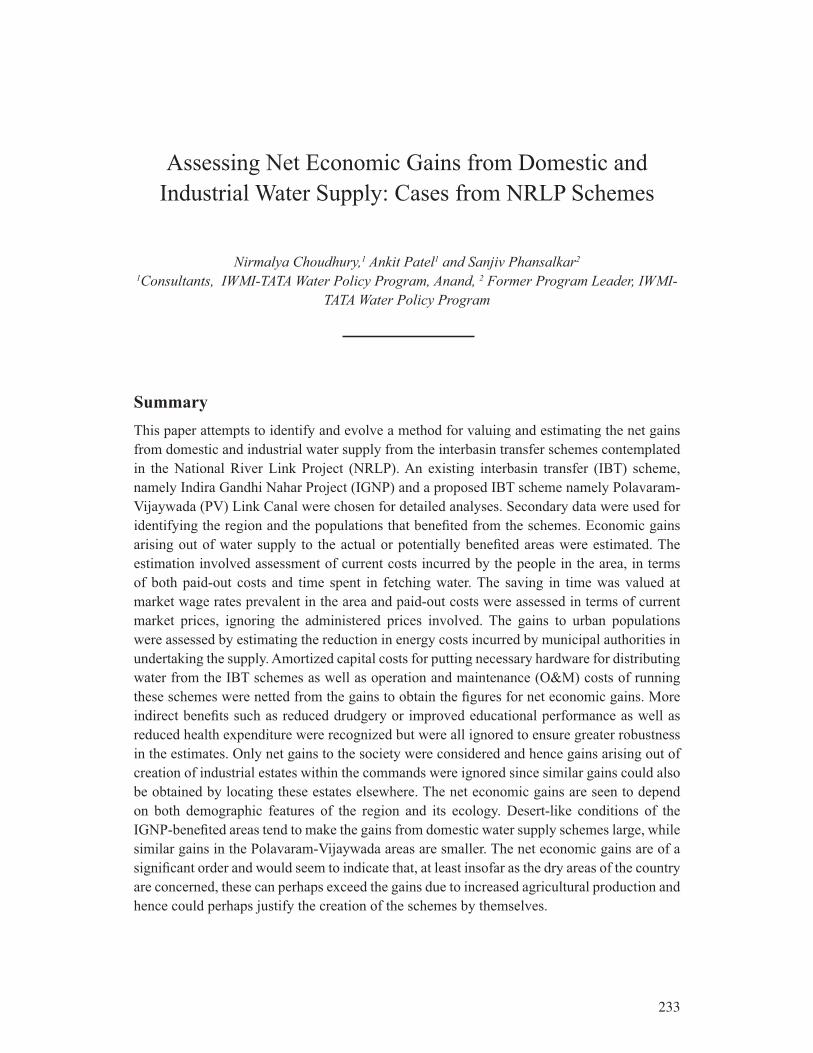
233
Assessing Net Economic Gains from Domestic and
Industrial Water Supply: Cases from NRLP Schemes
Nirmalya Choudhury,1 Ankit Patel1 and Sanjiv Phansalkar2
1Consultants, IWMI-TATA Water Policy Program, Anand, 2 Former Program Leader, IWMI-
TATA Water Policy Program
Summary
This paper attempts to identify and evolve a method for valuing and estimating the net gains
from domestic and industrial water supply from the interbasin transfer schemes contemplated
in the National River Link Project (NRLP). An existing interbasin transfer (IBT) scheme,
namely Indira Gandhi Nahar Project (IGNP) and a proposed IBT scheme namely Polavaram-
Vijaywada (PV) Link Canal were chosen for detailed analyses. Secondary data were used for
identifying the region and the populations that benefited from the schemes. Economic gains
arising out of water supply to the actual or potentially benefited areas were estimated. The
estimation involved assessment of current costs incurred by the people in the area, in terms
of both paid-out costs and time spent in fetching water. The saving in time was valued at
market wage rates prevalent in the area and paid-out costs were assessed in terms of current
market prices, ignoring the administered prices involved. The gains to urban populations
were assessed by estimating the reduction in energy costs incurred by municipal authorities in
undertaking the supply. Amortized capital costs for putting necessary hardware for distributing
water from the IBT schemes as well as operation and maintenance (O&M) costs of running
these schemes were netted from the gains to obtain the figures for net economic gains. More
indirect benefits such as reduced drudgery or improved educational performance as well as
reduced health expenditure were recognized but were all ignored to ensure greater robustness
in the estimates. Only net gains to the society were considered and hence gains arising out of
creation of industrial estates within the commands were ignored since similar gains could also
be obtained by locating these estates elsewhere. The net economic gains are seen to depend
on both demographic features of the region and its ecology. Desert-like conditions of the
IGNP-benefited areas tend to make the gains from domestic water supply schemes large, while
similar gains in the Polavaram-Vijaywada areas are smaller. The net economic gains are of a
significant order and would seem to indicate that, at least insofar as the dry areas of the country
are concerned, these can perhaps exceed the gains due to increased agricultural production and
hence could perhaps justify the creation of the schemes by themselves.
234
Nirmalya Choudhury, Ankit Patel and Sanjiv Phansalkar
Introduction
The proposed project to build 37 links between the Himalayan and peninsular rivers in the
country, together called the National River Link Project (NRLP), is a huge program, which
would change the face of the countryside. It envisages transferring of some 178 billion cubic
meters (Bm3) of water through these links and making large quantities of water available
for irrigation and other uses. The project does envisage benefits on three fronts: bringing
additional areas under irrigation for producing the food that would be required to feed an
estimated population of 1,580 million in the country; producing a huge amount of electricity
by installing hydropower projects on the Himalayan rivers; building infrastructures useful for
accomplishing water transfer, and delivering the supply of water for domestic and industrial
uses in water-starved southern and western peninsular regions. Much discourse about the
project revolves around the appropriateness of providing such extra irrigation through the link
schemes while significant attention has also been given to aspects of environmental impacts
and seismic stability of the structures on the Himalayan rivers. We believe that huge benefits
of the project are in the supply of drinking water to literally millions of households and also
in enabling industrial activity to take place in areas starved of water. We suggest that the
economic benefits accruing from these end uses are likely to be far more significant than
the irrigation benefits, particularly as there may be few alternatives to large-scale IBTs for
supporting dozens of thickly populated and growing urban centers.
According to recent experience from several large dams in the country (e.g., Narmada
Dam, Jayakwadi Dam on the Godavari and scores of smaller projects elsewhere), they may
be economically justified by looking at agricultural production they have enabled and the
electricity produced on these structures. Their contribution is most striking in enabling the
concerned state governments to augment and stabilize water supply for domestic purposes
to cities, towns and villages and in supplying water to industrial estates. The Jayakwadi, for
instance, not only sustains cities of Aurangabad and Jalna and several smaller townships by
supplying drinking water but has enabled the Walunj and other industrial estates to flourish.
The case of the Narmada Dam is even more pertinent. The project has not started irrigating
more than a fraction of its proposed command but already the project has enabled the state
government to augment and strengthen the water supply in over 200 cities and towns and in
a few thousand villages. In fact, the Government of Gujarat has been proud in proclaiming
its achievements in solving the drinking water crisis facing the difficult Saurashtra and Kutch
areas. The case of many other projects originally designed as irrigation schemes is similar:
the Pench project has turned out to be a boon in supporting the 3 million strong Najaur City;
but for the Upper Wardha project, the neighboring Amravati District would have continued to
face tough problems; the Nagarjuna-Sagar Dam gives water through the Telugu Ganga canal
to Chennai City; Ujani supports Solapur and soon Godavari water will be taken to support
Hyderbad-Secunderabad.
The premise of this exercise is that irrespective of the planning objectives of the projects
and the economic rationale on which they are justified, the various projects in the NRLP will,
in fact, be used, whether directly or indirectly (through the substitution route), to a significant
extent to address the question of supplying drinking water to populations facing the threat
of unreliable water supply and to augment water supply to industrial estates and units which
235
Assessing Net Economic Gains from Domestic and Industrial Water Supply
would find it difficult to carry out their industrial activities without water supply. The exercise
looks at one existing instance of interbasin transfer of water (namely the IGNP, from the Indus
to the Luni and other basins) and one proposed Polavaram-Vijaywada (PV) Link which would
be one of the elements of the NRLP design.1
The exercise is aimed at arriving at a broadly acceptable estimate of the (actual in case
of IGNP or likely in the second case) net economic gain resulting from the use of water from
these projects for domestic and industrial purposes. The tasks involved in the exercise include
identifying the benefits in the industrial and domestic water supply that can be attributed to
these projects, estimating the quantum of these gains and valuing them.
The Study Area
The tasks of identifying attributive gains relate to identifying geographic areas covering cities,
towns, villages and industrial estates to which the water from these projects actually flows
or will actually flow. For this purpose, the use of maps and other secondary materials from
concerned government offices is resorted to. The task of estimating the volume of gain consists
of identifying the current and potential water needs of geographic areas where the gains due to
water can be attributed to these schemes. This is an exercise in the projection of demographic
changes and possibly industrial growth. The former is relatively simple and in conjunction with
the work done under NRLP on demographic changes last year, it can be accomplished without
much effort. The latter is speculative since the industrial growth in a region is a determinant of
several factors, one of which is uninterrupted and adequate supply of water. Valuation remains
an issue and will be discussed later.
Indira Gandhi Nahar Pariyojana
The Indira Gandhi Nahar Pariyojana (IGNP) with a command area of 1.543 million hectares
(Mha) is the largest irrigation and drinking water project in northwestern Rajasthan. The
project was taken up in three stages. The first stage has already been completed, the second
was recently completed and the third is under execution. Stage II area of IGNP starts from
Pugal and comprises the main canal from 620 RD to 1458 RD. The main canal gets water from
the Sutlej River in Punjab through a feeder canal.
The climate of the region is arid with an average annual rainfall of about 200-250
mm. The temperature ranges from freezing point in winter to above 50o C in summer. The
area covered by the IGNP consists of sandy undulating plains with various types of low-to-
medium sand dunes. The thickness of sand cover varies from a few centimeters to 200 meters
(m). The top aeolian soils have high permeability but the underlying sediments, comprising
silty clay and kankar, have low permeability. Prior to introduction of the canal irrigation, only
rain-fed agriculture was practiced. But the introduction of canal irrigation has changed the
cultural practices. Groundwater was also not generally available before the introduction of
this canal system. Barring a few sweet water locations along buried channels, groundwater
where present, was deep and saline. The main cause of the rise in water tables in IGNP Stage-
1The Government of Andhra Pradesh (GoAP) has proposed the Pollavaram Dam and the link canal
to Vijaywada irrespective of the realization of the NRLP design. However, the same dam would be
a link between the Mahanadi-Godavari scheme on the one hand and Godavari-Krishna (Pollavaram-
Vijaywada) Link on the other.
236
Nirmalya Choudhury, Ankit Patel and Sanjiv Phansalkar
II command is the presence of a hard pan at shallow depths. This pan restricts the downward
movement of the groundwater, resulting in the formation of perched water tables.
The main soil types of the study area are deep and calcareous flood plain soils and sand
dunes. The geology of the area is marked by aeolian sand and alluvium of quaternary age forming
extensive sandy plains. Alluvium is mostly fluvial in origin and comprises unconsolidated to
loosely consolidated sediments, consisting of an alternate sequence of sand, silt and clay with
frequent lens of silty clays and kankar with occasional gravel horizons. Groundwater occurs
in these alluvial sediments under water-table conditions. Groundwater is generally saline in
most parts of the study area. The important components of groundwater recharge in the area
are the IGNP canal system and their distributaries, Ghaggar Diversion Channel (constructed to
divert the floodwater of Ghaggar River to inter-dunal depressions) and inter-dunal depressions
south of Suratgarh. A substantial part of recharge is contributed by return flow of irrigation
water and some by annual precipitation. The groundwater level in the area has been rising
since the commencement of canal irrigation leading to waterlogging in the area. This high rise
in groundwater levels has led to systematic monitoring of groundwater levels from the year
1981-82.
Polavaram-Vijaywada Link Canal Area
Andhra Pradesh is bestowed with 108 Bm3 of water from groundwater, local and interstate
rivers out of which only 78 Bm3 are usable (GoAP 2003 b) . The present total use is about 62.3
Bm3 which are expected to reach 113 Bm3 by 2025 assuming that 3.5, 108, 1.4 and 0.1 Bm3
are required for drinking water, irrigation, industries and for power generation, respectively,
Hence, by 2025, the total water demand would have crossed the total availability.
Besides, about 36% of rural habitations and 72% of urban bodies still do not have
adequate drinking water facilities. The key water challenge in the state is increasing demand
for industrial and domestic water, which will have to be met from the present allocation to the
agriculture sector.
Long-distance interbasin transfer of water from water-surplus basins to water-deficit
basins has been mooted in India in order to reduce the imbalance in the water availability among
various regions. A National Perspective Plan (NPP) was formulated in 1980 by the Union
Ministry of Irrigation (now Ministry of Water Resources) and the Central Water Commission,
identifying a number of interbasin water transfer links in respect of both the peninsular and
the Himalayan rivers of the country. The Peninsular Rivers Development and the Himalayan
Rivers Development components put together were expected to create an additional irrigation
potential of 35 Mha besides hydropower potential and other benefits.
The interlinking of Mahanadi–Godavari-Krishna-Pennar-Cauvery is one of the four
parts of the Peninsular Rivers Development Component of the NPP. Amongst the peninsular
rivers, the Mahanadi and the Godavari have sizeable surpluses after meeting the existing and
projected requirements within the basins. It is, therefore, proposed to divert the surplus water
of the Mahanadi and the Godavari to the water-short river basins: the Krishna, the Pennar and
the Cauvery. Three water transfer links have been proposed, connecting Godavari to Krishna,
forming part of the interlinking. They are: (i) Inchampalli-Nagarjunasagar, (ii) Inchampalli-
Pulichintala, and (iii) Polavaram-Vijayawada. This report deals with the feasibility of the third
link, i.e., diversion of a part of the surplus Godavari water from the proposed Polavaram
Reservoir to the Prakasam Barrage on the Krishna River through the Godavari (Polavaram).
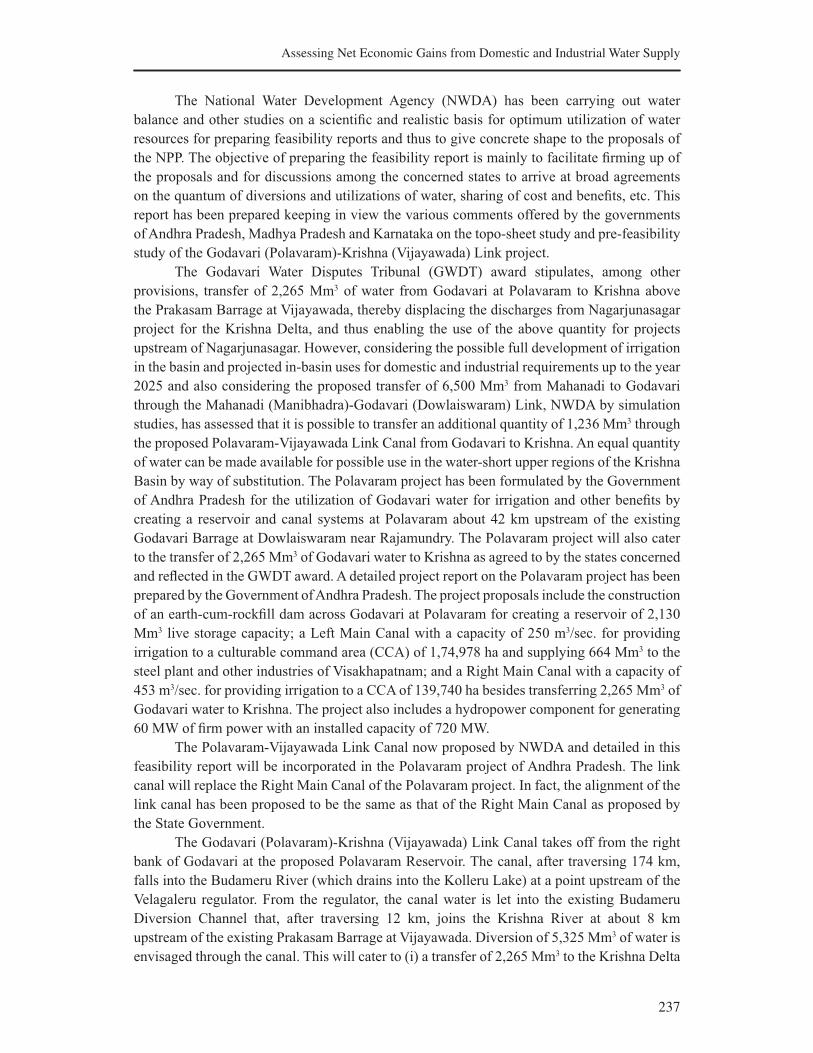
237
Assessing Net Economic Gains from Domestic and Industrial Water Supply
The National Water Development Agency (NWDA) has been carrying out water
balance and other studies on a scientific and realistic basis for optimum utilization of water
resources for preparing feasibility reports and thus to give concrete shape to the proposals of
the NPP. The objective of preparing the feasibility report is mainly to facilitate firming up of
the proposals and for discussions among the concerned states to arrive at broad agreements
on the quantum of diversions and utilizations of water, sharing of cost and benefits, etc. This
report has been prepared keeping in view the various comments offered by the governments
of Andhra Pradesh, Madhya Pradesh and Karnataka on the topo-sheet study and pre-feasibility
study of the Godavari (Polavaram)-Krishna (Vijayawada) Link project.
The Godavari Water Disputes Tribunal (GWDT) award stipulates, among other
provisions, transfer of 2,265 Mm3 of water from Godavari at Polavaram to Krishna above
the Prakasam Barrage at Vijayawada, thereby displacing the discharges from Nagarjunasagar
project for the Krishna Delta, and thus enabling the use of the above quantity for projects
upstream of Nagarjunasagar. However, considering the possible full development of irrigation
in the basin and projected in-basin uses for domestic and industrial requirements up to the year
2025 and also considering the proposed transfer of 6,500 Mm3 from Mahanadi to Godavari
through the Mahanadi (Manibhadra)-Godavari (Dowlaiswaram) Link, NWDA by simulation
studies, has assessed that it is possible to transfer an additional quantity of 1,236 Mm3 through
the proposed Polavaram-Vijayawada Link Canal from Godavari to Krishna. An equal quantity
of water can be made available for possible use in the water-short upper regions of the Krishna
Basin by way of substitution. The Polavaram project has been formulated by the Government
of Andhra Pradesh for the utilization of Godavari water for irrigation and other benefits by
creating a reservoir and canal systems at Polavaram about 42 km upstream of the existing
Godavari Barrage at Dowlaiswaram near Rajamundry. The Polavaram project will also cater
to the transfer of 2,265 Mm3 of Godavari water to Krishna as agreed to by the states concerned
and reflected in the GWDT award. A detailed project report on the Polavaram project has been
prepared by the Government of Andhra Pradesh. The project proposals include the construction
of an earth-cum-rockfill dam across Godavari at Polavaram for creating a reservoir of 2,130
Mm3 live storage capacity; a Left Main Canal with a capacity of 250 m3/sec. for providing
irrigation to a culturable command area (CCA) of 1,74,978 ha and supplying 664 Mm3 to the
steel plant and other industries of Visakhapatnam; and a Right Main Canal with a capacity of
453 m3/sec. for providing irrigation to a CCA of 139,740 ha besides transferring 2,265 Mm3 of
Godavari water to Krishna. The project also includes a hydropower component for generating
60 MW of firm power with an installed capacity of 720 MW.
The Polavaram-Vijayawada Link Canal now proposed by NWDA and detailed in this
feasibility report will be incorporated in the Polavaram project of Andhra Pradesh. The link
canal will replace the Right Main Canal of the Polavaram project. In fact, the alignment of the
link canal has been proposed to be the same as that of the Right Main Canal as proposed by
the State Government.
The Godavari (Polavaram)-Krishna (Vijayawada) Link Canal takes off from the right
bank of Godavari at the proposed Polavaram Reservoir. The canal, after traversing 174 km,
falls into the Budameru River (which drains into the Kolleru Lake) at a point upstream of the
Velagaleru regulator. From the regulator, the canal water is let into the existing Budameru
Diversion Channel that, after traversing 12 km, joins the Krishna River at about 8 km
upstream of the existing Prakasam Barrage at Vijayawada. Diversion of 5,325 Mm3 of water is
envisaged through the canal. This will cater to (i) a transfer of 2,265 Mm3 to the Krishna Delta
238
Nirmalya Choudhury, Ankit Patel and Sanjiv Phansalkar
as committed under the GWDT award, (ii) an en-route irrigation requirement of 1,402 Mm3,
(iii) en-route domestic and industrial requirements of 162 Mm3, and (iv) transmission losses
of 260 Mm3. The remaining 1,236 Mm3 of water will be utilized for stabilizing the existing
ayacut under the Krishna Delta. With 1,402 Mm3 of water available for en-route irrigation, an
area of 139,740 ha (CCA) will be benefited with 150% intensity of irrigation. The entire canal
and the command areas lie in Andhra Pradesh.
The total length of the link canal from Polavaram to Budameru will be 174 km. The
canal will pass through West Godavari and Krishna districts of Andhra Pradesh. The design
discharge at the head of the canal is 405.12 m3/sec. The canal will be trapezoidal and lined
throughout its length. The bed width will be 68.5 m and full supply depth 4.9 m. The bed slope
will be 1: 20,000. The link canal is proposed to be operated throughout the year.
The total cost of the Polavaram-Vijayawada Link project including the cost of command
area development, but excluding the apportioned cost of head works, i.e., Polavaram Dam and
appurtenant works, is estimated to be Rs 14,839.1 million at the 1994-95 price level. The net
value of annual benefits from irrigation in the en-route command due to the project works out
to Rs 2,011 million against the annual cost of Rs 1,646.274 million. Thus, the benefit:cost ratio
works out to 1.22.
The structures including the main link canal pass through the districts of East and West
Godavari and Krishna. These two districts have coastal alluvial soils in the east of the canal
and lateritic soils on the western parts of the canal. The western parts tend to be on a higher
elevation and water from the canal will not flow to them under gravity. The deltaic regions are
agriculturally very rich with crops such as sugarcane, paddy, banana and oil palm. Tobacco is
grown extensively on both the eastern and the western land masses of the canal. The Koleru
Lake widely known for its fish production lies to the east of the canal. The region has a tropical
humid climate.
Drinking Water Supply
Situation of Drinking Water in IGNP
There is widespread scarcity of potable water in the northwestern part of the state, which is
the area under IGNP. In the first place, groundwater is generally saline and unfit for human
consumption. Second, the existing surface water resources are not adequate or dependable.
The canal has become in its true sense a “life line” for this area. When the first revised
estimates for Stage-II of IGNP were sanctioned in May 1972, the available quantity of water
was to be used for agricultural purposes besides meeting the drinking water requirements of
the villages and abadis located in the command areas. Subsequently, requirements for water
for drinking and industrial purposes went on increasing. A provision of 1,073 Mm3 was kept
for nonagricultural purposes in the 1984 revised estimate of the project. The Public Health
Engineering Department (PHED), vested with the task of provision of drinking water, asked
for more reservation of water for drinking and industrial activities in the command area on the
basis of expected population rise in the following two decades.
The PHED supplies, on average, 1,344 million liters of water a day. Surface water
contributes 604 million liters (45% of the total), and groundwater the remaining 740 million
liters for Rajasthan (Tables 1 and 2).
239
Assessing Net Economic Gains from Domestic and Industrial Water Supply
Table 1. Population with drinking water facilities in Rajasthan.
District FC FC
(%)NC
NC
(%)PC
PC
(%)Grand total
Barmer 106,478 5.9 1,711,762 94.1 168 0.0 1,818,408
Bikaner 568,995 31.3 356,354 19.6 336,705 18.5 1,262,054
Churu 508,046 27.9 404,239 22.2 294,065 16.2 1,206,350
Ganganagar 1,077,473 59.3 127,223 7.0 140,490 7.7 1,345,186
Hanumangadh 747,088 41.1 35,583 2.0 428,425 23.6 1,211,096
Jaisalmer 50,334 2.8 355,074 19.5 26,448 1.5 431,856
Jhunjhanu 721,333 39.7 547,232 30.1 256,328 14.1 1,524,893
Jodhpur 41,567 2.3 1,640,413 90.2 231,718 12.7 1,913,698
Najaur 118,436 6.5 2,116,865 116.4 58,816 3.2 2,294,117
Sikar 519,198 28.6 786,928 43.3 509,124 28.0 1,815,250
Notes: FC=fully covered; NC= not covered; PC=partially covered.
Source: National Habitation Survey 2003, (GoI 2004).
Table 2. Sources of drinking water supply for the urban population.
Source of supply No. of towns and citiesQuantity supplied
Million liters/day Mm3/yr
Surface water 40 604 220.5
Groundwater 151 740 270.1
Surface water and groundwater 31
Total 222 1,344 490.5
Source: Report of the Expert Committee on Integrated Development of Water Resources, June 2005 (GoR 2005)
It is being proposed to provide water from IGNP not only for the project area but also
for cities and villages located outside the command area. At present, IGNP water is being
supplied to villages and towns partly or fully in eight districts. Two more districts will be
added. Ultimately, a population of about 20 million located in 24 cities/towns and 5,300
villages/settlements would draw drinking water supplies form this canal by the year 2045
(GoR 2002).
Drinking Water Situation in the Polavaram-Vijayawada (PV) Link Canal
Sources of drinking water in the areas of PV Link canal are the main groundwater-based.
Vishakhapattanam City slated to be among the main beneficiaries of the link in terms of supply
of water for domestic and industrial applications (Table 3). At present, out of a total 65.12
Bm3 water use, drinking water supply is 0.59 and industrial water use is 0.28 Bm3, while
irrigation receives the lion’s share of 64.21 Bm3 (GoAP 2003 b). There are several issues such
as inequality in distribution of water supply in rural as well as urban areas, deterioration of

240
Nirmalya Choudhury, Ankit Patel and Sanjiv Phansalkar
water quality due to municipal/domestic, industrial and agricultural pollution, pricing of water,
competing interests in the use and management of water and more efficient use of water in all
the sectors.
Table 3. Drinking water in the PV Link canal area.
District Mandalam FCFC
(%)NC
NC
(%)PC PC (%) Grand total
East Godavari Amalapuram 36 26 1 1 102 73 139
Biccavolu 3 17 0 15 83 18
Peddapuram 7 28 0 18 72 25
Seethanagaram 22 92 0 2 8 24
Krishna Nuzvid 28 56 2 4 20 40 50
Vizag Anakapalle 49 46 5 5 52 49 106
Narsipatnam 8 17 4 9 35 74 47
West Godavari Pedavegi 0 0 55 100 55
Tadepalligudem 23 61 1 3 14 37 38
Notes: FC=fully covered; NC= not covered; PC=partially covered.
Source: National Habitation Survey 2003, Status of Drinking Water Supply, GoI 2004.
According to the Public Health and Municipal Engineering Department of the
Government of Andhra Pradesh, only 33 out of 117 municipal bodies are being supplied
with adequate water. An average supply of only 48 liters per capita per day (lpcd) could be
achieved against the standards of 140 lpcd. Out of the 69,732 rural population in the state-
protected area, water supply has been provided to only 44,951, and the remaining population
is yet to be supplied with water. Nearly 75% of the rural drinking water requirement is met
using groundwater, which is around 800 Mm3 and likely to be 876 Mm3 by the year 2020
(Table 4). Already, a population of more than 21,000 is affected with poor-quality groundwater
(Panchayati Raj Rural Development Department RWS).
Table 4. Water requirement estimates of different sectors (Bm3).
Year Drinking waterBalance left for
irrigation
Water for
industries
Water for
power
Total
development
Present 0.59 64.21 0.28 0.03 65.12
2020 3.45 67.00 1.00 0.05 71.50
2025 3.45 107.98 1.44 0.06 112.94
Source: Andhra Pradesh Water Vision 2003 (GoAP 2003 a).
According to the Public Health and Municipal Engineering Department of the
Government of Andhra Pradesh, the cost of water supply from groundwater sources (bore
wells and subsurface water) is Rs 5 per kiloliter while that from surface water sources is Rs
10 per kiloliter; at the same time, the cost recovery is only Rs 2.25 per kiloliter. At present,
diversion of surface water for drinking water schemes is 5 mld, 14 mld million liters per day
and 10 mld from Godavari, Krishna and Pennar river basins, respectively. In the future, the
241
Assessing Net Economic Gains from Domestic and Industrial Water Supply
quantity of water diverted will have to be increased to 414, 378 and 90 mld from Godavari,
Krishna and Pennar river basins, respectively (GoAP 2003b).
Industrial Water
Industrial Water in IGNP Area
Except for some village-level wool manufacturing and leather and carpentry works, there
were hardly any industries in the project area before IGNP. In 1951, there were 17 registered
factories in Sri Ganganagar District, which rose to 85 in 1961. By 1980, the figure went up to
828, with 14,500 employees. The major contribution in the rapid growth of industries between
1961 and 1981 is due to IGNP, after the project commenced in this region in 1961. Now there
are many agro-based industries flourishing in the project area.
Industrial Water in PV Link Canal Area
Andhra Pradesh ranks sixth in industrial production in India. Major industries cover information
technology, bulk drugs and pharmaceuticals, basin chemicals, agro-processing, mineral-based
industries, metal industries, engineering, textiles, leather, cement, sugar, power, fertilizers,
gems, jewelry, papers, petrochemicals, etc. There are 242 industrial estates in the states, 3,055
medium- and large-scale units, 16,000 registered factories and 140,000 registered small-scale
industries. A considerable concentration of industries can be found around the Hyderabad and
Vishakhapatanam urban conglomeration. Employment in the industries increased from 0.4%
in 1961 to 1.5% in 2000. By 2025, the industrial sector is expected to grow 13-fold at a growth
rate of 11% per annum (GoAP 2003b). Industrial water requirement is likely to increase to
1.44 Bm3 by 2025 from the present 0.28 Bm3.
Issue of Water Quality
In the IGNP areas, water quality issues are connected with high levels of total dissolved solids
(TDS) in groundwater. Fluoride contamination is known to occur in several patches in the
area. The problem caused by high TDS and fluoride is exacerbating over time, and one of the
chief advantages of the domestic water supply from IGNP is seen as the reduction in health
syndromes arising out of poor water quality. In fact, the areas severely affected with these
issues will be given priority in the supply of domestic water from the IGNP and the task of
establishing relevant structures is expected to be completed by 2010.
The issues of water quality in the PV Link Canal areas are somewhat muted at this point
in time. Coastal salinity ingress in the East Godavari District has been reported to be rising.
Also, chemicals used in coastal aquaculture are said to be causing groundwater pollution
which is on the rise in the Krishna District. The supply of drinking water to these areas is thus
likely to have positive though somewhat less-prominent effects.
Review of Literature and Methods
This review mainly relates to literature pertaining to valuation of domestic and industrial
water gains. Possible methods of valuation include the Techniques of Valuation (source:
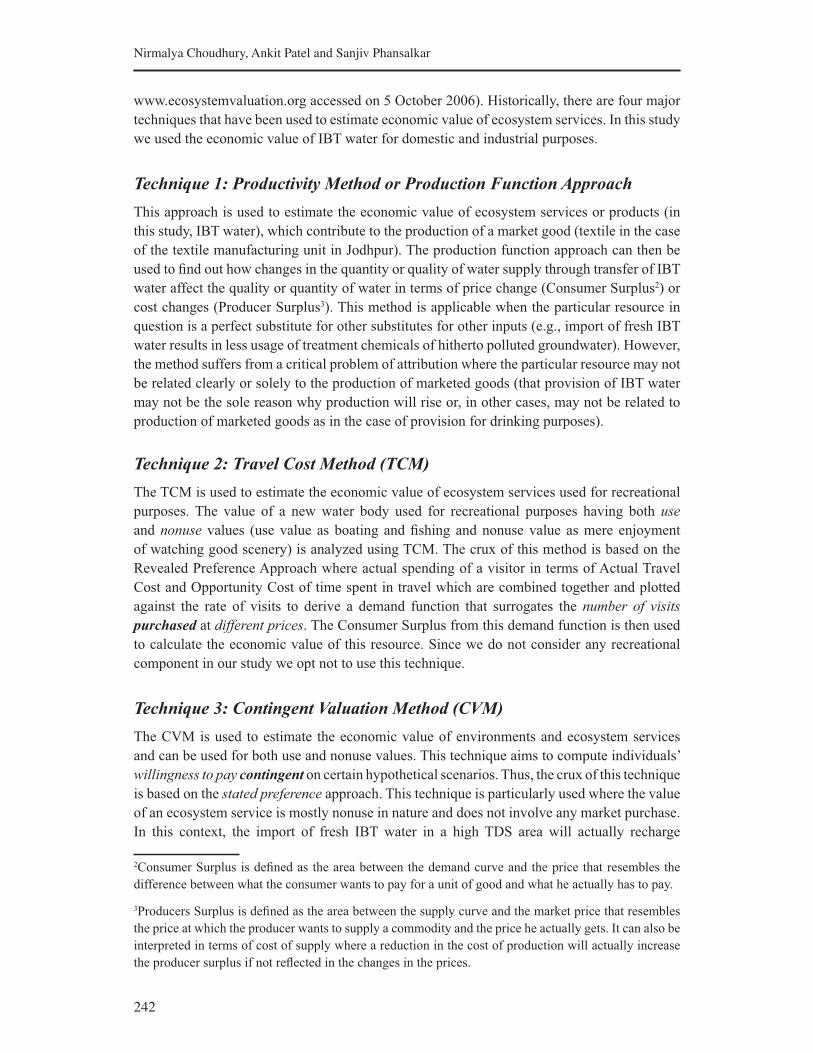
242
Nirmalya Choudhury, Ankit Patel and Sanjiv Phansalkar
www.ecosystemvaluation.org accessed on 5 October 2006). Historically, there are four major
techniques that have been used to estimate economic value of ecosystem services. In this study
we used the economic value of IBT water for domestic and industrial purposes.
Technique 1: Productivity Method or Production Function Approach
This approach is used to estimate the economic value of ecosystem services or products (in
this study, IBT water), which contribute to the production of a market good (textile in the case
of the textile manufacturing unit in Jodhpur). The production function approach can then be
used to find out how changes in the quantity or quality of water supply through transfer of IBT
water affect the quality or quantity of water in terms of price change (Consumer Surplus2) or
cost changes (Producer Surplus3). This method is applicable when the particular resource in
question is a perfect substitute for other substitutes for other inputs (e.g., import of fresh IBT
water results in less usage of treatment chemicals of hitherto polluted groundwater). However,
the method suffers from a critical problem of attribution where the particular resource may not
be related clearly or solely to the production of marketed goods (that provision of IBT water
may not be the sole reason why production will rise or, in other cases, may not be related to
production of marketed goods as in the case of provision for drinking purposes).
Technique 2: Travel Cost Method (TCM)
The TCM is used to estimate the economic value of ecosystem services used for recreational
purposes. The value of a new water body used for recreational purposes having both use
and nonuse values (use value as boating and fishing and nonuse value as mere enjoyment
of watching good scenery) is analyzed using TCM. The crux of this method is based on the
Revealed Preference Approach where actual spending of a visitor in terms of Actual Travel
Cost and Opportunity Cost of time spent in travel which are combined together and plotted
against the rate of visits to derive a demand function that surrogates the number of visits
purchased at different prices. The Consumer Surplus from this demand function is then used
to calculate the economic value of this resource. Since we do not consider any recreational
component in our study we opt not to use this technique.
Technique 3: Contingent Valuation Method (CVM)
The CVM is used to estimate the economic value of environments and ecosystem services
and can be used for both use and nonuse values. This technique aims to compute individuals’
willingness to pay contingent on certain hypothetical scenarios. Thus, the crux of this technique
is based on the stated preference approach. This technique is particularly used where the value
of an ecosystem service is mostly nonuse in nature and does not involve any market purchase.
In this context, the import of fresh IBT water in a high TDS area will actually recharge
2Consumer Surplus is defined as the area between the demand curve and the price that resembles the
difference between what the consumer wants to pay for a unit of good and what he actually has to pay.
3Producers Surplus is defined as the area between the supply curve and the market price that resembles
the price at which the producer wants to supply a commodity and the price he actually gets. It can also be
interpreted in terms of cost of supply where a reduction in the cost of production will actually increase
the producer surplus if not reflected in the changes in the prices.

243
Assessing Net Economic Gains from Domestic and Industrial Water Supply
groundwater and dilute the TDS content. But this passive use of IBT water remains outside
the market, which can be captured through this method. Although flexible, the methodology
of asking people questions rather than observing their behavior has made the technique very
controversial and the economic value computed using this technique is generally taken with
a pinch of salt!
Technique 4: Cost-Based Method Including Damage Control, Replacement
and Substitute Cost
The cost-based approach of valuation is often used to estimate the economic value of ecosystem
services in terms of Damage Cost Avoided, Replacement Cost and Substitute Cost. The
approach is based on the theoretical assumption that if the people incur costs to avoid damages
or provision for substitute services in the absence of the service in question then the services
must be worth at least what is paid to avoid, replace or substitute those services. Damage Cost
Avoided Method uses either the value of property protected or the cost of actions taken to avoid
damages as a measure of economic value of that service. In the context of this study, the cost
incurred in setting up a filtration plant or reverse osmosis (RO) plant in the case of industrial
use or fuel cost in boiling water in the case of domestic use would be an appropriate surrogate
of value of supply of fresh IBT water for domestic and industrial purposes.
The Replacement Cost Method uses the cost of replacing an ecosystem or its services as
an estimate of the value of those services. In the context of our study, if high TDS content of
groundwater causes erosion of boilers in the chilling plant of URMUL Dairy and thus compels
the industry to frequently replace the boiler or if a textile unit located in Jodhpur plans to shift
its entire production unit to another place because the contaminated groundwater in Jodhpur
actually affects their production then the cost of this replacement or relocation can act as a
surrogate value of supplying fresh IBT water to industrial units.
The Substitute Cost Method uses the cost of providing substitute services as an estimate
of the economic value of the ecosystem service. In the case of our study, the value of supplying
fresh IBT water could be the extra cost that the people (or units) incur while extracting
groundwater (which may include both pumping cost and quality impacts) or opportunity cost
in the case of an alternate source (in the case of purchase of tanker water or walking long
distances to a canal source or another village source to collect freshwater).
Method Adopted
For Domestic Water Supply
Humans and cattle, among others, have to obtain a minimum supply of water for survival. The
costs involved in obtaining the water are direct, indirect as well as in the nature of opportunity
gain/loss.
• Direct costs are those costs the consumers pay.
• Indirect costs are those imposed upon the users due to aspects of reliability and water
quality.
244
Nirmalya Choudhury, Ankit Patel and Sanjiv Phansalkar
• Opportunity gains or losses arise out of saving or increase in drudgery, labor, investment
(saving) of time and the consequential effects such as reduction in dropping in school
attendance, effect on health, etc.
Direct costs paid out for obtaining water supply from alternative sources are the easiest
to justify save for the fact that in a majority of the cases there is a significant element of subsidy
given by state agencies to the actual users. Thus, the costs paid out by actual user households
are not economic costs.4 The economic costs are absorbed by the water supply agencies and
the decisions on water levies to users are taken on the basis of parameters only one of which is
these direct paid-out costs. Thus, wherever households use water supplied by public agencies,
we need to look at costs incurred by these agencies and not by the households themselves
except so far as the households have to resort to self-provisioning when the public institutions
perform inadequately or unreliably. An assessment of the reliability and adequacy of the water
supply by public agencies and the costs paid out by users when the water from these sources
is not available is therefore necessary. The costs paid out by these agencies would be in the
nature of revenue expenditure on staff salaries, maintenance and power consumption, etc.,
as well as amortized components of the capital costs in installing water extraction, storage,
and purification and distribution systems. Some of these systems are/would be used by these
agencies even if the IBT water replaces current sources. Further, the use of IBT water would
perhaps entail installation of devices for conveying water from canal heads to cities, etc. The
gain to the system is therefore the difference between the existing paid-out costs and the new
costs.
Indirect costs arise due to effects of water quality. Wherever groundwater has high TDS
or has contaminants such as fluorine, treatment costs as well as costs in terms of lost wages
are imposed on users. Efforts have been exerted elsewhere to quantify these costs. There is a
wide diversity in situations concerning occurrence of contaminants and dissolved salts across
the region where IBT water is expected to flow in both the regions. Second, the assessment of
treatment costs and lost wages is a somewhat speculative exercise. In view of this, although
we propose to recognize these costs exist we choose to ignore them.
Householders who had to fetch water from far-off sources previously get opportunity
gains. Since fetching water is a task most often left to women and children of the households,
the task imposes severe drudgery on women and also leads to reduced attendance in schools
and health effects on young children. Easier and smoother supply of water using IBT water
coming into the village reduces this drudgery and investment of time and also contributes to
enhanced health and school attendance. Among these costs, the most directly measurable are
the “equivalent lost wage costs” for the time an adult woman has to spend on fetching water,
assuming, of course, that she has wage opportunities available on all the days of the year. The
gains due to health effects or increased attendance in schools, etc., are real but pose much
difficulty in valuation as they involve speculative assessment. Hence, we will consider only
the reduction in lost wage opportunity as the net gain due to IBT water.
Industrial Water Supply
Often, industrial activity in a location in India fails to come up only for want of a reliable water
supply. It is only when the entire value-addition in the industries which progress in a location
4Actual cost incurred for water supply varies from Rs 15 to 20 per 1,000 liters, while it is charged only Rs 1-5 per 1,000 liters.
245
Assessing Net Economic Gains from Domestic and Industrial Water Supply
after IBT water reaches it that it can be directly attributed to the water supply. However, it
can be argued that industries which fail to progress in place A do so in place B within the
country. As one is looking at costs and benefits at the national level and so long as one does not
explicitly place a value on a specific location of industries this is not a material consideration.
To argue that a certain industrial activity arises solely because water has become available
from IBT is untenable unless one can demonstrate that water at a specific place has a particular
contribution which another place would not have. In view of this, we do not choose to value
industrial activity made possible by the arrival of water from IBT at the full value-added
level.
The other advantage of water supply from IBT water comes in two forms. The first is
in avoidance of costs (both, amortized capital costs and revenue costs of electricity consumed,
etc.) incurred in obtaining water from alternative sources. Thus, if an industrial unit obtains
water from groundwater sources and subsequently starts obtaining water from IBT sources,
then the net consideration is the savings made by the industrial unit in terms of electricity
consumed, etc. The second benefit arises from the fact that the treatment costs on freshwater
supply from canals in the IBT schemes may possibly be lower than the treatment costs for
water obtained from alternative sources. It is tenable to argue that costs in demineralizing
water obtained from IBT sources would be smaller compared to those in demineralizing water
from groundwater sources (Kumar et al. 2002). The third benefit that arises in certain cases is
because use of better-quality water may enhance the quality of the product and hence fetch a
better price. We propose to consider these three benefits.
Sources of Data
Secondary data were collected from Bikaner, Hanumangarh, Jaipur and Jaisalmer offices of
the Indira Gandhi Nahar Board; all district offices, websites, annual reports, Census 2001 and
District Statistical Handbooks of the Public Health Engineering Department (PHED); District
Industrial Centre (DIC) and Rajasthan Industrial Investment Corporation (RIICO) offices in
various districts; and from State’s Economic and Statistical Department and its publications.
Primary data collection was carried out with the help of Urmul Trust, Bikaner. Data for the
exercise were obtained from three sources.
a. Secondary data sources were used for gathering information on the reach of the
domestic water supply schemes based on the two canals. These included the departments
connected with drinking water supply in Rajasthan and Andhra Pradesh.
b. Primary data at the level of households and villages were obtained by conducting a
primary survey as outlined below.
The survey was conducted in 10 districts of Rajasthan. In eight districts IGNP water is
being supplied for drinking and industrial purposes. These are Hanumangarh, Sri Ganganagar,
Bikaner, Churu, Jhunjhanu, Jaisalmer, Jodhpur and Barmer. Sikar and Najaur will receive
IGNP water very shortly. By and large, the study covered 497 households from 50 villages of
10 districts. The data represent the population of more than 225,000.
246
Nirmalya Choudhury, Ankit Patel and Sanjiv Phansalkar
Identification of Samples for Drinking Water
The sample villages were identified based on three criteria: villages depending upon canal
water, villages depending solely on groundwater and villages with a combination of these two.
Cities were identified based on the urban classifications, i.e., Class-I to Class-VI. Representative
towns/cities from all the urban classes were identified for the sample survey. Altogether, 17
towns/cities were identified. Lists of the sample villages and towns/cities are given in Tables
10 and 15. Households in these villages were identified randomly. In most of the villages, one
household from each vaas (hamlet) was identified and the householders interviewed with the
help of a questionnaire. The household survey form comprised information related to family
members, age, income, primary and alternative sources of drinking water during normal and
scarcity periods, direct cost paid out to obtain the water, time spent to collect from sources,
etc.
Apart from the household survey, village-level information was collected using the
village-level survey form, which mainly covered data pertaining to water supply, its source,
head works, methods of water supply, number of connections, tariff structure and recovery,
type of treatment given, etc. Similarly, town- and city-level survey forms were filled out. These
forms were filled out by the survey team as per the information given by the administrative
personnel. The survey was conducted by a team of five persons from December 2006 to
February 2007. This team had conducted surveys in all the 10 districts in around 10 weeks’
time. To reduce sample biases, the same survey team had covered all the sample villages and
households.
A similar procedure was followed in Andhra Pradesh. The survey work was done in
Vishakhapattanam, East Godavari, West Godavari and Krishna districts. In these districts, 359
households in 36 villages were covered. The survey instruments for the two regions of IGNP
canal command area and PV Link were the same. These were translated into the local language
and administered with the help of the partners: URMUL Trust in the case of IGNP and a
consultant, Nikhil Mathur, in the case of AP. Prior to a full-fledged survey, the instruments
were tested in Anand and the two respective areas.
Data from urban centers were obtained through personal interviews with the appropriate
municipal authorities as well as selected key informants as outlined below. In urban centers,
information from the secondary sources was collected to determine the cost paid out by the
households. Survey of tanker water suppliers, interviews of water supply department engineers,
and several indirect methods were used to estimate the economic costs of urban water scarcity.
These include using alternative costs of shortages paid out by the households and the average
number of days of water scarcity.
Sample Characterization
Sample Characteristics of Rural Drinking Water, IGNP
In the IGNP areas, 497 households were surveyed. In the sample, the average age of the
respondents was 47 years, while the average family size was 7.3 persons per household, with
the lowest, 5.9, in Barmer and the highest, 9.5, in Bikaner. A family’s average monthly income
was found to be Rs 3,643. The highest monthly income (Rs 5,909) was found in the Sikar
District and the lowest (Rs 2,481) in Churu. Mean monthly income was found to be Rs 3,646
(Table 5).
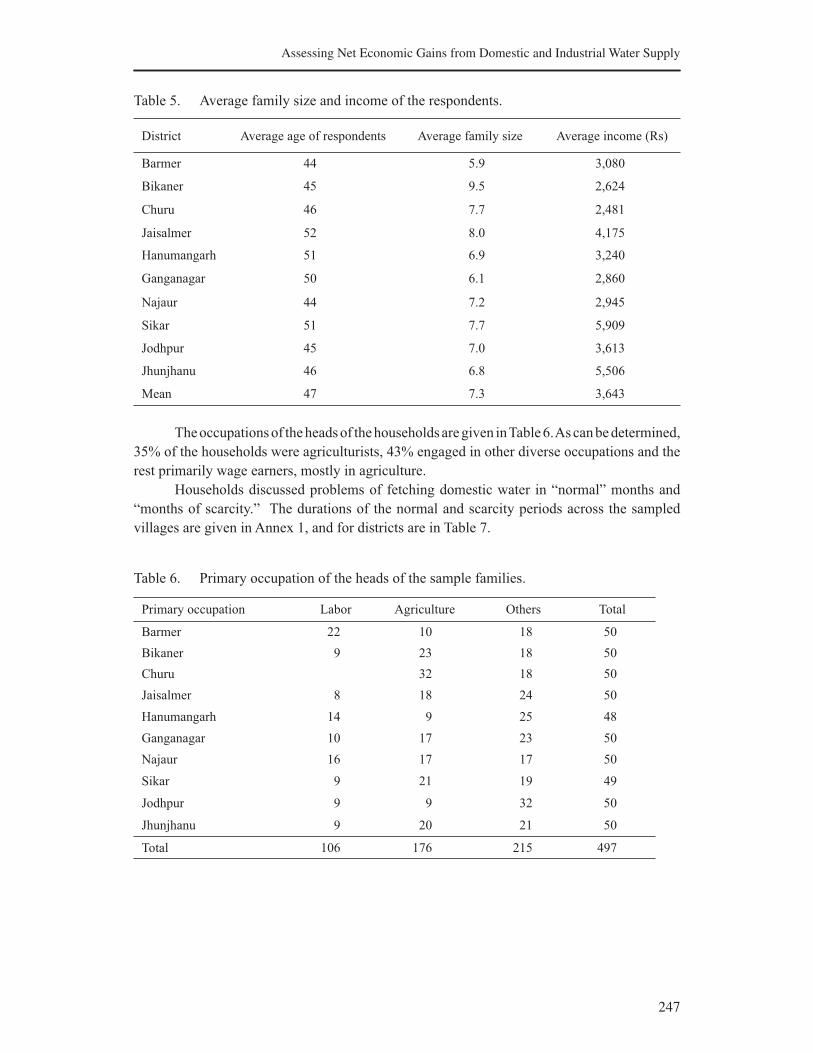
247
Assessing Net Economic Gains from Domestic and Industrial Water Supply
Table 5. Average family size and income of the respondents.
District Average age of respondents Average family size Average income (Rs)
Barmer 44 5.9 3,080
Bikaner 45 9.5 2,624
Churu 46 7.7 2,481
Jaisalmer 52 8.0 4,175
Hanumangarh 51 6.9 3,240
Ganganagar 50 6.1 2,860
Najaur 44 7.2 2,945
Sikar 51 7.7 5,909
Jodhpur 45 7.0 3,613
Jhunjhanu 46 6.8 5,506
Mean 47 7.3 3,643
The occupations of the heads of the households are given in Table 6. As can be determined,
35% of the households were agriculturists, 43% engaged in other diverse occupations and the
rest primarily wage earners, mostly in agriculture.
Households discussed problems of fetching domestic water in “normal” months and
“months of scarcity.” The durations of the normal and scarcity periods across the sampled
villages are given in Annex 1, and for districts are in Table 7.
Table 6. Primary occupation of the heads of the sample families.
Primary occupation Labor Agriculture Others Total
Barmer 22 10 18 50
Bikaner 9 23 18 50
Churu 32 18 50
Jaisalmer 8 18 24 50
Hanumangarh 14 9 25 48
Ganganagar 10 17 23 50
Najaur 16 17 17 50
Sikar 9 21 19 49
Jodhpur 9 9 32 50
Jhunjhanu 9 20 21 50
Total 106 176 215 497
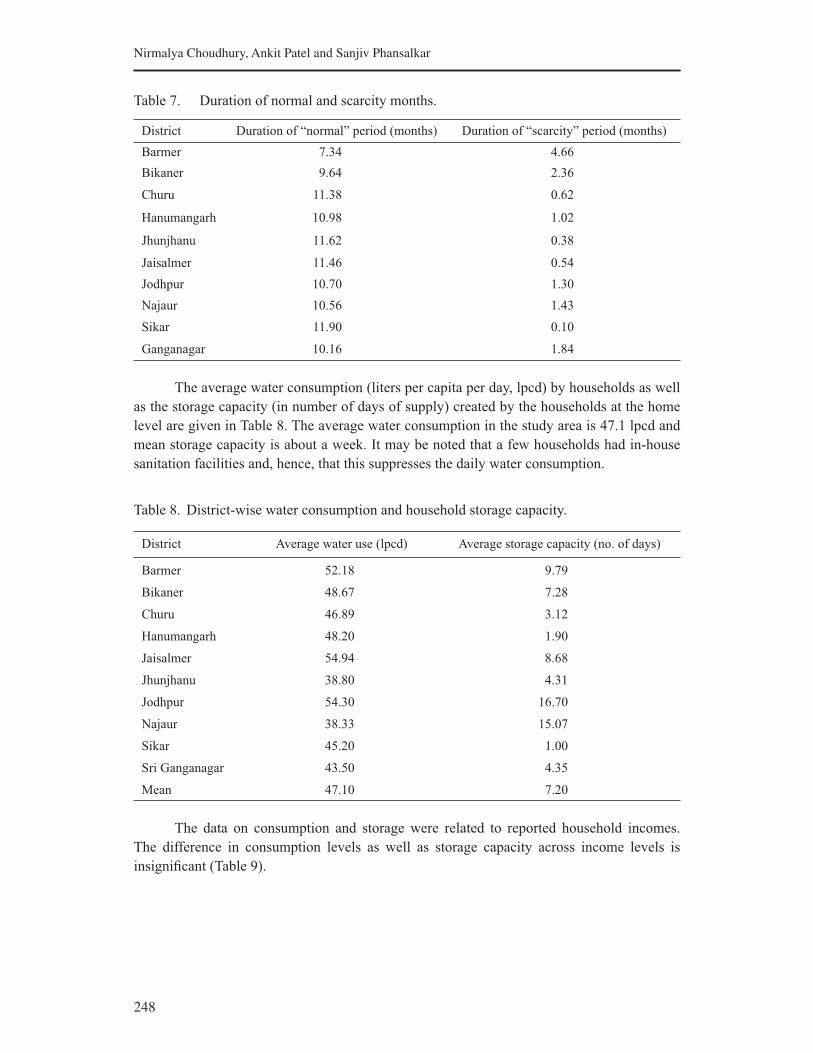
248
Nirmalya Choudhury, Ankit Patel and Sanjiv Phansalkar
Table 7. Duration of normal and scarcity months.
District Duration of “normal” period (months) Duration of “scarcity” period (months)
Barmer 7.34 4.66
Bikaner 9.64 2.36
Churu 11.38 0.62
Hanumangarh 10.98 1.02
Jhunjhanu 11.62 0.38
Jaisalmer 11.46 0.54
Jodhpur 10.70 1.30
Najaur 10.56 1.43
Sikar 11.90 0.10
Ganganagar 10.16 1.84
The average water consumption (liters per capita per day, lpcd) by households as well
as the storage capacity (in number of days of supply) created by the households at the home
level are given in Table 8. The average water consumption in the study area is 47.1 lpcd and
mean storage capacity is about a week. It may be noted that a few households had in-house
sanitation facilities and, hence, that this suppresses the daily water consumption.
Table 8. District-wise water consumption and household storage capacity.
District Average water use (lpcd) Average storage capacity (no. of days)
Barmer 52.18 9.79
Bikaner 48.67 7.28
Churu 46.89 3.12
Hanumangarh 48.20 1.90
Jaisalmer 54.94 8.68
Jhunjhanu 38.80 4.31
Jodhpur 54.30 16.70
Najaur 38.33 15.07
Sikar 45.20 1.00
Sri Ganganagar 43.50 4.35
Mean 47.10 7.20
The data on consumption and storage were related to reported household incomes.
The difference in consumption levels as well as storage capacity across income levels is
insignificant (Table 9).
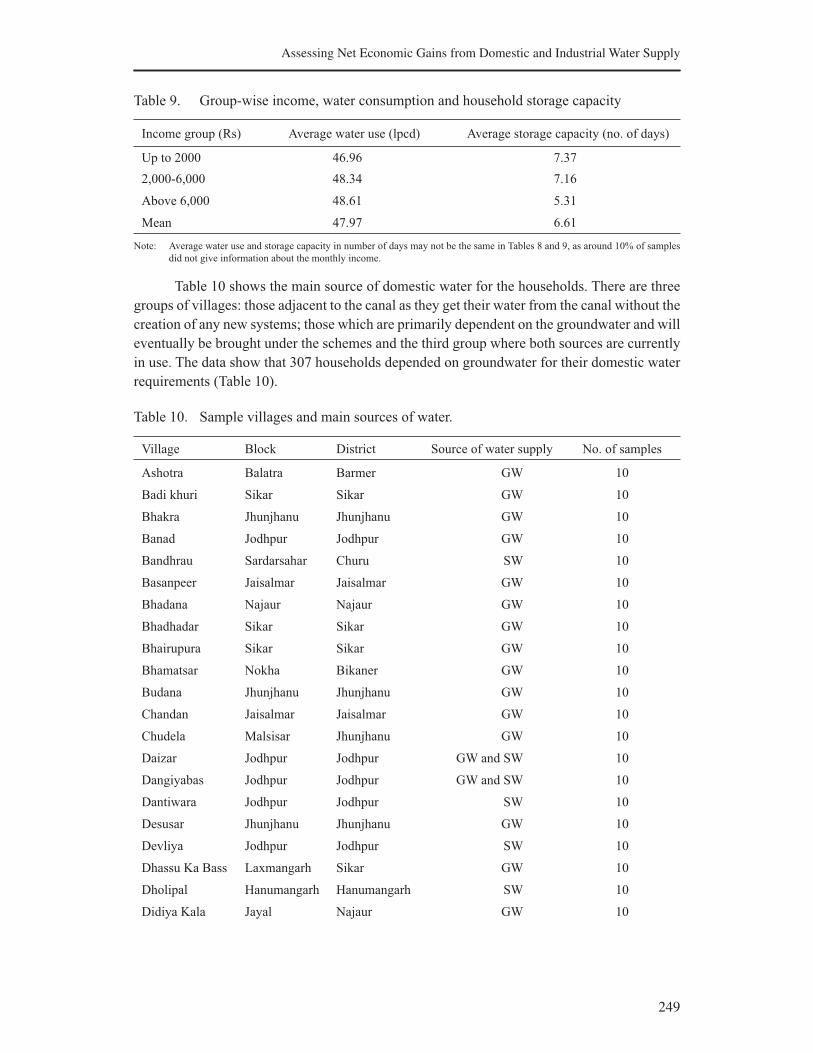
249
Assessing Net Economic Gains from Domestic and Industrial Water Supply
Table 9. Group-wise income, water consumption and household storage capacity
Income group (Rs) Average water use (lpcd) Average storage capacity (no. of days)
Up to 2000 46.96 7.37
2,000-6,000 48.34 7.16
Above 6,000 48.61 5.31
Mean 47.97 6.61
Note: Average water use and storage capacity in number of days may not be the same in Tables 8 and 9, as around 10% of samples
did not give information about the monthly income.
Table 10 shows the main source of domestic water for the households. There are three
groups of villages: those adjacent to the canal as they get their water from the canal without the
creation of any new systems; those which are primarily dependent on the groundwater and will
eventually be brought under the schemes and the third group where both sources are currently
in use. The data show that 307 households depended on groundwater for their domestic water
requirements (Table 10).
Table 10. Sample villages and main sources of water.
Village Block District Source of water supply No. of samples
Ashotra Balatra Barmer GW 10
Badi khuri Sikar Sikar GW 10
Bhakra Jhunjhanu Jhunjhanu GW 10
Banad Jodhpur Jodhpur GW 10
Bandhrau Sardarsahar Churu SW 10
Basanpeer Jaisalmar Jaisalmar GW 10
Bhadana Najaur Najaur GW 10
Bhadhadar Sikar Sikar GW 10
Bhairupura Sikar Sikar GW 10
Bhamatsar Nokha Bikaner GW 10
Budana Jhunjhanu Jhunjhanu GW 10
Chandan Jaisalmar Jaisalmar GW 10
Chudela Malsisar Jhunjhanu GW 10
Daizar Jodhpur Jodhpur GW and SW 10
Dangiyabas Jodhpur Jodhpur GW and SW 10
Dantiwara Jodhpur Jodhpur SW 10
Desusar Jhunjhanu Jhunjhanu GW 10
Devliya Jodhpur Jodhpur SW 10
Dhassu Ka Bass Laxmangarh Sikar GW 10
Dholipal Hanumangarh Hanumangarh SW 10
Didiya Kala Jayal Najaur GW 10
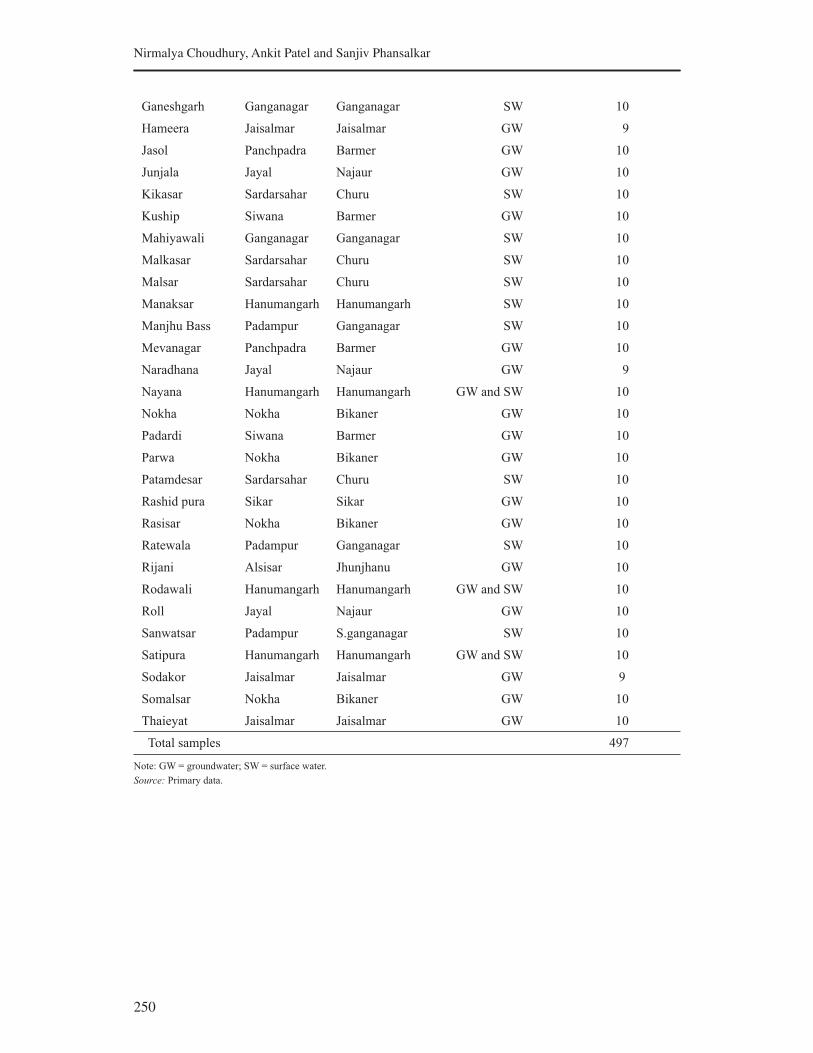
250
Nirmalya Choudhury, Ankit Patel and Sanjiv Phansalkar
Ganeshgarh Ganganagar Ganganagar SW 10
Hameera Jaisalmar Jaisalmar GW 9
Jasol Panchpadra Barmer GW 10
Junjala Jayal Najaur GW 10
Kikasar Sardarsahar Churu SW 10
Kuship Siwana Barmer GW 10
Mahiyawali Ganganagar Ganganagar SW 10
Malkasar Sardarsahar Churu SW 10
Malsar Sardarsahar Churu SW 10
Manaksar Hanumangarh Hanumangarh SW 10
Manjhu Bass Padampur Ganganagar SW 10
Mevanagar Panchpadra Barmer GW 10
Naradhana Jayal Najaur GW 9
Nayana Hanumangarh Hanumangarh GW and SW 10
Nokha Nokha Bikaner GW 10
Padardi Siwana Barmer GW 10
Parwa Nokha Bikaner GW 10
Patamdesar Sardarsahar Churu SW 10
Rashid pura Sikar Sikar GW 10
Rasisar Nokha Bikaner GW 10
Ratewala Padampur Ganganagar SW 10
Rijani Alsisar Jhunjhanu GW 10
Rodawali Hanumangarh Hanumangarh GW and SW 10
Roll Jayal Najaur GW 10
Sanwatsar Padampur S.ganganagar SW 10
Satipura Hanumangarh Hanumangarh GW and SW 10
Sodakor Jaisalmar Jaisalmar GW 9
Somalsar Nokha Bikaner GW 10
Thaieyat Jaisalmar Jaisalmar GW 10
Total samples 497
Note: GW = groundwater; SW = surface water.
Source: Primary data.
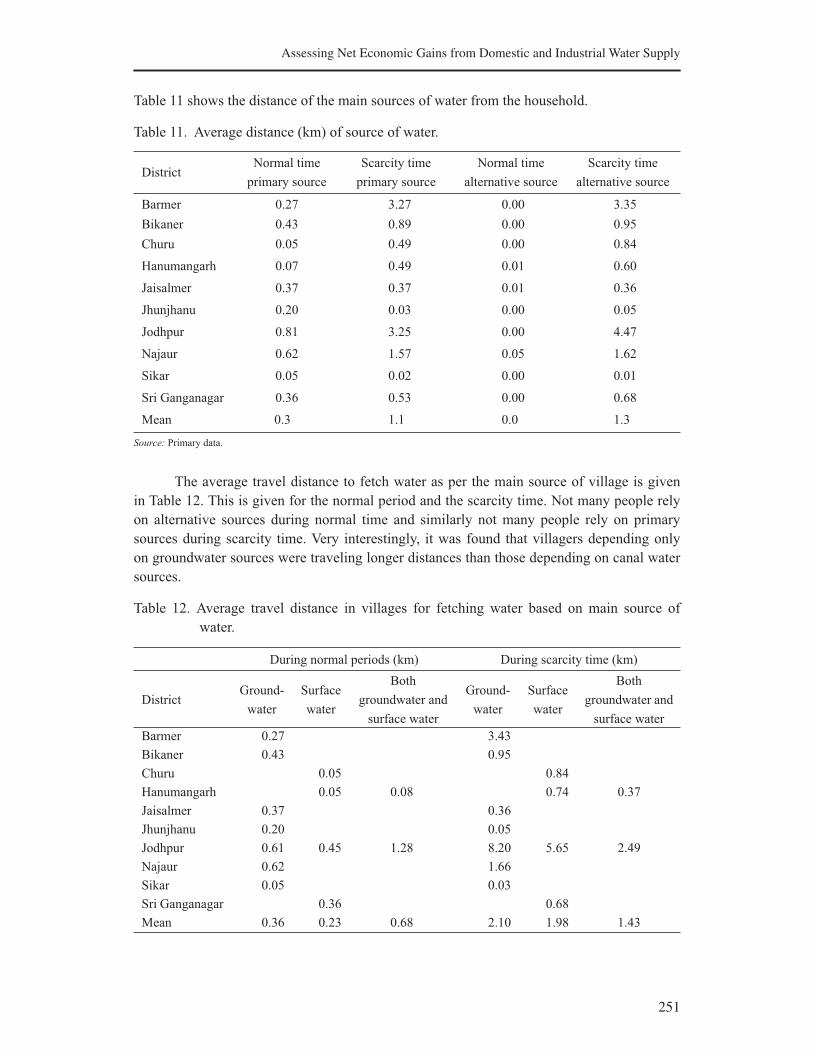
251
Assessing Net Economic Gains from Domestic and Industrial Water Supply
Table 11 shows the distance of the main sources of water from the household.
Table 11. Average distance (km) of source of water.
DistrictNormal time
primary source
Scarcity time
primary source
Normal time
alternative source
Scarcity time
alternative source
Barmer 0.27 3.27 0.00 3.35
Bikaner 0.43 0.89 0.00 0.95
Churu 0.05 0.49 0.00 0.84
Hanumangarh 0.07 0.49 0.01 0.60
Jaisalmer 0.37 0.37 0.01 0.36
Jhunjhanu 0.20 0.03 0.00 0.05
Jodhpur 0.81 3.25 0.00 4.47
Najaur 0.62 1.57 0.05 1.62
Sikar 0.05 0.02 0.00 0.01
Sri Ganganagar 0.36 0.53 0.00 0.68
Mean 0.3 1.1 0.0 1.3
Source: Primary data.
The average travel distance to fetch water as per the main source of village is given
in Table 12. This is given for the normal period and the scarcity time. Not many people rely
on alternative sources during normal time and similarly not many people rely on primary
sources during scarcity time. Very interestingly, it was found that villagers depending only
on groundwater sources were traveling longer distances than those depending on canal water
sources.
Table 12. Average travel distance in villages for fetching water based on main source of
water.
During normal periods (km) During scarcity time (km)
DistrictGround-
water
Surface
water
Both
groundwater and
surface water
Ground-
water
Surface
water
Both
groundwater and
surface water
Barmer 0.27 3.43
Bikaner 0.43 0.95
Churu 0.05 0.84
Hanumangarh 0.05 0.08 0.74 0.37
Jaisalmer 0.37 0.36
Jhunjhanu 0.20 0.05
Jodhpur 0.61 0.45 1.28 8.20 5.65 2.49
Najaur 0.62 1.66
Sikar 0.05 0.03
Sri Ganganagar 0.36 0.68
Mean 0.36 0.23 0.68 2.10 1.98 1.43
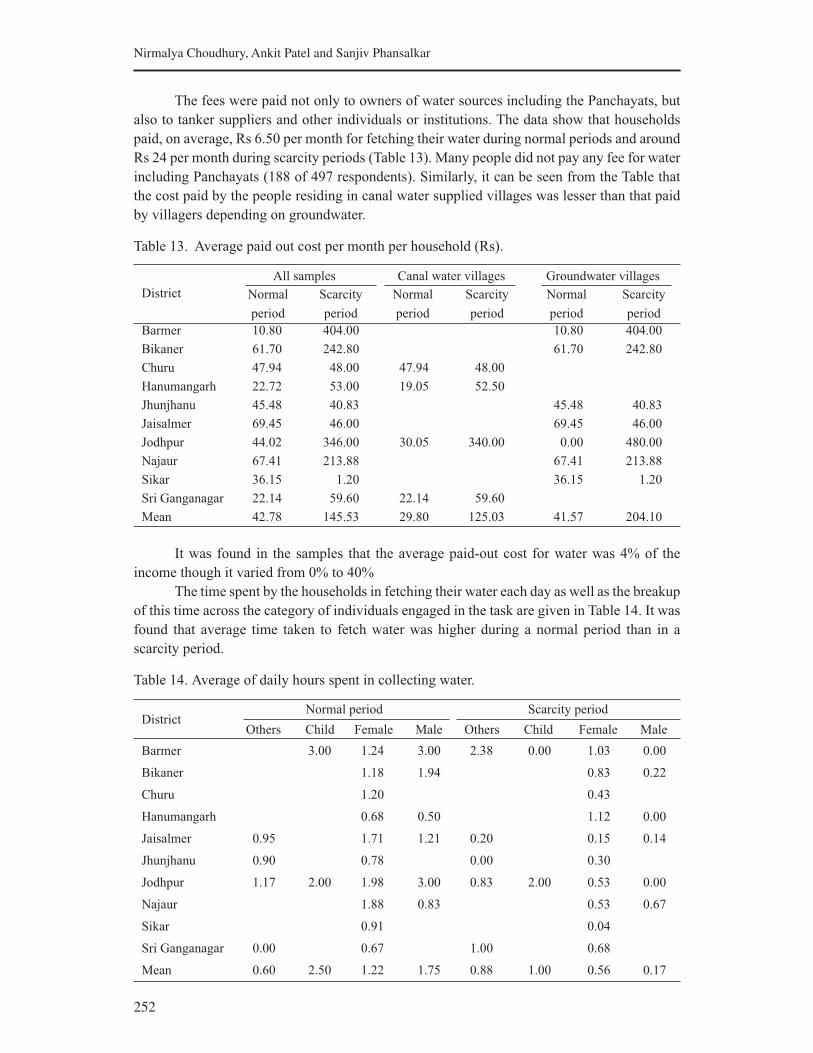
252
Nirmalya Choudhury, Ankit Patel and Sanjiv Phansalkar
The fees were paid not only to owners of water sources including the Panchayats, but
also to tanker suppliers and other individuals or institutions. The data show that households
paid, on average, Rs 6.50 per month for fetching their water during normal periods and around
Rs 24 per month during scarcity periods (Table 13). Many people did not pay any fee for water
including Panchayats (188 of 497 respondents). Similarly, it can be seen from the Table that
the cost paid by the people residing in canal water supplied villages was lesser than that paid
by villagers depending on groundwater.
Table 13. Average paid out cost per month per household (Rs).
District
All samples Canal water villages Groundwater villages
Normal
period
Scarcity
period
Normal
period
Scarcity
period
Normal
period
Scarcity
period
Barmer 10.80 404.00 10.80 404.00
Bikaner 61.70 242.80 61.70 242.80
Churu 47.94 48.00 47.94 48.00
Hanumangarh 22.72 53.00 19.05 52.50
Jhunjhanu 45.48 40.83 45.48 40.83
Jaisalmer 69.45 46.00 69.45 46.00
Jodhpur 44.02 346.00 30.05 340.00 0.00 480.00
Najaur 67.41 213.88 67.41 213.88
Sikar 36.15 1.20 36.15 1.20
Sri Ganganagar 22.14 59.60 22.14 59.60
Mean 42.78 145.53 29.80 125.03 41.57 204.10
It was found in the samples that the average paid-out cost for water was 4% of the
income though it varied from 0% to 40%
The time spent by the households in fetching their water each day as well as the breakup
of this time across the category of individuals engaged in the task are given in Table 14. It was
found that average time taken to fetch water was higher during a normal period than in a
scarcity period.
Table 14. Average of daily hours spent in collecting water.
DistrictNormal period Scarcity period
Others Child Female Male Others Child Female Male
Barmer 3.00 1.24 3.00 2.38 0.00 1.03 0.00
Bikaner 1.18 1.94 0.83 0.22
Churu 1.20 0.43
Hanumangarh 0.68 0.50 1.12 0.00
Jaisalmer 0.95 1.71 1.21 0.20 0.15 0.14
Jhunjhanu 0.90 0.78 0.00 0.30
Jodhpur 1.17 2.00 1.98 3.00 0.83 2.00 0.53 0.00
Najaur 1.88 0.83 0.53 0.67
Sikar 0.91 0.04
Sri Ganganagar 0.00 0.67 1.00 0.68
Mean 0.60 2.50 1.22 1.75 0.88 1.00 0.56 0.17
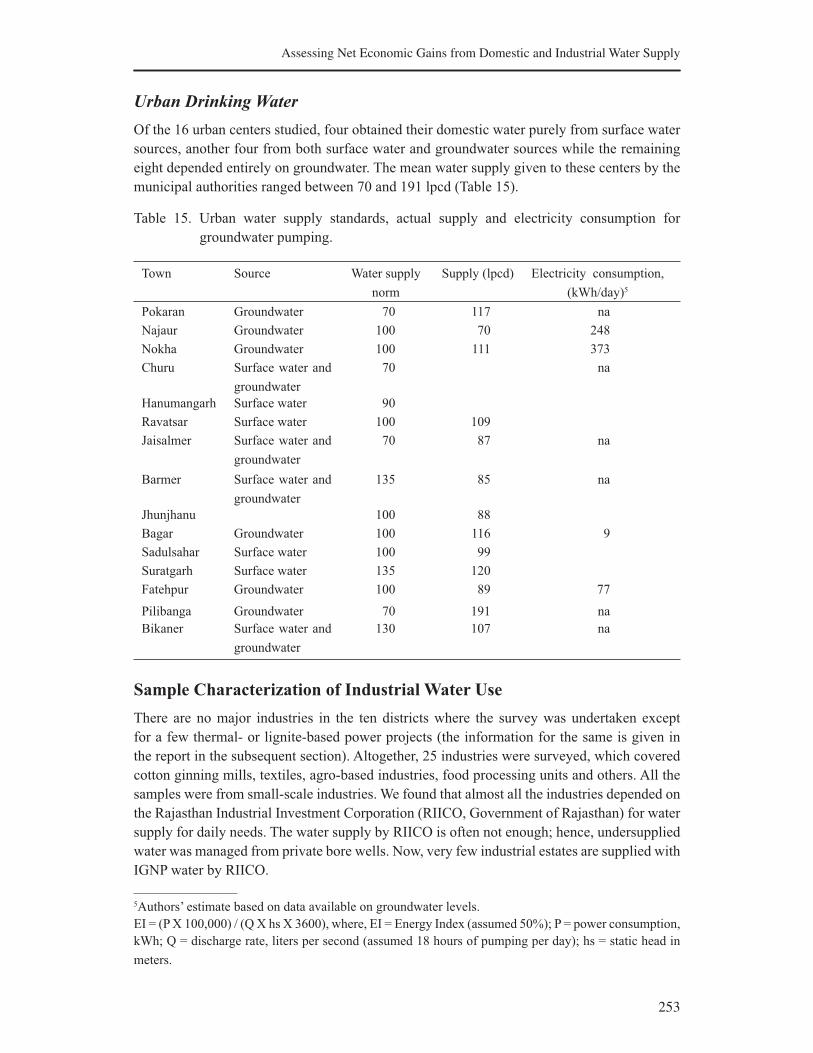
253
Assessing Net Economic Gains from Domestic and Industrial Water Supply
Urban Drinking Water
Of the 16 urban centers studied, four obtained their domestic water purely from surface water
sources, another four from both surface water and groundwater sources while the remaining
eight depended entirely on groundwater. The mean water supply given to these centers by the
municipal authorities ranged between 70 and 191 lpcd (Table 15).
Table 15. Urban water supply standards, actual supply and electricity consumption for
groundwater pumping.
Town Source Water supply
norm
Supply (lpcd) Electricity consumption,
(kWh/day)5
Pokaran Groundwater 70 117 na
Najaur Groundwater 100 70 248
Nokha Groundwater 100 111 373
Churu Surface water and
groundwater
70 na
Hanumangarh Surface water 90
Ravatsar Surface water 100 109
Jaisalmer Surface water and
groundwater
70 87 na
Barmer Surface water and
groundwater
135 85 na
Jhunjhanu 100 88
Bagar Groundwater 100 116 9
Sadulsahar Surface water 100 99
Suratgarh Surface water 135 120
Fatehpur Groundwater 100 89 77
Pilibanga Groundwater 70 191 na
Bikaner Surface water and
groundwater
130 107 na
Sample Characterization of Industrial Water Use
There are no major industries in the ten districts where the survey was undertaken except
for a few thermal- or lignite-based power projects (the information for the same is given in
the report in the subsequent section). Altogether, 25 industries were surveyed, which covered
cotton ginning mills, textiles, agro-based industries, food processing units and others. All the
samples were from small-scale industries. We found that almost all the industries depended on
the Rajasthan Industrial Investment Corporation (RIICO, Government of Rajasthan) for water
supply for daily needs. The water supply by RIICO is often not enough; hence, undersupplied
water was managed from private bore wells. Now, very few industrial estates are supplied with
IGNP water by RIICO.
5Authors’ estimate based on data available on groundwater levels.
EI = (P X 100,000) / (Q X hs X 3600), where, EI = Energy Index (assumed 50%); P = power consumption,
kWh; Q = discharge rate, liters per second (assumed 18 hours of pumping per day); hs = static head in
meters.
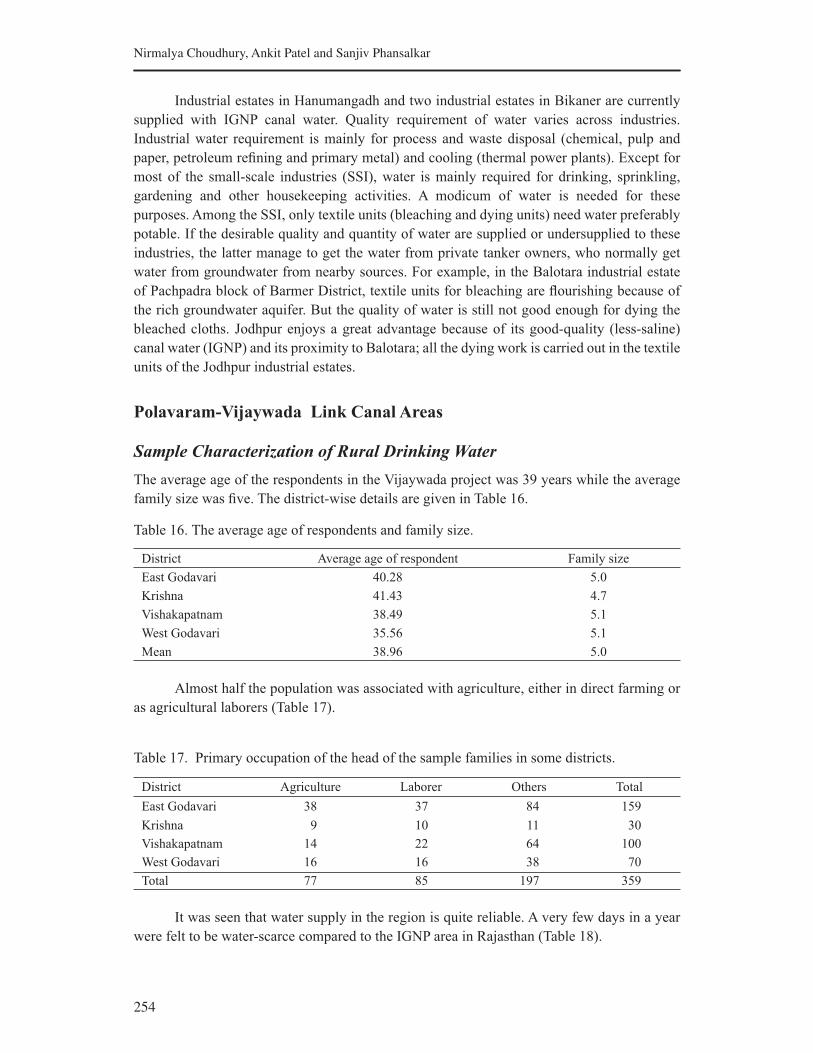
254
Nirmalya Choudhury, Ankit Patel and Sanjiv Phansalkar
Industrial estates in Hanumangadh and two industrial estates in Bikaner are currently
supplied with IGNP canal water. Quality requirement of water varies across industries.
Industrial water requirement is mainly for process and waste disposal (chemical, pulp and
paper, petroleum refining and primary metal) and cooling (thermal power plants). Except for
most of the small-scale industries (SSI), water is mainly required for drinking, sprinkling,
gardening and other housekeeping activities. A modicum of water is needed for these
purposes. Among the SSI, only textile units (bleaching and dying units) need water preferably
potable. If the desirable quality and quantity of water are supplied or undersupplied to these
industries, the latter manage to get the water from private tanker owners, who normally get
water from groundwater from nearby sources. For example, in the Balotara industrial estate
of Pachpadra block of Barmer District, textile units for bleaching are flourishing because of
the rich groundwater aquifer. But the quality of water is still not good enough for dying the
bleached cloths. Jodhpur enjoys a great advantage because of its good-quality (less-saline)
canal water (IGNP) and its proximity to Balotara; all the dying work is carried out in the textile
units of the Jodhpur industrial estates.
Polavaram-Vijaywada Link Canal Areas
Sample Characterization of Rural Drinking Water
The average age of the respondents in the Vijaywada project was 39 years while the average
family size was five. The district-wise details are given in Table 16.
Table 16. The average age of respondents and family size.
District Average age of respondent Family size
East Godavari 40.28 5.0
Krishna 41.43 4.7
Vishakapatnam 38.49 5.1
West Godavari 35.56 5.1
Mean 38.96 5.0
Almost half the population was associated with agriculture, either in direct farming or
as agricultural laborers (Table 17).
Table 17. Primary occupation of the head of the sample families in some districts.
District Agriculture Laborer Others Total
East Godavari 38 37 84 159
Krishna 9 10 11 30
Vishakapatnam 14 22 64 100
West Godavari 16 16 38 70
Total 77 85 197 359
It was seen that water supply in the region is quite reliable. A very few days in a year
were felt to be water-scarce compared to the IGNP area in Rajasthan (Table 18).
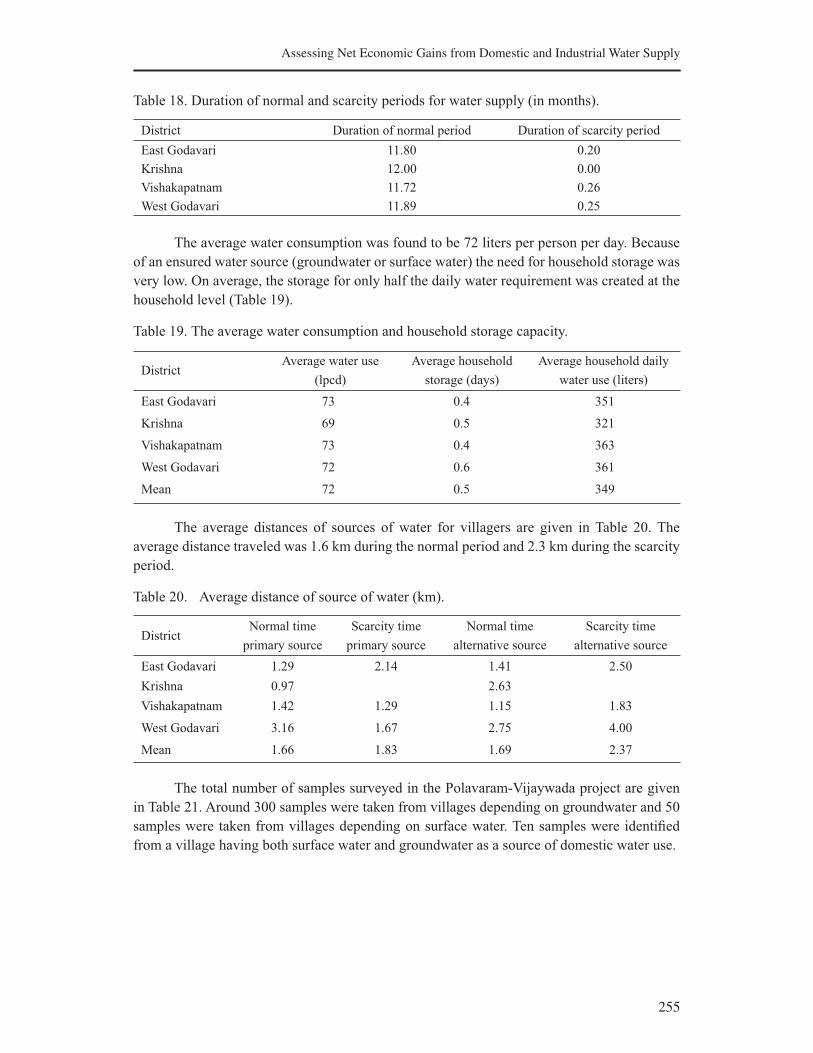
255
Assessing Net Economic Gains from Domestic and Industrial Water Supply
Table 18. Duration of normal and scarcity periods for water supply (in months).
District Duration of normal period Duration of scarcity period
East Godavari 11.80 0.20
Krishna 12.00 0.00
Vishakapatnam 11.72 0.26
West Godavari 11.89 0.25
The average water consumption was found to be 72 liters per person per day. Because
of an ensured water source (groundwater or surface water) the need for household storage was
very low. On average, the storage for only half the daily water requirement was created at the
household level (Table 19).
Table 19. The average water consumption and household storage capacity.
DistrictAverage water use
(lpcd)
Average household
storage (days)
Average household daily
water use (liters)
East Godavari 73 0.4 351
Krishna 69 0.5 321
Vishakapatnam 73 0.4 363
West Godavari 72 0.6 361
Mean 72 0.5 349
The average distances of sources of water for villagers are given in Table 20. The
average distance traveled was 1.6 km during the normal period and 2.3 km during the scarcity
period.
Table 20. Average distance of source of water (km).
DistrictNormal time
primary source
Scarcity time
primary source
Normal time
alternative source
Scarcity time
alternative source
East Godavari 1.29 2.14 1.41 2.50
Krishna 0.97 2.63
Vishakapatnam 1.42 1.29 1.15 1.83
West Godavari 3.16 1.67 2.75 4.00
Mean 1.66 1.83 1.69 2.37
The total number of samples surveyed in the Polavaram-Vijaywada project are given
in Table 21. Around 300 samples were taken from villages depending on groundwater and 50
samples were taken from villages depending on surface water. Ten samples were identified
from a village having both surface water and groundwater as a source of domestic water use.
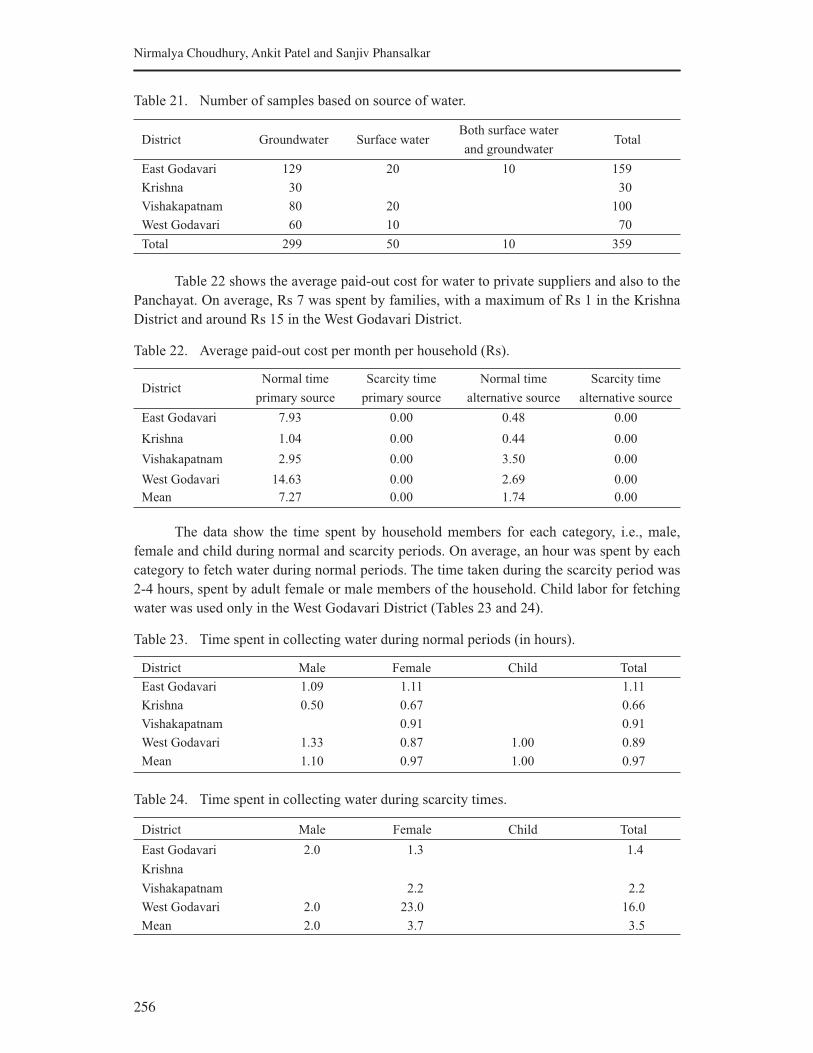
256
Nirmalya Choudhury, Ankit Patel and Sanjiv Phansalkar
Table 21. Number of samples based on source of water.
District Groundwater Surface waterBoth surface water
and groundwaterTotal
East Godavari 129 20 10 159
Krishna 30 30
Vishakapatnam 80 20 100
West Godavari 60 10 70
Total 299 50 10 359
Table 22 shows the average paid-out cost for water to private suppliers and also to the
Panchayat. On average, Rs 7 was spent by families, with a maximum of Rs 1 in the Krishna
District and around Rs 15 in the West Godavari District.
Table 22. Average paid-out cost per month per household (Rs).
DistrictNormal time
primary source
Scarcity time
primary source
Normal time
alternative source
Scarcity time
alternative source
East Godavari 7.93 0.00 0.48 0.00
Krishna 1.04 0.00 0.44 0.00
Vishakapatnam 2.95 0.00 3.50 0.00
West Godavari 14.63 0.00 2.69 0.00
Mean 7.27 0.00 1.74 0.00
The data show the time spent by household members for each category, i.e., male,
female and child during normal and scarcity periods. On average, an hour was spent by each
category to fetch water during normal periods. The time taken during the scarcity period was
2-4 hours, spent by adult female or male members of the household. Child labor for fetching
water was used only in the West Godavari District (Tables 23 and 24).
Table 23. Time spent in collecting water during normal periods (in hours).
District Male Female Child Total
East Godavari 1.09 1.11 1.11
Krishna 0.50 0.67 0.66
Vishakapatnam 0.91 0.91
West Godavari 1.33 0.87 1.00 0.89
Mean 1.10 0.97 1.00 0.97
Table 24. Time spent in collecting water during scarcity times.
District Male Female Child Total
East Godavari 2.0 1.3 1.4
Krishna
Vishakapatnam 2.2 2.2
West Godavari 2.0 23.0 16.0
Mean 2.0 3.7 3.5
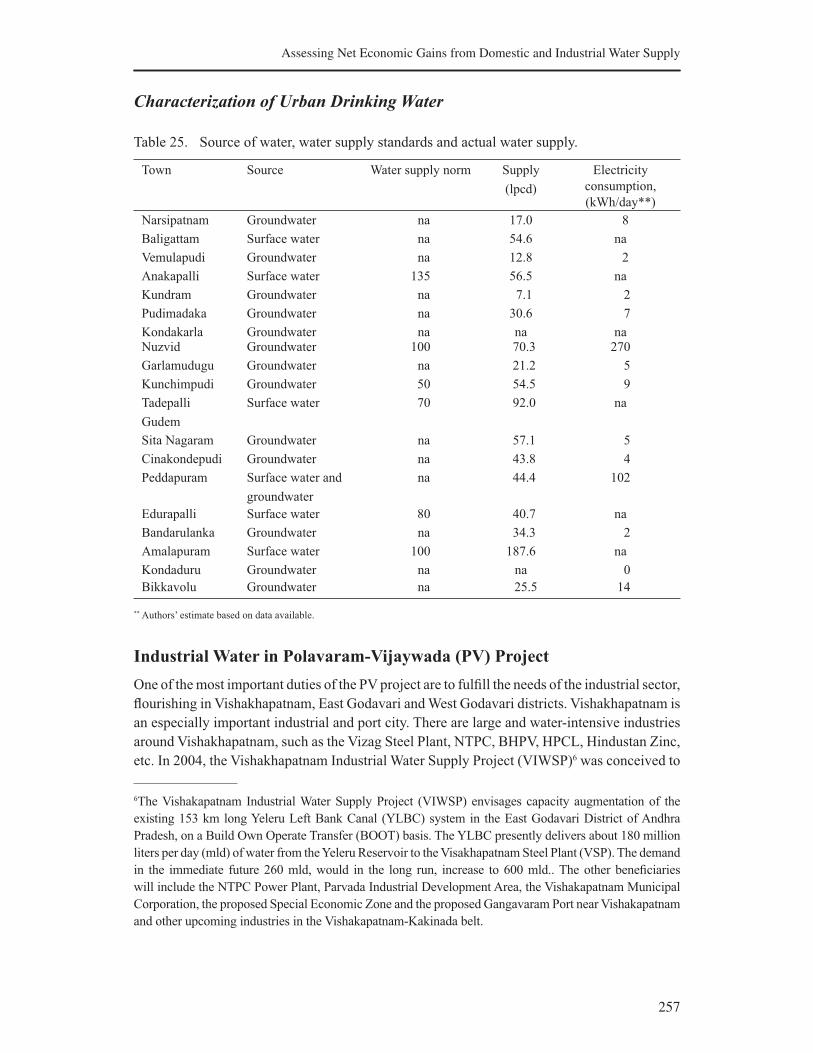
257
Assessing Net Economic Gains from Domestic and Industrial Water Supply
Characterization of Urban Drinking Water
Table 25. Source of water, water supply standards and actual water supply.
Town Source Water supply norm Supply
(lpcd)
Electricity
consumption,
(kWh/day**)
Narsipatnam Groundwater na 17.0 8
Baligattam Surface water na 54.6 na
Vemulapudi Groundwater na 12.8 2
Anakapalli Surface water 135 56.5 na
Kundram Groundwater na 7.1 2
Pudimadaka Groundwater na 30.6 7
Kondakarla Groundwater na na naNuzvid Groundwater 100 70.3 270
Garlamudugu Groundwater na 21.2 5
Kunchimpudi Groundwater 50 54.5 9
Tadepalli
Gudem
Surface water 70 92.0 na
Sita Nagaram Groundwater na 57.1 5
Cinakondepudi Groundwater na 43.8 4
Peddapuram Surface water and
groundwater
na 44.4 102
Edurapalli Surface water 80 40.7 na
Bandarulanka Groundwater na 34.3 2
Amalapuram Surface water 100 187.6 na
Kondaduru Groundwater na na 0
Bikkavolu Groundwater na 25.5 14
** Authors’ estimate based on data available.
Industrial Water in Polavaram-Vijaywada (PV) Project
One of the most important duties of the PV project are to fulfill the needs of the industrial sector,
flourishing in Vishakhapatnam, East Godavari and West Godavari districts. Vishakhapatnam is
an especially important industrial and port city. There are large and water-intensive industries
around Vishakhapatnam, such as the Vizag Steel Plant, NTPC, BHPV, HPCL, Hindustan Zinc,
etc. In 2004, the Vishakhapatnam Industrial Water Supply Project (VIWSP)6 was conceived to
6The Vishakapatnam Industrial Water Supply Project (VIWSP) envisages capacity augmentation of the
existing 153 km long Yeleru Left Bank Canal (YLBC) system in the East Godavari District of Andhra
Pradesh, on a Build Own Operate Transfer (BOOT) basis. The YLBC presently delivers about 180 million
liters per day (mld) of water from the Yeleru Reservoir to the Visakhapatnam Steel Plant (VSP). The demand
in the immediate future 260 mld, would in the long run, increase to 600 mld.. The other beneficiaries
will include the NTPC Power Plant, Parvada Industrial Development Area, the Vishakapatnam Municipal
Corporation, the proposed Special Economic Zone and the proposed Gangavaram Port near Vishakapatnam
and other upcoming industries in the Vishakapatnam-Kakinada belt.
258
Nirmalya Choudhury, Ankit Patel and Sanjiv Phansalkar
fulfill the industrial sector’s water requirement around Vishakhapatnam. Initially, a 388 mld
water supply project from the Yeleru Reservoir through the 153 km long Yeleru Canal and
another 388 mld water supply project from the Godavari River through a 56 km long MS (mild
steel) pipeline were commissioned. It was envisaged that supply provision would double once
the Polavaram project is completed.
Methodology of Estimating Net Gains
The basic premise, on which our methodology is based, is to find out the cost paid for the
NEXT BEST option for the water. The difference of the cost between IGNP benefited villages/
towns/cities and non-benefited areas (depending solely on groundwater) would be the direct
benefit accrued. This will be calculated based on the following formula:
V1 = (P
1 – P
2) x Q
1
where, P1 = price in non-benefited area
P2 = price in benefited area
Q1 = quantity of water used in non-benefited area.
In addition to this, there is a value in the time saved each day in fetching water because
people may now use that time for work or other activities.
V2 = [(T
1 / Q
1) – (T
2 / Q
2)] x W x Q
1
where, T1 = time spent water hauling in non-benefited area
Q1 = quantity of water used in non-benefited area
T2 = time spent water hauling in benefited area
Q2 = quantity of water used in benefited area
W = wage rate for time spent on water hauling (daily or hourly as appropriate)
While the above difference gives the gross benefit, the net gain due to IBT would be
obtained by removing the amortized capital costs of the hardware necessary for bringing the
IBT scheme water to villages/cities and the O&M costs on these schemes. Thus, an estimate
of these two would have to be deducted from the gross benefit.
Second, for the urban centers, we have data from the municipal authorities. The rate at
which urban consumers are charged for water is an administrative decision of the concerned
authority and need not enter our calculation. The actual cost incurred is the cost of accessing
water as of now and the gain is likely to accrue from reduction in this access cost. For the
eight cities dependent on groundwater alone this access cost is essentially the cost of pumping
the water from underground aquifers. This is assessed by considering the volume and fixing
a standard rate for power consumption per unit of water as well as a standard power rate of
Rs 4 per kWh. The pumping cost would vary by the depth of the aquifer in the concerned
city and the age of equipment. While refinement in these numbers is possible, we have taken
representative numbers for illustrating the gain.
259
Assessing Net Economic Gains from Domestic and Industrial Water Supply
Industrial Water Supply
The northwestern part of Rajasthan does not have major or large-scale industries. Most of the
districts except Jodhpur are industrially backward. Jodhpur has many medium- to large-scale
industries. The reason for poor industrial development relates to inadequate development of
transportation and communication facilities, lack of investment and, above all, acute water
shortages. Recently, the State Government took a few policy initiatives to attract entrepreneurs
from outside to set up industrial units in this area. It is envisaged and hoped that many industries
will come up in this area in the near future. Almost all the industries surveyed in Rajasthan
were small-scale. On average, these industries paid Rs 52.47 per m3 of water, with a minimum
of Rs 16 to a maximum of Rs 100 per m3. Similarly, out-of-pocket cost paid for alternative
sources of water supply by the industries varied from Rs 500 to nearly Rs 500,000 per year.
Power Projects
Lignite-based as well as thermal power plants are getting IGNP water or will get it in the near
future (Table 26).
Table 26. Power projects in the IGNP area.
Project District Capacity (megawatt)
Projects already conceived
Suratgarh Thermal Power Plant Sriganganagar 1,250
Barsingsar Bikaner 240
Ramgarh gas power plant Jaisalmer 160
Projects under consideration
Palana lignite Bikaner 120
Guja lignite Bikaner 240
Kapoordi lignite Bikaner 500
Jalipa lignite Bikaner 915
Kasnana-Igyar lignite Najaur 100
Mathania solar thermal Jodhpur 30
Projects for future
Thermal plant Najaur 500
Bishnok lignite Bikaner 80
Giral lignite Bikaner 100
Mertha road lignite Najaur 125
Mokala lignite Najaur 60
Grand total 4,170
Water is or will be supplied to these power plants from IGNP. Needless to say, without
IGNP water, these plants would not have even been conceived. There are incremental benefits
from the energy units generated. Here too the net gain is estimated on the cost side: the current
cost of accessing water is compared with the cost of fetching water from the canal and the
difference is attributed to the IBT scheme.
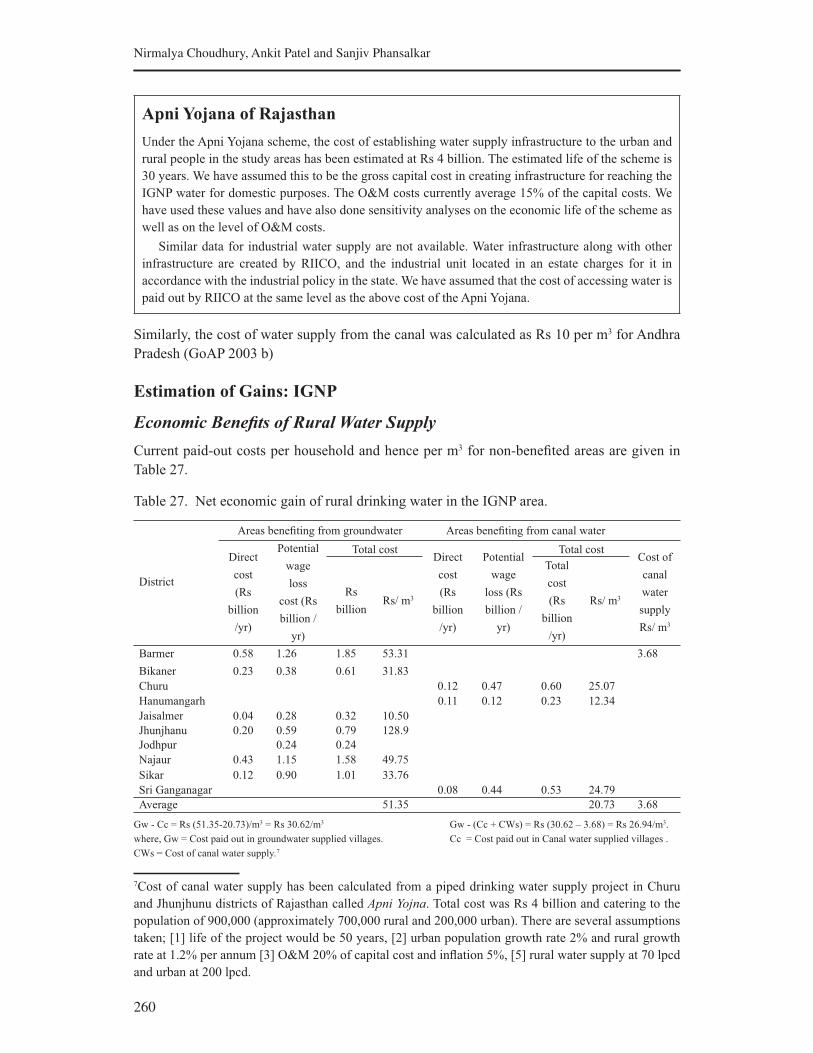
260
Nirmalya Choudhury, Ankit Patel and Sanjiv Phansalkar
Apni Yojana of Rajasthan
Under the Apni Yojana scheme, the cost of establishing water supply infrastructure to the urban and
rural people in the study areas has been estimated at Rs 4 billion. The estimated life of the scheme is
30 years. We have assumed this to be the gross capital cost in creating infrastructure for reaching the
IGNP water for domestic purposes. The O&M costs currently average 15% of the capital costs. We
have used these values and have also done sensitivity analyses on the economic life of the scheme as
well as on the level of O&M costs.
Similar data for industrial water supply are not available. Water infrastructure along with other
infrastructure are created by RIICO, and the industrial unit located in an estate charges for it in
accordance with the industrial policy in the state. We have assumed that the cost of accessing water is
paid out by RIICO at the same level as the above cost of the Apni Yojana.
Similarly, the cost of water supply from the canal was calculated as Rs 10 per m3 for Andhra
Pradesh (GoAP 2003 b)
Estimation of Gains: IGNP
Economic Benefits of Rural Water Supply
Current paid-out costs per household and hence per m3 for non-benefited areas are given in
Table 27.
Table 27. Net economic gain of rural drinking water in the IGNP area.
District
Areas benefiting from groundwater Areas benefiting from canal water
Direct
cost
(Rs
billion
/yr)
Potential
wage
loss
cost (Rs
billion /
yr)
Total costDirect
cost
(Rs
billion
/yr)
Potential
wage
loss (Rs
billion /
yr)
Total costCost of
canal
water
supply
Rs/ m3
Rs
billionRs/ m3
Total
cost
(Rs
billion
/yr)
Rs/ m3
Barmer 0.58 1.26 1.85 53.31 3.68
Bikaner 0.23 0.38 0.61 31.83
Churu 0.12 0.47 0.60 25.07
Hanumangarh 0.11 0.12 0.23 12.34
Jaisalmer 0.04 0.28 0.32 10.50
Jhunjhanu 0.20 0.59 0.79 128.9
Jodhpur 0.24 0.24
Najaur 0.43 1.15 1.58 49.75
Sikar 0.12 0.90 1.01 33.76
Sri Ganganagar 0.08 0.44 0.53 24.79
Average 51.35 20.73 3.68
Gw - Cc = Rs (51.35-20.73)/m3 = Rs 30.62/m3 Gw - (Cc + CWs) = Rs (30.62 – 3.68) = Rs 26.94/m3.
where, Gw = Cost paid out in groundwater supplied villages. Cc = Cost paid out in Canal water supplied villages .
CWs = Cost of canal water supply.5
7
7Cost of canal water supply has been calculated from a piped drinking water supply project in Churu
and Jhunjhunu districts of Rajasthan called Apni Yojna. Total cost was Rs 4 billion and catering to the
population of 900,000 (approximately 700,000 rural and 200,000 urban). There are several assumptions
taken; [1] life of the project would be 50 years, [2] urban population growth rate 2% and rural growth
rate at 1.2% per annum [3] O&M 20% of capital cost and inflation 5%, [5] rural water supply at 70 lpcd
and urban at 200 lpcd.
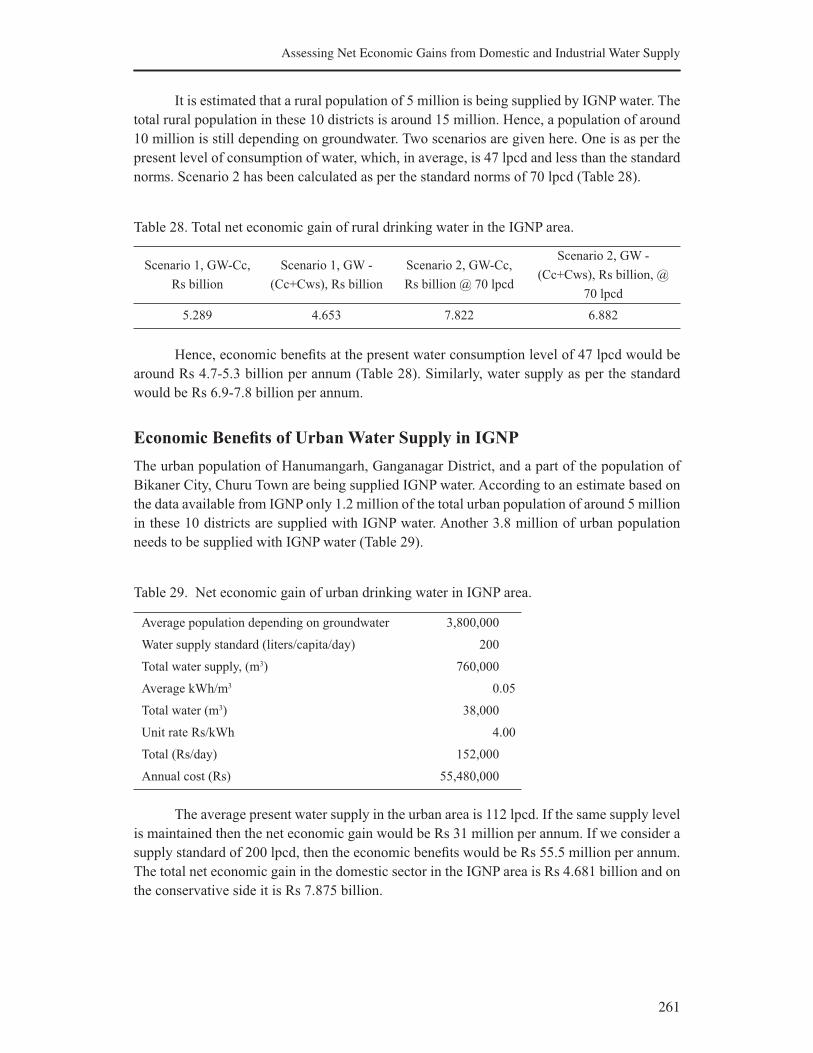
261
Assessing Net Economic Gains from Domestic and Industrial Water Supply
It is estimated that a rural population of 5 million is being supplied by IGNP water. The
total rural population in these 10 districts is around 15 million. Hence, a population of around
10 million is still depending on groundwater. Two scenarios are given here. One is as per the
present level of consumption of water, which, in average, is 47 lpcd and less than the standard
norms. Scenario 2 has been calculated as per the standard norms of 70 lpcd (Table 28).
Table 28. Total net economic gain of rural drinking water in the IGNP area.
Scenario 1, GW-Cc,
Rs billion
Scenario 1, GW -
(Cc+Cws), Rs billion
Scenario 2, GW-Cc,
Rs billion @ 70 lpcd
Scenario 2, GW -
(Cc+Cws), Rs billion, @
70 lpcd
5.289 4.653 7.822 6.882
Hence, economic benefits at the present water consumption level of 47 lpcd would be
around Rs 4.7-5.3 billion per annum (Table 28). Similarly, water supply as per the standard
would be Rs 6.9-7.8 billion per annum.
Economic Benefits of Urban Water Supply in IGNP
The urban population of Hanumangarh, Ganganagar District, and a part of the population of
Bikaner City, Churu Town are being supplied IGNP water. According to an estimate based on
the data available from IGNP only 1.2 million of the total urban population of around 5 million
in these 10 districts are supplied with IGNP water. Another 3.8 million of urban population
needs to be supplied with IGNP water (Table 29).
Table 29. Net economic gain of urban drinking water in IGNP area.
Average population depending on groundwater 3,800,000
Water supply standard (liters/capita/day) 200
Total water supply, (m3) 760,000
Average kWh/m3 0.05
Total water (m3) 38,000
Unit rate Rs/kWh 4.00
Total (Rs/day) 152,000
Annual cost (Rs) 55,480,000
The average present water supply in the urban area is 112 lpcd. If the same supply level
is maintained then the net economic gain would be Rs 31 million per annum. If we consider a
supply standard of 200 lpcd, then the economic benefits would be Rs 55.5 million per annum.
The total net economic gain in the domestic sector in the IGNP area is Rs 4.681 billion and on
the conservative side it is Rs 7.875 billion.
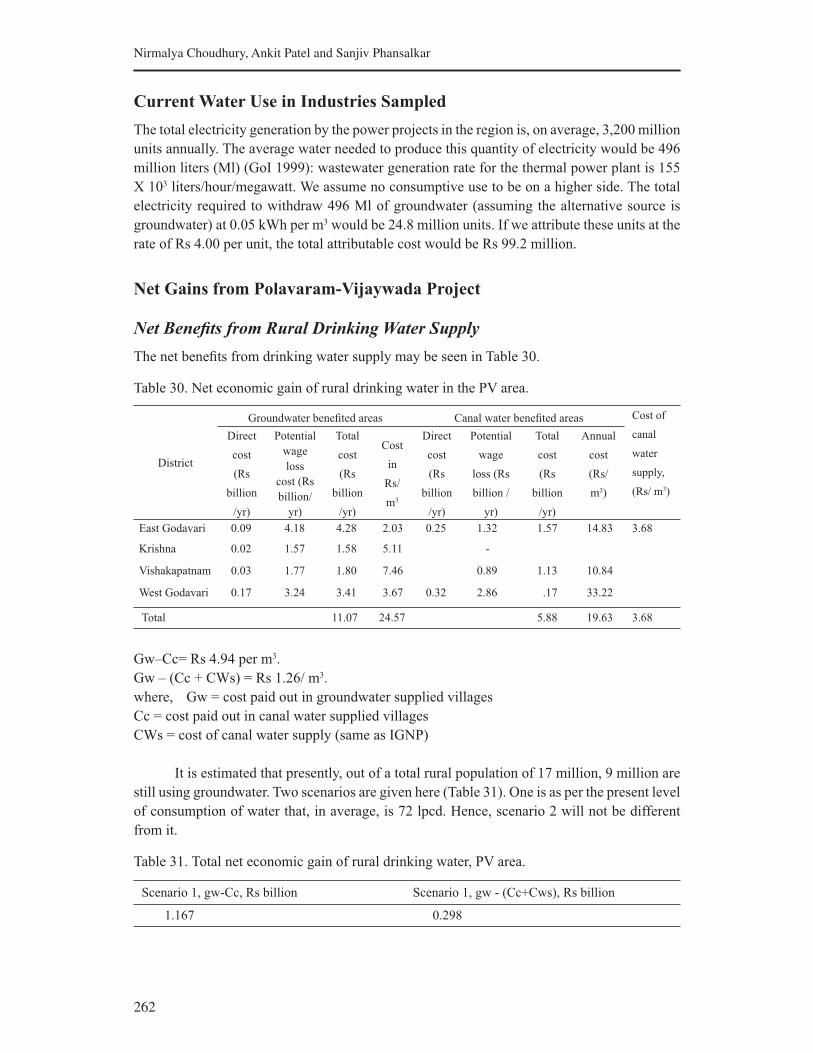
262
Nirmalya Choudhury, Ankit Patel and Sanjiv Phansalkar
Current Water Use in Industries Sampled
The total electricity generation by the power projects in the region is, on average, 3,200 million
units annually. The average water needed to produce this quantity of electricity would be 496
million liters (Ml) (GoI 1999): wastewater generation rate for the thermal power plant is 155
X 103 liters/hour/megawatt. We assume no consumptive use to be on a higher side. The total
electricity required to withdraw 496 Ml of groundwater (assuming the alternative source is
groundwater) at 0.05 kWh per m3 would be 24.8 million units. If we attribute these units at the
rate of Rs 4.00 per unit, the total attributable cost would be Rs 99.2 million.
Net Gains from Polavaram-Vijaywada Project
Net Benefits from Rural Drinking Water Supply
The net benefits from drinking water supply may be seen in Table 30.
Table 30. Net economic gain of rural drinking water in the PV area.
District
Groundwater benefited areas Canal water benefited areas Cost of
canal
water
supply,
(Rs/ m3)
Direct
cost
(Rs
billion
/yr)
Potential
wage
loss
cost (Rs
billion/
yr)
Total
cost
(Rs
billion
/yr)
Cost
in
Rs/
m3
Direct
cost
(Rs
billion
/yr)
Potential
wage
loss (Rs
billion /
yr)
Total
cost
(Rs
billion
/yr)
Annual
cost
(Rs/
m3)
East Godavari 0.09 4.18 4.28 2.03 0.25 1.32 1.57 14.83 3.68
Krishna 0.02 1.57 1.58 5.11 -
Vishakapatnam 0.03 1.77 1.80 7.46 0.89 1.13 10.84
West Godavari 0.17 3.24 3.41 3.67 0.32 2.86 .17 33.22
Total 11.07 24.57 5.88 19.63 3.68
Gw–Cc= Rs 4.94 per m3.
Gw – (Cc + CWs) = Rs 1.26/ m3.
where, Gw = cost paid out in groundwater supplied villages
Cc = cost paid out in canal water supplied villages
CWs = cost of canal water supply (same as IGNP)
It is estimated that presently, out of a total rural population of 17 million, 9 million are
still using groundwater. Two scenarios are given here (Table 31). One is as per the present level
of consumption of water that, in average, is 72 lpcd. Hence, scenario 2 will not be different
from it.
Table 31. Total net economic gain of rural drinking water, PV area.
Scenario 1, gw-Cc, Rs billion Scenario 1, gw - (Cc+Cws), Rs billion
1.167 0.298
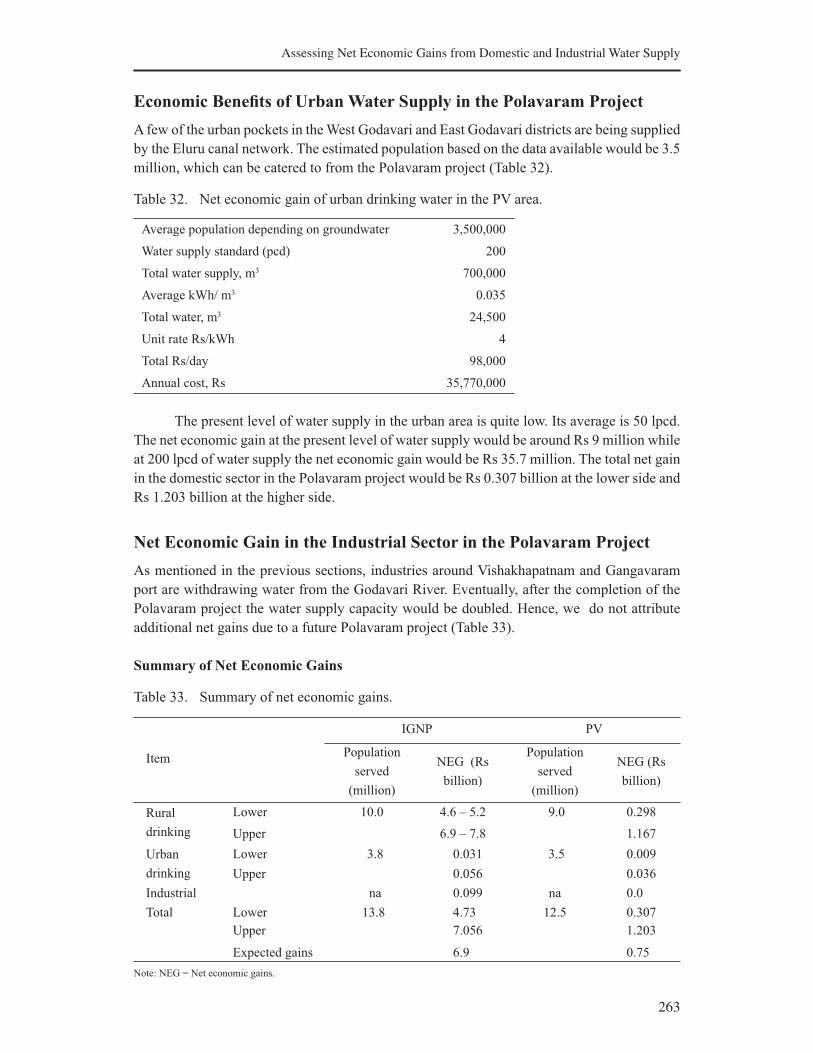
263
Assessing Net Economic Gains from Domestic and Industrial Water Supply
Economic Benefits of Urban Water Supply in the Polavaram Project
A few of the urban pockets in the West Godavari and East Godavari districts are being supplied
by the Eluru canal network. The estimated population based on the data available would be 3.5
million, which can be catered to from the Polavaram project (Table 32).
Table 32. Net economic gain of urban drinking water in the PV area.
Average population depending on groundwater 3,500,000
Water supply standard (pcd) 200
Total water supply, m3 700,000
Average kWh/ m3 0.035
Total water, m3 24,500
Unit rate Rs/kWh 4
Total Rs/day 98,000
Annual cost, Rs 35,770,000
The present level of water supply in the urban area is quite low. Its average is 50 lpcd.
The net economic gain at the present level of water supply would be around Rs 9 million while
at 200 lpcd of water supply the net economic gain would be Rs 35.7 million. The total net gain
in the domestic sector in the Polavaram project would be Rs 0.307 billion at the lower side and
Rs 1.203 billion at the higher side.
Net Economic Gain in the Industrial Sector in the Polavaram Project
As mentioned in the previous sections, industries around Vishakhapatnam and Gangavaram
port are withdrawing water from the Godavari River. Eventually, after the completion of the
Polavaram project the water supply capacity would be doubled. Hence, we do not attribute
additional net gains due to a future Polavaram project (Table 33).
Summary of Net Economic Gains
Table 33. Summary of net economic gains.
Item
IGNP PV
Population
served
(million)
NEG (Rs
billion)
Population
served
(million)
NEG (Rs
billion)
Rural
drinking
Lower 10.0 4.6 – 5.2 9.0 0.298
Upper 6.9 – 7.8 1.167
Urban
drinking
Lower 3.8 0.031 3.5 0.009
Upper 0.056 0.036
Industrial na 0.099 na 0.0
Total Lower 13.8 4.73 12.5 0.307
Upper 7.056 1.203
Expected gains 6.9 0.75
Note: NEG = Net economic gains.
264
Nirmalya Choudhury, Ankit Patel and Sanjiv Phansalkar
Discussions and Conclusion
An attempt has been made here to estimate the net economic gains from water supply from IBT
schemes to domestic and industrial sectors. The exercise is important for the chief reason that
seldom does an exercise that aims for economic gains from schemes for creating large water
structures explicitly consider the economic gains accruing from the use of water for domestic
and industrial purposes per se. Investments in these schemes are sought to be justified by
estimating the net contribution these schemes make in terms of increased production in the
agriculture sector and, in the case of multipurpose schemes, in terms of value of electricity
produced. Benefits such as domestic and industrial supply are mentioned but their values are
not computed. We have adopted what we consider the most defensible method. The schemes
are expected to supply water to domestic and industrial users. These users currently draw their
supplies from some existing sources, such as groundwater. In doing so, they have to incur
expenditure on energy for pumping water; and also spend hours trudging to the source of
water. We have basically captured the benefits in terms of reduced energy costs and time spent
on fetching water. These two benefits accrue to the economy via the agents who are directly
benefited. We have valued energy at the market rate and the time saved at the going wage rate.
There is a likelihood of a dispute about valuing time as it involves the tacit assumptions that
there is abundant demand for labor and that time saved from daily chores of collecting water
would be automatically sold in the market. Both these can be questioned on the grounds of
their relevance to reality.
Yet we submit that what we have obtained is a conservative estimate of the value to
these people. We have not really valued the negative utilities of drudgery, much of it regarding
women. Nor have we attributed any specific gains to the salutary impacts, thus saving of
children’s time on improved school attendance and on health. There is little dispute that these
benefits, in fact, do accrue, but there are issues about quantifying, valuing and estimating
the quantum of these benefits. We have perhaps erred on the conservative side in an obvious
manner in ignoring the salutary impacts on reduced health expenditure in the face of fairly
known consequences of negative health impacts of groundwater with high TDS as well
as contaminants such as fluorine. We have chosen to do so since the data on the extent of
prevalence of health syndromes arising out of contaminated groundwater and pertaining to
the cost of treatment as well as in terms of lost wages were not collected in these areas.
Since we have not measured the impacts in terms of reduced drudgery, improved educational
performance and avoided health impacts, we believe the above estimates to be conservative.
Demographic as well as ecological factors determine the size of these benefits. In the
case of IGNP, the benefited areas are dry, with a small population. In fact, the absence of the
canal may well have caused a situation that would require depopulating the region. Clearly,
the scheme has high benefits in this situation. On the other hand, the benefited areas of the PV
scheme, barring highland areas of Vizag, are in the delataic regions with abundant groundwater.
Here the benefits are more muted. The chief advantage of the supply of PV scheme water to the
Vizag industrial estate is said to be making industrial growth possible in that region. However,
we have not attributed any gains from such industrial growth to the scheme since it is possible
to argue that the same projects could easily come up in other regions where water is currently
available without any net gains to the economy. This argument does not hold for domestic
water supply in the case of IGNP as the people already exist out there and face a crunch.
265
Assessing Net Economic Gains from Domestic and Industrial Water Supply
An interesting question is how the benefits compare with the cost of creating the
structures. The current estimate of creating the whole PV scheme, including the dam on the
Godavari River at Pollavaram as well as the rehabilitation and resettlement is about Rs 13,000
crore, or Rs 130 billion. Against this, net economic gains from the industrial and domestic
water supply from the canals are estimated by us here at about Rs 0.75 billion per year. This
is about half a percent rate of return on an annual basis. It is, of course, a moot point whether
one should consider the entire investment for this comparison, or the investment on just
the canals, etc. The total package of benefits from the PV Link scheme includes enhanced
industrial production, incremental irrigation and revival of irrigation in the Krishna Delta
currently facing a water crisis. When viewed in their totality, the gains are not insignificant
even for the PV case. The size of these benefits is much more significant in the case of the
IGNP project. Here, the IGNP itself is expected to cost around Rs 20 billion and on that
the gains from domestic and industrial water supply as estimated by us come to about Rs
6.9 billion. This is quite a sizeable gain and it would appear in retrospect that the scheme
should be seen as making sense even if it were not to provide any irrigation benefits! The
dominance of gains from domestic and industrial water supply would be a common feature in
all regions which face massive distress on account of paucity of drinking water as in the case
of Gujarat, Marathwada, Karnataka, etc. An argument can broached that the chief advantage
of the IBT schemes proposed under the NRLP lies in reducing the distress for domestic water
faced by millions of people living in western and southern India. The question whether this
benefit necessarily involves the proposed configuration of irrigation hardware needs to be
thought over. In conclusion, we believe that the contribution of this paper lies in its attempt at
demonstrating a way of attributing, valuing and estimating benefits which have hitherto been
simply written as being incidental advantages of water structures.

266
Nirmalya Choudhury, Ankit Patel and Sanjiv Phansalkar
Acknowledgements
We wish to thank Urmul Trust for their assistance and participation in gathering primary data
in Rajasthan. We also wish to thank Shri Nikhil Mathur and his team for their assistance in
gathering the data in Andhra Pradesh.
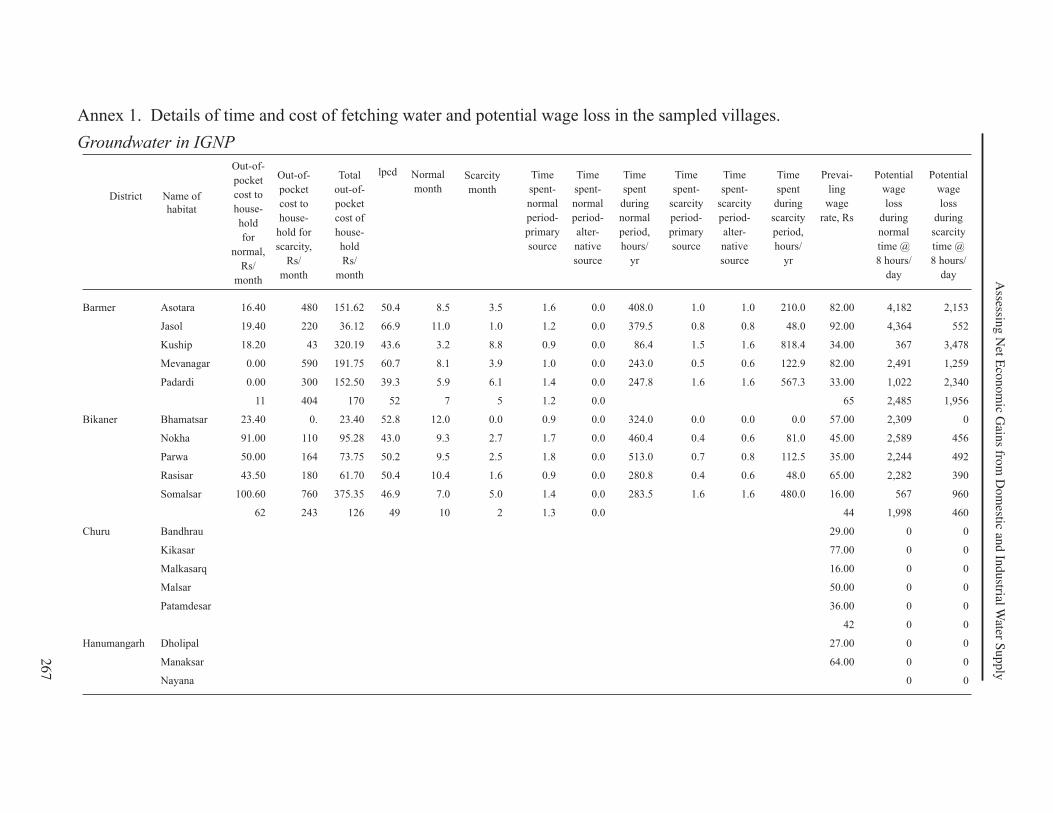
267
Assessin
g N
et Eco
no
mic G
ains fro
m D
om
estic and
Ind
ustrial W
ater Su
pp
ly
Annex 1. Details of time and cost of fetching water and potential wage loss in the sampled villages.
Groundwater in IGNP
Out-of-
cost to
house-
hold
for
normal,
Rs/
month
Barmer Asotara 16.40 480 151.62 50.4 8.5 3.5 1.6 0.0 408.0 1.0 1.0 210.0 82.00 4,182 2,153
Jasol 19.40 220 36.12 66.9 11.0 1.0 1.2 0.0 379.5 0.8 0.8 48.0 92.00 4,364 552
Kuship 18.20 43 320.19 43.6 3.2 8.8 0.9 0.0 86.4 1.5 1.6 818.4 34.00 367 3,478
Mevanagar 0.00 590 191.75 60.7 8.1 3.9 1.0 0.0 243.0 0.5 0.6 122.9 82.00 2,491 1,259
Padardi 0.00 300 152.50 39.3 5.9 6.1 1.4 0.0 247.8 1.6 1.6 567.3 33.00 1,022 2,340
11 404 170 52 7 5 1.2 0.0 65 2,485 1,956
Bikaner Bhamatsar 23.40 0. 23.40 52.8 12.0 0.0 0.9 0.0 324.0 0.0 0.0 0.0 57.00 2,309 0
Nokha 91.00 110 95.28 43.0 9.3 2.7 1.7 0.0 460.4 0.4 0.6 81.0 45.00 2,589 456
Parwa 50.00 164 73.75 50.2 9.5 2.5 1.8 0.0 513.0 0.7 0.8 112.5 35.00 2,244 492
Rasisar 43.50 180 61.70 50.4 10.4 1.6 0.9 0.0 280.8 0.4 0.6 48.0 65.00 2,282 390
Somalsar 100.60 760 375.35 46.9 7.0 5.0 1.4 0.0 283.5 1.6 1.6 480.0 16.00 567 960
62 243 126 49 10 2 1.3 0.0 44 1,998 460
Churu Bandhrau 29.00 0 0
Kikasar 77.00 0 0
Malkasarq 16.00 0 0
Malsar 50.00 0 0
Patamdesar 36.00 0 0
42 0 0
Hanumangarh Dholipal 27.00 0 0
Manaksar 64.00 0 0
Nayana 0 0
District Name of
habitat
Out-of-
cost to
house-
hold for
scarcity,
Rs/
month
Total
out-of-
cost of
house-
hold
Rs/
month
lpcd Normal
month
Scarcity
month
Time
spent-
normal
period-
primary
source
Time
spent-
normal
period-
alter-
native
source
Time
spent
during
normal
period,
hours/
yr
Time
spent-
scarcity
period-
primary
source
Time
spent-
scarcity
period-
alter-
native
source
Time
spent
during
scarcity
period,
hours/
yr
Prevai-
ling
wage
rate, Rs
Potential
wage
loss
during
normal
time @
8 hours/
day
Potential
wage
loss
during
scarcity
time @
8 hours/
day
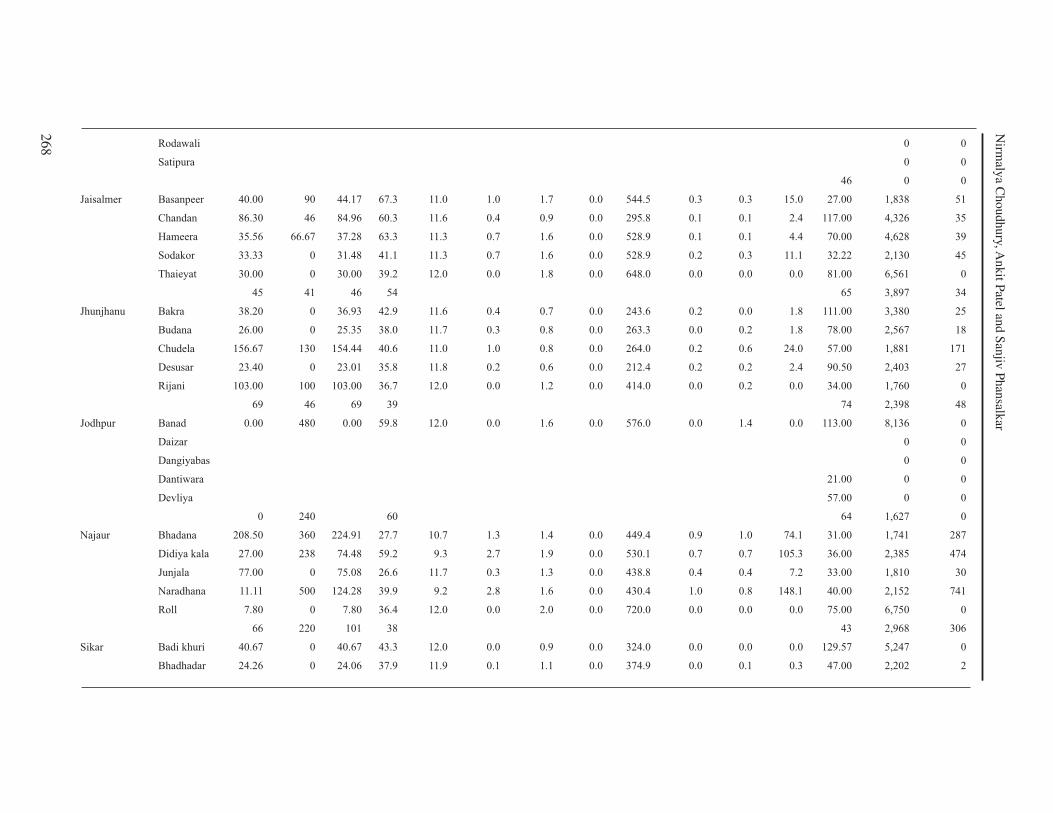
268
Nirm
alya C
houdhury, A
nkit P
atel and S
anjiv
Ph
ansalk
ar
Rodawali 0 0
Satipura 0 0
46 0 0
Jaisalmer Basanpeer 40.00 90 44.17 67.3 11.0 1.0 1.7 0.0 544.5 0.3 0.3 15.0 27.00 1,838 51
Chandan 86.30 46 84.96 60.3 11.6 0.4 0.9 0.0 295.8 0.1 0.1 2.4 117.00 4,326 35
Hameera 35.56 66.67 37.28 63.3 11.3 0.7 1.6 0.0 528.9 0.1 0.1 4.4 70.00 4,628 39
Sodakor 33.33 0 31.48 41.1 11.3 0.7 1.6 0.0 528.9 0.2 0.3 11.1 32.22 2,130 45
Thaieyat 30.00 0 30.00 39.2 12.0 0.0 1.8 0.0 648.0 0.0 0.0 0.0 81.00 6,561 0
45 41 46 54 65 3,897 34
Jhunjhanu Bakra 38.20 0 36.93 42.9 11.6 0.4 0.7 0.0 243.6 0.2 0.0 1.8 111.00 3,380 25
Budana 26.00 0 25.35 38.0 11.7 0.3 0.8 0.0 263.3 0.0 0.2 1.8 78.00 2,567 18
Chudela 156.67 130 154.44 40.6 11.0 1.0 0.8 0.0 264.0 0.2 0.6 24.0 57.00 1,881 171
Desusar 23.40 0 23.01 35.8 11.8 0.2 0.6 0.0 212.4 0.2 0.2 2.4 90.50 2,403 27
Rijani 103.00 100 103.00 36.7 12.0 0.0 1.2 0.0 414.0 0.0 0.2 0.0 34.00 1,760 0
69 46 69 39 74 2,398 48
Jodhpur Banad 0.00 480 0.00 59.8 12.0 0.0 1.6 0.0 576.0 0.0 1.4 0.0 113.00 8,136 0
Daizar 0 0
Dangiyabas 0 0
Dantiwara 21.00 0 0
Devliya 57.00 0 0
0 240 60 64 1,627 0
Najaur Bhadana 208.50 360 224.91 27.7 10.7 1.3 1.4 0.0 449.4 0.9 1.0 74.1 31.00 1,741 287
Didiya kala 27.00 238 74.48 59.2 9.3 2.7 1.9 0.0 530.1 0.7 0.7 105.3 36.00 2,385 474
Junjala 77.00 0 75.08 26.6 11.7 0.3 1.3 0.0 438.8 0.4 0.4 7.2 33.00 1,810 30
Naradhana 11.11 500 124.28 39.9 9.2 2.8 1.6 0.0 430.4 1.0 0.8 148.1 40.00 2,152 741
Roll 7.80 0 7.80 36.4 12.0 0.0 2.0 0.0 720.0 0.0 0.0 0.0 75.00 6,750 0
66 220 101 38 43 2,968 306
Sikar Badi khuri 40.67 0 40.67 43.3 12.0 0.0 0.9 0.0 324.0 0.0 0.0 0.0 129.57 5,247 0
Bhadhadar 24.26 0 24.06 37.9 11.9 0.1 1.1 0.0 374.9 0.0 0.1 0.3 47.00 2,202 2
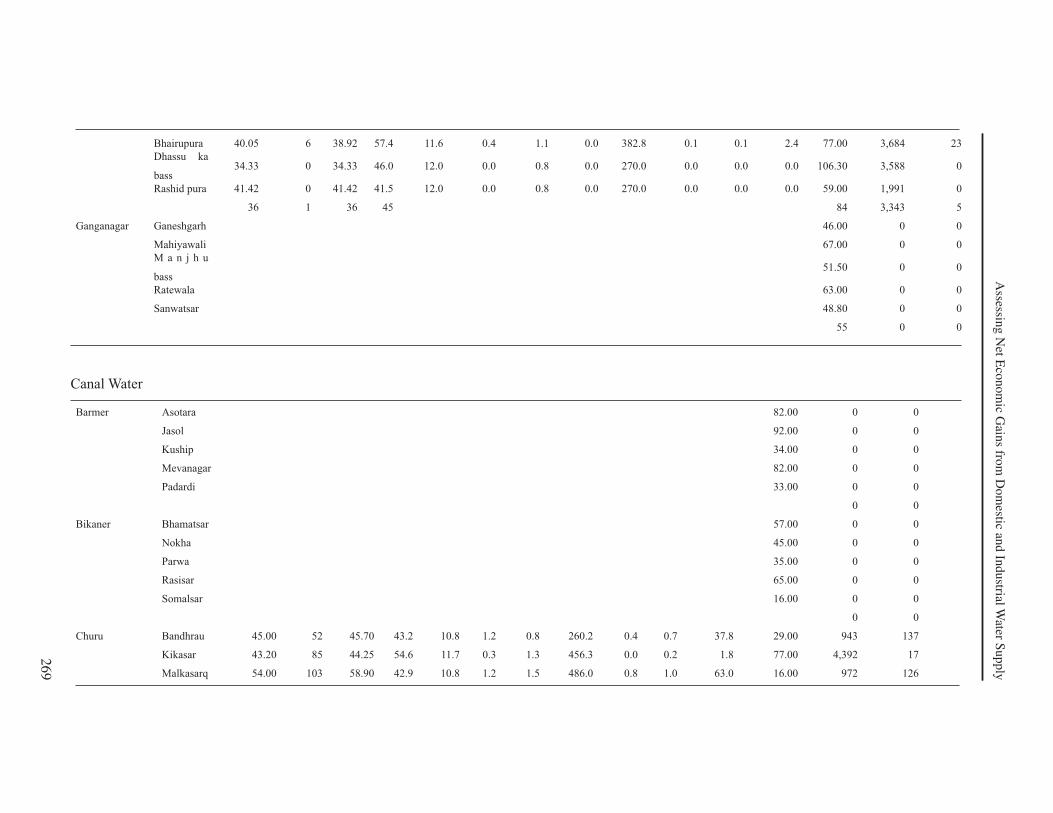
269
Assessin
g N
et Eco
no
mic G
ains fro
m D
om
estic and
Ind
ustrial W
ater Su
pp
ly
Bhairupura 40.05 6 38.92 57.4 11.6 0.4 1.1 0.0 382.8 0.1 0.1 2.4 77.00 3,684 23
Dhassu ka
bass34.33 0 34.33 46.0 12.0 0.0 0.8 0.0 270.0 0.0 0.0 0.0 106.30 3,588 0
Rashid pura 41.42 0 41.42 41.5 12.0 0.0 0.8 0.0 270.0 0.0 0.0 0.0 59.00 1,991 0
36 1 36 45 84 3,343 5
Ganganagar Ganeshgarh 46.00 0 0
Mahiyawali 67.00 0 0
M a n j h u
bass51.50 0 0
Ratewala 63.00 0 0
Sanwatsar 48.80 0 0
55 0 0
Canal Water
Barmer Asotara 82.00 0 0
Jasol 92.00 0 0
Kuship 34.00 0 0
Mevanagar 82.00 0 0
Padardi 33.00 0 0
0 0
Bikaner Bhamatsar 57.00 0 0
Nokha 45.00 0 0
Parwa 35.00 0 0
Rasisar 65.00 0 0
Somalsar 16.00 0 0
0 0
Churu Bandhrau 45.00 52 45.70 43.2 10.8 1.2 0.8 260.2 0.4 0.7 37.8 29.00 943 137
Kikasar 43.20 85 44.25 54.6 11.7 0.3 1.3 456.3 0.0 0.2 1.8 77.00 4,392 17
Malkasarq 54.00 103 58.90 42.9 10.8 1.2 1.5 486.0 0.8 1.0 63.0 16.00 972 126
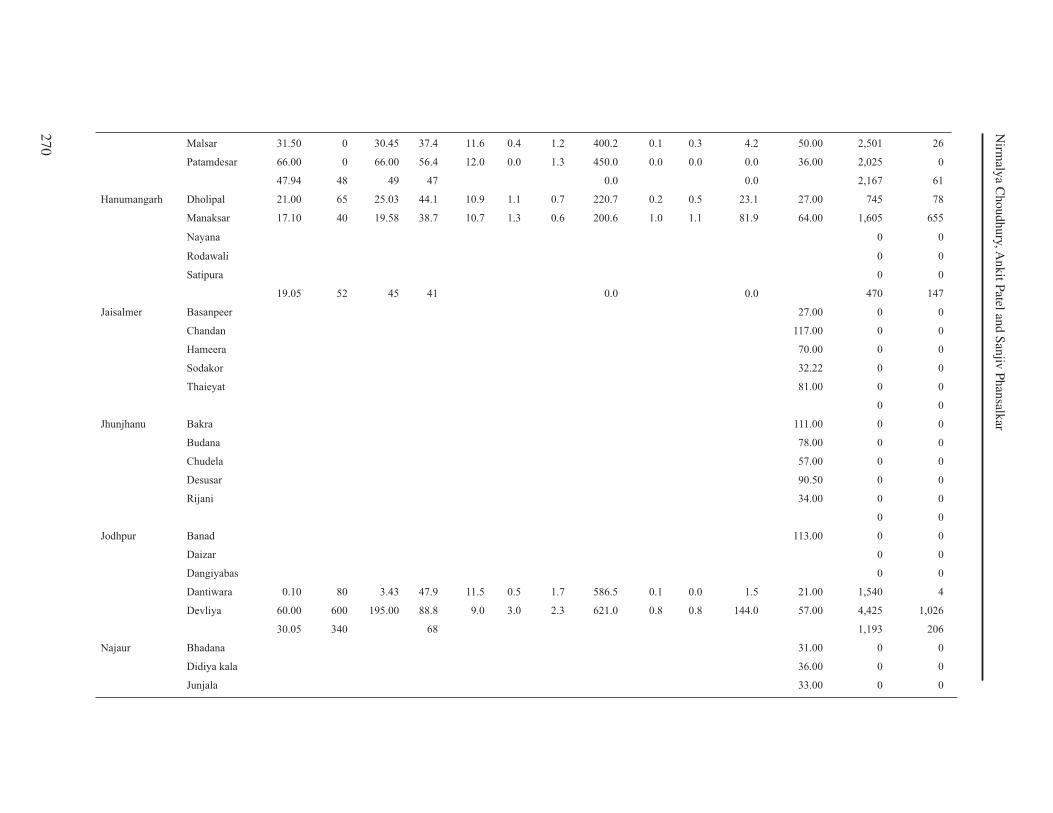
270
Nirm
alya C
houdhury, A
nkit P
atel and S
anjiv
Ph
ansalk
ar
Malsar 31.50 0 30.45 37.4 11.6 0.4 1.2 400.2 0.1 0.3 4.2 50.00 2,501 26
Patamdesar 66.00 0 66.00 56.4 12.0 0.0 1.3 450.0 0.0 0.0 0.0 36.00 2,025 0
47.94 48 49 47 0.0 0.0 2,167 61
Hanumangarh Dholipal 21.00 65 25.03 44.1 10.9 1.1 0.7 220.7 0.2 0.5 23.1 27.00 745 78
Manaksar 17.10 40 19.58 38.7 10.7 1.3 0.6 200.6 1.0 1.1 81.9 64.00 1,605 655
Nayana 0 0
Rodawali 0 0
Satipura 0 0
19.05 52 45 41 0.0 0.0 470 147
Jaisalmer Basanpeer 27.00 0 0
Chandan 117.00 0 0
Hameera 70.00 0 0
Sodakor 32.22 0 0
Thaieyat 81.00 0 0
0 0
Jhunjhanu Bakra 111.00 0 0
Budana 78.00 0 0
Chudela 57.00 0 0
Desusar 90.50 0 0
Rijani 34.00 0 0
0 0
Jodhpur Banad 113.00 0 0
Daizar 0 0
Dangiyabas 0 0
Dantiwara 0.10 80 3.43 47.9 11.5 0.5 1.7 586.5 0.1 0.0 1.5 21.00 1,540 4
Devliya 60.00 600 195.00 88.8 9.0 3.0 2.3 621.0 0.8 0.8 144.0 57.00 4,425 1,026
30.05 340 68 1,193 206
Najaur Bhadana 31.00 0 0
Didiya kala 36.00 0 0
Junjala 33.00 0 0

271
Assessin
g N
et Eco
no
mic G
ains fro
m D
om
estic and
Ind
ustrial W
ater Su
pp
ly
Naradhana 40.00 0 0
Roll 75.00 0 0
0 0
Sikar Badi khuri 129.57 0 0
Bhadhadar 47.00 0 0
Bhairupura 77.00 0 0
D h a s s u
ka bass 106.30 0 0
Rashid pura 59.00 0 0
0 0
Sriganganagar Ganeshgarh 20.80 115 48.28 33.2 8.5 3.5 0.5 115.5 0.6 0.6 126.0 46.00 664 725
Mahiyawali 20.80 0 19.93 47.7 11.5 0.5 0.6 189.8 0.2 0.5 10.5 67.00 1,589 88
Manjhu bass 23.40 133 38.01 48.7 10.4 1.6 0.5 149.1 0.2 0.3 22.8 51.50 960 147
Ratewala 24.90 35 27.26 40.9 9.2 2.8 1.2 317.4 1.4 1.6 243.6 63.00 2,500 1,918
Sanwatsar 20.80 15 20.41 47.0 11.2 0.8 0.7 219.7 0.4 0.5 19.2 48.80 1,340 117
22.14 60 31 44 1,411 599
Groundwater in PV
East Godavari Amalapuram 7.3 0 7.30 79 11.90 0.00 0.9 2.5 1,210.8 0.0 44.25 6,697 0
Bikkavolu 6.5 0 6.32 65 11.68 0.33 0.9 1.6 872.6 1.6 1.6 31.3 13.43 1,464 52
Peddapuram 6.0 0 5.93 70 11.87 0.13 0.9 1.2 750.4 0.9 0.9 7.0 29.33 2,752 26
Sita Nagaram 6.8 0 6.74 85 11.90 0.10 1.7 1.4 1,111.6 2.0 2.5 13.8 20.77 2,886 36
7 7 75 12 0 1 2 986 1 2 13 27 3,450 29
Krishna Nuzividu 1.5 0 1.49 69 12.00 0.00 0.7 1.3 714.6 0.0 17.33 1,548 0
1 0 1 69 12 0 1 1 715 NA NA 0 17 1,548 0
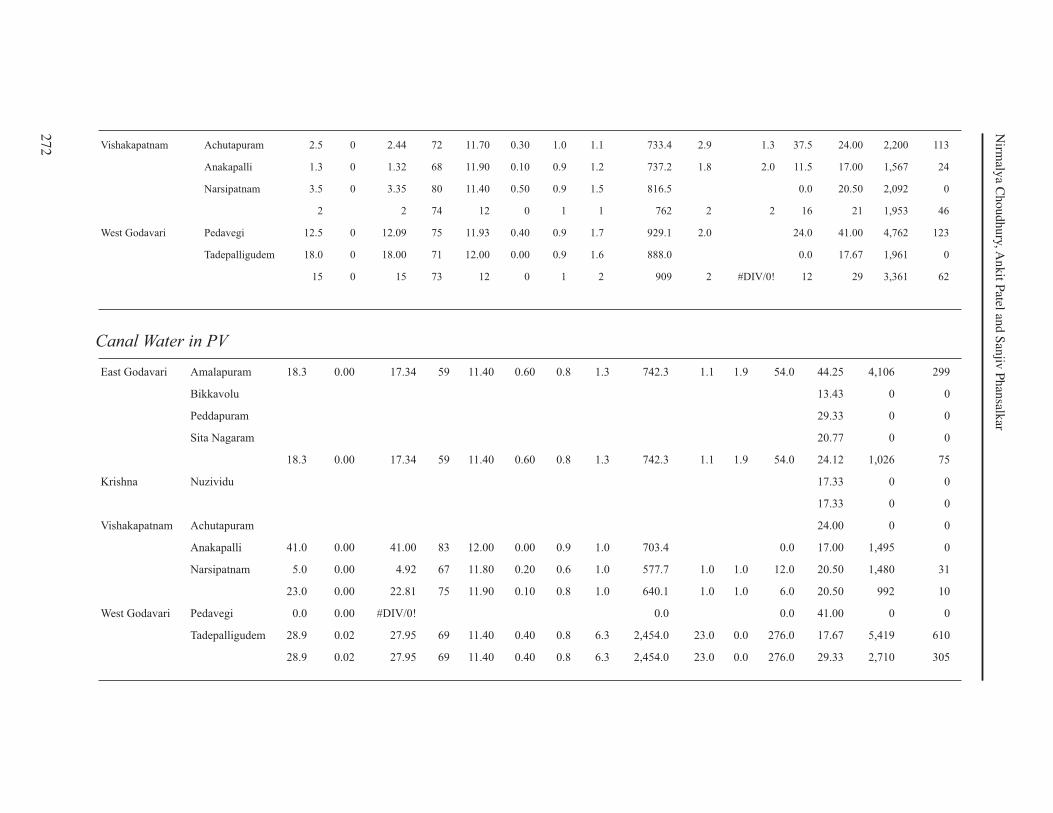
272
Nirm
alya C
houdhury, A
nkit P
atel and S
anjiv
Ph
ansalk
ar
Vishakapatnam Achutapuram 2.5 0 2.44 72 11.70 0.30 1.0 1.1 733.4 2.9 1.3 37.5 24.00 2,200 113
Anakapalli 1.3 0 1.32 68 11.90 0.10 0.9 1.2 737.2 1.8 2.0 11.5 17.00 1,567 24
Narsipatnam 3.5 0 3.35 80 11.40 0.50 0.9 1.5 816.5 0.0 20.50 2,092 0
2 2 74 12 0 1 1 762 2 2 16 21 1,953 46
West Godavari Pedavegi 12.5 0 12.09 75 11.93 0.40 0.9 1.7 929.1 2.0 24.0 41.00 4,762 123
Tadepalligudem 18.0 0 18.00 71 12.00 0.00 0.9 1.6 888.0 0.0 17.67 1,961 0
15 0 15 73 12 0 1 2 909 2 #DIV/0! 12 29 3,361 62
Canal Water in PV
East Godavari Amalapuram 18.3 0.00 17.34 59 11.40 0.60 0.8 1.3 742.3 1.1 1.9 54.0 44.25 4,106 299
Bikkavolu 13.43 0 0
Peddapuram 29.33 0 0
Sita Nagaram 20.77 0 0
18.3 0.00 17.34 59 11.40 0.60 0.8 1.3 742.3 1.1 1.9 54.0 24.12 1,026 75
Krishna Nuzividu 17.33 0 0
17.33 0 0
Vishakapatnam Achutapuram 24.00 0 0
Anakapalli 41.0 0.00 41.00 83 12.00 0.00 0.9 1.0 703.4 0.0 17.00 1,495 0
Narsipatnam 5.0 0.00 4.92 67 11.80 0.20 0.6 1.0 577.7 1.0 1.0 12.0 20.50 1,480 31
23.0 0.00 22.81 75 11.90 0.10 0.8 1.0 640.1 1.0 1.0 6.0 20.50 992 10
West Godavari Pedavegi 0.0 0.00 #DIV/0! 0.0 0.0 41.00 0 0
Tadepalligudem 28.9 0.02 27.95 69 11.40 0.40 0.8 6.3 2,454.0 23.0 0.0 276.0 17.67 5,419 610
28.9 0.02 27.95 69 11.40 0.40 0.8 6.3 2,454.0 23.0 0.0 276.0 29.33 2,710 305
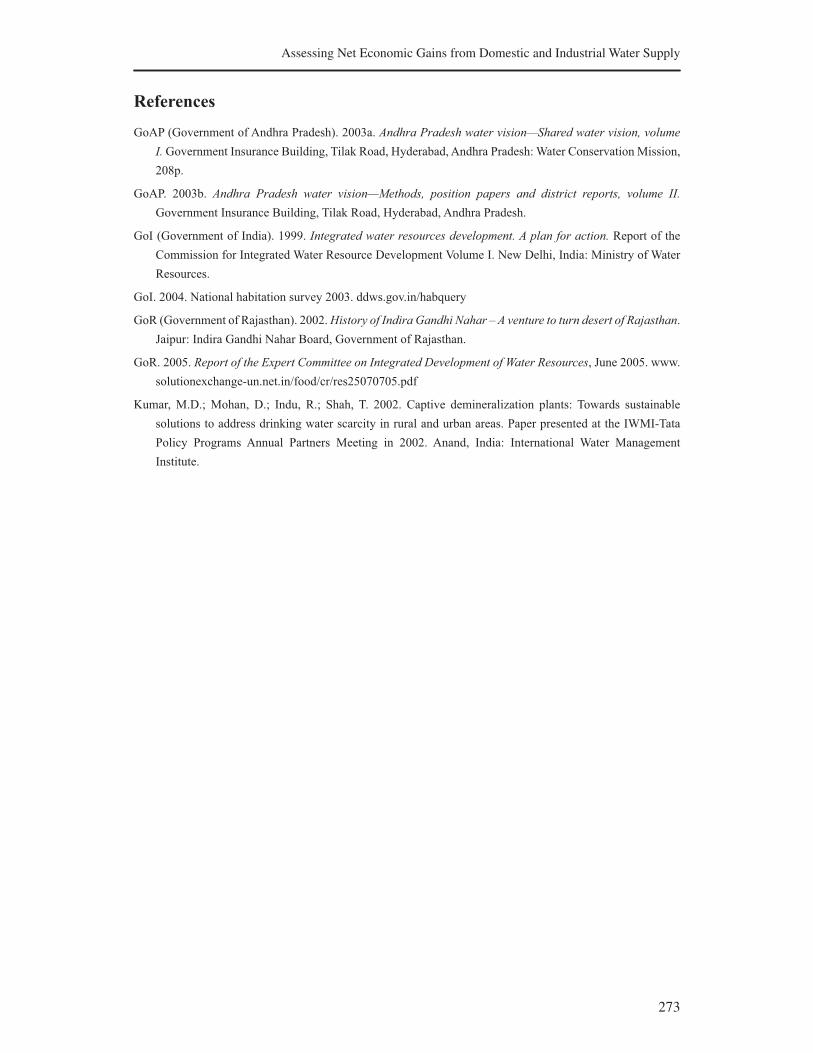
273
Assessing Net Economic Gains from Domestic and Industrial Water Supply
References
GoAP (Government of Andhra Pradesh). 2003a. Andhra Pradesh water vision—Shared water vision, volume
I. Government Insurance Building, Tilak Road, Hyderabad, Andhra Pradesh: Water Conservation Mission,
208p.
GoAP. 2003b. Andhra Pradesh water vision—Methods, position papers and district reports, volume II.
Government Insurance Building, Tilak Road, Hyderabad, Andhra Pradesh.
GoI (Government of India). 1999. Integrated water resources development. A plan for action. Report of the
Commission for Integrated Water Resource Development Volume I. New Delhi, India: Ministry of Water
Resources.
GoI. 2004. National habitation survey 2003. ddws.gov.in/habquery
GoR (Government of Rajasthan). 2002. History of Indira Gandhi Nahar – A venture to turn desert of Rajasthan.
Jaipur: Indira Gandhi Nahar Board, Government of Rajasthan.
GoR. 2005. Report of the Expert Committee on Integrated Development of Water Resources, June 2005. www.
solutionexchange-un.net.in/food/cr/res25070705.pdf
Kumar, M.D.; Mohan, D.; Indu, R.; Shah, T. 2002. Captive demineralization plants: Towards sustainable
solutions to address drinking water scarcity in rural and urban areas. Paper presented at the IWMI-Tata
Policy Programs Annual Partners Meeting in 2002. Anand, India: International Water Management
Institute.


275
State of Irrigation in Tamil Nadu:
Trends and Turning Points
Upali A. Amarasinghe,1 O.P. Singh,2 R. Sakthivadivel3 and K. Palanisami1
1 International Water Management Institute, India Office2 Banaras Hindu University, Varanasi, India
3 Consultant, Tamil Nadu (Former Fellow, International Water Management Institute)
Introduction
Irrigation is a vital input for food security in the State of Tamil Nadu. Rice is the major staple
food, accounting for three-fourths of the consumption of food grains. Irrigation covers most
parts of the rice area. In 2000, 96% of the rice production was carried out under irrigation
conditions. Groundwater contributes to a major part of the irrigated area. However, recent
trends of groundwater water use in the state show that its abstractions in many regions exceed
the total net annual recharge (CGWB 2006). Overall, groundwater exploitation exceeds 85%
of the annual recharge. Moreover, irrigated areas under tank commands, once a dominant
source of irrigation in Tamil Nadu, and under canal commands are decreasing. Besides, the
cropping and irrigation patterns are changing to meet the increasing demand of non-grain food
products. In view of the recent trends in irrigation, meeting food security in Tamil Nadu will
indeed be a major challenge.
What factors have influenced these changes in the state of irrigation in Tamil Nadu,
and how significant are they in the long run? Given the past trends, what types of investments
in agriculture, especially in irrigation, will yield higher returns and can meet food security in
the state? Answers to these questions are important for assessing future water demand, since
irrigation shares more than 90% of total water withdrawals at present. The major purpose of
this report is to assess the trends of irrigation development in Tamil Nadu over the last 35 years
(1970-2005).
After a brief introduction to the districts and regions, in section 2 we assess the trends
of major exogenous drivers that influence the water sector development. Section 3 presents the
spatial and temporal trends of land use and cropping patterns, and crop production. Finally, we
discuss major drivers that will influence the patterns of irrigation water use in the future.
Profile of Tamil Nadu
Tamil Nadu, located in the southeastern part of Peninsular India, with a geographical area of 13
million ha (Mha), is the tenth largest state in India (Figure 1). The state has been divided into
seven agroclimatic subzones for planning agricultural development (ARPU 1991). Semiarid
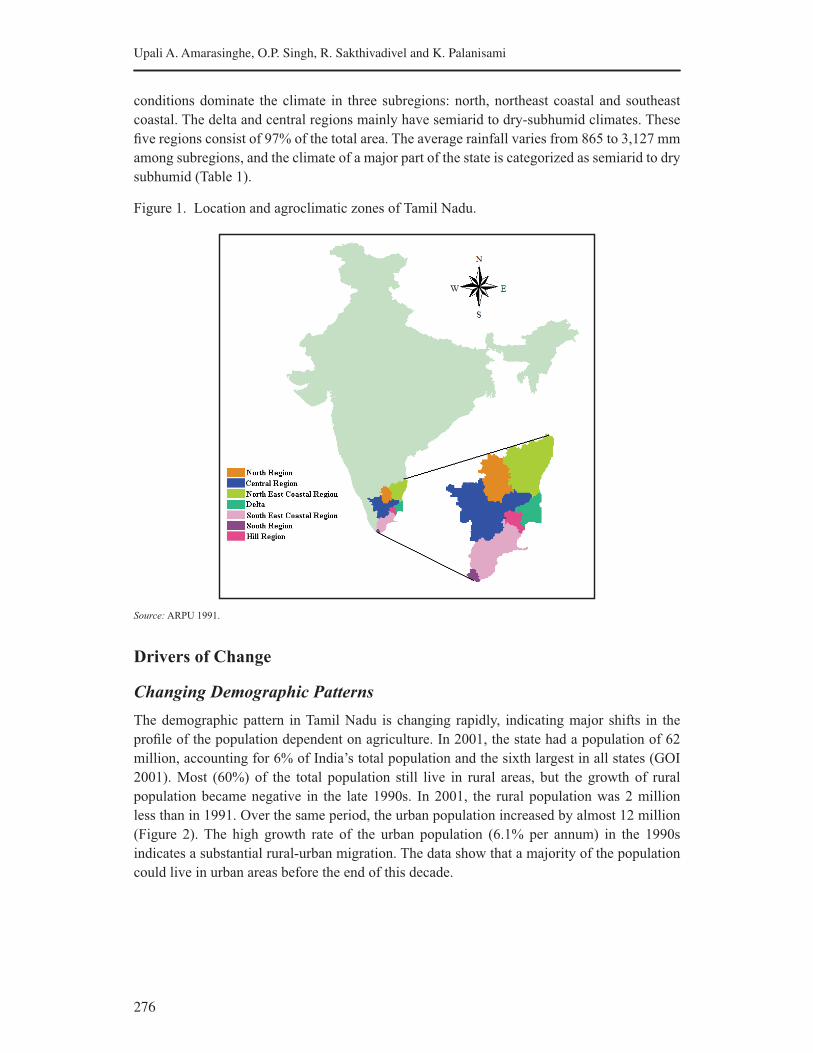
276
Upali A. Amarasinghe, O.P. Singh, R. Sakthivadivel and K. Palanisami
conditions dominate the climate in three subregions: north, northeast coastal and southeast
coastal. The delta and central regions mainly have semiarid to dry-subhumid climates. These
five regions consist of 97% of the total area. The average rainfall varies from 865 to 3,127 mm
among subregions, and the climate of a major part of the state is categorized as semiarid to dry
subhumid (Table 1).
Figure 1. Location and agroclimatic zones of Tamil Nadu.
Source: ARPU 1991.
Drivers of Change
Changing Demographic Patterns
The demographic pattern in Tamil Nadu is changing rapidly, indicating major shifts in the
profile of the population dependent on agriculture. In 2001, the state had a population of 62
million, accounting for 6% of India’s total population and the sixth largest in all states (GOI
2001). Most (60%) of the total population still live in rural areas, but the growth of rural
population became negative in the late 1990s. In 2001, the rural population was 2 million
less than in 1991. Over the same period, the urban population increased by almost 12 million
(Figure 2). The high growth rate of the urban population (6.1% per annum) in the 1990s
indicates a substantial rural-urban migration. The data show that a majority of the population
could live in urban areas before the end of this decade.
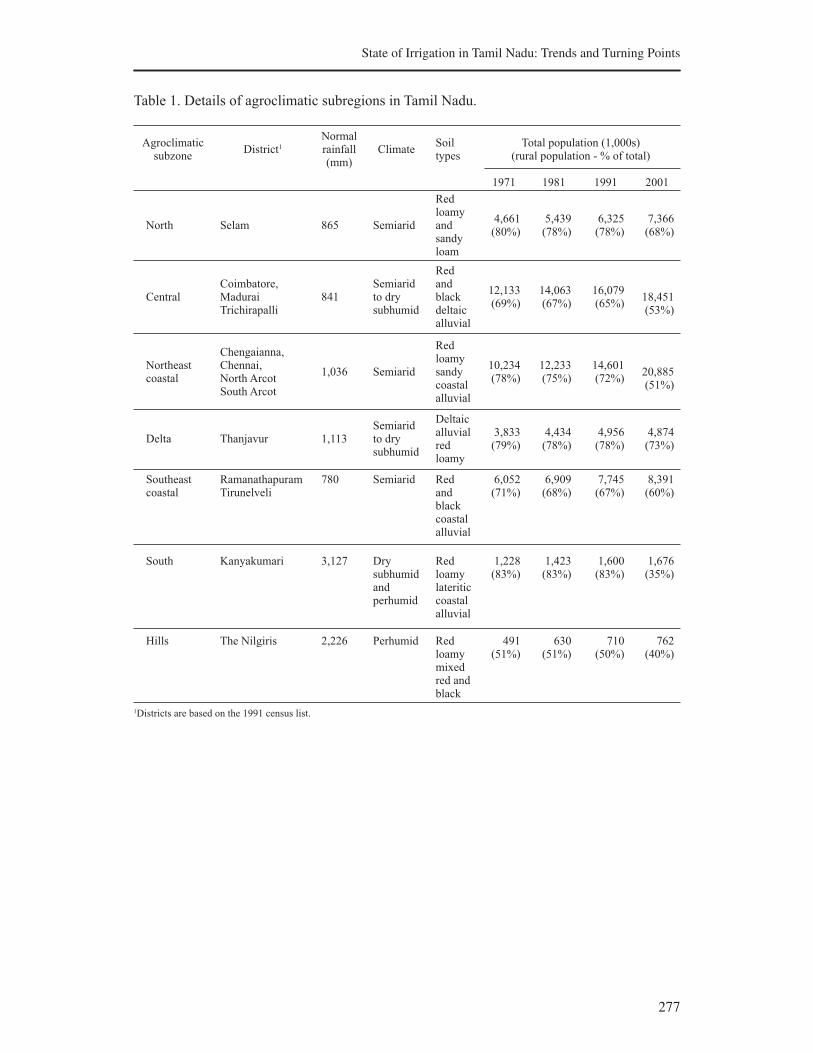
277
State of Irrigation in Tamil Nadu: Trends and Turning Points
Table 1. Details of agroclimatic subregions in Tamil Nadu.
Agroclimatic subzone
District1
Normal rainfall (mm)
ClimateSoil types
Total population (1,000s) (rural population - % of total)
1971 1981 1991 2001
North Selam 865 Semiarid
Red loamy and sandy loam
4,661(80%)
5,439 (78%)
6,325 (78%)
7,366 (68%)
CentralCoimbatore, Madurai Trichirapalli
841Semiarid to dry subhumid
Red and black deltaic alluvial
12,133(69%)
14,063(67%)
16,079(65%)
18,451(53%)
Northeast coastal
Chengaianna, Chennai, North ArcotSouth Arcot
1,036 Semiarid
Red loamy sandy coastal alluvial
10,234(78%)
12,233(75%)
14,601 (72%)
20,885 (51%)
Delta Thanjavur 1,113Semiarid to dry subhumid
Deltaic alluvial red loamy
3,833 (79%)
4,434 (78%)
4,956 (78%)
4,874 (73%)
Southeast coastal
RamanathapuramTirunelveli
780 Semiarid Red and black coastal alluvial
6,052 (71%)
6,909 (68%)
7,745 (67%)
8,391 (60%)
South Kanyakumari 3,127 Dry subhumid and perhumid
Red loamy lateritic coastal alluvial
1,228 (83%)
1,423 (83%)
1,600 (83%)
1,676 (35%)
Hills The Nilgiris 2,226 Perhumid Red loamy mixed red and black
491 (51%)
630 (51%)
710 (50%)
762 (40%)
1Districts are based on the 1991 census list.
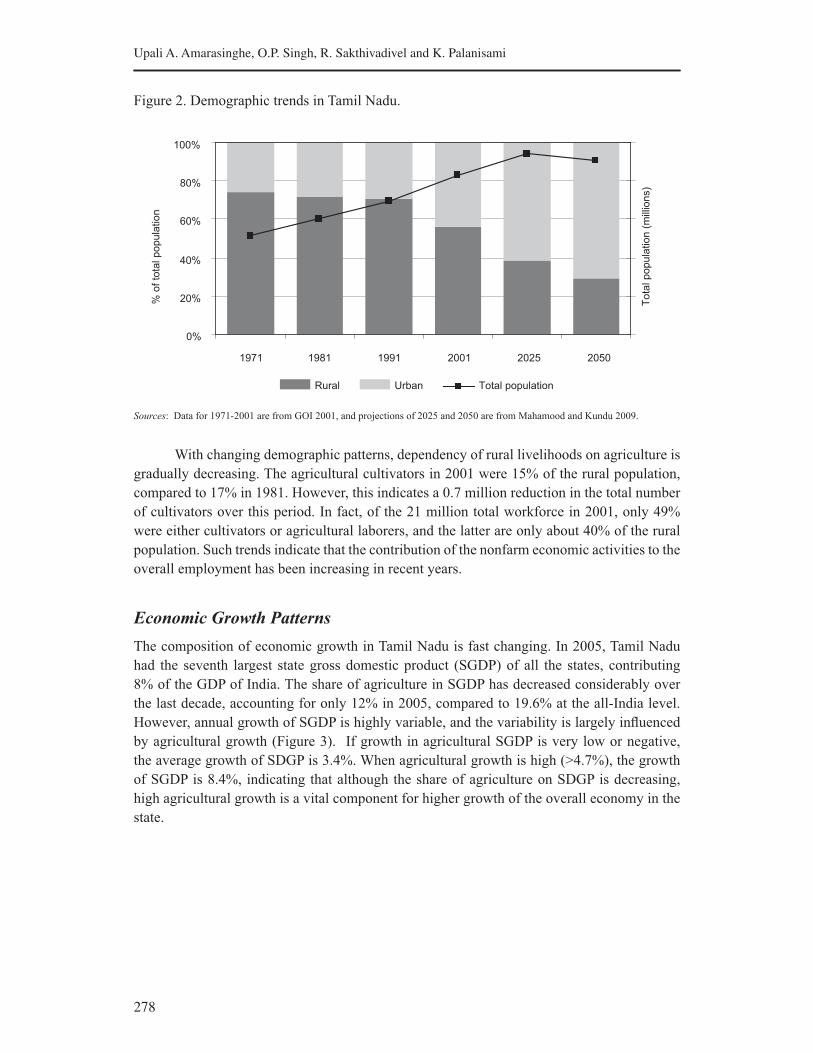
278
Upali A. Amarasinghe, O.P. Singh, R. Sakthivadivel and K. Palanisami
Figure 2. Demographic trends in Tamil Nadu.
Sources: Data for 1971-2001 are from GOI 2001, and projections of 2025 and 2050 are from Mahamood and Kundu 2009.
With changing demographic patterns, dependency of rural livelihoods on agriculture is
gradually decreasing. The agricultural cultivators in 2001 were 15% of the rural population,
compared to 17% in 1981. However, this indicates a 0.7 million reduction in the total number
of cultivators over this period. In fact, of the 21 million total workforce in 2001, only 49%
were either cultivators or agricultural laborers, and the latter are only about 40% of the rural
population. Such trends indicate that the contribution of the nonfarm economic activities to the
overall employment has been increasing in recent years.
Economic Growth Patterns
The composition of economic growth in Tamil Nadu is fast changing. In 2005, Tamil Nadu
had the seventh largest state gross domestic product (SGDP) of all the states, contributing
8% of the GDP of India. The share of agriculture in SGDP has decreased considerably over
the last decade, accounting for only 12% in 2005, compared to 19.6% at the all-India level.
However, annual growth of SGDP is highly variable, and the variability is largely influenced
by agricultural growth (Figure 3). If growth in agricultural SGDP is very low or negative,
the average growth of SDGP is 3.4%. When agricultural growth is high (>4.7%), the growth
of SGDP is 8.4%, indicating that although the share of agriculture on SDGP is decreasing,
high agricultural growth is a vital component for higher growth of the overall economy in the
state.
0%
20%
40%
60%
80%
100%
1971 1981 1991 2001 2025 2050
% o
f to
tal p
op
ula
tio
n
To
tal p
op
ula
tio
n (
mill
ion
s)
Rural Urban Total population
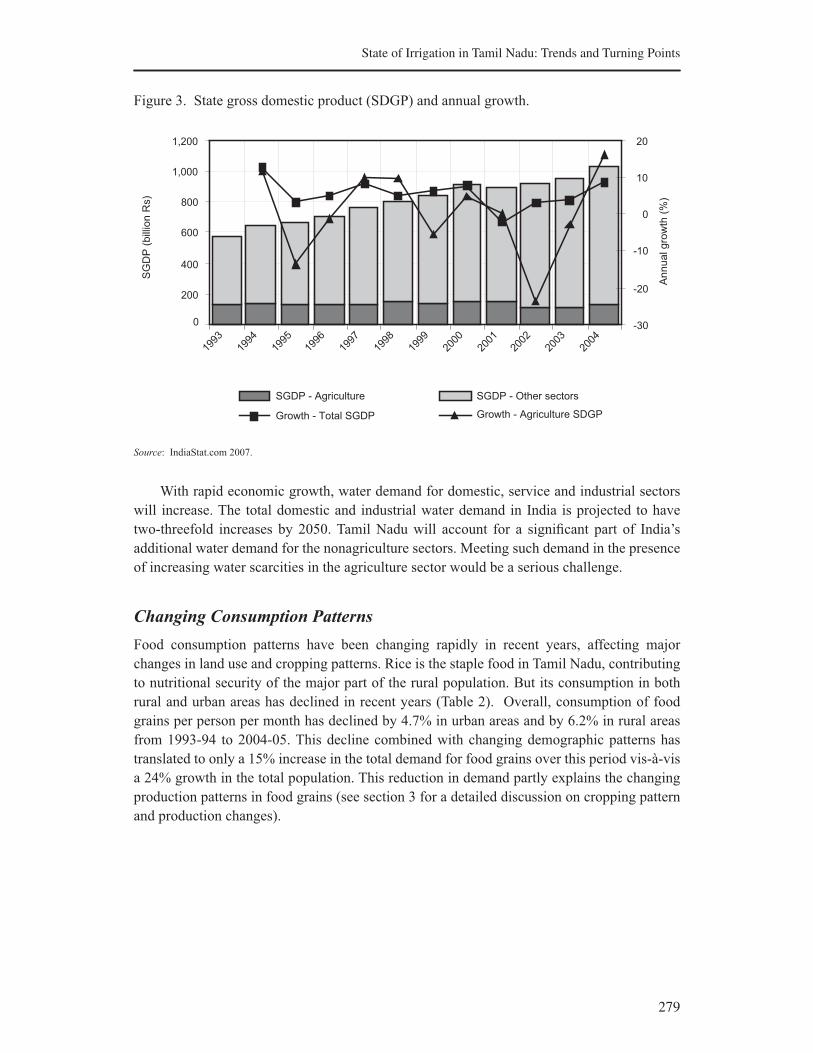
279
State of Irrigation in Tamil Nadu: Trends and Turning Points
Figure 3. State gross domestic product (SDGP) and annual growth.
Source: IndiaStat.com 2007.
With rapid economic growth, water demand for domestic, service and industrial sectors
will increase. The total domestic and industrial water demand in India is projected to have
two-threefold increases by 2050. Tamil Nadu will account for a significant part of India’s
additional water demand for the nonagriculture sectors. Meeting such demand in the presence
of increasing water scarcities in the agriculture sector would be a serious challenge.
Changing Consumption Patterns
Food consumption patterns have been changing rapidly in recent years, affecting major
changes in land use and cropping patterns. Rice is the staple food in Tamil Nadu, contributing
to nutritional security of the major part of the rural population. But its consumption in both
rural and urban areas has declined in recent years (Table 2). Overall, consumption of food
grains per person per month has declined by 4.7% in urban areas and by 6.2% in rural areas
from 1993-94 to 2004-05. This decline combined with changing demographic patterns has
translated to only a 15% increase in the total demand for food grains over this period vis-à-vis
a 24% growth in the total population. This reduction in demand partly explains the changing
production patterns in food grains (see section 3 for a detailed discussion on cropping pattern
and production changes).
200
400
600
800
1,000
1,200
1993
1994
1995
1996
1997
1998
1999
2000
2001
2002
2003
2004
SG
DP
(b
illio
n R
s)
-30
-20
-10
0
10
20
An
nu
al g
row
th (
%)
SGDP - Agriculture SGDP - Other sectors
Growth - Total SGDP Growth - Agriculture SDGP
0
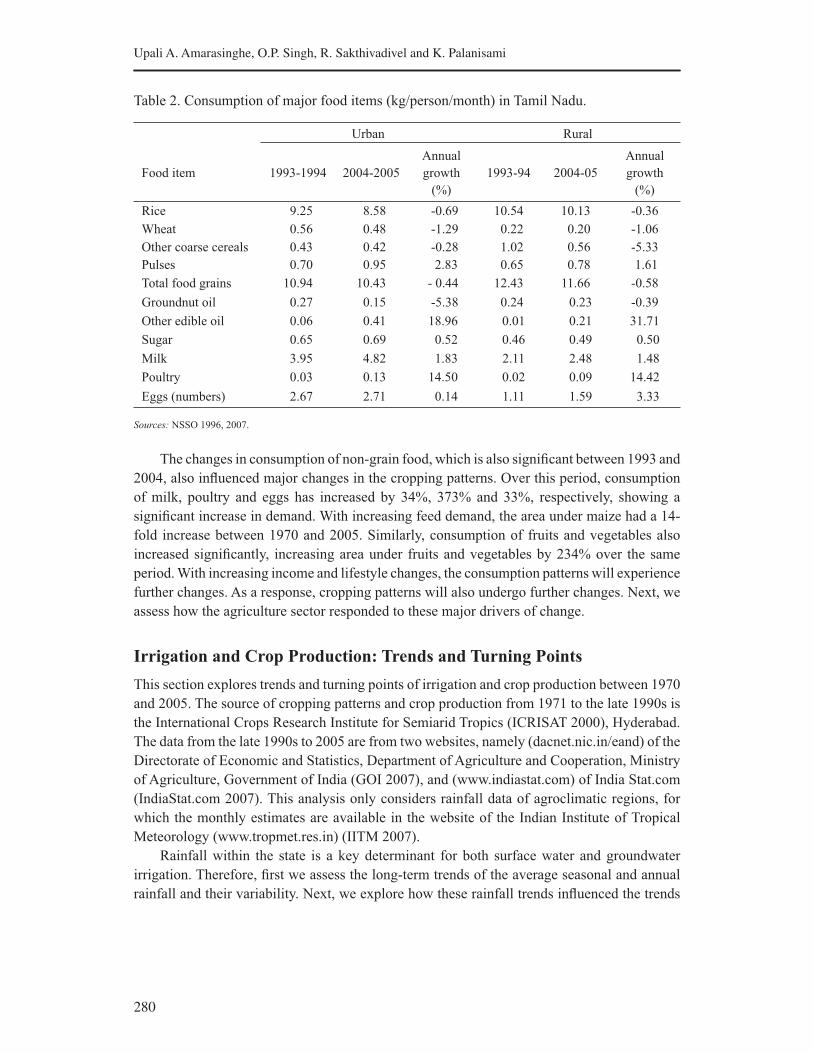
280
Upali A. Amarasinghe, O.P. Singh, R. Sakthivadivel and K. Palanisami
Table 2. Consumption of major food items (kg/person/month) in Tamil Nadu.
Urban Rural
Food item 1993-1994 2004-2005
Annual
growth
(%)
1993-94 2004-05
Annual
growth
(%)
Rice 9.25 8.58 -0.69 10.54 10.13 -0.36
Wheat 0.56 0.48 -1.29 0.22 0.20 -1.06
Other coarse cereals 0.43 0.42 -0.28 1.02 0.56 -5.33
Pulses 0.70 0.95 2.83 0.65 0.78 1.61
Total food grains 10.94 10.43 - 0.44 12.43 11.66 -0.58
Groundnut oil 0.27 0.15 -5.38 0.24 0.23 -0.39
Other edible oil 0.06 0.41 18.96 0.01 0.21 31.71
Sugar 0.65 0.69 0.52 0.46 0.49 0.50
Milk 3.95 4.82 1.83 2.11 2.48 1.48
Poultry 0.03 0.13 14.50 0.02 0.09 14.42
Eggs (numbers) 2.67 2.71 0.14 1.11 1.59 3.33
Sources: NSSO 1996, 2007.
The changes in consumption of non-grain food, which is also significant between 1993 and
2004, also influenced major changes in the cropping patterns. Over this period, consumption
of milk, poultry and eggs has increased by 34%, 373% and 33%, respectively, showing a
significant increase in demand. With increasing feed demand, the area under maize had a 14-
fold increase between 1970 and 2005. Similarly, consumption of fruits and vegetables also
increased significantly, increasing area under fruits and vegetables by 234% over the same
period. With increasing income and lifestyle changes, the consumption patterns will experience
further changes. As a response, cropping patterns will also undergo further changes. Next, we
assess how the agriculture sector responded to these major drivers of change.
Irrigation and Crop Production: Trends and Turning Points
This section explores trends and turning points of irrigation and crop production between 1970
and 2005. The source of cropping patterns and crop production from 1971 to the late 1990s is
the International Crops Research Institute for Semiarid Tropics (ICRISAT 2000), Hyderabad.
The data from the late 1990s to 2005 are from two websites, namely (dacnet.nic.in/eand) of the
Directorate of Economic and Statistics, Department of Agriculture and Cooperation, Ministry
of Agriculture, Government of India (GOI 2007), and (www.indiastat.com) of India Stat.com
(IndiaStat.com 2007). This analysis only considers rainfall data of agroclimatic regions, for
which the monthly estimates are available in the website of the Indian Institute of Tropical
Meteorology (www.tropmet.res.in) (IITM 2007).
Rainfall within the state is a key determinant for both surface water and groundwater
irrigation. Therefore, first we assess the long-term trends of the average seasonal and annual
rainfall and their variability. Next, we explore how these rainfall trends influenced the trends
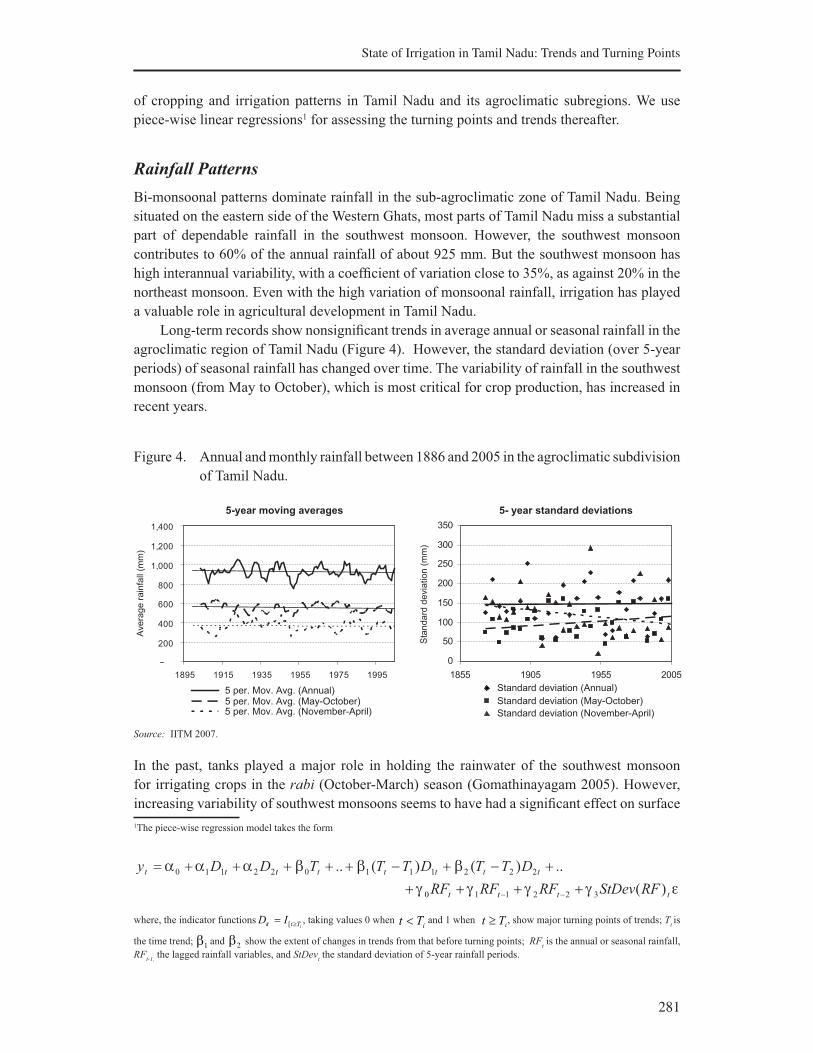
281
State of Irrigation in Tamil Nadu: Trends and Turning Points
of cropping and irrigation patterns in Tamil Nadu and its agroclimatic subregions. We use
piece-wise linear regressions1 for assessing the turning points and trends thereafter.
Rainfall Patterns
Bi-monsoonal patterns dominate rainfall in the sub-agroclimatic zone of Tamil Nadu. Being
situated on the eastern side of the Western Ghats, most parts of Tamil Nadu miss a substantial
part of dependable rainfall in the southwest monsoon. However, the southwest monsoon
contributes to 60% of the annual rainfall of about 925 mm. But the southwest monsoon has
high interannual variability, with a coefficient of variation close to 35%, as against 20% in the
northeast monsoon. Even with the high variation of monsoonal rainfall, irrigation has played
a valuable role in agricultural development in Tamil Nadu.
Long-term records show nonsignificant trends in average annual or seasonal rainfall in the
agroclimatic region of Tamil Nadu (Figure 4). However, the standard deviation (over 5-year
periods) of seasonal rainfall has changed over time. The variability of rainfall in the southwest
monsoon (from May to October), which is most critical for crop production, has increased in
recent years.
Figure 4. Annual and monthly rainfall between 1886 and 2005 in the agroclimatic subdivision
of Tamil Nadu.
Source: IITM 2007.
In the past, tanks played a major role in holding the rainwater of the southwest monsoon
for irrigating crops in the rabi (October-March) season (Gomathinayagam 2005). However,
increasing variability of southwest monsoons seems to have had a significant effect on surface
1The piece-wise regression model takes the form
tttt
tttttttt
RFStDevRFRFRF
DTTDTTTDDy
)(
..)()(..
322110
222111022110
++++
+−+−+++++=
−−
where, the indicator functions][ iTtit ID ≥= , taking values 0 when
iTt < and 1 when iTt ≥ , show major turning points of trends; T
t is
the time trend; 1β
and 2β show the extent of changes in trends from that before turning points; RF
t is the annual or seasonal rainfall,
RFt-1,
the lagged rainfall variables, and StDevt the standard deviation of 5-year rainfall periods.
5-year moving averages 5- year standard deviations
200
400
600
800
1,000
1,200
1,400
1895 1915 1935 1955 1975 1995
5 per. Mov. Avg. (Annual)5 per. Mov. Avg. (May-October)5 per. Mov. Avg. (November-April)
0
50
100
150
200
250
300
350
1855 1905 1955 2005
Sta
nd
ard
de
via
tio
n (
mm
)
Standard deviation (Annual)
Standard deviation (May-October)
Standard deviation (November-April)
Ave
rag
e r
ain
fall
(mm
)
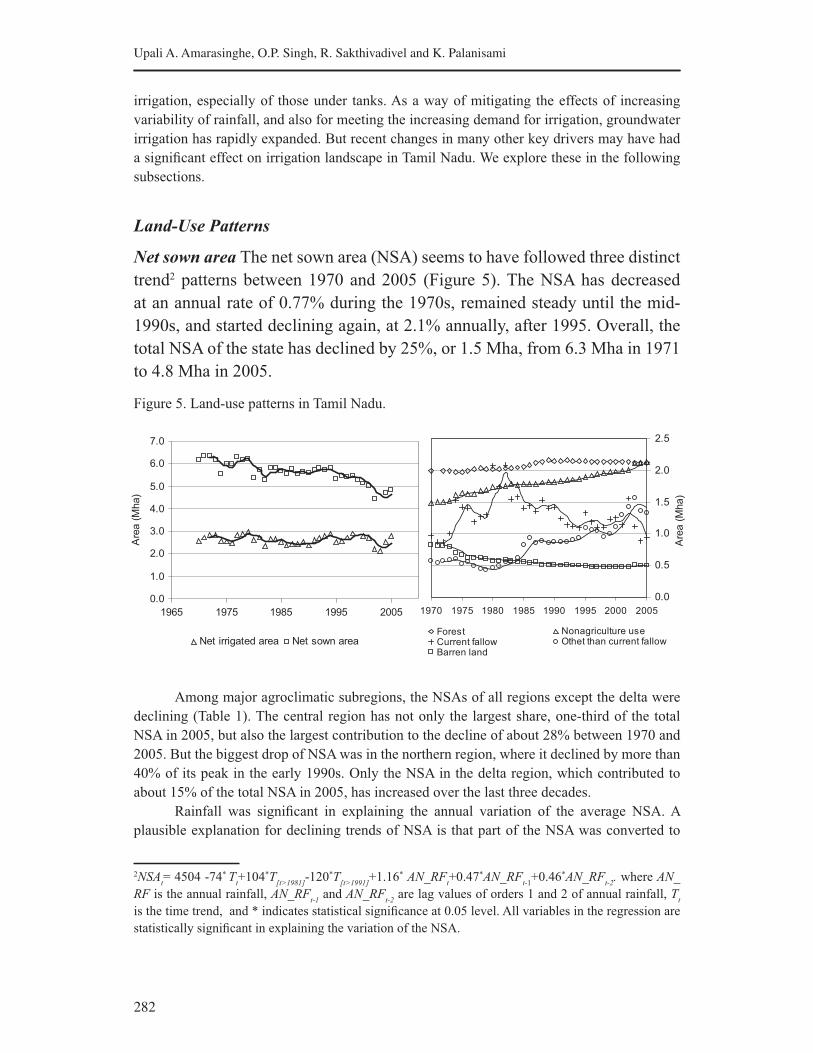
282
Upali A. Amarasinghe, O.P. Singh, R. Sakthivadivel and K. Palanisami
irrigation, especially of those under tanks. As a way of mitigating the effects of increasing
variability of rainfall, and also for meeting the increasing demand for irrigation, groundwater
irrigation has rapidly expanded. But recent changes in many other key drivers may have had
a significant effect on irrigation landscape in Tamil Nadu. We explore these in the following
subsections.
Land-Use Patterns
Net sown area The net sown area (NSA) seems to have followed three distinct
trend2 patterns between 1970 and 2005 (Figure 5). The NSA has decreased
at an annual rate of 0.77% during the 1970s, remained steady until the mid-
1990s, and started declining again, at 2.1% annually, after 1995. Overall, the
total NSA of the state has declined by 25%, or 1.5 Mha, from 6.3 Mha in 1971
to 4.8 Mha in 2005.
Figure 5. Land-use patterns in Tamil Nadu.
Among major agroclimatic subregions, the NSAs of all regions except the delta were
declining (Table 1). The central region has not only the largest share, one-third of the total
NSA in 2005, but also the largest contribution to the decline of about 28% between 1970 and
2005. But the biggest drop of NSA was in the northern region, where it declined by more than
40% of its peak in the early 1990s. Only the NSA in the delta region, which contributed to
about 15% of the total NSA in 2005, has increased over the last three decades.
Rainfall was significant in explaining the annual variation of the average NSA. A
plausible explanation for declining trends of NSA is that part of the NSA was converted to
2NSAt= 4504 -74* T
t+104*T
[t>1981]-120*T
[t>1991]+1.16* AN_RF
t+0.47*AN_RF
t-1+0.46*AN_RF
t-2. where AN_
RF is the annual rainfall, AN_RFt-1
and AN_RFt-2
are lag values of orders 1 and 2 of annual rainfall, Tt
is the time trend, and * indicates statistical significance at 0.05 level. All variables in the regression are
statistically significant in explaining the variation of the NSA.
0.0
1.0
2.0
3.0
4.0
5.0
6.0
7.0
1965 1975 1985 1995 2005
Are
a (
Mha)
Net irrigated area Net sown area
1970 1975 1980 1985 1990 1995 2000 2005
0.0
0.5
1.0
1.5
2.0
2.5
Are
a (
Mha)
Forest Nonagriculture useCurrent fallow Othet than current fallowBarren land
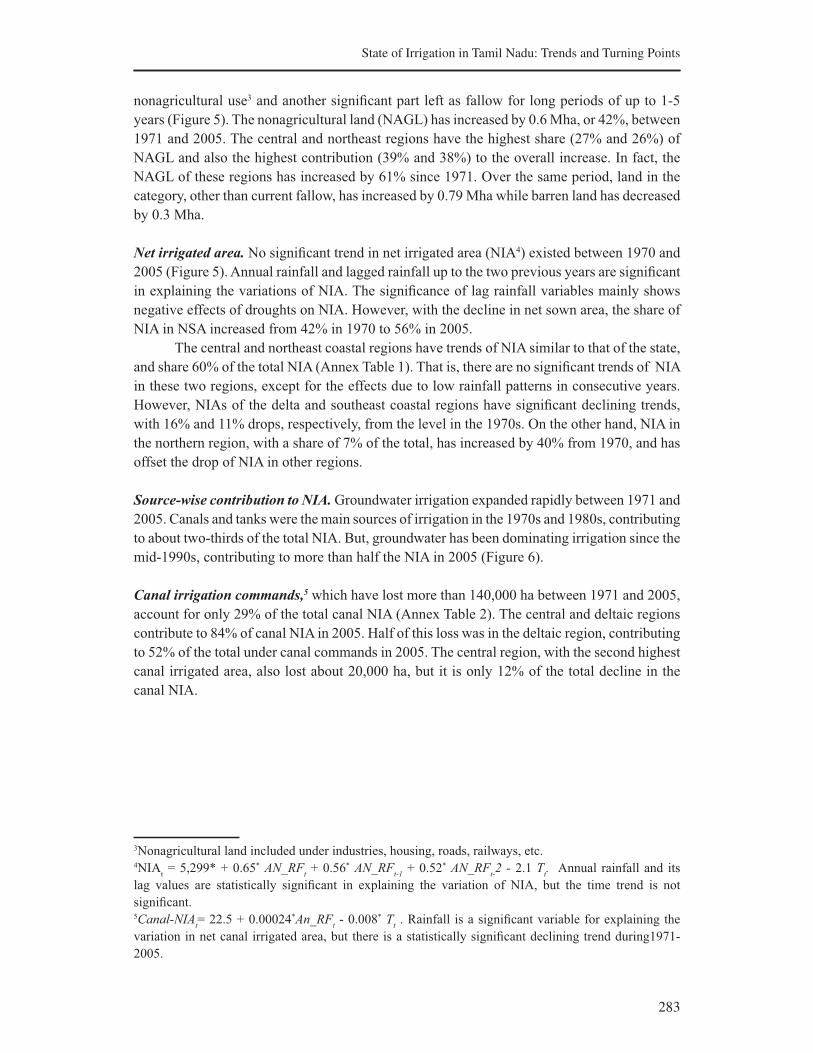
283
State of Irrigation in Tamil Nadu: Trends and Turning Points
nonagricultural use3 and another significant part left as fallow for long periods of up to 1-5
years (Figure 5). The nonagricultural land (NAGL) has increased by 0.6 Mha, or 42%, between
1971 and 2005. The central and northeast regions have the highest share (27% and 26%) of
NAGL and also the highest contribution (39% and 38%) to the overall increase. In fact, the
NAGL of these regions has increased by 61% since 1971. Over the same period, land in the
category, other than current fallow, has increased by 0.79 Mha while barren land has decreased
by 0.3 Mha.
Net irrigated area. No significant trend in net irrigated area (NIA4) existed between 1970 and
2005 (Figure 5). Annual rainfall and lagged rainfall up to the two previous years are significant
in explaining the variations of NIA. The significance of lag rainfall variables mainly shows
negative effects of droughts on NIA. However, with the decline in net sown area, the share of
NIA in NSA increased from 42% in 1970 to 56% in 2005.
The central and northeast coastal regions have trends of NIA similar to that of the state,
and share 60% of the total NIA (Annex Table 1). That is, there are no significant trends of NIA
in these two regions, except for the effects due to low rainfall patterns in consecutive years.
However, NIAs of the delta and southeast coastal regions have significant declining trends,
with 16% and 11% drops, respectively, from the level in the 1970s. On the other hand, NIA in
the northern region, with a share of 7% of the total, has increased by 40% from 1970, and has
offset the drop of NIA in other regions.
Source-wise contribution to NIA. Groundwater irrigation expanded rapidly between 1971 and
2005. Canals and tanks were the main sources of irrigation in the 1970s and 1980s, contributing
to about two-thirds of the total NIA. But, groundwater has been dominating irrigation since the
mid-1990s, contributing to more than half the NIA in 2005 (Figure 6).
Canal irrigation commands,5 which have lost more than 140,000 ha between 1971 and 2005,
account for only 29% of the total canal NIA (Annex Table 2). The central and deltaic regions
contribute to 84% of canal NIA in 2005. Half of this loss was in the deltaic region, contributing
to 52% of the total under canal commands in 2005. The central region, with the second highest
canal irrigated area, also lost about 20,000 ha, but it is only 12% of the total decline in the
canal NIA.
3Nonagricultural land included under industries, housing, roads, railways, etc.4NIA
t = 5,299* + 0.65* AN_RF
t + 0.56* AN_RF
t-1 + 0.52* AN_RF
t-2 - 2.1 T
t. Annual rainfall and its
lag values are statistically significant in explaining the variation of NIA, but the time trend is not
significant.5Canal-NIA
t= 22.5 + 0.00024*An_RF
t - 0.008* T
t . Rainfall is a significant variable for explaining the
variation in net canal irrigated area, but there is a statistically significant declining trend during1971-
2005.
284
Upali A. Amarasinghe, O.P. Singh, R. Sakthivadivel and K. Palanisami
Figure 6. Share of source-wise net irrigated area.
Tank irrigation,6 which contributed to one-third of the total NIA in 1971, has lost more than
half of its NIA by 2005 (Annex Table 2). The northeast and southeast coastal regions share
three-fourths of the NIA under tanks. And these two regions lost more than 54% and 24%,
respectively, of NIA under tank commands between 1971 and 2005. The central region, with
15% of total tank NIA, lost more than 27% area over the same period. Although low rainfall
in three consecutive years explains the short-term variation, there seems to be a consistent
declining trend in the recorded NIA under tanks during the last few decades.
However, not all of the NIA lost under tank irrigation systems, was lost from the
production system. Wherever the net tank irrigated area has decreased, much of that is replaced
by groundwater irrigation. This is especially true in central and northeast coastal regions,
where net tank irrigated area has decreased by 103,000 and 242,000 ha, respectively, while
the net groundwater irrigated area has increased by 194,000 and 307,000 ha, respectively. It
seems that tanks in these areas are operating as a valuable recharge structures for utilizing
groundwater irrigation.
Groundwater irrigation, which has contributed to a major part of NIA in recent years, had
some notable trend patterns between 1971 and 2005.
• First, groundwater has replaced part of surface irrigation, especially a part of the area
under tank irrigation. This pattern is prominent in the northeast coastal and central regions
(Annex Table 2), where the NIA under tank commands has decreased by 243,000 and
103,000 ha, respectively, and NIA under canal irrigated areas has decreased by 38,000
and 10,000 ha, respectively. Over this period, the NIAs under groundwater in the two
regions have increased by 303,000 and 195,000 ha, respectively, and have offset the loss
of surface irrigated area.
• Second, groundwater irrigation has also spread well outside surface command areas.
Increases in net groundwater irrigated area in central and northeast coastal regions far
exceed the loss of area under surface irrigation. In the north region, increase in groundwater
irrigated area is even higher than the combined area of canal and tank irrigation. Indeed,
these excess groundwater irrigated areas must have occurred outside the surface command
areas.
6Tank-NIAt = 48.24 + 0.05* AN_RF
t + 0.03* AN_RF
t-1 + 0.02* AN_RF
t-2 - 0.02*T
t. Annual rainfall and
rainfall in the two previous years explain the variation in net tank irrigated area. However, in spite of
these contributions, there was a significant declining trend of NIA under tank commands during 1971-
2005.
285
State of Irrigation in Tamil Nadu: Trends and Turning Points
• Third, recent growth patterns indicate that groundwater irrigation especially that through
dug wells, is not sustainable in many regions. Dug wells were the main contributor to the
growth of groundwater irrigation before late 1990s (Figure 7, right-hand graph). However,
the NIA through dug wells has been decreasing in recent years. Part of this decline was
due to the droughts of 2001-2003. But the declining trend seems to be continuing beyond
the drought period.
• Fourth, it is clear that reliance of tube-well irrigation is increasing. In fact, tube-well
irrigation seemed to be taking the place of dug wells in most regions (Figure 7, right-hand
graph). The central and northeast coastal regions had the largest increase with each region
recoding 34,000 ha of additional net tube-well irrigated area between 2000 and 2005. The
central and northeast coastal regions had, respectively, tenfold and twofold increases in
tube-well irrigated area between 1971 and 2005. Although small in magnitude, the north
region also nearly doubled its tube-well irrigated area from 2000 to 2005.
Figure 7. Net dug well and net tube-well irrigated areas in agroclimatic subregions.
Impacts of groundwater development. Although groundwater development has contributed
to maintaining NIA at the present level, it has led to environmental concerns in many regions.
As a whole, 85% of the net groundwater resource is already developed (Annex Table 2).
However, many regions are categorized as overexploited, where groundwater withdrawals far
exceed the net available resources. Of the 385 blocks, 142 are overexploited. And 33 blocks
are categorized as critical, where the stage of development is between 90 and 100% in both
pre- and post-monsoons, and 57 are semi-critical, where the stage of development is between
70 and 100% in either pre- or post-monsoons (CGWB 2006).
Many of the blocks in the north, central and northeast coastal regions are either critical
or overexploited. These regions have 74% of the net available groundwater resources of the
state, but contribute to 89% of the NIA under groundwater. Indeed, sustaining groundwater
irrigation at the present level is a major issue in these regions. In fact, after a continuous
growth, the NIA under dug wells in all three regions has decreased between 2000 and 2005
whereas that under tube wells has increased over the same period and helped maintain a
positive growth in area under groundwater irrigation.
286
Upali A. Amarasinghe, O.P. Singh, R. Sakthivadivel and K. Palanisami
However, with the present trends of falling groundwater tables, how long these growth
patterns of groundwater irrigation can be maintained is a critical issue.
Gross irrigated area. Although the NIA remains a constant, the gross irrigated area (GIA)
showed a statistically significant declining trend7 between 1971 and 2005 (Figure 8). This
indicates that the area that is irrigated more than once has declined over the last few decades.
In fact, the irrigation intensity, the ratio of GIA to NIA, has declined from 131% to 112%
between 1971 and 2005. As a result, the GIA has declined by 0.49 Mha, from 3.47 Mha in
1971 to 2.98 Mha by 2005.
The sharp decline8 of irrigation intensity and hence GIA started since the mid-1990s.
Part of this decline, especially the trends after 1995, can be attributed to low rainfall. But the
statistically significant time trend indicates that other factors are also contributing to decrease
GIA by about 3,500 ha annually. These factors include the increasing demand for water from
other sectors in dominantly canal irrigated areas, and increasing variability of water supply and
water scarcities and low profitability in tank irrigated areas. In fact, the largest contributions to
the decline of GIA are from the delta—a region dominantly canal-irrigated, and the northeast
coastal subregion—a region dominantly tank-irrigated. In both regions, GIA has decreased
by 0.21 Mha (Annex Table 3). In 1971, canals contributed to 93% of the irrigation in the
deltaic region, while tanks contributed to more than half the irrigation in the northeast coastal
region.
Table 3. State of groundwater development.
Agroclimatic
subregion
Annual
replenishable
groundwater
resources
Net
groundwater
availability1
Annual groundwater withdrawalsStage of
groundwater
development2Irrigation
Domestic
and
industries
Total
(Mm3) (Mm3) (Mm3) (Mm3) (Mm3) (%)
North 24.8 22.3 27.8 1.0 28.8 129.1
Central 58.5 52.6 41.6 2.3 43.9 83.4
Northeast
coastal 89.4 80.4 75.7 3.0 78.7 97.9
Delta 13.8 12.4 9.5 0.8 10.3 82.8
Southeast
coastal 30.4 27.4 11.1 1.1 12.2 44.7
South 2.9 2.6 0.2 0.2 0.4 16.2
Hill 10.9 9.8 1.9 .3 2.1 21.7
Tamil Nadu 230.7 207.7 167.8 8.8 176.5 85.0
Notes: 1 Net groundwater availability is the difference between annual replenishable groundwater resources and natural discharge
during non-monsoonal months
2 Stage of groundwater development is the ratio of groundwater withdrawals to net groundwater resources
Source: Authors’ estimates based on CGWB 2006.
7GIAit= -50.1+1.18*NIA_CAN
it+1.23*NIA_TANK
it+1.65*NIA_TW
it+1.16*NIA_DW
it+0.08* RF_AN
t+0.05*
RF_ANt-1
- 3.5*Tt; R2=95%. * indicates that the coefficients are statistically significant at the 0.05 level.
8IIt= 95.1*- 0.05 T
t 1.5* T
[t>1995] + 0.02*RF_AN
t + 0.01* RF_AN
t-1 ; R2= 70%.
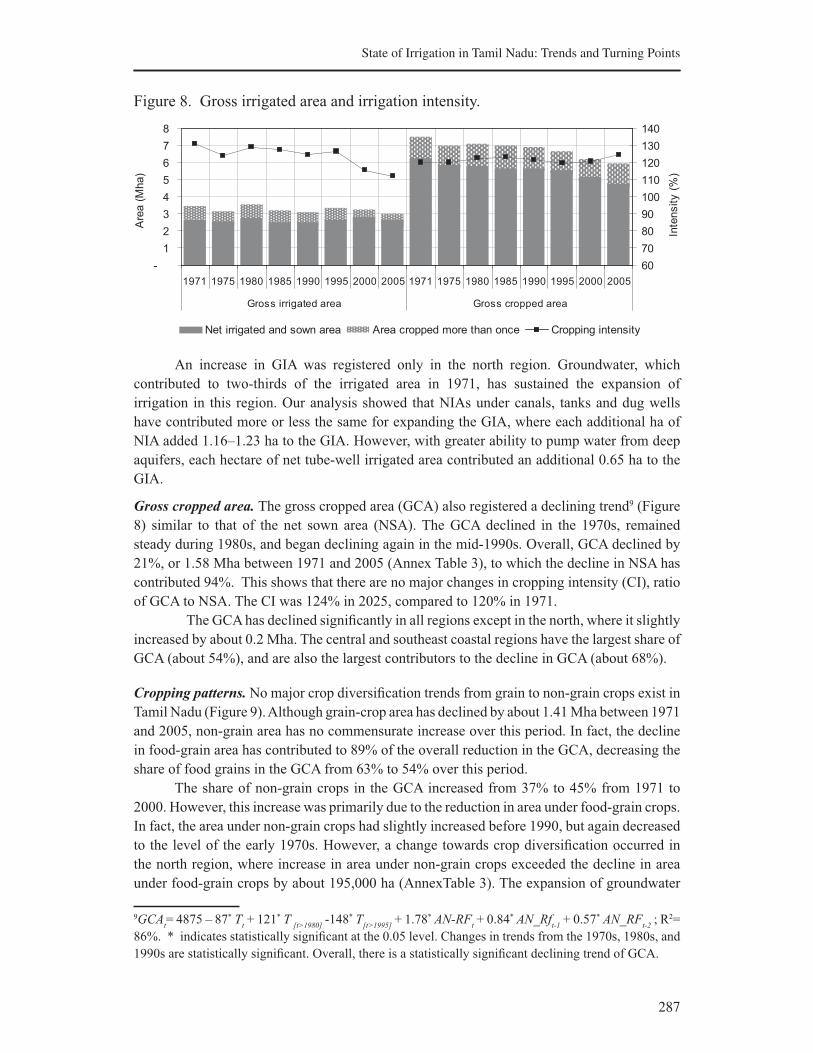
287
State of Irrigation in Tamil Nadu: Trends and Turning Points
Figure 8. Gross irrigated area and irrigation intensity.
1
2
3
4
5
6
7
8
1971 1975 1980 1985 1990 1995 2000 2005 1971 1975 1980 1985 1990 1995 2000 2005
Gross irrigated area Gross cropped area
Are
a (
Mha)
60
70
80
90
100
110
120
130
140
Inte
nsity (
%)
Net irrigated and sown area Area cropped more than once Cropping intensity
-
An increase in GIA was registered only in the north region. Groundwater, which
contributed to two-thirds of the irrigated area in 1971, has sustained the expansion of
irrigation in this region. Our analysis showed that NIAs under canals, tanks and dug wells
have contributed more or less the same for expanding the GIA, where each additional ha of
NIA added 1.16–1.23 ha to the GIA. However, with greater ability to pump water from deep
aquifers, each hectare of net tube-well irrigated area contributed an additional 0.65 ha to the
GIA.
Gross cropped area. The gross cropped area (GCA) also registered a declining trend9 (Figure
8) similar to that of the net sown area (NSA). The GCA declined in the 1970s, remained
steady during 1980s, and began declining again in the mid-1990s. Overall, GCA declined by
21%, or 1.58 Mha between 1971 and 2005 (Annex Table 3), to which the decline in NSA has
contributed 94%. This shows that there are no major changes in cropping intensity (CI), ratio
of GCA to NSA. The CI was 124% in 2025, compared to 120% in 1971.
The GCA has declined significantly in all regions except in the north, where it slightly
increased by about 0.2 Mha. The central and southeast coastal regions have the largest share of
GCA (about 54%), and are also the largest contributors to the decline in GCA (about 68%).
Cropping patterns. No major crop diversification trends from grain to non-grain crops exist in
Tamil Nadu (Figure 9). Although grain-crop area has declined by about 1.41 Mha between 1971
and 2005, non-grain area has no commensurate increase over this period. In fact, the decline
in food-grain area has contributed to 89% of the overall reduction in the GCA, decreasing the
share of food grains in the GCA from 63% to 54% over this period.
The share of non-grain crops in the GCA increased from 37% to 45% from 1971 to
2000. However, this increase was primarily due to the reduction in area under food-grain crops.
In fact, the area under non-grain crops had slightly increased before 1990, but again decreased
to the level of the early 1970s. However, a change towards crop diversification occurred in
the north region, where increase in area under non-grain crops exceeded the decline in area
under food-grain crops by about 195,000 ha (AnnexTable 3). The expansion of groundwater
9GCAt= 4875 – 87* T
t + 121* T
[t>1980] -148* T
[t>1995] + 1.78* AN-RF
t + 0.84* AN_Rf
t-1 + 0.57* AN_RF
t-2 ; R2=
86%. * indicates statistically significant at the 0.05 level. Changes in trends from the 1970s, 1980s, and
1990s are statistically significant. Overall, there is a statistically significant declining trend of GCA.
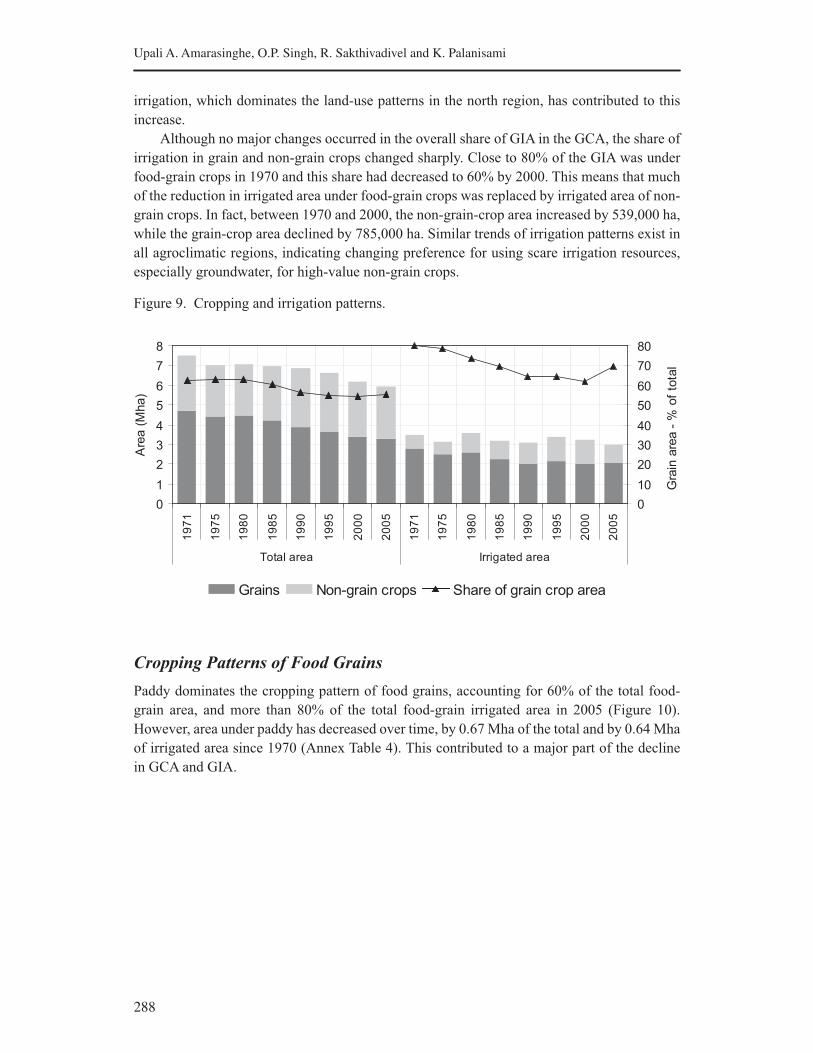
288
Upali A. Amarasinghe, O.P. Singh, R. Sakthivadivel and K. Palanisami
irrigation, which dominates the land-use patterns in the north region, has contributed to this
increase.
Although no major changes occurred in the overall share of GIA in the GCA, the share of
irrigation in grain and non-grain crops changed sharply. Close to 80% of the GIA was under
food-grain crops in 1970 and this share had decreased to 60% by 2000. This means that much
of the reduction in irrigated area under food-grain crops was replaced by irrigated area of non-
grain crops. In fact, between 1970 and 2000, the non-grain-crop area increased by 539,000 ha,
while the grain-crop area declined by 785,000 ha. Similar trends of irrigation patterns exist in
all agroclimatic regions, indicating changing preference for using scare irrigation resources,
especially groundwater, for high-value non-grain crops.
Figure 9. Cropping and irrigation patterns.
Cropping Patterns of Food Grains
Paddy dominates the cropping pattern of food grains, accounting for 60% of the total food-
grain area, and more than 80% of the total food-grain irrigated area in 2005 (Figure 10).
However, area under paddy has decreased over time, by 0.67 Mha of the total and by 0.64 Mha
of irrigated area since 1970 (Annex Table 4). This contributed to a major part of the decline
in GCA and GIA.
0
1
2
3
4
5
6
7
8
19
71
19
75
19
80
19
85
19
90
19
95
20
00
20
05
19
71
19
75
19
80
19
85
19
90
19
95
20
00
20
05
Total area Irrigated area
Are
a (
Mha)
0
10
20
30
40
50
60
70
80
Gra
in a
rea -
% o
f to
tal
Grains Non-grain crops Share of grain crop area
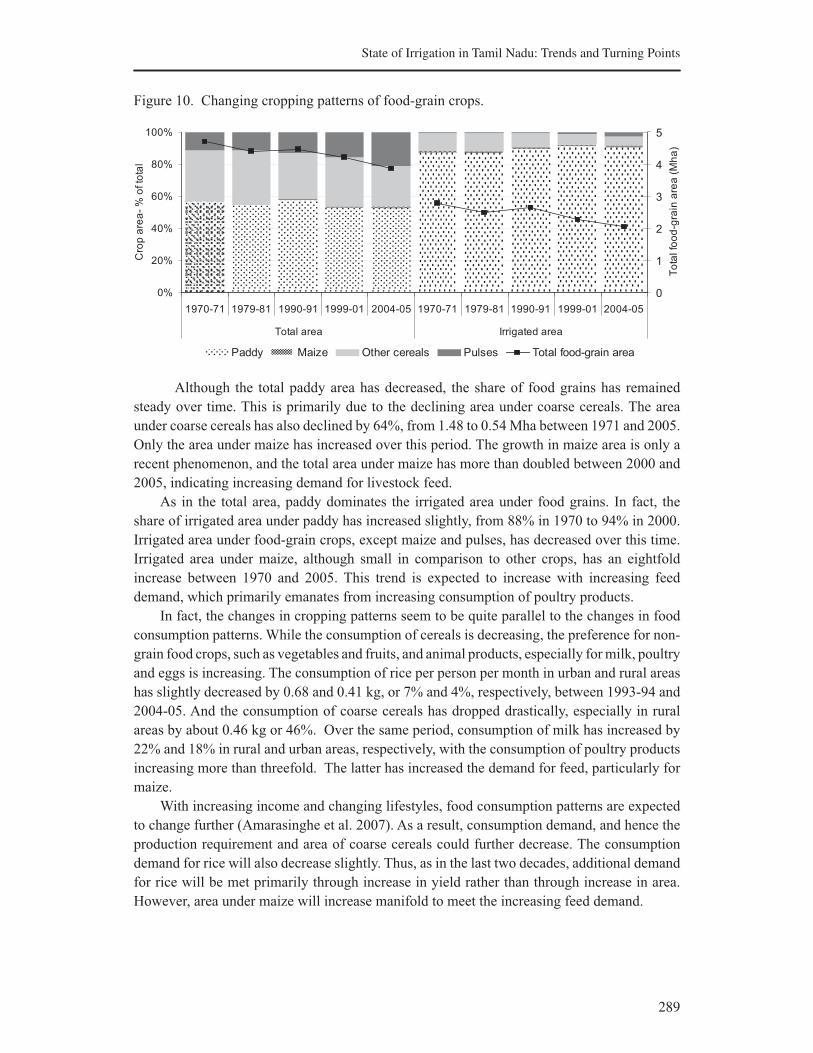
289
State of Irrigation in Tamil Nadu: Trends and Turning Points
Figure 10. Changing cropping patterns of food-grain crops.
Although the total paddy area has decreased, the share of food grains has remained
steady over time. This is primarily due to the declining area under coarse cereals. The area
under coarse cereals has also declined by 64%, from 1.48 to 0.54 Mha between 1971 and 2005.
Only the area under maize has increased over this period. The growth in maize area is only a
recent phenomenon, and the total area under maize has more than doubled between 2000 and
2005, indicating increasing demand for livestock feed.
As in the total area, paddy dominates the irrigated area under food grains. In fact, the
share of irrigated area under paddy has increased slightly, from 88% in 1970 to 94% in 2000.
Irrigated area under food-grain crops, except maize and pulses, has decreased over this time.
Irrigated area under maize, although small in comparison to other crops, has an eightfold
increase between 1970 and 2005. This trend is expected to increase with increasing feed
demand, which primarily emanates from increasing consumption of poultry products.
In fact, the changes in cropping patterns seem to be quite parallel to the changes in food
consumption patterns. While the consumption of cereals is decreasing, the preference for non-
grain food crops, such as vegetables and fruits, and animal products, especially for milk, poultry
and eggs is increasing. The consumption of rice per person per month in urban and rural areas
has slightly decreased by 0.68 and 0.41 kg, or 7% and 4%, respectively, between 1993-94 and
2004-05. And the consumption of coarse cereals has dropped drastically, especially in rural
areas by about 0.46 kg or 46%. Over the same period, consumption of milk has increased by
22% and 18% in rural and urban areas, respectively, with the consumption of poultry products
increasing more than threefold. The latter has increased the demand for feed, particularly for
maize.
With increasing income and changing lifestyles, food consumption patterns are expected
to change further (Amarasinghe et al. 2007). As a result, consumption demand, and hence the
production requirement and area of coarse cereals could further decrease. The consumption
demand for rice will also decrease slightly. Thus, as in the last two decades, additional demand
for rice will be met primarily through increase in yield rather than through increase in area.
However, area under maize will increase manifold to meet the increasing feed demand.
1970-71 1979-81 1990-91 1999-01 2004-05 1970-71 1979-81 1990-91 1999-01 2004-05
Total area Irrigated area
Cro
p a
rea
- %
of to
tal
0
1
2
3
4
5
To
tal fo
od
-gra
in a
rea
(M
ha
)
Paddy Maize Other cereals Pulses Total food-grain area
0%
20%
40%
60%
80%
100%
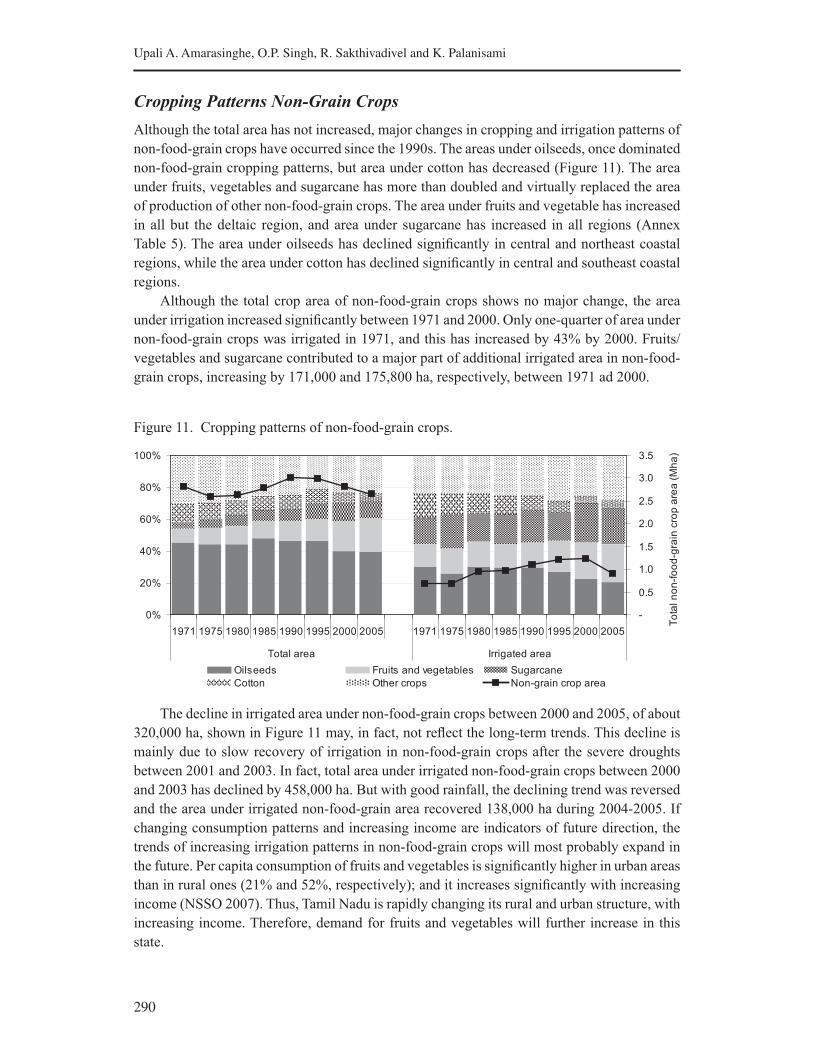
290
Upali A. Amarasinghe, O.P. Singh, R. Sakthivadivel and K. Palanisami
Cropping Patterns Non-Grain Crops
Although the total area has not increased, major changes in cropping and irrigation patterns of
non-food-grain crops have occurred since the 1990s. The areas under oilseeds, once dominated
non-food-grain cropping patterns, but area under cotton has decreased (Figure 11). The area
under fruits, vegetables and sugarcane has more than doubled and virtually replaced the area
of production of other non-food-grain crops. The area under fruits and vegetable has increased
in all but the deltaic region, and area under sugarcane has increased in all regions (Annex
Table 5). The area under oilseeds has declined significantly in central and northeast coastal
regions, while the area under cotton has declined significantly in central and southeast coastal
regions.
Although the total crop area of non-food-grain crops shows no major change, the area
under irrigation increased significantly between 1971 and 2000. Only one-quarter of area under
non-food-grain crops was irrigated in 1971, and this has increased by 43% by 2000. Fruits/
vegetables and sugarcane contributed to a major part of additional irrigated area in non-food-
grain crops, increasing by 171,000 and 175,800 ha, respectively, between 1971 ad 2000.
Figure 11. Cropping patterns of non-food-grain crops.
The decline in irrigated area under non-food-grain crops between 2000 and 2005, of about
320,000 ha, shown in Figure 11 may, in fact, not reflect the long-term trends. This decline is
mainly due to slow recovery of irrigation in non-food-grain crops after the severe droughts
between 2001 and 2003. In fact, total area under irrigated non-food-grain crops between 2000
and 2003 has declined by 458,000 ha. But with good rainfall, the declining trend was reversed
and the area under irrigated non-food-grain area recovered 138,000 ha during 2004-2005. If
changing consumption patterns and increasing income are indicators of future direction, the
trends of increasing irrigation patterns in non-food-grain crops will most probably expand in
the future. Per capita consumption of fruits and vegetables is significantly higher in urban areas
than in rural ones (21% and 52%, respectively); and it increases significantly with increasing
income (NSSO 2007). Thus, Tamil Nadu is rapidly changing its rural and urban structure, with
increasing income. Therefore, demand for fruits and vegetables will further increase in this
state.
0%
20%
40%
60%
80%
100%
1971 1975 1980 1985 1990 1995 2000 2005 1971 1975 1980 1985 1990 1995 2000 2005
Total area Irrigated area
-
0.5
1.0
1.5
2.0
2.5
3.0
3.5
To
tal n
on
-fo
od
-gra
in c
rop
are
a (
Mh
a)
Oilseeds Fruits and vegetables Sugarcane
Cotton Other crops Non-grain crop area
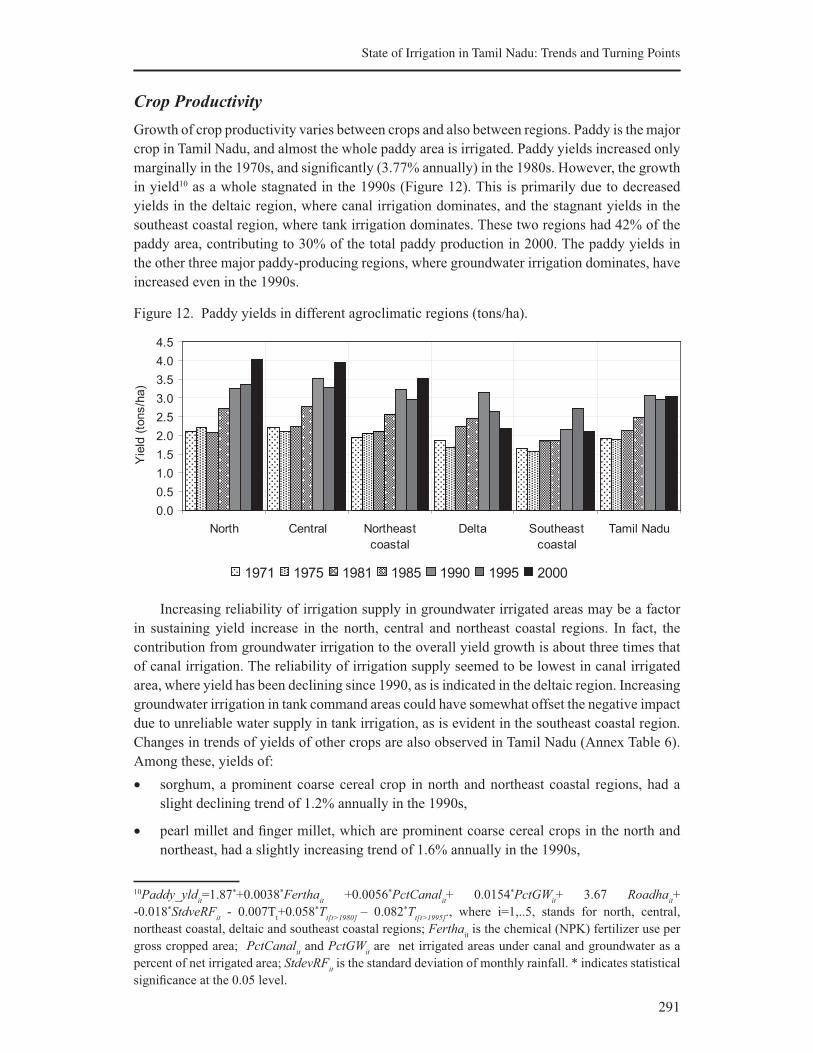
291
State of Irrigation in Tamil Nadu: Trends and Turning Points
Crop Productivity
Growth of crop productivity varies between crops and also between regions. Paddy is the major
crop in Tamil Nadu, and almost the whole paddy area is irrigated. Paddy yields increased only
marginally in the 1970s, and significantly (3.77% annually) in the 1980s. However, the growth
in yield10 as a whole stagnated in the 1990s (Figure 12). This is primarily due to decreased
yields in the deltaic region, where canal irrigation dominates, and the stagnant yields in the
southeast coastal region, where tank irrigation dominates. These two regions had 42% of the
paddy area, contributing to 30% of the total paddy production in 2000. The paddy yields in
the other three major paddy-producing regions, where groundwater irrigation dominates, have
increased even in the 1990s.
Figure 12. Paddy yields in different agroclimatic regions (tons/ha).
Increasing reliability of irrigation supply in groundwater irrigated areas may be a factor
in sustaining yield increase in the north, central and northeast coastal regions. In fact, the
contribution from groundwater irrigation to the overall yield growth is about three times that
of canal irrigation. The reliability of irrigation supply seemed to be lowest in canal irrigated
area, where yield has been declining since 1990, as is indicated in the deltaic region. Increasing
groundwater irrigation in tank command areas could have somewhat offset the negative impact
due to unreliable water supply in tank irrigation, as is evident in the southeast coastal region.
Changes in trends of yields of other crops are also observed in Tamil Nadu (Annex Table 6).
Among these, yields of:
• sorghum, a prominent coarse cereal crop in north and northeast coastal regions, had a
slight declining trend of 1.2% annually in the 1990s,
• pearl millet and finger millet, which are prominent coarse cereal crops in the north and
northeast, had a slightly increasing trend of 1.6% annually in the 1990s,
10Paddy_yldit=1.87*+0.0038*Fertha
it +0.0056*PctCanal
it+ 0.0154*PctGW
it+ 3.67 Roadha
it+
-0.018*StdveRFit - 0.007T
t+0.058*T
t[t>1980] – 0.082*T
t[t>1995]., where i=1,..5, stands for north, central,
northeast coastal, deltaic and southeast coastal regions; Ferthait is the chemical (NPK) fertilizer use per
gross cropped area; PctCanalit and PctGW
it are net irrigated areas under canal and groundwater as a
percent of net irrigated area; StdevRFit is the standard deviation of monthly rainfall. * indicates statistical
significance at the 0.05 level.
0.0
0.5
1.0
1.5
2.0
2.5
3.0
3.5
4.0
4.5
North Central Northeast
coastal
Delta Southeast
coastal
Tamil Nadu
Yie
ld (
tons/h
a)
1971 1975 1981 1985 1990 1995 2000

292
Upali A. Amarasinghe, O.P. Singh, R. Sakthivadivel and K. Palanisami
• pulses are stagnating in all regions except the north,
• oilseeds were gradually increasing by 1.21% in the 1980s and by 2.34% in the 1990s;
Groundnut is the major oilseed crop in the state, contributing to 94% of the total oil seed
production and its yield increased by 3.2% annually in the 1990s,
• sugarcane, a prominent crop in the state, had no significant yield increases since 1980,
and
• cotton increased by 4.2% in the 1980s and by 7.8% in the 1990s; the spreading of BT
cotton has contributed to the sharp growth in yield in the latter period; this has contributed
to increase cotton production by 42% between 1990 and 2000, although area under cotton
declined by 36% over the same period.
Declining productivity and crop area have had a severe effect on the state’s situation
in food-grain security. Supply of food grain in 2004-05 was only 65% of the demand, in
comparison to 96% in 2000. Importantly, rice production has dropped drastically, 31% over
this period, accounting for only 61% of the demand in 2004.
Discussion of Future Scenarios
In this section, we discuss a few future scenarios emerging from recent trends or to explore in
the irrigation sector in Tamil Nadu.
• The NSA of the state has been declining, and nonagricultural uses have taken up part of
the decreased area. With rapidly increasing urban population and expanding industrial and
service sectors, this trend is expected to continue.
• A part of the NSA area was also left fallow for an extended period of time. Increasing
migration of agricultural labor to nonagriculture sectors, decreasing the agriculture-
dependent population and increasing competition for water from other sectors could
aggravate this situation. Although no visible trends exist at present, opportunities for land
consolidation for increasing economies of scale in land use in agriculture could emerge in
the future.
• With increasing competition for surface water from other sectors, maintaining area under
major/medium irrigation schemes at the present level could be a serious challenge. It
is likely that net irrigated area under major/medium irrigation would further decrease.
And most of the surface irrigation under major/medium schemes will be confined to high
productive and high potential areas. Moreover, as a solution to the declining irrigated
area, changing operations of irrigation deliveries to increase adoption of water saving
technologies or changing to low-water-intensive cropping patterns needs to be explored.
• Increasing variability of rainfall and unreliable surface irrigation supplies are major causes
for declining tank irrigated area. Many small tanks cannot offer adequate irrigation supply
for even a single season. Thus, command area under tanks will decrease further. However,
many of these tanks can be used as water recharge structures for groundwater irrigation.
They will provide a better control of on-farm water use in irrigation. Additionally, it will
be a reliable drinking water supply for human beings and livestock in tank command
293
State of Irrigation in Tamil Nadu: Trends and Turning Points
areas. Thus, it is likely that groundwater irrigation will increase in the tank command
areas.
• In spite of the declining water tables, the number of dug wells and tube wells in most
regions are increasing, albeit at a slower rate. Groundwater irrigation has better control of
water use and can, in turn, contribute to higher crop productivity than surface irrigation.
Augmenting groundwater supply for maintaining or expanding groundwater irrigation
should be a key plank of the state water policy. Artificial groundwater recharge should be
promoted to the extent where there is no impact on downstream water users. These will
have major spatial distributional impacts on agriculture-dependent livelihoods.
• Micro-irrigation techniques improve water-use efficiency, reduce irrigation demand
and improve crop productivity. Yet, only about 66,000 ha of cropped area use drip and
sprinkler irrigation (Narayanamoorthy 2009), which is only 4% of the net area under
groundwater irrigation. In general, groundwater irrigation is conducive to adopting micro-
irrigation. Groundwater is the source for a large part of irrigated area of non-grain crops
such as vegetables, fruits and sugarcane. These crops and areas have the largest potential
for adopting drip and sprinkler irrigation in India.
• Decreasing per capita demand, water scarcities and low prices are major reasons for
decreasing paddy area. Paddy area seemed to have stabilized at around 2 million ha,
and most of that are irrigated. Providing a reliable irrigation supply to support paddy
growing in this area will be a key challenge. Water saving techniques, such as system
of rice intensification (SRI) or aerobic rice (AR), reduce the irrigation demand and, in
most cases, improve crop productivity. With increasing water scarcities, the demand for
introducing water saving techniques in paddy cultivation will increase.
• Food demand for coarse cereals is decreasing. Thus, the area under other cereals is also
decreasing. This trend will likely continue into the future.
• Demand for feed crops, such as maize, has increased sharply. The total and irrigated
maize area have had a sixfold and fourfold increase, respectively, since 1990. Maize
area will expand further, and much of that expansion will take place in areas under other
coarse cereals. Thus, additional water demand for increasing maize production could be
marginal.
• Sugarcane area, with most of it under irrigation, has increased until 2000 and declined
sharply since then. Even this area has a significant production surplus now. Whether this
decline is a blip in the cropping pattern or a continuous trend is not exactly clear.
• Although area under cotton is declining, its production is gradually increasing. Adoption
of high-yielding varieties, such as BT cotton, could be the main driver for yield growth.
This trend is likely to continue into the future.
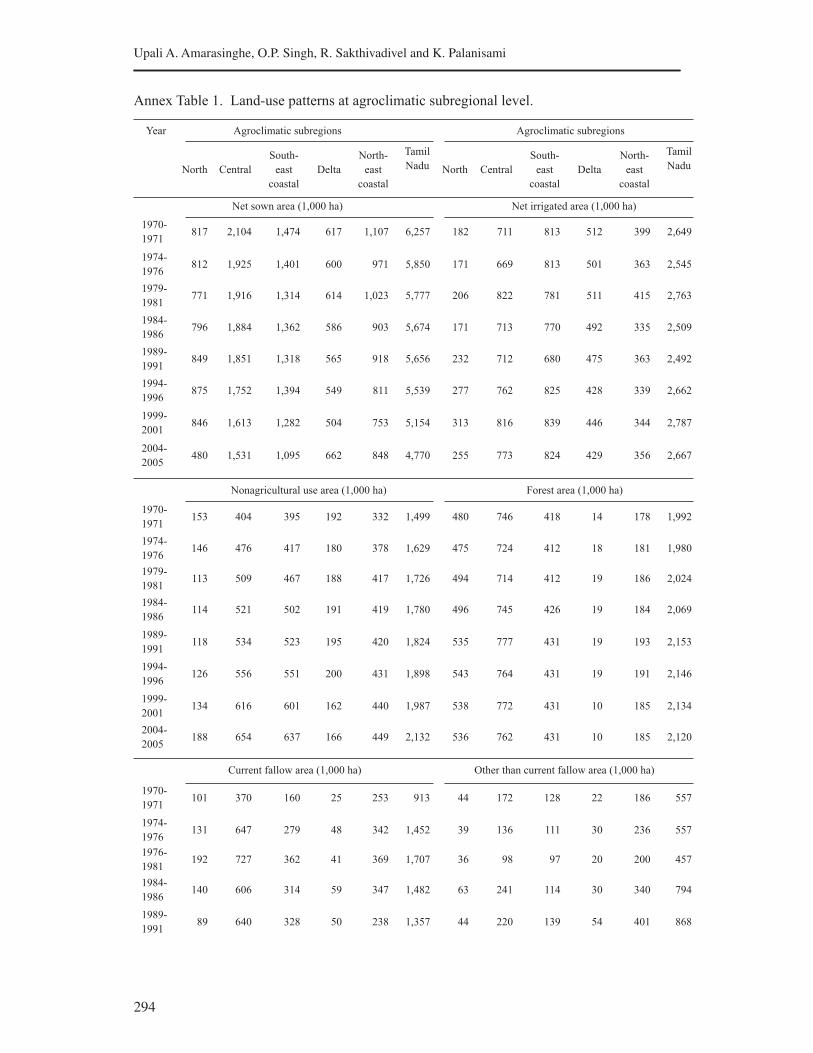
294
Upali A. Amarasinghe, O.P. Singh, R. Sakthivadivel and K. Palanisami
Annex Table 1. Land-use patterns at agroclimatic subregional level.
Year Agroclimatic subregions
Tamil
Nadu
Agroclimatic subregions
Tamil
NaduNorth Central
South-
east
coastal
Delta
North-
east
coastal
North Central
South-
east
coastal
Delta
North-
east
coastal
Net sown area (1,000 ha) Net irrigated area (1,000 ha)
1970-
1971817 2,104 1,474 617 1,107 6,257 182 711 813 512 399 2,649
1974-
1976812 1,925 1,401 600 971 5,850 171 669 813 501 363 2,545
1979-
1981771 1,916 1,314 614 1,023 5,777 206 822 781 511 415 2,763
1984-
1986796 1,884 1,362 586 903 5,674 171 713 770 492 335 2,509
1989-
1991849 1,851 1,318 565 918 5,656 232 712 680 475 363 2,492
1994-
1996875 1,752 1,394 549 811 5,539 277 762 825 428 339 2,662
1999-
2001846 1,613 1,282 504 753 5,154 313 816 839 446 344 2,787
2004-
2005480 1,531 1,095 662 848 4,770 255 773 824 429 356 2,667
Nonagricultural use area (1,000 ha) Forest area (1,000 ha)
1970-
1971153 404 395 192 332 1,499 480 746 418 14 178 1,992
1974-
1976146 476 417 180 378 1,629 475 724 412 18 181 1,980
1979-
1981113 509 467 188 417 1,726 494 714 412 19 186 2,024
1984-
1986114 521 502 191 419 1,780 496 745 426 19 184 2,069
1989-
1991118 534 523 195 420 1,824 535 777 431 19 193 2,153
1994-
1996126 556 551 200 431 1,898 543 764 431 19 191 2,146
1999-
2001134 616 601 162 440 1,987 538 772 431 10 185 2,134
2004-
2005188 654 637 166 449 2,132 536 762 431 10 185 2,120
Current fallow area (1,000 ha) Other than current fallow area (1,000 ha)
1970-
1971101 370 160 25 253 913 44 172 128 22 186 557
1974-
1976131 647 279 48 342 1,452 39 136 111 30 236 557
1976-
1981192 727 362 41 369 1,707 36 98 97 20 200 457
1984-
1986140 606 314 59 347 1,482 63 241 114 30 340 794
1989-
199189 640 328 50 238 1,357 44 220 139 54 401 868

295
State of Irrigation in Tamil Nadu: Trends and Turning Points
1994-
199674 637 215 39 230 1,207 30 269 197 69 457 1,030
1999-
200192 610 266 20 213 1,209 36 317 235 46 492 1,132
2004-
2005124 411 285 20 70 917 44 415 260 60 566 1,349
Permanent pasture and grazing land (1,000 ha) Barren land (1,000 ha)
1970-
197127 76 75 6 36 230 161 178 284 32 111 819
1974-
197626 65 58 5 27 189 149 152 233 36 63 663
1979-
198126 48 47 6 24 159 140 139 208 39 52 588
1984-
198626 38 44 6 25 145 132 137 183 39 56 556
1989-
199126 31 38 5 19 124 113 129 167 36 59 510
1994-
199627 30 41 5 18 125 110 118 156 39 60 490
1999-
200141 90 100 23 115 377 110 119 143 36 62 476
2004-
200546 102 96 22 122 396 110 147 142 36 64 506
Note: Hill and south regions have only 3% of NSA; 1% of NIA; 2% of nonagricultural use land, and less than 1% of the current
fallow, other than current fallow, permanent pasture and grazing land, but 8% of forest area in 2005.
Annex Table 2. Total source-wise net irrigated area and as a percent of total NIA in agroclimatic
subregions.
Year Agroclimatic subregions
Tamil
Nadu
Agroclimatic subregions
Tamil
NaduNorth Central
South-
east
coastal
Delta
North-
east
coastal
North Central
South-
east
coastal
Delta
North-
east
coastal
Net canal irrigated area (1,000 ha) Net canal irrigated area - % of total NIA
1970-
197125 267 98 474 23 907 14 38 12 93 6 34
1974-
197620 254 104 461 22 875 12 38 13 92 6 34
1979-
198125 282 96 470 22 907 12 34 12 92 5 33
1984-
198624 249 78 448 20 830 14 35 10 91 6 33
1989-
199125 265 62 417 22 801 11 37 9 88 6 32
1994-
199626 264 63 384 21 770 9 35 8 90 6 29
1999-
200130 265 69 425 21 822 10 32 8 95 6 29
2004-
200515 245 60 399 27 762 6 32 7 93 7 29
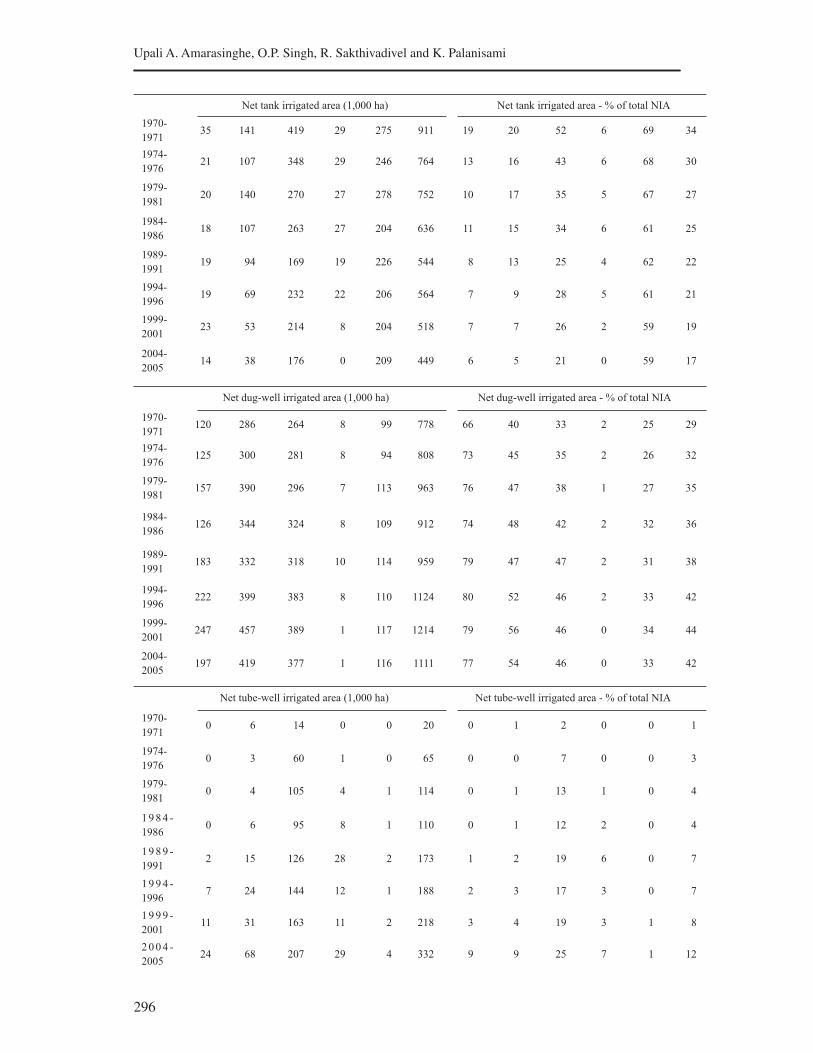
296
Upali A. Amarasinghe, O.P. Singh, R. Sakthivadivel and K. Palanisami
Net tank irrigated area (1,000 ha) Net tank irrigated area - % of total NIA
1970-
197135 141 419 29 275 911 19 20 52 6 69 34
1974-
197621 107 348 29 246 764 13 16 43 6 68 30
1979-
198120 140 270 27 278 752 10 17 35 5 67 27
1984-
198618 107 263 27 204 636 11 15 34 6 61 25
1989-
199119 94 169 19 226 544 8 13 25 4 62 22
1994-
199619 69 232 22 206 564 7 9 28 5 61 21
1999-
200123 53 214 8 204 518 7 7 26 2 59 19
2004-
200514 38 176 0 209 449 6 5 21 0 59 17
Net dug-well irrigated area (1,000 ha) Net dug-well irrigated area - % of total NIA
1970-
1971120 286 264 8 99 778 66 40 33 2 25 29
1974-
1976125 300 281 8 94 808 73 45 35 2 26 32
1979-
1981157 390 296 7 113 963 76 47 38 1 27 35
1984-
1986126 344 324 8 109 912 74 48 42 2 32 36
1989-
1991183 332 318 10 114 959 79 47 47 2 31 38
1994-
1996222 399 383 8 110 1124 80 52 46 2 33 42
1999-
2001247 457 389 1 117 1214 79 56 46 0 34 44
2004-
2005197 419 377 1 116 1111 77 54 46 0 33 42
Net tube-well irrigated area (1,000 ha) Net tube-well irrigated area - % of total NIA
1970-
19710 6 14 0 0 20 0 1 2 0 0 1
1974-
19760 3 60 1 0 65 0 0 7 0 0 3
1979-
19810 4 105 4 1 114 0 1 13 1 0 4
1 9 8 4 -
19860 6 95 8 1 110 0 1 12 2 0 4
1 9 8 9 -
19912 15 126 28 2 173 1 2 19 6 0 7
1 9 9 4 -
19967 24 144 12 1 188 2 3 17 3 0 7
1 9 9 9 -
200111 31 163 11 2 218 3 4 19 3 1 8
2 0 0 4 -
200524 68 207 29 4 332 9 9 25 7 1 12
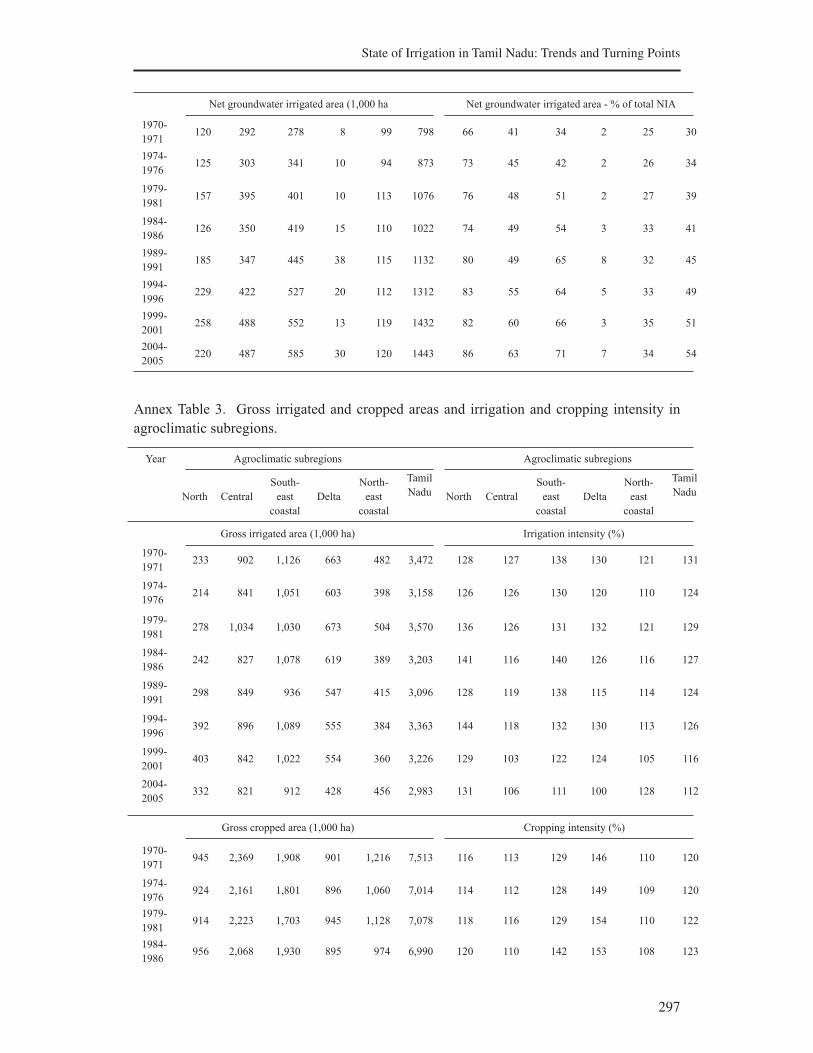
297
State of Irrigation in Tamil Nadu: Trends and Turning Points
Net groundwater irrigated area (1,000 ha Net groundwater irrigated area - % of total NIA
1970-
1971120 292 278 8 99 798 66 41 34 2 25 30
1974-
1976125 303 341 10 94 873 73 45 42 2 26 34
1979-
1981157 395 401 10 113 1076 76 48 51 2 27 39
1984-
1986126 350 419 15 110 1022 74 49 54 3 33 41
1989-
1991185 347 445 38 115 1132 80 49 65 8 32 45
1994-
1996229 422 527 20 112 1312 83 55 64 5 33 49
1999-
2001258 488 552 13 119 1432 82 60 66 3 35 51
2004-
2005220 487 585 30 120 1443 86 63 71 7 34 54
Annex Table 3. Gross irrigated and cropped areas and irrigation and cropping intensity in
agroclimatic subregions.
Year Agroclimatic subregions
Tamil
Nadu
Agroclimatic subregions
Tamil
NaduNorth Central
South-
east
coastal
Delta
North-
east
coastal
North Central
South-
east
coastal
Delta
North-
east
coastal
Gross irrigated area (1,000 ha) Irrigation intensity (%)
1970-
1971233 902 1,126 663 482 3,472 128 127 138 130 121 131
1974-
1976214 841 1,051 603 398 3,158 126 126 130 120 110 124
1979-
1981278 1,034 1,030 673 504 3,570 136 126 131 132 121 129
1984-
1986242 827 1,078 619 389 3,203 141 116 140 126 116 127
1989-
1991298 849 936 547 415 3,096 128 119 138 115 114 124
1994-
1996392 896 1,089 555 384 3,363 144 118 132 130 113 126
1999-
2001403 842 1,022 554 360 3,226 129 103 122 124 105 116
2004-
2005332 821 912 428 456 2,983 131 106 111 100 128 112
Gross cropped area (1,000 ha) Cropping intensity (%)
1970-
1971945 2,369 1,908 901 1,216 7,513 116 113 129 146 110 120
1974-
1976924 2,161 1,801 896 1,060 7,014 114 112 128 149 109 120
1979-
1981914 2,223 1,703 945 1,128 7,078 118 116 129 154 110 122
1984-
1986956 2,068 1,930 895 974 6,990 120 110 142 153 108 123

298
Upali A. Amarasinghe, O.P. Singh, R. Sakthivadivel and K. Palanisami
1989-
19911,075 2,060 1,745 831 993 6,884 127 111 133 147 108 122
1994-
19961,154 1,878 1,803 756 863 6,633 132 107 129 138 106 120
1999-
20011,140 1,742 1,570 779 794 6,199 135 108 122 155 105 120
2004-
2005950 1,731 1,465 733 886 5,932 198 113 134 111 104 124
Grain crop area (1,000 ha) Irrigated grain crop area (1,000 ha)
1970-
1971565 1,384 1,238 747 692 4,698 164 608 939 630 381 2,784
1974-
1976539 1,353 1,137 738 584 4,414 130 562 860 573 308 2,484
1979-
1981524 1,319 1,079 804 670 4,450 154 609 798 637 379 2,625
1984-
1986524 1,212 1,179 741 515 4,218 109 448 786 575 281 2,239
1989-
1991557 1,069 959 679 565 3,877 140 433 603 479 294 1,991
1994-
1996533 925 1,008 629 505 3,640 170 438 744 504 269 2,159
1999-
2001481 820 894 687 460 3,377 160 381 665 514 251 1,999
2004-
2005462 835 813 618 530 3,286 263 412 655 376 349 2,077
Non-grain crop area (1,000 ha) Irrigated no-grain crop area (1,000 ha)
1970-
1971380 985 670 154 524 2,815 69 294 187 33 101 687
1974-
1976385 808 663 158 476 2,600 83 278 191 30 90 675
1979-
1981390 905 623 141 458 2,628 124 425 232 36 124 945
1984-
1986432 855 751 155 459 2,772 133 379 292 44 108 964
1989-
1991518 991 786 152 428 3,008 159 416 333 67 121 1105
1994-
1996622 953 795 127 358 2,993 222 457 346 51 115 1205
1999-
2001659 922 676 93 334 2,822 243 462 358 41 110 1226
2004-
2005488 896 652 115 355 2,646 69 409 257 51 107 906

299
State of Irrigation in Tamil Nadu: Trends and Turning Points
Annex Table 4. Total crop and irrigated areas of rice, maize, other cereals and pulses in
agroclimatic subregions.
Year Agroclimatic subregions
Tamil
Nadu
Agroclimatic subregions
Tamil
NaduNorth Central
South-
east
coastal
Delta
North-
east
coastal
North Central
South-
east
coastal
Delta
North-
east
coastal
Paddy area (1,000 ha) Paddy irrigated area (1,000 ha)
1970-
1971122 479 940 653 405 2,665 122 457 865 625 325 2,456
1974-
1976104 446 850 614 331 2,397 89 422 782 568 254 2,164
1979-
1981116 514 790 657 445 2,573 116 475 741 634 347 2,362
1984-
198687 391 815 579 327 2,243 82 373 747 572 258 2,073
1989-
1991102 387 620 493 387 2,034 101 375 573 477 279 1,847
1994-
1996127 398 748 517 353 2,181 127 391 727 503 261 2,044
1999-
2001123 344 660 528 331 2,018 123 328 639 514 241 1,874
2004-
2005216 296 644 466 350 1,994 216 217 627 376 324 1,782
Maize area (1,000 ha) Maize irrigated area (1,000 ha)
1970-
19711 10 0 3 0 14 1 9 0 2 0 11
1974-
19761 14 1 5 0 20 1 12 0 4 0 16
1979-
19811 17 2 2 0 23 0 14 1 1 0 17
1984-
19862 19 1 2 1 25 1 12 0 2 0 16
1989-
19912 30 1 1 1 34 1 15 0 1 0 18
1994-
19963 39 0 0 5 47 2 23 0 0 1 27
1999-
20016 56 1 0 17 81 2 30 1 0 4 37
2004-
200517 146 8 1 23 196 7 61 5 1 7 80
Other cereal area (1,000 ha) Other cereal irrigated area (1,000 ha)
1970-
1971324 714 226 5 209 1,480 41 143 74 3 56 317
1974-
1976326 729 233 7 205 1,502 41 129 77 2 54 303
1979-
1981284 621 210 4 158 1,279 38 119 56 1 32 247
1984-
1986282 638 239 5 126 1,290 26 62 39 1 22 150
1989-
1991258 459 189 3 85 994 37 43 30 1 15 126
1994-
1996182 326 132 1 58 699 41 25 16 0 6 88
1999-
2001144 289 105 0 56 595 35 23 24 0 5 88
2004-
2005151 272 57 0 58 541 40 22 24 0 3 88
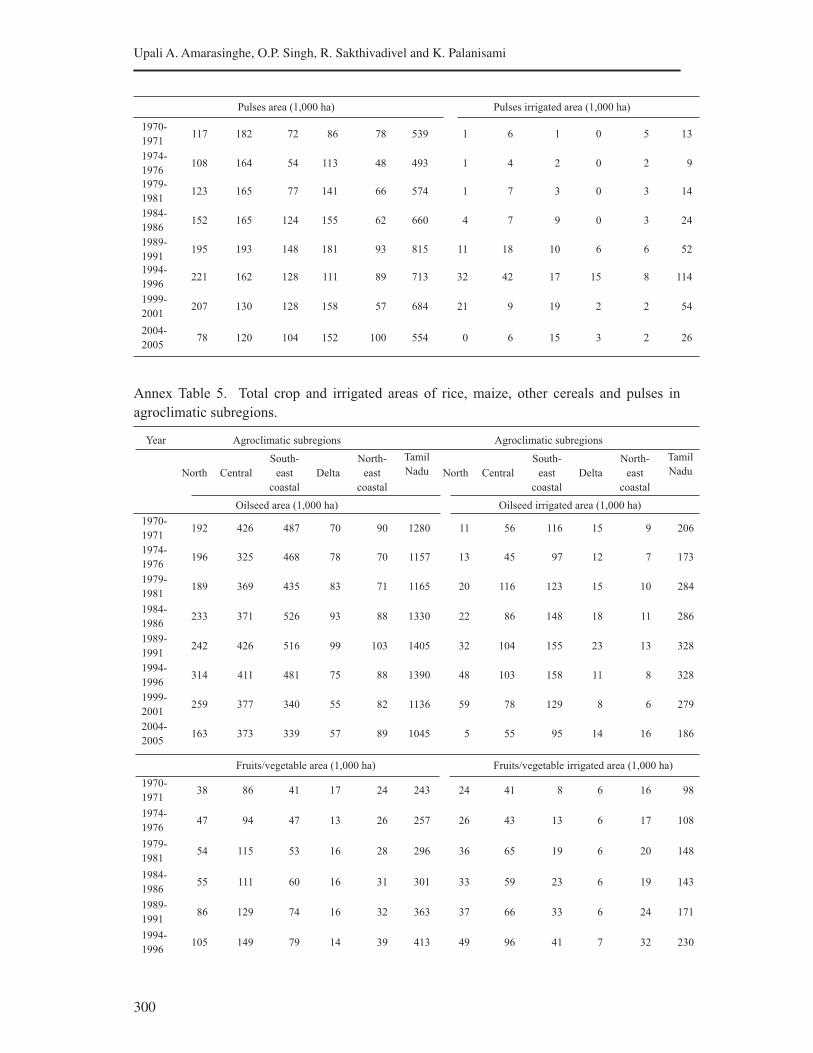
300
Upali A. Amarasinghe, O.P. Singh, R. Sakthivadivel and K. Palanisami
Pulses area (1,000 ha) Pulses irrigated area (1,000 ha)
1970-
1971117 182 72 86 78 539 1 6 1 0 5 13
1974-
1976108 164 54 113 48 493 1 4 2 0 2 9
1979-
1981123 165 77 141 66 574 1 7 3 0 3 14
1984-
1986152 165 124 155 62 660 4 7 9 0 3 24
1989-
1991195 193 148 181 93 815 11 18 10 6 6 52
1994-
1996221 162 128 111 89 713 32 42 17 15 8 114
1999-
2001207 130 128 158 57 684 21 9 19 2 2 54
2004-
200578 120 104 152 100 554 0 6 15 3 2 26
Annex Table 5. Total crop and irrigated areas of rice, maize, other cereals and pulses in
agroclimatic subregions.
Year Agroclimatic subregions
Tamil
Nadu
Agroclimatic subregions
Tamil
NaduNorth Central
South-
east
coastal
Delta
North-
east
coastal
North Central
South-
east
coastal
Delta
North-
east
coastal
Oilseed area (1,000 ha) Oilseed irrigated area (1,000 ha)
1970-
1971192 426 487 70 90 1280 11 56 116 15 9 206
1974-
1976196 325 468 78 70 1157 13 45 97 12 7 173
1979-
1981189 369 435 83 71 1165 20 116 123 15 10 284
1984-
1986233 371 526 93 88 1330 22 86 148 18 11 286
1989-
1991242 426 516 99 103 1405 32 104 155 23 13 328
1994-
1996314 411 481 75 88 1390 48 103 158 11 8 328
1999-
2001259 377 340 55 82 1136 59 78 129 8 6 279
2004-
2005163 373 339 57 89 1045 5 55 95 14 16 186
Fruits/vegetable area (1,000 ha) Fruits/vegetable irrigated area (1,000 ha)
1970-
197138 86 41 17 24 243 24 41 8 6 16 98
1974-
197647 94 47 13 26 257 26 43 13 6 17 108
1979-
198154 115 53 16 28 296 36 65 19 6 20 148
1984-
198655 111 60 16 31 301 33 59 23 6 19 143
1989-
199186 129 74 16 32 363 37 66 33 6 24 171
1994-
1996105 149 79 14 39 413 49 96 41 7 32 230
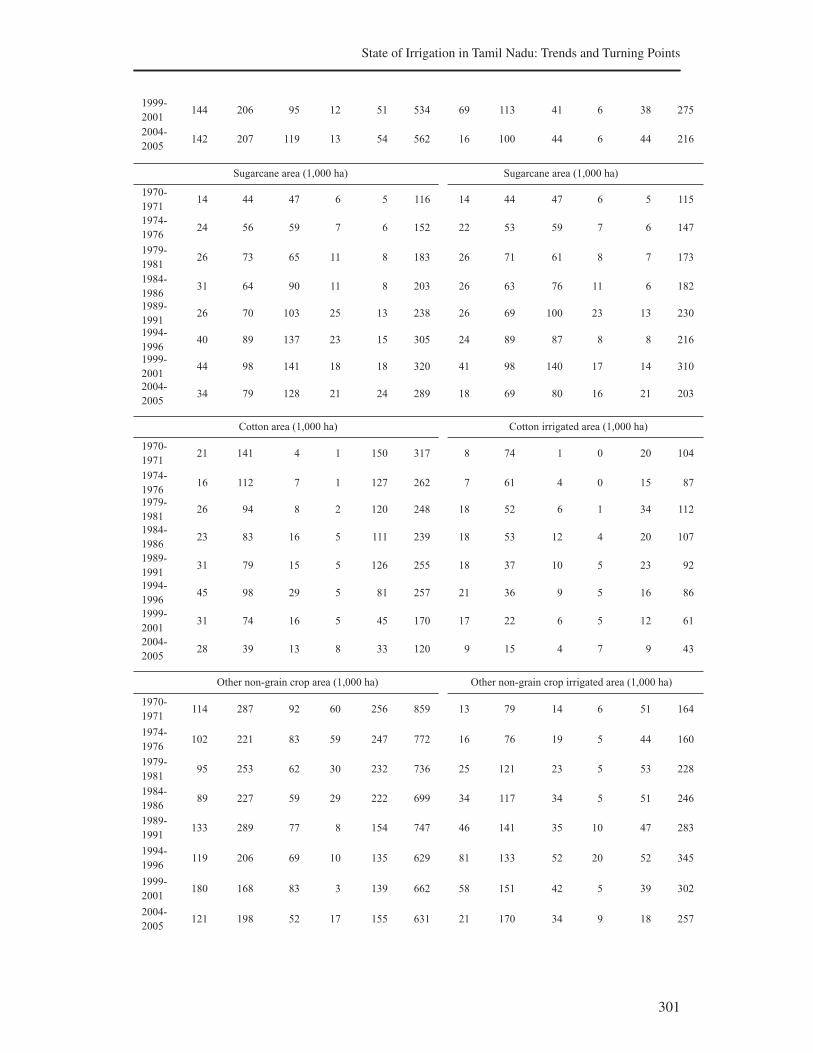
301
State of Irrigation in Tamil Nadu: Trends and Turning Points
1999-
2001144 206 95 12 51 534 69 113 41 6 38 275
2004-
2005142 207 119 13 54 562 16 100 44 6 44 216
Sugarcane area (1,000 ha) Sugarcane area (1,000 ha)
1970-
197114 44 47 6 5 116 14 44 47 6 5 115
1974-
197624 56 59 7 6 152 22 53 59 7 6 147
1979-
198126 73 65 11 8 183 26 71 61 8 7 173
1984-
198631 64 90 11 8 203 26 63 76 11 6 182
1989-
199126 70 103 25 13 238 26 69 100 23 13 230
1994-
199640 89 137 23 15 305 24 89 87 8 8 216
1999-
200144 98 141 18 18 320 41 98 140 17 14 310
2004-
200534 79 128 21 24 289 18 69 80 16 21 203
Cotton area (1,000 ha) Cotton irrigated area (1,000 ha)
1970-
197121 141 4 1 150 317 8 74 1 0 20 104
1974-
197616 112 7 1 127 262 7 61 4 0 15 87
1979-
198126 94 8 2 120 248 18 52 6 1 34 112
1984-
198623 83 16 5 111 239 18 53 12 4 20 107
1989-
199131 79 15 5 126 255 18 37 10 5 23 92
1994-
199645 98 29 5 81 257 21 36 9 5 16 86
1999-
200131 74 16 5 45 170 17 22 6 5 12 61
2004-
200528 39 13 8 33 120 9 15 4 7 9 43
Other non-grain crop area (1,000 ha) Other non-grain crop irrigated area (1,000 ha)
1970-
1971114 287 92 60 256 859 13 79 14 6 51 164
1974-
1976102 221 83 59 247 772 16 76 19 5 44 160
1979-
198195 253 62 30 232 736 25 121 23 5 53 228
1984-
198689 227 59 29 222 699 34 117 34 5 51 246
1989-
1991133 289 77 8 154 747 46 141 35 10 47 283
1994-
1996119 206 69 10 135 629 81 133 52 20 52 345
1999-
2001180 168 83 3 139 662 58 151 42 5 39 302
2004-
2005121 198 52 17 155 631 21 170 34 9 18 257

302
Upali A. Amarasinghe, O.P. Singh, R. Sakthivadivel and K. Palanisami
Annex Table 6. Crop yields of major crops in agroclimatic subregions (tons/ha).
Year Agroclimatic subregions
Tamil
Nadu
Agroclimatic subregions
Tamil
NaduNorth Central
South-
east
coastal
Delta
North-
east
coastal
North Central
South-
east
coastal
Delta
North-
east
coastal
Paddy Sorghum
1970-
19712.09 2.20 1.95 1.84 1.65 1.93 0.63 0.64 0.93 1.03 1.02 0.69
1974-
19762.19 2.10 2.06 1.68 1.58 1.91 0.59 0.65 1.21 0.81 0.96 0.71
1979-
19812.07 2.24 2.10 2.21 1.85 2.12 0.94 0.76 1.04 1.86 1.58 0.87
1984-
19862.74 2.78 2.54 2.45 1.87 2.46 1.25 0.76 1.33 0.95 1.29 0.93
1989-
19913.25 3.53 3.22 3.16 2.16 3.07 1.06 1.00 1.10 1.00 1.56 1.05
1994-
19963.36 3.27 2.94 2.64 2.73 2.94 1.35 0.82 1.19 0.88 1.66 1.00
1999-
20014.02 3.96 3.51 2.18 2.11 3.06 1.37 0.82 1.14 0.98 0.93
2004-
20051.28 3.24 2.83 1.63 2.23 2.35 1.03 0.62 1.13 0.87 0.74
Millet Pulses
1970-
19710.85 0.69 0.96 0.73 0.79 0.14 0.27 0.23 0.18 0.18 0.21
1974-
19760.91 0.92 1.34 0.69 0.96 0.23 0.28 0.37 0.29 0.26 0.28
1979-
19811.19 0.99 1.28 1.05 1.12 0.33 0.32 0.35 0.20 0.27 0.29
1984-
19861.29 1.01 1.46 1.10 1.24 0.48 0.46 0.43 0.36 0.34 0.42
1989-
19911.87 1.11 1.36 1.38 1.44 0.44 0.37 0.47 0.42 0.47 0.43
1994-
19961.99 0.96 1.30 1.47 1.48 0.46 0.35 0.42 0.32 0.29 0.39
1999-
20011.98 1.02 1.66 1.67 1.68 0.53 0.39 0.43 0.21 0.74 0.43
2004-
20051.34 1.02 1.39 1.54 1.33 0.38 0.37 0.42 0.14 0.58 0.35
Oilseed Groundnut
1970-
19710.97 0.91 0.99 0.62 0.67 0.91 1.11 1.07 1.07 0.92 0.97 1.06
1974-
19760.73 0.77 1.05 0.66 0.49 0.84 0.83 0.91 1.12 0.99 0.82 0.99
1979-
19810.83 0.97 0.93 0.65 0.55 0.87 1.20 1.31 1.14 1.22 1.17 1.21
1984-
19860.95 0.92 1.03 0.72 0.68 0.93 1.09 1.11 1.21 1.02 0.99 1.14
1989-
19911.10 0.90 1.18 0.65 0.58 0.98 1.30 1.21 1.29 1.28 0.96 1.25
1994-
19961.32 1.03 1.50 0.67 0.60 1.20 1.64 1.40 1.66 1.47 1.33 1.57
1999-
20011.36 1.06 1.70 0.40 0.63 1.24 1.80 1.39 1.98 1.69 1.59 1.72
2004-
20050.99 1.05 1.55 0.51 0.65 1.12 1.37 1.43 1.81 2.10 1.71 1.60
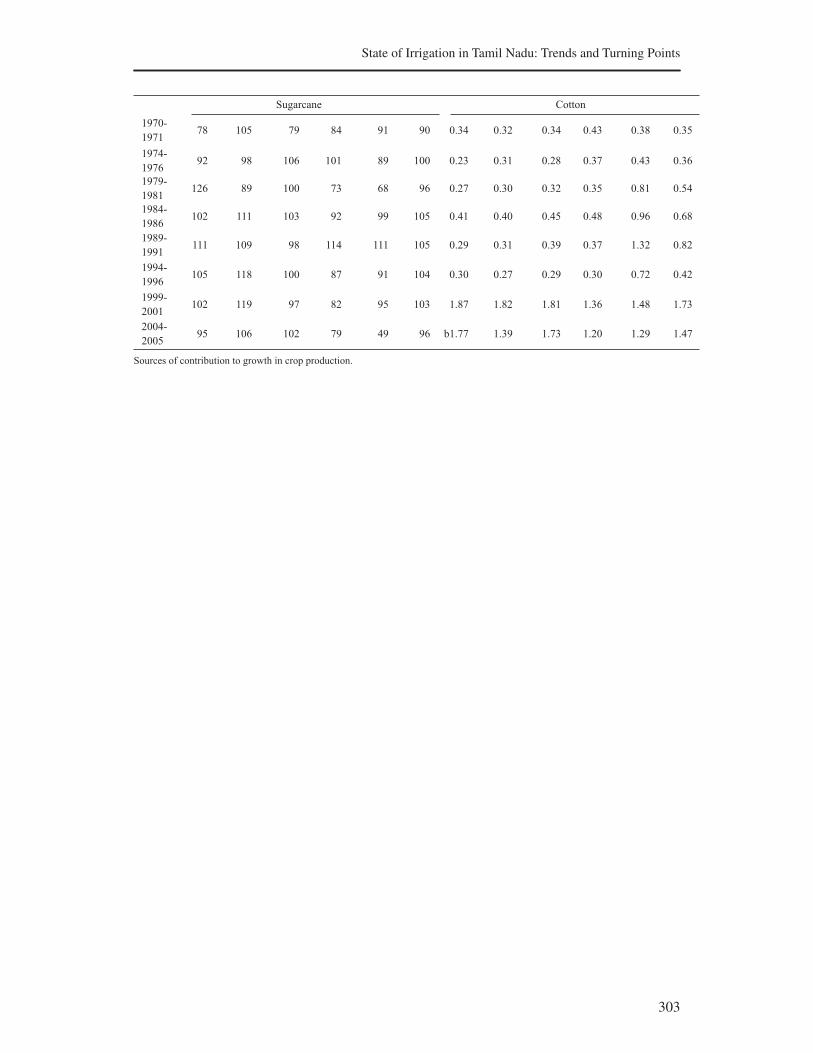
303
State of Irrigation in Tamil Nadu: Trends and Turning Points
Sugarcane Cotton
1970-
197178 105 79 84 91 90 0.34 0.32 0.34 0.43 0.38 0.35
1974-
197692 98 106 101 89 100 0.23 0.31 0.28 0.37 0.43 0.36
1979-
1981126 89 100 73 68 96 0.27 0.30 0.32 0.35 0.81 0.54
1984-
1986102 111 103 92 99 105 0.41 0.40 0.45 0.48 0.96 0.68
1989-
1991111 109 98 114 111 105 0.29 0.31 0.39 0.37 1.32 0.82
1994-
1996105 118 100 87 91 104 0.30 0.27 0.29 0.30 0.72 0.42
1999-
2001102 119 97 82 95 103 1.87 1.82 1.81 1.36 1.48 1.73
2004-
200595 106 102 79 49 96 b1.77 1.39 1.73 1.20 1.29 1.47
Sources of contribution to growth in crop production.
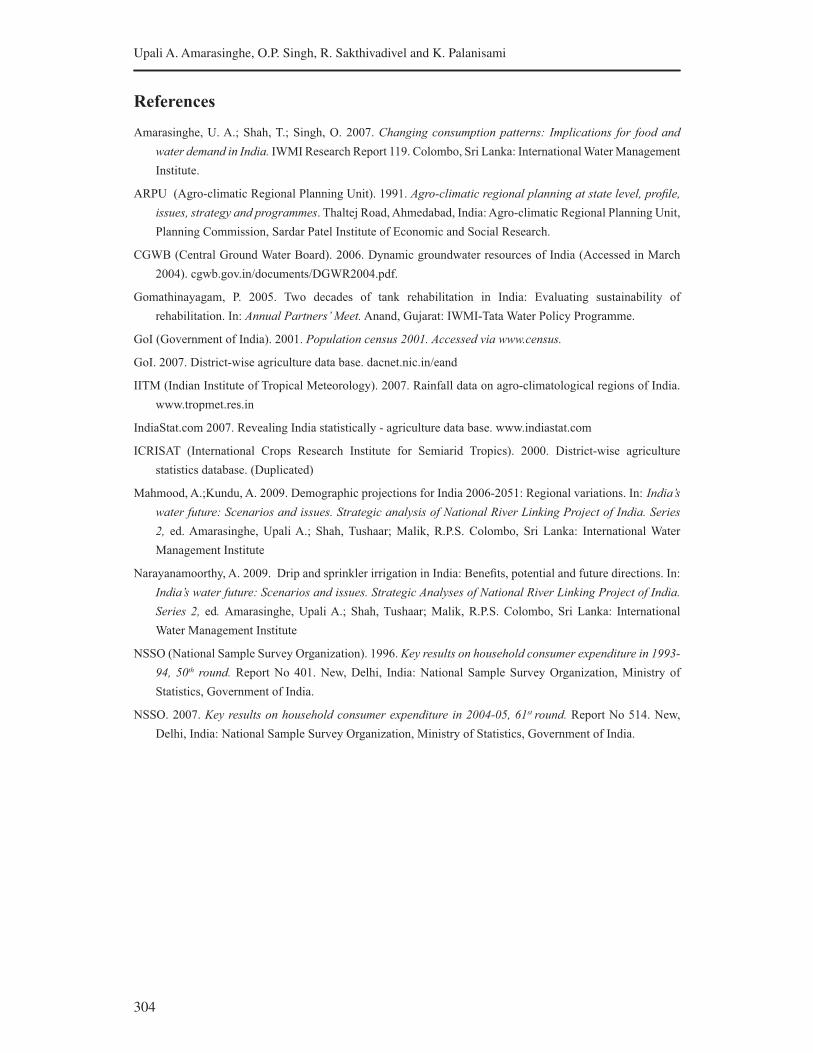
304
Upali A. Amarasinghe, O.P. Singh, R. Sakthivadivel and K. Palanisami
References
Amarasinghe, U. A.; Shah, T.; Singh, O. 2007. Changing consumption patterns: Implications for food and
water demand in India. IWMI Research Report 119. Colombo, Sri Lanka: International Water Management
Institute.
ARPU (Agro-climatic Regional Planning Unit). 1991. Agro-climatic regional planning at state level, profile,
issues, strategy and programmes. Thaltej Road, Ahmedabad, India: Agro-climatic Regional Planning Unit,
Planning Commission, Sardar Patel Institute of Economic and Social Research.
CGWB (Central Ground Water Board). 2006. Dynamic groundwater resources of India (Accessed in March
2004). cgwb.gov.in/documents/DGWR2004.pdf.
Gomathinayagam, P. 2005. Two decades of tank rehabilitation in India: Evaluating sustainability of
rehabilitation. In: Annual Partners’ Meet. Anand, Gujarat: IWMI-Tata Water Policy Programme.
GoI (Government of India). 2001. Population census 2001. Accessed via www.census.
GoI. 2007. District-wise agriculture data base. dacnet.nic.in/eand
IITM (Indian Institute of Tropical Meteorology). 2007. Rainfall data on agro-climatological regions of India.
www.tropmet.res.in
IndiaStat.com 2007. Revealing India statistically - agriculture data base. www.indiastat.com
ICRISAT (International Crops Research Institute for Semiarid Tropics). 2000. District-wise agriculture
statistics database. (Duplicated)
Mahmood, A.;Kundu, A. 2009. Demographic projections for India 2006-2051: Regional variations. In: India’s
water future: Scenarios and issues. Strategic analysis of National River Linking Project of India. Series
2, ed. Amarasinghe, Upali A.; Shah, Tushaar; Malik, R.P.S. Colombo, Sri Lanka: International Water
Management Institute
Narayanamoorthy, A. 2009. Drip and sprinkler irrigation in India: Benefits, potential and future directions. In:
India’s water future: Scenarios and issues. Strategic Analyses of National River Linking Project of India.
Series 2, ed. Amarasinghe, Upali A.; Shah, Tushaar; Malik, R.P.S. Colombo, Sri Lanka: International
Water Management Institute
NSSO (National Sample Survey Organization). 1996. Key results on household consumer expenditure in 1993-
94, 50th round. Report No 401. New, Delhi, India: National Sample Survey Organization, Ministry of
Statistics, Government of India.
NSSO. 2007. Key results on household consumer expenditure in 2004-05, 61st round. Report No 514. New,
Delhi, India: National Sample Survey Organization, Ministry of Statistics, Government of India.
305
Water Resources Management with Special Reference to
Tank Irrigation with Groundwater Use
K. Palanisami and Ananthini Nanthakumaran, Tamilnadu Agricultural University
Introduction
Tanks have existed in India from time immemorial and have been an important source of
irrigation, especially in the southern peninsular. Kings, Zamindars and even the British rulers
built many tanks in the eighteenth and nineteenth centuries. Though they are found in all parts
of the country, tanks are concentrated in the southern states, such as Andhra Pradesh, Karnataka
and Tamil Nadu, where they provided the largest source of irrigation until the mid-sixties.
There are more than 39,000 tanks in Tamil Nadu state alone, with varying sizes and types
and about 90% of them are rain-fed depending mainly on rainfall runoff for tank storage and
irrigation. The area irrigated by tanks has been continuously declining from 0.9 to 0.5 million
ha during the past 40 years and the share of the tanks in the total irrigated area has declined
from 37% in the 1960s to 20% in the 2000s. Even though the share of tanks is decreasing part
of it is replaced with groundwater irrigation in the tank command areas. Besides variation in
rainfall and tank filling, several factors such as siltation, encroachment, and channel obstruction
have reduced the tank irrigated area over the years. Also, over the years, increasing dug well
irrigation in the tank commands has complicated the water allocation and management in the
tanks (Palanisami and Easter 2000).
There are as many obstacles to tank irrigation as there are benefits, due to the large
number of tanks and the differences in water demand, managerial experiences and investment
needs for maintenance. In 2 out of 10 years the tank receives normal or excess rainfall; in 3
out of 10 years scanty rainfall results in tank failure; and in 5 out of 10 years deficit rainfall
results in reduction of crop yields. Some tanks are reported to be functioning for irrigation
only in normal/excess rainfall years and not so in poor/low-rainfall years. Since about 90%
of the tanks are nonsystem or rain-fed the effect on area reduction will be more significant
(Palanisami et al. 1997).
Over the years, farmers started supplementing tank water with well water, particularly
in deficit years. There are tanks now acting as groundwater recharge ponds, and also
meeting domestic and livestock water needs in the tank command areas where they use only
groundwater. In about 10% of the tanks with adequate number of wells in the command area,
the irrigated area has increased to 80%. However, due to constraints in the development of
wells, the number of wells, for example, for every 4 ha, ranges from less than one to two wells,
and the threshold level will be about one well for every 4 ha in a normal year, which will vary
306
K. Palanisami and Ananthini Nanthakumara
in different locations. In most cases, the tanks are having wells below the threshold level. It is
also reported in a few cases that a larger number of wells above the threshold level will also
affect the tank performance in terms of poor cooperation in operation and maintenance (O&M)
of the tanks. In recent times, a major function of some tanks has changed from a primarily
storage for surface irrigation to a groundwater recharge structure. However, these tanks do still
play a major role in providing domestic water supply for humans and drinking water supply
for the livestock population. Farmers, especially the rich and powerful, in the command area
of these tanks now use dug wells or tube wells to irrigate their lands. Thus changing water
use patterns in the command area of these tanks requires completely different management
options.
It is felt that wells will be an integral part of the tank systems in the future and further
research is needed to identify the role of tanks in providing water supply for different needs, and
to assess the required supporting management structures and investment needs. Keeping this
in mind, a detailed study was undertaken in Tamil Nadu, India with the following objectives.
• Study the implications (economic and hydrologic) of using tanks as percolation ponds
and increasing groundwater irrigation in the tank command areas on the performance of
tanks.
• Assess the groundwater recharge patterns with tanks as percolation ponds.
• Assess the threshold at which a tank can act as a groundwater recharge structure and
provide water for domestic and livestock purposes while promoting groundwater irrigation
in the tank command areas.
• Assess the management strategies of tanks and investment options for tank modernization
under increasing groundwater irrigation in the tank command areas.
Methodology
Three districts in Tamil Nadu, Coimbatore, Madurai and Sivagangai, were selected to obtain
the sample tanks for analysis. Ten tanks in each district were selected for the sampling. In
each tank 25 households were randomly selected for this study. The sample for this study
consists of 30 tanks and 750 households in those selected tanks. The purpose of selecting these
districts was to get the equal distribution of sample households in the three different situations
which are tank-only, tank-with-wells and wells-only. The 30 tanks selected randomly for this
study were categorized into three different typologies such as tank-only, tank-with-wells, and
wells-only. This categorization was based on the percentages of households depending on the
type of water source under each tank (Table 1).
Table 1. Sample household distribution in the study area.
Typology Tank-only Tank-with-wells Wells-only Total
Tank-only 173
(23)
27
(3.6) 0
200
(27)
Tank-with-wells 54
(7.2)
246
(33) 0
300
(40)
Wells-only 0 0 250
(33)
250
(33)
Total 227
(30.3)
273
(36.4)
250
(33.3)
750
(100)
Note: Percentages of the total are given in parentheses.
307
Water Resources Management with Special Reference to Tank Irrigation with Groundwater Use
If more than 80% of the households used a tank as the only source for irrigation, then
this tank was categorized as typology I (the tank-only situation). If more than 80% of the
households used only the wells as the source of irrigation in the tank area then this situation
was categorized as typology III (wells-only situation) and the rest were grouped into typology
II (tank-with-wells situation). In this study area, eight tanks in the Madurai District were
categorized under typology I (i.e., the tank-only situation). It consists of 173 households which
used tanks as the only source of water for irrigation. There were 27 households under those
particular tanks that used tanks with wells as the sources of water for irrigation. Likewise, 12
tanks in Sivagangai and Madurai districts were categorized under typology II (i.e., the tank-
with-wells situation). It consists of 246 households that used tanks-with-wells as the sources
of water for irrigation. There were 54 households in typology II that used only the tank as
the source of water for irrigation. Finally, 27 households in typology I and 54 households
in typology II were excluded from the analysis except for partial budgeting because these
households used the water source for irrigation that was different from the typological situation.
This exclusion was made to draw the conclusions and recommendations based on the results
obtained from each typological situation.
In the tank-only situation most of the households are marginal, accounting for 73% of
the total number of households while the large farmers account for only 2% of the total number
of households. In the tank-with-wells situation, nearly 45% are small farmers and around 18%
large farmers. In the wells-only situation nearly 50% of the households are small households
and around 28% large households (Table 2).
Table 2. Distribution of households (HH) and farm size in the three different situations.
Distribution of HH
Tank-only Tank-with-wells Wells-only
Farm sizeNo. of
HH
% of
totalNo. of HH
% of
total
No. of
HH
% of
total
No. of marginal households (< 1ha) 126 73 90 37 57 23
No. of small households (1-2 ha) 43 25 112 45 124 50
No. of large households ( >2 ha) 4 2 44 18 69 28
Total no. of households 173 100 246 100 250 100
General Characteristics of the Sample Households
General characteristics of the sample households like age, education and landholdings of
respondents, etc., were hypothesized to have significant influence on the adoption of new and
improved technology and income of the respondents. The participation of the farmers in the
tank and water management activities also depends on the socioeconomic characteristics.
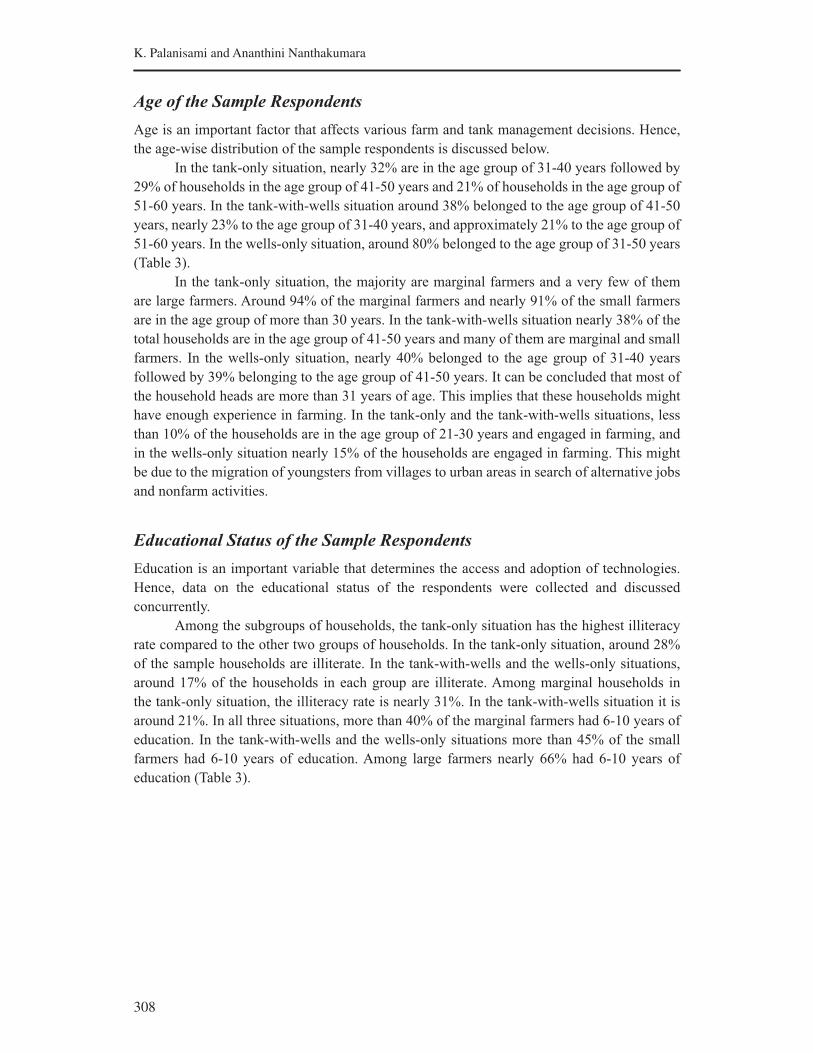
308
K. Palanisami and Ananthini Nanthakumara
Age of the Sample Respondents
Age is an important factor that affects various farm and tank management decisions. Hence,
the age-wise distribution of the sample respondents is discussed below.
In the tank-only situation, nearly 32% are in the age group of 31-40 years followed by
29% of households in the age group of 41-50 years and 21% of households in the age group of
51-60 years. In the tank-with-wells situation around 38% belonged to the age group of 41-50
years, nearly 23% to the age group of 31-40 years, and approximately 21% to the age group of
51-60 years. In the wells-only situation, around 80% belonged to the age group of 31-50 years
(Table 3).
In the tank-only situation, the majority are marginal farmers and a very few of them
are large farmers. Around 94% of the marginal farmers and nearly 91% of the small farmers
are in the age group of more than 30 years. In the tank-with-wells situation nearly 38% of the
total households are in the age group of 41-50 years and many of them are marginal and small
farmers. In the wells-only situation, nearly 40% belonged to the age group of 31-40 years
followed by 39% belonging to the age group of 41-50 years. It can be concluded that most of
the household heads are more than 31 years of age. This implies that these households might
have enough experience in farming. In the tank-only and the tank-with-wells situations, less
than 10% of the households are in the age group of 21-30 years and engaged in farming, and
in the wells-only situation nearly 15% of the households are engaged in farming. This might
be due to the migration of youngsters from villages to urban areas in search of alternative jobs
and nonfarm activities.
Educational Status of the Sample Respondents
Education is an important variable that determines the access and adoption of technologies.
Hence, data on the educational status of the respondents were collected and discussed
concurrently.
Among the subgroups of households, the tank-only situation has the highest illiteracy
rate compared to the other two groups of households. In the tank-only situation, around 28%
of the sample households are illiterate. In the tank-with-wells and the wells-only situations,
around 17% of the households in each group are illiterate. Among marginal households in
the tank-only situation, the illiteracy rate is nearly 31%. In the tank-with-wells situation it is
around 21%. In all three situations, more than 40% of the marginal farmers had 6-10 years of
education. In the tank-with-wells and the wells-only situations more than 45% of the small
farmers had 6-10 years of education. Among large farmers nearly 66% had 6-10 years of
education (Table 3).
309
Water R
esources M
anag
emen
t with
Sp
ecial Referen
ce to T
ank
Irrigatio
n w
ith G
rou
nd
water U
se
Table 3. Distribution of age and education in the study area.
Tank-only Tank-with-wells Wells-only
Marginal
farmers
Small
farmers
Large
farmersTotal
Marginal
farmers
Small
farmers
Large
farmersTotal
Marginal
farmers
Small
farmers
Large
farmersTotal
Age group (years)
21-30 8 4 0 12 8 2 4 14 7 18 8 33
(6.35) (9.30) (0.0) (6.94) (8.89) (1.79) (9.09) (5.95) (12.28) (14.51) (11.59) (14.96)
31-40 43 13 0 55 22 25 9 56 22 47 32 101
(34.13) (30.23) (0.0) (31.79) (24.44) (22.32) (20.45) (22.70) (38.60) (37.9) (46.38) (40.16)
41-50 37 12 2 50 30 44 19 93 24 50 25 99
(29.37) (27.91) (50.00) (28.90) (33.33) (39.29) (43.18) (38.38) (42.10) (40.32) (36.23) (38.58)
51-60 25 10 1 37 18 24 11 53 4 9 4 17
(19.84) (23.26) (25.00) (21.39) (20.00) (21.43) (25.00) (21.08) (7.02) (7.26) (5.80) (6.30)
61-70 11 4 1 17 11 15 1 27 0 0 0 0
(8.73) (9.30) (25.00) (9.83) (12.22) (13.39) (2.27) (10.81) (0.0) (0.0) (0.0) (0.00)
71-80 2 0 0 2 1 2 0 3 0 0 0 0
(1.59) (0.0) (0.0) (1.16) (1.11) (1.79) 0.00 (1.08) (0.0) (0.0) (0.0) (0.00)
Total 126 43 4 173 90 112 44 236 57 124 69 250
Educational status
Illiterate 39 8 0 88 19 18 4 31 13 21 9 43
(30.95) (18.60) (0.00) (28.30) (21.116) (16.07) (9.09) (16.76) (24.14) (16.67) (2.86) (17.32)
Primary 25 13 2 70 25 40 11 56 12 32 17 61
(19.84) (30.23) (50.00)
(22.51)(27.78) (35.71) (25.00) (30.27) (20.69) (25.4) (24.29) (24.02)
Secondary 57 18 1 137 38 50 29 89 26 65 33 124
(45.24) (41.86) (25.00) (44.05) (42.22) (44.64) (65.90) (48.11) (44.83) (53.17) (48.57) (50.00)
Plus 1 5 3 1 15 7 4 0 8 4 5 8 17
(3.97) (6.98) (25.00) (4.82) (7.78) (3.57) (0.0) (4.32) (6.90) (3.97) (11.43) (6.69)
College 0 1 0 1 1 0 0 1 2 1 2 5
Total 126 43 4 173 90 112 44 246 57 124 69 250
310
K. Palanisami and Ananthini Nanthakumara
In the sample as a whole, the number of farmers with 6-10 years of education was
greater in the tank-with-wells and the wells-only situations accounting for nearly 48% and
50%, respectively, whereas in the tank-only situation, the illiteracy rate and the proportion of
households were 1-5 years of education and around 50%, respectively.
The educational status showed that nearly 22% of the households were illiterate. Further,
most of the literates had less than 10 years of schooling. Hence, necessary effort should be
taken to educate the farmers on the new technology developed in the agriculture sector.
Cropping Pattern
In the sample, in the tank-only situation, around 84% of the households cultivated only one
crop per year and about 16% two crops per year. The source of water supply is the tank for the
first crop and rain for the second crop. Among the households cultivating two crops per year,
nearly 43% are large farmers. In the tank-with-wells situation, around 67% of the households
cultivated two crops a year, 32% only one crop a year and 1% three crops a year. In the wells-
only situation, around 84% of the households cultivated two crops a year, 16% only one crop
a year and 2% three crops a year. Clearly, this shows the availability of water in different
situations. The analysis shows that in all three situations most of the small and large farmers
cultivated two crops a year and the level of supplemental irrigation influenced the cropping
pattern.
In the tank-only situation, 99% of the farmers cultivated only paddy. In the tank-with-
wells situation, nearly 75% were involved in paddy cultivation and around 53% in sugarcane
cultivation. The percentage of households involved in coconut, cotton and banana were 15,
11 and 4, respectively. In the wells-only situation 45% of the households were involved in
cultivating banana, 41% in sugarcane, 43% in coconut, 32% in sorghum (rain-fed) and 8% in
maize while a very few of them (less than 4% of the households) were involved in cultivating
Bengal gram, turmeric, curry leaves and onion. This indicates that in the wells-only situation
most of the households cultivated high-value crops as there is less risk in the supply of water
through well irrigation, and in the tank-with-wells situation a considerable number of farmers
diverted their cultivation pattern towards high-value crops.
Productivity
Productivity refers to the yield per unit area of land. Table 4 indicates that the productivity
of the same crop varies with different typologies. The source of water supply is an important
factor that decides crop productivity. Productivity of paddy is higher in the tank-with-wells
situation than in the tank-only situation. Likewise, the productivity of sugarcane is nearly 8.6
tons/ha higher in the wells-only situation than in the tank-with-wells situation.
Income of the Sample Respondents
The average income per ha of the tank-only farmers from crop cultivation was Rs 17,599
whereas it was Rs 46,993 in the tank-with-wells situation and Rs 117,365 in the wells-only
situation (Table 5). The income from agricultural crops alone contributed nearly 24%, 50%
and 80% of the total income of the farmers in the tank-only, the tank-with-wells, and the
311
Water Resources Management with Special Reference to Tank Irrigation with Groundwater Use
wells-only situations, respectively. The contribution of income from nonagriculture was 27%
in the tank-only situation whereas it was 26% in the tank-with-wells situation and 9% in
the wells-only situation. The income from off-farm work contributed 16% in the tank-only,
11% in the tank-with-wells and 6% in the wells-only situations. The income from livestock
contributed 17% of the total income in the tank-only situation. In the tank-with-wells and the
wells-only situations the corresponding proportions were only 7% and 1.5%, respectively.
The contribution of tree resources to the total income of farmers was less than 8% in all three
situations.
In the tank-with-wells situation, all three categories of farmers (marginal, small and
large) received more than double the income of what they received in the tank-only situation
from agricultural crops alone. Similarly, the farmers in the wells-only situation earned more
than double the income of what they earned in the tank-with-wells situation from crop
cultivation. Table 4 shows that the income is increasing with assured water supply.
In the wells-only situation, farmers cultivated high-value crops as there was minimal
risk in water supply. This is the reason for getting a higher income. But in the tank-with-wells
situation, the majority of the farmers cultivated rice as the first crop and high-value crops as
their second choice. This is the reason for getting a considerably lower income in the tank-
with-wells situation compared to the wells-only situation.
From the above discussion, it could be concluded that agricultural crops were the
main source of income among the selected farmers in all the situations. Further, a significant
portion of the income was also from the nonfarm and off-farm activities. But in the tank-only
situation, contribution of income from nonfarm activities was slightly higher than that from
crop cultivation. It is necessary to strengthen the source of water supply to promote their major
income source of crop cultivation.
Tank Performance and Management
The characteristics of the farmers have an influence on the overall performance of the tanks
through farmers’ involvement in tank management. Table 6 summarizes the participation of
farmers in tank-management activities. It shows that the farmers in the tank-with-wells situation
had participated comparatively less in tank management than in the tank-only situation.
Farmers normally contributed labor, gunny bags and money for tank management. The average
period of participation was only 1 to 2 days. In the wells-only situation, participation in tank
management was very poor (Table 6).
For the sample as a whole, the number of farmers who contributed their labor for
tank management was comparatively higher in the tank-only situation (69.9%) than in the
tank-with-wells situation (22.3%). In contrast, the money contributed by the farmers for tank
management activities was higher in the tank-with-wells situation (43.0%) than in the tank-only
situation (27.2%), indicating that farmers felt the importance of tanks in crop production.
Water Management
Next to tank management activities, farmers’ participation in water management was considered
important, since in most of the years the tanks used to get below-normal supplies. Hence, an
analysis of water management among the tanks in different typologies was done (Table 7).
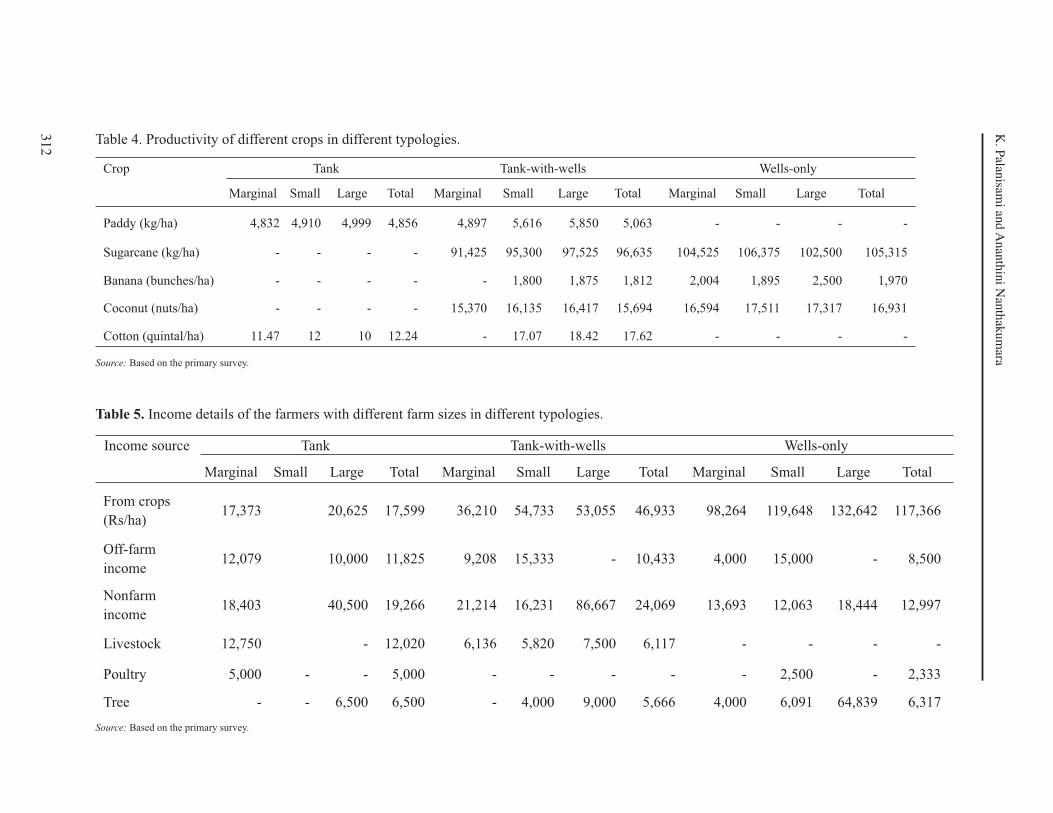
312
K. P
alanisam
i and A
nan
thin
i Nan
thak
um
ara
Table 4. Productivity of different crops in different typologies.
Crop Tank Tank-with-wells Wells-only
Marginal Small Large Total Marginal Small Large Total Marginal Small Large Total
Paddy (kg/ha) 4,832 4,910 4,999 4,856 4,897 5,616 5,850 5,063 - - - -
Sugarcane (kg/ha) - - - - 91,425 95,300 97,525 96,635 104,525 106,375 102,500 105,315
Banana (bunches/ha) - - - - - 1,800 1,875 1,812 2,004 1,895 2,500 1,970
Coconut (nuts/ha) - - - - 15,370 16,135 16,417 15,694 16,594 17,511 17,317 16,931
Cotton (quintal/ha) 11.47 12 10 12.24 - 17.07 18.42 17.62 - - - -
Source: Based on the primary survey.
Table 5. Income details of the farmers with different farm sizes in different typologies.
Income source Tank Tank-with-wells Wells-only
Marginal Small Large Total Marginal Small Large Total Marginal Small Large Total
From crops
(Rs/ha)17,373 20,625 17,599 36,210 54,733 53,055 46,933 98,264 119,648 132,642 117,366
Off-farm
income12,079 10,000 11,825 9,208 15,333 - 10,433 4,000 15,000 - 8,500
Nonfarm
income18,403 40,500 19,266 21,214 16,231 86,667 24,069 13,693 12,063 18,444 12,997
Livestock 12,750 - 12,020 6,136 5,820 7,500 6,117 - - - -
Poultry 5,000 - - 5,000 - - - - - 2,500 - 2,333
Tree - - 6,500 6,500 - 4,000 9,000 5,666 4,000 6,091 64,839 6,317
Source: Based on the primary survey.
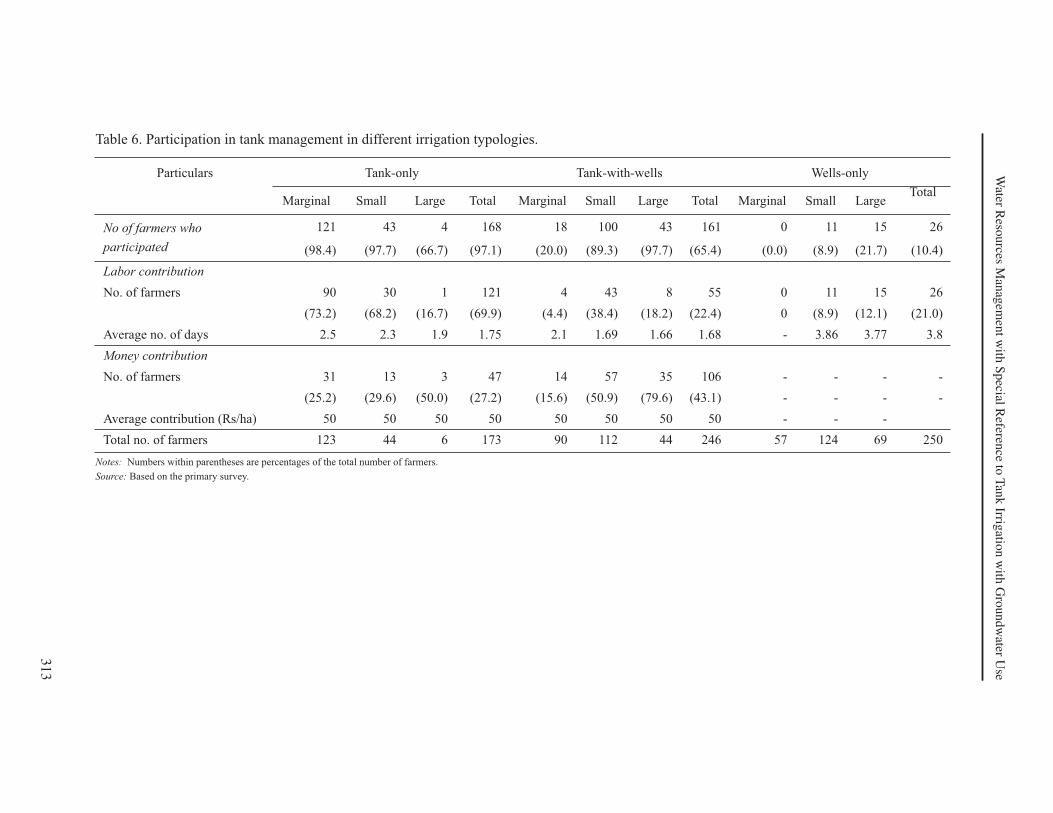
313
Water R
esources M
anag
emen
t with
Sp
ecial Referen
ce to T
ank
Irrigatio
n w
ith G
rou
nd
water U
se
Table 6. Participation in tank management in different irrigation typologies.
Particulars Tank-only Tank-with-wells Wells-only
Marginal Small Large Total Marginal Small Large Total Marginal Small LargeTotal
No of farmers who
participated
121 43 4 168 18 100 43 161 0 11 15 26
(98.4) (97.7) (66.7) (97.1) (20.0) (89.3) (97.7) (65.4) (0.0) (8.9) (21.7) (10.4)
Labor contribution
No. of farmers 90 30 1 121 4 43 8 55 0 11 15 26
(73.2) (68.2) (16.7) (69.9) (4.4) (38.4) (18.2) (22.4) 0 (8.9) (12.1) (21.0)
Average no. of days 2.5 2.3 1.9 1.75 2.1 1.69 1.66 1.68 - 3.86 3.77 3.8
Money contribution
No. of farmers 31 13 3 47 14 57 35 106 - - - -
(25.2) (29.6) (50.0) (27.2) (15.6) (50.9) (79.6) (43.1) - - - -
Average contribution (Rs/ha) 50 50 50 50 50 50 50 50 - - -
Total no. of farmers 123 44 6 173 90 112 44 246 57 124 69 250
Notes: Numbers within parentheses are percentages of the total number of farmers.
Source: Based on the primary survey.
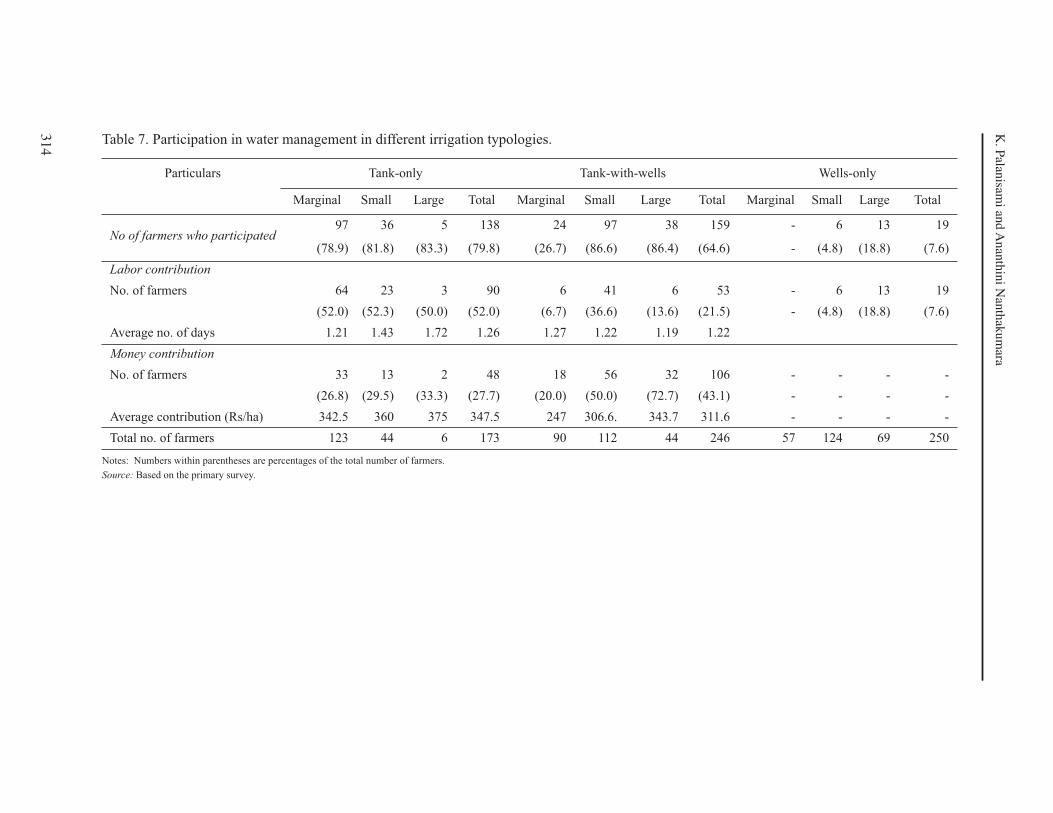
314
K. P
alanisam
i and A
nan
thin
i Nan
thak
um
ara
Table 7. Participation in water management in different irrigation typologies.
Particulars Tank-only Tank-with-wells Wells-only
Marginal Small Large Total Marginal Small Large Total Marginal Small Large Total
No of farmers who participated97 36 5 138 24 97 38 159 - 6 13 19
(78.9) (81.8) (83.3) (79.8) (26.7) (86.6) (86.4) (64.6) - (4.8) (18.8) (7.6)
Labor contribution
No. of farmers 64 23 3 90 6 41 6 53 - 6 13 19
(52.0) (52.3) (50.0) (52.0) (6.7) (36.6) (13.6) (21.5) - (4.8) (18.8) (7.6)
Average no. of days 1.21 1.43 1.72 1.26 1.27 1.22 1.19 1.22
Money contribution
No. of farmers 33 13 2 48 18 56 32 106 - - - -
(26.8) (29.5) (33.3) (27.7) (20.0) (50.0) (72.7) (43.1) - - - -
Average contribution (Rs/ha) 342.5 360 375 347.5 247 306.6. 343.7 311.6 - - - -
Total no. of farmers 123 44 6 173 90 112 44 246 57 124 69 250
Notes: Numbers within parentheses are percentages of the total number of farmers.
Source: Based on the primary survey.
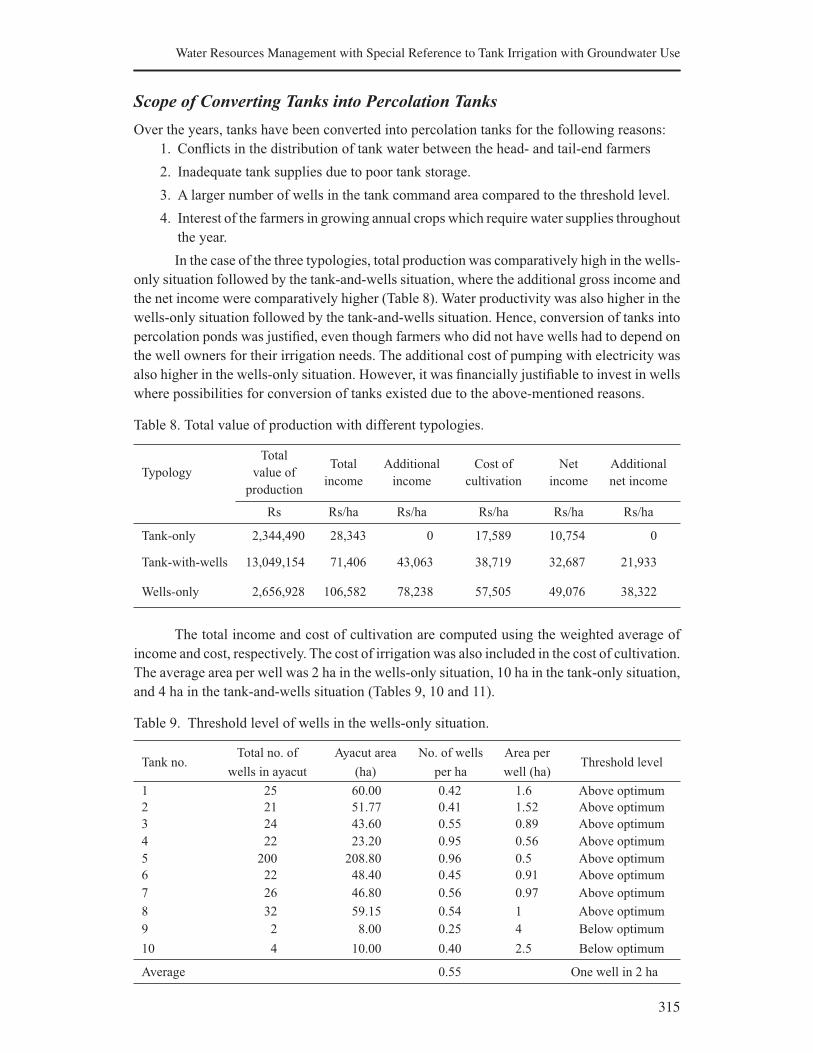
315
Water Resources Management with Special Reference to Tank Irrigation with Groundwater Use
Scope of Converting Tanks into Percolation Tanks
Over the years, tanks have been converted into percolation tanks for the following reasons:
1. Conflicts in the distribution of tank water between the head- and tail-end farmers
2. Inadequate tank supplies due to poor tank storage.
3. A larger number of wells in the tank command area compared to the threshold level.
4. Interest of the farmers in growing annual crops which require water supplies throughout
the year.
In the case of the three typologies, total production was comparatively high in the wells-
only situation followed by the tank-and-wells situation, where the additional gross income and
the net income were comparatively higher (Table 8). Water productivity was also higher in the
wells-only situation followed by the tank-and-wells situation. Hence, conversion of tanks into
percolation ponds was justified, even though farmers who did not have wells had to depend on
the well owners for their irrigation needs. The additional cost of pumping with electricity was
also higher in the wells-only situation. However, it was financially justifiable to invest in wells
where possibilities for conversion of tanks existed due to the above-mentioned reasons.
Table 8. Total value of production with different typologies.
Typology
Total
value of
production
Total
income
Additional
income
Cost of
cultivation
Net
income
Additional
net income
Rs Rs/ha Rs/ha Rs/ha Rs/ha Rs/ha
Tank-only 2,344,490 28,343 0 17,589 10,754 0
Tank-with-wells 13,049,154 71,406 43,063 38,719 32,687 21,933
Wells-only 2,656,928 106,582 78,238 57,505 49,076 38,322
The total income and cost of cultivation are computed using the weighted average of
income and cost, respectively. The cost of irrigation was also included in the cost of cultivation.
The average area per well was 2 ha in the wells-only situation, 10 ha in the tank-only situation,
and 4 ha in the tank-and-wells situation (Tables 9, 10 and 11).
Table 9. Threshold level of wells in the wells-only situation.
Tank no.Total no. of
wells in ayacut
Ayacut area
(ha)
No. of wells
per ha
Area per
well (ha)Threshold level
1 25 60.00 0.42 1.6 Above optimum
2 21 51.77 0.41 1.52 Above optimum
3 24 43.60 0.55 0.89 Above optimum
4 22 23.20 0.95 0.56 Above optimum
5 200 208.80 0.96 0.5 Above optimum
6 22 48.40 0.45 0.91 Above optimum
7 26 46.80 0.56 0.97 Above optimum
8 32 59.15 0.54 1 Above optimum
9 2 8.00 0.25 4 Below optimum
10 4 10.00 0.40 2.5 Below optimum
Average 0.55 One well in 2 ha
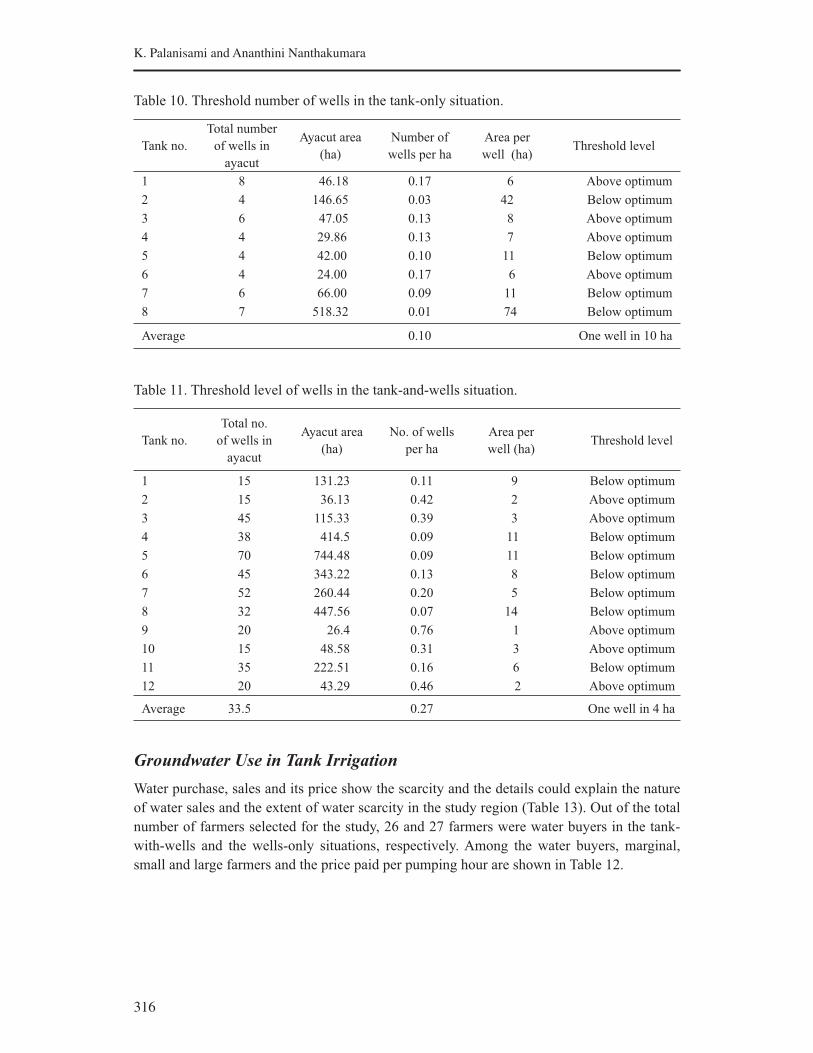
316
K. Palanisami and Ananthini Nanthakumara
Table 10. Threshold number of wells in the tank-only situation.
Tank no.
Total number
of wells in
ayacut
Ayacut area
(ha)
Number of
wells per ha
Area per
well (ha)Threshold level
1 8 46.18 0.17 6 Above optimum
2 4 146.65 0.03 42 Below optimum
3 6 47.05 0.13 8 Above optimum
4 4 29.86 0.13 7 Above optimum
5 4 42.00 0.10 11 Below optimum
6 4 24.00 0.17 6 Above optimum
7 6 66.00 0.09 11 Below optimum
8 7 518.32 0.01 74 Below optimum
Average 0.10 One well in 10 ha
Table 11. Threshold level of wells in the tank-and-wells situation.
Tank no.
Total no.
of wells in
ayacut
Ayacut area
(ha)
No. of wells
per ha
Area per
well (ha) Threshold level
1 15 131.23 0.11 9 Below optimum
2 15 36.13 0.42 2 Above optimum
3 45 115.33 0.39 3 Above optimum
4 38 414.5 0.09 11 Below optimum
5 70 744.48 0.09 11 Below optimum
6 45 343.22 0.13 8 Below optimum
7 52 260.44 0.20 5 Below optimum
8 32 447.56 0.07 14 Below optimum
9 20 26.4 0.76 1 Above optimum
10 15 48.58 0.31 3 Above optimum
11 35 222.51 0.16 6 Below optimum
12 20 43.29 0.46 2 Above optimum
Average 33.5 0.27 One well in 4 ha
Groundwater Use in Tank Irrigation
Water purchase, sales and its price show the scarcity and the details could explain the nature
of water sales and the extent of water scarcity in the study region (Table 13). Out of the total
number of farmers selected for the study, 26 and 27 farmers were water buyers in the tank-
with-wells and the wells-only situations, respectively. Among the water buyers, marginal,
small and large farmers and the price paid per pumping hour are shown in Table 12.

317
Water Resources Management with Special Reference to Tank Irrigation with Groundwater Use
Table 12. Details of water buyers in the tank-with-wells and the wells-only typologies.
Tank-with-wells Wells-only
ParticularsNo. of farmers
purchasing water
Price
Rs/hr
No. of farmers
purchasing water
Price
Rs/hr
Marginal farmers 3 10 0 -
Small farmers 20 16.81 13 23.26
Large farmers 3 35 14 29.7
Total 26 27
Price per pumping hour differs with locations of the wells, their depths and the
monopolistic behavior of the well owner. It ranged from Rs 10 per pumping hour to Rs 50
in the study area. The majority of the large farmers owned wells. A few of them did not own
wells. As they were large farmers, the well owners would fix a higher rate for them and also
due to the location of lands, the farmers paid a higher rate for a pumping hour in the study
area.
Yield and Input Use
Paddy was the main crop in the tank-only and the tank-with-wells situations but paddy was not
cultivated in the wells-only situation. Paddy performs better in the tank-with-wells situation
compared to the tank-only situation (Table 13). Input use is also less when compared to the
tank-only situation except in the case of farmyard manure.
Farmers cultivated sugarcane in the tank-with-wells and the wells-only situations. The
yield of sugarcane was nearly 8.6 tons/ha higher in the wells-only situation compared to the
tank-with-wells situation (Table 14). Except for human and machine labor other inputs were
used more in the tank-with-wells situation compared to the wells-only situation. The higher
yield in the wells-only situation may be due to more frequent usage of human and machine
labor besides better water control.
Table 13. Yield and input use in different typologies – paddy crop.
Typology Yield
Input use
Seed NPKHuman
labor
Machine
labor*Water Chemicals
Farm
manure
kg/ha kg/ha kg/haman-days
/hahours/ha m3/ha
No. of
sprays(tons/ha)
Tank-only 4,899 94.90 293.35 71.00 11.35 9,469 2.00 3.00
Tank-with-
wells5,063 85.38 289.13 65.69 9.94 7,956 1.39 3.50
Wells-only - - - - - - - -
*Water used excluding rainfall is given. The average rainfall received during the crop season was about 645 mm.
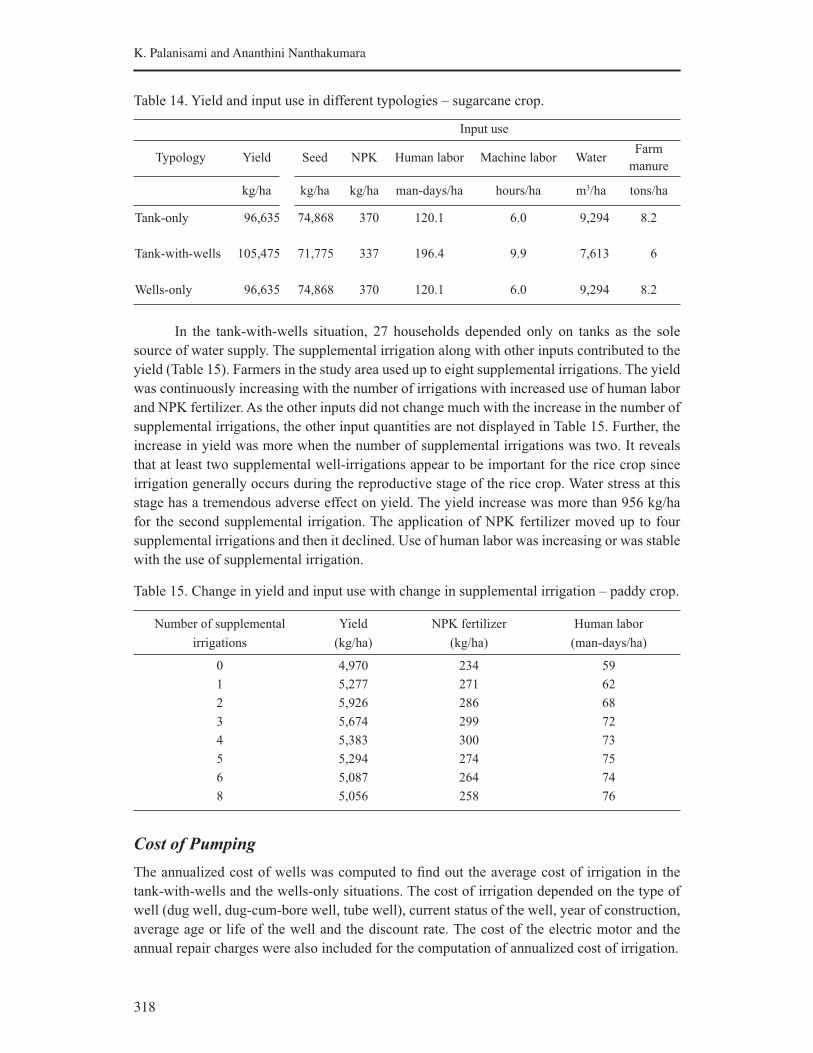
318
K. Palanisami and Ananthini Nanthakumara
Table 14. Yield and input use in different typologies – sugarcane crop.
Input use
Typology Yield Seed NPK Human labor Machine labor WaterFarm
manure
kg/ha kg/ha kg/ha man-days/ha hours/ha m3/ha tons/ha
Tank-only 96,635 74,868 370 120.1 6.0 9,294 8.2
Tank-with-wells 105,475 71,775 337 196.4 9.9 7,613 6
Wells-only 96,635 74,868 370 120.1 6.0 9,294 8.2
In the tank-with-wells situation, 27 households depended only on tanks as the sole
source of water supply. The supplemental irrigation along with other inputs contributed to the
yield (Table 15). Farmers in the study area used up to eight supplemental irrigations. The yield
was continuously increasing with the number of irrigations with increased use of human labor
and NPK fertilizer. As the other inputs did not change much with the increase in the number of
supplemental irrigations, the other input quantities are not displayed in Table 15. Further, the
increase in yield was more when the number of supplemental irrigations was two. It reveals
that at least two supplemental well-irrigations appear to be important for the rice crop since
irrigation generally occurs during the reproductive stage of the rice crop. Water stress at this
stage has a tremendous adverse effect on yield. The yield increase was more than 956 kg/ha
for the second supplemental irrigation. The application of NPK fertilizer moved up to four
supplemental irrigations and then it declined. Use of human labor was increasing or was stable
with the use of supplemental irrigation.
Table 15. Change in yield and input use with change in supplemental irrigation – paddy crop.
Number of supplemental
irrigations
Yield
(kg/ha)
NPK fertilizer
(kg/ha)
Human labor
(man-days/ha)
0 4,970 234 59
1 5,277 271 62
2 5,926 286 68
3 5,674 299 72
4 5,383 300 73
5 5,294 274 75
6 5,087 264 74
8 5,056 258 76
Cost of Pumping
The annualized cost of wells was computed to find out the average cost of irrigation in the
tank-with-wells and the wells-only situations. The cost of irrigation depended on the type of
well (dug well, dug-cum-bore well, tube well), current status of the well, year of construction,
average age or life of the well and the discount rate. The cost of the electric motor and the
annual repair charges were also included for the computation of annualized cost of irrigation.
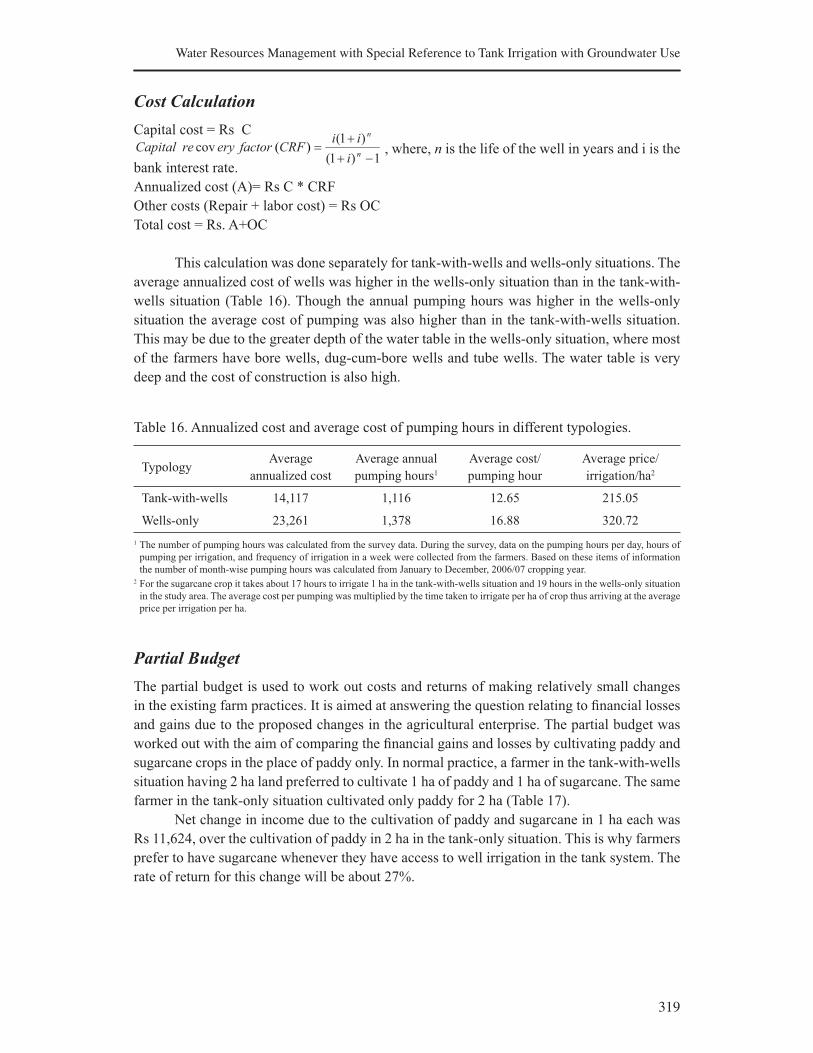
319
Water Resources Management with Special Reference to Tank Irrigation with Groundwater Use
Cost Calculation
Capital cost = Rs C
1)1(
)1()(cov
−+
+=
n
n
i
iiCRFfactoreryreCapital , where, n is the life of the well in years and i is the
bank interest rate.
Annualized cost (A)= Rs C * CRF
Other costs (Repair + labor cost) = Rs OC
Total cost = Rs. A+OC
This calculation was done separately for tank-with-wells and wells-only situations. The
average annualized cost of wells was higher in the wells-only situation than in the tank-with-
wells situation (Table 16). Though the annual pumping hours was higher in the wells-only
situation the average cost of pumping was also higher than in the tank-with-wells situation.
This may be due to the greater depth of the water table in the wells-only situation, where most
of the farmers have bore wells, dug-cum-bore wells and tube wells. The water table is very
deep and the cost of construction is also high.
Table 16. Annualized cost and average cost of pumping hours in different typologies.
TypologyAverage
annualized cost
Average annual
pumping hours1
Average cost/
pumping hour
Average price/
irrigation/ha2
Tank-with-wells 14,117 1,116 12.65 215.05
Wells-only 23,261 1,378 16.88 320.72
1 The number of pumping hours was calculated from the survey data. During the survey, data on the pumping hours per day, hours of
pumping per irrigation, and frequency of irrigation in a week were collected from the farmers. Based on these items of information
the number of month-wise pumping hours was calculated from January to December, 2006/07 cropping year.2 For the sugarcane crop it takes about 17 hours to irrigate 1 ha in the tank-with-wells situation and 19 hours in the wells-only situation
in the study area. The average cost per pumping was multiplied by the time taken to irrigate per ha of crop thus arriving at the average
price per irrigation per ha.
Partial Budget
The partial budget is used to work out costs and returns of making relatively small changes
in the existing farm practices. It is aimed at answering the question relating to financial losses
and gains due to the proposed changes in the agricultural enterprise. The partial budget was
worked out with the aim of comparing the financial gains and losses by cultivating paddy and
sugarcane crops in the place of paddy only. In normal practice, a farmer in the tank-with-wells
situation having 2 ha land preferred to cultivate 1 ha of paddy and 1 ha of sugarcane. The same
farmer in the tank-only situation cultivated only paddy for 2 ha (Table 17).
Net change in income due to the cultivation of paddy and sugarcane in 1 ha each was
Rs 11,624, over the cultivation of paddy in 2 ha in the tank-only situation. This is why farmers
prefer to have sugarcane whenever they have access to well irrigation in the tank system. The
rate of return for this change will be about 27%.
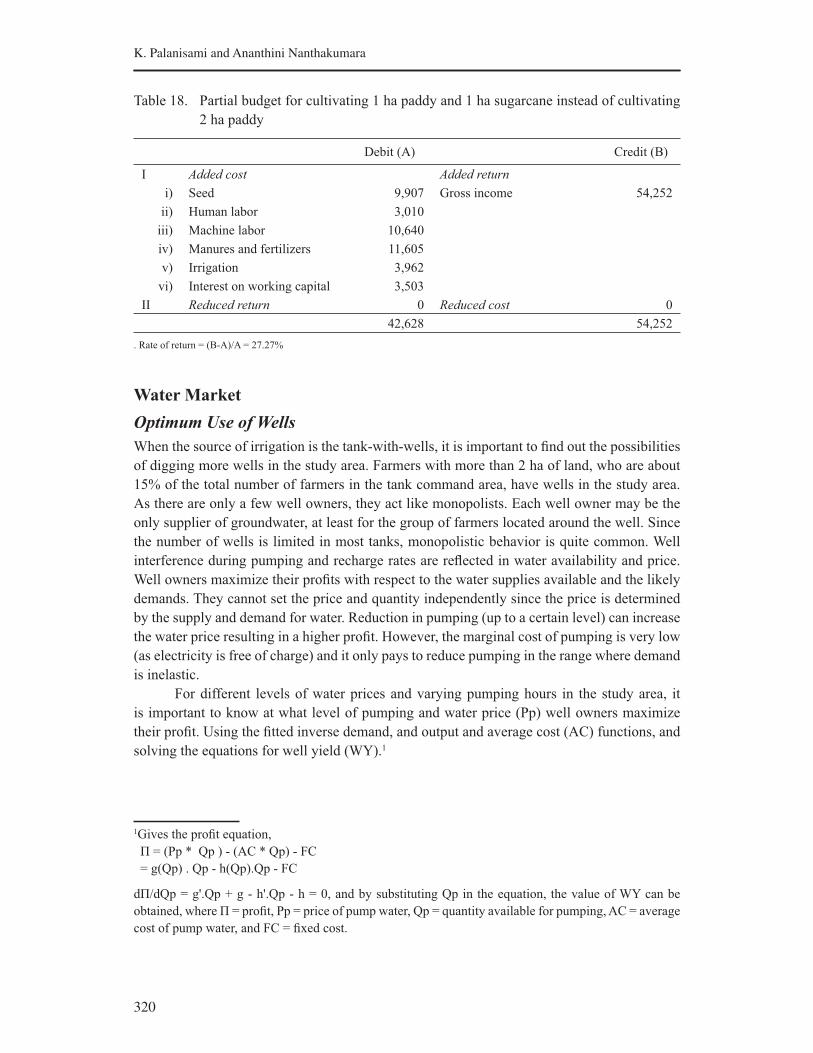
320
K. Palanisami and Ananthini Nanthakumara
Table 18. Partial budget for cultivating 1 ha paddy and 1 ha sugarcane instead of cultivating
2 ha paddy
Debit (A) Credit (B)
I Added cost Added return
i) Seed 9,907 Gross income 54,252
ii) Human labor 3,010
iii) Machine labor 10,640
iv) Manures and fertilizers 11,605
v) Irrigation 3,962
vi) Interest on working capital 3,503
II Reduced return 0 Reduced cost 0
42,628 54,252
. Rate of return = (B-A)/A = 27.27%
Water Market
Optimum Use of Wells
When the source of irrigation is the tank-with-wells, it is important to find out the possibilities
of digging more wells in the study area. Farmers with more than 2 ha of land, who are about
15% of the total number of farmers in the tank command area, have wells in the study area.
As there are only a few well owners, they act like monopolists. Each well owner may be the
only supplier of groundwater, at least for the group of farmers located around the well. Since
the number of wells is limited in most tanks, monopolistic behavior is quite common. Well
interference during pumping and recharge rates are reflected in water availability and price.
Well owners maximize their profits with respect to the water supplies available and the likely
demands. They cannot set the price and quantity independently since the price is determined
by the supply and demand for water. Reduction in pumping (up to a certain level) can increase
the water price resulting in a higher profit. However, the marginal cost of pumping is very low
(as electricity is free of charge) and it only pays to reduce pumping in the range where demand
is inelastic.
For different levels of water prices and varying pumping hours in the study area, it
is important to know at what level of pumping and water price (Pp) well owners maximize
their profit. Using the fitted inverse demand, and output and average cost (AC) functions, and
solving the equations for well yield (WY).1
1Gives the profit equation,
Π = (Pp * Qp ) - (AC * Qp) - FC
= g(Qp) . Qp - h(Qp).Qp - FC
dΠ/dQp = g'.Qp + g - h'.Qp - h = 0, and by substituting Qp in the equation, the value of WY can be
obtained, where Π = profit, Pp = price of pump water, Qp = quantity available for pumping, AC = average
cost of pump water, and FC = fixed cost.
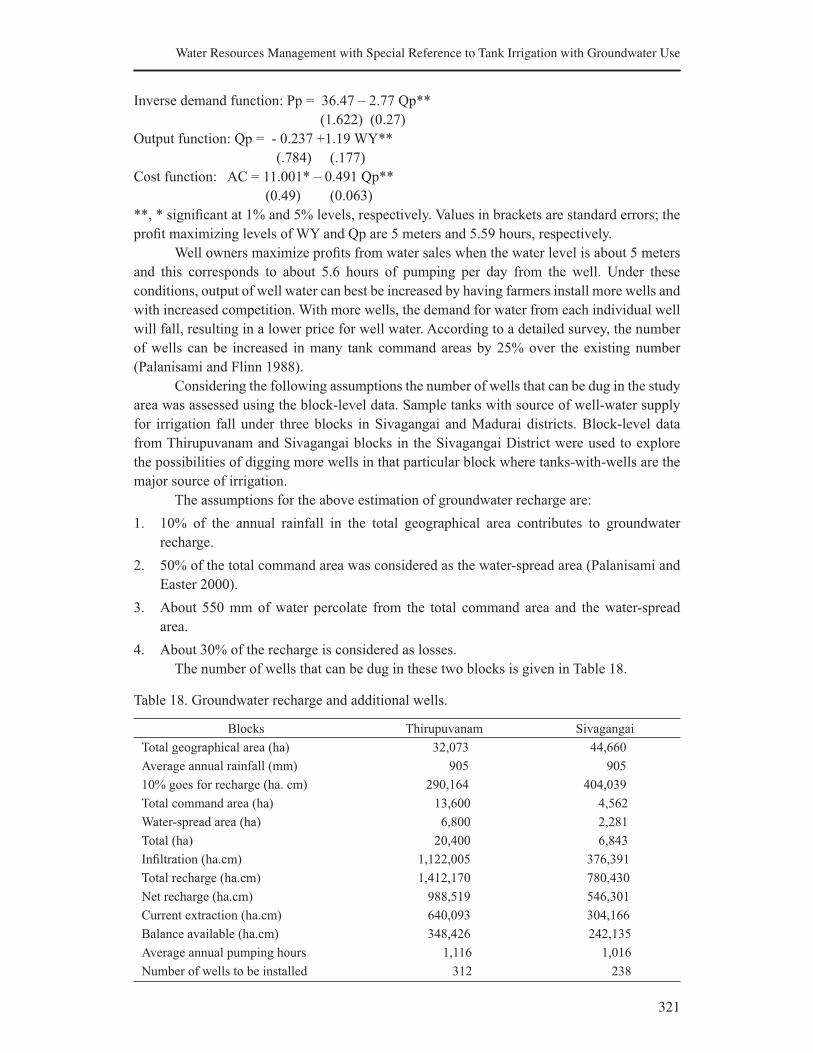
321
Water Resources Management with Special Reference to Tank Irrigation with Groundwater Use
Inverse demand function: Pp = 36.47 – 2.77 Qp**
(1.622) (0.27)
Output function: Qp = - 0.237 +1.19 WY**
(.784) (.177)
Cost function: AC = 11.001* – 0.491 Qp**
(0.49) (0.063)
**, * significant at 1% and 5% levels, respectively. Values in brackets are standard errors; the
profit maximizing levels of WY and Qp are 5 meters and 5.59 hours, respectively.
Well owners maximize profits from water sales when the water level is about 5 meters
and this corresponds to about 5.6 hours of pumping per day from the well. Under these
conditions, output of well water can best be increased by having farmers install more wells and
with increased competition. With more wells, the demand for water from each individual well
will fall, resulting in a lower price for well water. According to a detailed survey, the number
of wells can be increased in many tank command areas by 25% over the existing number
(Palanisami and Flinn 1988).
Considering the following assumptions the number of wells that can be dug in the study
area was assessed using the block-level data. Sample tanks with source of well-water supply
for irrigation fall under three blocks in Sivagangai and Madurai districts. Block-level data
from Thirupuvanam and Sivagangai blocks in the Sivagangai District were used to explore
the possibilities of digging more wells in that particular block where tanks-with-wells are the
major source of irrigation.
The assumptions for the above estimation of groundwater recharge are:
1. 10% of the annual rainfall in the total geographical area contributes to groundwater
recharge.
2. 50% of the total command area was considered as the water-spread area (Palanisami and
Easter 2000).
3. About 550 mm of water percolate from the total command area and the water-spread
area.
4. About 30% of the recharge is considered as losses.
The number of wells that can be dug in these two blocks is given in Table 18.
Table 18. Groundwater recharge and additional wells.
Blocks Thirupuvanam Sivagangai
Total geographical area (ha) 32,073 44,660
Average annual rainfall (mm) 905 905
10% goes for recharge (ha. cm) 290,164 404,039
Total command area (ha) 13,600 4,562
Water-spread area (ha) 6,800 2,281
Total (ha) 20,400 6,843
Infiltration (ha.cm) 1,122,005 376,391
Total recharge (ha.cm) 1,412,170 780,430
Net recharge (ha.cm) 988,519 546,301
Current extraction (ha.cm) 640,093 304,166
Balance available (ha.cm) 348,426 242,135
Average annual pumping hours 1,116 1,016
Number of wells to be installed 312 238
322
K. Palanisami and Ananthini Nanthakumara
Stabilization Value of Groundwater in Tank Irrigation Systems
Tanks serve the purposes of irrigation and enriching the water table through percolation. The
function of tanks is extremely useful in maintaining the water table to ensure sustained growth
of flora and fauna in the region. In recent years, due to poorly maintained structures (bunds,
surplus weirs), siltation of tank beds and disintegrated channels and weirs most of the tanks
are in a bad state (Palanisami and Easter 2000).
Supplies of tank water fluctuate randomly from year to year and within a year. Using 40
years’ rainfall data, it was estimated that out of 10 years tanks will be experiencing deficient
supply in 5 years; will fail in 3 years; and in will have full supply in 2 years (Palanisami et al.
1997). The poor performance of the tanks has resulted in heavy dependence on groundwater
supplementation. Groundwater stocks, on the other hand, are relatively stable because the
wells get recharged from both tanks and irrigated rice fields (Palanisami and Easter 2000).
Normally the number of supplemental irrigations required by the farmers could not
be met as only about 15% of the farmers owned wells in the tanks (Palanisami and Flinn
1989). Most of the farmers in the tank irrigated areas are marginal farmers each having less
than a hectare and it is expensive for them to invest in wells to meet the supplemental water
requirements. It is argued that the government can invest in community wells or encourage the
farmers to invest in their private wells so that all the farmers in the tank systems can share the
tank and well water. This is possible only when the value attributed to the groundwater, i.e.,
stabilization value of groundwater, is attractive. The justification for increasing the number of
wells in the tank systems is based on the stabilization value of groundwater supplementation.
Stabilization Value of Groundwater
The concept of “stabilization value of groundwater’ was introduced by Tsur (1997). Unless
the value of groundwater supplementation is attractive at the system level, subsequent
investment in new wells by the farmers or the government agencies cannot be justified. Hence,
it is important to study the value of groundwater at the tank level. As such, groundwater
supplementation reduces the variability associated with tank water, since in most of the years
tank storage is below normal. In the periods with below-normal tank supply, if groundwater
is not supplemented the crop yield will be drastically reduced or the crop will fail completely.
The variable reducing value of the groundwater carries an economic value, which is designated
as the stabilization value of groundwater. The stabilization value is largely relative to the
overall value of groundwater (Ranganathan and Palanisami 2004). Given the erratic tank-
filling behavior over the years, groundwater supplementation is highly warranted. However, at
the individual farm level, it is easy to appreciate the value of groundwater through additional
increases in the rice yield, which also varies between farms and tanks depending on the level
of groundwater supplementation.
Cross-sectional data related to the selected tanks with the source of irrigation of tank-
with-wells in Sivagangai and Madurai districts of Tamil Nadu state were used to estimate
the stabilization value of groundwater in the tanks. These tanks are located in a homogenous
region, and inter-tank differences in terms of rainfall, storage pattern, filling pattern and
irrigation pattern were observed to be the same.
In the tank-with-wells situation, farmers grow more than one crop. The choice of crop
is also not restricted to paddy alone. Field-level data regarding the water usage relating to
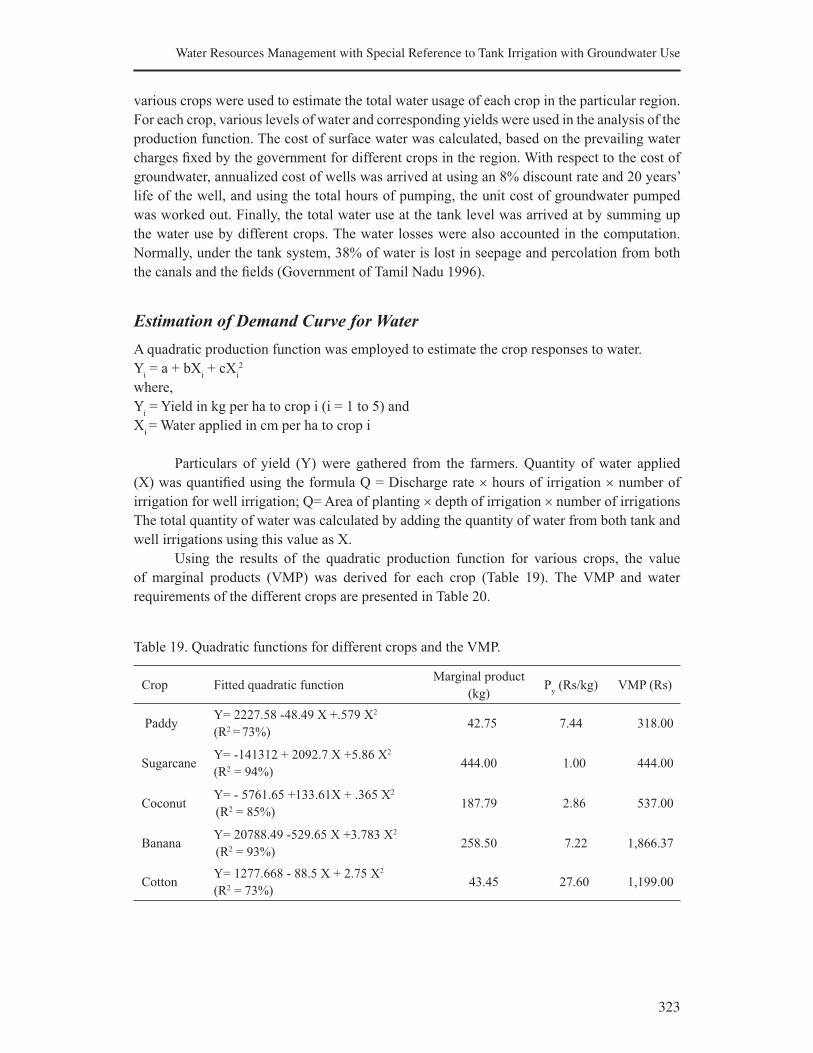
323
Water Resources Management with Special Reference to Tank Irrigation with Groundwater Use
various crops were used to estimate the total water usage of each crop in the particular region.
For each crop, various levels of water and corresponding yields were used in the analysis of the
production function. The cost of surface water was calculated, based on the prevailing water
charges fixed by the government for different crops in the region. With respect to the cost of
groundwater, annualized cost of wells was arrived at using an 8% discount rate and 20 years’
life of the well, and using the total hours of pumping, the unit cost of groundwater pumped
was worked out. Finally, the total water use at the tank level was arrived at by summing up
the water use by different crops. The water losses were also accounted in the computation.
Normally, under the tank system, 38% of water is lost in seepage and percolation from both
the canals and the fields (Government of Tamil Nadu 1996).
Estimation of Demand Curve for Water
A quadratic production function was employed to estimate the crop responses to water.
Yi = a + bX
i + cX
i2
where,
Yi = Yield in kg per ha to crop i (i = 1 to 5) and
Xi = Water applied in cm per ha to crop i
Particulars of yield (Y) were gathered from the farmers. Quantity of water applied
(X) was quantified using the formula Q = Discharge rate × hours of irrigation × number of
irrigation for well irrigation; Q= Area of planting × depth of irrigation × number of irrigations
The total quantity of water was calculated by adding the quantity of water from both tank and
well irrigations using this value as X.
Using the results of the quadratic production function for various crops, the value
of marginal products (VMP) was derived for each crop (Table 19). The VMP and water
requirements of the different crops are presented in Table 20.
Table 19. Quadratic functions for different crops and the VMP.
Crop Fitted quadratic functionMarginal product
(kg)P
y (Rs/kg) VMP (Rs)
PaddyY= 2227.58 -48.49 X +.579 X2
(R2 = 73%) 42.75 7.44 318.00
Sugarcane Y= -141312 + 2092.7 X +5.86 X2
(R2 = 94%)444.00 1.00 444.00
CoconutY= - 5761.65 +133.61X + .365 X2
(R2 = 85%)187.79 2.86 537.00
BananaY= 20788.49 -529.65 X +3.783 X2
(R2 = 93%)258.50 7.22 1,866.37
CottonY= 1277.668 - 88.5 X + 2.75 X2
(R2 = 73%) 43.45 27.60 1,199.00

324
K. Palanisami and Ananthini Nanthakumara
Table 20. Value of marginal product (VMP) and total water used for different crops.
Crops VMP (Rs) Total water used (ha.cm)
Banana 1,866 1,154
Cotton 1,199 2,382
Coconut 536 23,725
Sugarcane 444 93,092
Paddy 318 214,311
The amount of total water used was arrived at in a cumulative manner taking the mid-
point values in the histogram. This value of marginal product of each crop and its total water
requirement were plotted in the histogram. By arranging the crops in descending order of the
value of marginal value of the irrigation water, an approximate value of marginal productivity
curve for irrigation water was obtained. Then using these data, an exponential form of the
demand curve for water was derived (Figure 1).
sp -)e-(1
sp-dwae
)(
s
ks-
s
kw-
k
a
spYdws
s
o
s
o
s
=
=
−=
∫
∫
Similarly,
( ) gpspek
ags gs
gsk −−−=+ +− )/(1)(π
where, π = profit in Rs, s=surface water quantity in ha.cm, g=groundwater quantity in
ha.cm, ps=price of surface water in Rs/ha.cm, p
g=price of groundwater in Rs/ha.cm and a,
k=coefficients estimated from the model.
Figure 1. Demand curve for water.
y = 1089.6e-7E-06x
0
500
1,000
1,500
2,000
0 500,000 100,000 150,000 200,000 250,000
VMP (Rs)
Expon. (VMP (Rs))
R2 = 0.6609
Total water used (ha cm)
VM
P (
Rs)
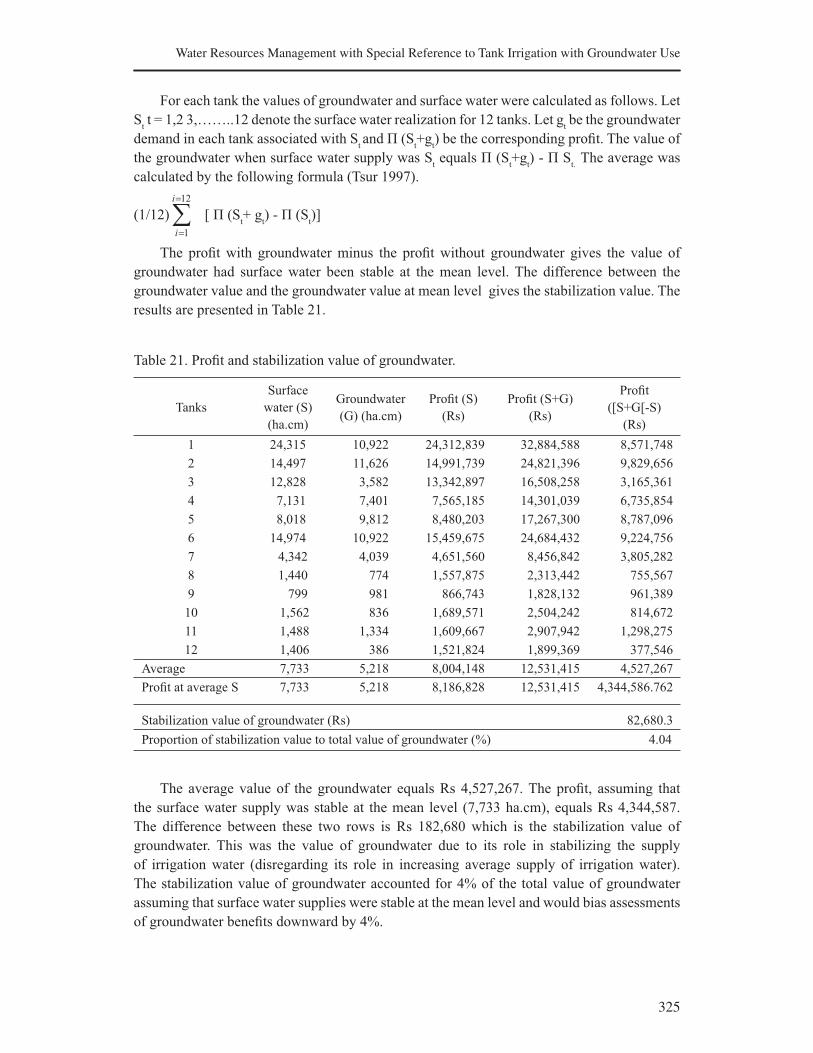
325
Water Resources Management with Special Reference to Tank Irrigation with Groundwater Use
For each tank the values of groundwater and surface water were calculated as follows. Let
St t = 1,2 3,……..12 denote the surface water realization for 12 tanks. Let g
t be the groundwater
demand in each tank associated with St and П (S
t+g
t) be the corresponding profit. The value of
the groundwater when surface water supply was St equals П (S
t+g
t) - П S
t. The average was
calculated by the following formula (Tsur 1997).
(1/12)
∑=
=
12
1
i
i
[ П (St+ g
t) - П (S
t)]
The profit with groundwater minus the profit without groundwater gives the value of
groundwater had surface water been stable at the mean level. The difference between the
groundwater value and the groundwater value at mean level gives the stabilization value. The
results are presented in Table 21.
Table 21. Profit and stabilization value of groundwater.
Tanks
Surface
water (S)
(ha.cm)
Groundwater
(G) (ha.cm)
Profit (S)
(Rs)
Profit (S+G)
(Rs)
Profit
([S+G[-S)
(Rs)
1 24,315 10,922 24,312,839 32,884,588 8,571,748
2 14,497 11,626 14,991,739 24,821,396 9,829,656
3 12,828 3,582 13,342,897 16,508,258 3,165,361
4 7,131 7,401 7,565,185 14,301,039 6,735,854
5 8,018 9,812 8,480,203 17,267,300 8,787,096
6 14,974 10,922 15,459,675 24,684,432 9,224,756
7 4,342 4,039 4,651,560 8,456,842 3,805,282
8 1,440 774 1,557,875 2,313,442 755,567
9 799 981 866,743 1,828,132 961,389
10 1,562 836 1,689,571 2,504,242 814,672
11 1,488 1,334 1,609,667 2,907,942 1,298,275
12 1,406 386 1,521,824 1,899,369 377,546
Average 7,733 5,218 8,004,148 12,531,415 4,527,267
Profit at average S 7,733 5,218 8,186,828 12,531,415 4,344,586.762
Stabilization value of groundwater (Rs) 82,680.3
Proportion of stabilization value to total value of groundwater (%) 4.04
The average value of the groundwater equals Rs 4,527,267. The profit, assuming that
the surface water supply was stable at the mean level (7,733 ha.cm), equals Rs 4,344,587.
The difference between these two rows is Rs 182,680 which is the stabilization value of
groundwater. This was the value of groundwater due to its role in stabilizing the supply
of irrigation water (disregarding its role in increasing average supply of irrigation water).
The stabilization value of groundwater accounted for 4% of the total value of groundwater
assuming that surface water supplies were stable at the mean level and would bias assessments
of groundwater benefits downward by 4%.
326
K. Palanisami and Ananthini Nanthakumara
Production Efficiency of the Farmers in Different Typologies
Normally, when endowed with adequate resources, farmers use inputs in excess, expecting to
reap higher yields. The excessive cost thereby included in the production process could not
only bring down their profit but waste the scarce resources. Subsidized agricultural inputs
could stimulate extensive use of other inputs. For instance, if irrigation water is available in
plenty and at subsidized rates, where water charges are minimal, farmers are tempted to use the
other resources like fertilizer, labor, etc., indiscriminately to get higher yields. However, not all
the farmers are irrational in their input use. Hence, it is necessary to study the efficiency of the
crops produced by the farmers, which will help address the issues of yield gap, etc.
Technical, Allocative and Economic Efficiencies of Farmers
Production efficiency has two components: technical and allocative. Technical efficiency (TE)
is the extent to which the maximum possible output is achieved from a given combination of
inputs. On the other hand, a producer is said to be allocatively efficient (AE) if production
occurs in a subset of the economic region of the production possibilities that satisfy the
producer’s behavioral objective.
Technical efficiency is the ability to produce a given level of output with a minimum
quantity of inputs under a certain technology. Allocative efficiency refers to the ability of
choosing optimal input levels for given factor prices. Overall productive efficiency or
economic efficiency (EE) is the product of technical and allocative efficiency. Thus, if a farm
has achieved both technically efficient and allcatively efficient levels of production, then it is
economically efficient and new investment streams may be critical for any new development
Average, minimum and maximum technical, allocative and economic efficiencies of
the farms in the study area are presented in Table 22. As there is no single crop cultivated in all
three typological situations, the farmers cultivating paddy in the tank-only and the tank-with-
wells situations and the farmers cultivating sugarcane in the tank-with-wells and the wells-
only situations were used for estimation purpose. The TE of all four groups of farmers such
as farmers cultivating paddy in the tank-only situation and the tank-with-wells situation and
farmers cultivating sugarcane in the tank-with-wells and the wells-only situations is higher
than the AE and EE. The paddy farmers in the tank-with-wells situation are technically more
efficient than the paddy farmers in the tank-only situation. Likewise, sugarcane farmers, in the
wells-only situation are technically more efficient than those in the tank-with-wells situation.
The results indicate that the TE indices range from 40 to 95% for the paddy farms in the
tank-only situation with an average of 82% (Table 22). This means that if the average farmer in
the sample is to achieve the TE level of his most efficient counterpart, then the average farmer
could realize 14% cost savings (i.e., 1-[82/95]). A similar calculation for the most technically
inefficient farmers reveals cost savings of 58% (i.e., 1-[40/95]). The mean AE of the sample is
61%, with a low of 45% and a high of 83%. The combined effect of technical and allocative
factors shows that the average EE level for this sample is 51% with a low of 21% and a high of
73%. These values indicate that if the average farmer in the sample is to reach the EE level of
his most efficient counterpart, then the average farmer could experience a cost saving of 30%
(i.e., 1-[51/73]). The same computation for the most economically inefficient farmer suggests
a gain in EE of 71% (i.e., 1-[21/73]).
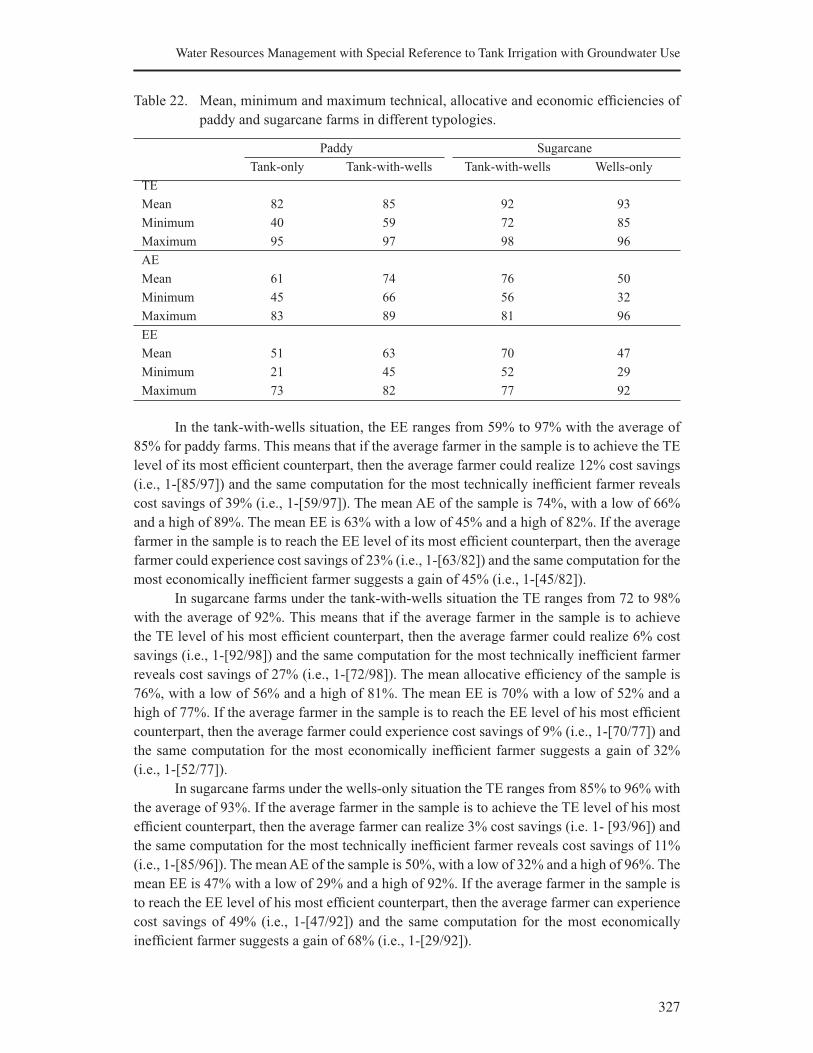
327
Water Resources Management with Special Reference to Tank Irrigation with Groundwater Use
Table 22. Mean, minimum and maximum technical, allocative and economic efficiencies of
paddy and sugarcane farms in different typologies.
Paddy Sugarcane
Tank-only Tank-with-wells Tank-with-wells Wells-only
TE
Mean 82 85 92 93
Minimum 40 59 72 85
Maximum 95 97 98 96
AE
Mean 61 74 76 50
Minimum 45 66 56 32
Maximum 83 89 81 96
EE
Mean 51 63 70 47
Minimum 21 45 52 29
Maximum 73 82 77 92
In the tank-with-wells situation, the EE ranges from 59% to 97% with the average of
85% for paddy farms. This means that if the average farmer in the sample is to achieve the TE
level of its most efficient counterpart, then the average farmer could realize 12% cost savings
(i.e., 1-[85/97]) and the same computation for the most technically inefficient farmer reveals
cost savings of 39% (i.e., 1-[59/97]). The mean AE of the sample is 74%, with a low of 66%
and a high of 89%. The mean EE is 63% with a low of 45% and a high of 82%. If the average
farmer in the sample is to reach the EE level of its most efficient counterpart, then the average
farmer could experience cost savings of 23% (i.e., 1-[63/82]) and the same computation for the
most economically inefficient farmer suggests a gain of 45% (i.e., 1-[45/82]).
In sugarcane farms under the tank-with-wells situation the TE ranges from 72 to 98%
with the average of 92%. This means that if the average farmer in the sample is to achieve
the TE level of his most efficient counterpart, then the average farmer could realize 6% cost
savings (i.e., 1-[92/98]) and the same computation for the most technically inefficient farmer
reveals cost savings of 27% (i.e., 1-[72/98]). The mean allocative efficiency of the sample is
76%, with a low of 56% and a high of 81%. The mean EE is 70% with a low of 52% and a
high of 77%. If the average farmer in the sample is to reach the EE level of his most efficient
counterpart, then the average farmer could experience cost savings of 9% (i.e., 1-[70/77]) and
the same computation for the most economically inefficient farmer suggests a gain of 32%
(i.e., 1-[52/77]).
In sugarcane farms under the wells-only situation the TE ranges from 85% to 96% with
the average of 93%. If the average farmer in the sample is to achieve the TE level of his most
efficient counterpart, then the average farmer can realize 3% cost savings (i.e. 1- [93/96]) and
the same computation for the most technically inefficient farmer reveals cost savings of 11%
(i.e., 1-[85/96]). The mean AE of the sample is 50%, with a low of 32% and a high of 96%. The
mean EE is 47% with a low of 29% and a high of 92%. If the average farmer in the sample is
to reach the EE level of his most efficient counterpart, then the average farmer can experience
cost savings of 49% (i.e., 1-[47/92]) and the same computation for the most economically
inefficient farmer suggests a gain of 68% (i.e., 1-[29/92]).
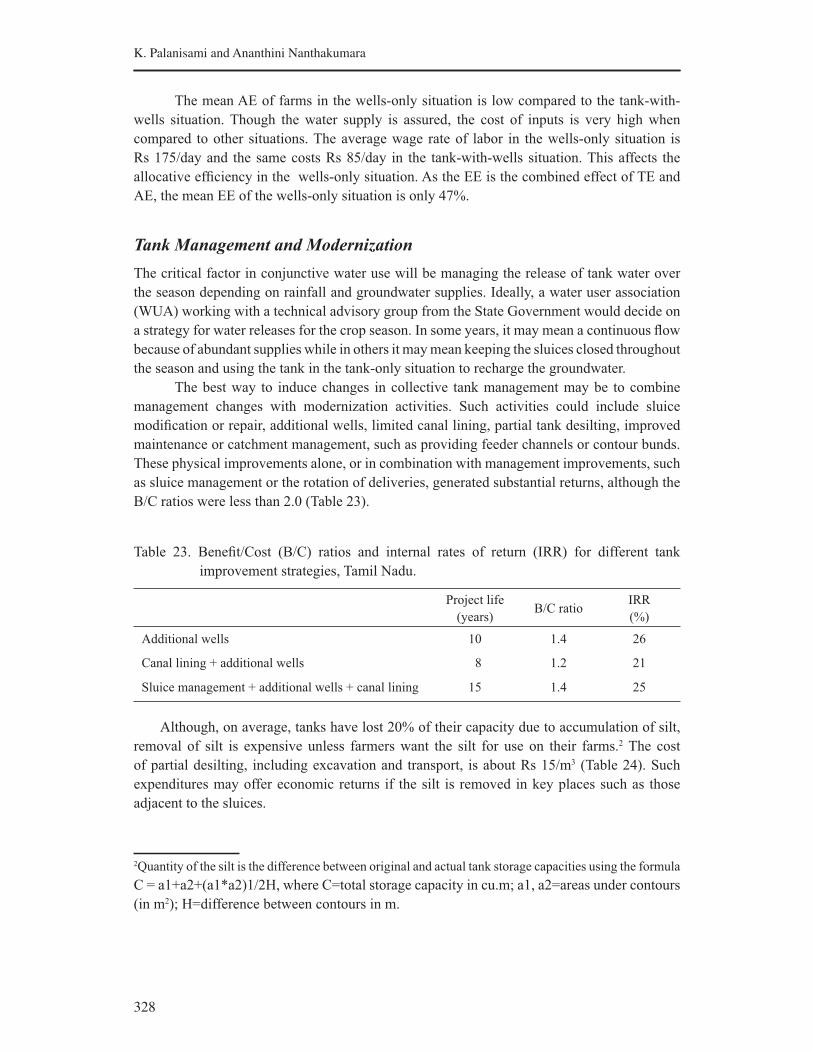
328
K. Palanisami and Ananthini Nanthakumara
The mean AE of farms in the wells-only situation is low compared to the tank-with-
wells situation. Though the water supply is assured, the cost of inputs is very high when
compared to other situations. The average wage rate of labor in the wells-only situation is
Rs 175/day and the same costs Rs 85/day in the tank-with-wells situation. This affects the
allocative efficiency in the wells-only situation. As the EE is the combined effect of TE and
AE, the mean EE of the wells-only situation is only 47%.
Tank Management and Modernization
The critical factor in conjunctive water use will be managing the release of tank water over
the season depending on rainfall and groundwater supplies. Ideally, a water user association
(WUA) working with a technical advisory group from the State Government would decide on
a strategy for water releases for the crop season. In some years, it may mean a continuous flow
because of abundant supplies while in others it may mean keeping the sluices closed throughout
the season and using the tank in the tank-only situation to recharge the groundwater.
The best way to induce changes in collective tank management may be to combine
management changes with modernization activities. Such activities could include sluice
modification or repair, additional wells, limited canal lining, partial tank desilting, improved
maintenance or catchment management, such as providing feeder channels or contour bunds.
These physical improvements alone, or in combination with management improvements, such
as sluice management or the rotation of deliveries, generated substantial returns, although the
B/C ratios were less than 2.0 (Table 23).
Table 23. Benefit/Cost (B/C) ratios and internal rates of return (IRR) for different tank
improvement strategies, Tamil Nadu.
Project life
(years)B/C ratio
IRR
(%)
Additional wells 10 1.4 26
Canal lining + additional wells 8 1.2 21
Sluice management + additional wells + canal lining 15 1.4 25
Although, on average, tanks have lost 20% of their capacity due to accumulation of silt,
removal of silt is expensive unless farmers want the silt for use on their farms.2 The cost
of partial desilting, including excavation and transport, is about Rs 15/m3 (Table 24). Such
expenditures may offer economic returns if the silt is removed in key places such as those
adjacent to the sluices.
2Quantity of the silt is the difference between original and actual tank storage capacities using the formula
C = a1+a2+(a1*a2)1/2H, where C=total storage capacity in cu.m; a1, a2=areas under contours
(in m2); H=difference between contours in m.
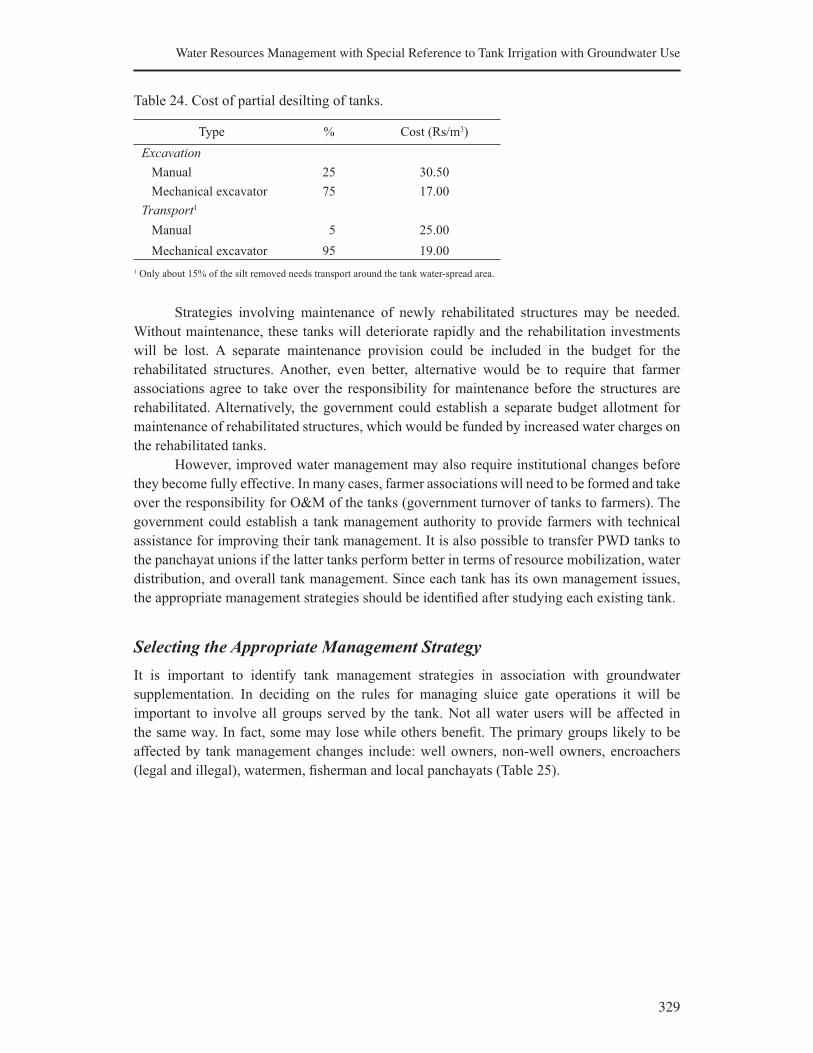
329
Water Resources Management with Special Reference to Tank Irrigation with Groundwater Use
Table 24. Cost of partial desilting of tanks.
Type % Cost (Rs/m3)
Excavation
Manual 25 30.50
Mechanical excavator 75 17.00
Transport1
Manual 5 25.00
Mechanical excavator 95 19.00
1 Only about 15% of the silt removed needs transport around the tank water-spread area.
Strategies involving maintenance of newly rehabilitated structures may be needed.
Without maintenance, these tanks will deteriorate rapidly and the rehabilitation investments
will be lost. A separate maintenance provision could be included in the budget for the
rehabilitated structures. Another, even better, alternative would be to require that farmer
associations agree to take over the responsibility for maintenance before the structures are
rehabilitated. Alternatively, the government could establish a separate budget allotment for
maintenance of rehabilitated structures, which would be funded by increased water charges on
the rehabilitated tanks.
However, improved water management may also require institutional changes before
they become fully effective. In many cases, farmer associations will need to be formed and take
over the responsibility for O&M of the tanks (government turnover of tanks to farmers). The
government could establish a tank management authority to provide farmers with technical
assistance for improving their tank management. It is also possible to transfer PWD tanks to
the panchayat unions if the latter tanks perform better in terms of resource mobilization, water
distribution, and overall tank management. Since each tank has its own management issues,
the appropriate management strategies should be identified after studying each existing tank.
Selecting the Appropriate Management Strategy
It is important to identify tank management strategies in association with groundwater
supplementation. In deciding on the rules for managing sluice gate operations it will be
important to involve all groups served by the tank. Not all water users will be affected in
the same way. In fact, some may lose while others benefit. The primary groups likely to be
affected by tank management changes include: well owners, non-well owners, encroachers
(legal and illegal), watermen, fisherman and local panchayats (Table 25).

330
K. Palanisami and Ananthini Nanthakumara
Table 25. Distribution of possible benefits from tank management changes.
Actors Level of benefits
Well owners High
Non-well owners Medium
Legal-encroachers None (loss)
Illegal-encroachers None (loss)
Watermen Low
Fishermen Medium
Panchayat Medium
WUAS High
The largest beneficiary may be the well owner in the command. Since only comparatively
well-off farmers could invest in wells, the management changes may tend to benefit higher-
income farmers the most. However, these well owners normally sell the well water to other
farmers during the later part of the rice crop season. It is highly likely that these well owners
will continue to sell well water to the non-well owners. Since electricity is free to farmers,
the well owners will be encouraged to sell the water at a comparatively low price. To make
sure that the management change works, it is important to have a detailed dialogue between
the well owners and the non-well owners. The local panchayat or WUA could play a role in
arriving at an agreeable solution. The WUA will benefit from the changes and dialogue, since
there would be fewer conflicts to be resolved to improve water distribution.
There are both legal and illegal encroachers in the tank beds or foreshore areas. The
legal encroachers are those who have obtained legal rights to cultivate these foreshore lands
when these areas are not submerging. However, there are illegal encroachers, who cultivate
the foreshore areas by paying a penalty. Since tanks will likely have standing water for a longer
period under the new management strategy, the encroachers may not be able to cultivate in
most years. The local panchayat and WUA will need to prevent the encroachers from illegally
opening the sluice gates to lower the water level in the tank. Watermen and fishermen in the
tanks have comparatively minor roles in most tanks and the new management strategy may not
affect them much. Fishermen who have fishing rights may benefit since the tanks will have
storage for a longer time. In the case of watermen, they could be given the responsibility to
carry out the new management rules.
However, there are also cost considerations. There will be additional electricity
consumption due to extra pumping by the well owners, because they will need to pump for the
neighboring non-well owners. Since electricity is free to farmers, it will add an extra burden to
the state electricity boards. Currently, the Village Administrative Officer (VAO) at the village
level is collecting the water charges, cess, and surcharges from the tank-beneficiary farmers.
The tank water charges go to the Revenue Department and the cess and surcharges are used by
the panchayat for village improvements.
The most domestic management change would be to close the sluices permanently and
use the tank as a percolation pond. In several locations, where well intensity is quite high and
over 50% of the tank storage capacity has been lost, this might be a good strategy. In fact, this
was effected in several cases in Andhra Pradesh.
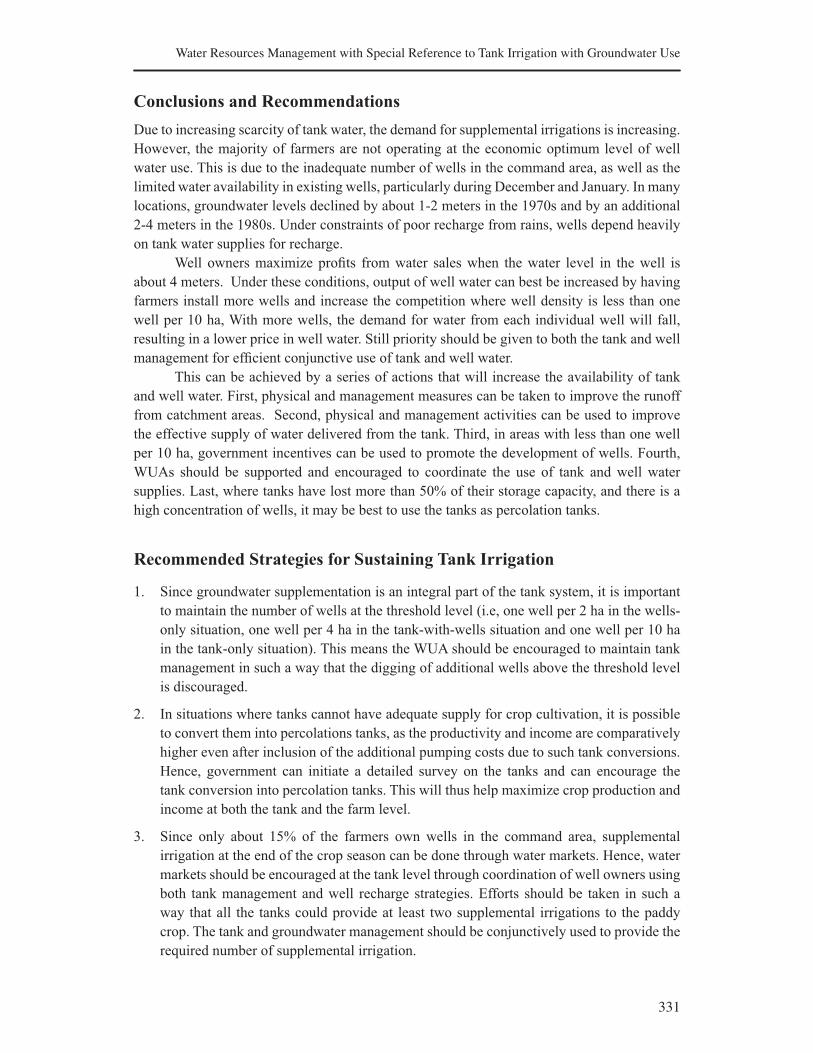
331
Water Resources Management with Special Reference to Tank Irrigation with Groundwater Use
Conclusions and Recommendations
Due to increasing scarcity of tank water, the demand for supplemental irrigations is increasing.
However, the majority of farmers are not operating at the economic optimum level of well
water use. This is due to the inadequate number of wells in the command area, as well as the
limited water availability in existing wells, particularly during December and January. In many
locations, groundwater levels declined by about 1-2 meters in the 1970s and by an additional
2-4 meters in the 1980s. Under constraints of poor recharge from rains, wells depend heavily
on tank water supplies for recharge.
Well owners maximize profits from water sales when the water level in the well is
about 4 meters. Under these conditions, output of well water can best be increased by having
farmers install more wells and increase the competition where well density is less than one
well per 10 ha, With more wells, the demand for water from each individual well will fall,
resulting in a lower price in well water. Still priority should be given to both the tank and well
management for efficient conjunctive use of tank and well water.
This can be achieved by a series of actions that will increase the availability of tank
and well water. First, physical and management measures can be taken to improve the runoff
from catchment areas. Second, physical and management activities can be used to improve
the effective supply of water delivered from the tank. Third, in areas with less than one well
per 10 ha, government incentives can be used to promote the development of wells. Fourth,
WUAs should be supported and encouraged to coordinate the use of tank and well water
supplies. Last, where tanks have lost more than 50% of their storage capacity, and there is a
high concentration of wells, it may be best to use the tanks as percolation tanks.
Recommended Strategies for Sustaining Tank Irrigation
1. Since groundwater supplementation is an integral part of the tank system, it is important
to maintain the number of wells at the threshold level (i.e, one well per 2 ha in the wells-
only situation, one well per 4 ha in the tank-with-wells situation and one well per 10 ha
in the tank-only situation). This means the WUA should be encouraged to maintain tank
management in such a way that the digging of additional wells above the threshold level
is discouraged.
2. In situations where tanks cannot have adequate supply for crop cultivation, it is possible
to convert them into percolations tanks, as the productivity and income are comparatively
higher even after inclusion of the additional pumping costs due to such tank conversions.
Hence, government can initiate a detailed survey on the tanks and can encourage the
tank conversion into percolation tanks. This will thus help maximize crop production and
income at both the tank and the farm level.
3. Since only about 15% of the farmers own wells in the command area, supplemental
irrigation at the end of the crop season can be done through water markets. Hence, water
markets should be encouraged at the tank level through coordination of well owners using
both tank management and well recharge strategies. Efforts should be taken in such a
way that all the tanks could provide at least two supplemental irrigations to the paddy
crop. The tank and groundwater management should be conjunctively used to provide the
required number of supplemental irrigation.
332
K. Palanisami and Ananthini Nanthakumara
4. The optimum number of pumping as evidenced from the study should be maintained in
all tanks which will have a positive impact on the water market and pricing of well water
when overexploitation of groundwater will be minimized.
5. Given the budget constraints, tank rehabilitation or modernization should start with
management options followed by physical investments as indicated by the higher internal
rate of returns. The national and international agencies should give priority for tank
rehabilitation and management based on the groundwater supplementation aspects.
6. Crop diversification towards non-rice crops such as pulses and oilseeds should be
encouraged, as the tanks have less than 50% storage in most of the years which is
insufficient for rice cultivation. Needed agricultural extension efforts with marketing
facilities should be promoted at the tank level.
333
Water Resources Management with Special Reference to Tank Irrigation with Groundwater Use
References
Government of Tamil Nadu. 1996. Water management in tank command – results from on-farm developments
works. Madurai: Agricultural Engineering Department (various records).
Palanisami, K.; Easter, K.W. 2000. Tank irrigation in the 21st century - what next? New Delhi: Discovery
Publishing House.
Palanisami, K.; Flinn, J.C. 1988. Evaluating the performance of tank irrigation systems. Agricultural System
28: 161-177.
Palanisami, K.; Flinn, J.C. 1989. Impact of varying water supply on input use and yields of tank-irrigated rice.
Agricultural Water Management 15: 347-359.
Palanisami, K.; Balasubramanian, R.; Ali, Mohamed A. 1997. Present status and future strategies of tank
irrigation in Tamil Nadu. Bulletin/97. Coimbatore: Water Technology Centre, Tamil Nadu Agricultural
University Press.
Ranganathan, C.R.; Palanisami, K. 2004. Modelling economics of conjunctive surface and groundwater
irrigation systems. Irrigation and Drainage Systems 8 (2): 127-143.
Tsur, Y. 1997. The economics of conjunctive ground and surface water. In: Decentralization and co-ordination
of water resource management, ed. Parker, D.; Tsur, Y. London: Kluwer Academic Publishers.

335
Impact of Watershed Development Programs in
Tamil Nadu
K. Palanisami and D. Suresh Kumar
Introduction
The concept of integrated and participatory watershed management has emerged as the
cornerstone of rural development in the dry, semiarid and rain-fed regions of the world.
Most watershed projects in India are implemented with the twin objectives of soil and water
conservation and enhancing the livelihoods of the rural poor (Sharma and Scott 2005). A
watershed is a geographical area that drains to a common point, which makes it an attractive
unit for technical efforts to conserve soil and maximize the utilization of surface water and
subsurface water for crop production (Kerr et al. 2000). Watershed development has been
conceived basically as a strategy for protecting the livelihoods of the people inhabiting the
fragile ecosystems experiencing soil erosion and moisture stress.
Different types of treatment activities are carried out in a watershed. They include soil
and moisture conservation measures in agricultural lands (contour/field bunding and summer
ploughing), drainage line treatment measures (loose boulder check dam, minor check dam,
major check dam, and retaining walls), water resources development management (percolation
pond, farm pond, and drip and sprinkler irrigation), crop demonstration, horticulture plantation
and afforestation (Palanisami and Suresh Kumar 2005). Periodically, training in watershed
technologies and related skills is also given to farmers in watersheds. In addition, members
are also taken to other successful watershed models and research institutes for exposure. These
efforts appear to be contributing to groundwater recharge. The aim has been to ensure the
availability of drinking water, fuelwood and fodder and raise income of, and employment
opportunities for, farmers and landless laborers through improvement in agricultural production
and productivity (Rao 2000). Today, watershed development has become the main intervention
for natural resource management. Watershed development programs not only protect and
conserve the environment but also contribute to livelihood security.
As an important development program, watershed development received much
attention from both the central and state governments. Up to the Tenth Plan (till March 2005),
17.24 million hectares (Mha) were treated with a total budget of Rs 93.6803 billion under the
Ministry of Agriculture, 27.52 Mha with an outlay of Rs 68.5566 billion under the Ministry
of Rural Development and 0.82 Mha with an outlay of Rs 8.1373 billion under the Ministry
of Environment and Forest. Altogether, 45.58 Mha were treated through various programs
with an investment of Rs 170.37 billion. Average expenditure per annum during the Tenth
Plan was around Rs 23 billion (Department of Land Resources 2006). As millions of rupees
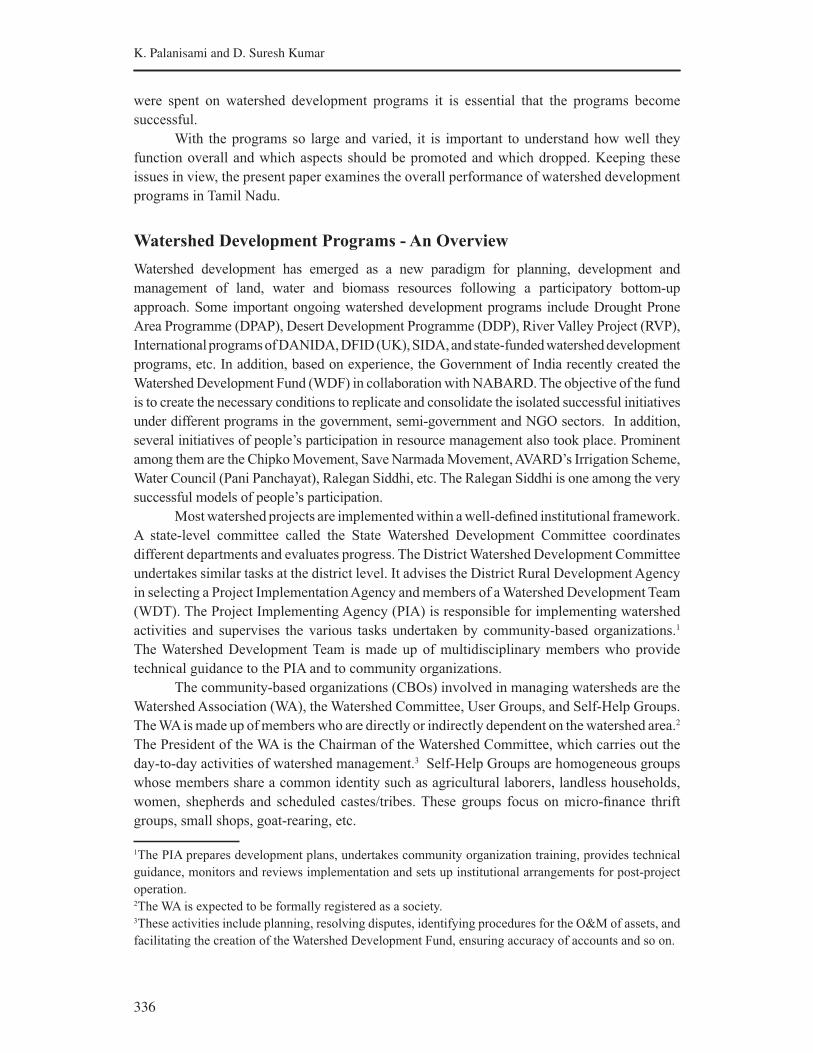
336
K. Palanisami and D. Suresh Kumar
were spent on watershed development programs it is essential that the programs become
successful.
With the programs so large and varied, it is important to understand how well they
function overall and which aspects should be promoted and which dropped. Keeping these
issues in view, the present paper examines the overall performance of watershed development
programs in Tamil Nadu.
Watershed Development Programs - An Overview
Watershed development has emerged as a new paradigm for planning, development and
management of land, water and biomass resources following a participatory bottom-up
approach. Some important ongoing watershed development programs include Drought Prone
Area Programme (DPAP), Desert Development Programme (DDP), River Valley Project (RVP),
International programs of DANIDA, DFID (UK), SIDA, and state-funded watershed development
programs, etc. In addition, based on experience, the Government of India recently created the
Watershed Development Fund (WDF) in collaboration with NABARD. The objective of the fund
is to create the necessary conditions to replicate and consolidate the isolated successful initiatives
under different programs in the government, semi-government and NGO sectors. In addition,
several initiatives of people’s participation in resource management also took place. Prominent
among them are the Chipko Movement, Save Narmada Movement, AVARD’s Irrigation Scheme,
Water Council (Pani Panchayat), Ralegan Siddhi, etc. The Ralegan Siddhi is one among the very
successful models of people’s participation.
Most watershed projects are implemented within a well-defined institutional framework.
A state-level committee called the State Watershed Development Committee coordinates
different departments and evaluates progress. The District Watershed Development Committee
undertakes similar tasks at the district level. It advises the District Rural Development Agency
in selecting a Project Implementation Agency and members of a Watershed Development Team
(WDT). The Project Implementing Agency (PIA) is responsible for implementing watershed
activities and supervises the various tasks undertaken by community-based organizations.1
The Watershed Development Team is made up of multidisciplinary members who provide
technical guidance to the PIA and to community organizations.
The community-based organizations (CBOs) involved in managing watersheds are the
Watershed Association (WA), the Watershed Committee, User Groups, and Self-Help Groups.
The WA is made up of members who are directly or indirectly dependent on the watershed area.2
The President of the WA is the Chairman of the Watershed Committee, which carries out the
day-to-day activities of watershed management.3 Self-Help Groups are homogeneous groups
whose members share a common identity such as agricultural laborers, landless households,
women, shepherds and scheduled castes/tribes. These groups focus on micro-finance thrift
groups, small shops, goat-rearing, etc.
1The PIA prepares development plans, undertakes community organization training, provides technical
guidance, monitors and reviews implementation and sets up institutional arrangements for post-project
operation.2The WA is expected to be formally registered as a society.3These activities include planning, resolving disputes, identifying procedures for the O&M of assets, and
facilitating the creation of the Watershed Development Fund, ensuring accuracy of accounts and so on.
337
Impact of Watershed Development Programs in Tamil Nadu
Generally, watersheds in India are allotted a budget of approximately Rs 6,000 per ha.
Thus, a watershed with a total area of 500 ha receives Rs 3 million for a 5-year period. The
bulk of this money (80%) is meant for development/treatment and construction activities.4
The WC opens a bank account and directly uses these funds. To promote participation of local
villagers in the implementation of watershed programs, guidelines for watershed development
were first issued in 1995 and subsequently revised in 2001. These guidelines emphasized the
formation of CBOs.
But, by and large, these community-based watershed management initiatives have not
produced the desired results in terms of people’s participation, particularly once the state
withdraws its support (Rao 2000; Palanisami and Suresh Kumar 2002). This led to further
revision of guidelines and the involvement of the panchayat raj (local government) institutions
in the planning, implementation and management of watersheds. New guidelines called the
Haryali guidelines were issued in April 2003. Under the new Haryali guidelines, the village
panchayats take the role of the Watershed Committee and the higher-level Gram Sabha
represents the WA. Realizing the lacuna of different guidelines, in 2008, the Government
of India issued new guidelines called Common Guidelines for Watershed Development
Projects.
Watershed Development in Tamil Nadu
Profile of the State
Agriculture is the major occupation in the state as it provides livelihood support to 56% of
the population. Incidentally, about 56% of the total cropped area of the state is under irrigated
condition while around 44% of the area is under dryland farming. Land use pattern in the state
has witnessed significant changes over the years. The net sown area has declined from 48%
of the total geographical area during 1979-80 to 42.8% in 1999-2000 and further to 38.5% in
2005-06. Tamil Nadu agriculture is dominated by marginal and small farmers. The marginal
farmers account for 74.3% of the total holdings operated only in about 30% of the total area
while the semi-medium, medium and large farmers account for a small proportion of 10%
of the holdings operated in a higher proportion of 46.1% of the total area. The number of
marginal farmers has been increasing over the years.
Tamil Nadu (Figure 1) state which accounts for 7% of the population of the country is
endowed with only 3% of water resources in India. The water potential of the state is 46,540
Mm3. The groundwater potential available for future development was estimated at 3,142.27
Mm3 as of January 2003.
4Funds are allotted for different activities as follows: Watershed treatment/development works -- 80%;
CBOs including entry point activities -- 5%; training -- 5%; administrative overheads --10%. According
to the new common guidelines of 2008, the budget allotment is Rs 12,000 per ha.
338
K. Palanisami and D. Suresh Kumar
Figure 1. Map of the State of Tamil Nadu.
Also the development of groundwater has led to increased “drought proofing” of the
state’s agricultural economy. An analysis of the variance in growth rates of irrigated and
unirrigated agriculture after the advent of new technology in the late 1960s revealed that the
degree of instability in irrigated agriculture was less than half of that in unirrigated agriculture
(World Bank 1998). Out of 385 blocks in Tamil Nadu, 180 blocks have almost exploited the
potential and out of the 1.8 million wells in the state, about 12% are dried up or abandoned
due to groundwater overexploitation (GoTN 2002). In some pockets of the state, the average
well failure rate is 47% for open wells and 9% for bore wells (Palanisami et al. 2008). Being a
hard-rock region, the externalities of groundwater depletion are felt in most parts of the state.
The overexploitation of groundwater in many areas of the state has resulted in lowering of the
water table below the economic pumping level. In this context, the watershed development
assumes critical proportions in the state.
Watershed Development Programs
To increase the overall agricultural production and improve the living conditions of the
farmers depending on the rain-fed lands, the watershed development programs are being
widely implemented in the state. There are 19,331 micro-watersheds identified in the state of
which, approximately 4,000 have already been treated. The details of number of watersheds
in the state are given in the Annex. The important programs such as DPAP, National
Watershed Development Project for Rain-fed Areas (NWDPRA) and Integrated Wasteland
Development Programme (IWDP) are implemented through a watershed approach apart
from the Comprehensive Watershed Development Projects implemented with assistance from
DANIDA.
The DPAP is implemented with the prime objective of promoting the overall economic
development of the watershed community through optimum utilization of natural resources,
employment generation and restoring ecological balance. The program is implemented in 80
339
Impact of Watershed Development Programs in Tamil Nadu
blocks of 16 districts which are Dharmapuri, Thoothukudi, Sivagangai, Ramanathapuram,
Virudhunagar, Pudukottai, Tirunelveli, Salem, Namakkal, Coimbatore, Tiruvannamalai,
Dindigul, Vellore, Tiruchirappalli, Perambalur and Karur. From 1999-2000 to 2006-07, the
Government of India sanctioned 1,222 watersheds in seven batches at a total cost of Rs 3,367
million, for treating a total area of 0.61 Mha (GoTN2009).
The IWDP has been under implementation in Tamil Nadu since 1993-94 to develop
non-forest wastelands on the principles of watershed development. This program is being
implemented in 96 blocks of 24 districts, which are Coimbatore, Dharmapuri, Dindigul, Karur,
Krishnagiri, Namakkal, Perambalur, Pudukkottai, Ramanathapuram, Salem, Sivagangai,
Tiruvannamalai, Thoothukudi, Tiruchirappalli, Tirunelveli, Vellore, Erode, Theni, Madurai,
Kancheepuram, Villupuram, Tiruvallur, Cuddalore and Virudhunagar. From 1999-2000 to
2006-07 the Government of India has sanctioned 910 watersheds at a total cost of Rs 2,622.
039 million, for treating a total area of 0.457 Mha (GoTN 2009).
The other important watershed development program is the NWDPRA. It is being
implemented in the state from 1990-91. During the period from 2002-03 to 2007-08, a
altogether 755 watersheds (0.290 Mha) with a total outlay of Rs 1,306.5 million have been
treated.
In addition to these major watershed development programs, watershed programs
assisted by the National Bank for Agriculture and Rural Development (NABARD) are being
implemented. This covers 100 watersheds at a cost of Rs 600 million in 23 districts of the
state.
Impacts
The watershed development programs involving the entire community and natural resources
influence (i) productivity and production of crops, changes in land use and cropping pattern,
adoption of modern technologies, increase in milk production, etc., (ii) attitude of the community
towards project activities and their participation in different stages of the project, (iii)
socioeconomic conditions of the people such as income, employment, assets, health, education
and energy use, (iv) impact on environment, (v) use of land, water, human and livestock
resources, (vi) development of institutions for implementation of watershed development
activities, and (vii) ensuring sustainability of improvements. It is thus clear that watershed
development is a key to sustainable production of food, fodder, fuelwood and meaningfully
addressing the social, economical and cultural conditions of the rural community.
Recognizing the importance of watershed development program in the state, a large
number of studies attempted to assess the impact of watershed development over a period of
time. These studies vary in purpose, regions and domain of impacts. The impact studies vary
from impact of specific water harvesting interventions such as percolation ponds to overall
impacts of the watershed development program. The impact assessment studies focus mainly
on the impact of different interventions, such as water resources development, soil and moisture
conservation measures, drainage line treatments and afforestation, and assess the impacts on
different aspects like increase in surface water and groundwater resources, cropping pattern
changes, yield, environmental conditions, and socioeconomic conditions including the social
capital and institution building as a result of watershed interventions.
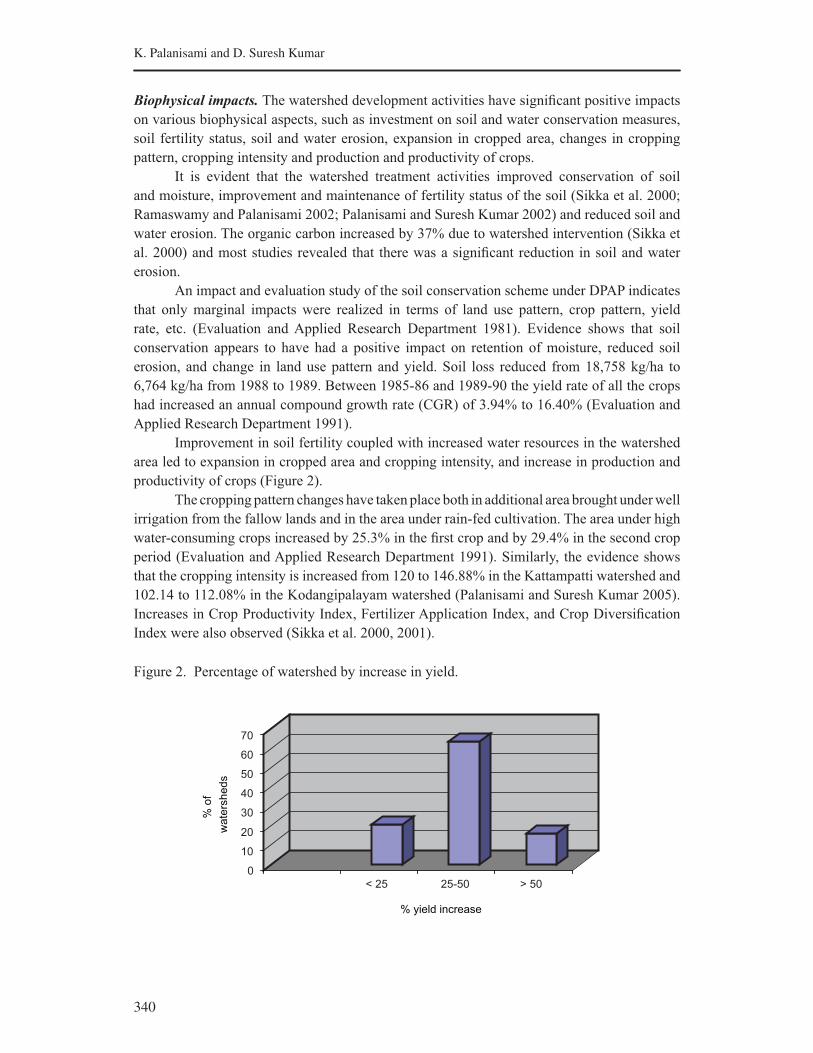
340
K. Palanisami and D. Suresh Kumar
Biophysical impacts. The watershed development activities have significant positive impacts
on various biophysical aspects, such as investment on soil and water conservation measures,
soil fertility status, soil and water erosion, expansion in cropped area, changes in cropping
pattern, cropping intensity and production and productivity of crops.
It is evident that the watershed treatment activities improved conservation of soil
and moisture, improvement and maintenance of fertility status of the soil (Sikka et al. 2000;
Ramaswamy and Palanisami 2002; Palanisami and Suresh Kumar 2002) and reduced soil and
water erosion. The organic carbon increased by 37% due to watershed intervention (Sikka et
al. 2000) and most studies revealed that there was a significant reduction in soil and water
erosion.
An impact and evaluation study of the soil conservation scheme under DPAP indicates
that only marginal impacts were realized in terms of land use pattern, crop pattern, yield
rate, etc. (Evaluation and Applied Research Department 1981). Evidence shows that soil
conservation appears to have had a positive impact on retention of moisture, reduced soil
erosion, and change in land use pattern and yield. Soil loss reduced from 18,758 kg/ha to
6,764 kg/ha from 1988 to 1989. Between 1985-86 and 1989-90 the yield rate of all the crops
had increased an annual compound growth rate (CGR) of 3.94% to 16.40% (Evaluation and
Applied Research Department 1991).
Improvement in soil fertility coupled with increased water resources in the watershed
area led to expansion in cropped area and cropping intensity, and increase in production and
productivity of crops (Figure 2).
The cropping pattern changes have taken place both in additional area brought under well
irrigation from the fallow lands and in the area under rain-fed cultivation. The area under high
water-consuming crops increased by 25.3% in the first crop and by 29.4% in the second crop
period (Evaluation and Applied Research Department 1991). Similarly, the evidence shows
that the cropping intensity is increased from 120 to 146.88% in the Kattampatti watershed and
102.14 to 112.08% in the Kodangipalayam watershed (Palanisami and Suresh Kumar 2005).
Increases in Crop Productivity Index, Fertilizer Application Index, and Crop Diversification
Index were also observed (Sikka et al. 2000, 2001).
Figure 2. Percentage of watershed by increase in yield.
0
10
20
30
40
50
60
70
% o
f
wa
ters
he
ds
< 25 25-50 > 50
% yield increase
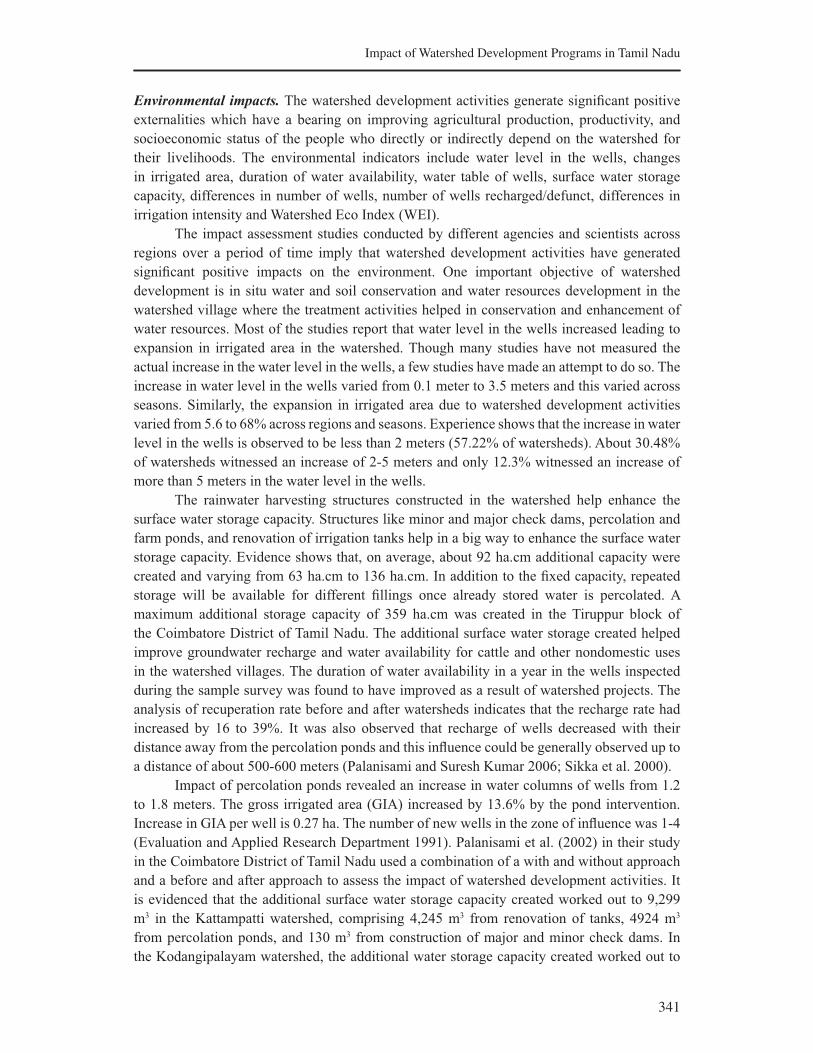
341
Impact of Watershed Development Programs in Tamil Nadu
Environmental impacts. The watershed development activities generate significant positive
externalities which have a bearing on improving agricultural production, productivity, and
socioeconomic status of the people who directly or indirectly depend on the watershed for
their livelihoods. The environmental indicators include water level in the wells, changes
in irrigated area, duration of water availability, water table of wells, surface water storage
capacity, differences in number of wells, number of wells recharged/defunct, differences in
irrigation intensity and Watershed Eco Index (WEI).
The impact assessment studies conducted by different agencies and scientists across
regions over a period of time imply that watershed development activities have generated
significant positive impacts on the environment. One important objective of watershed
development is in situ water and soil conservation and water resources development in the
watershed village where the treatment activities helped in conservation and enhancement of
water resources. Most of the studies report that water level in the wells increased leading to
expansion in irrigated area in the watershed. Though many studies have not measured the
actual increase in the water level in the wells, a few studies have made an attempt to do so. The
increase in water level in the wells varied from 0.1 meter to 3.5 meters and this varied across
seasons. Similarly, the expansion in irrigated area due to watershed development activities
varied from 5.6 to 68% across regions and seasons. Experience shows that the increase in water
level in the wells is observed to be less than 2 meters (57.22% of watersheds). About 30.48%
of watersheds witnessed an increase of 2-5 meters and only 12.3% witnessed an increase of
more than 5 meters in the water level in the wells.
The rainwater harvesting structures constructed in the watershed help enhance the
surface water storage capacity. Structures like minor and major check dams, percolation and
farm ponds, and renovation of irrigation tanks help in a big way to enhance the surface water
storage capacity. Evidence shows that, on average, about 92 ha.cm additional capacity were
created and varying from 63 ha.cm to 136 ha.cm. In addition to the fixed capacity, repeated
storage will be available for different fillings once already stored water is percolated. A
maximum additional storage capacity of 359 ha.cm was created in the Tiruppur block of
the Coimbatore District of Tamil Nadu. The additional surface water storage created helped
improve groundwater recharge and water availability for cattle and other nondomestic uses
in the watershed villages. The duration of water availability in a year in the wells inspected
during the sample survey was found to have improved as a result of watershed projects. The
analysis of recuperation rate before and after watersheds indicates that the recharge rate had
increased by 16 to 39%. It was also observed that recharge of wells decreased with their
distance away from the percolation ponds and this influence could be generally observed up to
a distance of about 500-600 meters (Palanisami and Suresh Kumar 2006; Sikka et al. 2000).
Impact of percolation ponds revealed an increase in water columns of wells from 1.2
to 1.8 meters. The gross irrigated area (GIA) increased by 13.6% by the pond intervention.
Increase in GIA per well is 0.27 ha. The number of new wells in the zone of influence was 1-4
(Evaluation and Applied Research Department 1991). Palanisami et al. (2002) in their study
in the Coimbatore District of Tamil Nadu used a combination of a with and without approach
and a before and after approach to assess the impact of watershed development activities. It
is evidenced that the additional surface water storage capacity created worked out to 9,299
m3 in the Kattampatti watershed, comprising 4,245 m3 from renovation of tanks, 4924 m3
from percolation ponds, and 130 m3 from construction of major and minor check dams. In
the Kodangipalayam watershed, the additional water storage capacity created worked out to
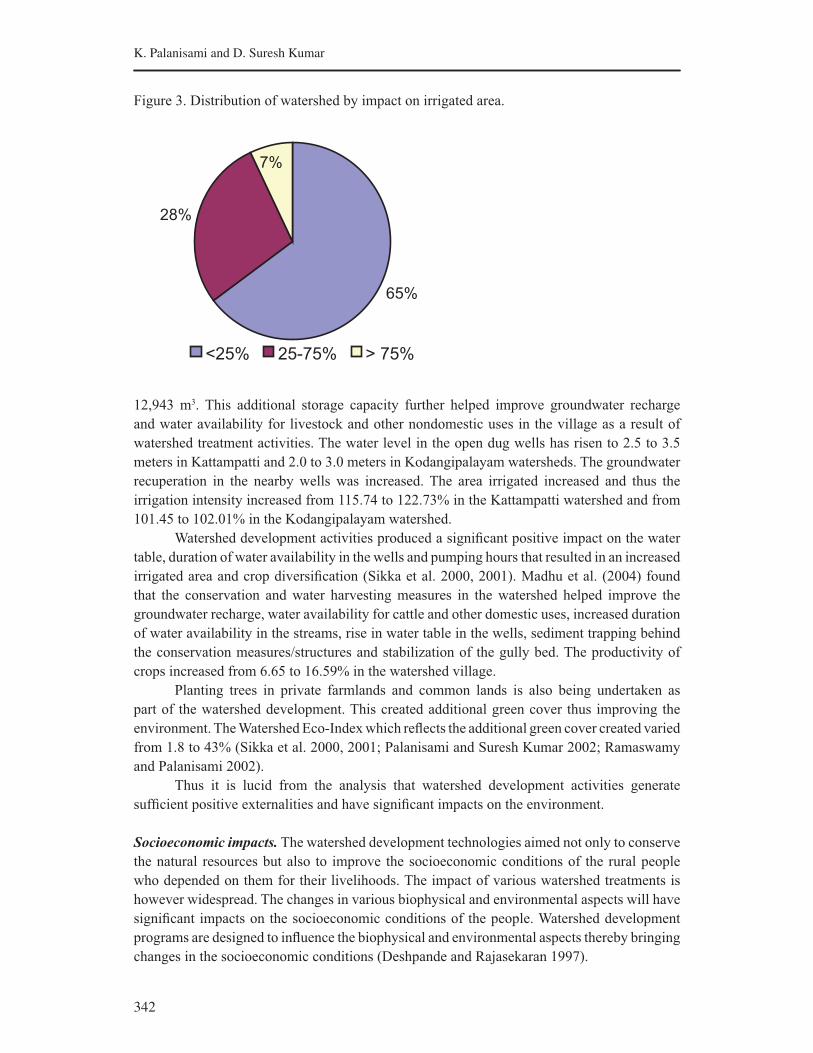
342
K. Palanisami and D. Suresh Kumar
Figure 3. Distribution of watershed by impact on irrigated area.
12,943 m3. This additional storage capacity further helped improve groundwater recharge
and water availability for livestock and other nondomestic uses in the village as a result of
watershed treatment activities. The water level in the open dug wells has risen to 2.5 to 3.5
meters in Kattampatti and 2.0 to 3.0 meters in Kodangipalayam watersheds. The groundwater
recuperation in the nearby wells was increased. The area irrigated increased and thus the
irrigation intensity increased from 115.74 to 122.73% in the Kattampatti watershed and from
101.45 to 102.01% in the Kodangipalayam watershed.
Watershed development activities produced a significant positive impact on the water
table, duration of water availability in the wells and pumping hours that resulted in an increased
irrigated area and crop diversification (Sikka et al. 2000, 2001). Madhu et al. (2004) found
that the conservation and water harvesting measures in the watershed helped improve the
groundwater recharge, water availability for cattle and other domestic uses, increased duration
of water availability in the streams, rise in water table in the wells, sediment trapping behind
the conservation measures/structures and stabilization of the gully bed. The productivity of
crops increased from 6.65 to 16.59% in the watershed village.
Planting trees in private farmlands and common lands is also being undertaken as
part of the watershed development. This created additional green cover thus improving the
environment. The Watershed Eco-Index which reflects the additional green cover created varied
from 1.8 to 43% (Sikka et al. 2000, 2001; Palanisami and Suresh Kumar 2002; Ramaswamy
and Palanisami 2002).
Thus it is lucid from the analysis that watershed development activities generate
sufficient positive externalities and have significant impacts on the environment.
Socioeconomic impacts. The watershed development technologies aimed not only to conserve
the natural resources but also to improve the socioeconomic conditions of the rural people
who depended on them for their livelihoods. The impact of various watershed treatments is
however widespread. The changes in various biophysical and environmental aspects will have
significant impacts on the socioeconomic conditions of the people. Watershed development
programs are designed to influence the biophysical and environmental aspects thereby bringing
changes in the socioeconomic conditions (Deshpande and Rajasekaran 1997).
25-75% > 75%<25%
28%
65%
7%
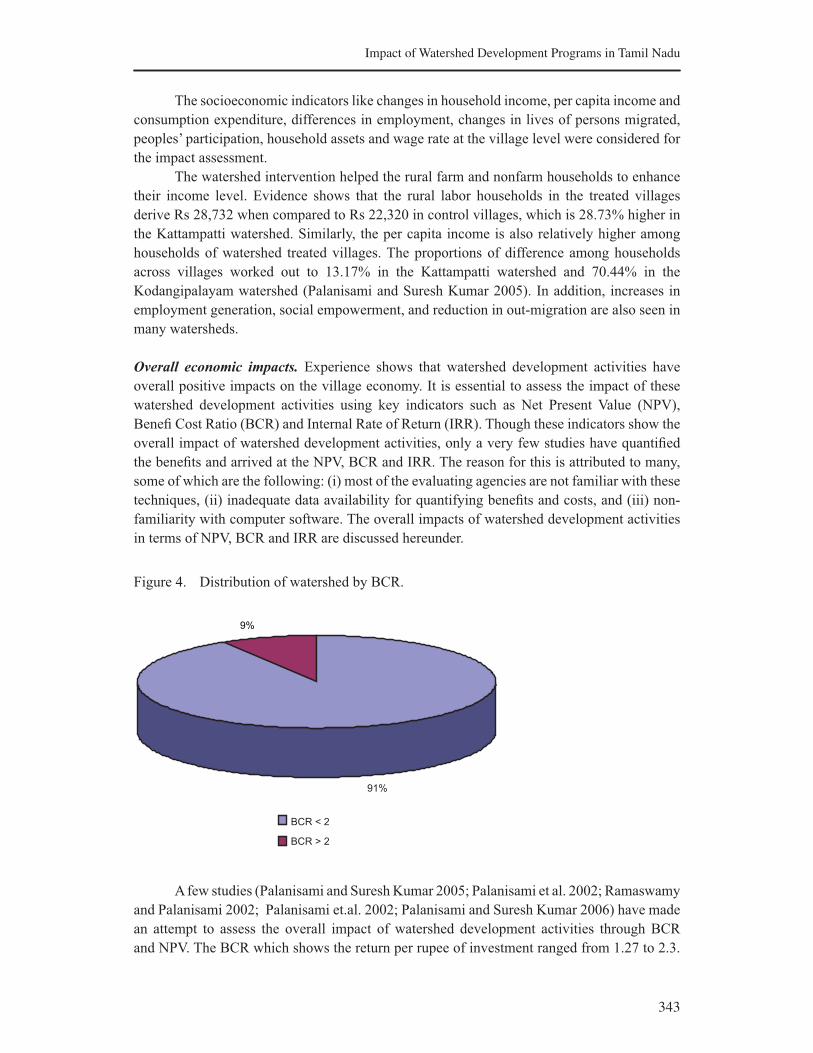
343
Impact of Watershed Development Programs in Tamil Nadu
The socioeconomic indicators like changes in household income, per capita income and
consumption expenditure, differences in employment, changes in lives of persons migrated,
peoples’ participation, household assets and wage rate at the village level were considered for
the impact assessment.
The watershed intervention helped the rural farm and nonfarm households to enhance
their income level. Evidence shows that the rural labor households in the treated villages
derive Rs 28,732 when compared to Rs 22,320 in control villages, which is 28.73% higher in
the Kattampatti watershed. Similarly, the per capita income is also relatively higher among
households of watershed treated villages. The proportions of difference among households
across villages worked out to 13.17% in the Kattampatti watershed and 70.44% in the
Kodangipalayam watershed (Palanisami and Suresh Kumar 2005). In addition, increases in
employment generation, social empowerment, and reduction in out-migration are also seen in
many watersheds.
Overall economic impacts. Experience shows that watershed development activities have
overall positive impacts on the village economy. It is essential to assess the impact of these
watershed development activities using key indicators such as Net Present Value (NPV),
Benefi Cost Ratio (BCR) and Internal Rate of Return (IRR). Though these indicators show the
overall impact of watershed development activities, only a very few studies have quantified
the benefits and arrived at the NPV, BCR and IRR. The reason for this is attributed to many,
some of which are the following: (i) most of the evaluating agencies are not familiar with these
techniques, (ii) inadequate data availability for quantifying benefits and costs, and (iii) non-
familiarity with computer software. The overall impacts of watershed development activities
in terms of NPV, BCR and IRR are discussed hereunder.
Figure 4. Distribution of watershed by BCR.
BCR < 2
BCR > 2
9%
91%
A few studies (Palanisami and Suresh Kumar 2005; Palanisami et al. 2002; Ramaswamy
and Palanisami 2002; Palanisami et.al. 2002; Palanisami and Suresh Kumar 2006) have made
an attempt to assess the overall impact of watershed development activities through BCR
and NPV. The BCR which shows the return per rupee of investment ranged from 1.27 to 2.3.
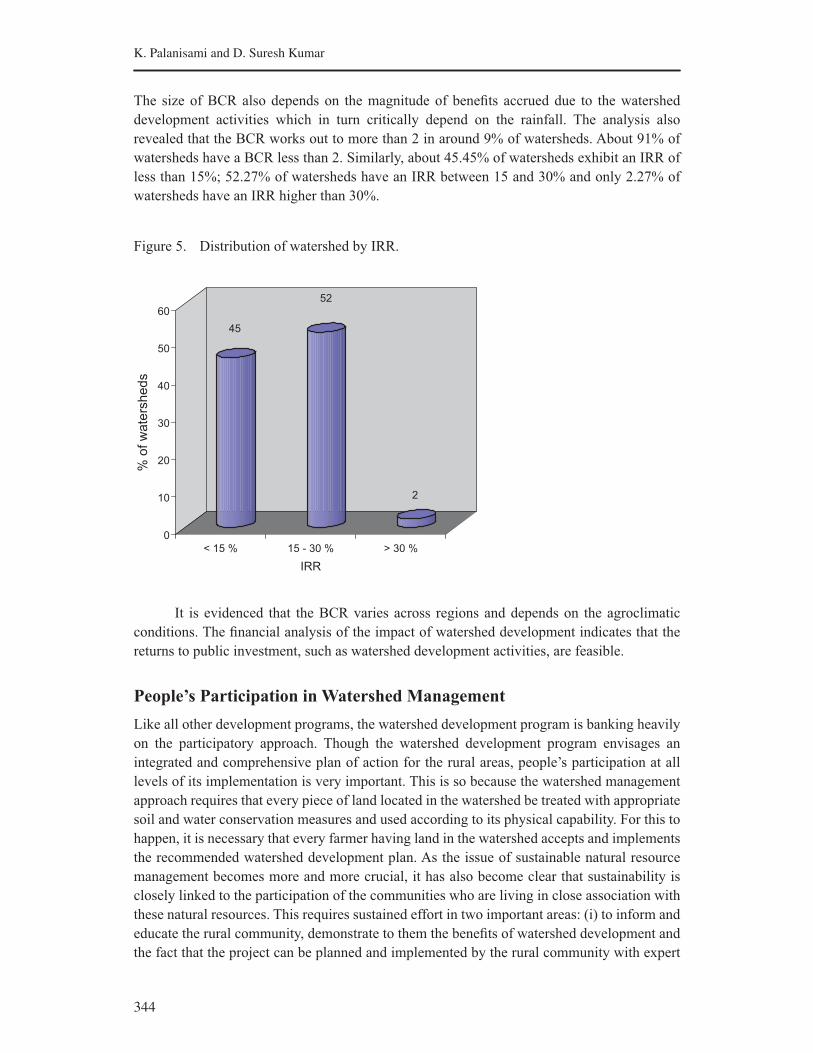
344
K. Palanisami and D. Suresh Kumar
The size of BCR also depends on the magnitude of benefits accrued due to the watershed
development activities which in turn critically depend on the rainfall. The analysis also
revealed that the BCR works out to more than 2 in around 9% of watersheds. About 91% of
watersheds have a BCR less than 2. Similarly, about 45.45% of watersheds exhibit an IRR of
less than 15%; 52.27% of watersheds have an IRR between 15 and 30% and only 2.27% of
watersheds have an IRR higher than 30%.
Figure 5. Distribution of watershed by IRR.
45
52
2
0
10
20
30
40
50
60
% o
f w
ate
rsh
ed
s
< 15 % 15 - 30 % > 30 %
IRR
It is evidenced that the BCR varies across regions and depends on the agroclimatic
conditions. The financial analysis of the impact of watershed development indicates that the
returns to public investment, such as watershed development activities, are feasible.
People’s Participation in Watershed Management
Like all other development programs, the watershed development program is banking heavily
on the participatory approach. Though the watershed development program envisages an
integrated and comprehensive plan of action for the rural areas, people’s participation at all
levels of its implementation is very important. This is so because the watershed management
approach requires that every piece of land located in the watershed be treated with appropriate
soil and water conservation measures and used according to its physical capability. For this to
happen, it is necessary that every farmer having land in the watershed accepts and implements
the recommended watershed development plan. As the issue of sustainable natural resource
management becomes more and more crucial, it has also become clear that sustainability is
closely linked to the participation of the communities who are living in close association with
these natural resources. This requires sustained effort in two important areas: (i) to inform and
educate the rural community, demonstrate to them the benefits of watershed development and
the fact that the project can be planned and implemented by the rural community with expert

345
Impact of Watershed Development Programs in Tamil Nadu
help from government and nongovernment sources, and (ii) to critically analyze the various
institutional and policy aspects of watershed development programs in relation to participatory
watershed management.
Experience from the evaluation study of 15 DPAP watersheds conducted in the
Coimbatore District of Tamil Nadu, India shows that the overall community participation was
found to be 42%. The participation was found to be 55, 44 and 27%, respectively, at planning,
implementation and maintenance stages. This suggests there should be more community
participation in watershed development programs. Similarly, overall contribution for work
on private land was found to be 14.71%. It varied from a low of 7% for fodder plots to a
maximum of 22% for horticulture and farm ponds. However, contribution in terms of cash/
or kind towards development of structures at common lands such as percolation ponds, check
dams, etc., was found to be nil. The level of adoption of various soil and moisture conservation
measures and their maintenance indicate that there is a wide variation in the level of adoption,
with a low of 2.4% in the farm pond, 30.40% in summer ploughing, 36.80% in land leveling,
and 44% in contour bunding. Follow-up activities by farmers are also found to be poor in most
of the technologies, which account for 5.23% in farm ponds, 21.58% for contour bunding, etc.
(Sikka et al. 2000).
Experience from DPAP and IWDP Watersheds in the Coimbatore District
Active participation of the watershed community at every stage of the watershed development
program, e.g., planning, implementation and maintenance and follow-up is a must for effective
development and sustenance of the watershed activities. This also helps improve their capacity-
building, sense of responsibility, etc.
People’s participation index (PPI) for planning (pre-implementation), implementation
and maintenance (post-implementation) stages of the watershed development program in
DPAP watersheds revealed that overall community participation was found to be low with an
overall PPI of 42% (Table1). The PPI is found to be 55, 44 and 27%, respectively, at planning,
implementation and maintenance stages. This suggests medium, low and very low levels of
community participation at planning, implementation and maintenance stages of the watershed
development program. This could be attributed to the fact that those who are not benefited
from the project directly might not have participated in implementation and maintenance.
Community Participation in Watershed Development Activities
Community participation can be judged based on their contribution/involvement in terms of
giving their time to the project and their contribution in cash/or kind towards works, both on
development and management of private and common property resources. It is evident that
the community members of watersheds have contributed in cash and kind towards the works
on private lands. Overall, their contribution for works on private land was found to be 14.71%
(Table 2). It varied from a low of 7% for fodder plots to a high of 22% for horticulture and
farm ponds. Overall, this can be considered good. However, contribution in terms of cash and/
or kind towards development of common property resources such as percolation ponds, check
dams, etc., is found to be nil.
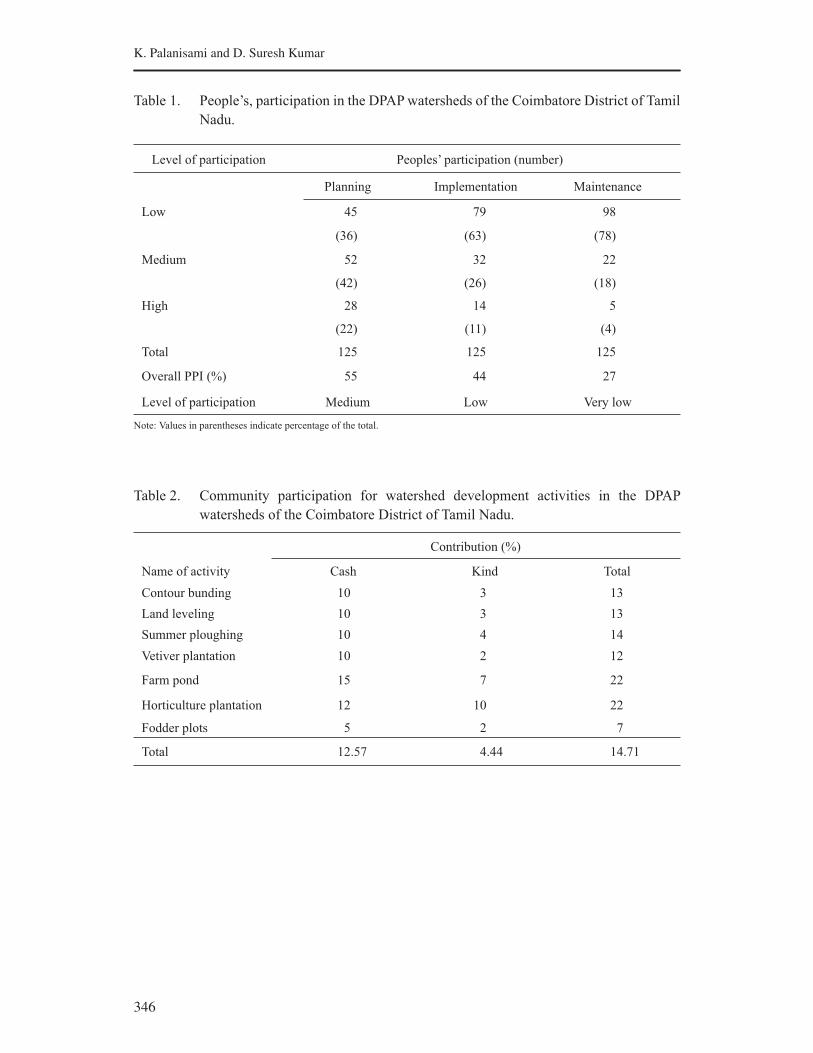
346
K. Palanisami and D. Suresh Kumar
Table 1. People’s, participation in the DPAP watersheds of the Coimbatore District of Tamil
Nadu.
Level of participation Peoples’ participation (number)
Planning Implementation Maintenance
Low 45 79 98
(36) (63) (78)
Medium 52 32 22
(42) (26) (18)
High 28 14 5
(22) (11) (4)
Total 125 125 125
Overall PPI (%) 55 44 27
Level of participation Medium Low Very low
Note: Values in parentheses indicate percentage of the total.
Table 2. Community participation for watershed development activities in the DPAP
watersheds of the Coimbatore District of Tamil Nadu.
Contribution (%)
Name of activity Cash Kind Total
Contour bunding 10 3 13
Land leveling 10 3 13
Summer ploughing 10 4 14
Vetiver plantation 10 2 12
Farm pond 15 7 22
Horticulture plantation 12 10 22
Fodder plots 5 2 7
Total 12.57 4.44 14.71
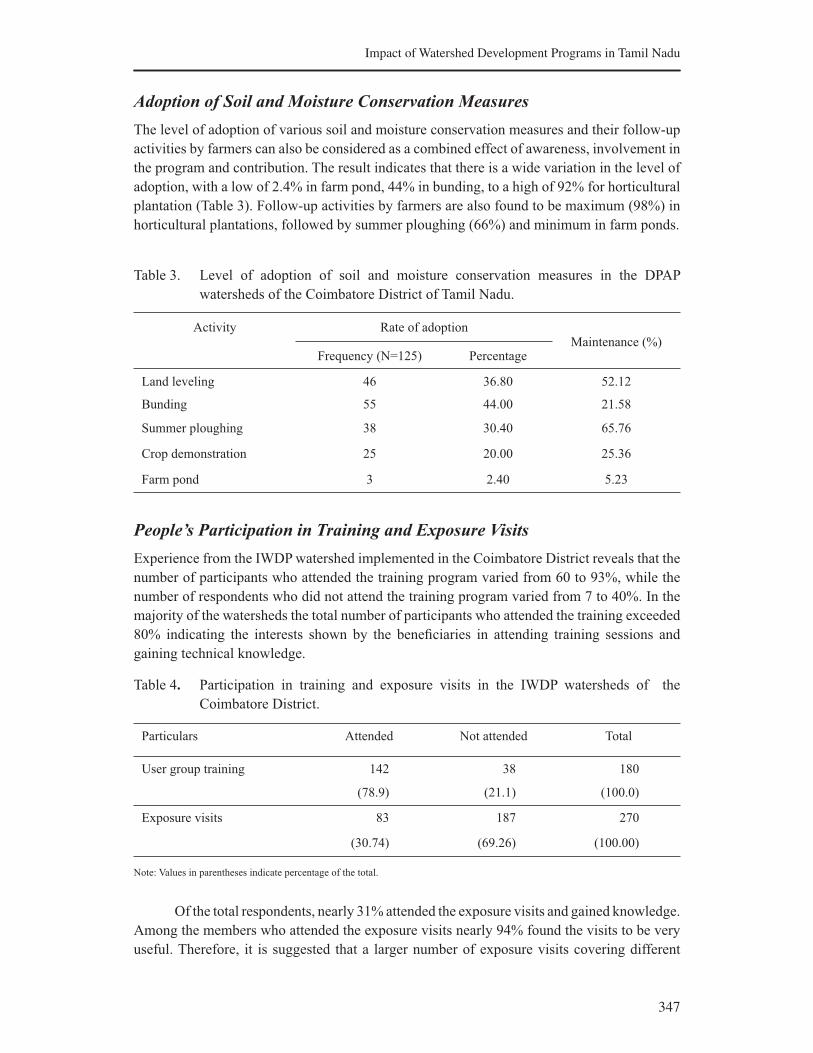
347
Impact of Watershed Development Programs in Tamil Nadu
Adoption of Soil and Moisture Conservation Measures
The level of adoption of various soil and moisture conservation measures and their follow-up
activities by farmers can also be considered as a combined effect of awareness, involvement in
the program and contribution. The result indicates that there is a wide variation in the level of
adoption, with a low of 2.4% in farm pond, 44% in bunding, to a high of 92% for horticultural
plantation (Table 3). Follow-up activities by farmers are also found to be maximum (98%) in
horticultural plantations, followed by summer ploughing (66%) and minimum in farm ponds.
Table 3. Level of adoption of soil and moisture conservation measures in the DPAP
watersheds of the Coimbatore District of Tamil Nadu.
Activity Rate of adoptionMaintenance (%)
Frequency (N=125) Percentage
Land leveling 46 36.80 52.12
Bunding 55 44.00 21.58
Summer ploughing 38 30.40 65.76
Crop demonstration 25 20.00 25.36
Farm pond 3 2.40 5.23
People’s Participation in Training and Exposure Visits
Experience from the IWDP watershed implemented in the Coimbatore District reveals that the
number of participants who attended the training program varied from 60 to 93%, while the
number of respondents who did not attend the training program varied from 7 to 40%. In the
majority of the watersheds the total number of participants who attended the training exceeded
80% indicating the interests shown by the beneficiaries in attending training sessions and
gaining technical knowledge.
Table 4. Participation in training and exposure visits in the IWDP watersheds of the
Coimbatore District.
Particulars Attended Not attended Total
User group training 142 38 180
(78.9) (21.1) (100.0)
Exposure visits 83 187 270
(30.74) (69.26) (100.00)
Note: Values in parentheses indicate percentage of the total.
Of the total respondents, nearly 31% attended the exposure visits and gained knowledge.
Among the members who attended the exposure visits nearly 94% found the visits to be very
useful. Therefore, it is suggested that a larger number of exposure visits covering different
348
K. Palanisami and D. Suresh Kumar
successful watershed models, community nurseries and research institutes involved in
watershed development research may be organized. This will help gain knowledge regarding
recent technical know-how and benefits of various watershed treatment activities among the
members.
Factors Influencing People’s Participation
A recent study indicates that the household contribution towards watershed development
and maintenance is influenced by various household-level and supra-household-level factors
(Suresh Kumar and Palanisami 2009). The factors such as number of workers in the farm family,
number of wells owned by the farm households, distance between the farm and the rainwater
harvesting structures are found to significantly influence the household contribution. Similarly,
the supra-household-level factors such as the extent of social homogeneity as represented by
caste at group level and the type of watershed technology positively and significantly influence
household contribution.
Drivers of Success
Watershed development has been conceived basically as a strategy for protecting the livelihoods
of the people inhabiting the fragile ecosystems experiencing soil erosion and moisture stress.
The aim has been to ensure the availability of drinking water, fuelwood and fodder and raise
income and employment for farmers and landless laborers through improvement in agricultural
production and productivity (Rao 2000).
Most of the watershed development programs being implemented in the state aimed
at (i) promotion of economic development of the village community which is directly or
indirectly dependent on the watershed through optimum utilization of the natural resources
of the watershed (land, water, vegetation) that will mitigate adverse effects of drought,
(ii) employment generation and development of the human and economic resources of the
watershed, and (iii) encouraging restoration of ecological balance in the watershed through
sustained community action.
Experience from various impact assessment studies conducted in the state revealed that
there is significant impact on soil and water erosion control, soil moisture conservation, water
resources development, cropping pattern and increase in yield. The watershed development
has also produced desired results in terms of improvement in socioeconomic conditions and
the environment.
There are several reasons for the successful implementation of watershed development
activities in the country. They include physical and agroclimatic conditions of the watershed
villages like rainfall, soil type and hydrogeological features. In addition, some of the
administrative and institutional issues such as guidelines for effective watershed development,
role of different organizations like the state and central governments, line departments, and
type of PIAs play a crucial role in implementing watershed development activities.
Future Directions
Watershed development programs not only protect and conserve the environment but also
contribute to livelihood security. With the large investment of financial resources in the
watershed program, it is important that the program becomes successful. For achieving the best
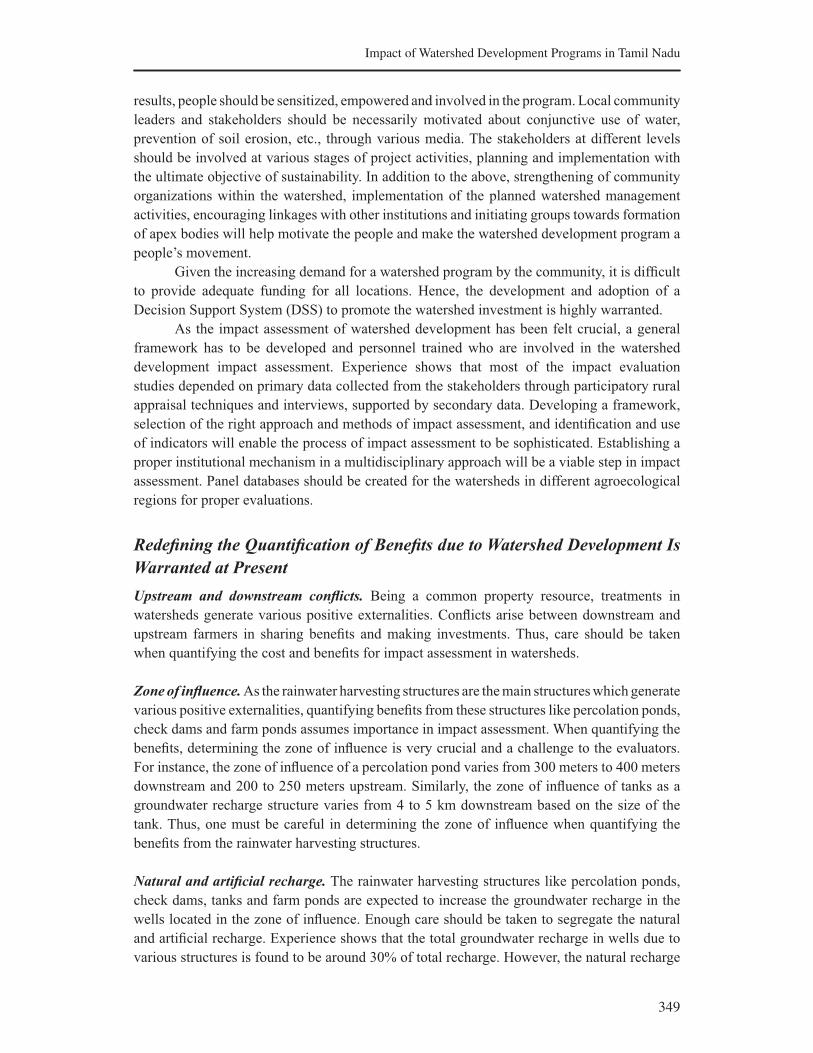
349
Impact of Watershed Development Programs in Tamil Nadu
results, people should be sensitized, empowered and involved in the program. Local community
leaders and stakeholders should be necessarily motivated about conjunctive use of water,
prevention of soil erosion, etc., through various media. The stakeholders at different levels
should be involved at various stages of project activities, planning and implementation with
the ultimate objective of sustainability. In addition to the above, strengthening of community
organizations within the watershed, implementation of the planned watershed management
activities, encouraging linkages with other institutions and initiating groups towards formation
of apex bodies will help motivate the people and make the watershed development program a
people’s movement.
Given the increasing demand for a watershed program by the community, it is difficult
to provide adequate funding for all locations. Hence, the development and adoption of a
Decision Support System (DSS) to promote the watershed investment is highly warranted.
As the impact assessment of watershed development has been felt crucial, a general
framework has to be developed and personnel trained who are involved in the watershed
development impact assessment. Experience shows that most of the impact evaluation
studies depended on primary data collected from the stakeholders through participatory rural
appraisal techniques and interviews, supported by secondary data. Developing a framework,
selection of the right approach and methods of impact assessment, and identification and use
of indicators will enable the process of impact assessment to be sophisticated. Establishing a
proper institutional mechanism in a multidisciplinary approach will be a viable step in impact
assessment. Panel databases should be created for the watersheds in different agroecological
regions for proper evaluations.
Redefining the Quantification of Benefits due to Watershed Development Is
Warranted at Present
Upstream and downstream conflicts. Being a common property resource, treatments in
watersheds generate various positive externalities. Conflicts arise between downstream and
upstream farmers in sharing benefits and making investments. Thus, care should be taken
when quantifying the cost and benefits for impact assessment in watersheds.
Zone of influence. As the rainwater harvesting structures are the main structures which generate
various positive externalities, quantifying benefits from these structures like percolation ponds,
check dams and farm ponds assumes importance in impact assessment. When quantifying the
benefits, determining the zone of influence is very crucial and a challenge to the evaluators.
For instance, the zone of influence of a percolation pond varies from 300 meters to 400 meters
downstream and 200 to 250 meters upstream. Similarly, the zone of influence of tanks as a
groundwater recharge structure varies from 4 to 5 km downstream based on the size of the
tank. Thus, one must be careful in determining the zone of influence when quantifying the
benefits from the rainwater harvesting structures.
Natural and artificial recharge. The rainwater harvesting structures like percolation ponds,
check dams, tanks and farm ponds are expected to increase the groundwater recharge in the
wells located in the zone of influence. Enough care should be taken to segregate the natural
and artificial recharge. Experience shows that the total groundwater recharge in wells due to
various structures is found to be around 30% of total recharge. However, the natural recharge
350
K. Palanisami and D. Suresh Kumar
without any rainwater harvesting structures is reported to be about 10%. Thus, the net recharge
due to rainwater harvesting structures is only 20%. Thus, while evaluating the impact of
recharge structures, care should be taken to account for the natural and artificial recharges
(Palanisami and Suresh Kumar 2006).
Addressing all these issues will help achieve sustainability in watershed management
in the state and elsewhere.
Conclusion and Policy Implications
Today, watershed development has become the main intervention for natural resource
management and rural development. Watershed development programs not only protect
and conserve the environment but also contribute to livelihood security. The importance of
watershed development as a conservation program is being recognized, not only for rain-fed
areas but also for high rainfall areas, coastal regions, and the catchments areas of dams. With
the large investment of financial resources in the watershed program, it is important that the
program becomes successful. Experience shows that the watershed development programs
have produced desired results and there are differences in their impacts. Hence, the watershed
impact assessment should be given due importance in the future planning and development
programs.
Watershed development activities have a significant impact on groundwater recharge,
access to groundwater and, hence, the expansion in irrigated area. Therefore, our policy focus
must be the development of these water harvesting structures, particularly percolation ponds
wherever feasible. In addition to these public investments, private investments through the
construction of farm ponds may be encouraged as these structures help in a big way to harvest
the available rainwater and, hence, groundwater recharge.
Watershed development activities have altered crop patterns, increased crop yields
and crop diversification and thereby provided enhanced employment and farm income.
Therefore, an alternative farming system combining agricultural crops, trees and livestock
components with comparable profit should be evolved and demonstrated to the farmers. Once
the groundwater is available, high water-intensive crops are introduced. Hence, appropriate
water saving technologies like drip should be introduced without affecting farmers’ choice
of crops. The creation and implementation of regulations in relation to depth of wells and
spacing between wells will reduce well failure, which could be possible through Watershed
Associations. The existing NABARD norms such as 150 meters spacing between two wells
should be strictly followed.
Therefore, the future strategy should be a movement towards a balanced approach of
matching the supply-driven menu with a set of demand-driven activities. People’s participation,
involvement of panchayat raj institutions, local user groups and NGOs alongside institutional
support from different levels, such as the Union Government, the State, the District and
block levels should be ensured to make the program more participatory interactive and cost-
effective. Convergence of various rural development programs in and around the watershed
could be ensured to promote the holistic development of watersheds. For its continued success,
the program should be economically efficient, financially viable, technically feasible and
socially acceptable while ensuring equity. For sustainable development, regular and routine
monitoring of environmental parameters is important as environmental enhancement increases
the credibility and acceptability of the program.
351
Impact of Watershed Development Programs in Tamil Nadu
Annex
Abstract of total number of watersheds in Tamil Nadu.
Name of districtNo. of
watersheds
No. of
sub-water-
sheds
No. of
mini-
water-
sheds
No. of micro-watersheds
Gr.I Gr.II Gr.III Gr.IV
Full Partial
Kancheepuram 1 6 24 80 349 169 7
Tiruvellor 3 3 11 47 107 165 170 116
Thiruvannamalai 2 10 27 86 302 409 213 8
Villupuram 2 6 34 74 367 273 156
Cuddalore 2 6 35 126 441 274 73 15
Vellore 5 10 22 85 82 257 95 34
Dharmapuri 7 6 21 115 330 462 400 257
Coimbatore 2 4 22 28 127 638 436 84
Nilgiris 5 1 34 153 258 297 37 2
Erode 5 10 13 41 131 149 82 19
Salem 2 10 21 104 411 410
Namakkal 7 12 37 105 202 144 113
Tiruchy 1 9 39 99 184 206 195 75
Perambalur 6 20 44 122 195 229 129
Karur 2 4 15 36 97 152 97 43
Tanjavur 5 28 15 28 93 413 182
Tiruvarur 4 9 49 328 104 0
Nagapattinam 5 16 93 245 171 15
Pudukkottai 2 7 19 70 216 161 41 13
Ramanathapuram 1 6 8 73 288
Sivagangai 1 10 20 68 233 214 90 15
Madurai 2 4 14 123 424 358 92
Virudhunagar 3 5 73 151 52
Theni 2 1 7 229 547 295 53
Dindigul 1 6 21 264 589 632 135 5
Tuticorin 3 4 37 103 676 279
Tirunelveli 4 6 14 39 167 299 167 35
Kanyakumari 2 1 6 9 77 200 318 30
Total 7,382 7,116 3,658 1,175
Micro-watersheds 19,331
Source: GoTN 2002.

352
K. Palanisami and D. Suresh Kumar
References
Department of Land Resources. 2006. Report of the Technical Committee on Watershed Programmes in India,
from Hariyali to Neeranchal. Hyderabad: Department of Land Resources Ministry of Rural Development,
Government of India.
Deshpande, R.S.; Rajasekaran, N. 1997. Impact of Watershed Development Programme: Experiences and
issues. Artha Vijnana 34 (3): 374-390.
Evaluation and Applied Research Department. 1981. An evaluation report on soil conservation scheme under
the DPAP in Ramanathapuram District. Chennai Evaluation and Applied Research Department. 1991.
Report on the evaluation of soil conservation works executed in Sholur micro watersheds in Nilgiris
District under HADP. Chennai.
GoTN (Government of Tamilnadu). 2002. Watershed Atlas of Tamilnadu. Agricultural Engineeing Department,
Chennai
GoTN. 2009. Groundwater resources of Tamil Nadu-Present status of development. Public Works Department,
Groundwater. Chennai.
Kerr, John; Pangare, Ganesh; Pangare, V.L.: George, P.J. 2000. An evaluation of dryland watershed development
projects in India. EPTD Discussion Paper No. 68. Washington, D.C.: International Food Policy Research
Institute.
Madhu, M.; Subhash Chand; Sundarambal, P.; Sikka, A.K. 2004. Report on impact evaluation of DPAP
watersheds in Coimbatore District (IV Batch). Uthagamandalam, Tamil Nadu: Central Soil and Water
Conservation Research and Training Institute, Research Centre.
Palanisami, K; Suresh Kumar, D. 2002. Participatory watershed development programmes: Institutional and
policy issues. Paper presented at the Workshop on Rainfed Agriculture in Asia: Targeting Research for
Development, 2-4 December 2002, International Crop Research Institute for Semiarid Tropics (ICRISAT),
Patancheru, India.
Palanisami, K.; Suresh Kumar, D. 2005. Leapfrogging the watershed mission: Building capacities of farmers,
professionals and institutions. In: Watershed management challenges: Improving productivity, resources
and livelihoods, ed. Sharma, B.R.; Samra, J.F.; Scott, C.A.; Wani, S.P. International Water Management
Institute (IWMI) and ICRISAT Publication. New Delhi: Malhotra Publishing House, pp.245-257.
Palanisami, K.; Suresh Kumar, D., eds. 2006. Challenges in impact assessment of watershed development:
Methodological issues and experiences. New Delhi: Associated Publishing Company Ltd..
Palanisami, K.; Devarajan, S.; Chellamuthu, M.; Suresh Kumar, D. 2002. Mid-term evaluation of IWDP
watersheds in Pongalur block of Coimbatore District. Technical Report. Coimbatore, India: Tamil Nadu
Agricultural University.
Palanisami, K.; Suresh Kumar, D.: Chandrasekaran, B., eds. 2002. Watershed development: Concept and
issues. Watershed management: Issues and policies for the 21st century. New Delhi: Associated Publishing
Company Ltd.
Palanisami, K.; Vidyavathi, A.; Ranganathan, C.R. 2008. Wells for welfare or illfare: Cost of groundwater
depletion in Coimbatore, Tamil Nadu, India. Water Policy 10 (4): 391-407.
Ramaswamy, K.; Palanisami, K. 2002. Some impact indicators and experiences of watershed development in
drought prone areas of Tamil Nadu. In: Watershed management – Issues and policies for 21st century, ed.
Palanisami, K. India: Associated Publishing Company, pp. 182-191.
353
Impact of Watershed Development Programs in Tamil Nadu
Rao, C.H. 2000. Watershed development in India: Recent experiences and emerging issues. Economic and
Political Weekly 35(45): 3943-3947.
Sharma, B.R.; Scott, C.A. 2005. Watershed management challenges: Introduction and overview. In: Watershed
management challenges: Improving productivity, resources and livelihoods, ed. Sharma, B.R.; Samra,
J.S.; Scott, C.A.; Wani, S.P. IWMI and ICRISAT publication. New Delhi: Malhotra Publishing House, pp.
245-257.
Sikka, A.K.; Narayanasamy, N.; Pandian, B.J.; Selvi, V.; Subhash Chand. 2001. Report on participatory impact
evaluation of comprehensive watershed development project, Tirunelveli. Uthagamandalam, Tamil Nadu:
Central Soil and Water Conservation Research and Training Institute, Research Centre.
Sikka, A. K.; Subhash Chand, Madhu, M.; Samra, J.S. 2000. Report on evaluation study of DPAP watersheds in
Coimbatore District. Udagamandalam, India: Central Soil and Water Conservation Research and Training
Institute.
Suresh Kumar, D.; Palanisami, K. 2009. An economic inquiry into collective action and household behaviour
in watershed management. Indian Journal of Agricultural Economics 64 (1): 108-123.
World Bank. 1998. India-Water Resources Management Sector Review, Groundwater Regulation and
Managemant Report. Washington, D. C.: World Bank.

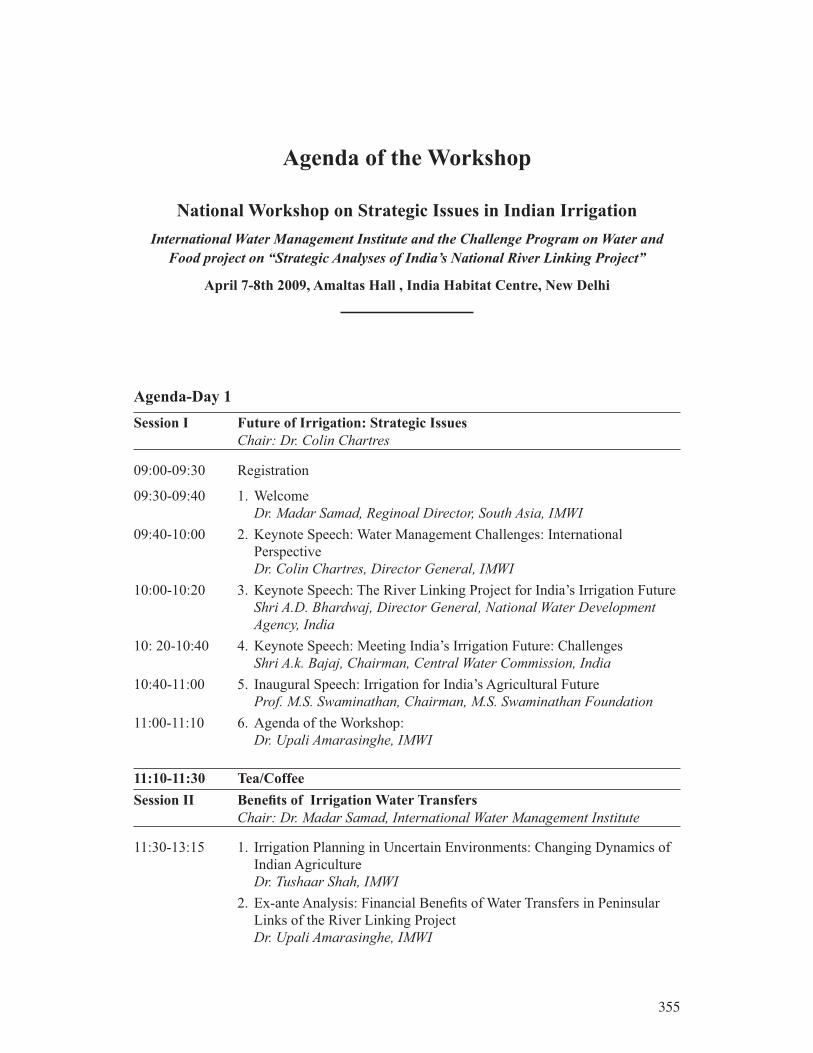
355
Agenda of the Workshop
National Workshop on Strategic Issues in Indian Irrigation
International Water Management Institute and the Challenge Program on Water and
Food project on “Strategic Analyses of India’s National River Linking Project”
April 7-8th 2009, Amaltas Hall , India Habitat Centre, New Delhi
Agenda-Day 1
Session I Future of Irrigation: Strategic Issues
Chair: Dr. Colin Chartres
09:00-09:30 Registration
09:30-09:40 1. Welcome
Dr. Madar Samad, Reginoal Director, South Asia, IMWI
09:40-10:00 2. Keynote Speech: Water Management Challenges: International
Perspective
Dr. Colin Chartres, Director General, IMWI
10:00-10:20 3. Keynote Speech: The River Linking Project for India’s Irrigation Future
Shri A.D. Bhardwaj, Director General, National Water Development
Agency, India
10: 20-10:40 4. Keynote Speech: Meeting India’s Irrigation Future: Challenges
Shri A.k. Bajaj, Chairman, Central Water Commission, India
10:40-11:00 5. Inaugural Speech: Irrigation for India’s Agricultural Future
Prof. M.S. Swaminathan, Chairman, M.S. Swaminathan Foundation
11:00-11:10 6. Agenda of the Workshop:
Dr. Upali Amarasinghe, IMWI
11:10-11:30 Tea/Coffee
Session II Benefits of Irrigation Water Transfers
Chair: Dr. Madar Samad, International Water Management Institute
11:30-13:15 1. Irrigation Planning in Uncertain Environments: Changing Dynamics of
Indian Agriculture
Dr. Tushaar Shah, IMWI
2. Ex-ante Analysis: Financial Benefits of Water Transfers in Peninsular
Links of the River Linking Project
Dr. Upali Amarasinghe, IMWI

356
3. Discussant – Dr. Ashok Gulati, Head IFPRI, Asia Program
4. Discussion
13:15-14:15 Lunch
Session III State of Irrigation of States
Chair: Shir Anil D. Mohile, Former Chairman, Central Water Commission
14:15-16:00 1. State of Irrigation in Tamil Nadu: Trends and Turning Points
Dr. R. Sakthivadivel, Consultant (Former IMWI Research Fellow)
2. Future of Irrigation in Tamil Nadu and Investment Options
Dr. K. Palanisami, Director, IMWI-TATA Policy Program
3. Discussant-Dr. Alok Sikka, Technical Expert (Watershed Development),
National Rainfed Area Authority
4. Discussion
16:00-16:15 Tea/Coffee
Session IV Lessons for new irrigation Projects
Chair: Dr. Ramaswamy Iyer, Visiting Professor, Centre for Policy
Research, New Delhi
16:15-18:15 1. Managing Rehabilitation and Resettlement of Displaced Population:
Lessons from Selected Hydro Projects
Dr. Madar Samad, IMWI
1. Managing Waterlogging and Salinity: Lessons from the IGNP
Dr. Bharat Sharma, IMWI
2. Planners Propose, Farmers Dispose: Salvaging the Sardar-Sarovar Project
Dr. Tushaar Shah, IMWI
3. Discussant – Shri Himanshu Thakker, Coordinator, South Asia Network
on Dams, Rivers & People
4. Discusion
Agenda-Day 2-April 8, 2009
Session V Meeting Increasing Water Demand: Potential from Demand
Management Strategies
Chair: Prof. Kanchan Chopra, Director Institute of Economic Growth
9:30-11:15 1. Demand Management Strategies in Irrigation: Synthesis of NRLP Research
Dr. Rathinasamy Maria Saleth, Madras Institute of Development Studies
2. Water Pricing as a Demand Management Option: Potentials, Problems
and Prospects
Dr. Ratna Reddy, Director, Livelihoods and Natural Resource
Management Institute
3. Discussant – Dr. L. Venkatachalam, Madras Institute of Development Studies
4. Discussion

357
11:15-11:30 Tea/Coffee
Session VI Meeting Increasing Water Demand: Potential from Water
Productivity Improvements
Chair: Shri. S. Gopalakrishnan, Secretary General, ICID
11:30-13:15 1. Potential Pathways for Improving Water Productivity in India: Synthesis
of NRLP Research
Dr. Dinesh Kumar, Director, Institute for Analysis of Resources and Policy
2. Increasing WP with Multiple Water Use: Some Case Study Results
Dr. Alok Sikka, Technical Expert (Watershed Development), National
Rainfed Area Authority
3. Discussant-Prof. A. Narayanamoorthy, Director, Centre for Rural
Development, Alagappa University, Tamil Nadu
4. Discussion
13:15-14:15 Lunch
Session VII Meeting Increasing Water Demand: Augmenting Water Supply
through Artificial Groundwater Recharge
Chair: Dr. J. S. Samra, Chief Executive Officer, National Rainfed Authority
14:15-16:15 1. Hydro-Climate Change and Food Security: India’s Storage Challenge
Dr. Tushaar Shah, IWMI
2. Assessment of Dug-Well Recharge Programs in India: Synthesis of
NRLP Research
Dr. Sunderrajan Krishnan, INREM, Anand
3. Virtual Water Trade as an Option
Mr. Shilp Verma, UNESCO-IHE and IWMI
4. Discussant – Dr. Bharat Sharma, International Water Management
Institute
5. Discussion
16:15-16:30 Conclusions Dr. Upali Amarasinghe
16:30 Tea/Coffee
358
Participants
No Participant Designation/Institute Affiliation
1. Prof. M. S. Swaminathan Chairman, M S Swaminathan Research Foundation, Chennai,
Tamil Nadu
2. Dr. Colin Chartres Director General, International Water Management Institute,
Colombo
3. Prof. (Mrs.) Kanchan Chopra Director, Institute of Economic Growth, New Delhi
4. Mr. Anil D. Mohile Former Chairman of Central Water Commission (CWC), New
Delhi
5. Mr. S. Goplakrishanan Secretary General, International Commission of Irrigation and
Drainage, New Delhi
6. Dr. Tushaar Shah Principal Researcher, International Water Management Institute,
Colombo
7. Dr. J. S. Samra Chief Executive Officer, National Rainfed Area Authority, New
Delhi
8. Mr. B. M. Jha Chairman, Central Ground Water Development Board, New
Delhi
9. Dr. Ashok Gulati Director Asia, International Food Policy Research Institute,
New Delhi
10. Dr. Alok Sikkar Director, ICAR-RCER & Basin Coordinator, Patna, Bihar
11. Mr. N. K. Bhandari Chief Engineer (HQ), NWDA, New Delhi
12. Mr. Govind Sharma OSD, CAD & WU, Secretariat, Jaipur, Rajasthan
13. Mr. R.K. Khanna Formerly Chief Engineer (EMO), Central Water Commissio
(CWC), New Delhi
14. Dr. K. Vass Director, Central Inland Fisheries Research Institute (CIFRI),
Calcutta
15. Dr. R. Sakthivadivel Formerly Principal Researcher and Senior Fellow of IWMI,
Chennai, Tamil Nadu
16. Mr. Ramaswamy R. Lyer Visiting Professor, Centre for Policy Research, New Delhi
17. Dr. A. Narayanamoorthy Reader, Gokhale Institute of Politics and Economics, Puna,
Maharashtra
18. Dr. Dinesh Kumar Director, Institute for Analysis of Resources and Policy,
Hyderabad
19. Dr. Sunderrajan Krishnan INREM Foundation, Anand, Gujart
Dr. Vishal Narain School of Public Policy and Governance, Gurgaon, Haryana
20. Dr. Rathna Reddy Director, Livelihoods and Natural Resource Management
Institute, Hyderabad
21. Dr. L. Venkatachalam Associate Professor, Madras Institute of Development Studies,
Chennai
22. Prof. M. Sridhar Acharyulu NALSAR University of Law, Hyderabad
23. Prof. M. S. Rathore Director, Centre for Environment and Development Studies
(CEDS), Nityanand Nagar, Jaipur
24. Dr. K. V. G. K. Rao Indwa Technologies, Hyderabad, Andhra Pradesh
25. Dr. M. A. Khan Director, ICAR, Research Complex for Eastern Region, Patna,
Bihar
359
26. Dr. O. P. Singh Lecturer, Banaras Hindu University, Varanesi Uttar Pradesh
27. Dr. Shrikant Daji Limaye Ground Water Institute, Pune
28. Dr. M. P. Ram Mohan The Energy and Resources Institute (TERI), New Delhi
29. Ms. G. Mini The Energy and Resources Institute (TERI), New Delhi
30. Dr. R. P. S. Malik Professor, Agricultural Economics Research Centre, University
of Delhi, New Delhi
31. Dr. S. A Kulkarni Director – I, International Commission on Irrigation and
Drainage (ICID), New Delhi
32. Dr. Vijaya K. Labhsetwar Director – II, International Commission on Irrigation and
Drainage (ICID), New Delhi
33. Mr. Ravi Chopra Director (Ex-Officio), People’s Science Institute, Deheradun
34. Dr. P. Sivaramakrishna Director, SAKTI, Hyderabad, Andhra Pradesh
35. Mr. Ravindra Singh Chauhan Project Director, Chhatrasal Sewa Sansthan (CSS), Hamipur,
Uttar Pradesh
36. Mr. Arvind Ojha Secretary, URMUL TRUST, Bikaner, Rajasthan
37. Mr. Himanshu Thakkar Coordinator, South Asia Network on Dams, Rivers & People
(SANDRP), New Delhi
38. Mr. Nitin Bassi Institute for Analysis of Resources and Policy, New Delhi
39. Mr. Lalith Dassanaike Project Officer, Challenge Program for Water and Food,
Colombo
40. Dr. Madar Samad Principal Researcher and Head, India Office, IWMI, Hyderabad
41. Dr. Bharat Sharma Senior Researcher and Head, IWMI, New Delhi
42. Dr. K. Planisami Head, IWMI-TATA Policy Program, IWMI, Hyderabad
43. Dr. Upali Amarasinghe Senior Researcher, IWMI, New Delhi
44. Dr. Stefanos Xenarios Post Doctoral Scientist, IWMI, New Delhi
45. Mr. Rajendran Srinivasulu Consultant, IWMI, New Delhi
46. Ms. Ambili Consultant, IWMI, New Delhi
47. Ms. Mala Ranaweke Administrative Officer, IWMI, Colombo
48. Mr. Nyayapati Aakanksh Administrative Associate, IWMI, New Delhi

Related Publications
Amarasinghe, U. A.; Shah, T.; Malik, R. P. S. (Eds.). 2009. Strategic analyses of the National River Linking Project (NRLP)
of India, Series 1: India’s water future: scenarios and issues. Colombo, Sri Lanka: International Water Management
Institute (IWMI). 403p.
www.iwmi.org/Publications/Other/PDF/NRLP%20series%201.pdf
Saleth, R. M. (Ed.). 2009. Strategic analyses of the National River Linking Project (NRLP) of India, Series 3: Promoting
irrigation demand management in India: potentials, problems and prospects. Colombo, Sri Lanka: International Water
Management Institute (IWMI). 169p.
www.iwmi.org/Publications/Other/PDF/NRLP%20Proceeding-3.pdf
Kumar, M. D.; Amarasinghe, U. A. (Eds.). 2009. Strategic analyses of the National River Linking Project (NRLP) of India,
Series 4: Water productivity improvements in Indian agriculture: potentials, constraints and prospects. Colombo,
Sri Lanka: International Water Management Institute (IWMI). 152p.
www.iwmi.org/Publications/Other/PDF/NRLP_series_4-final.pdf
Amarasinghe, U. A.; Sharma, B. R. (Eds.). 2008. Strategic analyses of the National River Linking Project (NRLP) of India,
Series 2: Proceedings of the Workshop on Analyses of Hydrological, Social and Ecological Issues of the NRLP, New
Delhi, India, 9-10 October 2007. Colombo, Sri Lanka: International Water Management Institute (IWMI). 476p.
www.iwmi.org/Publications/Other/PDF/NRLP_Proceedin-2.pdf
ISBN 978-92-9090-719-0