Water Management Plan CDM
167
San Joaquin County Flood Control and Water Conservation District Water Management Plan Phase 1 - Planning Analysis and Strategy Camp Dresser & McKee CDM October 2001 Volume 1
-
Upload
khangminh22 -
Category
Documents
-
view
0 -
download
0
Transcript of Water Management Plan CDM

San Joaquin CountyFlood Control and Water Conservation District
Water Management PlanPhase 1 - PlanningAnalysis and Strategy
Camp Dresser & McKeeCDM
October 2001
V o l u m e 1
RTD-147

ΑΒΑΒ i
Contents
Executive Summary
ES.1 Introduction................................................................................................... ES-1 ES.2 Water Issues in San Joaquin County ............................................................. ES-2 ES.3 Working Together to Plan ............................................................................. ES-3 ES.4 Summary of Findings .................................................................................... ES-4 ES.5 Water Management Options......................................................................... ES-7 ES.6 Strategic Rationale ......................................................................................... ES-9 ES.7 Recommended Strategy............................................................................... ES-12
Section 1 Introduction 1.1 Background and Purpose ................................................................................ 1-1 1.2 Organization of Report .................................................................................... 1-2 1.3 Acknowledgements......................................................................................... 1-2 1.4 Summary of Findings ...................................................................................... 1-4
1.4.1 General Findings and Conclusions.................................................... 1-4 1.5 Plan Implementation ....................................................................................... 1-6
Section 2 Water Resource Background
2.1 Overview of Water Issues in San Joaquin County .......................................... 2-1 2.2 Surface Water................................................................................................... 2-2
2.2.1 Delta................................................................................................... 2-5 2.2.1.1 Calaveras River................................................................ 2-5 2.2.1.2 Mokelumne River ............................................................ 2-6 2.2.1.3 Stanislaus River................................................................ 2-6 2.2.1.4 San Joaquin River............................................................. 2-6 2.2.1.5 Other Rivers..................................................................... 2-7
2.2.2 Surface Water Quality........................................................................ 2-7 2.3 Groundwater Conditions................................................................................. 2-8
2.3.1 Groundwater Flow Patterns and Trends........................................... 2-8 2.3.2 Groundwater Balance...................................................................... 2-12
2.4 Demands and Supplies.................................................................................. 2-17 2.4.1 Demands.......................................................................................... 2-17 2.4.2 Supplies............................................................................................ 2-21 2.4.3 Demand and Supply Summary....................................................... 2-23
Section 3 Water Management Options 3.1 Overview.......................................................................................................... 3-1 3.2 Surface Water Options..................................................................................... 3-1
3.2.1 New Surface Water Rights or Contracts............................................ 3-1 3.2.2 Wet Year/Flood Flows...................................................................... 3-1 3.2.3 Water Transfers.................................................................................. 3-2

Table of Contents San Joaquin County Water Management Plan
ΑΒΑΒ ii
3.2.4 Reoperation of Existing Facilities ...................................................... 3-2 3.3 Groundwater Recharge Options...................................................................... 3-3
3.3.1 Direct Recharge to Groundwater....................................................... 3-3 3.3.2 Injection Wells.................................................................................... 3-4 3.3.3 In-lieu Recharge................................................................................. 3-4 3.3.4 Groundwater Banking....................................................................... 3-5
3.4 Other Options.................................................................................................. 3-6 3.4.1 Water Reclamation............................................................................. 3-6 3.4.2 Water Conservation........................................................................... 3-6 3.4.3 Political Support for Other Negotiations........................................... 3-7
Section 4 The Planning Process
4.1 Stakeholder Involvement................................................................................. 4-1 4.2 Initial Options.................................................................................................. 4-1 4.3 Option Screening............................................................................................. 4-2 4.4 Option Combinations...................................................................................... 4-2 4.5 Alternative Creation ........................................................................................ 4-3 4.6 Evaluation Methodology................................................................................. 4-4
Section 5 The Master Alternative 5.1 Water Management Option Descriptions........................................................ 5-1
5.1.1 Exercise Full New Melones Rights.................................................... 5-1 5.1.2 WID Transfer ..................................................................................... 5-4 5.1.3 New Hogan Reoperation ................................................................... 5-6 5.1.4 Farmington Groundwater Recharge and Wetlands Project.............. 5-8 5.1.5 SSJID/OID Transfer to SEWD......................................................... 5-10 5.1.6 South County Water Supply Project................................................ 5-12 5.1.7 Stockton Delta Diversion................................................................. 5-14 5.1.8 Urban Water Conservation Improvements..................................... 5-16 5.1.9 Delta Area Water Supply Activities ................................................ 5-18 5.1.10 Southwest County Water Supply Activities.................................... 5-19 5.1.11 NSJWCD Groundwater Recharge Project ....................................... 5-20 5.1.12 Agricultural Water Conservation Improvements ........................... 5-20 5.1.13 Freeport Diversion........................................................................... 5-24 5.1.14 Urban Wastewater Reclamation...................................................... 5-26 5.1.15 Floodflows to Middlebar Reservoir................................................. 5-28 5.1.16 Floodflows to South Gulch Reservoir.............................................. 5-31 5.1.17 American River Water Rights.......................................................... 5-33
5.2 Modeling of Water Management Alternatives.............................................. 5-35 5.2.1 Modeling Overview......................................................................... 5-35 5.2.2 Groundwater Modeling of Water Management Options................ 5-35

Table of Contents San Joaquin County Water Management Plan
ΑΒΑΒ iii
Section 6 Management Framework and Organizational Structure 6.1 Overview.......................................................................................................... 6-1 6.2 Management Framework ................................................................................ 6-2
6.2.1 Individual Interest-based................................................................... 6-2 6.2.2 Mutual Interest-based........................................................................ 6-3 6.2.3 Mutual Interest-based with Local Control ........................................ 6-3
6.3 Organizational Structures................................................................................ 6-5 6.3.1 Joint Powers Agreement.................................................................... 6-5 6.3.2 Memorandum of Understanding...................................................... 6-5 6.3.3 Nonprofit Mutual Benefit Corporation............................................. 6-6 6.3.4 Various Types of Water Districts....................................................... 6-6
Section 7 Funding 7.1 Funding Sources .............................................................................................. 7-1
7.1.1 Federal Funding................................................................................. 7-1 7.1.2 State Funding..................................................................................... 7-2 7.1.3 Local Funding.................................................................................... 7-2
7.2 Funding Types................................................................................................. 7-3 7.2.1 Bonds ................................................................................................. 7-3 7.2.2 Fees..................................................................................................... 7-3 7.2.3 Grants................................................................................................. 7-3 7.2.4 Leases................................................................................................. 7-3 7.2.5 Loans.................................................................................................. 7-4 7.2.6 Public-Private, and General Partnering............................................. 7-4 7.2.7 Taxes .................................................................................................. 7-4
7.3 Case Study – Kaweah River Delta Corridor Enhancement Plan..................... 7-4 7.4 Funding for Water Management Options....................................................... 7-6
Section 8 Recommended Strategy
8.1 Strategic Rationale ........................................................................................... 8-1 8.1.1 Continued Joint Decision Making..................................................... 8-1 8.1.2 Limitations to County-wide Planning............................................... 8-3 8.1.3 Using Technical Tools for Planning................................................... 8-3 8.1.4 Moving Projects Toward Implementation......................................... 8-4 8.1.5 Funding Projects................................................................................ 8-5
8.2 Short-Term Recommendations........................................................................ 8-6 8.3 Long-Term Recommendations........................................................................ 8-8
8.3.1 Organizational Structure ................................................................... 8-8 8.3.2 Incorporation of New Options.......................................................... 8-9
Section 9 References

ΑΒΑΒ iv
Figures
ES-1 Water Management Issues in San Joaquin County 1-1 Water Management Plan by Phase 2-1 Water Management Issues in San Joaquin County 2-2 Regional Location Map 2-3 Major County Rivers and Reservoirs 2-4 Groundwater Basins Map 2-5 Simulated Groundwater Table Contour Map for 2000 2-6 Decline of Historic and Projected Groundwater Levels 2-7 “No Action” Projected Change in Storage 2-8 Simulated Groundwater Table Contour Map for 2030 2-9 Estimated 300 mg/L Total Dissolved Solids Line 2-10 Change in Future Water Demand 2-11 Regional Distribution of Current and Future Water Demand 3-1 Magnitude of Flood Flows for San Joaquin County Rivers 4-1 Planning Process 4-2 Goals and Objectives 5-1 Exercise Full New Melones Rights, Stanislaus River 5-2 WID Transfer, Mokelumne River 5-3 New Hogan Reoperation, Calaveras River 5-4 Farmington Groundwater Recharge and Wetlands Project 5-5 SSJID/OID Transfer to SEWD, Stanislaus River 5-6 South County Water Supply Project, Stanislaus River 5-7 Stockton Delta Diversion, San Joaquin River 5-8 Urban Water Conservation Improvements 5-11 NSJWCD Groundwater Recharge Project, Mokelumne River 5-12 Agricultural Water Conservation Improvements 5-13 Freeport Diversion, Sacramento River 5-14 Urban Wastewater Reclamation 5-15 Flood Flows to Middlebar Reservoir, Mokelumne River 5-16 Flood Flows to South Gulch Reservoir, Calaveras and Stanislaus River 5-17 American River Water Rights, American River 5-18 Simulated Groundwater Table Elevation, Baseline Conditions: Year 2000 5-19 Simulated Groundwater Table Elevation, Baseline Conditions: Year 2030 5-20 Simulated Groundwater Table Elevation, New Hogan Reoperation – In Lieu
SEWD and CSJWCD Year 2030 5-21 Simulated Groundwater Table Elevation, South County Surface Water
Supply Project Year 2030 5-22 Simulated Groundwater Table Elevation, Farmington Groundwater Recharge
Project Year 2030 5-23 Simulated Groundwater Table Elevation, Exercise New Melones Right – In
Lieu SEWD/CSJWCD Year 2030

Table of Contents San Joaquin Water Management Plan
ΑΒΑΒ v
5-24 Simulated Groundwater Table Elevation, Freeport Project – Recharge, In-lieu SEWD, NSJWCD Year 2030
5-25 Simulated Groundwater Table Elevation, Integrated Water Management Plan year 2030
5-26 Simulated Groundwater Levels (1970-2030) 5-27 Simulated Groundwater Levels (1970-2030) 5-28 Simulated Groundwater Levels (1970-2030) 5-29 Simulated Groundwater Levels (1970-2030) 5-30 Simulated Groundwater Levels (1970-2030) 5-31 Simulated Groundwater Levels (1970-2030) 5-32 Simulated Groundwater Levels (1970-2030) 5-33 Simulated Groundwater Levels (1970-2030) 5-34 Simulated Groundwater Levels (1970-2030) 5-35 Simulated Groundwater Levels (1970-2030) 5-36 Simulated Groundwater Levels (1970-2030) 5-37 Simulated Groundwater Levels (1970-2030) 5-38 Well Hydrograph Location Map 5-39 Groundwater Table Profile Along Highway 4 Under Various Conditions 6-1 Individual Interest-Based 6-2 Mutual Interest-Based 6-3 Mutual Interest-Based with Local Control (County Lead) 6-4 Mutual Interest-Based with Local Control (Lead by a New Agency)

ΑΒΑΒ vi
Tables
ES-1 San Joaquin County Water Management Planning Goals ES-2 Water Management Option Summary 1-1 Steering Committee Members – Acknowledgements 2-1 Major Area Reservoirs 2-2 Simplified Groundwater Balance for Current Conditions 2-3 Future Urban Water Demands 2-4 Estimated 1996 and Projected Agricultural Water Demands 2-5 Summary of Current Water Rights and Contracts 3-1 Groundwater Option Comparisons 4-1 Water Management Options in the Master Alternative 4-2 Water Management Options Prioritization 4-3 Rating Criteria for Option Evaluation 5-1 Water Quantities for South Counties Surface Water Supply Project 5-2 Farmington Project Recharge Amounts and Location 5-3 Estimated Current and Projected Deliveries from New Melones to SEWD and
CSJWCD 5-4 Summary of Recharge and Groundwater Pumping for Simulated Water
Management Options 5-5 Impact of Selected Options – Groundwater Levels 5-6 Impact of Selected Options – Saline Intrusion 6-1 Summary of Differences Between Alternative Organizational Structures 6-2 Joint Powers Agreements 6-3 Memorandum of Understanding 6-4 Nonprofit Mutual Benefit Corporation 7-1 Funding Opportunities for WMOs

ABAB vii
Abbreviations and Acronyms A
ac-ft Acre-feet
ASR Aquifer Storage and Recovery
B
BMP Best Management Practices
C
CCWD Calaveras County Water District
CDM Camp Dresser & McKee
CDWA Central Delta Water Agency
Corps U.S. Army Corps of Engineers
CSJWCD Central San Joaquin Water Conservation District
CVP Central Valley Project
D DCC Delta Cross Channel
DMC Delta Mendota Canal
DWR California Department of Water Resources
E
EBMUD East Bay Municipal Utility District
ESJCGB Eastern San Joaquin County Groundwater Basin
F
FERC Federal Energy Regulatory Commission
G
GBA Groundwater Banking Authority
GPCD Gallons Per-Capita Daily
I
ISI Integrated Storage Investigation
J
JPA Joint Powers Authority
M
MAF Million Acre-feet
MOU Memorandum of Understanding
MSL Mean Sea Level

Abbreviations and Acronyms San Joaquin Water Management Plan
ABAB viii
N
NDWA North Delta Water Agency NSJWCD North San Joaquin Water Conservation District
O
OID Oakdale Irrigation District
R
RFP Request for Proposal
S
SDWA South Delta Water Agency
SEWD Stockton East Water District
SJCFC&WCD San Joaquin County Flood Control and Water Conservation District
SJCWMP San Joaquin County Water Management Plan
SSJID South San Joaquin Irrigation District
SWP State Water Project
SWRCB State Water Resources Control Board
T
TAF Thousand acre-feet
TDS Total Dissolved Solids
U
USBR U.S. Bureau of Reclamation
W
WID Woodbridge Irrigation District
WMO Water Management Options
WRDA Water Resources Development Act
ABAB ES-1
Executive Summary
ES.1 Introduction Meeting the water needs of California is a significant challenge for water suppliers. California’s economy and population continue to expand at rates exceeding the national rate, and in addition to economic growth, the competition for water accelerated in the early 1990’s as changes in water policy dictated increased environmental use. With finite supplies, complex politics, and powerful players, the competition has become quite intense. Water managers must wield influence at the State and Federal echelons to gain funding and command resources. Further, contending with large, regional organizations and well-funded coalitions ups the ante for agencies with smaller customer bases. To be politically and financially viable
within the California water world, an organization requires broad political support and a clear strategy. The Water Management Plan represents San Joaquin County’s strategy, and embodies a new level of cooperation among the County’s water stakeholders, equipping the County to compete for its future water needs.
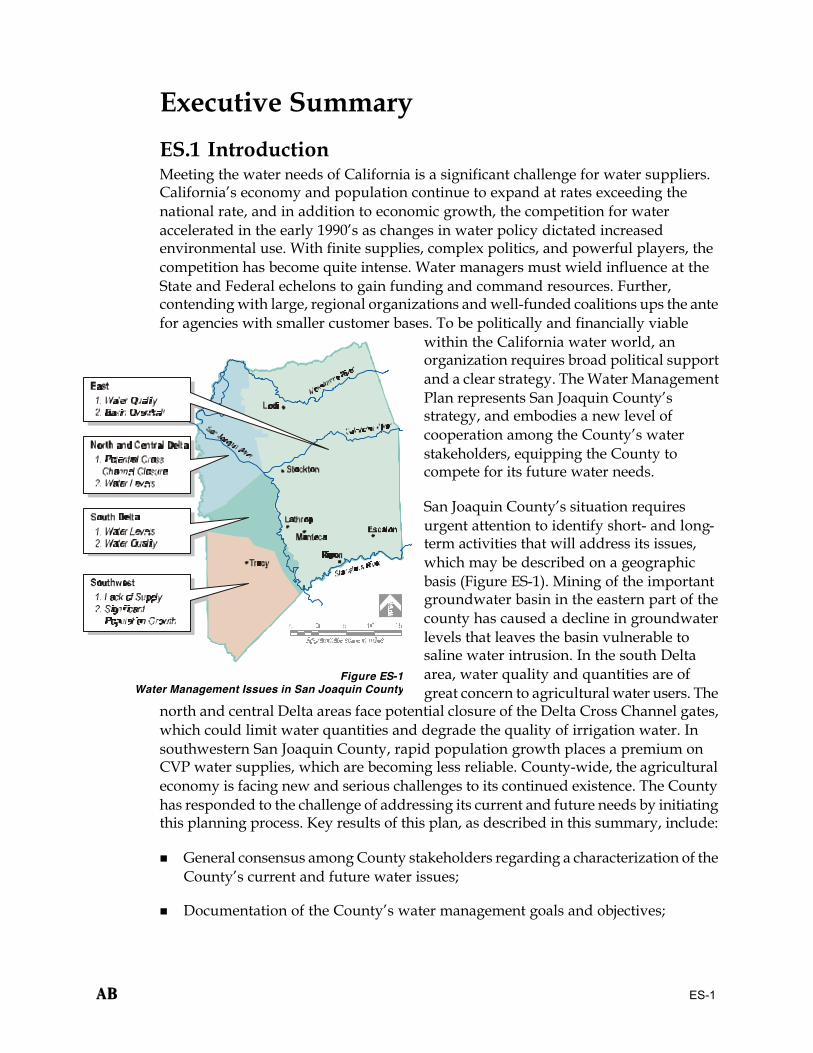
San Joaquin County’s situation requires urgent attention to identify short- and long-term activities that will address its issues, which may be described on a geographic basis (Figure ES-1). Mining of the important groundwater basin in the eastern part of the county has caused a decline in groundwater levels that leaves the basin vulnerable to saline water intrusion. In the south Delta area, water quality and quantities are of great concern to agricultural water users. The
north and central Delta areas face potential closure of the Delta Cross Channel gates, which could limit water quantities and degrade the quality of irrigation water. In southwestern San Joaquin County, rapid population growth places a premium on CVP water supplies, which are becoming less reliable. County-wide, the agricultural economy is facing new and serious challenges to its continued existence. The County has responded to the challenge of addressing its current and future needs by initiating this planning process. Key results of this plan, as described in this summary, include:
n General consensus among County stakeholders regarding a characterization of the County’s current and future water issues;
n Documentation of the County’s water management goals and objectives;
Figure ES-1Water Management Issues in San Joaquin County

San Joaquin County Comprehensive Water Management Plan Executive Summary
ES-2 ABAB
n Construction and application of a detailed groundwater model with the best tools available, making groundwater modeling results both useful and accessible for analysis of proposed projects and policies; and
n Development of a Master Alternative containing a prioritized list of water management projects that should be moved forward.
Equipped with a documented plan, analytical tools and their new joint decision-making capacity, County water stakeholders are poised to take action toward meeting the County’s future needs.
ES.2 Water Issues in San Joaquin County San Joaquin County, like the rest of California, has experienced record growth in recent years, with the current population of 580,000 projected to increase to more than 1.25 million by 2040. Water issues in the County are also reflective of the issues facing California as a whole. Sitting at the geographic and political nexus of California’s water issues, San Joaquin County endures the competing pressures of urban, environmental and agricultural demands on water, complicated by a management structure involving numerous local, State and Federal agencies.
Arguably, the single most important factor in San Joaquin County’s complicated water picture is the health of the Sacramento-San Joaquin Delta. Before the Delta was altered by human activity, it harbored an immense array of fish and other wildlife.
Currently, the Delta provides wildlife habitat and agricultural land and acts as the transition point for major water transfers to urban areas south and west. The Delta provides drinking water for two-thirds of California through the CVP and the SWP; however, Delta pumping comes at a significant cost. As a result of exports, many areas of the San Joaquin County Delta suffer from degraded water quality from tidal saltwater intrusion and reduced
water levels. The CALFED process seeks to restore Delta ecosystems and alleviate these chronic water management problems.
Surface water resources in San Joaquin County are largely appropriated and tightly controlled. Four major river systems (the Calaveras, San Joaquin, Stanislaus and Mokelumne) flow through the County, yet much of the water is exported to meet the increasing urban needs of central and southern California. There are limited new opportunities to develop new surface water sources in San Joaquin County, and those
Bay-Delta Near Stockton (Photograph from DWR)

San Joaquin County Comprehensive Water Management Plan Executive Summary
ABAB ES-3
few remaining opportunities will require significant political and financial support to become viable water sources. Due to the historical lack of surface water supplies, San Joaquin County has relied heavily on groundwater to supply both its predominantly agricultural and, more recently, urban needs. This reliance on groundwater has resulted in significant overdrafting of the groundwater basin, in turn causing saline water intrusion. Continued mining of groundwater and deterioration of water quality threaten the long-term viability of groundwater as a reliable source of water for the County.
The San Joaquin County Board of Supervisors and the San Joaquin County Flood Control and Water Conservation District (SJCFC&WCD) recognized that long-term economic and environmental health of the County is closely related to its access to sufficient water supplies of adequate quality. The County called together a Steering Committee of stakeholders from various agencies and water districts throughout the County to develop a plan. This Steering Committee took action by assessing the County’s current and 2030 water demands and issues and identified viable alternatives to meet future needs. The County subsequently signed a Memorandum of Understanding (MOU) with the state Department of Water Resources (DWR) to work together on County water issues.
Camp Dresser & McKee Inc (CDM) was contracted by SJCFC&WCD to assist in the development of this San Joaquin County Water Management Plan. The mission of the County’s planning process is to develop a comprehensive plan to provide reliable water supplies for sustaining San Joaquin County’s current and future economic, social and environmental viability. This report presents the culmination of over 16 months of planning activities conducted to accomplish this mission.
ES.3 Working Together to Plan Addressing San Joaquin County’s multifaceted and complex water issues will require significant political and technical support. Reaching this point in the planning process also required the support and participation of stakeholders from throughout the County. An interactive process was employed as part of this plan’s development, to provide a means for incorporating the expertise of local stakeholders. The Steering Committee, comprising 22 formal representatives from organizations with a common interest in the County’s water resources, provided this expertise. This group grew to over 40 formal and informal participants during the 16-month process.
To provide direction for the technical team and to account for the variety of stakeholders’ concerns, the Steering Committee established goals and objectives for water management in San Joaquin County at the beginning of the planning process.
The mission of the San Joaquin County Water Management Plan is to develop a comprehensive plan to provide reliable water supplies for sustaining San Joaquin County’s current and future economic, social and environmental viability.

San Joaquin County Comprehensive Water Management Plan Executive Summary
ES-4 ABAB
Agreement on these goals provided a preliminary basis for proceeding with planning in that the stakeholders, from various parts of the County, with diverse concerns, could unite toward common goals. This first phase of the County’s water management planning process considered water use projections and groundwater basin impacts and developed, screened, and prioritized a set of water management options. Through this phase, the Steering Committee worked together to seek integrated solutions that benefit the County as a whole. The County’s water management planning goals are listed below.
San Joaquin County Water Management Planning Goals
Be equitable
Minimize community
impacts
Protect water quality
Use affordable approaches Minimize land use impacts
Provide reliable supplies
Maintain existing supply and develop new supply for
SW county
Minimize cultural resource impacts
Restore and maintain eastern county
groundwater resources
Minimize biological resource impacts
Protect and preserve water rights and area
of origin rights
Support beneficial water conservation programs
ES.4 Summary of Findings A series of 10 Steering Committee meetings, and additional meetings with individual stakeholders, helped the technical team to understand and document concerns and ideas regarding water issues. To provide technical information for the Steering Committee, CDM conducted analyses of future demand and supplies, surface water availability, land use projections and groundwater modeling. The technical team informed and sought agreement from the Steering Committee at all key milestones during these analyses.
Through this integrated process, the CDM technical team arrived at a number of conclusions and findings regarding San Joaquin County’s water future, as listed below.
The County and Regional Context n San Joaquin County’s water supply problems are diverse, complex and
inextricably connected with water management at the regional and state level. Solutions to county water management issues will require coordination at a regional and state level.
n Some of this plan’s objectives, as described by its stakeholders, inherently conflict with other objectives. Increasing supplies to one area of the County, for example, could negatively affect stakeholders elsewhere. Stakeholders ought to consider the

San Joaquin County Comprehensive Water Management Plan Executive Summary
ABAB ES-5
entire County when developing solutions and strive for ways to combine projects to benefit all stakeholders.
Groundwater Resources n Excessive groundwater pumping in the eastern San Joaquin County Groundwater
Basin has and will continue to cause a decline in groundwater levels, which in turn causes the inflow of poorer quality groundwater from the west. Modeling has demonstrated that groundwater pumping currently exceeds the sustainable yield of the basin by approximately 150,000 ac-ft per year, and could possibly increase to 200,000 ac-ft per year by 2030. This threatens the long-term sustainability of a very important water resource for San Joaquin County.
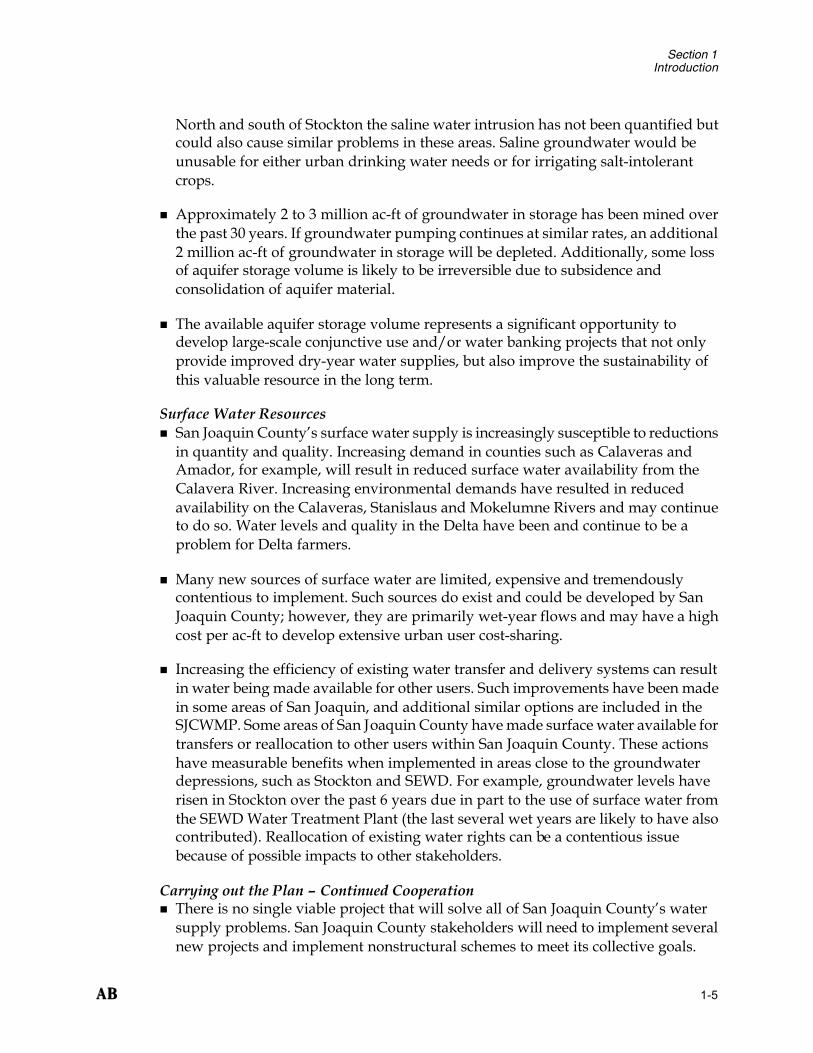
n As a result of the lowered groundwater levels in the eastern portion of the County, saline water is migrating eastward under Stockton. Groundwater modeling analysis indicates that with no action to address the issue, the saline front would be east of Highway 99 in Stockton within 30 years, which could have serious repercussions on the groundwater supply within the County. North and south of Stockton the saline water intrusion has not been quantified, but could also cause similar problems in these areas. Saline groundwater would be unusable
for either urban drinking water needs or for irrigating salt-intolerant crops.
n Approximately 2 to 3 million ac-ft of groundwater in storage has been mined over the past 30 years. If groundwater pumping continues at similar rates, an additional 2 million ac-ft of groundwater in storage will be depleted. Additionally, some loss of aquifer storage volume is likely to be irreversible due to subsidence and consolidation of aquifer material.
n This available aquifer storage volume represents a significant opportunity to develop large-scale
conjunctive use projects that not only provide improved dry-year water supplies, but also improve the sustainability of this valuable resource in the long-term.
Available aquifer storage volume represents a significant opportunity to develop large-scale conjunctive use projects that not only provide improved dry-year water supplies, but also improve the sustainability of this valuable resource in the long-term.

San Joaquin County Comprehensive Water Management Plan Executive Summary
ES-6 ABAB
Surface Water Resources n San Joaquin County’s surface water supply is increasingly susceptible to
reductions in quantity and quality. Increasing demand in counties such as Calaveras and Amador, for example, will result in reduced surface water availability from the Calaveras River. Surface water supplies available to the County are also affected by Delta exports for urban use outside the region. Increasing environmental demands have resulted in reduced availability on the Calaveras, Stanislaus and Mokelumne Rivers, and may continue to do so. Water levels and quality in the Delta have been and continue to be a problem for Delta farmers.
n Many new sources of surface water are limited, expensive and tremendously contentious to implement. Such sources do exist and could be developed by San Joaquin County; however, they are primarily wet-year flows, may have a high cost per acre-foot to develop and will likely require cooperation with urban users to share costs.
n Increasing the efficiency of existing water transfer and delivery systems can result in water being made available for other users. Such improvements have been made in some areas of San Joaquin County, and others are included in the SJCWMP. Some districts in San Joaquin County have made surface water available for transfers or reallocation to other users within the County. These actions have measurable benefits when implemented in areas close to the groundwater depressions, such as Stockton and Stockton East Water District (SEWD). For example, groundwater levels have risen in Stockton over the past 6 years due in part to the use of surface water from the SEWD Water Treatment Plant (the last several wet years are likely to have also contributed). Reallocation of existing water rights can be a contentious issue because of possible impacts to other stakeholders.
Historical Groundwater Levels in Lodi Area (Source: Lodi DPW)
-5
0
5
10
15
20
25
30
35
40
1927
1937
1947
1957
1967
1977
1989
1999
Year
Gro
undw
ater
Lev
el (E
leva
tion,
feet
, M
SL)

San Joaquin County Comprehensive Water Management Plan Executive Summary
ABAB ES-7
Future Water Demands n Countywide water demands are projected to increase slightly, from 1,617,000 acre-
feet per year to 1,631,000 acre-feet per year by the year 2030. The projected increase in urban population will result in an increase in urban land and water use and a corresponding decrease in agricultural land and water use.
n Currently, groundwater supplements surface water to meet demands. As mentioned above, groundwater pumping exceeds the basin’s sustainable yield by up to 165 TAF per year. If surface water supplies are reduced as anticipated, the net groundwater deficit will be approximately 200 TAF per year.
ES.5 Water Management Options In consideration of the findings listed above, and in the context of the County’s water management planning mission, goals, and objectives, the stakeholder process identified 14 water management options (WMOs) that together could provide up to 450 TAF of water for the County on an average annual basis. These WMOs could be pursued individually or collectively to develop the 200 TAF of additional water resources for the County. The WMOs include reallocated water projects, new water projects and water management strategies to protect the existing quality and quantity of water in the County. Table ES-2 presents the WMOs.
Using criteria based upon the County’s goals and objectives, the Steering Committee screened and prioritized the WMOs to form a Master Alternative for further study. The Steering Committee members emphasize that these WMOs do not represent projects ready for implementation. Rather, the Master Alternative represents a prioritized list of projects that are ready to enter the next phase of the plan, which includes feasibility studies and environmental documentation. A project will not be implemented until all necessary details are determined and the stakeholders agree that the project should proceed.

San Joaquin County Comprehensive Water Management Plan Executive Summary
ES-8 ABAB
Table ES-2
Water Management Option Summary
Option Name Option Type Location Quantity TAF
Cost $/AF
Wet year flows Stanislaus River, stored in New Melones
Exercise New Melones Rights
In-lieu recharge SEWD, city of Stockton, CSJWCD 18 $32
Water transfer Mokelumne River water from WID WID Transfer to SEWD and the City of Stockton In-lieu recharge City of Stockton and SEWD 10 $35
Reoperation of existing facilities New Hogan Reservoir New Hogan
Reoperation In-lieu recharge SEWD
25 $36
Wet year flows Littlejohns Creek Farmington Groundwater Recharge and Wetlands Project
Direct recharge (field flooding) SEWD, NSJWCD, CSJWCD
25 $72
Water transfer Stanislaus River water from SSJID/OID
SSJID/OID Transfer to SEWD
In-lieu recharge City of Stockton 30 $81
Water transfer Stanislaus River water from SSJID South County Water Supply Project
In-lieu recharge Cities of Escalon, Lathrop, Manteca and Tracy
44 $150
New surface water rights
San Joaquin River, in the Delta Stockton Delta Diversion
In-lieu recharge City of Stockton 20-126 $180
Urban Water Conservation Improvements
Urban water conservation Cities within the County 20 $260
Delta Area Water Supply Activities
Political Support Delta area NA NA
Southwest County Water Supply Activities
Political Support Southwest County NA NA
New surface water rights
Mokelumne River for NSJWCD NSJWCD water right for direct recharge Direct recharge
(spreading basins) NSJWCD
20 $150
Agricultural Water Conservation Improvements
Agricultural water conservation Agricultural areas within the County 20-40 $250
New surface water rights or contracts
Sacramento River
In-lieu recharge NSJWCD, SEWD Freeport Diversion Direct recharge (field flooding)
NSJWCD, SEWD
28 $270
Water reclamation Cities within the County Urban Wastewater Reclamation Injection wells City of Stockton
60 $500
Floodflows Mokelumne River Floodflows to Middlebar Reservoir
In-lieu recharge NSJWCD, SEWD 50 $450-$550
Floodflows Stanislaus and Calaveras Rivers Floodflows to South Gulch Reservoir
In-lieu recharge CSJWCD, SEWD 30 $490
American River Water Rights
Floodflows American River 20 $490

San Joaquin County Comprehensive Water Management Plan Executive Summary
ABAB ES-9
ES.6 Strategic Rationale The opportunities for developing new water projects in California are diminishing rapidly and are increasingly expensive. The competition for State and Federal funding to finance water projects is also increasingly fierce. Given this environment, the most effective way for San Joaquin County water users to develop new projects is to work cooperatively, in a manner that capitalizes on the strength of joint resources. The CDM technical team recommends an aggressive strategy for the County to build upon the progress made to date according to the rationale presented below.
Continued Joint Decision-Making The County is already realizing the benefits of the Steering Committee information sharing, discussion and decision-making. There are significant potential benefits to continuing planning at the County level, including:
n A reduction in redirected impacts. Close cooperation among stakeholders will reduce the probability that solving problems in one area of the County will exacerbate or create problems in other areas. Cooperation can also reduce the potential for expensive, litigious disputes over water project development. By collaborating, project proponents can identify potential project impacts early and either mitigate them or effect a modification to the project that lessens potential impacts.
n Organizational streamlining. Effective collaboration can reduce the complexity associated with funding applications, focus decision-making toward mutual benefit and promote partnerships for cost and benefit sharing.
n Greater political influence. A group of County stakeholders representing a “united front” can send a powerful political message to State and Federal decision-makers. Likewise, the demonstration of an agreed-on approach for water management (e.g., this document) can be wielded as a political tool. Entities operating cooperatively can also apply increased resources to more effectively facilitate— or block—projects that have benefits or impacts in San Joaquin County.
n Greater ability to obtain State and Federal funding. In the current market, obtaining some of the most desirable and significant funding requires that applicants develop partnerships and pursue relationships at the highest political levels. The financial and personnel resources of a County-wide organization can help the County operate at a level that will help gain access to funding that is otherwise unattainable.
A group of County stakeholders representing a “united front” can send a powerful political message to State and Federal decision-makers.

San Joaquin County Comprehensive Water Management Plan Executive Summary
ES-10 ABAB
To realize these benefits, the County’s strategy should include continued joint decision-making within a formalized relationship and should examine ways to improve the relationships among entities doing water resources planning in the County.
Using Technical Tools for Planning Planning is an iterative process, and continued analyses will be necessary as the County fulfills its water management mission. A County-wide planning agency tasked with evaluating and selecting options for implementation will require certain tools to make informed decisions regarding projects, programs and policies. Two tools that will be critical in the future are the County’s groundwater model, which was developed for this plan, and a decision-making framework based upon the goals and objectives documented by the stakeholders.
The Groundwater Model CDM developed the comprehensive model of the groundwater system in San Joaquin County with several improved characteristics over previous models. The 3-dimensional DYNFLOW model was designed to interact with the County's GIS system; land use information in the model is linked to the Arcview database of the County, and the results of the model can be exported for inclusion and display in the GIS system. Changes in management practices such as irrigation, pumping and diversion patterns can thus be planned and tracked in the GIS system, and then exported to the DYNFLOW model. The model also links the flow in the streams in the County to the groundwater aquifer, and permit full interaction between these components.
The County groundwater model provides graphical visualization of piezometric heads and flow patterns throughout the County. The system can also display all model inputs graphically - including land uses, cropping patterns, irrigation application rates and rainfall. Steady state and transient results can be displayed and compared to appropriate field data. This enables stakeholders and the public to clearly and comprehensively review the impact of proposed or future groundwater management schemes. The model has been installed at the SJCFC&WCD office in Stockton, and SJC personnel will be able to utilize this tool in the future. This model is an invaluable tool for evaluating the effects of WMOs.
A Decision-Making Framework The County’s water management mission, goals and objectives provide a clear direction for the stakeholders. By documenting in detail what the County should achieve with regard to water management, the Steering Committee has laid the foundation for a powerful planning tool. If quantifiable indicators were selected for each of the County’s objectives, the stakeholders would have a means for predicting or measuring whether a current or future project could be (or is) consistent with the goals. For example, these performance indicators could include water levels, flows and quality at several key locations in the County. This evaluative framework,

San Joaquin County Comprehensive Water Management Plan Executive Summary
ABAB ES-11
coupled with the data provided by the groundwater model and other technical tools, would allow the County to compare various courses of action comprehensively. Furthermore, the data developed for use in the framework, along with the comparative results, could be employed in a programmatic EIR, should the County choose to pursue one.
Moving Projects Toward Implementation CDM reviewed and collected a large amount of information for this plan. There remain, however, many areas where additional engineering and scientific studies are needed to properly evaluate the technical and economic viability of potential options, as well as identification of environmental and other impacts. For many projects, these studies may be the “next steps” necessary to move toward implementation. For others, political or funding steps may be required.
Putting the Master Alternative into action will test the ability of the Steering Committee (or its County-wide planning successor) to meet the County’s water management goals. Commencing implementation will help to maintain the momentum gathered by the Steering Committee in working together, and a successful project will demonstrate the capabilities of the County-wide planning group, both within the County and to State and Federal agencies. The stakeholders in the County must move forward with projects, or risk backtracking on the progress made thus far.
Funding Projects The key to receiving State or Federal funding for any of the WMOs in this plan lies in the collective effort of the local stakeholders and their ability to demonstrate that these projects can have statewide or regional benefits. A project’s local focus and benefits need not be sacrificed for the greater good, but if a project is to compete for funding in today’s market, its proponents must demonstrate that it can be mutually beneficial to both the proponents and to the people of California.
Projects that are implemented in today’s financial and political climate require leveraging and partnering. Competition for financial resources in this market is at its highest level, and to be successful a project proponent’s strategy must be aggressive and sophisticated. A successful proposal will demonstrate that the project would have many values. That is, a single-benefit water resources project will not compete well against one that has a variety of benefits. To be successful in obtaining State or Federal funding, projects should include:
Currently, the Steering Committee has not achieved consensus regarding the necessary next steps for several of the WMOs in the Master Alternative. Initiating or continuing implementation of the WMOs in the Master Alternative will require broader agreement on the readiness of projects to proceed.

San Joaquin County Comprehensive Water Management Plan Executive Summary
ES-12 ABAB
n Environmental benefits. Many of the State and Federal agencies that administer funds have environmental mandates. Project proposals should be crafted in a manner that explains how the proposal will help the funding agencies fulfill their mandates.
n Regional benefits. Funding agencies may cover large regions, or may be targeting funds at projects that have the potential to provide regional benefits. Project proponents seeking State or Federal funding should seek to expand the zone of benefit associated with a project as much as is feasible.
n Project partners. Most projects will benefit from multiple partners who can bring needed political, strategic, technical and financial support and can help develop projects and move them toward implementation.
Including these benefits or added values to a proposal is critical to having a project funded in California’s water resource market. Project proposals that bring these elements together, demonstrating balanced benefits among people and the environment, are the successful ones that move forward. Significant opportunities currently exist for any of this Water Management Plan’s project options to be funded through the State or Federal Government. The ability to obtain these resources is based on the strength of the proponents’ partnerships and proposals. Local funding is another option for the WMOs and may, for some projects that focus exclusively on local benefits, be the only appropriate source of money.
ES.7 Recommended Strategy Based on the planning process conducted with the participation of the Steering Committee, along with the analyses conducted by the CDM technical team and the rationale described above, the implementation of the SJCWMP will require significant additional effort to be implemented. The development of the content of this document completes Phase 1 of the planning process. Phase 2 will include detailed feasibility and environmental documentation. Implementation of the County’s water management options will begin in Phase 3, and Phase 4 will monitor the implemented options to provide feedback. Concurrent with other plan phases, key information and data should be updated as new information becomes available. Additionally the performance of implemented plan components needs to be monitored.
CDM recommends that the County stakeholders focus on the following specific actions to proceed with the subsequent phases.
1) Develop and sign an MOU that establishes a County-wide planning group based upon the current Steering Committee. To develop this MOU jointly, continue a process of facilitated Steering Committee meetings. This process should be coordinated with the DWR stakeholder assessment currently underway.

San Joaquin County Comprehensive Water Management Plan Executive Summary
ABAB ES-13
2) Revisit the MOU signed by the DWR and the SJCFC&WCD for development of the Water Management Plan and update it, if necessary.
3) Continue using the groundwater model to provide quantitative, predictive data for project evaluation. Update the model input data as necessary. Additionally, the County should continue its monitoring and data collection activities. In particular, the County should complete the development and implementation of the Data Management Model (DMM) currently under development.
4) Develop a comprehensive evaluation tool based upon the County’s mission, goals and objectives with appropriate quantitative performance measures. Apply this tool for decision-making and policy planning.
5) Define the appropriate “next steps” for each of the projects in the Master Alternative, working jointly within the Steering Committee or its County-wide planning successor group.
6) Develop specific Federal, State or local funding strategies for each of the projects in the Master Alternative. Recognizing that some funding may be dependent upon regional and/or environmental benefits, explore the potential for partnering and enhancing projects to increase their attractiveness to State and Federal funding agencies. Where appropriate, identify potential local funds.
7) Move forward as a County-wide planning group on projects that have a broad support within the County and that have the potential to provide significant benefits. This initial project action should be conducted cooperatively, to demonstrate the success of the County-wide planning effort, but will also likely require the dedicated efforts of project “champions.” Projects that may be suitable for this initial pursuit include:
o Farmington Groundwater Recharge and Wetlands Project;
o New Hogan Reoperation;
o Delta Area and Southwest County Water Supply Activities; and
o Middlebar Reservoir.

ABAB 1-1
Projected Population Growth in San Joaquin County
Section 1 Introduction
1.1 Background and Purpose From a water resources management perspective, San Joaquin County is arguably in a unique position. It is a microcosm of California water issues, exhibiting the range of complex and contentious issues that drive current water policy and management. A predominantly agricultural county, it is flanked by the Sierra Nevada to the east and the rapidly growing San Francisco Bay area to the west. San Joaquin County is close to the geographic center of California, near the hub of SWP and CVP projects, where the transition between water exporting areas and water importing areas occurs. Sections of the County include facilities to collect water to export to out-of-County areas, while other parts purchase water from the Delta Mendota Canal (a CVP export facility). To further complicate water issues, a large portion of the County is the legal boundary of the Sacramento – San Joaquin Delta.
Like California as whole, San Joaquin County is experiencing competing demands and limited water supplies to meet those demands. Traditional uses such as public supply, domestic, commercial, industrial and agricultural uses are increasingly in competition with environmental and instream uses to maintain or enhance fisheries
and wildlife habitat and provide recreation. Areas of San Joaquin County are also facing the pressures of urban growth. Communities such as Tracy have seen their populations increase by more than 50 percent percent in the last decade, with much of this increase attributed to migration from the Bay area.1
In response to these water resource management issues, the San Joaquin County Flood Control and Water Conservation District (SJCFC&WCD) undertook the initiative to assess the
current water resource needs and implement a planning process to
identify viable alternatives to meet them. SJCFC&WCD contracted Camp Dresser & McKee Inc (CDM) to develop the San Joaquin County Water Management Plan (SJCWMP) in close cooperation with stakeholders from various agencies and water districts. This report summarizes the planning process, technical evaluations and conclusions developed during this project.
1 City of Tracy website. Accessed on July 26, 2001 from: http://www.ci.tracy.ca.us/development-popgrowth.html

Section 1 Introduction
1-2 ABAB
1.2 Organization of Report After this introductory section, more detailed information on the water resources of San Joaquin County is presented in Section 2. Section 3 provides a general description of water management options, and Section 4 contains a description of the planning process conducted to screen and evaluate options. The master alternative selected by the stakeholder participants is described in Section 5. Sections 6 and 7 discuss the institutional and financial issues, and Section 8 summarizes CDM’s recommended strategy for building upon these planning processes.
Detailed information on water demands, supplies, geology, hydrology and modeling is provided in Volume 2 of the Water Management Plan. Volume 2 contains the Technical Memoranda that were developed during the planning process. Each memorandum reflects the planning process at the time that it was written, and it has evolved as more information was uncovered and new decisions were made. The plan information contained in Volume 1 is the most current, and the technical memoranda can be used to understand the process at different points in time during plan development.
1.3 Acknowledgements The Plan Technical Team includes representatives of the County, the Department of Water Resources (DWR) and their technical consultants. The team of consultants working for the County included:
n Camp Dresser & McKee Inc. (CDM);
n Borcalli & Associates;
n Surface Water Resources Inc. (SWRI);
n James C. Hanson Consulting Engineer; and
n Buethe Public Relations.
CDM and its sub-consultants worked closely with representatives from many agencies and water districts in San Joaquin County. These representatives (See Table 1-1) participated actively in the development of this plan as its Steering Committee. The Steering Committee provided invaluable information and feedback on a variety of issues.
Table 1-1 Steering Committee Members - Acknowledgements
Name Affiliation Morris Allen City of Stockton
Anthony Barkett Stockton East Water District
Roger Bennett City of Lathrop

Section 1 Introduction
ABAB 1-3
Table 1-1 (Continued) Steering Committee Members - Acknowledgements
Name Affiliation Raymond Borges San Joaquin County Environmental Health Andy Christensen Woodbridge Irrigation District
Bob Clark North Delta Water Agency
James Cornelius Calaveras County Water District
Sally Davis Oakdale Irrigation District
Patrick Dwyer Corps of Engineers
Tom Flinn San Joaquin County Department of Public Works
Ed Formosa City of Stockton Municipal Utilities
Tom Gau San Joaquin County Department of Public Works John Herrick South Delta Water Agency
Alex Hildebrand South Delta Water Agency
Kevin Kauffman Stockton East Water District
Manuel Lopez San Joaquin County Department of Public Works
Diane Martin City of Manteca
Rick Martin South San Joaquin Irrigation District
Tom Meagher Corps of Engineers Planning Division Frances Mizuno San Luis & Delta-Mendota Water Authority
Dante John Nomellini Sr. Central Delta Water Agency
David Olivares San Joaquin County Department of Public Works
Teresa Pacheco San Joaquin County Department of Public Works
Nick Pinhey City of Tracy
Richard Prima City of Lodi
Dale Ramey City of Ripon
Paul Risso California Water Service Co. Reid Roberts Central San Joaquin Water Conservation Dist.
Paul Sanguinetti Stockton East Water District Mahmoud Saqqa (Project Manager)
San Joaquin County Department of Public Works
Anthony Saracino Saracino-Kirby-Snow
Gerald Schwartz East Bay Municipal Utility District
Jack Sieglock Board of Supervisors
Ed Steffani North San Joaquin Water Conservation Dist.
John Stein South San Joaquin Irrigation District
Douglas Stidham City of Escalon
Matthew Terra San Joaquin Farm Bureau David Weisenberger Banta-Carbona Irrigation District
Richard Whitson Bureau of Reclamation
Mark Williamson East Bay Municipal Utility District
John Woodling Department of Water Resources

Section 1 Introduction
1-4 ABAB
1.4 Summary of Findings CDM conducted 10 Steering Committee meetings, and additional meetings with individual stakeholders to understand and document concerns and ideas. Additionally, CDM conducted analyses on future demand and supplies, surface water availability, land use projections and groundwater modeling to develop a clearer picture of future water issues. The conclusions and findings arrived at by the CDM technical team are presented below. These statements do not necessarily reflect the opinions of all stakeholders.
1.4.1 General Findings and Conclusions The County and Regional Context n San Joaquin County’s water supply problems are diverse, complex and inextricably
connected to water management at the regional and State level. Solutions to County water management issues will require coordination at a regional and State level.
n San Joaquin County will continue to experience urban growth. Although the overall demand within the County is not expected to increase dramatically, urban growth will require surface water supplies in the future that are more firm than existing supplies.
n Some of this plan’s objectives, as described by its stakeholders, inherently conflict with other objectives. Increasing supplies to one area of the County, for example, could require actions that affect the groundwater overdraft negatively elsewhere. Stakeholders ought to consider the entire County when developing solutions and strive for ways to combine projects to benefit all stakeholders.
Groundwater Resources n Excessive groundwater pumping in the eastern San
Joaquin County Groundwater Basin has and will continue to cause a decline in groundwater levels, which in turn causes the inflow of poorer quality groundwater from the west. Modeling has demonstrated that groundwater pumping currently exceeds the sustainable yield of the basin by approximately 150,000 ac-ft per year, and possibly increasing to 200,000 ac-ft per year by 2030. This threatens the long-term sustainability of a very important water resource for San Joaquin County.
n As a result of the lowered groundwater levels in the eastern portion of the County, saline water is migrating eastward under Stockton. Groundwater modeling analysis indicates that with no action to address the issue, the saline front would be east of Highway 99 in Stockton within 30 years, which could have serious repercussions on the groundwater supply within the County.
Section 1 Introduction
ABAB 1-5
North and south of Stockton the saline water intrusion has not been quantified but could also cause similar problems in these areas. Saline groundwater would be unusable for either urban drinking water needs or for irrigating salt-intolerant crops.
n Approximately 2 to 3 million ac-ft of groundwater in storage has been mined over the past 30 years. If groundwater pumping continues at similar rates, an additional 2 million ac-ft of groundwater in storage will be depleted. Additionally, some loss of aquifer storage volume is likely to be irreversible due to subsidence and consolidation of aquifer material.
n The available aquifer storage volume represents a significant opportunity to develop large-scale conjunctive use and/or water banking projects that not only provide improved dry-year water supplies, but also improve the sustainability of this valuable resource in the long term.
Surface Water Resources n San Joaquin County’s surface water supply is increasingly susceptible to reductions
in quantity and quality. Increasing demand in counties such as Calaveras and Amador, for example, will result in reduced surface water availability from the Calavera River. Increasing environmental demands have resulted in reduced availability on the Calaveras, Stanislaus and Mokelumne Rivers and may continue to do so. Water levels and quality in the Delta have been and continue to be a problem for Delta farmers.
n Many new sources of surface water are limited, expensive and tremendously contentious to implement. Such sources do exist and could be developed by San Joaquin County; however, they are primarily wet-year flows and may have a high cost per ac-ft to develop extensive urban user cost-sharing.
n Increasing the efficiency of existing water transfer and delivery systems can result in water being made available for other users. Such improvements have been made in some areas of San Joaquin, and additional similar options are included in the SJCWMP. Some areas of San Joaquin County have made surface water available for transfers or reallocation to other users within San Joaquin County. These actions have measurable benefits when implemented in areas close to the groundwater depressions, such as Stockton and SEWD. For example, groundwater levels have risen in Stockton over the past 6 years due in part to the use of surface water from the SEWD Water Treatment Plant (the last several wet years are likely to have also contributed). Reallocation of existing water rights can be a contentious issue because of possible impacts to other stakeholders.
Carrying out the Plan – Continued Cooperation n There is no single viable project that will solve all of San Joaquin County’s water
supply problems. San Joaquin County stakeholders will need to implement several new projects and implement nonstructural schemes to meet its collective goals.

Section 1 Introduction
1-6 ABAB
n Solving San Joaquin County water issues will require broad support among the stakeholder group and significant State and Federal funding assistance. The San Joaquin County Water Management Plan documented herein is the first step in an iterative planning process. Successful realization of the plan will require long-term commitment and cooperation among stakeholders to be successful.
n If water management planning in San Joaquin County is to be successful, it must be developed with the close cooperation of a broad, representative stakeholder group to ensure that solving problems in one area of the County does not exacerbate or create problems in other areas.
n It is vitally important that implementation of viable solutions and projects is not completely derailed or halted due to lack of complete consensus among stakeholders. However, it is imperative that key stakeholders, specifically those potentially affected by a project, be heard and their concerns taken into consideration during the development of a project.
n CDM reviewed and collected a large amount of information for this plan. However, many areas remain where additional engineering and scientific studies are needed to properly evaluate the technical and economic viability of potential alternatives, as well as identification of environmental and other impacts.
1.5 Plan Implementation The Steering Committee, in consideration of the findings presented above and through its interactions with the CDM Technical team, developed a plan for moving forward with a Master Alternative to meet the County’s water management objectives. This plan, depicted in Figure 1-1, lays out the next course of action for the County to take in meeting its needs in the future.
The development of the content of this document completes Phase 1 of a Countywide planning process. Phase 2 will include detailed feasibility, environmental documentation, design and implementation of the County’s water management options. Projects will be implemented in Phase 3, and Phase 4 will include monitoring and feedback to improve future projects. Concurrent with other plan phases, key information and data need to be updated periodically to ensure decisions are made on the best available information.
Phase 1 – Planning, Analysis and Strategy The work carried out over the past year represents the first phase of a planning process and will require years of additional effort to be implemented. Unlike building a stand-alone project, the planning process is an iterative one often requiring frequent updates and modification as conditions change and new information becomes available. Phase 1 primarily involved the following tasks:

Section 1 Introduction
ABAB 1-7
n Development of a stakeholder-driven process that represents water user interests throughout San Joaquin County.
n Compilation of existing studies and data to develop a clearer picture of Countywide current and projected water demands.
n Development of an integrated groundwater surface water model to assist in evaluating current and projected groundwater conditions.
n Compilation of information on a range of possible water management options and strategies.
n Preliminary evaluation of the options, including potential economic costs, benefits and stakeholder concerns.
n Evaluation of potential organizational structures and funding sources for continuing the plan.
Phase 1 was completed under an interim organizational structure, with the County as the lead agency. This structure, although effective for the initial phase of the plan, should be modified to provide a more integrated structure that broadens the decision- making and management capacity of the stakeholder group.
Phase 2-Feasibility/Evaluation Upon completion of the Phase 1, it is recommended that the stakeholders establish an organizational structure that will select water management options from the Master Alternative to move into Phase 2.
Additional goals of the organization should include:
n Creation of a planning group that would ensure fair representation of stakeholder interests in the selection of the options;
n Evaluation and selection of an institutional structure, as discussed in Section 6;
n Identification of funding for the study stage of selected options; and
n Development of an AB3030 Groundwater Management Plan.
Options that are selected as viable projects should then proceed to a feasibility study stage after an agreement has been made between the participating stakeholders. During the study stage, a numerical and impact analysis should be performed to determine the effects that a particular option may have under various conditions. The feasibility stage should also entail a detailed cost analysis and pursue funding for the environmental documentation that is required for project implementation according to standards of the California Environmental Quality Act and the National

Section 1 Introduction
1-8 ABAB
Environmental Protection Act. Additionally, upon the completion of the environmental documentation stage, funding for a potential executable project should be secured.
If the selected option is not chosen for implementation upon completion of the study stage, the plan does allow the flexibility for the lead agency/authority to select another option from the Master Alternative.
Phase 3-Project Implementation Once the project feasibility and evaluation has been completed, infrastructure and facility design should commence. During the design stage, it is recommended that a detailed engineering cost estimate be conducted. The optimal design will then be moved into the construction stage. Phase 3 concludes when project operation begins. During the operation stage, an in-house evaluation should be conducted to examine how to operate the facility in accordance with best management practices.
Phase 4- Monitoring In the final phase of the San Joaquin County Water Management Plan, it will be necessary to evaluate the success of the implemented options according to criteria that should be established by the stakeholders. Some example criteria include water balance, groundwater basin health and environmental health.
The water balance is a key criterion in defining the ESJCGB overdraft and water supply reliability. As planning efforts to reduce groundwater extraction to within the safe yield are implemented, water levels can be measured to monitor their impact. Ongoing groundwater quality monitoring and the improvement of the groundwater monitoring network will provide tools to evaluate the effects of implemented options with regards to the saline intrusion threat. Other water quality and environmental measures also need to be evaluated. Delta area water levels and water quality data need to be reviewed to ensure no degradation due to County or external project implementation.
With new information obtained from monitoring, the lead agency may adapt SJCWMP objectives. Changing political, environmental and economic conditions may also require modification or development of new water management options. Public involvement is also necessary to provide feedback and to build broad local support among San Joaquin County taxpayers and water users.

l
Phase 1 Phase 2 Phase 3
Identify Stakeholders Signed Board Order to create
Steering Committee
Identify Demand/Forecast for 2030 Technical Memorandum I
Baseline Conditions (Dynflow model)
Identify/Evaluate Options • Technical Memorandum III
Select Projects Agreement through consensus
Lead Agency/Authority Identify planning group
Identify an institutional structure Identify funding
AB 3030 Groundwater Management Plan
Study Preliminary modeling efforts, impact Analysis, and design of alternative
Feasibility investigation Environmental documentation
Planning Analysis/Strategy
Feasibility/Evaluation Project Implementation
Phase 4 Monitoring
San Joaquin County W a t e r M a n a g e m e n t P l a n
Water Balance Water availability Water demands
Basin Health Water quality
Environmental Health Impacts
Design Stage Infrastructure and facilities design
Select optimal detailed design
Construction Stage Assembly of option
Operation Stage In-house evaluation
Steering Committee Advisory Water Committee Board Water Committee San Joaquin County Board of Supervisors California Department of Water Resources
Steering Committee Advisory Water Committee Board Water Committee San Joaquin County Board of Supervisors State/Federal Agencies
INPUT INPUT INPUT
Master Alternative Ranked Options
No
Impl
emen
tatio
n
Impl
emen
tatio
n
Adaptive Management and Amendments to Master Alternative
Adoption Stakeholder consensus
Board of Supervisors’ approval
Figure 1-1

ABAB 2-1
Section 2 Water Resource Background This water management plan has been developed to address future water quality and supply needs for San Joaquin County. The County may be considered, for water management purposes, to have four distinct geographic areas, each with its own issues of concern (Section 2.1). Surface water (Section 2.2) and groundwater (Section 2.3) resources provide the County with supplies for meeting agricultural and urban water demand (Section 2.4). For additional information on the County’s surface and groundwater supplies and demands, see Technical Memorandum 1, included in Volume 2 of this plan.
2.1 Overview of Water Issues in San Joaquin County The water management issues of concern in San Joaquin County vary by geographic area. Figure 2-1 summarizes these issues, which are described below.
Southwest. In the southwestern portion of the County, issues of concern are unreliable Central Valley Project (CVP) contract water supplies, lack of alternative supplies and significant population growth in the City of Tracy.
South Delta. In the South Delta Water Agency area, a drop in water levels in Delta channels during the irrigation season presents problems, as does poor water quality. The drop in water levels is due primarily to CVP and State Water Project (SWP) pumping from the south Delta. Water quality problems are due to reduced San Joaquin River
flows and increased drainage from the west side of the San Joaquin Valley.
North and Central Delta. The north and central Delta areas have no serious water management problems at present, but potential concerns are the closure of the CVP Delta Cross Channel (DCC) gates (to protect emigrating salmon smolts) and the construction of an isolated canal from Hood (on the Sacramento River) to the CVP/SWP pumps, which could lead to permanent closure of the DCC gates. Closure of the DCC gates would result in a deterioration of water quality in the Delta. Water levels have also started to decline in the Central Delta area channels.
Figure 2-1

Section 2 Water Resource Background
2-2 ABAB
Eastern. In Eastern San Joaquin County, the principal water management concern is the degradation of groundwater quality caused by groundwater pumping that exceeds recharge in the Eastern San Joaquin County Groundwater Basin (ESJCGB). Excessive groundwater pumping has resulted in declining groundwater levels and a net reduction of groundwater in aquifer storage. The consequent lateral inflow of poorer quality groundwater from the Delta area threatens the continued use of the ESJCGB basin for urban and agricultural supply. Groundwater overdraft is not typically a problem in the southern portion of the ESJCGB, particularly in areas within SSJID and OID water districts, which have sufficient surface water supplies and conveyance facilities and have historically not relied heavily on groundwater for irrigation. In some areas of the ESJCGB additional surface water sources are available. The unreliability of some of these sources and the fact that groundwater is generally easier and cheaper to use have had the effect that the infrastructure required to convey and distribute the water has not been developed.
An important issue that has Countywide scope and impacts is urbanization. Urbanization has a wide range of environmental and social impacts. In this Plan, urbanization is only addressed inasmuch as it impacts water demand and supply. There are other significant impacts that concern stakeholders, such as the conversion of farmland to urban developments. However, addressing these issues is beyond the scope of this report. Other impacts of urbanization, such as the need for wastewater treatment and disposal, stormwater planning etc. are issues to be addressed at the local level.
2.2 Surface Water San Joaquin County lies at the northwestern corner of the San Joaquin Hydrologic Region as defined by DWR and shown on Figure 2-2. The major rivers in this hydrologic region are the San Joaquin, Cosumnes, Mokelumne, Calaveras, Stanislaus, Tuolumne, Merced, Chowchilla, and Fresno. The Calaveras, Mokelumne, and Stanislaus Rivers flow through or border San Joaquin County and at times discharge directly into the Delta, or into the San Joaquin River which in turn flows into the Delta. The west and southwestern portion of the County is part of the Delta, and the areas of primary and secondary concern are shown above. The Delta, major rivers and the associated facilities are shown on Figure 2-3 and are discussed in more detail below.
Map of Delta Primary and Secondary Zones (Source: Delta Protection Commission)

Figure 2-2
REGIONAL LOCATION MAP
SAN JOAQUIN COUNTYWATER MANAGEMENT PLAN
N
10 0 10 20 Miles
SAN
JOAQUIN
STANISLAUS
FRESNO
KINGSMONTEREY
SAN BENITO
MADERA
MERCED
MARIPOSA
SANTACRUZ
SANTA CLARA
SANMATEO
ALAMEDA
S.F.
MARIN
SOLANO
SACRAMENTO
AMADOR
ALPINE
EL DORADO
YOLO
NAPASONOMA
LAKE
COLUSA
SUTTER
YUBA
PLACER
NEVADA
GLENN BUTTE SIERRA
CONTRA COSTA
CALAVERAS
TUOLUMNE
MONO
LEGEND
Central CoastNorth CoastNorth LahontanSacramentoSan Francisco BaySan JoaquinTulare Lake
Hydrologic Regions
Source: California Department of Fish and Game

Figure 2-3
MAJOR COUNTY RIVERS AND
RESERVOIRS
SAN JOAQUIN COUNTYWATER MANAGEMENT PLAN
N
5 0 5 Miles
Dry Creek
Mokelumne River
Calaveras River
Mokelumne Aqueduct
Mormon Slough
Little John's Creek
Lone Tree Creek
Delta Mendota Canal
San J oa quin Ri verSta
nislaus River
California Aqueduct
Camanche
Reservoir
New Hogan
Reservoir
Farmington
Flood Control
Reservoir
Woodward
Reservoir
Pardee
Reservoir
Source: California Department of Water Resources

Section 2 Water Resource Background
ABAB 2-5
2.2.1 Delta The Sacramento-San Joaquin Delta covers more than 738,000 acres in five counties and comprises many small islands within a network of canals and natural sloughs. The Sacramento and San Joaquin Rivers come together in the Delta before they flow to the San Francisco Bay and out to the ocean. The Delta is the largest estuary on the west coast and is home to over 750 plant and animal species, many of which are endangered. The Delta provides drinking water for two-thirds of all Californians, and irrigation water for over 7 million acres of highly productive farmland. Rivers in San Joaquin County all flow into the Delta as they flow out to sea.
Table 2-1 provides a summary of the major reservoirs located in and serving San Joaquin County.
Table 2-1 Major Area Reservoirs
River Major Reservoirs Size (ac-ft)
Owning/Operating Agencies
Mokelumne Pardee Res. Camanche Res.
209,900 430,800
East Bay MUD
Calaveras New Hogan Lake 317,000 U.S. Army Corps of Engineers, Stockton East Water District
New Melones Res. 2,400,000 Central Valley Project Beardsley Res. Donnells Res. Tulloch Res.
98,000 64,000 70,000
Oakdale Irrigation District, South San Joaquin Irrigation District
Stanislaus
Goodwin Res. 500 Oakdale Irrigation District, South San Joaquin Irrigation District, Stockton East Water District
Sources: U.S. Department of the Interior, Bureau of Reclamation. Central Valley Project Improvement Act, Draft Programmatic Environmental Impact Statement. Sacramento, CA. California Department of Water Resources. The California Water Plan Update, Bulletin 160-98.
More detailed descriptions of the rivers and the associated facilities are provided in the following sections.
2.2.1.1 Calaveras River The Calaveras River watershed covers 363 square miles and stretches from Stockton east into the Sierra foothills. Flow in the Calaveras is rain driven, with essentially no snowmelt. The U.S. Army Corps of Engineers constructed New Hogan Dam in 1963 for flood control, municipal, industrial and irrigation purposes. New Hogan Lake has a capacity of 317,000 ac-ft and New Hogan Dam is operated by the Corps of Engineers during the flood control periods and SEWD the remainder of the year. SEWD and CCWD have rights to the yield from New Hogan. The current supply available to SEWD is subject to reduction from future demand in CCWD. CCWD currently uses approximately 3,500 ac-ft annually and estimates it will use up to 5,300 ac-ft annually by the year 2040 (Calaveras County Water District, 1996).

Section 2 Water Resource Background
2-6 ABAB
2.2.1.2 Mokelumne River The Mokelumne River has a watershed of approximately 660 square miles stretching from high in the Sierra Nevada westward toward the Delta. Snowmelt comprises a large portion of the river’s flow. The major facilities on the Mokelumne are the Salt Springs Reservoir on the North Fork of the Mokelumne and the Pardee and Camanche Reservoirs on the main channel. Salt Springs Reservoir is a PG&E facility built in 1963 and is operated for hydropower. Pardee and Camanche are both owned by EBMUD. Pardee Reservoir, which is upstream from Camanche, has a capacity of 209,900 ac-ft and is operated for water supply. Pardee water is diverted into the Mokelumne River Aqueducts to the EBMUD service area. Camanche Reservoir, with a capacity of 430,000, is operated for flood control and to meet instream flow requirements. Pardee has a 28 MW hydropower facility, and Camanche has an 11 MW facility (EBMUD, Urban Water Management Plan 2000).
Water rights on the Mokelumne form a complex hierarchy, with water rights held by Woodbridge Irrigation District, Amador County, Calaveras County, EBMUD, and North San Joaquin Water Conservation District. San Joaquin County has a water right application filed for floodflows and yield as part of a Middlebar Reservoir project, which would be just upstream from Pardee Reservoir.
2.2.1.3 Stanislaus River The Stanislaus River drains a watershed of 904 square miles and has an unimpaired runoff of approximately 1 million ac-ft. The majority of the runoff is from November to July, with peak flows typically occurring in summer months. More than half the runoff is snowmelt-derived (USBR, Website, undated). The U.S. Army Corps of Engineers (Corps) constructed New Melones Dam on the Stanislaus River in 1978, replacing the original Old Melones Dam. Old Melones Dam was constructed in 1924 jointly by OID and SSJID, which hold pre-1914 water rights on the Stanislaus River. New Melones Reservoir has a capacity of 2.4 million ac-ft and is operated as part of the CVP. The average runoff at New Melones for the 74 years from 1904 to 1977 was 1.12 million ac-ft.
There are an additional nine reservoirs and two diversion canals upstream from New Melones on the Stanislaus River, including Donnells, Beardsley and Tulloch Reservoirs which were constructed jointly by OID and SSJID and operated by the Tri-Dam Authority (USBR, Website, undated). Tulloch Lake located several miles downstream from New Melones is used to re-regulate releases from New Melones. SSJID, OID and SEWD divert from Goodwin Dam downstream from Tulloch Dam. Water can be diverted by gravity via Goodwin Tunnel to CSJWCD and SEWD. SSJID and OID are the principal users of Stanislaus River water in San Joaquin County. Both SEWD and CSJWCD have CVP contracts for deliveries from New Melones.
2.2.1.4 San Joaquin River The San Joaquin River originates in the Sierra Nevada and enters the San Joaquin Valley at Friant. The lower San Joaquin River is the section of the river from the

Section 2 Water Resource Background
ABAB 2-7
confluence with the Merced River north to Vernalis. The lower San Joaquin River has a drainage area of approximately 13,400 square miles. The majority of the flow in the lower San Joaquin River is derived from inflow from the Merced, Tuolumne and Stanislaus as the upper San Joaquin River contributes very little inflow.
2.2.1.5 Other Rivers Other rivers that have some relevance to discussions on water resources but are not located in San Joaquin County are the Tuolumne River, Cosumnes River and Dry Creek.
The Tuolumne River originates in the Sierra Nevada Mountains and is the largest tributary to the San Joaquin River. It has a watershed of approximately 1,500 square miles and an unimpaired runoff of approximately 1.8 million ac-ft. Flows in the lower reaches of the Tuolumne River are regulated by New Don Pedro Dam, which was constructed in 1971 and is owned by Turlock and Modesto Irrigation Districts. New Don Pedro Reservoir has a capacity of approximately 2 million ac-ft and is operated for irrigation, hydroelectric generation, fish/wildlife protection, recreation, and flood control. Irrigation water is diverted downstream from New Don Pedro at La Grange into the Modesto Main Canal and Turlock Main Canal. The City and County of San Francisco operate several facilities in the upper water of the Tuolumne, namely O’Shaughnessy Dam at Hetch Hetchy Valley, Lake Eleanor and Cherry Lake. These facilities are operated for municipal and industrial supply as well as hydropower.
The Cosumnes River is a tributary of the Mokelumne River. It meets the Mokelumne near the town of Thornton and has a watershed area of approximately 540 miles. Flows are primarily rain/runoff-derived.
Dry Creek is a relatively minor tributary to the Mokelumne River and forms the northern boundary between San Joaquin and Sacramento Counties. The Cosumnes, Dry Creek, Mokelumne and Calaveras Rivers are collectively referred to as the Eastside Streams.
2.2.2 Surface Water Quality Surface water quality for San Joaquin County water sources can be categorized into three geographical water service units, Sierra Nevada rivers and streams, Sacramento-San Joaquin Delta and CVP export water sources.
The Sierra Nevada rivers and streams are generally sources of high water quality, low total dissolved solids (TDS) loads. Reservoir storage on the Mokelumne, Calaveras and Stanislaus River systems helps to reduce solid particulate levels by settlement. During high water or flooding events, TDS levels can increase as the flow volume increases .
The Sacramento-San Joaquin Delta water quality is influenced by Central Valley hydrology and is regulated by the State Water Resources Control Board (SWRCB)

Section 2 Water Resource Background
2-8 ABAB
during the irrigation season for the protection of Delta lands and water rights. Generally, the Sacramento-San Joaquin Delta water quality is best during the winter and spring months as precipitation and snowmelt runoff have the greatest influence on Delta hydrology. Water quality then deteriorates through the irrigation season, when natural flows are lower and urban and irrigation return flows have a greater relative impact.
The San Joaquin River in the southern Delta, in the vicinity of Vernalis in the South Delta Water Agency, experiences periods of severely degraded water quality. The SWRCB has set water quality standards at Vernalis, which are a water right permit condition at New Melones Reservoir on the Stanislaus River for CVP contractors including SEWD and CSJWCD. The water quality in the San Joaquin River is influenced by factors such as hydrologic conditions, reservoir operations, and irrigation practices and irrigation return flows in the San Joaquin River basin. The development of the CVP agriculture along the westside of the San Joaquin basin and the westside drainage flows have significantly increased the salt load to the south Delta. The SWRCB has determined that the actions of the CVP are the principal cause of the salinity concentrations exceeding the objectives at Vernalis. In the southern Delta the hydrodynamics of water flow and water quality barrier placement and operation also significantly influence local water quality.
Many areas of southwest San Joaquin County receive surface water supplies from the CVP through the upper Delta Mendota Canal. The water quality from these sources is directly influenced by daily water quality conditions and standards and by the velocity of SWP and CVP export pumping in the Sacramento-San Joaquin Delta.
2.3 Groundwater Conditions San Joaquin County overlies the northernmost portion of the San Joaquin Valley Groundwater Basin. Within San Joaquin County this basin is further subdivided into three sub-basins - the Eastern San Joaquin County Groundwater Basin (ESJCGB), the Cosumnes, and Tracy, as shown on Figure 2-4. In this report the ESJCGB and the Cosumnes sub-basin, both located on the east side of the Sacramento and San Joaquin Rivers, are treated as one basin. For more information on groundwater conditions, see Technical Memorandum 1, provided in Volume 2 of this document.
2.3.1 Groundwater Flow Patterns and Trends Groundwater has been used for agriculture in the Central Valley since about 1850; before then the groundwater system was in a natural state of hydrologic equilibrium (Williamson, et. al., 1989). Under equilibrium or steady-state conditions, groundwater flowed from the natural recharge areas along the perimeter of the valley towards the low-lying areas along the Sacramento and San Joaquin Rivers. The natural groundwater and surface water discharge was through the Delta westward to San Francisco Bay. Throughout the Central Valley, extensive use of groundwater for irrigated agricultural has caused groundwater levels to decline. DWR in Bulletin 160-98 classified the ESJCGB as in a state of overdraft, stating that in Eastern San Joaquin
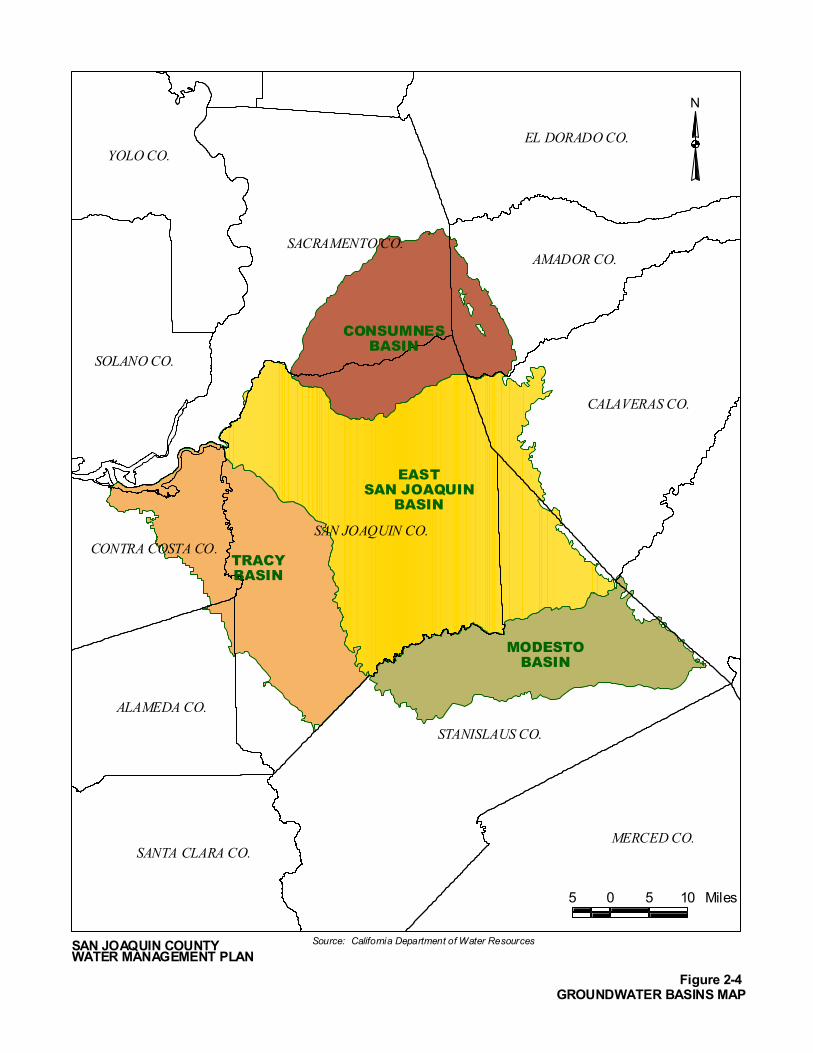
Figure 2-4
GROUNDWATER BASINS MAP
SAN JOAQUIN COUNTYWATER MANAGEMENT PLAN
N
5 0 5 10 Miles
SAN JOAQUIN CO.
MODESTO
BASIN
TRACY
BASIN
EAST
SAN JOAQUIN
BASIN
CONSUMNES
BASIN
EL DORADO CO.
AMADOR CO.
CALAVERAS CO.
SACRAMENTO CO.
YOLO CO.
SOLANO CO.
ALAMEDA CO.
MERCED CO.
STANISLAUS CO.
SANTA CLARA CO.
CONTRA COSTA CO.
Source: California Department of Water Resources

Section 2 Water Resource Background
2-10 ABAB
County“ …groundwater extraction to meet agricultural and urban demands has created two pronounced pumping depressions since the late 1940s and early 1950s.” DWR defined overdraft in Bulletin 118-80 as “the condition of a groundwater basin where the amount of water withdrawn exceeds the amount of water replenishing the basin over a period of time.”
In San Joaquin County the result of the this overdrafting is illustrated by the groundwater depression east of the City of Stockton, as shown on Figure 2-5. Excessive pumping has also resulted in a change in the flow patterns. In general, groundwater flow in ESJCGB now converges on this depression with relatively steep groundwater gradients westward toward the cone of depression and eastward gradients from the Delta area. The eastward flow from the Delta area is significant because of the typically poorer quality water now moving eastward toward Stockton from the Delta and possibly upward from older marine formations. Figure 2-6 shows historical groundwater levels at selected wells in San Joaquin County. These hydrographs clearly illustrate the historical trend of declining water levels in the ESJCGB. In some areas groundwater levels have dropped between 40 to 60 feet over the last 20 to 30 years. There are two areas where groundwater levels have declined over the long term. The main cone of depression is located east of the city of Stockton, where there is a large area with groundwater levels more than 60 feet below sea level. The second cone of depression is north of the Mokelumne River, where water levels are as low as 40 feet below sea level. The second cone of depression is caused by a combination of pumping in San Joaquin County and in Sacramento County. It should be noted that the Stockton urban area has made major investments in facilities to increase surface supplies and reduce reliance on groundwater.


Section 2 Water Resource Background
2-12 ABAB
2.3.2 Groundwater Balance As noted above, irrigated agriculture in the County has historically relied heavily on groundwater. Municipal and industrial use has also increased significantly and is expected to continue to increase in the future. The declining groundwater levels in San Joaquin County illustrate that the basin is in a state of overdraft. More specifically, groundwater withdrawals exceed groundwater replenishment. The result of this overdraft is that the total amount of groundwater available in San Joaquin is being reduced constantly as groundwater is withdrawn from aquifer storage. In the long-term this withdrawal is unsustainable, because there is a finite amount of groundwater in the basin. Before groundwater ‘runs out,’ however, it is likely that the resource will become unusable because of prohibitively high pumping costs or water quality degradation.
An understanding of the sustainable yield of the groundwater basin is required to minimize over-pumping of groundwater. Sustainable yield can be described as the amount of groundwater that can be withdrawn over the long term without causing drawdown or other effects that adversely impact environmental and other values. Sustainable yield is difficult to establish because of the complexity and variability of natural systems. It is not a simple, static number, but rather it is a function of various parameters – some of which are naturally variable and others that are controlled by human actions. For example, if groundwater pumping exceeds the natural replenishment of the aquifer, in addition to the water table dropping, other changes – such as increased leakage from streams or increased lateral inflow—are likely, thereby
Figure 2-6 Decline of Historic and Projected
Groundwater Levels

Section 2 Water Resource Background
ABAB 2-13
increasing the ‘natural’ replenishment of the aquifer and changing the apparent sustainable yield.
In the case of ESJCGB, increased lateral inflow from the west is undesirable, as this water has high TDS/chloride levels and is causing the degradation of water quality in the ESJCGB. Degradation of water quality due to TDS or chloride contamination threatens the long-term sustainability of a very important water resource for San Joaquin County, since water high in TDS and/or chloride is unusable for either urban drinking water needs or for irrigating crops. Damage to the aquifer system could for all practical purposes be irreversible due to saline water intrusion, withdrawal of groundwater from storage, and potentially subsidence and aquifer consolidation.
Table 2-2 presents a simplified groundwater balance for the ESJCGB. The numbers in the table are based on (1970 to 2000) average values.
Table 2-2 Simplified Groundwater Balance for Current Conditions
Groundwater Flow Component Average Value Explanation
Inflows (ac-ft per year)
Deep Percolation/Recharge 608,400 Net infiltration from rainfall, irrigation, canal leakage etc.
Gain from Streams 198,170 Net inflow from streams to groundwater system
Lateral Inflow 98,000 Subsurface inflows
Total Inflows 904,577
Outflows
Groundwater Pumping 867,600 Net agricultural, municipal and industrial pumping
Loss to Streams 108,898 Net outflow from groundwater system to streams
Lateral Outflow 35,300 Subsurface Outf lows
Total Outflows 1,011,815
Groundwater Overdraft Groundwater from Aquifer Storage 107,238 Total Inflows – Total Outflows
Estimated Saline Water
Intrusion 42,000 Lateral Inflow in the Stockton Area
Estimate Total Groundwater Overdraft 150,700 Aquifer Storage Loss + Saline Water
Intrusion
The net overdraft in the ESJCGB is approximately 150,000 ac-ft annually. This is calculated as the amount of groundwater lost from aquifer storage plus the lateral inflow from the Delta area. The lateral inflow from the Delta is part of the overdraft because this inflow is a result of declining water levels and is poor quality water. The depletion of groundwater from aquifer storage is shown on Figure 2-7. From 1970 to 1993, approximately 2,800,000 ac-ft of groundwater was mined.

Section 2 Water Resource Background
2-14 ABAB
A “no-action” or baseline simulation was conducted to predict how current groundwater and surface management practices, projected out to 2030, would impact the groundwater basin. Groundwater modeling conducted for this plan has shown that unless there is a change in how groundwater is used or managed, levels will continue to decline and storage will continue to be reduced. Figure 2-6 illustrates simulated groundwater levels from 2000 to 2030 at selected locations in the ESJCGB. At these locations groundwater levels drop between 10 to 20 feet between 2000 and 2030. Approximately 2 million ac-ft of additional groundwater was depleted from storage by 2030 (Figure 2-7) for a total estimated loss of 5 million ac-ft over the period 1970 to 2030. Figure 2-8 shows the corresponding simulated groundwater table for the year 2030 under baseline conditions. A large portion of the ESJCGB is shown to have groundwater levels 60 to 80 feet below sea level.
Further exacerbating the groundwater conditions, as already mentioned, is the lateral inflow of higher salinity water from the west, which could render parts of the aquifer unusable. Figure 2-9 illustrates the approximate present location of the 300 mg/l chloride concentration line. Groundwater modeling has indicated that the rate of eastward movement of this line is approximately 150 to 250 feet per year. Figure 2-9 also shows the projected location of the 300 mg/l chloride concentration line by the year 2030 under no-action conditions.
Groundwater modeling conducted for this plan has shown that unless there is a change in how groundwater is used or managed, levels will continue to decline.
Figure 2-7

#
#
#
#
#
#
#
"!- 30
"!- 20
"!- 10
"!0"!10
"!20
"!30
"!40
"!50
"!80
"!70
"!60"!50
"!40
"!30"!20"!10"!0"!- 10
"!- 20
"!- 30
"!- 40
"!- 50
"!- 60
"!- 70
"!- 80
"!-90
"!-80
"!- 70
"!- 60
"!- 50
"!- 40
"!-40
Figure 2-8
SIMULATED GROUNDWATER TABLE
CONTOUR MAP FOR 2030
SAN JOAQUIN COUNTY
WATER MANAGEMENT PLAN
N
5 0 5 Miles
Woodward
Reservoir
Farmington
Flood Control
Reservoir
New Hogan
Reservoir
Camanche
Reservoir
Pardee
Reservoir
River
Stanis
laus
Littlejohn's Creek
Morm
on Slough
Cala
ver
as
River
Mokel
um
ne A
queduct
M
okelum ne R
iver
Dry
Cre
ek
Ri v
er
San
Jo
aq
uin
California Aqued
uct
Delta
Mend
ota C
ana
l
Escalon
RiponTracy
Manteca
Lathrop
Stockton
Lodi
Groundwater Table Elevation Contours (Feet, MSL)10
LEGEND
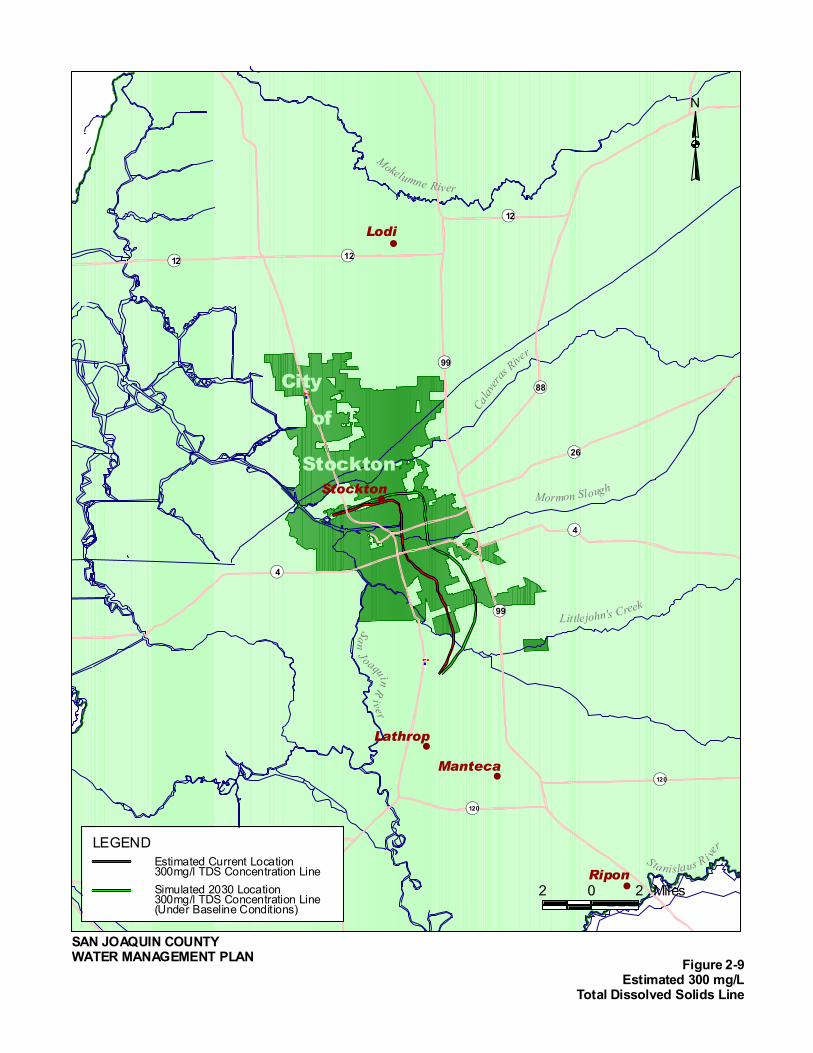
#
#
#
#
#
#
.-,5
.-,5
"!99
"!88
"!26
"!4
"!99
"!4
"!120
"!120
"!12
"!12
"!12
Figure 2-9
Estimated 300 mg/L
Total Dissolved Solids Line
SAN JOAQUIN COUNTY
WATER MANAGEMENT PLAN
N
2 0 2 Miles
Lathrop
Manteca
Stockton
Lodi
LEGENDEstimated Current Location300mg/l TDS Concentration LineSimulated 2030 Location300mg/l TDS Concentration Line(Under Baseline Conditions)
City
Stockton
of
Ripon
Mokelumne River
Calav
eras
River
Mormon Slough
Littlejohn's Creek
San J oaquin Riv er
S ta nislaus R i ver

Section 2 Water Resource Background
ABAB 2-17
In other portions of California’s Central Valley, declining groundwater levels have also resulted in land subsidence. Generally, this is not a widespread problem in the ESJCGB, but may be a localized issue in some areas.
In summary, current groundwater pumping exceeds natural replenishment and in the long term is unsustainable. Continued overpumping will continue to cause declining groundwater levels and migration of poorer quality water into the basin, resulting in potentially irreversible damage to San Joaquin County’s most valuable water resource.
2.4 Demands and Supplies This water management plan seeks to meet San Joaquin County’s future demands, while preserving the viability of San Joaquin County’s groundwater supply. By 2030, the current San Joaquin County population of about 580,000 is projected to increase 83 percent, to about 1,060,000.1 Most of this population expansion will be in urban areas due to an influx of Bay Area residents seeking more affordable housing. Growth is expected primarily along the western edge of San Joaquin County, in areas with easier access to the Bay Area. This growth will result in a change in land use patterns, which was projected to estimate future demands (Section 2.4.1). Future urban and agricultural demands were compared with available supplies to lay out the County’s future needs (Section 2.4.2). For additional information on demand and supply projections, see Technical Memorandum 1, which is provided in Volume 2 of this document.
2.4.1 Demands The majority of the land within the County is currently being used for agricultural or urban uses, and very little is undeveloped. Future urban development under current development patterns would require that agricultural land be taken out of service and converted to urban uses. Changes in urban and agricultural demand were projected assuming that land within each city’s sphere of influence will be converted to urban use. The sphere of influence bounds the area surrounding the existing city that will be annexed into the city limits in the future to provide area for urban growth. The spheres of influence within the County were updated in 2000 in the County’s General Plan Update, and they reflect anticipated future buildout.
Urban Demands Because water use per acre varies by city, water use per acre was determined for each city, as shown in Table 2-3. The area for each city was determined from DWR land use maps for San Joaquin County in 1996. The figures in Table 2-3 indicate that the total 1996 urban demand was 94,500 ac-ft annually, which is projected to increase by 146,000 ac-ft to 241,100 ac-ft annually by 2030.
1 State of California, Department of Finance, County Population Projections with Race/Ethnic Detail. Sacramento, CA, December 1998. Accessed on August 24, 2000 from website: http://www.dof.ca.gov/html/Demograp/Proj_race.htm.

Section 2 Water Resource Background
2-18 ABAB
Table 2-3
Future Urban Water Demands
City Current
Water Use (ac-ft)
Current Land Use
(acres)
Water Use/ Acre (ac-
ft/ac)
Future Land Use
(acres)
Future Water
Demand (ac-ft)
Net Increase in
Demand (ac-ft)
Escalon 1,400 932 1.5 2,106 3,200 1,800
Lathrop 1 2,900 3,409 0.85 13,254 11,300 8,400
Lodi 16,600 6,071 2.7 9,650 26,400 9,800
Manteca 11,2000 5,056 2.2 14,140 31,300 20,100
Ripon 3,500 1,764 2.0 6,676 13,200 9,700
Stockton 2 47,000 29,746 1.6 61,353 96,900 49,900
Tracy 11,900 6,388 1.9 31,570 58,800 46,900
Total 94,500 241,100 146,600
Sources: Technical Memorandum No. 1 (Volume 2)
Note 1: Lathrop water use per acre is lower than the remainder of the cities because their developments are less dense than other cities. The city’s future projections indicate that their water use per acre will increase to 1.4 ac-ft/ac. To maintain consistency, the water use per acre has been calculated as if it will stay the same over time. It is difficult to predict how development patterns will change, and the error that could be associated with this assumption is less than 0.5 percent of the future County demand.
Note 2: The demand for the city of Stockton only reflects the water use within city limits. Water providers for the Stockton area also provide significant water to the urban areas outside of the city limits. Total water deliveries for the Stockton urban area are approximately 62,000 ac-ft.
Agricultural Demands Table 2-4 illustrates the current agricultural demand by water district based on 1997 land use data. The data showed total annual San Joaquin County agricultural demand to be approximately 1,522,000 ac-ft, of which 954,000 ac-ft was in the eastern portion of the County.
This plan assumes that agricultural land will remain in production, except within city spheres of influence where urban conversion is projected to take place. This plan further assumes that agricultural crop mixes will not change drastically. Agricultural demands are projected to decrease because the areas cultivated within the cities’ spheres of influence will no longer be farmed. As shown on Table 2-4, the decrease in agricultural demand within city’s sphere of influence is estimated to be 132,000 ac-ft. With this decrease, the projected agricultural demand in 2030 is estimated to be 1,390,000 ac-ft per year.
Table 2-4 reflects the demand for applied water, which includes both consumptive use (water utilized by crops or people) and remaining water that is either lost or returns

Section 2 Water Resource Background
ABAB 2-19
to groundwater or surface water. The applied water demand is the information necessary for the groundwater model, which also takes into account the differences in consumptive use for each parcel of land. Urban areas have different consumptive use than agricultural areas, and consumptive use also varies between different types of crops.
The applied water demand represents the on-farm demand for water, and does not include conveyance losses or off-farm demands (such as riparian vegetation). Therefore, the applied water demand will usually be less than the diversion amounts maintained by each district.
Table 2-4
Estimated 1996 and Projected Agricultural Water Demands (Applied Water Requirement under Average Conditions)
District / Area (within San Joaquin County only)
1996 Estimated Applied Water Requirement
2030 Projected Applied Water Requirement
North Delta Water Agency 37,244 37,244 Central Delta Water Agency 209,622 209,622
South Delta Water Agency 206,759 206,759 West Side 17,205 17,205
City of Tracy 34,192 - Banta-Carbona 42,585 42,585
Lathrop 21,225 - South Delta Area (Total) 321,966 266,549 Del Puerto WD 15,529 15,529 Plain View WD 11,217 11,217 North San Joaquin WCD 88,022 88,022 Woodbridge ID 102,517 102,517 Lodi 5,124 -
Stockton East WD 151,210 151,210 Stockton 38,701 -
SEWD (Total) 189,911 151,210 Central San Joaquin WCD 159,554 159,554 Oakdale ID 48,391 48,391
South San Joaquin ID 126,709 126,709 Manteca 21,663 - Escalon 1,761 -
Ripon 9,508 - SSJID (Total) 159,641 126,709 Unincorporated Areas 173,390 173,390
TOTAL 1,522,128 1,389,954 Notes:
1. This table was modified based on comments received on the Draft SJCWMP. It was compiled from the DWR land use information linked to Private, State and Federal water district outlines in a GIS system. There are significant areas of overlap between city limits, spheres of influence, and between water districts themselves. Bearing this in mind, there are bound to be variations and differences between these estimates and those compiled using different methodology.
2. The figures in this table represent theoretical applied water requirements for average conditions. The quantity of water actually pumped, diverted and applied will be significantly different due to a variety of factors including distribution system inefficiencies and losses (typically ranging from 10 to 20 percent), climate, soil conditions, etc.
3. The loss of agricultural land to urban expansion is illustrated by the reduction in agricultural acreage currently located within urban spheres of influence. The urban areas and urban spheres of influence agricultural land are phased out completely by 2030. Other changes are likely to impact water demand, such changes in cropping patterns, irrigation methods, and farming of previously vacant land. However, these changes have not been quantitified in any systematic or reliable basis.

Section 2 Water Resource Background
2-20 ABAB
The decrease of 132,000 ac-ft of agricultural water use can be compared to an increase in urban water use of 146,000 ac-ft. In terms of net demand, this is not a significant change. This similarity in demand is due to an approximate one-to-one conversion rate between urban and agricultural use for each acre. The usage rates for agricultural and urban water use are similar, with urban water use slightly higher per acre. Most land around urban areas is currently farmed; thus, in order for the urban areas to expand, agricultural land would be converted at an approximate one-to-one ratio. Because each acre of new urban land results in 1 less acre of agricultural land, and the water use figures are similar, the water demands are projected to remain essentially constant throughout the planning period.
As noted above, the demand projections for agricultural and urban use were developed using the following assumptions:
n Agricultural cropping patterns will not change significantly. The analysis uses 1996 agricultural data, and some practices have already changed; however, these changes are within an acceptable margin of error for a planning-level document.
n No major changes will occur, such as new technology that dramatically alters water use.
n Countywide urban development practices will not change significantly. The County’s 2010 General Plan update calls for increased urban densities to allow population increases in urban areas without developing agricultural land. Development according to this guideline has yet to gain market acceptance and widespread application in the County. However, current development patterns, and their associated average unit water usage rates, are assumed to apply in the future. If a trend toward increasing urban density takes hold in the County, the projected urban water use amounts shown here will require revisiting, as urban land conversion will no longer result in a one-to-one decrease in agricultural demand.
n Local urban development practices will result in new developments with similar water use rate. Water use figures were calculated for each individual urban area, and these figures were applied to future development. This assumption was made because each urban area has a unique unit water use rate based upon local factors, such as amounts of open space and conservation practices.
n The urban spheres of influence reflect 2030 development. The urban spheres reflect the local plans for where expansion could occur in the future, but it is possible that the development will occur in different areas, or in different amounts than predicted. The State Department of Finance predicts future populations; the projected 2030 population can fit within the spheres at current urban densities.
These assumptions simplify the process of predicting future water demands. Using these assumptions does not imply that other changes are not likely, nor are the

Section 2 Water Resource Background
ABAB 2-21
assumptions intended to discourage implementation of structural or policy changes that improve water use efficiency. However, potential changes have not been quantitified and therefore incorporating them into the water demand projection at this stage would not necessarily result in more accurate estimates.
2.4.2 Supplies Surface Water Supplies Water supplies in the County are in high demand and are subject to a complex system of riparian, appropriative rights and water service contracts. Table 2-5 provides a synopsis of the major water rights and contracts held by San Joaquin County water agencies. It is estimated that San Joaquin County has approximately 1 million ac-ft to 1.2 million ac-ft of surface water available on a yearly basis. This amount includes approximately 500,000 ac-ft of water that is pumped from the Delta by farmers in the south and central Delta.
The actual quantity of water delivered varies significantly from year to year due to contractual and water rights nuances. The actual quantities utilized within San Joaquin County also varies significantly due to climatic conditions, infrastructure limitations and facility operation. For example, although SEWD has an interim contract with USBR for 75,000 ac-ft per year from New Melones Reservoir, this full quantity has yet to be made available to SEWD.
Surface water supplies are likely to decrease in the future. As shown in Table 2-5, there are several current contracts for “interim” supplies, which are available subject to requirements of upstream or senior rights holders. As development increases in upstream areas with senior water rights, San Joaquin County’s surface water supplies will be reduced.

Section 2 Water Resource Background
2-22 ABAB
Table 2-5
Summary of Current Water Rights and Contracts1 District/Agency Source
River/Reservoir Wet Year Quantity
Dry Year Quantity Comments
56,500 57,000 Firm, dry2 Calaveras/ New Hogan 27,000 27,000
Estimated unused portion of CCWDs 43,500 af allocation.
SEWD
Stanislaus/ New Melones
75,000 Less than 75,000
Interim, subject to other users requirements
60,000
39,000 Firm WID Mokelumne/
Camanche See note3 0 Nonfirm
NSJWCD Mokelumne/ Camanche
20,000 0 Wet, subject to future EBMUD requirements
CSJWCD Stanislaus/ New Melones 80,000 Less than
80,000
49,000 af firm supply, 31,000 af interim supply that is subject to other user’s requirements
SSJID/OID Stanislaus/ New Melones 320,000
Less than 320,000, subject to storage &
inflows
Estimated use in County. SSJID/OID have total right to 600,000 ac-ft.4
CDWA Delta 226,000 226,000
SDWA Delta 225,000 225,000
Estimated based on current demand. CVP-SWP Delta Standards
10,000 10,000 City of Tracy Delta Mendota Canal 7,500 7,500
Contract. CVP, Tracy PP/DMC
San Joaquin River 30,000 30,000 Dependent on flow West Side ID CVP 7,500 7,500 CVP Contract
Plain View WD Delta Mendota Canal
21,000 21,000 Contract. CVP, Tracy PP/DMC
Delta Mendota Canal
25,000 25,000 Contract Banta-Carbona WD San Joaquin River 30,000 30,000 Depends on flow
Hospital WD Delta Mendota Canal
34,000 34,000 Contract. CVP, Tracy PP/DMC
Notes
1. The figures in this table are not necessarily authoritative and are provided for general information purposes only. The actual quantity of water available from year to year and the quantity that is actually used vary si gnificantly.
2. New Hogan Reservoir has an estimated yield of 100,000 ac-ft per year. SEWD has a right to 56.5 percent of the yield, and Calaveras County Water District rights to the remaining 43.5 percent. CCWD currently uses approximately 3,500 ac-ft of its allocation, and riparian demand is 13,000 ac-ft. Based on an agreement between CCWD and SEWD, SEWD currently has use of the unused portion of CCWD’s allocation.
3. Under the WID-EBMUD water right settlement agreement, 60,000 ac-ft per year is the firm portion of the Woodbridge Irrigation District Water Rights [i.e., its pre-1914 rights and rights acquired under License 5945 and 8214 (Applications 5807 and 10249, respectively)]. The 60,000 ac-ft is the minimum amount available to WID during any year when the inflow to Pardee Reservoir is greater than 375,000 ac-ft. When the Pardee inflow is less than 375,000 ac-ft, the minimum amount available to WID is 39,000 ac-ft. WID is entitled to divert water in excess of the 60,000 ac-ft under the priority of its water right licenses when such water is available at WID’s point of diversion and is surplus to EMBUD’s downstream commitments under the Joint Settlement Agreement.
4. During years when OID receives its full allotment, 300,000 ac-ft of the joint OID-SSJID 600,000 ac-ft water right is available. In years when the full allotment is not available, the amount is less than 300,000 ac-ft and is based on a formula which is part of the agreement with USBR.

Section 2 Water Resource Background
ABAB 2-23
Groundwater Supplies Groundwater pumping quantities in San Joaquin County are not recorded at the water district or county level. Consequently, an accurate assessment of the quantity of groundwater used is difficult to establish. The approach adopted by DWR and other agencies to estimate groundwater withdrawals is based on land use and population. Using a similar approach with groundwater modeling, CDM estimated that the total agricultural and municipal groundwater pumping in eastern San Joaquin County has averaged 870,000 ac-ft per year over the last 20 to 30 years. Because the use of groundwater is not governed by the SWRCB and there is no system of groundwater rights, users need not apply for rights before extracting groundwater.
2.4.3 Demand and Supply Summary Countywide water demands are projected to increase slightly, from 1,617,000 ac-ft per year to 1,631,000 ac-ft per year. The County’s urban population will increase in the future, which will likely result in an increase in urban land and water use. The new
urban land area will come from the conversion of land that is currently in agricultural production. As urban water use increases, agricultural land will go out of production and agricultural water use will decrease. Urban water use is slightly higher per acre, so the newly urbanized areas will have slightly higher water demand after they convert from agricultural acres. Figure 2-10 illustrates this change in the expected composition of demand into the future. Although water demand is projected to increase only moderately, the reliability of the existing and new supplies will
become more important. Future demand is not anticipated to change significantly between the four regions of the County. Figure 2-11 illustrates the regional distribution of these projected demands.
Figure 2-10 Change in Future Water Demand

Section 2 Water Resource Background
2-24 ABAB
Currently, where demands are not satisfied by available surface water supplies, groundwater is used to make up the difference. Continued groundwater use practices are projected to result in declining groundwater levels, loss of storage and decreasing groundwater quality. Surface water supplies in some areas of the County offer neither reliable deliveries nor high quality. New water options must be examined to meet the County’s future needs. Section 3 describes possible future options for meeting the County’s needs.
Figure 2-11
Regional Distribution of Current and Future Water Demand

ABAB 3-1
Section 3 Water Management Options
3.1 Overview Water Management Options were identified to address the problems found in different regions of the County. An option, in the context of this plan, is defined as a project, program or policy that could be implemented to help meet the County’s needs in the future. The technical team compiled options through technical reconnaissance of the County, as well as discussions with stakeholders and examination of past reports. The water management options considered range from development of new surface water options to demand reduction and nonstructural approaches. Groundwater options and other options that address regional issues are also included.
3.2 Surface Water Options As demonstrated in Section 2, meeting future water demands in San Joaquin County requires new water supplies. New water supplies could be obtained from either new surface sources or changing the manner in which existing supplies are currently utilized.
3.2.1 New Surface Water Rights or Contracts Surface water supplies are finite, and the opportunities to obtain new surface water rights within California are limited. Most of the rivers in the region are considered fully developed, and several are classified by the State Water Resources Control Board (SWRCB) as fully appropriated. Nevertheless, there are some opportunities to obtain new water rights, or to obtain firm or interim water service contracts. New surface water could also be developed by exercising area-of-origin protections on waterways that are utilized by State or Federal projects.
3.2.2 Wet Year/Floodflows Wet-year water or floodflows are defined as releases made from reservoir/storage that are in excess of storage capacity, or made to maintain adequate storage capacity for storm/runoff events. It is assumed that the floodflows are also in excess of downstream requirements. Figure 3-1 illustrates the magnitudes of floodflows on several rivers within the County. Floodflows are addressed separately from new surface water rights because they are significantly more complicated to utilize and present different economic and technical challenges. Many of the rivers and streams that flow through San Joaquin County have wet-year flows that are generally unappropriated. A major challenge when utilizing floodflows is that the majority of this water typically flows through the river at one time, so a method to capture and store the water must be developed. These options usually include reliance on a regulating reservoir or use of existing surface storage.

Section 3 Water Management Options
3-2 ABAB
3.2.3 Water Transfers Opportunities exist to make more extensive use of existing surface water contracts within San Joaquin County. The reason for this is twofold. First, not all surface water rights or contracts within San Joaquin County are fully utilized. Second, in some areas, although the rights are being utilized, investment in additional infrastructure would result in increased efficiency and allow transfer or sale of water to other users. In these situations, the agency with the existing water right or contract can sell water to other entities, either as a short-term or long-term agreement. Generally, agencies with senior surface water rights are not over the groundwater depression, so transferring the water allows the water to be used in other areas where use of surface supplies could replace the use of groundwater.
3.2.4 Reoperation of Existing Facilities Existing reservoirs could be reoperated to increase their water supply benefits. Because reservoirs are typically operated to provide multiple benefits such as flood control, hydropower, water supply, temperature control and recreation, changing the mode of operation could impact the system’s other benefits. For example, the flood control capacity of a reservoir could be decreased, which would allow more yield for water supply. This action, however, would lead to increased risk of downstream flooding.
Another potential method of reoperating reservoirs is to utilize nearby groundwater storage in conjunction with the surface water storage. Instead of leaving water in the reservoir for carryover storage, the water would be stored in the groundwater aquifer. The water would still be in storage, but there would be additional capacity left in the
Figure 3-1 Magnitude of Flood Flows for San Joaquin County Rivers

Section 3 Water Management Options
ABAB 3-3
reservoir to capture flows during the wet season. In dry years, very little water would be available from the reservoir, but the stored groundwater could be used for supply.
3.3 Groundwater Recharge Options Once potential sources of water are identified, the water needs to be ‘used’ in such a way that the quantity or quality of San Joaquin County’s water supply is improved. New water supplies can be recharged to the groundwater basin. This would serve to provide additional water for users when other sources, such as surface water, are not available. Recharging the groundwater basin would also replenish the overdrafted groundwater basin, which could minimize groundwater quality degradation due to lateral inflow of saline water in the long term. This could be achieved in a variety of ways that are discussed below and summarized in Table 3-1.
3.3.1 Direct Recharge to Groundwater Direct recharge facilities include areas where water is ponded to slowly seep through the ground into the groundwater aquifer. Direct recharge can be accomplished using several techniques, as described below.
Field Flooding Agricultural areas not used in winter months could be flooded with available surface water supplies to recharge the groundwater. In general, this option could be used in fields with permeable soils and no impediments to vertical flow (such as clay/silt lenses or hardpan), or where these impediments are shallow enough that they could be ripped (heavy equipment would dig holes through the impermeable layer to allow percolation). Field flooding is not effective in vineyards and orchards, but does work well on row crops. There could be additional environmental benefits to this approach, such as providing habitats for migrating waterfowl.
Spreading Basins and Recharge Ponds Unlike field flooding, spreading basins or recharge ponds are dedicated facilities constructed to recharge specific quantities of water. Spreading basins are constructed in permeable areas and consist of relatively shallow basins, which are excavated to a depth of several feet. If present, shallow fine-grained sediment, hardpan or clay may be excavated to provide more favorable recharge conditions in recharge ponds.
Recharge Pits A recharge pit is similar to a spreading basin or recharge pond but is generally deeper and may be located in an existing natural or manmade depression such as a gravel quarry. A recharge pit may be a better alternative to spreading basins if substantial shallow fine-grained or impervious material requiring excavation is present.

Section 3 Water Management Options
3-4 ABAB
Canals In addition to basins and pits, canals can be constructed to both convey water from one place to another and provide groundwater recharge. Canals are most commonly used only to convey water, so the surfaces are compacted or lined to prevent recharge. An unlined canal with a large surface area could also serve as a recharge facility.
3.3.2 Injection Wells Injection wells pump water directly into the groundwater aquifer. Injecting water into the aquifer system is an effective option for providing hydraulic control in well-defined hydrogeologic and hydraulic conditions. Injection wells are often used in coastal settings to create a hydraulic barrier to seawater intrusion or migration into a freshwater basin. More complex dual injection/extraction well systems can be used for aquifer storage and recovery (ASR) projects. Although injection is probably not a feasible option for large-scale recharge for both technical and economic reasons, it may be a feasible option for localized control of salinity or water quality problems in conjunction with other groundwater recharge options.
3.3.3 In-lieu Recharge In-lieu recharge means using surface water in place of groundwater, thereby reducing net groundwater pumping and allowing more natural recharge. Surface water could be substituted for groundwater in both urban and agricultural settings in the County.
Agricultural In-lieu Agricultural in-lieu recharge offers significant opportunities within San Joaquin County because agricultural areas overlie much of the groundwater depression areas. Providing surface water to agricultural users provides additional benefit because it results in passive recharge from unlined canals and deep percolation from fields. Agricultural in-lieu often requires storage of some type because water is typically available during the winter, but it must be delivered during the irrigation seaseon.
To successfully implement agricultural in-lieu, the existing conveyance system would probably need to be expanded. Limited capacity exists, but there is a large area of farmland over the depression that is not accessible with the current conveyance system.
Farmers usually have one irrigation system that utilizes either surface water or groundwater. If in-lieu recharge is implemented, farms will need to be irrigated with

Section 3 Water Management Options
ABAB 3-5
surface water in some years, and groundwater during dry years when surface water is unavailable. On-farm improvements to create dual irrigation systems are necessary for agricultural in-lieu recharge to be effective.
Urban In-lieu Urban in-lieu has an advantage over agricultural in-lieu because urban areas typically have water distribution systems necessary for either groundwater or surface systems in place. Supplying surface water to urban areas may require the construction of transmission systems from the source to the urban area.
Table 3-1
Groundwater Option Comparisons Recharge Method
Infrastructure
Land Requirements
Effectiveness
Operation/ Maintenance
Direct Recharge: Field Flooding
Uses Existing Infrastructure
Uses seasonally fallow areas
Low effectiveness and only available
seasonally
Requires close co-operation between
Owners/WD/ County
Direct Recharge: Spreading Basins
New Infrastructure
Requires relatively large
dedicated areas
Potentially effective, requires detailed field
testing
Significant WD/county effort
Direct Recharge: Recharge Pit
New Infrastructure
Requires dedicated areas
Potentially effective, requires detailed field
testing
Significant WD/county effort
Injection: Injection Wells
New Infrastructure
Requires dedicated areas
Potentially effective in localized areas,
requires detailed field testing
Significant water district/county effort
In-lieu: surface water in-lieu of groundwater
New / Or Existing
Infrastructure
Little if any new area
Very Effective Additional effort required by owner/WD
3.3.4 Groundwater Banking The groundwater depletion has created a potential reservoir of storage underground in the County. It is possible to implement a groundwater banking program, which would store water underground during wet years, and utilize that storage during dry years. Any of the above recharge methods could be used to recharge water.
Groundwater banking could be implemented by County interests, where the County would secure a surface water source, recharge the water, and then use the water in-County during dry years. Another option is to partner with a third party, who would provide the surface water source, help finance the infrastructure improvements, and receive a portion of the water during dry years.

Section 3 Water Management Options
3-6 ABAB
3.4 Other Options A variety of nonstructural options could also be implemented to either reduce demand or increase supply. These are discussed briefly in the next sections.
3.4.1 Water Reclamation Water reclamation or water reuse is the retreatment of water that has been used previously as potable supply. Urban wastewater is typically discharged to an area waterway, which then flows into the ocean. Instead of discharging this water, it can be used for irrigation or non-potable uses. Reclaimed water can also undergo additional treatment and be blended with new surface water in storage for future potable use.
3.4.2 Water Conservation Development of new surface water supplies is increasingly difficult. There are fewer and fewer water sources that can be developed economically with minimal environmental and social impacts. Reducing demand can play a key role in long-term planning and management of water resources. It reduces the need for new water supply projects, often at relatively low cost, and assists in making wise use of the available supplies.
Urban Water Conservation The experience of active urban water conservation programs in California is that the potential water savings are about 10 to 20 percent of the volume of water used. Such programs typically include distribution system leak-reduction programs, household metering, tiered pricing to discourage high use, education of school children and the public and market-enforced transition to water-saving household plumbing devices.
Agricultural Water Conservation In agricultural production, the amount of water that each plant needs cannot be
conserved. The greatest potential for agricultural water conservation relates mainly to the use of more water-efficient irrigation technologies. Increasing irrigation efficiency decreases the amount of water that is lost to the system, or leaves the site through surface water runoff or deep percolation to groundwater.
For tree crops and viticulture, there is a potential to conserve water through the introduction of drip irrigation. There is also a potential for new technology to
increase the efficiency of existing irrigation types. One example project, developed

Section 3 Water Management Options
ABAB 3-7
recently for wine grapes, found that less water could be used to produce a better grape if evapotranspiration monitoring equipment was used to time irrigation (Pritchard, 2001). Similar technological advances could result in agricultural conservation for other crops.
3.4.3 Political Support for Other Negotiations Some areas of the County have problems or issues that cannot be solved by County agencies or entities. Examples of these problems include unreliable CVP supplies or low water levels in the south Delta. Although the County cannot independently solve these problems, it can lend united political support to help the areas in their negotiations with State and Federal agencies.

ABAB 4-1
Section 4 The Planning Process Solving San Joaquin County’s multifaceted water issues will require significant political and financial support. The most effective way to obtain this support is for the stakeholders to work in a cooperative manner to provide integrated solutions that benefit the County as a whole. Support for plan implementation, and future decision-making regarding County resources, will benefit from a continuing process that incorporates the contributions of stakeholders. The San Joaquin County Water Management Plan is the first step in building this process.
Figure 4-1 shows the planning process used for development of the Water Management Plan. The planning process included the technical development,
grouping and evaluation of Water Management Options according to the set of goals and objectives developed for the County. The Steering Committee participated actively in these steps, offering guidance and feedback to the technical team. The Steering Committee’s specific local expertise helped focus planning around those factors most important for the County. This section documents the steps undertaken by the Steering Committee to create the SJCWMP.
4.1 Stakeholder Involvement Development of the Water Management Plan centers around the involvement of over 20 representatives of agricultural and urban water organizations. (See Section 1 for Steering Committee Members.) These stakeholders participated in SJCWMP development through a process featuring interactive group workshops and individual meetings with the technical team members. To provide direction for the technical team during the process, and to account for the variety of concerns held by these stakeholders, the Steering Committee established goals and
objectives for the Plan at the beginning of the process. These goals and objectives are shown on Figure 4-2, at the end of this section. To select the Water Management Options (WMOs) that will be studied and developed further as part of the next planning phase, the Steering Committee’s evaluation examined how well the WMOs met these objectives.
4.2 Initial Options The previous section identifies categories of options that have potential to help address water management issues in various regions of the County. The technical team compiled an initial set of options within the surface and groundwater categories. The team then identified appropriate locations for these initial options, matching area or site characteristics with the corresponding methods and benefits that created
Figure 4-1 Planning Process
Section 4 The Planning Process
4-2 ABAB
matches between needed site characteristics and attainable local benefits, to create an expanded list of specific options. Some examples of these initial options were direct recharge in North San Joaquin Water Conservation District (to recharge groundwater), reoperating New Hogan Dam (to provide additional surface water) and providing political support for activities to help the Delta.
4.3 Option Screening After the expanded list of initial options was compiled, the options were screened to narrow the list to those options that would be considered feasible and would help to address water management issues in the four regions of the County. All water management options initially considered as part of this study were screened according to seven criteria:
n Cost ($/ac-ft): Estimated cost of water per ac-ft, including new or improved water supply, delivery, distribution or treatment infrastructure for project implementation.
n Legal Feasibility: Legally implementable by County interests, including ease of obtaining necessary regulatory permit and potential legal challenges.
n Political Feasibility: Political controversy, both within the County and outside the County.
n Financial Feasibility: Potential for out-of-County funding through grants or project partners and impacts of costs on local communities.
n Environmental Impacts: Likely environmental impacts from implementing projects.
n Water Quality: Potential to improve or degrade water quality of County interests.
n Benefits: Potential to improve the problems within various regions of the County.
The projects or options that were not likely to perform acceptably according to all the screening criteria were removed from further technical evaluation. Technical Memorandum No. 3, in Volume II of this report, contains the complete list of initial options before screening, as well as a detailed description of the screening process.
4.4 Option Combinations Many of the initial options described portions of water management projects, but could not be implemented independently. For example, the option including direct recharge in North San Joaquin Water Conservation District could not be implemented without including an option that would provide a water supply and conveyance for the water supply to reach the direct recharge sites.

Section 4 The Planning Process
ABAB 4-3
The initial options were grouped together into Water Management Options (WMOs) to clearly illustrate the links between options. A WMO contains all the elements necessary to implement a project. For example, the “New Hogan Reoperation” WMO combines a surface water supply (reoperating New Hogan reservoir) with an existing conveyance system and a groundwater recharge option (in-lieu recharge in Stockton East Water District).
4.5 Alternative Creation The WMOs were combined to create three alternatives to address the County’s water management issues and meet stakeholder goals and objectives. Stakeholders then revised these alternatives during a Steering Committee Meeting. Each of the resulting alternatives included several WMOs. There were many common elements among the alternatives, and the differences between the alternatives were minor. The Steering Committee decided to pursue development of a “Master Alternative” rather than carrying out an analysis of several very similar alternatives.
The Master Alternative contains all WMOs from the original alternatives because each WMO has implementation merit over the 30-year life of the plan. Carrying forward all the feasible WMOs provides the Master Alternative greater flexibility to move forward in the most positive direction. In the next phase of study, some options that appear to be easily implementable may prove to be less desirable, and a different WMO, kept “alive” as part of the Master Alternative, could be selected for implementation instead. Table 4-1 shows the WMOs within the Master Alternative, and the options that were combined to create each WMO.
The WMOs within the Master Alternative were prioritized to indicate which options should be pursued first, and this evaluation was performed using the goals and objectives established at the beginning of the process.

Section 4 The Planning Process
4-4 ABAB
Table 4-1 Water Management Options in the Master Alternative
Option Name Option Type Location Wet-year flows Stanislaus River, stored in New
Melones Exercise New Melones Rights
In-lieu recharge SEWD, City of Stockton, CSJWCD
Water transfer Mokelumne River water from WID
WID Transfer to SEWD and the City of Stockton
In-lieu recharge City of Stockton and SEWD Reoperation of existing facilities New Hogan Reservoir New Hogan Reoperation In-lieu recharge SEWD Wet-year flows Littlejohns Creek Farmington Groundwater
Recharge and Wetlands Project Direct recharge (field flooding) SEWD, NSJWCD, CSJWCD Water transfer Stanislaus River water from
SSJID/OID SSJID/OID Transfer to SEWD
In-lieu recharge City of Stockton Water transfer Stanislaus River water from
SSJID South County Water Supply Project
In-lieu recharge Cities of Escalon, Lathrop, Manteca, and Tracy
New surface water rights San Joaquin River, in the Delta Stockton Delta Diversion In-lieu recharge City of Stockton
Urban Water Conservation Improvements
Urban water conservation Cities within the County
Delta Area Water Supply Activities
Political Support Delta area
Southwest County Water Supply Activities
Political Support Southwest County
New surface water rights Mokelumne River for NSJWCD NSJWCD water right for direct recharge Direct recharge (spreading
basins) NSJWCD
Agricultural Water Conservation Improvements
Agricultural water conservation Agricultural areas within the County
New surface water rights or contracts
Sacramento River
In-lieu recharge NSJWCD, SEWD
Freeport Diversion
Direct recharge (field flooding) NSJWCD, SEWD Water reclamation Cities within the County Urban Wastewater Reclamation Injection wells City of Stockton Floodflows Mokelumne River Floodflows to Middlebar
Reservoir In-lieu recharge NSJWCD, SEWD Floodflows Stanislaus and Calaveras Rivers Floodflows to South Gulch
Reservoir In-lieu recharge CSJWCD, SEWD American River Water Rights Floodflows American River
4.6 Evaluation Methodology To select a set of WMOs for further study in the next phase of the plan, the Steering Committee prioritized the Master Alternative options to identify a path for the County to follow. This evaluation used a tiered system to prioritize the WMOs:
n Tier I elements are those that appear to perform well according to the objectives and should be included as high priorities for implementation.

Section 4 The Planning Process
ABAB 4-5
n Tier II options are those that meet some of the Plan objectives and should be included in the Plan for implementation, but are of lower priority.
n Tier III options are those that meet a few of the Plan objectives and should be considered low priority for implementation.
Options were not ranked within the Tiers. They are listed in order of cost per ac-ft because cost is very important to many stakeholders. However, it is very important to realize that options within each tier are not prioritized by this evaluation.
To aid in comparing the WMOs, this evaluation rated the WMOs according to each objective. The “Goals” column from the objectives hierarchy (Figure 4-2) was used to compare each option at a planning level. Only those goals that are applicable to individual WMOs were included in the prioritization. Some goals, such as “Minimize community impacts,” and “Be equitable” will be more appropriate for evaluating combinations of WMOs that have impacts and benefits throughout the County. These broader goals are more usefully applied when evaluating complete (County-wide) alternatives to decide the performance of entire packages according to the objectives.
The WMOs were evaluated according to each goal using “rating criteria” for each. Rating criteria determined how well an option meets each objective: well, partially or poorly. The technical team prepared a matrix depicting the WMO evaluation visually. Table 4-2 shows this matrix, which uses full, half-full and empty circles to depict ratings. In general, a full circle indicates that the option meets or exceeds the objective, a half-circle indicates that the option partially meets the objective or meets the objective with contingencies, and an empty circle illustrates that the option poorly addresses the objective. Table 4-3 shows the specific rating criteria for each objective.
The WMO prioritization was discussed at two Steering Committee Meetings, and the results of the technical work and stakeholder discussions are shown in Table 4-2. The Steering Group members indicated that it should be made very clear that this list does not represent a list of projects ready for implementation. Rather, the Master Alternative represents a prioritized list of projects that are ready to enter the next phase of the plan, which includes feasibility studies and environmental documentation. Projects will not be implemented until all details and impacts are determined and resolved.
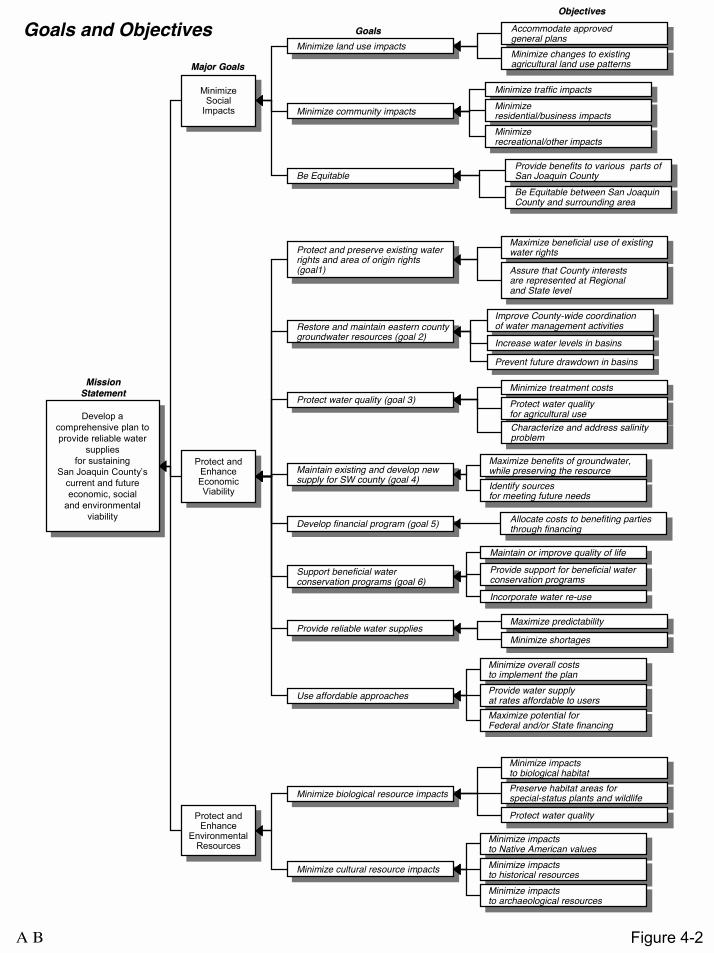
Develop a comprehensive plan to provide reliable water
supplies for sustaining
San Joaquin County’s current and future economic, social
and environmental viability
Develop a comprehensive plan to provide reliable water
supplies for sustaining
San Joaquin County’s current and future economic, social
and environmental viability
Protect and Enhance
Environmental Resources
Protect and Enhance
Environmental Resources
Minimize land use impactsMinimize land use impacts
Minimize community impactsMinimize community impacts
Protect and preserve existing water rights and area of origin rights (goal1)
Protect and preserve existing water rights and area of origin rights (goal1)
Restore and maintain eastern county groundwater resources (goal 2)
Restore and maintain eastern county groundwater resources (goal 2)
Protect water quality (goal 3)Protect water quality (goal 3)
Maintain existing and develop new supply for SW county (goal 4)
Maintain existing and develop new supply for SW county (goal 4)
Support beneficial water conservation programs (goal 6)
Support beneficial water conservation programs (goal 6)
Provide reliable water suppliesProvide reliable water supplies
Use affordable approachesUse affordable approaches
Minimize biological resource impactsMinimize biological resource impacts
Minimize cultural resource impactsMinimize cultural resource impacts
Protect and Enhance Economic Viability
Protect and Enhance Economic Viability
Minimize Social
Impacts
Minimize Social
Impacts
Major GoalsMajor Goals
Accommodate approved general plans
Accommodate approved general plans
Minimize changes to existing agricultural land use patterns
Minimize changes to existing agricultural land use patterns
Minimize traffic impactsMinimize traffic impacts
Minimize residential/business impacts
Minimize residential/business impacts
Minimize recreational/other impacts
Minimize recreational/other impacts
Maximize beneficial use of existing water rights
Maximize beneficial use of existing water rights
Assure that County interests are represented at Regional and State level
Assure that County interests are represented at Regional and State level
Improve County-wide coordination of water management activities
Improve County-wide coordination of water management activities
Increase water levels in basinsIncrease water levels in basins
Prevent future drawdown in basinsPrevent future drawdown in basins
Maximize benefits of groundwater, while preserving the resource
Maximize benefits of groundwater, while preserving the resource
Identify sources for meeting future needs
Identify sources for meeting future needs
Develop financial program (goal 5)Develop financial program (goal 5) Allocate costs to benefiting parties through financing
Allocate costs to benefiting parties through financing
Maximize predictabilityMaximize predictability
Minimize shortagesMinimize shortages
Minimize overall costs to implement the plan
Minimize overall costs to implement the plan
Provide water supply at rates affordable to users
Provide water supply at rates affordable to users
Maximize potential for Federal and/or State financing
Maximize potential for Federal and/or State financing
Minimize impacts to biological habitat
Minimize impacts to biological habitat
Preserve habitat areas for special-status plants and wildlife
Preserve habitat areas for special-status plants and wildlife
Protect water qualityProtect water quality
Minimize impacts to Native American values
Minimize impacts to Native American values
Minimize impacts to historical resources
Minimize impacts to historical resources
Minimize impacts to archaeological resources
Minimize impacts to archaeological resources
ObjectivesObjectives
Minimize treatment costsMinimize treatment costs
Protect water quality for agricultural use
Protect water quality for agricultural use
Characterize and address salinity problem
Characterize and address salinity problem
Be EquitableBe Equitable Provide benefits to various parts of San Joaquin County
Provide benefits to various parts of San Joaquin County
Be Equitable between San Joaquin County and surrounding area
Be Equitable between San Joaquin County and surrounding area
GoalsGoals
MissionMissionStatementStatement
Goals and Objectives
Maintain or improve quality of lifeMaintain or improve quality of life
Provide support for beneficial water conservation programs
Provide support for beneficial water conservation programs
Incorporate water re-useIncorporate water re-use
Figure 4-2Α Β

Exercise Full New Melones Rights
New Hogan Reoperation
Farmington Groundwater Recharge and Wetlands Project
SSJID/OID Transfer to SEWD
South County Water Supply Project
WID Transfer to SEWD
Stockton Delta Diversion
Urban Water Conservation Improvements
Delta Area Water Supply Activities
Southwest County Water Supply Activities
Total for Tier I
NSJWCD Groundwater Recharge Project
Agricultural Water Conservation Improvements
Freeport Diversion *
Urban Wastewater Reclamation
Flood Flows to Middlebar Reservoir
Flood Flows to South Gulch Reservoir
American River Water Rights
Stanislaus River
Calaveras River
Littlejohn’s Creek
Mokelumne River
Stanislaus River
Stanislaus River
18
10
25
25
30
44
20-126
20
192-298
$32
$35
$36
$72
$81
$150
San Joaquin River
Conservation
None
None
$180
$260
Mokelumne River
Reclamation
Mokelumne River
Conservation
Sacramento
20
20-40
28
60
50
178-198
$150
$250
$270
$500
$450-$550
Calaveras RiverStanislaus River
30 $490
$490
Table 4-2Water Management Options Prioritization
Qu
anti
ty
Ave
rag
eC
ost
per
Acr
e-F
oo
t
Use
Aff
ord
able
Ap
pro
ach
es
Min
imiz
eL
and
Use
Imp
acts
Pro
tect
Exi
stin
gW
ater
Rig
hts
Incr
ease
Gro
un
dw
ater
Lev
els
GroundwaterResources
OptionSource Water Dec
reas
eth
eR
ate
of
Sal
init
yIn
tru
sio
n
Pro
tect
Wat
erQ
ual
ity
Dev
elo
pN
ewS
up
plie
sfo
rS
WC
ou
nty
Su
pp
ort
Ben
efic
ial
Wat
erC
on
serv
atio
nP
rog
ram
s
Pro
vid
eR
elia
ble
Wat
erS
up
plie
s
Min
imiz
eB
iolo
gic
alan
dC
ult
ura
l Im
pac
ts
Imp
lem
enta
bili
ty
Tie
rI
Tie
rII
Tie
rIII
N/A
N/A
N/A
N/A
* Represents most recent project information from the GBA JPA Coordinating Committee.
Total for Tier III
Total for Tier II
American River 20
50

Table 4-3Rating Criteria for Option Evaluation
Estimated costs less than $100/AF
Estimated costs greater than $100/AF, but less than $300/AF
Estimated costs greater than $300/AF
Negligible land use impacts (less than 0.1 acres/TAF)
Moderate land use changes (0.1 acres/TAF to 10 acres/TAF)
Land use changes greater than 10 acres/TAF, or requires land that may be difficult to acquire
Increase use of existing water rights
No change to use of water rights, but rights are not lost
Decrease use of water rights, possibly resulting in loss of existing rights,or requires a new water right or a change in an existing water right
Use affordableapproaches
Minimizeland use impacts
Protect existingwater rights
Increasegroundwaterlevels
Decreasethe rate ofsalinity intrusion
Protectwater quality
Developnew suppliesfor SW County
Support waterconservationprograms
Provide reliablewater supplies
Minimizeenvironmentalimpacts
Implementability
Indicator DescriptionGoal
Groundwater levels increase by 20% or more from baseline
Groundwater levels increase by 10 to 20% from baseline
Groundwater levels increase by less than 10% from baseline
Rate of salinity intrusion is decreased by 50% or more
Rate of salinity intrusion is decreased by 25 to 50%
Rate of salinity intrusion is decreased by less than 25%
Increased water quality delivered to County residents
No change to water quality
Decreased water quality
New supplies available to Southwest County
No significant change to available supplies in Southwest County
Diminishes or interferes with Southwest County supplies
Actively creates new water conservation programs
Supports water conservation indirectly
Does not increase water conservation efforts
New water sources are available more than 80% of years
New water sources are available between 50 and 80% of years
New water sources are available less than 50% of years
Increases environmental habitat or has other beneficial environmental or cultural impacts
No biological or cultural impacts, or minimal impacts that are mitigated appropriately
Extensive biological and/or cultural impacts that cannot be mitigated
Project underway, or limited or no obstacles to implementation
Feasibility analysis underway or complete, and obstacles to implementation may be overcome
Major technical or political obstacles to implementation
ABAB 5-1
Section 5 The Master Alternative
5.1 Water Management Option Descriptions This section presents a description of all the water management options retained in the Master Alternative. As described in Section 4, the Master Alternative includes the options that the Steering Committee would like to retain for further study as part of the next planning phase. Table 4-2 contains a list of these options, as well as the average annual quantity, cost and strengths and weaknesses when compared to the objectives. For each option, this section presents:
n Description
n Potential Benefits
n Potential Drawbacks
n Current Status
n Next Steps
5.1.1 Exercise Full New Melones Rights Description This option involves use of Stanislaus River water at New Melones Reservoir for both SEWD/CSJWCD agriculture and city of Stockton water supply.
CSJWCD and SEWD together have a contractual right to 155,000 ac-ft per year for New Melones Project yield when available. Of this 155,000 ac-ft, only 31,000 ac-ft is a firm supply for CSJWCD, and the remainder is an interim supply (see Table 2-5). These districts currently only have the infrastructure to be able to utilize 90,000 ac-ft per year. Since the districts secured this contract, they have not been able to receive the 90,000 ac-ft that was agreed to because of increased water quality and fishery releases from New Melones. However, during very wet years, more than 90,000 ac-ft could be available to the districts if they had the capacity to utilize the water.
Increasing the two districts’ ability to fully utilize their respective contract water would decrease groundwater pumping by 65,000 ac-ft in wet years, with an annual average of 18,000 ac-ft. Utilizing this water for recharge would require an expansion of the districts’ existing distribution systems. Incentives would be required to effect changeover from ground to surface water supply among the districts’ agricultural customers. Financial assistance would be required to expand distribution systems and to make the price of surface water for farmers competitive with the cost of using groundwater. Farmers would need to maintain the ability to irrigate with groundwater during dry years.

Section 5 The Master Alternative
5-2 ABAB
Potential Benefits Using surface water in-lieu of groundwater pumping in the groundwater basin, especially in SEWD and Stockton, would immediately improve the overdraft situation and would contribute to reducing lateral saline groundwater inflow from the Delta area over time.
Because SEWD and CSJWCD already have the water allocation for this option, the process needed to implement the option is simplified. Parts of the conveyance system are already in place, including the Goodwin Tunnel and Upper and Lower Farmington Canals, although some sections may require improvements before they can accommodate increased flows.
Potential Drawbacks Contract water deliveries are not available during all years; consequently, farmers would need to maintain two systems to irrigate with groundwater or surface water. This is costly and provides no incentive to farmers to use surface water in-lieu of groundwater.
New Melones water is considered over-allocated. Water from New Melones is released to meet instream fish and water quality requirements downstream. A major concern to south Delta stakeholders is the water levels and water quality in the Delta, which are directly affected by reduced inflows from New Melones (as well as the San Joaquin River and its tributaries).
Current Status CSJWCD has implemented incentive programs to assist local farmers in developing the infrastructure required to begin using their full contract amount. There are sufficient natural streams in CSJWCD through which water could be conveyed, but additional investment in on-farm systems is required. SEWD currently sends part of its deliveries to the city of Stockton. Infrastructure improvements and additions in the SEWD-to-Stockton conveyance would be required to fully utilize the contractual amount.
Next Steps This option has measurable benefits to the groundwater basin. There are, however, potential impacts to other stakeholders in San Joaquin County associated with this option. Further engineering and environmental analysis must be performed, including more detailed hydrologic analysis to determine under exactly which conditions additional water from New Melones could be delivered to SEWD and CSJWCD without negative impacts to the south Delta.


Section 5 The Master Alternative
5-4 ABAB
5.1.2 WID Transfer Description Woodbridge Irrigation District (WID) has pre-1914 water rights on the Mokelumne River, as well as two licenses issued by the SWRCB. WID and EBMUD have a water rights settlement agreement that states that WID will receive a minimum of 60,000 ac-ft/year as a firm yield of all water rights, but it could decrease to 39,000 ac-ft/year during very dry years. Dry years are defined as those when inflow to Pardee Reservoir is less than 375,000 ac-ft. WID also has priority to use any water released from Camanche or Pardee that is not needed to meet downstream requirements.
WID currently uses this water, but has the potential to implement conservation measures, allowing an average of 10,000 ac-ft/year to be delivered to surrounding areas. In this option, the water conserved by WID could be transferred to neighboring cities or water districts, including SEWD and the city of Stockton, to be used for in-lieu recharge. WID has an extensive canal system that currently serves much of the north Stockton area where WID and SEWD overlap. WID has the capability to deliver large amounts of water from the Mokelumne River to SEWD and the city of Stockton at a very low cost. Such water could include water available to the Mokelumne River Water and Power Authority under rights obtainable pursuant to its pending water right application for the Middle Bar or Duck Creek Project.
WID would prefer to implement short-term transfers, although long-term transfers are also theoretically possible. Short-term transfers would need to be approved by the SWRCB under its temporary transfer proceedings. For a long-term transfer, WID would have to apply to the SWRCB to expand its area of use for the water right and to add these two new uses to its existing permits, which are currently for irrigation uses only.
Potential Benefits The groundwater levels under WID are high, primarily because the district allows their canals to leak in order to recharge groundwater. High groundwater also exists on the western fringe of the district due to inflow from Delta sloughs. Conservation could result in water moving from areas with adequate groundwater levels to areas over the East County groundwater depression.
Potential Drawbacks The project could result in a decrease in Delta inflow, which in turn could reduce Delta exports and cause protests by CVP and SWP water contractors.
To facilitate agricultural in-lieu recharge in SEWD or NSJWCD, farmers would need assistance in constructing a dual irrigation system to allow irrigation with surface water or groundwater, as described above.


Section 5 The Master Alternative
5-6 ABAB
Current Status Technical work on this option has not been performed.
Next Steps A feasibility study and environmental documentation would be necessary to proceed with the option.
5.1.3 New Hogan Reoperation Description This combination of options suggests that average annual deliveries to SEWD could be increased by about 25,000 ac-ft by maximizing the available supplies from New Hogan Reservoir. The reservoir is currently operated to save a certain amount of carryover storage each year; however, the carryover requirement limits the amount of storage available in wet years. All of the carryover storage water can be used in each year by farmers who currently use groundwater for irrigation. This in-lieu recharge would result in an increase of groundwater storage that could be used during dry years. Thus, this option effectively moves carryover storage from the reservoir into the groundwater basin. If the reservoir is fully emptied before the rainy season begins, then the reservoir could capture additional flows during wet years.
There may also be an opportunity to operate the reservoir at a higher water level in the spring and early summer months and still provide adequate flood protection. The reservoir operations were developed using conservative watershed runoff calculations. More sophisticated watershed modeling tools are now available to more reliably predict runoff levels, and they could be used to develop new estimates for required flood control capacities. By re-evaluating the watershed hydraulics, additional storage capacity could be gained.
No new conveyance facilities or treatment plants would need to be constructed. To facilitate in-lieu recharge in SEWD, farmers would need assistance in constructing a dual irrigation system, as described above, and more water would then need to be pumped out to the irrigators. SEWD, Calaveras County Water District (CCWD), and U.S. Army Corps of Engineers (Corps) would be involved in the realization of these proposed actions.
Potential Benefits Preliminary studies have indicated that reoperation of New Hogan Reservoir to increase yield could result in an additional 25,000 ac-ft of water available to be used for agriculture or urban water supply. The water would be supplied to areas directly over the groundwater depression, which would help reduce the salinity intrusion. Changing the operation of the reservoir would not require additional infrastructure at the reservoir, so this option is relatively inexpensive.


Section 5 The Master Alternative
5-8 ABAB
Potential Drawbacks CCWD also has rights to water from New Hogan Reservoir, and reducing the carryover storage could reduce their supply in dry years. CCWD’s rights to the water stored in New Hogan would have to be protected under this option. In addition to reduced dry year supply for CCWD, the lower lake levels would negatively impact recreational opportunities for Calaveras County.
Operation of the reservoir at a higher elevation following winter runoff increases the risk of flooding from a late season storm.
Current Status The Corps performed a limited hydrologic analysis, but a detailed feasibility study still needs to be conducted to evaluate the yield from reoperation and to identify possible impacts.
Next Steps Conduct pre-feasibility studies to update engineering and economic benefits, environmental impacts and possible mitigation measures.
5.1.4 Farmington Groundwater Recharge and Wetlands Project Description For this option, water originates from the significant flood releases made by Farmington Dam into Little Johns Creek. SEWD has applied for permission from the State Water Resources Control Board to divert water from the Little Johns Creek watershed. After receiving authorization, SEWD would then divert the water from several points along the creek to flood nearby fields and perform some agricultural in-lieu recharge. Flooded fields would provide a 10,000 ac-ft per month recharge amount, at a rate ranging from 0.25 to 0.5 ft/day. A thousand acres of agricultural land would be required for recharge, and the average annual quantity for the total project would be 25,000 ac-ft. Involved parties include SEWD, NSJWCD, CSJWCD and the Corps. The Corps proposed this project in January 2001 in the Farmington Groundwater Recharge and Wetlands Feasibility Study.
Potential Benefits Little Johns Creek has unappropriated floodflows that can be utilized with relatively minor impacts to others. Recharging in SEWD would contribute directly to reducing overdraft and help in mitigating saline water intrusion in the long term.
Flooded fields would accomplish multiple objectives, including recharging groundwater and creating seasonal wetlands.
Potential Drawbacks The project includes diverting water from the Farmington Flood Control area into fields during the wet season, but SEWD currently is only allowed to use the facilities


Section 5 The Master Alternative
5-10 ABAB
during the dry season. SEWD has applied to be able to use the facilities year round, but there is some concern that the facilities would not be available for flood control on the Stanislaus if needed.
Current Status The Farmington project was authorized in the Water Resources Development Acts (WRDA) in 1996 and 1999 for $25 million, but the appropriation must be included in the Federal budget before the money is available. The Corps and SEWD have conducted detailed feasibility studies. However, Federal funding has not been appropriated to date for future steps.
Next Steps Proceeding with the pilot project would provide additional information and experience with building and operating recharge facilities in the ESJGB. If the pilot project is successful, a full-scale design and implementation can follow. SEWD has already begun efforts to pursue Federal funding appropriate for the project.
5.1.5 SSJID/OID Transfer to SEWD Description Oakdale Irrigation District (OID) and South San Joaquin Irrigation District (SSJID) have implemented conservation measures to provide water to transfer to SEWD. The contract provides that a minimum of 8,000 ac-ft will be supplied in all years and will be increased to 12,500 ac-ft when the inflow to New Melones exceeds 450,000 ac-ft but is less than 500,000 ac-ft. When the inflow exceeds 500,000 ac-ft, SSJID and OID will provide 30,000 ac-ft to SEWD. This water is specifically earmarked for urban use by the city of Stockton, but may be reprogrammed for agricultural use or sold if not needed by Stockton, and if Stockton grants permission to SEWD to do so. The agreement was for a 10-year term, with a 10-year renewal option. The agreement has been in effect for 3 years. SEWD, OID, SSJID, and the city of Stockton are involved in this option, the future of which is uncertain.
Potential Benefits SSJID and OID have pre-1914 water rights on the Stanislaus River. While their water supply varies by storage and runoff in different water year types, they can reliably meet the terms of the contract and provide a steady water supply for urban uses. This option also moves water from areas with plentiful groundwater, depending on availability, to areas immediately over the groundwater depression (city of Stockton).
Potential Drawbacks This project has already been implemented, so there would be no additional negative impacts from continuing with the project for the length of the existing agreement.


Section 5 The Master Alternative
5-12 ABAB
Current Status The 10-year transfer agreement has been in place for 3 years, and the future of the agreement beyond that time is uncertain.
Next Steps Both sides would need to re-evaluate the transfer agreement to determine if it is meeting the needs of the parties involved. If water is still available, then the transfer could continue for the next 10 years of the agreement. After the agreement expires, the groups can determine if they wish to pursue another agreement.
5.1.6 South County Water Supply Project Description As part of the South County Water Supply Project, South San Joaquin Irrigation District would treat some of its water from Woodward Reservoir and sell it to urban areas within the County. The project would transport water from New Melones Reservoir, using the SSJID’s water rights on the Stanislaus River, to Woodward Reservoir using existing conveyance facilities. From Woodward Reservoir, water would be treated and pumped to four participating cities: Escalon, Lathrop, Manteca and Tracy. The project would require a new water treatment plant near the reservoir, as well as new transmission pipelines and pump stations for delivery of treated water. The project would result in an average of 44,000 ac-ft/year of urban in-lieu recharge.
Potential Benefits An in-lieu program in each of the four cities would involve the increased deliveries of surface water to the four cities, thereby reducing groundwater pumping. This project would provide water to the Southwest County, where the rapidly growing population is straining the water supply.
Potential Drawbacks USBR questioned this option in its comments on the environmental impact report, but it chose not to contest the District’s certification of the EIR.
Current Status Preliminary design and environmental documentation have been completed, but several parties have questioned the validity of the environmental documentation. DeltaKeeper, the Sierra Club and the California Sportfishing Protection Alliance filed a lawsuit to prevent the project from being implemented because they do not believe that the EIR is adequate to ensure that environmental interests in the Stanislaus River and the Delta are protected. A recent decision found that the EIR was adequate, but the environmental groups are considering an appeal.
Next Steps The involved parties must address concerns about instream flows and south Delta water quality. If these concerns are addressed, the project is ready for final design.


Section 5 The Master Alternative
5-14 ABAB
5.1.7 Stockton Delta Diversion Description In 1996, dwindling supplies caused the City of Stockton to submit a water right application for “1485” water and area-of-origin water from the Delta. Under Water Code 1485, if a city discharges wastewater into the San Joaquin River, it is entitled to divert water downstream from the point of discharge or from the Delta. Stockton must meet wastewater discharge permit requirements, which now include tertiary treatment in the summer months. The City of Stockton is now in the process of selecting a diversion point or points and planning other important features of the project. The most likely scenario would involve the construction of one diversion structure with an intake capacity of 60,000 ac-ft per year, a pipeline, and an expandable water treatment plant with an initial capacity of 30,000 ac-ft per year. Additional water would then be treated and pumped out to the city’s water users, relieving the strain on the groundwater basin. The project would initially provide an annual average of 20,000 ac-ft to the city, increasing over time to 126,000 ac-ft.
Potential Benefits Additional surface water supply for the city of Stockton would reduce groundwater pumping in the area immediately over the salinity intrusion. The 1485 water rights would be derived from the amount of wastewater discharged by the city, which is relatively constant, so the water supply would be very reliable.
Potential Drawbacks New diversions in the Delta could result in less water available for exporters, including CVP contractors in the southwest portion of San Joaquin County. The Delta is a very sensitive environment, and there would likely be environmental impacts that would need to be mitigated before the project could be implemented.
The area-of-origin water would likely be subject to “Term 91” limits. There are certain times of the year in which Delta outflow requirements cannot be met with natural flow, so the State and Federal projects release water from upstream reservoirs to meet the outflow standards. This period is known as “Term 91,” and area-of-origin water would not be available during this time. Term 91 restrictions occur during the summer in most years (even wet years).
Current Status Stockton is working on the detailed feasibility study and environmental documentation for the project.
Next Steps If the feasibility study and environmental documentation are adequate, then the city can move on to detailed design and construction.


Section 5 The Master Alternative
5-16 ABAB
5.1.8 Urban Water Conservation Improvements Description The experience of active urban water conservation programs in California is that the potential water savings are in the order of 10 to 20 percent of the volume of water used. In San Joaquin County, urban conservation could result in 20,000 ac-ft/year of demand reduction. Such programs typically include distribution system leak-reduction programs, household metering, rebates and other financial incentives, tiered pricing to discourage high use, education of school children and the public and market-enforced transition to water-saving household plumbing devices.
Typical costs of such programs (excluding meter installation) are in the range of $2 to $4.50 per capita per year in California cities. For households not already metered, the installation of a household meter typically costs about $450.
Potential Benefits Demand reduction could relieve pressure on the groundwater basin without needing to find a new surface water source. It is also less expensive than securing surface water, and there is less potential for environmental impacts.
Many State and Federal funding programs require conservation efforts in order to provide funding. There are established Best Management Practices (BMPs) that must be implemented, including metering, tiered pricing, water saving devices, and public education.
Potential Drawbacks Many people are accustomed to their current water use, and there may be reluctance to change water use habits. Significant educational efforts and/or incentives could be required to change patterns of water use among urban users.
Current Status Some urban areas have implemented conservation BMPs, but none of the cities have incorporated all of them. Stockton would be required to implement all BMPs as a condition of their water right for the Delta Diversion Project.
Next Steps It is likely that urban conservation efforts would need to be included in Federal and State funding applications for other projects. There have been many studies performed on urban conservation, so significant studies do not need to be completed; however, city-specific planning and budgeting for implementation of additional conservation BMPs must be done.

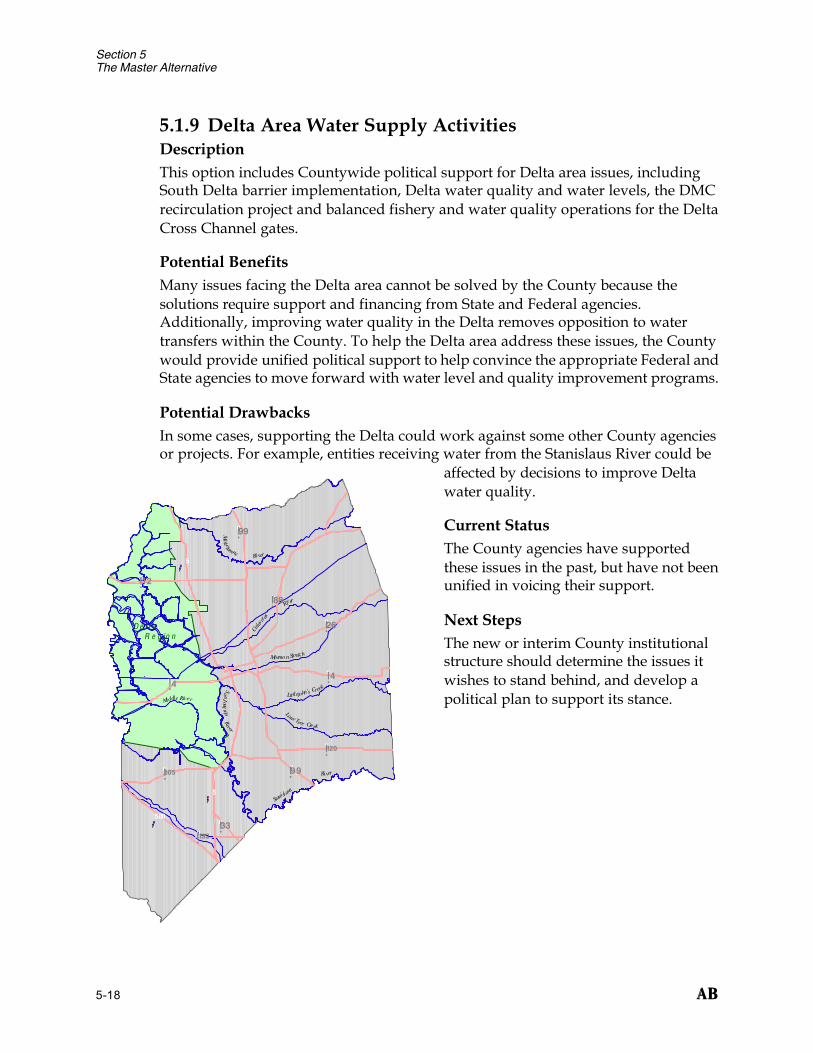
Section 5 The Master Alternative
5-18 ABAB
5.1.9 Delta Area Water Supply Activities Description This option includes Countywide political support for Delta area issues, including South Delta barrier implementation, Delta water quality and water levels, the DMC recirculation project and balanced fishery and water quality operations for the Delta Cross Channel gates.
Potential Benefits Many issues facing the Delta area cannot be solved by the County because the solutions require support and financing from State and Federal agencies. Additionally, improving water quality in the Delta removes opposition to water transfers within the County. To help the Delta area address these issues, the County would provide unified political support to help convince the appropriate Federal and State agencies to move forward with water level and quality improvement programs.
Potential Drawbacks In some cases, supporting the Delta could work against some other County agencies or projects. For example, entities receiving water from the Stanislaus River could be
affected by decisions to improve Delta water quality.
Current Status The County agencies have supported these issues in the past, but have not been unified in voicing their support.
Next Steps The new or interim County institutional structure should determine the issues it wishes to stand behind, and develop a political plan to support its stance.
.-, 5
.-, 5
.-,580
"!88
"!26
"!4
"!120
"!205
"!99
"!99
"!12
"!33"!132
"!4
Mok elumne River
Calav
eras
River
Mormo n Sloug h
Stanislau
s
River
Lone Tree Creek
Littlejohn's CreekSan Joaqui nRiv er
Middle River
D e l t a R e g io n

Section 5 The Master Alternative
ABAB 5-19
5.1.10 Southwest County Water Supply Activities Description This option includes Countywide political support for issues impacting the southwest portion of the County, including CVP water reliability, DMC/groundwater pump-in program and the City of Tracy water supply activities and programs.
Potential Benefits The Southwest County is similar to the Delta in that many of its issues cannot be addressed by County entities. However, County political support could help to
persuade State or Federal agencies to address these issues.
Potential Drawbacks One of the most significant issues in the Southwest County is unreliable CVP supplies. Several other options within the plan could reduce Delta inflow and therefore reduce exports to the CVP. This conflict could make it difficult for some County entities and the Southwest County to support each other’s projects.
Current Status Similar to the Delta area, the County is supporting the issues for the Southwest County, but not in a vocal or unified way.
Next Steps As discussed in the Delta area, the new institutional structure needs to develop a political plan to support its stance on issues in the Southwest County.
.-, 5
.-, 5
.-,580
"!88
"!26
"!4
"!120
"!205
"!99
"!99
"!12
"!33"!132
"!4
Mok elumne River
Calav
eras
River
Mormo n Sloug h
Stanislau
s
River
Lone Tree Creek
Littlejohn's CreekSan Joaqui nRiv er
Middle River
S o ut h w e stR e gi o n

Section 5 The Master Alternative
5-20 ABAB
5.1.11 NSJWCD Groundwater Recharge Project Description NSJWCD had a water right for up to 20,000 ac-ft per year for water from the Mokelumne River that is surplus to EBMUD’s needs, but the right expired last year. The district uses no more than 3,000 ac-ft per year currently, which leaves up to 17,000 ac-ft available for recharge into the basin if the water right can be renewed. The district received a CALFED grant for a pilot groundwater recharge project recently. This project calls for ponds to be constructed within earth berms on 10 acres of farmland south of the Mokelumne River in the Victor area of San Joaquin County. These ponds would be able to save and store about 1,000 ac-ft of water each year. Half of the recharged water would be extracted later and sent back into the Mokelumne River when the water is needed. NSJWCD and CALFED are the parties that would pursue this combination of options.
Potential Benefits Surface water could be used to recharge the northern area of the groundwater depression.
Potential Drawbacks Farmland would have to be removed from production to create the recharge basins.
Current Status Funding has been received by CALFED, but the water right needs to be secured again.
Next Steps Before the project can begin, the water right must be secured. After securing the water right, the pilot project can begin. If the pilot project is successful, design and implementation of a full-scale project could be pursued.
5.1.12 Agricultural Water Conservation Improvements Description As described in Section 3, the greatest potential for agricultural water conservation relates mainly to the use of more water-efficient irrigation technologies. Irrigation efficiency is defined as the consumptive use (water used by the plant) divided by the applied water (total water applied on a farm). The irrigation efficiencies for crops grown within San Joaquin County are shown in Tables 3-6 and 3-7 in Technical Memorandum 1 (included in Volume II), and range from 56 percent for rice to 90 percent for vineyards. The difference between consumptive use and applied water includes water that is lost to the system, water that percolates into groundwater, or surface water runoff. The consumptive use of a plant does not change, so conserving water means that irrigation efficiency should be increased, which results in a decrease in losses.


Section 5 The Master Alternative
5-22 ABAB
Losses are often defined as “recoverable” or “irrecoverable.” Recoverable losses are losses that return to the system and can be re-used, such as deep percolation to productive groundwater aquifers or surface water runoff. Irrecoverable losses are losses that leave the system, such as evaporation, losses to riparian vegetation that lines conveyance canals, or flow into saline waters. Ideally, the irrecoverable losses are the focus of agricultural conservation efforts. In San Joaquin County, irrecoverable losses account for 8 percent of all losses (CALFED, 1999). However, conserving water from recoverable losses can also be useful to the County in some areas. For example, conserving deep percolation in an area that has plentiful groundwater could result in water available in other areas of the County.
There is a potential to conserve water through the introduction of drip irrigation for tree crops and viticulture, as noted in Section 3. The actual use of such systems, however, would depend upon economic drivers that still must be quantified. Drip irrigation involves costs of pumping, filter systems at the points of use, tubing and drip facilities, and farmer education. The unit costs for drip irrigation can be estimated on the basis of other similar programs, but the total costs and volumes of water saved are subject to economic drivers specific to the County.
Potential Benefits Similar to urban conservation efforts, agricultural conservation reduces demand, which relieves pressure on the groundwater basin without the expense of securing a new surface water source. Conservation is less expensive and often has fewer environmental impacts than securing a new surface water source.
Potential Drawbacks Farming is a business, and water purchases are business decisions. It is difficult to justify conservation efforts that are more expensive than purchasing additional water.
Agricultural conservation could reduce deep percolation or surface water runoff, which could result in less water for downstream environmental, agricultural or urban users.
Current Status Most farmers have implemented cost-effective conservation measures.
Next Steps Additional studies could result in better ways to conserve. The example given in Section 3, in which a recent study revealed that better grapes could be produced with less water, illustrates the potential for identifying new conservation methods.


Section 5 The Master Alternative
5-24 ABAB
5.1.13 Freeport Diversion Description This combination of options calls for water to be diverted from the Sacramento River near the town of Freeport and transported to San Joaquin County for recharge. The project has been proposed by EBMUD as an alternative to its American River diversion, and Sacramento City and County are also participants. To implement this project, a diversion structure would need to be created on the Sacramento River near Freeport. In addition, a pipeline would need to be constructed to carry water to the existing portion of the Folsom South Canal, and then from the canal to the Mokelumne Aqueduct. The Northeastern San Joaquin County Groundwater Banking Authority (GBA) has been formed by the water agencies on the east side of the County to investigate and implement this option. This project is currently under development. Available supplies, costs and methods for groundwater recharge are still being determined for the project. The most recent plan indicates that water would be used for field flooding during the winter and in-lieu recharge during the irrigation season. The average annual amount of water available would be 28,000 ac-ft. Involved parties include EBMUD, the City of Sacramento, Sacramento County, and the GBA.
Potential Benefits Pursuing this option provides San Joaquin County with access to the Sacramento River, which is a new surface water source. The GBA is examining the concept of including a partner to help defray the costs of the option. The partner would provide the water rights on the Sacramento, and in return, could receive half the water stored in the groundwater basin.
This project has received political support from the Bureau as well as from area politicians, which will likely help the project to be implemented.
Potential Drawbacks This project would be very expensive to implement without a project partner. Unlike many surface water sources within the County, the water from the Sacramento River would need to be pumped up to the level needed for EBMUD. Electricity prices are very expensive right now, so pumping water seems less appealing. The project is also opposed by CVP contractors, who are concerned that dry-year diversions could impact water quality and flow in the Delta. San Joaquin County is only planning to divert water during wet years, but objections to EBMUD’s dry-year diversions could affect project implementation.
In the preliminary agreement between EBMUD, the city of Sacramento, Sacramento County and the GBA, the GBA has the lowest priority to water. The GBA can only access water from the proposed system if none of the other entities need the water. Water would most likely be available during wet years, when other sources of water are available within the County.


Section 5 The Master Alternative
5-26 ABAB
Current Status The GBA is currently determining the project parameters, including necessary conveyance and recharge facilities. In addition, the GBA is pursuing project partners to provide water to store in the groundwater basin. EBMUD is facilitating a process to address concerns of non-participants related to the environmental and social impacts of diverting water from the Sacramento River.
Next Steps The GBA needs to identify a project partner with rights to Sacramento River water to make this project economically viable.
5.1.14 Urban Wastewater Reclamation Description Urban wastewater from various cities within San Joaquin County could be used for groundwater recharge if it is treated to a high quality level. Facilities for additional chlorine contact, a reclamation pump station, and a distribution system must all be constructed to accomplish this level of treatment and prepare for recharge. Injection wells in the City of Stockton would also need to be constructed to accomplish the groundwater recharge portion of this option. Other cities such as Lathrop, Lodi, Manteca and Tracy may use reclaimed water for irrigation or other uses to provide in-lieu groundwater recharge. The total potential for urban wastewater reclamation for all cities within the County is approximately 60,000 ac-ft/year. Urban wastewater reclamation in Stockton could not be pursued in conjunction with Stockton’s Delta Diversion (Section 5.1.7) because both options utilize the same water source.
Potential Benefits Reclaimed wastewater is a very reliable supply, and it makes use of water that could otherwise flow out of the County. Additional water rights would not need to be pursued because urban areas are permitted to reuse their wastewater. In addition, injecting the water under Stockton could create a barrier for the salinity intrusion so that it does not proceed farther to the east.
Potential Drawbacks Many people are concerned about the potential public health risks associated with reusing wastewater, so the project would require a significant education campaign.
The city of Stockton performed an extensive study about wastewater reclamation and reuse, but did not pursue the concept because the public did not support the project. People most often object to use of reclaimed water for drinking or irrigating edible crops. This project does not directly suggest either of these options; however, wastewater injected into the ground enters the groundwater supply used for urban drinking water and agricultural irrigation.


Section 5 The Master Alternative
5-28 ABAB
Reclaiming wastewater also decreases the discharges from wastewater treatment plants, which currently discharge into either surface water bodies or groundwater through percolation basins. Using this water could result in less water for downstream water users or environmental needs. Also, urban use adds salt to the water, so reusing water makes the water even more saline. When this water is finally discharged, it could worsen salinity problems in areas that have existing water quality concerns.
Current Status Stockton performed a reclaimed wastewater study, but it was not pursued because the residents were not supportive. The study is still available, however, and contains information that would be helpful to implementing a project.
Next Steps Stockton has decided to pursue its Delta Diversion Project (5.1.7), and both projects cannot be pursued at the same time. Water reclamation in the city of Stockton could be pursued if the Delta Diversion Project does not move forward, but it is on hold until that point.
5.1.15 Floodflows to Middlebar Reservoir Description The Mokelumne River experiences floodflows that could be captured with a variety of facilities, including the proposed Duck Creek Reservoir (offstream storage), the proposed Middlebar Reservoir (onstream storage upstream from Pardee Reservoir) or by enlarging Pardee Reservoir. These options would provide approximately 50,000 ac-ft/year.
The proposed Duck Creek Reservoir would divert water from the southwest end of the existing Pardee Reservoir only when the water level is at maximum pool or higher. The water would be diverted using a tunnel 10,300 feet long that would generally parallel the EBMUD Pardee Tunnel. The tunnel would discharge directly into a 57,400-foot-long pipeline adjacent to the existing EBMUD Mokelumne Aqueduct and then turn due south and discharge directly into the proposed Duck Creek Reservoir. The proposed facilities would have a total diversion capacity of 1,000 cfs. New conveyance facilities would also need to be constructed to move the water from Duck Creek Reservoir to NSJWCD, although natural streams (Duck Creek) can be used to convey water to SEWD. To facilitate in-lieu recharge within the districts, farmers would need assistance in constructing a dual irrigation system, and more water would then need to be pumped out to the irrigators from the two districts, as discussed for other options above. The County suggested the proposed Middlebar Reservoir and filed for a water right with the SWRCB and a FERC preliminary permit. The water right and FERC permit have not been actively pursued, but have been kept open to see if the Water Management Plan would recommend the construction of Middlebar. Environmental concerns associated with onstream storage


Section 5 The Master Alternative
5-30 ABAB
could be difficult to mitigate, but the power generation associated with Middlebar could make the project more appealing.
Pardee Reservoir is owned and operated by EBMUD, which has considered expanding the reservoir. Local support from San Joaquin County would be instrumental in the expansion and would make it more feasible. A partnership with EBMUD might allow San Joaquin County to receive water from the newly expanded reservoir.
Potential Benefits Capturing floodflows on the Mokelumne River would provide the County with access to water that previously flowed out of the County. This water would be used to recharge areas directly over the groundwater depression, which would also help with the salinity intrusion under Stockton.
The projects include a power generation component, which has the potential to provide revenue to offset some of the costs associated with constructing and maintaining the facilities.
Potential Drawbacks Building a new surface storage facility or expanding an existing facility would be very expensive. The facilities would depend on floodflows, which are not always available. There would also be numerous environmental concerns regarding a new onstream facility, as well as some concerns regarding offstream storage.
The Duck Creek Project was strongly opposed by the landowner in 1985. In addition, the land the project would use has a Conservation Easement with the State of California. Due to the easement, the California Department of Fish and Game and the California Wildlife Conservation Board may oppose the project as well.
Current Status The Board of Supervisors recently approved a pre-feasibility study to determine if it should pursue a detailed feasibility study and environmental documentation for this option. The FERC preliminary permit will expire in November 2002, and it is unlikely that FERC will grant an extension if the County does not work towards completing the application. The FERC preliminary permit gives the County the first priority to submit a FERC application on the project, but it does not imply any rights until the application is filed.
A study on Duck Creek Reservoir was completed in 1993, with detailed hydrologic information. However, new fish flows have been implemented, so this study would need to be updated.

Section 5 The Master Alternative
ABAB 5-31
Next Steps If the results of the pre-feasibility indicate that the option has a fair chance of success, a detailed feasibility study and environmental documentation should be performed. These studies are necessary for the FERC application, and the County needs to show significant progress toward completion of the application to receive an extension after November 2002.
5.1.16 Floodflows to South Gulch Reservoir Description The water for this combination of options comes from excess floodflows originating in the Calaveras and Stanislaus Rivers. The water from the Calaveras River would be diverted through a tunnel at New Hogan to South Gulch, which would carry the water by gravity to the proposed South Gulch Reservoir for storage. Both the reservoir and the tunnel would need to be constructed. A permit would need to be obtained from the State Water Resources Control Board (SWRCB) to divert these flows. The water coming from the Stanislaus River would be diverted above the existing Goodwin Dam and then guided to the South Gulch Reservoir using existing and new conveyance facilities that would also have to be constructed. The initial 8 miles of lined canal from Goodwin Tunnel exist, but the remaining 15 miles still must be constructed. A short tunnel would also need to be put in near the town of Milton. This tunnel would convey water under the town, discharging it into a canal, which would terminate in the South Gulch Reservoir. The water would be conveyed from South Gulch Reservoir to SEWD and CSJWCD, using existing facilities for SEWD and new facilities for CSJWCD. To facilitate in-lieu recharge within the districts, farmers would need assistance in constructing a dual irrigation system, and more water would then need to be pumped out to the irrigators.
Potential Benefits This project would provide additional surface water to areas over the groundwater depression, which could reduce the groundwater overdraft and the salinity intrusion under Stockton. Capturing floodflows would provide the County with access to supplies that currently pass through the County without being used.
Potential Drawbacks Constructing a new surface water storage facility and associated conveyance would be very expensive. The facility would rely on floodflows, which are not reliable, for water supply. If the first several years after construction were dry, it would be difficult for involved parties to recoup their investment. There could also be environmental impacts associated with constructing a new surface storage facility.
Current Status A study was completed on the project in 1984, but the data do not reflect current conditions, including recent fish flows and instream flow requirements for the Stanislaus River.


Section 5 The Master Alternative
ABAB 5-33
Next Steps A new hydrologic study should be completed to update the available water calculations included in the original study.
5.1.17 American River Water Rights Description San Joaquin County applied for water rights to store and divert American River water in 1990. The application included two proposed alternatives, including diverting water from the South Fork of the American for storage in the proposed Countyline and Clay Station Reservoirs, or diverting water into the Folsom South Canal with storage in the proposed Clay Station Reservoir. From 1993 to 1998, the Bureau and San Joaquin County examined the feasibility of diverting American River water, but there were political complications associated with diverting water upstream from Sacramento. Since 1998, San Joaquin County has extended its application to allow completion of the Water Management Plan.
Potential Benefits The project would allow access to American River water, a source that is currently not available to County users.
Potential Drawbacks Conveyance and storage facilities would be very expensive.
Current Status The water right application is extended until January 1, 2002, pending completion of the SJCWMP.
Next Steps The new group formed by the SJCWMP needs to determine if this option is worth pursuing by January 2002. If the option is worth pursuing, the group needs to submit a work plan, budget and annual application fee of $40,430 to the SWRCB.

Figure 5-17
American River Water Rights,
American River
SAN JOAQUIN COUNTY
WATER MANAGEMENT PLAN
N
1
2
1 & 2
American
River
Sacram
ent o
Riv
er
Mokel umne River
Calaveras River
San Jo aquin Ri ver
Stanis
laus River
Folsom
Reservoir
Proposed
Countyline
Reservoir
Proposed
Clay Station
Reservoir
Proposed
Deer Creek
Reservoir
#
#
#
Camanche
Reservoir
Pardee
Reservoir
New Hogan
Reservoir
Farmington
Flood Control
Reservoir
Woodward
Reservoir
Options Number(s)1
LEGEND
5 0 5 Miles
SacramentoCounty
San JoaquinCounty

Section 5 The Master Alternative
ABAB 5-35
5.2 Modeling of Water Management Alternatives 5.2.1 Modeling Overview Two types of modeling are associated with the development and evaluation of the water management alternatives: hydrologic modeling and groundwater modeling. In general, hydrologic modeling is conducted to determine the yield and operational characteristics of the river-reservoir systems, whereas the purpose of groundwater modeling is to simulate the groundwater system response to a water management option.
In general, new hydrologic modeling was not conducted for the SJCWMP. Estimates of system yield, or changes in system yield due to new water management options, were determined from previous modeling work and reports. The analyses supporting the estimates of yield presented in this section are documented in two technical memoranda prepared by SWRI, provided in Volume 2.
New groundwater modeling work was conducted for the SJCWMP. An overview of the basin characterization based on the groundwater modeling work is included in Section 2. In this section, a summary of the results of the simulation of water management options is provided. More information on the groundwater model is presented in Volume 2.
5.2.2 Groundwater Modeling of Water Management Options The purpose of the integrated groundwater and surface water model simulations was to provide a quantitative assessment of the relative benefit to the groundwater system derived from each of the common components of the water management plan. Additionally, the overall impact of all the elements implemented under an integrated County water management plan was evaluated.
Methodology The model was first calibrated to steady-state conditions for 1970 and 1993. A transient calibration was then developed spanning the period from 1970 to 1993. The model was then applied to simulate the baseline conditions over the planning horizon of the water management plan (from 2001 to 2030).
For the simulation of the period from 2001 to 2030, the historical hydrologic record from 1970 to 2000 was used. The 1970 to 2000 period is comparable to the 1922-2000 period in terms of an average water-year index. From 1970 to 2000, there were more wet years when compared to 1922-2000, but there were also more “critically dry” years. On average, the 1970 to 2000 period provides a good representation of hydrologic conditions under which the water management plan can be evaluated.
Detailed information on the model and calibration is provided in Volume 2.

Section 5 The Master Alternative
5-36 ABAB
Baseline Condition The baseline condition refers to the current and predicted condition of the Eastern San Joaquin County Groundwater Basin through the year 2030. Under baseline conditions, all water demands not met by surface water sources are met by groundwater pumping.
The average groundwater table contours for the study area for the year 2000 and 2030 are shown on Figures 5-18 and 5-19. By 2030, the two cones of depression, east of Stockton and north of the Mokelumne, have merged, and a large portion of the ESJCGB has groundwater levels lower than 60 feet below sea level.
Water Management Option Simulations Selected individual water management options were simulated to evaluate their impact on the groundwater basin. The options simulated were:
n Water Management Option 1: New Hogan Reservoir Reoperation
n Water Management Option 2: South County Water Supply Project
n Water Management Option 3: Farmington Project
n Water Management Option 4: SEWD/CSJWCD Fully Exercise New Melones Rights
n Water Management Option 5: Freeport Groundwater Banking Project
The agreement for the transfer of 30,000 ac-ft between SSJID/OID and SEWD is incorporated into the baseline condition for the first 10 years; i.e., through 2010.
In addition to simulating each of these options individually, an integrated water management plan simulation was run. The integrated water management plan simulation included all the individual elements noted above, as well as an additional 125,000 ac-ft of recharge representing non-specific conjunctive use projects. These conjunctive use projects represent any number of water management options that may be implemented in the future, such as Middle Bar-Duck Creek option, WID Transfer, and NSJWCD Groundwater Recharge Project.
The main components of each simulation are described below.
New Hogan Reservoir Reoperation Preliminary studies indicate that the reoperation of New Hogan Reservoir could result in an increase in yield of 20,000 to 25,000 ac-ft per year (SWRI, 2000). For the simulation of this option, it was assumed that approximately 30,000 to 45,000 ac-ft of additional yield was available from New Hogan during wet or above-normal years. During below-normal, dry or critical years, no additional water was available. This resulted in an average increase of approximately 23,000 ac-ft on a yearly basis from 2000 to 2030. Figure 5-20 illustrates the resulting groundwater levels in 2030 with the

Section 5 The Master Alternative
ABAB 5-37
implementation of this option. Groundwater levels increase by approximately 30 percent in the Stockton area and by 19 percent in the SEWD area. In general, this option significantly reduces the extent of the groundwater overdraft area with groundwater levels less than 80 feet below mean sea level (feet-msl).
South County Water Supply Project For the simulation of this option, it was assumed that SSJID would deliver surface water to Escalon, Manteca and Lathrop as presented in the South County Surface Water Supply Project EIR, (ESA, 1999). The quantities to be delivered are summarized in Table 5-1. The actual quantities simulated as delivered in the model are linked to the growth in urban demand, and thus the net benefit to the groundwater basin is somewhat less than the planned capacity of this option. In the ESJCGB, the net reduction in groundwater pumping is approximately 30,000 ac-ft by the time all phases of the project are implemented. Note that since part of Lathrop and all of Tracy are outside the ESJCGB, not all of the surface water supplied to these cities contributes to overdraft reduction in the ESJCGB.
Table 5-1 Water Quantities for South Counties Surface Water Supply Project
Phase/Period Lathrop Escalon Manteca Tracy Phase 1: 2003-2011 3,200 0 11,000 10,000
Phase 2: 2012-2025
10,000 2,800 16,400 10,000
Figure 5-21 illustrates the resulting groundwater levels in 2030 with the implementation of this option. Groundwater levels increase by approximately 14 percent in the Stockton area and by 3 percent in the SEWD area.
Farmington Project The Farmington Recharge Project was simulated as consisting of two principal recharge zones: a recharge zone in NSJWCD and one in western SEWD (see Table 5-2). In the northern recharge zone, approximately 10,000 ac-ft was recharged during all years except critically dry years. In SEWD, 10,000 ac-ft was recharged in average and below normal years, and 40,000 ac-ft was recharged in wet- and above-normal years. Based on 1970 to 2000 hydrology, this results in approximately 25,000 ac-ft of recharge, and using 1922 to 1992 hydrology approximately 31,000 ac-ft of recharge.
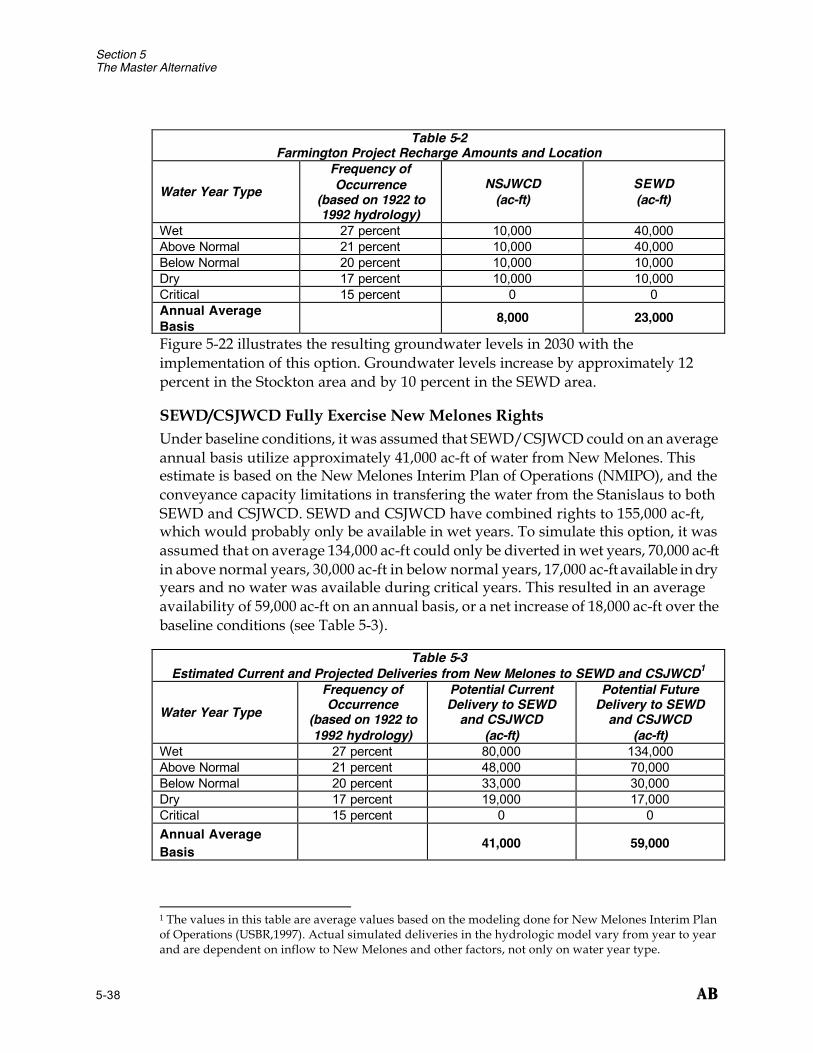
Section 5 The Master Alternative
5-38 ABAB
Table 5-2
Farmington Project Recharge Amounts and Location
Water Year Type Frequency of Occurrence
(based on 1922 to 1992 hydrology)
NSJWCD (ac-ft)
SEWD (ac-ft)
Wet 27 percent 10,000 40,000 Above Normal 21 percent 10,000 40,000 Below Normal 20 percent 10,000 10,000 Dry 17 percent 10,000 10,000 Critical 15 percent 0 0 Annual Average Basis 8,000 23,000
Figure 5-22 illustrates the resulting groundwater levels in 2030 with the implementation of this option. Groundwater levels increase by approximately 12 percent in the Stockton area and by 10 percent in the SEWD area.
SEWD/CSJWCD Fully Exercise New Melones Rights Under baseline conditions, it was assumed that SEWD/CSJWCD could on an average annual basis utilize approximately 41,000 ac-ft of water from New Melones. This estimate is based on the New Melones Interim Plan of Operations (NMIPO), and the conveyance capacity limitations in transfering the water from the Stanislaus to both SEWD and CSJWCD. SEWD and CSJWCD have combined rights to 155,000 ac-ft, which would probably only be available in wet years. To simulate this option, it was assumed that on average 134,000 ac-ft could only be diverted in wet years, 70,000 ac-ft in above normal years, 30,000 ac-ft in below normal years, 17,000 ac-ft available in dry years and no water was available during critical years. This resulted in an average availability of 59,000 ac-ft on an annual basis, or a net increase of 18,000 ac-ft over the baseline conditions (see Table 5-3).
Table 5-3 Estimated Current and Projected Deliveries from New Melones to SEWD and CSJWCD1
Water Year Type Frequency of Occurrence
(based on 1922 to 1992 hydrology)
Potential Current Delivery to SEWD
and CSJWCD (ac-ft)
Potential Future Delivery to SEWD
and CSJWCD (ac-ft)
Wet 27 percent 80,000 134,000 Above Normal 21 percent 48,000 70,000 Below Normal 20 percent 33,000 30,000 Dry 17 percent 19,000 17,000 Critical 15 percent 0 0 Annual Average Basis
41,000 59,000
1 The values in this table are average values based on the modeling done for New Melones Interim Plan of Operations (USBR,1997). Actual simulated deliveries in the hydrologic model vary from year to year and are dependent on inflow to New Melones and other factors, not only on water year type.

Section 5 The Master Alternative
ABAB 5-39
Figure 5-23 illustrates the resulting groundwater levels in 2030 with the implementation of this option. Groundwater levels increase by approximately 12 percent in the Stockton area and by 18 percent in the SEWD area.
Freeport Project The simulation of the Freeport Project involves the recharge of water diverted from the Sacramento River near the town of Freeport. The location and amount of recharge was based on the most recent project concept at the time the work was done. This involved recharging 31,000 ac-ft in NSJWCD and 62,000 ac-ft in SEWD, for a total recharge of 93,000 ac-ft. The final project concept will likely involve a combination of direct recharge and in-lieu. The recharge only occurs in years classified as “wet” and above normal years. In “below normal,” “dry” and “critical years,” 18,600 and 37,200 ac-ft of groundwater is pumped for export from NSJWCD and SEWD, respectively. The total groundwater export is 55,800 ac-ft per year in appropriate years.
The gain to the ESJCGB is 26,000 ac-ft per year. This was based on 1970 to 2000 hydrology in which 55 percent of the years were classified as either wet or above normal. Figure 5-24 illustrates the resulting groundwater levels in 2030 with the implementation of this option. Groundwater levels increase by approximately 5 feet (20 percent increase) in the Stockton area and by 19 feet (19 percent increase) in the SEWD area.
Integrated Water Management Plan The options listed above on an annual average basis could account for approximately 132,000 ac-ft of water being recharged to the groundwater basin. It is estimated that another 60,000 to 70,000 ac-ft of net recharge would be required to reduce the overdraft by 2030. The integrated water management plan was simulated with approximately 125,000 ac-ft of wet-year recharge and 75,000 ac-ft of groundwater pumping in dry years because these amounts created an average annual recharge of 60,000 ac-ft (Table 5-4). This represents any number of water management options that may be implemented in the future, such as Middle Bar-Duck Creek option, WID Transfer, and NSJWCD Groundwater Recharge Project.

Section 5 The Master Alternative
5-40 ABAB
Table 5-4
Summary of Recharge and Groundwater Pumping for Simulated Water Management Options (Based on 1970-2000 Hydrology)
Option Additional Quantity Recharged Through Direct Recharge or In-lieu for WMOs
Additional Quantity
Extracted in Dry Years
Net Gain to Groundwater
Basin
New Hogan Reoperation
23,000 0 23,000
South County Water Supply Project
34,000 0 34,000
Farmington Project 25,000 0 25,000 Exercise New Melones Rights
18,000 0 18,000
Freeport Project 93,000 55,800 32,000 Unspecified Conjunctive Use Projects
125,000 75,000 60,000
Figure 5-25 illustrates the resulting groundwater levels in 2030 with the implementation of the selected specific options, and the additional 60,000 ac-ft representing unspecified conjunctive use options. Groundwater levels increase by approximately 77 percent in the Stockton area and by approximately 80 percent in the SEWD area.
The time-varying results from the simulations are shown on figures 5-26 through 5-37. These figures illustrate the predicted groundwater levels under baseline conditions, and with the water management plan implemented at selected wells throughout the study area. The calibrated groundwater levels from 1970 to 2000 are also depicted. The locations of the selected wells are shown on Figure 5-38.
Figure 5-39 illustrates groundwater level profile along Highway 4 in Stockton and SEWD. The figure clearly illustrates the impact of implementing the core water management options, with water levels increasing in some areas by 50 feet.
Results Summary Tables 5-5 and 5-6 summarize the impact of the selected options individually and as part of an overall integrated water management plan. In Table 5-5, the average increases in groundwater levels in two areas are summarized.

Section 5 The Master Alternative
ABAB 5-41
Table 5-5
Impact of Selected Options – Groundwater Levels
Scenario/Option
Average groundwater level in
Stockton Area (feet, msl)
Average groundwater level in
SEWD (feet, msl)
No Action – Baseline (2030) -27 -81 Average Increase with Option/Plan (feet) Reoperation of New Hogan Reservoir 8 15 South County Water Supply Project 4 2 Farmington Recharge Project 3 8 Fully Exercise New Melones Rights 2 10 Freeport Project 5 19 Integrated Water Management Plan 13 40 In Table 5-6, the impact of the water management options in saline intrusion rates (rate of groundwater migration from west of Stockton toward the cone of the depression) is shown.
Table 5-6 Impact of Selected Options – Saline Intrusion
Water Management Option Rate of Saline Water
Intrusion (feet per year) No Action:Baseline Conditions (2030) 334 Reoperation of New Hogan Reservoir 196 South County Water Supply Project 184 Farmington Recharge Project 167 Fully Exercise New Melones Rights 168 Freeport Project 152 Integrated Water Management Plan 99


Simulated Average Annual Groundwater LevelsFor Baseline Conditions and Water Management Options
ABGW Head - Average 1970-2030.xls-26
Figure 5-26Simulated Groundwater Levels (1970-2030)
San Joaquin County Water Management Plan
-70
-60
-50
-40
-30
-20
-10
0
10
20
30
1970 1980 1990 2000 2010 2020 2030
Year
Gro
undw
ater
Lev
el (F
eet,
mea
n se
a le
vel)
Calibration-WELL1 BASELINE-WELL1 NHG SCSWP FARM NML FREE WMP:1
Baseline = Simulated Baseline Conditions from 1993 to 2030
Calibration = Calibrated Groundwater levels from 1970 to 1992
WMP = Groundwater Levels with Water Management Plan Implemented from 2000 to 2030NHG-New Hogan Reoperation. SCSWP-South County Surface Water Supply Project. FARM-Farmington Project. NML-Excercise New Melones Rights. FREE-Freeport Project

Average Groundwater LevelsFor Baseline Conditions and Water Management Plan (Core Elements)
ABGW Head - Average 1970-2030.xls-27
Figure 5-27Simulated Groundwater Levels (1970-2030)
San Joaquin County Water Management Plan
-100
-90
-80
-70
-60
-50
-40
-30
-20
-10
01970 1980 1990 2000 2010 2020 2030
Year
Gro
undw
ater
Lev
el (F
eet,
mea
n se
a le
vel)
Calibration-WELL3 BASELINE-WELL3 NHG SCSWP FARM NML FREE WMP:3
Baseline = Simulated Baseline Conditions from 1993 to 2030
Calibration = Calibrated Groundwater levels from 1970 to 1992
WMP = Groundwater Levels with Water Management Plan Implemented from 2000 to 2030
NHG-New Hogan Reoperation. SCSWP-South County Surface Water Supply Project. FARM-Farmington Project. NML-Excercise New Melones Rights. FREE-Freeport Project

Average Groundwater LevelsFor Baseline Conditions and Water Management Plan (Core Elements)
ABGW Head - Average 1970-2030.xls-28
Figure 5-28Simulated Groundwater Levels (1970-2030)
San Joaquin County Water Management Plan
-100
-90
-80
-70
-60
-50
-40
-30
-20
-10
01970 1980 1990 2000 2010 2020 2030
Year
Gro
undw
ater
Lev
el (F
eet,
mea
n se
a le
vel)
BASELINE-WELL4 Calibration-WELL4 NHG SCSWP FARM NML FREE WMP:4
Baseline = Simulated Baseline Conditions from 1993 to 2030
Calibration = Calibrated Groundwater levels from 1970 to 1992
WMP = Groundwater Levels with Water Management Plan Implemented from 2000 to 2030
NHG-New Hogan Reoperation. SCSWP-South County Surface Water Supply Project. FARM-Farmington Project. NML-Excercise New Melones Rights. FREE-Freeport Project

Average Groundwater LevelsFor Baseline Conditions and Water Management Plan (Core Elements)
ABGW Head - Average 1970-2030.xls-29
Figure 5-29Simulated Groundwater Levels (1970-2030)
San Joaquin County Water Management Plan
-100
-80
-60
-40
-20
0
20
1970 1980 1990 2000 2010 2020 2030
Year
Gro
undw
ater
Lev
el (F
eet,
mea
n se
a le
vel)
Calibration-WELL6 BASELINE-WELL6 NHG SCSWP FARM NML FREE WMP:6
Baseline = Simulated Baseline Conditions from 1993 to 2030Calibration = Calibrated Groundwater levels from 1970 to 1992WMP = Groundwater Levels with Water Management Plan Implemented from 2000 to 2030
NHG-New Hogan Reoperation. SCSWP-South County Surface Water Supply Project. FARM-Farmington Project. NML-Excercise New Melones Rights. FREE-Freeport Project
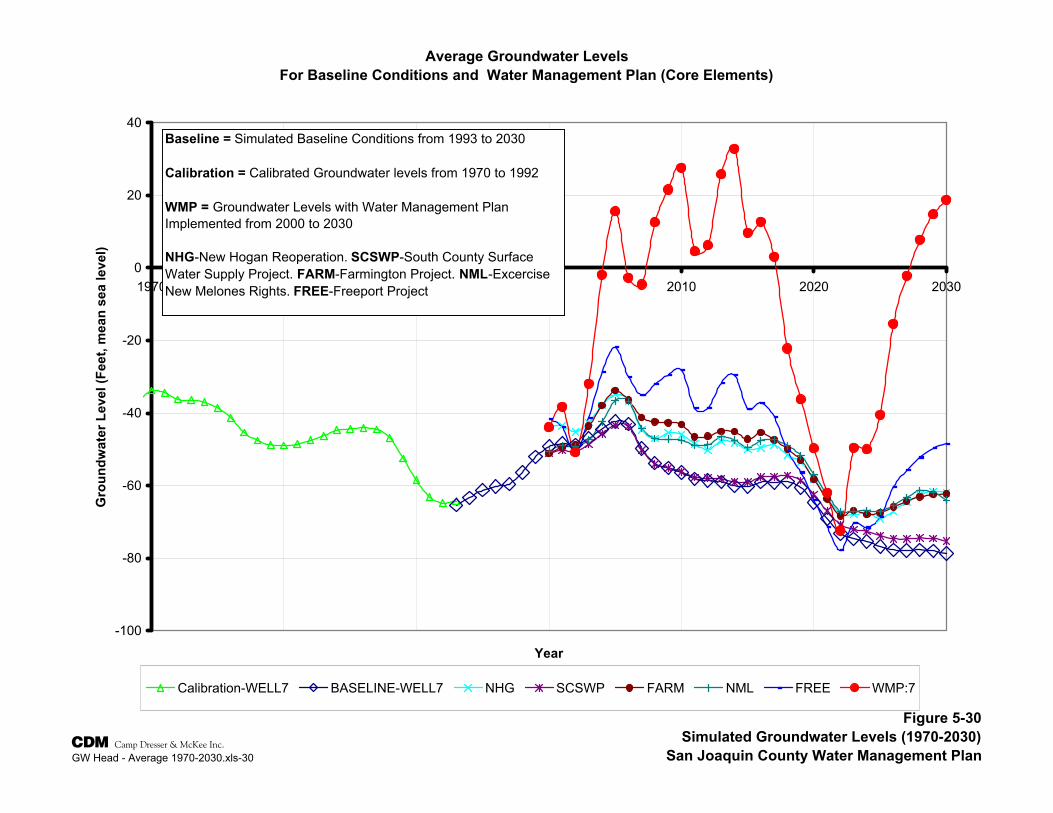
Average Groundwater LevelsFor Baseline Conditions and Water Management Plan (Core Elements)
ABGW Head - Average 1970-2030.xls-30
Figure 5-30Simulated Groundwater Levels (1970-2030)
San Joaquin County Water Management Plan
-100
-80
-60
-40
-20
0
20
40
1970 1980 1990 2000 2010 2020 2030
Year
Gro
undw
ater
Lev
el (F
eet,
mea
n se
a le
vel)
Calibration-WELL7 BASELINE-WELL7 NHG SCSWP FARM NML FREE WMP:7
Baseline = Simulated Baseline Conditions from 1993 to 2030
Calibration = Calibrated Groundwater levels from 1970 to 1992
WMP = Groundwater Levels with Water Management Plan Implemented from 2000 to 2030
NHG-New Hogan Reoperation. SCSWP-South County Surface Water Supply Project. FARM-Farmington Project. NML-Excercise New Melones Rights. FREE-Freeport Project

Average Groundwater LevelsFor Baseline Conditions and Water Management Plan (Core Elements)
ABGW Head - Average 1970-2030.xls-31
Figure 5-31Simulated Groundwater Levels (1970-2030)
San Joaquin County Water Management Plan
-100
-90
-80
-70
-60
-50
-40
-30
-20
-10
01970 1980 1990 2000 2010 2020 2030
Year
Gro
undw
ater
Lev
el (F
eet,
mea
n se
a le
vel)
Calibration-WELL8 BASELINE-WELL8 NHG SCSWP FARM NML FREE WMP:8
Baseline = Simulated Baseline Conditions from 1993 to 2030
Calibration = Calibrated Groundwater levels from 1970 to 1992
WMP = Groundwater Levels with Water Management Plan Implemented from 2000 to 2030
NHG-New Hogan Reoperation. SCSWP-South County Surface Water Supply Project. FARM-Farmington Project. NML-Excercise New Melones Rights. FREE-Freeport Project

Average Groundwater LevelsFor Baseline Conditions and Water Management Plan (Core Elements)
ABGW Head - Average 1970-2030.xls-32
Figure 5-32Simulated Groundwater Levels (1970-2030)
San Joaquin County Water Management Plan
-70
-60
-50
-40
-30
-20
-10
0
10
20
30
1970 1980 1990 2000 2010 2020 2030
Year
Gro
undw
ater
Lev
el (F
eet,
mea
n se
a le
vel)
Calibration-WELL9 BASELINE-WELL9 NHG SCSWP FARM NML FREE WMP:9
Baseline = Simulated Baseline Conditions from 1993 to 2030Calibration = Calibrated Groundwater levels from 1970 to 1992WMP = Groundwater Levels with Water Management Plan Implemented from 2000 to 2030NHG-New Hogan Reoperation. SCSWP-South County Surface Water Supply Project. FARM-Farmington Project. NML-Excercise New Melones Rights. FREE-Freeport Project

Average Groundwater LevelsFor Baseline Conditions and Water Management Plan (Core Elements)
ABGW Head - Average 1970-2030.xls-33
Figure 5-33Simulated Groundwater Levels (1970-2030)
San Joaquin County Water Management Plan
-100
-90
-80
-70
-60
-50
-40
-30
-20
-10
01970 1980 1990 2000 2010 2020 2030
Year
Gro
undw
ater
Lev
el (F
eet,
mea
n se
a le
vel)
Calibration-WELL10 BASELINE-WELL10 NHG SCSWP FARM NML FREE WMP:10
Baseline = Simulated Baseline Conditions from 1993 to 2030
Calibration = Calibrated Groundwater levels from 1970 to 1992
WMP = Groundwater Levels with Water Management Plan Implemented from 2000 to 2030
NHG-New Hogan Reoperation. SCSWP-South County Surface Water Supply Project. FARM-Farmington Project. NML-Excercise New Melones Rights. FREE-Freeport Project

Average Groundwater LevelsFor Baseline Conditions and Water Management Plan (Core Elements)
ABGW Head - Average 1970-2030.xls-34
Figure 5-34Simulated Groundwater Levels (1970-2030)
San Joaquin County Water Management Plan
-70
-60
-50
-40
-30
-20
-10
0
10
20
30
1970 1980 1990 2000 2010 2020 2030
Year
Gro
undw
ater
Lev
el (F
eet,
mea
n se
a le
vel)
Calibration-WELL11 BASELINE-WELL11 NHG SCSWP FARM NML FREE WMP:11
Baseline = Simulated Baseline Conditions from 1993 to 2030Calibration = Calibrated Groundwater levels from 1970 to 1992WMP = Groundwater Levels with Water Management Plan Implemented from 2000 to 2030
NHG-New Hogan Reoperation. SCSWP-South County Surface Water Supply Project. FARM-Farmington Project. NML-Excercise New Melones Rights. FREE-Freeport Project

Average Groundwater LevelsFor Baseline Conditions and Water Management Plan (Core Elements)
ABGW Head - Average 1970-2030.xls-35
Figure 5-35Simulated Groundwater Levels (1970-2030)
San Joaquin County Water Management Plan
-80
-70
-60
-50
-40
-30
-20
-10
0
10
20
1970 1980 1990 2000 2010 2020 2030
Year
Gro
undw
ater
Lev
el (F
eet,
mea
n se
a le
vel)
Calibration-WELL16 BASELINE-WELL16 NHG SCSWP FARM NML FREE WMP:16
Baseline = Simulated Baseline Conditions from 1993 to 2030Calibration = Calibrated Groundwater levels from 1970 to 1992WMP = Groundwater Levels with Water Management Plan Implemented from 2000 to 2030NHG-New Hogan Reoperation. SCSWP-South County Surface Water Supply Project. FARMFarmington Project. NML-Excercise New Melones Rights. FREE-Freeport Project

Average Groundwater LevelsFor Baseline Conditions and Water Management Plan (Core Elements)
ABGW Head - Average 1970-2030.xls-36
Figure 5-36Simulated Groundwater Levels (1970-2030)
San Joaquin County Water Management Plan
-100
-90
-80
-70
-60
-50
-40
-30
-20
-10
0
10
1970 1980 1990 2000 2010 2020 2030
Year
Gro
undw
ater
Lev
el (F
eet,
mea
n se
a le
vel)
Calibration-WELL18 BASELINE-WELL18 NHG SCSWP FARM NML FREE WMP:18
Baseline = Simulated Baseline Conditions from 1993 to 2030
Calibration = Calibrated Groundwater levels from 1970 to 1992
WMP = Groundwater Levels with Water Management Plan Implemented from 2000 to 2030
NHG-New Hogan Reoperation. SCSWP-South County Surface Water Supply Project. FARM-Farmington Project. NML-Excercise New Melones Rights. FREE-Freeport Project

Average Groundwater LevelsFor Baseline Conditions and Water Management Plan (Core Elements)
ABGW Head - Average 1970-2030.xls-37
Figure 5-37Simulated Groundwater Levels (1970-2030)
San Joaquin County Water Management Plan
-90
-80
-70
-60
-50
-40
-30
-20
-10
0
10
1970 1980 1990 2000 2010 2020 2030
Year
Gro
undw
ater
Lev
el (F
eet,
mea
n se
a le
vel)
Calibration-WELL21 BASELINE-WELL21 NHG SCSWP FARM NML FREE WMP:21
Baseline = Simulated Baseline Conditions from 1993 to 2030
Calibration = Calibrated Groundwater levels from 1970 to 1992
WMP = Groundwater Levels with Water Management Plan Implemented from 2000 to 2030
NHG-New Hogan Reoperation. SCSWP-South County Surface Water Supply Project. FARM-Farmington Project. NML-Excercise New Melones Rights. FREE-Freeport Project

AB
Figure 5-38 Well Hydrograph Location Map
WELL-9 WEL-10
WELL-16
WELL-11
WELL-12 WELL-14
WELL-17
WELL-5WELL-6
WELL-7
WELL-18
WELL-8
WELL-13
WELL-3
WELL-4
WELL-15
WELL-19
WELL-2
WELL-1
WELL-20
WELL-21
WELL-22

Groundwater Table Profile Along Highway 4 Under Various Conditions
ABWater Table Profile.xls-Baseline Profile
Figure 5-39San Joaquin County Water Management Plan
(90.0)
(80.0)
(70.0)
(60.0)
(50.0)
(40.0)
(30.0)
(20.0)
(10.0)
-
10.0
20.0
30.0
0 5 10 15 20 25
Distance from San Joaquin River along Highway 4 (miles)
Gro
undw
ater
Lev
el (f
eet,
mea
n se
a le
vel)
Year = 1970 Year = 1990 Year = 2030 WMP (2030)

ABAB 6-1
Section 6 Management Framework and Organizational Structure
6.1 Overview This Water Management Plan was developed through a collaborative process involving stakeholders with diverse needs and interests. Implementation of the water management options can best be achieved by continuing to work in a collective fashion to develop a broad base of political and financial support. Future actions undertaken in support of the plan may include project feasibility studies, design or construction.
The plan implementation stakeholder group will benefit by developing a management framework and supporting organizational structure that reflect the activities and needs of the group. The ability to procure project funding, for example, is often enhanced if the applicant is a formally recognized organization representing a broad base of local constituents.
• A management framework represents the hierarchy of relationships between plan participants and should be developed considering the actions being pursued and the range of participants involved, along with the degree of coordination and collaboration desired. Section 6.2 describes various types of management frameworks.
• An organizational structure represents a formal agreement between the water management plan implementation participants that defines how they conduct business. Examples of an organizational structure include a joint powers authority (JPA) or a memorandum of understanding (MOU). Section 6.3 discusses organizational structures.
Organizational structures can be created within any tier of the management framework as needed. For example, a stakeholder committee within the management framework could organize under a JPA or MOU. The management framework defines the various levels of responsibility within a group, while the organizational structure within any level of the management framework is developed in response to the type of powers that may be needed within the given level of responsibility.
To a large degree, the activities being pursued by a group dictate an appropriate management framework and organizational structure. During plan implementation, possible activities may include:
n Representation of local interests on a regional, State and Federal level;
n Pursuit of funding;

Section 6 Management Framework and Organizational Structure
6-2 ABAB
n Evaluation, design and construction of projects;
n Monitoring project success;
n Development of a unified approach to plan implementation; and
n Facilitation of public outreach.
Identification and prioritization of activities to be pursued by the stakeholder group helps to guide selection of an appropriate management framework and organizational structure during plan implementation.
6.2 Management Framework A management framework should reflect the management philosophy of its stakeholders. The management frameworks developed as examples for this project reflect the varying degrees of coordination and collaboration that could be desired by the individual members. The management frameworks discussed below range from an individual interest-based to a mutual interest-based framework.
6.2.1 Individual Interest-based An individual interest-based management framework reflects a philosophy whereby stakeholders are encouraged to retain individual powers to govern and develop water resources under their jurisdiction. Figure 6-1 provides an example flow diagram of this approach. Historically, management of water resources has been pursued using this approach.
The various districts, cities and existing organizational structures (e.g., a JPA), would develop, review and approve projects independently, using the county water management plan as a guide. Meetings would be held to discuss the progress of individual projects within the County; however, the project decision-making authority would remain exclusively within the jurisdiction of the entity sponsoring the project. County staff would attend progress meetings for updates on implementation of plan projects.
The individual interest-based management approach can result in implementation of projects identified in the plan; however, this approach does not encourage the consideration of evolving countywide issues and concerns during early stages of project evaluation and development. Funding opportunities that are contingent upon a demonstration of countywide and statewide benefits may be limited under this
Figure 6-1
Individual Interest - Based

Section 6 Management Framework and
Organizational Structure
ABAB 6-3
management framework if projects are not supported by formal recommendations by a broad base of stakeholders.
6.2.2 Mutual Interest-based The mutual interest-based management framework focuses on unification of individual powers to govern and develop water resources. A stakeholder advisory committee, represented by individual interests, would be responsible for review and recommendation of project-related proposals developed by individual water districts, communities or other agencies from within the county. An overseeing agency or authority would review proposals for consistency with the goals and objectives of the water management plan, and then forward the recommendation to the County Board of Supervisors for action. Figure 6-2 shows an example of this framework.
The widest range of countywide and statewide benefits for each project alternative under consideration will likely result from this type of management framework, due to the opportunities for early involvement by the full range of stakeholders. A potentially negative aspect of this management framework is that countywide stakeholders participate in the decision-making process, but financial responsibility remains with the project proponent.
6.2.3 Mutual Interest-based with Local Control A mutual interest-based management framework featuring local control represents a midpoint in the range of potential management frameworks bracketed by the individual interest-based and mutual interest-based approaches described above. Under this approach, plan projects would be developed and reviewed by stakeholders within the local area in which the project would be implemented. The
local stakeholders would recommend the project to a larger stakeholder advisory committee with countywide representation for approval and recommendation to the County Board of Supervisors. Figure 6-3 provides a graphical representation of the mutual interest-based with local control management framework.
Figure 6-3
Mutual Interest - Based with Local Control(County Lead)
Figure 6-2
Mutual Interest - Based

Section 6 Management Framework and Organizational Structure
6-4 ABAB
This approach allows stakeholders within the local management area to formulate a project considering local impacts and benefits, while at the same time allowing a group with wider representation to review the project for consistency with the countywide goals and objectives described in the water management plan. Recommendation of the project by the stakeholder advisory committee would demonstrate both local and countywide support for a project.
As shown on Figure 6-3, management areas representing geographic areas of stakeholder common interest would be formed to leverage funding pursuits and facilitate project implementation. The four distinct geographic areas of San Joaquin County (Southwest, South Delta, North and Central Delta, and Eastern) discussed in Section 2 could be formalized as separate management areas. Other counties (e.g., Butte County and Glenn County) have used groundwater basins, hydrologic boundaries, political boundaries or a combination thereof to define management areas. The management areas can be further subdivided into management sub-areas based on the predominant type of water use (e.g., agricultural, urban) and water supply (e.g., surface water or groundwater). Existing district boundaries are often used to define management sub-areas because of similar types of water use and supply within district boundaries.
Development of management areas within the county has additional benefits. Basin management objectives can be developed whereby stakeholders within each sub-area identify monitoring locations and elements (e.g., water levels, water quality, land subsidence) and then develop acceptable, quantified levels for each. This approach provides both a process for defining acceptable water management objectives within local areas and development of projects that reflect local needs.
This management structure is recognized by CALFED through DWR’s Integrated Storage Investigation (ISI) program, as it provides a framework for a stakeholder-guided program under which components of the water management plan can be developed and implemented with broad local support.
Other mutual interest-based water management frameworks featuring local control could be adopted, allowing for local control of the resource and projects, with a governing board responsible for ensuring conformance with goals and objectives identified in the water management plan. Figure 6-4 depicts such a management framework. Differing from the previous example, Figure 6-4 shows that individual
Figure 6-4
Mutual Interest – Based with Local Control(Lead by a New Agency)

Section 6 Management Framework and
Organizational Structure
ABAB 6-5
stakeholders would be organized by authorization under one of the water districts acts discussed in Section 6.3.4.
Formation of management areas under this framework would allow for local control of water resource management and associated projects. Representatives from management areas would report to a governing board, which would in turn report to the electorate of the legislatively authorized district.
6.3 Organizational Structures Stakeholders should select an organizational structure that reflects the anticipated activities and the associated powers needed to execute the activities. Stakeholders can be coordinated under one of various organizational structures for representation, including 1) Joint powers agreement, 2) Memorandum of understanding, 3) Nonprofit mutual benefit corporation or 4) various types of water districts (e.g., water replenishment district, water conservation district). Table 6-1 (at the end of this section) summarizes the differences between these alternative organizational structures. The following subsections discuss each type of organizational structure in more detail.
6.3.1 Joint Powers Agreement A joint powers agreement is a coordinating tool for separate parties with common interests as defined under Government Code Section 6500 et seq. Parties administer the purpose and goals of the agreement through a range of powers, including but not limited to: entering into contracts; employing agents and employees; bond issuance; and acquiring, constructing, managing or operating facilities. Authority available under a JPA is in addition to the power common to the member agencies. An example of a JPA is the Northeastern San Joaquin County Groundwater Banking Authority whose goal is to “…facilitate the development of locally supported groundwater banking projects that improve water supply reliability.” Table 6-2 (at the end of this section) provides additional information on joint powers agreements.
6.3.2 Memorandum of Understanding A memorandum of understanding is an organizational structure that allows signatory agencies to pursue a common purpose, but limits the agency formed by the MOU from contracting, incurring debt or employing staff directly. The organizational structure provided under a MOU has advantages, in that it may be formed for any purpose within the contracting authority of an agency and a MOU is easily formed through signature of the MOU contract by member agencies.
The Butte Basin Water Users Association in Butte County is an example of a group formed under an MOU who share common interests. The group, comprising agricultural and urban water purveyors, formed in the mid-1990’s in response to water management challenges encountered during drought. The group has combined financial and technical resources to better understand and manage the surface water

Section 6 Management Framework and Organizational Structure
6-6 ABAB
and groundwater resources. In addition to promoting improved water management by individual agencies through the collective sharing of information, an organizational structure formalized under an MOU can also help to demonstrate broad local support by member agencies pursuing funding for a common goal. Table 6-3 (at the end of this section) includes additional information regarding an MOU.
6.3.3 Nonprofit Mutual Benefit Corporation A nonprofit mutual benefit corporation (nonprofit) may be formed by one or more persons under the Corporations Code Section 7110 et seq. The corporation is formed by filing articles of incorporation with the Secretary of State setting forth the name, purpose and powers of the corporation. Bylaws developed by the corporation establish how members make decisions and generally carry out business.
The corporation has the power to, among other things, levy dues and assessments, enter into contracts, borrow and lend money, and participate in partnerships and joint ventures. Nonprofits have been successful in securing project funding in part because they represent a broad range of stakeholders with common interests. A summary table describing nonprofit corporations is provided in Table 6-4 (at the end of this section).
6.3.4 Various Types of Water Districts The State of California has 157 authorized water district acts, of which approximately 30 can be considered general (Department of Water Resources, 1994). Examples of general water district acts include County water authorities, County water districts, resource conservation districts, water districts, water storage districts and water replenishment districts. Department of Water Resource Bulletin 155 summarizes the various water district acts. In addition to these water district acts, special districts can be created by specific legislation.
Many of the individual entities represented on the water management plan stakeholder committee have utilized one of these acts as the basis for their organizational structure. Stakeholders may chose to organize under one of the existing water district acts, considering anticipated plan implementation activities.

Section 6 Management Framework and
Organizational Structure
ABAB 6-7
Table 6-1 Summary of Differences Between Alternative Organizational Structures
Authority & Functions of the Agency Created via
Each Alternative
Joint Powers Agreement
Memorandum of Understanding
Nonprofit Mutual Benefit Corporation
Water Districts (1)
Authority Government Code § 6500 et seq.
Basic contracting authority of member agencies
Corporations Code § 7110 et seq.
Various sections of Water Code
Formal filing requirements for formation? Yes No Yes Yes
Separate legal entity? Yes No Yes Yes
Authority to enter into contracts? Yes No Yes Yes
Authority to issue bonds? Yes No Yes Generally, Yes
Accountability/audit reports required?
Yes No Yes Yes
Subject to immunities and protections under the Government Code?
Yes N/A No Yes
Ability to involve non-party agencies and entities in the decision-making process?
Yes Yes Yes Yes
Notes: 1. This column refers to Water Districts in general and, more specifically, County Water Authorities, County Water Districts, Protection Districts (1907 Act), Resource
Conservation Districts, Water Conservation Districts (1931 Act), Water Districts, Water Replenishment Districts, and Water Storage Districts. It should be noted that features of some special districts vary from this generalized summary. Refer to Department of Water Resources Bulletin 155 for additional information.

Section 6 Management Framework and Organizational Structure
6-8 ABAB
Table 6-2 JOINT POWERS AGREEMENTS
Government Code Section 6500 et seq.
Purpose Purpose to be defined by member agencies but scope not to exceed agencies’ authority.
§ 6502; City of Oakland v. Williams
Authority for Agreement If authorized by their legislative or governing bodies, two or more public agencies by agreement may jointly exercise any power common to the contracting parties. It is not necessary that the power common to the contracting parties be exercisable by each member agency with respect to the geographical area in which the joint power is to be exercised.
§ 6502
Contents of Agreement Agreement must state the purpose of the agreement or power to be exercised, and the method by which the purpose will be accomplished or power exercised. Agreement must designate a treasurer from one of the member agencies or appoint an officer or employee to the position.
§ 6503; § 6505.6
Formation If the JPA’s purpose is to create a separate agency or entity, within 30 days after the effective date of the agreement (and within 30 days of any amendment to the agreement), the agency must notify the Secretary of State of the name of each public agency which is a party to the agreement, the date the agreement became effective, a statement of the purpose of the agreement or power to be exercise, and a description of the amendments made, if any. The filing fee with the Secretary of State is $5.
§ 6503.5; 2 Cal. Code of Regulations 21908

Section 6 Management Framework and
Organizational Structure
ABAB 6-9
Table 6-2 (Continued) JOINT POWERS AGREEMENTS
Government Code Section 6500 et seq. Powers Powers of the agency formed pursuant to the JPA include:
• make and enter contracts; • employ agents and employees; • acquire, construct, manage or operate building, works or improvements; • incur debts, liabilities or obligations; • sue or be sued in its own name; • authority and powers of the member agencies; • ability to issue bonds, note warrants or other forms of indebtedness. This authority is in addition to the power common to the member agencies, but shall not be exercised until authorized by parties. The bonds do not constitute a debt or liability of the member agencies.
§ 6508; § 6546; § 6546.5; § 6547; § 6547.1; § 6551
Organizational Structure The agency or entity provided by the JPA to administer the agreement may be one or more of the parties to the agreement or a commission or board constituted pursuant to the agreement or a person, firm or corporation designated in the agreement. Structure largely determined by member agencies.
§ 6506
Liability The agency created by the JPA is a public agency separate from the parties to the agreement. The agreement can specify that the debts, liabilities and obligations of the agency will be that of the agency created by the JPA, and not the member agencies. Unless the agreement so specifies, the debts, liabilities and obligations will be those of the individual parties to the agreement.
All privileges and immunities which apply to the activity of officers, agents or employees of the member agencies apply to them in the same degree and extent while performing functions and duties of the agency created by the JPA.
§ 6507; § 6505.8.1; § 6513
Funding Parties to the agreement may make contributions of public funds to fund the purposes set forth in the agreement, and may also use the parties’ personnel, equipment or property in lieu of other contributions.
§ 6504

Section 6 Management Framework and Organizational Structure
6-10 ABAB
Table 6-3 MEMORANDUM OF UNDERSTANDING
Purpose May be formed for any purpose within the agencies’ contracting authority.
Authority for Agreement Basic statutory authority of individual agencies and districts to enter into contracts and agreements.
Formation Signing the contract.
Powers Agency formed pursuant to an MOU has the power to carry out the mission and objectives of its member agencies, but not the power to contract, incur debt and employ staff directly.
Organizational Structure Determined by member agencies.
Liability The agency created through an MOU probably would not incur liability itself because it has no authority to contract or employ; the member agencies employing the individuals or contracting would likely incur the liability. To that extent, the member agencies would be protected by immunity and Tort Claims Act provisions of the Government Code.
Funding Parties to the agreement have the authority to reach agreements on funding the agency from their own budgets.

Section 6 Management Framework and
Organizational Structure
ABAB 6-11
Table 6-4
NONPROFIT MUTUAL BENEFIT CORPORATION Corporations Code Section 7110 et seq.
Purpose May be formed for any lawful purpose. § 7111 Authority for Formation One or more persons may form a nonprofit mutual benefit corporation under the
Corporations Code, but the name of the corporation must not “create the impression that the purpose of the corporation is public, charitable or religious.”
§ 7120; § 7122
Formation Formed by executing and filing articles of incorporation with the Secretary of State, setting forth the name, purpose and powers of the corporation.
§ 7120; § 7130
Powers Powers of the corporation include the power to:
• adopt, amend and repeal bylaws; • issue, purchase, sell and otherwise deal in its own bonds, notes and debt
securities;
• levy dues and assessments;
• assume obligations, enter into contracts, and borrow or lend money;
• participate in partnerships and joint ventures; • carry on a business at a profit.
§ 7140
Organizational Structure The corporation’s articles and bylaws establish how the members will make decisions, carry out business, etc. The activities of the corporation must be carried out by or under direction of the board of directors. The Board may delegate management activities to committees.
§ 7132, §§ 7150-7153; § 7210
Liability for Individual Directors and Officers
For volunteer directors and executive committee officers, no claim for money damages may be brought for acts occurring within the scope of the person’s duties as director or officer when acting in good faith, in a manner the person believes to be in the best interest of the corporation, and when acting with reasonable care. But this protection against money damages only applies to “trade, professional and labor organizations” operating for “fraternal, educational, and other nonprofit purposes.”
§ 7231.5

ABAB 7-1
Section 7 Funding This section describes the funding sources that may be available for implementation of the Water Management Plan, including Federal, State and local sources. In section 7.2, a brief discussion of the funding types is provided. A case study in Section 7.3 provides an example of another Central Valley planning effort that was particularly successful in obtaining funding, and Section 7.4 provides guidance and specific recommendations for seeking funding for Water Management Plan options.
At this point in the Water Management Plan process, it is not possible to have a complete funding strategy that indicates the funding source for each project. However, it is possible to identify a wide range of sources that can be kept in mind
during project development. As the flow chart to the left illustrates, there are several steps between the current position and the funding strategy. It is imperative to develop project partners, and the funding opportunities depend on the parties involved and achieving wide benefit. Additional details about the project must be known, and some details could change after project partners are determined. After project partners are determined, more funding opportunities can be developed, and a funding strategy can be finalized. This chapter provides an initial understanding of funding opportunities to guide the next steps of the process.
7.1 Funding Sources Three primary categories of funding may be available for implementation of the Water Management Plan, as discussed below. The information included here is intended as an introduction to the factors that the County should consider when developing a project funding strategy. Included in this discussion are:
n Funding from the Federal Government and how it can be secured;
n State funding and how it can be secured and leveraged; and
n Local revenue sources and how they can be managed optimally with State and Federal funds.
7.1.1 Federal Funding Federal funds can be received by the State, local districts, municipalities or non-government organizations and may be in the form of grants, loans and cost-shared agreements. When a local entity partners with or enters into an agreement with a Federal agency, the local organization is referred to as the project’s non-Federal sponsor, or local sponsor.
Section 7 Funding
ABAB 7-2
Federal funding can be secured for a project in three ways. First, a Federal agency such as the Corps of Engineers can work with a local agency (or non-Federal project sponsor) to identify a potential project. Once the project has been defined to the satisfaction of both the Corps and local project sponsor, the Corps can request funds for the project during its internal budgeting process. As Federal agencies have a 2- to 3-year budgeting horizon, and are typically working on budgets several years in advance, it can often take several years for funds to be secured using this approach.
The second Federal funding option is to secure funds through the legislative process and have the requested project funds included in the Federal budget. To initiate this type of funding, the local project sponsor requests project funding from its congressional representative. If the representative can identify an existing Federal program under which to make a budget request, the project could be appropriated, or funded, in that year’s budget. If, however, the project requires a new authorization, that is a separate act of Congress establishing a Federal interest in the project and setting a project funding limit, development of the new authorization will take an additional year. The project must be authorized 1 year and can then be appropriated the following year.
Finally, a third option is to apply for project funding under an existing grant, loan or assistance program administered by any of the various Federal agencies overseeing the resource management issues addressed by the specific project proposal.
7.1.2 State Funding State funds are similar to Federal funds in that they can also be secured through the legislative process and funded in the annual budget. The dollar amounts available from the State are usually not as substantial those obtained through the Federal Government, however the State process can be somewhat more streamlined than the Federal. The State also administers a number of grant and loan programs that have funds available to local agencies for implementation of plans and projects. These State programs are overseen by the different agencies whose mandates are in a particular area. For example, the Resources Agency has oversight over the Department of Water Resources, and CalEPA has oversight over the State Water Resources Control Board. Both of these agencies administer State grant and loan programs.
7.1.3 Local Funding Local revenues are usually collected as part of assessment programs. These funds also can be part of the local agencies Capitol Improvement Plan if they are targeted for a specific purpose. Local revenue sources can be critical in initiating a plan or project that reflects local stakeholder preferences and can be used as the basis of a cost-share agreement with State or Federal funds.

Section 7 Funding
ABAB 7-3
7.2 Funding Types 7.2.1 Bonds Bonds are instruments to borrow capital for a project and allocate the burden of repayment over a defined time span. Bonds can typically be used to finance capital facilities such as new reservoirs or pump stations, and the bond is repaid over time with revenues generated from the operation of facility. Bonds can generally be short term or long term. In general, individual water districts have the authority to issue bonds, which, because they have relatively secure revenue streams, are a good mechanism for funding infrastructure development.
7.2.2 Fees Fees can be levied for services provided to the public. A wide array of fees includes utility fees, user fees, impact fees, inspection fees, pollution/effluent discharge fees etc. The fee type and rate will be dependent on the service rendered and local laws.
7.2.3 Grants Grants are sums of money that do not need to be repaid. Grants can be obtained for the financing of a particular activity or facility. DWR has a variety of applicable grant programs available through Proposition 13, including:
n Water Use Efficiency Grants: The grants can be used for agricultural and urban water use efficiency projects that contribute toward reducing losses, improving water quality benefits or providing environmental benefits.
n Water Conservation Feasibility Study Grants: These grants can be used to fund feasibility studies for agricultural and urban water conservation projects
n Infrastructure Rehabilitation Feasibility Study and Construction Grants: These grants can be used for the study and construction of projects that include repair, restoration or rehabilitation of existing water distribution systems and/or delivery facilities that result in the improved efficiency in terms of water losses.
n Groundwater Recharge Feasibility Study Grants: These grants can be obtained to pay for feasibility studies for groundwater recharge projects.
n Groundwater Storage Feasibility Study/Pilot and Construction Projects Grants: Grants available under this program can be used to pay for feasibility studies and construction of projects designed to accomplish conjunctive management of surface water and groundwater.
7.2.4 Leases A lease is an agreement that allows one party to use land or a building for a specified time, usually in return for repayment. In San Joaquin County, for example, land

Section 7 Funding
ABAB 7-4
required for recharge facilities could be leased from owners for field flooding on a seasonal or period basis, depending on the availability of water.
7.2.5 Loans Loans are also available through Proposition 13. The loans available include:
n Water Conservation Capital Outlay Loans: These loans are available for capital expenditure on agricultural and urban programs to improve water use efficiency. Grants are available to fund project feasibility studies.
n Groundwater Recharge Construction Loans: Loans from the State are available to pay for the construction of groundwater recharge projects, including acquisition of land. Grants are available to fund project feasibility studies as mentioned above.
7.2.6 Public-Private and General Partnering Public-private partnerships are essentially joint ventures between the public and private sectors in projects or services that have traditionally been public sector activities. In the case of SJCWMP options, partnerships could be more general; that is, partnering with urban water suppliers to assist in the development of projects would offer a good opportunity to share costs as wells as benefits. The same approach can be used between different districts, cities and counties and has already been applied to different projects in San Joaquin County. 7.2.7 Taxes Taxes are charges typically against income, property, or the sale of goods and services. In addition to taxes levied for general government activities and services, specific taxes can be levied to raise funds for a specific activity. Taxes can be used to both raise revenues and to encourage or discourage certain behavior by offering tax reductions or increases. For example, an increase in groundwater “pump” taxes could provide the incentive to use more surface water. Implementation of new taxes or modification of existing tax regime is complex and has to be done on an equitable basis. For example, increasing the pump tax to discourage groundwater is only appropriate if the user has an alternative, such as surface water, otherwise the tax does not produce the desired effect.
7.3 Case Study – Kaweah River Delta Corridor Enhancement Plan
This case study provides an example demonstrating how a project can be developed through the cooperation of multiple stakeholders and funded with State and Federal sources. The project described below was planned such that it provides multiple benefits. Funding proposals that were prepared for this project highlighted these multiple benefits and were very successful.

Section 7 Funding
ABAB 7-5
Historically, the City of Visalia experienced flooding problems following heavy rains. At the same time, groundwater overdrafts in the area have resulted in low groundwater levels. The Kaweah Delta Water Conservation District, Tulare County, and the City of Visalia participated jointly in a two-phase Kaweah River Delta Corridor Enhancement Plan. The plan was designed to provide solutions for the flooding and overdraft problems through the implementation of a single program. The focus was to select and develop a long-term solution for flood control, groundwater recharge and, to the extent possible, native habitat conservation and restoration along the Kaweah River Delta corridor.
The study area lies on the east side of the central San Joaquin Valley, just downstream from Terminus Dam, between the St. Johns River to the north and the Kaweah River and its tributaries to the south. The study area extends west to the City of Visalia urban area boundary. The land use in the project area is agricultural. Significant remnants of the Valley Oak Riparian Forest are found along the waterways in the area and are unique in the San Joaquin Valley. The oak forest provides important wildlife habitat.
A conceptual plan was developed to meet the study’s multi-use objectives. The plan included a number of diversion structures and detention basins located along the river. During storm events, high flows would be diverted from the river to the basins where the water would be stored for possible discharge back into the river and/or allowed to percolate to assist with groundwater recharge. At times other than storm events, water could be purchased and diverted to the basins for additional groundwater storage.
The first phase of the study included the identification of sites along the river suitable for implementation of the plan. Sites were evaluated to determine their potential to provide the following:
n Flooding protection
n Groundwater recharge
n Environmental habitat benefits
The evaluation included the sites’ storage potential, pumping requirements, recharge potential, constructibility, order-of-magnitude cost of implementation and habitat restoration potential. At the beginning of Phase I, 20 sites were identified, all of which provided potential habitat benefits. Of these, 14 sites possessed flooding and recharge potential, and 6 sites were recommended for further investigation and study.
Phase II of the study included a more-detailed analysis of the six sites identified in Phase I. This included hydraulic analysis of the channel sections, percolation testing of the retention sites, hydrologic evaluation, and refined construction estimates. A

Section 7 Funding
ABAB 7-6
demonstration project site was identified and designed and the project was successfully constructed.
This case study demonstrates how a group of local agencies with diverse mandates can successfully partner to accomplish a program that was mutually beneficial to all. For the first phase of the planning process, the group wrote a project proposal and received a $100,000 grant from the State. With this completed document, the planning group took its request for the next phase and demonstration project funding to the Federal government and received a $1 million appropriation. The local contribution to this effort was the staff time to write proposals and administer the project and donation of land for the demonstration project.
7.4 Funding for Water Management Options The key to implementing any of the WMOs in this plan successfully lies in the collective effort of the local stakeholders and their ability to demonstrate that these projects can have Statewide or regional benefits. A project’s local focus and benefits need not be sacrificed for the greater good; however, if a project is to compete for funding in today’s market, its proponents must demonstrate that it can be mutually beneficial to both the proponents and to the people of California.
Projects that are implemented in today’s financial and political climate require leveraging and partnering. Competition for financial resources in this market is at its highest level, and to be successful a project proponent’s strategy must be aggressive and sophisticated. A successful proposal will demonstrate that the project would have many values. That is, a single-benefit water resources project will not compete well against one that has a variety of benefits.
When developing a funding proposal, project proponents should pay particular attention to incorporating these elements:
n Environmental benefits. Many of the State and Federal agencies that administer funds have environmental mandates. Project proposals should be crafted in a manner that explains how the proposal will help the funding agencies fulfill their mandates.
n Regional benefits. Funding agencies may cover large regions, or may be targeting funds at projects that have the potential to provide regional benefits. Project proponents should seek to expand the zone of benefit associated with a project as much as is feasible. Often, changes in a project design or implementation structure can result in added benefit for surface and groundwater, water quality and environmental values at a larger scale. The size of the project may need to be increased to achieve regional benefits.
n Project partners. Adding regional and natural resource benefits to a proposal can help to attract partners. Most projects will benefit from multiple partners, who can
Section 7 Funding
ABAB 7-7
bring needed political and financial support and can help leverage project funds. Many projects that would be cost prohibitive for a single sponsor come into the range of feasibility with the collective leveraging of financial resources provided by project partners.
n Professional assistance. There can be great strength in diverse partnerships, which can often furnish the collective power to a project that effectively secures funding. When the scale of the proposal requires legislative action to secure funds, however, professional assistance is likely to be required and should not be overlooked. The assistance of professionals can make an enormous difference in the success of a proposal. Consultants can help to develop and review proposals and often are aware of funding strategies that are not immediately apparent. Even the most well thought out project may not be able to compete against one that has a professional advocate guiding it through the process.
Including these benefits or added values to a proposal is critical to having a project funded in California’s water resource market. Project proposals that bring these elements together, demonstrating balanced benefits among people and the environment, are the successful ones that move forward.
Significant opportunities currently exist for any of this Water Management Plan’s project options to be funded through the State or Federal Government. The ability to obtain these resources is based on the strength of the proponents’ partnerships and proposals. Furthermore, the funding process is an extremely dynamic system that is constantly changing. A detailed strategy for each water management option would be premature at this time, as both additional technical work and stakeholder-consensus building activities need to be completed to make these options more fundable through either State or Federal programs. Table 7-1 presents specific funding information for each WMO within the Master Alternative.

Section 7 Funding
ABAB 7-8
Table 7-1 Funding Opportunities for WMOs
Water Management Option Tier Recommended Next Steps Potential Funding Exercise Full New Melones Rights I Feasibility Study: Detailed hydrologic analysis, including
evaluation of impact to the south Delta and possible mitigation measures.
Continue existing efforts. This option could be packaged with some agricultural conservation efforts, thereby offering better opportunities for State or Federal funding.
WID Transfer to SEWD and City of Stockton
I Feasibility Study: Engineering feasibility study and environmental documentation.
Continue existing efforts. Urban water projects could be packaged with urban conservation and infrastructure rehabilitation, which could be funded through Prop. 13 grants and/or loans.
New Hogan Reoperation I Pre-feasibility: Update engineering and economic benefits, environmental impacts, Identify environmental impacts and possible mitigation measures.
U.S. Army Corps of Engineers. As is the case with the New Melones Option, infrastructure improvements and some agricultural conservation efforts could be part of the option to leverage State or Federal funding.
Farmington Groundwater Recharge and Wetlands Project
I Pilot Program: Proceed with the pilot project. Implementation: Based on pilot program results, full-scale design and then implementation would follow.
Continue existing efforts: pursue Prop 13 funds if Corps funding is unavailable. Specifically: groundwater storage feasibility study and construction grants.
SSJID/OID transfer to SEWD I Re-evaluate costs and benefits to parties involved to see if the transfer will continue beyond its current contract period.
Project is already underway and funded.
South County Water Supply Project I Implementation: Final design is scheduled to begin in September 2001, with implementation to follow in late 2002.
Continue existing efforts. As noted above, urban conservation can be a component of this project to improve funding options from State or Federal programs.
Stockton Delta Diversion I Feasibility Study: Feasibility study and environmental documentation.
The city of Stockton is pursuing funding.
Urban Water Conservation Improvements
I Implementation of selected BMP in different Cities. State of California, DWR Urban Water Conservation Feasibility Grants Water Use Efficiency Grants
Delta Area Water Supply Activities I Development of an action plan that identifies key issues and projects that provide benefits to Delta stakeholders and can show broad County support.
State of California, DWR Water Use Efficiency Grants U.S. Bureau of Reclamation Efficiency Incentives Program

Section 7 Funding
ABAB 7-9
Table 7-1 (Continued)
Funding Opportunities for WMOs
Water Management Option Tier Recommended Next Steps Potential Funding Southwest County Water Supply Activities
I Development of an action plan that identifies key issues and projects that provide benefits to Southwest County stakeholders and can show broad County support.
Continue existing efforts
NSJWCD Groundwater Recharge Project
II Water Rights Application Continue existing efforts, including groundwater storage feasibility/pilot and construction grants.
Agricultural Water Conservation Improvements
II Additional Studies: No immediate action. State of California, DWR Agricultural Water Conservation Feasibility Grants
Freeport Diversion II Feasibility Study: A detailed feasibility study and environmental documentation.
Continue existing efforts, including groundwater recharge construction Loans and groundwater storage/conjunctive use grants.
Urban Wastewater Reclamation II Project retained in WMP, but no action recommended pending outcome of Stockton Delta Diversion Project
State of California, Cal EPA, SWRCB Water Recycling Financial Assistance Program
Floodflows to Middlebar Reservoir II Pre-feasibility: Based on results of this study, elect to move ahead with completing FERC application. Deadline for FERC Application is November 2002.
Partnering with other counties or water suppliers.
Floodflows to South Gulch Reservoir III Project retained in WMP but no immediate action recommended. When appropriate updated hydrologic analysis, engineering and economic feasibility studies will need to be completed.
Partnering with other counties or water suppliers.
American River Water Rights III Project retained in WMP, but no immediate action recommended.
Partnering with other counties or water suppliers.

ABAB 8-1
Section 8 Recommended Strategy Through a focused, dedicated effort involving a series of collaborative discussions, the Steering Committee has developed a portfolio of water management options that, with eventual implementation, will address the County’s water management issues. To maintain the momentum gained through the unprecedented cooperation achieved by the Steering Committee, the participants in this SJCWMP must take action in the short term. First and foremost, the County must continue to emphasize integrated countywide problem solving involving all stakeholders. To equip a planning entity for moving this SJCWMP into the implementation phase, Plan participants should establish a formal group, acquire funding and perform detailed studies that will provide the information necessary to begin putting the WMOs to work “on the ground.”
Study, design and implementation of some of these WMOs will take years, if not decades. Acquiring an SWRCB water rights permit, for example, can take an extensive, protracted effort. Making progress in addressing the County’s water issues will require the long-term attention of a committed, stable organization that is dedicated to carrying forth the excellent progress made by the Steering Committee in planning to date. The discussion provided in this section is the recommended strategy for moving forward quickly with the
process initiated through this Plan, and for ensuring that the Plan is an effective framework for long-term implementation.
8.1 Strategic Rationale Water projects have been devised, implemented and operated by independent agencies in San Joaquin County for decades, and this arrangement is likely to continue into the future. An opportunity exists, however, for the County to build upon the multiple stakeholder decision-making capabilities developed during the development of this Plan. It would be beneficial to continue working with a countywide focus at this juncture. It may, in fact, be necessary to do so, given the difficulty with which water projects are implemented in California. The need for working at a countywide level, and the limitations of that approach, is discussed below.
8.1.1 Continued Joint Decision Making The opportunities for developing new water projects in California are diminishing rapidly and are increasingly expensive. The competition for State and Federal funding to finance water projects is also increasingly fierce. Given this environment, the most
To maintain the momentum gained through the unprecedented cooperation achieved by the Steering Committee, the participants in this SJCWMP must take action in the short term.

Section 8 Recommended Strategy
8-2 ABAB
effective way for San Joaquin County water users to develop new projects is to work cooperatively, in a manner that capitalizes on the strength of joint resources. The County is already realizing the benefits of the Steering Committee information sharing, discussion and decision-making. There are significant potential benefits to continuing planning at the County level, including:
n A reduction in redirected impacts. Close cooperation among stakeholders will reduce the probability that solving problems in one area of the County will exacerbate or create problems in other areas. Cooperation can also reduce the potential for expensive litigious disputes over water project development. By collaborating, project proponents can identify potential project impacts early and either mitigate them or effect a modification to the project that lessens potential impacts.
n Organizational streamlining. Effective collaboration can reduce the complexity associated with funding applications, focus decision-making toward mutual benefit and promote partnerships for cost and benefit sharing.
n Greater political influence. A group of County stakeholders representing a “united front” can send a powerful political message to State and Federal decision-makers. Likewise, the demonstration of an agreed-on approach for water management (e.g., this document) can be wielded as a political tool. Entities operating cooperatively can also apply increased resources to more effectively facilitate— or block—projects that have benefits or impacts in San Joaquin County.
n Greater ability to obtain State and Federal funding. In the current market, obtaining some of the most desirable and significant funding requires that applicants develop partnerships and pursue relationships at the highest political levels. The financial and personnel resources of a countywide organization can help the County operate at a level that will help gain access to funding that would otherwise be unattainable.
Some water users in areas near San Joaquin County have joined together to form organizations that can better manage and leverage their collective resources. The Sacramento’s Regional Water Authority, for example, is a recently formed JPA including Sacramento area water providers. Such organizations will be competing for State and Federal funds, and are potentially more attractive to organizations seeking partners for expensive water development projects.
Countywide planning will not resolve all issues. Some objectives contained within the plan inherently conflict with others. A regional approach and organization will provide an effective forum for resolving internal issues, and at the same time could be a powerful force in representing collective San Joaquin County issues at the regional, State and Federal level.

Section 8 Recommended Strategy
ABAB 8-3
8.1.2 Limitations to Countywide Planning Countywide planning efforts, which must be sufficiently broad in scope to address the interrelated needs of a variety of stakeholders, may be too general to attend to the specific needs of all local stakeholders. Wide-scale information dissemination, for example, depends on the cooperation of key organizations at the County level, but will also require the participation of representatives at the local level to assure that an appropriate cross section of stakeholders is adequately informed.
Some projects and issues affect a very limited geographic or political area within the County, and these may be more appropriately managed at the local level. Development of a countywide organization and management plan does not preclude the continued management of water resources at the local level.
It is important to consider all projects within the context of the entire County, and that projects have support from the entire group of county stakeholders. A countywide planning approach can help further this agreement and support, as described above. The existence of a countywide planning organization does not, however, eliminate the need for the participation of project “champions” to provide specific local expertise and spur project movement through the phases of development. Project champions are typically the organizations at a municipal or district level that would benefit from implementing a project. Where there is a project champion organization, it would work with the rest of the countywide planning group to implement a project.
Some projects within the Plan have already begun and are being pursued by individual entities (or small groups) within the County. By including them in the Plan, the stakeholder group is agreeing that the projects should be moved forward to the next step of more-detailed study. While some projects will be pursued primarily by smaller groups, the countywide organization will support these projects as long as studies find them to be consistent with the County’s goals and objectives.
8.1.3 Using Technical Tools for Planning Planning is an iterative process, and continued analyses will be necessary as the County fulfills its water management mission. A countywide planning agency tasked with evaluating and selecting options for implementation will require certain tools to make informed decisions regarding projects, programs and policies. Two tools that will be critical in the future are the County’s groundwater model, which was developed for this plan, and a decision-making framework based upon the goals and objectives documented by the stakeholders.
The Groundwater Model CDM developed the comprehensive model of the groundwater system in San Joaquin County with several improved characteristics over previous models. The 3-dimensional DYNFLOW model was designed to interact with the County's GIS system; land use information in the model is linked to the ARCInfo database of the County, and the results of the model can be exported for inclusion and display in the

Section 8 Recommended Strategy
8-4 ABAB
GIS system. Changes in management practices such as irrigation, pumping and diversion patterns can thus be planned and tracked in the GIS system, and then exported to the DYNFLOW model. The model also links the flow in the streams in the County to the groundwater aquifer and permits full interaction between these components.
The County groundwater model provides graphical visualization of piezometric heads and flow patterns throughout the County. The system can also display all model inputs graphically, including land uses, cropping patterns, irrigation application rates and rainfall. Steady state and transient results can be displayed and compared to appropriate field data. This enables stakeholders and the public to clearly and comprehensively review the impact of proposed or future groundwater management schemes. The model has been installed at the SJCFC&WCD office in Stockton, and SJC personnel will be able to display ongoing changes in observed heads and future management schemes. This model is an invaluable tool for evaluating the effects of WMOs.
A Decision-Making Framework The County’s water management mission, goals and objectives provide a clear direction for the stakeholders. By documenting in detail what the County should achieve with regard to water management, the Steering Committee has laid the foundation for a powerful planning tool. If quantifiable indicators were selected for each of the County’s objectives, the stakeholders would have a means for predicting or measuring whether a current or future project could be (or is) consistent with the goals. For example, these performance indicators could include water levels, flows and quality at several key locations in the County. This evaluative framework, coupled with the data provided by the groundwater model and other technical tools, would allow the County to compare various courses of action comprehensively. Furthermore, the data developed for use in the framework, along with the comparative results, could be employed in a programmatic EIR, should the County choose to pursue one.
8.1.4 Moving Projects Toward Implementation CDM reviewed and collected a large amount of information for this plan. There remain, however, many areas where additional engineering and scientific studies are needed to properly evaluate the technical and economic viability of potential options, as well as identification of environmental and other impacts. For many projects, these studies may be the “next steps” necessary to move toward implementation. For others, political or funding steps may be required. Currently, the Steering Committee has not achieved consensus regarding the necessary next steps for several of the WMOs in the Master Alternative. Initiating or continuing implementation of the WMOs in the Master Alternative will require broader agreement on the readiness of projects to proceed.

Section 8 Recommended Strategy
ABAB 8-5
Stakeholders identified several pieces of technical information that should be included in further studies. Each option should be examined to determine to what degree it:
n Increases the overall water supply in the Central Valley;
n Utilizes water within the County that would otherwise leave without being used;
n Shifts water from one County user to another;
n Relies on water that may not be available in all years; and
n Relies on water that is “conserved,” but is not a reduction in consumptive use and is merely a reduction in excess applied water (in which case “conservation” may have other merits but does not increase the water supply available for use within the County).
Putting the Master Alternative into action will test the ability of the Steering Committee (or its countywide planning successor) to meet the County’s water management goals. Commencing implementation will help to maintain the momentum gathered by the Steering Committee in working together, and a successful project will demonstrate the capabilities of the Countywide planning group, both within the County and to State and Federal agencies. The stakeholders in the County must move forward with projects or risk backtracking on the progress made thus far.
8.1.5 Funding Projects The key to receiving State or Federal funding for any of the WMOs in this plan lies in the collective effort of the local stakeholders and their ability to demonstrate that these projects can have Statewide or regional benefits. A project’s local focus and benefits need not be sacrificed for the greater good, but if a project is to compete for funding in today’s market, its proponents must demonstrate that it can be mutually beneficial to both the proponents and to the people of California.
Projects that are implemented in today’s financial and political climate require leveraging and partnering. Competition for financial resources in this market is at its highest level, and to be successful a project proponent’s strategy must be aggressive and sophisticated. A successful proposal will demonstrate that the project would have many values. That is, a single benefit water resources project will not compete well against one that has a variety of benefits. To be successful in obtaining State or Federal funding, projects should include:
n Environmental benefits. Many of the State and Federal agencies that administer funds have environmental mandates. Project proposals should be crafted in a manner that explains how the proposal will help the funding agencies fulfill their mandates.
Section 8 Recommended Strategy
8-6 ABAB
n Regional benefits. Funding agencies may cover large regions, or may be targeting funds at projects that have the potential to provide regional benefits. Project proponents seeking State or Federal funding should seek to expand the zone of benefit associated with a project as much as is feasible.
n Project partners. Most projects will benefit from multiple partners who can bring needed political, strategic, technical and financial support and can help develop projects and move them toward implementation.
Including these benefits or added values to a proposal is critical to having a project funded in California’s water resource market. Project proposals that bring these elements together, demonstrating balanced benefits among people and the environment, are the successful ones that move forward. Significant opportunities currently exist for any of this Water Management Plan’s project options to be funded through the State or Federal Government. The ability to obtain these resources is based on the strength of the proponents’ partnerships and proposals. Local funding is another option for the WMOs and may, for some projects that focus exclusively on local benefits, be the only appropriate source of money.
8.2 Short-Term Recommendations These short-term recommendations refer to actions that the stakeholder group should start and complete in the next 6 to 36 months. These recommendations build on the first phase of plan development, which is finalized with the completion of this document. This Plan includes a general approach for addressing County concerns and a pre-feasibility screening of Water Management Options. The pre-feasibility screening was based primarily on consensus among County stakeholders that WMOs are viable projects from a technical and economic perspective. By including projects in the SJCWMP, the stakeholders agree that the projects should be moved to the next phase of development, in which they will be studied in more detail. The recommendations below describe the actions needed to plan and finance these studies. Based on the planning process conducted with the participation of the Steering Committee, along with the analyses conducted by the CDM technical team and the rationale described above, the implementation of the SJCSJCWMP will require signficant additional effort to be implemented. Concurrent with other plan phases, key information and data should be updated as new information becomes available. Additionally, the performance of implemented plan components needs to be monitored.
CDM recommends that the County stakeholders focus on the following specific actions to proceed with the subsequent phases.

Section 8 Recommended Strategy
ABAB 8-7
1) Develop and sign an MOU that establishes a countywide planning group based upon the current Steering Committee. To develop this MOU jointly, continue a process of facilitated Steering Committee meetings. This process should be coordinated with the DWR stakeholder assessment currently underway. At a minimum the MOU should identify goals and objectives, stakeholders and participants, functions that the group is expected to perform and the manner in which the participants will conduct business.
Working with an MOU will allow the stakeholders to proceed with the next steps without delay because it will not require extensive new efforts. This MOU structure will be a more formal version of the existing Steering Committee, but will not significantly change how the group works together. The technical team recommends operating within the current Steering Committee structure until an MOU is completed. By continuing a series of monthly facilitated meetings, the Steering Committee can develop and sign an MOU under which to work in the next phase.
2) Revisit the MOU signed by the DWR and the SJCFC&WCD for development of the Water Management Plan and update it, if necessary.
3) Continue using the groundwater model to provide quantitative, predictive data for project evaluation. Update the model input data as necessary. Additionally, the County should continue its monitoring and data collection activities. In particular, the County should complete the development and implementation of the Data Management Model (DMM) currently under development.
4) Develop a comprehensive evaluation tool based upon the County’s mission, goals and objectives with appropriate quantitative performance measures. Apply this tool for decision-making and policy planning.
5) Define the appropriate “next steps” for each of the projects in the Master Alternative, working jointly within the Steering Committee or its countywide planning successor group. These next steps will likely include developing scopes and cost estimates for feasibility studies for the WMOs in the Master Alternative.
6) Develop specific Federal, State or local funding strategies for each of the projects in the Master Alternative. Recognizing that some funding may be dependent upon regional and/or environmental benefits, explore the potential for partnering and enhancing projects to increase their attractiveness to State and Federal funding agencies. Where appropriate, identify potential local funds.
7) Move forward as a countywide planning group on projects that have a broad support within the County and that have the potential to provide significant benefits. This initial project action should be conducted cooperatively, to demonstrate the success of the countywide planning effort, but will also likely

Section 8 Recommended Strategy
8-8 ABAB
require the dedicated efforts of project “champions.” Projects that may be suitable for this initial pursuit include:
n Farmington Groundwater Recharge and Wetlands Project;
n New Hogan Reoperation;
n Delta Area and Southwest County Water Supply Activities; and
n Middlebar Reservoir.
Some of these activities could be financed through the County’s Zone 2 assessment and supported by contributions from stakeholder agencies. The group should also seek DWR assistance for technical support and facilitation. While much of the group’s work may be accomplished using internal resources during this phase, the group should consider retaining a consultant to provide as-needed specific support, especially for the identification and pursuit of funding opportunities. Consultants would probably contract with the County in this case, as the group could not enter into contracts as an MOU.
8.3 Long-Term Recommendations It is very important that the group continues to work together in the long term. The continued collaboration among San Joaquin County stakeholders will help in assuring the SJCWMP’s success. After the initial phase of work is complete, the group will be ready to proceed with more detailed work on projects and will have increased its capacity for meeting the challenges associated with project implementation.
All decisions on project implementation will not be made in the short term. Most likely, stakeholders will decide in the short term to move forward with several projects. It is possible that additional study may prove some projects infeasible, or will indicate that additional projects will be required. The group will need to continue to make these decisions as it proceeds under the SJCWMP. The group must have the stability to be a reliable decision-making body and the flexibility to evolve for increased effectiveness. By carefully considering and selecting an appropriate organizational structure and developing a framework for incorporating new options, the group will continue to be an effective manager of water resources at the County level.
8.3.1 Organizational Structure During development of the SJCWMP, one Steering Committee meeting focused on funding and organizational structures. Many stakeholders commented during the meeting that the group is not ready to define its final structure. The Steering Committee needs to determine which options will move forward, and what functions are necessary to implement these options, before it can select a long-term structure. The technical team recommends an approach in which the organizational structure evolves as the activities conducted by the group increase in complexity and scope.

Section 8 Recommended Strategy
ABAB 8-9
Section 6 of this report describes several concepts for organizational structures and management frameworks, and these concepts can be implemented as the group develops an understanding of the activities and appropriate structure needed for moving forward. This adaptive approach will result in an organization that is capable of evolving to meet the changing needs and issues facing the group.
8.3.2 Incorporation of New Options While the SJCWMP development process included a screening, evaluation and prioritization of all currently available water management options, it is very likely that stakeholders will develop new options as the plan moves into the future. If newly identified options address the issues and concerns established in Section 2 and meet the goals and objectives described in Section 4, then the group should support the options moving forward. The group requires a means for evaluating and incorporating new options that are developed as the plan moves forward. That is, the group must be able to first determine whether a proposed option is feasible, beneficial and consistent with the County’s goals and objectives. The group must then have a process for adding the project to its Master Alternative and prioritizing it among the other options being implemented.

ABAB 9-1
Section 9 References American River Basin Cooperating Agencies. 2000. Regional Water Master Plan Phase II Task 5 Develop and Refine Groundwater Model North American River IGSM Water Level Hydrographs 1970-1995-Draft.
American River Water Resources Investigation, 1995, Plan Formulation Report and Administrative Draft Environmental Impact Report/Environmental Impact Statement. (Excerpts from Draft EIR/EIS).
Bertoldi, G. L., 1991, Ground Water in the Central Valley, California - A Summary Report, Regional Aquifer-System Analysis-Central Valley, California, U.S. Geological Survey, Professional Paper 1401-A.
Borcalli & Associates, Inc. 1995. County Water Master Plan (revised 1996). Borcalli & Associates, Sacramento, CA. Report Prepared for Calaveras County Water District.
Boyle Engineering Corporation. 1999. Beckman Test Injection/Extraction Project. Boyle Engineering, Sacramento, CA. Report prepared for East San Joaquin Parties Water Authority in Conjunction with East Bay Municipal Utility District.
Brown and Caldwell Consulting Engineers. 1985. Eastern San Joaquin County Groundwater Study, San Joaquin County Flood Control and Water Conservation District, Final Report. Brown and Caldwell, Sacramento, CA. Prepared for San Joaquin County Flood Control and Water Conservation District.
Brown & Caldwell Consulting Engineers, 1995, Final Report, Eastern San Joaquin County Groundwater Study, San Joaquin County Flood Control and Water Conservation District.
Brown and Caldwell Consulting Engineers. 2001. Urban Water Management Plan. Brown and Caldwell, Rancho Cordova, CA. Prepared for the City of Lodi.
Calaveras County Water District. 1996. County Water Master Plan.
CALFED Bay-Delta Program. 1999. Water Use Efficiency Program Plan, Draft Programmatic EIS/EIR Technical Appendix.
California Department of Water Resources, 1997. Bulletin 160-98. Accessed July 20, 2001. Available from: http://wwwowe.water.ca.gov/pubs.jsp
California State Water Resources Control Board, 1978, Maps of Salinity Intrusion into the Bay-Delta Area.
Section 9 References
9-2 ABAB
Carollo Engineers. 1996. Recycled Water Market Evaluation. Report Prepared for the City of Stockton, Department of Municipal Utilities.
CH2Mhill, 1999, Stanislaus Basin Integrated Groundwater and Surface Water Model Report, Prepared for U.S. Bureau of Reclamation.
City of Lathrop. 1991. Comprehensive General Plan and Environmental Impact Report for the City of Lathrop, California.
City of Lodi. 1996. 1995 City of Lodi Urban Water Management Plan.
City of Ripon. 1997. General Plan 2035, Volume I-Policy Document and Volume II-Environmental Impact Report.
City of Stockton. 1990. General Plan, Background Report. Stockton, CA
City of Stockton. 1990. General Plan, Policy Document. Stockton, CA.
City of Stockton, Department of Municipal Utilities. 1996. 1995 Update Urban Water Management Plan-Draft.
City of Tracy and The Planning Center. 1993. General Plan, An Urban Management Plan. Tracy, CA.
Department of Water Resources, 1967, San Joaquin County Groundwater Investigation, Bulletin No. 146.
Department of Water Resources, 1994. General Comparisons of Water District Acts, Bulletin 155. Accessed June 20, 2001. Available from http://elib.cs.berkeley.edu/kopec/b155/html/home.html
Department of Water Resources, 1998, The California Water Plan Update, Bulletin No. 160-98.
Environmental Science Associates (ESA). 1999. South County Surface Water Supply Project Environmental Impact Report. ESA, California. Prepared for South San Joaquin Irrigation District.
Groundwater Atlas of the United States - Segment 1 California Nevada, U.S. Geological Survey.
Haight and Weatherby. 1970. Calveras County Comprehensive Water and Sewer Study. Haight and Weatherby, San Andreas, California. Report prepared for Calveras County Water District.

Section 9 References
ABAB 9-3
J. Laurence Mintier & Associates, Jones & Stokes Associates, Joseph R. Holland and Pepper Associates. 1988. Manteca General Plan-Assessment Report (Final EIR). Report prepared for City of Manteca.
J. Laurence Mintier & Associates, Jones & Stokes Associates, Joseph R. Holland and Pepper Associates. 1988. Manteca General Plan-Background Report. Report prepared for City of Manteca.
J. Laurence Mintier & Associates, Jones & Stokes Associates, Joseph R. Holland and Pepper Associates. 1988. Manteca General Plan-Policy Document. Report prepared for City of Manteca.
James M Montgomery Consulting Engineers Inc. (JMM) 1990. Documentation and User’s Manual for Integrated Groundwater and Surface Water Model. JMM. Report prepared for U.S. Bureau of Reclamation, California Department of Water Resources, California State Water Control Board, Contra Costa Water District, California.
Jones & Stokes Associates Inc. 1991. City of Lodi General Plan- Policy Document. Jones & Stockes, Sacramento, California. Report prepared for the City of Lodi.
Kennedy/Jenks Consultants. 1994. Final Report, Water Master Plan, City of Tracy, California. Kennedy/Jenks, San Francisco, California. Report prepared for the City of Tracy.
Kennedy/Jenks Engineers. 1985. Final Report, Water System Master Plan, City of Manteca. Kennedy/Jenks, San Francisco, California. Report prepared for the City of Manteca.
Kjeldsen-Sinnock & Associates, Inc. 1981. City of Escalon Master Water Plan. Kjeldsen-Sinnock & Associates, Inc., Stockton, California. Report prepared for the City of Escalon.
Lew-Garcia-Davis Engineers/surveyors. 1992. Water System Master Plan, City of Lathrop. Lew-Garcia-Davis, Ceres, California.
Montgomery Watson, 1990, Central Valley Ground-Surface Water Model, Central Valley, California (CVGSM).
Montgomery Watson Americas, Inc. in association with CH2M HILL. 1996. Mokelumne Aquifer Recharge and Storage Project. Montgomery Watson, Sacramento, CA. Report prepared for East Bay Municipal Utility District and the Eastern San Joaquin Parties
Montgomery Watson, 1999, Final Technical Memorandum I, Identification of Candidate Recharge Areas and Pilot Test Sites, Farmington Groundwater Recharge/Wetlands Feasibility Study. U.S. Army Corps of Engineers.

Section 9 References
9-4 ABAB
Montgomery Watson. 2000. Farmington Groundwater Recharge/Wetlands Feasibility Study. Draft—Technical Memorandum II Drilling Results & Pilot Test Design. Montgomery Watson, Sacramento, CA. Report Prepared for U.S. Army Corps of Engineers, Stockton East Water District, City of Stockton, San Joaquin County, Central San Joaquin Water Conservation District, North San Joaquin Water Conservation District.
Oakdale Irrigation District. 1995. Groundwater Management Plan.
Nolte Associates, Inc. 2000. City of Lathrop Water, Wastewater, Recycled Water Master Plan. Nolte Associates, Sacramento, CA. Report prepared for the City of Lathrop.
Page, R. W., 1986, Geology of the Fresh Ground-Water Basin of the Central Valley, California, with Texture Maps and Sections. Regional Aquifer-System Analysis: U.S. Geological Survey, Professional Paper 1401-C.
Pichard, Terry L., Verdegaal, Paul S., 2001. Irrigation of Quality Wine Grapes. University of California, Davis.
PSOMAS. 1990. City of Lodi, Water Master Plan. Report prepared for the City of Lodi.
Sacramento Metropolitan Water Authority, U.S. Bureau of Reclamation. 1995. American River Water Resources Investigation Plan Formulation Report and Administrative Draft Environmental Impact Report/Environmental Impact Statement.
Sacramento Metropolitan Water Authority and U.S. Department of the Interior Bureau of Reclamation. 1996. American River Water Investigation (ARWI). Planning Report and Draft Environmental Impact Report/Environmental Impact Statement. Appendices, Volume I
San Joaquin County. 1992. General Plan 2010, Volume I: Policies/Implementation
San Joaquin County. 1992. General Plan 2010, Volume II: Community Plans.
San Joaquin County. 1992. General Plan 2010, Volume III: Technical Appendices.
San Joaquin County. 2000. General Plan 2010 Review.
Stoddard & Associates. 1995. Groundwater Management Plan for the Northern Agencies in the Delta-Mendota Canal Service Area and a Portion of San Joaquin County. Stoddard & Associates, Los Banos, CA. Report Prepared for San Luis & Delta-Mendota Water Authority.

Section 9 References
ABAB 9-5
Surface Water Resources Inc. November 2000. Memorandum on Surface Water Availability.
United States Bureau of Reclamation. New Melones Dam. Accessed July 20, 2001. Available from: http://dataweb.usbr.gov/dams/ca10246.htm
United States Department of the Interior Bureau of Reclamation. 12/08/00. Long Term Contract Renewal Process. Available from http://www.mp.usbr.gov/cvpia/3404c/ea_eis/index.html
Williamson, A. K., 1989, Ground-Water Flow in the Central Valley, California, Regional Aquifer-System Analysis: U.S. Geological Survey, Professional Paper 1401-D.
Woodbridge Irrigation District. 1994. Woodbridge Irrigation District Agricultural Water Management Plan Informal Report.