
Water Management Plan for the town of Pingelly
240
Water Management Plan for the town of Pingelly Mark Pridham February 2010 ISSN 1039-7205 RESOURCE MANAGEMENT TECHNICAL REPORT 354
-
Upload
khangminh22 -
Category
Documents
-
view
0 -
download
0
Transcript of Water Management Plan for the town of Pingelly

Water Management Plan for the town of Pingelly
Mark Pridham
February 2010
ISSN 1039-7205
RESOURCE MANAGEMENT TECHNICAL REPORT 354

Water Management Plan for the town of Pingelly
December 2009

Acknowledgements Thank you to all those who contributed to this Water Management Plan.
This project was made possible through Commonwealth and State Government funding, some of the investment being determined by the Avon Catchment Council. Funding and technical assistance was also contributed by the council and staff of the Pingelly Shire.
The water management report was prepared by Ceidwen Pengelly of the Department of Agriculture and Food, Western Australia (DAFWA).
Supporting technical reports were produced by Ed Wronski, Bob Paul and Chris Boyes (DAFWA), Jeff Turner, Joanne Willers, Steve Marvanek, Olga Barron, Tony Barr, Geoff Hodgson, Andrew Grant and Ashok Sharma from the CSIRO, Peter McCafferty (Chemistry Centre) and Paul Wilkes (Curtin University). The drainage sump design and supervision services were provided by Geoff Love and others from GHD Consultants.
The document was edited and produced by Mark Pridham, DAFWA.
Disclaimer The Chief Executive Officer of the Department of Agriculture and Food and the State of Western Australia accept no liability whatsoever by reason of negligence or otherwise arising from use or release of this information or any part of it.
Copies of this document are available in alternative formats upon request. 3 Baron-Hay Court, South Perth WA 6151 Tel: (08) 9368 3333 Email: [email protected] www.agric.wa.gov.au

Pingelly Water Management Plan
i
S ummary The Rural Towns—Liquid Assets (RT–LA) project was established in 2005 with the aim of integrating salinity, waterlogging and flooding control with the development of new water supplies in wheatbelt towns. This water resource is then available for purposes such as irrigation of Shire ovals, parks, and public gardens as well as for commercial use.
Following the identification of effective integrated water management strategies, these have been partially implemented in the 15 shires participating in the RT-LA project.
This report summarised the outcomes from all scientific investigations undertaken for Pingelly. In addition it presents the water management options, a preliminary analysis of those options and priority recommendations.
The majority of on-ground works proposed in Pingelly are focussed on surface water control and harvesting. The recommended plan for surface water management is cost effective.
At an average cost of $0.14/kL per annum to produce locally sourced water, this represents a saving of approximately $2.86/kL on the purchase of scheme water. The equation will shift more in favour of locally sourced irrigation water as the cost of scheme water increases and supplies become less available. The current and proposed surface water diversion and harvesting infrastructure will improve the groundwater level situation in time.
Pingelly shallow groundwater levels have remained relatively stable and deeper piezometric levels are showing a declining trend since 2000, when groundwater monitoring commenced. However, where water levels are near the surface in some areas of the town they are causing damage to infrastructure such as roads and buildings.
The groundwater investigations identified that groundwater pumping is not an effective solution for Pingelly to lower groundwater tables in the high risk areas of the townsite. The results demonstrate that only limited volumes of groundwater are accessible and that the draw-down affects would be constrained by geological barriers such as the fracture zone striking SW to NE through the northern area of town. Small quantities of water may be abstracted from the fracture although groundwater pumping is not an economically viable option.
A watching brief should still be maintained on critical groundwater levels and the rate of change of cumulative rainfall and should the situation change the town needs to reassess surface management options for watertable management.
The RT-LA project has focussed on surface water management options that will enable the integration of salinity, watertable, waterlogging and flooding control as well as provide cost-effective solutions to new water supplies.
Appendix C includes modelled runoff volumes within the Pingelly town sub catchments. This data has been used to evaluate the proposed options for surface water management.
The current and proposed surface water diversion and harvesting infrastructure is primarily aimed at harvesting town stormwater and reducing dependence on scheme water for irrigation. Option 1 is recommended as the first priority and involves the construction of a 20 ML storage dam to increase storage capacity.
A combination of surface water engineering solutions has been identified to enable management of the town’s surface water that can provide an additional effective 30 ML/yr which is 100 per cent of the existing demand with an additional 28 ML.

Pingelly Water Management Plan
ii
Contents Page
Summary .................................................................................................................................. i 1. Introduction .................................................................................................................... 1
1.1 Background ............................................................................................................ 1 1.2 Water management objectives ............................................................................... 1 1.3 Socio-economic study results ................................................................................. 1 1.4 Shire priorities ........................................................................................................ 2 1.5 Purpose of the Water Management Plan ................................................................ 4 1.6 Summary of the issues ........................................................................................... 4
2. Townsite water management concerns ........................................................................ 7 3. Townsite water status .................................................................................................... 7
3.1 Water inputs ........................................................................................................... 7 3.2 Surface water status ............................................................................................... 8 3.3 Groundwater status ................................................................................................ 9 3.4 Salinity and water quality ........................................................................................ 11
4. Surface water summary and recommendations ........................................................... 13 5. Water management options ........................................................................................... 13
5.1 Surface water harvesting options ............................................................................ 13 5.2 Groundwater pumping options ................................................................................ 14 5.3 Other water management options ........................................................................... 15
6. Summarised water management costs ......................................................................... 15 7. Analysis of water management options ........................................................................ 15
7.2 Cost effectiveness .................................................................................................. 16
8. Recommendations ......................................................................................................... 17 9. References ............................................................................................................ 17

Pingelly Water Management Plan
iii
Page
Figures Figure 1 Locations of Pingelly and other towns participating in the RT-LA Project ....................... 9
Figure 2 Distribution of groundwater levels in Pingelly ................................................................ 16
Figure 3 Pingelly Salinity Risk Map ............................................................................................. 18
Figure 4 Surface water management options for Pingelly ........................................................... 20
Tables Table 1 Aquacycle yields for Pingelly sub-catchments ................................................................ 9
Table 2 Capital costs for options 1–4 .......................................................................................... 15
Table 3 Water yields from existing and proposed works .............................................................. 16


Pingelly Water Management Plan
1
1. Introduc tion
1.1 B ac kground The Department of Agriculture and Food, Western Australia (DAFWA) with a number of project partners including CSIRO, CRC LEME, UWA and the WA Chemistry Centre is delivering the $6 million Rural Towns—Liquid Assets (RT-LA) project.
The project was funded by the Western Australian Government, 15 Local Government Authorities and the National Action Plan for Salinity and Water Quality. The other major stakeholders are the Avon Catchment Council, the Northern Agricultural Catchment Council, the South West Catchment Council and South Coast Natural Resource Management Inc.
The Project aims to devise solutions to potential and existing townsite salinity problems as well as developing new locally based water resources for the participating 15 rural towns. New research and existing knowledge of groundwater systems will be used to identify water management options and construct townsite Water Management Plans (WMPs) that focus on improved and integrated water management strategies.
Pingelly, one of the 15 towns participating in the Project, is located approximately 135 kilometres south-east of Perth (Figure 1) and has a population of approximately 760 residents. The Pingelly Shire has been involved in the Rural Towns Program since 1999.
1.2 Water management objec tives The objectives are to develop a water management plan that will:
● identify opportunities for ground and surface water resource development, primarily for irrigation
● improve salinity and waterlogging and surface water management
● identify socio-economic concerns associated with greater water resource availability.
1.3 S oc io-ec onomic s tudy res ults A short desktop socio-economic study was conducted with a small group of residents (Appendix A) to identify perceived water management issues within the town. This study highlighted issues surrounding water management are associated with availability and quality of water resources (for residents on farm without access to scheme water) and salinity.
Salinity is perceived as more of a problem for residents outside the town; however some residents have observed rising damp problems in cellars and other buildings within the town.
Suggested uses for additional water sources included town beautification, storing excess water to aid in drought proofing farms and for new water related industries such as salt tolerant plants, aquaculture, nurseries, viticulture and olives.

Pingelly Water Management Plan
2
1.4 S hire priorities On 15 February 2006 a meeting was held with the Shire and the Project Planning Team to identify specific water management priorities and issues. This information was used to guide the direction and focus of this water management plan. A summary of the meeting outcomes is in Appendix B. The high priorities identified at the workshop were:
1. Stormwater management as precursor to priority 2.
2. Harvesting surface water to a new 'commercial' dam. Enhancing surface water harvesting efficiency and additional storage.
3. New dam could be sited near existing dam?
4. Pioneer Park water feature upgrade and creekline vegetation rehabilitation.
5. Managing watertables/salinity and building damage in hot-spots (e.g. Sharow Street, Parade (main) Street). Also in SE areas of the townsite.
6. Up-slope surface water harvesting for additional supplies.
7. Deep sewerage over entire townsite: septic systems overflow and are ineffective during wet periods.

Pingelly Water Management Plan
3
Figure 1 Locations of Pingelly and other towns participating in the RT-LA Project.

Pingelly Water Management Plan
4
1.5 P urpos e of the Water Management P lan The Water Management Plan for Pingelly is based on ten technical reports covering the following topics. The reports are attached to this report:
● A brief socio-economic report and Shire consultation notes (Appendix A and B).
● Surface water management (Appendix C).
● Geophysics (Appendix D).
● Groundwater management options (Appendix E).
● Assessment of infrastructure damage (Appendix F).
● Groundwater quality (Appendix G).
● Urban water balance study (Appendix H).
● Methodology for assessment of water management options (Appendix I).
● Stormwater harvesting for the Townsite East Priority Sub-catchment (Appendix J).
Based on these technical reports the purpose of the Water Management Plan is to:
○ Recommend priority water management options for controlling salinity and developing new water supplies.
○ Present preliminary engineering designs for water management options.
○ Present a cost analysis for the recommended water management options.
1.6 S ummary of the is s ues While many towns in the agricultural region of Western Australia have limited or expensive water supplies, they also have problems caused by too much water—usually salinity, waterlogging and inundation. These excess water problems result in damage to the environment and infrastructure. This project explores whether the excess water causing the damage can be converted to useable water supplies.
Even in small towns, hydrological systems are usually complex. Water comes into town in several ways: as rain falling directly on the townsite, as surface water run-on, groundwater inflows from surrounding catchments and through the scheme. It is likely that all of these sources contribute to some degree to the salinity, waterlogging and inundation problems. General descriptions of what is meant by the terms inundation, salinity and waterlogging and their main causes are described in Box 1.

Pingelly Water Management Plan
5
Box 1: General definitions and descriptions of processes
Inundation An area covered in water is said to be inundated. The water may be flowing or still (ponded). The source of the water may be: • rain falling directly on the area • surface water inflow from surrounding upslope areas • water overflowing the banks of a natural or manmade watercourse (flooding), or • a combination of more than one of these sources.
It is possible for groundwater discharge to contribute to surface inundation, but generally in Western Australian wheatbelt towns this is a small component. A rise in watertable level below an area can worsen its risk of inundation because there is less capacity in the soil for storing infiltrating surface water.
Salinity
Most Western Australian salinity problems are caused by groundwater, but the processes involved can change from site to site. Commonly, the salinisation is a result of either rises in watertable or increases in pressure of deep groundwater systems, or a combination of both. The extra water causing the salinisation can enter the groundwater systems close to or far away from the problem area.
Rising Damp/Waterlogging In towns, this can affect buildings, paved areas and underground services. This can be caused by: o water perching above a shallow, low permeability layer such as bedrock, cemented soils, or a clay layer; or o elevated watertables or high groundwater pressure.
The water may be fresh or saline.
Two conventional approaches to reducing the damage are:
● diverting water before it reaches an area of inundation, salinisation or waterlogging
● removing or diverting water from the affected site.
Unlike natural catchments, townsites have low runoff thresholds. That is, they can produce runoff from low intensity or infrequent rainfall events because water flows from the streets, roofs and other hard surfaces In contrast to many farmland catchments, townsite runoff is often relatively high quality; uncontaminated by salt, sediment or debris.
As a general rule, salinity, waterlogging and flooding impacts are reduced if the water is diverted before it reaches the affected area. Generally, water quality is also improved if it is diverted earlier than later.
In order to produce this Water Management Plan, a number of investigations were completed to identify the sources of problem water and strategies for its diversion.
A set of principles has been adopted in drafting this water management plan (Box 2).

Pingelly Water Management Plan
6
Box 2: Principles guiding RT-LA Water Management Plans
Water is valuable: minimise unnecessary use and pollution. • Excess groundwater recharge commonly causes problems: minimise recharge unless an ecosystem or
water supply is dependent on it. • Reduce surface water flows where they cause damage but maintain good quality surface water flows to
dependent ecosystems. • Minimise dependence on scheme water where fit-for-purpose alternatives are available, e.g. for townsite
irrigation.
Assessing impacts of management changes The aim is to identify, quantify and document the likely environmental, social and economic impacts (both within and outside of the town) of any proposed water management changes so that they can be taken into consideration by decision-makers so that water management changes neither create nor worsen any problems.
RT-LA plans are designed to enhance land condition, not to trigger or exacerbate existing land degradation.
Encourage adoption of Waterwise and Saltwise guidelines Encourage adoption of Water Corporation Waterwise and DAFWA Waterwise = Saltwise guidelines for households, businesses, schools and councils.
Practical approaches to applying principles • Reduce dependence on scheme water. Supplement with harvested surface and groundwater. • Reduce local recharge and associated salinity, waterlogging and flooding, by irrigating less frequently. • Ensure no infiltration from leaky manmade drainage, pipework and storage systems. • Reduce wastewater volumes, thus reducing the need for excess treatment and storage capacity. • Minimise evaporation losses from water supply storages by covering dams or using tanks.
Benefits • Increased volume of water available for watering townsite amenities. • Less dependence on high quality and expensive scheme water for irrigation. • Less townsite salinity, flooding and waterlogging. • A ‘greener, softer, cooler’ townscape in which to live in, work in and visit. • More water available for environmental flows or commercial uses.
Costs • Time and money spent in establishing more efficient water management systems and practices. • Less wastewater from the treatment plant available for recycling. • Cost of professionally designed and constructed infrastructure.

Pingelly Water Management Plan
7
2. Towns ite water management c oncerns Water-related problems identified by the Pingelly Shire Council and community were: damage to buildings and roads in town, securing water resources for the future and for expansion of industries and the high cost of scheme water (Appendix A and B).
Water demand in Pingelly for indoor and outdoor use has been modelled as 174 ML/yr. The irrigation of Shire parks and gardens with scheme water costs about $6 000 a year (2 ML) in addition to the estimated 15 ML of water from the Sports Oval Dam.
The Pingelly Sports Oval irrigation is unmetered and in previous years reduced reticulation has had to be imposed due to lack of water and cost of obtaining scheme water, this may have been due to it receiving a very generous irrigation rate. If an efficient irrigation regime was adopted, this would not only reduce the recharge to the groundwater in the area, but enable a greater proportion of the Sports Oval Dam’s water supplies to be utilised by future needs.
Visible water damage to roads and buildings in the townsite caused by inundation, waterlogging or salinity has been documented but not their rates of increase. It is not known whether the damage is stable, or increasing.
A salinity risk map (Figure X), based on interpolating groundwater level and salinity measurements between piezometer sites has been prepared for Pingelly along with estimates of damage cost to infrastructure (Appendix F).
Since saline land is one of the possible causes of high conductivity levels, this map may provide indications of distribution and severity of salinity.
Although all these types of salinity maps provide some information on salt-affected sites, they do not tell us clearly when expansions in the problems have occurred (worsening every winter, or after large summer storms, or after inundation events, etc.) or if further increases are probable.
3. Towns ite water s tatus This section presents some estimates of the status and volumes of water associated with the various components of Pingelly’s water balance. It is intended to place the different surface water sources into context and to indicate those which are suited to developing as water supplies.
3.1 Water inputs The town inputs to be estimated are:
● direct rainfall on the town
● surface water flowing into the town
● groundwater flowing into the town
● scheme water and wastewater piped into the town or to the water treatment plant.

Pingelly Water Management Plan
8
3.2 S urfac e water s tatus
3.2.1 Direc t rainfall on the towns ite
The long term average rainfall supplied by the Bureau of Meteorology is 448 millimetres at the Pingelly Station. Climate file data from the SILO Agro-Meteorological Datasets for Geo-Spatial Modellers covering 56 years from 1950 to 2005 was used to model the average annual rainfall of 443 millimetres and an average of 1 708 millimetres of evaporation. Note that rainfall and evaporation are highly seasonal, with the wet months of May to August having the most rainfall and least evaporation and extremely high evaporation and low rainfall in the summer months (Appendix H).
The annual average rainfall for the 118 years has been 447.4 mm while the annual average for the last nine years is 391.8 mm, a decrease of almost 12.5 per cent from the long term annual average. A decrease in annual rainfall should lead to a decrease in groundwater recharge (Appendix G).
3.2.2 Inflowing s urfac e water
Surface water flows originate from the catchments east and west of the townsite; they enter the Avon River South which flows through the central part of the town from the south to the northern boundary of Pingelly. The Avon River subsequently joins the eastern Avon River branch before flowing into the Swan River which eventually discharges to the ocean at Fremantle.
The landscape surrounding Pingelly dictates the surface water process to be one described as a Riverine process. In a Riverine system surface water processes encompass two components: runoff and subsurface flow.
Runoff is derived from soil infiltration excess or soil saturation excess. When rainfall occurs, a proportion infiltrates the soil surface and the remainder is attributed to runoff.
Subsurface flow is the portion of rainfall that has infiltrated the soil profile. If the soil profile has sufficient conductivity (porosity) and connectivity (permeability) then water can move through the soil, and slope water will drain down slope until a change in soil type or characteristic occurs.
Once runoff enters valley landscapes it is described as stream flow and these flows combine with flows from adjacent watersheds until they enter a river, lake, estuary, reservoir, wetland, sea or an ocean.
The town of Pingelly has both surface and subsurface runoff processes to manage.
The RT-LA project has calculated runoff and surface flow volumes from the Pingelly town catchment (approximately 700 ha) using the Aquacycle® computer model.
Table 1 below shows a summary of the modelled surface water yields for each sub-catchment, based on the data in the GHD Report prepared for this project (Appendix J). It indicates a total discharge of nearly 488 ML per annum. This information has been useful in formulating surface water strategies outlined for Pingelly. Further description of the surface water sub-catchment boundaries and their water yields in Pingelly are shown in Appendix C.

Pingelly Water Management Plan
9
Table 1 Aquacycle yields for Pingelly sub-catchments
Catchment Townsite East
Townsite Northwest
Northwest Extended
Farmland Southeast
Balance Townsite
Total Area Townsite
Catchment area (ha) 32.4 79.5 34.4 109.7 443.20 699.2
Rainfall (mm) 447
Stormwater yield (mm) 109 61 112 63 67 70
Stormwater yield (ML) 35.32 48.50 38.53 69.11 296.55 488.00
Est. runoff threshold (mm) 3.5 5.1 2.3 6.3 6.5 6.1
3.3 G roundwater s tatus The RT-LA Program undertook a drilling program to assess the viability of obtaining a groundwater supply from bores within the township that could also lower watertables and help control salinity (Appendix E).
The townsite occupies around 180 ha (Figure 2) and is located within a small catchment of approximately 700 ha which is drained by a north trending creekline, at the headwaters of the Avon River South.
Remnant vegetation covers a little less than half the catchment. Grazing and some annual cropping occurs over about 120 ha of cleared farmland south-east of the town. Cleared smallholdings make up about another 120 ha.
As the town is located so high in the Avon catchment, close to the catchment divide, the potential for locating significant alluvial deposits with a capacity to store groundwater is small. Results of previous drilling indicate that the basement in Pingelly is a weathered granite averaging 11.2 m deep. Deeper weathering is associated with some lineaments in the town area where production bores could be sited if the groundwater yield was high enough.
Analysis of all available data and site inspections indicated damage to infrastructure was occurring mainly in the commercial area of town near the creekline. This includes damage to buildings through fretting of mortar and damage to road infrastructure through heaving.
3.3.1 2001 R T P G roundwater s tudy
A DAFWA drilling program in 2000/01 failed to locate a production bore site so concluded that groundwater abstraction by pumping from bores or by deep drainage was not likely to be effective in managing salinity or other problems caused by shallow groundwater (Crossley 2001). However, the study indicated the presence of a narrow lineament, possible a fracture zone, striking NE–SW in the northern half of town, heading across the main drainage line.
In conclusion, groundwater modelling showed that the four options of; do nothing differently, groundwater pumping, groundwater drainage and tree planting would have very limited salinity benefits for the town of Pingelly.

Pingelly Water Management Plan
10
3.3.2 2006 R T -L A groundwater s urvey
Based on the 2000/01 hydrogeological study and a subsequent geophysics (magnetic), survey of Pingelly (Appendix D), the lineament was chosen as the drilling target in the 2006 drilling program. A geophysical survey (Appendix D) confirmed the presence of a lineament, possible a fracture zone first identified by Crossley in 2001.
The 2006 groundwater study found the lineament drilled produced only limited quantities of groundwater and a production bore was not drilled.
Monitoring groundwater levels in the townsite since 2000 showed that watertable levels were shallowest (less than 1 metre deep) in all the observation bores in the riparian zone (Figure 2). The deep bores showed a declining groundwater trend from 2000 to 2009 and most of the shallow bores were dry in the summer of 2008/09.
Rainfall records from Pingelly reveal there has been a decrease in rainfall of almost 12.5 per cent over the long term trend since 2000, which has led to a decrease in groundwater infiltration and recharge.
The 2006 drilling program did not identify any significant groundwater resource and the RT-LA focus switched to surface water as the best management option for Pingelly.
507200 507400 507600 507800 508000 508200 508400 508600 5088006399600
6399800
6400000
6400200
6400400
6400600
6400800
6401000
6401200
Figure 2 Distribution of groundwater levels in Pingelly (metres below ground level).

Pingelly Water Management Plan
11
3.4 S alinity and water quality The township of Pingelly has potential for damage to infrastructure from high watertables and waterlogging particularly in the high salinity risk areas to the south and east of the townsite.
Runoff scenarios for different areas of surface water inflow to the town are presented in Appendix C along with identification of the most important source areas for each of those events.
The water distribution process and rainfall dictates where recharge occurs. If the water is inundating areas or flooding areas, in-situ recharge will occur. There are locations around the townsite where inundation and in-situ recharge occurs. It is therefore important to remove water from these sites before recharge can occur.
Hydrographs of the watertable show that fluctuations in water level reflect seasonal rainfall patterns. Therefore fluctuations result from vertical movement of water rather than horizontal flows (Appendix G). This supports the recharge and degradation processes mentioned above.
Sources of recharge and waterlogging within the townsite are likely to be: o direct infiltration of rain where it falls o infiltration below areas subject to inundation (termed ‘indirect’ infiltration) o percolation below over-irrigated vegetation o leakage from water supply and wastewater pipes, drains, dams, pools, sumps o limited laterally moving groundwater controlled by break-of-slope topography.
Most direct infiltration probably occurs below seasonally vegetated areas with minor amounts below compacted soils and well-vegetated areas, and only negligible amounts below roofs and paved areas. Direct infiltration of rainfall will be confined to when rainfall events occur. However, short duration but intensive (episodic), summer rains can have as much impact on watertables as prolonged winter rains.
Recharge from over-irrigation of parks, sportsgrounds and gardens, will be restricted to areas below or close to those areas. Most recharge from over-irrigation could be expected to occur during non-rainy periods (unless watering habits are particularly profligate).
Any leakage from pipes is likely to occur throughout the year, seepage from dams, pools or sumps could occur whenever they contain water, but drain leakage would depend on runoff from recent rainfall.
Groundwater salinity in Pingelly is actually the fourth lowest of all fifteen towns in the RT-LA project, ranging in EC from less than 100 up to 2 100 mS/m (equivalent to a total dissolved solids range between 400 mg/L and 11 000 mg/L). The average groundwater salinity in the townsite is about 1 300 mS/m or about 7 000 mg/L (Groundwater Quality, Appendix G).
Based on the groundwater quality study, groundwater salinity trends are steady, particularly in the deeper groundwater system. Trace element organics and microbiological status of groundwater was found to be acceptable for groundwater recovery for non-potable use with no occurrences of undesirable organics and microbiological contamination detected.

Pingelly Water Management Plan
12
Groundwater pumping is not recommended at this time (Appendix E) as it would not be cost effective due to the low groundwater yields.
Infrastructure damage through salinity Evaluation of the salinity risk towards the infrastructure damage was based on the long-term average groundwater level for the shallow observation bores. The level of risk was estimated in accordance with soil saturation level at 1 m depth below the ground level (Figure 3).
The estimated damage cost caused to infrastructure is $12.5K annually and projected NPV of costs over next 20 years within a do-nothing scenario is $132.5K (Appendix F).
Figure 3 Pingelly Salinity Risk Map.

Pingelly Water Management Plan
13
4. S urface water s ummary and recommendations The Project has identified a number of surface water engineering solutions to achieve two major goals:
1. Reduced reliance on scheme water (currently purchased at approx $6 000 per annum) for reticulation of the towns sporting and recreational areas.
2. Reduced salinity by diverting surface water from salt affected and waterlogging prone areas.
Two main surface water control strategies are recommended:
● Divert surface water flows to dams or tanks at points further along flow paths—(see Option 1 in Section 5).
● Collect rain close to where it falls (roof tanks; tanks or dams at intervals along roads; tanks or dams just downslope of large areas of other hard surfaces). Details of rainwater tank performance are given in Appendix H).
Additional surface water harvesting opportunities have been identified which will permit the Shire to be less dependent on the need to use scheme water for irrigation purposes. The options and costs for surface water management are presented in Sections 5 and 6.
5. Water management options Water management options were formulated following investigation of current practices, and discussions between the planning team and Shire representatives.
Water management options are outlined below. These address water resources, salinity and socio-economic development objectives.
5.1 S urfac e water harves ting options There are four surface water management options suggested for Pingelly. These are discussed below and shown in Figure 4.
Option 1: Construct proposed 20 ML Storage Dam Construct a new 20 ML dam immediately east of the Sports Oval to enable the shire to store greater volumes of surface water captured from the existing water harvesting system in the Priority eastern sub-catchment.
This increases the storage capacity by 20 ML or 80 per cent increase of current capacity at a cost of approximately $150 000.
Option 2: Upgrade the water harvesting system from the CBH site Upgrade existing 1 000 m3 existing sump to 2 000 m3 to capture more runoff from the CBH site. Surface water runoff generated by the CBH facility is a significant opportunity particularly due to the low run off threshold of this structure and surrounding sealed surfaces.
At a cost of approximately $25 000, this option would provide significant water supplies and would warrant further investigation if there is an increased demand for water within the Shire, for example for the development of an industry.

Pingelly Water Management Plan
14
Option 3: Connect the proposed storage dam to the Sports Oval Dam Install a 1.75 km pipeline (110 mm) between the proposed storage dam to the existing dam and both of the existing and proposed water harvesting systems to create a more flexible water storage network.
At an approximate cost of $18 000, this option will enable the town to maximise the flexibility of the system and utilise the harvested water.
Option 4: Construct a second water harvesting system in the North West extended sub-catchment Construct a second sump and pump water harvesting system in the north-west extended sub-catchment to capture 38.5 ML per annum of runoff from this area.
At an approximate cost of $25 000, this option will provide the town with an additional annual yield of 15 ML.
Figure 4 Surface water management options for Pingelly.
5.2 G roundwater pumping options No groundwater pumping or drainage options are recommended at this stage.

Pingelly Water Management Plan
15
5.3 Other water management options ● Waterwise = Saltwise. Plant drought tolerant or salt tolerant species following
guidelines in the DAFWA Bulletin #4628 which can be found at: http://www.agric.wa.gov.au/content/HORT/FLOR/BULLETIN4628.PDF
● This website also contains other useful material from the Pingelly Waterwise = Saltwise workshop held in 2004.
● Optimise irrigation scheduling and water use efficiency so as not to over water sportsground, parks and gardens.
6. S ummaris ed water management c os ts
Table 2 Capital costs for options 1–4
Option Details Estimated cost ($)
1. New Sports Oval Dam Construct a new 20 ML storage dam with HDPE plastic liner adjacent to the town oval.
150 000
2. CBH sump Upgrade 1000 m3 existing sump to 2 000 m3 to capture more runoff from the CBH site.
25 000
3. Sports-Oval Dam connection Install pipeline to transfer water from proposed sump to existing Sports Oval Dam. Link the existing Sports Oval Dam to the proposed Sports Oval Dam with a pipeline and pumping system.
9 000
9 000
4. Proposed north-west extended sub-catchment sump
Install a second 2 ML water harvesting sump/pump system in the north-west extended sub-catchment.
25 000
Total cost for options 218 000
7. A nalys is of water management options Pingelly Shire has a total estimated irrigation demand of 17 ML/year within the town (Appendix C). An estimated net 15 ML/yr is supplied by the wastewater treatment plant (WWTP) and stored in the Sports Oval Dam.
The total scheme water consumption within the town is 174 ML/yr, comprising 93 ML for indoor (household) use and 81 ML/yr of outdoor use (Appendix H).
Of the 81 ML/yr for outdoor use, 2 ML/yr (costing $6 000) is consumed by the Shire for irrigation of parks and gardens. The remaining 79 ML/yr of scheme water is used outdoors by local residents and businesses.
Pingelly has the potential to increase the demand of irrigation quality water by an additional 30 ML/year to a total of 45 ML/year1.

Pingelly Water Management Plan
16
Although there is an existing 2 ML irrigation water shortfall, there is a potential additional 28 ML that could be supplied by the proposed water supply improvements summarised in Table 2 below.
Table 3 Water yields from existing and proposed works
Option
Dam storage volume
(ML)
Catchment description and
area (ha)
Average estimated
yield (ML/year)
Effective volume2
(depends on dam volume or pumping
rates) (ML)
Surplus generated
for new industries
(ML)
Existing Sports Oval Dam (SOD) supplied by WWTP and Stratford St Sump.
25
No natural inflows. Stores water pumped from WWTP pond
30 WWTP
35 Sump
15
15
15 Stratford St stormwater harvesting system pumping to existing SOD at 5 L/s.
Assume 15 ML used on the oval.
1.7 Priority eastern 32.4 ha sub-catchment
Existing treated effluent system pumping to existing SOD at 5 L/s 0.2 Pumped to the
Sports Oval dam
Proposed Option 1 Construct proposed 20 ML storage dam.
20 Immediately east of the sports oval
Proposed Option 2 Upgrade 1 000 m3 existing sump to 2 000 m3 to capture more runoff from the CBH site.
Assume transfer water to new SOD at 5 L/s.
2 TBD TBD TBD TBD
Proposed Option 3 Link the proposed storage dam to the old Sports-Oval Dam and both harvesting systems to get a flexible reticulation network.
N/A N/A N/A N/A N/A
Proposed Option 4 Install a second water harvesting system in the North west extended sub-catchment.
Assume pumping at 5 L/s.
2 34.4 39 15 15
TOTALS 45 30
7.2 C os t effec tivenes s The Shire is currently buying 2 ML of scheme water at $3 a kilolitre (Water Corporation website). At this price, the 28 ML of additional water supplied by these options is valued at $84 000.
Installation of the proposed 20 ML dam (Option 1) would provide the storage mechanism for the net yield of approximately 30 ML from the Stratford Street Sump (existing) and the CBH Sump (Option 2).

Pingelly Water Management Plan
17
Installation of the CBH Sump (Option 2) and the connection of the two dams and the two stormwater systems (Option 3) will enable a flexible water management system.
At a total cost of $218 000, the options 1–3 would deliver 100 per cent of the town’s total existing demand plus generate a surplus of 28 ML of irrigation water.
Option 4 is available if in the future, more demand for irrigation quality water exists.
Options 1–3 compares favourably with the reported average cost of $3.00/kL paid currently by the Shire for scheme water whenever locally sourced irrigation water runs out.
As the price of scheme water increases and high quality water becomes less available for irrigation, i.e. water restrictions then locally sourced water is an increasingly attractive options.
Even writing off the total investment in the first year this represents an average cost of only $0.14/kL to produce locally sourced water; this represents a saving of approximately $2.86 kL in 2009 prices on the purchase of scheme water. The equation will shift more in favour of locally sourced irrigation water as the cost of scheme water increases and supplies become less available.
8. R ec ommendations At the time of writing there was no need for direct intervention to manage groundwater levels. However, bore water levels should continue to be monitored and if rising watertables are detected, then further surface water management strategies plus shallow subsurface drainage could be employed.
A number of engineering solutions to manage the town’s surface water have been recommended:
Option 1: Construct proposed 20 ML storage dam.
Option 2: Upgrade the water harvesting system from the CBH site.
Option 3: Connect the proposed storage dam to the Sports Oval Dam.
Option 4: Construct a second water harvesting system in the north west extended sub-catchment.
By implementing recommendations above an additional 20 ML of water storage will be provided. This is an 80 per cent increase of the Shire’s current storage capacity and should enable the dependence on scheme water for irrigation purposes to be eliminated.
9. R eferences Crossley, EK 2001, Groundwater study of the Pingelly townsite. Agriculture Western
Australia, Resource Management Technical Report 219.


Appendix A: Rural Towns – Liquid assets
Meeting with Pingelly Shire – 15 February 2006

Appendix A: Rural Towns – Liquid Assets
A1
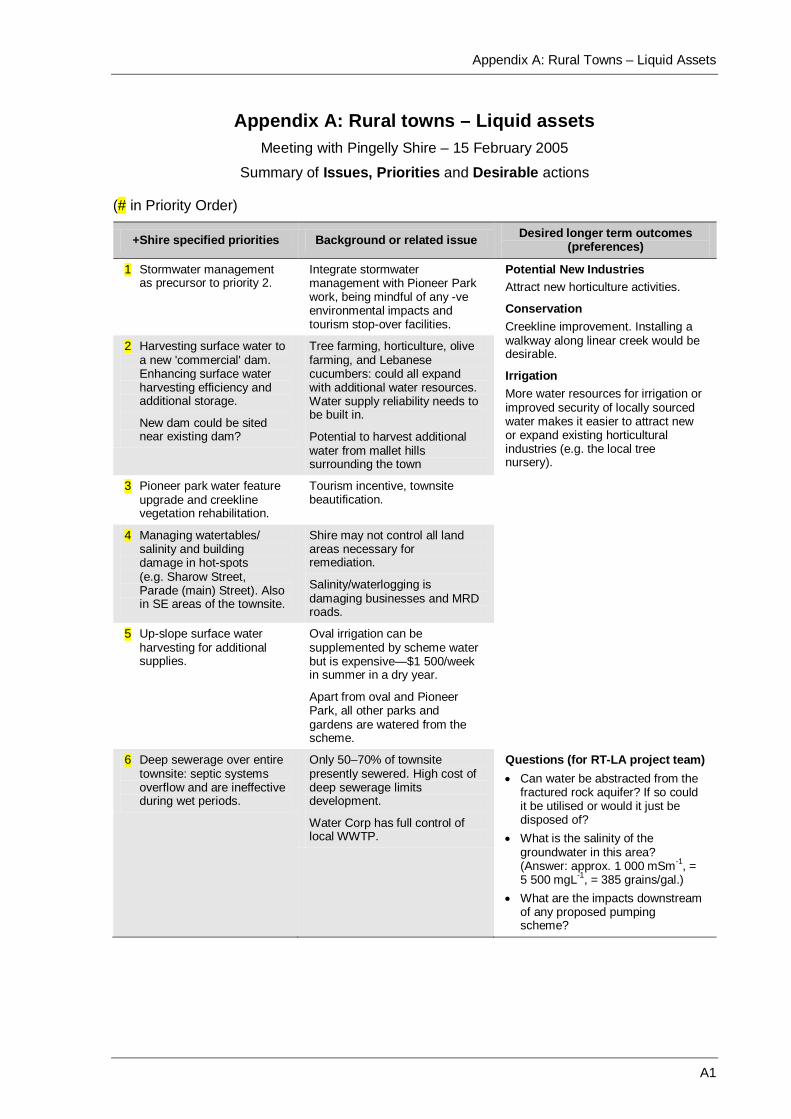
Appendix A: Rural towns – Liquid assets Meeting with Pingelly Shire – 15 February 2005
Summary of Issues, Priorities and Desirable actions
(# in Priority Order)
+Shire specified priorities Background or related issue Desired longer term outcomes (preferences)
1 Stormwater management as precursor to priority 2.
Integrate stormwater management with Pioneer Park work, being mindful of any -ve environmental impacts and tourism stop-over facilities.
Potential New Industries Attract new horticulture activities.
Conservation Creekline improvement. Installing a walkway along linear creek would be desirable.
Irrigation More water resources for irrigation or improved security of locally sourced water makes it easier to attract new or expand existing horticultural industries (e.g. the local tree nursery).
2 Harvesting surface water to a new 'commercial' dam. Enhancing surface water harvesting efficiency and additional storage.
New dam could be sited near existing dam?
Tree farming, horticulture, olive farming, and Lebanese cucumbers: could all expand with additional water resources. Water supply reliability needs to be built in.
Potential to harvest additional water from mallet hills surrounding the town
3 Pioneer park water feature upgrade and creekline vegetation rehabilitation.
Tourism incentive, townsite beautification.
4 Managing watertables/ salinity and building damage in hot-spots (e.g. Sharow Street, Parade (main) Street). Also in SE areas of the townsite.
Shire may not control all land areas necessary for remediation.
Salinity/waterlogging is damaging businesses and MRD roads.
5 Up-slope surface water harvesting for additional supplies.
Oval irrigation can be supplemented by scheme water but is expensive—$1 500/week in summer in a dry year.
Apart from oval and Pioneer Park, all other parks and gardens are watered from the scheme.
6 Deep sewerage over entire townsite: septic systems overflow and are ineffective during wet periods.
Only 50–70% of townsite presently sewered. High cost of deep sewerage limits development.
Water Corp has full control of local WWTP.
Questions (for RT-LA project team) • Can water be abstracted from the
fractured rock aquifer? If so could it be utilised or would it just be disposed of?
• What is the salinity of the groundwater in this area? (Answer: approx. 1 000 mSm-1, = 5 500 mgL-1, = 385 grains/gal.)
• What are the impacts downstream of any proposed pumping scheme?


Appendix B: Preliminary Community Profile for the Shire of Pingelly
Joanne Willers
CSIRO Land and Water The University of Western Australia
February 2007


Appendix B: Social Analysis
Bi
Contents Page
1. Abstract .......................................................................................................................... 1
2. Introduction .................................................................................................................... 2
3. Demographic trends and indicators .............................................................................. 2 3.1 Population .............................................................................................................. 2 3.2 Employment ........................................................................................................... 6 3.3 Industry .................................................................................................................. 9 3.4 Finance .................................................................................................................. 13 3.5 Residence Statistics ............................................................................................... 14 3.6 Education ............................................................................................................... 15
4. Post Survey Review ....................................................................................................... 17
5. Conclusions and Recommendations ............................................................................ 21
6. References ...................................................................................................................... 22


Appendix B: Social Analysis
B1
1. A bs trac t The Shire of Pingelly is located in the State’s central south and is approximately 158 km from Perth. In 2001 the Shire of Pingelly had a population of 1 222 people (ABS, 2001). The Shire exhibits the typical characteristics of a traditional Western Australian rural town. Pingelly is a mixed farming town producing predominantly sheep and wheat. The town income, as with most Wheatbelt towns is derived mainly from servicing the surrounding agricultural population. The key regional issues for the Wheatbelt, including Pingelly, revolve around maintaining sustainable communities that are of sufficient size to provide a level of services that enable residents to enjoy an appropriate lifestyle.
The scheme water is supplied to Pingelly via a comprehensive water scheme from the Harris River Dam. It was determined via questionnaires carried out by a number of residents in the Shire that the quality of scheme water is good overall but may vary seasonally. Given that agriculture is the predominant industry in the town and is the highest contributor to the economy in the region, water is often the defining resource that determines the profitability of the industry. The demographic profile (population, employment, income, occupation) of the town will often fluctuate depending on the success of the agricultural industry and so for farmers to remain sustainable it is vital to ensure quality resources for the future. The surveys carried out in Pingelly revealed that no one is more aware of this crisis than the farmers themselves. Many farmers have detailed water management plans. It is important to utilise this local knowledge and possibly adopt some of these ideas into the water management plan derived within the project in order to ensure the future sustainability of water in Pingelly. It was also established that the water crisis was not felt so severely by those who had access to scheme water. They were not affected by lack of supply and rarely affected by poor quality water.
Urban salinity has a significant economic impact on 38 rural towns in Western Australia. The WA Salinity Investment Framework (SIF) predicts that damage within those towns will be more than $55 million statewide over the next 30 years. With increasing water restrictions, economic and social development is also being stifled by declining water supplies. Salinity management based solely on water abstraction isn’t cost effective. However, an integrated approach incorporating salinity management with new industries (based on local water production) may be viable and produce multiple benefits. As a part of this project people’s perceptions and concerns relating to townsite salinity were investigated. Most residents from the town who participated believed there was no problem with salinity in the townsite. Those who said there was a salt problem in the town mentioned that they could not visually see any problems but had been told by someone that there was salt in the water. Quite a different response was presented from farmers who were interviewed. Most farmers thought there were salinity problems in the town and were also aware of the rising groundwater problems in the town.
Other important issues such as the possibility of recycled water consumption, waterwise gardening, water management and water related industries were also assessed.
Aside from community perspective relating to water, outlined in a copy of the Shire of Pingelly’s council minutes for July 2004 is a statement relating to expectations of the new RT-LA project and included the following outcomes: 'The liquid assets project will focus on abstraction and treatment of saline groundwater, use and reuse of local water sources, harvesting town catchments runoff and salinity control. The project will provide an integrated water management approach and will also research the commercial potential for new water based industries'. These prospects for each Shire are imperative as we then are able to better fulfil the expectations of everyone involved in the project.

Appendix B: Social Analysis
B2
As a result of this preliminary investigation into the Shire of Pingelly a set of recommendations were derived that will aid in the successful completion of the project for all parties involved. These recommendations are as follows; determine each towns expectations for the RT-LA project, enhancement of community based initiatives to combat rural depopulation, revisit Pingelly and conduct a more thorough investigation with a larger sample size, increase community education and communication among stakeholders and finally further investigations into new water related industries.
2. Introduc tion The Shire of Pingelly is located in the State’s central south and is approximately 158 km from Perth. In 2001 the Shire of Pingelly had a population of 1 222 people (ABS (520057140), 2002). Pingelly has a number of local tourist attractions. The Boyagin Rock Nature Reserve is popular for its scenic views and wildflowers in spring (Shire of Pingelly, 2005). The Tutanning Flora and Fauna Reserve is renowned for its abundance and diversity of species. It covers about 2 000 ha and due to its experimental importance has no recreational facilities on site (Shire of Pingelly, 2005). Moorumbine is situated 8 km east of Pingelly and was the first townsite to be settled in this area. The townsite is valued for its historical significance and many tourists are often attracted to this site. Recently, the Barna Mia Animal Sanctuary was opened in the conservation area Dryandra Woodland just south of Pingelly. This setting provides tourists with the opportunity to observe some of the State’s unique mammals and spectacular wild flowers in their natural state (Shire of Pingelly, 2005). Located in the main street of Pingelly is the Memorial Park and Courthouse Museum, which includes a picnic area, playground and gardens for recreational use (Shire of Pingelly, 2005). Also, adjacent to the railway, Pioneer Park is a popular venue for locals and tourists for barbequing and picnicking. Pingelly is also home to the Pingelly Heights Astronomical Observatory that won the Tourism Adventure Award in 2001. The observatory provides guided tours that enable people to participate in some star-gazing (Shire of Pingelly, 2005).
Pingelly is a mixed farming town producing predominantly sheep and wheat. The town income, as with most Wheatbelt towns is derived mainly from servicing the surrounding agricultural population. Town facilities include a variety of health and education organisations including the Pingelly District High School, churches, a range of sporting clubs, a telecentre, banks and postal services, a swimming pool, a range of recreational sites as well as a tavern and many other general purpose type stores.
The key regional issues for the Wheatbelt, including Pingelly, revolve around maintaining sustainable communities that are of sufficient size to provide a level of services that enable residents to enjoy an appropriate lifestyle.
3. Demographic trends and indic ators
3.1 P opulation The population of the Shire of Pingelly was 1 190 in June 2002. This represented a decrease of 1.7 per cent from the previous year. Over the same period the population of regional Western Australia grew by 1.1 per cent (Department of Local Government and Regional Development, Government of Western Australia (c), 2003). Furthermore, in August 2001 there were 1 122 people (562 males and 560 females) in Pingelly (ABS (520057140), 2002). At this point in time there was an unusually even split of males and females in the community, which is often not the case for farming communities. These figures represent a decrease of 1.1 per cent of people since the 1996 census and 4.2 per cent of people since the 1991 census (Table 1).

Appendix B: Social Analysis
B3
Table 1
2001 1996 1991 % Change 1991-2001
Male 562 589 591 -4.9%
Female 560 546 580 -3.4%
Total 1 122 1 135 1 171 -4.2%
Note: Overseas visitors are included in these counts. (ABS (520057140), 2002).
In June 2002 the population of the Shire of Pingelly made up 0.2 per cent of the people living in regional Western Australia and 0.06 per cent of the State’s population. The Shire experienced a steady decline in population until 1997 where it grew significantly by approximately 2.0 per cent (Figure 1a).
Population [Annual]
1160
1170
1180
1190
1200
1210
1220
1230
1993 1994 1995 1996 1997 1998 1999 2000 2001 2002
No.
of P
eopl
e
-3.50%-3.00%-2.50%-2.00%-1.50%-1.00%
-0.50%0.00%0.50%1.00%1.50%2.00%
Gro
wth
Rat
e (%
)
Population Growth
Figure 1a Annual population and population growth rates for the Shire of Pingelly.
The median age of people in the 2001 census was 38 years. This represents an increase from 35 in the 1996 census and 31 in the 1991 census (ABS (520057140), 2002). These are quite substantial increases in the median age of a population. In fact, Pingelly had the highest median age increase (up 7 years to 38) in the 2001 census for the entire Wheatbelt region (Anon (a), 2005).

Appendix B: Social Analysis
B4
Total Population Ages in Pingelly
0
20
40
60
80
100
120
140
0-4 5-910
-1415
-1920
-2425
-2930
-3435
-3940
-4445
-4950
-5455
-5960
-6465
-6970
-7475
-7980
-8485
-89
90 ye
ars an
d ove
r
No.
of P
eopl
e
1991
1996
2001
Figure 1b Population ages over three census counts—Shire of Pingelly.
When looking at the age distribution of the population in Pingelly there is a number of trends occurring. Firstly, the number of elderly people in the Shire (70 and above) is significantly greater than that of either Lake Grace or Woodanilling. It is important to note that on the Pingelly shire website there is a large emphasis on the town’s health and aged care facilities, which may promote a stronger aged community. Much the same as Lake Grace and Woodanilling the dominant age group seems to be between 0 and 14. In Pingelly however, there seems to be less of a decline in population in the 15–19 age bracket in comparison to the other two towns. This could possibly be attributed to the community’s ability to keep their youth by promoting youthful activities such as free concerts (Slim Jim and the Phatts) and public holiday activities (Australia Day breakfast). It is also evident that in Pingelly there is a more even spread of the population over all age groups compared to the other two towns. This is positive for the town as it brings a diversity of opinions that can lead to optimistic changes. As with Woodanilling and Lake Grace the bulk of the population remains in the 25-50 age bracket. In terms of making comparisons of age distribution between census years possibly the most obvious trend is the decline in population between 0 and 9 from 1991 to 1996 and significant increase in 10–14 year olds from 1991 to 1996. There seems to be a steady decline in people aged between 25 and 29 and 30 and 34. It is also clear the significant increase in people aged 55–59, 65–69 and 75–79 in the 2001 census compared to 1996 (Figure 1b).

Appendix B: Social Analysis
B5
Figure 1c A comparison of age versus sex in Pingelly (Anon. 2004).
The predominant age group in Pingelly is 10–19 years of age (Figure 1c). It is also evident that in this age group there are significantly higher portions of males compared to females. Conversely, in the 40–59 and 80 plus age category the females dominate the population (Figure 1c). When comparing the population distribution of Pingelly to rural towns such as Lake Grace and Woodanilling it is evident that there is a more even spread of people across all age groups in Pingelly.
In 2001 81.1 per cent of people in the Shire of Pingelly were Australian born. This figure has decreased from 83 per cent in 1996 and 86.3 per cent in 1991 (ABS (520057140), 2002). In terms of those born overseas, in 2001 8.2 per cent were born in the UK, 1.9 per cent in New Zealand and 0.8 per cent in Italy (ABS (520057140), 2002). The remainder of those born overseas were made up of people from the US, Malaysia, Ireland, Indonesia and India. In 2001 the three most common ancestries in Pingelly were Australian (46.3 per cent), English (44.2 per cent) and Irish (6.8 per cent) (ABS (520057140), 2002). These results were consistent with the other two towns.
Religious Affiliation - Pingelly
050
100150200250300350
A
nglica
n
B
aptis
t
C
atholi
c
J
ehov
ah's
Witnes
ses
L
atter
Day Sain
ts
L
uthera
n
P
resby
terian
and R
eform
ed
S
alvati
on A
rmy
S
even
th-da
y Adv
entis
t
U
niting
Chu
rch
O
ther C
hristi
an(a)
Juda
ism
No reli
gion(b
)
Not sta
ted
No.
of P
eopl
e
Figure 1d Religious affiliation of the population—Shire of Pingelly.

Appendix B: Social Analysis
B6
Similarly to Lake Grace and Woodanilling, there is a strong Catholic and Uniting Church influence in the Shire. However, Pingelly also exhibits a large Anglican and Baptist community (Figure 1d).
3.2 E mployment Total employment in the Shire of Pingelly in the June 2003 quarter was 587 people. This represents an increase of 1.6 per cent over the previous quarter (Department of Local Government and Regional Development, Government of Western Australia (c), 2003) (Figure 2a). When comparing employment statistics from the Shire for June 2003 with the same quarter in the previous year, total employment decreased by 10.7 per cent (Figure 2a) (Department of Local Government and Regional Development, Government of Western Australia (c), 2003).
Employment [Quarterly]
0
100
200
300
400
500
600
700
J-99
S-99
D-99
M-00
J-00
S-00
D-00
M-01
J-01
S-01
D-01
M-02
J-02
S-02
D-02
M-03
J-03
No.
of P
eopl
e
-12.00%
-10.00%
-8.00%
-6.00%
-4.00%
-2.00%
0.00%
2.00%
4.00%
6.00%
8.00%
Gro
wth
Rat
e (%
)
Employment Growth
Figure 2a Quarterly employment statistics for the Shire of Pingelly.
In the June 2003 quarter there were 40 unemployed people in the Shire of Pingelly, this compared to 36 people for June 2002 (Figure 2b). The unemployment rate for the shire in the June 2003 quarter was 6.4 per cent (Department of Local Government and Regional Development, Government of Western Australia (c), 2003). This is a significant unemployment rate for the Shire compared to those of Lake Grace and Woodanilling. This could possibly be attributed to the considerable portion of youth in the town that may not be in the workforce. Even so the Wheatbelt Area Consultative Committee believes that these figures do not give a true picture of the unemployment status of particular regions due to the fact that people (particularly young people) are being forced to leave their small communities when they become unemployed to find work in the larger centres (Bothams, 1998). The process of rural depopulation due to lack of employment opportunities is not accounted for in the unemployment status of rural towns and may therefore be highly underestimated. Hidden unemployment statistics is a significant regional issue that needs to be reassessed before making any assumptions about the employment status of a rural town. It should also be noted that the unemployment rate will inevitably increase with increasing population (Figure 2b).

Appendix B: Social Analysis
B7
Unemployment [Quarterly]
0
10
20
30
40
50
60
J-99
S-99
D-99
M-00
J-00
S-00
D-00
M-01
J-01
S-01
D-01
M-02
J-02
S-02
D-02
M-03
J-03
No.
of P
eopl
e
0.00%1.00%2.00%3.00%4.00%5.00%6.00%7.00%8.00%
Une
mpl
oym
ent R
ate
(%)
Persons Unemployment Rate
Figure 2b Quarterly unemployment statistics for the Shire of Pingelly.
Unemployment in Pingelly
0
10
20
30
40
50
60
1991 1996 2001
No.
of P
eopl
e
MalesFemalesPersons
Figure 2c Number of people unemployed over three census years—Shire of Pingelly.
It is also interesting to note that census results show a decrease in unemployment from 1991 to 1996 and then a slight increase in employment from 1996 to 2001 for both males and females in the Shire of Pingelly (Figure 2c).

Appendix B: Social Analysis
B8
Labour Force Status - Pingelly
0
5
10
15
20
25
30
35
40
45
Full Time Part Time Not Stated
Perc
enta
ge (%
) of E
mpl
oyed
Per
sons
MalesFemales
Figure 2d Labour force status for the Shire of Pingelly comparing gender and the number of full time and part time positions.
Labour Force Status Pingelly
0
50
100
150
200
250
300
350
1991 1996 2001
Num
ber o
f Peo
ple
Full Time Part Time
Figure 2e A comparison of full time and part time employment trends in Pingelly over time.
In all regions of the Wheatbelt including Pingelly, part time employment is growing while the number of full time positions is declining. This trend is evident in Figure 2e, in which the number of part time positions in the shire of Pingelly has increased from 1991 to 2001 and the number of full time positions has declined. A reoccurring trend shows the number of females increasing as a proportion of the work force. The proportion of women in part time work is almost twice that of men. More than half of the female population in the workforce work part time, while the great majority of men work full time (Bothams, 1998). These trends are specific to Pingelly and many other rural towns (Figure 2d). These results are similar to those of Lake Grace and Woodanilling suggesting that possible industries that allow females to be employed on a part time basis and incorporate water use may be a viable and sustainable option for the future.

Appendix B: Social Analysis
B9
3.3 Indus try Throughout the Shire of Pingelly, the Agricultural sector remains the economic mainstay for the region. However, many other industries have developed in response to the growing need to service this dominant industry. In 200/01 total agricultural production in the Shire of Pingelly was valued at $28.4 million (Figure 3a) (Department of Local Government and Regional Development, Government of Western Australia (c), 2003). This represents a 4.7 per cent decrease in total agricultural production from the previous year compared to a 7.7 per cent decline for the industry statewide (Department of Local Government and Regional Development, Government of Western Australia (c), 2003). The Shire as a whole contributes 0.6 per cent of the states total agricultural production by value (Department of Local Government and Regional Development, Government of Western Australia (c), 2003). This is significantly less than the contribution made by Lake Grace.
Agricultural Production [Annual]
0
5
10
15
20
25
30
35
40
45
50
1992/93 1993/94 1994/95 1995/96 1996/97 1997/98 1998/99 1999/00 2000/01
Valu
e ($
m)
-0.6
-0.4
-0.2
0
0.2
0.4
0.6
0.8
Gro
wth
(%)
Production ($m) Growth
Figure 3a Annual agricultural production value—Shire of Pingelly.
In the Shire of Pingelly there was clearly a dramatic increase in agricultural production in the years 1997/98 (Figure 3a). However, this sharp increase was short lived as production fell in the following years. Some statistics are outlined below comparing the Shire of Pingelly’s agricultural contribution to that of the rest of the region and statewide (Table 2).
Table 2 Comparative Statistics—Shire of Pingelly 1996/97
Region GVAP ($M) Farm Area ('000 Ha) No. of Farms
Shire of Pingelly 26 127 87
Central Agricultural Region 1 467 8 070 3 507
Total WA 4 261 112 482 13 872
(Annan et al. 2000).

Appendix B: Social Analysis
B10
Pingelly contributes $26 million to the regions gross value of agricultural production (Annan et al. 2000). Wheat is the major commodity produced throughout the Shire of Pingelly and was worth over $9 million in 1996/97 (Table 3). The next most important commodity is wool ($7 million followed by sheep ($3 million) (Annan et al. 2000) (Figure 3d).
Figure 3d Proportion of GVAP by commodity— Shire of Pingelly 1996/97. (Annan et al. 2000).
The Shire suffered from a collapse in wool prices over the period of 1988/89 to 1990/91 in which the GVAP dropped $10 million over that two-year period (Annan et al. 2000). In conjunction with this decline in agricultural production, rural depopulation and farm amalgamation are ever present due to the fact that the number of farms in the Shire has dropped from 104 in 1982/83 to 87 in 1996/97 and possibly even further to this date (Annan et al. 2000).
Table 3 GVAP, area and dollars per hectare for major agricultural activities, Shire of Pingelly 1996/97
Agricultural Industry Value of farm production ($'000)
Total area of production (ha)
Dollars per hectare ($/ha)
Intensive animal products 912.6 24.5 37 249
Pasture animal products 10 253 67 643 152
Crops—Broadscale 15 084 44 386 340
Crops—Horticulture 0 0 0
Non productive land 15 380
Total Shire of Pingelly 26 250 112 053 234
(Annan et al. 2000).
Other significant industries that contribute heavily to the Pingelly employment status and economy are outlined below (Figure 3b).

Appendix B: Social Analysis
B11
Industries in Pingelly (Excluding Agriculture)
0
10
20
30
40
50
60M
inin
g
Man
ufac
turin
g
Ele
ctric
ity, G
asan
d W
ater
Con
stru
ctio
n
Who
lesa
leTr
ade
Ret
ail T
rade
Acc
omm
odat
ion,
Caf
es a
nd
Tran
spor
t and
Sto
rage
Com
mun
icat
ion
Ser
vice
s
Fina
nce
and
Insu
ranc
e
Pro
perty
and
Bus
ines
s
Gov
ernm
ent
Adm
inis
tratio
n
Edu
catio
n
Hea
lth a
ndC
omm
unity
Cul
tura
l and
Rec
reat
iona
l
Per
sona
l and
Oth
er S
ervi
ces
No.
of E
mpl
oyed
Per
sons
199119962001
Figure 3b Industries of employment in the Shire of Pingelly.
In contrast to Lake Grace, Pingelly exhibits a fairly uneven spread of industry employment. It is clear that the booming industries with respect to employment for Pingelly over the past three census counts have remained wholesale trade, retail trade, government administration, education and health and community services (Figure 3b). In the 2001 census 3.2 per cent of people were employed in manufacturing, 0.6 per cent were employed in construction, 10.8 per cent in retail trade, 2.5 per cent in property and business, education employed 6.2 per cent and there were 8.3 per cent of people in the Shire employed in the health and community services industry (ABS (520057140), 2002). When looking at the statistics it is clear that the retail trade industry, personal services and communication services has continued to grow from 1991 to 2001 in Pingelly. The number of people employed in the education industry dropped significantly in 2001, which may be due to the significant drop in population in the Shire from 1999 to 2000. The finance and insurance sector has continually declined since 1991 over the past 10 years. Construction work and employment has remained relatively steady over the past 10 years.
It is interesting to note that although retail, wholesale trade, health and community services, education and government administration industries are dominating the Shire of Pingelly, it is these industries that are also dominated by women, excluding agriculture. There are far more woman employed in this industry compared to men. On the other hand, the property and business, transport, construction, electricity, gas, water and manufacturing sectors are almost solely dominated by men (Figure 3c).

Appendix B: Social Analysis
B12
Industry Employment (Excluding Agriculture)
0
5
10
15
20
25
30
35
Man
ufac
turin
g:
Ele
ctric
ity, G
asan
d W
ater
Sup
ply:
Con
stru
ctio
n:
Gov
ernm
ent
Adm
inis
tratio
nan
d D
efen
ce:
Edu
catio
n
Hea
lth a
ndC
omm
unity
Ser
vice
s:P
erso
nal a
ndO
ther
Ser
vice
s:
Who
lesa
leTr
ade:
Ret
ail T
rade
:
Acc
omm
odat
ion,
Caf
es a
ndR
esta
uran
tsTr
ansp
ort a
ndS
tora
ge:
Com
mun
icat
ion
Ser
vice
s
Fina
nce
and
Insu
ranc
e:P
rope
rty a
ndB
usin
ess
Ser
vice
s:
No.
of P
eopl
e
Males Females
Figure 3c Comparing the distribution of gender to the number of people employed in particular industries Shire of Pingelly (census 2001).
In terms of the occupational status of employed people in the Shire of Pingelly, similar to other rural centres, the majority of people (37.2 per cent) are employed as managers and administrators including land managers. Aside from this approximately 14.8 per cent of people were employed as some kind of professional in 2001 (ABS (520057140), 2002). It is highly likely that many of these professionals work in industries that in some way serve the agricultural community.
The census 2001 statistics also show that the largest sector for employment by far in the shire of Pingelly remains the private sector, followed by the state government. The state government employs significantly more females than males in the 2001 census year and the private sector employed more males than females (due to agriculture being the major employer in the private sector) (Figure 3d).

Appendix B: Social Analysis
B13
Industry Sector Employment - Pingelly
050
100150200250300350400450500
Com
mon
wea
lthG
over
nmen
t
Sta
te/T
errit
ory
Gov
ernm
ent
Loca
lG
over
nmen
t
Priv
ate
sect
or
Com
mun
ityD
evel
opm
ent
Em
ploy
men
tP
rogr
am
No.
of P
eopl
e
MalesFemalesPersons/Total
Figure 3d Industry sector employment—Shire of Pingelly (census 2001).
3.4 F inanc e The average taxable income for all individual taxpayers in the Shire of Pingelly for 1999/00 was $29 554, which represents an increase of 9.0 per cent since 1998/99 (all amounts in nominal values) (Department of Local Government and Regional Development, Government of Western Australia (c), 2003) (Figure 4a).
Average Taxable Income [Annual]
230002400025000260002700028000290003000031000
1995/96 1996/97 1997/98 1998/99 1999/00
Avg.
Inco
me
($)
-0.2-0.15
-0.1-0.0500.05
0.10.15
Annu
al G
row
th (%
)
Income Growth
Figure 4a Annual average taxable income for the Shire of Pingelly.
The average taxable income in 1999/00 for all individual taxpayers in regional Western Australia was $33 958, approximately 13.0 per cent higher than for the Shire of Pingelly. In 1995/96 there was a significant drop in taxable income in the Shire with the annual average income falling over $4 000. These statistics may also be related to Figure 3a in which total agricultural production also fell dramatically over this same time period.

Appendix B: Social Analysis
B14
Figure 4b Annual household income—Shire of Pingelly (Anon. 2004).
Throughout the shire the highest percent of the population earns an annual household income of between $15 000 and $26 000 (Figure 4b).
3.5 R es idenc e S tatis tic s Family statistics from Pingelly (2001) show that 41.2 per cent of the population lives in couple families with children, 43.9 per cent of people exist as couple families without children and 13.1 per cent are lone parent families. There were 0.3 per cent of the population in group households and 9.3 per cent in lone person households (ABS (520057140), 2002). Clearly, the majority of the population of Pingelly exists as either couple family with children or couples without children (Figure 5a).
Figure 5a Household structure Shire of Pingelly (Anon. 2004).
When comparing these statistics to the Shire of Lake Grace it becomes evident that there are far more childless couples and far less lone households in Pingelly.

Appendix B: Social Analysis
B15
As can be seen in Figure 5b below, the marital status of the majority of the population is either married or never been married (single). This is clearly reflected in the family statistics above.
Marital Status
0
50
100
150
200
250
Married Separated Divorced Widowed Nevermarried
Empl
oyed
Per
sons
Males Females
Figure 5b Marital status, Shire of Pingelly (Census 2001).
These statistics are comparable to those of both Lake Grace and Woodanilling.
3.6 E duc ation A significant portion of the residence in Pingelly completed high school to either year 10 or year 12. This is to be expected in most areas, as these are the two most common years for students to finish secondary education. However, in Pingelly there are also quite a large number of people who have only completed high school to year 8. This may be accredited to the fact that there are quite a high percentage of elderly people in the Shire of Pingelly who were not kept at school until minimum year 10.
Highest Level of Schooling Completed
050
100150200250300
Year 8
or belo
w
Year 9
or equ
ivalen
t
Year 1
0 or eq
uivale
nt
Year 1
1 or eq
uivale
nt
Year 1
2 or eq
uivale
nt
Still at
scho
ol
Not sta
ted
No. o
f Peo
ple
Figure 6a Highest level of schooling completed, Shire of Pingelly (census 2001).

Appendix B: Social Analysis
B16
In the 2001 census 7 (0.8 per cent) of people had a postgraduate degree. This statistic remained constant over town census counts. 4.6 per cent of people held a bachelor degree in 2001; this figure represents an increase from previous census years. There were 16.6 per cent of people with an advanced diploma; also representing an increased number from previous years, and 77.9 per cent of people had no formal qualifications (Figure 6b) (ABS (520057140), 2002).
Non School Qualification Level of Education
0
20
40
60
80
100
120
Pos
tgra
duat
eD
egre
e
Gra
duat
eD
iplo
ma
and
Gra
duat
eC
ertif
icat
e
Bac
helo
rD
egre
e
Adv
ance
dD
iplo
ma
and
Dip
lom
a
Cer
tific
ate
Not
sta
ted
No
of P
eopl
e
Figure 6b Non school qualifications, Shire of Pingelly (census 2001).
Type of Education Attending (if attensing) - Pingelly
0
20
40
60
80
100
120
140
160
1991 1996 2001
No.
of P
eopl
e
Infants/Primary
Secondary
Further EducationalInstitutionTertiary Institution
Other
Figure 6c Comparing different types of educational institutions, Shire of Pingelly (census 2001).
It is evident that the great majority of Pingelly residences attending some form of educational institution are those at either playschools or the primary school. Very few residents attend a tertiary institution (Figure 6c). The estimates for the amount of people attending tertiary studies may be underestimated due to the fact that this classification only accounts for the people who have remained in the Shire and acquired a tertiary education via external studies. This does not account for those who have gone away to university and come back.

Appendix B: Social Analysis
B17
4. P os t S urvey R eview A survey was constructed and designed to gather information from key recognised groups in the Pingelly Shire and aimed to gain an understanding of what issues are seen as important by the local community, and of hopes and concerns for the future of the town. Individual questionnaires were designed for members of the residential and industrial population and a set of questions were allocated to the CEO of each town. It is important to note that there was only a very small sample of the population surveyed and so the opinions described are not necessarily representative of the entire Shire’s population. It is also essential to understand that the findings documented below are in fact people’s opinions rather than facts and so some findings may be variations from the facts depending on people’s perceptions. Overall, when comparing the three towns I looked at, Pingelly had the highest participation rate in the Surveys. In this section the key findings from the questionnaires completed in Pingelly will be summarised.
When reviewing the questionnaire, it’s structure and it’s effectiveness it was clear that the question that posed the most problems to the majority of participants was the biodiversity question. The majority of participants either had to ask what the word meant or assumed that biodiversity related to diversity of businesses in the Shire. Those who I explained the meaning of the word biodiversity to mostly said that it was important to their town and that water management strategies were affecting the state of biodiversity in Pingelly. However, I expect that this was a common response due to the fact that they were still unsure of what the word meant and felt this was the right answer to give rather than what they actually believed. For those who believed biodiversity related to the diversity of businesses in an area, most participants felt quite strongly about the importance of diversifying businesses in country areas and believed that water management strategies would effect this prospect. After conducting this survey it is clear that biodiversity is not a major issue in the Pingelly Shire as little people actually know what it refers to and those who did believed it was unfortunately not profitable to protect biodiversity and therefore not feasible.
In many surveys discussion of water supply in Pingelly relating to quality and quantity was quite a topical conversation. The majority of residents interviewed who lived in town generally had no issues with supply of water. Most of them had scheme water and supplemented this with rainwater in which they used to reduce their reliance on scheme water. From residents living in town some mentioned that their scheme water had never run out when they turned the tap on so they assumed supply was not an issue. Most said the quality of rainwater was fantastic and was used for drinking and all household purposes. In terms of scheme water peoples responses varied in terms of quality. However, most people said the quality of the scheme water was good but often included in their response that they had a filter on their scheme water going to the house. Comment was regularly made relating to the improvement in quality of scheme water since the source had changed. Previously scheme water for the Shire of Pingelly came from Wellington dam. It was often mentioned that Wellington dam’s water quality wasn’t good so people began to use more rainwater and put filters on their scheme water, but now the scheme water comes from the Harris River and the quality has greatly improved.
An important issue that the surveys revealed was that there was more concern regarding water supply and quality from the residents living on farms outside of the town compared to those living on residential blocks in the town. Many of these people surveyed did not have access to scheme water and so did display concern for their future water supplies and the sustainability of their farms. Most were more apprehensive towards future supply of water rather than quality however quality was still a major issue. It was clear when speaking to people on farms that there was a divide between two types of people and their opinions

Appendix B: Social Analysis
B18
relating to water in Pingelly. These two groups included those who had secured private water sources on their properties and those who did not either because the quality of water under their property was too saline or the water just wasn’t there. There was a definite split of opinion relating to water between these two groups. Those who had private water sources on their property of sufficient quality were not so concerned about the future of water supplies in Pingelly. Many of the questions relating to water they were not able to answer or believed there was no problem and stated that they had never really had to consider issues like that because they have never been in a situation where quality water was lacking and probably never will be. On the other hand, those who were unable to secure private water sources or had private water sources that were very poor in quality showed more concern about the future especially in relation to sustainability. Those who had an abundance of water on their property also mentioned on numerous occasions how they believe that what ever water is on the property that they own, they should be entitled to and shouldn’t have to share with other people. I got the impression that rather than the future of water supplies in Pingelly, this was the major concern of these people that this project was not going to aim to take their water away from them and share it between others.
When participants were asked what they would like to see any excess water being used on in the Shire there was once again quite a divide between those who lived in the town and those who lived on farms. Almost 100 per cent of participants (residents, farmers and industry people) stated they would like to see the water used for town beautification purposes. For some the reasoning behind this was purely for personal satisfaction and lifestyle concerns, while others related better parks and gardens to attracting more people to the town and an improved standard of living which would in turn benefit Pingelly. Although this response was common across town’s people, farmers and industry, the farmers also made it clear that as well as town beautification they would like to see any excess water stored for the future to aid in drought proofing farms. This was a very common response across most farmers who thought storing the water in dams or other storage facilities would be a good idea considering the future implications to the Shire relating to lack of water.
Respondents were also asked if they recycle any water within their household or business. The responses from this question could be split into three categories, residential, industry and farmers. Most residential people surveyed in Pingelly stated they did recycle some of their grey water onto the garden however none of them had a wastewater treatment or recycling device installed in their home. When specific businesses were surveyed very few said they recycled water within the business unless the productivity of their industry directly depended on water (farmers), examples of such businesses include the hotel and local supermarket. At the other end of the scale farmers that were interviewed seemed to be quite self sufficient when it comes to recycling water. Many had specific management plans when it came to water harvesting and recycling of their water. Although the majority of farmers were quite concerned with recycling water very few of them said they had actual wastewater treatment facilities installed on their farms. Most mentioned that this would be highly desirable for them to have and most made specific reference to desalination facilities but said that the costs are too high for such systems and a substantial amount of funding would be necessary to make this a viable option for their businesses.
The concept of the waterwise gardening initiative was introduced to those participating in the residential questionnaire. Most respondents stated that they were aware of this initiative and understood the reasoning behind planting plants that were better suited to drier conditions. The majority of participants had adopted these plants as a part of their household gardens and mentioned that every time one of their old plants died they would make sure they chose a waterwise plant to replace it. Most did not have a whole garden made up of these plants but said that a substantial portion of there gardens was made up of natives. Although a

Appendix B: Social Analysis
B19
significant portion of the residents interviewed were supportive of the waterwise garden initiative there was still the occasional person who felt quite strongly about maintaining their traditional English garden and would not be adopting any of these native plants.
Participants were also questioned about their willingness to drink recycled water. Again there was a split in responses between people living in the town and farmers. The majority of people surveyed on farms all had no problems with the thought of drinking recycled water. There was little questioning about this concept, most just agreed straight away and made comments such as, when you know what it’s like to have a lack of water you will drink anything and that many of them already drink from their dams, which are not very clean. Most people in town also agreed that they would drink recycled water. However, just about all of the people interviewed from the town in Pingelly who said yes were very apprehensive and mentioned that they would have to be assured it was safe and that there was no decline in quality. One woman entertained the concept that perhaps she wasn’t to keen on drinking recycled water just because the word ‘recycled’ sounds dirty. In my opinion it sounded like many of the participants surveyed from the town said yes to this question because they thought that was the right answer that I wanted to here, but did not really mean it. This problem is often encountered in surveys similar to this one in which people can say they are going to do certain things, but the question often is whether they are actually going to do them or not? Using willingness to pay (WTP) questions can usually counteract this problem. However, in this questionnaire the WTP question may not have been as effective as expected. This question could only be asked if people said no to drinking recycled water, but in most cases people said yes and may not have necessarily meant it and so the question was rarely used in the surveys. For future research I think these questions must be reviewed due to the fact that there was some confusion over the lack of specific details as to what type of recycled water they would be drinking. An answer to this question was highly dependent on people’s interpretation of the question. Some people interpreted it as drinking recycled sewerage water and there were very little people who said yes to drink this. Whereas others interpreted it as drinking recycled saline water and so were more inclined to answer yes to the question.
All people who participated in the survey were asked if they had any ideas for innovative water management and new water related industries. Some of the responses to innovative water management ideas are outlined as follows: managing eroded catchments to improve water resources and runoff, desalination was mentioned quite regularly as being highly beneficial but too expensive at the moment, pumping of underground water and feeding it to farmers, capturing surface water runoff from hard surfaces in the town, installing more rain water tanks in homes, groundwater that doesn’t get used and goes to waste and the promotion of water reuse in the town as this is not being done very effectively at the moment. The main response to this question was centred on the concept of water harvesting and was mentioned in many different forms. In terms of new water related industries, suggestions included, aquaculture (trout/yabbie farming), which was the most popular of responses, nurseries, viticulture/olives (some people in the community are already interested in expanding this industry), solar technology and reusable energy and growing and hydroponics industries.
After this question the participants were given a list of water related industries and asked to identify whether or not they would like them introduced into the Shire. Most people were happy for any industry to open up because this would bring more people to Pingelly and expand the Shire. This was the general feeling from most participants. However, there were some industries that were preferred more than others. A common response that seemed to come up with many respondents when suggesting some of the industries was that the extreme temperatures and lack of rainfall wouldn’t permit many of these industries to be viable business options and so they would not like them to be opened up in Pingelly. As

Appendix B: Social Analysis
B20
mentioned most people were happy to introduce any new industries that would bring people and money into the Shire but there were some common concerns about certain industries that did arise. It is important to remember that because such a small amount of the Shire’s population was interviewed we cannot take these concerns to be a representation of the entire population. Such concerns included the fact that wineries, floriculture, horticulture and tree farms may be affected from the chemicals from the farms and are often not compatible with broad acre farming techniques and chemicals. In terms of expanding the town’s recreational facilities many people were against this, as they believed Pingelly already has good recreational facilities, they just need to be maintained. Most people reacted positively to the introduction of intensive animal industries but a few people mentioned that they would not be happy if they were built close to the townsite. The expansion of eco-tourism in Pingelly was quite divided in terms of people’s opinions. Some people felt quite strongly that there would be nothing in Pingelly that people would want to come and see whereas others were very positive. Evan Hodges (past Shire president) made the following comment; there are a lot of avenues to be looked into because Pingelly is only 1.5 hrs from Perth and may be explored for day trips and buses go through the town to go to wave rock. The introduction of salt tolerant plant industries into Pingelly was the most encouraged industry by all participants, followed by aquaculture. Every participant thought it was a very good idea although one respondent made an interesting point which is outlined below; the introduction of salt tolerant plant industries would be a good industry for the Shire but it may be a bit of a “cop out” and will possibly be detrimental to water related issues in Pingelly (in terms of quality and quantity). He said people would take the easy option out and spend money on trees instead of treating water to make quality better. He said if water sources are improved this is the most positive thing you can do for the town because it will open up the market to new industries in the Shire that could previously not operate due to water restrictions, and this will bring far more benefits than salt tolerant plant industries alone.
Most people interviewed in Pingelly agreed that an increase of population could be supported as long as the increase was gradual rather than a large sudden influx. It was regularly mentioned that the amount of housing would need to increase in order for this to be possible but the land is available to be built on. With reference to transport it was also mentioned that the Brookton High Way was just upgraded and the roads are in good condition.
Finally, all participants were asked if they see salinity as a problem in the town. Most residents from the town who participated believed there was no problem with salinity in the townsite. Those who said there was a salt problem in the town mentioned that they could not visually see any problems but had either been told by someone that there was salt in the water or had seen the signs put up around town by the council saying they were ‘tackling townsite salinity’. Quite a different response was presented from farmers who were interviewed. Most farmers thought there were salinity problems in the town and were also aware of the rising groundwater problems in the town. Some interesting comments made by two participants relating to salinity in the town of Pingelly are outlined below:
● The respondent mentioned that when summer comes you could spell chlorine in the drinking water more. She said that someone was talking to her about how they couldn’t drink the water because it was too high in chlorine and she automatically associated/assumed this was because of the high salt content. She then mentioned that this must mean there are salinity problems in the town.
● In the creek line there is a bit of salinity but it’s not too bad in the town. She believes the problem was more related to the build up of water rather than the salinity and that is affecting the houses. Pubs have water in their cellars and mud brick houses have rising damp. She thinks the residents aren’t really aware of that. They’ve tries to make them aware of it. Tried educating kids took them to the hotel and creek and involved them in

Appendix B: Social Analysis
B21
picking seed for salt tolerant plants. She mentioned that they tried to educate the adults about salinity and groundwater problems but they are quite 'blasé' about the issues and are not really aware of it. She would like to find a way to educate adults on these issues.
In terms of specific findings for the Shire of Pingelly it is interesting to note that the town’s population has been slightly increasing over the past 10 years while the Shire population as a hole has been steadily declining. It was suggested by Shire CEO Greg Carter that this might possibly be due to the fact that Pingelly is within such close proximity to Perth and there seems to be a trend of older people coming back to Pingelly to retire. He mentioned this was a lifestyle decision that Pingelly aims to be able to cater for more in the future.
With respect to tourism the major focus for the Shire is on Natural Heritage type plans. Pingelly has a small amount of rare flora and fauna in which they wish to secure a niche market in the tourism industry.
In the 2005 Pingelly budget one of the economic development activities is stated as water harvesting. The Shire CEO Greg Carter mentioned this was related to the RT-LA project. It is expected that the town will receive water-harvesting options from this project that can be implemented in the town. However, the Shire is waiting to here from a representative from the project to see where they are currently at with respect to this.
It was also identified that there is a local conservation committee currently being assembled to work as a part of the RT-LA project, but again they were waiting for some direction or contact from someone involved in the project.
5. C onclus ions and R ec ommendations After completing the desktop study for the Shire of Pingelly it was evident that the Shire’s demographic profile was consistent with that of a traditional Western Australian rural town. Population is steadily declining and much of the community and local businesses are dependent on the success of the surrounding agricultural industry. After conducting surveys in the town it became evident that residents were keen to diversify and reduce their reliance on the success of the agricultural industry. This was reflected in the survey when participants responded positively to the suggestion of the introduction of a number of water related industries to the Shire. It was generally felt that the introduction of any industry would bring positive flow on benefits to the Shires economic state. The questionnaires revealed that water was a prominent concern in the Shire. However there was a clear divide between those people who received scheme water (majority of the town and some farms) and those who had to secure their own water source. It was clear that the latter were more proactive in their outlook towards water management strategies and had some good suggestions relating to facing the problems associated with future water supplies. In Pingelly it was clear that salinity was not a major issue in the townsite. Although it was affecting the profitability of the agricultural industry it was perceived that the state of the townsite itself was not under threat. After considering all of the information gathered from the desktop study and the perceptions gathered from the surveys, a set of recommendations for the Shire of Pingelly are outlined below:
1. Promote more community initiative type events: The CEO mentioned there were no specific community initiatives being promoted to combat rural depopulation. It is recommended that the Shire works more towards this type of thing to ensure a vibrant connected community. By doing so people become more concerned about local issues and more proactive. This may play a role in the success of the community in the future especially in regards to water.

Appendix B: Social Analysis
B22
2. Revisit Pingelly: It is suggested that a more in depth study is done on Pingelly to gain a more accurate picture of people’s expectations and perceptions regarding water in the Shire. It is proposed that a greater number of people be surveyed to ensure you are receiving an even spread of the population when collating your data. Consideration should also be taken into designing questions that are more suited to statistical analysis if time permits.
3. Determine each town’s expectations for the RT-LA project: It is of vital importance to ensure project team members are aware of the expectations of the council and community in relations to the outcomes they expect the project to deliver. We need to be conscious of these expectations to ensure each town is going to be happy with the final outcome.
4. Community education and communication: More communication is required in regards to the actual project objectives and what the project aims to deliver. Many participants from the survey who were aware of the RT-LA project all made mention of the fact that water was going to be pumped from under the townsite and that this water should be used to start more industries. I think it is important to make people aware that this is only a possibility and that not all towns will be pumping groundwater. Education is also required to inform people of the differences between rising groundwater problems and salt being in the water.
5. Further investigation into new water related industries: More research needs to be done into the viability and sustainability of many of the water related industries. There is no point suggesting particular industries to residents if we are unsure as to whether they would work in the Shire.
6. R eferences Australian Bureau of Statistics (ABS) 2002, 520057140 Pingelly statistical local area, A
snapshot of Pingelly [online] [Available at:] http://www.abs.gov.au/Ausstats/[email protected]/0/46EBDE572D3DA7CECA256BBF0001A0DC?Open.
Shire of Pingelly 2005, Local Government Authority, and Shire of Pingelly [online] [Available at:] http://www.pingelly.wa.gov.au.
Department of Local Government and Regional Development, Government of Western Australia (c) 2003, Regional Trends and Indicators, Shire of Woodanilling [online] [Available at:] http://www.dlgrd.wa.gov.au/statisticInfo/regionTrendsIndicators.asp.
Anonymous (a) 2005, Highlights of the Wheatbelt—2001 Census Statistics [online] [Available at:] http://www.wheatbeltacc.com.au/Statistics/Census_highlights-Wheatbelt_Statistics.html.
Bothams C 1998, The Impact of Competition Policy Reforms on Rural and Regional Australia—Wheatbelt Area Consultative Committee Inc [online] [Available at:] http://www.pc.gov.au/inquiry/compol/subs/Sub04.pdf.
Annan, G and Dearden, M 2000, Agricultural Statistical Overview 1996/97, Shire of Pingelly-Department of Agriculture [online] [available at:]http://agspsrv34.agric.wa.gov.au/programs/srd/agplan/regionstats/pingelly.pdf.
Anonymous 2004, RP Data, and Property Reports (Lake Grace) [online] [Available at:] http://www.realestate.com.au/cgi-bin/rsearch.

Appendix B: Social Analysis
B23
Crossley EK 2001, Groundwater Study of the Pingelly Townsite Resource Management technical Report 219, Rural Towns Program [online] [Available at:] http://www.agric.wa.gov.au/pls/portal30/docs/FOLDER/KMP/LWE/CRS/RURALD/REGION/TR219_1.pdf.
Addison D 2001, Groundwater Study of the Lake Grace Town Site, Resource Management Technical Report 212, and Rural Towns Program [online] [Available at:] http://agspsrv34agric.wa.gov.au/environment/publications/RMtechreports.
Bureau of Meteorology 2004, Any Point-Australia, and Lake Grace—Climate [online] [Available at:] http://home.vicnet.net.au/~neils/africa/lake_grace_climate.htm.
Water Corporation (a) 2004, 2004/2005 Rates and Charges—Country Commercial [online] [Available at:] http://www.watercorporation.com.au/residential/accounts_rates_country_comm.cfm.
Water Corporation (b) 2004, 2004/2005 Rates and Charges—Residential [online] [Available at:] http://www.watercorporation.com.au/residential/accounts_rates_country_res.cfm.


Appendix C: Pingelly surface water
Christopher Boyes
Department of Agriculture and Food, Western Australia
September 2009


Appendix C: Pingelly Surface Water
Ci
Contents Page
1. Introduction . . . . . . . . . . . . . . . . . . . . . . . . . . . . . . . . . . . . . . . . . . . . . . . . . . . . . . . . . . . . . . . . . . . . . . . . . . . . . . . . . . . . . . . . . . . . . . . . . . . . . . . . . . . . . . . . . . . . 1
2. B ackground . . . . . . . . . . . . . . . . . . . . . . . . . . . . . . . . . . . . . . . . . . . . . . . . . . . . . . . . . . . . . . . . . . . . . . . . . . . . . . . . . . . . . . . . . . . . . . . . . . . . . . . . . . . . . . . . . . . . 1
3. S urface Water P roces s es . . . . . . . . . . . . . . . . . . . . . . . . . . . . . . . . . . . . . . . . . . . . . . . . . . . . . . . . . . . . . . . . . . . . . . . . . . . . . . . . . . . . . . . . . . . . . . . 2
3.1 Landscape influence on surface water processes ................................................... 2
3.2 Surface water flow characteristics ........................................................................... 2
3.3 Catchment Analysis ................................................................................................ 3 3.3.1 Pingelly Greater Catchments ........................................................................ 3 3.3.2 Pingelly Sub Catchments .............................................................................. 4 3.3.3 Pingelly irrigation quality water sources, use and availability ......................... 5
3.3.3.1 Irrigation Quality Water Sources from within the town ....................... 5 3.3.3.2 Minimising ground water recharge by surface water
management .................................................................................... 5 3.3.3.4 Computed surface water yields ......................................................... 6
3.3.4 Pingelly existing water storage and reticulation facilities ................................ 6 3.3.4 Pingelly water storage facilities proposed by RT-LA Project .......................... 6
3.4 Hydrological assessment ........................................................................................ 9 3.4.1 Water redistribution ...................................................................................... 9 3.4.2 Recharge process ........................................................................................ 9 3.4.3 Salinity risk assessment ................................................................................ 9
4. Water Management P lan (Management) . . . . . . . . . . . . . . . . . . . . . . . . . . . . . . . . . . . . . . . . . . . . . . . . . . . . . . . . . . . . . . . . . . . . . . . . 9
4.1 Town water resources ............................................................................................ 9 4.1.1 Current water storages ................................................................................. 9 4.1.2 Water usage and deficiencies ....................................................................... 10
4.2 Water resource development .................................................................................. 10 4.2.1 Town sump adjacent to the treated sewage ponds ........................................ 10 4.2.2 Proposed new 20 ML storage dam ................................................................ 10 4.2.3 Harvested surface water quality .................................................................... 11 4.2.4 New Reticulation Infrastructure ..................................................................... 11
4.3 Salinity management .............................................................................................. 11 4.3.1 Surface water management to remove excess water .................................... 11 4.3.2 Waterwise initiatives—tanks, native plants, watering regimes ........................ 11 4.3.3 Stormwater management—overflow into curbing, grates, etc. ....................... 12
5. C onclus ions . . . . . . . . . . . . . . . . . . . . . . . . . . . . . . . . . . . . . . . . . . . . . . . . . . . . . . . . . . . . . . . . . . . . . . . . . . . . . . . . . . . . . . . . . . . . . . . . . . . . . . . . . . . . . . . . . . . 12
6. R ecommendations . . . . . . . . . . . . . . . . . . . . . . . . . . . . . . . . . . . . . . . . . . . . . . . . . . . . . . . . . . . . . . . . . . . . . . . . . . . . . . . . . . . . . . . . . . . . . . . . . . . . . . . . . 12
7. R eferences . . . . . . . . . . . . . . . . . . . . . . . . . . . . . . . . . . . . . . . . . . . . . . . . . . . . . . . . . . . . . . . . . . . . . . . . . . . . . . . . . . . . . . . . . . . . . . . . . . . . . . . . . . . . . . . . . . . . . . 12
Attachment: G los s ary of s urface water proces s es . . . . . . . . . . . . . . . . . . . . . . . . . . . . . . . . . . . . . . . . . . . . . . . . . . . . . . . . . . . . . . . . 13


Appendix C: Pingelly Surface Water
C1
1. Introduc tion This section of the overall report covers surface water aspects and associated processes in the Rural Towns Liquid Assets Project (RT-LA Project) for the town of Pingelly. The report will define identified surface water problems and recommend associated management options as part of the Water Management Plan for the shire of Pingelly.
Water management priorities and objectives introduced under the RT-LA project are designed to develop water resources for sustainable water use throughout the town and promote new water use options, whilst emolliating any town site salinity. The study area encompasses the town site and the catchment area principally to the west of the town.
A drilling project conducted throughout the town landscape under the Rural Town 1 and 2 project banner previously defined the groundwater status, salinity risk, groundwater modelling, flood risk analysis and introduced an ongoing monitoring program (see Appendix D, 'Ground Water'). This 'Surface Water Report' extends the research, knowledge and management potential of the Shire of Pingelly’s’ Liquid Assets.
This section of the overall report concentrates on the assessment of surface water flows affecting the town of Pingelly, management techniques and options (current and proposed) that aim to maximise the asset value of these surface water flows, to develop an entire town water balance and ultimately a town water resource management plan. All surface water referred to in this report is only suitable for irrigation purpose and must NOT be used for human consumption.
2. B ackground The Pingelly shire has been involved in the Rural Towns project since 2004. The RT-LA project follows on from the success of the original Rural Towns Program since 1999. Figure C1 below shows the catchment council boundaries, Pingelly Shire boundary and the location of the town of Pingelly.
Pingelly is located approximately 135 kilometres South East of Perth in a central area of the wheat belt and it has a population of approximately 760 residents.
This report will focus on surface water processes and interactions that will permit development of sustainable water resources and management of these water resources, whilst identifying compatible salinity management options.
Figure C1 Regional Catchment Council boundaries.

Appendix C: Pingelly Surface Water
C2
3. S urface W ater P roces s es
3.1 L ands c ape influenc e on s urfac e water proc es s es In the wheat belt rural towns of Western Australia, there are principally four landscape attributes that influence surface water processes and characteristics, these are: 1. Riverine 2. Basin 3. Break of Slope 4. Valley floor
See the Attachment to this report for definitions of the above landscape types
3.2 S urfac e water flow c harac teris tic s The surface water flows affecting the Town of Pingelly are characterised by the term 'Riverine', this mechanism will be explained in greater detail below.
Surface water processes encompass two components: runoff and subsurface flow. Runoff is derived from soil infiltration excess or soil saturation excess. When rainfall occurs, a proportion infiltrates the soil surface and the remainder is attributed to runoff. Runoff can distribute across the landscape from meters to many 100s of meters.
Subsurface flow is the portion of rainfall that has infiltrated the soil profile. If the soil profile has sufficient conductivity (porosity) and connectivity (permeability) then water can move through the soil, and slope water will drain down slope until a change in soil type or characteristic occurs.
Once runoff enters valley landscapes it is described as stream flow and these flows combine with flows from adjacent watersheds, eventually the flows from all the watersheds enter a river, lake, estuary, reservoir, wetland, sea or an ocean.
At localised low points water will collect and will cause some form of land degradation, either water logging or salinity.
Runoff and stream flow can degrade the landscape if redistribution is not sufficiently controlled and any excess removed safely. Overland flow can become saline through two processes: accumulation of salt by passing over degraded saline soils or once inundated the water infiltrates the soil and under capillary and evaporative pressure ex-filtrates causing the remobilisation of salt towards the ground surface. Over time the soil and water resources become increasingly more saline.
The town of Pingelly has both surface and subsurface runoff processes to manage. The reason for this will be explained in the next section of this report.

Appendix C: Pingelly Surface Water
C3
3.3 C atc hment analys is
3.3.1 P ingelly greater catc hments
Pingelly is located in a medium to low rainfall district with average annual rainfall of 447 mm. The town site is located on the Avon river system, and is affected by catchments to the west of the town. Figure C2 below depicts the greater catchments up to 50 km radius from Pingelly.
The combination of reducing average annual rainfall since year 2000 and reduced efficiency of these catchments in terms of 'their high run off threshold', has lead to the concept of using hard surfaces (with a low run off threshold) within towns to generate a new source of water.
Figure C2 Greater catchments in the Pingelly District.

Appendix C: Pingelly Surface Water
C4
3.3.2 P ingelly S ub C atc hments
Figure C3 below depicts the sub-catchments within a radius of 5 km surrounding the Pingelly town site. For the same reasons stated in the above paragraphs where the greater catchments were discussed, unsealed sub catchments do not offer a reliable high quality source of water to the town of Pingelly.
The sub-catchments have been computed from DEM (digital elevation model) data, please note, for clarity minor stream flows have been aggregated to form the major stream flows indicated. Refer to table C1 for sub catchment parameters and harvesting yields.
Figure C3 Sub catchments and modelled surface water flows.
Figure C3 shows the boundaries of the sub catchments that create runoff that affects the town of Pingelly. The sub-catchments cover an area of approximately 700 ha and varies in elevation from 340 m above Australian Height Datum (AHD) in the southern sub catchment boundary to 285 m above AHD north of Pingelly town site. The very low gradient of the landscape makes Pingelly susceptible to flooding when the Greater catchments of the Avon River generate significant flows caused by storm or cyclonic weather patterns.
In essence surface water flows originate from ground east and west of the town site; they enter the Avon River which flows through the central part of the town from the south to the northern boundary of Pingelly. The Avon River subsequently flows into the Swan River which eventually discharges in to the ocean at Fremantle west of Perth. The landscape surrounding Pingelly dictates the surface water process to be one described as a Riverine process.

Appendix C: Pingelly Surface Water
C5
3.3.3 P ingelly irr igation quality water s ourc es , us e and availability
3.3.3.1 Irrigation quality water s ourc es from within the town
The town has a total area of approximately 700 ha and consists of 5 main sub catchments. For the purposes of this analysis the sub catchments have been named: • Priority eastern sub catchment • North West extended sub catchment • North West sub catchment • South eastern agricultural sub catchment • Remainder of the town site sub catchment
Refer to Figure C3 for details of sub catchment boundaries. The surface water runoff from the priority eastern sub catchment has been evaluated as 35.3 ML per annum and the shire has constructed a water harvesting system involving a 1.7 ML sump.
The North West extended sub catchment is also a good candidate for a second harvesting system and runoff from this sub catchment has been evaluated at 38.5 ML per annum.
The treated sewage ponds produce 30 ML per annum yield, combining the yields from the priority eastern sub catchment with that of the North west extended sub catchment with the treated sewage out put results in an effective irrigation quality water resource of approximately 45 ML per annum after allowing for evaporative losses.
Surface water run off generated by the CBH facility is also a significant opportunity particularly due to the low run off threshold of this structure and surrounding sealed surfaces. This surface water could be harvested; this option will be discussed later in this section of the water management report (see also Section 5.0 Conclusions and Section 6.0 Recommendations).
The above options are listed in order of preference to provide low salinity run off from sealed surfaces that will provide the highest yields whilst minimising ground water recharge.
The quantity of surface water available for harvesting off the town site sub catchments could be increased significantly by ensuring that all rain water from roofs is piped in to suitable stormwater drains as apposed to being deposited on pervious land immediately adjacent to the buildings/roofs generating the flows. A second advantage of piping the water on to sealed surfaces that feed in to suitable drains would be the minimisation of ground water recharge with in the town site.
3.3.3.2 Minimis ing ground water rec harge by s urfac e water management
By upgrading the existing surface water drainage system and installing suitable surface water harvesting infrastructure the town of Pingelly can create a new source of water from the sealed surfaces within the town, whilst minimising ground water recharge and hence salinity risk.
The reduction of annual rainfall since 2000 in rural towns has lead to lowering of watertables monitored by the rural towns program, this suggests that ground water levels are highly sensitive to recharge from surface water. The proposed new works to capture the surface water from sealed surfaces will be detailed later in this section.

Appendix C: Pingelly Surface Water
C6
Water quality data collected in similar WA rural towns have shown that surface water run off from with in a town site is of high quality and ideally suited for irrigation purposes without any treatment.
3.3.3.4 C omputed s urface water yields
Table C1 shows the modelled surface water yields from the sub catchments studied. The data was produced by consultants GHD (see Appendix J) and has been reproduced here for your convenience.
Table C1 Aquacycle annual yields for Pingelly
Catchment Townsite east
Townsite northwest
Northwest extended
Farmland southeast
Balance townsite
Total area townsite
Catchment area (ha) 32.4 79.5 34.4 109.7 443.20 699.2
Rainfall (mm) 447
Stormwater yield (mm) 109 61 112 63 67 70
Stormwater yield (ML) 35.32 48.50 38.53 69.11 296.55 488.00
Est. runoff threshold (mm) 3.5 5.1 2.3 6.3 6.5 6.1
3.1.6 P ingelly ex is ting water s torage and retic ulation fac ilities
The town of Pingelly has the following liquid asset infrastructure:
Sports ground dam 25 ML Treated sewage dam (estimate) 15 ML
The water from the treated sewage plant is pumped to the sports ground dam and then to the sports oval for reticulation purposes.
The above dam data was provided by the shire of Pingelly in September 2009.
3.3.4 P ingelly water s torage fac ilities propos ed by R T -L A P rojec t
It is proposed to construct a second water harvesting system to increase the quantity of water available to irrigate the towns’ ovals and parks. The water harvesting system will consist of an enlarged 2.0 ML sump located adjacent to the treated sewage dam. This sump will collect surface water from the CBH site.
It is also proposed to construct a second storage dam of 20 ML capacity to be located immediately east of the sports oval.
Figure C4 shows locations suitable for the proposed enlarged sump, new storage dam and new pipeline associated with the proposed surface water harvesting scheme.

Appendix C: Pingelly Surface Water
C7
Figure C4 Proposed enlarged sump, new storage dam and new pipeline.
Table C2 overleaf depicts current and proposed surface water management assets.

Appendix C: Pingelly Surface Water
C8
Table C2 Existing work, and proposed dams, sumps, tanks, and irrigation pipelines Key: TS = Town Site
Asset # Status Dams Sumps Tanks Irrigation pipelines Volume or length Capital cost Operating cost
per annum
1 Existing Town Storage Dam 25 M L
2 Existing Treated sewage dam 15 M L
3 Existing Stratford Street 1.7 M L
4 From Stratford Street sump to Town Storage Dam
Asset # Status Dams Sumps Tanks Irrigation pipelines Volume or length Capital cost Operating cost
per annum
5 Proposed New storage dam with liner 20 M L $150 000 $3 000
6 Proposed enlargement of existing sump
Adjacent to sewage ponds
2.0 M L $20 000 $5 000
7 Proposed Pipeline from the new 2.0 ML sump to existing Dam and new proposed 20 ML Dam 1.75 km $18 000
Note: The capital cost of 'the new sump and new storage dam' includes a provision for the supply of pumps and power supply.
Table C3
Ref # Assumptions Cost
1 Cost of pipeline per km $5 000
2 Cost of pump at sump adjacent to the sewage ponds $3 416
3 Cost of power provision $15 000
4 Operating costs of pumps are supplied by Grundfos

Appendix C: Pingelly Surface Water
C9
3.4 Hydrologic al as s es s ment
3.4.1 Water redis tribution
There are two main surface water flows active in Pingelly; those from sub catchments that consist of predominantly sealed surfaces and the remainder from sub catchments that have predominantly unsealed surfaces. Run off from the priority eastern sub catchment and the extended north western sub catchments yield surface flows efficiently due to having low run off thresholds. The remainder of the sub catchments are less efficient due to having relatively high run off thresholds.
Surface water flows from the higher ground to the east and west enter the Avon River which runs through the middle of Pingelly in a northerly direction. Opportunities exist to intercept and harvest surface water run off prior to it entering the Avon River.
3.4.2 R ec harge proces s
Recharge processes are driven by rainfall and runoff infiltration and water distribution. Pingelly has soils that may exhibit low to moderate infiltration rates, but as a result of the town site catchment being positioned on slopes, the probability of deeper percolation of water and recharge is lower.
The water distribution process and rainfall dictates where recharge occurs. If the water is inundating areas or flooding areas, in-situ recharge will occur. There are possibilities currently around the town landscape where inundation and in-situ recharge occur. It is important to remove water available for in-situ recharge.
Hydrographs trends of the watertable show that fluctuations in water level reflect seasonal rainfall patterns. Therefore fluctuations result from vertical movement of water rather than horizontal pressure changes (flows). This supports the recharge and degradation processes mentioned above.
3.4.3 S alinity ris k as s es s ment
Evidence exists that points toward a low risk of salinity at the surface throughout the town of Pingelly, refer to Appendix F—Pingelly assessment of infrastructure damage caused by salinity impact.
4. Water Management P lan (Management)
4.1 Town water res ourc es Currently the town of Pingelly is close to completing their first surface water harvesting project which collects run off from the priority eastern sub catchment. This harvesting scheme when linked to the sports storage dam will provide an additional (after evaporative losses) annual average of 15 ML of water suitable for irrigation purposes.
Treated sewage is pumped to the 25 ML sports oval storage dam and subsequently used to reticulate the sports oval. The effective yield from the treated sewage ponds is estimated to be 15 ML per annum after allowing for evaporative losses.
4.1.1 C urrent water s torages
Sports oval dam 25 ML
Treated sewage plant (estimated) 15 ML

Appendix C: Pingelly Surface Water
C10
4.1.2 Water us age and defic ienc ies
Total storage volume of water available for reticulation of Pingelly’s sports oval, is 25 ML. Information provided by the shire indicates that during periods of peak watering demand a shortfall has existed resulting in deterioration in the quality of the sports oval.
Currently the Shire of Pingelly purchases approximately $6 000 (2 ML) of scheme water per annum to irrigate parks and gardens.
Increasing the towns storage capacity by an additional 20 ML via the proposed new dam and harvesting systems will result in approximately an additional 30 ML of surface water, should enable the shire to adequately water the town’s oval and negate the requirement to purchase the $6 000 of scheme water currently used for irrigation of parks and gardens.
4.2 Water res ourc e development Proposed new water storage and harvesting infrastructure: 1. Construct a new 20 ML storage dam immediately east of the sports oval 2. Upgrade the surface water harvesting system from the CBH site (est. 15 ML yield). 3. Link the two harvesting systems to both the existing and new dams 4. Harvest a net 15 ML of water from the extended north western sub catchment.
4.2.1 T own s ump adjacent to the treated s ewage ponds
The proposed town sump adjacent to the treated sewage ponds is intended to create a new water source for the town of Pingelly by harvesting the surface water from the extended north western sub catchment. The proposed size of the sump is approximately 2 ML and is intended to capture surface water that will be stored in either the existing 25 ML dam or the proposed new 20 ML dam situated immediately east of the sports oval.
Pumping rates between the sump and the new dam have been modelled, at 5 L/s, this rate results in predicted net annual harvesting quantities of approximately 15 ML/year.
Total annual yield from the recently installed priority eastern sub catchment and the extended North West catchment has been modelled at approximately 70 ML based on annual average rainfall of 447 mm.
4.2.2 P ropos ed new 20 ML s torage dam
The yield from the recently installed priority eastern sub catchment harvesting system and the proposed extended north western harvesting system is designed to supplement the town of Pingelly’s water sources efficiently by harvesting water from sealed surfaces within the town. A new 20 ML storage dam is required to store the harvested surface water. The new dam will achieve two objectives:
1. Optimise harvesting of surface water, particularly when infrequent high intensity rain events result in high discharge volumes from the two harvesting systems.
2. Increase the town of Pingelly’s irrigation water storage capacity from 25 ML to 40 ML an increase of 80 per cent.
This increased storage capacity of relatively high quality reticulation water will assist the town to eliminate any use of scheme water for reticulating the towns ovals, parks and gardens when below average annual rainfall occurs.

Appendix C: Pingelly Surface Water
C11
4.2.3 Harves ted s urfac e water quality
The installation of new monitoring equipment in Moora in October 2008 has provided essential water quality data that previously was not available. Data logged indicates that the surface water collected in the storm water drain is of relatively high quality having an EC (Electrical Conductivity) value between 600 and 1 200 ms/m and a ph of approximately 6.8. Both these parameters prove that the water is suitable for reticulating gardens and ovals without further treatment.
4.2.4 New R etic ulation Infras truc ture
We recommend linking the proposed new storage dam to the existing dam and both of the water harvesting systems to create a flexible water storage network. Refer to Figure C5 below for details of the proposed pipelines.
Figure C5 Proposed new pipelines.
4.3 S alinity management
4.3.1 S urface water management to remove exces s water
Refer to paragraphs 4.2.1. to 4.2.4 above for details of how we propose to remove excess water via harvesting and appropriate storage of surface water. Improved surface water management will also reduce the risk of salinity, however little evidence of a significant salinity risk exists currently within the town of Pingelly.
4.3.2 Waterwis e initiatives —tanks , native plants , watering regimes
Please refer to Appendix H of the overall report for detailed information on waterwise initiatives—tanks, natives and watering regimes. Further information is available from Bulletin 4628 ISSN 1448–0352 entitled Wheatbelt waterwise = saltwise, which can be viewed at: http://www.agric.wa.gov.au/content/HORT/FLOR/BULLETIN4628.PDF.

Appendix C: Pingelly Surface Water
C12
4.3.3 S tormwater management—overflow into c urbing, grates , etc .
A large percentage of water generated throughout the town catchment is from imperious surfaces, this run off or stormwater has been calculated to be a significant liquid asset for the town of Pingelly. Stormwater management improvements in Pingelly can be made in the following areas:
Encourage all owners of both business and residential properties to pipe the roof water to the curb side to ensure it is captured by the storm water drainage network.
Automated pump activation equipment at the water harvesting sumps to eliminate or minimise any harvesting losses due to the sumps overflowing.
Improve the existing stormwater infrastructure to maximise the sub catchment yields being harvested.
5. C onclus ions DAFWA have identified a unique engineering solution to enable the management of the town’s surface water in order to achieve the following goals: 1. Increase the town’s ability to cope with the effects of lower than average annual rainfall
caused by climate change. 2. Reduce reliance on scheme water for reticulation of the towns sporting and recreational
assets, and 3. Reduce salinity risks by minimising ground water recharge via improved management
of surface water.
By implementing the recommendations outlined below the town of Pingelly will have increased storage capacity of harvested surface water to use for irrigation purposes.
6. R ec ommendations 1. Construct a new 20 ML dam immediately east of sports oval. 2. Upgrade the surface water harvesting system from the CBH site. 3. Link the proposed storage dam to the existing dam and both of the water harvesting
systems to create a flexible reticulation network. 4. Install a second water harvesting system to utilise the extended north western sub
catchment.
7. R eferences Australian Rainfall and Runoff Book Five Estimation of Design Flood Hydrographs.
BOM Rainfall Data for Pingelly.
DAFWA (2004) Bulletin 4628 ISSN 1448 – 0352: Wheatbelt waterwise = saltwise
GHD report (see Appendix J).

Appendix C: Pingelly Surface Water
C13
A ttachment: G los s ary of s urface water proces s es
Basin A bowl-shaped depression in the surface of the land or ocean floor.
Break of Slope An abrupt change in slope of the terrain.
Valley floor An elongated depression in the earth's surface which generally slopes from one end to the other.
Riverine Includes all wetlands and deepwater habitats contained within a channel.


Appendix D: Geophysical studies at Pingelly
Paul Wilkes
Exploration Geophysics Curtin University of Technology


Appendix D: Geophysics
Di
S ummary Ground magnetic data were acquired along 16 lines in Pingelly in 2006. Data were acquired on 5 May and 1 June 2006 using two Geometrics G 856 proton precession magnetometers. One was used as a roving magnetometer and the second one as a base station to measure the time varying component of the magnetic field. Data were acquired at approximately 2 metre intervals along the lines. Some lines were along streets and others in open ground away from streets. A total of 7.6 line km of data were acquired.
Crossley (2001) had interpreted some possible photo lineaments. Two of these are close to but not exactly coincident with rock unit contacts seen in the ground magnetic images.

Appendix C: Pingelly Surface Water
Dii
Contents Page
Summary .................................................................................................................................. i
1. Introduction .................................................................................................................... 1
2. Background to the use of magnetic method ................................................................. 1
3. Magnetic survey ............................................................................................................. 1
4. Geology .......................................................................................................................... 1
5. Geophysical results and interpretation ......................................................................... 4
6. References ..................................................................................................................... 7
Figures
Figure D1 Local geology for Pingelly area, from GSWA .............................................................. 2
Figure D2 Aerial photograph and interpreted photo lineaments (Crossley, 2001) ........................ 3
Figure D3 Ground magnetic image and street map ..................................................................... 5
Figure D4 Ground magnetic image and photo lineaments from Crossley, 2001 .......................... 6

Appendix D: Geophysical Studies at Pingelly
D1
1. Introduc tion It is important to understand the underlying geology of rural towns and especially the geometry of the underlying basement rocks and the regolith material that lies between bedrock and ground surface. This information is also important in understanding the hydrogeology of the towns.
Geophysics has been used to provide information on the underlying geology.
Geophysical methods are useful because they do not disturb the ground, are low cost and rapid. Magnetic measurements are susceptible to power lines and magnetic objects. Measurements were not made when vehicles were passing the magnetometer.
All the maps in this Appendix use GDA94 map zone 50 coordinates.
Crossley (2001) interpreted some photo lineaments which run through the townsite of Pingelly. These were interpreted as possible faults and/or dykes. Four of these are shown in figure D2 of this Appendix.
The magnetic survey reported in this Appendix was designed to see whether these lineaments were seen in the magnetic data.
2. B ackground to the us e of magnetic method The magnetic method measures variations in the Earth’s magnetic field due to the presence of iron minerals in the local geology earth and by measuring with high accuracy (about 1 part in 500 000) we can map detail in the underlying geology. The strength of the earth’s magnetic field in SW WA is approximately 58 000 nano-teslas (nT).
3. Magnetic s urvey Magnetic measurements were made in Pingelly on 5 May and 1 June 2006. The stations were located along streets and roads as shown in Figure D1. Station spacing was approximately 2 metres. Each measurement takes approximately 10 seconds. Data are stored in the magnetometer and downloaded later to computer.
Ground magnetic data were acquired along 16 lines in Pingelly. Two Geometrics G 856 proton precession magnetometers were used—one was used as a roving magnetometer and the second one as a base station to measure the time varying component of the magnetic field. This was later subtracted from the roving dataset. Data were acquired at approximately 2 metre intervals along the lines. Sensor height for the magnetometer was approximately 2 metres above ground.
Some lines were along streets and others in open ground away from streets. A total of 7.6 line km of data were acquired.
4. G eology Pingelly is located near the western boundary of the Corrigin 1:250 000 scale map sheet at approximately 32 degrees 32 minutes south and 117 degrees 5 minutes Eastern China (1986) summarises the geology and provide a geological map for the Corrigin map sheet.
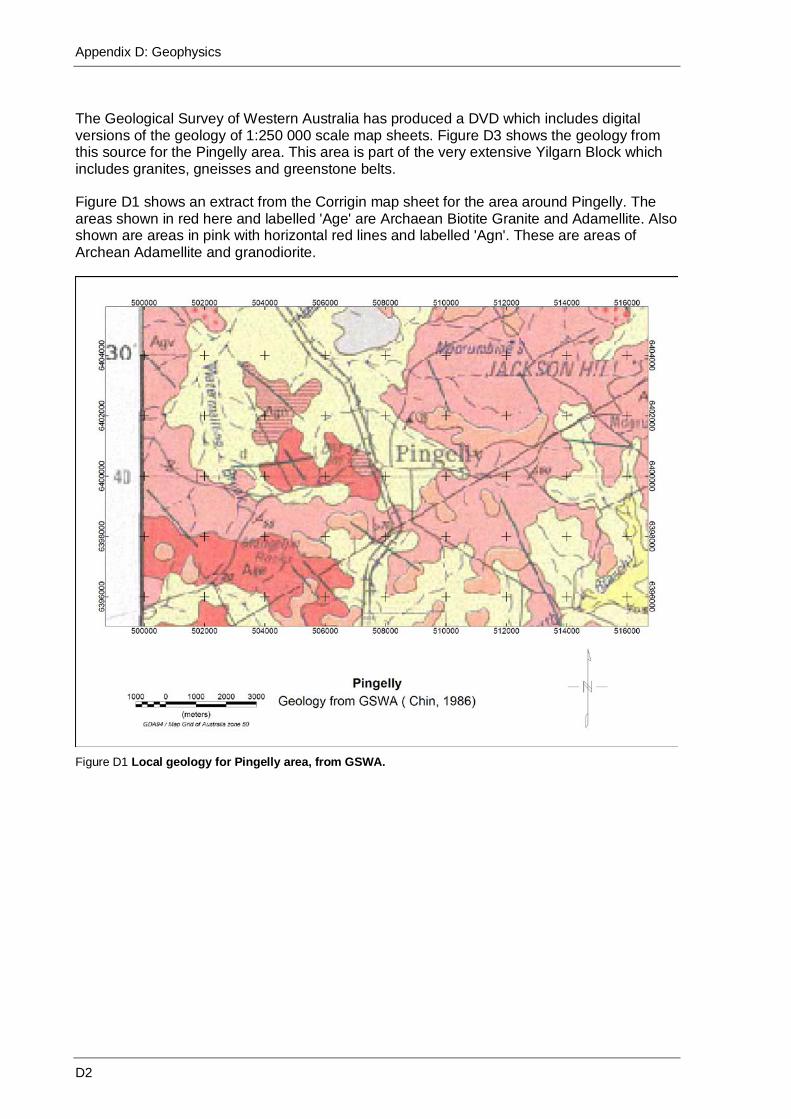
Appendix D: Geophysics
D2
The Geological Survey of Western Australia has produced a DVD which includes digital versions of the geology of 1:250 000 scale map sheets. Figure D3 shows the geology from this source for the Pingelly area. This area is part of the very extensive Yilgarn Block which includes granites, gneisses and greenstone belts.
Figure D1 shows an extract from the Corrigin map sheet for the area around Pingelly. The areas shown in red here and labelled 'Age' are Archaean Biotite Granite and Adamellite. Also shown are areas in pink with horizontal red lines and labelled 'Agn'. These are areas of Archean Adamellite and granodiorite.
Figure D1 Local geology for Pingelly area, from GSWA.

Appendix D: Geophysics
D3
Figure D2 Aerial photograph and interpreted photo lineaments (Crossley, 2001).

Appendix D: Geophysics
D4
5. G eophys ic al res ults and interpretation The ground magnetic data have been processed as follows:
1. Base station data have been subtracted from the roving magnetometer data to create diurnally corrected magnetic data.
2. Ground coordinates have been merged with the diurnally corrected magnetic data to create a magnetic database.
3. Ground magnetic data have been interpolated on to a regular 10 m x 10 m grid ready for imaging.
4. Images of the ground magnetic data have been created and combined with a photographic image of the Pingelly area and also the photo lineaments interpreted by Crossley, 2001.
Images are included here as Figures D3 and D4. Figure D3 shows the magnetic image with line locations superimposed on a street map. Figure D4 shows the magnetic image with photo background and lineaments A, B, C, D. Lineaments A and D are close to magnetic contacts (rock unit boundaries) but are not exactly coincident with these. Lineaments B and C are not evident in the magnetic data.

Appendix D: Geophysics
D5
Figure D3 Ground magnetic image and street map.

Appendix D: Geophysics
D6
Figure D4 Ground magnetic image and photo lineaments from Crossley, 2001.

Appendix D: Geophysics
D7
6. R eferences Chin RJ 1988, Explanatory notes for Corrigin 1:250 000 geological map sheet. Geological
Survey of Western Australia.
Crossley EK 2001, Groundwater study of the Pingelly town site, Resources Management Technical Report 219, WA Department of Agriculture.


Appendix E: Groundwater study of the Pingelly townsite
Ed Wronski and Bob Paul
Department of Agriculture and Food, Western Australia


Appendix E: Groundwater
Ei
S ummary The township of Pingelly is located 130 km south east of Perth, Western Australian. The town has a limited local water supply that is supplemented by imported water via a pipeline from a dam near Perth. Despite the shortage of water, watertables have risen in recent years and damage to infrastructure is occurring from high watertables. In 2006, the Rural Towns—Liquid Assets Program undertook to explore for groundwater resources within the township. The exploration program focused on assessing the viability of obtaining a water supply from an E-W trending lineament on the western side of the township as a precursor to obtaining possible supplies from other lineaments that cross the town. Two potential drilling targets on an E-W fault line were identified based on a review of the hydrogeology, supported by detailed geophysical magnetic survey across the township.
The fault zone was probably capturing at least part of the annual recharge of a small catchment of about 20 ha in area. It could store within it the total expected annual groundwater recharge for the catchment. Water quality was just above 1 000 mS/m, so the resource is of sufficient quality to irrigate about 1 ha of recreational or park facilities.
Rainfall records from Pingelly show that there has been a decrease in rainfall of almost 12.5 per cent from the long term trend. This means that in the longer term there should be less groundwater recharge and the supply may not be sustainable.

Appendix E: Groundwater
Eii

Eiii
Contents Page
Summary .................................................................................................................................. i
1. Introduction .................................................................................................................... 1
2. Previous investigations ................................................................................................. 3
2.1 Investigation Program 1996 .................................................................................... 3
2.2 Investigation Program 2000 .................................................................................... 3
2.3 Groundwater modelling ........................................................................................... 6
2.4 Groundwater monitoring ......................................................................................... 7
3. Methods .......................................................................................................................... 10
3.1 Groundwater exploration strategy ........................................................................... 10
3.2 Drilling method and bore construction ..................................................................... 11
3.3 Geophysical investigations ..................................................................................... 11
3.4 Hydraulic characteristics of aquifers ........................................................................ 12
4. Results ............................................................................................................................ 12
4.1 Geophysics ............................................................................................................ 12
4.2 Hydrogeology ......................................................................................................... 12
4.3 Groundwater resources .......................................................................................... 13
4.4 Water quality .......................................................................................................... 14
4.5 Hydraulic characteristics of aquifers ........................................................................ 14
5. Discussion ...................................................................................................................... 14
6. References ...................................................................................................................... 16
7. Attachment A: Pingelly water levels 2000–2009 ........................................................... 17
8. Attachment B: Lithological logs .................................................................................... 26


Appendix E: Groundwater
E1
1. Introduc tion Pingelly is located in the Central Wheat Belt of Western Australia 130 km south east of Perth (Figure E 1–1). In the Australian Bureau of Statistics 2006 census there were 814 residing people in Pingelly (ABS, 2009). The town site occupies around 180 ha and is located within a small catchment of approximately 700 ha which is drained by a northerly trending creek line, in the headwaters of the Avon River South Branch. As the town is located so high in the Avon catchment, close to the catchment divide, the potential for locating significant alluvial deposits with a capacity to store groundwater is small.
Remnant vegetation covers a little less than half the catchment, of which about 20 ha of sparse remnant vegetation occurs within the town. The south-western and western catchment boundaries are still covered by remnant vegetation. Grazing and some annual cropping occurs over about 120 ha of cleared farmland south-east of the town. Cleared smallholdings make up about another 120 ha.
The Rural Towns—Liquid Assets Program commenced its latest project in 2004 with the aim of acquiring sufficient information for the drafting of integrated water management plans for sixteen towns over a period of four years. Observations have shown that watertables are rising below many towns. High watertables, at depths less than 2 m below the ground surface, are damaging infrastructure such as roads and buildings. These integrated water management plans will outline options for augmenting each town’s water supply, as well as controlling the depth of watertables to protect assets.
In general irrigation or stock drinking quality water rather than high quality water equivalent to the piped scheme water is being sought. Such waters can be shandied with fresher runoff water or desalinated and then shandied with untreated water to produce a resource suitable for irrigation of sporting and other facilities. The project has already demonstrated at Wagin and Merredin that the pumping of water from bores is a feasible option for some towns.
The water supply of Pingelly currently consists of piped scheme water and treated effluent. Storm water runoff is going to be harvested in the near future. Historically, groundwater supplies have been found on the eastern side of the valley. A soak was once located at the corner of Somerset and Shire street. The location of the soak corresponds to a point on a NW trending lineament through the town. Another bore was previously located on the corner of New and Raglan Street. Early investigations for water supply indicated saline groundwater mainly on the western side of the township with fresher water located on the eastern side of town.
Crossley (2001) undertook a groundwater study in the Pingelly townsite in 2000. Crossley drilled several holes on lineaments thought to be fault lines, east of the main creek line, some of which were located near former bores. The drilling did not identify any significant water resource.
The aim of the drilling in 2006 was to locate a potential water supply bore that could also lower watertables. Crossley’s description of the hydrogeology was reviewed in the context of these requirements. To locate a suitable site for a production bore would require the maximum depth to basement possible and need to be located in an aquifer that extended laterally as far as possible beneath the area affected by high watertables. Considering the hydrogeology of the town it was thought the main target for a bore that could lower watertables in the town was the lineaments. The main problem was the shallow depth to granitic basement (< 10 m depth) under most of the town which would limit the storage capacity of any aquifer.

Appendix E: Groundwater
E2
Figure E 1–1 Location of Pingelly townsite.

Appendix E: Groundwater
E3
2. P revious inves tigations Groundwater studies were carried out in the townsite of Pingelly in 1996 and 2000. Monitoring bore locations are shown in Figure E 2–1. Regular groundwater monitoring of the bores has been carried out since August 2000.
2.1 Inves tigation P rogram 1996 Baxter et al. (1996) looked at groundwater near Pingelly Park after salinity damage was noticed. They installed piezometers and observation bores at four sites along a dolerite dyke crossing the town from west to east and passing below the football oval. They considered the dolerite dyke was influencing groundwater flow below the townsite. Table E 2–1 contains a summary of these bores and the bore locations are shown in Figure E 2–1.
Table E 2–1 Summary of 1996 bores
Bore name Date drilled Drilled depth (m)
Casing total length (m)
Casing height above ground
level (m)
Slotted casing interval
(metres below ground level)
Aquifer type response
LCDC1S 05/06/1996 2.1 2.40 0.30 1.1–2.1 Shallow
LCDC1D 05/06/1996 8.4 8.70 0.30 6.9–8.4 Intermediate
LCDC2 05/06/1996 7.2 7.50 0.30 5.7–7.2 Intermediate
LCDC3 05/06/1996 7.2 7.50 0.30 5.7–7.2 Intermediate
LCDC4 05/06/1996 5.1 5.05 0.05 3.6–5.1 Intermediate
2.2 Inves tigation program 2000 The 2000 groundwater study consisted of a drilling investigation and installation of a groundwater monitoring network, groundwater flow modelling and a flood risk analysis (Crossley 2001). Nineteen piezometers and 17 observation bores were installed at 22 sites. A number of sites (00PY02, 00PY16 and 00PY18) were selected adjacent to lineaments identified from aerial photographs. The lineaments identified by Crossley are shown in Figure E 2–2.
Crossley (2001) described the stratigraphy of Pingelly as follows. The regolith in Pingelly is a weathered granite saprolite of average depth 11.2 m (median 9.96 m, mode about 13 m). Where fault lines were intersected by drilling, depth to basement increased, with 00PY02D drilled to 41 metres depth. Depth to basement was generally deeper west of the main creek line at around 13 m depth than on the east where depth to bedrock ranged from 3.7 to 11.6 m. In the riparian zone the bedrock was always less than 6.5 m deep and commonly outcrops (almost always in the stream bed).
The basement was mainly weathered biotite granite, but there were minor occurrences of pegmatite and felsic granite. Typically 0.5 to 3 m of colluvium over-laid variably weathered saprolite (sandy clay). Due to the relatively shallow nature of the regolith, the pallid saprolite clay zone was weakly developed or absent in most cases and less than 8 m thick at all sites. Indurated (ferricrete and silcrete) layers at the transition from the colluvial clay were encountered at some sites. A gritty saprolite/saprock layer above the competent bedrock was between 0.5 and 14 m thick. There are remnants of lateritic duricrust on the upper margins of the catchment.

Appendix E: Groundwater
E4
Groundwater levels were shallowest (less than 1 metre deep) in all the observation bores in the riparian zone in 2000. Most of the observation bores on the western fringe of the built-up area of the town were dry in 2000. Groundwater in October 2000 was more than 2 metres below ground level (mbgl) in most of the piezometers. The exceptions were 00PY16D at 0.87 metres above ground level, 00PY18D at 0.1 mbgl, 00PY17 at 1.4 mbgl, 00PY02D at 1.1 mbgl and 00PY22D at 1.3 mbgl. Groundwater electrical conductivity values ranged from fresh to moderately saline (2,950 mS/m in 00PY19S, west of the swimming pool). In all but two (00PY12 and 00PY19) of the nine nested bore sites that had water in the shallow observation bore, the observation bores were fresher than the adjacent piezometers. A summary of the bores drilled in 2000 is in Table E 2–2 and the bore locations are shown in Figure E 2-1.
Table E 2–2 2000 Pingelly borehole summary
Bore name Easting (MGA94)
Northing (MGA94)
Ground elevation
above AHD (m)
Depth drilled
(m)
Slotted section depth (m)
Groundwater depth
13/10/2000 (mbgl)
Groundwater EC 13/10/2000
(mS/m)
Aquifer type response
00PY01D 507600 6401241 294.39 9.94 7.94–9.94 -4.43 2270 Intermediate 00PY01S 507601 6401241 294.39 3.7 1.7–3.7 Dry at -3.70 - Shallow 00PY02D 507612 6400816 300.52 38.3 36.3–38.3 -1.12 1066 Deep 00PY02S 507612 6400815 300.59 2.46 0.46–2.46 -1.33 449 Shallow 00PY03D 507390 6400673 308.03 13.1 11.1–13.1 -6.80 603 Deep 00PY03S 507391 6400673 308.01 5.54 3.54–5.54 Dry at -5.54 - Shallow 00PY04D 507760 6400563 302.52 13.4 11.4–13.4 -3.26 1740 Deep 00PY04S 507760 6400564 302.51 2.59 0.59–2.59 -2.39 147 Shallow 00PY05I 507888 6400306 301.26 5.51 3.51–5.51 -2.85 2310 Intermediate 00PY06D 507786 6400092 304.38 2.58 0.58–2.58 -1.47 245 Shallow 00PY07D 507527 6400358 315.32 13.74 11.74–13.74 -5.83 672 Deep 00PY07S 507527 6400359 315.32 3.53 1.53–3.53 Dry at -3.53 - Shallow 00PY08D 508070 6400125 302 16.14 14.14–16.14 -1.10 1266 Deep 00PY08S 508070 6400126 302.04 2.37 0.37–2.37 -1.00 984 Shallow 00PY09D 508102 6399840 306.77 9.96 7.96 –9.96 -3.61 1760 Intermediate 00PY09S 508102 6399841 306.71 3.5 1.5–3.5 -3.43 - Shallow 00PY10D 507882 6399653 315.02 24.28 22.28–24.28 -5.89 1785 Deep 00PY10S 507882 6399654 315 5.62 3.62–5.62 Dry at -5.62 - Shallow 00PY11D 507705 6399982 308.48 16.86 14.86–16.86 -4.29 1450 Deep 00PY11S 507706 6399982 308.48 3.1 1.1–3.1 Dry at -3.10 - Shallow 00PY12S 507812 6401055 291.69 2.49 0.49–2.49 -1.44 1940 Shallow 00PY13D 507961 6400579 294.56 4.23 2.23–4.23 -0.61 1500 Shallow 00PY14D 508106 6400326 297.35 3.37 1.37–3.37 -0.35 1410 Shallow 00PY15D 508265 6400012 301.49 6.55 4.55–6.55 -0.73 1201 Intermediate 00PY15S 508265 6400013 301.45 3.28 1.28–3.28 -0.74 600 Shallow 00PY16D 508549 6399848 309.05 8.18 6.18–8.18 1.87 1300 Intermediate 00PY16S 508549 6399849 309.06 3.6 1.6–3.6 -0.61 1210 Shallow 00PY17D 508509 6400202 306.47 3.73 1.73–3.73 -1.42 1500 Shallow 00PY18D 508535 6400422 309.23 4.41 2.41–4.41 -0.14 914 Shallow 00PY19D 508599 6400615 312.05 6.81 4.81–6.81 -2.14 1930 Intermediate 00PY19S 508600 6400615 312.06 2.65 0.65–2.65 -2.10 2950 Shallow 00PY20D 508306 6400658 304.72 11.61 9.61–11.61 -2.11 898 Deep 00PY20S 508306 6400657 304.74 2.71 0.71–2.71 -1.77 99 Shallow 00PY21D 507370 6401068 302.79 25.5 23.5–25.5 -7.74 1590 Deep 00PY21S 507371 6401068 302.87 5.57 3.57–5.57 Dry at -5.57 - Shallow 00PY22D 507186 6400469 322 5.25 3.25–5.25 -1.33 40 Intermediate

Appendix E: Groundwater
E5
Figure E 2–1 Location of bores drilled in Pingelly Township.

Appendix E: Groundwater
E6
Figure E 2–2 Lineaments identified by Crossley from aerial photographs.
2.3 G roundwater modelling A groundwater model was developed for Pingelly townsite to study the impacts on watertables of a selection of possible strategies (Crossley, 2001). The four strategies looked at were: do nothing differently, groundwater pumping, groundwater drainage and tree planting. The model simulations extended over 30-year periods with an assumed average recharge rate of 45.4 mm/year. The model gave an indication of what might be expected from the four strategies. A summary of the model outcomes for the four strategies is in Table E 2–3.
Table E 2–3 Modelling strategy outcomes
Strategy Predicted model outcome
Do nothing differently Model suggested that Pingelly townsite had already reached hydraulic equilibrium and that areas underlain by shallow groundwater would not expand in future.
Groundwater pumping Modelling using 21 production bores, the model predicted that the watertable would not lower to 3 metres below ground level and would only reduce the size of the salt-effected area by about 50%.
Groundwater drainage The model predicted that this strategy would lower the watertables to the base of the drain over 30 years but they were only effective within 20 metres of the drains.
Tree planting The model predicted that the vegetation would have little to no impact on lowering the watertable below the salinity-affected areas.

Appendix E: Groundwater
E7
2.4 G roundwater monitoring Monitoring of groundwater levels and EC started in Pingelly in August 2000 and has continued every three months since then.
2.4.1 P ingelly rainfall
The Bureau of Meteorology (BoM, 2009) has been recording rainfall data at Pingelly (station 010626) since 1891. The monthly averages for the period 1891–2008 and 2000-2008 are presented in Table E 2-4.
Table E 2–4 Pingelly average monthly rainfall
Statistics Jan. Feb. Mar. Apr. May Jun. Jul. Aug. Sep. Oct. Nov. Dec. Annual Years
Mean rainfall (mm) 10.6 13.8 16.4 27.9 58.4 83.0 82.3 62.3 40.5 25.1 15.1 12.0 447.4 118 (1891–2008)
Mean rainfall (mm) 25.9 5.8 11.4 32.0 42.4 53.1 79.3 55.7 35.8 20.6 14.2 15.8 391.8 9 (2000–2008)
red = highest value blue = lowest value.
The annual average rainfall for the 118 years has been 447.4 mm while the annual average for the last nine years is 391.8 mm, a decrease of almost 12.5 per cent from the long term annual average. Figure E 2–3 shows the average monthly rainfall for the two time periods. The plot shows that, while there has been a decrease in rainfall in most months, January, April and December have shown an increase in monthly rainfall. A decrease in annual rainfall should lead to a decrease in groundwater recharge.
Pingelly Average Monthly Rainfall
0
10
20
30
40
50
60
70
80
90
Jan Feb Mar Apr May Jun Jul Aug Sep Oct Nov Dec
Month
Mon
thly
Rai
nfal
l (m
m)
1891 - 20082000 - 2008
Figure E 2–3 Pingelly average monthly rainfall.
2.4.2 G roundwater levels
The groundwater level data and rainfall data are presented in Attachment 1. Bores with similar groundwater trends and locations have been plotted together. A comparison between 2001 and 2008 water levels and EC values are in Table E 2–5.

Appendix E: Groundwater
E8
507200 507400 507600 507800 508000 508200 508400 508600 5088006399600
6399800
6400000
6400200
6400400
6400600
6400800
6401000
6401200
Table E 2–5 2001 and 2008 water levels and EC values.
Most shallow bores showed a watertable level increase between 2001 and 2008 while most of the deep piezometers showed a long term declining trend between 2001 and 2008. The bores showing the biggest decline were 00PY02D, 00PY03D, 00PY04D, 00PY07D, 00PY11D, 00PY21D and LCDC03D, which all declined over one metre. The bore showing the biggest rise in watertable was 00PY09S which increased 1.23 metres between 2001 and 2008.
The bores showing the deepest water levels are on the western side of Pingelly. As the bores get closer to the Avon River South Branch the watertable gets shallower. Bore 00PY16D is the only bore to show piezometric levels above ground level. The watertable in the shallow bore 00PY16S is below ground level. This suggests that 00PY16D is near a groundwater barrier.
The EC of most of the ground waters was relatively stable between 2001 and 2008. The bores showing the biggest increase in EC were 00PY08S, 00PY12S, 00PY13D and 00PY17D.

Appendix E: Groundwater
E9
The Pingelly depth to water levels on 24/11/2008 has been plotted in a contour program and is shown in Figure E 2–4. In a set of nested bores, if the shallow bore was dry the depth to water for the D bore was used. The contour diagram shows that the area where the watertable is closest to the ground surface is along the main creek line in front of the commercial centre and upstream and to the east of the creek line along Shire Street.
The Pingelly bore water levels have also been contoured up as height above Australian Height Datum (AHD) and Figure E 2–5 shows the water level elevations. From the elevation contours the groundwater movement is to the north in the southern part of Pingelly and is moving towards the main drainage line. In eastern Pingelly the groundwater movement is to the north west and in western Pingelly the groundwater movement is to the north east.
The convergence of groundwater flows towards the 00PY12S area shows that bore 00PY12S is close to a discharge zone. The discharge zone in Pingelly is the Avon River South Branch drainage line. The main drainage line below the commercial centre has been cleaned out in 2009 and the bottom of the drainage line is now 1.5–2 metres below the top of the bank. The base of the drainage line in this area is mostly granite bedrock. If the groundwater levels are high enough, groundwater discharges into the creek line will contribute to flows in the creek. The times when groundwater levels are highest are usually at the end of winter after groundwater recharge from winter rains.
507200 507400 507600 507800 508000 508200 508400 508600 5088006399600
6399800
6400000
6400200
6400400
6400600
6400800
6401000
6401200
Figure E 2–4 Shallow watertable depth below ground level on 24/11/2008. Contour intervals 0.5 metres.

Appendix E: Groundwater
E10
507200 507400 507600 507800 508000 508200 508400 508600 5088006399600
6399800
6400000
6400200
6400400
6400600
6400800
6401000
6401200
Figure E 2–5 Pingelly watertable elevation AHD on 24/11/2008. Contour intervals 1 metre.
3. Methods A number of lineaments have been identified which cross the town, most of which are faults. The 2006 magnetics survey results indicated that a northeast trending lineament on the southern part of the town corresponds to an long outcrop of mafic rock that could also be associated with a fault. Another E-W lineament corresponds to a fault line, but its eastern extent also corresponds to a mafic dyke (Figure E 2–2).
3.1 G roundwater exploration s trategy Viable sources of groundwater generally occur in stratigraphic units composed of sands and gravels of high hydraulic conductivity. Such sediments are rare in the West Australian Wheat Belt except where they constitute beds within relict drainage channels. Most areas are underlain by an Archean granitic basement, covered by in situ weathering products and accumulations of alluvium located in relict basins.

Appendix E: Groundwater
E11
The depth of weathering and presumably also the thickness of the grit layer is expected to be greatest in locations where the depth to unweathered basement is greatest. Thus, in the geological environment of Pingelly, viable groundwater sources are most likely to be obtained in lineaments where the depth to the impermeable basement is greatest.
Faults that fracture the underlying basement generates localised deepening of the weathered zone and enhanced lateral weathering away from the fault line, which in turn increases the potential water yield. Accordingly, the strategy of the hydrological investigations conducted in 2006 in Pingelly was to locate fault lines where the depth to bedrock was greatest and then drill test holes into them to test the water yield.
Constraints used to prioritise these target areas were:
a) The drilling targets must be located as close to the commercial centre of the town as possible
b) The drilling rig could safely operate without causing excessive inconvenience
c) Electrical power sources or lines were located close by. This could reduce the costs of further testing, and establishment of bore sites.
Once the targets were drilled, the criteria for converting a drillhole to a production bore was that the water yield during airlifting of the bore should exceed 1 L/s. This criteria was based on the results of previous hydrogeological investigations in wheat belt towns that had identified viable production bores.
3.2 Drilling method and bore c ons truc tion The 2006 holes were located west of the main creek line. Two were located in a park, bounded by Quartz, Stone and Eliot Streets, on the upper slopes of the catchment and the remainder on pending Council Reserve, just east of the railway line.
A total of eleven 150 mm diameter exploratory holes were drilled using the rotary air blast method. Of these, six located near the railway reserve was converted to piezometers. All other exploratory bores had observations piezometers located within 100 m distance, and the requirement of more observation bores could not be justified.
Piezometer construction was as follows: From the bottom of the hole upwards, 2 metres of 50 mm class 12 casing commercially slotted (1 mm slots) was fitted with an end cap; then 50 mm class 12 plain casing was run to the ground surface. Two 25 kg bags (0.033 m3) of graded (1.6–3.2 mm) gravel pack were poured into the borehole annulus. This should provide approximately 0.5 m of pack above the slots. This was overlain by a layer of coarse drill spoil to act as a buffer and keep the bentonite seal from seeping into the gravel pack. The spoil was then overlain by a pail (known to fill the annulus over a depth of 1 metre) of slow release bentonite pellets and finally the remainder of the hole was backfilled with drill spoil. The aim of the bentonite seal was to prevent groundwater or surface water moving down the outside of the casing to the gravel pack around the piezometer.
3.3 G eophys ic al inves tigations A detailed magnetic survey was conducted over the township area to assist in obtaining the exact location of the lineaments (Wilkes, 2009). The 2006 drilling program explored the potential of lineament LAN in greater detail (Figure E 2–2), to try to yield a better supplementary water supply for the township. This lineament was traced and drilling concentrated on identifying the nature and dimensions of the lineament and resource associated with it as a precursor to further investigations.

Appendix E: Groundwater
E12
3.4 Hydraulic c harac teris tic s of aquifers Slug tests were undertaken in three of the test holes that the drilling log indicated suffered the least from collapse during insertion of the casing. They were located east of the railway line. These tests involved placing a pressure transducer below the watertable and measuring the change in pressure head in response to the displacement of the watertable caused by the removal of a solid 1 m long by 50 mm diameter slug. The rate at which the watertable changes in response to the removal of the slug is a measure of how quickly water moves from the surrounding formation into the borehole. This in turn is indicative of the hydraulic conductivity of the transmitting formation.
The records from these holes, yielded decay times from the onset of the perturbations in head so induced. Using the method of Hvorslev (1951) an average hydraulic conductivity for the test section was calculated.
4. R es ults
4.1 G eophys ic s Magnetic measurements were made in Pingelly on 5 May and 1 June 2006 (Wilkes, 2009). Lineaments LAN and LDN are close to magnetic contacts (rock unit boundaries) but are not exactly coincident with these. Lineaments LBN and LCN are not evident in the magnetic data.
4.2 Hydrogeology Drillhole 06PY01Ex was located in the centre of a shallow drainage line on the lineament and was drilled to 31 m depth before drill refusal. What was immediately noticeable about this hole was the absence of a pale saprolite zone similar to that elsewhere in the region. It has a lithology consistent with weathering within a fracture zone. Weathering has occurred, but minerals that would generally be expected to have been completely transformed into clays and/or gone into solution, are still intact quite close to the surface (e.g. mica). From 10 m down to 15 m depth the unweathered visible micas give the material a silky feel. Below 15 m depth unweathered felspar also appeared giving way to the usual 'grits' composed of unweathered felspar, quartz and, in this case, mica as well extending over a depth interval approaching 10 m.
Only 20 m away to the south, the depth to the granite basement was only 13 m. The relatively unweathered nature and depth of the weathering zone is considered characteristic of a fault zone in granite. Drillhole 06PY02Ex was located about 100 m along the same lineament but did not make significant water. It appears the drill site was slightly offset from the centre of the lineament (Figure E 2–2).
The holes drilled on the lineament just east of the railway line had a similar lithology except that there was a bleached saprolite between 6m and 15 m depth. Below 15 m depth essentially the same profile occurred suggesting that in the upper parts of the catchment the top layers of the original relict profile have been eroded off.
Lower in the landscape near the railway line the width of the deeper weathered zone increased relative to upslope deepening from 1–3 m depth to 30–40 m depth over a distance of 20 m. The total effective width of the fault zone was 80–100 m width compared to 50 m upslope where it was previously not mapped. Further to the east basic rocks are mapped as extending along this lineament.

Appendix E: Groundwater
E13
Table E 4–1 Location and summary of bores drilled in Pingelly in 2006
Site ID Drillhole ID EASTING
(MGA94) NORTHING
(MGA94) Depth drilled
(m) Salinity (mS/m)
Water yield (L/s)
Hole conversion
1 06PY01Ex 507392 6400707 32 1000 ~ 0.5 Hole filled in
2 06PY02Ex 507481.28 6400780.97 36 1000 small Hole filled in
3 06PY03Ex 507814.31 6400900.43 18 1200 small Hole filled in
4 06PY04Ex 507827.83 6400870.32 3 dry hole - Hole filled in
5 06PY23S 507800.78 6400930.13 39 800–1000 1.0 dropping to 0.5 after
4 hours PVC casing
6 06PY05Ex 507793.09 6400958.85 31 1800 ~ 0.5 Hole filled in
7 06PY24D 507826.47 6400954.07 30 2100 ~ 0.5 PVC casing
8 06PY25D 507848.50 6400982.10 20 1950 small PVC casing
9 06PY25I 507854.47 6400963.37 25.5 1600 small PVC casing
10 06PY24I 507834.29 6400945.01 14 1600 < 0.5 PVC casing
11 06PY23D 507800.27 6400932.42 39 1600 ~ 0.5 PVC casing
Analysis of all available data and site inspections indicated that damage to infrastructure was occurring mainly where water was flowing down slope and then brought close to the ground surface by shallow underlying impermeable basement. The potential of drains for controlling watertables and obtaining better quality water than deep bores was assessed and considered impractical mainly because high watertables in the township were also associated with very shallow depths to basement with basement actually outcropping just down slope of some affected areas. Because of the shallow basement drains located in the streets would be separated by distances too great to lower the watertable below 2 metres depth over most of the area between the drains.
4.3 G roundwater res ourc es The water yield from borehole 00PY02D that intersected the lineament in 2000 was limited. Drillhole number 06PY01EX, (Table E 4–1) was at the centre of a very shallow depression that extended upslope to the west of the original interpretation of the lineaments location. No boreholes were drilled further up slope, as the location was getting close to the catchment divide and the total surface water resource that could recharge it was therefore quite limited. Drillhole 06PY01Ex yielded a little over 0.5 L/s, less than the criteria of 1 L/s used to determine if the hole should be converted to a production bore. Drillhole 06PY02Ex was located on the line joining 06PY01Ex and 00PY02D but no significant yield was obtained. Drillhole 06PY02Ex appears to have been slightly offset from the centre of the fault line.
Further holes were drilled on the same lineament east of OOPY02D and the railway line crossing the town, in the riparian zone, where the lineament of interest intersected the extrapolation of the NW trending lineament LCN. A good yield of just over 1 L/s was obtained from 06PY23S, but after airlifting for 4 hours the yield declined. The hole collapsed after withdrawal of the rods. A hole drilled 3 metres away, 06PY23D, produced less than 0.5 L/s yield so it was not converted to a production bore.
Other holes drilled within 50 m of 06PYO5 did not give yields greater than 0.5 L/s. It was clear from the drop in yield obtained from 06PY23S and the depth to basement found in nearby holes that the fault line would not give a sustainable yield of 1 L/s so no further drilling was undertaken.

Appendix E: Groundwater
E14
4.4 Water quality The water quality obtained from the drillholes west of railway lines was around 1000 mS/m. Water quality east of the railway line increased in salinity from 800 mS/m to 2000 mS/m as the drainage line to the east was approached. While the groundwater closer to the railway line was fresher, it increased in salinity from 800 mS/m to about 1500 mS/m as flows declined during air-lifting.
4.5 Hydraulic c harac teris tic s of aquifers Drillholes located at the centre of the lineament LAN made water as soon as the zone containing unweathered micas was encountered (Table E 4–1). This generally occurred at depths greater than 10 m. The ability of a drillhole to make water was very site specific. For example, drillhole 06PY23S, located presumably right on the fault line, initially made good water while drillhole 06PY23D, less than 5 m away, drilled after collapse of drillhole 07PY23S during air-lifting, made less than 0.5 L/s. The same contrast in yield occurred in the two holes, 06PY01Ex and 06PY02Ex, west of the railway line. This indicated that the transmissivity of the grit zone was changing rapidly with distance away from the fault line. Slug tests conducted on three piezometers indicated that the hydraulic conductivity of the grits in holes east of the railway line was low.
5. Dis c us s ion The reduction in water yield obtained from 06PY23S during development over a period of 4 hours is characteristic of bores located near impermeable boundaries, which in this case was each side of the fault line were weathering was not as intense. Modelling is likely to show the cone of depression extends out to the edges of the fault line and then potentiometric heads drop more quickly than normal as the rest of the cone extends along the fault line. The increase in salinity observed as the bore was developed is consistent with the bore drawing water from the riparian zone where higher salinity water was expected due to the vegetation drawing water from a fairly restricted depth of soil flowing down slope on top of the basement and the low depth to the watertable in parts of this area up-gradient.
The lineament drilled, LAN, is located in a weak depression that floods from time to time. As there were no hydraulically impeding layers encountered during drilling the fault line aquifer is likely to be recharged from flows down the gully, when they occur. Further down gradient of 06PY02Ex drainage is redirected by street drainage systems and recharge would then be only by subsurface flow on top of the basement. To a first approximation the magnitude of the resource might be estimated from the area of the sub-catchment from which it obtains its recharge. This is estimated to be about 20 ha.
It is estimated that about every second year recharge could be expected to exceed 20 mm and every five years 120 mm so the average annual recharge might be expected to be in the range of 25–50 mm, giving a total extractable volume of the order of 5 000 to 10 000 m3/year. This volume of relatively fresh water is probably just sufficient to irrigate 1 ha of nature reserved and parkland in the township.
A bore pumping near the railway line at 0.5 L/s could potentially pump the average annual recharge in less than the six month summer period. However, drawdown at the bore would be expected to limit the rate of pumping after a few days to less than this amount, so additional bores would be required along the length of the aquifer to sustain an average pumping rate at this level over the length of the fault. Given the salinity of the groundwater is greater than 1 000 mS/m, but generally less than 2 000 mS/m (moderately saline), it would

Appendix E: Groundwater
E15
have to be shandied with fresh water in the proportion of less than 1:1, depending on the quality of the water that recharges into the fault line. Irrespective of whether it is shandied with fresher water it will be necessary to consider the course of drainage through the township from such facilities so as to ensure the additional localised recharge does not have adverse impacts down slope.
An advantage of using a groundwater supply is that potentially the need for capital expenditure on water storage facilities is eliminated. The fault line itself would be expected to store, west of the railway line, the order of the annual expected recharge (5 000 to 10 000 m3). Accordingly it does seem feasible to use the fault lines as potential groundwater resources providing bores can be located exactly in the fracture line. Unfortunately the location of the bore(s) to obtain the water supply associated with fault line LAN, is unlikely to reduce the level of the watertables in more southerly parts of the town where infrastructure is being adversely affected by high watertables.

Appendix E: Groundwater
E16
6. R eferences Baxter A, Wardell-Johnson I and George RG 1996, Assessment of Pingelly Park, prepared
for Pingelly Shire Council, unpublished.
Australian Bureau of Statistics 2009, 2006 Census QuickStats: Pingelly (L) (Urban Centre/Locality). [Data file]. Available from the Australian Bureau of Statistics site: http://www.censusdata.abs.gov.au/ABSNavigation/prenav/ProductSelect?newproducttype=QuickStats&btnSelectProduct=View+QuickStats+%3E&collection=Census&period=2006&areacode=UCL523200&geography=&method=&productlabel=&producttype=&topic=&navmapdisplayed=true&javascript=true&breadcrumb=LP&topholder=0&leftholder=0¤taction=201&action=401&textversion=false.
Bureau of Meteorology 2009, Climate statistics for Australian locations (Pingelly, site number 010626). [Data file] Available from the Bureau of Meteorology site, http://www.bom.gov.au/climate/averages/tables/cw_010626.shtml.
Crossley EK 2001, Groundwater study of the Pingelly townsite. Agriculture Western Australia, Resource Management Technical Report 219.
Hvorslev MJ 1951, Time lag and soil permeability in ground-water observations: Vicksburg, Miss., U.S. Army Corps of Engineers, Waterways Experiment Station, Bulletin 36, 50 p.
Wilkes P 2009, Geophysical Studies at Pingelly, Appendix D of 2009 Pingelly Water Management Report.

Appendix E: Groundwater
E17
7. A ttachment A: P ingelly Water L evels 2000–2009

Appendix E: Groundwater
E18
Jan-2000 Jan-2001 Jan-2002 Jan-2003 Jan-2004 Jan-2005 Jan-2006 Jan-2007 Jan-2008 Jan-2009Date
12
8
4
0
Dep
th to
Wat
er (m
etre
s be
low
gro
und
leve
l)
0
50
100
150
Dai
ly R
ainf
all (
mm
)
Graph 100PY03D00PY07D00PY10D00PY11D00PY21DPingelly Daily Rainfall
Pingelly - Western Bores bottom of screen greater than 10 metres

Appendix E: Groundwater
E19
Jan-2000 Jan-2001 Jan-2002 Jan-2003 Jan-2004 Jan-2005 Jan-2006 Jan-2007 Jan-2008 Jan-2009Date
12
8
4
0D
epth
to W
ater
(met
res
belo
w g
roun
d le
vel)
0
50
100
150
Dai
ly R
ainf
all (
mm
)Graph 100PY02D00PY04D00PY08D00PY20D06PY23D06PY23SPingelly Daily Rainfall
Pingelly - Central Bores bottom of screen greater than 10 metres

Appendix E: Groundwater
E20
Jan-2000 Jan-2001 Jan-2002 Jan-2003 Jan-2004 Jan-2005 Jan-2006 Jan-2007 Jan-2008 Jan-2009Date
12
8
4
0
Dep
th to
Wat
er (m
etre
s be
low
gro
und
leve
l)
0
50
100
150
Dai
ly R
ainf
all (
mm
)
Graph 100PY01D00PY05I00PY09D
00PY15D00PY19D00PY22DLCDC02D
LCDC03DLCDC04DPingelly Daily Rainfall
Pingelly - Bores bottom of screen between 5 - 10 metres

Appendix E: Groundwater
E21
Jan-2000 Jan-2001 Jan-2002 Jan-2003 Jan-2004 Jan-2005 Jan-2006 Jan-2007 Jan-2008 Jan-2009
Date
12
8
4
0D
epth
to W
ater
(met
res
belo
w g
roun
d le
vel)
0
50
100
150
Dai
ly R
ainf
all (
mm
)
Graph 100PY13D00PY14D00PY15S00PY16S00PY17D00PY18DPingelly Daily Rainfall
Pingelly - Eastern Bores bottom of screen less than 5 metres
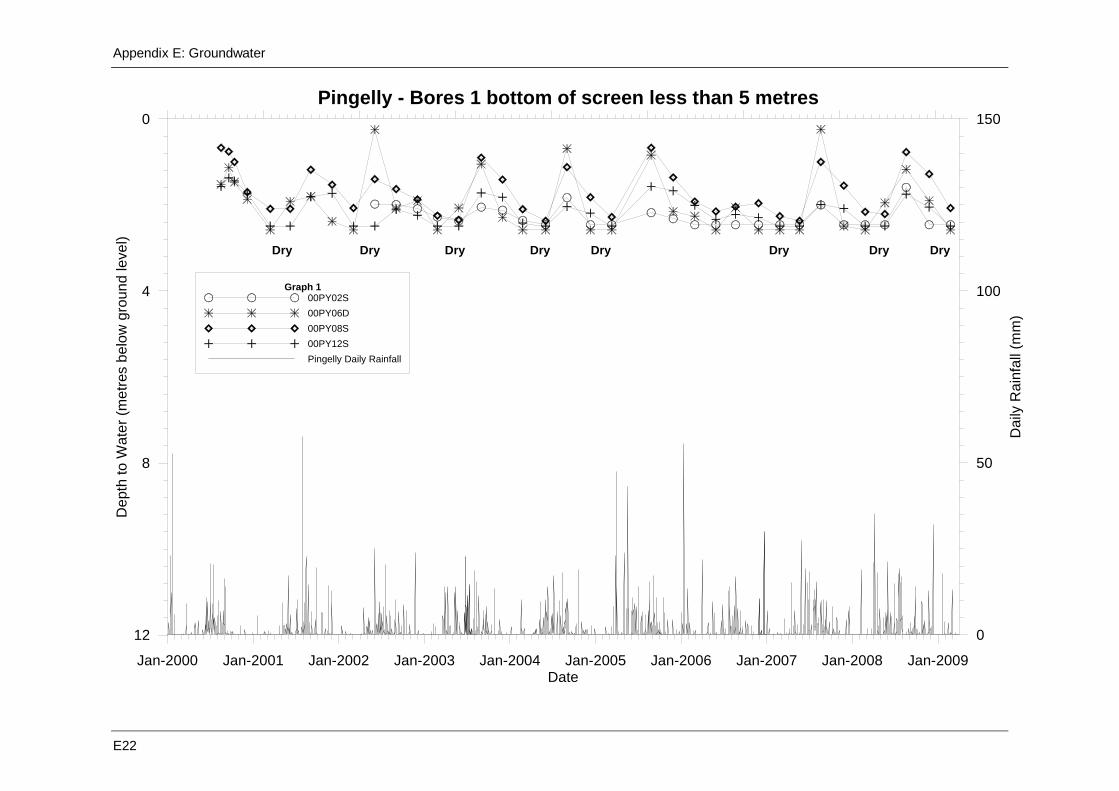
Appendix E: Groundwater
E22
Jan-2000 Jan-2001 Jan-2002 Jan-2003 Jan-2004 Jan-2005 Jan-2006 Jan-2007 Jan-2008 Jan-2009Date
12
8
4
0D
epth
to W
ater
(met
res
belo
w g
roun
d le
vel)
0
50
100
150
Dai
ly R
ainf
all (
mm
)
Graph 100PY02S00PY06D00PY08S00PY12SPingelly Daily Rainfall
Pingelly - Bores 1 bottom of screen less than 5 metres
Dry Dry DryDryDryDry Dry Dry

Appendix E: Groundwater
E23
Jan-2000 Jan-2001 Jan-2002 Jan-2003 Jan-2004 Jan-2005 Jan-2006 Jan-2007 Jan-2008 Jan-2009Date
12
8
4
0D
epth
to W
ater
(met
res
belo
w g
roun
d le
vel)
0
50
100
150
Dai
ly R
ainf
all (
mm
)Graph 100PY04S00PY09S00PY20SPingelly Daily Rainfall
Pingelly - Bores 2 bottom of screen less than 5 metres
Dry Dry Dry Dry Dry Dry Dry

Appendix E: Groundwater
E24
Jan-2000 Jan-2001 Jan-2002 Jan-2003 Jan-2004 Jan-2005 Jan-2006 Jan-2007 Jan-2008 Jan-2009Date
12
8
4
0D
epth
to W
ater
(met
res
belo
w g
roun
d le
vel)
0
50
100
150
Dai
ly R
ainf
all (
mm
)
Graph 100PY01S00PY07S00PY11S00PY19SPingelly Daily Rainfall
Pingelly - Bores 3 bottom of screen less than 5 metres
Dry Dry Dry Dry Dry

Appendix E: Groundwater
E25
Jan-2000 Jan-2001 Jan-2002 Jan-2003 Jan-2004 Jan-2005 Jan-2006 Jan-2007 Jan-2008 Jan-2009Date
10
8
6
4
2
0
-2
Dep
th to
Wat
er (m
etre
s be
low
gro
und
leve
l)
0
50
100
150
Dai
ly R
ainf
all (
mm
)
Graph 100PY16D00PY16S00PY17D
00PY09D00PY10D00PY15DPingelly Daily Rainfall
Pingelly - Bores south east
Ground level

Appendix E: Groundwater
E26
8. A ttachment B : L ithologic al L ogs
Field Lithological Logs
Pingelly site ID Core samples every 1 m
1
1
2
2
3
5
5
6
6
7
7
9
9
8
10

Appendix E: Groundwater
E27
Pingelly Site 1 Hole No. 06PY01Ex
Located in Stone St, 30 m north of bore 00PY03D Depth (mbgl) This drillhole is located in the centre of a shallow drainage line on a lineament. It has a
lithology and broken texture that is consistent with microfracture weathering. Weathering has occurred but minerals that would generally be expected to have been completely transformed into clays are still intact quite close to the surface (e.g. mica). From 10 m down the unweathered micas are associated with this silky feel. What is also noticeable about this hole also is the absence of the saprolite zone. Only 20 m away depth of the granite is only 3 m or so and this hole is in the gully of a drainage line and on a lineament. The relatively unweathered nature and depth of the weathering zone is considered characteristic of a fault zone in granite. Hole made 0.5 L/s-quality was 1 000 mS/m.
0–1 dark brown loam with gravel fragments 1–2 red-brown SC loam
2–4 pale brown to grey SC with white silcrete-feldspar particles and quartz particles up to 2 mm across
4–9 yellow brown clayey sand with quartz particles up to 5 mm across 9–10 green brown clayey sand with quartz particles up to 5 mm across 9–11 brown silky clay with visible mica
11–15 brown sandy silky clay, visible mica plus white crushable weathered feldspar fragments 15–17 light brown clayey sand with large feldspars and quartz up to 7 mm across (start of the grits) 17–32 quartz and feldspar fragments/grits
Pingelly Site 2 Hole No. 06PY02Ex Depth (mbgl) Hole depth is 36 m and is located at corner of the park. No significant water yield
0–2 pisolitic red gravels in a clay loam 2–3 dark brown gravelly SC 3–4 grey sandy clay hard lumps within it perhaps hardpan 4–7 olive-green SC quartz is also present as large fragments 7–27 grey-green clays containing feldspar and quartz fragments less than 2 mm across
27–36 grit composed of quartz and feldspar fragments up to 5 mm diameter with very little clay Pingelly Site 3 Hole No. 06PY03Ex
Notes Hole drilled to 18 m depth, no grits, struck granite and abandoned Pingelly Site 4 Hole No. 06PY04Ex
Notes Hole drilled to 3 m depth before striking granite—abandoned Pingelly Site 5 Hole No. 06PY23S
Depth (mbgl) This hole yielded water (800 mSm-1) increasing to 1L/s initially between 17 and 28 m depth. No additional water yield below 28 m depth. Yield declined after about 2–3 hours to 0.5 L/s.
0–1 Red SC 1–3 red-grey SC ferruginous speckling 1 to 2 cm across 3–5 grey SC with large (10 mm) fragments silicified hardpan 5–6 white SC with a silky feel 6–7 white SC with a silky feel plus quartz fragments (< 10 mm diameter) 7–16 white SC containing the quartz fragments (saprolite)
16–20 grey-brown SC with visible mica—considerable water 20–27 grey-brown SC with fine feldspar and quartz fragments (making up sandy component) 27–39 brown feldspar and quartz grit with minimal clay
Pingelly Site 6 Hole No. 06PY05Ex Depth (mbgl)
0–6 brown SC (weathered zone)
6–14 white sandy clay with quartz vein fragments and hardpan fragments composed of silicifed saprolite at 8 m

Appendix E: Groundwater
E28
14–15 brown clay and white clay containing quartz fragments
15–25 pale brown clays containing quartz fragments up to 1 cm diameter plus a brown mineral increasing in concentration with depth
25–31 pale brown clays containing quartz and feldspar fragments up to 1 cm diameter plus a brown mineral
Pingelly Site 7 Hole No. 06PY24D Depth (mbgl)
0–5 Brown SC 5–9 pale olive-green SC 9–14 pale olive-green SC plus a brown mineral increasing in concentration with depth
14–30 the brown mineral plus feldspar plus quartz in a grit Pingelly Site 8 Hole No. 06PY25
Depth (mbgl) 0–3.5 Brown SC 3.5–5 grey white SC in a hardpan
5–15 pale grey SC containing brown mineral fragments that increase in concentration with depth and quartz fragments.
15–20 grit composed of feldspar, quartz and brown mineral fragments in a fine liquid clay Pingelly Site 9 Hole No. 06PY25
Depth (mbgl) 0–3 brown gravelly SC 3–4 iron rich hardpan formation incorporating SC
4–10 pale grey SC containing brown mineral fragments that increase in concentration with depth and quartz fragments.
10–25.5 grit composed of feldspar, quartz and brown mineral fragments in a fine liquid clay Pingelly Site 10 Hole No. 06PY24S
Depth (mbgl) 0–3 brown SC 3–4 pale brown clayey sand 4–6 Silcrete? +pale brown SC containing quartz fragments up to 2 cm across 6–14 SC plus feldspar
Pingelly Site 11 Hole No. 06PY23D (3 m from 06PY23S) Depth (mbgl)
0–1 red SC 1–3 red-grey SC ferruginous speckling 1 to 2 cm across 3–5 grey SC with large (10 mm) fragments silicified hardpan 5–6 white SC with a silky feel 6–7 white SC with a silky feel plus quartz fragments (< 10 mm diameter) 7–16 white SC containing the quartz fragments (saprolite)
16–20 grey-brown SC with visible mica—considerable water 20–27 grey-brown SC with fine feldspar and quartz fragments (making up sandy component) 27–39 brown feldspar and quartz grit with minimal clay

Appendix F
An Evaluation of Pingelly Infrastructure Damage Caused by Salinity
Steve Marvanek, Olga Barron, Tony Barr and Geoff Hodgson
CSIRO
October 2006


Appendix F: Salinity Damage Assessment
F1
1. S alinity r is k Evaluation of the salinity risk towards the infrastructure damage was based on the long-term average groundwater level for the shallow observation bores. The level of risk was estimated in accordance with soil saturation level at the 1m depth below the ground level. The extent of the salinity risk map is confined by the extent of the observation bores in each town, hence the salinity risk maps only cover a portion of each town.
1.1 Infras truc ture damage c os t Infrastructure damage costs are calculated based on the simultaneous analysis of the salinity risk and infrastructure type within each land parcel landuse, where surface types, area and structures have been identified. The average salinity risk of each land parcel is calculated, and using an algorithm adapted from the USEAP model, damage can be calculated (Table 1).
USEAP divides the town infrastructure into 5 key groups: residential housing, commercial/offices, public open space, ovals/playing fields and roads. Roads are classified as either sealed or gravel. Each category has an assigned annual damage cost, derived from the USEAP value assuming a 100 per cent impact. This damage is then moderated based upon estimated degree of soil saturation, so that damage falls as soil saturation falls.
Table 1 USEAP damage cost
Name Quantity Cost $
Residential building per/household 463
Commercial building per/1000 sqm 663
Oval per/hectare 1900
Open space per/hectare 685
Sealed road per/1000 m 400
Unsealed road per/1000 m 200
It is important to note that the damage costs are only an indication, and that the only a part of the gazetted townsite was considered. The water level is assumed to be at equilibrium currently. If the intention is to identify the impact of changes in management, then an assessment of only those areas which may feasibly be impacted by that management need to be considered. It is important to note that these are the estimates of current damage within the area, and as such are the MAXIMUM cost reduction that could be achieved if management options were introduced that completely ameliorated the problem. It is almost certainly the case that such total amelioration options will not be economic to achieve, and such options are not considered in the water management plans. However, these values give an indication of the overall size of the infrastructure damage problem within these towns. The details of the proposed methodology are given in the report 'A Systems Approach to Rural Town Water Management'.
1.2 S patial dis tribution The spatial distribution of the salinity risk for Pingelly townsite is shown in Figure 1. The high salinity risk zones are located along the local drainage path, and salinity risk reduces to the north-east and south-west from the high values.

Appendix F: Salinity Damage Assessment
F2
The estimated damage cost for the different land use zones as described in the town planning scheme is given in Table 2 as an annual damage cost ($12.5K) and projected NPV of costs over next 20 years within a do-nothing scenario ($132.5K).
Table 2 Pingelly damage cost
Name Cost year 1 $ Projected NPV (@ 7%) over 20 years $
Community 1 023 10 839
Industrial 589 6 239
Recreation and open space 157 1 663
Residential 5 658 59 943
Rural residential 380 4 024
Town centre 1 390 14 724
Roads 3 311 35 077
Total 12 508 132 508

Appendix F: Salinity Damage Assessment
F3
Figure 1 Pingelly salinity risk map.


Appendix G
Pingelly Water Quality
Jeff Turner
CSIRO


Appendix G: Water Quality
Gi
S ummary The township of Pingelly suffers from a water scarcity and potential damage to infrastructure from high watertables and waterlogging particularly in the high salinity risk areas to the south and east of the townsite. Spatial and temporal monitoring and interpretation of deep and shallow water quality parameters in a network of observation bores was undertaken within the Pingelly townsite. At Pingelly, temporal monitoring was undertaken quarterly from 2001 to 2004 allowing temporal trends in key water quality parameters to be determined in response to rainfall-recharge events and assessment of whether the salinity trends in groundwater are degrading, improving, or remaining constant. Based on the analysis it can be concluded that groundwater salinity trends are steady, particularly in the deep groundwater system. Spatial characterisation of major and trace ion compositions, organics and microbiological status was carried out to assess the potable or substitute potable suitability of groundwater. Trace element organics and microbiological status of groundwater was found to be acceptable for groundwater recovery for non-potable use with no occurrences of undesirable organics and microbiological contamination detected. The level of groundwater salinity in Pingelly is the fourth lowest of all sixteen rural towns in the RTLA project, ranging in EC from less than 100 up to 2100 mS/m, equivalent to a total dissolved solids (TDS) range from a minimum of 400 mg/L to a maximum of 11 000 mg/L. The average TDS is about 7 000 mg/L. The spatial trend of lower to higher salinity distribution across the townsite does follow the topographic slope (higher salinity to the SE of the townsite) and there is an axis of higher salinity groundwater in both shallow and deep observation wells to the north west of the townsite. Shallow groundwater salinity is generally lower than deep groundwater EC, noting that one shallow observation wells (00PY12S) has a high salinity which has risen steadily over the study period. Generally though, time trends and spatial patterns indicates that the Pingelly townsite is situated under the influence of a classic hillslope recharge-discharge zone system, and that direct rainfall and run-off into the townsite infiltrates causing: i) the spatially variable salinity distribution observed across the townsite; and ii) recharge-infiltration within the townsite causes the observed lower salinity in shallower groundwater.
The spatial and temporal trends in groundwater salinity and pH affirm that surface water management (stormwater collection, diversion and management, harvesting surface water) is the best option for Pingelly to manage its shallow watertables and waterlogging problems. Groundwater quality trends and distribution (low range of salinity) does not preclude strategically located shallow drainage as a water management strategy, subject to appropriate design and location of shallow drains. The location and geometry of shallow drains would determine the quality of groundwater likely to discharge into them. The spatial and temporal groundwater quality data presented in this report can be used to assess the likely drainage water quality, depending on location. Groundwater pumping to control watertables is not indicated for Pingelly as a first priority, rather improved surface water management.
Surface drainage is indicated as a possible option for managing shallow watertables in Pingelly. On the basis of the relatively low salinity groundwater quality in Pingelly, management of shallow watertables via surface drainage can be considered as a viable option. With appropriate blending with fresher impounded surface water from dams, groundwater could be blended to arrive at a water quality suitable for townsite irrigation, for example with salt tolerant turf. Salt harvesting from groundwater and RO treatment of recovered groundwater are not considered a viable option because groundwater recovery by pumping bores is not currently proposed at Pingelly.

Appendix G: Water Quality
Gii

Appendix G: Water Quality
Giii
Contents Page
Summary .................................................................................................................................. i
Introduction .............................................................................................................................. iv
1. Approach and Methodology .......................................................................................... 1
2. Data collected and results ............................................................................................. 2
2.1 Spatial distribution and temporal trends in salinity and pH ....................................... 2
2.2 Trace elements ...................................................................................................... 3
2.3 Organics and pathogens ......................................................................................... 4
2.4 Groundwater use options: salt production potential of saline groundwater and reverse osmosis .............................................................................................. 4
List of Figures Figure 1 Spatial distribution of groundwater salinity (EC as mS/m) in shallow
groundwater in the Pingelly townsite ............................................................................ 8
Figure 2 Spatial distribution of groundwater salinity (EC as mS/m) in deep groundwater in the Pingelly townsite ................................................................................................ 9
Figure 3 Spatial distribution of pH in shallow groundwater in the Pingelly townsite ..................... 10
Figure 4 Spatial distribution of pH in deep groundwater in the Pingelly townsite ......................... 11
Figure 5 Temporal variation in shallow groundwater salinity in Pingelly townsite ........................ 12
Figure 6 Temporal variation in deep groundwater salinity in Pingelly townsite ............................ 14
Figure 7 Temporal pattern of groundwater pH in shallow groundwater in Pingelly townsite ...................................................................................................................... 16
Figure 8 Temporal pattern of groundwater pH in deep groundwater in Pingelly townsite ............ 18
Figure 9 Major ion distribution (Schoeller Plot) in Pingelly groundwater ...................................... 20
Figure 10 Major ion compositions (Piper Diagram) in Pingelly groundwater (data from Table G1) .................................................................................................................... 20

Appendix G: Water Quality
Giv
Introduc tion Ground and surface water quality, such as parameters including gross salinity level (electrical conductivity), major ion composition, trace element composition, organic compound composition and total organic carbon, and pathogen (bacterial) status are key determinants for assessment and decision making in several aspects of water resources management of the RT-WM project. Determination of water quality parameters is necessary as a basis for feasibility assessment of options for townsite water management. These include water treatment options (e.g. reverse osmosis desalination, nanofiltration, evaporative desalination), the suitability of treated water as either potable water supply or as potable substitute water, assessment of bulk mineral harvesting potential from saline water, water disposal options, long term implications of de-watering or drainage to control waterlogging and townsite salinisation, water quality assessment for new industries and downstream water users such as livestock, intensive horticulture, aquaculture and townsite irrigation. In addition to these water management issues, groundwater quality and its spatial and temporal distribution and variation provides key information on groundwater surface water interaction and interconnection within groundwater systems when integrated with hydrogeology, groundwater modelling, geophysics and surface hydrology. For example, when integrated with groundwater modelling of townsite dewatering scenarios, knowledge of the spatial distribution of groundwater salinity enables long term predictions of the volume and salinity of recovered groundwater. Such information is critical to the development of long term water treatment and water re-use scenarios and the identification of downstream uses of the recovered groundwater.

Appendix G: Water Quality
G1
1. A pproach and methodology For rural town groundwater, the methodologies developed and employed included:
i) Spatial and temporal monitoring and interpretation of deep, intermediate and shallow water quality parameters in a network of observation bores within each townsite. At Pingelly, temporal monitoring was undertaken approximately quarterly from 2001 to 2004 allowing temporal trends in key water quality parameters to be determined and assessment of whether the salinity trends in groundwater are degrading, improving, or remaining constant. Indicators of the extent of groundwater mixing, surface water-groundwater interaction and recharge to groundwater within townsites were developed from analysis of the spatial and temporal data.
ii) Integration of the spatial distribution of groundwater quality with subsurface basement topography determined by seismic geophysics. Such integration enables more robust and reliable long-term predictions of groundwater recovery volumes and salinity. Development of the necessary data integration and software processing capacity to merge subsurface geophysical interpretation with spatial groundwater quality has been an important methodological development.
iii) Spatial characterisation of major and trace ion compositions, trace contaminant organics and microbiological status was carried out to assess the potable or potable-substitute suitability of groundwater, predict the long term characteristics of recovered or drained groundwater and define the parameters of its desalination by RO and related technologies, and estimate the recovery potential of bulk mineral salts from recovered groundwater,
iv) Establishment of salt and water mass balances of groundwater will provide base data for: a) economic analysis of groundwater pumping and water treatment as a potential source of new, useable water resources as a by-product of shallow watertable waterlogging alleviation; and b) facilitate comparison between recovered groundwater volumes, water quality, recovery and treatment cost in comparison to available or harvestable surface water volumes and quality.
For surface water, very little or no prior information was available and due to low or zero flow conditions in 2004–06, new data could not be collected. Reconnaissance electrical conductivity (salinity) in townsite runoff is being measured at 2 locations at the northern and southern ends of the townsite.
Expected outcomes from these methodologies were the interpretation of groundwater-surface water interaction, especially evidence for whether groundwater recharge occurs within the townsites and, on this basis, determining whether management of townsite surface water will be effective in alleviating waterlogging and salinisation due to shallow watertables. Conversely, it is important to determine whether townsite groundwater management (pumping, drainage) will be effective in long term alleviation of waterlogging, or whether seasonal surface water recharge will rapidly overturn any benefits achieved by groundwater management. Overall, the methodologies provide information that forms the basis for hydrologically and socio-economically sound decision making in relation to the alleviation of salinisation and waterlogging in rural towns.

Appendix G: Water Quality
G2
2. Data c ollected and res ults Groundwater quality data from Pingelly was collected for multiple purposes including:
i) Spatial and temporal monitoring and hydrological interpretation of deep, intermediate and shallow water quality parameters in a network of observation bores. Interpretation of this data in the context of hydrological processes (e.g. recharge, groundwater sources) in the context of developing townsite water management plans is the main purpose for this data.
ii) Determination of the potable or potable substitute potential of treated groundwater by characterisation of major and trace ion compositions, organics and microbiological status.
iii) Determination of desalination potential, in particular variants of RO technologies, for water treatment, downstream water uses and bulk mineral recovery.
In the context of the overall Water Management Plan for Pingelly, where it is concluded that groundwater recovery by pumping was not a necessary or viable water management option, the emphasis in this report and the importance of the application of water quality interpretations will be on point (i) above. Nevertheless, reporting of the details of the extensive groundwater quality data sets collated, collected and analysed is provided in this report.
2.1 S patial dis tribution and temporal trends in s alinity and pH Figures 1 and 2 show the spatial distribution of EC in deep groundwater overlain on DEM, topographic contour and cadastral information for Pingelly. The level of groundwater salinity in Pingelly is the fourth lowest of all sixteen rural towns in the RTLA project, ranging in EC from less than 100 up to 2100 mS/m, equivalent to a total dissolved solids (TDS) range from a minimum of 400 mg/L to a maximum of 11 000 mg/L. The average TDS is about 7 000 mg/L. The spatial trend of lower to higher salinity distribution across the townsite does follow the topographic slope (higher salinity to the SE of the townsite) and there is an axis of higher salinity groundwater in both shallow and deep observation wells to the north west of the townsite. Shallow groundwater salinity is generally lower than deep groundwater EC, noting that one shallow observation wells (00PY12S) has a high salinity (see also Figure 5) which has risen steadily over the study period. Deep groundwater salinities are variable within s smaller band than shallow groundwater and do not show evidence of a rising or changing trend. Generally though, shallow observation wells show a more variable salinity, reflecting the influence of rainfall/infiltration dilution and mixing on shallow groundwater. Thus there is evidence for the frequently observed occurrence of higher salinity in topographically low parts of the landscape and this is highlighted in the salinity risk mapping for Pingelly (Appendix F) which combines salinity with the proximity of the shallow groundwater to the ground surface. This indicates that the Pingelly townsite is situated under the influence of a classic hillslope recharge-discharge zone system, and that direct rainfall and run-off into the townsite infiltrates causing: i) the spatially and temporally variable salinity distribution observed across the townsite (e.g. note the low salinity region clustered around shallow observation bores 00PY2S, 00PY3S, 00PY4S and 00PY20S and 00PY19S in Figure 1); and ii) recharge-infiltration within the townsite causing the observed lower salinity and temporal variability in shallower groundwater.
Figures 3 and 4 show the spatial distribution of pH in shallow and deep groundwaters respectively, overlain on DEM, topographic contour and cadastral information for Pingelly demonstrating the circum-neutral to slightly acidic pH nature of Pingelly groundwater and a trend toward higher pH in shallow groundwaters toward the north of the townsite, although note that the trends are quite weak and spatially variable. Figures 5 and 6 show the

Appendix G: Water Quality
G3
corresponding temporal trends in groundwater salinity for shallow and deep groundwater respectively, during the period 2000 to 2004 indicating the broad range and variability of shallow groundwater EC values and similarly the broad band (but constant) of deep groundwater EC over the range 500–2500 mS/m. Shallow groundwater salinities are temporally quite variable and span a wider range than the range of EC of deep groundwater. Only one observation well (00PY12S) shows a consistently rising EC trend, however the explanation for this is not clear. By contrast the deep groundwaters follow a steady trend over time. Figure 7 shows the corresponding temporal trends in deep groundwater pH during 2000 to 2003 suggesting a slight downward trend in pH from circum-neutral to slightly acidic conditions. Figures 9 and 10 show Schoeller and Piper plots respectively of the major ion composition of groundwater sampled in late 2004 (Table 1). The Schoeller plot shows the clear tendency of shallow groundwater being less saline than deep groundwater, despite the limited number of shallow groundwaters shown in Figure 9.
Shallow groundwaters are generally less saline than deeper groundwater, indicating that rainfall/runoff-infiltration process occurs within the townsite with the net effect of diluting shallow groundwater. This points to surface water diversion and management as being a prospective tool in managing groundwater levels, infiltration and thus waterlogging by shallow groundwater in the townsite. Surface drainage is indicated as a preferred option for managing shallow watertables in Pingelly (Appendix C). The location and geometry of shallow drains would determine the quality of groundwater likely to discharge into them. The spatial and temporal groundwater quality data presented in this report can be used to assess the likely drainage water quality, depending on location. On the basis of the relatively low salinity groundwater quality in Pingelly, management of shallow watertables via surface drainage can be considered as a viable option. With appropriate blending with fresher impounded surface water from dams, groundwater could be blended to arrive at a water quality suitable for townsite irrigation, for example with salt tolerant turf.
The spatial and temporal trends in groundwater salinity and pH affirm that surface water management (stormwater collection, diversion and management, harvesting surface water) is the best option for Pingelly to manage its shallow watertables and waterlogging problems. Groundwater quality trends and distribution (low range of salinity) does not preclude strategically located shallow drainage as a water management strategy, subject to appropriate design and location of shallow drains. Groundwater pumping to control watertables is not indicated for Pingelly as a first priority, rather improved surface water management.
2.2 Trac e elements Trace element concentrations in groundwater for Pingelly are shown in Table 1 and for reference the final column in Table 1 shows the Australian Drinking Water Guideline (ADWG) for the corresponding element. The ADWG is presented as a reference only and does not imply an intention that the groundwater would be used as potable supply as its gross major ion salinity alone is well above the ADWG. Pingelly groundwater has generally lower trace element concentrations than other rural towns due to the generally lower salinity levels and also because pH levels in Pingelly groundwaters are generally circum-neutral thus limiting metal mobility. Iron and manganese levels are low and would not present any difficulties were desalination to be considered, for example by reverse osmosis. Silica levels are somewhat elevated and could be an issue for water treatment by reverse osmosis. Thus in general, Pingelly does not present any unusually high trace element concentrations that would be cause for concern for water use.

Appendix G: Water Quality
G4
2.3 Organic s and pathogens Table G2 shows a set of organic compounds measured to determine whether Pingelly groundwater demonstrated any significant organic contamination from urban sources. The reconnaissance sampling did not identify any location showing clear evidence of low level contamination by organic compounds.
Table G3 shows low level of bacterial counts and are indicated in none of the 13 groundwater samples taken. The occurrence of e-coli was not found. Septic systems are used in Pingelly however no bacteriological contamination was found, however only a limited number of shallow bores could be sampled due to dry wells.
2.4 G roundwater us e options : s alt produc tion potential of s aline groundwater and revers e os mos is
Salt harvesting from groundwater at Pingelly was investigated as a possible use for Pingelly groundwater. However, because Pingelly has relatively low salinity groundwater, it was concluded from related work described in RTLA Water Management Plans in this series and work conducted in parallel on analysis of salt recovery, that groundwater recovery and salt production was not a viable water management option for Pingelly. Similarly RO treatment of recovered groundwater is not considered a viable option because groundwater recovery by pumping bores is not currently proposed at Pingelly. Due to the relatively low salinity of Pingelly groundwater, there is a possibility that groundwater could be pumped and blended with low salinity surface water to supplement irrigation water for townsite watering. However as indicated above groundwater pumping as such is not indicated as a water management strategy. Results from the salt-tolerant turf trials at Wagin could be reviewed to determine whether this is a viable option for Pingelly.

Appendix G: Water Quality
G5
Table G1 Major and minor elements measured in Pingelly groundwater*
Bore description Ccwa id Client ID
Method Units/ Conc.
PY10D 05E1028/001
36
PY08D 05E1028/002
37
PY07D 05E1028/003
38
PY22D 05E1028/004
39
PY02D 05E1028/005
40
PY21D 05E1028/006
41
PY04D 05E1028/007
42
PY13D 05E1028/008
43
PY14D 05E1028/009
44
PY16D 05E1028/010
45
PY16S 05E1028/011
46
PY15D 05E1028/012
47
PY15S 05E1028/0131
48
PY20D 05E1028/014
49
ADWG guideline
Dissolve Oxygen WTW % 42.60 18.80 11.70 17.20 31.80 34.60 35.60 26.50 12.50 4.10 6.00 0.50 6.10 21.10 Elect. Cond. WTW mS/cm 20.80 13.03 5.16 0.71 12.37 16.90 19.07 15.26 14.74 13.50 12.60 12.46 10.98 7.78 pH WTW 5.25 6.40 4.93 6.03 6.36 6.01 3.86 6.35 6.44 6.20 6.9 6.45 6.16 5.97 Temperature WTW C○ 21.30 21.40 22.00 22.00 21.40 21.10 21.50 23.50 24.40 23.90 24.80 20.00 11.60 21.30 Ag iMETIWCICP mg/L < 0.005 < 0.005 < 0.005 < 0.005 < 0.005 < 0.005 < 0.005 < 0.005 < 0.005 < 0.005 < 0.005 < 0.005 < 0.005 < 0.005 A1 iMETIWCICP mg/L 0.57 0.012 0.36 0.02 0.01 < 0.005 8.5 0.1 0.007 0.006 < 0.005 < 0.005 0.007 < 0.005 < 0.2 Alkalinity iALK1WATI mg/L 15 120 30 160 155 130 < 2 150 225 90 85 190 85 80 As iAS1WCVG mg/L < 0.001 < 0.001 < 0.001 < 0.001 0.001 0.001 < 0.001 < 0.001 < 0.001 < 0.001 < 0.001 < 0.001 < 0.001 < 0.001 < 0.007 Ba iMETIWCICP mg/L 0.3 0.041 0.023 0.06 0.058 0.055 0.035 0.089 0.075 0.044 0.057 0.073 0.18 0.042 < 0.7 Be iMETIWCICP mg/L 0.023 < 0.001 < 0.001 < 0.001 < 0.001 < 0.001 0.03 < 0.001 < 0.001 < 0.001 < 0.001 < 0.001 < 0.001 < 0.001 N/A Co3 iALK1WATI mg/L < 2 < 2 < 2 < 2 < 2 < 2 < 2 < 2 < 2 < 2 < 2 < 2 < 2 < 2 Ca iMETIWCICP mg/L 172 52 22.7 14.7 52 105 28.5 86.6 65.5 31.5 31.2 44.6 44.9 10.5 Cd iMETIWCICP mg/L < 0.002 < 0.002 < 0.002 < 0.002 < 0.002 < 0.002 < 0.002 < 0.002 < 0.002 < 0.002 < 0.002 < 0.002 < 0.002 < 0.002 C1 iCL1WAAA mg/L 7130 4030 1440 129 3750 5590 6110 6010 4580 4210 4010 3940 3560 2270 Cr iMETIWCICP mg/L < 0.002 < 0.002 < 0.002 < 0.002 < 0.002 0.004 0.004 < 0.002 < 0.002 < 0.002 < 0.002 < 0.002 < 0.002 < 0.002 < 0.05 Cu iMETIWCICP mg/L 0.007 < 0.005 0.009 < 0.005 0.011 0.008 0.097 0.011 < 0.005 < 0.005 < 0.005 < 0.005 < 0.005 < 0.005 < 2.0 ECond iEC1WZSE mg/L 1980 1250 509 86.6 1220 1610 1810 1650 1420 1290 1230 1180 1040 760 F iF1WASE mg/L 1 0.8 < 0.1 < 0.1 0.4 0.4 1.9 0.5 0.7 0.1 0.2 0.2 0.1 < 0.1 < 1.5 Fe iMETIWCICP mg/L 0.018 < 0.005 0.012 7.4 0.062 0.058 0.15 0.034 0.01 0.016 0.026 3.033 2 0.019 < 0.3 HCO3 iALK1WATI mg/L 18 146 37 195 189 159 < 2 183 275 110 104 232 104 98 K iMETIWCICP mg/L 45.7 35.7 38.7 7.5 47.4 54.8 26.2 42.4 35.4 54.2 57.2 46.3 39.6 17 < 0.001 Mg iMETIWCICP mg/L 859 299 72.8 16.4 363 429 466 490 346 379 359 372 341 97 Mn iMETIWCICP mg/L 12 0.17 0.13 0.06 0.003 0.005 8.1 0.31 0.039 0.042 0.11 0.24 0.23 0.19 N_NO2 iNTRN1WFIA mg/L < 0.02 < 0.02 < 0.02 < 0.02 < 0.02 < 0.02 < 0.02 < 0.02 < 0.02 < 0.02 < 0.02 < 0.02 < 0.02 < 0.02 < 0.5 N_NO3 iNTAN1WFIA mg/L 0.04 0.94 1.7 0.03 0.22 0.04 0.83 0.21 0.58 0.98 0.56 0.02 0.01 2.5 Na iMETIWCICP mg/L 2990 2150 834 103 1790 2880 3460 3140 2550 220 2230 1880 1760 1310 < 50.0 Ni iMETIWCICP mg/L 0.12 < 0.01 < 0.01 < 0.01 < 0.01 0.01 0.02 < 0.01 < 0.01 < 0.01 < 0.01 < 0.01 < 0.01 < 0.01 P_SR iP1WTFIA mg/L < 0.01 0.01 0.03 0.02 0.05 0.03 < 0.01 0.01 0.03 0.01 0.02 0.03 0.02 0.03 < 0.02 P_total iP1WTFIA mg/L < 0.01 0.04 0.03 0.13 0.06 0.03 < 0.01 0.03 0.13 0.01 0.04 0.04 0.06 0.07 Pb iMET1WCMS mg/L 0.019 0.0012 0.0037 0.0001 < 0.0005 0.0008 0.095 0.0025 0.005 0.008 0.0007 0.0016 < 0.0005 0.0006 N/A S iMET1WCICP mg/L 33 150 100 8.3 150 160 270 220 160 150 140 93 80 85 < 0.01 SO4 iANIO1WAIC mg/L 92 410 260 25 490 500 950 750 490 580 470 250 70 260 Sb iMETIWCICP mg/L < 0.05 < 0.05 < 0.05 < 0.05 < 0.05 < 0.05 < 0.05 < 0.05 < 0.05 < 0.05 < 0.05 < 0.05 < 0.05 < 0.05 Se iMETIWCICP mg/L < 0.05 < 0.05 < 0.05 < 0.05 < 0.05 < 0.05 < 0.05 < 0.05 < 0.05 < 0.05 < 0.05 < 0.05 < 0.05 < 0.05 < 0.003 SiO2_Si iSIIWCICP mg/L 89 71 55 43 79 85 110 87 82 68 66 79 75 77 < 0.01 Solid_suspended iSOL1WPGR mg/L < 10 < 10 250 3200 42 < 10 20 9700 730 56 720 750 240 83 Sr iMETIWCICP mg/L 2.1 0.5 0.33 0.15 0.49 0.51 0.71 1.1 0.74 0.32 0.36 0.57 0.56 0.34 TDS sum ixTDS_sm2 mg/L 11000 7100 2700 390 6500 9600 11000 11000 8200 7400 7100 6700 6000 4000 N/A TDS_180C iSOL1WDGR mg/L 13000 8000 3100 530 7586 10000 11000 11000 9000 8400 8000 7600 6600 4600 TOC eCTO1WTCO mg/L 4 7 12 17 2 5 11 11 13 6 9 4 28 11 Zn iMETIWCICP mg/L 0.11 0.008 0.023 0.023 0.016 0.022 0.056 0.073 0.009 0.021 0.013 0.005 0.96 0.03 aION_BAL ixIONBAL3 mg/L 1.8 -1 -3 -5 -3 -1 0 -2 0 -1 1.9 -2 1.9 -4 N/A pH iPH1WASE 5.5 6.4 5.1 6.2 6.4 6.1 4.1 6.4 6.5 6.2 6.2 6.4 6.2 6
* Sampling date: 20/12/2005.

Appendix G: Water Quality
G6
Table G2 Trace organics measured in Pingelly groundwater*
Bore description Ccwa id Client ID
Units/Conc. PY10D
05E1028/001 36
PY08D 05E1028/002
37
PY07D 05E1028/003
38
PY22D 05E1028/004
39
PY02D 05E1028/005
40
PY21D 05E1028/006
41
PY04D 05E1028/007
42
PY13D 05E1028/008
43
PY14D 05E1028/009
44
PY16D 05E1028/010
45
PY16S 05E1028/011
46
PY15D 05E1028/012
47
PY15S 05E1028/0131
48
PY20D 05E1028/014
49
Benzene ug per L H20 < 500 < 500 < 500 < 500 < 500 < 500 < 500 < 500 < 500 < 500 < 500 < 500 < 500 < 500
Toluene ug per L H20 < 200 < 200 < 200 < 200 < 200 < 200 < 200 < 200 < 200 < 200 < 200 < 200 < 200 < 200
Ethylbenzene ug per L H20 < 300 < 300 < 300 < 300 < 300 < 300 < 300 < 300 < 300 < 300 < 300 < 300 < 300 < 300
m&p-xlyene ug per L H20 < 1000 < 1000 < 1000 < 1000 < 1000 < 1000 < 1000 < 1000 < 1000 < 1000 < 1000 < 1000 < 1000 < 1000
o-xylene ug per L H20 < 300 < 300 < 300 < 300 < 300 < 300 < 300 < 300 < 300 < 300 < 300 < 300 < 300 < 300
1,2,3-trimethylbenze ug per L H20 < 1.5 < 1.5 < 1.5 < 1.5 < 1.5 < 1.5 < 1.5 < 1.5 < 1.5 < 1.5 < 1.5 < 1.5 < 1.5 < 1.5
1,2,4-trimethylbenze ug per L H20 < 60 < 60 < 60 < 60 < 60 < 60 < 60 < 60 < 60 < 60 < 60 < 60 < 60 < 60
1,3,5-trimethylbenze ug per L H20 < 10 < 10 < 10 < 10 < 10 < 10 < 10 < 10 < 10 < 10 < 10 < 10 < 10 < 10
Naphthalene ug per L H20 < 10 < 10 < 10 < 10 < 10 < 10 < 10 < 10 < 10 < 10 < 10 < 10 < 10 < 10
2-methylnaphthalene ug per L H20 < 10 < 10 < 10 < 10 < 10 < 10 < 10 < 10 < 10 < 10 < 10 < 10 < 10 < 10
1-methylnaphthalene ug per L H20 < 10 < 10 < 10 < 10 < 10 < 10 < 10 < 10 < 10 < 10 < 10 < 10 < 10 < 10
1,2-DMN ug per L H20 < 10 < 10 < 10 < 10 < 10 < 10 < 10 < 10 < 10 < 10 < 10 < 10 < 10 < 10
1,3/1,7-DMN ug per L H20 < 10 < 10 < 10 < 10 < 10 < 10 < 10 < 10 < 10 < 10 < 10 < 10 < 10 < 10
1,6-DMN ug per L H20 < 10 < 10 < 10 < 10 < 10 < 10 < 10 < 10 < 10 < 10 < 10 < 10 < 10 < 10
2,3/1,4/1,5-DMN ug per L H20 < 10 < 10 < 10 < 10 < 10 < 10 < 10 < 10 < 10 < 10 < 10 < 10 < 10 < 10
2,6/2,7-DMN ug per L H20 < 10 < 10 < 10 < 10 < 10 < 10 < 10 < 10 < 10 < 10 < 10 < 10 < 10 < 10
Phenol ug per L H20 < 500 < 500 < 500 < 500 < 500 < 500 < 500 < 500 < 500 < 500 < 500 < 500 < 500 < 500
m&p-cresol ug per L H20 < 200 < 200 < 200 < 200 < 200 < 200 < 200 < 200 < 200 < 200 < 200 < 200 < 200 < 200
o-cresol ug per L H20 < 200 < 200 < 200 < 200 < 200 < 200 < 200 < 200 < 200 < 200 < 200 < 200 < 200 < 200
* Sampling date: 20/12/2005.

Appendix G: Water Quality
G7
Table G3 Pathogens measured in Pingelly groundwater (Sampling date 20/12/2005)

Appendix G: Water Quality
G8
Figure 1 Spatial distribution of groundwater salinity (EC as mS/m) in shallow groundwater in the Pingelly townsite.

Appendix G: Water Quality
G9
Figure 2 Spatial distribution of groundwater salinity (EC as mS/m) in deep groundwater in the Pingelly townsite.

Appendix G: Water Quality
G10
Figure 3 Spatial distribution of pH in shallow groundwater in the Pingelly townsite.

Appendix G: Water Quality
G11
Figure 4 Spatial distribution of pH in deep groundwater in the Pingelly townsite.

Appendix G: Water Quality
G12
EC of Pingelly Shallow Bores Part 1
0
500
1000
1500
2000
2500
3000
3500
4000
4500
5000
15-Mar-00 01-Oct-00 19-Apr-01 05-Nov-01 24-May-02 10-Dec-02
28-Jun-03 14-Jan-04 01-Aug-04
Date
EC m
S/m
)
00PY01S
00PY02S
00PY03S
00PY04S
00PY07S
00PY08S
00PY09S
EC of Pingelly Shallow Bores Part 2
0
500
1000
1500
2000
2500
3000
3500
4000
4500
5000
15-Mar-00 01-Oct-00 19-Apr-01 05-Nov-01 24-May-02 10-Dec-02
28-Jun-03 14-Jan-04 01-Aug-04
Date
EC (m
S/m
)
00PY10S
00PY11S
00PY12S
00PY15S
00PY16S
00PY19S
00PY20S
00PY21S
Figure 5 Temporal variation in shallow groundwater salinity in Pingelly townsite.

Appendix G: Water Quality
G13
EC of Pingelly Shallow Bores All
0
500
1000
1500
2000
2500
3000
3500
4000
4500
5000
15-Mar-00 01-Oct-00 19-Apr-01 05-Nov-01 24-May-02 10-Dec-02 28-Jun-03 14-Jan-04 01-Aug-04
Date
EC (m
S/m
)
00PY01S00PY02S00PY03S00PY04S00PY07S00PY08S00PY09S00PY10S00PY11S00PY12S00PY15S00PY16S00PY19S00PY20S00PY21S
Figure 5 (continued) Temporal variation in shallow groundwater salinity (all observation wells) in Pingelly townsite.

Appendix G: Water Quality
G14
EC of Pingelly Deep Bores Part 1
0
500
1000
1500
2000
2500
3000
3500
15-Mar-00 01-Oct-00 19-Apr-01 05-Nov-01 24-May-02 10-Dec-02
28-Jun-03 14-Jan-04 01-Aug-04
Date
EC (m
S/m
)
00PY01D
00PY02D
00PY03D
00PY04D
00PY06D
00PY07D
00PY08D
00PY09D
EC of Pingelly Deep Bores Part 2
0
500
1000
1500
2000
2500
3000
3500
15-Mar-00 01-Oct-00 19-Apr-01 05-Nov-01 24-May-02 10-Dec-02 28-Jun-03 14-Jan-04 01-Aug-04
Date
EC (m
S/m
)
00PY10D
00PY11D
00PY13D
00PY14D
00PY15D
00PY16D
00PY17D
00PY18D
Figure 6 Temporal variation in deep groundwater salinity in Pingelly townsite.

Appendix G: Water Quality
G15
EC of Pingelly Deep Bores Part 3
0
500
1000
1500
2000
2500
3000
3500
15-Mar-00 01-Oct-00 19-Apr-01 05-Nov-01 24-May-02 10-Dec-02 28-Jun-03 14-Jan-04 01-Aug-04
Date
EC (m
S/m
)
00PY19D
00PY20D
00PY21D
00PY22D
LCDC02D
LCDC03D
LCDC04D
EC of Pingelly Deep Bores All
0
500
1000
1500
2000
2500
3000
3500
15-Mar-00 01-Oct-00 19-Apr-01 05-Nov-01 24-May-02 10-Dec-02 28-Jun-03 14-Jan-04 01-Aug-04
Date
EC (m
S/m
)
00PY01D
00PY02D
00PY03D
00PY04D
00PY06D
00PY07D
00PY08D
00PY09D
00PY10D
00PY11D
00PY13D
00PY14D
00PY15D
00PY16D
00PY17D
00PY18D
00PY19D
00PY20D
00PY21D
00PY22D
LCDC02D
LCDC03D
LCDC04D Figure 6 (continued) Temporal variation in deep groundwater salinity in Pingelly townsite.

Appendix G: Water Quality
G16
pH of Pingelly Shallow Bores Part 1
3
3.5
4
4.5
5
5.5
6
6.5
7
7.5
15-Mar-00 01-Oct-00 19-Apr-01 05-Nov-01 24-May-02 10-Dec-02 28-Jun-03 14-Jan-04
Date
pH
00PY01S
00PY02S
00PY03S
00PY04S
00PY07S
00PY08S
00PY09S
pH of Pingelly Shallow Bores Part 2
3
3.5
4
4.5
5
5.5
6
6.5
7
15-Mar-00 01-Oct-00 19-Apr-01 05-Nov-01 24-May-02 10-Dec-02 28-Jun-03 14-Jan-04
Date
pH
00PY10S
00PY11S
00PY12S
00PY15S
00PY16S
00PY19S
00PY20S
00PY21S
Figure 7 Temporal pattern of groundwater pH in shallow groundwater in Pingelly townsite.

Appendix G: Water Quality
G17
pH of Pingelly Shallow Bores All
3
3.5
4
4.5
5
5.5
6
6.5
7
7.5
15-Mar-00 01-Oct-00 19-Apr-01 05-Nov-01 24-May-02 10-Dec-02 28-Jun-03 14-Jan-04
Date
pH
00PY01S
00PY02S
00PY03S
00PY04S
00PY07S
00PY08S
00PY09S
00PY10S
00PY11S
00PY12S
00PY15S
00PY16S
00PY19S
00PY20S
00PY21S
Figure 7 (continued) Temporal pattern of groundwater pH in shallow groundwater in Pingelly townsite.

Appendix G: Water Quality
G18
pH of Pingelly Deep Bores Part 1
3
3.5
4
4.5
5
5.5
6
6.5
7
15-Mar-00 01-Oct-00 19-Apr-01 05-Nov-01 24-May-02 10-Dec-02 28-Jun-03 14-Jan-04
Date
pH
00PY01D
00PY02D
00PY03D
00PY04D
00PY06D
00PY07D
00PY08D
00PY09D
pH of Pingelly Deep Bores Part 2
3
3.5
4
4.5
5
5.5
6
6.5
7
15-Mar-00 01-Oct-00 19-Apr-01 05-Nov-01 24-May-02 10-Dec-02 28-Jun-03 14-Jan-04
Date
pH
00PY10D
00PY11D
00PY13D
00PY14D
00PY15D
00PY16D
00PY17D
00PY18D
Figure 8 Temporal pattern of groundwater pH in deep groundwater in Pingelly townsite.

Appendix G: Water Quality
G19
pH of Pingelly Deep Bores Part 3
3
3.5
4
4.5
5
5.5
6
6.5
7
15-Mar-00 01-Oct-00 19-Apr-01 05-Nov-01 24-May-02 10-Dec-02 28-Jun-03 14-Jan-04
Date
pH
00PY19D
00PY20D
00PY21D
00PY22D
LCDC02D
LCDC03D
LCDC04D
pH of Pingelly Deep Bores All
3
3.5
4
4.5
5
5.5
6
6.5
7
15-Mar-00 01-Oct-00 19-Apr-01 05-Nov-01 24-May-02 10-Dec-02 28-Jun-03 14-Jan-04
Date
pH
00PY01D
00PY02D
00PY03D
00PY04D
00PY06D
00PY07D
00PY08D
00PY09D
00PY10D
00PY11D
00PY13D
00PY14D
00PY15D
00PY16D
00PY17D
00PY18D
00PY19D
00PY20D
00PY21D
00PY22D
LCDC02D
LCDC03D
LCDC04D Figure 8 (continued) Temporal pattern of groundwater pH in deep groundwater in Pingelly townsite.

Appendix G: Water Quality
G20
Ca Mg Na Cl SO4 HCO3
Major ion
1.0
10.0
100.0
1000.0
10000.0
(mg/
l)
Schoeller Plot - Pingelly Groundwater
LegendLegend
Deep Groundwater
Shallow Groundwater
Figure 9 Major ion distribution (Schoeller Plot) in Pingelly groundwater.
80 60 40 20 20 40 60 80
2040
6080
2040
6080
2040
6080
2040
6080
Ca Na+K HCO3 Cl
Mg SO4
<=Ca + Mg
Cl +
SO4=
>
Piper Diagram - Pingelly Groundwater
LL
L
L L
L
L L
L
LL
L
L
L
L
LL
L
LL
L
LL
L
JJ
J
LL
L
JJ
J
L L
L
LL
L
LL
L
Pingelly GroundwaterPingelly Groundwater
L Deep Groundwater
J Shallow Groundwater
Figure 10 Major ion compositions (Piper Diagram) in Pingelly groundwater (data from Table G1).

Appendix H
Water balance study of Pingelly
Andrew Grant and Ashok Sharma
CSIRO


Appendix H: Water Balance
Hi
S ummary The township of Pingelly (Western Australia) is subject to the problems of scarce water and urban salinity. The purpose of this study is to complete a water balance of the Pingelly township. The results of the water balance will enable more informed decisions to be made about how to address water scarcity and urban salinity in Pingelly.
Water balance modelling allows us to understand where water is being distributed within a township over time. The volume of stormwater runoff, wastewater discharge and scheme water consumption is calculated each day for the period of the study, which in this case is 1950–2005. Calculating water flows for each day allows us to understand the variation in water flows and the reliability of water supplies (both proposed and existing). It also allows us to evaluate potential water management options such as rainwater tanks, greywater tanks, reclaimed water, stormwater harvesting and aquifer storage and recharge.
The water balance for Pingelly was calculated using end-use consumption data supplied by the Water Corporation of Western Australia and making a series of assumptions. The water balance results are shown in Table E1 below. Confidence can be placed in the water demand figures as they are based primarily on Water Corporation data. Wastewater figures are derived from the water demand figures. The stormwater figures should be considered indicative only and should not be relied upon because they rely on engineering judgement only and have not been calibrated to any real data.
Table E1 Water balance summary
Population 729
Climate Rainfall 443 Evaporation 1 708
Scheme Water Supply (ML/y) Total 174 Indoor 93 Outdoor 81
Scheme Water Supply (kL/cap/y) Total 239 Indoor 127 Outdoor 111
Residential Scheme Water Supply (kL/cap/y) Total 159 Indoor 66 Outdoor 93
Wastewater (ML/y) 93 (kL/cap/y) 127
Stormwater Runoff (ML/y) 488 (kL/cap/y) 669
Rainwater tanks and greywater reuse are specifically investigated in this study to determine their effectiveness in supplying residential areas. Each house was modelled with a rainwater tank of 10 kL for residential areas and 30 kL for semi-rural areas. This size was considered to be an appropriate balance between rainwater tank volume and expected rainwater consumption however a detailed cost benefit analysis was not completed. The demand placed upon the tanks was for toilet flushing and garden irrigation. The study found that rainwater tanks would not be able to meet this demand and would only succeed to in reducing total scheme water consumption by 7 per cent (see Table E2). Stormwater runoff in the study area would be reduced by 3 per cent (see Table E2).

Appendix H: Water Balance
Hii
Greywater use would be more effective than rainwater tanks for reducing scheme water consumption. If simple diversion of greywater (i.e. kitchen, bathroom and laundry water) to garden were undertaken for each property, scheme water consumption could be reduced by 12 per cent and wastewater discharge by 23 per cent (Table E3). If a greywater treatment and storage system were used for toilet flushing and garden irrigation, scheme water consumption could be reduced by 16 per cent and wastewater consumption by 31 per cent (Table E3).
Table E2 Rainwater tank summary
Residential roof runoff generation (ML/yr) 17
Raintank water use* (ML/yr) 15
Scheme water supply saving (%) 7%
Residential roof runoff reduction (%) 76%
Stormwater runoff reduction for study area (%) 3% * This is equal to roof runoff reduction (ML/yr).
Table E3 Greywater use summary
Greywater Generation (ML/yr) 38
Greywater use (ML/yr) Irrigation 22 Irrigation and toilet 28
Scheme water supply saving (%) Irrigation 12% Irrigation and toilet 16%
Reduction in wastewater flows (%) Irrigation 23% Irrigation and toilet 31%
* This is equal to reduction in flows to the wastewater treatment plant.
Greywater use and rainwater tanks can improve the management of water in Pingelly however they are not the only options. End use demand management in the form of water efficient appliances could achieve a significant reduction in scheme water consumption (up to approximately 12 per cent). Water consumption in Pingelly is well above to the state average. Pingelly residential water consumption is estimated to be 159 kL/capita/year which compares to the Western Australian average for 2000–01 of 132 kL/cap/year (ABS 2004) and the Perth average for single residential houses of 136 kL/cap/year (Loh & Coghlan 2003). End use demand management is therefore an attractive option. If reclaimed water use for parks and gardens is not already employed in Pingelly consideration should be given to doing so. Other management options such as stormwater collection and use, groundwater extraction and use, and reclaimed water use for year round demands (e.g. toilet flushing, industrial use) could also be considered. Further analysis is required to determine how effective and feasible these options would be.

Appendix H: Water Balance
Hiii
Contents Page
Summary .................................................................................................................................. i
1. Introduction .................................................................................................................... 1
2. Input data ........................................................................................................................ 1
2.1 End use data .......................................................................................................... 1
2.2 Topography data .................................................................................................... 5
2.3 Climate data ........................................................................................................... 6
2.4 Stormwater runoff ................................................................................................... 7
3. Water balance ................................................................................................................. 8
3.1 Modelling approach ................................................................................................ 8
3.2 Results ................................................................................................................... 9 3.2.1 Base Case—Scheme water for all end uses ............................................... 9 3.2.2 Scenario 1: Rainwater tanks supplying garden and toilets .......................... 12 3.2.2 Scenario 2: Greywater reuse for garden and toilet ...................................... 15 3.2.4 Scenario 3: Greywater diversion to garden ................................................. 17 3.2.5 Comparison ............................................................................................... 18
4. Discussion ...................................................................................................................... 20
4.1 Rainwater tanks ...................................................................................................... 20 4.1.1 Rainwater tanks for irrigation only ................................................................. 20 4.1.2 Greywater ..................................................................................................... 21 4.1.3 Outdoor water use ........................................................................................ 22 4.1.4 End use demand management ..................................................................... 23 4.1.5 Reclaimed water and stormwater collection and use ..................................... 23 4.1.6 Rainwater tank, greywater system and plumbing costs ................................. 24
5. Conclusion ..................................................................................................................... 26
6. References ...................................................................................................................... 28

Appendix H: Water Balance
Hiv
Page
Tables Table 1 Water servicing options to be modelled .......................................................................... 1
Table 2 End Use for each sector in Pingelly ............................................................................... 2
Table 3 Monthly consumption figures for Dowerin, Merredin and Katanning ............................... 2
Table 4 Estimated indoor and outdoor scheme water consumption for each Pingelly sector ........ 3
Table 5 Estimated Residential Indoor End Use Breakdown ........................................................ 3
Table 6 Topographical data for Pingelly ...................................................................................... 5
Table 7 Aquacycle Parameters .................................................................................................. 9
Table 8 Average yearly scheme water use, wastewater discharge and stormwater runoff for base case .............................................................................................................. 10
Table 9 Summary of end use for Pingelly ................................................................................... 11
Table 10 Average monthly stormwater runoff and wastewater generation for Pingelly base case ................................................................................................................... 12
Table 11 Average yearly scheme water use, rainwater tank use, wastewater discharge and stormwater runoff for Pingelly Scenario 1 .............................................................. 14
Table 12 Average monthly stormwater runoff and wastewater generation for Pingelly Scenario 1 ................................................................................................................... 15
Table 13 Average yearly scheme water use, greywater tank use, wastewater discharge and stormwater runoff for Pingelly Scenario 2 .............................................................. 17
Table 14 Average yearly scheme water use, greywater tank use, wastewater discharge and stormwater runoff for Pingelly Scenario 3 .............................................................. 18
Table 15 Comparison of Scenarios ............................................................................................ 19
Table 16 Percentage difference from base case to Scenario 1, Scenario 2 and Scenario 3 ......... 20
Table 17 Comparison of rainwater tanks used for irrigation with rainwater tanks used for irrigation and toilet flushing .......................................................................................... 21
Table 18 Comparison of greywater used for irrigation with greywater used for irrigation and toilet flushing ........................................................................................................ 21
Table 19 Outdoor water use summary ........................................................................................ 23
Table 20 Rainwater tank installation and pump costs ................................................................. 25
Table 21 Total cost of 20 Kilolitre rainwater tank ......................................................................... 25
Table 22 Cost of Rainwater Tanks ............................................................................................. 25
Table 23 Greywater system materials, costs, energy and maintenance requirements (Diaper 2004) .............................................................................................................. 26
Table 24 Water balance summary .............................................................................................. 27
Table 25 Rainwater tank summary ............................................................................................. 27
Table 26 Greywater use summary .............................................................................................. 28

Appendix H: Water Balance
Hv
Page Figures Figure 1 Scheme water end use breakdown for Pingelly ............................................................. 4
Figure 2 Rainfall and Evaporation for Pingelly ............................................................................ 6
Figure 3 Average monthly rainfall and evaporation ..................................................................... 7
Figure 4 Imported water consumption, stormwater runoff and wastewater discharge over time for Pingelly base case ........................................................................................... 10
Figure 5 Volumetric reliability and consumption curves for rainwater tanks ................................. 13
Figure 6 Imported water consumption, stormwater runoff, rainwater tank use and wastewater discharge over time for Pingelly Scenario 1 ................................................ 14
Figure 7 Volumetric reliability and consumption curves for greywater tanks ................................ 16
Figure 8 Imported water consumption, stormwater runoff, greywater tank use and wastewater discharge over time for Pingelly Scenario 2 ................................................ 17
Figure 9 Imported water consumption, stormwater runoff, greywater use and wastewater discharge over time for Pingelly Scenario 3 .................................................................. 18


Appendix H: Water Balance
H1
1. Introduc tion This report details water balance results for the township of Pingelly, Western Australia. Water balance modelling enables us to understand where water is being distributed within a township. It considers the volume of water being imported into the township, the volume of stormwater runoff and the volume of wastewater discharge. All water balance calculations have been calculated on a daily time step which means the model can reflect seasonal factors such as rainfall and evaporation which influence (among others) irrigation demand and stormwater runoff.
Water balance modelling also allows us to compare water management options. In the case of Pingelly, possible water management options include rainwater tanks, end-use demand management, groundwater extraction and use, stormwater reuse, wastewater reuse and greywater reuse. Water balance modelling will be able to determine how much imported water, wastewater discharge and stormwater runoff would vary for different options and the estimated required size of water storages (such as rainwater tanks, greywater tanks, stormwater storages, groundwater storages and treated wastewater storages).
This report analyses the base case, or in other words, the existing water balance of Pingelly and compares it to scenarios where: i) every house uses a rainwater tank for garden irrigation and toilet flushing; ii) every house treats, stores and reuses greywater for garden irrigation and toilet flushing; and iii) every house diverts untreated greywater for sub-surface garden irrigation. ('Greywater' refers to water being produced from the kitchen, laundry and bathroom.) A summary of the scenarios being modelled is shown in Table 1.
Table 1 Water servicing options to be modelled
Residential Other
Other Garden Toilet All end uses
Base Case Imported water
Scenario 1 Rainwater
Scenario 2 Treated Greywater from on site treatment and storage unit
Scenario 3 Direct Greywater sub-surface irrigation (no storage)
This report forms part of CSIRO’s 'Water for a Healthy Country' Rural Town—Liquid Assets project.
2. Input data
2.1 E nd us e data End use data was supplied by the Water Corporation of Western Australia. The data were annual figures (for the years 2003 and 2004) with splits between land use types of ‘residential’, ‘commercial’, ‘farmland’, ‘vacant land’ and ‘other’. The data were for use of ‘scheme water’ only (i.e. there was no data on alternative water uses such as rainwater tanks, recycled water, bore water, etc.). ‘Scheme water’ refers to water that is supplied by the Water Corporation of WA.
The end use data was matched with the topographic data (supplied by CSIRO Land and Water) and population data to produce estimated end use for each urban sector as shown in Table 2. Industrial, Commercial and Community sectors were lumped together because the

Appendix H: Water Balance
H2
data were not of a high enough resolution to estimate each individual sector. Residential houses were assumed to have the same occupancy rate (in this case, 2.03 people per unit based on ABS, 2002).
The breakdown between indoor and outdoor consumption was estimated using monthly end use data for the nearby towns of Dowerin, Katanning and Merredin (there was no monthly data available for Pingelly). Monthly end use data is very useful as it demonstrates seasonal variation in end use. To estimate the percentage of consumption that was seasonal (i.e. outdoor use), it was assumed that during the month of least consumption there is no irrigation.
Table , which shows summarised data from Dowerin, Katanning and Merredin, shows that the month of least consumption is September. Outdoor use is assumed to be the difference between total use and the baseline, where baseline is assumed to be equal to the average daily water use in September.
Table 2 End use for each sector in Pingelly
Population Lots People per unit Water use (ML/yr)
Residential 654 323 2.03 104
Semi rural 75 37 2.03 12
Vacant land 177 5
Industrial, commercial and community 103 53
Total 729 174
Table 3 Monthly consumption figures for Dowerin, Merredin and Katanning
Total
consumption (ML)
Estimated outdoor
consumption (ML)
January 129 85
February 114 74
March 112 68
April 88 46
May 66 22
June 45 2
July 45 1
August 44 0
September 42 0
October 79 35
November 102 60
December 113 70
Total 979 464

Appendix H: Water Balance
H3
All other end use, i.e. residential outdoor and the other sectors, were estimated using the monthly data and the annual data and can be seen in Table 4. Breakdown in indoor residential consumption to each end use was based on data for Perth homes, Loh & Coghlan, 2003, and is summarised in Table .
Table 4 Estimated indoor and outdoor scheme water consumption for each Pingelly sector
Pop. Lots Water use (ML/yr)
Indoor use (kL/yr)
Outdoor use (kL/yr)
Indoor use
(kL/unit/ year)
Outdoor use
(kL/unit/ year)
Residential 654 323 104 43 61 134 189
Semi rural 75 37 12 5 7 134 189
Vacant land 177 5 0 5 0 26
Industrial, commercial and community 103 53 45 9 433 83
Total 729 174 93 81
Table 5 Estimated residential indoor end use breakdown
End use Percentage indoor use L/capita/day
Toilet 21% 38
Laundry 32% 58
Bathroom 38% 69
Kitchen 9% 16
Total 100% 181
The proportion of scheme water being used for garden irrigation in residential houses is estimated at 59 per cent, which compares to the Western Australian average of 50 per cent (ABS 2004) and the Perth detached houses average of 54 per cent (Loh & Coghlan 2003). Possible reasons for this difference include the very dry climate in Pingelly, the water consumption culture of Pingelly being different to Perth and Western Australia in general or an under estimation of indoor water use in Pingelly (which would lead to an over-estimation of outdoor water use). The estimated breakdown in scheme water consumption for Pingelly is shown in Figure 1.

Appendix H: Water Balance
H4
Average Annual Water Usage = 174 ML
Residential - Toilet6%
Residential - Laundry9%
Residential - Bathroom11%
Residential - Kitchen2%
Residential - Outdoor38%
Industrial, Commercial, Community (seasonal)
5%
Industrial, Commercial, Community (baseline)
26%
Vacant Land3%
Figure 1 Scheme water end use breakdown for Pingelly.

Appendix H: Water Balance
H5
2.2 Topography data The topography data was supplied by CSIRO Land & Water using town planning zone classification information. This data can be sourced from the GIS information on ftp://[email protected]/rural_towns/BaseData/ for those with access.
Table 6 Topographical data for Pingelly
Population Lots People per unit Average block size (m2)
Average roof area (m2)
Average paved area (m2)
Average garden/ lawn area (m2)
Total size (ha)
Residential 654 323 2.03 2 040 125 22 1 894 65.90
Semi Rural 75 37 2.03 18 207 266 47 17 894 67.37
Vacant Land 177 5 118 0 0 5 118 90.60
Industrial, Commercial and Community 103 2 717 206 148 2 363 27.99
Open Space 334.26
Road and Rail 113.05
Total 729 699.15

Appendix H: Water Balance
H6
2.3 C limate data Climate file data has been sourced from SILO Data Drill (latitude and longitude 32 33'S 117 06'E). Evaporation data prior to 1970 is synthetic pan, and from 1/1/1970, class A pan. The climate series used for modelling covered 56 years from 1950 to 2005. Annual figures for rainfall and evaporation are shown in Figure 2.
The average annual rainfall for this climate series is 443 millimetres and the average annual evaporation is 1 708 millimetres. This compares to the long term averages supplied by the Bureau of Meteorology (see www.bom.gov.au/climate/averages/) of 448 millimetres of rainfall at Pingelly Station (there is no recorded data on evaporation).
0
500
1000
1500
2000
2500
1950 1960 1970 1980 1990 2000
Mill
imet
ress
Rainfall Evaporation
Figure 2 Rainfall and evaporation for Pingelly.
Figure 3 shows the average monthly rainfall and evaporation for the data set (1950–2005). Note that rainfall and evaporation are both highly seasonal, with the wet months of May to August having the most rainfall and least evaporation and extremely high evaporation and low rainfall in the summer months.

Appendix H: Water Balance
H7
0
10
20
30
40
50
60
70
80
90
Jan Feb Mar Apr May Jun Jul Aug Sep Oct Nov Dec
Mill
imet
res
of R
ainf
all
0
50
100
150
200
250
300
Mill
imet
res
of E
vapo
ratio
n
Rainfall Evaporation
Figure 3 Average monthly rainfall and evaporation.
2.4 S tormwater runoff It is very important to understand that stormwater runoff data was not available to calibrate the model. Ideally, volumetric runoff coefficients would have been available (i.e. the volume of stormwater runoff divided by the volume of rainfall) for each surface type in the study area. This would have allowed us to adjust variables in the model such as 'percentage effective area', 'initial loss' and 'soil depth capacity' to calibrate the stormwater runoff with recorded results. Using typical values for Aquacycle (Table 7) resulted in a volumetric runoff coefficient of 16 per cent. Such a value is reflective of the large percentage of pervious area within the study area and the dry climate however we cannot be sure of the true value. The lack of stormwater runoff calibration means that the values seen in the results section can only be considered as indicative and should not be relied upon for design and treated with caution for decision making.

Appendix H: Water Balance
H8
3. Water balance
3.1 Modelling approac h A water balance computer model ‘AQUACYCLE’ (Mitchell, 2000) has been used to analyse the water balance outcomes for the various water servicing options considered for the area.
Aquacycle integrates potable water supply, wastewater reticulation and stormwater flows into a single framework, and thus provides a holistic view of the urban water system in terms of the total water management. It uses a daily time step and represents an urban area in a quasi-distributed manner. Climate, land use and water servicing options associated with infrastructure required are the inputs into Aquacycle. It is able to account for:
● a variety of land use types; residential, industrial, commercial, parks and public open spaces
● different conventional water infrastructure designs such as combined sewers, septic tanks, separate stormwater systems, and groundwater bores
● local climatic conditions.
Aquacycle has three nested spatial scales to describe the components of an urban area. The unit block (single allotment) represents a building and associated paved and pervious areas such as paths, driveways and gardens. The proportion of these areas are specified by the user, allowing a range of allotment types such as flats, commercial premises and industry to be represented as well as detached dwellings. The neighbourhood (cluster) comprises of a number of identical unit blocks as well as roads and public open space. The catchment represents the grouping of one or more clusters that may or may not have the same land use. The order in which stormwater and wastewater flows from one cluster to another can be specified by the user, providing the ability to represent how they actually flow through a catchment
The different spatial scales allow a variety of different water infrastructure to be modelled, for example:
● At allotment scale—water usage efficiency, rain tanks, greywater collection and sub-surface irrigation, on-site wastewater collection, treatment and reuse.
● At neighbourhood scale—open space irrigation efficiency, aquifer storage and recovery, stormwater collection, treatment and use, and local wastewater collection, treatment and use.
● At catchment/estate scale—stormwater collection, treatment and use, and wastewater collection, treatment and use.
Assumptions used in modelling representation The following assumptions have been made for the water balance of the development site:
● The geology has been considered constant throughout the area. This simplifies the data input requirements and allows the analysis of simulation results to focus on land use impacts alone, discounting impacts due to geological variations.
● Indoor water use is constant throughout the year. There is no day-to-day and household-to-household variation considered.
● Garden irrigation was based on soil moisture content. Irrigation was performed when the soil moisture fell below a certain level. The level was calibrated based on the end use data shown in Table 4.

Appendix H: Water Balance
H9
The calibration parameters used in the water balance modelling are given Table 7.
Table 7 Aquacycle parameters
Parameters Values
Area of pervious soil store 1 (%) 50
Capacity of soil store 1 (mm) 50
Capacity of soil store 2 (mm) 120
Roof area maximum initial loss (mm) 1
Effective roof area % 95
Paved area maximum initial loss (mm) 1.5
Effective paved area % 10
Road area maximum initial loss (mm) 1.5
Effective road area % 20
Base flow index 0.1
Base flow recession constant 0
Infiltration index 0
Infiltration store recession constant 0
% surface runoff as inflow 0
Garden trigger to irrigate 0.27–0.33
Rainwater tank first flush 25
3.2 R es ults
3.2.1 B as e c as e—s c heme water for all end us es
As can be seen in Figure 4, imported water volume and wastewater discharge volume is fairly constant from year to year for the base case, hovering around 170 ML and 90 ML respectively. Imported water varies from a peak of 194 ML in 1994 to a trough of 151 ML in 1955. Stormwater discharge varies from 57 ML in 1979 to 1 657 ML in 1955. Note that in 1955 we have the highest stormwater discharge and lowest imported water consumption. This is not a coincidence as the imported water volume and stormwater flow is influenced by the amount of rainfall and evaporation. In reality, wastewater discharge would be influenced by stormwater infiltration and would vary from year to year, however stormwater infiltration to the wastewater system was not included in the model. Stormwater runoff is highly variable because it is heavily dependant on rainfall which is highly variable.
As can be seen in Figure 4, the average annual scheme water use, wastewater discharge and stormwater runoff is estimated to be 174 ML per year, 93 ML per year and 488 ML per year respectively. The high stormwater runoff is due to the large amount rural, road and open space area included in the study area. A large portion of the stormwater runoff is from road and open space area (80 per cent), which comprises approximately 64 per cent of the study area. The disproportionately high runoff from the road and open space sector is due to the paved road surface which causes greater volumes of runoff than the predominantly pervious surfaces in the study area.

Appendix H: Water Balance
H10
0
50
100
150
200
250
1950 1960 1970 1980 1990 2000
Year
Impo
rted
Wat
er a
nd W
aste
wat
er D
isch
arge
(M
egal
itres
per
yea
r)
0
200
400
600
800
1000
1200
1400
1600
1800
Stor
mw
ater
Dis
char
ge (M
egal
itres
per
yea
r)
Imported Water (ML/yr) Wastewater discharge (ML/yr) Stormwater discharge (ML/yr)
Figure 4 Imported water consumption, stormwater runoff and wastewater discharge over time for Pingelly base case.
Table 8 Average yearly scheme water use, wastewater discharge and stormwater runoff for base case
Neighbourhood Imported water use (ML/yr)
Wastewater discharge (ML/yr)
Stormwater runoff (ML/yr)
Residential small 104 43 34
Semi rural 12 5 22
Rural/vacant land 5 0 25
Commercial, Industrial and Community 53 45 16
Road and open space 0 0 392
Total 174 93 488
Table 9 shows the breakdown in water consumption between indoor and outdoor use for different land use zones. The total annual figure and breakdown between zones has been calibrated to Water Corporation water consumption data. The proportion of water used indoor and outdoor has been based on monthly water consumption data, also supplied by Water Corporation.
Stormwater runoff from the study area totals 488 ML per year on average and this is largely from pervious areas (due to the large rural/open space area included in the study). Average monthly runoff has been summarised in

Appendix H: Water Balance
H11
Table 0. Runoff from the pervious areas is largely confined to the wettest months of the year, May through to August, which make up almost 90 per cent of runoff. February also has a high amount of runoff compared to adjoining months which is due to a number of extreme rainfall events in the climate sequence (82 mm on 17 February 1955, 65 mm on 28 February 1976, 60 mm on 18 February 1981). Runoff from residential rooves comprises approximately 3 per cent of stormwater flow in the study area and approximately 30 per cent in residential and semi rural areas.
Table 9 Summary of end use for Pingelly
Month
Indoor use (ML) Outdoor use (ML)
Residential Others Subtotal Residential
Commercial, industrial, community
Other Subtotal Toilet Others
January 0.9 3.2 3.8 7.9 10.1 1.3 0.7 12.0
February 0.8 2.9 3.5 7.2 8.4 1.1 0.6 10.0
March 0.9 3.2 3.8 7.9 9.3 1.2 0.6 11.1
April 0.8 3.1 3.7 7.6 6.9 0.9 0.5 8.2
May 0.9 3.2 3.8 7.9 4.3 0.5 0.3 5.2
June 0.8 3.1 3.7 7.6 0.6 0.1 0.0 0.7
July 0.9 3.2 3.8 7.9 0.2 0.0 0.0 0.3
August 0.9 3.2 3.8 7.9 0.4 0.0 0.0 0.4
September 0.8 3.1 3.7 7.6 2.6 0.3 0.2 3.0
October 0.9 3.2 3.8 7.9 7.0 0.9 0.5 8.3
November 0.8 3.1 3.7 7.6 8.4 1.1 0.6 10.0
December 0.9 3.2 3.8 7.9 10.0 1.3 0.7 12.0
Total 10.1 38.1 44.6 92.8 68.0 8.5 4.5 81.1

Appendix H: Water Balance
H12
Table 10 Average monthly stormwater runoff and wastewater generation for Pingelly base case
Month Wastewater generation
(ML/y)
Stormwater runoff (ML)
Total Total impervious
Residential rooves
Other impervious
(roads, paved areas)
Total pervious
Garden (inc. semi
rural)
January 7.9 11.5 2.9 0.5 2.5 8.6 0.2
February 7.2 16.8 4.5 0.7 3.8 12.2 2.4
March 7.9 5.2 3.5 0.6 2.9 1.7 0.1
April 7.6 11.0 6.6 1.1 5.5 4.5 0.2
May 7.9 36.4 13.3 2.2 11.1 23.0 0.4
June 7.6 132.3 19.7 3.2 16.5 112.6 19.5
July 7.9 164.9 18.1 3.0 15.1 146.8 39.0
August 7.9 81.5 12.9 2.2 10.8 68.6 26.0
September 7.6 13.6 7.7 1.3 6.4 6.0 2.0
October 7.9 6.0 4.9 0.8 4.1 1.1 0.0
November 7.6 3.5 3.5 0.6 2.9 0.0 0.0
December 7.9 4.9 2.4 0.4 2.0 2.5 0.1
Total 92.9 487.6 100.0 16.6 83.4 387.6 89.8
3.2.2 S cenario 1: R ainwater tanks s upplying garden and toilets
Scenario 1 is an investigation into the effectiveness of rainwater tanks in reducing scheme water use and stormwater runoff. The size of rainwater tanks to be used was based on the volumetric efficiency curves shown in Figure 5 (where volumetric efficiency is defined as the percentage of demand met over the modelling period). Rainwater tanks of 10 kilolitres for residential areas and 30 kilolitres for semi-rural areas have been chosen. This is seen as a compromise between available space, cost and maximising volumetric efficiency (and is essentially represented by the point on the graph where the curves begin to flatten).

Appendix H: Water Balance
H13
0%
5%
10%
15%
20%
25%
30%
35%
40%
45%
0 10 20 30 40 50 60 70 80 90 100
Volume (kL)
Volu
met
ric E
ffici
eny
(%)
0
10
20
30
40
50
60
70
80
90
100
Con
sum
ptio
n (k
L/ho
useh
old/
year
)
Residential (VolumetricEfficiency)
Semi Rural (VolumetricEfficiency)
Residential(Consumption)
Semi Rural(Consumption)
Figure 5 Volumetric reliability and consumption curves for rainwater tanks.
Figure 6 below shows that scheme water consumption varies over the modelling period from a peak of 186 ML in 1972 to 132 ML in 1955. This is a reduction in peak of 8 ML from the base case. Stormwater runoff varies from 48 ML in 1979 to 1 638 ML in 1955. This is a reduction in peak of 19 ML from the base case.

Appendix H: Water Balance
H14
0
20
40
60
80
100
120
140
160
180
200
1950 1960 1970 1980 1990 2000
Year
Impo
rted
Wat
er, R
aint
ank
Use
and
Was
tew
ater
D
isch
arge
(Meg
alitr
es p
er y
ear)
0
200
400
600
800
1000
1200
1400
1600
1800
Stor
mw
ater
Dis
char
ge (M
egal
itres
per
yea
r)
Imported Water (ML/yr) Wastewater discharge (ML/yr)Raintank Use (ML/yr) Stormwater discharge (ML/yr)
Figure 6 Imported water consumption, stormwater runoff, and rainwater tank use and wastewater discharge over time for Pingelly Scenario 1.
Adoption of rainwater tanks for toilet and garden use in every residential household would mean approximately 13 ML of rainwater and 161 ML of scheme water would be consumed on average each year. A summary of water consumption and discharge from each sector within Pingelly is shown in Table 11.
Table 11 Average yearly scheme water use, rainwater tank use, and wastewater discharge and stormwater runoff for Pingelly Scenario 1
Neighbourhood Rainwater tank use (ML/yr)
Imported water use
(ML/yr)
Wastewater discharge
(ML/yr) Stormwater
runoff (ML/yr)
Residential 10 94 43 23
Semi rural 2 10 5 19
Rural/vacant land 0 5 0 25
Commercial, Industrial and Community 0 53 45 16
Road and open space 0 0 0 392
Total 13 161 93 475
Adoption of rainwater tanks would reduce stormwater runoff from the study area by an average of approximately 13 ML per year. Rainwater tanks only have a minor impact on stormwater runoff from the study area because a large portion of runoff comes from non-residential areas. Residential rooves make up only a small portion of total stormwater runoff (see Table 12).

Appendix H: Water Balance
H15
Table 12 Average monthly stormwater runoff and wastewater generation for Pingelly Scenario 1
Month Wastewater generation
(ML/y)
Stormwater runoff (ML)
Total Total impervious
Residential rooves
Other impervious
(roads, paved areas)
Total pervious
Garden (inc. semi
rural)
January 7.9 11.1 2.5 0.5 2.5 8.6 0.2
February 7.2 16.1 3.8 0.7 3.8 12.3 2.4
March 7.9 4.6 2.9 0.6 2.9 1.8 0.1
April 7.6 9.9 5.4 1.1 5.5 4.5 0.2
May 7.9 34.3 11.2 2.2 11.1 23.1 0.4
June 7.6 129.9 17.2 3.2 16.5 112.6 19.5
July 7.9 163.4 16.5 3.0 15.1 146.9 39.0
August 7.9 80.4 11.8 2.2 10.8 68.7 26.0
September 7.6 12.6 6.6 1.3 6.4 6.0 2.0
October 7.9 5.2 4.1 0.8 4.1 1.1 0.0
November 7.6 2.9 2.9 0.6 2.9 0.1 0.0
December 7.9 4.5 2.0 0.4 2.0 2.5 0.1
Total 92.9 474.9 86.8 16.6 83.4 388.1 89.8
3.2.2 S cenario 2: G reywater reus e for garden and toilet
Scenario 2 is an investigation into the effectiveness of on-site greywater treatment and storage in reducing scheme water use and wastewater discharge. The size of the greywater tank to be used was based on the volumetric efficiency curves shown in Figure 7 (where volumetric efficiency is defined as the percentage of demand met over the modelling period). A greywater tank of 1 kL was adopted for all residential properties. A greywater tank size greater than 1 kL would only improve efficiency marginally, so a small storage of 1 kL is adequate.
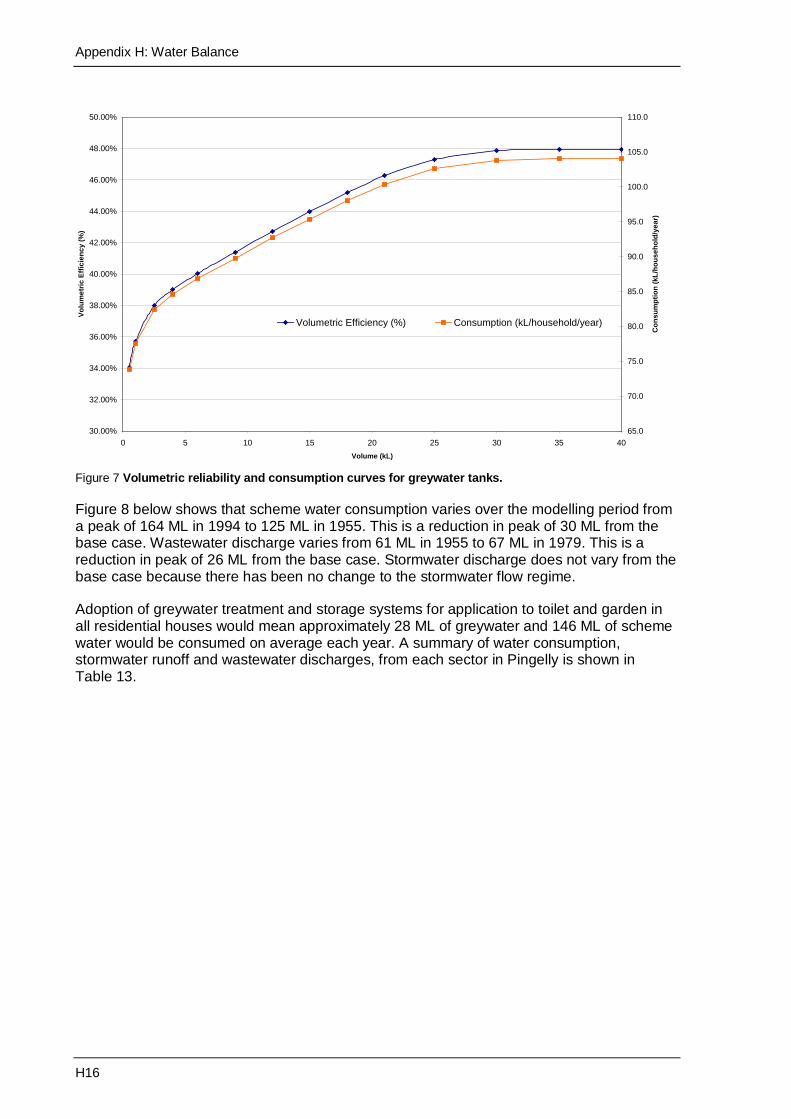
Appendix H: Water Balance
H16
30.00%
32.00%
34.00%
36.00%
38.00%
40.00%
42.00%
44.00%
46.00%
48.00%
50.00%
0 5 10 15 20 25 30 35 40Volume (kL)
Volu
met
ric E
ffici
ency
(%)
65.0
70.0
75.0
80.0
85.0
90.0
95.0
100.0
105.0
110.0
Con
sum
ptio
n (k
L/ho
useh
old/
year
)
Volumetric Efficiency (%) Consumption (kL/household/year)
Figure 7 Volumetric reliability and consumption curves for greywater tanks.
Figure 8 below shows that scheme water consumption varies over the modelling period from a peak of 164 ML in 1994 to 125 ML in 1955. This is a reduction in peak of 30 ML from the base case. Wastewater discharge varies from 61 ML in 1955 to 67 ML in 1979. This is a reduction in peak of 26 ML from the base case. Stormwater discharge does not vary from the base case because there has been no change to the stormwater flow regime.
Adoption of greywater treatment and storage systems for application to toilet and garden in all residential houses would mean approximately 28 ML of greywater and 146 ML of scheme water would be consumed on average each year. A summary of water consumption, stormwater runoff and wastewater discharges, from each sector in Pingelly is shown in Table 13.

Appendix H: Water Balance
H17
0
20
40
60
80
100
120
140
160
180
1950 1960 1970 1980 1990 2000
Year
Impo
rted
Wat
er, G
reyw
ater
Use
and
Was
tew
ater
D
isch
arge
(Meg
alitr
es p
er y
ear)
0
200
400
600
800
1000
1200
1400
1600
1800
Stor
mw
ater
Dis
char
ge (M
egal
itres
per
yea
r)
Imported Water (ML/yr) Wastewater discharge (ML/yr)Greywater Use (ML/yr) Stormwater discharge (ML/yr)
Figure 8 Imported water consumption, stormwater runoff, and greywater tank use and wastewater discharge over time for Pingelly Scenario 2.
Table 14 Average yearly scheme water use, greywater tank use, and wastewater discharge and stormwater runoff for Pingelly Scenario 2
Neighbourhood Greywater tank use (ML/yr)
Imported water use (ML/yr)
Wastewater discharge
(ML/yr) Stormwater
runoff (ML/yr)
Residential 26 79 18 34
Semi Rural 3 9 2 22
Rural/Vacant Land 0 5 0 25
Commercial, Industrial and Community 0 53 45 16
Road and Open Space 0 0 0 392
Total 28 146 65 488
Adoption of greywater treatment and storage systems would have little impact on stormwater runoff as they would not impact on the stormwater flow regime. Runoff for Scenario 2 is the same as the base case.
3.2.4 S cenario 3: G reywater divers ion to garden
Scenario 3 is an investigation into the effectiveness of a simple greywater diversion to garden. It has been assumed sub surface irrigation would be the irrigation method as this is a safer way to deal with greywater than surface application.
Figure 9 shows that scheme water consumption varies over the modelling period from a peak of 169 ML in 1994 to 134 ML in 1955. This is a reduction in peak of 25 ML from the base case. Wastewater discharge varies from 67 ML in 1994 to 76 ML in 1955. This is a reduction in peak of 17 ML from the base case.

Appendix H: Water Balance
H18
0
20
40
60
80
100
120
140
160
180
1950 1960 1970 1980 1990 2000
Year
Impo
rted
Wat
er, G
reyw
ater
Use
and
Was
tew
ater
D
isch
arge
(Meg
alitr
es p
er y
ear)
0
200
400
600
800
1000
1200
1400
1600
1800
Stor
mw
ater
Dis
char
ge (M
egal
itres
per
yea
r)
Imported Water (ML/yr) Wastewater discharge (ML/yr)Greywater Use (ML/yr) Stormwater discharge (ML/yr)
Figure 9 Imported water consumption, stormwater runoff, greywater use and wastewater discharge over time for Pingelly Scenario 3.
Adoption of greywater diversion in every residential house in Pingelly would mean approximately 22 ML of greywater and 152 ML of scheme water would be consumed on average each year. A summary of water consumption, stormwater runoff and wastewater discharges, from each sector in Pingelly is shown in Table 15.
Table 15 Average yearly scheme water use, greywater tank use, and wastewater discharge and stormwater runoff for Pingelly Scenario 3
Neighbourhood Greywater use (ML/yr)
Imported water use (ML/yr)
Wastewater discharge (ML/yr)
Stormwater runoff (ML/yr)
Residential 19 85 24 34
Semi Rural 2 10 3 22
Rural/Vacant Land 0 5 0 25
Commercial, Industrial and Community 0 53 45 16
Road and Open Space 0 0 0 392
Total 22 152 71 488
Adoption of greywater diversion for garden irrigation would have very little impact on stormwater runoff as greywater diverters have no impact on the stormwater flow regime. Runoff for Scenario 3 is the same as the base case (refer to Table 16 for a summary of the monthly flows from various surfaces in Scenario 3).
3.2.5 C omparis on
Greywater reuse has a greater impact on reducing scheme water consumption and wastewater discharge however rainwater tanks have the benefit of reducing stormwater flows. This is demonstrated in Table and Table 16 which compare and summarise each scenario.

Appendix H: Water Balance
H19
Table 16 compares Scenario 1, 2 and 3 with the base case and reports a percentage reduction in imported water use, wastewater discharge and stormwater runoff from each land use type. Table reports flows of various streams within the urban water cycle for each scenario.
If greywater were to be applied to the garden (as in Scenario 3), approximately 22 ML would be used each year, which equates to a 12 per cent reduction in scheme water consumption and a 23 per cent reduction in wastewater flows. If the greywater were used for toilet flushing as well as garden irrigation (as in Scenario 2), greywater consumption could be increased to 28 ML which equates to a 16 per cent reduction in scheme water consumption and a 31 per cent reduction in wastewater flows. Rainwater tanks would not be as effective in reducing scheme water consumption. When used for garden irrigation and toilet flushing (as in Scenario 1), they have the potential to reduce scheme water consumption by 13 ML which equates to a 7 per cent reduction in scheme water consumption and a 3 per cent reduction in stormwater flows. The small reduction in stormwater is due to only a small portion of runoff coming from residential rooves. See Table and Table 16 for a detailed comparison of the scenarios.
Table 16 Comparison of scenarios
Base case Scenario 1: Rainwater tanks
Scenario 2: Greywater tanks
Scenario 3: Direct greywater diversion
Population 729 729 729 729 Climate Rainfall 443 443 443 443
Evaporation 1 708 1 708 1 708 1 708
Scheme water supply (ML/y)
Total 174 161 146 152 Indoor 93 90 88 93 Outdoor 81 71 58 59
Scheme water supply (kL/cap/y)
Total 239 221 200 209 Indoor 127 124 120 127 Outdoor 111 98 79 82
Residential scheme water supply (kL/cap/y)
Total 159 142 120 130 Indoor 66 62 59 66 Outdoor 93 80 61 64
Wastewater (ML/y) 93 93 65 71 (kL/cap/y) 127 127 88 98
Stormwater runoff (ML/y) 488 475 488 488 (kL/cap/y) 669 651 669 669
Rainwater use (ML/y) Total 0 13 0 0 Indoor 0 3 0 0 Outdoor 0 10 0 0
Rainwater use (kL/cap/y)
Total 0 17 0 0 Indoor 0 4 0 0 Outdoor 0 14 0 0
Greywater use (ML/y) Total 0 0 28 22 Indoor 0 0 5 0 Outdoor 0 0 23 22
Greywater use (kL/cap/y)
Total 0 0 39 30 Indoor 0 0 7 0 Outdoor 0 0 32 30

Appendix H: Water Balance
H20
Table 17 Percentage difference from base case to Scenario 1, Scenario 2 and Scenario 3
Imported water use (ML/yr)
Wastewater discharge
(ML/yr) Stormwater
runoff (ML/yr)
Residential small Scenario 1 10% 0% 31% Scenario 2 24% 59% 0% Scenario 3 19% 45% 0%
Semi rural Scenario 1 21% 0% 11% Scenario 2 24% 59% 0% Scenario 3 19% 45% 0%
Total Scenario 1 7% 0% 3% Scenario 2 16% 31% 0% Scenario 3 12% 23% 0%
4. Dis c us s ion
4.1 R ainwater tanks Analysis of the results in Section 0 and the end use figures in Section 2.1 leads to a number of conclusions. These include:
● Rainwater tanks have only a minor impact in reducing scheme water use, ranging from 10 per cent for residential houses to 24 per cent for semi-rural houses.
● Rainwater tanks significantly reduce runoff from lots (ranging from 11 per cent for semi-rural to 31 per cent for residential) however they have only a minor impact in reducing overall stormwater runoff volumes (3 per cent). This is because the study area is very large and the residential/semi rural lots only make up a small portion of the study area (133 ha of 609 ha). Whilst rainwater tanks are effective in capturing most roof runoff, roof runoff only makes up a small portion of total runoff.
● Very large rainwater tanks are required to achieve reasonable volumetric efficiencies (where volumetric efficiency is defined as the percentage of demand met over the modelling period) due to the infrequent and highly seasonal rainfall. Rainwater tanks of 10 kL for residential areas and 30 kL for semi rural areas were chosen to achieve volumetric efficiencies ranging from ~15 per cent (residential) to ~30 per cent (semi-rural). If there was no limitation on the size of rainwater tanks, the maximum volumetric efficiencies that could be achieved range from ~18 per cent (residential) to ~41 per cent (semi rural) depending on roof size and demand placed on the tank. (The proposed tank sizes in this study are a compromise between tank volume and volumetric reliability however no cost-benefit analysis was conducted).
4.1.1 R ainwater tanks for irrigation only Rainwater tanks in the Scenario 1 water balances were used for toilet flushing and irrigation rather than irrigation only despite the cheaper plumbing costs for supplying irrigation only. This is because irrigation is a highly seasonal demand with low demand during the wet winter months and very high demand during the dry summer months. If rainwater tanks supplied irrigation only they would fail to meet demand in summer and would be of limited use in winter because there would be reduced demand. Much of the roof runoff would overflow from the rainwater tanks during winter months. Using rainwater tanks for toilet flushing, which has a constant demand, allows the rainwater tank to become more useful during the winter months because it can reduce demand on imported water and at the same time reduce roof runoff.

Appendix H: Water Balance
H21
Table 17 shows a comparison of rainwater tanks supplying irrigation with rainwater tanks supplying irrigation and toilet flushing. The rainwater tank volumes are kept constant for each scenario and are the same volumes used in Scenario 1 (see Section 0). As expected, the saving in scheme water is higher when toilets are connected to the rainwater tanks as is the reduction in roof runoff.
It should be noted that the high irrigation demand mitigates the difference between the effectiveness of the two options. If irrigation demand was reduced, the difference between supplying ‘toilet and irrigation’ and ‘irrigation only’ would be increased (both for roof runoff and rainwater consumption).
Table 17 Comparison of rainwater tanks used for irrigation with rainwater tanks used for irrigation and toilet flushing
Residential roof runoff generation (ML/yr) 17
Raintank water use (ML/yr) Irrigation 10 Irrigation and toilet 15
Scheme water supply saving (%) Irrigation 5.7% Irrigation and toilet 7.1%
Residential roof runoff reduction (%) Irrigation 59% Irrigation and toilet 76%
4.1.2 G reywater
Use of greywater in residential lots has the potential to significantly reduce scheme water consumption and flows to the wastewater treatment plant. Comparison of Scenario 1 with Scenario 2 and Scenario 3 demonstrates that greywater use would be more effective than rainwater tanks in reducing scheme water consumption. If greywater is used for garden irrigation, scheme water use is reduced in Pingelly by 12 per cent. If greywater is used for garden irrigation and toilet flushing, scheme water use is reduced by 16 per cent. This compares to rainwater tanks which would save 5.7 per cent and 7.1 per cent for garden irrigation and garden irrigation/toilet flushing respectively. Greywater use is therefore more effective in reducing scheme water consumption than rainwater tanks.
For a comparison of the benefits of using greywater for garden and toilet rather than only the garden, see Table 18. (Note this is a comparison of direct greywater reuse to the garden and greywater treatment and storage in a 1 kL tank for garden and toilet.) Due to the constant, year round demand for toilet water, when the greywater is plumbed to the toilet, the potential for scheme water reduction and wastewater flow reduction is increased than for when greywater it is used for irrigation only.
Table 18 Comparison of greywater used for irrigation with greywater used for irrigation and toilet flushing
Greywater Generation (ML/yr) 38
Greywater use (ML/yr) Irrigation 22 Irrigation and toilet 28
Scheme water supply saving (%) Irrigation 12% Irrigation and toilet 16%
Reduction in wastewater flows (%) Irrigation 23% Irrigation and toilet 31%

Appendix H: Water Balance
H22
Arguments against using greywater include:
● Contaminant loads to land are increased
● Wastewater flows are decreased which may cause clogging problems in the sewers and counteracts the potential benefits of centralised reclaimed water use
● Greywater system maintenance can be costly and beyond the ability of some occupants.
Counter arguments include:
● Contaminants from greywater use would not be significant in Pingelly due to the low density nature of the development. The soils should be capable of dealing with the extra contaminants/nutrients (especially in the case where the greywater is treated)
● A decentralised reuse system such as greywater does not require an expensive third pipe to be plumbed to every household. The infrastructure of a greywater system would also be above ground and therefore have a reduced chance of being affected by salinity
● A well operated and designed greywater treatment and storage system should not require excessive maintenance. Direct greywater diversion for sub-surface irrigation would require very little maintenance or cost.
Further analysis (e.g. costs, contaminant loads, local conditions and community attitudes) is required to determine which arguments would prevail and for a definitive answer on the benefits and costs of greywater use in Pingelly. Local laws and legislation regarding use of greywater would also need to be investigated.
4.1.3 Outdoor Water Us e
Outdoor water use in Pingelly is estimated to be 93 kL/capita/year (Table 19). This compares to the Western Australian average for 2000–2001 of 66 kL/capita/year (ABS 2004) and the Perth detached house residential average of 77 kL/capita/year (Loh & Coghlan 2003). The reasons for discrepancies are plentiful and may include climatic factors, cultural factors (e.g. socially acceptable garden type), land block size, population density, soil type and existing alternative water sources for irrigation.
Seasonal variation in residential outdoor water use ranges from 217 kL in July to 10 062 kL in January (see Table 19 for more details). The extreme variation in irrigation consumption is a direct result of the extremely seasonal climate (see Figure 3). Outdoor water use in the non-residential areas was estimated to vary from 39 kL in July to 1 941 kL in December.
It should be noted that the figures shown in Table 19 are outputs from the modelling and are therefore estimates only. They are based on seasonal consumption patterns, modelling assumptions and assumptions about residential indoor use. The figures represent scheme water consumption only and do not include alternative supplies such as reclaimed water or locally collected stormwater.

Appendix H: Water Balance
H23
Table 19 Outdoor water use summary
Month Residential (kL) Non residential (kL)
Total Per capita Total Per capita January 10 062 14 1 941 3 February 8 375 11 1 615 2 March 9 323 13 1 796 2 April 6 884 9 1 320 2 May 4 328 6 825 1 June 578 1 106 0 July 217 0 39 0 August 358 0 64 0 September 2 553 4 476 1 October 6 969 10 1 327 2 November 8 350 11 1 607 2 December 10 049 14 1 938 3 Total 68 047 93 13 056 18
4.1.4 E nd us e demand management
End use demand management is a very effective way of reducing water consumption. End use demand management could be in the form of structural changes, such as water efficient showerheads, revised garden landscaping or water efficient washing machines; or in the form of non-structural changes, such as educating consumers to reduce consumption. A study of the impact of structural end use demand management in Canberra (Diaper et al. 2003) reported annual water savings that can be achieved from water efficient appliances as:
Water efficient dishwashers – save 0.6 kilolitres per year per household Water efficient showerheads – save 26 kilolitres per year per household Dual flush toilets – save 18 kilolitres per year per household Water efficient washing machines – save 10 kilolitres per year per household
This amounts to 55 kL of water per house annually that can be saved with adoption of water efficient appliances and does not include improved garden irrigation practices or non-structural demand management.
The saving of 55 kL per house per year for Canberra is not directly transferable to Pingelly however it can be safely assumed that significant savings can be made. A saving of 55 kL per house in Pingelly translates to 41 per cent of residential indoor use, 17 per cent of total residential use and 12 per cent of total use in Pingelly.
4.1.5 R ec laimed water and s tormwater c ollec tion and us e
If a reclaimed water program is not already in operation at Pingelly then consideration should be given to beginning one. Reclaimed water programs often involve supply of parks and gardens for irrigation. Consideration should also be given to supplying a constant, year round end use such as industry or residential toilet flushing. A constant, year round end use has the advantage over seasonal end use in that large volumes of water are consumed in winter. The required storage volume for the reclaimed water is hence reduced and total reclaimed water volume has the potential to be greater.

Appendix H: Water Balance
H24
Stormwater collection and use could also be considered to supplement scheme water use. The annual stormwater runoff figures are high enough to warrant further analysis, however the infrequent and seasonal nature of rainfall would mean a large storage would be required. The storage volume could be minimised if Aquifer Storage and Recovery (ASR) is possible because this would minimise the evaporation from the storage. It should also be noted that the annual stormwater runoff figures include areas beyond the immediate township and it may not be practical to collect all of the stormwater runoff. Stormwater collection and use for toilet flushing and irrigation has the potential to reduce scheme water consumption by roughly 35 per cent to 50 per cent however these figures would need to be confirmed by more detailed analysis.
Reclaimed water use has the benefit over stormwater collection and use in that the supply is constant and not subject to seasonal variation. This means the size of the reclaimed water storage will be significantly less than a stormwater storage with the same volumetric efficiency. Reclaimed water use for toilet flushing and irrigation has the potential to reduce scheme water consumption by roughly 40 per cent (further detailed analysis would be required to confidently predict this figure).
4.1.6 R ainwater tank, greywater s ys tem and plumbing c os ts
It is difficult to exactly estimate the cost of rainwater tanks and greywater systems as the cost will vary from one place to another. The information in this section has been collected from suppliers, web sites and past studies conducted in this area. The cost of the rainwater tanks from some of the manufacturers is listed in Table 22. The costs for various styles of greywater systems (sourced from Diaper et al. 2004) are listed in Table 23. The prices are indicative for estimation purposes only.
In addition to cost of the rainwater tanks there are a number of other items to be considered for costing such as transportation, installation, additional plumbing, first flush devices, maintenance and insect proof screening. Some of these costs have been estimated by Grant et al. 2003, see Table 20. Table 20 should only be considered as indicative because installation costs of rainwater tanks are site specific.
Based on Table 20 and Table 21 the total cost of a 20 kL tank should be around $3 195 as shown in Table 21.
The total cost of a greywater system will depend upon the complexity of the design. Simple diversion valves cost very little ($30–$40) but the cost of a system will increase if storage, pumping and a sub-surface irrigation system is employed. A greywater treatment and storage system such as proposed in Scenario 2 could range from $2 000 to $10 000 depending upon style of treatment used, plus the cost of pumping and a sub-surface irrigation system. (Note that sub surface irrigation systems are eligible for a rebate under the State Water Strategy www.statewaterstrategy.wa.gov.au).
A rough estimate for the cost of a greywater system for Scenario 2 is $6 000 for the treatment and storage system, $200 for the sub-surface irrigation system and $720 for plumbing costs. This totals to approximately $7 000.
A rough estimate for the greywater system in Scenario 3 is $40 for the diverter valve, $200 for the sub-surface irrigation system and conservatively $200 for plumber’s charges. This totals to approximately $450.

Appendix H: Water Balance
H25
Table 20 Rainwater tank installation and pump costs
Item Cost ($A) Pipes and fittings 70 Plumber charges 200 Pump 350 Electrician 100 Total 720
Table 21 Total cost of 20 kilolitre rainwater tank
Item Cost ($A) 20 kL tank 2 375 Delivery 100 Installation 720 Total 3 195
Table 22 Cost of rainwater tanks
Tank capacity
Team-poly tanks (Black)1 ARI Plastank2 Tankmasta3 Aquasource3
Litres Cost ($AU) Cost ($AU) Cost ($AU) Cost ($AU) 1 000 410 1 300 565 1 500 2 340 2 000 685 2 250 590 2 750 3 000 3 270 3 300 890 3 600 825 4 500 825 1 020 5 600 1 100 5 900 1 155 9 000 1 397 1 435 1 390
10 000 1 460 12 000 1 785 13 500 1 837 1 825 16 200 2 230 18 000 2 090 20 000 2 375 22 000 2 475 22 800 2 525 25 000 2 625 27 000 2 838 2 470 2 875 30 000 3 220 35 000 4 480 45 000 5 020 5 250
1 www.enviro-friendly.com/team-poly-water-tanks.shtml. 2 http://www.enviro-friendly.com/ari-plastank-water-tanks.shtml. 3 http://www.enviro-friendly.com/pricelist.shtml.

Appendix H: Water Balance
H26
Table 23 Greywater system materials, costs, and energy and maintenance requirements (Diaper 2004)
Process type Lo or Hi tech
Materials/major components
Capital cost per
household Energy usage Operation and maintenance
requirement
Simple diverter valve
Low uPVC pipe $30–40 None—Gravity fed for irrigation
Minimal maintenance of valve. Continuous user control of irrigation area
Sedimentation tank and ecosoil irrigation field
Low Standard piping Tank Gravel/ecosoil
$12 000 (1 000 L/
day)
Gravity fed or pumped
Continuous user control of irrigation Desludging of sedimentation tank
Diverter valve, filtration, storage (drip irrigation)
Low Piping Tank Pump Drip piping
$30–40 $250 $250
$1–2/m
Pumping required
Continuous user control of irrigation Filter cleaning
Sand filter (for subsurface irrigation or toilet flushing)
Low Tank Pump UV lamp
$5 500 Pumping and UV 7.2 kWh/kL (80% for UV)
Continuous user control of irrigation None specified UV lamp replacement?
Aeration (for toilet, garden and clothes), e.g. Pontos
High Coarse filtration Tank Pumps Air blower UV lamp Microprocessor
$6 500 Air blower Pumping UV Total 0.6 kWh/day (for 2 400 L)
UV lamp replacement (annually)
Electroflotation (for toilet, garden and clothes)
High Tank Pumps x2 Electrodes pH control Microprocessor
$7 500 0.5–0.8 kWh/kL Electrode replacement
Pressure filtration (toilet, garden and clothes)
High Coarse filtration Tanks Pumps Filtration medium UV lamp Microprocessor
NA Pumping required
Coarse filter cleaning (monthly) Replace filter media (annually) Desludge tank (annually) UV lamp replacement (annually)
5. C onclus ion Residential water consumption in Pingelly (~159 kL/capita/year) is well above average for Western Australia. The ABS estimated residential consumption in Western Australia to be 132 kL/capita/year (ABS 2004) for 2000–2001 and Perth is estimated to consume 136 kL/capita/year in detached residential households (Loh & Coghlan 2003).
Estimated stormwater runoff from the study area (Table 24) is 488 ML per year, which represents an annual volumetric runoff coefficient of 16 per cent. No data was available for calibration however a volumetric runoff coefficient of 16 per cent is reflective of the large percentage of pervious area within the study area. Stormwater collection and use is a possible water management option however it must be remembered that stormwater flows are highly seasonal and infrequent by nature. The study area extends well beyond the immediate township so runoff collection may be impractical in some areas. If stormwater is seriously considered for collection and reuse, the possibility of aquifer storage and recovery should be considered to minimise evaporation which is very high in Pingelly (1 708 mm per year).

Appendix H: Water Balance
H27
Wastewater discharge from the study area (Table 4) is estimated at 93 ML/yr and has potential to be reclaimed and used for irrigation and other non-potable uses in Pingelly. If reclaimed water use for parks and gardens is not already employed in Pingelly consideration should be given to doing so. The wastewater numbers in Table are more reliable than the stormwater numbers because they are based on data provided by the Water Corporation of Western Australia. Wastewater reclamation and reuse is likely to be preferable to stormwater collection and use because wastewater has a constant supply which means the reliability of wastewater reuse is higher than stormwater use for the same sized storages.
Table 24 Water balance summary
Population 729
Climate Rainfall 443 Evaporation 1 708
Scheme Water Supply (ML/y) Total 174 Indoor 93 Outdoor 81
Scheme Water Supply (kL/cap/y) Total 239 Indoor 127 Outdoor 111
Residential Scheme Water Supply (kL/cap/y) Total 159 Indoor 66 Outdoor 93
Wastewater (ML/y) 93 (kL/cap/y) 127
Stormwater Runoff (ML/y) 488 (kL/cap/y) 669
Rainwater tanks would only reduce scheme water consumption by 7 per cent and stormwater runoff by 3 per cent. Rainwater tanks are very good at intercepting roof runoff however roof runoff only makes up a small portion of total stormwater runoff. Even though roof runoff is reduced by 76 per cent, stormwater runoff is reduced by only 3 per cent (see Table 25).
Table 25 Rainwater tank summary
Residential roof runoff generation (ML/yr) 17
Raintank water use* (ML/yr) 15
Scheme water supply saving (%) 7%
Residential roof runoff reduction (%) 76%
Stormwater runoff reduction for study area (%) 3% * This is equal to roof runoff reduction (ML/yr).
Use of greywater on individual residential lots has the potential to be more effective than rainwater tanks. Use of greywater on every residential lot for garden irrigation has the potential to reduce scheme water use by 12 per cent (22 ML per year). If toilet flushing is included, this increases to 16 per cent (33 ML per year). This equates to a reduction in flows to the wastewater treatment plant of 23 per cent when greywater is used for irrigation and 31 per cent when greywater is used for irrigation and toilet flushing.

Appendix H: Water Balance
H28
Table 26 Greywater use summary
Greywater generation (ML/yr) 38
Greywater use (ML/yr) Irrigation 22 Irrigation and toilet 28
Scheme water supply saving (%) Irrigation 12% Irrigation and toilet 16%
Reduction in wastewater flows (%) Irrigation 23% Irrigation and toilet 31%
* This is equal to reduction in flows to the wastewater treatment plant.
To achieve significant improvements in water management, i.e. to achieve a reduction in scheme water consumption, wastewater discharge and stormwater runoff, measures beyond rainwater tanks need to be considered. On-site reuse of greywater offers a potential significant reduction in scheme water consumption and wastewater flows. End use demand management in the form of water efficient appliances, public education, water efficient gardens and water pricing would also reduce scheme water consumption and wastewater flows. Other management options such as stormwater collection and use, groundwater extraction and reclaimed water could also be considered.
6. R eferences Australian Bureau of Statistics 2004, Water Account of Australia 2000–01, cat. No. 4610.0,
ABS, Canberra.
Australian Bureau of Statistics 2002, Basic Community Profile—Pingelly—UCL523200, Retrieved June 21, 2006 from: http://www.abs.gov.au/ausstats/[email protected]/
Diaper C, Sharma A, Gray S, Mitchell G and Howe C 2003, Technologies for the provision of infrastructure to urban developments—Canberra case study, CSIRO, Highett, Victoria, CMIT 2003–183.
Diaper C 2004, Innovation in on-site domestic water management systems in Australia: a review of rainwater, greywater, stormwater and wastewater utilisation techniques, CSIRO, Highett, Victoria CMIT 2004–073.
Grant T and Hallmann M 2003, ‘Urban Domestic Water Tanks: Life Cycle Assessment’, Journal of the Australian Water Association, Vol 30, No. 5, pp. 36–41.
Hallmann M, Grant T and Alsop N 2003, Life cycle assessment and life cycle costing of water tanks as a supplement to main water supply-YVW, Centre for Design, RMIT, Melbourne.
Loh M & Coghlan P 2003, Domestic Water Use Study in Perth, Western Australia 1998-2001, Water Corporation, Perth.

Appendix I
Methodology for assessment of water management options
Olga Baron and Trevor Smales
CSIRO
October 2005


Appendix I. Assessment methodology
Ii
Contents Page
1. Introduction .................................................................................................................... 1
2. Expert systems and their applications .......................................................................... 2
3. Framework for prioritisation of the water management options (FPWMO) ................. 4 3.1 Townsite investigation strategy ............................................................................... 4 3.2 Evaluation of the town’s water needs and the availability of local water
resources to satisfy demands ................................................................................. 4 3.3 Selection of the townsite water management options .............................................. 6
4. Questions ....................................................................................................................... 6 4.1 Is salinity a significant problem in the town? ............................................................ 6 4.1.1 Stormwater accumulation ............................................................................. 6 4.1.2 Average annual groundwater level within townsite ........................................ 6 4.1.3 Groundwater level trends .............................................................................. 8 4.1.4 Section of the townsite affected by shallow groundwater ............................... 8 4.1.5 Infrastructure damage within the area affected by salinity .............................. 8 4.2 How is salinity best managed? ................................................................................ 8 4.3 Is there significant demand for new water supply? .................................................. 12 4.4 Identifying the scope for the townsite water management plan and ranking
the water management options ............................................................................... 14
5. Conclusions ................................................................................................................... 17
6. References ...................................................................................................................... 18
Figures Figure I1 The framework for townsite prioritisation ...................................................................... 5
Figure I2 Infrastructure damage by waterlogging and salinity ...................................................... 7
Figure I3 Management options for waterlogging and salinity control ............................................ 9
Figure I4 Variation in the vertical groundwater gradient (downward and upward) ........................ 11
Figure I5 Townsite water demands ............................................................................................. 13
Tables Table I1 Shallow groundwater fluxes .......................................................................................... 10
Table I2 Sources of the local water resources ............................................................................ 14
Table I3 Water management options aimed at improving rural town water management (the current batch of rural towns fit within a number of the shaded yellow boxes) .......... 15
Table I4 Criteria for water management option selection ............................................................. 16


Appendix I. Assessment methodology
I1
1. Introduc tion Current water management practice and townsite salinity issues in the WA Rural Towns-Liquid Assets (RT-LA) have certain similarities which are associated with their water supply schemes, the geological and geographical characteristics of the townsite catchments and their history of development. Commonly, all towns included in the RT-LA project experience certain damage to the local infrastructure due to the corrosive effects of saline soil and groundwater. There is also a concern related to fresh water availability, its quality and costs associated with water delivery to the towns. These similarities allow identifying urban salinity and rural water supply as the major objectives of the RT-LA project.
However, variations in townsite characteristics influence the town-specific water management issues and priorities.
Urban salinity and waterlogging may be related to the regional processes (such as rising regional groundwater levels or regular flooding), localised processes (such as enhanced infiltration as a result of water use in the towns or stormwater ponding in landscape depressions and upstream from local infrastructure such as roads) or both. Accordingly, water management options or their combination will be different in each case. For instance, in a case of a rising regional groundwater levels, stormwater management may provide only a limited capacity to control salinity in the towns, and groundwater abstraction may become an important component of the Water Management Plan. On the other hand, stormwater management may be adequate when salinity is caused by localised surface water accumulation.
It is important to note that the social survey, undertaken during 2004–2005 as a part of the project, indicated that local communities often do not consider townsite salinity as a pressing issue for their towns. Wall rendering is often used to protect local buildings, regular road repairs cover the damage caused by waterlogging, and overall salinity becomes a background feature of the townsite life which often remains unnoticed.
Similarly, issues related to the townsite water supply were not identified by the towns’ residents as serious. Most of the towns included in the project have no restrictions on water use. However, shires are concerned with the cost of water used for irrigation of the towns’ recreation grounds and parks. Although there are local non-potable water sources available to shires (such as treated wastewater and local dams), they do not provide a sufficient and reliable resource for shire water demand. Accordingly, scheme water is often used for watering townsite public areas.
Yet the current water price, while it may be considered high by shires, is nevertheless heavily subsidised by the State Government, so that the introduction of any new water supply schemes may be limited by the current water pricing policy. It is important to define conditions/circumstances, when an alternative water supply may be cost effective (such as government subsidies, price policy alteration, etc.).
Interestingly, there existed a desire, by many communities, to beautify their townsite, which largely relates to the improvement of townsite vegetation ('leafy streets') and therefore requires additional water resources for irrigation.
New alternative local water supply sources may be possible through:
● surface water harvesting in the vicinity of the townsite
● restoration of the existing large dams previously used for the water supply (and still owned by the Water Corporation); and/or

Appendix I. Assessment methodology
I2
● desalination of groundwater, produced by methods to control groundwater levels under the towns.
Each town requires an evaluation and comparison of various, and sometimes conflicting, objectives and water management options. This prioritisation framework aims to navigate a path through townsite’s specific issues and to facilitate development of the strategy for each townsite investigation and Water Management Plan design.
The nature of the task is well suited to an expert system (ES) methodology. An important outcome of this approach is in providing a transparent, while structured and knowledge-based appraisal of complex issues and solutions leading to a Water Management Plan that is more likely to be accepted by shareholders. Furthermore, this approach facilitates the integration of outcomes from multidisciplinary research employed in the project. The disciplines encompassed hydrogeology, geophysics, surface hydrology, water quality, urban drainage, social and economic studies.
A general description of expert system’s approach is provided in Section 2. Section 3 details the methodology as applied to this project. The methodology is presented in several steps; each step is illustrated in Section 4 using the information collected/generated for the four towns currently undergoing investigations.
The described below approach has been developed and adopted within the project Rural Town–Liquid Assets and approved by the project management team.
2. E xpert s ys tems and their applic ations The study of water related management issues and decision options are a complex interaction of disciplines and social and economic criteria. Development of expert systems (ES) and multi-criteria analysis (MCA) enables a simpler framework to tackle a complex problem for the decision maker. Use of MCA and ES provide a greater understanding of the problem for decision makers through a simplistic, transparent and systematic evaluation that can be repeated and modified as required (Özelkan and Duckstein 1996; Verbeek et al. 1996). MCA and ES provide a better general understanding of the structure of problems as well as a better understanding of possible outcome options and the prioritisation of options (Özelkan and Duckstein 1996). This is increasingly important as public awareness of environmental issues increase and valuable public input is included in a MCA or ES. (Khadam et al. 2003).
Expert systems are a branch of applied artificial intelligence (AI), which were broadly developed in mid 1960s (Liao 2005). The ESs allows expert knowledge to be transferred to a computer program in a structured manner, which can then be used if specific advice is needed. ESs often use heuristic reasoning rather then numeric calculations, focus on acceptable rather then optimal solutions, allow separation knowledge and control, and incorporate human expertise. They also tend to be suitable for ill-structured and semi-structured problems (Shepard 1997). ESs are usually developed for specific domains rather then for a generic application. ES development requires a degree of interaction between the system developer and the user.
ESs provide a powerful and flexible means for obtaining solutions to a variety of problems that often cannot be dealt with by other, more traditional methods. They are particularly useful when multi-disciplinary complex problems are addressed. There are a number of ES categories (e.g. rule-based systems, knowledge-based systems, neural networks, fuzzy expert systems, etc.) which may be applied to a variety of the subjects such as system development (Mulvaney and Bristow 1997), geoscience (Soh et al. 2004), environmental

Appendix I. Assessment methodology
I3
protection (Gomolka and Orlowski 2000), urban design (Xirogiannis et al. 2004), waste management (Fu 1998), ecological planning (Zhu et al. 1996), water supply forecast (Mahabir et al. 2003) and others.
The report presents the initial stage of an expert system development aiming to support decision making process on water management improvement in WA rural towns. As such it describes an algorithm which in the later stage could be translated to a commuter-based ES.
Key to the development of MCA and ES systems is the identification of decision objectives. Decision objectives will form the foundation of criteria used in the MCA and ES. The objectives can be translated into measurable criteria that reflect the common questions of the decision maker (Rosa et al. 1993; Verbeek et al. 1996; Khadam et al. 2003). Carter et al. (2005) and Chen et al. (2005) used MCA for water management based on a long term objective of water demand and consumption coupled with resource availability and efficiency of use. Objective based criteria and expert knowledge can be factored together with management policy, public values and political and administrative criteria that is difficult to quantify (Rosa et al. 1993; Verbeek et al. 1996). An integrated approach to water management is widely accepted, it can highlight the interactions between ground and surface water and between water and human factors (Carter et al. 2005). Carter et al. (2005) gives the example of urban development policy compromising groundwater recharge and quality. Rosa et al. 1993 used an ES to asses the field vulnerability of agrochemicals. The system combined local factors relating to soils, climate, water and chemicals with land management factors. Verbeek et al. 1996 used and MCA that combined various models and administrative policies to create an Integrated decision support system.
The majority of MCA and ES within water management can be classed into two groups. Those that assess the physical aspect of water management, such as risk assessment (Khadam et al. 2003), condition classification, vulnerability (Rosa et al. 1993), and those that assess the outcomes of water management such as, reactions to policy and various options (Bethune 2004). Khadam et al. (2003) used MCA to assess risk of contaminated groundwater, when risk was analysed as being un-acceptable a number of remedial alternative were identified. MCA analysis was also used to rank the remedial measures. Khadam et al. (2003) stated that when no one dominant measure can be identified as either the best or worst, MCA was a useful tool in ranking the outcomes. MCA has been used to assess options for the abstraction of bores at risk of chlorinated solvents. MCA was used in two parts, firstly problem identification and secondly for the prioritisation of monitoring strategies (Tait et al. 2004). Lee et al. (1997) studied the use of a fuzzy ES for the classification of stream water quality. The ES was focused on streams for which quantitative water quality data was not collected. Using ecological information to classify the streams, based on physical characteristics (e.g. turbidity) and biological indicator species, the results showed that the fuzzy ES represented the real world well and better than conventional ES on a comparison.

Appendix I. Assessment methodology
I4
3. F ramework for prioritis ation of the water management options (F P WMO)
A proposed framework is schematically presented in Figure I1 and outlined below. The RT-LA project has two main objectives: mitigation of townsite salinity and opportunities for new water supply resources.
Within these objectives, FPWMO will help identify the townsite’s specific issues, related to current water management and within existing and forecasted constraints such as: ● policy changes ● consideration for regional priorities; and/or ● water pricing changes.
As shown in Figure I1, the identified issues could be outside the project scope (e.g. limitation in energy supply, demographic trends), but those which are relevant to the project objectives need to be considered within the context of the Triple Bottom Line (TBL). Those solutions may be directly related to water resources management (groundwater or surface water) or water use/demand management. Alternatively they may be addressed by measures unrelated to the water management options, such as infrastructure modification providing a barrier between infrastructure and soil moisture or water efficient appliances, reducing potable water demands in the town.
The proposed solutions can be ranked, costed and brought to the stakeholders’ attention. The water management options selected as a result of community consultations will be recommended for an engineering evaluation and be included in the Town Integrated Water Management Plan.
The framework was developed to accommodate the project specific conditions, and as such is applicable at various stages in project development. It is also based on the data available to the project at its different stages.
3.1 Towns ite inves tigation s trategy The framework enables to help define the townsite specific issues and to guide the townsite investigations
At this stage the decision-making process is largely based on the data generated by the Department of Agriculture and Food, Western Australia’s (DAFWA) Rural Towns Program, which among other aspects includes groundwater monitoring records, preliminary geological/hydrogeological system description based on the drilling and a flood risk analysis.
3.2 E valuation of the town’s water needs and the availability of loc al water res ourc es to s atis fy demands
At this stage the framework guide the 'water audit' process, when the local water resources, defined during the townsite investigations, are considered simultaneously with the town water demand and in the context of the current water supply.
The local water resources include stormwater generated within the townsite, waste water and local groundwater. The methodology for the townsite water balance evaluation is described in Appendix H.

Appendix I. Assessment methodology
I5
Water supply data for each town has been provided by the Water Corporation, while shires supplied information on water use for community purposes within each town.
Figure I1 Framework for townsite prioritisation.

Appendix I. Assessment methodology
I6
3.3 S elec tion of the towns ite water management options The framework leads to definition of the generic water management options and provides the basis for their prioritisation. It is particularly valuable that the framework facilitates engagement of the local communities in this process.
The main outcome at this stage is a final scope for the Water Management Plan (WMP) individually designed for townsite-specific conditions. Ideally WMPs also need to address new water demands for townsite beautification, new industry development and introduction of demand management options (alternative water appliances, third pipe, rain tank water use for toilet flushing and others).
Following on from the project objectives, an integrated townsite Water Management Plan is required to address both urban salinity and the potential for developing new water resources. FPWMO allows facilitating the selection of water management options, while clarifying three major questions: ● Is salinity a significant problem in a town? ● If so, how is it managed best? ● Is there sufficient demand for a new water supply?
4. Ques tions
4.1 Is s alinity a s ignific ant problem in the town? As mentioned above, townsite salinity is not often considered by the local communities as a pressing issue. However, in some cases this opinion may be contradicted by observed salinity-related damage of local infrastructure. There were also references to the estimated cost of the WA townsite infrastructure damage as close to $50M over the next 30 years (URS 2001).
Figure I2 illustrates a structured approach to verify the query if salinity control should be included in the RT-LA scope. The decision here is largely based on the available data generated during the townsite monitoring undertaken by DAFWA’s Rural Town Program.
At this stage the framework required identification of the following:
4.1.1 S tormwater acc umulation
If there is a potential for surface water accumulation within the townsite during storm events or flooding, then salinity may potentially become an issue within the affected areas.
4.1.2 Average annual groundwater level within towns ite
For the purposes of the townsite prioritisation it is feasible to use the trigger value for the groundwater level (1.8 m) proposed by Nulsen (1989). It was assumed that this depth indicates an annual average groundwater level. For more detailed analysis a salinity risk assessment could be used (Barron et al. 2005).

Appendix I. Assessment methodology
I7
Figure I2 Infrastructure damage by waterlogging and salinity.

Appendix I. Assessment methodology
I8
4.1.3 G roundwater level trends
If the groundwater level was found to be below the trigger depth, it is also important to define trends in the groundwater level fluctuation. If an upward trend is observed then salinity may potentially become an issue, and further investigations are required to support a decision making process.
4.1.4 S ec tion of the towns ite affec ted by s hallow groundwater
Due to landscape, depths to the groundwater within townsites may vary, and salinity processes may affect only a limited part of the townsite. In this case the requirements for salinity management need to be defined based on an evaluation of infrastructure damage cost, and are unlikely to be significant if the annual average groundwater level < 1.8 m occur within less than 10 per cent townsite. At this stage the assessment is based on the up to date experience within RT-LA, but further evaluation is required.
4.1.5 Infras truc ture damage within the area affec ted by s alinity
The final decision on an individual case is made based on the type of infrastructure affected and should include consultation with community/shire representatives.
The proposed triggered values for an annual average groundwater level and extent of the affected townsite area are indicative at this stage and require further verification.
4.2 How is s alinity bes t managed? Once salinity is defined as a townsite issue, a number of options may be applied to control the process. They may include shallow and deep drainage, groundwater pumping or surface water rerouting. There may also be options which are not related to water management (such as the use of salt-resistant construction materials, infrastructure relocation or land use alteration). In order to develop the most appropriate salinity control measures, it is important to define the nature of the salinity process in the townsite, which will allow dealing with the causes of salinity development rather then its manifestation. The methodology to verify the answers to this question is shown in Figure I3.
Within the framework the characterisation of the salinity is considered in the context of the shallow groundwater balance, where possible water fluxes within the shallow groundwater system are defined (Table I1).
Often the groundwater systems in the WA wheatbelt consist of shallow and deeper aquifers. The difference between the groundwater and hydraulic head of the deeper aquifer describes the vertical groundwater gradient, and provides an indication of the shallow water balance components. A downward gradient (the groundwater is positioned above the hydraulic head of the deeper aquifer (Figure I4) indicates a downward flux from the shallow to the deep groundwater system (providing the shallow and deep aquifers are hydraulically connected). In such a case the drawdown of the shallow groundwater may be achieved by reduction in the local groundwater recharge, such as the elimination of stormwater accumulation or alteration in the gardens/parks irrigation regime. This scenario provides an opportunity for surface water harvesting within the townsite (subject to water quality).

Appendix I. Assessment methodology
I9
Figure I3 Management options for waterlogging and salinity control.
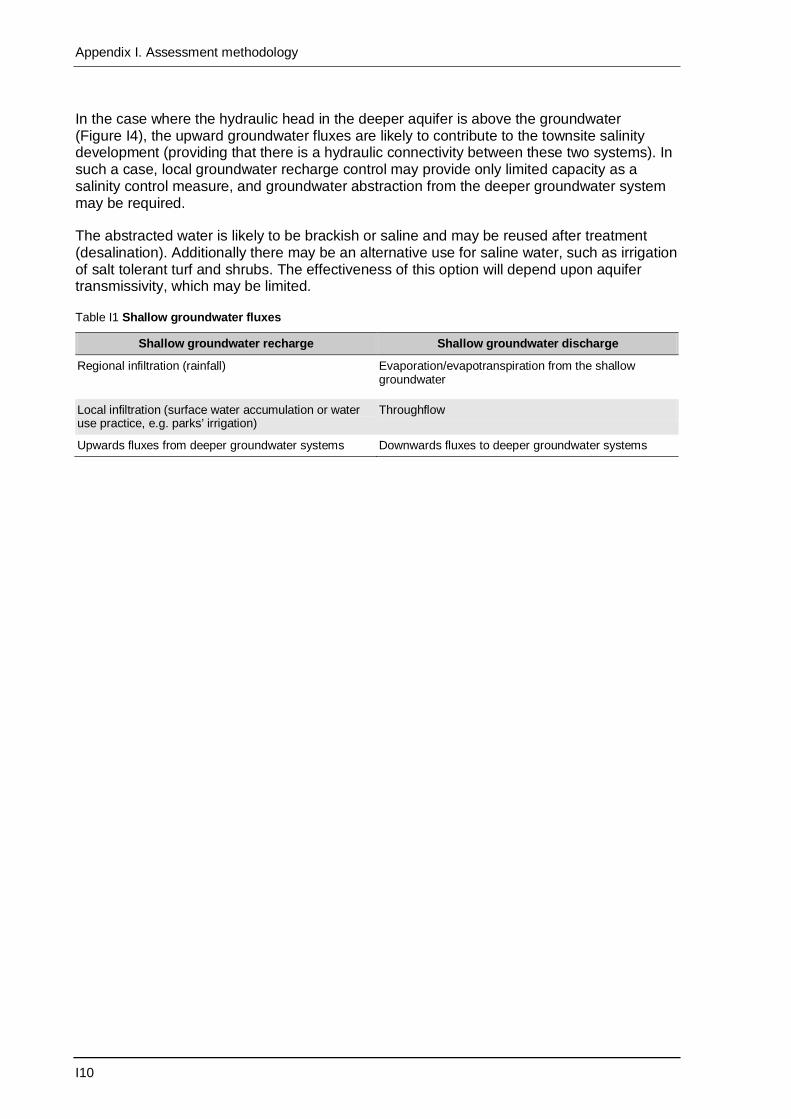
Appendix I. Assessment methodology
I10
In the case where the hydraulic head in the deeper aquifer is above the groundwater (Figure I4), the upward groundwater fluxes are likely to contribute to the townsite salinity development (providing that there is a hydraulic connectivity between these two systems). In such a case, local groundwater recharge control may provide only limited capacity as a salinity control measure, and groundwater abstraction from the deeper groundwater system may be required.
The abstracted water is likely to be brackish or saline and may be reused after treatment (desalination). Additionally there may be an alternative use for saline water, such as irrigation of salt tolerant turf and shrubs. The effectiveness of this option will depend upon aquifer transmissivity, which may be limited.
Table I1 Shallow groundwater fluxes
Shallow groundwater recharge Shallow groundwater discharge
Regional infiltration (rainfall) Evaporation/evapotranspiration from the shallow groundwater
Local infiltration (surface water accumulation or water use practice, e.g. parks’ irrigation)
Throughflow
Upwards fluxes from deeper groundwater systems Downwards fluxes to deeper groundwater systems

Appendix I. Assessment methodology
I11
Figure I4 Variation in the vertical groundwater gradient (downward and upward).

Appendix I. Assessment methodology
I12
4.3 Is there s ignific ant demand for new water s upply? Water use in WA rural towns predominantly relies on the scheme water supply, which is supplemented by treated waste water and surface water harvested in the local dams. Commonly water supply from the local resources combines up to 90 per cent treated waste water and up to 25–30 ML harvested water. Local dam capacity in some towns is not sufficient to supply scheme water needs throughout the dry season, and the quality may be poor for drinking. The local fresh water resources are used by shires for irrigation of the town parks and sport grounds, often in combination with scheme water.
Drinking water demands in towns are commonly satisfied by the existing water supply scheme. Scheme water use is currently restricted only in towns located along the Goldfields and Agricultural Water Scheme.
It is important to identify the motivation of rural town communities to develop a new or alternative water supply. The requirement for new water resources is often driven by the water costs, which are considerable for the larger rural water users, such as shires and industrial groups. For instance, the annual water cost of the Katanning meatworks (WAMMCO) is in the range of $0.5M, while the Shire of Wagin scheme water use costs up to $20K per year (Woodanilling—up to $8K, Nyabing—up to $6K, Lake Grace up to $18K).
Rural water supply is subsidised by Community Service Obligations (CSOs) and as a result rural town water tariffs at the lower ranks of water use (350 KL) are comparable with the metropolitan water prices. The introduction of new local water resources, potentially including desalination of saline groundwater, is likely to carry much greater cost, and as such could be a less favourable alternative to the current water supplies.
The Water Management Plan aims to address the current water demands and water quality constraints for townsite water supply. It also identifies potential water users if additional water supplies become available. This is preferably considered simultaneously with the water management options proposed to mitigate townsite salinity, as proposed within the FPWMO and demonstrated schematically in Figure I5.
On the other hand it is anticipated that there may be demands for three main water quality types:
1. Potable water for human consumption and some industrial use which may have specific water quality requirements: Supply of this water type is a subject to rigorous regulation and any new potable water resources will need to health standards and risk management.
2. Fresh water for non-potable use for irrigation of domestic gardens and townsite parks and ovals.
3. Brackish/saline water, which is not commonly used in towns, but the opportunities for brackish/saline water use for irrigation of salt-tolerant turf or aquiculture are within the scope of this project.
The potential sources for those water demands are summarised in Table I2.

Appendix I. Assessment methodology
I13
Figure I5 Townsite water demands.

Appendix I. Assessment methodology
I14
Table I2 Sources of the local water resources
Water quality Sources of water resources
Potable water
Potable water demand may be reduced by the introduction of alternative in-door water appliances or supplementing outdoor water use with fresh, but non-potable water supply.
New potable water may be generated via groundwater desalination, providing the local groundwater water quality and quantity are adequate for desalination (contributing to salinity risk reduction).
Fresh water for non-potable use
New resources may be generated via townsite stormwater harvesting (contributing to salinity risk reduction).
Catchment water harvesting or improvement of the existing dams (dam catchment enhancement, dams’ alteration) may provide additional fresh water resources. In some cases (as in Lake Grace) this option will also reduce the salinity risk within the townsite.
Abandoned Water Corporation dams, previously used for local water supplies.
Brackish/saline water Brackish/saline water used for irrigation of salt-tolerant turf.
Brackish/saline water used for aquiculture.
4.4 Identifying the s c ope for the towns ite water management plan and ranking the water management options
As described above FPWMO is designed to identify both key issues and potential water management options which in turn lead to the definition of the townsite Water Management Plan scope.
The most commonly considered generic water management options are given in Table I3. The final decision on the WMP scope is based on comparisons and ranking of the preliminary selected options in view of the cost of their implementation and maintenance, local community preferences and environmental safety.
To guide community engagement in the process of water management option selection, a multi-criteria ranking system was employed. The method allowed the ranking of water management options, based on the following:
● Twelve selection criteria
● Criteria weighting as an identification of its relevance to an individual town’s needs and/or community aspiration; and
● Option score identifying the relevance of an individual water management option to satisfy the relevant criteria.

Appendix I. Assessment methodology
I15
Table I3 Water management options aimed at improving rural town water management (the current batch of rural towns fit within a number of the shaded yellow boxes)
Additional water demands
Potable water Non-potable water
None Fresh Brackish/Saline
Salin
ity is
an
issu
e
Townsite stormwater management
Direct use
Disposal
Treatment and reuse
Groundwater abstraction
Direct use
Disposal
Treatment
Improvement in townsite water use
Adoption of the salt resistant building materials
Salin
ity is
not
an
issu
e
Catchment runoff harvesting
Use
Treatment
Groundwater abstraction
Reuse
Disposal
Treatment
An example of the criteria, their weighting and scoring system is given in Table I4. While there is a suite of common criteria, their final selection is town specific and needs to be defined in consultation with main stakeholders.
This approach may be further expanded to more refined multicriteria analysis.

Appendix I. Assessment methodology
I16
Table I4 Criteria for water management option selection
Criterion Weighing
factor (1–10)
Option score
High (9) Medium (3) Low (1)
Reduction in infrastructure damage > $100 000 $50 000–$100 000 < $50 000
Additional water supply
Reliable new water resource available for new user
Above current Shire water demand to support townsite beautiful
Below current Shire water demand
Capital cost for the option < $250 000 $250 000–$1 000 000 > $1 000 000
Annual operating and maintenance cost < $50 000 $50 000–$100 000 > $100 000
Is the technology proven? Yes Sometime used No
Energy requirements Low Medium High
Ease of operation Fully automated Some manual input
Manually operated
Downstream income Economic Profitable
Positive benefit within TBL
Positive total benefit within TBL
Shire resources to implement the option No resources required
Minimum resources required
Resources required
Potential external funding Fully sponsored by external sources
Partly sponsored by external sources
Minimum sponsored by external sources
Employment Long term employment
Short-term and long-term employment
Sort term employment only
Downstream environmental impact Low risk Medium risk High risk

Appendix I. Assessment methodology
I17
5. C onclus ions The proposed methodology facilitates prioritisation of water management options in Western Australian towns. The framework has been adopted by the RT-LA project team to guide the project through the investigations of the next 12 towns.
The framework identifies the most important issues related to townsite water management, which provides a number of benefits:
● Identification of the research focus area within each town
● Simultaneous identification of issues and opportunities which could be addressed by townsite Water Management Plans
● Linkage of water demands with potential water resources
● Engagement of local community in the decision make process
● The structured format for a further expert system development.
The framework is applicable at various stages of the townsite investigations and Water Management Plan development:
● Research initiation which can be focused on the identify priority issue
● Selection of water management options to utilise local water resources and match them to townsite water demands
● Prioritisation of the water management options in consultation with the local community.
It is anticipated that the framework will be advanced during the next stages of the RT-LA project with opportunities possible in the following areas:
● Advancement in the integration of the social aspects which will provide a greater community engagement in the Water Management Plan design and therefore ensure the community ownership of the plan and its implementation
● Deliver greater scientific platform for the expert system and multicriteria analysis
● Potential computerisation of the framework aiming for design of a user-friendly tool for decision making process by various stakeholders.

Appendix I. Assessment methodology
I18
6. R eferences Barr A 2005, 'Hydrogeological modelling of first four towns: Lake Grace, Nyabing, Wagin and
Woodanilling', Interim Technical Report to the CSIRO Flagship Water for Healthy Country.
Barron O, Barr A, Smales T, Burton M and Pluske J 2005, Systems Approach to Rural Town Water Management, Interim Technical Report to the CSIRO Flagship Water for Healthy Country.
Barron O, Barr A, Green M, Johnston, C, Smales, T, Turner J, Burton M and Pluske J 2005, Urban salinity and water management in Rural WA towns, Interim Technical Report to the CSIRO Flagship Water for Healthy Country.
Bethune MG, Gyles OA and Wang QJ 2004, 'Options for management of saline groundwater in an irrigated farming system, Australian Journal of Experimental Agriculture 44, 181-188.
Carter N, Kreutzwiser RD and de Loë RC 2005, Closing the circle: linking land use planning and water management at the local level, Land Use Policy 22, 115–127.
Chen Y, Zhang D, Sun Y, Lui X, Wang N and Savenije HHG 2005, Water demand management: A case study of the Heihe river basin in China, Physics and Chemistry of the Earth 30, 408–419.
Fu Y and Shen R 2004, GA based CBR approach in Q&A system, Expert System with Applications 26, 167–170.
Gomolka Z and Orlowski C 2000, Knowledge management in creating hybrid system for environmental protection, Cybernetics and Systems: as International Journal 31, 507-529.
Grant A and Sharma A 2005, Water Balance Study of Wagin, Lake Grace, Nyabing and Woodanilling, Technical Report (CMIT) to the CSIRO Flagship Water for Healthy Country.
Johnston C, Green M and Helmert E 2005, Rural towns-liquid assets: Social scoping study for the towns of Merredin, Moora, Tambellup and Wagin, Interim Technical Report to the CSIRO Flagship Water for Healthy Country.
Khadam IM and Kaluarachchi JJ 2003, Multi-criteria decision analysis with probabilistic risk assessment for the management of contaminated groundwater, Environmental Impact Assessment Review 23, 683–721.
Lee HK, Oh KD, Park DH, Jung JH and Yoon SJ 1997, Fuzzy expert system to determine stream water quality classification from ecological information, Water Science Technology 36 199–206.
Liao S-H 2005, Expert system methodologies and applications—a decade review from 1995 to 2004, Expert System with Applications 28, 93–103.
Mahabir C, Hicks FE and Fayek AK 2003, Application of fuzzy logic to forecast seasonal runoff, Hydrological Processes 17, 3749–62.
Mulvaney D and Bristow C 1997, A rule-based extension to the C++ language, Software Practice and Experience 27, 747–761.
Özelkan EC and Duckstein L 1996, Analysing water resources alternatives and handling criteria by multi criteria decision techniques, Journal of Environmental Management 48, 69-96.

Appendix I. Assessment methodology
I19
De La Rosa D, Moreno JA and Garcia LV 1993, Expert evaluation system for assessing vulnerability to agrochemical compounds in Mediterranean regions, Journal of Agricultural of Engineering Research 56, 153–164.
Shepard A 1997, Interactive implementation: promoting acceptance of the expert systems, Compute., Environ. and Urban Systems 21(5), 317–333.
Soh LK, Tsatsoulis C, Gineris D and Bertoia C 2004, ARKTOS: an intelligent system for SAR sea ice image classification, IEEE Transactions on Geoscience and Remote Sensing 42, 229–248.
Tait NG, Lerner DN, Smith JWN and Leharne SA 2004, Prioritisation of abstraction boreholes at risk from chlorinated solvent contamination on the UK permo-triassic sandstone aquifer using a GIS, The Science of the Total Environment 319, 77–98.
URS (2001) Economic Impacts of Salinity on Townsite Infrastructure, Rural Towns Program, Department of Agriculture WA, Bulletin 4525.
Verbeek M, Post H, Pouwels I and Herman W 1996, Policy analysis for strategic choices in integrated water management, Water Science Technology 34, 17–24.
Xirogiannis G, Stefanou J and Glykas M 2004, A fuzzy cognitive map approach to support urban design, Expert Systems with Applications 26, 257–268.
Zhu A, Band LE, Dutton B and Nimlos TJ 1996, Automated soil interference under fuzzy logic, Ecological Modelling 90, 123–145.


Appendix J
Stormwater Harvesting at Pingelly
Surface Water Modelling
GHD
October 2007

Appendix J. GHD Stormwater Harvesting
Ji
Contents Page
1. Summary ........................................................................................................................ 1 1.1 Introduction ............................................................................................................ 1 1.2 Methodology ........................................................................................................... 1 1.3 Results and Recommendations .............................................................................. 2
2. Introduction .................................................................................................................... 3 2.1 Background ............................................................................................................ 3 2.2 Current study .......................................................................................................... 3
3. Yield modelling ............................................................................................................... 4 3.1 Aquacycle model .................................................................................................... 4
3.1.1 Methodology ................................................................................................. 4 3.1.2 Results ......................................................................................................... 5 3.1.3 Discussion .................................................................................................... 5
3.2 Peak Runoff Model ................................................................................................. 6 3.2.1 Methodology ................................................................................................. 6 3.2.3 ILSAX Results .............................................................................................. 7 3.2.3 Discussion .................................................................................................... 7
4. Townsite East Preliminary Design ................................................................................ 8 4.1 Catchment Description ........................................................................................... 8 4.2 Hydrology ............................................................................................................... 8 4.3 Design requirements .............................................................................................. 8
4.3.1 Drains and Culverts ...................................................................................... 8 4.3.2 Collection Sump ........................................................................................... 12 4.3.3 Pump Installation .......................................................................................... 13 4.3.4 Pumping Main .............................................................................................. 13 4.3.5 Sportsground Storage ................................................................................... 13
5. Townsite East estimated costs ...................................................................................... 13
6. Discussion and Conclusions ......................................................................................... 14
7. Recommendations ......................................................................................................... 15
8. References ...................................................................................................................... 15
Attachment A: .......................................................................................................................... 17
Attachment B: .......................................................................................................................... 18
Attachment C: .......................................................................................................................... 22

Appendix J. GHD Stormwater Harvesting
Jii
Page Table Index Table 1 Aquacycle Annual Yields for Pingelly ............................................................................. 5
Table 2 ILSAX Hygrograph Results for Pingelly .......................................................................... 7
Table 3 Preliminary Costing—Townsite East Capital Works ....................................................... 14
Figure Index Figure 1 Pingelly Townsite Catchment Area ...............................................................................
Figure 2 Townsite East Subcatchment .......................................................................................
Figure 3 Townsite East Priority Subcatchment ........................................................................... 13

Appendix J. GHD Stormwater Harvesting
J1
1. S ummary
1.1 Introduc tion Pingelly Townsite, located near the south-western boundary of the Avon Catchment, has experienced problems with dryland salinity and resultant impacts on a range of urban infrastructure. A lack of water for irrigation of recreation areas and for construction purposes has also provided challenges over the last 10 years. Further, runoff when it does occur, becomes contaminated with salinity upon entering local watercourses already compromised by saline seeps and surficial concentration processes.
Annual rainfall for Pingelly is 447 mm and evaporation is approximately 1 700 mm. Whilst rainfall is very seasonal, occurring mainly as light falls of longer duration during winter months, there is nevertheless occasional high intensity late summer and early autumn storms.
Previous investigation, initiated by the Shire of Pingelly, examined the potential for stormwater harvesting to mitigate salinisation processes and also reduce dependence on the Water Corporation IWSS (Integrated Water Supply Scheme). The engineering approach is based on diverting relatively fresh upslope stormwater runoff before it becomes contaminated within the local watercourse on the lower slopes (John Duff & Associates, 2000).
In 2006, CSIRO and the Department of Agriculture and Food, Western Australia (DAFWA), in conjunction with the Avon Catchment Council (ACC), undertook a high-level investigation of urban water management options for the Pingelly Townsite. This water balance study, utilising the Aquacycle Model, provided a comprehensive evaluation of a range of measures, including stormwater harvesting, rainwater tanks and grey water re-use. It focussed on the beneficial use of low cost stormwater, at the same time reducing the impacts of urban salinity ('Rural Liquid Assets: Water Balance Study for Pingelly', CSIRO, 2006).
It would appear from the CSIRO study that a total of around 488 ML per annum of stormwater would be available from the townsite. In the future, this may provide some opportunity to develop horticultural and other commercial enterprises. Effective (achievable) water harvesting volume will be governed to some extent by the site conditions and opportunities to adapt existing infrastructure to collection and transfer of stormwater.
1.2 Methodology This current study, under the direction of the Rural Towns Liquid Assets alliance (RT-LA), between CSIRO and DAFWA, extends previous water balance work by focussing on selected subcatchments within Pingelly Townsite in order assess stormwater yields and preliminary design options/costings for the development of stormwater harvesting. In addition to the selected subcatchment, three other areas were modelled within the townsite to provide yield comparisons and perhaps indicate future direction for integrated development of the surface water resource in Pingelly.
In the current study, the Aquacycle water balance model (eWater CRC, 2006) was employed in a similar manner to that of the above RT-LA study. Because of a lack of catchment monitoring data within Pingelly, this study adopts similar calibration parameters to the CSIRO study to provide a measure of consistency between both studies and to give better agreement if/when such data becomes available. As this current study concentrates purely on stormwater harvesting, the reader is referred to the above study for information on full

Appendix J. GHD Stormwater Harvesting
J2
range of options assessed previously. It is important to note that principal aims in using Aquacycle were to obtain annual yield estimates for the nominated subcatchments and to maintain systematic consistency with previous work.
As in the CSIRO investigation, the water balance was modelled with end use data supplied by the Water Corporation of Western Australia and by applying similar assumptions. The same qualifications on data also apply. The wastewater and water demand data are regarded as quite accurate. Stormwater models can still not be calibrated, as there are no actual catchment flow data available.
An important addition to this study has been event-based modelling to estimate stormwater volumes expected to be delivered by higher intensity storms. Probabilistic Rational Method and Index Flood Method were used to calibrate a simplified hydrograph model (using ILSAX, in this case) from which storm runoff volumes were obtained.
1.3 R es ults and rec ommendations This study provides details of runoff behaviour of four subcatchments within the Pingelly Townsite, including the priority subcatchment identified by the RT-LA Team. Subcatchments have been defined to provide a degree of consistency with the original evaluation study of 2000 (John Duff & Associates, 2000). This integration will facilitate discussion and aid further economic evaluation of enterprises in the future.
For the priority subcatchment area (Townsite East) it was found that approximately 35 ML/year could be harvested from stormwater flows with an estimated capital cost (commercial rates) of $235 690. This information is essential in order for the Shire of Pingelly to make an economic decision on a stormwater harvesting strategy. Over a 20 year project life this amounts to an annual cost of $18 912 (5 per cent discount rate, not including operating and maintenance cost). This is equivalent to $0.54/kL, comparing favourably to the current $1.38/kL for supply of water from the Water Corporation Integrated Water Supply Scheme (IWSS). This in turn represents a life cycle saving of $366 388 above the capital expenditure. Operation and maintenance costs (commercial rates) are expected to be in the order of $5 000 per year. This would reduce the total project life cycle saving to around $304 075.
It is believed that a stormwater harvesting strategy represents a cost-effective means of pursuing greater self-sufficiency, reducing reliance on the IWSS and at the same time providing collateral environmental and infrastructure protection benefits. However, it is important to regard this as the first stage in an adaptive process that can progressively look to other water management measures in the light of future climate change and varying market signals.
Consequently, it is recommended:
1. ACC, in conjunction with the RT-LA group, proceed to development of a preliminary engineering design for the priority Townsite East subcatchment. This design would include sufficient detail to enable more accurate costing to be provided which would support capital works budgeting by Shire of Pingelly.
2. As part of the above partnership, funding sources should be investigated to undertake appropriate instrumentation in the identified subcatchments. This would allow hydrological and water quality data (incl. flow, rainfall and conductivity) to be captured, which could inform future modelling, work in Pingelly and other rural towns.
3. Consideration be given to expansion of stormwater harvesting to other identified subcatchments and the funding opportunities which might support such a strategy.

Appendix J. GHD Stormwater Harvesting
J3
2. Introduc tion
2.1 B ac kground Pingelly Townsite, located near the south-western boundaries of the Avon Catchment, has experienced problems with dryland salinity and consequent impacts on a range of urban infrastructure. A lack of water for irrigation of recreation areas and for construction purposes has also provided challenges over the last 10 years. Further, runoff when it does occur, becomes contaminated with salinity upon entering local watercourses which are compromised by saline seeps and surficial concentration processes.
The Shire of Pingelly has been proactive in its approach to integrated management of available water resources. The Shire has been using treated effluent from the Wastewater Treatment Plant to irrigate playing fields under controlled conditions, for approximately 10 years. Similarly, the Shire instigated a formal investigation into the practicability of using stormwater to replace consumption of potable water from Water Corporation Integrated Water Supply Scheme (IWSS).
The report 'Pingelly: Irrigation Feasibility Study' (John Duff & Assoc, 2000) found that around 320 ML should be available for use in a range of horticultural, aquaculture and industrial enterprises, as well as in general Shire uses. Several potential businesses were evaluated to assess the effective cost of harvested stormwater ($1.25/kL) compared to IWSS supply rates (then $1.90/kL). This was found to provide a saving of ~$15 000/yr for one operator with a projected consumption of about 12.5 ML/yr. The report noted IWSS costs were likely to rise (currently ~$1.38/kL for Shire consumption). Current (2007) saving for the same enterprise would be in the order of $22 000.
If commercialisation of harvested stormwater resources were to be pursued, further work would be required, coordinated at Shire level, to establish more accurate yields, reliability, risk and associated development costs of townsite subcatchments.
In 2006, CSIRO and the Department of Agriculture and Food, Western Australia (DAFWA), in conjunction with the Avon Catchment Council (ACC) undertook an investigation of urban water management options for the total Pingelly Townsite. The water balance study treated the townsite as a bulk entity and did not recognise individual subcatchments. It provided a comprehensive evaluation of a range of measures, including stormwater harvesting, rainwater tanks and grey water re-use, which might ‘capture’ more water and at the same time reduce the impacts of urban salinity (Grant & Sharma, CSIRO, 2006).
The CSIRO study evaluated the existing water balance of Pingelly (nominally the ‘Base Case') and compared this with several scenarios comprising various combinations of greywater re-use and rainwater tanks for garden irrigation and toilet flushing. It would appear from this model, given an upgraded system of collection channels, sumps and rising mains that around 488 ML per annum of stormwater would be available from the total townsite area of 700 ha.
2.2 C urrent s tudy The current study, initiated by ACC and under the direction of the Rural Towns Liquid Assets Team (RT-LA), between CSIRO and DAFWA, extends previous water balance work by focussing on a selected ‘priority’ subcatchment within Pingelly Townsite in order assess stormwater yields and preliminary design options/costings for the development of stormwater

Appendix J. GHD Stormwater Harvesting
J4
harvesting. In addition to the selected subcatchment, three other areas were modelled within the townsite to provide yield comparisons and perhaps indicate future direction for integrated development of the surface water resource in Pingelly.
Figure 1 gives details of the overall Pingelly Townsite and the location of subcatchments of interest within that area. The Townsite East subcatchment was identified as a priority for further investigation and preliminary design by the RT-LA consultative team. This was in part due to its proximity to the existing Sportsground Storage and the potential for integration of this supply system.
3. Y ield modelling
3.1 Aquac yc le model
3.1.1 Methodology
The Aquacycle model is a daily water balance model that assesses water distribution pathways and fluxes within an urban and peri-urban context. It considers the volume of water being imported into the area, the volume of stormwater run-off and the volume of wastewater discharge. The model operates on extended records of actual daily rainfall and evaporation and gives an average annual yield based on full hydrological cycle processes.
In the current investigation, four subcatchments were identified and modelled including the specific ‘priority catchment’ (Townsite East) nominated by the RT-LA group (CSIRO and DAFWA). Figure 1 gives details of subcatchments within the Pingelly Townsite. In addition, the complete townsite was also modelled with Aquacycle to allow comparative consistency with the earlier CSIRO work (Grant & Sharma, CSIRO, 2006).
Calibration parameters were varied for the individual catchments to reflect estimated variations in runoff characteristics such as impervious area (roofs, roads and other pavement) and catchment cover conditions. The aim was to produce stormwater yields from each subcatchment that were believable in the context of the greater townsite.
Input Data: End user data for the years 2003–2004 was adopted from the CSIRO Report (Grant & Sharma, CSIRO, 2006), being originally sourced from the Water Corporation of Western Australia with the same land use differentiations (residential, commercial, farmland, vacant land and other). The reader is directed to Tables 2, 3, 4, 5 and 6 in the CSIRO Study. Climate data was also provided from the CSIRO study, having been sourced from a SILO Data Drill comprising 56 years of synthetic rainfall and evaporation data.
As with the CSIRO study, no stormwater flow data was available that might allow meaningful calibration of the Aquacycle model. The CSIRO study notes: 'The lack of calibration means that the values seen in the results section can only be considered as indicative and should not be relied upon for design and treated with caution for decision-making.' Stream gauging (incl. flow, rain gauge and conductivity) is a matter that requires further consideration, particularly recognising the need for increased water management efficiencies in the light of expected climate change effects.
Model Parameters: In order to preserve overall townsite model consistency. specific Aquacycle parameters were adopted from the previous CSIRO Study (Grant & Sharma, CSIRO, 2006). Due to a small software revision, a 'public open space trigger to irrigate' ratio replaced the original rainwater tank first flush parameter. Within the individual subcatchments these parameters were varied to reflect runoff characteristics of each area. A summary of weighted average parameters for each subcatchment is given in Table 1.

Appendix J. GHD Stormwater Harvesting
J5
Subcatchment characteristics were adjusted to reflect expected variation in potential yield across the townsite. These yield results are considered to be consistent with the Base Case scenario of the previous CSIRO study that is: scheme water access by all end users and no conservation measures.
3.1.2 R es ults
Table 1, below gives a summary of annual yield results for individual subcatchments and the total townsite area. Figure 1, above shows the location of the various subcatchments within the overall Townsite.
Table 1 Aquacycle annual yields for Pingelly
Catchment Townsite
east X1
Townsite northwest
X2
Northwest extended
X3
Farmland southeast
X4 Balance townsite
Total area townsite
Catchment area (ha) 32.4 79.5 34.4 109.7 443.20 699.2
Rainfall (mm) 447
Stormwater yield (mm) 109 61 112 63 67 70
Stormwater yield (ML) 35.32 48.50 38.53 69.11 296.55 488.00
Est. runoff threshold (mm) 3.5 5.1 2.3 6.3 6.5 6.1
3.1.3 Dis c us s ion
It is important to note that the above results can still only be regarded as ‘reasonable estimates’ because of the lack of calibration data. The previous CSIRO Report warns: 'values… can only be considered as indicative and should not be relied upon for design and treated with caution for decision-making'. The new results improve the differentiation or resolution at the subcatchment level and are considered to provide the best information available at the current time. Unfortunately subcatchment results suffer from the same problem as the complete townsite: as yet, they cannot be compared/calibrated against actual flow records even in the main watercourse. Preliminary design options for Townsite East subcatchment are provided with the qualification that final investigation and design should review any available field data, including anecdotal information that might assist to reconcile the calibration problem.
Table 1 allows comparison of predicted Aquacycle yields for the four subcatchments within the Pingelly Townsite Area. The variation of runoff across the subcatchments is a function of the runoff producing characteristics including the extent of developed impervious surfaces, compacted soil conditions and levels of cultivation. The combination of subcatchments (incl. Balance Townsite) reflects the same bulk runoff coefficient (0.16) found across the total townsite in the CSIRO study.
Runoff thresholds have been estimated from Aquacycle model outputs and are based on a low antecedent moisture content, i.e. practically dry surface conditions. Under these conditions the thresholds represent rainfall required to produce 0.2 mm of runoff from the respective catchments.
Thresholds are highly dependent upon antecedent moisture conditions and to a certain extent ‘moisture conditioning’ as in the case of hydrophobic soils like those in many sections of Pingelly townsite. All catchments exhibit unusually low thresholds and are considered to be generally too low to represent the true surface wetting processes. The complex wetting responses of such hydrophobic soils is not easily reproduced in hydrological modelling.

Appendix J. GHD Stormwater Harvesting
J6
Consequently, it believed the most effective means of improving the Aquacycle model is by direct calibration of shallow store behaviour with actual rainfall/runoff data.
Townsite East: Moderate development and high runoff, soil conditions that result in an estimated average yield of 109 mm or 35.32 ML/yr. This subcatchment is identified as the priority for stormwater harvesting, being close to areas of intended usage and the existing Sportsground Storage. Due to the existing system of open drains, development costs should also be moderate.
Townsite Northwest: contains significant areas of woodland and shrubs as well as some cropped land. Runoff characteristics were adjusted to reflect the influence of these factors. The predicted yield of 48.50 ML/yr would be of interest if an integrated scheme could be devised to also include the Northwest Extended subcatchment. This combined approach could produce about 85 ML/yr if there are no site complications related to salinity. Further investigation of this combined option is therefore warranted.
Northwest Extended: Expected high runoff from the developed areas suggesting an annual yield of around 112 mm or 38.53 ML. John Duff & Associates also anticipated this potential in their study (John Duff & Assoc., 2000). Although development costs would appear to be greater in this subcatchment than for the priority Townsite East area, it probably does show the next best potential as it is also linked to urban salinity and infrastructure issues of the business precinct.
Farmland Southeast: Shows good potential for development although yields from the mainly cropped catchment are expected to be depressed in drier years. Although it does not have a high yield coefficient the total estimated yield of 69 ML/yr does allow the potential to develop a new dedicated water harvesting project to the south of the town. Due to the reduced service density in this area development costs would be expected to be considerably lower than for the urban subcatchments.
It should be noted that catchment stormwater development would also be guided by such things as storage site (collection sump and storage dam) availability, subsoil conditions, remnant vegetation, service density and length of pumping main required.
The above table indicates that the priority subcatchment, Townsite East could produce around 35 ML/yr over the long term with a volumetric runoff coefficient of ~0.24. This is considerably in excess of the runoff coefficient for the total Townsite Area of ~0.16. Importantly, within this area drainage infrastructure lends itself more easily to the function of stormwater harvesting. Design and development issues related to the Townsite East subcatchment are further dealt with in Section 4.
3.2 P eak R unoff Model
3.2.1 Methodology
A second catchment model was employed to estimate event-based yields, or those volumes that might be expected from limited duration storm events. This was necessary to provide peak flow information for the preliminary design of drains, waterways, sumps and other components. It was also used to derive a statistical runoff duration relationship to guide the sizing of the temporary collection sumps.
Figure 1 shows the selected subcatchments modelled within the overall Pingelly Townsite.

Appendix J. GHD Stormwater Harvesting
J7
The Probabilistic Rational Method and Index Flood Method in AR&R for Western Australia (Australian Rainfall and Runoff, Inst. Engineers, Aust., 2006) were used to give a best estimate of peak flow rates at a range of different frequencies or ARIs (Average Recurrence Intervals). These peak values were then used to calibrate a simplified runoff routing model, in this case ILSAX (O’Loughlin, 1997), which provided estimates of actual stormwater volume corresponding to each flow peak.
It should be noted that ILSAX was used as a means of hydrograph generation and was applied in a relatively coarse form in terms of subcatchment description. It is believed that this approach was justified with volumetric errors expected to be in the order of 5 per cent. A comprehensive error analysis was not performed at this stage.
3.2.3 IL S AX res ults
Table 2, below gives a summary of subcatchment peak flows and volumes for storm events ranging from a frequency of 2 Year ARI up to the 100 Year ARI. Specific peak flow/volume results for the priority Townsite East subcatchment are shown in graphical form in Figure 3 (Section 4.2, below).
3.2.3 Dis c us s ion
Anecdotal information (D Stanton, DAFWA, pers. comm.) indicates that rainfall/runoff behaviour of the townsite subcatchments is expected to be quite rapid due to the wetting characteristics of some of the soils (low initial losses). This is compounded by the shallow soil depth (soil store) and likely low value for continuing losses due to often-high levels of compaction over much of the townsite area. Hydrographs generated by ILSAX do reflect this high-early peaking behaviour. There is however, some doubt in relation to catchment response times (‘time of concentration’) of some derived hydrographs which peak earlier than would be expected given the catchment size. This would suggest that mainstream flow velocities are slightly high. Nevertheless, specific hydrograph volumes are believed to provide reasonable consistency when examined across the range of ARIs (see Figure 3, Section 4.2, below).
Table 2 ILSAX hygrograph results for Pingelly
ARI (years) Value Townsite east Townsite
northwest Northwest extended
Farmland southeast
2 Q2 (m3/s) 0.213 0.347 0.164 0.446 Hydrograph (m3) 372 788 406 799
5 Q5 (m3/s) 0.429 0.706 0.331 0.908 Hydrograph (m3) 535 1 011 605 1 536
10 Q10 (m3/s) 0.759 1.235 0.594 1.606 Hydrograph (m3) 671 1 473 788 1 510
20 Q20 (m3/s) 1.338 2.170 1.040 2.781 Hydrograph (m3) 1 077 2 289 1 110 2 264
50 Q50 (m3/s) 2.409 3.880 1.876 5.018 Hydrograph (m3) 1 953 3 873 1 709 3 845
100 Q100 (m3/s) 4.206 6.722 3.312 8.709 Hydrograph (m3) 3 558 6 667 2 923 6 895
Issues related to the development of the Townsite East subcatchment are dealt with in Section 4.

Appendix J. GHD Stormwater Harvesting
J8
4. Towns ite E as t P reliminary Des ign
4.1 C atc hment des c ription The Townsite East subcatchment consists of a partly developed residential area located to the east of the main watercourse, a minor tributary of the Avon River. Developed levels vary from approximately 15 to 60 per cent with higher concentration of dwellings noted in the vicinity of Brown and Stratford Streets.
The catchment has a westerly aspect with slopes ranging from < 1–4 per cent.
Soils consist of shallow sandy loam topsoils over varying depths of sandy clays and weathered sedimentary material of mainly conglomerates and limestones. Soils tend to exhibit a hydrophobic, ‘water repellent’ wetting behaviour, with initial losses, particularly with high intensity short duration storms, expected to be very low and approaching values associated with natural indurated sediments.
Vegetation is generally quite sparse in the Townsite East subcatchment, having been largely cleared for agriculture and residential construction in the past. Perennial vegetation (shrubs and trees) has the potential to modify infiltration processes by modifying soil structure and providing entry channels along root paths thereby greatly increasing initial and continuing loss values and accessible soil store volumes.
Figure 2 shows the layout of the Townsite East subcatchment. Existing drainage infrastructure consists mainly of table drains along the road shoulder, culverts at crossing points with an open drain discharging along the unformed portions of Rennet Street. There is evidence of high rates of soils loss and culverts and open drains are generally in need of de-silting.
4.2 Hydrology Annual rainfall for Pingelly is 447 mm whilst evaporation is approximately 1 700 mm. Whilst rainfall is very seasonal, occurring mainly as light falls of longer duration during winter months, there is nevertheless a chance of high intensity late summer and early autumn storms.
The Townsite East subcatchment has a moderate level of development and is expected to produce runoff yield rates above those for the total townsite area.
Table 1 (Section 3.1.3, above) gives details of the annual yield whilst Table 2 (Section 3.2.2) shows the short duration peak flows and hydrograph volumes.
4.3 Des ign requirements
4.3.1 Drains and c ulverts
Open channel drains and culverts are significant in the conveyance of peak flows from higher intensity storms. A minimum 10 year ARI design standard should be applied to such structures where a safe overflow route exists. Where drain overflows could result in inundation of private land and habitable areas much higher standards should be chosen. Preliminary design should include an evaluation of existing capacities and re-design where necessary to comply with current requirements of AR&R (Inst Engrs Aust, 1997). The following summarises estimated works required to bring drains and culverts up to a satisfactory standard—locations refer to the layout given in Figure 2.

Appendix J. GHD Stormwater Harvesting
J9
Node 2 Culvert beneath Somerset Street: This culvert has an approximate capacity of 1.1 m3/s corresponding to a design ARI of ~70 years at that node. This culvert is not a constraint on the stormwater system however, localised flooding problems could relate to reduced capacity of the downstream open drain.
Node 2 Culvert beneath Somerset Street.
From Node 2 Open Channel down Rennet Street: This open channel, along the unformed road, is heavily silted and requires cleaning/reshaping. The 20 Year ARI design flow of 0.63 m3/s would require a trapezoidal channel of approximate dimensions: 0.45 m depth × 1.50 m base × 2:1 batters, at a grade of ~2.60 per cent. Consideration could be given to stone revetment lining of this drain due to its strategic importance, ease of maintenance and the need to reduce transmission losses in stormwater harvesting.
Open Channel down Rennet Street.

Appendix J. GHD Stormwater Harvesting
J10
To Node 3 Open Channel down Stratford Street: This channel runs along the rear of the layback kerb, conveying flows from Rennet Street along Stratford Street to Node 3 at the existing culvert crossing. The existing channel is moderately silted and requires cleaning and re-trimming. The base depth will be generally limited by the inverts of pipes in the several vehicle entry crossings along this reach. Trimming should produce a trapezoidal section of about 0.60 m depth × 1.20 m base × 2:1 batters, at a grade of ~1.50 per cent. This channel would have an estimated capacity of ~2.60 m3/s.
The 20 year design flow of 1.33 m3/s accumulates along this reach towards Node 3, indicating a channel of the following dimensions: 0.45 m depth × 1.20 m base × 2:1 batters, allowing for silt transmission. The above trimmed dimensions will more than satisfy flow requirements. Consideration should be given to stone revetment lining of this drain due to its strategic importance, ease of maintenance and the need to reduce transmission losses.
Node 3 Culvert beneath Stratford Street to Open Drain: This culvert traverses Stratford Street at the sag point, discharging into an open drain that crosses an adjacent vacant allotment. It is a small box culvert ~0.45 m depth × 1.20 m width in size and is heavily silted. Once cleaned it should have a capacity of about 0.70 m3/s, given a relatively free tail water. As the 20 Year ARI flow at this node is ~1.20 m3/s a surcharge of ~0.63 m3/s is expected to occur as weir flow, approximately 60 mm deep across the road crown to the vacant lot beyond. This situation is considered to be reasonable in terms of public safety.
Open Channel down Stratford Street.

Appendix J. GHD Stormwater Harvesting
J11
Node 3 Culvert beneath Stratford Street to Open Drain.
From Node 3 Open Channel to Collection Sump: The culvert currently discharges into a very heavily silted open drain leading towards the main watercourse. Depending on land tenure, it is proposed to divert this drain to convey subcatchment flows to the proposed Collection Sump. In this case the 20 Year ARI design flow of ~1.33 m3/s would still apply and a channel section of 0.60 m depth × 1.80 m base × 2:1 batters, at a grade of ~0.75 per cent, would be appropriate (includes a suitable siltation allowance). Consideration should be given to stone revetment lining of this drain due to its strategic importance, ease of maintenance and the need to reduce transmission losses.
Open Channel to Collection Sump.

Appendix J. GHD Stormwater Harvesting
J12
4.3.2 C ollec tion s ump
The collection sump should be sized to economically contain flow volumes expected from both storm peak flows and extended duration catchment flows. Figure 3, below shows that a 20 Year ARI event with a hydrograph volume of 1 077 m3 is equalled or exceeded only 5 per cent of the time in the long run. That is a volume of ~1 100 m3 will contain runoff from ~95 per cent of the storm events over the long term. This volume consistent with the 20 Year ARI design standard and is adopted as a convenient size for the purposes of preliminary design.
0
500
1,000
1,500
2,000
2,500
3,000
3,500
4,000
4,500
2 5 10 20 50 100
Annual Recurrence Interval (years)
Pea
k Fl
ow V
olum
e (m
3 )
0
0.5
1
1.5
2
2.5
3
3.5
4
4.5
Pea
k Fl
ow (m
3 /s)
Peak Flow Volume Peak Flow
Figure 3 Townsite East Priority Subcatchment. Peak flow and volume excedence curves
The proposed location of the Collection Sump is shown in Figure 2, above. It should be noted that final siting and design will be guided by land ownership and access as well as detailed survey to ensure assumed channel alignments are practicable. With batters of 3:1 (hor:ver) 1 100 m3 would be accommodated in an excavated tank: 1.83 m deep, with approximate base dimensions of 14.6 × 24.6 m and SWL dimensions of 25.4 × 35.4 m. A freeboard of at least 300 mm should be provided. A level sill outlet (bywash) should be provided. This should be designed to discharge excess flows up to 100 Year ARI peak discharge.
It is believed that batters of 3:1 would be stable given anticipated subsoil conditions. This should be confirmed by geotechnical assessment of a trial pit in the preferred location, prior to construction. Lining of the sump should be considered to limit accession of saline groundwater during winter and to reduce seepage losses during dry times. A dewatering filter is recommended to stop silt from entering the pump suction line and to allow ease of maintenance around the filter. These details can be confirmed in final design.
Close consideration should be given to fencing out this feature in order to discharge the Shire’s duty of care in relation to public risk.

Appendix J. GHD Stormwater Harvesting
J13
4.3.3 P ump ins tallation
Sportsground Storage to the north (See Figure 2, above). It is considered that dewatering of the full 1 100 m3 sump volume should be achieved over a total time span of 50 hours, i.e. in 5 days at 10 hours per day. This will give a sufficiently quick transfer thus making room for the capture of subsequent low flows on the recession limb of the storm hydrograph. The pumping main will discharge to the existing Sportsground Storage to the north of Review Street, a change in elevation of approximately 10.0 m. Allowing for a residual delivery head of ~3.0 m the total pumping duty is estimated at 36.0 m at 5.0 L/s. On this basis a Davey Monsoon 2P multistage pump set is suggested. This set includes a pressure vessel and the required valves and is supplied in modular skid base form. This should be located in a weather/vandal proof acoustic enclosure.
4.3.4 P umping main
The pumping main transfers water from the Collection Sump to the Sportsground Storage located to the north of Review Street. A DN75 mm Class 9 Polythene Pipe is selected in view of the need to limit pumping times and to provide good durability in the ground. The proposed alignment of this main is shown on Figure 2, above. It is important to note that this pipe should be trenched to a depth of 450 mm to give better durability and to protect the main and fittings from temperature fluctuations. Appropriate care should be taken in the vicinity of other underground services.
4.3.5 S ports ground s torage
The Sportsground Storage currently receives treated effluent from Pingelly WWTP. The volume of storage available is believed to be in the order of 25 ML. It is considered that this storage would be suitable to receive harvested stormwater from the Townsite East subcatchment. Prior to design a full evaluation of this storage should be made with a view to establishing a storage operating strategy to accommodate anticipated stormwater volumes. Harvested stormwater should improve the water quality of this storage by diluting nutrients and reducing the frequency of algal blooms.
No assessment has been made at this stage of the effectiveness of existing irrigation mains or equipment, or the potential to extend water delivery to other enterprises. It is understood that Shire of Pingelly currently controls access to the water in this storage. If new stakeholders are to be included it might be advisable to consider upgrading the suction line to accommodate and better regulate other users. Issues relating to public risk need to be assessed by the Shire of Pingelly in consultation with the community and legal advisors.
5. Towns ite E as t es timated c os ts A preliminary estimate of upgrading and development costs has been made for the Townsite East subcatchment. Costs have been estimated based upon the descriptions given in Section 4, above. The estimate is provided as a rudimentary basis for initial budgeting and as such is considered to be quite conservative (i.e. probable overestimate). No costings are provided for the other subcatchments that were modelled (viz Townsite Northwest, Northwest Extended and Townsite Southeast).
Unit rates adopted for Townsite East works are consistent with the DAFWA/Shire Rates used in other recent RT-LA projects (e.g. 'Lake Grace Water Management Options-Engineering Analysis', KBR, 2005). An appropriate allowance for inflation has been included. The current DAFWA (Department of Agriculture and Food Western Australia) Shire Rates derive from those previously provided by David Stanton and Mark Pridham of DAFWA. These in turn were originally based on experience from past rural towns projects of similar scope.

Appendix J. GHD Stormwater Harvesting
J14
Commercial Rates have been similarly adapted from those supplied by KBR in the Lake Grace study, above. No allowances have been made for open channel lining in either case. Shire of Pingelly rates may vary from those assumed.
Table 3 gives a summary of the quantities, rates and estimated costs for the Townsite East capital works.
Table 3 Preliminary costing—Townsite East Capital Works
Proposed works Quantity Commercial rates
DAFWA/Shires rates
Trim table drain along Somerset Street to Node 2 200 m $2 500 $300
Clean and reshape open channel down Rennet Street towards Stratford Street (20 Year design standard)
275 m $35 800 $825
Clean and trim table drain along Stratford Street to Node 3 (20 Year ARI)
75 m $10 000 $275
Desilt existing box culvert Stratford Street Allow $2 500 $500
Clean and reshape open channel across vacant allotment (20 Year design standard)
50 m $7 000 $200
Construct proposed open channel across rear of lots (20 Year design standard)
140 m $21 000 $700
Construct 1 100 m3 Collection Sump with freeboard and spillway allowance, topsoil, sow and fence
Item $70 000 $20 000
Install Davey Pump Set (incl. Civils and Electricals) Item $12 000 $10 000
Construct DN75 Class 9 polythene pumping main + fittings (supply, excavate, lay, joint and backfill)
385 m $18 000 $14 000
Stabilise entry to Sportsground Storage Allow $2 500 $800
Contractor Preliminaries (establishment, insurances, clean-up, etc.)
20% $36 260 $9 520
EPCM (Engineering, Procurement, Construction and Management) Fees
10% $18 130 $4 760
Totals $235 690 $61 880
6. Dis c us s ion and conc lus ions For the priority subcatchment area (Townsite East) it was found that approximately 35 ML/year could be harvested from stormwater flows with an estimated capital cost (commercial rates) of $235 690. Over a 20 year project life this amounts to an annual cost of $18 912 (5 per cent discount rate, not including operating and maintenance cost). This is equivalent to $0.54/kL which compares well to the current $1.38/kL for the supply of water from the Water Corporation Integrated Water Supply Scheme (IWSS) representing a life cycle saving of $366 388 in relation to the capital expenditure. Operation and maintenance costs (commercial rates) are expected to be in the order of $5 000 per year. This would reduce the total project life cycle saving to around $304 075.
No assessment has been made at this stage of the effectiveness of existing irrigation mains or equipment, or indeed the potential to extend water delivery to other enterprises. At present it is understood that Pingelly Shire controls access to the water in the Sportsground Storage. If new stakeholders are to be included it might be advisable to consider upgrading the suction line to accommodate and better regulate other users. Issues relating to public risk need to be assessed by Pingelly Shire in consultation with the community and legal advisors.

Appendix J. GHD Stormwater Harvesting
J15
In order to better understand catchment runoff behaviour, and to provide better design of stormwater harvesting and distribution systems, there is now a strong need to install flow monitoring equipment within the main watercourse. It should be capable of continuously recording rainfall and stream flow data as well as conductivity. It would also be instructive to monitor salinity within the subcatchment areas during runoff events, perhaps by utilising a Stream Watch team from the local school community. This is an initiative has the ability to provide a better basis for the design of a wide range of community infrastructure and opportunities not specifically confined to stormwater harvesting.
It is believed that a stormwater harvesting strategy represents a cost-effective means of pursuing greater self-sufficiency, reducing reliance on the IWSS and at the same time providing collateral environmental and infrastructure protection benefits. However, it is still important to regard this as the first stage in an adaptive process that can progressively look to other water management measures in the light of future climate change and varying market conditions.
7. R ec ommendations Stormwater harvesting in several subcatchments, within the Pingelly Townsite, appears to be practicable and financially viable given the current cost of the potable water alternative from the Water Corporation’s IWSS. It is in everyone’s interest to preserve higher quality potable supplies and utilise them sensibly for corresponding higher level uses. Increases in community self-sufficiency in non-potable water supplies can save a considerable amount on an annual basis. Increased self-reliance reduces energy costs incurred as the Water Corporation schemes move potable water unnecessarily over long distances. It can also afford the opportunity for the Corporation to manage the large centralised storages on a much more sustainable basis. The Pingelly initiative contributes strongly to this overall community goal.
Consequently, it is recommended:
1. ACC, in conjunction with the RT-LA group, proceed to development of a preliminary engineering design for the priority Townsite East subcatchment. This design would include sufficient detail to enable more accurate costing this initiative to be provided which would support capital works budgeting by Shire of Pingelly
2. As part of the above partnership, funding sources should be investigated to install appropriate instrumentation in the identified subcatchments. This would allow hydrological and water quality data (incl. flow, rainfall and conductivity) to be captured that could inform future modelling work in Pingelly and other rural towns
3. Consideration be given to expansion of stormwater harvesting to other identified subcatchments and funding opportunities sought, which might support such a strategy.
8. R eferences Inst. Engineers, Australia 2006, Australian Rainfall and Runoff Volume 1—A Guide to Flood
Estimation (Inst. Engrs. Aust., Barton ACT).
Grant A, Sharma A 2006, Rural Liquid Assets: Water Balance Study of Pingelly (CSIRO).
John Duff & Assoc 2000, Pingelly: Irrigation Feasibility Study (Shire of Pingelly).
Kellogg Brown & Root 2000, Lake Grace Water Management Options—Engineering Analysis (Dept. Agriculture Western Australia, South Perth).
Loh M and Coghlan P 2003, Domestic Water Use Study in Perth, Western Australia 1998-2001. (Water Corporation, Perth.)

Appendix J. GHD Stormwater Harvesting
J16
Mitchell G 2005, Aquacycle: A Daily Urban Water Balance Model—downloaded from http://www.toolkit.net.au/cgi-bin/WebObjects/toolkit.woa/ (eWater CRC).
O’Loughlin G 1986, The ILSAX Program for Urban Design & Analysis (NSW Inst. of Technology).
Reed Construction Data 2007, Western Australian Commercial/Industrial and Housing Building Cost Guide (Cordell Products).

Appendix J. GHD Stormwater Harvesting
J17
A ttachment A: Typical stormwater harvesting layout

Appendix J. GHD Stormwater Harvesting
J18
A ttachment B : Stratford Street sump engineering drawings

Appendix J. GHD Stormwater Harvesting
J19

Appendix J. GHD Stormwater Harvesting
J20

Appendix J. GHD Stormwater Harvesting
J21

Appendix J. GHD Stormwater Harvesting
J22
A ttachment C : Aquacycle Yield Estimates
Annual Yield Catchment X1
0
50
100
150
200
250
300
1950
1952
1954
1956
1958
1960
1962
1964
1966
1968
1970
1972
1974
1976
1978
1980
1982
1984
1986
1988
1990
1992
1994
1996
1998
2000
2002
2004
Year
Ann
ual Y
ield
(mm
)
Annual Yield
Annual Average Yield 109 mm
35.3 ML
Townsite East Catchment.
Annual Yield Catchment X2
0
50
100
150
200
250
1950
1952
1954
1956
1958
1960
1962
1964
1966
1968
1970
1972
1974
1976
1978
1980
1982
1984
1986
1988
1990
1992
1994
1996
1998
2000
2002
2004
Year
Ann
ual Y
ield
(mm
)
Annual Yield
Annual Average Yield 61 mm
48.5 ML
Townsite Northwest Catchment.

Appendix J. GHD Stormwater Harvesting
J23
Annual Yield Catchment X3
0
50
100
150
200
250
300
35019
50
1952
1954
1956
1958
1960
1962
1964
1966
1968
1970
1972
1974
1976
1978
1980
1982
1984
1986
1988
1990
1992
1994
1996
1998
2000
2002
2004
Year
Ann
ual Y
ield
(mm
)
Annual Yield
Annual Average Yield 112 mm
38.5 ML
Northwest Extended Catchment.
Annual Yield Catchment X4
0
50
100
150
200
250
1950
1952
1954
1956
1958
1960
1962
1964
1966
1968
1970
1972
1974
1976
1978
1980
1982
1984
1986
1988
1990
1992
1994
1996
1998
2000
2002
2004
Year
Ann
ual Y
ield
(mm
)
Annual Yield
Annual Average Yield 63 mm
69.1 ML
Farmland Southeast Catchment