Welcome to the 2021 Skagit Valley Tulip Festival - Visit Skagit Valley
Upload
khangminh22Category
view
0download
0
Integrated Water Resource Plan
Lower Rio Grande Valley Development Council
Policy Management Committee
re:' ('N ~ n M ~ r\
0: r .. :2Z. L., .~ ~- , In\ ~: I i/ :: i
11n11. ·.:; E p ·. '· 19q9 ! '~ i.·.1
1· u il ~ . , ·~ v ! i I,
L~--~~~·---··· ·-·---~~ .J ~/ REGION!l.L PL•.NNING
&PROJEt1rS
Technical Report
February 1999
Lower Rio Grande Valley Development Council 311 N. 15'" St.
McAllen, Texas 78501-4705 (956)682-3481
Perez!Freese and Nichols, L.L.C, 3233 N. McColl Rd.
McAllen, Texas 78501 (956) 631-4482

Integrated Water Resource Plan Lower Rio Grande Valley Development Council
Freese and Nichols, Inc.
Policy Management Committee
Report Summary Technical Report
February 1999
Perez!Freese and Nichols, L.L.C.
In Association with:
Texas Agricultural Experiment Station DB Consulting
Sigler Winston Greenwood and Associates Gonzalez Engineering and Surveying, Inc.
Guzman & Munoz Engineering and Surveying, Inc. Corder/Thompson and Associates, Inc.

~ Integrated Water Resource Plan
Lower Rio Grande Valley Development Council Final Report - Table of Contents
.
Table of Contents Section Title Page
Section 1 Introduction Ll Description ofPlanning area 1.1 1.2 Objectives of Study 1.2 1.3 Study Funding Sources 1.3 1.4 Policy Management Committee 1.4 1.5 Technical Support Team 1.6 1.6 Public Participation Process 1.6 1.7 Scope of Services 1.8 1.8 Key Elements of Project Approach 1.9 1.9 Relationship of this Study to Senate Bill1 Regional Water Planning 1.9
Process
Section 2 Regional Population And Anticipated Growth 2.1 Historical Population 2.1 2.2 Existing Social Economic Conditions 2.1 2.3 Current Employment Statistics 2.4 2.4 Contributions of Agribusiness 2.8 2.5 Projected Year 2000 to Year 2050 Populations 2.10
Section 3 Regional Water Requirements and Anticipated Changes 3.1 Municipal Water Requirements 3.1 3.2 Manufacturing Water Requirements 3.12 3.3 Irrigation Water Requirements 3.13 3.4 Steam Electric Power Generation Water Requirements 3.21 3.5 Mining Water Requirements 3.22 3.6 Livestock Water Requirements 3.23 3.7 GIS Mapping of Region and Use in Projected Water Requirements 3.23 3.8 Typical Monthly Pattern of Water Use 3.30 3.9 Projected Regional Water Requirements Year 2000 to Year 2050 3.32
Section 4 Description of Current Water Supplies 4.1 Falcon-Amistad Reservoir System 4.1 4.2 Existing Water Rights 4.5 4.3 Groundwater Data 4.7 4.4 Wastewater Reuse 4.10 4.5 Existing Water Supply Governmental Entities and Irrigation Districts 4.16
Section 5 Analysis of Water Supply and Requirements 5.1 Analysis of Distribution of Regional Water Requirements 5.1 5.2 Water Supply of the Lower Rio Grande Valley 5.7

5.3
Section 6 6.1
6.2
6.3
6.4
6.5
6.6
6.7
Section 7 7.1
7.2
7.3 7.4 7.5
Section 8 8.1
8.2 8.3
8.4
Section 9 9.1 9.2
Section 10
10.1
Integrated Water Resource Plan Lower Rio Grande Valley Development Council
Final Report - Table of Contents
Comparison ofWater Requirements and Supply 5.9
Analysis of Components ofFuture Water Supplies Analysis ofWater Development through Potential Changes in Falcon- 6.1 Amistad Reservoir System Analysis of Water Development through Reduction in Irrigation Delivery 6.11 System Conveyance Losses Analysis of Water Development through Construction of a Pipeline System 6.27 from Falcon Reservoir Analysis of Water Development through Municipal and Industrial Water 6.48 Conservation Efforts Analysis of Water Development through Increased Agricultural 6.52 Conservation Efforts Analysis of Water Development through Augmentation ofExisting Supply 6.61 Sources with Brownsville Weir and Channel Storage Runoff Water Storage 6.62
Baseline Environmental Conditions Summary of Available Documentation on Vegetation and Wetlands in the 7.1 Region Summary of Endangered and Threatened Species of Wildlife Existing in 7.5 Region Summary of Water Quality in the Region 7.16 Potential Environmental Impacts of Components for Future Water Supplies 7.19 Economic Value ofNatural Resources 7.27
Cost of Water and Water Economics Summary of Cost for Delivery ofMunicipal and Agricultural Water 8.1 Supplies Water Costs and Competing Forces for the Limited Water Supply 8.4 Estimated Price of Water that Includes Not Only Cost, but Also Value of 8.4 the Water Economic Impact of Water Supply Components on the Cost ofWater 8.11 Delivery Systems
Potential Alternative Institutional Frameworks Coalition 9.1 Regional Water Authority 9.2
Water Management and Drought Continency Plan for the Lower Rio Grande Valley Introduction 10.1

10.2 10.3 10.4 10.5 10.6
Section 11 11.1 11.2
Integrated Water Resource Plan Lower Rio Grande Valley Development Council
Final Report - Table of Contents
Potential Municipal Measures Potential Industrial Measures Potential Agricultural Measures Potential State Measures Water Management Plan
Conclusions and Recommendations Decision Matrix that Compares the Water Supply Components Recommendations on Components for Future Water Supply
10.1 10.5 10.6 10.6 10.7
11.1 11.11

Table Number
Section I 1.1 1.2
Section 2 2.1 2.2 2.3 2.4 2.5 2.6 2.7 2.8 2.9
2.10
2.11
2.12
Section 3 3.1
3.2 3.3
3.4 3.5 3.6 3.7
3.8
3.9 3.10
Integrated Water Resource Plan Lower Rio Grande Valley Development Council
Final Report- List of Tables
List of Tables
Description Page
LRGVDC Integrated Regional Water Plan Funding Sources 1. 4 LRGVDC Policy Management Committee 1. 5
1990 Historical Populations Reported by TWDB 2.2 Current Population of the Lower Rio Grande Basin 2.3 BEAFACTS- Cameron County, Texas 1995-96 2.5 BEAFACTS- Hidalgo County, Texas 1995-96 2.6 BEAFACTS- Willacy County, Texas 1995-96 2.7 Lower Rio Grande Valley Employment Statistics, December 1997 2.8 1996 Consensus Texas Water Plan Adjusted for Regional Input 2.11 Percent of County Population Outside ofMunicipalities 2.12 Comparison of Regional Population Projections with TWDB Projections- 2.13 Cameron County Comparison ofRegional Population Projections with TWDB Projections- 2.14 Hidalgo County Comparison of Regional Population Projections with TWDB Projections- 2.14 Willacy County Most Likely Scenario-Projected Population Densities for 2000 and 2050 2.17
Per Capita Consumption Rates Recommended for Planning Municipal Water 3.2 Supply Demands Without Water Conservation Measures Components ofMunicipal Water Conservation Savings 3.5 State's Projected Percent Reductions in Water Consumption Based on 3.6 Various Water Conservation Measures Projected Municipal Water Requirements in Cameron County 3.6 Projected Municipal Water Requirements in Hidalgo County 3.9 Projected Municipal Water Requirements in Willacy County 3.12 Comparison of 1996 Consensus Texas Water Plan Consumptive 3.13 Manufacturing Water Demand Forecasts with TWDB Industrial Water Use Survey Texas Water Development Board Projections of the Lower Rio Grande 3.14 Valley Irrigation Water Requirements Projected Rural Acres in Irrigation Districts Lost due to Urbanization 3.15 Assumed Potential Water Savings with Various Irrigation WaterApplication 3.16 Techniques

3.11 3.12 3.13 3.14
3.15 3.16 3.17 3.18
3.19
3.20
Section 4 4.1 4.2 4.3 4.4
Section 5 5.1
5.2
5.3
5.4
5.5 5.6
5.7 5.8
5.9
Integrated Water Resource Plan Lower Rio Grande Valley Development Council
Final Report - List of Tables
Calculated Weighted Average Water Use per Acre Composite per Acre Water Use for Varying Application Techniques Total Agricultural Water Requirements Comparison of 1996 Consensus Texas Water Plan Consumptive SteamElectric Power Production Water Demand Forecast with TWDB Industrial Water Use Survey 1996 Texas Water Plan Consumptive Water Demand Forecast for Mining 1996 Texas Water Plan Consumptive Water Demand Forecasts for Livestock GIS Coverage Sources and Development LRGVDC Regional Integrated Water Plan Consumptive Water Demand Forecast-Cameron County Compared to TWDB- Consumptive Water Demand Forecast LRGVDC Regional Integrated Water Plan Consumptive Water Demand Forecast- Hidalgo County Compared to TWDB- Consumptive Water Demand Forecast LRGVDC Regional Integrated Water Plan Consumptive Water Demand Forecast- Willacy County Compared to TWDB- Consumptive Water Demand Forecast
1999 Lower Rio Grande Water Rights by Type of Use Wastewater Reuse Unit Process Contaminant Barrier Wastewater Reuse Process Evaluation Considerations Existing Irrigation Districts, Municipalities Identified by TWDB and Water Supply Corporations
Projected Cameron County Water Requirements, Below-normal Weather, Expected Case Projected Hidalgo County Water Requirements, Below-normal Weather, Expected Case Projected Willacy County Water Requirements, Below-normal Weather, Expected Case Projected Regional Water Requirements, Below-normal Weather, Expected Case Water Use Values by Type ofUse, 1991-1997 Three County AreaDiversions Reductions in Water Requirements Due to Assumed Water Conservation Measures and the Impacts of Urbanization Municipal and Rural Populations and Demands by County Current Distribution of United States and Mexico Demand and Yields From the Falcon-Amistad Reservoir System Comparison of Water Requirements Including Current Level of Transmission Losses and Supply
3.17 3.18 3.19 3.22
3.22 3.23 3.29 3.33
3.39
3.47
4.7 4.16 4.17 4.18
5.1
5.2
5.3
5.4
5.5 5.6
5.7 5.8
5.9

Section 6 6.1 6.2 6.3 6.4
6.5
6.6
6.7
6.8 6.9 6.10 6.11 6.12 6.13
6.14 6.15
6.16
6.17 6.18 6.19
6.20 6.21 6.22
6.23 6.24 6.25
6.26
6.27
Integrated Water Resource Plan Lower Rio Grande Valley Development Council
Final Report- List of Tables
Annual Quantities in Amistad/Falcon ROM Simulation Diversion Shortages for Alternative Shortage Reallocation Plans Annual Dependable Yields for Alternative Shortage Reallocation Plans Estimated Current Irrigable Acres and Authorized Agricultural Water Rights for 28 Water Districts in Cameron, Hidalgo, and Willacy Counties of the Lower Rio Grande Valley Canal Sizes and Lining Material for the Primary Irrigation Distribution Systems in the Hidalgo, Cameron, and Willacy Counties included on the Regional GIS Map Miles of Canals, Pipelines and Resacas of the Main Irrigation Distribution Systems in Hidalgo, Cameron, and Willacy Counties included on the Regional GIS Map Distribution Systems of28 Irrigation Districts in the Lower Rio Grande Valley of Texas Based on Survey Responses and GIS Analysis Rio Grande Diversions, 1971-1991 Water Use Values by Type ofUse, 1991-1997, Three County Area County Level Irrigation System Delivery Efficiency Canal Seepage Rates Reported in Published Studies Canal Seepage Rated Reported in the Lower Rio Grande Valley Seepage Rates Measured in Five Irrigation Canals in the Lower Rio Grande Valley of Texas Classification of Water Losses in Irrigation Districts Conveyance Efficiencies and Farm Deliveries to Irrigation Districts in the Western US Potential Water Savings Achievable by Increasing Conveyance Efficiency of 28 Irrigation Districts in the Lower Rio Grande Valley to 80 and 90% Top Six Districts Ranked by Potential Water Savings Range of Total Capital Cost of Rehabilitation to Delivery Efficiency Projected Increases in Domestic Water Requirements Between 2000 and 2050 Projected Annual Below-normal Demands for Pipeline Delivery Points Summary ofEvaluated Pipeline Alternatives Number of Obstructions of Cross-Country Pipeline Between Falcon and Municipal Area Number of Obstructions on the Pipeline in the Municipal Areas Summary of Capital Costs for the Raw Water Pipeline to Moore Field Summary of Capital Costs for Treated Water Systems from Falcon Reservoir along Route A Summary of Capital Costs for Raw Water Pipeline to Starr County Balancing Reservoir and Water Treatment Plant at the Balancing Reservoir Summary of Capital Costs for System with Treatment Plant in Starr County Compared to Multiple Regional Water Treatment Plants in the Service-Area Route A and 200 MGD
6.5 6.8 6.8 6.13
6.14
6.14
6.15
6.16 6.18 6.19 6.19 6.20 6.20
6.22 6.23
6.24
6.25 6.27 6.29
6.29 6.35 6.36
6.38 6.43 6.44
6.45
6.46

6.28 6.29 6.30
6.31
6.32
6.33 6.34 6.35 6.36 6.37
Section 7 7.1 7.2
Section 8 8.1
8.2
8.3 8.4 8.5 8.6 8.7 8.8
8.9 8.10
Section 11 11.1
11.2
11.3
11.4
11.5 11.6
Integrated Water Resource Plan Lower Rio Grande Valley Development Council
Final Report- List of Tables
Municipal Water Conservation Plans Provided Summary of"Unaccounted" Water Records provided Average of Farm Irrigation Efficiency Measured in 11 Districts in the Western United States Between 1975-1978 Water Savings Observed or Estimated from Metering and Poly Pipe Experiments during the 1990's in the Lower Rio Grande Valley On-Farm Water Savings Potential and Factors Used in Lower Rio Grande Valley Integrated Water Resources Plan-Phase II Project Assumptions for Applying Water Savings Factors in Table 6.32 Estimated Cost ofMetering Implementation Poly-Pipe Implementation Costs High Management Water Savings Cost Calculation Potential Water Quantity Savings through Agricultural Water Conservation
Endangered and Threatened Plant Species Endangered and Threatened Animal Species
LRGV Representative Municipal and Water Supply Corporation Monthly Water Bills 1998 Texas Municipal League Summary of Water and Wastewater Survey Results Summary of Representative Irrigation Water Costs for the LRGV Net Projected Returns for Various Crops in South Texas Range of Total Capital Cost of Rehabilitation to 800/o Delivery Efficiency Summary of Preliminary Capital Costs for Evaluated Pipeline Alternatives Potential Water Quantity Savings through Agricultural Water Conservation Update of Construction Cost Grandbury 3.5- MGD Demineralization Water Treatment Plant- One of the Largest Operating Plant in the State of Texas Comparison of Reuse and Conventional Supply Costs Estimated Capital Costs for the Construction of Water Treatment Plants
Summary ofPotential Components for an Increased Raw Water Supply Water Savings, Preliminary Costs, and Implementation Factors Summary ofPotential Components for an Increased Treated Water Supply Water Savings, Preliminary Costs, and Implementation Factors Projected Regional Water Requirements Below-normal Weather, Expected Case Comparison of Water Requirements with Current Level of Transmission Losses Included and Supply Potential Water Quantity Savings Through Agricultural Water Conservation Recommendation on Data Sources Where Improved Accuracy is Needed
6.48 6.52 6.53
6.53
6.54
6.55 6.56 6.57 6.58 6.58
7.12 7.13
8.1
8.2
8.3 8.9 8.12 8.13 8.14 8.16
8.17 8.19
11.2
11.3
11.4
11.6
11.8 11.12

e Integrated Water Resource Plan
Lower Rio Grande Valley Development Council Final Report- List of Figures i
List of Figures Figure Page Section I
1.1 LRGVDC Integrated Regional Water Plan Study Area 1.1 1.2 Regional Water Planning Process 1.10
Section 2 2.1 Projected City and County Urbanization Growth, 2000-2050 2.15
Section 3 3.1 Projected Percent Decline in Irrigation Water Use, Year 2000-2050 3.20 3.2 Sample Portion ofNW Mission DOQ 3.24 3.3 Digital Ortho quarter Quad (DOQ) Availability for Hidalgo, Cameron, 3.25
and Willacy Counties 3.4 Sample Portion ofLRGV Quad Sheet 3.26 3.5 Sample Legend for LRGV Sheet Maps 3.27 3.6 Municipal Use Pattern for Large Users 3.28 3.7 Municipal Users 3.28 3.8 Industrial Users 3.30 3.9 Irrigated Water Use Minimum-Average-Maximum, 1989-1996 3.31
Section 4 4.1 Sample Range of 1996 Revenues and Expenses Lower Rio Grande 4.26
Valley Irrigation Districts 4.2 Sample 1996 Expenses per liTigable Acre Lower Rio Grande Valley 4.26
Irrigation District
Section 6 6.1 Rio Grande Basin 6.2 6.2 Rio Grande Basin, Stream Gage Stations 6.9 6.3 Water District Boundaries with County Outlines for Willacy, Hidalgo, 6.11
and Cameron Counties 6.4 Irrigation Districts and Main Distribution Systems, Lower Rio Grande 6.17
Valley of Texas 6.5 General Soil Map of the Lower Rio Grande Valley of Texas 6.21 6.6 Falcon Pipeline Alternative for Municipal Water Supply, Route A 6.32 6.7 Falcon Pipeline Alternative for Municipal Water Supply, Route B 6.33 6.8 Falcon Pipeline Alternative for Municipal Water Supply, Route C 6.34 6.9 Route A, Pipeline Obstructions 6.36 6.10 Route B, Pipeline Obstructions 6.37 6.11 Pipeline Obstructions in the Municipal Area 6.38 6.12 Generalized Cost Curve Data Water Treatment Plants (1998 Prices) 6.41

Section 8 8.1 8.2
Integrated Water Resource Plan Lower Rio Grande Valley Development Council
Final Report- List of Figures
Normalized Water Lease Prices Required Increase in Municipal Price at the Tap Under Free Market Conditions
8.4 8.5

Integrated Water Resource Plan Lower Rio Grande Valley Development Council
Final Report -Report Summary
Lower Rio Grande Valley Development Council Integrated Water Resource Plan - Phase II
Report Summary
The drought conditions of the last four years (1995-1998) have made the citizens of the Lower Rio Grande Valley aware of the significant impacts a dwindling water supply can have on a region. During the Summer of 1998, the situation became critical when the U.S. share of the Falcon-Amistad Reservoir System reached a low of near 19% while Mexico's share remained near 26% when Mexico stopped irrigation. The Integrated Water Resource Plan defines an approach to meet the critical water needs of the Lower Rio Grande Valley through the year 2050 with construction of improved irrigation canal delivery systems, implementing aggressive water conservation programs, and improved water management. These actions are very significant undertakings.
The impact of the drought in the summer of 1998 leaves no doubt that action is needed now
or the water shortage problem will be worse next time.
This Integrated Water Resource Plan was undertaken during the early stages of this current drought in recognition of the following:
• Only a specific amount of water is available from the Rio Grande for the Lower Rio Grande Valley.
• The management of the available water is critical to the continued development of Cameron, Hidalgo, and Willacy Counties.
In addition, other underlying objectives of the study and their impacts are:
• Identifying enough water for the region that is essential to the economy, health, environment and quality oflife in the Lower Rio Grande Valley
• Developing recommendations on many topics, such as water pricing, conservation measures, water allocation, etc. that will impact local citizens and organizations
LRGVDC Integrated Regional Water Plan Report Summary, Page 1

Integrated Water Resource Plan Lower Rio Grande Valley Development Council
Final Report- Report Summary
• Evolving an effective regional water plan that reflects the needs and ideas of the local citizens
The results of the Integrated Water Resource Plan- Phase II indicate that the projected increase in urbanization and associated increase in municipal water demands will be accompanied by a decrease in the irrigation water demands. These shifts, coupled with significant water conservation efforts in all areas of water consumption, are projected to create a situation where the available supply is nearly equal to the projected demand through the planning period (Year 2050 ). The recommended approaches are multiple individual steps that will maintain relatively inexpensive water for the Lower Rio Grande Valley. The typical alternative for areas anticipating high growth rates is the development of a new source of supply. The potential consequence, or problem of not pursuing the proposed multiple task approach, is the requirement to development a more expensive alternative water supply at an earlier date. Through a collaborative effort, improved management of the available water resources will be a major step in the reduction of the projected significant impacts.
Even though the Policy Management Committee believes the water needs of the three -county area can be met without the development of new sources for the region, the challenges of satisfying the needs of the region will be significant including:
• $100,000,000 or more (1998 Dollars) will need to be spent to achieve the water conservation goals to provide an adequate water supply by year 2050
• Some individual communities will need to consider other sources including wastewater reuse, desalting groundwater and sea water where cost effective.
In an Integrated Regional Water Planning process, the key words are comprehensive, leastcost analysis, open and participatory, and multiple institutions. Effort was made throughout the planning process to incorporate these key words. Working within this framework of an integrated water resource plan, the following goals were established for this study:
Development of options for more effective, efficient and environmentally-sound ways to supply water to the region
Review of the roles and potential working relationships among regional organizations involved in managing the supply of water
Development of a Water Management and Drought Contingency Plan
LRGVDC Integrated Regional Water Plan Report Summary, Page 2

Integrated Water Resource Plan Lower Rio Grande Valley Development Council
Final Report- Report Summary
This report represents the fulfilment of the initiative by the Valley Water Policy and Management Council (Valley Water Committee, Inc.) through and in conjunction with the Lower Rio Grande Valley Development Council (LRGVDC) and its Policy Management Committee (Table I) to complete Phase II of an Integrated Water Resource Plan for the Lower Rio Grande Valley. The Council initiated the planning process in I996. In the Phase I, the future water needs of the region were briefly assessed and a scope of work was outlined to determine the water requirements and water availability for the three-county region (Cameron, Hidalgo and Willacy) through to the year 2050.
Under its agreement with the Valley Water Policy Management Council, the LRGVDC established the Policy Management Committee to guide the progress of the study. This committee represented a cross se~tion of individuals from across the region who were interested in the Lower Rio Grande Valley's water issues.
Table I 0 ICy anagement LRGVDCP r M C omm1ttee
Ray Prewett, Chairman Sonny Hinojosa, General Manager Executive Vice President Hidalgo County Irrigation District 2 Texas Citrus Mutual Dr. Jose Amador, Center Director, Lee Kirkpatrick, Vice President Texas A&M University Texas State Bank Agricultural Research and Extension Center Charles "Chuck" Browning, General Manager Glenn Jarvis, Attorney North Alamo Water Supply Corp. McAllen John Bruciak, General Manager James R. Matz, Connnissioner Brownsville PUB Cameron County Mary Lou Campbell Jack Nelson, President Conservationist Rio Grande Valley Sugar Growers, Inc. Wayne Halbert, General Manager Bobby Sparks, General Manager Harlingen Irrigation District S.R.S. Farms John Herrera, Manager of Operations Jo Jo White, General Manager Magic Valley Electric Co-Op Hidalgo & Cameron Counties Irrigapon District 9 Gordon Hill, General Manager Cloice Whitely, General Manager Bayview Irrigation District 11 Harlingen Waterworks System Bart Hines, P.E., General Manager Arnoldo Cantu* McAllen PUB Bill Thompson*
* Honorary members, IJOSt-mortem
The Policy Management Committee determined that, for the planning process to be successful, as wide an audience as possible needed to know about the study and have an opportunity to express themselves and provide comments and suggestions. The public participation process was an integral part of the project. A Citizens Advisory Subcommittee on Public Participation was established to provide input to the Policy Management Committee. Meetings were held with
LRGVDC Integrated Regional Water Plan Report Summary, Page 3

Integrated Water Resource Plan Lower Rio Grande Valley Development Council
Final Report- Report Summary
various stakeholder groups, which included irrigation districts, municipalities and industrial users, environmental groups and the public. There were three rounds of public meetings held across the region during the course of the project. Newsletters were mailed on a regular basis to more than 600 citizens who had an interest in the region's water issues.
The funding for the project was from federal, state and local sources. The entities providing the funds were, the Economic Development Administration, the US Bureau of Reclamation, the Texas Water Development Board (TWDB), and local municipalities, irrigation districts, utility companies and private sources, as described in Table 2.
Table 2 LRGVDC Integrated Regional Water Plan Funding
Sources Federal Government Economic Development Administration $ 600,000 Bureau of Reclamation $ 100,000
State of Texas Texas Water Development Board $ 250,000
Local Fundine Match Municipalities $ 50,000 Irrigation Districts $ 25,000 Utility Companies and Private Funding Sources ~ 25,000
Combined $ 1,050,000
General Background
The general approach in performing the study was to agree on the population trends through to the year 2050, and assess the water demands based on historical data for the municipal, agricultural and other users over the same time period. The next step considered the current water supplies. These supplies were then compared to the projected demand. Possible future water supply options that would enable the region to satisfy its projected water requirements were investigated. The pertinent environmental issues were identified which must be considered when implementing any of the options. The preliminary costs of implementing the options were estimated and institutional issues were outlined that must also be addressed when the schemes are implemented. The conclusions and recommendations reflect the Policy Management Committee position on the future direction ofthe planning process. The report also includes an outline for a water management and drought contingency plan for the Lower Rio Grande Valley.
LRGVDC Integrated Regional Water Plan Report SllltiiJiaiY, Page 4

Fi re 1
0
Population Growth
Integrated Water Resource Plan Lower Rio Grande Valley Development Council
Final Report- Report Summary
Figure 1 - Projected Reg anal Population
2000 2010 2020 2030 2040 2050
Year
- ReglonaiTh'ee Courty IIIID HdalgoCounty
IZI cameron ca.mty • WllaC-)1 County
The population of the region had been projected by the TWDB as part of their Water for Texas plan issued in 1997. These projections were reviewed with the municipalities and although some adjustments
were required for the projected growth of certain communities, no changes were made in the mostlikely county totals as projected by the TWDB. The population of the region is expected to grow from approximately 900,000 in 2000 to 2.1 million in 2050, a 123 percent increase. The TWDB projections divided the population into those living within and outside a municipal boundary. In 2050, 35.4 percent of the population is estimated to be outside corporate city boundaries. The projections for each county and the total region for the 2000-2050 period have been summarized in Figure 1.
LRGVDC Integrated Regional Water Plan Report Summary, Page 5

Fi re 2
1,200,000
1.000.000
800,000
600,000
400,000
200.000
0
2000
Water Demands
Integrated Water Resource Plan Lower Rio Grande Valley Development Council
Final Report- Report Summary
Figure 2- Regional Water Demand
2010 20:10
RegiOneiTh,... County
II Mmic:i;llll Demand
2030 2040
lffiii Aglt::lJtureiO.mand
• OlherDemend
2050
The water demands for the region were projected by the TWDB as part of their Water for Texas plan issued in 1997. The projected areas of water use were municipalities, agriculture,
manufacturing, mining, livestock, and steam electric generation. The manufacturing, mining, livestock and steam electric generation only account for slightly more than one percent of the total water usage so the emphasis was placed on performing a detailed review of the municipal and agricultural estimates. The TWDB projections for manufacturing, mining, livestock and steam electric generation were used with only minor adjustments.
Municipal Water Demands
The TWDB municipal water demand estimates were based on population projections and assumed per capita consumption rates for normal and below normal weather conditions based on historical data. The historical consumption rates were obtained from the municipalities and,
LRGVDC Integrated Regional Water Plan Report Summary, Page 6
Integrated Water Resource Plan Lower Rio Grande Valley Development Council
Final Report- Report Summary
together with the projected population growth, a comparison was made with the TWDB estimates. The TWDB numbers assumed certain conservation measures would be implemented by the municipalities. The TWDB projections assume the conservation measures would gradually reduce consumption over time by 19. 5 percent for normal weather conditions and by 17. 5 percent for below-normal weather case.
The projected domestic water use by the municipalities has been included in the Figure 2 above, assuming general achievement of the State's expected water conservation levels and with no additional water conservation program. The domestic water requirements are projected to increase from 212,266 acre-feet per year in the year 2000 to 402,730 acre-feet per year in the year 2050. These projections are in general agreement with the estimates developed by the TWDB. However, the TWDB projections did not specifically allow for any transportation losses in the irrigation canal systems used to deliver most of the water to the municipalities.
Agricultural Water Demands
The major water demand in the region is the agricultural irrigation and it accounts for approximately 85% of the total water demand under normal conditions. The projected water requirements for agriculture will be declining over time as land is taken out of production to accommodate the increasing population. The TWDB, in its estimates of future agricultural water requirements, did not specifically account for the amount of agricultural land that will be taken out of production in the Lower Rio Grande Valley. The projected reduced agricultural demands due to urbanization and proposed on-farm water conservation measures have been summarized in the Figure 2 above. Assuming 90% of all irrigable acres are irrigated, the agricultural water demands will decrease from 1,349,400 acre-feet per year in the year 2000 to 647,100 acre-feet per year in the year 2050. These reductions in demand do not include the additional water savings in transportation losses that will result from the proposed improvements to the irrigation canal delivery systems which are required to Achieve maximum benefit from the on-farm water conservation measures.
Current Water Supplies
Rio Grande
The Rio Grande is the principal water supply for the Lower Rio Grande Valley. The FalconAmistad Reservoir System on the Rio Grande provides the primary storage to meet the water supply needs of the Lower Rio Grande Valley. A map of the Rio Grande watershed is shown in Figure 3. In addition to water supply, the dams were also designed to provide flood control and to generate hydroelectric power. The operations of the dams are controlled by the International
LRGVDC Integrated Regional Water Plan Report Summary, Page 7

Integrated Water Resource Plan Lower Rio Grande Valley Development Council
Final Report- Report Summary
Boundary and Water Commission (IBWC) and reservoirs are operated jointly with Mexico under the Treaty of 1944.
The administration of water released from the dam for the United States is the responsibility of the Watermaster's office of the Texas Natural Resource Conservation Commission (TNRCC). The Watermaster's office monitors the accounts of the approximately 1,600 water rights holders. The procedure for obtaining water from the system is primarily through the irrigation districts. Irrigation districts communicate the needs of individual farmers, municipalities, and water supply corporations to the Watermaster's office which in turn schedules releases through coordination with the IBWC. The Watermaster's office monitors the individual accounts to make certain they are not overdrawn. The TNRCC' s current operating rules of providing a reservoir for the municipal demands and recognizing a higher priory for these uses should continue to provide a high level of protection for non-irrigation demands.
The system supplies an estimated firm yield of an estimated 1,194,000 acre-feet per year to the nearly 1,200,000 people in the river basin on the U.S. side and approximately 992,000 acre-feet per year to the nearly 7,000,000 people in the river basin in Mexico. The firm yield is the maximum annual diversion rate that can be maintained continuously during a repetition of historical period-of-record hydrology based on specific premises regarding operating policies and other assumptions incorporated in the simulation model. These firm yields are expected to decrease due to sedimentation accumulation in the reservoirs to 1,044,000 acre-feet per year for the United States by the year 2050 and to 916,000 acre-feet per year for Mexico. The Rio Grande is a silt-laden river and the Amistad and Falcon reservoirs act as a natural barrier for deposition. The IBWC has been monitoring the accumulation of sediment for a number ofyears.
Based on the US water rights in the Rio Grande below the Falcon-Amistad Reservoir System, approximately 88.5% of this firm yield is available to the Lower Rio Grande Valley. Taking this fact into account, the present firm yield available to the three-county area is reduced to 1,021,500 acre-feet per year, and the 2050 firm yield is reduced to 893,200 acre-feet per year.
Additional analysis needs to be performed to incorporate the impacts that recently constructed dams and reservoirs in Mexico will have on the firm yield. It is expected that the influence of the operation of these reservoirs may further reduce the firm yield.
Groundwater, Seawater and Wastewater Reuse
Another water source that is used on a limited basis is brackish groundwater. Groundwater is available within the Lower Rio Grande Valley. The estimates on the available groundwater include 75,000 acre-feet per foot of drawdown for Rio Grande alluvium formation, and 350,000 acre-feet in the Brownsville area. Use for irrigation, municipalities, industry, and domestic and stock is
LRGVDC Integrated Regional Water Plan Report Summary, Page 8

Integrated Water Resource Plan Lower Rio Grande Valley Development Council
Final Report- Report Summary
limited. However, the mitigating factors against its use are the poor quality in relation to that of the Rio Grande and the low cost of surface water. Desalination of brackish groundwater and seawater will be part of the future water supply, but it is too expensive except for selected communities.
Wastewater reuse is being utilized on a limited basis in the region. There are several reuse options for treated wastewater. These include, use by industries, irrigation of landscaped areas, groundwater recharge and indirect potable reuse. The economic factors dictate whether a municipality or industry will decide whether to proceed with this option. Reuse of wastewater will be part of the future water supply, but it is too expensive to consider as a regional solution.
Comparison of Water Demand and Supply
The projected water demands as shown in the Figure 2 above indicate that the total demand will decrease over time. Even though there is an increase in the municipal demand, it is more than offset by a decrease in the agricultural requirements as urbanization takes place.
A comparison of the projected water demands and the supply available to the Lower Rio Grande Valley from the Falcon-Amistad Reservoir System has been illustrated in Figure 4 below. The data indicate that a deficiency will exist throughout the planning period if the region depends solely on the Falcon-Amistad Reservoir System to meet its projected total water demands even with the implementation of the assumed conservation measures for municipal and agricultural users. A key point in making this comparison is the phrase "projected total water demand." The municipal, manufacturing, mining, livestock, and steam electric generation only represent approximately a third of the total water demand. The municipal and industrial users have a higher priority than agricultural users. The municipal and industrial storage reserve that is always maintained in the system by the TNRCC Watermaster is 225,000 acre-feet. The additional operating reserve that fluctuates between 275,000 and 380,000 acre-feet depending on the amount of water in storage is also maintained. The amount of storage specified in the allocation rules for the operating reserve is somewhat arbitrary but considered prudent. Historically, the region has provided water to satisfy the municipal demands during drought conditions through following these rules and reducing the quantity of water available to agriculture.
Options for Water Conservation
A number of options are available to the Lower Rio Grande Valley to conserve a significant amount water. The projections compared in Figure 4 contain the assumption that municipal and agricultural water conservation programs will be put in place. A third key activity that is included is the improvement to the irrigation delivery canal system which is critical to achieving the maximum benefit from the agricultural water conservation programs.
LRGVDC Integrated Regional Water Plan Report Summary, Page 9

Integrated Water Resource Plan Lower Rio Grande Valley Development Council
Final Report- Report Summary
Irrigation Delivery System. A survey was undertaken to determine the potential benefits which may accrue to an improved delivery system. The present main canal systems of the irrigation districts include approximately 270 miles of concrete lined canals, 346 miles of earth canals and 25 miles undesignated. This information was obtained from the irrigation districts and the results of the GIS mapping of the study region that was undertaken as part of this planning study.
A preliminary survey was conducted on the efficiency of the irrigation districts canal systems. A review oflocal and national seepage studies was developed, and a field monitoring program was performed to ascertain specific field seepage losses. Few of the irrigation districts had actual data on delivery efficiency, but all had a general idea of the order of magnitude. Overall the efficiencies of the conveyance systems are lower than desirable. The difference in the magnitude of efficiencies between districts is a reflection on whether the majority of their main distribution systems are pipe, concrete or earth canals. Experiences with other canal systems indicated that, if the appropriate rehabilitation measures were implemented, an overall efficiency of 80 to 90 percent could be attained.
Agricultural Conservation. The present agricultural conservation measures being implemented in some irrigation districts are metering the water used on farms and encouraging the use of poly or gated pipe. Metering only has the potential to produce water saving through the use of more efficient application rates when coupled with volumetric pricing of irrigation water sales. These measures are relatively inexpensive and may be accommodated within certain crop's operating budgets. The potential reduction in water use by adopting these techniques is in the order of20 percent. The projections assumed these conservation measures would be adopted Valley wide over the next I 0 years. The other options include drip or micro jet systems, but their adoption will depend on the whether the farmer can generate the income from the crop to justify the expense.
Municipal and Industrial Conservation. The Rio Grande watershed is in arid to semiarid region and is subject to periods of drought. A drought is defined as "a period of abnormally dry weather sufficiently prolonged for the lack of water to cause a serious imbalance in the affected area." The region has been in a drought since 1994 and, therefore, it is incumbent on water authorities and water users to plan for these contingencies.
The options available to municipalities to encourage water conservation include public education and information programs, a water conservation oriented rate structure, universal metering and meter replacement and repair programs, leak detection and repair, water conservation plumbing code, water conservation plumbing retrofit program, water conservation landscaping, implementation and enforcement actions, annual reporting, wholesale water contracts, recycling and reuse, control of water pressure and water wells.
LRGVDC Integrated Regional Water Plan Report Summary, Page 10

Figure 3
Integrated Water Resource Plan Lower Rio Grande Valley Development Council
Final Report- Report Summary
Rio Grande Basin
~ N
' 0 100
SCAt.£ IN .,_L[S
• ~ 0YPt - 300.0110 ACJtl-ftcT
• AESD¥011 a.o - s.ooo ,I("E-np
• orr ~ fltSOl'o()llt Milt sooo .r.c.:-nrT . --. ""'
TEXAS
LRGVDC Integrated Regional Water Plan Report Summary, Page 11

Integrated Water Resource Plan Lower Rio Grande Valley Development Council
Final Report- Report Summary
Figure 4
Figure 4- Comparison of Supply and Demand Assumhg Fullmplemertation of Acton Plan
~41891
1.400.000 +--"~o:------------------------------
l1 1" 7m I 1 065.146 I
-11.021.947 I 1982 zzsl 1.:<DO,OOO Jt::::1~1:541~71:~::::::=~~~~:::~~~==~~~ 1 .000.000 ..... -
~ J, 021 sao I ~ I -I- I ... ·- I -' - I - I- I -. - I !l!!l ... lgzo ooo 1 ,944 soo' ,9189001 - ·- •
1:; 2oo'f
~ 800.000 +------------------------------===--------'=~~------~~~
' " ~ 600,000~--------------------------------G1il0.23il
400~oo '---------------------r~~r--~~~n~.B~~7=--~==~ I la38.377 J •• ~----·· r::::-:-:::-1 1290,9651 ............. --~ 12580fi.L--··---.--·•·"" _., ...... ------
200~00~~------------------------------
0 ~-------------------------------------------------------------2000 2010 2020 2030 2040 2050
YeBI"
- RegionaiThNe Courty Wa•r Demand
- • - Anrual Film Yiatl of Falcon-Amistad Reservarsystem
• • ••• Non-agriculural Demand
A total of 18 municipalities and seven irrigation districts provided copies of their water conservation plans for review. The review indicated a similarity in the plans with varying stages of a drought but differing trigger conditions. The Model Municipal Drought Contingency Plan in the Final Report has three recommended stages. The trigger conditions are for Stage 1, the US reservoir storage level reaches 51 percent of capacity or when the demand in the municipality is at 75 percent of their design capacity. Stage 2 becomes effective when the US reservoir capacity drops to 25 percent or when the demand on the municipalities system is at 90 percent of design capacity. The comparable numbers for Stage 3 are US reservoir capacity is at 15 percent or the municipalities system at 100 percent of design capacity.
Pipeline from the Falcon Reservoir: The intent of the pipeline from the Falcon Reservoir is to provide an alternative route to deliver a portion of the municipal supply directly from the
LRGVDC Integrated Regional Water Plan Report Summary, Page 12

Integrated Water Resource Plan Lower Rio Grande Valley Development Council
Final Report- Report Summary
reservoir. Another benefit of the pipeline is it would provide an additional level of reliability to the municipalities in the delivery of water to the customers. At present, the irrigation districts are the providers and there is little or no alternative in the case of a major catastrophe. The water savings from the pipeline would accrue from the reduction in the transportation losses that are projected to occur if the water was delivered through the irrigation canals. The pipeline was sized to provide the increase in the municipal water demand due to the urban growth from 2000 to 2050. The preliminary route was located to the north of municipalities to avoid conflict with heavily urbanized areas, and minimize the number of major obstructions along the route, such as roads, pipelines, wetlands and other environmentally sensitive areas, power lines, canals, railroads, quarries and reservoirs. The pipeline alternatives envision large regional water treatment plants at the major termination points. The treatment plants would be designed to meet the needs of the population in the northern areas of the municipalities.
Options to Increase the Available Water Supply
Changes in the Operation of Falcon-Amistad Reservoir System. The improvement in the reservoir operation system was one of the investigated management strategies. The strategies studied were, multiple reservoir system operations, coordination of the Falcon-Amistad Reservoir System operations with downstream inflows and storage, coordination of supply and demand management, reallocation of storage capacity in the municipal and operating pools, multipurpose operations, and permanent or seasonal reallocation of storage capacity between flood control and conservation pools.
The present operation of maintaining a high level of storage in the Amistad reservoir while allowing most of the system fluctuation in the Falcon reservoir is common practice. The analysis indicated that little gain would be achieved in attempting to change any of these methods of operation.
Brownsville Weir. The Brownsville Weir is a proposed gated spillway structure on the Rio Grande just above the Brownsville gage. The project is being developed under the auspices of the Brownsville Public Utility Board and is in the permitting stage. The reservoir will have a capacity of 6,000 acre-feet, and the permit allows the diversion of 40,000 acre-feet per year.
There is the possibility of further enhancing the storage capabilities of the river system below Falcon. The present Anzalduas dam facilitates the use of unregulated flows and releases from the Falcon Reservoir. One of the purposes of the proposed Brownsville Weir Project is to collect and use some of the unregulated flow. This issue should be investigated further to determine whether improved water supply capability can be achieved by constructing off-stream storage reservoirs and coordination of the entire Rio Grande reservoir/river system.
LRGVDC Integrated Regional Water Plan Report Summary, Page 13

Integrated Water Resource Plan Lower Rio Grande Valley Development Council
Final Report- Report Summary
Runoff Water Storage. Significant rainfall events occur in the Lower Rio Grande Valley during the Spring and Fall. Most of this runoff leaves the Valley through natural drainage. Opportunities to store this runoff locally at specific site should be investigated. Evaporation losses over a year are at least three times the rainfall, and this factor could make this option infeasible unless fairly deep sites are available.
Environmental
The Lower Rio Grande Valley is a semitropical region that has many distinct and important characteristics. This area is an overlap point of the western desert and the subtropic. This provides for a unique and varied terrestrial and aquatic environment. The population of the flora and fauna is characterized by eleven distinct biotic communities stretching from the Falcon Reservoir to the Gulf of Mexico. The communities to the northeast are arid semi desert thorny brush and toward the coast contain more marshes and saline environment. The biotic communities are going from Falcon to the coast are ramaderos, chihuauan thorn forest, upper valley flood forest, barretal, upland thorn scrub, mid-valley riparian woodland, woodland potholes and basins, mid-delta thorn forest, sabal palms forest, loam tidal flats, and coastal brush land potholes.
There are several protected areas in the Lower Rio Grande Valley. These are refuges and preserves that have been created by public and private interests to protect pristine vegetation and the habitat of endangered and threatened species. Some of the protected areas are the Laguna Atacosta National Wildlife Refuge, the Lower Rio Grande Valley National Wildlife Refuge, Santa Ana Wildlife Refuge, Falcon State Park, Sabal Palms Audubon Center and Sanctuary, Bentsen-Rio Grande Valley State Park and the Lower Rio Grande Wildlife Corridor.
The region contains several endangered and threatened species that have been identified by the US Fish and Wildlife Service or the Texas Parks and Wildlife Department. These include seven plant species and 49 animal species which include six amphibians, 20 birds, four fishes, seven mammals and 12 reptiles.
One of the major environmental issues in the Rio Grande watershed is water quality. There is an extensive monitoring program underway by the US and Mexican authorities. There is a concern that the water quality of the Rio Grande basin may be deteriorating because of increases in measured concentrations of various pollutants and in decreased return flow to the watershed. The major categories of pollutants which affect the environment and public health are salinity, nutrients, bacteria and toxic substances. Although the long-term data indicate water quality is deteriorating in some areas, other areas are improving because of recent efforts to decrease the amount of pollutants entering the river.
LRGVDC Integrated Regional Water Plan Report Summary, Page 14

Integrated Water Resource Plan Lower Rio Grande Valley Development Council
Final Report- Report Summary
Any project implemented as a result of this planning process will be required to meet the applicable federal, state, and local laws and regulations. The environmental issues which need addressing will, to a greater or lesser extent depending on the project, include riparian corridors and wildlife habitat, threatened and endangered species, water quality, freshwater flow and nutrients into the Laguna Madre, fisheries and other important aquatic organisms, flow changes in the Rio Grande, and flood plain vegetation.
Cost of Water
The information on the water rate structure in the region was obtained from visits to the municipalities, water supply corporations and irrigation districts. The average bills across the region for domestic water provided by the municipalities and water supply corporations were approximately $I5.00 for 5,000 gallons per month, $22.50 for IO,OOO gallons per month and $48.50 for 25,000 gallons per month. The rate for the water declined as the volume increased. The highest rates were for the smaller municipalities and water supply corporations and lowest in Harlingen and McAllen. The bills and rates in the region were comparable to the results of the utility rate surveys conducted by the Texas Municipal League.
The information collected from the irrigation districts indicated the charges were a combination of flat rate charges per acre and a rate for water use per acre. The average flat rate was $I2.64 and water use $9.60. The flat rate is higher for the more urbanized irrigation districts because they have a reduced number of irrigable acres over which to spread the fixed costs.
Water Supply Entities
The entities responsible for supplying the water are irrigation districts, municipalities and water supply corporations. The irrigation districts are bound by the Texas Water Code and provide untreated water to the farmers and municipalities, but they "shall not engage in the treatment or delivery of treated water for domestic consumption or the construction, maintenance or operation of sewerage treatment facilities or provide any other similar municipal services."
The municipalities supply treated water to the residences within their corporate limits and may contract to provide service outside their limits. The water supply corporations are governed by the corporate laws and may furnish " a water supply or sewer service or both to towns, cities, private corporations, and military camps and bases ... ". There are 28 irrigation districts, 3 2 municipalities and II water supply corporations involved in the distribution of water in the region.
Potential alternative institutional frameworks were to support the existing entities were considered. A Rio Grande Valley Municipal Water Authority was established in I969 and abolished in I997 by the State Legislature. A coalition, a loosely organized and voluntary
LRGVDC Integrated Regional Water Plan Report Summary, Page 15

Integrated Water Resource Plan Lower Rio Grande Valley Development Council
Final Report- Report Summary
organization of the various water suppliers, is recommended prior to any attempted creation of an organization similar to a formal authority.
Conclusions and Recommendations
The key factors identified by the Policy Management Committee to be weighed in the evaluation of options to address the short-term and long-term water needs of the Lower Rio Grande Valley have been summarized on Tables 3 and 4. The table indicates the potential water savings, preliminary capital costs, construction costs in $/1,000 gallons of water saved, debt service cost in $/1,000 gallons of water saved, availability of funding, the time to implement the project, relative environmental impact, water quality impact, relative difficulty to implement, the institutional complexity, and the need for regional coordination. The cost to implement the various water planing options were computed using current construction cost estimating data.
LRGVDC Integrated Regional Water Plan Report Summary, Page 16

Integrated Water Resource Plan Lower Rio Grande Valley Development Council
Final Report- Report Summary
Table 3 Options for Water Savings to Meet Agricultural and Municipal Demands Summary of Potential Components For An Increased Raw Water Supply
Water avm~s, Prehmmary osts, and ImplementatiOn Factors s . c . Water Savings Construction Cost Debt Service Cost (acre-feet per Preliminary $per 1, 000 gallons $per 1, 000 gallons
Components year) Capital Costs of water saved of water saved Improvements to 82,600 $33,000,000 to $1.23 to $3.07 $0.094 to $0.233 (I) Irrigation Canals $82,000,000
On-farm with 115,000 $8,031,000 $0.21 $0.030 (2) application metering
On-farm with 57,000 $1,631,000 $0.08 $0.033 (3) installation of poly-
pipe On-fann with training 34,500 $2,600,000 $0.05 N/A
for high tech management
Falcon-Amistad 31,200 $198,000,000 to $19.49 to $22.45 $1.493 to $1.719 (1) Pipeline $228,100,000
Brownsville Weir and 40,000 $36,500,000 $2.80 $0.215 (1) Reservoir Project
Runoff Water Storage Site Specific Site Specific Site Specific Site Specific
Avail-ability of FundinJ<
Medium
Low
Low
Low
Low
Medium
Low
PotentUJl for Time to Relative Water Relative Institutional Regional
Components Implement Environmental Quality DifficuiJy Complexity Coordination Impact
Improvements to 3 to 5 years Medium No Change Medium Medium High Irrigation Canals
On-farm with 1 to 3 years Low No Change Medium Medium Low application metering
On-farm with 2 to 3 years Low No Change Medium Medium Low installation of poly-pipe
On-farm with training 5 years Low No Change Medium Medium Medium for high tech management
Falcon-Amistad 4 to 6years Medium Higher High Medium High Pipeline
Brownsville Weir and 10 to 15 years High Low High Low Low Reservoir Project
Runoff Water Storage 3 to 5 years Medium Low Medium Medium High (1) 6.5% mterest rate for 30 years (2) 6.5% mterest rate for 10 years (3) 6.5% mterest rate for 3 years
LRGVDC Integrated Regional Water Plan Report Summary, Page 17

Integrated Water Resource Plan Lower Rio Grande Valley Development Council
Final Report- Report Summary
Table 4 Options to Supplement the Municipal Water Supply
Summary of Potential Components For An Increased Treated Water Supply Water Savings, Preliminary Costs, and Implementation Factors
Supplemental Construction Debt Service Operating Total Unit Water Supply Cost Cost Cost cost
(acre- Preliminary $per 1,000 $per 1,000 $per 1,000 $per 1,000 Components feet/year) Capital Costs gallons gallons gals gallons
Desalination of 11,200 $12,000,000 $3.29 $0.094 (1) $1.32 $1.414 Brackish Groundwater
(treatment of 10.0 MGD)
Desalination of 11,200 $50,000,000 $13.71 $1.050 (1) $2.90 $3.95 Seawater (treatment of
10.0MGD) Wastewater Reuse 6,721 $20,170,000 $9.22 $0.706 (1) $1.25 $1.956
(treatment of 6.0 MGD)
Availability Relative Potentia/for Time to of Environmental Water Relative Institutional Regional
Components Implement Funding Impact Quality Difficulty Complexity Coordination
Desalination of 3 to 5 years Medium Medium High Medium Low Medium Brackish Groundwater
(treatment of 10.0 MGD)
Desalination of 3to 5years Low Medium High Medium Low Medium Seawater (treatment of
10.0MGD) Wastewater Reuse 2 to 3 years Medium Low High Medium Low Medium
(treatment of6.0 MGD)
(1) 6.5% mterest rate for 30 years
The four general conclusions reached as the results of this study are presented below. For each conclusion, recommendations and justifications are presented. For Conclusion I, the recommendations have been separated into Immediate Actions, Near Term Actions, and On-going Investigations.
LRGVDC Integrated Regional Water Plan Report Summary, Page 18

Integrated Water Resource Plan Lower Rio Grande Valley Development Council
Final Report- Report Summary
The key conclusion of the Integrated Water Resource Plan- Phase II is:
The dramatic growth in population will result in an increase in non-agricultural water requirements, but these increasing non-agricultural plus the remaining agricultural water requirements, after the impacts of urbanization are considered, can be met through:
• construction of improvements to the irrigation canal delivery system, • an aggressive water conservation effort in all areas of consumption, and • an implementation of reuse wastewater, desalination of brackish groundwater and
desalination of seawater where cost effective.
Based on this key conclusion, the following Action Plan 2000-2010 was developed by the Policy Management committee and was recommended to the Lower Rio Grande Valley Development Council Board.
Action Plan 2000- 2010 Water Savings
Components Acre-Feetper Year Investment Agricuhural improvements to irrigation Canals 82,600 $82,000,000
Application of region-wide on-farm metering and 115,000 $8,000,000 volumetric pricing Installation of on-farm high-tech application methods 57,000 $4,900,000
Training for on-farm high-tech management 34,500 $2,600,000
Non-agricultural water conservation 22,400 $150,000
Impacts of Urbanization on Irrigation Water 71,000 $150,000 Requirements Region-wide Water Accounting System for Accurate Required to Support $1,500,000 Measurement of the Water Conservation Projects Other Components SCAD A System to More Effectively Monitor and Required to Support $200,000 Manage the Delivery of Water From the Falcon- Other Components Amistad Reservoir system to the Lower Rio Grande Valley IBWC TNRCC Rio Grande Watermaster
Total 382,500 $99,500,000
LRGVDC Integrated Regional Water Plan Report Summary, Page 19

Conclusion 1
Integrated Water Resource Plan Lower Rio Grande Valley Development Council
Final Report- Report Summary
The projected total water requirements of the Lower Rio Grande Valley through the year 2050 will exceed the Valley's share of the available dependable yield of the Falcon-Amistad Reservoir System even with the consideration of the impacts of urbanization and aggressive water conservation measures assuming all potentially irrigable acres are in production.
Recommendations For Immediate Action:
Recommendation A The irrigation canal must be improved to reduce the transmission losses to the maximum extent possible.
Justification A The irrigation canal system delivers untreated water to both irrigators and domestic customers throughout most of the Lower Rio Grande Valley. Much of the system was constructed in the early part of this century, and it has had limited upgrading through the years. The study revealed significant water losses in this delivery system. Also, the full benefit of the on-farm water savings cannot be achieved without these canal improvements. A program to reduce these losses will provide a greater quantity of water for beneficial use.
Recommendation B Economic incentives must be established to encourage irrigators to implement on-farm water conservation measures such as, metering, poly or gated pipe, and drip or micro jet systems and to provide education to receive maximum benefit.
Justification B Since approximately 85% of the current water consumption in the Lower Rio Grande Valley is in agricultural production, water conservation will have a significant impact on the future water requirements. At the present time, agricultural economics is marginal for many crops. Some of the land in production is leased from absentee owners. The water rights are owned by the irrigation districts and there are no guarantees that the water will always be available to the irrigators under the present Falcon-Amistad Reservoir System operating rules.
LRGVDC Integrated Regional Water Plan Report Summary, Page 20

Recommendation C
Justification C
Recommendation D
Justification D
Integrated Water Resource Plan Lower Rio Grande Valley Development Council
Final Report- Report Summary
An enhanced region-wide municipal and industrial water conservation program must be established. Water conservation programs have been adopted by many of the municipalities and water supply corporations. The ''Water Smart" program has been pursued Valley-wide. Domestic and industrial water conservation is a key element in meeting the future water requirements.
A region-wide water accounting system must be established to permit the accurate measurement of the effects of implementation of water conservation projects. In the development of the technical analysis for these recommendations, a number of water related data sets available from sources in the Valley and at the State level were reviewed and utilized. In many cases, inconsistencies were noted between the data sets and the level of accuracy was inadequate. A number of concurrent water conservation actions are proposed in these recommendations. To measure their benefit, a reliable and complete region-wide water accounting system is needed.
Recommendations for Near Term Action
Recommendation E The alternative use desalinated brackish groundwater should be evaluated as an option for each proposed additional significant demand.
Justification E Brackish groundwater is available in many sections of the Lower Rio Grande Valley. Since the available supply from the Falcon-Amistad Reservoir System will not satisfy all the demands, each opportunity to use an alternate source should be evaluated.
Recommendation F The alternative use of reuse wastewater should be evaluated as an option for each new proposed additional significant demand.
Justification F Reuse of highly treated wastewater has been evaluated at several locations in the Lower Rio Grande Valley. Since the available supply from Falcon-Amistad Reservoir System will not satisfY all the demands, each opportunity to use an alternate source should be evaluated.
LRGVDC Integrated Regional Water Plan Report Summary, Page 21

Recommendation G
Justification G
Recommendation H
Justification H
Integrated Water Resource Plan Lower Rio Grande Valley Development Council
Final Report- Report Summary
The alternative use of desalinated seawater should be evaluated as an option for each new proposed additional significant demand. Use of desalinated seawater has been evaluated at several locations near the coast in the Lower Rio Grande Valley. Since the available supply from Falcon-Amistad Reservoir System will not satisfy all the demands, each opportunity to use an alternate source should be evaluated.
The full investigation of the potential impact of the Falcon-Amistad Reservoir System firm yield due to the development and operation of the recently constructed reservoirs in Mexico must be completed through continued coordination with IBWC. The Falcon-Amistad Reservoir System provides nearly all the water to the Lower Rio Grande Valley. In recent years, a number of new reservoirs have been constructed on tributaries of the Rio Grande in Mexico. Mexico is currently investigating system-wide operating rules that will allow the maximization of their portion of the supply. This activity, although within the IBWC operating rules, could reduce the quantity available to the United States over the amount historically available.
Recommendations for On-going Investigations
Recommendation I The investigation of the Brownsville Weir and Channel Storage option should continue as a project of local interest until all the issues are addressed.
Justification I The Brownsville Weir and Channel Storage project has been under consideration for several years. The capital cost per 1,000 gallons for this project included in Table 1 is comparable to several of the other options.
Recommendation J The investigation of the Falcon-Amistad pipeline option should continue as a project of interest to the municipalities and water supply corporations.
Justification J The Falcon-Amistad pipeline option provides a second delivery route for a portion of the domestic demand which provides added reliability to the system. Although the initial construction cost is high in relation to other options, the pipeline's construction costs can be weighed against potential construction costs for improvements to the irrigation
LRGVDC Integrated Regional Water Plan Report Summary, Page 22

Conclusion 2
Integrated Water Resource Plan Lower Rio Grande Valley Development Council
Final Report- Report Summary
delivery system to provide increased reliability and delivery of untreated water to the urbanizing area north of US 83 and along FM I 07 and against the financial impact on the irrigation districts.
Non-irrigation projected water requirements of the Lower Rio Grande Valley in the year 2050, such as municipal, manufacturing, mining, livestock, and steam electric power cooling, will represent 40 percent of the available firm yield of the Falcon-Amistad Reservoir System.
Recommendations:
Recommendation A Institutional procedures must be defined that will provide necessary protection of the municipal, manufacturing, mining, livestock, and steam electric power cooling water requirements while optimizing the amount of water available for agricultural irrigation.
Justification A The vast majority of the water rights in the Lower Rio Grande Valley are currently held by the irrigation districts. The projected urbanization will reduce the agricultural demand over the next fifty years making water available to satisfy the increasing domestic and industrial demands. How this shift in demands will be addressed from water rights and water resource management perspective is an issue that has been addressed and mechanisms are in place in some areas, but it is an issue that needs continuous attention.
Recommendation B The merits of a regional authority must be fully investigated as a means of providing financing for anticipated regional projects and for providing improved management of the finite amount of surface water available to the Lower Rio Grande Valley. A coalition, a loosely organized and voluntary organization of the various water suppliers is recommended prior to any attempted creation of an organization similar to a formal authority.
Justification B The supply of water to the Lower Rio Grande Valley is currently shared by approximately 28 irrigation districts, 32 municipalities, and II water supply corporations. The untreated water is delivered by the irrigation districts for both irrigation and domestic requirements. The municipalities and water supply corporations treat and deliver treated water to domestic and industrial customers. The current system requires a high level of cooperation and does not take full advantage of the economies of scale in both financing and operation.
LRGVDC Integrated Regional Water Plan Report Summary, Page 23
Conclusion 3
Integrated Water Resource Plan Lower Rio Grande Valley Development Council
Final Report- Report Summary
The urbanization of much of the Lower Rio Grande Valley and the anticipated significant growth in population in Northern Mexico will have a profound impact on the requirements for and the distribution of water and on the quality oflife.
Recommendations:
Recommendation A The process to establish the procedures to maximize the construction of regional water treatment plants must be fully investigated since the economies of regionalization are clearly established.
Justification A The construction cost and operating cost per unit of capacity for water treatment plants decrease in proportion to their size. Encouraging the construction of regional water treatment plants will reduce the unit cost to the consumer and improve the quality of water delivered.
Recommendation B The merits of a regional coalition or entity to lead the planning needed to address the impacts of urbanization on water requirements must be fully investigated.
Justification B The urbanization of the Lower Rio Grande Valley will remove significant acreage from active agricultural production. This transition will reduce the quantity of water required for irrigation districts and increase the amount required for domestic and industrial use.
Conclusion 4 The unique environmental setting of the Lower Rio Grande Valley must be protected and enhanced to the maximum extent feasible.
Recommendation:
Recommendation A The region-wide, as well as the site-specific, environmental impacts must be considered in the evaluation of each water supply option for each new proposed additional significant demand.
Justification A The Lower Rio Grande Valley is a semitropical region that has many distinct and important characteristics. This area is an overlap point of the
LRGVDC Integrated Regional Water Plan Report Summary, Page 24

Integrated Water Resource Plan Lower Rio Grande Valley Development Council
Final Report- Report Summary
western desert and the subtropics and thus provides for a unique and varied terrestrial and aquatic environment. This environmental arrangement needs consideration in the planning of each new project.
Recommendations For Specific Immediate Action
Given the fact that the Lower Rio Grande Valley remains in a drought situation, proceeding with implementation with certain specific actions is recommended. Listed below are selected items from the above recommendation that should be considered for immediate action.
1. Develop an aggressive effort to obtain funding from state and federal agencies to implement the water conservation efforts outlined in this plan.
2. Seek funding for technical assistance to irrigation districts so they can implement the most cost effective water saving and conservation programs.
3. Utilize the opportunities of the Senate Billl Rio Grande Region planning process to refine water loss estimates and review population projections.
4. Pursue preliminary engineering and economic evaluations on the following: A Implementation of the Irrigation District Management Systems (DMS) in all the irrigation
districts in included the Visual System, IRRDESS, and distribution system routing. B. Cooperation among the irrigation districts on the consolidation of facilities to serve the
remaining irrigable acres as urbanization occurs. C. Irrigation canal delivery systems to reduce the transmission losses to the maximum extent
feasible. D. Cooperation between irrigation districts and municipalities and water supply corporations
to improve the delivery system for water conservation and increased reliability.
5. Investigate potential economic incentives for land owners/operators to invest, implement and adopt on-farm irrigation conservation technologies and establish, with the cooperation of an irrigation district, a prototype to demonstrate the effectiveness over a two-year period that desirably includes a drought or water shortage period.
6. Develop an enhanced municipal and industrial water conservation programs.
7. Define program and establish cost for a water accounting system to permit the accurate measurement of the effects of implementation of water conservation projects. A Standardized methodologies for municipalities and water supply corporations to report total
water requirements including transportation losses in delivery system.
LRGVDC Integrated Regional Water Plan Report SUII1Il1liiY, Page 25

Integrated Water Resource Plan Lower Rio Grande Valley Development Council
Final Report- Report Summary
B. Improved metering of diversion from Rio Grande by irrigation district. C. Improved metering qualities of water delivered to irrigators. D. An improved set of data on the distribution system (mains and laterals) of all irrigation
districts. E. An improved set of data on current condition and capacity of the irrigation districts pump
stations. F. An improved set of data on current seepage losses in the irrigation district' canal systems.
8. Explore the need for additional resources allocated to the Rio Grande Watermaster's office too more adequately monitor the water delivery system.
9. Establish a coalition of regional water suppliers and water users a means of providing discussion on financing for anticipated projects and on proving improved management of the finite amount of surface water available to the Lower Rio Grande Valley.
10. Preliminary engineering and economic evaluations on the potential for regional water treatment plants in the vicinity of major urbanizing areas.
11. Detailed evaluation of the impacts of projected urbanization on irrigation requirements.
LRGVDC Integrated Regional Water Plan Report Summary, Page 26

f3l ~ l.Olntroduction
Integrated Water Resource Plan Lower Rio Grande Valley Development Council
Final Report - Introduction
The drought conditions of the last four years (1995-1998) have made the citizens of the Lower Rio Grande Valley aware of the significant impacts a dwindling water supply can have on a region. This was emphasized even more strongly when the United States share of the conservation water storage capacity of the Falcon-Amistad Reservoir System reached a low of only 19% during the summer of 1998. Through a cooporative effort, improved management of the available water resources will be a major step in the reduction of these significant impacts.
The impact of the drought in the summer of 1998 leaves no doubt that action is needed now or the water shortage problem will be worse next time
1.1 Description of Planning Area
The planning area for the Lower Rio Grande Valley Integrated Water Plan consists of Cameron, Hidalgo and Willacy Counties, as illustrated on Figure 1.1. The Lower Rio Grande Valley, which developed in the twentieth century as a major agricultural center, is now experiencing one of the nation's highest population growth rates. This population growth causes
Figure 1.1
\ ' ' I \ \ i
LRGVDC Integrated Regional Water Plan Study Area
LRGVDC Integrated Regional Water Plan Section I, Page I

Integrated Water Resource Plan Lower Rio Grande Valley Development Council
Final Report - Introduction
a stronger competition for the finite quantity of water that is currently available to the Lower Rio Grande Valley, primarily from the Rio Grande's Falcon-Amistad Reservoir System.
1.2 Objectives of Study
The vast majority of the water rights in the Lower Rio Grande Valley are held by the Irrigation Districts for use in the agricultural production. The current water use in the Lower Rio Grande Valley, under non-drought conditions, is approximately eighty five percent to the agricultural sector and the balance to municipalities and industry. Under agreements recognized in the courts, municipal and industrial water demands are protected and given a priority over agricultural demands. In other words, if the quantity becomes limited, as it was in the Summer of 1998, the water supply will be managed in such a manner as to meet the municipal and industrial water demands and limit the amount available for agricultural uses.
The objective of this study has been to analyze the Lower Rio Grande Valley's water needs and projected uses through the year 2050 and develop water supply options that can contribute to addressing those needs. Consequently, the management of the water resources available to the Lower Rio Grande Valley requires an integrated approach that combines the collective interests and concerns of the municipalities, industrial, agricultural and other stakeholders. An effective, comprehensive management plan can only be developed through an open and participatory decision-making process. The overall goal was to engage as wide an audience as possible in the planning process.
The National Regulatory Research Institute has developed the following definition for an integrated water resource plan.
"Integrated resource planning is a comprehensive form of planning that encompasses least-cost analysis (including demand-side and supply-side management options), an open and participatory decision-making process, and consideration of the multiple institutions concerned with water policy."
The key words in this definition are:
Comprehensive Least-cost Analysis
Open and Participatory Multiple Institutions
Effort has been made throughout the planning process to incorporate these key words. Working within this framework of an integrated water resource plan, the following goals were established for this study:
• Development of options for more effective, efficient and environmentally-sound ways to supply water to the region
LRGVDC Integrated Regional Water Plan Section 1, Page 2
Integrated Water Resource Plan Lower Rio Grande Valley Development Council
Final Report- Introduction
• Review of the roles and potential working relationships among regional organizations involved in managing the supply of water
• Development of a Water Management and Drought Contingency Plan
This integrated water resource plan was undertaken during the early stages of this current drought in recognition of the following:
• Only a specific amount of water is available from the Rio Grande for the Lower Rio Grande Valley.
• The management of the available water is critical to the continued development of Cameron, Hidalgo, and Willacy Counties.
In addition, other underlying objectives of the study and their impacts were:
• Identifying enough water for the region that is essential to the economy, health, environment and quality of life in the Lower Rio Grande Valley
• Developing recommendations on many topics, such as water pricing, conservation measures, water allocation, etc. that will impact local citizens and organizations
• Evolving an effective regional water plan that reflects the needs and ideas of the local citizens
1.3 Study Funding Sources
A study of this magnitude could not have been initiated without the financial support of a number of institutions and individuals. The support illustrates the importance that government entities outside of the Lower Rio Grande Valley place on the stability and continued development of this region. Summarized below are the levels of support provided by the contributors.
LRGVDC Integrated Regional Water Plan Section I, Page 3

~ ~
Integrated Water Resource Plan Lower Rio Grande Valley Development Council
Final Report - Introduction
Table 1.1 LRGVDC Integrated Regional Water Plan Funding Sources
Federal Government
Economic Development Administration $ 600,000 Bureau of Reclamation $ 100,000 State of Texas Texas Water Development Board $ 250,000 Local Fundin!( Match Municipalities $ 50,000 Irrigation Districts $ 25,000 Utility Companies and Private Funding $ 25,000 Sources Combined $ 1,050,000
1.4 Policy Management Committee
The Lower Rio Grande Valley Development Council established a special Policy Management Committee to oversee and provide guidance on the study. The Policy Management Committee helped achieve one of the project goals of an open and participatory decision process through the total involvement of its members. The Committee members included a cross section of the individuals involved in the water delivery, water treatment, water distribution, environment, conservation, and business in the Lower Rio Grande Valley. In part, their role was to represent all the individuals and institutions in the decision-making process. The Committee met at least monthly, normally in three-hour progress meetings, with the consulting team. In addition they attended numerous public and stakeholder meetings conducted throughout the year-long planning process. The members of the Policy Management Committee are listed in Table 1.2.
LRGVDC Integrated Regional Water Plan Section 1, Page 4

Integrated Water Resource Plan Lower Rio Grande Valley Development Council
Final Report- Introduction
Table 1.2 LRVGDC Policy Management Committee
Ray Prewett, Chairman Sonny Hinojosa Executive Vice President General Manager Texas Citrus Mutual Hidalgo County Irrigation District #2
Dr. Jose Amador Lee Kirkpatrick Center Director, Texas A&M University Vice President Agricultural Research and Extension Center Texas State Bank
Charles "Chuck" Browning Glenn Jarvis General Manager Attorney North Alamo Water Supply Corp. McAllen
John Bruciak James R. Matz General Manager Commissioner Brownsville PUB Cameron County
Mary Lou Campbell Jack Nelson Conservationist President
Rio Grande Valley Sugar Growers, Inc.
Wayne Halbert Bobby Sparks General Manager General Manager Harlingen Irrigation District S.R.S. Farms
John Herrera JoJo White Manager of Operations General Manager Magic Valley Electric Co-Op Hidalgo & Cameron Counties Irrigation District #9
Gordon Hill Cloice Whitely General Manager General Manager Bayview Irrigation District #II Harlingen Waterworks System
Bart Hines, P.E. Arnoldo Cantu* General Manager Bill Thompson* McAllen PUB * Honorary Members, Post-Mortem
LRGVDC Integrated Regional Water Plan Section 1, Page 5

Integrated Water Resource Plan Lower Rio Grande Valley Development Council
Final Report - Introduction
1.5 Technical Support Team
In the Fall of 1997, the Policy Management Committee received written proposals and interviewed short listed teams to undertake the Phase II of the Integrated Water Resource Plan. The team lead by PerezJFreese and Nichols, L.L.C. of McAllen, Texas was selected for the assignment. The Team consisted oflocal engineering and key specialty consultants from around the State of Texas.
The consultants were:
Freese and Nichols, Inc. Fort Worth Texas Agriculture Experiment Station College Station and Weslaco
Sigler, Winston, Greenwood and Associates, Inc. Weslaco DB Consulting La Feria
Guzman & Munoz Engineering and Surveying, Inc. Harlingen Gonzalez Engineering and Surveying, Inc. Brownsville
Corderffhornpson & Associates Austin
1.6 Public Participation Process
The goals of the public participation program for the Lower Rio Grande Valley Integrated Water Resource Plan- Phase II were as follows:
• Provide information about the goals of the project • Update members of the public about consultants' findings and recommendations • Solicit input regarding public concerns and suggestions • Provide information on the public participation process
The Public Participation Program had the following components:
Public Meetings: Public meetings were planned for three stages of the project. The first round of public meetings was held on January 21, 1998, in Brownsville and McAllen. The objectives of the initial meetings were to introduce the project and the issues, to introduce the consultants, and to solicit any general concerns or suggestions about water management issues.
A second round of meetings was also held in Brownsville and McAllen on July 2, 1998. At these meetings the consultants presented initial findings on growth and water use projections, described five possible alternatives for water management, and solicited public comments.
The third round of public meetings was conducted during the 30-day public comment period on the Initial Draft of the Interim Technical Report on November 9, 1998, in Brownsville and McAllen. These final meetings for the project focused on presenting the recommendations, collecting comments from the public, and outlining the next phase of the water management
LRGVDC Integrated Regional Water Plan Section I, Page 6

Integrated Water Resource Plan Lower Rio Grande Valley Development Council
Final Report - Introduction
planning process as presented in the Interim Draft Report as approved by the Policy Management Committee.
Stakeholder Meetings:
Meetings were held with a variety of stakeholder groups to share information and to solicit input about the project. These meetings provided an opportunity to discuss the issues in more detail and to address the specific concerns of each group.
Irrigation Districts: On April21, 1998, project consultants met with members of the Lower Rio Grande Water District Managers Association. The meeting provided an update on the key water management issues, strategies for completing the data collection process, and comments from the district managers.
Municipal and Industrial Users: On April24, 1998, meetings were held in Brownsville, Harlingen and McAllen. At these meetings, municipal representatives provided input on the consultants' population growth estimates and provided comments and suggestions on the project from the municipal perspective.
Environmental Issues: On April30, 1998, a meeting was held in Harlingen for citizens who wished to discuss the potential environmental impacts of any water management initiatives. The consultants provided an initial overview and assessment of the environmental issues and answered questions about potential environmental impacts. More than 15 groups were represented, including the Sierra Club, U.S. Fish and Wildlife, Edinburg 2020 Environmental Coalition, Texas Parks and Wildlife, and CEMAC.
Citizen Advisory Subcommittee on Public Participation: A 30-member subcommittee was appointed by the Policy Management Committee to provide broad-based community input to project consultants and the Policy Management Committee on plans for and effectiveness of public meetings. The process for gathering information focused on community needs, concerns and suggested actions. The subcommittee met on January 12, 1998, in Weslaco. The meeting served as an orientation to the project and to the subcommittee's role as advisors to the public participation process. In addition, subcommittee members provided some initial input on strategies to involve the public and suggestions for the first round of public meetings.
On May 14, 1998, a second meeting was held in Weslaco. This meeting was a work session which focused mainly on briefing subcommittee members on details of the project and reviewing possible water management alternative scenarios.
On November 2, 1998, a third meeting was held in Weslaco to plan for the public comment period. The subcommittee members were briefed on the recommendations of the report and they provided input for the public participation process.
LRGVDC Integrated Regional Water Plan Section 1, Page 7

~ ~
Integrated Water Resource Plan Lower Rio Grande Valley Development Council
Final Report- Introduction
Irrigation District Managers and Board Members: On November 12, 1998, a meeting was held in Weslaco with Irrigation District Managers and Board Members to discuss the outcome and methodology of the water projections of this report.
Newsletter: The purpose of the newsletter was to reach those citizens who are most interested in water management issues or who are most likely to be affected by the water management plan. The newsletter was distributed by the Lower Rio Grande Valley Development Council through a mailing list that included more than 600 citizens, including members of the key stakeholder groups, and attendees from the public meetings.
The first newsletter was mailed in December 1997 and introduced the project sponsors, the consultants, the issues to be addressed, and the methods for public input. The second newsletter was mailed in March 1998 and outlined the four key water management issues to be addressed in the project. A third mailing in June 1998 had a question/answer format that addressed common questions about the Integrated Water Resource Plan project, as well as invitations to upcoming public and stakeholder meetings. A final mailing was distributed in the Fall of 1998 to publicize the recommendations, the public comment period, and opportunities for input.
A complete set of summaries of the public and stakeholder meetings has been included in Appendix A. The appendix includes the communities and groups represented at the meetings, as well as a summary of the public comments.
1. 7 Scope of Services
A detailed technical scope of services was developed in Phase I of the planning process. The Phase I process reviewed and evaluated available data and question and concerns shared by members of the Policy Management Committee. The complete scope of services for Phase II developed through this process has been included in Appendix C. The major components are listed below:
• Establish Plan Goals and Proposed Actions • Refine Water Demands and Needed Information • Formulate Alternative Future Water Supply Plan Components • Review Water Supply Institutional Structures • Establish Baseline Environmental Conditions • Conduct an Alternative Analysis of the Major Components • Prepare Interim Technical Report • Perform Project Management and Coordination • Develop Water Management and Drought Contingency Plan for the Lower Rio
Grande Valley • Prepare Scope of Service for Next Phase of Planning/Implementation
LRGVDC Integrated Regional Water Plan Section I, Page 8

Integrated Water Resource Plan Lower Rio Grande Valley Development Council
Final Report- Introduction
1.8 Key Elements of Project Approach
A general description of the key elements of the project approach has been described in the points outlined below. To the maximum extent possible throughout the planning process, the key terms of an integrated water resource planning process (comprehensive, least-cost analysis, open and participatory, and multiple institutions) have been followed.
• Reviewing basic data collected in Phase I and acquiring additional basic data required for the planning study.
• Incorporating a process that permits a high level of public participation. • Developing updated base maps of the region that contain major water supply and
delivery facilities. • Reviewing the historical population and water use patterns and projecting future
populations and water uses. • Providing a detailed evaluation of the Falcon-Amistad Reservoir System water supply
capabilities • Estimating irrigation system conveyance losses. • Considering existing and potential agricultural water conservation programs. • Considering existing and potential municipal and industrial water conservation
programs.
1.9 Relationship of this Study to Senate Bill 1 Regional Water Planning Process
Traditionally, the State of Texas Water Plan has been a top down process. With the passage of Senate Bill1, the process has been converted to a bottom-up process with a significant amount of technical support from the state. The scope of services and funding for the Lower Rio Grande Valley Integrated Water Resource Plan were in place when Senate Bill 1 was enacted. Although the rules and regulations for implementing Senate Bill 1 were being established while the development of the Integrated Water Resource Plan was underway, an effort has been made to prepare the analysis and findings, to the maximum extent possible, so that they can be incorporated in the Rio Grande Regional Water Plan with the minimum of effort.
Originally, a Phase III of the Integrated Water Resource Plan on implementation and institutional issues was planned. It is anticipated that much of the Phase II of the Integrated Water Resource Plan effort will be incorporated in the Senate Bill 1 which will not be completed until September 2000. The final adoption by the State is not scheduled until September 2001. This transition process has been illustrated in Figure 1.2. The Policy Management Committee has concluded that delaying nearly three years until the Senate Bill 1 process is completed to continue with the consideration of potential implementation and institutional issues that are so critical to the Lower Rio Grande Valley at the present time is not in the best interest of the region. The Committee has expressed an interest in encouraging continuing consideration of the potential implementation and institutional options and in seeking funding for their evaluation and initiation.
LRGVDC Integrated Regional Water Plan Section 1, Page 9
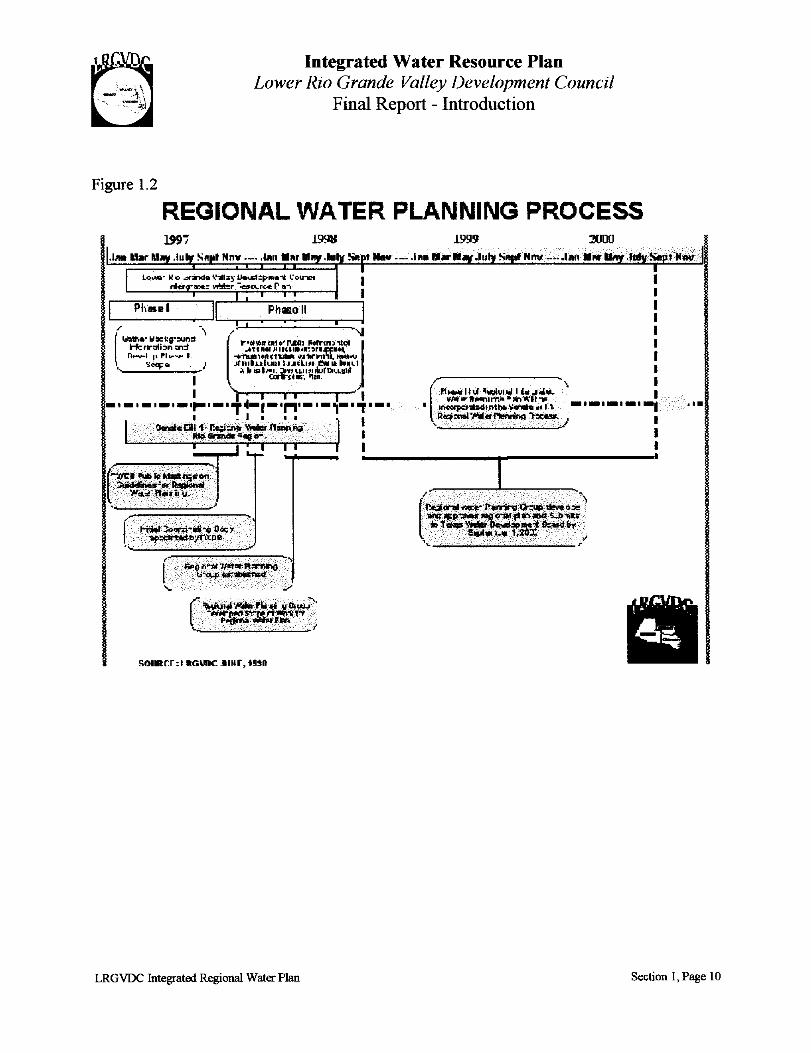
Figure 1.2
Integrated Water Resource Plan Lower Rio Grande Valley Development Council
Final Report- Introduction
REGIONAL WATER PLANNING PROCESS 199i
F \
(
Wd\6• Yzt:g-~::1 Hc:rrali:::m a'd n.....,..t ,,,. ..... ...,,
• scq:o 1
1991:1 1999
I I I I I I I I
' l/ll#f=l"1tflllllnlrr.:ra:t::nll."lt~
(. Ph ..... II II'"""'"'"""""'- \ :
I~;.;,;=~~~~~'/-·-·-·-·-·
r ... ~. ·.·.· .. ···.HI.· ··.·w,·.·.·~ •. ··.· .. ··.···'"···· ... · .. ·.· .. ···.v. o.. -.· .· '"'.··.··.· .. -~~~~T'T 'I,.'' .:::-_ .. :._:,_:-;·;;.>·---c-'_',;:~~-·'.':'"_::·'·-Oi
SOIIRr.r: I RGIJIIC .IINr, tRM
...
LRGVDC Integrated Regional Water Plan Section 1, Page 10

Integrated Water Resource Plan Lower Rio Grande Valley Development Council
Final Report- Regional Population and Anticipated Growth
2.0 Regional Population and Anticipated Growth
2.1 Historical Populations
The historical 1990 populations for the three-county study area and for the major municipalities are tabulated in Table 2.1. The total 1990 three-county population was 661,370. Of the total, 58.0 percent resided in Hidalgo County, 39.3 percent in Cameron County, and 2.7 percent in Willacy County.
In Hidalgo County, 68.3 percent of the population resided in the cities, while the remaining 31.7 percent, represented the rural county population. For Cameron County, 76.6 percent of the population resided in the cities, with the balance, 23.4 percent, in the rural county area. In Willacy County, 59.6 percent of the population was located in the cities, while the remainder, 40.4 percent, represented the rural county population.
2.2 Existing Social Economic Conditions
The Lower Rio Grande Valley has received a significant amount of national attention as the area transitions from a predominately agricultural region to a center with increasing manufacturing, trade, and retail. In January of 1998, USA Today identified three of the nation's top 10 fastest-growing metro areas as located along the Mexico border in South Texas. These were Laredo (2nd), McAllen (3rd), and Brownsville (lOth). The McAllen metro area, for example, leaped from 77th place to the nation's 3rd in terms of growth rate. with an estimated 29.2% increase in its population from 1990 to 1996. The Brownsville metro area, with an estimated 21.1% increase in its population, also leaped from being ranked 119th to, being ranked lOth in the nation. The article noted that in these areas, where many jobs are low-paying, thousands of immigrants have nevertheless settled, attracted by the communities' strong cultural and family ties with Mexico. Forbes Magazine (1) agreed with USA Today when it observed that McAllen's overall unemployment jumped well above the nation's average in 1995, with a 3.8% increase. Forbes also noted that because of constant floods of immigrants and the area's historic abundance of migrant workers, the unemployment level remained unusually high.
McAllen's and Brownsville's growth is attributed in large part to the existence of the emerging Maquiladora industry. The region has realized its growth is strongly linked directly to that of Mexico. When considering the social economic conditions of the Lower Rio Grande Valley, the border areas of the two countries have to be considered together.
The economic, political and social relationship between Texas and Mexico will have an increasing importance to both governments and their populace. The population of Mexico is now about one third that of the United States, rather than the 15 percent it was in 1940. Mexico's population growth rate has been about three times higher than that of the United States. CIEMAX-WEFA, Mexican Economic Outlook (2) service in October 1994
LRGVDC Integrated Regional Water Plan Section 2, Page I
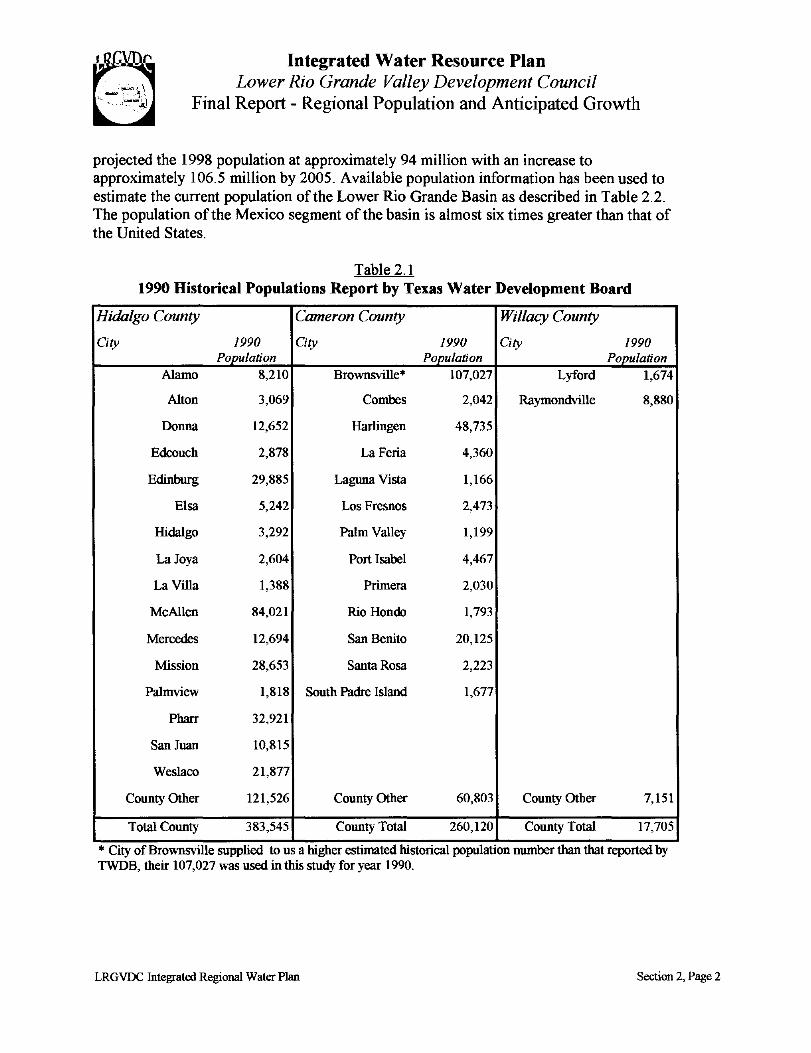
Integrated Water Resource Plan Lower Rio Grande Valley Development Council a . . Final Report- Regional Population and Anticipated Growth
projected the 1998 population at approximately 94 million with an increase to approximately 106.5 million by 2005. Available population information has been used to estimate the current population of the Lower Rio Grande Basin as described in Table 2.2. The population of the Mexico segment of the basin is almost six times greater than that of the United States.
Table 2.1 1990 Historical Populations Report by Texas Water Development Board
Hidalgo County Cameron County Willacy County
City 1990 City 1990 City 1990 Population Population Population
Alamo 8,210 Brownsville* 107,027 Lyford 1,674
Alton 3,069 Combes 2,042 Raymondville 8,880
Donna 12,652 Harlingen 48,735
Edcouch 2,878 La Feria 4,360
Edinburg 29,885 Laguna Vista 1,166
Elsa 5,242 Los Fresnos 2,473
Hidalgo 3,292 Palm Valley 1,199
LaJoya 2,604 Port Isabel 4,467
La Villa 1,388 Prim era 2,030
McAllen 84,021 Rio Hondo 1,793
Mercedes 12,694 San Benito 20,125
Mission 28,653 Santa Rosa 2,223
Palmview 1,818 South Padre Island 1,677
Pharr 32,921
SanJuan 10,815
Weslaco 21,877
County Other 121,526 County Other 60,803 County Other 7,151
Total County 383,545 County Total 260,120 County Total 17,705
* City of BroWIISVllle supplied to us a higher estimated histoncal population number than that reported by TWDB, their 107,027 was used in this study for year 1990.
LRGVDC Integrated RegiOilll! Water Plan Section 2, Page 2

Integrated Water Resource Plan Lower Rio Grande Valley Development Council
Final Report- Regional Population and Anticipated Growth
Table 2.2 c urren tP If opu a 100 o e ower 0 ran e asm fth L Ri G d B .
Segment United States Mexico Combined
Fort Quitman to Amistad 27,300 1,164,700 1,186,000
Amistad to Falcon 274,500 1,025,500 1,300,000
Falcon to Gulf of Mexico 819,800 4,769,800 5,589,600
Pecos 59,700 0 59,700
Total 1,181,300 6,960,000 8,141,300
Population alone does not convey the complete picture of the relationship between the two sides of the Rio Grande. The growth in personal income per capita in Mexico was interrupted in December 1994 with the devaluation of the peso, but the projections of CIEMAX-WEF A indicate that it should continue to grow in the future. The per capita income of Mexico in US dollars decreased from $3,384 in 1994 to $2,146 in 1995. At that same time, the estimated per capita income in Texas was approximately $20,000.
An Atlantic Monthly (3) article in February 1997 described the division of Mexico into three regions --Mex-America in the north, Mex-Central America in the south, and citystate Mexico City. Northern Mexico was described as integrated into the sphere of American prosperity, with Sun Belt-style towns featuring American restaurants and car dealerships and American businesspeople everywhere. The article contained an estimate that at least two thirds of the Maquiladoras were located in northern Mexico. The air links between the southwestern United States and northern Mexican cities such as Monterrey and Chihuahua have increased. In many ways, the article states "the reunification of the Lone Star State and northern eastern Mexico is history quietly and boringly in the making." The future may hold new cultural-regional identities in which Monterrey has more in common with cities in Texas than those cities have with other places in the United States.
The Maquiladoras have driven expansion on both sides of the border. Traditionally, Maquiladoras were used for labor-intensive assembly, but recently there has been a shift toward full transformation of raw materials to finished products. Under the Maquiladora Program, foreign investors are granted duty-free status for the movement of raw materials into Mexico for further processing. Duties are only applied to the goods upon the return to the United States. With NAFTA, the ability for Maquiladoras to sell an increasing percentage of their production directly into the Mexican market was established.
The information on personal income and industry earnings as published by the Bureau of Economic Analysis in its BEARF ACTS ( 4) for Cameron, Hidalgo, and Willacy Counties has been summarized in Tables 2.3, 2.4, and 2.5, respectively. A general
LRGVDC Integrated Regional Water Plan Section 2, Page 3

Integrated Water Resource Plan Lower Rio Grande Valley Development Council
Final Report- Regional Population and Anticipated Growth
conclusion that can be drawn from these tables, and the discussion above, is that the Lower Rio Grande Valley region is experiencing a significant growth, which triggers the need for major infrastructure improvements. This growth is occurring in a region which, at the current time, has limited financial ability to respond due to its very low economic ranking in relation to the remainder of Texas and the United States.
2.3 Current Employment Statistics
The Texas Workforce Commission is the source for employment statistics in the region. The Commission released its employment statistics for 1997 in January 1998. A January 28, 1998, McAllen Monitor headline following the release of these statistics stated "Valley Untouched by Hot Texas Job Market." The article indicates that the unemployment rates in the Rio Grande Valley were largely unchanged from a year ago. The December 1997 Lower Rio Grande Valley employment statistics are summarized in Table 2.6.
In Hidalgo County, December 1997's unemployment rate of 17.7 percent matched the December 1996level, but it was down from the November 1997level of 17.8 percent. Hidalgo County continues to have the highest unemployment rate among Texas's 27 major metropolitan areas.
Cameron County in December 1997 had the second highest unemployment rate among Texas's 27 major metropolitan areas. The rate dropped a full percent in a month from 12.3 percent in November 1997 to 11.3 percent in December 1997. According to the Texas Workforce Commission, the December 1996 rate was 11 percent. The unemployment rate in Willacy County dipped from the December 1996 rate of20.4 percent to 17.1 percent in December 1997.
The statewide unemployment rate barely moved in 1997. The Texas Workforce Commission numbers were 4.5 percent for December 1997, down from the December 1996level of 4.9 percent. Representatives of the Texas Workforce Commission indicated that the area posted higher job growth numbers during December 1997, but the number of people looking for work also increased. For example in Hidalgo County, total employment grew by 1,600 jobs in December 1997, but the labor force increased by 1, 700, nullifying the employment gains. Overall, Hidalgo County gained 9,000 jobs, or 6.9 percent, in 1997.
LRGVDC Integrated Regional Water Plan Section 2, Page 4

Integrated Water Resource Plan Lower Rio Grande Valley Development Council
Final Report - Regional Population and Anticipated Growth
Table 2.3 Bureau of Economic Analysis (BEARFACTS) Cameron County, Texas 1995-96
Part of the Brownsville-Harlingen-San Benito Metropolitan Area. Its 1995 population of 307,869 ranked 11th out of254 counties in the State of Texas.
PER CAPITA PERSONAL INCOME
In 1996, Cameron County had a per capita personal income of$ 12,461. This level ranked 23lth in the State and was 56 percent of the State average of$ 22,324, and was 51 percent of the national average of$ 24,436. The 1996 per capita personal income reflected an increase of3.6 percent from 1995. The 1995-96 State change was 4.4 percent and the national change was 4.6 percent.
TOTAL PERSONAL INCOME
In 1996, Cameron County had a total personal income of$ 3,910,587,000. This level ranked 20th in the State and accounted for 0.9 percent of the State total. The 1996 total personal income reflected an increase of6.1 percent from 1995. The 1995-96 State change was 6.4 percent and the national change was 5.6 percent.
COMPONENTS OF TOTAL PERSONAL INCOME
Total personal income includes the earnings (wages and salaries, other labor income, proprietors' income); dividends, interest, and rent; and transfer payments received by the residents of Cameron County. In 1996, earnings were 56.4 percent of the total personal income; dividends, interest, and rent were 14.6 percent; and transfer payments were 29.0 percent. From 1995 to 1996, earnings increased 5.3 percent; dividends, interest, and rent increased 6.8 percent; and transfer payments increased 7.4 percent.
EARNINGS BY INDUSTRY
Earnings by persons employed in Cameron County increased form $ 2,288,153,000 in 1995 to$ 2,399,420,000 in 1996, an increase of 4.9 percent. The largest industries in 1996 were service, 28.6 percent of earnings; state and local government, 21.5 percent; and retail trade, 12.5 percent. Of the industries that accounted for at least 5 percent of earnings in 1996, the slowest growing from 1995 to 1996 was nondurable goods manufacturing (6.6 percent of earnings in 1996), which decreased 3.6 percent; the fastest were services, which increased 7.3 percent.
LRGVOC Integrated Regional Water Plan Section 2, Page 5
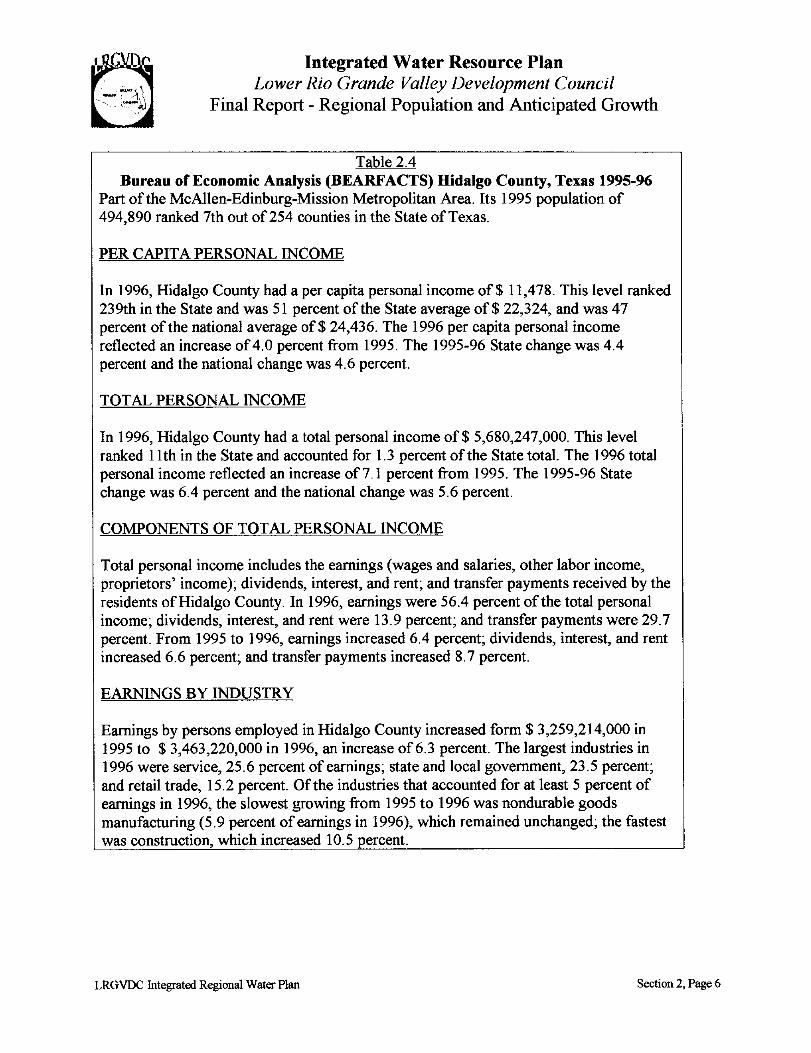
Integrated Water Resource Plan Lower Rio Grande Valley Development Council
Final Report- Regional Population and Anticipated Growth
Table 2.4 Bureau of Economic Analysis (BEARFACTS) Hidalgo County, Texas 1995-96
Part of the McAllen-Edinburg-Mission Metropolitan Area. Its 1995 population of 494,890 ranked 7th out of254 counties in the State of Texas.
PER CAPITA PERSONAL INCOME
In 1996, Hidalgo County had a per capita personal income of$ 11,478. This level ranked 239th in the State and was 51 percent ofthe State average of$ 22,324, and was 47 percent of the national average of$ 24,436. The 1996 per capita personal income reflected an increase of 4. 0 percent from 1995. The 1995-96 State change was 4.4 percent and the national change was 4.6 percent.
TOTAL PERSONAL INCOME
In 1996, Hidalgo County had a total personal income of$ 5,680,247,000. This level ranked 11th in the State and accounted for 1. 3 percent of the State total. The 1996 total personal income reflected an increase of 7.1 percent from 1995. The 1995-96 State change was 6.4 percent and the national change was 5.6 percent.
COMPONENTS OF TOTAL PERSONAL INCOME
Total personal income includes the earnings (wages and salaries, other labor income, proprietors' income); dividends, interest, and rent; and transfer payments received by the residents ofHidalgo County. In 1996, earnings were 56.4 percent of the total personal income; dividends, interest, and rent were 13.9 percent; and transfer payments were 29.7 percent. From 1995 to 1996, earnings increased 6.4 percent; dividends, interest, and rent increased 6. 6 percent; and transfer payments increased 8. 7 percent.
EARNINGS BY INDUSTRY
Earnings by persons employed in Hidalgo County increased form$ 3,259,214,000 in 1995 to $ 3,463,220,000 in 1996, an increase of6.3 percent. The largest industries in 1996 were service, 25.6 percent of earnings; state and local government, 23. 5 percent; and retail trade, 15.2 percent. Of the industries that accounted for at least 5 percent of earnings in 1996, the slowest growing from 1995 to 1996 was nondurable goods manufacturing ( 5. 9 percent of earnings in 1996), which remained unchanged; the fastest was construction, which increased 10.5 percent.
LRGVDC Integrated Regional Water Plan Section 2, Page 6

Integrated Water Resource Plan Lower Rio Grande Valley Development Council
Final Report- Regional Population and Anticipated Growth
Table 2.5 Bureau of Economic Analysis (BEARFACTS) Willacy County, Texas 1995-96
Willacy County is not part of a metropolitan area. Its 199 S population of 19,416 ranked 11Sth out of2S4 counties in the State of Texas.
PER CAPITA PERSONAL INCOME
In 1996, Willacy County had a per capita personal income of$ 11,644. This level ranked 236th in the State and was 52 percent of the State average of$ 22,324, and was 48 percent of the national average of$ 24,436. The 1996 per capita personal income reflected an increase of 16.9 percent from 1995. The 1995-96 State change was 4.4 percent and the national change was 4.6 percent.
TOTAL PERSONAL INCOME
In 1996, Willacy County had a total personal income of$ 226,072,000. This level ranked 143th in the State and accounted for 0.1 percent of the State total. The 1996 total personal income reflected an increase of 18.1 percent from 1995. The 1995-96 State change was 6.4 percent and the national change was 5.6 percent.
COMPONENTS OF TOTAL PERSONAL INCOME
Total personal income includes the earnings (wages and salaries, other labor income, proprietors' income); dividends, interest, and rent; and transfer payments received by the residents of Willacy County. In 1996, earnings were SO. S percent of the total personal income; dividends, interest, and rent were 13.0 percent; and transfer payments were 36.4 percent. From 1995 to 1996, earnings increased 32.7 percent; dividends, interest, and rent increased 5.7 percent; and transfer payments increased 6.3 percent.
EARNINGS BY INDUSTRY
Earnings by persons employed in Willacy increased form $ 74,520,000 in 1995 to $102,463,000 in 1996, an increase of37.S percent. The largest industries in 1996 were state and local government, 29.0 percent of earnings; services, 13.1 percent; and retail trade, 9. 7 percent. Of the industries that accounted for at least S percent of earnings in 1996, the slowest growing from 1995 to 1996 was retail trade, which decreased 2.9 percent; the fastest was services, which increased 15.4 percent.
LRGVDC Integrated Regional Water Plan Section 2, Page 7

Integrated Water Resource Plan Lower Rio Grande Valley Development Council ~
~ Final Report - Regional Population and Anticipated Growth
Table 2.6 L ower RiG 0 rande Valley E I S mployment tat1stics- December 1997
Cameron Hidalgo Wi//acy
Labor Force 127,539 201,472 7,487
Employment 113,098 165,790 6,208
Unemployment 14,441 35,692 1,279
Rate 11.3 17.7 17.1
2.4 Contributions of Agribusiness
Agribusiness has been a major contributor to the economy and employment in the Lower Rio Grande Valley. All too often, it requires a natural disaster or unfavorable market forces to boost agriculture and agribusiness into the forefront of the minds of the public. As generations of Americans have become further removed from their agricultural roots, it becomes all too convenient to take for granted the contribution that agribusiness provides to the economy and well-being of rural and urban citizens alike.
The agribusiness in the Lower Rio Grande Valley can be described as a survivalist. It has overcome natural perils, rapid urbanization, and evolving technologies and consumer preferences. Agribusiness states that it provides Americans with the highest-quality, lowest-cost and safest food and fiber supply in the world. While many people might consider agriculture as an industry of yesteryear, others hope that this myth may be set aside. Modem agribusiness is expanding across many horizons including the areas of retail trade, manufacturing, and wholesale trade.
The contribution of agribusiness to the economy of the Lower Rio Grande Valley is extensive. The annual value of agricultural commodities and the annual payroll of agribusiness firms was recently estimated at $1.4 billion with an estimated impact of more than $3.4 billion.
The production segment of the agribusiness industry continues to play an important role in the area's economy. The Lower Rio Grande Valley has a wide variety of production agricultural, ranging from the traditional to the non-traditional. The region is home to more than 1,600 farms and ranches that produce everything from beef cattle to bees to palm trees to peanuts. If you consider typical harvesting dates, there doesn't appear to be any off-season for the Rio Grande Valley agriculture. Approximately 57%, 66%, and 68% of the land in Cameron, Hidalgo, and Willacy counties, respectively, are used for agricultural production. According to the 1993-1998 "Annual Increment Report," agricultural commodities produced in the Lower Rio Grande Valley had an average annual value of$528.68 million.
LRGVDC httegrated Regional Water Plan Section 2, Page 8

Integrated Water Resource Plan Lower Rio Grande Valley Development Council
Final Report- Regional Population and Anticipated Growth
Agribusiness is indeed big business in the Lower Rio Grande Valley. Agribusiness accounts for 30 percent ofthe employment, 24 percent of annual payrolls, and 19 percent of all business establishments in the Rio Grande Valley. The impact of agribusiness should continue to expand across both new and existing horizons as the industry adopts more-efficient production, processing, manufacturing, and marketing practices. The Lower Rio Grande Valley stands poised to lead the State in agribusiness due to its geographic location, proximity to and excellent relationship with Mexico, its developing workforce and outstanding local leadership.
2.5 Projected Year 2000 to Year 2050 Populations
The population projections for water resource planning for the State of Texas have been developed by the TWDB and are presented in Water For Texas- Today and Tomorrow, A 1996 Consensus-Based Update to the Texas Water Plan, Volume III, Water Use Planning Data Appendix (5) prepared by Water Demand/Drought Management Technical Advisory Committee of the Consensus-Based State Water Plan, supported by staffs of Texas Water Development Board, Texas Natural Resources Conservation Commission and Texas Parks and Wildlife Department. This document sets forth the State's consensus-based methodology for the projections of populations and water demands for the period 2000 through 2050. The approach adopted for this project included an inquiry to each municipality during the visits by the local consultants to obtain the municipality's opinion on the appropriateness of the projections. A follow-up letter with the projections was sent to each municipality during November 1998 requesting a second review of the projections. Based on these observations and additional discussions with representatives of the TWDB, some adjustments have been made to individual municipality populations. The total population for each county agrees with the TWDB projections.
After the initiation of this study, Senate Bill I was passed by the Texas Legislature. Paragraph (d) of Section 357.5, Guidelines for Development ofRegional Plans, sets forth the following:
Use of population and water demands. In developing regional water plans, regional water planning groups shall use:
(1) state population and water demand projections contained in the state water plan or adopted by the board qfter consultation with the Texas Natural Resource Conservation Commission and Texas Parks and Wildlife Department in preparation for revision of the state water plan; or
(2) in lieu of paragraph (1) of this subsection, population or water demand projection revisions that have been adopted by the board, qfter coordination with Texas Natural Resource Conservation Commission and Texas Parks and Wildlife Department, based on changed conditions and availability of new information. Within 45 days of receipt of a request from a regional planning group for revision of population or water demand projections, the
LRGVDC Integrated Regional Water Plan Section 2, Page 9

Integrated Water Resource Plan Lower Rio Grande Valley Development Council
Final Report - Regional Population and Anticipated Growth
executive administrator shall consult with the requesting regional water planning group and respond to their request.
The Water For Texas_report states, "Projections of municipal water uses are developed at the city level using city-specific water use characteristics and future estimates of population. The county population projections provide the overall control totals for all city-specific and county rural population projections. By developing projections of population and water uses at the county level, county projections can be aggregated and delineated to river and coastal basins, water resource planning regions, metropolitan statistical areas, or any other desired regional aggregations."
The State of Texas's most-likely scenario populations, adjusted for known municipal changes for the Lower Rio Grande Valley Integrated Water Resource Plan study area, have been summarized in Table 2.7. These adjustments have been reviewed with the TWDB. The details of the population projections for these counties for the various migration rates have been included in the Appendix D.
For Cameron County, the most-likely population projection has been based on the assumption that the migration rate will continue at the 1980-1990 rate through 2000. The migration rate is then assumed to decline over the 2000-2050 period. If the migration rate remained at the 1980-1990 level throughout the planning period, the projected population for the year 2050 would be nearly 800,000, or approximately 22.4% greater than the most-likely population scenario. The logic that influenced the State to reduce the assumed migration rate is not presented in the State's Consensus Planning Report. The discussion on the limitations of the analysis as it relates to NAFT A, included in Section 2.2.4 of the Consensus Planning Report (see Appendix D), should be noted. If the assumed reduction in the immigration into the U.S. from Mexico does not occur, then the total population could be significantly increased and, therefore, the total municipal water demand would be greater. This assumption needs to be thoroughly reviewed as the Integrated Water Resource Plan is updated in the future.
For Hidalgo County, the most-likely population projection has been also based on the assumption that the migration rate will continue at the 1980-1990 rate through 2000 and then decline over the 2000-2050 period. If the migration rate remained at the 1980-1990 level throughout the planning period, the projected population for the year 2050 would be approximately 2,113,000 or 50.5% greater than the most-likely population scenario. The assumed decline in the immigration rate represents a major decrease in the migration rate and the assumption needs to be continuously monitored as the Integrated Water Resource Plan is implemented.
For Willacy County, the most-likely population projection is the same as that projected for zero migration rate. The data indicate that, if the 1980-1990 migration rate was extended through the planning period, lower population projections would be obtained. This condition must indicate that a negative migration rate occurred in Willacy County during the 1980-1990 period.
LRGVDC Integrated Regional Water Plan Section 2, Page 10
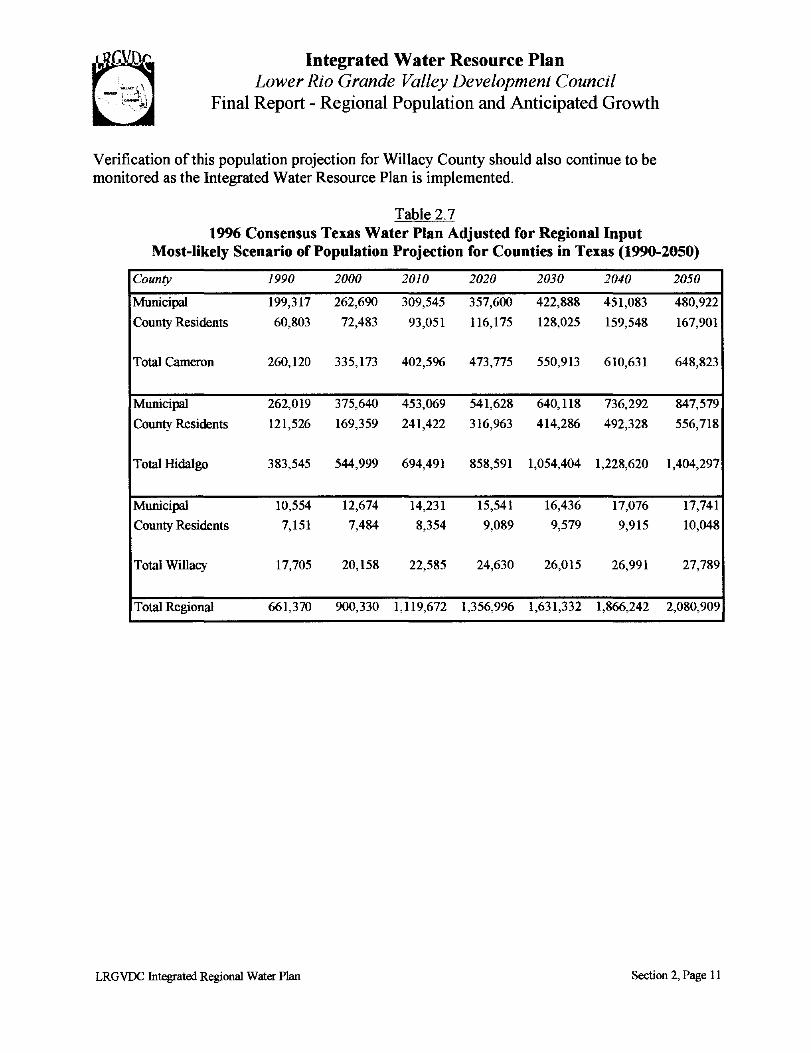
Integrated Water Resource Plan Lower Rio Grande Valley Development Council
Final Report- Regional Population and Anticipated Growth
Verification of this population projection for Willacy County should also continue to be monitored as the Integrated Water Resource Plan is implemented.
Table 2.7 1996 Consensus Texas Water Plan Adjusted for Regional Input
Most-likely Scenario of Population Projection for Counties in Texas (1990-2050)
County 1990 2000 2010 2020 2030 2040 2050
Municipal 199,317 262,690 309,545 357,600 422,888 451,083 480,922
County Residents 60,803 72,483 93,051 116,175 128,025 159,548 167,901
Total Cameron 260,120 335,173 402,5% 473,775 550,913 610,631 648,823
Municipal 262,019 375,640 453,069 541,628 640,118 736,292 847,579
County Residents 121,526 169,359 241,422 316,963 414,286 492,328 556,718
Total Hidalgo 383,545 544,999 694,491 858,591 1,054,404 1,228,620 1,404,297
Municipal 10,554 12,674 14,231 15,541 16,436 17,076 17,741
County Residents 7,151 7,484 8,354 9,089 9,579 9,915 10,048
Total Willacy 17,705 20,158 22,585 24,630 26,015 26,991 27,789
Total Regional 661,370 900,330 1,119,672 1,356,996 1,631,332 1,866,242 2,080,909
LRGVDC Integrated Regional Water Plan Section 2, Page II

Cameron
Hidalgo
Willacy
Integrated Water Resource Plan Lower Rio Grande Valley Development Council
Final Report - Regional Population and Anticipated Growth
Table 2.8 Percent of County Population Outside of Municipalities
1990 2020 2050 23.4% 24.5% 25.9% 31.7% 39.1% 41.0% 40.4% 36.9"/o 36.2%
The number of citizens residing in the counties outside of the municipalities represents a significant percentage of the total county population. Summarized in Table 2.8 are the changes in these percentages projected by the State for the most-likely population scenario. Both Cameron and Hidalgo Counties show an increase in the percentage over the 1990-2050 period, while Willacy County shows a decrease in the percentage. In terms of actual numbers, Cameron County is projected to have approximately 170,000 citizens outside the municipalities by the year 2050 and Hidalgo is projected to have approximately 575,000 citizens outside the municipalities by the year 2050. These populations equate to a significant water requirement and raise important issues that the County governments and the water supply corporations will need to address.
The State of Texas's most-likely scenario populations for the principal municipalities in Cameron, Hidalgo, and Willacy Counties, along with the populations used in this study, have been summarized in Tables 2.9, 2.10, and 2.11. The same set of migration conditions assumed for the counties is also used for the municipalities. The adjustments to the migration rates after the year 2000 vary from municipality to municipality. The populations highlighted in the table are those which were adjusted based on comments from the respective municipality.
LRGVDC Integrated Regional Water Plan Section 2, Page 12

Integrated Water Resource Plan Lower Rio Grande Valley Development Council
Final Report- Regional Population and Anticipated Growth
Table 2.9 Comparison of Regional Population Projections with TWDB Projections for Cameron County
(1990-2050)
1990 2000 2010 2020 2030 2040 2050
City LRGVDC TWDB LRGVD TWDB LRGVD TWDB LRGVD TWDB LRGVD TWDB LRGVD TWDB LRGVD TWDB c c c c c c
Browns- 107,027 98,%2 147,305 136,205 172,894 159,866 201,684 186,487 239,281 221,251 253,728 234,610 269,049 248,777 ville
Combes 2,042 2,042 2,759 2,759 3,245 3,245 3,785 3,785 4,490 4,490 4,761 4,761 5,049 5,049
Harlingen 48,735 48,735 59,661 59,661 70,033 70,033 79,739 79,739 93,695 93,695 98,869 98,869 104,330 104,330
La Feria 4,360 4,360 6,104 5,548 7,324 6,525 8,789 7,610 10,547 9,029 12,657 9,575 15,188 10,153
Laguna 1,166 1,166 1,393 1,393 1,574 1,574 1,766 1,766 1,990 1,990 2,154 2,154 2,331 2,331 Vista
Los 2,473 2,473 3,900 2,970 5,500 3,489 5,710 3,970 7,000 4,665 8,500 4,922 10,000 5,193 Fresnos
Palm 1,199 1,199 1,509 1,509 1,812 1,812 2,132 2,132 2,479 2,479 2,748 2,748 2,920 2,920 Valley
Portlsabe1 4,467 4,467 5,482 5,482 6,447 6,447 7,340 7,340 8,625 8,625 9,100 9,100 9,602 9,602
Primera 2,030 2,030 2,743 2,743 3,227 3,227 3,763 3,763 4,465 4,465 5,076 5,076 5,771 5,771
Rio 1,793 1,793 2,391 2,391 2,873 2,873 3,380 3,380 3,931 3,931 4,357 4,357 4,629 4,629 Hondo
San 20,125 20,125 24,483 24,483 28,737 28,737 32,721 32,721 38,447 38,447 40,570 40,570 42,811 42,811 Benito Santa 2,223 2,223 2,802 2,802 3,289 3,289 3,745 3,745 4,399 4,399 4,641 4,641 4,897 4,897 Rosa
South 1,677 1,677 2,158 2,158 2,631 2,590 3,207 3,046 3,909 3,539 4,765 3,922 5,809 4,345 Padre Island
County 60,803 68,868 72,483 85,069 93,010 108,889 116,014 134,291 127,655 149,908 158,705 185,326 166,437 198,015 Other
County 260,1201260,120 335,1731335,173 402,5961402,596 473,7751473,775 550,9131550,913 610,6311610,631 648,8231648,823 Total
LRGVDC Integrated Regional Water Plan Section 2, Page 13

City
Alamo
Alton
Donna
Edcouch
Edinburg
Elsa
Hidalgo
LaJoya
La Villa
McAllen
Mercedes
Mission
Palm view
Pharr
San Juan
Weslaco
County Other Total
County
Integrated Water Resource Plan Lower Rio Grande Valley Development Council
Final Report - Regional Population and Anticipated Growth
Table 2.10 Comparison of Regional Population Projections with TWDB Projections for Hidalgo County
(1990-2050) 1990 2000 2010 2020 2030 2040 2050
LRGVDC TWDB LRGVDC TWDB LRGVD TWDB LRGVD TWDB LRGVDC TWDB LRGVDC TWDB LRGVDC c c
8,2IO 8,2IO Il,955 II ,955 I5,447 I5,447 I7,955 17,955 20,856 20,856 22,512 22,5I2 24,299
3,069 3,069 5,098 5,098 6,035 6,035 6,946 6,946 7,855 7,855 8,572 8,572 9,354
12,652 I2,652 I6,449 I6,449 20,627 20,627 25,213 25,213 30,738 30,738 35,686 35,686 4I,430
2,878 2,878 3,493 3,493 3,993 3,993 4,542 4,542 5,266 5,266 5,954 5,954 6,732
29,885 29,885 43,814 40,680 57,300 50,467 72,852 61,208 92,624 74,240 11I,260 85,%0 133,646
5,242 5,242 6,233 6,233 7,010 7,010 7,860 7,860 9,02I 9,02I 10,I40 IO,I40 11,398
3,292 3,292 5,03I 5,03I 6,680 6,680 8,492 8,492 10,6II I0,611 I2,472 I2,472 I4,660
2,604 2,604 4,133 4,133 5,543 5,543 6,893 6,893 8,I6I 8,161 9,I08 9,108 10,165
1,388 1,388 2,002 2,002 2,552 2,552 3,154 3,154 3,873 3,873 4,5I4 4,514 5,159
84,021 84,021 116,891 116,89I 128,278 128,278 139,070 139,070 I54,689 154,689 178,632 178,632 206,280
12,694 12,694 15,%2 15,%2 18,745 18,745 21,797 21,797 25,691 25,69I 29,302 29,302 33,421
28,653 28,653 44,401 43,075 57,933 56,702 80,193 71,664 97,764 89,235 113,229 104,700 131,375
1,8I8 I,8I8 2,607 2,607 3,339 3,339 4,145 4,145 5,102 5,102 5,951 5,951 6,942
32,92I 32,921 45,%0 45,%0 61,198 6I,l98 77,929 77,929 97,479 97,479 114,63I I 14,631 134,800
10,8I5 10,815 25,310 15,296 28,981 18,%7 32,521 22,507 35,952 25,938 38,585 28,571 41,485
21,877 21,877 29,435 29,435 36,241 36,241 43,710 43,710 52,820 52,820 61,044 61,044 70,548
121,526 121,526 166,225 180,699 234,589 252,667 305,319 335,506 395,902 432,829 467,028 510,871 522,603
383,545 383,545 544,999 544,999 694,491 694,491 858,591 858,591 1,054,404 1,054,404 1,228,620 1,228,620 1,404,297
Table 2.11 Comparison of Regional Population Projections with TWDB Projections for Willacy County
(1990-2050)
1990 2000 2010 2020 2030 2040 2050
TWDB
24,25
9,3~
4I,4:
6,7:
99,5:
11,35
I4,6<'
IO,H
5,1~
206,2f
33,4;
122,8L
6,9L
134,8(
31,4~
70,5L
575,2(
1,404,2~
City LRGVD TWDB LRGVD TWDB LRGVD TWDB LRGVD TWDB LRGVD TWDB LRGVD TWDB LRGVD TWDB c c c c c c c
Lyford 1,674 1,674 I,900 1,900 2,I50 2,I50 2,360 2,360 2,507 2,507 2,6I7 2,617 2,732 2,732 Raymondville 8,880 8,880 10,774 10,774 I2,08I I2,081 13,18I 13,I81 13,929 13,929 I4,459 I4,459 I5,009 15,009 Cowny Other 7,I51 7,I5I 7,484 7,484 8,354 8,354 9,089 9,089 9,579 9,579 9,9I5 9,915 10,048
County Total I7,705 17,705 20,I58 20,158 22,585 22,585 24,630 24,630 26,015 26,0I5 26,991 26,99I 27,789
As the municipalities increase in population, the size of the area required to accommodate the increased population at a reasonable density will also have to increase. For the evaluated municipalities, the estimated densities for the year 2000 populations based on the current city
LRGVDC Integrated Regional Water Plan Section 2, Page 14
10,048 27,789
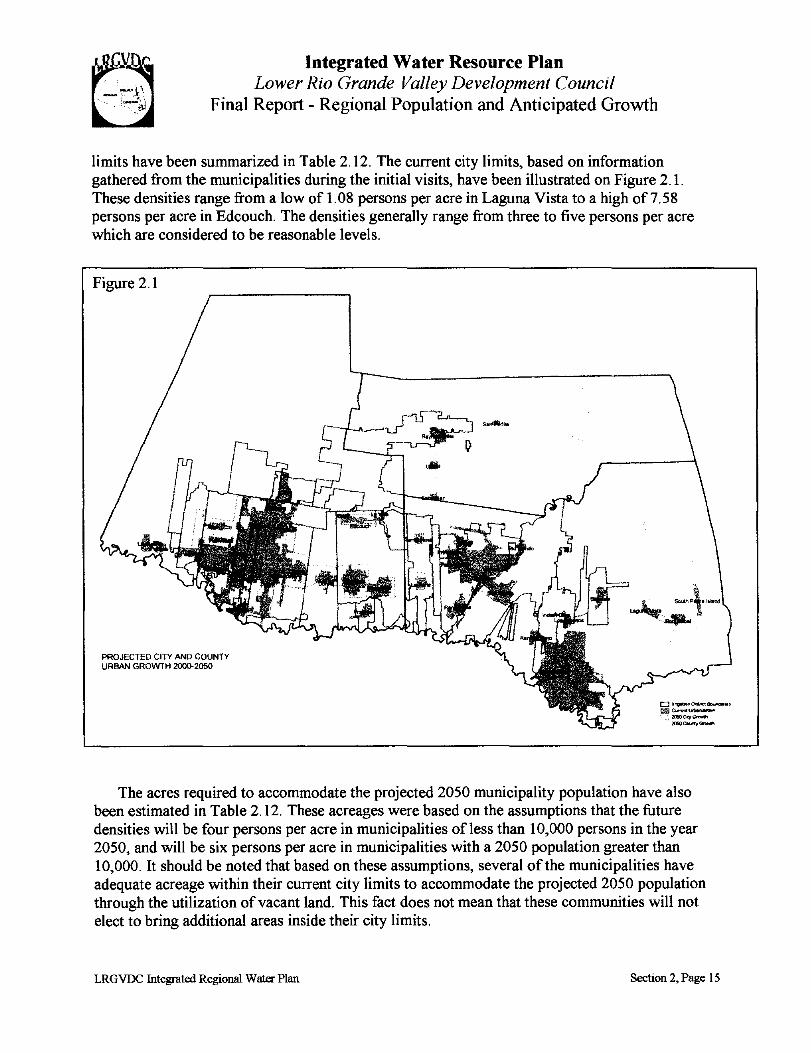
Integrated Water Resource Plan Lower Rio Grande Valley Development Council
Final Report- Regional Population and Anticipated Growth
limits have been summarized in Table 2.12. The current city limits, based on information gathered from the municipalities during the initial visits, have been illustrated on Figure 2.1. These densities range from a low of 1.08 persons per acre in Laguna Vista to a high of7.58 persons per acre in Edcouch. The densities generally range from three to five persons per acre which are considered to be reasonable levels.
Figure 2.1
PROJECTED CITY ANO COUNTY URBAN GROWTH 2000-2050
Qi•~P*t:ra...-•• milljCuonont~
',21:1:!0C4~
""'"""'-
The acres required to accommodate the projected 2050 municipality population have also been estimated in Table 2.12. These acreages were based on the assumptions that the future densities will be four persons per acre in municipalities ofless than 10,000 persons in the year 2050, and will be six persons per acre in municipalities with a 2050 population greater than 10,000. It should be noted that based on these assumptions, several of the municipalities have adequate acreage within their current city limits to accommodate the projected 2050 population through the utilization of vacant land. This fact does not mean that these communities will not elect to bring additional areas inside their city limits.
LRGVDC lntegrated Regional Water Plan Section 2, Page 15

Integrated Water Resource Plan Lower Rio Grande Valley Development Council
Final Report- Regional Population and Anticipated Growth
For those municipalities that require additional acreage, the assumed growth areas have been illustrated on the map of the region presented in Figure 2.1. The anticipated highly urbanized areas within the counties have also been illustrated in Figure 2.1. All acreages shown in Figure 2.1 are approximate and were measured on the GIS maps developed as part of this study. The directions of growth have been based upon the best available estimates of the locations where growth is expected to occur. The exact locations of city growth are a function of the preferences and economic situation of the current rural property owners, the state of the overall economy, and the proximity of the land to current urban areas. Cities will likely expand adjacent to their current jurisdictions due to the high cost of establishing infrastructure and this guided the analysis location of growth. Given this inherent locational uncertainty, only the final expected year 2050 growth areas are depicted. Transitional areas for each decade are not presented as originally planned, but could be updated in future efforts with considerable effort and cooperation of local officials.
The identification of the likely urban growth areas is extremely important in the projection of future water requirements, because it will help identify the agricultural acreage that will likely be taken out of production. Urban growth can be more effectively addressed on a subregional basis rather than by individual municipalities. The evaluation of the merits of a regional entity to lead the planning needed to fully address the impacts of urbanization is recommended. The use of the digital ortho quad photos with a high resolution of one meter accuracy which have been purchased as part of this study (discussed in Section 3.7) should be used in this planning effort. The results would be a detailed existing land use assessment that should be updated at some reasonable frequency (not more frequently than quarterly) as land use changes are approved by municipalities. The land use assessment could be used to establish a more refined estimate of the water requirements for major segments of the region and to estimate changes in the requirements as land uses modified. This information is believed to be essential to good regional water supply planning due to the near balance in the supply and demand as discussed in Section 5.2.
LRGVDC Integrated Regional Water Plan Section 2, Page 16

City
Alamo Alton
Brownsville Combes
Donna Edcouch Edinburg
Elsa Harlingen
Hidalgo La Feria LaJoya La Villa
Laguna Vista Los Fresnos
Lyford McAllen
Mercedes Mission
Palm Valley Palmview
Pharr Port Isabel
Prim era Raymondville
Rio Hondo San Benito
SanJuan Santa Rosa
South Padre Weslaco
Integrated Water Resource Plan Lower Rio Grande Valley Development Council
Final Report - Regional Population and Anticipated Growth
Table 2.12 Most-likely Scenario - Projected Population Densities for 2000 and 2050
1990 2000 Area Area 2050 Assumed Required Pop. Pop. sq. meters acres Density Population Density Acres
8,210 11,955 10,959,655 2,708 4.41 24,299 6 4,050 3,069 5,098 5,603,141 1,385 3.68 9,354 4 2,339
107,027 147,305 164,330,224 40,607 3.62 269,049 6 44,842 2,042 2,759 6,087,946 1,504 1.83 5,049 4 1,262 12,652 16,449 ll,l50,473 2,755 5.97 41,430 6 6,905 2,878 3,493 1,864,606 461 7.58 6,732 4 1,683
29,885 43,814 79,232,152 19,579 2.24 133,646 6 22,274 5,242 6,233 3,703,024 915 6.81 ll,398 6 1,900
48,735 59,661 82,152,456 20,300 2.94 104,330 6 17,388 3,292 5,031 11,986,089 2,962 1.70 14,660 6 2,443 4,360 6,104 4,099,039 1,013 6.03 15,188 6 2,531 2,604 4,133 7,084,524 1,751 2.36 10,165 6 1,694 1,388 2,002 1,101,141 272 7.36 5,159 4 1,290 1,166 1,393 5,214,391 1,289 1.08 2,331 4 583 2,473 3,900 4,520,832 l,ll7 3.49 10,000 4 2,500 1,674 1,900 2,8ll,270 695 2.73 2,732 4 683
84,021 116,891 1ll,720,424 27,607 4.23 206,280 6 34,380 12,694 15,%2 19,456,380 4,808 3.32 33,421 6 5,570 28,653 44,401 49,531,8% 12,240 3.63 131,375 6 21,896 1,199 1,509 6,941,041 1,715 0.88 2,920 4 730 1,818 2,607 6,080,179 1,502 1.74 6,942 4 1,736
32,921 45,960 51,291,340 12,674 3.63 134,800 6 22,467 4,467 5,482 4,585,042 1,133 4.84 9,603 4 2,401 2,030 2,743 6,034,479 1,491 1.84 5,771 4 1,443 8,880 10,774 9,542,588 2,358 4.57 15,009 6 2,502 1,793 2,391 3,565,623 881 2.71 4,629 4 1,157
20,125 24,483 23,709,858 5,859 4.18 42,811 6 7,135 10,815 25,310 22,807,748 5,636 4.49 41,485 6 6,914 2,223 2,802 2,144,730 530 5.29 4,897 4 1,224 1,677 2,158 5,218,642 1,290 15.87* 8,641 15.87* 544
21,877 29,435 26,459,0% 6,538 4.50 70,548 6 11,758
Ratio to Current
1.50 1.69 l.IO 0.84 2.51 3.65 l.l4 2.08 0.86 0.82 2.50 0.97 4.74 0.45 2.24 0.98 1.25 l.l6 1.79 0.43 l.l6 1.77 2.12 0.97 1.06 1.31 1.22 1.23 2.31 0.42 1.80
* South Padre Island's Situation IS urn que. Therr density IS Significantly higher due to there bemg 6. 9 houses/acre tJ.mes 2. 3 people/house.
LRGVDC Integrated Regional Water Plan Section 2, Page 17

Integrated Water Resource Plan Lower Rio Grande Valley Development Council
Final Report- Regional Water Requirements and Anticipated Changes
3.0 Regional Water Requirements and Anticipated Changes
Descriptions of the development of the specific types of water requirements have been explained below. The development of the municipal water requirements has generally been based on the TWDB methodology using adjusted factors. The irrigation water requirements have been based on a detailed analysis of irrigable lands and reasonable application rates. Other nonagricultural uses have been based on reported values. These projections can be compared with recent annual reported diversions presented in Table 5.5 in Section 5, Page 5.
3.1 Municipal Water Requirements
The traditional method for estimating future municipal water requirements is to establish projected future per capita consumption rates and multiply these by the projected populations. The Texas Water Development Board developed municipal water requirement projections in the August 1997 Water For Texas. The methodology used in the development ofthese projections was spelled out in Water For Texas- Today and Tomorrow, A 1996 Consensus-Based Update to the Texas Water Plan, Volume III, Water Use Planning Data Appendix, prepared by Water Demand/Drought Management Technical Advisory Committee of the Consensus-Based State Water Plan, supported by staffs of Texas Water Development Board, Texas Natural Resources Conservation Commission and Texas Parks and Wildlife Department. The key elements in this methodology have been summarized in Appendix E of this report.
After the initiation of this planning process for the Integrated Regional Water Plan, Senate Bill 1 was passed by the Texas Legislature. The Guidelines for Development of Regional Plans sets forth the following requirements:
Use of population and water demands. In developing regional water plans, regional water planning groups shall use:
(1) state population and water demand projections contained in the state water plan or adopted by the board qfter consultation with the Texas Natural Resource Conservation Commission and Texas Parks and Wildlife Department in preparation for revision of the state water plan; or
(2) in lieu of paragraph (1) of this subsection, population or water demand projection revisions that have been adopted by the board, qfter coordination with Texas Natural Resource Conservation Commission and Texas Parks and Wildlife Department, based on changed conditions and availability of new information. Within 45 days of receipt of a request from a regional planning group for revision of population or water demand projections, the executive administrator shall consult with the requesting regional water planning group and respond to their request.
LRGVDC Integrated Regional Water Plan Section 3, Page I

e . . .
Integrated Water Resource Plan Lower Rio Grande Valley Development Council
Final Report- Regional Water Requirements and Anticipated Changes
The State of Texas projections of the municipal per capita consumption rates for normal weather conditions and below-normal weather conditions for the principal municipalities in Cameron, Hidalgo, and Willacy Counties and for the remainder of each of the Counties have been summarized in Table 3 .1. The details of the State's projections of municipal per capita consumption rates and municipal water demands for various weather and water conservation conditions have been included in Appendix E.
Table 3.1 Per Capita Consumption Rates Recommended For Planning
Municipal Water Supply Demands Without Water Conservation Measures
Below Below Normal Normal Normal Normal Weather Weather Weather Weather
Conditions Conditions Conditions Conditions State Recommended State Recommended
Municipality GPCD GPCD GPCD GPCD
Cameron Coun!I
Brownsville 166 179 208 191
Combes 54 65* 61 68*
Harlingen 133 151 166 180
La Feria 78 103 98 ll9
Laguna Vista ll2.8 ll8 ll6 126
Los Fresnos l2l.l 128 152 150
Palm Valley 204.1 216 227 243
Port Isabel 355 383 405 419
Primera ll4.9 ll4 145 212
Rio Hondo 138.1 120 174 139
San Benito 180 152 218 219
Santa Rosa 87.9 ll9 Ill 131
South Padre Island 733.9 732 751 788
County Citizens 138 138 147 147
Willaq: Count!
Lyford 121.2 141 152 218
Raymondville 477 492 569 548
County Citizens ll8 ll8 148 148
Hid!!!l:o Coun!I
Alamo 97 128 122 144
Alton 152 209 192 285
Donna 137 153 157 166
LRGVOC Integrated Regional Water Plan Section 3, Page 2

Integrated Water Resource Plan Lower Rio Grande Valley Development Council
Final Report- Regional Water Requirements and Anticipated Changes
Table 3.1, (Continued)
Below Below Normal Normal Normal Normal Weather Weather Weather Weather
Conditions Conditions Conditions Conditions State Recommended State Recommended
Municipality GPCD GPCD GPCD GPCD
Edcouch 97.1 121 122 130
Edinburg 152 143 167 l77
Elsa ll9 144 150 163
Hidalgo 116.1 122 137 149
LaJoya ll6 ll7 146 162
La Villa 86.1 88* 109 124
McAllen 200 203 231 242
Mercedes 128 128 152 135
Mission 144 175 181 193
Palmview 162 156 162 174
Pharr 140 135 176 164
SanJuan 138 144 172 185
Weslaco ll9 133 150 144
County Citizens 108 108 135 135 .. ..
*Used 100 gpcd rn proJections to account for antiCipated rncrease rn standard of hvrng.
The historical water consumptions reported to the TWDB by each municipality have also included in Appendix E. In reviewing these historical data, it was noted that for a number of municipalities, the estimated population increased significantly during the 1980-1990 period and then the estimate was reduced to match the census count in 1990. Since this approach does not represent a realistic growth pattern, the populations were adjusted for the 1980-1990 period to represent a more likely growth rate and revised municipal per capita consumption rates were computed for use in this study.
The municipal per capita consumption rates recommended for long-range water supply planning without the benefit of any water conservation measures are summarized in Table 3 .1. These values were based on the historical rates that were experienced during the 1990 through 1995 period. These values should represent a realistic estimate of current conditions without considering the effects of varying water conservation measures that were imposed in some cases during the 1996 and 1997 years.
Effects of Water Conservation Measures
The State has an extensive discussion on its expectation for water conservation in the August 1997 Water for Texas Report which has been included in Appendix E. The State included the
LRGVDC Integrated Regional Water Plan Section 3, Page 3

Integrated Water Resource Plan Lower Rio Grande Valley Development Council
Final Report- Regional Water Requirements and Anticipated Changes
statement, "Although staffs of the three agencies feel the identified array of conservation measures embodied in the projections are reasonable and feasible, the selection of specific water conservation goals and implementation of strategies to achieve those goals is the primary responsibility of the utility manager and local government."
During the visits to the municipalities, information was collected on current water conservation programs and drought contingency plans that have been adopted in the Lower Rio Grande Valley. These documents have been used as a guide to establish the types of water conservation programs that have been historically acceptable in the Lower Rio Grande Valley and their effect on per capita consumption rates.
The TWDB estimates a Statewide rate of 189 GPCD for the planning per capita use for below-normal rainfall conditions and rate of 165 GPCD for the planning per capita use for normal weather conditions. These rates are generally consistent with the historical rates reported for the larger municipalities in the Lower Rio Grande Valley. These rates are noticeably higher than those for many of the smaller municipalities in the Valley. The rates are also noticeably higher than for residents outside of municipalities' boundaries.
The components of municipal water conservation savings assumed by the State are summarized in Table 3.2 and projected percent reductions have been listed in Table 3.3. A certain minimum level of per capita water consumption should be expected for basic necessities. The Lower Rio Grande Valley historical data indicate that there is a measurable increase in the per capita consumption rate for citizens who reside in municipalities with a population of 10,000 to 20,000 over those who reside in municipalities with a population ofless than I 0,000. With this in mind, the assumption that the same percent reduction in water use can be achieved throughout the Lower Rio Grande Valley would appear to be unreasonable. Any reduction through water conservation programs could be offset by an increase in consumption related to a changing lifestyle as the overall economic standard ofliving increases in the Valley.
The historical water use data indicate very high per capita consumptions rate in South Padre Island and in Port Isabel that are likely related to tourism. It is unlikely the State's assumed level of reduction in these municipalities can be achieved because of the influence of the tourist industry.
As noted by the State, "the selection of specific water conservation goals and implementation of strategies to achieve those goals is the primary responsibility of the utility manager and local government." There is a need to establish some reasonable assumptions that will permit projection of the municipal water requirements in the Lower Rio Grande Valley. These initial assumptions have been outlined below.
Initial Municipal Water Requirements Planning Assumptions:
• The per capita consumption rates recommended in Table 3.1 will be used
LRGVDC Integrated Regional Water Plan Section 3, Page 4
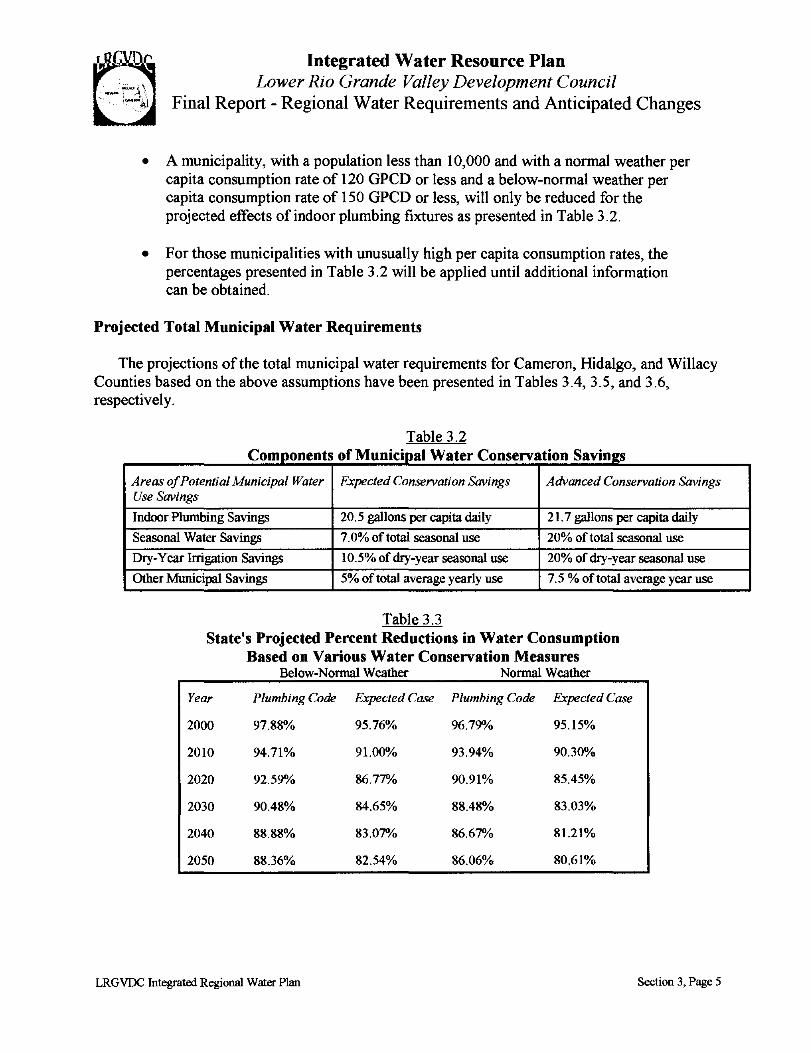
~ ~
•
Integrated Water Resource Plan Lower Rio Grande Valley Development Council
Final Report- Regional Water Requirements and Anticipated Changes
A municipality, with a population less than 10,000 and with a normal weather per capita consumption rate of 120 GPCD or less and a below-normal weather per capita consumption rate of 150 GPCD or less, will only be reduced for the projected effects of indoor plumbing fixtures as presented in Table 3 .2.
• For those municipalities with unusually high per capita consumption rates, the percentages presented in Table 3.2 will be applied until additional information can be obtained.
Projected Total Municipal Water Requirements
The projections of the total municipal water requirements for Cameron, Hidalgo, and Willacy Counties based on the above assumptions have been presented in Tables 3.4, 3.5, and 3.6, respectively.
c omponents o fM UDIClpa ater Table 3.2
IW C onservataon s aVID2S
Areas of Potential Municipal Water Expected Conservation Savings Advanced Conservation Savings Use Savings
Indoor Plumbing Savings 20.5 gallons per capita daily 21.7 gallons per capita daily
Seasonal Water Savings 7.0% of total seasonal use 20% of total seasonal use
Dry-Year Irrigation Savings 10.5% of dry-year seasonal use 20% of dry-year seasonal use
Other Municipal Savings 5% of total average yearly use 7.5% of total average year use
Table 3.3 State's Projected Percent Reductions in Water Consumption
Based on Various Water Conservation Measures Below-Normal Weather Normal Weather
Year Plumbing Code Expected Case Plumbing Code Expected Case
2000 97.88% 95.76% 96.79"/o 95.15%
2010 94.71% 91.00% 93.94% 90.30%
2020 92.59"/o 86.77% 90.91% 85.45%
2030 90.48% 84.65% 88.48% 83.03%
2040 88.88% 83.07% 86.67% 81.21%
2050 88.36% 82.54% 86.06% 80.61%
LRGVDC futegrated Regional Water Plan Section 3, Page 5
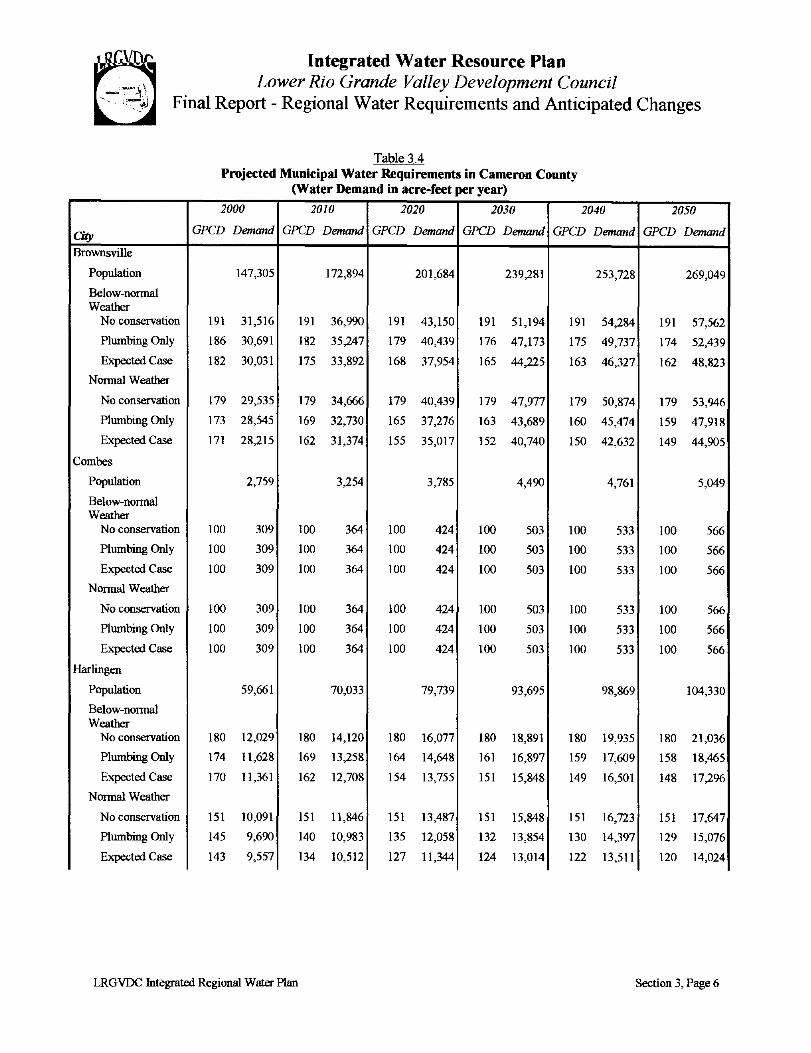
Integrated Water Resource Plan Lower Rio Grande Valley Development Council
Final Report- Regional Water Requirements and Anticipated Changes
City Brownsville
Population
Below-normal Weather
No conservation
Plumbing Only
Expected Case
Normal Weather
No conservation
Plumbing Only
Expected Case
Combes
Population
Below-nonual Weather
No conservation
Plumbing Only
Expected Case
Normal Weather
No conservation
Plumbing Only
Expected Case
Harlingen
Population
Below-nonual Weather
No conservation
Plumbing Only
Expected Case
Nonual Weather
No conservation
Plumbing Only
Expected Case
Table 3.4 Projected Municipal Water Requirements in Cameron County
(Water Demand in acre-feet per year)
2000 2010 2020 2030 2040
GPCD Demand GPCD Demand GPCD Demand GPCD Demand GPCD Demand
147,305 172,894 201,684 239,281 253,728
191 31,516 191 36,990 191 43,150 191 51,194 191 54,284
186 30,691 182 35,247 179 40,439 176 47,173 175 49,737
182 30,031 175 33,892 168 37,954 165 44,225 163 46,327
179 29,535 179 34,666 179 40,439 179 47,977 179 50,874
173 28,545 169 32,730 165 37,276 163 43,689 160 45,474
171 28,215 162 31,374 155 35,017 152 40,740 150 42,632
2,759 3,254 3,785 4,490 4,761
100 309 100 364 100 424 100 503 100 533
100 309 100 364 100 424 100 503 100 533
100 309 100 364 100 424 100 503 100 533
100 309 100 364 100 424 100 503 100 533
100 309 100 364 100 424 100 503 100 533
100 309 100 364 100 424 100 503 100 533
59,661 70,033 79,739 93,695 98,869
180 12,029 180 14,120 180 16,077 180 18,891 180 19,935
174 11,628 169 13,258 164 14,648 161 16,897 159 17,609
170 11,361 162 12,708 154 13,755 151 15,848 149 16,501
151 10,091 151 11,846 151 13,487 151 15,848 151 16,723
145 9,690 140 10,983 135 12,058 132 13,854 130 14,397
143 9,557 134 10,512 127 11,344 124 13,014 122 13,511
LRGVDC Integrated Regional Water Plan
2050
GPCD Demand
269,049
191 57,562
174 52,439
162 48,823
179 53,946
159 47,918
149 44,905
5,049
100 566
100 566
100 566
100 566
100 566
100 566
104,330
180 21,036
158 18,465
148 17,296
151 17,647
129 15,076
120 14,024
Section 3, Page 6

Integrated Water Resource Plan Lower Rio Grande Valley Development Council
Final Report- Regional Water Requirements and Anticipated Changes
Table 3.4 (Continued)
2000 2010 2020 2030 2040 2050
City GPCD Demand GPCD Demand GPCD Demand GPCD Demand GPCD Demand GPCD Demand
La Feria
Population 6,104 7,324 8,789 10,547 12,657 15,188 Below-nonnal Weather
No conservation 119 814 119 976 119 1,172 119 1,406 119 1,687 119 2,025
Plumbing Only 112 766 106 870 101 994 100 1,181 100 1,418 100 1,701 Expected Case 109 745 102 837 100 984 100 1,181 100 1,418 100 1,701
Nonnal Weather
No conservation 103 704 103 845 103 1,014 103 1,217 103 1,460 103 1,752 Plumbing Only 100 684 100 820 100 984 100 1,181 100 1,418 100 1,701 Expected Case 100 684 100 820 100 984 100 1,181 100 1,418 100 1,701
Laguna Vista
Population 1,393 1,574 1,766 1,990 2,154 2,331
Below-nonnal Weather
No conservation 126 197 126 222 126 249 126 281 126 304 126 329
Plumbing Only 110 172 110 194 104 206 100 223 100 241 100 261
Expected Case 108 169 106 187 100 198 100 223 100 241 100 261 Nonnal Weather
No conservation 118 184 118 208 118 233 118 263 118 285 118 308
Plumbing Only 109 170 102 180 100 198 100 223 100 241 106 277
Expected Case 108 169 100 176 100 198 100 223 100 241 100 261
Los Fresnos
Population 3,900 5,500 5,710 7,000 8,500 10,000
Below-nonnal Weather
No conservation 150 655 !50 924 150 959 !50 1,176 !50 1,428 150 1,680
Plumbing Only 144 629 138 850 134 857 131 1,027 128 1,219 127 1,423
Expected Case 141 616 133 819 125 800 123 964 120 1,143 119 1,333
Nonnal Weather
No conservation 128 559 128 789 128 819 128 1,004 128 1,219 128 1,434
Plumbing Only 122 533 117 721 112 716 109 855 107 1,019 106 1,187
Expected Case 120 524 112 690 105 672 102 800 100 952 100 1120
LRGVDC Integrated Regional Water Plan Section 3, Page 7

Integrated Water Resource Plan Lower Rio Grande Valley Development Council
Final Report- Regional Water Requirements and Anticipated Changes
Table 3.4 (Continued)
2000 2010 2020 2030 2040 2050
City GPCD Demand GPCD Demand GPCD Demand GPCD Demand GPCD Demand GPCD Demand
San Benito
Population 24,483 28,737 32,721 38,447 40,570 42,811
Below-normal Weather
No conservation 219 6,006 219 7,050 219 8,027 219 9,431 219 9,952 219 10,502
Plumbing Only 214 5,869 207 6,663 202 7,404 199 8,570 197 8,953 196 9,399
Expected Case 209 5,732 199 6,406 189 6,927 186 8,010 184 8,362 183 8,776
Normal Weather
No conservation 152 4,169 152 4,893 152 5,571 152 6,546 152 6,908 152 7,289
Plumbing Only 147 4,031 139 4,474 138 5,058 136 5,857 134 6,090 134 6,426
Expected Case 144 3,949 136 4,378 130 4,765 128 5,512 126 5,726 125 5,994
Santa Rosa
Population 2,802 3,289 3,745 4,399 4,641 4,897
Below-normal Weather
No conservation 131 411 131 483 131 550 131 646 131 681 131 719
Plumbing Only 125 392 118 435 113 474 110 542 106 551 107 587
Expected Case 123 386 114 420 106 445 103 508 100 520 100 549
Normal Weather
No conservation 119 373 119 438 119 499 119 586 119 619 119 653
Plumbing Only 112 352 105 387 100 419 100 493 100 520 100 549
Expected Case 110 345 101 372 100 419 100 493 100 520 100 549
South Padre Island
Population 2,158 2,631 3,207 3,909 4,765 5,809
Below-normal Weather
No conservation 788 1,905 788 2,322 788 2,831 788 3,450 788 4,206 788 5,127
Plumbing Only 767 1,854 743 2,190 724 2,601 722 3,161 720 3,843 721 4,691
Expected Case 751 1,815 714 2,104 679 2,439 676 2,960 673 3,592 673 4,379
Normal Weather
No conservation 732 1,769 732 2,157 732 2,630 732 3,205 732 3,907 732 4,763
Plumbing Only 709 1,714 689 2,031 669 2,403 667 2,921 666 3,555 665 4,327
Expected Case 697 1,685 662 1,951 629 2,260 626 2,741 624 3,331 623 4,054
LRGVDC Integrated Regional Water Plan Section 3, Page 8
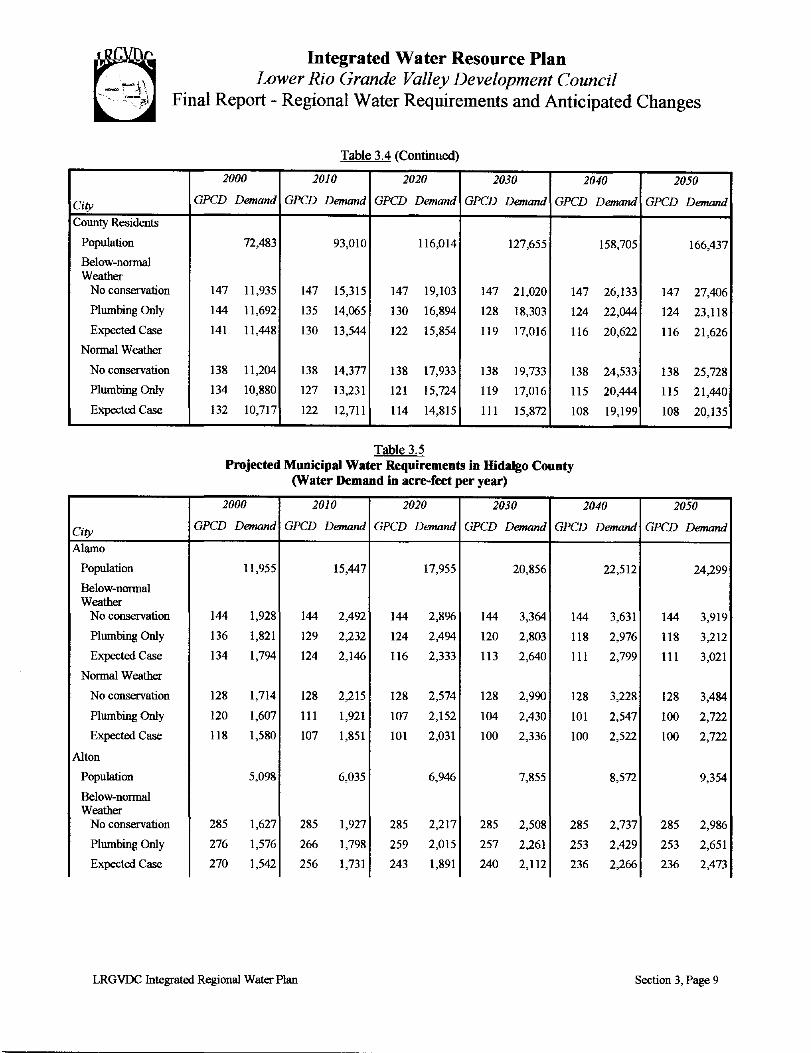
City County Residents
Population
Below-nonnal Weather
No conservation
Plwnbing Only
Expected Case
Nonnal Weather
No conservation
Plwnbing Only
Expected Case
City Alamo
Population
Below-nonnal Weather
No conservation
P1wnbing Only
Expected Case
Nonnal Weather
No conservation
Plwnbing Only
Expected Case
Alton
Population
Be1ow-nonnal Weather
No conservation
P1wnbing Only
Expected Case
Integrated Water Resource Plan Lower Rio Grande Valley Development Council
Final Report- Regional Water Requirements and Anticipated Changes
Table 3 4 (Continued)
2000 2010 2020 2030 2040
GPCD Demand GPCD Demand GPCD Demand GPCD Demand GPCD Demand
72,483 93,010 116,014 127,655 158,705
147 11,935 147 15,315 147 19,103 147 21,020 147 26,133
144 11,692 135 14,065 130 16,894 128 18,303 124 22,044
141 11,448 130 13,544 122 15,854 119 17,016 116 20,622
138 11,204 138 14,377 138 17,933 138 19,733 138 24,533
134 10,880 127 13,231 121 15,724 119 17,016 115 20,444
132 10,717 122 12,711 114 14,815 Ill 15,872 108 19,199
Table 3.5 Projected Municipal Water Requirements in Hidalgo County
(Water Demand in acre-feet per year)
2000 2010 2020 2030 2040
GPCD Demand GPCD Demand GPCD Demand GPCD Demand GPCD Demand
11,955 15,447 17,955 20,856 22,512
144 1,928 144 2,492 144 2,8% 144 3,364 144 3,631
136 1,821 129 2,232 124 2,494 120 2,803 118 2,976
134 1,794 124 2,146 116 2,333 113 2,640 ll1 2,799
128 1,714 128 2,215 128 2,574 128 2,990 128 3,228
120 1,607 Ill 1,921 107 2,152 104 2,430 101 2,547
118 1,580 107 1,851 101 2,031 100 2,336 100 2,522
5,098 6,035 6,946 7,855 8,572
285 1,627 285 1,927 285 2,217 285 2,508 285 2,737
276 1,576 266 1,798 259 2,015 257 2,261 253 2,429
270 1,542 256 1,731 243 1,891 240 2,112 236 2,266
2050
GPCD Demand
166,437
147 27,406
124 23,118
116 21,626
138 25,728
115 21,440
108 20,135
2050
GPCD Demand
24,299
144 3,919
118 3,212
111 3,021
128 3,484
100 2,722
100 2,722
9,354
285 2,986
253 2,651
236 2,473
LRGVDC Integrated Regional Water Plao Section 3, Page 9

Integrated Water Resource Plan Lower Rio Grande Valley Development Council
Final Report- Regional Water Requirements and Anticipated Changes
Table 3 5 (Continued)
2000 2010 2020 2030 2040 2050
City GPCD Demand GPCD Demand GPCD Demand GPCD Demand GPCD Demand GPCD Demand
Normal Weather
No conservation 209 1,193 209 1,413 209 1,626 209 1,839 209 2,007 209 2,190
Plwnbing Only 199 1,136 193 1,305 188 1,463 184 1,619 181 1,738 175 1,834
Expected Case 196 1,119 186 1,257 177 1,377 173 1,522 170 1,632 169 1,771
Donna
Population 16,449 20,627 25,213 30,738 35,686 41,430
Below-nonnal Weather
No conservation 166 3,059 166 3,835 166 4,688 166 5,716 166 6,636 166 7,704
Plwnbing Only 160 2,948 !53 3,535 149 4,208 145 4,992 143 5,716 142 6,590
Expected Case !57 2,893 147 3,3% 139 3,926 136 4,683 134 5,356 133 6,172
Nonnal Weather
No conservation !53 2,819 !53 3,535 !53 4,321 !53 5,268 !53 6,116 !53 7,100
Plwnbing Only 147 2,709 139 3,212 135 3,813 132 4,545 129 5,157 129 5,987
Expected Case 144 2,653 134 3,0% 126 3,559 123 4,235 121 4,837 121 5,615
Edcouch
Population 3,493 3,993 4,542 5,266 5,964 6,732
Below-nonnal Weather
No conservation 130 509 130 581 130 661 130 767 130 868 130 980
Plwnbing Only 124 485 118 528 113 575 110 649 108 721 107 807
Expected Case 121 473 114 510 106 539 103 608 101 675 100 754
Nonnal Weather
No conservation 121 473 121 541 121 616 121 714 121 808 121 912
Plwnbing Only 115 450 107 479 106 539 100 590 100 668 102 769
Expected Case 113 442 103 461 100 509 100 590 100 668 100 754
Edinburg
Population 43,814 57,300 72,852 92,624 111,260 133,646
Below-nonnal Weather
No conservation 177 8,687 177 11,361 177 14,444 177 18,364 177 22,059 177 26,497
Plwnbing Only 171 8,392 164 10,526 160 13,057 !57 16,289 !55 19,317 !54 23,054
Expected Case 167 8,1% !58 10,141 !50 12,241 147 15,252 145 18,071 144 21,557
Normal Weather
No conservation 143 7,018 143 9,178 143 11,669 143 14,837 143 17,822 143 21,407
Plwnbing Only 138 6,773 132 8,472 128 10,445 125 12,%9 124 15,454 116 17,366
Expected Case 136 6,675 127 8,151 120 9,793 118 12,243 116 14,457 116 17,366
LRGVDC Integrated Regional Water Plan Section 3, Page I 0

Integrated Water Resource Plan Lower Rio Grande Valley Development Council
Final Report- Regional Water Requirements and Anticipated Changes
Table 3.5 (Continued)
2000 2010 2020 2030 2040 2050
City GPCD Demand GPCD Demand GPCD Demand GPCD Demand GPCD Demand GPCD Demand
Elsa
Population 6,233 7,010 7,860 9,021 10,140 11,398
Below-normal Weather
No conservation 163 1,138 163 1,280 163 1,435 163 1,647 163 1,851 163 2,081
Plumbing Only 158 1,103 !52 1,194 147 1,294 143 1,445 141 1,602 140 1,787
Expected Case 154 1,075 146 1,146 138 1,215 134 1,354 132 1,499 131 1,673
Normal Weather
No conservation 144 1,005 144 1,131 144 1,268 144 1,455 144 1,636 144 1,839
Plumbing Only 138 963 132 1,036 127 1,118 124 1,253 120 1,363 119 1,519
Expected Case 135 943 127 997 119 1,048 116 1,172 113 1,283 Ill 1,417
Hidalgo
Population 5,031 6,680 8,492 10,611 12,472 14,660
Below-normal Weather
No conservation 149 840 149 1,115 149 1,417 149 1,771 149 2,082 149 2,447
Plumbing Only 134 755 128 958 124 1,180 121 1,438 0
LRGVDC futegrated Regional Water Plan Section 3, Page II

Integrated Water Resource Plan Lower Rio Grande Valley Development Council
Final Report -Regional Water Requirements and Anticipated Changes
City
Table 3.6 Projected Municipal Water Requirements in Willacy County
(Water Demand in acre-feet per year)
2000 2010 2020 2030 2040 2050
GPCD Demand GPCD Demand GPCD Demand GPCD Demand GPCD Demand GPCD Demand
Lyford
Population I ,900 2,150 2,360 2,507 2,617 2,732
Below-normal Weather
No conservation 218 464 218 525 218 576 218 612 218 639 218 667
PllUllbing Only 210 447 200 482 195 515 190 534 187 548 186 569
Expected Case 206 438 193 465 183 484 178 500 175 513 174 532
Normal Weather
No conservation 141 300 141 340 141 373 141 396 141 413 141 431
PllUllbing Only 135 287 129 311 124 328 128 359 117 343 116 355
Expected Case 133 283 124 299 116 307 113 317 110 322 108 331
Raymondville
Population 10,774 12,081 13,181 13,929 14,459 I 5,009
Below-normal Weather
No conservation 548 6,613 548 7,416 548 8,091 548 8,550 548 8,875 548 9,213
P!lUllbing Only 542 6,541 533 7,213 529 7,810 527 8,223 524 8,487 524 8,810
Expected Case 530 6,3% 513 6,942 496 7,323 493 7,692 490 7,936 489 8,221
Normal Weather
No conservation 492 5,938 492 6,658 492 7,264 492 7,676 492 7,969 492 8,272
PllUllbing Only 485 5,853 480 6,4% 476 7,028 473 7,380 471 7,628 470 7,902
Expected Case 477 5,757 462 6,252 447 6,600 444 6,928 441 7,143 440 7,397
CoWlty Citizens
Population 7,484 8,354 9,089 9,579 9,915 10,048
Below-normal Weather
No conservation 148 1,241 148 1,385 148 1,507 148 1,588 148 1,644 148 1,666
PllUllbing Only 145 1,216 139 1,301 134 1,364 131 1,406 129 1,433 125 1,407
Expected Case 142 1,190 134 1,254 126 1,283 123 1,320 120 1,333 117 1,317
Normal Weather
No conservation 118 989 118 1,104 118 1,201 118 1,266 118 1,311 118 1,328
PllUllbing Only 114 956 109 1,020 105 1,069 101 1,084 98 1,088 97 1,092
Expected Case 112 939 105 983 99 1,008 95 1,019 92 1,022 91 1,024
LRGVDC Integrated Regional Water Plan Section 3, Page 12

Integrated Water Resource Plan Lower Rio Grande Valley Development Council
Final Report- Regional Water Requirements and Anticipated Changes
3.2 Manufacturing Water Requirements
The State's projections for manufacturing water requirements have been summarized in Table 3. 7 along with data for the period 1992 through 1996 from the TWD B Industrial Water Use Survey. The details of the State's projection methodology have been included in Appendix F. The total projected manufacturing water requirement represents a small component of the total projected regional water requirements. The State's projection for both Cameron and Hidalgo Counties appear consistent with the available historical data. The State has projected zero manufacturing for Willacy County. The State's forecast has been adopted for use in this analysis of the total regional water requirements.
Table 3.7 Comparison of 1996 Consensus Texas Water Plan Consumptive Manufacturing
Water Demand Forecasts with TWDB Industrial Water Use Survey (Values are in Acre-Feet per Year)
Year 1990 1992 1993 1994 1995 1996 2000 2010 2020 2030 2040 2050
Hidalgo County
Forecasts 3267 3718 4115 4374 4541 4927 5307
Survey 1890 2040 3678 3912 3628
Cameron County
Forecasts 1123 1257 1391 1504 1628 1804 1985
Survey 1169 1102 1125 1288 1368
3.3 Irrigation Water Requirements
The agricultural water demand, primarily for irrigation, currently represents approximately 85% of the total water requirements under normal conditions in the Lower Rio Grande Valley. The TWDB's projections of the future water demands are estimated on a county level basis and are based on a linear programming modeL For the development of the irrigation water demand projections, the objective function of the model was structured to solve for the maximization of farm income based on the profitability of specific crops grown in Texas using the resources necessary for the production of these crops. The agricultural demand for water can experience a significant decline because, if population grows as projected, there will be less land to be used for agriculture and the water use can be reduced with delivery system improvements and on-farm conservation methods.
LRGVDC Integrated Regional Water Plan Section 3, Page 13

~ ~
Integrated Water Resource Plan Lower Rio Grande Valley Development Council
Final Report- Regional Water Requirements and Anticipated Changes
To simplify the modeling process, the TWDB used the Texas A&M University delineation of major agricultural production regions in the State. Several types of variables were used in the State's modeling procedures to determine future irrigation water demands by geographical location. These variables include crop prices, yields, production costs, water costs, and six types of irrigation delivery systems. These data are crop-specific and reflect the major crops grown in Texas, which include cotton, grain sorghum, wheat, corn, rice, peanuts, alfalfa hay, fruits, vegetables, nuts, and sugar cane. As part of the revenue stream, federal farm deficiency payments for specific crops and land set-aside requirements for compliance with federal farm programs are included in the model.
The TWDB's irrigation water requirements for the Lower Rio Grande Valleys are summarized in Table 3.8. A more complete description of the State's modeling process has been included in Appendix G.
Year
1990
2000
2010
2020
2030
2040
2050
Table 3.8 Texas Water Development Board Projections of the
Lower Rio Grande Valley Irrigation Water Requirements (Values in acre-feet per year)
Cameron County Hidalgo County Willacy County
391,500 713,903 50,500
414,728 742,368 54,028
404,444 716,214 53,461
393,763 686,997 52,577
381,650 656,018 51,479
370,973 628,229 50,547
359,658 600,069 49,505
Total
1,155,903
1,211,124
1,174,119
1,133,337
1,087,147
1,049,749
1,009,232
The Lower Rio Grande Valley is projected to experience a significant increase in population. This increase will result in the urbanization of a significant amount of currently rural land, much of which is currently irrigated. The description of the TWDB's projection methodology does not indicate that the impacts of intense urbanization have been included. Because the irrigation requirements of the Lower Rio Grande Valley represent such a high percentage of the total water requirements, a more in-depth analysis was undertaken as part of this study. The study was performed primarily by representatives of the Texas Agricultural Experiment Station, but required information for such a study could not have been obtained without the cooperation of the Lower Rio Grande Valley irrigation district boards, managers, and staffs.
The full description of the analysis has been included in Appendix G. The basis of the analysis considers in-depth three key factors that should influence the total quantity of water required for irrigation in the Lower Rio Grande Valley in future years. These key factors are:
• Assumptions on the amount and general location of currently rural areas that will be converted into urban to accommodate the population increase
LRGVDC Integrated Regional Water Plan Section 3, Page 14

Integrated Water Resource Plan Lower Rio Grande Valley Development Council ~
0 Final Report- Regional Water Requirements and Anticipated Changes
• Assumptions on the impact of metering irrigation water as well as an increase in the use of poly or gated pipe for on-field applications and on the impact of improvements to the distribution system.
• Assumptions on appropriate irrigation application rates based on projected crop mixes.
The potential impacts of urbanization of the irrigation requirements can be clearly seen traveling through the Lower Rio Grande Valley. This impact not only includes acres that have been taken out of production by actual construction, but also limitations that have been placed on agricultural practices on the land in proximity to an urbanizing area. The estimated current rural acres inside irrigation districts and the projected reductions in acres by decades that are anticipated to occur due to the urbanization of the Lower Rio Grande Valley have been summarized in Table 3.9. The Cameron County irrigation districts' rural acres are reduced by 27.4% during the planning period. Hidalgo and Willacy Counties' irrigation districts' rural acres are reduced by 52% and 1. 7%, respectively, due to urbanization. The projected impacts on individual irrigation districts have been included in Appendix G. Obviously, the impact on the Hidalgo County irrigation districts is much greater than occurs in the other two counties due to a projected higher level of urbanization.
Table 3.9 Projected Rural Acres in Irrigation Districts Lost due to Urbanization
Cameron County Hidalgo County Willacy County Total
Current Rural Acres 265,745 396,611 36,906 699,262
Lost 2000 to 2010 15,656 35,858 209 51,722
Lost 2010 to 2020 16,524 39,362 176 56,062
Lost 2020 to 2030 17,909 46,969 117 64,995
Lost 2030 to 2040 13,885 41,791 81 55,737
Lost 2040 to 2050 8,868 42,136 32 51,037
Total 72,822 206,116 615 269,553
The general approach for projecting the agricultural water demands consisted of surveying all of the irrigation districts for as much data as possible, coupled with the selection of two districts (Hidalgo # 6 and Cameron #2) for more detailed study as well as limited direct testing of conveyance losses. Data from the two detailed studies were intended to provide insight as to what conveyance losses, costs, etc. might be extrapolated for use in the remaining districts. This process met with limited success due to several factors: 1) survey results were spotty despite three attempts and 2) delays occurred in both detailed district efforts. The delays within the two irrigation districts occurred due to the unfortunate death of one manager and the lack of adequate district personnel to process data. The IRRDESS irrigation management model was integrated with a GIS framework as planned, but the baseline data needed to analyze the alternative district
LRGVDC Integrated Regional Water Plan Section 3, Page 15

.
Integrated Water Resource Plan Lower Rio Grande Valley Development Council a ' Final Report- Regional Water Requirements and Anticipated Changes
level management systems was not fully developed in the time period available. Components of what was learned in the survey and detailed district level efforts have been described in Section 6.2.
Early in the study, it became apparent that one of the most promising areas for reducing the demand for agricultural water were metering and the use of poly or gated pipe. Metering, in lieu of pricing water on an estimated per acre basis, gives the producer and the irrigation district much better information on total water use, and when combined with some form of volumetric pricing, provides strong incentives for water conservation. Use of gated and poly pipe has increased significantly in the Valley in recent years and reduces seepage losses in conveying water from the lateral to the individual furrows. It can also reduce overall labor requirements, and, if adequate head is available in the system, it provides additional water savings over conventional furrow application with siphon tubes and dirt ditches. The presence of adequate head is especially necessary for receiving full benefit of the savings estimated within this report, and that concept should be carried throughout the interpretation of the results presented.
Efficiency improvements accompanying the use of metering reported in the Lower Rio Grande Valley range from 10% to 44%. Consultation with several irrigation district managers revealed the opinion that although widespread use of metering and poly-pipe was possible, a third potential area that needed to be considered was the issue of system delivery pressure as well as the soil types. Differences among the various districts delivery systems and the resulting water delivery pressure (or head) as well as the presence oflighter soils in some areas, made Valleywide high use of metering and poly/gated pipe techniques improbable. Efficiency improvements can also be achieved through higher levels of management on the farm. High levels of management were assumed possible only when metering and/or poly-pipe were in use and only in those areas in which adequate head could be assured. As a result of this observation, the potential areas considered for improvement included the three components of use of metering, the use of poly or gated pipe, and the adoption of higher management levels at the field level. The assumed levels of potential savings accompanying the adoption of these techniques have been presented in Table 3.10. All of these values are believed to be conservatively low estimates of savings given the observations described above.
Table 3.10 Assumed Potential Water Savings with Various Irrigation Water
Application Techniques
Potential %Savings % Savings Employed Technique from Baseline Furrow in the Analysis
Metering 0-15% 10%
Poly or Gated Pipe 5-20% 10%
High Management 10-30% 20%
LRGVDC lntegrated Regional Water Plan Section 3, Page 16

Integrated Water Resource Plan Lower Rio Grande Valley Development Council ~
~ Final Report- Regional Water Requirements and Anticipated Changes
Other key variables in the overall calculation of the irrigation water requirements involve the assumed crop mix and the water use by crop. Water application rates vary across the Lower Rio Grande Valley depending in part on the total available water supplies and the weather. The use of the EPIC crop growth model was initially planned to estimate specific monthly water use values for the great diversity of crops grown in the region. This approach was not accomplished due to the large number of crops and the numerous soil types in the area. General crop categories were assembled and crop water requirements (including potential evaporation) were calculated by month assuming a moderately dry weather year. These values were aggregated and have been presented in Table 3 .II .The planned use of a mathematical programming model to determine future crop mixes as discussed above was not used due to data limitations. Consequently, the regional crop mix for 1997 was deemed as the best estimate of future crop mixes and was used as a weighting factor to determine a composite-acre water use application rate. The proportion of acres for each crop, with respect to the total acres, were multiplied by the per acre water application rate. This composite-acre rate provides the estimate of the on-farm application rate for one acre of land with the crops grown in the assumed proportions. In this analysis, the proportion of the various crops was assumed to remained unchanged throughout the study period.
Table 3.11 cu a e121 e verage a er se per Cal I ted W . ht d A W t U A ere
Water Use/ac (ac-in) Furrow Poly or Metering
Metering Gated Metering w!Poly-Baseline & Poly or Pipe And Pipe
1997 Baseline Fu"ow High Gated w/High Poly- &High Acres Prop. Fu"ow w/Metering Mgmt Pipe Mgmt Pipe Mgmt
Column 1 2 3 4 5 6 7 8 9 No.1
Cotton, other 319,540 0.7280 16.75 15.075 11.725 15.075 11.725 13.4 10.05 Row Crops Ve~~;etables 31,300 0.0713 22.51 20.259 15.757 20.259 15.757 18.008 13.506 Citrus 33,100 0.0754 30.14 27.126 21.098 27.126 21.098 24.112 18.084 Melon 13,502 0.0308 14.27 12.843 9.989 512.843 9.989 11.416 11.416 SuSl,!lf cane 41,500 0.0945 53.06 47.754 37.142 47.754 37.142 42.448 31.836
Total Acres 438,942 Water Use/ac (ac-in)
Cotton, other 12.19 10.97 8.54 10.97 8.54 9.75 7.32 Row Crops Vegetables 1.61 1.44 1.12 1.44 1.12 1.28 0.96 Citrus 2.27 2.05 1.59 2.05 1.59 1.82 1.36 Melons 0.44 0.40 0.31 0.40 0.31 0.35 0.35 Sugarcane 5.02 4.51 3.51 4.51 3.51 4.01 3.01
Weighted Avg. Water 21.05 19.4 15.1 19.4 15.1 17.2 13.0 Use/ac
Percent Water Savings 10.00% 30.00% 10.00% 30.00% 20.00% 40.000/o
The computed weighted average application rates reflecting the varying application techniques under consideration, for the year 2000 and the ensuing decades have summarized for
LRGVDC Integrated Regional Water Plan Section 3, Page 17

a \ ' .
Integrated Water Resource Plan Lower Rio Grande Valley Development Council
Final Report- Regional Water Requirements and Anticipated Changes
each irrigation district in Table 3.12. Values shown for the 2010 to 2050 period vary little across the irrigation districts due to the assumed constant levels of high management and consistent use of poly-pipe and metering throughout the Lower Rio Grande Valley. Greater disparity in these composite application rates exists for the year 2000 case due to differing initial conditions in the use of metering, poly-pipe, and baseline furrow.
Table 3.12 Composite per Acre Water Use for Varying Application Techniques
Year 2000 Years 2010-2050 WeightedAvg Water WeightedAvg Water Application per ac Ap]J]i cation _]J(!f' ac
County_ District (ac-in)_ (ac-in)
Cameron Adams Garden ID 20.02 15.32 Cameron Bayview ID # 11 16.42 13.47 Cameron Brownsville I & DD 18.35 13.63 Cameron CCWC&ID#6 20.92 15.32 Cameron CCWID#IO 21.23 15.32 Cameron CCWID#l6 21.53 15.32 Cameron CCWID#l7 21.23 15.32 Cameron Cameron County ID #2 20.02 15.32 Cameron Harlingen ID 19.72 15.32 Cameron LaFeriaiD 18.16 15.32 Cameron Santa Maria ID 18.81 15.32 Cameron H&CCWC& ID#9 19.72 15.32 Cameron Valley Acres 20.02 15.32 Hidalgo DonnaiD 17.75 14.48 Hidalgo En!!leman ID 18.81 15.32 Hidalgo HCID# 16 20.02 15.32 Hidalgo HCID# 1 20.86 15.32 Hidalgo HCID#2 21.23 15.32 Hidalgo HCID#5 20.02 15.32 Hidalgo HCID#6 20.02 15.32 Hidalgo HCID# 13 21.53 15.32 Hidalgo HCWC&ID# 18 20.02 15.32 Hidalgo HCWC&ID# 19 20.02 15.32 Hidalgo HCWID#3 21.53 15.32 Hidalgo Santa Cruz ID # 15 20.02 15.32 Hidalgo UnitediD 20.02 15.32 Hidalgo H & CCWC & ID # 9 19.72 15.32 Hidalgo Valley Acres 20.02 15.32 Hidalgo Delta Lake ID 17.75 15.32
Willacv Delta Lake ID 17.85 15.32
Using these factors, the total agricultural water requirements including transportation losses were computed by decade for each county. These computed values have been summarized in Table 3.13. The estimates of transportation losses have been based on data provided by the
LRGVDC Integrated Regional Water Plan Section 3, Page 18

Integrated Water Resource Plan Lower Rio Grande Valley Development Council
Final Report- Regional Water Requirements and Anticipated Changes
irrigation districts where available and an assumed 25% delivery loss for those districts for which no information was available. Due to the concerns about the reliability of the data, additional study efforts are recommended to determine more accurate values for the expected transmission losses.
2000 On-farm use
Transportation
Total Use
2010 On-farm use
Transportation
Total Use
2020 On-farm use
Transportation
Total Use
2030 On-farm use
Transportation
Total Use
2040 On-farm use
Transportation
Total Use
2050 On-farm use
Transportation
Total Use
Table 3.13 Total Agricultural Water Requirements
(Values in Acre-feet per Year)
Cameron County Hidalgo County
326,771 678,130
111,714 171,566
438,485 849,6%
237,718 481,306
83,131 123,486
320,848 604,792
224,970 431,970
80,832 111,828
305,802 543,798
210,267 369,551
78,104 97,042
288,370 466,592
199,187 312,699
76,172 83,587
275,359 396,286
192,934 253,361
75,302 69,537
268,236 322,899
Willacy County
48,962
12,241
61,203
42,483
10,621
53,103
42,972
10,743
53,715
43,524
10,881
54,405
44,117
11,029
55,147
44,767
11,192
55,969
Total potential agricultural water requirements has been projected to decline sharply from 1,349,000 acre-feet per year in the year 2000 down to 647,100 acre-feet in the year 2050. Initial consideration might prompt some concern over the apparent high value for the base year 2000 use. This value, however, is below the historical usage of 1.5 million acre-feet of 1989. Agricultural water use in that year was at all time high with dry, hot conditions in the lower Valley and plenty of water in the reservoirs. In addition, the charge given the consultants in the scope of services was to determine whether current and future supplies could meet projected demands. The approach presented was designed to address that requirement. The adopted approach here is for the rare, but possible case, which meets those conditions: great demand in the lower Valley due to weather conditions and adequate supplies in the system. In reality, actual annual agricultural water use (as the residual claimant) will adjust to available supplies in the reservoirs, with acreages generally declining and per acre application rates increasing during times of drought.
LRGVDC Integrated Regional Water Plan Section 3, Page 19

Integrated Water Resource Plan Lower Rio Grande Valley Development Council
Final Report- Regional Water Requirements and Anticipated Changes
Changes over time in agricultural water use are due to a combination of factors: adopting metering, greater use of poly-pipe and other technologies, and the decline in irrigated agriculture due to the growth of urban areas. The latter component is especially important locally, and the map (Figure 2.1) depicting urbanized growth also roughly depicts the decline in acreage available for irrigated agriculture. As noted previously, the relative size of the urbanizing areas is believed to be accurate, but the exact placement of the acreages lost to urban growth is subject to change. Percent declines in irrigated water use for each district for the year 2000 to year 2050 period are also depicted in Figure 3 .1. Greatest declines have been generally the darker colors,
Figure 3.1
Projected Percent lledine in Irrigation Water Use, Year 2000-2050
and those districts with total loss of irrigation function have been portrayed in bright yellow. Greatest losses are in western Hidalgo county and near Brownsville. These data have been further summarized in Table 9.2 with surplus water values shown for the case where no changes in technology and/or metering occur, and for the case where such changes are implemented.
Potential benefits to the region of the proposed changes in technology and use of metering, coupled with the water freed by urban growth, are numerous. They include the obvious water freed up for municipal and industrial use, but also include greater supplies within the irrigation districts, improved flexibility in supplying water to all sectors (assuming the relevant freedom to do so within district transfer rules), and increased flows in the river year round for environmental purposes due to the less seasonal demand of the cities vs. agriculture. Given the mobile nature of
LRGVDC Integrated Regional Water Plan Section 3, Page 20
Integrated Water Resource Plan Lower Rio Grande Valley Development Council
Final Report- Regional Water Requirements and Anticipated Changes
water rights, no long term shortages are foreseen for the area given the technology adoption and urban growth assumed. The water rights will "migrate" to the locations where they are valued the most via outright sale or lease. All areas of the Valley can benefit from the proposed technology adoptions.
Note should be made of the changing role of the irrigation districts, especially those which have been projected to lose most of the agricultural base. Those districts will change in function from selling water for agricultural production to being transportation utilities for the cities and water wholesaler irrigation districts. Pricing water/services for both of these sectors as the relative mix of services changes over time will be a major challenge for the districts.
The adoption of metering and associated practices will present a challenge to the districts and to producers in the short run as they adjust to pricing water on a different basis. In general, the districts attempt to be average cost pricers, balancing total returns with total costs of running the district. It is expected that some form of a fixed charge per irrigation plus a marginal charge per volume of water applied will be implemented. This setup is currently in use in one or more of the districts which are currently metering. Some experimentation and careful consideration will be required to determine what the fixed and variable charges should be in order for the districts to recover their costs. Final total cost to the on-farm producer may increase or decrease, depending on their own internal response to the new pricing setup and the crops they grow. Pricing on a near true volumetric basis, however, will provide a much better signal to the on-farm producer of the relative scarcity and true value of the water than the present mainline practice of charging for water on a per acre irrigated basis.
3.4 Steam Electric Power Generation Water Requirements
The State's projections for steam electric power production water requirements have been summarized in Table 3.14 along with data for the period 1992 through 1996 from the TWDB Industrial Water Use Survey. The details of the State's projection methodology have been summarized in Appendix G. The total projected steam electric power production water requirements represent a small component of the total projected regional water requirements. The State's projections for Hidalgo County appear consistent with the available historical data. The State's projections for Cameron County for the Years 2000 and 2010 appear to be low when compared to the historical data. It appears that additional power production was added at an earlier date than what the State had anticipated.
Through comments furnished by Central Power and Light Company on the Initial Draft Report, their recorded usage in Hidalgo and Cameron Counties has been incorporated in Table 3.14. The recorded usage in 1996 includes 1, 700 acre-feet of groundwater. With the exception of 1996, CPL's recorded data appear to be consistent with the State's data.
The State's forecast has been adopted for use in this analysis of the total regional water requirements with the exception that the Cameron County forecast for the Years 2000 and 201 0
LRGVDC Integrated Regional Water Plan Section 3, Page 21

Integrated Water Resource Plan Lower Rio Grande Valley Development Council ~
~ Final Report- Regional Water Requirements and Anticipated Changes
have been increased to 3,000 acre-feet per year. The State has projected zero steam electric power production water requirement for Willacy County.
Table 3.14 Comparison of 1996 Consensus Texas Water Plan Consumptive Steam-Electric Power
Production Water Demand Forecasts with TWDB Industrial Water Use Survey (Values are in Acre-Feet per Year)
Year 1990 1992 1993 1994 1995 1996 2000 2010 2020 2030 2040 2050
Hidalgo County
Forecasts 1539 1500 2000 2000 2000 2000 2000
Survey 1683 1912 1960 1392 1085
Cameron County
Forecasts 1650 1650 1650 3000 3000 3000 3000
Survey 2159 1825 2427 2309 2166
Hidalgo and 3842 3737 4387 3701 3251 3150 3650 5000 5000 5000 5000 Cameron Total
CPL's Recorded 3459 3326 4141 3661 4502 Usage
3.5 Mining Water Requirements
The State's projections for mining water requirements have been summarized in Table 3.15. The details of the State's projection methodology have been summarized in Appendix H. The total projected mining water requirements represent a small component of the total projected regional water requirements. The State's forecast for mining water requirements have been used in the regional projections.
Table 3.15 1996 Texas Water Plan Consumptive Water Demand
Forecasts for Mining
Year 1990 2000 2010 2020 2030 2040 2050
Cameron 0 12 8 4 1 0 0 County
Hidalgo County 586 689 670 708 751 796 850
Willacy County 0 12 8 5 2 0 0
LRGVDC Integrated Regional Water Plan Section 3, Page 22

Integrated Water Resource Plan Lower Rio Grande Valley Development Council ~
~ Final Report- Regional Water Requirements and Anticipated Changes
3.6 Livestock Water Requirements
The State's projections for livestock water requirements have been summarized in Table 3.16. The details of the State's projection methodology have been summarized in Appendix I. The total projected livestock's water requirements represent a small component of the total projected regional water requirements. The State's forecast for livestock water requirements have been used in the regional projections.
Table 3.16 1996 Texas Water Plan Consumptive Water Demand Forecasts for Livestock
Year 1990 2000 2010 2020 2030 2040 2050
Cameron County 892 1456 1456 1456 1456 1456 1456
Hidalgo County 1003 763 763 763 763 763 763
Willacy County 174 144 144 144 144 144 144
3.7 GIS Mapping of Region and Use in Projected Water Requirements
Introduction
Use of a Geographic Information System (GIS) to catalog, analyze, and display information was a major effort of this study. TAES (Texas Agricultural Experiment Station), TAEX (Texas Agricultural Extension Service), Perez/Freese and Nichols and the local consulting firms worked together to collect and produce the GIS information. GIS technology links a computer database program to specialized software which enables the user to manipulate spatially referenced features (such as roads, canals, land blocks, etc.). Locations of those features are stored in digital form (a collection of numeric x and y coordinate values), using one of several possible coordinate systems to specify the location on the earth's surface. Attributes such as canal width, road type, or crop on the land block are stored within the database and the user can query the system to display and map only those features which meet a certain selection criterion. One example might be to show only those canals which are unlined and to calculate the surface area of those canals when making estimates of the costs oflining. GIS systems are well suited for such tasks and also serve as very flexible mapping tools for displaying the collected information.
Study Efforts
A previous geophysical study by the University of Texas Bureau ofEconomic Geology resulted in a beginning coverage (GIS data set or layer) for the canal system. This coverage was incomplete and a primary task of the Phase II analysis was to update this coverage given the great importance of the water delivery system to the study. Baseline maps of the irrigation district boundaries, county boundaries, and the canal system were disseminated to the local consultants. Those firms then consulted with the individual irrigation districts in order to update the district boundaries with greater accuracy and to delineate the locations of the major canals.
LRGVDC Integrated Regional Water Plan Section 3, Page 23

~ ~
Integrated Water Resource Plan Lower Rio Grande Valley Development Council
Final Report- Regional Water Requirements and Anticipated Changes
The original maps were printed out on a 7.5 minute quadrangle basis and approximately 300 3'x4' maps were produced in order to facilitate this ground level truth effort by the local consultants. Municipalities and water supply corporations in the three-county study area were similarly consulted concerning their jurisdictional boundaries and canals within their boundaries.
Once the paper maps were updated, Perez/Freese and Nichols, L.L.C. summarized the
r-----------------------------, needed updates on a single clean set of
LRGVDC Integrated Regional Water Plan
paper maps, and the Mapping Science Lab atTexasA&M digitized the updates for the boundaries and canal locations into the GIS. A second set of maps was produced and resubmitted to the cities and irrigation districts for their approval. Similar efforts were used to determine the locations of water treatment plants and water diversion points on the Rio Grande River.
Additional digital data for features in the Lower Rio Grande Valley were also available from other data sources including the Texas Natural Resources Information System (TNRIS), USDA mapping lab at Weslaco, and the U.S. Bureau of the Census TIGER files. The coverages collected and developed in the analysis and the source, if applicable, have been summarized in Table
Section 3, Page 24

Integrated Water Resource Plan Lower Rio Grande Valley Development Council
Final Report- Regional Water Requirements and Anticipated Changes
Figure 3.3
3.17. In addition, high resolution photos (1 meter accuracy) of the area were available from the U.S. Geological Survey (USGS). These photos were purchased in digital form to serve as a baseline for future mapping efforts in the area and to allow more accurate digitization of selected features such as canals and irrigated fields. A sample of these DOQ (digital ortho quad) photos with selected features highlighted has been portrayed in Figure 3.2. Quadrangles (quads) in the three-county map for which DOQ photos in digital form are available have been highlighted in Figure 3.3
Preliminary digital land use data from the Texas GAP analysis have also included in the coverages noted in Table 3 .17. Based upon 1992 and 1993 satellite photos of the area, it was anticipated that these data would provide adequate resolution so that row crops could be distinguished from the remaining irrigated lands. The 30-meter resolution and mixed results in classifying the image pixels precluded development of the polygon coverages as anticipated. The classified image however has been included as a coverage for future refinement and analysis.
These maps will be valuable assets to numerous entities in the Lower Rio Grande Valley as the use of GIS and additional mapping efforts increase. Figure 3.4 depicts much of the data gathered and processed in the study, and it is accompanied by a legend for the symbols employed in Figure 3.5.
LRGVDC Integrated Regional Water Plan Section 3, Page 25

Integrated Water Resource Plan Lower Rio Grande Valley Development Council ~
~ Final Report- Regional Water Requirements and Anticipated Changes
LRGVDC Integrated Regional Water Plan Section 3, Page 26

Integrated Water Resource Plan Lower Rio Grande Valley Development Council
Final Report- Regional Water Requirements and Anticipated Changes
Figure 3.5
Semple legend for LRGV QUAD Sheet Maps
LRGVDC futegrated Regional Water Plan
D USGS 7.5' QUAD BOUNDARY WATER CONTROL POINT FEATURES
(<> PUMP STATION 6 Water Treatment Plant !i!l Wastewater Treatment Plant * RESERVOIR 4 DIVERSION POINT
NHIGHWAY . . . ..·FRONTAGE ROAD/RAMP .\:1 URBAN HIGHWAY
&RURAL HIGHWAY 1\fHIGHWAYBRIDGE
·': .• ;URBAN HIGHWAY BRIDGE /'·.,";'·RURAL HIGHWAY BRIDGE /v BOULEVARD
1r::-..J CITY STREET /\ f COUNTY ROAD BRIDGE N RURAL SUBDIVISION STREETS
EARTH COUNTY ROADS N ALL WEATHER COUNTY ROAD N PAVED COUNTY ROAD /• ,. · RAILROAD MAIN LINE
. :'\ ,/RAILROAD SPUR i\/DAM . · · MISC. BOUNDARY
!\/AIRPORT • ·.: ETJ Zone
' · HARBOR ZONE HYDROGRAPHY -attributed
. canal /'· .. ·...-pipe · · ' unknown
HYDROGRAPHY -unattributed N COASTAL SHORELINE
INLAND WATERWAY .· : :;/ SUGARCANE ~)i'ff.J CITRUS i ! i Water Supply Corp. Boundary 0 MUNICIPAL GROWTH AREA
COUNTY GROWTH AREA
IIIBD CURRENT URBANIZATION H-f- CITY BOUNDARY
Section 3, Page 27

Figure 3.6
Figure 3.7
Integrated Water Resource Plan Lower Rio Grande Valley Development Council
Final Report- Regional Water Requirements and Anticipated Changes
Municipal Use Pallem for Large Users
......
Municipal Users
LRGVDC Integrated Regional Water Plan Section 3, Page 28

Integrated Water Resource Plan Lower Rio Grande Valley Development Council
Final Report- Regional Water Requirements and Anticipated Changes
Table 3.17 GIS Coverage Sources and Development
Name Source Development
l.Roads TXDOT via TNRIS Combined selected Roads (http://www.state.txlgispage.html) and US Bureau of Census TIGER files
2. County boundaries TNRIS (http://www.state.txlgispage.html)
3. QUAD boundaries USGS
4. Digital Ortho Quarter Purchased from USGS Combined header information with photo data Quad Photos (I meter) and pressed new CO's for easy use
5. Irrigation District UT Bureau of Economic Geology Stndy Updated and redigitized for greater accuracy Boundaries Eric Reiken, UT-Pan Am, ( 956) 381-3521
6. Main Canal and UT Bureau of Economic Geology Study Updated as to location and canal attnbute data Floodway Hydrology Eric Reiken, UT-Pan Am, (956) 381-3521 added where possible
7. Water Supply Corp. Digitized from information gathered by the and City Limit Boundaries Project's local consultants 8. Water Treatment Plant Digitized from information gathered by the
Locations Project's local consultants 9. River Diversion Points Digitized from information gathered by the
Project's local consultants 10. Citrus Acreage USDA Mapping Lab, Weslaco, TX
ll. 1998 Sugar Cane Hardcopy maps from Sugar Mill at Digitized and places in proper coordinate Acreage Norman Rozeff system.
12. General Soils Map Digitized from County Soil Survey Maps
13. Current Heavily Digitized from current road coverages Populated Areas 14. Year 2050 Urban Digitized from information gathered by local Growth Areas consultants 15. Year 2050 Rural Digitized from information gathered by local Growth Areas consultants 16. 1995 Land Use Texas GAP Analysis Classified aerial photography pixels nsing
computerized algorithms and baseline ground truth data
LRGVOC Integrated Regional Water Plan Section 3, Page 29

Integrated Water Resource Plan Lower Rio Grande Valley Development Council 9 I Final Report- Regional Water Requirements and Anticipated Changes
Figure 3.8
lndustlal Users
Additional Efforts
Two irrigation districts were selected for in-depth study of their delivery systems and the GIS effort was expanded to include detailed mapping of the majority of the canal/pipeline network for Hidalgo County Irrigation District No. 6 as well as Cameron County Irrigation District No. 2. Collection of attributes such as canal widths, slope, and capacities for these two districts provided a basis for extrapolating delivery system performance attributes to other districts in the Valley. Detailed digitization of the individual fields (by water ticket number) was also begun so as to link water use data to the actual field of use in the GIS. An educational effort was undertaken in order to allow personnel from the two districts to aid in the mapping and data collection effort for the GIS and at least 6 other irrigation districts in the study chose to purchase the GIS software and to engage in similar mapping efforts of their delivery systems and water ticket field information. Each district realized the value of the cataloging their delivery systems and linking their water ticket level data to the GIS digital forms of maps of their districts. Initial development of a valuable management tool for the districts was aided greatly by these efforts.
3.8 Typical Monthly Pattern of Water Use
Water is not consumed at a constant rate throughout a year. Municipal demands increase during the summer months when lawn irrigation occurs. The monthly demand patterns for the larger municipalities in the Lower Rio Grande Valley have been illustrated in Figure 3.6. The
LRGVOC Integrated Regional Water Plan Section 3, Page 30

Integrated Water Resource Plan Lower Rio Grande Valley Development Council
Final Report- Regional Water Requirements and Anticipated Changes
monthly demand patterns for small, medium and large users have been illustrated on Figure 3.7. As would be expected, the highest monthly use occurs during August regardless of the size of the municipality. The usage in the November through February period is relatively uniform.
The industrial users monthly consumption patterns have been illustrated on Figure 3.8. Food processors and all other industrial users monthly consumption patterns are relatively uniform throughout the year. Water for the steam electric power production increase significantly during the summer months when the demand for electric for air conditioners is greatest. The demand for irrigation water is a function of the growing seasons, but it is highly dependent on the rainfall patterns. These demand patterns have been used in the evaluations of the water supply and delivery systems. These demand patterns have been specifically used in the evaluation of the Falcon-Amistad Reservoir System.
Seasonal agricultural demand also varies monthly as seen in Figure 3.9. Minimum, average, and maximum irrigation use for the years 1989-1996 for the entire Falcon-Amistad system are depicted and vary significantly by month. Greatest historical uses have occurred in May, followed by July, April, and August respectively. Irrigated use declines slightly in September and then edges upward again in October and November as irrigation of fall crops occurs.
Figure 3.9
120,000.00
100,000.00
80,000.00
;:-w w :t 60.00000
~ 40,000.00
20,000.00
0.00
I
I I I
1
Irrigated Water u .. :Minimum-Average-Maximum, 1989-1996
..
.
.
1 .u J .1 r 1 _I J JAN FEB MAR APR MAY JUN JUL AUG SEP OCT NOV DEC
Li>.lMtN .AVG DMAX
LRGVDC Integrated Regional Water Plan Section 3, Page 31

Integrated Water Resource Plan Lower Rio Grande Valley Development Council
Final Report- Regional Water Requirements and Anticipated Changes
3.9 Projected Regional Water Requirements Year 2000 to Year 2050
The combined regional water requirements for Year 2000 to Year 2050 by counties have been summarized in Tables 3.18, 3.19, and 3.20. The projections from the Texas Water Development Board have been compared with those developed in this study, a comparison which is required by Senate Bill No. I. For both cases, an allowance for transportation losses in the irrigation canal delivery systems has not been specifically included. The water use data reported by the municipalities was inconsistent on whether transportation losses were included. It is very important to note that the assumed water conservation programs for both the municipal and agricultural demands have been incorporated in the projections.
The projections developed by the Texas Water Development Board are higher than those developed in this study. The primary differences are the lower projections for irrigation water requirements due to the impacts of urbanization on the area. This study has also made some adjustments in the per capita consumption rates to account for lower gains in the municipal water conservation effort being offset by increases in the general standard ofliving by many Lower Rio Grande Valley residents. The colonia improvements will increase the demand for water.
LRGVDC Integrated Regional Water Plan Section 3, Page 32
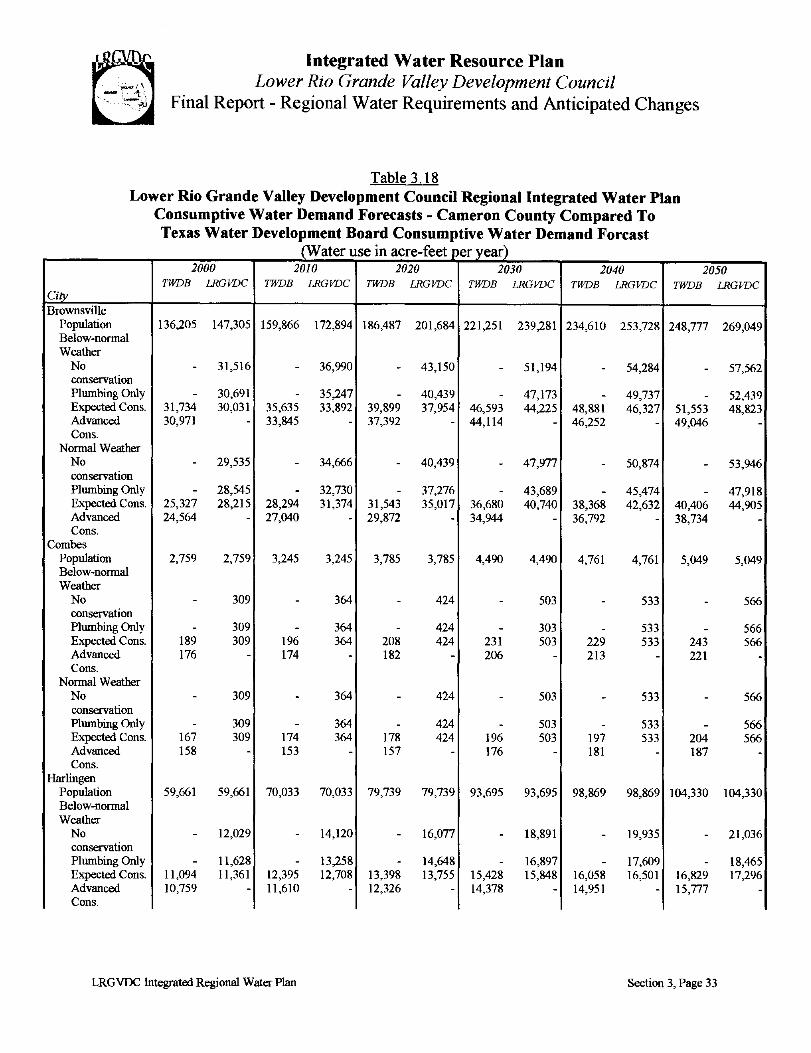
Integrated Water Resource Plan Lower Rio Grande Valley Development Council
Final Report- Regional Water Requirements and Anticipated Changes
Table 3.18 Lower Rio Grande Valley Development Council Regional Integrated Water Plan
Consumptive Water Demand Forecasts- Cameron County Compared To Texas Water Development Board Consumptive Water Demand Forcast
_0Y_ater use in acre-feet per year) 2000 2010 2020 2030 2040 2050
TWDB LRGVDC TWDB LRGVDC TWDB LRGVDC TWDB LRGVDC TWDB LRGVDC TWDB LR.GVDC Citv Brownsville
Population 136,205 147,305 159,866 172,894 186,487 201,684 221,251 239,281 234,610 253,728 248,777 269,049 Below-normal Weather
No - 31,516 - 36,990 - 43,150 - 51,194 - 54,284 - 57,562 conservation Plumbing Only - 30,691 - 35,247 - 40,439 - 47,173 - 49,737 - 52,439 Expected Cons. 31,734 30,031 35,635 33,892 39,899 37,954 46,593 44,225 48,881 46,327 51,553 48,823 Advanced 30,971 - 33,845 - 37,392 - 44,114 - 46,252 - 49,046 -Cons.
Normal Weather No - 29,535 - 34,666 - 40,439 - 47,977 - 50,874 - 53,946 conservation Plumbing Only - 28,545 - 32,730 - 37,276 - 43,689 - 45,474 - 47,918 Expected Cons. 25,327 28,215 28,294 31,374 31,543 35,017 36,680 40,740 38,368 42,632 40,406 44,905 Advanced 24,564 - 27,040 - 29,872 - 34,944 - 36,792 - 38,734 -Cons.
Combes Population 2,759 2,759 3,245 3,245 3,785 3,785 4,490 4,490 4,761 4,761 5,049 5,049 Below-normal Weather
No - 309 - 364 - 424 - 503 - 533 - 566 conservation Plumbing Only - 309 - 364 - 424 - 303 - 533 - 566 Expected Cons. 189 309 196 364 208 424 231 503 229 533 243 566 Advanced 176 - 174 - 182 - 206 - 213 - 221 -Cons.
Normal Weather No - 309 - 364 - 424 - 503 - 533 - 566 conservation Plumbing Only - 309 - 364 - 424 - 503 - 533 - 566 Expected Cons. 167 309 174 364 178 424 196 503 197 533 204 566 Advanced 158 - 153 - 157 - 176 - 181 - 187 -Cons.
Harlingen Population 59,661 59,661 70,033 70,033 79,739 79,739 93,695 93,695 98,869 98,869 104,330 104,330 Below-normal Weather
No - 12,029 - 14,120 - 16,077 - 18,891 - 19,935 - 21,036 conservation Plumbing Only - 11,628 - 13,258 - 14,648 - 16,897 - 17,609 - 18,465 Expected Cons. ll,094 ll,361 12,395 12,708 13,398 13,755 15,428 15,848 16,058 16,501 16,829 17,296 Advanced 10,759 - 11,610 - 12,326 - 14,378 - 14,951 - 15,777 -Cons.
LRGVDC futegrated Regional Water Plan Section 3, Page 33

City Nonnal Weather
No conservation P1lllllbing Only Expected Cons. Advanced Cons.
La Feria Population Below-normal Weather
No conservation Pllllllbing Only Expected Cons. Advanced Cons.
Normal Weather No conservation Pllllllbing Only Expected Cons. Advanced Cons.
Laguna Vista Population Below-nonnal Weather
No conservation Pllllllbing Only Expected Cons. Advanced Cons.
Nol1llill Weather No conservation Pllllllbing Only Expected Cons. Advanced Cons.
Los Fresnos Population Below-no=! Weather
No conservation Pllllllbing Only Expected Cons. Advanced Cons.
Integrated Water Resource Plan Lower Rio Grande Valley Development Council
Final Report- Regional Water Requirements and Anticipated Changes
Table 3.18 (Continued)
2000 2010 2020 2030 2040 2050 TWDB LRGVDC TWDB LRGVDC TWDB LRGVDC TWDB LRGVDC TWDB LRGVDC TWDB LRGVDC
- 10,091 - 11,846 - 13,487 - 15,848 - 16,723 - 17,647
- 9,690 - 10,983 - 12,058 - 13,854 - 14,397 - 15,076 8,888 9,557 9,806 10,512 10,540 11,344 12,069 13,014 12,514 13,511 13,089 14,024 8,554 - 9,178 - 9,825 - 11,335 - 11,850 - 12,388 -
5,548 6,104 6,525 7,324 7,610 8,789 9,029 10,547 9,575 12,657 10,153 15,188
- 814 - 976 - 1,172 - 1,406 - 1,687 - 2,025
- 766 - 870 - 994 - 1,181 - 1,418 - 1,701 609 745 665 837 725 984 819 1,181 847 1,418 887 1,701 584 - 607 - 648 - 759 - 783 - 830 -
- 704 - 845 - 1,014 - 1,217 - 1,460 - 1,752
- 684 - 820 - 984 - 1,181 - 1,418 - 1,701 485 684 519 820 563 984 627 1,181 644 1,418 671 1,701 460 - 475 - 503 - 576 - 601 - 626 -
1,393 1,393 1,574 1,574 1,766 1,766 1,990 1,990 2,154 2,154 2,331 2,331
- 197 - 222 - 249 - 281 - 304 - 329
- 172 - 194 - 206 - 223 - 241 - 261 181 169 187 187 192 198 207 223 220 241 235 261 167 - 157 - 146 160 - 171 - 183 -
- 184 - 208 - 233 - 263 - 285 - 308
- 170 - 180 - 196 - 223 - 241 - 277 176 169 182 176 186 198 203 223 212 241 227 261 162 - !52 - 142 - !56 - 164 - 175 -
2,970 3,900 3,489 5,500 3,970 5,710 4,665 7,000 4,922 8,500 5,193 10,000
- 655 - 924 - 959 - 1,176 - 1,428 - 1,680
- 629 - 850 - 857 - 1,027 - 1,219 - 1,423 506 616 559 819 600 800 690 964 711 1,143 745 1,333 486 - 516 - 543 - 627 - 656 - 686 -
LRGVDC Integrated Regional Water Plan Section 3, Page 34

Integrated Water Resource Plan Lower Rio Grande Valley Development Council
Final Report- Regional Water Requirements and Anticipated Changes
Table 3.18 (Continued) 2000 2010 2020 2030 2040 2050
TWDB LRGVDC TWDB LRGVDC TWDB LRGVDC TWDB LRGVDC TWDB LRGVDC TWDB LRGVDC Citv
Nonnal Weather No - 559 - 789 - 819 - 1,004 - 1,219 - 1,434 conservation Plumbing Only - 533 - 721 - 716 - 855 - 1,019 - 1,187 Expected Cons. 403 524 442 690 471 672 538 800 557 952 582 1,120 Advanced 386 - 410 - 431 - 496 - 518 - 541 -Cons.
Palm Valley Population 1,509 1,509 1,812 1,812 2,132 2,132 2,479 2,479 2,748 2,748 2,920 2,920 Below-nonnal Weather
No - 411 - 493 - 580 - 675 - 748 - 795 conservation Plumbing Only - 392 - 449 - 504 - 578 - 659 - 674 Expected Cons. 384 384 430 430 473 473 541 541 594 594 628 628 Advanced 360 - 373 - 380 - 439 - 480 - 510 -Cons.
Nonnal Weather No - 365 - 438 - 516 - 600 - 665 - 706 conservation Plumbing Only - 348 - 424 - 447 - 511 - 557 - 592 Expected Cons. 345 343 384 382 423 418 483 478 526 520 559 553 Advanced 321 - 331 - 334 - 383 - 422 - 445 -Cons.
Port Isabel Population 5,482 5,482 6,447 6,447 7,340 7,340 8,625 8,625 9,100 9,100 9,602 9,602 Below-normal Weather
No - 2,573 - 3,026 - 3,445 - 4,048 - 4,271 - 4,507 conservation Plumbing Only - 2,260 - 2,932 - 3,305 - 3,855 - 4,057 - 4,270 Expected Cons. 2,487 2,487 2,816 2,816 3,100 3,100 3,613 3,613 3,792 3,792 3,990 3,990 Advanced 2,432 - 2,694 - 2,911 - 3,410 - 3,578 - 3,775 -Cons.
Normal Weather No - 2,352 - 2,766 - 3,149 - 3,700 - 3,904 - 4,119 conservation Plumbing Only - 2,315 - 2,679 - 3,017 - 3,526 - 3,690 - 3,883 Expected Cons. 2,180 2,272 2,470 2,578 2,721 3,837 3,169 3,304 3,313 3,456 3,485 3,635 Advanced 2,131 - 2,369 - 2,573 - 3,005 - 3,160 - 3,323 -Cons.
Prim era Population 2,743 2,743 3,227 3,227 3,763 3,763 4,465 4,465 5,076 5,076 5,771 5,771 Below-nonnal Weather
No - 651 - 766 - 894 - 1,060 - 1,205 - 1,370 conservation Plumbing Only - 627 - 705 - 797 - 920 - 1,029 - 1,164 Expected Cons. 446 611 492 676 544 746 625 860 699 961 789 1,086 Advanced 430 - 459 - 497 580 - 654 - 737 -Cons.
LRGVOC Integrated Regional Water Plan Section 3, Page 35

City Normal Weather
No conservation Plumbing Only Expected Cons. Advanced Cons.
Rio Hondo Population Below-normal Weather
No conservation Plumbing Only Expected Cons. Advanced Cons.
Normal Weather No conservation Plumbing Only Expected Cons. Advanced Cons.
San Benito Population Below-normal Weather
No conservation Plumbing Only Expected Cons. Advanced Cons.
Normal Weather No conservation Plumbing Only Expected Cons. Advanced Cons.
Santa Rosa Population Below-normal Weather
No conservation Plumbing Only Expected Cons. Advanced Cons.
Normal Weather No conservation Plumbing Only Expected Cons. Advanced Cons.
Integrated Water Resource Plan Lower Rio Grande Valley Development Council
Final Report- Regional Water Requirements and Anticipated Changes
Table 3.18 (Continued) 2000 2010 2020 2030 2040 2050
TWDB LRGVDC TWDB LRGVDC TWDB LRGVDC TWDB LRGVDC TWDB LRGVDC TWDB LRGVDC
- 350 - 412 - 481 - 570 - 648 - 737 - 332 - 372 - 417 - 480 - 548 - 608
353 326 387 358 426 392 490 455 540 500 614 569 341 - 361 - 392 - 455 - 512 - 575 -
2,391 2,391 2,873 2,873 3,380 3,380 3,931 3,931 4,357 4,357 4,629 4,629
- 372 - 447 - 526 - 612 - 678 - 721 - 362 - 415 - 451 - 546 - 595 - 627
466 354 528 399 591 424 674 511 737 556 778 586 450 - 496 - 541 - 621 - 683 - 721 -
- 321 - 386 - 454 - 528 - 586 - 622 - 308 - 354 - 405 - 458 - 503 - 529
370 303 418 341 466 379 528 432 576 488 607 519 356 - 393 - 428 - 493 - 537 - 570 -
24,483 24,483 28,737 28,737 32,721 32,721 38,447 38,447 40,570 40,570 42,811 42,811
- 6,006 - 7,050 - 8,027 - 9,431 - 9,952 - 10,502 - 5,869 - 6,663 - 7,404 - 8,570 - 8,953 - 9,399
5,979 5,732 6,663 6,406 7,220 6,927 8,355 8,010 8,725 8,362 9,159 8,776 5,787 - 6,245 - 6,634 - 7,709 - 8,089 - 8,488 -
- 4,169 - 4,893 - 5,571 - 6,546 - 6,908 - 7,289 - 4,031 - 4,474 - 5,058 - 5,857 - 6,090 - 6,426
4,936 3,949 5,472 4,378 5,938 4,765 6,848 5,512 7,135 5,726 7,481 5,994 4,772 - 5,150 - 5,498 - 6,374 - 6,680 - 7,001 -
2,802 2,802 3,289 3,289 3,745 3,745 4,399 4,399 4,641 4,641 4,897 4,897
- 411 - 483 - 550 - 646 - 681 - 719 - 392 - 435 - 474 - 542 - 551 - 587
348 386 379 420 403 445 458 508 468 520 494 549 333 - 346 - 361 - 414 - 431 - 450 -
- 373 - 438 - 499 - 586 - 619 - 653 - 352 - 387 - 419 - 493 - 520 - 549
276 345 295 372 310 419 350 493 359 520 373 549 264 - 273 - 281 - 320 - 333 - 346 -
LRGVDC Integrated Regional Water Plan Section 3, Page 36

City South Padre Island
Population Below-normal Weather
No conservation Plumbing Only Expected Cons. Advanced Cons.
Normal Weather No conservation Plumbing Only Expected Cons. Advanced Cons.
County Residents Population Below-normal Weather
No conservation Plumbing Only Expected Cons. Advanced Cons.
Normal Weather No conservation Plumbing Only Expected Cons. Advanced Cons.
Municipal County Total
Population Below-normal Weather
No conservation Plumbing Only Expected Cons. Advanced Cons.
Normal Weather No conservation Plumbing Only Expected Cons. Advanced Cons.
Integrated Water Resource Plan Lower Rio Grande Valley Development Council
Final Report- Regional Water Requirements and Anticipated Changes
Table 3.18 (Continued) 2000 2010 2020 2030 2040 2050
TWDB LRGVDC TWDB LRGVDC TWDB LRGVDC TWDB LRGVDC TWDB LRGVDC TWDB LRGVDC
2,158 2,158 2,631 2,631 3,207 3,207 3,909 3,909 4,765 4,765 5,809 5,809
- 1,905 - 2,322 - 2,831 - 3,450 - 4,206 - 5,127 - 1,854 - 2,190 - 2,601 - 3,161 - 3,843 - 4,691
1,815 1,815 2,071 2,104 2,317 2,439 2,680 2,960 2,957 3,592 3,276 4,379 1,714 - 1,825 - 1,894 - 2,192 - 2,425 - 2,682 -
- 1,769 - 2,157 - 2,630 - 3,205 - 3,907 - 4,763 - 1,714 - 2,031 - 2,403 - 2,921 - 3,555 - 4,327
1,774 1,685 2,022 1,951 2,259 2,260 2,612 2,741 2,886 3,331 3,193 4,054 1,673 - 1,778 - 1,842 - 2,137 - 2,359 - 2,614 -
85,069 72,483 108,889 93,010 134,291 116,014 149,908 127,655 185,326 158,705 198,015 166,437
- 11,935 - 15,315 - 19,103 - 21,020 - 26,133 - 27,406 - 11,692 - 14,065 - 16,894 - 18,303 - 22,044 - 23,118
13,967 11,448 16,456 13,544 19,073 15,854 20,872 17,016 25,010 20,622 26,674 21,626 13,490 - 15,481 - 17,720 - 19,529 - 23,557 - 25,120 -
- II ,204 - 14,377 - 17,933 - 19,733 - 24,533 - 25,728 - 10,880 - 13,231 - 15,724 - 17,016 - 20,444 - 21,440
13,110 10,717 15,481 12,711 17,871 14,815 19,529 15,872 23,349 19,199 24,899 20,135 12,729 - 14,627 - 16,667 - 18,185 - 22,104 - 23,568 -
335,173 335,173 402,637 402,596 473,936 473,775 551,283 550,913 611,474 610,631 650,287 648,823
0 69,784 0 83,498 0 97,987 0 114,393 0 126,045 0 134,345 0 67,643 0 78,637 0 89,998 0 103,279 0 112,488 0 119,385
70,205 66,448 79,472 75,602 88,743 84,523 101,786 96,%3 109,928 105,162 116,280 111,600 68,139 0 74,828 0 82,175 0 95,138 0 102,923 0 109,226 0
0 62,285 0 74,585 0 87,649 0 102,280 0 112,864 0 120,270 0 60,211 0 69,750 0 79,544 0 91,567 0 98,989 0 105,079
58,790 59,398 66,346 67,007 73,895 75,924 84,322 85,748 91,176 93,027 96,390 98,585 56,871 0 62,690 0 68,945 0 79,035 0 86,213 0 91,093 0
LRGVDC Integrated Regional Water Plan Section 3, Page 37

~ ~
Integrated Water Resource Plan Lower Rio Grande Valley Development Council
Final Report- Regional Water Requirements and Anticipated Changes
Table 3.18 (Continued) 2000 2010 2020 2030 2040 2050
TWDB LRGVDC TWDB LRGVDC TWDB LRGVDC TWDB LRGVDC TWDB LRGVDC TWDB LRGVDC City
Manufacturing 1,257 1,257 1,391 1,391 1,504 1,504 1,628 1,628 1,804 1,804 1,985 1,985 S.E.Power 1,650 3,000 1,650 3,000 3,000 3,000 3,000 3,000 3,000 3,000 3,000 3,000 Cooling Mining 12 12 8 8 4 4 I I 0 0 0 0 Irrigation - Case 414,728 438,485 404,444 320,848 393,763 305,802 381,650 288,370 370,973 275,359 359,658 268,236 A livestock 1,456 1,456 1,456 1,456 1,456 1,456 1,456 1,456 1,456 1,456 1,456 1,456
Subtotal: 419,103 444,210 408,949 326,703 399,727 311,766 387,735 294,455 377,233 281,619 366,099 274,677
Total County Water Use
Below-normal Weather
No - 513,994 - 410,201 - 409,753 - 408,848 - 407,664 - 409,022 conservation Plumbing Only - 511,853 - 405,340 - 401,764 - 397,734 - 394,107 - 394,062 Expected Cons. 489,308 510,658 488,421 402,305 488,470 396,289 489,521 391,418 487,161 386,781 482,379 386,277 Advanced 487,242 - 483,777 - 481,902 - 482,873 - 480,156 - 475,325 -Cons.
Normal Weather No - 506,495 - 401,288 - 399,415 - 396,735 - 394,483 - 394,947 conservation Plumbing Only - 504,421 - 396,453 - 391,310 - 386,022 - 380,608 - 379,756 Expected Cons. 477,893 503,608 475,295 393,710 473,622 387,690 472,057 380,203 468,409 374,646 462,489 373,262 Advanced 475,974 - 471,639 - 468,672 - 466,770 - 463,446 - 457,192 -Cons.
LRGVDC Integrated Regional Water Plan Section 3, Page 38

~ ~
Integrated Water Resource Plan Lower Rio Grande Valley Development Council
Final Report- Regional Water Requirements and Anticipated Changes
Table3.19 Lower Rio Grande Valley Development Council Regional Integrated Water Plan
Consumptive Water Demand Forecasts- Hidalgo County Compared To Texas Water Development Board Consumptive Water Demand Forcast
(Water use in acre-feet per year)
2000 2010 2020 2030 2040 2050
City TWDB LRGVDC TWDB LRGVDC TWDB LRGVDC TWDB LRGVDC TWDB LRGVDC TWDB LRGVDC
Alamo
Population II ,955 11,955 15,447 15,447 17,955 17,955 20,856 20,856 22,512 22,512 24,299 24,299
Below-normal Weather
No conservation - 1,928 - 2,492 - 2,8% - 3,364 - 3,631 - 3,919
P1wnbing Only - 1,821 - 2,232 - 2,494 - 2,803 - 2,976 - 3,212
Expected Cons. 1,634 1,794 1,955 2,146 2,132 2,333 2,406 2,640 2,547 2,799 2,749 3,021
Advanced Cons. 1,567 - 1,799 - 1,931 - 2,1% - 2,345 - 2,504 -Normal Weather
No conservation - 1,714 - 2,215 - 2,574 - 2,990 - 3,228 - 3,484
Plwnbing Only - 1,607 - 1,921 - 2,152 - 2,430 - 2,547 - 2,722
Expected Cons. 1,299 1,580 1,523 1,851 1,669 2,031 1,869 2,336 1,967 2,522 2,0% 2,722
Advanced Cons. 1,232 - 1,419 - 1,508 - 1,705 - 1,816 - 1,960 -
Alton
Population 5,098 5,098 6,035 6,035 6,946 6,946 7,855 7,855 8,572 8,572 9,354 9,354
Below-normal Weather
No conservation - 1,627 - 1,927 - 2,217 - 2,508 - 2,737 - 2,986
Plwnbing Only - 1,576 - 1,798 - 2,015 - 2,261 - 2,429 - 2,651
Expected Cons. 1,0% 1,542 1,230 1,731 1,346 1,891 1,505 2,112 1,613 2,266 1,760 2,473
Advanced Cons. 1,056 - 1,156 - 1,237 - 1,390 - 1,498 - 1,624 -
Normal Weather
No conservation - 1,193 - 1,413 - 1,626 - 1,839 - 2,007 - 2,190
Plwnbing Only - 1,136 - 1,305 - 1,463 - 1,619 - 1,738 - 1,834
Expected Cons. 868 1,119 973 1,257 1,066 1,377 1,179 1,522 1,267 1,632 1,373 1,771
Advanced Cons. 839 - 913 - 980 - 1,100 - 1,181 - 1,289 -
Donna
Population 16,449 16,449 20,627 20,627 25,213 25,213 30,738 30,738 35,686 35,686 41,430 41,430
Below-normal Weather
No conservation - 3,059 - 3,835 - 4,688 - 5,716 - 6,636 - 7,704
Plwnbing Only - 2,948 - 3,535 - 4,208 - 4,992 - 5,716 - 6,590
Expected Cons. 2,893 2,893 3,3% 3,3% 3,926 3,926 4,683 4,683 5,356 5,356 6,172 6,172
Advanced Cons. 2,782 - 3,165 - 3,587 - 4,338 - 4,997 - 5,755 -
LRGVDC Integrated Regional Water Plan Section 3, Page 39

9 . .
City Normal Weather
No conservation
Plumbing Only
Expected Cons.
Advanced Cons.
Edcouch
Population
Below-normal Weather
No conservation
Plumbing Only
Expected Cons.
Advanced Cons.
Normal Weather
No conservation
Plumbing Only
Expected Cons.
Advanced Cons.
Edinburg
Population
Below-normal Weather
No conservation
Plumbing Only
Expected Cons.
Advanced Cons.
Normal Weather
No conservation
Plumbing Only
Expected Cons.
Advanced Cons.
Integrated Water Resource Plan Lower Rio Grande Valley Development Council
Final Report- Regional Water Requirements and Anticipated Changes
Table 3.19 (Continued)
2000 2010 2020 2030 2040 2050
TWDB LRGVDC TWDB LRGVDC TWDB LRGVDC TWDB LRGVDC TWDB LRGVDC TWDB LRGVDC
- 2,819 - 3,535 - 4,321 - 5,268 - 6,116 - 7,100
2,709 - 3,212 - 3,813 - 4,545 - 5,157 - 5,987
2,524 2,653 2,934 3,0% 3,389 3,559 4,028 4,235 4,597 4,837 5,337 5,615
2,432 - 2,750 - 3,135 - 3,753 - 4,317 - 4,966 -
3,493 3,493 3,993 3,993 4,542 4,542 5,266 5,266 5,954 5,954 6,732 6,732
- 509 - 581 - 661 - 767 - 868 - 980
- 485 - 528 - 575 - 649 - 721 - 807
477 473 510 510 539 539 608 608 674 675 754 754
458 - 470 - 488 - 554 - 620 - 694 -
- 473 - 541 - 616 - 714 - 808 - 912
- 450 - 479 - 539 - 590 - 668 - 769
380 442 398 461 422 509 472 590 514 668 573 754
364 - 367 - 382 - 431 - 480 - 535 -
40,680 43,814 50,467 57,300 61,208 72,852 74,240 92,624 85,%0 lll,260 99,531 133,646
- 8,687 - 11,361 - 14,444 - 18,364 - 22,059 - 26,497
- 8,392 - 10,526 - 13,057 - 16,289 - 19,317 - 23,054
7,610 8,1% 8,932 10,141 10,284 12,241 12,224 15,252 13,%2 18,071 16,054 21,557
7,382 - 8,366 - 9,462 - 11,310 - 12,999 - 15,051 -
- 7,018 - 9,178 - 11,669 - 14,837 - 17,822 - 21,407
- 6,773 - 8,472 - 10,445 - 12,%9 - 15,454 - 17,366
6,926 6,675 8,084 8,151 9,256 9,793 10,977 12,243 12,517 14,457 14,494 17,366
6,698 - 7,575 - 8,570 - 10,229 - 11,747 - 13,602 -
LRGVDC Integrated Regional Water Plan Section 3, Page 40

City
Elsa
~ ~
Population
Below-normal Weather
No conservation
Pl11Illhing Only
Expected Cons.
Advanced Cons.
Normal Weather
No conservation
Pl11Illbing Only
Expected Cons.
Advanced Cons.
Hidalgo
Population
Below-normal Weather
No conservation
Pl11Illhing Only
Expected Cons.
Advanced Cons.
Normal Weather
No conservation
Pl11Illbing Only
Expected Cons.
Advanced Cons.
LaJoya
Population
Below-normal Weather
No conservation
Pl11Illhing Only
Expected Cons.
Advanced Cons.
Integrated Water Resource Plan Lower Rio Grande Valley Development Council
Final Report- Regional Water Requirements and Anticipated Changes
Table 3.19 (Continued)
2000 2010 2020 2030 2040 2050
TWDB LRGVDC TWDB LRGVDC TWDB LRGVDC TWDB LRGVDC TWDB LRGVDC TWDB LRGVDC
6,233 6,233 7,010 7,010 7,860 7,860 9,021 9,021 10,140 10,140 IJ,398 ll,398
- 1,138 - 1,280 - 1,435 - 1,647 - 1,851 - 2,081
- 1,103 - 1,194 - 1,294 - 1,445 - 1,602 - 1,787
1,047 1,075 1,115 1,146 1,180 1,215 1,314 1,334 1,454 1,499 1,621 1,673
1,012 - 1,036 - 1,074 - 1,213 - 1,352 - 1,507 -
- 1,005 - 1,131 - 1,268 - 1,455 - 1,636 - 1,839
- 963 - 1,036 - 1,118 - 1,253 - 1,363 - 1,519
831 943 879 997 924 1,048 1,031 1,172 1,124 1,283 1,251 1,417
803 - 817 - 845 - 960 - 1,056 - 1,175 -
5,031 5,031 6,680 6,680 8,492 8,492 10,61J 10,611 12,472 12,472 14,660 14,660
- 840 - 1,115 - 1,417 - 1,771 - 2,082 - 2,447
- 755 - 958 - 1,180 - 1,438 - 1,662 - 1,954
772 738 958 920 1,151 1,103 1,403 1,343 1,621 1,551 1,905 1,823
744 - 890 - 1,046 - 1,2% - 1,509 - 1,757 -
- 688 - 913 - 1,160 - 1,450 - 1,704 - 2,003
- 654 - 816 - 999 - 1,212 - 1,411 - 1,642
654 642 801 786 961 951 1,165 1,189 1,355 1,397 1,576 1,642
626 - 748 - 885 - 1,082 - 1,257 - 1,478 -
4,133 4,133 5,543 5,543 6,893 6,893 8,161 8,161 9,108 9,108 10,165 10,165
- 750 - 1,006 - 1,251 - 1,481 - 1,653 - 1,845
- 718 - 913 - 1,104 - 1,280 - 1,398 - 1,571
676 699 844 875 996 1,035 1,152 1,198 1,265 1,306 1,412 1,469
648 - 789 - 911 - 1,060 - 1,173 - 1,298 -
LRGVDC Integrated Regional Water Plan Section 3, Page 41

Citv Normal Weather
No conservation Plumbing Only Expected Cons. Advanced Cons.
La Villa Population Below-nonnal Weather
No conservation Plumbing Only Expected Cons. Advanced Cons.
Nonnal Weather No conservation Plumbing Only Expected Cons. Advanced Cons.
McAllen Population Below-normal Weather
No conservation Plumbing Only Expected Cons. Advanced Cons.
Nonnal Weather No conservation Plumbing Only Expected Cons. Advanced Cons.
Integrated Water Resource Plan Lower Rio Grande Valley Development Council
Final Report- Regional Water Requirements and Anticipated Changes
Table 3.19 (Continued) 2000 2010 2020 2030 2040 2050
TWDB LRGVDC TWDB LRGVDC TWDB LRGVDC TWDB LRGVDC TWDB LRGVDC TWDB LRGVDC
- 542 - 726 - 903 - 1,070 - 1,194 - 1,332 - 509 - 646 - 780 - 914 - 1,020 - 1,139
537 505 664 621 780 772 896 914 990 1,020 1,093 1,139 514 - 621 - 718 - 832 - 918 - 1,025 -
2,002 2,002 2,552 2,552 3,154 3,154 3,873 3,873 4,514 4,514 5,159 5,159
- 278 - 354 - 438 - 538 - 627 - 717 - 265 - 317 - 378 - 447 - 511 - 578
244 258 286 303 332 353 395 434 450 506 509 537 233 - 263 - 297 - 360 - 415 - 468 -
- 224 - 286 - 353 - 434 - 506 - 578 - 224 - 286 - 353 - 434 - 506 - 578
193 224 223 286 254 353 299 434 339 506 387 578 184 - 206 - 230 - 273 - 313 - 358 -
116,891 116,891 128,278 128,278 139,070 139,070 154,689 154,689 178,632 178,632 206,280 206,280
- 31,686 - 34,773 - 37,698 - 41,932 - 48,423 - 55,917 - 30,901 - 32,905 - 35,050 - 38,467 - 43,820 - 50,372
30,246 30,246 31,612 31,612 32,869 32,869 36,041 36,041 41,019 41,019 47,137 47,137 29,198 - 29,744 - 30,221 - 33,269 - 38,218 - 43,902 -
- 26,580 - 29,169 - 31,623 - 35,175 - 40,619 - 46,906 - 25,663 - 27,588 - 29,286 - 31,882 - 35,617 - 39,974
26,187 25,270 27,445 26,439 28,507 27,573 31,016 29,976 35,417 34,216 40,667 39,281 25,401 - 25,864 - 26,327 - 28,937 - 33,015 - 37,894 -
LRGVDC Integrated Regional Water Plan Section 3, Page 42

City
Mercedes
Population
Below-normal Weather
No conservation Plumbing Only
Expected Cons.
Advanced Cons.
Normal Weather
No conservation Plumbing Only
Expected Cons.
Advanced Cons.
Mission
Population
Below-normal Weather
No conservation Plumbing Only
Expected Cons.
Advanced Cons.
Normal Weather
No conservation Plumbing Only
Expected Cons.
Advanced Cons.
Palm view
Population
Below-normal Weather
No conservation Plumbing Only
Expected Cons.
Advanced Cons.
Integrated Water Resource Plan Lower Rio Grande Valley Development Council
Final Report- Regional Water Requirements and Anticipated Changes
Table 3.19 (Continued)
2000 2010 2020 2030 2040 2050
TWDB LRGVDC TWDB LRGVDC TWDB LRGVDC TWDB LRGVDC TWDB LRGVDC TWDB LRGVDC
15,%2 15,%2 18,745 18,745 21,797 21,797 25,691 25,691 29,302 29,302 33,421 33,421
- 2,414 - 2,835 - 3,2% - 3,885 - 4,431 - 5,054
- 2,342 - 2,646 - 2,979 - 3,453 - 3,939 - 4,380
2,718 2,289 3,003 2,541 3,321 2,808 3,827 3,223 4,300 3,676 4,867 4,118
2,628 - 2,814 - 3,076 - 3,568 - 4,037 - 4,567 -
- 2,289 - 2,688 - 3,125 - 3,684 - 4,201 - 4,792
- 2,181 - 2,478 - 2,808 - 3,194 - 3,643 - 4,043
2,289 2,146 2,541 2,394 2,808 2,637 3,194 2,993 3,578 3,414 4,043 3,781
2,217 - 2,373 - 2,588 - 2,993 - 3,381 - 3,819 -
43,075 44,401 56,702 57,933 71,664 80,193 89,235 97,764 104,700 113,229 122,846 131,375
- 9,599 - 12,524 - 17,337 - 21,135 - 24,479 - 28,402
- 9,301 - 11,681 - 15,810 - 19,055 - 21,815 - 25,164
8,733 9,102 10,861 11,227 13,085 14,822 16,093 17,850 18,647 20,420 21,742 23,545
8,444 - 10,226 - 12,202 14,993 - 17,475 - 20,366 -
- 8,704 - 11,356 - 15,720 - 19,164 - 22,196 - 25,753
- 8,356 - 10,448 - 14,103 - 16,865 - 19,279 - 22,221
6,948 8,206 8,574 9,994 10,355 13,294 12,594 15,769 14,660 18,137 17,063 20,897
6,707 - 8,130 - 9,633 - 11,895 - 13,839 - 16,100 -
2,607 2,607 3,339 3,339 4,145 4,145 5,102 5,102 5,951 5,951 6,942 6,942
- 508 - 651 - 808 - 994 - 1,160 - 1,353
482 - 576 - 678 - 817 - 940 - 1,104
473 470 557 554 641 636 772 766 887 880 1,034 1,026
438 - 475 - 501 - 612 - 707 - 816 -
LRGVOC Integrated Regional Water Plan Section 3, Page 43

City
Normal Weather
No conservation
Plmnbing Only
Expected Cons.
Advanced Cons.
Pharr
Population
Below-normal Weather
No conservation
P1mnbing Only
Expected Cons.
Advanced Cons.
Normal Weather
No conservation
Plmnbing Only
Expected Cons.
Advanced Cons.
SanJuan
Population
Below-normal Weather
No conservation
Plmnbing Only
Expected Cons.
Advanced Cons.
Normal Weather
No conservation
Plmnbing Only
Expected Cons.
Advanced Cons.
Integrated Water Resource Plan Lower Rio Grande Valley Development Council
Final Report- Regional Water Requirements and Anticipated Changes
Table 3.19 (Continued)
2000 2010 2020 2030 2040 2050
TWDB LRGVDC TWDB LRGVDC TWDB LRGVDC TWDB LRGVDC TWDB LRGVDC TWDB LRGVDC
- 456 - 583 - 724 - 892 - 1,040 - 1,213
- 429 - 516 - 608 - 737 - 847 - 988
473 423 557 497 641 571 772 692 887 793 1,034 925
438 - 475 - 501 - 612 - 707 - 816 -
45,960 45,960 61,198 61,198 77,929 77,929 97,479 97,479 114,631 114,631 134,800 134,800
- 8,443 - 11,242 - 14,316 - 17,907 - 21,058 - 24,763
- 8,186 - 10,488 - 13,006 - 15,942 - 18,747 - 21,894
9,061 8,031 11,379 10,777 13,792 12,221 16,925 14,959 19,774 17,463 23,102 20,384
8,752 - 10,694 - 12,832 - 15,942 - 18,618 - 21,743 -
- 6,950 - 9,254 - 11,784 - 14,741 - 17,334 - 20,384
- 6,693 - 8,500 - 10,562 - 12,884 - 15,023 - 17,666
7,207 6,538 8,980 8,158 10,911 9,951 13,321 12,120 15,408 13,996 18,119 16,458
6,950 - 8,500 - 10,213 - 12,557 - 14,638 - 17,213 -
15,296 25,310 18,967 28,981 22,507 32,521 25,938 35,952 28,571 38,585 31,471 41,485
- 5,245 - 6,006 - 6,739 - 7,450 - 7,996 - 8,597
- 5,103 - 5,616 - 6,156 - 6,725 - 7,131 - 7,621
2,947 4,990 3,463 5,421 3,908 5,756 4,445 6,282 4,833 6,656 5,288 7,110
2,844 - 3,272 - 3,656 - 4,155 - 4,545 - 4,971 -
- 4,083 - 4,675 - 5,246 - 5,799 - 6,224 - 6,692
- 3,941 - 4,350 - 4,736 - 5,155 - 5,403 - 5,762
2,364 3,856 2,762 4,155 3,126 4,444 3,516 4,833 3,808 5,100 4,160 5,437
2,279 - 2,613 - 2,924 - 3,312 - 3,616 - 3,948 -
LRGVDC Integrated Regional Water Plan Section 3, Page 44

City
Weslaco
Population
Below-normal Weather
No conservation Plumbing Only Expected Cons. Advanced Cons.
Normal Weather
No conservation Plumbing Only Expected Cons. Advanced Cons.
County Residents
Population
Below-normal Weather
No conservation Plumbing Only Expected Cons. Advanced Cons.
Normal Weather
No conservation Plumbing Only Expected Cons. Advanced Cons.
Integrated Water Resource Plan Lower Rio Grande Valley Development Council
Final Report- Regional Water Requirements and Anticipated Changes
Table 3.19 (Continued)
2000 2010 2020 2030 2040 2050
TWDB LRGVDC TWDB LRGVDC TWDB LRGVDC TWDB LRGVDC TWDB LRGVDC TWDB LRGVDC
29,435 29,435 36,241 36,241 43,710 43,710 52,820 52,820 61,044 61,044 70,548 70,548
- 4,748 - 5,846 - 7,050 - 8,520 - 9,846 - 11,379
- 4,583 - 5,359 - 6,316 - 7,455 - 8,479 - 9,820
4,946 4,484 5,683 5,156 6,512 5,875 7,692 6,982 8,752 7,932 10,036 9,088
4,748 - 5,318 - 5,973 - 7,100 - 8,137 - 9,325 -
- 4,385 - 5,399 - 6,512 - 7,869 - 9,094 - 10,510
- 4,154 - 4,871 - 5,631 - 6,627 - 7,522 - 8,614
3,924 4,088 4,506 4,709 5,092 5,337 5,976 6,212 6,769 7,043 7,744 8,060
3,792 - 4,222 - 4,700 - 5,621 - 6,359 - 7,349 -
180,699 166,225 252,667 234,589 335,506 305,319 432,829 395,902 510,871 467,028 575,261 522,603
- 26,254 - 35,474 - 46,170 - 59,868 - 70,624 - 79,028
- 25,695 - 32,058 - 40,356 - 50,999 - 59,115 - 66,149
27,297 25,136 34,745 31,007 43,250 37,620 54,598 47,894 63,158 55,453 71,019 62,051
26,084 - 32,481 - 39,491 - 50,235 - 58,579 - 65,220 -
- 21,040 - 28,380 - 36,936 - 47,894 - 56,499 - 63,222
- 20,482 - 26,277 - 34,200 - 44,347 - 52,314 - 58,539
21,832 20,109 27,386 26,277 33,854 34,200 42,478 44,347 48,851 52,314 54,909 58,539
20,820 - 25,688 - 31,223 - 39,084 - 45,989 - 51,044 -
LRGVOC Integrated Regional Water Plan Section 3, Page 45

Integrated Water Resource Plan Lower Rio Grande Valley Development Council
Final Report- Regional Water Requirements and Anticipated Changes
Table 3.19 (Continued)
2000 2010 2020 2030 2040 2050
City TWDB LRGVDC TWDB LRGVDC TWDB LRGVDC TWDB LRGVDC TWDB LRGVDC TWDB LRGVDC
Municipal Collllty Total Population 1544,999 544,999 694,491 694,491 858,591 858,591 1,054,404 1,054,404 1,228,620 1,228,620 1,404,297 1,404,297 Below-normal Weather
No 0 107,713 0 133,302 0 162,861 0 197,847 0 230,161 0 263,669 conservation Plwnbing 0 104,656 0 123,330 0 146,656 0 174,517 0 200,318 0 228,708 Only Expected 102,870 102,416 120,529 119,463 139,264 137,243 166,083 163,601 190,312 187,528 217,161 213,938 Cons. Advanced 99,018 0 112,958 0 127,985 0 153,591 0 177,224 0 201,568 0 Cons.
Normal Weather No 0 90,163 0 111,442 0 136,160 0 165,275 0 192,228 0 220,317 conservation Plwnbing 0 86,924 0 103,201 0 123,596 0 147,657 0 169,512 0 191,363 Only Expected 85,436 85,419 99,230 100,129 114,015 118,400 134,783 141,577 154,048 163,335 175,919 186,382 Cons. Advanced 82,296 0 93,281 0 105,362 0 125,376 0 144,629 0 164,571 0 Cons.
Manufacturing 3,718 3,718 4,115 4,115 4,374 4,374 4,541 4,541 4,927 4,927 5,307 5,307 S.E. Power 1,500 1,500 2,000 2,000 2,000 2,000 2,000 2,000 2,000 2,000 2,000 2,000 Cooling Mining 689 689 670 670 708 708 751 751 796 796 850 850 Irrigation - 742,368 849,696 716,214 604,792 686,997 543,798 656,018 466,592 628,229 3%,286 600,069 322,899 Case A livestock 763 763 763 763 763 763 763 763 763 763 763 763
Subtotal: 749,038 856,366 723,762 612,340 694,842 551,643 664,073 474,647 636,715 404,772 608,989 331,819 Total County Water Use
Below-normal Weather No - 964,079 - 745,642 - 714,504 - 672,494 - 634,933 - 595,488 conservation Plwnbing - 961,022 - 735,670 - 698,299 - 649,164 - 605,090 - 560,527 Only Expected 851,908 958,782 844,291 731,803 834,106 688,886 830,156 638,248 827,027 592,300 826,150 545,757 Cons. Advanced 848,056 - 836,720 - 822,827 - 817,664 - 813,939 - 810,557 -Cons.
Normal Weather No - 946,529 - 723,782 - 687,803 - 639,922 - 597,000 - 552,136 conservation Plwnbing - 943,290 - 715,541 - 675,239 - 622,304 - 574,284 - 523,182 Only Expected 834,474 941,785 822,992 712,469 808,857 670,043 798,856 616,224 790,763 568,107 784,908 518,201 Cons. Advanced 831,334 - 817,043 - 800,204 - 789,449 - 781,344 - 773,560 -Cons.
LRGVDC Integrated Regional Water Plan Section 3, Page 46

Integrated Water Resource Plan Lower Rio Grande Valley Development Council
Final Report- Regional Water Requirements and Anticipated Changes
Table 3.20 Lower Rio Grande Valley Development Council Regional Integrated Water Plan
Consumptive Water Demand Forecasts - Willacy County Compared To Texas Water Development Board Consumptive Water Demand Forcast
(Water use in acre-feet per year) 2000 2010 2020 2030 2040 2050
City T~B ~GffiC T~B ~GWC T~B ~GWC T~B ~GffiC T~B ~GWC T~B ~GWC
Lyford Population Below-nonnal Weather
No conservation Plwnbing Only Expected Cons. Advanced Cons.
Normal Weather
1,900
323 311
1,900
464 447 438
No conservation 300 Plwnbing Only 287
2,150
342 318
2,150
525 482 465
Expected Cons. 258 283 272
340 31 I 299
Advanced Cons. 247 250 Raymondville
Population 10,774 10,774 12,081 12,081 Below-normal Weather
No conservation 6,613 6,541 Plwnbing Only
Expected Cons. Advanced Cons.
6,867 6,3%
Normal Weather No conservation Plwnbing Only
6,698
Expected Cons. 5,757 Advanced Cons. 5,624
County Citizens Population 7,484 Below-normal Weather
No conservation Plwnbing Only Expected Cons. I ,241 Advanced Cons. I, 199
Normal Weather No conservation Plwnbing Only Expected Cons. 989 Advanced Cons. 956
Municipal County Total
5,938 5,853 5,757
7,484
1,241 1,216 1,190
989 956 939
7,416 7,213
7,443 6,942 7,077
6,252 5,954
8,354
6,658 5,4% 6,252
8,354
1,385 1,301
1,301 1,254 1,207
1,104 1,020
1,029 983 954
2,360
357 323
2,360
576 515 484
373 328
280 307 254
13,181 13,181
8,091 7,810
7,855 7,323 7,294
6,600 6,172
9,089
1,344 1,201
7,264 7,028 6,600
9,089
1,507 1,364 1,283
1,201 1,069
1,059 1,008 957
2,507
368 337
2,507
612 534 500
396 359
289 317 267
13,929 13,929
8,550 8,223
8,254 7,692 7,692
6,928 6,506
9,579
1,373 1,255
7,676 7,380 6,928
9,579
1,588 1,406 1,320
1,266 1,084
1,073 1,019 987
2,617
378 349
2,617
639 548 513
413 343
293 322 273
14,459 14,459
8,875 8,487
8,519 7,936 7,952
7,143 6,721
9,915
7,969 7,628 7,143
9,915
1,644 1,433
1,388 1,333 1,277
1,311 1,088
1,077 1,022 1,011
2,732
392 361
2,732
667 569 532
431 355
303 331 282
15,009 15,009
9,213 8,810
8,826 8,221 8,238
8,272 7,902
7,397 7,397 6,960
I 0,048 I 0,048
1,3% 1,283
1,666 1,407 1,317
1,328 1,092
1,080 1,024 1,002
Population 20,158 20,158 22,585 22,585 24,630 24,630 26,015 26,015 26,991 26,991 27,789 27,789 Below-nonnal Weather
No conservation Plwnbing Only Expected Cons. Advanced Cons.
0 0
8,431 8,208
8,318 8,204 8,024
0
0 0
9,086 8,602
LRGVDC Integrated Regional Water Plan
9,326 8,9% 8,661
0
0 0
9,556 8,818
10,174 9,689 9,090
0
0 0
9,995 9,284
10,750 10,163 9,512
0
0 0
10,285 9,578
11,158 10,468 9,782
0
0 0
10,614 9,882
I 1,546 10,786 10,070
0
Section 3, Page 47

~ Integrated Water Resource Plan
Lower Rio Grande Valley Development Council Final Report- Regional Water Requirements and Anticipated Changes
'
Table 3.20 (Continued)
2000 2010 2020 2030 2040 2050 City TWDB LRGVDC TWDB LRGVDC TWDB LRGVDC TWDB LRGVDC TWDB LRGVDC TWDB LRGVDC
Noi1Ilal Weather No conservation 0 7,227 0 8,102 0 8,838 0 9,338 0 9,693 0 10,031 Plwnbing Only 0 7,0% 0 6,827 0 8,425 0 8,823 0 9,059 0 9,349 Expected Cons. 7,004 6,979 7,553 7,534 7,939 7,915 8,290 8,264 8,513 8,487 8,780 8,752 Advanced Cons. 6,827 0 7,158 0 7,383 0 7,760 0 8,005 0 8,244 0
Manufacturing 0 0 0 0 0 0 0 0 0 0 0 S.E. Power Cooling 0 0 0 0 0 0 0 0 0 0 0 Mining 0 0 8 8 5 5 2 2 0 0 0 Irrigation - Case A 54,028 61,203 53,461 53,103 52,577 53,715 51,479 54,405 50,547 55,147 49,505 55,959 Livestock 144 144 144 144 144 144 144 144 144 144 144 144
Subtotal: 54,172 61,347 53,613 53,255 52,726 53,864 51,625 54,551 50,691 55,291 49,649 56,103
Total County Water Use
Below-no=! Weather
No conservation 69,665 62,581 64,038 65,301 66,449 67,649 Plwnbing Only 69,551 62,251 63,553 64,714 65,759 66,889 Expected Cons. 62,603 69,371 62,699 61,916 62,282 62,954 61,620 64,063 60,976 65,073 60,263 66,173 Advanced Cons. 62,380 62,215 61,544 60,909 60,269 59,531
Noi1Ilal Weather No conservation 68,574 61,357 62,702 63,889 64,984 66,134 Plwnbing Only 68,443 60,082 62,289 63,374 64,350 65,452 Expected Cons. 61,176 68,326 61,166 60,789 60,665 61,779 59,915 62,815 59,204 63,778 58,429 64,855 Advanced Cons. 60,999 60,771 60,109 59,385 58,696 57,893
LRGVDC Integrated Regional Water Plan Section 3, Page 48

Integrated Water Resource Plan Lower Rio Grande Valley Development Council
Final Report - Description of Current Water Supplies
4.0 Description of Current Water Supplies
4.1 Falcon-Amistad Reservoir System
The Falcon-Amistad Reservoir System and two channel diversion dams (Anzalduas and Retamal) are operated as a system by the International Boundary and Water Commission (IBWC) to regulate stream flows in the Lower Rio Grande. Several dams have been constructed on the upper reaches of the Rio Grande, and many other dams are located on tributaries in both Mexico and the United States. The Falcon-Amistad Reservoir System provides primary storage to meet the water supply needs of the Lower Rio Grande Valley. Reduction of flood flows along the Lower Rio Grande is also a primary objective of the system operation. A more complete description of the Falcon-Amistad Reservoir System and its operating rules have been included in Appendix L.
Amistad Dam, with construction completed in 1969, is located 12.9 miles upstream of the international bridge at Del Rio, Texas, and Acuna, Coahuila. Falcon Dam, completed in 1953, is located 86.1 river miles downstream from Laredo, Texas, and Nuevo Laredo, Tamaulipas.
In terms of either total capacity or conservation storage capacity, Amistad Reservoir is the second largest reservoir in Texas. Falcon is the fifth largest reservoir in Texas. The two-reservoir storage system has a combined total conservation storage capacity of5,800,000 acre-feet. An additional storage capacity of2,1000,000 acre-feet below the top of the spillway gates in the two reservoirs is used for flood control. Reservoir storage capacity is lost over time due to sedimentation. The IBWC periodically performs sedimentation surveys to determine current conditions. The latest water surface-elevation versus area and capacity relationship reflects 1992 sediment conditions in both reservoirs.
Using the reservoir operations model discussed below in Section 4.1.5 and the IBWC furnished inflows, the annual dependable yield has been estimated to be 1,194,000 acre-feet per year for the United States and 992,000 acre-feet per year for Mexico. Annual dependable yield is defined as the maximum annual diversion rate that can be maintained continuously during repetition of historical period-of-record hydrology, based on specific premises regarding operating policies and other assumptions incorporated in the simulation model. This annual dependable yield is based on historical hydrologic conditions. Additional hydrologic analysis is needed to improve the annual depenable yield estimate by: I) reviewing and improving the estimate of the historical reservoir inflows, 2) accounting for the changes to the historical inflows due to tributary reservoir development, and 3) extending the hydrologic record to cover more of the 1994-1998 drought.
The Falcon-Amistad Reservoir System is owned and operated jointly by the Mexican and United States Sections of the IBWC under the 1944 Treaty. The system is operated to store, conserve, and regulate the waters of the Rio Grande and to generate hydroelectric energy. During normal non-flood periods, releases from conservation storage are made as necessary to meet
LRGVDC Integrated Regional Water Plan Section 4, Page I

a I . .
Integrated Water Resource Plan Lower Rio Grande Valley Development Council
Final Report- Description of Current Water Supplies
water supply demands. Hydroelectric power is generated almost entirely by water released for downstream water supply or spills to evacuate the flood control pools.
Most of the water used in the Lower Rio Grande Valley is regulated by the Falcon-Amistad Reservoir System. Most of the water in these two large reservoir projects is diverted from the river below Falcon Dam. To the extent possible, the Amistad conservation pool is maintained at fairly constant high storage levels, with most of the pool level fluctuations occurring in Falcon Reservoir. In the United States, water users depending on the Falcon-Amistad Reservoir System divert water from the river at hundreds of locations along the of the Rio Grande below Amistad. The largest quantities of the diversions are made by irrigation districts that supply water to municipalities and industries as well as agricultural users. The Watermaster's Office of the Texas Natural Resource Conservation Commission (TNRCC) administers the water rights allocation system for use of water in Texas.
4.1.1 Falcon-Amistad Reservoir Operating Rules
Allocation of the water resources of the Rio Grande Basin is governed by two international treaties and, within the United States, by two interstate compacts. Allocation of the Texas share of the water to irrigators, cities, and other water users is based on state law.
The waters of the Rio Grande above Fort Quitman are allocated separately from the waters of the Rio Grande between Fort Quitman and the Gulf of Mexico. Fort Quitman, Texas is located 90 miles downstream ofEl Paso and 1,150 river miles above the GulfofMexico. The FalconAmistad Reservoir System is operated in accordance with the allocation of waters below Fort Quitman under the 1944 Treaty between Mexico and the United States. Within Texas, the state water rights system, governing U.S. releases from the Falcon-Amistad Reservoir System, is applicable only to the Rio Grande below Fort Quitman. The details of the allocation of waters below Fort Quitman under the 1944 Treaty have been set forth in Appendix L.
4.1.2 Coordination with the TNRCC Watermaster
The United States share of the water supply in the Falcon-Amistad Reservoir System is used to meet the demands in the lower basin as administered by the TNRCC in accordance with the water rights system. A number of visits were made to the Watermaster and her staff during the preparation of this report. The required understanding of the operation of the Falcon-Amistad Reservoir System could have not been achieved without the cooperation of the TNRCC staff
Irrigation districts, individual farmers, municipalities, and water supply corporations communicate their water needs directly to the TNRCC Rio Grande Watermaster Office, with headquarters in McAllen, which in tum schedules releases from the Falcon-Amistad Reservoir System. The ffiWC makes releases as requested by the TNRCC Watermaster. The Watermaster Office maintains records of the amount of water used and the amount of water in reservoir storage allocated to each of the approximately 1,600 water rights accounts.
LRGVDC Integrated Regional Water Plan Section 4, Page 2

Integrated Water Resource Plan Lower Rio Grande Valley Development Council
Final Report- Description of Current Water Supplies
The Watermaster makes daily requests to the ffiWC for releases from the reservoirs. In determining Falcon Reservoir releases for the Lower Rio Grande Valley, the Watermaster Office considers the quantities of water requested by all users and their diversion locations, potential channel losses and gains, watershed runoff and tributary inflows, channel and bank storage, waters stored by weirs, and storage at Anzalduas Dam. Some water users near the coast are more than 200 river miles below Falcon Dam. Requests for releases are made five to seven days in advance to allow for travel time. To aid in scheduling water deliveries, the Rio Grande from Falcon Dam downstream to the lowest gage near the Gulf of Mexico has been divided into seven reaches with each reach having a travel time of approximately one day. The mwc provides the Watermaster information regarding flow rates at the various gages along the river and estimates of the United States' share of the river flows and waters stored at Anzalduas Dam.
Using the diversion information and ffiWC reported available storage, the Watermaster allocates the storage in the Falcon-Amistad Reservoir System to each of the water rights each month. Each water right is limited by both its permitted annual diversion amount and the water available in storage to supply the diversion. The current allocation rules are outlined in the Texas Water Code. Chapter 303.
Each month, the ffiWC informs the TNRCC Watermaster of the total volume of water in storage in the Falcon-Amistad Reservoir System allocated to the United States. The Watermaster Office distributes the storage to all the water rights accounts. The allocation procedure followed by the Watermaster is based on the steps outlined below. Additional detailed information on the process has been included in Appendix L.
1. From the total amount of usable United States water stored in the Falcon-Amistad Reservoir System conservation pools, the first step consists of reserving 225,000 acre-feet for domestic, municipal and industrial uses. This is called the municipal pool. Domestic, municipal, and industrial uses are given highest priority by deducting the municipal pool as the first step in the monthly reallocation.
2. From the remaining storage, the total end-of-month account balances for all irrigation and mining rights are deducted.
3. Next, available water is allocated to an operating reserve that normally fluctuates between 380,000 acre-feet and 275,000 acre-feet, depending on the amount of water in storage. If the amount of water available is between 275,000 acre-feet and 150,000 acre-feet, that amount is allocated to the operating reserve. However, if the balance available for the operating reserve happens to fall below 150,000 acre-feet, deductions are made from the irrigation and mining accounts as necessary to provide 150,000 acre-feet for the operating reserve. The operating reserve provides for loss of water by seepage and evaporation, adjustments required as the United States-Mexico water ownership computations are finalized each month, conveyance losses and emergency requirements.
LRGVDC Integrated Regional Water Plan Section 4, Page 3

Integrated Water Resource Plan Lower Rio Grande Valley Development Council
Final Report- Description of Current Water Supplies
4. Any remaining water in storage is allocated among all the irrigation and mining rights accounts. The storage is basically allocated in proportion to annual diversion rights, except the Class A rights are multiplied by a factor of 1. 7 to allow them a greater storage allocation than Class B rights. Other provisions include limiting each storage allotment to not exceed more than 1. 41 times its authorized diversion right. If an irrigation right does not use water for two consecutive years, its storage amount is reduced to zero.
4.1.3 Coordination with the International Boundary and Water Commission
During the development ofthis study, a number of contacts and coordination meetings were conducted with the IBWC. Much of the coordination has focused on developing a better understanding of the IBWC methodology used in the monthly water accounting procedures. IBWC performs two sets of water accounting calculations. First, they make preliminary, weekly calculations based on current storage in the reservoirs. These calculations are used by the TNRCC Watermaster. On a monthly basis, IBWC performs a detailed accounting calculation and adjusts the weekly determination of national ownership in the reservoirs accordingly. The monthly accounting calculation are reviewed by both the United States and Mexican Sections of IBWC. Once both Sections agree, the calculations are officially adopted.
The monthly water accounting procedure was first used in November 1953 and has been modified somewhat over time. IBWC has a manual that contains the original worksheets that were initially used to make these calculations. Today, the IBWC uses a computer program to make the calculations. A number of sets of inflow computations have been made through the years by the IBWC for the period prior to November 1953. A reliable set of inflow data is important for use in the Reservoir Operations Model discussed below.
The analysis of the IBWC monthly water accounting data for the 1945-1996 period has been summarized in Appendix M. This information has been furnished to the IBWC for their review. A meeting with IBWC was held on September 9, 1998 to discuss discrepancies in the data and these data are under review by the IBWC staff at the present time. This step is extremely important in establishing a reliable set of hydrologic data for the Falcon-Amistad Reservoir System that can be used to measure the combined impacts of developments that have occurred in the total watershed during the existence of the reservoirs. This step also enables the evaluation of potential changes in basin reservoir operating procedures, in both the United States and Mexico, which could impact the quantity of water available from the system in the future.
4.1.4 Coordination with Mexico
Representatives from the Lower Rio Grande Valley have been meeting with representatives from Mexico in sessions arranged by IBWC for a number of years. A meeting was held in February 1998 to discuss the reservoir operation models. A meeting was also held in Monterrey, Mexico on June 16 and 17, 1998 to discuss a number of issues of concern to both countries. Presentations were made by United States representatives on the initial results of Falcon-Amistad
LRGVDC Integrated Regional Water Plan Section 4, Page 4

Integrated Water Resource Plan Lower Rio Grande Valley Development Council
Final Report- Description of Current Water Supplies
Reservoir System modeling work that was underway at that time. This presentation was based on a draft of the material included in Appendix L. The representative from Mexico also presented optimization studies of the Mexico reservoirs in the Rio Conchos watershed. The Rio Conchos is a major tributary to the Rio Grande in Mexico. A summary of this presentation has been included in Appendix N.
One result of the above meeting was the scheduling of a second meeting to discuss in greater detail the methodologies and hydrologic data utilized by each country in the development of the reservoir system models. That meeting occurred in McAllen, Texas on July 10, 1998. Representatives ofboth the United States and Mexico presented detailed descriptions of their country's development of the reservoir model system. Extensive time was invested in responding to questions so that a thorough understanding of the models was achieved.
The intention is to maintain this line of communication through the IBWC with the long-term objective of creating a basin wide (both United States and Mexico) reservoir system model that could be used by both countries. This goal could be a significant step in the maximization of the available water to both countries from the Rio Grande/Rio Bravo Basin.
4.1.5 Review of Reservoir Operation Model
The Reservoir Operations Model (ROM) for the Falcon-Amistad Reservoir System was recently developed by R. J. Brandes Company for the Valley Water Policy and Management Council of the Lower Rio Grande Water Committee, Inc. with funding from the Texas Water Development Board. The ROM simulates the water operations of the Falcon-Amistad Reservoir System using a monthly time step. The Rio Grande system has been simulated using the ROM with a 1945-1996 period -of-analysis.
The ROM was developed by modifying SIMYLD-11 to incorporate (I) the previously discussed rules for allocating Amistad and Falcon inflows and storage between Mexico and the United States pursuant to the 1944 Treaty and (2) water use requirements reflecting the allocation of the United States share of streamflow and storage in accordance with the State water rights system. SIMYLD-11 is a generalized model for simulating reservoir/river system operations and water allocation, which was developed by the Texas Water Development Board (1972). The ROM was developed by expanding the SIMYLD-11 Fortran code to incorporate into the computations the rules for allocating water between the United States and Mexico. Inflows, releases, storage, evaporation, and spills are accounted for separately for Mexico and the United States. The municipal pool, operating pool, and other provisions of the TNRCC Watermaster allocation rules are also incorporated in the model. A more detailed description of the Reservoir Operation Model has been included in Appendix L.
4.2 Existing Water Rights
Water rights in the Lower Rio Grande Valley consist of a three-tiered system of rights with municipal rights taking precedent over agricultural rights. The agricultural rights have two levels
LRGVOC Integrated Regional Water Plan Section 4, Page 5

Integrated Water Resource Plan Lower Rio Grande Valley Development Council
Final Report- Description of Current Water Supplies
(A and B), with A rights holders having precedent over type B holders. The current system came into being in 1971 after years oflegal wrangling over water ownership in the region. State court adjudication set the current system in place based upon several factors. Irrigation rights were distributed in proportion to the amount of land that claimants had historically used for irrigated agriculture. Similarly, municipalities were granted rights based upon historical use plus an allowance for future growth.
Administering the accounts, withdrawals, and transfers of water within the Valley is the responsibility of the Rio Grande Watermaster's office, a division of the Texas Natural Resource Conservation Commission (TNRCC). In order to divert water, a rights holder in the Valley must contact the Watermaster's office to request a release from Falcon Reservoir. The appropriate amount is then deducted from the respective account. Most rights holders must wait before drawing the requested water to account for travel time from the dam to the point of a diversion. This delay may vary from 1 to 5 or more days, depending on location. Irrigation districts which own the various canal systems throughout the Valley then transport the water to the various customers (municipalities, farmers, industry, etc.) in the region. Most municipalities are dependent on irrigation districts to convey water to their cities, and are especially dependent on "piggybacking" their flows on irrigation water during the irrigation season.
As discussed above, the overall allocation process insures municipal supplies first, followed by an operating reserve and conservation needs prior to adding to any agricultural balances. The so-called municipal reserve of225,000 acre-feet is refilled each month prior to any other allocations being made, and within the present set of rules, agriculture must shoulder the majority of adverse impacts of drought. The municipal reserve remains constant throughout the year, regardless of how much water has been withdrawn from municipal accounts.
Current rights in the Valley have been permanently transferred at times. The selling price has been fairly expensive at $700-1,000 per acre-foot per year of supply. Transfer from an agricultural designation to a municipal one requires certification and results in a reduction in the quantity of the right by 80% with respect to Class Band 50% to Class A of water rights. This is an implicit recognition of the more "soft" nature of the agricultural right. Transfer or sale of water has also take place and is relatively inexpensive ($10-$50 per ac-ft). Once the municipal right is established, that water may only be used for that particular use. Cities may not transfer municipal water to irrigators or vice versa. Irrigation districts may transfer water to other districts or municipalities, although some irrigation districts have internal rules limiting or precluding such transactions.
An additional point of note is that the irrigation districts are often the actual rights holders, with the land holders within their respective boundaries only having the right to purchase water at a given rate if it is available. The land holders do not have a fixed right to so many acre-feet of water unless the districts establish "allocations," a situation brought on by reduced account balances in an attempt to allocate the limited supplies more fairly to all concerned land holders. Those limited supplies are usually allocated on a pro rata basis, determined by the relative amount of land owned by each individual.
LRGVDC Integrated Regional Water Plan Section 4, Page 6

Integrated Water Resource Plan Lower Rio Grande Valley Development Council
Final Report- Description of Current Water Supplies
This approach presents some difficulties for producers growing more water intensive crops such as sugar cane or citrus. Their water needs (and investment) on these perennial or semiperennial crops are greater than those growing the more traditional row crops of cotton or grain sorghum. The fact that the irrigation districts hold the water right, and not each land holder, also lessens the overall incentive for individual producers to seek out water saving technologies. Under the majority of pricing schemes currently in use, water is priced on a per acre irrigated basis. Growers pay a one time assessed fee per acre, then pay subsequent fixed rates per irrigation. Water is priced therefore on a per irrigation and not a volumetric basis, and the grower does not benefit financially in most cases from employing water saving technologies. The district receives the same payment for two or three irrigations and also benefits from having more water to sell if the grower has reduced his or her applications from the normally assumed six acreinches per application.
Current water rights for the four-county area (Starr, Hidalgo, Cameron, and Willacy counties), below Falcon Dam as reported by the Austin Office of the TNRCC (January 1999) appear in Table 4.1 Some discrepancies exist between data in the Austin and Rio Grande Valley TNRCC databases and the two are undergoing a process to rectify those differences and establish a single point of control. Several types of water use are permitted, including from municipal and domestic to irrigation, industrial, and mining. Irrigation rights are easily the dominant category with more than 86.6% of the 1.9 million acre-feet total. The amount of irrigation rights has decreased over time as cities have purchased some agricultural rights. Small upstream holders have, in the past, served as a valuable source of liquidity for water rights, and the Valley water rights system has served as one of the more successful water markets in the nation with sales activity occurring in both the permanent and transfer arenas.
Table 4.1 1999 Lower Rio Grande Water Rights by Type of Use
(Values in Acre Feet per Year) Type of Use Total
Municipal/Domestic 209, 169
Industrial 8,855
Irrigation 1,694,392
Mining 458
Total 1,912,874
Source: TNRCC Rio Grande Watermaster, Cindy Martinez, on 2/12/99.
4.3 Groundwater Data
Although not part of the written scope of services for Phase II - Integrated Regional Water Plan, the Policy Management Committee showed interest and asked questions concerning the
LRGVDC Integrated Regional Water Plan Section 4, Page 7

Integrated Water Resource Plan Lower Rio Grande Valley Development Council
Final Report- Description of Current Water Supplies
potential for the use of groundwater as a separate and independent source of supply for the Lower Rio Grande Valley and, it was agreed that the previously published material would be incorporated in the Phase II report. Two principal sources of information are available. Limited text related to groundwater was included in the report on the LRGVDC Regional Water PlanPhase I ( 6). Findings and recommendations on groundwater were also included in the 1990 TWDB study entitled, Evaluation of Ground-Water Resources in the Lower Rio Grande Valley. In 1985 the Sixty-ninth Texas Legislature enacted House Bill2. House Bill2 directed water agencies to identify crucial groundwater areas, conduct studies of those areas, and submit the findings and recommendations to address groundwater problems.
Cameron, Hidalgo, Starr and Willacy Counties were identified as crucial groundwater areas and a study (7) was done in 1990 by the TWDB to address groundwater issues.
Ground Water Quality
The ground water of the Lower Rio Grande Valley is characterized by its generally poor quality in relation to the waters of the Rio Grande. Suiface water from the Rio Grande usually has a dissolved solids content of from 400-750 milligrams per liter (mgll) and is classified as fresh in quality. Ground water from all the aquifers in the study generally exceeds 1,000 mg/1 dissolved solids (slightly saline) and often exceeds 3,000 mg/1 (moderately saline). Additionally, constituents such as chloride and sulfate often exceed the Texas Department of Health recommended drinking water standards, (ATTACHMENT B).
Ground Water Supply
Overall ground water quality is poor to marginal throughout the Lower Rio Grande Valley. Only two areas, the Linn-Faysville area in north central Hidalgo County and the southern portion of Hidalgo County and the southwestern portion of Cameron County along the Rio Grande, yield appreciable quantities of fresh-quality ground water, (ATTACHMENTS B&C).
• 75,000 acre-feet- Estimated yield for each foot that the water level could be lowered along the deposits of the Rio Grande, Baker and Dale(J961).
• Not enough data are available for Linn-Faysville to accurately determine total storage.
• Other areas yield ground water with high dissolved solids, high chloride, and high sulfate concentrations which preclude its widespread use for domestic and irrigation supply.
Source And Occu"ence Of Ground Water
Precipitation. In general, recharge to the aquifers in the study area is by precipitation on the land surface. Water, that does not run off and is not lost through evapotranspiration, percolates into the subsurface. The degree of subsurface infiltration is determined by the
LRGVDC Integrated Regional Water Plan Section 4, Page 8

Integrated Water Resource Plan Lower Rio Grande Valley Development Council
Final Report- Description of Current Water Supplies
permeability of the soil stratum and underlying beds. The soils in the Lower Rio Grande Valley vary in permeability from low, less than 0. 06 inches per hour, to high, 6. 0 inches per hour (U.S. Soil Conservation Service, 1972, 1977, 1981, 1982)
Infiltration. Recharge can also occur in irrigated area by irifiltration of excess irrigated water. Along the Rio Grande and the numerous unlined floodways and irrigation canals, water percolates into the subsurface.
Leakage between formation boundaries. Collectively, the entire suite of geologic strata in the study area form a large, leaky, artesian system in which recharge can occur across formational boundaries where permeable sands are in contact (Muller and Price, 1979)
Water Levels
Figure 9. 0 shows the water-level rise and decline for wells in the study are from 1970 to 1988, as well as selected hydrographs of area wells. In general, water level throughout the Lower Rio Grande Valley show a slight rise of a few feet since 1970. The hydrographs show fluctuations of water level with a trend toward a slightly rising water level. Since ground-water usage is only two percent of total water usage in the Lower Rio Grande Valley, these fluctuations may reflect more than the historical rairifal/ amounts rather than pumpage amounts (ATTACHMENT D).
Potential For Additional Ground Water Development
Given the poor suitability of ground water in the Lower Rio Grande Valley for irrigation, additional groundwater development could only be used to augment public drinking supplies. This could be accomplished in some areas by mixing ground and surface water to extend supplies, and by treatment of poor quality water by such methods as electrodialysis or reverse osmosis. Increased development of ground water along the Rio Grande in Hidalgo and Cameron Counties would have an adverse effect. Since this area is primarily recharged by the Rio Grande, removal of large amounts of ground water could result in lowered flows in the river below Landrum in Cameron County (Baker and Dale, 1961; Preston, 1983). Additionally, heavy pumpage could result in lowering the water levels in these deposits, as happened in the 1950's.
The LRGVDC Regional Water Plan-Phase I contained the following information on groundwater in the Lower Rio Grande Valley.
Groundwater in the Lower Rio Grande Valley (Hidalgo, Cameron, Eastern Starr, and Willacy Counties) has provided a small but steady contribution to the water needs of irrigation, municipalities, industry, and domestic and stock use since the early 1990's. The attached list of papers (Appendix 1) documents the long history of groundwater as an important resource for the region.
LRGVDC futegrated Regional Water Plan Section 4, Page 9

Integrated Water Resource Plan Lower Rio Grande Valley Development Council
Final Report - Description of Current Water Supplies
In the Valley, there is ample ground water available. Baker and Dale (1961) estimated 75,000 acre-feet of ground water per foot of drawdown for the Rio Grande alluvium alone. Preston (1983) estimated 350,000 acre-fee in the deep zone of the Rio Grande Alluvium in the Brownsville area. Historically only a minor amount of available ground water in any of the aquifers has been developed In 1995, 858, 786 acre-feet of total water was used in the Lower Rio Grande region, but only 17,268 acre-feet of ground water had been pumped .from all the aquifers in the Valley. Groundwater represented less than two percent of the total water used This lack of development has resulted primarily because of generally poor ground water quality, the inability to predict where permeable zones with good water quality do exist, and the availability of extensive, low cost, high-quality surface water supplies.
The Executive Summary of the LRGVDC Regional Water Plan-Phase I Report contains the following statements concerning groundwater.
Substantial quantities of groundwater are known to exist in the LRVG. However, groundwater provides only about two percent of the total water demand in the LRGV. The limited development of groundwater is due primarily to its generally poor quality and to the availability of relatively low-cost surface water supplies.
The Executive Summary continues at another point:
Significant groundwater resources underlie much of the LRGV. However, as previously noted, the generally poor quality of groundwater has limited the development and use of this resource. In most areas of the region, the salinity (i.e., dissolved solids) of the groundwater exceeds public health standards for drinking water. The salinity levels of groundwater are, however far lower than that of seawater, which means that treatment costs would be substantially less. Previous studies of the economic feasibility of demineralizing brackish groundwater in the LRGV, using reverse osmosis or electrodialysis reversal technology, have shown promising results. There is also potential for developing brackish groundwater from geopressurizedformations which could provide an inexpensive energy source to power demineralization processes.
4.4 Wastewater Reuse
Although not part of the written scope of services for Phase II- Integrated Regional Water Plan, the Policy Management Committee has also shown interest and asked questions concerning the potential for wastewater reuse as an additional source of water supply for the Lower Rio Grande Valley. It was agreed that available information and the previously published Phase I material would be incorporated in the Phase II report.
The text related to reuse of wastewater that was included in the report on the LRG VDC Regional Water Plan-Phase I is included below.
LRGVOC Integrated Regional Water Plan Section 4, Page I 0

Integrated Water Resource Plan Lower Rio Grande Valley Development Council
Final Report- Description of Current Water Supplies
Treahnentforreuse
As water demand increases in relation to the available water supply, water reuse will become a more attractive source of water supply in the Lower Rio Grande Valley. The following paragraphs summarize the potential types of reuse that could be implemented in the Lower Rio Grande Valley and treatment requirements associated with each.
Urban Reuse
Urban reuse systems can provide reclaimed water for various nonpotable purposes within an urban area. Reclaimed water can be used for irrigation of almost any landscape areas. It is frequently economical to provide reclaimed water to irrigate large tracts such as highway medians, campus areas near public buildings, parks and golf courses. It is somewhat more expensive to provide reclaimed water for irrigating residential/awns, but this is being done in other parts of the country. Reclaimed water can also be used for fire protection or dust control of construction projects. The treatment requirements for urban reuse are dependent upon public accessibility to the site receiving reclaimed water and the type of delivery system. The following water quality limits apply to reclaimed water before discharge to initial holding ponds or a reclaimed water distribution system.
Water Quality Parameter Water Quality Limits BODs or CBOD5
2 5-30 mg/l} Turbidity 3-No Limit (NTU)1
Fecal Coliform 20-200 CFU/100 ml~ Fecal Coliform 75-800 CFU/100 ml4
I 30- day average 2 CBOD5 has an upper limit of 15 mgiL for a delivery system other than a pond system. 3 Geometric mean 4 Single grab sample
Industrial Reuse
Industries represent a significant potential customer of reclaimed water. Potable water quality is not required for many processes. Alternatively, some processes have to apply additional treatment regardless of the source. Cooling water is the predominant industrial reuse application. Other industrial applications for reclaimed water include boiler-feed water, process water, and wash waters. Treatment requirements for industry are very specific to the industry and the proposed use. Generalizations are not meaningful.
LRGVOC lntegrated Regional Water Plan Section 4, Page II

Integrated Water Resource Plan Lower Rio Grande Valley Development Council
Final Report- Description of Current Water Supplies
Agricultural Reuse
Like industries, agriculture also represents a significant potential customer of reclaimed water. Additional treatment is typically not required when reclaimed water is used for agricultural purposes. However, since waters in the Valley tend to have a relatively high mineral content, the suitability of reclaimed water for agricultural reuse may be sitespecific. It will be dependent upon factors such as soil and crop type as well as the mineral composition of the proposed water supply and application methods.
Groundwater Recharge
Reclaimed water may be used as groundwater recharge for various purposes. The purposes of groundwater recharge can include the establishment of saltwater intrusion barriers in coastal aquifers and to prevent or control ground subsidence. It may also include further treatment for future reuse or augmentation of potable and nonpotable acquifers (Camp Dresser & Mckee Inc., I 99 2).
Indirect Potable Reuse
As water demand increases, indirect potable reuse may become a viable alternative for augmenting a public water supply source in the Lower Rio Grande Valley. Studies are currently being conducted in the Lower Rio Grande Valley to determine the feasibility of indirect potable reuse. The type of treatment currently being studied for indirect potable reuse includes biological nutrient removal, microfiltration, reverse osmosis, ultraviolet disinfection, and ozonation at the water treatment plant.
The Executive Summary continues at another point:
Wastewater Reclamation and Reuse
There is considerable potential for reuse and recycling of "reclaimed" water (e.g., treated municipal wastewater effluent) in the LRGV In addition to extending available water supplies, the use of reclaimed water is often seen as an attractive, reliable "drought proof" supply source. Reuse opportunities include such nonpotable applications as irrigation of agricultural crops and urban landscaping (e.g., golf courses and other large turf areas) or as a supply of nonpotable water for industrial processes and cooling. Notably, there are at least two golf courses in the LRGV that use reclaimed water to supply a portion of their water requirements, and the City of Harlingen is currently supplying 2.5 million gallons per day of reclaimed water to an apparel manufacturer for use in its fabric dying operations. There is also a potential for indirect reuse of reclaimed water for potable purposes through the blending of highly treated reclaimed water with raw municipal water supplies. As noted previously, this type of reuse strategy has been recently evaluated for the cities of McAllen and Edinburg.
LRGVDC Integrated Regional Water Plan Section 4, Page 12

Integrated Water Resource Plan Lower Rio Grande Valley Development Council
Final Report- Description of Current Water Supplies
As with other water supply options, the economic feasibility of water reuse in the LRGV is dependent upon a number of factors which tend to be largely site-specific. The most important factors qffecting the cost of using reclaimed water are the quantity and quality of an available source of reclaimed water relative to the quantity and quality requirements of the particular application. For example, the typically high mineral content of wastewater effluent in the LRGV may severely limit irrigation applications, both agricultural and urban. Also, the proximity of a reclaimed water source to a potential application can be a significant cost factor. It is proposed that regional potential and cost-effectiveness of wastewater reclamation and reuse be explored in some detail in Phase II of the IWRP process.
In January of 1997 Perez!Freese and Nichols, L.L.C., in association with Freese and Nichols and CH2M Hill completed the Edinburg/McAllen Reuse Feasibility Study (8) for LRGVDC, City of McAllen, City of Edinburg and TWDB. This study investigated the technical and economical feasibility of wastewater reclamation to augment limited water supply sources in the Lower Rio Grande Valley.
The evaluation indicated that increasing water supply through reuse is likely to cost about twice as much as the cost of obtaining additional water rights through the purchase and conversion of irrigation rights. For Edinburg, 3,833 acre-feet of water rights, or 3.47 MGD, was estimated to cost $0.81 per 1,000 gallons compared to $2.19 per 1,000 for reclaimed wastewater. For McAllen, 6,721 acre-feet of water rights, or 6.0 MGD, was estimated to cost $1.01 per 1,000 gallons compared to $2.02 per 1,000 gallons for reclaimed wastewater.
The report continues that reuse offers several benefits which should be weighted against the additional cost. It stated that the principal benefit is the reliability of this source of water during drought conditions.
"The net costs for purchasing additional rights equivalent to the reclaimed water and providing the additional treatment is summarized in Table 6.1. For Edinburg, the projected reuse cost is about 2-I/2 times the cost of additional irrigation rights. For McAllen, the projected cost for reclaimed water is approximately twice the cost for conventional supply.
It is apparent from the above comparison that the Cities of Edinburg and McAllen may purchase additional Rio Grande water at the assumed rate of $800 per acre-foot/year more economically than they can treat wastewater effluent using the scenarios prepared for this study. If water rights continue to increase in cost as expected, the option of reuse will become more attractive from an economic standpoint."
Unit processes traditionally included in a potable reuse facility include: • Biological treatment (with or without nutrient removal) • High lime treatment with recarbonation
LRGVDC Integrated Regional Water Plan Section 4, Page 13

Integrated Water Resource Plan Lower Rio Grande Valley Development Council
Final Report- Description of Current Water Supplies
• Filtration
• Granular activated carbon • Demineralization (membrane treatment) • Disinfection
In these facilities, the removal of a contaminant is considered a relative measure of the ability of a unit process to act as a barrier to that contaminant. Potable water recovery systems normally contain considerably more contaminant barriers than a conventional water treatment plant, because wastewater is typically of poorer quality that a conventional surface water or groundwater supply.
Under the Safe Drinking Water Act, every state is granted Program Primacy in approving sources for public water supply. It is the designated agency's call as to whether or not a given source is of acceptable quality and of acceptable risk. The TNRCC has indicated that all potential effluent to be reclaimed for potable reuse must be treated to meet or exceed the level of current Rio Grande River Quality.
Several process steps are required to fully implement wastewater reuse. The steps outlined were obtained from the LRGVDC Edinburg/McAllen Reuse Study Final Report and serve as a general indication of the implementation process for wastewater reuse.
Pilot Testing
Pi lot testing is recommended to determine the treatability of the water using one or more of the recommended treatment processes. This is particularly important with the membrane techniques proposed Pilot testing will demonstrate the applicability of newly available membranes which operate at lower pressures, and will allow better estimates to be made of chemical requirements, water loss with the rejected brine, and the quality of the treated product. This information will in tum allow better estimates of the probable capital and operating costs.
TNRCC Review
One meeting was held with representatives of the TNRCC Public Drinking Water Section during this study to assess the regulatory requirements for a planned indirect potable reuse project. They expressed qualified support for a project of this type, provided the treated effluent could be demonstrated to be of equal or better quality to the existing raw water supply. There are no specific treatment techniques required by state or federal regulations, but regulatory support for this type of project wi II be important to its success. It is therefore recommended that the proposed projects be presented to representatives of TNRCC for additional discussions prior to the preliminary design phase.
LRGVDC Integrated Regional Water Plan Section 4, Page 14

Integrated Water Resource Plan Lower Rio Grande Valley Development Council
Final Report- Description of Current Water Supplies
Financing and Rate Study
The proposed projects involve substantial investments by each city, and it will be important to review available funding options and select a suitable financing plan. The possibility of state or federal cost-sharing should also be investigated The innovative nature of the projects, plus the location near the U.S.-Mexico Border may create opportunities for grant.fundingfor portions of the proposed facilities. A rate study is recommended to determine appropriate utility rates to repay funds borrowed for reuse projects and other capital improvements. The rate study should be conducted near the completion of the preliminary design phase to allow updated estimates of project costs to be considered
Environmental Review
A cursory environmental review has been conducted in this study, and it does not appear there are major environmental impacts which would preclude implementation of a reuse project. However, a more complete environmental review should be conducted in the next phase to address the specific projects proposed
Preliminary Design
Following additional discussion of proposed treatment with TNRCC representatives, and completion of the membrane pilot testing, preliminary engineering of each proposed project can be performed This phase would establish the specific layout and sizing of treatment units at each facility and determination of the desired route for required pipelines. The preliminary design report would include a refined estimate of project cost for use in the rate study and arranging project financing. Following completion of the preliminary design report, a final decision can be made to continue with detailed design and construction or to pursue other water supply alternatives.
Final Design, Award and Construction
The final design phase would consist of the preparation of detailed plans and specifications based on the accepted preliminary design. The plans and specifications would allow one or more construction projects to be bid and awarded to contractors for construction. Careful coordination of construction sequencing will be required to maintain operation of essential facilities.
Start-up and Permanent Operation
Project start-up will be particularly important for a potable reuse system. Each component of the system must be adequately tested to confirm its ability to accomplish the treatment goals established for it. When each of the unit processes is performing satisfactorily, effluent can gradually be introduced to the raw water reservoir. As
LRGVDC Integrated Regional Water Plan Section 4, Page 15

Integrated Water Resource Plan Lower Rio Grande Valley Development Council
Final Report- Description of Current Water Supplies
rigorous testing confirms the quality of the water produced, the amount of effluent blended can be increased up to the design capacity of the reclamation facilities.
Public Education/Participation
A key objective of a water utility is to maintain or strengthen public confidence in the drinking water supply. A continuing effort to educate the public and address local concerns should be an integral part of a potable reuse project. Each city has taken an important first step by including the citizens advisory committees in this study. If either city proceeds with implementation of a project, the public outreach should be expanded to include a larger audience with each step. It is hoped that a proactive public education program will not only allay fears from the proposed reuse, but will actually boost consumer confidence in the safety of their water supply.
The LRGVDC Edinburg/McAllen Reuse Study Final Report lists the gross contaminant categories and the potential unit processes for treatment as summarized in Table 4.2. The report also identifies the advantages, disadvantages, capital costs and operating and maintenance costs for a 10.0 MGD capacity for each treatment process as tabulated in Table 4.3.
Table 4.2 Wastewater Reuse Unit Process Contaminant Barrier
Biological Gross Treatment Biological High lime Granular Membrane Membrane Contaminant Biological w!Nutrient Nitrogen w!Recarb- Activated Demineral- Wetland Particle Category Treatment Removal Removal onation Filtration Carbon ization System Removal Suspended X X X X X X X Solids
Dissolved X Solids Biological X X X X X X X X o~:ygen
Demand
Total Organic X X X X X Carbon
Heavy Metals X X X X X
Nutrients X X X X X X
Microbial X X X X X X X Factors
LRGVIX Integrated Regional Water Plan Section 4, Page 16

Integrated Water Resource Plan ~ ~
Lower Rio Grande Valley Development Council Final Report- Description of Current Water Supplies
Table 4.3 Wastewater Reuse Process Evaluation Considerations
Treatment Process Advantage Disadvantage
Chemical Treatment Low Capital Cost Potentially high chemical costs, increase in solids disposal, sludge disposal
Biological Nutrient Reduction in chemical High capital costs Removal treatment costs
Electrodialysis High removal efficiencies High capital and 0 & M Costs. Not Reversal broadly used technology
Filtration Easy operation, high High 0 & M requirements removal efficiencies
Ion Exchange High removal efficiencies High capital and 0 & M costs
Microfiltration High removal efficiencies High capital costs
Natural Soil Filtration Low cost Potential for high electrical costs, Permitting, Right of Capture, Well Head Protection
Ozone Superior in ability to High capital costs, lack of residual inactivate viruses protection
Reverse Osmosis Best overall treatment High capital and O&M costs, Brine process disposal
Ultrafiltration High removal efficiencies High capital and O&M costs
Ultraviolet Requires no chemicals, Lack of residual protection, high Disinfection low O&M costs capital costs
Wetlands Low maintenance Land constraints, Permitting
,, Innovative and Alternative Technology Assessment Manual
2Estimating Water Treatment Costs Vol. 2
Costs (10 MGD) Capitai/O&M
' minimaV$6. 9M
New: $10M/$22M, Modify existing: $3M/$2.2M $9M/$0.5M
"$1.1M/$0. 7M
'$6.9M/$0.8M
$6M/$0.7M
'$2.6M/$0.24M
'$2.9M/$0.4M
1$9.4M/$2.5M
$6M/$1.5M
$1.3M/$0.1M
$7.6M/$0.15M
4.5 Existing Water Supply Governmental Entities and Irrigation Districts
4.5.1 Listing of Governmental Entities Involved in the Supply, Distribution, or Regulation of Water Supply in the Lower Rio Grande Valley
The governmental entities involved in the supply and distribution of water supply in the Lower Rio Grande Valley are listed in Table 4.4. The TNRCC and the IBWC are involved in the regulation of water supply in the Lower Rio Grande Valley.
LRGVDC Integrated Regional Water Plan Section 4, Page 17

1 2 3 4 5 6 7
~ 9 10 11 12 13 14 15 16 17 18 19 20 21 22 23 24
25 26 27 28
Integrated Water Resource Plan Lower Rio Grande Valley Development Council
Final Report- Description of Current Water Supplies
Table 4.4 Existing Irrigation Districts, Municipalities Identified by TWDB
an ater up ply dW S I C orporat1ons l"igation District
Contractual Name Common Name Water Supply Corporations
Adams Gardens Irrigation District No. 19 Adams Gardens District ArroyoWSC Bayview Irrigation District No. 11 Bayview District East Rio Hondo WSC Brownsville Irrigation and Drainage District No. 5 Brownsville El Jardin WSC
Cameron County Irrigation District No. 3, La Feria La Feria District LaJoya WSC
Cameron County Irrigation District No. 4, Santa Maria Santa Maria District Military Hwy WSC
Cameron County Irrigation District No. 6 Los Fresnos District North Alamo WSC
Cameron County Water Improvement District No. 10 Rutherford-Harding Olmito WSC
Cameron County Water Improvement District No. 16 Cameron District #16 Sharyland WSC
Cameron County Water Improvement District No. 17 Cameron District #17 Sunney Dew WSC
Cameron County Water Improvement District No. 2 San Benito District Municipalities Delta Lake Irrigation District Delta Lake District Donna Irrigation District Hidalgo County No. 1 Donna District City of Alamo
Engleman Irrigation District Engleman Gardens Dist. City of Alton
Harlingen Irrigation District No. 1 Harlingen District City of Brownsville
Hidalgo and Cameron Counties Irrigation District No. 9 Mercedes District City of Combes
Hidalgo County Improvement District No. 19 Sharyland Plantation City of Donna
Hidalgo County Irrigation District No. 1 Edinburg District City of Edcouch
Hidalgo County Irrigation District No. 2 San Juan District City of Edinburg
Hidalgo County Water Irrigation District No. 3 McAllen No. 3 City of Elsa
Hidalgo County Irrigation District No. 5 Progreso District City of Harlingen City of Hidalgo
Hidalgo County Irrigation District No. 6 Mission District #6 City of La Feria Hidalgo County Irrigation District No. 16 Mission No. 16 City of La Joya Hidalgo County Irrigation District No. 13 Baptist Seminary City of La Villa Hidalgo County Water Control and Irrigation District Monte Grande Village of Laguna Vista No. 18 City of Los Fresnos Hidalgo County MUD No. 1 City of Lyford Santa Cruz Irrigation District No. 15 Santa Cruz District City of McAllen United Irrigation District of Hidalgo County United District City of Mercedes
Valley Acres Water District Valley Acres District City of Mission
Municipal Utility Districts City ofPalmhurst City of Palmview
Laguna Madre Water District City of Pharr
Palm Valley Estates Utility District City of Port Isabel
Sebastian Municipal Utility District City of Primera
Valley Municipal Utility District No. 2 City of Progreso Town of Ranch Viejo City of Raymondville City of Rio Hondo City of San Benito City of San Juan City of Santa Rosa Town of South Padre Island City of Weslaco
LRGVDC futegrated Regional Water Plan Section 4, Page 18

~ ~
Integrated Water Resource Plan Lower Rio Grande Valley Development Council
Final Report- Description of Current Water Supplies
4.5.2 Comparison of the Legal Authorities of the Various Entities
The key points on legal authorities from the Texas Water Code related to water supply duties and responsibilities for irrigation district, municipalities, and water supply corporations have been provided below.
Irrigation District:
§ 58.121. Purposes of District (a) Irrigation districts operating under this chapter are limited purpose districts
established primarily to deliver untreated water for irrigation and to provide for drainage of lands and such other junctions as are incidental to the accomplishment of such limited purposes. An irrigation district shall not engage in the treatment or delivery of treated water for domestic consumption or the construction, maintenance, or operation of sewage facilities or provide any other similar municipal services. An irrigation district may cooperate with the United States under the federal reclamation laws for the purpose of:
(1) construction of irrigation and drainage facilities necessary to maintain the irrigability of the land;
(2) purchase, extension, operation, or maintenance of constructed facilities; or (3) assumption, as principal or guarantor of indebtedness to the United States on
account of district lands.
(b) An irrigation district operating under this chapter may contract with municipalities, political subdivisions, water supply corporations, or water users for the delivery of untreated water.
LRGVDC Integrated Regional Water Plan Section 4, Page I 9

Integrated Water Resource Plan Lower Rio Grande Valley Development Council
Final Report- Description of Current Water Supplies
§ 58.122. Powers of District
The district has the functions, powers, authority, rights, and duties which will permit the accomplishment of the purposes for which it was created, including the investigation and, in case a plan for improvements is adopted, the construction, maintenance, and operation of necessary improvements, plants, works, and facilities, and the acquisition of water rights and all other properties, land, tenements, materials, borrow and waste ground, easements, right-of-way, and everything considered necessary, incident, or helpful to accomplish by any practicable mechanical means, any one or more of the objects authorized for the district, subject only to the restrictions imposed by the Constitutions of Texas or the United States. A district also may acquire property deemed necessary for the extension or enlargement of the plant, works, improvements, or service of the district.
§ 58.124. Planning
The board may make investigations and plans necessary to the operation of the district and the construction of improvements. It may employ engineers, attorneys, bond experts, and other agents and employees required to perform this duty.
§ 58.125. Construction of Improvements
A district may construct all works and improvements necessary:
(I) for the irrigation of land in the district; (2) for the drainage of land in the district, including drainage ditches or other
facilities for drainage; and (3) for the construction of levees to protect the land in the district from overflow.
§ 58.127. Adopting Rules
A district may adopt and make known reasonable rules to:
(1) prevent waste or the unauthorized use of water; and (2) regulate residence, hunting, fishing, boating, and camping, and all recreational
and business privileges on any body or stream of water, or any body of land, or any easement owned or controlled by the district.
§ 58.136. Power to Contract
The district may enter into a contract for the use by another of its water, facilities, or service, either inside or outside the district, except that a contract may not be made
LRGVDC Integrated Regional Water Plan Section 4, Page 20

Integrated Water Resource Plan Lower Rio Grande Valley Development Council
Final Report- Description of Current Water Supplies
which impairs the ability of the district to serve lawful demands for service within the district.
Municipal:
Among all of the different types of local governments, cities perform the greatest number of functions, both governmental and proprietary. The Texas Municipal League exists to provide services to Texas cities. Among those service, it has assembled a summary of the duties and responsibilities of cities in the area of utilities (9).
Texas law specifically defines and lists certain activities as either governmental or proprietary. The law lists 34 functions that are governmental. Included among them are police and fire protection, health and sanitation services, street construction and design, transportation systems, and establishment and maintenance of jails. Three functions are listed as proprietary: the operation and maintenance of a public utility, amusements owned and operated by the city, and any activity that is abnormally dangerous or ultrahazardous.
There are two categories of cities in Texas: home rule and general law. General law cities are smaller cities whose powers are limited. They operate according to specific state statutes that define their powers and duties. They are restricted to doing what the state directs or permits them to do. If a general law city has not been granted the express or implied power by the state to initiate a particular action, none may be taken.
Home rule cities are cities more than 5,000 in population in which citizens have adopted home rule charters. A charter is a document that establishes the city's governmental structure and provides for the distribution of powers and duties among the various branches of government. In order to be implemented, the charter must be approved by the people at an election. Likewise, changes must be approved by the people by a vote of the people.
The legal position of home rule cities is the reverse of general law cities. Rather than looking to state law to determine what they may do, as general law cities must, home rule cities look to the state constitution, and state statutes to determine what they may not do. Thus, if a proposed home rule city action has not been prohibited or pre-emptied by the state, the city generally can proceed.
Both home rule cities and general law cities have the authority to erect, construct, and maintain a wide variety of facilities for public use, including water and sewage systems. Most Texas home rule and general law cities own water and sewer systems. Among those that own water and sewer systems, the revenue produced by utility billings accounts for a substantial portion of all money taken in at city hall.
Bonds are frequently used to finance major water and sewer improvements. There is only one type of bond secured by a pledge of revenues from an income-producing facility such as a utility system. These obligations are revenue bonds, and usually are designed with the name of the
LRGVDC Integrated Regional Water Plan Section 4, Page 21

Integrated Water Resource Plan Lower Rio Grande Valley Development Council
Final Report- Description of Current Water Supplies
system that pledges the revenues. When utility revenues are pledged to support revenue bonds, the pledge is made of the system' net revenues-- that is, gross revenues minus operating and maintenance costs. Such bonds are payable solely from these revenues, and include a statement on their face that the holder will never be entitled to demand payment from property taxes.
In determining whether the amount of the pledged revenues is sufficient to repay the outstanding revenue bonds of a utility system, analysis will look at the ratio between the system's net earnings and the requirements of principal and interest maturities over a period of years. As a rule, net revenues should be at least 1.25 times larger than the average annual debt service requirements of the system. This ratio is called "coverage," and revenue bonds are said to have 1.25 times coverage, or 2.23 times coverage, and so on. The higher the coverage, the better the security for the bonds, and, all other things being equal, the lower the rate of interest at which the bonds can be issued.
In pledging the revenues of a utility system, it is common to make a "cross pledge," or "combined pledge." This is a pledge of the revenues of one system to repay bonds issued for improvements to a different system: for example, pledging the net revenues of the water system to the payment of bonds issued to improve the sewer system. On the other hand, the revenues of a utility system may not be cross pledged to the payment of bonds issued on behalf of a nonrevenue producing facility. For instance, water system revenues cannot be pledged to the payment of bonds issued to build a city halL
Water Supply Corporation:
The principal law pertaining to water supply corporations is contained in Article 1434a. Water supply or sewer service corporations.
Formation of Corporation Section 1.
On and after the passage of this Act, three or more persons who are citizens of the State of Texas, may form a water supply corporation for the purpose of furnishing a water supply or sewer service, or both, to towns, cities, private corporations, individuals, and military camps and bases and for the purpose of providing a flood control and drainage system for towns, cities, counties, other political subdivisions, private corporations, individuals, and other persons. The incorporators may provide in the charter of such corporation that no dividends shall ever be paid upon the stock and that all profits arising from the operation of such business shall be annually paid out to cities, towns, counties, other political subdivisions, private corporations, and other persons who have during the past year transacted business with such corporation, in direct proportion to the amount of business so transacted, provided that no such dividends shall ever be paid while any indebtedness of the corporation remains unpaid and, provided also, that the directors of such corporation may allocate to a sinking fund such amounts of the annual profits as they deem necessary for maintenance, upkeep, operation and replacements.
LRGVDC Integrated Regional Water Plan Section 4, Page 22

Integrated Water Resource Plan Lower Rio Grande Valley Development Council
Final Report- Description of Current Water Supplies
Contracts with Federal Agencies and Political subdivisions; Power to construct, Acquire, Improve, and Maintain Facilities; Application of Non-Profit Corporation Act. Section 2
(a) The said corporation is hereby vested with power to negotiate and contract with any and all cities, counties, other political subdivisions and Federal Government agencies including, without exclusion because of enumeration, the Emergency Conservation Acts, Public Works Acts, Self-liquidating Acts, Housing Unit Acts, and the Reconstruction Finance Corporation Act of January 22, 1932, Acts of the Seventysecond Congress of the United States of America, First Session, and with others, for the acquisition, construction and/or maintenance of such projects and improvements; to obtain money from such cities, county, other political subdivision, Federal Government agency other sources for the purpose of financing said acquisition, and encumber the properties so acquired or constructed and the income ,fees, rents, and other charges thereafter accruing to the said corporation in the operation of said properties; and to evidence the transaction by the issuance of bonds, notes or warrants to secure the funds so obtained But it is hereby expressly provided that the bonds, notes and/or warrants so issued shall not constitute general obligation or indebtedness of the said corporation, but shall represent solely a charge upon specifically encumbered properties and the revenue therefrom, as herein provided
Acquisition of Water Supply; Operation of Plants and Equipment; Eminent Domain Section 4.
Such Water Supply or Sewer Service Corporations shall have the right to purchase, own, hold and lease and otherwise acquire water wells, springs and other sources of water supply, to build, operate and maintain pipe lines for the transportation of water or wastewater, to build and operate a plants and equipment necessary for the distribution of water or for the treatment and disposal of wastewater, and to sell water or to provide wastewater services to towns, cities and other political subdivisions of the State of Texas, to private corporations and to individuals. Such corporations shall have the right of eminent domain to acquire sites for plants and facilities and to acquire rights-of-way and shall have the right to use the rights-of-way of the public highways of the State for the laying of pipelines under supervision of the Texas Transportation Commission. This section shall only apply to a county with a population of less than 2 million.
4.5.3 Comparison of the Functions of the Various Entities
From the above information, the primary functions of the three entities discussed (irrigation districts, municipalities and water supply corporations) can be compared as follows:
Irrigation Districts: Deliver untreated water for irrigation, and they may contract with municipalities and water supply corporations for the delivery of untreated water.
One question that arises concerns whether the current setup of the irrigation districts is adequate for the future demands on their operation from an institutional standpoint. In general,
LRGVOC Integrated Regional Water Plan Section 4, Page 23

Integrated Water Resource Plan Lower Rio Grande Valley Development Council
Final Report- Description of Current Water Supplies
those irrigation districts are reasonably flexible, especially in light of the recent agreements between districts and cities to exchange water rights for financial aid for improvements. Some concerns do arise as to the further urbanization of the districts and the composition of Boards of Directors. Agricultural residents could have some concern over whether a more urban oriented Board might redirect the purpose of the districts. In addition, the districts will face some challenges as they move from being primarily water sellers to utilities delivering water to the city diversion points. This change in function will be accompanied with some challenges in pricing of those services, but irrigation districts which have assumed this role have fared well.
Municipalities: Both home rule cities and general law cities have the authority to erect, construct, and maintain a wide variety of facilities for public use, including water facilities.
Water Supply Corporations: Can purchase, own, hold and lease and otherwise acquire sources of water; build, operate and maintain transportation facilities; build and operate treatment plants and distribution facilities; and sell water to political subdivisions, private corporation and individuals.
In the simple terms, irrigation districts have been limited to untreated water deliver while municipalities and water supply corporations can be involved in both untreated and treated water delivery. The municipalities and water supply corporations have the ability to contract with irrigation districts for the delivery of untreated water.
4.5.4 Review the Current Service Area of Each Entities and the Projected Future Water Demand in Each Entity
The current service areas of municipalities and water supply corporations have been defined and are controlled under Certificates of Convenience and Necessity. Filings were made by water supply entities in the 1970's to define the limits of their service area. Where conflicts were identified, they were resolved so that only one water supply entity was permitted to serve a specific area or customer with treated water. Contracts between entities to provide service in another's area and the revision of the boundaries through agreements is permitted. Revisions of CCN boundaries have historically occurred in the Lower Rio Grande Valley between municipalities and the surrounding water supply corporation as cities have grown. The annexation of an area into a municipality does not automatically revise the CCN boundaries. The irrigation district limits are defined by legal description of their boundaries that are part of their creation process. The CCN boundaries and the irrigation district boundaries have been obtained and included in the GIS data set information.
The water demands have been defined and estimated for future conditions for the irrigation districts. At the present time, the municipal demands generally define the water demands within their CCN. The county residential demand generally defines the water demands that are supplied by the water supply corporations. As the municipalities increase in population and increase their city limits, a portion of their demand would be supplied by the water supply corporations unless an agreement is reached on adjustments in the CCN boundaries. An estimation of how this might
LRGVDC Integrated Regional Water Plan Section 4, Page 24
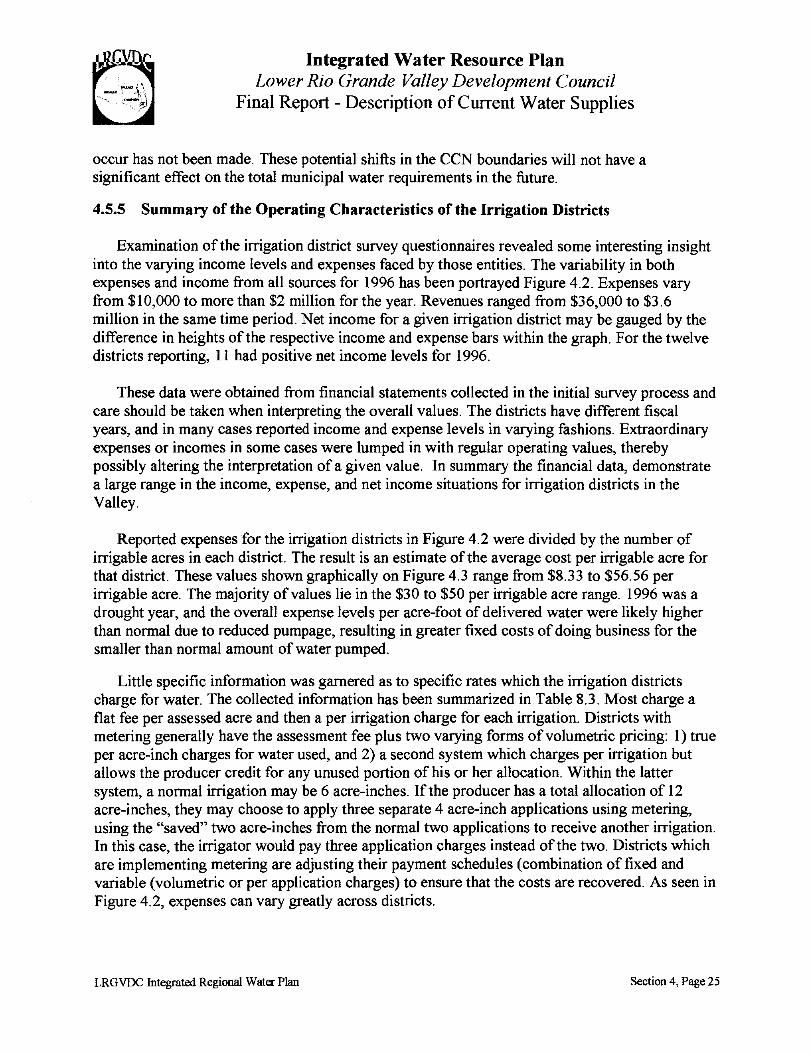
Integrated Water Resource Plan Lower Rio Grande Valley Development Council
Final Report- Description of Current Water Supplies
occur has not been made. These potential shifts in the CCN boundaries will not have a significant effect on the total municipal water requirements in the future.
4.5.5 Summary of the Operating Characteristics of the Irrigation Districts
Examination of the irrigation district survey questionnaires revealed some interesting insight into the varying income levels and expenses faced by those entities. The variability in both expenses and income from all sources for 1996 has been portrayed Figure 4.2. Expenses vary from $10,000 to more than $2 million for the year. Revenues ranged from $36,000 to $3.6 million in the same time period. Net income for a given irrigation district may be gauged by the difference in heights of the respective income and expense bars within the graph. For the twelve districts reporting, 11 had positive net income levels for 1996.
These data were obtained from financial statements collected in the initial survey process and care should be taken when interpreting the overall values. The districts have different fiscal years, and in many cases reported income and expense levels in varying fashions. Extraordinary expenses or incomes in some cases were lumped in with regular operating values, thereby possibly altering the interpretation of a given value. In summary the financial data, demonstrate a large range in the income, expense, and net income situations for irrigation districts in the Valley.
Reported expenses for the irrigation districts in Figure 4.2 were divided by the number of irrigable acres in each district. The result is an estimate of the average cost per irrigable acre for that district. These values shown graphically on Figure 4.3 range from $8.33 to $56.56 per irrigable acre. The majority of values lie in the $30 to $50 per irrigable acre range. 1996 was a drought year, and the overall expense levels per acre-foot of delivered water were likely higher than normal due to reduced pumpage, resulting in greater fixed costs of doing business for the smaller than normal amount of water pumped.
Little specific information was garnered as to specific rates which the irrigation districts charge for water. The collected information has been summarized in Table 8.3. Most charge a flat fee per assessed acre and then a per irrigation charge for each irrigation. Districts with metering generally have the assessment fee plus two varying forms of volumetric pricing: 1) true per acre-inch charges for water used, and 2) a second system which charges per irrigation but allows the producer credit for any unused portion of his or her allocation. Within the latter system, a normal irrigation may be 6 acre-inches. If the producer has a total allocation of 12 acre-inches, they may choose to apply three separate 4 acre-inch applications using metering, using the "saved" two acre-inches from the normal two applications to receive another irrigation. In this case, the irrigator would pay three application charges instead of the two. Districts which are implementing metering are adjusting their payment schedules (combination of fixed and variable (volumetric or per application charges) to ensure that the costs are recovered. As seen in Figure 4.2, expenses can vary greatly across districts.
LRGVDC Integrated Regional Water Plan Section 4, Page 25

Integrated Water.Resource Plan Lower Rio Grande Valley Development Council
Final Report- Description of Current Water Supplies
Figure 4.1 Sample Range of 1996 Revenues and Expenses Lower Rio Grande Valley Irrigation Districts
4,000 ..--------------,
3,000 . ---·--·----·--··----·--·---···--
8 § 2,000 ~
1,000
JSm revenues • expenses
LRGVDC Integrated Regional Water Plan
Figure 4.2 Sample 1996 Expenses per Irrigable Acre
Lower Rio Grande Valley Irrigation Districts
$60 ,-------------,
$50
Q)
::; $40 ~ :ll $30 c: Q) Q.
~ $20
$10
Section 4, Page 26

Integrated Water Resource Plan Lower Rio Grande Valley Development Council
Final Report- Analysis of Water Supply and Requirements
5.0 Analysis of Water Supply and Requirements
5.1 Analysis of Distribution of Regional Water Requirements
In the planning of an integrated regional water system for an area as large as the Lower Rio Grande Valley, consideration should be given to the general distribution of the water demands. This information is needed to assist in the planning of improvements to diversion pump stations, main delivery canals, transmission pipelines, and local/ regional water treatment plants.
5.1.1 Distribution of Water Requirements by County
The projected regional water requirements have been summarized by counties in Tables 5 .I, 5.2, and 5.3. These requirements have been compared with those developed by the TWDB in these tables. For Cameron and Hidalgo Counties, the IWRP projections start out higher than the TWDB projections, but by the year 2010, they are less than the TWDB projections and they remain at a lower level throughout the planning period. The Willacy County projections are greater than those developed by the TWDB throughout the planning period.
Table 5.1 Projected Cameron County Water Requirements
Below-normal Weather, Expected Case (Values in Acre-Feet per Year)
2000 2010 2020 2030
Cameron County Municipal 55,000 62,058 68,669 79,947
Cameron County Citizens 11,448 13,544 15,854 17,016
Total Domestic Demand 66,448 75,602 84,523 96,963
Domestic Transmission Losses @ 20% 13,290 15,120 16,905 19,393
Total Domestic Requirement 79,738 90,722 101,428 116,356
Agricultural Demand 326,771 237,718 224,970 210,267
Agricultural Transmission Losses 111,714 83,131 80,833 78,104
Total Agricultural Requirement 438,485 320,849 305,803 288,371
Manufacturing 1,257 1,391 1,504 1,628
Stearn Electric Power Cooling 3,000 3,000 3,000 3,000
Mining 12 8 4 I
Livestock 1,456 1,456 1,456 1,456
Total Other Requirement 5,725 5,855 5,964 6,085
-Total Water Requirement 523,948 417,426 413,195 410,812
Total TWDB Regional Water 489,308 488,421 488,470 489,521 Requirement
LRGVDC Integrated Regional Water Plan
2040 2050
84,540 89,974
20,622 21,626
105,162 111,600
21,032 22,320
126,194 133,920
199,187 192,934
76,172 75,302
275,359 268,236
1,804 1,985
3,000 3,000
0 0
1,456 1,456
6,260 6,441
407,813 408,597
487,161 482,379
Section 5, Page I

Integrated Water Resource Plan Lower Rio Grande Valley Development Council
Final Report- Analysis of Water Supply and Requirements
Table 5.2 Projected Hidalgo County Water Requirements
Below-normal Weather, Expected Case (Values in Acre-Feet per Year)
2000 2010 2020
Hidalgo County Municipal 77,280 88,456 99,623
Hidalgo County Citizens 25,136 31,007 37,620
Total Domestic Demand 102,416 119,463 137,243
Domestic Transmission Losses @ 20% 20,483 23,893 27,449
Total Domestic Requirement 122,899 143,356 164,692
Agricultural Demand 678,130 481,306 431,970
Agricultural Transmission Losses 171,566 123,486 111,828
Total Agricultural Requirement 849,696 604,792 543,798
Manufacturing 3,718 4,115 4,374
Steam Electric Power Cooling 1,500 2,000 2,000
Mining 689 670 708
Livestock 763 763 763
Total Other Requirement 6,670 7,548 7,845
Total Water Requirement 979,265 755,696 716,335
Total TWDB Regional Water Requirement 851,908 844,291 834,106
2030 2040
115,707 132,075
47,894 55,453
163,601 187,528
32,720 37,506
196,321 225,034
369,551 312,699
97,042 83,587
466,593 396,286
4,541 4,927
2,000 2,000
751 796
763 763
8,055 8,486
670,969 629,806
830,156 827,027
2050
151,887
62,051
213,938
42,788
256,726
253,361
69,537
322,898
5,307
2,000
850
763
8,920
588,544
826,150
LRGVDC Integrated Regional Water Plan Section 5, Page 2

Integrated Water Resource Plan Lower Rio Grande Valley Development Council
Final Report- Analysis of Water Supply and Requirements
Table 5.3 Projected Willacy County Water Requirements
Below-normal Weather, Expected Case uesm ere- eet per ear (Val . A F Y )
2000 2010 2020 2030 2040
Willacy County Municipal 6,834 7,407 7,807 8,192 8,449
Willacy County Citizens 1,190 1,254 1,283 1,320 1,333
Total Domestic Demand 8,024 8,661 9,090 9,512 9,782
Domestic Transmission Losses @ 20% 1,605 1,732 1,818 1,902 1,956
Total Domestic Requirement 9,629 10,393 10,908 11,414 11,738
Agricultural Demand 48,962 42,483 42,972 43,524 44,117
Agricultural Transmission Losses @ 23.9% 12,241 10,621 10,743 10,881 11,029
Total Agricultural Requirement 61,203 53,104 53,715 54,405 55,146
Manufacturing 0 0 0 0 0
Steam Electric Power Cooling 0 0 0 0 0
Mining 0 8 5 2 0
Livestock 144 144 144 144 144
Total Other Requirement 144 152 149 146 144
Total Water Requirement 70,976 63,649 64,772 65,965 67,028
Total TWDB Regional Water Requirement 62,603 62,699 62,282 61,620 60,976
2050
8,753
1,317
10,070
2,014
12,084
44,767
11,192
55,959
0
0
0
144
144
68,187
60,263
The total projected regional water requirements have been summarized in Table 5.4. The total domestic requirements, including transmission losses, increase to slightly less than 400,000 acre-feet per year in the year 2050. This rate of consumption is approximately one third of the yield of the Falcon-Amistad Reservoir System. Even with domestic consumption at this increased level, a significant amount of water remains available for agricultural irrigation and other uses.
LRGVDC Integrated Regional Water Plan Section 5, Page 3

Integrated Water Resource Plan Lower Rio Grande Valley Development Council
Final Report- Analysis of Water Supply and Requirements
Table 5.4 Projected Regional Water Requirements Below-normal Weather, Expected Case
(Values in Acre-Feet per Year)
2000 2010 2020 2030 2040 2050
Cameron County Municipal 55,000 62,058 68,669 79,947 84,540 89,974
Cameron County Citizens 11,448 13,544 15,854 17,016 20,622 21,626
Hidalgo County Municipal 77,280 88,456 99,623 115,707 132,075 151,887
Hidalgo County Citizens 25,136 31,007 37,620 47,894 55,453 62,051
Willacy County Municipal 6,834 7,407 7,807 8,192 8,449 8,753
Willacy County Citizens 1,190 1,254 1,283 1,320 1,333 1,317
Total Domestic Demand 176,888 203,726 230,856 270,076 302,472 335,608
Domestic Transmission Losses @ 20% 35,378 40,745 46,171 54,015 60,494 67,122
Total Domestic Requirement 212,266 244,471 277,027 324,091 362,966 402,730
Agricultural Demand 1,053,863 761,507 699,912 623,342 556,003 491,062
Agricultural Transmission Losses 295,521 217,238 203,404 186,027 170,788 156,031
Total Agricultural Requirement 1,349,384 978,745 903,316 809,369 726,791 647,093
Manufacturing 4,975 5,506 5,878 6,169 6,731 7,292
Steam Electric Power Cooling 4,500 5,000 5,000 5,000 5,000 5,000
Mining 701 686 717 754 796 850
Livestock 2,363 2,363 2,363 2,363 2,363 2,363
Total Other Requirement 12,539 13,555 13,958 14,286 14,890 15,505
Total Water Requirement 1,574,189 1,236,771 1,194,301 1,147,746 1,104,647 1,065,328
Total TWDB Regional Water Requirement 1,403,819 1,395,411 1,384,196 1,381,297 1,375,164 1,368,792
The reported diversions by type of use for the 1991-1997 period have been presented in Table 5.5. The reported types of use are mining, industrial, domestic, municipal, and irrigation. The projected mining is significantly more than the recent reported diversions. The projected steam electric power cooling is slightly greater than the recent reported diversions. The projected municipal and manufacturing have been assumed to be equivalent to the sum of recent domestic and municipal reported diversions. The projected municipal and manufacturing sum is approximately 17.5% greater than the average of the domestic and municipal reported diversions for the 1995-1997 period. A portion of this difference is due to the projected growth, but the remainder may be related to transmission losses that were included in the reported municipal consumption rates that were used for projections.
The Integrated Water Resource Plan projections have been based on the critical assumptions that certain water conservation and water management programs will be implemented and that
LRGVDC Integrated Regional Water Plan Section 5, Page 4

Integrated Water Resource Plan Lower Rio Grande Valley Development Council
Final Report- Analysis of Water Supply and Requirements
urban development will occur. On the municipal side, the water conservation measures incorporated in the projections presented in Section 3 have been assumed to have occurred. On the agricultural side, the savings due to on-farm conservation have been assumed to be achieved. The on-farm savings may be more difficult to achieve due to current economic conditions and lack of financial incentives for irrigators. The computed impact on irrigation requirements due to urbanization is also assumed to occur. The overall estimated reductions in water requirements that result from these assumptions have been summarized in Table 5.6. The total savings indicated in Table 5.6 are exclusive of any water savings that might be achieved due to reductions in transmission losses and are the additional amounts of water that would be required if the water conservation measures were not implemented and if the impacts of urbanization were not taken into account.
Table 5.5 Water Use Values by Type of Use, 1991-1997,
Three-County Area Diversions Mining Industrial Domestic Municipal Irrigation Total
(aj) (a f) (a f) (a f) (a f) (a f)
1991 0 3,432 14,926 122,157 808,898 949,413
1992 0 35 0 25,405 497,436 522,876
1993 0 3,ll1 15,819 ll9,050 817,552 955,532
1994 0 4,245 22,013 144,255 913,548 1,084,061
1995 53 4,576 23,925 160,558 922,672 1,111,784
1996 113 3,510 22,137 161,553 846,765 1,034,078
1997 75 4,340 23,081 162,647 552,754 742,897
These assumed reductions in water requirements have a significant impact on the total water requirements and the need and timing for development of additional sources ofwater supply. The total year-2000 water requirement projected for the planning area in Table 5.4 of 1,574,054 acre-feet per year, assuming the potential demand of 90% of all irrigable acres is met, is approximately 50% greater than the current yield of the Falcon-Amistad Reservoir System. For example, by the year 2020, the total projected water requirement would have increased to 1,618,928 acre-feet per year, or approximately 59% greater than the estimated current yield of the Falcon-Amistad Reservoir System, if water conservation measures have not been implemented and achieved.
LRGVDC Integrated Regional Water Plan Section 5, Page 5

Integrated Water Resource Plan Lower Rio Grande Valley Development Council
Final Report- Analysis of Water Supply and Requirements
5.1.2 Distribution of Domestic Water Requirements by Urban and Rural
For the projected populations as presented in Table 2.7, the percentage of the Cameron County population outside of the municipalities has been projected to increase from 23.4% in 1990 to 25.9% in 2050. For Hidalgo County, the percentage ofthe population outside ofthe municipalities is projected to increase from 31.7 % in 1990 to 41.0% in 2050. The rural population ofWillacy County is projected to decline during the period, from 40.4% in 1990 to 36.2% in 2050.
Table 5.6 Reductions in Water Requirements Due To Assumed Water Conservation
Measures and the Impacts of Urbanization (Values in Acre feet per Year)
Year Domestic Water On-farm Water Urbanization Impact Total Conservation Conservation on Irrigation Water
Savings Savings Requirements 2000 8,900 0 0 8,900
2010 22,400 221,000 71,000 314,400
2020 40,100 201,000 153,000 394,100
2030 52,800 176,000 255,000 483,800
2040 64,700 153,000 345,000 562,700
2050 73.700 132,000 431,000 637,700
The impacts of the population increases on the domestic water requirements, without the transmission losses, for both the municipal and rural areas have been summarized in Table 5. 7. Several important facts can be determined from the data. By the year 2050, approximately 1. 75 times as much demand will occur in Hidalgo County as in Cameron and Willacy Counties combined. Within Hidalgo County, more than thirty percent of the demand will be in the rural areas which will place a significant responsibility on the water supply corporations and the county government if no institutional changes are made. In Cameron County, approximately 19.7% percent of the domestic demand in 2050 will occur in the rural area.
LRGVDC Integrated Regional Water Plan Section 5, Page 6

Integrated Water Resource Plan Lower Rio Grande Valley Development Council
Final Report- Analysis of Water Supply and Requirements
Table 5.7 Municipal and Rural Populations and Demands by County
(Demands in Acre-Feet per Year)
2000 2010 2020 2030 2040
Cameron County
Municipal Population 262,690 309,586 357,761 423,258 451,926
Municipal Demand 55,000 62,058 68,669 79,947 84,540
Rural Population 72,483 93,010 116,014 127,655 158,705
Rural Demand 11,448 13,544 15,854 17,016 20,622
Hidalgo County
Municipal Population 378,774 459,902 553,272 658,502 761,592
Municipal Demand 77,280 88,456 99,623 115,707 132,075
Rural Population 166,225 234,589 305,319 395,902 467,028
Rural Demand 251,136 31,007 37,620 47,894 55,453
Willacy County
Municipal Population 12,674 14,231 15,541 16,436 17,076
Municipal Demand 6,834 7,407 7,807 8,192 8,449
Rural Population 7,484 8,354 9,089 9,579 9,915
Rural Demand 1,190 1,254 1,283 1,320 1,333
5.2 Water Supply of the Lower Rio Grande Valley
5.2.1 Water Availability Defined by the SIMYLD -II ROM
The Falcon-Amistad Reservoir system supplies the vast majority of the water consumed in the Lower Rio Grande Valley. The amount of water historically available from the system is described by a revised SIMYLD-11 Reservoir Operation Model (ROM) (Brandes, 1998). The ROM is based on current operation strategies and constraints as described in Appendix K and Brandes (1998).
Through coordination with ffiWC, it has been determined that the yield estimates published in the SIMYLD-11 model report were based on inaccurate inflow estimates. The inflow estimates have been reviewed for the period from 1945 to 1968 based on current ffiWC procedures. The results of this review are described in Appendix L. Freese & Nichols reviewed these inflows, and through consultation with the ffiWC and Dr. Brandes agreed to correct the estimates for inflows prior to June 1968. These corrections include the following: (1) corrections to the Mexico Amistad inflows prior to 1954 to account for the actual Del Rio flow measurements, (2) the addition of Goodenough spring flow to the US Amistad inflows prior to 1968, and (3) revised inflows between Amistad and Falcon from 1954 to 1968.
Current annual dependable yield estimates for the Amistad-Falcon system based on the revised inflows are 1,473,000 TCM per year (1, 194,000 acre-feet per year) for the US and 1,224,000 TCM per year (992,000 acre-feet per year) for Mexico. With the exception of the
LRGVDC Integrated Regional Water Plan Section 5, Page 7
2050
482,386
89,974
166,437
21,626
881,694
151,887
522,603
62,051
17,741
8,753
10,048
1,317

Integrated Water Resource Plan Lower Rio Grande Valley Development Council
Final Report- Analysis of Water Supply and Requirements
inflow estimates, these yield estimates are based on the same assumptions outlined by Brandes (1998). For all the yield studies, the percentages of different diversion types remains constant as shown in Table 5.8
Table 5.8 Current Distribution of United States and Mexico Demands and Yields
From the Falcon-Amistad Reservoir System United States Use Current Demand Current Yield %
Acre-feet per Year Acre-feet per Year DMI above Falcon 34,000 29,745 2.49
Irrigation above Falcon 127,000 111,169 9.31
DMI below Falcon 125,000 109,410 9.16
Irrrigation below Falcon 1,078,000 943,658 79.04
Total 1,364,000 1,194,000 100
Mexico Use
Total above Falcon 66,000 50,746 5.12
Total below Falcon 1,224,000 941,254 94.88
Total 1,290,000 992,000 100
The critical period for both countries is currently estimated to begin on November 1949 and extend to April 1954 for the US and to June 1954 for Mexico. The yields are about 5% lower than previous estimates for the US and about 12% lower for Mexico. However, possible additional corrections may also be warranted that could increase or decrease the annual dependable yield estimates. Specifically, corrections may be applied to the current treatment of reservoir evaporation as described in Appendix L. In addition, revisions to account for changes in watershed conditions, particularly reservoir development in the Conchos Basin, may reduce yields.
5.2.2 Impacts of Sedimentation on System Supply for the Years 2000 and 2050
The ffiWC has periodically performed bathymetric surveys of Amistad and Falcon in the Rio Grande since their construction in the late 1960's and mid-1950's, respectively. The ffiWC surveys show that sediment accumulation has decreased the storage capacity of both reservoirs over time. The Amistad-Falcon SIMYLD-11 model was used to estimate the yield of the system in 2050, if current sedimentation rates continue to reduce the storage capacity of the reservoirs. The results of this analysis show that if no countermeasures are implemented, sediment accumulation can be expected to eliminate about 150,000 acre-feet per year of the United States yield and about 76,000 acre-feet per year of the Mexico yield from the Falcon-Amistad Reservoir System. Coupling these yield losses with the losses from the new inflow estimates, the
LRGVDC Integrated Regional Water Plan Section 5, Page 8

Integrated Water Resource Plan Lower Rio Grande Valley Development Council
Final Report- Analysis of Water Supply and Requirements
projected United States yield from the Falcon-Amistad Reservoir System in 2050 will be about 1,044,000 acre-feet per year and the Mexico yield will be about 916,000 acre-feet per year.
5.3 Comparison of Water Requirements and Supply
Not all of the yield of the Falcon-Amistad Reservoir System is available to the Lower Rio Grande Valley. Currently, 88.2% of the water use in the basin occurs below Falcon Dam. Similarly, the data in Table 4.1 indicate that only 97% of the water rights below Falcon Dam are in the three county study area. The annual dependable yield of the system available to the study area and the projected water requirements with the current level of transmission losses are shown in Table 5.8.
Two important conclusions can be drawn from this comparison. First, the domestic and other non-irrigation water requirements will represent more than 40% of the estimated yield of the Falcon-Amistad Reservoir System in the year 2050. The TNRCC current operating rules of providing a reserve for these demands and recognizing a higher priority for these uses should continue to provide a high level of protection for non-irrigation needs.
Year
2000
2010
2020
2030
2040
2050
Table 5.9 Comparison of Water Requirements Including Current
Level of Transmission Losses and Supply Percent of
Falcon-Amistad Domestic, Other Percent of Domestic and Reservoir System Non-Irrigation, Falcon-Amistad Other Non- Annual and Irrigation Reservoir System
Irrigation Water Dependable Yield Water Annual Dependable Yield Requirements 20001 205a' Requirements 20001 205a'
224,805 22.01% 25.17% 1,574,189 154.10% 176.24%
258,026 25.26% 28.89% I ,236,771 121.07% 138.46%
290,985 28.49% 32.58% 1,194,301 116.91% 133.71%
338,377 33.13% 37.88% 1,147,746 112.36% 128.50%
377,856 36.99% 42.30% 1,104,647 108.14% 123.68%
418,235 40.94% 46.83% 1,065,328 104.29% 119.27%
1 - Based on annual dependable y1eld of 1,021,514 acre-feet per year avallable to the study area m2000, which 1s 97% of 88.2% of the 1,194,000 acre-feet per year annual dependable yield. 2
- Based on annual dependable yield of 893,184 acre-feet per year available to the study area in 2050, which is 97% of88.2% of the 1,044,000 acre-feet per year annual dependable yield.
Second, the water requirement projections for both domestic and irrigation, including transmission losses of the current levels, have been based on an expanded and more aggressive water conservation programs than those currently in place. They also assume urbanization will reduce the irrigation demand. The estimated year-2050 annual dependable yield of the Falcon-
LRGVDC Integrated Regional Watcr Plan Section 5, Page 9

I~!tegrated Water Resource Plan Lower Rio Grande Valley Development Council
Final Report- Analysis of Water Supply and Requirements
Amistad Reservoir System available to the Lower Rio Grande Valley is less than the projected total requirements throughout the planning period. Normally, this condition would be unacceptable, but this has historically been provided by irrigation water which can be reduced under the operating rules in the case of the Lower Rio Grande Valley. This shortage can be further reduced or eliminated through the achievement of the transmission loss savings described in Section 6.2. These activities will have a significant impact on the balance between the available supply and the requirements, and, consequently, an annual program to collect the relevant data to monitor the changes would seem to be appropriate as discussed in Section 6.
LRGVDC Integrated Regional Water Plan Section 5, Page 10
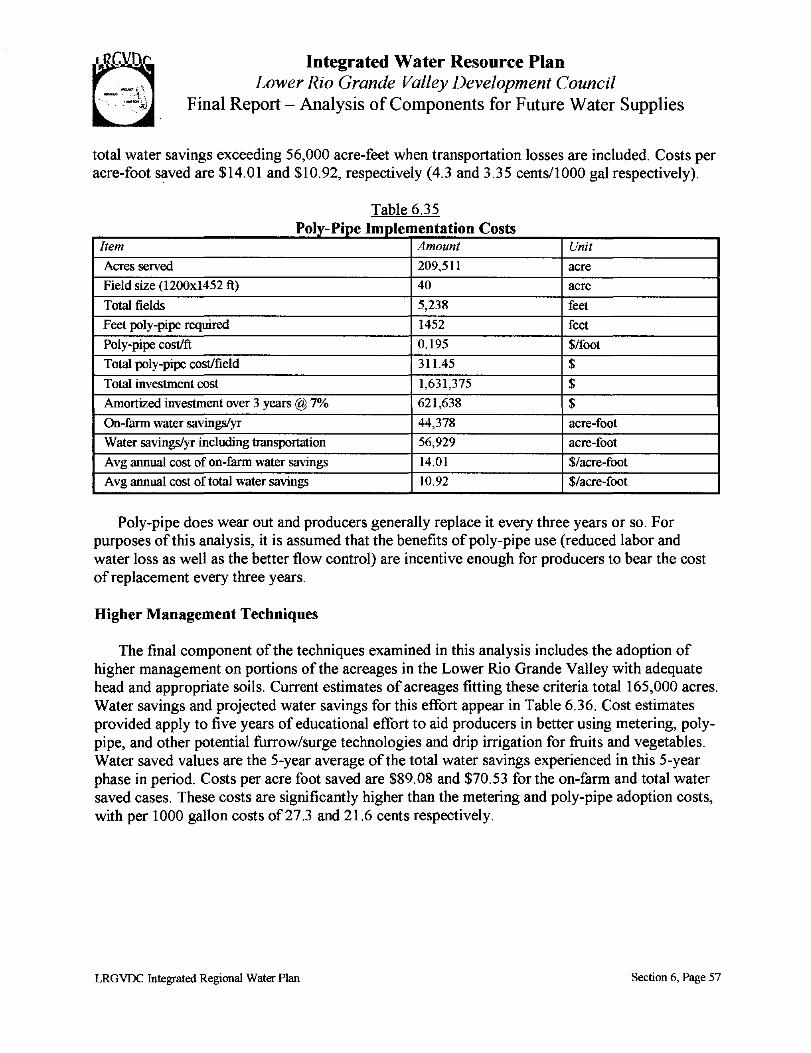
Integrated Water Resource Plan Lower Rio Grande Valley Development Council ~
~ Final Report- Analysis of Components for Future Water Supplies
total water savings exceeding 56,000 acre-feet when transportation losses are included. Costs per acre-foot saved are $14.01 and $10.92, respectively (4.3 and 3.35 cents/1000 gal respectively).
Table 6.35 Oly- tpe mpl ementatton P I p· I I C osts
Item Amount Unit
Acres served 209,511 acre
Field size (1200xl452 ft) 40 acre
Total fields 5,238 feet
Feet poly-pipe required 1452 feet
Poly-pipe cost/ft 0.195 $/foot
Total poly-pipe cost/field 311.45 $
Total investment cost 1,631,375 $
Amortized investment over 3 years @ 7% 621,638 $
On-farm water savingsfyr 44,378 acre-foot
Water savingslyr including transportation 56,929 acre-foot
Avg annual cost of on-farm water savings 14.01 $/acre-foot
Avg annual cost oftotal water savings 10.92 $/acre-foot
Poly-pipe does wear out and producers generally replace it every three years or so. For purposes of this analysis, it is assumed that the benefits of poly-pipe use (reduced labor and water loss as well as the better flow control) are incentive enough for producers to bear the cost of replacement every three years.
Higher Management Techniques
The final component of the techniques examined in this analysis includes the adoption of higher management on portions of the acreages in the Lower Rio Grande Valley with adequate head and appropriate soils. Current estimates of acreages fitting these criteria total 165,000 acres. Water savings and projected water savings for this effort appear in Table 6.36. Cost estimates provided apply to five years of educational effort to aid producers in better using metering, polypipe, and other potential furrow/surge technologies and drip irrigation for fiuits and vegetables. Water saved values are the 5-year average of the total water savings experienced in this 5-year phase in period. Costs per acre foot saved are $89.08 and $70.53 for the on-farm and total water saved cases. These costs are significantly higher than the metering and poly-pipe adoption costs, with per 1000 gallon costs of27.3 and 21.6 cents respectively.
LRGVOC Integrated Regional Water Plan Section 6, Page 57

Integrated Water Resource Plan Lower Rio Grande Valley Development Council
Final Report- Analysis of Components for Future Water Supplies
Table 6.36 High Management Water Savings Cost Calculation
Item Amount Unit
Acres served 165,163 acre
Educational investment (5 yrs @ $200,000) 1,000,000 $
Avg water saved/yr on-farm 27,313 acre-feet
Avg water saved/yr including transportation 34,493 acre-feet
Avg annual cost of on-farm water saved 89.08 $/acre-foot
Avg annual cost of water saved including transportation 70.53 $/acre-foot
6.5.4 Potential Water Quantity Savings through Agricultural Water Conversation Measures
The potential water quantity savings estimated to be available through conservation measures on-farm, as well as the capital costs of those efforts, are summarized in Table 6.37. Values for water saved are 1 0 year averages of the total water saved as the new measures are adopted in the region.
Table 6.37 Potential Water Quantity Savings
Through Agricultural Water Conservation* Savings Capital Investment
On-farm water savings, including 114,973 acre-feet per year $ 8,031,091 transportation losses, with metering On-furm water savings, including 56,929 acre-feet per year $ 1,631,375 transportation losses, with poly-pipe On-farm water savings, including 34,493 acre-feet per year $2,600,000 transportation losses, with high management Total 206,395 acre-feet per year $ 12,262,466
.. *Includes reduced transportatl.on losses due to reduced delivenes to the field which benefits mumctpal and other users.
The initial capital investment is equal to approximately $52.00 per acre-foot, or $0.16 per 1,000 gallons. This cost is well below the estimated costs of$1.23 to $3.07 per 1,000 gallons associated with canal rehabilitation of the major canal system to 800/o delivery efficiency. Note, however, that these measures (metering, poly-pipe, and advanced management) all assume the systems under consideration have adequate head for proper delivery. Water saved values (Table 6.37) do include the reduced transportation losses due to fewer deliveries to the field accompanying the use of the assumed technology and management changes.
LRGVDC Integrated Regional Water Plan Section 6, Page 58

9 , I Integrated Water Resource Plan
Lower Rio Grande Valley Development Council Final Report- Analysis of Components for Future Water Supplies
6.5.5 Potential Funding Mechanisms for On-farm Water Conservation Technology
Several potential funding alternatives exist for at least a portion of the on-farm improvements proposed within the analysis. Use of metering has been shown to have significant merit at a very reasonable cost, and agencies such as the Texas Water Development Board (TWDB) might readily consider aid for the installation of meters for the region. A legislative initiative could be fashioned to help remedy water problems in the Valley, and the estimated $8 million fee for the purchase and installation of meters in the remaining unmetered portions ofthe Valley might well qualify as one of the State's best uses of current budget surpluses. Such funding would greatly aid the Valley in getting ahead of the current impacts of the drought and overcoming the overall current water shortages for agriculture and potential future urban shortages.
A second alternative would be to have a low cost loan program, similar to the one fashioned by the State for adoption of more efficient irrigation systems. Producers and/or irrigation districts could then borrow money at reduced interest rates for purchase of the meters and installation, thereby accelerating the adoption and use of these water saving means. The more efficient irrigation systems program has been in place for some time. Only a limited amount of money has been used in the Lower Rio Granlie Valley because the irrigation district board of directors has to be held personally liable for the loans. The projected savings of 10% assumed in the study with the use of metering is likely conservative in many cases, and the irrigation districts would likely need aid in revising their pricing schedules so as to preserve their financial integrity while maintaining the agricultural base of the region. Greater savings could very likely accrue with a properly fashioned pricing structure. Custom schedules could be developed by trained personnel for each district and use of the resulting programs be required as a condition of receiving financial aid.
Potential funding for the adoption of the use of poly-pipe is assumed to be borne by the individual producer. Direct and immediate on-farm benefits are believed to be sufficient to cover the cost. External funding sources are also generally hesitant to fund purchase of equipment, such as poly-pipe, which have relatively short useful lives. Funding of educational efforts for proper use of the metering and/or poly-pipe, however, is another area that should be presented to the TWDB, and the State legislature for strong consideration. Additional funding for such efforts, potentially through the Texas Agricultural Extension Service, would greatly aid in getting greater use of these technologies in use. Current usage of metering and/or poly-pipe, as noted in the year 2000 conditions, is already fairly high. Slow adopters could be encouraged through greater educational efforts.
Another major source of funding could be cooperative agreements between municipal water users (cities and/or water supply corporations) and the irrigation districts. Discussions on this approach where the municipal water users help fund improvements in the irrigation districts in exchange for either long-term leases or outright exchange of agricultural water rights have been previously conducted in the Lower Rio Grande Valley. Municipalities and water supply corporations are concerned with insuring their long-term water supply situation and the nearby
LRGVDC Integrated Regional Water Plan Section 6, Page 59

Integrated Water Resource Plan Lower Rio Grande Valley Development Council ~
~ Final Report- Analysis of Components for Future Water Supplies
irrigation districts are obvious choices for obtaining the required water at a reasonable cost. The districts benefit by having greater capital for improvements (possibly for canal rehabilitation as well as aiding the adoption of on-farm technology). Past efforts along these lines have generally resulted in additional water savings within the district, allowing even more transfer of water to municipalities as the funded improvements come on line within the districts. A known out-ofstate agreement consists of the contract between the Imperial Irrigation District and the Municipal Water District of California. The latter funded several million dollars worth of canal rehabilitation in exchange for water rights. Water savings fueled by the improvements allowed the transfer of water rights. Similar agreements have recently been reached in the Lower Rio Grande Valley between the City ofRoma and Cameron County Irrigation District No.2.
6.5.6 Description of the Social and Economic Impacts of the Agricultural Water Conservation Measures on the Lower Rio Grande Valley
Use of the proposed remedies will have varying social and economic impacts on the Lower Rio Grande Valley, with the magnitude of those impacts depending primarily on the speed at which they are implemented. The use of metering and poly-pipe already have significant footholds in the region and further adoption appears inevitable. External stimulus for both, through potential state or internal funding, will accelerate that adoption, both in time and extent. Obvious impacts are the maintenance of some types of agricultural employment as the agricultural economy is supported in a more stable economic/physical resource environment. Use of metering and improved irrigation technology, such as poly-pipe, will help reduce some of the inherent risk associated with the water allocation system for agriculture in the region. Not all types of employees will benefit from this technology adoption. In some cases, use of poly-pipe reduces labor requirements and the relatively unskilled labor generally associated with moving siphon pipes used with traditional furrow irrigation will have to seek employment elsewhere. This impact may not be significant given that such jobs are seasonal and those involved very likely have already developed other job skills. Other beneficiaries include the equipment and suppliers for agricultural. Increased maintained demand for their products will obviously aid those sectors.
Much greater impacts will occur if major rehabilitation efforts are undertaken for the canal systems. Improvements in the laterals or main canal systems might consist of the lining of earthen canals, installation of pipelines, and installation of automated gates. All of these options require extensive capital investments as well as relatively large construction efforts. The magnitude of the impact depends on the magnitude of the effort. Such rehabilitation efforts will likely be targeted to areas which have the most potential for beneficial results and which are able to obtain funding. In the short run the consultants will benefit as feasibility studies occur. These will be followed by the construction efforts with possible impacts on the materials and housing sectors. External personnel and equipment might very likely be required if the construction efforts are large enough.
Some minor environmental impacts will occur. Saved water in one sector will probably be used in another sector. Some small areas of wetland, previously fed by a leaking canal, may dry
LRGVDC Integrated Regional Water Plan Section 6, Page 60
Integrated Water Resource Plan Lower Rio Grande Valley Development Council ~
~ Final Report- Analysis of Components for Future Water Supplies
up and selected species of wildlife forced to move. On the whole, however, it is believed that much larger impacts will occur due to other forces rather than those accruing due to the proposed remedies of this study. The droughts of 1996 and 1998 resulted in multimillion dollar losses to agriculture and the associated sectors of the Lower Rio Grande Valley economy. Use of the proposed remedies will help soften the blow of such droughts. Urban growth in the area will result in greater economic and social change than that brought about by the adoption of metering, greater use of poly-pipe or rehabilitation of canals. The NAFT A trade agreement, downsizing of U.S. farm supports, and a devaluation of the peso all have much greater impact on the Valley economy than the activities proposed here.
6.6 Analysis of Water Development through Augmentation of Existing Supply Sources with Brownsville Weir and Channel Storage
6.6.1 Conclusions from Previous Reports
The Brownsville weir and reservoir project is proposed at River Mile 47.8 on the Rio Grande, just above the Brownsville gage. The site is 124 river miles downstream from Anzalduas Dam and the pool would be contained within the banks of the Rio Grande. The reservoir would have a capacity of approximately 6,000 acre-feet, a surface area of approximately 600 acres, and a maximum depth of approximately 26 feet.
Brownsville has water rights under Permit 183 8A. This permit was granted in 1956 and it was amended in 1994. The permit grants the right to divert 40,000 acre-feet per year, but diversions can only be made when the flow at the Brownsville gage is at least 25 cfs. The permit also allows for the construction of 26,500 acre-feet of off-channel storage. The project was studied by the IBWC in 1957, in 1981, and in 1983.
Brownsville PUB and Rio Grande Valley Municipal Water authority applied in 1985 in Application 5259 for a joint Brownsville and Retamal project. The application was amended to remove Retamal in 1989 in response to foundation problems and after objections from Mexico. The amendment added use of unallocated storage in Anzalduas and it became the Brownsville/Anzalduas project. The application was amended again in 1994 to remove Anzalduas in response to a ruling on the need to change Texas' Rio Grande operating rules.
A plan was underway in 1998 during the preparation of this study to request an additional amendment for storage only with diversions under Permit 1838A. The weir and reservoir would be constructed for only on-channel storage and diversions would only be made when the flow at the Brownsville gage was at least 25 cfs.
The most recent estimate of the probable construction cost for the Brownsville Weir and Reservoir Project was set at $ 36,500,000. Project opponents have questions about the need for the project in light of anticipated decreasing agricultural demands.
LRGVDC Integrated Regional Water Plan Section 6, Page 61

Integrated Water Resource Plan Lower Rio Grande Valley Development Council
Final Report- Analysis of Components for Future Water Supplies
6.6.2 Descriptions of the International and Ownership Issues Associated with the Project
The Rio Grande is an international river. The planning and management of the river are under the United States and Mexico Sections of the ffiWC. To date, no official position on the Brownsville Weir and Reservoir project has been taken by either section of the ffiWC. The US Section of the ffiWC has responded that they want a demonstration of state support (i.e. permit) for the project before they will approach Mexico about the weir. The sharing of the potential international saved water remains an unresolved issue.
6.6.3 Environmental Issues Associated with the Project
Environmental concerns associated with the project include the possibility of upstream flooding. Environmental concerns associated with reduced flows downstream include impacts to riparian resources (especially the Sabal Palm Refuge and Southmost Ranch), water quality (from wastewater and salt water intrusion), and instream and estuary habitat There may also be impacts on ocelot and jaguarundi habitatin the reservoir pool as well as indirect environmental impacts associated with brush clearing. Concerns have also been expressed about the retention of sediments in the reservoir during low flows and their discharge during flood stages.
6.6.4 Impacts of "no-charge" water on the Project
The Brownsville Weir and Reservoir project should not effect the availability of"no charge" water to upstream users. "No charge" pumping can occur when the Watermaster notifies users that substantial flows exist in the river due to high runoff conditions or flood spills or releases from upstream reservoirs. The conditions that create opportunities for "no charge" pumping are independent of Brownsville project While the project capitalizes on excess water in the river, it cannot limit upstream users ability to capture that water beyond its permit
6.6.5 Potential Water Quantity Savings through Construction of the Brownsville Weir and Channel Storage
The major Mexican diversion from the Lower Rio Grande is to the Anzalduas canal. Only a few small Mexican diversions occur below Anzalduas, while in the US, hundreds of diversions occur up and down the river. The ffiWC maintains five stream gages below Anzalduas, including one below the proposed Brownsville Weir and Reservoir project. The addition of a new accounting point at the Brownsville Weir should not effect the increased yield estimates for the Rio Grande system. The most recent hydrology report for the project bases the yield estimates on capture of only US water (Brandes Co., 1994). The potential sharing of saved international water remains an unresolved issue.
6. 7 Runoff Water Storage
LRGVDC Integrated Regional Water Plan Section 6, Page 62

Integrated Water Resource Plan Lower Rio Grande Valley Development Council
Final Report- Analysis of Components for Future Water Supplies
Significant rainfall events occur in the Lower Rio Grande Valley during the Spring and Fall. Most of this runoff leaves the Valley through natural drainage. Opportunities to store this runoff locally at specific sites should be investigated. Evaporation losses over a year are at least three times the rainfall, and this factor could make this option infeasible unless fairly deep sites are available.
LRGVOC Integrated Regional Water Plan Section 6, Page 63
Integrated Water Resource Plan Lower Rio Grande Valley Development Council
Final Report- Analysis of Components for Future Water Supplies
6.0 Analysis of Components for Future Water Supplies
6.1. Analysis of Water Development through Potential Changes in Falcon- Amistad Reservoir System
Improvements in the Falcon-Amistad Reservoir System operations were one of the several management strategies that have been investigated in conjunction with the development of an integrated water management plan for the Lower Rio Grande Valley. A map of the entire Rio Grande Basin has been included as Figure 6.1. Due to upstream development, only the drainage area below Fort Quitman normally contributes significantly to the Falcon-Amistad Reservoir System. In this segment of the Rio Grande, the Pecos and Devils Rivers are the principal tributaries in the United States and the Rio Conchos and the Rio Salado are the principal tributaries in Mexico.
Potential operational changes to expand water supply capabilities have been briefly outlined in this section. The discussion has been organized on the basis of categories of operational changes as follows.
• multiple reservoir system operations • coordination of the Falcon-Amistad Reservoir System operations with downstream
inflows and storage • coordination of supply management and demand management • reallocation of storage capacity in the municipal and operating pools • multiple-purpose operations • permanent or seasonal reallocation of storage capacity between flood control and
conservation purposes
6.1.1. Preliminary Assessment of Operational Changes in the Rio Grande Water System
Multiple-Reservoir System Operations
Operation of the Falcon-Amistad Reservoir System is based on maintaining constant high levels of storage in Amistad Reservoir while allowing most of the system storage fluctuations to occur in Falcon Reservoir. Maximizing storage in upstream reservoirs is common practice in many river basins, due to the additional flexibility in supplying multiple users, and is required for the Rio Grande by the 1944 Treaty. Water stored in Amistad Reservoir maximizes reliability for diversions located upstream of Falcon Reservoir as well as also being available for diversions downstream of Falcon.
Maximizing storage in Amistad Reservoir also minimizes evaporation. Evaporation losses are significant, averaging about 20 percent of reservoir inflows. During drought conditions, evaporation losses may be much greater than inflows. Evaporation volumes are directly proportional to water surface area. The mean depth or ratio of storage volume to water surface
LRGVDC Integrated Regional Water Plan Section 6, Page I

Figure 6.1
Integrated Water Resource Plan Lower Rio Grande Valley Development Council
Final Report- Analysis of Components for Future Water Supplies
-- Rio Grande Basin
~ N
' 0 ~ 100
SCAlE IN "ILES
• RtWM'Mt O'loGt - 200.001) ..eM -tl£'1
Ao ~ ~- s.ooo ~-mr • IYf ~ ti£SUM)ft CNtR $001) ..ai£-JUl . --. "" 0 Cl.OUO 8ASNS
TEXAS
LRGVDC Integrated Regional Water Plan Section 6, Page 2

Integrated Water Resource Plan Lower Rio Grande Valley Development Council
Final Report- Analysis of Components for Future Water Supplies
area is significantly greater for Amistad Reservoir than for Falcon Reservoir. Amistad's smaller surface area for the storage volume means lower evaporation losses. The ratios of volume to area for full conservation pools are compared as follows.
Volume Area Ratio (acre-feet) (acres) (feet)
Amistad Reservoir 3,151,319 64,438 48.9 Falcon Reservoir 2,653,803 87,181 30.4
Keeping Amistad Reservoir relatively full while allowing most of the storage fluctuations to occur in Falcon Reservoir is already a well-established component of the operating procedures. Opportunities for refinements in the coordination of storage and releases for the two reservoirs may still exist. However, incremental improvements in water supply reliability will be relatively small. Since the cost of implementing improvements would likely be minimal, further studies in this regard may still be warranted.
Coordination of Supply and Demand Management
Storage levels in Falcon-Amistad Reservoir system provide a triggering mechanism for curtailing water use and implementing demand management strategies. The TNRCC W atermaster accounting system for allocating storage to each water right account provides information to users regarding the risk of future water shortages. Individual water users can manage their available supply in accordance with their perception of the risk and consequences of possible water shortages. Water districts, cities, and other public entities may take appropriate action in anticipation of impending shortages. Water rights marketing and implementation of water conservation measures may be triggered by storage in Falcon-Amistad Reservoir System falling to low levels.
The Conditional Probability Model (CPM) (Appendix K) provides a tool for analyzing the risk of shortages. Given a current storage level, probabilities are estimated for the occurrence of water supply failures and reservoir storage levels during the next season or year. The CPM can be used in performing drought planning studies and developing drought management plans. This decision support model can provide water managers additional analytical information upon which to base demand management and supply management decisions during drought conditions.
Reallocation of Storage Capacity in the Municipal and Operating Pools
The United States share of the reservoir storage capacity and streamflow is allocated among users in accordance with the TNRCC administered water rights rules. Domestic, municipal, and industrial water uses have a higher priority than irrigation and mining uses. The municipal storage reserve in the Falcon-Amistad Reservoir System is the mechanism used to assure a higher level of reliability for supplying domestic, municipal, and industrial water uses. The first
LRGVDC futegrated Regional Water Plan Section 6, Page 3

Integrated Water Resource Plan Lower Rio Grande Valley Development Council
Final Report- Analysis of Components for Future Water Supplies
step in the storage accounting procedures is to maintain a reserve of225,000 acre-feet in the tworeservoir system for domestic, municipal, and industrial water use. This reserve is not available to irrigation and mining users.
An operating reserve is also maintained with a target that fluctuates between 380,000 and 275,000 acre-feet depending on the amount of water in storage. Insufficient water may cause the operating reserve to fall below 275,000 acre-feet. If the balance available for the operating pool is between 380,000 and 275,000 acre-feet, the available amount is reserved. However, if the amount, otherwise available for the operating reserve, falls below 150,000 acre-feet, irrigation and mining accounts are reduced as necessary to maintain an operating reserve of 150,000 acrefeet. The operating reserve provides for seepage and other conveyance losses, emergency needs, and adjustments in storage allocations required during finalizing the provisional computations by theiBWC.
The tradeoffs are significant between: (1) maintaining the municipal reserve and associated high reliability for municipal water supply, (2) use of an operating reserve to deal with various contingencies, and (3) maximizing the amount and reliability of irrigation water supplies. Overall system reliability for all users including irrigation must be balanced with the objective of assuring a very high reliability of meeting domestic, municipal, and industrial water needs during infrequent severe drought conditions. The amount of storage specified in the allocation rules for the operating reserve is necessarily somewhat arbitrary.
Multiple-Purpose Reservoir Operations
Interactions between purposes are always important in the management of large multiplepurpose reservoir systems. Falcon-Amistad Reservoir System is operated for water supply, flood control, hydroelectric power, and recreation. Water supply is a high priority primary purpose. Hydroelectric energy is generated with releases that are being made for water supply or spills to empty the flood control storage. Further refinements in coordination between water supply, hydroelectric power, and recreation may be possible, but they are not expected to result in major improvements in water supply.
6.1.2. Coordination of Reservoir System Operation with Anzalduas and Other Reservoirs
Significant flows enter the Rio Grande below Falcon Dam. Since these flows are minimal during drought, their firm or high-reliability yields are minimal. However, use of downstream inflows, when available, combined with releases from the upstream reservoirs during low-flow conditions results in annual dependable yields significantly greater than provided by reservoir releases alone. Relatively small downstream storage facilities may significantly enhance the use of these downstream inflows as well as re-regulating releases from Falcon Reservoir.
Anzalduas Dam facilitates the use of otherwise unregulated flows as well as releases from Falcon Reservoir. The water demands from Falcon Reservoir are based on reservoir release records rather than diversion records. Thus, use of downstream flows is implicit in the reservoir
LRGVDC Integrated Regional Water Plan Section 6, Page 4

Integrated Water Resource Plan Lower Rio Grande Valley Development Council
Final Report- Analysis of Components for Future Water Supplies
system operations. However, the effects of combining downstream inflows and reservoir releases are not explicitly analyzed in that particular ROM simulation.
The Brownsville Weir and Reservoir Project on the Lower Rio Grande in Cameron County is being proposed by the Public Utilities Board of Brownsville and previously in cooperation with the Rio Grande Valley Municipal Water Authority before it was abolished in 1997. Proposals for channel dams on the Lower Rio Grande have been investigated dating back to IBWC studies during the 1950's and TWDB studies during the early 1980's.
Coordination of operations of the Falcon-Amistad Reservoir System with smaller projects to further develop the flows of the Lower Rio Grande is important. The water supply capabilities to be achieved by coordinated management of the entire Rio Grande reservoir/river system should be significantly greater than the sum of individual projects operated independently.
Table 6.1 Annual Quantities in Amistad/Falcon ROM Simulation
Quantities in acre-feet per year) Year U.S. Inflows U.S. u.s. U.S. Mexico Mexico Mexico Mexico
Evaporation Shortages Spills Inflows Evaporation ShorlaJ<eS Spills 1945 1,448,203 626,461 0 0 1,161,389 369,920 0 c 1946 1,718,854 498,710 0 0 1,430,841 253,136 0 c 1947 1,399,130 496,860 0 0 1,040,063 219,589 0 c 1948 2,049,024 418,506 0 0 1,209,768 195,842 0 c 1949 2,449,097 439,485 0 0 1,484,898 187,034 0 c 1950 1,341,569 501,360 0 0 914,227 168,434 0 c 1951 1,114,512 358,073 0 0 730,486 101,871 0 c 1952 736,293 242,023 0 0 492,901 21,029 398,309 c 1953 885,469 185,984 860,016 0 1,225,231 91,454 884,138 0 1954 3,970,792 355,743 101,094 0 1,114,520 174,659 0 0 1955 1,423,811 363,131 0 0 1,021,620 156,729 0 0 1956 708,265 306,970 0 0 450,154 51,996 0 0 1957 2,304,200 277,942 16,771 0 1,292,030 29,100 215,579 0 1958 3,257,139 270,871 0 0 3,501,723 52,365 288,182 0 1959 1,814,229 505,702 0 0 1,157,285 322,452 0 0 1960 1,487,304 520,455 0 0 1,156,303 231,120 0 0 1961 1,611,853 472,210 0 0 1,208,544 203,848 0 0 1962 1,129,269 446,423 0 0 751,165 166,75 0 0 1963 1,030,13" 300,656 0 0 788,451 56,390 0 0 1964 2,152,091 228,464 751 0 1,221,088 36,067 461,084 0 1965 1,374,399 291,301 0 c 839,779 33,711 0 0 1966 1,709,701 232,761 0 c 1,420,305 17,335 344,317 0 1967 1,667,42" 275,927 0 c 1,467,261 57,293 178,838 0 1968 1,285,961 223,078 0 c 1,223,323 76,271 0 0 1969 1,190,540 203,216 0 c 1,087,842 73,791 0 0
LRGVDC Integrated Regional Water Plan Section 6, Page 5

Integrated Water Resource Plan Lower Rio Grande Valley Development Council ~ u Final Report- Analysis of Components for Future Water Supplies
Table 6.1 (Continued)
Year U.S. Inflows U.S. U.S. U.S. Mexico Mexico Mexico Mexico Evaporation Shortages Spills Inflows Evawration Shortages Spills
1970 1,141,815 144,056 199,248 0 903,603 23,467 279,381 c 1971 3,984,106 250,293 255,680 471,541 3,794,270 117,636 385,434 1,024,23'1 1972 1,876,700 516,074 0 0 1,473,295 225,328 0 (
1973 1,625,856 446,341 0 0 1,420,82/ 192,899 0 c 1974 3,317,228 486,178 0 228,793 1,517,152 215,152 0 23,775 1975 1,974,648 501,67S 0 121,492 1,662,148 348,340 0 163,65C 1976 2,669,234 455,515 0 741,291 2,467,178 301,686 0 831,58C' 1977 1,627,565 519,168 0 0 1,105,771 357,243 0 28,647 1978 2,299,662 471,355 0 77,640 2,318,49" 241,645 0 347,786 1979 1,839,699 517,195 0 121,055 1,566,850 376,443 0 122,808 1980 1,738,551 519,791 0 c 1,361,638 307,859 0 0 1981 2,882,903 457,589 0 598,68S 2,668,850 327,362 0 764,390 1982 1,458,930 519,224 0 0 1,003,189 331,873 0 0 1983 1,253,672 450,292 0 (] 788,763 198,716 0 0 1984 1,320,549 398,42' 0 0 1,018,808 130,341 0 0 1985 1,467,746 286,512 0 0 1,146,181 70,944 0 0 1986 2,264,721 286,971 0 0 1,748,591 67,188 55,407 0 1987 2,428,644 388,036 0 0 1,952,463 198,949 0 0 1988 2,009,094 451,997 0 0 1,761,635 230,98 0 0 1989 1,333,316 527,621 0 0 874,095 276,954 0 (]
1990 2,495,386 441,759 0 c 2,226,809 200,797 0 (]
1991 2,336,391 521,725 0 26,13' 2,215,339 352,495 0 247,055 1992 2,220,265 531,723 0 299,67C 1,906,695 391,271 0 406,941 1993 1,431,890 561,194 0 c 1,018,709 346,351 0 0 1994 1,219,854 500,058 0 c 744,394 218,430 0 (]
1995 1,113,964 388,442 0 c 628,732 88,055 0 (]
1996 1,184,139 298,58'7 0 c 701,431 22,151 489,349 0
Mean 1,803,381 401,541 27,568 51,66C 1,372,829 182,861 76,539 76,171
6.1.3 Impacts of Converting Flood Storage to Conservation Storage
Approximately 1/3 of the total controlled storage capacity below the top of the spillway gates in Amistad Reservoir is designated for flood control. About 16 percent of the controlled storage capacity below the top of the spillway gates in Falcon Reservoir is designated for flood control. The flood control pools remain empty except during and following a flood event. Permanent or seasonal reallocation of a portion of the flood control storage capacity can be implemented by simply raising the designated top of conservation pool elevation.
Rule curve operations in which the allocation of storage between the flood control and conservation pools varies seasonally are common in many areas of the United States with distinct flood seasons. However, seasonal rule curve operations typically have not been adopted in Texas largely because the likelihood of flooding is significant throughout the year.
LRGVDC Integrated Regional Water Plan Section 6, Page 6

Integrated Water Resource Plan Lower Rio Grande Valley Development Council
Final Report- Analysis of Components for Future Water Supplies
Permanent reallocations are also being considered as demands on limited water resources intensify in many regions. The majority of the major reservoirs in the United States with both flood control and water supply storage are owned and operated by the U.S. Army Corps of Engineers, with the U.S. Bureau ofReclamation having the next largest number of such reservoirs. The Corps ofEngineers has investigated permanent reallocation of flood control storage to water supply at a number of reservoirs throughout the United States and in some cases reallocations have been implemented (IO).
Current ffiWC operating procedures include sometimes storing water in the flood control pool during the period November through April when the threat of flooding, related particularly to hurricanes, is minimal. There are no set rules for this seasonal storage reallocation. The amount of flood control storage capacity seasonally used for water supply storage has varied considerably from year to year ranging from none to a maximum of about I 00,000 acre-feet in each reservoir.
The Reservoir Operations Model (ROM) provides an opportunity for a preliminary investigation of the potential for increasing the water supply capabilities of the Falcon-Amistad Reservoir System by raising the designated top of conservation pools. The current operating policy reflected in the basic ROM simulation includes increasing the conservation storage by I 00,000 acre-feet in each reservoir during the period November-April each year by using this much of the flood control pools. The ROM has been rerun to simulate alternative storage reallocations as outlined below.
Diversion shortages and diversion spills for each year of the I945-I996 simulation have been tabulated in Table 6. I. No municipal shortages occur for the U.S. During the period of analysis, i.e. all of the shortages in Table 6.I are irrigation demand. Although no spills occur in the period of analysis prior to the shortages, flood water transfers between the U.S. and Mexico do occur. Thus, the potential for a reduction in shortages from a storage reallocation is very small
Alternative Reallocation Plans
The ROM was rerun with several different storage amounts reallocated from the flood control to the conservation pools of Falcon-Amistad Reservoir System, in order to evaluate the general sensitivity of water supply capabilities to increases in designated conservation storage capacity. The alternative storage reallocation plans have been defined in the first three columns of Table 6.2 and first five columns of Table 6.3. The original operating plan is labeled Plan 0, and the alternative reallocations are designated Plans I through 6. The original operating plan (Plan 0) includes temporarily reallocating IOO,OOO acre-feet of flood control storage to the conservation pool of each reservoir during November through April of each year. Plan I consists of removing the seasonal reallocation with everything else remaining constant. No flood control storage is used in Plan I. In Plan 2, IOO,OOO acre-feet of flood control storage is permanently reallocated to water supply in each reservoir. The difference between Plan 2 and Plan 0 is that the Plan 2 reallocation is permanent rather than seasonal. Plan 2 is identical to Plan I except for raising the
LRGVOC Integrated Regional Water Plan Section 6, Page 7

Integrated Water Resource Plan Lower Rio Grande Valley Development Council
Final Report- Analysis of Components for Future Water Supplies
top of conservation pool to add 100,000 acre-feet of conservation storage in both Falcon and Amistad Reservoirs (200,000 acre-feet total). In Plan 3, 200,000 acre-feet of flood control storage in each reservoir is permanently reallocated to water supply. Plan 6 represents the extreme of reallocating most of the flood control storage in the two reservoirs to water supply. All conservation storage capacity in Amistad Reservoir is allocated 56.2% to the United States and 43.8% to Mexico. The allocation ofFalcon storage is 58.6% U.S. and 41.4% Mexico.
Plan
0 1 2 3 4 5 6
Plan
0 I 2 3 4 5 6
Table 6.2 D ivers1on s horta~es or ternative fi AI S tora~e Reallocation p laos
Reallocation (acre-feet) U.S. Shortages Mexico U.S. Evaporation Mex. Shortages Evaporation
Amistad Falcon (1, 000 acre-feet) (1, 000 acre-feet) (1, 000 acre-foet) (1, 000 acre-feet)
original operating plati 1,434 3,980 20,880 9,509 no seasonal reallocatio~ 1,469 4,122 20,821 9,311
A
IOO,OOC 100,00C 1,437 200,000 200,000 1,434 300,00C 300,000 1,379 400,000 350,000 1,371
1,000,000 350,000 1,043
nnua ID epen a e ae s or ternative Table 6.3
d bl y· ld fi AI
3,930 21,170 9,55~
3,731 21,398 9,800 3,629 21,642 10,020 3,527 21,840 10,144 3,480 22,796 10,226
s to rage R II ea ocation PI ans Reallocation (acre-feet) U.S. Shortages Mexico Shortages U.S. Evaporation Mex. Evaporation
Amistad Falcon (1, 000 acre-feet) (1,000 acre-feet) (1,000 acre-feet) (1, 000 acre-feet)
origina operating plati 1,434 3,980 20,880 9,50S no seasonal reallocation 1,469 4,122 20,821 9,311 100,000 100,000 1,43" 3,930 21,170 9,55 200,000 200,000 1,434 3,731 21,398 9,80( 300,000 300,000 1,379 3,629 21,642 10,02( 400,000 350,000 1,371 3,521 21,840 10,144
1,000,000 350,000 1,043 3,480 22,796 10,226
All of the ROM simulations begin in January 1945 with the same amount of water in storage. In all of the plans, the initial January 1945 storage content is set at the same level, which is the original (Plan 0) May-October top of conservation storage capacity. These two-reservoir system storage totals are 3,326,170 acre-feet for the United States and 2,4 78,952 acre-feet for Mexico. Plan 0 is the only plan in which the conservation storage capacity varies seasonally. The November-April two-reservoir conservation storage capacities are 3,440,970 acre-feet allocated to the United States and 2,564,152 acre-feet allocated to Mexico. The only difference in operating plans I through 6 is the amount of designated conservation storage capacity, as tabulated in Table 6.3.
LRGVDC Integrated Regional Water Plan Section 6, Page 8

~ 0
Figure 6.2
Integrated Water Resource Plan Lower Rio Grande Valley Development Council
Final Report- Analysis of Components for Future Water Supplies
Rio Grande Basin Stream Gage Stations
The results of seven runs of the ROM with alternative storage reallocations have been presented in Table 6.2 in terms of the effects on reducing diversion shortages. Shortages represent failures to fully meet the specified water demands. These simulations all incorporate estimates of current water demands, totaling 1,364,000 acre-feet per year for the United States and 1,290,000 acre-
LRGVOC Integrated Regional Water Plan Section 6, Page 9

9 . \ Integrated Water Resource Plan
Lower Rio Grande Valley Development Council Final Report- Analysis of Components for Future Water Supplies
feet per year for Mexico. The diversion shortages with the original operating plan, have been listed first in Table 6.2 as Plan 0. Table 6.2 shows that the shortages are reduced by increasing the designated conservation storage capacity, but some shortages occur even with the extreme reallocation of Plan 6.
6.1.4 Description of Ways a Real- Time SCADA System could be Useful for Reservoir Operation and Monitoring
SCAD A systems provide real-time information about complex systems. SCAD A stands for Supervisory Control And Data Acquisition, and elements of a SCAD A system can be found throughout the Rio Grande Basin. The IBWC/CILA, USGS, and CNA maintain stream gage stations within the basin as shown in Figure 6.2. Almost all of the US gages have some form of telemetry, so that data from the gages can be gathered remotely. Within the Lower Rio Grande Valley below Falcon, the Watermaster monitors flow in the Rio Grande using radio telemetry. From Presidio to Laredo, IBWC stream gages can be monitored using a LANLINE telephone system, and the Fort Quitman gage below El Paso is accessed via satellite as part of the Bureau ofReclamation HYDRO-MET system. A consolidation and update of these components would facilitate the management of the Amistad-Falcon reservoir system and the Rio Grande River below Falcon.
Within its year 2000 budget request to Congress, the IBWC requested $1.5M to improve flow measurement in the Rio Grande. Included in their request is a proposal to update and consolidate telemetry throughout the basin and make preliminary flow measurements available on the internet. The IBWC would like to pattern their new system after the satellite system created by the USGS. Ken Rakestraw of the IBWC and Richard Hawkinson of the USGS met in late October of 1998 to discuss the logistics of the USGS system. Although the IBWC is interested in upgrading its telemetry, the improvements are not a high priority, and they may easily be delayed.
The Watermaster monitors flow from gages in the Lower Rio Grande below Falcon using a system of radio transmitters. The Watermaster uses real-time gage height measurements and calibration factors provided by the IBWC to estimate the flow in the river. They base their release requests to the IBWC on these flow estimates. If the Watermaster can see that tributary flow below Falcon is supplementing Rio Grande flow, they may request less be released from the Amistad-Falcon system. The Watermaster monitoring system is relatively simple, consisting of only a radio receiver and a 286 PC for displaying a table of measurements. Nevertheless, the system does effectively show the current river conditions. Many of the components of other full scale river management systems are not currently available to the Watermaster.
Within the scope of a SCADA system for water users in the Lower Rio Grande, the IBWC maintains the data acquisition function of the current system through its stream gages and radio telemetry. Other river management systems monitor precipitation gages, weather stations, and anemometers with additional remote terminal units (RTUs). Such weather information could also serve the Watermaster about the need to call for releases from Amistad and Falcon. In addition to
LRGVDC Integrated Regional Water Plan Section 6, Page I 0

,..,_ Rio Grande Basin
~ N
I 0 50 100
SCALE IN MILES
... RESEFM:>IR OVER - 200.000 ACRE-FEET
RESERVOIR OVER - 5,000 ACR£-FEET
DrF" CH.t.NNEL RESERVOIR OVER 5000 ACRE-F"EET
S 19WC GAGE
a CITY
D CLOSED BASINS
TEXAS
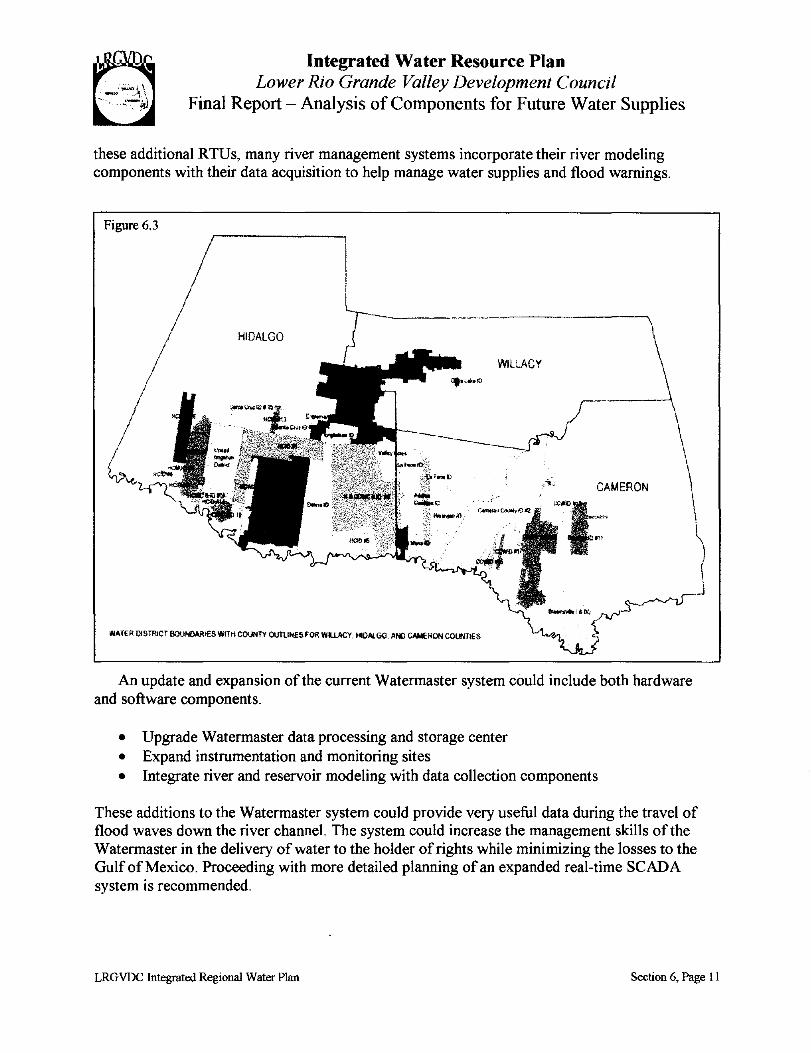
Integrated Water Resource Plan Lower Rio Grande Valley Development Council
Final Report- Analysis of Components for Future Water Supplies
these additional RTUs, many river management systems incorporate their river modeling components with their data acquisition to help manage water supplies and flood warnings.
Figure 6.3
HIDALGO
WILLACY
CAMERON
WATER O<STRICT BOUNOARI€8 WITH COUNTY OUTUI<ESFOR WII.LACY. ttOAI.GQ Ml) CAMERON COUPinES
An update and expansion of the current Watermaster system could include both hardware and software components.
• Upgrade Watermaster data processing and storage center • Expand instrumentation and monitoring sites • Integrate river and reservoir modeling with data collection components
These additions to the W atermaster system could provide very useful data during the travel of flood waves down the river channel. The system could increase the management skills of the Watermaster in the delivery of water to the holder of rights while minimizing the losses to the Gulf of Mexico. Proceeding with more detailed planning of an expanded real-time SCAD A system is recommended.
LRGVDC Integrated Regional Water Plan Section 6, Page II

Integrated Water Resource Plan Lower Rio Grande Valley Development Council
Final Report- Analysis of Components for Future Water Supplies
6.2 Analysis of Water Development through Reduction in Irrigation Delivery System Conveyance Losses
Conventional wisdom concerning the water delivery system utilized in the Valley suggested that significant savings might accrue due to improved delivery systems. The large system of lined and unlined open canals likely loses significant amounts of water to evaporation and seepage. Three major efforts were undertaken within the study to determine the potential benefits of rehabilitating portions of the delivery system. These efforts included:
I. A survey of the irrigation districts concerning their estimate of delivery losses, 2. A review of local and national seepage studies to determine representative values, and 3. A field monitoring program to determine Valley specific seepage loss estimates.
There are 28 water districts in Hidalgo, Cameron and Willacy Counties with authorized agricultural water rights totaling 1,468,314 acre-feet as set forth in Table 6.4. The general boundaries of these districts have been illustrated on Figure 6.3. These districts vary greatly in size, with the smallest district holding 625 acre-feet of water rights and the largest district with water rights of 174,776 acre-feet. However, the four largest districts (Mercedes, Delta Lake, San Benito, and San Juan) account for 44% of the all agricultural water rights, and the largest eight districts (adding Harlingen, Donna, Edinburg, and Santa Cruz) account for 6<Jl/o of the total.
Generally, these districts separate their water distribution systems into two categories: the main canals and laterals. The current understanding of the extent of the main distribution systems has been illustrated in Figure 6.4. In producing this map, an irrigation distribution system map was obtained from University of Texas- Pan American which contained canals and some laterals, but no attribute information (such as canal size, lining material, etc.) was attached. With assistance from the irrigation district managers, a detailed attribute data set was developed using available information, and corrected and an expanded version of the original map was developed.
The extent of and attributes for the main distribution systems have been summarized in Tables 6.5 and 6.6. The total miles of canals by size (based on top width) and lining status have been listed in Table 6.5. Information on the size was not available on 39% of the lined canals and about 50% of the unlined canals. An overall summary the main distribution systems which include 641.9 miles of canals, 9. 7 miles of pipelines, and 44.6 miles ofresacas has been provided in Table 6.6.
LRGVDC Integrated Regional Water Plan Section 6, Page 12

Integrated Water Resource Plan Lower Rio Grande Valley Development Council
Final Report- Analysis of Components for Future Water Supplies
Table 6.4 Estimated Current Irrigable Acres and Authorized Agricultural Water
Rights for 28 Water Districts in Cameron, Hidalgo, and Willacy Counties of the Lower Rio Grande Valley
District /rrigable Acres Authorized Water Right (ac-ft)
Adams Garden 7,400 18,737
Bayview 6,000 17,978
Brownsville 17,000 34,876
CCID#2 (San Benito) 75,000 151,941
CCID#6 (Los Fresnos) 15,000 52,142
CCWID#IO 3,453 10,213
CCWID#I6 1,753 3913
CCWID#I7 1,399 625
Delta Lake 70,000 174,776
Donna 32,000 94,063
Engleman 7,761 20,031
Harlingen 39,000 98,233
HCID# I (Edinburgh) 30,000 85,615
HCID#2 (San Juan) 46,709 147,675
HCMUD 0 1,120
HCWID#3 (McAllen) 3,200 9,752
HCWID#5 (Progresso) 5,700 14,234
HCID#6 (Mission) 16,531 42,545
HCCID#9 (Mercedes) 65,000 177,151
HCID#l3 1,200 4,856
HCID#16 (Mission) 4,948 30,749
HCWCID#18 2,100 5,505
HCWCID#19 5,000 11,777
La Feria IDCC#3 27,500 75,626
Santa Cruz ID#15 32,800 82,008
Santa Maria IDCC#4 3,700 10,182
UnitediD 26,836 69,491
Valley Acres 7,948 22,500
1,468,314
LRGVDC Integrated Regional Water Plan Section 6, Page 13

~ ~
Integrated Water Resource Plan Lower Rio Grande Valley Development Council
Final Report- Analysis of Components for Future Water Supplies
Table 6.5 Canal Sizes and Lining Material for the Primary Irrigation Distribution Systems in the Hidalgo, Cameron, and Willacy
C . . I d d h R . I GIS M ount1es me u e on t e e21ona ap. Canal Type
(or lining material) Top Width (miles)
(feet) concrete earth
<10 41.6 1.0
10-20 98.0 11.9
20-30 25.2 52.2
30-40 3.8 35.1
40-50 1.1 60.1
50-75 1.4 30.9
75- 100 0 11.1
> 100 0 9.7
Unknown Widths 99 134.5
Total Miles' 270.1 346.4
.. . . . . no siZe or lining information IS avru1ab1e on an additional25.4 miles of
canals
Table 6.6 Miles of Canals, Pipelines and Resacas of the Main Irrigation Distribution Systems in
Hidalgo, Cameron, and Willacy Counties included on the Re2ional GIS Map Canals (miles) Pipelines (miles) Resacas (miles) Unknown (miles) Total (miles)
641.9 9.7 44.6 0.1 696.3
The total extent of the distribution systems (mains and laterals) of each district, based on all available information, including data obtained from the GIS analysis, questionnaires and survey results, and direct contacts with district managers, has been summarized in Table 6.7. The dash lines in the table indicate that no information was available for that category. A number of districts provided incomplete or no information concerning their distribution systems.
LRGVDC Integrated Regional Water Plan Section 6, Page 14

Integrated Water Resource Plan Lower Rio Grande Valley Development Council
Final Report- Analysis of Components for Future Water Supplies
Table 6.7 Distribution Systems of28 Irrigation Districts in the Lower Rio Grande Valley of Texas
B d S R GSA ase on urvey espouses and I nalysis Canals (miles)
Pipelines Resacas District Total Lined Unlined (miles) (miles)
Adams Garden 23.5 15.6 7.9 3.0 --Bayview 16.7 7.1 9.6 76 14.5
Brownsville 2 -- 2 122 --CCID#2 204.7 1.2 203.5 34.7 13.9
CCID#6 (Los Fresnos) 100 25 75 25 ll.8
Delta Lake 292 250 42 173.98 --Donna 32.3 28.3 4 -- --
Engleman 10.4 10.4 -- 2.7 --Harlingen 74 28 46 157.3 --
HCID#l (Edinburg) lll 87 22.7 80 --HCID#2 71.3 26.5 41.9 218.5 --HCMUD -- -- -- 200 --
HCWID#3 17 12 5 -- --HCID#5 0.5 -- 0.5 -- --HCID#6 45.5 45 .5 95 --
HCCID#9 (Mercedes) 76.3 56.3 20 250 --HCID#l3 -- -- -- 3.5 --HCID#l6 17.2 17.2 -- 1.7 --
HCWCID#l8 0.5 0.5 -- 7 --HCWCID#l9 4.7 2.3 2.4 -- --
La Feria IDCC#3 43.8 22.5 21.3 120 --Santa Maria IDCC#4 3.5 -- 3.5 -- --
United ill 53.1 18.5 34.6 88 --Valley Acres 7.0 5.0 2 20 --
' Little or no information was provided for CCWlD#lO, #16, #17, Santa Cruz
6.2.1 Summary oflrrigation District Records for Pumped Flow and Water Use for Agricultural Acreage and Municipal and Industrial Usage
Data collected in three separate efforts provided mixed results concerning water usage in the Valley. Great variability exists in the sophistication of the various databases among the 28 irrigation districts in the Valley, and a consistent set of data across the districts could not be collected from the districts themselves. Records of total diversions and water use by permit number were, however, available from the Texas Natural Resource Conservation Commission and the Watermaster's office. The Watermaster reported diversions for the 1971 to 1997 time period have been listed in Table 6.8. These data came from hardcopy sources and in some cases
LRGVDC Integrated Regional Water Plan Section 6, Page 15

Integrated Water Resource Plan Lower Rio Grande Valley Development Council
Final Report- Analysis of Components for Future Water Supplies
some months were missing as noted in the table. The maximum diversions occurred in 1989, a year with good water supplies in the reservoirs and dry conditions in the three-county area.
Table 6.8 Rio Grande Diversions, 1971-1991
Total LRGV Diversions Cameron, Hidalgo & Willacy County Year (acrefoet) Diversions Missing data
(acre feet) 1971 861,119 855,127
1972 726,930 719,891 .. 1973 724,284 718,936
1974 1,111,798 1,102,157
1975 1,038,741 1,028,574
1976 843,974 834,910 .. 1977 1,010,827 997,819
1978 1,075,753 1,065,905
1979 788,631 780,110 .. 1980 1,267,062 1,255,854
1981 864,672 857,564
1982 1,322,300 1,312,859
1983 1,022,686 1,015,012 .. 1984 1,044,111 1,032,191
1985 702,365 694,332 .. 1986 880,365 870,050 .. 1987 893,865 884,501
1988 1,159,708 1,147,500 .. 1989 1,524,193 1,507,575
1990 1,288,693 1,274,262
1991 1,090,552 1,078,210
1992 795,449 784,181
1993 1,047,393 1,034,936
1994 1,100,397 1,087,529
1995 1,126,804 1,112,761
1996 1,093,116 1,079,657
1997 753,999 745,544
Source: TNRCC Source: Watennaster's Office.
Similar data, but for the 1991 to 1997 time period, from a different data set, has been portrayed by type of water use in Table 6.9. Reported domestic use of zero acre-feet for 1992 represents a missing value. The other low values for that year may indicate missing data in the other use categories as well. Irrigation use has historically accounted for the vast majority of
LRGVDC Integrated Regional Water Plan Section 6, Page 16

Figure 6.4
MI-,XlCO
Integrated Water Resource Plan Lower Rio Grande Valley Development Council
Final Report- Analysis of Components for Future Water Supplies
1 rrigation Districts and Main Distribution Systems The Lower Rio (;raode Valley of Texas
l <'M.:r Rifl(il:iud.; V~k~ lnt.;rjl1at..:.i \o\Btvr w..,.,ur""' l'l:m -l"'l:l!iO.' ll Al!r~r~ttmlll'n¢n«ri11f. l.:"M ,\&;:!\1 Vniwo.il;.
water use, yet it has been declining over the last few years of the time period shown. This decline is due in part to the drought of 1996, but the decline is believed to be a reflection of the lessening of U.S. government farm support programs. As the subsidies for those programs decline, irrigated acreages tend to decline as well. Urban growth in this time period also contributed to the decline in irrigation water use. Municipal water use shows a gradual increase during this time period as expected. The municipal use averaged 162,000 acre-feet per year for the 1996 and 1997 period.
As noted previously, the contents of Tables 6.8 (diversions) and Table 6.9 (water uses) were obtained from two separate data sources within TNRCC. The total diversions do not sum to the total uses for the common years shown in the tables. These differences are parially due to the missing data in hardcopies, and are currently under examination by the TNRCC.
LRGVDC futegrated Regional Water Plan Section 6, Page 17

Integrated Water Resource Plan Lower Rio Grande Valley Development Council
Final Report- Analysis of Components for Future Water Supplies
Table 6.9 Water Use Values by Type of Use, 1991-1997, Three-County Area
Mining Industrial Domestic Municipal Irrigation Year (a f) (aj) (a f) (aj) (aj)
1991 0 3,432 14,926 122,157 808,898
1992 0 35 0 25,405 497,436
1993 0 3,111 15,819 119,050 817,552
1994 0 4,245 22,013 144,255 913,548
1995 53 4,576 23,925 160,558 922,672
1996 113 3,510 22,137 161,553 846,765
1997 75 4,340 23,081 162,647 552,754
6.2.2 Description of Existing Conveyance Loss Improvements
Several of the irrigation district surveys revealed past rehabilitation programs although significant co-funding efforts by the Bureau of Reclamation have not occurred in several years. Selected districts have undertaken programs of their own, with some replacing portions of their delivery systems with pipelines. Perhaps the best indicator of system improvements entails the estimate of current lined versus unlined main delivery canals. Results of the iterative survey process resulted in the mileages shown in Table 6. 7 for unlined, concrete lined, and unknown mileages of main delivery canals. Districts responded with mileages in tabular form in some cases, and in other cases identified section of canals on maps. Mileage estimates for the lengths in the latter case were then estimated using the GIS digital maps for the main canal systems. These results apply for the majority, but not all, of the irrigation districts in the Valley. Additional potential improvements for mitigating conveyance losses include rehabilitation of pumping units, and repair of existing concrete linings as well as gates. Some districts did report the dates of their last major pump repairs, but a formal study of this facet still needs to be undertaken. Since potential water savings through reduction in conveyance losses represents a potential major improvement in water use, continue effort to obtain and develop more complete data is recommended.
6.2.3 Identification of Areas with Known or Potential Conveyance Losses
Survey results from the districts revealed almost no point specific data concerning areas of known significant delivery losses and the resulting few points were not mapped in a separate GIS coverage. Somewhat better data, however, was collected concerning the estimated transmission losses for the districts as a whole. Many of the districts deliver water to third parties such as municipalities and/or water supply corporations and routinely charge those entities an estimated delivery loss charge. Many of these charged values are based solely on "expert opinion" due to the lack of past formal seepage loss studies. Some districts do, however, have a reasonable idea of transportation losses due to detailed accounting studies during non-irrigation periods of the year. Metered withdrawals by municipalities are matched against metered diversions at the river
LRGVDC Integrated Regional Water Plan Section 6, Page 18

Integrated Water Resource Plan Lower Rio Grande Valley Development Council
Final Report- Analysis of Components for Future Water Supplies
and therefore aid the districts in determining conveyance losses. The estimated conveyance efficiency by county have been summarized in Table 6.10. Reported losses average 23.2% for the Valley as a whole, but the losses have not been weighted by miles of canal within the respective districts.
Table 6.10 County Level Irrigation System Delivery Efficiency
Cameron County 66.2%
Hidalgo County 74.9%
Willacy County 75%
6.2.4 Description of Field Monitoring Program
An extensive literature search on seepage loss rates reported in the scientific literature was conducted. Several studies that reported measured seepage loss rates for different lining materials and soil types, and three studies that contained extensive seepage loss measurements were found. Loss rates from these studies have been summarized in Tables 6.11 and 6.12 by soil type and lining material. The data in Table 6.12 are of particular interest since they give seepage loss rates measured in five irrigation districts in South Texas including the United and San Benito Irrigation Districts.
For the current study, the original field reconnaissance plans were to use portable open channel flow meters, including velocity meters and doppler meters, to determine seepage loss rates in representative canals throughout the area. However, after two days of comparative testing of these flow devices against a calibrated weir structure, the conclusion was reached that their accuracy (± 5%) was not sufficient to permit the determination of seepage losses in canal sections.
Table 6.11 Canal Seep~_g_e Rates Reported in Published Studies
LRGVDC Integrated Regional Water Plan
lining Type plastic
concrete
gunite
compacted earth clay
Seepage Rate gatlfr !day 0.08-3.74
0.06-3.22 0.06-0.94
O.o7- 0.6
0.37-2.99 loam 4.49 - 7.48
sand 9.34- 19.45
Sources: BR,l963; OSU, 1979.
Section 6, Page 19

Integrated Water Resource Plan Lower Rio Grande Valley Development Council
Final Report- Analysis of Components for Future Water Supplies
Table 6.12 Canal Seepage Rates Reported in the Lower Rio Grande
VII a ey Seepage Loss Rate
Soil Type J<alif/;day clay 1.5
Silty clay loam 2.24
Clay loam 2.99
Silt loam earth 4.49
Loam 7.48
Fine sandy loam 9.35
sandy loam 11.22
Source:113~, 1946
As an alternative, ponding tests in six canals and one pipeline network were conducted in cooperation with four districts. The results of the ponding tests have been summarized in Table 6.13. The three lined canals had very high seepage loss rates compared to the scientific literature, indicating problems with their construction or maintenance. The seepage rates of the two unlined canals fell in the ranges reported in the scientific literature (Table 6.11 ). The pipeline network measurements were undertaken in the Brownsville Irrigation District and the results showed very little seepage loss during the 24-hour test.
A general soil map of the area and possible seepage rates based on soil types have been presented on Figure 6.5. Smaller, unlined canals in the more permeable areas are likely to have significant higher seepage rates. However, the Valley is an alluvial region, and soil's type can very dramatically over small areas. In addition, actual seepage losses depend on many factors besides soil type, including construction techniques, maintenance, distance to the shallow water table, and silt deposits. Thus, canals need to be evaluated on an individual basis to determine potential seepage losses and benefits from lining or pipeline replacement.
Table 6.13 Seepage Rates Measured in Five Irrigation Canals in the
ower 0 ran e a ey_o L Ri G d V II fT exas Test# Canal Type Top Width Length Seepage Loss Rate Total Loss in Canal
(Feet) (Feet) (Gai!Frl !Day) (Acre-Feet per Mile) per day per year*
1 concrete 19 2,557 4.28 0.81 243
2 earth (clay) 38 3,342 1.62 0.82 246
3 earth (sandy clay loam) 45 6,336 1.69 1.05 315
4 concrete 12 2,583 2.12 0.20 60
5 concrete 12.5 9,525 2.49 0.25 75
*based on 300 days per year.
LRGVDC Integrated Regional Water Plan Section 6, Page 20

Integrated Water Resource Plan Lower Rio Grande Valley Development Council ~
0 Final Report- Analysis of Components for Future Water Supplies
Figure 6.5
;\'--~----
(;eneral Soil Ma11 The Lower Rio Grande Valle~ Of Te•as
1 <'><!~''' ~l•k\a,c 1•-~<~lc~!V.uk R-.""-''•~<I':UI •'I.,..H .\,-s;,-\,; ,o·o ll;)~i-k~WI_~, \._:-.:_~:\.\"-\', ~J,;;[~!h
On the original questionnaire form, only five districts reported areas ofknown seepage losses: Harlingen (West main canal), Mercedes (East-side main canal, siphon at Bus. 83), Santa Maria (Disdor), United (Mission main, N Bryan) and Hidalgo# I (Penitas and East).
A consistent understanding of the concept of conveyance efficiency is important in a discussion of an irrigation district's delivery loss. The term conveyance efficiency (or water duty) is a measurement of all the losses in an irrigation distribution system from the river (or a diversion point) to the field. Conveyance efficiency is calculated from the total inches pumped in order to supply a certain amount (usually 6 inches) to a field. It can be expressed as (I) total efficiency, (2) the percent of water lost, or (3) amount of water pumped in feet. For example, District A must pump eight inches from the river in order to deliver six inches to the field. District A losses can be expressed as a conveyance efficiency of 75%, a water duty of 25%, or a water duty of0.67 ft.
Conveyance loss includes a number of factors in addition to seepage and evaporation. The classification system for conveyance losses which is composed of transportation, accounting, and operational losses used in this report has been presented in Table 6.14. One difficulty encountered in the basic information used to estimate conveyance efficiency is the amount of uncertainty in the amount of water pumped or diverted into the system and the actual amount of
LRGVDC Integrated Regional Water Plan Section 6, Page 21

Integrated Water Resource Plan Lower Rio Grande Valley Development Council ~
~ Final Report- Analysis of Components for Future Water Supplies
water delivered to the field. The doppler flow meters currently used at many river pumping plants were calibrated at each site based on estimates of the current pumping rates and/or pumping plant capacity based on engine/motor and pump performance. Thus, it is difficult to independently verify these rates. Likewise, little metering has been done at the field turnout and the amount delivered has also been an estimate in most cases.
Table 6.14 Cl "fi f aSSI ICa IOU 0 a er osses m rr12a ton IS riC S rw t L I · t· n· t · t
Transportation Accounting Operation
seepage in main unlined canals accuracy of field-level deliveries charging empty pipelines and canals (estimates of canal riders/irrigators)
seepage in secondary unlined- unauthorized use spills (end of canals) canals leakage from lined-canals metering at main pumping plant partial use of water in dead-end lines
leakage from pipelines water rights accounting system
evaporation (canals and storage reservoirs
6.2.5 Potential Water Quantity Savings through Conveyance System Improvements
The conveyance efficiencies for twelve irrigation districts in the Western United States have been summarized in Table 6.15, and they range from about 60 to 95%. Based on this information and discussions with district managers and engineers in the Western United States, it was concluded that an efficiency of 80 to 90% appears to be obtainable for all irrigation districts.
Using the current estimates of conveyance efficiencies, the potential water savings can be calculated assuming that all irrigation districts were improved to an 80 and 90% conveyance efficiency. These estimated savings have been summarized in Table 6.16. The total water diversions by each district during the period 1991 - 1997 were analyzed and a pattern in the amount of water diverted in relation to the authorized water rights of each district was identified. For the data presented in Table 6.16, a "low water use year" is defined as 35% of authorized water right and a "high water use year"as 80% of the authorized water rights. For those districts that were identified as water short, a higher percentage of their water rights are normally used, and the range of 45 - 90% was assumed. Based on this analysis, a total water savings of about 54,000 to 223,000 acre-feet per year should be achievable. For the six districts with the largest potential, total water savings have been estimated to be about 47,000 to 165,000 acre-feet per year as described in Table 6.17.
LRGVDC Integrated Regional Water Plan Section 6, Page 22

Integrated Water Resource Plan Lower Rio Grande Valley Development Council
Final Report- Analysis of Components for Future Water Supplies
Table6.15 Conveyance Efficiencies and Farm Deliveries to Irrigation Districts in the Western US
Irrigated Fann Per Acre M&J Conveyance Irrigation Division or Area Diversion Delivery Delivery Delivery Eft.
District (acres) (ac-fi) (ac-fi) (ac-filac) (ac-fi) (%) Arizona
Wellton-Mohawk Div. 60,324 442,140 397,836 6.6 1,080 90.2
Mesa Unit 17,454 290,747 273,927 15.69 2,018 94.9
North Gila Valley Unit 6,319 51,163 44,483 7.04 0.00 86.9
South Gila Valley Unit 9,628 59,595 56,551 5.87 0.00 94.9
Salt River Valley 54,174 840,921 333,859 6.16 291,149 74.3
Yuma Valley Division 45,761 360,020 263,048 5.75 19,564 78.5
Yuma Auxiliary 2,717 33,745 28,904 10.64 0.00 85.7
California
Coachella Valley WD 61,052 299,237 260,060 4.26 0.00 86.9
Imperial ID 463,030 2,974,647 2,654,689 5.73 26,223 90.1
Bard Reservation Unit 6,689 40,642 36,046 5.39 0.00 88.7
Indian Reservation Unit 6,541 49,661 42,562 6.51 0.00 85.7
Nevada
New lands 64,637 270,228 163,407 2.53 0.00 60.5
Notes: (I) A portion of the irrigated area within CVWD receives its entire water supply from groundwater. Additionally, some of the area that receives Colorado River water also receives supplemental groundwater. Because of these conditions, the total actual per-acre delivery is greater than the reported 4.26 acre-feet per acre. (2) The Newlands Project area has a growing season of approximately six months with a much lower crop water requirement than the other irrigation districts in the comparison. Source: Imperial Irrigation District Report: History of Water Conservation within the Imperial Irrigation District, April 28, 1998
LRGVDC Integrated Regional Water Plan Section 6, Page 23

Integrated Water Resource Plan Lower Rio Grande Valley Development Council
Final Report- Analysis of Components for Future Water Supplies
Table 6.16 Potential Water Savings Achievable by Increasing the Conveyance Efficiency of 28
I . . n· . . h L Ri G d V II 80 d Oo/. rngatton Istr1cts m t e ower 0 ran e a ey to an 9 0
Potential Water Savings (ac-fi/yr)
80% Conveyance Efficiency 90% Conveyance Efficiency
District Low Use Year High Use Year Low Use Year High Use Year
Adams Garden* 0 0 422 843
Bayview 0 0 315 719
Brownsville 0 0 0 0
CCID#2* 27349 54699 34187 68373
CCID#6* 4693 9386 7039 14078
CCWID#10 179 409 536 1226
CCWID#I6 68 157 205 470
CCWID#I7 II 25 33 75
Delta Lake* 3932 7864 ll797 23593
Donna 6255 14298 9547 21823
Engleman 351 801 1052 2404
Harlingen 0 0 1719 3929
HCID#l 0 0 2997 6849
HCID#2 l55I 3544 6719 15358
HCMUD 0 0 0 0
HCWID#3 0 0 0 0
HCID#5 0 0 0 0
HCID#6 745 I702 2234 5105
HCCID#9 3100 7086 9300 21258
HCID#l3 85 194 255 583
HCID#l6* 0 0 692 1384
HCWCID#18 96 220 289 66I
HCWCID#19* 265 530 795 1590
La Feria* 1702 3403 5105 10210
Santa Cruz 1435 3280 4305 9841
SantaMaria 178 407 535 1222
United 1216 2780 3648 8336
Valley Acres 394 900 ll8l 2700
TOTALS 53605 111685 104906 222632
* water short districts, calculations based on 45% for low water use year and 90% for high water use year, otherwise 35% of authorized water right for low water use year and 80"/o of authorized water right for high water use year
LRGVDC Integrated Regional Water Plan Section 6, Page 24
Integrated Water Resource Plan Lower Rio Grande Valley Development Council ~
~ Final Report- Analysis of Components for Future Water Supplies
T s· n· op IX 1stncts Table 6.17
Ra k db p . IW n e >Y otent1a ater s avmgs Potential Water Savings (ac-ftlyr)
District low high
CCID#2 27,349 68,373
De1taLake 3,932 23,593
Donna 6,255 21,823
HCCID#9 3,100 21,258
HCID#2 1,551 15,358
CCID#6 4,693 14,078
TOTAL 46,880 164,483
6.2.6 Combined or Shared Conveyance Systems
The advantages of sharing or combining main distribution canals included reduction in evaporation and seepage losses and reducing the operation and maintenance costs of districts. Important factors that must be considered include capacity of both the canal system and pumping plant as related to the daily, weekly, monthly and seasonal water demand in the districts under consideration. Major limiting factors include the capital costs, as well as the regulatory and permitting difficulties in constructing new canals to interconnect districts or to substantially increase the capacity and sizes of existing canals.
There is only one current situation in which sharing main canals may be feasible which would not involve new construction. Hidalgo County #1 and United Irrigation District's main canals cross in the segment leading from the river pumping plant to the districts. Combining this segment would reduce about 8 to 10 miles of a large earthen canal. However, more detailed study is required before final recommendation could be made.
In the future, increased opportunities for sharing of canals will occur, particularly due to the urban growth patterns along US 83 corridor. This growth pattern will leave all large districts essentially split into north and south irrigated areas separated by municipalities. Possible sharing of distribution systems, however, would require the expansion of existing canals and construction of new canals. Consolidation of distribution systems may become feasible in two groups of districts, one group including Delta Lakes, Mercedes, Engleman and Donna, the other group including the western districts ofHidalgo County #16, Hidalgo #6, Hidalgo #1, United and Santa Cruz.
Consolidating of the administrative functions of districts has already occurred. Recent examples include Adams Garden and Harlingen Irrigation Districts, and Hidalgo County #16 and United Irrigation Districts; both involving a small district and a much larger district with a large support staff. Such consolidations improve the economics and often the level of services that districts can provide. Individual board of directors can still exist providing for the current levels of property owner representation. Future consolidations are likely, particularly among the
LRGVDC Integrated Regional Water Plan Section 6, Page 25

Integrated Water Resource Plan Lower Rio Grande Valley Development Council
Final Report- Analysis of Components for Future Water Supplies
smaller districts in Hidalgo County, as these districts continue to lose land and fragment due to municipal growth.
The scope of work called for explicit consideration of estimating the economies of scale associated with district consolidation. The relatively sparse data available on economic viability of the districts precluded this level of analysis. Some general observations, however, were noted. As mentioned above, the administrative function does likely benefit from consolidation. Physical improvements and economies, however, are a much more local consideration and will change over time as the delivery function of the districts changes as urban growth occurs. In practice, site specific studies will be required, augmented by detailed knowledge of the mixture of municipal and agricultural demands and the locations of those demands as well as the detailed information on the delivery system capacity.
6.2. 7 Estimates of Preliminary Capital and Operational Costs
Initial survey efforts to quantify canal dimensions and capacities within all the districts were only partially successful. As noted in Table 6.6, there are approximately 640 miles of main canals and nearly 10 miles of pipeline in the main delivery system. Total mileages of canals and pipeline in the districts are much higher (nearly 2,500 and 1,400 miles, respectively). Detailed information on top width, bottom width, slope, and capacity was only obtained for a fraction of that mileage. Much of these data likely exists in the records of the irrigation district offices, but the cost to assemble was prohibitive for this study. Efforts to continue the collection should be maintained.
This lack of data precluded making preliminary estimates of the potential savings and related construction for main canal improvements based on the physical characteristics of the canals. A range of estimates has been made using historical costs of improvement which have occurred in other areas. Similar improvements in canal/pipeline systems range have ranged in cost from $400 to $1,000 per acre-foot of water saved (Imperial Irrigation District, California). If the assumption is made that delivery efficiency is to be improved to the 80% level, projected water savings would be as indicated in Table 6.16.
Values for a high and low delivery water year have been shown in that table. If the high and low water savings scenarios are averaged, water saved for 80% and 90% delivery efficiencies are approximately 82,600 and 163,800 acre-feet, respectively. Applying the $400 and $1000 per acre-foot saved values to the 82,600 acre-feet saved at 80% efficiency results in the estimated capital cost for rehabilitation presented in Table 6.18.
LRGVDC Integrated Regional Water Plan Section 6, Page 26

~ ~
Ra
per acre-ft
$400
$1000
Integrated Water Resource Plan Lower Rio Grande Valley Development Council
Final Report- Analysis of Components for Future Water Supplies
ngeo fT I C . I C ota aptta ost o Cost range
per 1,000 gal.
$1.23
$3.07
Table6.18 fR h bT e a tltatlon to
Total Cost
$33,040,000
$82,600,000
soo;. n r 0 e •very Effi . tctency*
.. *Assumes an additional average of 82,600 acre-feet of water saved per year once the 80"/o delivery efficiency of 80% is achieved Valley wide.
6.3 Analysis of Water Development through Construction of a Pipeline System From Falcon Reservoir
One ofthe measures studied in this plan was the development of a pipeline to convey municipal water supplies from Falcon Lake on the Rio Grande to the Lower Rio Grande. Currently, municipal and irrigation water supplies are released from Falcon Lake and conveyed down the Rio Grande to the Lower Rio Grande Valley, where they are diverted and used. Most municipal supplies are actually diverted by irrigation districts, who have well-established canal systems in Cameron, Hidalgo, and Willacy Counties. The districts deliver the water to the cities and charge the cities a fee for the service.
A pipeline from Falcon Lake for the delivery of all or part of the municipal water supplies would offer several advantages:
• Water losses in the Rio Grande and in the irrigation district canals would be avoided.
• The water delivered in a pipeline directly from Falcon Lake would probably be of higher quality than water delivered by the Rio Grande and the canals.
• The cities would not be dependent on the irrigation districts for this service and would save the fees they currently pay the districts.
• In the recent (1994-1998) drought, some cities had trouble with water deliveries when the irrigation districts delivering their water ran low on irrigation water and began to shut their systems down. A pipeline would mitigate this problem.
• The pipeline could make the development of regional water treatment plants to supply multiple domestic users easier.
• A water delivery pipeline could deliver treated water as well as raw water.
On the other hand, development of a municipal delivery pipeline would also have several disadvantages:
LRGVDC Integrated Regional WateJ Plan Section 6, Page 27

Integrated Water Resource Plan Lower Rio Grande Valley Development Council ~
~ Final Report- Analysis of Components for Future Water Supplies
• The construction process and the facilities themselves would have an impact on the environment.
• The loss of municipal deliveries in the Rio Grande would decrease the flows in the river. This impact would be most significant during the winter months, when irrigation deliveries are at a minimum and municipal flows are a large portion of the total flow in the river. The plans noted below assume that deliveries would still be made through the existing supply system including the Rio Grande and the diversion points along the Southern tier of the Valley.
• The loss of the revenues from delivering municipal supplies could have a negative financial impact on the irrigation districts. Proposed pipelines described below would serve the growth areas in the Northern portion of the study area. This approach would continue the use of existing facilities in the Southern area, maintain significant river flow for environmental concerns and also maintain some level of income for those districts currently selling transportation services to cities. Limited data from the irrigation districts indicates that the income derived from such deliveries is significant for some districts, varying from none to 50% of their current income. Only a relatively small portion of this income would be lost should the pipeline be built due to the location of the demand in the Northern portion for new urban growth. Past deliveries to current demand points and water treatment plants in the Southern portion would continue and likely increase due to some greater populations (greater density) in the currently served areas. The revenue that would be lost is the revenue from irrigation sales in the Northern area. This lost could be offset by the sales of the water for domestic purposes. Physical changes to the districts would be minimal due to the relatively small capacity of the pipeline and the increased municipal demand throughout the region.
• The pipeline would be costly in relation to the .water saved.
6.3.1 Alternative Pipeline Operation Scenarios
The projected domestic water requirements for Cameron, Hidalgo, and Willacy Counties from 2000 through 2050 have been summarized in Tables 3.18, 3.19 and 3.20. The expected changes in the domestic water requirements for normal and below normal rainfall, with expected water conservation between 2000 and 2050, but without irrigation canal transmission losses, have been summarized in Table 6.19. Valley-wide domestic water use in a year of normal rainfall is expected to increase from 152,000 acre-feet in 2000 to 295,000 acre-feet in 2050. A year of below-normal rainfall would require greater water use, increasing from 177,000 acre-feet per year in 2000 to 337,000 acre-feet per year in 2050.
For each alternative pipeline evaluated, the key assumption was made that the system would be sized to deliver the difference between the estimated year-2000 domestic demand and the estimated year-2050 domestic demand. This approach permits the continued use of the existing
LRGVDC Integrated Regional Water Plan Section 6, Page 28

Integrated Water Resource Plan Lower Rio Grande Valley Development Council
Final Report- Analysis of Components for Future Water Supplies
diversion and water treatment facilities in which an investment has already been made. These facilities are located primarily in the southern portions of Hidalgo and Cameron Counties. The anticipated growth areas are primarily north ofU.S. 83 up to FM 107.
Table 6.19 Projected Increases in Domestic Water Requirements between 2000 and 2050
(Values in Acre-feet per Year) County Year 2000 Year 2050 Increase in Demand
Cameron Below Normal 66,448 113,367 46,919
Normal 59,348 100,218 40,820
Hidalgo Below Normal 102,416 213,938 111,522
Normal 85,419 186,382 100,963
Willacy Below Normal 8,024 10,070 2,046
Normal 6,979 8,752 1,773
Total Below Normal 176,888 337,375 160,487
Normal 151,796 295,352 143,559
In the evaluation of alternatives, four delivery points for either raw water or treated water were established. The first was assumed to be located in the vicinity of Moore Field. The second and third were assumed located in the vicinity of Elsa and Combes, respectively. The eastern most delivery point was assumed located in the vicinity of Olmito. The estimated amounts of water that would be required at these four delivery points under various alternatives have been summarized in Table 6.20.
Table 6.20 Projected Annual Below-normal Demands for Pipeline Delivery Points
Year Year Diffirence Diffirence Raw Water Treated Water Delivery 2000 2050 Ac-Ft!Yr MGD Delivery Delivery Rate Point Customer Ac-Ft!Yr Ac-Ft!Yr Rate MGD
MGD Olmito Delivery Point
Brownsville 27,768 45,144 17,376 15.50 23.25 31.00
Laguna Vista 169 261 92 0.08 0.12 0.16
Los Fresnos 616 1,333 717 0.64 0.96 1.28
Port Isabel 2,487 3,990 1,503 1.34 2.01 2.68
South Padre Island 1,815 3,276 1,461 1.30 1.96 2.61
1/2 Cameron County 6,600 12,226 5,626 5.02 7.53 10.04 Residents
39,455 66,230 26,775 23.89 35.83 47.77
Cumulative 66,230
LRGVDC Integrated Regional Water Plan Section 6, Page 2 9

Integrated Water Resource Plan Lower Rio Grande Valley Development Council ~
D Final Report- Analysis of Components for Future Water Supplies
Table 6.20 (Continued)
Year Year Diffirence Difference Raw Water Treated Water
Delivery Customer 2000 2050 Ac-Ft!Yr MGD Delivery Delivery Rate
Point Ac-Ft!Yr Ac-Ft!Yr Rate MGD MGD
Combes Delivery Point
Combes 309 566 257 0.23 0.34 0.46
Harlingen 11,361 17,296 5,935 5.29 7.94 10.59
La Feria 745 1,701 956 0.85 1.28 1.71
Palm Valley 384 628 244 0.22 0.33 0.44
Prim era 704 1,241 537 0.48 0.72 0.96
Rio Hondo 354 586 232 0.21 0.31 0.41
San Benito 5,732 8,776 3,044 2.72 4.07 5.43
Santa Rosa 386 549 163 0.15 0.22 0.29
112 Cameron County 6,601 12,225 5,624 5.02 7.53 10.03 Residents
Lyford 438 532 94 0.08 0.13 0.17
Raymondville 6,396 8,221 1,825 1.63 2.44 3.26
Willacy County Residents 1,190 1,317 127 0.11 0.17 0.23
34,600 53,638 19,038 16.98 25.48 33.97
Cumulative 119,868 45,813 40.87 61.3 81.74
Elsa Delivery Point
Donna 2,893 6,172 3,279 2.93 4.39 5.85
Edcouch 473 754 281 0.25 0.38 0.5
Elsa 1,075 1,673 598 0.53 0.8 1.07
La Villa 258 537 279 0.25 0.37 0.5
Mercedes 2,289 4,118 1,829 1.63 2.45 3.26
Weslaco 4,484 9,088 4,604 4.11 6.16 8.21
2/3 Hidalgo County Residents 17,081 44,090 27,009 24.09 36.14 48.19
28,553 66,432 37,879 33.79 50.69 67.58
Cumulative 186,300 83,692 74.66 111.99 149.32
LRGVDC futegrated Regional Water Plan Section 6, Page 30

~ D
Integrated Water Resource Plan Lower Rio Grande Valley Development Council
Final Report- Analysis of Components for Future Water Supplies
Table 6.20 (Continued)
Year Year Diffirence Diffirence Raw Water Treated Water
Delivery Customer 2000 2050 Ac-Ft/Yr MGD Delivery Delivery Rate
Point Ac-Ft/Yr Ac-Ft/Yr Rate MGD MGD
Moore Field Delivery Point
Alamo 1,794 3,021 1,227 1.09 1.64
Alton 1,542 2,473 931 0.83 1.25
Edinburg 7,610 16,054 8,444 7.53 11.3
Hidalgo 738 1,823 1,085 0.97 1.45
LaJoya 699 1,469 770 0.69 1.03
McAllen 30,246 47,137 16,891 15.07 22.6
Mission 9,102 23,545 14,443 12.88 19.33
Palmview 470 1,026 556 0.50 0.74
Pharr 8,031 20,384 12,353 11.02 16.53
SanJuan 4,990 7,110 2,120 1.89 2.84
113 Hidalgo County Residents 8,529 22,012 13,483 12.03 18.04
73,751 146,054 72,303 64.50 96.75
Total 332,354 155,995 139.16 208.74
6.3.2 Size and Capacity of the Facilities
The pipeline alternatives considered consisted of as many as four sections: a cross-country section to the municipal area, and three additional sections that extend into municipal areas. The cross-country section was assumed to end near Moore Field as illustrated in Figures 6.6, 6.7, and 6.8. The first municipal section was assumed to end near the city of Elsa (North of Mercedes), the second section ends north of Harlingen near Combes, and the final section extends to Olmito north ofBrownsville. The municipal sections of the pipeline follow a route (north of the current heaviest urbanization) near the cities, but three cross-country options have been routed. Two of the cross- country pipeline options take water from Falcon Lake, and the third route diverts water from the Rio Grande near an existing canal diversion point.
LRGVDC Integrated Regional Water Plan Section 6, Page 31
2.19
1.66
15.07
1.94
1.37
30.14
25.77
0.99
22.04
3.78
24.06
129
278.33

Integrated Water Resource Plan Lower Rio Grande Valley Development Council
Final Report- Analysis of Components for Future Water Supplies
Figure 6.6
-·. \ \
JERIJI-'",AL S'C;t;._(;[ •J"< B.-,L<\\Ci'\-C R;~S[i?'/CIR
0::. P;)5Sfilf. V,A:f"? TR[J1:-MfNT PlA\If
PUW::> ST,t.TION
.. ,, <
..
·:!>•.:-'"·,
,- \
+.i t
I \ \
\ I f ·I I ·r. ,.
Route A (utility easement) is 55.5 miles in length and originates at Falcon, and it then follows an electric utility line easement from the hydropower facility at the Falcon Dam toward Moore Field.
Route B (Rio Grande City) is 57.4 miles in length and originates at Falcon, and it travels further south than Option A toward Rio Grande City before turning east to Moore Field.
Route C (Los Ebanos) is 22.3 miles in length and originates at the Rio Grande near Los Ebanos, and it then travels northeast along an existing pipeline easement before turning east to Moore Field along the utility line easement of Route A
LRGVDC Integrated Regional Water Plan Section 6, Page 32

Integrated Water Resource Plan Lower Rio Grande Valley Development Council
Final Report- Analysis of Components for Future Water Supplies
These three routes for the raw water delivery options have been compared, but only Route A was considered in the alternatives involving the delivery of treated water. This approach was adopted to limit the number of alternatives evaluated. The alternatives that have been evaluated have been listed in Table 6.21. Routes B and C could also be used for treated water delivery. The following assumptions were made in establishing the system layouts:
Figure 6.7
L. t.k'/ !'(~.._ :;.; :.!-.:A:_,::_ 'JR ::;A_ANC N:; :<ESD<VOlR
"-:::~SfR ~ 1/l,[fR -RF,CM~'l{ PI,\~~-:-
•f·-···
: .. : -·r·:.
."1: ..•
• The systems would be sized to deliver the difference between estimated year-2000 municipal demands and estimated year-2050 municipal demands.
• Pipeline, pump station, and treatment plant capacity would be based on below-normal rainfall, expected conservation demands.
LRGVDC Integrated Regional Water Plan Section 6, Page 33

Integrated Water Resource Plan Lower Rio Grande Valley Development Council
Final Report- Analysis of Components for Future Water Supplies
Figure 6.8
L:. r--;_·,·~:.-;a-;u_ ·."<A t ,~
F;:E.t..H-tEN~ F j:-41
' ~)
) ~--.· '
~,.
: . .-
. -;>. ··-·-- '\ ..
• The pipelines would be developed for approximately Yz of the ultimate water use initially and would be paralleled at a later date.
• The treatment plants would be developed for approximately liS of the ultimate water use initially and would be expanded as required.
• The diameter of the pipe was selected to minimize the annualized cost of the pipeline system.
• Raw water terminal storage capacity for five days of use at all treatment plants was included in the water supply alternatives.
• Treated water storage for two hours of capacity use after all treatment plants was included in the water supply alternatives.
• Pipelines from the raw water source to the treatment plant were sized to carry peak month demands (1.5 times average demand).
• Pipelines from the treatment plants to the cities were sized to carry peak day demands (2 times average demand).
• 150-foot pipeline right of way width was assumed.
LRGVDC Integrated Regional Water Plan Section 6, Page 34

Alternative 1
Alternative 2
Alternative 3
Alternative 4
Alternative 5.
Alternative 6
Alternative 7
Alternative 8
Alternative 9
Alternative 10
Alternative 11
Alternative 12
Alternative 13
Alternative 14
Alternative 15
Alternative 16
Integrated Water Resource Plan Lower Rio Grande Valley Development Council
Final Report- Analysis of Components for Future Water Supplies
Table 6.21 s ummaryo va uate 1peme fE I d p· I' AI ternatiVes
Falcon Pipeline to Lower Rio Grande Valley, Moore Field and Elsa, Route A, 150 MGD Raw Water Pipeline Falcon Pipeline to Lower Rio Grande Valley, Moore Field, Elsa and Combes, Route A, 175 MGD Raw Water Pipeline Falcon Pipeline to Lower Rio Grande Valley, Moore Field, Elsa, Combes and Olmito, Route A, 209 MGD Raw Water Pipeline Falcon Pipeline to Lower Rio Grande Valley Moore Field and Elsa, Route B, 150 MGD Raw Water Pipeline Falcon Pipeline to Lower Rio Grande Valley, Moore Field, Elsa, and Combes, Route B, 175 MGD Raw Water Pipeline Falcon Pipeline to Lower Rio Grande Valley, Moore Field, Elsa, Combes and Olmito, Route B, 209 MGD Raw Water Pipeline Los Ebanos Pipeline to Lower Rio Valley, Moore Field and Elsa, Route C, 150 MGD Raw Water Pipeline Los Ebanos Pipeline to Lower Rio Valley, Moore Field, Elsa, and Combes, Route C, 175 MGD Raw Water Pipeline Los Ebanos Pipeline to Lower Rio Valley, Moore Field, Elsa, Combes and Olmito, Route C, 208.8 MGD Raw Water Pipeline Water Treatment Plant at Falcon Reservoir, Route A, 200 MGD Pipeline to Moore Field and Elsa Delivery Points Water Treatment Plant at Falcon Reservoir, Route A, 230 MGD Pipeline to Moore Field, Elsa and Combes Delivery Points Water Treatment Plant at Falcon Reservoir, Route A, 280 MGD Pipeline to Moore Field, Elsa, Combes, and Olmito Delivery Points Single Treatmeot Plant in Starr County, Route A, 200 Pipeline to Moore Filed and Elsa
Delivery Points Single Treatment Plant in Starr County, Route A, 230 Pipeline to Moore Field, Elsa and Combes Delivery Points Single Treatmeot Plant in Starr County, Route A, 280 Pipeline to Moore Field, Elsa, Combes and Olmito Delivery Points Falcon Pipeline to Lower Rio Grande Valley, Moore and Elsa, Route A, Multiple Treatment Plants in Service Area
USGS 1:24,000 scale maps and National Wetland Inventory maps were used to complete an initial assessment of the physical impact of the pipeline routes. The larger obstructions that may complicate the cross-country pipeline construction have been shown on Figures 6.9 and 6.10. The numbers of obstructions each option is likely to encounter have been summarized in Table 6.22.
LRGVOC Integrated Regional Water Plan Section 6, Page 35

Figure 6.9
450
400
350
300
g 250 .. .g & 200
150
100
50
Integrated Water Resource Plan Lower Rio Grande Valley Development Council
Final Report- Analysis of Components for Future Water Supplies
Route A, Pipeline Obstructions
RR
pipelines
pend
creaks
reeks
wetland
0+-----------------.-----------------.-----------------.-------0 100,000 200,000
Distance from Falcon (ft)
Table 6.22 Number of Obstructions on Cross-country Pipeline
Btw Fl dM lA e een a con an UDIClpa rea Obstruction Route A RouteB
Unimproved Road 48 73
Stream 40 53
Light-Duty road 19 29
Heavy-duty road 6 3
Pipeline 8 7
Wetland 8 6
Powerline 1 5
Elevated Canal 2 2
Railroad 1 1
Quarry 1
Reservoirs 1
LRGVDC Integrated Regional Water Plan
300,000
Section 6, Page 36

Figure6.10
300
g 250 ~ g ! ~ ! ~ 100 ~ ~ l
i 150 ~
i
10l• l
i 50 l
i
'
Integrated Water Resource Plan Lower Rio Grande Valley Development Council
Final Report- Analysis of Components for Future Water Supplies
Route B, Pipeline Obstructions
t
l ;·(e€'1 +
0::1"''"~
~ t ! I I ! 1 y.:;sf>ilhJ
I• f! /1.' p~!ll-8~
/ ,, t /j I
I I '-I
0 --i---~----------, -----~----~-,----- ·---------------,.-------------,--- ·---·-----------,-···------·-·-----,--------~
0 50,000 100,000 150,000 200.000 250,000 300.000 350.000
Distance !rom Fakoo (fl)
The sections of the pipeline passing through the municipalities were routed to the north of the municipalities to minimize the number of conflicts with heavily urbanized areas. The larger obstructions associated with the pipeline construction in the municipal areas have been illustrated on Figure 6.11. The numbers of obstructions the pipeline is likely to encounter north of the municipal area have been summarized in Table 6.23.
LRGVDC Integrated Regional Water Plan Section 6, Page 37

~ ~
Figure 6.II
10900 l I
:j 60i
s I J 50 I
40 ~ I
30 ~ I
20 ~
,..,,.,
Integrated Water Resource Plan Lower Rio Grande Valley Development Council
Final Report- Analysis of Components for Future Water Supplies
Pipeline Obstructions in the Municipal Area
M!:;;soun Pac:1f1: RR
/ / (.Jfla!
i Mssoun Pauf.._ ~R t
I_JI~···'•; .· / I i \, .jR
lr i ~\ i \,_
10 _,1 . R"sa(adoO'!vsC~E'S
o L-------------.----·-~-~-~----~-,------------...------------------------.--------~---------~ 300.000 350.000 400,000 450,000
Diltanet rrom Falcon 1ft)
Table 6.23
500,000 550.000 600,000
Number of Obstructions on the Pipeline in the Municipal Areas
Obstruction No. Obstruction No.
Light-duty road 34 River 4
Unimproved Road 26 Channel 3
Stream 13 Levee 3
Medium-Duty road I2 Drain I
Canal 11 Pond I
Railroad 7 Spoil Bank I
Heavy-Duty Road 5
LRGVOC Integrated Regional Water Plan Section 6, Page 38

Integrated Water Resource Plan Lower Rio Grande Valley Development Council 9 \ . Final Report- Analysis of Components for Future Water Supplies
6.3.3 Preliminary Assessment of Environmental Effects
A pipeline from Falcon Reservoir to the municipalities in the Lower Rio Grande Valley would have environmental impacts associated with construction and operation. Similar environmental impacts are possible with the construction and operation of other pipelines. Construction impacts would be associated with the activities that cause physical disturbance to the landscape, while operational effects would relate to changes such as instream flow rates and flows into bays and estuaries.
Environmental impacts due to construction would likely occur as a result of the pipeline right-of-way impacting the following environmental features:
• Cultural resources • Threatened and endangered species • Special natural areas • Stream crossings • Wetlands • Prime farmland soils
Many adverse impacts can be avoided or minimized by routing pipeline corridors away from sensitive areas (such as archaeological sites, wetlands, special natural areas, etc.) or by mitigative actions to compensate for unavoidable impacts. Areas disturbed by construction can be largely reclaimed with native vegetation to minimize the long term impacts. Operational impacts would need to consider changes, if any, to the Rio Grande flow regime.
6.3.4 Potential Options for an Entity with the Responsibility for Constructing, Owning and Operating the Pipeline and Associated Facilities
The responsibility for constructing, owning and operating a pipeline and associated facilities is a significant undertaking. It is not without precedence. To cite two examples in the State of Texas, the Dallas/Fort Worth area has been served since the drought of the 1950's through several systems using large diameter pipelines to transport significant quantities of water from East Texas to this rapidly developing area. The Colorado River Municipal Water District has connected a number of reservoirs and cities in West Texas with pipelines reaching up to 150 miles in length.
In each of these cases and in others that could be noted, a regional water authority type of organization has assumed the responsibility for development, funding and operation of the system. A regional organization would also likely be needed for the implementation of a large diameter pipeline project from either Falcon Reservoir or the Rio Grande upstream of the developed area. A major difference between these other pipeline projects and one that might be developed for the Lower Rio Grande Valley is the ownership of the water rights. In these other
LRGVOC Integrated Regional Water Plan Section 6, Page 39

Integrated Water Resource Plan Lower Rio Grande Valley Development Council
Final Report- Analysis of Components for Future Water Supplies
examples, the authority is the holder of most, if not all the water rights. Since the water rights in the Lower Rio Grande Valley are held by many entities and individuals, a method might have to be developed to consolidate a sufficient number of these water rights or lease of the water rights for long-term delivery contracts to make the financial support of the project feasible, using the authority as a funding vehicle. Another factor that must be weighed is that most of the water rights required for a successful project are currently held by the irrigation districts. Some of these will likely be sold to municipalities and water supply corporations over the life of the project. The obvious question is then, "How can a domestic entity sign a long-term contract for something that it does not own?" This question can likely be answered through some type of long term agreement between municipalities and water supply corporation with irrigation districts to sell water rights, or dedicated water for domestic purposes, as urbanization and water conservation measures take affect.
6.3.5 Estimates of Preliminary Capital and Operational Costs
Reconnaissance level cost estimates for the domestic water supply pipeline alternatives have been developed. These capital and life-cycle cost estimates provide a basis for economic comparisons of different proposed water supply systems. A thorough evaluation of any water supply system will require consideration of other factors, including among others, environmental, regulatory, and administrative concerns.
Capital cost for the water supply systems incorporate estimates for pump stations, pipelines, and water treatment plants have been based on the following assumptions. Cost estimates were developed using 1998 price levels.
• Land acquisition costs would be $1,000 per acre in the countryside and $20,000 per acre in the cities.
• Pipe construction and installation cost depends on the diameter of the pipe. For pipe greater than a 36" diameter, a cost of $2.75 per inch diameter per foot of length was assumed.
• Balancing reservoirs and terminal storage for water treatment plants were assumed to cost $20,000 per million gallons of raw water storage capacity.
• Water treatment plant capital costs for conventional facilities were estimated from Figure 6.12. For example, construction of a 1 00-MGD water treatment plant was estimated to cost $70 million.
• All pipeline conflicts were estimated to cost $300 per inch pipe diameter for each conflict.
• Contingencies at 25% of construction costs were included. • Administration and engineering costs at 15% of construction costs were included.
LRGVDC Integrated Regional Water Plan Section 6, Page 40

Integrated Water Resource Plan Lower Rio Grande Valley Development Council
Final Report- Analysis of Components for Future Water Supplies
Figure 6.12
Generalized Cost Curve Data: Water Treatment Plants (1998 prices)
WTPCapatily(MCD)
Life-cycle cost projections were based on the following assumptions:
• Minimum use would be 30 percent of initial plant capacity. Beyond the minimum, use would be the increase from the year 2000 rate.
• Projected use beyond the minimum would be based on normal year, expected conservation demands.
• The annual inflation rate for future capital, pumping, and O&M costs at 3%. • The debt service interest rate at 6.5% and the length of debt service for each project at 30
years. • The 1998 electricity cost for pumping at $0.05 per kilowatt-hour. • The wire-to-water pumping efficiency of 70%. • The pipeline O&M cost at 0.5% of the capital cost, subject to inflation. • The pump station O&M cost at 4% of the capital cost, subject to inflation. • The 1998 fixed O&M cost for the WTP at $30,000 per MGD capacity, and variable costs
at $0.15 per thousand gallons of treated water. • Annual administrative costs at $150,000 during phase I, and $300,000 during phase II. • The annual discount rate to compute present worth is 3%.
LRGVDC Integrated Regional Water Plan Section 6, Page 41

a . . Integrated Water Resource Plan
Lower Rio Grande Valley Development Council Final Report- Analysis of Components for Future Water Supplies
The capital costs for the raw water pipelines following the proposed routes to the municipal areas have been summarized in Table 6.24. More detailed capital cost estimates for all the routes to each municipal delivery point have been included in Tables I - 9 of Appendix N. Capital costs for raw water pipelines are controlled by the size and length of the pipe. Route C from the Rio Grande River near Los Ebanos is the shortest route, and consequently offers considerable savings over routes originating from Falcon. The capital costs have also been expressed in terms of dollars per 1,000 gallons of design capacity and in terms of dollars per acre-foot per year of design capacity.
The pipe diameter that produced the minimum annual costs of the water supply system was selected. Annual costs include debt service for the initial capital investment, operation and management costs, and energy costs. Although smaller pipe diameters could be used to reduce capital costs, increased headloss and high energy requirements were considered in the selection process.
The feasibility of a delivery systems incorporating booster pumps was also considered. These systems enabled smaller pipeline diameters to be used, but they were not economically advantageous because of high energy requirements.
The costs presented in Table 6.24 are only for the delivery of raw water to the Moore Field area. An evaluation was also made on the capital cost to deliver treated water from Falcon Reservoir to the developing areas. The evaluation was prepared for Route A, but a similar comparison could have been developed for the other routes. The estimated capital costs for the conditions described in Table 6.21 for Alternatives 10 through 12 have been summarized in Table 6.25. These costs are significantly greater than those presented in Table 6.24 for raw water delivery, but these estimated capital costs include a water treatment plant at Falcon Reservoir. If the estimated water treatment plant costs are subtracted, the treated water pipeline costs for the three conditions are $238, 13 6, 000, $340,560,000, and $409,714,000, respective! y. These treated water pipeline costs can be compared with those for the Route A raw water pipeline in Table 6.24. The treated water pipeline estimated capital costs are greater, as should be expected, since the treated water pipeline was designed for peaking factor of2.0 while the raw water pipeline was designed for a peaking factor of 1. 5. For the treated water pipeline from Fa! con Reservoir to be cost effective, the region would have to plan to spend more than the sum of the cost for the Falcon Reservoir water treatment plant and the difference in the cost between the cost of the treated water pipeline and the raw water pipeline on the capital cost for water treatment in the developing area if the minor difference between raw water storage and treated water storage is not considered.
LRGVDC Integrated Regional Water Plan Section 6, Page 42

Integrated Water Resource Plan Lower Rio Grande Valley Development Council
Final Report- Analysis of Components for Future Water Supplies
Table 6.24 Summary of Capital Costs for the Raw Water Pipelines to Moore Field
(Values in$ 1,000)
Route A Route B
150 175 209 150 175 209 150 MGD MGD MGD MGD MGD MGD MGD
Phase I
Falcon Reservoir Pump Station $3,040 $3,740 $4,200 $2,660 $3,400 $3,380 $3,550
Falcon Reservoir Pump Station $3,040 $3,740 $4,200 $2,660 $3,400 $3,380 $1,170 Intake
Pipeline to Moore Field $62,320 $63,950 $69,035 $63,370 $64,870 $73,694 $25,900
Starr County Balancing $3,050 $3,450 $4,260 $3,050 $3,450 $4,260 $3,050 Reservoir
Contingencies $17,860 $18,720 $20,420 $17,940 $18,780 $21,180 $8,420
Administration & Engineering $10,720 $11,230 $12,250 $10,760 $11,270 $12,710 $5,050
Total Cost Phase I $100,030 $104,830 $114,365 $100,44 $105,170 $118,604 $47,140 0
Phase II
Falcon Reservoir Pump Station $3,040 $3,740 $4,200 $2,660 $3,400 $4,420 $3,550 Expansion
Falcon Reservoir Pump Station $3,040 $3,740 $4,200 $2,660 $3,400 $4,420 $1,170 Intake Expansion
Parallel Pipeline to Moore Field $61,310 $62,940 $67,785 $62,360 $63,860 $65,175 $25,490
Starr County Balancing Res. $3,000 $3,400 $4,200 $3,000 $3,400 $4,200 $3,000 Expansion
Contingencies $17,600 $18,460 $20,100 $17,670 $18,520 $19,550 $8,300
Administration & Engineering $10,560 $11,070 $12,060 $10,600 $11,110 $11,730 $4,980
Total Cost Phase II $98,550 $103,350 $112,545 $98,950 $103,690 $109,495 $46,490
Total Cost Phases I and II $198,580 $208,180 $226,910 $/99,39 $208,860 $228,099 $93,630 0
Capital Cost per 1,000 gallons $3.63 $3.26 $2.97 $3.64 $3.27 $2.99 $1.71 of Capacity
Capital Cost per Acre-Foot per $1,181 $1,238 $1,350 $1,186 $1,242 $1,357 $557 Year of Capacity
Route C
175 MGD
$3,650
$1,200
$28,700
$3,450
$9,250
$5,550
$51,800
$3,650
$1,200
$28,290
$3,400
$9,140
$5,480
$51,160
$102,96 0
$1.61
$612
LRGVDC Integrated Regional Water Plan Section 6, Page 43
209 MGD
$3,820
$1,260
$30,280
$4,260
$9,910
$5,940
$55,470
$3,820
$1,260
$29,870
$4,200
$9,790
$5,870
$54,810
$110,280
$1.45
$656

Integrated Water Resource Plan Lower Rio Grande Valley Development Council
Final Report- Analysis of Components for Future Water Supplies
Table 6.25 Summary of Capital Costs for Treated Water System
from Falcon Reservoir along Route A (Values in$ 1,000)
200MGD 230MGD
Phase]
Falcon Reservoir Pump Station $4,300 $4,490
Pump Station Intake $4,300 $4,490
Water Treatment Plant $73,700 $85,160
Pipeline to Moore Field $64,100 $69,040
Pipeline, Moore Field to Elsa $18,520
Pipeline, Moore Field to Combes $45,310
Pipeline, Moore Field to Olmito
Treated Water Storage $2,498 $2,790
Contingencies $23,430 $31,530
Administration & Engineering $14,060 $18,920
Total Costs- Phase I $204,908 $261,730
Phase!! Falcon Reservoir Pump Station Expansion $4,300 $4,490
Pump Station Intake Expansion $4,300 $4,490
Water Treatment Plant Expansion $65,578 $74,173
Pipeline to Moore Field $63,090 $68,030
Pipeline, Moore Field to Elsa $12,300
Pipeline, Moore Field to Combes $26,710
Pipeline, Moore Field to Olmito
Treated Water Storage $2,498 $2,790
Contingencies $21,620 $26,630
Administration & Engineering $12,970 $15,980
Total Cost - Phase ll $186,656 $223,293
Total Cost - Phases I and ll $391,564 $485,023
Capital Cost per 1,000 gallons of Capacity $5.36 $5.78
Capital Cost per Acre-Foot per Year of $1,747 $2,163 Capacity
280MGD
$4,860
$4,860
$101,160
$74,280
$74,129
$3,763
$40,470
$24,280
$327,802
$4,860
$4,860
$86,446
$73,270
$52,719
$3,763
$34,870
$20,920
$281,708
$609,510
$5.96
$2,719
An option for locating a regional water treatment plant closer to the developing urban area should be to locate it near the proposed balancing reservoir in Starr County. The estimated capital costs associated with this approach have been summarized in Table 6.26. These estimated capital costs are essentially equal to those with the water treatment plant located at Falcon Reservoir. The savings in the pipeline costs is essentially offset by the construction of the balancing reservoir in Starr County.
LRGVOC futegrated Regional Water Plan Section 6, Page 44

Integrated Water Resource Plan Lower Rio Grande Valley Development Council
Final Report- Analysis of Components for Future Water Supplies
Table 6.26 Summary of Capital Costs for Raw Water Pipeline to Starr County
Balancing Reservoir and Water Treatment Plant at the Balancing Reservoir (Values in$ 1,000)
200MGD 230MGD 280MGD
Phase I
Falcon Reservoir Pump Intake $3,040 $3,740 $4,200
Falcon Reservoir Pump Station $3,040 $3,740 $4,200 Raw Water Pipeline to Balancing $64,100 $65,680 $70,725
Reservoir Balancing Reservoir $5,080 $5,890 $7,110
Water Treatment Plant $73,700 $85,160 $101,160
Treated Water Pipeline to Elsa $18,520
Treated Water Pipeline to Combes $45,310
Treated Water Pipeline to Olmito $74,129
Treated Water Storage $2,498 $2,790 $3,763
Contingencies $24,070 $31,790 $41,030
Administration & Engineering $14,440 $19,070 $24,620
Total Cost -Phase I $208,488 $263,170 $330,937
Phase II
Falcon Reservoir Pump Intake $3,040 $3,740 $4,200 Expansion
Falcon Reservoir Pump Station $3,040 $3,740 $4,200 Expansion
Parallel Raw Water Pipeline to $63,090 $64,670 $69,475 Balancing Reservoir
Balancing Reservoir Expansion $3,000 $3,400 $4,200
Water Treatment Plant Expansion $65,578 $74,173 $86,173
Parallel Treated Water Pipeline to $12,300 Elsa
Parallel Treated Water Pipeline to $26,290 Combes
Parallel Treated Water Pipeline to $52,719 Olmita
Treated Water Storage Expansion $2,498 $2,790 $3,763
Contingencies $21,740 $26,160 $34,640
Administration & Engineering $13,050 $15,690 $30,780
Total Cost- Phase II $187,336 $220,653 $290,150
Total Cost - Phases I and II $395,824 $483,823 $621,087
Capital Cost per 1,000 gallons of $5.42 $5.76 $6.08 Capacity Capital Cost per Acre-Foot per Year $1,766 $2,158 $2,770 of Capacity
LRGVDC futegrated Regional Water Plan Section 6, Page 45

Integrated Water Resource Plan Lower Rio Grande Valley Development Council
Final Report- Analysis of Components for Future Water Supplies
To obtain an understanding ofthe merits of a single regional water treatment plant over multiple regional water treatment plants, a comparison has been made in Table 6.27. In this comparison, multiple regional water treatment plants have been assumed near Moore Field, Doolittle Road, and Elsa. For these conditions, a single regional water treatment plant near the Starr County balancing reservoir is more cost effective than three regional water treatment plants located at key locations in Hidalgo County. The capital cost difference would become greater as the number of water treatment plants in the service area increase due to the increasing unit cost for smaller water treatment plants.
Table 6.27 Summary of Capital Costs for System With Treatment Plant in Starr County Compared to Multiple Regional Water Treatment
Plants in the Service Area- Route A and 200 MGD (Values in$ 1,000)
Starr County Multiple Regional
Phase! Falcon Reservoir Pump Station
Pump Station Intake
Raw Water Pipeline to Balancing Reservoir
Balancing Reservoir
Water Treatment Plant in Starr County
Treated Water Pipeline to Elsa
Raw Water Pipeline to Elsa
Treated Water Storage
Raw Water Storage
Moore Field Regional Water Treatment Plant
Doolittle Road Regional Water Treatment Plant
Elsa Regional Watre Treatment Plant
Contingencies
Administration & Engineering
Total- Phase I
LRGVDC Integrated Regional Water Plan
$3,040
$3,040
$64,100
$5,080
$73,700
$18,520
$2,498
$24,070
$14,440
$208,488
$3,040
$3,040
$62,420
$3,050
$16,250
$2,498
$9,600
$34,560
$32,320
$13,610
$24,970
$14,980 $220,338
Section 6, Page 46
.
Integrated Water Resource Plan Lower Rio Grande Valley Development Council 9 \ . Final Report- Analysis of Components for Future Water Supplies
Table 6.27 (Continued)
Starr County Multiple Regional
Phase -II
Falcon Reservoir Pump Station $3,040 $3,040 Pump Station Intake Expansion $3,040 $3,040
Raw Water Pipeline to Balancing Reservoir $63,090 $61,310 Balancing Reservoir $3,000 $3,000
Water Treatment Plant in Starr County $65,578
Treated Water Pipeline to Elsa $12,300
Raw Water Pipeline to Elsa $10,030
Treated Water Storage $2,498 $2,498 Raw Water Storage $7,400
Moore Field Regional Water Treatment Plant $34,560
Doolittle Road Regional Water Treatment Plant $32,320 Elsa Regional Watre Treatment Plant $13,610
Contingencies $21,740 $22,580
Administration & Engineering $13,050 $13,550 Total Phase- II $187,336 $206,938
Total Phases I and II $395,824 $427,276
Capital Cost per 1,000 gallons of Capacity $5.42 $5.85
Capital Cost per Acre-Foot per Year of Capacity $1,766 $1,906
6.3.6 Description of the Social and Economic Impacts of the Pipeline on the Lower Rio Grande Valley
A number of social and economic impacts on the Lower Rio Grande Valley could occur as the result of the construction of a regional pipeline to serve a portion of the domestic demand. The construction of a regional pipeline project represents a major investment that would likely cause an increase in the cost of treated water during the earlier years of operation when the full potential of the pipeline would not be utilized. A higher quality water, and one less subject to pollution by development along the Rio Grande, should be available directly from Falcon Reservoir or the river near Los Ebanos. The increase cost for water treatment to delivered of all the domestic requirements through the current irrigation system would have to be determined before a final decision can be made on the cost impact on the individual.
A portion of some irrigation districts' operational income is currently derived through the transportation charges to the municipalities and water supply corporations for the delivery of their water. Under the proposed concept of having the pipeline only deliver the projected increase in canal system, the impact on operational income of the irrigation districts should be minimal.
LRGVDC Integrated Regional Water Plan Section 6, Page 47

Integrated Water Resource Plan Lower Rio Grande Valley Development Council
Final Report- Analysis of Components for Future Water Supplies
A source of high quality water is considered important to some businesses. The quality and reliability of the domestic water supply could have a direct impact on the types of businesses that might choose to locate in the Lower Rio Grande Valley in the future.
6.3.7 Potential Water Quantity Savings through a Pipeline System from Falcon Reservoir
The potential water quantity savings would come from the reduction in the transportation losses that have been projected to occur if the water were delivered through the irrigation canals. In Table 5.4, the domestic transportation losses have been projected to increase from 35,400 acre-feet per year to 66,600 acre-feet per year, at a 20% loss rate, if all the domestic demand were supplied through the irrigation system. For these assumptions, the quantity of water saved would be 31,200 acre-feet per year. The actual transportation loss rate was discussed in Section 6.2.
6.4 Analysis of Water Development through Municipal and Industrial Water Conservation Efforts.
6.4.1 Summary of Existing Water Conservation Studies and Plans
Various elements have been used in the development of a water conservation plan in the Lower Rio Grande Valley. Seventeen water conservation plans were received from municipalities and water supply corporation. The entities that provided a copy of their water conservation plan are listed in Table 6.28.
Table 6.28 M UDICtpa IW ater C PI onservahon ans p "ded rOVI
Brownsville East Rio Hondo WSC Edcouch
Edinburg Harlingen Hidalgo
LaJoya McAllen Mercedes
Military Highway WSC Mission Pharr
Raymondville Rio Hondo SanJuan
North Alamo WSC Weslaco
The most common components in water conservation plans in the Lower Rio Grande Valley are listed below.
• Public Education and Information Program • Water Conservation Oriented-Rate Structure • Universal Metering and Meter Repair/Replacement • Leak Detection and Repair • Water Conservation Plumbing Code • Water Conservation Plumbing Retrofit Program
LRGVDC Integrated Regional Water Plan Section 6, Page 48

Integrated Water Resource Plan Lower Rio Grande Valley Development Council
Final Report- Analysis of Components for Future Water Supplies
• Water Conservation Landscaping • Implementation and Enforcement • Annual Reporting • Recycling and Reuse • Wholesale Contracts • Control of Water Pressure • Water Wells • Fire Hydrants/Trucks • Pool Refill • Ornamental Fountains • Automotive Washing
Public Education and Information Program
The municipalities and water supply corporations promote water conservation by informing the public of methods to conserve water. Some of the public education consists ofbrochures, a long-term program, new customer program and regular articles published in local papers. The TWDB suggests that the public be informed of the process by public meetings, radio and TV announcements, newspaper articles, letters, bill inserts, and brochures to customers.
Water Conservation Oriented-Rate Structure
Some entities have their rate structure tailored toward water conservation. Some of the current rate structures take the form of an inverted block rate so that high volume users are penalized for high water usage, in essence: the more you use, the more you pay. Others use the step rate structure with excess use fees or a base fee plus a uniform rate.
Universal Metering and Meter Repair/Replacement
Most of the cities and the water supply corporations water customers are presently IOO% metered. Master meters are installed and periodically calibrated at all existing water sources. Some of the cities have the following meter testing schedules: Production Meter - test once a year; meters larger than I" - test once a year; meters I" and smaller - test every ten years.
Leak Detection and Repair
Most cities perform a continuous leak detection, location, and repair program to conserve water. Meters showing abnormal usage are checked to determine any possible leak, repair or replacement problem.
LRGVDC Integrated Regional Water Plan Section 6, Page 49

Integrated Water Resource Plan Lower Rio Grande Valley Development Council ~
~ Final Report- Analysis of Components for Future Water Supplies
Water Conservation Plumbing Code
Cities have adopted the use of water saving toilets, low flow shower heads and faucets, and water conserving appliances.
Water Conservation Plumbing Retrofit Program
Customers in existing buildings which do not have water saving devices are encouraged to replace their old plumbing fixtures. Most cities have an outreach program to help their customers be informed ofthe advantages of installing water saving devices. Pamphlets, brochures, newsletters and bill inserts are the most popular sources of keeping water customers informed about retrofit programs. Some cities have water saving kits made available for their customers.
Water Conservation Landscaping
Some cities do not plan to require water conserving landscaping; however, through education and information they encourage the use of water conservation. The public education program includes suggestions on landscaping and irrigation procedures which result in reduced water consumption and reduced water bills. These practices are implemented on some public grounds to sent an example for the general public. Nurseries and other businesses that sell outdoor plants, grasses, and irrigation equipment are encouraged to make products that conserve water available to public.
Programs of Implementation and Enforcement
In most cities, the City Council adopts· the water conservation plan and enacts an ordinance. A field inspector or existing staff is used to insure that the plumbing fixtures that are proposed in the service tap application are installed in new buildings. Some cities do not give service to those who do not meet the requirements of the water conservation plumbing fixtures. Nor do some cities allow their building inspectors to certify new construction unless it has met the proposed plumbing codes.
Annual Reporting
For those cities or water supply corporations that have a TWDB loan, an annual report is submitted on or before sixty days after the anniversary date of the loan closing each year. Most of the reports include: (a) public information which has been issued, (b) public response to plan, (c) effectiveness of water conservation plan in replacing water consumption by providing production and sales records, (d) implementation progress and status of a plan.
Wholesale Water Contracts
The cities require, through a contractual agreement, that any city or political subdivision contracting with the cities for wholesale water supply or wastewater services either (1) adopt the
LRGVOC Integrated Regional Water Plan Section 6, Page 50

Integrated Water Resource Plan Lower Rio Grande Valley Development Council ~
~ Final Report- Analysis of Components for Future Water Supplies
provisions of the city's water conservation plan, or (2) develop and adopt a plan which is approved by the Texas Water Development Board.
Recycling and Reuse
Reuse utilizes treated eflluent from an industry, municipal system or agriculture return flows to replace an existing use that currently required fresh water from a utility's supply. Recycling utilizes in-plant process or cooling water to reduce the amount of fresh water required by other industrial operations. At present, most of the recycling is done at the water plants. The back washing of the water plant is done and the water is recycled after the sludge has settled. Most of the plans say that they have the ability to use wastewater effiuent to irrigate golf courses, but only the City of Harlingen's plan states that the Town of Palm Valley utilizes its wastewater to irrigate the Harlingen Country Club golf coarse. McAllen irrigates the Palmview golf course. Based on Laguna Madre Water District's conservation plan dated August 1996, the District plans to provide effiuent for reuse for restricted and unrestricted areas for the existing and future wastewater treatment plants.
Control of Water Pressure
The City of Weslaco is of the opinion that pressure reduction will help save water by reducing the amount of water that will flow through an opened valve or faucet in a given time. Their conservation plan states that pressure reduction also saves water by reducing excessive mechanical stress on plumbing fixtures and appliances and on distribution system.
Water Wells
The City of Weslaco is the only city which had water wells as an element in its water conservation plan. The City ban the use of water wells for personal use under any circumstances. According to its plan, the City of Weslaco is the only entity entitled to dig or construct water wells for citizens ofWeslaco.
6.4.2 Summary of"Unaccounted" Water Records
The data furnished by the municipalities on the levels of"unaccounted" water have been summarized in Table 6.29. The available data do not make clear if all the unaccounted for percentages are computed in the same manner. Unaccounted for percentages in the 10 to 15 percent range are considered good. Since a number of the municipalities submitting data fall above this range, the potential for water conservation in the area may exist.
6.4.3 Potential Water Quantity Savings through Municipal and Industrial Water Conservation
The estimated water quantity savings through municipal and industrial water conservation included in the projection of the future water requirements were summarized in Table 5.5. The
LRGVDC Integrated Regional Water Plan Section 6, Page 51

.
Integrated Water Resource Plan Lower Rio Grande Valley Development Council 9 . Final Report- Analysis of Components for Future Water Supplies
savings have been projected to increase from the current level by an additional 67,800 acre-feet per year in the year 2050. To accomplish the level of water conservation will likely require a regional program and the cooperation of all municipalities, water supply corporations, and individual citizens.
Table 6.29 Summary of "Unaccounted" Water Records Provided
(Percent a~ es) '87 '90 '91 '92 '93 '94 '95 '96 '97 Avg.
Brownsville 23.6 24.1 23.9 23.9 23.3 23.8
Edinburg 15.3 9.7 -9.1 -14.7 6.8 1.60
Harlingen 13.2
McAllen 9.9 9.9 9.9 9.9 9.9 9.90
Mercedes 17.5 22.6 20.5 25.3 31.9 22.4 23.4
Mission 12.0 12.0
Pharr 18 18.0
Santa Rosa 30 30.0
Weslaco 14 14.0
East Rio Hondo WSC 9.06 11.78 12.48 12.22 12.32 11.6
North Alamo WSC 17.75 17.81 13.62 13.18 13.71 15.21
Military Hwy WSC 13.60 18.10 5.90 12.8 11.7 12.42
OlmitoWSC 8.08 8.08
6.5 Analysis of Water Development through Increased Agricultural Conservation Efforts
6.5.1 Description of Existing Agricultural Water Conservation Measures
On-farm irrigation efficiency is defined as the ratio of the amount of water needed to grow the crop to the amount of water delivered to afield. The amount of water needed to grow a crop is usually estimated from evapotranspiration (ET) data as adjusted for beneficial rainfall and leaching requirements. Surface irrigation generally has low efficiencies. For example, the average on-farm irrigation efficiencies measured in eleven districts in the Western United States have been listed in Table 6.30. In this study, on-farm irrigation efficiency was found to range widely, 30- 800/o. Generally, on-farm surface irrigation efficiencies of60- 70% should be expected. Various practices and field improvements can increase this efficiency to 70- 80%, or even higher with good management and improved technology. Limitations of a producer affect the level of efficiency.
LRGVDC Integrated Regional Water Plan Section 6, Page 52

~ ~
Integrated Water Resource Plan Lower Rio Grande Valley Development Council
Final Report- Analysis of Components for Future Water Supplies
Table 6.30 Average on Farm Irrigation Efficiency Measured in 11
Districts in the Western United States between 1975-1978 Average On-Farm Irrigation
District Efficiency(%) Imperial Irrigation District 78
Coachella Valley Water District 52 Reservation Division 52
Yuma County Water User 71 Association Yuma Mesa Irrigation and 31 Drainage Unit "B" Irrigation District 33 Yuma Irrigation District 61
North Gila Irrigation District 39 Wellton-Mohawk Irrigation 58 District Colorado River Indian Tribes 65
Palo Verde Irrigation District 43
Source: Impenal Imgat10n Drstrrct Repart: Hrstory of Water Conservation within the Imperial Irrigation District, April 28, 1998. Unpublished data collected by the Bureau of Reclamation.
Table 6.31 Water Savings Observed or Estimated from Metering and Poly Pipe
E . d . h 1990' . h Lo Ri G d V II xpenments urmg t e s m t e wer 0 ran e a ev Water Savings Observed
District % Meterinf!. and GaJt.ed Pipe' Bayview 36
Brownsville 33
Delta Lakes 33
San Benito 40
Metering Only
Donna 20
La Feria lO
1 .. May mclude additional benefits from unplementmg unproved on-farm water management
practices or due to changes in irrigation technology
The observed water savings reported in four districts in the Lower Rio Grande Valley (Bayview, Brownsville, Delta Lakes, San Benito) from recent experiments with layflat tubing
LRGVDC Integrated Regional Water Plan Section 6, Page 53

Integrated Water Resource Plan Lower Rio Grande Valley Development Council
Final Report- Analysis of Components for Future Water Supplies
replacement of siphon tubes and on-farm metering have been provided above in Table 6.31. In some cases, improved technology or water management were also implemented. The numbers reported for Donna and La Feria are for metering only.
6.5.2 Identification of Potential Agricultural Water Conservation Measures for the Lower Rio Grande Valley
From these observations and supporting information, the conclusion can be reached that significant water savings at the farm level are possible in the Lower Rio Grande Valley. However, one major limiting factor is that in about half of the area, water is not delivered to the field at adequate head (sufficient volume and/or pressure) to allow for efficient furrow irrigation. Without improvements in the distribution systems, on-farm water saving potential in about half the irrigated land will be limited.
For this analysis, on-farm water savings were classified into three components: (1) metering, (2) gated pipe replacement of field ditches and siphon tubes, and (3) high water management and/or improved irrigation technology meters don't save water, but their use provides a better opportunity for water savings through more effective applications and volumetric pricing. The expected range of water savings for each practice and the factor used in this analysis have been listed in Table 6.32. The assumptions used in applying these factors to this area have been summarized in Table 6.33. For example, the first two factors were not applied to the area currently under metering and gated pipe. In addition, benefits from high water management (better training) were not applied to the half of the area with head problems. Increased on-farm efficiency can only be achieved in these areas by improvements in the distribution systems and/or adoption of pumped and pressurized irrigation systems such as drip and sprinkler irrigation.
Table 6.32 On-farm Water Savings Potential and Factors Used
in Lower Rio Grande Valley Integrated Water Resources Plan- Phase II Project. Technique Expected Water Savings Factor Used
Metering for more effective applications and 0-15% 10% volumetric pricing Poly/gated pipe replacement of field ditches/siphon 5-20% 10% tubes High management/improved irrigation technology 10-30% 20%
LRGVDC Integrated Regional Water Plan Section 6, Page 54

Integrated Water Resource Plan Lower Rio Grande Valley Development Council
Final Report- Analysis of Components for Future Water Supplies
Table 6.33 Assumptions for Applying Water Savings Factors in Table 6.32
Technique Assumptions for Calculations
Metering for more effective -adopted Valley-wide by 2010 applications and volumetric pricing - land area currently under metering excluded Poly/gated pipe -adopted by 90% of Valley by 2010
- approximately 50% of Valley already using gated/poly pipe -factor applied to remaining 40% of Valley not currently using poly/gated pipe (0.9- 0.5 = 0.4)
High management/improved -adopted on half of Valley by 2010 irrigation technology - approximately 20% of area currently under high management or using
improved technologies - factor applied to 30% of area (0.5 - 0.2 = 0.3)
An additional component of the agricultural water use projections is the assumed crop mix to be used. Initial intentions were to employ a previously developed mathematical programming model to determine the mixture of technologies and crops expected in the Lower Rio Grande Valley for each decade of the planning horizon. Uncertainty as to the relative cost of the improved technologies to be adopted, especially 50 years from now, as well as the unknown world economic situation with resulting impacts on crop demand, led to use of the current crop mix as the best estimate of future crop mixes. Programming models rely heavily on the relative cost of alternatives to choose among those alternatives, and the strong uncertainty both as to the form and cost of technologies available as well as in use 50 years from today led to the not employing the previously noted mathematical programming setup. Also, in practice, the impact of the water application technologies used was believed to be much more significant in affecting total water use than crop mix.
6.5.3 Estimate of Preliminary Capital and Operational Costs Metering
Adoption of a Valley-wide metering program could save an estimated, at the minimum, 10% of historical average applications not using the technique. As noted earlier, greater savings have been obtained both in the Valley and in other areas of the U.S. The current estimate indicates approximately 84% ofirrigable acreage (465,000 acres) has not been metered. The estimated costs of implementing metering have been summarized in Table 6.34. Applying the assumed 90 percent irrigated/irrigable acreage factor results in an estimated 418,000 additional acres available for metering.
Meters currently cost approximately $800 apiece. A 20% increase has been assumed for minor alterations to the site for installation of turnouts and other improvements. Field sizes vary dramatically in the Valley, ranging from five to several hundred acres. In addition, the meters may be moved around from one field to another. Meters may also, obviously, be used more than once per year if irrigable acres are double cropped. Given these factors, one meter was assumed to cover 50 irrigated acres, resulting in coverage of an even larger number of acres when
LRGVOC Integrated Regional Water Plan Section 6, Page 55

Integrated Water Resource Plan Lower Rio Grande Valley Development Council ~
~ Final Report- Analysis of Components for Future Water Supplies
accounting for double cropping. Division of the 418,000 irrigated acres served by the assumed 50 acres/meter resulted in an estimated 8,366 meters needed and a total investment of slightly more than $8 million. Amortizing this value over 10 years at 7% results in an average annual repayment cost of $1.14 million. Projected water savings are calculated for the year-2000 crop and technology mix for both the on-farm and the total water saved (including transportation losses avoided) cases. Average annual costs per acre-foot saved are $12.72 per acre-foot saved on-farm, and fall to $9.95 per acre-foot saved when the saved transportation losses are included. The costs are 3.9 and 3.05 cents per 1000 gallons respectively. Overall, these cost estimates are believed to be conservative. Each meters could likely cover more acres, and quantity discounts for meters might apply for large orders placed by one or more irrigation districts and/or a central coordinating entity.
Table 6.34 E' stimate dC ost o fM I I eterm2 moJementation
Item Amt Unit Acres served 418,286 acre
Meters required (assumes 50 acres served by each meter) 8,366 Number of meters
Cost per meter 960 $
Total on-farm investment 8,031,091 $
Amortized investment (10 yrs@ 7%) 1,143,485 $
On-farm water savingslyr 89,905 acre-feet
Water saved/yr including transportation 114,973 acre-feet
Avg annual cost of on-farm water savings 12.72 $/acre-feet
Avg annual cost of total water savings 9.95 $/acre-feet
Poly or Gated Pipe
Current estimates place approximately 58% of the irrigable acres in the Lower Rio Grande Valley as using poly or gated pipe. This leaves approximately 233,000 acres being available for potentially expanded use of poly pipe. Overall study conditions assume that 90% of the irrigable acres are irrigated, and 90% of the irrigated acres will eventually use a poly or gated pipe. This results in approximately 209,000 acres available for installation of poly-pipe or gated pipe.
The cost calculations for the poly-pipe implementation program have been summarized in Table 6.35. Field sizes in the Lower Rio Grande Valley vary considerably, but for illustration purposes a rectangular field (1,200x1,452 ft) of 40 acres is assumed to be representative. The shorter side of the rectangular generally forms the run of the irrigation row, yielding a length of 1,452 ft of poly-pipe. A roll (1,320 ft) of 15 inch poly-pipe costs around $258, or 19.5 cents per foot. Total cost for poly-pipe is then $283.14 per field, and this value is increased by 10% to allow for miscellaneous expenses of installation and the plugs which some irrigators use to control flow and head. Total estimated cost for purchase of poly-pipe for the eligible acres is then $1.6 million. This value could obviously vary as the field size varies across the Valley. Estimated annual water savings for the year 2000 conditions are 44,378 acre-feet on-farm, with a
LRGVDC Integrated Regional Water Plan Section 6, Page 56

Integrated Water Resource Plan Lower Rio Grande Valley Development Council
Final Report- Baseline Environmental Conditions
7.0 Baseline Environmental Conditions
7.1 Summary of Available Documentation on Vegetation and Wetlands in the Region
The Lower Rio Grande Valley is located in the Matamoran district of the Tamaulipan Biotic Province. It is the northern boundary of much of the semitropical biota ofMexico. Plants and animals from the drier areas to the west and the moister areas to the northeast converge in the Lower Rio Grande area.
The Rio Grande area is an overlap point of western desert, northern, and tropical plants. This results in a unique and varied population of flora and fauna. Western desert plants such as mesquite, (proopis glan dulosa) leatherstem lotebrush ziziplos obtusifolia and brazil (Cordalia hockeri) are found in this area. Sugar hackberry (Celtis loevigata) and Texas persimmon (Diospyra texana), more frequent to the north, are also located in the Valley. Lantana horrida, heartseed, anacahuite and Texas ebony (Pithecellobum ebano) are typically more tropical in location. Montezuma bald cypress (Taxucliving mucronatum), Gregg wild buckwheat, (Eriogoniumg reggi) heartseed, Texas ebony and anacahuite have their northernmost extension in the Lower Rio Grande Valley. Since 1900, more than ninety percent of riparian vegetation has been cleared. Surface water is present in arroyos for a brief period after substantial rainfalls. The scarcity of water has resulted in vegetation types being closely correlated to topographic characteristics (LBJSP A, 197 6).
Efforts were made to obtain DOQ's as satellite imagery of the area to permit a classification of land use to identify areas of suspected wetland environments along the Rio Grande watercources. The DOQ's were not available in a timely manner, and National Wetland Inventory (NWI)maps were used to identify areas with wetlands along the Rio Grande.
Biotic Communities
The Lower Rio Grande Valley consists of eleven distinct biotic communities, stretching from Falcon Reservoir to the Gulf of Mexico (USFWS, 1997). The communities to the northwest are arid, semi-desert thorny brush. Toward the coast the communities contain more wetlands, marshes and saline environments.
Ramaderos
This region, which occupies western central Starr county, consists of arroyos that provide extended habitat into the interior for wildlife.
LRGVDC Integrated Regional Water Plan Section 7, Page 1

Integrated Water Resource Plan Lower Rio Grande Valley Development Council
Final Report- Baseline Environmental Conditions
Chihuahuan Thorn Forest
This community, located below Falcon Dam along the Rio Grande, includes a narrow riparian zone and a desert shrub community on the uplands. Rare plants such as the Montezuma baldcypress and Johnston's frankenia (Frankeniajohnstonii) are found here, as well as uncommon birds such as the Brown Jay (Cyanocorax morio), Ringed Kingfisher (Ceryle torquata) and Red-billed Pigeon (Columbajlavirostris).
Upper Valley Flood Forest
This community is located along the Rio Grande from south-central Starr county to the western border of Hidalgo county. The floodplain narrows in this region, with typical river bank trees such as Rio Grande ash (Fraxinus berlandieriana), sugar hackberry, black willow (Salix nigra), cedar elm (Ulmus crassifolia) shifting to honey mesquite, granjeno (Celtis pal/ida), and prickly pear (Opuntia lindheimeri) only a short distance from the river.
Barre tal
This community occurs in southeastern Starr county just north of the Upper Valley Flood Forest. Barreta (Helietta parvifolia), a small tree located on gravelly caliche hilltops, and palo verde (Cercidium texanrum), guajillo (Acacia berlandieri), blackbrush (Acacia rigidula), anacahuita (Cordia boissieri), yucca (Yucca treculeana), and many species of cacti are typical of this community.
Upland Thorn Scrub
This community occurs in southwestern Hidalgo county, and is the most common community in the Tamaulipan Biotic Province. Typical woody plants include anacahuita (Cordia boissieri), cenizo (Leucophyliumfrutescens), and palo verde.
Mid-valley Riparian Woodland
This community is located along the Rio Grande from western Hidalgo county eastward to the Saba! Palm Forest. This is a tall, dense, and canopied bottomland hardwood forest favored by Chachalacas and Green Jays, birds more typical of Mexico. Trees of this area include Rio Grande ash, sugar hackberry, black willow, cedar elm, Texas ebony, and anacua.
Woodland Potholes and Basins
Central Hidalgo county and western Willacy county contain this community of seasonal wetlands and playa lakes. In addition, three hypersaline lakes are present which attract migrating shorebirds. The ocelot can be located in dense thickets. Wetlands are located in low woodlands
LRGVDC Integrated Regional Water Plan Section 7, Page 2

Integrated Water Resource Plan Lower Rio Grande Valley Development Council
Final Report - Baseline Environmental Conditions
of honey mesquite, granjeno, prickly pear, lotebush, elbow bush (Forestiera angustifolia) and braeil.
Mid-Delta Thorn Forest
This plant community originally covered eastern Hidalgo county, the western two-thirds of Cameron county, and southwest Willacy county, but conversion ofland for agricultural and urban uses has left only isolated pockets of native vegetation. Typical plants include honey mesquite, Texas ebony, coma, anacua, granjeno, colima (Zanthoxylumfagara), and other species that form dense thickets. This region provides excellent wildlife habitat and is a preferred area for white-winged dove (Eenaida asiatica).
Saba/ Palms Forest
This area of riparian forest contains the last 50 acres of original Sabal Palm forest in South Texas. It is located on the Rio Grande at the southernmost point of Texas. Vegetation in this region includes Texas sabal palm (Saba/ texana), Texas ebony, tepeguaje (Leucaena pulverulenta), anacua, brasil, and granjeno. The Sabal Palm Grove Sanctuary is located in this area.
Loma Tidal Flats
Located at the mouth of the Rio Grande, this area consists of clay dunes, saline flats, marshes and shallow bays along the Gulf of Mexico. Sea ox-eye (Borrichia frutescens), saltwort (Batis maritima), glasswort (Salicornia sp. ), gulf cordgrass (Spartina spartinae), Berlandier's fiddlewood (Citharexylum berlandieri), Texas ebony and yucca are typical plants in this region.
Coastal Brush/and Potholes
This area is dense brushy woodland around freshwater ponds changing to low brush and grasslands around brackish ponds and saline estuaries nearer the Gulf Typical plants include honey mesquite, granjeno, barbed-wire cactus (Acanthocereus pentagonus) and gulf cordgrass. Wetlands in this area are heavily used by migratory waterfowl.
Protected Areas
Several refuges and preserves in the Lower Rio Grande Valley have been created by public and private interests to protect remaining vegetation and the habitats of endangered and threatened species. These include the Santa Ana Wildlife Refuge, Laguna Atascosa National Wildlife Refuge, Bentsen-Rio Grande Valley State Park, Sabal Palm Grove Sanctuary, and the Lower Rio Grande Valley National Wildlife Corridor. In addition, areas such as the Falcon Woodland below Falcon Dam have special vegetation and wildlife characteristics.
LRGVDC Integrated Regional Water Plan Section 7, Page 3

Integrated Water Resource Plan Lower Rio Grande Valley Development Council
Final Report - Baseline Environmental Conditions
Laguna Atascosa National Wildlife Refuge
This is the largest protected area in the Lower Rio Grande Valley, with more than 45,000 acres ofland. It is located north of the Rio Grande and south of the Arroyo Colorado along the Laguna Madre.
Lower Rio Grande Valley National Wildlife Refuge
This refuge serves as the largest component of the Lower Rio Grande wildlife corridor (described below) being established by the U.S. Fish and Wildlife Service (USFWS). It currently covers 65,000 acres, and USFWS plans to increase the size of the refuge to 132,000 acres through purchases and conservation easements.
Santa Ana Wildlife Refuge
This 2,000-acre refuge receives extensive bird watching attention because it is located at the convergence of two major migratory waterfowl flyways, the Central and the Mississippi. More than half of all butterfly species in the United States are found in this refuge.
Falcon State Park
This park, managed by Texas Parks and Wildlife Department (TDWD), is located on over 500 acres below Falcon Dam. It is popular with bird watchers because of its varied collection of birds.
Saba/ Palm Audubon Center and Sanctuary
This sanctuary, owned by the Audubon Society, is located in the southernmost point of Texas on the Rio Grande. It is a 527-acre forested area which includes a substantial portion of the remaining saba! palm forest. The sanctuary is popular with bird watchers and other nature enthusiasts for its wildlife. The ocelot and jaguarundi are believed to inhabit parts of Saba! Palm Sanctuary.
Bentsen-Rio Grande Valley State Park
This park, managed by Texas Parks and Wildlife, is located west of Mission in Hidalgo county. It consists of almost 600 acres of subtropical resaca woodlands and brushland. It is also a popular bird watching area.
LRGVDC Integrated Regional Water Plan Section 7, Page 4

Integrated Water Resource Plan Lower Rio Grande Valley Development Council
Final Report - Baseline Environmental Conditions
Lower Rio Grande Wildlife Corridor
The US FWS, with the support and assistance ofTPWD and several private organizations and individuals, is attempting to create a wildlife corridor along the Rio Grande from Falcon Dam to the Gulf of Mexico. The previously mentioned wildlife refuges are part of this system. Other lands are purchased from willing sellers at fair market price or obtained through conservation easements.
7.2 Summary of Endangered and Threatened Species ofWildlife Existing in the Region
The USFWS) and (TPWD) maintain databases on federal and state protected species of plants and animals. Information for the following sections was compiled using the TPWD Biological and Conservation Data System (TBCDS, 1998). Tables 7.2-1 and 7.2-2 at the end of Section 7.2 summarize information on the status of each species by county.
7.2.1 Endangered or Threatened Plant Species in the Lower Rio Grande Valley
Seven plant species ofthe Lower Rio Grande Valley are listed as endangered or threatened by the USFWS or the TPWD (TBCDS, 1998).
South Texas Ambrosia (Ambrosia cheiranthifolia) is a wildflower that was historically found in Cameron and Jim Wells counties. It is now known also to exist in six locations in Nueces and Kleberg counties. Habitat loss from land conversion and competition from buffelgrass (Cenchrus ciliaris) and King Ranch bluestem (Bothriochloa ischaemum var. songarica) have led to a decline in this species. It grows at low elevations in open-clay loam to sandy-loam prairies and savannas (TPWD, 1998).
Star Cactas (Astrophytum asterias) is a flat dome-shaped cactus that historically occurred in Cameron, Starr, and Hidalgo Counties. Only one population is known to exist currently in the U. S. It is found along a creek drainage in the plains of Starr county. Habitat conversion and brush clearing have led to the decline in this species (TPWD, 1998).
Texas Ayenia (Ayenia limitaris) is a wildflower known to exist in only one location in the U. S. It occurs on terraces and floodplains, and it may be dependent on flooding for nutrient enrichment and seed dispersal. Conversion ofland for agricultural or urban use, flood control and the spread of non-native species such as guineagrass (Panicum maximum) have contributed to the species' decline. The known U. S. population is found in Hidalgo county. It is also found in the Mexican state ofTamaulipas (TPWD, 1998).
Johnston's Frankenia_(Frankenia johnstonii) is a grayish-green, spineless, salt-loving shrub that is located in Starr county. Thirty populations exist in Starr, Webb and Zapata Counties.
LRGVDC Integrated Regional Water Plan Section 7, Page 5

Integrated Water Resource Plan Lower Rio Grande Valley Development Council
Final Report - Baseline Environmental Conditions
Johnston's frankenia is found in highly saline soils associated with the Maverick soil series (TPWD, 1998).
Zapata Bladderpod_(Lesquerella thamnophila) is a warm season, perennial plant native to Texas. It is only known to occur in the South Texas Plains Region of southwestern Texas, specifically in Starr and Zapata Counties (TAMU, 1998). Available ecological information indicates support of listing as endangered or threatened by the USFWS (TPWD, 1998).
Walker's Manioc (Manihotwalkerae) is a wildflower that occupies areas of sandy loam with an underlying caliche layer in open area within native brush. Two populations in Hidalgo county are known to exist, with additional populations in Mexico. Loss of habitat from brush clearing is believed to be a significant factor in the decline in numbers for Walker's Manioc (TPWD, 1998).
Ashy Dogweed (Thymophylla tephroleuca), an herbaceous perennial wildflower, is located in sandy pockets of Maverick-Catarina, Copita-Zapata, and Nueces-Comita soils. It was historically found in Starr county, but is currently known to be only in the brush country of Zapata county and Webb county (TPWD, 1998).
7.2.2 Endangered or Threatened Animal Species in the Lower Rio Grande Valley
Forty nine species of animals located in the Lower Rio Grande Valley are listed as threatened or endangered by the USFWS or the TPWD (TBCDS, 1998). These include 6 species of amphibians, 20 birds, 4 fishes, 7 mammals, and 12 reptiles.
Amphibians
The six amphibian species protected by the TPWD include three frogs (sheep frog (Hypopachus variolosus) ',white-lipped frog, mexican treefrog (Leptodactylus labialis), the Mexican burrowing toad (Rhinophrynus dorsalis), the South Texas siren (Sirensp), and the Black-Spotted Newt (lophthalmus idionalis). The range of these animals extends from the southern tip of Texas to areas as far south as Venezuela and Costa Rica. The frog and toad species prefer low areas with loose soil for burrowing. They generally burrow into damp soil during the day and forage at night, mainly on termites and ants. Breeding occurs in the spring and summer after heavy rainfall (University of Texas, 1998).
The siren and newt species prefer shallow, warm water habitats with vegetative cover and may be found in ponds, ditches, and swamps. Their diets consist of crawfish, worms, mollusks and other small aquatic invertebrates. Females lay eggs in shallow water during the spring (newt) and late winter (siren) (University of Texas, 1998).
LRGVDC Integrated Regional Water Plan Section 7, Page 6

Birds
Integrated Water Resource Plan Lower Rio Grande Valley Development Council
Final Report - Baseline Environmental Conditions
Twenty birds, including seven federal and nineteen state protected species are presented in this section. The federally protected species include three subspecies of Peregrine Falcon, the Northern Aplomado Falcon, the Piping Plover, the Brown Pelican, and the Interior Least Tern.
Peregrine Falcon (Falco peregrinus) has been proposed by USFWS to be removed from the list of endangered and threatened wildlife (Federal Register, August 26, 1998). The available data indicate that restrictions on organochlorine pesticide use in the United States and Canada and successful management activities have resulted in recovery of this species. The proposed rule would also remove the designation of endangered due to similarity of appearance for any peregrine falcons within the 48 conterminous states. It would not, however, affect protection provided to this species by the Migratory Bird Treaty Act (MBTA) and the Convention on International Trade in Endangered Species (CITES).
Northern Aplomado Falcon (Falco femora/is septentrionalis) is a bird of prey that feeds mostly on other birds and insects in open grassland or savanna with scattered trees or shrubs in the South Texas region. Decreased grassland habitat from overgrazing, brush invasion or conversion to farmland has led to a decline in population in Texas. Bioaccumulation of pesticides has also had an adverse impact on the falcons (TPWD, 1998).
Piping Plover (Charadrius melodus) is a small bird, approximately 2 inches long with a wingspan of about 15 inches. They nest on sandy beaches along the Atlantic Coast from Canada to North Carolina, along the shores of the Great Lakes, and on river sandbars and shorelines of inland lakes in the northern Great Plains. They spend the winter along the southern Atlantic Coast and Gulf Coast from Florida to Mexico. Wintering Piping Plovers in Texas feed on marine worms, beetles, spiders, crustaceans, mollusks and other small marine animals on tidal mudflats or sandflats. Their numbers have declined because of increased recreational, residential, and commercial development along beach areas (TPWD, 1998).
Brown Pelican (Pelecanus occidenta/is) is a large bird, weighing approximately 9 pounds and having a 6-foot wingspan. They live along the Atlantic and Gulf of Mexico coasts and eat a diet mainly of menhaden (Erevoortia patronus) and mullet (Mugil cephalus). Pelican numbers have declined in previous years because of exposure to the pesticide DDT causing them to lay thin-shelled eggs. The number ofPelicans dropped to less than 100 birds during the years 1967-1974; however, since DDT was banned in 1972, pelicans have made a steady comeback (TPWD, 1998).
Interior Least Tern (Sterna antillarum athalassos) is a small bird which typically nests on salt flats, broad sandbars and barren shores along wide, shallow rivers and is known to breed along waterways of the Rio Grande system. Alteration of river flow through reservoir
LRGVDC Integrated Regional Water Plan Section 7, Page 7

Integrated Water Resource Plan Lower Rio Grande Valley Development Council
Final Report - Baseline Environmental Conditions
development has resulted in an unfavorable vegetational succession in traditional breeding areas which has led to the decline of this species (TPWD, 1998).
Birds listed by the TPWD as threatened but which are not included on the federal list are Texas Botteri's Sparrow, four species of hawks, the Northern Beardless-tyrannulet, Reddish Egret, Cactus Ferruginous Pygmy Owl, Wood Stork, the Rose-throated Becard, Tropical Parula, White"faced Ibis, and Sooty Tern (Peterson, 1963; Robbins, et al., 1966).
Texas Botteri 's Sparrow (Aimophila botterii texana) occurs in the LRGV during summer months, but migrates farther south during the winter. It prefers tall grass of coastal prairies and has been found in Cameron and Willacy counties.
White-tailed Hawk (Buteo albicaudatus) is located in grasslands and to the border of deserts. The Rio Grande forms the northern boundary of the species' range.
Zone-tailed Hawk (Buteo albonotatus) is located in canyons and along rivers. Its range extends north to the Rio Grande.
Gray Hawk (Buteo nitidus) is a small gray buteo located mainly in Mexico, but is seen in the extreme southern tip of Texas, as well as along the border in Arizona.
Common Black Hawk (Buteogallus anthracinus) is rare in the United States, being located mostly in Mexico. It is found in the Lower Rio Grande Valley in the summer months.
Northern Beardless-tyrannulet (Camptostoma imberbe), a small nondescript flycatcher, is located in woodlands and thickets along the Rio Grande delta.
Reddish Egret (Egretta rujescens}, a dark heron, inhabits saltwater flats, shores and lagoons. It nests in small bushes or on the ground in colonies. The Reddish Egret is a resident of the southern Texas gulf area, rarely migrating to the upper coast in winter.
Ferruginous Pygmy Owl (Glaucidium brasilianum) is a small owl found in river bottoms and saguaro deserts near the Rio Grande on the Mexican border. It is not commonly found in the United States.
Wood Stork (Mycteria americana), also known as the Wood Ibis, and the White Faced Ibis (Plegadis chihi) are medium to large wading birds inhabiting marshes, swamps, and ponds. The Wood Stork is an irregular visitor along the Texas coast from June to November. The White Faced Ibis is a resident along the Texas coast, breeding as far inland as San Antonio.
LRGVDC Integrated Regional Water Plan Section 7, Page 8

Integrated Water Resource Plan Lower Rio Grande Valley Development Council
Final Report - Baseline Environmental Conditions
Rose-throated Becard (Pachyramphus aglaiae) is a thick-billed bird of varying colors inhabiting woodlands and wooded areas around resacas. It is believed to be a rare summer resident in Hidalgo county.
Tropical Peru/a (Peru/a pitiayumi) is a small, bluish warbler found in the southern tip of Texas and northern Mexico, south to northern Argentina. It prefers a habitat of woodlands with Spanish moss.
Sooty Tern (Sterna fuscata) is the only tern that is black above and white below (Peterson, 1963). It prefers tropical oceans and is occasionally blown inland by hurricanes. It breeds singly or in very small groups with Royal Terns.
Fishes
Four fishes in the LRGV are listed by the TPWD as threatened species, but they do not occur on the USFWS list. These include the river goby (Awaostajasia), the blackfin goby (Gobionellus atripinis), the opossum pipefish (Microphis brachyurus) and the bluntnose shiner (Notropis simus). The River Goby is reportedly common along the Atlantic and gulf coasts of Florida to Brazil and is primarily found in the West Indies and Caribbean coast of Central America (Horizon, 1994). The blackfin goby ranges from extreme southern Texas to Veracruz, Mexico. It is known to occur in brackish and freshwater habitats but has been collected mostly from coastal freshwater streams. The opossum pipefish is found in fresh and brackish waters of Central America. The bluntnose shiner is listed as extirpated and is believed to have been last collected in the Rio Grande River in 1975 (TEC, 1995).
According to Horizon (1994), the river goby and the opossum pipefish were collected during a 1990 sampling event conducted by the Texas A&M University at Galveston. The blackfin goby and the Bluntnose Shiner were not collected during the 1990 study.
Mammals
Four federally listed species of mammals occur in the LRGV region. These include the ocelot, the jaguarundi, the jaguar, and the West Indian manatee (Davis & Schmidly, 1998; USFWS, 1998). Three species listed by the TPWD, but not on the federal list, are the southern yellow bat, the white-nosed coati, and the Coues' rice rat.
Ocelot (Felis pardalis) is a medium-sized spotted cat which once was located all over southern Texas, but is now only found in several counties along the Rio Grande. These animals prefer dense chaparral thickets for their habitat.
LRGVDC Integrated Regional Water Plan Section 7, Page 9

Integrated Water Resource Plan Lower Rio Grande Valley Development Council
Final Report - Baseline Environmental Conditions
Jaguanmdi (Felis yaguarondi cacomitli) is a slender cat located in brush country of Cameron, Hidalgo, Starr and Willacy counties. They survive in the dense, thorny thickets of South Texas where dogs and man are not able to follow them. They feed on rats, mice, birds, and rabbits, and are believed to take poultry at times. Clearing ofbrushland in the Valley continues to reduce the jaguarundi's habitat.
Jaguar (Panthera onca) is the largest spotted American cat. It inhabits dense chaparral and timbered sections of the New World tropics. While once fairly common in southern Texas, the jaguar is now believed to have been extirpated from the state.
West Indian Manatee (Trichechus manatus) is a large gray or brown aquatic mammal. Adults average about 10 feet long and weigh 1,000 pounds. They have no hindlimbs, and their forelimbs are modified as flippers. During the winter months, the United States' manatee population confines itself to the coastal waters of the southern half of peninsular Florida and to springs and warm water outfalls as far north as southeast Georgia. During summer months, they may migrate as far north as coastal Virginia on the east coast and the Louisiana coast on the Gulf of Mexico.
Southern Yellow Bat (Lasiurus ega) is whitish buff, yellowish, or orange, and usually has a blackish wash. Bats of this genus generally occur in wooded areas and roost in foliage, occasionally roosting in tree holes or buildings. It is associated with introduced palms, which is thought to be a reason for the bat's recent expansion northward. It eats insects caught in flight, but is also known to alight on vegetation to pick off insects. Mating occurs in the late summer or fall with sperm being stored overwinter in the uterus. Ovulation and fertilization occur in the spring with births occurring from late May to early July. These bats are generally solitary, but females of some related species are known to form small nursery colonies and form flocks of several hundred for migration. Males do not generally congregate in summer, but may congregate during winter (University ofMichigan, 1998).
White-nosed Coati (Nasua narica) is a slender raccoon-like carnivore with a long snout and tail. It inhabits woodland areas of Central America and Mexico, and reaches its northern limit in extreme southern Texas. It has been located in Cameron, Hidalgo and Starr counties, as well as several other Rio Grande border counties from Brownsville to Big Bend.
Coues' Rice Rat (Oryzomys couesi aquatleus) is a small Mexican rat with the northern extreme of its range in Cameron and Hidalgo counties. It inhabits marshes and grassy areas around resacas, while avoiding riparian woodland, subtropical evergreen woodland and brushland to a large degree. They build their nests in cattails or small trees over or near the water. The species' decline has been attributed to loss of habitat from agricultural land drainage practices.
LRGVDC Integrated Regional Water Plan Section 7, Page 10

Reptiles
Integrated Water Resource Plan Lower Rio Grande Valley Development Council
Final Report - Baseline Environmental Conditions
Of the twelve protected reptile species, five are federally listed. These include the loggerhead sea turtle (Caretta caretta), green sea turtle (Chelonia mydas), leatherback sea turtle (Dermochylys coriaced), atlantic hawksbill sea turtle (Eretmochelys imbricata imbricata), and Kemp's Ridley Sea Turtle. Sea turtles generally prefer open marine habitats but they may also be found in brackish waters of coastal lagoons and river mouths where nesting and feeding activities may occur. These species are occasional or rare visitors to the Texas coast (University of Texas, 1998).
The remaining state protected species include four snakes (black-striped snake, indigo snake, speckled racer, northern cat-eyed snake), the reticulate collared lizard, the Texas homed lizard, and the Texas tortoise (University of Texas, 1998).
Black-striped snake (Coniophanes imperialis) is a mildly venomous snake that prefers loose sandy soil habitats with scattered debris or piles of rotting cacti, and it feeds on small vertebrates. It is found in Texas only in Cameron, Hidalgo and Willacy Counties.
Texas Indigo Snake (Drymarchon corais erebennus), a nonvenomous snake, prefers moist riparian breaks in thorn brush woodlands and mesquite savannah of the coastal plains.
Speckled Racer (Drymobius margaretiferus) is a nonvenomous snake found in dense thickets and palm groves, almost always near a water source. It feeds mainly on frogs and toads. The speckled racer is found in Texas only in Cameron and Hidalgo Counties.
Northern Cat-eyed Snake (Leptodeira spetentrionalis), a tan or cream-colored snake, is located in Cameron, Hidalgo, Willacy, Kenedy and Kleberg Counties.
Reticulate Collared Lizard (Crotaphytus reticulatus) is a lizard that occupies a variety of habitats, which include rock piles, escarpments, and burrows in brushy environments. In Texas, it is found along the Rio Grande in the southern part of the state, excluding the coastal area.
Texas Horned Lizard (Phrynosoma cornutum) prefers warm, sandy, arid environments and is typically found in flat, open areas with little vegetation. It seeks shelter among brush and may also cover itself in loose sand. It feeds on large ants and hibernates from late summer to late spring. The Texas Homed Lizard is now seen only in the western third of the state.
Texas Tortoise (Gopherus berlandieri) The range of the Texas tortoise extends from SouthCentral Texas in the United States southward into the Mexican states of Coahuila, Nuevo Leon, and Tamaulipas. There are two other species of this genus occurring in the United States: G. polyphemus, which ranges from South Carolina along the coastal states to eastern Louisiana; and G. agassizii, which is found in southern portions of Nevada, California, and Arizona and the
LRGVDC Integrated Regional Water Plan Section 7, Page 11

Integrated Water Resource Plan Lower Rio Grande Valley Development Council
Final Report- Baseline Environmental Conditions
state of Sonora in Mexico. Although captive specimens have been known to eat meat, these very docile creatures are primarily vegetarian. They feed heavily on the fruit of the common prickly pear and on other mostly succulent plants available to them (TPWD, 1998).
Table 7.1 Endangered and Threatened Plant Species
Cameron Co. Hidalgo Co. Starr Co. WillacyCo.
Scientific Name Common Name USFWS TPWD USFWS TPWD USFWS TPWD USFWS TPWD
Ambrosia South Texas LE E cheiranthifolia Ambrosia Astrophytum Star Cactus LE E LE E LE E asterias Ayenia limitaris Texas Ayenia LE E LE E
Frankenia Johnston's LE E johnstonii Frankenia Lesquerella Zapata Cl thamnophila Bladderpod Manihot walkerae Walkers's LE E LE E
Manioc Thymophylla Ashy Dogweed LE E tephroleuca LE, LT- Federally Lzsted Endangered/Threatened CJ -Federal Candidate, Category 1; information supports proposing to list as endangered/threatened E, T- State Endangered/Threatened
LRGVDC Integrated Regional Water Plan Section 7, Page 12
SCIENTIFIC NAME
AMPHIBIANS
Hypopachus variolosus Leptodactylus labia/is Notophthalmus meridiana/is Rhinophrynus dorsalis Siren sp.l
Smi/isca baudinii
BIRDS
Aimophila botterii texan a Buteo albicaudatus
Buteo albonotatus
Buteo nitidus
Buteogallus anthracinus Camptostoma imberbe
Charadrius melodus
Integrated Water Resource Plan Lower Rio Grande Valley Development Council
Final Report - Baseline Environmental Conditions
Table 7.2 Endangered and Threatened Animal Species.
Cameron County Hidalgo Starr County County
COMMON NAME USFWS IPWD USFWS I TPWD USFWS IPWD
Sheep Frog T T T
White-Lipped T T T Frog Black-Spotted T T Newt Mexican T Burrowing Toad South Texas T T T Siren (large form) Mexican T T Treefrog
Texas Botteri's T Sparrow Whtie-Tailed T T T Hawk Zone-Tailed T T T Hawk Gray Hawk T
Conunon Black- T T T Hawk Northern T T T Bear less-Tyrannuiet Piping Plover LT T
Willacy County USFWS LTPWD
T
T
T
T
T
T
T
LT T
LRGVDC Integrated Regional Water Plan Section 7, Page 13
Egretta rujescens
LRGVDC Integra
Integrated Water Resource Plan Lower Rio Grande Valley Development Council
Final Report - Baseline Environmental Conditions
Reddish Egret
ed Regional Water P lan Secti n 7, Page 4

~ t::J
SCIENTIFIC NAME
Nasua narica
Oryzomys couesi
Panthera onca
Trichechus manatus
REPTILES
Caretta caretta
Chelonia mydas
Coniophanes imperialis
Crotaphytus reticulatus
Dermochelys coriacea
Drymarchon corais
Drymobius margaritiferus Eretmochelys imbricata
Gopherus berlandieri
Lepidochelys kempii
Leptodeira septentrionalis Phrynosoma cornutum
Integrated Water Resource Plan Lower Rio Grande Valley Development Council
Final Report - Baseline Environmental Conditions
Cameron Hidalgo Starr County County County
COMMON USFWS TPW USFW TPW USFW TPWD
NAME D s D s White-Nosed T T T Coati Coues' Rice Rat T T T
Jaguar LE T
West Indian LE E Manatee
Loggerhead Sea LT T Turtle Green Sea Turtle LT T
Black-Striped T T Snake Reticulate T T Collared Lizard Leatherback Sea LE E Turtle Indigo Snake T T T
Speckled Racer T T
Atlantic LE E Hawksbill Sea Turtle Texas Tortoise T T T
Kemp's Ridley LE E Sea Turtle Northern Cat- T T Eyed Snake Texas Homed T T T Lizard
LE, LT- Federally L1sted Endangered/Threatened E. SA, TSA -Federally Endangered/Threatened by Similarity of Appearance CJ -Federal Candidate, Category 1; information supports proposing to list as endangered/threatened E, T, - State Endangered/Threatened
Willacy County USFWS TPWD
T
LE E
LT T
LT T
T
LE E
T
LE E
T
LE E
T
T
LRGVDC Integrated Regional Water Plan Section 7, Page 15

Integrated Water Resource Plan Lower Rio Grande Valley Development Council
Final Report- Baseline Environmental Conditions
7.3 Summary of Water Quality in the Region
This section summarizes major water quality concerns for the Rio Grande watershed. A more detailed discussion of water quality conditions, water quality initiatives and resultant monitoring activities in the Rio Grande watershed has been presented in Appendix 0 of this report.
Several major policy initiatives between the United States of America and the United Mexican States have set the stage for the current level of water quality monitoring in the Rio Grande/Rio Bravo Basin. These include the La Paz Agreement, the North American Free Trade Agreement (NAFT A), the Border Environment Cooperation Commission (BECC), the North American Development Bank (NADBank), the Integrated Border Environmental Plan (IBEP) and Border XXI.
Although the policy initiatives and monitoring activities are broad in scope, for the purpose of this report emphasis is placed on water quality issues of the LRGV and watershed issues of the U.S. side of this binational region. The majority of the available watershed data pertaining to these issues is related to the U.S. side of the border.
Contact was made with representatives from TNRCC, TPWD, and TWDB on studies of the Laguna Madre. The agencies are jointly conducting studies of the Texas bays and estuaries to develop inflow needs. However, the study on Laguna Madre has not yet been completed.
Contact was made with representatives from TWDB, TNRCC, IBWC, and T AES to identify water quality data for Anzalduas Reservoir which could be used to determine the effects of reduced demands on stratification and salinity. Dr. Seeichi Miyamoto, who is conducting an extensive salinity study in the Rio Grande, indicated that no data regarding stratification in Anzalduas was available. In addition, as Anzalduas has a relatively short hydraulic time (about 25 days), it is unlikely that there would be sufficient time for the reservoir to become stratified.
Although the use of water may change from primarily agriculture to municipal, it has not been shown that the demands will be reduced significantly as the population is projected to double in the next 50 years. Although agricultural use is projected to decrease, municipal use is projected to increase. A reduction in agricultural return flows could result in a reduction in salinity. However, the major point sources of salt loads originate in Mexico. If a pipeline is constructed to supply the growth in municipal demands, the flow through the pipeline would only be a small portion of what the historical flows as discussed in Section 7.4.
7.3.1 Setting
Major water bodies in the Texas portion of the Rio Grande basin are divided by the TNRCC into seventeen classified water body segments (see Appendix 0). The mainstem of the Rio Grande is divided into nine segments between El Paso and the Laguna Madre including
LRGVDC Integrated Regional Water Plan Section 7, Page 16

Integrated Water Resource Plan Lower Rio Grande Valley Development Council
Final Report - Baseline Environmental Conditions
International Falcon and International Amistad Reservoirs, and terminates at the Gulf of Mexico. Major tributaries to the Rio Grande include the Pecos River (three segments), Devils River (one segment), and San Felipe Creek (one segment). The Arroyo Colorado (two segments) empties into the Laguna Madre (one segment) and is included in this report because of its significance as a water resource for residents of the LRGV. These stream and reservoir segments total 1, 794 miles in length, and terminate in both the Laguna Madre or the Gulf of Mexico.
The 1996 State ofTexas Water Quality Inventory (TNRCC, 1996a) contains descriptions of each classified segment in the Rio Grande and Arroyo Colorado watersheds, including a complete listing of all TNRCC special study and intensive survey publications pertaining to each segment (see Appendix 0). These studies provide intensive, short term assessments of water quality and do not include analyses of trends or other statistical tests. The water quality issues identified for the segments in the LRGV reflect major water quality concerns of the region and identify indicators of individual pollutant types. The water quality concerns identified under the program are presented in the TNRCC report in the context of water quality standards and the designated uses of each segment. This approach utilizes the existing regulatory framework for identifying degradation of sensitive and high priority water bodies, such as drinking water supplies.
7 .3.2 Water Quality Concerns
There are concerns that water quality of the Rio Grande basin may be deteriorating because of increases in measured concentrations of various pollutants and decreases in return flows from the watershed. Information from available literature and ongoing studies indicates that the major categories of pollutants which affect environmental and public health in the Rio Grande watershed are salinity, nutrients, bacteria, and toxic substances. Selected parameters from each of these categories have been monitored as indicators of the current status and trends of water quality throughout the region.
Salinity
Increased salinity has been a major water quality concern of residents within the Rio Grande basin for its impact on the agricultural sector and because of increased treatment costs of drinking water supplies. Salinity is most often measured by chloride concentrations, but some studies may also include analysis of total dissolved solids and sulfate. Natural salt deposits which occur in the western parts of the state, particularly in the Pecos River watershed, provide a steady supply of dissolved solids to lower stream reaches and reservoirs. Another source of salinity is from nonpoint sources such as bank seepage down slope from irrigated agricultural areas. As the water from rainfall and applied irrigation is removed through evaporation or used by plants, dissolved salts are left behind in the soil and shallow groundwater. These shallow deposits move slowly to the stream bed during dry periods or are flushed to the stream during periods of rainfall or increased stream flow.
LRGVDC Integrated Regional Water Plan Section 7, Page 17

Integrated Water Resource Plan Lower Rio Grande Valley Development Council
Final Report- Baseline Environmental Conditions
Nutrients/Eutrophication
Nutrients of concern in the region are largely the dissolved forms of nitrogen and phosphorus which may arrive in water bodies from either natural or man-made sources. These forms are readily available for plant use and, in elevated concentrations, may cause excessive growth of aquatic vegetation. Natural deposits of nutrient-laden soils may contribute nitrogen to streams and reservoirs by way of springs or other natural pathways along stream channels. The most common source of nutrients from human activities is the return flow of municipal wastewater, fertilizers applied to crops, and other urban nonpoint sources. Nutrients can be detrimental to surface waters in several ways, mostly through the production of abundant aquatic macrophytes and algal blooms. Impacts include impairment of aesthetics and recreational use, increased cost associated with treatment of drinking or industrial water, impairment of aquatic life by depressed nighttime dissolved oxygen concentrations, and a human health risk associated with high nitrate concentrations in drinking water.
Fecal Coliform Bacteria
Fecal coliform bacteria are measured and incorporated into water quality assessments as indicators of potential contamination by human or animal wastes. Natural sources of fecal coliform bacteria to surface water include any warm blooded animals which may travel in or near the water body. Fecal coliform bacteria may also enter the water as a result of inadequately treated wastewater, improperly managed animal waste, and runoff from urban and industrial land.
Toxic Substances
Toxic substances include metals and organic compounds which are known or suspected to cause harm to aquatic communities and human health. These substances enter water bodies from many different sources related to human activities. At significant levels, toxic substances in water, sediment and aquatic organisms pose a threat to human health through consumption or contact recreation with the water body. Although the specific toxic substances targeted in each of the reports reviewed in Appendix 0 varied according to the objectives of each study, metals such as mercury, lead and chromium, and organic compounds such as PCB's and pesticides were measured in most of the studies.
Coastal Issues
The Regional Environmental Monitoring and Assessment Program Study (R-EMAP) of the Arroyo Colorado tidal area, the Rio Grande tidal area, and the East Bay Bayou was conducted in 1993 and is a follow-up study to the 1991 USEP A Environmental Monitoring and Assessment Program (EMAP) Estuaries: Louisiana Province studies (Macauley, et al., 1995). The R-EMAP
LRGVDC Integrated Regional Water Plan Section 7, Page 18

Integrated Water Resource Plan Lower Rio Grande Valley Development Council
Final Report - Baseline Environmental Conditions
study addresses the ecological health of the estuaries through community structure, fish community structure and fish pathologies, toxicity of sediments, and concentrations of various pollutants in sediments.
7.3.3 Conclusions
The major categories of pollutants which affect environmental and public health in the Rio Grande/ Arroyo Colorado watershed are salinty, nutrients, bacteria, and toxic substances. Overall, water quality in the Rio Grande/ Arroyo Colorado basin is closely related to population centers and the degree of human disturbance. Natural soil characteristics, climate, and the lack of flow of the region results in the limited capacity of the river system to maintain its chemical and biological balance while accommodating human activities in the watershed. Although long-term data indicates that water quality is getting worse in some areas, isolated areas of improved water quality can be directly related to recent efforts to decrease the amount of pollutants entering the river.
According to studies discussed in Appendix 0, nutrients are a concern for five of the Rio Grande mainstem segments, two tributary segments, and all three of the segments associated with the Arroyo Colorado. Salinity is identifed as a concern for the Pecos River and the Rio Grande below the Riverside diversion dam. Bacteria measured as fecal coliform is a concern for six segments of the mainstem and the Laguna Madre. Toxic substances are identified as a concern for five mainstem segments, one tributary (Red Bluff Reservoir), and two segments associated with the Arroyo Colorado. According to the Water Quality Inventory (TNRCC, 1996a), Amistad Reservoir, Falcon Reservoir, and the Devils River have no significant water quality concerns.
7.4 Potential Environmental Impacts of Components for Future Water Supplies
Environmental concerns and issues associated with the various components of activities associated with water supply improvements in the LRGV are discussed below. This analysis is meant to be generic in nature, with the understanding that any specific proposal would have to be evaluated individually to determine impacts and environmental requirements for approval of the project.
Common to all of the components considered would be the need for compliance with applicable local, state, and federal laws and regulations. Among these are 404 and Section 10 permitting requirements for impacts to "waters of the U. S.," including wetlands, and navigable waters; impacts to archaeological and cultural resources, impacts to prime farmland soils; impacts to threatened and endangered species and their habitats; and floodplain alterations.
Environmental concerns that could be important for proposed water development projects in the LRGV include the following:
LRGVDC Integrated Regional Water Plan Section 7, Page 19

Integrated Water Resource Plan Lower Rio Grande Valley Development Council
Final Report - Baseline Environmental Conditions
• riparian corridors as wildlife habitat; • threatened/endangered species; • water quality in lower Rio Grande; • freshwater flow and nutrients into Laguna Madre; • fisheries and other important aquatic organisms; • flow changes in Rio Grande; • flood plain vegetation; • cultural resources-archaeological and historical; • socioeconomic impacts; and • conversion of land from agricultural to urban uses.
Brownsville Weir
The potential environmental impacts of the proposed Brownsville Weir and Reservoir Project (BWR Project) are documented in the Environmental Assessment (EA) (Horizon 1994) for the project. The following paragraphs summarize the findings documented in the EA. The major features of the BWR Project are a riverine impoundment created by a weir to be located about eight river miles downstream of the Gateway River Bridge in Brownsville, TX. The reservoir would have a storage capacity of about 6,000 acre-feet at maximum pool elevation of26 feet msl. The reservoir would extend 42 river miles and inundate approximately 600 acres of river channel when full. The purpose of the project is to provide on-channel storage to capture: 1) a portion of the released water that is not diverted upstream; and 2) a portion of the United States' share of excess surface water and runoff occurring below Falcon Dam.
The proposed BWR Project was projected to include both short- and long-term impacts to the environment in the area of the proposed weir, the river below the weir site, and the Rio Grande estuary. Potentially significant impacts identified in the Executive Summary of the EA are discussed below.
Surface Water Hydrology
The proposed operation of the Brownsville Weir would result in a reduced and regulated flow downstream of the weir. The median flow just downstream from the weir would be about 141 cfs; the historical flow is 237 cfs. The projected mean flow downstream of the weir is about 9,600 acre-feet of water after its construction. Approximately 41 miles of river channel upstream of the weir would be innundated, with the normal stage of the river raised by about 22 feet. At maximum pool level (26 feet msl), 42 miles of river channel would be inundated.
River stage levels downstream of the weir would be lowered about 0.4 foot under normal flow conditions. During flood flow periods (>4,000 cfs), water levels in the river upstream of the
LRGVDC Integrated Regional Water Plan Section 7, Page 20

Integrated Water Resource Plan Lower Rio Grande Valley Development Council
Final Report - Baseline Environmental Conditions
weir would be about the same as historical levels. These flood flows would be passed directly through the Brownsville Reservoir.
Total flows to the Gulf of Mexico would be reduced from about 873,000 acre-feet per year to 815,000 acre-feet per year. The project would not have any impact on Mexico's share of water in the lower Rio Grande.
Surface Water Quality
The low salinity effluent from the Brownsville Southside Wastewater Treatment Plant (7.8 MGD) and the dedicated releases from the proposed project would prevent salt water intrusion below river mile 25. Dissolved oxygen levels would be maintained above 5 mg/L through releases from the Brownsville Reservoir.
Hydrogeology
According to the EA, no adverse impacts to ground water resources are expected as a result of the weir's construction or operation. The groundwater levels upstream of the weir may rise, but should not be adversely affected. Downstream, the median groundwater level is projected to be one foot lower than the historical condition, and this change is not expected to significantly alter local ground water levels.
Aquatic Biota
Approximately 11 acres of river habitat would be removed. Near the construction site temporary disruptions of aquatic biota due to potential increases in turbidity and siltation would occur.
Operation of the project would result in the permanent conversion of 40 acres of riverine habitat to a shallow reservoir habitat over a 10-mile reach of river. Another 32 miles of the river would be subjected to periodic inundation.
Potential adverse impacts to the dominant fish species in the river are considered to be minimal in the EA due to the species also being common in reservoirs. Below the weir the existing estuarine zone could be expanded and a potential increase in production is projected. No significant adverse impacts to state listed threatened or endangered aquatic species is anticipated. No federally listed species are identified in the EA as being in the project area.
Vegetation and Wildlife
LRGVDC Integrated Regional Water Plan Section 7, Page 21

Integrated Water Resource Plan Lower Rio Grande Valley Development Council
Final Report - Baseline Environmental Conditions
Approximately 84 acres of vegetation (river margin wetland, grassland, and abandoned orchard) would be directly impacted by construction. Ofthe 84 acres, approximately 51 acres would be required for temporary easements and would be revegetated after use, while 33 acres would be preempted for the life of the project. No adverse impacts to threatened or endangered plant or wildlife species are identified in the EA.
Communities such as river margin wetlands may be enhanced by increased frequency of low flows between Anzalduas Reservoir and Brownsville Reservoir. About 62 acres of existing bank vegetation would normally be inundated under median flow conditions up to 10 feet above the historical median flow depth at the weir. Below the weir, the median surface water elevation would decrease by about one foot, resulting in a minor increase in the surface extent of river margin wetland. No adverse impacts in the delta region (river mile 19) are reported in the EA. Potential impacts to the Saba! Palm Sanctuary are projected that would require more frequent water pumping to maintain a large playa for ground water replenishment.
Socioeconomics
According to the EA, the proposed project is projected to generate more than $27 million for the local economy during construction. Salaries and wages for up to 50 people would total approximately $34 million. During its operation, the project would have a nominal positive impact on local employment. Providing for reliable safe drinking water is projected in the EA to be a major socioeconomic benefit for residents of Cameron county.
Cultural Resources
The activities associated with construction of the weir would potentially impact cultural resource sites. Any sites discovered as a result of pre-construction surveys or during construction would be mitigated based on consultation with state regulatory authorities.
Review Comments to EA
Review of the Environmental Assessment by US Fish and Wildlife Service (USFWS) (letter from William M. Seawell, June 20, 1997) resulted in questioning several of the assumptions and evaluation of potential impacts. Some of the issues raised by USFWS are listed below:
• cumulative effects of floodplain obstructions was not addressed; • impacts to the flood way system upstream of the project were not adequately
addressed; • impacts to riparian corridors and threatened/endangered species were not supported as
"not significant;" • more information on Mexican water needed; • water quality determination in lower Rio Grande needs State validation;
LRGVDC Integrated Regional Water Plan Section 7, Page 22

Integrated Water Resource Plan Lower Rio Grande Valley Development Council
Final Report - Baseline Environmental Conditions
• flow modeling should use more recent data; • more analysis needed on estuarine inflows; • impacts of increased flow and nutrients into Laguna Madre needs to qualify statement
regarding "benefits" to system; • fisheries discussion is misleading and needs more supporting information; • discussion of effects of reduced flow downstream ofweir not adequate; • more information on construction impacts needed; • impacts to flood plain vegetation needs revision; and • indirect effects on brush corridor should be addressed.
Falcon Reservoir Pipeline
A pipeline from Falcon Reservoir to the municipalities in the Lower Rio Grande Valley would have potential environmental impacts associated with both construction and operation. Similar environmental impacts would be possible with the construction and operation of other pipelines. Construction impacts would be associated with the activities that cause physical disturbance to the landscape, while operational effects would relate to changes such as instream flow rates in the Rio Grande, alteration of reservoir capacity, and flows into bays and estuaries.
Impacts due to construction would occur as a result of the pipeline right-of way impacting the following environmental features:
• Cultural resources; • Threatened and endangered species; • Special natural areas; • Stream crossings; • Wetlands; and • Prime farmland soils
Many adverse impacts can be avoided or minimized by routing pipeline corridors away from sensitive areas (such as archaeological sites, wetlands, special natural areas, etc.) or by mitigative actions to compensate for unavoidable impacts. Areas disturbed by construction could be largely reclaimed with native vegetation to minimize the long term impacts. Operational impacts would need to consider impacts, if any, to the Rio Grande flow regime and reservoir releases for agricultural uses.
This option was not more fully investigated after the Policy Management Committee meeting in June when it was determined to place greater emphasis on the effective water savings that come from agricultural efforts. As an added note, a comparison was made between the proposed I 00 MGD and 200 MGD diversion rates to the total historical flow (July I953 - December I995) at the Rio Grande at Rio Grande City USGS gage. The I 00 MGD diversion represents less than
LRGVDC Integrated Regional Water Plan Section 7, Page 23

Integrated Water Resource Plan Lower Rio Grande Valley Development Council
Final Report- Baseline Environmental Conditions
3.4% of the gaged historical flow at the gage 99% of the time. The 200 MGD diversion represents 6.7% of the river's historical flow 99 %of the time. The 100 MGD diversion averages 0.6% of the flow in the river over the historical period of record, while the 200 MGD diversion represents an average of 1.3 %of the historical flow in the river.
New Canals
Construction of new canals could be proposed to increase the efficiency of the existing water distribution system and/or to provide water to service new areas as the population or agriculture expands. The new canals could be of a variety oftypes-lined, unlined, or covered.
Construction of new canals would have similar environmental impacts as described for pipelines above, with a main difference being the permanent commitment of resources in a larger area for the canal "footprint." The construction of new canals has the potential to alter drainage patterns and may affect the floodplain and flooding duration and intensity.
In addition, controlling nuisance species such as hydrilla and water hyacinth could be a problem that affects both the amount and quality of water supplied through canals. The environmental effects of controlling unwanted aquatic vegetation would depend on the type of control measures used-biological, chemical or mechanical. Each of the different control strategies have strengths and weaknesses and different environmental constraints. Biological control using fish, insects, snails or pathogens has the potential to impact non-target vegetation, introduce undesirable species in other water bodies, and has unpredictable effects. Chemical control using herbicides are difficult to use in flowing water because of potential undesirable downstream impacts (killing non-target species) and with dosing rate difficulties. Mechanical control has less potential for inadvertent environmental impacts, but can sometimes, as in the case ofhydrilla, cause the spread of the nuisance by increasing the number of reproductive fragments.
Modified Canals
Environmental impacts of modifying canals would probably be limited to construction impacts for access and staging areas to facilitate restructuring, lining, covering or otherwise modifying the canals. Impacted areas not previously disturbed would need to be surveyed for the presence of cultural resources, threatened or endangered species, sensitive natural areas, etc.
New Freshwater Water Treatment Plants
Construction of new water treatment plants would require that siting studies be performed to assess the environmental impacts. Issues that would need to be documented include potential impacts to cultural resources; threatened and endangered species; special natural areas; wetlands;
LRGVDC Integrated Regional Water Plan Section 7, Page 24

Integrated Water Resource Plan Lower Rio Grande Valley Development Council
Final Report - Baseline Environmental Conditions
prime farmland soils; and other resources that would be permanently displaced by the new facility.
New Desalination Plant
Desalination plants use distillation and reverse osmosis (RO) technologies to produce high quality water from seawater, brackish water, groundwater, or reclaimed fresh water. Although these technologies may include many different steps in various combinations, the overall process is simple. Saline water (feedwater) is removed from the environment through intakes and pipelines or from wells. The feedwater is then transported to the desalination plant where chemicals may be added in a pretreatment process and impurities are removed (desalination). The concentrated water containing impurities and high concentration of salt (brine) are discharged into the environment or transported to a remote disposal site. The desalted water (product water) is then delivered to the water distribution system for use by customers. The type and extent of environmental impact associated with desalination plants vary according to the technology, sub-processes, and management employed at a particular plant, as well as site specific environmental considerations.
Analysis of environmental impacts of desalination requires that each component of the overall process (feedwater acquisition, desalination, brine disposal and product delivery) be evaluated. Direct impacts associated with operation and maintenance activities include increased energy use, air quality, water quality, impacts to marine and other natural resources, recreation, aesthetics, and noise. Indirect environmental impacts may be identified by evaluating the overall operation and maintenance of the plant. Indirect impacts associated with supporting facilities may include the construction of additional power generation plants.
A 1993 report by the California Coastal Commission (CCC, 1993) regarding seawater desalination in California discusses the types of potential impacts which should be considered and addressed for desalination plants. These include construction, energy use, air quality, impacts to the marine environment, increased local development and other coastal zone issues.
Environmental impacts due to construction of new desalination plants include those impacts typical to most construction sites- emission of dust and particulates, erosion and runoff during construction, disturbance to protected species and their habitats, disturbance to cultural resources, noise, and interference with public access and recreation. Construction activities associated with intake structures may also impact sand dune stability and sea floor ecology. Proper and efficient siting of a new plant, e.g. near an existing distribution system, can minimize these types of impacts.
Desalination plants require a significant amount of energy to operate and can have a significant impact on local and regional energy resources. The energy required for desalination is primarily in the forms of electricity and heat. Energy requirements for specific plants depend on
LRGVDC Integrated Regional Water Plan Section 7, Page 25

Integrated Water Resource Plan Lower Rio Grande Valley Development Council
Final Report - Baseline Environmental Conditions
the feedwater salinity and temperature, desalting technology used, and quality of the product water. California seawater desalination plants are estimated to use between 2,500 and 29,500 kilowatt hours per acre-foot of product water (CCC, 1993). Desalination plants may be designed to conserve energy (cogeneration) by using waste heat from generating electricity for other steps in the desalting process.
Air quality may be impacted by emissions from desalination plants and from regional electrical generation facilities which may supply energy to the plant. Generally, air emissions by desalination plants consist only of nitrogen and oxygen which are discharged from both distillation and RO plants. The level of air quality impact varies according to the sub-processes employed at each plant and the degree of cogeneration which is used.
Both marine and freshwater resources in the vicinity of a desalination plant may be affected by the processes of feedwater intake and waste discharge. Location of intake structures near the point of freshwater inflow may alter instream flow patterns, decrease the amount of freshwater reaching the marine environment, and increase the salinity of the otherwise brackish water body. Location of intake structures in the open ocean is known to result in loss of marine species due to impingement and entrainment (CCC, 1993). The oceanic intake structure may also alter natural currents in the area of the intake structure. Intake structures such as beach wells or infiltration galleries may help to eliminate some of these impacts, but introduces other impacts due to construction, disturbance of sand dunes, and saltwater intrusion of freshwater aquifers.
A potential source of feedwater in the LRGV is groundwater in the Gulf Coast and other aquifers. Groundwater salinity is far lower than seawater, so reverse osmosis or electrodialysis reversal technology may be feasible. There is also the possibility of using the energy from geopressurized formations to power demineralization processes.
Waste disposal is a significant potential environmental concern associated with all desalination plants. The quantity of waste produced is proportional to the quantity of product water produced. Because of the potential quantity and quality of waste which may be produced, brine and other waste products may require disposal in appropriate off-site locations rather than direct discharge. Waste discharged directly into nearby receiving water bodies may result in impacts to instream flows, physical aquatic habitat, water quality, and aquatic communities. The quality of waste varies according to the technology of the plant, quality of the feedwater, quality of the product water, pretreatment methods, cleaning methods, and RO membrane storage method. In addition to brine, constituents and characteristics of the waste discharge may include biocides such as chlorine (cleaning and pretreatment), coagulants such as ferric chloride and the impurities contained in the coagulated sludge (pretreatment), anti-sealants such as polyacrylic acid (cleaning), antifoaming agents to reduce foam produced by boiling water (desalination), dilute alkaline or acid solutions (cleaning), preservation solutions such as sodium bisulfite (preservation), temperatures and turbidity levels which may be above those of potential receiving
LRGVDC Integrated Regional Water Plan Section 7, Page 26

Integrated Water Resource Plan Lower Rio Grande Valley Development Council
Final Report- Baseline Environmental Conditions
water bodies, oxygen concentrations below those of receiving waters, and organics and metals which are concentrated in the desalination process.
Desalination plants are constructed to meet water supply demands in areas where supplies are limited. As this need is met, particularly in areas where limited water is the major constraint to development, new desalination projects could result in new development and increased local or regional population. Regional growth measures such as zoning and other standard land use regulatory devices may be necessary to minimize impacts due to development.
Other environmental considerations for new desalination plants include those associated with human activities. Impacts due to accidental discharges of hazardous materials should be considered in plant design and siting. Impacts to commercial fishing and navigation, public access and recreation, visual aesthetics, and noise provide significant environmental issues which may be of particular interest to the public.
Although desalination technology provides a valuable product from a potentially endless resource, many issues should be analyzed when considering construction of a new plant. Each component of the process and the process as a whole provide unique challenges to the environment and requires specific issues be addressed in the planning and design phase of the project as well as in the day to day operation and maintenance of the plant. Site specific environmental conditions and the technology and processes used at a plant will determine the type and extent of potential environmental impacts associated with the plant.
7.5 Economic Value of Natural Resources
The economic value of natural resources in the Lower Rio Grande Valley is related to both consumptive and non-consumptive uses. Nature tourism and the commercial shrimping and fishing industry are two segments of natural resource use that have substantial economic impacts to the economy of the state. Nature tourism in the LRGV includes the following outdoor activities:
• Wildlife Viewing • Hiking, Walking, and Backpacking • Bird Watching • Outdoor Photography • Birding and Nature Festivals • Wildlife Tours • Camping and R V'ing • Swimming and Scuba Diving • Fishing • Native Plant Tours • Hunting
Projected year-2000 outdoor recreation participation (in 1000's of Annual User Occasions) for selected activities in Planning Region 21 (Hidalgo, Cameron and Willacy Counties) are summarized below (Texas Parks and Wildlife Department (TPWD), 1995):
LRGVDC Integrated Regional Water Plan Section 7, Page 27

Integrated Water Resource Plan Lower Rio Grande Valley Development Council
Final Report- Baseline Environmental Conditions
Camping 937 Freshwater Fishing 978 Saltwater Fishing 2104 Hunting 262 Nature Study 1005
In 1991, Texans spent about one billion dollars on food, lodging. and other expenses for "wildlife appreciation activities" (TPWD, http://www.tpwd.state.tx.us/adv/ntour/ntour.htm). In 1992, Texas ranked second as the most visited state, with about 155 million travelers.
According to the TPWD, nature-related travel is the fastest growing segment of the travel industry and wildlife viewing is the number one outdoor activity in the U.S. By the year 2000, 18 million Texans will participate in nature tourism. American Birding Association members listed Texas as the most-popular destination for birding tours over the past 5 years. In 1992, bird watchers generated $4-6 million of economic impact along the upper Texas coast.
Shrimp are an important component of Texas coastal Gulf of Mexico ecosystem. Shrimp are one of the most valuable commercial food fisheries in the United States. The Texas shrimp (brown, white, and pink) harvest in 1997 was over 64 million pounds and was worth $180 million. The total economic impact of shrimp landings in the marketing system is estimated to be at least $500 million to the Texas economy.
During 1991-92, anglers used an estimated 2 million pounds of shrimp as bait, costing $8 million. Although about 60% of bait shrimp is used as dead bait, the value oflive bait shrimp is over two and one-half times greater than dead bait shrimp per unit weight. (Information is derived from "Fisheries ofthe United States, 1992. 1994. U.S. Department ofCommerce, Current Fishery Statistics No. 9300")
LRGVDC Integrated Regional Water Plan Section 7, Page 28

Integrated Water Resource Plan Lower Rio Grande Valley Development Council
Final Report - Baseline Environmental Conditions
Acronyms and Abbreviations
BECC BRC CEC CILA CNA DDE DDT EMAP IBEP IBWC IMTA INIFAP LRGV LRGVDC NADBank NAFTA NASQAN-11 NEI NOAA NPS PCB R-EMAP SEMARNAP TAES TAMU TBCDS TDA TDH TDS TGLO TNRCC TPWD TSSWCB USDHHS USEPA USFWS USGS
Border Environment Cooperation Commission Blackland Research Center North American Commission for Environmental Cooperation Comision Intemacional de Limites y Aguas Comision Nacional de Agua Dichloro-Diphenyl-Ethylene Dichloro-Diphenyl-Trichloroethane Environmental Monitoring and Assessment Program Integrated Border Environmental Plan International Boundary Water Commission Mexican Institute of Water Technology Mexican National Institute of Forestry and Agricultural Studies Lower Rio Grande Valley Lower Rio Grande Valley Development Council North American Development Bank North American Free Trade Agreement National Stream Quality Accounting Network Phase II National Estuarine Inventory National Oceanic and Atmospheric Administration Nonpoint source Polychlorinated biphenyl Regional Environmental Monitoring and Assessment Program Secretaria de Medio Ambiente, Recursos Naturales, y Pescas Texas Agricultural Experiment Station Texas A & M University Texas Biological and Conservation Data System Texas Department of Agriculture Texas Department of Health Total dissolved solids Texas General Land Office Texas Natural Resource Conservation Commission Texas Parks and Wildlife Department Texas State Soil and Water Conservation Board United States Department of Health United States Environmental Protection Agency United States Fish and Wildlife Service United States Geologic Survey
LRGVDC Integrated Regional Water Plan Section 7, Page 29

Integrated Water Resource Plan Lower Rio Grande Valley Development Council
Final Report - Baseline Environmental Conditions
References
California Coastal Commission (CCC). 1993. Seawater Desalination in California. California Resources Agency, California Coastal Commission. San Francisco, California.
Davis, W.B. and D.J. Schmidly. Texas Tech University Natural Science Research Laboratory Web: Mammals of Texas [Online] (1998) Available URL: http://www.nsrl.ttu.edu/tmot/pantoca.htm.
Horizon Environmental Services, Inc. (Horizon). 1994. Environmental Assessment: Brownsville Weir and Reservoir Project. Texas Natural Resource Conservation Commission, Austin, Texas.
Lyndon B. Johnson School ofPublic Affairs (LBJSPA). 1976. Rio Grande-Falcon Thorn Woodland, A Natural Area Survey No. 13, University of Texas, Austin.
Macauley, J.M., J.K. Summers, V.D. Engle, P.T. Heitmuller, and A.M. Adams. 1995. Annual Statistical Summary: EMAP- Estuaries Louisiana Province- 1993. U.S. Environmental Protection Agency, Offices ofResearch and Development, Environmental Research Laboratory, Gulf Breeze, FL EPA/620/R-96/003.
Cornell University. Cornell Laboratory of Ornithology Web:BirdSource, {Online} (September 8, 1998). Available URL:http://birdsource.cornell.edu.
Peterson, R. T. A Field Guide to the Birds of Texas. 1963. Houghton Mifflin Co. New York, NY.
Robbins, C.S., B. Bruun, and H.S. Zim. 1966. A Guide to Field Identification- Birds ofNorth America. Golden Press, New York, NY.
Texas A&M University (TAMU). TAMU Web: S.M. Tracy Herbarium, [Online] (1998). Available URL: http://www. csdl. tamu.edu/FLOR/taes. tracy/homeNF .html.
Texas Biological and Conservation Data System (TBCDS). Texas Parks and Wildlife Department, Endangered Resources Branch. County Lists of Texas' Special Species. Cameron County, revised 97-09-30; Hidalgo County. revised 97-09-30; Starr County, revised 97-09-30; Willacy County, revised 97-09-02.
Texas Environmental Center (TEC). TEC Web: Texas Environmental Almanac, Chapter 4, Wildlife, Page 2, [Online] (1995). Available URL: http:/ /www.tec.org/almanac/LANDIWILDLIFECH4P2.HTML.
LRGVDC Integrated Regional Water Plan Section 7, Page 30

Integrated Water Resource Plan Lower Rio Grande Valley Development Council
Final Report - Baseline Environmental Conditions
Texas Parks and Wildlife Department (TPWD). TPWD Web:Endangered and Threatened Species, [Online] (1998). Available URL: http://www.tpwd.state.tx.us/nature/endang/.
Texas Natural Resource Conservation Commission (TNRCC). 1996a. The State ofTexas Water Quality Inventory 13th Ed, Vol. 4. Texas Natural Resource Conservation Commission, Surface Water Quality Monitoring Program. Austin, Texas.
Texas Natural Resource Conservation Commission (TNRCC). 1996b. Regional Assessment of Water Quality in the Rio Grande Basin. Texas Natural Resource Conservation Commission, Watershed Management Division. Austin, Texas. Report# SFR-041.
Texas Natural Resource Conservation Commission (TNRCC). 1994. Regional Assessment of Water Quality in the Rio Grande Basin. Texas Natural Resource Conservation Commission, Watershed Management Division. Austin, Texas. Report# AS-34.
U.S. Fish and Wildlife Service (USFWS). 1997. Final Lower Rio Grande Valley and Santa Ana National Wildlife Refuges Interim Comprehensive Mangement Plan. U.S. Fish and Wildlife Service, U.S. Department ofthe Interior.
University ofMichigan. Museum of Zoology Web: Animal Diversity Web, [Online] (1998). Available URL:http://www.oit.itd.umich.edu/projects/ADW/.
University of Texas. University of Texas College ofNatural Sciences and Texas Memorial Museum Web:Herps ofTexas, [Online] (1998). Available URL: http://www .zo. utexas. edu!research/txherps.
LRGVDC Integrated Regional Water Plan Section 7, Page 31

~ ~
Integrated Water Resource Plan Lower Rio Grande Valley Development Council
Final Report- Cost of Water and Water Economics
8.0 Cost of Water and Water Economics
8.1 Summary of Costs for Delivery of Municipal and Agricultural Water Supplies
During the visits to the municipalities, water supply corporations and the irrigation districts, information was requested on the current water rate structures. This type of information can become dated rather quickly and has been presented in this report to establish an average and general cost-range baseline for municipal and water supply corporation treated water delivery costs and irrigation district raw water delivery costs. Establishing these general baselines will permit a measurement of the financial impact one ofthe proposed water supply components will have on the typical urban customer and on the typical agricultural irrigator.
The domestic treated water services for 5,000, 10,000 and 25,000 gallons per month for several municipalities and water supply corporations in the Lower Rio Grande Valley who furnished information, have been summarized in Table 8.1. For these entities, the average water bill for 5,000 gallons per month is $14.81 which is equivalent to$ 2.96 per 1,000 gallons. The minimum amount and per unit rate charge vary from entity to entity. For a 10,000-gallon and 25,000-gallon monthly water bill, the average unit costs are$ 2.25 and$ 1.94 per 1,000 gallons, respectively. These average rates decline because the minimum cost of service is spread over a larger quantity. For the reported rates, the lowest existed in Harlingen and McAllen. The highest existed in the water supply corporation and in the smaller municipalities.
Table 8.1 Lower Rio Grande Valley Representative
Municipal and Water Supply Corporation Monthly Water Bills Municipal Entity 5,000gal. JO,OOOgal. 25,000gal. Effoctive As Of
Brownsville $16.01 $22.71 $48.84 1998
East Rio Hondo WSC $16.50 $24.00 $46.50
Edcouch $15.00 $23.75 $50.00
Edinburg $11.75 $21.00 $48.75 1997
El Jardin WSC $27.10 $35.00 $72.95 1998
Harlingen $5.80 $13.20 $30.70 1992
LaJoya $15.30 $22.60 $51.75 1997
La Feria $14.25 $22.50 $48.40 1993
LaJoya WSC $15.90 $24.40 $69.90
McAllen $7.18 $11.98 $27.30 1997
Military HWY WSC $17.50 $32.50 $77.50 1998
North Alamo WSC $16.48 $22.68 $42.78 1998
Olmito WSC $21.00 $31.00 $64.50 1996
LRGVDC Integrated Regional Water Plan Section 8, Page I

Municipal Entity
Prim era
Raymondville Rio Hondo
San Benito
SanJuan Weslaco Local Average
Integrated Water Resource Plan Lower Rio Grande Valley Development Council
Final Report- Cost of Water and Water Economics
Table 8.1 (Continued)
5,000gal. JO,OOOgal. 25,000gal. Effective As Of
$16.00 $23.50 $45.75 1986-present
$14.50 $23.75 $51.50 1998 $16.06 $22.50 $45.00 1991 $10.75 $14.25 $24.75 1994
$10.30 $15.80 $32.30 1993 $14.00 $21.00 $42.00 1997 $14.81 $22.53 $48.48
The Texas Municipal League periodically conducts utility rate surveys. The results of the in June 1998 have been summarized in Table 8.2. The average cost of water service at that time for residential usage of 5,000 gallons in all cities responding was $15.15 while the average cost for I 0,000 gallons was $25.27. These amounts are consistent with those found in the Lower Rio Grande Valley. The results of the survey do indicate that water service rates are generally higher in the smaller cities. The average monthly consumption amount during the survey was 9,260 gallons, but the range was+/- 2,000 gallons per month from the average.
Table 8.2 1998 Texas Municipal League
Summary of Water and Wastewater Survey Results
No. of Cities Residential later Average Fee for
Population Group Reporting 5, 000 gal. 10, 000 gal.
2, 000 or less 263 $19.61 $30.79
2,001 - 5,000 139 $17.08 $27.80 5,001 - 10,000 74 $15.00 $24.83
10,001 - 15,000 38 $15.27 $26.09 15,001 - 20,000 17 $16.Ql $26.81 20,001 - 25,000 20 $17.05 $27.79
25,001 - 30,000 7 $16.25 $27.35
30,001 - 50,000 19 $14.88 $24.89
50,001 - 75,000 10 $14.59 $24.96
75,001 - 100,000 6 $12.30 $20.25 100,001 - 200,000 9 $11.54 $19.70 More than 200,000 6 $12.21 $22.02
Total/Averages 608 $15.15 $25.27
*Source: Texas Town & Country- August 1998
Information was also collected on the current rate structures for delivery of irrigation water. The gathered information has been summarized in Table 8.3. Most of the irrigation districts rate structures consist of a flat rate and cost per irrigated acre. Two of the reporting irrigation districts, base their charges on the flat rate and a cost per acre-foot.
LRGVDC Integrated Regional Water Plan Section 8, Page 2

Integrated Water Resource Plan Lower Rio Grande Valley Development Council
Final Report- Cost of Water and Water Economics
Table 8.3 Summary of Representative Irrigation Water Costs
for the Lower Rio Grande Valley
Flat Rate Water Per Water per Irrigation District Per Acre Acre-Ft. Irrigated Acre
Santa Cruz Irrigation District No. 15 $14.00 $20.00
Hidalgo County Irrigation Dist No. 13 $25.00 (1)
Hidalgo County Irrigation District No. 6 $21.00 $27.00
Hidalgo County Irrigation District No. 5 $6.25 $7.50
Hidalgo County Irrigation District No. 2 $8.25 $7.50
Hidalgo County Irrigation District No. 1 $18.00 $9.00
Donna Irrigation District $12.00 $8.00
Engelman Irrigation District $12.00 $8.00
Delta Lake Irrigation District $10.00 $12.00
Cameron County Irrigation District No. 10 $14.00 $9.00
Cameron County Irrigation District No. 6 $10.00 $7.00
La Feria Irrigation District $13.50 $8.00
Average $12.64 $0.00 $9.60
Total to l"igate 100 Acres once
vr. $3,400.00
$1,250.00
$3,450.00(2)
$1,375.00
$1,575.00
$2,700.00
$2,000.00
$2,000.00
$2,200.00
$2,300.00
$1,700.00
$2,150.00
$1,887.50
(1) All revenue that the distnct recelVes 1s from water sales outsu:le the distnct and from CD's. Irrigators within the district buy water directly from Irrigation District No. 1 and from Santa Cruz No. 15. (2) A typical 6-inch application per acre was assumed.
An understanding of the development of the flat rate charge applied by the irrigation districts is important. The water code requires that not less than one-third nor more than two-thirds of the estimated maintenance and operating expenses are to be paid by assessment against all land in the district to which the district can furnish water through its irrigation system or through an extension of its irrigation system. The assessment is to be levied against all irrigable land in the district on a per acre basis, whether or not the land is actually irrigated. The irrigation district board determines the proportionate amount of the expenses which will be borne by water users. The remainder of the estimated expenses is paid by assessments against persons in the district who use or who make application to use water. The irrigation district board is to prorate the remainder as equitably as possible among the applicants for water and may consider the acreage each applicant planted, the crops grown, and the amount of water per acre used.
Following these requirements means that, as an irrigation district becomes more urbanized and areas are excluded, certain fixed costs have to be spread over few irrigable acres, thus increasing the flat rate cost. This condition could account for the higher flat rate assessments in Hidalgo County Irrigation District No.1 and Hidalgo County Irrigation District No. 6 which are located in more highly urbanized areas.
LRGVDC Integrated Regional Water Plan Section 8, Page 3

Integrated Water Resource Plan Lower Rio Grande Valley Development Council
Final Report- Cost of Water and Water Economics
8.2 Water Costs and Competing Forces for the Limited Water Supply
Several factors affect the relative competition for water and the prices which are paid for raw water in the Valley. Chief among those factors is the aspect of the water rights system (described in section 4.2). The various classifications of water rights and the regulations of the various irrigation districts limiting transfer to other districts result in numerous markets rather than a single market for water in the Valley. This results in higher water prices, especially in times of shortage, due to the inflexibility of transfer options.
In addition the water rights system, with agriculture being the residual claimant on water supply inflows, results in significant risk placed on the agricultural sector. Such risk is evidenced in the lease prices paid in the two sectors in the recent years since the drought of 1996 as portrayed in Figure 5.1. Normalized (to 1994levels) lease prices for municipal and irrigation waters are presented for the 1994 thru 1997 period. As reservoir storage approached record lows in the summer of 1996, the lease price for irrigation water rose sharply and remained relatively high throughout the remainder of the year and into 1997. Lease prices for municipal water, conversely, remained relatively stable and significantly lower throughout 1996 and much of 1997. In addition, the lack of any leasing activity within the municipal sector during a number of months in the earlier stages of the drought (denoted by the absence of a symbol) provide a further indication that municipalities were feeling fewer impacts from increasing scarcity. As the drought persisted, shortages in several cities pushed municipal lease prices higher, but the increase was considerably less than that occurring in the agricultural sector.
$60
$50
$40
$30
$20
$10
$0
Figure 8.1 Normalized Water Lease Prices ($/at), 1994-1997
Average Monthly Water Lease Prices
~ l~
LRGVDC Integrated Regional Water Plan Section 8, Page 4

f5 D
Integrated Water Resource Plan Lower Rio Grande Valley Development Council
Final Report- Cost of Water and Water Economics
This analysis suggests that the higher priority assigned municipal rights, via both the magnitude of the municipal reserve and the prohibition of municipal to irrigation leases, has essentially protected municipal users from the economic effects of drought. The question then arises as to whether such protection is warranted. A subsequent analysis (Charaklis, Griffin, and Bedient) utilizing mathematical programming techniques and accepted economic theory, demonstrates that under conditions of perfect competition (i.e., no municipal reserve and no
Figure 8.2 Required Increase in Municipal Price
at the Tap Under Free Market Conditions
0.08
0.06
0.04
0.02
0.00
828
Total Water Supply (1 ,000 af)
prohibition on sector to sector leasing), municipal water prices at the tap would increase relatively little (1 0 cents or less per 1000 gal) for total supply values to the Valley (both agricultural and municipal) ranging from 828,000 up to 1.286 million ac-ft (Figure 5.2). The lower total supply value of828,000 ac-feet represents a significant drought, and the 1 0
cents per 1000 gallon increase corresponds to a 1 or 2 dollars per month increase in the water bill for a typical household using 10,000 to 12,000 gallons per month.
Assumptions within the above-mentioned analysis include the possibility of irrigators leasing irrigation water to the cities (and vice-versa), especially in times of drought, and allowing the water to move from lower valued agricultural uses to the municipal sector which has the ability and willingness to pay for the scarce water. There is some evidence that such leases already do take place (although illegally), and their existence raises another potential deficiency in the overall legal setting for water use in the area. Under the current rules, the irrigation districts as holders of the water rights, realize the income from the leasing of the water. These quasi-public entities may reinvest the revenue from the water leases into normal operating costs or possibly improve the overall efficiency of the water delivery system. This setup, however, provides little incentive for on-farm conservation and the accompanying investment in water saving technologies. Growers, in general, do not realize the direct benefits from such on-farm investment, especially under the currently prevalent pricing structure of per acre irrigated water charges. Some means ofbetter sharing the benefits of water leases, some of which are the result
LRGVDC Integrated Regional Water Plan Section 8, Page 5

Integrated Water Resource Plan Lower Rio Grande Valley Development Council
Final Report- Cost of Water and Water Economics
of improved management on-farm, is needed. Removing this impediment would provide greater incentives for the adoption of water saving technologies on-farm.
8.3 Estimated Price of Water that Includes Not Only Cost, but also Value of the Water
A recent report (29) on the value of water set forth these two key basic concepts:
• willingness to pay - is what a person, organization or community would give up to have water.
• opportunity cost - is what a person, organization or community must give up to have water.
Everyone who lives on their income recognizes that each consumption expenditure involves a tradeoff- some other valued item of consumption that must be foregone. This could very much be the case for the Lower Rio Grande Valley as it contemplates attempting to live on its currently available water supply or investing in new more expensive water supply options. To live within the currently available water supply, it is increasingly apparent that using more water in one way means using less water in another. In other words, what has to be given up to get water? Where water is scarce, the answer can be "some other water use." When politicians, water managers and the public answer this question, they should try to make certain that the water use given up is a low-valued one, keeping their opportunity cost down.
An effort to keep the Lower Rio Grande Valley total water use into line with the average renewable supply, for as long as possible, will require a mixture of interaction, regulation, cooperation, adaptation in social values, and changes in pricing practices throughout the Lower Rio Grande Valley. In the typical situation in the absence of intervening public policies and decisions, municipal willingness-to-pay will rises faster and higher than willingness-to-pay of other water users, and the marketplace will move water to these uses beginning with those agricultural uses which are most the marginal economically. This action has occurred historically in the Lower Rio Grande Valley. Approximately 75,000 acre-feet of water rights has been converted from agricultural to municipal and industrial in the Valley, but used in the Laredo area, since the rights were adjudicated.
In growing arid and semi-arid regions, everyone should eventually recognize that water is a significant limiting natural factor. It shapes human institutions and actions as much as it affects the natural environment. As a significant limiting factor, decisions about water are more effectively decisions about the shaping the future of the Lower Rio Grande Valley than most others. The task of merging competing interests on the value of water into effective decisions, though very difficult, is made easier when this common recognition of the limiting role of water emerges. Absent a consensus on a shared vision for the future of the Lower Rio Grande Valley, the process for determining its future may be adversarial and competitive in tone with political forces struggling with market forces to fashion the outcome. It is important to keep in mind that financial lenders have also learned the importance of a secure water supply to the cities and
LRGVOC Integrated Regional Water Plan Section 8, Page 6

Integrated Water Resource Plan Lower Rio Grande Valley Development Council
Final Report- Cost of Water and Water Economics
corporations, and they measure the risk of investment in a public or private institution that cannot demonstrate a secure source of water supply.
For most of the twentieth century, there was a standard answer to the question of what a region should do when it discovered that it needed more water: go somewhere else and get it. But, for practical purposes, this period of development has been replaced by an era of water management in which other water management techniques including conservation, recycling of effluent, and transfers of existing water rights from agriculture to cities have become the dominant means of restructuring or extending water supplies. The availability, the cost of obtaining distant sources of water, and the environmental impacts that generally accompanies development and long distance transport of water have combined to severely limit the "new supply" development option of the past.
Water management practices which combine dissimilar types of water resources in a diversified portfolio, are termed "conjunctive management." As growing regions continue to search for new water, new sources that are more likely to enter their conjunctive management strategies are low-quality groundwater, stormwater runoff, water conserved through enhancement of the operational efficiency of the basin's water system, leased water, recycled effluent, etc. These resources are often closely related, but each is unique in its quality, cost of diversion and /or treatment, predictability, seasonality, location, terms of ownership, relationship to riparian ecosystems, and applicability, and each characteristic will affect the economic value of the water resources.
Sustainable development has been defined as "development that meets the needs of the present without compromising the ability of future generations to meet their own needs." This sort of coordination requires first a good understanding of the hydrologic and natural systems, and this is one reason why the Lower Rio Grande Valley, the State and the federal governments are investing heavily in research to improve present knowledge of the Rio Grande/Rio Bravo. In addition, regional decision making requires a recognition of the values of different distributions of water among water users.
Opportunity cost of future water supplies
To illustrate the concept of opportunity cost, the following three alternative approaches to accommodating a growing population within the limits of 1,194,000 acre-feet per year constraint of the Falcon-Amistad Reservoir System have been developed. They are not intended to be all inclusive, but they are to illustrate the concept.
The Lower Rio Grande Valley has been fortunate in having been able to grow to its present size while having available a water supply that is not only low-cost in terms of outlays, but which has had low opportunity costs as well. This period may be coming to a close as the lowcost options for additional supplies are used up, and the region faces increasingly harder choices as it seeks to provide water for its growing population. If other supplies become available to the Lower Rio Grande Valley, the examples given below will change, but the message remains the
LRGVDC Integrated Regional Water Plan Section 8, Page 7

Integrated Water Resource Plan Lower Rio Grande Valley Development Council
Final Report- Cost of Water and Water Economics
same. Living within a water budget means that every new use requires a reduction of an existing use.
Example 1: Increases in urban demand to be supplied through purchase of agricultural rights and retirement of irrigated land. The Lower Rio Grande Valley has already experienced the retirement of irrigated acreage to meet the growing urban population demands. Continuing to meet the growing municipal and industrial demands by decreasing irrigation usage implies some consequences for Lower Rio Grande Valley's traditions and environment.
The objective of this analysis is intended to help assess the acceptability of the consequences of sole reliance on agricultural water for future supplies. The first question is "How much of today's agricultural water would have to be retired to supply the Lower Rio Grande Valley' projected urban population of2050 at the expected water conservation rates?"
Municipal users held approximately 312,000 acre-feet per year in water rights in 1995. The projected Year 2050 municipal demand has been estimated to be 332,396 acre-feet per year. If the estimated 20% transmission losses are included, the total required municipal requirement would be approximately 400,000 acre-feet per year, or an additional67,000 acre-feet per year of water rights would be required.
The total authorized water rights in the Lower Rio Grande Valley are greater than I. 9 million acre-feet. The current estimated dependable yield of the Falcon-Amistad Reservoir system is approximately 1,220,000 acre-feet per year. The rules for allocating storage in the FalconAmistad Reservoir System were previously discussed in Section 4. Under these rules, municipal and industrial uses are granted the highest priority. Also, at the beginning of each month a 225,000 acre-foot reserve is set aside for domestic, municipal, and industrial uses. These rules provide a high level of protection for the municipal rights, and it is likely that this condition will continue in the future even though the reservoir system is over allocated.
The projection of the future agricultural demands discussed in Section 3.3 included the assumption that the urbanization of the Valley will eliminate some of the currently irrigated lands from production. If the projected Year 2050 municipal demands (400,000 acre-feet per year) are subtracted from the Falcon-Amistad Reservoir System current dependable yield of 1,220,000 acre-feet per year, the balance is 850,000 acre-feet per year. This amount is greater than the projected Year 2050 agricultural demand of approximately 736,000 acre-feet per year. The difference, 114,000 acre feet per year, is more than adequate to meet other water demands in the Valley.
How acceptable is this approach? That is, what will it cost to supply urban growth in the Lower Rio Grande Valley by retiring irrigation?
The opportunity costs of supplying urban water through conversion of agricultural acreage include the loss of crop value, which should be reflected in the price of agricultural water rights, as well as the loss of secondary incomes associated with agricultural. The net projected returns
LRGVDC Integrated Regional Water Plan Section 8, Page 8

Integrated Water Resource Plan Lower Rio Grande Valley Development Council
Final Report- Cost of Water and Water Economics
for various crops in South Texas for 1998 have been summarized in Table 8.4. It can be clearly seen that some crops were projected to have a much higher net return than others. All other things being equal, the opportunity costs for water rights for those acreages with lower net projected returns would be less. Urban development patterns do not keep all other things equal. Initial efforts have been made in this study to define the areas that are likely to become highly urbanized during the 2000 to 2050 period. A more rigorous regional urban development plan, coupled with the detailed information on agricultural acreages that can now be developed from the DOQQs, should make a more definitive definition of the impacts of urbanization on agriculture possible.
Table 8.4 Net Projected Returns for Various Crops in South Texas
Crops Gross Variable Fixed Net Projected Income Cost Cost Return
Bell Peppers, Irrigated $3,477.50 $2,596.78 $141.82 $738.90
Broccoli, Irrigated $4,200.00 $3,697.57 $250.84 $251.59
Cabbage, Irrigated $4,060.00 $3,147.43 $195.14 $717.43
Cantaloupes, Irrigated $3,510.00 $2,927.31 $195.15 $387.54
Carrots, Irrigated $2,320.00 $1,800.50 $177.86 $341.63
Com, Irrigated $243.60 $236.37 $145.25 ($138.02)
Cotton, Dryland $393.60 $289.69 $106.95 ($3.04)
Cotton, Irrigated $512.10 $462.37 $139.86 ($90.14)
Cucumbers, Irrrigated $1,620.00 $1,380.58 $136.64 $102.79
Honeydews, Irrigated $4,025.00 $3,610.29 $176.00 $238.71
Jalapeno Peppers, Irrigated $2,225.00 $1,894.14 $251.27 $79.59
Yell ow Onions, Irrigated $4,150.00 $2,755.57 $159.32 $1,235.12
Sorghum, Dryland, Conservation Tillage $123.20 $85.22 $73.05 ($35.07)
Sorghum, Irrigated $193.60 $144.87 $139.83 ($91.10)
Soybeans, Irrigated $232.40 $176.28 $100.23 ($44.12)
Plant Cane $891.00 $550.11 $251.34 $89.56
Ratoon Sugar Cane $742.50 $352.29 $307.70 $82.51
Fresh Spring Tomatoes, Irrigated $1,225.00 $1,102.41 $196.39 ($73.79)
Watermelons, Dryland $725.00 $748.94 $78.72 ($102.66)
Watermelons, Irrigated $1,087.50 $1,071.94 $151.55 ($136.00)
Citms Establislunent -Avg Yrs 1&2, 140 $0.00 $1,478.45 $182.50 ($1,660.95) Trees/acre
Grapefruit, Young Orchard, Fruit Bearing, Avg 3- $765.00 $664.99 $197.50 ($97.49) 7
Grapefruit, Mature Orchard, Fruit Bearing $1,955.00 $759.16 $197.50 $998.34
Orange, Young Orchard, Fruit Bearing, Avg 3-7 $805.00 $632.49 $197.50 ($24.99)
Orange, Mature Orchard, Fruit Bearing, Avg 8 $2,070.00 $726.56 $197.50 $1,145.94 Yrs
Source:Texas Crop Enterprise Budgets, South Texas District, Projected for 1998, Texas Agricultural Extension Service
LRGVDC Integrated Regional Water Plan Section 8, Page 9

Integrated Water Resource Plan Lower Rio Grande Valley Development Council
Final Report- Cost of Water and Water Economics
Example 2: Urban water supply from municipal conservation. Another potential water policy is the direct inverse of the "transfer from irrigation" scenario ofExample I. This position rejects the historical American attitude that progress is built on taming and controlling nature. The position could be that social water use should fit into the natural balance without interfering with natural processes. This position could support a variety of alternative policy recommendations such as aggressive restriction of growth. In this example, it could mean that urban growth cannot decrease the water available to agriculture and natural water uses.
If the quantity of water available to municipalities cannot be increased, than it can be assumed to be limited to the 312,000 acre feet per year of existing municipal water rights. This amount is equivalent to approximately 134 gpcd for the projected population of2,080,909 in the Year 2050. Referring to the data in Section 3 on the municipal water requirement projections and including 20% transmission losses, a 208 gpcd below-normal weather conditions consumption rate can be computed for the Year 2050 if no water conservation measures implemented. For the assumed water conservation practices, which generally are consistent with those anticipated by the State, the per capita consumption rate drops to 175 GPCD, or 18.2%, by the Year 2050. To achieve the 134 gpcd would require an approximately 46% reduction.
The changes in life style required to meet this level of per capita consumption could include:
• Vigorous zoning and land development polices: The proportion of people living in multifamily housing would increase and residential housing would become denser.
• Household water conservation: Single-family and multiple-family consumptive water use would drop significantly.
• Commercial and industrial conservation: All reasonable conservation would be achieved, but conservation requirements might be less stringent than residential conservation since this might affect employment and income.
• Conservation in public parks and urban turf: The municipalities would become less green with lower per capita turf areas in parks and golf courses and the amount of water per acre in turf irrigation would drop, implying intensive xeriscaping.
What is the opportunity costs of municipal conservation? Domestic expenditures on water would increase, and costs would be incurred to retrofit for low-water use and change landscaping practices, in addition the enforcement costs of a municipal conservation program, that would so strongly alter water consumption patterns, would rise. It is, however, the indirect opportunity costs of very stringent municipal water conservation that could be of most concern when this type of program is considered. If the Lower Rio Grande Valley were perceived as a watertight region, economic growth could suffer. Industrial and commercial firms could choose greener pastures. Reducing greenspace could result in degraded quality of life. Zoning for higher densities could make an open, sprawling community into a crowded stressful urban center.
LRGVDC Integrated Regional Water Plan Section 8, Page 1 0

Integrated Water Resource Plan Lower Rio Grande Valley Development Council
Final Report- Cost of Water and Water Economics
Most of these costly consequences depend on how the conservation program is implemented. A major consideration has to be regional consistency. Almost equally important is public vision and commitment. If the public message of municipal conservation is not desperation about water, but a commitment to sustainability and responsibility, industry with a long-time horizon might be drawn to the area by the conservation program instead of driven away. If water conservation in public parks and greenspaces is well designed, replacing areas of water intense turf with a richer xeriscape of desert plants relieved by small shaded areas may bring a net benefit aesthetically as well as reducing water use. Careful and creative high-density zoning that leaves open space to ease the eye and ear, and establishes traffic patterns that disperse the growing population need not make the Valley into a little Los Angeles.
All of these means of reducing the opportunity costs of municipal conservation require regional cooperation and clear and proactive municipal programs with wide public support. Moreover, all of these measures become both more costly and more challenging as the conservation requirements become more severe.
Example 3: Urban water supply burden shared across sectors. Each of the extreme examples described above gave the entire burden of providing water for urban growth to a single sector. In each case it appeared that the marginal opportunity costs-what would have to be given up for the last acre-foot of water taken from the sector that carried the burden would be considerably greater than what would have had to be sacrificed for that acre-foot to be taken from another sectors. Clearly, to avoid very high opportunity costs, the water conservation burden should be distributed among all sectors.
Section 8.4- Economic Impact of Water Supply Components on the Cost of Water Delivery Systems
Summarized in the following sections are the estimated costs associate with the various option components. The relative economic impacts of the water supply and water conservation components on the cost of the water delivery system have been described.
Improvements to Irrigation Delivery System: Initial survey efforts to quantify canal dimensions and capacities within all the districts were only partially successful. As noted in Section 6.2, there are approximately 640 miles of main canals and nearly 10 miles of pipeline in the main delivery system. Total mileages of canals and pipeline in the districts are much higher (nearly 2,500 and 1,400 miles, respectively).
Lack of detailed data precluded making reasonable estimates ofthe potential savings and related construction for main canal improvements based on the physical characteristics of the canals. A range of estimates was made using historical costs of improvement which have occurred in other areas. Similar improvements in canal/pipeline systems range have ranged in cost from $400 to $1,000 per acre-foot of water saved (Imperial Irrigation District, California). If the assumption is made that delivery efficiency is to be improved to the 80% level, projected water savings would be as indicated in Table 6.16.
LRGVDC Integrated Regional Water Plan Section 8, Page II

~ ~
Integrated Water Resource Plan Lower Rio Grande Valley Development Council
Final Report- Cost of Water and Water Economics
Values for a high and low delivery water year are shown in that table. The averages of the high and low water savings scenarios, average water saved for 80% and 90% delivery efficiencies, are approximately 82,600 and 163,800 acre-feet, respectively. Applying the $400 and $1000 per acre-foot saved values to the 82,600 acre-feet saved at 80% efficiency results in the estimated capital cost for rehabilitation presented in Table 8.5.
Table 8.5 Range of Total Capital Cost of Rehabilitation to 80%
Delivery Efficiency Cost range
per acre-ft per 1, 000 gal. Total Cost
$400 $1.23 $33,040,000
$1000 $3.07 $82,600,000
Construction of a Pipeline System: The comparative construction costs of pipeline alternatives from Falcon Reservoir to the Lower Rio Grande Valley have been summarized in Table 8.6. This information was discussed in Section 6.3. The pipelines have been generally sized to delivery the increasing water requirements for the northern growth area. In some cases, the entire requirements of smaller communities located in the northern region would be supplied from the pipeline.
The capital construction cost for a raw water pipeline from Falcon Reservoir range from approximately$ 4.46 to$ 5.45 per 1,000 gallons of average-day delivery capacity, or the debt service will range from$ 0.36 to$ 0.44 per 1,000 gallons based on the average day capacity, assuming a 7 % interest rate and 30-year repayment period.
Interest has also been expressed in considering a water treatment plant located at Falcon Reservoir with delivery of treated water to the Valley. This approach would be compared to the concept of the regional water treatment plants located in the Valley and the delivery of raw water through the pipeline. The estimated capital costs for these two options have also been summarized in Table 8.6. The comparison indicates that the delivery of raw water and construction of multiple regional water treatment plants to be slightly more expensive.
Implementation of Municipal and Industrial Water Conservation: The costs associated with implementing a regional municipal and industrial water conservation plan are not clearly defined. The TWDB (5) has said that a primary assumption associated with the definition of the "expected" municipal water conservation case is that these levels of savings are likely to occur from both market forces and regulatory requirements. The typical plumbing fixtures and applications available for purchase are noticeably more water-efficient than those sold in earlier decades. The availability of water-efficient landscaping in the marketplace and improved
LRGVDC Integrated Regional Water Plan Section 8, Page 12

Integrated Water Resource Plan Lower Rio Grande Valley Development Council
Final Report- Cost of Water and Water Economics
landscaping practices are changing outdoor water uses. Better public education on efficient indoor and outdoor water uses and pricing "signals" from the marketplace is also changing consumer behavior.
Table 8.6
Summary of Preliminary Capital Costs for Evaluated Pipeline Alternatives
Alternative 1 Falcon Pipeline to Lower Rio Grande Valley, Moore Field and Elsa, Route A, 150 MGD Raw Water Pipeline- $198,580,000
Alternative 2 Falcon Pipeline to Lower Rio Grande Valley, Moore Field, Elsa and Combes, Route A, 175 MGD Raw Water Pipeline- $208,180,000
Alternative 3 Falcon Pipeline to Lower Rio Grande Valley, Moore Field, Elsa, Combes and Olmito, Route A, 209 MGD Raw Water Pipeline- $226,910,000
Alternative 4 Falcon Pipeline to Lower Rio Grande Valley Moore Field and Elsa, Route B, 150 MGD Raw Water Pipeline- $199,390,000
Alternative 5 Falcon Pipeline to Lower Rio Grande Valley, Moore Field, Elsa, and Combes, Route B, 175 MGD Raw Water Pipeline - $208,860,000
Alternative 6 Falcon Pipeline to Lower Rio Grande Valley, Moore Field, Elsa, Combes and Olmito, Route B, 209 MGD Raw Water Pipeline- $228,099,000
Alternative 7 Los Ebanos Pipeline to Lower Rio Valley, Moore Field and Elsa, Route C, 150 MGD Raw Water Pipeline - $93,630,000
Alternative 8 Los Ebanos Pipeline to Lower Rio Valley, Moore Field, Elsa, and Combes, Route C, 175 MGD Raw Water Pipeline- $102,960,000
Alternative 9 Los Ebanos Pipeline to Lower Rio Valley, Moore Field, Elsa, Combes and Olmito, Route C, 208.8 MGD Raw Water Pipeline- $110,280,000
Alternative 10 Water Treatment Plant at Falcon Reservoir, Route A, 200 MGD Pipeline to Moore Field and Elsa Delivery Points- $391,564,000
Alternative 11 Water Treatment Plant at Falcon Reservoir, Route A, 230 MGD Pipeline to Moore Field, Elsa and Combes Delivery Points- $485,023,000
Alternative 12 Water Treatment Plant at Falcon Reservoir, Route A, 280 MGD Pipeline to Moore Field, Elsa, Combes, and Olmito Delivery Points- $609,510,000
Alternative 13 Single Treatment Plant in Starr County, Route A, 200 Pipeline to Moore Filed and Elsa Delivery Points - $395,824,000
Alternative 14 Single Treatment Plant in Starr County, Route A, 230 Pipeline to Moore Field, Elsa and Combes Delivery Points- $483,823,000
Alternative 15 Single Treatment Plant in Starr County, Route A, 280 Pipeline to Moore Field, Elsa, Combes and Olmito Delivery Points- $621,087,000
Alternative 16 Falcon Pipeline to Lower Rio Grande Valley, Moore and Elsa, Route A, Multiple Treatment Plants in Service Area- $427,276,000
In addition to the market-type forces, a driving force underlying the expected municipal water conservation savings is the likely effect produced by the State Water-Efficient Plumbing Act be passed in 1991. Not only are these potential water savings from the implementation ofthe Act believed to be substantial, but the TWDB believed they are economically sound from a costsaving perspective, do not require day-to-day behavior changes by the consumer, affect the larger year-round base water use, and will occur with a relatively high degree of predictability.
LRGVDC Integrated Regional Water Plan Section 8, Page 13

Integrated Water Resource Plan Lower Rio Grande Valley Development Council
Final Report- Cost of Water and Water Economics
Implementation of Agricultural Water Conservation: Implementation of agricultural water conservation was discussed in Section 6.5. The potential water quantity savings through agricultural water measures and the initial capital cost have been summarized in Table 8.7. The initial capital investment is equal to $ 52 per acre-foot, or $ 0.16 per I 000 gallons.
Table 8.7
Potential Water Quantity Savings Through Agricultural Water Conservation
Savings Capital Investment
On-farm water savings, including 114,973 acre-feet per year $ 8,031,091 transportation losses, wi~ metering
On-farm water savings, including 56,929 acre-feet per year $ 1,631,375 transportation losses, with poly-pipe
On-farm water savings, including 34,493 acre-feet per year $2,600,000 transportation losses, with high management
Total 206,395 acre-feet per year $ 10,642,466
Utilization of Desalination of Brackish Groundwater: The Texas Water Development Board published a report, "Desalting Technology and Board Funded Research" in February 1994. The report defines desalting as the process of removing dissolved minerals (salts) from brackish and saline water resources to render them fit for useful purposes. The report states ''there are several types of desalting processes in use today that can be broadly classified as either distillation or membrane processes. The choice of process is generally determined by analysis of the chemistry and physical condition of the raw water supply, the required production rate, and the energy source available to power the desalt plant. The cost of treatment is influenced by the number of variables including the process chosen, raw water quality, plant capacity, cost of energy, operations staff, and_site-specific conditions. Desalting is now viewed as an "off the shelf technology" that must be designed "site specifically."
The report contains descriptions of the following processes:
• Multi-Stage Flash (MSF) (saline water, seawater)
• Multi-Effect Distillation (MED)
• Vapor Compression (VC)
• Electrodialysis (ED) and Electrodialysis Reversal (EDR)
• Reverse Osmosis (RO)
Processes
• Thermal Processes (MSF, MED, VC)
LRGVDC Integrated Regional Water Plan Section 8, Page 14

Integrated Water Resource Plan Lower Rio Grande Valley Development Council
Final Report- Cost of Water and Water Economics
+ Usually for seawater
+ Higher capital and O&M costs
+ More labor intensive
• Membrane Processes (ED, EDR, RO)
+ Usually for brackish water except SWRO
+ More pretreatment requirements
+ Requires highly proficient O&M staff
The TWDB report also contains the projected total water costs for typical municipal brackish 2,500 mg/1 TDS groundwater desalination plant with a capacity of 10.0 MGD. A cost comparison is provided with an electric cost@ $0.08/K.wh and with geopressured/geothermal (GP/GT) energy@ 0.032/K.wh.
Process Capital Costs Annual Costs
Electric
RO $11,210,000 $1.29/1000 gals
EDR $13,960,000 $1.40/1000 gals
GP!GT
RO $11,210,000 $1.08/1000 gals
EDR $13,960,000 $1.14/1000 gals
One of the largest desalination water treatment plants in Texas for brackish water is located on Lake Granbury in North Texas. The water quality is approximately 2,500 mg/1. The water is treated with an EDR process. Information on the current operating cost and original construction cost was obtained by Freese and Nichols. Inc. in February 1996 from the Brazos River Authority. At that time, the average flow of the plant was about 2.4 MGD. The annual operating budget of the plant was approximately$ 1,265,000. The plant's ultimate capacity is about 5.0 MGD, but the plant only had a 3.5 MGD capacity of the EDR portion.
The information on the original construction cost has been summarized in Table 8.8. An estimate of the construction cost in 1998 dollars has also been presented. At the time of construction, the plant was permitted to return the waste brine to Lake Granbury. It is unlikely that this right would be granted under today's permitting process and additional dollars have been included in the current estimate for brine disposal.
The 1998 estimated construction cost is $ 18,363,700. This amount is an annual debt payment of approximately$ 1, 733,300 assuming a 7% interest rate and a 20-year repayment period which are the same as used in the State's numbers above. Based on the 1996 annual
LRGVDC Integrated Regional Water Plan Section 8, Page 15

Integrated Water Resource Plan Lower Rio Grande Valley Development Council
Final Report- Cost of Water and Water Economics
operating budget of$ 1,265,000 at an average flow rate of2.4 MGD, the annual operating cost is estimated to be approximately$ 2,214,000 if the plant were operated at full capacity. The combined annual debt payment and annual operating cost is equivalent to approximately$ 3.00 per 1,000 gallons. This number is approximately twice the State's estimate for EDR process with brackish water.
Table 8.8 Update of Construction Cost Granbury 3.5-MGD Demineralization Water Treatment Plant One
of the Largest Operating Plants in the State of Texas
Construction Cost Estimated Construction Item 1988 Cost 1998
Raw Water Intake Pump Station, $1,697,000 $2,211,191 Pipeline, and Diffusers Coventional 5.0-MGD Water Treatment $6,270,000 $8,169,810 Plant Sludge Lagoon Modifications $210,000 $273,630
Electrodialysis Reversal 3.5-MGD $2,706,697 $3,526,826 Facilities (EDR) Neutralization System for pH Control of $391,000 $509,473 Wastewater Brine Disposal Facilities $0 $3,672,733
Total $11,274,697 $18,363,663
Note: Construction cost information obtamed from Jay Emanu of the Brazos River Authonty through Freese and Nichols, Inc.
Utilization of Desalination of Seawater: The TWDB report contains the projected total water costs for three alternate processes for a typical municipal seawater desalination plant on the Atlantic coast with a capacity of 10.0 MGD.
Process SWRO MED MSF
Total Capital Costs $49,700,000 $70,400,000 $60,500,000
Total AnuualCosts $13 ,600, 000 $13,500,000 $15,600,000
Costs/1,000 Gallons@ 90"/o load $4.14 $4.11 $4.75
Application of Reuse of Wastewater: In January of 1997 PerezJFreese and Nichols, in association with Freese and Nichols and CH2M Hill completed the Edinburg/McAllen Reuse Feasibility Study for LRGVDC, City ofMcAllen, City ofEdinburg and TWDB. This study investigated the technical and economical feasibility of wastewater reclamation to augment limited water supply sources in the Lower Rio Grande Valley.
LRGVDC Integrated Regional Water Plan Section 8, Page 16
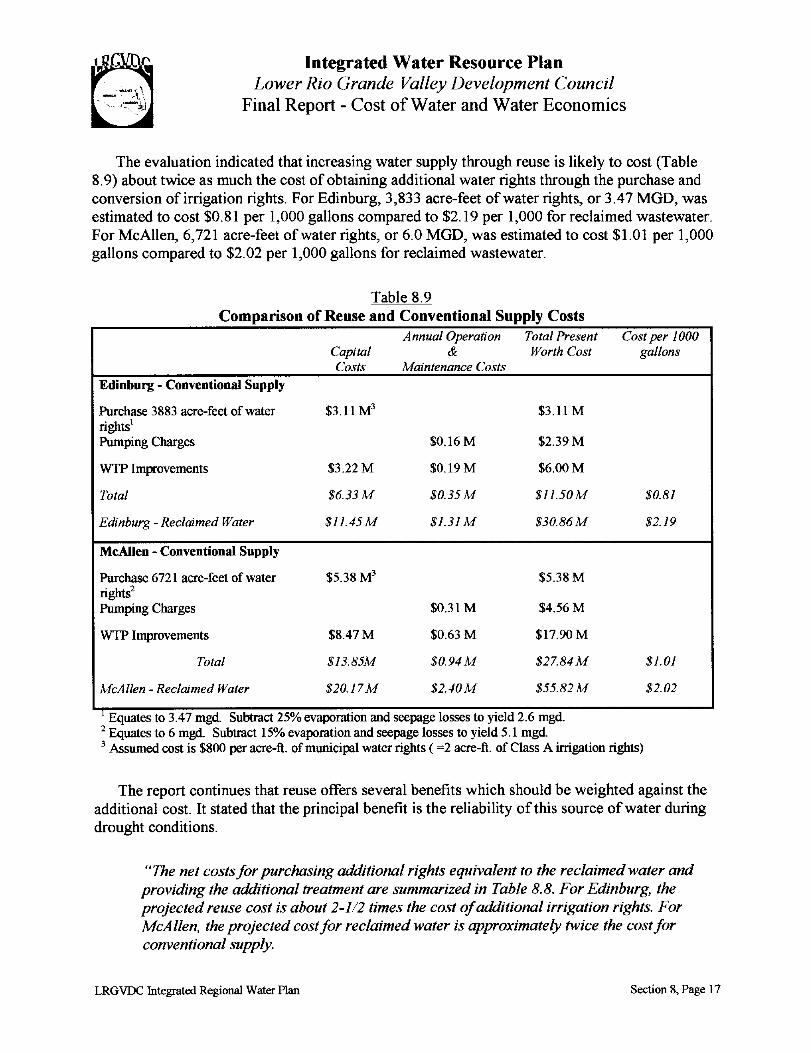
~ ~
Integrated Water Resource Plan Lower Rio Grande Valley Development Council
Final Report- Cost of Water and Water Economics
The evaluation indicated that increasing water supply through reuse is likely to cost (Table 8.9) about twice as much the cost of obtaining additional water rights through the purchase and conversion of irrigation rights. For Edinburg, 3,833 acre-feet of water rights, or 3.47 MGD, was estimated to cost $0.81 per 1,000 gallons compared to $2.19 per 1,000 for reclaimed wastewater. For McAllen, 6,721 acre-feet of water rights, or 6.0 MGD, was estimated to cost $1.01 per 1,000 gallons compared to $2.02 per 1,000 gallons for reclaimed wastewater.
Table 8.9 Comparison of Reuse and Conventional Supply Costs
Annual Operation Total Present Capital & Worth Cost Costs Maintenance Costs
Edinburg - Conventional Supply
Purchase 3883 acre-feet of water $3.11 M3 $3.11 M rights1
Pumping Charges $0.16M $2.39M
WfP Improvements $3.22M $0.19M $6.00M
Total $6.33M $0.35M $11.50M
Edinburg- Reclaimed Water $11.45 M $1.31 M $30.86M
McAllen - Conventional Supply
Purchase 6721 acre-feet of water $5.38M3 $5.38M rights2
Pumping Charges $0.31 M $4.56M
WfP Improvements $8.47M $0.63M $17.90 M
Total $13.85M $0.94M $27.84M
McAllen -Reclaimed Water $20.17M $2.40M $55.82M
l 0 Equates to 3.47 mgd. Subtract 25 Yo evaporation and seepage losses to yield 2.6 mgd. 2 Equates to 6 mgd Subtract 15% evaporation and seepage losses to yield 5.1 mgd
Cost per 1000 gallons
$0.81
$2.19
$1.01
$2.02
3 Assumed cost is $800 per acre-ft. of municipal water rights ( =2 acre-ft. of Class A irrigation rights)
The report continues that reuse offers several benefits which should be weighted against the additional cost. It stated that the principal benefit is the reliability of this source of water during drought conditions.
"The net costs for purchasing additional rights equivalent to the reclaimed water and providing the additional treatment are summarized in Table 8.8. For Edinburg, the projected reuse cost is about 2-112 times the cost of additional irrigation rights. For McAllen, the projected cost for reclaimed water is approximately twice the cost for conventional supply.
LRGVDC futegrated Regional Water Plan Section 8, Page 17

Integrated Water Resource Plan Lower Rio Grande Valley Development Council
Final Report- Cost of Water and Water Economics
It is apparent from the above comparison that the Cities of Edinburg and McAllen may purchase additional Rio Grande water at the assumed rate of $800 per acre-foot/year more economically than they can treat wastewater effluent using the scenarios prepared for this study. Jf water rights continue to increase in cost as expected, the option of reuse will become more attractive from an economic standpoint."
Construction of Water Treatment Plants: To serve the projected population increase through the year 2050, additional water treatment capacity will be required. The current estimates of the additional water treatment capacities, if each entity was responsible for its own requirements, and the capital cost for the construction of additional capacity has been summarized in Table 8.1 0. These data were developed to provide an indication of the potential economic savings that can be achieved through the development of regional water treatment plants. The effort is not designed to present a specific plan for the development. The population projections developed for this study have been for municipalities and county residences. To develop specific plans, the boundaries of the Certificates of Convenience and Necessity must be respected. The scope of work did not require the development of projections of water requirements within CCN boundaries. In general, considering the CCN boundaries, the requirements for the water supply corporations will increase and the requirements for the municipalities will decrease.
The information in Table 8.10 is presented for both the expansion of the individual water treatment plants and also for construction of regional water treatment plants to serve the northern growth areas. The regional plants were initially planned to be served by the proposed FalconAmistad Pipeline. The region should also consider the merits of regional plants that could be served through the existing or improved irrigation canal system.
The estimated construction costs for the expansion of individual water treatment plants and three regional alternatives have been summarized below:
Expansion of individual water treatment plants= $ 481,030,200
Alternative 1: Expansion of individual water treatment plants and construction of regional plants near Moore Field, Doolittle Road and Elsa = $ 384,155,000.
Alternative 2: Expansion of individual water treatment plants and construction of regional water treatment plants near Moore Field, Doolittle Road, Elsa, and Primera-Combes = $359,506,000.
Alternative 3: Expansion of individual water treatment plants and construction of regional water treatment plants near Moore Field, Doolittle Road, Elsa, Primera-Combes, FM345, and Olmito = $ 333,073,200.
LRGVDC Integrated Regional Water Plan Section 8, Page 18

Integrated Water Resource Plan Lower Rio Grande Valley Development Council
Final Report- Cost of Water and Water Economics
Although the exact locations for regional water treatment plants would have to be established through more detailed studies, it is clear that regional facilities are more economical to construct. It is also true that regional facilities are more economical to operate and consistently produce a higher quality water.
Table 8.10 Estimated Capital Costs for the Construction of Water Treatment Plants
Entity Ext. WFP Year 2050 AvgDay Peak Delta Estimated Const Cost Cost for Cost for Capacity Requirement Demand Day Cap Const. for Delta Alt. 1 Alt. 2
MGD Ac-Ft per Yr MGD Demand MGD Cost Cap. MGD $/Gallon
Alamo, City of 2.8 3,021 2.70 5.40 2.60 2.06 5,356,000 0.00 0.00
ArroyoWSC - -Brownsville 20 45,144 - -Public Utility District Plants ( 2 @ 20 20 - - -ea.)
El Jardin WSC 7,335 - -Total Capacity 40 52,479 46.85 93.70 53.70 0.90 48,330,000 48,330,000 48,330,000 Brownsville
Cost for Alt. 3
0.00
0.00
Donna, City of 3.4 6,172 5.51 11.02 7.62 1.40 10,668,000 10,668,000 10,668,000 10,668,000
East Rio Hondo 2.6 7,335 6.55 13.10 10.50 1.20 12,600,000 12,600,000 12,600,000 0.00
wsc Edcouch, City of 072 754 0.67 1.34 0.62 2.50 1,550,000 1,550,000 1,550,000 1,550,000
Edinburg, City of 10 16,054 14.33 28.66 18.66 1.10 20,526,000 0.00 0.00 0.00
Elsa, City of 3 1,673 1.49 2.98 (0.02) 0.00 0.00 0.00 0.00
Harlingen Water 17,296 - - -
Works System Downtown Plant 7.8 - - -SWPlant 2 - - -Combes 566 - - -
Prim era 1,241 - - -
Palm Valley 628 - - -Total 9.8 19,731 17.61 35.22 25.42 1.75 44,485,000 44,485,000 0.00 0.00
Hidalgo - 0.00 0.00 0.00 0.00
Municipal Water Dist. No.1 Hidalgo, City 0.00 0.00 0.00 0.00
obtains well water La Feria, City of 2.2 1,701 1.52 3.04 0.84 2.50 2,100,000 2,100,000 2,100,000 2,100,000
LRGVDC Integrated Regional Water Plan Section 8, Page 19

Entity Ext. WTP Capacity
MGD
Laguna Madre Water District Laguna Vista 5
Plant
Port Isabel Plant 4.1
Laguna Vista
Port Isabel
SPI
County
Total 9.1
LaJoyaWSC
La Habana Plant 1.5
FM492 Plant 3.1
Palmview
County
Total 4.6
La Joy a, City of 1.15
La Villa, City of 0.3
Los Fresnos, City I
of Lyford, City of
McAllen, City of 38
Mercedes, City of 3
Mission, City of 8
MDitary 2.1
Hi2hwayWSC North Alamo wsc Plant I 2
Plant 2 2.5
Plant 3 I
Plant4 3.3
Plant 5 9.6
Plant6 1.3
Total 19.7
Integrated Water Resource Plan Lower Rio Grande Valley Development Council
Final Report- Cost of Water and Water Economics
Table 8.10 (Continued)
Year 2050 AvgDay Peak Delta Estimated Const. Cost Cost for Requirement Demand Day Cap Const. for Delta Alt. 1 Ac-Ft perYr MGD Demand MGD Cost Cap.
MGD $/Gallon
-
-
-261 -
3,990 -3,276 -
-7,527 6.72 13.44 4.34 1.70 7,378,000 7,378,000
--
-
1,221 -11,898 -
13,119 11.71 23.42 18.82 1.15 21,643,000 0.00
10,165 9.07 18.14 16.99 1.12 19,028,800 19,028,800
578 0.52 1.04 0.74 2.50 1,850,000 1,850,000
1,333 1.19 2.38 1.38 2.50 3,450,000 3,450,000
0.00 0.00 0.00 0.00 0.00
47,137 42.08 84.16 46.16 0.90 41,544,000 0.00
4,118 3.68 7.36 4.36 1.70 7,412,000 7,412,000
23,545 21.02 42.04 34.04 0.93 31,657,200 0.00
9,834 8.78 17.56 15.46 1.13 17,469,800 17,469,800
-
--
-
---
50,640 45.21 90.42 70.72 0.88 62,233,600 0.00
Cost for Cost for Aft 2 Aft 3
- -
- -
- -- -- -
- -- -
7,378,000 7,378,000
- -
- -
- -
- -
- -0.00 0.00
19,028,800 19,028,800
1,850,000 1,850,000
3,450,000 3,450,000
0.00 0.00
0.00 0.00
7,412,000 7,412,000
0.00 0.00
17,469,800 17,469,800
- -
- -- -
- -
- -- -- -
0.00 0.00
LRGVDC Integrated Regional Water Plan Section 8, Page 20

Entity
Olmito
County
~ ~
Pharr, City of
Raymondville, City of Rio Hondo, City of San Benito, City of San Juan, City of
Santa Rosa., City of Sebastian MUD
Sharyland WSC
Plant 1
Plant 2
Alton
County
Total:
USDA-APHIS-PPO-RMSS U.S. Immigration & Naturalization Services Valley MUD No. 2 Rancho Viejo Weslaco, City of
Total Individual Improvements
Alternative 3
Regional WfP -Moorefield Regional WfP -Doolittle Road Regional WfP -Elsa Total Alternative 3
Ext. WTP Capacity
MGD
0.8
6.5
3
0.8
6
2.7
0.8
0.144
6
2
8
7.9
Integrated Water Resource Plan Lower Rio Grande Valley Development Council
Final Report- Cost of Water and Water Economics
Table 8.10 (Continued)
Year 2050 AvgDay Peak Delta Estimated Const. Cost Cost for Requirement Demand Day Cap Const. for Delta Alt. 1 Ac-Ft per Yr MGD Demand MGD Cost Cap.
MGD $/Gallon
7,335 6.55 13.10 12.30 1.24 15,252,000 15,252,000
20,384 18.20 36.40 29.90 0.98 29,302,000 0.00
8,221 7.34 14.68 11.68 1.25 14,600,000 14,600,000
586 0.52 1.04 0.24 2.50 600,000 600,000
8,776 7.83 15.66 9.66 1.30 12,558,000 12,558,000
7,110 6.35 12.70 10.00 1.27 12,700,000 0.00
549 0.49 0.98 0.18 2.50 450,000 450,000
0.00 -0.14 0.00 0.00
-
-
-2,473 2.21 -15,864 14.16 -
18,337 16.37 32.74 24.74 1.07 26,471,800 0.00
0.00 0.00 0.00 0.00 0.00
0.00 0.00 0.00 0.00 0.00
0.00 0.00 0.00 0.00 0.00
8,060 720 14.40 6.50 1.51 9,815,000 9,815,000
481,030,200
78.50 0.88 69,080,000
72.10 0.88 63,448,000
19.67 1.12 22,030,400
384,155,000
Cost for Cost for Alt. 2 Alt. 3
15,252,000 0.00
0.00 0.00
14,600,000 14,600,000
600,000 600,000
12,558,000 0.00
0.00 0.00
450,000 450,000
0.00 0.00
- -
- -- -- -- -
0.00 0.00
0.00 0.00
0.00 0.00
0.00 0.00
9,815,000 9,815,000
69,080,000 69,080,000
63,448,000 63,448,000
22,030,400 22,030,400
LRGVDC Integrated Regional Water Plan Section 8, Page 21

Entity Ext. WFP Capacity
MGD
Alternative 4 Regional WTP -Primera-Combes Total Alternative 4
Alternative 5 Regional WTP -Olmito Regional WTP -FM345 Total Alternative 5
Integrated Water Resource Plan Lower Rio Grande Valley Development Council
Final Report- Cost of Water and Water Economics
Table 8.10 (Continued)
Year 2050 AvgDay Peak Delta Estimated Requirement Demand Day Cap Canst. Ac-Ft perYr MGD Demand MGD Cost
MGD $/Gallon
17.40 1.14
45.36 0.90
18.52 1.16
Canst. Cost Cost for Cost for Alt. Cost for Alt. for Delta Alt. 1 2 3
Cap.
19,836,000 19,836,000
359,506,000
40,824,000
21,483,200
333,073,200
96,875,200 121,524,200 147,957,000
Individual 229,596,600 185,111,600 96,371,600
Regional 154,558,400 174,394,400 236,701,600
384,155,000 359,506,000 333,073,200
LRGVDC Integrated Regional Water Plan Section 8, Page 22

Integrated Water Resource Plan Lower Rio Grande Valley Development Council
Final Report - Potential Alternative Institutional Frameworks
9.0 Potential Alternative Institutional Frameworks
9.1 Coalition
A coalition, a loosely organized and voluntary organization of the various water suppliers, is recommended prior to any attempted creation of an organization similar to a formal authority. This approach has worked very well in the Dallas/Fort Worth area as the water suppliers prepared themselves to meet the challenges of Senate Bill 1. Several months ago, the North Texas Commission created the North Texas Water Coalition for the purpose oflearning more about the impact of Senate Bill! and developing a plan to deal with the requirements of this important legislation. The North Texas Commission is a nonprofit organization supported by local governments and the private sector, and was created for the purpose of promoting DFW Airport as well as supporting the local chambers of commerce in matters that will enhance economic development in the Metroplex. In recent times, the Commission has made a major effort in regional highway planning as well as water resource planning.
The North Texas Water Coalition has approximately 20 members who represent the major water suppliers such as the city of Dallas, Tarrant Regional Water District, North Texas Municipal Water District and the Trinity River Authority. Some of the cities in the area such as Denton, Irving and Weatherford are represented as well as the Trinity Improvement Association and the North Central Texas Council of Governments. Other entities represented are the city of Fort Worth, Texas Utilities, the Upper Trinity Regional Water District and possibly others.
The coalition is not a structured organization. There are no officers, bylaws or rules of procedure. It is simply an organization where all of the parties sit down and discuss matters of mutual interest, reach conclusions and take positions as a group under the umbrella of the North Texas Commission. The coalition is led by a facilitator, who is a staff member ofthe commission. The commission prepares the meeting agendas, keeps the minutes and is a repository of the records. This approach has worked extremely well, and the coalition appears to have been very effective in the formation of the Region C Water Planning Group.
The coalition also took the lead in negotiations with the Region D Water Planning Group to develop a plan of cooperation between Region C and Region D. This was necessary because a major portion of the future water supplies for Region C will come from the Sulphur River Basin, which is in Region D.
A similar approach might be the first step to bring an expanded group of the various water interests together in the Valley. An organization, perhaps called the Lower Rio Grande Valley Water Coalition, sponsored by the Lower Rio Grande Valley Development Council might be the initial organization that could grow into something more structured at a later date if desired by the various interested parties. Each water supplier, municipal and agricultural, could appoint a member of their board or city council and a staff person to the coalition, making two representatives of each associated entity. A facilitator could be appointed by this group,
LRGVDC Integrated Regional Water Plan Section 9, Page 1

Integrated Water Resource Plan Lower Rio Grande Valley Development Council a \ Final Report - Potential Alternative Institutional Frameworks
preferably someone associated with the Lower Rio Grande Valley Development Council. The facilitator and the council would be responsible for organizing the meetings, keeping the records and could represent the coalition to the public as well as the coalition.
A great deal could be accomplished by the creation of an organization like the coalition. People would see each other on a fairly regular basis, which would help develop a comfort factor among the participants. Communications could be improved, the various needs of the participants could be discussed and possible solutions considered. Discussions could be held in the absence of pressure and politics, making it easier to do business with each other in such matters as buying, trading and leasing water.
The North Texas Water Coalition has been funded by the North Texas Commission, and the various representatives have paid their own out-or-pocket expenses. The Lower Rio Grande Valley Water Coalition would not require a great deal of funding, which could be accomplished through a voluntary assessment of some kind.
9.2 Regional Water Authority
The Sixty-first Legislature of the State of Texas passed during its Regular Session in 1969 H.B. No. 1368 establishing the Rio Grande Valley Municipal Water Authority. A copy of the initial legislation and subsequent amendments have been included in Appendix P.
The Authority was authorized to acquire or construct within or without the boundaries of the authority a dam or dams and all works, plants and other facilities necessary or useful for the purpose of diverting, impounding, storing, treating and transporting water to cities and others for municipal, domestic and industrial purposes or any of such facilities for any one or more such purposes. The authority was also empowered to purchase, sell or transport for others water within and without the boundaries of the Authority. The authority was further empowered and authorized to develop or otherwise acquire underground sources of water. The legislation specifically provided that the Authority could not divert, impound, store, treat or transport water for agricultural irrigation.
The Authority contained all of the territory contained in the boundaries of most of the key cities and towns in Cameron, Hidalgo, Starr, and Willacy Counties. The Authority was not given the authority to levy taxes, but the Authority was empowered to issue its bonds to be payable from the revenues of the Authority as were pledged by resolution of the board. The initial board of directors and those directors whose terms expired were appointed by the Governor. The representation on the board was to always be three directories who were residents of Hidalgo County, two directors who were residents of Cameron County, one director who was a resident of Starr County, and one director who is a resident ofWillacy County.
In 1983, the Sixty-eight Legislature amended the permit to allow the Authority to divert, impound, store, treat, or transport water for agricultural purposes, to allow the acquiring of water appropriation permits from owners of permits through contracting or to acquire rights in and to
LRGVDC Integrated Regional Water Plan Section 9, Page 2

Integrated Water Resource Plan Lower Rio Grande Valley Development Council
Final Report- Potential Alternative Institutional Frameworks
storage and storage capacity in any reservoir, and to increase the number of directors to eight with three directors who were residents of Cameron County.
In 1997, the Seventy-fifth Legislature abolished the Rio Grande Valley Municipal Water Authority. With this action, the possible use of this Authority and its authorized capabilities to assist in the implementation of the Integrated Water Resource Plan has passed. The concepts included in this legislation could be used as a guide if regional interest existed in establishing a new regional authority.
Some form of region-wide water authority could be considered again by the Coalition as a potential benefit to the operational efficiency of the irrigation delivery system and to requirement of meeting the non-agricultural water demands. In some regions of the country, irrigation water districts are managed holistically by an overriding authority which determines, among other things, the timing of water deliveries. Certain sections of the irrigation district may obtain water say only every two weeks on a fixed schedule. Potential advantages include greater head in the limited area irrigated, with disadvantages being the loss of a degree of grower control over irrigation scheduling and the obvious loss of management control ofthe individual districts. An additional potential advantage is possible reduced delivery losses due to some sections of the canals not being wet all the time if deliveries are made on a fixed schedule.
In many of the areas utilizing such schemes, groundwater is a viable supplemental water source, making the system more flexible. This approach is not an option for the vast majority of the Lower Rio Grande Valley given the very limited and poor quality groundwater supplies in the region. The relative lack of reliable data on the overall capacity of the entire Lower Rio Grande Valley irrigation delivery system, as well as the lack of solid economic data on operational costs, precluded a formal analysis of this as an option at this time. Such analysis is possible when the data are available. One approach that could merit further study would be a significant update of the Reservoir Operation Management Model accompanied with full integration of the irrigation scheduling model (IRRDESS). These would be major efforts, and in practice, the districts and producers would not be very unlikely to give up their control over deliveries.
Additional functions could be performed by a regional authority include serving as a regional source of information for improvements, managing grants for those improvements, and serving the collective good of the Lower Rio Grande Valley. Such a function would fit well with the currently recommended improvement of installing meters and improving irrigation practices. Similar statements apply for the adoption of poly-pipe and working out of trade agreements between districts and cities.
After a review oflegislation creating and abolishing the Rio Grande Valley Municipal Water Authority, it appears its resurrection might meet some of the institutional needs, but it probably would create more questions and concerns than solutions.
LRGVDC Integrated Regional Water Plan Section 9, Page 3

Integrated Water Resource Plan Lower Rio Grande Valley Development Council
Final Report- Potential Alternative Institutional Frameworks
For one thing, it would be very difficult to create a board of directors that was acceptable to both the municipal and agricultural water suppliers. The bill provides that the directors would be appointed by the governor, and there probably would be some objection to this by at least some of the parties involved. Bottom line, this type of structured organization with a governing body would not likely be acceptable practically or politically at the present time.
LRGVDC Integrated Regional Water Plan Section 9, Page 4

Integrated Water Resource Plan Lower Rio Grande Valley Development Council
Final Report- Water Management and Drought Contingency Plan for the Lower Rio Grande Valley
10.0 Water Management and Drought Contingency Plan for the Lower Rio Grande Valley
10.1 Introduction
The Lower Rio Grande Valley (Valley) is classified as semi-arid, receiving an average of25 inches of rain per year. The region has historically been and will continue to be subject to periods of below normal rainfall. A technical definition of drought is "a period of abnormally dry weather sufficiently prolonged for the lack of water to cause a serious hydrologic imbalance in the affected area." A more general definition of a drought is a period of time when water supplies are inadequate to satisfy demands.
The frequency of droughts in the Valley requires that water users take certain planning steps to prepare for periods of below normal rainfall. During the information gathering phase of this project, a survey was conducted to obtain a substantial amount of data, including requesting copies of water conservation/drought contingency plans from municipalities and irrigation districts. As a result of the survey, a total of 18 municipalities and 7 irrigation districts provided copies of their plans.
A review of the municipal plans indicated that the plans were similar with varying stages of drought identified by differing trigger conditions. Some of the municipal plans had drought trigger conditions based on demand reaching certain levels of system capacity, while others had trigger conditions based on percent of total U.S. storage remaining in Amistad and Falcon Reservoirs. Components which were included in the plans ranged from implementing education programs which result in little consumer impact to steep increases in water rates during times of drought, which have potentially significant economic impacts on consumers.
The plans which were prepared by the irrigation districts were all built around the water storage accounts of each district. The irrigation districts' plans detail procedures for going on allocation and limiting either the number of irrigations or the amount of water each farmer will be allowed, depending upon the status of the districts' accounts.
The remainder of this plan focuses on long term water conservation elements as well as water use reduction strategies to be implemented during periods of drought. The following sections are divided by use type (municipal, industrial and agricultural) with varying strategies for each. A final section deals with some potential regional or state level planning measures, such as water marketing. In addition, a list of resources, including Internet sites, from which additional information can be obtained are included in this section.
10.2 Potential Municipal Measures
The first step in drought planning is to identify drought trigger conditions. It may be prudent to adopt trigger conditions based on both the system capacity and on the content of the
LRGVOC Integrated Regional Water Plan Section 10, Page I

9 Integrated Water Resource Plan
Lower Rio Grande Valley Development Council Final Report- Water Management and Drought Contingency Plan for the
Lower Rio Grande Valley
International Reservoirs. For example, the drought experienced by the north Texas region in 1998 placed an extreme burden on municipal water treatment plants and distribution systems which resulted in numerous pump failures and water transmission pipeline and water main breaks. However, the reservoirs upon which the region relies were near capacity due to rains received in 1997 and early in 1998. Low reservoir contents can also have a significant impact on water supplies, as shown by the current drought in the Rio Grande.
In 1998, the LRGVDC recommended three trigger levels for municipalities to adopt in their water management plans based on the level ofU.S. water stored in the Amistad and Falcon Reservoirs. Stage I, voluntary water conservation trigger, is set when the level of U.S. water stored in Amistad and Falcon Reservoirs reaches 51 percent or 1.66 million acre-feet; stage 2, mandatory water conservation, is set when the level ofU.S. water stored in Amistad and Falcon Reservoirs reaches 25 percent or 834,600 acre-feet; and stage 3, water curtailment, is set when the level of U.S. water stored in Amistad and Falcon Reservoirs reaches 15 percent or 504,600 acre-feet. The drought trigger conditions identified in Senate Bill I are when reservoirs are at 75 percent of their normal capacity and 50 percent of their normal capacity.
It may be more reasonable to set trigger conditions on a seasonal basis. The storage content in the reservoirs is much more critical in May than in October. Once the Reservoir Operations Model inflows have been adjusted to account for development in the basin, a frequency analysis could be conducted to establish other drought trigger conditions, including seasonal triggers.
The region as a whole should decide on the trigger conditions which are based on the U.S. contents in the International Reservoirs. Each municipality should then evaluate its own system and customers, and adopt appropriate trigger conditions based on system capacity and adopt the regionally agreed upon reservoir trigger conditions.
There are many programs that municipalities can implement to encourage water conservation during times of drought. These include adopting landscape ordinances, sponsoring plumbing retrofit programs, conducting audits to detect water leaks, developing conservation oriented rate structures, and promoting public awareness through public information/education campaigns. In addition, there are some municipalities in Texas with some innovative incentive programs which may be applicable to cities in the Valley.
Landscape Ordinances. Some ordinances may affect new development and require developers of new subdivisions to use xeriscape landscaping techniques, while others restrict outdoor water usage during times of droughts. Xeriscape landscapes include the use of indigenous plants, mulches and efficient irrigation techniques, such as drip irrigation systems. The benefits ofxeriscape landscaping include reduced water use, decreased energy use (less pumping and treatment), reduced heating and cooling costs because of carefully placed trees, decreased storm water and irrigation runoff, fewer yard wastes, increased habitat for plants and animals and lower labor and maintenance costs (USEPA, 1993).
LRGVDC Integrated Regional Water Plan Section 10, Page 2

Integrated Water Resource Plan Lower Rio Grande Valley Development Council
Final Report- Water Management and Drought Contingency Plan for the Lower Rio Grande Valley
Ordinances which affect existing landscapes are those which restrict outdoor watering during times of drought. Outdoor water use may be restricted to designated days of the week, times of the day, or only when hand held equipment is used. Consideration should be given to excluding a limitation on the use of drip systems from the ordinances. Experiences in other cities during times of drought indicate that odd/even watering schedules may have the opposite intended effect by actually increasing water use. For example, if watering is allowed on Monday, Wednesday and Friday for addresses ending in odd numbers and on Tuesday, Thursday and Saturday for those ending in even numbers, some homeowners may water on every eligible day. This could actually increase water use if the homeowner would only typically water twice in a seven-day period. Therefore, careful consideration should be given to tying the watering schedule to some other city service, such as trash or recycling pick-up. For example, if trash pickup is on Monday and recycling pickup is on Thursday, homeowners would be allowed to water on those days. Since most cities stagger these services throughout their service area, this would spread watering out throughout the week and reduce peak usage. Commercial landscape watering could be scheduled on a day of the week that residential watering would not be occurring. In the example above, commercial landscape watering would be allowed on Wednesdays.
In addition to days of the week, times of the day that residential or commercial watering is allowed can also be restricted to reduce peak demand. For example, since most evaporation occurs during midday, it may be prudent to allow outdoor watering to occur only between the hours of 10:00 p.m. and 8:00a.m ..
Before prohibiting outdoor water use altogether, cities may offer the option to homeowners and commercial facilities to allow outdoor watering with hand held hoses only. This would reduce water lost through runoff or evaporation and reduce overall water use, but still allow homeowners and businesses to maintain a potentially significant investment in landscape plants.
Plumbing Retrofit Programs. Cities can implement programs to encourage homeowners to purchase water efficient fixtures when they replace them, or to even offer incentives for homeowners to replace fixtures with water conserving fixtures. The American Water Works Association (A WW A) estimates that indoor water use can potentially be reduced by up to 32 percent by installing more efficient fixtures such as water saving toilets, low flow shower heads and faucets, and water conserving appliances such as dish washers and washing machines (AWWA, 1998).
Municipalities can implement programs which provide homeowners with kits containing toilet leak detection tablets, toilet tank dams, low flow shower heads, low flow faucets for installation with existing plumbing. As an alternative, cities may choose to offer rebates on water bills or direct cash incentives to those homeowners who demonstrate that they have carried out the retrofit measures.
Water Audit Programs. Municipalities can offer to conduct audits of indoor plumbing fixtures and outdoor sprinkler systems, especially for customers with consistently higher than
LRGVDC Integrated Regional Water Plan Section I 0, Page 3

Integrated Water Resource Plan . Lower Rio Grande Valley Development C:ouncil
Fmal Report- Water Management and Drought Contmgency Plan for the Lower Rio Grande Valley
average monthly water bills. The water audits can be conducted to assist homeowners identify sources of water leaks and offer suggestions for repairs.
Public Information/Public Education Campaigns. Sometimes, the most effective way to reduce water use, especially during times of drought, is with simple communication type programs and a general education program to raise public awareness during a drought. Most citizens are willing to do their part to be good stewards of water resources, but lack the information on what they can do to contribute. Municipalities can provide brochures, public service announcements, and messages on or with water bills of simple water saving steps that the public can take. These can include things like not letting the water run while brushing teeth, using a hose with a cut off nozzle to wash a car, washing clothes and dishes only in full loads, insulating hot water heaters and piping to reduce the amount of water wasted waiting for hot water to reach the faucet, and sweeping sidewalks and driveways rather than washing them down with a water hose. In addition, providing information regarding the current status of the water supply source, the system demand and capacity can keep citizens informed of the need to reduce water and the effectiveness of the current water reduction strategies.
A number of public information brochures are available through the Texas Water Development Board (TWDB) and the Texas Natural Resource Conservation Commission. The TWDB also has developed a curriculum for use with school-aged children, the Major Rivers program, to educate them on the source of our water, the treatment process, the wastewater treatment process and the need to use water wisely. Municipalities should consider encouraging school districts to use the Major Rivers program in their curriculum.
Conservation-Oriented Rate Structures. Conservation-oriented price structures have historically shown to be extremely effective in achieving conservation goals. Customers tend to use less water when they have to pay more for it. However, water utility managers must establish and design water rates that meet revenue goals, but are fair and equitable to all economic classes of customers. Examples of conservation-oriented rate structures are increasing block rates and surcharges. Increasing block rates are rate structures that increase as the volume of water used increases and would be in effect at all times. A water surcharge imposes a higher rate on excessive water use or high water use during a period of drought or in seasons when water usage increases. Surcharges could be imposed on water use in excess of the average daily per capita or per household consumption rates for the city's system.
Innovative Approaches. The City of Austin is currently offering an incentive program for homeowners and businesses encouraging the installation of rainwater harvesting systems. The system collects rainwater from roofs and directs it to holding tanks to be used for landscape irrigation. The City is offering a limited number of rebates (30 percent or up to $500) on the cost of demonstration systems. Only customers that receive 100 percent of their water from the City are eligible for the program.
Some cities have developed grey water systems which are separate from the potable water system. For example, the city of St. Petersburg, Florida, has implemented an urban dual
LRGVDC Integrated Regional Water Plan Section 10, Page 4

Integrated Water Resource Plan . Lower Rio Grande Valley Development C:ouncil
Fmal Report- Water Management and Drought Contmgency Plan for the Lower Rio Grande Valley
distribution system for reclaimed water for non potable uses. The system provides reclaimed water for more than 7,000 residences and businesses. Cities in Texas that want to consider this innovative approach should contact TNRCC to discuss the regulatory requirements for implementing such a system.
Conservation/Drought Planning Resources. There are a number of state agencies that provide information and assistance to cities with their water conservation/drought planning needs. In addition, there are several national organizations such as the American Water Works Association (A WW A), which provide assistance and public information brochures. The EPA and the A WW A have developed some simplified PC applications which can be used to evaluate certain conservation applications and the cost vs. water savings benefits that they would afford the municipal water system. The EPA program is called Water Conservation Techniques, while the A WW A program is Water Plan. The EPA program can be downloaded from EPA's website. The A WW A program is available through that organization. A list of contact names and Internet addresses for the resources mentioned above and others is included as an attachment to this report.
10.3 Potential Industrial Measures
Industrial processes can be water use intensive and place extraordinary demands on water supplies and distribution systems. Some measures that industrial facilities can consider to reduce potable water use are water recycling, water reuse, water monitoring, cooling water reuse, and employee education programs.
Water Recycling. Water recycling is the reuse of water for the same application for which it was originally used. Recycled water may need to be treated prior to using it again depending on the application. For example, facilities with vehicle or equipment wash racks may want to consider installing closed loop systems. Small package treatment systems are used to remove solids and oil and grease from the used wash water. It is then recycled through the system for use as wash water again, rather than being discharged to the sanitary sewer.
Water Reuse. Water reuse is the use of wastewater or reclaimed water from one application such as municipal wastewater treatment, for another application, such as landscape water. Reuse opportunities may include the use of wastewater treatment plant effluent for cooling water, or landscaping irrigation (e.g., golf course irrigation). It should be noted that there are state regulations which govern the handling and storage requirements for wastewater effluent and the applications in which wastewater effluent can be used.
Water Use Monitoring. Industries can implement in-facility monitoring systems to identify processes which are more water intensive and therefore, identify potential areas for reuse or recycling. In addition, information gained by the monitoring program may locate processes which have leaks in the system and are in need of repair.
LRGVDC Integrated Regional Water Plan Section 10, Page 5

Integrated Water Resource Plan Lower Rio Grande Valley Development Council
Final Report- Water Management and Drought Contingency Plan for the Lower Rio Grande Valley
Cooling Water Reuse. Evaporative cooling towers are a significant source of water losses in an industrial application. Water savings associated with the use of evaporative cooling towers can be increased by reducing blowdown or water discharges from cooling towers.
Employee Education Programs. Like municipal public information campaigns, industrial facilities can implement programs to inform employees on ways to use water wisely and more efficiently and to encourage employees to develop new ideas for water conservation within the industrial facility.
10.4 Potential Agricultural Measures
The rules detailed in the Texas Water Code for the operation of the Rio Grande system designate the amount of water that is available to agricultural users of water. Due to the accounting procedures, the agricultural users of water have a much more definitive process for identifying the amount of water available for irrigation at any given time. The irrigation districts notify farmers early on to inform them of the amount of water that will be available for irrigation so that the farmers can plan on the number of acres and types of crops to plant.
Additional measures which may be useful in improving conservation and may warrant investigation by each irrigation district are metering, pricing structures, canal rehabilitation, onfarm delivery improvements and farmer education programs.
10.5 Potential State Measures
In addition to the local measures, discussed above or those that have, been investigated and implemented, there are some additional measures that may warrant investigation, but will most likely need to come from a state level. This includes primarily a system of water marketing which would be in addition to any existing local water marketing. Water marketing can transfer water from existing users to new users who need it more. Sellers benefit by receiving a profit on water, while buyers benefit by obtaining a new source of water at a relatively cheap price when compared to developing new water supplies. Proponents of water marketing state that it encourages the efficient use of water, is a tool for managing drought, provides water for environmental and recreational needs and uses, and offers an alternative to new reservoir construction (Kaiser, 1994). As water becomes more scarce in Texas, the benefits of a water marketing system may be sufficient to change the regulations to encourage movement of water more freely between buyers and sellers. Municipal utility managers and irrigation districts should consider working together with their state legislators to encourage rule changes to allow water marketing. Recent experience in California has shown that water marketing can be an effective and beneficial program for both municipal and agricultural water users.
Any water management plan should coexist with a long term water conservation strategy. Education and incentives for water use reductions and optimization should be provided to water users in the region. The Texas Water Development Board has developed a variety of educational pamphlets and public service announcements to educate water users on ways to conserve water
LRGVIX Integrated Regional Water Plan Section 10, Page 6

Integrated Water Resource Plan . Lower Rio Grande Valley Development c:ouncil
Fmal Report- Water Management and Drought Contmgency Plan for the Lower Rio Grande Valley
and save money. Several municipalities in the region have already instituted incentive programs to encourage water users to install water saving devices, such as low-flow shower heads, low volume toilets and water efficient washing machines. Long term water conservation strategies serve to reduce the impact and severity of droughts when they do occur.
10.6 Water Management Plan
This section presents a model Municipal Water Management Plan. The model has been included as a guide in the report. Each municipality and water supply corporation can adopt this model to fit its particular needs and situation.
A) Trigger Conditions
Drought trigger conditions for the Lower Rio Grande Valley municipal district area are based on United States storage in Falcon and Amistad Reservoirs, as reported by the TNRCC Watermaster and on the municipal system capacity. Three levels of drought are to be followed, with Stage 1 being implemented for mild drought conditions, Stage 2 for moderate drought conditions, and Stage 3 for severe drought conditions.
1) Stage 1 of the water management plan is put into effect when the level ofU.S. water stored in Amistad and Falcon Reservoirs reaches 51% (1.66 million acre-feet) or when the demand in (the City) is at 75 percent of (the City's) system design capacity. A key focus of this stage is to make citizens aware of the drought conditions. Water use restrictions are intended to be conservatory and efficient, but not at a level which distresses socioeconomic conditions.
2) Stage 2 of the water management plan becomes effective when the level of U.S. water stored in Amistad and Falcon Reservoirs drops to 25% (834,600 acre-feet) or when demand in (the City) reaches 90 percent of (the City's) system design capacity. Water use restrictions are designed to conserve water without sacrificing human health and safety or creating a significant impact on socioeconomic conditions.
3) Stage 3 of the water management plan becomes effective when the level ofU.S. water stored in Amistad and Falcon Reservoirs drops to 15% (504,600 acre-feet) or when the demand in (the City) reaches 100 percent of (the City's) system design capacity. Protection of human health and safety is the primary factor considered in developing water use restrictions at this stage.
B) Drought Management Measures 1) Stage 1 Drought Level
Voluntary water conservation measures are suggested for citizens in the affected drought area. Elimination of wasteful water uses is requested, and attempts to reduce necessary water use is encouraged. a) The municipality should enact an education campaign to promote efficient water
practices. These include the following: i) Curtail water sweeping of driveways, sidewalks and streets.
LRGVDC Integrated Regional Water Plan Section 10, Page 7
Integrated Water Resource Plan Lower Rio Grande Valley Development Council
Final Report- Water Management and Drought Contingency Plan for the Lower Rio Grande Valley
ii) Water landscaping thoroughly, but infrequently. Excessive water that runs off into the street is considered to be a wasteful usage of water.
iii) Wash only full loads of clothes and dishes. iv) Repair any leaks. Leaking toilets can be detected by placing a dye tablet in the
tank and looking for the dye color in the bowl. v) Install low-flow shower heads and low-volume toilets. vi) Plant water-wise plants that are drought resistant. vii) Additional water conservation techniques are available from the Texas Water
Development Board. b) Industrial water users should develop a water conservation plan to document methods
for reducing water use at each stage of a drought.
Model Municipal Water Management Plan
Stage One of the drought plan requests voluntary water-use reduction through means of efficiency and conservation. The primary intent at this stage is to increase awareness about the local drought conditions and to educate water users on methods to conserve water in everyday uses. Water conservation tips and recommendations will be distributed to water users through billing inserts, mailers, and media outlets. In addition, industrial water users will be requested to develop a facility water conservation plan to reduce water use to the maximum extent practicable.
Stage Two of the drought plan requests specific water-use restrictions, such as residential and commercial irrigation rationing and limited vehicle washing. Lawn watering is limited too twice per seven days. Industrial water users are requested to implement their facility water conservation measures at this stage. Stage Two limits water use to levels adequate to extend the storage supply of water, protect human health and safety, and have minimal effect on socioeconomic conditions.
Stage Three of the plan details severe water-use reductions to account for the serious level of the drought. Water washing, recreational and new landscaping uses of water are requested to be curtailed until the drought situation improves. Lawn irrigation is limited to once per seven days. Industrial water users are requested to implement planned severe water restrictions described in the facility water conservation plan.
2) Stage 2 Drought Level
In addition to the water conservation recommendations detailed in Stage 1, the following restrictions apply in a Stage 2 drought condition:
LRGVDC Integrated Regional Water Plan Section 10, Page 8

Integrated Water Resource Plan . Lower Rio Grande Valley Development r:ouncil
Fmal Report- Water Management and Drought Contmgency Plan for the Lower Rio Grande Valley
a) Irrigation utilizing sprinkler systems are restricted to the hours between 8:00p.m. and 10:00 a.m. on an odd-even watering schedule. Residences with addresses ending in odd numbers may water on Monday and Thursday. Even numbered residences may water on Tuesday and Friday. Drip irrigation or watering with a hand-held, faucetfilled bucket of five gallons or less is permitted at any time.
b) Washing of automobiles, trucks, trailers, boats, airplanes, and other mobile equipment is prohibited except on designated irrigation days between the hours of8:00 p.m. and 10:00 a.m. A hand-held bucket or a hand-held hose with a positive shutoff nozzle must be used for rinsing. Washing may be done at any time on the immediate premises of a commercial carwash or commercial service station. Washing necessary to protect the health, safety and welfare of the public is exempted from these restrictions. Examples include garbage trucks and food transport vehicles.
c) Foundation watering is prohibited except on designated irrigation days between the hours of8:00 p.m. and 10:00 a.m.
d) The refilling or adding of water to swimming and/or wading pools is prohibited except on designated irrigation days between the hours of8:00 p.m. and 10:00 a.m. Covering of pools when not in use to reduce evaporation is encouraged.
e) The operation of any ornamental fountain or other decorative water use is restricted to those structures with a water recycling system.
t) The use of water for watering golf courses is restricted to watering tees and greens on designated irrigation days between the hours of6:00 p.m. and 10:00 a.m. Approved watering with wastewater effiuent is exempted from this restriction.
g) Use of fire hydrants is restricted to firefighting and related activities, and/or other governmental activities necessary to protect human health, safety and welfare.
h) Controllable leaks should be repaired. i) Landscape irrigation water should not be allowed to run into the street, ditches,
gulleys, or drains. This is considered to be a waste of water. j) Water should not be used to wash paved areas, such as sidewalks, streets, driveways
and parking areas, except to alleviate fire hazards. k) Water should not be used for dust control. I) Industrial customers should implement approved facility specific water conservation
plans.
3) Stage 3 Drought Level
At reservoir levels of 15% capacity, Stage 3 drought measures are implemented. The following provisions are to be instituted along with Stage I and Stage 2 provisions. Stage 3 provisions take precedence over any conflicting Stage I and Stage 2 provisions.
a) Irrigation utilizing sprinkler systems are restricted to the hours between 6:00p.m. and 10:00 a.m. on a once per seven-day watering schedule. Residences with addresses ending in an odd number may water on Monday. Residences with addresses ending in and even number may water in Tuesday. Drip irrigation or watering with a hand-held, faucet-filled bucket of five gallons or less is permitted at any time.
LRGVDC Integrated Regional Water Plan Section 10, Page 9

Integrated Water Resource Plan Lower Rio Grande Valley Development Council
Final Report- Water Management and Drought Contingency Plan for the Lower Rio Grande Valley
b) No noncommercial washing ofvehicles should take place. Commercial carwash facilities and service stations are requested to operate between 6:00a.m. and 10:00 a.m. and 6:00p.m. and 10:00 p.m.
c) The use of water for residential, commercial, municipally owned swimming pools, wading pools, hot tubs, and the like is prohibited.
d) The use of water for new planting or landscaping is prohibited. e) The use of water for scenic ponds and lakes is prohibited. f) Water shall not be served to a patron at a restaurant unless specifically requested. g) Golf course irrigation is restricted to watering greens on designated irrigation days. h) The washing of building exteriors and interiors, trailers, and railroad cars is
prohibited except as permitted by the City's Director of Public Health to protect public health.
i) Industrial water users are requested to severely curtail water use to the amount deemed absolutely necessary, as specified in the facility water conservation plan.
C) Drought Notification System
Based on water level notifications from the TNRCC Watermaster, a designated representative for each entity will notify their water users of any changes in drought stage levels. Notification will be made through major media outlets. The designated city representative will notify water users when water use restrictions have been eased due to lessening of drought conditions.
D) Drought Education
Information on how to conserve water during the drought will be provided to the public through multiple outlets. City representatives will coordinate with news media to provide accurate information on existing drought conditions and affiliated water use restrictions. Notifications of water use restrictions must be clear and descriptive to eliminate confusion and to ensure maximum participation.
Notification of drought stage levels and accompanying restrictions will be provided through television, radio and newspaper news stories and public service announcements. Additionally, information should be provided as billing inserts and/or separate mailings. Notifications should detail the severity of the drought, the importance of reducing water usage, methods of conserving water, and sources to locate additional information.
Resources
• Texas Natural Resource Conservation Commission- http://www.tnrcc.state.tx.us • Texas Water Development Board- http://www.twdb.state.tx.us • Environmental Protection Agency- http://www.epa.gov • American Water Works Association- http://www.awwa.org
LRGVDC Integrated Regional Water Plan Section 10, Page 10

Integrated Water Resource Plan Lower Rio Grande Valley Development Council
Final Report- Water Management and Drought Contingency Plan for the Lower Rio Grande Valley
• Texas Water Resources Institute- http://www.twri.tamu.edu • Water Supply and Conservation Program- Senate Bill I -
http://www.tx-water-ed.tamu.edu
References
American Water Works Association. 1998. "Household end use of water without and with conservation." 1998 Residential water use summary - typical single family home. Internet web site http://www. waterwiser. org/wateuse98/tables. html.
Kaiser, Ron. 1994. "Legal and institutional barriers to water marketing" Technical Report No. 167. Texas Water Resources Institute. College Station, Texas.
U.S. Environmental Protection Agency. 1993. Xeriscape landscaping, Preventing pollution and using resources efficiently. EPA/840/B/93/001. U.S. Environmental Protection Agency, Office ofWater, Washington, DC.
LRGVDC Integrated Regional Water Plan Section I 0, Page II

Integrated Water Resource Plan Lower Rio Grande Valley Development Council
Final Report- Conclusions and Recommendations
11.0 Conclusions and Recommendations
11.1 Decision Matrix that Compares the Water Supply Components
The decision matrix that compares the potential water supply components for raw water and treated water are presented in Table 11.1 and Table 11.2, respectively. Summarized below are the key findings identified in the development of this analysis and report.
Introduction
• There must be agreement up front with all involved that there is a problem that must be solved.
• With only a specific amount of water currently available to the Lower Rio Grande Valley, the management of the available water is critical to the continued development of the Lower Rio Grande Valley.
• The public participation process contributed to the development of an Integrated Regional Water Plan that should be responsive to the views of the public.
• The effort has been made to prepare the analysis and findings, to the maximum extent possible, so that they can be incorporated in the Senate Bill 1 process.
Regional Population and Anticipated Growth
• The Lower Rio Grande Valley has been one of the fastest growing regions in the United States during the 1990's.
• Unemployment remains among the highest in the State, and per capita personal income remains among the lowest in the State.
• The contribution of agribusiness to the economy of the Lower Rio Grande Valley is extensive.
• The region population is projected to increase from approximately 900,300 in the year 2000 to approximately 2,081,000 in the year 2050.
• An unusually high percentage of the population is projected to reside outside the municipalities, which places an increased responsibility on the counties and water supply corporations.
LRGVDC Integrated Regional Water Plan Section II, Page I

Integrated Water Resource Plan Lower Rio Grande Valley Development Council
Final Report- Conclusions and Recommendations
Table 11.1 Summary Potential Components for an Increased Raw Water Supply
Water Savings, Preliminary Costs, and Implementation Factors
Components Water Savings Preliminary Construction Cost Debt Service Cost Capital Costs $per 1, 000 gallons $per 1, 000 gallons
of water saved of water saved
Improvements to 82,600 ac-ft/yr $33,000,000 to $1.23 to $3.07 $0.094 to $0.233 (1) Irrigation Canals $82,000,000 On-farm with 115,000 ac-ft/yr $8,031,000 $0.21 $0.030 (2) application metering On-farm with 57,000 ac-ft/yr $1,631,000 $0.08 $0.033 (3) installation of poly-lJiQe On-farm with training 34,500 ac-ft/!yr $2,600,000 $0.05 N/A for high tech management Falcon-Amistad 31,200 ac-ft/yr $198,000,000 to $19.49 to $22.45 $1.493 to $1.719 (1) Pipeline $228,100,000 Brownsville Weir and 40,000 ac-ft/yr $36,500,000 $2.80 $0.215 (1) Reservoir Project Runoff Water Storage Site Specific Site Specific Site Specific Site Specific
Components Time to Relative Environ- Water Relative Institutional Implement mental Impoct Quality Difficulty Complexity
Improvements to 3 to 5 years Medium No Change Medium Medium Irrigation Canals On-farm with 1 to 2 years Low No Change Medium Medium application metering On-farm with 2 to 3 years Low No Change Medium Medium installation of poly-
!pipe On-farm with training 5 years Low No Change Medium Medium for high tech management Falcon-Amistad 4 to 6years Medium Higher High Medium Pipeline Brownsville Weir and 10 to 15 years High Low High Low Reservoir Project Runoff Water Storage 3to 5 years Medium Low Medium Medium
(1) 6.5% mterest rate for 30 years (2) 6.5% mterest rate for 10 years (3) 6.5% mterest rate for 3 years
Availability of Funding
Medium
Low
Low
Low
Low
Medium
Low
Potentia/for Regional
Coordination High
Low
Low
Medium
High
Low
High
LRGVDC Integrated Regional Water Plan Section II, Page 2

Integrated Water Resource Plan Lower Rio Grande Valley Development Council
Final Report - Conclusions and Recommendations
Table 11.2 Summary of Potential Components For An Increased Treated Water Supply
Water Savings, Prelimnary Costs, and Implementation Factors
Construction Debt Service Operating Cost Cost Cost Total Unit cost
Preliminary $per I,OOO $per I,OOO $per I,OOO $per I,OOO Components Water Savings Capital Costs gallons gallons gallons gallons
Desalination of 11,200 ac-ftlyr $12,000,000 $3.29 $0.094 (1) $1.32 $1.414 Brackish Groundwater
(treatment of 10.0 MGD)
Desalination of 11,200 ac-ftlyr $50,000,000 $13.71 $1.050 (1) $2.90 $3.95 Seawater (treatment of
lO.OMGD) Wastewater Reuse 6,721 ac-ftlyr $20,170,000 $9.22 $0.706 (1) $1.25 $1.956
,(treatment of6.0 MGD)
Components Time to Availability of Relative Water Relative Institutional Potentia/for Implement Funding Environ- Quality Difficulty Complexity Regional
menta/Impact Coordination
Desalination of Brackish Groundwater
(treatment of 10.0 MGD)
Desalination of Seawater (treatment of
lO.OMGD) Wastewater Reuse
(treatment of6.0 MGD)
(1) 6.5% mterest rate for 30 years
3 to 5 years Medium Medium
3 to 5 years Low Medium
2 to 3 years Medium Low
Regional Water Requirements and Anticipated Changes
High Medium Low
High Medium Low
High Medium Low
The projected regional water requirements have been summarized in Table 11.3.
• Municipal per capita consumption rates are projected to decrease due to an increased regional emphasis on water conservation, but the rates will not decline as much as the State's projections due to an anticipated general increase in the standard of living in lower income areas.
Medium
Medium
Medium
• Manufacturing water demand is projected to increase during the study period, but it will continue to represent less than 0.6% of the total requirements.
• Irrigation water demand currently represents approximately 85% of the total water requirements in the Lower Rio Grande Valley.
LRGVDC Integrated Regional Water Plan Section 11, Page 3

Integrated Water Resource Plan Lower Rio Grande Valley Development Council
Final Report - Conclusions and Recommendations
• Irrigation water requirements have been projected to decrease to approximately 64% of the total water requirements during the study period, due to increased use of on-farm water saving techniques and the loss of irrigable lands through urbanization.
• Steam-electric power production water demand has been projected to increase during the study period, but it will continue to represent less than 0.5% of the total requirements.
• Mining water requirement has been projected to increase during the study period, but it will continue to represent less than 0. I% of the total requirements.
• Livestock water requirement has been projected to remain constant during the study period, but it will continue to represent less than 0.2% of the total requirements.
• GIS mapping has been developed for the region and used in the projection of the water requirements.
Cameron County Municipal
Cameron County Citizens
Hidalgo County Municipal
Hidalgo County Citizens
Willacy County Municipal
Willacy County Citizens
Total Domestic Demand
Domestic Transmission Losses@20%
Total Domestic Requirement
Agricultural Demand
Agricultural Transmission Losses
Total Agricultural Requirement
Manufacturing
Steam Electirc Power Cooling
Mining
Livestock
Total Other Requirement
Total Water Requirement
Total TWDB Regional Water Requirement
Table 11.3 Projected Regional Water Requirements Below-normal Weather, Expected Case
(Values in Acre-Feet per Year)
2000 2010 2020 2030
55,000 62,058 68,669 79,947
11,448 13,544 15,854 17,016
77,280 88,456 99,623 115,707
25,136 31,007 37,620 47,894
6,834 7,407 7,807 8,192
1,190 1,254 1,283 1,320
176,888 203,726 230,856 270,076
35,378 40,745 46,171 54,015
212,266 244,471 277,027 324,091
1,053,863 761,507 699,912 623,342
295,521 217,238 203,404 186,027
1,349,384 978,745 903,316 809,369
4,975 5,506 5,878 6,169
4,500 5,000 5,000 5,000
701 686 717 754
2,363 2,363 2,363 2,363
12,539 13,555 13,958 14,286
1,574,189 1,236,771 1,194,301 1,147,746
1,403,819 1,395,411 1,384,196 1,381,297
LRGVOC Integrated Regional Water Plan
2040 2050
84,540 89,974
20,622 21,626
132,075 151,887
55,453 62,051
8,449 8,753
1,333 1,317
302,472 335,608
60,494 67,122
362,966 402,730
556,003 491,062
170,788 156,031
726,791 647,093
6,731 7,292
5,000 5,000
796 850
2,363 2,363
14,890 15,505
1,104,647 1,065,328
1,375,164 1,368,792
Section 11, Page 4

Integrated Water Resource Plan Lower Rio Grande Valley Development Council
Final Report - Conclusions and Recommendations
Description of Current Water Supplies
• The Falcon-Amistad Reservoir System provides primary storage to meet the water supply needs of the Lower Rio Grande Valley.
• The current firm estimate ofthe Falcon-Amistad Reservoir System is 1,194,000 acre-feet per year, based on a review of the hydrologic data. The impact of the development of other water supplies in the watershed needs to be evaluated.
• Within Texas, the state water rights system, governing U.S. releases from the FalconAmistad Reservoir System, is applicable only to the Rio Grande below Fort Quitman.
• The recently developed reservoir operations model (ROM) for the Falcon-Amistad Reservoir System provides an appropriate representation of the system.
• Significant groundwater resources underlie much of the Lower Rio Grande Valley, but the generally poor quality has limited the development and use of this resource.
• As water demand increases in relation to the available water supply, wastewater reuse will become a more attractive source of water supply in the Lower Rio Grande Valley.
• Irrigation districts primarily deliver untreated water for irrigation, but they may contract to deliver untreated water for municipalities and water supply corporations.
• One ofthe proprietary functions of a municipality is the operation and maintenance of a public utility, including water and sewer systems.
• A water supply corporation operates under the corporate laws, but it may be formed to furnish a water supply to cities, private corporations and individuals.
Analysis of Water Supply and Requirements
The projected water requirements including transmission losses at the current levels have been compared with the supply from the Falcon-Amistad Reservoir System in Table 11.4.
• The supply available from the Falcon-Amistad Reservoir System is less than the total water requirement including transmission losses at the current levels at the present time, but the projected total water requirements will approach the available yield as the water conservation measures are put in place.
• These shortages can be further reduced or eliminated through the estimated potential irrigation canal transmission loss savings.
• The domestic and other water requirements increase from 19.8% of the total supply in 2000 to 41.0% of the total supply in 2050.
• The total water requirements are based on the important assumption that certain water conservation and water management programs will be implemented and that urban development will occur.
LRGVDC Integrated Regional Water Plan Section 11, Page 5

Integrated Water Resource Plan Lower Rio Grande Valley Development Council
Final Report - Conclusions and Recommendations
Table 11.4 Comparison of Water Requirements with Current Level of Transmission Losses
Ildd dS I ncu e an up ply Percent of Percent of
Fa/con-Amistad Domestic, Other Dalcon-Amistad Domestic and Reservoir System Non-Irrigation, Reservoir System
Other Non- Annual Estimated Yield and Irrigation Annual Estimated Yield irrigation Water
20502 Water
Year Requirements 20001
Requirements 20001 20502
2000 224,805 22.01% 25.17"/o 1,574,189 154.10"/o 176.24%
2010 258,026 25.26% 28.89% 1,236,771 121.07"/o 138.46%
2020 290,985 28.49% 32.58% 1,194,301 116.91% 133.71%
2030 338,377 33.13% 37.88% 1,147,746 112.36% 128.50"/o
2040 377,856 36.99% 42.30"/o 1,104,647 108.14% 123.68%
2050 418,235 40.94% 46.83% 1,065,328 104.29% 119.27"/o
j· Based on annual dependable yteld of 1,021,514 acre-feet per year avrulableto the study area m 2000, which IS 97"/o of 88.2% of the 1,194,000 acre-feet per year annual dependable yield. 2Based on annual dependable yield of 893, 184 acre-feet per year available to the study area in 2050, which is 97% of 88.2% of the 1,044,000 acre-feet per year annual dependable yield
Potential changes in the Amistad Falcon Reservoir System
• The present method of operation in maintaining a high level of storage in the Amistad Reservoir while allowing most of the system fluctuation in the Falcon Reservoir is proper operations of the system, and there is no need to change.
• The Watermaster' s operation of coordinating the supply and demand of the reservoir system is understood and accredited by the water users, and no change is needed.
• The allocation of the municipal reserve and the additional operating reserve is necessarily somewhat arbitrary but considered prudent.
• There is the possibility of enhancing the storage capabilities of the river system below Falcon. Alternatives are the Brownsville Weir and off-channel storage.
• The potential for converting flood storage to conservation storage is limited. • The current estimated U.S. portion of the annual dependable yield of the Falcon-Amistad
Reservoir System is I, 194,000 acre-feet per year and for Mexico 992,000 acre-feet per year.
• The impact of sediment build up in the reservoir system will reduce the U.S. portion of the firm yield in 2050 to 1,044,000 acre-feet per year and to 915,000 acre-feet per year for Mexico.
• A real time SCAD A system could aid the TNRCC Watermaster in the water management of the river.
LRGVDC Integrated Regional Water Plan Section 11, Page 6

Integrated Water Resource Plan ~ 0
Lower Rio Grande Valley Development Council Final Report - Conclusions and Recommendations
Reduction in irrigation district losses
• The present main canal systems of the irrigation districts include approximately 270 miles of concrete lined canals, 346 miles of earth, and 25 miles undesignated.
• A review of the 1991-1997 diversion reports from the Watermaster's office showed a gradual decline in agricultural use. The factors were due to the drought and reduction in irrigated acres.
• The estimated irrigation system delivery efficiency at the county level are: Cameron County- 66.2%; Hidalgo County- 74.9% and Willacy County- 75%
• Field tests were conducted to compare actual seepage losses with values from the scientific literature. Some canals had very high losses, indicating problems with their construction or maintenance.
• Because of the variability of soil across the Lower Rio Grande Valley, canals need to be evaluated on an individual basis to determine seepage losses.
• A conveyance efficiency of80-90% appears attainable if canal improvements are implemented. This would result in water savings ranging from 54,000 to 223,000 acrefeet per year.
• Combined or shared main distribution canals should be possible in some districts. The opportunities will increase with the growth in the urban population.
• Consolidation of the administrative function of districts has occurred and further consolidation is likely.
• Historical costs from other parts of the country for improvements in canal/pipeline systems have ranged from $400 to $1,000 per acre-feet of water saved.
Pipeline from Falcon Reservoir
• The pipeline is intended to provide only the additional municipal water supply requirements that will result from urban growth from 2000 to 2050.
• Four general delivery points for the pipeline were established. The first termination point was in the vicinity of Moore Field to serve Western Hidalgo County. The second segment of the pipeline extended to Elsa to serve the Edcouch/ Weslaco areas. The third segment extended to Combes to serve the general Harlingen area. The final segment extended the pipeline to near Olmito to serve the general Brownsville area.
• The preferred route of the pipeline was to the north of most of the current municipalities to avoid conflict with heavily urbanized areas. The route was also selected to minimize the conflicts with major obstructions and environmentally sensitive areas.
• The pipeline concept considered the construction of large regional water treatment plants near the termination points.
• The transportation losses for water supply to the municipalities through the irrigation districts are projected to increase from 35,300 acre-feet per year in 2000 to 66,500 acrefeet per year in 2050. The water saved in using the pipeline would be 31,200 acre-feet per year in 2050.
• The pipeline would provide an additional level of reliability to the municipalities in the
LRGVDC Integrated Regional Water Plan Section 11, Page 7

Integrated Water Resource Plan
9 \ Lower Rio Grande Valley Development Council Final Report- Conclusions and Recommendations
delivery of water to their customers by providing a second delivery route. • A regional authority would likely be required to assume the responsibility for the
development, funding and operation of the system.
Municipal and Industrial Conservation
• At least seventeen municipalities and water supply districts have water conservation plans.
• Several municipalities had the percentage of unaccounted water at or below 10 to 15% which is considered good.
• Other municipalities had percentages greater than 15 which indicates potential savings in this area.
• Regional programs and cooperation of all municipalities, water supply corporations and individual citizens will be required to achieve the level of water conservation assumed in the projections of future water requirements.
Agricultural Conservation
• Water savings observed from use on metering and gaged pipe by four irrigation. districts averaged 35%.
• The averaged water savings reported by two districts for metering only was 15%. • A factor of20% for on-farm irrigation water savings was used in the analysis. This
assumes a combination of improved water management and irrigation technology. • Potential water quantity savings through various agricultural conservation measures
along with the project initial capital costs have been shown below: • Potential funding sources for the adoption of on-farm conservation technologies that
should be explored include the TWDB, the State Legislature, or low cost loan programs. • Improvement to the canal systems could be funded through cooperative agreements
between municipalities and irrigation districts.
Table ll.5 Potential Water Quantity Savings
rougl ~gr1cu tura ater Th hA I IW C onservation Savings Capital Investment
On-fann water savings, including 114,973 acre-feet per year $ 8,031,091 transportation losses, with metering On-fann water savings, including 56,929 acre-feet per year $ 1,631,375 transportation losses, with poly-pipe On-fann water savings, including 34,493 acre-feet per year $2,600,000 transportation losses, with high management
Total 206,395 acre-feet per year $ 10,662,466
LRGVOC Integrated Regional Water Plan Section II, Page 8

Integrated Water Resource Plan Lower Rio Grande Valley Development Council
Final Report- Conclusions and Recommendations
Brownsville W~ir
• The Brownsville weir project is being developed under the auspices of Brownsville Public Utility Board.
• The philosophy of the project is it would be the last reservoir to capture excess flows on the Rio Grande before entering the Gulf of Mexico.
• The reservoir will have a capacity of approximately 6,000 acre-feet. • The requested permit would allow the diversion of 40,000 acre-feet per year for off
channel storage. • The current estimated construction cost is $36.5 million. • No official positions on the project have been taken by the IBWC or Mexico.
Baseline Environmental Conditions
• The Lower Rio Grande Valley is a semi-tropical region that has a unique and varied terrestrial and aquatic environment.
• The population of the plants is characterized by eleven distinct biotic communities that stretches from the Falcon Reservoir to the Gulf of Mexico.
• There are seven refuges and preserves in the Lower Rio Grande Valley, which have been created by public and private interests to protect remaining pristine vegetation and the habitat of endangered and threatened species.
• There are seven plants and 49 animal species in the Lower Rio Grande Valley that have been identified by the USFWS and TPWD as endangered and threatened.
• One of the major environmental concerns in the Rio Grande watershed is water quality. • The major categories of pollutants in the river which affect environmental and public
health are salinity, nutrients/eutrophication, fecal coliform bacteria, and toxic substances. • Long-term data indicated poor water quality in some areas, while other areas are
improving because of recent efforts to decrease the amount of pollutants entering the nver.
• Any project implemented, as a result of this planning process, would have to comply with all applicable local, state, and federal laws and regulations.
• The main environmental issues associated with the projects identified in this study are (1) for the Brownsville Weir: water and land issues along the river, (2) for the Falcon Pipeline: cross-country issues, (3) for new canals: similar issues as pipelines, (4) modifying existing canals: construction impacts, (5) for treatment plants: siting issues, and (6) for desalination plants: siting issues and disposal of waste.
• Nature tourism and the commercial shrimping and fishing industries produce a substantial economic benefit for the region.
LRGVDC Integrated Regional Water Plan Section 11 , Page 9

Integrated Water Resource Plan Lower Rio Grande Valley Development Council
Final Report- Conclusions and Recommendations
Cost of Water and Water Economics
• The average bill across the region for domestic water provided by the municipalities and water supply corporations was $15.00 for 5,000 gallons per month, $22.50 for 10,000 gallons per month and $48.50 for 25,000 gallons per month.
• The highest rates were for the smaller municipalities and water supply corporations and the lowest rates were found in Harlingen and McAllen.
• The water bills and rates in the region were comparable to the results of the utility rate surveys conducted by the Texas Municipal League.
• The charges for water use by most irrigation districts were a combination of a flat rate change per acre and a rate for water use per acre. The average flat rate charge was $12.64 per acre and water use $9.60 per acre-foot.
• The flat rate is higher for the more urbanized irrigation districts because the Texas Water Code dictates that a portion of their fixed rate cost must be prorated based on the irrigable area.
• Three possible approaches to meeting the future municipal demand based on the value of water were identified. The first is to purchase additional water rights from urbanized agricultural lands. The second is to institute aggressive conservation and land development policies to keep within the current municipal water rights. The third is to share the burden between the agricultural and municipal communities.
• The cost to implement the various water planning options have been summarized on Table 11.1.
Water Management and Drought Contingency Plan for the Lower Rio Grande Valley
• The Rio Grande Watershed is in an arid, to semi-arid region, and subject to periodic droughts.
• The region has been in a drought since 1994. • Many of the irrigation districts and municipalities have drought contingency plans. • The contingency plans are similar but have differing trigger conditions. • A water management option is to develop a formalized water marketing system which
would facilitate the trading of water in periods of drought and non-drought situations. • The three trigger conditions proposed in the model municipal drought contingency plan
are:
US Storage Level Demand as percent of design capacity
Stage 1 51% 75%
Stage 2 25% 90%
Stage 3 15% 100%
LRGVDC Integrated Regional Water Plan Section II , Page 10

Integrated Water Resource Plan Lower Rio Grande Valley Development Council
Final Report - Conclusions and Recommendations
11.2 Recommendations on Components for Future Water Supply
At this point in the development of the Integrated Regional Water Plan, there are many specific unanswered questions. Many of these questions stem from the numerous inconsistences and unavailable data that were reviewed in the development of this study. Historically, the accurate accounting of the total water system has not been a major concern, because more than enough water was available for everyone under most conditions. With the urbanization of the Lower Rio Grande Valley, it is appropriate to consider a more thorough and comprehensive water accounting system for the Rio Grande Basin. Listed below in Table 11.6 is a preliminary tabulation of these data sets where improved accuracy in accounting would be beneficial to the region
Even with these shortcomings in the basic data, it is clear that the balance between the supplies and demand will be tight, and every opportunity for better management and development of the available water resources must be exercised. To achieve an adequate supply for all potential users, each of the following conclusions and recommendations should be developed. The degree to which each can and should be a contributor will depend on more detailed evaluations.
Conclusions and Recommendations
The key factors identified by the committee to be weighed in the evaluation of options to address the short-term and long-term water needs of the Lower Rio Grande Valley have been summarized in Table 11.1 and Table 11.2. The tables indicates the potential water savings, preliminary capital costs, the unit capital costs in $/1,000 gallons of water saved, the debt service unit costs in $/1,000 gallons of water saved, the time to implement the project, availability of funding, relative environmental impact, water quality impact, relative difficulty to implement, the institutional complexity, and the need for regional coordination. The cost to implement the various water planning options were computed using current construction cost estimating data.
Conclusion 1 The projected total water requirements of the Lower Rio Grande Valley through the year 2050 will exceed the Valley's share of the available annual estimated yield of the Falcon-Amistad Reservoir System even with the consideration of the impacts of urbanization and aggressive water conservation measures assuming all potentially irrigable acres are in production.
LRGVDC Integrated Regional Water Plan Section II, Page II

1.
2. 3. 4.
5.
6.
Integrated Water Resource Plan Lower Rio Grande Valley Development Council
Final Report- Conclusions and Recommendations
Table 11.6 Recommendation on Data Sources
ere mprove ccuracy IS ee e Wh I dA .Ndd Standard methodology for municipalities and water supply corporations to report total water requirements including transportation losses in delivery system. Improved metering of diversion from Rio Grande bv irrigation districts. Improved measurement of quantities of water delivered to irrigators. An improved set of data on the distribution system (mains and laterals) of all irrigation districts. An improved set of data on current condition and capacity of the irrigation districts pump stations. An improved set of data on current seepage losses in the irrigation districts' canal systems.
Recommendations for Immediate Action:
a. The irrigation canal delivery system must be improved to reduce the transmission losses to the maximum extent possible.
Estimated implementation cost $33,000,000 to $82,000,000, or $1.23 to $3.07 per 1, 000 gallons, with annual average water savings of 82,600 acre-feet per year at an 80% efficiency.
Justification:
The irrigation canal system delivers untreated water to both irrigators and domestic customers throughout most of the Lower Rio Grande Valley. Much of the system was constructed in the early part of this century, and it has had limited upgrading through the years. The study revealed significant water losses in this delivery system. Also, the full benefit of the on-farm water savings cannot be achieved without these canal improvements. A program to reduce these losses will provide a greater quantity of water for beneficial use and projected differences between supply and demand can be reduced or eliminated through the achievement of transmission loss reductions.
Specific Recommended Actions:
1. Preliminary engineering and economic evaluations on the implementation of the irrigation district management system (DMS) in all the irrigation districts in included the Visual system, IRRDESS, and distribution system routing.
2. Preliminary engineering and economic evaluations on the potential cooperation among all irrigation districts on the consolidation of facilities to serve the remaing irrigable acres as urbanization occurs.
LRGVDC Integrated Regional Water Plan Section 11 , Page 12

Integrated Water Resource Plan ~ ~
Lower Rio Grande Valley Development Council Final Report - Conclusions and Recommendations
3. Preliminary engineering and economic evaluations on improvements to the irrigation canal delivery systems to reduce the transmission losses to the maximum extent feasible.
4. Preliminary engineering and economic evaluations on the potential cooperation between irrigation districts and municipalities and water supply cooperations to improve the delivery system for water conservation and increased reliability.
b. Economic incentives must be established to encourage irrigators to implement on-farm water conservation measures such as metering coupled with volumetric pricing instead of per irrigation, poly and gated pipe, and drip or micro jet systems, and education required to achieve maximum savings.
Estimated implementation cost $8, 0 31, 000 for metering, or $0. 21 per 1, 000 gallons with water savings of 115,000acre-feet per year, $1,631,000for poly pipe, or $0.09 per 1,000 gallons with water savings of 57,000 acre-feet per year, and $2,600,000 for training for high tech management, or $0.05 per 1, 000 gallons with water savings of 34,5000 acre-feet per year.
Justification:
Since approximately 85% of the current water consumption in the Lower Rio Grande Valley is in agricultural production, water conservation will have a significant impact on the future water requirements. At the present time, agricultural economics is marginal for many crops. Some of the land in production is leased from absentee owners. The water rights are owned by the irrigation districts, and there are no guarantees that the water will always be available to the irrigator under the present Falcon-Amistad Reservoir System operating rules.
Specific Recommended Action:
Investigate potential economic incentives for land owners/operators to invest, implement and adopt on-farm irrigation conservation technologies and establish, with the cooperation of an irrigation district, a prototype to demonstrate the effectiveness over a two-year period that desirably includes a drought or water shortage period.
c. An enhanced region-wide municipal and industrial water conservation program must be established.
Estimated implementation cost $150,000 with water savings increasing from 8,900 acre-feet per year in 2000 to 73,700 acre-feet per year in 2050.
Justification:
Water conservation programs have been adopted by many of the municipalities and water supply corporations. The "Water Smart" program has been pursued Valley-wide. Domestic and industrial water conservation is a key element in meeting the future water requirements
LRGVDC Integrated Regional Water Plan Section 11, Page 13

Integrated Water Resource Plan Lower Rio Grande Valley Development Council
Final Report- Conclusions and Recommendations
Specific Recommended Action:
Define program and establish cost for an enhanced municipal and industrial water conservation program.
d. A region-wide water accounting system must be established to permit the accurate measurement of the effects of implementation of water conservation projects.
Estimated implementation cost $150,000 and water savings are difficult to estimate.
Justification:
In the development of the technical analysis for these recommendations, a number of water related data sets available from sources in the Valley and at the State level were reviewed and utilized. In many cases, inconsistencies were noted between the data sets and the level of accuracy was inadequate. A number of concurrent water conservation actions are proposed in these recommendations. To measure of their benefit, a reliable and complete region-wide water accounting system is needed.
Specific Recommended Actions:
1. Define program and establish cost for a water accounting system to permit the accurate measurement of the effects of implementation of water conservation projects.
2. Explore the need for additional resources allocated to the Rio Grande Watermaster's office too more adequately monitor the water delivery system.
Recommendations for Near Term Action
e. The alternative use of desalinated brackish groundwater should be evaluated as an option for each new proposed additional significant use.
Estimated implementation cost $12,000,000 per 10MGD, or $3.29 per 1,000 gallons of capacity. Operating expenses will be $1. 3 2 per 1, 000 gallons.
Justification:
Brackish groundwater is available in many sections of the Lower Rio Grande Valley. Since the available supply from the Falcon-Amistad Reservoir System will not satisfy all the demands, each opportunity to use an alternate source should be evaluated.
f. The alternative use of reuse wastewater should be evaluated as an option for each new proposed additional significant demand.
LRGVOC Integrated Regional Water Plan Section 11, Page 14

9 I Integrated Water Resource Plan
Lower Rio Grande Valley Development Council Final Report- Conclusions and Recommendations
Estimated implementation cost $20,170,000 per 6 MGD, or $9.22 per 1, 000 gallons of capacity. Operating expenses will be $1.25 per 1,000 gallons.
Justification:
Reuse of highly treated wastewater has been evaluated at several locations in the Lower Rio Grande Valley. Since the available supply from Falcon- Amistad Reservoir System will not satisfy all the demands, each opportunity to use an alternate source should be evaluated.
g. The alternative use of desalinated seawater should be evaluated as an option for each new proposed additional significant use.
Estimated implementation cost $50,000,000 per 10MGD, or $13.71 per 1,000 gallons of capacity. Operating expenses will be $2.90 per 1,000 gallons.
Justification:
Use of desalinated seawater has been evaluated at several locations near the coast in the Lower Rio Grande Valley. Since the available supply from Falcon-Amistad Reservoir System will not satisfy all the demands, each opportunity to use an alternate source should be evaluated.
h. The full investigation of the potential impact of the Falcon-Amistad Reservoir System firm yield due to the development and operation of the recently constructed reservoirs in Mexico must be completed through continued coordination with mwc.
Estimated implementation cost $75,000 and water savings are difficult to estimate.
Justification:
The Falcon-Amistad Reservoir System provides nearly all the water to the Lower Rio Grande Valley. In recent years, a number of new reservoirs have been constructed on tributaries of the Rio Grande in Mexico. Mexico is currently investigating system-wide operating rules that will allow the maximization of their portion of the supply. This activity, although within the IBWC operating rules, could reduce the quantity available to the United States over the amount historically available.
Recommendations for On-going Investigations
i. The investigation of the Brownsville Weir and Channel Storage option should continue as a project of local interest until the key issues are addressed.
Estimated implementation cost $36,500,000, or $2.80 per 1, 000 gallons.
LRGVDC Integrated Regional Water Plan Section II, Page 15

Justification:
Integrated Water Resource Plan Lower Rio Grande Valley Development Council
Final Report - Conclusions and Recommendations
The Brownsville Weir and Channel Storage project has been under consideration for several years. The capital cost per 1,000 gallons for this project included in Table II. I is comparable to several of the other options.
J· The investigation of the Falcon-Amistad pipeline option should continue as a project of interest to the municipalities and water supply corporations.
Estimated implementation cost $198,000,000 to $228,000,000, or $19.49 to $22.45 per 1, 000 gallons.
Justification:
The Falcon-Amistad pipeline option provides a second delivery route for a portion of the domestic demand which provides added reliability to the system. Although the initial construction cost is high in relation to other options, the pipeline's construction costs can be weighed against potential construction costs for improvements to the irrigation delivery system to provide increased reliability and delivery of untreated water to the urbanizing area north of US 83 and along FM I 07 and against the financial impact on the irrigation districts.
Conclusion 2 Non-irrigation projected water requirements of the Lower Rio Grande Valley in the year 2050, such as municipal, manufacturing, mining, livestock, and steam electric power cooling, will represent 40 percent of the available annual dependable yield of the Falcon-Amistad Reservoir System.
Recommendations:
a. Institutional procedures must be defined that will provide the necessary protection of the municipal, manufacturing, mining, livestock, and steam electric power cooling water requirements while optimizing the amount of water available for agricultural irrigation.
Justification:
The vast majority of the water rights in the Lower Rio Grande Valley are currently held by the irrigation districts. The projected urbanization will reduce the agricultural demand over the next fifty years, making water available to satisfy the increasing domestic and industrial demands. How this shift in demands will be addressed from water rights and water resource management perspective is an issue that has been addressed and mechanisms are in place in some areas, but it is an issue that needs continuous attention.
LRGVDC Integrated Regional Water Plan Section II, Page 16

Integrated Water Resource Plan Lower Rio Grande Valley Development Council
Final Report - Conclusions and Recommendations
Specific Recommended Action
Establish a coalition of regional water suppliers and users as a means of providing discussion on financing for anticipated regional projects and on providing improved management of the finite amount of surface water available to the Lower Rio Grande Valley.
b. The merits of a regional authority must be fully investigated as a means of providing financing for anticipated regional projects and of providing improved management of the finite amount of surface water available to the Lower Rio Grande Valley.
Justification:
The supply of water to the Lower Rio Grande Valley is currently shared by approximately 28 irrigation districts, 32 municipalities, and II water supply corporations. The untreated water is delivered by the irrigation districts for both irrigation and domestic requirements. The municipalities and water supply corporations treat and deliver treated water to domestic and industrial customers. The current system requires a high level of cooperation and does not take full advantage ofthe economies of scale in both financing and operation.
Conclusion 3 The urbanization of much of the Lower Rio Grande Valley and the anticipated significant growth in population in Northern Mexico will have a profound impact on the requirements for and the distribution of water and on the quality of life.
Recommendations:
a. The process to establish the procedures to maximize the construction of regional water treatment plants must be fully investigated since the economies of regionalization are clearly established.
Justification:
The construction cost and operating cost per unit of capacity for water treatment plants decrease in proportion to their size. Encouraging the construction of regional water treatment plants will reduce the unit cost to the consumer and improve the quality of water delivered.
Specific Recommended Action:
Preliminary engineering and economic evaluations on the potential for regional water treatment plants in the vicinity of major urbanizing areas.
b. The merits of a regional entity to lead the planning needed to address the impacts of urbanization must be fully investigated.
LRGVDC Integrated Regional Water Plan Section 11, Page 17

Integrated Water Resource Plan Lower Rio Grande Valley Development Council
Final Report - Conclusions and Recommendations
Justification:
The urbanization of the Lower Rio Grande Valley will remove significant acreage from active agricultural production. This transition will reduce the quantity of water required for irrigation districts and increase the amount required for domestic and industrial use.
Specific Recommended Action:
Detailed evaluation of the impacts of projected urbanization on irrigation requirements.
Conclusion 4 The unique environmental setting of the Lower Rio Grande Valley must protected and enhanced to the maximum extent feasible.
Recommendation:
a. The region-wide, as well as the site-specific, environmental impacts must be considered in the evaluation of each water supply option for each new proposed additional significant demand.
Justification:
The Lower Rio Grande Valley is a semitropical region that has many distinct and important characteristics. This area is an overlap point of the western desert and the subtropics and thus provides for a unique and varied terrestrial and aquatic environment. This environmental arrangement needs consideration in the planning of each new project.
LRGVDC Integrated Regional Water Plan Section II, Page 18
Copyright © 2022 FDOKUMEN