city of hollister final water distribution system master plan
161
sdf Prepared by C ITY OF H OLLISTER F INAL WATER D ISTRIBUTION S YSTEM MASTER P LAN AUGUST 2018
-
Upload
khangminh22 -
Category
Documents
-
view
4 -
download
0
Transcript of city of hollister final water distribution system master plan
s d f
Prepared byCITY OF HOLLISTERFINAL WATER DISTRIBUTION SYSTEM MASTER PLAN AUGUST 2018
Page i
Table of Contents
EXECUTIVE SUMMARY ................................................................................................................................................. ES 1-1
CHAPTER 1 INTRODUCTION .............................................................................................................................................. 1-1
BACKGROUND ....................................................................................................................................................................... 1-1 ENVIRONMENTAL REVIEW .................................................................................................................................................... 1-1 AUTHORIZATION AND SCOPE OF WORK ................................................................................................................................ 1-1 ACKNOWLEDGEMENTS ......................................................................................................................................................... 1-4
CHAPTER 2 WATER DISTRIBUTION SYSTEM OVERVIEW .................................................................................................... 2-1
INTRODUCTION ..................................................................................................................................................................... 2-1 WATER DISTRIBUTION SYSTEM ............................................................................................................................................. 2-1
City Distribution System Pressure Zones ............................................................................................................................ 2-2
CHAPTER 3 LAND USE AND POPULATION ......................................................................................................................... 3-1
INTRODUCTION ..................................................................................................................................................................... 3-1 Existing Service Area Boundary ......................................................................................................................................... 3-1 Study Area ......................................................................................................................................................................... 3-2
LAND USE............................................................................................................................................................................... 3-2 Existing Water Service Area Land Use ............................................................................................................................... 3-2 Future Developments ......................................................................................................................................................... 3-2
POPULATION ......................................................................................................................................................................... 3-2 Existing Service Area Population........................................................................................................................................ 3-3 Future Population .............................................................................................................................................................. 3-4
CHAPTER 4 WATER DEMAND ............................................................................................................................................ 4-1
INTRODUCTION ..................................................................................................................................................................... 4-1 HISTORICAL WATER DEMANDS ............................................................................................................................................. 4-1 HYDRAULIC DEMAND PARAMETERS ..................................................................................................................................... 4-2
Average Day Demand (ADD).............................................................................................................................................. 4-2 Maximum Day Demand (MDD) ......................................................................................................................................... 4-2 Peak Hour Demand (PHD) .................................................................................................................................................. 4-2 Water Demand Categories ................................................................................................................................................ 4-3
FUTURE WATER DEMANDS ................................................................................................................................................... 4-4
CHAPTER 5 WATER SUPPLY OVERVIEW ............................................................................................................................ 5-1
INTRODUCTION ..................................................................................................................................................................... 5-1 Groundwater ..................................................................................................................................................................... 5-1 Imported Surface Water .................................................................................................................................................... 5-2
CHAPTER 6 WATER STORAGE............................................................................................................................................ 6-1
EXISTING WATER STORAGE FACILITIES .................................................................................................................................. 6-1 EXISTING AND FUTURE STORAGE ANALYSIS .......................................................................................................................... 6-1
Operational Storage .......................................................................................................................................................... 6-1 Fire Protection Storage ...................................................................................................................................................... 6-2 Emergency Storage ............................................................................................................................................................ 6-2 Un-useable Storage ........................................................................................................................................................... 6-3 Storage Summary .............................................................................................................................................................. 6-3
OVERALL STORAGE RECOMMENDATIONS ............................................................................................................................... 6-3 Seismic and Mixing System Upgrades ............................................................................................................................... 6-4
Page ii
CHAPTER 7 WATER PUMP STATIONS ................................................................................................................................ 7-1
PUMP STATIONS .................................................................................................................................................................... 7-1
CHAPTER 8 WATER DISTRIBUTION SYSTEM ANALYSIS ...................................................................................................... 8-1
WATER SYSTEM DESIGN CRITERIA ......................................................................................................................................... 8-1 Overall Water System Pressures ........................................................................................................................................ 8-1 Water Demand Requirements ........................................................................................................................................... 8-2 Fire Flow Requirements ..................................................................................................................................................... 8-2 Hydrant Spacing ................................................................................................................................................................ 8-3 Valve Spacing ..................................................................................................................................................................... 8-3 Pipe Sizes and Material ...................................................................................................................................................... 8-4
WATER MODEL DEVELOPMENT .................................................................................................................................................... 8-5 Model Calibration .............................................................................................................................................................. 8-6
EXISTING SYSTEM PERFORMANCE .................................................................................................................................................. 8-6 FUTURE SYSTEM PERFORMANCE ................................................................................................................................................... 8-9
CHAPTER 9 CIENEGA VALLEY WATER SYSTEM ................................................................................................................... 9-1
WATER DISTRIBUTION SYSTEM OVERVIEW ........................................................................................................................... 9-1 WATER MODEL DEVELOPMENT .................................................................................................................................................... 9-1
Water Demand .................................................................................................................................................................. 9-1 Model Calibration .............................................................................................................................................................. 9-1
EXISTING SYSTEM PERFORMANCE .................................................................................................................................................. 9-2 FUTURE SYSTEM PERFORMANCE ................................................................................................................................................... 9-2 STORAGE ANALYSIS ............................................................................................................................................................... 9-2
Operational Storage .......................................................................................................................................................... 9-2 Fire Protection Storage ...................................................................................................................................................... 9-2 Emergency Storage ............................................................................................................................................................ 9-2 Un-useable Storage ........................................................................................................................................................... 9-3 Storage Summary .............................................................................................................................................................. 9-3
CHAPTER 10 SUMMARY OF RECOMMENDATIONS .......................................................................................................... 10-1
RECOMMENDED MASTER PLAN IMPROVEMENT PROJECTS ............................................................................................... 10-1 FIRST PRIORITY MASTER PLAN IMPROVEMENT PROJECTS .................................................................................................. 10-1 SECOND PRIORITY MASTER PLAN IMPROVEMENT PROJECTS ............................................................................................. 10-2 THIRD PRIORITY MASTER PLAN IMPROVEMENT PROJECTS ................................................................................................. 10-2 MASTER PLAN IMPROVEMENT PROJECT RANKING AND COSTS .......................................................................................... 10-2 OPERATIONS AND MAINTENANCE IMPROVEMENT PROJECTS ............................................................................................ 10-3
Page iii
List of Tables Table 2-1 Existing Water Main Inventory by Diameter .......................................................................................... 2-1 Table 2-2 Existing Water Main Inventory by Material ........................................................................................... 2-1 Table 2-3 Intertie Description Summary ................................................................................................................ 2-4 Table 2-4 PRV Hydraulic Parameters ...................................................................................................................... 2-4 Table 3-1 City of Hollister Existing Water Service Area Land Use .......................................................................... 3-5 Table 3-2 City of Hollister Future Residential Developments ................................................................................ 3-6 Table 3-3 City of Hollister Future Non-Residential Developments ........................................................................ 3-7 Table 3-4 Water Service Population Estimate per 2018 SSCSMPU ........................................................................ 3-7 Table 3-5 Water Service Population Estimate per MetCalf & Eddy ....................................................................... 3-7 Table 4-1 Summary of Historical Water Demands (ac-ft) ...................................................................................... 4-1 Table 4-2 Average Day Demand ............................................................................................................................. 4-3 Table 4-3 Hydraulic Demand Parameters............................................................................................................... 4-3 Table 4-4 Existing Average (2015-2017) Water Demand Factors .......................................................................... 4-3 Table 4-5 Future Water Demand Factors ............................................................................................................... 4-4 Table 4-6 Future Water System Demands ............................................................................................................. 4-4 Table 5-1 Annual City Well Production................................................................................................................... 5-2 Table 6-1 Water Storage Facility Summary ............................................................................................................ 6-1 Table 6-2 Operational Storage Recommendations ................................................................................................ 6-2 Table 6-3 Fire Protection Storage Recommendations ........................................................................................... 6-2 Table 6-4 Emergency Storage Recommendations ................................................................................................. 6-2 Table 6-5 Required Storage Summary .................................................................................................................... 6-3 Table 7-1 Pump Station Function Summary ........................................................................................................... 7-1 Table 7-2 Memorial Booster Station Summary ...................................................................................................... 7-1 Table 8-1 Fire Flow Requirements .......................................................................................................................... 8-3 Table 8-2 Summary of Hydraulic Parameters and Design Criteria ......................................................................... 8-5 Table 8-3 Recommended Hazen-William’s “C” Factor ........................................................................................... 8-6 Table 9-1 Sally Flats Operational Storage Recommendations ............................................................................... 9-2 Table 9-2 Sally Flats Fire Protection Storage Recommendations ........................................................................... 9-2 Table 9-3 Sally Flats Emergency Storage Recommendations ................................................................................. 9-3 Table 9-4 Sally Flats Required Storage Summary ................................................................................................... 9-3 Table 10-4 Unit Cost for Construction of Water Mains ........................................................................................ 10-3 Table 10-5 Operations and Maintenance Improvement Projects ........................................................................ 10-3 Table 10-1 First Priority Master Plan Improvement Projects ............................................................................... 10-4 Table 10-2 Second Priority Master Plan Improvement Projects .......................................................................... 10-5 Table 10-3 Third Priority Master Plan Improvement Projects ............................................................................. 10-6
Page iv
List of Figures
Figure 2-1 City and SSCWD Service Areas .............................................................................................................. 2-5
Figure 2-2 City of Hollister Pressure Zones ............................................................................................................ 2-6
Figure 2-3 Existing Distribution System Major Facilities ........................................................................................ 2-7
Figure 2-4 Existing Distribution System Pipe Diameter .......................................................................................... 2-8
Figure 2-5 Existing Distribution System Pipe Material ........................................................................................... 2-9
Figure 2-6 City of Hollister and SSCWD Pressure Zone Boundaries ..................................................................... 2-10
Figure 2-7 Existing Water System Hydraulic Profile ............................................................................................. 2-11
Figure 3-1 Study Area ............................................................................................................................................. 3-8
Figure 3-2 Existing Service Area Land Use .............................................................................................................. 3-9
Figure 3-3 Future Developments .......................................................................................................................... 3-10
Figure 3-4 Future Study Area Land Use ................................................................................................................ 3-11
Figure 8-1 Proposed Zone Modification ............................................................................................................... 8-11
Figure 8-2 Proposed Zone Modification Boundary .............................................................................................. 8-12
Figure 8-3 Future Water System Hydraulic Profile ............................................................................................... 8-13
Figure 9-1 Cienega Valley Water System ................................................................................................................ 9-4
Figure 10-1 First Priority Project No. 1: Park Hill Boosted Zone ........................................................................... 10-7
Figure 10-2 First Priority Project No. 2: San Felipe Road Pipeline/Airport-Industrial Area.................................. 10-8
Figure 10-3 First Priority Project No. 3: Middle Zone Boundary Modification ..................................................... 10-9
Figure 10-4 First Priority Project No. 4: East Street ............................................................................................ 10-10
Figure 10-5 First Priority Project No. 5: Walnut Lane ......................................................................................... 10-11
Figure 10-6 First Priority Project No. 6: Park Hill Tanks Operations & Maintenance ......................................... 10-12
Figure 10-7 Second Priority Project No. 1: East Airport Industrial ..................................................................... 10-13
Figure 10-8 Second Priority Project No. 2: Suiter Street .................................................................................... 10-14
Figure 10-9 Second Priority Project No. 3: South Street .................................................................................... 10-15
Figure 10-10 Second Priority Project No. 4: Monterey Street ........................................................................... 10-16
Figure 10-11 Second Priority Project No. 5: Powell Street ................................................................................. 10-17
Figure 10-12 Second Priority Project No. 6: Hazel Street ................................................................................... 10-18
Figure 10-13 Second Priority Project No. 7: North Airport-Industrial ................................................................ 10-19
Figure 10-14 Third Priority Project No. 1: West Street ...................................................................................... 10-20
Figure 10-15 Third Priority Project No. 2: Park Street ........................................................................................ 10-21
Figure 10-16 Third Priority Project No. 3: Locust Avenue .................................................................................. 10-22
Figure 10-17 Third Priority Project No. 4: Hamilton Court ................................................................................. 10-23
Figure 10-18 Third Priority Project No. 5: Quail Run .......................................................................................... 10-24
Figure 10-19 Third Priority Project No. 6: Ball Court .......................................................................................... 10-25
Figure 10-20 Third Priority Project No. 7: Brandy Court .................................................................................... 10-26
Figure 10-21 Third Priority Project No. 8: Replace 4-, 6-, and 8-inch Cast Iron ................................................. 10-27
Figure 10-22 Third Priority Project No. 9: Replace 10-inch and 12-inch Cast Iron ............................................. 10-28
Figure 10-23 Third Priority Project No. 10: Replace 16-inch Cast Iron ............................................................... 10-29
Figure 10-24 Third Priority Project No. 11: Replace 4-inch PVC ......................................................................... 10-30
LIST OF APPENDICES
Appendix A – Memorial Booster Station Pump Curve
Appendix B – Fire Hydrant Test Result
Appendix C – Water Model Results
Appendix D – Exhibits
Page v
List of Acronyms
ADD Average Day Demand AMBAG Association of Monterey Bay Area Government AWWA American Water Works Association CCR Consumer Confidence Report CEQA California Environmental Quality Act CIP Capital Improvement Projects City City of Hollister Compliance Plan Hexavalent Chromium Compliance Plan for Groundwater Supply County San Benito County CVP Central Valley Project D/DBP Disinfection Byproducts DI Ductile Iron DDW Division of Drinking Water E.I.T. Engineering In Training EIR Environmental Impact Reports ENR Engineering New Record EPA Environmental Protection Agency ESRI Environmental Systems Research Institute FPS Feet per Second Ft Feet GAC Granular Activated Carbon GIS Geographic Information System GPD Gallons Per Day GPCD Gallons Per Capita Per Day GPM Gallons Per Minute HAA5 Haloacetic Acids LF Linear Feet MCL Maximum Contaminant Level MDD Maximum Day Demand MG Million Gallons MGD Million Gallons Per Day MF Multi-Family N/A Not Available ND Negative Declarations P.E. Professional Engineer PHD Peak Hour Demand PPB Parts Per Billion PRV Pressure Reducing Valve PVC Polyvinyl Chloride RDWWTP Regional Domestic Wastewater Treatment Plant RWQCB Regional Water Quality Control Board SBCWD San Benito County Water District SCADA Supervisory Control and Data Acquisition
Page vi
SDWIS Safe Drinking Water Information System SFD Single Family Development SSCSMPU Sanitary Sewer Collection System Master Plan Update SSCWD Sunnyslope County Water District SWRCB State Water Resources Control Board TTHM Total Trihalomethane UAW Unaccounted-for-Water UFC Uniform Fire Code WDSMP Water Distribution System Master Plan
Page vii
List of References
1. Association of Monterey Bay Area Governments Regional Growth Forecast, 2014
2. California Code of Regulations, Title 22.
3. California State Board Safe Drinking Water Information System, 2018.
4. City of Hollister, annual and monthly water consumption data. 2015-2017.
5. City of Hollister, Consumer Confidence Reports, 2009-2017
6. City of Hollister, Engineering Standards, 1992.
7. City of Hollister, Engineering Standard Details, 2013.
8. City of Hollister, General Plan, 2005.
9. City of Hollister, Sanitary Sewer Collection System Master Plan Update, 2018.
10. County of San Benito, GIS Data, 2017.
11. Fire Hydrant Testing conducted April 2018.
12. Hollister Urban Area Water and Wastewater Master Plan, 2008.
13. Hollister Urban Area Water and Wastewater Master Plan Update, 2017.
14. McGraw Hill ENR Construction Cost Index of 11069, June 2018.
15. Metcalf & Eddy design handbook “Wastewater Engineering, Treatment and Reuse, Fifth Addition”, 2014.
16. Personal Communication with Danny Hillstock, City Engineer and Henry Gonzalez, Utilities
Supervisor.
17. Personal Communication with Don Ridenhour, SSCWD General Manager and Rob Hillebrecht, SSCWD Assistant Engineer.
18. Pump Curve provided by City of Hollister.
19. San Benito County 2035 General Plan, 2015.
20. SSCWD-Hollister Intertie Description, 2011.
21. United States Bureau of the Census, 2017.
ES-1
EXECUTIVE SUMMARY This report presents the Water Distribution System Master Plan (WDSMP) for the City of Hollister (City). The City is located in San Benito County (County), 40 miles east of the City of Monterey and 30 miles north of Salinas. The City is intersected by State Highways 156 and 25. The City is governed by a City Council made up of a Mayor, Mayor Pro Tempore, and three council members. The City is currently responsible for the maintenance and operation of the City’s water distribution system. The City owns and operates approximately 90 miles of water mains for transmission and distribution within the City's water service area boundary.
INTRODUCTION The City supplies water service and fire suppression to approximately half of the City residents on the western half of the City. The rest of the City is served by Sunnyslope County Water District (SSCWD). The City owns and operates the water transmission and distribution system within the City's water service area boundary. Preparation of the WDSMP will assist the City in prioritizing both current and future water system needs and set forth a mechanism for addressing those needs. The WDSMP does the following:
1. Addresses existing deficiencies within the water distribution system based on today’s standards and requirements;
2. Addresses deficiencies within the water distribution system to meet future build-out needs; and 3. Provides a prioritized capital improvement program and list of recommended projects to address
existing deficiencies and future needs.
On August 21, 2017, the City authorized Wallace Group to prepare a comprehensive Water Distribution System Master Plan. The Water Distribution System Master Plan was prepared in accordance with Wallace Group’s proposal dated May 12, 2017, and includes analyses of the City’s current and projected water demands, evaluation of the water distribution system and storage facilities, and a prioritized capital improvement program. This Water Distribution System Master Plan is presented in ten chapters, summarized as follows: Chapter 1: Introduction. This chapter presents an overview of the goals of this report, authorization and scope of work, and acknowledgement of the various staff and personnel involved in the preparation of this document. Chapter 2: Water Distribution System. This chapter presents an overview of the City’s existing water distribution system, which consists of approximately 90 miles of water mains ranging in diameter from 4-inch to 18-inch. This chapter also includes a discussion of the five pressure zones within City limits—three pressure zones within the City’s service area and two pressure zones within SSCWD’s service area. Both the City system and SSCWD system are interconnected through multiple PRVs and interties. Chapter 3: Land Use and Population. This chapter focuses on the City’s General Plan, service and study area boundaries, land uses, existing and future population projections and other considerations pertinent to projecting the City’s existing and future water demands. The existing population within the City’s water service area is estimated at 22,940 persons using the population density factors presented in the City’s Sanitary Sewer
ES-2
Collection System Master Plan Update (SSCSMPU). The total estimated future population for the study area is 42,133 persons. This future projection is based on future developments identified by the City and SSCSMPU population density factors. This population will likely not occur by the City’s 2023 planning horizon; however, it does represent a conservative estimate if all potential future development that the City has identified were to occur. Chapter 4: Water Demand. This chapter provides an analysis and summary of the City’s existing and future water demands, based on planning/demographic information presented in Chapter 3 and metered consumption and production records provided by the City. These water demands form the basis of the recommendations for recommended capital improvements within the distribution system. The City’s existing average day demand (ADD) is 1,752 gallons per minute (gpm), with an estimated future average day demand of 2,893 gpm. Chapter 5: Water Supply Overview. This chapter presents an overview of the City’s water supply portfolio. An analysis of the reliability and adequacy of the City’s water supply was not a part of the scope for this report. The City obtains its water supply from both groundwater and surface water. Three groundwater wells operate within City limits and two groundwater wells feed the Cienega Valley. Additionally, surface water is imported from the Central Valley Project via the Hollister Conduit and treated at either the Lessalt Water Treatment Plant or West Hill Water Treatment Plant, both owned by San Benito County Water District (SBCWD) and operated by SSCWD. The Crosstown Pipeline Project currently transports West Hills treated water to blend with the groundwater at City Wells No. 4 and No.5. The second phase of the project, anticipated to be brought online in 2019, will distribute West Hills treated water to blend with the groundwater at City Well No. 2, and two other locations in SSCWD’s service area. Chapter 6: Water Storage. This chapter describes the existing and projected water storage requirements for the City. The City owns and operates two (2) water storage tanks at Park Hill. The older Park Hill tank (Park) has a capacity of 2.0 million gallons (MG) and the newer Park Hill tank (Vista) has a capacity of 3.5 MG. The City also owns and operates the 0.5 MG Sally Flats Reservoir, which is located south of the City’s boundary and only serves Riverview Estates (Cienega Water System). These storage facilities were evaluated for emergency, fire, and operational needs. It was determined that in existing conditions, the City has a storage surplus of approximately 539,480 gallons; however, in future conditions, the City has a storage deficit of approximately 2.9 million gallons. It is recommended that the City evaluate future storage from a regional perspective, including SSCWD’s storage facilities. Chapter 7: Water Pump Stations. This chapter provides an overview of Memorial Booster Station. This booster station transfers water from the City Low Zone to the City and SSCWD Middle Zone. With the completion of the Crosstown Pipeline Project, Memorial Booster Station will be used for emergency operations only. This chapter is for the City’s informational purposes as there are no pump station recommendations or improvements. Chapter 8: Water Distribution System Analysis. This chapter presents the hydraulic model that was developed and calibrated to analyze the City’s water distribution system under existing and future conditions. The design requirements used to determine any deficiencies in the water distribution system relate to the fire flow and pressure delivered by the system to the customers. The flow requirements examined in the hydraulic model include average day demand, peak hour demand, and fire flow plus maximum day demand. This chapter identifies the water systems that did not meet design standards and the recommended upgrades to bring the system into compliance.
Chapter 9: Cienega Valley Water System. This chapter describes the Cienega Valley Water System, which is owned and operated by the City, but separate from the City’s existing distribution system. The City’s Cienega
ES-3
zone is served by the Sally Flats Reservoir and feeds directly into a small-housing development just south of City limits, Riverview Estates. In the model, it was determined that the separate Cienega water system has no existing or future deficiencies; and therefore, no improvement projects were identified for the area. Chapter 10: Summary of Recommendations. This chapter presents the capital improvement program (CIP), which identifies required Near Term and Long Term water distribution system improvements, including capital costs. This CIP will be used by the City as a strategic planning tool to forecast needed capital budgets for anticipated water distribution system improvements.
WATER SYSTEM DESIGN CRITERIA The State Water Resources Control Board’s (SWRCB) Division of Drinking Water regulates the requirements for minimum system pressures within a water distribution system. Per the existing Waterworks Standards, Chapter 16, Section 64602, last updated on April 10, 2017:
a) Each distribution system shall be operated in a manner to assure that the minimum operating pressure in the water main at the user service line connection throughout the distribution system is not less than 20 pounds per square inch (psi) at all times.
b) Each new distribution system that expands the existing system service connections by more than 20 percent or that may otherwise adversely affect the distribution system pressure shall be designed to provide a minimum operating pressure throughout the new distribution system of not less than 40 pounds per square inch (psi) at all times excluding fire flow.
Ideally, normal operating (static) pressures should be within the range of 40 to 80 psi. This is the range that most people find comfortable and will serve most fire sprinkler systems. For the existing system, the design criteria for this WDSMP is to recommend average day, maximum day, and peak hour pressures to be no less than 40 psi. This falls in line with SWRCB’s intention for all new water distribution systems or systems that are still expanding. Per the 1992 City Standards, the required fire flow rates are to be determined with a minimum of 20 psi residual pressure within all portions of the water distribution system. To analyze the system for its ability to meet this requirement, the maximum fire flow at each hydrant (based on the structure type) is modeled to verify that the minimum pressure at all nodes in the system does not drop below 20 psi while the hydrant is flowing.
WATER SYSTEM MODEL DEVELOPMENT A computer based hydraulic model was developed using computer program WaterCAD V8i by Bentley Systems Inc. Elevation, pipe diameter, and material data for the distribution system were obtained using the City’s contour data, existing water model created by HDR, data from the City’s InfraMap, and input from City staff. The hydraulic model was calibrated using field hydrant testing that was conducted on April 19, 2018. Different areas of the city were broken up into zones and analyzed in the model by simulating the field fire flow tests and comparing the resulting modeled pressures with those observed in the field. Adjustments to pipe friction factors (Hazen-Williams coefficient) were made in to calibrate each zone. Each zone was calibrated to within +/- 5 psi of the fire hydrant tests conducted.
ES-4
EXISTING SYSTEM PERFORMANCE The performance of the City’s water distribution system was evaluated under existing conditions based on the current pressure zone configuration. The model was evaluated under Average Day Demand (ADD), Peak Hour Demand (PHD), and Fire Flow plus Max Day Demand (MDD) to identify where the deficiencies are within each zone. The following provides a description of the water systems that did not meet design standards and the recommended upgrades to bring the system into compliance. The City has two distinct areas that were identified to have pressures under 40 psi during either ADD or PHD conditions. These locations are as follows:
Park Hill: The houses on Hill Court and Hill Street have pressures between 30-40 psi during ADD, MDD, and PHD. Additionally, the existing water main on Park Hill is unable to provide between 25-50% of the required fire flow. DeNova Homes/Allendale development is currently under construction immediately north at the base of Park Hill. This development requires a new booster station to deliver potable water from the existing City Low Zone to high point in the Allendale Development. To increase pressure and fire flow at Park Hill it is recommended to construct a new 12-inch PVC water main that begins at the discharge of the Allendale booster station and extends approximately 2,500 feet to connect to the existing water mains supplying the houses on Hill Court and Hill Street. Low Pressure Area: Under PHD, the southerly portion of City limits experiences system pressures that are less than 40 psi. It is recommended that the City modify the Middle Zone Boundary via closed valves or PRV to increase the pressures in the deficient area of the City. The new City Middle Zone would extend from Cienega Road to Memorial Drive, and be bounded by Bundeson Drive, Cushman Street, Tres Pinos Road, a portion of McCray Street, and Hillcrest Road.
The water system upgrades provided below are based on the proposed zone modification. If the City chooses not to modify the distribution zones, additional CIPs may be required and some of the proposed CIPs may no longer be necessary. Additional analysis should be completed to quantify the impacts of not modifying the zones. The following projects are recommended for the City’s existing system. The following upgrades proposed were a result of existing fire flows that were less than 50% of the required fire flow:
East Street: Replace approximately 700-feet of 6-inch cast iron to 8-inch PVC on East Street from South Street to Hawkins Street. Walnut Lane: Replace approximately 850-feet of 6-inch cast iron to 8-inch PVC on Walnut Lane from Powell Street to the end of the cul-de-sac.
The following upgrades proposed were a result of existing fire flow’s that were between 50% and 75% of the required fire flow:
Airport-Industrial: The industrial buildings near the Hollister Municipal Airport are currently served by one 12-inch water main along San Felipe Road. This results in several issues for the industrial area.
ES-5
First, this long, single water main is unable to provide between 50-75% of required fire flow for industrial areas. Second, if this water main were to break, the entire industrial area would be without water until the water main is repaired. Last, the City experiences water quality issues in the industrial area because there are several long dead-end water mains and no looping back to the main part of the City. To increase fire flows and reliability in the industrial area, it is recommended to construct two projects in the airport area:
o The first project would be to construct approximately 5,350 feet of 16-inch DI water main parallel to the existing water main on San Felipe Road. The new pipe would start at the intersection of Chappell Road and San Felipe Road and connect to the existing water main on McCloskey Road. From there the existing water main extends North approximately 700-feet, then the new pipe connects at this location and continues along San Felipe Road to connect and end to the crossing water main at Flynn Road. This new pipe will offer additional supply and redundancy to the airport-industrial area. It is recognized that the Airport-Industrial area has routinely experienced high Total Trihalomethane (TTHM) and Haloacetic Acids (HAA5). With the addition of the 16-inch main along San Felipe Road, a regular flushing program will be required to address the water quality issue in this area. Additionally, the 2017 Hollister Urban Area Water and Wastewater Master Plan Update identifies a potential new well and treatment facility in this northern airport area, which will provide high quality water for this area. This proposed water supply source is supported as a long-term water system improvement to help support future growth, improve water quality and reliability in the Airport Area. This source of water should be brought into the water distribution system at the same hydraulic grade as the existing City Low Zone.
o The second project would be to construct approximately 2,250 feet of 12-inch PVC to loop the
west side of the City’s existing system in the airport/industrial area. This new water main would begin at the intersection of Flynn Road and Highway 25, continue northwest along APN 019-020-015, continue along APN 053-420-034 boundary, and connect to the existing 12-inch pipe on Airway Drive.
Note: There are additional routing alternatives that can be explored based on future development and looping alternatives; however, it is unknown when future development will occur, and this is a high priority deficiency within the City’s water system. Adding a parallel 16-inch water main along San Felipe Road will impact water quality negatively but will provide significant benefit for reliability and fire protection. The City should continue to pursue with SBCWD an alternative water supply source to the north of the City that can also supply the airport area more effectively. Additionally, the City should continue to pursue ways to loop the Airport system to eliminate all long dead-end water mains. East Airport-Industrial: Construct new approximately 3,370 feet of 8-inch PVC parallel to the private water line on Park Center Drive and the adjacent west and north easements of the adjacent agriculture lots (APN 019-050-005 and APN 019-050-003) to connect to the existing 12-inch water main on Shelton Drive. Note: It is recommended that the City acquire the private water main along Park Center Drive to reduce construct costs. The fire flows identified at the end of Park Center Drive (50%-75%) are with both the Airport-Industrial Upgrade completed. Completion of this project will loop the west side of the City’s existing system in the Airport/Industrial area.
ES-6
Suiter Street: Construct new approximately 290 feet of 8-inch PVC at North Suiter Street Alley from Suiter Street to Powell Street. South Street: Replace approximately 1,040 feet of 6-inch cast iron to 8-inch PVC on South Street from Line Street to College Street. Monterey Street: Replace approximately 1,250 feet of 4-inch cast iron to 8-inch PVC on Monterey Street from Hawkins Street to B Street. Powell Street: Replace approximately 670 feet of 6-inch cast iron to 8-inch PVC on Powell Street from C Street to Nash Road. Hazel Street: Complete the following projects:
o Replace approximately 945 feet of 8-inch cast iron to 8-inch PVC on Hazel Street from Prospect Avenue to Sally Street
o Replace approximately 710 feet of 8-inch cast iron to 8-inch PVC on Railroad Avenue o Construct new approximately 380 feet of 8-inch PVC and connect to new 8-inch main on
Railroad Avenue; extend new main to the intersection of Hazel Street and Sally Street North Airport-Industrial: To further address the water quality issue in the Airport-Industrial area, it is recommended that the City construct the following projects:
o Construct approximately 2,630 feet of 12-inch PVC to connect at the existing water main on Bert Drive, follow the southern boundary of APN 014-120-015, down San Felipe Road, and connect to the existing water main on Armory Drive.
o Construct approximately 1,920 feet of 12-inch PVC to connect at the existing water main along the western service road at the airport, follow APN 053-420-003 and APN 053-420-002 western boundaries to connect to the proposed 12-inch water main identified in the second project of Airport-Industrial.
The following upgrades proposed were a result of existing fire flows that were between 75% and 100% of the required fire flow:
West Street: Replace approximately 1,200 feet of 8-inch cast iron to 8-inch PVC on West Street from B Street to Nash Road Park Street: Replace approximately 380 feet of 4-inch cast iron to 8-inch PVC on Park Street from Sally Street to Prune Street. Locust Avenue: Replace approximately 880 feet of 4-inch PVC to 8-inch PVC on Locust Avenue from Central Avenue to College Street. Hamilton Court: Replace approximately 480 feet of 8-inch PVC to 12-inch on Hamilton Court at Shelton Drive. Note: the fire flow identified (75%-100%) is with the Airport-Industrial Upgrade completed. Quail Run: Replace approximately 720 feet of 6-inch PVC to 8-inch PVC on Quail Run at Nash Road.
ES-7
Ball Court: Replace the existing water main on Ball Court serving the East side of Felice Drive. To accommodate potential future growth on the vacant lot on the west side of Felice Drive at Piane Crate, it is also recommended that this existing water main be upgraded. The overall recommendation includes upgrading approximately 510 feet of 6-inch PVC to 8-inch PVC on Ball Court at Felice Drive. Brandy Court: Replace approximately 220 feet of 4-inch PVC to 8-inch PVC on Brandy Court at Buena Vista Road.
MASTER PLAN IMPROVEMENT PROJECT RANKING AND COSTS First, Second, and Third Priority Master Plan Improvement Projects were ranked to determine what priority the recommended projects should be constructed. The ranking was based on severity of the deficiency and the size of the community the deficiency impacts. Exhibit 1 in Appendix D illustrates the location of each of the proposed Maser Plan Improvement Projects. These tables also provide estimates of the construction and “soft”costs for each project. The project costs are based on engineering judgment, confirmed bid prices for similar work in the San Benito County area, consultation with vendors and contractors, established budgetary unit prices for the work, and other reliable sources. All CIP costs are expressed in Year 2018 dollars, using McGraw-Hill ENR Construction Cost Index of 11069 (June 2018). Operations and Maintenance Improvement Projects Additional to the Capital Improvement Program, there are multiple recommended operations and maintenance improvement projects. The recommendations will optimize the City’s water distribution system and storage facilities. The operations and maintenance improvement projects identified in the report are as follows:
Water Meter Calibration: City to routinely calibrate and replace water meters. Park Hill Tanks: City to add a mixing system to Park Hill Tank #2 (Vista) and perform a dive-inspection of both tanks to determine the next interior coating project. Every 5 years, the City should complete an external tank coating inspection, and every 10-15 years, the City should complete an external tank coating. Hydrant Spacing: It is highly recommended that the City update their standards for fire hydrant spacing and conduct a fire hydrant spacing study within 2 years. Valve Spacing: It is highly recommended that the City update their standards for valve spacing and conduct a valve spacing study within 2 years. Additionally, every year the City should implement or maintain a valve exercise program.
1-1
CHAPTER 1 INTRODUCTION
This report presents the Water Distribution System Master Plan (WDSMP) for the City of Hollister (City). The City supplies water service and fire suppression to approximately half of the City residents on the western half of the City. The rest of the City is served by Sunnyslope County Water District (SSCWD). As new development projects are constructed, it is the City’s goal to construct water improvements to meet the current and ultimate needs within the City’s service boundary. In order to facilitate this goal, and to adequately plan for the capital resources needed, the City commissioned this comprehensive Water Distribution System Master Plan that evaluates all aspects of the City’s water distribution system and its ability to meet the current and long-term needs of the portion of the City that it serves.
Preparation of the WDSMP will assist the City in prioritizing both current and future water system needs and set forth a mechanism for addressing those needs. The WDSMP does the following:
4. Addresses existing deficiencies within the water distribution system based on today’s standards and requirements;
5. Addresses deficiencies within the water distribution system to meet future build-out needs; and 6. Provides a prioritized capital improvement program and list of recommended projects to address
existing deficiencies and future needs.
BACKGROUND The City is located in San Benito County (County), 40 miles east of the City of Monterey and 30 miles north of Salinas. The City is intersected by State Highways 156 and 25. The City’s residents are provided water service by both the City of Hollister and the SSCWD. The City is governed by a City Council made up of a Mayor, Mayor Pro Tempore, and three council members. The City is currently responsible for the maintenance and operation of the City’s water distribution system.
ENVIRONMENTAL REVIEW In accordance with Title 14, California Code of Regulations, Chapter 3, Article 18 (Statutory Exemptions), this WDSMP is considered a planning study and therefore adoption of this document is exempt from the requirements to prepare Environmental Impact Reports (EIR) or Negative Declarations (ND). However, on a project-specific basis, the California Environmental Quality Act (CEQA) must be satisfied for any major capital improvement projects described in this report that will be implemented by the City in the future, through the preparation of an appropriate EIR or ND.
AUTHORIZATION AND SCOPE OF WORK On August 21, 2017, the City authorized Wallace Group to prepare a comprehensive Water Distribution System Master Plan. The Water Distribution System Master Plan was prepared in accordance with Wallace Group’s proposal dated May 12, 2017. A summarized scope of work is as follows:
1-2
1. Kick-Off Meeting, Project Review Meetings, Field Reviews and Operation Staff Interviews: Coordinate and attend a kick-off meeting with key Team members and City staff. Immediately following the meeting, conduct an interview with the City’s operations staff and an initial field investigation of the City’s water tanks and pump stations to understand layouts and system operations.
2. Existing Data Collection: Obtain and review documents that will provide an understanding of the City’s current water operations. City staff will provide the needed population projections based on City land use and zoning, General Plan and other planning information including water usage and land use data.
3. GIS Atlas Map: Create a water distributions system GIS database and prepare atlas maps using a grid system. GIS dataset developed in an Environmental Systems Research Institute (ESRI) compatible Geometric Network.
4. Preliminary Findings Memorandum: Prepare a description and general inventory of the water, storage and distribution system based on review of plans, reports, and studies and other City records, visits with staff, and field inspections. We will document all parts of the existing water supply, storage and distribution system, including facilities, condition of equipment and system components, processes, and hydraulic requirements for existing water sources (water supply wells), reservoirs/storage tanks, booster pump stations, pressure zones, and distribution/transmission pipelines; document capital improvements and system expansions completed over the past 10-20 years, based on record drawings and other detailed information provided by City staff; and document compliance requirements for the City’s operating permit issued by the State Division of Drinking Water (formerly Department of Health Services).
5. Water Model Development and Calibration: Utilize present and future water demand information to model and determine water distribution system improvements including upsizing pipe sizes, addition of new water mains to transport flows through the system within appropriate pressure levels to all areas within the system.
6. Water Storage and Supply Evaluation: Identify current and future water reservoir storage requirements for operational (peak demand), emergency, and fire storage. Wallace Group will coordinate with the City, the City Fire Department (if required), and use the current Uniform Fire Code to ascertain, update and confirm fire flow requirements throughout the service area.
7. Develop Capital Improvement Program: Evaluate the existing Water Distribution System and identify hydraulic deficiencies with maintenance and mitigation recommendations and identify the discrete system improvements needed to correct the deficiencies based upon Master Plan projected growth, and system design criteria. We will identify capital improvements to water supply, including potential need and timing for any additional reservoirs, pump stations, expanded waterline capacity, and recommendations for improvements to the existing SCADA systems. We will prepare a map of the water system and summary tables indicating the locations, functional data (size, material, etc.), estimated costs and implementation timeframes of the
1-3
improvements proposed for inclusion in the capital improvement plan. We will prepare a Capital Improvement Program (CIP), phased in Priority 1, 2, and 3 categories for recommended improvements, which can be used by the City to fiscally plan over the next 15 to 20 years. The projects will be ranked. The cost for these improvements will be prepared based on Engineer’s Estimates of Probable Costs, referencing the current ENR Indices. This will allow the City to project future CIP costs from the date of the report to the current fiscal year the capital improvement will be implemented.
8. Prepare Water Distribution System Master Plan Report: Prepare the Water Distribution System Master Plan. Wallace Group will prepare a Draft, Draft-Final for City Council approval and a Final Report.
1-4
ACKNOWLEDGEMENTS Wallace Group thanks and gratefully acknowledges the City of Hollister, Sunnyslope County Water District, and San Benito County Water District staff for their efforts, involvement, input and assistance in preparing the WDSMP: City of Hollister
Bryan Swanson, Development Services Director Danny Hillstock, P.E., City Engineer Abraham Prado, Development Services Henry Gonzales, Utility Supervisor Michael Grzan, Utility Technician
Sunnyslope County Water District
Don Ridenhour, P.E., General Manager Jim Filice, Water/Wastewater Superintendent Rob Hillebrecht, P.E., Assistant Engineer
San Benito County Water District Garrett Haertel, P.E., Deputy District Engineer
The WDSMP was completed with the efforts of many team members. They include: Wallace Group
Kari Wagner, P.E., Director of Water Resources Steve Tanaka, P.E., Principal Civil Engineer Valerie Huff, P.E., Senior Civil Engineer Kyle Anderson, P.E., Civil Engineer Andrea Kingsbury, E.I.T., Associate Engineer Jeff LeNay, GIS Specialist
2-1
CHAPTER 2 WATER DISTRIBUTION SYSTEM OVERVIEW
Chapter 2 describes the features of the City’s water distribution system as a general overview. All figures are located at the end of this chapter.
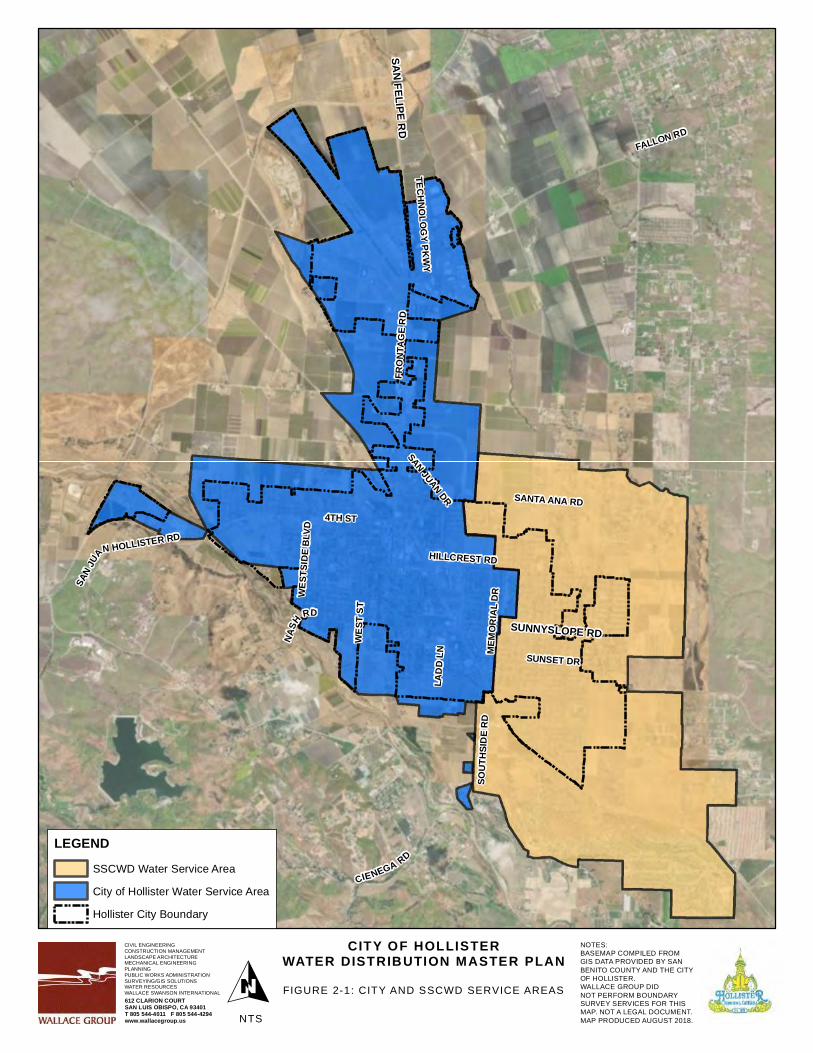
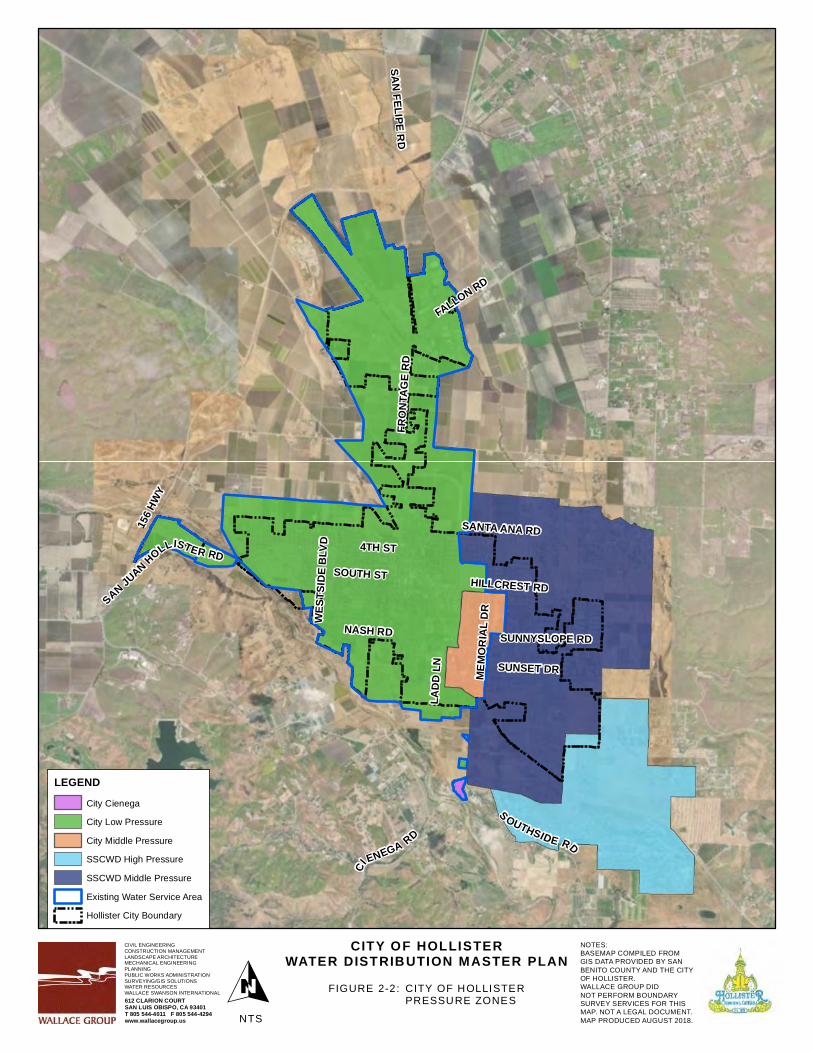
INTRODUCTION Water service to the residents of the City of Hollister is provided by two water agencies, the City and Sunnyslope County Water District (SSCWD). Figure 2-1 illustrates the City’s boundary and outlines the current water service areas for both the City and SSCWD. The City serves the western portion of the City of Hollister, which is split into three (3) zones: the City’s Low Pressure Zone, the City’s Middle Pressure Zone, and the City’s Cienega Pressure Zone. SSCWD serves the eastern portion of the City which is split into two (2) zones: SSCWD’s Middle Pressure Zone, which has the same hydraulic grade as the City’s Middle Pressure Zone, and SSCWD’s High Pressure Zone. Figure 2-2 displays each of the five pressure zones.
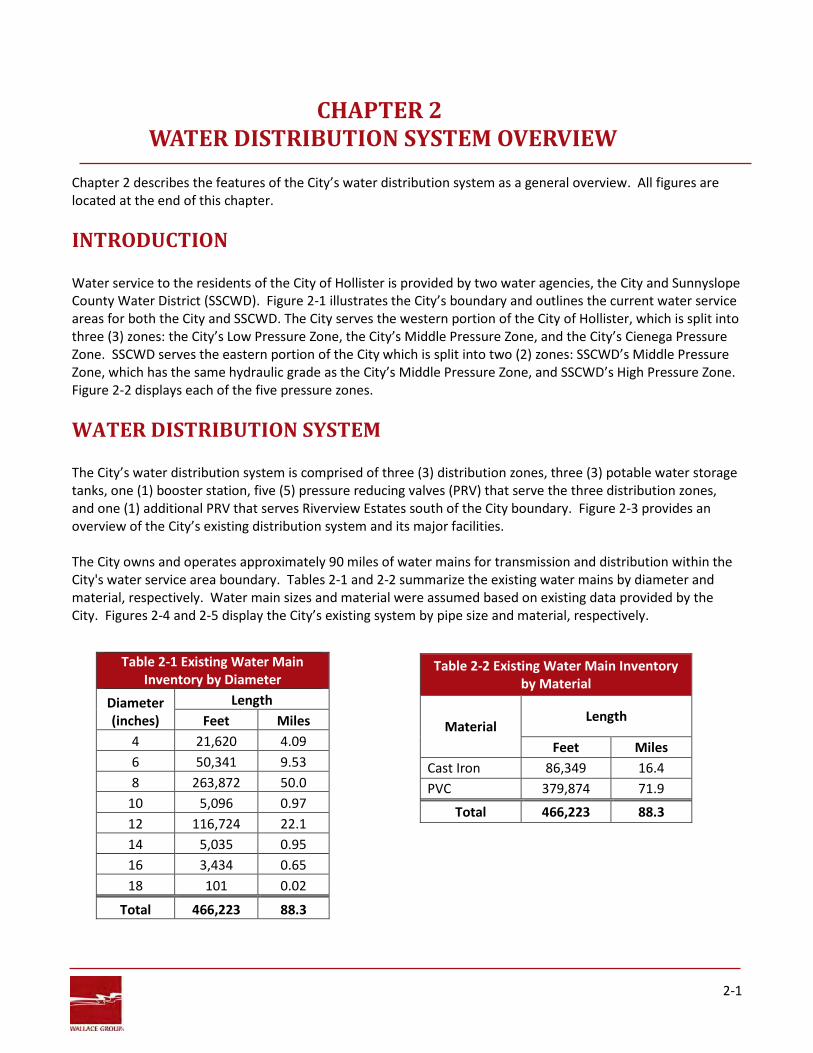
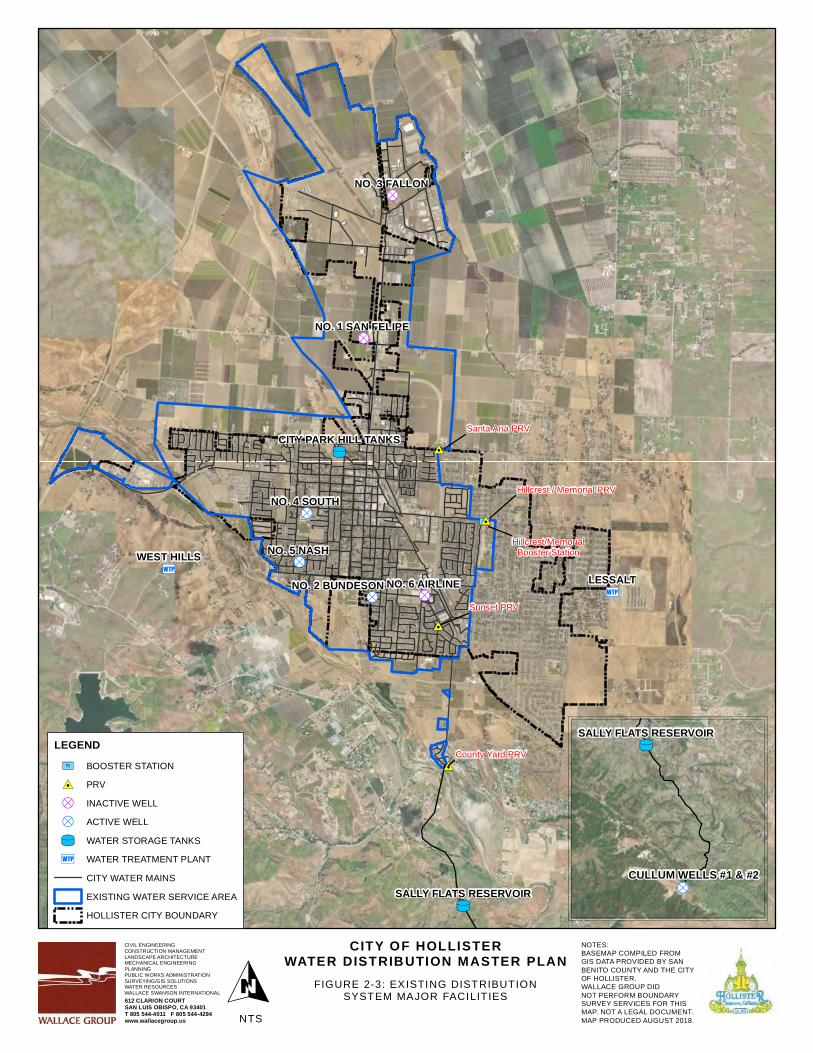
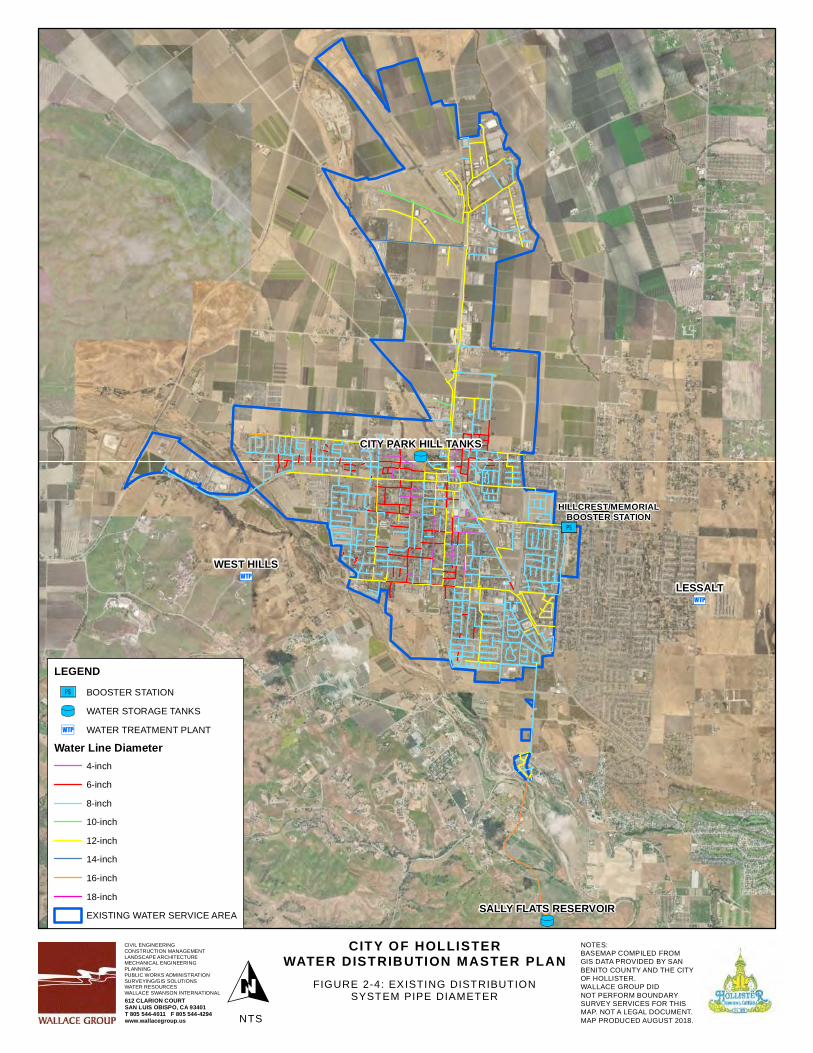
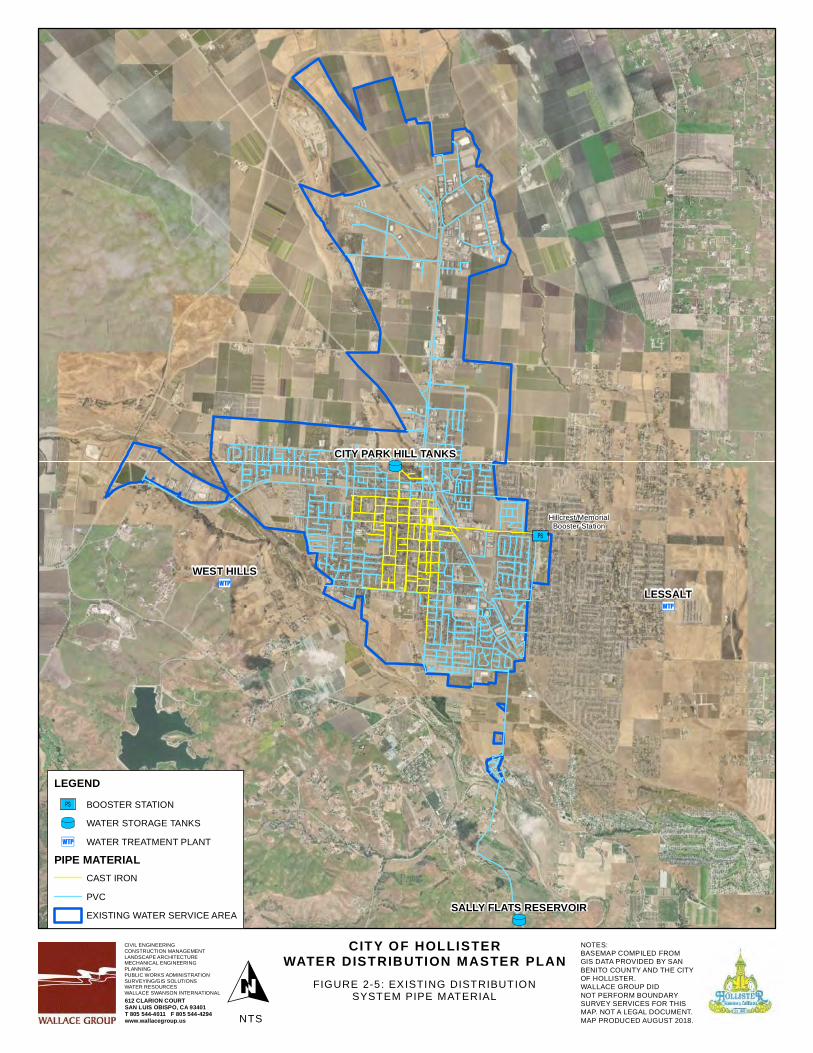
WATER DISTRIBUTION SYSTEM The City’s water distribution system is comprised of three (3) distribution zones, three (3) potable water storage tanks, one (1) booster station, five (5) pressure reducing valves (PRV) that serve the three distribution zones, and one (1) additional PRV that serves Riverview Estates south of the City boundary. Figure 2-3 provides an overview of the City’s existing distribution system and its major facilities. The City owns and operates approximately 90 miles of water mains for transmission and distribution within the City's water service area boundary. Tables 2-1 and 2-2 summarize the existing water mains by diameter and material, respectively. Water main sizes and material were assumed based on existing data provided by the City. Figures 2-4 and 2-5 display the City’s existing system by pipe size and material, respectively.
Table 2-1 Existing Water Main
Inventory by Diameter
Diameter (inches)
Length Feet Miles
4 21,620 4.09 6 50,341 9.53 8 263,872 50.0
10 5,096 0.97 12 116,724 22.1 14 5,035 0.95 16 3,434 0.65 18 101 0.02
Total 466,223 88.3
Table 2-2 Existing Water Main Inventory
by Material
Material Length
Feet Miles Cast Iron 86,349 16.4 PVC 379,874 71.9
Total 466,223 88.3
2-2
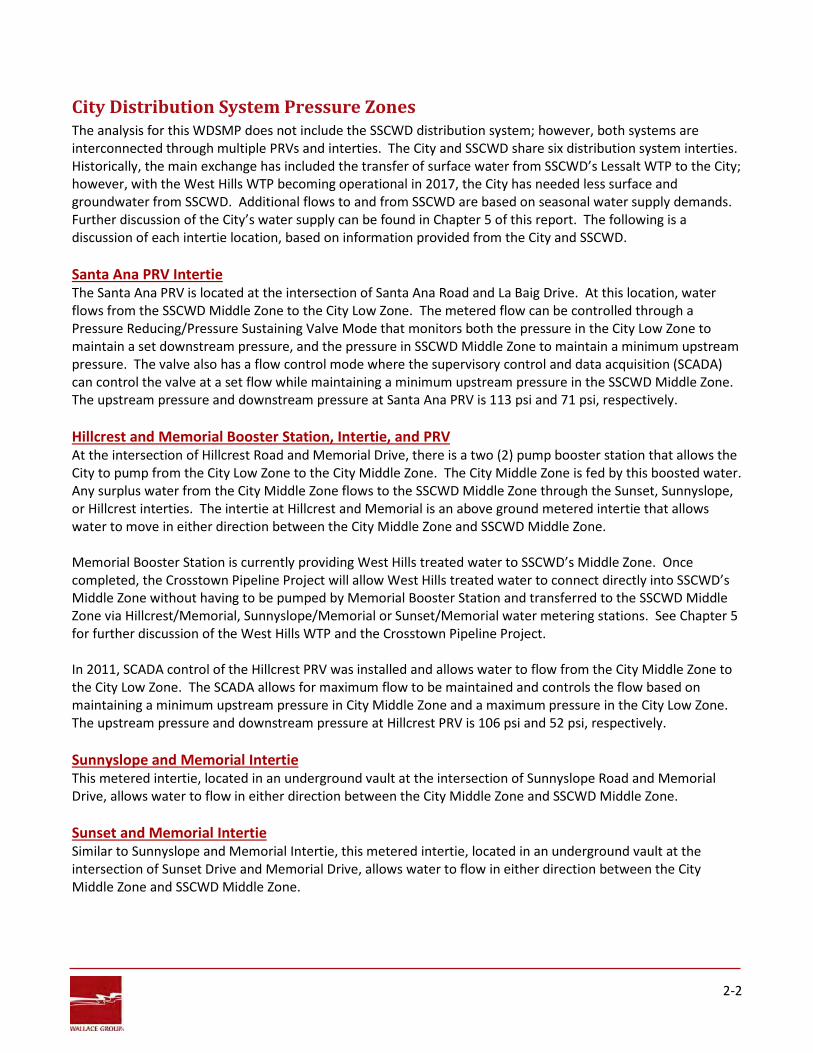
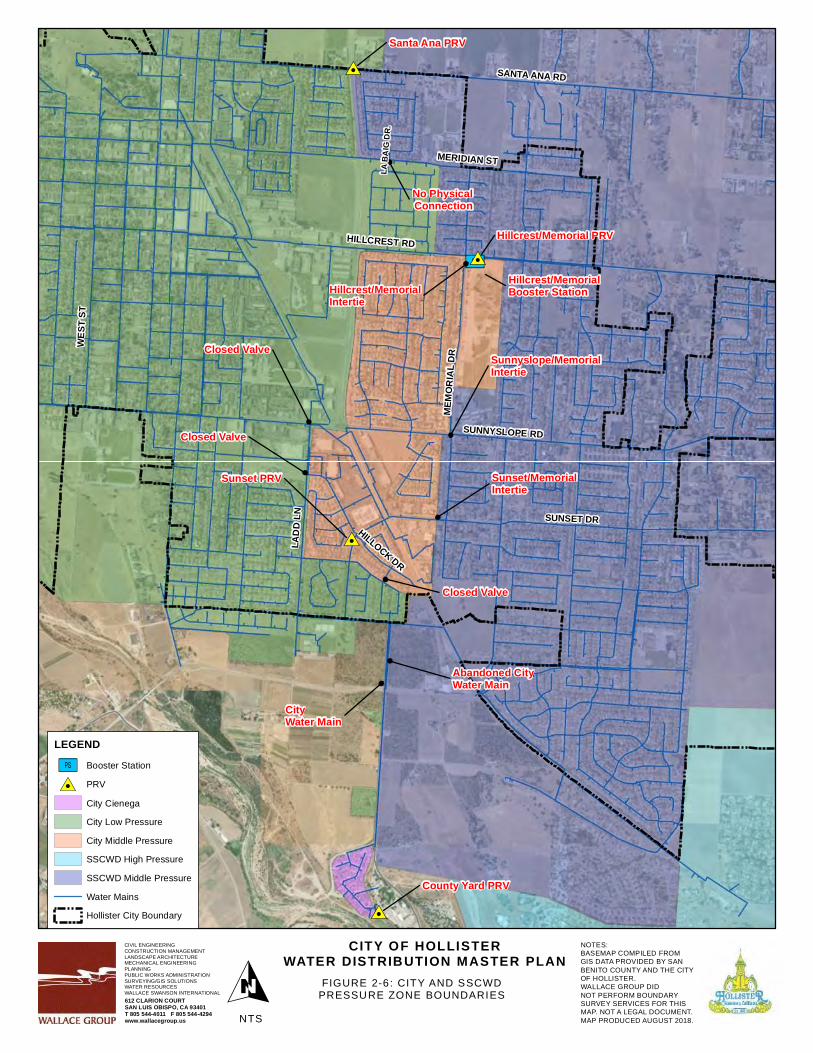
City Distribution System Pressure Zones The analysis for this WDSMP does not include the SSCWD distribution system; however, both systems are interconnected through multiple PRVs and interties. The City and SSCWD share six distribution system interties. Historically, the main exchange has included the transfer of surface water from SSCWD’s Lessalt WTP to the City; however, with the West Hills WTP becoming operational in 2017, the City has needed less surface and groundwater from SSCWD. Additional flows to and from SSCWD are based on seasonal water supply demands. Further discussion of the City’s water supply can be found in Chapter 5 of this report. The following is a discussion of each intertie location, based on information provided from the City and SSCWD. Santa Ana PRV Intertie The Santa Ana PRV is located at the intersection of Santa Ana Road and La Baig Drive. At this location, water flows from the SSCWD Middle Zone to the City Low Zone. The metered flow can be controlled through a Pressure Reducing/Pressure Sustaining Valve Mode that monitors both the pressure in the City Low Zone to maintain a set downstream pressure, and the pressure in SSCWD Middle Zone to maintain a minimum upstream pressure. The valve also has a flow control mode where the supervisory control and data acquisition (SCADA) can control the valve at a set flow while maintaining a minimum upstream pressure in the SSCWD Middle Zone. The upstream pressure and downstream pressure at Santa Ana PRV is 113 psi and 71 psi, respectively. Hillcrest and Memorial Booster Station, Intertie, and PRV At the intersection of Hillcrest Road and Memorial Drive, there is a two (2) pump booster station that allows the City to pump from the City Low Zone to the City Middle Zone. The City Middle Zone is fed by this boosted water. Any surplus water from the City Middle Zone flows to the SSCWD Middle Zone through the Sunset, Sunnyslope, or Hillcrest interties. The intertie at Hillcrest and Memorial is an above ground metered intertie that allows water to move in either direction between the City Middle Zone and SSCWD Middle Zone. Memorial Booster Station is currently providing West Hills treated water to SSCWD’s Middle Zone. Once completed, the Crosstown Pipeline Project will allow West Hills treated water to connect directly into SSCWD’s Middle Zone without having to be pumped by Memorial Booster Station and transferred to the SSCWD Middle Zone via Hillcrest/Memorial, Sunnyslope/Memorial or Sunset/Memorial water metering stations. See Chapter 5 for further discussion of the West Hills WTP and the Crosstown Pipeline Project. In 2011, SCADA control of the Hillcrest PRV was installed and allows water to flow from the City Middle Zone to the City Low Zone. The SCADA allows for maximum flow to be maintained and controls the flow based on maintaining a minimum upstream pressure in City Middle Zone and a maximum pressure in the City Low Zone. The upstream pressure and downstream pressure at Hillcrest PRV is 106 psi and 52 psi, respectively.
Sunnyslope and Memorial Intertie This metered intertie, located in an underground vault at the intersection of Sunnyslope Road and Memorial Drive, allows water to flow in either direction between the City Middle Zone and SSCWD Middle Zone. Sunset and Memorial Intertie Similar to Sunnyslope and Memorial Intertie, this metered intertie, located in an underground vault at the intersection of Sunset Drive and Memorial Drive, allows water to flow in either direction between the City Middle Zone and SSCWD Middle Zone.
2-3
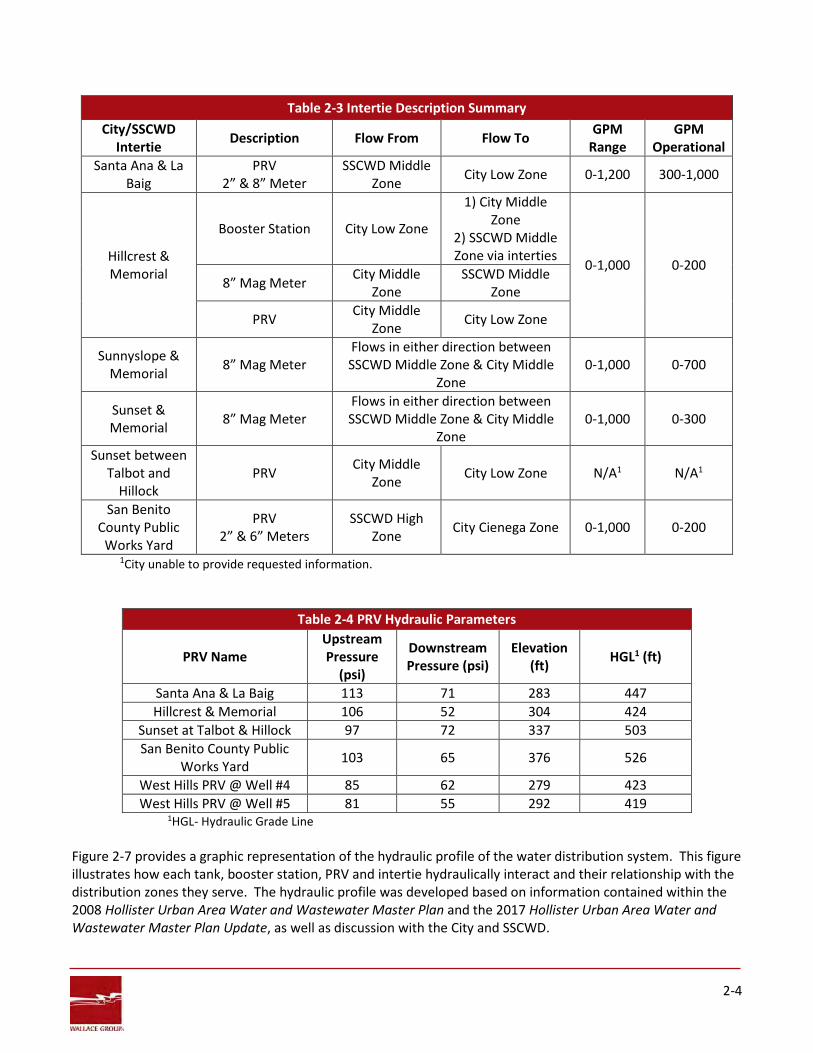
Sunset PRV at Talbot and Hillock The Sunset PRV is located on Sunset Drive between Hillock Drive and Talbot Drive. At this location, the City’s Middle Zone water flows to the City Low Zone, west of Ladd Lane. The upstream pressure and downstream pressure at Sunset PRV is 97 psi and 72 psi, respectively. San Benito County Yard PRV The City’s Cienega Zone is served by the City’s Sally Flats Reservoir, which has groundwater pumped from the City’s Cullum Wells No. 1 and No. 2 approximately 15 miles away from the reservoir. If Sally Flats Reservoir is unable to serve the Cienega Zone, then the San Benito County Yard PRV, located at the San Benito County Public Works Yard south of City limits, feeds water from the SSCWD High Zone to the City’s Cienega Zone. The metered flow can be controlled through a Pressure Reducing Pressure Sustaining Valve Mode that monitors both the pressure in the City Cienega Zone, to maintain a set downstream pressure, and the pressure in the SSCWD High Zone, to maintain a minimum upstream pressure. The upstream pressure and downstream pressure at San Benito County Yard PRV is 103 psi and 65 psi, respectively. Although the City owns and operates the Cienega Zone, the water system is not directly connected to the City’s existing distribution system. Further discussion of the Cienega water system can be found in Chapter 9 of this report. West Hills WTP to City Low Zone Connection West Hills WTP currently ties into the City’s distribution system at City Wells No. 4 and No. 5. At these connection points, there are Pressure Reducing/Pressure Sustaining valves which maintain a minimum pressure on the WTP transmission main and a maximum pressure in the City Low Zone. Flow entering the City’s system is regulated by these valves in order to meet set points from West Hills WTP. This same set-up will be configured at City Well No. 2 as part of the Crosstown Pipeline Project. The upstream pressure and downstream pressure at City Well No. 4 PRV is 85 psi and 62 psi, respectively. Likewise, the upstream pressure and downstream pressure at City Well No. 5 PRV are 81 psi and 55 psi, respectively. Table 2-3 summarizes the description of each intertie location. The GPM Range column shows the full flow potential at each intertie; however, the interties do not operate at full capacity. The actual range of each intertie is shown in the GPM Operational column. Figure 2-6 depicts each intertie, PRV, and closed valve at the pressure boundaries. It should be noted that at the pressure zone boundary at La Baig Drive and Meridian Street, there is no physical connection between the SSCWD Middle Zone water main and the City Low Zone water main. Table 2-4 summarizes the individual PRV hydraulic parameters.
2-4
Table 2-3 Intertie Description Summary City/SSCWD
Intertie Description Flow From Flow To GPM Range
GPM Operational
Santa Ana & La Baig
PRV 2” & 8” Meter
SSCWD Middle Zone City Low Zone 0-1,200 300-1,000
Hillcrest & Memorial
Booster Station City Low Zone
1) City Middle Zone
2) SSCWD Middle Zone via interties
0-1,000 0-200 8” Mag Meter City Middle
Zone SSCWD Middle
Zone
PRV City Middle Zone City Low Zone
Sunnyslope & Memorial 8” Mag Meter
Flows in either direction between SSCWD Middle Zone & City Middle
Zone 0-1,000 0-700
Sunset & Memorial 8” Mag Meter
Flows in either direction between SSCWD Middle Zone & City Middle
Zone 0-1,000 0-300
Sunset between Talbot and
Hillock PRV City Middle
Zone City Low Zone N/A1 N/A1
San Benito County Public
Works Yard
PRV 2” & 6” Meters
SSCWD High Zone City Cienega Zone 0-1,000 0-200
1City unable to provide requested information.
Table 2-4 PRV Hydraulic Parameters
PRV Name Upstream Pressure
(psi)
Downstream Pressure (psi)
Elevation (ft) HGL1 (ft)
Santa Ana & La Baig 113 71 283 447 Hillcrest & Memorial 106 52 304 424
Sunset at Talbot & Hillock 97 72 337 503 San Benito County Public
Works Yard 103 65 376 526
West Hills PRV @ Well #4 85 62 279 423 West Hills PRV @ Well #5 81 55 292 419
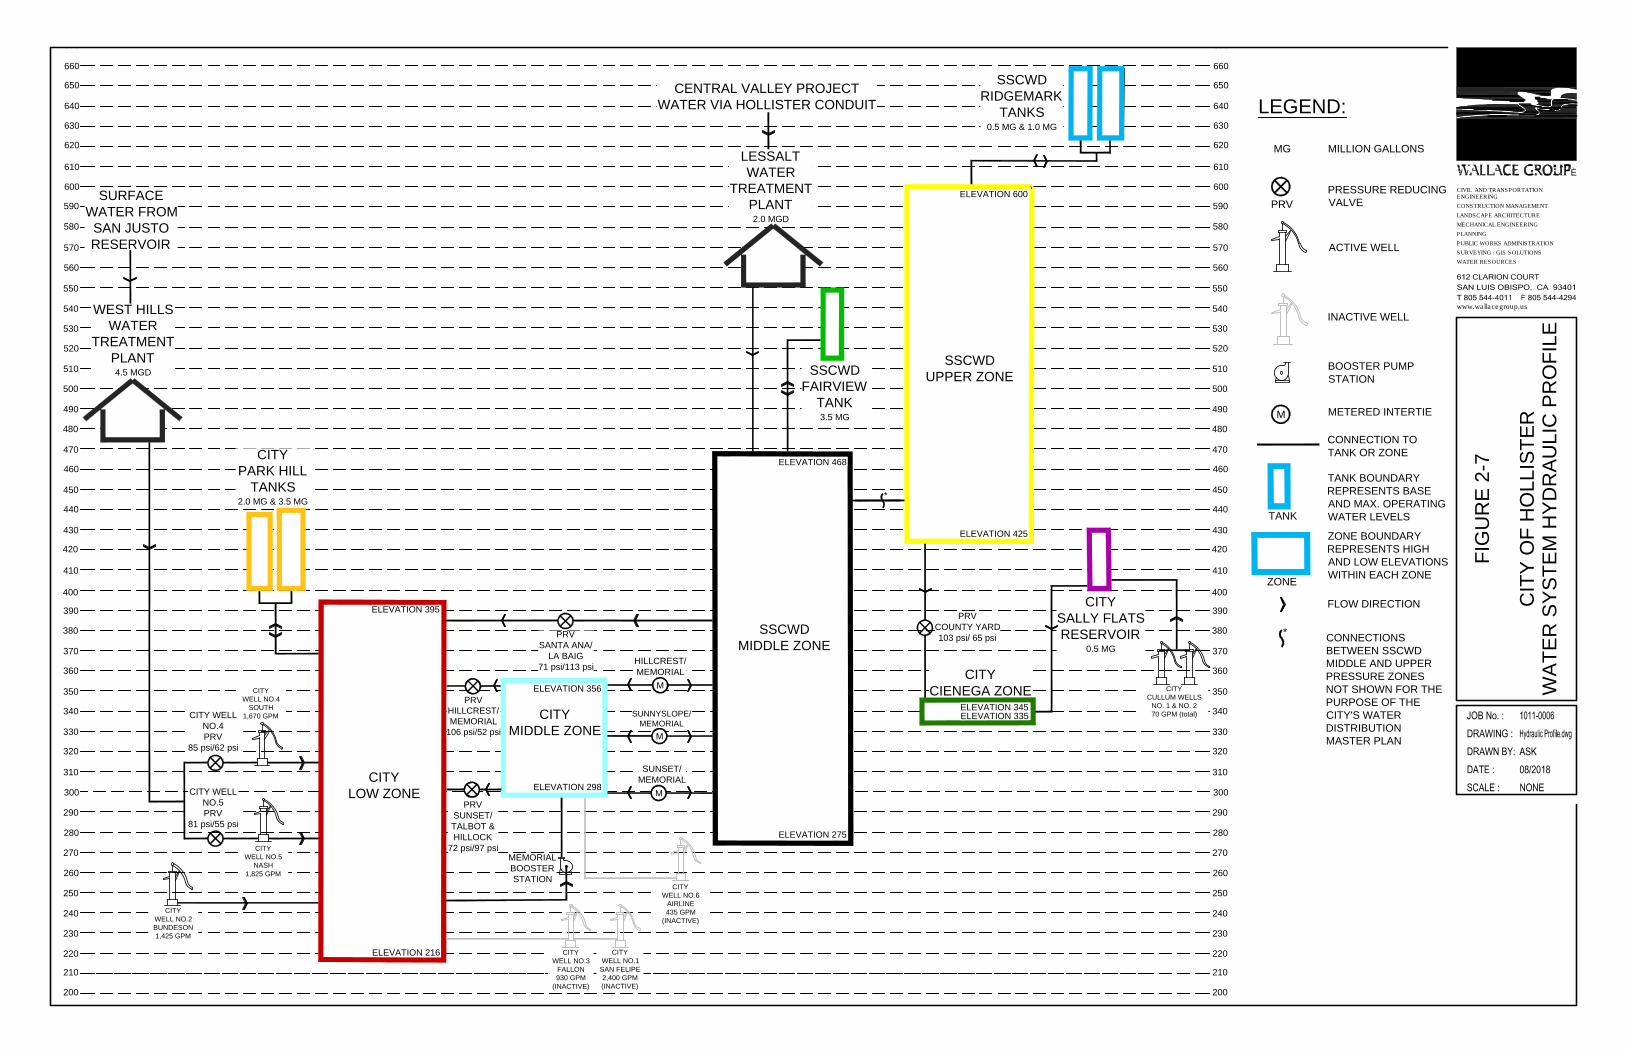
1HGL- Hydraulic Grade Line Figure 2-7 provides a graphic representation of the hydraulic profile of the water distribution system. This figure illustrates how each tank, booster station, PRV and intertie hydraulically interact and their relationship with the distribution zones they serve. The hydraulic profile was developed based on information contained within the 2008 Hollister Urban Area Water and Wastewater Master Plan and the 2017 Hollister Urban Area Water and Wastewater Master Plan Update, as well as discussion with the City and SSCWD.
SAN FELIPE RD
FALLON RD
NASH
RD
FRON
TAGE
RD
WEST
SIDE
BLV
D
MEMO
RIAL
DR
CIENEGA RD
4TH ST
LADD
LN
SANTA ANA RD
SAN JU
AN HOLLISTER RD
SUNSET DR
HILLCREST RD
TECHNOLOGY PKWYSAN JUAN DR
WEST
ST
SOUT
HSID
E RD
SUNNYSLOPE RD
CITY OF HOLLISTERWATER DISTRIBUTION MASTER PLAN
OCIVIL ENGINEERINGCONSTRUCTION MANAGEMENTLANDSCAPE ARCHITECTUREMECHANICAL ENGINEERINGPLANNINGPUBLIC WORKS ADMINISTRATIONSURVEYING/GIS SOLUTIONSWATER RESOURCESWALLACE SWANSON INTERNATIONAL612 CLARION COURTSAN LUIS OBISPO, CA 93401T 805 544-4011 F 805 544-4294www.wallacegroup.us
LEGENDSSCWD Water Service Area
City of Hollister Water Service Area
Hollister City Boundary
NOTES:BASEMAP COMPILED FROMGIS DATA PROVIDED BY SANBENITO COUNTY AND THE CITYOF HOLLISTER. WALLACE GROUP DID NOT PERFORM BOUNDARY SURVEY SERVICES FOR THIS MAP. NOT A LEGAL DOCUMENT. MAP PRODUCED AUGUST 2018. NTS
FIGURE 2-1: CITY AND SSCWD SERVICE AREAS
FALLON RD
S OUTHSIDE RD
NASH RD
SANTA ANA RD
SAN FELIPE RD
SOUTH ST HILLCREST RD
4TH ST
CIENEGA RD
156 H
WY
MEMO
RIAL
DR
LADD
LN
FRON
TAGE
RD
WEST
SIDE
BLV
D
SUNNYSLOPE RD
SAN JUAN HOLLISTER RD
SUNSET DR
CITY OF HOLLISTERWATER DISTRIBUTION MASTER PLAN
OCIVIL ENGINEERINGCONSTRUCTION MANAGEMENTLANDSCAPE ARCHITECTUREMECHANICAL ENGINEERINGPLANNINGPUBLIC WORKS ADMINISTRATIONSURVEYING/GIS SOLUTIONSWATER RESOURCESWALLACE SWANSON INTERNATIONAL612 CLARION COURTSAN LUIS OBISPO, CA 93401T 805 544-4011 F 805 544-4294www.wallacegroup.us
LEGENDCity Cienega
City Low Pressure
City Middle Pressure
SSCWD High Pressure
SSCWD Middle Pressure
Existing Water Service Area
Hollister City Boundary
NOTES:BASEMAP COMPILED FROMGIS DATA PROVIDED BY SANBENITO COUNTY AND THE CITYOF HOLLISTER. WALLACE GROUP DID NOT PERFORM BOUNDARY SURVEY SERVICES FOR THIS MAP. NOT A LEGAL DOCUMENT. MAP PRODUCED AUGUST 2018. NTS
FIGURE 2-2: CITY OF HOLLISTERPRESSURE ZONES
&.
&.
&.
&.
&.
&.
UT
3Q
UT
3Q
3Ú
#0
#0
#0
#0
Sunset PRV
Santa Ana PRV
County Yard PRV
Hillcrest / Memorial PRV
Hillcrest/MemorialBooster StationNO. 5 NASH
NO. 4 SOUTH
NO. 3 FALLON
NO. 6 AIRLINENO. 2 BUNDESON
NO. 1 SAN FELIPE
LESSALTWEST HILLS
CITY PARK HILL TANKS
SALLY FLATS RESERVOIR
CITY OF HOLLISTERWATER DISTRIBUTION MASTER PLAN
OCIVIL ENGINEERINGCONSTRUCTION MANAGEMENTLANDSCAPE ARCHITECTUREMECHANICAL ENGINEERINGPLANNINGPUBLIC WORKS ADMINISTRATIONSURVEYING/GIS SOLUTIONSWATER RESOURCESWALLACE SWANSON INTERNATIONAL612 CLARION COURTSAN LUIS OBISPO, CA 93401T 805 544-4011 F 805 544-4294www.wallacegroup.us
LEGEND3Ú BOOSTER STATION
#0 PRV
&. INACTIVE WELL
&. ACTIVE WELL
UT WATER STORAGE TANKS
3Q WATER TREATMENT PLANT
CITY WATER MAINS
EXISTING WATER SERVICE AREA
HOLLISTER CITY BOUNDARY
FIGURE 2-3: EXISTING DISTRIBUTIONSYSTEM MAJOR FACILITIES
NOTES:BASEMAP COMPILED FROMGIS DATA PROVIDED BY SANBENITO COUNTY AND THE CITYOF HOLLISTER. WALLACE GROUP DID NOT PERFORM BOUNDARY SURVEY SERVICES FOR THIS MAP. NOT A LEGAL DOCUMENT. MAP PRODUCED AUGUST 2018. NTS
&.&.
UT
#0
CULLUM WELLS #1 & #2
SALLY FLATS RESERVOIR
UT
3Q
UT
3Q
[Ú
HILLCREST/MEMORIALBOOSTER STATION
LESSALTWEST HILLS
CITY PARK HILL TANKS
SALLY FLATS RESERVOIR
CITY OF HOLLISTERWATER DISTRIBUTION MASTER PLAN
OCIVIL ENGINEERINGCONSTRUCTION MANAGEMENTLANDSCAPE ARCHITECTUREMECHANICAL ENGINEERINGPLANNINGPUBLIC WORKS ADMINISTRATIONSURVEYING/GIS SOLUTIONSWATER RESOURCESWALLACE SWANSON INTERNATIONAL612 CLARION COURTSAN LUIS OBISPO, CA 93401T 805 544-4011 F 805 544-4294www.wallacegroup.us
LEGEND[Ú BOOSTER STATION
UT WATER STORAGE TANKS
3Q WATER TREATMENT PLANT
Water Line Diameter4-inch
6-inch
8-inch
10-inch
12-inch
14-inch
16-inch
18-inch
EXISTING WATER SERVICE AREA
FIGURE 2-4: EXISTING DISTRIBUTIONSYSTEM PIPE DIAMETER
NOTES:BASEMAP COMPILED FROMGIS DATA PROVIDED BY SANBENITO COUNTY AND THE CITYOF HOLLISTER. WALLACE GROUP DID NOT PERFORM BOUNDARY SURVEY SERVICES FOR THIS MAP. NOT A LEGAL DOCUMENT. MAP PRODUCED AUGUST 2018. NTS
UT
3Q
UT
3Q
[Ú
Hillcrest/MemorialBooster Station
LESSALTWEST HILLS
CITY PARK HILL TANKS
SALLY FLATS RESERVOIR
CITY OF HOLLISTERWATER DISTRIBUTION MASTER PLAN
OCIVIL ENGINEERINGCONSTRUCTION MANAGEMENTLANDSCAPE ARCHITECTUREMECHANICAL ENGINEERINGPLANNINGPUBLIC WORKS ADMINISTRATIONSURVEYING/GIS SOLUTIONSWATER RESOURCESWALLACE SWANSON INTERNATIONAL612 CLARION COURTSAN LUIS OBISPO, CA 93401T 805 544-4011 F 805 544-4294www.wallacegroup.us
LEGEND[Ú BOOSTER STATION
UT WATER STORAGE TANKS
3Q WATER TREATMENT PLANT
PIPE MATERIALCAST IRON
PVC
EXISTING WATER SERVICE AREA
FIGURE 2-5: EXISTING DISTRIBUTIONSYSTEM PIPE MATERIAL
NOTES:BASEMAP COMPILED FROMGIS DATA PROVIDED BY SANBENITO COUNTY AND THE CITYOF HOLLISTER. WALLACE GROUP DID NOT PERFORM BOUNDARY SURVEY SERVICES FOR THIS MAP. NOT A LEGAL DOCUMENT. MAP PRODUCED AUGUST 2018. NTS
3Ú
#0
#0
#0
#0
Santa Ana PRV
Hillcrest/MemorialIntertie
Hillcrest/Memorial PRV
Hillcrest/MemorialBooster Station
Sunnyslope/MemorialIntertie
Sunset PRV
County Yard PRV
Closed Valve
Closed Valve
Closed Valve
City Water Main
Abandoned CityWater Main
No PhysicalConnection
Sunset/MemorialIntertie
LA B
AIG
DR.
CIENEGA RD
WEST
ST
4TH ST
MEMO
RIAL
DR
HILLCREST RD
LADD
LN
SANTA ANA RD
SUNNYSLOPE RD
SUNSET DRHILLOCK DR
MERIDIAN ST
CITY OF HOLLISTERWATER DISTRIBUTION MASTER PLAN
OCIVIL ENGINEERINGCONSTRUCTION MANAGEMENTLANDSCAPE ARCHITECTUREMECHANICAL ENGINEERINGPLANNINGPUBLIC WORKS ADMINISTRATIONSURVEYING/GIS SOLUTIONSWATER RESOURCESWALLACE SWANSON INTERNATIONAL612 CLARION COURTSAN LUIS OBISPO, CA 93401T 805 544-4011 F 805 544-4294www.wallacegroup.us
LEGEND3Ú Booster Station
#0 PRV
City Cienega
City Low Pressure
City Middle Pressure
SSCWD High Pressure
SSCWD Middle Pressure
Water Mains
Hollister City Boundary
FIGURE 2-6: CITY AND SSCWDPRESSURE ZONE BOUNDARIES
NOTES:BASEMAP COMPILED FROMGIS DATA PROVIDED BY SANBENITO COUNTY AND THE CITYOF HOLLISTER. WALLACE GROUP DID NOT PERFORM BOUNDARY SURVEY SERVICES FOR THIS MAP. NOT A LEGAL DOCUMENT. MAP PRODUCED AUGUST 2018. NTS
270
290
310
370
330
350
390
410
470
430
450
490
510
250
260
280
300
320
340
360
380
400
420
440
460
480
500
SSCWD
RIDGEMARK
TANKS
0.5 MG & 1.0 MG
SSCWD
FAIRVIEW
TANK
3.5 MG
CITY
LOW ZONE
ELEVATION 395
ELEVATION 425
ELEVATION 216
ELEVATION 275
SSCWD
UPPER ZONE
520
530
540
550
240
230
220
210
CITY
PARK HILL
TANKS
2.0 MG & 3.5 MG
CITY
WELL NO.6
AIRLINE
435 GPM
(INACTIVE)
CITY
WELL NO.1
SAN FELIPE
2,400 GPM
(INACTIVE)
CITY
WELL NO.3
FALLON
930 GPM
(INACTIVE)
CITY
WELL NO.2
BUNDESON
1,425 GPM
CITY
WELL NO.5
NASH
1,825 GPM
CITY
WELL NO.4
SOUTH
1,670 GPM
PRV
HILLCREST/
MEMORIAL
106 psi/52 psi
MEMORIAL
BOOSTER
STATION
600
590
580
570
560
CITY
MIDDLE ZONE
200
610
620
630
640
650
660
670
270
290
310
370
330
350
390
410
470
430
450
490
510
250
260
280
300
320
340
360
380
400
420
440
460
480
500
520
530
540
550
240
230
220
210
600
590
580
570
560
200
610
620
630
640
650
660
670
WEST HILLS
WATER
TREATMENT
PLANT
4.5 MGD
LESSALT
WATER
TREATMENT
PLANT
2.0 MGD
SSCWD
MIDDLE ZONE
CITY
SALLY FLATS
RESERVOIR
0.5 MG
CITY
CIENEGA ZONE
M
HILLCREST/
MEMORIAL
SUNNYSLOPE/
MEMORIAL
SUNSET/
MEMORIAL
ELEVATION 298
ELEVATION 356
ELEVATION 468
ELEVATION 600
ELEVATION 335
ELEVATION 345
PRV
SUNSET/
TALBOT &
HILLOCK
72 psi/97 psi
PRV
SANTA ANA/
LA BAIG
71 psi/113 psi
CITY
CULLUM WELLS
NO. 1 & NO. 2
70 GPM (total)
*
M
M
CITY WELL
NO.4
PRV
85 psi/62 psi
PRV
COUNTY YARD
103 psi/ 65 psi
SURFACE
WATER FROM
SAN JUSTO
RESERVOIR
CENTRAL VALLEY PROJECT
WATER VIA HOLLISTER CONDUIT
CITY WELL
NO.5
PRV
81 psi/55 psi
LEGEND:
PRESSURE REDUCING
VALVE
ZONE BOUNDARY
REPRESENTS HIGH
AND LOW ELEVATIONS
WITHIN EACH ZONE
CONNECTION TO
TANK OR ZONE
ZONE
BOOSTER PUMP
STATION
PRV
MILLION GALLONSMG
TANK BOUNDARY
REPRESENTS BASE
AND MAX. OPERATING
WATER LEVELSTANK
FLOW DIRECTION
ACTIVE WELL
INACTIVE WELL
METERED INTERTIE
M
*
CONNECTIONS
BETWEEN SSCWD
MIDDLE AND UPPER
PRESSURE ZONES
NOT SHOWN FOR THE
PURPOSE OF THE
CITY'S WATER
DISTRIBUTION
MASTER PLAN
CONSTRUCTION MANAGEMENT
PUBLIC WORKS ADMINISTRATION
SAN LUIS OBISPO, CA 93401
T 805 544-4011 F 805 544-4294
612 CLARION COURT
www.wallacegroup.us
WATER RESOURCES
SURVEYING / GIS SOLUTIONS
LANDSCAPE ARCHITECTURE
MECHANICAL ENGINEERING
PLANNING
CIVIL AND TRANSPORTATION
DATE :
SCALE :
DRAWING :
DRAWN BY:
JOB No. :
®
ENGINEERING
FIG
UR
E 2-7
CIT
Y O
F H
OLLIS
TE
R
WA
TE
R S
YS
TE
M H
YD
RA
ULIC
P
RO
FILE
1011-0006
Hydraulic Profile.dwg
ASK
08/2018
NONE
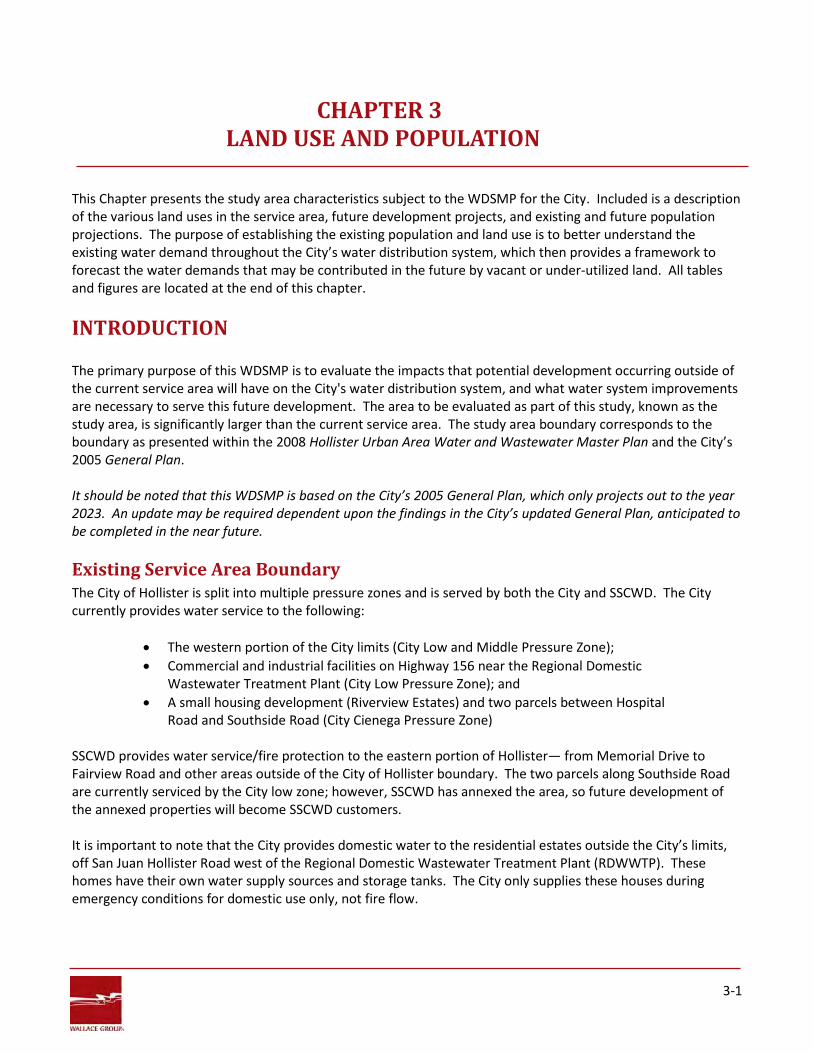
3-1
CHAPTER 3 LAND USE AND POPULATION
This Chapter presents the study area characteristics subject to the WDSMP for the City. Included is a description of the various land uses in the service area, future development projects, and existing and future population projections. The purpose of establishing the existing population and land use is to better understand the existing water demand throughout the City’s water distribution system, which then provides a framework to forecast the water demands that may be contributed in the future by vacant or under-utilized land. All tables and figures are located at the end of this chapter.
INTRODUCTION The primary purpose of this WDSMP is to evaluate the impacts that potential development occurring outside of the current service area will have on the City's water distribution system, and what water system improvements are necessary to serve this future development. The area to be evaluated as part of this study, known as the study area, is significantly larger than the current service area. The study area boundary corresponds to the boundary as presented within the 2008 Hollister Urban Area Water and Wastewater Master Plan and the City’s 2005 General Plan.
It should be noted that this WDSMP is based on the City’s 2005 General Plan, which only projects out to the year 2023. An update may be required dependent upon the findings in the City’s updated General Plan, anticipated to be completed in the near future.
Existing Service Area Boundary The City of Hollister is split into multiple pressure zones and is served by both the City and SSCWD. The City currently provides water service to the following:
• The western portion of the City limits (City Low and Middle Pressure Zone); • Commercial and industrial facilities on Highway 156 near the Regional Domestic
Wastewater Treatment Plant (City Low Pressure Zone); and • A small housing development (Riverview Estates) and two parcels between Hospital
Road and Southside Road (City Cienega Pressure Zone)
SSCWD provides water service/fire protection to the eastern portion of Hollister— from Memorial Drive to Fairview Road and other areas outside of the City of Hollister boundary. The two parcels along Southside Road are currently serviced by the City low zone; however, SSCWD has annexed the area, so future development of the annexed properties will become SSCWD customers. It is important to note that the City provides domestic water to the residential estates outside the City’s limits, off San Juan Hollister Road west of the Regional Domestic Wastewater Treatment Plant (RDWWTP). These homes have their own water supply sources and storage tanks. The City only supplies these houses during emergency conditions for domestic use only, not fire flow.
3-2
Study Area The study area boundary represents the City’s projected water system distribution service area. The study area boundary is larger than the existing service area boundary because it includes land planned for future development that will require water supply from the City. The study area, as shown in Figure 3-1, also includes the City limits and the 2005 General Plan boundary.
LAND USE The following sections discuss the existing and future land uses within the study area. The existing land uses are based on San Benito County’s GIS database.
Existing Water Service Area Land Use The City is comprised of primarily residential development, with commercial development in and around the downtown area, and a heavy concentration of industrial development near the Hollister Municipal Airport at the northern end of the City. The City’s current water service area is comprised of 6,984 parcels (5,264 acres). Figure 3-2 illustrates the land use designation for the existing water service area. Existing land uses within the service area are summarized in Table 3-1. Within the existing water service area, 32.9% of the parcel acreage is agriculture. Approximately 19.4% of the land use is residential, with low density residential accounting for 17.1%. The next largest existing land use category is industrial, comprising of 9.6% the service area. Vacant parcels account for 19.5% of the total existing land use. The breakdown of vacant land is shown in Table 3-1, and includes 292 un-developed residential parcels.
Future Developments In December 2008, the Regional Water Quality Control Board (RWQCB) lifted the six-year building moratorium from the City, allowing for housing and commercial developments. For the purposes of this WDSMP, developments approved in 2016 or later, or have approved Tentative Maps, are considered future developments as they have not yet contributed to the existing water demands used to develop the water model. Table 3-2 provides a summary of the future residential projects and Table 3-3 provides a summary of the future non-residential projects within the City’s projected water distribution area.
This list is not inclusive of all potential development within the study area and only includes those projects currently identified by the City. Additional potential future development was accounted for in this analysis based on projected density in accordance with the City General Plan. Locations of these approved and potential future development projects are depicted on Figure 3-3. Figure 3-4 represents the future land use identified for the entire study area.
POPULATION Population for the WDSMP is comprised of the City population and unincorporated land of the County within the study area. Since the existing water service area includes only the western portion of the City, the following section describes the methods used to obtain the existing service area population.
3-3
Existing Service Area Population According to the U.S. Census Bureau, in July 2017 the total population for San Benito County was estimated to be 60,310 persons, of which the City of Hollister was estimated to have a population of 38,404 persons (within City of Hollister and SSCWD water service areas). The existing service area population for the WDSMP does not include the entire population of the City of Hollister, but rather the number of people being serviced by the City’s water distribution system (which excludes the SSCWD water system). The population of the area served by the City outside of the City limits includes the unincorporated 56-unit subdivision (Riverview Estates, served by City Cienega distribution zone) south of the City on Southside Road. Population for this area outside of City limits is estimated to be 182 persons, based on the Association of Monterey Bay Area Governments (AMBAG) population density for the County of 3.25 persons per household. The following sources of information were utilized to evaluate and estimate the existing population for the existing water service area:
1. City of Hollister 2018 Sanitary Sewer Collection System Master Plan Update (SSCSMPU) 2. MetCalf and Eddy Design Handbook, “Wastewater Engineering, Treatment, and
Resource Recovery, Fifth Edition”, 2014 3. California State Board Safe Drinking Water Information System (SDWIS)
City of Hollister 2018 SSCSMPU Wallace Group prepared the 2018 Sanitary Sewer Collection System Master Plan Update (SSCSMPU), which identified the density of persons per residential unit based on the number of residential units per wastewater tributary area, service area population, and total gallons per day. Although the service area boundary for the SSCSMPU is larger than the service area boundary for the WDSMP, the density of persons per residential unit from the SSCSMPU can be used to estimate the population within the WDSMP service area boundary. Table 3-4 summarizes the estimated service area population based on the wastewater tributary area densities found in the 2018 SSCSMPU.
MetCalf and Eddy Domestic Water Demands An industry standard reference for domestic water usage is the Metcalf and Eddy Design Handbook, “Wastewater Engineering, Treatment, and Resource Recovery, Fifth Edition”, 2014. This engineering reference recommends a total domestic water demand of 100 gallons per capita per day (gpcd)—65 gpcd coming from indoor water use and 35 gpcd coming from outdoor water use. Based on the annual total metered consumption provided by the City for single and multiple dwelling units, Table 3-5 summarizes the estimate population for the service area.
Using the MetCalf and Eddy demand factor of 100 gpcd, the population for 2017 was estimated to be 16,440 persons. Due to state mandates in water conservation during the most recent California drought, it is reasonable to assume that the demand factor for the City’s service area is lower than the assumed 100 gpcd. Therefore, the MetCalf and Eddy domestic water demand method was not considered in estimating the City’s existing service area population.
EPA Safe Drinking Water Information System The Safe Drinking Water Information System (SDWIS) is a database that contains information about public water systems, as reported by the States to the Environmental Protection Agency (EPA). According to California State
3-4
Board’s SDWIS, the City of Hollister (Water System No. CA3510001) currently provides water service to a total population of 22,940 persons. Existing Population Summary and Conclusion Based on a review of the three different methodologies used to arrive at an existing population for the City’s service area, the 2018 SSCSMPU population estimate of 22,877 persons verifies the EPA’s SDWIS population estimate of 22,940 persons. For the purposes of this WDSMP, it is assumed that the existing service area population is 22,940 persons. Future Population The study area for this master plan lies within both the City and the County. In order to identify the future development potential for the study area, future land use designations per the City and County’s General Plan and SSCSMPU population density factors were utilized to estimate the future population within the study area.
Future Development Projects Future developments include those projects identified in Table 3-2, as well as all potential future developments on vacant parcels. Vacant parcel projections are based on maximum permitted density per the designated land use category. For parcels included in a tentative map or approved development project, the proposed project density was used for analysis. The total number of future residential developments within the study area on both the identified and vacant parcels is 7,006 units.
The total estimated future population for the study area is 42,133 persons. This population will likely not occur by the year 2023, which is the City’s 2005 General Plan planning horizon, but rather, the population represents full build-out. It is the intention of this report to anticipate the potential future impact that water demands from the various customers may have on the distribution system without knowing where the development may occur first. Therefore, the conservative approach is to assume that all development potential will occur. Decisions on completion of upgrades to the distribution system should be based on the most current General Plan and on development as it occurs and not based on this theoretical population projection from this report.
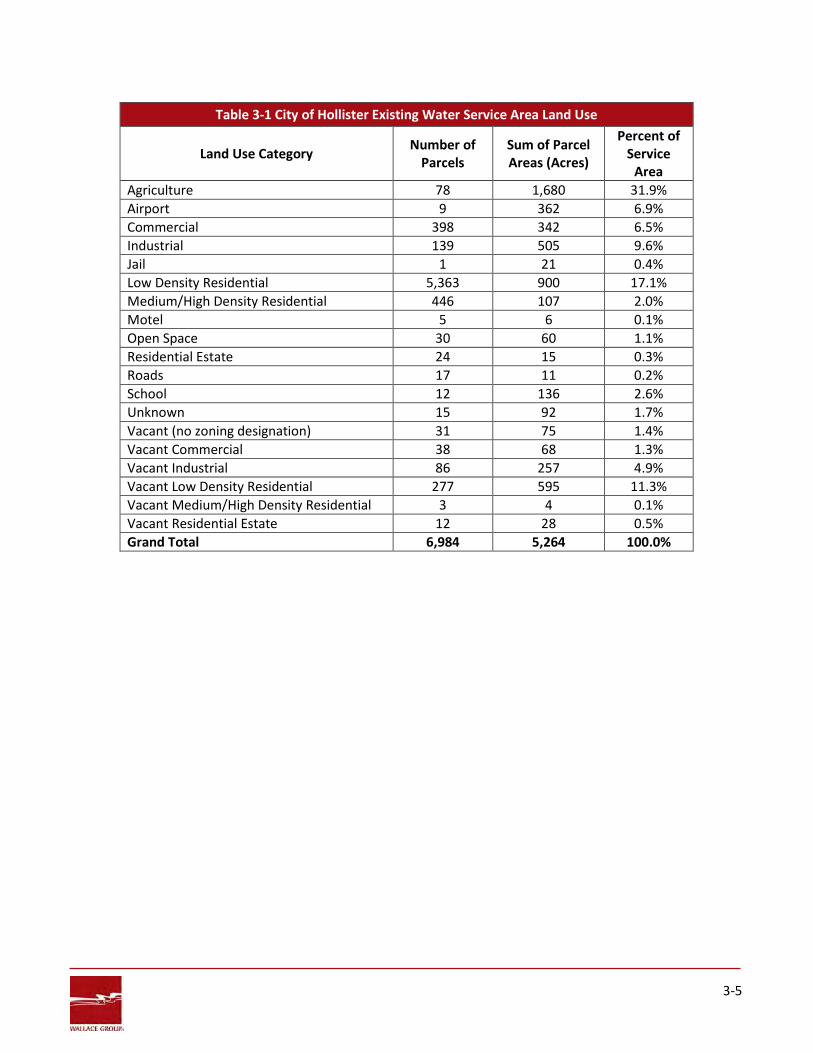
3-5
Table 3-1 City of Hollister Existing Water Service Area Land Use
Land Use Category Number of Parcels
Sum of Parcel Areas (Acres)
Percent of Service
Area Agriculture 78 1,680 31.9% Airport 9 362 6.9% Commercial 398 342 6.5% Industrial 139 505 9.6% Jail 1 21 0.4% Low Density Residential 5,363 900 17.1% Medium/High Density Residential 446 107 2.0% Motel 5 6 0.1% Open Space 30 60 1.1% Residential Estate 24 15 0.3% Roads 17 11 0.2% School 12 136 2.6% Unknown 15 92 1.7% Vacant (no zoning designation) 31 75 1.4% Vacant Commercial 38 68 1.3% Vacant Industrial 86 257 4.9% Vacant Low Density Residential 277 595 11.3% Vacant Medium/High Density Residential 3 4 0.1% Vacant Residential Estate 12 28 0.5% Grand Total 6,984 5,264 100.0%
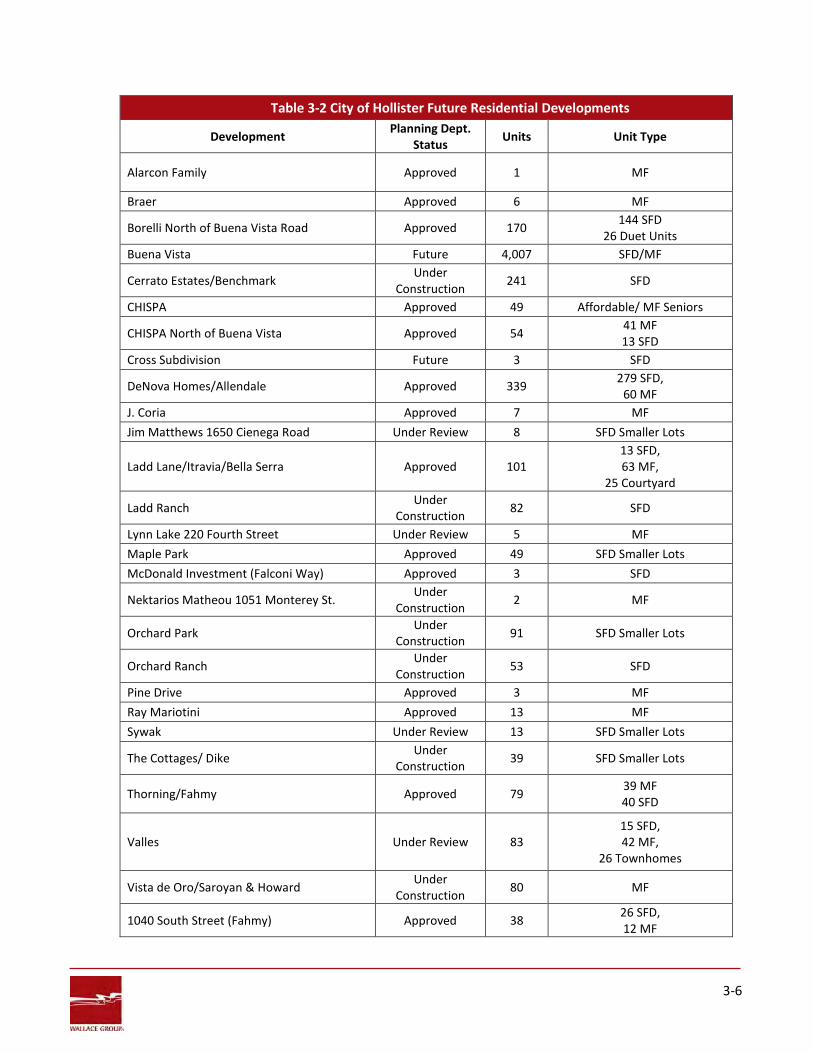
3-6
Table 3-2 City of Hollister Future Residential Developments
Development Planning Dept. Status Units Unit Type
Alarcon Family Approved 1 MF
Braer Approved 6 MF
Borelli North of Buena Vista Road Approved 170 144 SFD 26 Duet Units
Buena Vista Future 4,007 SFD/MF
Cerrato Estates/Benchmark Under Construction 241 SFD
CHISPA Approved 49 Affordable/ MF Seniors
CHISPA North of Buena Vista Approved 54 41 MF 13 SFD
Cross Subdivision Future 3 SFD
DeNova Homes/Allendale Approved 339 279 SFD, 60 MF
J. Coria Approved 7 MF Jim Matthews 1650 Cienega Road Under Review 8 SFD Smaller Lots
Ladd Lane/Itravia/Bella Serra Approved 101 13 SFD, 63 MF,
25 Courtyard
Ladd Ranch Under Construction 82 SFD
Lynn Lake 220 Fourth Street Under Review 5 MF Maple Park Approved 49 SFD Smaller Lots McDonald Investment (Falconi Way) Approved 3 SFD
Nektarios Matheou 1051 Monterey St. Under Construction 2 MF
Orchard Park Under Construction 91 SFD Smaller Lots
Orchard Ranch Under Construction 53 SFD
Pine Drive Approved 3 MF Ray Mariotini Approved 13 MF Sywak Under Review 13 SFD Smaller Lots
The Cottages/ Dike Under Construction 39 SFD Smaller Lots
Thorning/Fahmy Approved 79 39 MF 40 SFD
Valles Under Review 83 15 SFD, 42 MF,
26 Townhomes
Vista de Oro/Saroyan & Howard Under Construction 80 MF
1040 South Street (Fahmy) Approved 38 26 SFD, 12 MF
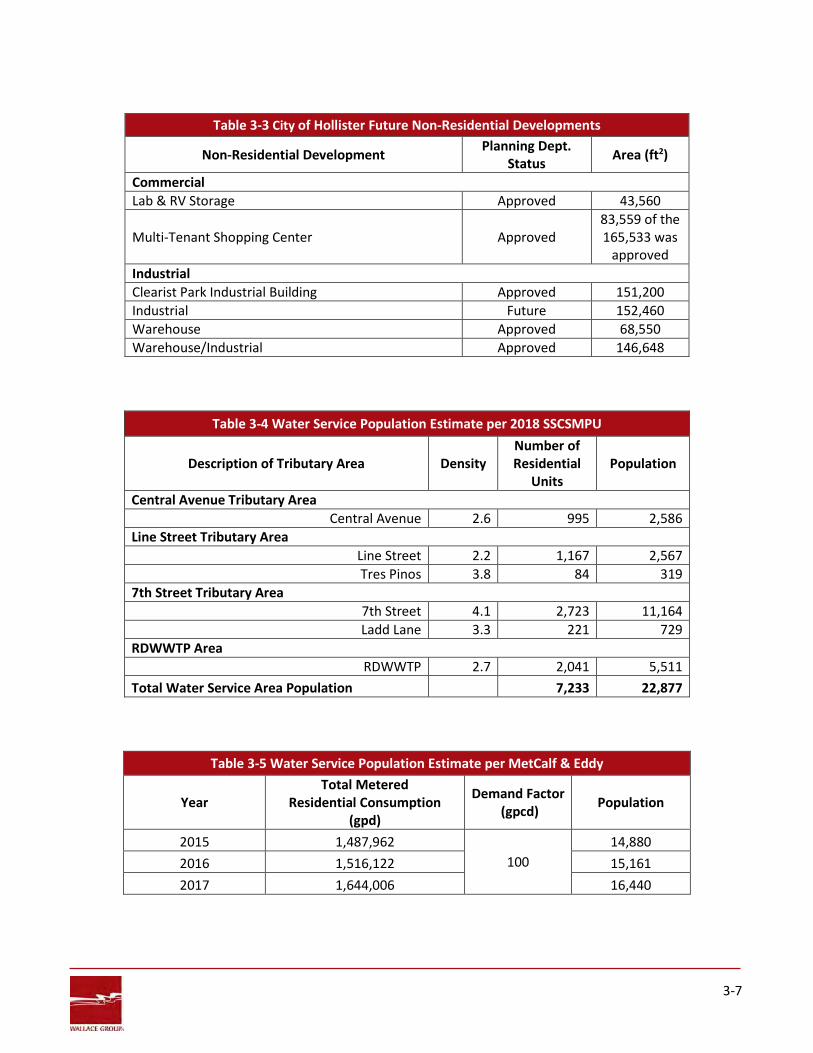
3-7
Table 3-3 City of Hollister Future Non-Residential Developments
Non-Residential Development Planning Dept. Status Area (ft2)
Commercial Lab & RV Storage Approved 43,560
Multi-Tenant Shopping Center Approved 83,559 of the 165,533 was
approved Industrial Clearist Park Industrial Building Approved 151,200 Industrial Future 152,460 Warehouse Approved 68,550 Warehouse/Industrial Approved 146,648
Table 3-4 Water Service Population Estimate per 2018 SSCSMPU
Description of Tributary Area Density Number of Residential
Units Population
Central Avenue Tributary Area Central Avenue 2.6 995 2,586
Line Street Tributary Area Line Street 2.2 1,167 2,567 Tres Pinos 3.8 84 319
7th Street Tributary Area 7th Street 4.1 2,723 11,164 Ladd Lane 3.3 221 729
RDWWTP Area RDWWTP 2.7 2,041 5,511
Total Water Service Area Population 7,233 22,877
Table 3-5 Water Service Population Estimate per MetCalf & Eddy
Year Total Metered
Residential Consumption (gpd)
Demand Factor (gpcd) Population
2015 1,487,962 100
14,880 2016 1,516,122 15,161 2017 1,644,006 16,440
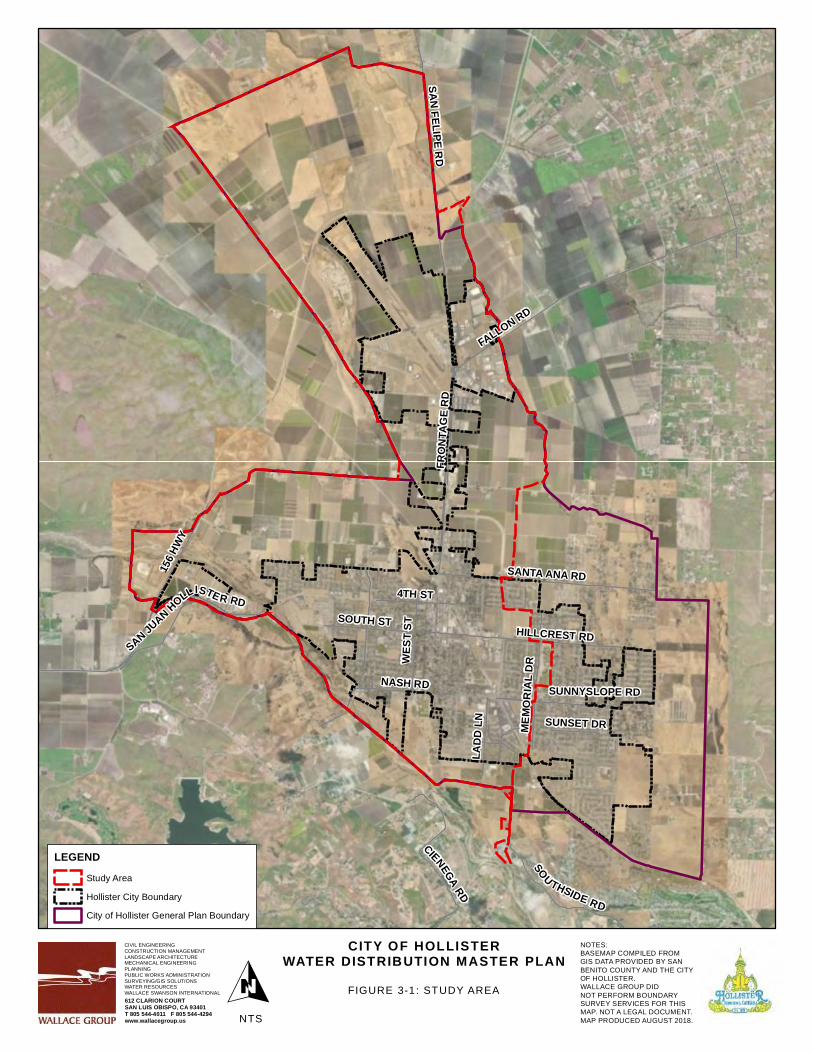
FALLON RD
156 H
WY
SOU THSIDE RD
SAN FELIPE RD
NASH RD
SANTA ANA RD
SOUTH ST HILLCREST RD
4TH ST
WEST
ST
CIENEGA RD
MEMO
RIAL
DR
LADD
LN
FRON
TAGE
RD
SUNNYSLOPE RD
SAN JUAN HOLLISTER RD
SUNSET DR
CITY OF HOLLISTERWATER DISTRIBUTION MASTER PLAN
OCIVIL ENGINEERINGCONSTRUCTION MANAGEMENTLANDSCAPE ARCHITECTUREMECHANICAL ENGINEERINGPLANNINGPUBLIC WORKS ADMINISTRATIONSURVEYING/GIS SOLUTIONSWATER RESOURCESWALLACE SWANSON INTERNATIONAL612 CLARION COURTSAN LUIS OBISPO, CA 93401T 805 544-4011 F 805 544-4294www.wallacegroup.us
LEGENDStudy Area
Hollister City Boundary
City of Hollister General Plan Boundary
FIGURE 3-1: STUDY AREA
NOTES:BASEMAP COMPILED FROMGIS DATA PROVIDED BY SANBENITO COUNTY AND THE CITYOF HOLLISTER. WALLACE GROUP DID NOT PERFORM BOUNDARY SURVEY SERVICES FOR THIS MAP. NOT A LEGAL DOCUMENT. MAP PRODUCED AUGUST 2018. NTS
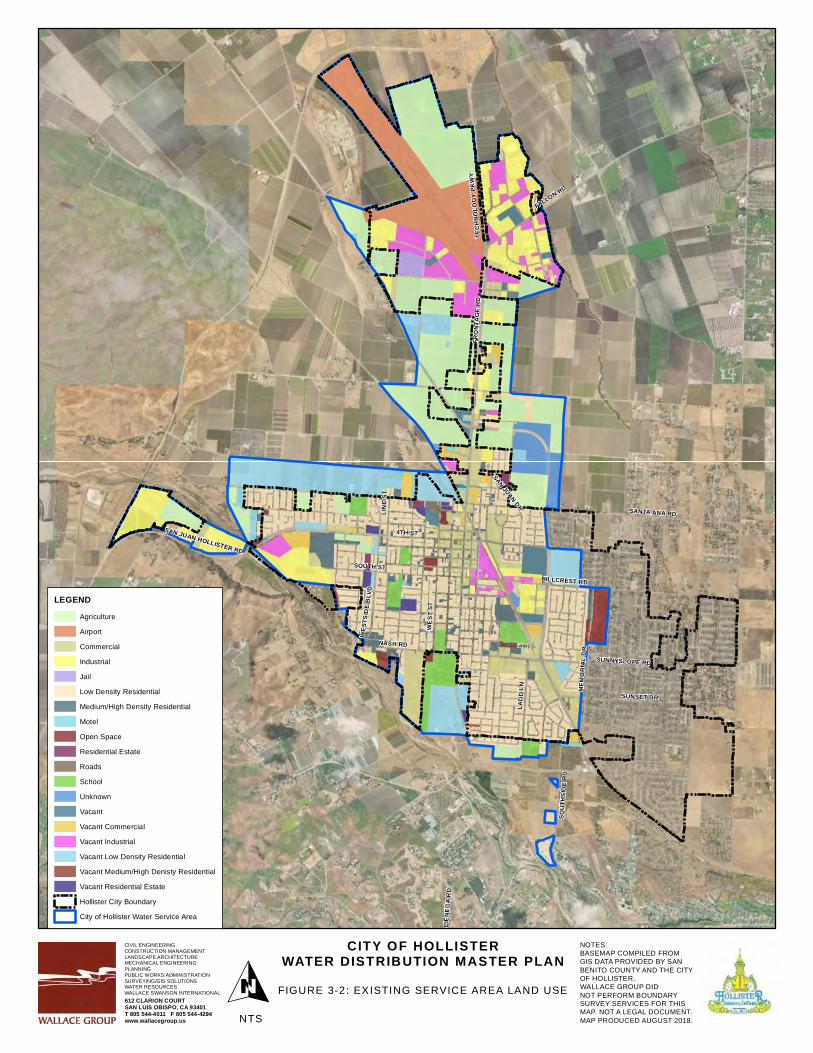
FALLON RD
NASH RD
FRON
TAGE
RD
CIEN
EGA
RD
WEST
ST
4TH ST
MEMO
RIAL
DR
SAN JUAN HOLLISTER RD
HILLCREST RD
LADD
LN
SOUTH ST
SANTA ANA RD
WEST
SIDE
BLV
D
SUNSET DR
LINE
ST
SUNNYSLOPE RD
SAN JUAN DR
SOUT
HSID
E RD
TECH
NOLO
GY P
KWY
C ITY OF HOLLISTERWATER DISTRIBUTION MASTER PLAN
OCIVIL ENGINEERINGCONSTRUCTION MANAGEMENTLANDSCAPE ARCHITECTUREMECHANICAL ENGINEERINGPLANNINGPUBLIC WORKS ADMINISTRATIONSURVEYING/GIS SOLUTIONSWATER RESOURCESWALLACE SWANSON INTERNATIONAL612 CLARION COURTSAN LUIS OBISPO, CA 93401T 805 544-4011 F 805 544-4294www.wallacegroup.us
LEGENDAgriculture
Airport
Commercial
Industrial
Jail
Low Density Residential
Medium/High Density Residential
Motel
Open Space
Residential Estate
Roads
School
Unknown
Vacant
Vacant Commercial
Vacant Industrial
Vacant Low Density Residential
Vacant Medium/High Denisty Residential
Vacant Residential Estate
Hollister City Boundary
City of Hollister Water Service Area
FIGURE 3-2: EXISTING SERVICE AREA LAND USE
NOTES:BASEMAP COMPILED FROMGIS DATA PROVIDED BY SANBENITO COUNTY AND THE CITYOF HOLLISTER. WALLACE GROUP DID NOT PERFORM BOUNDARY SURVEY SERVICES FOR THIS MAP. NOT A LEGAL DOCUMENT. MAP PRODUCED AUGUST 2018. NTS
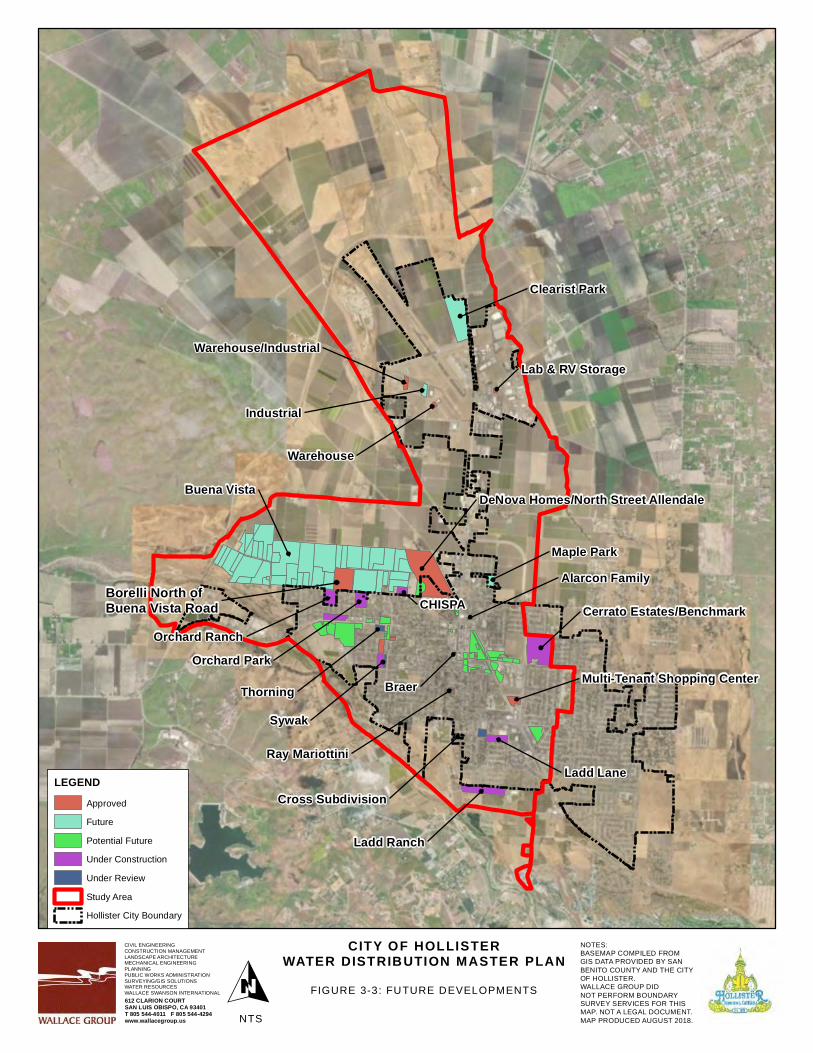
Borelli North of Buena Vista Road
Buena Vista
Clearist Park
Ladd Ranch
DeNova Homes/North Street Allendale
Cerrato Estates/Benchmark
Ladd Lane
Orchard RanchOrchard Park
CHISPA
Maple Park
Industrial
ThorningSywak
Multi-Tenant Shopping Center
Warehouse/Industrial
Warehouse
Lab & RV Storage
Cross Subdivision
Ray Mariottini
Braer
Alarcon Family
CITY OF HOLLISTERWATER DISTRIBUTION MASTER PLAN
OCIVIL ENGINEERINGCONSTRUCTION MANAGEMENTLANDSCAPE ARCHITECTUREMECHANICAL ENGINEERINGPLANNINGPUBLIC WORKS ADMINISTRATIONSURVEYING/GIS SOLUTIONSWATER RESOURCESWALLACE SWANSON INTERNATIONAL612 CLARION COURTSAN LUIS OBISPO, CA 93401T 805 544-4011 F 805 544-4294www.wallacegroup.us
LEGENDApproved
Future
Potential Future
Under Construction
Under Review
Study Area
Hollister City Boundary
FIGURE 3-3: FUTURE DEVELOPMENTS
NOTES:BASEMAP COMPILED FROMGIS DATA PROVIDED BY SANBENITO COUNTY AND THE CITYOF HOLLISTER. WALLACE GROUP DID NOT PERFORM BOUNDARY SURVEY SERVICES FOR THIS MAP. NOT A LEGAL DOCUMENT. MAP PRODUCED AUGUST 2018. NTS
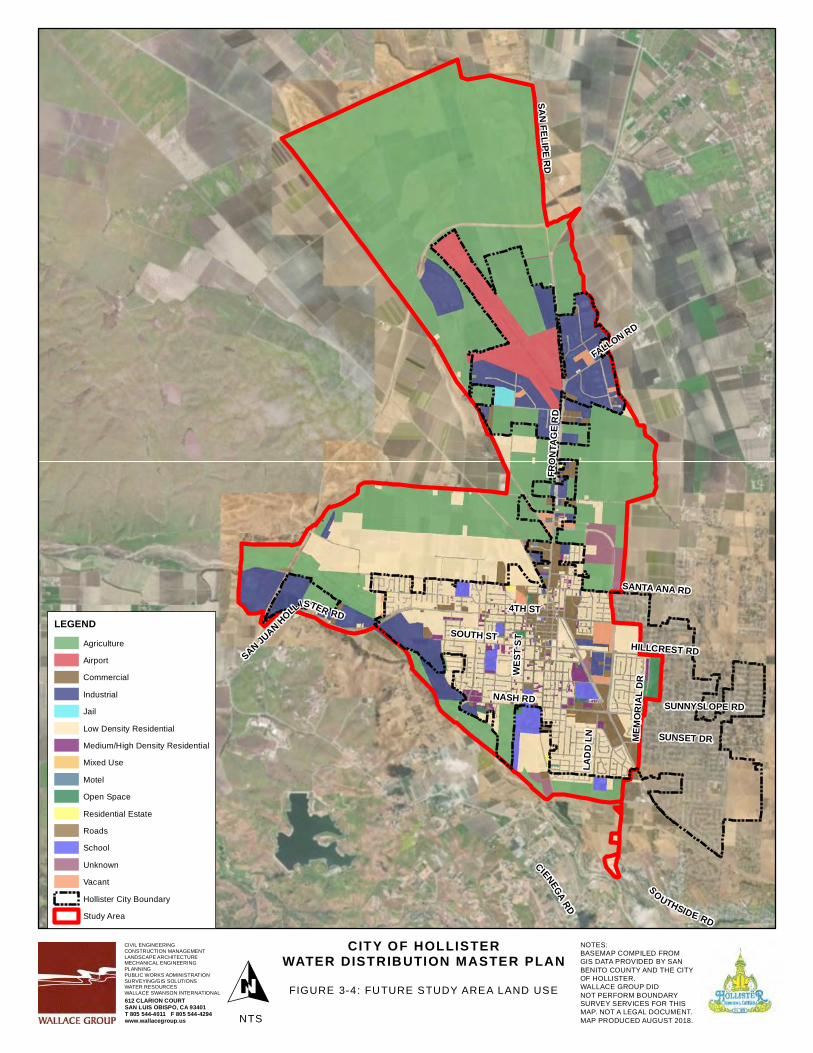
156 HWY
FALLON RD
SAN FELIPE RD
NASH RD
SANTA ANA RD
SOUTH ST
SOUTHSIDE RD
HILLCREST RD
4TH ST
WEST
ST
MEMO
RIAL
DR
CIENEGA RD
LADD
LN
FRON
TAGE
RD
SUNNYSLOPE RD
SAN JUAN HOLLISTER RD
SUNSET DR
CITY OF HOLLISTERWATER DISTRIBUTION MASTER PLAN
OCIVIL ENGINEERINGCONSTRUCTION MANAGEMENTLANDSCAPE ARCHITECTUREMECHANICAL ENGINEERINGPLANNINGPUBLIC WORKS ADMINISTRATIONSURVEYING/GIS SOLUTIONSWATER RESOURCESWALLACE SWANSON INTERNATIONAL612 CLARION COURTSAN LUIS OBISPO, CA 93401T 805 544-4011 F 805 544-4294www.wallacegroup.us
LEGENDAgriculture
Airport
Commercial
Industrial
Jail
Low Density Residential
Medium/High Density Residential
Mixed Use
Motel
Open Space
Residential Estate
Roads
School
Unknown
Vacant
Hollister City Boundary
Study Area
FIGURE 3-4: FUTURE STUDY AREA LAND USE
NOTES:BASEMAP COMPILED FROMGIS DATA PROVIDED BY SANBENITO COUNTY AND THE CITYOF HOLLISTER. WALLACE GROUP DID NOT PERFORM BOUNDARY SURVEY SERVICES FOR THIS MAP. NOT A LEGAL DOCUMENT. MAP PRODUCED AUGUST 2018. NTS
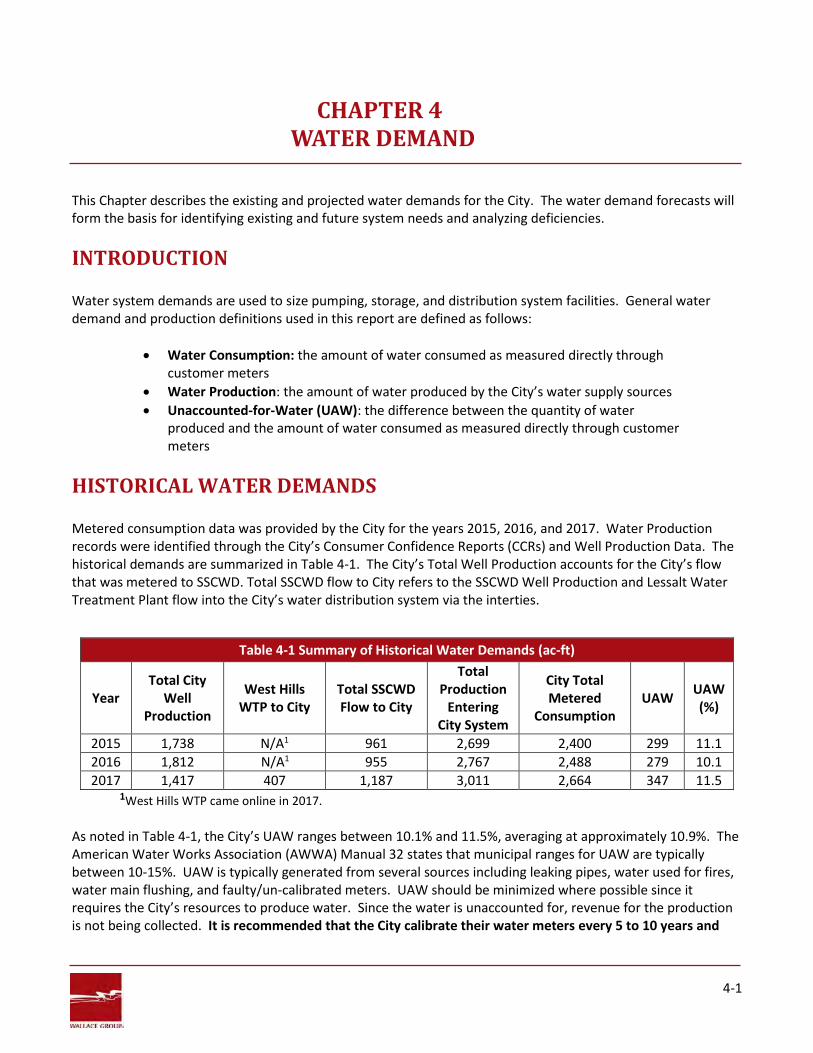
4-1
CHAPTER 4 WATER DEMAND
This Chapter describes the existing and projected water demands for the City. The water demand forecasts will form the basis for identifying existing and future system needs and analyzing deficiencies.
INTRODUCTION Water system demands are used to size pumping, storage, and distribution system facilities. General water demand and production definitions used in this report are defined as follows:
• Water Consumption: the amount of water consumed as measured directly through customer meters
• Water Production: the amount of water produced by the City’s water supply sources • Unaccounted-for-Water (UAW): the difference between the quantity of water
produced and the amount of water consumed as measured directly through customer meters
HISTORICAL WATER DEMANDS Metered consumption data was provided by the City for the years 2015, 2016, and 2017. Water Production records were identified through the City’s Consumer Confidence Reports (CCRs) and Well Production Data. The historical demands are summarized in Table 4-1. The City’s Total Well Production accounts for the City’s flow that was metered to SSCWD. Total SSCWD flow to City refers to the SSCWD Well Production and Lessalt Water Treatment Plant flow into the City’s water distribution system via the interties.
1West Hills WTP came online in 2017.
As noted in Table 4-1, the City’s UAW ranges between 10.1% and 11.5%, averaging at approximately 10.9%. The American Water Works Association (AWWA) Manual 32 states that municipal ranges for UAW are typically between 10-15%. UAW is typically generated from several sources including leaking pipes, water used for fires, water main flushing, and faulty/un-calibrated meters. UAW should be minimized where possible since it requires the City’s resources to produce water. Since the water is unaccounted for, revenue for the production is not being collected. It is recommended that the City calibrate their water meters every 5 to 10 years and
Table 4-1 Summary of Historical Water Demands (ac-ft)
Year Total City
Well Production
West Hills WTP to City
Total SSCWD Flow to City
Total Production
Entering City System
City Total Metered
Consumption UAW UAW
(%)
2015 1,738 N/A1 961 2,699 2,400 299 11.1 2016 1,812 N/A1 955 2,767 2,488 279 10.1 2017 1,417 407 1,187 3,011 2,664 347 11.5
4-2
replace all water meters every 20 to 25 years. This meter replacement should be budgeted in the City’s Operation and Maintenance Budget annually.
HYDRAULIC DEMAND PARAMETERS The water system hydraulic characteristics are used to identify existing and future water distribution system requirements. The data used to calculate existing average water demands is based on annual production from 2015-2017. Peaking factors for maximum day demand and peak hour demand were found using the California Code of Regulations Title 22, Division 4, Chapter 16, Article 2, Section 64554 for monthly water data. The hydraulic demand parameters used to evaluate the City’s water distribution system are described in the following sections and summarized in Table 4-3. Average Day Demand (ADD) The average day demand (ADD) is the average water production needed to meet the daily demand calculated over the year and generally determined by production records. The ADD is used to also determine the average per capita demand, which is used to project future water system demands based on population growth. Table 4-2 provides a summary of the ADD for 2015-2017, which averages 1,752 gpm or 2.52 million gallons per day (mgd). Maximum Day Demand (MDD) The maximum day demand (MDD) is the daily usage of water needed to meet the peak day demand of the year. This is generally during the summer as a result of increased irrigation demand and heightened outdoor activities. A public water system’s water source shall have the capacity to meet the system’s MDD.
According to California Code of Regulations Title 22, if daily production data is not available, the maximum day demand should be found using the maximum month during the highest annual use and multiplying the average daily usage for that month by a factor of 1.5. The maximum month between 2015 and 2017 for the City was September 2017, with an average daily use of 2,667 gpm. Using this methodology, the MDD for the City’s service area is 4,000 gpm or 5.76 mgd. This equates to a peaking factor of 2.28 for MDD. Peak Hour Demand (PHD) Peak hour demand (PHD) is used to size water mains and pumping facilities. The PHD is generally determined by calculating the specific demand within the day by monitoring tank levels and pumping records; however, in many municipal systems, the exact calculation can be difficult to ascertain. The City does not maintain hourly usage records, which would be used to determine PHD. Per the California Code of Regulations Title 22 for monthly water usage data, if hourly production data is not available, PHD can be calculated by multiplying a peaking factor of at least 1.5 to the average hourly flow during the MDD. Using this method, the PHD for the City’s service area is 6,000 gpm or 8.64 mgd. This equates to a peaking factor of 3.43 for PHD.
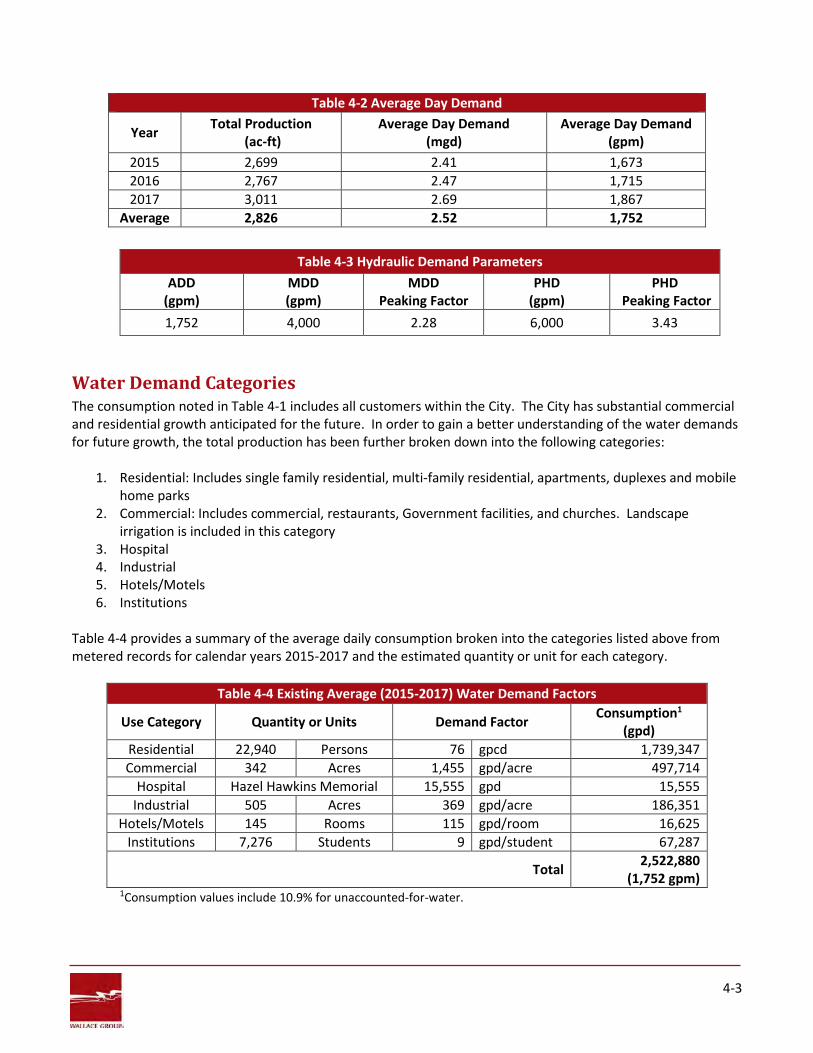
4-3
Water Demand Categories The consumption noted in Table 4-1 includes all customers within the City. The City has substantial commercial and residential growth anticipated for the future. In order to gain a better understanding of the water demands for future growth, the total production has been further broken down into the following categories:
1. Residential: Includes single family residential, multi-family residential, apartments, duplexes and mobile home parks
2. Commercial: Includes commercial, restaurants, Government facilities, and churches. Landscape irrigation is included in this category
3. Hospital 4. Industrial 5. Hotels/Motels 6. Institutions
Table 4-4 provides a summary of the average daily consumption broken into the categories listed above from metered records for calendar years 2015-2017 and the estimated quantity or unit for each category.
Table 4-4 Existing Average (2015-2017) Water Demand Factors
Use Category Quantity or Units Demand Factor Consumption1 (gpd)
Residential 22,940 Persons 76 gpcd 1,739,347 Commercial 342 Acres 1,455 gpd/acre 497,714
Hospital Hazel Hawkins Memorial 15,555 gpd 15,555 Industrial 505 Acres 369 gpd/acre 186,351
Hotels/Motels 145 Rooms 115 gpd/room 16,625 Institutions 7,276 Students 9 gpd/student 67,287
Total 2,522,880 (1,752 gpm)
1Consumption values include 10.9% for unaccounted-for-water.
Table 4-2 Average Day Demand
Year Total Production (ac-ft)
Average Day Demand (mgd)
Average Day Demand (gpm)
2015 2,699 2.41 1,673 2016 2,767 2.47 1,715 2017 3,011 2.69 1,867
Average 2,826 2.52 1,752
Table 4-3 Hydraulic Demand Parameters ADD
(gpm) MDD (gpm)
MDD Peaking Factor
PHD (gpm)
PHD Peaking Factor
1,752 4,000 2.28 6,000 3.43
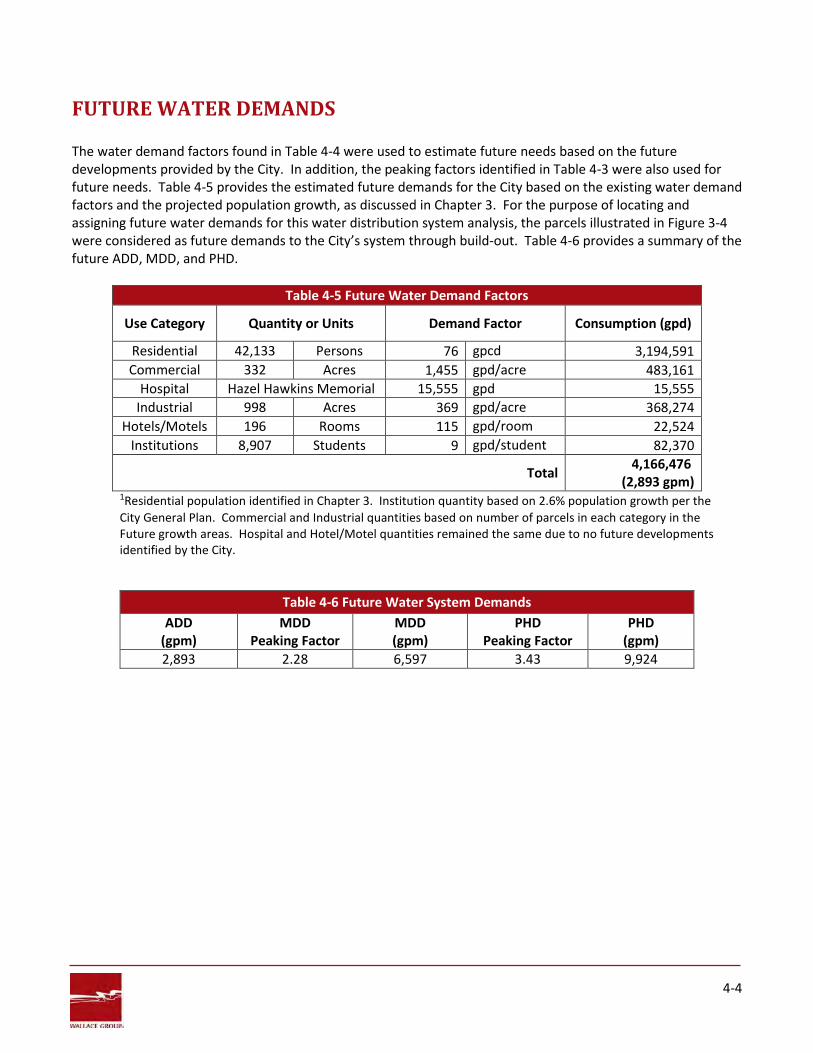
4-4
FUTURE WATER DEMANDS The water demand factors found in Table 4-4 were used to estimate future needs based on the future developments provided by the City. In addition, the peaking factors identified in Table 4-3 were also used for future needs. Table 4-5 provides the estimated future demands for the City based on the existing water demand factors and the projected population growth, as discussed in Chapter 3. For the purpose of locating and assigning future water demands for this water distribution system analysis, the parcels illustrated in Figure 3-4 were considered as future demands to the City’s system through build-out. Table 4-6 provides a summary of the future ADD, MDD, and PHD.
Table 4-5 Future Water Demand Factors
Use Category Quantity or Units Demand Factor Consumption (gpd)
Residential 42,133 Persons 76 gpcd 3,194,591 Commercial 332 Acres 1,455 gpd/acre 483,161
Hospital Hazel Hawkins Memorial 15,555 gpd 15,555 Industrial 998 Acres 369 gpd/acre 368,274
Hotels/Motels 196 Rooms 115 gpd/room 22,524 Institutions 8,907 Students 9 gpd/student 82,370
Total 4,166,476 (2,893 gpm)
1Residential population identified in Chapter 3. Institution quantity based on 2.6% population growth per the City General Plan. Commercial and Industrial quantities based on number of parcels in each category in the Future growth areas. Hospital and Hotel/Motel quantities remained the same due to no future developments identified by the City.
Table 4-6 Future Water System Demands ADD
(gpm) MDD
Peaking Factor MDD (gpm)
PHD Peaking Factor
PHD (gpm)
2,893 2.28 6,597 3.43 9,924
5-1
CHAPTER 5 WATER SUPPLY OVERVIEW
Chapter 5 provides an overview of the City’s water supply portfolio. A water supply analysis was not included as part of the scope of this WDSMP; however, it is important to understand the City’s water supplies as they pertain to overall water service to the City’s residents. More detailed information about the City’s water supply and the redundancy and reliability of the water supplies is located in the 2008 Hollister Urban Area Water and Wastewater Master Plan and the 2017 Hollister Urban Area Master Plan Update.
INTRODUCTION The City obtains its water supply from both groundwater and surface water. Three (3) groundwater wells operate within City limits and two groundwater wells feed the Cienega Valley. Additionally, surface water is imported from the Central Valley Project via the Hollister Conduit to augment the City’s water supply.
Groundwater The City maintains eight (8) groundwater wells that extract water from the underlying groundwater basin for their municipal supply. Within City limits, the City currently operates three (3) wells, City Well No. 2 Bundeson, No. 4 South, and No. 5 Nash, which feed into two storage tanks. City Wells No. 1 San Felipe and No. 3 Fallon are inactive due to a presence of high nitrate levels. A change to the source status of City Well No. 6 Airline from emergency standby to inactive was recently approved by the State Water Resources Control Board (SWRCB) due to excessive sand and consistently high lab results for aluminum. As discussed in Chapter 2, the City also maintains two groundwater wells, Cullum Wells No. 1 and No. 2, that feed into Sally Flats Reservoir in the Cienega Valley, south of City limits. Table 5-1 shows the City’s annual well production and the percent of total water production based on the City’s Consumer Confidence Reports. Per the 2017 Hollister Urban Area Master Plan Update, the Division of Drinking Water (DDW) adopted a new Maximum Contaminant Level (MCL) in 2014 of Hexavelent Chromium to 10 parts per billion (ppb) in drinking water. Results from water quality sampling showed that all of the City’s active water supply wells exceeded the new MCL. In 2015, the City prepared the Hexavalent Chromium Compliance Plan for Groundwater Supply (Compliance Plan), which recommended blending at the existing wells with treated surface water. The DDW is currently working on a new regulation for Hexavalent Chromium. It should be noted that the recommendations made in the Compliance Plan are conservative.
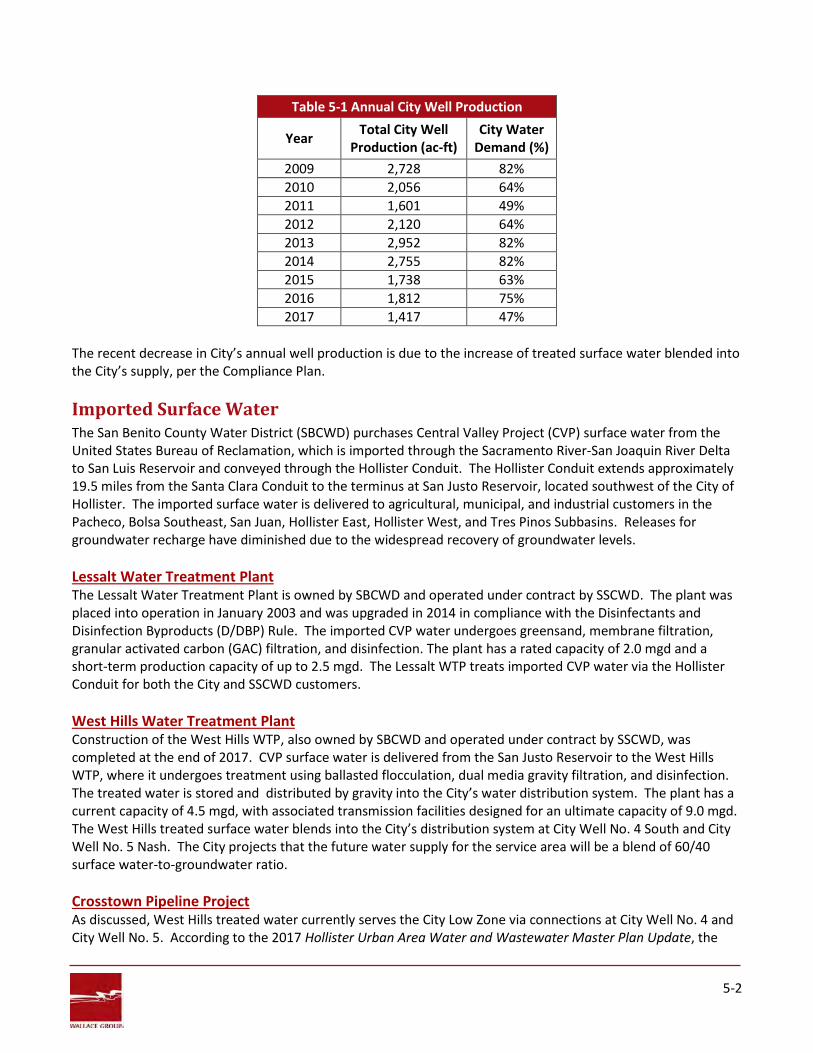
5-2
Table 5-1 Annual City Well Production
Year Total City Well Production (ac-ft)
City Water Demand (%)
2009 2,728 82% 2010 2,056 64% 2011 1,601 49% 2012 2,120 64% 2013 2,952 82% 2014 2,755 82% 2015 1,738 63% 2016 1,812 75% 2017 1,417 47%
The recent decrease in City’s annual well production is due to the increase of treated surface water blended into the City’s supply, per the Compliance Plan.
Imported Surface Water The San Benito County Water District (SBCWD) purchases Central Valley Project (CVP) surface water from the United States Bureau of Reclamation, which is imported through the Sacramento River-San Joaquin River Delta to San Luis Reservoir and conveyed through the Hollister Conduit. The Hollister Conduit extends approximately 19.5 miles from the Santa Clara Conduit to the terminus at San Justo Reservoir, located southwest of the City of Hollister. The imported surface water is delivered to agricultural, municipal, and industrial customers in the Pacheco, Bolsa Southeast, San Juan, Hollister East, Hollister West, and Tres Pinos Subbasins. Releases for groundwater recharge have diminished due to the widespread recovery of groundwater levels.
Lessalt Water Treatment Plant The Lessalt Water Treatment Plant is owned by SBCWD and operated under contract by SSCWD. The plant was placed into operation in January 2003 and was upgraded in 2014 in compliance with the Disinfectants and Disinfection Byproducts (D/DBP) Rule. The imported CVP water undergoes greensand, membrane filtration, granular activated carbon (GAC) filtration, and disinfection. The plant has a rated capacity of 2.0 mgd and a short-term production capacity of up to 2.5 mgd. The Lessalt WTP treats imported CVP water via the Hollister Conduit for both the City and SSCWD customers. West Hills Water Treatment Plant Construction of the West Hills WTP, also owned by SBCWD and operated under contract by SSCWD, was completed at the end of 2017. CVP surface water is delivered from the San Justo Reservoir to the West Hills WTP, where it undergoes treatment using ballasted flocculation, dual media gravity filtration, and disinfection. The treated water is stored and distributed by gravity into the City’s water distribution system. The plant has a current capacity of 4.5 mgd, with associated transmission facilities designed for an ultimate capacity of 9.0 mgd. The West Hills treated surface water blends into the City’s distribution system at City Well No. 4 South and City Well No. 5 Nash. The City projects that the future water supply for the service area will be a blend of 60/40 surface water-to-groundwater ratio.
Crosstown Pipeline Project As discussed, West Hills treated water currently serves the City Low Zone via connections at City Well No. 4 and City Well No. 5. According to the 2017 Hollister Urban Area Water and Wastewater Master Plan Update, the

5-3
Crosstown Pipeline was planned as a future pipeline to extend delivery of treated surface water from the West Hills WTP to SSCWD’s Middle Zone. The project was accelerated in order to comply with the California Hexavalent Chromium regulations for the groundwater supplies. The Crosstown Pipeline will add an additional City connection at City Well No. 2 and will connect to SSCWD’s Middle Zone at SSCWD’s Well No. 2 and No. 11. Both the City and SSCWD’s water systems will benefit in the distribution of high quality surface water, lowering both TDS and hardness. The Crosstown Pipeline will also enhance reliability for seasonal demand and emergency operations. The Crosstown Pipeline is anticipated to be brought on line in 2019.
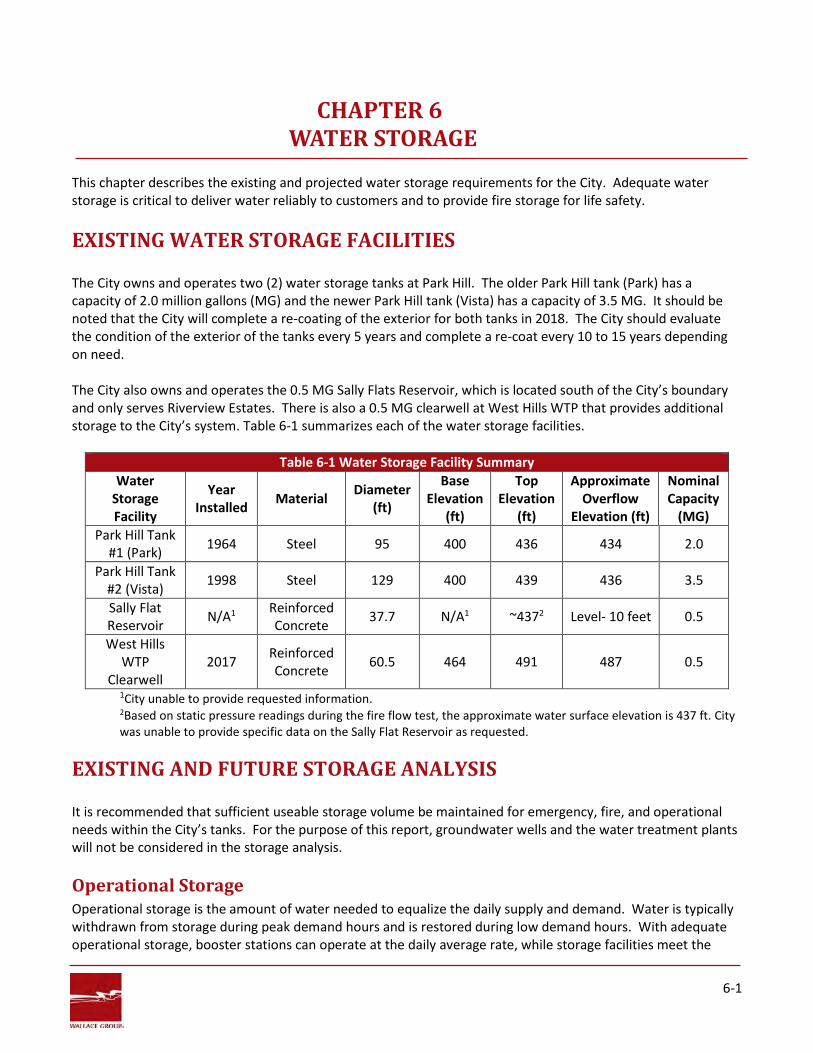
6-1
CHAPTER 6 WATER STORAGE
This chapter describes the existing and projected water storage requirements for the City. Adequate water storage is critical to deliver water reliably to customers and to provide fire storage for life safety.
EXISTING WATER STORAGE FACILITIES The City owns and operates two (2) water storage tanks at Park Hill. The older Park Hill tank (Park) has a capacity of 2.0 million gallons (MG) and the newer Park Hill tank (Vista) has a capacity of 3.5 MG. It should be noted that the City will complete a re-coating of the exterior for both tanks in 2018. The City should evaluate the condition of the exterior of the tanks every 5 years and complete a re-coat every 10 to 15 years depending on need. The City also owns and operates the 0.5 MG Sally Flats Reservoir, which is located south of the City’s boundary and only serves Riverview Estates. There is also a 0.5 MG clearwell at West Hills WTP that provides additional storage to the City’s system. Table 6-1 summarizes each of the water storage facilities.
Table 6-1 Water Storage Facility Summary Water
Storage Facility
Year Installed Material Diameter
(ft)
Base Elevation
(ft)
Top Elevation
(ft)
Approximate Overflow
Elevation (ft)
Nominal Capacity
(MG) Park Hill Tank
#1 (Park) 1964 Steel 95 400 436 434 2.0
Park Hill Tank #2 (Vista) 1998 Steel 129 400 439 436 3.5
Sally Flat Reservoir N/A1 Reinforced
Concrete 37.7 N/A1 ~4372 Level- 10 feet 0.5
West Hills WTP
Clearwell 2017 Reinforced
Concrete 60.5 464 491 487 0.5
1City unable to provide requested information. 2Based on static pressure readings during the fire flow test, the approximate water surface elevation is 437 ft. City was unable to provide specific data on the Sally Flat Reservoir as requested.
EXISTING AND FUTURE STORAGE ANALYSIS It is recommended that sufficient useable storage volume be maintained for emergency, fire, and operational needs within the City’s tanks. For the purpose of this report, groundwater wells and the water treatment plants will not be considered in the storage analysis. Operational Storage Operational storage is the amount of water needed to equalize the daily supply and demand. Water is typically withdrawn from storage during peak demand hours and is restored during low demand hours. With adequate operational storage, booster stations can operate at the daily average rate, while storage facilities meet the
6-2
hourly peaks. AWWA M-32 recommends operational storage of 20-25% of ADD, or up to 15% of the MDD. Based on the more stringent criteria for the City being 15% of MDD, the recommended operational storage for existing and future conditions is summarized in Table 6-2.
Table 6-2 Operational Storage Recommendations MDD Storage (gpm) (gal)
Existing 4,000 864,000 Future 6,597 1,424,950
Fire Protection Storage Fire protection storage is the volume of water needed to control an anticipated fire in a building or group of buildings. The determination of this storage is based upon the most stringent zoning within a distribution zone, and the required fire flow and duration in the zone while maintaining 20 psi pressure throughout the system. These fire flow requirements are per the Uniform Fire Code (UFC). The required fire flow for the City based on the most stringent land use is provided in Table 6-3.
Table 6-3 Fire Protection Storage Recommendations Fire Flow Duration Storage (gpm) (hrs) (gal)
Existing 4,000 4 960,000 Future 4,000 4 960,000
Emergency Storage Emergency storage is intended to provide water supply during extended power outages, pump failures, and other similar problems. Most water planners accept that during emergencies, supply per capita may be reduced to minimum levels. Typically, on that basis, an emergency storage volume of 50 gpcd for three days is accepted as a reasonable value. Table 6-4 provides a summary of the emergency storage recommendations for the existing and future population for the City.
Table 6-4 Emergency Storage Recommendations
Population Gallons/Capita Per Day
Storage (gal)
Existing 22,940 50 3,441,000 Future 42,133 50 6,319,950
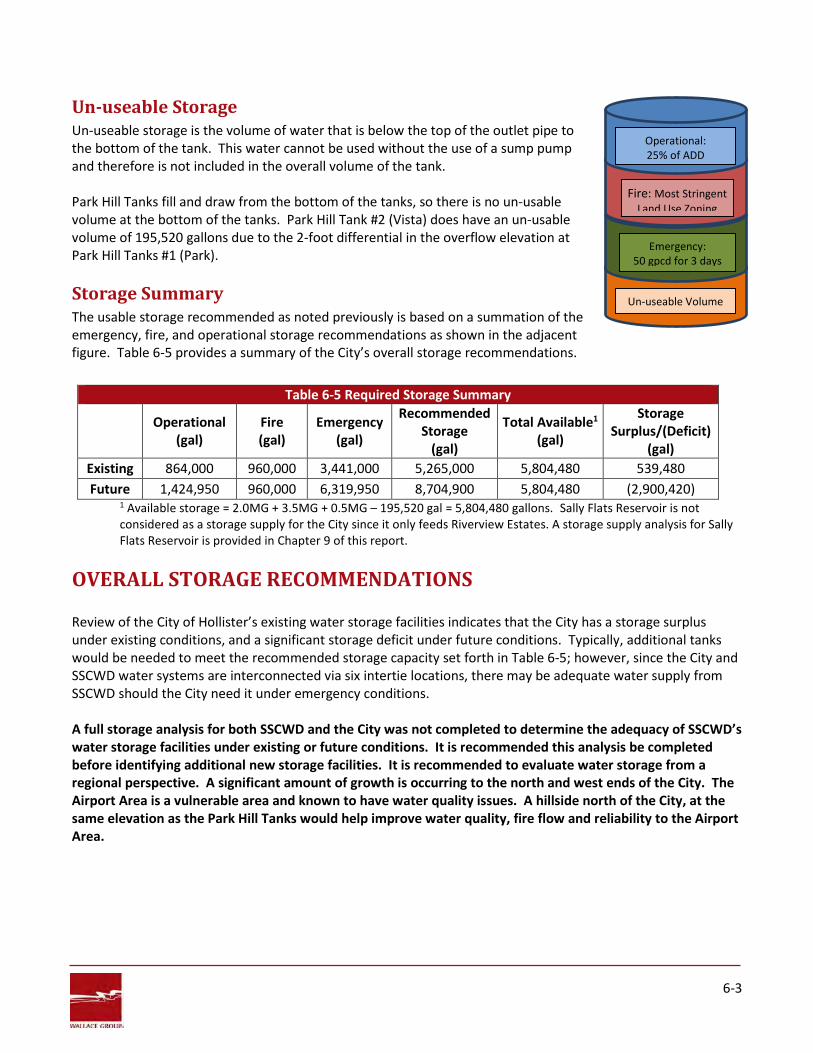
6-3
Un-useable Storage Un-useable storage is the volume of water that is below the top of the outlet pipe to the bottom of the tank. This water cannot be used without the use of a sump pump and therefore is not included in the overall volume of the tank. Park Hill Tanks fill and draw from the bottom of the tanks, so there is no un-usable volume at the bottom of the tanks. Park Hill Tank #2 (Vista) does have an un-usable volume of 195,520 gallons due to the 2-foot differential in the overflow elevation at Park Hill Tanks #1 (Park).
Storage Summary The usable storage recommended as noted previously is based on a summation of the emergency, fire, and operational storage recommendations as shown in the adjacent figure. Table 6-5 provides a summary of the City’s overall storage recommendations.
1 Available storage = 2.0MG + 3.5MG + 0.5MG – 195,520 gal = 5,804,480 gallons. Sally Flats Reservoir is not considered as a storage supply for the City since it only feeds Riverview Estates. A storage supply analysis for Sally Flats Reservoir is provided in Chapter 9 of this report.
OVERALL STORAGE RECOMMENDATIONS Review of the City of Hollister’s existing water storage facilities indicates that the City has a storage surplus under existing conditions, and a significant storage deficit under future conditions. Typically, additional tanks would be needed to meet the recommended storage capacity set forth in Table 6-5; however, since the City and SSCWD water systems are interconnected via six intertie locations, there may be adequate water supply from SSCWD should the City need it under emergency conditions. A full storage analysis for both SSCWD and the City was not completed to determine the adequacy of SSCWD’s water storage facilities under existing or future conditions. It is recommended this analysis be completed before identifying additional new storage facilities. It is recommended to evaluate water storage from a regional perspective. A significant amount of growth is occurring to the north and west ends of the City. The Airport Area is a vulnerable area and known to have water quality issues. A hillside north of the City, at the same elevation as the Park Hill Tanks would help improve water quality, fire flow and reliability to the Airport Area.
Table 6-5 Required Storage Summary Operational
(gal) Fire (gal)
Emergency (gal)
Recommended Storage
(gal)
Total Available1 (gal)
Storage Surplus/(Deficit)
(gal)
Existing 864,000 960,000 3,441,000 5,265,000 5,804,480 539,480 Future 1,424,950 960,000 6,319,950 8,704,900 5,804,480 (2,900,420)
Emergency: 50 gpcd for 3 days
Fire: Most Stringent Land Use Zoning
Operational: 25% of ADD
Un-useable Volume
6-4
Seismic and Mixing System Upgrades Both Park Hill Tanks have single bottom penetration for fill and draw. Park Hill Tank #1 (Park) has an internal mixing system; however, Park Hill Tank #2 (Vista) does not. It is recommended that the inlet/outlet for Vista Tank either be re-configured to meet current Division of Drinking Water (DDW) regulations or install a Tide flex© Red Valve Mixing System or similar unit inside the tank to promote mixing and eliminate stagnation within zones of the tank. These upgrades will bring the tanks into compliance with current DDW requirements. It is also recommended that the City perform a dive-inspection on the tank interiors, which will help the City plan for the next interior coating project.
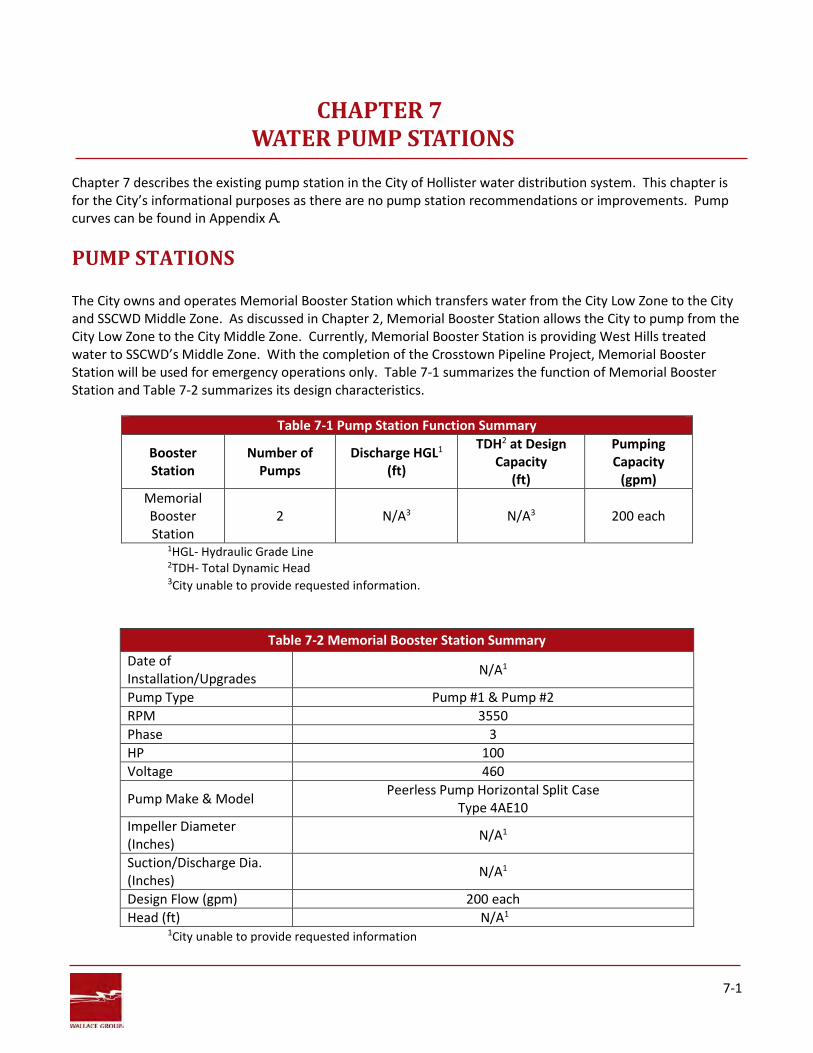
7-1
CHAPTER 7 WATER PUMP STATIONS
Chapter 7 describes the existing pump station in the City of Hollister water distribution system. This chapter is for the City’s informational purposes as there are no pump station recommendations or improvements. Pump curves can be found in Appendix A.
PUMP STATIONS The City owns and operates Memorial Booster Station which transfers water from the City Low Zone to the City and SSCWD Middle Zone. As discussed in Chapter 2, Memorial Booster Station allows the City to pump from the City Low Zone to the City Middle Zone. Currently, Memorial Booster Station is providing West Hills treated water to SSCWD’s Middle Zone. With the completion of the Crosstown Pipeline Project, Memorial Booster Station will be used for emergency operations only. Table 7-1 summarizes the function of Memorial Booster Station and Table 7-2 summarizes its design characteristics.
Table 7-1 Pump Station Function Summary
Booster Station
Number of Pumps
Discharge HGL1 (ft)
TDH2 at Design Capacity
(ft)
Pumping Capacity
(gpm) Memorial Booster Station
2 N/A3 N/A3 200 each
1HGL- Hydraulic Grade Line 2TDH- Total Dynamic Head 3City unable to provide requested information.
Table 7-2 Memorial Booster Station Summary Date of Installation/Upgrades N/A1
Pump Type Pump #1 & Pump #2 RPM 3550 Phase 3 HP 100 Voltage 460
Pump Make & Model Peerless Pump Horizontal Split Case Type 4AE10
Impeller Diameter (Inches) N/A1
Suction/Discharge Dia. (Inches) N/A1
Design Flow (gpm) 200 each Head (ft) N/A1
1City unable to provide requested information
8-1
CHAPTER 8 WATER DISTRIBUTION SYSTEM ANALYSIS
Chapter 8 describes the water system design criteria, water model development and calibration, and overall system performances. All figures can be found at the end of this chapter.
WATER SYSTEM DESIGN CRITERIA A hydraulic model was developed and calibrated to analyze the City’s water distribution system under existing and future conditions. The design requirements used to determine any deficiencies in the water distribution system relate to the flow and pressure delivered by the system to the customers. Overall Water System Pressures The State Water Resources Control Board’s (SWRCB) Division of Drinking Water regulates the requirements for minimum system pressures within a water distribution system. Per the existing Waterworks Standards, Chapter 16, Section 64602, last updated on April 10, 2017:
a) Each distribution system shall be operated in a manner to assure that the minimum operating pressure in the water main at the user service line connection throughout the distribution system is not less than 20 pounds per square inch (psi) at all times.
b) Each new distribution system that expands the existing system service connections by more than 20 percent or that may otherwise adversely affect the distribution system pressure shall be designed to provide a minimum operating pressure throughout the new distribution system of not less than 40 pounds per square inch (psi) at all times excluding fire flow.
Ideally, normal operating (static) pressures should be within the range of 40 to 80 psi. This is the range that most people find comfortable and will serve most fire sprinkler systems. For the existing system, the design criteria for this WDSMP is to recommend average day, maximum day, and peak hour pressures to be no less than 40 psi. This falls in line with SWRCB’s intention for all new water distribution systems or systems that are still expanding. It should be noted that prior to this SWRCB update, the required system pressure under all conditions, except fire flow, was 30 psi. As noted in b) above, unless the City expands the system, the system pressure is “grand-fathered in” to a service pressure of 30 psi. However, the City is expected to expand more than 20%; therefore, when completing the water model analysis, the water system will be analyzed to maintain 40 psi throughout the entire distribution system. Pressures higher than 80 psi are acceptable within the distribution system but should be reduced to 80 psi or lower at the service connection with an individual home pressure reducing valve to prevent water hammer effects or leakage through washers and seats.
8-2
Water Demand Requirements The flow requirements examined in the hydraulic model include average day demand, peak hour demand, and fire flow plus maximum day demand. The various flow scenarios are summarized as follows: Average Day Demand (ADD) This flow condition is used to evaluate the system subject to the most common conditions. The existing demands were assigned throughout the distribution system based on the demands noted in Chapter 4. The tanks were modeled full (two feet below overflow) during this scenario to identify the highest system pressure conditions the City’s customers will experience on a daily basis. In addition, all wells and booster stations are turned off. Peak Hour Demand (PHD) This demand condition is used to identify system deficiencies at the maximum domestic use. A peaking factor per Table 4-3 of this report was applied to average day demand to obtain peak hour demand. The tanks were modeled at ½ full during this scenario to identify the lowest system pressure conditions the City’s customers will experience on a daily basis. In addition, all wells and booster stations are turned off. Fire Flow (FF) Plus Maximum Day Demand (MDD) This demand condition is used to identify system deficiencies under fire flow conditions. A peaking factor per Table 4-3 of this report was applied to average day demand to obtain maximum day demand. The tanks were modeled at ¾ full during this scenario. This tank level is most common throughout the day. In addition, all wells and booster stations are turned off, and only one fire flow City-wide is modeled at any one time. Fire Flow Requirements Per the 1992 City Standards, the required fire flow rates are to be determined with a minimum of 20 psi residual pressure within all portions of the water distribution system. To analyze the system for its ability to meet this requirement, the maximum fire flow at each hydrant (based on the structure type) is modeled to verify that the minimum pressure at all nodes in the system does not drop below 20 psi while the hydrant is flowing. Capital improvement projects will be identified if the water distribution system does not meet this requirement. Table 8-1 summarizes the recommended fire flow requirements for each type of zoning. The fire flow requirements identified are only a guide to assist in developing capital improvement projects and are based typically on the most stringent fire flow requirements for the zoning noted. The City Fire Department is responsible for determining exact fire flow requirements, higher or lower, for all buildings throughout the City. If it is determined that a facility or residential structure requires higher fire flow demands than what is identified in Table 8-1, additional water modeling should be completed to determine if the water distribution system can meet the increased fire flow requirements. In addition, if the highest fire flow requirement in the City increases above 4,000 gpm, this will impact the storage requirement noted in Chapter 6.

8-3
Table 8-1 Fire Flow Requirements
Zoning Fire Flow (gpm)
Duration (hours) Notes
Residential (low and medium density) 1,500 2
Residential (high density) 2,000 2
Neighborhood Commercial 1,500 2 Commercial businesses within residential neighborhoods
Commercial 2,500 2 All other commercial not identified in Neighborhood or Big Box
Big Box Commercial 4,000 4 Large square footage commercial buildings
Industrial 4,000 4 Hotels 4,000 4 Large hotels
Hospital 2,375 4 Hazel Hawkins Memorial (sprinklered)
Churches 2,500 2 Schools 2,500 2
Hydrant Spacing According to the 1992 City Standards, fire hydrants on streets without fronting residential lots shall have a maximum spacing of 600 feet, and the minimum size water main serving a fire hydrant shall be 8-inches with no more than three hydrants allowed on any 8-inch line between intersecting lines. The City of Hollister 2013 Standard Detail for Fire Hydrant Location and Notes (B-1-2) states that fire hydrant installation is not to exceed 250-foot spacing. It is recommended that the City update their City standards for fire hydrant spacing to ensure that the City is meeting State Health Standards. In addition, the City’s GIS database has incorporated fire hydrants into the database based on old record maps. It is recommended that the City conduct a fire hydrant spacing study to determine the accuracy of the fire hydrant placement and confirm that the spacing of fire hydrants throughout the City meets City standards. Valve Spacing Per the 1992 City Standards, the number of valves shall be sufficient so that no single shutdown will result in service removal from the length of a pipe greater than 250 feet in high density and 600 feet in other districts. Additionally, no more than two fire hydrants shall be removed from service. Per the California Code of Regulations Title 22, Division 4, Chapter 16, Article 4, Section 64577, isolation valves shall be installed on all new water mains within the distribution system as follows:
a) No farther than 1,320 linear feet apart on all mains having a diameter of 12 inches or less.
b) At each tee or crossing connection between mains that have a diameter of 12 inches or less, within 100 feet of the tee or crossing connection with the primary main.
8-4
c) Between the water main and each fire hydrant served by the main. It is recommended that the City update their City standards for valve spacing to ensure that the City is meeting State Health Standards. In addition, the City’s GIS database has incorporated valves into the database base on old record maps. It is recommended that the City conduct a valving spacing study to determine the accuracy of the valve placement and confirm that the spacing of the valves throughout the City meets City standards. It is also recommended that the City implement or maintain a valve exercise program. All valves should be fully opened and closed every year to ensure that the valves are properly functioning and will fully close in the event of an emergency shutoff. All ceased valves should be replaced. Pipe Sizes and Material According to the 1992 City Standards, the minimum size water main shall have a diameter of 8-inches and be PVC. The installation of 6-inch PVC water mains are permitted in cul-de-sacs less than 250-feet where there are no fire hydrants served by the 6-inch main. Any cul-de-sac longer than 250 feet should have a fire hydrant at the end of the street and therefore should be served by an 8-inch PVC water main. All dead-end mains are to be provided with a City standard blow-off or other acceptable means of flushing, such as a fire hydrant. The following parameters were employed to identify deficiencies within the water distribution system for each run of the model:
1. Domestic pressures below 40 psi for ADD, MDD, and PHD 2. Pipeline velocities exceeding five feet per second (fps) at ADD, MDD, and PHD are identified.
In general, velocities higher than five fps create excessive pressure losses. 3. Pipeline velocities exceeding 10 fps during the fire flow conditions plus MDD are identified.
Pipelines near the source of the fire are identified if velocities exceeded 15 fps. 4. During fire flow model runs, service pressures below 20 psi at any node within the
distributions system were identified.
The hydraulic parameters and design criteria for the evaluation of the City’s water system are summarized in Table 8-2.
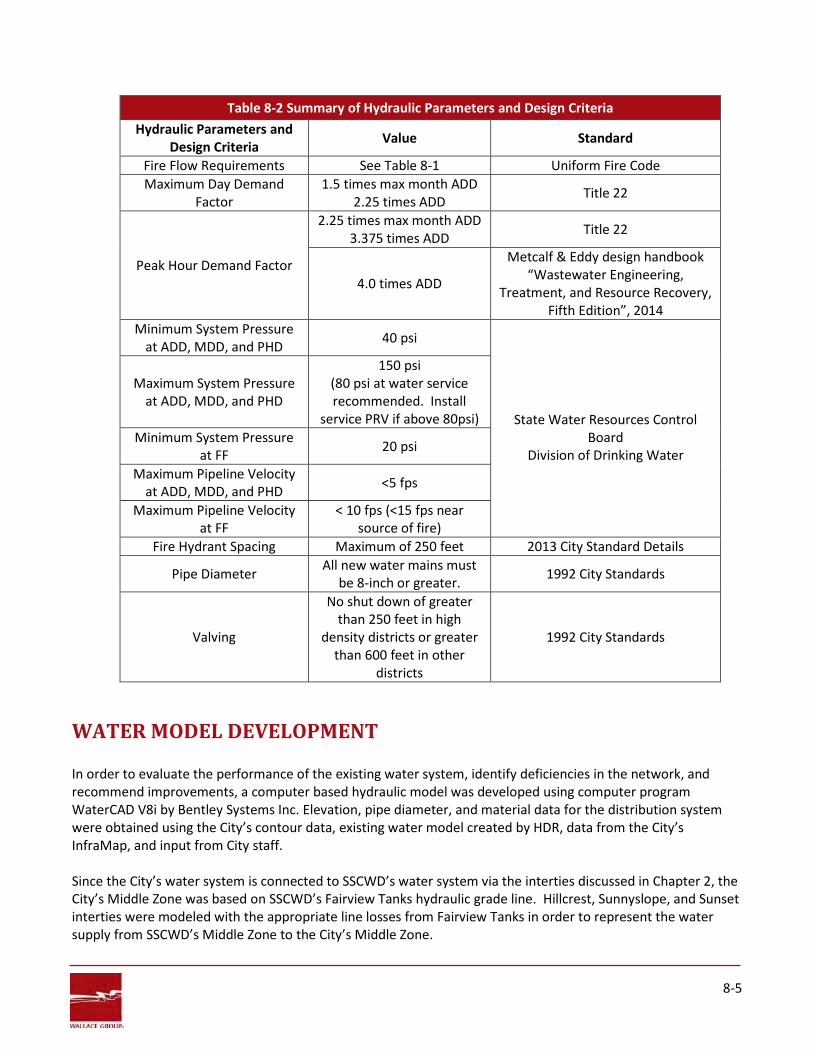
8-5
Table 8-2 Summary of Hydraulic Parameters and Design Criteria Hydraulic Parameters and
Design Criteria Value Standard
Fire Flow Requirements See Table 8-1 Uniform Fire Code Maximum Day Demand
Factor 1.5 times max month ADD
2.25 times ADD Title 22
Peak Hour Demand Factor
2.25 times max month ADD 3.375 times ADD Title 22
4.0 times ADD
Metcalf & Eddy design handbook “Wastewater Engineering,
Treatment, and Resource Recovery, Fifth Edition”, 2014
Minimum System Pressure at ADD, MDD, and PHD 40 psi
State Water Resources Control
Board Division of Drinking Water
Maximum System Pressure at ADD, MDD, and PHD
150 psi (80 psi at water service recommended. Install
service PRV if above 80psi) Minimum System Pressure
at FF 20 psi
Maximum Pipeline Velocity at ADD, MDD, and PHD <5 fps
Maximum Pipeline Velocity at FF
< 10 fps (<15 fps near source of fire)
Fire Hydrant Spacing Maximum of 250 feet 2013 City Standard Details
Pipe Diameter All new water mains must be 8-inch or greater. 1992 City Standards
Valving
No shut down of greater than 250 feet in high
density districts or greater than 600 feet in other
districts
1992 City Standards
WATER MODEL DEVELOPMENT In order to evaluate the performance of the existing water system, identify deficiencies in the network, and recommend improvements, a computer based hydraulic model was developed using computer program WaterCAD V8i by Bentley Systems Inc. Elevation, pipe diameter, and material data for the distribution system were obtained using the City’s contour data, existing water model created by HDR, data from the City’s InfraMap, and input from City staff.
Since the City’s water system is connected to SSCWD’s water system via the interties discussed in Chapter 2, the City’s Middle Zone was based on SSCWD’s Fairview Tanks hydraulic grade line. Hillcrest, Sunnyslope, and Sunset interties were modeled with the appropriate line losses from Fairview Tanks in order to represent the water supply from SSCWD’s Middle Zone to the City’s Middle Zone.
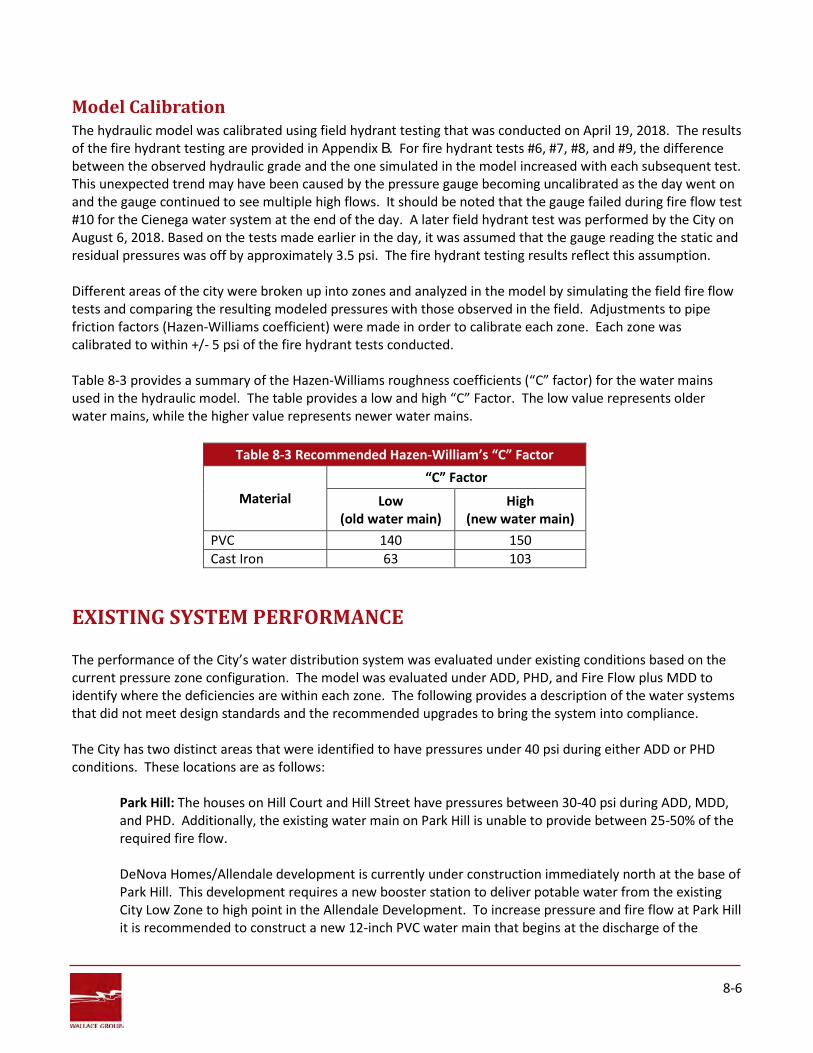
8-6
Model Calibration The hydraulic model was calibrated using field hydrant testing that was conducted on April 19, 2018. The results of the fire hydrant testing are provided in Appendix B. For fire hydrant tests #6, #7, #8, and #9, the difference between the observed hydraulic grade and the one simulated in the model increased with each subsequent test. This unexpected trend may have been caused by the pressure gauge becoming uncalibrated as the day went on and the gauge continued to see multiple high flows. It should be noted that the gauge failed during fire flow test #10 for the Cienega water system at the end of the day. A later field hydrant test was performed by the City on August 6, 2018. Based on the tests made earlier in the day, it was assumed that the gauge reading the static and residual pressures was off by approximately 3.5 psi. The fire hydrant testing results reflect this assumption. Different areas of the city were broken up into zones and analyzed in the model by simulating the field fire flow tests and comparing the resulting modeled pressures with those observed in the field. Adjustments to pipe friction factors (Hazen-Williams coefficient) were made in order to calibrate each zone. Each zone was calibrated to within +/- 5 psi of the fire hydrant tests conducted. Table 8-3 provides a summary of the Hazen-Williams roughness coefficients (“C” factor) for the water mains used in the hydraulic model. The table provides a low and high “C” Factor. The low value represents older water mains, while the higher value represents newer water mains.
Table 8-3 Recommended Hazen-William’s “C” Factor
Material “C” Factor
Low (old water main)
High (new water main)
PVC 140 150 Cast Iron 63 103
EXISTING SYSTEM PERFORMANCE The performance of the City’s water distribution system was evaluated under existing conditions based on the current pressure zone configuration. The model was evaluated under ADD, PHD, and Fire Flow plus MDD to identify where the deficiencies are within each zone. The following provides a description of the water systems that did not meet design standards and the recommended upgrades to bring the system into compliance. The City has two distinct areas that were identified to have pressures under 40 psi during either ADD or PHD conditions. These locations are as follows:
Park Hill: The houses on Hill Court and Hill Street have pressures between 30-40 psi during ADD, MDD, and PHD. Additionally, the existing water main on Park Hill is unable to provide between 25-50% of the required fire flow. DeNova Homes/Allendale development is currently under construction immediately north at the base of Park Hill. This development requires a new booster station to deliver potable water from the existing City Low Zone to high point in the Allendale Development. To increase pressure and fire flow at Park Hill it is recommended to construct a new 12-inch PVC water main that begins at the discharge of the
8-7
Allendale booster station and extends approximately 2,500 feet to connect to the existing water mains supplying the houses on Hill Court and Hill Street. Low Pressure Area: Under PHD, the southerly portion of City limits experiences system pressures that are less than 40 psi. It is recommended that the City modify the Middle Zone Boundary via closed valves or PRVs to increase the pressures in the deficient area of the City. The new City Middle Zone would extend from Cienega Road to Memorial Drive, and be bounded by Bundeson Drive, Cushman Street, Tres Pinos Road, a portion of McCray Street, and Hillcrest Road. Figure 8-1 provides an overview of the proposed Middle Zone modification with its new boundary presented in Figure 8-2.
The water system upgrades provided below are based on the proposed zone modification. If the City chooses not to modify the distribution zones, additional CIPs may be required and some of the proposed CIPs may no longer be necessary. Additional analysis should be completed to quantify the impacts of not modifying the zones. The following projects are recommended for the City’s existing system. The following upgrades proposed were a result of existing fire flows that were less than 50% of the required fire flow:
East Street: Replace approximately 700-feet of 6-inch cast iron to 8-inch PVC on East Street from South Street to Hawkins Street. Walnut Lane: Replace approximately 850-feet of 6-inch cast iron to 8-inch PVC on Walnut Lane from Powell Street to the end of the cul-de-sac.
The following upgrades proposed were a result of existing fire flow’s that were between 50% and 75% of the required fire flow:
Airport-Industrial: The industrial buildings near the Hollister Municipal Airport are currently served by one 12-inch water main along San Felipe Road. This results in several issues for the industrial area. First, this long, single water main is unable to provide between 50-75% of required fire flow for industrial areas. Second, if this water main were to break, the entire industrial area would be without water until the water main is repaired. Last, the City experiences water quality issues in the industrial area because there are several long dead-end water mains and no looping back to the main part of the City. To increase fire flows and reliability in the industrial area, it is recommended to construct two projects in the airport area:
o The first project would be to construct approximately 5,350 feet of 16-inch DI water main parallel to the existing water main on San Felipe Road. The new pipe would start at the intersection of Chappell Road and San Felipe Road and connect to the existing water main on McCloskey Road. From there the existing water main extends North approximately 700-feet, then the new pipe connects at this location and continues along San Felipe Road to connect and end to the crossing water main at Flynn Road. This new pipe will offer additional supply and redundancy to the airport-industrial area. It is recognized that the Airport-Industrial area has routinely experienced high Total Trihalomethane (TTHM) and Haloacetic Acids (HAA5). With the addition of the 16-inch main
8-8
along San Felipe Road, a regular flushing program will be required to address the water quality issue in this area. Additionally, the 2017 Hollister Urban Area Water and Wastewater Master Plan Update identifies a potential new well and treatment facility in this northern airport area, which will provide high quality water for this area. This proposed water supply source is supported as a long-term water system improvement to help support future growth, improve water quality and reliability in the Airport Area. This source of water should be brought into the water distribution system at the same hydraulic grade as the existing City Low Zone.
o The second project would be to construct approximately 2,250 feet of 12-inch PVC to loop the
west side of the City’s existing system in the airport/industrial area. This new water main would begin at the intersection of Flynn Road and Highway 25, continue northwest along APN 019-020-015, continue along APN 053-420-034 boundary, and connect to the existing 12-inch pipe on Airway Drive.
Note: There are additional routing alternatives that can be explored based on future development and looping alternatives; however, it is unknown when future development will occur, and this is a high priority deficiency within the City’s water system. Adding a parallel 16-inch water main along San Felipe Road will impact water quality negatively but will provide significant benefit for reliability and fire protection. The City should continue to pursue with SBCWD an alternative water supply source to the north of the City that can also supply the airport area more effectively. Additionally, the City should continue to pursue ways to loop the Airport system to eliminate all long dead-end water mains. East Airport-Industrial: Construct new approximately 3,370 feet of 8-inch PVC parallel to the private water line on Park Center Drive and the adjacent west and north easements of the adjacent agriculture lots (APN 019-050-005 and APN 019-050-003) to connect to the existing 12-inch water main on Shelton Drive. Note: It is recommended that the City acquire the private water main along Park Center Drive to reduce construct costs. The fire flows identified at the end of Park Center Drive (50%-75%) are with both the Airport-Industrial Upgrade completed. Completion of this project will loop the west side of the City’s existing system in the Airport/Industrial area. Suiter Street: Construct new approximately 290 feet of 8-inch PVC at North Suiter Street Alley from Suiter Street to Powell Street. South Street: Replace approximately 1,040 feet of 6-inch cast iron to 8-inch PVC on South Street from Line Street to College Street. Monterey Street: Replace approximately 1,250 feet of 4-inch cast iron to 8-inch PVC on Monterey Street from Hawkins Street to B Street. Powell Street: Replace approximately 670 feet of 6-inch cast iron to 8-inch PVC on Powell Street from C Street to Nash Road. Hazel Street: Complete the following projects:
o Replace approximately 945 feet of 8-inch cast iron to 8-inch PVC on Hazel Street from Prospect Avenue to Sally Street
o Replace approximately 710 feet of 8-inch cast iron to 8-inch PVC on Railroad Avenue
8-9
o Construct new approximately 380 feet of 8-inch PVC and connect to new 8-inch main on Railroad Avenue; extend new main to the intersection of Hazel Street and Sally Street
North Airport-Industrial: To further address the water quality issue in the Airport-Industrial area, it is recommended that the City construct the following projects:
o Construct approximately 2,630 feet of 12-inch PVC to connect at the existing water main on Bert Drive, follow the southern boundary of APN 014-120-015, down San Felipe Road, and connect to the existing water main on Armory Drive.
o Construct approximately 1,920 feet of 12-inch PVC to connect at the existing water main along the western service road at the airport, follow APN 053-420-003 and APN 053-420-002 western boundaries to connect to the proposed 12-inch water main identified in the second project of Airport-Industrial.
The following upgrades proposed were a result of existing fire flows that were between 75% and 100% of the required fire flow:
West Street: Replace approximately 1,200 feet of 8-inch cast iron to 8-inch PVC on West Street from B Street to Nash Road Park Street: Replace approximately 380 feet of 4-inch cast iron to 8-inch PVC on Park Street from Sally Street to Prune Street. Locust Avenue: Replace approximately 880 feet of 4-inch PVC to 8-inch PVC on Locust Avenue from Central Avenue to College Street. Hamilton Court: Replace approximately 480 feet of 8-inch PVC to 12-inch on Hamilton Court at Shelton Drive. Note: the fire flow identified (75%-100%) is with the Airport-Industrial Upgrade completed. Quail Run: Replace approximately 720 feet of 6-inch PVC to 8-inch PVC on Quail Run at Nash Road. Ball Court: Replace the existing water main on Ball Court serving the East side of Felice Drive. To accommodate potential future growth on the vacant lot on the west side of Felice Drive at Piane Crate, it is also recommended that this existing water main be upgraded. The overall recommendation includes upgrading approximately 510 feet of 6-inch PVC to 8-inch PVC on Ball Court at Felice Drive. Brandy Court: Replace approximately 220 feet of 4-inch PVC to 8-inch PVC on Brandy Court at Buena Vista Road.
FUTURE SYSTEM PERFORMANCE To evaluate the City’s water system under future conditions, all developments after 2016 were included in the water model and demand projections as identified in Chapter 2 were input into the water model. For any future developments that are identified, but no water system layout is provided, or properties that do not have tentative maps, only demands were placed on nodes in the region of the proposed development. For these developments, it is recommended that the water model be updated once these projects become “real” to confirm any water system upgrades that may be required.
8-10
The performance of the City’s water distribution system was evaluated under future demand conditions, which included ADD, PHD, and Fire Flow plus MDD. The water distribution system was modeled with all the proposed projects completed that were identified as existing deficiencies. With the proposed upgrades complete and in place to correct existing deficiencies, the City’s water distribution system did not have any additional projects that were required to meet future distribution system needs, except Ball Court and the looping of the Airport/Industrial area, both of which have been previously identified. It should be noted that future development does require existing capital improvement projects to be completed to serve the project adequately. Since the timeframe for the construction of future development is unknown, it is recommended that as development is proposed in the Planning Stage, an evaluation be completed to identify which of the proposed existing recommended capital improvement projects be completed to adequately serve the proposed development. This may dictate the priority and timing of a recommended capital improvement project in the future. In addition, it should be noted the improvements to the existing water distribution system provide significant benefit to future development, ensuring that the water distribution system can provide the required fire flow and system pressures to future development. Figure 8-3 provides a graphical representation of the future hydraulic profile due to the Middle Zone Boundary Modification and Allendale Booster Station.
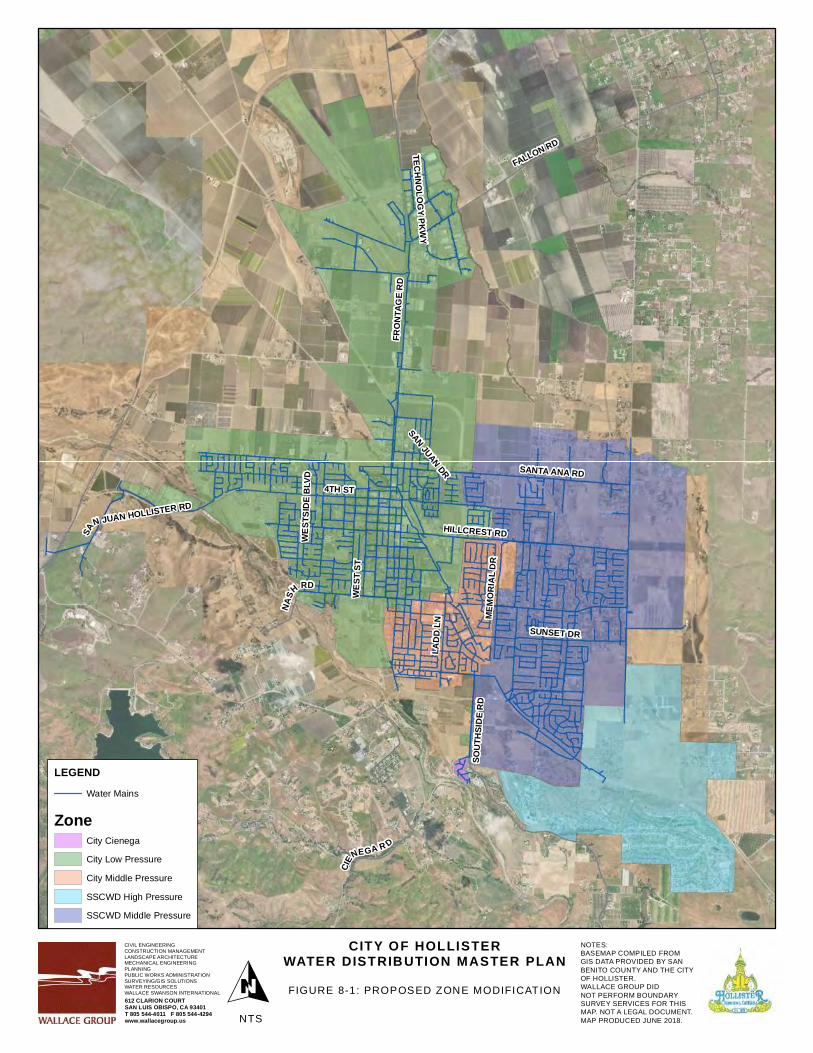
NASH
RD
FRON
TAGE
RD
MEMO
RIAL
DR
FALLON RD
CIE
NEGA R D
4TH ST
HILLCREST RDWEST
SIDE
BLV
D
LADD
LN
SANTA ANA RD
SA
N JUAN HOLLISTER RD
SUNSET DR
WEST
ST
SOUT
HSID
E RD
TECHNOLOGY PKWYSAN JUAN DR
CITY OF HOLLISTERWATER DISTRIBUTION MASTER PLAN
OCIVIL ENGINEERINGCONSTRUCTION MANAGEMENTLANDSCAPE ARCHITECTUREMECHANICAL ENGINEERINGPLANNINGPUBLIC WORKS ADMINISTRATIONSURVEYING/GIS SOLUTIONSWATER RESOURCESWALLACE SWANSON INTERNATIONAL612 CLARION COURTSAN LUIS OBISPO, CA 93401T 805 544-4011 F 805 544-4294www.wallacegroup.us
LEGENDWater Mains
ZoneCity Cienega
City Low Pressure
City Middle Pressure
SSCWD High Pressure
SSCWD Middle Pressure
FIGURE 8-1: PROPOSED ZONE MODIFICATION
NOTES:BASEMAP COMPILED FROMGIS DATA PROVIDED BY SANBENITO COUNTY AND THE CITYOF HOLLISTER. WALLACE GROUP DID NOT PERFORM BOUNDARY SURVEY SERVICES FOR THIS MAP. NOT A LEGAL DOCUMENT. MAP PRODUCED JUNE 2018. NTS
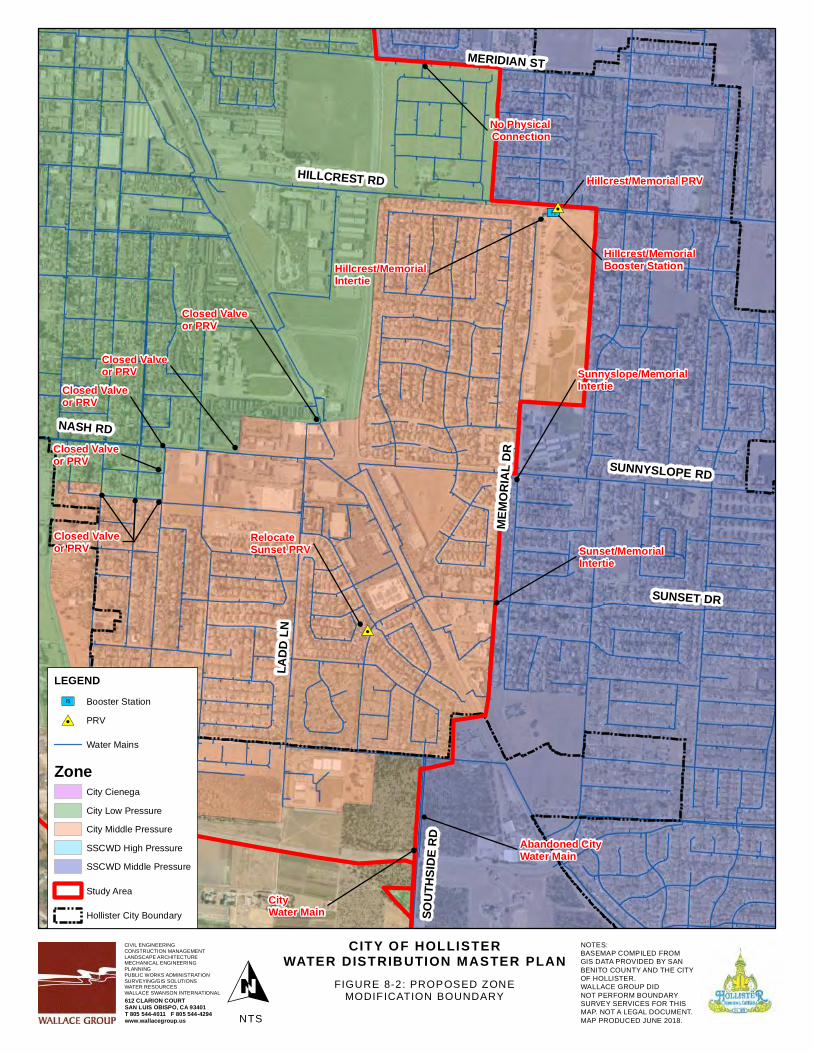
[Ú
#0
#0
Hillcrest/MemorialIntertie
Hillcrest/Memorial PRV
Hillcrest/MemorialBooster Station
Sunnyslope/MemorialIntertie
!
RelocateSunset PRV
Closed Valveor PRV
Closed Valveor PRV
City Water Main
Abandoned CityWater Main
No PhysicalConnection
Sunset/MemorialIntertie
Closed Valveor PRV
Closed Valveor PRV
Closed Valveor PRV
! !
MEMO
RIAL
DR
HILLCREST RD
LADD
LN
SUNSET DR
SOUT
HSID
E RD
NASH RD
SUNNYSLOPE RD
MERIDIAN ST
CITY OF HOLLISTERWATER DISTRIBUTION MASTER PLAN
OCIVIL ENGINEERINGCONSTRUCTION MANAGEMENTLANDSCAPE ARCHITECTUREMECHANICAL ENGINEERINGPLANNINGPUBLIC WORKS ADMINISTRATIONSURVEYING/GIS SOLUTIONSWATER RESOURCESWALLACE SWANSON INTERNATIONAL612 CLARION COURTSAN LUIS OBISPO, CA 93401T 805 544-4011 F 805 544-4294www.wallacegroup.us
LEGEND[Ú Booster Station
#0 PRV
Water Mains
ZoneCity Cienega
City Low Pressure
City Middle Pressure
SSCWD High Pressure
SSCWD Middle Pressure
Study Area
Hollister City Boundary
FIGURE 8-2: PROPOSED ZONEMODIFICATION BOUNDARY
NOTES:BASEMAP COMPILED FROMGIS DATA PROVIDED BY SANBENITO COUNTY AND THE CITYOF HOLLISTER. WALLACE GROUP DID NOT PERFORM BOUNDARY SURVEY SERVICES FOR THIS MAP. NOT A LEGAL DOCUMENT. MAP PRODUCED JUNE 2018. NTS
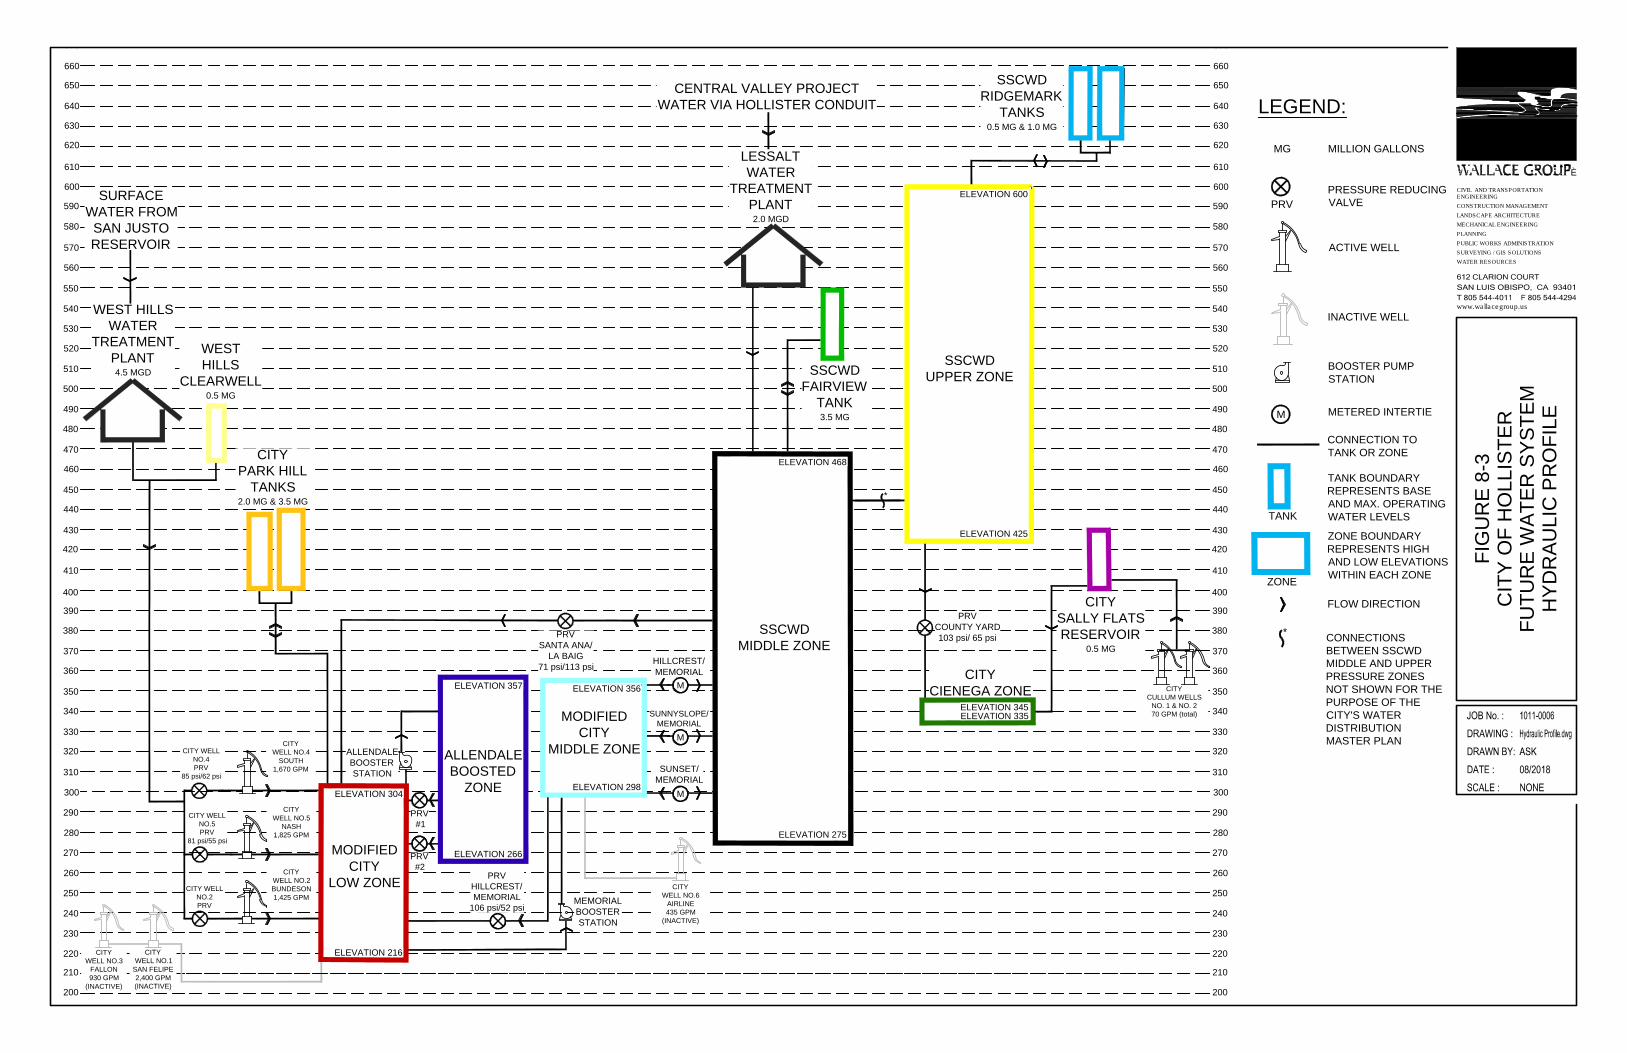
270
290
310
370
330
350
390
410
470
430
450
490
510
250
260
280
300
320
340
360
380
400
420
440
460
480
500
SSCWD
RIDGEMARK
TANKS
0.5 MG & 1.0 MG
SSCWD
FAIRVIEW
TANK
3.5 MG
MODIFIED
CITY
LOW ZONE
ELEVATION 304
ELEVATION 425
ELEVATION 216
ELEVATION 275
SSCWD
UPPER ZONE
520
530
540
550
240
230
220
210
CITY
PARK HILL
TANKS
2.0 MG & 3.5 MG
CITY
WELL NO.6
AIRLINE
435 GPM
(INACTIVE)
CITY
WELL NO.1
SAN FELIPE
2,400 GPM
(INACTIVE)
CITY
WELL NO.3
FALLON
930 GPM
(INACTIVE)
CITY
WELL NO.2
BUNDESON
1,425 GPM
CITY
WELL NO.5
NASH
1,825 GPM
CITY
WELL NO.4
SOUTH
1,670 GPM
PRV
HILLCREST/
MEMORIAL
106 psi/52 psi
MEMORIAL
BOOSTER
STATION
600
590
580
570
560
MODIFIED
CITY
MIDDLE ZONE
200
610
620
630
640
650
660
670
270
290
310
370
330
350
390
410
470
430
450
490
510
250
260
280
300
320
340
360
380
400
420
440
460
480
500
520
530
540
550
240
230
220
210
600
590
580
570
560
200
610
620
630
640
650
660
670
WEST HILLS
WATER
TREATMENT
PLANT
4.5 MGD
LESSALT
WATER
TREATMENT
PLANT
2.0 MGD
SSCWD
MIDDLE ZONE
CITY
SALLY FLATS
RESERVOIR
0.5 MG
CITY
CIENEGA ZONE
M
HILLCREST/
MEMORIAL
SUNNYSLOPE/
MEMORIAL
SUNSET/
MEMORIAL
ELEVATION 298
ELEVATION 356
ELEVATION 468
ELEVATION 600
ELEVATION 335
ELEVATION 345
PRV
SANTA ANA/
LA BAIG
71 psi/113 psi
CITY
CULLUM WELLS
NO. 1 & NO. 2
70 GPM (total)
*
CITY WELL
NO.4
PRV
85 psi/62 psi
PRV
COUNTY YARD
103 psi/ 65 psi
SURFACE
WATER FROM
SAN JUSTO
RESERVOIR
CENTRAL VALLEY PROJECT
WATER VIA HOLLISTER CONDUIT
CITY WELL
NO.5
PRV
81 psi/55 psi
M
M
ALLENDALE
BOOSTED
ZONE
PRV
#1
PRV
#2
ELEVATION 357
ELEVATION 266
ALLENDALE
BOOSTER
STATION
CITY WELL
NO.2
PRV
WEST
HILLS
CLEARWELL
0.5 MG
LEGEND:
PRESSURE REDUCING
VALVE
ZONE BOUNDARY
REPRESENTS HIGH
AND LOW ELEVATIONS
WITHIN EACH ZONE
CONNECTION TO
TANK OR ZONE
ZONE
BOOSTER PUMP
STATION
PRV
MILLION GALLONSMG
TANK BOUNDARY
REPRESENTS BASE
AND MAX. OPERATING
WATER LEVELSTANK
FLOW DIRECTION
ACTIVE WELL
INACTIVE WELL
METERED INTERTIE
M
*
CONNECTIONS
BETWEEN SSCWD
MIDDLE AND UPPER
PRESSURE ZONES
NOT SHOWN FOR THE
PURPOSE OF THE
CITY'S WATER
DISTRIBUTION
MASTER PLAN
CONSTRUCTION MANAGEMENT
PUBLIC WORKS ADMINISTRATION
SAN LUIS OBISPO, CA 93401
T 805 544-4011 F 805 544-4294
612 CLARION COURT
www.wallacegroup.us
WATER RESOURCES
SURVEYING / GIS SOLUTIONS
LANDSCAPE ARCHITECTURE
MECHANICAL ENGINEERING
PLANNING
CIVIL AND TRANSPORTATION
DATE :
SCALE :
DRAWING :
DRAWN BY:
JOB No. :
®
ENGINEERING
FIG
UR
E 8-3
CIT
Y O
F H
OLLIS
TE
R
FU
TU
RE
W
AT
ER
S
YS
TE
M
HY
DR
AU
LIC
P
RO
FILE
1011-0006
Hydraulic Profile.dwg
ASK
08/2018
NONE
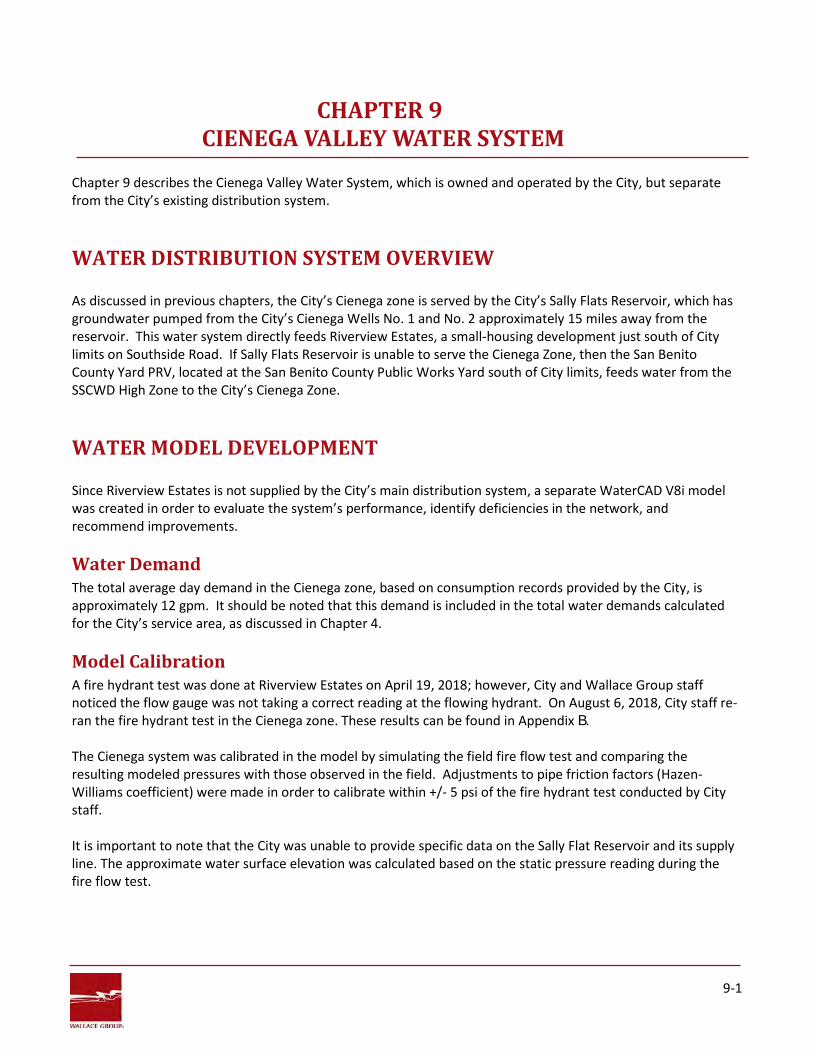
9-1
CHAPTER 9 CIENEGA VALLEY WATER SYSTEM
Chapter 9 describes the Cienega Valley Water System, which is owned and operated by the City, but separate from the City’s existing distribution system.
WATER DISTRIBUTION SYSTEM OVERVIEW As discussed in previous chapters, the City’s Cienega zone is served by the City’s Sally Flats Reservoir, which has groundwater pumped from the City’s Cienega Wells No. 1 and No. 2 approximately 15 miles away from the reservoir. This water system directly feeds Riverview Estates, a small-housing development just south of City limits on Southside Road. If Sally Flats Reservoir is unable to serve the Cienega Zone, then the San Benito County Yard PRV, located at the San Benito County Public Works Yard south of City limits, feeds water from the SSCWD High Zone to the City’s Cienega Zone.
WATER MODEL DEVELOPMENT Since Riverview Estates is not supplied by the City’s main distribution system, a separate WaterCAD V8i model was created in order to evaluate the system’s performance, identify deficiencies in the network, and recommend improvements. Water Demand The total average day demand in the Cienega zone, based on consumption records provided by the City, is approximately 12 gpm. It should be noted that this demand is included in the total water demands calculated for the City’s service area, as discussed in Chapter 4.
Model Calibration A fire hydrant test was done at Riverview Estates on April 19, 2018; however, City and Wallace Group staff noticed the flow gauge was not taking a correct reading at the flowing hydrant. On August 6, 2018, City staff re-ran the fire hydrant test in the Cienega zone. These results can be found in Appendix B. The Cienega system was calibrated in the model by simulating the field fire flow test and comparing the resulting modeled pressures with those observed in the field. Adjustments to pipe friction factors (Hazen-Williams coefficient) were made in order to calibrate within +/- 5 psi of the fire hydrant test conducted by City staff. It is important to note that the City was unable to provide specific data on the Sally Flat Reservoir and its supply line. The approximate water surface elevation was calculated based on the static pressure reading during the fire flow test.
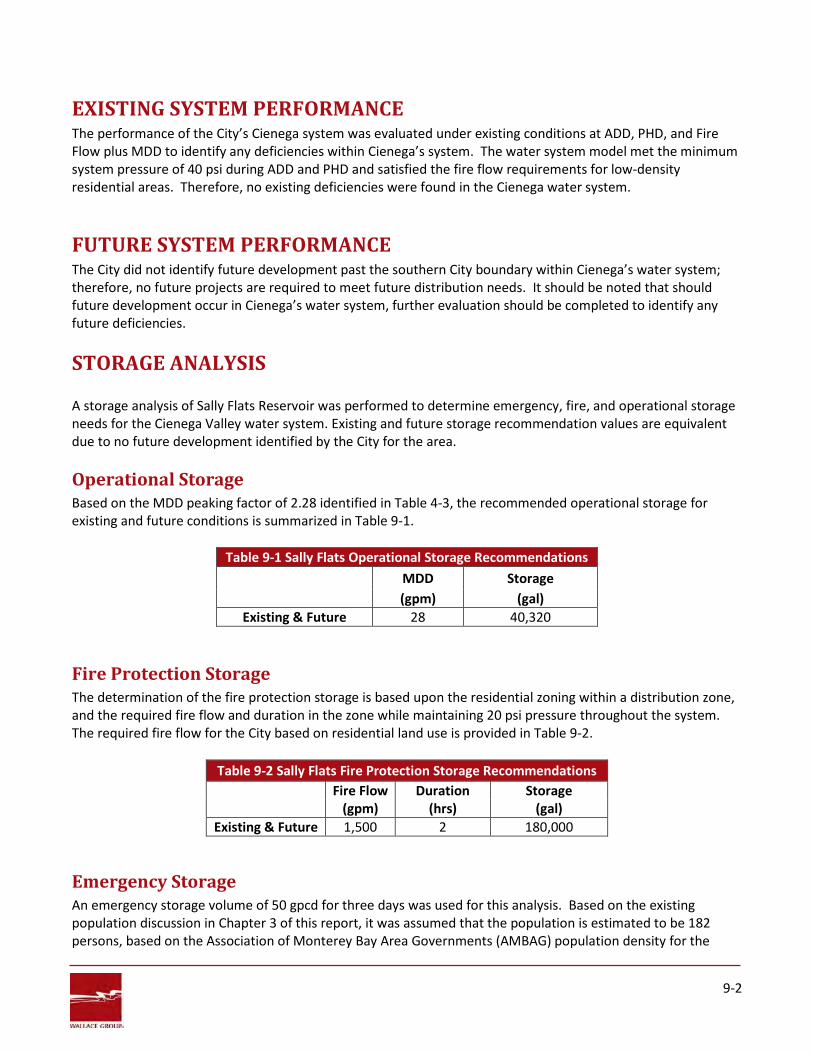
9-2
EXISTING SYSTEM PERFORMANCE The performance of the City’s Cienega system was evaluated under existing conditions at ADD, PHD, and Fire Flow plus MDD to identify any deficiencies within Cienega’s system. The water system model met the minimum system pressure of 40 psi during ADD and PHD and satisfied the fire flow requirements for low-density residential areas. Therefore, no existing deficiencies were found in the Cienega water system.
FUTURE SYSTEM PERFORMANCE The City did not identify future development past the southern City boundary within Cienega’s water system; therefore, no future projects are required to meet future distribution needs. It should be noted that should future development occur in Cienega’s water system, further evaluation should be completed to identify any future deficiencies.
STORAGE ANALYSIS A storage analysis of Sally Flats Reservoir was performed to determine emergency, fire, and operational storage needs for the Cienega Valley water system. Existing and future storage recommendation values are equivalent due to no future development identified by the City for the area. Operational Storage Based on the MDD peaking factor of 2.28 identified in Table 4-3, the recommended operational storage for existing and future conditions is summarized in Table 9-1.
Table 9-1 Sally Flats Operational Storage Recommendations MDD Storage (gpm) (gal)
Existing & Future 28 40,320 Fire Protection Storage The determination of the fire protection storage is based upon the residential zoning within a distribution zone, and the required fire flow and duration in the zone while maintaining 20 psi pressure throughout the system. The required fire flow for the City based on residential land use is provided in Table 9-2.
Table 9-2 Sally Flats Fire Protection Storage Recommendations
Fire Flow Duration Storage (gpm) (hrs) (gal)
Existing & Future 1,500 2 180,000
Emergency Storage An emergency storage volume of 50 gpcd for three days was used for this analysis. Based on the existing population discussion in Chapter 3 of this report, it was assumed that the population is estimated to be 182 persons, based on the Association of Monterey Bay Area Governments (AMBAG) population density for the
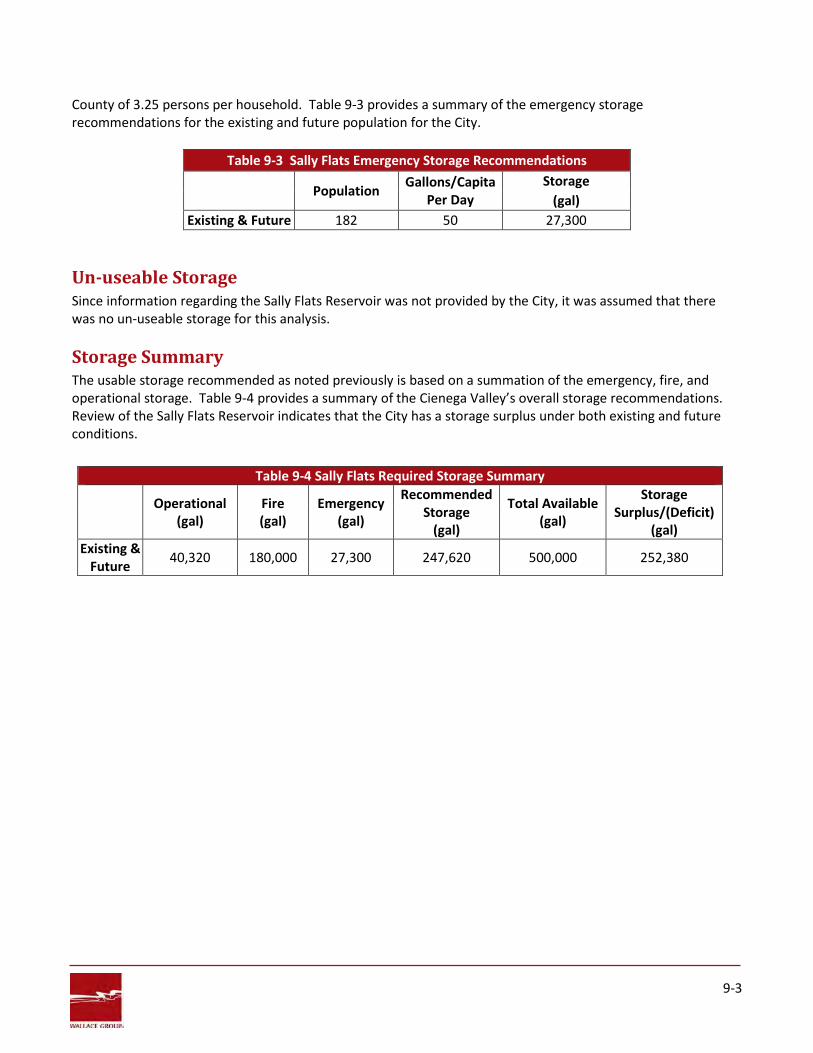
9-3
County of 3.25 persons per household. Table 9-3 provides a summary of the emergency storage recommendations for the existing and future population for the City.
Table 9-3 Sally Flats Emergency Storage Recommendations
Population Gallons/Capita Per Day
Storage (gal)
Existing & Future 182 50 27,300
Un-useable Storage Since information regarding the Sally Flats Reservoir was not provided by the City, it was assumed that there was no un-useable storage for this analysis.
Storage Summary The usable storage recommended as noted previously is based on a summation of the emergency, fire, and operational storage. Table 9-4 provides a summary of the Cienega Valley’s overall storage recommendations. Review of the Sally Flats Reservoir indicates that the City has a storage surplus under both existing and future conditions.
Table 9-4 Sally Flats Required Storage Summary Operational
(gal) Fire (gal)
Emergency (gal)
Recommended Storage
(gal)
Total Available (gal)
Storage Surplus/(Deficit)
(gal)
Existing & Future 40,320 180,000 27,300 247,620 500,000 252,380
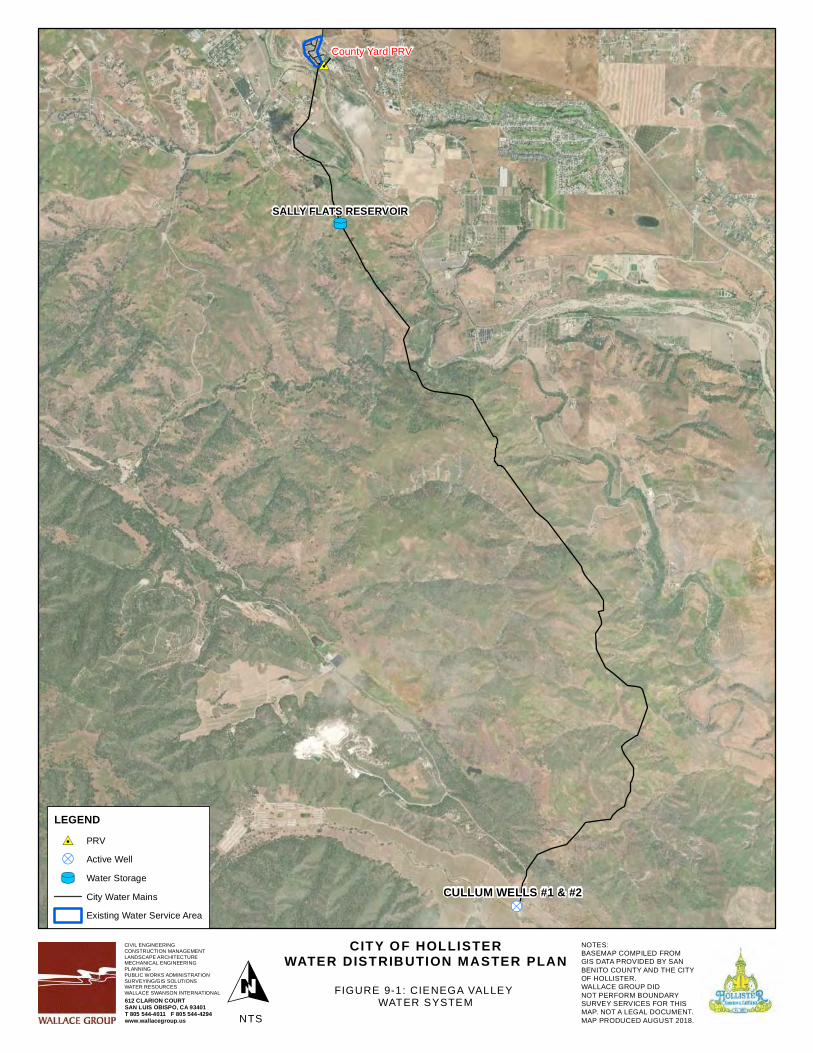
&.&.
UT
#0County Yard PRV
CULLUM WELLS #1 & #2
SALLY FLATS RESERVOIR
CITY OF HOLLISTERWATER DISTRIBUTION MASTER PLAN
OCIVIL ENGINEERINGCONSTRUCTION MANAGEMENTLANDSCAPE ARCHITECTUREMECHANICAL ENGINEERINGPLANNINGPUBLIC WORKS ADMINISTRATIONSURVEYING/GIS SOLUTIONSWATER RESOURCESWALLACE SWANSON INTERNATIONAL612 CLARION COURTSAN LUIS OBISPO, CA 93401T 805 544-4011 F 805 544-4294www.wallacegroup.us
LEGEND#0 PRV
&. Active Well
UT Water Storage
City Water Mains
Existing Water Service Area
FIGURE 9-1: CIENEGA VALLEY WATER SYSTEM
NOTES:BASEMAP COMPILED FROMGIS DATA PROVIDED BY SANBENITO COUNTY AND THE CITYOF HOLLISTER. WALLACE GROUP DID NOT PERFORM BOUNDARY SURVEY SERVICES FOR THIS MAP. NOT A LEGAL DOCUMENT. MAP PRODUCED AUGUST 2018. NTS
10-1
CHAPTER 10 SUMMARY OF RECOMMENDATIONS
This chapter summarizes the City’s recommended master plan improvement projects to meet existing and future needs, and the master plan improvement program to assist in the financial planning aspects of implementing the recommended improvements. The improvements are described as first, second, and third priorities. Additionally, there is a summary of the recommended operations and maintenance improvement projects that have been discussed throughout the report. All tables and figures are located at the end of this chapter.
RECOMMENDED MASTER PLAN IMPROVEMENT PROJECTS Based on the hydraulic model, a series of master plan improvement projects have been identified within the water distribution system. The projects have been classified into three categories: First, Second, and Third Priority. First priority projects are a result of significant health and safety concerns, including substandard pressures and fire flows during any demand situation. These projects are recommended to be completed within five years. Second priority projects address sections of the City’s water system that are experiencing slightly substandard pressures and/or fire flows but are not as critical as first priority projects. These projects are recommended to be completed within 10 years. Third priority projects include upgrades that are not critical in nature but are recommended during routine future replacements. These projects are recommended to be completed within 15 years. As development projects occur throughout the City, any proposed First, Second or Third priority projects should be identified and completed to address these deficiencies prior to the proposed development being constructed. Also, the proposed land uses, distribution system layout, demands and fire flow requirements should be re-evaluated for each project in the planning stage to confirm assumptions made for the purpose of this Water Distribution System Master Plan are accurate and confirm that no additional upgrades will be required.
FIRST PRIORITY MASTER PLAN IMPROVEMENT PROJECTS First Priority Projects have the highest health and safety deficiencies within the distribution system. Typically, these deficiencies are identified due to fire flow capacities that are less than 50% of the required fire flow. First Priority projects were determined using the following criteria:
• Pressures below 30 psi during ADD, MDD, PHD • Velocities greater than 5 fps during ADD, MDD, PHD • Fire flows that cannot meet a minimum of 50% of the required fire flow:
o Residential single and multi-family areas - 750 GPM o Commercial, Office Professional, and Schools - 1,250 GPM o Hospitals: Sprinklered - 1,190 gpm o Big Box Commercial, Industrial, and Hotel - 2,000 gpm
• Operational and maintenance projects that were identified by the City due to continuous maintenance repairs for line breaks
• Water mains that were greater than 75 years old
10-2
SECOND PRIORITY MASTER PLAN IMPROVEMENT PROJECTS Second Priority Projects have the second highest health and safety deficiencies within the distribution system. Typically, these deficiencies are identified due to fire flow capacities that are between 50% and 75% of the required fire flow. Second priority projects were determined using the following criteria:
• Pressures below 40 psi during ADD, MDD, PHD • Fire flows that cannot meet between 50% and 75% of the required fire flow:
o Residential single and multi-family - 1,125 GPM o Commercial, Office Professional, and School - 1,875 GPM o Hospitals: Sprinklered - 1,785 gpm o Big Box Commercial, Industrial, and Hotel - 3,000 gpm
• Operational and maintenance projects identified by the City where water mains are between 50 and 75 years old
THIRD PRIORITY MASTER PLAN IMPROVEMENT PROJECTS Third Priority Projects have minor deficiencies within the distribution system. Typically, these deficiencies are identified due to fire flow capacities that are between 75% and 100% of the required fire flow. In addition, third priority projects are those projects that are recommended because the water main doesn’t meet current day standards such as minimum pipe diameter or material. Third priority projects were determined using the following criteria:
• Fire flows that cannot meet between 75% and 100% of the required fire flow: o Residential single and multi-family - 1,500 GPM o Commercial, Office Professional, and School - 2,500 GPM o Hospitals: Sprinklered - 2,375 gpm o Big Box Commercial, Industrial, and Hotel - 4,000 gpm
• Operational and maintenance projects that were identified by the City that were less than 50 years old
• All remaining cast iron pipe that were not identified as hydraulic deficiencies • PVC water mains that do not meet current design standards (i.e. 4-inch water mains)
that were not identified as hydraulic deficiencies
MASTER PLAN IMPROVEMENT PROJECT RANKING AND COSTS First, Second, and Third Priority Master Plan Improvement Projects were ranked to determine what priority the recommended projects should be constructed. The ranking was based on severity of the deficiency and the size of the community the deficiency impacts. Exhibit 1 in Appendix D illustrates the location of each of the proposed Maser Plan Improvement Projects. Tables 10-1, 10-2, and 10-3 provide a summary of all the recommended Master Plan Improvement Projects in order of ranking for first, second, and third priority projects, respectively. These tables also provide estimates of the construction and “soft” costs for each project. The project costs are based on engineering judgment, confirmed bid prices for similar work in the San Benito
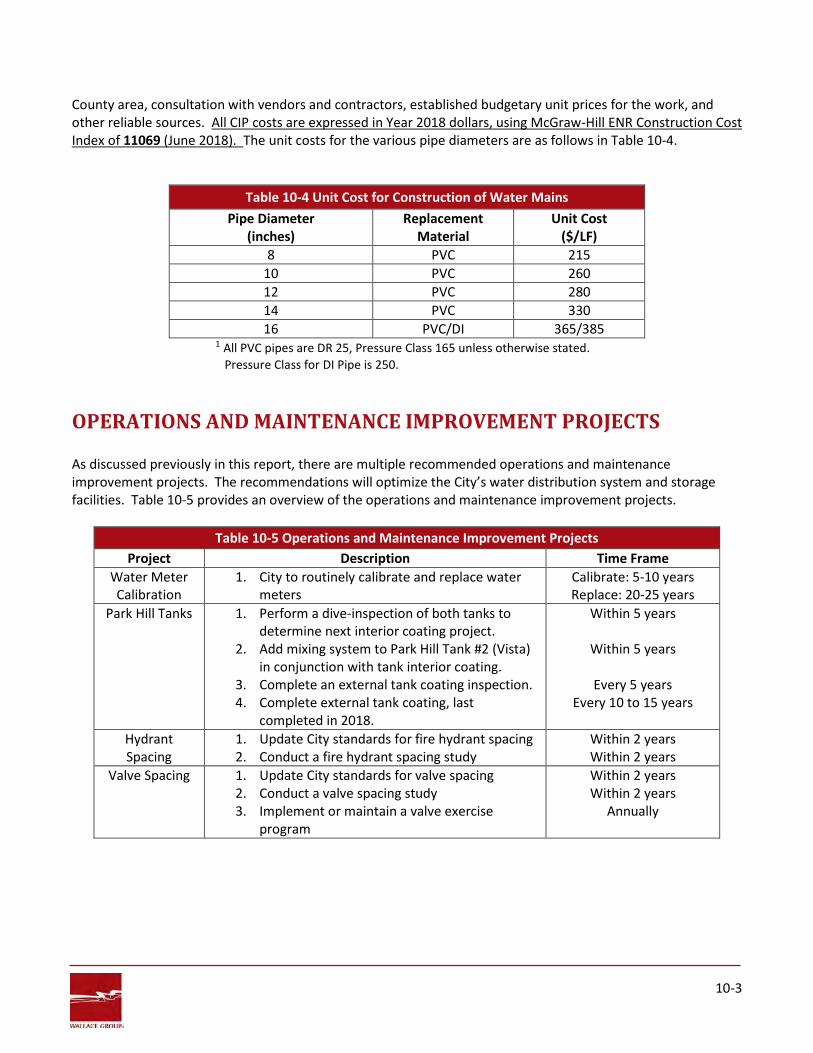
10-3
County area, consultation with vendors and contractors, established budgetary unit prices for the work, and other reliable sources. All CIP costs are expressed in Year 2018 dollars, using McGraw-Hill ENR Construction Cost Index of 11069 (June 2018). The unit costs for the various pipe diameters are as follows in Table 10-4.
Table 10-4 Unit Cost for Construction of Water Mains Pipe Diameter
(inches) Replacement
Material Unit Cost
($/LF) 8 PVC 215
10 PVC 260 12 PVC 280 14 PVC 330 16 PVC/DI 365/385
1 All PVC pipes are DR 25, Pressure Class 165 unless otherwise stated. Pressure Class for DI Pipe is 250.
OPERATIONS AND MAINTENANCE IMPROVEMENT PROJECTS As discussed previously in this report, there are multiple recommended operations and maintenance improvement projects. The recommendations will optimize the City’s water distribution system and storage facilities. Table 10-5 provides an overview of the operations and maintenance improvement projects.
Table 10-5 Operations and Maintenance Improvement Projects
Project Description Time Frame Water Meter Calibration
1. City to routinely calibrate and replace water meters
Calibrate: 5-10 years Replace: 20-25 years
Park Hill Tanks 1. Perform a dive-inspection of both tanks to determine next interior coating project.
2. Add mixing system to Park Hill Tank #2 (Vista) in conjunction with tank interior coating.
3. Complete an external tank coating inspection. 4. Complete external tank coating, last
completed in 2018.
Within 5 years
Within 5 years
Every 5 years Every 10 to 15 years
Hydrant Spacing
1. Update City standards for fire hydrant spacing 2. Conduct a fire hydrant spacing study
Within 2 years Within 2 years
Valve Spacing 1. Update City standards for valve spacing 2. Conduct a valve spacing study 3. Implement or maintain a valve exercise
program
Within 2 years Within 2 years
Annually
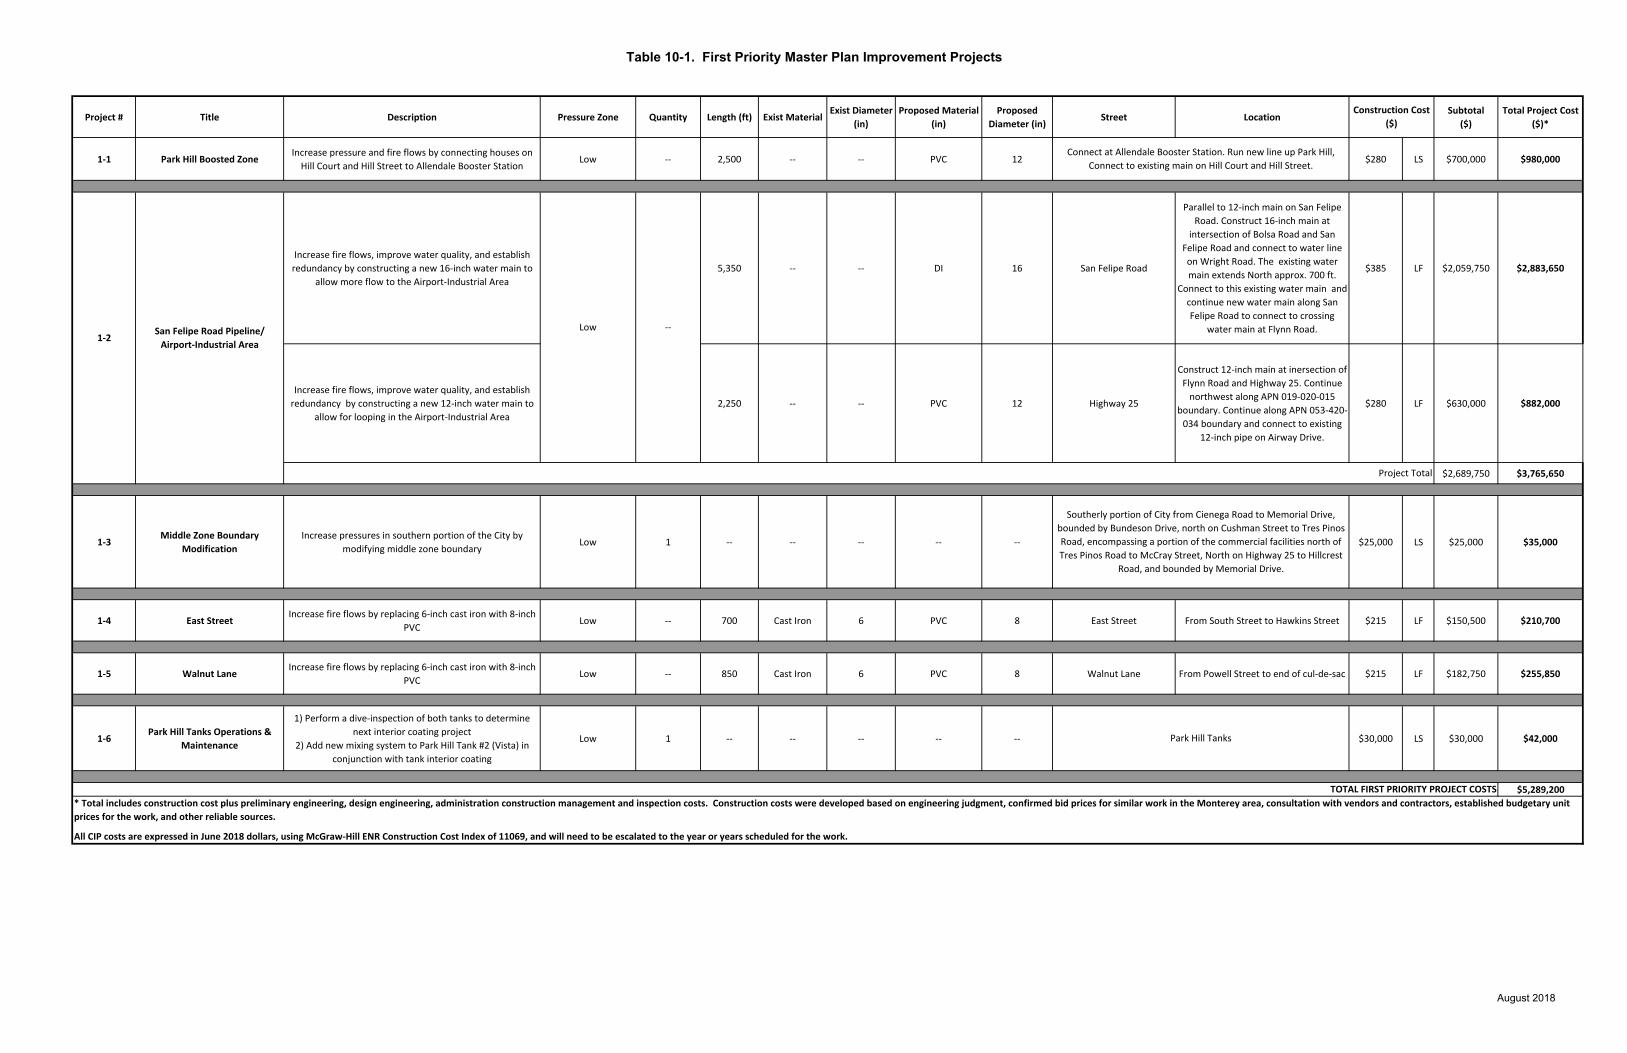
Table 10-1. First Priority Master Plan Improvement Projects
Project # Title Description Pressure Zone Quantity Length (ft) Exist MaterialExist Diameter
(in)
Proposed Material
(in)
Proposed
Diameter (in)Street Location
Subtotal
($)
Total Project Cost
($)*
1-1 Park Hill Boosted ZoneIncrease pressure and fire flows by connecting houses on
Hill Court and Hill Street to Allendale Booster StationLow -- 2,500 -- -- PVC 12 $280 LS $700,000 $980,000
Increase fire flows, improve water quality, and establish
redundancy by constructing a new 16-inch water main to
allow more flow to the Airport-Industrial Area
5,350 -- -- DI 16 San Felipe Road
Parallel to 12-inch main on San Felipe
Road. Construct 16-inch main at
intersection of Bolsa Road and San
Felipe Road and connect to water line
on Wright Road. The existing water
main extends North approx. 700 ft.
Connect to this existing water main and
continue new water main along San
Felipe Road to connect to crossing
water main at Flynn Road.
$385 LF $2,059,750 $2,883,650
Increase fire flows, improve water quality, and establish
redundancy by constructing a new 12-inch water main to
allow for looping in the Airport-Industrial Area
2,250 -- -- PVC 12 Highway 25
Construct 12-inch main at inersection of
Flynn Road and Highway 25. Continue
northwest along APN 019-020-015
boundary. Continue along APN 053-420-
034 boundary and connect to existing
12-inch pipe on Airway Drive.
$280 LF $630,000 $882,000
$2,689,750 $3,765,650
1-3Middle Zone Boundary
Modification
Increase pressures in southern portion of the City by
modifying middle zone boundaryLow 1 -- -- -- -- -- $25,000 LS $25,000 $35,000
1-4 East StreetIncrease fire flows by replacing 6-inch cast iron with 8-inch
PVCLow -- 700 Cast Iron 6 PVC 8 East Street From South Street to Hawkins Street $215 LF $150,500 $210,700
1-5 Walnut LaneIncrease fire flows by replacing 6-inch cast iron with 8-inch
PVCLow -- 850 Cast Iron 6 PVC 8 Walnut Lane From Powell Street to end of cul-de-sac $215 LF $182,750 $255,850
1-6Park Hill Tanks Operations &
Maintenance
1) Perform a dive-inspection of both tanks to determine
next interior coating project
2) Add new mixing system to Park Hill Tank #2 (Vista) in
conjunction with tank interior coating
Low 1 -- -- -- -- -- $30,000 LS $30,000 $42,000
$5,289,200
San Felipe Road Pipeline/
Airport-Industrial Area
Project Total
Southerly portion of City from Cienega Road to Memorial Drive,
bounded by Bundeson Drive, north on Cushman Street to Tres Pinos
Road, encompassing a portion of the commercial facilities north of
Tres Pinos Road to McCray Street, North on Highway 25 to Hillcrest
Road, and bounded by Memorial Drive.
Construction Cost
($)
All CIP costs are expressed in June 2018 dollars, using McGraw-Hill ENR Construction Cost Index of 11069, and will need to be escalated to the year or years scheduled for the work.
* Total includes construction cost plus preliminary engineering, design engineering, administration construction management and inspection costs. Construction costs were developed based on engineering judgment, confirmed bid prices for similar work in the Monterey area, consultation with vendors and contractors, established budgetary unit
prices for the work, and other reliable sources.
TOTAL FIRST PRIORITY PROJECT COSTS
Connect at Allendale Booster Station. Run new line up Park Hill,
Connect to existing main on Hill Court and Hill Street.
Park Hill Tanks
Low --1-2
August 2018
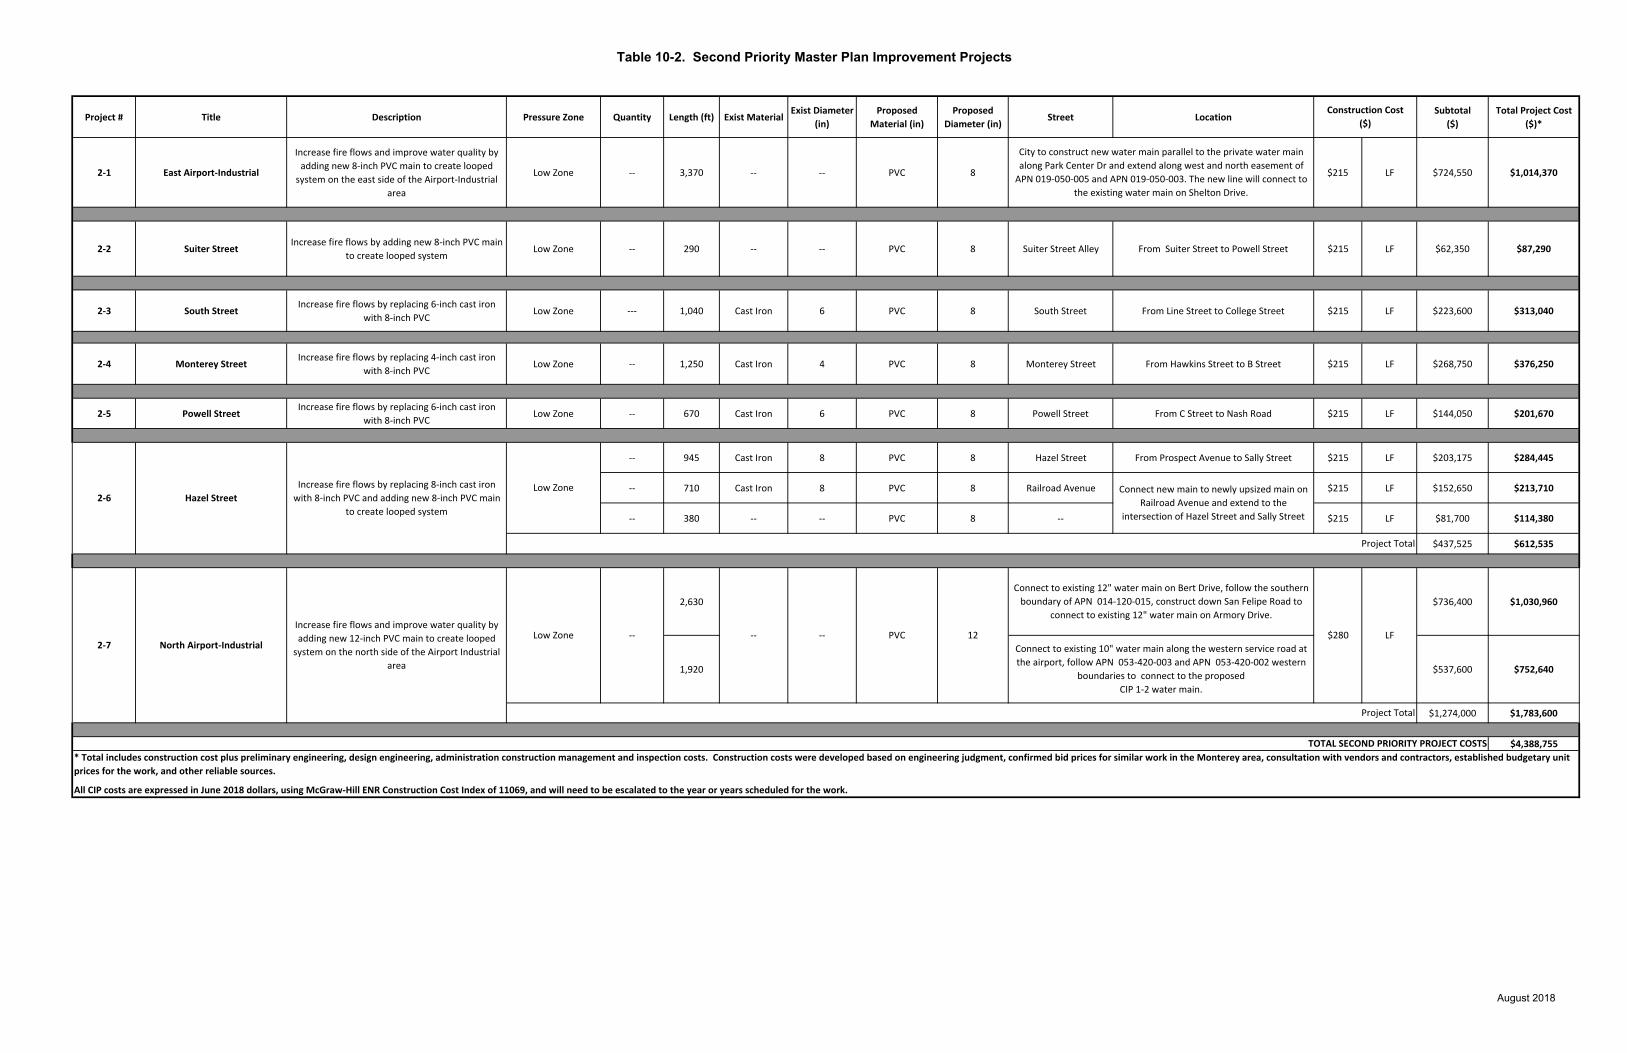
Table 10-2. Second Priority Master Plan Improvement Projects
Project # Title Description Pressure Zone Quantity Length (ft) Exist MaterialExist Diameter
(in)
Proposed
Material (in)
Proposed
Diameter (in)Street Location
Subtotal
($)
Total Project Cost
($)*
2-1 East Airport-Industrial
Increase fire flows and improve water quality by
adding new 8-inch PVC main to create looped
system on the east side of the Airport-Industrial
area
Low Zone -- 3,370 -- -- PVC 8 $215 LF $724,550 $1,014,370
2-2 Suiter StreetIncrease fire flows by adding new 8-inch PVC main
to create looped systemLow Zone -- 290 -- -- PVC 8 Suiter Street Alley From Suiter Street to Powell Street $215 LF $62,350 $87,290
2-3 South StreetIncrease fire flows by replacing 6-inch cast iron
with 8-inch PVCLow Zone --- 1,040 Cast Iron 6 PVC 8 South Street From Line Street to College Street $215 LF $223,600 $313,040
2-4 Monterey StreetIncrease fire flows by replacing 4-inch cast iron
with 8-inch PVCLow Zone -- 1,250 Cast Iron 4 PVC 8 Monterey Street From Hawkins Street to B Street $215 LF $268,750 $376,250
2-5 Powell StreetIncrease fire flows by replacing 6-inch cast iron
with 8-inch PVCLow Zone -- 670 Cast Iron 6 PVC 8 Powell Street From C Street to Nash Road $215 LF $144,050 $201,670
-- 945 Cast Iron 8 PVC 8 Hazel Street From Prospect Avenue to Sally Street $215 LF $203,175 $284,445
-- 710 Cast Iron 8 PVC 8 Railroad Avenue $215 LF $152,650 $213,710
-- 380 -- -- PVC 8 -- $215 LF $81,700 $114,380
$437,525 $612,535
2,630 $736,400 $1,030,960
1,920 $537,600 $752,640
$1,274,000 $1,783,600
$4,388,755
2-7
Project Total
PVC 12
Connect to existing 12" water main on Bert Drive, follow the southern
boundary of APN 014-120-015, construct down San Felipe Road to
connect to existing 12" water main on Armory Drive.
Connect to existing 10" water main along the western service road at
the airport, follow APN 053-420-003 and APN 053-420-002 western
boundaries to connect to the proposed
CIP 1-2 water main.
$280Low Zone -- -- --
Construction Cost
($)
All CIP costs are expressed in June 2018 dollars, using McGraw-Hill ENR Construction Cost Index of 11069, and will need to be escalated to the year or years scheduled for the work.
City to construct new water main parallel to the private water main
along Park Center Dr and extend along west and north easement of
APN 019-050-005 and APN 019-050-003. The new line will connect to
the existing water main on Shelton Drive.
Connect new main to newly upsized main on
Railroad Avenue and extend to the
intersection of Hazel Street and Sally Street
TOTAL SECOND PRIORITY PROJECT COSTS
Low Zone
* Total includes construction cost plus preliminary engineering, design engineering, administration construction management and inspection costs. Construction costs were developed based on engineering judgment, confirmed bid prices for similar work in the Monterey area, consultation with vendors and contractors, established budgetary unit
prices for the work, and other reliable sources.
2-6 Hazel Street
Increase fire flows by replacing 8-inch cast iron
with 8-inch PVC and adding new 8-inch PVC main
to create looped system
Project Total
LFIncrease fire flows and improve water quality by
adding new 12-inch PVC main to create looped
system on the north side of the Airport Industrial
area
North Airport-Industrial
August 2018
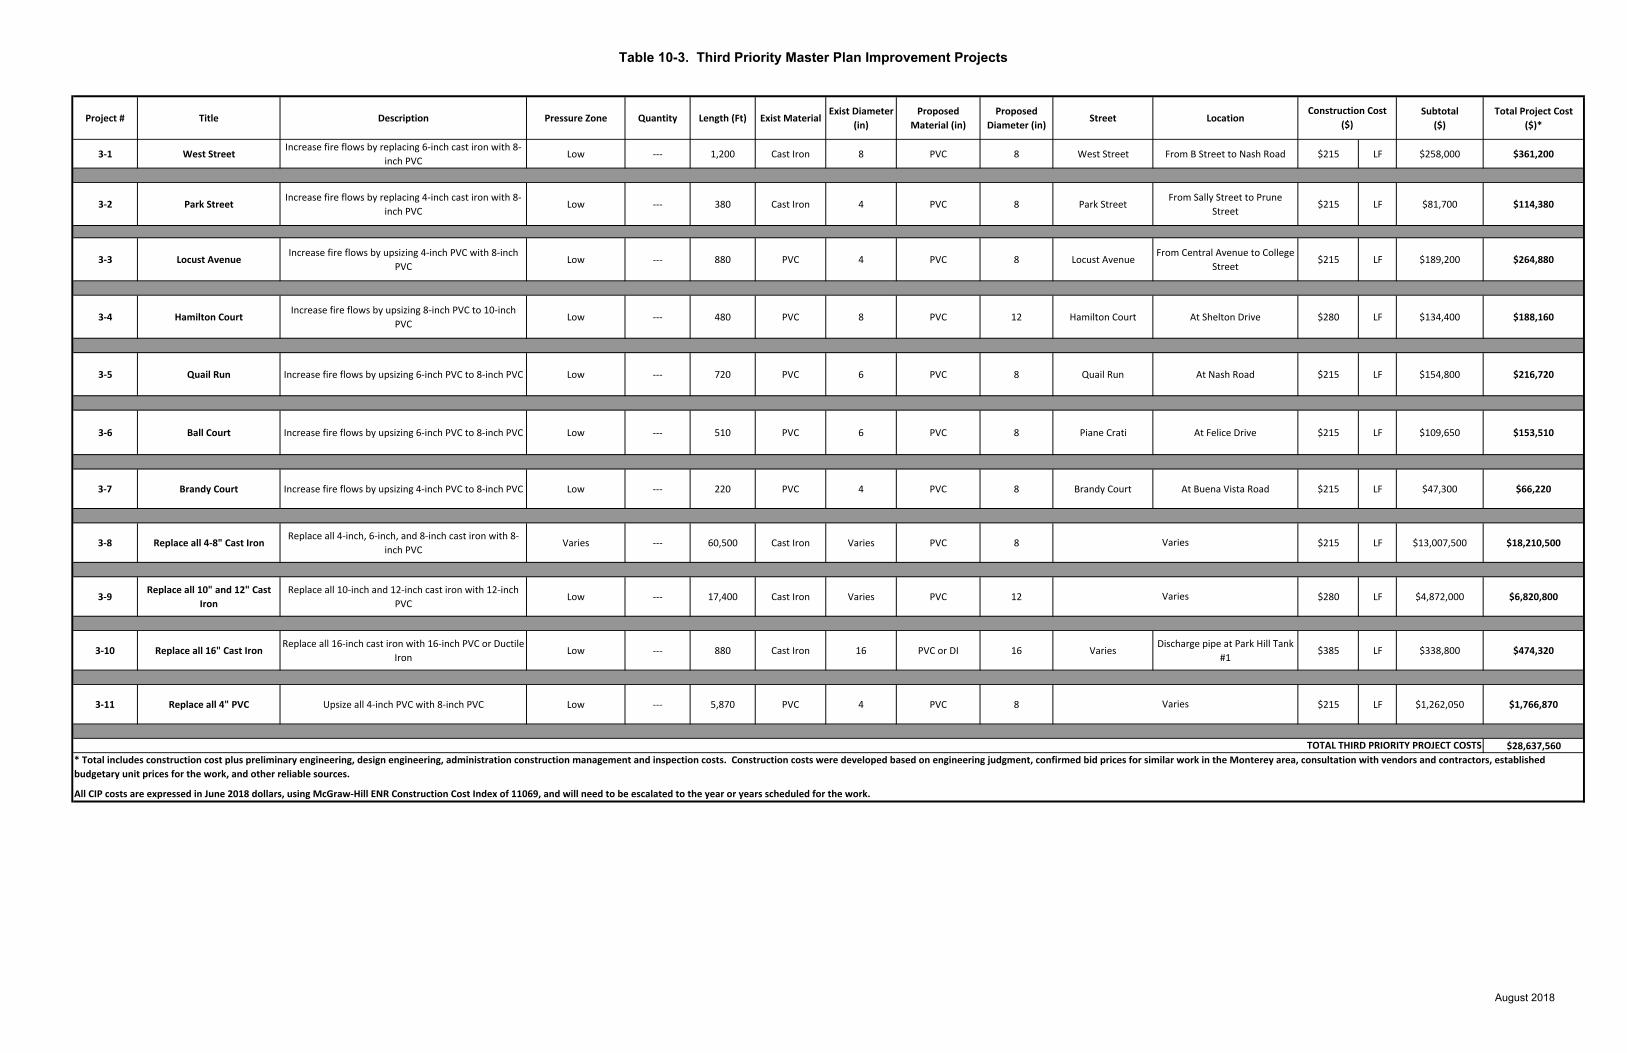
Table 10-3. Third Priority Master Plan Improvement Projects
Project # Title Description Pressure Zone Quantity Length (Ft) Exist MaterialExist Diameter
(in)
Proposed
Material (in)
Proposed
Diameter (in)Street Location
Subtotal
($)
Total Project Cost
($)*
3-1 West StreetIncrease fire flows by replacing 6-inch cast iron with 8-
inch PVCLow --- 1,200 Cast Iron 8 PVC 8 West Street From B Street to Nash Road $215 LF $258,000 $361,200
3-2 Park StreetIncrease fire flows by replacing 4-inch cast iron with 8-
inch PVCLow --- 380 Cast Iron 4 PVC 8 Park Street
From Sally Street to Prune
Street$215 LF $81,700 $114,380
3-3 Locust AvenueIncrease fire flows by upsizing 4-inch PVC with 8-inch
PVCLow --- 880 PVC 4 PVC 8 Locust Avenue
From Central Avenue to College
Street$215 LF $189,200 $264,880
3-4 Hamilton CourtIncrease fire flows by upsizing 8-inch PVC to 10-inch
PVCLow --- 480 PVC 8 PVC 12 Hamilton Court At Shelton Drive $280 LF $134,400 $188,160
3-5 Quail Run Increase fire flows by upsizing 6-inch PVC to 8-inch PVC Low --- 720 PVC 6 PVC 8 Quail Run At Nash Road $215 LF $154,800 $216,720
3-6 Ball Court Increase fire flows by upsizing 6-inch PVC to 8-inch PVC Low --- 510 PVC 6 PVC 8 Piane Crati At Felice Drive $215 LF $109,650 $153,510
3-7 Brandy Court Increase fire flows by upsizing 4-inch PVC to 8-inch PVC Low --- 220 PVC 4 PVC 8 Brandy Court At Buena Vista Road $215 LF $47,300 $66,220
3-8 Replace all 4-8" Cast IronReplace all 4-inch, 6-inch, and 8-inch cast iron with 8-
inch PVCVaries --- 60,500 Cast Iron Varies PVC 8 $215 LF $13,007,500 $18,210,500
3-9Replace all 10" and 12" Cast
Iron
Replace all 10-inch and 12-inch cast iron with 12-inch
PVCLow --- 17,400 Cast Iron Varies PVC 12 $280 LF $4,872,000 $6,820,800
3-10 Replace all 16" Cast Iron Replace all 16-inch cast iron with 16-inch PVC or Ductile
IronLow --- 880 Cast Iron 16 PVC or DI 16 Varies
Discharge pipe at Park Hill Tank
#1$385 LF $338,800 $474,320
3-11 Replace all 4" PVC Upsize all 4-inch PVC with 8-inch PVC Low --- 5,870 PVC 4 PVC 8 $215 LF $1,262,050 $1,766,870
$28,637,560
Construction Cost
($)
TOTAL THIRD PRIORITY PROJECT COSTS
All CIP costs are expressed in June 2018 dollars, using McGraw-Hill ENR Construction Cost Index of 11069, and will need to be escalated to the year or years scheduled for the work.
* Total includes construction cost plus preliminary engineering, design engineering, administration construction management and inspection costs. Construction costs were developed based on engineering judgment, confirmed bid prices for similar work in the Monterey area, consultation with vendors and contractors, established
budgetary unit prices for the work, and other reliable sources.
Varies
Varies
Varies
August 2018
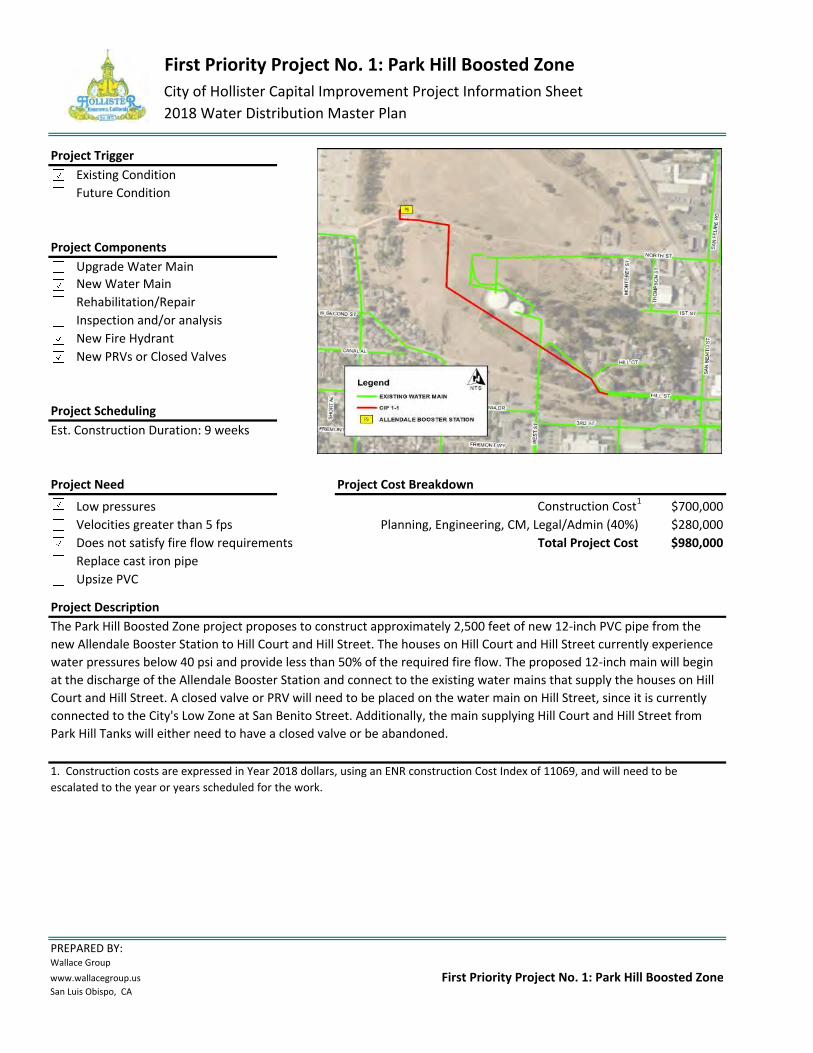
First Priority Project No. 1: Park Hill Boosted Zone
City of Hollister Capital Improvement Project Information Sheet
2018 Water Distribution Master Plan
Project Trigger
Existing Condition
Future Condition
Project Components
Upgrade Water Main
New Water Main
Rehabilitation/Repair
Inspection and/or analysis
New Fire Hydrant
New PRVs or Closed Valves
Project Scheduling
Est. Construction Duration: 9 weeks
Project Need Project Cost Breakdown
Low pressures Construction Cost1
$700,000
Velocities greater than 5 fps Planning, Engineering, CM, Legal/Admin (40%) $280,000
Does not satisfy fire flow requirements Total Project Cost $980,000
Replace cast iron pipe
Upsize PVC
Project Description
PREPARED BY:Wallace Group
www.wallacegroup.us
San Luis Obispo, CA
The Park Hill Boosted Zone project proposes to construct approximately 2,500 feet of new 12-inch PVC pipe from the
new Allendale Booster Station to Hill Court and Hill Street. The houses on Hill Court and Hill Street currently experience
water pressures below 40 psi and provide less than 50% of the required fire flow. The proposed 12-inch main will begin
at the discharge of the Allendale Booster Station and connect to the existing water mains that supply the houses on Hill
Court and Hill Street. A closed valve or PRV will need to be placed on the water main on Hill Street, since it is currently
connected to the City's Low Zone at San Benito Street. Additionally, the main supplying Hill Court and Hill Street from
Park Hill Tanks will either need to have a closed valve or be abandoned.
1. Construction costs are expressed in Year 2018 dollars, using an ENR construction Cost Index of 11069, and will need to be
escalated to the year or years scheduled for the work.
First Priority Project No. 1: Park Hill Boosted Zone
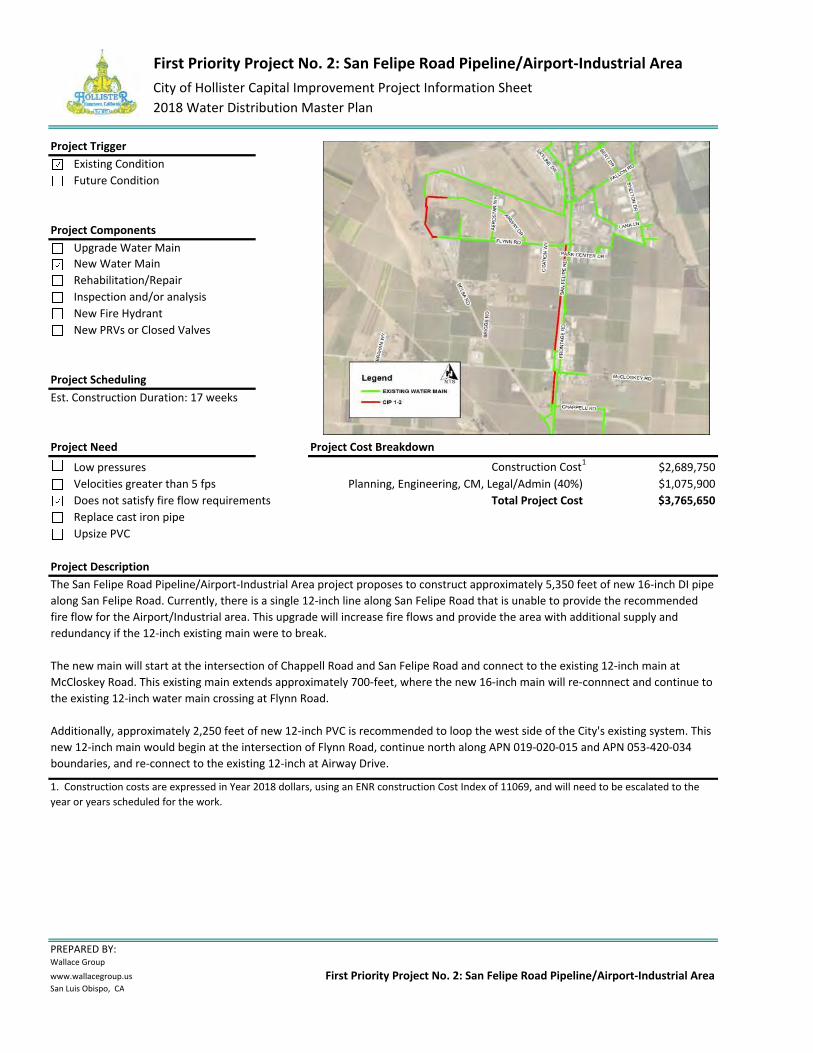
First Priority Project No. 2: San Felipe Road Pipeline/Airport-Industrial Area
City of Hollister Capital Improvement Project Information Sheet
2018 Water Distribution Master Plan
Project Trigger
Existing Condition
Future Condition
Project Components
Upgrade Water Main
New Water Main
Rehabilitation/Repair
Inspection and/or analysis
New Fire Hydrant
New PRVs or Closed Valves
Project Scheduling
Est. Construction Duration: 17 weeks
Project Need Project Cost Breakdown
Low pressures Construction Cost1
$2,689,750
Velocities greater than 5 fps Planning, Engineering, CM, Legal/Admin (40%) $1,075,900
Does not satisfy fire flow requirements Total Project Cost $3,765,650
Replace cast iron pipe
Upsize PVC
Project Description
PREPARED BY:Wallace Group
www.wallacegroup.us
San Luis Obispo, CA
The San Felipe Road Pipeline/Airport-Industrial Area project proposes to construct approximately 5,350 feet of new 16-inch DI pipe
along San Felipe Road. Currently, there is a single 12-inch line along San Felipe Road that is unable to provide the recommended
fire flow for the Airport/Industrial area. This upgrade will increase fire flows and provide the area with additional supply and
redundancy if the 12-inch existing main were to break.
The new main will start at the intersection of Chappell Road and San Felipe Road and connect to the existing 12-inch main at
McCloskey Road. This existing main extends approximately 700-feet, where the new 16-inch main will re-connnect and continue to
the existing 12-inch water main crossing at Flynn Road.
Additionally, approximately 2,250 feet of new 12-inch PVC is recommended to loop the west side of the City's existing system. This
new 12-inch main would begin at the intersection of Flynn Road, continue north along APN 019-020-015 and APN 053-420-034
boundaries, and re-connect to the existing 12-inch at Airway Drive.
1. Construction costs are expressed in Year 2018 dollars, using an ENR construction Cost Index of 11069, and will need to be escalated to the
year or years scheduled for the work.
First Priority Project No. 2: San Felipe Road Pipeline/Airport-Industrial Area
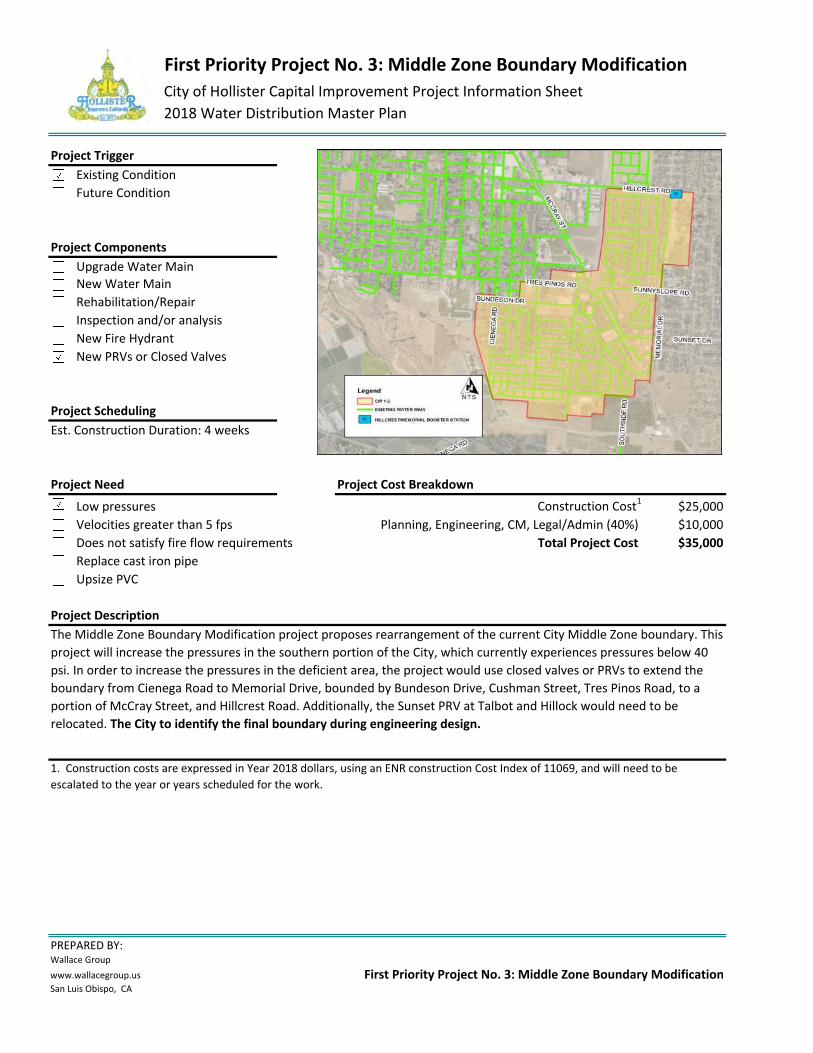
First Priority Project No. 3: Middle Zone Boundary Modification
City of Hollister Capital Improvement Project Information Sheet
2018 Water Distribution Master Plan
Project Trigger
Existing Condition
Future Condition
Project Components
Upgrade Water Main
New Water Main
Rehabilitation/Repair
Inspection and/or analysis
New Fire Hydrant
New PRVs or Closed Valves
Project Scheduling
Est. Construction Duration: 4 weeks
Project Need Project Cost Breakdown
Low pressures Construction Cost1
$25,000
Velocities greater than 5 fps Planning, Engineering, CM, Legal/Admin (40%) $10,000
Does not satisfy fire flow requirements Total Project Cost $35,000
Replace cast iron pipe
Upsize PVC
Project Description
PREPARED BY:Wallace Group
www.wallacegroup.us
San Luis Obispo, CA
The Middle Zone Boundary Modification project proposes rearrangement of the current City Middle Zone boundary. This
project will increase the pressures in the southern portion of the City, which currently experiences pressures below 40
psi. In order to increase the pressures in the deficient area, the project would use closed valves or PRVs to extend the
boundary from Cienega Road to Memorial Drive, bounded by Bundeson Drive, Cushman Street, Tres Pinos Road, to a
portion of McCray Street, and Hillcrest Road. Additionally, the Sunset PRV at Talbot and Hillock would need to be
relocated. The City to identify the final boundary during engineering design.
1. Construction costs are expressed in Year 2018 dollars, using an ENR construction Cost Index of 11069, and will need to be
escalated to the year or years scheduled for the work.
First Priority Project No. 3: Middle Zone Boundary Modification
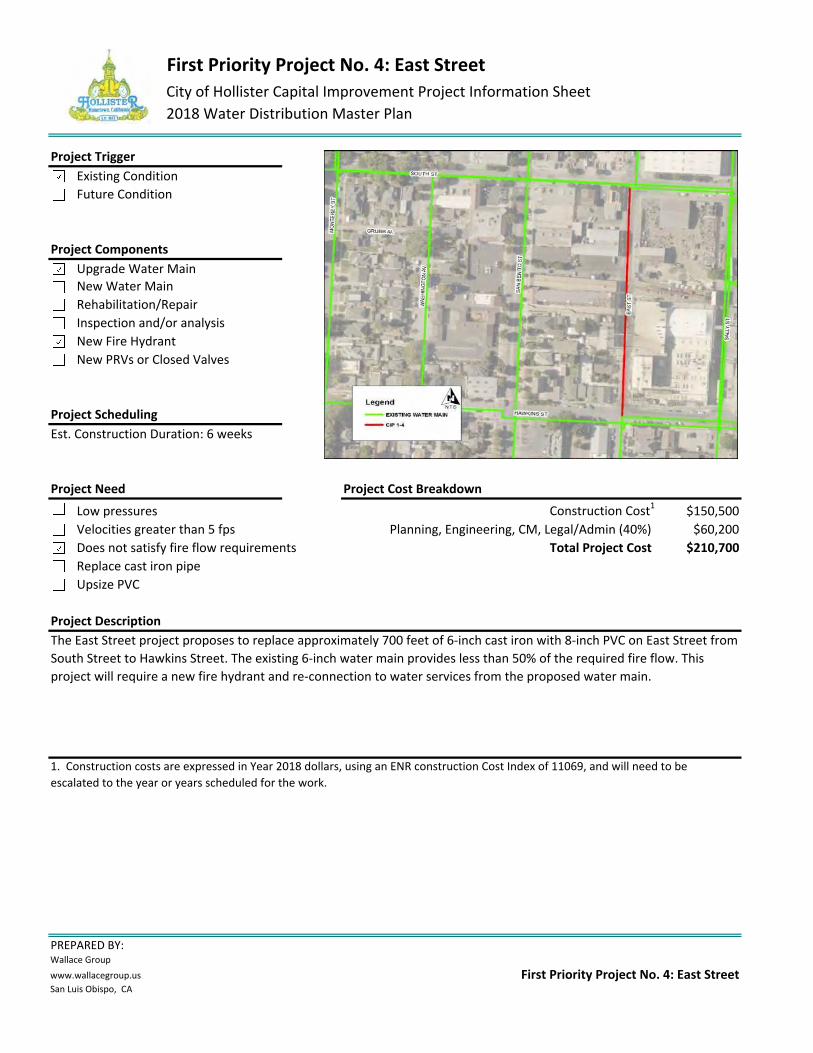
First Priority Project No. 4: East Street
City of Hollister Capital Improvement Project Information Sheet
2018 Water Distribution Master Plan
Project Trigger
Existing Condition
Future Condition
Project Components
Upgrade Water Main
New Water Main
Rehabilitation/Repair
Inspection and/or analysis
New Fire Hydrant
New PRVs or Closed Valves
Project Scheduling
Est. Construction Duration: 6 weeks
Project Need Project Cost Breakdown
Low pressures Construction Cost1
$150,500
Velocities greater than 5 fps Planning, Engineering, CM, Legal/Admin (40%) $60,200
Does not satisfy fire flow requirements Total Project Cost $210,700
Replace cast iron pipe
Upsize PVC
Project Description
PREPARED BY:Wallace Group
www.wallacegroup.us
San Luis Obispo, CA
The East Street project proposes to replace approximately 700 feet of 6-inch cast iron with 8-inch PVC on East Street from
South Street to Hawkins Street. The existing 6-inch water main provides less than 50% of the required fire flow. This
project will require a new fire hydrant and re-connection to water services from the proposed water main.
1. Construction costs are expressed in Year 2018 dollars, using an ENR construction Cost Index of 11069, and will need to be
escalated to the year or years scheduled for the work.
First Priority Project No. 4: East Street

First Priority Project No. 5: Walnut Lane
City of Hollister Capital Improvement Project Information Sheet
2018 Water Distribution Master Plan
Project Trigger
Existing Condition
Future Condition
Project Components
Upgrade Water Main
New Water Main
Rehabilitation/Repair
Inspection and/or analysis
New Fire Hydrant
New PRVs or Closed Valves
Project Scheduling
Est. Construction Duration: 6 weeks
Project Need Project Cost Breakdown
Low pressures Construction Cost1
$182,750
Velocities greater than 5 fps Planning, Engineering, CM, Legal/Admin (40%) $73,100
Does not satisfy fire flow requirements Total Project Cost $255,850
Replace cast iron pipe
Upsize PVC
Project Description
PREPARED BY:Wallace Group
www.wallacegroup.us
San Luis Obispo, CA
The Walnut Lane project proposes to replace approximately 850 feet of 6-inch cast iron with 8-inch PVC on Walnut Lane
from Powell Street to the end of the cul-de-sac. The existing 6-inch water main provides less than 50% of the required fire
flow. This project will require new fire hydrants and re-connection to water services from the proposed water main.
1. Construction costs are expressed in Year 2018 dollars, using an ENR construction Cost Index of 11069, and will need to be
escalated to the year or years scheduled for the work.
First Priority Project No. 5: Walnut Lane
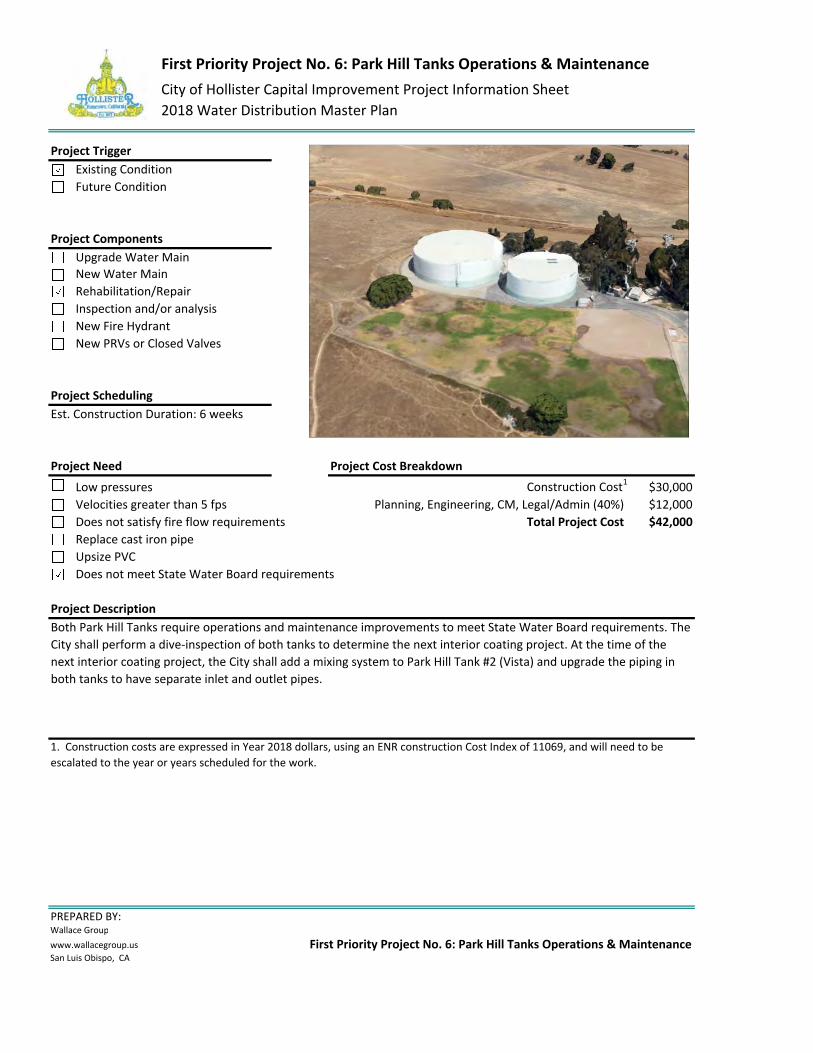
First Priority Project No. 6: Park Hill Tanks Operations & Maintenance
City of Hollister Capital Improvement Project Information Sheet
2018 Water Distribution Master Plan
Project Trigger
Existing Condition
Future Condition
Project Components
Upgrade Water Main
New Water Main
Rehabilitation/Repair
Inspection and/or analysis
New Fire Hydrant
New PRVs or Closed Valves
Project Scheduling
Est. Construction Duration: 6 weeks
Project Need Project Cost Breakdown
Low pressures Construction Cost1
$30,000
Velocities greater than 5 fps Planning, Engineering, CM, Legal/Admin (40%) $12,000
Does not satisfy fire flow requirements Total Project Cost $42,000
Replace cast iron pipe
Upsize PVC
Does not meet State Water Board requirements
Project Description
PREPARED BY:Wallace Group
www.wallacegroup.us
San Luis Obispo, CA
Both Park Hill Tanks require operations and maintenance improvements to meet State Water Board requirements. The
City shall perform a dive-inspection of both tanks to determine the next interior coating project. At the time of the
next interior coating project, the City shall add a mixing system to Park Hill Tank #2 (Vista) and upgrade the piping in
both tanks to have separate inlet and outlet pipes.
1. Construction costs are expressed in Year 2018 dollars, using an ENR construction Cost Index of 11069, and will need to be
escalated to the year or years scheduled for the work.
First Priority Project No. 6: Park Hill Tanks Operations & Maintenance
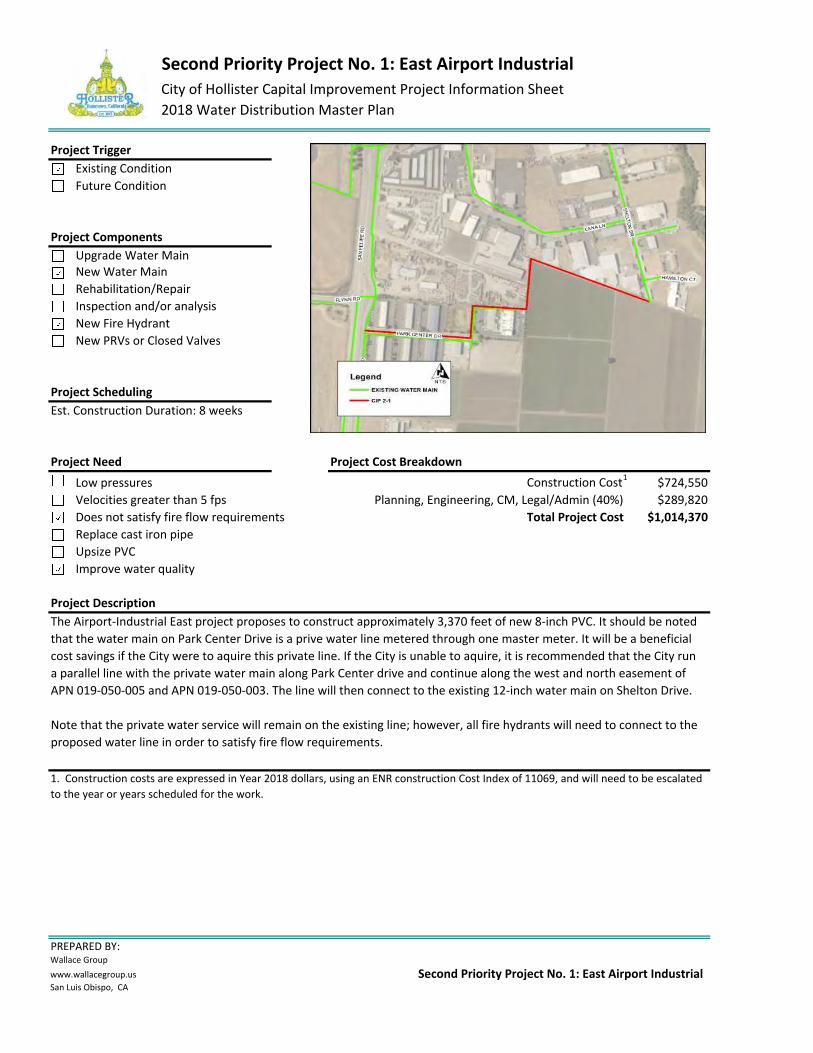
Second Priority Project No. 1: East Airport Industrial
City of Hollister Capital Improvement Project Information Sheet
2018 Water Distribution Master Plan
Project Trigger
Existing Condition
Future Condition
Project Components
Upgrade Water Main
New Water Main
Rehabilitation/Repair
Inspection and/or analysis
New Fire Hydrant
New PRVs or Closed Valves
Project Scheduling
Est. Construction Duration: 8 weeks
Project Need Project Cost Breakdown
Low pressures Construction Cost1
$724,550
Velocities greater than 5 fps Planning, Engineering, CM, Legal/Admin (40%) $289,820
Does not satisfy fire flow requirements Total Project Cost $1,014,370
Replace cast iron pipe
Upsize PVC
Improve water quality
Project Description
PREPARED BY:Wallace Group
www.wallacegroup.us
San Luis Obispo, CA
The Airport-Industrial East project proposes to construct approximately 3,370 feet of new 8-inch PVC. It should be noted
that the water main on Park Center Drive is a prive water line metered through one master meter. It will be a beneficial
cost savings if the City were to aquire this private line. If the City is unable to aquire, it is recommended that the City run
a parallel line with the private water main along Park Center drive and continue along the west and north easement of
APN 019-050-005 and APN 019-050-003. The line will then connect to the existing 12-inch water main on Shelton Drive.
Note that the private water service will remain on the existing line; however, all fire hydrants will need to connect to the
proposed water line in order to satisfy fire flow requirements.
1. Construction costs are expressed in Year 2018 dollars, using an ENR construction Cost Index of 11069, and will need to be escalated
to the year or years scheduled for the work.
Second Priority Project No. 1: East Airport Industrial
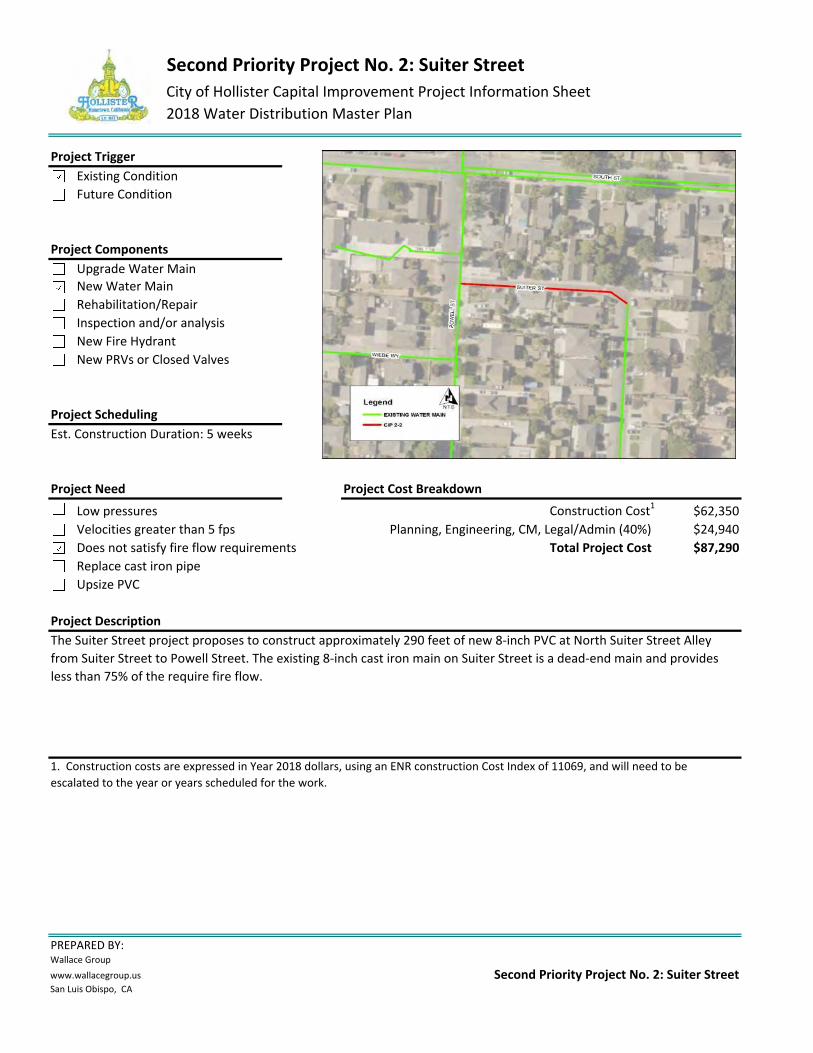
Second Priority Project No. 2: Suiter Street
City of Hollister Capital Improvement Project Information Sheet
2018 Water Distribution Master Plan
Project Trigger
Existing Condition
Future Condition
Project Components
Upgrade Water Main
New Water Main
Rehabilitation/Repair
Inspection and/or analysis
New Fire Hydrant
New PRVs or Closed Valves
Project Scheduling
Est. Construction Duration: 5 weeks
Project Need Project Cost Breakdown
Low pressures Construction Cost1
$62,350
Velocities greater than 5 fps Planning, Engineering, CM, Legal/Admin (40%) $24,940
Does not satisfy fire flow requirements Total Project Cost $87,290
Replace cast iron pipe
Upsize PVC
Project Description
PREPARED BY:Wallace Group
www.wallacegroup.us
San Luis Obispo, CA
The Suiter Street project proposes to construct approximately 290 feet of new 8-inch PVC at North Suiter Street Alley
from Suiter Street to Powell Street. The existing 8-inch cast iron main on Suiter Street is a dead-end main and provides
less than 75% of the require fire flow.
1. Construction costs are expressed in Year 2018 dollars, using an ENR construction Cost Index of 11069, and will need to be
escalated to the year or years scheduled for the work.
Second Priority Project No. 2: Suiter Street
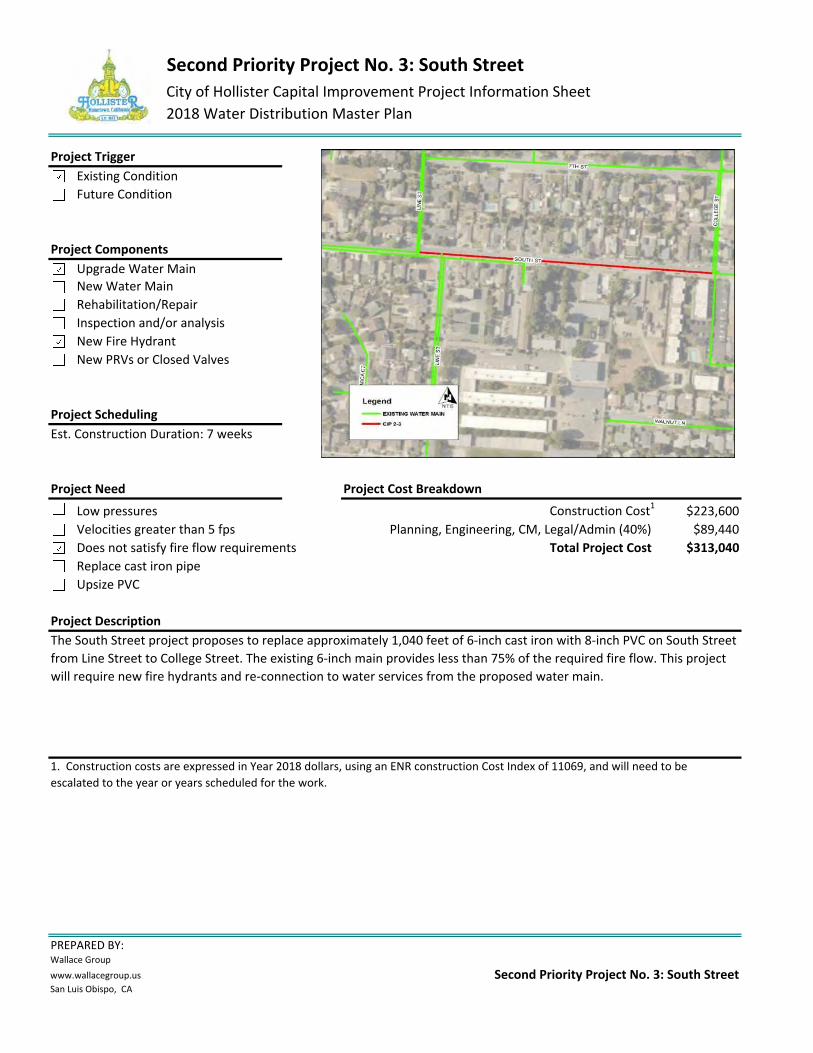
Second Priority Project No. 3: South Street
City of Hollister Capital Improvement Project Information Sheet
2018 Water Distribution Master Plan
Project Trigger
Existing Condition
Future Condition
Project Components
Upgrade Water Main
New Water Main
Rehabilitation/Repair
Inspection and/or analysis
New Fire Hydrant
New PRVs or Closed Valves
Project Scheduling
Est. Construction Duration: 7 weeks
Project Need Project Cost Breakdown
Low pressures Construction Cost1
$223,600
Velocities greater than 5 fps Planning, Engineering, CM, Legal/Admin (40%) $89,440
Does not satisfy fire flow requirements Total Project Cost $313,040
Replace cast iron pipe
Upsize PVC
Project Description
PREPARED BY:Wallace Group
www.wallacegroup.us
San Luis Obispo, CA
The South Street project proposes to replace approximately 1,040 feet of 6-inch cast iron with 8-inch PVC on South Street
from Line Street to College Street. The existing 6-inch main provides less than 75% of the required fire flow. This project
will require new fire hydrants and re-connection to water services from the proposed water main.
1. Construction costs are expressed in Year 2018 dollars, using an ENR construction Cost Index of 11069, and will need to be
escalated to the year or years scheduled for the work.
Second Priority Project No. 3: South Street
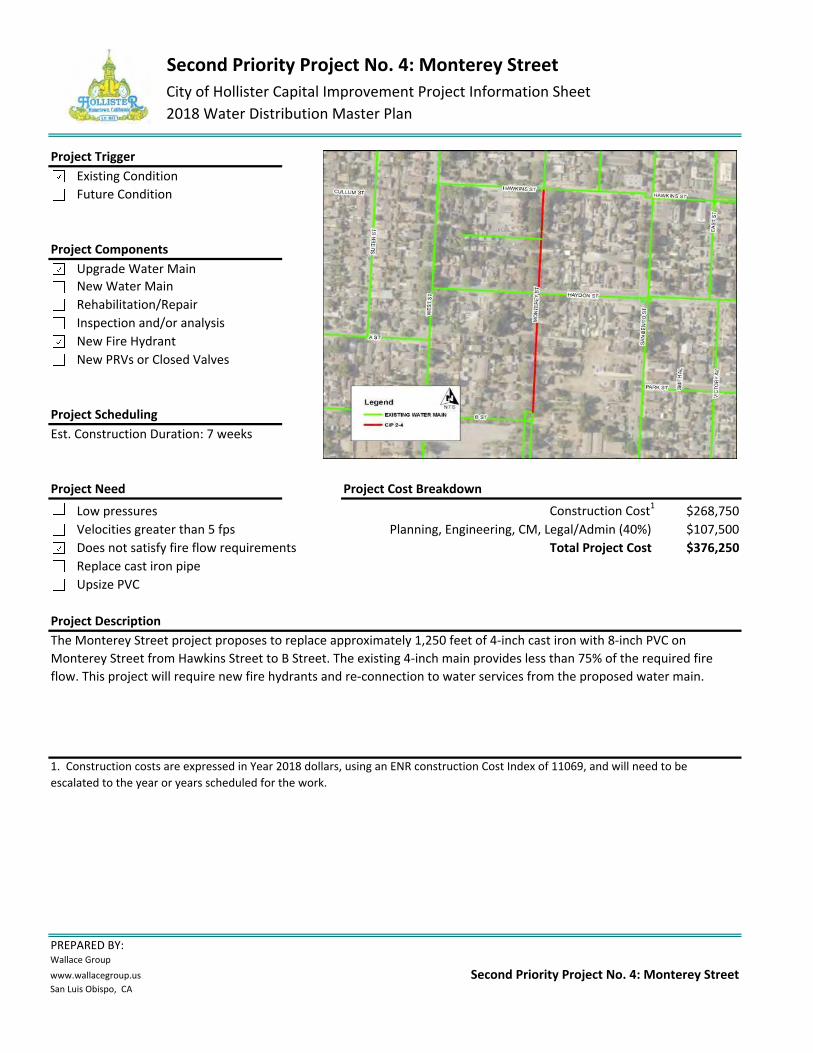
Second Priority Project No. 4: Monterey Street
City of Hollister Capital Improvement Project Information Sheet
2018 Water Distribution Master Plan
Project Trigger
Existing Condition
Future Condition
Project Components
Upgrade Water Main
New Water Main
Rehabilitation/Repair
Inspection and/or analysis
New Fire Hydrant
New PRVs or Closed Valves
Project Scheduling
Est. Construction Duration: 7 weeks
Project Need Project Cost Breakdown
Low pressures Construction Cost1
$268,750
Velocities greater than 5 fps Planning, Engineering, CM, Legal/Admin (40%) $107,500
Does not satisfy fire flow requirements Total Project Cost $376,250
Replace cast iron pipe
Upsize PVC
Project Description
PREPARED BY:Wallace Group
www.wallacegroup.us
San Luis Obispo, CA
The Monterey Street project proposes to replace approximately 1,250 feet of 4-inch cast iron with 8-inch PVC on
Monterey Street from Hawkins Street to B Street. The existing 4-inch main provides less than 75% of the required fire
flow. This project will require new fire hydrants and re-connection to water services from the proposed water main.
1. Construction costs are expressed in Year 2018 dollars, using an ENR construction Cost Index of 11069, and will need to be
escalated to the year or years scheduled for the work.
Second Priority Project No. 4: Monterey Street
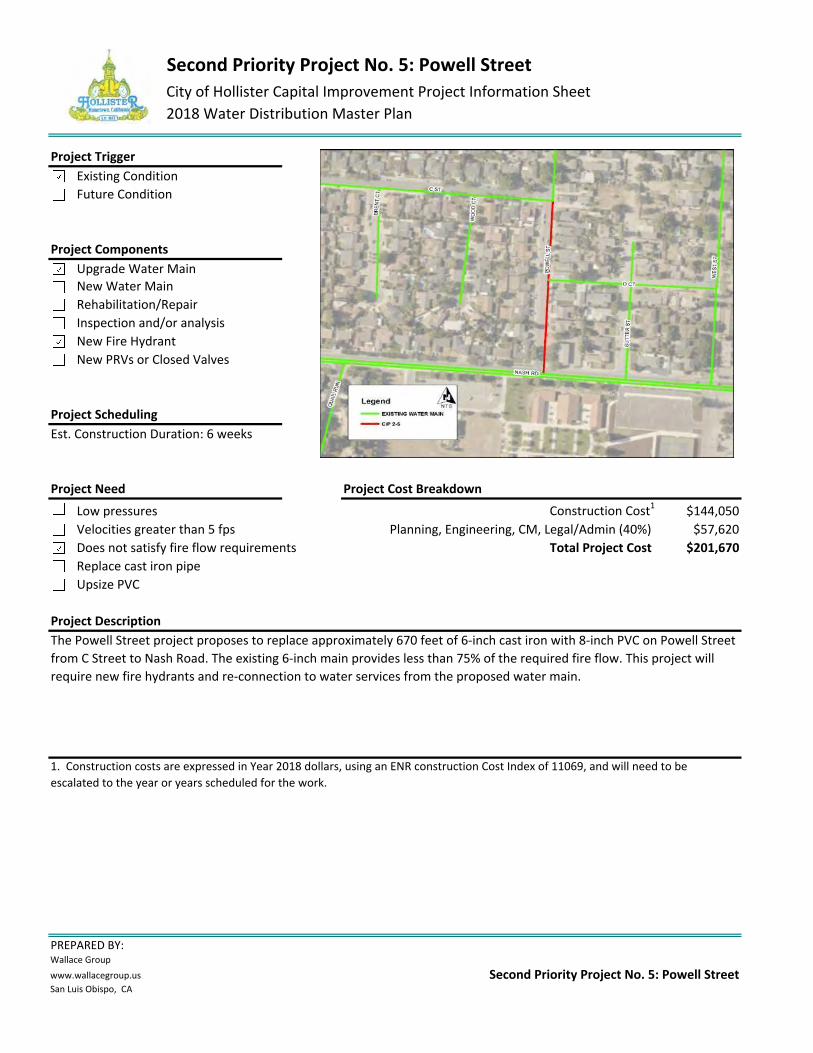
Second Priority Project No. 5: Powell Street
City of Hollister Capital Improvement Project Information Sheet
2018 Water Distribution Master Plan
Project Trigger
Existing Condition
Future Condition
Project Components
Upgrade Water Main
New Water Main
Rehabilitation/Repair
Inspection and/or analysis
New Fire Hydrant
New PRVs or Closed Valves
Project Scheduling
Est. Construction Duration: 6 weeks
Project Need Project Cost Breakdown
Low pressures Construction Cost1
$144,050
Velocities greater than 5 fps Planning, Engineering, CM, Legal/Admin (40%) $57,620
Does not satisfy fire flow requirements Total Project Cost $201,670
Replace cast iron pipe
Upsize PVC
Project Description
PREPARED BY:Wallace Group
www.wallacegroup.us
San Luis Obispo, CA
The Powell Street project proposes to replace approximately 670 feet of 6-inch cast iron with 8-inch PVC on Powell Street
from C Street to Nash Road. The existing 6-inch main provides less than 75% of the required fire flow. This project will
require new fire hydrants and re-connection to water services from the proposed water main.
1. Construction costs are expressed in Year 2018 dollars, using an ENR construction Cost Index of 11069, and will need to be
escalated to the year or years scheduled for the work.
Second Priority Project No. 5: Powell Street
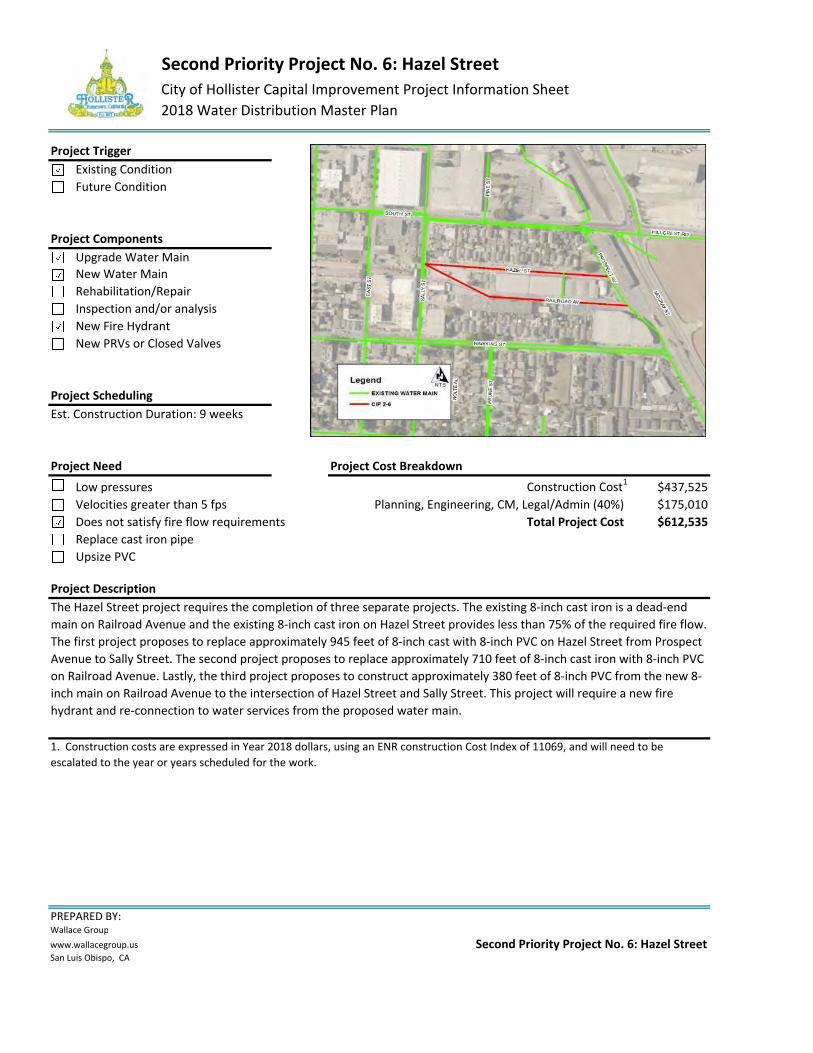
Second Priority Project No. 6: Hazel Street
City of Hollister Capital Improvement Project Information Sheet
2018 Water Distribution Master Plan
Project Trigger
Existing Condition
Future Condition
Project Components
Upgrade Water Main
New Water Main
Rehabilitation/Repair
Inspection and/or analysis
New Fire Hydrant
New PRVs or Closed Valves
Project Scheduling
Est. Construction Duration: 9 weeks
Project Need Project Cost Breakdown
Low pressures Construction Cost1
$437,525
Velocities greater than 5 fps Planning, Engineering, CM, Legal/Admin (40%) $175,010
Does not satisfy fire flow requirements Total Project Cost $612,535
Replace cast iron pipe
Upsize PVC
Project Description
PREPARED BY:Wallace Group
www.wallacegroup.us
San Luis Obispo, CA
The Hazel Street project requires the completion of three separate projects. The existing 8-inch cast iron is a dead-end
main on Railroad Avenue and the existing 8-inch cast iron on Hazel Street provides less than 75% of the required fire flow.
The first project proposes to replace approximately 945 feet of 8-inch cast with 8-inch PVC on Hazel Street from Prospect
Avenue to Sally Street. The second project proposes to replace approximately 710 feet of 8-inch cast iron with 8-inch PVC
on Railroad Avenue. Lastly, the third project proposes to construct approximately 380 feet of 8-inch PVC from the new 8-
inch main on Railroad Avenue to the intersection of Hazel Street and Sally Street. This project will require a new fire
hydrant and re-connection to water services from the proposed water main.
1. Construction costs are expressed in Year 2018 dollars, using an ENR construction Cost Index of 11069, and will need to be
escalated to the year or years scheduled for the work.
Second Priority Project No. 6: Hazel Street
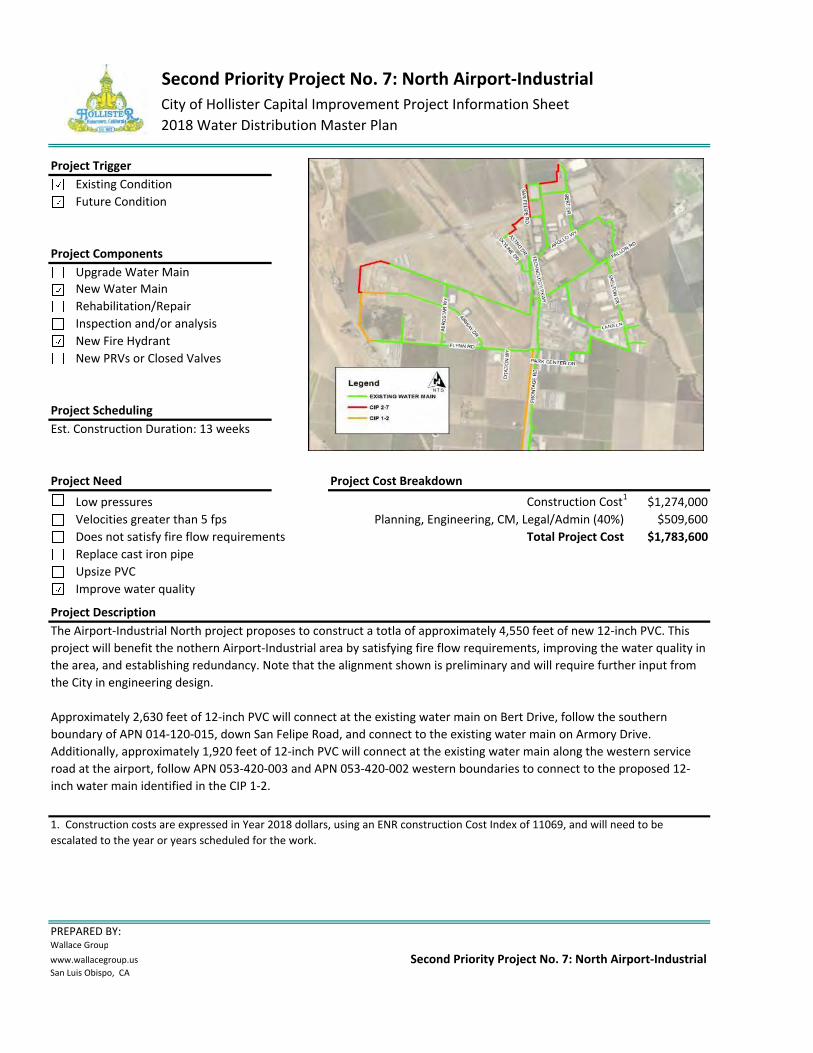
Second Priority Project No. 7: North Airport-Industrial
City of Hollister Capital Improvement Project Information Sheet
2018 Water Distribution Master Plan
Project Trigger
Existing Condition
Future Condition
Project Components
Upgrade Water Main
New Water Main
Rehabilitation/Repair
Inspection and/or analysis
New Fire Hydrant
New PRVs or Closed Valves
Project Scheduling
Est. Construction Duration: 13 weeks
Project Need Project Cost Breakdown
Low pressures Construction Cost1
$1,274,000
Velocities greater than 5 fps Planning, Engineering, CM, Legal/Admin (40%) $509,600
Does not satisfy fire flow requirements Total Project Cost $1,783,600
Replace cast iron pipe
Upsize PVC
Improve water quality
Project Description
PREPARED BY:Wallace Group
www.wallacegroup.us
San Luis Obispo, CA
The Airport-Industrial North project proposes to construct a totla of approximately 4,550 feet of new 12-inch PVC. This
project will benefit the nothern Airport-Industrial area by satisfying fire flow requirements, improving the water quality in
the area, and establishing redundancy. Note that the alignment shown is preliminary and will require further input from
the City in engineering design.
Approximately 2,630 feet of 12-inch PVC will connect at the existing water main on Bert Drive, follow the southern
boundary of APN 014-120-015, down San Felipe Road, and connect to the existing water main on Armory Drive.
Additionally, approximately 1,920 feet of 12-inch PVC will connect at the existing water main along the western service
road at the airport, follow APN 053-420-003 and APN 053-420-002 western boundaries to connect to the proposed 12-
inch water main identified in the CIP 1-2.
1. Construction costs are expressed in Year 2018 dollars, using an ENR construction Cost Index of 11069, and will need to be
escalated to the year or years scheduled for the work.
Second Priority Project No. 7: North Airport-Industrial
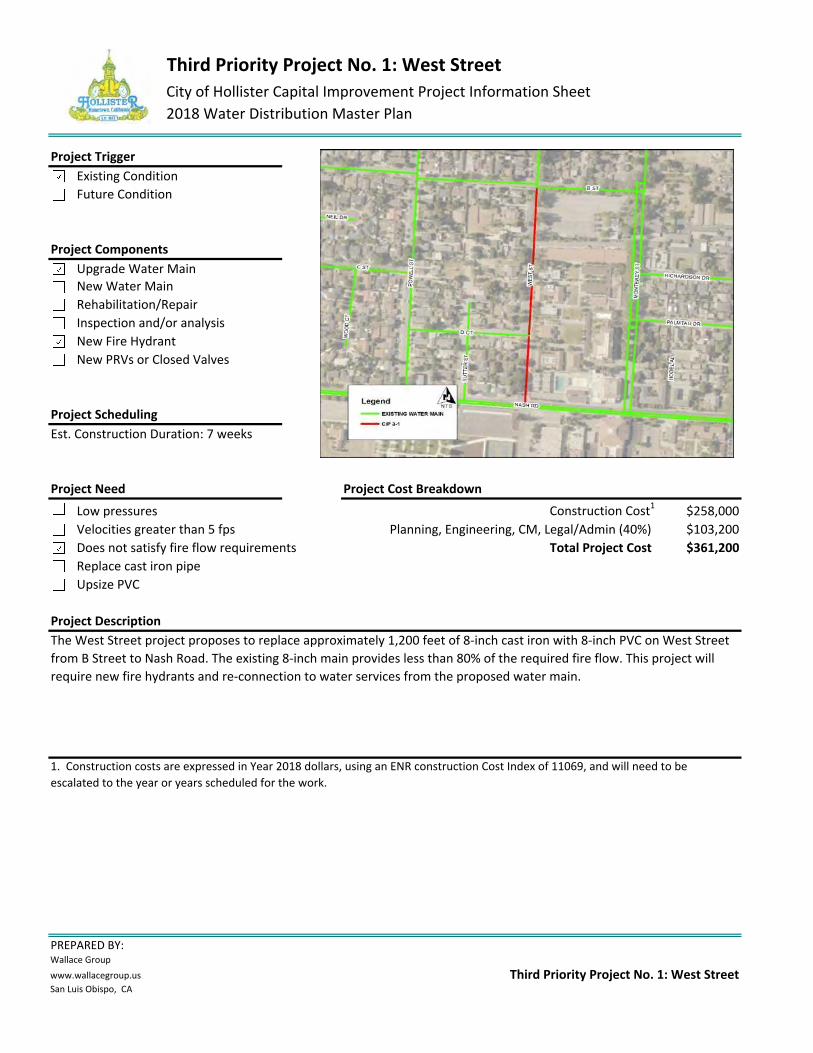
Third Priority Project No. 1: West Street
City of Hollister Capital Improvement Project Information Sheet
2018 Water Distribution Master Plan
Project Trigger
Existing Condition
Future Condition
Project Components
Upgrade Water Main
New Water Main
Rehabilitation/Repair
Inspection and/or analysis
New Fire Hydrant
New PRVs or Closed Valves
Project Scheduling
Est. Construction Duration: 7 weeks
Project Need Project Cost Breakdown
Low pressures Construction Cost1
$258,000
Velocities greater than 5 fps Planning, Engineering, CM, Legal/Admin (40%) $103,200
Does not satisfy fire flow requirements Total Project Cost $361,200
Replace cast iron pipe
Upsize PVC
Project Description
PREPARED BY:Wallace Group
www.wallacegroup.us
San Luis Obispo, CA
The West Street project proposes to replace approximately 1,200 feet of 8-inch cast iron with 8-inch PVC on West Street
from B Street to Nash Road. The existing 8-inch main provides less than 80% of the required fire flow. This project will
require new fire hydrants and re-connection to water services from the proposed water main.
1. Construction costs are expressed in Year 2018 dollars, using an ENR construction Cost Index of 11069, and will need to be
escalated to the year or years scheduled for the work.
Third Priority Project No. 1: West Street
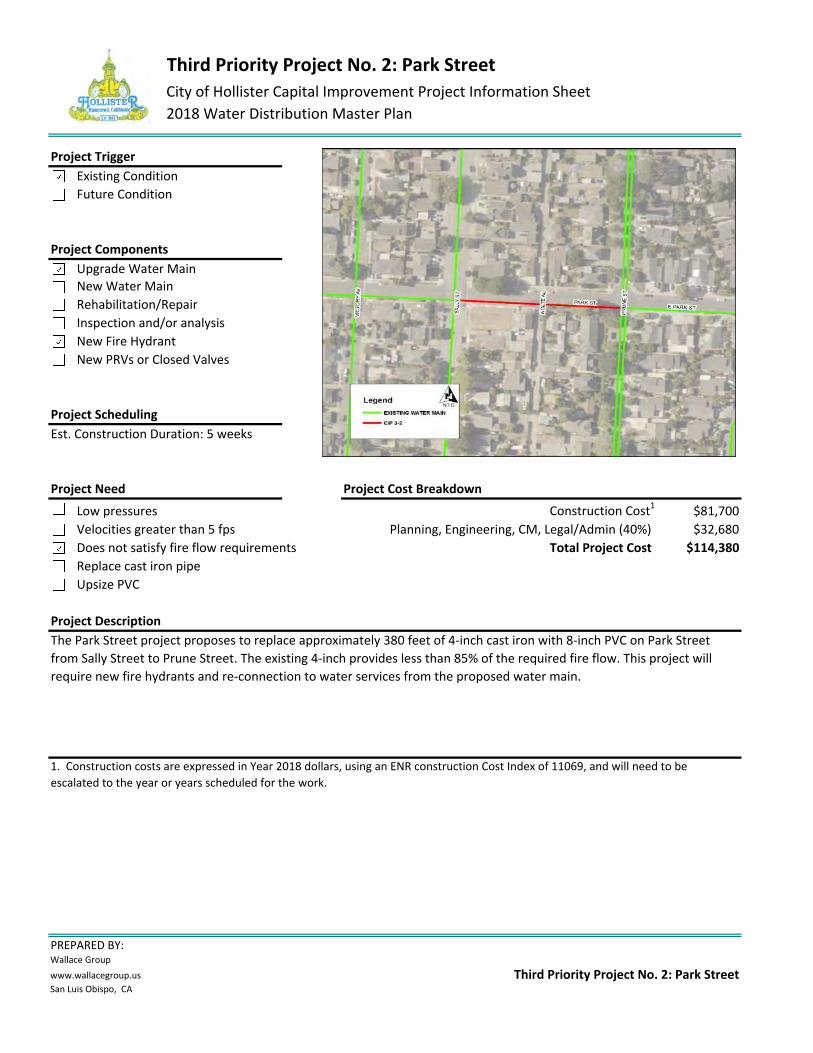
Third Priority Project No. 2: Park Street
City of Hollister Capital Improvement Project Information Sheet
2018 Water Distribution Master Plan
Project Trigger
Existing Condition
Future Condition
Project Components
Upgrade Water Main
New Water Main
Rehabilitation/Repair
Inspection and/or analysis
New Fire Hydrant
New PRVs or Closed Valves
Project Scheduling
Est. Construction Duration: 5 weeks
Project Need Project Cost Breakdown
Low pressures Construction Cost1
$81,700
Velocities greater than 5 fps Planning, Engineering, CM, Legal/Admin (40%) $32,680
Does not satisfy fire flow requirements Total Project Cost $114,380
Replace cast iron pipe
Upsize PVC
Project Description
PREPARED BY:Wallace Group
www.wallacegroup.us
San Luis Obispo, CA
The Park Street project proposes to replace approximately 380 feet of 4-inch cast iron with 8-inch PVC on Park Street
from Sally Street to Prune Street. The existing 4-inch provides less than 85% of the required fire flow. This project will
require new fire hydrants and re-connection to water services from the proposed water main.
1. Construction costs are expressed in Year 2018 dollars, using an ENR construction Cost Index of 11069, and will need to be
escalated to the year or years scheduled for the work.
Third Priority Project No. 2: Park Street
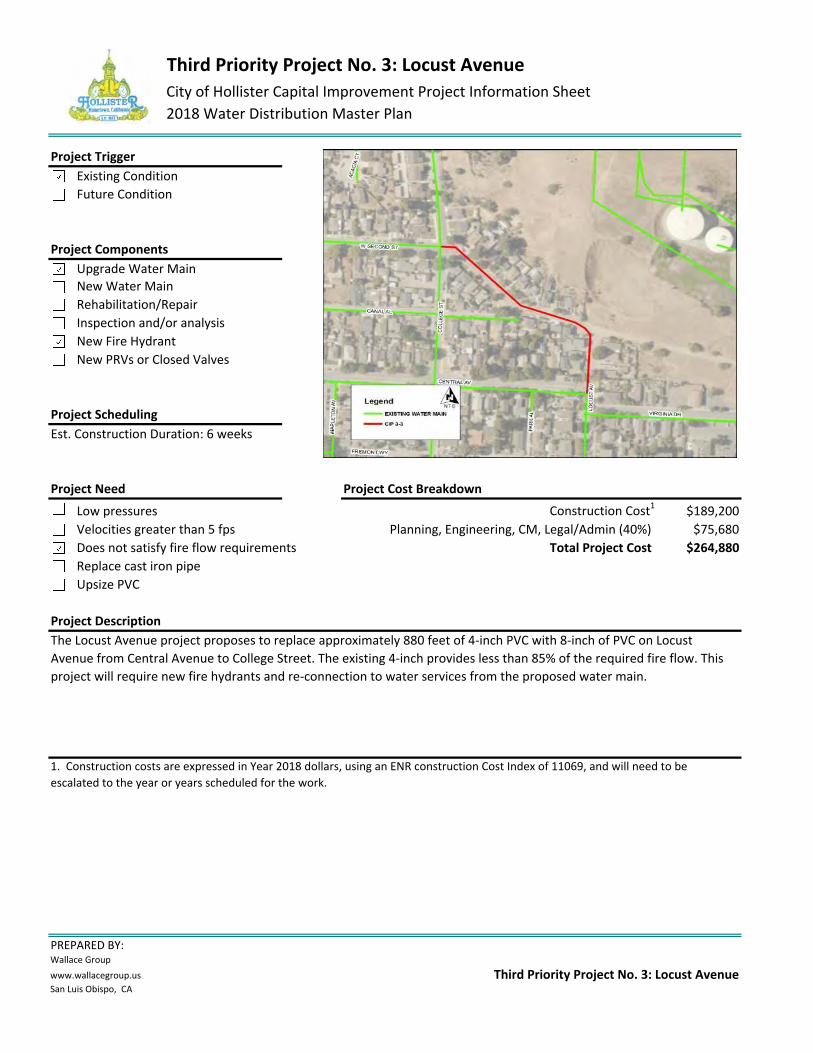
Third Priority Project No. 3: Locust Avenue
City of Hollister Capital Improvement Project Information Sheet
2018 Water Distribution Master Plan
Project Trigger
Existing Condition
Future Condition
Project Components
Upgrade Water Main
New Water Main
Rehabilitation/Repair
Inspection and/or analysis
New Fire Hydrant
New PRVs or Closed Valves
Project Scheduling
Est. Construction Duration: 6 weeks
Project Need Project Cost Breakdown
Low pressures Construction Cost1
$189,200
Velocities greater than 5 fps Planning, Engineering, CM, Legal/Admin (40%) $75,680
Does not satisfy fire flow requirements Total Project Cost $264,880
Replace cast iron pipe
Upsize PVC
Project Description
PREPARED BY:Wallace Group
www.wallacegroup.us
San Luis Obispo, CA
The Locust Avenue project proposes to replace approximately 880 feet of 4-inch PVC with 8-inch of PVC on Locust
Avenue from Central Avenue to College Street. The existing 4-inch provides less than 85% of the required fire flow. This
project will require new fire hydrants and re-connection to water services from the proposed water main.
1. Construction costs are expressed in Year 2018 dollars, using an ENR construction Cost Index of 11069, and will need to be
escalated to the year or years scheduled for the work.
Third Priority Project No. 3: Locust Avenue
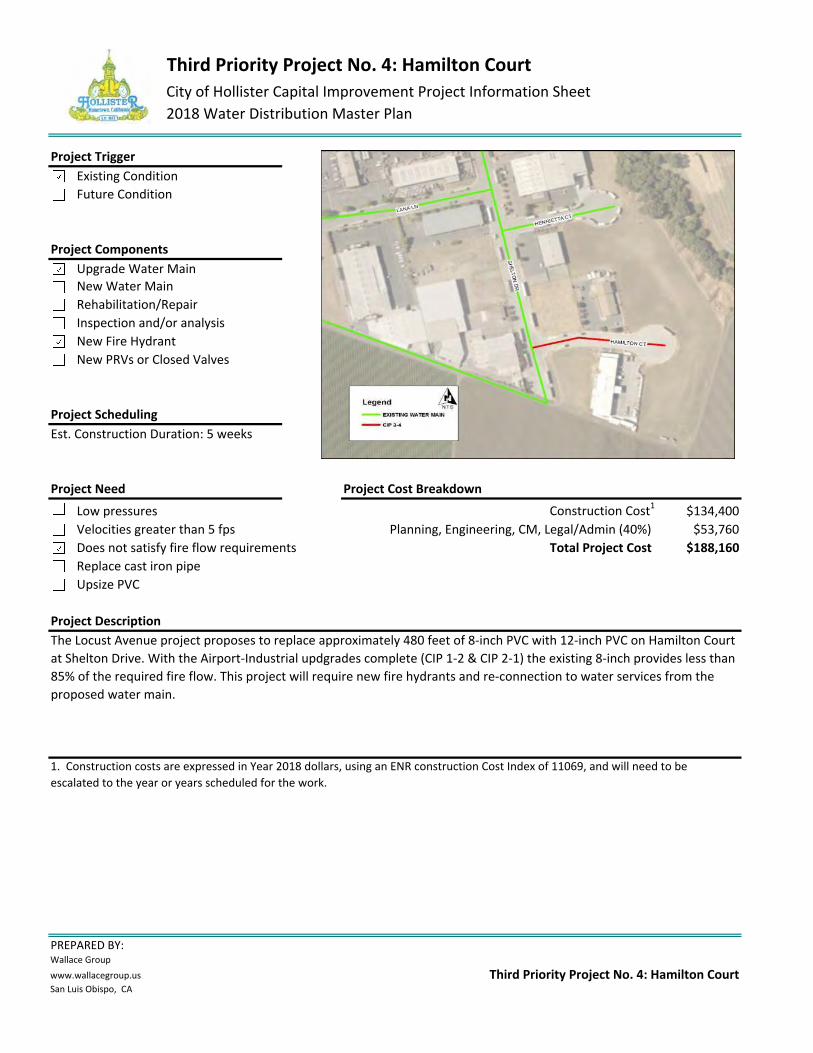
Third Priority Project No. 4: Hamilton Court
City of Hollister Capital Improvement Project Information Sheet
2018 Water Distribution Master Plan
Project Trigger
Existing Condition
Future Condition
Project Components
Upgrade Water Main
New Water Main
Rehabilitation/Repair
Inspection and/or analysis
New Fire Hydrant
New PRVs or Closed Valves
Project Scheduling
Est. Construction Duration: 5 weeks
Project Need Project Cost Breakdown
Low pressures Construction Cost1
$134,400
Velocities greater than 5 fps Planning, Engineering, CM, Legal/Admin (40%) $53,760
Does not satisfy fire flow requirements Total Project Cost $188,160
Replace cast iron pipe
Upsize PVC
Project Description
PREPARED BY:Wallace Group
www.wallacegroup.us
San Luis Obispo, CA
The Locust Avenue project proposes to replace approximately 480 feet of 8-inch PVC with 12-inch PVC on Hamilton Court
at Shelton Drive. With the Airport-Industrial updgrades complete (CIP 1-2 & CIP 2-1) the existing 8-inch provides less than
85% of the required fire flow. This project will require new fire hydrants and re-connection to water services from the
proposed water main.
1. Construction costs are expressed in Year 2018 dollars, using an ENR construction Cost Index of 11069, and will need to be
escalated to the year or years scheduled for the work.
Third Priority Project No. 4: Hamilton Court
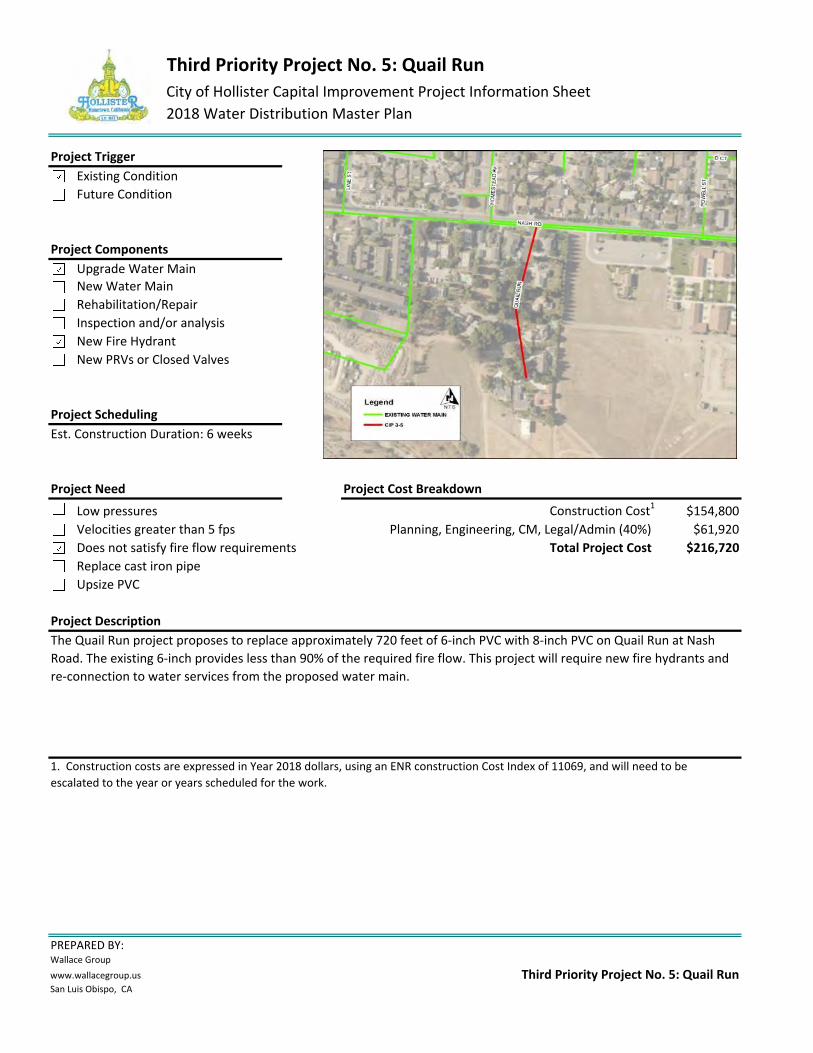
Third Priority Project No. 5: Quail Run
City of Hollister Capital Improvement Project Information Sheet
2018 Water Distribution Master Plan
Project Trigger
Existing Condition
Future Condition
Project Components
Upgrade Water Main
New Water Main
Rehabilitation/Repair
Inspection and/or analysis
New Fire Hydrant
New PRVs or Closed Valves
Project Scheduling
Est. Construction Duration: 6 weeks
Project Need Project Cost Breakdown
Low pressures Construction Cost1
$154,800
Velocities greater than 5 fps Planning, Engineering, CM, Legal/Admin (40%) $61,920
Does not satisfy fire flow requirements Total Project Cost $216,720
Replace cast iron pipe
Upsize PVC
Project Description
PREPARED BY:Wallace Group
www.wallacegroup.us
San Luis Obispo, CA
The Quail Run project proposes to replace approximately 720 feet of 6-inch PVC with 8-inch PVC on Quail Run at Nash
Road. The existing 6-inch provides less than 90% of the required fire flow. This project will require new fire hydrants and
re-connection to water services from the proposed water main.
1. Construction costs are expressed in Year 2018 dollars, using an ENR construction Cost Index of 11069, and will need to be
escalated to the year or years scheduled for the work.
Third Priority Project No. 5: Quail Run
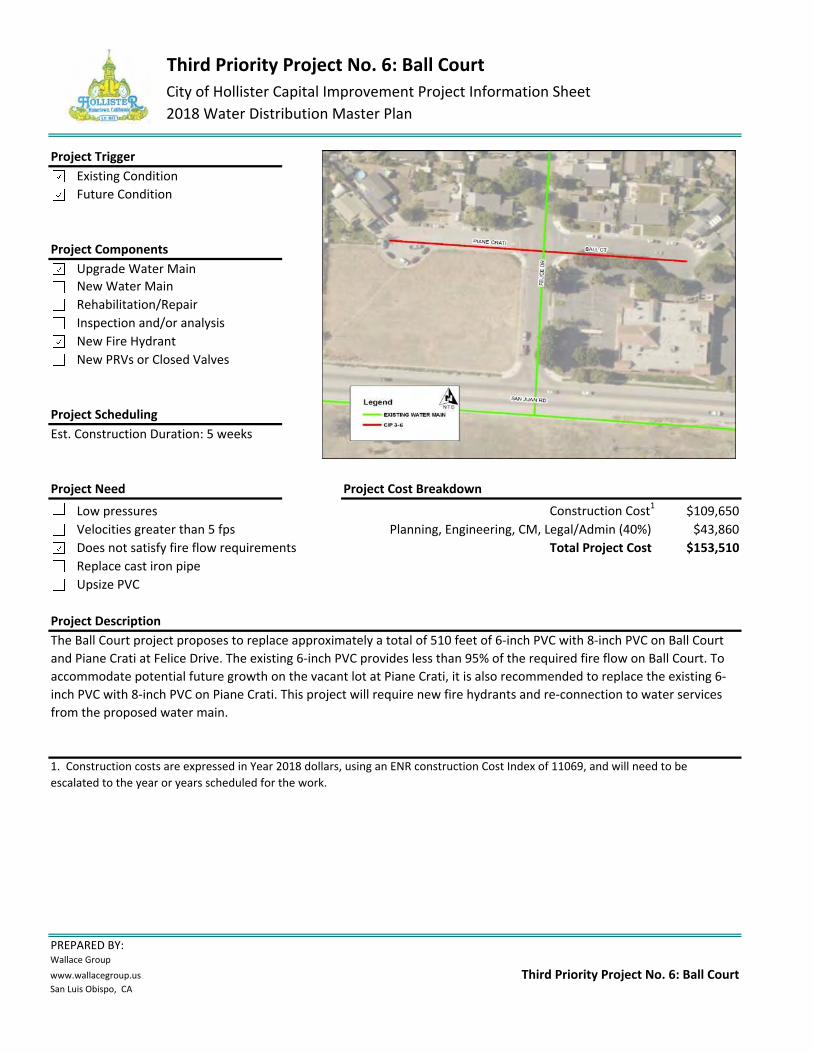
Third Priority Project No. 6: Ball Court
City of Hollister Capital Improvement Project Information Sheet
2018 Water Distribution Master Plan
Project Trigger
Existing Condition
Future Condition
Project Components
Upgrade Water Main
New Water Main
Rehabilitation/Repair
Inspection and/or analysis
New Fire Hydrant
New PRVs or Closed Valves
Project Scheduling
Est. Construction Duration: 5 weeks
Project Need Project Cost Breakdown
Low pressures Construction Cost1
$109,650
Velocities greater than 5 fps Planning, Engineering, CM, Legal/Admin (40%) $43,860
Does not satisfy fire flow requirements Total Project Cost $153,510
Replace cast iron pipe
Upsize PVC
Project Description
PREPARED BY:Wallace Group
www.wallacegroup.us
San Luis Obispo, CA
The Ball Court project proposes to replace approximately a total of 510 feet of 6-inch PVC with 8-inch PVC on Ball Court
and Piane Crati at Felice Drive. The existing 6-inch PVC provides less than 95% of the required fire flow on Ball Court. To
accommodate potential future growth on the vacant lot at Piane Crati, it is also recommended to replace the existing 6-
inch PVC with 8-inch PVC on Piane Crati. This project will require new fire hydrants and re-connection to water services
from the proposed water main.
1. Construction costs are expressed in Year 2018 dollars, using an ENR construction Cost Index of 11069, and will need to be
escalated to the year or years scheduled for the work.
Third Priority Project No. 6: Ball Court
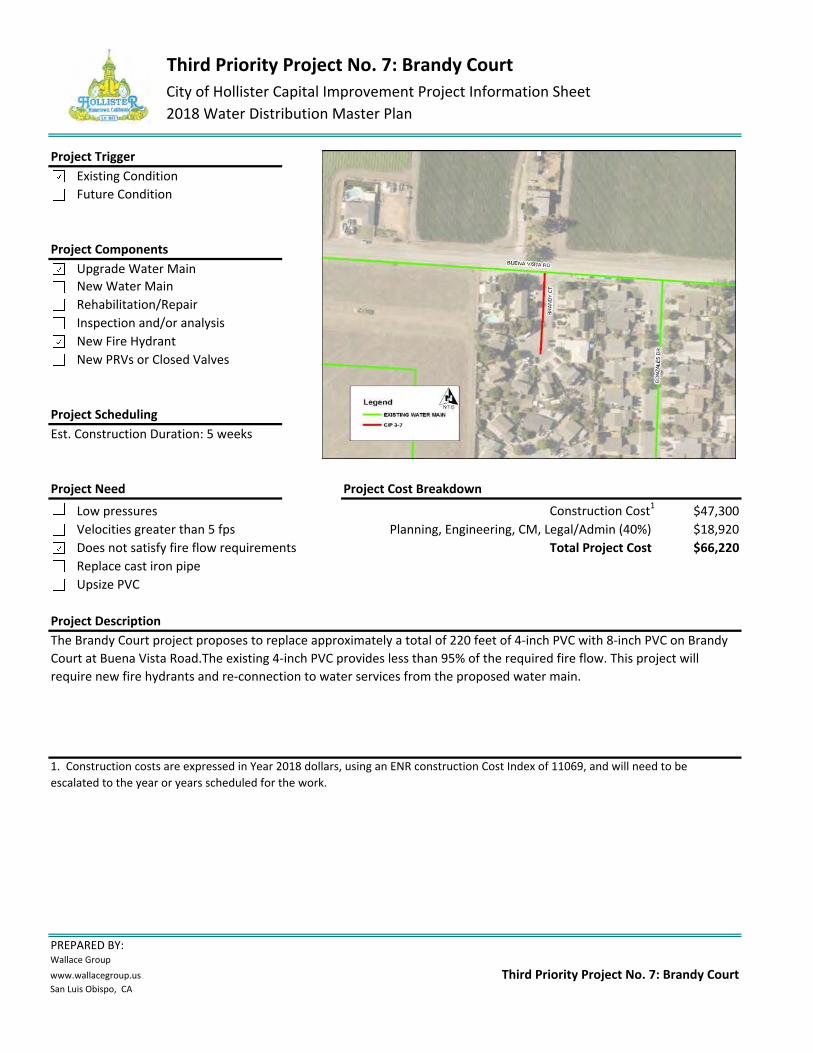
Third Priority Project No. 7: Brandy Court
City of Hollister Capital Improvement Project Information Sheet
2018 Water Distribution Master Plan
Project Trigger
Existing Condition
Future Condition
Project Components
Upgrade Water Main
New Water Main
Rehabilitation/Repair
Inspection and/or analysis
New Fire Hydrant
New PRVs or Closed Valves
Project Scheduling
Est. Construction Duration: 5 weeks
Project Need Project Cost Breakdown
Low pressures Construction Cost1
$47,300
Velocities greater than 5 fps Planning, Engineering, CM, Legal/Admin (40%) $18,920
Does not satisfy fire flow requirements Total Project Cost $66,220
Replace cast iron pipe
Upsize PVC
Project Description
PREPARED BY:Wallace Group
www.wallacegroup.us
San Luis Obispo, CA
The Brandy Court project proposes to replace approximately a total of 220 feet of 4-inch PVC with 8-inch PVC on Brandy
Court at Buena Vista Road.The existing 4-inch PVC provides less than 95% of the required fire flow. This project will
require new fire hydrants and re-connection to water services from the proposed water main.
1. Construction costs are expressed in Year 2018 dollars, using an ENR construction Cost Index of 11069, and will need to be
escalated to the year or years scheduled for the work.
Third Priority Project No. 7: Brandy Court
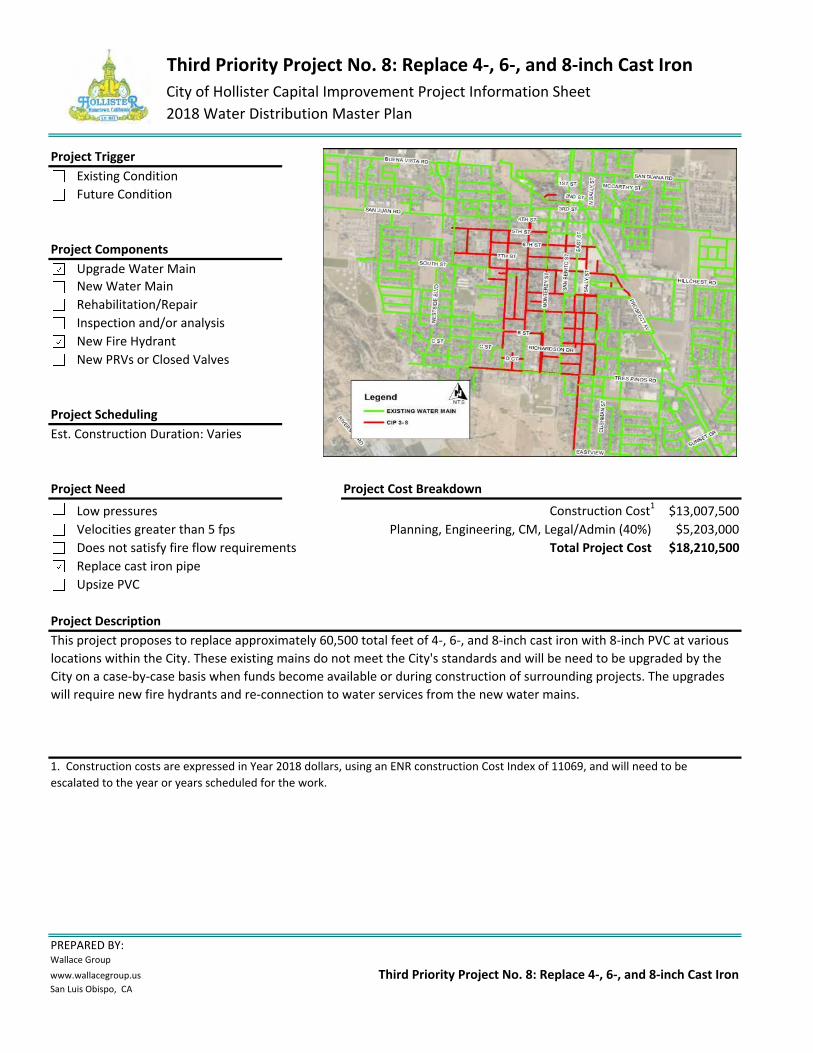
Third Priority Project No. 8: Replace 4-, 6-, and 8-inch Cast Iron
City of Hollister Capital Improvement Project Information Sheet
2018 Water Distribution Master Plan
Project Trigger
Existing Condition
Future Condition
Project Components
Upgrade Water Main
New Water Main
Rehabilitation/Repair
Inspection and/or analysis
New Fire Hydrant
New PRVs or Closed Valves
Project Scheduling
Est. Construction Duration: Varies
Project Need Project Cost Breakdown
Low pressures Construction Cost1
$13,007,500
Velocities greater than 5 fps Planning, Engineering, CM, Legal/Admin (40%) $5,203,000
Does not satisfy fire flow requirements Total Project Cost $18,210,500
Replace cast iron pipe
Upsize PVC
Project Description
PREPARED BY:Wallace Group
www.wallacegroup.us
San Luis Obispo, CA
This project proposes to replace approximately 60,500 total feet of 4-, 6-, and 8-inch cast iron with 8-inch PVC at various
locations within the City. These existing mains do not meet the City's standards and will be need to be upgraded by the
City on a case-by-case basis when funds become available or during construction of surrounding projects. The upgrades
will require new fire hydrants and re-connection to water services from the new water mains.
1. Construction costs are expressed in Year 2018 dollars, using an ENR construction Cost Index of 11069, and will need to be
escalated to the year or years scheduled for the work.
Third Priority Project No. 8: Replace 4-, 6-, and 8-inch Cast Iron
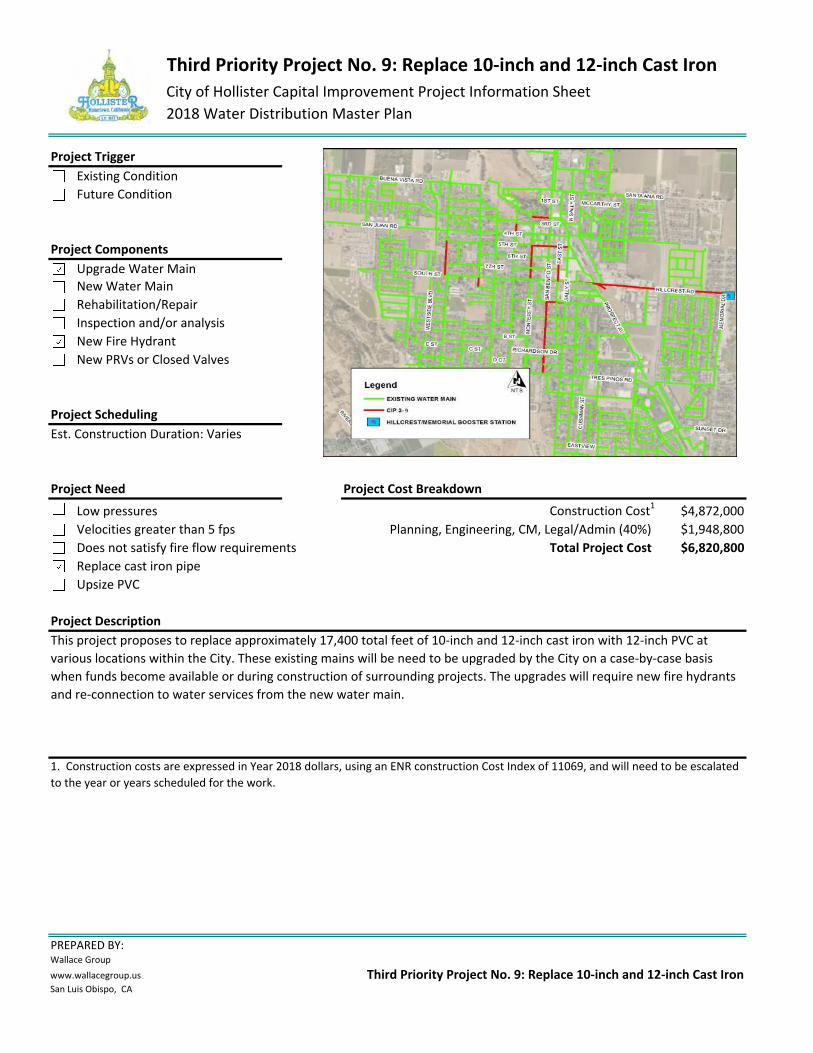
Third Priority Project No. 9: Replace 10-inch and 12-inch Cast Iron
City of Hollister Capital Improvement Project Information Sheet
2018 Water Distribution Master Plan
Project Trigger
Existing Condition
Future Condition
Project Components
Upgrade Water Main
New Water Main
Rehabilitation/Repair
Inspection and/or analysis
New Fire Hydrant
New PRVs or Closed Valves
Project Scheduling
Est. Construction Duration: Varies
Project Need Project Cost Breakdown
Low pressures Construction Cost1
$4,872,000
Velocities greater than 5 fps Planning, Engineering, CM, Legal/Admin (40%) $1,948,800
Does not satisfy fire flow requirements Total Project Cost $6,820,800
Replace cast iron pipe
Upsize PVC
Project Description
PREPARED BY:Wallace Group
www.wallacegroup.us
San Luis Obispo, CA
This project proposes to replace approximately 17,400 total feet of 10-inch and 12-inch cast iron with 12-inch PVC at
various locations within the City. These existing mains will be need to be upgraded by the City on a case-by-case basis
when funds become available or during construction of surrounding projects. The upgrades will require new fire hydrants
and re-connection to water services from the new water main.
1. Construction costs are expressed in Year 2018 dollars, using an ENR construction Cost Index of 11069, and will need to be escalated
to the year or years scheduled for the work.
Third Priority Project No. 9: Replace 10-inch and 12-inch Cast Iron
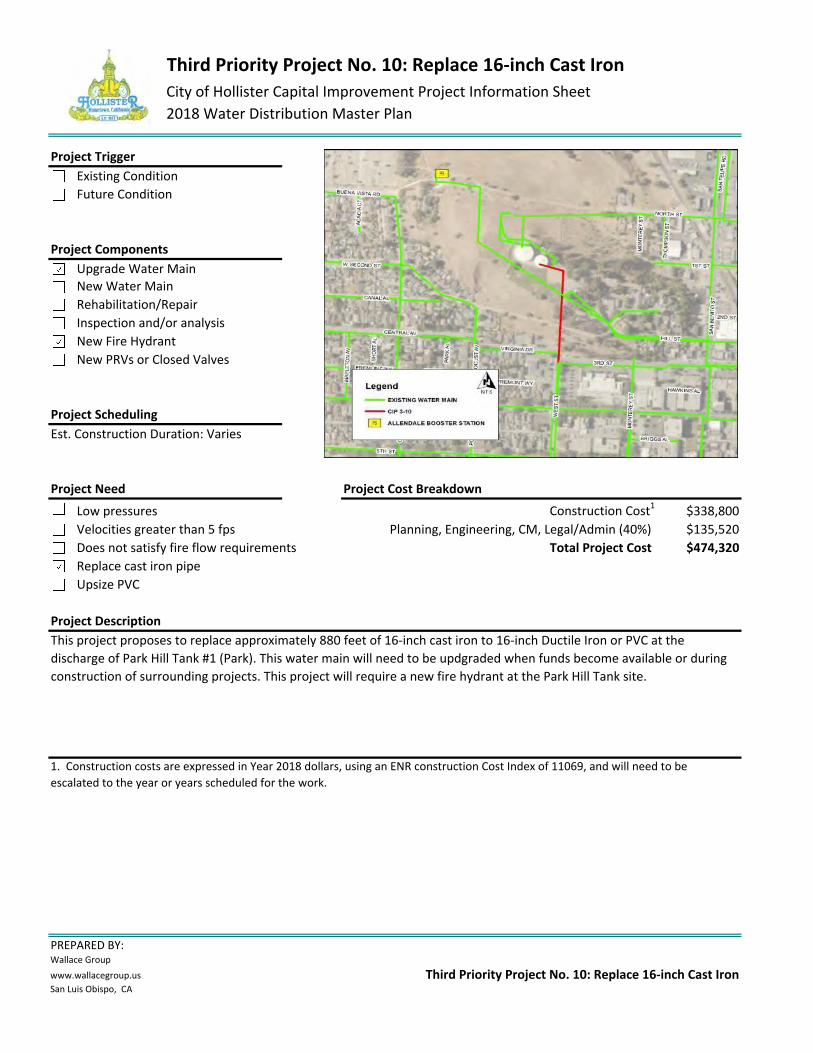
Third Priority Project No. 10: Replace 16-inch Cast Iron
City of Hollister Capital Improvement Project Information Sheet
2018 Water Distribution Master Plan
Project Trigger
Existing Condition
Future Condition
Project Components
Upgrade Water Main
New Water Main
Rehabilitation/Repair
Inspection and/or analysis
New Fire Hydrant
New PRVs or Closed Valves
Project Scheduling
Est. Construction Duration: Varies
Project Need Project Cost Breakdown
Low pressures Construction Cost1
$338,800
Velocities greater than 5 fps Planning, Engineering, CM, Legal/Admin (40%) $135,520
Does not satisfy fire flow requirements Total Project Cost $474,320
Replace cast iron pipe
Upsize PVC
Project Description
PREPARED BY:Wallace Group
www.wallacegroup.us
San Luis Obispo, CA
This project proposes to replace approximately 880 feet of 16-inch cast iron to 16-inch Ductile Iron or PVC at the
discharge of Park Hill Tank #1 (Park). This water main will need to be updgraded when funds become available or during
construction of surrounding projects. This project will require a new fire hydrant at the Park Hill Tank site.
1. Construction costs are expressed in Year 2018 dollars, using an ENR construction Cost Index of 11069, and will need to be
escalated to the year or years scheduled for the work.
Third Priority Project No. 10: Replace 16-inch Cast Iron
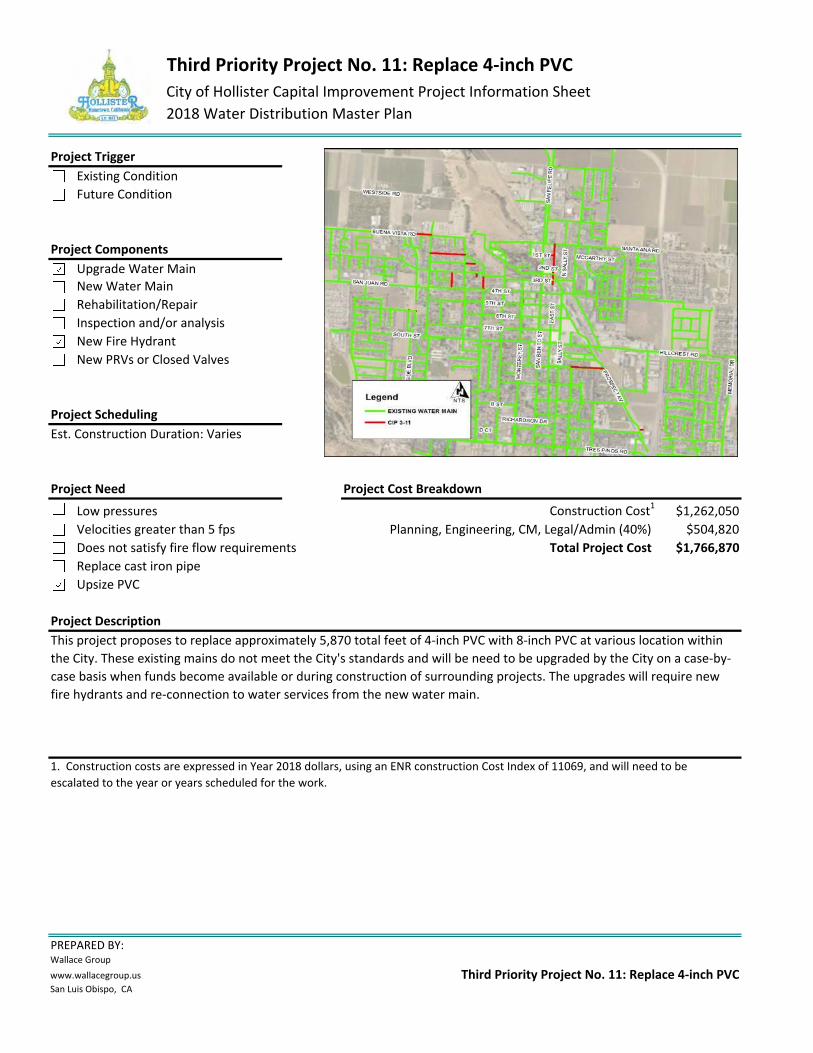
Third Priority Project No. 11: Replace 4-inch PVC
City of Hollister Capital Improvement Project Information Sheet
2018 Water Distribution Master Plan
Project Trigger
Existing Condition
Future Condition
Project Components
Upgrade Water Main
New Water Main
Rehabilitation/Repair
Inspection and/or analysis
New Fire Hydrant
New PRVs or Closed Valves
Project Scheduling
Est. Construction Duration: Varies
Project Need Project Cost Breakdown
Low pressures Construction Cost1
$1,262,050
Velocities greater than 5 fps Planning, Engineering, CM, Legal/Admin (40%) $504,820
Does not satisfy fire flow requirements Total Project Cost $1,766,870
Replace cast iron pipe
Upsize PVC
Project Description
PREPARED BY:Wallace Group
www.wallacegroup.us
San Luis Obispo, CA
This project proposes to replace approximately 5,870 total feet of 4-inch PVC with 8-inch PVC at various location within
the City. These existing mains do not meet the City's standards and will be need to be upgraded by the City on a case-by-
case basis when funds become available or during construction of surrounding projects. The upgrades will require new
fire hydrants and re-connection to water services from the new water main.
1. Construction costs are expressed in Year 2018 dollars, using an ENR construction Cost Index of 11069, and will need to be
escalated to the year or years scheduled for the work.
Third Priority Project No. 11: Replace 4-inch PVC

APPENDIX A
Memorial Booster Station Pump Curve
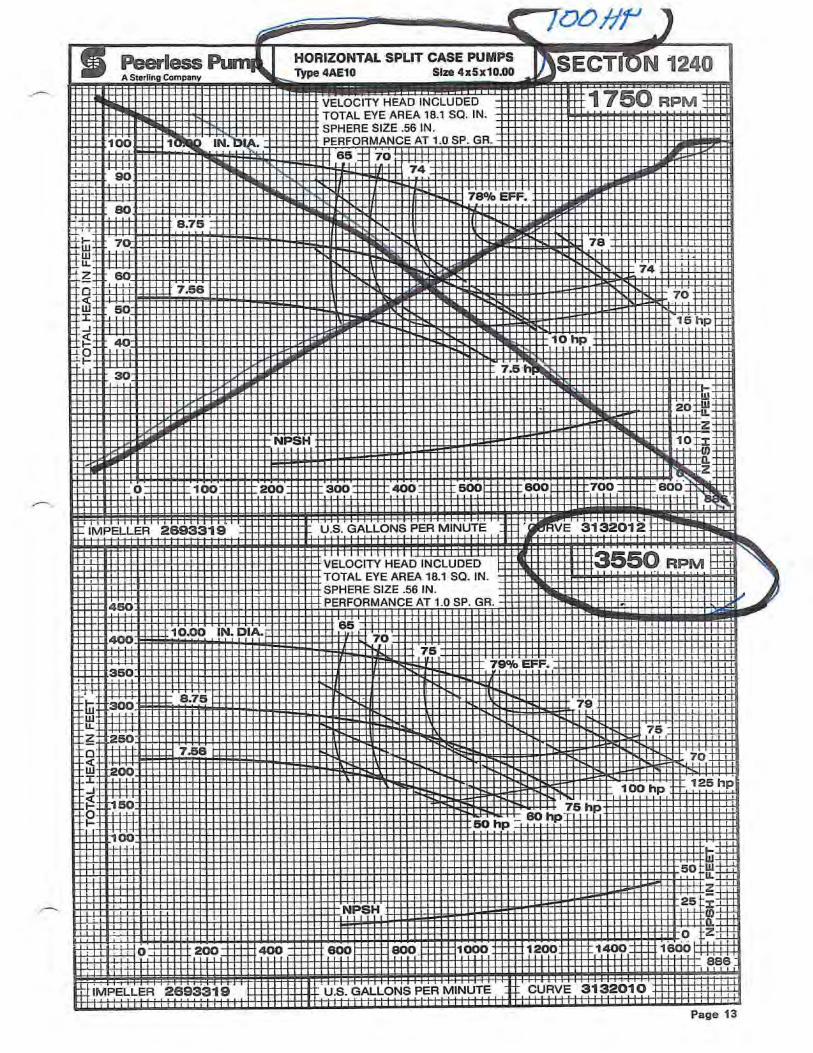

APPENDIX B
Fire Hydrant Test Results
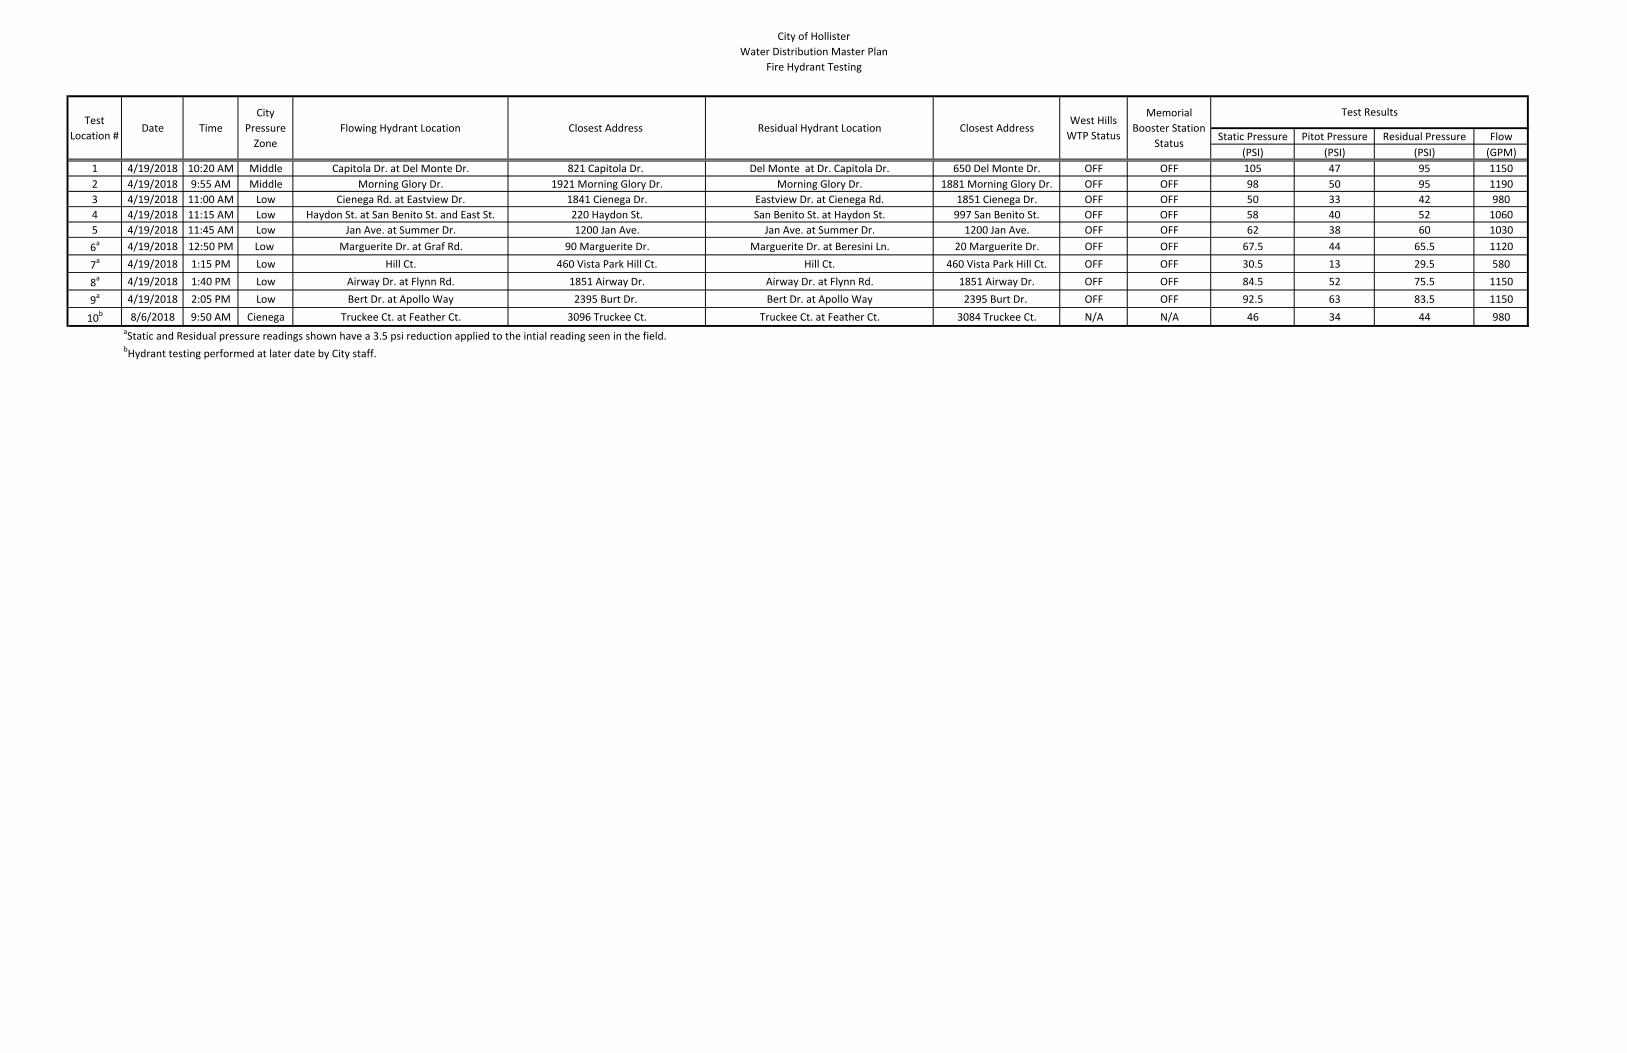
City of Hollister
Water Distribution Master Plan
Fire Hydrant Testing
Static Pressure Pitot Pressure Residual Pressure Flow
(PSI) (PSI) (PSI) (GPM)
1 4/19/2018 10:20 AM Middle Capitola Dr. at Del Monte Dr. 821 Capitola Dr. Del Monte at Dr. Capitola Dr. 650 Del Monte Dr. OFF OFF 105 47 95 1150
2 4/19/2018 9:55 AM Middle Morning Glory Dr. 1921 Morning Glory Dr. Morning Glory Dr. 1881 Morning Glory Dr. OFF OFF 98 50 95 1190
3 4/19/2018 11:00 AM Low Cienega Rd. at Eastview Dr. 1841 Cienega Dr. Eastview Dr. at Cienega Rd. 1851 Cienega Dr. OFF OFF 50 33 42 980
4 4/19/2018 11:15 AM Low Haydon St. at San Benito St. and East St. 220 Haydon St. San Benito St. at Haydon St. 997 San Benito St. OFF OFF 58 40 52 1060
5 4/19/2018 11:45 AM Low Jan Ave. at Summer Dr. 1200 Jan Ave. Jan Ave. at Summer Dr. 1200 Jan Ave. OFF OFF 62 38 60 1030
6a 4/19/2018 12:50 PM Low Marguerite Dr. at Graf Rd. 90 Marguerite Dr. Marguerite Dr. at Beresini Ln. 20 Marguerite Dr. OFF OFF 67.5 44 65.5 1120
7a 4/19/2018 1:15 PM Low Hill Ct. 460 Vista Park Hill Ct. Hill Ct. 460 Vista Park Hill Ct. OFF OFF 30.5 13 29.5 580
8a 4/19/2018 1:40 PM Low Airway Dr. at Flynn Rd. 1851 Airway Dr. Airway Dr. at Flynn Rd. 1851 Airway Dr. OFF OFF 84.5 52 75.5 1150
9a 4/19/2018 2:05 PM Low Bert Dr. at Apollo Way 2395 Burt Dr. Bert Dr. at Apollo Way 2395 Burt Dr. OFF OFF 92.5 63 83.5 1150
10b 8/6/2018 9:50 AM Cienega Truckee Ct. at Feather Ct. 3096 Truckee Ct. Truckee Ct. at Feather Ct. 3084 Truckee Ct. N/A N/A 46 34 44 980
aStatic and Residual pressure readings shown have a 3.5 psi reduction applied to the intial reading seen in the field.
bHydrant testing performed at later date by City staff.
Test ResultsMemorial
Booster Station
Status
West Hills
WTP Status
Test
Location #Date Time Residual Hydrant LocationClosest Address Flowing Hydrant Location
City
Pressure
Zone
Closest Address

APPENDIX C
Water Model Results
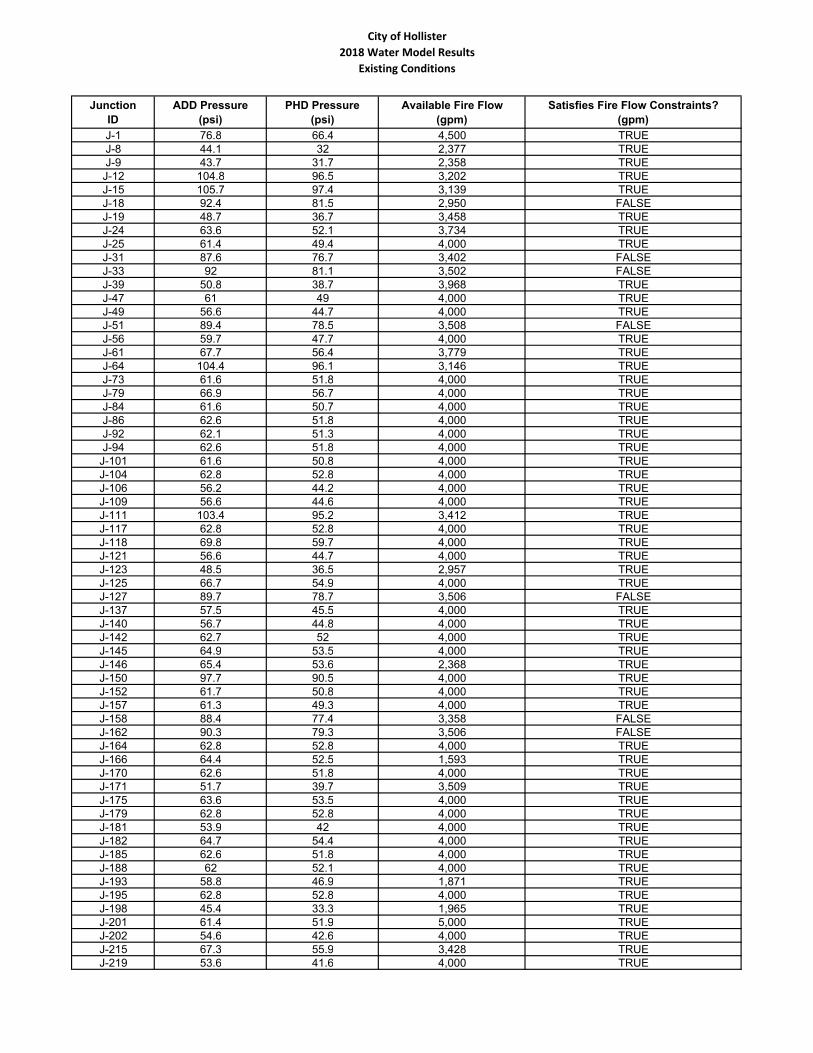
City of Hollister
2018 Water Model Results
Existing Conditions
Junction
ID
ADD Pressure
(psi)
PHD Pressure
(psi)
Available Fire Flow
(gpm)
Satisfies Fire Flow Constraints?
(gpm)
J-1 76.8 66.4 4,500 TRUE
J-8 44.1 32 2,377 TRUE
J-9 43.7 31.7 2,358 TRUE
J-12 104.8 96.5 3,202 TRUE
J-15 105.7 97.4 3,139 TRUE
J-18 92.4 81.5 2,950 FALSE
J-19 48.7 36.7 3,458 TRUE
J-24 63.6 52.1 3,734 TRUE
J-25 61.4 49.4 4,000 TRUE
J-31 87.6 76.7 3,402 FALSE
J-33 92 81.1 3,502 FALSE
J-39 50.8 38.7 3,968 TRUE
J-47 61 49 4,000 TRUE
J-49 56.6 44.7 4,000 TRUE
J-51 89.4 78.5 3,508 FALSE
J-56 59.7 47.7 4,000 TRUE
J-61 67.7 56.4 3,779 TRUE
J-64 104.4 96.1 3,146 TRUE
J-73 61.6 51.8 4,000 TRUE
J-79 66.9 56.7 4,000 TRUE
J-84 61.6 50.7 4,000 TRUE
J-86 62.6 51.8 4,000 TRUE
J-92 62.1 51.3 4,000 TRUE
J-94 62.6 51.8 4,000 TRUE
J-101 61.6 50.8 4,000 TRUE
J-104 62.8 52.8 4,000 TRUE
J-106 56.2 44.2 4,000 TRUE
J-109 56.6 44.6 4,000 TRUE
J-111 103.4 95.2 3,412 TRUE
J-117 62.8 52.8 4,000 TRUE
J-118 69.8 59.7 4,000 TRUE
J-121 56.6 44.7 4,000 TRUE
J-123 48.5 36.5 2,957 TRUE
J-125 66.7 54.9 4,000 TRUE
J-127 89.7 78.7 3,506 FALSE
J-137 57.5 45.5 4,000 TRUE
J-140 56.7 44.8 4,000 TRUE
J-142 62.7 52 4,000 TRUE
J-145 64.9 53.5 4,000 TRUE
J-146 65.4 53.6 2,368 TRUE
J-150 97.7 90.5 4,000 TRUE
J-152 61.7 50.8 4,000 TRUE
J-157 61.3 49.3 4,000 TRUE
J-158 88.4 77.4 3,358 FALSE
J-162 90.3 79.3 3,506 FALSE
J-164 62.8 52.8 4,000 TRUE
J-166 64.4 52.5 1,593 TRUE
J-170 62.6 51.8 4,000 TRUE
J-171 51.7 39.7 3,509 TRUE
J-175 63.6 53.5 4,000 TRUE
J-179 62.8 52.8 4,000 TRUE
J-181 53.9 42 4,000 TRUE
J-182 64.7 54.4 4,000 TRUE
J-185 62.6 51.8 4,000 TRUE
J-188 62 52.1 4,000 TRUE
J-193 58.8 46.9 1,871 TRUE
J-195 62.8 52.8 4,000 TRUE
J-198 45.4 33.3 1,965 TRUE
J-201 61.4 51.9 5,000 TRUE
J-202 54.6 42.6 4,000 TRUE
J-215 67.3 55.9 3,428 TRUE
J-219 53.6 41.6 4,000 TRUE
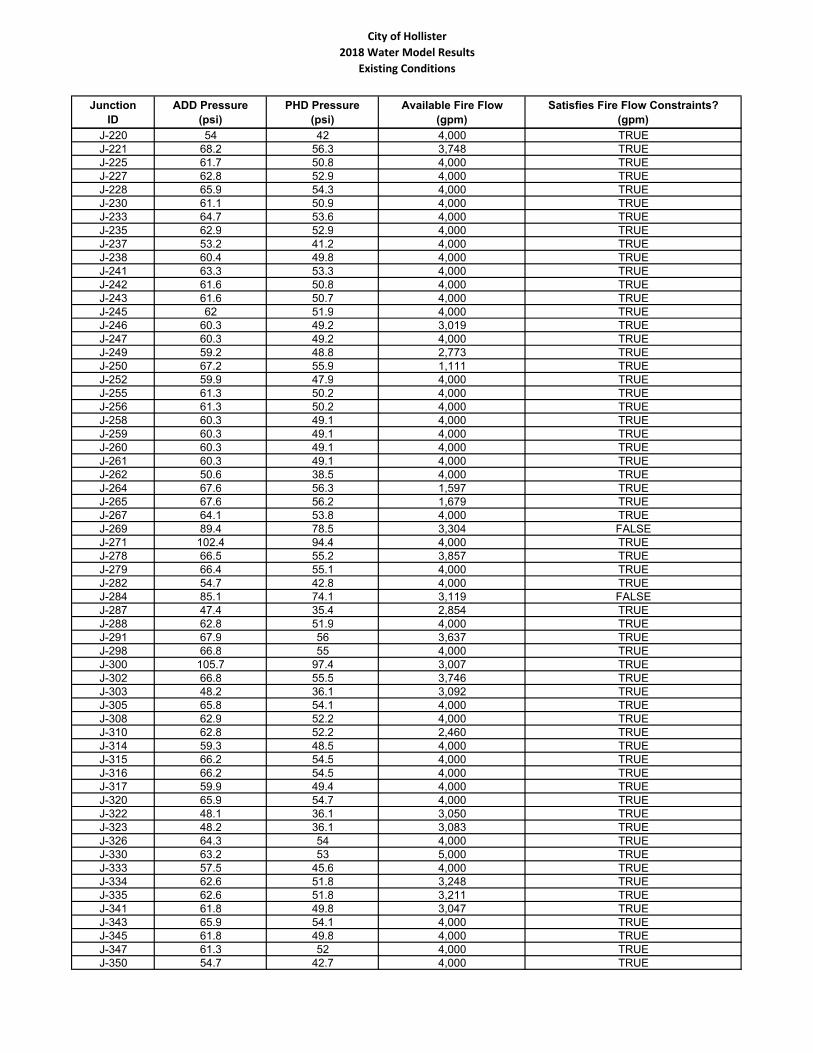
City of Hollister
2018 Water Model Results
Existing Conditions
Junction
ID
ADD Pressure
(psi)
PHD Pressure
(psi)
Available Fire Flow
(gpm)
Satisfies Fire Flow Constraints?
(gpm)
J-220 54 42 4,000 TRUE
J-221 68.2 56.3 3,748 TRUE
J-225 61.7 50.8 4,000 TRUE
J-227 62.8 52.9 4,000 TRUE
J-228 65.9 54.3 4,000 TRUE
J-230 61.1 50.9 4,000 TRUE
J-233 64.7 53.6 4,000 TRUE
J-235 62.9 52.9 4,000 TRUE
J-237 53.2 41.2 4,000 TRUE
J-238 60.4 49.8 4,000 TRUE
J-241 63.3 53.3 4,000 TRUE
J-242 61.6 50.8 4,000 TRUE
J-243 61.6 50.7 4,000 TRUE
J-245 62 51.9 4,000 TRUE
J-246 60.3 49.2 3,019 TRUE
J-247 60.3 49.2 4,000 TRUE
J-249 59.2 48.8 2,773 TRUE
J-250 67.2 55.9 1,111 TRUE
J-252 59.9 47.9 4,000 TRUE
J-255 61.3 50.2 4,000 TRUE
J-256 61.3 50.2 4,000 TRUE
J-258 60.3 49.1 4,000 TRUE
J-259 60.3 49.1 4,000 TRUE
J-260 60.3 49.1 4,000 TRUE
J-261 60.3 49.1 4,000 TRUE
J-262 50.6 38.5 4,000 TRUE
J-264 67.6 56.3 1,597 TRUE
J-265 67.6 56.2 1,679 TRUE
J-267 64.1 53.8 4,000 TRUE
J-269 89.4 78.5 3,304 FALSE
J-271 102.4 94.4 4,000 TRUE
J-278 66.5 55.2 3,857 TRUE
J-279 66.4 55.1 4,000 TRUE
J-282 54.7 42.8 4,000 TRUE
J-284 85.1 74.1 3,119 FALSE
J-287 47.4 35.4 2,854 TRUE
J-288 62.8 51.9 4,000 TRUE
J-291 67.9 56 3,637 TRUE
J-298 66.8 55 4,000 TRUE
J-300 105.7 97.4 3,007 TRUE
J-302 66.8 55.5 3,746 TRUE
J-303 48.2 36.1 3,092 TRUE
J-305 65.8 54.1 4,000 TRUE
J-308 62.9 52.2 4,000 TRUE
J-310 62.8 52.2 2,460 TRUE
J-314 59.3 48.5 4,000 TRUE
J-315 66.2 54.5 4,000 TRUE
J-316 66.2 54.5 4,000 TRUE
J-317 59.9 49.4 4,000 TRUE
J-320 65.9 54.7 4,000 TRUE
J-322 48.1 36.1 3,050 TRUE
J-323 48.2 36.1 3,083 TRUE
J-326 64.3 54 4,000 TRUE
J-330 63.2 53 5,000 TRUE
J-333 57.5 45.6 4,000 TRUE
J-334 62.6 51.8 3,248 TRUE
J-335 62.6 51.8 3,211 TRUE
J-341 61.8 49.8 3,047 TRUE
J-343 65.9 54.1 4,000 TRUE
J-345 61.8 49.8 4,000 TRUE
J-347 61.3 52 4,000 TRUE
J-350 54.7 42.7 4,000 TRUE
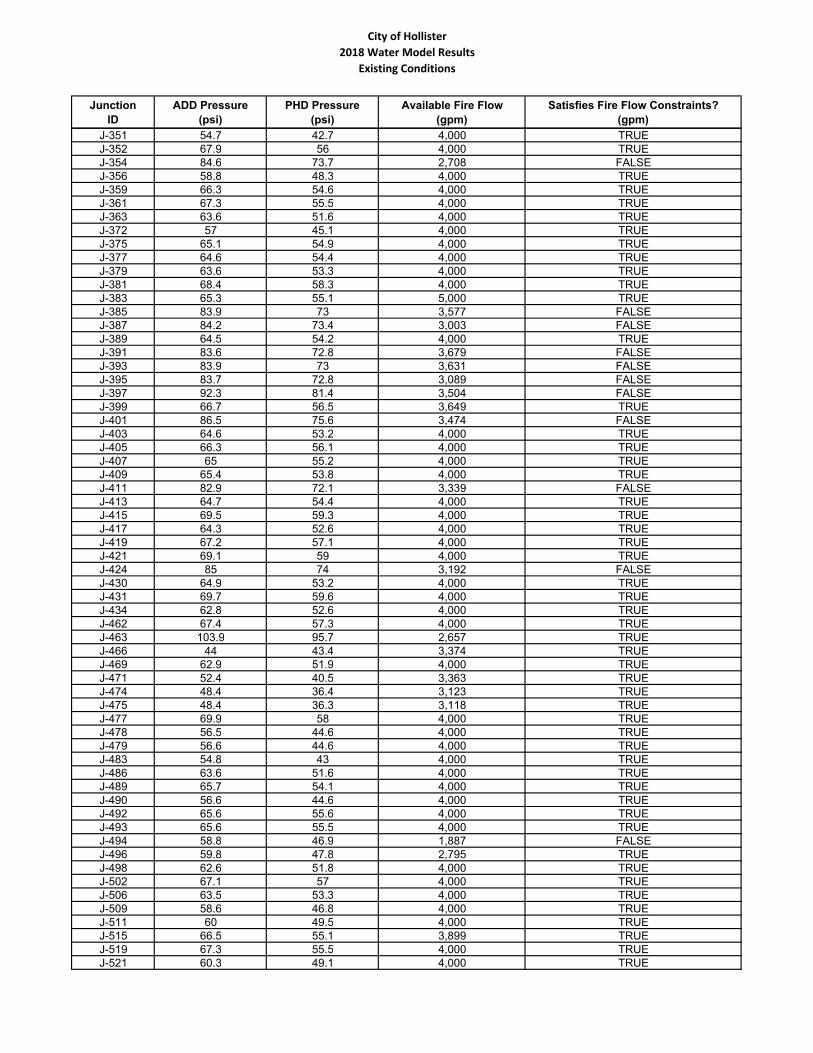
City of Hollister
2018 Water Model Results
Existing Conditions
Junction
ID
ADD Pressure
(psi)
PHD Pressure
(psi)
Available Fire Flow
(gpm)
Satisfies Fire Flow Constraints?
(gpm)
J-351 54.7 42.7 4,000 TRUE
J-352 67.9 56 4,000 TRUE
J-354 84.6 73.7 2,708 FALSE
J-356 58.8 48.3 4,000 TRUE
J-359 66.3 54.6 4,000 TRUE
J-361 67.3 55.5 4,000 TRUE
J-363 63.6 51.6 4,000 TRUE
J-372 57 45.1 4,000 TRUE
J-375 65.1 54.9 4,000 TRUE
J-377 64.6 54.4 4,000 TRUE
J-379 63.6 53.3 4,000 TRUE
J-381 68.4 58.3 4,000 TRUE
J-383 65.3 55.1 5,000 TRUE
J-385 83.9 73 3,577 FALSE
J-387 84.2 73.4 3,003 FALSE
J-389 64.5 54.2 4,000 TRUE
J-391 83.6 72.8 3,679 FALSE
J-393 83.9 73 3,631 FALSE
J-395 83.7 72.8 3,089 FALSE
J-397 92.3 81.4 3,504 FALSE
J-399 66.7 56.5 3,649 TRUE
J-401 86.5 75.6 3,474 FALSE
J-403 64.6 53.2 4,000 TRUE
J-405 66.3 56.1 4,000 TRUE
J-407 65 55.2 4,000 TRUE
J-409 65.4 53.8 4,000 TRUE
J-411 82.9 72.1 3,339 FALSE
J-413 64.7 54.4 4,000 TRUE
J-415 69.5 59.3 4,000 TRUE
J-417 64.3 52.6 4,000 TRUE
J-419 67.2 57.1 4,000 TRUE
J-421 69.1 59 4,000 TRUE
J-424 85 74 3,192 FALSE
J-430 64.9 53.2 4,000 TRUE
J-431 69.7 59.6 4,000 TRUE
J-434 62.8 52.6 4,000 TRUE
J-462 67.4 57.3 4,000 TRUE
J-463 103.9 95.7 2,657 TRUE
J-466 44 43.4 3,374 TRUE
J-469 62.9 51.9 4,000 TRUE
J-471 52.4 40.5 3,363 TRUE
J-474 48.4 36.4 3,123 TRUE
J-475 48.4 36.3 3,118 TRUE
J-477 69.9 58 4,000 TRUE
J-478 56.5 44.6 4,000 TRUE
J-479 56.6 44.6 4,000 TRUE
J-483 54.8 43 4,000 TRUE
J-486 63.6 51.6 4,000 TRUE
J-489 65.7 54.1 4,000 TRUE
J-490 56.6 44.6 4,000 TRUE
J-492 65.6 55.6 4,000 TRUE
J-493 65.6 55.5 4,000 TRUE
J-494 58.8 46.9 1,887 FALSE
J-496 59.8 47.8 2,795 TRUE
J-498 62.6 51.8 4,000 TRUE
J-502 67.1 57 4,000 TRUE
J-506 63.5 53.3 4,000 TRUE
J-509 58.6 46.8 4,000 TRUE
J-511 60 49.5 4,000 TRUE
J-515 66.5 55.1 3,899 TRUE
J-519 67.3 55.5 4,000 TRUE
J-521 60.3 49.1 4,000 TRUE
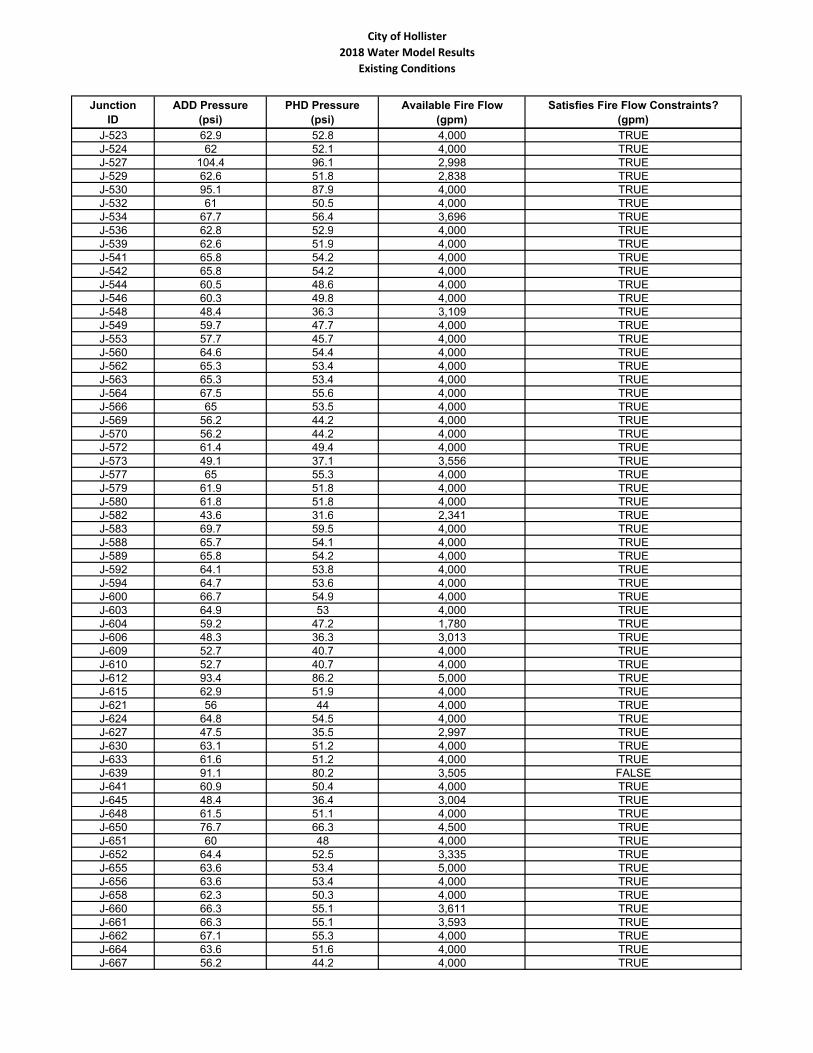
City of Hollister
2018 Water Model Results
Existing Conditions
Junction
ID
ADD Pressure
(psi)
PHD Pressure
(psi)
Available Fire Flow
(gpm)
Satisfies Fire Flow Constraints?
(gpm)
J-523 62.9 52.8 4,000 TRUE
J-524 62 52.1 4,000 TRUE
J-527 104.4 96.1 2,998 TRUE
J-529 62.6 51.8 2,838 TRUE
J-530 95.1 87.9 4,000 TRUE
J-532 61 50.5 4,000 TRUE
J-534 67.7 56.4 3,696 TRUE
J-536 62.8 52.9 4,000 TRUE
J-539 62.6 51.9 4,000 TRUE
J-541 65.8 54.2 4,000 TRUE
J-542 65.8 54.2 4,000 TRUE
J-544 60.5 48.6 4,000 TRUE
J-546 60.3 49.8 4,000 TRUE
J-548 48.4 36.3 3,109 TRUE
J-549 59.7 47.7 4,000 TRUE
J-553 57.7 45.7 4,000 TRUE
J-560 64.6 54.4 4,000 TRUE
J-562 65.3 53.4 4,000 TRUE
J-563 65.3 53.4 4,000 TRUE
J-564 67.5 55.6 4,000 TRUE
J-566 65 53.5 4,000 TRUE
J-569 56.2 44.2 4,000 TRUE
J-570 56.2 44.2 4,000 TRUE
J-572 61.4 49.4 4,000 TRUE
J-573 49.1 37.1 3,556 TRUE
J-577 65 55.3 4,000 TRUE
J-579 61.9 51.8 4,000 TRUE
J-580 61.8 51.8 4,000 TRUE
J-582 43.6 31.6 2,341 TRUE
J-583 69.7 59.5 4,000 TRUE
J-588 65.7 54.1 4,000 TRUE
J-589 65.8 54.2 4,000 TRUE
J-592 64.1 53.8 4,000 TRUE
J-594 64.7 53.6 4,000 TRUE
J-600 66.7 54.9 4,000 TRUE
J-603 64.9 53 4,000 TRUE
J-604 59.2 47.2 1,780 TRUE
J-606 48.3 36.3 3,013 TRUE
J-609 52.7 40.7 4,000 TRUE
J-610 52.7 40.7 4,000 TRUE
J-612 93.4 86.2 5,000 TRUE
J-615 62.9 51.9 4,000 TRUE
J-621 56 44 4,000 TRUE
J-624 64.8 54.5 4,000 TRUE
J-627 47.5 35.5 2,997 TRUE
J-630 63.1 51.2 4,000 TRUE
J-633 61.6 51.2 4,000 TRUE
J-639 91.1 80.2 3,505 FALSE
J-641 60.9 50.4 4,000 TRUE
J-645 48.4 36.4 3,004 TRUE
J-648 61.5 51.1 4,000 TRUE
J-650 76.7 66.3 4,500 TRUE
J-651 60 48 4,000 TRUE
J-652 64.4 52.5 3,335 TRUE
J-655 63.6 53.4 5,000 TRUE
J-656 63.6 53.4 4,000 TRUE
J-658 62.3 50.3 4,000 TRUE
J-660 66.3 55.1 3,611 TRUE
J-661 66.3 55.1 3,593 TRUE
J-662 67.1 55.3 4,000 TRUE
J-664 63.6 51.6 4,000 TRUE
J-667 56.2 44.2 4,000 TRUE
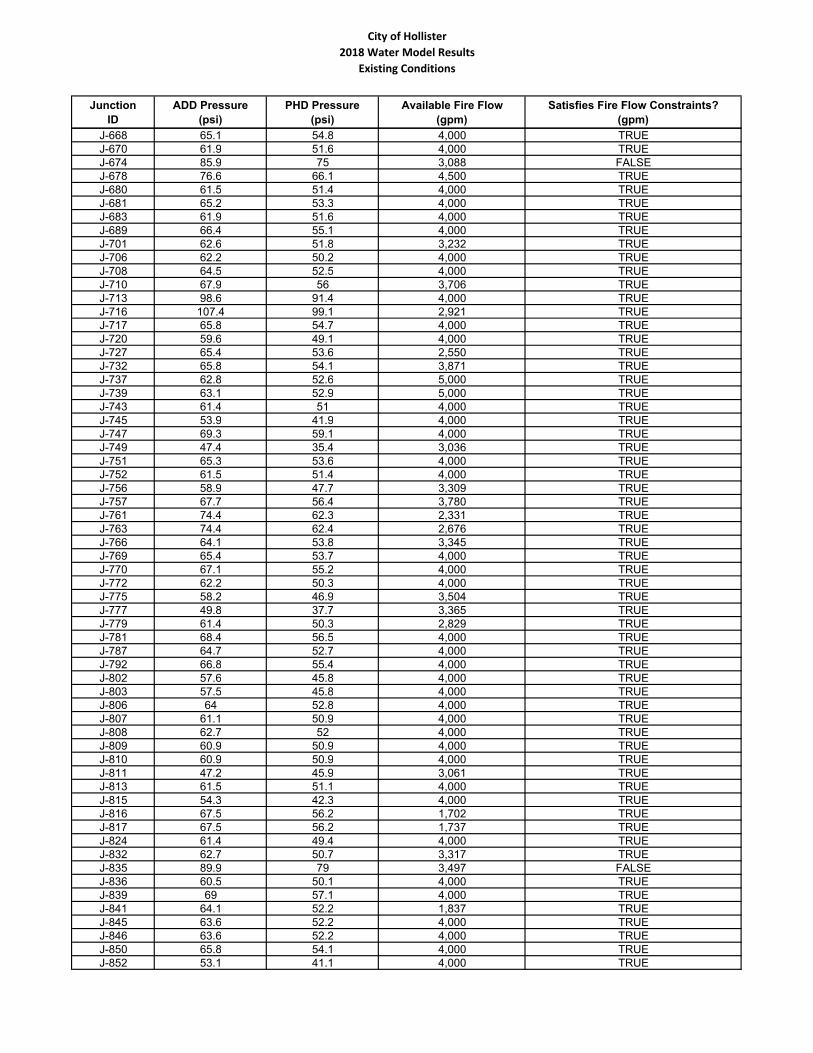
City of Hollister
2018 Water Model Results
Existing Conditions
Junction
ID
ADD Pressure
(psi)
PHD Pressure
(psi)
Available Fire Flow
(gpm)
Satisfies Fire Flow Constraints?
(gpm)
J-668 65.1 54.8 4,000 TRUE
J-670 61.9 51.6 4,000 TRUE
J-674 85.9 75 3,088 FALSE
J-678 76.6 66.1 4,500 TRUE
J-680 61.5 51.4 4,000 TRUE
J-681 65.2 53.3 4,000 TRUE
J-683 61.9 51.6 4,000 TRUE
J-689 66.4 55.1 4,000 TRUE
J-701 62.6 51.8 3,232 TRUE
J-706 62.2 50.2 4,000 TRUE
J-708 64.5 52.5 4,000 TRUE
J-710 67.9 56 3,706 TRUE
J-713 98.6 91.4 4,000 TRUE
J-716 107.4 99.1 2,921 TRUE
J-717 65.8 54.7 4,000 TRUE
J-720 59.6 49.1 4,000 TRUE
J-727 65.4 53.6 2,550 TRUE
J-732 65.8 54.1 3,871 TRUE
J-737 62.8 52.6 5,000 TRUE
J-739 63.1 52.9 5,000 TRUE
J-743 61.4 51 4,000 TRUE
J-745 53.9 41.9 4,000 TRUE
J-747 69.3 59.1 4,000 TRUE
J-749 47.4 35.4 3,036 TRUE
J-751 65.3 53.6 4,000 TRUE
J-752 61.5 51.4 4,000 TRUE
J-756 58.9 47.7 3,309 TRUE
J-757 67.7 56.4 3,780 TRUE
J-761 74.4 62.3 2,331 TRUE
J-763 74.4 62.4 2,676 TRUE
J-766 64.1 53.8 3,345 TRUE
J-769 65.4 53.7 4,000 TRUE
J-770 67.1 55.2 4,000 TRUE
J-772 62.2 50.3 4,000 TRUE
J-775 58.2 46.9 3,504 TRUE
J-777 49.8 37.7 3,365 TRUE
J-779 61.4 50.3 2,829 TRUE
J-781 68.4 56.5 4,000 TRUE
J-787 64.7 52.7 4,000 TRUE
J-792 66.8 55.4 4,000 TRUE
J-802 57.6 45.8 4,000 TRUE
J-803 57.5 45.8 4,000 TRUE
J-806 64 52.8 4,000 TRUE
J-807 61.1 50.9 4,000 TRUE
J-808 62.7 52 4,000 TRUE
J-809 60.9 50.9 4,000 TRUE
J-810 60.9 50.9 4,000 TRUE
J-811 47.2 45.9 3,061 TRUE
J-813 61.5 51.1 4,000 TRUE
J-815 54.3 42.3 4,000 TRUE
J-816 67.5 56.2 1,702 TRUE
J-817 67.5 56.2 1,737 TRUE
J-824 61.4 49.4 4,000 TRUE
J-832 62.7 50.7 3,317 TRUE
J-835 89.9 79 3,497 FALSE
J-836 60.5 50.1 4,000 TRUE
J-839 69 57.1 4,000 TRUE
J-841 64.1 52.2 1,837 TRUE
J-845 63.6 52.2 4,000 TRUE
J-846 63.6 52.2 4,000 TRUE
J-850 65.8 54.1 4,000 TRUE
J-852 53.1 41.1 4,000 TRUE
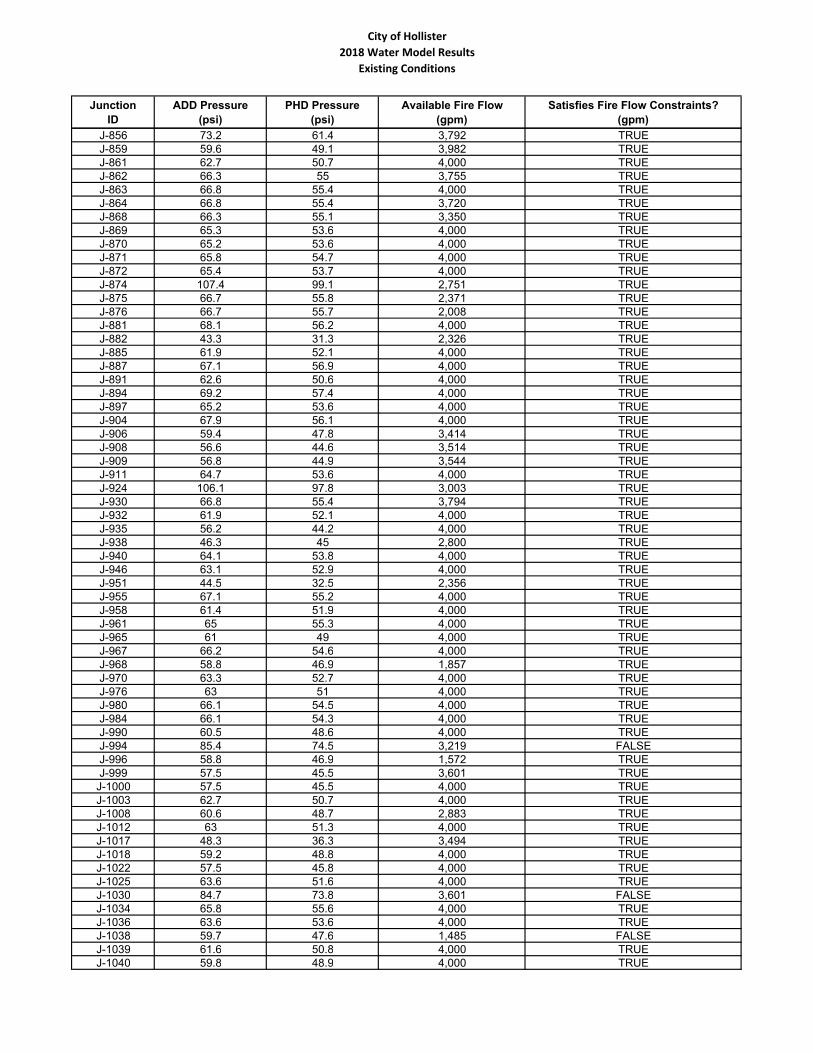
City of Hollister
2018 Water Model Results
Existing Conditions
Junction
ID
ADD Pressure
(psi)
PHD Pressure
(psi)
Available Fire Flow
(gpm)
Satisfies Fire Flow Constraints?
(gpm)
J-856 73.2 61.4 3,792 TRUE
J-859 59.6 49.1 3,982 TRUE
J-861 62.7 50.7 4,000 TRUE
J-862 66.3 55 3,755 TRUE
J-863 66.8 55.4 4,000 TRUE
J-864 66.8 55.4 3,720 TRUE
J-868 66.3 55.1 3,350 TRUE
J-869 65.3 53.6 4,000 TRUE
J-870 65.2 53.6 4,000 TRUE
J-871 65.8 54.7 4,000 TRUE
J-872 65.4 53.7 4,000 TRUE
J-874 107.4 99.1 2,751 TRUE
J-875 66.7 55.8 2,371 TRUE
J-876 66.7 55.7 2,008 TRUE
J-881 68.1 56.2 4,000 TRUE
J-882 43.3 31.3 2,326 TRUE
J-885 61.9 52.1 4,000 TRUE
J-887 67.1 56.9 4,000 TRUE
J-891 62.6 50.6 4,000 TRUE
J-894 69.2 57.4 4,000 TRUE
J-897 65.2 53.6 4,000 TRUE
J-904 67.9 56.1 4,000 TRUE
J-906 59.4 47.8 3,414 TRUE
J-908 56.6 44.6 3,514 TRUE
J-909 56.8 44.9 3,544 TRUE
J-911 64.7 53.6 4,000 TRUE
J-924 106.1 97.8 3,003 TRUE
J-930 66.8 55.4 3,794 TRUE
J-932 61.9 52.1 4,000 TRUE
J-935 56.2 44.2 4,000 TRUE
J-938 46.3 45 2,800 TRUE
J-940 64.1 53.8 4,000 TRUE
J-946 63.1 52.9 4,000 TRUE
J-951 44.5 32.5 2,356 TRUE
J-955 67.1 55.2 4,000 TRUE
J-958 61.4 51.9 4,000 TRUE
J-961 65 55.3 4,000 TRUE
J-965 61 49 4,000 TRUE
J-967 66.2 54.6 4,000 TRUE
J-968 58.8 46.9 1,857 TRUE
J-970 63.3 52.7 4,000 TRUE
J-976 63 51 4,000 TRUE
J-980 66.1 54.5 4,000 TRUE
J-984 66.1 54.3 4,000 TRUE
J-990 60.5 48.6 4,000 TRUE
J-994 85.4 74.5 3,219 FALSE
J-996 58.8 46.9 1,572 TRUE
J-999 57.5 45.5 3,601 TRUE
J-1000 57.5 45.5 4,000 TRUE
J-1003 62.7 50.7 4,000 TRUE
J-1008 60.6 48.7 2,883 TRUE
J-1012 63 51.3 4,000 TRUE
J-1017 48.3 36.3 3,494 TRUE
J-1018 59.2 48.8 4,000 TRUE
J-1022 57.5 45.8 4,000 TRUE
J-1025 63.6 51.6 4,000 TRUE
J-1030 84.7 73.8 3,601 FALSE
J-1034 65.8 55.6 4,000 TRUE
J-1036 63.6 53.6 4,000 TRUE
J-1038 59.7 47.6 1,485 FALSE
J-1039 61.6 50.8 4,000 TRUE
J-1040 59.8 48.9 4,000 TRUE
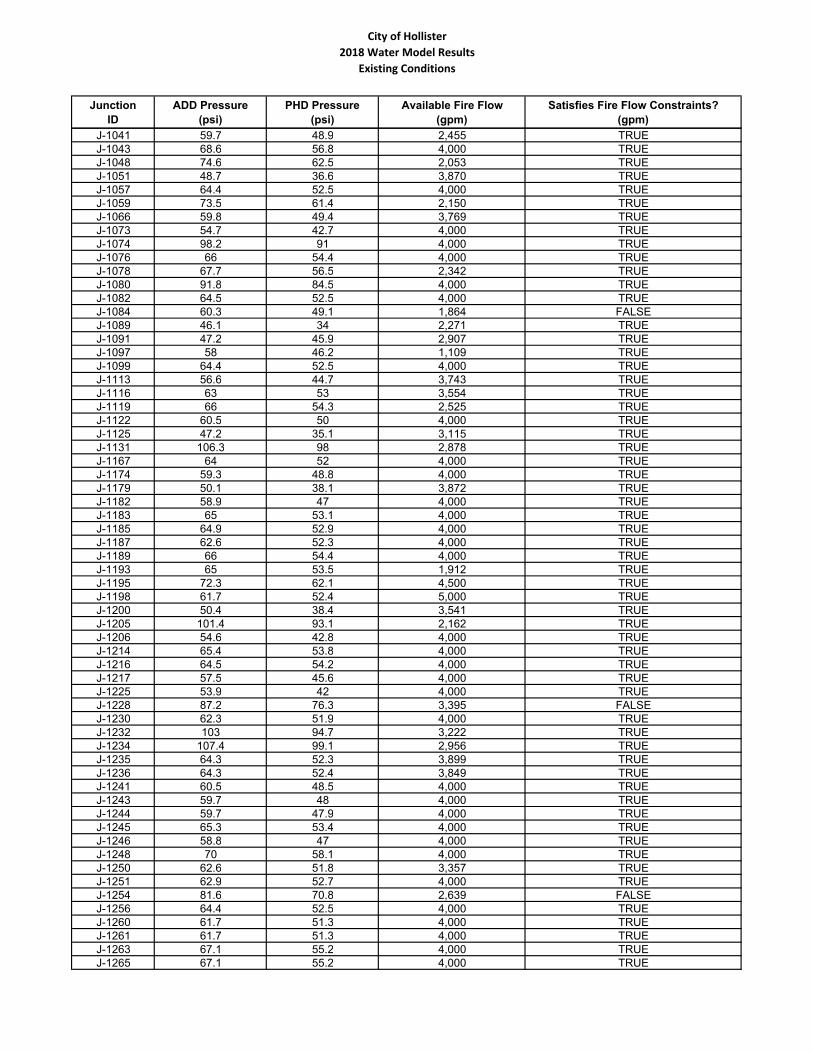
City of Hollister
2018 Water Model Results
Existing Conditions
Junction
ID
ADD Pressure
(psi)
PHD Pressure
(psi)
Available Fire Flow
(gpm)
Satisfies Fire Flow Constraints?
(gpm)
J-1041 59.7 48.9 2,455 TRUE
J-1043 68.6 56.8 4,000 TRUE
J-1048 74.6 62.5 2,053 TRUE
J-1051 48.7 36.6 3,870 TRUE
J-1057 64.4 52.5 4,000 TRUE
J-1059 73.5 61.4 2,150 TRUE
J-1066 59.8 49.4 3,769 TRUE
J-1073 54.7 42.7 4,000 TRUE
J-1074 98.2 91 4,000 TRUE
J-1076 66 54.4 4,000 TRUE
J-1078 67.7 56.5 2,342 TRUE
J-1080 91.8 84.5 4,000 TRUE
J-1082 64.5 52.5 4,000 TRUE
J-1084 60.3 49.1 1,864 FALSE
J-1089 46.1 34 2,271 TRUE
J-1091 47.2 45.9 2,907 TRUE
J-1097 58 46.2 1,109 TRUE
J-1099 64.4 52.5 4,000 TRUE
J-1113 56.6 44.7 3,743 TRUE
J-1116 63 53 3,554 TRUE
J-1119 66 54.3 2,525 TRUE
J-1122 60.5 50 4,000 TRUE
J-1125 47.2 35.1 3,115 TRUE
J-1131 106.3 98 2,878 TRUE
J-1167 64 52 4,000 TRUE
J-1174 59.3 48.8 4,000 TRUE
J-1179 50.1 38.1 3,872 TRUE
J-1182 58.9 47 4,000 TRUE
J-1183 65 53.1 4,000 TRUE
J-1185 64.9 52.9 4,000 TRUE
J-1187 62.6 52.3 4,000 TRUE
J-1189 66 54.4 4,000 TRUE
J-1193 65 53.5 1,912 TRUE
J-1195 72.3 62.1 4,500 TRUE
J-1198 61.7 52.4 5,000 TRUE
J-1200 50.4 38.4 3,541 TRUE
J-1205 101.4 93.1 2,162 TRUE
J-1206 54.6 42.8 4,000 TRUE
J-1214 65.4 53.8 4,000 TRUE
J-1216 64.5 54.2 4,000 TRUE
J-1217 57.5 45.6 4,000 TRUE
J-1225 53.9 42 4,000 TRUE
J-1228 87.2 76.3 3,395 FALSE
J-1230 62.3 51.9 4,000 TRUE
J-1232 103 94.7 3,222 TRUE
J-1234 107.4 99.1 2,956 TRUE
J-1235 64.3 52.3 3,899 TRUE
J-1236 64.3 52.4 3,849 TRUE
J-1241 60.5 48.5 4,000 TRUE
J-1243 59.7 48 4,000 TRUE
J-1244 59.7 47.9 4,000 TRUE
J-1245 65.3 53.4 4,000 TRUE
J-1246 58.8 47 4,000 TRUE
J-1248 70 58.1 4,000 TRUE
J-1250 62.6 51.8 3,357 TRUE
J-1251 62.9 52.7 4,000 TRUE
J-1254 81.6 70.8 2,639 FALSE
J-1256 64.4 52.5 4,000 TRUE
J-1260 61.7 51.3 4,000 TRUE
J-1261 61.7 51.3 4,000 TRUE
J-1263 67.1 55.2 4,000 TRUE
J-1265 67.1 55.2 4,000 TRUE
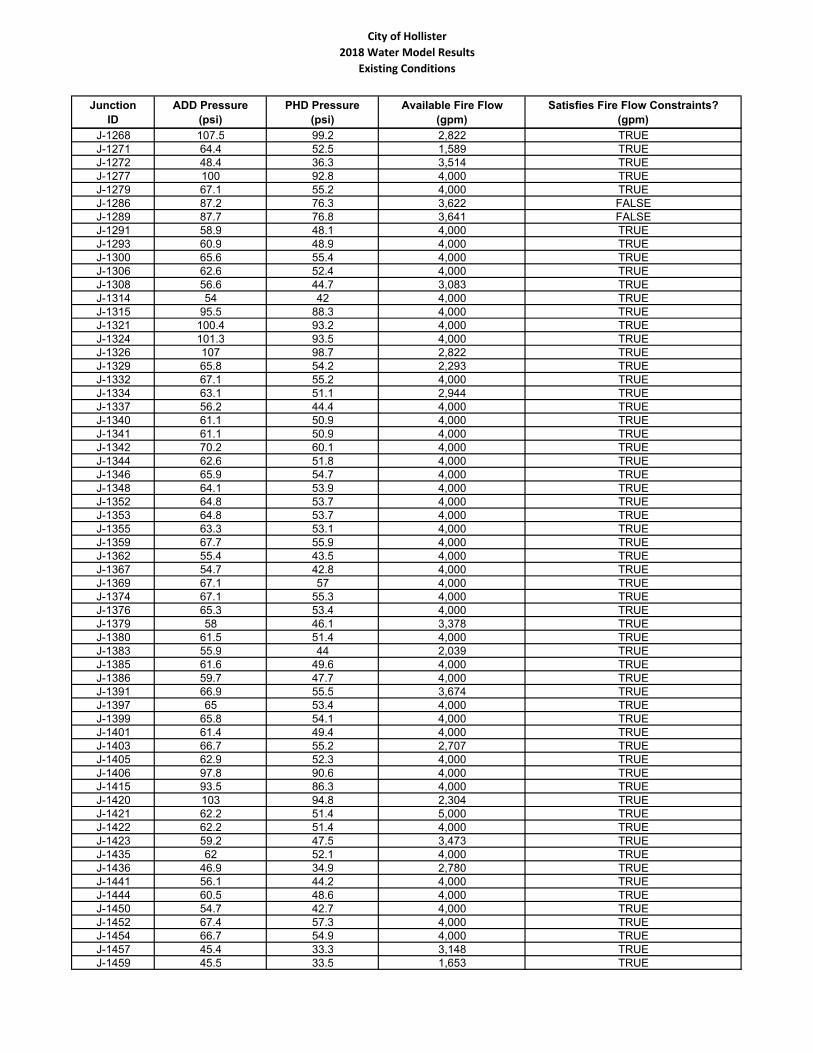
City of Hollister
2018 Water Model Results
Existing Conditions
Junction
ID
ADD Pressure
(psi)
PHD Pressure
(psi)
Available Fire Flow
(gpm)
Satisfies Fire Flow Constraints?
(gpm)
J-1268 107.5 99.2 2,822 TRUE
J-1271 64.4 52.5 1,589 TRUE
J-1272 48.4 36.3 3,514 TRUE
J-1277 100 92.8 4,000 TRUE
J-1279 67.1 55.2 4,000 TRUE
J-1286 87.2 76.3 3,622 FALSE
J-1289 87.7 76.8 3,641 FALSE
J-1291 58.9 48.1 4,000 TRUE
J-1293 60.9 48.9 4,000 TRUE
J-1300 65.6 55.4 4,000 TRUE
J-1306 62.6 52.4 4,000 TRUE
J-1308 56.6 44.7 3,083 TRUE
J-1314 54 42 4,000 TRUE
J-1315 95.5 88.3 4,000 TRUE
J-1321 100.4 93.2 4,000 TRUE
J-1324 101.3 93.5 4,000 TRUE
J-1326 107 98.7 2,822 TRUE
J-1329 65.8 54.2 2,293 TRUE
J-1332 67.1 55.2 4,000 TRUE
J-1334 63.1 51.1 2,944 TRUE
J-1337 56.2 44.4 4,000 TRUE
J-1340 61.1 50.9 4,000 TRUE
J-1341 61.1 50.9 4,000 TRUE
J-1342 70.2 60.1 4,000 TRUE
J-1344 62.6 51.8 4,000 TRUE
J-1346 65.9 54.7 4,000 TRUE
J-1348 64.1 53.9 4,000 TRUE
J-1352 64.8 53.7 4,000 TRUE
J-1353 64.8 53.7 4,000 TRUE
J-1355 63.3 53.1 4,000 TRUE
J-1359 67.7 55.9 4,000 TRUE
J-1362 55.4 43.5 4,000 TRUE
J-1367 54.7 42.8 4,000 TRUE
J-1369 67.1 57 4,000 TRUE
J-1374 67.1 55.3 4,000 TRUE
J-1376 65.3 53.4 4,000 TRUE
J-1379 58 46.1 3,378 TRUE
J-1380 61.5 51.4 4,000 TRUE
J-1383 55.9 44 2,039 TRUE
J-1385 61.6 49.6 4,000 TRUE
J-1386 59.7 47.7 4,000 TRUE
J-1391 66.9 55.5 3,674 TRUE
J-1397 65 53.4 4,000 TRUE
J-1399 65.8 54.1 4,000 TRUE
J-1401 61.4 49.4 4,000 TRUE
J-1403 66.7 55.2 2,707 TRUE
J-1405 62.9 52.3 4,000 TRUE
J-1406 97.8 90.6 4,000 TRUE
J-1415 93.5 86.3 4,000 TRUE
J-1420 103 94.8 2,304 TRUE
J-1421 62.2 51.4 5,000 TRUE
J-1422 62.2 51.4 4,000 TRUE
J-1423 59.2 47.5 3,473 TRUE
J-1435 62 52.1 4,000 TRUE
J-1436 46.9 34.9 2,780 TRUE
J-1441 56.1 44.2 4,000 TRUE
J-1444 60.5 48.6 4,000 TRUE
J-1450 54.7 42.7 4,000 TRUE
J-1452 67.4 57.3 4,000 TRUE
J-1454 66.7 54.9 4,000 TRUE
J-1457 45.4 33.3 3,148 TRUE
J-1459 45.5 33.5 1,653 TRUE
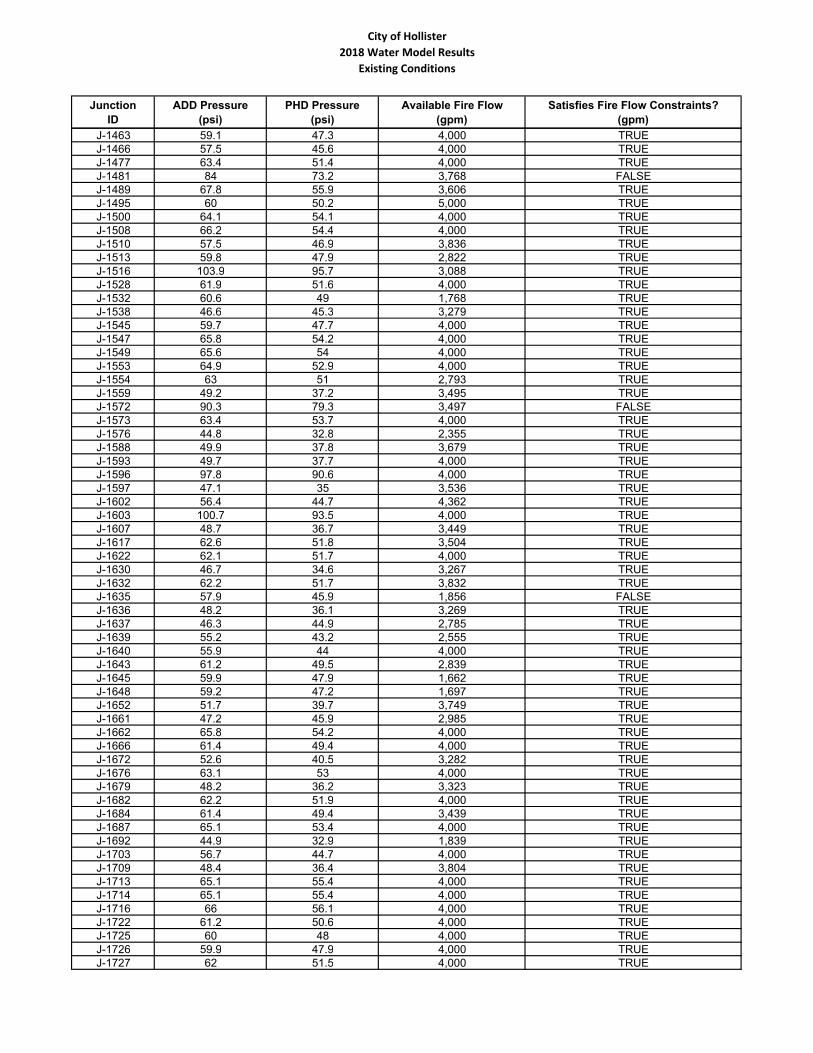
City of Hollister
2018 Water Model Results
Existing Conditions
Junction
ID
ADD Pressure
(psi)
PHD Pressure
(psi)
Available Fire Flow
(gpm)
Satisfies Fire Flow Constraints?
(gpm)
J-1463 59.1 47.3 4,000 TRUE
J-1466 57.5 45.6 4,000 TRUE
J-1477 63.4 51.4 4,000 TRUE
J-1481 84 73.2 3,768 FALSE
J-1489 67.8 55.9 3,606 TRUE
J-1495 60 50.2 5,000 TRUE
J-1500 64.1 54.1 4,000 TRUE
J-1508 66.2 54.4 4,000 TRUE
J-1510 57.5 46.9 3,836 TRUE
J-1513 59.8 47.9 2,822 TRUE
J-1516 103.9 95.7 3,088 TRUE
J-1528 61.9 51.6 4,000 TRUE
J-1532 60.6 49 1,768 TRUE
J-1538 46.6 45.3 3,279 TRUE
J-1545 59.7 47.7 4,000 TRUE
J-1547 65.8 54.2 4,000 TRUE
J-1549 65.6 54 4,000 TRUE
J-1553 64.9 52.9 4,000 TRUE
J-1554 63 51 2,793 TRUE
J-1559 49.2 37.2 3,495 TRUE
J-1572 90.3 79.3 3,497 FALSE
J-1573 63.4 53.7 4,000 TRUE
J-1576 44.8 32.8 2,355 TRUE
J-1588 49.9 37.8 3,679 TRUE
J-1593 49.7 37.7 4,000 TRUE
J-1596 97.8 90.6 4,000 TRUE
J-1597 47.1 35 3,536 TRUE
J-1602 56.4 44.7 4,362 TRUE
J-1603 100.7 93.5 4,000 TRUE
J-1607 48.7 36.7 3,449 TRUE
J-1617 62.6 51.8 3,504 TRUE
J-1622 62.1 51.7 4,000 TRUE
J-1630 46.7 34.6 3,267 TRUE
J-1632 62.2 51.7 3,832 TRUE
J-1635 57.9 45.9 1,856 FALSE
J-1636 48.2 36.1 3,269 TRUE
J-1637 46.3 44.9 2,785 TRUE
J-1639 55.2 43.2 2,555 TRUE
J-1640 55.9 44 4,000 TRUE
J-1643 61.2 49.5 2,839 TRUE
J-1645 59.9 47.9 1,662 TRUE
J-1648 59.2 47.2 1,697 TRUE
J-1652 51.7 39.7 3,749 TRUE
J-1661 47.2 45.9 2,985 TRUE
J-1662 65.8 54.2 4,000 TRUE
J-1666 61.4 49.4 4,000 TRUE
J-1672 52.6 40.5 3,282 TRUE
J-1676 63.1 53 4,000 TRUE
J-1679 48.2 36.2 3,323 TRUE
J-1682 62.2 51.9 4,000 TRUE
J-1684 61.4 49.4 3,439 TRUE
J-1687 65.1 53.4 4,000 TRUE
J-1692 44.9 32.9 1,839 TRUE
J-1703 56.7 44.7 4,000 TRUE
J-1709 48.4 36.4 3,804 TRUE
J-1713 65.1 55.4 4,000 TRUE
J-1714 65.1 55.4 4,000 TRUE
J-1716 66 56.1 4,000 TRUE
J-1722 61.2 50.6 4,000 TRUE
J-1725 60 48 4,000 TRUE
J-1726 59.9 47.9 4,000 TRUE
J-1727 62 51.5 4,000 TRUE
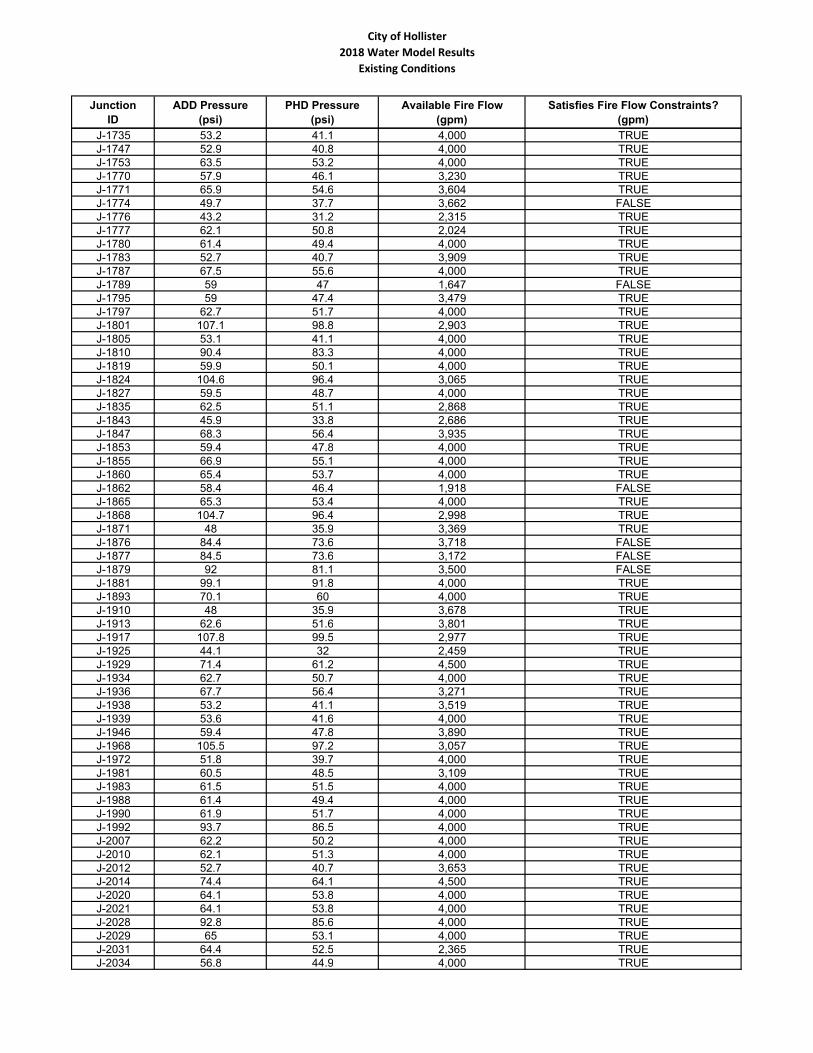
City of Hollister
2018 Water Model Results
Existing Conditions
Junction
ID
ADD Pressure
(psi)
PHD Pressure
(psi)
Available Fire Flow
(gpm)
Satisfies Fire Flow Constraints?
(gpm)
J-1735 53.2 41.1 4,000 TRUE
J-1747 52.9 40.8 4,000 TRUE
J-1753 63.5 53.2 4,000 TRUE
J-1770 57.9 46.1 3,230 TRUE
J-1771 65.9 54.6 3,604 TRUE
J-1774 49.7 37.7 3,662 FALSE
J-1776 43.2 31.2 2,315 TRUE
J-1777 62.1 50.8 2,024 TRUE
J-1780 61.4 49.4 4,000 TRUE
J-1783 52.7 40.7 3,909 TRUE
J-1787 67.5 55.6 4,000 TRUE
J-1789 59 47 1,647 FALSE
J-1795 59 47.4 3,479 TRUE
J-1797 62.7 51.7 4,000 TRUE
J-1801 107.1 98.8 2,903 TRUE
J-1805 53.1 41.1 4,000 TRUE
J-1810 90.4 83.3 4,000 TRUE
J-1819 59.9 50.1 4,000 TRUE
J-1824 104.6 96.4 3,065 TRUE
J-1827 59.5 48.7 4,000 TRUE
J-1835 62.5 51.1 2,868 TRUE
J-1843 45.9 33.8 2,686 TRUE
J-1847 68.3 56.4 3,935 TRUE
J-1853 59.4 47.8 4,000 TRUE
J-1855 66.9 55.1 4,000 TRUE
J-1860 65.4 53.7 4,000 TRUE
J-1862 58.4 46.4 1,918 FALSE
J-1865 65.3 53.4 4,000 TRUE
J-1868 104.7 96.4 2,998 TRUE
J-1871 48 35.9 3,369 TRUE
J-1876 84.4 73.6 3,718 FALSE
J-1877 84.5 73.6 3,172 FALSE
J-1879 92 81.1 3,500 FALSE
J-1881 99.1 91.8 4,000 TRUE
J-1893 70.1 60 4,000 TRUE
J-1910 48 35.9 3,678 TRUE
J-1913 62.6 51.6 3,801 TRUE
J-1917 107.8 99.5 2,977 TRUE
J-1925 44.1 32 2,459 TRUE
J-1929 71.4 61.2 4,500 TRUE
J-1934 62.7 50.7 4,000 TRUE
J-1936 67.7 56.4 3,271 TRUE
J-1938 53.2 41.1 3,519 TRUE
J-1939 53.6 41.6 4,000 TRUE
J-1946 59.4 47.8 3,890 TRUE
J-1968 105.5 97.2 3,057 TRUE
J-1972 51.8 39.7 4,000 TRUE
J-1981 60.5 48.5 3,109 TRUE
J-1983 61.5 51.5 4,000 TRUE
J-1988 61.4 49.4 4,000 TRUE
J-1990 61.9 51.7 4,000 TRUE
J-1992 93.7 86.5 4,000 TRUE
J-2007 62.2 50.2 4,000 TRUE
J-2010 62.1 51.3 4,000 TRUE
J-2012 52.7 40.7 3,653 TRUE
J-2014 74.4 64.1 4,500 TRUE
J-2020 64.1 53.8 4,000 TRUE
J-2021 64.1 53.8 4,000 TRUE
J-2028 92.8 85.6 4,000 TRUE
J-2029 65 53.1 4,000 TRUE
J-2031 64.4 52.5 2,365 TRUE
J-2034 56.8 44.9 4,000 TRUE
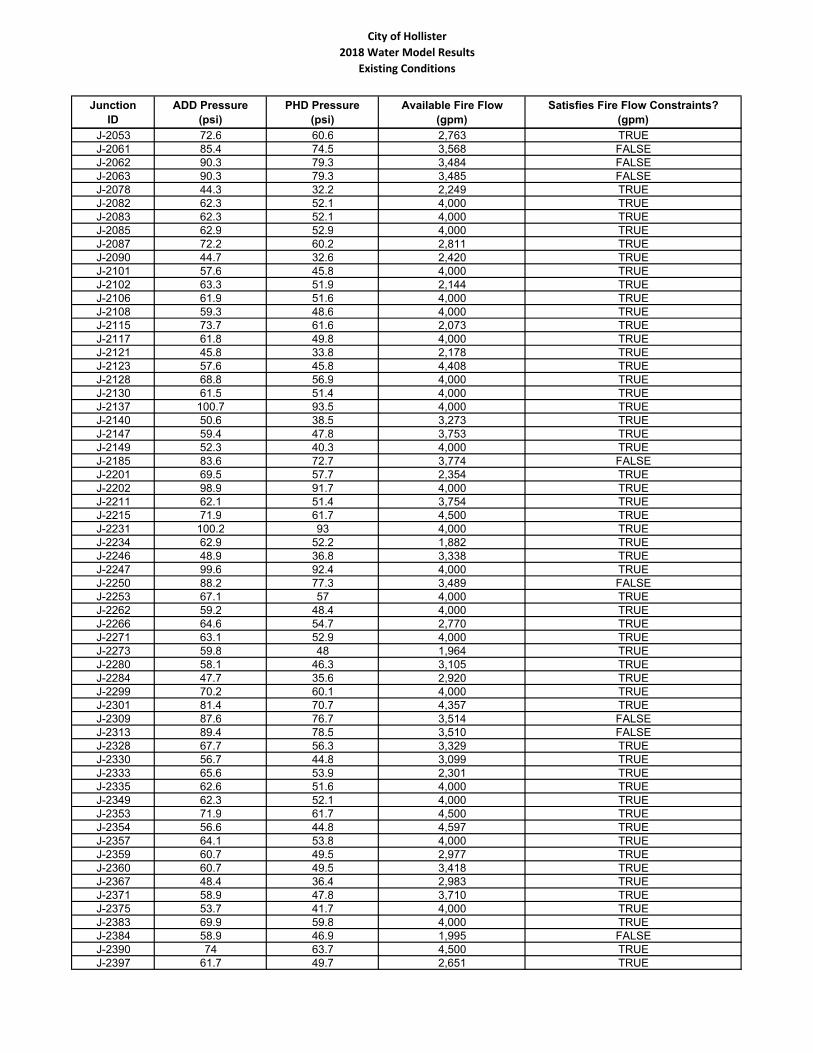
City of Hollister
2018 Water Model Results
Existing Conditions
Junction
ID
ADD Pressure
(psi)
PHD Pressure
(psi)
Available Fire Flow
(gpm)
Satisfies Fire Flow Constraints?
(gpm)
J-2053 72.6 60.6 2,763 TRUE
J-2061 85.4 74.5 3,568 FALSE
J-2062 90.3 79.3 3,484 FALSE
J-2063 90.3 79.3 3,485 FALSE
J-2078 44.3 32.2 2,249 TRUE
J-2082 62.3 52.1 4,000 TRUE
J-2083 62.3 52.1 4,000 TRUE
J-2085 62.9 52.9 4,000 TRUE
J-2087 72.2 60.2 2,811 TRUE
J-2090 44.7 32.6 2,420 TRUE
J-2101 57.6 45.8 4,000 TRUE
J-2102 63.3 51.9 2,144 TRUE
J-2106 61.9 51.6 4,000 TRUE
J-2108 59.3 48.6 4,000 TRUE
J-2115 73.7 61.6 2,073 TRUE
J-2117 61.8 49.8 4,000 TRUE
J-2121 45.8 33.8 2,178 TRUE
J-2123 57.6 45.8 4,408 TRUE
J-2128 68.8 56.9 4,000 TRUE
J-2130 61.5 51.4 4,000 TRUE
J-2137 100.7 93.5 4,000 TRUE
J-2140 50.6 38.5 3,273 TRUE
J-2147 59.4 47.8 3,753 TRUE
J-2149 52.3 40.3 4,000 TRUE
J-2185 83.6 72.7 3,774 FALSE
J-2201 69.5 57.7 2,354 TRUE
J-2202 98.9 91.7 4,000 TRUE
J-2211 62.1 51.4 3,754 TRUE
J-2215 71.9 61.7 4,500 TRUE
J-2231 100.2 93 4,000 TRUE
J-2234 62.9 52.2 1,882 TRUE
J-2246 48.9 36.8 3,338 TRUE
J-2247 99.6 92.4 4,000 TRUE
J-2250 88.2 77.3 3,489 FALSE
J-2253 67.1 57 4,000 TRUE
J-2262 59.2 48.4 4,000 TRUE
J-2266 64.6 54.7 2,770 TRUE
J-2271 63.1 52.9 4,000 TRUE
J-2273 59.8 48 1,964 TRUE
J-2280 58.1 46.3 3,105 TRUE
J-2284 47.7 35.6 2,920 TRUE
J-2299 70.2 60.1 4,000 TRUE
J-2301 81.4 70.7 4,357 TRUE
J-2309 87.6 76.7 3,514 FALSE
J-2313 89.4 78.5 3,510 FALSE
J-2328 67.7 56.3 3,329 TRUE
J-2330 56.7 44.8 3,099 TRUE
J-2333 65.6 53.9 2,301 TRUE
J-2335 62.6 51.6 4,000 TRUE
J-2349 62.3 52.1 4,000 TRUE
J-2353 71.9 61.7 4,500 TRUE
J-2354 56.6 44.8 4,597 TRUE
J-2357 64.1 53.8 4,000 TRUE
J-2359 60.7 49.5 2,977 TRUE
J-2360 60.7 49.5 3,418 TRUE
J-2367 48.4 36.4 2,983 TRUE
J-2371 58.9 47.8 3,710 TRUE
J-2375 53.7 41.7 4,000 TRUE
J-2383 69.9 59.8 4,000 TRUE
J-2384 58.9 46.9 1,995 FALSE
J-2390 74 63.7 4,500 TRUE
J-2397 61.7 49.7 2,651 TRUE
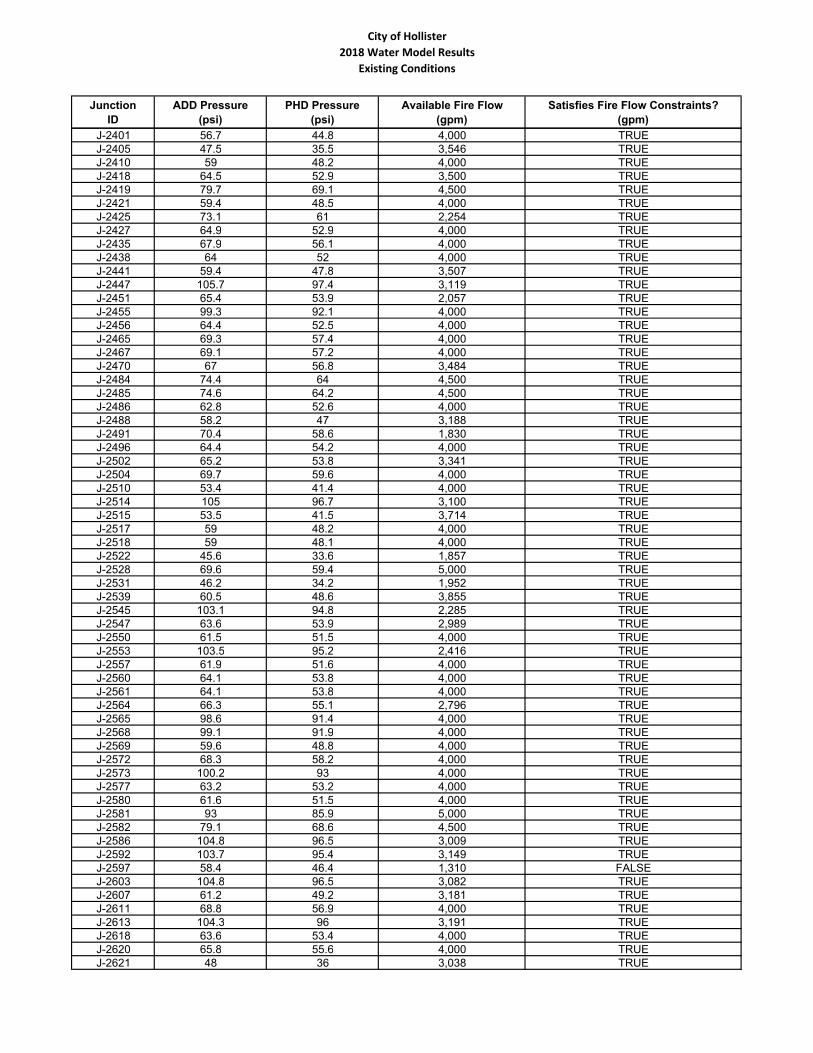
City of Hollister
2018 Water Model Results
Existing Conditions
Junction
ID
ADD Pressure
(psi)
PHD Pressure
(psi)
Available Fire Flow
(gpm)
Satisfies Fire Flow Constraints?
(gpm)
J-2401 56.7 44.8 4,000 TRUE
J-2405 47.5 35.5 3,546 TRUE
J-2410 59 48.2 4,000 TRUE
J-2418 64.5 52.9 3,500 TRUE
J-2419 79.7 69.1 4,500 TRUE
J-2421 59.4 48.5 4,000 TRUE
J-2425 73.1 61 2,254 TRUE
J-2427 64.9 52.9 4,000 TRUE
J-2435 67.9 56.1 4,000 TRUE
J-2438 64 52 4,000 TRUE
J-2441 59.4 47.8 3,507 TRUE
J-2447 105.7 97.4 3,119 TRUE
J-2451 65.4 53.9 2,057 TRUE
J-2455 99.3 92.1 4,000 TRUE
J-2456 64.4 52.5 4,000 TRUE
J-2465 69.3 57.4 4,000 TRUE
J-2467 69.1 57.2 4,000 TRUE
J-2470 67 56.8 3,484 TRUE
J-2484 74.4 64 4,500 TRUE
J-2485 74.6 64.2 4,500 TRUE
J-2486 62.8 52.6 4,000 TRUE
J-2488 58.2 47 3,188 TRUE
J-2491 70.4 58.6 1,830 TRUE
J-2496 64.4 54.2 4,000 TRUE
J-2502 65.2 53.8 3,341 TRUE
J-2504 69.7 59.6 4,000 TRUE
J-2510 53.4 41.4 4,000 TRUE
J-2514 105 96.7 3,100 TRUE
J-2515 53.5 41.5 3,714 TRUE
J-2517 59 48.2 4,000 TRUE
J-2518 59 48.1 4,000 TRUE
J-2522 45.6 33.6 1,857 TRUE
J-2528 69.6 59.4 5,000 TRUE
J-2531 46.2 34.2 1,952 TRUE
J-2539 60.5 48.6 3,855 TRUE
J-2545 103.1 94.8 2,285 TRUE
J-2547 63.6 53.9 2,989 TRUE
J-2550 61.5 51.5 4,000 TRUE
J-2553 103.5 95.2 2,416 TRUE
J-2557 61.9 51.6 4,000 TRUE
J-2560 64.1 53.8 4,000 TRUE
J-2561 64.1 53.8 4,000 TRUE
J-2564 66.3 55.1 2,796 TRUE
J-2565 98.6 91.4 4,000 TRUE
J-2568 99.1 91.9 4,000 TRUE
J-2569 59.6 48.8 4,000 TRUE
J-2572 68.3 58.2 4,000 TRUE
J-2573 100.2 93 4,000 TRUE
J-2577 63.2 53.2 4,000 TRUE
J-2580 61.6 51.5 4,000 TRUE
J-2581 93 85.9 5,000 TRUE
J-2582 79.1 68.6 4,500 TRUE
J-2586 104.8 96.5 3,009 TRUE
J-2592 103.7 95.4 3,149 TRUE
J-2597 58.4 46.4 1,310 FALSE
J-2603 104.8 96.5 3,082 TRUE
J-2607 61.2 49.2 3,181 TRUE
J-2611 68.8 56.9 4,000 TRUE
J-2613 104.3 96 3,191 TRUE
J-2618 63.6 53.4 4,000 TRUE
J-2620 65.8 55.6 4,000 TRUE
J-2621 48 36 3,038 TRUE
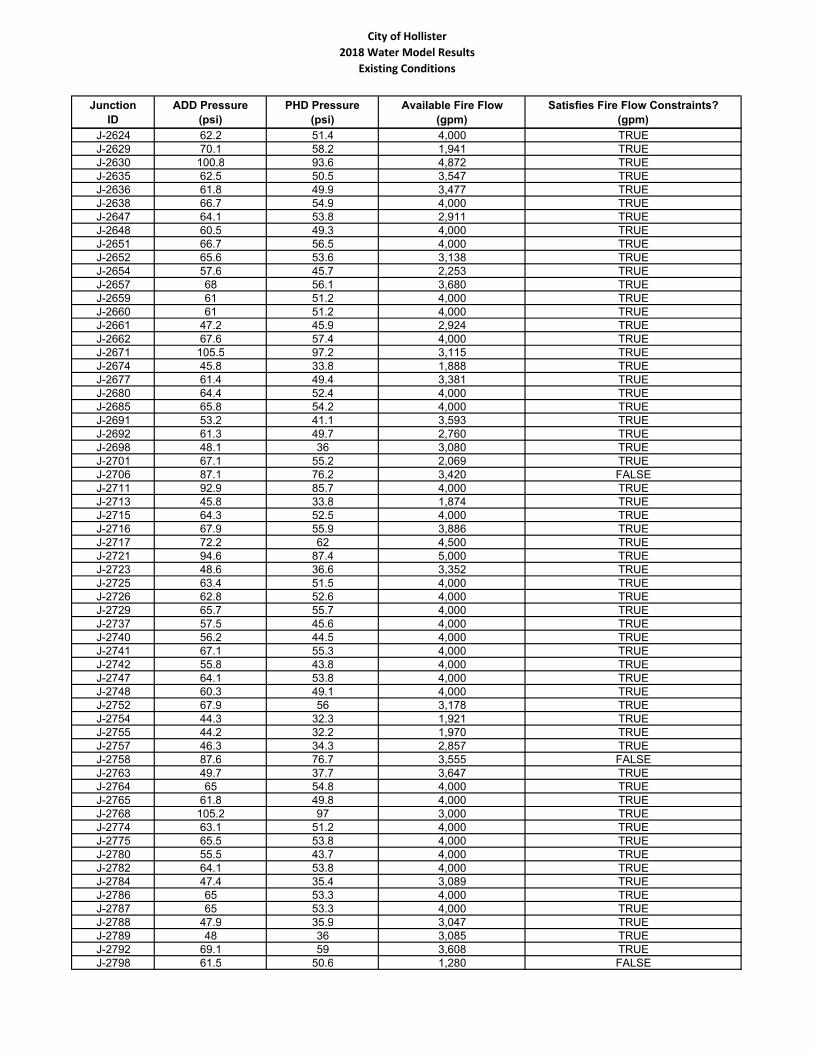
City of Hollister
2018 Water Model Results
Existing Conditions
Junction
ID
ADD Pressure
(psi)
PHD Pressure
(psi)
Available Fire Flow
(gpm)
Satisfies Fire Flow Constraints?
(gpm)
J-2624 62.2 51.4 4,000 TRUE
J-2629 70.1 58.2 1,941 TRUE
J-2630 100.8 93.6 4,872 TRUE
J-2635 62.5 50.5 3,547 TRUE
J-2636 61.8 49.9 3,477 TRUE
J-2638 66.7 54.9 4,000 TRUE
J-2647 64.1 53.8 2,911 TRUE
J-2648 60.5 49.3 4,000 TRUE
J-2651 66.7 56.5 4,000 TRUE
J-2652 65.6 53.6 3,138 TRUE
J-2654 57.6 45.7 2,253 TRUE
J-2657 68 56.1 3,680 TRUE
J-2659 61 51.2 4,000 TRUE
J-2660 61 51.2 4,000 TRUE
J-2661 47.2 45.9 2,924 TRUE
J-2662 67.6 57.4 4,000 TRUE
J-2671 105.5 97.2 3,115 TRUE
J-2674 45.8 33.8 1,888 TRUE
J-2677 61.4 49.4 3,381 TRUE
J-2680 64.4 52.4 4,000 TRUE
J-2685 65.8 54.2 4,000 TRUE
J-2691 53.2 41.1 3,593 TRUE
J-2692 61.3 49.7 2,760 TRUE
J-2698 48.1 36 3,080 TRUE
J-2701 67.1 55.2 2,069 TRUE
J-2706 87.1 76.2 3,420 FALSE
J-2711 92.9 85.7 4,000 TRUE
J-2713 45.8 33.8 1,874 TRUE
J-2715 64.3 52.5 4,000 TRUE
J-2716 67.9 55.9 3,886 TRUE
J-2717 72.2 62 4,500 TRUE
J-2721 94.6 87.4 5,000 TRUE
J-2723 48.6 36.6 3,352 TRUE
J-2725 63.4 51.5 4,000 TRUE
J-2726 62.8 52.6 4,000 TRUE
J-2729 65.7 55.7 4,000 TRUE
J-2737 57.5 45.6 4,000 TRUE
J-2740 56.2 44.5 4,000 TRUE
J-2741 67.1 55.3 4,000 TRUE
J-2742 55.8 43.8 4,000 TRUE
J-2747 64.1 53.8 4,000 TRUE
J-2748 60.3 49.1 4,000 TRUE
J-2752 67.9 56 3,178 TRUE
J-2754 44.3 32.3 1,921 TRUE
J-2755 44.2 32.2 1,970 TRUE
J-2757 46.3 34.3 2,857 TRUE
J-2758 87.6 76.7 3,555 FALSE
J-2763 49.7 37.7 3,647 TRUE
J-2764 65 54.8 4,000 TRUE
J-2765 61.8 49.8 4,000 TRUE
J-2768 105.2 97 3,000 TRUE
J-2774 63.1 51.2 4,000 TRUE
J-2775 65.5 53.8 4,000 TRUE
J-2780 55.5 43.7 4,000 TRUE
J-2782 64.1 53.8 4,000 TRUE
J-2784 47.4 35.4 3,089 TRUE
J-2786 65 53.3 4,000 TRUE
J-2787 65 53.3 4,000 TRUE
J-2788 47.9 35.9 3,047 TRUE
J-2789 48 36 3,085 TRUE
J-2792 69.1 59 3,608 TRUE
J-2798 61.5 50.6 1,280 FALSE
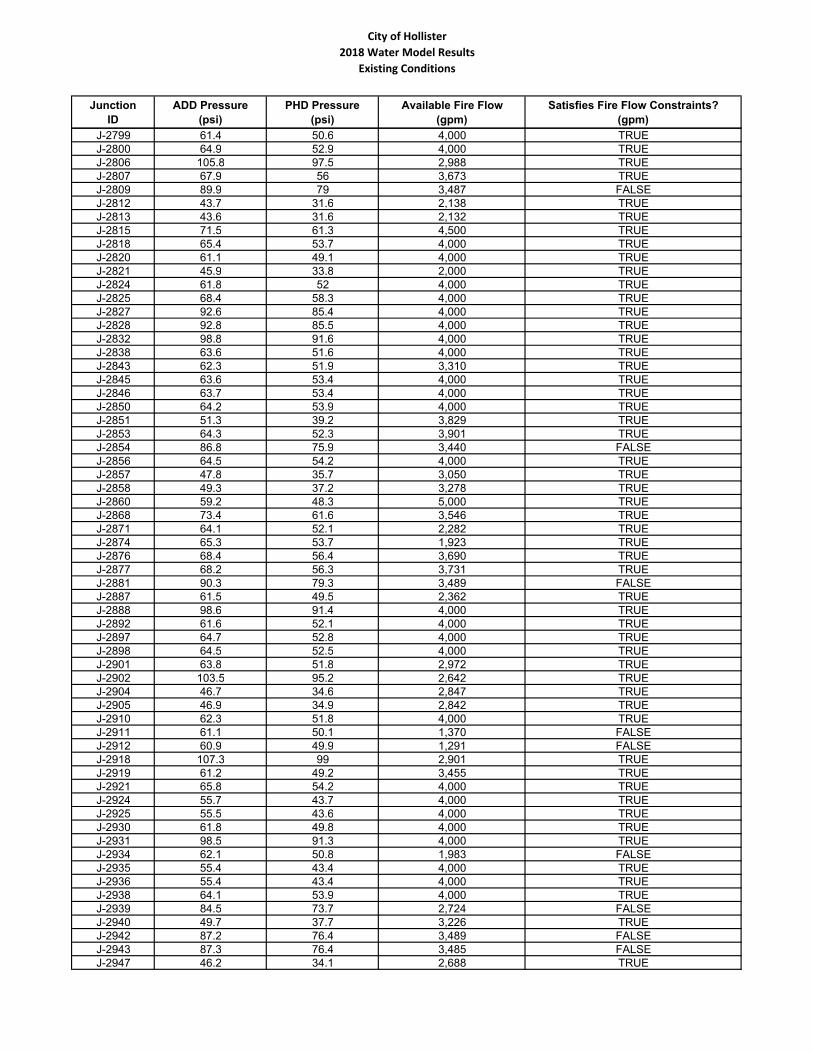
City of Hollister
2018 Water Model Results
Existing Conditions
Junction
ID
ADD Pressure
(psi)
PHD Pressure
(psi)
Available Fire Flow
(gpm)
Satisfies Fire Flow Constraints?
(gpm)
J-2799 61.4 50.6 4,000 TRUE
J-2800 64.9 52.9 4,000 TRUE
J-2806 105.8 97.5 2,988 TRUE
J-2807 67.9 56 3,673 TRUE
J-2809 89.9 79 3,487 FALSE
J-2812 43.7 31.6 2,138 TRUE
J-2813 43.6 31.6 2,132 TRUE
J-2815 71.5 61.3 4,500 TRUE
J-2818 65.4 53.7 4,000 TRUE
J-2820 61.1 49.1 4,000 TRUE
J-2821 45.9 33.8 2,000 TRUE
J-2824 61.8 52 4,000 TRUE
J-2825 68.4 58.3 4,000 TRUE
J-2827 92.6 85.4 4,000 TRUE
J-2828 92.8 85.5 4,000 TRUE
J-2832 98.8 91.6 4,000 TRUE
J-2838 63.6 51.6 4,000 TRUE
J-2843 62.3 51.9 3,310 TRUE
J-2845 63.6 53.4 4,000 TRUE
J-2846 63.7 53.4 4,000 TRUE
J-2850 64.2 53.9 4,000 TRUE
J-2851 51.3 39.2 3,829 TRUE
J-2853 64.3 52.3 3,901 TRUE
J-2854 86.8 75.9 3,440 FALSE
J-2856 64.5 54.2 4,000 TRUE
J-2857 47.8 35.7 3,050 TRUE
J-2858 49.3 37.2 3,278 TRUE
J-2860 59.2 48.3 5,000 TRUE
J-2868 73.4 61.6 3,546 TRUE
J-2871 64.1 52.1 2,282 TRUE
J-2874 65.3 53.7 1,923 TRUE
J-2876 68.4 56.4 3,690 TRUE
J-2877 68.2 56.3 3,731 TRUE
J-2881 90.3 79.3 3,489 FALSE
J-2887 61.5 49.5 2,362 TRUE
J-2888 98.6 91.4 4,000 TRUE
J-2892 61.6 52.1 4,000 TRUE
J-2897 64.7 52.8 4,000 TRUE
J-2898 64.5 52.5 4,000 TRUE
J-2901 63.8 51.8 2,972 TRUE
J-2902 103.5 95.2 2,642 TRUE
J-2904 46.7 34.6 2,847 TRUE
J-2905 46.9 34.9 2,842 TRUE
J-2910 62.3 51.8 4,000 TRUE
J-2911 61.1 50.1 1,370 FALSE
J-2912 60.9 49.9 1,291 FALSE
J-2918 107.3 99 2,901 TRUE
J-2919 61.2 49.2 3,455 TRUE
J-2921 65.8 54.2 4,000 TRUE
J-2924 55.7 43.7 4,000 TRUE
J-2925 55.5 43.6 4,000 TRUE
J-2930 61.8 49.8 4,000 TRUE
J-2931 98.5 91.3 4,000 TRUE
J-2934 62.1 50.8 1,983 FALSE
J-2935 55.4 43.4 4,000 TRUE
J-2936 55.4 43.4 4,000 TRUE
J-2938 64.1 53.9 4,000 TRUE
J-2939 84.5 73.7 2,724 FALSE
J-2940 49.7 37.7 3,226 TRUE
J-2942 87.2 76.4 3,489 FALSE
J-2943 87.3 76.4 3,485 FALSE
J-2947 46.2 34.1 2,688 TRUE
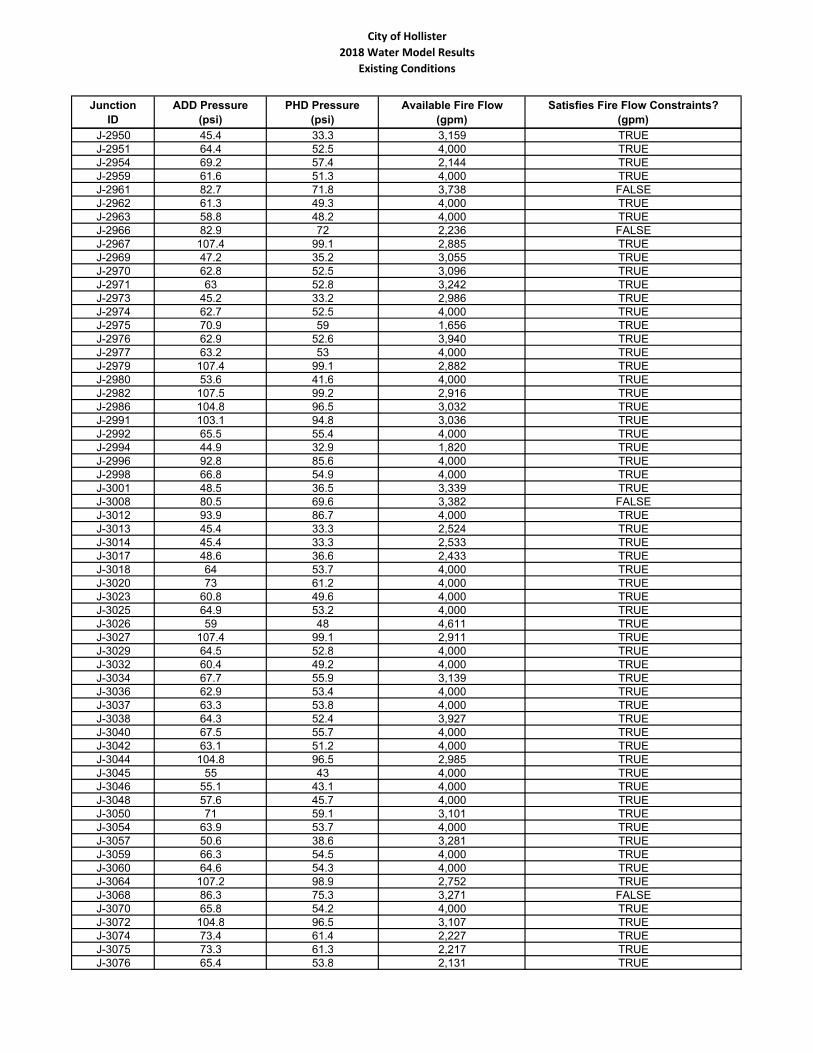
City of Hollister
2018 Water Model Results
Existing Conditions
Junction
ID
ADD Pressure
(psi)
PHD Pressure
(psi)
Available Fire Flow
(gpm)
Satisfies Fire Flow Constraints?
(gpm)
J-2950 45.4 33.3 3,159 TRUE
J-2951 64.4 52.5 4,000 TRUE
J-2954 69.2 57.4 2,144 TRUE
J-2959 61.6 51.3 4,000 TRUE
J-2961 82.7 71.8 3,738 FALSE
J-2962 61.3 49.3 4,000 TRUE
J-2963 58.8 48.2 4,000 TRUE
J-2966 82.9 72 2,236 FALSE
J-2967 107.4 99.1 2,885 TRUE
J-2969 47.2 35.2 3,055 TRUE
J-2970 62.8 52.5 3,096 TRUE
J-2971 63 52.8 3,242 TRUE
J-2973 45.2 33.2 2,986 TRUE
J-2974 62.7 52.5 4,000 TRUE
J-2975 70.9 59 1,656 TRUE
J-2976 62.9 52.6 3,940 TRUE
J-2977 63.2 53 4,000 TRUE
J-2979 107.4 99.1 2,882 TRUE
J-2980 53.6 41.6 4,000 TRUE
J-2982 107.5 99.2 2,916 TRUE
J-2986 104.8 96.5 3,032 TRUE
J-2991 103.1 94.8 3,036 TRUE
J-2992 65.5 55.4 4,000 TRUE
J-2994 44.9 32.9 1,820 TRUE
J-2996 92.8 85.6 4,000 TRUE
J-2998 66.8 54.9 4,000 TRUE
J-3001 48.5 36.5 3,339 TRUE
J-3008 80.5 69.6 3,382 FALSE
J-3012 93.9 86.7 4,000 TRUE
J-3013 45.4 33.3 2,524 TRUE
J-3014 45.4 33.3 2,533 TRUE
J-3017 48.6 36.6 2,433 TRUE
J-3018 64 53.7 4,000 TRUE
J-3020 73 61.2 4,000 TRUE
J-3023 60.8 49.6 4,000 TRUE
J-3025 64.9 53.2 4,000 TRUE
J-3026 59 48 4,611 TRUE
J-3027 107.4 99.1 2,911 TRUE
J-3029 64.5 52.8 4,000 TRUE
J-3032 60.4 49.2 4,000 TRUE
J-3034 67.7 55.9 3,139 TRUE
J-3036 62.9 53.4 4,000 TRUE
J-3037 63.3 53.8 4,000 TRUE
J-3038 64.3 52.4 3,927 TRUE
J-3040 67.5 55.7 4,000 TRUE
J-3042 63.1 51.2 4,000 TRUE
J-3044 104.8 96.5 2,985 TRUE
J-3045 55 43 4,000 TRUE
J-3046 55.1 43.1 4,000 TRUE
J-3048 57.6 45.7 4,000 TRUE
J-3050 71 59.1 3,101 TRUE
J-3054 63.9 53.7 4,000 TRUE
J-3057 50.6 38.6 3,281 TRUE
J-3059 66.3 54.5 4,000 TRUE
J-3060 64.6 54.3 4,000 TRUE
J-3064 107.2 98.9 2,752 TRUE
J-3068 86.3 75.3 3,271 FALSE
J-3070 65.8 54.2 4,000 TRUE
J-3072 104.8 96.5 3,107 TRUE
J-3074 73.4 61.4 2,227 TRUE
J-3075 73.3 61.3 2,217 TRUE
J-3076 65.4 53.8 2,131 TRUE
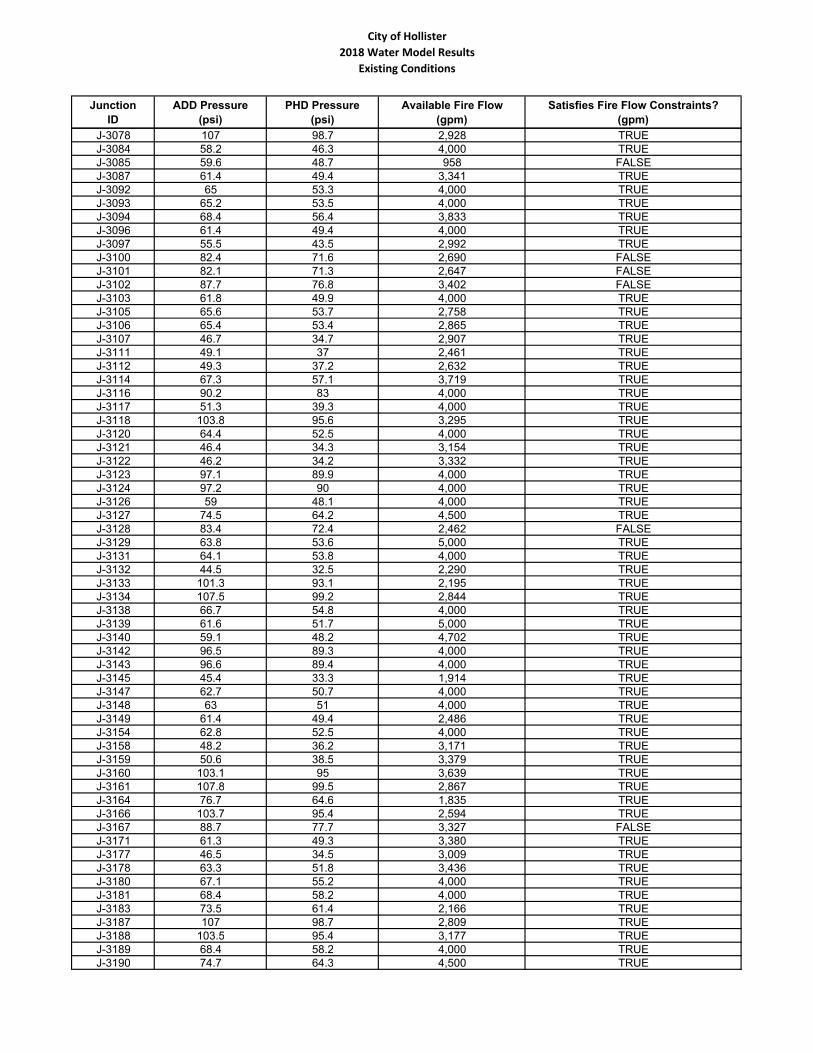
City of Hollister
2018 Water Model Results
Existing Conditions
Junction
ID
ADD Pressure
(psi)
PHD Pressure
(psi)
Available Fire Flow
(gpm)
Satisfies Fire Flow Constraints?
(gpm)
J-3078 107 98.7 2,928 TRUE
J-3084 58.2 46.3 4,000 TRUE
J-3085 59.6 48.7 958 FALSE
J-3087 61.4 49.4 3,341 TRUE
J-3092 65 53.3 4,000 TRUE
J-3093 65.2 53.5 4,000 TRUE
J-3094 68.4 56.4 3,833 TRUE
J-3096 61.4 49.4 4,000 TRUE
J-3097 55.5 43.5 2,992 TRUE
J-3100 82.4 71.6 2,690 FALSE
J-3101 82.1 71.3 2,647 FALSE
J-3102 87.7 76.8 3,402 FALSE
J-3103 61.8 49.9 4,000 TRUE
J-3105 65.6 53.7 2,758 TRUE
J-3106 65.4 53.4 2,865 TRUE
J-3107 46.7 34.7 2,907 TRUE
J-3111 49.1 37 2,461 TRUE
J-3112 49.3 37.2 2,632 TRUE
J-3114 67.3 57.1 3,719 TRUE
J-3116 90.2 83 4,000 TRUE
J-3117 51.3 39.3 4,000 TRUE
J-3118 103.8 95.6 3,295 TRUE
J-3120 64.4 52.5 4,000 TRUE
J-3121 46.4 34.3 3,154 TRUE
J-3122 46.2 34.2 3,332 TRUE
J-3123 97.1 89.9 4,000 TRUE
J-3124 97.2 90 4,000 TRUE
J-3126 59 48.1 4,000 TRUE
J-3127 74.5 64.2 4,500 TRUE
J-3128 83.4 72.4 2,462 FALSE
J-3129 63.8 53.6 5,000 TRUE
J-3131 64.1 53.8 4,000 TRUE
J-3132 44.5 32.5 2,290 TRUE
J-3133 101.3 93.1 2,195 TRUE
J-3134 107.5 99.2 2,844 TRUE
J-3138 66.7 54.8 4,000 TRUE
J-3139 61.6 51.7 5,000 TRUE
J-3140 59.1 48.2 4,702 TRUE
J-3142 96.5 89.3 4,000 TRUE
J-3143 96.6 89.4 4,000 TRUE
J-3145 45.4 33.3 1,914 TRUE
J-3147 62.7 50.7 4,000 TRUE
J-3148 63 51 4,000 TRUE
J-3149 61.4 49.4 2,486 TRUE
J-3154 62.8 52.5 4,000 TRUE
J-3158 48.2 36.2 3,171 TRUE
J-3159 50.6 38.5 3,379 TRUE
J-3160 103.1 95 3,639 TRUE
J-3161 107.8 99.5 2,867 TRUE
J-3164 76.7 64.6 1,835 TRUE
J-3166 103.7 95.4 2,594 TRUE
J-3167 88.7 77.7 3,327 FALSE
J-3171 61.3 49.3 3,380 TRUE
J-3177 46.5 34.5 3,009 TRUE
J-3178 63.3 51.8 3,436 TRUE
J-3180 67.1 55.2 4,000 TRUE
J-3181 68.4 58.2 4,000 TRUE
J-3183 73.5 61.4 2,166 TRUE
J-3187 107 98.7 2,809 TRUE
J-3188 103.5 95.4 3,177 TRUE
J-3189 68.4 58.2 4,000 TRUE
J-3190 74.7 64.3 4,500 TRUE
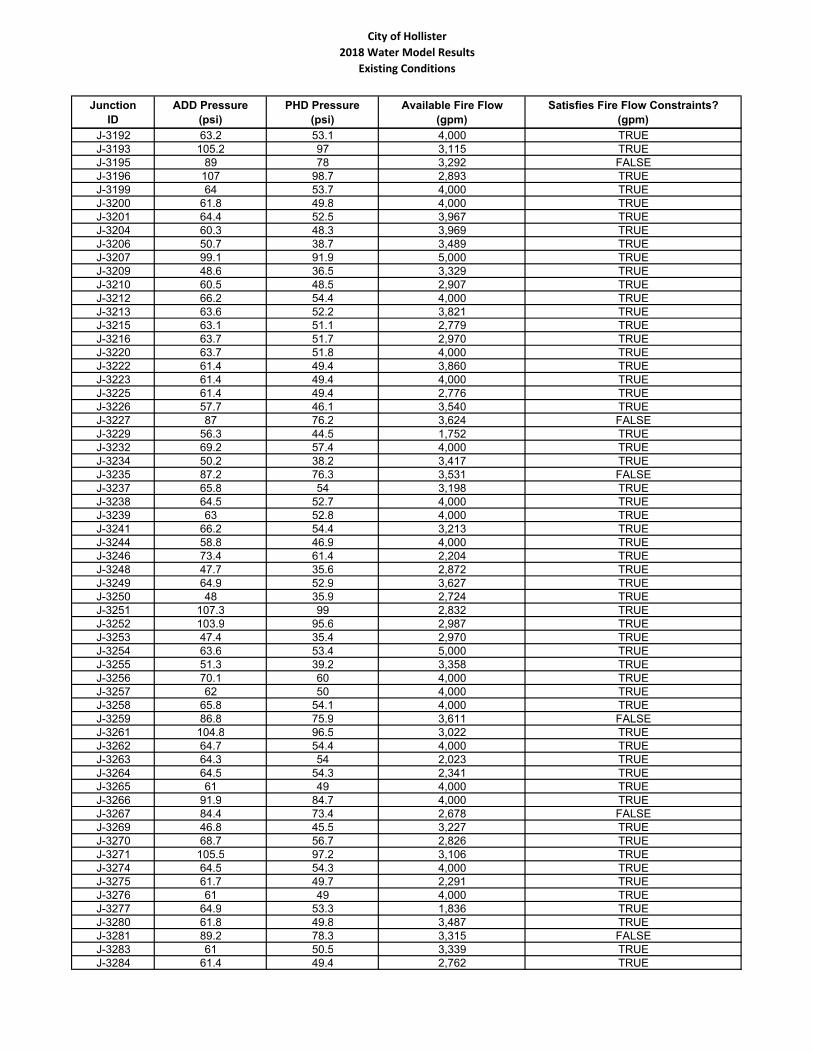
City of Hollister
2018 Water Model Results
Existing Conditions
Junction
ID
ADD Pressure
(psi)
PHD Pressure
(psi)
Available Fire Flow
(gpm)
Satisfies Fire Flow Constraints?
(gpm)
J-3192 63.2 53.1 4,000 TRUE
J-3193 105.2 97 3,115 TRUE
J-3195 89 78 3,292 FALSE
J-3196 107 98.7 2,893 TRUE
J-3199 64 53.7 4,000 TRUE
J-3200 61.8 49.8 4,000 TRUE
J-3201 64.4 52.5 3,967 TRUE
J-3204 60.3 48.3 3,969 TRUE
J-3206 50.7 38.7 3,489 TRUE
J-3207 99.1 91.9 5,000 TRUE
J-3209 48.6 36.5 3,329 TRUE
J-3210 60.5 48.5 2,907 TRUE
J-3212 66.2 54.4 4,000 TRUE
J-3213 63.6 52.2 3,821 TRUE
J-3215 63.1 51.1 2,779 TRUE
J-3216 63.7 51.7 2,970 TRUE
J-3220 63.7 51.8 4,000 TRUE
J-3222 61.4 49.4 3,860 TRUE
J-3223 61.4 49.4 4,000 TRUE
J-3225 61.4 49.4 2,776 TRUE
J-3226 57.7 46.1 3,540 TRUE
J-3227 87 76.2 3,624 FALSE
J-3229 56.3 44.5 1,752 TRUE
J-3232 69.2 57.4 4,000 TRUE
J-3234 50.2 38.2 3,417 TRUE
J-3235 87.2 76.3 3,531 FALSE
J-3237 65.8 54 3,198 TRUE
J-3238 64.5 52.7 4,000 TRUE
J-3239 63 52.8 4,000 TRUE
J-3241 66.2 54.4 3,213 TRUE
J-3244 58.8 46.9 4,000 TRUE
J-3246 73.4 61.4 2,204 TRUE
J-3248 47.7 35.6 2,872 TRUE
J-3249 64.9 52.9 3,627 TRUE
J-3250 48 35.9 2,724 TRUE
J-3251 107.3 99 2,832 TRUE
J-3252 103.9 95.6 2,987 TRUE
J-3253 47.4 35.4 2,970 TRUE
J-3254 63.6 53.4 5,000 TRUE
J-3255 51.3 39.2 3,358 TRUE
J-3256 70.1 60 4,000 TRUE
J-3257 62 50 4,000 TRUE
J-3258 65.8 54.1 4,000 TRUE
J-3259 86.8 75.9 3,611 FALSE
J-3261 104.8 96.5 3,022 TRUE
J-3262 64.7 54.4 4,000 TRUE
J-3263 64.3 54 2,023 TRUE
J-3264 64.5 54.3 2,341 TRUE
J-3265 61 49 4,000 TRUE
J-3266 91.9 84.7 4,000 TRUE
J-3267 84.4 73.4 2,678 FALSE
J-3269 46.8 45.5 3,227 TRUE
J-3270 68.7 56.7 2,826 TRUE
J-3271 105.5 97.2 3,106 TRUE
J-3274 64.5 54.3 4,000 TRUE
J-3275 61.7 49.7 2,291 TRUE
J-3276 61 49 4,000 TRUE
J-3277 64.9 53.3 1,836 TRUE
J-3280 61.8 49.8 3,487 TRUE
J-3281 89.2 78.3 3,315 FALSE
J-3283 61 50.5 3,339 TRUE
J-3284 61.4 49.4 2,762 TRUE

City of Hollister
2018 Water Model Results
Existing Conditions
Junction
ID
ADD Pressure
(psi)
PHD Pressure
(psi)
Available Fire Flow
(gpm)
Satisfies Fire Flow Constraints?
(gpm)
J-3285 89.6 78.7 3,026 FALSE
J-3288 79.9 69.3 4,500 TRUE
J-3289 62.8 50.8 4,000 TRUE
J-3290 61.3 50.3 4,000 TRUE
J-3291 44.5 32.5 2,367 TRUE
J-3292 101.2 94 4,000 TRUE
J-3293 73.5 61.4 2,300 TRUE
J-3294 105.7 97.4 2,889 TRUE
J-3295 46.7 45.4 2,857 TRUE
J-3297 63.2 53 5,000 TRUE
J-3301 67.6 55.7 3,258 TRUE
J-3302 51.6 43 4,000 TRUE
J-3304 99.5 92.3 4,000 TRUE
J-3305 99.4 92.2 4,000 TRUE
J-3306 106.1 97.8 2,829 TRUE
J-3307 106.4 98.1 2,926 TRUE
J-3308 66.6 54.9 4,000 TRUE
J-3311 65.3 53.6 4,000 TRUE
J-3312 89.4 78.5 3,366 FALSE
J-3315 65.4 53.7 3,217 TRUE
J-3318 96.6 89.4 4,000 TRUE
J-3319 45.4 33.3 2,257 TRUE
J-3320 44.7 32.6 2,031 TRUE
J-3321 106.5 98.2 2,805 TRUE
J-3322 106.7 98.4 2,900 TRUE
J-3324 59.9 47.9 4,000 TRUE
J-3325 73.8 61.8 2,774 TRUE
J-3326 97.1 89.9 4,000 TRUE
J-3327 63.6 51.6 2,636 TRUE
J-3329 67.2 57.1 4,000 TRUE
J-3330 83.4 76.2 4,000 TRUE
J-3331 65.5 53.7 4,000 TRUE
J-3332 62.6 52.7 1,299 TRUE
J-3333 53.5 41.6 3,364 TRUE
J-3334 67.3 55.4 2,283 TRUE
J-3336 56.4 44.4 4,000 TRUE
J-3337 64.4 52.5 4,000 TRUE
J-3340 51.6 39.6 3,819 TRUE
J-3341 73.6 61.7 3,408 TRUE
J-3343 83.4 72.5 3,721 FALSE
J-3345 64.5 54.2 4,000 TRUE
J-3347 46.2 34.2 2,648 TRUE
J-3350 97.3 90.1 4,000 TRUE
J-3351 98.3 91.1 4,000 TRUE
J-3352 68.8 56.9 4,000 TRUE
J-3354 100.8 93.6 4,000 TRUE
J-3356 67 55.2 4,000 TRUE
J-3363 62.8 51.9 3,568 TRUE
J-3364 63 52.2 1,227 TRUE
J-3365 66.9 55.1 2,907 TRUE
J-3366 48.4 36.4 3,521 TRUE
J-3367 68.7 56.8 4,000 TRUE
J-3369 65 53.3 4,000 TRUE
J-3374 47.2 45.9 2,392 TRUE
J-3375 102.2 94.2 3,739 TRUE
J-3376 47.6 35.6 3,150 TRUE
J-3377 61.4 49.4 4,000 TRUE
J-3379 47.2 45.9 2,879 TRUE
J-3380 46.6 34.5 3,378 TRUE
J-3381 58.5 47.6 4,000 TRUE
J-3382 55.3 43.3 3,431 TRUE
J-3383 67.1 55.2 3,600 TRUE
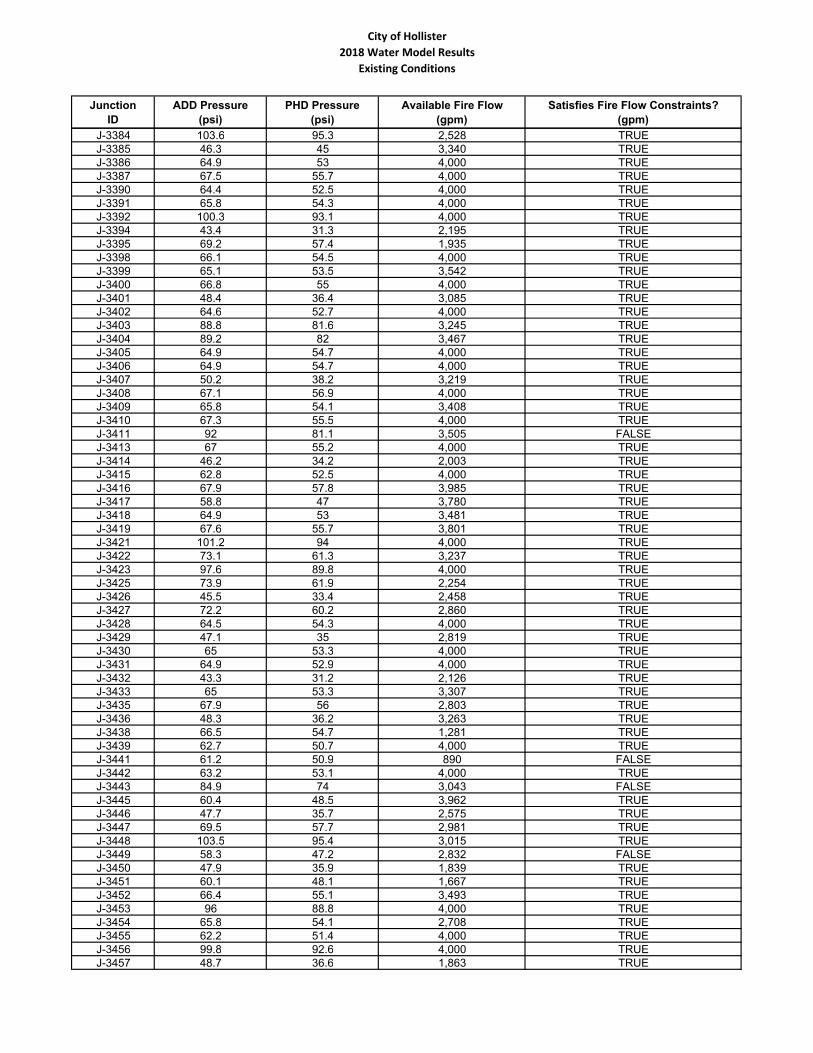
City of Hollister
2018 Water Model Results
Existing Conditions
Junction
ID
ADD Pressure
(psi)
PHD Pressure
(psi)
Available Fire Flow
(gpm)
Satisfies Fire Flow Constraints?
(gpm)
J-3384 103.6 95.3 2,528 TRUE
J-3385 46.3 45 3,340 TRUE
J-3386 64.9 53 4,000 TRUE
J-3387 67.5 55.7 4,000 TRUE
J-3390 64.4 52.5 4,000 TRUE
J-3391 65.8 54.3 4,000 TRUE
J-3392 100.3 93.1 4,000 TRUE
J-3394 43.4 31.3 2,195 TRUE
J-3395 69.2 57.4 1,935 TRUE
J-3398 66.1 54.5 4,000 TRUE
J-3399 65.1 53.5 3,542 TRUE
J-3400 66.8 55 4,000 TRUE
J-3401 48.4 36.4 3,085 TRUE
J-3402 64.6 52.7 4,000 TRUE
J-3403 88.8 81.6 3,245 TRUE
J-3404 89.2 82 3,467 TRUE
J-3405 64.9 54.7 4,000 TRUE
J-3406 64.9 54.7 4,000 TRUE
J-3407 50.2 38.2 3,219 TRUE
J-3408 67.1 56.9 4,000 TRUE
J-3409 65.8 54.1 3,408 TRUE
J-3410 67.3 55.5 4,000 TRUE
J-3411 92 81.1 3,505 FALSE
J-3413 67 55.2 4,000 TRUE
J-3414 46.2 34.2 2,003 TRUE
J-3415 62.8 52.5 4,000 TRUE
J-3416 67.9 57.8 3,985 TRUE
J-3417 58.8 47 3,780 TRUE
J-3418 64.9 53 3,481 TRUE
J-3419 67.6 55.7 3,801 TRUE
J-3421 101.2 94 4,000 TRUE
J-3422 73.1 61.3 3,237 TRUE
J-3423 97.6 89.8 4,000 TRUE
J-3425 73.9 61.9 2,254 TRUE
J-3426 45.5 33.4 2,458 TRUE
J-3427 72.2 60.2 2,860 TRUE
J-3428 64.5 54.3 4,000 TRUE
J-3429 47.1 35 2,819 TRUE
J-3430 65 53.3 4,000 TRUE
J-3431 64.9 52.9 4,000 TRUE
J-3432 43.3 31.2 2,126 TRUE
J-3433 65 53.3 3,307 TRUE
J-3435 67.9 56 2,803 TRUE
J-3436 48.3 36.2 3,263 TRUE
J-3438 66.5 54.7 1,281 TRUE
J-3439 62.7 50.7 4,000 TRUE
J-3441 61.2 50.9 890 FALSE
J-3442 63.2 53.1 4,000 TRUE
J-3443 84.9 74 3,043 FALSE
J-3445 60.4 48.5 3,962 TRUE
J-3446 47.7 35.7 2,575 TRUE
J-3447 69.5 57.7 2,981 TRUE
J-3448 103.5 95.4 3,015 TRUE
J-3449 58.3 47.2 2,832 FALSE
J-3450 47.9 35.9 1,839 TRUE
J-3451 60.1 48.1 1,667 TRUE
J-3452 66.4 55.1 3,493 TRUE
J-3453 96 88.8 4,000 TRUE
J-3454 65.8 54.1 2,708 TRUE
J-3455 62.2 51.4 4,000 TRUE
J-3456 99.8 92.6 4,000 TRUE
J-3457 48.7 36.6 1,863 TRUE
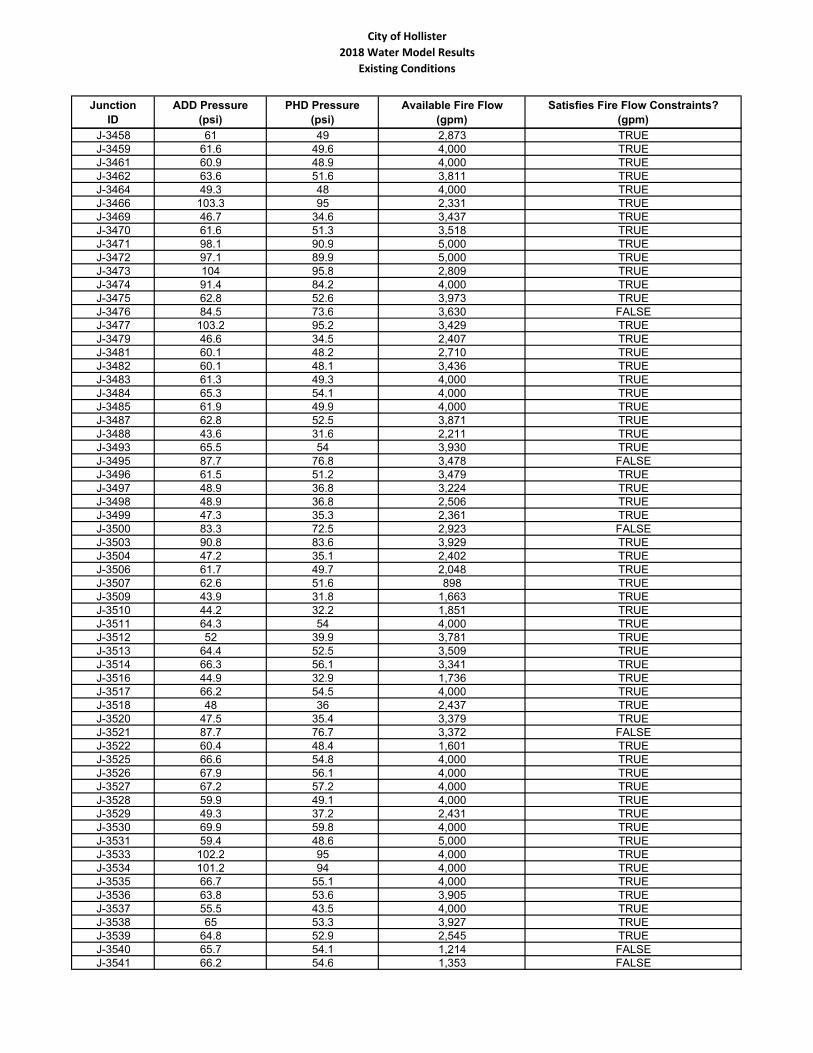
City of Hollister
2018 Water Model Results
Existing Conditions
Junction
ID
ADD Pressure
(psi)
PHD Pressure
(psi)
Available Fire Flow
(gpm)
Satisfies Fire Flow Constraints?
(gpm)
J-3458 61 49 2,873 TRUE
J-3459 61.6 49.6 4,000 TRUE
J-3461 60.9 48.9 4,000 TRUE
J-3462 63.6 51.6 3,811 TRUE
J-3464 49.3 48 4,000 TRUE
J-3466 103.3 95 2,331 TRUE
J-3469 46.7 34.6 3,437 TRUE
J-3470 61.6 51.3 3,518 TRUE
J-3471 98.1 90.9 5,000 TRUE
J-3472 97.1 89.9 5,000 TRUE
J-3473 104 95.8 2,809 TRUE
J-3474 91.4 84.2 4,000 TRUE
J-3475 62.8 52.6 3,973 TRUE
J-3476 84.5 73.6 3,630 FALSE
J-3477 103.2 95.2 3,429 TRUE
J-3479 46.6 34.5 2,407 TRUE
J-3481 60.1 48.2 2,710 TRUE
J-3482 60.1 48.1 3,436 TRUE
J-3483 61.3 49.3 4,000 TRUE
J-3484 65.3 54.1 4,000 TRUE
J-3485 61.9 49.9 4,000 TRUE
J-3487 62.8 52.5 3,871 TRUE
J-3488 43.6 31.6 2,211 TRUE
J-3493 65.5 54 3,930 TRUE
J-3495 87.7 76.8 3,478 FALSE
J-3496 61.5 51.2 3,479 TRUE
J-3497 48.9 36.8 3,224 TRUE
J-3498 48.9 36.8 2,506 TRUE
J-3499 47.3 35.3 2,361 TRUE
J-3500 83.3 72.5 2,923 FALSE
J-3503 90.8 83.6 3,929 TRUE
J-3504 47.2 35.1 2,402 TRUE
J-3506 61.7 49.7 2,048 TRUE
J-3507 62.6 51.6 898 TRUE
J-3509 43.9 31.8 1,663 TRUE
J-3510 44.2 32.2 1,851 TRUE
J-3511 64.3 54 4,000 TRUE
J-3512 52 39.9 3,781 TRUE
J-3513 64.4 52.5 3,509 TRUE
J-3514 66.3 56.1 3,341 TRUE
J-3516 44.9 32.9 1,736 TRUE
J-3517 66.2 54.5 4,000 TRUE
J-3518 48 36 2,437 TRUE
J-3520 47.5 35.4 3,379 TRUE
J-3521 87.7 76.7 3,372 FALSE
J-3522 60.4 48.4 1,601 TRUE
J-3525 66.6 54.8 4,000 TRUE
J-3526 67.9 56.1 4,000 TRUE
J-3527 67.2 57.2 4,000 TRUE
J-3528 59.9 49.1 4,000 TRUE
J-3529 49.3 37.2 2,431 TRUE
J-3530 69.9 59.8 4,000 TRUE
J-3531 59.4 48.6 5,000 TRUE
J-3533 102.2 95 4,000 TRUE
J-3534 101.2 94 4,000 TRUE
J-3535 66.7 55.1 4,000 TRUE
J-3536 63.8 53.6 3,905 TRUE
J-3537 55.5 43.5 4,000 TRUE
J-3538 65 53.3 3,927 TRUE
J-3539 64.8 52.9 2,545 TRUE
J-3540 65.7 54.1 1,214 FALSE
J-3541 66.2 54.6 1,353 FALSE
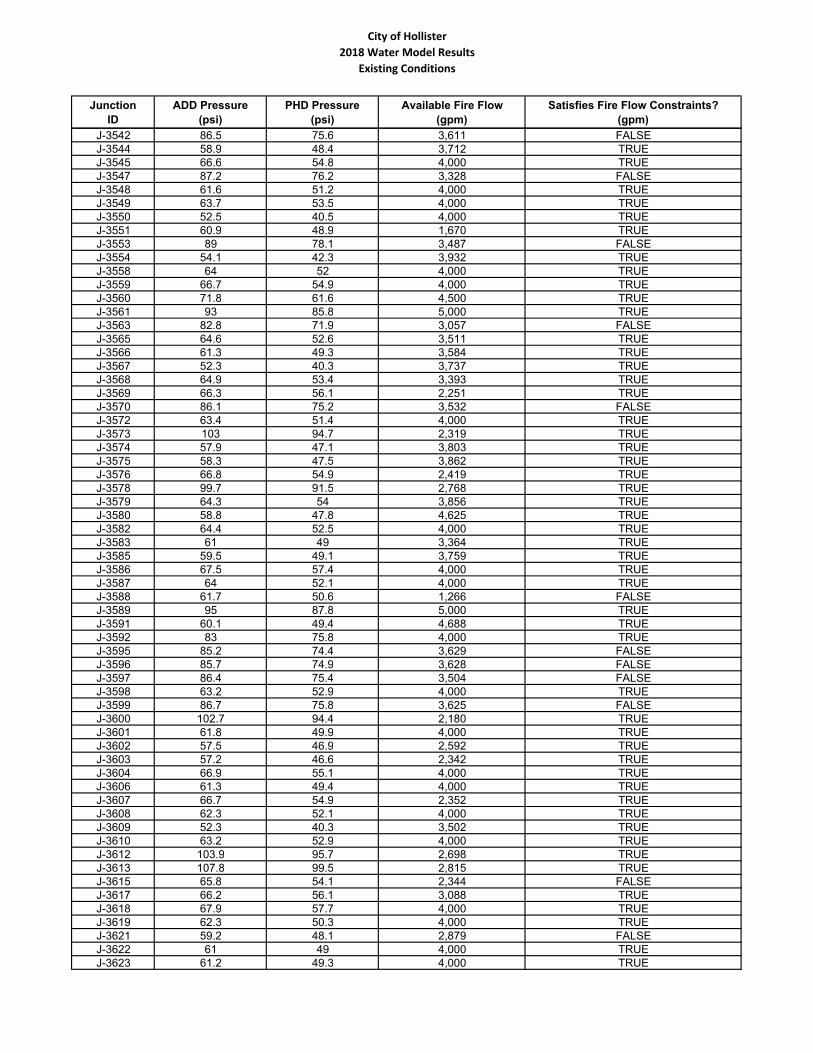
City of Hollister
2018 Water Model Results
Existing Conditions
Junction
ID
ADD Pressure
(psi)
PHD Pressure
(psi)
Available Fire Flow
(gpm)
Satisfies Fire Flow Constraints?
(gpm)
J-3542 86.5 75.6 3,611 FALSE
J-3544 58.9 48.4 3,712 TRUE
J-3545 66.6 54.8 4,000 TRUE
J-3547 87.2 76.2 3,328 FALSE
J-3548 61.6 51.2 4,000 TRUE
J-3549 63.7 53.5 4,000 TRUE
J-3550 52.5 40.5 4,000 TRUE
J-3551 60.9 48.9 1,670 TRUE
J-3553 89 78.1 3,487 FALSE
J-3554 54.1 42.3 3,932 TRUE
J-3558 64 52 4,000 TRUE
J-3559 66.7 54.9 4,000 TRUE
J-3560 71.8 61.6 4,500 TRUE
J-3561 93 85.8 5,000 TRUE
J-3563 82.8 71.9 3,057 FALSE
J-3565 64.6 52.6 3,511 TRUE
J-3566 61.3 49.3 3,584 TRUE
J-3567 52.3 40.3 3,737 TRUE
J-3568 64.9 53.4 3,393 TRUE
J-3569 66.3 56.1 2,251 TRUE
J-3570 86.1 75.2 3,532 FALSE
J-3572 63.4 51.4 4,000 TRUE
J-3573 103 94.7 2,319 TRUE
J-3574 57.9 47.1 3,803 TRUE
J-3575 58.3 47.5 3,862 TRUE
J-3576 66.8 54.9 2,419 TRUE
J-3578 99.7 91.5 2,768 TRUE
J-3579 64.3 54 3,856 TRUE
J-3580 58.8 47.8 4,625 TRUE
J-3582 64.4 52.5 4,000 TRUE
J-3583 61 49 3,364 TRUE
J-3585 59.5 49.1 3,759 TRUE
J-3586 67.5 57.4 4,000 TRUE
J-3587 64 52.1 4,000 TRUE
J-3588 61.7 50.6 1,266 FALSE
J-3589 95 87.8 5,000 TRUE
J-3591 60.1 49.4 4,688 TRUE
J-3592 83 75.8 4,000 TRUE
J-3595 85.2 74.4 3,629 FALSE
J-3596 85.7 74.9 3,628 FALSE
J-3597 86.4 75.4 3,504 FALSE
J-3598 63.2 52.9 4,000 TRUE
J-3599 86.7 75.8 3,625 FALSE
J-3600 102.7 94.4 2,180 TRUE
J-3601 61.8 49.9 4,000 TRUE
J-3602 57.5 46.9 2,592 TRUE
J-3603 57.2 46.6 2,342 TRUE
J-3604 66.9 55.1 4,000 TRUE
J-3606 61.3 49.4 4,000 TRUE
J-3607 66.7 54.9 2,352 TRUE
J-3608 62.3 52.1 4,000 TRUE
J-3609 52.3 40.3 3,502 TRUE
J-3610 63.2 52.9 4,000 TRUE
J-3612 103.9 95.7 2,698 TRUE
J-3613 107.8 99.5 2,815 TRUE
J-3615 65.8 54.1 2,344 FALSE
J-3617 66.2 56.1 3,088 TRUE
J-3618 67.9 57.7 4,000 TRUE
J-3619 62.3 50.3 4,000 TRUE
J-3621 59.2 48.1 2,879 FALSE
J-3622 61 49 4,000 TRUE
J-3623 61.2 49.3 4,000 TRUE
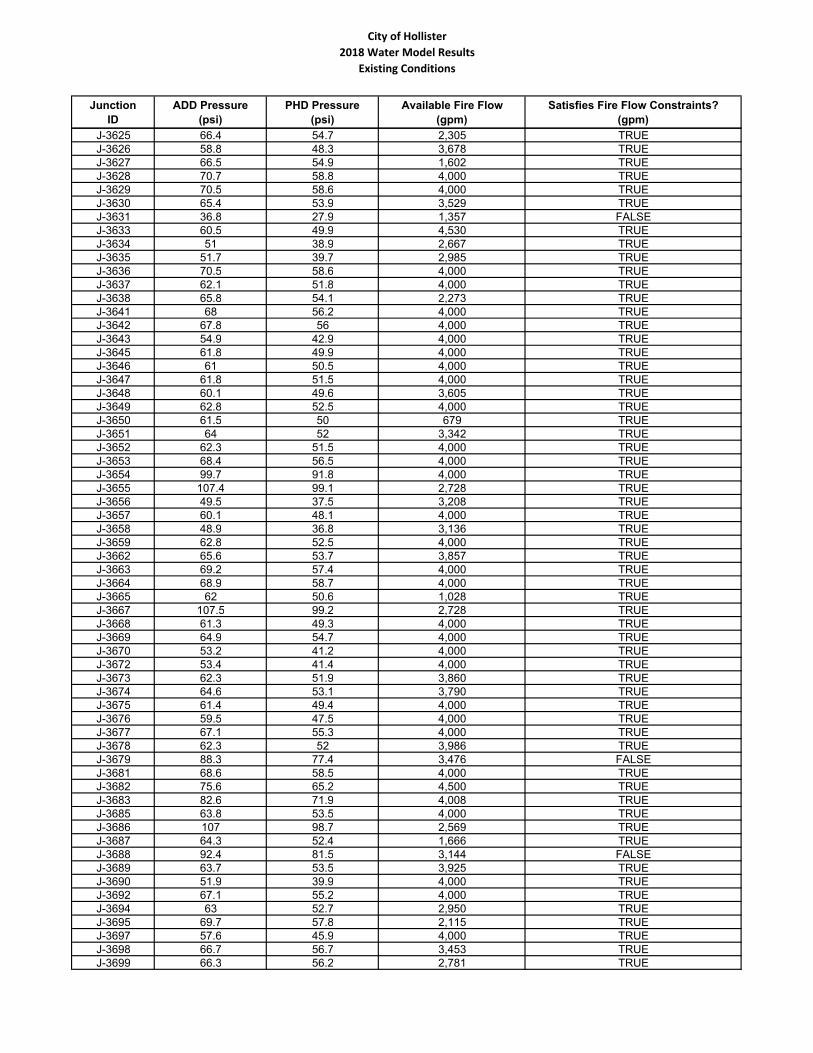
City of Hollister
2018 Water Model Results
Existing Conditions
Junction
ID
ADD Pressure
(psi)
PHD Pressure
(psi)
Available Fire Flow
(gpm)
Satisfies Fire Flow Constraints?
(gpm)
J-3625 66.4 54.7 2,305 TRUE
J-3626 58.8 48.3 3,678 TRUE
J-3627 66.5 54.9 1,602 TRUE
J-3628 70.7 58.8 4,000 TRUE
J-3629 70.5 58.6 4,000 TRUE
J-3630 65.4 53.9 3,529 TRUE
J-3631 36.8 27.9 1,357 FALSE
J-3633 60.5 49.9 4,530 TRUE
J-3634 51 38.9 2,667 TRUE
J-3635 51.7 39.7 2,985 TRUE
J-3636 70.5 58.6 4,000 TRUE
J-3637 62.1 51.8 4,000 TRUE
J-3638 65.8 54.1 2,273 TRUE
J-3641 68 56.2 4,000 TRUE
J-3642 67.8 56 4,000 TRUE
J-3643 54.9 42.9 4,000 TRUE
J-3645 61.8 49.9 4,000 TRUE
J-3646 61 50.5 4,000 TRUE
J-3647 61.8 51.5 4,000 TRUE
J-3648 60.1 49.6 3,605 TRUE
J-3649 62.8 52.5 4,000 TRUE
J-3650 61.5 50 679 TRUE
J-3651 64 52 3,342 TRUE
J-3652 62.3 51.5 4,000 TRUE
J-3653 68.4 56.5 4,000 TRUE
J-3654 99.7 91.8 4,000 TRUE
J-3655 107.4 99.1 2,728 TRUE
J-3656 49.5 37.5 3,208 TRUE
J-3657 60.1 48.1 4,000 TRUE
J-3658 48.9 36.8 3,136 TRUE
J-3659 62.8 52.5 4,000 TRUE
J-3662 65.6 53.7 3,857 TRUE
J-3663 69.2 57.4 4,000 TRUE
J-3664 68.9 58.7 4,000 TRUE
J-3665 62 50.6 1,028 TRUE
J-3667 107.5 99.2 2,728 TRUE
J-3668 61.3 49.3 4,000 TRUE
J-3669 64.9 54.7 4,000 TRUE
J-3670 53.2 41.2 4,000 TRUE
J-3672 53.4 41.4 4,000 TRUE
J-3673 62.3 51.9 3,860 TRUE
J-3674 64.6 53.1 3,790 TRUE
J-3675 61.4 49.4 4,000 TRUE
J-3676 59.5 47.5 4,000 TRUE
J-3677 67.1 55.3 4,000 TRUE
J-3678 62.3 52 3,986 TRUE
J-3679 88.3 77.4 3,476 FALSE
J-3681 68.6 58.5 4,000 TRUE
J-3682 75.6 65.2 4,500 TRUE
J-3683 82.6 71.9 4,008 TRUE
J-3685 63.8 53.5 4,000 TRUE
J-3686 107 98.7 2,569 TRUE
J-3687 64.3 52.4 1,666 TRUE
J-3688 92.4 81.5 3,144 FALSE
J-3689 63.7 53.5 3,925 TRUE
J-3690 51.9 39.9 4,000 TRUE
J-3692 67.1 55.2 4,000 TRUE
J-3694 63 52.7 2,950 TRUE
J-3695 69.7 57.8 2,115 TRUE
J-3697 57.6 45.9 4,000 TRUE
J-3698 66.7 56.7 3,453 TRUE
J-3699 66.3 56.2 2,781 TRUE
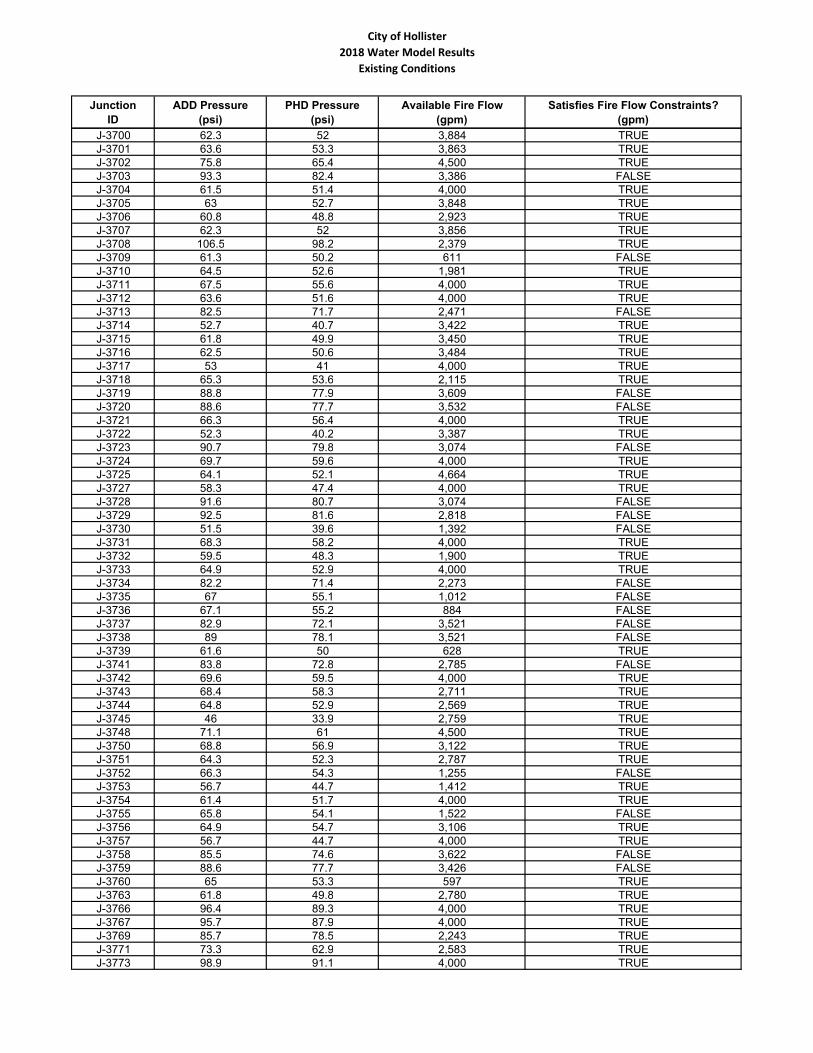
City of Hollister
2018 Water Model Results
Existing Conditions
Junction
ID
ADD Pressure
(psi)
PHD Pressure
(psi)
Available Fire Flow
(gpm)
Satisfies Fire Flow Constraints?
(gpm)
J-3700 62.3 52 3,884 TRUE
J-3701 63.6 53.3 3,863 TRUE
J-3702 75.8 65.4 4,500 TRUE
J-3703 93.3 82.4 3,386 FALSE
J-3704 61.5 51.4 4,000 TRUE
J-3705 63 52.7 3,848 TRUE
J-3706 60.8 48.8 2,923 TRUE
J-3707 62.3 52 3,856 TRUE
J-3708 106.5 98.2 2,379 TRUE
J-3709 61.3 50.2 611 FALSE
J-3710 64.5 52.6 1,981 TRUE
J-3711 67.5 55.6 4,000 TRUE
J-3712 63.6 51.6 4,000 TRUE
J-3713 82.5 71.7 2,471 FALSE
J-3714 52.7 40.7 3,422 TRUE
J-3715 61.8 49.9 3,450 TRUE
J-3716 62.5 50.6 3,484 TRUE
J-3717 53 41 4,000 TRUE
J-3718 65.3 53.6 2,115 TRUE
J-3719 88.8 77.9 3,609 FALSE
J-3720 88.6 77.7 3,532 FALSE
J-3721 66.3 56.4 4,000 TRUE
J-3722 52.3 40.2 3,387 TRUE
J-3723 90.7 79.8 3,074 FALSE
J-3724 69.7 59.6 4,000 TRUE
J-3725 64.1 52.1 4,664 TRUE
J-3727 58.3 47.4 4,000 TRUE
J-3728 91.6 80.7 3,074 FALSE
J-3729 92.5 81.6 2,818 FALSE
J-3730 51.5 39.6 1,392 FALSE
J-3731 68.3 58.2 4,000 TRUE
J-3732 59.5 48.3 1,900 TRUE
J-3733 64.9 52.9 4,000 TRUE
J-3734 82.2 71.4 2,273 FALSE
J-3735 67 55.1 1,012 FALSE
J-3736 67.1 55.2 884 FALSE
J-3737 82.9 72.1 3,521 FALSE
J-3738 89 78.1 3,521 FALSE
J-3739 61.6 50 628 TRUE
J-3741 83.8 72.8 2,785 FALSE
J-3742 69.6 59.5 4,000 TRUE
J-3743 68.4 58.3 2,711 TRUE
J-3744 64.8 52.9 2,569 TRUE
J-3745 46 33.9 2,759 TRUE
J-3748 71.1 61 4,500 TRUE
J-3750 68.8 56.9 3,122 TRUE
J-3751 64.3 52.3 2,787 TRUE
J-3752 66.3 54.3 1,255 FALSE
J-3753 56.7 44.7 1,412 TRUE
J-3754 61.4 51.7 4,000 TRUE
J-3755 65.8 54.1 1,522 FALSE
J-3756 64.9 54.7 3,106 TRUE
J-3757 56.7 44.7 4,000 TRUE
J-3758 85.5 74.6 3,622 FALSE
J-3759 88.6 77.7 3,426 FALSE
J-3760 65 53.3 597 TRUE
J-3763 61.8 49.8 2,780 TRUE
J-3766 96.4 89.3 4,000 TRUE
J-3767 95.7 87.9 4,000 TRUE
J-3769 85.7 78.5 2,243 TRUE
J-3771 73.3 62.9 2,583 TRUE
J-3773 98.9 91.1 4,000 TRUE
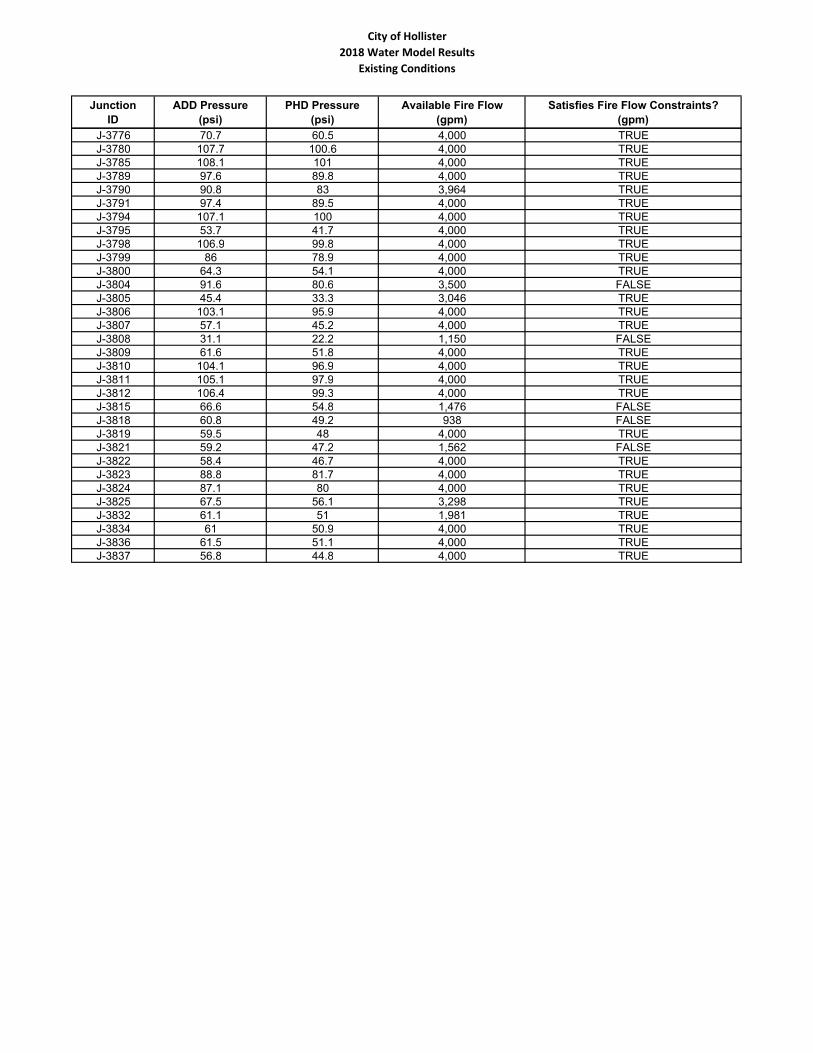
City of Hollister
2018 Water Model Results
Existing Conditions
Junction
ID
ADD Pressure
(psi)
PHD Pressure
(psi)
Available Fire Flow
(gpm)
Satisfies Fire Flow Constraints?
(gpm)
J-3776 70.7 60.5 4,000 TRUE
J-3780 107.7 100.6 4,000 TRUE
J-3785 108.1 101 4,000 TRUE
J-3789 97.6 89.8 4,000 TRUE
J-3790 90.8 83 3,964 TRUE
J-3791 97.4 89.5 4,000 TRUE
J-3794 107.1 100 4,000 TRUE
J-3795 53.7 41.7 4,000 TRUE
J-3798 106.9 99.8 4,000 TRUE
J-3799 86 78.9 4,000 TRUE
J-3800 64.3 54.1 4,000 TRUE
J-3804 91.6 80.6 3,500 FALSE
J-3805 45.4 33.3 3,046 TRUE
J-3806 103.1 95.9 4,000 TRUE
J-3807 57.1 45.2 4,000 TRUE
J-3808 31.1 22.2 1,150 FALSE
J-3809 61.6 51.8 4,000 TRUE
J-3810 104.1 96.9 4,000 TRUE
J-3811 105.1 97.9 4,000 TRUE
J-3812 106.4 99.3 4,000 TRUE
J-3815 66.6 54.8 1,476 FALSE
J-3818 60.8 49.2 938 FALSE
J-3819 59.5 48 4,000 TRUE
J-3821 59.2 47.2 1,562 FALSE
J-3822 58.4 46.7 4,000 TRUE
J-3823 88.8 81.7 4,000 TRUE
J-3824 87.1 80 4,000 TRUE
J-3825 67.5 56.1 3,298 TRUE
J-3832 61.1 51 1,981 TRUE
J-3834 61 50.9 4,000 TRUE
J-3836 61.5 51.1 4,000 TRUE
J-3837 56.8 44.8 4,000 TRUE
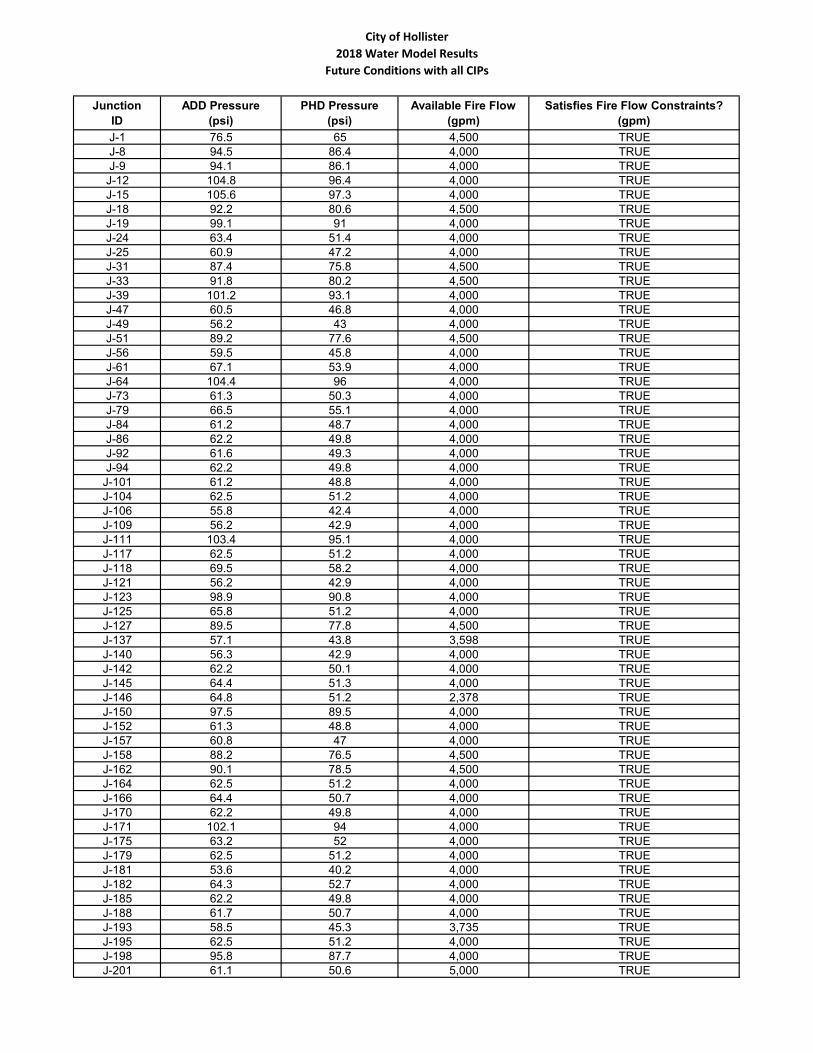
City of Hollister
2018 Water Model Results
Future Conditions with all CIPs
Junction
ID
ADD Pressure
(psi)
PHD Pressure
(psi)
Available Fire Flow
(gpm)
Satisfies Fire Flow Constraints?
(gpm)
J-1 76.5 65 4,500 TRUE
J-8 94.5 86.4 4,000 TRUE
J-9 94.1 86.1 4,000 TRUE
J-12 104.8 96.4 4,000 TRUE
J-15 105.6 97.3 4,000 TRUE
J-18 92.2 80.6 4,500 TRUE
J-19 99.1 91 4,000 TRUE
J-24 63.4 51.4 4,000 TRUE
J-25 60.9 47.2 4,000 TRUE
J-31 87.4 75.8 4,500 TRUE
J-33 91.8 80.2 4,500 TRUE
J-39 101.2 93.1 4,000 TRUE
J-47 60.5 46.8 4,000 TRUE
J-49 56.2 43 4,000 TRUE
J-51 89.2 77.6 4,500 TRUE
J-56 59.5 45.8 4,000 TRUE
J-61 67.1 53.9 4,000 TRUE
J-64 104.4 96 4,000 TRUE
J-73 61.3 50.3 4,000 TRUE
J-79 66.5 55.1 4,000 TRUE
J-84 61.2 48.7 4,000 TRUE
J-86 62.2 49.8 4,000 TRUE
J-92 61.6 49.3 4,000 TRUE
J-94 62.2 49.8 4,000 TRUE
J-101 61.2 48.8 4,000 TRUE
J-104 62.5 51.2 4,000 TRUE
J-106 55.8 42.4 4,000 TRUE
J-109 56.2 42.9 4,000 TRUE
J-111 103.4 95.1 4,000 TRUE
J-117 62.5 51.2 4,000 TRUE
J-118 69.5 58.2 4,000 TRUE
J-121 56.2 42.9 4,000 TRUE
J-123 98.9 90.8 4,000 TRUE
J-125 65.8 51.2 4,000 TRUE
J-127 89.5 77.8 4,500 TRUE
J-137 57.1 43.8 3,598 TRUE
J-140 56.3 42.9 4,000 TRUE
J-142 62.2 50.1 4,000 TRUE
J-145 64.4 51.3 4,000 TRUE
J-146 64.8 51.2 2,378 TRUE
J-150 97.5 89.5 4,000 TRUE
J-152 61.3 48.8 4,000 TRUE
J-157 60.8 47 4,000 TRUE
J-158 88.2 76.5 4,500 TRUE
J-162 90.1 78.5 4,500 TRUE
J-164 62.5 51.2 4,000 TRUE
J-166 64.4 50.7 4,000 TRUE
J-170 62.2 49.8 4,000 TRUE
J-171 102.1 94 4,000 TRUE
J-175 63.2 52 4,000 TRUE
J-179 62.5 51.2 4,000 TRUE
J-181 53.6 40.2 4,000 TRUE
J-182 64.3 52.7 4,000 TRUE
J-185 62.2 49.8 4,000 TRUE
J-188 61.7 50.7 4,000 TRUE
J-193 58.5 45.3 3,735 TRUE
J-195 62.5 51.2 4,000 TRUE
J-198 95.8 87.7 4,000 TRUE
J-201 61.1 50.6 5,000 TRUE
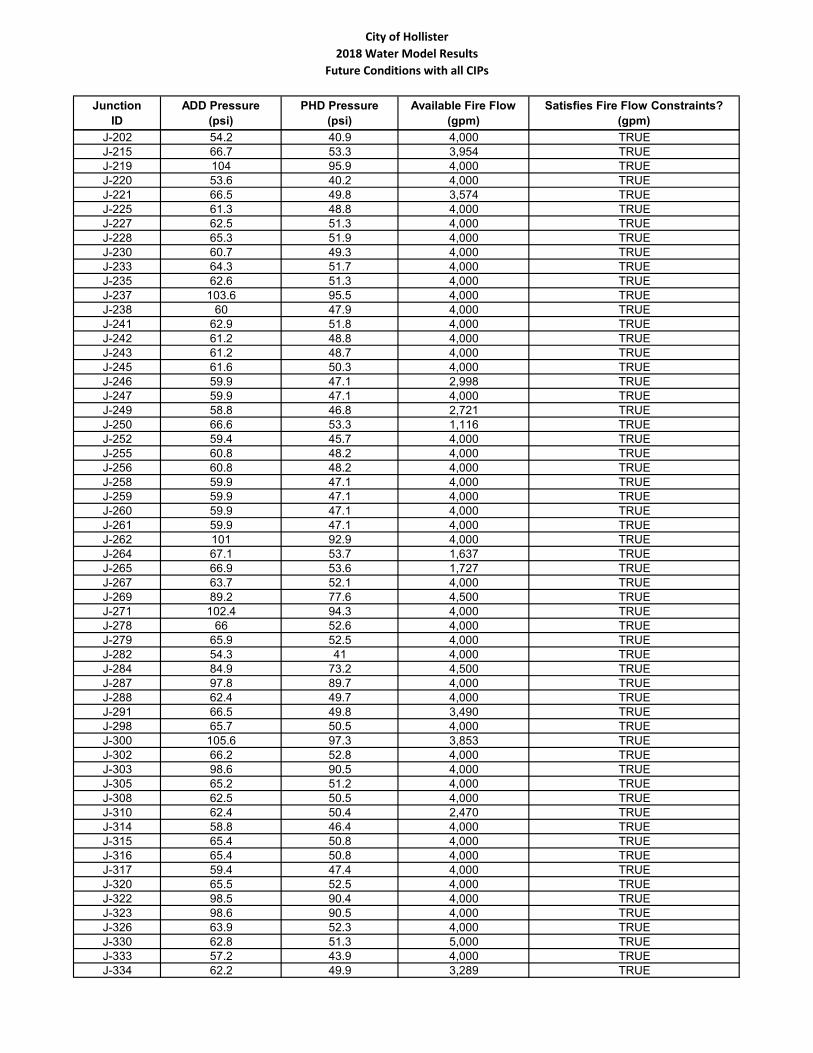
City of Hollister
2018 Water Model Results
Future Conditions with all CIPs
Junction
ID
ADD Pressure
(psi)
PHD Pressure
(psi)
Available Fire Flow
(gpm)
Satisfies Fire Flow Constraints?
(gpm)
J-202 54.2 40.9 4,000 TRUE
J-215 66.7 53.3 3,954 TRUE
J-219 104 95.9 4,000 TRUE
J-220 53.6 40.2 4,000 TRUE
J-221 66.5 49.8 3,574 TRUE
J-225 61.3 48.8 4,000 TRUE
J-227 62.5 51.3 4,000 TRUE
J-228 65.3 51.9 4,000 TRUE
J-230 60.7 49.3 4,000 TRUE
J-233 64.3 51.7 4,000 TRUE
J-235 62.6 51.3 4,000 TRUE
J-237 103.6 95.5 4,000 TRUE
J-238 60 47.9 4,000 TRUE
J-241 62.9 51.8 4,000 TRUE
J-242 61.2 48.8 4,000 TRUE
J-243 61.2 48.7 4,000 TRUE
J-245 61.6 50.3 4,000 TRUE
J-246 59.9 47.1 2,998 TRUE
J-247 59.9 47.1 4,000 TRUE
J-249 58.8 46.8 2,721 TRUE
J-250 66.6 53.3 1,116 TRUE
J-252 59.4 45.7 4,000 TRUE
J-255 60.8 48.2 4,000 TRUE
J-256 60.8 48.2 4,000 TRUE
J-258 59.9 47.1 4,000 TRUE
J-259 59.9 47.1 4,000 TRUE
J-260 59.9 47.1 4,000 TRUE
J-261 59.9 47.1 4,000 TRUE
J-262 101 92.9 4,000 TRUE
J-264 67.1 53.7 1,637 TRUE
J-265 66.9 53.6 1,727 TRUE
J-267 63.7 52.1 4,000 TRUE
J-269 89.2 77.6 4,500 TRUE
J-271 102.4 94.3 4,000 TRUE
J-278 66 52.6 4,000 TRUE
J-279 65.9 52.5 4,000 TRUE
J-282 54.3 41 4,000 TRUE
J-284 84.9 73.2 4,500 TRUE
J-287 97.8 89.7 4,000 TRUE
J-288 62.4 49.7 4,000 TRUE
J-291 66.5 49.8 3,490 TRUE
J-298 65.7 50.5 4,000 TRUE
J-300 105.6 97.3 3,853 TRUE
J-302 66.2 52.8 4,000 TRUE
J-303 98.6 90.5 4,000 TRUE
J-305 65.2 51.2 4,000 TRUE
J-308 62.5 50.5 4,000 TRUE
J-310 62.4 50.4 2,470 TRUE
J-314 58.8 46.4 4,000 TRUE
J-315 65.4 50.8 4,000 TRUE
J-316 65.4 50.8 4,000 TRUE
J-317 59.4 47.4 4,000 TRUE
J-320 65.5 52.5 4,000 TRUE
J-322 98.5 90.4 4,000 TRUE
J-323 98.6 90.5 4,000 TRUE
J-326 63.9 52.3 4,000 TRUE
J-330 62.8 51.3 5,000 TRUE
J-333 57.2 43.9 4,000 TRUE
J-334 62.2 49.9 3,289 TRUE
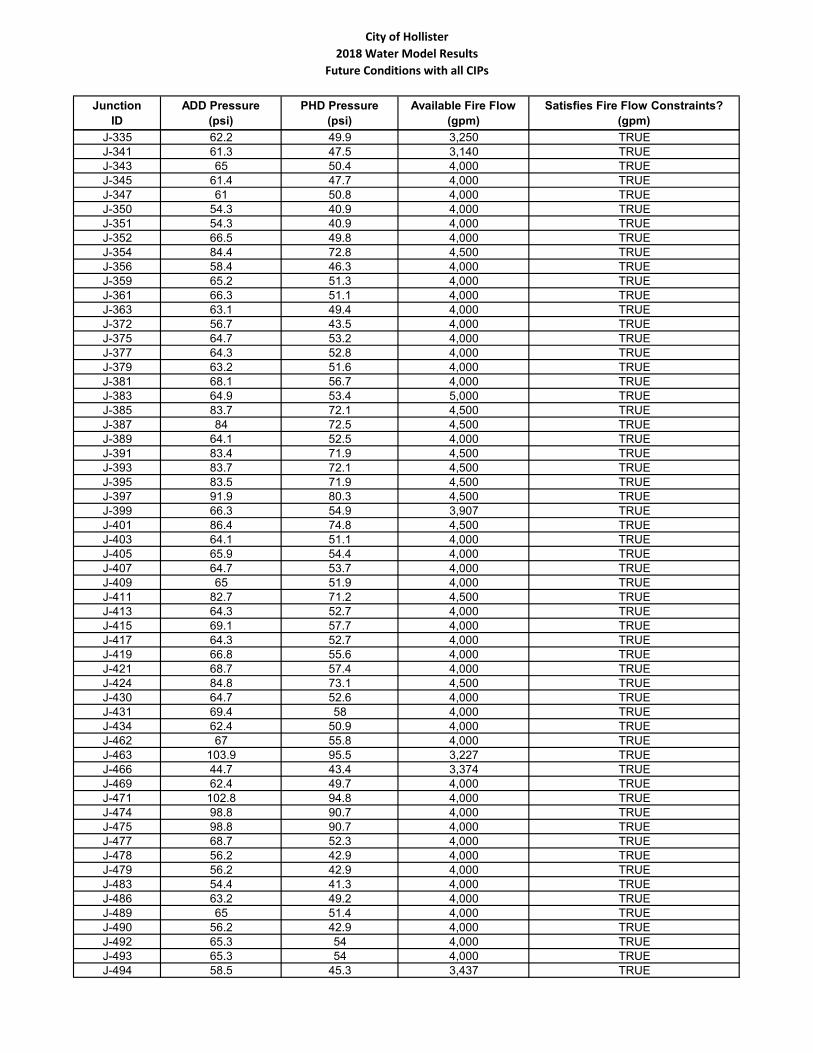
City of Hollister
2018 Water Model Results
Future Conditions with all CIPs
Junction
ID
ADD Pressure
(psi)
PHD Pressure
(psi)
Available Fire Flow
(gpm)
Satisfies Fire Flow Constraints?
(gpm)
J-335 62.2 49.9 3,250 TRUE
J-341 61.3 47.5 3,140 TRUE
J-343 65 50.4 4,000 TRUE
J-345 61.4 47.7 4,000 TRUE
J-347 61 50.8 4,000 TRUE
J-350 54.3 40.9 4,000 TRUE
J-351 54.3 40.9 4,000 TRUE
J-352 66.5 49.8 4,000 TRUE
J-354 84.4 72.8 4,500 TRUE
J-356 58.4 46.3 4,000 TRUE
J-359 65.2 51.3 4,000 TRUE
J-361 66.3 51.1 4,000 TRUE
J-363 63.1 49.4 4,000 TRUE
J-372 56.7 43.5 4,000 TRUE
J-375 64.7 53.2 4,000 TRUE
J-377 64.3 52.8 4,000 TRUE
J-379 63.2 51.6 4,000 TRUE
J-381 68.1 56.7 4,000 TRUE
J-383 64.9 53.4 5,000 TRUE
J-385 83.7 72.1 4,500 TRUE
J-387 84 72.5 4,500 TRUE
J-389 64.1 52.5 4,000 TRUE
J-391 83.4 71.9 4,500 TRUE
J-393 83.7 72.1 4,500 TRUE
J-395 83.5 71.9 4,500 TRUE
J-397 91.9 80.3 4,500 TRUE
J-399 66.3 54.9 3,907 TRUE
J-401 86.4 74.8 4,500 TRUE
J-403 64.1 51.1 4,000 TRUE
J-405 65.9 54.4 4,000 TRUE
J-407 64.7 53.7 4,000 TRUE
J-409 65 51.9 4,000 TRUE
J-411 82.7 71.2 4,500 TRUE
J-413 64.3 52.7 4,000 TRUE
J-415 69.1 57.7 4,000 TRUE
J-417 64.3 52.7 4,000 TRUE
J-419 66.8 55.6 4,000 TRUE
J-421 68.7 57.4 4,000 TRUE
J-424 84.8 73.1 4,500 TRUE
J-430 64.7 52.6 4,000 TRUE
J-431 69.4 58 4,000 TRUE
J-434 62.4 50.9 4,000 TRUE
J-462 67 55.8 4,000 TRUE
J-463 103.9 95.5 3,227 TRUE
J-466 44.7 43.4 3,374 TRUE
J-469 62.4 49.7 4,000 TRUE
J-471 102.8 94.8 4,000 TRUE
J-474 98.8 90.7 4,000 TRUE
J-475 98.8 90.7 4,000 TRUE
J-477 68.7 52.3 4,000 TRUE
J-478 56.2 42.9 4,000 TRUE
J-479 56.2 42.9 4,000 TRUE
J-483 54.4 41.3 4,000 TRUE
J-486 63.2 49.2 4,000 TRUE
J-489 65 51.4 4,000 TRUE
J-490 56.2 42.9 4,000 TRUE
J-492 65.3 54 4,000 TRUE
J-493 65.3 54 4,000 TRUE
J-494 58.5 45.3 3,437 TRUE
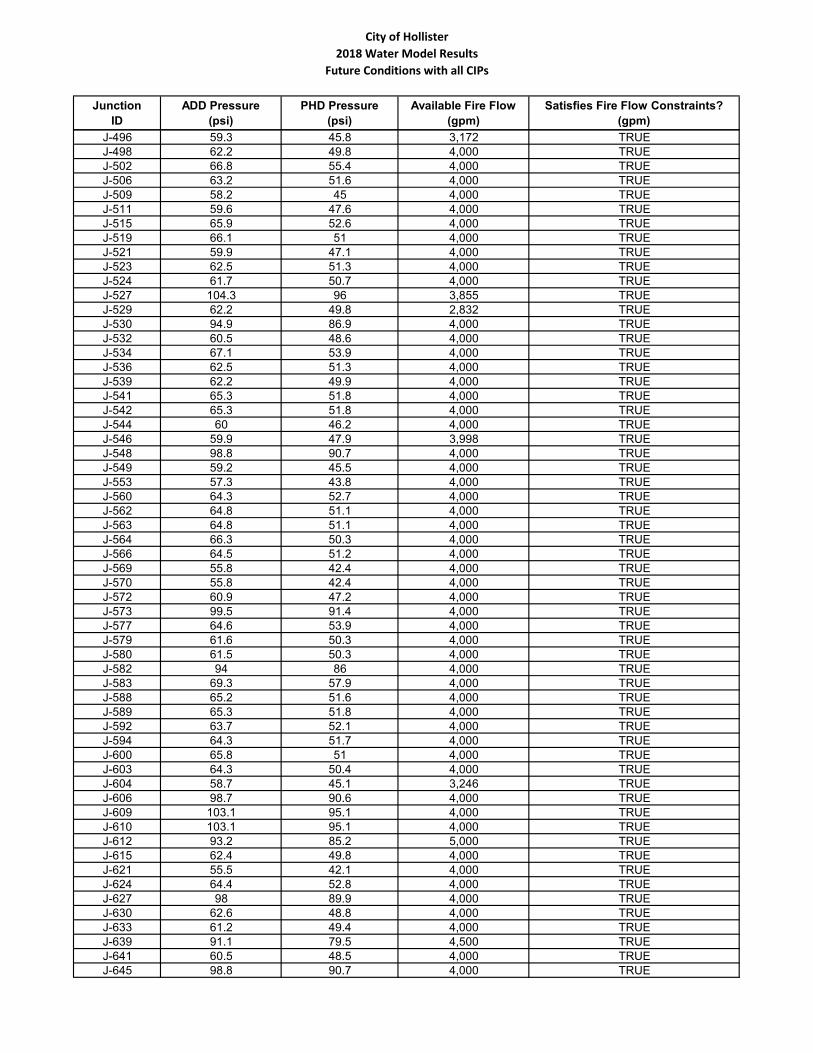
City of Hollister
2018 Water Model Results
Future Conditions with all CIPs
Junction
ID
ADD Pressure
(psi)
PHD Pressure
(psi)
Available Fire Flow
(gpm)
Satisfies Fire Flow Constraints?
(gpm)
J-496 59.3 45.8 3,172 TRUE
J-498 62.2 49.8 4,000 TRUE
J-502 66.8 55.4 4,000 TRUE
J-506 63.2 51.6 4,000 TRUE
J-509 58.2 45 4,000 TRUE
J-511 59.6 47.6 4,000 TRUE
J-515 65.9 52.6 4,000 TRUE
J-519 66.1 51 4,000 TRUE
J-521 59.9 47.1 4,000 TRUE
J-523 62.5 51.3 4,000 TRUE
J-524 61.7 50.7 4,000 TRUE
J-527 104.3 96 3,855 TRUE
J-529 62.2 49.8 2,832 TRUE
J-530 94.9 86.9 4,000 TRUE
J-532 60.5 48.6 4,000 TRUE
J-534 67.1 53.9 4,000 TRUE
J-536 62.5 51.3 4,000 TRUE
J-539 62.2 49.9 4,000 TRUE
J-541 65.3 51.8 4,000 TRUE
J-542 65.3 51.8 4,000 TRUE
J-544 60 46.2 4,000 TRUE
J-546 59.9 47.9 3,998 TRUE
J-548 98.8 90.7 4,000 TRUE
J-549 59.2 45.5 4,000 TRUE
J-553 57.3 43.8 4,000 TRUE
J-560 64.3 52.7 4,000 TRUE
J-562 64.8 51.1 4,000 TRUE
J-563 64.8 51.1 4,000 TRUE
J-564 66.3 50.3 4,000 TRUE
J-566 64.5 51.2 4,000 TRUE
J-569 55.8 42.4 4,000 TRUE
J-570 55.8 42.4 4,000 TRUE
J-572 60.9 47.2 4,000 TRUE
J-573 99.5 91.4 4,000 TRUE
J-577 64.6 53.9 4,000 TRUE
J-579 61.6 50.3 4,000 TRUE
J-580 61.5 50.3 4,000 TRUE
J-582 94 86 4,000 TRUE
J-583 69.3 57.9 4,000 TRUE
J-588 65.2 51.6 4,000 TRUE
J-589 65.3 51.8 4,000 TRUE
J-592 63.7 52.1 4,000 TRUE
J-594 64.3 51.7 4,000 TRUE
J-600 65.8 51 4,000 TRUE
J-603 64.3 50.4 4,000 TRUE
J-604 58.7 45.1 3,246 TRUE
J-606 98.7 90.6 4,000 TRUE
J-609 103.1 95.1 4,000 TRUE
J-610 103.1 95.1 4,000 TRUE
J-612 93.2 85.2 5,000 TRUE
J-615 62.4 49.8 4,000 TRUE
J-621 55.5 42.1 4,000 TRUE
J-624 64.4 52.8 4,000 TRUE
J-627 98 89.9 4,000 TRUE
J-630 62.6 48.8 4,000 TRUE
J-633 61.2 49.4 4,000 TRUE
J-639 91.1 79.5 4,500 TRUE
J-641 60.5 48.5 4,000 TRUE
J-645 98.8 90.7 4,000 TRUE
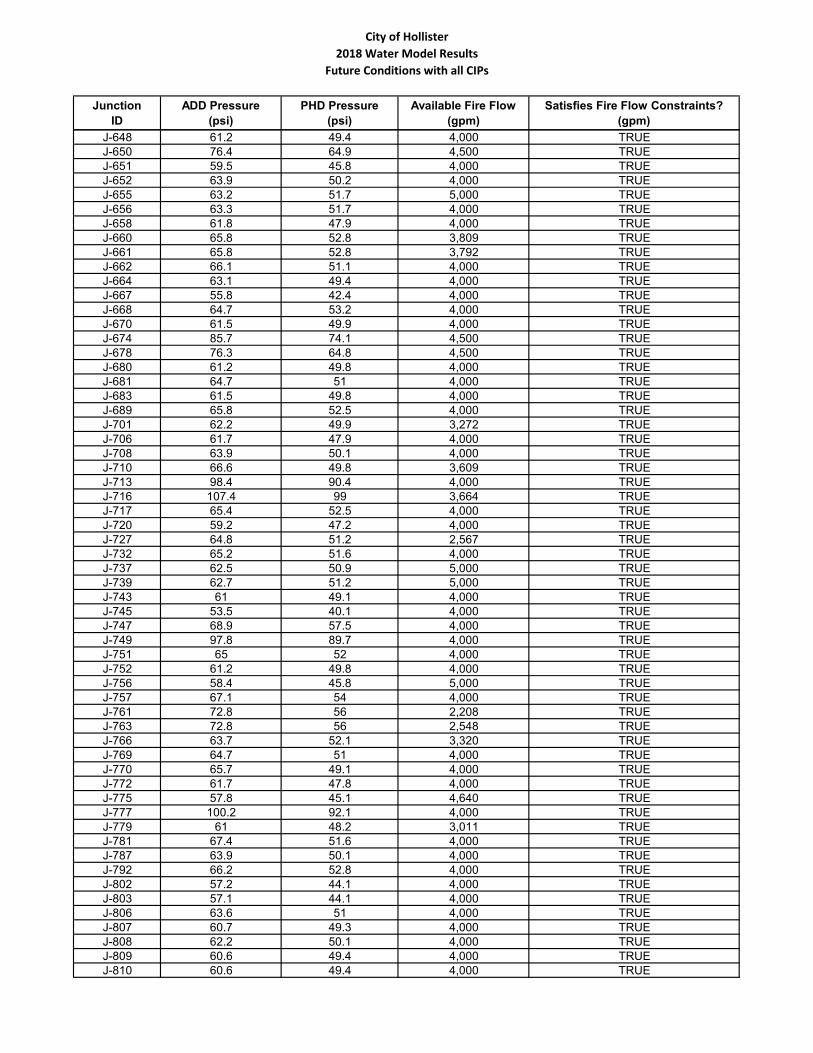
City of Hollister
2018 Water Model Results
Future Conditions with all CIPs
Junction
ID
ADD Pressure
(psi)
PHD Pressure
(psi)
Available Fire Flow
(gpm)
Satisfies Fire Flow Constraints?
(gpm)
J-648 61.2 49.4 4,000 TRUE
J-650 76.4 64.9 4,500 TRUE
J-651 59.5 45.8 4,000 TRUE
J-652 63.9 50.2 4,000 TRUE
J-655 63.2 51.7 5,000 TRUE
J-656 63.3 51.7 4,000 TRUE
J-658 61.8 47.9 4,000 TRUE
J-660 65.8 52.8 3,809 TRUE
J-661 65.8 52.8 3,792 TRUE
J-662 66.1 51.1 4,000 TRUE
J-664 63.1 49.4 4,000 TRUE
J-667 55.8 42.4 4,000 TRUE
J-668 64.7 53.2 4,000 TRUE
J-670 61.5 49.9 4,000 TRUE
J-674 85.7 74.1 4,500 TRUE
J-678 76.3 64.8 4,500 TRUE
J-680 61.2 49.8 4,000 TRUE
J-681 64.7 51 4,000 TRUE
J-683 61.5 49.8 4,000 TRUE
J-689 65.8 52.5 4,000 TRUE
J-701 62.2 49.9 3,272 TRUE
J-706 61.7 47.9 4,000 TRUE
J-708 63.9 50.1 4,000 TRUE
J-710 66.6 49.8 3,609 TRUE
J-713 98.4 90.4 4,000 TRUE
J-716 107.4 99 3,664 TRUE
J-717 65.4 52.5 4,000 TRUE
J-720 59.2 47.2 4,000 TRUE
J-727 64.8 51.2 2,567 TRUE
J-732 65.2 51.6 4,000 TRUE
J-737 62.5 50.9 5,000 TRUE
J-739 62.7 51.2 5,000 TRUE
J-743 61 49.1 4,000 TRUE
J-745 53.5 40.1 4,000 TRUE
J-747 68.9 57.5 4,000 TRUE
J-749 97.8 89.7 4,000 TRUE
J-751 65 52 4,000 TRUE
J-752 61.2 49.8 4,000 TRUE
J-756 58.4 45.8 5,000 TRUE
J-757 67.1 54 4,000 TRUE
J-761 72.8 56 2,208 TRUE
J-763 72.8 56 2,548 TRUE
J-766 63.7 52.1 3,320 TRUE
J-769 64.7 51 4,000 TRUE
J-770 65.7 49.1 4,000 TRUE
J-772 61.7 47.8 4,000 TRUE
J-775 57.8 45.1 4,640 TRUE
J-777 100.2 92.1 4,000 TRUE
J-779 61 48.2 3,011 TRUE
J-781 67.4 51.6 4,000 TRUE
J-787 63.9 50.1 4,000 TRUE
J-792 66.2 52.8 4,000 TRUE
J-802 57.2 44.1 4,000 TRUE
J-803 57.1 44.1 4,000 TRUE
J-806 63.6 51 4,000 TRUE
J-807 60.7 49.3 4,000 TRUE
J-808 62.2 50.1 4,000 TRUE
J-809 60.6 49.4 4,000 TRUE
J-810 60.6 49.4 4,000 TRUE
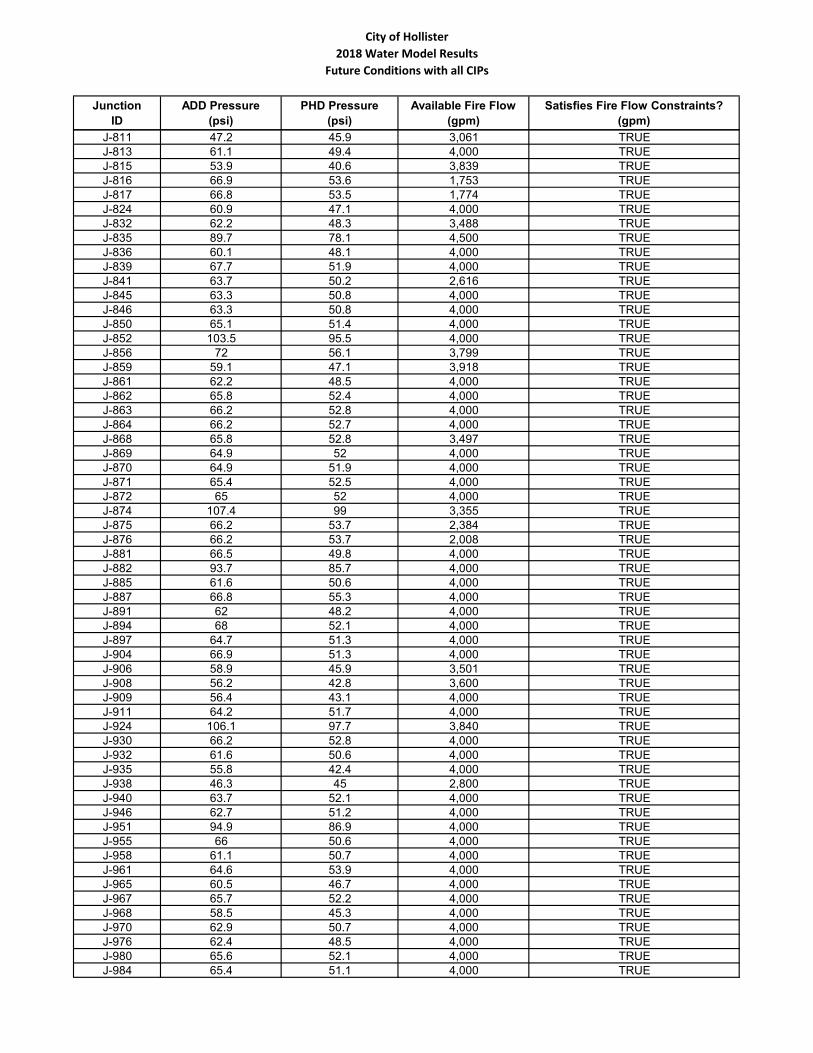
City of Hollister
2018 Water Model Results
Future Conditions with all CIPs
Junction
ID
ADD Pressure
(psi)
PHD Pressure
(psi)
Available Fire Flow
(gpm)
Satisfies Fire Flow Constraints?
(gpm)
J-811 47.2 45.9 3,061 TRUE
J-813 61.1 49.4 4,000 TRUE
J-815 53.9 40.6 3,839 TRUE
J-816 66.9 53.6 1,753 TRUE
J-817 66.8 53.5 1,774 TRUE
J-824 60.9 47.1 4,000 TRUE
J-832 62.2 48.3 3,488 TRUE
J-835 89.7 78.1 4,500 TRUE
J-836 60.1 48.1 4,000 TRUE
J-839 67.7 51.9 4,000 TRUE
J-841 63.7 50.2 2,616 TRUE
J-845 63.3 50.8 4,000 TRUE
J-846 63.3 50.8 4,000 TRUE
J-850 65.1 51.4 4,000 TRUE
J-852 103.5 95.5 4,000 TRUE
J-856 72 56.1 3,799 TRUE
J-859 59.1 47.1 3,918 TRUE
J-861 62.2 48.5 4,000 TRUE
J-862 65.8 52.4 4,000 TRUE
J-863 66.2 52.8 4,000 TRUE
J-864 66.2 52.7 4,000 TRUE
J-868 65.8 52.8 3,497 TRUE
J-869 64.9 52 4,000 TRUE
J-870 64.9 51.9 4,000 TRUE
J-871 65.4 52.5 4,000 TRUE
J-872 65 52 4,000 TRUE
J-874 107.4 99 3,355 TRUE
J-875 66.2 53.7 2,384 TRUE
J-876 66.2 53.7 2,008 TRUE
J-881 66.5 49.8 4,000 TRUE
J-882 93.7 85.7 4,000 TRUE
J-885 61.6 50.6 4,000 TRUE
J-887 66.8 55.3 4,000 TRUE
J-891 62 48.2 4,000 TRUE
J-894 68 52.1 4,000 TRUE
J-897 64.7 51.3 4,000 TRUE
J-904 66.9 51.3 4,000 TRUE
J-906 58.9 45.9 3,501 TRUE
J-908 56.2 42.8 3,600 TRUE
J-909 56.4 43.1 4,000 TRUE
J-911 64.2 51.7 4,000 TRUE
J-924 106.1 97.7 3,840 TRUE
J-930 66.2 52.8 4,000 TRUE
J-932 61.6 50.6 4,000 TRUE
J-935 55.8 42.4 4,000 TRUE
J-938 46.3 45 2,800 TRUE
J-940 63.7 52.1 4,000 TRUE
J-946 62.7 51.2 4,000 TRUE
J-951 94.9 86.9 4,000 TRUE
J-955 66 50.6 4,000 TRUE
J-958 61.1 50.7 4,000 TRUE
J-961 64.6 53.9 4,000 TRUE
J-965 60.5 46.7 4,000 TRUE
J-967 65.7 52.2 4,000 TRUE
J-968 58.5 45.3 4,000 TRUE
J-970 62.9 50.7 4,000 TRUE
J-976 62.4 48.5 4,000 TRUE
J-980 65.6 52.1 4,000 TRUE
J-984 65.4 51.1 4,000 TRUE
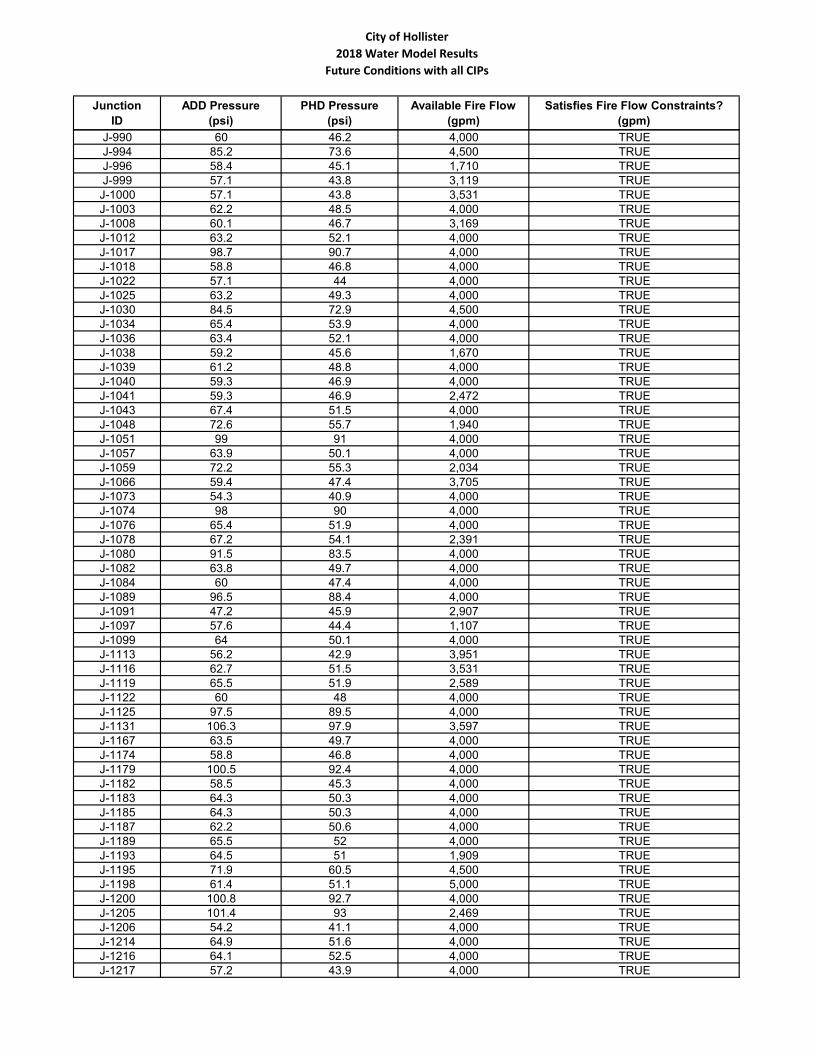
City of Hollister
2018 Water Model Results
Future Conditions with all CIPs
Junction
ID
ADD Pressure
(psi)
PHD Pressure
(psi)
Available Fire Flow
(gpm)
Satisfies Fire Flow Constraints?
(gpm)
J-990 60 46.2 4,000 TRUE
J-994 85.2 73.6 4,500 TRUE
J-996 58.4 45.1 1,710 TRUE
J-999 57.1 43.8 3,119 TRUE
J-1000 57.1 43.8 3,531 TRUE
J-1003 62.2 48.5 4,000 TRUE
J-1008 60.1 46.7 3,169 TRUE
J-1012 63.2 52.1 4,000 TRUE
J-1017 98.7 90.7 4,000 TRUE
J-1018 58.8 46.8 4,000 TRUE
J-1022 57.1 44 4,000 TRUE
J-1025 63.2 49.3 4,000 TRUE
J-1030 84.5 72.9 4,500 TRUE
J-1034 65.4 53.9 4,000 TRUE
J-1036 63.4 52.1 4,000 TRUE
J-1038 59.2 45.6 1,670 TRUE
J-1039 61.2 48.8 4,000 TRUE
J-1040 59.3 46.9 4,000 TRUE
J-1041 59.3 46.9 2,472 TRUE
J-1043 67.4 51.5 4,000 TRUE
J-1048 72.6 55.7 1,940 TRUE
J-1051 99 91 4,000 TRUE
J-1057 63.9 50.1 4,000 TRUE
J-1059 72.2 55.3 2,034 TRUE
J-1066 59.4 47.4 3,705 TRUE
J-1073 54.3 40.9 4,000 TRUE
J-1074 98 90 4,000 TRUE
J-1076 65.4 51.9 4,000 TRUE
J-1078 67.2 54.1 2,391 TRUE
J-1080 91.5 83.5 4,000 TRUE
J-1082 63.8 49.7 4,000 TRUE
J-1084 60 47.4 4,000 TRUE
J-1089 96.5 88.4 4,000 TRUE
J-1091 47.2 45.9 2,907 TRUE
J-1097 57.6 44.4 1,107 TRUE
J-1099 64 50.1 4,000 TRUE
J-1113 56.2 42.9 3,951 TRUE
J-1116 62.7 51.5 3,531 TRUE
J-1119 65.5 51.9 2,589 TRUE
J-1122 60 48 4,000 TRUE
J-1125 97.5 89.5 4,000 TRUE
J-1131 106.3 97.9 3,597 TRUE
J-1167 63.5 49.7 4,000 TRUE
J-1174 58.8 46.8 4,000 TRUE
J-1179 100.5 92.4 4,000 TRUE
J-1182 58.5 45.3 4,000 TRUE
J-1183 64.3 50.3 4,000 TRUE
J-1185 64.3 50.3 4,000 TRUE
J-1187 62.2 50.6 4,000 TRUE
J-1189 65.5 52 4,000 TRUE
J-1193 64.5 51 1,909 TRUE
J-1195 71.9 60.5 4,500 TRUE
J-1198 61.4 51.1 5,000 TRUE
J-1200 100.8 92.7 4,000 TRUE
J-1205 101.4 93 2,469 TRUE
J-1206 54.2 41.1 4,000 TRUE
J-1214 64.9 51.6 4,000 TRUE
J-1216 64.1 52.5 4,000 TRUE
J-1217 57.2 43.9 4,000 TRUE
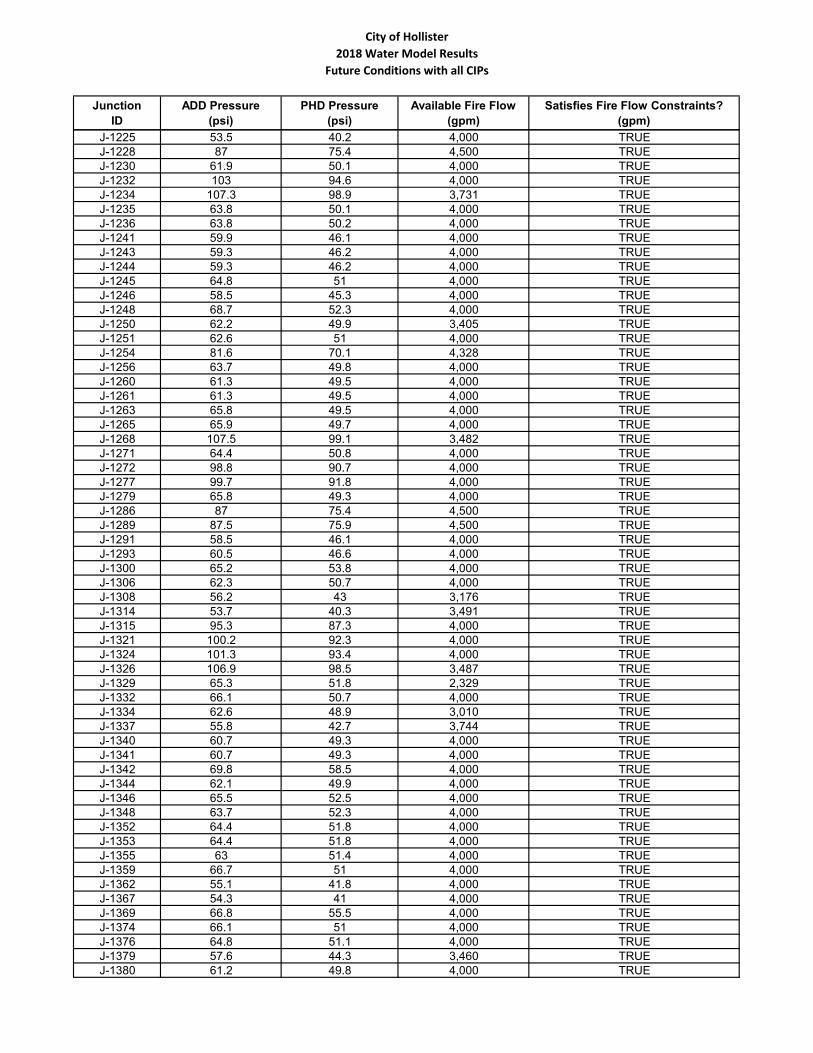
City of Hollister
2018 Water Model Results
Future Conditions with all CIPs
Junction
ID
ADD Pressure
(psi)
PHD Pressure
(psi)
Available Fire Flow
(gpm)
Satisfies Fire Flow Constraints?
(gpm)
J-1225 53.5 40.2 4,000 TRUE
J-1228 87 75.4 4,500 TRUE
J-1230 61.9 50.1 4,000 TRUE
J-1232 103 94.6 4,000 TRUE
J-1234 107.3 98.9 3,731 TRUE
J-1235 63.8 50.1 4,000 TRUE
J-1236 63.8 50.2 4,000 TRUE
J-1241 59.9 46.1 4,000 TRUE
J-1243 59.3 46.2 4,000 TRUE
J-1244 59.3 46.2 4,000 TRUE
J-1245 64.8 51 4,000 TRUE
J-1246 58.5 45.3 4,000 TRUE
J-1248 68.7 52.3 4,000 TRUE
J-1250 62.2 49.9 3,405 TRUE
J-1251 62.6 51 4,000 TRUE
J-1254 81.6 70.1 4,328 TRUE
J-1256 63.7 49.8 4,000 TRUE
J-1260 61.3 49.5 4,000 TRUE
J-1261 61.3 49.5 4,000 TRUE
J-1263 65.8 49.5 4,000 TRUE
J-1265 65.9 49.7 4,000 TRUE
J-1268 107.5 99.1 3,482 TRUE
J-1271 64.4 50.8 4,000 TRUE
J-1272 98.8 90.7 4,000 TRUE
J-1277 99.7 91.8 4,000 TRUE
J-1279 65.8 49.3 4,000 TRUE
J-1286 87 75.4 4,500 TRUE
J-1289 87.5 75.9 4,500 TRUE
J-1291 58.5 46.1 4,000 TRUE
J-1293 60.5 46.6 4,000 TRUE
J-1300 65.2 53.8 4,000 TRUE
J-1306 62.3 50.7 4,000 TRUE
J-1308 56.2 43 3,176 TRUE
J-1314 53.7 40.3 3,491 TRUE
J-1315 95.3 87.3 4,000 TRUE
J-1321 100.2 92.3 4,000 TRUE
J-1324 101.3 93.4 4,000 TRUE
J-1326 106.9 98.5 3,487 TRUE
J-1329 65.3 51.8 2,329 TRUE
J-1332 66.1 50.7 4,000 TRUE
J-1334 62.6 48.9 3,010 TRUE
J-1337 55.8 42.7 3,744 TRUE
J-1340 60.7 49.3 4,000 TRUE
J-1341 60.7 49.3 4,000 TRUE
J-1342 69.8 58.5 4,000 TRUE
J-1344 62.1 49.9 4,000 TRUE
J-1346 65.5 52.5 4,000 TRUE
J-1348 63.7 52.3 4,000 TRUE
J-1352 64.4 51.8 4,000 TRUE
J-1353 64.4 51.8 4,000 TRUE
J-1355 63 51.4 4,000 TRUE
J-1359 66.7 51 4,000 TRUE
J-1362 55.1 41.8 4,000 TRUE
J-1367 54.3 41 4,000 TRUE
J-1369 66.8 55.5 4,000 TRUE
J-1374 66.1 51 4,000 TRUE
J-1376 64.8 51.1 4,000 TRUE
J-1379 57.6 44.3 3,460 TRUE
J-1380 61.2 49.8 4,000 TRUE
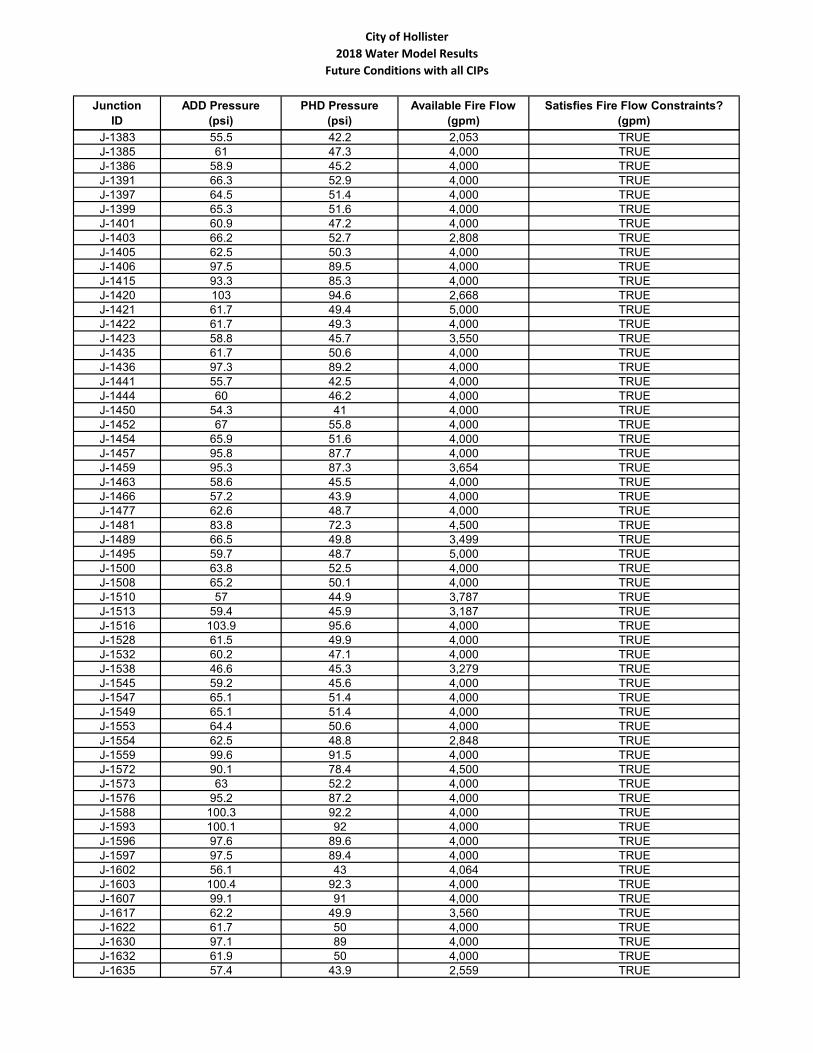
City of Hollister
2018 Water Model Results
Future Conditions with all CIPs
Junction
ID
ADD Pressure
(psi)
PHD Pressure
(psi)
Available Fire Flow
(gpm)
Satisfies Fire Flow Constraints?
(gpm)
J-1383 55.5 42.2 2,053 TRUE
J-1385 61 47.3 4,000 TRUE
J-1386 58.9 45.2 4,000 TRUE
J-1391 66.3 52.9 4,000 TRUE
J-1397 64.5 51.4 4,000 TRUE
J-1399 65.3 51.6 4,000 TRUE
J-1401 60.9 47.2 4,000 TRUE
J-1403 66.2 52.7 2,808 TRUE
J-1405 62.5 50.3 4,000 TRUE
J-1406 97.5 89.5 4,000 TRUE
J-1415 93.3 85.3 4,000 TRUE
J-1420 103 94.6 2,668 TRUE
J-1421 61.7 49.4 5,000 TRUE
J-1422 61.7 49.3 4,000 TRUE
J-1423 58.8 45.7 3,550 TRUE
J-1435 61.7 50.6 4,000 TRUE
J-1436 97.3 89.2 4,000 TRUE
J-1441 55.7 42.5 4,000 TRUE
J-1444 60 46.2 4,000 TRUE
J-1450 54.3 41 4,000 TRUE
J-1452 67 55.8 4,000 TRUE
J-1454 65.9 51.6 4,000 TRUE
J-1457 95.8 87.7 4,000 TRUE
J-1459 95.3 87.3 3,654 TRUE
J-1463 58.6 45.5 4,000 TRUE
J-1466 57.2 43.9 4,000 TRUE
J-1477 62.6 48.7 4,000 TRUE
J-1481 83.8 72.3 4,500 TRUE
J-1489 66.5 49.8 3,499 TRUE
J-1495 59.7 48.7 5,000 TRUE
J-1500 63.8 52.5 4,000 TRUE
J-1508 65.2 50.1 4,000 TRUE
J-1510 57 44.9 3,787 TRUE
J-1513 59.4 45.9 3,187 TRUE
J-1516 103.9 95.6 4,000 TRUE
J-1528 61.5 49.9 4,000 TRUE
J-1532 60.2 47.1 4,000 TRUE
J-1538 46.6 45.3 3,279 TRUE
J-1545 59.2 45.6 4,000 TRUE
J-1547 65.1 51.4 4,000 TRUE
J-1549 65.1 51.4 4,000 TRUE
J-1553 64.4 50.6 4,000 TRUE
J-1554 62.5 48.8 2,848 TRUE
J-1559 99.6 91.5 4,000 TRUE
J-1572 90.1 78.4 4,500 TRUE
J-1573 63 52.2 4,000 TRUE
J-1576 95.2 87.2 4,000 TRUE
J-1588 100.3 92.2 4,000 TRUE
J-1593 100.1 92 4,000 TRUE
J-1596 97.6 89.6 4,000 TRUE
J-1597 97.5 89.4 4,000 TRUE
J-1602 56.1 43 4,064 TRUE
J-1603 100.4 92.3 4,000 TRUE
J-1607 99.1 91 4,000 TRUE
J-1617 62.2 49.9 3,560 TRUE
J-1622 61.7 50 4,000 TRUE
J-1630 97.1 89 4,000 TRUE
J-1632 61.9 50 4,000 TRUE
J-1635 57.4 43.9 2,559 TRUE

City of Hollister
2018 Water Model Results
Future Conditions with all CIPs
Junction
ID
ADD Pressure
(psi)
PHD Pressure
(psi)
Available Fire Flow
(gpm)
Satisfies Fire Flow Constraints?
(gpm)
J-1636 98.5 90.5 4,000 TRUE
J-1637 46.3 44.9 2,785 TRUE
J-1639 54.8 41.4 2,581 TRUE
J-1640 55.5 42.2 4,000 TRUE
J-1643 60.7 47.5 3,032 TRUE
J-1645 59.5 45.8 3,244 TRUE
J-1648 58.8 45.2 2,019 TRUE
J-1652 102.1 94.1 4,000 TRUE
J-1661 47.2 45.9 2,985 TRUE
J-1662 65.3 51.8 4,000 TRUE
J-1666 60.9 47.1 4,000 TRUE
J-1672 102.9 94.9 4,000 TRUE
J-1676 62.8 51.3 4,000 TRUE
J-1679 98.6 90.5 4,000 TRUE
J-1682 61.8 50.2 4,000 TRUE
J-1684 60.9 47.2 3,859 TRUE
J-1687 64.5 50.7 4,000 TRUE
J-1692 95.3 87.3 4,000 TRUE
J-1703 56.3 43 4,000 TRUE
J-1709 98.8 90.7 4,000 TRUE
J-1713 64.8 54 4,000 TRUE
J-1714 64.8 54 4,000 TRUE
J-1716 65.7 54.6 4,000 TRUE
J-1722 60.8 48.7 4,000 TRUE
J-1725 59.5 45.9 4,000 TRUE
J-1726 59.4 45.8 4,000 TRUE
J-1727 61.7 49.9 4,000 TRUE
J-1735 103.6 95.5 4,000 TRUE
J-1747 103.2 95.2 4,000 TRUE
J-1753 63.1 51.6 4,000 TRUE
J-1770 57.5 44.3 4,000 TRUE
J-1771 65.5 52.5 3,744 TRUE
J-1774 100.1 92 5,000 TRUE
J-1776 93.6 85.6 4,000 TRUE
J-1777 61.5 48.5 3,905 TRUE
J-1780 60.9 47.1 4,000 TRUE
J-1783 103.1 95.1 4,000 TRUE
J-1787 66 49.5 4,000 TRUE
J-1789 58.6 44.9 2,905 TRUE
J-1795 58.6 45.5 3,551 TRUE
J-1797 62.2 49.6 4,000 TRUE
J-1801 107.1 98.7 3,634 TRUE
J-1805 103.5 95.4 4,000 TRUE
J-1810 90.3 82.4 4,000 TRUE
J-1819 55.3 44.3 4,000 TRUE
J-1824 104.6 96.2 3,987 TRUE
J-1827 58.9 46.6 4,000 TRUE
J-1835 62 48.9 2,958 TRUE
J-1843 96.3 88.2 4,000 TRUE
J-1847 66.8 50.1 3,835 TRUE
J-1853 58.9 45.9 4,000 TRUE
J-1855 66.2 51.9 4,000 TRUE
J-1860 64.8 51.1 4,000 TRUE
J-1862 58 44.5 2,714 TRUE
J-1865 64.8 51.1 4,000 TRUE
J-1868 104.7 96.3 3,852 TRUE
J-1871 98.4 90.3 4,000 TRUE
J-1876 84.2 72.6 4,500 TRUE
J-1877 84.3 72.7 4,500 TRUE
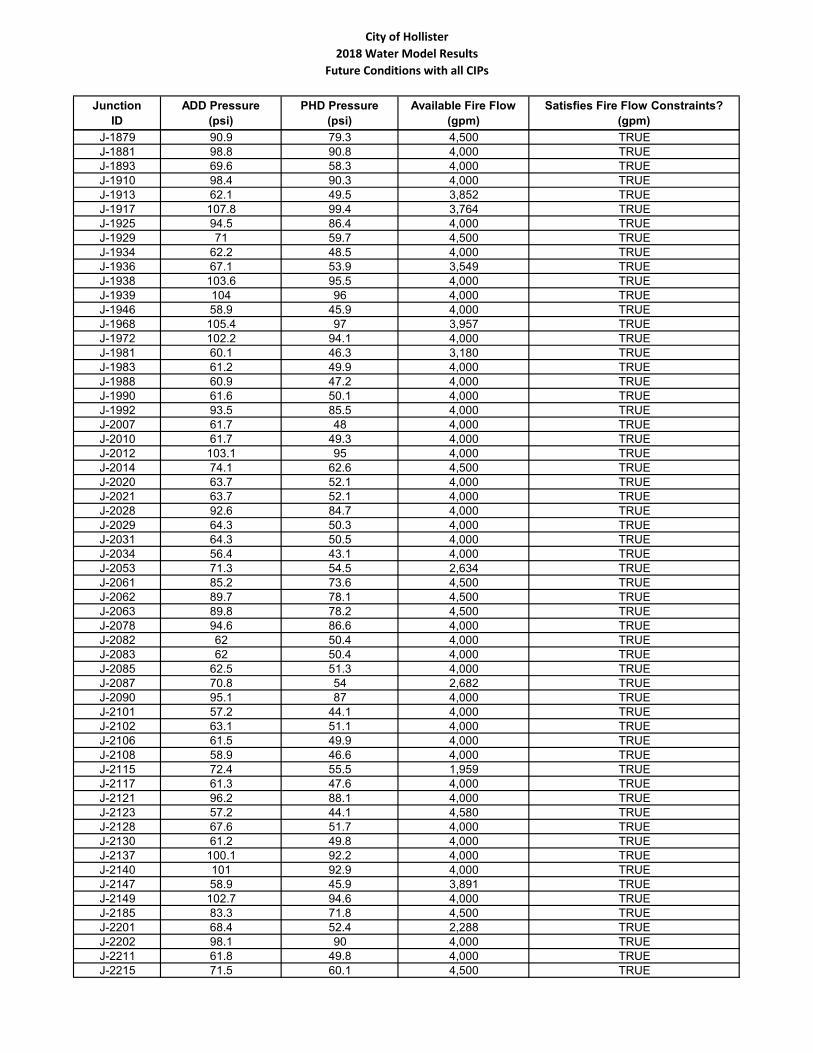
City of Hollister
2018 Water Model Results
Future Conditions with all CIPs
Junction
ID
ADD Pressure
(psi)
PHD Pressure
(psi)
Available Fire Flow
(gpm)
Satisfies Fire Flow Constraints?
(gpm)
J-1879 90.9 79.3 4,500 TRUE
J-1881 98.8 90.8 4,000 TRUE
J-1893 69.6 58.3 4,000 TRUE
J-1910 98.4 90.3 4,000 TRUE
J-1913 62.1 49.5 3,852 TRUE
J-1917 107.8 99.4 3,764 TRUE
J-1925 94.5 86.4 4,000 TRUE
J-1929 71 59.7 4,500 TRUE
J-1934 62.2 48.5 4,000 TRUE
J-1936 67.1 53.9 3,549 TRUE
J-1938 103.6 95.5 4,000 TRUE
J-1939 104 96 4,000 TRUE
J-1946 58.9 45.9 4,000 TRUE
J-1968 105.4 97 3,957 TRUE
J-1972 102.2 94.1 4,000 TRUE
J-1981 60.1 46.3 3,180 TRUE
J-1983 61.2 49.9 4,000 TRUE
J-1988 60.9 47.2 4,000 TRUE
J-1990 61.6 50.1 4,000 TRUE
J-1992 93.5 85.5 4,000 TRUE
J-2007 61.7 48 4,000 TRUE
J-2010 61.7 49.3 4,000 TRUE
J-2012 103.1 95 4,000 TRUE
J-2014 74.1 62.6 4,500 TRUE
J-2020 63.7 52.1 4,000 TRUE
J-2021 63.7 52.1 4,000 TRUE
J-2028 92.6 84.7 4,000 TRUE
J-2029 64.3 50.3 4,000 TRUE
J-2031 64.3 50.5 4,000 TRUE
J-2034 56.4 43.1 4,000 TRUE
J-2053 71.3 54.5 2,634 TRUE
J-2061 85.2 73.6 4,500 TRUE
J-2062 89.7 78.1 4,500 TRUE
J-2063 89.8 78.2 4,500 TRUE
J-2078 94.6 86.6 4,000 TRUE
J-2082 62 50.4 4,000 TRUE
J-2083 62 50.4 4,000 TRUE
J-2085 62.5 51.3 4,000 TRUE
J-2087 70.8 54 2,682 TRUE
J-2090 95.1 87 4,000 TRUE
J-2101 57.2 44.1 4,000 TRUE
J-2102 63.1 51.1 4,000 TRUE
J-2106 61.5 49.9 4,000 TRUE
J-2108 58.9 46.6 4,000 TRUE
J-2115 72.4 55.5 1,959 TRUE
J-2117 61.3 47.6 4,000 TRUE
J-2121 96.2 88.1 4,000 TRUE
J-2123 57.2 44.1 4,580 TRUE
J-2128 67.6 51.7 4,000 TRUE
J-2130 61.2 49.8 4,000 TRUE
J-2137 100.1 92.2 4,000 TRUE
J-2140 101 92.9 4,000 TRUE
J-2147 58.9 45.9 3,891 TRUE
J-2149 102.7 94.6 4,000 TRUE
J-2185 83.3 71.8 4,500 TRUE
J-2201 68.4 52.4 2,288 TRUE
J-2202 98.1 90 4,000 TRUE
J-2211 61.8 49.8 4,000 TRUE
J-2215 71.5 60.1 4,500 TRUE

City of Hollister
2018 Water Model Results
Future Conditions with all CIPs
Junction
ID
ADD Pressure
(psi)
PHD Pressure
(psi)
Available Fire Flow
(gpm)
Satisfies Fire Flow Constraints?
(gpm)
J-2231 100 92 4,000 TRUE
J-2234 62.3 50.4 1,883 TRUE
J-2246 99.2 91.2 4,000 TRUE
J-2247 99.5 91.4 4,000 TRUE
J-2250 88 76.4 4,500 TRUE
J-2253 66.8 55.4 4,000 TRUE
J-2262 58.8 46.3 4,000 TRUE
J-2266 64.3 53.2 2,754 TRUE
J-2271 62.7 51.2 4,000 TRUE
J-2273 59.4 46.3 1,960 TRUE
J-2280 57.7 44.5 3,970 TRUE
J-2284 98.1 90 4,000 TRUE
J-2299 69.8 58.5 4,000 TRUE
J-2301 81.2 69.6 4,500 TRUE
J-2309 87.4 75.8 4,500 TRUE
J-2313 89.2 77.6 4,500 TRUE
J-2328 67.1 53.8 3,911 TRUE
J-2330 56.3 43 3,196 TRUE
J-2333 64.7 50 2,295 TRUE
J-2335 62.1 49.5 4,000 TRUE
J-2349 62 50.4 4,000 TRUE
J-2353 71.7 60.2 4,500 TRUE
J-2354 56.2 43.1 4,213 TRUE
J-2357 63.7 52.1 4,000 TRUE
J-2359 60.3 47.5 2,993 TRUE
J-2360 60.2 47.5 3,447 TRUE
J-2367 98.8 90.7 4,000 TRUE
J-2371 58.5 45.9 5,000 TRUE
J-2375 53.3 40.1 3,980 TRUE
J-2383 69.6 58.3 4,000 TRUE
J-2384 58.4 44.9 2,834 TRUE
J-2390 73.7 62.3 4,500 TRUE
J-2397 60.9 47.1 2,693 TRUE
J-2401 56.3 43 4,000 TRUE
J-2405 97.9 89.9 4,000 TRUE
J-2410 58.6 46.2 4,000 TRUE
J-2418 64.5 52.9 4,000 TRUE
J-2419 79.4 67.9 4,500 TRUE
J-2421 59 46.5 4,000 TRUE
J-2425 71.6 54.7 2,134 TRUE
J-2427 64.2 50.2 4,000 TRUE
J-2435 66.8 51 4,000 TRUE
J-2438 63.5 49.7 4,000 TRUE
J-2441 58.9 45.9 3,607 TRUE
J-2447 105.6 97.3 4,000 TRUE
J-2451 64.9 51.5 2,058 TRUE
J-2455 99.1 91.1 4,000 TRUE
J-2456 63.9 50.1 4,000 TRUE
J-2465 68.1 51.8 4,000 TRUE
J-2467 67.7 51.6 4,000 TRUE
J-2470 66.6 55.2 3,624 TRUE
J-2484 73.9 62.4 4,500 TRUE
J-2485 74.3 62.9 4,500 TRUE
J-2486 62.4 50.9 4,000 TRUE
J-2488 57.8 45.1 4,506 TRUE
J-2491 69.1 53.1 1,766 TRUE
J-2496 64 52.5 4,000 TRUE
J-2502 64.8 51.7 3,483 TRUE
J-2504 69.3 58 4,000 TRUE

City of Hollister
2018 Water Model Results
Future Conditions with all CIPs
Junction
ID
ADD Pressure
(psi)
PHD Pressure
(psi)
Available Fire Flow
(gpm)
Satisfies Fire Flow Constraints?
(gpm)
J-2510 103.8 95.7 4,000 TRUE
J-2514 105.5 97.1 4,000 TRUE
J-2515 104 95.9 4,000 TRUE
J-2517 58.6 46.2 4,000 TRUE
J-2518 58.5 46.1 4,000 TRUE
J-2522 96 88 4,000 TRUE
J-2528 69.2 57.8 5,000 TRUE
J-2531 96.6 88.6 4,000 TRUE
J-2539 60 46.2 4,000 TRUE
J-2545 102.9 94.5 2,594 TRUE
J-2547 63.3 52.4 2,962 TRUE
J-2550 61.2 49.9 4,000 TRUE
J-2553 103.5 95.1 2,878 TRUE
J-2557 61.5 49.9 4,000 TRUE
J-2560 63.7 52.1 4,000 TRUE
J-2561 63.7 52.1 4,000 TRUE
J-2564 65.8 52.8 2,863 TRUE
J-2565 98.4 90.4 4,000 TRUE
J-2568 98.8 90.8 4,000 TRUE
J-2569 59.1 46.7 4,000 TRUE
J-2572 67.9 56.5 4,000 TRUE
J-2573 100 92 4,000 TRUE
J-2577 62.9 51.7 4,000 TRUE
J-2580 61.3 50 4,000 TRUE
J-2581 92.9 85 5,000 TRUE
J-2582 78.9 67.3 4,500 TRUE
J-2586 104.8 96.4 3,871 TRUE
J-2592 103.6 95.3 4,000 TRUE
J-2597 57.9 44.3 2,515 TRUE
J-2603 104.8 96.4 4,000 TRUE
J-2607 60.7 47 3,652 TRUE
J-2611 67.6 51.6 4,000 TRUE
J-2613 104.2 95.9 4,000 TRUE
J-2618 63.3 51.7 4,000 TRUE
J-2620 65.4 53.9 4,000 TRUE
J-2621 98.4 90.4 4,000 TRUE
J-2624 61.7 49.3 4,000 TRUE
J-2629 68.9 53 1,880 TRUE
J-2630 100.5 92.5 5,000 TRUE
J-2635 62 48.2 3,737 TRUE
J-2636 61.2 47.4 3,644 TRUE
J-2638 65.8 51.2 4,000 TRUE
J-2647 63.7 52.1 2,885 TRUE
J-2648 60.1 47.3 4,000 TRUE
J-2651 66.3 54.9 4,000 TRUE
J-2652 65 51.3 3,163 TRUE
J-2654 57.2 44 4,000 TRUE
J-2657 66.7 50 3,595 TRUE
J-2659 60.7 49.7 4,000 TRUE
J-2660 60.7 49.7 4,000 TRUE
J-2661 47.2 45.9 2,924 TRUE
J-2662 67.2 55.8 4,000 TRUE
J-2671 105.5 97.1 4,000 TRUE
J-2674 96.2 88.1 4,000 TRUE
J-2677 60.9 47.1 3,540 TRUE
J-2680 63.9 50.1 4,000 TRUE
J-2685 65.3 51.6 4,000 TRUE
J-2691 103.6 95.5 4,000 TRUE
J-2692 60.9 47.6 2,917 TRUE
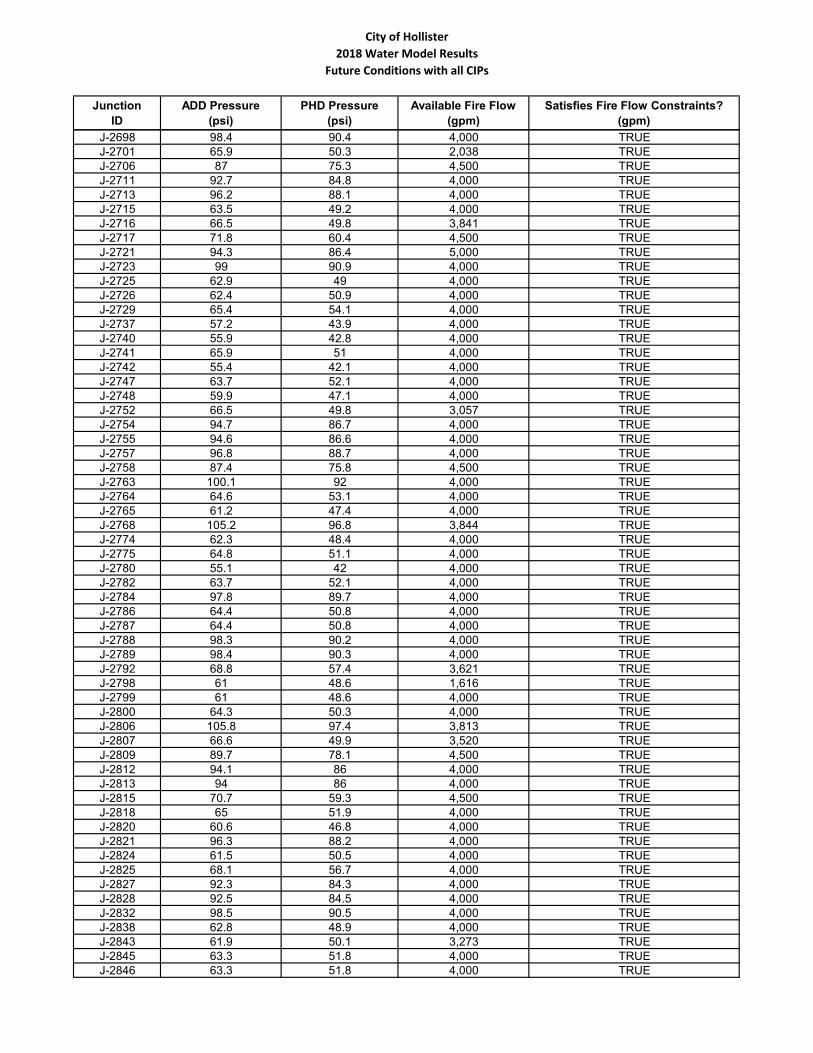
City of Hollister
2018 Water Model Results
Future Conditions with all CIPs
Junction
ID
ADD Pressure
(psi)
PHD Pressure
(psi)
Available Fire Flow
(gpm)
Satisfies Fire Flow Constraints?
(gpm)
J-2698 98.4 90.4 4,000 TRUE
J-2701 65.9 50.3 2,038 TRUE
J-2706 87 75.3 4,500 TRUE
J-2711 92.7 84.8 4,000 TRUE
J-2713 96.2 88.1 4,000 TRUE
J-2715 63.5 49.2 4,000 TRUE
J-2716 66.5 49.8 3,841 TRUE
J-2717 71.8 60.4 4,500 TRUE
J-2721 94.3 86.4 5,000 TRUE
J-2723 99 90.9 4,000 TRUE
J-2725 62.9 49 4,000 TRUE
J-2726 62.4 50.9 4,000 TRUE
J-2729 65.4 54.1 4,000 TRUE
J-2737 57.2 43.9 4,000 TRUE
J-2740 55.9 42.8 4,000 TRUE
J-2741 65.9 51 4,000 TRUE
J-2742 55.4 42.1 4,000 TRUE
J-2747 63.7 52.1 4,000 TRUE
J-2748 59.9 47.1 4,000 TRUE
J-2752 66.5 49.8 3,057 TRUE
J-2754 94.7 86.7 4,000 TRUE
J-2755 94.6 86.6 4,000 TRUE
J-2757 96.8 88.7 4,000 TRUE
J-2758 87.4 75.8 4,500 TRUE
J-2763 100.1 92 4,000 TRUE
J-2764 64.6 53.1 4,000 TRUE
J-2765 61.2 47.4 4,000 TRUE
J-2768 105.2 96.8 3,844 TRUE
J-2774 62.3 48.4 4,000 TRUE
J-2775 64.8 51.1 4,000 TRUE
J-2780 55.1 42 4,000 TRUE
J-2782 63.7 52.1 4,000 TRUE
J-2784 97.8 89.7 4,000 TRUE
J-2786 64.4 50.8 4,000 TRUE
J-2787 64.4 50.8 4,000 TRUE
J-2788 98.3 90.2 4,000 TRUE
J-2789 98.4 90.3 4,000 TRUE
J-2792 68.8 57.4 3,621 TRUE
J-2798 61 48.6 1,616 TRUE
J-2799 61 48.6 4,000 TRUE
J-2800 64.3 50.3 4,000 TRUE
J-2806 105.8 97.4 3,813 TRUE
J-2807 66.6 49.9 3,520 TRUE
J-2809 89.7 78.1 4,500 TRUE
J-2812 94.1 86 4,000 TRUE
J-2813 94 86 4,000 TRUE
J-2815 70.7 59.3 4,500 TRUE
J-2818 65 51.9 4,000 TRUE
J-2820 60.6 46.8 4,000 TRUE
J-2821 96.3 88.2 4,000 TRUE
J-2824 61.5 50.5 4,000 TRUE
J-2825 68.1 56.7 4,000 TRUE
J-2827 92.3 84.3 4,000 TRUE
J-2828 92.5 84.5 4,000 TRUE
J-2832 98.5 90.5 4,000 TRUE
J-2838 62.8 48.9 4,000 TRUE
J-2843 61.9 50.1 3,273 TRUE
J-2845 63.3 51.8 4,000 TRUE
J-2846 63.3 51.8 4,000 TRUE
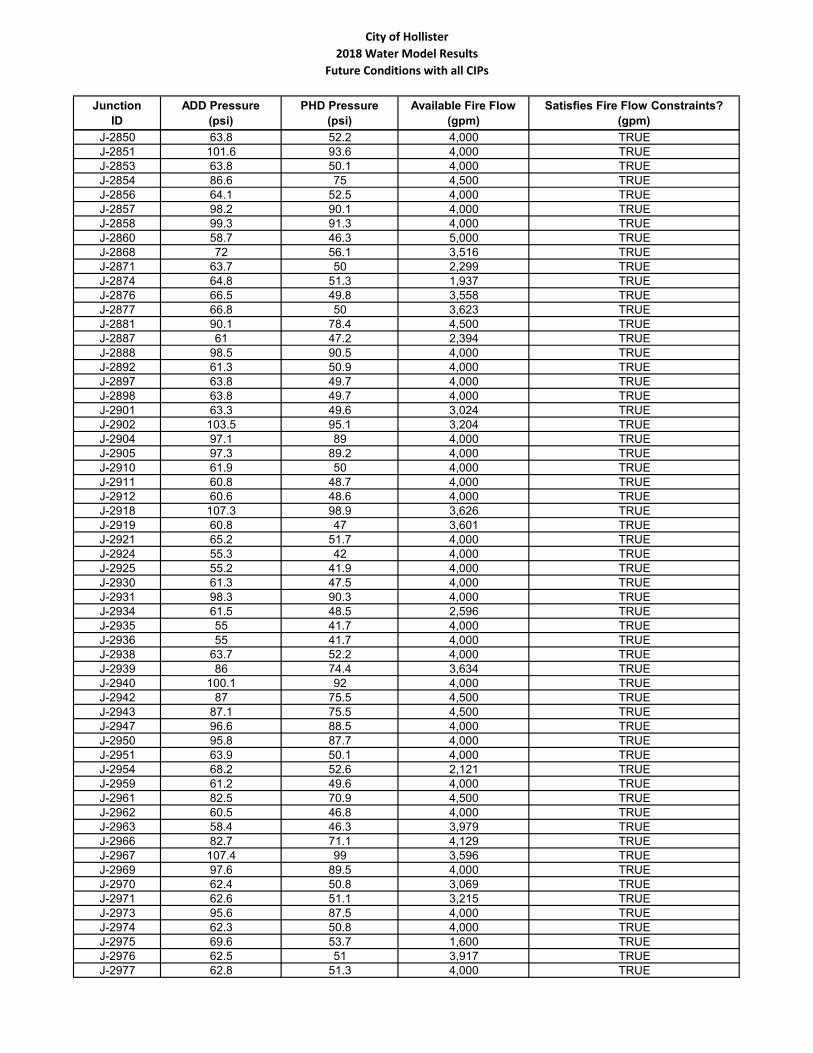
City of Hollister
2018 Water Model Results
Future Conditions with all CIPs
Junction
ID
ADD Pressure
(psi)
PHD Pressure
(psi)
Available Fire Flow
(gpm)
Satisfies Fire Flow Constraints?
(gpm)
J-2850 63.8 52.2 4,000 TRUE
J-2851 101.6 93.6 4,000 TRUE
J-2853 63.8 50.1 4,000 TRUE
J-2854 86.6 75 4,500 TRUE
J-2856 64.1 52.5 4,000 TRUE
J-2857 98.2 90.1 4,000 TRUE
J-2858 99.3 91.3 4,000 TRUE
J-2860 58.7 46.3 5,000 TRUE
J-2868 72 56.1 3,516 TRUE
J-2871 63.7 50 2,299 TRUE
J-2874 64.8 51.3 1,937 TRUE
J-2876 66.5 49.8 3,558 TRUE
J-2877 66.8 50 3,623 TRUE
J-2881 90.1 78.4 4,500 TRUE
J-2887 61 47.2 2,394 TRUE
J-2888 98.5 90.5 4,000 TRUE
J-2892 61.3 50.9 4,000 TRUE
J-2897 63.8 49.7 4,000 TRUE
J-2898 63.8 49.7 4,000 TRUE
J-2901 63.3 49.6 3,024 TRUE
J-2902 103.5 95.1 3,204 TRUE
J-2904 97.1 89 4,000 TRUE
J-2905 97.3 89.2 4,000 TRUE
J-2910 61.9 50 4,000 TRUE
J-2911 60.8 48.7 4,000 TRUE
J-2912 60.6 48.6 4,000 TRUE
J-2918 107.3 98.9 3,626 TRUE
J-2919 60.8 47 3,601 TRUE
J-2921 65.2 51.7 4,000 TRUE
J-2924 55.3 42 4,000 TRUE
J-2925 55.2 41.9 4,000 TRUE
J-2930 61.3 47.5 4,000 TRUE
J-2931 98.3 90.3 4,000 TRUE
J-2934 61.5 48.5 2,596 TRUE
J-2935 55 41.7 4,000 TRUE
J-2936 55 41.7 4,000 TRUE
J-2938 63.7 52.2 4,000 TRUE
J-2939 86 74.4 3,634 TRUE
J-2940 100.1 92 4,000 TRUE
J-2942 87 75.5 4,500 TRUE
J-2943 87.1 75.5 4,500 TRUE
J-2947 96.6 88.5 4,000 TRUE
J-2950 95.8 87.7 4,000 TRUE
J-2951 63.9 50.1 4,000 TRUE
J-2954 68.2 52.6 2,121 TRUE
J-2959 61.2 49.6 4,000 TRUE
J-2961 82.5 70.9 4,500 TRUE
J-2962 60.5 46.8 4,000 TRUE
J-2963 58.4 46.3 3,979 TRUE
J-2966 82.7 71.1 4,129 TRUE
J-2967 107.4 99 3,596 TRUE
J-2969 97.6 89.5 4,000 TRUE
J-2970 62.4 50.8 3,069 TRUE
J-2971 62.6 51.1 3,215 TRUE
J-2973 95.6 87.5 4,000 TRUE
J-2974 62.3 50.8 4,000 TRUE
J-2975 69.6 53.7 1,600 TRUE
J-2976 62.5 51 3,917 TRUE
J-2977 62.8 51.3 4,000 TRUE

City of Hollister
2018 Water Model Results
Future Conditions with all CIPs
Junction
ID
ADD Pressure
(psi)
PHD Pressure
(psi)
Available Fire Flow
(gpm)
Satisfies Fire Flow Constraints?
(gpm)
J-2979 107.4 99 3,591 TRUE
J-2980 53.3 40 3,914 TRUE
J-2982 107.5 99.1 3,653 TRUE
J-2986 104.8 96.4 3,916 TRUE
J-2991 103.1 94.7 4,000 TRUE
J-2992 65.1 53.7 4,000 TRUE
J-2994 95.3 87.3 4,000 TRUE
J-2996 92.5 84.5 4,000 TRUE
J-2998 65.6 50 4,000 TRUE
J-3001 98.9 90.8 4,000 TRUE
J-3008 80.3 68.7 4,500 TRUE
J-3012 93.7 85.7 4,000 TRUE
J-3013 95.8 87.7 4,000 TRUE
J-3014 95.8 87.7 4,000 TRUE
J-3017 99 90.9 4,000 TRUE
J-3018 63.6 52.1 4,000 TRUE
J-3020 71.9 56 4,000 TRUE
J-3023 60.3 47.6 4,000 TRUE
J-3025 64.7 52.5 4,000 TRUE
J-3026 58.2 45.7 4,743 TRUE
J-3027 107.4 99 3,656 TRUE
J-3029 64.5 52.7 4,000 TRUE
J-3032 59.9 47.2 4,000 TRUE
J-3034 66.7 51.3 4,000 TRUE
J-3036 62.6 52 4,000 TRUE
J-3037 63 52.5 4,000 TRUE
J-3038 63.8 50.1 4,000 TRUE
J-3040 66.6 51.4 4,000 TRUE
J-3042 62.7 48.8 4,000 TRUE
J-3044 104.8 96.4 3,820 TRUE
J-3045 54.6 41.4 4,000 TRUE
J-3046 54.7 41.5 4,000 TRUE
J-3048 57.2 44 4,000 TRUE
J-3050 69.7 53.5 3,037 TRUE
J-3054 63.6 52 4,000 TRUE
J-3057 101 92.9 4,000 TRUE
J-3059 65.4 50.8 4,000 TRUE
J-3060 64.2 52.6 4,000 TRUE
J-3064 107.3 98.9 3,382 TRUE
J-3068 86.1 74.5 4,500 TRUE
J-3070 65.3 51.6 4,000 TRUE
J-3072 104.8 96.4 4,000 TRUE
J-3074 71.8 54.9 2,108 TRUE
J-3075 71.7 54.9 2,099 TRUE
J-3076 64.8 51.3 2,145 TRUE
J-3078 106.9 98.5 3,681 TRUE
J-3084 57.8 44.6 4,000 TRUE
J-3085 59.1 46.7 1,211 TRUE
J-3087 60.7 47 3,233 TRUE
J-3092 64.4 50.9 4,000 TRUE
J-3093 64.6 51.2 4,000 TRUE
J-3094 67 50.2 3,735 TRUE
J-3096 60.8 47 4,000 TRUE
J-3097 55.1 41.7 2,950 TRUE
J-3100 82.2 70.6 4,500 TRUE
J-3101 81.9 70.3 4,334 TRUE
J-3102 87.5 75.9 4,500 TRUE
J-3103 61.1 47.3 4,000 TRUE
J-3105 65 51 2,849 TRUE
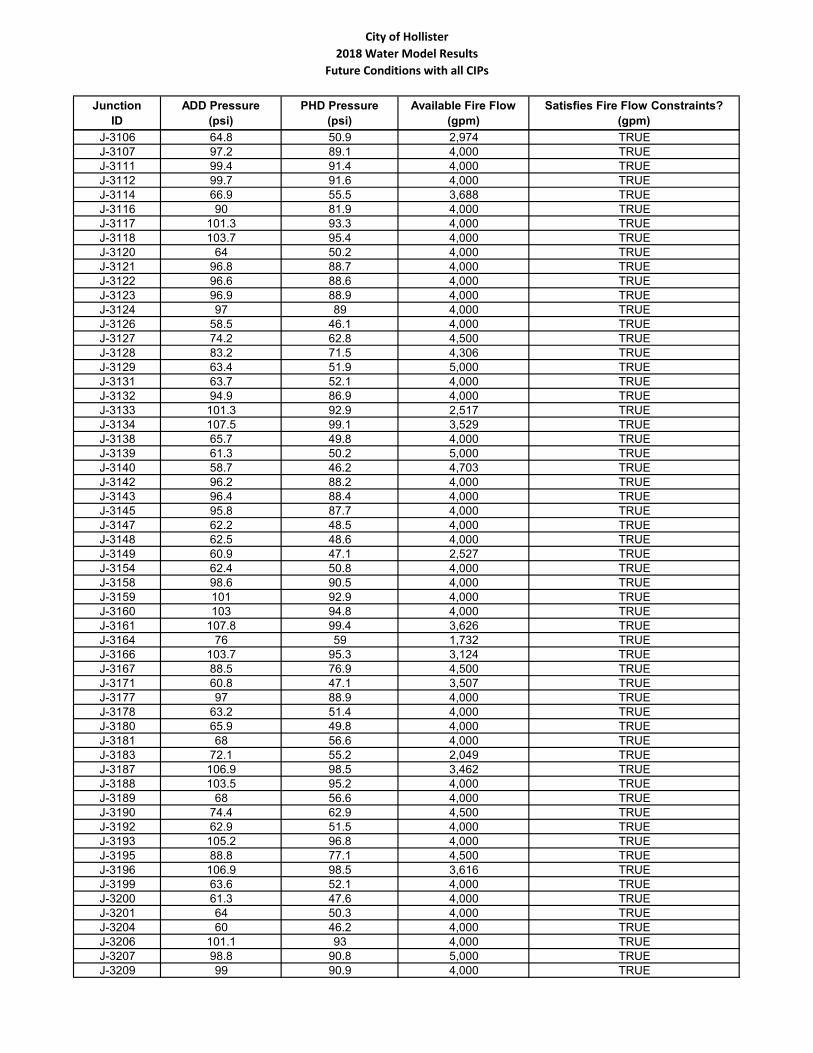
City of Hollister
2018 Water Model Results
Future Conditions with all CIPs
Junction
ID
ADD Pressure
(psi)
PHD Pressure
(psi)
Available Fire Flow
(gpm)
Satisfies Fire Flow Constraints?
(gpm)
J-3106 64.8 50.9 2,974 TRUE
J-3107 97.2 89.1 4,000 TRUE
J-3111 99.4 91.4 4,000 TRUE
J-3112 99.7 91.6 4,000 TRUE
J-3114 66.9 55.5 3,688 TRUE
J-3116 90 81.9 4,000 TRUE
J-3117 101.3 93.3 4,000 TRUE
J-3118 103.7 95.4 4,000 TRUE
J-3120 64 50.2 4,000 TRUE
J-3121 96.8 88.7 4,000 TRUE
J-3122 96.6 88.6 4,000 TRUE
J-3123 96.9 88.9 4,000 TRUE
J-3124 97 89 4,000 TRUE
J-3126 58.5 46.1 4,000 TRUE
J-3127 74.2 62.8 4,500 TRUE
J-3128 83.2 71.5 4,306 TRUE
J-3129 63.4 51.9 5,000 TRUE
J-3131 63.7 52.1 4,000 TRUE
J-3132 94.9 86.9 4,000 TRUE
J-3133 101.3 92.9 2,517 TRUE
J-3134 107.5 99.1 3,529 TRUE
J-3138 65.7 49.8 4,000 TRUE
J-3139 61.3 50.2 5,000 TRUE
J-3140 58.7 46.2 4,703 TRUE
J-3142 96.2 88.2 4,000 TRUE
J-3143 96.4 88.4 4,000 TRUE
J-3145 95.8 87.7 4,000 TRUE
J-3147 62.2 48.5 4,000 TRUE
J-3148 62.5 48.6 4,000 TRUE
J-3149 60.9 47.1 2,527 TRUE
J-3154 62.4 50.8 4,000 TRUE
J-3158 98.6 90.5 4,000 TRUE
J-3159 101 92.9 4,000 TRUE
J-3160 103 94.8 4,000 TRUE
J-3161 107.8 99.4 3,626 TRUE
J-3164 76 59 1,732 TRUE
J-3166 103.7 95.3 3,124 TRUE
J-3167 88.5 76.9 4,500 TRUE
J-3171 60.8 47.1 3,507 TRUE
J-3177 97 88.9 4,000 TRUE
J-3178 63.2 51.4 4,000 TRUE
J-3180 65.9 49.8 4,000 TRUE
J-3181 68 56.6 4,000 TRUE
J-3183 72.1 55.2 2,049 TRUE
J-3187 106.9 98.5 3,462 TRUE
J-3188 103.5 95.2 4,000 TRUE
J-3189 68 56.6 4,000 TRUE
J-3190 74.4 62.9 4,500 TRUE
J-3192 62.9 51.5 4,000 TRUE
J-3193 105.2 96.8 4,000 TRUE
J-3195 88.8 77.1 4,500 TRUE
J-3196 106.9 98.5 3,616 TRUE
J-3199 63.6 52.1 4,000 TRUE
J-3200 61.3 47.6 4,000 TRUE
J-3201 64 50.3 4,000 TRUE
J-3204 60 46.2 4,000 TRUE
J-3206 101.1 93 4,000 TRUE
J-3207 98.8 90.8 5,000 TRUE
J-3209 99 90.9 4,000 TRUE
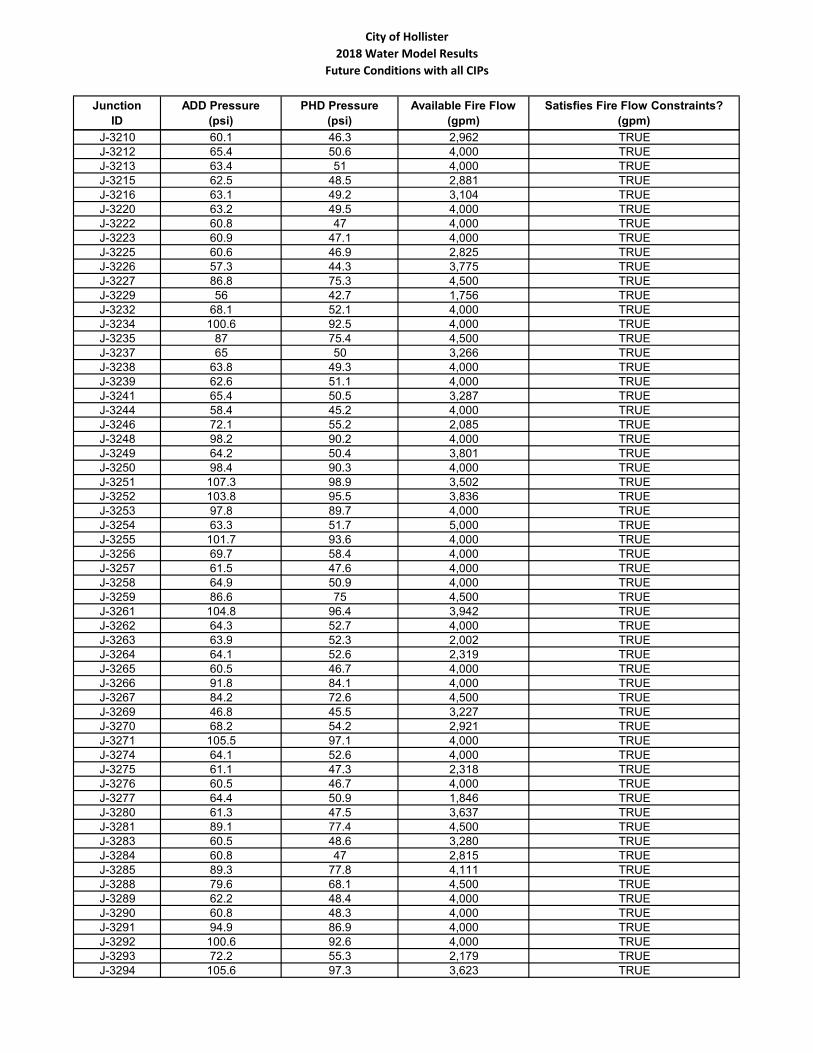
City of Hollister
2018 Water Model Results
Future Conditions with all CIPs
Junction
ID
ADD Pressure
(psi)
PHD Pressure
(psi)
Available Fire Flow
(gpm)
Satisfies Fire Flow Constraints?
(gpm)
J-3210 60.1 46.3 2,962 TRUE
J-3212 65.4 50.6 4,000 TRUE
J-3213 63.4 51 4,000 TRUE
J-3215 62.5 48.5 2,881 TRUE
J-3216 63.1 49.2 3,104 TRUE
J-3220 63.2 49.5 4,000 TRUE
J-3222 60.8 47 4,000 TRUE
J-3223 60.9 47.1 4,000 TRUE
J-3225 60.6 46.9 2,825 TRUE
J-3226 57.3 44.3 3,775 TRUE
J-3227 86.8 75.3 4,500 TRUE
J-3229 56 42.7 1,756 TRUE
J-3232 68.1 52.1 4,000 TRUE
J-3234 100.6 92.5 4,000 TRUE
J-3235 87 75.4 4,500 TRUE
J-3237 65 50 3,266 TRUE
J-3238 63.8 49.3 4,000 TRUE
J-3239 62.6 51.1 4,000 TRUE
J-3241 65.4 50.5 3,287 TRUE
J-3244 58.4 45.2 4,000 TRUE
J-3246 72.1 55.2 2,085 TRUE
J-3248 98.2 90.2 4,000 TRUE
J-3249 64.2 50.4 3,801 TRUE
J-3250 98.4 90.3 4,000 TRUE
J-3251 107.3 98.9 3,502 TRUE
J-3252 103.8 95.5 3,836 TRUE
J-3253 97.8 89.7 4,000 TRUE
J-3254 63.3 51.7 5,000 TRUE
J-3255 101.7 93.6 4,000 TRUE
J-3256 69.7 58.4 4,000 TRUE
J-3257 61.5 47.6 4,000 TRUE
J-3258 64.9 50.9 4,000 TRUE
J-3259 86.6 75 4,500 TRUE
J-3261 104.8 96.4 3,942 TRUE
J-3262 64.3 52.7 4,000 TRUE
J-3263 63.9 52.3 2,002 TRUE
J-3264 64.1 52.6 2,319 TRUE
J-3265 60.5 46.7 4,000 TRUE
J-3266 91.8 84.1 4,000 TRUE
J-3267 84.2 72.6 4,500 TRUE
J-3269 46.8 45.5 3,227 TRUE
J-3270 68.2 54.2 2,921 TRUE
J-3271 105.5 97.1 4,000 TRUE
J-3274 64.1 52.6 4,000 TRUE
J-3275 61.1 47.3 2,318 TRUE
J-3276 60.5 46.7 4,000 TRUE
J-3277 64.4 50.9 1,846 TRUE
J-3280 61.3 47.5 3,637 TRUE
J-3281 89.1 77.4 4,500 TRUE
J-3283 60.5 48.6 3,280 TRUE
J-3284 60.8 47 2,815 TRUE
J-3285 89.3 77.8 4,111 TRUE
J-3288 79.6 68.1 4,500 TRUE
J-3289 62.2 48.4 4,000 TRUE
J-3290 60.8 48.3 4,000 TRUE
J-3291 94.9 86.9 4,000 TRUE
J-3292 100.6 92.6 4,000 TRUE
J-3293 72.2 55.3 2,179 TRUE
J-3294 105.6 97.3 3,623 TRUE
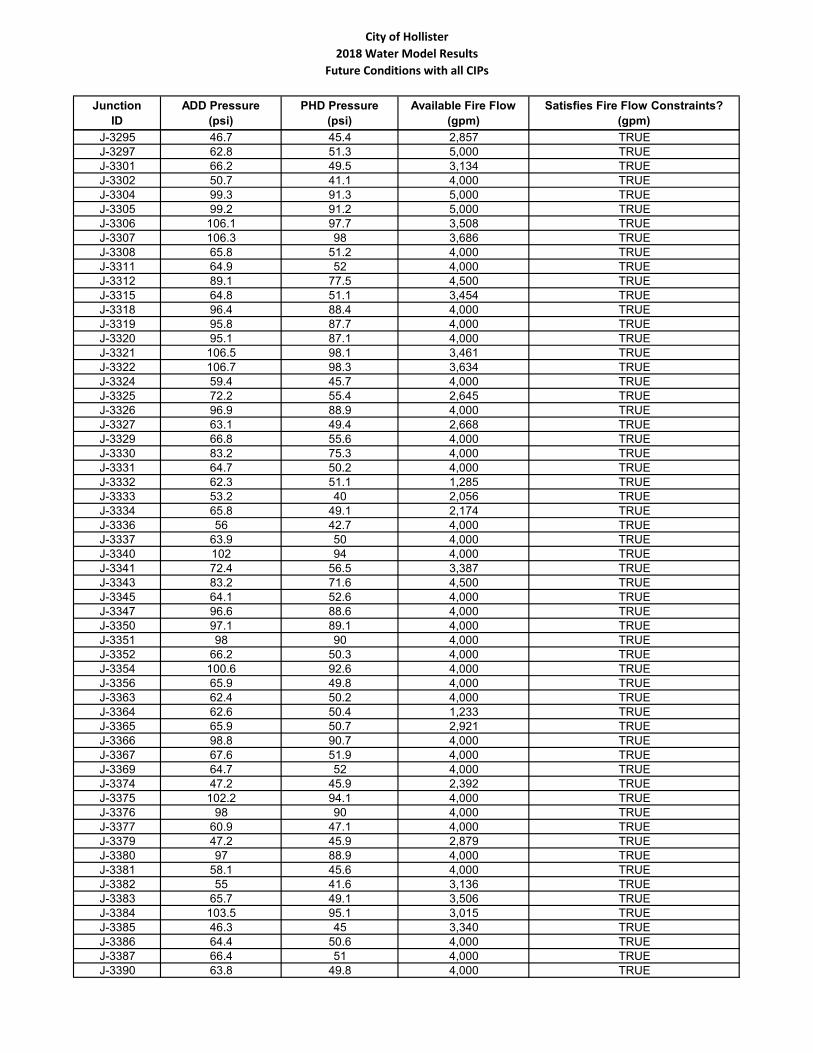
City of Hollister
2018 Water Model Results
Future Conditions with all CIPs
Junction
ID
ADD Pressure
(psi)
PHD Pressure
(psi)
Available Fire Flow
(gpm)
Satisfies Fire Flow Constraints?
(gpm)
J-3295 46.7 45.4 2,857 TRUE
J-3297 62.8 51.3 5,000 TRUE
J-3301 66.2 49.5 3,134 TRUE
J-3302 50.7 41.1 4,000 TRUE
J-3304 99.3 91.3 5,000 TRUE
J-3305 99.2 91.2 5,000 TRUE
J-3306 106.1 97.7 3,508 TRUE
J-3307 106.3 98 3,686 TRUE
J-3308 65.8 51.2 4,000 TRUE
J-3311 64.9 52 4,000 TRUE
J-3312 89.1 77.5 4,500 TRUE
J-3315 64.8 51.1 3,454 TRUE
J-3318 96.4 88.4 4,000 TRUE
J-3319 95.8 87.7 4,000 TRUE
J-3320 95.1 87.1 4,000 TRUE
J-3321 106.5 98.1 3,461 TRUE
J-3322 106.7 98.3 3,634 TRUE
J-3324 59.4 45.7 4,000 TRUE
J-3325 72.2 55.4 2,645 TRUE
J-3326 96.9 88.9 4,000 TRUE
J-3327 63.1 49.4 2,668 TRUE
J-3329 66.8 55.6 4,000 TRUE
J-3330 83.2 75.3 4,000 TRUE
J-3331 64.7 50.2 4,000 TRUE
J-3332 62.3 51.1 1,285 TRUE
J-3333 53.2 40 2,056 TRUE
J-3334 65.8 49.1 2,174 TRUE
J-3336 56 42.7 4,000 TRUE
J-3337 63.9 50 4,000 TRUE
J-3340 102 94 4,000 TRUE
J-3341 72.4 56.5 3,387 TRUE
J-3343 83.2 71.6 4,500 TRUE
J-3345 64.1 52.6 4,000 TRUE
J-3347 96.6 88.6 4,000 TRUE
J-3350 97.1 89.1 4,000 TRUE
J-3351 98 90 4,000 TRUE
J-3352 66.2 50.3 4,000 TRUE
J-3354 100.6 92.6 4,000 TRUE
J-3356 65.9 49.8 4,000 TRUE
J-3363 62.4 50.2 4,000 TRUE
J-3364 62.6 50.4 1,233 TRUE
J-3365 65.9 50.7 2,921 TRUE
J-3366 98.8 90.7 4,000 TRUE
J-3367 67.6 51.9 4,000 TRUE
J-3369 64.7 52 4,000 TRUE
J-3374 47.2 45.9 2,392 TRUE
J-3375 102.2 94.1 4,000 TRUE
J-3376 98 90 4,000 TRUE
J-3377 60.9 47.1 4,000 TRUE
J-3379 47.2 45.9 2,879 TRUE
J-3380 97 88.9 4,000 TRUE
J-3381 58.1 45.6 4,000 TRUE
J-3382 55 41.6 3,136 TRUE
J-3383 65.7 49.1 3,506 TRUE
J-3384 103.5 95.1 3,015 TRUE
J-3385 46.3 45 3,340 TRUE
J-3386 64.4 50.6 4,000 TRUE
J-3387 66.4 51 4,000 TRUE
J-3390 63.8 49.8 4,000 TRUE
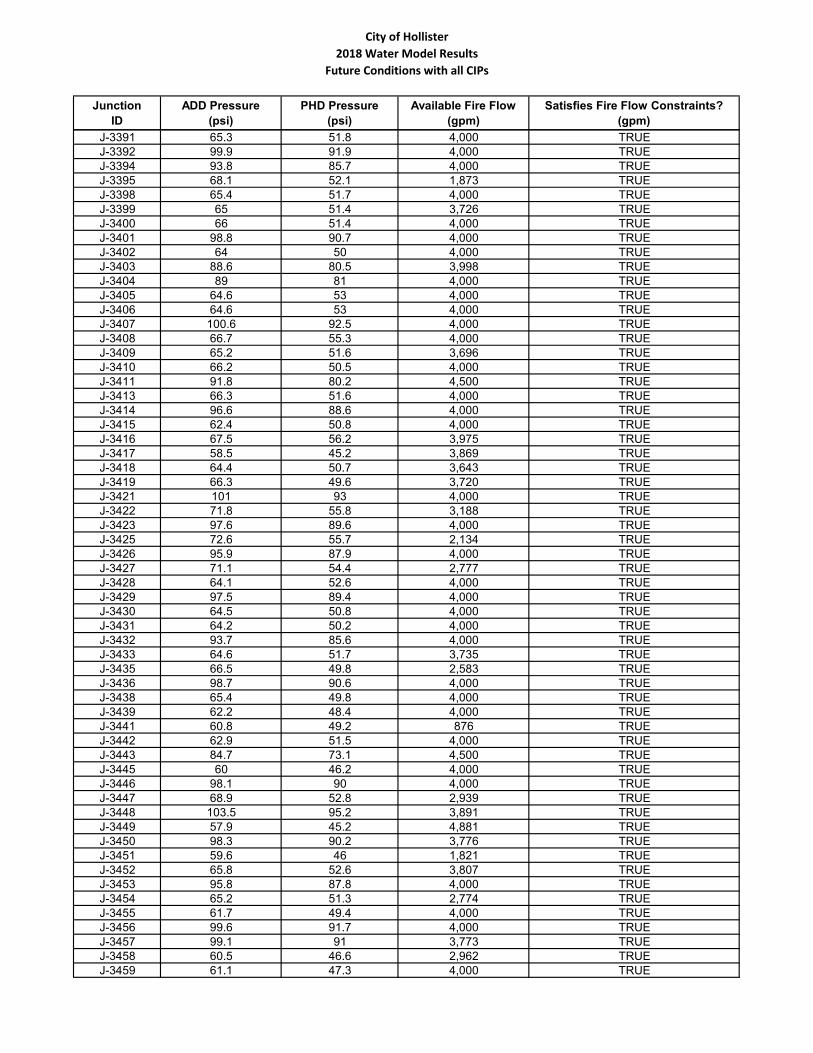
City of Hollister
2018 Water Model Results
Future Conditions with all CIPs
Junction
ID
ADD Pressure
(psi)
PHD Pressure
(psi)
Available Fire Flow
(gpm)
Satisfies Fire Flow Constraints?
(gpm)
J-3391 65.3 51.8 4,000 TRUE
J-3392 99.9 91.9 4,000 TRUE
J-3394 93.8 85.7 4,000 TRUE
J-3395 68.1 52.1 1,873 TRUE
J-3398 65.4 51.7 4,000 TRUE
J-3399 65 51.4 3,726 TRUE
J-3400 66 51.4 4,000 TRUE
J-3401 98.8 90.7 4,000 TRUE
J-3402 64 50 4,000 TRUE
J-3403 88.6 80.5 3,998 TRUE
J-3404 89 81 4,000 TRUE
J-3405 64.6 53 4,000 TRUE
J-3406 64.6 53 4,000 TRUE
J-3407 100.6 92.5 4,000 TRUE
J-3408 66.7 55.3 4,000 TRUE
J-3409 65.2 51.6 3,696 TRUE
J-3410 66.2 50.5 4,000 TRUE
J-3411 91.8 80.2 4,500 TRUE
J-3413 66.3 51.6 4,000 TRUE
J-3414 96.6 88.6 4,000 TRUE
J-3415 62.4 50.8 4,000 TRUE
J-3416 67.5 56.2 3,975 TRUE
J-3417 58.5 45.2 3,869 TRUE
J-3418 64.4 50.7 3,643 TRUE
J-3419 66.3 49.6 3,720 TRUE
J-3421 101 93 4,000 TRUE
J-3422 71.8 55.8 3,188 TRUE
J-3423 97.6 89.6 4,000 TRUE
J-3425 72.6 55.7 2,134 TRUE
J-3426 95.9 87.9 4,000 TRUE
J-3427 71.1 54.4 2,777 TRUE
J-3428 64.1 52.6 4,000 TRUE
J-3429 97.5 89.4 4,000 TRUE
J-3430 64.5 50.8 4,000 TRUE
J-3431 64.2 50.2 4,000 TRUE
J-3432 93.7 85.6 4,000 TRUE
J-3433 64.6 51.7 3,735 TRUE
J-3435 66.5 49.8 2,583 TRUE
J-3436 98.7 90.6 4,000 TRUE
J-3438 65.4 49.8 4,000 TRUE
J-3439 62.2 48.4 4,000 TRUE
J-3441 60.8 49.2 876 TRUE
J-3442 62.9 51.5 4,000 TRUE
J-3443 84.7 73.1 4,500 TRUE
J-3445 60 46.2 4,000 TRUE
J-3446 98.1 90 4,000 TRUE
J-3447 68.9 52.8 2,939 TRUE
J-3448 103.5 95.2 3,891 TRUE
J-3449 57.9 45.2 4,881 TRUE
J-3450 98.3 90.2 3,776 TRUE
J-3451 59.6 46 1,821 TRUE
J-3452 65.8 52.6 3,807 TRUE
J-3453 95.8 87.8 4,000 TRUE
J-3454 65.2 51.3 2,774 TRUE
J-3455 61.7 49.4 4,000 TRUE
J-3456 99.6 91.7 4,000 TRUE
J-3457 99.1 91 3,773 TRUE
J-3458 60.5 46.6 2,962 TRUE
J-3459 61.1 47.3 4,000 TRUE
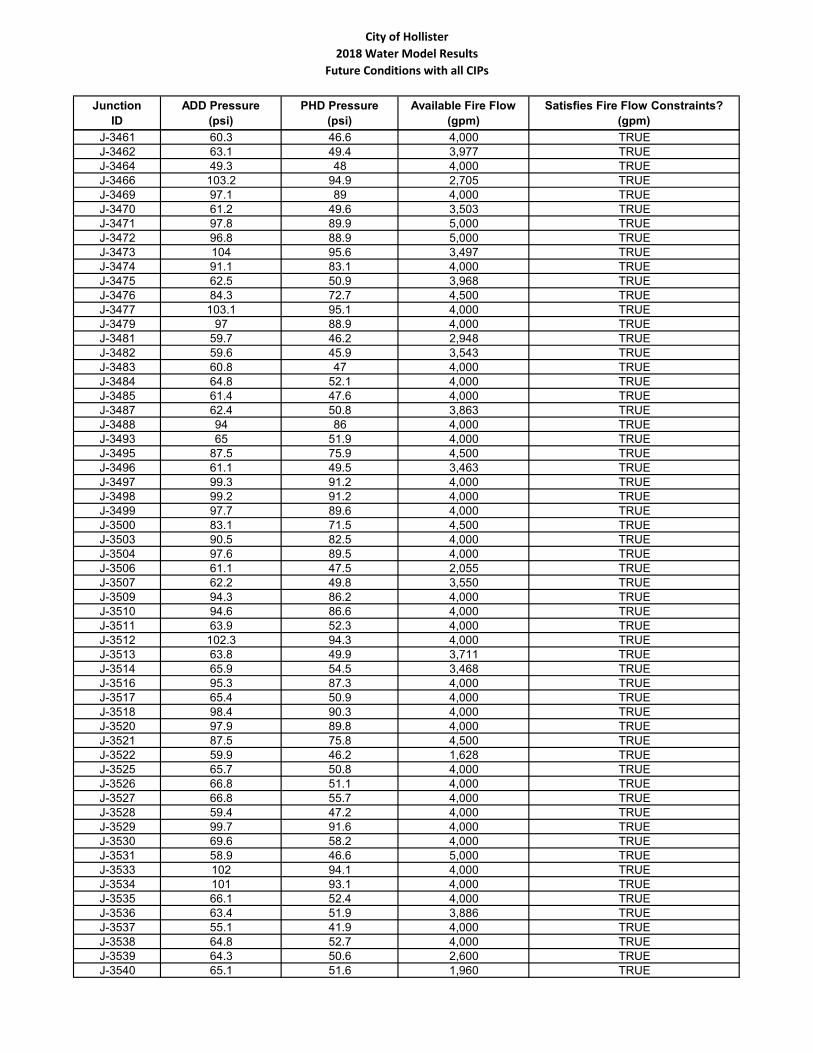
City of Hollister
2018 Water Model Results
Future Conditions with all CIPs
Junction
ID
ADD Pressure
(psi)
PHD Pressure
(psi)
Available Fire Flow
(gpm)
Satisfies Fire Flow Constraints?
(gpm)
J-3461 60.3 46.6 4,000 TRUE
J-3462 63.1 49.4 3,977 TRUE
J-3464 49.3 48 4,000 TRUE
J-3466 103.2 94.9 2,705 TRUE
J-3469 97.1 89 4,000 TRUE
J-3470 61.2 49.6 3,503 TRUE
J-3471 97.8 89.9 5,000 TRUE
J-3472 96.8 88.9 5,000 TRUE
J-3473 104 95.6 3,497 TRUE
J-3474 91.1 83.1 4,000 TRUE
J-3475 62.5 50.9 3,968 TRUE
J-3476 84.3 72.7 4,500 TRUE
J-3477 103.1 95.1 4,000 TRUE
J-3479 97 88.9 4,000 TRUE
J-3481 59.7 46.2 2,948 TRUE
J-3482 59.6 45.9 3,543 TRUE
J-3483 60.8 47 4,000 TRUE
J-3484 64.8 52.1 4,000 TRUE
J-3485 61.4 47.6 4,000 TRUE
J-3487 62.4 50.8 3,863 TRUE
J-3488 94 86 4,000 TRUE
J-3493 65 51.9 4,000 TRUE
J-3495 87.5 75.9 4,500 TRUE
J-3496 61.1 49.5 3,463 TRUE
J-3497 99.3 91.2 4,000 TRUE
J-3498 99.2 91.2 4,000 TRUE
J-3499 97.7 89.6 4,000 TRUE
J-3500 83.1 71.5 4,500 TRUE
J-3503 90.5 82.5 4,000 TRUE
J-3504 97.6 89.5 4,000 TRUE
J-3506 61.1 47.5 2,055 TRUE
J-3507 62.2 49.8 3,550 TRUE
J-3509 94.3 86.2 4,000 TRUE
J-3510 94.6 86.6 4,000 TRUE
J-3511 63.9 52.3 4,000 TRUE
J-3512 102.3 94.3 4,000 TRUE
J-3513 63.8 49.9 3,711 TRUE
J-3514 65.9 54.5 3,468 TRUE
J-3516 95.3 87.3 4,000 TRUE
J-3517 65.4 50.9 4,000 TRUE
J-3518 98.4 90.3 4,000 TRUE
J-3520 97.9 89.8 4,000 TRUE
J-3521 87.5 75.8 4,500 TRUE
J-3522 59.9 46.2 1,628 TRUE
J-3525 65.7 50.8 4,000 TRUE
J-3526 66.8 51.1 4,000 TRUE
J-3527 66.8 55.7 4,000 TRUE
J-3528 59.4 47.2 4,000 TRUE
J-3529 99.7 91.6 4,000 TRUE
J-3530 69.6 58.2 4,000 TRUE
J-3531 58.9 46.6 5,000 TRUE
J-3533 102 94.1 4,000 TRUE
J-3534 101 93.1 4,000 TRUE
J-3535 66.1 52.4 4,000 TRUE
J-3536 63.4 51.9 3,886 TRUE
J-3537 55.1 41.9 4,000 TRUE
J-3538 64.8 52.7 4,000 TRUE
J-3539 64.3 50.6 2,600 TRUE
J-3540 65.1 51.6 1,960 TRUE
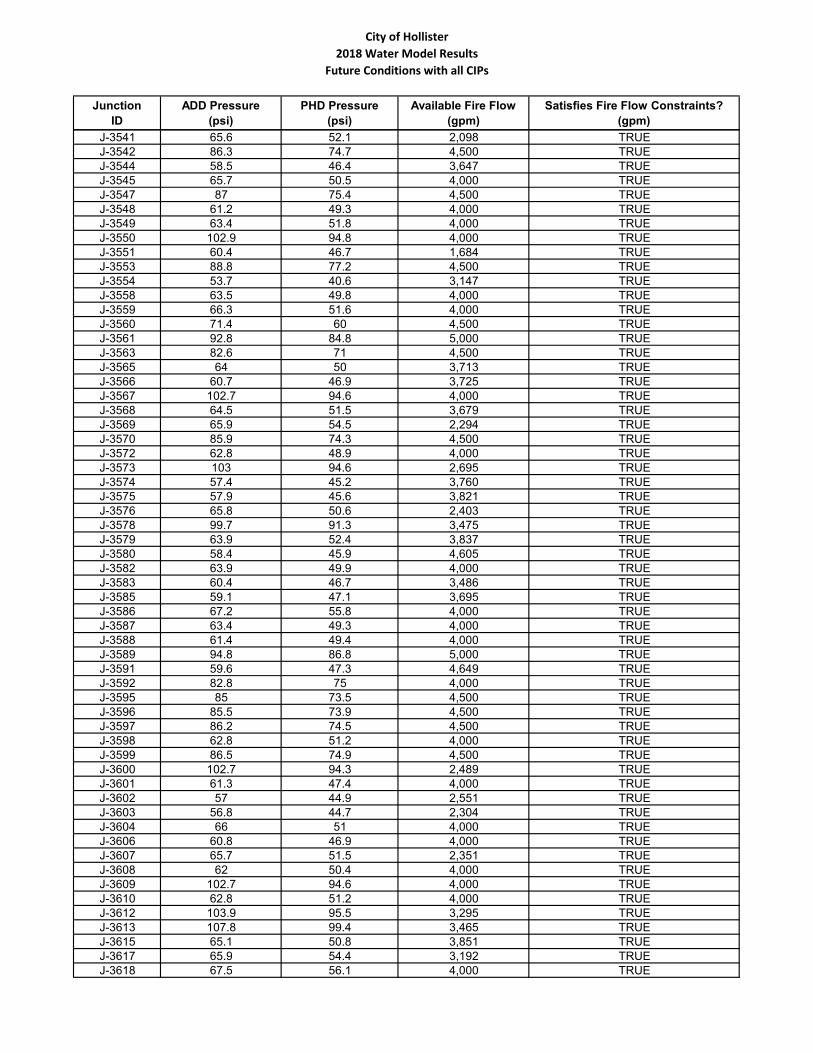
City of Hollister
2018 Water Model Results
Future Conditions with all CIPs
Junction
ID
ADD Pressure
(psi)
PHD Pressure
(psi)
Available Fire Flow
(gpm)
Satisfies Fire Flow Constraints?
(gpm)
J-3541 65.6 52.1 2,098 TRUE
J-3542 86.3 74.7 4,500 TRUE
J-3544 58.5 46.4 3,647 TRUE
J-3545 65.7 50.5 4,000 TRUE
J-3547 87 75.4 4,500 TRUE
J-3548 61.2 49.3 4,000 TRUE
J-3549 63.4 51.8 4,000 TRUE
J-3550 102.9 94.8 4,000 TRUE
J-3551 60.4 46.7 1,684 TRUE
J-3553 88.8 77.2 4,500 TRUE
J-3554 53.7 40.6 3,147 TRUE
J-3558 63.5 49.8 4,000 TRUE
J-3559 66.3 51.6 4,000 TRUE
J-3560 71.4 60 4,500 TRUE
J-3561 92.8 84.8 5,000 TRUE
J-3563 82.6 71 4,500 TRUE
J-3565 64 50 3,713 TRUE
J-3566 60.7 46.9 3,725 TRUE
J-3567 102.7 94.6 4,000 TRUE
J-3568 64.5 51.5 3,679 TRUE
J-3569 65.9 54.5 2,294 TRUE
J-3570 85.9 74.3 4,500 TRUE
J-3572 62.8 48.9 4,000 TRUE
J-3573 103 94.6 2,695 TRUE
J-3574 57.4 45.2 3,760 TRUE
J-3575 57.9 45.6 3,821 TRUE
J-3576 65.8 50.6 2,403 TRUE
J-3578 99.7 91.3 3,475 TRUE
J-3579 63.9 52.4 3,837 TRUE
J-3580 58.4 45.9 4,605 TRUE
J-3582 63.9 49.9 4,000 TRUE
J-3583 60.4 46.7 3,486 TRUE
J-3585 59.1 47.1 3,695 TRUE
J-3586 67.2 55.8 4,000 TRUE
J-3587 63.4 49.3 4,000 TRUE
J-3588 61.4 49.4 4,000 TRUE
J-3589 94.8 86.8 5,000 TRUE
J-3591 59.6 47.3 4,649 TRUE
J-3592 82.8 75 4,000 TRUE
J-3595 85 73.5 4,500 TRUE
J-3596 85.5 73.9 4,500 TRUE
J-3597 86.2 74.5 4,500 TRUE
J-3598 62.8 51.2 4,000 TRUE
J-3599 86.5 74.9 4,500 TRUE
J-3600 102.7 94.3 2,489 TRUE
J-3601 61.3 47.4 4,000 TRUE
J-3602 57 44.9 2,551 TRUE
J-3603 56.8 44.7 2,304 TRUE
J-3604 66 51 4,000 TRUE
J-3606 60.8 46.9 4,000 TRUE
J-3607 65.7 51.5 2,351 TRUE
J-3608 62 50.4 4,000 TRUE
J-3609 102.7 94.6 4,000 TRUE
J-3610 62.8 51.2 4,000 TRUE
J-3612 103.9 95.5 3,295 TRUE
J-3613 107.8 99.4 3,465 TRUE
J-3615 65.1 50.8 3,851 TRUE
J-3617 65.9 54.4 3,192 TRUE
J-3618 67.5 56.1 4,000 TRUE

City of Hollister
2018 Water Model Results
Future Conditions with all CIPs
Junction
ID
ADD Pressure
(psi)
PHD Pressure
(psi)
Available Fire Flow
(gpm)
Satisfies Fire Flow Constraints?
(gpm)
J-3619 61.7 48 4,000 TRUE
J-3621 58.8 46.2 4,863 TRUE
J-3622 60.4 46.6 4,000 TRUE
J-3623 60.7 46.9 4,000 TRUE
J-3625 65.5 51.2 2,303 TRUE
J-3626 58.3 46.3 3,614 TRUE
J-3627 65.9 52.4 2,300 TRUE
J-3628 69.4 53 4,000 TRUE
J-3629 69.2 52.9 4,000 TRUE
J-3630 65 51.8 3,718 TRUE
J-3631 66.8 59.3 1,865 TRUE
J-3633 60.1 47.9 4,497 TRUE
J-3634 101.4 93.3 4,000 TRUE
J-3635 102.1 94 4,000 TRUE
J-3636 68.8 52.2 4,000 TRUE
J-3637 61.7 50 4,000 TRUE
J-3638 65.1 50.8 3,766 TRUE
J-3641 66.8 50.5 4,000 TRUE
J-3642 66.5 50 4,000 TRUE
J-3643 54.6 41.3 4,000 TRUE
J-3645 61.3 47.6 4,000 TRUE
J-3646 60.5 48.6 4,000 TRUE
J-3647 61.4 49.7 4,000 TRUE
J-3648 60.4 48.4 3,734 TRUE
J-3649 62.4 50.8 4,000 TRUE
J-3650 61.1 48 4,000 TRUE
J-3651 63.3 49.3 3,525 TRUE
J-3652 61.9 49.5 4,000 TRUE
J-3653 67.4 51.2 4,000 TRUE
J-3654 99.6 91.7 4,000 TRUE
J-3655 107.4 99 3,316 TRUE
J-3656 99.9 91.8 4,000 TRUE
J-3657 59.7 46 4,000 TRUE
J-3658 99.3 91.2 4,000 TRUE
J-3659 62.4 50.8 4,000 TRUE
J-3662 65.1 51.4 4,000 TRUE
J-3663 68 51.9 4,000 TRUE
J-3664 68.5 57.1 4,000 TRUE
J-3665 61.7 49.2 1,031 TRUE
J-3667 107.5 99.1 3,315 TRUE
J-3668 60.8 47.1 4,000 TRUE
J-3669 64.6 53 4,000 TRUE
J-3670 103.6 95.5 4,000 TRUE
J-3672 103.8 95.7 4,000 TRUE
J-3673 61.9 50.1 3,860 TRUE
J-3674 64.2 51.4 4,000 TRUE
J-3675 60.9 47.2 4,000 TRUE
J-3676 59.1 45.5 4,000 TRUE
J-3677 66.1 51 4,000 TRUE
J-3678 61.9 50.3 3,962 TRUE
J-3679 88.1 76.5 4,500 TRUE
J-3681 68.2 56.9 4,000 TRUE
J-3682 75.3 63.8 4,500 TRUE
J-3683 82.4 70.9 4,500 TRUE
J-3685 63.4 51.8 4,000 TRUE
J-3686 106.9 98.5 3,054 TRUE
J-3687 63.8 50.1 1,669 TRUE
J-3688 92.3 80.6 4,426 TRUE
J-3689 63.3 51.8 3,907 TRUE
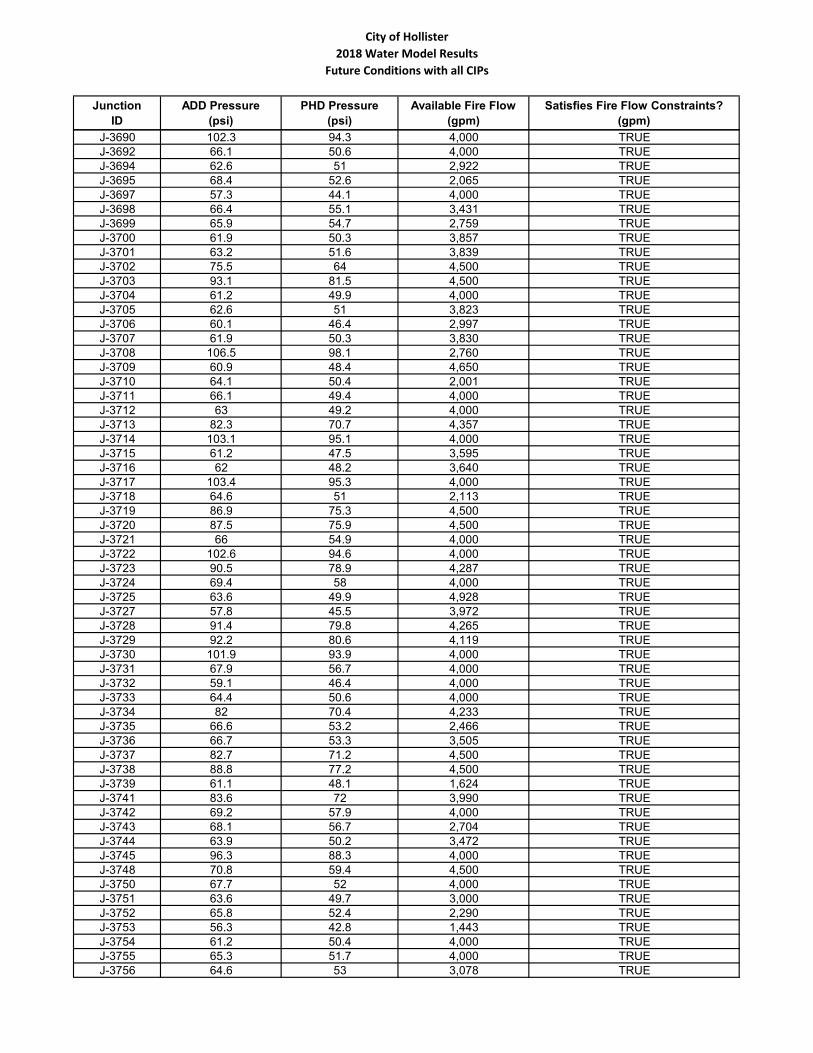
City of Hollister
2018 Water Model Results
Future Conditions with all CIPs
Junction
ID
ADD Pressure
(psi)
PHD Pressure
(psi)
Available Fire Flow
(gpm)
Satisfies Fire Flow Constraints?
(gpm)
J-3690 102.3 94.3 4,000 TRUE
J-3692 66.1 50.6 4,000 TRUE
J-3694 62.6 51 2,922 TRUE
J-3695 68.4 52.6 2,065 TRUE
J-3697 57.3 44.1 4,000 TRUE
J-3698 66.4 55.1 3,431 TRUE
J-3699 65.9 54.7 2,759 TRUE
J-3700 61.9 50.3 3,857 TRUE
J-3701 63.2 51.6 3,839 TRUE
J-3702 75.5 64 4,500 TRUE
J-3703 93.1 81.5 4,500 TRUE
J-3704 61.2 49.9 4,000 TRUE
J-3705 62.6 51 3,823 TRUE
J-3706 60.1 46.4 2,997 TRUE
J-3707 61.9 50.3 3,830 TRUE
J-3708 106.5 98.1 2,760 TRUE
J-3709 60.9 48.4 4,650 TRUE
J-3710 64.1 50.4 2,001 TRUE
J-3711 66.1 49.4 4,000 TRUE
J-3712 63 49.2 4,000 TRUE
J-3713 82.3 70.7 4,357 TRUE
J-3714 103.1 95.1 4,000 TRUE
J-3715 61.2 47.5 3,595 TRUE
J-3716 62 48.2 3,640 TRUE
J-3717 103.4 95.3 4,000 TRUE
J-3718 64.6 51 2,113 TRUE
J-3719 86.9 75.3 4,500 TRUE
J-3720 87.5 75.9 4,500 TRUE
J-3721 66 54.9 4,000 TRUE
J-3722 102.6 94.6 4,000 TRUE
J-3723 90.5 78.9 4,287 TRUE
J-3724 69.4 58 4,000 TRUE
J-3725 63.6 49.9 4,928 TRUE
J-3727 57.8 45.5 3,972 TRUE
J-3728 91.4 79.8 4,265 TRUE
J-3729 92.2 80.6 4,119 TRUE
J-3730 101.9 93.9 4,000 TRUE
J-3731 67.9 56.7 4,000 TRUE
J-3732 59.1 46.4 4,000 TRUE
J-3733 64.4 50.6 4,000 TRUE
J-3734 82 70.4 4,233 TRUE
J-3735 66.6 53.2 2,466 TRUE
J-3736 66.7 53.3 3,505 TRUE
J-3737 82.7 71.2 4,500 TRUE
J-3738 88.8 77.2 4,500 TRUE
J-3739 61.1 48.1 1,624 TRUE
J-3741 83.6 72 3,990 TRUE
J-3742 69.2 57.9 4,000 TRUE
J-3743 68.1 56.7 2,704 TRUE
J-3744 63.9 50.2 3,472 TRUE
J-3745 96.3 88.3 4,000 TRUE
J-3748 70.8 59.4 4,500 TRUE
J-3750 67.7 52 4,000 TRUE
J-3751 63.6 49.7 3,000 TRUE
J-3752 65.8 52.4 2,290 TRUE
J-3753 56.3 42.8 1,443 TRUE
J-3754 61.2 50.4 4,000 TRUE
J-3755 65.3 51.7 4,000 TRUE
J-3756 64.6 53 3,078 TRUE
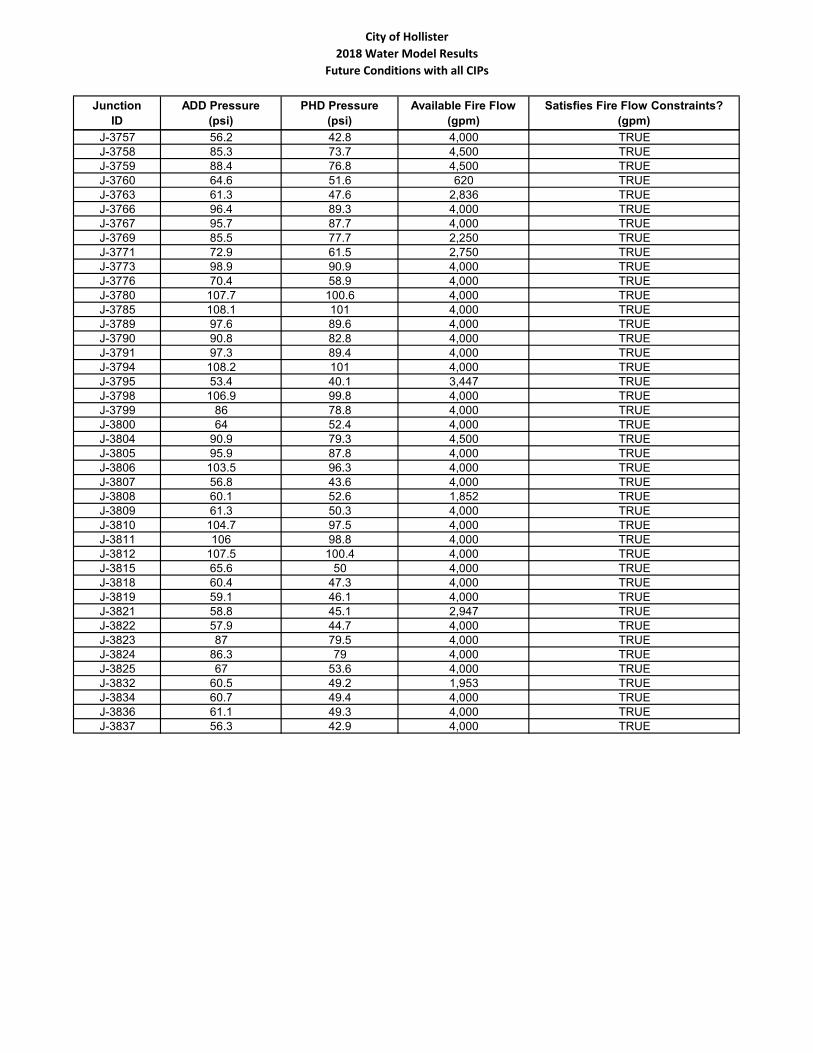
City of Hollister
2018 Water Model Results
Future Conditions with all CIPs
Junction
ID
ADD Pressure
(psi)
PHD Pressure
(psi)
Available Fire Flow
(gpm)
Satisfies Fire Flow Constraints?
(gpm)
J-3757 56.2 42.8 4,000 TRUE
J-3758 85.3 73.7 4,500 TRUE
J-3759 88.4 76.8 4,500 TRUE
J-3760 64.6 51.6 620 TRUE
J-3763 61.3 47.6 2,836 TRUE
J-3766 96.4 89.3 4,000 TRUE
J-3767 95.7 87.7 4,000 TRUE
J-3769 85.5 77.7 2,250 TRUE
J-3771 72.9 61.5 2,750 TRUE
J-3773 98.9 90.9 4,000 TRUE
J-3776 70.4 58.9 4,000 TRUE
J-3780 107.7 100.6 4,000 TRUE
J-3785 108.1 101 4,000 TRUE
J-3789 97.6 89.6 4,000 TRUE
J-3790 90.8 82.8 4,000 TRUE
J-3791 97.3 89.4 4,000 TRUE
J-3794 108.2 101 4,000 TRUE
J-3795 53.4 40.1 3,447 TRUE
J-3798 106.9 99.8 4,000 TRUE
J-3799 86 78.8 4,000 TRUE
J-3800 64 52.4 4,000 TRUE
J-3804 90.9 79.3 4,500 TRUE
J-3805 95.9 87.8 4,000 TRUE
J-3806 103.5 96.3 4,000 TRUE
J-3807 56.8 43.6 4,000 TRUE
J-3808 60.1 52.6 1,852 TRUE
J-3809 61.3 50.3 4,000 TRUE
J-3810 104.7 97.5 4,000 TRUE
J-3811 106 98.8 4,000 TRUE
J-3812 107.5 100.4 4,000 TRUE
J-3815 65.6 50 4,000 TRUE
J-3818 60.4 47.3 4,000 TRUE
J-3819 59.1 46.1 4,000 TRUE
J-3821 58.8 45.1 2,947 TRUE
J-3822 57.9 44.7 4,000 TRUE
J-3823 87 79.5 4,000 TRUE
J-3824 86.3 79 4,000 TRUE
J-3825 67 53.6 4,000 TRUE
J-3832 60.5 49.2 1,953 TRUE
J-3834 60.7 49.4 4,000 TRUE
J-3836 61.1 49.3 4,000 TRUE
J-3837 56.3 42.9 4,000 TRUE

APPENDIX D
Exhibits
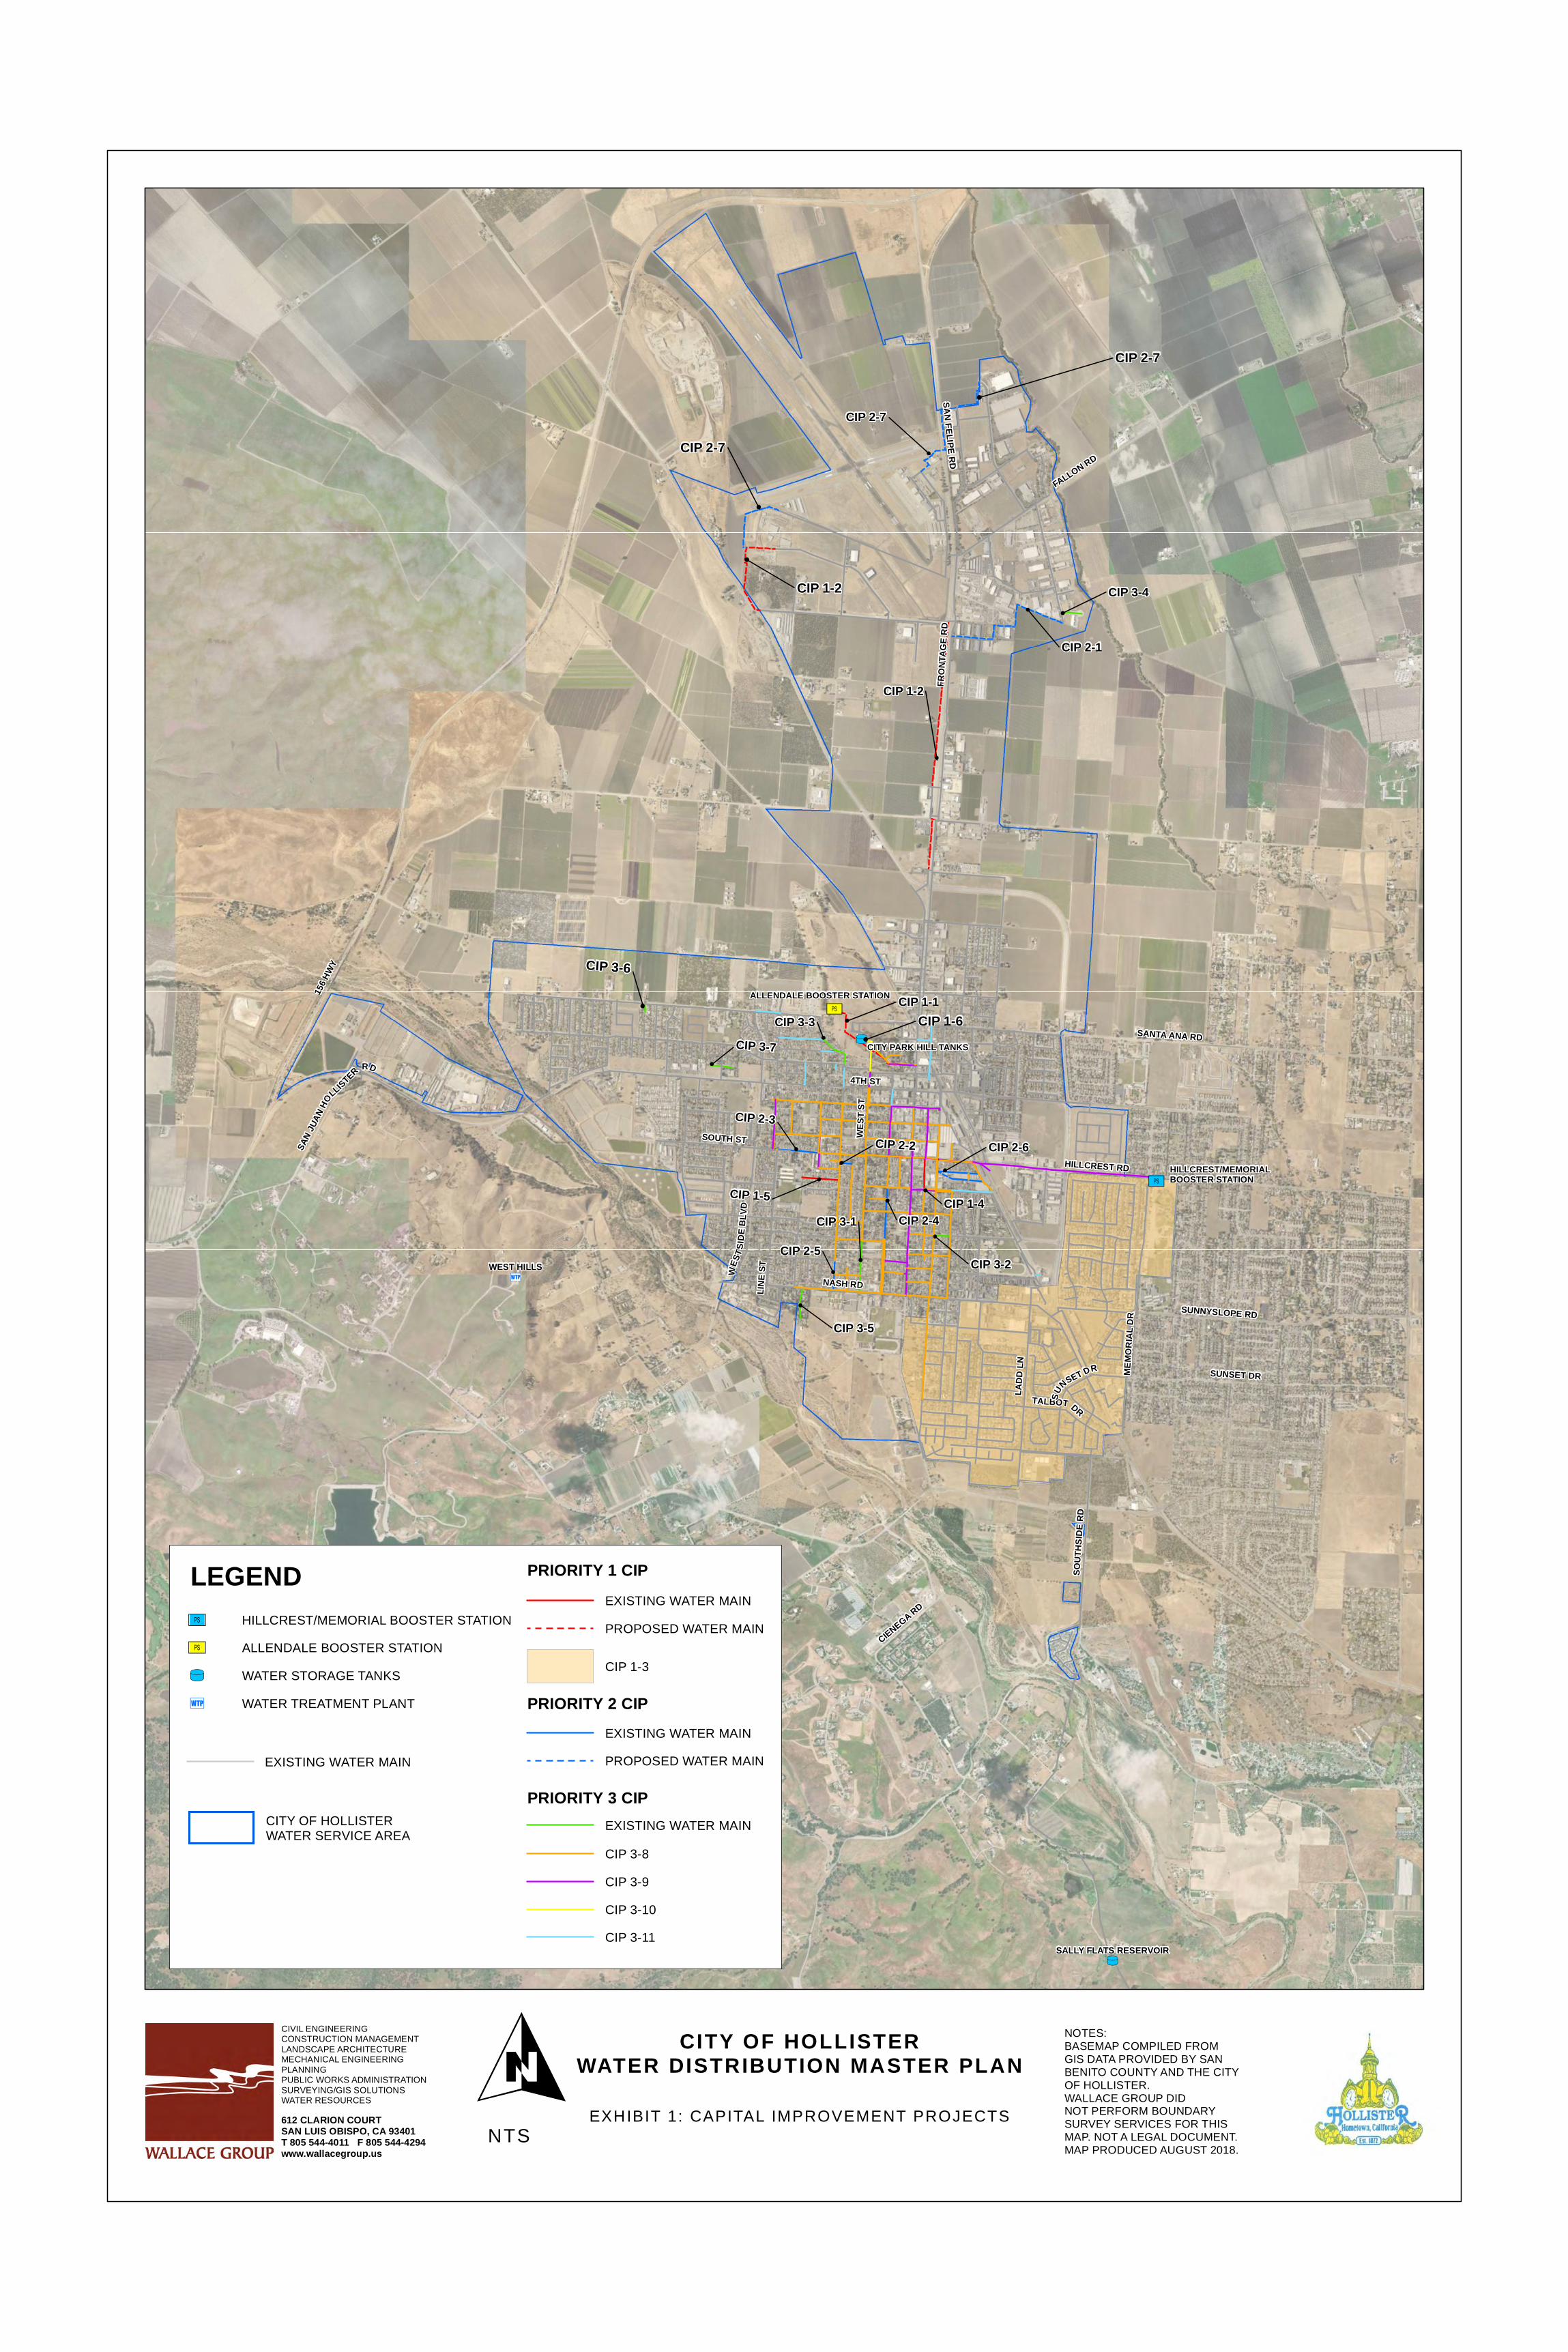
3Ú
3Ú
UT
UT
3Q
ALLENDALE BOOSTER STATION
HILLCREST/MEMORIALBOOSTER STATION
CIP 3-6
CIP 1-2
CIP 2-7
CIP 2-7
CIP 1-6
CIP 1-2
CIP 1-1
CIP 2-1
CIP 2-6
CIP 3-1
CIP 2-3
CIP 1-5
CIP 3-2
CIP 2-7
CIP 3-5
CIP 3-3
CIP 3-4
CIP 2-5
CIP 1-4
CIP 2-2
CIP 2-4
CIP 3-7
FALLON RD
SOUT
HSID
E RD
NASH RD
SANTA ANA RD
SOUTH ST
HILLCREST RD
4TH ST
CIENEGA RD
WEST
ST
156 H
WY
MEMO
RIAL
DR
LADD
LN
FRON
TAGE
RD
SAN FELIPE RD
WES
TSID
E BLV
D
SUNNYSLOPE RD
SAN JU
ANHO
LLISTER RD
SUNSET DR
TALBOT DR
LINE
ST
SU
NSET DR
WEST HILLS
CITY PARK HILL TANKS
SALLY FLATS RESERVOIR
CITY OF HOLLISTERWATER DISTRIBUTION MASTER PLAN
EXHIBIT 1: CAPITAL IMPROVEMENT PROJECTS
NOTES:BASEMAP COMPILED FROMGIS DATA PROVIDED BY SANBENITO COUNTY AND THE CITYOF HOLLISTER. WALLACE GROUP DID NOT PERFORM BOUNDARY SURVEY SERVICES FOR THIS MAP. NOT A LEGAL DOCUMENT. MAP PRODUCED AUGUST 2018.
ONTS
CIVIL ENGINEERINGCONSTRUCTION MANAGEMENTLANDSCAPE ARCHITECTUREMECHANICAL ENGINEERINGPLANNINGPUBLIC WORKS ADMINISTRATIONSURVEYING/GIS SOLUTIONSWATER RESOURCES
612 CLARION COURTSAN LUIS OBISPO, CA 93401T 805 544-4011 F 805 544-4294www.wallacegroup.us
LEGEND
WATER TREATMENT PLANT3Q
HILLCREST/MEMORIAL BOOSTER STATION[Ú
ALLENDALE BOOSTER STATION[Ú
EXISTING WATER MAIN
CITY OF HOLLISTERWATER SERVICE AREA
EXISTING WATER MAIN
PROPOSED WATER MAIN
PRIORITY 2 CIPCIP 1-3
PRIORITY 1 CIP
PROPOSED WATER MAIN
EXISTING WATER MAIN
WATER STORAGE TANKSUT
EXISTING WATER MAIN
PRIORITY 3 CIP
CIP 3-8
CIP 3-9
CIP 3-10
CIP 3-11
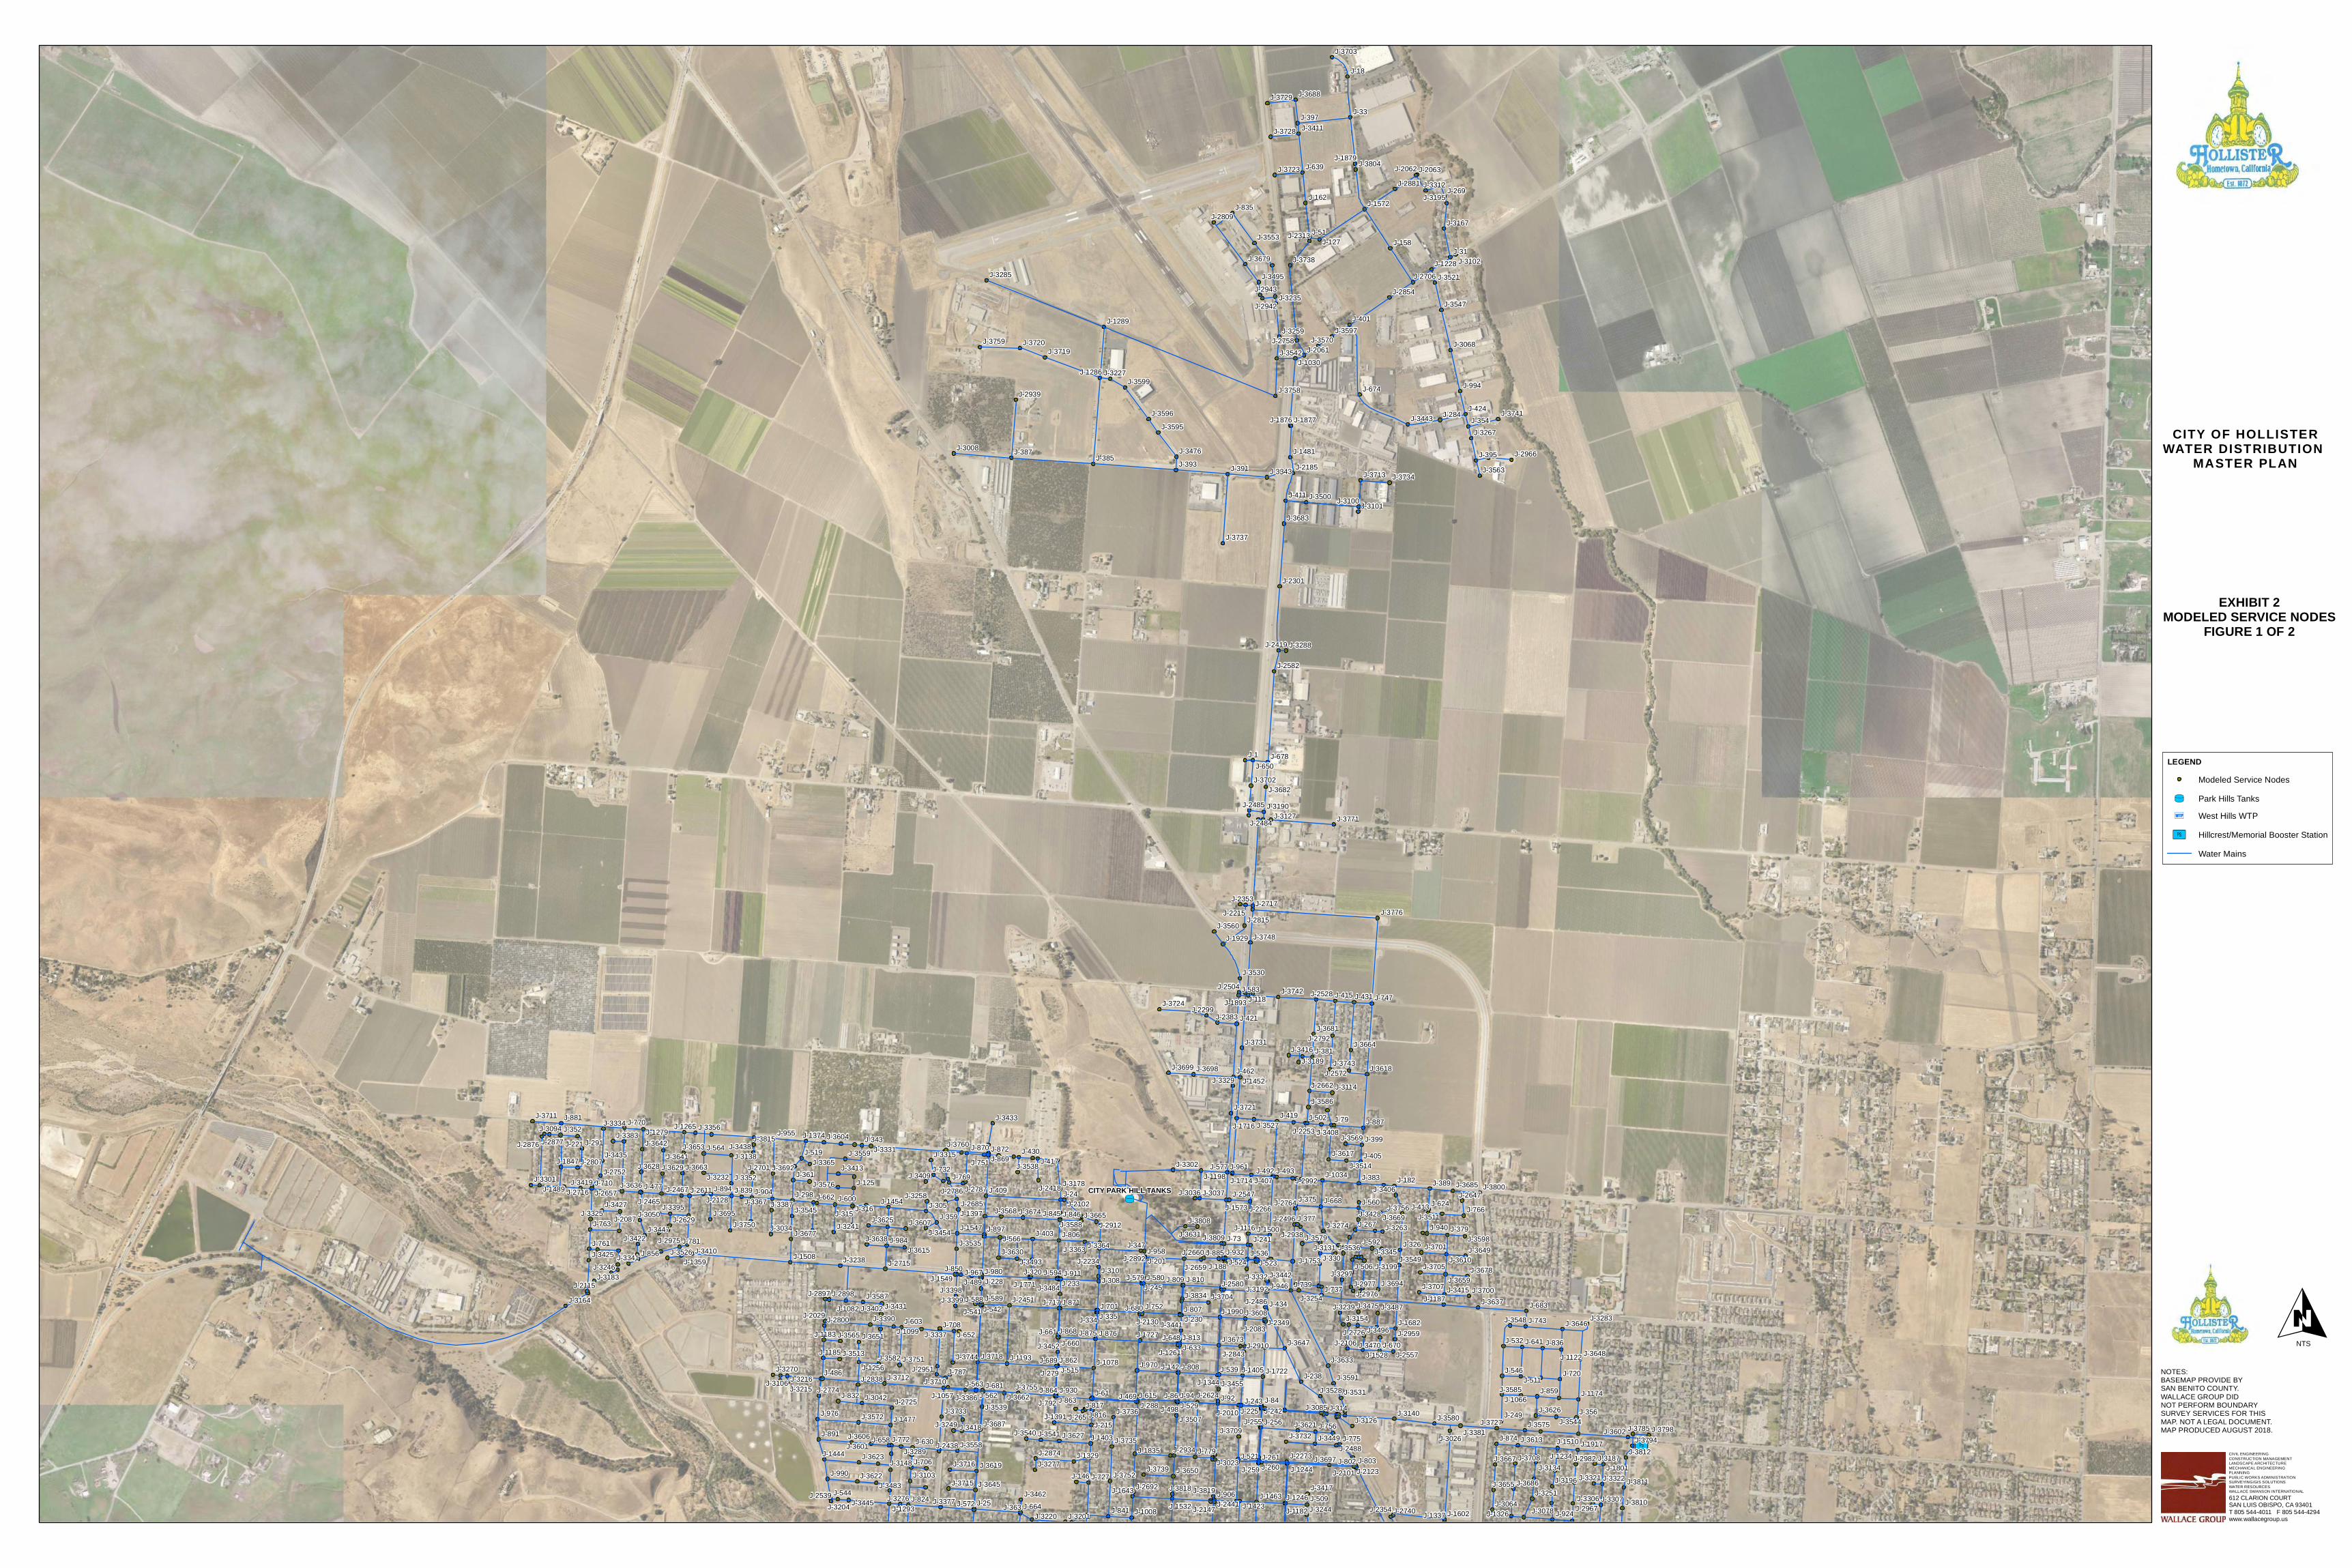
3Ú
UT
J-1
J-94 J-92J-86 J-84
J-79
J-73
J-61
J-51
J-33
J-31
J-25
J-24
J-18
J-994
J-990
J-984
J-980
J-976
J-970
J-967
J-961
J-958
J-955
J-946
J-940
J-932
J-930
J-924
J-911
J-906
J-904
J-897
J-894
J-891
J-887
J-885
J-881
J-876J-875
J-874
J-872
J-871
J-870J-869
J-868
J-864J-863
J-862
J-859
J-856
J-850
J-846J-845
J-841
J-839
J-836
J-835
J-832
J-824
J-817J-816
J-813
J-810J-809
J-808
J-807
J-806
J-803J-802
J-792
J-787
J-781
J-779
J-775J-772
J-770
J-769
J-766
J-763
J-761
J-756
J-752
J-751
J-747
J-743
J-739J-737
J-732
J-727
J-720
J-717
J-710
J-708
J-706
J-701
J-689
J-683
J-681
J-680
J-678
J-674
J-670
J-668
J-664
J-662
J-661J-660
J-658
J-652
J-650
J-648 J-641
J-639
J-633
J-630
J-624
J-615
J-603
J-600
J-594
J-592
J-589J-588
J-583
J-580J-579
J-577
J-572
J-566
J-564
J-563J-562
J-560
J-546
J-544
J-542J-541
J-539
J-536
J-532
J-529
J-524 J-523
J-521
J-519
J-515J-511
J-509
J-506
J-502
J-498
J-493J-492
J-489
J-486
J-477
J-469
J-462
J-434
J-431
J-430
J-424
J-421
J-419
J-417
J-415
J-413
J-411
J-409J-407
J-405
J-403
J-401
J-399
J-397
J-395J-393 J-391
J-389
J-387J-385
J-383
J-381
J-379J-377
J-375
J-363
J-361
J-359
J-356
J-354
J-352
J-347
J-343
J-335J-334
J-330
J-326
J-320
J-316J-315
J-314
J-310J-308
J-305J-298
J-291
J-288
J-284
J-279
J-269
J-267
J-265
J-261J-260J-259
J-256J-255J-249
J-245
J-243J-242
J-241
J-238
J-233
J-230
J-228
J-225
J-221
J-215
J-201J-188
J-182
J-162
J-158
J-146
J-142
J-127
J-125
J-118
J-3834
J-3819J-3818
J-3815
J-3812
J-3811
J-3810
J-3809
J-3808
J-3804
J-3800
J-3798J-3794
J-3785
J-3776
J-3771
J-3760
J-3759
J-3758
J-3756
J-3755
J-3752
J-3751
J-3750
J-3748
J-3744
J-3743
J-3742
J-3741
J-3739
J-3738
J-3737
J-3736
J-3735
J-3734
J-3733
J-3732
J-3731
J-3729
J-3728
J-3727
J-3724
J-3723
J-3721
J-3720J-3719
J-3718
J-3716
J-3715
J-3713
J-3712
J-3711
J-3710
J-3709
J-3708
J-3707
J-3705
J-3704
J-3703
J-3702
J-3701
J-3700
J-3699 J-3698
J-3697
J-3695
J-3694
J-3692
J-3688
J-3687
J-3686
J-3685
J-3683
J-3682
J-3681
J-3679
J-3678
J-3677
J-3674
J-3673
J-3669
J-3667
J-3665
J-3664
J-3663
J-3662
J-3659
J-3655
J-3653
J-3651
J-3650
J-3649
J-3648J-3647
J-3646
J-3645
J-3642
J-3641
J-3638
J-3637
J-3636
J-3633
J-3631
J-3630
J-3629J-3628
J-3627
J-3626
J-3625
J-3623
J-3622
J-3621
J-3619
J-3618
J-3617
J-3615
J-3613
J-3610
J-3608
J-3607
J-3606
J-3604
J-3602
J-3601
J-3599
J-3598
J-3597
J-3596
J-3595
J-3591
J-3588
J-3587
J-3586
J-3585
J-3582
J-3580
J-3579
J-3576
J-3575J-3572
J-3570
J-3569
J-3568
J-3565
J-3563
J-3560
J-3559
J-3558
J-3553
J-3549
J-3548
J-3547
J-3545
J-3544
J-3542
J-3541J-3540
J-3539
J-3538
J-3536J-3535
J-3531
J-3530
J-3528
J-3527
J-3526
J-3521
J-3514
J-3513
J-3511
J-3507
J-3500
J-3496
J-3495
J-3493
J-3487
J-3484
J-3483
J-3476
J-3475
J-3470
J-3462
J-3455
J-3454
J-3452
J-3449
J-3447
J-3445
J-3443
J-3442
J-3441
J-3438J-3435
J-3433
J-3431
J-3428J-3427
J-3425
J-3422
J-3419
J-3418
J-3417
J-3416
J-3415
J-3413
J-3411
J-3410
J-3409
J-3408
J-3406
J-3402J-3399J-3398
J-3395
J-3390
J-3387
J-3386
J-3383
J-3381
J-3377
J-3367
J-3365
J-3364J-3363
J-3356
J-3352
J-3345
J-3343
J-3341
J-3337
J-3334
J-3332
J-3331
J-3329
J-3325
J-3322J-3321
J-3315
J-3312
J-3307J-3306
J-3302
J-3301
J-3297
J-3289
J-3288
J-3285
J-3283
J-3277
J-3276
J-3274
J-3270
J-3267
J-3263
J-3259
J-3258
J-3254
J-3251
J-3249
J-3246
J-3244
J-3241
J-3239
J-3238
J-3235
J-3232
J-3227
J-3220
J-3216J-3215
J-3204J-3201
J-3199
J-3196
J-3195
J-3192
J-3190
J-3189
J-3187
J-3183
J-3178
J-3167
J-3164
J-3154
J-3148
J-3140
J-3138
J-3134
J-3131
J-3127
J-3126
J-3114
J-3106
J-3103
J-3102
J-3101J-3100
J-3094
J-3085
J-3078
J-3068
J-3064
J-3050
J-3042
J-3037J-3036
J-3034
J-3026
J-3023
J-3008
J-2992
J-2982
J-2977J-2976
J-2975
J-2967
J-2966
J-2959
J-2951
J-2943
J-2942
J-2939
J-2938
J-2934
J-2912
J-2910
J-2898J-2897
J-2892
J-2881
J-2877J-2876
J-2874
J-2854
J-2843
J-2838
J-2815
J-2809
J-2807
J-2800
J-2792
J-2787J-2786
J-2774
J-2764
J-2758
J-2752
J-2740
J-2726
J-2725
J-2717
J-2716
J-2715
J-2706
J-2701
J-2692
J-2685
J-2662
J-2660
J-2659
J-2657 J-2647
J-2629
J-2624
J-2611
J-2582
J-2580
J-2572
J-2557
J-2547
J-2539
J-2528J-2504
J-2496
J-2488
J-2486
J-2485
J-2484
J-2467
J-2465
J-2451
J-2441
J-2438
J-2419
J-2418
J-2383
J-2354
J-2353
J-2349
J-2313
J-2301
J-2299
J-2273
J-2266
J-2253
J-2234
J-2215
J-2185
J-2147
J-2130
J-2128
J-2123
J-2115
J-2106
J-2102
J-2101
J-2087
J-2083
J-2063J-2062
J-2061
J-2029
J-2010
J-1990
J-1929
J-1917
J-1893
J-1879
J-1877J-1876
J-1847
J-1835
J-1801
J-1771
J-1753
J-1727
J-1722
J-1716
J-1714
J-1682
J-1643
J-1602
J-1573
J-1572
J-1549
J-1547
J-1532
J-1528
J-1510
J-1508
J-1500
J-1489
J-1481
J-1477
J-1463
J-1454
J-1452
J-1444
J-1423
J-1405
J-1403
J-1397
J-1391
J-1374
J-1359
J-1344
J-1337
J-1329
J-1326J-1293
J-1289
J-1286
J-1279J-1265
J-1261
J-1256
J-1246
J-1244
J-1234
J-1228
J-1198
J-1193
J-1187
J-1185
J-1183
J-1182
J-1174
J-1122
J-1116
J-1099
J-1082
J-1078
J-1066J-1057
J-1034
J-1030
J-1008
CITY PARK HILL TANKS
NOTES:BASEMAP PROVIDE BYSAN BENITO COUNTY. WALLACE GROUP DID NOT PERFORM BOUNDARY SURVEY SERVICES FOR THIS MAP. NOT A LEGAL DOCUMENT. MAP PRODUCED AUGUST 2018.
O
LEGENDModeled Service Nodes
UT Park Hills Tanks
3Q West Hills WTP
3Ú Hillcrest/Memorial Booster Station
Water Mains
612 CLARION COURTSAN LUIS OBISPO, CA 93401T 805 544-4011 F 805 544-4294www.wallacegroup.us
CIVIL ENGINEERINGCONSTRUCTION MANAGEMENTLANDSCAPE ARCHITECTUREMECHANICAL ENGINEERINGPLANNINGPUBLIC WORKS ADMINISTRATIONSURVEYING/GIS SOLUTIONSWATER RESOURCESWALLACE SWANSON INTERNATIONAL
EXHIBIT 2MODELED SERVICE NODES
FIGURE 1 OF 2
NTS
CITY OF HOLLISTERWATER DISTRIBUTION
MASTER PLAN
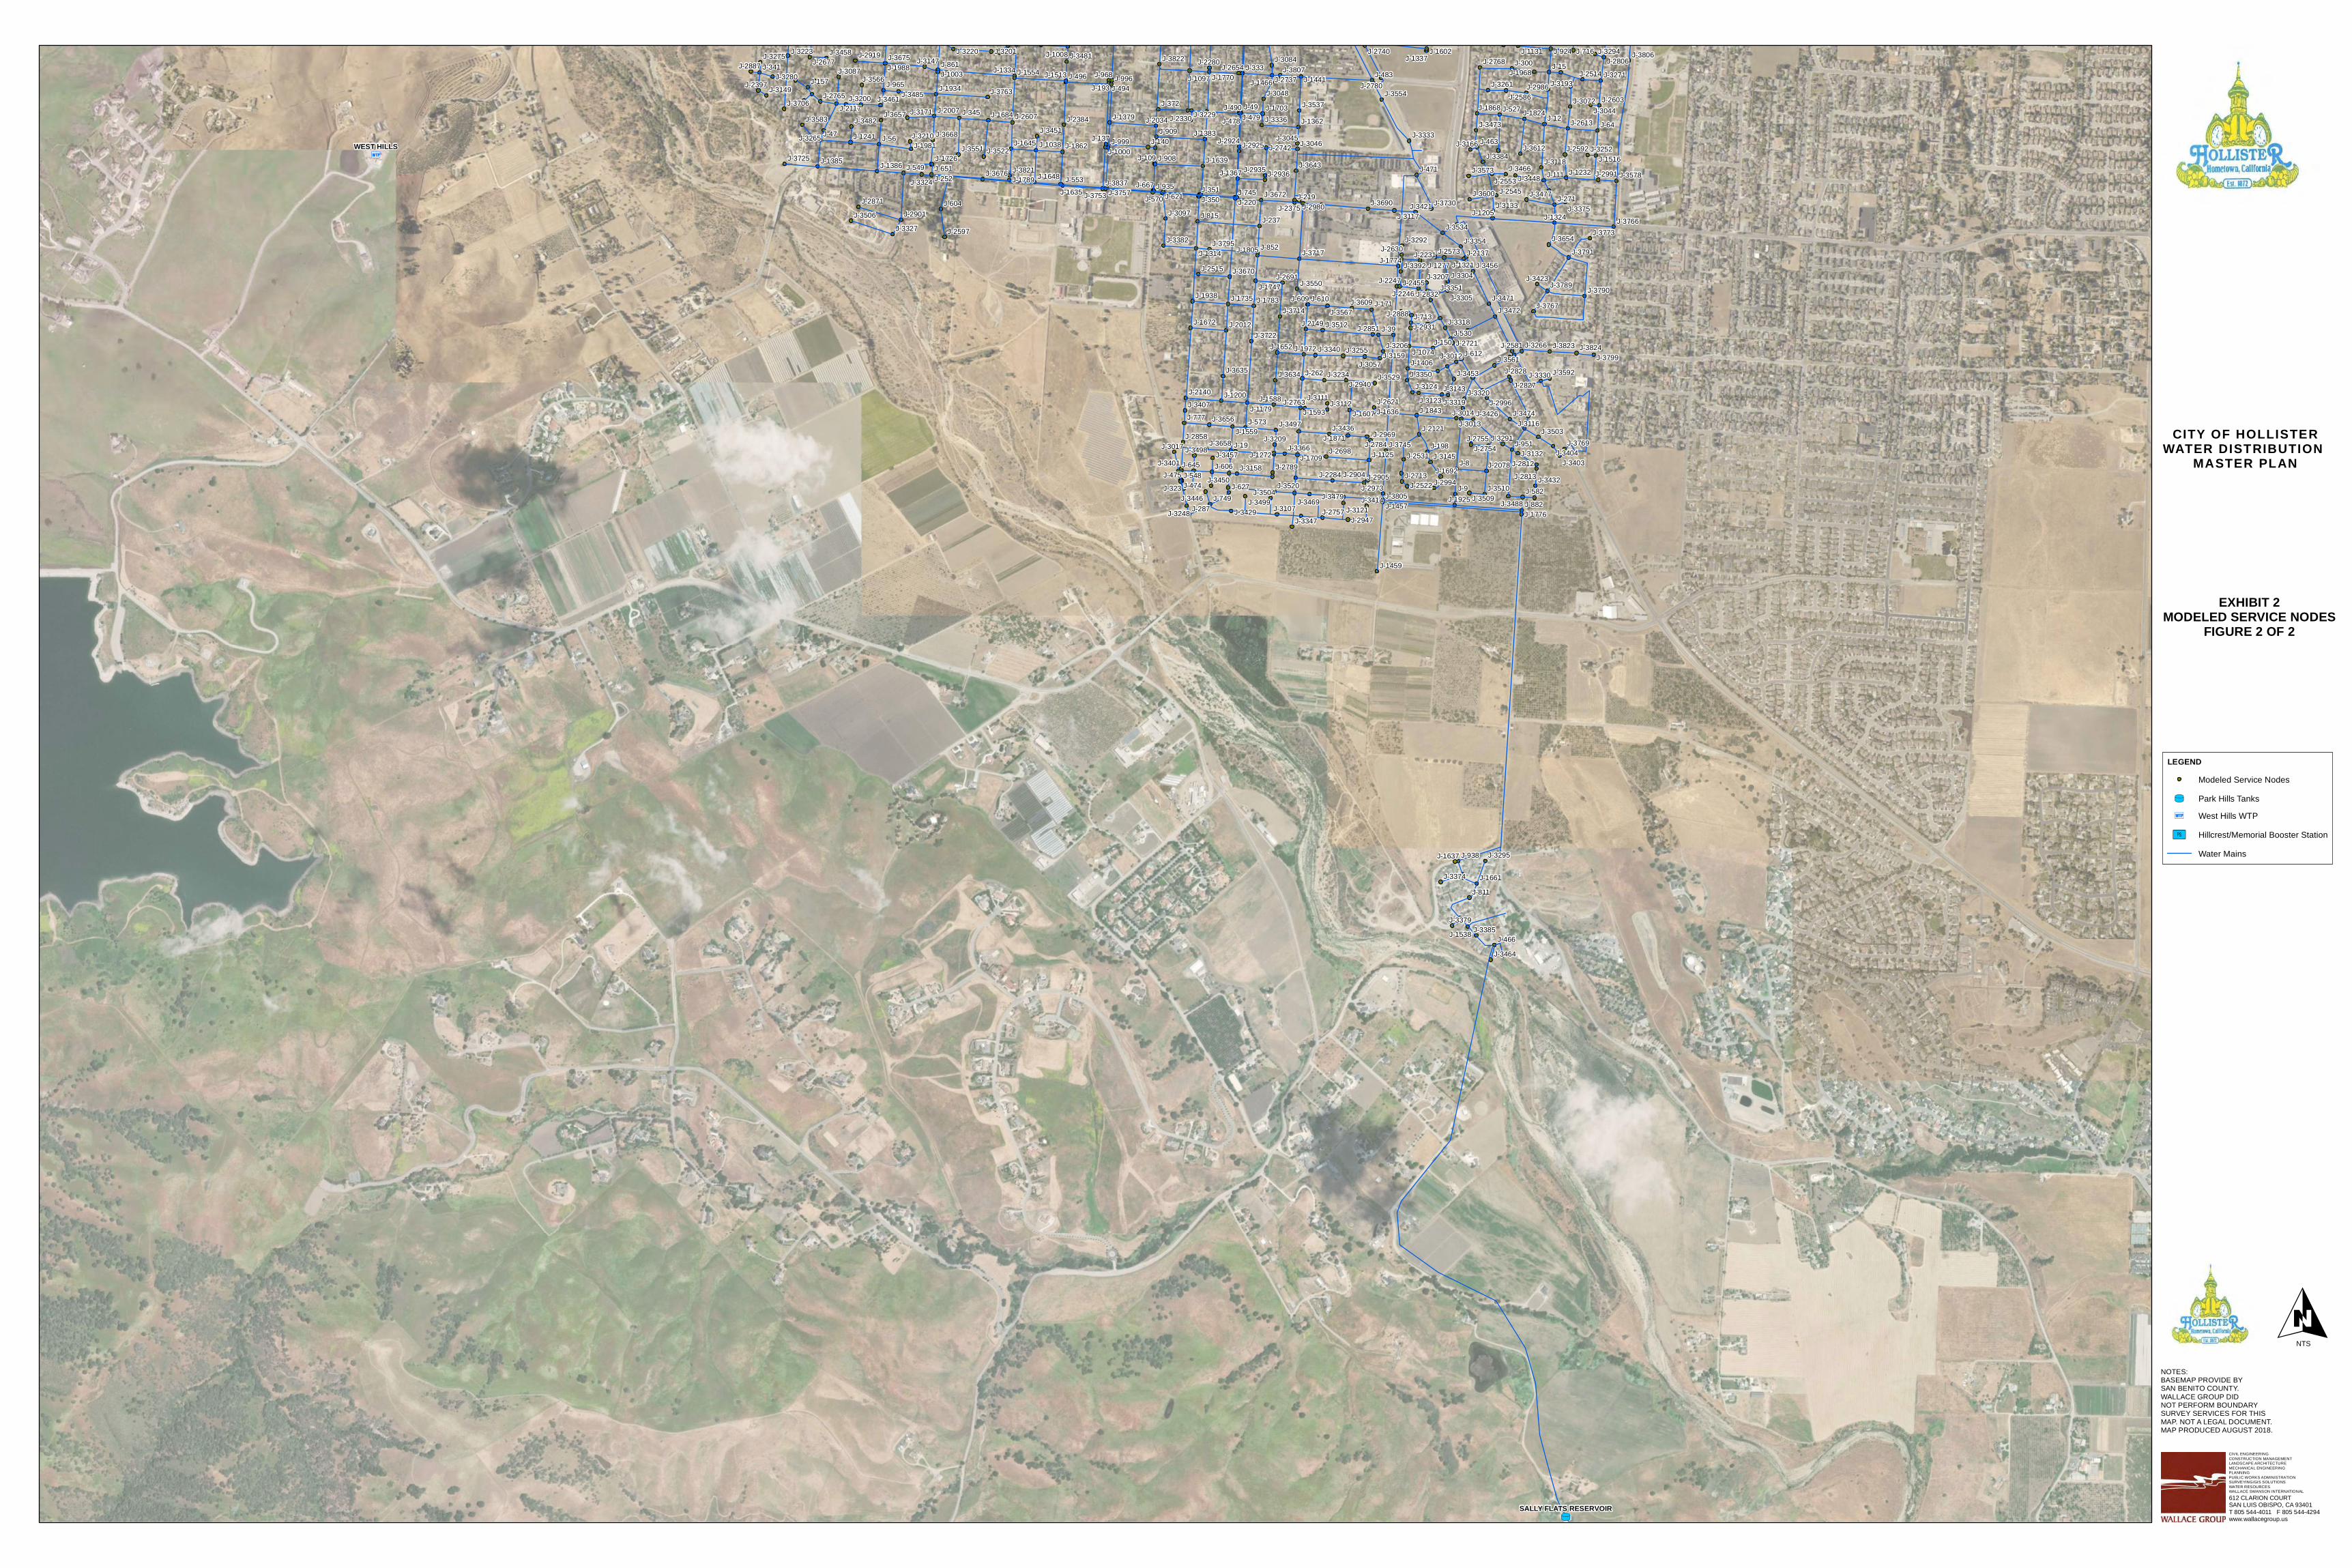
UT
3Q
J-9
J-8
J-64
J-56
J-49
J-47
J-39
J-19
J-15
J-12
J-999
J-996J-968J-965
J-951
J-938
J-935
J-924
J-909
J-908
J-882
J-861
J-852
J-815
J-811
J-777
J-749
J-745
J-716
J-713
J-667
J-651
J-645
J-627
J-621
J-612
J-610J-609
J-606
J-604
J-582
J-573
J-570
J-553
J-549
J-548
J-530
J-527
J-496
J-494
J-490
J-483
J-479J-478
J-475J-474
J-471
J-466
J-463
J-372
J-351J-350
J-345
J-341 J-333
J-323
J-300
J-287
J-271
J-262
J-252
J-237
J-220J-219
J-198
J-193
J-171
J-157
J-150
J-140J-137
J-111
J-109
J-3837
J-3824J-3823
J-3822
J-3821
J-3807
J-3806
J-3805
J-3799
J-3795J-3791
J-3790J-3789
J-3773
J-3769
J-3767
J-3766
J-3763
J-3757J-3753
J-3745
J-3730
J-3725
J-3722
J-3717
J-3714
J-3706
J-3690
J-3676
J-3675
J-3672
J-3670
J-3668
J-3658
J-3657
J-3656
J-3654
J-3643
J-3635 J-3634
J-3612
J-3609
J-3600
J-3592
J-3583
J-3578J-3573
J-3567
J-3566
J-3561
J-3554
J-3551
J-3550
J-3537
J-3534
J-3529
J-3522
J-3520
J-3512
J-3510J-3509
J-3506
J-3504
J-3503
J-3499
J-3498
J-3497
J-3488
J-3485
J-3482
J-3481
J-3479
J-3477
J-3474
J-3473
J-3472
J-3471
J-3469
J-3466
J-3464
J-3461
J-3458
J-3457
J-3456
J-3453
J-3451
J-3450
J-3448
J-3446
J-3436
J-3432
J-3429
J-3426
J-3423
J-3421
J-3414
J-3407
J-3404J-3403J-3401
J-3392
J-3385
J-3384
J-3382
J-3379
J-3375
J-3374
J-3366
J-3354
J-3351
J-3350
J-3347
J-3340
J-3336
J-3333
J-3330
J-3327
J-3324
J-3320J-3319
J-3318
J-3305
J-3304
J-3295
J-3294
J-3292
J-3291
J-3280
J-3275
J-3271
J-3266
J-3265
J-3261
J-3255
J-3252
J-3248
J-3234
J-3229
J-3223 J-3220
J-3210
J-3209
J-3207
J-3206
J-3201
J-3200
J-3193
J-3171
J-3166
J-3159
J-3158
J-3149
J-3147
J-3145
J-3143
J-3133
J-3132
J-3124
J-3123
J-3121
J-3118
J-3117
J-3116
J-3112J-3111
J-3107
J-3097
J-3087J-3084
J-3072
J-3057
J-3048
J-3046J-3045
J-3044
J-3017
J-3014J-3013
J-3012
J-2996
J-2994
J-2991
J-2986
J-2980
J-2973
J-2969
J-2947
J-2940
J-2936J-2935
J-2931
J-2925J-2924
J-2919
J-2905J-2904
J-2901
J-2888
J-2887
J-2871
J-2858
J-2851
J-2832
J-2828
J-2827
J-2813
J-2812
J-2806
J-2789
J-2784
J-2780
J-2768
J-2765
J-2763
J-2757
J-2755J-2754
J-2742
J-2740
J-2737
J-2721
J-2713
J-2698
J-2691
J-2677J-2654
J-2630
J-2621
J-2613J-2607
J-2603
J-2597
J-2592
J-2586
J-2581
J-2573
J-2553J-2545
J-2531
J-2522
J-2515
J-2514
J-2455
J-2397
J-2384
J-2375
J-2330
J-2284
J-2280
J-2247
J-2246
J-2231
J-2149
J-2140
J-2137
J-2121
J-2117
J-2078
J-2034
J-2012
J-2007
J-1988
J-1981
J-1972
J-1968
J-1938
J-1934
J-1925
J-1871
J-1868
J-1862
J-1843
J-1824
J-1805
J-1789
J-1783
J-1776
J-1774
J-1770
J-1747J-1735
J-1726
J-1709
J-1703
J-1692
J-1684
J-1672
J-1661
J-1652
J-1648
J-1645
J-1639
J-1637
J-1636
J-1635
J-1607
J-1602
J-1593
J-1588
J-1559
J-1554
J-1538
J-1516
J-1513J-1466
J-1459
J-1457
J-1441
J-1406
J-1386J-1385
J-1383
J-1379
J-1367
J-1362
J-1337J-1334
J-1324
J-1321J-1314
J-1277
J-1272
J-1241
J-1232
J-1205
J-1200
J-1179
J-1131
J-1125
J-1097
J-1074
J-1038
J-1008
J-1003
J-1000WEST HILLS
SALLY FLATS RESERVOIR
NOTES:BASEMAP PROVIDE BYSAN BENITO COUNTY. WALLACE GROUP DID NOT PERFORM BOUNDARY SURVEY SERVICES FOR THIS MAP. NOT A LEGAL DOCUMENT. MAP PRODUCED AUGUST 2018.
O
LEGENDModeled Service Nodes
UT Park Hills Tanks
3Q West Hills WTP
3Ú Hillcrest/Memorial Booster Station
Water Mains
612 CLARION COURTSAN LUIS OBISPO, CA 93401T 805 544-4011 F 805 544-4294www.wallacegroup.us
CIVIL ENGINEERINGCONSTRUCTION MANAGEMENTLANDSCAPE ARCHITECTUREMECHANICAL ENGINEERINGPLANNINGPUBLIC WORKS ADMINISTRATIONSURVEYING/GIS SOLUTIONSWATER RESOURCESWALLACE SWANSON INTERNATIONAL
EXHIBIT 2MODELED SERVICE NODES
FIGURE 2 OF 2
NTS
CITY OF HOLLISTERWATER DISTRIBUTION
MASTER PLAN