Commercial thermal distribution systems, Final report for CIEE/CEC
297
LBNL-44320 Commercial Thermal Distribution Systems FINAL REPORT For CIEE/CEC Tengfang Xu, Olivier Bechu, Rémi Carrié, Darryl Dickerhoff, William Fisk, Ellen Franconi, Øyvind Kristiansen, Ronnen Levinson, Jennifer McWilliams, Duo Wang, and Mark Modera Indoor Environment Department Lawrence Berkeley National Laboratory Berkeley CA 94720 Tom Webster, Erik Ring, Qiang Zhang, Charlie Huizenga, Fred Bauman, and Ed Arens Center for Environmental Design Research 390 Wurster Hall University of California Berkeley Berkeley, CA 94720-1839 December 1999 This report is prepared as the combination of research projects conducted by the Lawrence Berkeley National Laboratory (LBNL) and Center for Environmental Design Research (CEDR), University of California, Berkeley. The report presents the result of work sponsored by the California Energy Commission (Commission), through a contract with the Regents of the University of California, California Institute for Energy Efficiency (CIEE). It does not necessarily represent the views of the Commission, its employees, the State of California, The Regents, or CIEE. The Commission, the Regents, the State of California, CIEE, their employees, contractors, and subcontractors, make no warranty, express or implied, and assume no legal liability for the information in this report; nor does any party represent that the use of this information will not infringe upon privately owned rights. This report has not been approved or disapproved by the Commission or CIEE, nor has the Commission or CIEE passed upon the accuracy or adequacy of the information in this report. This work was also supported by the Assistant Secretary for Energy Efficiency and Renewable Energy, Office of Building Technology of the U.S. Department of Energy under contract no. DE- AC03-76SF00098. We wish to thank Karl Brown (CIEE), Mazi Shirakh (CEC), and Dennis Clough (USDOE) for their support and valuable input throughout the course of this project. We also wish to thank Woody Delp (LBNL) for his valuable advice regarding the field characterization work; Oscar Ortiz and David Montano (LBNL) for their assistance in the LBNL project on duct research. We also wish to thank David Jump of Schiller Associates, Bud Offerman of IEESF, and Graham Carter of Ove Arup, Cliff Federspiel and Nora Watanabe (CEDR) for their contributions to the CEDR project on fan research.
Transcript of Commercial thermal distribution systems, Final report for CIEE/CEC

LBNL-44320
Commercial Thermal Distribution Systems FINAL REPORT
For CIEE/CEC
Tengfang Xu, Olivier Bechu, Rémi Carrié, Darryl Dickerhoff, William Fisk, Ellen
Franconi, Øyvind Kristiansen, Ronnen Levinson, Jennifer McWilliams, Duo Wang,
and Mark Modera Indoor Environment Department
Lawrence Berkeley National Laboratory Berkeley CA 94720
Tom Webster, Erik Ring, Qiang Zhang, Charlie Huizenga, Fred Bauman, and Ed Arens
Center for Environmental Design Research 390 Wurster Hall
University of California Berkeley Berkeley, CA 94720-1839
December 1999
This report is prepared as the combination of research projects conducted by the Lawrence Berkeley National Laboratory (LBNL) and Center for Environmental Design Research (CEDR), University of California, Berkeley. The report presents the result of work sponsored by the California Energy Commission (Commission), through a contract with the Regents of the University of California, California Institute for Energy Efficiency (CIEE). It does not necessarily represent the views of the Commission, its employees, the State of California, The Regents, or CIEE. The Commission, the Regents, the State of California, CIEE, their employees, contractors, and subcontractors, make no warranty, express or implied, and assume no legal liability for the information in this report; nor does any party represent that the use of this information will not infringe upon privately owned rights. This report has not been approved or disapproved by the Commission or CIEE, nor has the Commission or CIEE passed upon the accuracy or adequacy of the information in this report.
This work was also supported by the Assistant Secretary for Energy Efficiency and Renewable Energy, Office of Building Technology of the U.S. Department of Energy under contract no. DE-AC03-76SF00098.
We wish to thank Karl Brown (CIEE), Mazi Shirakh (CEC), and Dennis Clough (USDOE) for their support and valuable input throughout the course of this project. We also wish to thank Woody Delp (LBNL) for his valuable advice regarding the field characterization work; Oscar Ortiz and David Montano (LBNL) for their assistance in the LBNL project on duct research. We also wish to thank David Jump of Schiller Associates, Bud Offerman of IEESF, and Graham Carter of Ove Arup, Cliff Federspiel and Nora Watanabe (CEDR) for their contributions to the CEDR project on fan research.

LBNL-44320
Disclaimer This document was prepared as an account of work sponsored by the United States Government. While this document is believed to contain correct information, neither the United States nor any agency thereof, nor The Regents of the University of California, nor any of their employees, makes any warranty, express or implied, or assumes any legal responsibility for the accuracy, completeness, or usefulness of any information, apparatus, product or process disclosed, or represents that its use would not infringe privately owned rights. Reference herein to any specific commercial product, process, or service by its name, trademark, manufacturer, or otherwise, does not necessarily constitute or imply its endorsement, recommendation, or favoring by the United States Government or any agency thereof, or The Regents of the University of California. The views and opinions of the authors expressed herein do not necessarily state or reflect those of the United States Government or any agency thereof, or The Regents of the University of California.
Ernest Orlando Lawrence Berkeley National Laboratory is an equal opportunity employer.
Contract No. DE-AC03-76SF00098 with the Department of Energy

1
Table of Contents
Table of Contents .................................................................................................................................... 1
List of Figures .......................................................................................................................................... 6
List of Tables.......................................................................................................................................... 10
0. Executive summary.................................................................................................................. 11 0.1 Introduction ................................................................................................................................ 11
0.2 Field characterization of thermal distribution systems in large and light commercial buildings ................................................................................................................................................. 12
0.2.1 Introduction..........................................................................................................................................12 0.2.2 Objectives ............................................................................................................................................13 0.2.3 Outcomes .............................................................................................................................................13 0.2.4 Conclusions..........................................................................................................................................15 0.2.5 Recommendations................................................................................................................................15
0.3 Evaluation of duct performance in the non-residential portion of the California’s Energy Efficiency Standards for Residential and Non-Residential Buildings (Title 24).............................. 16
0.3.1 Introduction..........................................................................................................................................16 0.3.2 Objectives ............................................................................................................................................16 0.3.3 Outcomes .............................................................................................................................................16 0.3.4 Conclusions..........................................................................................................................................17 0.3.5 Recommendations................................................................................................................................17
0.4 Aerosol sealing: Laboratory and field testing of an aerosol-based duct sealing technology for large commercial buildings ............................................................................................................ 18
0.4.1 Introduction..........................................................................................................................................18 0.4.2 Objectives ............................................................................................................................................18 0.4.3 Outcomes .............................................................................................................................................19 0.4.4 Conclusions..........................................................................................................................................19 0.4.5 Recommendations................................................................................................................................20
0.5 Aerosol coating of in-situ duct liner.......................................................................................... 20 0.5.1 Introduction..........................................................................................................................................20 0.5.2 Objectives ............................................................................................................................................20 0.5.3 Outcomes .............................................................................................................................................20 0.5.4 Conclusions..........................................................................................................................................21 0.5.5 Recommendations................................................................................................................................21
0.6 Reducing Fan Energy in Built-up Fan Systems....................................................................... 22 0.6.1 Introduction..........................................................................................................................................22 0.6.2 Objectives ............................................................................................................................................22 0.6.3 Outcomes .............................................................................................................................................22 0.6.4 Conclusions..........................................................................................................................................23 0.6.5 Recommendations................................................................................................................................24
1 Field characterization of thermal distribution systems in large and light commercial buildings ....................................................................................................................................... 25
1.1 Introduction ................................................................................................................................ 25
1.2 Objectives .................................................................................................................................... 26
1.3 Approaches.................................................................................................................................. 27 1.3.1 Physical characterization of duct system .............................................................................................27

2
1.3.2 Leakage area measurements ................................................................................................................27 1.3.3 Duct system pressure measurements....................................................................................................30 1.3.4 Airflow measurements at the registers.................................................................................................30 1.3.5 Tracer gas measurement of fan flow....................................................................................................32 1.3.6 Duct air leakage flow rates ..................................................................................................................33 1.3.7 Air leakage estimated from ELA and pressure ....................................................................................33 1.3.8 Air leakage estimated from upstream duct flow and register flows.....................................................33 1.3.9 Conduction heat gains..........................................................................................................................34 1.3.10 Equipment performance monitoring ....................................................................................................35
1.4 Results.......................................................................................................................................... 35 1.4.1 Physical characteristics of building systems........................................................................................35 1.4.2 Effective leakage areas, air leakage classes, and static pressures ........................................................40 1.4.3 Small commercial systems...................................................................................................................44 1.4.4 Fan flow rates ......................................................................................................................................47 1.4.5 Estimated leakage ratios from ducts ....................................................................................................48 1.4.6 Conduction heat gains and losses ........................................................................................................50 1.4.7 Equipment performance monitoring ....................................................................................................69 1.4.8 Summary of the field characterization results......................................................................................74
1.5 Discussion.................................................................................................................................... 76 1.5.1 Air leakage characterization ................................................................................................................76 1.5.2 Thermal losses through heat conduction..............................................................................................77 1.5.3 Energy saving potentials ......................................................................................................................78
1.6 Conclusions ................................................................................................................................. 78
1.7 Recommendations....................................................................................................................... 79
2 Evaluation of duct performance in the non-residential portion of the California’s Energy Efficiency Standards for Residential and Non-Residential Buildings (Title 24) ...................... 80
2.1 Introduction ................................................................................................................................ 80 2.1.1 Background..........................................................................................................................................80
2.2 Objective...................................................................................................................................... 82
2.3 Approaches.................................................................................................................................. 82 2.3.1 Heat conduction and air leakage through ducts ...................................................................................82 2.3.2 DOE-2 duct air leakage and conduction modeling ..............................................................................85 2.3.3 DOE-2.1E duct air leakage modeling guidelines .................................................................................90
2.4 Results.......................................................................................................................................... 96 2.4.1 Light commercial building analysis.....................................................................................................97 2.4.2 DOE-2.1E performance predictions.....................................................................................................99 2.4.3 Summary............................................................................................................................................101
2.5 Discussion.................................................................................................................................. 102 2.5.1 Issues and implications ......................................................................................................................104 2.5.2 Prescriptive compliance .....................................................................................................................104 2.5.3 Performance Compliance...................................................................................................................104 2.5.4 Validating alternative calculation methods........................................................................................105 2.5.5 Large commercial buildings ..............................................................................................................105
2.6 Conclusions ............................................................................................................................... 105
2.7 Recommendations..................................................................................................................... 106
2.8 Notation ..................................................................................................................................... 108

3
3 Aerosol sealing: Laboratory and field testing of an aerosol-based duct sealing technology for large commercial buildings.................................................................................................. 109
3.1 Introduction .............................................................................................................................. 109
3.2 Objectives .................................................................................................................................. 110
3.3 Background............................................................................................................................... 110
3.4 Approaches................................................................................................................................ 111 3.4.1 Hardware developments ....................................................................................................................111 3.4.2 Characterization of aerosol injectors..................................................................................................113 3.4.3 Creating airflow outlets to increase aerosol penetration ....................................................................116 3.4.4 Modeling particle transport and deposition in duct systems ..............................................................116 3.4.5 Operating pressure limits of sealant...................................................................................................117 3.4.6 Field testing of aerosol duct sealing...................................................................................................120
3.5 Results........................................................................................................................................ 122 3.5.1 Laboratory characterization of injection devices ...............................................................................122 3.5.2 Operating pressure limits of sealant...................................................................................................126 3.5.3 Modeling of particle penetration........................................................................................................127 3.5.4 Field testing in two large commercial buildings ................................................................................128
3.6 Discussion.................................................................................................................................. 134
3.7 Conclusions ............................................................................................................................... 136
3.8 Recommendations..................................................................................................................... 136
4 Aerosol coating of in-situ duct liner ................................................................................... 137 4.1 Introduction .............................................................................................................................. 137
4.2 Objectives .................................................................................................................................. 137
4.3 Background............................................................................................................................... 137
4.4 Approaches................................................................................................................................ 138 4.4.1 Measurement of spot conductance.....................................................................................................138 4.4.2 Low-water-content surface sealant ....................................................................................................139 4.4.3 Pressure-driven in-situ coating ..........................................................................................................140 4.4.4 Theoretical estimate of maximum coating rate..................................................................................141
4.5 Results........................................................................................................................................ 143 4.5.1 Experiments .......................................................................................................................................143 4.5.2 Energy-savings potential of coating process......................................................................................168 4.5.3 Cost effectiveness of coating process ................................................................................................176 4.5.4 Patentability of coating process .........................................................................................................177
4.6 Discussion.................................................................................................................................. 179 4.6.1 Conductance reduction achieved by various sealants ........................................................................179 4.6.2 Efficacy of pressure-driven in-situ coating process ...........................................................................179 4.6.3 Energy savings...................................................................................................................................180 4.6.4 Patentability of coating process .........................................................................................................181 4.6.5 Modification of robot-based coating services ....................................................................................181
4.7 Conclusions ............................................................................................................................... 181
4.8 Recommendations..................................................................................................................... 182
5 Reducing fan energy in built-up fan systems..................................................................... 183

4
5.1 Introduction .............................................................................................................................. 183
5.2 Objectives .................................................................................................................................. 184
5.3 Background............................................................................................................................... 185
5.4 Approaches................................................................................................................................ 185
5.5 Results - Protocol development: Field data collection........................................................... 187 5.5.1 Introduction........................................................................................................................................187 5.5.2 Data Collection Protocols ..................................................................................................................191 5.5.3 Data error analysis .............................................................................................................................193 5.5.4 One-time Measurements ....................................................................................................................197 5.5.5 Time-Series Measurements................................................................................................................203
5.6 Results - Protocol development: Data analysis software tools.............................................. 205 5.6.1 Introduction........................................................................................................................................205 5.6.2 Fan Analysis Tool..............................................................................................................................205 5.6.3 Fan Benchmarking Tool ....................................................................................................................216 5.6.4 Fan Power Analysis Tool...................................................................................................................222 5.6.5 System Temperature Analysis Tool...................................................................................................228 5.6.6 Reheat Temperature Analysis Tool....................................................................................................235 5.6.7 Static Pressure Analysis Tool ............................................................................................................242 5.6.8 Zone Temperature Analysis Tool ......................................................................................................247 5.6.9 Motor Efficiency Tool .......................................................................................................................252
5.7 Results - Protocol development: Public access to protocols.................................................. 254 5.7.1 Web-site development .......................................................................................................................254 5.7.2 Third party collaboration ...................................................................................................................257
5.8 Results - Low-cost monitoring: Tracer gas airflow measurement....................................... 257 5.8.1 Background........................................................................................................................................257 5.8.2 Issues Summary .................................................................................................................................258 5.8.3 Constant Injection method .................................................................................................................259 5.8.4 Other Issues .......................................................................................................................................262 5.8.5 Global Warming Analysis .................................................................................................................262 5.8.6 Functional Requirement Recommendations ......................................................................................262
5.9 Conclusions ............................................................................................................................... 264
5.10 Recommendations..................................................................................................................... 264 5.10.1 Protocol development ........................................................................................................................264 5.10.2 Low-cost monitoring..........................................................................................................................265
6 References............................................................................................................................ 268 7 Appendices ........................................................................................................................... 274
7.1 Airflow calibration systems ..................................................................................................... 274
7.2 Turbo Blaster high-flow calibrated fan.................................................................................. 277 7.2.1 Calibration in pressurization mode ....................................................................................................279 7.2.2 Calibration in depressurization mode ................................................................................................280
7.3 Summary of characteristics of large-commercial buildings and systems............................ 281
7.4 Delivery effectiveness ............................................................................................................... 284
7.5 Bulk (macroscopic) and spot (microscopic) conductances.................................................... 284
7.6 Darcy-Forschheimer’s law....................................................................................................... 284

5
7.7 Fan protocols nomenclature .................................................................................................... 286 7.7.1 Abbreviations.....................................................................................................................................286 7.7.2 Parameters..........................................................................................................................................287
7.8 Problem identification summary.............................................................................................288
7.9 Data-collection support tools ................................................................................................... 289 7.9.1 Field-data collection sheets................................................................................................................289 7.9.2 Instrumentation and measurements summary....................................................................................291

6
List of Figures
Figure 1. Apparatus used to measure a duct system’s effective leakage area..............................................................30 Figure 2. Fan-powered flow hood apparatus used to measure airflow rates through registers. ...................................32 Figure 3. Static pressure trends of System L3 ducts upstream and downstream of VAV boxes. ................................42 Figure 4. Static pressure trends of System L4 ducts upstream and downstream of VAV boxes. ................................43 Figure 5. Static pressure trends of System L5 ducts upstream and downstream of mixing boxes...............................44 Figure 6. Total effective leakage area (ELA25) vs. floor area using data of present study, previous LBNL data (Delp
et al. 1998), FSEC small commercial data (Cummings et al. 1996), and residential summary information (Jump et al. 1996). ..........................................................................................................................................................46
Figure 7. Fan flow rate versus surface area in light commercial buildings using LBNL data sets (1996 through 1999)....................................................................................................................................................................48
Figure 8. Temperature trend in duct System L1 of a supermarket store. .....................................................................52 Figure 9. Registers and supply duct layout in System L1 of a supermarket store. ......................................................52 Figure 10 Temperature trend and fan operation in duct System L2 (heating, long duct). ...........................................53 Figure 11. Registers and supply duct layout in duct System L2 (heating, long duct)..................................................53 Figure 12. Temperature trends for duct System L3 (cooling, VAV duct system). ......................................................54 Figure 13. Monitored VAV boxes and registers layout for duct System L3. ..............................................................55 Figure 14. Temperature trend for cooling cycles duct System S1 (small office).........................................................56 Figure 15. Temperature trend for cooling cycles in duct System S3 (small office).....................................................57 Figure 16. Temperature trend for heating cycles in duct System S3 (small office).....................................................57 Figure 17. Temperature trend for cooling cycles in duct System S5 (small office).....................................................58 Figure 18. Temperature trend for heating cycles in duct System S5 (small office).....................................................59 Figure 19. Fan room pressure trend in VAV System L3. ............................................................................................64 Figure 20. Short-term temperature effectiveness for VAV boxes and registers. .........................................................66 Figure 21. Cumulative supply effectiveness versus cycle on-time percentage for systems tested ..............................67 Figure 22 System S3: Calculated COP, outside air temperature, space temperature and the electricity energy demand
during continuous operation ................................................................................................................................70 Figure 23 System S3: Calculated COP, outside air temperature, space temperature and the electricity energy demand
during intermittent operation ...............................................................................................................................71 Figure 24 System S5: Measured COP, outside air temperature, space temperature and the electricity energy demand
during intermittent operation ...............................................................................................................................72 Figure 25. Main injector unit (high-flow fan, heater, liquid pump, and atomizer). ...................................................112 Figure 26. Compact injector unit (heater and atomizer). ...........................................................................................112 Figure 27. Vortex nozzles: (a) standard nozzle with one inlet wheel (bottom of nozzle), and (b) modified nozzle with
two inlet wheels (bottom of nozzle). .................................................................................................................113 Figure 28. Face of vortex nozzle. Counter-rotating swirling flows generated by the upper and lower wheels (Figure
27) atomize a liquid stream delivered by the central tube. ................................................................................113 Figure 29. Main injector configuration: aerosol sprayed into 4-m long, 52-cm diameter thin-walled plastic tube, with
particle size distribution sampled 3 m from the injection point. ........................................................................114 Figure 30. Compact-injector configuration: aerosol sprayed into 4-m long, 30-cm diameter thin-walled plastic tube,
with particle size distribution sampled 3 m from the injection point.................................................................115 Figure 31. Particle-collection cutoff diameters of cascade impactor stages versus sampling airflow rate. The final
filter stage (curve not shown) collects all remaining particles...........................................................................116 Figure 32. Fifty-millimeter long slots of 3, 6, and 16-mm width sealed with aerosolized glue. ...............................118 Figure 33. Sealing slots in a duct cap by aerosol injection. .......................................................................................118 Figure 34. Two-ply plastic sheeting clamped over the open end of the duct cap to form a closed volume...............119 Figure 35. Measuring the bursting pressure of an aerosol-sealed slot. ......................................................................120 Figure 36. Particle-size distributions of aerosols generated by two main-injector and two compact-injector
configurations, measured three meters downstream of the injection point (see Figure 29 and Figure 30)........124 Figure 37. Deposition of solid sealant on duct wall due to impingement, turbulence, and gravity versus distance from
the injection point, shown for two configurations of the main injector (see Figure 29). Discrepancies in the results of multiple trials seem to be due to atomizer misalignment. ..................................................................125

7
Figure 38. Deposition of solid sealant on duct wall due to impingement, turbulence, and gravity versus distance from the injection point, shown for two configurations of the compact injector (see Figure 30). Discrepancies in the results of multiple trials seem to be due to atomizer misalignment. ..................................................................126
Figure 39. Aerosol-sealed 6-mm-wide slot after bursting. ........................................................................................127 Figure 40. Simulated particle mass flux in a 30 cm diameter, 60 m long duct when using multi-point injection
strategy. .............................................................................................................................................................128 Figure 41. Duct layout, main and compact injector installation, and aerosol sampling locations in building L-5. ...130 Figure 42. Duct layout, main injector installation, and aerosol sampling locations in building L-2. ........................131 Figure 43. Aerosol concentrations measured at several locations in building L-5 using the impaction plate method.
Initial concentration is calculated based on the fan flow rate and the liquid injection flow rate. ......................132 Figure 44. Effective leakage area (ELA) and sealing rate during sealing process in building L-5. The solid vertical
line shows when the compact injector was turned on. The beginning of the experiment (about 20 minutes) has been removed for clarity. ...................................................................................................................................133
Figure 45. Effective leakage area (ELA) and sealing rate in building L-2 during the sealing process. The solid vertical line shows when the pressure-relief outlet was opened. For clarity, periods where injection was turned off are removed..................................................................................................................................................134
Figure 46. Liner sample clamped inside spot-conductance measurement instrument. ..............................................139 Figure 47. Airflow through a liner sample in the spot-conductance measurement device. .......................................139 Figure 48. Sealant deposition on duct liner in the pressure-driven in-situ coating process. ......................................141 Figure 49. Maximum water evaporation rate in an idealized aerosol-injection system that combines streams of dry
air, liquid water, and heat to create a stream of water-saturated air...................................................................142 Figure 50. Longitudinal airflow through liner “coated” with duct-tape. ...................................................................145 Figure 51. Longitudinal bulk velocity (flow per normal area) though coated fiberglass duct liner...........................145 Figure 52. Sheet-metal-box duct block......................................................................................................................146 Figure 53. Short sheet-metal-box block with a foam-board facing............................................................................147 Figure 54. Balloon block inflated inside a lined, rectangular duct. ...........................................................................148 Figure 55. Setup of coating experiment A (adhesive, high duct pressure, foam-board block, and fixed coating
length.)...............................................................................................................................................................150 Figure 56. Operating conditions of coating experiment A (adhesive, high duct pressure, foam-board block, and fixed
coating length.) ..................................................................................................................................................150 Figure 57. Left-wall liner coated in experiment A (adhesive, high duct pressure, foam-board block, and fixed coating
length). Sizeable particle deposition is evident at the block location. ...............................................................151 Figure 58. Spot conductance measurements of liner pieces coated in experiment A (adhesive, high duct pressure,
foam-board block, and fixed coating length). ....................................................................................................151 Figure 59. Setup of coating experiment B (adhesive, high duct pressure, metal-box block, and variable coating
length). The same apparatus was used in experiments C and E.........................................................................152 Figure 60. Operating conditions of coating experiment B (adhesive, high duct pressure, metal-box block, and
variable coating length). ....................................................................................................................................153 Figure 61. Duct liner coated in coating experiment B (adhesive, high duct pressure, metal box block, variable
coating length). ..................................................................................................................................................154 Figure 62. Spot conductance measurements of liner pieces coated in experiment B (adhesive, high duct pressure,
metal box block, variable coating length)..........................................................................................................154 Figure 63. Operating conditions of experiment C (adhesive, low and moderate duct pressures, metal-box block, and
variable coating length.) ....................................................................................................................................155 Figure 64. Duct liner coated in experiment C (adhesive, low and moderate duct pressures, metal-box block, and
variable coating length.) ....................................................................................................................................156 Figure 65. Spot conductance measurements of liner pieces coated in experiment C (adhesive, low and moderate duct
pressures, metal-box block, variable coating length.)........................................................................................157 Figure 66. Setup of experiment D (adhesive, moderate duct pressure, balloon block, variable coating length). ......158 Figure 67. Inflatable-balloon duct block....................................................................................................................159 Figure 68. Operating conditions of experiment D (adhesive, moderate duct pressure, balloon block, variable coating
length)................................................................................................................................................................159 Figure 69. Spot conductance measurements of liner pieces coated in experiment D (adhesive, moderate duct
pressure, balloon block, variable coating length). .............................................................................................160 Figure 70. Operating conditions of experiment E (paint and adhesive, low duct pressure, metal-box block, fixed
coating length). ..................................................................................................................................................161

8
Figure 71. Duct liner coated in experiment E (paint and adhesive, low duct pressure, metal-box block, fixed coating length)................................................................................................................................................................162
Figure 72. Spot conductance measurements of liner pieces coated in experiment E (paint and adhesive, low duct pressure, metal-box block, fixed coating length). ..............................................................................................163
Figure 73. Silicone caulking joining the edges of the metal-and-foam-board block to the duct liner, preventing leaks around the block’s edges. ..................................................................................................................................164
Figure 74. Setup of coating experiment F (adhesive, moderate-to-high pressure, fixed coating length, perfectly and imperfectly-sealed metal-and-foam blocks). .....................................................................................................165
Figure 75. Operating conditions of experiment F (adhesive, moderate-to-high pressure, fixed coating length, perfectly and imperfectly-sealed metal-and-foam blocks).................................................................................165
Figure 76. Duct liner coated in experiment F with an imperfect block (adhesive, moderate-to-high duct pressure, fixed coating length, imperfectly sealed metal-and-foam block).......................................................................166
Figure 77. Duct liner coated in experiment F with an perfect block (adhesive, moderate-to-high duct pressure, fixed coating length, perfectly sealed metal-and-foam block). ...................................................................................167
Figure 78. Coating rate vs. length of liner in ducts coated using perfect and imperfect blocks in Experiment F (adhesive, moderate-to-high pressure, fixed coating length, perfectly and imperfectly-sealed metal-and-foam blocks). ..............................................................................................................................................................168
Figure 79. Variation with duct air speed of the effective thermal conductivity at 24 °C of perviously- and imperviously-faced fiberglass blankets (density 13 kg m-3) in flexible ducts. Also shown is the nominal, still-air effective thermal conductivity for both blankets. ..............................................................................................169
Figure 80. Variation with duct air speed in the infiltration-induced fractional increase of the conductivities of low-density and high-density fiberglass blankets. The low-density-blanket’s conductivity was measured, while the high-density blanket’s conductivity was extrapolated from that of the low-density-blanket result...................170
Figure 81. Variation with duct air speed of the effectiveness gain achieved by encapsulating the air-facing surface of the fiberglass-insulated, flexible branch duct described in Table 19. ................................................................171
Figure 82. Variation with duct air speed of the effectiveness gain achieved by encapsulating the air-stream surface of the fiberglass-insulated, rigid main duct described in Table 19.........................................................................172
Figure 83. Longitudinal flow through the duct cavity and duct liner. .......................................................................176 Figure 84. Equation for Estimating Belt Drive Efficiency versus AMCA Data........................................................188 Figure 85. Example Summary Page from Fan Analysis Tool ...................................................................................210 Figure 86. Example Quick Analysis from Fan Analysis Tool ...................................................................................211 Figure 87. Example Motor Summary from Fan Analysis Tool .................................................................................211 Figure 88. Example Fan Plots from Fan Analysis Tool.............................................................................................213 Figure 89. Example SFPI Plots from Fan Analysis Tool...........................................................................................215 Figure 90. Example Population Parameters from Fan Benchmarking Tool ..............................................................217 Figure 91. Example Benchmarking Chart from Fan Benchmarking Tool.................................................................219 Figure 92. Example Benchmarking Chart from Fan Benchmarking Tool.................................................................220 Figure 93. Example Benchmarking Chart from Fan Benchmarking Tool.................................................................221 Figure 94. Example Summary Tab from Fan Power Analysis Tool..........................................................................223 Figure 95. Example Load Factor Histogram from Fan Power Analysis Tool ...........................................................224 Figure 96. Example LF-OAT Chart from Fan Power Analysis Tool ........................................................................225 Figure 97. Example LF-Time of Day Chart from Fan Power Analysis Tool ............................................................226 Figure 98. Example Power-Time Chart from Fan Power Analysis Tool...................................................................227 Figure 99. Summary Tab from System Temperature Analysis Tool .........................................................................229 Figure 100. Example ‘MAT-OAT Chart’ from System Temperature Analysis Tool................................................230 Figure 101. Example ‘SAT-OAT Chart’ from System Temperature Analysis Tool .................................................231 Figure 102. Example ‘SAT, RAT-Time of Day Chart’ from System Temperature Analysis Tool ...........................232 Figure 103. Example ‘MAT, OAT-Time of Day Chart’ from System Temperature Analysis Tool..........................233 Figure 104. Example ‘SAT, RAT, MAT, OAT-Time Chart’ from System Temperature Analysis Tool ..................234 Figure 105. Summary Tab from Reheat Temperature Analysis Tool........................................................................236 Figure 106. Example ‘ZAT, HWDT-OAT Chart’ from Reheat Temperature Analysis Tool....................................237 Figure 107. Example ‘HWST, HWRT-OAT Chart’ from Reheat Temperature Analysis Tool ................................238 Figure 108. Example ‘ZAT, HWDT-Time of Day Chart’ from Reheat Temperature Analysis Tool.......................239 Figure 109. Example ‘HWST, HWRT-Time of Day Chart’ from Reheat Temperature Analysis Tool ....................240 Figure 110. Example ‘ZAT, HWDT-Time Chart’ from Reheat Temperature Analysis Tool ...................................241 Figure 111. Example Summary Tab from Static Pressure Analysis Tool .................................................................243

9
Figure 112. Example ‘SP -OAT Chart’ from Static Pressure Analysis Tool.............................................................244 Figure 113. Example ‘SP -Time of Day Chart’ from Static Pressure Analysis Tool.................................................245 Figure 114. Example ‘SP-Time Chart’ from Static Pressure Analysis Tool .............................................................246 Figure 115. Summary Tab from Zone Temp Analysis Tool......................................................................................248 Figure 116. Example ZAT-OAT Chart from Zone Temp Analysis Tool ..................................................................249 Figure 117. Example ZAT-Time of Day Chart from Zone Temp Analysis Tool ......................................................250 Figure 118. Example ZAT-Time Chart from Zone Temp Analysis Tool..................................................................251 Figure 119. START Tab from Motor Efficiency Tool ..............................................................................................253 Figure 120. Example Motor Efficiency Chart from Motor Efficiency Tool..............................................................254 Figure 121. Project Web-Site Architecture................................................................................................................255 Figure 122. Project Web Site Map ............................................................................................................................256 Figure 123. Example Screen from Project Web Site .................................................................................................256 Figure 124. Uncertainty of Flow Measurements in Ducts .........................................................................................260 Figure 125. Operation of a nozzle Pitot flow meter...................................................................................................275 Figure 126. Flow versus pressure in 6-inch calibration nozzle..................................................................................276 Figure 127. Flow versus pressure in 18-inch calibration nozzle................................................................................276 Figure 128. KD-16 fan flow as a function of static pressure. ....................................................................................278 Figure 129. Dimensions of the KD-16 fan.................................................................................................................278 Figure 130. Schematic of Turbo Blaster’s flow sensor..............................................................................................279 Figure 131. Calibration of Turbo Blaster in pressurization mode. ............................................................................280 Figure 132. Calibration of Turbo Blaster in depressurization mode..........................................................................280 Figure 133. Field Data Sheet .....................................................................................................................................289 Figure 134. Volumetric Flow Data Collection Sheet.................................................................................................290

10
List of Tables
Table 1. Physical characteristics of duct system sections for large commercial systems. ...........................................38 Table 2. Physical characteristics of duct system sections for small commercial systems. ..........................................39 Table 3. Measured air duct system effective leakage areas, air leakage classes, and static pressures in large
commercial buildings...........................................................................................................................................41 Table 4. Measured air duct system effective leakage areas, air leakage classes, and static pressures in light
commercial buildings...........................................................................................................................................45 Table 5. Comparisons of supply and return plenum operating pressures of current study with those in previous
studies. .................................................................................................................................................................47 Table 6. Estimates of leakage ratios as percent of fan flow in two large commercial building systems, using three
methods................................................................................................................................................................49 Table 7. Estimates of air leakage ratios as percent of fan flow in light commercial buildings, using different
methods................................................................................................................................................................50 Table 8. Cycle on-time fraction and temperature rise/drop in registers or terminal boxes. .........................................61 Table 9. The overall cumulative effectiveness of supply ducts for the systems tested. ...............................................63 Table 10 Short-term electricity energy demand and electricity consumption..............................................................72 Table 11. Keywords for DOE 2.1E versions 110+ related to duct performance. ........................................................86 Table 12. ZONE Command Keywords that Impact Duct Loss Analysis.....................................................................91 Table 13. Command Keywords that Impact Duct Loss Analysis. ...............................................................................93 Table 14. DOE-2 Duct air leakage modeling results for a small office in Sacramento.* ............................................98 Table 15. DOE-2 Duct air leakage modeling performance.*.......................................................................................98 Table 16. Operating conditions, particle-size distributions, and wall-depositions of four aerosol-injector
configurations (see Figure 29 and Figure 30). Additional data of duct wall deposition measurements only are shown in brackets. Discrepancies in the results seem to be due to atomizer misalignment...............................124
Table 17. Large-commercial duct system characteristics. .........................................................................................129 Table 18. Leakage area before and after field trials of aerosol-sealing. ....................................................................132 Table 19. Properties of modeled flexible and rigid ducts. .........................................................................................172 Table 20. Plenum, room, and ambient air conditions for heating and cooling ducts inside and outside of the room’s
thermal envelope................................................................................................................................................173 Table 21. Potential savings on fan energy use due to surface roughness reduction and effectiveness gain subsequent
to the coating process in the system described in Table 22. ..............................................................................174 Table 22. Characteristics of the duct system used in the pressure drop and cost effectiveness analyses of the coating
process. ..............................................................................................................................................................175 Table 23. Patents describing the use of a pressure gradient to impregnate a porous body or fibrous web with a fluid
or solid. Patents involving aerosol particles are in bold type.............................................................................178 Table 24. Summary of in-situ coating experiments performed with 2:1 diluted adhesive as the sealant. .................180 Table 25. Summary of Uncertainty Estimates, Percentage of Reading/Value...........................................................195 Table 26. Summary of One-time Measurements .......................................................................................................198 Table 27. Summary of One-time Measurements (cont'd) ..........................................................................................199 Table 28. Summary of Time-series Measurements ...................................................................................................204 Table 29. List of Data Inputs for the Fan Analysis and Benchmarking Tool ............................................................207 Table 30. Calculated Metrics for Fan Analysis Tool .................................................................................................209 Table 31. SFPI Plot Quadrants ..................................................................................................................................214 Table 32. Percentage Difference and COV for Tracer Gas Concentrations ..............................................................261 Table 33. Problem Ranking .......................................................................................................................................288 Table 34. Instrument Manufacturer and Model Numbers..........................................................................................291

11
0. Executive summary This report summarizes the work performed by Lawrence Berkeley National Laboratory (LBNL), and the Center for Environmental Design Research (CEDR), University of California at Berkeley, between October 1998 and September 1999 on Thermal Energy Distribution Systems in Commercial Buildings. This research project was supported by California Energy Commission (CEC) Public Interest Energy Research (PIER) Program Transition Funding, through the California Institute for Energy Efficiency (CIEE), and the U.S. Department of Energy. The work builds on the Commercial Thermal Distribution Systems multi-year research project supported by CIEE.
0.1 Introduction
According to the California Energy Commission (CEC 1998a), California commercial buildings account for 35% of statewide electricity consumption, and 16% of statewide gas consumption. Space conditioning accounts for roughly 16,000 GWh of electricity and 800 million therms of natural gas annually, and the vast majority of this space conditioning energy passes through thermal distribution systems in these buildings. In addition, 8600 GWh per year is consumed by fans and pumps in commercial buildings, most of which is used to move the thermal energy through these systems.
Research work at Lawrence Berkeley National Laboratory (LBNL) has been ongoing over the past five years to investigate the energy efficiency of these thermal distribution systems, and to explore possibilities for improving that energy efficiency. Based upon that work, annual savings estimates of 1 kWh/ft2 for light commercial buildings, and 1-2 kWh/ft2 in large commercial buildings have been developed for the particular aspects of thermal distribution system performance being addressed by this project. Those savings estimates, combined with a distribution of the building stock based upon an extensive stock characterization study (Modera et al. 1999a), and technical penetration estimates, translate into statewide saving potentials of 2000 GWh/year and 75 million therms/year, as well as an electricity peak reduction potential of 0.7 GW.
The overall goal of this research program is to provide new technology and application knowledge that will allow the design, construction, and energy services industries to reduce the energy waste associated with thermal distribution systems in California commercial buildings. The specific goals of the LBNL efforts over the past year were: 1) to advance the state of knowledge about system performance and energy losses in commercial-building thermal distribution systems; 2) to evaluate the potential of reducing thermal losses through duct sealing, duct insulation, and improved equipment sizing; and 3) to develop and evaluate innovative techniques applicable to large buildings for sealing ducts and encapsulating internal duct insulation. In the UCB fan project, the goals were: 1) to develop a protocol for testing, analyzing and diagnosing problems in large commercial building built-up air handling systems, and 2) to develop low-cost measurement techniques to improve short term monitoring practices. To meet our stated goals and objectives, this project: (1) continued to investigate and characterize the performance of thermal distribution systems in commercial buildings; (2) performed energy analyses and evaluation for duct-performance improvements for both small and large commercial buildings; (3) developed aerosol injection technologies for both duct

12
sealing and liner encapsulation in commercial buildings; and 4) designed energy-related diagnostic protocols based on short term measurement and used a benchmarking database to compare subject systems with other measured systems for certain performance metrics.
This year’s efforts consisted of the following distinct tasks: • performing characterization measurements for five light commercial building systems and
five large-commercial-building systems; • analyzing the potential for including duct performance in California’s Energy Efficiency
Standards for Residential and Non-Residential Buildings (Title 24), including performing energy and equipment sizing analyses of air distribution systems using DOE 2.1E for non-residential buildings;
• conducting laboratory experiments, field experiments, and modeling of new aerosol injection technologies concepts for sealing and coating, including field testing aerosol-based sealing in two large commercial buildings;
• improving low-cost fan monitoring techniques measurements, and disseminating fan tools by working with energy practitioners directly where possible and publishing the results of this research and the tools developed on a web-site.
The final report consists of five sections listed below. Each section includes its related background information, the research methods employed, new measurement techniques developed, the results, and discussion. Each of the sections ends with conclusions and recommendations. This whole report concludes with references, and then appendices illustrating the raw data, experimental methods, and calculation methods developed and used in the project. Specifically, the five sections are:
• Field characterization of thermal distribution systems in large and light commercial buildings (LBNL);
• Evaluation of duct performance in the non-residential portion of California’s Energy Efficiency Standards for Residential and Non-Residential Buildings, Title 24 (LBNL);
• Aerosol sealing, specifically, laboratory and field testing of an aerosol-based duct sealing technology for large commercial buildings (LBNL);
• Aerosol coating of in-situ duct liner (LBNL); and • Reducing fan energy in built-up fan systems (UCB).
The remainder of this executive summary presents brief descriptions of each of the sections, including objectives, descriptions of outcomes, conclusions and recommendations.
0.2 Field characterization of thermal distribution systems in large and light commercial buildings
0.2.1 Introduction
Non-residential buildings with floor areas less than 930 m2 (10,000 ft2), termed “light commercial” buildings in this report, make up approximately three quarters of non-residential buildings in the U.S. and California, corresponding to approximately 20% of the floor area of commercial buildings. The duct systems attached to the packaged rooftop units typically found in

13
these buildings are similar to residential duct systems. First-cost considerations dominate the design and construction practices. Previous characterizations of air leakage from ducts in light-commercial buildings conducted in California and Florida found that leakage airflow from ducts in light commercial buildings equals approximately one quarter of system fan flow (Delp et al. 1998, and Delp et al. 1998a). These field studies also suggest that the duct air leakage area per unit floor area served by these systems is typically much higher than that for residential buildings. The large variations in air leakage were found to be poorly correlated with the number of registers, the length of the duct system, or the duct surface area (Delp et al. 1999). The field studies performed by LBNL also showed that almost half of these duct systems were located outside the conditioned envelope of the buildings, which would make their energy savings potential even larger than that observed in residences.
LBNL’s previous characterizations of several large commercial buildings suggest that per unit floor area served, their duct systems have leakage areas comparable to those measured in residences (Fisk et al. 1998). The leakage classes calculated for these large commercial buildings were significantly higher than the range reported by ASHRAE (1997) for quality duct construction. However, the ASHRAE values neglect leakage at connections to duct-mounted equipment, or ductwork/diffusers downstream of terminal boxes. LBNL’s characterization effort also uncovered significant thermal losses due to heat conduction through duct walls and air leakage flow under normal operating conditions. Underestimation of thermal losses caused by air leakage and heat conduction leads to inappropriate sizing, design, and inefficient operation of HVAC equipment.
0.2.2 Objectives
The objectives of the field characterization on thermal distribution systems are to • add to the limited existing empirical data on the rates of air leakage in small commercial and
large commercial duct systems; • compare two approaches of assessing air leakage, one based on duct system leakage area and
pressure measurements, and the other based on the difference between measurements of upstream and downstream of airflow rates;
• assess the magnitude of conduction heat gains and/or heat losses in some commercial duct systems; and
• assess system energy performance by thermal and energy measurements of the system efficiency.
0.2.3 Outcomes
In contrast with previous studies conducted by LBNL, our building selection this year was geared towards large-building systems. We conducted field characterization testing on five HVAC systems (or system sections) in four large commercial buildings, and on five HVAC systems in four light commercial buildings in northern California. To support this fieldwork we also designed and built a calibration facility for flow measurement, as well as a high-capacity fan pressurization system for measuring duct-system leakage areas and large register flows (up to 1.4 m3s-1, or 3000 cfm) in large systems.

14
SUPPLY DUCT EFFECTIVE LEAKAGE AREA (ELA25). For large systems, specific effective leakage area (ELA25) of ducts with 25 Pa reference pressure varied widely from system to system, ranging from 0.3 to 7.7 cm2/m2 of floor area served, and from 0.7 to 12.9 cm2/m2 of duct surface area. In one variable-air-volume (VAV) system, the ELA25 normalized by the duct surface area of the section upstream of the VAV boxes was found to be eight times smaller than that of the downstream branches. For small systems, the specific ELA25 ranged from 0.8 to 5.3 cm2/m2 of served floor area, and from 3.7 to 7.5 cm2/m2 of duct surface area. The averaged specific ELA25 was 2.6 cm2/m2 of floor area, which is somewhat lower than that found in our previous studies.
AIR LEAKAGE CLASS. For large systems, the air leakage classes for main supply ducts (upstream of VAV or mixing boxes) for all large systems tested ranged from 34 to 246, while those downstream (usually branches) varied widely from 58 to 606. In the present study, the total leakage classes (supply, return, and air handler) of the small systems ranged from 244 to 414, averaging 333, once again lower than 447 average reported in LBNL’s previous studies.
OPERATING PRESSURE. The average supply-plenum static pressure relative to the conditioned space observed in small commercial systems was 30 Pa, about 50% lower than the average found in the previous LBNL studies on light commercial buildings. The statistical significance of this difference is inconclusive at this stage, since we only studied five such small systems. For large-building systems, we found large variations of operating pressures among different systems, and among different sections of the same systems. Duct sections or branches downstream of terminal boxes had average operating pressures similar to the operating pressures observed in the small-building systems.
AIR LEAKAGE RATIOS. In small systems, the average air leakage ratio, the ratio of air leakage flow to the total supply air flow, was approximately 10%, lower than the 26% of fan flow average value reported by previous LBNL’s studies. In large systems with terminal units (VAV or mixing boxes), it is necessary to separately characterize the leakage of sections that operate at different pressures, namely upstream and downstream of terminal units. Using two different methods in this study, the range of the estimated leakage ratios in two large constant-air-volume systems was estimated to be up to one-third of total supply airflow, a range similar to the findings in LBNL’s previous study.
HEAT CONDUCTION LOSSES. We improved the accuracy of temperature measurements in the duct systems by employing self-powered portable data-loggers (HOBO-Pro) for this year’s experiments. The effectiveness [(Tregister – Troom)/(Tplenum – Troom)] for small-building systems ranged from 0.76 to 0.91, and the fractional on-time for cooling cycles in these buildings ranged from 14 to 48% during occupied hours. The system-average temperature rise between the outlet of the cooling coils and the supply registers due to heat gains ranged from 1.2 to 2.4 °C for the small-building systems. For large systems, the corresponding effectiveness was between 0.77 and 0.98 for the two constant-air-volume (CAV) systems tested in heating mode, with building-average temperature drops of up to 4 °C. As expected, the effectiveness decreased with the distance downstream of the supply plenum. For the one VAV system that we tested in cooling mode about a quarter of the total cooling energy was lost before it was delivered to each of the VAV boxes during one particular peak-hour. During that same period, about additional 15 percent points of the cooling energy delivered to a particular register was lost downstream of its parent VAV-box.

15
0.2.4 Conclusions
The field portions of this year’s research brought home a couple of key points. First, it is clear that there can be significant duct air leakage in large commercial buildings, similar to the duct air leakage that has been found in residences and light commercial buildings. Although we cannot draw any conclusions about the population of buildings in California based upon the few buildings that we tested, it is clear that there can be significant leakage, and that there are large variations in leakage levels between and within buildings.
The situation with respect to duct-system conduction losses (including convection and radiation losses) in large buildings is similar to that for air leakage. The duct-system temperature changes associated with these losses were clearly shown to be well above the “designer’s rule of thumb” of 1 °F, ranging between 0.3 °C and 6.2 °C (0.5 to 11.2 °F) for branches without “induction” units. As conduction losses have been shown to have energy impacts similar to those for leakage, it is clear that the energy savings potential associated with the losses is also significant. Moreover, our data and analyses also indicate that the energy saving associated with the use of VAV systems is being systematically reduced by conduction losses. Specifically, as the flow and velocity through the ductwork is reduced by the VAV dampers, the conduction losses increase, which forces the VAV dampers to open further to increase the flows to meet the loads.
0.2.5 Recommendations
Based upon these findings, it is also clear that we are just scratching the surface with respect to quantifying and addressing duct air leakage issues in this building sector, as the number of buildings that we have characterized remains small, while the diversity and complexity within this building sector remains large. More field characterization is needed to improve our knowledge on the duct system performance, especially in the large commercial systems. In addition, based upon our earlier analysis of the energy implications of the duct air leakage, it is clear that it is worth continuing our pursuit of energy savings by means of duct sealing in large commercial buildings.
The conduction problem, which is something that merits further investigation, would need augmentation and application of analysis tools, and including diagnostic and improvement technology. Most likely, the largest impact in this area will come in the new-construction area.
The key recommendation with respect to small buildings based upon this year’s work is that diagnostic tools need to be improved to provide quick, accurate diagnoses of performance. This stems from our observation of a significantly different level of leakage in this year’s sample of buildings, and the fact that our measurements continued to take too long to perform.

16
0.3 Evaluation of duct performance in the non-residential portion of the California’s Energy Efficiency Standards for Residential and Non-Residential Buildings (Title 24)
0.3.1 Introduction
As compared to light commercial buildings, a much larger fraction of HVAC energy use in large commercial buildings is associated with the fans, and earlier research has shown that this fan power is dramatically impacted by air leakage and thermal losses. Based upon simulation of a variable-air-volume (VAV) system with a leakage class of 137 (compare to the range of 60 to 270 measured by Fisk et al. 1998), Franconi et al. (1999) report an HVAC energy cost increase of 14% and an annual fan energy use increase of 55% induced by duct air leakage. This suggests that sealing duct leaks in large commercial buildings may be an effective measure to increase energy efficiency in this sector. Similar, but less detailed, analyses showed comparable fan-power savings potentials associated with reducing conduction losses.
0.3.2 Objectives
The objective is to identify a strategy for recognizing duct performance within the Non-Residential portion of the California’s Energy Efficiency Standards for Residential and Non-Residential Buildings (Title 24).
0.3.3 Outcomes
At the outset of this effort, we first found that: 1) the impacts of duct performance are essentially not considered in the non-residential portion of Title 24, and 2) the DOE-2.1E building simulation program plays an important role in the evaluation of California non-residential compliance, although EnergyPlus is under development. This meant that much of this effort revolved around investigating how DOE 2.1E treats, and can be made to treat duct performance.
At first glance, it appears that DOE2.1E addresses duct losses, and that the incorporation of duct losses would be relatively straightforward. Unfortunately, this optimism was not supported by our detailed analyses. In brief, although DOE-2.1E does include the basic capabilities for modeling duct air leakage and heat loss in supply ducts, there are a number of hurdles to be overcome. Some salient issues include: • The lack of an algorithm for return duct losses/gains; • The use of a fixed supply-duct air leakage ratio, even for VAV systems; • A ponderous set of keyword choices that can easily derail even the most conscientious,
skilled, and motivated user of the program; • A number of hardwired assumptions about the implications of duct losses on building and
plenum-zone loads and temperatures.
We made a number of comparisons between DOE-2.1E results and our best estimates of the impacts of duct performance, and found significant discrepancies. Although we seem to have explanations for most of the discrepancies, additional digging within the DOE2.1E program will be needed to obtain a roadmap for addressing duct performance in an accurate and straightforward manner.

17
On the positive side, commercial vendors of non-residential compliance tools were supportive of these efforts, and seemed to be willing to implement our ultimate strategy, assuming that it is practical. Since the tools available use DOE-2.1E as the calculation engine, they can tap into the existing duct performance modeling capabilities offered by the program, and ultimately into our improvements.
0.3.4 Conclusions
The principal conclusion to be drawn based upon our analysis of how to incorporate duct performance into the Title-24 (Non-Residential portion) is that the most pragmatic and likely-to-succeed pathway is through the DOE-2.1E program. The DOE-2.1E program is well entrenched into the Title-24 compliance path, and most importantly, is used to benchmark alternative compliance models, which means that unless the DOE2.1E program gets the correct answer, alternative programs that do get the right answer will not be certified. The DOE 2.1E program already explicitly addresses duct performance. However, based upon our analysis this year, we conclude that a number of modeling assumptions, problems, complexities, and/or ambiguities associated with that program need to be addressed. These include, but are not limited to: 1) a fixed, supply-duct air leakage ratio 2) no treatment of return-duct losses/gains, 3) an apparent over-specification associated with capacities, flows and temperatures, 4) lumping of duct losses into a single zone, and 5) the assumption of outdoor air make-up for all duct air leakage.
Assuming that the technical issues identified in this study can be addressed in a straightforward manner, incorporating duct modeling capabilities into existing, CEC-approved, non-residential compliance tools is straightforward from a regulatory perspective. Since the tools available use DOE-2.1E as the calculation engine, they can be modified to use the existing duct performance modeling capabilities offered by the program. While a critical part of that effort, applying the duct modeling guidelines provided in this study, as well as those that we expect will come out of a detailed assessment of both large and small buildings.
0.3.5 Recommendations
Incorporating duct-modeling capabilities into compliance tools is only one aspect of the changes that need to be made to the non-residential standards. Other issues that must be addressed and resolved before duct performance can be accounted for in Title-24 include: 1) definition of duct condition in the standard building, 2) development of compliance tests for evaluating duct performance based on the Alternative Calculation Method (ACM) Approval Manual (CEC 1998), 3) documentation of the impact of duct efficiency measures in actual buildings, 4) specification and testing of duct air leakage measurement techniques that can be practically applied in this sector, and 5) assurance of consistency between simulated duct performance impacts and actual impacts. The duct air leakage measurement efforts described elsewhere in this report, and the parallel efforts expended previously for the residential standard are important steps towards resolving the fourth issue, however significant challenges remain with respect to leakage measurements in large commercial buildings. More research is needed to improve measurement technologies.
Our recommendation is that the DOE-2.1E program needs further assessment and refinement in order to provide accurate unambiguous treatment of duct-system performance. The assessment is

18
required to identify performance impact inaccuracies, document the shortcomings of the current DOE-2.1E model, and develop modeling improvements. The assessment should be based on typical building characterizations determined from field data and detailed duct performance energy models. The research projects described in this report build the foundation for conducting DOE-2.1E modeling assessments in the future. It is also important that the assessment address the issue of fan power impacts in large commercial buildings in a manner similar to what was done in this report for small thermally dominated buildings.
In addition, since time-of-use is an important issue in electricity energy peak demand, it’s likely that the future version of Title 24 should include time-of-use energy analyses for the non-residential standards. This creates an additional need to incorporate time-of-use in the DOE 2.1E simulation tool, thereby increasing the demands on DOE-2.1E’s capability to accurately model building and system performance. It is worth noting that our analyses show that duct loss impacts are larger during peak demand periods in light commercial buildings, and that the fractional impacts of duct losses do not change significantly between seasonal and peak-demand periods.
Currently, the impacts of duct performance are considered in the California residential standards, but not in the commercial standards (Non-Residential portion of the Title 24). Much of the reason for this is that research on residential duct performance has been ongoing for the past decade, whereas the data available for duct performance in the commercial sector has been limited. Accounting for duct performance in the Non-Residential portion of Title 24 should encourage the installation of duct-related efficiency measures in new commercial buildings, and is therefore an important goal of this research program.
0.4 Aerosol sealing: Laboratory and field testing of an aerosol-based duct sealing technology for large commercial buildings
0.4.1 Introduction
Earlier research has indicated that the aerosol-based sealing technology developed at LBNL for residential applications has potentially significant applications in the commercial buildings sector. This technology involves blowing an aerosol sealant through the duct system, and depositing particles as they try to escape under pressure through duct’s cracks. Before the sealant is injected, the normal exit points (i.e., diffusers) are blocked and sensitive equipment (e.g., a heat exchanger) is isolated. Although this technique has been successfully used in several hundred residences (Modera et al. 1996) and is currently commercialized for that building sector in the U.S. (Aeroseal Inc., Austin, TX), its application to large commercial duct systems poses new challenges. Namely, our limited field experience based on two sections of two large commercial systems (Modera et al. 1999b) has indicated that the sealing process involved 2.5 hours to 5 hours of aerosol injection, which implied that efforts to increase the sealing rate are needed.
0.4.2 Objectives
The objective is to evaluate and improve methods to seal leaks in the ductwork of large commercial buildings.

19
0.4.3 Outcomes
The key outcomes in the laboratory were: 1) a characterization of the performance of two different nozzles and injectors, 2) design and outside construction of “compact particle injectors”, 3) measurement of the failure pressure for aerosol seals, and 4) a comparison of the relative sealing times for two different leak geometries. For the nozzles and injectors, we characterized both the particle size distribution (with a newly modified measurement apparatus), and the fraction of particles lost to the plastic tubing surrounding the nozzle. These particle size distributions both allow us to better model the sealing process, and to choose the most efficient injection technique.
One set of injectors that we characterized were “compact injectors,” which are freestanding particle injectors that can be installed at different points throughout the duct system to increase the material injection and sealing rates. These injectors represent an important advance with respect to sealing duct systems in large buildings. Another important finding was that the aerosol seals are able to withstand very high pressure differentials (6000 Pa or 24 in. H20) before failing, which means that these seals will easily be able to withstand the pressures (up to 600 Pa) observed in commercial building duct systems. Moreover, failures were not catastrophic, with the broken seals sometimes “repairing” themselves when the pressure differential was taken away. Finally, we found that the sealing process was approximately three times faster for “joint”-type leaks, as compared to “hole”-type leaks, which suggests that our sealing process may be considerably faster in actual systems, as compared to what our current model (based on hole-type leaks) suggests.
We also performed field experiments with aerosol sealing in two large-commercial buildings. We found that the sealing rate increased considerably when a compact injector was used, and that adding an opening in the downstream section of the duct (end) allowed us to continue the sealing process after the threshold limit for the duct pressure (500 Pa with the present apparatus) was reached. The leakage classes of the systems (or sections) were reduced from 657 down to 103, and from 40 down to 3, corresponding to leakage reductions of more than 80 and 90% respectively.
0.4.4 Conclusions
The principal conclusion based upon our field study of aerosol-based duct sealing in this report is that aerosol duct sealing in large commercial buildings is promising, but that additional research efforts to increase the efficiency of the technology should be pursued before its widespread use can be envisioned. Our rough analysis of the economics indicates that the payback for this type of sealing is less than one year. On the other hand, the speed and technical complexity of the current sealing process mean that it is not yet ready for commercialization.
Unanswered questions remain regarding the potential deterioration of sensitive equipment (e.g., smoke detectors, IAQ sensors), and the time required to seal the registers. We also believe that the optimum pressure and flow conditions for sealing typical leaks should be experimentally investigated, as previous work in this area cannot be applied directly to the current sealing protocols.

20
Some smaller conclusions based upon our work on duct sealing this year are: 1) that the seals created with the current sealant material are able to withstand pressures far in excess of what is found in commercial-building duct systems (up to 600 Pa), 2) that “compact injectors” can increase sealing rates substantially, and 3) that “joint”-type leaks seal considerably faster than “hole”-type leaks.
0.4.5 Recommendations
Additional research in the laboratory and field is needed to investigate the effective and efficient ways of sealing duct systems, especially for large commercial buildings. Our recommendations for the future are that we set up a full-scale large-commercial duct system in a laboratory facility to better understand and tune the adjustable parameters of the process. This laboratory setup should also yield estimates of the size of the duct systems that can be tightened in a reasonable time with this process.
0.5 Aerosol coating of in-situ duct liner
0.5.1 Introduction
Earlier research also indicated that the aerosol injection technology may also be able to encapsulate the inside surface of internally insulated ductwork (e.g., duct board, or internally insulated sheet-metal ducts). This internal duct insulation is typically installed in large-commercial ductwork to provide sound attenuation and thermal insulation. However this insulation has proven to be considerably more difficult to clean (as compared to sheet-metal inner surfaces), and questions about erosion of the surface have been raised. These effects have generated a set of specialty contractors that apply coatings to internal duct insulation by either spraying the liner with coating material from short distances, or by guiding a robotic cart with a camera and sprayer down the ductwork. The objective of our research in this area has been to determine whether we can produce an impermeable coating on the air-side surface of internal fiberglass duct insulation that would not only address cleaning issues, but also fan power consumption. Fan power consumption would be indirectly reduced by reducing conduction losses due to infiltration of the fiberglass (Levinson et al. 1998), as well as by reducing the effective surface roughness.
0.5.2 Objectives
The objectives are to investigate the feasibility and efficacy of remotely creating an impermeable membrane by aerosol injection, and to estimate energy savings potential associated with creating an impermeable membrane.
0.5.3 Outcomes
Our research on aerosol coating this year resolved a number of key issues, including: 1) the issue of whether we can create an impermeable membrane remotely within a duct, 2) the development of tools to quantify the relative flow resistance of different parts of the liner, and 3) an estimation of the energy savings potential associated with creating an impermeable membrane within the duct. Concerning the first issue, we were able to create impermeable membranes on liners from

21
as much as 4.6 m (15 ft) away, which is a significant breakthrough. We also developed an apparatus for quantifying the flow-resistance uniformity of the membrane created. This device was used to demonstrate that the membrane created was rather uniform with respect to airflow resistance.
The issue of quantifying the energy saving potential of creating an impermeable liner membrane provided a less encouraging result. In particular, the high duct velocities that cause the degradation of porous-insulation performance also result in relatively short residence times of conditioned air in the ductwork. This means that even though we can achieve significant improvements in insulation R-value at high velocities, the absolute savings are relatively small. The reductions in fan power due to the improvement of the R-value of the insulation is on the order of a few percent, and the overall savings, including the impact of the membrane on flow resistance is not likely to be more than 10% of fan power. On the other hand, since there is already an industry that is applying “permeable” coatings to the inside of duct liners for IAQ purposes, this technology could prove to be an important augmentation of their service, and might create a better barrier to future particle and microbial depositions in the liner, thus providing the energy savings at a low incremental cost.
Our research on aerosol coating to reduce duct-liner permeability and surface roughness also provided some important breakthroughs this year. Our most significant breakthrough was that we were able to produce reduced-permeability coatings remotely for the first time. A second important conclusion based upon our work this year is that the potential of this technology to reduce thermal conduction is limited by the fact that the high velocities that reduce duct-liner thermal performance also reduce residence times in the ductwork, thereby reducing the savings potential of liner encapsulation. On the other hand, our rough estimate of the simple payback was short enough that we cannot dismiss the savings opportunity associated with this technology. Moreover, since there is already an industry that is applying “permeable” coatings to the inside of duct liners for IAQ purposes, this technology could prove to be an important augmentation of their service, creating a better barrier to future particle and microbial depositions in the liner, and providing the energy savings at a low incremental cost.
0.5.4 Conclusions
Based upon these findings, and our experimentation in the laboratory, we can conclude that: 1) we need significant improvements before commercialization, 2) the energy savings from coating are modest compared to those from sealing, 3) coating will be motivated by IAQ concerns, with energy savings as a fringe benefit, and 4) in-situ coating is an evolutionary, not revolutionary technology.
0.5.5 Recommendations
In terms of recommendations for the future, it seems that a modest effort in this area is justified, focusing initially on a better understanding of the in-situ interior-encapsulation industry.

22
0.6 Reducing Fan Energy in Built-up Fan Systems
0.6.1 Introduction
The focus of this project has been on buildings with built-up or central air handling systems (such as large offices, hospitals, and schools) where fan energy makes up anywhere from 13% to 40% of the total HVAC energy (i.e., not including lighting). Built-up air handlers are custom engineered, project specific, and site assembled air handlers as opposed to factory assembled packaged units. For many of these buildings there is a significant opportunity to improve the performance of the fan systems to reduce energy use and at the same time improve indoor air quality and thermal comfort. In order to improve the performance of these systems, practitioners need tools for cost-effectively identifying fan-system problems. UCB has been involved in this research since 1994. This reports includes the work of this past year plus the unpublished results from previous years.
0.6.2 Objectives
The primary objectives of this project are to develop a set of widely applicable publicly accessible data measurement, monitoring, and analysis protocols for problem detection in built-up air handling systems (building specific designed and field assembled components), and to develop low-cost measurement techniques to facilitate the use of the protocols.
0.6.3 Outcomes The outcomes of this phase of work include the following:
PROTOCOL IMPROVEMENTS. We extended and improved the diagnostic protocols developed during previous phases of this project. Both VAV and CAV systems are now covered in the protocols. Specific Excel based software tools were developed to support each problem detection procedure. We developed a preliminary uncertainty analysis of the measurements and metrics used for diagnosing problems and incorporated its representation into the data visualization tools.
BENCHMARKING DATABASE. The benchmarking database has been improved. The tool includes the ability to enter new data as well as to select metrics with which comparisons can be made and to filter the data sets used for comparison. Propagation of uncertainty of the basic measurements has been included in the presentation of comparisons.
WEB-SITE. We developed a web-site that provides interested parties access to the information developed during this project (i.e., all project reports), made the software tools downloadable, and have provided a demonstration of a web-based implementation of the benchmarking database.
FIELD DATA COLLECTION FORMS. The data collection forms developed during previous phases were improved. These forms provide valuable assistance to the practitioner by ensuring that only the required data is collected.
TRACER GAS AIRFLOW MEASUREMENT. We conducted an analysis of all development work to date and concluded that an ideal tracer gas (TG) airflow measurement apparatus would have the following characteristics: 1) minimum number of sample points, 2) overall uncertainty as close up to 5% as possible, 3) use of a benign and inexpensive tracer gas, 4)

23
capable of real-time monitoring (i.e., no syringe sampling, and short time sampling for each flow rate), 5) simplified, automatic calibration, 6) automated operation and data acquisition, and 7) low cost, rugged, reliable, portable field deployable integrated “package.”
We completed a set of measurement and analysis protocols to the point that they are now ready for extensive field-testing and validation. The methodologies developed are embodied in a collection of materials that make up a suite of tools. This suite includes the following items: • A ranked list of potential fan system problems. • Data collection and measurement specifications aimed at the specific problems to be
detected. • Field data collection forms to facilitate and focus field work. • Data analysis software tools customized for the problems of interest. • A fan performance database used for feedback to designers and to assist in identification of
fan problems.
In addition, the analysis indicates that it may be possible to reduce sampling to a small number of points around the centerline of the duct. We developed a functional specification for a field deployable TG airflow measurement system based on this conjecture. Once a suitable sampling apparatus is developed to accomplish this, a system could be engineered to produce a portable analysis prototype consisting of the following elements: injection apparatus, downstream plane sampling apparatus, sulfur hexaflouride (SF6) tracer has bottle, and a portable analyzer device that includes a gas chromatographs (GC) customized for SF6, a mass flow controller (MFC), small SF6 calibration bottles, and a real-time micro-controller that serves as a system controller and data acquisition computer. This system would be designed to operate as outlined in the body of this report.
0.6.4 Conclusions
We have concluded that built-up fan systems can be successfully diagnosed for energy related problems when a consistent set of measurement and diagnostic procedures are used. Pre-selected energy and comfort related performance problems can be analyzed using a combination of short term monitoring, a benchmarking database of performance metrics, and customized diagnostic data displays. While the overall efficacy still needs to be proven by more extensive field testing, the techniques developed are a major step forward in providing energy practitioners with the means to assess performance problems in a relatively simple, consistent, and straightforward manner.
From our analysis of previous studies and consideration of practicality issues including global warming impacts, it has been concluded that a field-deployable system could feasibly be constructed from the basic elements outlined in the functional specification that appears in the body of this report. For this system gas chromatographs operating at sampling concentrations in the range of 0-20 ppb and customized for SF6 tracer gas are most appropriate for a field-deployed system. This will require that the mass flow controller SF6 injection rate to adjusted based on the airflow rates to be measured. This conclusion is contingent on proving the feasibility of conducting real-time sampling with a small number of samples.

24
0.6.5 Recommendations
Although considerable progress has been made in development of the fan problem detection technology described in this report, additional work is required to establish these methods as widely applicable protocols and to facilitate commercial implementation. Among the issues that could benefit from further research and development of the protocols are to: • populate benchmarking database via field testing; • centralize hosting of the database; • migrate the fan performance database from Excel to relational database software; • develop drill-down procedures for more fine grained diagnostics; • analyze energy savings opportunities; and to • refine tools.
A number of improvements could be made in low-cost measurements that would increase the efficiency of conducting the short term monitoring upon which the diagnostics are based. More research is needed in the following areas: • fan static pressure measurement techniques; • constant injection tracer gas (CITG) airflow measurement technique; • alternative ways to use fan power data; and • equipment for low-cost power measurements.

25
1 Field characterization of thermal distribution systems in large and light commercial buildings
1.1 Introduction
Non-residential buildings with floor areas less than 930 m2 (10,000 ft2), termed light-commercial buildings in this report, make up approximately three quarters of non-residential buildings in the U.S. and California, corresponding to approximately 20% of the floor area. During the 1996 and 1998 cooling seasons, researchers at Lawrence Berkeley National Laboratory (LBNL) studied the performance of over 30 duct systems in light commercial buildings (Delp et al. 1998a, 1998b, 1999). Another significant work in the area of small commercial systems is from the Florida Solar Energy Center (FSEC, Cummings et al. 1998), whose primary concern was with uncontrolled airflow across commercial building envelopes. FSEC conducted envelope leakage studies in 70 light-commercial buildings, and performed air leakage measurements in about 40 of these duct systems. The Energy Information Administration (EIA, 1991) of the Department of Energy reported that 61% of commercial buildings with cooling in the Western census region have packaged cooling units; 76% have ducts, 21% have heat pumps, 7% have central chillers and 5% have fan-coil units as part of their cooling systems.
The previous review and characterization of the small duct systems attached to packaged-rooftop units in commercial buildings found that they are similar to ducts in residential systems. First-cost consideration dominates the design and construction practices. Previous characterizations of air leakage from ducts in light-commercial buildings conducted in California and Florida found that leakage airflow from duct systems in light commercial buildings equals approximately one quarter of system-fan airflow. These field studies also suggest that the duct air leakage area per unit floor area served by these systems is typically much higher than that of residential buildings. The large variations in air leakage class were found to be poorly correlated with the number of registers, the length of the duct system, and the duct surface area (Delp et al. 1999). The studies performed by LBNL also showed that approximately 50% of these duct systems were located outside the conditioned envelope of the buildings. This would make their energy savings potential even larger than that observed in residences.
In contrast, non-residential buildings with floor areas over 930 m2 (10,000 ft2), make up approximately one quarter of non-residential buildings in the U.S. and California, corresponding to approximately 80% of the floor area. Compared to the research on duct systems of residential and light commercial buildings, there exists very limited study on duct systems in large commercial buildings.
In this project, we term the commercial buildings with floor area more than 930 m2 (10,000 ft2) as large commercial buildings. LBNL’s previous characterizations of several large commercial buildings suggest that their duct systems also have leakage areas comparable to those measured in residences on a per-unit-floor-area basis (Fisk et al. 1998). The leakage classes calculated for these large commercial buildings were significantly higher than the range reported by ASHRAE (1997) for quality duct construction. However, the ASHRAE values neglect leakage at connections to duct-mounted equipment. LBNL’s characterization efforts also uncovered significant thermal losses due to both heat conduction through duct walls and air leakage under

26
normal operating conditions. Underestimation of thermal losses caused by air leakage and heat conduction leads to inappropriate sizing, inappropriate design, and inefficient operation of HVAC equipment.
In some HVAC systems, duct air leakage was found to induce excessive fan-power requirements and/or significant thermal energy losses during the transportation of conditioned air through ductwork. Limited field studies conducted at LBNL (Fisk et al. 1998) report SMACNA leakage classes that range from 60 to 270 in large commercial buildings. These values are generally well above the ASHRAE value of 48 assigned to “unsealed” duct systems. Based on simulations of a variable-air-volume (VAV) system with a leakage class of 137, Franconi et al. (1999) reported an increase of 14% in HVAC energy cost and an annual fan energy use increase of 55% due to air leakage through ducts. Thus, sealing duct leaks in large commercial buildings appears to be an effective measure to raise the energy efficiency performance in this sector. Other benefits to airtight duct systems in such buildings include better control of airflow at the registers (flow balancing) and potentially better indoor air quality and thermal comfort. There is, however, a lack of information about the performance of thermal distribution systems, especially in large commercial buildings. To further understand the existing thermal distribution systems in real buildings, it is necessary to characterize the air leakage through ducts and the thermal performance of system operation in more buildings.
An important part of this project was to continue the 1996-1998 LBNL characterization study by obtaining field data on the thermal performance of duct systems in California commercial buildings, including characterizations of the spaces in which those ducts are located. This thermal performance evaluation consisted of both air leakage and heat conduction measurements. The thermal performances of five light commercial building systems and five large commercial building systems were characterized. The study measured air leakage through ducts of 10 systems in eight buildings, including five small systems in four light commercial buildings, and five large systems in four large commercial buildings. The current study examined as many large commercial large systems as possible, and these systems were chosen to be typical of those found in large commercial buildings, including two variable-air-volume (VAV), two constant-air-volume (CAV) single duct, and one dual-duct system. All light commercial buildings studied were packaged-rooftop systems.
Since the buildings in this study were generally occupied, the tests had to be as non-obtrusive as possible. This required working outside of the normal (daytime) schedules of the occupants. Studies on each of the systems included contacts with building managers and engineers; system characterization by walking-through and literature review; measurements of air leakage, pressure, airflow, and heat gain or loss; and data analyses.
1.2 Objectives
The objectives of the field characterization of the performance of thermal distribution systems were • to add to the limited existing empirical data on the rates of air leakage in small commercial
and large-commercial duct systems;

27
• to compare two approaches of assessing air leakage, one based on duct system leakage areas and pressure measurements, and the other based on the difference between measurements of upstream and downstream airflow rates;
• to assess the magnitude of conduction heat gains and/or heat losses in some commercial duct systems; and
• to assess the system energy performance by thermal and energy consumption and energy demand monitoring.
1.3 Approaches
1.3.1 Physical characterization of duct system
To characterize each system, we gathered the dimensional and/or graphical characteristics of duct systems, including duct diameters, lengths, and surface areas, system types, and cooling tonnage. The information was compiled from the review of building and system plans, interviews with building engineers, and physical inspections of installed duct systems. For some of the large building systems, excessive effort would have been required to characterize the entire duct system. In these cases, representative sections of ductwork were characterized, such as a main trunk of a VAV supply duct, branches of downstream VAV boxes, or branches of dual-duct mixing boxes. We selected and characterized large ducts representing common HVAC system types, such as constant-air-volume, variable-air-volume, single-duct, and dual-duct systems.
1.3.2 Leakage area measurements
To characterize the airtightness of building thermal distribution systems, the effective leakage areas (ELAs) of isolated sections of ductwork were measured using fan-pressurization procedures. The ELA is defined as the area of a perfect nozzle that, at some reference pressure difference, would produce the same flow as that passing through all the leaks in the system. The equation linking the volumetric leakage flow rate through an isolated section of ductwork to the pressure difference is
n
PPPELAQ
∆∆∆×=
ref
ref2ρ
, (1)
where Q is the volumetric flow rate (m3 s-1), ELA is the effective leakage area (m2), ∆P is the pressure difference across the leaks in the system (Pa), refP∆ is a reference pressure difference (Pa), n is the pressure exponent (-), and ρ is the air density (kg m-3).
By artificially creating a series of pressure differences across the leaks, the ELA can be determined by fitting the flow and pressure data to Eq. (1). The method is well documented in the literature (SMACNA, 1985; ASTM, 1987; Delp et al. 1997). The basic procedure is to use a variable-speed fan with an integral airflow meter (e.g., Minneapolis Duct Blaster by Energy Conservatory, Minneapolis, Minnesota; or Turbo Blaster developed in this study) to inject air into the isolated section of duct (Appendix 7.2). This is done for various flow rates while monitoring the pressure difference between the interior and exterior of the duct. Injected flow rates and simultaneous pressure differences are recorded for pressure differences ranging from 10 to 200 Pa.

28
The pressure exponent n typically has a value near 0.6. Given the uncertainties in measured air injection rates1 and average measured pressure across leaks2, the uncertainty in the measured ELA is estimated to be about ± 10%.
In the field, the isolation of sections of ductwork is time-consuming. We employed large adhesive-coated plastic films to seal the registers, and, when necessary, cut access hatches in duct walls to install polystyrene or cardboard blocks in duct cavities. This isolation process requires about 10 person-hours for small systems and usually requires much more person-hours in large commercial buildings. When setup is ready, the actual test lasts about 10 minutes. Therefore, where appropriate, the ELA measurement protocol detailed in Levinson et al. (1997) was adopted to limit the set-up time. This method enables us to determine simultaneously the leakage area of the entire system and the split between the supply and return components. It involves creating a series of different pressure conditions across the heat exchanger by removing some of the blocks on the supply side. This allows the heat exchanger to be “calibrated” as a flow meter, and the supply and return leakage areas can be determined. The key advantage to this technique is that it does not require physically separating the supply side from the return side. However, the major drawback is that the mathematical set of equations is poorly determined when the pressure drop across the heat exchanger is low.
The technique described above can rarely be applied in large commercial buildings. Large commercial systems are much more complex than those typically found in light commercial buildings, rendering prohibitive the time required to seal all of the registers. Furthermore, it is necessary to test separately ductwork sections that operate at significantly different pressures, such as those upstream and downstream of a terminal unit. Therefore, in these cases, sections were isolated from the remainder of the duct system and from the indoor/outdoor air to measure the ELA. Depending on the section of interest and its accessibility, the isolation process usually requires many more person-hours for large systems buildings than for small systems.
The reference pressure P∆ is usually set to 25 Pa for characterization of U.S. duct systems. This pressure has been found to be typical of the pressure across residential and small-commercial duct leaks during normal fan operation. Choice of this value is questionable for large commercial buildings, where duct operating pressures are usually considerably higher. Nevertheless, since it remains a common metric to measure and compare air leakage through ducts in the U.S., the 25-Pa characterization is used in this paper. To allow comparisons between different building systems, duct system ELAs were normalized either by the floor area served by the duct system or by the surface area of the ductwork.
The leakage class, LC , is another common metric used to characterize the leakage area of U.S. duct systems (ASHRAE 1997). The leakage class is defined as the 710 times the leakage flow rate in liters per seconds per square meter of duct surface area at 250 Pa static pressure. Once the ELA is determined, Eq. (1) may be used to determine the leakage class of a system if the duct
1 The manufacturer’s rated accuracy of the flow sensor integral to the fan is ±3% (for turbo blaster ±1%); however, we have assumed a 5% uncertainty to account for fluctuations in the pressure difference at the flow sensor. 2 Static pressures in the duct system during the ELA measurement may vary slightly with location. We estimate that the true average pressure drop across leaks in the duct may vary by ±2 Pa from the average measured static pressure in the duct during the ELA measurements.

29
surface area is known. By definition, the leakage class is the leakage flow rate normalized by duct surface area at a hypothetical operating pressure. It is inherently dimensional (cfm per 100 ft2); the factor of 710 converts L s-1 m-2 to cfm per 100 ft2. To avoid confusion between unit systems, it is reported herein as a number with the unit of cfm per 100 ft2.
The following equation is generally used to characterize the leakage class (ASHRAE 1997, chapter 32):
65.0710PA
QCL ∆= (2)
where Q is the leakage flow rate (L s-1), A is the duct surface area (m2), and P∆ is the pressure difference during the leakage measurement (Pa).
It is noteworthy that the pressure exponent is arbitrarily set to 0.65. According to ASHRAE (1997), this value is based on a variety of component air leakage tests. However, a number of tests conducted in U.S. residences and light commercial buildings suggest that the exponent for the entire system is close to 0.6. Since the procedures used in this study enable us to measure the pressure exponent, the measured pressure exponent is instead used to characterize the leakage class.
Using their leakage classes can compare systems of different sizes. ASHRAE (1997, Chapter 32) lists attainable leakage classes ranging from 3 to 12 for “quality construction and sealing practices,” but notes that these attainable leakage classes do not account for leakage at connections to grills or diffusers, access doors, and other duct-mounted equipment. For unsealed ducts, ASHRAE (1997, chapter 32) predicts leakage classes of 30 to 48.
Both the normalized duct system ELA25 and the leakage class quantify the duct air leakage per square meter of duct surface area. However, because they are not referenced to the same pressure (25 Pa vs. 250 Pa), two systems with a similar ELA at 25 Pa per square meter of duct surface area may have significantly different leakage classes

30
Polystyrene orcardboard panel
Tape
Pressuretransducer
Supplyregister
Register sealedwith adhesiveplastic film
Supply duct
Variablespeed fanwith integralflow meter
Figure 1. Apparatus used to measure a duct system’s effective leakage area.
1.3.3 Duct system pressure measurements
Operating pressures in ductwork can be significantly different from one system to another or even within one single system. Operating pressures upstream and downstream of a terminal unit (e.g. a VAV box) may vary by a factor of 10 or more. Therefore, to characterize the air leakage flows of field systems with the ELA defined in Eq. (1), it is necessary to measure duct system pressures during normal operation. In constant-air-volume HVAC systems, static pressures across the ductwork do not vary considerably over time during normal system operation. They were measured at multiple locations in the ductwork (e.g., plenums, branch locations, and terminal units) using handheld electronic pressure transducers with a 0.1 Pa resolution (Energy Conservatory: Minneapolis Pressure & Fan Flow Gauge, Model DG3, Minneapolis, Minnesota) using conditioned space as the reference. In VAV HVAC systems, the static pressures may likely change over time. The pressures were monitored with a data logger (Energy Conservatory: Automated Performance Testing System, Minneapolis, Minnesota) for an extended operating period (several days). These measurements covered a range of operating pressures induced by varied fan speeds and VAV damper positions.
Pressure pan measurements were made to estimate operating pressures in the ductwork. The method consists of blocking the registers one by one with other registers open as normal and recording the pressure difference across the block. Its key advantage over the direct register pressure measurement using a single tube-probe connected to pressure transducers is that it is much more repeatable (Walker et al. 1998).
1.3.4 Airflow measurements at the registers
To measure airflow through supply registers more accurately than possible with commercially available passive flow hoods, we used an LBNL-designed, fan-powered flow hood (Figure 2). During the measurement, air leaving the register passes through a collection hood, then into a duct connected to a variable-speed fan equipped with an integral flow meter (Energy Conservatory: Minneapolis Duct Blaster, Minneapolis, Minnesota). The fan speed was adjusted manually to maintain a steady static-pressure difference between the interior of the collection hood and the room air. The flow rate was determined with the fan’s integral flow meter. Multi-

31
point measurements were taken near zero pressure difference (0±0.5 up to 0±1.0 Pa) between the collection hood interior and the room, enabling us to interpolate the flow at zero pressure difference. We can assume that the flow rate through the register is only marginally affected by the presence of the flow hood, the boundary conditions seen by the register being the same with and without the device. Note, however, that the minimum pressure drop across the register should be at least 5 Pa to limit to 5% the measurement uncertainty due to small deviations of the pressure boundary condition. (3)
There remain some unanswered questions pertaining to this technique, including (a) where to locate the pressure sensor to ensure that the boundary conditions seen by the register remain identical, and (b) the sensitivity of the measurement to the zero pressure reading. Fisk et al. (1999) indicate that in one large commercial building, an individual register flow rate changed by less than 1% as the static pressures in the hood deviated from zero by ± 0.5 Pa. However, sensitivity analyses on one large system (System L2) in the present study suggested that the sum of the register flows changed by about 6% as static pressures in the hood deviated from zero up to ± 0.5 Pa. It is unclear whether these potential variations in the hood pressure induce bias or precision errors on a single measurement. It is also unclear whether these uncertainties may cancel each other when summing the register flows for a given system. If they do, the uncertainty in the sum of register flow rates is primarily due to the bias in measurement of flow rate through the calibrated fan, estimated to be up to ± 5%.
For VAV HVAC systems, it would have been possible in theory to force the fan and dampers to a set point to establish constant fan and supply airflow rates for the duration of flow measurements. In practice, this would take too long. This procedure would also provide only a narrow picture of the system airflow, considering the variety of damper positions and fan speeds that could be expected. Therefore, we did not use this measurement approach for these systems.
3 This error analysis assumes that the flow through the register is proportional to the square root of the pressure difference at the boot, and that the pressure boundary condition deviates from its value of 0.5 Pa due to the presence of the hood.

32
Variable-speedfan with integralflow meter
Supply duct
Collectionhood
Air flow
Pressuretransducer
Flex duct
P~ 0
Figure 2. Fan-powered flow hood apparatus used to measure airflow rates through registers.
1.3.5 Tracer gas measurement of fan flow
In constant air volume systems, we used the tracer gas method to measure the fan flow. The approach was to inject sulfur hexafluoride tracer gas into the duct system through one return register at a constant and measured rate. During injection, we monitored the change in tracer gas concentration at one supply register with an infrared analyzer (Bruel & Kjaer: Type 1302, Denmark) calibrated at the measurement site. When the injection is turned on, the gas concentration at the supply registers will experience a sudden rise. The concentration step-up enables us to calculate the fan airflow rate from the following equation:
CIQ fan ∆
= , (3)
where Qfan is the fan flow rate ([m3 air] s-1), I is the tracer gas injection rate ([m3 gas] s-1), and ∆C is the increase in tracer gas concentrations induced by injection ([m3 gas] [m3 air]-1).
The major obstacle to tracer gas measurements of fan flow was potentially poor mixing of tracer in the air stream between tracer injection point and the downstream location where tracer gas concentration was measured. Mixing was checked by collecting and analyzing samples from multiple downstream locations inside the duct.
Uncertainties in these airflow rate measurements are due to uncertainties in the magnitude of tracer gas concentration; uncertainties in the tracer gas injection-rate; sampling imperfect mixing of the tracer gas in the air; and uncertainties in the step increase in tracer gas concentration due to

33
the time quantization of sampling. With proper calibration and operation of instruments, both uncertainties in the tracer gas concentration and in the tracer gas injection-rate can be as low as approximately 2% individually, and uncertainties due to an imperfect characterization of the well-mixed tracer concentration downstream of the injection point can be 5%. Adding these together, the maximum bias uncertainty is 9%. Adding precision errors of 5% (in quadrature) due to time quantization of sampling, the resulting overall uncertainty in the measured fan airflow rate is estimated to be about 11% with the current measurement protocol.
1.3.6 Duct air leakage flow rates
Measuring air leakage flow rates remains a challenging task despite the considerable efforts undertaken in this area (Walker et al. 1998; Fisk et al. 1998). In this study we use two methods for measuring these air leakage flow rates through duct systems: 1) air leakage flow rates estimated from ELAs and operating pressures, and 2) air leakage flow rates estimated from upstream duct flow and register flows.
1.3.7 Air leakage estimated from ELA and pressure
The first method of estimating rates of air leakage is to calculate Q from Eq. (1), using as inputs (a) the measured pressure exponent n and (b) the temporal and/or spatial average static pressure in the duct system during normal HVAC system operation. For a re-circulation system, this method requires accurate determination of the split between the supply and return leakage areas. More generally, it requires that the leakage areas of sections of the ductwork that operate at very different pressures be determined separately.
One of the major drawbacks of this technique is that the pressures are monitored only at a few locations. This implies that the variations of the static pressures with the leak sites and/or with time are mostly unknown. The method also assumes that the discharge coefficient of the flow going through the leaks during the ELA test remains the same as that during normal operating conditions. Walker et al. (1998) have used essentially the same method to measure air leakage from residential ducts, and they estimated that the maximum uncertainty was 40% of the measured air leakage flow rate. Therefore, this approach can only provide an estimate of the air-leakage rates.
1.3.8 Air leakage estimated from upstream duct flow and register flows
The second method of estimating the rate of air leakage from a section of ductwork is to (a) measure the airflow rate though a cross section in the ductwork using the tracer gas method; (b) measure airflow rates through all downstream supply registers; and (c) subtract the sum of the register flow rates from the upstream flow rate at the duct cross section. The main limitation to this approach is that the expected difference between the upstream flow rate and sum of register flow rates was comparable in magnitude to the measurement uncertainty. We might expect a ±5% uncertainty in both the total register flow rate, and an ±11% uncertainty the upstream duct flow using tracer gas measurement. For example, the measurement error bound in the air-leakage rate would be approximately ±15% for duct section with a 20% fraction of air leakage. In this case the measured air leakage ratios would be between 5 and 35%.

34
1.3.9 Conduction heat gains
Previous work at LBNL has documented various problems in light-commercial thermal distribution systems (Delp et al. 1998a, 1998b; Levinson et al. 1997). Thermal losses are due not only to air leakage but also to heat conduction. Conduction loss assessment focused on the measurement of temperatures in the system and on the calculation of cumulative effectiveness.
Thermal measurements were made with stand-alone temperature loggers in the plenum (downstream of the cooling/heating coil), in selected supply registers, in the room, in the ceiling cavity, and in the outside air. The battery-powered temperature loggers with external temperature sensors were HOBO-Pro’s (On-Set Computer Corporation, Pocasset, MA) with 0.03 °C resolution and an accuracy of ±0.2 °C in high-resolution mode. The temperatures measured by multiple collocated HOBO-Pro’s shows a maximum differential of 0.25 °C and a standard deviation of less than 0.1 °C. The self-powered portable data-logger (HOBO-Pro) is more accurate than the Stowaway HOBOs used in a previous LBNL study (Fisk et al. 1998; 0.2 °C resolution, ±0.3 °C accuracy, and a maximum spread of 0.44 °C)
Delp et al. (1998a, 1998b) evaluate the effectiveness of heat transport through ducts in terms of the duct’s “cumulative effectiveness,” defined as the ratio of the energy delivered at the register to the potential available at the plenum (upstream of conduction losses). Equation (4) shows the definition of the effectiveness (Delp et al. 1998a, 1998b).
Since often latent heat due to moisture contents could be negligible, it equals the ratio of the sensible heat capacity for heating or cooling delivered at the register to the capacity available at the plenum. Based on the assumption that the airflow through the ductwork is constant over time and space, and impact of leakage flow on temperature change is negligible, it can be simplified by calculating the temperature differential between the register temperature, plenum temperature and the reference temperature which is essentially the conditioned-space temperature. The second part of the equation shows the actual calculation.
ε s,i ′ t ( ) ≡delivered capacity at register i up to time ′ t
potential capacity at the plenum up to time ′ t
=Treg ,i(t) − Troom (t)[ ]dt
0
t'
∫Tplenum (t) − Troom (t)[ ]dt
0
t'
∫
(4)
Here ′ t is the elapsed period of time of interest, normally a combination of cycles; Treg,i t( ) is the temperatures of supply register i at time t ( °C); Troom t( ) is the room temperature at time t ( °C); Tplenum t( ) is the supply plenum temperature at time t ( °C); and ε s,i ′ t ( ) is the cumulative effectiveness of register i up to time ′ t .
For variable-air-volume systems, the airflow rates usually change over the course of a day. Although the assessment on energy delivery effectiveness has to be linked to the airflow rates over a period of time (e.g., a day), it makes sense to look at the “temperature effectiveness” for a shorter period of time during which the airflow can be considered constant. The cumulative

35
temperature effectiveness for a certain supply is the ratio of the temperature difference between the register and space to the temperature difference between the supply plenum and space for a certain period of time. Eq. (5) defines the cumulative temperature effectiveness for heating or cooling delivery, an indicator for temperature gain/loss by heat conduction through supply-duct systems:
( )
[ ][ ]∫
∫−
−≡
′′
≡′
'
0 roomplenum
'
0 room,reg
,
)()(
)()(
time toup plenum at the difference re temperatuintegrated time toup register at difference re temperatuintegrated
t
t
i
is
dttTtT
dttTtT
ttitτ
(5)
Under stable airflow conditions, temperature effectiveness is equivalent to the ratio of the sensible heat capacity (energy) for heating or cooling delivered at the register to the capacity available at the plenum over a cumulative period of time, which is the “cumulative effectiveness” used in previous LBNL studies. However, the temperature effectiveness does not directly indicate energy delivery efficiency for variable airflow systems, or for terminal units associated with an induction unit.
1.3.10 Equipment performance monitoring
Characterization of the performance of thermal distribution systems includes characterizing the cycling characteristics of the cooling/heating equipment, monitoring short-term energy consumption, and monitoring maximum electricity demand. This is done by reviewing system information obtained from the building management and engineers. Information on nominal capacity and measurement energy consumption and equipment efficiency is then used to evaluate the economy of system design and operation. The energy monitoring includes using a diagnostics tool (ACRx) to collect short-term data of electric energy consumption and equipment efficiency for rooftop packaged units in the field during hot summer days. Since the large system would add more complexity and expense to the monitoring, we perform the measurement on two small systems that we tested for air leakage through ducts.
1.4 Results
Field study results include the physical characteristics of buildings and building systems, air leakage assessments using effective leakage areas (ELAs), air leakage classes, static pressures, and leakage flow fractions, and evaluation of thermal losses due to heat conduction.
1.4.1 Physical characteristics of building systems
Table 1 and Table 2 summarize the physical characteristics of buildings and duct systems or sections in the large-commercial and small-commercial buildings, respectively. These include five HVAC systems in four large commercial buildings, and five roof-packaged HVAC systems in four light commercial buildings. More details of the buildings and systems tested are shown in Appendix 7.3.

36
Table 1 shows that the floor areas of large commercial buildings range from 2,183 to 6,075 m2
(23,500 to 65,400 ft2), with total cooling capacities ranging from 130 to 760 kW (37 to 216 tons). The systems tested have cooling capacities ranging from 130 to 486 kW (37 to 138 tons).
LARGE COMMERCIAL SYSTEMS. System L1, with 130 kW (37 tons) of cooling capacity, has constant air flow in supply and return ducts, serving the spaces of a supermarket store with a space area of 5,125 m2 (55,164 ft2). System L2 is a heating supply duct with heating capacity of 12.8 kW. The heating duct is 60 m (198 ft) long, and serves one floor of perimeter offices in a large building with a total area of 2,183 m2 (23,500 ft2). This building has four such heating systems and is connected to another building of the same use and of similar floor plan. System L3 (141 kW or 40 tons) is a variable-air-volume system, with induction units at some of the VAV boxes serving the core office spaces of the same building as System L2. System L4 (484 kW or 138 tons) is also a VAV system, with induction units at different VAV boxes serving office spaces of an office building with a floor area of 6,075 m2 (65,400 ft2). The VAV systems (systems L3 and L4) have few return ducts in their ceiling plenums. System L5 (352 kW or 100 tons) is a dual-duct system with mixing boxes downstream of the heating and cooling ducts to supply the office spaces of 3,198 m2 (34,420 ft2). Each building other than that containing system L1 is connected with another office building of comparable size or identical floor plan.
In all large buildings, the main trunks of supply ducts (upstream of VAV boxes in large systems) are located in a ceiling plenum. Most supply and return ductwork (if any) is also located in a ceiling plenum. In one of the large buildings (system L4), the ductwork downstream of its VAV boxes is exposed to the occupied space.
The maximum equivalent diameters of duct cross-sections ranged from 30 to 125 cm (12 to 49 in.). The maximum airflow path length of the main trunks inspected ranged from 60 to 101 m (198 to 330 ft).
The static pressures of main trunks range from 480 to 610 Pa (1.93 to 2.45 iwc) during normal operation of the two VAV systems, and from 79 to 245 Pa (0.32 to 0.98 iwc) in the three CAV systems (System L1, System L2, and System L5). The static pressures of ducts downstream of terminal boxes (VAV or mixing boxes) ranged from 16 to 47 Pa (0.06 to 0.19 iwc) during normal operation. Floor area per supply register ranged from 5.2 to 29.3 m2 (56 to 315 ft2) for office buildings, and was 176 m2 (1,891 ft2) for the supermarket store, which housed many freezers with significant internal cooling.
SMALL COMMERCIAL SYSTEMS. Table 2 presents similar information for small commercial systems. The total floor areas of light commercial buildings ranged from 167 to 745 m2 (1,800 to 8,024 ft2), with total cooling capacities of 11 to 65 kW (3 to 18.5 tons). The individual capacities of packaged units in our study ranged from 11 to 18 kW (3 to 5 tons).
We found that in all five light commercial buildings tested, the supply ducts and return ducts were located in a ceiling plenum. All supply ducts were insulated with an external fiberglass layer at least 6.4 cm (2.5 in) thick.
In these small systems, equivalent diameters of duct cross-sections ranged from 25 to 51 cm (10 to 20 in) at the maximum duct sizes. Maximum airflow path length within a building floor

37
ranged from 10.7 to 29.3 m (35 to 96 feet). Air velocities calculated from the flow in the largest (furthest upstream) duct cross section ranged from 4.1 to 7.2 m/s (809 to 1,427 fpm).
The supply plenum static pressures ranged from 14 to 61 Pa (0.056 to 0.24 iwc). Floor areas per supply register ranged from 15.2 to 33.4 m2 (164 to 360 ft2). Fan flow per cooling capacity ranged from 0.0335 to 0.0475 m3 kW-1 s-1 (249 to 353 cfm ton-1), and fan flow per unit of served areas ranged from 2.03 to 9.14 L s-1 m-2 (0.4 to 1.8 cfm ft-2).

38
Table 1. Physical characteristics of duct system sections for large commercial systems.
LARGE COMMERCIAL BUILDING UNIT(S) L1 L2 L3 L3a L3b L4 L4a L4b L5 L5a L5b L5c L5d Year (from plans) - 1996 1979 1979 1979 1982 1982 1990 1990 Space Description - Grocery Store office office office office office office office
ft2 55164 23500 23500 23500 65400 65400 34420 34420 Building Floor Area m2 5125 2183 2183 2183 6075 6075 3198 3198 Connected to another Building? - Y Y Y Y Y Y Y Y Y
Ton 37 heating 40 138 100 Cooling/heating capacity kW 130 12.8 141 486 352 ft2 47265 4544 NA 11750 2640 NA 630 625 NA 668 950 408 168 Floor Area of Section Measured m2 4391 422 NA 1092 245 NA 59 58 NA 62 88 38 16
SUPPLY-AIR SYSTEM TYPE - Constant Constant VAV with Induction VAV with Induction Dual duct with economizer ft2 47265 4544 23500 23500 65400 65400 34420 34420 HVAC System Floor Area m2 4391 422 2183 2183 6075 6075 3198 3198 cfm 21287 916 NA NA NA NA NA NA Max Flow in Duct Section L/s 10045 432 NA NA NA NA NA NA iwc 1.04 0.32 2.4>p>1.92 1.92 0.12 2.44 0.19 0.48 0.20 0.07 NA 0.06 Max Static Press of Section Pa 260 79 600>p>480 480 30 610 47 120 50 18 NA 16
Duct in Ceiling Plenum (Y/N) - y y y y some n y y Duct Insulated? (Y/N/Part) - y y y y y n y y
ft2 5543 728 NA 1869 331 NA 303 244 NA 350 171 226 92 Supply Duct Surface Area m2 515 68 NA 174 31 NA 28 23 NA 33 16 21 9 ft2 1848 0 NA NA NA NA NA NA Return Duct Surface Area m2 172 0 NA NA NA NA NA NA ft2 7391 728 NA NA NA 350 171 226 92 Total Duct Surface Area m2 687 68 NA NA NA 33 16 21 9 in 49 12 NA 20 10 42 17 16 NA 16 12 12 9 Equivalent Max Duct Dim ** cm 126 30 NA 51 25 107 43 41 NA 41 30 30 23 in 8 NA NA 6 12 6 17 16 NA 8 Min Duct Dim ++ cm 20 NA NA 15 NA 15 43 41 NA 20 ft2 330 198 NA 162 28 NA 72 57 NA 65 12 52 26 Supply Max Flow Path Length m 102 60 NA 49 9 NA 22 17 NA 20 4 16 8
ft2/min 1597 1166 NA NA NA NA NA NA Air Velocity at Max. Duct Dimension m/s 8 6 NA NA NA NA NA NA # of Terminal Units - 0 0 NA 12 1 NA 1 NA 1 # of Supply Registers - 25 21 292 71 11 292 2 NA 9 4 6 3 # of Return Registers - 10 0 NA NA NA NA NA NA # Registers – Rectangular - 35 1 142 71 11 NA 0 NA 1 0 0 1 # Registers – Linear - 0 20 0 0 NA 0 NA 16 8 12 4 # Registers – Circular - 0 0 0 0 NA 2 NA 0
Ft2/reg. 1891 216 165 165 240 224 224 224 NA 74 238 68 56 System Floor Area per Supply register m2/reg. 176 20 15 15 22 21 21 21 NA 7 22 6 5 # Fire/Smoke Dampers - 0 0 6 1 0 NA 0 NA 0 ** Downstream of fan (L1, L2, L4) or terminal box (L3a, L3b,L4a, L4b, L5a, L5b, L5c, L5d) ++Upstream of a terminal unit (or feeding the section measured) Items in italics represent the whole system for branches or sections tested. L2 and L3 are different HVAC units in the same building,

39
Table 2. Physical characteristics of duct system sections for small commercial systems.
Small Commercial BUILDING Information UNIT(S) S1 S2 S3 S4 S5 Year Built - 1988 1988 1996 1996 1996 Building Type - office office office office office
ft2 1800 2160 5440 5440 8024 Building Floor Area m2 167 201 505 505 745 Connected to another Building? - y y y y y
tons 3 4 18.5 18.5 14 Cooling Capacity kW 11 14 65 65 49
SUPPLY-AIR SYSTEM - rooftop rooftop rooftop w/ economizer
rooftop w/ economizer
rooftop w/ economizer
tons 3 4 5 5 4 Cooling Capacity of HVAC unit tested kW 11 14 18 18 14 ft2 1800 2160 1000 1800 1056 HVAC System Floor Area m2 167 201 93 167 98 cfm 746 1122 1764 1507 1353 Fan Flow L/s 352 529 832 711 638 iwc 0.11 0.06 0.24 0.12 0.09 Max Static Press Pa 29 14 61 30 23
Duct in Ceiling Plenum (Y/N) - y y y y y Duct Insulated? (Y/N/Part) - y y y y y
ft2 225 291 540 360 274 Supply Duct Surface Area m2 21 27 50 33 25 ft2 159 182 320 120 209 Return Duct Surface Area m2 15 17 30 11 19 ft2 384 473 860 480 483 Total Duct Surface Area m2 36 44 80 45 45 ft2/reg. 360 164 200 360 211 Floor Area / Number of Supply Registers m2/reg. 33 15 19 33 20 in 10 12 20 16 16 Max Duct Dim cm 25 30 51 41 41 in 6 6 10 14 10 Min Duct Dim cm 15 15 25 36 25 ft 35 33 96 62 42 Longest Supply Duct Run m 11 10 29 19 13 ft/min 1368 1429 809 1079 969 Air Velocity at max duct size m/s 7 7 4 5 5 cfm/ton 249 281 353 301 338 Fan Flow/capacity L/s/kW 33 38 47 40 45 cfm/ft2 0.4 0.6 1.8 0.8 1.3 Fan Flow/Floor Area of Section Measured L/s/m2 2 3 9 4 7 cfm/ft2 3 3 3 4 5 Fan Flow/Supply Duct Surface Area L/s/m2 17 17 17 21 25
# Supply Registers (All rectangular) - 5 11 5 5 5 # Return Registers (All rectangular) - 5 6 5 2 4 # Fire/Smoke Dampers - 0 0 0 0 0

40
1.4.2 Effective leakage areas, air leakage classes, and static pressures
ELAs and static pressures were measured in five large commercial building systems: • supply and return ducts in a supermarket store; • the supply duct in one perimeter system in one large office building; • four supply sections downstream of mixing boxes in a large office building with dual-
duct systems; • the main trunk of a VAV supply duct and one VAV box branch in one large office
building; and • two branches of supply ducts of a VAV system in a large office building.
The sections or branches were selected for the VAV systems or dual-duct systems on the basis of physical accessibility.
ELAs and static pressures were all measured in supply and return ducts for all five small commercial systems. Leakage measurement results are summarized in Table 3 (large systems) and Table 4 (small systems). Comparisons of duct pressure scales with other studies are presented in Table 5.
1.4.2.1 Large commercial systems
Table 3 shows the measured effective leakage areas, air leakage classes, and static pressures in large commercial building systems.
System L1 is in a supermarket grocery store in which the supply and return sections were tested. System L2 is a single-duct perimeter system in an office building. System L3 contains section L3a, the main duct upstream of the VAV boxes and induction unit in the office building, and section L3b, one of the branches downstream of a VAV box with induction unit. Section L4a and L4b in System L4 are two of the branches downstream of their VAV boxes with induction units in an office building. Sections a-d of System L5 are four branches downstream of their mixing boxes in an dual-duct system of another office building.
The supply duct ELAs at 25 Pa vary widely from system to system, ranging from 0.1 to 7.7 cm2 per m2 of floor area served, and from 0.7 to 12.9 cm2 per m2 of duct surface area. Within the same system, the supply duct ELAs per duct surface area vary by a factor of up to eight; e.g., the leakage area of the section of system L3 upstream of VAV boxes is about eight times smaller than that of the downstream section. Specific ELAs (by duct surface area or floor area) of the four sections downstream of mixing boxes in system L5 were much larger than those of the other systems tested: their ELAs ranged from 2.0 to 7.7 cm2 per m2 of floor area served, and from 7.8 to 12.9 cm2 per m2 of duct surface area.

41
Table 3. Measured air duct system effective leakage areas, air leakage classes, and static pressures in large commercial buildings
System L1 System L2 System L3a
System L3b
System L4a
System L4b
System L5a
System L5b
System L5c
System L5d
Duct system CAV CAV VAV VAV VAV VAV Dual Dual Dual Dual
description Supply Return Overall Supply duct
Main Trunk
Branch Branch Branch Duct Duct Duct Duct
Year built 1996 1979 1979 1979 1980 1980 1990 1990 1990 1990
ELA per unit served floor area (cm2/m2 at
25 Pa) 0.3 0.3 0.3 0.1 0.1 0.7 0.3 0.3 5.1 2.0 7.7 5.0
ELA per unit duct surface area
(cm2/m2 at 25 Pa) 2.5 8.8 1.9 0.7 0.7 5.4 0.9 1.3 9.9 12.9 11.5 9.7
Pressure exponent (-) 0.59 0.52 0.59 0.60 0.61 0.70 0.69 0.63 0.55 0.57 0.60 0.60
Air leakage class Cfm/100 ft2 @1 iwc† 121 370 96 36 34 341 58 70 441 606 394 490
Plenum or terminal box pressure (Pa) * 245 -260 79 79 480 29.5 47 47 50 18 - 16
† Air leakage class is based on the measured duct ELA at 25 Pa and the calculated leakage flow at 250 Pa static pressure, using the measured pressure exponent. * Average value of pressure pan measurements on all registers.
Air leakage classes of the supply and return ducts of System L1 of the supermarket store were 121 and 370, respectively, indicating greater leakage in the return duct.
In System L2 with the long single duct, the leakage class was 96 when including the heating units and return section, and 36 when including only the main supply duct without equipment enclosures or return sections.
The air leakage class of the main trunk upstream of VAV boxes (System L3a) was 34, while one of the branches downstream of VAV boxes was measured at 341. This indicates that the main duct upstream of VAV boxes is about ten times tighter than the downstream VAV branches. This trend contrary to what we found from a previous study of another VAV system (Fisk et al. 1998), where sections upstream and downstream of the VAV boxes in one building had leakage classes of 110 and 48, respectively. In the two sections (L4a and L4b) downstream of VAV boxes and induction units in System L4, the air leakage classes were 58 and 70, respectively.
In System L5 with dual duct mixing boxes, we observed air leakage classes ranging from 441 to 606 for four sections (L5a-L5d) downstream of their mixing boxes.
Overall, the air leakage classes for main supply ducts (upstream of VAV boxes, or mixing boxes if any) for all systems tested ranged from 34 to 246, while those downstream (usually branches) ranged from 58 to 606. Compared to other duct sections studied by Fisk et al. 1998, our new data showed a much wider range of air leakage classes for sections downstream of VAV boxes, or mixing boxes if any. From the data shown in

42
Table 3, the leakage classes of all duct sections (including return ducts) ranged from 34 to 757. The median based on the sample presented in Table 3 is about 300.
In system L1, the operating pressure in the supply plenum was 245 Pa, and that in the return plenum was negative 260 Pa. However, the pan pressures at supply registers ranged from 12 to 59 Pa, with the average of 39 Pa and standard deviation of 11. In System L2, the plenum pressure was measured at 79 Pa.
In system L3, the fan was usually operating at 60 to 80% of full speed. Figure 3 shows the pressures monitored over a 24-hour period for system L3. The static pressure measured at the main trunk of the supply duct (floor supply) and another location upstream of one of the VAV control units (supply branch) on the same floor were almost the same throughout the time, averaging about 480 Pa. This indicated that there was very little pressure drop along the main trunk upstream of the VAV supply duct. However, we found that the pressure upstream of the VAV units fluctuated by about 100 Pa over the course of a day. The pressures downstream of the VAV box were low, typically about 30 to 40 Pa for Branch A and 1 to 10 Pa for Branch B, depending on their distances from the main supply and the operating position of dampers associated with them. The whole building was pressurized during normal operation, with positive pressure ranging up to 28 Pa.
System L3
-30
0
30
60
12:00 AM 6:00 AM 12:00 PM 6:00 PM 12:00 AMTime of Day
Stat
ic P
ress
ure
(Pa)
-300
-200
-100
0
100
200
300
400
500
600
Stat
ic P
ress
ure
(Pa)
Outside
Downstream VAV Box A
Downstream VAV Box B
Supply branch (right axis)
Floor Supply Plenum (right axis)
Figure 3. Static pressure trends of System L3 ducts upstream and downstream of VAV boxes.
Similar to System L3, System L4 is a VAV system with induction units. The monitored pressures in the ductwork and the space are presented in Figure 4. The space pressure was

43
slightly (about 1 to 5 Pa) lower than the outdoor air pressure during operation. During the monitoring period, the main duct pressure just upstream of the VAV boxes for the same floor averaged 610 Pa, while the duct pressure after the VAV boxes averaged 50 Pa over time, with an induction unit inlet pressure of approximate minus 10 Pa. A spot check indicated that the register pressure was about 20 Pa. The building was depressurized by about 1 to 5 Pa during normal operation.
System L4
-20
0
20
40
60
80
100
12:00 AM 6:00 AM 12:00 PM 6:00 PM 12:00 AM
Time of Day
Pres
sure
(Pa)
-200
0
200
400
600
800
1000
Pres
sure
(Pa)
Downstreamof VAV Box A
Induction Unit
Ceiling Plemum
Outside
Upstream of VAV Box A(Right Axis)
Figure 4. Static pressure trends of System L4 ducts upstream and downstream of VAV boxes.
Figure 5 shows the results of monitored pressures upstream and downstream of mixing boxes in the dual-duct system we tested (System L5). The operating pressure in the hot deck ranged from zero to 145 Pa, while the cold deck pressure ranged from 60 to 80 Pa. The pressures in the mixing boxes A, B and C were close to each other and were relatively stable. They ranged from 12 to 18 Pa. The pressures at the outlet of supply registers downstream of the terminal mixing boxes ranged from 4 to 5 Pa.

44
System L5
-20
0
20
40
60
80
100
120
140
160
180
12:00 AM 6:00 AM 12:00 PM 6:00 PM 12:00 AM
Time of Day
Pres
sure
(Pa)
Mixing Box A Mixing Box B
Mixing Box C Supply Register A-1
Supply Register B-2 Supply Register C-1
Hot Deck Cold Deck
Figure 5. Static pressure trends of System L5 ducts upstream and downstream of mixing boxes.
1.4.3 Small commercial systems
The ELA25 and leakage class results for the small systems we studied are displayed in Table 4. Some problems were found with the use of the method reported in Levinson et al. (1997) for measuring simultaneously the supply and return components of air leakage. In building systems S3, S4, and S5, the strict application of this method yields a supply-side pressure exponent significantly lower than 0.5, which is inconsistent with the ideal system physics. These results were probably due to the poorly determined set of equations yielded when the pressure drop across the heat exchanger was too low to allow its accurate calibration as a flow meter. Therefore, only the total leakage is reported in Table 4.
The total ELAs in this study ranged from 0.8 to 5.3 cm2 per m2 of floor area served, with an average value of 2.6 cm2/m2 and a standard deviation of 1.8 cm2/m2. They ranged from 3.7 to 7.5 cm2 per m2 of duct surface area, with an average value of 6.1 cm2/m2 and a standard deviation of 1.4 cm2/m2. The averaged specific ELA is lower than the average of 3.1 cm2/m2 of floor area reported by Delp et al. (1999), while very close to the results reported by FSEC (2.7 cm2/m2).
In the present study, the total leakage class (supply, return, and air handler) of the small systems ranged from 232 to 414, averaging 333, a value lower than that of 447 reported by Delp et al. (1999). Previous LBNL tests of light-commercial systems found that the

45
total leakage class (supply, return, and cabinet) ranged from 130 to over 1,300, with a mean of 447 and a standard deviation of 272. This pattern is consistent with the averaged specific ELA25 found in this study. Table 4. Measured air duct system effective leakage areas, air leakage classes, and static pressures in light commercial buildings.
System S1
System S2
System S3
System S4
System S5
Mean Std. Dev.
Year 1988 1988 1996 1996 1996
ELA per unit served floor area (cm2/m2 at 25 Pa) 0.80 1.67 5.30 1.81 3.44 2.6 1.8
ELA per unit duct surface area (cm2/m2 at 25 Pa) 3.7 6.4 6.2 6.8 7.5 6.1 1.4
Supply plenum pressure (Pa) 28.7 14.0 61.2 30.1 22.6 31.3 17.9
Return plenum pressure (Pa) -19.6 -13.7 -39.9 -8.8 -13.6 -19.1 12.2
Pan pressure (supply) (Pa)* 19.1 10.2 23.7 12.5 10.1 15.1 6.0
Pan pressure (return) (Pa)* -12.3 -12.5 -18.4 -16.2 -10.8 -14.0 3.1
Duct air leakage class† (cfm/100ft2 @1 iwc) 232 414 319 320 380 333 70
Pressure exponent (-) 0.69 0.71 0.61 0.57 0.6 0.64 0.06
† Air leakage class is based on the measured duct ELA at 25 Pa and the calculated leakage flow at 250 Pa static pressure, using the measured pressure exponent. * Average value of pressure pan measurements on all registers.
Figure 6 shows the total effective leakage area versus floor area for the five systems tested in the present study, the previous LBNL data (Delp et al. 1998a; Delp et al. 1998b), FSEC data, and a summary of LBNL residential data (Jump et al. 1996).

46
Floor Area (m2)
0 100 200 300 400
Tota
l ELA
25 (c
m2 )
0
200
400
600
800
1000
1200
1400
1600
1800
Floor Area (ft2)
0 1000 2000 3000 4000 5000
Tota
l ELA
25 (i
n2 )
0255075100125150175200225250275
95% Confidence Interval
New LBNL DataPrevious LBNL DataFSEC Comm.
New LBNL 2.7 1.9Previous LBNL 3.1 2.0FSEC Comm. 2.7 1.7Residential 1.3 .65
(cm2/m2) Avg. Std. Dev.
Figure 6. Total effective leakage area (ELA25) vs. floor area using data of present study, previous LBNL data (Delp et al. 1998), FSEC small commercial data (Cummings et al. 1996), and residential summary information (Jump et al. 1996).
Table 4 also shows the static pressures of the supply and return plenums, as well as the average pan pressures at the registers in each small system. The measured static pressures ranged from 14 to 61 Pa at the most upstream section of ductwork (supply plenum), and from approximately 10 to 24 Pa at the furthest downstream supply register.
Table 5 compares the supply and return plenum operating pressures of the current study with those in previous studies. The average supply plenum pressure observed for small systems in this study was consistently about 50% lower than the average found in previous LBNL studies of light commercial buildings. The statistical significance of this difference is not convincing at this stage, because we only studied five such small systems. For large building systems, the comparison with the previous study (Fisk et al. 1998) shows no significant statistical implication; however, we find large variations of operating pressures between different systems, and between different sections of same systems. Duct sections or branches downstream of terminal boxes have average operating pressures similar to the operating pressures observed in the small systems.

47
Table 5. Comparisons of supply and return plenum operating pressures of current study with those in previous studies.
Operating pressures (Pa) Supply duct sections Return duct sections
Mean Std. Dev.
Total # Mean
Std. Dev.
Total #
Small Commercial (present study) 31 18 5 -19 12 5
Small Commercial (Delp et al. 1999) 66 36 30 -43 25 30
Residential (Jump et al. 1996)*
44 N/A N/A -64 N/A N/A
Large Commercial Upstream of Terminal Boxes (present study)
377 199 6 -260 - 1
Large Commercial Upstream of Terminal Boxes (Fisk et al. 1998)
270 - 1 - - -
Large Commercial Downstream of Terminal Boxes (present study)
36 13 8 - - -
Large Commercial Downstream of Terminal Boxes (Fisk et al. 1998)
33 18 4 - - -
*unreported
1.4.4 Fan flow rates
Although there is no direct relationship between the delivered airflow rate and a system’s total surface area, ASHRAE (1997, Chapter 32) provides typical values of total fan flow divided by duct surface area of 10 to 25 L s-1 per m2.
Large commercial building systems L1 and L2 had ratios of fan flow to total (supply and return) duct surface area slightly out of that range (6.4 and 29.9 L s-1 per m2, respectively). However, ASHRAE’s typical values are in good agreement with the LBNL small commercial systems dataset (1996 through 1999). For these data, the fan flow to duct surface area ratio ranged from 6.5 to 44 L s-1 per m2 of duct surface area, averaging 15.7 L s-1 per m2 with a standard deviation of 7.7 L s-1 per m2.

48
A verage = 15.7, S T D = 7.7 [L/s/m 2̂ ]
Fraction [-]
F an F low / D uct S urface A rea [L/s/m 2̂ ]0 20 40
0
.1
.2
.3
Figure 7. Fan flow rate versus surface area in light commercial buildings using LBNL data sets (1996 through 1999).
1.4.5 Estimated leakage ratios from ducts
To ease comparisons between systems, the air leakage flow rate is usually expressed in terms of the air leakage ratio, defined as the leakage airflow rate divided by the total airflow rate through the duct sections of interest. Using the ELA method, the leakage airflow rate Q can be calculated by supply typical duct operating pressure to Eq. (1). The air leakage flow rates can also be obtained by finding the difference between upstream and downstream flow rates. The air leakage ratio is the estimated air leakage flow rates divided by the total fan flow.
Based on duct system accessibility and the register types on which register flows could be measured reliably using our existing equipment, we chose to measure the fan flow for two large-commercial and five small-commercial constant air volume systems. We derived the air leakage ratios in System L1 and System L2 using both of the previously described measurement methods. For all light commercial buildings, the air leakage rates were also estimated using both of the measurement methods. Table 6 and Table 7 provide the estimated leakage ratios from the duct systems in large and small systems, respectively.
1.4.5.1 Large commercial systems
Table 6 provides estimated air leakage ratios from Systems L1 and L2. System L1 results suggest that the pressure experienced by the leaks is considerably lower than half the plenum pressure. This assumption was found to yield reasonable results in light commercial buildings (Levinson et al. 1997). It would be very difficult to justify this

49
assumption rigorously, but it is consistent with the actual pressure at any given leakage site being somewhere between the plenum pressure and zero.
In system L1, there was a significant pressure drop between the supply plenum and the register outlets. Taking half of the value measured in the supply plenum is a way to estimate the operation pressure in light commercial buildings. Another estimate of the average operating pressure in the supply duct is the average from the register pan pressure measurements. The estimate of the supply section’s air leakage ratio is 21% based on the first method (half plenum pressure), and 10% if using the average pan pressure as the input for operating pressure. The estimated air leakage ratio for the return section is 23% based on the method of half plenum pressure, and 6% if based on the average pan pressure method. As discussed in the approach section, Walker et al. (1998) have used essentially the same method to estimate air leakage from residential ducts, and they estimated that the maximum uncertainty was 40% of the measured air-leakage rate.
By using the flow-subtraction method, the estimation of the leakage ratio for supply section in system L1 is 3%, which is associated with the combined uncertainty of ±16%, as discussed in section 1.3.8. A comparison between the two methods indicates that the leakage ratio for the supply duct of system L1 would be in the range from zero to 19%.
In System L2, pan pressures varied from register to register. The estimated air leakage ratio for the supply section is 26% based on the method of half plenum pressure, and based on the average pan pressure method. By using the flow-subtraction method, we measured a leakage ratio of 17% associated with the uncertainty of ±16%. With the uncertainties pertaining to the estimation, these results were in agreement, ranging approximately from zero to 33%.
Overall, given the uncertainties associated with the two different methods used in this study, the range of the estimated leakage ratios in System L1 and L2 is similar to the findings in a previous study by Fisk et al. 1998. In that study, the estimated air-leakage rates as a percentage of the inlet airflow rate varied widely from zero to approximately 30% with most of the estimates falling between 10 and 20%. Table 6. Estimates of leakage ratios as percent of fan flow in two large commercial building systems, using three methods.
Leakage ratios based on
Method Fan flow – Sum of register flows
ELA and half plenum pressure
ELA and average pan pressure
System L1 (supply) 3% 21% 10%
System L1 (return) - 23% 6%
System L2 17% 26% 26%
In System L3, which consisted of the main trunk and downstream VAV branches, we monitored the pressures in the main trunk and some of the VAV boxes over time as described in Figure 3. Assuming that the results of system L3b (downstream of the VAV

50
unit tested) can be extrapolated to all VAV units connected to the upstream section tested, the total leakage flow rate at 15 Pa (about half of the average VAV box pressure) for the downstream part of the system would be about 320 L s-1. The trunk section upstream of VAV boxes in system L3 is about eight times tighter than the downstream section on both normalized duct ELA25 (based on per unit of duct surface area). However, because the pressure is considerably higher in the upstream section, the total actual leakage flow in trunk section was about 450 L s-1, about 40% greater than the total of the downstream VAV sections. In large systems with terminal units (VAV, or mixing boxes), it is necessary to characterize separately the leakage of sections that operate at different pressures, namely that of sections upstream and downstream of terminal units.
1.4.5.2 Small commercial systems
Table 7 shows the leakage airflow rates as percent of total fan flow using the flow subtraction method for all light commercial building systems. The ELA-to-leakage-flow conversion method based on half the plenum pressure is also used in System S2 because the supply and return leakage areas were measured separately. For the supply duct in System S2, both methods yield a 9% air leakage ratio. Overall, in the present sample, the average leakage ratio is 10%, somewhat lower than the 26% average value reported by Delp et al. 1999. Table 7. Estimates of air leakage ratios as percent of fan flow in light commercial buildings, using different methods.
Leakage ratios based on Supply Return
Method Fan flow - Sum of register flows
ELA and half plenum pressure
Fan flow - Sum of register flows
ELA and half plenum pressure
System S1 0% - (-7%) - System S2 9% 9% 18% 4% System S3 13% - 27% - System S4 10% - (-5%) - System S5 17% - 16% -
Average 10% 9% 20%* 4% Std. Dev. 6% - 6%* -
*calculation excludes negative values.
1.4.6 Conduction heat gains and losses
Since the weather was mild during the period when the field tests were performed, most of the systems were not operating at their full capacity all the time. One would expect frequent “on-off” operation for cooling cycles and sometimes for heating cycles. In cooling mode, heat gains between the outlet of the cooling coils and the supply registers usually caused supply-air temperatures to increase, thus lowering the cumulative effectiveness of cooling. When the system was in heating mode, heat loss between the outlet of the heating coils and the supply registers caused supply-air temperatures to decrease, also reducing the cumulative effectiveness of heating.

51
1.4.6.1 Temperature trends
We monitored duct air temperatures in three systems in large commercial buildings, and in three systems in light commercial buildings. Measurements were made over several days at an interval of 10 seconds to detect temperature swings. The following are the main findings in temperature monitoring and heat conduction analysis.
TEMPERATURE TREND IN LARGE SYSTEMS. Figure 8, Figure 10, and
Figure 12 show the temperature trends for each of the large building systems (L1, L2, L3), while Figure 9, Figure 11, and Figure 13 show the general duct layout for each of the large systems, respectively.
Figure 8 shows the temperature trend and fan operation for a large system (L1) with a constant supply fan during a 24-hour monitored period in a supermarket located in Pleasanton. The figure indicates that the fan was always on 24 hours a day to satisfy the conditioning task. Interestingly, the HVAC cooling never came on even during the daytime, probably because the freezers were adequate to cool the store in mild weather. The heating was, however, occasionally on at night during our 3-day monitoring period in April. The registers and duct layout are shown in Figure 9.
Figure 10 shows the temperature trend and fan operation for a long duct system (L2) with a constant heating supply fan for perimeter offices of a large office building in Palo Alto. The figure indicates that the fan was constantly on roughly from 7 AM to 5 PM on workdays to maintain the office temperatures at certain levels. The registers and duct layout are shown in Figure 11.

52
System L1 Heating
0
5
10
15
20
25
30
6:00 AM 9:00 AM 12:00 PM 3:00 PM 6:00 PM
Time of Day
Tem
pera
ture
(°C
)
Room
Supply Plenum
Supply Register A (64 m from Supply Plenum)
Supply Register B (104 m from Supply Plenum)
Figure 8. Temperature trend in duct System L1 of a supermarket store.
Supply Register ASupply Register B
40 m
32 m
SupplyDuct
12 m
Supply Plenum
81 m
Figure 9. Registers and supply duct layout in System L1 of a supermarket store.

53
System L2 Heating
0
10
20
30
40
50
60
6:00 AM 9:00 AM 12:00 PM 3:00 PM 6:00 PM
Time of Day
Tem
pera
ture
(°C
)
RoomCeiling PlenumSupply PlenumSupply Register A (14.3 m or 47 ft from Supply Plenum)Supply Register B (32.9 m or 108 ft form Supply Plenum)Supply Register C (51.8 m or 170 ft form Supply Plenum)
Figure 10 Temperature trend and fan operation in duct System L2 (heating, long duct).
Return
4 m10 m
SupplyRegister
A
SupplyRegister
B
19 m
SupplyRegister
C
17 m
2 m
16 m
HeatingUnit
Supply AirFlow
Figure 11. Registers and supply duct layout in duct System L2 (heating, long duct).

54
Figure 12 shows the temperature trends for a VAV duct system (System L3) with three VAV boxes and three two downstream registers in a large office building in Palo Alto. The temperature differences between the supply plenum and VAV boxes (or registers) indicate temperature rises throughout ductwork during cooling operation.
System L3 Cooling
10
15
20
25
30
6:00 AM 9:00 AM 12:00 PM 3:00 PM 6:00 PM
Time of Day
Tem
pera
ture
(°C
)
Register A
Register B
Register C
VAV Box B
Room
VAV Box D
Supply Plenum
VAV Box A
Figure 12. Temperature trends for duct System L3 (cooling, VAV duct system).

55
VAV Box A
VAV Box B
VAV Box C
VAV Box D
System L2
SupplyRegister C
SupplyRegister A
SupplyRegister B
System L3
Induction Unit A
Supply Air
36 m
13 m
Induction Unit C
Figure 13. Monitored VAV boxes and registers layout for duct System L3.
TEMPERATURE TREND IN SMALL SYSTEMS. Figure 14 though Figure 18 show the temperature trends in cooling and/or heating modes for each of the small building systems.
Figure 14 shows the temperature trend for a small duct system (System S1) during regular working hours (9 AM – 6 PM). The figure indicates that during the daytime, the system came on and off to cool the space.
Figure 15 shows the temperature trend for a small duct system (System S3) during regular working hours (9 AM – 6 PM). The figure indicates that during the daytime, the system came on and off to cool the space. Interestingly, Figure 16 shows that the system ran at night to heat the unoccupied space.
Figure 17 shows the temperature trend for a small duct system (System S5) during regular working hours (9 AM – 6 PM). The figure indicates that during the daytime, the system came on and off to cool the space, while at night the system was running to heat up the space (Figure 18).

56
System S1 Cooling
0
5
10
15
20
25
30
6:00 AM 9:00 AM 12:00 PM 3:00 PM 6:00 PM
Time of Day
Tem
pera
ture
(°C
)
Room Ceiling Plenum Supply Plenum
Supply Register A Supply Register B Supply Register C
Figure 14. Temperature trend for cooling cycles duct System S1 (small office).

57
System S3 Cooling
0
5
10
15
20
25
30
9:00 AM 12:00 PM 3:00 PM 6:00 PM
Time of Day
Tem
pera
ture
(°C
)
Room Supply Plenum Supply Register A
Supply Register B Supply Register C Supply Register D
Supply Register E
Figure 15. Temperature trend for cooling cycles in duct System S3 (small office).
System S3 Heating
0
10
20
30
40
50
60
12:00 AM 3:00 AM 6:00 AM 9:00 AMTime of Day
Tem
pera
ture
(°C
)
Room Supply PlenumSupply Register A Supply Register BSupply Register C Supply Register DSupply Register E
Figure 16. Temperature trend for heating cycles in duct System S3 (small office).

58
System S5 Cooling
0
5
10
15
20
25
30
9:00 AM 12:00 PM 3:00 PM 6:00 PM
Time of Day
Tem
pera
ture
(°C
)
Room Ceiling Plenum Supply Plenum
Supply Register A Supply Register B Supply Register C
Supply Register D Supply Register E
Figure 17. Temperature trend for cooling cycles in duct System S5 (small office).

59
System S5 Heating
0
5
10
15
20
25
30
12:00 AM 3:00 AM 6:00 AM 9:00 AM
Time of Day
Tem
pera
ture
(°C
)
Room Ceiling Plenum Supply Plenum
Supply Register A Supply Register B Supply Register C
Supply Register D Supply Register E
Figure 18. Temperature trend for heating cycles in duct System S5 (small office).
1.4.6.2 Temperature rise or drop in the supply ductwork
For most systems’ operation in this study, the supply temperature swing significantly, so did the air temperature exiting the supply registers. The temperature difference between supply registers and supply plenum thus varied accordingly. In this report we calculate the temperature difference between supply plenum and terminal units (registers, VAV boxes) at the end of each temperature swings as a way to assess magnitudes of thermal loss through conduction in different systems.
Table 8 presents temperature rise (+, in cooling mode) or drop (-, in heating mode) relative to the supply plenum for each of the registers at the end of each temperature swing. The table also presents the average percentages of cooling/or heating cycle-on time for each small system. The values in the right column show the average temperature rise or drop for individual registers monitored. These can be used as the rough estimates of temperature rise or drop at the end of swing for each of the system operations, and an indication of the heat conduction impacts through ductwork.
TEMPERATURE DROP IN LARGE SYSTEMS. In two of the large systems (L1 and L2), the supply air was heated upstream of the duct systems and supplied through constant speed fans. The temperatures of supply registers in the ducts dropped by 0.3 to 6.2 °C at the end of usual heat-on cycles. In System L1, the heat was on about a quarter of the time from 6 AM to 12 PM. The temperature drop from the supply plenum to the registers was 1.5 °C in the first 68 m (210 ft), and an additional 1 °C in the next 40 m (120 ft, Figure 9). In System L2, system heating was on from 7 AM to 5 PM, accounting for about 83% of the

60
time between 6 AM to 6 PM. The temperature drops ranged from 0.3 °C at 15 m (47 ft) to 6.2 °C at 56 m (170 ft) in the 65-m (198-ft) long duct (Figure 11). Although the registers in this system were closer to the plenum, they exhibited greater temperature drops. This is an indication of worse supply-duct insulation in System L2 as compared to System L1.
TEMPERATURE DROP IN SMALL SYSTEMS. For the small systems (S3 and S5) operating in heating mode, the heat loss if any between the supply plenum and the supply registers caused supply air temperatures to drop by up to 4.3 °C at the end of heating-on cycles in these small building systems. In one of the systems (S5), the average temperature drop of registers was close to zero. In System S3, heating-on time accounted for about one-third of its operation time (3 AM to 9 AM). In System S5, heating-on time accounted for about 40% of its operation time (3 AM to 9 AM).
TEMPERATURE RISE IN A LARGE VAV SYSTEM. For System L3, which was a VAV system, we monitored the temperatures of three VAV boxes (A, B, E), and three registers downstream of different VAV boxes (A, B, C).
Figure 12 shows the temperature trends with periodic temperature swings in the supply plenum. Since two identical compressors served the system, the temperature swings indicated that at least one of the compressors were operating intermittently for cooling every 15 minutes or so. The layout of measurement points in Figure 13 shows that the VAV boxes and registers monitored represented a wide range of delivered distances from the supply plenum. Table 8 shows the temperatures rises in VAV Boxes A, B, D, and Registers A, B, C, at the end of temperature upswings between around 1 PM to 2 PM. The temperatures rises in VAV Boxes B, A, D ranged from 1.8 to 6.5 °C, increasing with distance from the plenum. In System L3, register B was one of the registers in Branch B, with an average temperature rise of 4.5 °C. The temperature rise for the register from its VAV box (B) was about 3 °C, a large value given its proximity to the box (< 6m) [17 ft]. This indicates significant thermal loss per unit of airflow within the branch. Register A was furthest downstream of a VAV box (<10m) [29 ft], and the temperature rise was almost 12 °C. Register C was the furthest register downstream of Branch C (10 m), with a temperature increase of approximately 11 °C. The significant rises of the register temperature were probably due both to heat conduction through the duct wall and to induction-unit mixing of the duct air with warmer ceiling plenum air.
The temperature rises along the duct varied significantly from terminal unit to terminal unit. The difference in temperature rises between VAV boxes were likely due to variations in distance from the supply plenum, the extents to which the airflow modulations were open, and the presence of induction units. Since we did not monitor the exact airflow delivered through each VAV box or the operation of induction units, it is premature to predict their impacts on the temperature rise. Thermal loss through downstream sections can only be evaluated by the combination of temperature drops and operating airflow rates.
TEMPERATURE RISE IN SMALL SYSTEMS. For the small systems (S1, S3 and S5) operating in cooling mode, the heat gains between supply plenum and the supply registers caused

61
supply-air temperatures to rise by up to 4.1 °C at the end of cooling-on cycles. In System S1, cooling-on time accounts for half of the time when cycling was active (9 AM to 4 PM). In System S3 cooling-on time accounted for only 14% of the time when cycling was active (12 PM to 6 PM. In System S5 cooling-on time accounted for half of the time when cycling was active (12 PM to 6 PM). Table 8. Cycle on-time fraction and temperature rise/drop in registers or terminal boxes.
Temperature rise/drop at end of heat/cooling-ON swings ( °C)
System type
Operating Mode
Fraction of heating/ cooling
ON-Time
Supply register A
Supply register B
Supply register C
Supply register D
Supply register E
Average
L1 CAV, store
Heating 23% -1.5 -2.5 - - - -2.0
L2 CAV, office
Heating 83% -0.3 -4.2 -6.2 - - -3.6
NA 4.4 1.8 - 6.5 4.3
Large systems
L3 VAV, office
Cooling
NA 11.8 4.5 11.0 - 9.1
S1, Roof-top Unit
Cooling 48% 1.1 1.9 - - - 1.5
S3 Roof-top Unit
Heating 35% -4.3 -2.2 -1.8 -1.5 -2.2 -2.4
Cooling 14% 4.1 2.3 1.8 1.8 2.0 2.4
S5 Roof-top Unit
Heating 46% -0.1 -0.1 -0.1 -0.1 -0.3 -0.1
Small systems
Cooling 39% 0.9 0.8 0.9 1.4 2.0 1.2
Note: data in the shaded cells are from VAV boxes, not registers.

62
1.4.6.3 Heat conduction through ducts
Table 9 summarizes the overall cumulative effectiveness for each register in supply duct systems monitored (L1, L2, S1, S3, S5).
HEAT CONDUCTION LOSS IN LARGE SYSTEMS. In large systems, we calculated the cumulative effectiveness by applying Eq. (4) to systems with constant air volume supply.
Table 9 shows that for large systems, the cumulative effectiveness of supply registers in heating mode ranged from 0.77 to 0.98 in Systems L1 and L2. In each of the systems, the cumulative effectiveness decreased with the increase in distance of downstream registers from the supply plenum. If the cumulative effectiveness was representative of all registers in the systems, heat conduction through ducts reduced the heating capacity of the supply air exiting registers by little in System L1 (2%) and by nearly 25% in System L2. The magnitude of estimated heating loss in System L1 indicated that the supply duct in the grocery store was well insulated, while the estimated heating loss in System L2 indicated that the supply duct in the office building was worse insulated. This is consistent with findings in register temperature drops along their supply ducts.
HEAT CONDUCTION LOSS IN SMALL SYSTEMS. Among the three small systems (S1, S3, and S5) monitored during unoccupied period (usually, 12 AM to 6 AM), the overall cumulative effectiveness of supply registers in heating mode ranged from 0.76 to more than 1.0. The cumulative effectiveness for most of the supply registers exceeded 100% in System S5. This indicated that additional heat gains through the ductwork (from the ceiling plenum) contributed to the registers’ nighttime temperature increases. The ceiling plenum temperature was always higher than the room temperature, and was higher than the duct temperature roughly half of the time at night. This resulted in register temperatures that equaled or exceeded the supply plenum temperature for a significant portion of the time.

63
Table 9. The overall cumulative effectiveness of supply ducts for the systems tested.
Overall Cumulative Effectiveness System type
Operation
Mode Supply register A
Supply register B
Supply register C
Supply register D
Supply register E
Average
L1 CAV, store
Heating 0.96 0.95 - - - 0.96 Large systems
L2 CAV, office
Heating 0.98 0.84 0.77 - - 0.87
S1, Roof-top Unit
Cooling 0.89 0.80 - - - 0.85
Heating 0.76 0.88 0.89 0.93 0.87 0.87 S3 Roof-top Unit
Cooling 0.66 0.73 0.84 0.81 0.79 0.76
Heating 1.02 1.04 0.94 1.05 0.88 0.99
Small systems
S5 Roof-top Unit
Cooling 0.93 0.94 0.93 0.89 0.85 0.91
HEAT CONDUCTION GAIN IN A LARGE VAV SYSTEM. Since the airflow in VAV systems usually changed over time, the cumulative effectiveness defined by Delp et al. [Eq. (4)] would not hold. We use the temperature effectiveness as defined in Eq. (5) to roughly evaluate the thermal losses in the VAV duct system. In the VAV system (L3), we used Pitot tubes to monitor the dynamic pressure at the exit of system’s main fan and in VAV boxes (A and B), as shown in Figure 19.

64
System L3
0
100
200
300
6 7 8 9 10 11 12 13 14 15 16 17 18Time of Day
Dyn
amic
Pre
ssur
e (P
a)
VAV Box B
VAV Box A
System Supply Plenum
System Supply Plenum Average
Figure 19. Fan room pressure trend in VAV System L3.
During the occupied hours (8 AM to 6 PM) the dynamic pressure of main supply plenum ranged from 70 to 112 Pa, with an average pressure of 84 Pa. Assuming that the average total flow changed with the dynamic pressure monitored, the total fan flow would be within approximately ±15% of the average flow rate, and within ±8% of the average flow rate during 90% of the occupied period. The figure also shows that during some short periods of time, the total fan flow was fairly constant. For example, between 1 PM and 2 PM, the dynamic pressure ranged from 70 to 77 Pa with an average of 74 Pa. The corresponding fan flow ranged within ±3% of its average, indicating little change in the fan flow between 1 PM and 2 PM.
During the same occupied hours, the dynamic pressure in VAV box A ranged from zero to 2 Pa with an average of approximate 1 Pa, while the dynamic pressure in VAV box B ranged from zero to 13 Pa with an average of approximate 7 Pa. Airflow through VAV box A or B was relatively stable for the periods with the scales of 2 to 3 hours.
We calculate the temperature effectiveness for three VAV boxes and registers to assess the magnitude of heat conduction loss for some branches and registers for the building peak-load-hour between 1 PM and 2 PM. Figure 20 shows the instant temperature effectiveness for one VAV box (B), and overall temperature effectiveness for three VAV boxes (A, B, E), and three registers (A, B, C) from around 1 PM to 2 PM. The positions of the VAV boxes and registers are shown in Figure 13.

65
The instant temperature effectiveness of VAV box B changed periodically with temperature swings (every 15 minutes or less), while the aggregated temperature effectiveness achieved a relatively stable value (0.90) shortly after only one temperature swing, which usually lasted for less than 15 minutes. For the one-hour period, the short-term temperature effectiveness was 0.90 for VAV box B, 0.73 for box A, and 0.62 for box E. This indicates that the further the VAV box was from the supply plenum, the lower the temperature effectiveness was. The temperature effectiveness was 0.72 for register B, 0.16 for register A, and 0.07 for register C.
Since the dynamic pressure in VAV box A or B was quite stable during the hour, the short-term aggregated temperature effectiveness can be used to estimate the thermal conduction loss for each of the VAV boxes. The overall thermal loss in the duct upstream of VAV boxes can then be obtained by weighting the flow rate through each VAV terminals. If we assume that VAV Boxes A, B, and D represented the typical distribution of all VAV boxes in this system and that each VAV box carried the same flow rate, then the overall temperature effectiveness of all VAV boxes in the system would be about 0.75. This rough estimate indicates that about a quarter of the cooling energy was lost before it was delivered to each of the VAV boxes during the one-hour period of time. This estimate is somewhat consistent with the large temperature drops in the VAV boxes as discussed in the previous section.
The temperature effectiveness of VAV boxes decreased with distance downstream. Additional temperature rises in registers downstream of a VAV box rendered the temperature effectiveness of downstream registers significantly lower than that of their parent-VAV box. For example, the temperature effectiveness of register B was 0.76, about an additional 14% reduction for the temperature effectiveness in VAV box B (0.90). Assuming register B was representative of the registers in this particular branch, the actual thermal losses (heat gain) through duct conduction downstream of VAV box B account for 14% of the heat gain in the branch during the peak-hour period. Since registers A and C were associated with induction units, the temperature effectiveness of registers A and C could not be used to directly estimate the cooling energy lost in either VAV branch.

0.00
0.10
0.20
0.30
0.40
0.50
0.60
0.70
0.80
0.90
1.00
12:00
Tem
pera
ture
effe
ctiv
enes
sVAV Box B
E
VAV Box A
Register B
Instant temperatureeffectiveness for
VAV Box BInstant temperature
effectiveness for VAV Box B
Figure 20. Short-term
HEAT CONDUCTION Gcumulative effectivenmonitored supply regcumulative effectiveIf we assume that thein the systems, heat cair exiting registers b
When looking at the for each individual crose, the effectivenesthe ducts. Since the dcool or heat the ductsfraction increased, thtotal energy to be delto cycling was reducconsistent with the fi
VAV BoxVAV Box D
66
12:30 13:00 13:30 14:00 14:30 15:00Time of date
Register A
Register C
Time of day
temperature effectiveness for VAV boxes and registers.
AIN IN SMALL SYSTEMS. For the small systems, Table 9 shows the ess using Equation (4). The cumulative effectiveness of all isters in cooling mode ranged from 0.66 to 0.94. On average,
ness ranged from 0.76 to 0.91 for the three small systems monitored. measured cumulative effectiveness is representative of all registers onduction through ducts reduced the cooling capacity of the supply y 9 to 24% for the small systems.
cumulative effectiveness and small systems’ cycle on-time fractions ooling cycle, there is a trend that when the cooling-on-time fractions s increased (Figure 21). This was likely due to thermal cycling of uct system has a certain thermal capacity, the energy required to to certain temperature should be constant. When the cycle on-time e required cooling/heating energy became a smaller fraction of the ivered from the system. This means that excessive energy waste due ed, thereby increasing the cumulative effectiveness. This was nding by Delp et al. (1999).

67
0.3
0.4
0.5
0.6
0.7
0.8
0.9
1
0% 10% 20% 30% 40% 50% 60% 70% 80% 90% 100%Percentage of Small Systems' Cooling-on Time
Cum
ulat
ive
Effe
ctiv
enes
s1997/1998 Delp et al 1998
1999 LBNL New Data
Figure 21. Cumulative supply effectiveness versus cycle on-time percentage for systems tested
1.4.6.4 Summary of effectiveness analysis
COOLING MODE. During cooling operation, the supply temperature swing significantly, so did the air temperature exiting the supply registers. The temperature difference between supply registers and supply plenum thus varied accordingly. Temperature difference between supply plenum and terminal units (registers, VAV boxes) at the end of each temperature swings was used to indicate magnitudes of thermal loss through conduction of different systems. For small systems in cooling mode, the average temperature rises between the outlet of the cooling coils and the supply registers due to conduction heat gains ranged from 1.2 to 2.4 °C, while temperature rises in individual registers ranged from 0.8 to 4.1 °C. For one large VAV system tested in cooling mode, the temperature rises (at the end of each temperature swings) between the supply plenum and VAV boxes ranged from 1.8 to 6.5 °C, while average temperature rises between the supply plenum and the supply registers ranged from 4.5 °C (without induction unit) to almost 12 °C (with induction unit).
HEATING MODE. For small systems in heating mode, the temperature drops between the outlet of the cooling coils and the supply registers due to conduction heat loss ranged from 0.1 to 2.4 °C, while temperature rises in individual registers ranged from 0.1 to 4.2 °C. For two large CAV systems tested in heating mode, the average temperature drop (at the end of each temperature swing) between the supply plenum and the supply

68
registers ranged from 2 to 3.6 °C, while temperature drop in individual register ranged from 0.3 to 6.2 °C.
THERMAL LOSS. Overall, the average cumulative effectiveness for each small cooling system was estimated to range from 0.76 to 0.91, while average fractional cooling on-time ranged from 14 to 48%. The effectiveness for each small system in heating mode was estimated to range from 0.76 to over 1.0, while average fractional cooling on-time ranged from 23 to 83%. For two large CAV systems in heating mode, the corresponding cumulative effectiveness of downstream registers was 0.77 and 0.98. Within each of the systems, the further the distance downstream of the supply plenum, the lower the cumulative effectiveness was.
An estimate on temperature effectiveness for a VAV system during a short period of peak-load time (one hour) indicates that the heat conduction gains through the duct reduce the cooling capacity of the VAV systems by roughly 25% for the upstream main trunk at peak hour, and the heat conduction reduced the cooling capacity by an additional 14% points in one of the VAV branch studied.

69
1.4.7 Equipment performance monitoring
During the review process of the system characterization, we gathered information on the nominal capacity and on some cycling characteristics of the cooling/heating equipment, as presented in the previous sections. We have used an “ACRx,” a service tool for monitoring vapor-compression-refrigerating cycle and for fault detection. We used it for short-term monitoring of energy performance of the HVAC units in light commercial buildings. The purpose of monitoring is to provide the diagnostic information on air-conditioner (AC) operation, its electricity power consumption, and the steady-state coefficient of performance (COP) of the air-conditioner. An advantage of the tool is that it comes standard with remote wireless communication to a PC. In practice, we could download data at our office to retrieve data by dialing the cellular phone within the service tool. We measured the unit COP, the short-term energy consumption, and the maximum energy demand for two AC units during different one-week-long periods of time in August and September.
1.4.7.1 Measured efficiency of the air-conditioners
To assess the performance of AC units in operation, we monitor the temperatures and pressures of refrigerant at different stages (e.g., before and after the compressor/condenser) of small rooftop packaged units. The coefficient of performance (COP) can then be calculated based on the enthalpies representing the electricity energy input and cooling energy output. However, the values of calculated COP based on instant temperature and pressure data do not necessarily represent the true energy efficiency of the unit because the unit may not operate in a steady-state. Two systems, System S3 and System S5, were tested in this study.
Figure 22 shows trend of calculated COP, outside air temperature, room temperature, and the electricity energy demand during a one-day operation (9:00 AM – 6:00 PM) for System S3 in August. From the plot, we observe that the unit was operating on-and-off quite often. On average the unit was on for approximately 20 to 40 minutes, and then 5 to 10 minutes off. The calculated COP during each on-cycle approaches a stable number when the unit’s cooling operation and measurement sensors approach a steady state. Usually this takes about 10 to 20 minutes. The trend of calculated COP curves indicate that due to unstable refrigerant flow rates at the beginning of units’ start-up, the minimal time needed for the refrigerant tubes to reach thermal balance with ambient condition and the temperature sensor, the calculated COP values only become meaningful when they approach a steady-state. In general, the steady-state COP values were between 4.2 to 4.3, while the space temperature ranging from 22 to 23°C and outdoor temperature ranging from 27°C in the morning and up to 34°C.
Figure 23 also shows the trend of calculated COP, outside air temperature, space temperature and the electricity energy demand during another one-day operation for System S3 in August. From this plot, we observe that the same unit was in operation most of the time (9:00 AM – 6:00 PM). While the temperatures, pressures and flow of the refrigerant in the AC unit may change slightly over time due to variations in the ambient

70
conditions, we can consider the temperatures, pressures and flow of the refrigerant monitored represent the instantaneous system parameters, so do the refrigerant enthalpies derived from these parameters. In this case COP values over time is reliable for assessing the unit efficiency. As expected, the COP changed with the change in ambient temperature while the space temperature was stable. During the one-day operation , the indoor temperature was held very stable at about 23°C. In the morning, when outdoor temperatures ranged between 25 and 27°C during 11:00 AM - 12:00 AM, the COP ranged between 3.9 and 4.0; there was a trend that COP reduced with the increase of outdoor air temperature. When outside air temperature was higher (averaged 31°C during 3:00PM and 6:00PM), the units’ COP dropped more to approximately 3.7 during the continuous operation. One would expect that given same indoor temperature, when the outside air was cooler the system would have operating on-and-off more often than it does when it was warmer. Compared to Figure 22, when the outdoor temperature was slightly lower (up to -3°C) and indoor temperature slightly higher (up to 0.5°C), System S3 surprisingly was in operation most of the time during the office hours. Since there are other units serving the same office building as S3 does and each system’s operation was largely affected by the individual thermostat set-point, this indicates that system control have large impact on the operation pattern of the individual system.
0
2
4
6
8
10
9:00 AM 12:00 PM 3:00 PM 6:00 PM
Time of the Day
Cal
cula
ted
CO
P
0
10
20
30
40
50
Tem
pera
ture
[C°]
/ El
ectr
icity
Ene
rgy
Dem
and
[kW
]
Electricity Energy Demand
Room Temperature
Calculated COP
Outside Air Temperature
Figure 22 System S3: Calculated COP, outside air temperature, space temperature and the electricity energy demand during continuous operation

71
0
1
2
3
4
5
9:00 AM 12:00 PM 3:00 PM 6:00 PM
Time of the Day
Cal
cula
ted
CO
P
0
10
20
30
40
50
Tem
pera
ture
[C°]
/ El
ectr
icity
Ene
rgy
Dem
and
[kW
]Calculated COP
Outside Air Temperature
Room Temperature
Electricity Energy Demand
Figure 23 System S3: Calculated COP, outside air temperature, space temperature and the electricity energy demand during intermittent operation
Overall, four out of five weekdays for System S3 had similar operation patterns shown in Figure 22. This indicate that most of the time during the week in late August the system was often operating on-and-off. Since there are other units serving the same office building as S3 does, and each system’s operation was largely affected by the individual thermostat set-point, it is hard at this stage to judge whether or not the specific system is oversized.
For System S5, we observed similar operation patterns seen in System S3 during another one-week monitoring in another light office building (Figure 24). The system was on-and-off so often that often the calculated enthalpies (and COPs) based on temperature and pressure measurement did not approach steady-state.

72
0
2
4
6
8
10
9:00 AM 12:00 PM 3:00 PM 6:00 PM
Time of the Day
Cal
cula
ted
CO
P
0
10
20
30
40
50
Tem
pera
ture
[C°]
/ El
ectr
icity
Ene
rgy
Dem
and
[kW
]
Electricity Energy Demand
Calculated COP
Outside Air Temperature
Room Temperature
Figure 24 System S5: Measured COP, outside air temperature, space temperature and the electricity energy demand during intermittent operation
1.4.7.2 Energy demand and energy use of the air-conditioners
Table 10 shows the electricity energy demand of both systems for selected days and short-term electricity consumption. Table 10 Short-term electricity energy demand and electricity consumption
AC System System S3 System S5
Electricity demand (kW)*
One-week electricity use
(kWh)
Electricity demand (kW)
One-week electricity use
(kWh)
Intermittent operation
7.9 5.1
Continuous operation
7.0
353 (70%)** 4.7
140 (90%)*
* Includes fan power and power for controls. ** Percentage represents the ratio of electricity energy use of the AC system from 9 AM to 6 PM to the total electricity use of the AC system during the week.

73
In this discussion, we define that the unit was operating continuously if it was on continuously for three or more hours during the daytime. From the table we see that for the same system, electricity energy demand (kW) becomes higher when the system was operating intermittently compared to when it was operating continuously (7.9 kW vs. 7.0 kW for S3, and 5.1 kW vs. 4.7 kW for S5) during the week of monitoring.
From the energy use we find that about 70% of the total electricity use of the AC system (S3) during the week actually occurred during 9 AM and 6 PM, indicating significant energy use outside of normal business hours. For System S5, the electricity use of the AC system during 9 AM and 6 PM accounted for 90% of the unit’s total electricity use. Since we observed that the office is open during normal office hours, the ACRx monitoring shows that excessive energy was used to condition spaces, an indication that system control schedule had some problems.
1.4.7.3 Discussion
ACRx provides a useful tool for field diagnostics of air-conditioner unit. The monitoring of refrigerant temperature, pressure, and electricity energy can provide diagnostic information on unit’s energy performance. It becomes valuable in the following aspects: 1) detecting unit’s on-and-off operation pattern, which may be used as an indication of system’s failure, oversize, or improper control, 2) providing performance data during steady-state operation, 3) providing the data of energy use and energy demand of the unit during a certain period of time as selected by users, and 4) continuous collecting data at users’ needs once the tools is setup and working properly.
The shortcomings of the system include its inability to monitor accurately the unit performance during non-steady-state operations. Also, the measurement setup-time required was somewhat long, and telecommunication technique used sometimes was not stable. Although shortfalls in the tool’s setup and data retrieval process seemed to be a concern, they could be improved in terms of future tool design. Nevertheless, the tool can become effective for system diagnostics during steady-state operation.

74
1.4.8 Summary of the field characterization results
In contrast with previous studies conducted by LBNL, our building selection this year was geared towards large-building systems. We characterized five HVAC systems (or system sections) in four large commercial buildings, and five HVAC systems in four light commercial buildings in northern California. The following summarizes the results of this study.
1.4.8.1 Air leakage
SUPPLY DUCT ELA25. For large systems, normalized leakage area (ELA25) varied widely from system to system, ranging from 0.3 to 7.7 cm2 per m2 of floor area served, and from 0.7 to 12.9 cm2 per m2 of duct surface area. Within the same VAV system, the normalized leakage areas of supply ducts (per unit duct surface area) varied by a factor of up to eight, indicating that the upstream ducts were much tighter than downstream branches. For small systems, the ELA25 ranged from 0.8 to 5.3 cm2 per m2 of served floor area, and from 3.7 to 7.5 cm2 per m2 of duct surface area. The averaged specific ELA25 was 2.6 cm2/m2 floor area, somewhat lower than that found in our previous studies.
AIR LEAKAGE CLASS. For large systems, the air leakage classes for main supply ducts (upstream of VAV or mixing boxes) for all large systems tested ranged from 34 to 246, while those downstream (usually branches) varied widely from 58 to 606. In the present study, the total leakage class (supply, return, and air handler) of the small systems ranged from 244 to 414. The average was 333, lower than the 447 average reported in LBNL’s previous studies. Compared to the predicted duct leakage class by ASHRAE (3-12 for sealed ducts, and 30-48 for unsealed ducts), these systems appeared to be quite leaky.
OPERATING PRESSURE. The average supply-plenum pressure observed in small commercial systems was 30 Pa, about 50% lower than the average found in the previous LBNL studies of light commercial buildings. The statistical significance of this difference is not convincing at this stage, since we only studied five such small systems. For large-building systems, we found large variations of operating pressures among different systems, and among different sections of the same systems. Duct sections or branches downstream of terminal boxes had average operating pressures similar to the operating pressures observed in the small-building systems.
AIR LEAKAGE RATIOS. In small systems, the average leakage ratio was 10%, considerably lower than the 26% average value reported in previous LBNL studies. In large systems with terminal units (VAV or mixing boxes), it is necessary to separately characterize the leakage of sections that operate at different pressures (i.e., upstream and downstream of terminal units). Using two different methods in this study, the range of the estimated leakage ratios in two large constant-air-volume systems was estimated to be between zero to 33%, a range similar to the findings in LBNL’s previous study.

75
1.4.8.2 Heat conduction losses
We improved the accuracy of temperature measurements in the duct systems by using self-powered portable data-loggers (HOBO-Pro, Onset Computer 1999) for this year’s experiments. Findings from small and large systems are summarized as follows.
SMALL SYSTEMS. For small systems in cooling mode (during occupied hours), the average temperature rises between the outlet of the cooling coils and the supply registers due to conduction heat gains ranged from 1.2 to 2.4 °C from system to system, while temperature rises in all registers ranged from 0.8 to 4.1 °C. The estimated cooling energy loss through duct conduction for small-building systems ranged about 9% to 24%, and the fractional on-time for cooling cycles in these buildings ranged from 14 to 48% during occupied hours.
For small systems in heating mode, the average temperature drops between the outlet of the cooling coils and the supply registers due to conduction heat loss ranged from 0.1 to 2.4 °C, while temperature rises in individual registers ranged from 0.1 to 4.2 °C. The heating energy loss through duct conduction or small systems in heating mode (during unoccupied hours) was estimated to range from 0 to 24%, while average fractional on-time for cooling cycles ranged from 23 to 83%.
LARGE SYSTEMS. For one large VAV system tested in cooling mode, the temperature rises (at the end of each temperature swings) between the supply plenum and VAV boxes ranged from 1.8 to 6.5 °C, while average temperature rises between the supply plenum and the supply registers ranged from 4.5 °C (without induction unit) to almost 12 °C (with induction unit). This study indicates much higher temperature rises in the large system than those found in the study by Fisk et al. (1999). The dramatic variations of temperature rises in the VAV boxes and registers were probably due to traveling distance of the air from the supply plenum, the insulation of duct, the opening degrees of the VAV’s airflow modulator, and induction units (if any) associated with the VAV terminals. An estimate on temperature effectiveness for a VAV system during a short period of peak-load time (one hour) indicates that the heat conduction gains through the duct reduce the cooling capacity of the VAV systems by roughly 25% for the upstream main trunk at peak hour, and the heat conduction reduced the cooling capacity by an additional 14% in one of the VAV branch studied.
For two large CAV systems tested in heating mode, the average temperature drop (at the end of each temperature swing) between the supply plenum and the supply registers ranged from 2 to 3.6 °C, while the temperature drop at all registers tested ranged from 0.3 to 6.2 °C. The corresponding effectiveness was between 0.77 and 0.98 for the two CAV systems tested in heating mode.
Within all systems tested, the cumulative effectiveness decreased with the distance between terminal units (including registers) and the supply plenum.

76
1.5 Discussion
1.5.1 Air leakage characterization
Characterizing the thermal performance of large commercial distribution systems remains a very challenging task. Measurement of the leakage rates in these larger duct systems is labor-intensive because of the size and complexity of these systems. Single-duct systems with constant air volume are usually easier to study than are VAV or dual-duct systems. However, our field characterization of air leakage through ducts includes measurements of the Effective Leakage Area (ELA), the airflow through registers and fan, pressures, and temperature rise and drops in ducts. These would typically require 100 to 200 person-hours. For example, approximately 180 person-hours were required to obtain the field data for system L1, excluding the time needed for subsequent data analyses. The complexities of systems, available measurement techniques, and labor intensities are major barriers to performing similar research on larger samples. Besides, the measurement methods employed in the study had drawbacks similar to those encountered in the residential and small-commercial sectors.
In variable-air-volume systems, another major challenge is to measure the airflow, which may vary considerably over time. In this case, estimates of air leakage ratios and their variations during the normal operation are extremely difficult to obtain with the research methods developed so far. Besides, to date, their implications on the fan energy use can be assessed only via detailed numerical simulations. There is clearly a need for simplified methods for characterizing the thermal performance of such systems based on a limited number of inputs from the field.
The determination of the duct system operating pressure, which is known to yield the largest uncertainties in the conversion of ELA to leakage flow in residences and light commercial buildings, appears to be an even more challenging task in large commercial buildings. The factors that make it more difficult for large systems include the size of the duct system, the spatial variations among the ductwork sections, the unknowns in the distribution of leaks, the definition of typical sections, physical accessibility of duct sections, and the varieties of systems used (e.g., VAV, CAV, and dual-duct). Currently, we use a data logger and long tubes to monitor the pressures in different sections of the large systems. One of the drawbacks to this method was that it took a long time to set up the pressure monitoring equipment while keeping our equipment as unobtrusive as possible (so as not to disturb business in the building). A simpler approach for pressure monitoring is needed.
The field data reported here confirm the trends reported in previous studies (Delp et al. 1999) regarding the poor thermal performance of small systems. However, the methods developed to characterize these systems are still being improved towards better accuracy and simplicity. Additional research is needed to develop duct system diagnostic protocols that could be used on a wider scale.
The ELA measurement, including the split between the supply and the return sides, could be significantly improved by modifying the protocol reported in Levinson et al. (1997).

77
The basic idea would be to artificially increase the resistance to the flow through the heat exchanger. Practically, inflating a balloon or an inner tube in the return duct just before the cabinet could do this.
The measurement of fan flow used in our research requires significant time to set up, calibrate, and perform the flow measurement tests. The tracer gas measurement is sensitive and expensive, and its performance requires expertise. For field diagnostics purpose, we need to have a greatly-simplified protocol that can produce acceptable accuracy.
1.5.2 Thermal losses through heat conduction
The cumulative effectiveness was defined as energy delivery effectiveness through ductwork by Delp et al 1998. Assuming latent heat change is negligible compared to sensible heat change within duct systems, the second equal sign “=” in Eq. (4) would hold based on two assumptions: 1) no air leakage through the ductwork, (i.e., the airflow is constant along the duct), and 2) the airflow is stable all the time.
Usually the first assumption could be compromised since the impact of air leakage on register outlet temperature could be negligible when the leakage ratio is not excessively high. For example, if a CAV duct has 20% air leakage distributed evenly along the length of duct, the temperature difference between the register and supply plenum would be about 10% larger than when there is no leakage. If we assume that the actual temperature difference between the register and supply plenum is 4 °C (as observed from large CAV systems in this study), and we also assume the temperature difference between the space and supply plenum is about 10 °C, then the temperature rise caused by leakage would have been more by 0.4 °C. This accounts for an actual 4% difference in results of cumulative effectiveness. The calculated cumulative effectiveness by using Equation (4) would have overestimated the thermal loss due solely to heat conduction by 4%. However, if the air leakage ratio were significant higher (e.g., 50%), its impact on the register outlet temperature would be comparable or even greater than the impact by heat conduction. In latter case, the results of cumulative effectiveness, which is intended for conduction loss assessment, would be misleading without considering the actual impact of air leakage.
In the constant air volume systems observed in many small systems and some large systems (e.g., L1 and L2), the cumulative effectiveness introduced by Delp et al. (1998) is the same as temperature effectiveness defined in Equation. In any case, in order to estimate the overall energy delivery efficiency in the duct systems the amount of airflow must be integrated or weighted toward the temperature effectiveness. The average effectiveness weighted by air flow rate over time can then be directly used as the overall effectiveness for the systems of interest.
The analysis performed in this study yielded useful results from both large and small systems operating in different conditioning modes (i.e., heating vs. cooling). We should also note that the system operation and control, internal loads, weather conditions, and equipment sizes had influenced the temperatures we monitored.

78
Small systems are likely to exhibit a lower percentage of cooling cycling-on time operations in transitional seasons (spring and fall) than in summer, because the loads are lower. Thus, cumulative cooling effectiveness will probably be lower in transitional seasons than in summer.
1.5.3 Energy saving potentials
The influence of air leakage and conduction losses on HVAC energy use depends on many factors, including duct insulation, locations of air leaks, locations of ducts, and control strategies in the HVAC system (e.g., thermostat set-points, airflow controls and systems types). To evaluate the energy penalties induced by air leakage, it is appropriate to evaluate the leakage ratio (i.e., the leakage flow rate divided by the total fan flow rate). Based on the flow-subtraction method, the leakage ratios in systems L1 and L2 are of 3% and 17%, respectively. Though there is no direct relationship between the delivered airflow rate and the system’s surface area, ASHRAE (1997, Chapter 32) provides typical values of total fan flow divided by total duct surface area of 10 to 25 L s-1 per m2. If we assume that a large system has equal duct surface areas upstream and downstream of the terminal units in supply ducts, and average operating pressures of 400 Pa and 15 Pa in upstream and downstream sections, respectively (as observed for VAV system L3), and if the leakage classes of the upstream and downstream section were 30 and 200, respectively, the resulting leakage ratios would be in the range of 7 to 18%.
Franconi et al. (1999) have predicted a 65% increase in fan energy and a 10% increase in cooling coil loads when 20% of the supply air leaks from the supply ducts of a variable-air-volume (VAV) system. If the air leakage ratios reported in this study are representative of California large commercial buildings, the energy losses due to air leakage from ducts alone in statewide large commercial buildings would be significant. Successful duct sealing for HVAC systems in large commercial buildings would reduce the required fan airflow rates for conditioning without adversely affecting the indoor quality, thus significantly reducing energy use. Such retrofits for 10% of the fans in service in California’s large commercial buildings would result in energy savings in the region of 35 GWh per year.4
1.6 Conclusions
The field portions of this year’s research brought home a couple of key points. First, it is clear that there can be significant duct air leakage in large commercial buildings, similar to the duct air leakage that has been found in residences and light commercial buildings. Although we cannot draw any conclusions about the population of buildings in California based upon the few buildings that we tested, it is clear that there can be significant leakage, and that there are large variations in leakage levels between and within buildings.
4 This is based on the assumption—inferred from the work of Franconi et al. (1999)—that 50% of the fan energy can be saved, and a floor-area based ratio of the fan energy consumed in large commercial buildings. In the U.S., these buildings represent 44% of the total floor area in commercial buildings.

79
The situation with respect to duct-system conduction losses (including convection and radiation losses) in large buildings is similar to that for air leakage. The duct-system temperature changes associated with these losses were clearly shown to be well above the “designer’s rule of thumb” of 1 °F, ranging between 0.3 °C and 6.2 °C (0.5 to 11.2 °F) for branches without “induction” units. As conduction losses have been shown to have energy impacts similar to those for leakage, it is clear that the energy savings potential associated with the losses is also significant. Moreover, our data and analyses also indicate that the energy savings associated with the use of VAV systems is being systematically reduced by conduction losses. Specifically, as the flow and velocity through the ductwork is reduced by the VAV dampers, the conduction losses increase, which forces the VAV dampers to open further to increase the flows to meet the loads.
Characterization of the thermal performance of large commercial systems was more difficult and complicated than that of small systems. Large systems studied had much wider ranges of leakage classes, specific ELA25, and operating pressures than those of the small systems did. Duct sections downstream of terminal boxes had average operating pressures similar to the average operating pressures observed in the small-building systems. The magnitude of temperature drops and rises were likely to increase with duct length in large and small systems.
1.7 Recommendations
Based upon these findings, it is also clear that we are just scratching the surface with respect to quantifying and addressing duct air leakage issues in this building sector, as the number of buildings that we have characterized remains small, while the diversity and complexity within this building sector remains large. More field characterization is needed to improve our knowledge on the duct system performance, especially in the large commercial systems. In addition, based upon our earlier analysis of the energy implications of the duct air leakage, it is clear that it is worth continuing our pursuit of energy savings by means of duct sealing in large commercial buildings.
The conduction problem, which is something that merits further investigation, would need augmentation and application of analysis tools, and including diagnostic and improvement technology. Most likely, the largest impact in this area will come in the new-construction area.
The key recommendation with respect to small buildings based upon this year’s work is that diagnostic tools need to be improved to provide quick, accurate diagnoses of performance. This stems from our observation of a significantly different level of leakage in this year’s sample of buildings, and the fact that our measurements continued to take too long to perform.

80
2 Evaluation of duct performance in the non-residential portion of the California’s Energy Efficiency Standards for Residential and Non-Residential Buildings (Title 24)
2.1 Introduction
After approximately a decade of research in the area, the impacts of duct performance on building energy use have recently been incorporated into the California Title-24 Residential Energy Standard, a major milestone for the standards (requiring some in-situ performance testing) and for the researchers working in this area. More recent field studies have indicated that duct systems in light commercial buildings are typically more leaky than those in residential buildings (Cummings 1998; Delp et al. 1998a; Delp et al. 1998b), and that the duct air leakage levels in large commercial buildings may be comparable to those in residential systems (Fisk et al. 1998). In addition, energy performance analyses predict significant opportunities for energy savings and capacity improvement associated with sealing duct air leakage in commercial buildings (Delp et al. 1998c; Franconi et al. 1998). This study presents information pertinent to incorporating duct impacts on building energy efficiency into the Title-24, Non-Residential Building Energy Standards.
2.1.1 Background
Duct system inefficiencies, particularly duct air leakage, have been the subject of considerable research over the past ten years. The vast majority of the research has been focused on single-family residential buildings (Cummings et al. 1990; Davis 1993; Jump and Modera 1994; Modera 1993; Modera and Jump 1995; Parker 1993; Proctor et al. 1992). The general consensus that evolves from reading those papers is that residential duct systems have considerable leakage (10-20% of fan flow on each side of the fan), and that that leakage has important impacts on energy use and cooling capacity.
Over the past few years, several field studies of duct air leakage in light commercial buildings (generally less than 930 m2, or10,000 ft2) have been conducted in California and Florida (Cummings 1998; Delp et al. 1998; Delp et al. 1998a). These field studies suggest that duct air leakage in these buildings is actually higher than that found in residences, the average leakage in the supply ducts being 26% of fan flow.
The duct air leakage situation in large commercial buildings, defined as buildings larger than 930 m2 (10,000 ft2) that use continuous fan operation during occupied hours, is less clear. Leakage rates have been measured in very few large commercial buildings. Although the existing data is limited, it is clear that some fraction of these buildings have significant (i.e., over 10%) duct air leakage. A recent field study of large commercial buildings in California determined their effective leakage areas per floor-area values to be comparable to the values measured for residences (Fisk et al. 1998).
Results from the commercial-building field characterization studies have been used to estimate the impact of sealing leaky ducts. These performance analyses predict

81
significant opportunities for energy savings and capacity improvement associated with sealing duct air leakage in the commercial building market (Delp et al. 1998c; Franconi et al. 1998).
2.1.1.1 Compliance
The California Code of Regulations (Title-24, Part 6) states that all non-residential buildings subject to Title-24 shall be designed, constructed, and installed to comply with energy efficiency requirements. Compliance with requirements is determined by either a prescriptive or performance analysis approach. Compliance using a prescriptive approach is based on the proposed building having an envelope, space-conditioning system, hot-water heating system, and lighting system that meet minimum component performance specifications. Compliance using the performance approach is based on an energy budget. To comply, the energy use of the proposed building must be no greater than that determined for the standard building in the same climate zone. The standard building is a building physically similar to the proposed building but specified with energy-use components that meet the performance requirements outlined in the prescriptive compliance approach.
To evaluate non-residential compliance with the performance approach, two software packages are commercially available - Perform95 and EnergyPro. The programs are available through CEC and Martyn Dodd/EnergySoft, respectively. Both programs serve as a front-end to the building simulation program DOE-2.1E (Winkelman et al. 1993). DOE-2.1E is an hourly, whole-building energy analysis program that calculates energy performance and life-cycle economics.
To evaluate compliance with either of the two commercially available tools, the user enters data describing the proposed building. Based on the input data, a building description file is created for the proposed building and the corresponding standard building. The DOE simulation is run for the two buildings. If the proposed building’s energy use is less than that of the standard building, compliance is met.
2.1.1.2 Alternative calculation methods
Interested vendors can develop and market tools for Title-24 compliance. To be considered for CEC certification, the tool must meet the analysis specifications outlined in the Alternative Calculation Method (ACM) Approval Manual (CEC 1998). As part of the certification, the ACM must be tested to check modeling accuracy. Accuracy is determined relative to the reference computer program, DOE 2.1E. This involves seventy-six conformance tests involving several building prototypes, climate zones, and design/system permutations, to be completed. The tests are designed to systematically vary one or more features that impact building energy use.
2.1.1.3 Reliance on DOE 2.1E
The ACM Manual does not require that compliance tools use the DOE 2.1E program to perform the compliance analysis. The requirement is only that the performance differences between the proposed and standard buildings be within 15% of the DOE 2.1E

82
results. However, the two compliance tools currently commercially available do use the DOE-2.1E program for their performance calculation engine. Therefore due to the reliance of the ACM conformance testing procedures and existing ACM programs on the DOE 2.1E computer simulation program, it is inherent that this study examine the duct air leakage modeling capabilities and accuracy of DOE-2.1E.
2.2 Objective
The objective of is to outline a strategy for getting duct performance recognized within the Non-Residential portion of the California’s Energy Efficiency Standards for Residential and Non-Residential Buildings (Title 24). Currently, the performance impacts of duct air leakage and duct-conduction heat-transfer are not considered in the non-residential standards.
2.3 Approaches
In section 2.3.1, we commence with a review of duct conduction and leakage concepts. In section 2.3.2, the modeling capabilities of the DOE 2.1E computer simulation program are described. Section 2.3.3 presents guidelines for using these modeling features in DOE 2.1E. The modeling procedure for several configurations of ducts and leakage zones are explained. Section 2.4 discusses the limitations associated with the duct performance algorithms currently present in the DOE 2.1E program.
2.3.1 Heat conduction and air leakage through ducts
To understand the benefits and limitations of different methods for evaluating the impacts of duct performance on building energy efficiency, it is helpful to be familiar with the underlying principles that drive conduction and air leakage to/from ducts. A brief overview is presented here. A more detailed description of these effects can be found in (ASHRAE 1997a; ASHRAE 1997b; Franconi et al. 1998).
2.3.1.1 Heat conduction through ducts
Although the heat transfer across the duct surface is referred to as duct conduction in this report, the heat transfer is dependent not only on conduction through the insulation, but also on convection and radiation on the outer and inner surfaces. In the introductory analysis presented below, radiation effects are neglected.
The overall duct heat-transfer coefficient is dependent on the duct conduction and air convection heat transfer resistances (neglecting radiation). The overall duct heat transfer coefficient can be determined from the sum of the reciprocals of the resistances associated with the conduction and convection layers. This can be expressed as
exteriorconvcondinteriorconv
duct RRRUA
,,
111 ++= . (6)
The conduction resistance of the duct wall is dependent on the duct construction material, thickness, and insulation R-value. The convection resistance of the external flow assuming laminar flow characteristics is dependent on the temperature differential and the

83
duct diameter (ASHRAE 1997a). The convection resistance of the internal flow, assuming turbulent flow characteristics, is dependent on the air velocity and duct diameter (ASHRAE 1997a). The steady-state heat transfer rate is dependent on the total duct heat transfer coefficient and the temperature difference between the air inside the duct and the air surrounding the duct. The heat transfer rate from the ducted supply air to the exterior air across the duct wall is equal to
( )interiorexteriorduct TTUAQ −= . (7) The higher the resistance associated with the convection and conduction layers, the lower the heat transfer coefficient and heat transfer rate. For uninsulated ducts, the resistance from the convection layers is generally greater than that from the conduction layer.
2.3.1.2 Duct air leakage
The functional form usually used to describe the relationship between the pressure in a duct and the flow through the leaks in ducts is a power law:
pCCFM nSpacetoDuct∆= . (8)
Eq. (8) states that the duct air leakage rate is proportional to the pressure difference between the duct and surrounding space raised to the power of n. According to the equation, higher system pressures lead to higher duct air leakage rates.
When testing ducts for leakage by fan pressurization, a known measured pressure differential is applied, and the flow required to maintain that pressure differential is determined by using a calibrated fan. By using several data points for CFM and ∆p, one can solve for C and n. For leaks that look like orifices (e.g., holes), n is 0.5, whereas for leaks with some length (lap joints between duct sections) n is approximately 0.6.
2.3.1.2.1 LEAKAGE WITH CONSTANT-AIR-VOLUME FAN CONTROL
In air distribution systems with constant-air-volume fans, the pressure in the duct is typically not actively controlled. The pressure at the fan exit is dependent on system flow rate and fan performance characteristics. The pressures across the leaks in the ducts can be related to the pressure drop through the downstream section of the duct after the fan. Assuming a linear pressure drop through the duct, and that the zone supply-air exits the diffuser and enters the space at ambient pressure, the average pressure in the duct equals half the pressure drop through the duct. If turbulent flow is assumed, the airflow rate affects the duct pressure drop according to the square law. This pressure-flow relationship can be expressed as
( )22
2ductDuct
SpaceDucts
CFMpp ∝∆=∆ − . (9)
If large holes are assumed in the ducts, n = 0.5 in Eq. (8). Assuming all air leaks from the duct half-way through the duct, Eq. (9) can be substituted into Eq. (8) to solve for the leakage rate as follows:
ductSpaceDuctsleak CFMCpCCFM 25.0
)(1 == −∆ . (10)

84
In this rough simplification, the leakage ratio remains fixed regardless of system flow rate and fan pressure. This result assumes that • duct air flow is turbulent, • the pressure drop across all system components follows a square law, • duct pressure drop is linear along the length of the duct, • all duct air leakage occurs in the middle of the duct run, and • all leaks have a pressure exponent of 0.5.
While these assumptions are plausible for constant volume systems, they are not consistent with the conditions produced by variable-air-volume systems as described below.
2.3.1.2.2 LEAKAGE WITH VARIABLE-AIR-VOLUME FAN CONTROL
Some air-distribution systems have active pressure and fan-flow controls. This is typical of variable-air-volume (VAV) systems. In VAV systems, maintaining a constant static pressure at some point in the duct system upstream of the VAV boxes typically controls system flow rate. The fan speed and power vary to maintain the pressure set point in response to fluctuations in VAV zone box flow rates and damper resistances. As a result, the pressure upstream of the zone boxes (strictly only at the pressure controller) is unaffected by damper position and flow rate. This means that duct air leakage occurring at this point in the duct system will have the same flow rate at design as at part-load fan operation.
The system pressures downstream of the VAV boxes are much more dramatically influenced by the positions of the zone box dampers, where each zone damper modulates in response to the room temperature and the thermostat set point. Thus, downstream of the zone boxes, the duct pressure will vary similarly to that for constant air volume systems. Thus for VAV systems, it may be most appropriate to assume some leakage occurs at a fixed rate and some leakage occurs at a fixed fraction of supply air (Franconi et al. 1998).
2.3.1.3 Fan performance
Electric fan power is dependent on the flow through the fan, the total pressure rise across the fan, the motor efficiency, and the blade efficiency. The pressure rise across the fan must be sufficient to overcome the pressure drop in the system. The system pressure drop is composed of four major components: duct and duct-like elements (dampers, fittings, etc.), coils, filters, and the static-pressure set-point (which is “used” by the VAV boxes downstream.)
Duct and duct-like pressure drops increase as a function of the square of the flow through them. If ducts were the only component in the system, the fan power would be a cubic function of the flow through the system. Filters and coils usually follow a power-law functional relationship between pressure drop and flow. For these elements the pressure

85
drop is proportional to the flow raised to 1/n. If one of these items were the only one in the system, the fan power would be a function of the flow raised to the power (1+1/n): 5
C
CFMPn/1
=∆ . (11)
Knowing the design flows and pressure drops (along with the appropriate n’s) it is possible to plot the system pressure drops over a range of flows. If the system resistance changes due to changes in zone box damper positions (as in VAV systems), the plot would consist of a family of system curves. Each system curve presents the pressure-drop/flow relationship for a fixed system resistance.
When the system performance curves are plotted along with fan performance curves on flow versus pressure plots, the curve intersections show the unique system operating points. From intersection data, a polynomial expression can be developed to express the fan power as a function of flow rate for the system.
In many hourly simulation programs, including DOE-2, the fan performance subroutines are based on a third-order polynomial relating fan power to fan flow part load ratio. The form of the equation is
33
2210 PLRCPLRCPLRCCFPR ⋅+⋅+⋅+= , (12)
where FPR, the fan power ratio, is the ratio of the fan power at that time to the fan power under design conditions; PLR, the part load ratio, is the ratio of the fan flow at that time to the fan flow under design conditions; and C0 …C3 are constant coefficients for the curve fit. Determination of these coefficients depends on the pressure drop and flow characteristics of the system.
2.3.2 DOE-2 duct air leakage and conduction modeling
For the last twenty years, the U.S. Department of Energy has supported development of the DOE-2 computer simulation program. The program consists of hundreds of subroutines working together to simulate mass and energy flows in a building (Crawley et al. 1998). The last major revision of the program available to the public is DOE 2.1E. Within each major revision, minor improvements and bug fixes are made periodically. The most recent updates for the DOE 2.1E program are included in version 131.
Recently, new major revisions to the DOE-2 program have been made. The release of the DOE 2.2 program is imminent. In DOE-2.2, many of the programming improvements affect plant equipment modeling (Hirsch, personal communication). Also being developed is a computer simulation program that combines the best of DOE-2 with another building simulation program, BLAST. The U.S. government has supported development of both building simulation programs since the 1970s. The main difference between the programs is the building load calculation method. DOE-2 uses transfer functions and weighing factors while BLAST uses an energy-balance approach. The new
5 The value of n varies from 0.5 to 1. This bounds the fan power as somewhere between a square and a cubic function of fan flow.

86
combined-program, called EnergyPlus, is presently in a beta-test form developed for in-house testing purposes.
In early versions of DOE 2.1E, versions prior to 110, the program’s duct conduction and leakage modeling capabilities were limited. In these versions, the energy associated with the duct air leakage was not accounted for in an energy balance. To model duct conduction, the capabilities of these early versions of 2.1E are also limited. For these versions, duct conduction is not modeled using fundamental heat transfer relationships as presented in equation (13). Instead, duct conduction is modeled by specifying a constant average duct air temperature increase (DUCT-DT). The DUCT-DT is added to the system supply air temperature for each hour of the year. Adjustments are not made to the DUCT-DT value to account for changes in the heat transfer rate due to the fluctuations in the temperature of the air surrounding the ducts.
Improved duct air leakage modeling is available in DOE-2.1E versions 110 and higher. The following section describes the keywords pertinent to these versions of the program. Since current Title-24 conformance tools use DOE 2.1E, incorporating these modeling capabilities into the existing tools is trivial.6 The keywords available in DOE 2.1E versions 110 and higher are the same keywords used in the soon-to-be-released DOE 2.2 program. However, the duct heat transfer algorithm in DOE 2.2 is improved and based on a true heat exchanger model (Hirsch, personal communication).
2.3.2.1 DOE 2.1E modeling keywords and description
The keywords listed in Table 11 are used to model duct performance in DOE-2.1E version 110 and higher. The keywords are pertinent for modeling duct air leakage and conduction heat transfer from the supply-air ductwork. The keywords are contained in the SYSTEM-AIR and SYSTEM commands in the DOE-2 systems subprogram.
Table 11. Keywords for DOE 2.1E versions 110+ related to duct performance.
6 Based on personal communications during February 1999 with Martyn Dodd of Gabel Dodd/EnergySoft, LLC, Novato, CA.

87
SYSTEM-AIR Keywords Description Duct-Air-Loss Fraction of supply air lost to the PIPE&DUCT-ZONE. Fraction is
specified with respect to the system SUPPLY-CFM, which is the fan flow rate. The leakage ratio is the same for design and part-load flow operation.
Duct-DT or Duct-UA
DUCT-DT accepts a positive value that defines the average temperature rise in the duct when cooled air is delivered under design conditions. If duct-DT is specified, its value is used to calculate the duct conduction heat transfer coefficient, DUCT-UA. duct-UA can also be input directly. DUCT-UA is the overall duct heat transfer coefficient as defined in Eq. (6).
HOT-DUCT-DT or HOT-DUCT-UA
HOT-DUCT-DT and HOT-DUCT-UA apply only to the hot duct in a dual duct system. Single duct systems use DUCT-UA to determine duct conduction losses. HOT-DUCT-DT accepts a negative value that defines the average temperature drop when heated air is delivered under design conditions. The value is used similarly to DUCT-DT to calculate the HOT-DUCT-UA.
SYSTEM Keywords Description Pipe&Duct-Zone Space name that ductwork is in. The space receives the energy
and mass transferred from the duct. It may be an unconditioned space or a plenum
The keywords in Table 11 lead to enhanced modeling capabilities from earlier versions of the DOE-2.1E program. The duct heat transfer calculation is improved and duct air leakage into a plenum or unconditioned zone can now be modeled. The destination of the energy associated with duct conduction losses and air leakage is taken into account. Specifically, the keywords can be used to model duct conduction and air leakage in single-duct systems as follows.
DUCT HEAT TRANSFER. The overall duct heat transfer coefficient can be input directly as DUCT-UA or determined from the DUCT-DT value for design conditions. Since the heat transfer coefficient is used in DOE 2.1E v. 110 and higher, the temperature change of the supply air is no longer fixed for every hour of the year. Instead, the heat transfer rate is explicitly calculated from the DUCT-UA and the temperature difference between the supply air and the PIPE&DUCT-ZONE. The temperature rise of the supply air is dependent on the duct heat transfer rate and the supply airflow rate. Thus, while the DUCT-UA is constant, the supply air temperature rise will be different for different part-load flows. In addition, for a given flow (assuming a fixed supply air set point temperature after the cooling coil), the supply air temperature rise may differ as a result of temperature variations in the ducted space (the PIPE&DUCT-ZONE). The duct heat transfer rate and duct air temperature increase (or decrease) will vary according to the actual temperature potential driving the heat transfer process. The amount of heat transferred from the duct is taken into account in the energy balance for the DUCT&PIPE-ZONE specified. For a CAV system, the design flow is increased to account for a higher supply air temperature resulting from conduction occurring under design conditions. For the VAV system, the flow rate of air that is delivered to the zone is dependent on the supply air temperature and the zone load. The supply air temperature into the zone box is equal to the supply-air-temperature set point plus the conduction delta-T. Thus, if the supply air set point is 55F and the heat added from duct conduction accounts for an increase in 2 F, the air going into the zone box is 57 F. To meet the same

88
zone load with a higher temperature air stream requires greater airflow. For this case as described, the VAV flow is increased to meet the load in DOE-2.
DUCT AIR LEAKAGE. In DOE 2.1E, the supply-duct air-leakage ratio is fixed for design and off-design flow conditions. The fraction is specified with the keyword DUCT-AIR-LOSS. DOE 2.1E versions 110 and higher allow leakage to be modeled to an unconditioned space or plenum. If a plenum is specified as the DUCT&PIPE-ZONE, the mass and energy transferred from the duct due to air leakage is accounted for in the plenum energy balance. Through the energy balance, the leakage (and conduction) affect the temperature of the plenum. Thus, the heating and cooling loads of conditioned zones adjacent to the plenum may also be affected. These secondary effects on loads can be accounted for in DOE 2.1E. With a plenum serving as the DUCT&PIPE-ZONE, the type of return can also affect system performance. If an open-plenum-return is modeled, the leaked air is recycled to the heating, ventilation, and air-conditioning system (HVAC) system. If a ducted return is modeled, the leaked air is not recycled to the system. Modeling a ducted return is similar to modeling leakage to an un-conditioned space. For a CAV system, the design flow is increased to account for a higher supply air temperature resulting from conduction occurring under design conditions. For a VAV system, the design flow is also increased to account for a higher supply air temperature. For off-design flow, the flow is increased to meet zone loads with higher temperature air. This results in increased fan energy use.
The only difference between a ducted return and a open-plenum return is that the return air has different characteristics. There is no difference on the supply-side. For a ducted return, the return airflow and temperature is the same as that for a system without leaks. It is like modeling leakage to an unconditioned space. For an open-plenum return, the plenum energy balance accounts for leaked air (which is returned to the system) and duct conduction. The plenum energy balance results in an increase in the return air flowrate and a decrease in the return-air temperature.
In summary for DOE-2.1E versions 110 and higher, supply-duct conduction is modeled using a duct heat transfer coefficient. The coefficient value is fixed for all simulation hours. This means that the supply-air temperature rise varies between design and part-load flow conditions. The supply-duct air leakage rate is specified as a fixed fraction for design and off-design fan flow. The ducts may be modeled in an unconditioned or plenum space. For a plenum space, the mass and energy transferred from the supply ducts is accounted for in the plenum energy balance. With ducts located in a plenum, the return can be modeled as an open-plenum or ducted return. With an open-plenum return, the leaked air is returned to the system. With a ducted return, the leaked air does not return to the system. For more technical details on modeling duct conduction and air leakage in DOE-2.1E versions 110 and higher, see the updated section of the DOE-2 manual that introduces these new program capabilities (Hirsch 1996).
2.3.2.2 Modeling limitations
The duct-loss algorithms in DOE2.1E version 130 were tested as part of the research conducted for this report. Although the duct loss algorithms for DOE-2.1E versions 110

89
and higher are more sophisticated than earlier versions, the testing revealed distribution system sizing problems related to modeling duct air leakage in the 2.1E program. Since then, 2.1E version 131 has been released, which is supposed to have the duct-loss-related program bugs fixed.
Although versions 110 and higher have the latest duct loss modeling capabilities, there exist limitations on modeling all types of loss configurations with the program. The basic limitations of DOE 2.1E’s modeling capabilities are described below. A more detailed account of the program’s modeling limitations and algorithm inaccuracies based on commercial building simulation results are presented in Section 2.4.
The duct air leakage rate is modeled as a fixed fraction for all flow rates. This is a rough assumption for CAV systems and an inaccurate assumption for VAV systems. This may not be the case in actual systems. Duct air leakage rate is dependent on the location of the leaks relative to the VAV boxes, the duct-system operating pressure, and the fan flow control method.
The impact that leaks have on fan power in DOE-2 is also based on simplifying assumptions. Since the fan power part-load-ratio quadratic expression is the same for modeling leaks or no-leaks, the model effectively assumes that all leaks occur at the end of the duct run.
In commercial buildings, the controls of the supply-air fan and the return-air fan are often linked in VAV systems or initially calibrated in CAV systems to prevent building pressurization. For distribution systems with leaks, this can actually result in the system depressurizing the building. For example if a system has many leaks on the supply side of the system with air lost to the plenum, the supply flow rate to the zones will be less than the return flow rate from the zones. This will cause the building to be depressurized and will result in an increase in the infiltration rate to the conditioned zones of the building. This phenomenon is not explicitly modeled in DOE-2.
The imbalance between supply air and return air flow due to duct air leakage necessitates that make-up air be provided to the supply fan. In actual buildings, the make-up air may be relatively warm if it is pulled from a plenum outside the conditioned building space. In DOE-2, the impact this has on the cooling coil load can not be accounted for with a ducted return since the make-up air comes from the outdoors.
Duct conduction and leakage is modeled for the supply-air ducts only. Keywords to model duct loss of the return-air stream are not available.
The total duct heat transfer coefficient is fixed for each hour of the simulation. Based on empirical relationships for calculating the duct convection resistance, the heat transfer coefficient may actually vary. The convection components of the heat transfer coefficients are dependent on distribution system airflow rate and the internal-external air-temperature difference.

90
The radiant component of the duct thermal losses is not currently being accounted for. For ductwork located in an unconditioned space such as an attic, the effect of radiation may be significant (Hirsch 1996).
In the duct heat transfer calculation in DOE 2.1E, the duct air temperature is based on the average supply-air temperature. In actual systems, the temperature of the duct will vary along its length. Thus, the heat transfer rate is more accurately determined using a log-mean temperature difference value or a method akin to those developed for heat exchanger analysis. In DOE 2.2, the heat exchanger analysis approach is used. In DOE 2.1E, it is not.
With respect to system coil loads, all duct air leakage occurs after the central coils and before the reheat coils. In actual buildings, reheat energy may be impacted by duct air leakage downstream of the zone boxes and coils.
The lost energy and mass from the supply duct is accounted for in a single building space. In actual commercial buildings, duct loss may occur in several spaces such as an equipment room and a return-air plenum, or in an unconditioned ceiling plenum for the top story and conditioned ceiling plenums for the lower stories. The duct loss to a zone is not necessarily assigned to the zone the air is being delivered to. For each system, supply duct air leakage and conduction energy is accounted for in an energy balance for “one” space. For example, it can leak to Plenum-A. It can not leak to Plenum-A and Plenum-B.
Ductwork can not be modeled in an appropriate manner for a conditioned building space.
2.3.3 DOE-2.1E duct air leakage modeling guidelines
While the basic keywords related to modeling duct air leakage are outlined in section 2.3.2, there are other DOE-2 keywords that should be noted to ensure proper and consistent modeling of duct heat transfer and air leakage. In general, when applying the keywords to non-residential compliance, the values of the keywords below should be the same for the proposed and standard building in the DOE-2 model. If performance credit is desired for properly sizing equipment after sealing leaks, the values will differ between the proposed and standard building in the evaluation. For example for sealing and resizing, the keywords describing duct air leakage rate, supply-air design flow-rate, and supply-fan power at design conditions will have different values for the proposed and standard building models.
2.3.3.1 Additional keywords that impact duct performance modeling
The duct-loss related keywords in Table 12 and Table 13 are part of the system simulation subprogram in DOE-2.1E. In Table 4.1, the listed keywords are contained under ZONE commands. In Table 4.2, the listed keywords are contained under SYSTEM commands. The tables are organized by the command name under which the keyword is contained. The implications column states the role the keyword plays on duct conduction and leakage modeling in the program.

91
2.3.3.2 Modeling options
The keywords listed in Table 11, Table 12 and Table 13 permit several possibilities for modeling duct heat transfer and air leakage in DOE-2. Several basic modeling strategies are outlined below.
In general, the building space that “receives” the duct heat transfer and leakage air is specified with the PIPE&DUCT-ZONE keyword. Typically, this is a plenum or it may also be an unconditioned space. If the plenum or unconditioned space is adjacent to conditioned zones, the zone loads must be determined by specifying SIZING-OPTION = ADJUST-LOADS for the conditioned spaces under the ZONE command. In doing so, the zone will have its load calculations adjusted for changes in the plenum or unconditioned space temperature.
If the building has a plenum, the location of the insulation in the plenum space can significantly impact building system energy use. Specifically for the top story of a building, insulation located at the ceiling effectively places the ducts outside the conditioned space while insulation located at the roof places the ducts inside the conditioned space. Similarly, the air-tightness of the roof deck relative to the ceiling can also affect the thermal location of the ducts. Table 12. ZONE Command Keywords that Impact Duct Loss Analysis.
ZONE-AIR Command Description Implications ASSIGNED-CFM or CFM/SQFT
Design supply-air flow rate to the zone. If omitted, the program calculates value based on peak loads determined from the LOADS program.
The sum of the zone flow rates plus the duct air leakage rate equals the system SUPPLY-CFM, which is the fan flow rate.
OUTSIDE-AIR-CFM or OA-CFM/PER or OA-CHANGES
Outdoor air ventilation rate when fans are operating, specified at the zone level.
If fans are resized when leaky ducts are fixed, the outdoor-air flow rate may decrease if the outdoor-air, inlet-aperture area is fixed.
ZONE Command Description Implications SIZING-OPTION Specifying ADJUST-LOADS
causes the program to correct the LOADS program calculations to adjust the zone load to account for temperature fluctuations in adjacent unconditioned zones. Default is FROM-LOADS
Specifying ADJUST-LOADS is required for analyzing duct air leakage when the PIPE&DUCT-ZONE is adjacent to conditioned zones, which is almost always the case.
2.3.3.2.1 OPEN PLENUM RETURN
When a ZONE-TYPE = PLENUM is specified, the return air path defaults to an open plenum return. In an open plenum return, the return is not ducted and the zone air returns to the HVAC system via the plenum. When modeling duct loss from supply ducts located in the plenum, the keyword PIPE&DUCT-ZONE should be set to the name of the plenum

92
zone. In doing so, energy from supply-duct conduction-losses and air leakage impact the energy balance of the plenum and the plenum space temperature.
With an open plenum return, air leaked and energy lost from the ducts are recycled to the return air stream and back to the HVAC system. The recycle lessens the impact of supply duct heat transfer and air leakage on system coil loads.
2.3.3.2.2 DUCTED RETURN THROUGH PLENUM
Commercial building ducts often run through plenums that are not open-plenum returns. If the supply and return are ducted and the ducts are located in a plenum, a different modeling strategy is required than the one outlined above. For the case of a ducted return through a plenum, the plenum space should not be modeled as a ZONE-TYPE = PLENUM. Instead, it should be modeled as a ZONE-TYPE = UNCONDITIONED. Modeling the plenum as an unconditioned space allows the user to specify the RETURN-AIR-PATH keyword to be DUCT without its value being overwritten.

93
Table 13. Command Keywords that Impact Duct Loss Analysis.
SYSTEM-CONTROL Command
Description Implications
COOL-SET-T The control set-point for cooling when COOL-CONTROL=CONSTANT. It is the supply air temperature out of the air handler. It includes any added heat from the fan.
If not specified, it will default to the MIN-SUPPLY-T value corrected for duct thermal loss. Thus, do not specify its value when simulating duct loss.
MIN-SUPPLY-T Supply air temperature entering the zones under design conditions. General default is 55ºF (system dependent).
User must put in a reasonable value if duct thermal losses are modeled. It is used to determine DUCT-UA when DUCT-DT is specified. It equals COOL-SET-T plus DUCT-DT. It is not used in any hourly simulation calculation.
SYSTEM-AIR Command Description Implications MIN-OUTSIDE-AIR Outdoor air ventilation rate
when fans are operating, specified at the system level. Value expressed as fraction of SUPPLY-CFM.
If fans are resized when leaky ducts are fixed, the outdoor air fraction may change. If the outdoor-air inlet aperture area is fixed, the fraction won’t change. Any change in outdoor air fraction should be accounted for by adjusting this value.
SUPPLY-CFM Design capacity of the supply air fan. Entry is normally omitted. Value is determined from zone flows at design conditions.
Input actual value for existing buildings. Program proportions user-input values of zone flows if also specified.
SYSTEM-FANS Command Description Implications SUPPLY-KW Fan power at design in units of
kW/CFM. Default value dependent on system type.
Specify actual fan design kW/CFM if desired.
SUPPLY-DELTA-T Temperature rise in the air stream due to fan inefficiencies. Default value based on system type. Alternatively, if fan efficiency and fan static-pressure keyword values are specified, temperature rise is calculated from the two values.
If fan is resized after leaks are sealed and SUPPLY-KW and fan efficiency remains the same, the temperature increase will also remain the same. Otherwise, user may want to specify the value.

94
Table 13 (continued) SYSTEM Command Keywords that Impact Duct Loss Analysis
SYSTEM-FANS Command (continued)
Description Implications
FAN-CONTROL Keyword value may be CYCLING, CONSTANT-AIR-VOLUME, SPEED, INLET, DISCHARGE, or TWO-SPEED. Selects the fan part-load-ratio power curve.
For a given control type, program uses the same fan power-flow relationship for systems with or without leakage. This effectively assumes that all leaks occur at the end of the duct run. To adjust fan performance for leakage, new fan power curves must be developed and defined in DOE-2.
INDOOR-FAN-MODE Keyword value may be set to CONTINUOUS or INTERMITTENT. Intermittent operation available for RESYS and PSZ systems only.
To model cycling supply fan operation, set INDOOR-FAN-MODE to INTERMITTENT and FAN-CONTROL to CYCLING.
SYSTEM Command Description Implications RETURN-AIR-PATH Keyword value may be
DIRECT, DUCT, or PLENUM-ZONES. If a zone-type PLENUM is modeled, RETURN-AIR-PATH defaults to PLENUM-ZONES.
With leaky ducts, the type of return air path strongly affects HVAC energy use. Specifying keyword value as PLENUM-ZONES causes leaked air to return to system else air is lost to unconditioned space.
COOLING-CAPACITY or HEATING-CAPACITY
Central cooling coil or central heating coil capacity in Btu/hour.
The coil capacity should be the same for systems with or without duct loss unless equipment is resized.
% Hours Zones Outside of Throttling Range
Output value provided in BEPS report - Value can become large for undersized systems with duct air leakage.
With a ducted return, the air leaking from the supply ducts does not return to the space-conditioning system. Therefore, the duct air leakage not only has a stronger impact on fan energy consumption but also a stronger impact on HVAC system cooling and heating coil loads, which should increase loads in some zones and decrease loads in others, even more so than is the case for plenum returns.
2.3.3.2.3 INTERMITTENT FAN OPERATION
An undocumented feature of DOE-2.1E is its ability to model intermittent indoor-fan operation. This type of operation is common in residential and small commercial systems. With intermittent fan operation, the distribution system fan (or fans) cycles on when the controlling zone temperature is outside the set point throttling range. When the zone set point is achieved, the fan cycles off. It should be noted that while this type of system is found in small buildings, it does not maintain a continuous fresh air supply to the occupants.

95
Intermittent, indoor-side fan operation (as opposed to outside, compressor fan) can be modeled for two systems in DOE-2: the residential system (RESYS) and the packaged single zone (PSZ). To model intermittent operation, two keywords must be set appropriately under the SYSTEM-FANS command. The keyword FAN-CONTROL must equal CYCLING and the keyword INDOOR-FAN-MODE must equal INTERMITTENT. FAN-CONTROL simply selects the proper part-load-ratio fan performance curve. INDOOR-FAN-MODE actually sets the system controls for intermittent operation.
2.3.3.2.4 OUTSIDE AIR VENTILATION
Another consideration in the accurate modeling of the impacts of duct air leakage is outside air ventilation rate. There are several methods of specifying building fresh air requirements in DOE 2.1E. One method uses the keywords in the ZONE-AIR command in the Systems subprogram. The other method uses the keywords in the SYSTEM-AIR command in the Systems subprogram.
Using the outside-air keywords under the ZONE-AIR command allows a fixed volumetric flow rate of outside air entering the zone to be specified. The outdoor airflow rate does not change even if the supply-fan flow rate changes. Specifying outdoor airflow rates using the zone keywords ensures that specific ventilation rates established by building codes and standards are met. Yet assuming that these rates are met may not necessarily be true for actual buildings. Unless carbon dioxide (CO2) sensors or other sophisticated controls are used to control the outdoor airflow, it is more typical that the outdoor airflow rate is a fixed fraction of the supply-fan flow rate.
More realistic modeling of typical building behavior may be achieved by specifying the fraction of outdoor air under the SYSTEM-AIR command (versus flow rate under the ZONE-AIR command). The keyword MIN-OUTSIDE-AIR contained in the SYSTEM-AIR command is the outdoor airflow rate expressed as a decimal fraction of the supply-fan airflow rate. A fixed fraction of outdoor air is supplied to an actual building when there is a fixed outdoor-air aperture area at the air-handling-unit inlet.
In general, for a system with leaks, the supply-fan flow rate will be greater than that for the system operating without leaks. For an air-handling unit with a fixed aperture at the outdoor-air inlet, the outdoor-air fraction will be the same whether the system operates with or without leaks. In order to achieve the same absolute outdoor-air flow rate after a leaky system is sealed and its flow rate reduced, the outdoor-air aperture area must be widened. If a CO2 sensor or other device is used to control outdoor-air flow rate, the outdoor air fraction may increase when leaks are sealed. To accurately assess the impact of fixing leaky ducts, knowledge of the method and changes made to the outdoor-air control must be known.
2.3.3.2.5 EQUIPMENT SIZING
Once a leaky system is sealed, additional performance improvements can be achieved by replacing the original or base-case HVAC equipment with properly sized equipment. In general, larger equipment sizes are required with leaky systems, because fan flow rates

96
are higher and coil loads are greater. To evaluate the benefit of equipment resizing in compliance analysis, the proposed building performance is compared against the standard building performance. The standard building is the base case. It should be defined as having a typical leakage level. Its system equipment size is specified based on the loads associated with the building and the duct air leakage level. To take credit for resizing equipment after sealing leaks in the proposed building, it should be modeled with a reduced leakage level and smaller equipment. To model these changes in DOE-2.1E, several keyword values will differ between the standard building run and the proposed building run. The SYSTEM keywords affected by fan and coil resizing are fan SUPPLY-CFM, coil COOLING-CAPACITY, and coil HEATING-CAPACITY. If the plant equipment is also being resized, the keyword value for SIZE needs to be modified as well. Other SYSTEM keywords that may be affected by equipment resizing include: fan SUPPLY-KW, fan SUPPLY-DELTA-T, and system MIN-OUTSIDE-AIR.
Duct air leakage can have a larger impact on performance than one might expect. Therefore, it is recommended that all compliance evaluation tools confirm that zone and plant loads are met in both the standard and proposed building simulation runs. If the specified sizes of fan, coil, or plant equipment are insufficient, loads will not be met and zone temperatures will fall outside the comfort range. The Building Energy Performance Summary (BEPS) is a DOE-2 output report. In the BEPS report, the percent of hours outside the throttling range is stated. By checking this report, it can be confirmed that zone loads are being met.
2.3.3.3 Upward compatibility
The DOE-2.1E keywords directly related to duct performance and listed in Table 11 are the same keywords used to model duct performance in DOE 2.2. Thus, with respect to duct performance modeling, the DOE 2.1E program is upwardly compatible with DOE 2.2. Therefore, it should be a straight-forward matter to update the duct modeling components of compliance tools from DOE 2.1E to DOE 2.2. Of course, upgrading existing compliance tools to DOE 2.2 would require modifying the model input file to account for other simulation program version updates.
Although the duct performance keywords are the same in DOE 2.1E and 2.2, the algorithms used in the modeling are not. For instance in DOE 2.2, the duct conduction calculations are improved and are based on a heat exchanger model. Therefore, updating to the 2.2 program should result in some improvement in duct modeling.
2.4 Results
In general, light commercial buildings are envelope-dominated, while large commercial buildings are internal-gain dominated. As a result, small building loads fluctuate more with outdoor temperatures than large building loads do. Due to high internal gains, large commercial buildings tend to have cooling loads throughout the year, particularly in interior zones. To accommodate these differences in building loads, some distribution systems are more appropriate for smaller buildings than for larger buildings. Differences between systems impact how duct air leakage and conduction loss affect system energy

97
consumption. In this subsection, the impacts of duct performance in light commercial buildings are discussed. Limited analyses have been published describing the impacts of duct performance in large commercial buildings. One such study found that sealing duct leaks in a large office building with VAV, air-distribution systems decreased total HVAC energy consumption by 14% and reduced fan energy consumption by 55% (Franconi et al. 1998). The results are based on field measurements of system leakage area and observed duct characteristics. The field values were used to determine leakage rate under design conditions. An approximate duct air leakage model for VAV systems incorporated into the TRANSYS simulation program were used to calculate the impact of leakage on performance. A comparison between large-building results obtained with DOE-2 and with the TRANSYS model used in the Franconi study was initiated during this project, but was not completed, as it was beyond the scope of this project. Future work should pick up where that work left off.
In this study, the capabilities and limitations of the DOE 2.1E version 131 computer simulation program were explored by modeling two types of system operation in a light commercial building. The distribution system modeled was a constant-air-volume, single-zone device. For one type of operation, the system fan cycled. A CAV system with intermittent fan operation is similar to the type systems that serve residential buildings. For the other type of operation, the system fan operated continuously. This type of operation is typical for medium and large commercial buildings. Comparing the two types of system operation demonstrates the differences in their modeling concerns and duct performance impacts.
2.4.1 Light commercial building analysis
The DOE 2.1E program (version 131) was used to evaluate the simulation tool’s estimation of the impacts of duct air leakage on HVAC performance in a light commercial building. The building modeled was a single-story, 4500 ft2 office building located in Sacramento. The distribution system was a single-zone CAV system with a ducted return through the ceiling plenum. The building had R-11 insulation located above the ceiling in the plenum space. The roof was uninsulated. The basic building simulation model was developed from a DOE-2 building prototype developed by LBNL (Huang and Franconi 1996, Huang et al. 1990). The prototype model is based on typical construction materials, insulation levels, operating schedules, and occupant density determined from Commercial Building Energy and Consumption Survey data compiled by the Energy Information Agency (EIA) (EIA 1995).
The heating, cooling, and ventilation system was a packaged, single-zone unit. It does not have an economizer cycle. For cooling, the unit uses a direct-expansion coil. Heating is by natural-gas combustion. The supply-air fan is constant volume. Two types of fan operation were modeled, intermittent (cycling) and continuous. For intermittent operation, the supply fan operates only when the zone demands heating or cooling to maintain the thermostat set point. For continuous fan operation, the fan continually supplies conditioned air to the zone. The valves controlling the central heating and cooling coils open and close as needed to maintain the zone temperature within the throttling range.

98
The ducted supply and ducted return air streams are located in a plenum space. Since the return is ducted, energy from supply duct air leakage is not returned to the system. For leaky systems with a ducted return, the DOE-2 model assumes that all make-up air is supplied from the outdoors.
The simulation analysis includes typical and no leakage cases. The typical leakage rate is set at 26 percent of the supply-air flow rate. This represents the average leakage rate found in field studies of duct air leakage in light commercial buildings (Cummings 1998, Delp et al. 1998a, and Delp et al. 1998b). In the simulation evaluation, no duct conduction losses are modeled. For both leakage cases, the outdoor-air flow rate is fixed.
The DOE-2 simulation results for the small office located in Sacramento, CA are presented in Table 14 and Table 15. Table 14 presents sizing and annual performance data for the building with and without duct air leakage (26% vs. 0%). The table also shows results for a third case (0% resize) in which the leaks are sealed and the supply fan is resized to deliver air at the building design flow rate. For the three cases, the heating and cooling equipment and coil capacities are the same. Note that changing the flow rate without changing the cooling capacity should change the temperature of the supply air. Table 14. DOE-2 Duct air leakage modeling results for a small office in Sacramento.*
Fan Control Intermittent Fan Operation Continuous Fan OperationLeakage Case 26% 0% 0% Resize 26% 0% 0% ResizeCooling Capacity (kBtu/hr) 95 95 95 95 95 95Heating Capacity (kBtu/hr) -155 -155 -155 -155 -155 -155Supply Flowrate (CFM) 3450 3450 2553 3450 3450 2553Zones Flowrate (CFM) 2553 3450 2553 2553 3450 2553HVAC Peak Electric (KW) 16.4 13.4 13.9 16.4 14.8 14.1Heating Gas (Mbtu/year) 34 26.4 26.4 56.6 22.6 24.8Cooling Electric (Mbtu/year) 35.4 26.8 28.3 35.1 31.4 29.6Fans Electric (Mbtu/year) 9.3 6.9 6.7 28.3 28.4 21.0Zone Loads Not Met % hours 0.8 0 0 0.9 0 0Plant Loads Not Met % hours 0 0 0 0 0 0 Table 15. DOE-2 Duct air leakage modeling performance.*
Fan Control Intermittent Fan Operation Continuous Fan OperationLeakage Case 26% 0% 0% Resize 26% 0% 0% ResizeHVAC Peak Electric 1.23 1.00 1.04 1.11 1.00 0.95Heating Gas 1.29 1.00 1.00 2.50 1.00 1.10Cooling Electric 1.32 1.00 1.06 1.12 1.00 0.94Fan Electric 1.35 1.00 0.97 1.00 1.00 0.74 *Run results are for a one-story, 4500 square foot office building with a packaged, single-zone, HVAC system. The system has a ducted supply and return through a plenum space. Ceiling insulation equals R-11 and the roof is uninsulated. Supply air leakage rates are 26% and 0%. No-leakage-with-resize has supply fan flow equal to design zone-air-flow rate. The building, outdoor-air, ventilation rate is fixed for all runs. For runs with leaks, make-up air is supplied from the outdoors. The system does not have an economizer cycle.
In the simulation runs for the 26% and 0% leakage cases, the supply fan flow rate is 3450 CFM. With 26% leakage, only 2553 CFM is delivered to the zone. With sealed leaks, the

99
fan becomes oversized, as 3450 CFM is delivered to the zone when only 2553 CFM are required during peak cooling conditions. For the sealed-leaks fan-resize case, the fan and zone flow rates are equal at 2553 CFM.
The simulation analysis gives surprising results though the trends make more sense once the simulation assumptions are understood. Nevertheless, the trends are not all consistent with those expected in actual buildings. The simulation findings are discussed in detail below.
2.4.2 DOE-2.1E performance predictions
Overall, the energy use of the system with intermittent fan operation is less than the system with continuous fan operation. For CAV systems with continuous fan operation, the fan energy use approaches the cooling electric use. For CAV systems with intermittent fan operation, the fan energy is approximately 25% of the cooling electric. While the CAV system that operates with fan cycling has energy benefits, the system does not supply fresh, outdoor air to the building continuously.
Table 15 presents performance data for the three leakage cases relative to the fixed-leaks case. The data include the peak system electric (direct-expansion, air conditioning and fan electricity), annual gas consumption, annual cooling electric, and annual fan electric. The results from the simulation runs show very different trends for the different leakage cases for a CAV system with cycling fan verses continuous fan operation. These results are discussed for each type of fan operation below.
2.4.2.1 Intermittent fan operation
For intermittent fan operation, the results in Table 14 and Table 15 indicate that 26% supply duct air leakage causes a 23% increase in peak demand. The energy consumption of each of the system components is also increased by duct air leakage, ranging from 29 to 35% for heating, cooling, and fans. Although these simulation results seem reasonable, there are several inconsistencies worth noting. First, it is not clear why the peak savings is smaller than the average cooling savings, as most residential-system simulations and field data indicate significantly larger impacts at peak. Some of this difference can be explained by the lack of conduction losses and return leakage in the commercial building simulations, however it does seem that makeup air should be hotter under cooling design conditions.
Another inconsistency is that according to the simulation model, resizing the fan after sealing leaks with intermittent operation does not produce significant fan energy savings. In the model, hourly fan energy is determined from the design fan power and the on-time part-load-ratio (PLR). The model assumes the design fan power is proportional to the system design flow rate. The PLR for cycling is determined from the ratio of the zone load for the hour and the maximum cooling extraction rate (ERMAX) for the hour. The ERMAX is the amount of cooling that would be delivered to the zone with the cooling coil and fan operating continuously for the hour. The fan energy is the product of the PLR and the design fan power. Thus, if the fan is 30% oversized, the design power will be 1.3

100
times that of the properly sized system. For the oversized system, ERMAX will also be 1.3 times greater. This increase in cooling extraction rate reduces the fan on-time during the hour. This results in the fan energy for the over-sized fan being nearly equal to that of the properly-sized fan. This is why the simulation does not show much of an energy benefit for resizing the fan with intermittent operation. The problem seems to be that ERMAX should not be 1.3 times greater when the fan is 30% larger, as the capacity of the cooling equipment was not changed. Apparently there needs to be some consistency check to assure that all of the various keywords describing system operation do not create a logically inconsistent over-specification of the system.
The simulation model also predicts a small increase in annual cooling energy when resizing the fan after sealing leaks with intermittent fan operation. This counter-intuitive finding apparently results from the resized system having lower supply airflow delivered at a cooler air temperature. To remove the same amount of energy from a zone, one can use a higher flow rate with a higher supply temperature or a lower flow rate and a lower supply temperature. A higher flow rate should result in greater fan energy use and therefore more heat generation. A lower supply temperature should result in lower compressor efficiencies and higher air-conditioning energy use. In theory, this result demonstrates the performance trade-off between fan energy and cooling energy in air systems, however we could not determine whether DOE-2.1E properly accounts for these two physical phenomena. In addition, if the ducts had conduction losses, which actual ducts all do, the conduction losses would also be impacted by airflow rate. In that case, the tradeoff is between residence time in the duct and the temperature drop across the coil.
2.4.2.2 Continuous fan operation
The simulation predicts that the performance impacts of leakage for continuous fan operation differ from those with intermittent fan operation. The results suggest that resizing the fan is necessary to achieve fan energy savings for CAV systems with the fan operating continuously. This makes sense, as the fan energy use is not impacted by thermal losses. After sealing leaks and resizing, the fan energy use decreases by 26% or 3.7 MBtu/year, or 12600 kWh/year. According to Table 14, for continuous fan operation, fan energy use is a large percentage of total HVAC energy use. Therefore, a 26% decrease in annual fan energy consumption is much more significant than the same percentage decrease for fan cycling.
When leaks are sealed with continuous fan operation, substantial heating energy savings are achieved. Heating energy for the leaky system is more than double that of the sealed systems – the difference being about 24 MBtu/year. This is more than the 26% expected due to the increased supply-fan airflow rate reaching the zones. The heating savings is high because the model assumes the make-up air for leaky systems with ducted returns comes from the outdoors. The effect this assumption has on system performance is explained below.
With leaks, 26% of the air leaves the system and is lost. The supply-fan flow rate is greater than the volume of air supplied to the zones and returned to the system. As a

101
result, make-up air must be provided to the supply-air fan. DOE-2 assumes that the make-up air comes from the outdoors. For a system with leaks and continuous fan operation, make-up air will be supplied throughout the hour and not for only a fraction of the hour as it is with cycling. This effect on heating energy use is large. For Sacramento, the building has relatively small zone heating loads and the generally low part-load-fractions required to meet the building heating loads with cycling. With continual fan operation, heating occurs during the remainder of the hour to heat the make-up air (the 26% supply air lost) to the zone temperature. Thus, sealing leaks with continual fan operation results is greater than 26% energy savings for heating.
For cooling, the impact of fixing leaks is less dramatic than heating with continuous fan operation. Because of the assumption that the make-up air is from the outdoors, the cooling energy savings for sealing leaks is less than 26%. The simulation output shows that for many hours of the year, the make-up air decreases the mixed air temperature when there is a cooling load. During these hours, the make-up air functions like an economizer cycle and decreases the cooling coil load. For the other hours when it is hot outside, the cooling coil load increases due to off-cycle fan operation. Overall, the increase in cooling load due to off-cycle leakage is exceeded by the economizer effect, resulting in the annual cooling energy savings being less than 26% when leaks are sealed in Sacramento. For cooling, the leaky system uses 12% and 18% more energy than the sealed system and the sealed/resized system respectively.
In actual buildings, the make-up air will typically come from the plenum, equipment room, or possibly the conditioned space. When the make-up air comes from the plenum space between the roof and ceiling, its temperature is often elevated, which can increase the load on the cooling coil significantly. Due to the simulation assumption that the make-up air comes from the outdoors, the expected trend for cooling energy savings is not shown in the simulations presented.
For the sealed-leaks, resized-fan case, the heating and cooling energy consumption differs from the sealed-leaks case, although the coil loads remain the same. The difference in energy use is due to fan energy losses. For a given fan size, the same amount of fan energy is added to the system whether it is heating or cooling. Since the annual heating and cooling energy consumption differ, the fan energy impacts the percentage savings differently. During hours with a heating load, the decrease in fan size results in less energy being added to the system and higher coil loads. This effect increases the annual heating energy consumption by 10%. During hours with a cooling load, the decrease in fan size results in less energy being added to the system and lower coil loads. This effect decreases the annual cooling energy consumption by 6%.
2.4.3 Summary
The performance trends determined for the light commercial building using DOE 2.1E and presented in Table 14 and Table 15 are inconsistent with the behavior of actual, typical light commercial buildings. The results make sense from a modeling perspective but not from an actual building perspective. In compliance analysis, it is important that compliance be based on actual performance impacts. Therefore, the duct modeling

102
algorithms in DOE-2 may need refining to reflect the true impact duct performance has on commercial buildings before the duct performance aspects of the program can be adopted for use in compliance analysis. The shortcomings in the model, as demonstrated by the light commercial building runs for the CAV system with cycling and continuous fan operation, are summarized below: • DOE-2.1E does not show a benefit to properly sizing the fan when leaks are sealed in
the CAV system with cycling. • For leaky system with a fixed outdoor-air ventilation rate, the cooling energy for
continuous fan operation should typically be higher than that for a cycling fan. DOE-2 does not show this trend, apparently due to the assumption that the make-up air is outdoor air.
• The heating energy savings associated with sealing leaks for continuous fan operation is much greater than expected due to the assumption that the make-up air is outdoor air.
• The cooling energy savings associated with sealing leaks for continuous fan operation is much smaller than expected due to the assumption that the make-up air is outdoor air.
• There is a problem with the way that reducing the fan flow impacts energy use for cycling operation.
• The impact of duct air leakage on peak performance is most likely larger than, rather than smaller than, the energy-use impact.
Evaluating theses run results has revealed some differences between the modeling assumptions used in DOE-2 and the situations typically found in light commercial buildings. Similar evaluations should be performed for other commercial building types, building sizes, and distribution systems so that the appropriateness of the DOE-2 duct performance algorithms can be understood.
2.5 Discussion
Our detailed evaluation of DOE-2.1E has revealed a number of promising strengths, as well as a number of shortcomings associated with its duct performance modeling capabilities, modeling assumptions and calculation algorithms. The major strength of the program is the detailed, integrated analysis of spaces, systems, and plant equipment that capture most effects of supply-duct performance. As the simulation results demonstrate, the impacts of duct performance are not always intuitive. Therefore, using a detailed simulation program that includes energy and mass balances between the distribution system, conditioned spaces, and ambient as well as equipment performance algorithms based on typical HVAC controls, assists in the proper evaluation of duct performance impacts.
However, the DOE-2.1E program does not model all effects associated with duct performance. Some of the shortcomings of the program, as recognized in this report and discussed in section 2.3.2, include: • Duct conduction and leakage cannot be modeled for return ducts

103
• Duct heat loss coefficient does not include radiation effects, the dependence on air stream flow rate, or the dependence on the internal-external air-temperature difference.
• Duct heat transfer rate is not calculated according to a heat exchanger model. • Actual duct air leakage rates are dependent on the location of leaks, duct pressure,
and fan flow control. DOE-2.1E’s assumption of a fixed leakage rate is therefore a simplified case.
• In DOE-2.1E the same fan power, part-load-ratio, quadratic expressions are used with or without leakage. Therefore, the model effectively assumes all leaks occur at the end of the duct run for all system types.
• In actual buildings, supply air duct air leakage may result in building depressurization and increased air infiltration rates. These effects are not explicitly modeled in DOE-2.1E.
In addition, as noted in section 2.4, the duct performance modeling algorithms did not always give the expected energy saving trends. For the light commercial building with a CAV system, the run results reveal the following problems. • Fan resizing did not indicate an energy benefit for intermittent fan operation. • For a ducted return, the make-up air is outside air. This results in higher heating loads
and lower cooling loads than is expected for systems with make-up air supplied from the plenum.
The choices for incorporating the impacts of duct performance into the Title-24, Non-Residential Building Energy Standards include 1) using the DOE-2 program, 2) using an add-on calculation routine along with DOE-2, or 3) using an alternative calculation method or simulation program. Because the DOE-2.1E program is already in integral part of the non-residential standards analysis, it is most practical to use that program to evaluate duct performance impacts. According to Dodd7, incorporating the DOE-2.1E duct modeling capabilities into the two, existing, non-residential, conformance tools is trivial. However, deciding on the criteria for setting parameter and simplifying assumptions to make this alternative a practical compliance alternative may not be trivial.
While incorporating duct modeling capabilities into compliance tools using DOE-2.1E may be straight-forward, the ability of the program to accurately predict duct performance impacts is less clear due to the modeling limitations outlined above. Therefore, it is recommended that the DOE-2.1E program be used to evaluate the impact of duct performance, but that a full assessment of its duct performance modeling assumptions and limitations be undertaken. The assessment is required to identify performance impact inaccuracies, document the shortcomings of the current model, identify strategies for and encourage future modeling improvements. In summary, the recommended strategy for incorporating duct performance impacts into the Title-24, Non-residential Standard for light-commercial (thermally-dominated) buildings is:
7 Based on personal communications during February 1999 with Martyn Dodd of Gabel Dodd/EnergySoft, LLC, Novato, CA .

104
1. Define a standard commercial building base case that includes pertinent duct performance parameters in accordance with the modeling capabilities of DOE 2.1E version 131.
2. Establish the required modeling capabilities for ACMs based on the current capabilities of the DOE 2.1E version 131.
3. Expand the ACM minimum conformance tests to include a duct air leakage and loss test series.
4. Specify the DOE 2.1E version 131 program as the reference program against which ACMs are evaluated.
5. Assess the impacts of duct performance modeling considerations not currently included in the DOE 2.1E program.
6. Encourage the incorporation of new modeling capabilities into DOE-2.1E that have the largest impacts on duct performance evaluation.
7. If timely program changes are not made to the DOE-2.1E program, develop add-on calculation subroutines to improve modeling accuracy.
2.5.1 Issues and implications
A first step towards incorporating duct performance into the non-residential energy standard is to establish the standard commercial-building duct-performance parameters. These performance parameters include duct supply-air leakage-fraction and duct UA-value. If the standard building description includes a typical duct air leakage rate, then proposed buildings will be rewarded for sealing ducts. If the standard building has a reduced leakage level, proposed buildings that are not sealed will be penalized. The decision of what leakage level to assume the standard building description will depend upon the preparedness of the market to handle required duct efficiency improvements, as opposed to optional improvements. The residential standards currently provide for optional improvements, but may have created enough market transformation to make effectively mandatory improvements an option for both residential and light commercial buildings by the next revision of the standards.
2.5.2 Prescriptive compliance
If the standard-building duct performance parameters are established to correspond to typical duct air leakage, determining compliance using the prescriptive approach is straightforward. If the proposed building has a typical duct air leakage level and uninsulated ducts, the building complies with respect to ducts. In other words with nothing done to improve duct performance in the building, it would meet the minimal duct performance level in this case. On the other hand, if the standard building has tighter-than-typical duct air leakage specifications, then compliance would require either performance measurements (i.e., duct air leakage measurements), or increased energy efficiency of other building components.
2.5.3 Performance Compliance
With the standard building defined as having leaky, uninsulated ducts, improving the proposed building duct performance affects compliance only if the performance budget

105
approach is used. As demonstrated by the simulation results, some commercial HVAC system configurations and controls manifest greater savings from sealing leaks than others do. Therefore, guidelines would need to be provided to assist building owners in making duct performance improvement decisions. In some cases, duct sealing performance improvements are only achieved if the fan is resized. Thus, a method for setting the proper equipment size for the standard building with leaks would need to be established. Additionally if leaks are sealed as a compliance conservation measure, standardized testing methods must be adopted for the verification of reduced leakage rates. Leakage rates determined from the tests would be part of the duct performance input data in the performance compliance analysis for the proposed building.
2.5.4 Validating alternative calculation methods
Subsection 5 of the Alternative Calculation Method Approval Manual (CEC 1998) lists series of tests that must be performed on ACMs before they are approved by CEC. The proper modeling of duct performance in ACMs must be evaluated as part of these capability tests. Since the current non-residential compliance tools are rooted in DOE-2.1E, the reference evaluation program, it is not expected that the compliance tools’ results will differ substantially from the reference program results. Of more concern, is that the intricacies of modeling duct air leakage in DOE-2 will lead to modeling errors in both the reference and the ACM analysis. Thus, it is recommended that performance trend for a given building with a variety of systems and configurations be evaluated as part of the tests. In addition to evaluating the trends against the DOE-2 reference program, they should be evaluated against independently derived trends/benchmarks - like those provided in this report.
2.5.5 Large commercial buildings
A key issue that has not been addressed in this report is the ability of DOE2.1E to predict increases in fan power associated with duct air leakage in large fan-power-dominated systems. Earlier research has shown that the impact of duct leaks on fan power in such buildings is very large (Franconi et al. 1998), on the order of 50-60%. Some effort was put into examining the ability of DOE2.1E to reproduce the impact estimates obtained by means of TRANSYS in that study, and earlier “back-of-the-envelope” calculations, and the initial results were not encouraging. However, considering the detailed level of analysis required to understand what is happening with respect to light commercial buildings, it is not surprising that we did not obtain reasonable results for large commercial buildings on the first pass. This is an important issue that will need further detailed analysis.
2.6 Conclusions
The principal conclusion to be drawn based upon our analysis of how to incorporate duct performance into the Title-24 (Non-Residential portion) is that the most pragmatic and likely-to-succeed pathway is through the DOE-2.1E program. The DOE-2.1E program is well entrenched into the Title-24 compliance path, and most importantly, is used to benchmark alternative compliance models, which means that unless the DOE2.1E

106
program gets the correct answer, alternative programs that do get the right answer will not be certified. The DOE 2.1E program already explicitly addresses duct performance. However, based upon our analysis this year, we conclude that a number of modeling assumptions, problems, complexities, and/or ambiguities associated with that program need to be addressed. These include, but are not limited to: 1) a fixed, supply-duct air leakage ratio 2) no treatment of return-duct losses/gains, 3) an apparent over-specification associated with capacities, flows and temperatures, 4) lumping of duct losses into a single zone, and 5) the assumption of outdoor air make-up for all duct air leakage.
Assuming that the technical issues identified in this study can be addressed in a straight-forward manner, incorporating duct modeling capabilities into existing, CEC-approved, non-residential compliance tools is straight-forward from a regulatory perspective. Since the tools available use DOE-2.1E as the calculation engine, they can be modified to use the existing duct performance modeling capabilities offered by the program. While a critical part of that effort, applying the duct modeling guidelines provided in this study, as well as those that we expect will come out of a detailed assessment of both large and small buildings.
2.7 Recommendations
DOE-2.1E duct-performance modeling features include the specification of 1) a fixed, supply-duct air leakage ratio and 2) a supply-duct heat-transfer coefficient. For a constant-air-volume system, assuming a fixed supply duct air leakage ratio provides a rough simplification of actual performance. For variable-air-volume systems, the simplification has even less accuracy. For conduction, modeling a specific heat transfer coefficient is an improvement over earlier program versions that assume a constant supply-air temperature rise (or drop).
DOE-2.1E does include the basic capabilities for modeling duct air leakage and heat loss in supply ducts. Although the sophistication and accuracy of the modeling methods should be improved, it is recommended that the DOE-2 program be used to evaluate duct performance since it plays a fundamental role in California non-residential building compliance analysis.
To prioritize recommendations for DOE-2 modeling improvements, the appropriateness of the program’s modeling assumptions need further assessment. The assessment is required to identify performance impact inaccuracies, document the shortcomings of the current DOE-2 model, and encourage future modeling improvements. The assessment should be based on typical building characterizations determined from field data and detailed duct performance energy models. The research projects described in this report build the foundation for conducting DOE-2 modeling assessments in the future. It is also very important that the assessment address the issue of fan power impacts in large commercial buildings in a manner similar to what was done in this report for small thermally-dominated buildings.
Assuming that the technical issues identified in this study can be addressed in a straight-forward manner, incorporating duct modeling capabilities into existing, CEC-approved,

107
non-residential compliance tools is straight-forward from a regulatory perspective. Since the tools available use DOE-2.1E as the calculation engine, they can tap into the existing duct performance modeling capabilities offered by the program. Applying the duct modeling guidelines provided in this study, and which we expect will come out of a detailed assessment of both large and small buildings, will be a critical part of that effort.
Incorporating duct-modeling capabilities into compliance tools is only one aspect of the changes that need to be made to the non-residential standards. Other issues that must be addressed and resolved before duct performance can be accounted for in Title-24 include: 1) definition of duct condition in the standard building, 2) development of compliance tests for evaluating duct performance based on the Alternative Calculation Method (ACM) Approval Manual (CEC 1998), 3) documentation of the impact of duct efficiency measures in actual buildings, 4) specification and testing of duct air leakage measurement techniques that can be practically applied in this sector, and 5) assurance of consistency between simulated duct performance impacts and actual impacts. The duct air leakage measurement efforts described elsewhere in this report, and the parallel efforts expended previously for the residential standard are important steps towards resolving the fourth issue, however significant challenges remain with respect to leakage measurements in large commercial buildings. More research are needed to improve measurement technologies.
Our recommendation is that the DOE-2.1E program needs further assessment and refinement in order to provide accurate unambiguous treatment of duct-system performance. The assessment is required to identify performance impact inaccuracies, document the shortcomings of the current DOE-2.1E model, and develop modeling improvements. The assessment should be based on typical building characterizations determined from field data and detailed duct performance energy models. The research projects described in this report build the foundation for conducting DOE-2.1E modeling assessments in the future. It is also important that the assessment address the issue of fan power impacts in large commercial buildings in a manner similar to what was done in this report for small thermally-dominated buildings.
In addition, since time-of-use is an important issue in electricity energy peak demand, it’s likely that the future version of Title 24 should include time-of-use energy analyses for the non-residential standards. This creates an additional need to incorporate time-of-use in the DOE 2.1E simulation tool, thereby increasing the demands on DOE-2.1E’s capability to accurately model building and system performance. It is worth noting that our analyses show that duct loss impacts are larger during peak demand periods in light commercial buildings, and that the fractional impacts of duct losses do not change significantly between seasonal and peak-demand periods.
Currently, the impacts of duct performance are considered in the California residential standards, but not in the commercial standards (Non-Residential portion of the Title 24). Much of the reason for this is that research on residential duct performance has been ongoing for the past decade, whereas the data available for duct performance in the commercial sector has been limited. Accounting for duct performance in the Non-Residential portion of Title 24 should encourage the installation of duct-related efficiency

108
measures in new commercial buildings, and is therefore an important goal of this research program.
2.8 Notation Symbol Parameter Units
A area ft2 C proportionality constant equation dependent
CFM flow rate cubic feet per minute FPR fan design power part-load-ratio -
n exponential power - p pressure inches of water column
PLR fan flow part-load-ratio - Q heat transfer rate Btu/hr R resistance hr oF/Btu T temperature oF
UA heat transfer coefficient Btu/hr F

109
3 Aerosol sealing: Laboratory and field testing of an aerosol-based duct sealing technology for large commercial buildings
3.1 Introduction
Air distribution duct systems are frequently used in U.S. residences and commercial buildings to transport conditioned air to the occupied space and/or to provide fresh air. Air leaking in or out of these systems has been identified as a major source of energy loss in U.S. buildings. There exists a substantial body of research on residential air distribution system leakage that includes both detailed field characterizations and energy analyses (Cummings et al. 1990; Davis, 1993; Jump and Modera, 1994; Modera, 1993; Modera and Jump, 1995; Parker, 1993; Proctor et al. 1992; Walker et al. 1998). Published material on these subjects indicate that duct system inefficiencies account for approximately 30% of space conditioning energy use in U.S. residences; these inefficiencies explain the considerable efforts that are being undertaken to retrofit these systems, or to better design and install them.
Despite their potentially large energy implications, very little information is available on the magnitude and impact of air leakage and heat conduction gains in large commercial buildings. In fact, in California, heating and cooling in commercial buildings typically accounts for 18% of their electricity consumption and 42% of their natural gas consumption. This represents roughly 15,600 GWh of the electricity and 24,000 GWh of the gas consumed statewide. It is estimated that an additional 8,600 GWh of electricity is used to operate the fans and pumps (Modera et al. 1999), of which about 6,200 GWh of electricity is used by packaged units and central systems.
Limited field studies conducted at LBNL (Fisk et al. 1998) report ASHRAE leakage classes that range from 60 to 270 in large commercial buildings. These values are generally well above the “unsealed” values of 30 to 48 typically assumed (ASHRAE, 1997). Based on simulations of a variable-air-volume (VAV) system with a leakage class of 137, Franconi et al. (1998) predict an energy-cost increase of 14% and an increase in annual fan energy use of 55% due to duct air leakage. Thus, sealing duct leaks in large-commercial buildings appears to be an effective means for improving the energy efficiency of this sector.
In this report, we investigate the commercial-building potential of an aerosol-based duct sealing technology, which has been developed at LBNL for residential applications (Carrié and Modera, 1998). The technology involves blowing an aerosol through the duct system to seal the leaks from the inside, the principle being that the aerosol particles deposit in the holes and the cracks of the ductwork as they try to escape under pressure. Before the sealant is injected, the registers are blocked, and sensitive components (e.g., the heat exchangers) are isolated from the aerosol sealant. Although this technique has been successfully used in several hundred residences8 and is currently commercialized for 8 Some of the tests are reported in (Modera et al. 1996).

110
this building sector in the U.S. (Aeroseal Inc., Austin, TX), its application to large commercial duct systems poses new challenges. This reports the development of new methods and concepts to overcome these challenges, and their assessment via field trials in two large commercial buildings in California.
3.2 Objectives
One of the objectives is to explore the feasibility of reducing duct air leakage in large commercial building duct systems with an aerosol sealant. This work entails the following objectives: 1) to quantify the losses near the aerosol generator; 2) to evaluate new concepts to improve the sealing rates; 3) to evaluate the ability of the seals to withstand the high pressures encountered in large commercial duct systems; and 4) to conduct field experiments to assess the ability to seal large and long ducts in a reasonable amount of time. This work is part of a broader research program that aims to 1) evaluate the energy implications of duct air leakage and conduction gains in large-commercial duct systems, and 2) develop new technologies to improve the thermal performance of those systems.
3.3 Background
The proof-of-concept of the use of aerosol particles to remotely seal leaks in duct systems from the inside was demonstrated in 1994 by researchers at the Lawrence Berkeley National Laboratory (LBNL) (Carrié and Modera, 1998). The current protocol requires first that all of the registers be blocked and sensitive equipment (e.g. heat exchangers) in the system be isolated. The aerosol is generated and blown into the system through a conveniently-located opening in the duct system, using a single device that incorporates a fan, a heater, and an atomizer. The device is connected to the duct inlet with thin-wall plastic tubing. It is designed to monitor the sealing process, and measures the airtightness of the system before, during, and after aerosol injection. The aerosol is highly concentrated (typically 0.1 to 1 g/m3) and is made of sticky particles whose diameter typically lies between 5 and 30 µm. As the aerosol is forced through the leaks, some particles tend to leave the air stream and collide with the leak walls. As a result, they gradually form a bridge over the crack. This technique has proved to be very efficient at sealing duct leaks in residences (Modera et al. 1996).
There are two major advantages to this technique. First, it is an automated remote sealing process since the particles “automatically” find the leaks in the system. Second, in residences, the technique has proved to be geometry-independent as the particles can travel within the whole system and thus access any leak site.
In large commercial buildings, however, the systems are much larger and much more complex than those in residences are. To seal the large and long ducts in commercial buildings, several challenges are faced, including: 1) higher aerosol-production rates are required; 2) aerosol deposition on the surfaces of long ducts may reduce the efficiency of the sealing process; 3) the aerosol seals must withstand the higher operating pressures of commercial ducts; and 4) new technologies and protocols are required to seal commercial registers and to isolate sensitive equipment from the aerosol flow. In addition, large

111
commercial buildings systems have a large surface area and operate at higher pressures than residential systems or light commercial systems.9 Thus, to attain reasonable leakage-to-fan flow ratios, the leakage classes should be considerably smaller than that desirable in residences or even light commercial buildings.
3.4 Approaches
Evaluating the application of this aerosol-based technology to large-commercial buildings involves overcoming many practical problems. Injected aerosol particles tend to deposit on the duct walls, mainly because of gravitational settling and turbulent diffusion in the system, but also by impingement near the aerosol generator. Therefore, it is necessary a) to develop methods that can ensure sufficient particle transport into the entire system, and b) to quantify the particle losses near the injection location.
Hardware development was undertaken on the injectors to improve the aerosol generation and aerosol delivery processes. Laboratory experiments were designed to a) characterize the fraction of particles removed from the air stream near the injector; b) assess the size distribution of the particles left for sealing a few meters downstream of the injection device; and c) evaluate the bursting pressure of properly sealed leaks.
3.4.1 Hardware developments
3.4.1.1 Multi-point injection
The classic aerosol sealing procedure involves only one main injector (Figure 25). The multi-point injection method developed and tested herein adds extra sources of pre-heated aerosol spray at distances far from the main fan/heater/injector apparatus at the duct’s inlet. This process is intended to accelerate the sealing process by increasing the aerosol mass flux delivered to leaks. For multi-point injection, we designed and had fabricated compact injector units (Figure 26) that deliver about 20 ml min-1 of sealant material.10 The atomizer airflow rate is about 14 L s-1 and is added to the carrying airflow generated by the main injector.
9 Operating pressures upstream of a VAV unit are typically in the range of 400 to 700 Pa. 10 The sealant is a 2:1 volumetric dilution of a water-based vinyl-acetate polymer liquid adhesive (Duct Seal, Puma Technologies, Austin, TX). There are 0.121 g of solid adhesive per mL of sealant.

112
Figure 25. Main injector unit (high-flow fan, heater, liquid pump, and atomizer).
Figure 26. Compact injector unit (heater and atomizer).
3.4.1.2 Atomizers
The atomizer of each injector may be equipped with either a standard vortex nozzle or a modified vortex nozzle. The modified nozzle has been equipped with an extra wheel-shaped fin, or “wheel” (Figure 27). The vortex nozzles use counter-rotating swirls of air generated by the wheels to atomize a liquid stream. An extra wheel was added to the standard vortex nozzle in an attempt to decrease the fraction of injected sealant that deposits on the duct walls.

113
(a)
(b)
Figure 27. Vortex nozzles: (a) standard nozzle with one inlet wheel (bottom of nozzle), and (b) modified nozzle with two inlet wheels (bottom of nozzle).
Figure 28. Face of vortex nozzle. Counter-rotating swirling flows generated by the upper and lower wheels (Figure 27) atomize a liquid stream delivered by the central tube.
3.4.2 Characterization of aerosol injectors
Evaluating the application of this aerosol-based technology to large-commercial buildings requires an accurate understanding of particle deposition processes in duct systems. These are closely linked to the size distribution of the particulate matter injected into the system, which in turn depends on the injection setup being used (e.g., type of atomizer) and the boundary-conditions (e.g., the airflow rate).

114
We have characterized the injection devices being used in this study under varying airflow conditions. Each injector was used to spray an aerosol of sealant particles into a four-meter-long duct of pressurized, thin-walled plastic tubing for a period of one to two hours (Figure 29 and Figure 30). A cascade impactor sampled the aerosol three meters downstream of the injector’s atomizer nozzle to determine the size distribution of the airborne sealant particles (Hinds, 1982). Deposition of sealant on the duct wall due to impingement, turbulence, and gravity was measured by weighing the net deposition per 50-cm-long segment of the first three meters of the duct.
MAIN INJECTOR
3.0 m
HEPAFILTER
MASS FLOWCONTROLLER
VACUUMPUMP
φ = 52 cm
CASCADE IMPACTOR Nozzle φ = 1.3 cm
φ = 25 cm
PUMP
Figure 29. Main injector configuration: aerosol sprayed into 4-m long, 52-cm diameter thin-walled plastic tube, with particle size distribution sampled 3 m from the injection point.
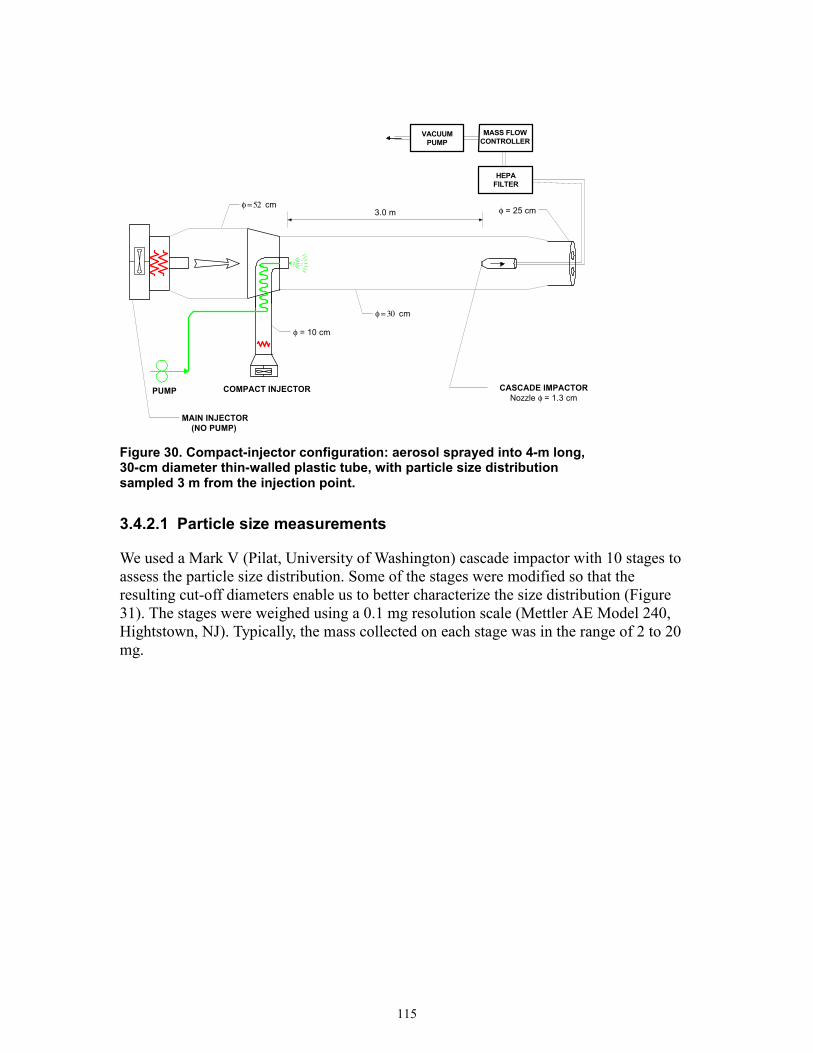
115
CASCADE IMPACTORNozzle φ = 1.3 cm
MAIN INJECTOR (NO PUMP)
PUMP COMPACT INJECTOR
φ = 30 cm
φ = 10 cm
3.0 m
HEPAFILTER
MASS FLOWCONTROLLER
VACUUMPUMP
φ = 52 cmφ = 25 cm
Figure 30. Compact-injector configuration: aerosol sprayed into 4-m long, 30-cm diameter thin-walled plastic tube, with particle size distribution sampled 3 m from the injection point.
3.4.2.1 Particle size measurements
We used a Mark V (Pilat, University of Washington) cascade impactor with 10 stages to assess the particle size distribution. Some of the stages were modified so that the resulting cut-off diameters enable us to better characterize the size distribution (Figure 31). The stages were weighed using a 0.1 mg resolution scale (Mettler AE Model 240, Hightstown, NJ). Typically, the mass collected on each stage was in the range of 2 to 20 mg.

116
Sampling Airflow Rate (L min-1)
0 5 10 15 20
50%
-Effi
cien
cy C
olle
ctio
n D
iam
eter
, d50
(µm
)
0
10
20
30
40
50
60
70
80A: n=1, φ=500 mil B: n=6, φ=228 mil C: n=6, φ=200 mil D: n=6, φ=160 mil E: n=6, φ=130 mil F: n=12, φ=79 mil G: n=90, φ=31 mil H: n=110, φ=20 mil I: n=110, φ=13.5 mil
A
B
C
D
E
F
GHI
Figure 31. Particle-collection cutoff diameters of cascade impactor stages versus sampling airflow rate. The final filter stage (curve not shown) collects all remaining particles.
3.4.2.2 Particle losses near injection location
The sealant deposition per unit length of duct versus distance from the injection point was measured by cutting the first three meters of the coated duct into 50-cm-long segments, weighting each segment, and subtracting out the segment’s uncoated mass. The deposition is expressed as a fraction of the total sealant mass injected into the duct, and the cumulative deposition is plotted versus distance from the injection point.
3.4.3 Creating airflow outlets to increase aerosol penetration
Small openings in the duct system can intentionally be made at points far from the main airflow generator. At low leakage rates, these openings allow a larger airflow in the system and reduce particle removal by gravitational settling. The openings also serve as pressure relief, allowing us to continue the sealing process even after the standard-protocol threshold limit value for the pressure has been attained. With the currently available apparatus, this pressure is set to 500 Pa based on the field experience on the residential systems. Although most large-commercial ductwork systems should be able to withstand larger pressures, we kept the same value as that adopted for the residential systems, because the fan in the current equipment cannot supply adequate flows at higher pressures.
3.4.4 Modeling particle transport and deposition in duct systems
Aerosol duct sealing simulations were intended to provide rough estimates of the sealing time with different injection scenarios (e.g., different fan curves). Particles are removed

117
from the air stream in the ducts by deposition in and leakage through cracks, gravitational settling, turbulent deposition and impaction in singularities (e.g., bends). A model of particle transport and deposition in duct systems has been developed at LBNL to predict the flux of particles in the different branches of the duct system. Turbulent deposition modeling is mainly based on previous work in this area (Liu and Agarwal 1974; Liu and Ilori 1974; Agarwal 1975; Anand and Mc Farland 1989). In its current version, the model ignores deposition in singularities.
Leak deposition modeling is based on the work of Carrié and Modera (1998), and enables us to simulate the sealing process. It should be noted that this model assumes (a) that all the leaks look like an orifice slot oriented perpendicular to the flow; and (b) an arbitrary leak-size and leak-site distribution. Moreover, Carrié and Modera (1998) have shown significant discrepancies between their model predictions and their experimental results at pressure differentials across the leaks that exceed 80 Pa. However, to our knowledge, there exists no other work in this area.
3.4.5 Operating pressure limits of sealant
The bursting pressure of a duct leak sealed with aerosolized glue is the duct air pressure at which the force exerted by the air punctures the glue bridge sealing the leak. The bursting pressures of glue-sealed 3, 6, and 16-mm wide slots were measured in the laboratory.
Fifty-millimeter-long slots of widths 3, 6, and 16 mm were cut in a 26-gauge sheet metal duct cap. The slots were sealed by attaching the cap to the end of a duct system into which aerosolized duct particles were injected for several hours (Figure 33). The sealant color was changed over the course of the sealing process. When the color of sealant being injected did not appear in the glue bridge spanning the slot, the gap was considered sealed.

118
Figure 32. Fifty-millimeter long slots of 3, 6, and 16-mm width sealed with aerosolized glue.
PUMP
φ = 41 cm φ = 25 cm
φ = 25 cm
φ = 25 cm
DAMPER
DUCT CAP WITH SLOTS
INJECTOR
Figure 33. Sealing slots in a duct cap by aerosol injection.
Bursting pressure was measured by increasing the air pressure difference across each sealed slot until the pressure difference suddenly dropped, indicating that the seal had been punctured. The following procedure was followed for each of the three sealed slots.

119
The positive-pressure-side surface of two of the three sealed slots was covered with petroleum jelly, wax paper, and metal tape to leave only one sealed slot exposed to puncture by air pressure. A two-ply plastic sheet was clamped over the open end of the duct cap to form a closed volume (Figure 34). A pump and a mass flow controller were used to inject air at a known rate into the enclosed duct cap, and the difference in air pressure between the system interior and the room—i.e., the pressure across the seal—was measured with an electronic transducer. The flow rate and pressure were recorded by a computer-driven data logger (Figure 35).
Figure 34. Two-ply plastic sheeting clamped over the open end of the duct cap to form a closed volume.

120
AIR PUMPMASS FLOWCONTROLLER
PRESSUREGAUGE
DATA LOGGER COMPUTER
Figure 35. Measuring the bursting pressure of an aerosol-sealed slot.
As the air-injection flow rate was rapidly increased from zero to about 1 L min-1, the system pressure rose to a steady value at which the pressure-driven air losses through small leaks in the system (e.g. imperfections in the duct-cap construction) equaled the injection rate. The air-injection rate was increased in steps of about 1 L min-1, raising the system-pressure, until a leak in the slot’s seal was indicated by a sudden system pressure drop. The presence of a leak through the sealed slot was confirmed by the appearance of a jet through the sealant.
3.4.6 Field testing of aerosol duct sealing
The most common metric used to evaluate the effectiveness of a sealing technique is the Effective Leakage Area (ELA) measured before and after retrofitting. ELA is defined as the cross-sectional area of a perfect nozzle that would produce the same flow as that passing through the leaks at a reference pressure. The reference pressure is usually set to 25 Pa for U.S. duct system characterization. This reference pressure is questionable for commercial buildings, where operating pressures are often considerably higher. Nevertheless, since it remains a common metric to measure and compare duct air leakage in the U.S., the 25 Pa characterization is used in this paper. The ASHRAE leakage classes (based on a 250 Pa characterization) can be derived from the ELA at 25 Pa by inputting a pressure exponent. With the currently available apparatus, ELA is measured with the standard one-point pressurization technique at 25 Pa.
In addition to leakage area measurements, the field testing protocol for the two buildings included the following measurements: • measurement of the particle mass deposited on the thin-wall plastic tubing used to
connect the main injector to the duct inlet; • aerosol concentration measurements at different locations in the system, either by
using impaction plates in system L-5 (as reported by Modera et al. (1998)), or by using gravimetric disposable filters in system L-2;
• velocity measurements at different locations in the system, using a hot-wire anemometer (for system L-2 only).

121
The measurement of aerosol concentration is complicated by the significant fraction of the particles that have high inertia; therefore, isokinetic sampling conditions should be achieved to obtain a representative sample. Sampling probe misalignment and velocity mismatch effects are negligible when the Stokes number (based on the air velocity in the duct) is less than 0.01 and when the ratio of the sampling to the duct air velocity ( UU0 ) satisfies 52.0 0 << UU (Hinds, 1982). Since this is not the case for most particles in our sampling conditions, non-isokinetic sampling can lead to significant errors. Still, aerosol concentration measurements yield valuable information about relative aerosol penetration at various locations in the system, and help explain the sealing rate behavior.

122
3.5 Results
3.5.1 Laboratory characterization of injection devices
The sealing process employs two types of aerosol injectors: a main injector—a high-airflow, high-heat, high-sealant-flow unit connected to the inlet of a duct system with large-diameter plastic tubing; and a compact injector—a very-low-flow, medium-heat, and medium-sealant-flow unit that injects aerosol particles in the middle of a duct system, sealing leaks far downstream of the duct inlet.
Four injector configurations were evaluated: a. main injector with a standard vortex nozzle; b. main injector with a modified vortex nozzle; c. compact injector operated in low duct airflow; and d. compact injector operated in high duct airflow.
Main-injector configurations (a) and (b) were identical except in choice of nozzle, while compact-injector configurations (c) and (d) were identical except in choice of total duct airflow (Table 16).
3.5.1.1 Main injector configurations
The main injector with a modified vortex nozzle yielded about 50% or more deposition on the first three meters of duct wall than did the main injector with a modified vortex nozzle. The standard-nozzle main injector deposited 22 to 24% of the injected sealant on the first three meters of duct wall, mostly within one meter of the injection point. The modified-nozzle main injector deposited 34 to 44% of the injected sealant on the first three meters of the duct wall, also mostly within one meter of the injection point (Figure 37). Little deposition occurred more than two meters downstream of the injector in either configuration.
The modified-nozzle injector also yielded larger particles three meters downstream of the injection point than did the standard-nozzle injector. The downstream mass-median particle diameters of particles generated by the modified and standard vortex nozzles were 14.9 and 8.1 µm, respectively, with geometric standard deviations of 3.2 and 3.1 (Figure 36).
The particles lost in the plastic tubing connecting the aerosol injector to the building’s duct system are not available for sealing the leaks. The wall-deposition results indicate that a main injector equipped with a standard nozzle will deliver approximately 75% of injected sealant to duct inlet, while a main injector with a modified nozzle will deliver only about 60% of the injected sealant to the duct system.

123
3.5.1.2 Compact injector configurations
All aerosol particles produced by the compact injector enter the duct system, but a portion deposit near the injection location, and therefore are not available for sealing the leaks. The results are provided in Table 16 and Figure 38. With the low duct airflow, 47 to 66% of the injected sealant deposited on first three meters of duct wall, mostly within 50 cm of the injection point. With the high duct airflow, 25 to 29% of the injected sealant deposited on the first three meters of the duct wall, mostly within one meter of the injection point. Little deposition occurred more than one meter downstream of the injector in either configuration.
The discrepancies in the results are probably due to slight variations in the alignment of the atomizer. This explanation is consistent with the significant variations in particle deposition by impingement observed within the first meter (Figure 37 and Figure 38). However, this suggests that the nozzle should be aligned very carefully for best results.
The sizes of the particles still airborne 3 m downstream of the compact injector varied with the airflow rate. With the lower airflow rate (38 L s-1), the mass median diameter was 5.5 µm, with a geometric standard deviation of 2.4. With a flow rate of 142 L s-1, the mass median diameter was 17.6 µm, with a geometric standard deviation of 3.4 (Figure 36).

124
Table 16. Operating conditions, particle-size distributions, and wall-depositions of four aerosol-injector configurations (see Figure 29 and Figure 30). Additional data of duct wall deposition measurements only are shown in brackets. Discrepancies in the results seem to be due to atomizer misalignment.
Configuration Main injector, vortex nozzle
Main injector, modified
vortex nozzle
Compact injector, low
airflow
Compact injector, high
airflow Injector main main compact compact Nozzle vortex modified vortex vortex vortex
Liquid sealant flow rate (ml min-1) 20 20 20 20
Duct diameter (cm) 52 52 30 30 Total duct airflow rate (L s-1) 84 84 38 142
Air temperature immediately upstream of injector nozzle ( °C)
[multiple trials]
78 [77] [77]
74 [79] [77]
74 [60]
68 [71]
Mass fraction deposited on duct wall (-) [multiple trials]
22% [24%] [24%]
44% [34%] [35%]
47% [66%]
25% [29%]
Cascade impactor sampling airflow rate (L min-1) 3.0 3.0 4.4 16.3
Mass median particle diameter (µµµµm) 8.1 14.9 5.5 17.6
Mass geometric standard deviation 3.1 3.2 2.4 3.4
Particle Diameter (µm)
2 5 20 501 10 100
Perc
ent S
mal
ler T
han
Indi
cate
d Si
ze (%
)
1
10
30
50
70
90
99Injector Configuration
Main Injector, Medium Airflow,Vortex NozzleMain Injector, Medium Airflow,Vortex NozzleCompact Injector, Vortex Nozzle,Low Airflow Compact Injector, Vortex Nozzle,High Airflow
Figure 36. Particle-size distributions of aerosols generated by two main-injector and two compact-injector configurations, measured three meters downstream of the injection point (see Figure 29 and Figure 30).

125
Distance From Start of Tubing (feet)
0.0 0.5 1.0 1.5 2.0 2.5 3.00
10
20
30
40
50
60
70
80Main Injector, 52-cm φ φ φ φ Duct
Vortex Nozzle (trial A)Vortex Nozzle (trial B)Vortex Nozzle (trial C)Modified Vortex Nozzle (trial A)Modified Vortex Nozzle (trial B)Modified Vortex Nozzle (trial C)
Distance From Injector Nozzle (m)
Cum
ulat
ive
Frac
tion
of In
ject
ed S
olid
Mas
s D
epos
ited
(%)
Figure 37. Deposition of solid sealant on duct wall due to impingement, turbulence, and gravity versus distance from the injection point, shown for two configurations of the main injector (see Figure 29). Discrepancies in the results of multiple trials seem to be due to atomizer misalignment.

126
Distance From Injector Nozzle (m)
Cum
ulat
ive
Frac
tion
of In
ject
ed S
olid
Mas
s D
epos
ited
(%)
0.0 0.5 1.0 1.5 2.0 2.5 3.00
10
20
30
40
50
60
70
80
90
100Compact Injector, 30-cm φ φ φ φ Duct
Low Airflow (trial A)Low Airflow (trial B)High Airflow (trial A)High Airflow (trial B)
Figure 38. Deposition of solid sealant on duct wall due to impingement, turbulence, and gravity versus distance from the injection point, shown for two configurations of the compact injector (see Figure 30). Discrepancies in the results of multiple trials seem to be due to atomizer misalignment.
3.5.2 Operating pressure limits of sealant
The 3-mm-wide seal developed a small puncture at a pressure above 5,600 Pa, which was the highest pressure measurable with the pressure sensor used. The hole was not visible to the unaided eye, but a jet of air could be detected, and the pressure suddenly dropped to 4,100 Pa. The 6-mm-wide seal developed a similar hole at a pressure of 5,200 Pa, and the system pressure rapidly decreased to 2,200 Pa. This hole was also invisible to the unaided eye (Figure 39). The 16-mm-wide slot was never fully spanned by the aerosol-sealing process, even after 6 hours of injection. Hence, its seal always leaked, and it was not possible to raise the system pressure above 660 Pa.
These results indicate that the bursting pressure of a properly-sealed slot leak exceeded 5,000 Pa, which is well above normal operating pressures in commercial building duct systems.

127
Figure 39. Aerosol-sealed 6-mm-wide slot after bursting.
3.5.3 Modeling of particle penetration
Preliminary model runs based on “typical” duct lengths in a large commercial buildings have indicated very significant drops in the aerosol concentration, which induces low sealing rates.
Simulations of a 30-cm diameter, 60-m long duct show that the use of three compact injectors should considerably increase the particle flux (and thus the sealing rate) when the leakage (carrying) airflow is large (Figure 40). However, this result is not as clear when the leakage airflow rates are low, because a large fraction of the sealant mass injected by the compact injectors will fall to the bottom of the duct.

128
3 compact injectors (each 14 L s-1 airflow, 20 mL min-1 liquid flow)Main injector liquid flow rate = 40 mL min-1
ELA of system at 25 Pa = 180 cm2 (Leakage Class = 155)Duct pressure = 188 Pa
0
50
100
150
200
250
300
350
400
450
500
0 10 20 30 40 50 60 70Duct length (m)
Airfl
ow ra
te (L
s-1
)
0
0.01
0.02
0.03
0.04
0.05
0.06
0.07
0.08
0.09
0.1
Flux
(g s
-1)
Airflow rate entering duct section (L/s) Particle flux (g/s)
Figure 40. Simulated particle mass flux in a 30 cm diameter, 60 m long duct when using multi-point injection strategy.
3.5.4 Field testing in two large commercial buildings
Tests were performed on isolated sections of two large-commercial buildings whose characteristics are summarized in Table 17. Schematic representations of the systems’ layouts, along with injection and sample locations, are provided in Figure 41 and Figure 42. The tests were performed in two phases. In building L-5, we started with the “classic” injection procedure (i.e., a main injector delivering the aerosol to the duct system at a single location via a 6-m length of plastic tubing), then continued by adding one compact injector to the main injector. In building L-2, we started with the classic injection procedure, and then created a downstream leak in the duct to help maintain airflow sufficient to transport the particles to the leaks while keeping the pressure in the system below 500 Pa.
Figure 43 shows particle concentration measurements in building L-5. The concentration was considerably increased downstream of the compact injector (location 3) when the injector was turned on. It should be noted that compact injectors do not necessarily increase particle penetration11 in the system. However, they increase the particle flux downstream of their location. 11 Penetration is defined as the ratio of the particle flux at some location to the total particle flux injected.

129
Significant deposition was observed in the lay-flat tubing. In building L-5, 35% of the mass injected was collected in this tubing over the course of the test. In building L-2, a temporary failure of the equipment to properly atomize the liquid sealant yielded significant liquid deposition in the lay-flat tubing, preventing a quantitative analysis of those losses.
The changes in the duct air leakage area are summarized in Table 18, Figure 44, and Figure 45. The ELA at 25 Pa over the course of the experiment was calculated assuming a pressure exponent of 0.6 (12,13). The sealing rate increased considerably when the compact injector was turned on. However, the sealing rate did not decrease when the compact injector was turned off between 6.4 hours and 6.8 hours of elapsed time, probably because the leakage downstream of its location was small compared to that of the rest of the system.
Figure 45 illustrates the ELA versus time in building L-2. The section started with a relatively low initial ELA25 of 45 cm2 and was reduced to about 4 cm2. As expected, adding an opening in the downstream section of the duct at 0.4 hours allowed us to continue the sealing process after the threshold limit value for the pressure (500 Pa, with the present apparatus) was reached. Table 17. Large-commercial duct system characteristics.
12 In system L-5, the pressure was found to be significantly lower in mixing boxes 3 and 4. While the presence of a flow restriction in mixing box 4 can explain the lower pressure in the downstream trunk, it is unclear why a lower pressure was observed downstream of mixing box 3. There may have been an unobserved restriction in that section. In any case, the ELAs reported herein have been corrected for the pressure differences measured by assuming that the ratios between the leakage coefficients of each branch remain constant over the course of the test. This crude assumption can explain the discrepancies between the initial ELA displayed in Figure 44 and the initial ELA reported in Table 18. 13 In Figure 45, the leakage area measurement of the system during the second phase of the test was corrected for the air flowing through the outlet. The calculation of the airflow outlet leakage coefficient was based on the leakage area measurements with the outlet in closed and open conditions. The pressure exponent through the outlet was assumed to be 0.5, while that of the flow through the leaks was assumed to be 0.6.

130
System Age (years) Total floor area (m2)
Floor area served by
sealed section
(m2)
Duct surface area of sealed section
(m2)
Number of diffusers in
sealed section (-)
L-5 9 3,200 140 47 13 L-2 20 2,200 422 64 21
MB5
MB4
MB3
Block
Collectionplate 1
Collectionplate 2
Collectionplate 3
MainAerosolInjector
Compactinjector
MB = Mixing boxterminal unit
Figure 41. Duct layout, main and compact injector installation, and aerosol sampling locations in building L-5.

131
filter 14.5 mfilter 2
13 m
filter 3Block
Exaust to outside
AHU
MainAerosolInjector
12 m 14 m 18 m
Figure 42. Duct layout, main injector installation, and aerosol sampling locations in building L-2.

132
Table 18. Leakage area before and after field trials of aerosol-sealing.
Building Pre-sealing
ELA at 25 Pa (cm2)
Pre-sealing leakage class (-)
Post-sealing
ELA at 25 Pa (cm2)
Post-sealing leakage class (-)
Percentage of
reduction (%)
Duration of aerosol injection
(h) L-5 544 657 95 103 83 8.5 L-2 45 40 4 3 92 0.7
Sample number
Start time (h)
End time (h)
1 -0.2 0.5 2 0.5 1.9 3 1.9 3.3 4 3.3 4.8 5 4.8 6.4 6 6.4 6.8 7 6.9 7.4 8 7.4 8.3
0
0.05
0.1
0.15
0.2
0.25
0.3
1 2 3 4 5 6 7 8Sample number
Con
cent
ratio
n (g
/m3)
Initial concentrationLocation 1Location 2Location 3, downstream of compact injector
Compact injector ONCompact injector OFF
OFF
ON
Figure 43. Aerosol concentrations measured at several locations in building L-5 using the impaction plate method. Initial concentration is calculated based on the fan flow rate and the liquid injection flow rate.

133
0
50
100
150
200
250
300
350
400
450
500
0 1 2 3 4 5 6 7 8 9
Time (h)
ELA
(cm
2 )
0
20
40
60
80
100
120
140
160
180
200
Seal
ing
rate
(cm
2 h-1
)
ELA Sealing rate Compact injector ON/OFF
Compact injector OFF
Compact injector ON
OFF
Compact injector ON
Figure 44. Effective leakage area (ELA) and sealing rate during sealing process in building L-5. The solid vertical line shows when the compact injector was turned on. The beginning of the experiment (about 20 minutes) has been removed for clarity.

134
0
5
10
15
20
25
30
35
40
45
50
0 0.1 0.2 0.3 0.4 0.5 0.6 0.7 0.8Elapsed time (h)
ELA
(cm
2 )
0
10
20
30
40
50
60
70
80
90
100
Seal
ing
rate
(cm
2 h-1
)
ELA Sealing rate
Airflow outlet closed Airflow outlet open
Figure 45. Effective leakage area (ELA) and sealing rate in building L-2 during the sealing process. The solid vertical line shows when the pressure-relief outlet was opened. For clarity, periods where injection was turned off are removed.
3.6 Discussion
The laboratory characterization of the aerosol injectors in use show that particle losses near the injection point are quite high under some operating conditions. This suggests that further optimization of the sealing hardware may be helpful to increase the efficiency of the technology.
The laboratory tests performed to evaluate the operating-pressure limits of the sealant show that the failure of properly-sealed leaks is very unlikely under the operating pressures encountered in commercial HVAC systems. Therefore, there is no need to improve the strength of the seals for this application.
We have tested our multi-point aerosol injection technique in the sealing test of one section of a large-commercial building system. Adding a single compact injector to our existing sealing apparatus increased the sealing rate by a factor of four; this was a major breakthrough. The leakage area of system L-5 was reduced by more than 80%. Another breakthrough of this study was to demonstrate that leakage levels as low as ASHRAE leakage class 3 (14) could be attained with an airflow outlet in a 30-cm diameter, 60-m 14 This leakage class corresponds to the Eurovent leakage class C that is usually required and fulfilled for circular systems larger than 50 m2 in Sweden (AMA98 1998). Recent field studies indicate that Belgian and French systems are typically about 30 times leakier (Carrié et al. 1999).

135
long duct. Overall, these results suggest that the new concepts tested and developed herein are promising.
Nevertheless, this aerosol-sealing technique possesses several potential shortcomings, which have not been addressed in this study. One major difference between residential and large-commercial systems is that the latter are more likely to have components that may be harmed by sticky aerosol deposition. These include hot-wire anemometers, smoke or IAQ sensors, and heating or cooling coils at terminal units. The two systems of the present study did not have such components; however, we believe that these issues should be carefully addressed should this technique prove to be viable for long, large, and complex systems. In two previous trials (Modera et al. 1998; Levinson et al. 1997), aerosol sealing did not modify the calibration of the airflow rate sensors in a pressure-signal VAV unit. However, further experiments with other units are needed. The time required to block all of the registers in large systems is another practical issue that needs to be addressed.
The sealing rate was found to be very low in system L-5 (on average, 60 cm2 hr-1), probably because only one compact injector was used in the long duct runs. It was difficult to install more compact injectors in this particular system because of its octopus-like layout. For this type of duct systems, practical ways to increase the sealing rate by installing multiple compact injection units in complex systems should be investigated.
Only parts of the complete building HVAC systems were tested. If we assume that a sealing rate of 150 cm2 hr-1 (15) can be achieved with the concepts brought to light herein (and possibly with other new concepts), a CL=800 duct system of about 100 m2 (1,100 ft2) of duct surface area can be sealed down to leakage class 12 in about 8 hours. A CL=200 duct system of about 1,840 m2 (19,800 ft2) (16) of duct surface area would be equally sealed in about 46 hours. In other words, buildings that have a very large total duct air leakage area may best be served by injecting in multiple sections of the duct system at the same time. Note also that the time required for aerosol-sealing should be compared with the time involved in the retrofitting of a duct system using conventional techniques.
Cost analyses of the sealing process were performed on a large office building that has a floor area of 4,600 m2 (50,000 ft2) with a CL=200 duct system of about 1,840 m2 (19,800 ft2) (16). Typically, the fan energy use for this kind of building is about 30 kWh m-2 (3 kWh ft-2) in California (Modera et al., 1999). To seal the system down to a leakage class of 12, the cost of the sealant material would be of about US$800, which results in a total cost for the process (including the labor cost) of about US$4,000 (17). If we assume that 30% savings can be achieved on the fan energy use (Franconi et al. 1998), the simple pay-back period of aerosol duct sealing in this particular building would be less than one year.
15 A sealing rate of 150 cm2/hour is a typical value in residences. 16 If we assume a total duct surface area of 40% of building floor area (Fisk et al. 1998), this corresponds to a building with a floor area of about 4,600 m2 (50,000 ft2). 17 Based on the market experience in residences, we assume that the entire process cost (including labor cost) is about 5 times that of the material cost.

136
3.7 Conclusions
Successful sealing of large-commercial-building duct systems would allow reduction of the fan airflow rates without adversely affecting the indoor climate in those buildings, thereby significantly decreasing fan energy use. Such retrofits for 50% of commercial air central systems and large-office packaged air systems in California would result in an energy savings potential of 480 GWh per year.18 Other benefits to airtight duct systems in such buildings include better control of airflow at the registers (flow balancing) and potentially-better indoor air quality and thermal comfort. However, there remains a significant lack of experience in characterizing the magnitude of duct air leakage in large commercial buildings as well as in sealing their duct systems; this makes any definite conclusions premature.
The principal conclusion based upon our field study of aerosol-based duct sealing in this report is that aerosol duct sealing in large commercial buildings is promising, but that additional research efforts to increase the efficiency of the technology should be pursued before its widespread use can be envisioned. Our rough analysis of the economics indicates that the payback for this type of sealing is less than one year. On the other hand, the speed and technical complexity of the current sealing process mean that it is not yet ready for commercialization.
Unanswered questions remain regarding the potential deterioration of sensitive equipment (e.g., smoke detectors, IAQ sensors), and the time required to seal the registers. We also believe that the optimum pressure and flow conditions for sealing typical leaks should be experimentally investigated, as previous work in this area cannot be applied directly to the current sealing protocols.
Some smaller conclusions based upon our work on duct sealing this year are: 1) that the seals created with the current sealant material are able to withstand pressures far in excess of what is found in commercial-building duct systems (up to 600 Pa), 2) that “compact injectors” can increase sealing rates substantially, and 3) that “joint”-type leaks seal considerably faster than “hole”-type leaks.
3.8 Recommendations
Additional research in the laboratory and field is needed to investigate the effective and efficient ways of sealing duct systems, especially for large commercial buildings. Our recommendations for the future are that we set up a full-scale large-commercial duct system in a laboratory facility to better understand and tune the adjustable parameters of the process. This laboratory setup should also yield estimates of the size of the duct systems that can be tightened in a reasonable time with this process.
18 This is based on the assumption—inferred from the work of Franconi et al. (1998)—that 30 to 50% of the fan energy can be saved.

137
4 Aerosol coating of in-situ duct liner
4.1 Introduction
An HVAC duct may be internally lined with a fiberglass blanket for acoustic control and thermal insulation. The LBNL aerosol-injection technology originally developed to seal leaks in duct walls has been evaluated to determine if it can be used to coat the inner surface of fiberglass duct liner with a thin layer of sealant, rendering the liner’s surface airtight. This process of “aerosol coating” could potentially improve indoor air quality (IAQ) by (a) encapsulating microbes on the liner’s surface, and (b) preventing the dispersion of loose fibers from the duct system to the occupied space through the duct system. Coating the surface of duct liners would also (c) increase the liner’s thermal resistance by preventing air motion within the fiberglass, and (d) decrease frictional losses of duct air motion by reducing the liner’s effective surface roughness.
Recent topics in LBNL’s aerosol-coating research have included • development of a instrument to measure a liner’s “spot conductance,” or the
conductance to airflow of a small area of fiberglass blanket; • testing of low-water-content sealants that reduce the need for heat in the production
of dry aerosols; • development of a new technique that uses a pressure difference to coat in-situ duct
liners; and • evaluation of the energy savings achievable through aerosol coating.
4.2 Objectives
The objectives of this section are • to test the feasibility of an innovative in-situ coating process under development at
LBNL; • to better understand the effect of surface coatings on the thermal resistance and
surface roughness of duct liners; • to evaluate the effect of coating on the thermal losses and pressure drops of
internally-insulated duct systems, and to estimate the potential energy savings; and • to determine whether some or all aspects of our coating process can be patented.
4.3 Background
Two phenomena can affect the performance of permeable duct liners. First, air may flow through the liner when entrained by the air flowing through the duct cavity. Such Infiltration enhances the heat exchange within the porous medium and lowers its thermal resistance. Lowering thermal resistance increases thermal losses from the duct, and decreases the duct’s delivery effectiveness, defined as the ratio of the thermal capacity at its outlet to the thermal capacity at its inlet (Appendix 7.4). When the delivery

138
effectiveness is reduced, the airflow rate must be increased to satisfy the heating or cooling load of the conditioned space.
Second, the conductance increases the roughness height of the duct’s inner surface, adding resistance to the flow of air though the duct and increasing the duct system pressure drop for the fan to overcome.
Both phenomena increase the fan energy consumption. Approximate analyses generally assume that the increase in airflow rate required to meet the heating or cooling load is proportional to the increase in delivery effectiveness. It is also commonly assumed that the fan power demand is proportional to (a) the cube of the airflow generated by the fan, and (b) the total pressure drop across the fan.
4.4 Approaches
4.4.1 Measurement of spot conductance
The airflow conductance of a porous medium is the ratio of the airflow through the medium to the pressure difference across the medium (Appendix 7.5). Changes in bulk airflow conductance gauge the extent to which the coating process can render a large section of liner airtight. A technique for measuring bulk conductance by clamping a liner sample to the outlet of a pressurized duct was developed in an earlier LBNL study (Stordahl 1997). This year, in order to understand the uniformity of the coating process, an instrument to measure spot conductance was devised. Spot conductance measurements were used to characterize the conductance reductions achieved by the coating process.
The duct liner used in LBNL’s studies is a medium-density (24 kg m-3), 2.5-cm thick fiberglass blanket with a 1-mm thick facing on its air-side surface (Aeroflex 150, Owens-Corning, Toledo, OH).
The spot-conductance measurement device uses a narrow-tipped probe to draw air through a small region (φ=1.3 cm) of a duct liner’s surface. The liner sample is wedged between two metal plates spaced 2.5 cm apart (Figure 46). Air drawn through a hole in the lower plate flows through the liner and into the probe, which is pressed into the top surface of the fiberglass. The conductance of the spot under the probe is determined by measuring the airflow through the liner as a function of the pressure difference across the liner.

139
Figure 46. Liner sample clamped inside spot-conductance measurement instrument.
The probe was surrounded by a metal cap to ensure that the sampled airflow originates from the bottom, rather than the top, of the liner (Figure 47). Conductance measurements made with and without a silicone seal joining the cap to the liner’s surface indicate that no more than 6% of the flow through the probe is drawn though gaps between the cap and the liner’s surface.
The spot conductance of a sample of uncoated liner was found to vary from 0.62 to 0.80 cm Pa-1 s-1, with a mean value of 0.71±0.09 cm Pa-1 s-1. The bulk conductance of a large section of uncoated liner (φ=25 cm) was also 0.71 cm Pa-1 s-1.
Duct liner
Cap
Hose/Probe
2.5 cm
1.9 cm
Flow (sucking)
1.3 cm
7.5 cm
Figure 47. Airflow through a liner sample in the spot-conductance measurement device.
4.4.2 Low-water-content surface sealant
An earlier LBNL study demonstrated that the surface conductance of a fiberglass liner could be reduced 50-fold by forcing an aerosol of solid adhesive particles through the liner. This deposits the adhesive on the liner’s surface and creates a coating about 0.1-mm thick. However, the liquid sealant from which the aerosol of dry adhesive particles is formed (a 2:1 volumetric dilution of Duct Seal, Puma Technologies, Austin, TX) is 88%

140
water by mass, and therefore requires a great deal of heat to evaporate the water and dry the wet particles. A variety of low-water-content paints, including five household paints and one duct paint, were tested as alternative surface sealant.
The presence of a pressure differential across the liner can affect the conductance reduction achieved in the application of a sealant to the liner’s surface. All sealant were sprayed or brushed onto liner samples to determine the conductance reductions yielded without a pressure differential. The adhesive sealant and duct paint were also aerosolized and forced through liner samples to measure the conductance reductions achievable with a benefit of a pressure difference. The household paints were not tested in this manner.
4.4.3 Pressure-driven in-situ coating
LBNL’s prior efforts to coat in-situ duct liners used turbulence and gravity to deposit aerosolized adhesive particles on the liner. This did not measurably reduce the liner’s conductance. Adhesive particles striking the liner’s surface tended to land on existing adhesive deposits, yielding a permeable coating characterized by well-separated clumps of adhesive (Stordahl 1997).
Since experiments had shown that forcing an aerosol of adhesive particles through a permeable fiberglass liner leaves an impermeable film on its surface, a technique was devised to create a pressure differential across in-situ liner. Blocking the free air path through the duct, or duct cavity develops the pressure differential. This creates a high-pressure zone upstream of the block, and a low-pressure zone downstream of the block. The pressure differential forces aerosol to flow through the liner bordering the block, depositing adhesive particles on the liner immediately upstream of the block (Figure 48). As this liner region is rendered impermeable by coating, the aerosol penetrates and coats bare liner upstream of the already coated section.
In theory, installing a block slightly upstream of the duct’s outlet could coat the entire liner. However, the resistance to longitudinal flow through the liner grows with the length of liner coated, increasing the duct air pressure and decreasing the duct airflow. The high pressure mechanically stresses the duct, and the low airflow limits the rate of sealant injection. Therefore, it is more practical to coat the duct by initially placing the block near the aerosol injection point, and gradually moving it downstream.

141
Injection side,airflow with
sealant
Duct wall Duct liner Block
Exhaust side,no sealants in
airflow
Streamlines
Figure 48. Sealant deposition on duct liner in the pressure-driven in-situ coating process.
Our investigations of the pressure-driven in-situ coating process included the following: • measurement of the resistance to longitudinal airflow through a coated liner; • thermodynamic prediction of the maximum coating rate (area coated per unit time)
when using a water-based sealant; • design of an effective duct-cavity block; • high-pressure coating with aerosolized adhesive, with the block fixed at the end of the
duct; • low, moderate and high-pressure coating with aerosolized adhesive, with the blocked
moved downstream at over time; and • coating with aerosolized duct paint using low and moderate driving pressures, with
the block fixed at the end of the duct.
4.4.4 Theoretical estimate of maximum coating rate
An ideal aerosol-injection coating system will deposit all injected sealant on the liner’s surface, forming a uniform, impermeable coating. The rate at which this system coats duct liner (liner area per unit time) will be the ratio of the sealant mass injection rate to the mass of sealant per unit area required to render the liner impermeable. Since water-based sealant must be dried once atomized, the maximum rate at which a water-based sealant can be sprayed into a duct is limited by the duct airflow rate and the heating power delivered to the aerosol particles.
The injector system can be idealized as a steady-state, constant-enthalpy control volume that inputs room-temperature air, room-temperature water, and heat, and outputs water-saturated air. The maximum water evaporation rate is a function of the airflow and heating rates, and the maximum rate at which solid sealant particles can be injected depends on the ratio of solids to water in the liquid sealant.
The aerosol injector used in LBNL trials has about 6 kW of heating power. The duct airflow rate in the pressure-driven in-situ coating process is constrained by the resistance

142
to airflow through the liner and by the maximum allowable duct pressure. In a typical trial, the duct airflow will decrease from 80 to 60 L s-1 and the duct pressure will rise from 1,100 to 1,800 Pa as the liner is coated. The maximum water evaporation rate theoretically attainable with a 6 kW, 70 L s-1 system is about 120 g min-1 (Figure 49).
0
20
40
60
80
100
120
140
0 1000 2000 3000 4000 5000 6000
Heating Power [W]
Max
imum
Wat
er E
vapo
ratio
n R
ate
[g/m
in]
AirflowRate(L s-1)
50
100
200
150
Figure 49. Maximum water evaporation rate in an idealized aerosol-injection system that combines streams of dry air, liquid water, and heat to create a stream of water-saturated air.
The 2:1 diluted liquid adhesive sealant used for the aerosol coating process in the current study is 88% water and 12% solid by mass, and has a density of 1 g cm-3. For this dilution, an injection rate of 120 g H20 min-1 corresponds to a liquid sealant injection rate of 140 ml min-1, and a solid adhesive injection rate of 16 g min-1.
It has been experimentally determined that coating a duct liner with about 60 g m-2 of solid adhesive reduces the liner’s airflow conductance by a factor of 10. Using that figure, the maximum coating rate for this aerosol injection system using 2:1 diluted liquid is about 16 m2 hr-1.
Supplying more heat can increase the maximum coating rate. However, since the injector heats air before it comes in constant with the wet aerosol, high heat at low airflow can

143
produce air temperatures high enough to damage the injection system or the duct. Air temperatures above 75 °C are considered undesirable.
Reducing the dilution of the sealant, which is probably a practical alternative, can also increase the maximum sealing rate. The current dilution ratio is an artifact of the use of this material for sealing, where the dilution was used to minimize particle size. The particles can be considerably larger for coating, and thus the maximum coating rate could be increased by a factor of three by using undiluted sealant (35% solid by mass). It may also be possible to use even less dilute sealant (greater than 35% solid by mass), which could further increase the coating rate.
The maximum coating rate can also be increased by depressurizing the downstream side of the block to increase airflow through the liner without increasing the pressure on the aerosol-injection side. This procedure could probably increase the maximum possible airflow, and thus the maximum possible sealant flow, by about 50%.
In the current experiment, the system’s actual coating rate will be reduced by loss of sealant mass, either to deposition of sealant on the tubing connecting the injector to the lined duct, or to aerosol flow around the edges of a leaky duct block). It can also be lowered by non-uniform deposition on the liner. Reducing the heating power (and thus the sealant injection rate) to prevent the system from overheating at low airflow will also decrease the coating rate.
Consider an example in which 50% of the sealant mass is lost to tubing deposition and edge leaks, the heating power is limited to 3 kW to limit the air temperature, and the efficiency of heat transfer from the air to the water particles is 50%, so that only 1.5 kW is available for evaporation. The maximum injection rate of water will be about 40 g min-1; the maximum sealant injection rate will be about 45 ml min-1; and the maximum solid adhesive injection rate will be about 5.5 g min-1. Since only half of the injected mass deposits on the liner, the maximum coating rate under those conditions will be about 2.7 m2 hr-1.
4.5 Results
4.5.1 Experiments
4.5.1.1 Liner conductance reduction yielded by various sealant
4.5.1.1.1 COATING WITHOUT A PRESSURE DIFFERENTIAL ACROSS THE LINER
ADHESIVE. An adhesive sealant (2:1 volumetric dilution of Duct Seal) was sprayed onto liner samples using a compact injector, a device that incorporates a high-pressure fan, heater, and atomizing nozzle. Coatings 0.08 to 0.18 mm thick reduced the liner’s conductance by factors less than two. The adhesive did not penetrate the liner’s surface.
HOUSEHOLD PAINTS. Liner samples were sprayed with approximately 0.1-mm thick coatings of five household paints, including two enamels, a ceiling paint, a clear finish,

144
and a liquid plastic. These coatings reduced the liners’ spot conductance by factors less than two, and all but the liquid plastic seeped through the liners’ surfaces.
DUCT PAINT. An acrylic HVAC primer/finish (Portersept, Porter Paints, Louisville, KY; 27% water by mass) was also tested as a surface sealant. Brush-painting a liner sample with a 0.5-mm thick coating of Portersept reduced its spot conductance by a factor of 25 to 50 in locations where the liner surface was intact, and by a factor of 3 where the liner surface was flawed. The paint dried rapidly and did not seep though the liner’s surface.
4.5.1.1.2 COATING WITH A PRESSURE DIFFERENTIAL ACROSS THE LINER
Liner samples were clamped over the outlet of a pressurized duct carrying aerosol. The pressure difference between the duct interior and the room forced the aerosol to flow through the liner, depositing sealant particles on the liner’s surface as the air passed through the liner.
ADHESIVE. Forcing an aerosol of dry Duct Seal particles through liner samples for various lengths of time created sticky coatings 0.06 to 0.1 mm thick. The liners’ bulk conductances were reduced by factors of 10 to 50, and the adhesive particles penetrated about 1 cm into the liner. Penetration made the liner’s interior sticky, but did not noticeably decrease its void fraction.
DUCT PAINT. Forcing an aerosol of Portersept particles to flow through a liner sample created a smooth, non-sticky coating about 0.5-mm thick that reduced the liner’s bulk conductance by a factor of 10. Thus, reducing conductance tenfold required a Portersept coating about eight times thicker than that of Duct Seal. No heat other than the waste heat generated by the atomizer’s 800-W vacuum-motor fan was required to dry the Portersept particles. One problem with these experiments was that the Portsept particles were dried out too quickly, resulting in poor adhesion and no “liquid flow” after impaction on the liner. Further efforts should attempt to reduce heating for this type of application.
4.5.1.1.3 RESISTANCE TO LONGITUDINAL AIRFLOW THROUGH COATED LINER
The resistance to longitudinal airflow through duct liner was determined by lining one side of a 30.5 cm x 30.5 cm duct with 2.5-cm thick fiberglass insulation, obstructing the duct cavity with a 2.5-cm thick block, and forcing duct air to flow through the liner beneath the block (Figure 50). The liner was “coated” upstream of the block with duct tape. The pressure drop across the block was measured as a function of airflow as the tape-coated length increased from 9 to 110 cm. The bulk velocity of longitudinal liner airflow versus coating length at a driving pressure of 500 Pa decreased 16% per meter coated (Figure 51).

145
Injection side
Duct wall
Duct liner
Block, Foam
Exhaust side
Streamlines
"Coating", Duct Tape
Duct Tape
Support bar
Figure 50. Longitudinal airflow through liner “coated” with duct-tape.
500
600
700
800
900
1000
1100
0 20 40 60 80 100 120
Coated Length x [cm]
Bulk
Vel
ocity
u [c
m/s
]
u = u0(1-1.5*10-3x)u0 = 1000 cm/s
Duct Pressure P = 500 Pa
Figure 51. Longitudinal bulk velocity (flow per normal area) though coated fiberglass duct liner.
4.5.1.2 Duct block design
A duct block is an barrier that forces air to flow through a duct’s liner, rather than through the duct cavity. An perfect duct block will fit snugly inside the lined duct and permit no airflow around the block’s edges. Edge leaks can waste a significant fraction of the injected sealant because the aerosol follows the path of least resistance around the block by flowing through the leaks. The loss of sealant mass slows the pressure-driven coating process.

146
Several block designs were explored, including a foam-board slab, a sheet-metal box, a short sheet-metal box with a foam-board upstream face, and an inflatable, inelastic plastic balloon.
4.5.1.2.1 FOAM-BOARD SLAB
The 2.5-cm thick, closed-cell foam-board slab was slightly larger in cross section than the lined duct cavity, and compressed the liner about 25%. The slab was easy to make, but difficult to mount securely in the duct. The pressure difference across the slab (500 to 2,000 Pa) tended to push it out of place, particularly when the duct walls bowed outward under pressure (Figure 50). A coating trial with the foam-board slab block (high-pressure coating with Duct Seal) exhibited high edge leakage, with more adhesive deposited around the block than on the duct liner’s surface.
4.5.1.2.2 SHEET-METAL BOX
A sheet-metal-box block took more effort to build, but could be mounted securely by screwing its sides to the duct wall (Figure 52). Screw mounting reduced the outward bowing of the duct wall under high pressure, but made repositioning of the block inconvenient. Edge leakage was small: in trials with sheet-metal blocks, most of the injected adhesive was deposited on the liner, rather than around the block.
27 cm
27 cm
30 cm
Screw and nut forfixing the block to
the duct wall
Flow direction
Figure 52. Sheet-metal-box duct block.
4.5.1.2.3 SHORT SHEET-METAL BOX WITH FOAM-BOARD FACE
A 2.5-cm thick foam-board slab was mounted on the upstream face of a short (4.5-cm long) sheet-metal box to combine the snug fit of the foam-board with the stability of the metal box (Figure 53). This design was as inconvenient to install as the full-size sheet-metal box block, but exhibited less edge leakage.

147
foam board
29.2 cm
2.5 cm4.5
cm
sheet metal
Figure 53. Short sheet-metal-box block with a foam-board facing.
4.5.1.2.4 BALLOON
A balloon block made from non-elastic plastic sheeting was inflated to about 1,500 Pa within the rectangular duct, expanding to fill the duct cavity (Figure 54). The balloon was oversized, with a fully-inflated cross-sectional area much larger than that of the cavity. The ballroom was easy to install, secure in place, and reposition; however, it leaked at the duct’s corners. Edge leakage was comparable to that of the foam-board block.
An elastic balloon might better fill the duct’s corners.

148
Block(Balloon)
Duct liner
Duct wallLeak
Figure 54. Balloon block inflated inside a lined, rectangular duct.
4.5.1.3

149
4.5.1.4 In-situ coating experiments
The pressure-driven in-situ coating process was tested in a series of experiments. The following configurations of sealant material, duct air pressure, liner coating length, and duct block were used: A. adhesive, high duct pressure, fixed coating length, foam-board block; B. adhesive, high duct pressure, variable coating length, metal-box block; C. adhesive, low and moderate duct pressures, variable coating length, metal-box block; D. adhesive, moderate duct pressure, variable coating length, balloon block; E. paint and adhesive, low duct pressure, fixed coating length, metal-box block; and F. adhesive, moderate-to-high duct pressure, fixed coating length, perfectly and
imperfectly sealed metal-and-foam-board block.
Adhesive refers to a 2:1 volumetric dilution of Duct Seal, and paint refers to Portersept. Low, moderate, and high duct pressures are about 500, 1000, and 1500 Pa. A fixed coating length indicates that the block was stationed in one place, while a variable coating length was achieved by repositioning the block downstream one or more times during the experiment. The variable “x” will be used to refer to distance downstream of a duct’s inlet.
4.5.1.4.1 EXPERIMENT A: ADHESIVE, HIGH DUCT PRESSURE, FIXED COATING LENGTH, FOAM-BOARD BLOCK
A foam-board block was mounted 10 cm upstream of the outlet of a 2.4-m long, 30.5 cm x 30.5 cm (outside dimensions) lined sheet metal duct (Figure 55). 50 ml min-1 of adhesive was blown into the duct for 100 minutes at an airflow rate of 100 to 190 L s-1, an air temperature of 40 to 55 °C, and a duct pressure of 800 to 1800 Pa. The sealant color was changed over the course of the experiment from yellow to red to green to indicate the order in which liner regions were coated (Figure 56).

150
2.4 m30 cm60 cm
Lay flat tubing, Ø 41cmHigh pressure fan
Injector
Injector fan Duct, 30.5cm x 30.5cm
Depressurized tent
Metal connector, 25 cm / 15 cm
BlockØ 15cm
Figure 55. Setup of coating experiment A (adhesive, high duct pressure, foam-board block, and fixed coating length.)
0
200
400
600
800
1000
1200
1400
1600
1800
2000
0 20 40 60 80 100Coating time t [min]
Duc
t Pre
ssur
e P
[Pa]
0
50
100
150
200
250
Flow
G [L
/s],
Tem
pera
ture
T [C
]
Duct Pressure Flow Temperature
# 1# 0
Liquid injection: 50 mL/minHeating power: 4.5 kW
Fan Ring:
Sealant color:Yellow red green
Figure 56. Operating conditions of coating experiment A (adhesive, high duct pressure, foam-board block, and fixed coating length.)
As expected, adhesive deposited first on the liner nearest the block, and also in the gaps between the block and the liner. Later, it deposited on the liner regions further upstream (Figure 57). Based on visual observation, penetration of the liner’s surface by aerosol particles was insignificant.
Spot conductances measured along the centerlines of the top, bottom, left, and right wall liners indicated that within 50 cm of the block, conductances were reduced by a factor of

151
at least 50 on all four sides. Conductances were not significantly reduced 75 cm away from the block, except on the top liner (Figure 58). The coating rate was 0.3 m2 hr-1.
0.6 m
0.3 m
Yellow/red Duct SealGreen Duct Seal
Block position
Figure 57. Left-wall liner coated in experiment A (adhesive, high duct pressure, foam-board block, and fixed coating length). Sizeable particle deposition is evident at the block location.
0
0.1
0.2
0.3
0.4
0.5
0.6
0.7
0.8
0.9
0 0.5 1 1.5 2 2.5
Distance from Block [m]
Perm
eabi
lity
of C
oate
d Li
ner /
Perm
eabi
lity
of U
ncoa
ted
Line
r [-] Left Liner Bottom Liner
Top Liner Right Liner
Duct Pressure 750 Pa
Con
duct
ance
of C
oate
d Li
ner /
Con
duct
ance
of U
ncoa
ted
Line
r [-]
Figure 58. Spot conductance measurements of liner pieces coated in experiment A (adhesive, high duct pressure, foam-board block, and fixed coating length).

152
4.5.1.4.2 EXPERIMENT B: ADHESIVE, HIGH PRESSURE, VARIABLE COATING LENGTH, SHEET-METAL BLOCK
The foam-board block was replaced with a sheet-metal box block that could be securely screw-mounted to the duct’s metal walls. The block was moved downstream over the course of the experiment to reduce the length of coated liner through which the duct air was required to flow, and thus limit the duct air pressure.
The metal-box block was installed in a 2.4-m long, 30.5 cm x 30.5 cm, lined sheet metal duct (Figure 59). Adhesive was blown into the duct for 80 minutes at an airflow rate of 60 to 80 L s-1, an air temperature of 40 to 55 °C, and a duct pressure of 1,400 to 1,800 Pa (Figure 60). The sealant injection rate was lowered from 80 to 40 ml min-1 as the liner was coated, because decreasing airflow and increasing duct air temperature made a reduction in heating power necessary.
2.4 m
30 cm
90 cm
Lay flat tubing, Ø 41cmHigh pressure fan
Injector
Injector fan
Duct, 30.5cm x 30.5cm
Depressurized tent
Metal connector, 25 cm / 15 cm
Block
Ø 15cm
90 cm
Wye-connector, Ø 30.5 cm
Metal connector, Ø 30.5cm
End cap (round 30.5 cm to square 30.5 cm)
Vacuum-motor airinlet
Figure 59. Setup of coating experiment B (adhesive, high duct pressure, metal-box block, and variable coating length). The same apparatus was used in experiments C and E.

153
0
200
400
600
800
1000
1200
1400
1600
1800
2000
0 10 20 30 40 50 60 70Coating time t [min]
Duc
t Pre
ssur
e P
[Pa]
0
10
20
30
40
50
60
70
80
90
Flow
G [L
/s] ,
Duc
t Tem
pera
ture
T [C
]
Duct Pressure Flow Temperature
Injection rate [mL/min]80 40 80 40 80 40
Block Position x =1.1 mCoating Region Length ∆x =1.1 m
x = 1.4 m∆x = 0.3 m
x =1.7 m∆x =0.3 m
Total mass of coating: M = 0.16 kg
Figure 60. Operating conditions of coating experiment B (adhesive, high duct pressure, metal-box block, and variable coating length).
For the first 35 minutes of coating, the block was 1.1 m downstream of the duct’s inlet (x=1.1 m), and the sealant color was white. After 35 minutes, the block was repositioned to x=1.4 m, and the sealant was dyed yellow. After 57 minutes, the block was moved to x=1.7 m, and the sealant was colored red.
As expected, the first section of the liner (x=0 to 1.1 m) was coated with white sealant, the second section (x=1.1 to 1.4 m) was coated with yellow sealant, and the third section (x=1.4 to 1.7 m) was coated with red sealant. Some yellow sealant deposited near the duct entrance, indicating that the region of the first liner section furthest from the block was not fully coated during the first 35 minutes of injection (Figure 61).
Spot conductances measured along the centerlines of the top, bottom, left and right liner sections indicated that coating reduced the liner’s conductance by a factor of at least 25 (and on average 35) on all four sides of the duct (Figure 62). The coating rate was 1.4 m hr-1.

154
1.1 m, white
0.3 m, yellow
0.3 m, red
Final block positionFinal block position
Figure 61. Duct liner coated in coating experiment B (adhesive, high duct pressure, metal box block, variable coating length).
0
0.1
0.2
0.3
0.4
0.5
0.6
0.7
0.8
0.9
1
0 20 40 60 80 100 120 140 160
Distance from Duct Entrance [cm]
Perm
eabi
lity
of C
oate
d Li
ner /
Perm
eabi
lity
of U
ncoa
ted
Line
r [-]
Top liner Right liner Bottom liner Left liner
Block position: #1 # 2 # 3
Duct Pressure 750 Pa
Con
duct
ance
of C
oate
d Li
ner /
Con
duct
ance
of U
ncoa
ted
Line
r [-]
Figure 62. Spot conductance measurements of liner pieces coated in experiment B (adhesive, high duct pressure, metal box block, variable coating length).

155
4.5.1.4.3 EXPERIMENT C: ADHESIVE, LOW AND MODERATE DUCT PRESSURES, VARIABLE COATING LENGTH, METAL-BOX BLOCK
Low duct pressures would be desirable when coating the interior of non-metal ducts, such as those made of rigid fiberglass ductboard. In this experiment, the duct air pressure was reduced to about 500 Pa by lowering the duct airflow. The apparatus was the same as used in experiment B (Figure 59).
The plan was to coat a section of liner with the block mounted 1.1 m downstream of the duct inlet, then move the block further downstream to x=1.4 m and x=1.7 m to coat the more distant sections, as in experiment B. However, the low airflow rate limited the sealant injection rate to 10 ml min-1, and the first section (x=0 to 1.1 m) did not fully coat after 85 minutes of injection. Thus, the airflow rate, duct air pressure, and sealant injection rate were increased to finish coating the first section. The injection rate for moderate-pressure coating (1,000 Pa) was 40 to 80 ml min-1. The block was then moved to the second position (x=1.4 m), and the second section was coated at moderate pressure. The block was not moved to the third position (x=1.7 m).
The sealant colors were white (low pressure, block at x=1.1 m), yellow (moderate pressure, block at x=1.1 m), and red (moderate pressure, block at x=1.4 m) (Figure 63).
0
200
400
600
800
1000
1200
1400
1600
0 20 40 60 80 100 120Coating Time t [min]
Duc
t Pre
ssur
e P
[Pa]
0
10
20
30
40
50
60
70
80
Flow
G [L
/s] ,
Tem
pera
ture
T [C
]
Duct Pressure Flow Duct Temperature
Injection Rate [ml/min]:10204060 80 60 40 80 60
Total Coating Mass, M = 0.15 kg
Block Position x = 1.1 mCoating Region Length ∆ x = 1.1 m
x = 1.1 m∆ x = 1.1 m
x = 1.4 m∆ x = 0.3 m
Figure 63. Operating conditions of experiment C (adhesive, low and moderate duct pressures, metal-box block, and variable coating length.)
The low-pressure injection with the block at x=1.1 m coated the liner 0 to 0.5 m upstream of the block (x=0.6 to 1.1 m) with white sealant. The moderate-pressure injection with the block at x=1.1 m covered the liner 0.5 to 1.1 m upstream of the block (i.e., from x=0 to 0.6 m) with yellow sealant. The moderate pressure injection with the block at x=1.4 m coated the second section of liner (x=1.1 to 1.4 m) with red sealant (Figure 64).

156
Spot conductances measured along the centerlines of the top, bottom, left and right liner sections indicated that coating reduced the entire liner’s conductance by a factor of at least 10 (and on average 25) on all four sides of the duct (Figure 65). Low-pressure coating was much slower than moderate-pressure coating; the rate of low-pressure coating was 0.4 m2 hr-1, while that of moderate-pressure coating was 1.2 m2 hr-1. This is an unsurprising consequence of their respective sealant injection rates.
0.3 m, red Duct Seal
0.5 m, white Duct Seal
0.6 m, yellow Duct Seal
Block positionsBlock positions
Figure 64. Duct liner coated in experiment C (adhesive, low and moderate duct pressures, metal-box block, and variable coating length.)

157
0
0.1
0.2
0.3
0.4
0.5
0.6
0.7
0.8
0.9
1
0 20 40 60 80 100 120
Distance from Duct Entrance [cm]
Perm
eabi
lity
of C
oate
d Li
ner /
Perm
eabi
lity
of U
ncoa
ted
Line
r [-]
Top Liner Right Liner Bottom Liner Left Liner
Block Position # 1 # 2
Duct Pressure 750 Pa
Con
duct
ance
of C
oate
d Li
ner /
Con
duct
ance
of U
ncoa
ted
Line
r [-]
Figure 65. Spot conductance measurements of liner pieces coated in experiment C (adhesive, low and moderate duct pressures, metal-box block, variable coating length.)

158
4.5.1.4.4 EXPERIMENT D: ADHESIVE, MODERATE PRESSURE, VARIABLE COATING LENGTH, BALLOON BLOCK
The metal-box block was replaced with an inflatable, inelastic balloon block made of plastic sheeting. This type of block can be inflated inside the duct, and is more convenient than a metal-box block to build and install.
The balloon block was inflated inside a 4.8-m long, 30.5 cm x 30.5 cm lined duct, and held in place by a string tied to the inlet of the duct (Figure 66 and Figure 67). Adhesive injected at a rate of 40 to 60 ml min-1 for 445 minutes (7.4 hours) at a duct air pressure of 1,100 to 1,400 Pa and an airflow rate of 40 to 65 L s-1. The block was first placed 0.6 m downstream of the duct inlet, then moved to x=2.3, 3.3, and 4.2 m. The balloon was inflated to pressures of 1,500 to 1,800 Pa in its first two positions, and to lower pressures of 1,300 to 1,400 Pa in its last two positions (Figure 68).
4.8 m3.1 m
Lay flat tubing, Ø 51cmHigh pressure fan
Injector
Injector fanDuct, 30.5cm x 30.5cm
Depressurized tent
Injector fan
Flex duct
Figure 66. Setup of experiment D (adhesive, moderate duct pressure, balloon block, variable coating length).

159
Tube to pressure gauge
Tube to high pressure air source
StringString
Duct wall Duct liner
Block made of lay flat tubing
Injection side
Figure 67. Inflatable-balloon duct block.
0
500
1000
1500
2000
2500
0 50 100 150 200 250 300 350 400 450
Coating Time [min]
Duc
t Pre
ssur
e [P
a],
Ballo
on P
ress
ure
[Pa]
0
10
20
30
40
50
60
70
80
Flow
[L/s
]
Duct Pressure Balloon Pressure Flow
40 40 50 50 60 60 50Injection rate [mL/min]:
Block Position:x = 0.6 m x = 2.3 m x = 3.3 m x = 4.2 m
Coating Mass, M = 0.75 kg
Figure 68. Operating conditions of experiment D (adhesive, moderate duct pressure, balloon block, variable coating length).
The first two sections (x=0 to 0.6 m and x=0.6 to 2.3 m) were fully coated, but only half of each of the last two sections were coated (i.e., x=2.8 to 3.3 m and x=2.7 to 4.2 m). Excessive edge leakage hindered coating of the last two sections.
Spot conductances measured along the centerlines of the top and bottom liner sections indicated that coating reduced the liner’s conductance by a factor of at least 35 on the top and bottom of the first liner section (x=0 to 0.6 m). Conductance reduction was inconsistent in the other three sections (x=0.6 to 4.2 m), with some areas of greatly-reduced conductance and other areas of high conductance (Figure 69).
The balloon block was generally leaky and therefore inefficient. Most of the liner was poorly coated, and the well-coated section of liner was coated slowly (0.3 m2 hr-1). The latter rate is comparable to that achieved with the foam-board block in experiment A.

160
0
0.1
0.2
0.3
0.4
0.5
0.6
0.7
0.8
0.9
1
0 0.5 1 1.5 2 2.5 3 3.5 4
Distance from Duct Entrance [m]
Perm
eabi
lity
of C
oate
d Li
ner /
Pe
rmea
bilit
y of
Unc
oate
d Li
ner [
-]
Top Liner Bottom Liner
Block Position:# 1 # 2 # 3 # 4
Con
duct
ance
of C
oate
d Li
ner /
Con
duct
ance
of U
ncoa
ted
Line
r [-]
Figure 69. Spot conductance measurements of liner pieces coated in experiment D (adhesive, moderate duct pressure, balloon block, variable coating length).

161
4.5.1.4.5 EXPERIMENT E: PAINT AND ADHESIVE, LOW PRESSURE, FIXED COATING LENGTH, METAL-BOX BLOCK
In this experiment, Portersept paint was sprayed into a lined duct. The coating process could take place with low airflow and low duct pressure because no heat was required to dry the atomized paint particles. The apparatus of experiments B and C was used (Figure 59).
A metal-box block was screw-mounted 1.1 m downstream of the inlet of a 2.4-m long, 30.5 cm x 30.5 cm lined sheet-metal duct. Paint was injected at 40 ml min-1 for 82 minutes, with a duct airflow of about 90 L s-1 and a duct pressure of 500 to 600 Pa (Figure 70). The slowness of the rise in duct air pressure during the experiment indicated that the paint was poorly sealing the liner’s surface, the leaks around the block, or both. Therefore, colored Duct Seal adhesive was sprayed into the duct. Deposition of adhesive above the paint would indicate that the paint coating was permeable.
0
200
400
600
800
1000
1200
1400
0 10 20 30 40 50 60 70 80 90
Coating time t [min]
Duc
t Pre
ssur
e P
[Pa]
0
20
40
60
80
100
120
140
Flow
[L/s
]
Duct Pressure Flow
40 40 60 40
Sealant: Portersept PorterseptDuctSeal
Total Coating Mass, M = 0.125 kg
Injection rate [mL/min]:Block position x = 1.1 m x = 1.1 m x =
1.1 m
Figure 70. Operating conditions of experiment E (paint and adhesive, low duct pressure, metal-box block, fixed coating length).
The paint uniformly covered nearly the entire surface of the liner, with a few thin spots on the top and side walls near the duct entrance. However, a thin layer of colored adhesive covered the entire liner, indicating that the liner remained permeable after coating with paint. The adhesive completely covered the paint near the block (Figure 71).
The aerosol injection apparatus was not ideally suited to spraying Portersept. The paint clogged the atomizing nozzle, and most of the particles deposited in the plastic tubing that connected the injector to the inlet of the lined duct. Approximately 800 W of waste heat from the atomizer’s vacuum-motor fan also inappropriately dried the paint.

162
Spot conductances measured along the centerlines of the top, bottom, left, and right wall liners indicated that the coating of paint and adhesive reduced the conductance of the downstream half of the liner (x=0.5 to 1.1 m) by a factor of at least 10, and reduced the conductance of the rest of the liner (x=0 to 0.5 m) by a factor of at least 3 (
Figure 72).
The paint coating alone did not render the liner’s surface impermeable. The coating rate for the combination of low-pressure paint coating and moderate-pressure adhesive coating was 0.7 m2 hr-1.
1.1 m
Portersept with a layer of Duct Seal on top
Block positionBlock position
Figure 71. Duct liner coated in experiment E (paint and adhesive, low duct pressure, metal-box block, fixed coating length).

163
0
0.1
0.2
0.3
0.4
0.5
0.6
0.7
0.8
0.9
1
0 20 40 60 80 100
Distance from Duct Entrance [cm]
Perm
eabi
lity
of C
oate
d Li
ner /
Perm
eabi
lity
of U
ncoa
ted
Line
r [-]
Top liner Right liner Bottom liner Left liner
Block position
Duct Pressure 750 Pa
Con
duct
ance
of C
oate
d Li
ner /
Con
duct
ance
of U
ncoa
ted
Line
r [-]
Figure 72. Spot conductance measurements of liner pieces coated in experiment E (paint and adhesive, low duct pressure, metal-box block, fixed coating length).

164
4.5.1.4.6 EXPERIMENT F: ADHESIVE, MODERATE-TO-HIGH DUCT PRESSURE, FIXED COATING LENGTH, PERFECTLY AND IMPERFECTLY SEALED METAL-AND-FOAM BLOCKS
The effect of airflow leaks around the edge of the block was investigated by comparing the coating rates obtained using an imperfect (leaky) and a perfect (airtight) block. A sheet-metal box with a foam-board slab affixed to its upstream face served as an imperfect block. Joining the edge of the foam-board to the duct liner with silicone caulking formed a perfect block.
IMPERFECT BLOCK. A 2.5 cm thick foam-board slab was attached to the upstream face of a 4.5 cm deep sheet-metal box block. The block was screw-mounted two meters downstream of the inlet of a 4.8-m long, 30.5 cm x 30.5 cm lined duct (Figure 74). Diluted adhesive sealant was injected at a rate of 80 ml min-1 for 36 minutes, with a duct airflow rate of 35 to 65 L s-1 and a duct pressure of 1,000 to 1,500 Pa (Figure 75). The sealant color was white from t=0 to 10 min, green from t=10 to 18 min, blue from t=18 to 28 min, and red from t=28 to 36 min.
PERFECT BLOCK. The metal-and-foam block was screw-mounted two meters downstream of the inlet of a 4.8-m long, 30.5 cm x 30.5 cm lined duct, and its upstream face joined to the duct liner with silicone caulking (Figure 73). Diluted adhesive sealant was injected at a rate of 80 ml min-1 for 43 minutes, with a duct airflow rate of 30 to 60 L s-1 and a duct pressure of 1,000 to 1,600 Pa (Figure 75). The sealant color was white from t=0 to 9 min, green from t=9 to 15 min, blue from t=15 to 33 min, and red from t=33 to 43 min.
Figure 73. Silicone caulking joining the edges of the metal-and-foam-board block to the duct liner, preventing leaks around the block’s edges.

165
Lay flattubing
Injector
30.5cm x 30.5cmsquare duct
Damper
2 m
Data Logger- (pressure)
High pressure fan
block
To the tent
Figure 74. Setup of coating experiment F (adhesive, moderate-to-high pressure, fixed coating length, perfectly and imperfectly-sealed metal-and-foam blocks).
0
200
400
600
800
1000
1200
1400
1600
1800
0 5 10 15 20 25 30 35 40 45
Coating Time [min]
Pres
sure
Dro
p Ac
ross
The
Blo
ck [P
a]
0
10
20
30
40
50
60
70
Duct Airflow
Rate [L/s]
Pressure, Imperfect BlockPressure, Perfect BlockAirflow, Imperfect BlockAirflow, Perfect Block
Figure 75. Operating conditions of experiment F (adhesive, moderate-to-high pressure, fixed coating length, perfectly and imperfectly-sealed metal-and-foam blocks).

166
The imperfect-block system coated 1.2 m of duct liner in 36 min (average of 2.0 m2 hr-1), while the perfect-block system coated 0.9 m in 43 min (average of 1.3 m2 hr-1) (Figure 76 and Figure 77). The coating rates were estimated by dividing the area covered with each color of sealant by the colored sealant’s injection time. The initial coatings rate are comparable (about 2 m2 hr-1), but the imperfect-block system appears to have a higher terminal coating rate (Figure 78). However, the latter result is highly uncertain due to the difficulty of estimating distances coated by each color sealant.
Figure 76. Duct liner coated in experiment F with an imperfect block (adhesive, moderate-to-high duct pressure, fixed coating length, imperfectly sealed metal-and-foam block).

167
Figure 77. Duct liner coated in experiment F with an perfect block (adhesive, moderate-to-high duct pressure, fixed coating length, perfectly sealed metal-and-foam block).

168
0
0.5
1
1.5
2
2.5
3
3.5
4
0.00 0.25 0.50 0.75 1.00 1.25 1.50
Coating Length [m]
Coa
ting
Rat
e [m
2 hr-1
]
perfect blockimperfect block
Figure 78. Coating rate vs. length of liner in ducts coated using perfect and imperfect blocks in Experiment F (adhesive, moderate-to-high pressure, fixed coating length, perfectly and imperfectly-sealed metal-and-foam blocks).
4.5.2 Energy-savings potential of coating process
4.5.2.1 Reducing conduction losses in supply-air ducts
A LBNL study (Levinson, 1999) indicates that the effective thermal conductivity of permeably-faced fiberglass duct liner increases with the square of the duct air velocity, while that of impermeably-faced liner is independent of duct air speed (Figure 79). Aerosol coating can render a liner’s surface impermeable, avoiding the increase in effective thermal conductivity induced by infiltration (Figure 80). For example, at a duct air velocity of 8 m s-1, an impermeable surface coating will reduce the thermal conductivity of a high-density fiberglass blanket (e.g., duct liner) by about 20%. However, simulations indicate that the energy savings achievable by rendering liner impermeable through aerosol coating are modest. A supply-air duct’s delivery effectiveness is the ratio of the air’s thermal capacity at the duct’s outlet to that at its inlet. The increase in delivery effectiveness of a typical flexible branch duct would be less than 0.6% (Figure 81), while that of a typical rigid main duct would be less than 1% (Figure 82). The simulation parameters are summarized in Table 19 and Table 20.
An impermeable coating provides only a small decrease in conduction losses because the conditioned air’s residence time in the duct decreases as the duct air speed increases. At low air speeds, the gain in thermal resistance in negligible; at high air speeds, the improvement in thermal resistance is substantial, but the time that the air spends in the duct, and hence the total heat lost as it traverses the duct, is small.

169
0.00
0.02
0.04
0.06
0.08
0.10
0.12
0.14
0 2 4 6 8 10 12 14 16 18
Duct Air Velocity v (m s-1)
Effe
ctiv
e Th
erm
al C
ondu
ctiv
ity a
t 24
o C k
f* (
W m
-1 K-1
)Imperviously-Faced Fiberglass BlanketPerviously-Faced Fiberglass BlanketNominal Still-Air ValueQuadratic Fit (Pervious)Constant-Value Fit (Impervious)
(B) Nominal: k f * = 0.039 (C) Impervious: k f * = 0.037
(A) Pervious: k f * = 0.041 (1+ 0.0062 v 2 )
C
A
B
residential branch commercial branch
commercialmain
residentialmain
Figure 79. Variation with duct air speed of the effective thermal conductivity at 24 °C of perviously- and imperviously-faced fiberglass blankets (density 13 kg m-3) in flexible ducts. Also shown is the nominal, still-air effective thermal conductivity for both blankets.

170
0%
20%
40%
60%
80%
100%
120%
140%
0 2 4 6 8 10 12 14
Duct Air Velocity v (m s-1)
Incr
ease
in C
ondu
ctiv
ity O
ver S
till-A
ir Va
lue,
(kf-
k f0)/k
f0
(-)Low-Density Fiberglass Blanket (Flexible Duct), MeasuredHigh-Density Fiberglass Blanket (Rigid Duct), Predicted
residential branch commercial branch
commercial main
residentialmain
Figure 80. Variation with duct air speed in the infiltration-induced fractional increase of the conductivities of low-density and high-density fiberglass blankets. The low-density-blanket’s conductivity was measured, while the high-density blanket’s conductivity was extrapolated from that of the low-density-blanket result.

171
0%
1%
2%
0 2 4 6 8 10 12 14 16
Duct Air Velocity v (m s-1)
Effe
ctiv
enes
s G
ain
∆εC
(-)
Hot-Air Duct Outside Thermal EnvelopeCold-Air Duct Outside Thermal EnvelopeHot-Air Duct Inside Thermal EnvelopeCold-Air Duct Inside Thermal Envelope
Flexible Branch Ductinner diameter = 20 cmlength = 7.5 m
residential branchcommercial branch
Figure 81. Variation with duct air speed of the effectiveness gain achieved by encapsulating the air-facing surface of the fiberglass-insulated, flexible branch duct described in Table 19.

172
0%
1%
2%
0 2 4 6 8 10 12 14 16
Duct Air Velocity v (m s-1)
Effe
ctiv
enes
s G
ain
∆εC
(-)
Hot-Air Duct Outside Thermal EnvelopeCold-Air Duct Outside Thermal EnvelopeHot-Air Duct Inside Thermal EnvelopeCold-Air Duct Inside Thermal Envelope
Rigid Main Ductouter dimensions = 30 cm x 91 cmlength = 30 m
commercial mainresidential main
Figure 82. Variation with duct air speed of the effectiveness gain achieved by encapsulating the air-stream surface of the fiberglass-insulated, rigid main duct described in Table 19.
Table 19. Properties of modeled flexible and rigid ducts.
Flexible Branch Duct Rigid Main Duct Length (m) 7.5 30
Inner Diameter (cm) 20 - Outer Height and Width (cm) - 30 x 91
Outer-Surface Long-Wave Emissivity (-) 0.8 0.8 Insulation Density (kg m-3) 13 24 Insulation Thickness (cm) 2.9 2.5
Insulation’s Nominal Flat-Form, Still-Air Thermal Resistance (m2 K W-1) 0.74 0.63
Velocity Sensitivity of Insulation Conductivity (s m-1) 0.14 0.06 Temperature Sensitivity of Insulation Conductivity (K-1) 0.0047 0.0018

173
Table 20. Plenum, room, and ambient air conditions for heating and cooling ducts inside and outside of the room’s thermal envelope.
Cooling Duct Inside Thermal
Envelope
Cooling Duct Outside Thermal
Envelope
Heating Duct Inside Thermal
Envelope
Heating Duct Outside Thermal
Envelope Room Air Temperature ( °C) 25 25 22 22 Room Air Humidity Ratio (-) 0.010 0.010 0.005 0.005
Plenum Air Temperature ( °C) 13 13 55 55 Plenum Air Humidity Ratio (-) 0.009 0.009 0.005 0.005 Ambient Air Temperature ( °C) 27 35 24 0
Ambient Air Velocity (m s-1) 0.1 0.1 0.1 0.1
4.5.2.2 Reducing duct pressure drop
Coating the duct liner with a suitable sealant or combination of sealants can potentially reduce the pressure drop in the liner duct by reducing the liner’s surface roughness.
The airflow through duct lined with a permeable insulation is illustrated in Figure 83. Since there is no net airflow through the porous interface, the flow is parallel to the liner’s surface. Furthermore, the pressure gradient at the porous liner’s interface is null; i.e., the air pressure in the duct equals the pressure in the porous medium. Consequently, the linear pressure drop in the liner is equal to that in the plain medium:
2
1 2liner Df
h
f uD
fLp
Lp ρ
=∆
−=∆− , (13)
where fp∆ is the pressure drop in the duct over the duct length (Pa), linerp∆ is the pressure drop in the liner over the duct length (Pa), L is the duct length (m), fρ is the density of air, Du is the fluid velocity in the duct (m), f is the friction factor (-), and hD is the duct’s inner hydraulic diameter (m).
The friction factor quantifies the wall shear stress, which depends on the velocity profile near the wall. It can be evaluated with the following Eq. (Eq. (ASHRAE, 1997):
25.0'
Re6811.0
+=
h
r
Df ε ,
018.0 if '' ≥= fff , 018.0 if 0028.085.0 '' <+= fff ,
(14)
where Re is the Reynolds number of the air flowing through the duct (-), and εr is the surface roughness (m). The surface roughness concept integrates all aspects that can potentially affect the velocity profile at the wall, such as the size of the protrusions of the surface, or air infiltration through the liner. This latter phenomenon seems to result in larger velocity gradients at the wall—the values reported in the literature for the surface roughness of ducts with fibrous glass on the inside are much greater than the size of the

174
protrusions of the liner’s surface. For this type of ducts, ASHRAE (1997) gives a range of 1.5 to 4.5 mm, depending on the duct characteristics.
According to Equation (14), the friction factor f increases approximately with the fourth root of the surface roughness at the flow regimes of interest in the main ducts of commercial systems (i.e., at high Reynolds numbers). Therefore, reducing the surface roughness by a factor of two in a duct section reduces the pressure drop in that section by 16%.
Table 21 gives a range of potential reductions in fan energy use based on the system described in Table 22. The potential savings lie between 1 and 13% of the fan energy consumption, with a typical value of about 5%. Combined with the effectiveness gain discussed in the previous section, the potential savings lie between 4 and 15% of the fan energy consumption, with a typical value of about 8%. Table 21. Potential savings on fan energy use due to surface roughness reduction and effectiveness gain subsequent to the coating process in the system described in Table 22.
Inputs Outputs Initial roughness
height (mm) Final roughness
height (mm) Fraction of
pressure drop in sections to be
coated (%)
Potential fan power reduction due to surface
roughness reduction only
(%)
Potential fan power reduction due to surface
roughness reduction and effectiveness
gain (%)
4.5 0.5 30 13 15 4.5 0.5 20 8 11 4.5 0.5 10 4 7
4.5 1.0 30 9 12 4.5 1.0 20 6 9 4.5 1.0 10 3 6
3.0 0.5 30 11 13 3.0 0.5 20 7 10 3.0 0.5 10 4 6
3.0 1.0 30 7 10 3.0 1.0 20 5 8 3.0 1.0 10 2 5
1.5 0.5 30 7 10 1.5 0.5 20 5 8 1.5 0.5 10 2 5
1.5 1.0 30 3 6 1.5 1.0 20 2 5 1.5 1.0 10 1 4

175
Table 22. Characteristics of the duct system used in the pressure drop and cost effectiveness analyses of the coating process.
Building floor area 4,645 m2 (50,000 ft2) Fan power consumption 28 kWh m-2 (3 kWh ft-2)
Duct surface area 40% of building floor area Type of system Variable-air-volume (VAV) with variable speed
fan Coated ducts Trunks upstream of VAV terminal units.
Air velocity: 8 m s-1 (26 ft/s) Surface area: 30% of total duct area
Length: 60 m (180 ft) Width: 0.9 m (3 ft) Height: 0.3 m (1 ft)
Linear pressure drop in coated sections versus total pressure
drop in the system
10 to 30%
Surface roughness of coated sections (before coating
process)
4.5 to 1.5 mm
Surface roughness of coated sections (after coating process)
1.0 to 0.5 mm
Effectiveness gain in coated sections
1%

176
y,v
porous medium
Parallel flow Dh
x,u
Impermeable surface
L
Figure 83. Longitudinal flow through the duct cavity and duct liner.
4.5.3 Cost effectiveness of coating process
Calculations were performed to provide rough estimates of the cost effectiveness of the coating process on the system described in Table 22. These calculations were based on the assumption that 50 g of dry sealant material were needed per m2 of duct surface area to coat the liners. This results in a total cost (including labor) of US$5.5 per m2 of coated duct surface area. 19
With these assumptions, the simple pay-back period ranges from about 2 years for the largest initial surface roughness (4.5 mm) to about 5 years for the lowest relative surface roughness reduction (from 1.5 to 1.0 mm).
19 Based on Duct Seal cost. Total cost is about 5 times the material cost based on the experience in aerosol-sealing in residences. It is assumed that there is no material loss, which is realistic if the aerosol is injected locally as suggested in Section 4.6.5.

177
4.5.4 Patentability of coating process
A online database of U.S. patents from 1971 to present (www.patents.ibm.com) was searched for patents related to pressure-aided impregnation of porous materials. A search for keywords (impreg* and (porous or fibrous) and (pressur* or vacuum)) within the international patent classification B05D (processes for applying liquids or other fluent materials to surfaces, in general) yielded 117 matches. At least 14 patents described processes and apparatus for the fluid impregnation of a porous medium with the aid of a pressure difference (Table 23). Some processes involve placing an object in a vessel, evacuating the vessel, then allowing a fluid to enter the vessel. Others describe the vacuum impregnation of a fibrous web by using a pressure difference to draw fluid into one face of the web.
Three patents describe the use of a pressure gradient for the deposition of solid or liquid aerosol particles onto or onto and into the surface of an air-permeable medium; these are listed in bold type in Table 23. None of these three specifically claims the reduction of permeability as a goal.
All patents discovered were geared toward industrial processes, rather than toward in-situ coating applications.

178
Table 23. Patents describing the use of a pressure gradient to impregnate a porous body or fibrous web with a fluid or solid. Patents involving aerosol particles are in bold type.
Patent Year Title Summary U.S. 4288475 1981 Method And Apparatus For
Impregnating A Fibrous Web vacuum impregnation of a fibrous web
U.S. 4338353 1982 Method For Increasing The Strength Of A Porous Body
vacuum impregnation of porous body within a vessel
U.S. 4311735 1982 Impregnation Of Porous Articles vacuum impregnation of porous body inside a vessel
U.S. 4551191 1985 Method For Uniformly Distributing Particles On A Moving Porous Web
pressure-gradient driven deposition of aerosol particles onto a moving
porous web U.S. 4620991 1986 Apparatus For The Impregnation Of
Porous Articles apparatus for vacuum impregnation of
a porous object within a vessel U.S. 4767643 1988 Method And Of Continuously Vacuum
Impregnating Fibrous Sheet Material vacuum impregnation of a porous
sheet with resin U.S. 4740391 1988 Pattern Forming Saturator And
Method vacuum deposition on a porous
medium with high and low pressure gradient to create patterns
U.S. 4968534 1990 Method And Apparatus For Pattern Impregnation Of A Porous Web
spraying chemical on one side of porous web while applying vacuum to
other side U.S. 5004645 1991 Barrier Products pressure-driven aerosol deposition
onto surface of porous medium to reduce penetrability by
microorganisms while not reducing air permeability
U.S. 5094886 1992 Method And Apparatus For Pattern Impregnation Of Paper And Other
Non-Woven Web
vacuum impregnation of web with pattern
U.S. 5281439 1994 Process For Uniformly Integrating A Solid Charge Within A Porous
Substate
vacuum impregnation of solids within a porous medium
U.S. 5281437 1994 Production Of Particulate Solid-Bearing Low Density Air Permeable
Sheet Materials
pressure-gradient driven deposition of solid particles in a gas carrier on or onto and into an air-permeable
material U.S. 5496629 1996 Modification Of Porous Materials pressure-gradient driven deposition
of a liquid-droplet aerosol onto a porous surface
U.S. 5876645 1999 Impregnation Of Liners vacuum impregnation of felt

179
4.6 Discussion
4.6.1 Conductance reduction achieved by various sealants
Spray-coating duct liner samples with 0.1 mm thick layers of adhesive or various household paints with no pressure difference across the liner reduced liner conductance by a factor of less than two. Better results were obtained by forcing an aerosol of duct paint through a liner, which reduced conductance tenfold with a 0.5 mm thick layer, and by forcing an aerosol of adhesive though a liner, which reduced conductance by a factor of 10 to 50 with a layer 0.06 to 0.1 mm thick. Pressure-applied adhesive can reduce liner conductance tenfold with a layer about five times thinner that that required when using pressure-applied duct paint. However, duct paint is still an attractive option because it has a low water content and can be applied without heat.
4.6.2 Efficacy of pressure-driven in-situ coating process
Experiments demonstrated that the pressure-driven coating process could successfully encapsulate several meters of in-situ duct liner.
OPTIMAL DUCT BLOCK DESIGN. A short sheet-metal box with a slab of foam-board affixed to its upstream face could be securely screw-mounted to the duct wall, and snugly blocked the duct cavity. However, building, installing and repositioning a screw-mounted box block was inconvenient. A balloon block was easier to fashion and install, but leaked excessively around its edges.
OPTIMAL OPERATING CONDITIONS. As expected, the coating rate depended on the rate of sealant injection and the extent of leakage around the edges of the duct-cavity block. When heating duct air to dry wet airborne adhesive particles, the injection rate of diluted adhesive was limited to about 80 ml min-1 by the need to keep duct air temperatures below about 75 °C and to keep duct air pressure below about 2,000 Pa. Reducing airflow to lower the duct pressure reduced the amount of heat that could be added to the duct air, necessitating a reduction in the sealant injection rate and thus lowering the coating rate. Hence, high-injection, high-heat, high-airflow, and high-pressure operation maximized the speed of the current coating process. However, it may be possible to operate with much lower airflow and duct pressures when applying a sealant that does not require heating (e.g., Portersept duct paint).
CHANGE IN CONDUCTANCE. Coating with adhesive sealant and a metal-box block reduced the liner’s flow conductance by a factor of a least 10 (typically about 25) over the entire coated region . Using a metal-box block while coating with a combination of duct paint and adhesive was less successful; the conductance reduction factor was ranged from three to upwards of 10.
COATING RATE AND EFFICIENCY. The best coating rate observed (2 m2 hr-1) was obtained by injecting 80 ml min-1 of 2:1 dilute adhesive sealant into a duct whose cavity was

180
blocked by a short sheet-metal box with a foam-board upstream face (experiment F). However, the conductance reduction achieved was not measured for this trial. The best coating rate observed for a known conductance reduction (factor of 35) was 1.4 m2 hr-1, achieved by injecting an average of 68 ml min-1 of 2:1 dilute adhesive sealant into a duct whose cavity was blocked by a long sheet-metal box (experiment B).
Each coating trial wasted sealant through deposition in the tubing between the injector and lined duct, excessive deposition on the lined duct, and the flow of sealant around the edges of the block. The solid mass injected per unit area coat ranged from about 300 to 1,200 g m-2, reducing the permeability of the coated are by factors of 25 to 50 (Table 24); the amount required to reduce the liner’s conductance by a factor of 10 is about 60 g m-2, and that required to reduce conductance by factors of 25 to 50 is about 80 to 100 g m-2.
Raising the coating efficiency, the sealant injection rate, or both could increase the coating rate. Better delivering the injected sealant to the liner could increase the coating efficiency. The sealant injection rate could be increased by (a) not diluting the adhesive sealant, (b) increasing the fraction of heat delivered directly to the liquid, or (c) replacing the adhesive sealant with a sealant that does not require heating (e.g., duct paint). Table 24. Summary of in-situ coating experiments performed with 2:1 diluted adhesive as the sealant.
Trial Block Design
Block Position
Average Duct Pressure (Pa)
Average Injection Rate (ml min-1)
Average Coating Rate (m2 hr-1)
Solid Mass Injected Per Area Coated (g m-2)
Average Conductance Reduction Factor (-)
A foam-board slab
fixed 1,200 50 0.3 1,210 50
B long metal box
variable 1,600 68 1.4 350 35
C (i) long metal box
variable 600 16 0.4 300 25
C (ii) long metal box
variable 1,300 65 1.2 390 25
D (i) balloon variable 1,300 40 0.3 970 25 F (i) short metal
box w/foam-board face
fixed 1,300 80 2.0 290 N/A
F (ii) short metal box w/foam-board face,
caulked
fixed 1,500 80 1.3 450 N/A
Note: Trials C (i) and C(ii) refer to experiments conducted at low and moderate pressures, respectively; trial D (i) refers to the portion of the balloon experiment in which the block was stationed at x=0.6 m; and trials F (i) and F (ii) refer to the imperfectly and perfectly sealed blocks.
4.6.3 Energy savings
The potential thermal energy savings from coating-induced reductions in lined-duct conduction losses is quite small—typically less than 1%. The potential fan-power savings

181
are greater, possibly as high as 15%. However, estimates of fan-power savings depend on the roughness-height reduction attainable by coating, which is quite speculative.
4.6.4 Patentability of coating process
Numerous patents have been issued for the pressure-driven impregnation of a porous material. However, none claim the reduction of permeability as a goal, or describe to the coating of in-situ duct liner.
4.6.5 Modification of robot-based coating services
Some specialty contractors apply coatings to internal duct insulation by guiding a robotic cart with a camera and sprayer down the ductwork. Our results indicate that spraying coating material directly on the liner’s surface is considerably less efficient in terms of conductance reduction than forcing the particles through the liner. Therefore, the use of a robot to both inject aerosol particles locally and create a pressure gradient across the liner on limited duct sections should bring a considerable added-value to the existing service. Furthermore, this new technology should solve two major shortcomings encountered with the remote injection. First, there is no constraint on the airflow to carry the particles. This should allow us to operate at lower pressure differences across the coated sections. Second, there is no material loss as the particles are generated locally. The major drawback of this technique is that, unlike the aerosol-sealing technique, it is geometry-dependent.
4.7 Conclusions
Our research on aerosol-coating to reduce duct-liner permeability also provided some important breakthroughs this year. Our most significant breakthrough was that we were able to produce reduced-permeability coatings remotely for the first time. A second important conclusion based upon our work this year is that the potential of this technology to reduce thermal conduction is limited by the fact that the high velocities that reduce duct-liner thermal performance also reduce residence times in the ductwork, thereby reducing the savings potential of liner encapsulation. On the other hand, our rough estimate of the simple payback was short enough that we cannot dismiss the savings opportunity associated with this technology. Moreover, since there is already an industry that is applying “permeable” coatings to the inside of duct liners for IAQ purposes, this technology could prove to be an important augmentation of their service, creating a better barrier to future particle and microbial depositions in the liner, and providing the energy savings at a low incremental cost.
Based upon these findings, and our experimentation in the laboratory, we can conclude that: 1) we need significant improvements before commercialization, 2) the energy savings from coating are modest compared to those from sealing, 3) coating will be motivated by IAQ concerns, with energy savings as a fringe benefit, and 4) in-situ coating is an evolutionary, not revolutionary technology.

182
4.8 Recommendations
In terms of recommendations for the future, it seems that a modest effort in this area is justified, focusing initially on a better understanding of the in-situ interior-encapsulation industry.

183
5 Reducing fan energy in built-up fan systems
5.1 Introduction
One objective of this project is to develop a publicly available set of widely applicable data measurement, monitoring, and analysis protocols for problem detection in built-up air handling systems. Built-up air handlers are custom engineered, project specific, and site assembled air handlers as opposed to factory assembled packaged units. These protocols include data visualization and data benchmarking tools that will reduce the engineering analysis required to identify typical air handling system problems with significant energy impacts.. The justification for retrofits must be based on a sound economic analysis of costs vs. benefits once the problems are identified; the protocols described here should be considered a first step in the evaluation process.
This work departs from other related efforts in that it was designed from a practitioner’s point of view without being constrained by the prevailing model-based and knowledge-based diagnostics methodologies used in classical failure and fault detection (FDD) analysis. We have attempted to maintain a very practical orientation throughout this work. We currently conceive of this work as more representative of problem detection than fault detection and diagnosis technology.
This methodology relies on short term monitoring techniques. One of the distinct advantages of this approach is that data quality and instrument placement is under the control of the practitioner. This fact alone should allow significant reduction in bias and ambiguity in the data. Likewise, the methodology is focused on certain predefined problems that are known to have significant energy impacts so the assessments are tightly focused and can be conducted efficiently. Finally, the analysis techniques use standard data presentations generally familiar to practitioners. The fan benchmarking presentations are exceptions, but their utility outweighs this drawback
Our intention is to develop protocols and procedures that are relevant to the practical needs of the intended audience. These protocols will be best used by energy service companies (ESCO), either as standalone organizations or as part of a set of energy management services offered by energy service providers (ESP), where a primary business activity is evaluation of retrofit possibilities. Facility management engineers and mechanical contractors may also find the protocols useful because of their need to assess performance problems in their facilities. Commissioning agents may be able to use the protocols to assist with problem identification during the startup and commissioning process. HVAC system designers would best utilize the benchmarking database to understand how actual fan systems perform relative to design data.
The specific problems being addressed span the range of design, operation, and control problems typically found in CAV and VAV systems in large commercial buildings such as offices and hospitals. The entire air handling system including fans, coils, dampers, duct system, and terminal devices are the purview of these techniques. Issues of duct leakage and thermal losses associated with the air handling system are not subjects of this work.

184
In this report we discuss the development of a functional problem detection suite of tools that make up the fan assessment protocols. This suite consists of a set of software tools, data collection procedures and field forms, and a description of analysis methodologies including a fan performance database use for benchmarking performance metrics. Sections 5.5 and 5.6 provide extensive documentation of these data collection and analysis protocols and tools.
The fan performance database and all associated data visualization tools have been included in a web-site created to facilitate their dissemination to interested parties, and to demonstrate a concept of how these protocols could be implemented in a practitioner’s work environment. The web-site, described in Section 5.7, also includes access to and downloading of all materials generated during the course of this project as well as links to other relevant information sources. These materials include all reports, software tools, and data collection forms. The fan performance database, however, is only downloadable as an Excel version at this time; interested parties can contact CEDR to inquire about the web-enabled version. Section 5.7 also describes the most recent efforts to work with third parties and to secure funding for future work.
To address our second objective to develop low-cost monitoring tools, Section 5.8 covers the formulation of a preliminary functional description for a field deployable tracer gas-monitoring tool. This is based on an analysis of work done in previous phases. Finally, in Section 5.10 we provide recommendations for future work that will be instrumental to establishing these tools as part of the regular protocols employed by a variety of energy practitioners.
Throughout this report we have attempted to maintain the same nomenclature as used in previous reports; the nomenclature is included as Appendix 7.7 for reference purposes.
5.2 Objectives
The two major objectives of this project are to develop:
1. Measurement and analysis protocols that would establish a consistent framework of methods for detecting problems in the primary types of built-up air handling systems; and
2. Low-cost measurement techniques to facilitate use of the protocols.
PROTOCOL DEVELOPMENT. The specific objectives of the work over the past year have been to expand and improve the measurement and diagnostics protocols by:
• advancing the analysis methods • improving data visualization tools including the benchmarking fan performance
database • creating a publicly accessible web-site.
LOW COST MONITORING. During this phase the focus of low-cost monitoring work has been on furthering the development of the constant injection tracer gas (CITG) airflow

185
measurement technique by development of a functional specification for a portable field deployable CITG airflow measurement system.
5.3 Background
Previous phases of this project were devoted to 1) defining the problems that are of greatest importance to energy practitioners and designers, and 2) development of field methods to identify these problems in buildings. These studies included case study analysis and investigations of low cost monitoring techniques. In Phase II, a list of 12 common problems was compiled and a preliminary estimate of energy impact of each was made. In Phase III the original list of problems defined in Phase II was expanded and ranked according to overall importance based on energy impact, cost of mitigation, and difficulty of assessment. This ranking is included as Appendix 7.8. Phase III focused on development of CAV protocols, development of a demonstration fan performance database based on MS Access, and extension of the work on tracer gas airflow measurement.
Past reports on this project provide a description of how these techniques compare with other diagnostic methods and will not be repeated here. Likewise, the Phase III report contains a description of most of the calculations embedded into the software tools. The techniques developed in this project are somewhat unique in that they are based on established measurement methods, are focused on a specific set of problems, use semi-automated data management and visualization formats customized for the problems of interest, and incorporate benchmarking techniques to assist analysis of problems. This latter element, once it is populated, should be of great interest to the design community.
During the current phase of the project we have focused on incorporating all the work that has been done to date into a functional suite of tools and protocols. While a number of areas could benefit from further research, we believe the tool suite is now in a form that will make it possible to perform verification testing. This testing is the next step necessary for creating a robust commercial tool. In their current form they could be used to assist assessments but the fan performance database in particular lacks the necessary data to be of significant help in assessments or feedback to designers.
5.4 Approaches
To meet our overall goals and objectives, we continued to 1) develop and improve the fan performance diagnostic protocols and their associated software tools, and 2) develop a low-cost monitoring methods for making airflow measurements using a constant injection tracer gas (CITG) technique.
PROTOCOL DEVELOPMENT. Specifically, our tasks during this phase related to protocol development were to : • Reformulate the software tools in Microsoft Excel 97, • Merge the CAV and VAV protocols into an integrated system with the problems as
the primary orienting mechanism, • Improve the fan performance benchmarking database,

186
• Develop a web-enabled tool suite that demonstrates how these methods could be implemented in a real-world environment and to provide a vehicle for dissemination of the results of the project,
• Incorporate an explicit treatment of measurement errors, • Develop a web-site to facilitate public access to the protocols and software tools.
Reformulating the tools and calculations in Excel was done to facilitate changes and modifications to the charting of data and to the calculations performed. Working in the MS Access environment turned out to be a serious impediment to development. However, this demonstration software does exemplify many of the features we believe will be important in a commercial implementation of these protocols. Being based on Excel does allow for this technology to be fairly readily ported to other software environments, especially Microsoft based ones.
Merging of the CAV and VAV protocols was conceived to be a more straightforward way to apply the techniques. While it is important to always keep the distinction between CAV and VAV systems clearly in mind, many problems and their detection protocols are the same for both types of systems. Situations where a procedure is applicable to only one system type have been so identified. Adopting a “problems up” orientation we believe to be appropriate for the intended audience of field assessment technicians. Web-enabling the protocols facilitates their access by practitioners in large heterogeneous organizations and demonstrates how they could be implemented in a commercial form.
Incorporating the error analysis explicitly is critical to assisting with decision analysis and should mitigate confusing results to some extent. It also represents a more honest expression of the data quality issues and will help identify where there are deficiencies in measurement quality.
It should be noted that we have not attempted to overly refine and simplify the tools as yet. We believe this process will naturally occur during extensive field use and verification of the protocols; we did not want to limit the capabilities at this early stage.
LOW-COST MONITORING. Tasks to further the development of low-cost airflow monitoring consisted of: • Analysis of data from previous phases to ascertain the feasibility of developing a low
cost field deployable system • Analysis of the impact on global warming of using this technique • Development of a functional specification for a portable CITG system.
Although, the tracer gas work may appear to be somewhat tangential to our core work of protocol development, it continues to be an important and compelling technique, which, with further development, will improve the implementation of these protocols. The work to date suggests that a relatively inexpensive, practical, field deployable device is possible.

187
5.5 Results - Protocol development: Field data collection
5.5.1 Introduction
Collecting accurate field data is essential to a pertinent analysis of energy and operational issues for in-situ built-up fan systems. Obtaining accurate field data can be, however, problematic. In this project we have focused on limiting the field data collection requirement to the most useful and relevant data points. We have also tried to be realistic about the error inherent in any field measurement and the limitations in collecting accurate and meaningful field data. In the sections below where data collection is discussed we have provided a guide to measurements; these are summarized in Appendix 7.9.
5.5.1.1 One-time Measurements
One-time measurements are basic measurements of fan performance, such as flow, pressure, and power input, that are used to determine operational and energy characteristics of the fan. In this project, one-time measurements serve primarily as data inputs for the Fan Analysis and Benchmarking software tools described later in this report.
One-time measurements should generally be made on a single visit to the site. Depending on schedule and workload, it may be possible to deploy time series measurement loggers during the same visit (i.e. to begin the time-series data collection). The decision of which time-series measurements to undertake, however, may be influenced by results of the fan analysis and/or benchmarking analysis. In addition, the fan performance measurements may have to be deferred until all fan belt problems are corrected.
A general guideline for collecting one-time data includes: • Double-check that all necessary measurement equipment is available, calibrated, and
in good working order before visiting the site. • At the site, first identify the most appropriate measurement locations and make any
necessary preparations, such as drilling holes etc. • Record the location and dimensions of all measurement points, particularly the flow
measurement grid and pressure measurements locations. • Using the best instruments available (see recommended instrument characteristics
later in this report), collect the data for each fan system to be analyzed. • Take multiple readings for each data point in order to minimize the measurement
error. • Record the data and any notes on a single data sheet.
The principal one-time measurements used in this protocol for calculating fan metrics and analyzing built-up fan systems include: • Fan Static Pressure Rise (SPout – SPin - VPin) (see Phase III report for a complete
explanation of FSP) • Volumetric Air Flow (calculated from Pitot-tube measurements), • Fan Speed,

188
• Fan Motor Electrical Data (voltage, current, power factor, and power), • Air Density at the Fan Outlet (based on air temperature, relative humidity, and
barometric pressure).
5.5.1.2 Estimation of Fan Drive and Motor Efficiency FAN BELT DRIVE EFFICIENCY
In order to determine total fan efficiency for a built-up fan system, the power losses in the fan motor and drive must be determined. It is very difficult, however, to directly measure motor efficiency or drive efficiency for installed systems. Therefore, various techniques are used to estimate in-situ motor and fan efficiency.
The Air Movement and Control Association International, Inc. (AMCA) has established a table for estimating fan belt drive losses as a function of the output horsepower of the motor. This table of motor horsepower versus belt drive losses is found in Appendix L of AMCA Standard 203-90 [AMCA, 1990] and was generated from data from over 400 tests of fan belt drive losses. For this project, we used the data from AMCA Standard 203 to develop an equation (see Figure 84) used to analytically estimate belt drive efficiency.
125.0*0.7100 −−= MotorDrive HPN
This equation matches the AMCA data very closely for fans in the 10 to 100 horsepower range and is accurate to approximately +/- 2% for all normally operating fans in this range, based on AMCA's data.
y = 0.07x-0.125
0%
1%
2%
3%
4%
5%
6%
7%
8%
9%
0 20 40 60 80 100
Motor Horsepower
Bel
t Driv
e Lo
ss
Low Efficiency
Average Efficiency
High Efficiency
Data is from AMCA Standard 203-90
Appendix L
Figure 84. Equation for Estimating Belt Drive Efficiency versus AMCA Data

189
AMCA standard 203 assumes a properly tightened belt operating under normal conditions. If it is clear from inspection that the fan belt is loose, mis-aligned, or over-heating, the equation for estimating belt drive losses will not be valid.
Obvious problems with fan belts should be corrected before further fan and motor measurements are performed. MOTOR EFFICIENCY
Motor efficiency varies significantly with the size, type, and operating load factor of a motor. For this project, a software analysis tool was developed to assist users in estimating efficiency for a given motor. This tool, the Motor Efficiency Tool, is described in another section of the report. The techniques used by the software tool to estimate in-situ motor efficiency are based on the analytical techniques and database of typical motor efficiency values employed by MotorMaster+, a robust motor analysis software application developed under the auspices of DOE.
5.5.1.3 Time-series Data
Many of the analytical techniques developed for this project require time-series data collection (also called logged or time-stamped data). There are a number of commercially available data loggers, instruments for recording time-series logs of temperature, motor power, motor current and other variables pertinent to analyzing built-up fan systems.
A general guideline for taking time-series measurements includes: • Before going to the site, insure that data loggers are properly programmed and
calibrated and, if applicable, have sufficient battery life. • Data loggers should be used to collect data from approximately 1 to 4 weeks. • The sampling rate of the data should be no less than once per hour and generally need
not be more than every 5 minutes. In typical situations, a 15-minute logging interval is appropriate.
• Data collection will be most relevant if performed during a time of year where there are high loads and/or substantial load changes due to variable weather or operating conditions.
• Data collection should not be performed only during atypical periods such as holidays, or during a building renovation.
The time-series measurements used as part of the analyses developed for this project include: • Outside Air Temperature (OAT) • Return Air Temperature (RAT) • Supply Air Temperature (SAT) • Mixed Air Temperature (MAT) • Input Motor Power (or motor current as a proxy for power) • Fan Output Static Pressure • Reheat System Hot Water Supply Temperature (HWST) • Reheat System Hot Water Return Temperature (HWRT)

190
• Zone Air Temperature (ZAT)

191
5.5.2 Data Collection Protocols
5.5.2.1 Design Drawings/Reference Data
In order to evaluate the energy and operation characteristics of a built-up fan system, a reference datum for the expected operation must be established. Generally this reference will be the designer's specifications for the fan although there may be situations when reference data other than the design data is more pertinent. For example, if the fan has been re-sheaved or other significant modifications have been performed, the testing and balance data which immediately followed the modifications will be more relevant than the original fan design data. Similarly, if commissioning data is available it can serve as a valid reference to the original, as-installed operating characteristics of the fan, more pertinent than the designer's specifications. It should be noted, however, that the designer’s specifications are what define system sizing so an analysis of actual performance has to be considered in this light.
5.5.2.2 Occupant/Operator Interviews
At the initial site visit and system inspection the following activities should be conducted: • Interview building operations personnel. Ask about problems, complaints, and a brief
history of the building from an operations and systems point of view. Find out where worst case zones are in the building.
• Obtain operating schedule information, on/off times for weekdays and weekends. • Obtain and review design and as-built drawings and specifications. Develop an
understanding about the systems and the areas served, building functions, and operating schedules.
• Review occupant complaint logs. • Obtain controls system design as-built drawings and specifications. Interview
operations personnel about controls settings and sequences.
5.5.2.3 Observations • During the system inspection, be sure to note outstanding characteristics such as
locations for flow measurements, ductwork construction that will have a significant impact on system effect, condition of the drives, duct construction and leakage potential.
• Inspect fans to identify obvious problems such as runaround/recirculation (parallel fans) and fans running backwards.
• Note whether the fans have inlet vanes or not. Some CAV fans use inlet vanes to adjust operating point rather than changing sheaves. These are locked in position after the adjustments are made. The position of these inlet vanes must be noted in order for the measured data to be corrected properly to design conditions. (See Phase III report [Webster, 1998].)
• Take photographs of the system sections of interest, especially the inlet and outlet duct arrangements.
• Make a diagram with dimensions to all measurement planes and points.
192
5.5.2.4 Field Data Sheets
Appendix 7.9 contains two data collection forms that can be used to collect field data for input to the Fan Analysis and Benchmarking software tool. The forms are designed to provide the practitioner with a guide for collecting only the design data and measurements that are needed for this protocol. The first form includes spaces to fill in all one-time measurements necessary for the fan analysis. A separate data sheet has been prepared for recording the Pitot-tube measurements required to calculate volumetric airflow. This data sheet also includes a look-up chart for determining in-situ air density from temperature, relative humidity, and barometric pressure. Pitot-tube measurement data can be entered into an Excel spreadsheet program that automates the calculations of airflow.

193
5.5.3 Data error analysis
5.5.3.1 Introduction
Field data collection always includes some error due to random, unpredictable variations in operating conditions and bias, and precision errors in the measurement instruments. Sources of error include instrument inaccuracy, non-ideal measurement locations, and the dynamic nature of fan operating conditions. Although a detailed uncertainty analysis is beyond the scope of this work, we believe it is important to explicitly consider error sources and magnitudes to have meaningful results. We have attempted to minimize the effort for practitioners in determining these errors, but they depend on good judgement being exercised to arrive at a reasonable estimate of uncertainty. Further work in this area could refine these error-estimations.
5.5.3.2 Measurement Error in Fan Performance Analysis
Table 25contains expected range and default values of uncertainties for various measurements and calculated parameters used in the data analysis protocols for the Fan Analysis software tool developed for this project. The practitioner should select a value within the ranges shown in Table 25 consistent with his assessment of the quality of individual measurements made in the field.
The values are based on AMCA and ASHRAE standards and guidelines [AMCA, 1974], as well as the results of work done during Phase II of this project [Carter, 1998]. These standards appear to include primarily measurement errors and how other measurement effects influence them but it is not clear to what extent errors such as instrument location and process dynamics have been included. Additional guidance is provided in Section 5.8, Figure 124 for airflow measurements. These values are relative (i.e., percentage) uncertainties and include both precision and bias errors.
Where parameters (metrics) are computed from a set of individual measurements, the uncertainty in the parameter is computed using statistical methods. Done rigorously [ Coleman, 1989], such an analysis considers elemental bias and precision errors individually propagated into the computed parameter or metric using differential equations. The elemental bias and precision estimates are substituted into these equations independently, and then are combined using the root-sum-square (RSS) procedure to arrive at the overall uncertainty. Typically this is all done to 95% probability or two-standard deviations level. This represents a zeroth order replication analysis [Coleman, 1989] and provides an uncertainty estimate for a single set of measurements. Alternatively, the total RSS uncertainty (i.e., the elemental uncertainty) of each variable can be substituted into the propagation equations to compute the overall uncertainty of the result. This latter procedure was adopted for this work. Where necessary (e.g., the benchmarking metrics) the propagation equations were developed and the elemental uncertainties listed in Table 25 were used to determine the uncertainty bar in the various metrics used in the benchmarking charts.

194
In some cases the propagation of measurement error leads to large errors in the calculated metrics. For example, using the default values above, it is only possible to determine fan efficiency with in +/- 7.9%. With this error, a fan with a calculated total efficiency of 50% would be in the range of 46-54% efficiency and a fan with calculated efficiency of 75% would be in the range 69-81% efficiency.
The default values of relative error listed in Table 25 are included in the software tool. These default values are based on our own experience collecting field data as well as published guidelines and the work of other researchers (Carter 1998). If a user feels that these values do not accurately reflect the error in their measurements, the default error values can be over-ridden.
Errors due to variations in in-situ air density are minimized in this work since all measured performance parameters are corrected to standard conditions.

195
Table 25. Summary of Uncertainty Estimates, Percentage of Reading/Value
Parameter Error Range Default Source Remarks Min Max Error
Airflow 2.2% 9.7% 5% AMCA 203-90 See Section 5.8 for additional recommendations
Fan Static Pressure
2.3% 7.8% 5% AMCA 203-90 As measured with manometers and Pitot-static tubes; includes mental averaging error, effects of density, fan speed error, and propagation of the difference between two measurements. Electronic pressure transducers should minimize instrument and averaging errors, but pressure fluctuations, especially at the fan outlet can be significant.
Motor Input Power
1.0% 7.0% 2% Powersight 3000 Manual AMCA 203-90
Considers power meter reading only, including any mental averaging; its effect on fan power input is included with drive and motor when propagated.
Motor Efficiency
1% 3% 2% MotorMaster+ Data
Fan Drive Efficiency, belt drives
1.1% 2.6% 2% AMCA 203-90 Based on data in Appendix L of AMCA 203-90, there is more uncertainty for belt drive efficiency in lower horsepower fan systems.
Fan Drive Efficiency, VSD
2%
5.5.3.3 Measurement Error and Uncertainty in the Benchmarking Analysis
The measurement error analysis described above for the Fan Analysis Tool also applies to the comparison metrics used in the Fan Benchmarking software tool. Data inputs for the

196
two analyses are identical and the measurement error calculated for metrics in the Fan Analysis will also be used for the metrics in the Benchmarking analysis. The error in the user-selected metric for the subject fan appears on the Benchmarking Chart as the width in the "subject fan" bar.
Uncertainty in the comparison population mean is derived from the population size and standard deviation for the comparison fans in the database. This uncertainty appears on the Benchmarking Chart as the width of the "population average" bar.
The uncertainty in the population mean is computed form the following equation:
),( σNTUmean =
Where T is the student-t distribution, N is the number of samples in the (filtered) population of comparison fans, and σ is the standard deviation of the database sample set.
5.5.3.4 Measurement Error in the Time-series Data Analysis
Errors in time logged measurements are not explicitly treated since they are primarily compared to themselves when used for tracking trends. However, when used for analyses where parameters are calculated, such as the economizer and reheat ∆T analyses, or when measurements made with different loggers are compared to one another, these errors should be considered. This work is left to a future phase of this project when logged data management procedures are refined.

197
5.5.4 One-time Measurements
5.5.4.1 One-time Measurement Summary
Good quality, calibrated instrumentation and careful technique are important in collecting accurate field data and minimizing measurement error. The fan analysis developed for this project requires several field measurements using a variety of measurement equipment. The values to be measured are summarized in the table below.

198
Table 26. Summary of One-time Measurements
Measured Data
Recommended Instrument(s)
Remarks
Fan Belt Drive Efficiency (%)
Infrared thermometer
Before other measurements are taken the fan belt drive should be inspected for proper operation. An infrared (non-contact) thermometer can be useful in determining if the belt is over-heating due to misalignment or excessive slip.
Fan Air Temperature (°F)
Digital temperature detector (RTD or thermistor)
Fan air density should be estimated for accurate comparison between field and design data. Fan air temperature, humidity, and barometric pressure, therefore must be measured. For draw through supply fans, air temperature can be measured at the inlet. For return fans measure at the outlet; exhaust fans at the inlet in the return plenum.
Fan Air Relative Humidity (%)
Wetbulb Thermometer
RH at the fan outlet should be measured or estimated in order to estimate in-situ air density. Look-up tables have been prepared for estimating fan air density from measured pressure, RH, and temperature data.
Barometric Pressure (psia or In. Hg)
Barometer Barometric pressure varies with climate conditions and altitude. Look-up tables have been prepared for estimating fan air density from measured pressure, RH, and temperature data (See Appendix 7.9).
Volumetric Airflow (CFM)
Pitot static tube and manometer. Digital manometer with averaging capabilities.
Use AMCA standard procedures for measuring air flow in a duct using a traverse of velocity pressure measurements [AMCA 1974]. A spreadsheet for automating the flow calculation from VP measurements has been developed for this project.
Inlet and Outlet Static Pressure (iwc)
Pitot tube (or pressure taps) and manometer.
Outlet static pressure should be determined by averaging multiple readings in a duct section close to the fan discharge.
Inlet Velocity Pressure (iwc)
Pitot tube and manometer.
This value is typically zero for built-up supply fans since virtually all have no inlet ductwork, exhaust fans but is non-zero for return fans.

199
Table 27. Summary of One-time Measurements (cont'd)
Fan Speed (RPM)
Strobe tachometer
Fan speed should be determined with a strobe tachometer so that the in-situ data can be accurately compared to the reference fan data.
Motor Speed (RPM)
Strobe tachometer
It is not absolutely necessary to measure motor speed, although this can be used as indication of the motor load factor for CAV fans and VAV fans controlled by inlet vanes. For VAV fans controlled by VSDs, fan speed can be derived from motor speed.
Motor Input Power (KW)
RMS power meter, preferably with averaging capability. Power also can be determined from separate V, I, and power factor measurements.
The best and simplest way to measure power is to use a high quality true RMS power meter. This avoids all the complexities of taking separate measurements of current, voltage and power factor and calculating the power. Using current as a proxy for power is not applicable for one-time measurements. Current as a proxy for power is more appropriate for time-series measurements on VAV systems.
Motor Current (Amps)
Multi-meter It is not necessary for the analysis to measure motor current (if a power meter is used), but this measurement can be useful in determining if the motor is operating as designed.
Motor Voltage (Volts)
Multi-meter It is not necessary for the analysis to measure motor voltage (if a power meter is used), but this measurement can be useful in determining if the motor is operating as designed.
Motor Power Factor (%)
Multi-meter It is not necessary for the analysis to measure motor power factor (if a power meter is used), but this measurement can be useful in determining if the motor is operating as designed.

200
5.5.4.2 Field Instruments and Equipment
The essential instruments necessary for all of the one-time field measurements are: • Manometer (prefer digital with averaging capability) • Pitot Tube • RMS Power Meter (preferred) or Multi-meter • Strobe Tachometer • Air Temperature Probe
Other equipment that may be useful in making all of the appropriate field measurements includes: • Flashlight (we found that head lamps are most useful) • Clipboard, pen, and pad • Camera • Tape Measure • Screw Driver and pliers • Cordless drill for creating Pitot tube measurement points in ductwork • Hole plugs for sealing any measurement points in ductwork • Power cords and/or extra batteries for all equipment • Infrared thermometer for checking temperature of fan belt drive • Barometer and wetbulb thermometer for estimating air density
5.5.4.3 One-time Measurements Caveats MOTOR INPUT POWER
WARNING: ONLY QUALIFIED PERSONNEL SHOULD PERFORM MOTOR POWER AND OTHER ELECTRICAL MEASUREMENTS.
Fan power is measured best with a state-of-the-art power meter that includes transient and harmonic analysis capabilities as well as automatic averaging. Data logging capabilities are also an important feature for VAV system monitoring. Attempting to mentally average power meter readings is difficult and error prone. Measurement location should be noted. For example, sometimes it is not feasible to measure power either before or after a VSD controller. If power is measured after the VSD then VSD efficiency does not need to be included in the drive efficiency calculations.
FAN DRIVE EFFICIENCY
An inspection and evaluation of the fan drive is the first step in collecting field data for a built-up fan system. If it is apparent that the fan belt is loose, mis-aligned, or excessively worn, the belt drive should be repaired before other measurements are collected.

201
VOLUMETRIC FLOW
Fan volumetric flow is measured by taking a grid of velocity pressure measurements in the fan outlet ductwork with a Pitot tube and manometer. For this project we have assumed units of cubic feet per minute (CFM) for fan volumetric flow. The Pitot tube flow measurement technique is a well-established but time-consuming procedure. Until alternatives such as the constant injection tracer gas technique reported in Section 5.8 are developed, it remains the most reasonable way to measure duct airflow.
FAN STATIC PRESSURE RISE
Fan Static Pressure (FSP) rise is determined from three measurements: inlet velocity pressure, inlet static pressure, and outlet static pressure. For this project we have assumed FSP measurements in units of inches of water column (iwc). Inlet velocity pressure will be zero for supply fans and most exhaust fans, but not for return fans. Inlet static pressure should be measured near the fan inlet. Outlet static pressure can be difficult to accurately determine in the field. ASHRAE and AMCA recommend taking static pressure measurements on all sides of the outlet duct (top, bottom, left and right). The measurement location should be close to the fan outlet, preferably in a straight section of duct, prior to any major duct transitions.
FAN SPEED
Fan speed must be measured at the fan with a tachometer. During fieldwork for this project, we found that handheld contact tachometers can be difficult to operate in cramped fan rooms. Strobe tachometers are significantly easier to use, although also more expensive, than contact tachometers.
MOTOR ELECTRICAL MEASUREMENTS
Motor electrical measurements (3-phase voltage, 3-phase current, power factor, and RMS power) are used to determine the power being delivered to the fan. A 3-phase power-meter with harmonic measurement capabilities should be used to make these measurements. If a power-meter is not available, a standard multi-meter with a current transducer can be used to measure voltage and current. In this case the motor nameplate power factor, along with the measured voltage and current, should be used to calculate power. With any electrical measurement equipment it is important to follow standard safety precautions and to use equipment (particularly current transducers) appropriately sized for the expected load.
VAV DESIGN POINT SIMULATION
For VAV air handling units, one-time measurements should be made at or near the design point (full speed). For VAV systems this is done best by resetting the supply air temperature set point upward until the design fan speed is reached. Merely setting the speed up without forcing the boxes to a position equivalent to the diversified peak (i.e., block full load) condition will not allow a comparison to design specifications. For VAV

202
systems with inlet vanes it may be easier to send a false control signal to the inlet vane controller indicating that full flow is required.
VSD EFFICIENCY FOR VAV SYSTEMS
For VAV systems controlled by an VSD, also called an Adjustable Speed Drive (ASD), Variable Frequency Drive (VFD), or Variable Frequency Controller, (VFC) drive efficiency should be estimated and included in the fan drive efficiency. The software protocol assumes additional 2% power losses in the fan drive for VAV systems compared to comparable CAV systems, due to power losses in the ASD.

203
5.5.5 Time-Series Measurements
5.5.5.1 Time-series Measurement Summary
Obtaining useful time-series data for a built-up fan system requires a combination of good data logging equipment, appropriate installation of equipment, and a monitoring period representative of typical operating conditions and with load variation. Several analysis techniques have been developed for this project using time-series data to identify operational problems in built-up fan systems. The time-series measurements incorporated in these analyses are summarized in the table below.

204
Table 28. Summary of Time-series Measurements
Measured Data Recommended Instrument(s)
Remarks
System Temperatures: Supply Air Temp. (SAT) Return Air Temp. (RAT) Mixed Air Temp .(MAT) Outside Air Temp. (OAT)
Four single-channel or one 4-channel air temperature data logger.
Temperature probe placement is important. RAT probe should be in return ductwork away from influence of OAT or AHU coils. MAT probe should be placed before the fan and coils, SAT probe after the fan and coils. OAT probe should be shielded from direct sun exposure.
Fan Power: Motor Input Power, or Motor Input Current
KW-transducer and data logger, or current transducer and data-logger.
KW-transducers are difficult to install and may require an electrician. Some power-meters include data logging capability. For VAV systems, some VSDs include data-logging capability. Current transducers are less expensive and easier to install than KW-transducers but require calibration with a power meter.
Zone Air Temperature (ZAT)
Air temperature data logger.
ZAT probe should be placed in a "typical" location away from direct solar exposure and HVAC supply grills. The zone thermostat location can be used if a better location is not evident.
Fan Static Pressure
Static pressure transducer and data logger.
Static pressure should be logged at the fan outlet.
Hot Water Reheat Temperature Supply Temp. (HWST) Return Temp. (HWRT)
Two single-channel or one multiple-channel temperature logger with "Pete's plug" probes.
Pete's plug temperature probes are available as an accessory for many temperature data-logging systems.
5.5.5.2 Time Series Measurements Caveats CONFIGURING AND LAUNCHING DATA LOGGERS
If possible, all data loggers used for a given project should be launched from the same computer (so that the clock will be the same), with the same logging interval and the same start time. This eliminates the need to synchronize varying time-stamps for the same data analysis. With multi-channel data loggers synchronizing the data collection will be automatic, but for projects with multiple loggers (such as fan power and OAT)

205
some attention must be paid to the start time and logging interval for each logger. If data from a BMS is to be used, time should be synchronized between both systems.
LOGGING INTERVALS
Data-loggers have a finite amount of memory. Therefore shorter logging intervals cause the data logger to exhaust its memory more quickly. In our experience a 15-minute logging interval is adequate for an informative analysis and will allow for up to several weeks of data logging with most standard data loggers available today. Logging intervals shorter than 5 minutes are rarely appropriate for analysis of built-up fan systems. Conversely, logging intervals greater than one hour may not provide enough data for a useful analysis.
LOCATING AND PROTECTING DATA LOGGERS
Data loggers placed in the field for several weeks at a time should be mounted in such a way that they will not interfere with the operation of the system and will not be subject to damage. Further, data loggers should be carefully located to measure only the appropriate variable without undue influence from other factors. For example, a data logger recording OAT should be shielded from direct solar radiation and a data logger recording ZAT should not be placed too close to an HVAC supply duct.
5.6 Results - Protocol development: Data analysis software tools
5.6.1 Introduction
Although the primary focus of this work is to develop standard methodologies for built-up fan system problem detection, these methodologies need a practical expression before they can become viable and useful methods. In addition, the efficacy of the methods cannot be verified without a means to test them. The analysis tools described in this section were developed as a vehicle to accomplish these two functions. A further benefit of these tools is that they can be used as the basis for development of commercial fan performance assessment applications.
5.6.2 Fan Analysis Tool
5.6.2.1 Methodology & Assumptions
The Fan Analysis Tool is one part of a somewhat broader software tool "Fan Analysis and Benchmarking,” which has been assembled in Microsoft Excel 97. The Fan Analysis Tool compares in-situ measurements of fan performance to a reference datum, generally the fan design data. The Fan Benchmarking Tool compares performance metrics for a given fan to a population of similar fans. As both software tools require the same data inputs they have been integrated into a single Excel file the "Fan Analysis and Benchmarking" tool. In this report the Fan Analysis Tool will be discussed independently from the Fan Benchmarking Tool, which is described in the next section.

206
The Fan Analysis Tool provides a way to compare field measured, in-situ fan data to reference data for a given fan. This reference data is typically the fan design data but could also be manufacturer’s data or commissioning data if design data is not available or not appropriate. For example commissioning data, when available, may be a more useful reference than design data in determining how a fan's performance characteristics may have changed since installation.
The Fan Analysis Tool is intended to provide initial problem detection for operational changes and energy related problems in built-up HVAC fan systems. The two problems the tool is primarily intended to diagnose are excessive system resistance and fan inefficiency. Excessive system resistance may be due to dirty filters, clogged coils, sound traps, or system effect. Fan inefficiency can be caused by any number of factors including poor fan construction (factory defects), poor fan installation, or the fan running backwards.
The Fan Analysis Tool is not explicitly intended to diagnose motor inefficiency or excessive drive belt slip, both of which will result in a loss of fan efficiency. Motor inefficiency can be evaluated using the Motor Efficiency Charts Tool, which was developed for this project and is described in another section of the report, or through using a more rigorous motor assessment protocol such as MotorMaster+.
Excessive belt slip can be evaluated through visual inspection of the fan or through established techniques that use fan belt temperature as an indication of slip. For fans that demonstrate excessive slip, it is strongly recommended that the fan belt drive be repaired or replaced as necessary before collecting data for the Fan Analysis Tool or pursuing with other analysis protocols.
The Fan Analysis Tool can be used to analyze fan resistance and fan inefficiency problems in both CAV and VAV fan systems. For a VAV system the measurements should be taken at or near design speed.
5.6.2.2 Data Inputs
The data inputs to the Fan Analysis Tool include a standard set of design data (or other reference data) and field measurements for the fan to be analyzed. Nameplate motor data and electrical measurements for the fan motor must also be collected.
Estimated measurement error for select field measurements can be input into the software tool. Default values are included but these values should be replaced if the user has a better estimate.
Data input to the Fan Analysis Tool is made on the 'ENTER-UPDATE DATA' Tab of the Excel workbook. Space has been provided so that data for up to 100 fans can be recorded on this tab. The composite of the fan data entered on this tab is used in the "Fan Benchmarking Tool" described in the next section of this report. The Fan Analysis Tool only analyzes data for one fan from the database at a time.

207
The input data required for the Fan Analysis Tool is broadly classified into seven categories: Fan ID, General Fan Data, Reference Fan Data, Motor Nameplate Data, Measured Fan Data, Measured Motor Data, and Estimated Measurement Error. Table 29. List of Data Inputs for the Fan Analysis and Benchmarking Tool
Data Input (Units/Options)
Data Input (Units/Options)
Fan ID: Measured Fan Data: Fan ID (Text) Measured Flow (CFM) General Fan Data: Measured Outlet SP (Iwc) Fan Function (Supply, Return, Exhaust) Measured Inlet SP (Iwc) Fan Control (CAV, VAV) Measured Inlet VP (Iwc) Fan Manufacturer Measured Fan Speed (RPM) Fan Design (SWSI, SWDI, DWSI, DWDI) Air Density (Lb/ft3) Fan Size (15-25", 25-35" 35-45", Over 45') Measured Motor Data: Fan Type (FC, BC, Axial) Measured KW (KW) Fan Configuration (Plug, Shrouded) Measured RPM (RPM) Motor Type (TEFC, Open Drip-proof) Measured Amp (Amp) Square Footage (Square feet) Measured Volt (Volt) Reference Fan Data: Measured PF (%) Design Flow (CFM) Estimated Eff (%) Design SP Rise (Iwc) Estimated Measurement Error: Design Speed (RPM) Flow Measurement Error (%) Design BHP (BHP) Static Pressure Measurement Error (%) Motor Nameplate Data: Power Measurement Error (%) Motor HP (HP) Motor Efficiency Measurement Error (%) Motor Synchronous RPM (900, 1200, 1800, 3600) Drive Efficiency Measurement Error (%) Motor Full Load RPM (RPM)
Nameplate Amps (Amps)
Nameplate Volts (Volts)
Nameplate PF (%)
Nameplate Motor Efficiency (%)
5.6.2.3 Calculated Metrics
Several metrics are calculated based on the input data, including: • Fan Efficiency (%), • Specific Fan Power, SFPI, (watts/cfm) • Motor Load Factor (%), • Flow Density (cfm/sf), and • Fan Efficiency Ratio (%)
Fan efficiency is the ratio of power delivered to useful work (flow and pressure) provided by the fan. As calculated from field measurements, fan efficiency is a function of motor efficiency, belt drive efficiency, input power to the motor, and the combined air pressure and flow delivered by the fan. Although fan efficiency is in many ways the most meaningful metric of fan energy performance, it is difficult to determine in-situ with

208
precision, due to the significant measurement error inherent in determining flow, pressure, belt drive efficiency, and motor efficiency.
Specific Fan Power for an Individual fan (SFPI) is measured in watts/cfm. This metric provides a simple and less error prone measure of the relative energy use of a fan. A high SFPI value indicates excessive energy consumption caused by poor fan efficiency, high system resistance, or both. From an energy efficiency perspective, reducing SFPI in a fan system is always preferable.
Motor Load Factor is the ratio of the motor power demand to the rated full load demand. Motor load factor can be used as an indication of over- or under-sized motors. This measurement for a VAV system should be made at a simulated full-load operating condition. An over-sized motor (load factor < 50%) will generally be much less efficient that a more appropriately sized motors as motor efficiency drops off sharply at low loads. The relationship between motor load factor and motor efficiency is analyzed in more detail by the Motor Efficiency tool, described in another section of this report. An under-sized motor (load factor > 95%) may wear out much faster than a properly sized motor. Motor load factor should generally be determined by taking the ratio of measured power (KW) to full load power, calculated based on motor nameplate electrical data. Load factor can also be determined by taking the ratio of measured current (Amps) multiplied by measured voltage (Volts) to nameplate current multiplied by nameplate volts. This method should only be used, however, when a power meter is not available and the instruments at hand can measure power factor, as the KW-method of determining load factor is generally more accurate than the Amp-method.
Flow Density (cfm/sf) provides an indication of the HVAC load being served by a supply fan. Systems with high flow densities are generally serving higher heating and cooling loads than systems with low flow densities, given equivalent supply air temperatures.
The Fan Efficiency Ratio provides a metric for comparing the measured in-situ fan efficiency to the reference (expected) fan efficiency. Most fan systems will have a fan efficiency ratio at or below 1.0. Systems with significant fan efficiency and or system resistance problems will have fan efficiency ratios much less than 1.0. Fan efficiency ratio is a metric that can reasonably be used to compare fans across size and type classifications, thereby allowing virtually all data in the database to be used.
The metrics described above are calculated for three distinct fan conditions: • Design Data • Measured Data • Corrected Data
Design metrics are calculated from the reference data. Measured metrics are calculated directly from the field measured data. Corrected metrics are based on the field-measured data and corrected to standard air density (0.075 lb/ft3) and to the reference fan speed. These corrections are made using the ideal fan laws. The corrected data point is used to provide a more direct "apples-to-apples" comparison between measured and reference data when fan speed and/or air density are significantly different between the design data

209
and field measured conditions. In this way any differences in the operating point of the measured and reference data can be evaluated, independent of fan speed and air density differences. It is assumed that the reference data was taken at standard air density. This assumption is true for the vast majority of manufacturer's data and corresponding design data. Table 30 summarizes the calculated metrics and the data used to calculate each. Table 30. Calculated Metrics for Fan Analysis Tool
Calculated Metric: (unit)
Design Data
Field Measured Data
Corrected to Design Speed
Fan Efficiency (%)
Calculated from: Design BHP Design SP Rise Design Flow
Calculated from: Motor KW Measured Inlet SP Measured Outlet SP Measured Inlet VP Measured Flow Est. Drive Eff. Est. Motor Eff.
Fan efficiency for the Corrected Data is identical to the Measured Data.
SFPI (watt/cfm)
Calculated from: Design BHP Design Flow
Calculated from: Measured KW Measured Flow Est. Drive Eff. Est. Motor Eff.
Calculated from: Measured SFPI Air Density Measured Speed Design Speed
Flow Density (cfm/sf)
Calculated from: Square Footage Design Flow
Calculated from: Square Footage Measured Flow
Calculated from: Square Footage Measured Flow Air Density Measured Speed Design Speed
Motor Load Factor (%)
N/A Calculated from: Nameplate Amps Nameplate Volts Nameplate PF Measured KW
N/A
Fan Efficiency Ratio (%)
N/A Calculated from: Measured Fan Eff. Design Fan Eff.
N/A
The metrics for each fan are calculated and recorded in the 'METRICS' tab of the Excel workbook. The 'METRICS' tab has no explicit data entry, it simply references the user entered data on the 'ENTER-UPDATE DATA' tab. All cells on the 'METRICS' tab are grayed-back and users of the Fan Analysis Tool should not alter the calculations made on this page.

210
5.6.2.4 Output Graphics and Problem Analysis SUMMARY TAB
A 'SUMMARY' tab is included in the Fan Analysis Tool. The subject fan can be selected on this tab from the list of fans entered on the 'ENTER-UPDATE DATA' Tab. The summary page presents the relevant data and calculated metrics for each fan condition (design, measured, and speed corrected) in a tabular form. The calculated error for the field measured data and metrics is also included. This fan summary table allows for comparison of how the fan power, efficiency and operating point may be different between the reference/design, field measured, and corrected conditions. CIEE Fan ProjectFan Analysis & Benchmarking Tool: Summary Page
Select Subject Fan: Function: Control: Design:EX-1 S-2 SF-1 Supply VAV SWSI
Size: Type: Configuration:25"- 35" Forward Curved Plug
FAN SUMMARY INFORMATION Design Data
Field Measured
Data
Corrected to Design
Speed
Measurement Error (+/-)
Fan Power (KW) 15.29 15.28 14.50 0.36Volumetric Flow (CFM) 30,000 29,100 28,467 1,139Fan Static Pressure (In. W.C.) 3.50 3.45 3.35 0.27Fan Speed (RPM) 1,125 1,150 1,125 - Specific Fan Power (Watt/CFM) 0.51 0.53 0.51 0.02Flow Density (CFM/SF) 0.88 0.86 0.84 0.03Fan Total Efficiency 81% 77% 77% 7.2%
Figure 85. Example Summary Page from Fan Analysis Tool
A "quick analysis" function is provided on the 'SUMMARY' tab that determines if the fan efficiency and/or fan operating point for the field measured data is significantly different (outside the measurement error bounds) than the design data. The Fan Efficiency Ratio, the ratio of the measured fan efficiency to the reference fan efficiency, is also presented on this tab.

211
QUICK ANALYSIS: MEASURED VS. DESIGN DATA
Measured Fan Power: Equivalent to DesignMeasured Fan Speed: Equivalent to Design
Measured Fan Operating Point: Equivalent Equiv. Volume Equiv. Pressure
Corrected Fan Opearting Point: Different: Lower Volume Equiv. PressureMeasured Fan Efficiency: Equivalent to Design
Fan Efficiency Ratio 0.96Ratio of measured fan efficiency to reference (design) fan efficiency
Figure 86. Example Quick Analysis from Fan Analysis Tool
A motor summary table is provided to demonstrate any differences between the motor nameplate and field measured electrical data. Calculated motor load factor is also presented on this page.
MOTOR SUMMARY INFORMATION
Namplate Data
Field Measured
DataMotor Output (HP) 25Motor Speed (RPM) 1765 1774Motor Current (Amps) 30.10 25.70Motor Voltage (Volts) 460 463Motor Power Factor 83% 84%Motor Efficiency 94% 93%Motor Input (KW) 19.91 17.30
Motor Load Factor KW Method Amp MethodMotor Load Factor: 87% 86%
Figure 87. Example Motor Summary from Fan Analysis Tool
FAN PLOT
The Fan Analysis Tool plots the fan operating point data, static pressure rise and volumetric flow, for the three fan conditions (design, measured, and corrected data) on the 'FAN PLOT' tab. The x-axis for this plot is fan flow (CFM) and the y-axis is fan static pressure (Iwc). System curves (assuming a square law characteristic), are included for the design and corrected data points. The Fan Plot allows for a graphical assessment of how the fan operating point is different between the expected (design) condition and the speed corrected condition. The corrected point is based on the field measured data but adjusted using the ideal fan laws to the same fan speed (RPM) as the design condition. This allows for a more meaningful comparison than simply comparing design data to field measured data, which may be at significantly different fan speeds. The corrected data point also accounts for non-standard air density conditions in the field measurements. Error bars are included on the plot for the corrected data point. These error bars are based on the input measurement error data and/or the default vales for measurement error assumed by the tool.

212
Figure 88 shows four examples of the Fan Plot for fans with the same design data but somewhat different measured and corrected data. Examples 1 and 3 demonstrate system resistance changes between the design point and the corrected point. Significant resistance and/or volume changes between the design and in-situ conditions can be easily interpreted on this plot. Examples 2 and 4 demonstrate fan efficiency changes between the design and the corrected data. The Fan Plot only presents operating points (flow and pressure) for the different fan conditions and the plot has no indication of motor power. Therefore, any fan efficiency differences between the design and corrected points will not be evident on this plot. Fan efficiency differences are apparent, however, on the SFPI Plot, which is described in the next section.
FAN PLOT FOR SUBJECT FAN:
0.00
0.50
1.00
1.50
2.00
2.50
3.00
3.50
4.00
4.50
0 5,000 10,000 15,000 20,000 25,000Fan Volumetric Flow (CFM)
Fan
Stat
ic P
ress
ure
(In. W
.C.) Design
Measured
Corrected
EX-1 "High Resistance"
FAN PLOT FOR SUBJECT FAN:
0.00
0.50
1.00
1.50
2.00
2.50
3.00
3.50
0 5,000 10,000 15,000 20,000 25,000Fan Volumetric Flow (CFM)
Fan
Stat
ic P
ress
ure
(In. W
.C.) Design
Measured
Corrected
EX-2 "Low Efficiency"

213
FAN PLOT FOR SUBJECT FAN:
0.00
0.50
1.00
1.50
2.00
2.50
3.00
3.50
0 5,000 10,000 15,000 20,000 25,000 30,000Fan Volumetric Flow (CFM)
Fan
Stat
ic P
ress
ure
(In. W
.C.) Design
Measured
Corrected
EX-3 "Low Resistance"
FAN PLOT FOR SUBJECT FAN:
0.00
0.50
1.00
1.50
2.00
2.50
3.00
3.50
4.00
0 5,000 10,000 15,000 20,000 25,000Fan Volumetric Flow (CFM)
Fan
Stat
ic P
ress
ure
(In. W
.C.) Design
Measured
Corrected
EX-4 "High Efficiency"
Figure 88. Example Fan Plots from Fan Analysis Tool

214
SFPI PLOT
A second plot comparing design fan data to field measured and corrected data is presented on the 'SFPI PLOT' tab. This plot includes SFPI (watt/cfm) on the y-axis with fan static pressure rise (Iwc) on the x-axis. Fan efficiency lines appear on this plot as straight lines that converge at the origin of the plot. The "corrected" data point on the plot includes error bars, calculated based on the given measurement error for the subject fan.
The "design" data point on the SFPI Plot includes heavy lines that divide the plot into quadrants. A quick diagnosis of the relationship between the design and corrected data points can be made based on where the corrected point falls with respect to these four quadrants. Table 31. SFPI Plot Quadrants
Corrected Data compared to Design Data: Quadrant
Corrected Data compared to Design Data: Efficiency
Corrected Data compared to Design Data: System Resistance
Energy-Use Implications
Upper-Left Lower Efficiency
Lower Resistance
Energy saving potential from improving fan efficiency
Upper-Right Lower Efficiency
Higher Resistance
Energy saving potential from improving fan efficiency and/or by reducing system resistance.
Lower-Left Higher Efficiency
Lower Resistance
No obvious energy savings potential.
Lower-Right Higher Efficiency
Higher Resistance
Energy saving potential from reducing system resistance.
Four example SFPI plots are shown in Figure 89 demonstrating example data in each of the four quadrants.

215
SPECIFC FAN POWER PLOT FOR SUBJECT FAN:
60%
65%
70%75%80%85%
55%
50%45%40%
0.00
0.20
0.40
0.60
0.80
1.00
1.20
0.00 1.00 2.00 3.00 4.00 5.00 6.00Static Pressure (In. W.C.)
SFPI
(wat
t/cfm
)
Design
Measured
Corrected
EX-1 "High Resistance"
SPECIFC FAN POWER PLOT FOR SUBJECT FAN:
60%
65%
70%75%80%85%
55%50%45%40%
0.00
0.20
0.40
0.60
0.80
1.00
0.00 1.00 2.00 3.00 4.00 5.00Static Pressure (In. W.C.)
SFPI
(wat
t/cfm
)
Design
Measured
Corrected
EX-2 "Low Efficiency"
SPECIFC FAN POWER PLOT FOR SUBJECT FAN:
60%
65%
70%75%80%85%
55%50%45%40%
0.00
0.20
0.40
0.60
0.80
1.00
0.00 1.00 2.00 3.00 4.00 5.00Static Pressure (In. W.C.)
SFPI
(wat
t/cfm
)
Design
Measured
Corrected
EX-3 "Low Resistance"
SPECIFC FAN POWER PLOT FOR SUBJECT FAN:
60%
65%
70%75%80%85%
55%50%45%40%
0.00
0.20
0.40
0.60
0.80
1.00
1.20
0.00 1.00 2.00 3.00 4.00 5.00Static Pressure (In. W.C.)
SFPI
(wat
t/cfm
)
Design
Measured
Corrected
EX-4 "High Efficiency"
Figure 89. Example SFPI Plots from Fan Analysis Tool

216
5.6.3 Fan Benchmarking Tool
5.6.3.1 Methodology & Assumptions
The Fan Benchmarking Tool is one part of a somewhat broader software tool "Fan Analysis and Benchmarking,” which has been assembled in Microsoft Excel 97. While the Fan Analysis Tool compares in-situ measurements of fan performance to a single reference datum, the Fan Benchmarking Tool compares a performance metric for the subject fan to a distribution of that metric from a population of similar fans. As both software tools require the same data inputs they have been integrated into a single Excel file the "Fan Analysis and Benchmarking" tool. In this report the Fan Benchmarking Tool is discussed independently from the Fan Analysis Tool, which was described in the previous section.
The Fan Benchmarking Tool provides a protocol for comparing a performance metric of a subject fan to a distribution of that metric derived from a population of data from many fans. The tool relies on the database of fan information input on the 'ENTER-DATA' tab. From this data, various fan performance metrics are calculated and tabulated in the 'BENCHMARKING' tab. The software tool filters this data set based on user selections determining which fans are to be included in the comparison population. Extremely poor performing fans are assumed to have significant defects not representative of typical fan systems and are automatically filtered out of the comparison data set.
Once the parameters of the comparison fan population have been established, the mean and standard deviation of this population is calculated for a selected performance metric. A normal distribution curve is then plotted on the 'BENCHMARKING Chart' tab based on the calculated mean and standard deviation. It is assumed that a normal distribution exists for the selected performance metric among the comparison population of fans.
The value of the selected fan performance metric for the subject fan is also plotted on the 'BENCHMARKING Chart' tab. In this way the user can evaluate how the subject fan compares to a population of similar fans for various performance metrics. The user selects the subject fan on the 'SUMMARY' tab. The subject fan is the same for the "Fan Analysis Tool" and the "Fan Benchmarking Tool.”
5.6.3.2 Data Inputs and Selections
The data inputs to the Fan Benchmarking Tool are identical to the data inputs required for the Fan Analysis Tool, described in the previous section. These data inputs are made on the 'ENTER-UPDATE DATA' Tab of the Excel workbook. Space has been provided so that data for up to 100 fans can be recorded on this tab. The composite of the fan data entered on this tab is used as the database of comparison fans.
The subject fan for the Fan Benchmarking Tool is selected on the 'SUMMARY' tab of the workbook and is the same subject fan used for the Fan Analysis Tool. The selected subject fan and its various parameters (function, size, type, etc.) are displayed in greyed-out cells at the top of the 'BENCHMARKING' Tab.

217
The user can select settings for the comparison population parameters to match the parameters of the subject fan. For each of the parameters, the user can also select 'any', which will include all fans in the database.
5.6.3.3 Comparison Population Parameters (Data Set Filters)
In the Fan Benchmarking Tool, the user can define parameters for a population of fans that will be used as a comparison to the subject fan. The comparison population is filtered using a set of six parameters (data set filters). • Fan Function (Supply, Return, Exhaust, Any) • Fan Control (VAV, CAV, Any) • Fan Design (SWSI, SWDI, DWSI, DWDI, Any) • Fan Size (15"-25", 25"-35", 35"-45", Over 45", Any) • Fan Type (Forward-curved, Backward-curved, Axial, Any) • Fan Configuration (Plug, Shrouded, Any)
For example, if the user wishes to compare the subject fan only to other VAV supply fans, the Fan Function cell on the 'BENCHMARKING' tab would be set to 'Supply' and the Fan Control cell would be set to 'VAV'. All other parameters would be set to 'Any' allowing for fans of various design, size, type, and configuration in the comparison population. Figure 90 below shows an example of filtering the database to include only Backward Curved Supply fans.
CIEE Fan Project
Benchmarking Page Function: Control: Design: Size: Type: Configuration:
Subject Fan: Supply VAV DWDI 15" - 25" Backward Curved Shrouded
Select Comparison Population Parameters: Supply Any Any Any Backward Curved Any
Select Comparison Metric: Measured Efficiency (%)
EX-1 S-1 SF-1
Figure 90. Example Population Parameters from Fan Benchmarking Tool
If all of the data set filters are set to 'ANY' then all of the fans in the database will be included in the comparison population, with the exception of extremely poor performing fans, which are automatically excluded from the comparison data set. It is assumed that if a fan has an fan efficiency ratio (ratio of measured efficiency to reference efficiency) less than 50%, then a significant operating problem or defect exists and the fan is automatically excluded from the comparison population.
5.6.3.4 Comparison Metrics
There are eight fan metrics that the user may select to serve as a basis of comparison between the population of fans in the database and the selected subject fan. • Design SFPI (watt/cfm) • Design Efficiency (%) • Design CFM Per SF • Measured SFPI (watt/cfm)

218
• Measured Efficiency (%) • Measured CFM Per SF • Fan Efficiency Ratio (%) • Motor Load Factor (%)
5.6.3.5 Problem Analysis with Frequency Distribution Plot
Once the user has selected the population parameters and a comparison metric, the mean and standard deviation of this metric for the comparison population of fans is calculated. The software assumes a normal distribution for the given comparison metric and population of comparison fans. This normal distribution, indicating the standard deviation and mean, is plotted on the 'BENCHMARKING Chart' tab.
The 95% confidence interval in the mean is also calculated. On the Benchmarking Chart the mean for the population of comparison fans is displayed as a range within this 95% confidence interval. For comparison populations with many fans, the confidence interval will be a small value and the mean will appear as a narrow band on the Benchmarking Plot. For comparison populations with few fans, the 95% confidence interval in the mean will be a larger value and on the chart the mean will appear as a wider band (see Section 5.5.3.2 for a more complete description of errors).
The Benchmarking Chart also indicates the value of the comparison metric for the subject fan. The subject fan appears on the chart as a black bar, with the width of the bar controlled by the amount of measurement error in the calculated comparison metric for the subject fan.
In this way the user can determine how the subject fan compares to a defined population of other fans for a selected fan performance metric. If the subject fan appears near the mean on the chart, the subject fan can be considered typical of the comparison population of fans for the comparison metric. Conversely, if the subject fan is at the edge of the population, above or below one standard deviation from the mean, it is in the upper or lower 20% of the given population for the give performance metric. The inclusion of confidence interval in the mean and measurement error in the subject fan data are intended to help determine when there is not enough data and/or too much error in data to make a relevant comparison.

219
NORMALIZED FREQUENCY DISTRIBUTION FOR SELECTED POPULATION OF FANS
0.30 0.36 0.42 0.49 0.55 0.61 0.67 0.73 0.79 0.85 0.91 0.97 1.03 1.09 1.15
Rel
ativ
e Fr
eque
ncy
+/- One Standard Deviation
Population Mean (95% Confidence Interval)
Subject Fan (Width Indicates Error)
Motor Load Factor (%)
Subject Fan: EX-1 "High Resistance"
Figure 91. Example Benchmarking Chart from Fan Benchmarking Tool
The chart above presents an example where Motor Load Factor was chosen as the comparison metric. The motor load factor for the subject fan is completely within the confidence interval of the mean of the comparison population. This would indicate that the motor load factor of subject fan is very typical of this population of fans.

220
NORMALIZED FREQUENCY DISTRIBUTION FOR SELECTED POPULATION OF FANS
0.26 0.31 0.36 0.42 0.47 0.52 0.57 0.62 0.67 0.73 0.78 0.83 0.88 0.93 0.99
Rel
ativ
e Fr
eque
ncy
+/- One Standard Deviation
Population Mean (95% Confidence Interval)
Subject Fan (Width Indicates Error)
Measured Efficiency (%)
Subject Fan: EX-2 "Low Efficiency"
Figure 92. Example Benchmarking Chart from Fan Benchmarking Tool
In the example above measured fan efficiency has been selected as the performance metric to compare the subject fan and comparison population of fans. There is a significant error in the measured fan efficiency calculation so the subject fan is plotted over a wide range, from approximately 44% - 54%. Despite this error, however, it is clear that the measured fan efficiency of the subject fan is on the low end of the comparison population, at or below one standard deviation from the mean. This would imply that approximately 80% of the fans in the comparison population are more efficient than the subject fan.

221
NORMALIZED FREQUENCY DISTRIBUTION FOR SELECTED POPULATION OF FANS
0.28 0.34 0.39 0.45 0.51 0.56 0.62 0.67 0.73 0.79 0.84 0.90 0.95 1.01 1.07
Rel
ativ
e Fr
eque
ncy
+/- One Standard Deviation
Population Mean (95% Confidence Interval)
Subject Fan (Width Indicates Error)
Design Efficiency (%)
Subject Fan: MVTH Sys-3 SF-3
Figure 93. Example Benchmarking Chart from Fan Benchmarking Tool
For the example above, design fan efficiency was selected as comparison metric. For the comparison population, most fans have a design efficiency between approximately 63% and 79%. The subject fan, with a design efficiency of 83%, is in the upper 20% of fans in this population. Since there is no measurement error in calculating design efficiency, the subject fan appears on the plot as a narrow spike.

222
5.6.4 Fan Power Analysis Tool
5.6.4.1 Methodology and Assumptions
The Fan Power Analysis Tool has been developed in Microsoft Excel 97. The tool is designed to analyze logged fan power (or current as a proxy for power) data in order to evaluate energy problems including excessive run time and inadequate VAV turndown. The tool can be used to analyze both CAV and VAV systems, although it is more informative when evaluating VAV systems.
5.6.4.2 Data Inputs
The required data inputs for the Fan Power Analysis Tool are: • Motor nameplate electrical data • HVAC schedule information • Logged input motor power (KW) or logged input motor current (Amp) • Logged Outside Air Temperature
The motor nameplate electrical information (voltage, current, and power factor) should be recorded for the fan to be analyzed and input on the 'START' tab in the Fan Analysis Tool. The motor nameplate data is used to calculate the full-load power of the motor and determine operating load factors based on the measured power (or current) data.
An HVAC schedule must also be input on the 'START' tab. This schedule is used to filter the data into two bins, scheduled-on hours and scheduled-off hours.
Logging input motor power requires a power transducer and a data logger. Current transducers are more common and generally easier to install and use than power transducers. For this reason the Fan Power Analysis tool has been set up to accept either power or current as an input data series. If current is used as a proxy for power, the tool assumes the user inputs for nameplate voltage and power factor in calculating power. This assumption breaks down at low load conditions. For this reason it is not advisable to use current as a proxy for power for fan systems with significant low load operation (load factor < 50%). Also if measured voltage and power factor are significantly different than nameplate, the measured values should be input in order to use current as a proxy for power more accurately.
Logged outside air temperature is used as an indication for load. For systems serving zones with high internal loads and/or for monitored periods little variation in outside air temperature, the logged outside air temperature will have limited relevance for this analysis.

223
5.6.4.3 Output Graphics and Problem Analysis SUMMARY TAB
The 'SUMMARY' Tab presents a statistical break-down of Minimum, Average, Maximum, and Standard Deviation values for motor input power, operating load factor and outside air temperature, in both the scheduled-on and scheduled-off periods, as well as for all monitored hours. This summary information allows for a quick determination of significant off-hours fan operation. Based on the monitored power data, projections for annual operating hours and annual energy consumption (kWh per year) in both the scheduled-on and scheduled-off periods are also calculated.
CIEE Fan Project
Fan Power Analysis ToolSummary of Logged Data
Data Collection Parameters Scheduled On-Hours
Scheduled Off-Hours
All Measured Hours
Data log start time: 4/7/93 0:14Data log end time: 4/14/93 23:59Logging Interval: 15.0 minutesTotal Measured Hours: 191.50 HrsOperating Hours:* 111.50 80.00 189.50 HrsOperating Hrs. as % of Total Hrs: 58.2% 41.8% 99.0%Projected Operating Hrs/Yr: 5,100 3,660 8,669 Hrs/Yr* Hours with Power > 0.1 KW
Motor Input Power Scheduled On-Hours
Scheduled Off-Hours
All Measured Hours
Minimum Power Demand 1.00 0.00 0.00 KWAverage Power Demand 4.27 2.03 3.33 KWMaximum Power Demand 5.70 4.40 5.70 KWStandard Deviation 0.72 1.29 1.49 KWProjected KWH/Yr. 21,768 7,423 29,192 KWH/Yr
Operating Load Factor(% of Full Load Motor Power) Scheduled
On-HoursScheduled Off-Hours
All Measured Hours
Minimum Load Factor 17% 0% 0%Average Load Factor 73% 35% 57%Maximum Load Factor 97% 75% 97%Standard Deviation 12% 22% 25%
Outside Air Temperature Scheduled On-Hours
Scheduled Off-Hours
All Measured Hours
Minimum OAT 51.7 51.7 51.7 FAverage OAT 61.9 55.8 59.4 FMaximum OAT 74.0 58.6 74.0 FStandard Deviation 4.7 1.7 4.8 F
Figure 94. Example Summary Tab from Fan Power Analysis Tool

224
LOAD FACTOR HISTOGRAM
The Fan Power Analysis Tool calculates operating load factor values in the scheduled-on and scheduled-off hours periods and then assigns the load factor data to one of eleven bins from 0% to 100%. The load factor bins are plotted on the 'LF Histogram' tab. This chart allows for quick analysis of how much turn-down a VAV system is realizing and how much off-hours operation was measured. For CAV systems, all data should appear in one bin.
OPERATING LOAD FACTOR HISTOGRAM(ALL MONITORED HOURS)
0
10
20
30
40
50
60
0% 1-10% 11-20% 21-30% 31-40% 41-50% 51-60% 61-70% 71-80% 81-90% 91-100%
Load Factor
Hou
rs o
f Ope
ratio
n
All Hours Scheduled On Hours Scheduled Off Hours
Figure 95. Example Load Factor Histogram from Fan Power Analysis Tool

225
LOAD FACTOR VS. OAT CHART
The 'LF-OAT Chart' is a scattered plot with operating load factor on the y-axis and outside air temperature on the x-axis. Data points are designated as 'Scheduled-On Hours' and 'Scheduled-Off Hours'. For CAV systems this data should be relatively flat (horizontal line) with little scatter. For VAV systems a general upward trend would be expected, with higher LF at higher OAT (especially for perimeter zones). For interior zones and other zones with high internal loads, increased scatter in the data can be expected as cooling load and OAT will not be strongly correlated. For monitored periods with limited variation in OAT, the data on this chart will not be as useful as for periods with significant OAT swings.
OPERATING LOAD FACTOR ANALYSIS
0%
10%
20%
30%
40%
50%
60%
70%
80%
90%
100%
40 45 50 55 60 65 70 75 80
OAT (F)
Ope
ratin
g Lo
ad F
acto
r (%
)
Scheduled On Hours Scheduled Off Hours Figure 96. Example LF-OAT Chart from Fan Power Analysis Tool

226
LOAD FACTOR (LF) VS. TIME-OF-DAY CHART
The LF-Time of Day Chart shows load factor on the y-axis with the Time-of-day on the x-axis. Data points are designated as 'Scheduled-On Hours' or 'Scheduled-off Hours'. For CAV systems, LF data should be consistent (horizontal line). For VAV systems, the data should demonstrate a trend with generally higher LF values at higher load periods, typically in the mid-afternoon and lower LF values during low-load periods, typically in the early morning and off-hours. The relative magnitude and frequency of any measured off-hours operation is apparent on this chart.
LOAD FACTOR HOURLY ANALYSIS(ALL MONITORED HOURS)
0%
10%
20%
30%
40%
50%
60%
70%
80%
90%
100%
0.00 3.00 6.00 9.00 12.00 15.00 18.00 21.00 24.00
Time of Day (Hour)
Ope
ratin
g Lo
ad F
acto
r (%
)
Scheduled On Hours Scheduled Off Hours Figure 97. Example LF-Time of Day Chart from Fan Power Analysis Tool

227
POWER VS. TIME CHART
The Power-Time chart shows the entire data stream for measured input motor power (or power calculated from measured current) over the course of the monitoring period. The designated system schedule is also plotted on this chart along with the monitored OAT.
FAN MOTOR INPUT POWER PROFILE(ALL MONITORED HOURS)
0.0
1.0
2.0
3.0
4.0
5.0
6.0
7.0
4/6/9312:00
4/7/930:00
4/7/9312:00
4/8/930:00
4/8/9312:00
4/9/930:00
4/9/9312:00
4/10/930:00
4/10/9312:00
4/11/930:00
4/11/9312:00
4/12/930:00
4/12/9312:00
4/13/930:00
4/13/9312:00
4/14/930:00
4/14/9312:00
4/15/930:00
4/15/9312:00
Date and Time
KW
0
10
20
30
40
50
60
70
80
Tem
pera
ture
(F)
Input Motor Power Schedule OAT
Figure 98. Example Power-Time Chart from Fan Power Analysis Tool

228
5.6.5 System Temperature Analysis Tool
5.6.5.1 Methodology & Assumptions
The System Temperature Analysis tool is a Microsoft Excel 97 worksheet intended to help diagnose operational problems in a built-up air handler including a malfunctioning economizer cycle and supply air temperature controls. The tool can be used for both CAV and VAV systems.
5.6.5.2 Data Inputs
The required data inputs for the System Temperature Analysis Tool are: • Supply Air Temperature setpoint (if applicable) • Economizer control settings (if applicable) • HVAC schedule information • Logged Supply Air Temperature (SAT) • Logged Return Air Temperature (RAT) • Logged Mixed Air Temperature (MAT) • Logged Outside Air Temperature (OAT)
If the SAT setpoint is fixed for the analyzed system (i.e., if an SAT reset control strategy is not employed), the system SAT Setpoint should be entered on the 'START' tab of the System Temperature Analysis Tool. If a SAT reset control scheme is used, then the SAT Setpoint can be left blank.
The assumed HVAC schedule must also be input on the 'START' tab. This schedule is used to filter the data so that only data points taken while the system was operating are evaluated.
If the analyzed system includes an airside economizer, an Economizer High Limit, Economizer Low Limit and Minimum OSA (%) should be entered on the 'START' tab. It is assumed that the economizer is in minimum position for outside air temperatures below the economizer low limit and above the economizer high limit, and is in a full open (100% OSA) position between the high and low limits. For economizers that use a different control strategy, these setpoints should be left blank.
The SAT, RAT, MAT, and OAT data logs should be pasted into the 'ENTER DATA' tab. The tool is set-up to handle up to 1,345 data points, equivalent to two weeks of data at a 15-minute logging interval or eight weeks of data at a 1-hour logging interval. Any set of logged temperature data with 1,345 points or less can be used. It is assumed that Farenheight measurements will be used. If Celsius measurements are used the axes on some charts must be reformatted. The rest of the cells on this tab, which are grayed-back, are setup to sort and filter the data and should not be changed.

229
5.6.5.3 Output Graphics and Problem Analysis SUMMARY TAB
The 'SUMMARY' Tab presents a statistical break-down of the data with Minimum, Average, Maximum, and Standard Deviation values for each measured data set, during Scheduled-on hours. The coincident value of each data set at the maximum and minimum ambient (OAT) conditions is also presented.
CIEE Fan ProjectSystem Temperature Data Analysis Tool
System Parameters
Supply Air Temperature Setpoint HVAC ScheduleSAT Setpoint: 56 F Weekday On: 5:45 AM
Off: 11:15 PM
Economizer High/Low Limits Saturday On: 5:45 AM
Economizer high limit: 70 F Off: 11:15 PM
Economizer low limit: 55 F Sunday On: 5:45 AM
Minimum OSA: 25% Off: 11:15 PM
Figure 99. Summary Tab from System Temperature Analysis Tool
MAT VS. OAT CHART (ECONOMIZER ANALYSIS)
The 'MAT-OAT Chart' in the System Temperature Analysis tool is a scatter chart with MAT on the y-axis and OAT on the x-axis. Only data points taken during scheduled-on periods are plotted. An "ideal" economizer operation line is also plotted based on the entered economizer setpoints and the control strategy described above. If the economizer is working correctly, data should fall on or near the ideal economizer line. If the data on this chart is generally flat (horizontal line), it indicates minimal ventilation air is being delivered to the system. If the data has a strong upward trend (higher MAT at higher OAT), this indicates relatively high ventilation rates. If the data is widely scattered, it may indicate a malfunctioning economizer. Widely scattered data may also indicate a misplaced MAT or OAT sensor.

230
MIXED AIR TEMPERATURE ANALYSIS(SCHEDULED-ON HOURS ONLY)
40
45
50
55
60
65
70
75
40 45 50 55 60 65 70 75 80
Outside Air Temperature (F)
Mix
ed A
ir Te
mpe
ratu
re (F
)
MAT Ideal Economizer Operation
Figure 100. Example ‘MAT-OAT Chart’ from System Temperature Analysis Tool

231
SAT VS. OAT CHART (SAT RESET ANALYSIS)
The 'SAT-OAT Chart' has SAT on the y-axis and OAT on the x-axis. Only data points taken during scheduled-on hours are plotted. The SAT setpoint (when entered) is plotted as a horizontal line. Systems with a fixed SAT setpoint (or inoperative SAT reset) should generally see flat data around the setpoint value. Systems with SAT reset controls should see a general downward trend in the data, with lower SAT at higher OAT. If the data shows an upward trend (higher SAT at higher OAT conditions), this may indicate that the cooling coils are capacity limited or the airflow is too low. Widely scattered data may be an indication of a failure in the cooling coil controls or a misplaced OAT or SAT sensor.
SUPPLY AIR TEMPERATURE ANALYSIS(SCHEDULED-ON HOURS ONLY)
40
45
50
55
60
65
70
40 45 50 55 60 65 70 75 80
Outside Air Temperature (F)
Supp
ly A
ir Te
mpe
ratu
re (F
)
SAT SAT Setpoint
Figure 101. Example ‘SAT-OAT Chart’ from System Temperature Analysis Tool

232
SAT AND RAT VS. TIME OF DAY CHART
The 'SAT, RAT-Time of Day Chart' shows SAT and RAT on the y-axis with the Time-of-day on the x-axis. Only data points taken during scheduled-on hours are plotted. RAT data should be relatively flat at or slightly above the desired zone temperature. Scatter in the RAT data may indicate that zone temperatures are not being held consistent or that the sensor was misplaced. SAT data should be flat if a SAT reset control strategy is not used. If SAT reset is employed, the data should demonstrate a trend with generally lower SAT values at higher load periods (typically in the mid-afternoon) and higher SAT values.
SAT AND RAT HOURLY ANALYSIS(SCHEDULED-ON HOURS ONLY)
40
45
50
55
60
65
70
75
0.00 3.00 6.00 9.00 12.00 15.00 18.00 21.00 24.00
Time of Day (Hour)
Tem
pera
ture
(F)
RAT SAT
Figure 102. Example ‘SAT, RAT-Time of Day Chart’ from System Temperature Analysis Tool

233
MAT AND OAT VS. TIME OF DAY CHART
The 'MAT, OAT-Time of Day Chart' shows MAT and OAT on the y-axis with the Time-of-day on the x-axis. Only data points taken during scheduled-on hours are plotted. OAT data should show a typical diurnal trend with lower temperatures in the morning and peak temperatures in mid afternoon. MAT temperatures should follow a similar, but dampened trend as the OAT data.
MAT AND OAT HOURLY ANALYSIS(SCHEDULED-ON HOURS ONLY)
40
45
50
55
60
65
70
75
80
0.00 3.00 6.00 9.00 12.00 15.00 18.00 21.00 24.00
Time of Day (Hour)
Tem
pera
ture
(F)
OAT MAT
Figure 103. Example ‘MAT, OAT-Time of Day Chart’ from System Temperature Analysis Tool

234
SYSTEM TEMPERATURES VS. TIME CHART
This chart presents all of the data streams over the course of the logging period. The input HVAC schedule is also presented on this plot. Atypical periods in the data can be determined quickly from this plot. OAT should demonstrate a standard diurnal cycle. During scheduled-off hours, SAT should rise, RAT and MAT may decrease some. If there is little change between scheduled-on and scheduled off hours, either the system is not shutting down during off-hours or the schedule input on the 'START' tab is not the actual schedule used by the HVAC system.
SYSTEM AIR TEMPERATURES(ALL MONITORED HOURS)
40
45
50
55
60
65
70
75
80
4/6/9312:00
4/7/930:00
4/7/9312:00
4/8/930:00
4/8/9312:00
4/9/930:00
4/9/9312:00
4/10/930:00
4/10/9312:00
4/11/930:00
4/11/9312:00
4/12/930:00
4/12/9312:00
4/13/930:00
4/13/9312:00
4/14/930:00
4/14/9312:00
4/15/930:00
4/15/9312:00
Date and Time
Tem
pera
ture
(F)
OAT MAT RAT SAT Schedule
Figure 104. Example ‘SAT, RAT, MAT, OAT-Time Chart’ from System Temperature Analysis Tool

235
5.6.6 Reheat Temperature Analysis Tool
5.6.6.1 Methodology & Assumptions
The Reheat Temperature Analysis tool is a Microsoft Excel 97 worksheet intended to help diagnose over-air and under-air conditions in zones served by built-up air handlers. The tool is only applicable to CAV systems.
5.6.6.2 Data Inputs
The required data inputs for the System Temperature Analysis Tool are: • HVAC schedule information • Logged Zone Air Temperature (SAT) for up to two “worst-case” zones • Logged Hot Water Supply Temperature (HWST) • Logged Hot Water Return Temperature (HWRT) • Logged Outside Air Temperature (OAT)
An HVAC schedule must be input on the 'START' tab. This schedule is used to filter the data so that only data points taken while the system was operating are evaluated.
The ZAT, HWST, HWRT, and OAT data logs should be pasted into the 'ENTER DATA' tab. For each data point, the difference between the reheat supply and return temperatures (HWST and HWRT) is calculated and stored as a separate data stream, Hot Water Delta-T (HWDT). The tool is set-up to handle up to 1,345 data points, equivalent to two weeks of data at a 15-minute logging interval or eight weeks of data at a 1-hour logging interval, however, any set of logged temperature data with 1,345 points or less can be used. It is assumed that Farenheight measurements will be used. If Celsius measurements are used the axis on some charts must be reformatted. The rest of the cells on this tab, which are greyed-back, are setup to sort and filter the data and should not be changed.
5.6.6.3 Output Graphics & Problem Analysis SUMMARY TAB
The 'SUMMARY' Tab presents a statistical break-down of the data with Minimum, Average, Maximum, and Standard Deviation values for each measured data set (ZAT, HWST, HWRT, HWDT), during Scheduled-on hours. The coincident value of each data set at the maximum and minimum ambient (OAT) conditions is also presented.

236
CIEE Fan ProjectZone Air Temperature Analysis ToolSummary of Logged Data:
Data Collection ParametersData log start time: 1/16/99 23:01Data log end time: 1/26/99 7:01Logging Interval: 10 minutesTotal Logged Hours: 224.00 hoursScheduled On Hours: 126.70 hoursOn Hours as % of Total: 57%
Zone Temperature Statistical Analysis*Minimum Average Maximum Std. Dev.
Outside Air Temp 2.0 30.1 49.0 12.6Zone 1 69.7 71.5 76.7 0.9Zone 2 71.8 73.7 75.8 0.9HWST 84.7 95.5 110.8 6.4HWRT 75.8 81.8 86.1 2.0HW Delta T 0.3 13.7 34.7 8.1
*Data is for scheduled operarting hours only
Zone Temperature at Peak Ambient Conditions*At Min OAT At Max OAT
Outside Air Temp 2.0 49.0Zone 1 72.2 70.5Zone 2 74.2 73.6HWST 110.3 85.9HWRT 76.3 83.0HW Delta T 33.9 2.9
*Data is for scheduled operarting hours only
0102030405060708090
Outside Air Temp Zone 1 Zone 2 HW Delta T
Maximum Average Minimum
0
10
20
30
40
50
60
70
80
Outside Air Temp Zone 1 Zone 2 HW Delta T
At Min OAT At Max OAT
Figure 105. Summary Tab from Reheat Temperature Analysis Tool

237
ZAT,HWDT-OAT CHART
The 'ZAT,HWDT-OAT Chart' in the Reheat Temperature Analysis tool is a scatter chart with ZAT and HWDT on the y-axis and OAT on the x-axis. Only data points taken during scheduled-on periods are plotted. If the CAV zones being analyzed have an appropriate amount of air, the ZAT should be held relatively consistent in all load conditions, while the HWDT should increase at low load conditions and go to zero at high cooling load conditions. An over-aired zone will show excessive reheat even at high cooling loads. An under-aired system will have little if any reheat at moderate and high cooling loads. An under-aired zone will likely also show an increase in ZAT at high cooling loads.
On the 'ZAT,HWDT-OAT Chart' an under-aired system may appear with overall low HWDT and an upward trend in ZAT with higher ZAT at higher OAT. An over-aired system will show significant HWDT even at high OAT.
Widely scattered data on the chart may indicate a misplaced ZAT or OAT sensor. Scattered data may also be an indication of an internal load dominated zone. Generally this analysis will be more meaningful in “worst-case” perimeter zones.
ZONE TEMPERATURE AND REHEAT DELTA-T ANALYSIS(SCHEDULED HOURS ONLY)
55
60
65
70
75
80
85
0 5 10 15 20 25 30 35 40 45 50 55
Outside Air Temperature (F)
Zone
Air
Tem
pera
ture
(F)
0
10
20
30
40
50
60
Reh
eat D
elta
-T (F
)
Zone 1 Zone 2 Zone 1 Setpoint Zone 2 Setpoint Reheat Delta-T
Figure 106. Example ‘ZAT, HWDT-OAT Chart’ from Reheat Temperature Analysis Tool

238
'HWST,HWRT-OAT CHART
The 'HWST,HWRT-OAT Chart' has hot water supply temperature (HWST) and hot water return temperature (HWRT) on the y-axis with OAT on the x-axis. Only data points taken during scheduled-on hours are plotted. Systems with a fixed hot water supply temperature setpoint should have consistent data for HWST (horizontal line) with an upward trend for HWRT, with higher reheat return temperature at higher OAT conditions. Systems with hot water reset controls should see decreasing HWST at higher OAT conditions. In these systems HWRT may increase somewhat at higher OAT conditions.
The 'HWST,HWRT-OAT Chart' provides an indication of whether system reheat temperatures are varying in a predictable way. If neither HWST nor HWRT show variation with OAT, it is likely that reheat energy is being wasted and/or Zone temperatures are not being maintained.
REHEAT SUPPLY AND RETURN TEMPERATURES ANALYSIS(SCHEDULED HOURS ONLY)
75
80
85
90
95
100
105
110
115
0 5 10 15 20 25 30 35 40 45 50 55
Outside Air Temperature (F)
Tem
pera
ture
(F)
HWST HWRT
Figure 107. Example ‘HWST, HWRT-OAT Chart’ from Reheat Temperature Analysis Tool

239
'ZAT, HWDT-TIME OF DAY CHART
The 'ZAT, HWDT-Time of Day Chart' shows ZAT and HWDT on the y-axis with the Time-of-day on the x-axis. Only data points taken during scheduled-on hours are plotted. ZAT data should be relatively flat at the desired zone temperature (thermostat). Scatter in the ZAT data may indicate that zone temperatures are not being held consistent and the zone may be under or over-aired. HWDT data should demonstrate a trend with generally lower HWDT values at higher load periods (typically in the mid-afternoon) and higher HWDT values at low load conditions (typically in the morning).
ZONE TEMPERATURE AND REHEAT DELTA-T HOURLY ANALYSIS(SCHEDULED HOURS ONLY)
45
50
55
60
65
70
75
80
85
0.00 3.00 6.00 9.00 12.00 15.00 18.00 21.00 24.00
Time of Day (Hour)
Tem
pera
ture
(F)
5
10
15
20
25
30
35
40
45
Reh
eat D
elta
-T (F
)
Zone 1 Zone 2 Zone 1 Setpoint Zone 2 Setpoint Series3
Figure 108. Example ‘ZAT, HWDT-Time of Day Chart’ from Reheat Temperature Analysis Tool

240
'HWST,HWRT-TIME OF DAY CHART'
The 'HWST,HWRT-Time of Day Chart' shows HWST and HWRT on the y-axis with the Time-of-day on the x-axis. Only data points taken during scheduled-on hours are plotted. HWST data should be consistent if a hot water reset control strategy is not used. If hot water reset is employed, the data should demonstrate a trend with generally lower HWST values at higher load periods (typically in the mid-afternoon) and higher HWST values at lower load periods (typically in the morning).
REHEAT SUPPLY AND RETURN TEMPERATURES HOURLY ANALYSIS(SCHEDULED HOURS ONLY)
75
80
85
90
95
100
105
110
115
0.00 3.00 6.00 9.00 12.00 15.00 18.00 21.00 24.00
Time of Day (Hour)
Tem
pera
ture
(F)
HWST HWRT
Figure 109. Example ‘HWST, HWRT-Time of Day Chart’ from Reheat Temperature Analysis Tool

241
ZONE AND REHEAT TEMPERATURES VS. TIME CHART
This chart presents all of the data streams over the course of the logging period. The input HVAC schedule is also presented on this plot. Atypical periods in the data can be determined quickly from this plot. OAT should demonstrate a standard diurnal cycle. During scheduled-off hours, ZAT may rise, while HWDT should fall. If there is little change between scheduled-on and scheduled off hours, either the system is not shutting down during off-hours or the schedule input on the 'START' tab is not the actual schedule used by the HVAC system.
ZONE AIR TEMPERATURE AND REHEAT PROFILE(ALL MONITORED HOURS)
0
10
20
30
40
50
60
70
80
90
1/16/990:00
1/16/9912:00
1/17/990:00
1/17/9912:00
1/18/990:00
1/18/9912:00
1/19/990:00
1/19/9912:00
1/20/990:00
1/20/9912:00
1/21/990:00
1/21/9912:00
1/22/990:00
1/22/9912:00
1/23/990:00
1/23/9912:00
1/24/990:00
1/24/9912:00
1/25/990:00
1/25/9912:00
1/26/990:00
1/26/9912:00
1/27/990:00
Date and Time
Tem
pera
ture
(F)
Zone 1 Zone 2 OAT Reheat Delta T Schedule Figure 110. Example ‘ZAT, HWDT-Time Chart’ from Reheat Temperature Analysis Tool

242
5.6.7 Static Pressure Analysis Tool
5.6.7.1 Methodology & Assumptions
The Static Pressure Analysis tool is a Microsoft Excel 97 worksheet intended to help diagnose operational problems in VAV built-up air handlers. The tool is only applicable to VAV systems.
5.6.7.2 Data Inputs
The required data inputs for the Static Pressure Analysis Tool are: • HVAC schedule information • Logged Fan Output Static Pressure (SPout) • Logged Outside Air Temperature (OAT)
An HVAC schedule must be input on the 'START' tab. This schedule is used to filter the data so that only data points taken while the system was operating are evaluated.
The SPout and OAT data logs should be pasted into the 'ENTER DATA' tab. The tool is set-up to handle up to 1,345 data points, equivalent to two weeks of data at a 15-minute logging interval or eight weeks of data at a 1-hour logging interval, however, any set of logged temperature data with 1,345 points or less can be used. It is assumed that temperature measurements will be in Fahrenheit and static pressure measurements will be in inches of water. If other units are used, the axis on some charts must be reformatted. The rest of the cells on this tab, which are greyed-back, are setup to sort and filter the data and should not be changed.
5.6.7.3 Output Graphics & Problem Analysis SUMMARY TAB
The 'SUMMARY' Tab presents a statistical break-down of the data with Minimum, Average, Maximum, and Standard Deviation values for each measured data set (SPout and OAT), during Scheduled-on hours. The coincident value of SPout set at the maximum and minimum OAT condition is also presented.

243
CIEE Fan ProjectStatic Pressure Data Analysis ToolSummary of Logged Data
Data Collection ParametersData log start time: 4/7/93 0:14Data log end time: 4/14/93 23:59Logging Interval: 15 hoursTotal Logged Hours: 191.75 hrsScheduled On Hours: 90.15 hrsOn Hours as % of Total: 47%
Static Pressure Statistical Analysis*Minimum Average Maximum Std. Dev.
Static Pressure 1.34 1.45 1.64 0.05 Outside Air Temperature 51.7 62.1 74.0 5.0 *Data is for scheduled operarting hours only
40
50
60
70
80
Minimum Average Maximum0.2
0.6
1.0
1.4
1.8
Outside Air Temperature Static Pressure
Figure 111. Example Summary Tab from Static Pressure Analysis Tool

244
SP VS. OAT CHART
The ‘SP -OAT Chart' has fan output static pressure on the y-axis with OAT on the x-axis. Only data points taken during scheduled-on hours are plotted. For VAV built-up air handling units, outlet static pressure should increase at higher cooling loads. If the VAV system is throttling appropriately the SPout -OAT Chart should demonstrate an upward trend with increased SPout at higher OAT conditions. For buildings that are internal load dominated or for monitoring periods where there is limited variation in OAT, there may be limited correlation between OAT and cooling load. For these conditions the SPout -OAT chart will show more scatter in the data and less directionality.
STATIC PRESSURE RESET ANALYSIS(SCHEDULED HOURS ONLY)
1.0
1.1
1.2
1.3
1.4
1.5
1.6
1.7
40 45 50 55 60 65 70 75 80
Outside Air Temperature (F)
Stat
ic P
ress
ure
(in. w
.c.)
SP SP Setpoint
Figure 112. Example ‘SP -OAT Chart’ from Static Pressure Analysis Tool

245
SP VS. TIME OF DAY ChART
The ‘SP -Time of Day Chart' shows SPout on the y-axis with the hour of the day on the x-axis. Only data points taken during scheduled-on hours are plotted. For properly controlled VAV air handling units, there will be increased fan outlet static pressure at higher overall cooling loads. Higher loads will generally occur in the afternoon with the lowest loads in the morning. This will vary with the specific operating schedule and load profile of the area served by the air handler.
STATIC PRESSURE HOURLY ANALYSIS(SCHEDULED HOURS ONLY)
1.0
1.1
1.2
1.3
1.4
1.5
1.6
1.7
0.00 3.00 6.00 9.00 12.00 15.00 18.00 21.00 24.00
Time of Day (Hour)
Stat
ic P
ress
ure
(in. w
.c.)
SP SP Setpoint Figure 113. Example ‘SP -Time of Day Chart’ from Static Pressure Analysis Tool

246
SPOUT VS. TIME CHART
The ‘SPout -Time' shows SPout on the y-axis with the hour of the day on the x-axis. Only data points taken during scheduled-on hours are plotted. For properly controlled VAV air handling units, there will be increased fan outlet static pressure at higher overall cooling loads. Higher loads will generally occur in the afternoon with the lowest loads in the morning. This will vary with the specific operating schedule and load profile of the area served by the air handler.
STATIC PRESSURE
40
45
50
55
60
65
70
75
80
4/6/9312:00
4/7/930:00
4/7/9312:00
4/8/930:00
4/8/9312:00
4/9/930:00
4/9/9312:00
4/10/930:00
4/10/9312:00
4/11/930:00
4/11/9312:00
4/12/930:00
4/12/9312:00
4/13/930:00
4/13/9312:00
4/14/930:00
4/14/9312:00
4/15/930:00
4/15/9312:00
Date and Time
Tem
pera
ture
(F)
0.2
0.4
0.6
0.8
1
1.2
1.4
1.6
1.8
Stat
ic P
ress
ure
(in. w
.c.)
OAT Schedule SP
Figure 114. Example ‘SP-Time Chart’ from Static Pressure Analysis Tool
This chart presents the SPout and OAT data streams over the course of the logging period. The input HVAC schedule is also presented on this plot. Atypical periods in the data can be determined quickly from this plot. OAT should demonstrate a standard diurnal cycle. During scheduled-off hours, F SPout SP should go to zero. If there is an SPout reading during scheduled off hours, either the system is not shutting down properly or the schedule input on the 'START' tab is not the actual schedule used by the HVAC system.

247
5.6.8 Zone Temperature Analysis Tool
5.6.8.1 Methodology & Assumptions
The Zone Temp Analysis Tool is a Microsoft Excel 97 workbook intended to help analyze logged zone temperature data for up to four HVAC zones simultaneously. This can help determine over-heating/under-heating or over-cooling/under-cooling in these zones. The tool can also be used to investigate occupant temperature complaints and to identify the "worst-case" zone in a building.
5.6.8.2 Data Inputs
The required data inputs for the Zone Temperature Analysis Tool are: • HVAC schedule information • Logged Zone Air Temperature (ZAT) for up to four zones • Logged Outside Air Temperature (OAT)
Each zone can also be given a name on the 'START' tab. These names will then appear on the 'SUMMARY' tab and all charts output by the tool. The default is to name the zones: Zone 1, Zone 2, Zone 3, and Zone 4.
An HVAC schedule must also be input on the 'START' tab. This schedule is used to filter the data so that only data points taken while the system was operating are evaluated.
Zone Air Temperature should be logged for up to four zones. Generally this measurement should be taken in a 'typical' location in each zone. Logging temperature data at the zone thermostat can be useful in determining if the system is operating correctly and/or if the thermostat is well calibrated.
The ZAT and OAT data logs should be pasted into the 'ENTER DATA' tab. The tool is set-up to handle up to 1,345 data points, equivalent to two weeks of data at a 15-minute logging interval or eight weeks of data at a 1-hour logging interval, however, any set of logged temperature data with 1,345 points or less can be used. It is assumed that Farenheight measurements will be used. If Celsius measurements are used the axes on some charts must be reformatted. The rest of the cells on the 'ENTER DATA' tab, which are greyed-back, are setup to sort and filter the data and should not be changed.
5.6.8.3 Output Graphics & Problem Analysis SUMMARY TAB
The 'SUMMARY' Tab presents a statistical break-down of the data with Minimum, Average, Maximum, and Standard Deviation values for each monitored zone, during Scheduled-on hours. The coincident value of each data set at the maximum and minimum ambient (OAT) conditions is also presented. A set of check-boxes on the 'SUMMARY' tab allows the user to view data for the zones of interest only.

248
CIEE Fan Project
Zone Air Temperature Analysis ToolSummary of Logged Data:
Data Collection ParametersData log start time: 1/16/99 23:01Data log end time: 1/26/99 7:01Logging Interval: 10.0 minutesTotal Logged Hours: 224.00 hoursScheduled On Hours: 224.17 hoursOn Hours as % of Total: 100%
Zone Temperature Statistical Analysis*Minimum Average Maximum Std. Dev.
Outside Air Temp 1.4 29.0 49.6 12.6#### Zone 1 69.7 71.5 76.7 0.8#### Zone 2 71.8 73.5 76.4 0.9#### Zone 3 69.4 72.6 79.4 1.4#### Zone 4 68.7 71.6 74.4 1.1
*Data is for scheduled operarting hours only
Zone Temperature at Peak Ambient Conditions*At Min OAT At Max OAT
Outside Air Temperature 1.4 49.6Zone 1 71.8 70.0Zone 2 74.2 74.6Zone 3 74.1 72.3Zone 4 69.9 71.7
*Data is for scheduled operarting hours only
0102030405060708090
Outside AirTemp
Zone 1 Zone 2 Zone 3 Zone 4
Maximum Average Minimum
01020304050607080
Outside AirTemperature
Zone 1 Zone 2 Zone 3 Zone 4
At Max OAT At Min OAT
Figure 115. Summary Tab from Zone Temp Analysis Tool

249
ZAT VS. OAT CHART
The 'ZAT-OAT Chart' has ZAT on the y-axis and OAT on the x-axis. Only data points taken during scheduled-on hours are plotted. For any of the up to four zones analyzed by the tool, the display on this chart can be switched off using the check boxes in the lower right corner of the chart. The zone temperature setpoints (when entered) are plotted as horizontal lines. For a well performing system, the data should stay near the zone setpoint (within the thermostat dead-band) for all outside air temperatures. If the data demonstrates an upward trend, with high ZAT at high OAT and/or low ZAT at low OAT, this may indicate that there is not enough cooling or heating capacity supplied to the zone (i.e. this is an indication of under-cooling or under-heating). If the data indicates a downward trend, with high ZAT at low OAT and/or low ZAT at high OAT, this may indicate that there is too much cooling or heating capacity supplied to the zone (over-cooling or over-heating). A consistent difference between the measured ZAT and the zone setpoint may be an indication of a mis-calibrated thermostat. Scatter in the data may be an indication of failed zone controls or a misplaced OAT or ZAT sensor.
ZONE AIR TEMPERATURE ANALYSIS(SCHEDULED HOURS ONLY)
60
65
70
75
80
0 5 10 15 20 25 30 35 40 45 50 55
Outside Air Temperature (F)
Zone
Air
Tem
pera
ture
(F)
Zone 1 Zone 2 Zone 3 Zone 4Zone 1 Setpoint Zone 2 Setpoint Zone 3 Setpoint Zone 4 Setpoint
Zone 1
Zone 2
Zone 3
Zone 4
Figure 116. Example ZAT-OAT Chart from Zone Temp Analysis Tool

250
ZAT VS. TIME OF DAY CHART
The 'ZAT-Time of Day Chart' shows ZAT on the y-axis with the Time-of-day on the x-axis. Only data points taken during scheduled-on hours are plotted. For any of the up to four zones analyzed, the display on this chart can be switched off using the check boxes in the lower right corner of the chart. The zone temperature setpoints (when entered) are plotted as horizontal lines. This plot can give an indication if zone temperatures are consistently outside the expected range at certain times of day. For example if the zone is not well controlled to handle morning cool-down/warm-up or if the solar exposure of the zone means that zone temperatures always rise in late afternoon.
ZONE TEMPERATURE HOURLY ANALYSIS(SCHEDULED HOURS ONLY)
60
65
70
75
80
85
0.00 3.00 6.00 9.00 12.00 15.00 18.00 21.00 24.00
Time of Day (Hour)
Zone
Air
Tem
pera
ture
(F)
Zone 1 Zone 2 Zone 3 Zone 4Zone 1 Setpoint Zone 2 Setpoint Zone 3 Setpoint Zone 4 Setpoint
Zone 1
Zone 2
Zone 3
Zone 4
Figure 117. Example ZAT-Time of Day Chart from Zone Temp Analysis Tool

251
ZAT VS. TIME CHART
The 'ZAT-Time Chart' presents all of the data streams over the course of the logging period. For any of the up to four zones analyzed, the display on this chart can be switched off using the check boxes in the lower right corner of the chart. The input HVAC schedule is also presented on this plot. Atypical periods in the data can be determined quickly from this plot. Off-hours periods should see a rise in zone temperature during the cooling season or a drop in zone temperature during the heating season. If there is little change between scheduled-on and scheduled off hours, either the system is not shutting down during off-hours or the schedule input on the 'START' tab is not the actual schedule used by the HVAC system.
ZONE AIR TEMPERATURE PROFILE(ALL MONITORED HOURS)
0
5
10
15
20
25
30
35
40
45
50
55
60
65
70
75
80
85
1/16/990:00
1/16/9912:00
1/17/990:00
1/17/9912:00
1/18/990:00
1/18/9912:00
1/19/990:00
1/19/9912:00
1/20/990:00
1/20/9912:00
1/21/990:00
1/21/9912:00
1/22/990:00
1/22/9912:00
1/23/990:00
1/23/9912:00
1/24/990:00
1/24/9912:00
1/25/990:00
1/25/9912:00
1/26/990:00
1/26/9912:00
1/27/990:00
Date and Time
Tem
p (F
)
Zone 1 Zone 2 Zone 3 Zone 4 OAT Schedule
Zone 1
Zone 2
Zone 3
Zone 4
Figure 118. Example ZAT-Time Chart from Zone Temp Analysis Tool

252
5.6.9 Motor Efficiency Tool
5.6.9.1 Methodology & Assumptions
The Motor Efficiency Tool is a Microsoft Excel 97 workbook intended to help estimate in-situ motor efficiency, to calculate motor load factor, and to allow for graphical analysis of motor efficiency improvement potential due to motor replacement options.
Determining motor efficiency precisely can be difficult. Efficiency varies significantly with the size, type, and synchronous speed (900, 1200, 1800, or 3600 RPM) of different motors. Additionally, due to regulatory changes (the Energy Policy Act of 1992) and manufacturing improvements, recently installed motors are somewhat more efficient than older motors that may still be in service. Estimating in-situ motor efficiency is complicated by the fact that, for every motor, efficiency varies with load factor, although the motor nameplate only indicates the efficiency at full load.
MotorMaster+ is a comprehensive software tool developed by the U.S. Department of Energy for evaluating energy issues associated motors. The MotorMaster+ software package includes an iterative protocol for estimating in-situ motor efficiency from field measured data. The software includes a database of typical motor efficiency values for any combination of motor size (rated horsepower), type (open drip-proof, or totally-enclosed fan-cooled), speed (900, 1200, 1800, or 3600 RPM), and relative efficiency level (standard, high, or premium). This database is based on a composite of data from several motor manufacturers and includes typical efficiency values for each type of motor in the database at four different motor load factors (100%, 75%, 50%, and 25%). MotorMaster+ uses this database to estimate the in-situ motor efficiency based on user inputs for the size, type, speed, relative efficiency level, and load factor of a given motor. The program calculates the motor load factor based on the rated horsepower, the full-load efficiency, and field measured electrical data (voltage, current, power factor, and power).
For this project we have adopted the motor efficiency data from MotorMaster+ and developed a similar protocol for estimating in-situ motor efficiency. We have also provided charts of motor efficiency vs. motor load factor for several sizes and types of motors. These charts can serve as a quick motor-efficiency estimation tool and can help users evaluate any motor efficiency improvements possible due to motor replacements.
5.6.9.2 Data Inputs
The required data inputs for the Motor Efficiency Tool are: • Motor size (horsepower) • Motor type (open drip-proof, or totally-enclosed fan-cooled) • Motor synchronous speed (900, 1200, 1800, or 3600 RPM) • Relative efficiency level (standard, high, or premium) • Motor nameplate electrical data • Field measured electrical data

253
User selections for motor size, type, and speed are made on the ‘START’ tab of the Motor Efficiency tool. The user must select a relative efficiency level (standard, high, or premium) for the motor to be analyzed. The spreadsheet presents the assumed full load efficiency for the designated size, type, speed, and relative efficiency level, based on the database of typical motor efficiency values. Users should compare the nameplate efficiency of the motor to be analyzed with the full load efficiency assumed by the software tool, in order to confirm that the appropriate efficiency level (standard, high, or premium) has been selected. Nameplate and field measured electrical data should then be entered on the ‘START’ tab.
When all data inputs have been made, the spreadsheet calculates the motor load factor and estimates the in-situ efficiency based on the database of motor efficiency values, which is contained on the ‘DATA’ tab. Calculated load factor and estimated efficiency values are presented in a box on the ‘START’ tab. CIEE Fan ProjectMotor Efficiency Charts Tool
MOTOR INFORMATIONMotor Output (HP) 25Sync. Speed (RPM) 1800Motor Type Open Drip-Proof
Relative Efficiency PremiumAssumed Full Load Efficiency For Given Motor Type: 93.1%
ELECTRICAL DATA
Namplate Data
Field Measured Data
Motor Current (Amps) 30.10 25.70Motor Voltage (Volts) 460 463Motor Power Factor 83% 84%Motor Efficiency 93.0%Motor Input (KW) 19.91 17.31
Calculated Motor MetricsMotor Load Factor: 87.0%Estimated In-Situ Efficiency: 93.5%
To Graphically Evaluate Efficiency:Go to Tab: 25HP 1800RPM
Examine Data for: ODP-PREMAt Load Factor: 87%
Figure 119. START Tab from Motor Efficiency Tool
5.6.9.3 Output Graphics & Problem Analysis
For each combination of motor size and speed, from 2HP-900RPM through 100HP-3600RPM, a chart of motor efficiency versus motor load factor is included in the spreadsheet. Each of these charts presents six trend-lines, one for each motor type and relative efficiency pair (e.g. Open drip-proof Standard Efficiency or Totally Enclosed Fan

254
Cooled Premium Efficiency). When printed, these charts can serve as a quick reference in the field for estimating in-situ motor efficiency. Further these charts can be used to evaluate how replacing a motor with a more efficient and/or more appropriately sized motor may improve the motor efficiency.
25 HP, 1800 RPM Motors
82.00
84.00
86.00
88.00
90.00
92.00
94.00
20% 30% 40% 50% 60% 70% 80% 90% 100%
Motor Load Factor
Mot
or E
ffici
ency TEFC-PREM
ODP-PREMODP-HIGHTEFC-HIGHTEFC-STDODP-STD
Figure 120. Example Motor Efficiency Chart from Motor Efficiency Tool
5.7 Results - Protocol development: Public access to protocols
5.7.1 Web-site development
5.7.1.1 Introduction
Our vision for the tool suite is for it to be a fully web-enabled application to make it broadly available to members of energy services organizations. With today’s technology this should not be difficult. We have implemented a prototype version to demonstrate how this could be done and to exemplify how it would work. Although additional work is required to make it a robust application, all the basic elements are available to allow this to be done. This could be accomplished using internal or contracted resources of various organizations including CEDR.
The web site developed for this project has three primary purposes: • Provide information about the project • Provide for downloading of software tools, field data sheets and reports • Provide a demonstration of future web-enabled version of the tool

255
The web-site is located on the CEDR Building Science web server and can be accessed via http://www-archfp.ced.berkeley.edu/bldgsci/research/cieefan.htm). A brief summary of all major aspects of the project is provided on the web site. Contact information for the project participants and links to related web sites will also be provided. The full text of this and previous reports is available to download in Adobe Acrobat (*.pdf) format. We encourage feedback about the tools and techniques and have provided forms for doing so. We will be tracking hits and registrations for downloading tools in order to monitor the degree of interest in this technology.
5.7.1.2 Web-site design
All of the tools described in previous sections can be viewed and downloaded from the web-site. Using most browsers, demonstration versions of the tools can be viewed by clicking on a given tool under the Software menu. Usable versions of these tools can be downloaded in .zip format in the Download section of the menu. To exemplify how the tools would be used in a web-enabled environment, we have implemented the Fan Analysis and Benchmarking tools as shown in Figure 121. In this case an MS Access database is stored on the database server and can be updated via form pages. Excel runs in the web-server and queries the database at 5-second intervals based on settings selected by the user. Results can be viewed by accessing the Excel charts in the web-server. All other tools require time-series logs to be inserted and therefore must be downloaded and unzipped first. Figure 122 shows a map of the web-site and Figure 123 shows an example page from the web-site.
UCB LAN
Internet
User Computer
User Workstation Database Server
User Computer
Web-Server Gateway
Figure 121. Project Web-Site Architecture

256
Home
Contact Information
Related Links Site Map
About the Project
Protocol Chart
Software Tools Index
Download Index
Field Measurement
Information
Measurment Uncertainty Information
Data Logging Information
Fan Analysis & Benchmarking
Tool
Logged System Temperature
Tool
Logged Zone Temperature
Tool
Data Analysis Information
Problem Identification/
Diagnosis Information
Tracer GasLogged Static Pressure Tool
Logged Fan Power Tool
Logged Hot Water Reheat Temperature
Tool
Report Download
Field Datasheet Download
Software Download
Figure 122. Project Web Site Map
Figure 123. Example Screen from Project Web Site

257
Eventually we would like to web-enable all of the tools. The fan performance database could be fully web-enabled on a centrally managed site that could be available to all users via the Internet. In this way all users of the Benchmarking tool could contribute data to and derive benefit from a more robust set of fan performance data.
5.7.2 Third party collaboration
Enron continues to express interest in the work being done on this project, but several scheduled meetings had to be called off due to conflicts. We believe the web site will offer a better means for Enron to review the work independent of scheduling meetings.
The software was demonstrated to diagnostics practitioners at LBL and discussions are being held to explore integration of these techniques into the wider array of diagnostic technologies that LBL and others are developing. We anticipate that funding will be requested as part of the programmatic solicitations currently being offered by the CEC. Discussions are also on going with LBL personnel about advanced methods for airflow monitoring.
The software was also demonstrated to tools development personnel at Pacific Energy Center (PEC). There appears to be good synergy between the work of this project and the universal translator tool being developed at PEC. Discussions are on-going about the possibility of the PEC providing funding to further the development of the protocols portion of this work.
The potential for collaboration with Schiller Associates still exists with respect to tracer gas airflow monitoring. Schiller Associates, under contract to PG&E, has developed a research plan for further development of a system similar to that outlined in Section 5.8.3 that may be submitted to CEC by PG&E for funding.
Contacts have been initiated with UC Berkeley Construction and Planning to explore the possibility of participation in the deferred maintenance program. This program is becoming very active and will include diagnosing fan system problems for many of the buildings on campus.
5.8 Results - Low-cost monitoring: Tracer gas airflow measurement
5.8.1 Background
It is well documented and generally understood that in-situ air flow measurement using traditional Pitot tube (PT) techniques yields uncertain results primarily due to constraints in finding a location where fully developed flow exists. The impetus for developing tracer gas (TG) techniques for making airflow measurements is the promise of ameliorating this one overriding problem; the lack of a suitable location for making PT measurements. Further complicating the uncertainty in PT measurements is the estimating procedures used for assessing this uncertainty. Carter [Carter, 1998] has provided an excellent critique of the deficiencies in previous methods as well as a thorough analysis of the

258
uncertainties of both TG and PT techniques based on the work done in Phase II of this project. ASTM is in the process of approving a draft standard [ASTM, 1997] for constant injection tracer gas (CITG) airflow measurement that is a step toward making these measurements widely applicable to the HVAC industry. However, the techniques used for the standard do not address some of the significant barriers to more widespread use of CITG in the HVAC industry. The bulk of our work is aimed at addressing these barriers.
In Phase III of this project, Offerman [Offerman, 1999] conducted additional tests to investigate mixing issues, the largest source of uncertainty in the TG technique. This study sought to determine the effect on mixing in three different fan systems (two systems with single airfoil centrifugals and one with dual vane axial fans) operated at two different flow rates when sampled at typical flow monitoring planes. The same 4-point injection apparatus was used for each system, and a 12-point sampling grid was used for downstream measurements. Samples were simultaneously drawn with six syringes at a time. Results from these tests showed concentration coefficient of variation (COV) to be in the range of 2-14% over all system types and flow rates. However, for airfoil centrifugal fans COV was 4-6% at high flow and only 2-4% at low flow. Another interesting finding was that centerline concentrations for airfoils were within 0-5% of the 12-point average.
5.8.2 Issues Summary
The objective of the tracer gas work for this phase of the project was to compile results of previous work and formulate a preliminary description of functional requirements for a field deployable measurement system. Our aim is to stimulate commercial development of a system that will reduce the inefficiencies of implementation encountered with research apparatus while preserving the accuracy of the technique. Our vision for such a system includes the following major elements: • Minimum number of sample points • Overall uncertainty as close to 5% as possible • Capable of real-time monitoring (i.e., no syringe sampling, and short time sampling
for each flow rate) • Simplified, automatic calibration • Automated operation and data acquisition • Low cost, rugged, reliable, portable field deployable integrated “package.”
We believe that such a system could substantially reduce the measurement inefficiencies and cost of equipment to the point that CITG could become the preferred method for airflow measurement in the HVAC industry. It is also clear that development of such a system will require further work on apparatus design, and additional testing to corroborate and augment the findings from research done to date. The following summarizes the findings that are most relevant to a commercialization effort and form the foundation for the functional requirements outlined below.

259
5.8.3 Constant Injection method
Carter’s review of various tracer gas techniques documents the reasons why a constant injection method using sulfur hexaflouride (SF6) is preferred for duct airflow measurements. The ASTM draft standard also is based on the constant injection tracer gas (CITG) technique, but may not be appropriate for the HVAC industry. Equipment vendors have also embraced SF6 as the best alternative for these types of measurements [Lagus, 1998]. The primary issues related to this method are: • Accuracy of the flow controller - the accuracy of the CITG technique is heavily
dependent on having an accurate measure of TG injection rate. • Recirculation- recirculation of TG must be considered since testing cannot be assured
to occur during 100% outside air operation. Even with 100% outside are, leakage at the return dampers can skew results (i.e., Offerman’s results showed some leakage back into the supply air stream). This problem is typically resolved by obtaining samples upstream of the injection point or by using other measurement strategies. Offerman’s testing showed that the decay time to background levels once injection was terminated was short and the subsequent decay time of the background concentrations was relatively long so that taking a sample near termination of the injection was adequate for determining recalculating concentrations. This departs significantly from the ASTM method but is crucial in lowering the cost of applying the CITG technique. The background decay for systems operating at less than 100% should be even less since the outside air exchange rate is lower.
5.8.3.1 Analyzers and Injection rates
Two types of analyzers typically are used for this work: mass spectrometers and electron capture gas chromatographs (GC). Both of these instruments were used in Carter’s work. Only a GC was used for Offerman’s study. Mass spectrometers have the advantage of fast response times on the order of several seconds that makes them ideal for real-time sample analysis. However, they are bulky and expensive instruments generally intended for laboratory work covering analysis of a wide variety of gases. GCs on the other hand have response times in the range of 2-3 minutes and thus are not easily adapted to real-time sample analysis if a large number of samples are required. For this reason they are used to analyze samples taken with syringes and therefore do not need to be on-site. GCs have the advantage of being more appropriate for field deployment and can be customized to a single gas such as SF6 making it a lower cost instrument [Lagus, 1998]. GCs typically operate over a range of 2-125 ppb for SF6, while mass spectrometers require rates in the range of several ppm, 3-4 orders of magnitude greater than GCs. Thus the amount of SF6 required for a study is substantially less for GCs. This may also influence the recirculation impact and may be one reason that Offerman’s work showed slow decay rates for the recirculated tracer.
From these considerations it has been concluded that GCs operating at sampling concentrations in the range of 0-20 ppb and customized for SF6 tracer gas are most appropriate for a field deployed system. This conclusion is contingent on proving the feasibility of conducting real-time sampling with a small number of samples. This will

260
require that the mass flow controller SF6 injection rate to be adjusted based on the airflow rates to be measured.
5.8.3.2 Sampling
Carter [Carter, 1998] has shown that there are two major areas where implementation inefficiencies could be improved – sampling time, analysis, and injection and sampling apparatus setup time. With regard to sampling, Carter has shown that the number of samples for both CITG and PT can be minimized without compromising accuracy. Figure 124 shows that there is little to be gained from a 40-point over a 12-point PT traverse. For CITG this is even more pronounced and it appears that as little as 4 sampling points can be used even where mixing is not completely uniform (i.e., Plane A is not uniformly mixed due to imperfect injection conditions.). Figure 124 also highlights the fact that for fully developed flow planes CITG and PT have equivalent accuracy, but for non-ideal measurement planes (probably the majority of the cases in typical systems) CITG is clearly superior.
0%
5%
10%
15%
20%
25%
0 1 2 3 4Distance From Bend at Fan Outlet (De)
% T
otal
Unc
ert
ain
Tracer Gas - 12 Tracer Gas - 4 Tracer Gas - 2Pitot Tube - 40 Pitot Tube - 12 Pitot Tube - 4
Pitot Tube - 2
Plane A Plane C
Figure 124. Uncertainty of Flow Measurements in Ducts
Further work using the results from Carter and Phase III TG testing combined indicates that it may be possible to reduce TG sampling to a small number of points around the centerline. Table 32 summarizes the result of this analysis. Data points around the center of the duct were selected for analysis from Carter’s and Offerman’s measured concentration data sets. Carter has shown that the variance of tracer gas concentrations can be used as a proxy for airflow even though the precision of airflow measurements are

261
much less than the COV of concentrations. The COV shown in Table 32 is based on the precision of the mean value of concentration (i.e., mean concentration of all tests divided by square root of number of tests). Using COV in this manner tends to normalize results for different numbers of tests to allow for an “apples to apples” comparison between the various tests. The percent difference refers to the difference between the mean of all selected points and the best-measured value as determined by a12-point sample.
The highlighted portion of Table 32 shows that the percent difference and COV for 2 to 4 points at the center of the duct are reasonably small. This suggests that an appropriately designed sampling apparatus located in the center of the duct may provide a reasonably accurate measurement. It should be noted that the Carter Lagus test is not included because poor injection conditions caused poor mixing at the measurement plane for this test.
Table 32. Percentage Difference and COV for Tracer Gas Concentrations
Test Flow 1 Pt. - Centerline 2 Pt. 4 Pt. 12 Pt. % Diff % COV,
Mean % Diff % COV,
Mean % Diff % COV,
Mean % COV, Mean
Ph III, T1 100% 0.06% 5.29% 5.55% 3.68% 0.75% 1.25% 0.55% Ph III, T2 100% -3.16% 1.92% -3.34% 1.85% -1.60% 1.63% 0.38% Ph III, T3 100% -4.95% 0.08% -2.75% 0.15% -2.90% 0.13% 0.28% Ph III, T1 50% 7.26% 0.86% 9.13% 2.42% 2.80% 0.72% 0.79% Ph III, T2 50% 3.09% 0.14% 1.51% 1.26% 0.70% 0.85% 0.05% Ph III, T3 50% 0.34% 0.93% 0.19% 0.74% -0.52% 0.54% 0.79% Carter, 4 Point Inj. - Plane A
100% -5.51% 1.84% -3.29% 0.99% -1.46% 1.52% 1.73%
Carter, Lagus Inj.- Plane A
100% 2.39% 1.82% -2.36% 1.71% 5.77% 0.84% 1.16%
Other possibilities, although unexplored to date, are related to obtaining average samples. For example, with a suitable device several points in the grid could be obtained simultaneous and combined (i.e., averaged) reducing the sampling to one per flow rate. Repetition in sampling this single point would reduce uncertainty. Another alternative would be to develop some other method of obtaining an average reading using alternative sampling technologies. The aim of all these techniques is to both reduce sampling time and to allow for real-time sampling and analysis by a GC thus eliminating the use of syringes; a time consuming, tedious, and error prone process. This would also allow the possibility of semi-continuos monitoring for VAV systems.
Issues related to improvements in sampling and injection apparatus could be solved via a suitable mechanical design and testing effort.

262
5.8.4 Other Issues
Calibration of the GC is required at least before each run. Additional work needs to be done to refine this procedure so that it could be automated using on-board sample bottles. To minimize the number of concentration bottles needed, the use of one or two bottles along with a known calibration curve shape (derived from a history of more extensive calibrations) might be possible.
Carter has suggested that a bias is introduced in the flow rate measurements due to differences in tracer gas density between the mass flow controller and the air stream injection point. He estimates this bias to be in the range of –1.7 to –3.4 %. This bias could be removed by measuring the temperature at both locations and correcting for density differences.
5.8.5 Global Warming Analysis
Although SF6 is a good candidate for tracer gas work due to its extremely low atmospheric concentrations, it is a potent greenhouse gas with a Global Warming Potential (GWP) of 23,900. Fortunately it is used in very small quantities, only about 1450 metric tons are produced globally each year. For airflow analysis the concentration needed for detection is very low, about 20 ppb when used with electron capture GCs. The system described in Section 5.8.3 would require only a few minutes to measure a single airflow. VAV systems might require a number of airflow measurements while CAV systems generally only require one or two for a commissioning or assessment project. Assuming that the CITG technique was used in 50% of all large commercial buildings in California to which these fan protocols are applicable, for 150 minutes per year; and assuming that these buildings operated with an average airflow rate of 1.5 cfm/sf, a total of about 0.21 metric tons of SF6 would be released. This corresponds to about 1400 metric tons carbon equivalent. On the other hand, we estimate that implementation of a mixture of the savings opportunities detected using the protocols would result in savings of at least 385 M kWh per year in site energy. At the source, this has a carbon equivalent of about 62000 metric tons. Thus the SF6 emissions amount to only about 2% of the savings generated emissions reductions.
5.8.6 Functional Requirement Recommendations
Based on research done to date we recommend the following design guidelines for development of a field deployable CITG system: • The system shall consist of four basic elements: injection apparatus, downstream
plane sampling apparatus, SF6 tracer has bottle, and a portable analyzer device that includes a GC customized for SF6, a mass flow controller (MFC), small SF6 calibration bottles, real-time micro-controller that serves as a system controller and data acquisition computer.
• Injection tubes to be portable and expandable with a minimum of four equally distributed injection ports. This device to include suitable methods of attachment to the filter bank.

263
• Sampling apparatus to be designed to provide one averaged sample or equivalent per flow rate test, not including repetition.
• The portable analyzer device shall include an electron capture detector GC customized to operate in the range of 2-50 ppb with SF6 tracer gas with an accuracy of 3% or less. A real-time micro-controller/computer shall provide for control of the on-board mass flow controller, monitor the MFC and injection point temperatures, and perform flow rate computations and data logging functions. The temperatures are to be used to adjust the concentrations for SF6 density changes. The real-time controller will also provide for automated calibration of the GC and control of the following procedure:
• Turn on MFC and periodically draw samples from the downstream sample collector while adjusting the MFC to obtain a downstream concentration in the range of 20 ppb.
• Once adjustment of the MFC has been made, allow flow to stabilize for a few minutes, then draw multiple samples at ~3-minute intervals. Each sample should be time stamped.
• Cut off MFC flow and again draw multiple samples for determination of recirculated tracer concentrations, time stamping the samples.
• Record temperatures before and after sampling. • Compute flow rate from MFC setting, average of sample concentrations minus the
average of recirculation sample concentrations, modified by density corrections. Record computed flow rates by run number.
• The micro-controller/computer shall support a suitable user interface to allow the operator to conveniently setup and monitor progress. Access will be provided to allow downloading of data to a PC for further analysis.

264
5.9 Conclusions
Based on the work accomplished during this project we have concluded that built-up fan systems can be successfully diagnosed for energy related problems when a consistent set of measurement and diagnostic procedures are used. Pre-selected energy and comfort related performance problems can be analyzed using a combination of short term monitoring, a benchmarking database of performance metrics, and customized diagnostic data displays. While the overall efficacy still needs to be proven by more extensive field testing, the techniques developed are a major step forward in providing energy practitioners with the means to assess performance problems in a relatively simple, consistent, and straightforward manner.
From our analysis of previous studies and consideration of practicality issues including global warming impacts, it has been concluded that a field-deployable system could feasibly be constructed from the basic elements outlined in the functional specification that appears in the body of this report. For this system gas chromatographs operating at sampling concentrations in the range of 0-20 ppb and customized for SF6 tracer gas are most appropriate for a field-deployed system. This will require that the mass flow controller SF6 injection rate to be adjusted based on the airflow rates to be measured. This conclusion is contingent on proving the feasibility of conducting real-time sampling with a small number of samples.
5.10 Recommendations
5.10.1 Protocol development
Although considerable progress has been made in development of the fan problem detection technology described in this report, additional work is required to establish these methods as widely applicable protocols and to facilitate commercial implementation. Among the issues that could benefit from further research and development of the protocols are:
POPULATE DATABASE. One of the major impediments to establishing these techniques as widely applicable protocols is verification of their efficacy. In particular, the fan performance database will not be useful until it is sufficiently populated to provide for meaningful comparisons. Both of these goals could be accomplished with an extensive field-testing program. The tools described in this report have been developed to the point where they could be used in such a testing program. Through this testing program they would be refined and simplified making them much more acceptable for use by service practitioners. The fan performance database alone would be of significant benefit to practitioners and design professionals.
“DRILL DOWN.” The protocols developed to date could be extended to a more detailed level by development of additional procedures. This could also be accomplished via an

265
extensive field-testing program, and could lead to incorporation of a knowledge-based system.
ECONOMICS. Any diagnostic procedure aimed at uncovering energy savings opportunities has limited usefulness without an economic analysis that assists the practitioner with prioritizing the problems detected. During Phase II of this project an initial estimate was made of savings potentials, but this work needs to be extended to create simple methods by which the practitioner can evaluate the impact of the problems being detected.
TOOLS REFINEMENTS. There are a number of areas where the tools could be improved. Many others no doubt would be discovered during extensive field-testing. The tools to date intentionally were left in a somewhat modular and overly broad state so that the function of each could be more easily evaluated during testing. • The time series data input could be significantly enhanced by incorporation of more
robust data management techniques such as those offered by PEC’s Universal Translator software.
• The database structure of the tools needs to be implemented in a robust relational database environment to improve the utility, access to information, and scalability of these tools. A model for a MS Access implementation was developed in Phase III of this project. Section 5.6 describes a preliminary web-enabled version of a MS Access implementation.
• The Fan Analysis Tool could be improved by making it more generic. For example, by incorporating fan similarity principles more completely the performance changes due to system resistance and efficiency degradation may be able to be represented over a broad range of fan types and operating conditions by plotting on a percent peak FSP vs. % WOV chart. Other methods should also be explored.
UNCERTAINTY. The uncertainty analysis presented here should be considered preliminary and could benefit from a more detailed study to provide better guidance as to expected error in a variety of measurement situations. This could possibly be incorporated with the economic analysis using risk and decision analysis techniques.
DATABASE HOSTING. Hosting of the database by an independent organization such as CEDR should be considered. This would allow for creation of a much larger and more robust database that could be of benefit to the entire practitioner community.
5.10.2 Low-cost monitoring Among the issues that could benefit from further research and development of the of low-cost measurements to support fan diagnostics protocols are:
5.10.2.1 Measurements
FAN STATIC PRESSURE AND AIRFLOW. Accurate measurements of FSP and airflow are critical to these methods. In order to avoid making guesses as to the magnitude of system effect and therefore improve the accuracy of computing fan power output, static pressure measurement techniques need to be improved.

266
Section 5.8 describes a concept that could lead to an affordable and accurate alternative to Pitot tube measurements for measuring airflow in duct systems. This (and other alternative concepts) should be pursued because of their potential to simplify measurement effort and improve accuracy in field measurements for this and other assessment methodologies.
For VAV systems, a technique to accurately monitor changes in airflow, i.e., a proxy for airflow, would be a of significant benefit. Methods for using some simple measurement either with or, preferably, without calibration should be explored.
5.10.2.2 Fan Power
Work reported by other researchers [LBNL, 1999] [Norford, 1999] suggests that fan power can be an even more powerful tool for diagnostics than has been attempted in this project. For example, harmonic signature analysis of fan power data may be a good adjunct to the fan power analysis developed here. These leads should be pursued to expand the diagnostics capabilities of these protocols.
VSD EFFICIENCY. The analysis of drive efficiency for VSDs has not been completed. Data about drive efficiency is not readily available from drive vendors. As the cost of these drives continue to decrease they will become even more prevalent and characterization of drive efficiency is crucial to determining fan efficiency in the analysis protocols. Additional work should be done to characterize VSD drive efficiencies in a manner that will allow practitioners to easily estimate this efficiency.
POWER MEASUREMENT. Low cost power measurements continue to suffer from a lack of appropriate logging equipment. While using proxy for power is a viable strategy it is somewhat unwieldy in that multiple measurements must be made to perform the calibrations and correlate CT measurements with power calibration readings. On the other hand, available power meters with logging capabilities are too bulky and expensive and generally the leads and clamps are not reliable and sturdy enough to leave deployed as a logging device. Additional work should be done to find or influence the development of power loggers better suited to the needs of these protocols.
5.10.2.3 Tracer Gas Airflow
In order to develop the system outlined in Section 5.8.3, further work needs to be done in the following areas.
SAMPLING. Studies on the impact of mixing need to be undertaken to prove that low order sampling and/or averaging can be used without introducing unacceptable bias in the measurements of concentration. Although previous work provides indications that sampling can be reduced to one or two points, further testing for a variety of fan systems needs to be done to prove this supposition. In addition, averaging methods should be explored to understand their potential. This will require conception, design, and testing of various multi-sample averaging schemes. These studies should also include investigation of alternative sampling with alternative technologies that could augment the methods

267
already being considered or obviate the need for gas detectors. Other work should be conducted on the following issues: • Injection device designs need to be refined to make this apparatus more universal and
simpler to apply in various types of systems. • The automated protocols outlined need to be fully tested to verify their efficacy. In
particular the recirculation technique should be verified.
MARKET ASSESSMENT. A market study should be performed to verify the market potential for a system as outlined in Section 5.8.3. This is a crucial step in justifying further development of the type being suggested here. This study should include a review of the ASTM standard process and possible involvement in its modification to include findings from this research.
PROTOTYPE. Once the individual elements mentioned above are more fully understood, a prototype system should be designed, built and tested. The prototype would serve as a major inducement to involve equipment vendors in a commercial development effort.

268
6 References Agarwal, J.K. (1975). Aerosol sampling and transport. Ph.D. thesis. University of Minnesota, MN, USA, 175 p.
AMCA, 1974. Laboratory Methods of testing Fans for Rating, Publication 210-74, Air Movement and Control Association, Inc, Arlington Heights
AMCA, 1990. AMCA Fan Application Manual, “Air Systems,” Publication 200. “Fans and Systems,” Publication 201-90. “Troubleshooting,” Publication 202-88. “Field Performance Measurements of Fan Systems,” Publication 203-90, Air Movement and Control Association, Inc., Arlington Heights.
Anand, N.K. and McFarland, A.R. (1989). “Particle deposition in aerosol sampling lines caused by turbulent diffusion and gravitational settling,” American Industrial Hygiene Association, 50(6), pp. 307-312.
ASHRAE (1997). 1997 ASHRAE Handbook: Fundamentals, American Society of Heating, Refrigerating, and Air Conditioning Engineers, Inc., Atlanta.
ASHRAE. 1997a. 1997 ASHRAE Handbook: Fundamentals, Chapter 3, “Heat Transfer.” Atlanta, American Society of Heating, Refrigeration, and Air-Conditioning Engineers, Inc.
ASHRAE. 1997b. 1997 ASHRAE Handbook: Fundamentals, Chapter 32, “Duct Design.” Atlanta, American Society of Heating, Refrigeration, and Air-Conditioning Engineers, Inc.
ASHRAE, 1997c. ASHRAE Standard 129, “Standard Method of Measuring Air Change Effectiveness.” ASHRAE, Atlanta, 1997.
ASHRAE/SMACNA/TIMA. (1985) “Investigation of duct leakage,” ASHRAE Research Project 308.
Carrié, F.R., Andersson, J, and Wouters, P. (1999). “It is time for tighter air distribution ductwork,” to be published by the Air Infiltration and Ventilation Centre.
Carrié, F.R. and Modera, M.P. (1998). “Particle deposition in a two-dimensional slot from a transverse stream,” Lawrence Berkeley National Laboratory, LBL-34829. Also Aerosol Science and Technology, 28(3), pp. 235-246.
Carter, G., 1998. “Tracer Gas Air Flow Rate Measurement As An Alternative To Pitot Tube Traverse In Commercial Building Ventilation Systems,” masters thesis, UC Berkeley, Berkeley, May 1998.

269
Carter, G., Huizenga, C., Pecora, P., Webster, T., Bauman, F. and Arens, E., May 1998. “Reducing Fan Energy in Built-up Fan systems,” Final Report: Phase II, Center for Environmental Design Research, Berkeley, CEDR-02-98.
California Energy Commission (CEC). 1998a. 1998 Baseline Energy Outlook. California Energy Commission, P300-98-012, August 1998.
California Energy Commission (CEC). 1998. Alternative Calculation Method Approval Manual. California Energy Commission, P400-98-011, April 1998.
Coleman, H.W. and Steele, W.G., 1989. Experimentation and Uncertainty Analysis for Engineers. New York, NY: John Wiley & Sons.
Cory B., 1988. “Why Fan Test Methods Are Enough To Blow The Engineer’s Cool,” Australian Refrigeration, Air Conditioning and Heating , March 1988, pp. 35-38.
Cory, W.T.W., 1984. “The Effects of Inlet Conditions on the Performance of a High Specific Speed Centrifugal Fan”. Published in Installation Effects in Ducted Fan Systems. I Mech E. Conference publication May 1-2, 1984. London, UK. pp. 29-45.
Coward, C.W., 1990. “System Effect – A Design Fundamental.” ASHRAE Journal, ASHRAE, Atlanta, May 1990.
Crawley, D.B., Lawrie, L. K., Pedersen, C. O., Liesen, R. J., Fisher, D.l E., Strand, R. K., Taylor, R. D., Winkelmann, F. C., Buhl, W.F., Huang, Y. J., Erdem, A. E. (1998). “Beyond BLAST and DOE-2: EnergyPlus, a new-generation energy simulation program,” 1998 ACEEE Summer Study Conference, Pacific Grove, CA, August 1998, Volume 3, pp. 3.89-3.104.
Cummings, J. B., Tooley, J. J., Jr., and Dunsmore, R. (1990). "Impacts of duct air leakage on infiltration rates, space conditioning energy use, and peak electrical demand in Florida homes," Proceedings of ACEEE Summer Study, Pacific Grove, California, August 1990. American Council for an Energy Efficient Economy, Washington, D.C.
Cummings, J. B., Withers, C. R. (1998). “Building cavities used as ducts; Air leakage characteristics and impacts in light commercial buildings,” ASHRAE Transactions, Volume 104 (2): 743-752.
Cummings, J. B., Withers, C. R., Moyer, N., Fairey, P., and McKendry, B. (1996) “Uncontrolled airflow in non-residential buildings,” Florida Solar Energy Center, FSEC-CR-878-96.
Delp, W.W., J. McWilliams, D.J. Dickerhoff, D.Wang, and M. Modera. (1999). “Commercial Thermal Distribution Systems FINAL REPORT For California Institute for Energy Efficiency: Thermal distribution losses in light commercial buildings,” Lawrence Berkeley National Laboratory, LBNL-42339. Submitted to Energy and Buildings, 1999.

270
Delp, W.W., Matson N. E., Tschudy E., Modera M.P., and Diamond R.C. (1998a). “Field investigation of duct system performance in California light commercial buildings,” ASHRAE, 1998.
Delp, W.W., Matson, N. E., Tschudy, E., Modera, M.P. (1998b) “Field investigation of duct system performance in California light commercial buildings (round II)” Proc. ACEEE Summer Study 1998
Delp, W.W., McWilliams, J., Dickerhoff, D.J., Wang, D., and Modera, M.P. (1998c) “Thermal distribution losses in light commercial buildings,” Lawrence Berkeley National Laboratory, LBNL-42415.
Delp, W.W., N. E. Matson, E. Tschudy, M.P. Modera, and R.C. Diamond. (1997). “Field investigation of duct system performance in California light-commercial buildings,” Lawrence Berkeley National Laboratory, LBNL-40102.Delp, W.W., N. E. Matson, E. Tschudy, and M.P. Modera. (1998b). “Field investigation of duct system performance in California light commercial buildings (round II),” Proc. ACEEE Summer Study 1998, pp. 3.105-3.116.
Delp, W.W., N. Matson, D. J. Dickerhoff, D. Wang, R. C. Diamond, and M. P. Modera. (1998a). Field investigation of duct system performance in California light commercial buildings. ASHRAE Trans. 104(II) 1998, June 1998.
Energy Information Administration (EIA). (1991). Commercial Buildings Characteristics 1989. DOE/EIA-0246(89), June 1991.
Fisk, W. J., Delp W.W., R. Diamond, D.J. Dickerhoff, R. Levinson, M.P. Modera, M. Nematollahi, D. Wang. (1998). “Commercial Thermal Distribution Systems FINAL REPORT For California Institute for Energy Efficiency: Duct systems in large commercial buildings: physical characterization, air leakage, and heat conduction gains,” Lawrence Berkeley National Laboratory, LBNL-42339. Submitted to Energy and Buildings, 1999.
Franconi E., W.W. Delp, and M. Modera. 1998. “Commercial Thermal Distribution Systems FINAL REPORT For California Institute for Energy Efficiency: Impact of duct leakage on VAV system energy use,” Lawrence Berkeley National Laboratory, LBNL-42339. Submitted to Energy and Buildings, 1999.
Franconi, E., Delp, W.W., and Modera, M. (1998). “Impact of duct leakage on VAV system energy use,” Lawrence Berkeley National Laboratory, LBNL-42417.
Greenheck, 1995. “Centrifugal Fan Catalog Supplement.” June 1995.
Hinds, W.C. (1982). Aerosol Technology: Properties, behavior, and measurement of airborne particles. John Wiley & Sons. New York, USA.
Hirsch, J.J. (1996) “DOE-2.1E-110 Enhancements,” Application notes for the DOE 2.1E program version 110, September 1996.

271
Huang, Y.J, Akbari, H., Rainer, L., and Ritschard, R. (1991). “481 prototypical commercial buildings for 20 urban market areas,” Lawrence Berkeley National Laboratory, LBL-29798.
Huang, Y.J. and Franconi, E. (1995). “Commercial Building Heating and Cooling Loads Component Analysis,” Lawrence Berkeley National Laboratory, LBNL-37208.
Jagemar, L., 1995. “Energy Efficient HVAC Systems in Office Buildings.” Sittard Netherlands: Centre for the Analysis and Dissemination of Demonstrated Energy Technologies (CADDET), Analysis Series No. 15, Netherlands, 1995.
Lagus, 1999. Autorac product literature, Lagus Applied Technology. San Diego, 1999.
LBNL, 1999. Proceedings from Diagnostics for Commercial Buildings: Research to Practice Workshop, Lawrence Berkeley National Laboratory, Berkeley, 1999.
Levinson R., Delp W., Dickerhoff D., Fisk B., Nematollahi M., Stordahl I., Torre C., Wang D., Diamond R., and Modera M. (1997). “Commercial Thermal Distribution Systems FINAL REPORT For California Institute for Energy Efficiency,” Lawrence Berkeley National Laboratory, LBNL-40105.
Levinson, R. Delp, W., Dickerhoff, D, and Modera, M. (1998) “Effects of air infiltration on the effective thermal conductivity of internal fiberglass duct insulation and on the delivery of thermal capacity,” Lawrence Berkeley National Laboratory, LBNL-42499.
Liu, B.Y.H. and Agarwal, J.K. (1974). “Experimental observation of aerosol deposition in turbulent flow,” Journal of Aerosol Science, 5, pp. 145-155.
Liu, B.Y.H. and Ilori, T.A. (1974). “Aerosol deposition in turbulent pipe flow,” Environmental Science and Technology, 8(4), pp.351-356.
Modera et al. (1998). “Sealing ducts in large commercial buildings with aerosolized sealant particles,” Lawrence Berkeley National Laboratory, LBNL-42414.
Modera, M. P. (1993). “Characterizing the performance of residential air distribution systems,” Energy and Buildings, 20(1):65-75. Also Lawrence Berkeley National Laboratory, LBL-32532.
Modera, M. P., and Jump, D. A. (1995). “Field measurements of the interactions between heat pumps and duct systems in residential buildings,” Proceedings of ASME International Solar Energy Conference, March, 1995. Also Lawrence Berkeley National Laboratory, LBL-36047.
Modera, M. P., and Treidler, E. B. (1995). “Improved modeling of HVAC system/envelope interactions in residential buildings,” Proceedings of ASME International Solar Energy Conference, March, 1995. Also Lawrence Berkeley National Laboratory, LBL-36048.

272
Modera, M. P., Andrews, J., and Kweller, E. (1992). “A comprehensive yardstick for residential thermal distribution efficiency,” Proceedings of ACEEE Summer Study, Pacific Grove, California. Also Lawrence Berkeley National Laboratory, LBL-31579.
Modera, M. P., Xu, T., Feustel, H., Matson, N., Huizenga, C., Bauman, F., Arens, E., and Borgers, T. 1999a. “Efficient Thermal Energy Distribution in Commercial Buildings.” Final report to California Institute of Energy Efficiency. Lawrence Berkeley National Laboratory, LBNL-41365.
Modera, M. P., R. F. Carrie, et al. 1999b. “Sealing Duct in Large Commercial Buildings with Aerosolized Sealant Particles.” Lawrence Berkeley National Laboratory. Submitted to Energy and Buildings.
Motor Challenge, 1998. “Motor Challenge Handbook,” “Energy Management for Motor Drive Systems,” and “Motor Master Plus,” v 2.01, DOE, University of Washington, Seattle, 1998.
Norford, L.K., Leeb, D., Luo, D., Shaw, S.R., 1999. “Advanced Electrical Load Monitoring: A Wealth of Information at Low Cost.” Proc. Diagnostics for Commercial Buildings: Research to Practice, San Francisco, 1999.
Offermann, Francis J., 1999. “Tracer Gas Measurement of Air Flow Rates in HVAC Fan Systems.” Indoor Environmental Engineering, San Francisco, 1999.
Onset Computer Corporation, www.onsetcomp.com, Massachusetts, June 1999.
Parker, D. S. (1989). “Evidence of increased levels of space heat consumption and air leakage associated with forced air heating systems in houses in the Pacific Northwest,” ASHRAE Trans. 96:2.
Parker, D., Fairey, P., and Gu, L. (1993). "Simulation of the effects of duct air leakage and heat transfer on residential space-cooling energy use,” Energy and Buildings 20(2):97-114.
Proctor, J. P., and Pernick, R. K. (1992). “Getting it right the second time: measured savings and peak reduction from duct and appliance repairs,” Proceedings of ACEEE Summer Study, Pacific Grove, California, August 1992. American Council for an Energy Efficient Economy, Washington, D.C.
Stordahl, I. (1997). “Internal aerosol injection in commercial building duct systems,” Lawrence Berkeley National Laboratory.
Vanderburgh, C.R., and Paulauskis, J.A., 1994. “The Causes and Unwanted Results of Aerodynamic System Effect.” ASHRAE Journal, February 1994, ASHRAE, Atlanta.
VVS AMA 98. Allmän material- och arbetsbeskrivning för VVS-tekniska arbeten. AB Svensk Byggtjänst. Stockholm 1998. Copyright 1998.

273
Walker, I., Sherman, M., Modera, M., and Siegel, J. (1998) “Leakage diagnostics, sealant longevity, sizing and technology transfer in residential thermal distribution systems,” Lawrence Berkeley National Laboratory, LBNL-41118.
Waterbury, S., D. Frey, K. Johnson, 1994. “Commercial Building Performance Evaluation System for HVAC Diagnostics and Commissioning.” Proceedings of the 1994 ACEEE Summer Study on Energy Efficiency in Buildings, Volume 5, PP 249-255. American Council for an Energy Efficient Economy, Washington, D.C.
Webster, T, Ring, E., Huizenga, C., Bauman, F. and Arens, E., 1999. “Reducing Fan Energy in Built-up Fan systems,” Draft Final Report: Phase III, Center for Environmental Design Research, Berkeley, 1999.
Winkelmann, F. C., Birdsall, B. E., Buhl, W. F., Ellington, K. L., Erdem, A. E., Hirsch, J. J., and Gates, S. (1993). DOE-2 Supplement, Version 2.IE, LBL-34947, November 1993, Lawrence Berkeley National Laboratory. Springfield, Virginia: National Technical. Information Service.

274
7 Appendices
7.1 Airflow calibration systems
Accurately-calibrated flow measurements are required in LBNL’s laboratory experiments and building characterization tests, including measurement of effective leakage area (ELA), fan flow, register flow, aerosol particle distribution, aerosol particle wall deposition, and duct sealant longevity. For the purpose of calibrating new apparatus and re-calibrating existing airflow measurement devices, we developed flow-measurement calibration systems for airflow ranging 0.024 m3s-1 and above. (50 cfm and more).
The flow calibration system used for prior LBNL studies is a standard orifice flow meter consisting of a straight smooth duct with an upstream length at least 20 times its diameter. If used in to measure both supply and return flows, the duct’s length would have to be between 20 and 40 times its diameter. New calibration devices were devised to obtain easily-measurable pressure differentials with a compact system.
The two new calibration systems use patented nozzle Pitot flow sensors (NZP 1000 series, Brandt, Minneapolis, Minnesota) as flow meters. Both the 6-inch (15.2 cm) and the18-inch (45.7 cm) diameter sensors measure flows with ±0.5% accuracy and ±0.1% repeatability. The flow meters are only 61 cm long, which is much shorter than standard orifice meters and most of other flow meters. Figure 125 shows how the flow nozzle works.

275
Figure 125. Operation of a nozzle Pitot flow meter.
The airflow Q is calculated from the following relations: P = 1
2 ρv2 (15) and
Q = v A , (16) where P is the dynamic pressure measured from the Pitot tube array, v is the air velocity, ρ is the air density, and A is the effective area.
The effective area of the 15.2 cm (6-inch) and 45.7 cm (18-inch) diameter flow meters are 779 cm2 (0.84 ft2) and 1641 cm2 (1.77 ft2), respectively. Combining Eqs. (15) and (16), the air flow rates are
]/[
][2)359.8(][ 313
mkgPaPEsmQ
ρ⋅−=− (17)
and
]/[
][2)0779.0(][ 313
mkgPaPsmQ
ρ⋅=− , (18)
respectively.
The flow versus pressure charts in Figure 126 and Figure 127 assume an air density of 1.20 kg m-3.

276
6" NZP 1000 Nozzle Calibration
0
50
100
150
200
250
300
350
400
450
0 50 100 150 200 250 300
Pitot Tube Pressure [Pa]
Flow
[CFM
]
Figure 126. Flow versus pressure in 6-inch calibration nozzle.
18" NZP 1000 Nozzle Calibration
0
500
1000
1500
2000
2500
3000
3500
4000
0 50 100 150 200 250 300
Pressure of Pitot Tube [Pa]
FLow
[CFM
]
Figure 127. Flow versus pressure in 18-inch calibration nozzle.
Each calibration system has a fan that can be operated in pressurization or depressurization mode. The ducts that connect to the flow meter are spiral pipes of 20-gauge galvanized sheet metal.
These two calibrated systems can calibrate the airflow ranging from 0.024 m3s-1 to 1.42 m3s-1 (50 to 3,000 cfm), which largely cover the airflow encountered in building system characterization. For example, we can use the calibration systems to calibrate existing

277
fan-powered blasters and the newly developed Turbo Blaster described in the next section. To calibrate flows below 0.024 m3s-1 (50 cfm) possibly for some of our laboratory tests, it is needed to design or configure another calibration device.
7.2 Turbo Blaster high-flow calibrated fan
To measure high fan flows, airflow through the duct registers, and large-system ELAs, we developed the Turbo Blaster, a fan-powered flow measurement device. The Turbo Blaster consists of a speed controllable inline fan (Model KD-16, Kanalflakt Inc., Sarasota, Florida).
KD-16 Fan Curv e
0
500
1000
1500
2000
2500
3000
3500
0 100 200 300 400 500
Static Pre ssu re [Pa]
Flow
[cfm
]
Figure 128 and Figure 129), and a flow straightener attached at the inlet of the fan when the device is operated in depressurization mode. In pressurization mode, the fan inlet is open to the room, and the air is blown into a duct. In depressurization mode, air is sucked through a 14-inch (35.6 cm) diameter flow straightener into the fan inlet and exhausted to the room.
The fan’s free airflow is 1426 L s-1 (3021 cfm), twice that of the Minneapolis Duct Blaster (Energy Conservatory, Minneapolis, Minnesota), and can also overcome higher back pressures. The following is the description of its calibrations in two pressurization modes.
The KD-16 fan draws up to 6.8 A at 115 VAC, and uses speed-controller model (RPE 10, Kanalflakt Inc., Sarasota, Florida).

278
KD-16 Fan Curv e
0
500
1000
1500
2000
2500
3000
3500
0 100 200 300 400 500
Static Pre ssu re [Pa]
Flow
[cfm
]
Figure 128. KD-16 fan flow as a function of static pressure.
Figure 129. Dimensions of the KD-16 fan.
The flow sensor consists of four tubes whose openings lie at the airflow inlet (Figure 130). The other ends of tubes were connected to obtain an average pressure. Fan flow is determined by measuring the slight vacuum pressure created by the air flowing over the sensor. When the Turbo Blaster is used in depressurization mode, the pressure at the flow straightener should be used as the reference pressure.

279
Flow
Vacuum
Airflow
Figure 130. Schematic of Turbo Blaster’s flow sensor.
7.2.1 Calibration in pressurization mode
The pressurization-mode calibration of the Turbo Blaster is illustrated in Figure 131. The flow nozzle manufactured by Brandt has 0.5% accuracy. The Turbo Blaster was calibrated for fan pressures of 40.1 to 237.2 Pa, and fan flows of 0.37 to 0.75 m3s-1 (792 to 1,592 cfm). The relative error of a curve fit to nine data points was less than 1%. The calibration formula is
Flow [m3s-1] = 0.0576 (Fan Pressure in Pascal) 0.5072 (19)
The calibration deteriorates at higher back pressures. When the back pressure reaches 320 Pa, the relative errors passes 3%. In field measures of effective leakage area, we used the Turbo Blaster to produce duct pressures of up to 200 Pa.

280
TurboBlaster
18" NZP1000 Flow
NozzleAirflow
Pressure PressureBack Pressure
Figure 131. Calibration of Turbo Blaster in pressurization mode.
7.2.2 Calibration in depressurization mode
The pressurization-mode calibration of the Turbo Blaster is illustrated in Figure 132. The Turbo Blaster was calibrated in the ranges of 25.0 to 112.7 Pa of fan pressure, and fan flows ranging from 0.412 to 0.876 m3s-1 (873 to 1,856 cfm). The relative error of a curve fit to ten data points was less than 1%. The calibration formula is
Flow [m3s-1] = 0.0827 (Fan Pressure in Pascal) 0.5000 (20)
18" NZP1000 Flow
Nozzle
Airflow
Pressure
TurboBlaster
PressureFlow Straightener
Figure 132. Calibration of Turbo Blaster in depressurization mode.

281
7.3 Summary of characteristics of large-commercial buildings and systems
LARGE COMMERCIAL BUILDING
UNIT(S)
L1 L2 L3 ** L3a L3b Building Type - food sales office officeConventional Use? - conventional conventional conventional Year Built - 1996 1979 1979
ft2 55164 23500 23500 Building Floor Area m2 5125 2183 2183 Connected to another Building? - yes yes yes No. of Stories - 1 2 2
ft 16 10 10 Avg. Ceiling Ht m 5 3 3 ft3 882624 235000 235000 Occupied Volume m3 24992 6654 6654
Roof Type - built-up other other Roof Insulation - na fiberglass batt fiberglass batt Ceiling Type - drop drop drop Ceiling Insulation - none none none Wall Type - block block block Wall Insulation - unknown unknown unknown Internal Equipment - medium medium medium Large Equipment? - bakery, deli none none % of Building Conditioned - 90 100 100 Number of Units in Building - 4 5 5 Year Units Installed - 1996 1979 1979 Retrofits - no no no
ft2 47265 4544 23500 HVAC SYSTEM Floor Area (One System Studied) m2 4391 422 2183 tons 37 (heating only) 32 Cooling Capacity of Unit Studied
kW 130 (heating only) 113 ft2/ton 1277 (heating only) 734 Floor Area of HVAC System / Cooling Capacity m2/kW 34 (heating only) 19
AHU Location - roof ceiling plenum basement Duct Location - ceiling plenum ceiling plenum ceiling plenum
ft2 47265 4544 na 11750 2640 Floor Area of Section Measured m2 4391 422 na 1092 245
ft2 1848 0 na Return Duct Surface Area m2 84172 0 na
ft2 5543 728 na 1869 331 Supply Duct Surface Area m2 515 68 na 174 31
ft2 7391 728 na Total Duct Surface Area m2 687 68 na Supply Duct Type - flex duct sheet metal spiral sheet metal sheet metal spiral Return Duct Type - flex duct na na Duct Insulation - R4 R4 R4 No. of Supply Registers - 25 21 142 71 11 No. of Return Registers - 10 0 na Economizer - no no no Thermal Barrier Location - roof ceiling tiles ceiling tiles Method of Determining Thermal Barrier Location - visual inspection visual inspection visual inspection - roof ceiling tiles ceiling tiles Method of Determining Thermal Barrier Location - thermal visual inspection visual inspection
cfm 20694 763 na na na Sum of Supplies L/s 9765 360 na na na
cfm 23303 na na Sum of Returns L/s 10997 na na
cfm 0 0 Varied ++ Outside Air Flow L/s 0 0 Varied
cfm 21287 916 Varied Varied Varied Flow Rate in Duct Section L/s 10045 432 Varied Varied Varied
cfm/ton 575 (heating only) Varied Fan Flow / System Capacity L/s/kW 77 (heating only) Varied
cfm/ft2 0.45 0.20 Varied Varied Varied Supply Flow/Floor Area of Section Measured L/s/m2 2.3 1.0 Varied Varied Varied
cfm/ft2 3.8 1.3 Varied Varied Varied Supply Flow / Supply Duct Surface Area L/s/m2 19.5 6.4 Varied Varied Varied Fan Cycles with Equipment - no yes no
in2 196 20 na 18 26 Supply ELA25 cm2 1263 132 na 116 165
in2 235 na na Return ELA25 cm2 1513 na na
iwc 0.98 0.32 na 1.92 0.12 Supply Plenum (or Terminal Box for Sections) Pressure Pa 245 79 na 480 30
iwc -1.04 na na Return Plenum Pressure Pa -260 na na in 430 na na Total ELA25 cm 2776 na
Supply Leakage Class cfm/100 ft2
@ 1 iwc 121 97 na 34 341
Return Leakage Class cfm/100 ft2
@ 1 iwc 370 na na

282
BUILDING UNIT(S) L4 L4a L4b L5 L5a L5b L5c L5d Building Type - office office Conventional Use? - conventional conventional Year Built - 1980 1990
ft2 65400 34420 Building Floor Area m2 6075 3198 Connected to another Building? - yes yes No. of Stories - 4 2
ft 10 9 Avg. Ceiling Ht m 3 3 ft3 654000 309780 Occupied Volume m3 18225 8772
Roof Type - Unknown asphalt shingle Roof Insulation - fiberglass batt fiberglass batt Ceiling Type - exposed drop Ceiling Insulation - na none Wall Type - block block Wall Insulation - unknown unknown Internal Equipment - medium medium Large Equipment? - none none % of Building Conditioned - 100 100 Number of Units in Building - 1 1 Year Units Installed - 1980 1990 (1996 compressor) Retrofits - no yes
ft2 65400 34420 HVAC SYSTEM Floor Area (One System Studied) m2 6075 3198
tons 138 100 Cooling Capacity of Unit Studied kW 486 352 ft2/ton 325 344 Floor Area of HVAC System / Cooling Capacity m2/kW 9 9
AHU Location - roof roof Duct Location - Half exposed exposed ceiling plenum
ft2 na 630 625 na 668 950 408 168 Floor Area of Section Measured m2 na 59 58 na 62 88 38 16 ft2 na na Return Duct Surface Area m2 na na ft2 na 303 244 na 350 171 226 92 Supply Duct Surface Area m2 na 28 23 na 33 16 21 9 ft2 na na Total Duct Surface Area m2 na na
Supply Duct Type - sheet metal sheet metal spiral sheet metal sheet metal spiral Return Duct Type - Ceiling Plenum Ceiling Plenum Duct Insulation - R4 R4 No. of Supply Registers - 292 2 2 na 9 4 6 3 No. of Return Registers - na na Economizer - yes yes Thermal Barrier Location - roof roof Method of Determining Thermal Barrier Location - visual inspection visual inspection Air Barrier Location - roof roof Method of Determining Air Barrier Location - visual inspection visual inspection
cfm na na na na na na na na Sum of Supplies L/s na na na na na na na na cfm na na Sum of Returns L/s na na cfm varied varied Outside Air Flow L/s varied varied cfm varied varied varied na varied varied varied varied Flow Rate in Duct Section L/s varied varied varied na varied varied varied varied
cfm/ton varied na Fan Flow / System Capacity L/s/kW varied na cfm/ft2 varied na na na varied varied varied varied Supply Flow/Floor Area of Section Measured L/s/m2 varied na na na varied varied varied varied cfm/ft2 varied na na na varied varied varied varied Supply Flow / Supply Duct Surface Area cfm/m2 varied na na na varied varied varied varied
Fan Cycles with Equipment - yes no in2 na 4 4 na 49 27 45 12 Supply ELA25 cm2 na 26 29 na 315 174 292 78 in2 na na Return ELA25 cm2 na na iwc 2.44 0.19 0.19 1.3 to 2.1 0.20 0.07 na 0.06 Supply Plenum (or Terminal Box for Sections)
Pressure Pa 610 47 47 325 to 525 50 18 na 16 iwc na na
Return Plenum Pressure Pa na na in na na
Total ELA25 cm na na
Supply Leakage Class cfm/100 ft2
@ 1 iwc na 57 70 na 441 605 394 490
Return Leakage Class cfm/100 ft2
@ 1 iwc na na
** Buildings 2 and 3 are actually two different HVAC systems in the same building. ++ Flows varied and were not measured. Items in italics represent the whole system for branches or sections tested

283
Summary of characteristics of light-commercial buildings and systems
Small Commercial Systems Building UNIT(S) S1 S2 S3 S4 S5 Building Type - office office office office office Conventional Use? - conventional conventional conventional conventional conventional Year Built - 1988 1988 1996 1996 1996
ft2 1800 2160 5440 5440 8024 Building Floor Area m2 167 201 505 505 745 Connected to another Building? - y y y y y No. of Stories - 1 1 1 1 1
ft 8 8 10 10 10 Avg. Ceiling Ht m 2.4 2.4 2.9 2.9 2.9 ft3 14400 17280 51680 51680 76228 Occupied Volume m3 408 489 1463 1463 2158
Roof Type - asphalt shingle asphalt shingle wood wood wood Roof Insulation - unknown unknown fiberglass batt fiberglass batt fiberglass batt Ceiling Type - drop drop drop drop drop Ceiling Insulation - fiberglass batt fiberglass batt none none none Wall Type - stud wall stud wall block block block Wall Insulation - Unknown unknown unknown unknown unknown Internal Equipment - high medium medium medium medium Large Equipment? - yes none none none none
ton 3 4 18.5 18.5 14 Cooling Capacity kW 11 14 65 65 49 % of Building Conditioned - 100 100 100 100 100
ft2 1800 2160 1000 1800 1056 HVAC System Floor Area m2 167 201 93 167 98
Number of Units in Building - 1 1 4 4 4 Year HVAC unit(s) Installed - 1988 1988 1996 1996 1996 Retrofits - no no no no no
tons 3 4 5 5 4 HVAC unit tested kW 11 14 18 18 14 ft2/ton 600 450 200 360 264 HVAC System Floor Area/Ton of System m2/kW 16 12 5 10 7
AHU Location - roof roof roof roof roof Duct Location - ceiling plenum ceiling plenum ceiling plenum ceiling plenum ceiling plenum
ft2 159 182 320 120 209 Return Duct Surface Area m2 15 27 30 11 19 ft2 225 291 540 360 274 Supply Duct Surface Area m2 21 17 50 33 25 ft2 384 473 860 480 483 Total System Duct Surface Area m2 36 44 80 45 45
Supply Duct Type - flex duct flex duct flex duct flex duct flex duct Return Duct Type - flex duct flex duct flex duct flex duct flex duct Duct Insulation - R10 R10 R4 R4 R4 No. of Supply Registers - 5 11 5 5 5 No. of Return Registers - 5 6 5 2 4 Economizer - no no yes yes yes Thermal Barrier Location - ceiling tiles ceiling tiles roof roof roof Method of Det. Thermal Barrier Location - visual inspection visual inspection thermal thermal thermal Air Barrier - ceiling tiles ceiling tiles roof roof roof Method of Determining Air Barrier - visual inspection visual inspection thermal thermal thermal
cfm 748 1018 1535 1355 1117 Sum of Supplies L/s 353 480 724 639 527 cfm 799 914 1289 706 1139 Sum of Returns L/s 377 431 608 333 537 cfm 0 0 0 877 0 Outside Air L/s 0 0 0 414 0 cfm 746 1122 1764 1507 1353 Fan Flow L/s 352 529 832 711 638
cfm/ton 249 281 353 301 338 Fan Flow/capacity L/s/kW 33 38 47 40 45 cfm/ft2 0.4 0.6 1.8 0.8 1.3 Fan Flow/System Floor Area L/s/m2 2 3 9 4 7 cfm/ft2 3 3 3 4 5 Fan Flow/Supply Duct Surface Area L/s/m2 17 17 17 21 25
Fan Cycles with Equipment - yes yes no no no in2 12 30 45 36 34 Supply ELA25 cm2 79 191 291 233 217 in2 9 14 38 13 20 Return ELA25 cm2 58 88 243 83 126 iwc 0.18 0.08 0.24 0.12 0.09 Supply Plenum Pressure Pa 45 21 61 30 23 iwc -0.14 -0.08 -0.16 -0.04 -0.05 Return Plenum Pressure Pa -36 -21 -40 -9 -14 in2 21 43 83 49 53 Total ELA25 cm2 137 279 534 316 343
Supply Leakage Class Cfm/100 ft2 @ 1 iwc 244 458 320 262 370
Return Leakage Class Cfm/100 ft2 @ 1 iwc 212 352 307 496 386

284
7.4 Delivery effectiveness
To maintain the air in a conditioned room at constant temperature and humidity, the room’s net influx of enthalpy from the inflow of supply air and outflow of room air must equal its net thermal load. If the room’s airflow is balanced,
roomQHmHm Raa =− && , (21) where roomQ is the room’s net thermal load, am& is the mass flow rate of the dry-air component of the supply air, and H and RH are the enthalpies per unit mass dry air of the supply air and room air. This net enthalpy influx is the supply’s air thermal capacity,
( )Ra HHmC −≡ & . (22)
The effectiveness with which a duct delivers capacity is defined as the ratio of the capacity at its outlet, BC , to the capacity at its inlet, AC . If the duct is airtight and free of internal condensation, its delivery effectiveness is
( )( )
( )RA
BAp
RA
BA
RAa
RBa
A
BC HH
TTcHHHH
HHmHHm
CC
−−
−=−−−=
−−=≡ 11
&
&ε , (23)
where AT and BT are the temperatures at inlet and outlet, and pc is the air’s specific heat per unit mass.
Coating the air-facing surface of a fiberglass duct liner with an impermeable film prevents the flow of duct air through the liner. This increases the liner’s thermal resistance, reduces conduction heat losses through the duct wall, and decreases the temperature drop from the duct’s inlet to its outlet. The energy savings achieved by aerosol coating can be gauged by calculating the duct’s delivery effectiveness before and after coating.
7.5 Bulk (macroscopic) and spot (microscopic) conductances
A fiberglass blanket used to line the interior of a duct is typically made of a thick layer of low-density fiberglass that is faced with a thin, bound layer of compressed fiberglass. The flow conductance to air of the fiberglass blanket, U , is defined as the ratio of the bulk velocity of airflow across the blanket, u , to the pressure difference across the blanket, ∆P :
PAG
PuU
∆=
∆= , (24)
where G is the volumetric rate of airflow and A is the area through which the airflow. The conductance of a large region of liner (e.g., φ=25 cm) that may have varied surface features is a macroscopic, or bulk, conductance. The conductance of a small liner region (e.g., φ=1 cm) with a uniform surface is a microscopic, or spot, conductance.
7.6 Darcy-Forschheimer’s law
The flow through a porous medium can be evaluated with the following equation:

285
2uugrad fbKP ρµ
+=− , (25)
where P is the pressure in the medium (Pa), K is the liner conductance (m2), µ is the dynamic viscosity of the fluid (kg m-1 s-1), u is the bulk velocity vector (m s-1), b is an empirical constant (m-1), and ρf is the density of the fluid (kg m-3). The second term of the right hand side may be ignored at low Reynolds numbers, reducing the equation to the standard Darcy-flow model.

286
7.7 Fan protocols nomenclature
Throughout Section 5 of this report the following variable definitions, symbols, and representations are used:
7.7.1 Abbreviations AHU Air Handling Unit AMCA Air Movement and Conditioning Association International Amps Amperes ASD Adjustable Speed Drive ASHRAE American Society of Heating, Refrigeration, and Air Conditioning
Engineers BHP Brake horsepower BMS Building Management System CAV Constant air volume CEDR Center for Environmental Design Research CFM or cfm Cubic feet per minute CIEE California Institute of Energy Efficiency DOE Department of Energy Eff. Efficiency ESCO Energy Service Company ESP Energy Service Provider FSP Fan Static Pressure Ft Foot HP Horsepower HVAC Heating, Ventilation and Air Conditioning In. Hg Inches of mercury Iwc Inches of water column KW Kilowatt LB Pound MS Microsoft Psia Pounds per square inch absolute RMS Root-mean-square RPM Revolutions per minute Sf Square feet SFPI Specific Fan power for an Individual fan SPin Inlet static pressure SPout Outlet static pressure VAV Variable-air-volume VFC Variable Frequency Controller (see ASD) VFD Variable Frequency Drive (see ASD) VPin Inlet velocity pressure VPout Outlet velocity pressure VSD Variable Speed Drive (see ASD)

287
7.7.2 Parameters Parameter Symbol Units Area A Square feet (ft2, sf) Barometric pressure pb Inches of mercury (In. Hg) Density (specific weight) ρ Pounds per cubic foot (lb/ft3) Efficiency η, eff. Percent (%) Energy E Kilowatt-hours (kWh) Fan power, input BHP Brake horsepower (bhp, BHP) Fan Static Pressure Rise FSP Inches water column (Iwc) Mixed air temperature MAT Degrees Fahrenheit (°F) Motor power, input P Watts (W), Kilowatts (kW, KW) Motor power, output HP Horsepower (hp or HP) Outdoor air temperature OAT Degrees Fahrenheit (°F) Reheat system delta temperature HW∆T Degrees Fahrenheit (°F) Reheat system return temperature HWRT Degrees Fahrenheit (°F) Reheat system supply temperature HWST Degrees Fahrenheit (°F) Return air temperature RAT Degrees Fahrenheit (°F) Specific fan power SFP Watts per cfm (W/cfm) Specific fan power, individual fan SFPI Watts per cfm (W/cfm) Speed N Revolutions per minute (rpm) Static pressure SP Inches water column (Iwc) Supply air temperature SAT Degrees Fahrenheit (°F) Temperature: Tx Degrees Fahrenheit (°F) Total pressure TP Inches water column (Iwc) Velocity pressure VP Inches water column (Iwc) Volumetric Airflow Q Cubic feet per minute (cfm, CFM) Zone air (room) temperature ZAT Degrees Fahrenheit (°F)

288
7.8 Problem identification summary Table 33. Problem Ranking
Problem System Cost to Correct
Cost to assess
Energy Impact
Total Score
Average Score
Remarks
1=low, 4=high
1=low, 4=high
1=high, 4=low
Run time Both 1 1 1 3 1.0 Fan running backwards Both 1 1 2 4 1.3 SAT reset CAV 1 2 1 4 1.3 Fan runaround Both 2 1 2 5 1.7 Pre-filters Both 1 1 3 5 1.7 Dirty coils Both 2 2 2 6 2.0 Belt drive problems Both 2 1 3 6 2.0 Correcting loose belts may actually increase energy
use. Inefficient motor Both 2 1 3 6 2.0 Too much air CAV 2 3 1 6 2.0 Sound traps Both 2 2 3 7 2.3 Duct air leakage Both 3 3 2 8 2.7 Although duct air leakage effects on energy
performance can be complex, for the fan system they appear as system resistance changes. Extensive testing is required to determine the magnitude of leakage [Fisk, 1998].
Fan construction Both 4 2 3 9 3.0 Fan wheel changeout for improved efficiency and to correct large gaps, etc.
VAV Retrofit CAV 4 3 2 9 3.0 Too little air CAV 2 3 4 9 3.0 Fan System Effect Both 4 3 3 10 3.3 Ductwork design Both 4 4 2 10 3.3 High/low duct static setpoint VAV 1 2 2 5 1.7 SP sensor location/setting VAV 2 1 2 5 1.7 Little VAV turndown VAV 2 2 2 6 2.0 SAT reset VAV 1 2 4 7 2.3 High pressure VAV boxes VAV 3 2 2 7 2.3 Fan VFD retrofit VAV 3 2 2 7 2.3 Timing problems at startup VAV 2 3 3 8 2.7 Poor system design or construction
1. Problems organized on the basis of average (un-weighted) score for the three criteria shown. A “1” indicates best overall opportunities, a “4” indicates least.
2. Problems shown in bold Italics indicate problems directly or indirectly addressed by the protocol described in this report.

289 289
7.9 Data-collection support tools
7.9.1 Field-data collection sheets
Two field data sheets were developed as part of this project in order to assist technicians in collecting the required field data. The first data sheet includes spaces for all data used as input to the Fan Analysis and Benchmarking Tool. California Institute for Energy Efficiency Entered by:FAN DATA COLLECTION SHEET Date:
Building Information: System Information:Building System
Address
SAT Setpoint oF
SAT Reset Controls?
Economizer?
Bldg. Square Footage sf Economizer Low Limit oF
Economizer High Limit oF
Measurement Conditions: Minimum OSA % %
Date/Time Sys. Square Footage sf
Fan Air Temperature oF
Fan Air Humidity % Fan Information:Fan Air Density * lb/ft3 Fan
*estimated* Fan Function Supply / Return / Exhaust
Schedule: On Off Fan Control CAV / VAV
Mon - Fri Fan Design SWSI / SWDI / DWSI / DWDI
Sat Fan Type FC / BC / Axial
Sun Fan Configuration Plug / Shrouded
Fan Data: Error (+/-): Notes:
Manufacturer
Model Number
Diameter in in
Volumetric Flow CFM CFM
Static Pressure Rise: in. w.c. Outlet: in. w.c.
Inlet: in. w.c.
Velocity Pressure Inlet: in. w.c. Inlet: in. w.c.
Fan Speed rpm rpm
Fan Power BHP
Motor Information and Data:Manufacturer Nameplate HP HP
Model Number Syncronous RPM
Error (+/-): Notes:Motor Speed rpm
Motor Efficiency %
Input Power KW
Current A A/B/C
Voltage v A/B/C
Power Factor % A/B/C
** use separate flow measurement data sheet to record pitot tube measurements*****use MotorMaster+ or other computational technique to estimate actual motor efficiency based on field measurements***
***
Measured Data900 / 1200 / 1800 / 3600
Nameplate Data
Design Data Measured Data
Yes / No
Yes / No
**
Figure 133. Field Data Sheet

290
The second field data sheet is intended to assist practitioners in collecting Pitot-static measurements for calculating fan volumetric air flow. A look-up table for air density values is also included on this data sheet. California Institute for Energy Efficiency Entered by:FLOW MEASUREMENT DATA SHEET Date:
Building Information: Measurement Conditions:Building Barometric Pressure
Fan Fan Air Temperature oF
Fan Function Supply / Return / Exhaust Fan Air Humidity %
Fan Air Density * lb/ft3
*use look-up chart below*
Air Density Look-Up Chart:Measure: Temperature (F) and Barometric Pressure (In. HG or PSIA). Estimate Relative Humidiry
In. HG:
PSIA:RH: 0% 100% 0% 100% 0% 100% 0% 100% 0% 100% 0% 100% 0% 100% 0% 100%
120 0.060 0.052 0.062 0.054 0.064 0.056 0.067 0.059 0.068 0.060 0.069 0.061 0.070 0.062 0.071 0.063
110 0.061 0.055 0.063 0.057 0.065 0.059 0.068 0.062 0.069 0.063 0.070 0.064 0.071 0.065 0.072 0.066
100 0.062 0.057 0.064 0.059 0.067 0.062 0.069 0.064 0.070 0.065 0.071 0.067 0.073 0.068 0.074 0.069
90 0.063 0.059 0.065 0.062 0.068 0.064 0.070 0.067 0.071 0.068 0.073 0.069 0.074 0.070 0.075 0.071
80 0.064 0.061 0.067 0.064 0.069 0.066 0.072 0.069 0.073 0.070 0.074 0.071 0.075 0.073 0.076 0.074
70 0.065 0.063 0.068 0.066 0.070 0.068 0.073 0.071 0.074 0.072 0.075 0.073 0.077 0.075 0.078 0.076
60 0.067 0.065 0.069 0.068 0.072 0.070 0.074 0.073 0.076 0.074 0.077 0.075 0.078 0.077 0.079 0.078
50 0.068 0.067 0.071 0.069 0.073 0.072 0.076 0.075 0.077 0.076 0.078 0.077 0.080 0.079 0.081 0.08040 0.069 0.068 0.072 0.071 0.075 0.074 0.077 0.076 0.079 0.078 0.080 0.079 0.081 0.080 0.083 0.082
Density values are in lb/ft2
Fan Flow Data:Enter pitot-tube velocity pressure readings (In. W.C.) in cells below:
Duct Width (outside dimension): in. Duct Width (inside dimension): in.
Duct Depth (outside dimension): in. Duct Depth (inside dimension): in.
Distance between readings (width): in. Distance between readings (depth): in.
29.5 30 30.514.29 14.53
3115.2715.0214.7812.81
Sea Level
13.7913.3026 27 28 29
Figure 134. Volumetric Flow Data Collection Sheet

291
7.9.2 Instrumentation and measurements summary
The following table includes manufacturer and model number suggestions for various measurement instruments used for the measurement protocol described in this report.
The table is not meant as an endorsement of any specific manufacturer or product.
All of the instruments listed in the table can be obtained from various manufacturers and dealers, in a range of prices and with varying specifications. There are several catalogs and web sites that sell a wide range of HVAC field instruments.
Table 34. Instrument Manufacturer and Model Numbers
Equipment
Selected Manufacturer Product & Model Number
Comments
3-Phase Power Meter
Fluke Manufacturing Company, Inc. Fluke 39 Power Meter Model No. 39 Summit Technology, Inc Powersight Energy Analyzer Model No. PS-3000
In general, 3-phase power meters are significantly more expensive and sophisticated than electrical multi-meters. A 3-phase power meter includes 4 current transducers (one for each leg and one for ground) along with voltage leads. Often power meters include data-logging capability and harmonic analysis functions.
Multi-meter Fluke Manufacturing Company, Inc. Fluke 87 True RMS Multi-meter Model No. 87 Amprobe Instruments Digital Multi-meter AM-50 Series
Electrical multi-meters come in a range of prices, sizes, and levels of sophistication. A digital multi-meter with averaging capability is recommended for this project (if a power meter is not available). As with all electrical instruments, ensure that the multi-meter is properly sized for the anticipated load before making measurements.
Manometer
Dwyer Instruments Handheld Digital Manometer Series 477 Solomat Neotronics Zephyr Digital Micro-manometer
The most common manometers are simple analog gauges. More sophisticated digital manometers with averaging capability and data storage features are useful, particularly when pressure readings are unstable or inconsistent.
Pitot Tube
Dwyer Instruments Standard Model 160 Pitot Tube
A Pitot tube trace remains the most cost-effective way to measure flow

292
through a duct. A Pitot tube is, therefore, a standard instrument for most HVAC technicians.
Stroboscope (Strobe Tachometer)
Amprobe Instruments Digital Non-contact Tachometer Model No. TMOT-220 Monarch Instruments Digital Strobe Tachometer Nova-Strobe DB Plus
A stroboscope is significantly easier to use than a non-contact tachometer (which requires placing a reflective sticker on the rotating shaft) or a contact tachometer, which requires touching the instrument to the rotating shaft.
Air Temperature Probe
Fluke Manufacturing Company, Inc. Model 51, Model 52
There are a variety of thermocouple based digital air temperature probes available from a variety of manufacturers. For this project almost any temperature measurement will suffice as the measurement is only used for estimating in-situ air density.
Infrared Surface Temperature Probe
Fluke Manufacturing Company, Inc. Model 65 Raytek Raynger ST Series
An infrared surface temperature probe can be useful in determining if a fan belt drive is overheating, but is not essential to the measurement protocol.
Single-channel Data Loggers
Onset Computer Company Single Channel Data-loggers HOBO and StowAway lines Dwyer Instruments Low Cost Data Logger Series LCL
Single-channel data loggers specifically designed to record one environmental variable (typically temperature or relative humidity) are often the most economical data logging option.
Multi-channel Data Loggers
Architectural Energy Corporation MicroDataLogger Onset Computer Company Single Channel Data-loggers HOBO and StowAway lines
Multi-channel data loggers often offer more features than single-channel loggers and may include the ability to reconfigure the logger in various ways to measure several variables.
Power Transducer/ Power Data Logger
Amprobe Instrument Kilowatt Hour Recorders LAW78KWH and LAW79KWH Architectural Energy Corporation MicroDataLogger
Portable field data-loggers for recording 3-phase RMS power are generally very expensive and sophisticated. Power meters may include some capability for data logging.

293
Current Transducer/ Current Data Logger
Architectural Energy Corporation MicroDataLogger
The simplest way to log current is to use a low-cost current transducer with a voltage output and a data-logger that records voltage. Several companies manufacture current transducers and voltage loggers.
Pressure Transducer/ Pressure Data Logger
Dwyer Instruments Differential Pressure Data Logger Series DL7 Dwyer Instruments Pressure Data Logger Series DL6
Dwyer pressure data loggers can also record temperature and RH using optional external probes.
7.9.2.1 Selected manufacturer contact information Amprobe Instruments (800) 477-8658 http://www.amprobe.com Architectural Energy Corporation 2540 Frontier Avenue, Suite 201 Boulder, CO 80301 (303) 444-4149 http://www.archenergy.com Dwyer Instruments P.O. Box 373 Michigan City, IN 46361 (219) 879-8000 http://www.dwyer-inst.com Fluke Manufacturing Company P.O. Box 9090 Everett, WA 98206 (800) 443-5853 http://www.fluke.com
Monarch Instrument 15 Columbia Drive Amherst, NH 03031 (800) 999-3390 http://www.monarchinstrument.com Onset Computer Corporation PO Box 3450 Pocasset, MA 02559-3450 (800) 564-4377 http://www.onsetcomp.com Raytek Corporation 1201 Shaffer Road Santa Cruz, CA 95060-5729 (800) 866-5478 http://www.raytek.com Summit Technology, Inc. 2248 Oakvale Rd. Walnut Creek, CA 94596 (510) 944-1212 http://www.summittechnology.com


295