Volume 6, Issue 1 (III): January – March 2019 - Indian ...
220
Volume 6, Issue 1 (III) ISSN 2394 - 7780 January - March 2019 International Journal of Advance and Innovative Research (Conference Special) Indian Academicians and Researchers Association www.iaraedu.com
-
Upload
khangminh22 -
Category
Documents
-
view
3 -
download
0
Transcript of Volume 6, Issue 1 (III): January – March 2019 - Indian ...
Volume 6, Issue 1 (III) ISSN 2394 - 7780 January - March 2019
International Journal of
Advance and Innovative Research (Conference Special)
Indian Academicians and Researchers Association
www.iaraedu.com
International Conference on
Marketing
Organized by Department of Management Studies
Jawaharlal Nehru National College of Engineering, Shimoga January 4-5, 2019
Publication Partner
Indian Academicians and Researcher’s Association

JAWAHARLAL NEHRU NATIONAL COLLEGE OF ENGINEERING SHIMOGA

Special Volume Editor Dr. Ravisha N. S Assistant Professor
Department of Management Studies Jawaharlal Nehru National College of Engineering
Shimoga
ORGANIZING COMMITTEE
Patron
Dr. H. R. Mahadevaswamy Principal, JNN College of Engineering, Shimoga
Dr. L. K. Sripathi Vice Principal, JNN College of Engineering, Shimoga
International Advisory Committee Ajai Gaur
Associate Professor and Vice Chair, Rutgers Business School, Rutgers University, Newark
B. Nimalathasan Professor
University of Jaffna, Jaffna, Sri Lanka
Dr. Huong Ha School of Business, Singapore University of Social Sciences, Singapore
Murli Rajan Associate Dean
Kania School of Management, University of Scranton Scranton, PA
Prof. Bethel Erastus-Obilo Professor
Pregen Business School, Naperville Illinois, USA
Dr. Anand S Director, Post-graduate Studies and Research Department,
College of Banking and Financial Studies Muscat, Sultanate of Oman
Dr. R. Kasilingam Associate Professor
Department of Management Studies, Pondicherry University, Puducherry
Dr. Kausik Gangopadhyay Associate Professor
Indian Institute of Management Kozhikode, Kozhikode
Dr. M H Bala Subrahmanya Professor, Management Studies, IISc, Bangalore
Conference Chair Dr. C. Srikant
HOD-MBA, JNN College of Engineering, Shimoga
Conference Convener Dr. M. G. Krishnamurthy
Professor-MBA, JNN College of Engineering, Shimoga
Organizing Secretary Dr. B. V. Srinivasa Murthy
Organising Committee Dr. Lakshmeesha Kanti K. S Dr. K. S. H. Rahman Mrs. C. K. Anuradha Dr. Srikant G. Sugur Dr. Subhadra P. S
Dr. D. K. Vikrama Dr. V. Vikram Dr. Ravisha N. S Dr. Santosha S Mrs. Aishwarya V. Hittanagi
ABOUT NATIONAL EDUCATION SOCIETY Founded in 1946 by freedom fighters and philanthropists, NES has been a pioneer in the education scene of this region. It runs 35 institutions –from primary schools to PG and research centers-having about 15,000 students and 1200 teaching and non-teaching staff. Higher education is imparted in various disciplines like commerce, business management, applied science, law, education, pharmacy and engineering.
ABOUT JAWAHARLAL NEHRU NATIONAL COLLEGE OF ENGINEERING (JNNCE) Established by NES in 1980, JNNCE is approved by Government of Karnataka and AICTE; affiliated to Visvesvaraya Technological University, Belgaum and accredited by NAAC. A preferred destination of students seeking technical education, the institution offers BE degree in 7 branches, 3 PG Courses, namely, M. Tech., MCA and MBA, besides M.Sc. (Engg.) and Ph.D. in nine disciplines. Spread over a sprawling campus of 39.4 acres, the institution is reputed for its high-caliber faculty, excellent infrastructure, academic environment and placement. Around 15000 graduates and post-graduates have so far passed out from this College and have been making significant contributions in academic institutions, industry R & D organisations and Government Departments in India and abroad.
ABOUT DEPARTMENT OF MANAGEMENT STUDIES Started in 1996, the Department offers 2-year full- time MBA Programme, affiliated to VTU and recognised by AICTE. The faculty members have rich and varied experience in industry and academics. The Department is equipped with spacious lecture halls, an advanced Computer laboratory with internet facility, exclusive library with more than 11000 books and 50 national and international journals and an active Placement Cell that assists students in project and final placements. The Dept. is also recognized as a Research Centre by VTU.
ABOUT IARA Indian Academicians and Researchers Association ( IARA ) is an educational and scientific research organization of Academicians, Research Scholars and practitioners responsible for sharing information about research activities, projects, conferences to its members. IARA offers an excellent opportunity for networking with other members and exchange knowledge. It also takes immense pride in its services offerings to undergraduate and graduate students. Students are provided opportunities to develop and clarify their research interests and skills as part of their preparation to become faculty members and researcher. Visit our website www.iaraedu.com for more details.
ABOUT THE INTERNATIONAL CONFERENCE Marketing in the 21st century has become dynamic and complex. The dawn of digital age has transformed Marketing all over the world. Digital technology has opened new channels to reach customers and sell products. It gives the consumer more opportunities to explore any kind of product from anywhere at any time. This environment is changing quickly as today’s best technology is tomorrow’s obsolete technology. In this rapidly changing environment, business enterprises need to be innovative in reaching and engaging customers and to compete in the market. The shift from traditional to digital marketing has put immense pressure on business enterprises to understand their customers' buying habits and behaviour better. This is changing the landscape of marketing in India. New rules are to be framed in acquiring, engaging and retaining Indian consumer. With this backdrop, it is intended to seek the intellectual contributions of experts from industry, academia, and research pertaining to Trends, Issues and Challenges in Digital marketing

MESSAGES

S. N. Nagaraj Secretary National Education Society Shimoga
Message
I am extremely happy to note that the Department of Management Studies of JNNCE is organizing a Two-Day
International Conference on “Marketing in the Digital World” on 4-5, January, 2019.
Marketing is the most talked about function today. The traditional role of this function is getting expanded.
The marketers have come to realize the need to satisfy more stakeholders than customers and now face the need
to market themselves within and outside their organizations by harnessing emerging media.
Hence, I find this Conference to be of utmost significance and wish the event to attract large number of
academicians, practicing managers research scholars and students under one roof for meaningful deliberations
on the topic. I hope the Conference would play a greater role in updating the knowledge of the people
concerned in the field of Marketing in this era of Digital technologies & media.
I congratulate and wish all the best to the faculty involved in the organization of this mega event, and the
Conference to be a grand success
S. N. Nagaraj
Dr. H. R. Mahadevaswamy Principal JNN College of Engineering Shimoga
Message
It is a matter of great pride to note that the Department of Management Studies of our college is organizing a
Two-Day International Conference on “Marketing in the Digital World” on 4-5, January, 2019.
In this New Year, we look back with pride the progress which the College has made. Whether we have reached
near the ladder of distinctive competence is a matter we need to introspect. The institution has grown by leaps
and bounds, both in infrastructure and in academics, including research. Considerable contribution has been
made by the staff –both teaching & non-teaching- to make this College the pride of the society. Our
benefactors and well-wishers have strengthened us by supporting us intellectually and financially. We, at
Jawaharlal Nehru National College of Engineering, have laid down a path of growth trajectory through the most
powerful and value-based instrument, viz., service and excellence!
It is in this context the “International Conference on Marketing in Digital World” being organized by the
Department of Management Studies provides a platform to the academicians and industry experts to deliberate
on Trends, Opportunities & Challenges of this new-era phenomenon, to see how service & excellence can act as
an instrument in Achieving Distinctive Competence in today’s business world.
I compliment the Department for choosing the right theme at the right time by keeping in mind the motto of our
institution. I hope the Conference will be well appreciated by all the delegates, faculty members and scholars. I
wish all the delegates a fruitful stay and time on our Campus.
Dr. H. R. Mahadevaswamy
Dr. C. Srikant Director Department of Management Studies JNN College of Engineering Shimoga
Message
Hearty welcome to the Two-Day International Conference on Marketing in the Digital World being organized
by our Department on 4-5, January, 2019. It is a great honour and privilege to have all of you as our guests.
As 2019 approaches, the digital marketing landscape that encompasses SEO, social media, PPC, content
marketing and more is witnessing a dramatic shift. There may have been a time when one could’ve dismissed
artificial intelligence or visual search as gimmicks from the latest blockbuster science fiction film, but that time
is long gone.
There are many new digital marketing trends and strategies that are evolving in the current high-tech, Internet-
connected era and businesses now need to use them to succeed in their efforts because what worked for them
last year may not work this year.
In this background, we, at the Dept. of Management Studies, have set out to organize this Conference, seeking
to examine the trends, opportunities & challenges of digital marketing.
I would like to express my indebtedness to NES Management and the Principal & Vice Principal, JNNCE for
the support and encouragement throughout. I express my sincere gratitude to my dynamic and highly motivated
faculty team in organizing this event. I also thank all the experts, contributors and sponsors for their patronage
& co-operation extended to this programme.
I wish all the delegates a great time!
Dr. C. Srikant
PREFACE
Marketing in the 21st century has become dynamic and complex. The dawn of digital age has transformed Marketing all over the world. Digital technology has opened new channels to reach customers and sell products. It gives the consumer more opportunities to explore any kind of product from anywhere at any time. This environment is changing quickly as today’s best technology is tomorrow’s obsolete technology. In this rapidly changing environment, business enterprises need to be innovative in reaching and engaging customers and to compete in the market. The shift from traditional to digital marketing has put immense pressure on business enterprises to understand their customers' buying habits and behaviour better. This is changing the landscape of marketing in India. New rules are to be framed in acquiring, engaging and retaining Indian consumer.
Digital marketing is the marketing of products or services using digital technologies, mainly on the Internet, but also including mobile phones, display advertising, and any other digital medium. Digital marketing encompasses all marketing efforts that use an electronic device or the internet. Businesses leverage digital channels such as search engines, social media, email, and their websites to connect with current and prospective customers. In a nutshell, Digital marketing is any form of marketing products or services that involves electronic devices.
The best digital marketers have a clear picture of how each digital marketing campaign supports their overarching goals. And depending on the goals of their marketing strategy, marketers can support a larger campaign through the free and paid channels at their disposal.
Digital marketers are in charge of driving brand awareness and lead generation through all the digital channels -- both free and paid -- that are at a company's disposal. These channels include social media, the company's own website, search engine rankings, email, display advertising, and the company's blog.
The digital marketer usually focuses on a different key performance indicator (KPI) for each channel so they can properly measure the company's performance across each one. A digital marketer who's in charge of SEO, for example, measures their website's "organic traffic" -- of that traffic coming from website visitors who found a page of the business's website via a Google search.
Digital marketing is carried out across many marketing roles today. In small companies, one generalist might own many of the digital marketing tactics described above at the same time. In larger companies, these tactics have multiple specialists that each focus on just one or two of the brand's digital channels.
Digital marketing can work for any business in any industry. Regardless of what your company sells, digital marketing still involves building out buyer personas to identify your audience's needs, and creating valuable online content. However, that's not to say all businesses should implement a digital marketing strategy in the same way.
Unlike most offline marketing efforts, digital marketing allows marketers to see accurate results in real time. If you've ever put an advert in a newspaper, you'll know how difficult it is to estimate how many people actually flipped to that page and paid attention to your ad. There's no surefire way to know if that ad was responsible for any sales at all. On the other hand, with digital marketing, you can measure the ROI of pretty much any aspect of your marketing efforts.
With this backdrop, it is intended to seek the intellectual contributions of experts from industry, academia, and research pertaining to Trends, Issues and Challenges in Digital marketing. Conference sub-themes, inter alia, comprise of the following:
Digital Marketing & Digital Transformation: Content Marketing / Social Media Marketing/Email Marketing / Mobile Marketing & Re-targeting / Brand Management and Strategy / Event Marketing / Value driven Marketing / Green Marketing / Sports Marketing / Strategic Marketing / Technology Marketing / Services marketing / Rural Marketing / Virtual Marketing / Viral/buzz Marketing
Data-driven Marketing & Marketing Analytics: Big Data in Digital Marketing / Web Analytics & a/b Testing / Predictive Analysis & Attribution / Conversion Rate Optimization / Search Engine Optimization / Paid Search Marketing / Geo-targeting
We are privileged to have received very good response to this event from academicians and practitioners working in the area of marketing in general and digital marketing in particular. A good number of research papers have been received and are presented in the foregoing pages. Several domain experts have assured to take part in the proceedings and interact with the delegates. Extensive deliberations planned at different technical sessions are expected to generate ample insights into and conclusions on this important issue. We acknowledge the scholastic contributions and support being extended to us by these experts, authors and delegates.
We congratulate and profusely thank all the authors of the papers. The confluence of delegates and experts makes this Conference fruitful and memorable. It has been possible to bring out this Conference Proceedings because of the astute involvement of the staff, both teaching and non-teaching, of our Department. The Conference proceedings have been painstakingly edited by Dr. Ravisha N.S. and meticulously processed by M/s Web World, Shimoga, to whom the organizers are very grateful.
We thank the members of Management, Principal, Vice Principal, Faculty members of Dept. of Management Studies and our sponsors for their kind support and co-operation this endeavor.
Thank you for participating in this International Conference and enjoy a great Conference experience!
Dr. M. G. Krishnamurthy Conference Convener
JNN College of Engineering Shimoga
International Journal of Advance and Innovative Research Volume 6, Issue 1 ( III ): January - March 2019
Editor- In-Chief Dr. Tazyn Rahman
Members of Editorial Advisory Board
Mr. Nakibur Rahman Ex. General Manager ( Project ) Bongaigoan Refinery, IOC Ltd, Assam
Dr. Mukesh Saxena Pro Vice Chancellor, University of Technology and Management, Shillong
Dr. Alka Agarwal Director, Mewar Institute of Management, Ghaziabad
Dr. Archana A. Ghatule Director, SKN Sinhgad Business School, Pandharpur
Prof. (Dr.) Sudhansu Ranjan Mohapatra Dean, Faculty of Law, Sambalpur University, Sambalpur
Prof. (Dr.) Monoj Kumar Chowdhury Professor, Department of Business Administration, Guahati University, Guwahati
Dr. P. Malyadri Principal, Government Degree College, Hyderabad
Prof. (Dr.) Baljeet Singh Hothi Professor, Gitarattan International Business School, Delhi
Prof.(Dr.) Shareef Hoque Professor, North South University, Bangladesh
Prof. (Dr.) Badiuddin Ahmed Professor & Head, Department of Commerce, Maulana Azad Nationl Urdu University, Hyderabad
Prof.(Dr.) Michael J. Riordan Professor, Sanda University, Jiashan, China
Dr. Anindita Sharma Dean & Associate Professor, Jaipuria School of Business, Indirapuram, Ghaziabad
Prof.(Dr.) James Steve Professor, Fresno Pacific University, California, USA
Prof. (Dr.) Jose Vargas Hernandez Research Professor, University of Guadalajara,Jalisco, México
Prof.(Dr.) Chris Wilson Professor, Curtin University, Singapore
Prof. (Dr.) P. Madhu Sudana Rao Professor, Mekelle University, Mekelle, Ethiopia
Prof. (Dr.) Amer A. Taqa Professor, DBS Department, University of Mosul, Iraq
Prof. (Dr.) Himanshu Pandey Professor, Department of Mathematics and Statistics Gorakhpur University, Gorakhpur
Dr. Nurul Fadly Habidin Faculty of Management and Economics, Universiti Pendidikan Sultan Idris, Malaysia
Prof. (Dr.) Agbo Johnson Madaki Faculty, Faculty of Law, Catholic University of Eastern Africa, Nairobi, Kenya
Dr. Neetu Singh HOD, Department of Biotechnology, Mewar Institute, Vasundhara, Ghaziabad
Prof. (Dr.) D. Durga Bhavani Professor, CVR College of Engineering, Hyderabad, Telangana
Prof. (Dr.) Shashi Singhal Professor, Amity University, Jaipur
Prof. (Dr.) Aradhna Yadav Professor, Krupanidhi School of Management, Bengaluru
Prof. (Dr.) Alireza Heidari Professor, Faculty of Chemistry, California South University, California, USA
Prof.(Dr.) Robert Allen Professor Carnegie Mellon University, Australia
Prof. (Dr.) A. Mahadevan Professor S. G. School of Business Management, Salem
Prof. (Dr.) S. Nallusamy Professor & Dean, Dr. M.G.R. Educational & Research Institute,Chennai
Prof. (Dr.) Hemant Sharma Professor, Amity University, Haryana
Prof. (Dr.) Ravi Kumar Bommisetti Professor, Amrita Sai Institute of Science & Technology, Paritala
Dr. C. Shalini Kumar Principal, Vidhya Sagar Women’s College, Chengalpet
Dr. Syed Mehartaj Begum Professor, Hamdard University, New Delhi
Prof. (Dr.) Badar Alam Iqbal Adjunct Professor, Monarch University, Switzerland
Dr. Darshana Narayanan Head of Research, Pymetrics, New York, USA
Prof.(Dr.) D. Madan Mohan Professor, Indur PG College of MBA, Bodhan, Nizamabad
Dr. Rosemary Ekechukwu Associate Dean, University of Port Harcourt, Nigeria
Dr. Sandeep Kumar Sahratia Professor Sreyas Institute of Engineering & Technology
Dr. P.V. Praveen Sundar Director, Shanmuga Industries Arts and Science College
Dr. S. Balamurugan Director - Research & Development, Mindnotix Technologies, Coimbatore
Dr. Manoj P. K. Associate Professor, Cochin University of Science and Technology
Dr. Dhananjay Prabhakar Awasarikar Associate Professor, Suryadutta Institute, Pune
Dr. Indu Santosh Associate Professor, Dr. C. V.Raman University, Chhattisgath
Dr. Mohammad Younis Associate Professor, King Abdullah University, Saudi Arabia
Dr. Pranjal Sharma Associate Professor, Department of Management Mile Stone Institute of Higher Management, Ghaziabad
Dr. Kavita Gidwani Associate Professor, Chanakya Technical Campus, Jaipur
Dr. Lalata K Pani Reader, Bhadrak Autonomous College, Bhadrak, Odisha
Dr. Vijit Chaturvedi Associate Professor, Amity University, Noida
Dr. Pradeepta Kishore Sahoo Associate Professor, B.S.A, Institute of Law, Faridabad
Dr. Marwan Mustafa Shammot Associate Professor, King Saud University, Saudi Arabia
Dr. R. Navaneeth Krishnan Associate Professor, Bharathiyan College of Engg & Tech, Puducherry

Dr. Mahendra Daiya Associate Professor, JIET Group of Institutions, Jodhpur
Dr. G. Valarmathi Associate Professor, Vidhya Sagar Women's College, Chengalpet
Dr. Parbin Sultana Associate Professor, University of Science & Technology Meghalaya
Dr. M. I. Qadir Assistant Professor, Bahauddin Zakariya University, Pakistan
Dr. Kalpesh T. Patel Principal (In-charge) Shree G. N. Patel Commerce College, Nanikadi
Dr. Brijesh H. Joshi Principal (In-charge) B. L. Parikh College of BBA, Palanpur
Dr. Juhab Hussain Assistant Professor, King Abdulaziz University, Saudi Arabia
Dr. Namita Dixit Associate Professor, ITS Institute of Management, Ghaziabad
Dr. V. Tulasi Das Assistant Professor, Acharya Nagarjuna University, Guntur, A.P.
Dr. Nidhi Agrawal Assistant Professor, Institute of Technology & Science, Ghaziabad
Dr. Urmila Yadav Assistant Professor, Sharda University, Greater Noida
Dr. Ashutosh Pandey Assistant Professor, Lovely Professional University, Punjab
Dr. M. Kanagarathinam Head, Department of Commerce Nehru Arts and Science College, Coimbatore
Dr. Subha Ganguly Scientist (Food Microbiology) West Bengal University of A. & F Sciences, Kolkata
Dr. V. Ananthaswamy Assistant Professor The Madura College (Autonomous), Madurai
Dr. R. Suresh Assistant Professor, Department of Management Mahatma Gandhi University
Dr. S. R. Boselin Prabhu Assistant Professor, SVS College of Engineering, Coimbatore
Dr. V. Subba Reddy Assistant Professor, RGM Group of Institutions, Kadapa
Dr. A. Anbu Assistant Professor, Achariya College of Education, Puducherry
Dr. R. Jayanthi Assistant Professor, Vidhya Sagar Women's College, Chengalpattu
Dr. C. Sankar Assistant Professor, VLB Janakiammal College of Arts and Science
Dr. Manisha Gupta Assistant Professor, Jagannath International Management School
Copyright @ 2018 Indian Academicians and Researchers Association, Guwahati All rights reserved. No part of this publication may be reproduced or transmitted in any form or by any means, or stored in any retrieval system of any nature without prior written permission. Application for permission for other use of copyright material including permission to reproduce extracts in other published works shall be made to the publishers. Full acknowledgment of author, publishers and source must be given. The views expressed in the articles are those of the contributors and not necessarily of the Editorial Board or the IARA. Although every care has been taken to avoid errors or omissions, this publication is being published on the condition and understanding that information given in this journal is merely for reference and must not be taken as having authority of or binding in any way on the authors, editors and publishers, who do not owe any responsibility for any damage or loss to any person, for the result of any action taken on the basis of this work. All disputes are subject to Guwahati jurisdiction only.
International Journal of Advance and Innovative Research Volume 6, Issue 1 ( III ) : January – March 2019
CONTENTS
Research Papers
NOVEL MODELS IN HORTICULTURE MARKETING IN INDIA
Dr. Vijaymahantesh and Vijaya Hosamani
1 – 7
DIGITAL MARKETING OF MUTUAL FUNDS: A DEMOGRAPHIC APPROACH
Madhukar S M and Dr. M G Krishnamurthy
8 – 10
CUSTOMER ATTITUDE TOWARDS VIRTUAL BANKING SERVICES WITH SPECIAL REFERENCE TO KASARAGOD DISTRICT, KERALA
Rajesh Kumar. M
11 – 12
BIG DATA: A POWERFUL TOOL OF MARKET ANALYSIS
Shashwathi B S and Rohith N R
13 – 16
CONSUMER AWARENESS AND ATTITUDE FOR GREEN MARKETING AND GREEN PRODUCTS
Chetana Bhat and Amruta Anant Hegde
17 – 21
AN INTRODUCTION TO DATA MINING
Vinay and Dr. Archana
22 – 25
ROLE OF BIG DATA IN BANKING SECTOR
Asha S, Dr. Srikant G Sugur and Dr. A Venkatraju
26 – 31
A CONCEPTUAL STUDY ON E-COMMERCE AND E-MARKETING WITH REFERENCE TO AMAZON
K. Umesh Shetty and Bhanuprakash
32 – 37
AN EMPERICAL STUDY ON TECHNOLOGICAL IMPACT ON CUSTOMER RETENTION
Rajani Talikoti and Anuradha C. K. and Dr. P. S. Subhadra
38 – 43
PROBLEMS AND PROSPECTS OF DIGITAL MARKETING IN RURAL TOURISM WITH SPECIAL REFERENCE TO KARNATAKA STATE, INDIA
Dr. Vikrama D K
44 – 47
OPPORTUNITIES AND CHALLENGES OF SOCIAL MEDIA MARKETING IN INDIA – A STUDY
Ravi I A and Dr. Sudharshan G M
48 – 51
THE VALUE OF MOBILE MARKETING: A LITERATURE REVIEW
Dr. U Bhojanna P. Archana
52 – 59
EFFECTIVENESS OF WEB ANALYTICS, SEO AND PPC OVER OTHER COMPONENTS OF DIGITAL MARKETING IN THE VIRTUAL MARKET
Karthik Guptha, Shivaprasad B S and Dr. Srikant C
60 – 66

GREEN MARKETING-ISSUES AND CHALLENGES AND ITS INFLUENCE ON BUYING BEHAVIOUR OF CONSUMERS
Bharmappa T and Dr. Raghunandan G
67 – 74
DIGITAL MARKETING – TRENDS, OPPORTUNITIES AND CHALLENGES
Dr. Archana H. N.
75 – 78
VIRTUAL REALITY TECHNOLOGY IN THE EDUCATION SECTOR – A HOLISTIC PERSPECTIVE
Avishek Mukhopadhyay and Dr. Pankajakshi R.
79 – 86
CHALLENGES OF MARKETING FOR ARECA SUPPLEMENTARY PRODUCTS
Vishnu Sharma D D and Nagendra A S
87 – 89
A REVIEW ON EVOLUTION OF TECHNOLOGY ADOPTION THEORIES AND MODELS
Aishwarya V. Hittanagi and Dr. K. S. Habeebur Rahman
90 – 101
IMPACT OF SOCIAL MEDIA ADVERTISEMENTS ON CONSUMER BEHAVIOUR
Anjan A. Kaikini and Shreelakshmi Shreepada Bhat
102 – 107
A PRAGMATIC ASSESSMENT OF DIGITIZATION OF EDUCATION
Dr. M. B. Srinidhi and Girish Karanth
108 – 113
DIGITAL SOLUTION USING PROCESS AUTOMATION AND ANALYTICS FOR NPA IN INDIA
Shyam S Bhat and R. Jagdeesh
114 – 117
IMPACT OF DIGITAL TECHNOLOGY IN COOPERATIVE BANKS
Praveen Kumar B H, Manjunatha. M. G and Dr. Ravisha N. S
118 – 122
DIGITALIZATION- A WAY OF CREATING DIGITAL ECONOMY FOR HEALTH CARE SECTOR
Roshan K
123 – 129
E-TAILING SUPERSEDES OVER BRICK-AND-MORTAR, E-COMMERCE IN INDIA AND THE FUTURE GROWTH
Dr. V Vikram
130 – 133
HUMAN RESOURCE ANALYTICS (HR ANALYTICS) –A DIGITAL PATHWAY FOR ORGANIZATIONAL PERFORMANCE & SUCCESS
Dr. Meera Uday and C. N. Udayashankar
134 – 143
RETAILER’S SATISFACTION TOWARDS EXTENDED P’S OF E-COMMERCE COMPANIES
Dr. Somashekhar I. C and Dr. Hema Patil
144 – 152
TRANSFORMATION OF TOURISM THROUGH DIGITALIZATION, A CASE STUDY OF KARNATAKA
Dr. Srinivasa Murthy B. V, Dr. Noor Afza and Dr .Venkatesh
153 – 156
IMPACT OF DIGITAL MARKETING ON RURAL MARKETING - OPPORTUNITIES AND CHALLENGES
Vinutha P. Shenoy and Eshwar S M
157 – 160

MARKETING IN DIGITAL WORLD VIRAL/BUZZ MARKETING
Vinay H B and Gururaj N
161 – 163
GREEN MARKETING
Baibhab Sur and Mbanthaipou Ngaomei
164 – 170
A STUDY ON USAGE OF DIGITAL MARKETING TOOLS BY SMES, OPPORTUNITIES AND CHALLENGES
Ashwini H A and Dr. M G Krishnamurthy
171 – 173
A STUDY ON EFFECTIVENESS OF ADVERTISEMENTS BY THE MINISTRY OF TOURISM – WITH SPECIAL REFERENCE TO THE STATUE OF UNITY
Dr. Hanumantharaya T and Shruthi J
174 – 176
IMPACT OF TECHNOLOGICAL ADVANCEMENTS ON SERVICE QUALITY IN BANKING INDUSTRY
Somya Agarwal, Dr. Santhosha and Dr. Lakshmeesha Kanti K. S.
177 – 181
THE IMPACT OF BIG DATA AND PAID SEARCH IN THE VIRTUAL MARKET
Arunkumar M.S and Srihari S. V
182 – 184
IMPACT OF DIGITAL MARKETING ON BRAND MANAGEMENT
Chandan U. A and Mala V
185 – 187
A STUDY ON DIGITAL SHOPPING BEHAVIOUR AND WORK LIFE BALANCE OF BANKING EMPLOYEES IN TIER -2 CITIES IN KARNATAKA: A STUDY WITH SPECIAL REFERENCE TO SHIMOGA DISTRICT
Dr. Subhadra P. S, C. K Anuradha and Aishwarya V. Hittanagi
188 – 193
A STUDY ON RECENT TRENDS IN RURAL MARKETING IN INDIA
Madhuri P. A. and Praveen D. P.
194 – 197

International Journal of Advance and Innovative Research Volume 6, Issue 1 (III): January - March, 2019
1
ISSN 2394 - 7780
NOVEL MODELS IN HORTICULTURE MARKETING IN INDIA
Dr. Vijaymahantesh and Vijaya Hosamani Assistant Professor of Agronomy, Directorate of Extension, University of Horticultural Sciences, Bagalkot
ABSTRACT World horticulture market is worth more than two and half hundred billion and growing at the rate of 10%. Fruits and vegetables account for nearly 90% of total horticulture production in the country. India is now the second largest producer of fruits and vegetables in the world and is the leader in several horticultural crops, namely mango, banana, papaya, cashew-nuts, areca nut, potato and okra. Fruits, vegetables and flowers form the major bulk of export and import market. India is one among the key contributor for export and import. Importance of horticultural crops is felt all over the world for which Horticulture in India is also rapidly rising. The marketing of horticultural crops is complex and risky due to their unique conditions. Because of their high perishability, seasonability and bulkiness, horticultural crops require special care and attention in providing time, form and space utilities which in turn adds to the marketing costs. The other important problem in marketing horticultural crops is the prevalence of imperfect market structure for these commodities mainly due to a few traders in the business. These two factors have great bearing on the marketing system influencing the ultimate prices realised for these commodities by the growers. To overcome these problems in India amended APMC act and allowed cooperatives and private entrepreneurs to set up special markets for fruits, vegetables and flowers, India opened up post 1990, a number of innovative liberalized markets for F&V in the WTO regime to eliminate middlemen and facilitate direct contact between producer and consumers. Along with Central government different state governments have also come with novel models for horticulture marketing viz., RythuBazaar (AndhraPradesh ) , Apni Mandi (Punjab), Uzhavar Sandhai (Farmers’Markets )- TamilNadu. Hardaspar Vegetable Market- Pune, Shetkari Bazar- Maharastra, KrushakBazars- Orissa, Mother Dairy Booths –Dlehi, Hopcoms –Karnataka, Raitha Santhe- Karnataka Contract marketing, Safal Marketing –Delhi, Forward and Future Markets, Commodity Exchanges, E-trading, Food retail super markets. No doubt all these models are working well but however, It is necessary to study and understand these markets functions, market strategies, performance and success.
INTRODUCTION Fruits and vegetables account for nearly 90% of total horticulture production in the country. India is now the second largest producer of fruits and vegetables in the world and is the leader in several horticultural crops, namely mango, banana, papaya, cashew-nuts, areca nut, potato and okra. Over the last decade, the area under horticulture grew by about 3% per annum and annual production increased by 5.4%. During 2016-17, the production of horticulture crops was about 295.2 million tonnes from an area of 24.9 million hectares. Presently horticulture contributes 30 per cent of Agricultural GDP and 54% of Agricultural Exports in India. India plans to increase the production of horticultural crops to 350 million tones by 2020 (Government of India, 2001). The sector is growing at an average growth rate of 3.6 per cent over the last decade. The consumption basket is changing towards fruits and vegetables. Hence the success of horticulture marketing is very important as it decides success of entire sector. Marketing is one of the most important factors in determining the success of any farming enterprise. Marketing includes all the operations and decisions made by producers. These decisions range from deter-mining the most marketable crops for production to deciding how to best deliver quality produce to the consumers at a profit. However, contrary to popular belief, marketing does not begin after a crop is produced. Instead, marketing alternatives need to be considered even before production takes place. One of the vital role of an institute is assisting farmers to improve marketing so that the farmers hard work in field should be paid good revenue. Very often, marketing chains are not coordinated and the participants can be blind to the existence of others and their needs, problems and opportunities. Hence there exist an important role in creating opportunities for buyers and sellers to meet, to share information, to exchange ideas and to explore trading opportunities. Keeping this in view the study was conducted by collecting secondary data on different marketing models developed and released for the benefit of farmers in different states are here discussed below in different headings. MARKETING OF FRUITS AND VEGETABLES Most of the horticultural commodity markets in India generally operate under the normal forces of demand
and supply.

International Journal of Advance and Innovative Research Volume 6, Issue 1 (III): January - March, 2019
2
ISSN 2394 - 7780
The buying and selling of horticulture produce takes place in the market yards where numbers of market functionaries are involved.
Government of India(2001) reported that as per survey conducted recently, the farmer is getting only one rupee out of every Rs 3.50 paid by the consumer, the retailers is getting Rs 0.75, the wholesaler is getting Rs 0.50 and rest of the amount Rs 1.25 is going to commission agents and traders.
PRODUCER SHARE The share of producer in consumer’s price depend upon the types of marketing channels followed in sales
transactions by the farmers.
Studies indicate that the share of producers varies from 56 to 83 per cent in food grains and 79 to 95 per cent in pulses, 65-96 per cent in oilseeds and 33 to 75 per cent in case of fruit and vegetables.
In order to provide the remunerative prices to the farmers, there is a need to eliminate the chain of middlemen etc., by introducing innovative marketing channels like direct marketing, contract farming, etc.
START OF INNOVATIVE MODELS IN HORTICULTURE India amended APMC act and allowed cooperatives and private entrepreneurs to set up special markets for
fruits, vegetables and flowers
India opened up post 1990, a number of innovative liberalized markets for F&V in the WTO regime to eliminate middlemen and facilitate direct contact between producer and consumers.
Economic reforms led India to opened up post –1990, a number of new private retail liberalized markets FOR F&V in the WTO regime
It is necessary to study and understand these markets functions, market strategies, performance and success.
OBJECTIVES To study the different innovative marketing institutions, their functions, and mandates in horticulture
marketing in India.
To trace marketing models, strategies and policy principles practicing by different marketing institutions in horticulture marketing in India
To suggest suitable strategies or policies to guide for effective marketing of fruits and vegetables of horticulture sector in India
DATA AND METHODOLOGY This is basically a quick diagnostic study.
Information on public and private markets in horticulture were collected from websites, primary and secondary sources.
The different marketing institutions, their functions, and mandates were analyzed and put in matrix format.
The status, growth and future plans, marketing models and strategies of public and private retailing markets were analyzed
Features of different marketing models for marketing of F&V studied as case study in Hyderabad, A.P.
The focus was on change in functions and mandate of marketing institutions over the years particularly pre and post market reforms.
Finally, suggestions are made for effective marketing of Fruits and vegetables in India.
New Liberalized Public Agricultural Marketing Institutions for Fruits &Vegetables in India during WTO regime.
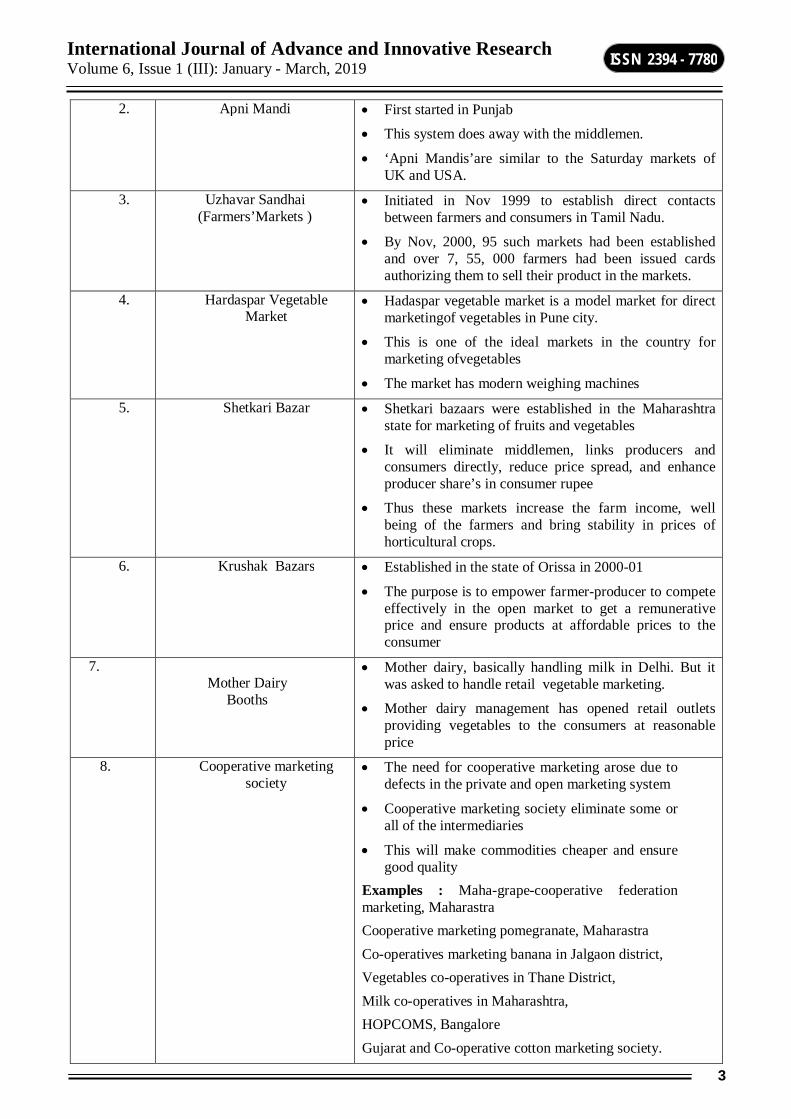
No. Marketing Institutions Status/ Key function/Mandate/Strategies 1. Rythu Bazaar Started in Andhra Pradesh
To avoid the exploitation of both the farmers and the consumers by the middlemen
As of now, there are 96 Raythu Bazaars operating in the state.
International Journal of Advance and Innovative Research Volume 6, Issue 1 (III): January - March, 2019
3
ISSN 2394 - 7780
2. Apni Mandi First started in Punjab
This system does away with the middlemen.
‘Apni Mandis’are similar to the Saturday markets of UK and USA.
3. Uzhavar Sandhai (Farmers’Markets )
Initiated in Nov 1999 to establish direct contacts between farmers and consumers in Tamil Nadu.
By Nov, 2000, 95 such markets had been established and over 7, 55, 000 farmers had been issued cards authorizing them to sell their product in the markets.
4. Hardaspar Vegetable Market
Hadaspar vegetable market is a model market for direct marketingof vegetables in Pune city.
This is one of the ideal markets in the country for marketing ofvegetables
The market has modern weighing machines
5. Shetkari Bazar Shetkari bazaars were established in the Maharashtra state for marketing of fruits and vegetables
It will eliminate middlemen, links producers and consumers directly, reduce price spread, and enhance producer share’s in consumer rupee
Thus these markets increase the farm income, well being of the farmers and bring stability in prices of horticultural crops.
6. Krushak Bazars Established in the state of Orissa in 2000-01
The purpose is to empower farmer-producer to compete effectively in the open market to get a remunerative price and ensure products at affordable prices to the consumer
7. Mother Dairy
Booths
Mother dairy, basically handling milk in Delhi. But it was asked to handle retail vegetable marketing.
Mother dairy management has opened retail outlets providing vegetables to the consumers at reasonable price
8. Cooperative marketing society
The need for cooperative marketing arose due to defects in the private and open marketing system
Cooperative marketing society eliminate some or all of the intermediaries
This will make commodities cheaper and ensure good quality
Examples : Maha-grape-cooperative federation marketing, Maharastra Cooperative marketing pomegranate, Maharastra Co-operatives marketing banana in Jalgaon district, Vegetables co-operatives in Thane District, Milk co-operatives in Maharashtra, HOPCOMS, Bangalore Gujarat and Co-operative cotton marketing society.
International Journal of Advance and Innovative Research Volume 6, Issue 1 (III): January - March, 2019
4
ISSN 2394 - 7780
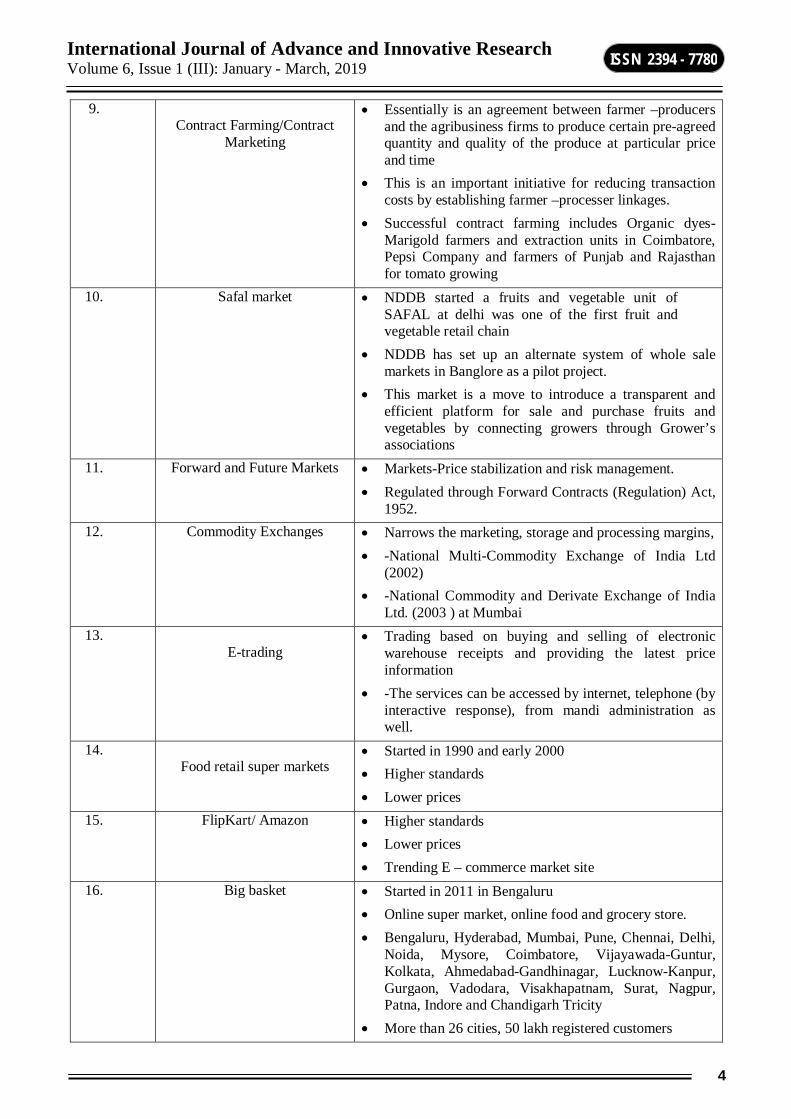
9. Contract Farming/Contract
Marketing
Essentially is an agreement between farmer –producers and the agribusiness firms to produce certain pre-agreed quantity and quality of the produce at particular price and time
This is an important initiative for reducing transaction costs by establishing farmer –processer linkages.
Successful contract farming includes Organic dyes-Marigold farmers and extraction units in Coimbatore, Pepsi Company and farmers of Punjab and Rajasthan for tomato growing
10. Safal market
NDDB started a fruits and vegetable unit of SAFAL at delhi was one of the first fruit and vegetable retail chain
NDDB has set up an alternate system of whole sale markets in Banglore as a pilot project.
This market is a move to introduce a transparent and efficient platform for sale and purchase fruits and vegetables by connecting growers through Grower’s associations
11. Forward and Future Markets Markets-Price stabilization and risk management. Regulated through Forward Contracts (Regulation) Act,
1952. 12. Commodity Exchanges
Narrows the marketing, storage and processing margins, -National Multi-Commodity Exchange of India Ltd
(2002) -National Commodity and Derivate Exchange of India
Ltd. (2003 ) at Mumbai 13.
E-trading
Trading based on buying and selling of electronic warehouse receipts and providing the latest price information
-The services can be accessed by internet, telephone (by interactive response), from mandi administration as well.
14. Food retail super markets
Started in 1990 and early 2000 Higher standards Lower prices
15. FlipKart/ Amazon Higher standards Lower prices Trending E – commerce market site
16. Big basket Started in 2011 in Bengaluru Online super market, online food and grocery store. Bengaluru, Hyderabad, Mumbai, Pune, Chennai, Delhi,
Noida, Mysore, Coimbatore, Vijayawada-Guntur, Kolkata, Ahmedabad-Gandhinagar, Lucknow-Kanpur, Gurgaon, Vadodara, Visakhapatnam, Surat, Nagpur, Patna, Indore and Chandigarh Tricity
More than 26 cities, 50 lakh registered customers
International Journal of Advance and Innovative Research Volume 6, Issue 1 (III): January - March, 2019
5
ISSN 2394 - 7780
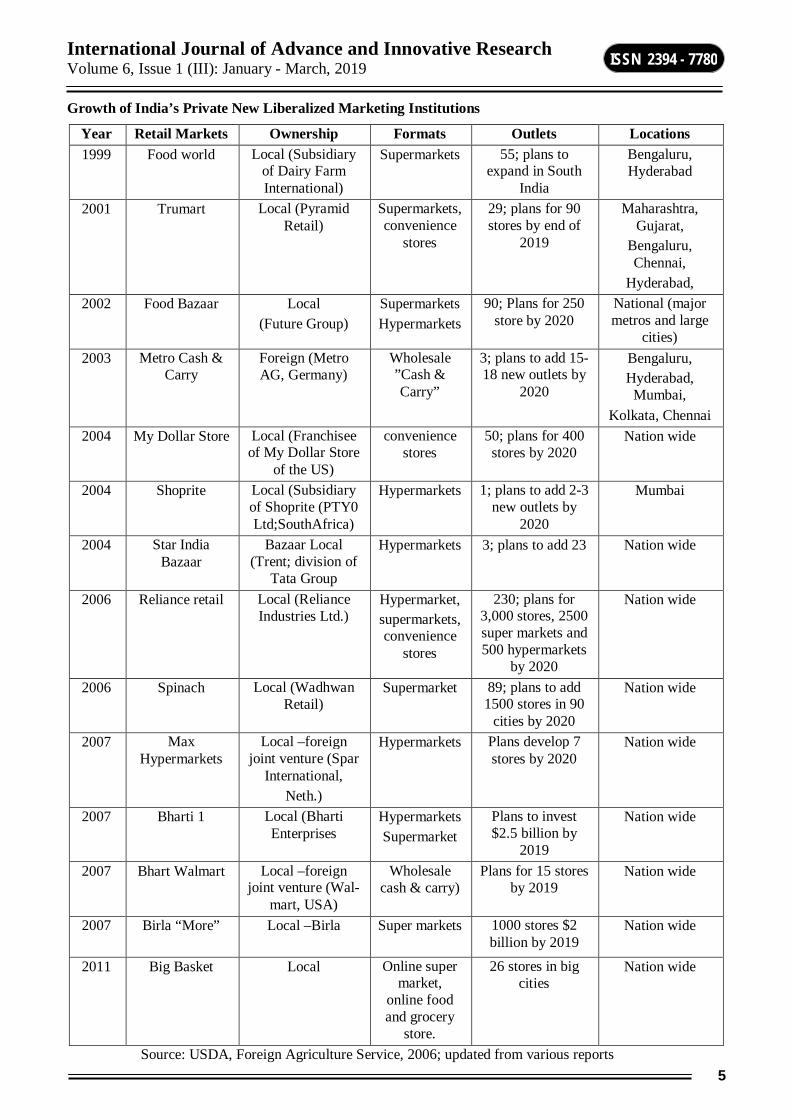
Growth of India’s Private New Liberalized Marketing Institutions
Year Retail Markets Ownership Formats Outlets Locations 1999 Food world Local (Subsidiary
of Dairy Farm International)
Supermarkets 55; plans to expand in South
India
Bengaluru, Hyderabad
2001 Trumart
Local (Pyramid Retail)
Supermarkets, convenience
stores
29; plans for 90 stores by end of
2019
Maharashtra, Gujarat,
Bengaluru, Chennai,
Hyderabad, 2002
Food Bazaar Local
(Future Group) Supermarkets Hypermarkets
90; Plans for 250 store by 2020
National (major metros and large
cities) 2003 Metro Cash &
Carry Foreign (Metro AG, Germany)
Wholesale ”Cash & Carry”
3; plans to add 15-18 new outlets by
2020
Bengaluru, Hyderabad,
Mumbai, Kolkata, Chennai
2004 My Dollar Store Local (Franchisee of My Dollar Store
of the US)
convenience stores
50; plans for 400 stores by 2020
Nation wide
2004 Shoprite Local (Subsidiary of Shoprite (PTY0 Ltd;SouthAfrica)
Hypermarkets 1; plans to add 2-3 new outlets by
2020
Mumbai
2004 Star India Bazaar
Bazaar Local (Trent; division of
Tata Group
Hypermarkets 3; plans to add 23 Nation wide
2006 Reliance retail Local (Reliance Industries Ltd.)
Hypermarket, supermarkets, convenience
stores
230; plans for 3,000 stores, 2500 super markets and 500 hypermarkets
by 2020
Nation wide
2006 Spinach Local (Wadhwan Retail)
Supermarket 89; plans to add 1500 stores in 90
cities by 2020
Nation wide
2007 Max Hypermarkets
Local –foreign joint venture (Spar
International, Neth.)
Hypermarkets Plans develop 7 stores by 2020
Nation wide
2007 Bharti 1 Local (Bharti Enterprises
Hypermarkets Supermarket
Plans to invest $2.5 billion by
2019
Nation wide
2007 Bhart Walmart Local –foreign joint venture (Wal-
mart, USA)
Wholesale cash & carry)
Plans for 15 stores by 2019
Nation wide
2007 Birla “More” Local –Birla
Super markets
1000 stores $2 billion by 2019
Nation wide
2011 Big Basket Local Online super market,
online food and grocery
store.
26 stores in big cities
Nation wide
Source: USDA, Foreign Agriculture Service, 2006; updated from various reports
International Journal of Advance and Innovative Research Volume 6, Issue 1 (III): January - March, 2019
6
ISSN 2394 - 7780
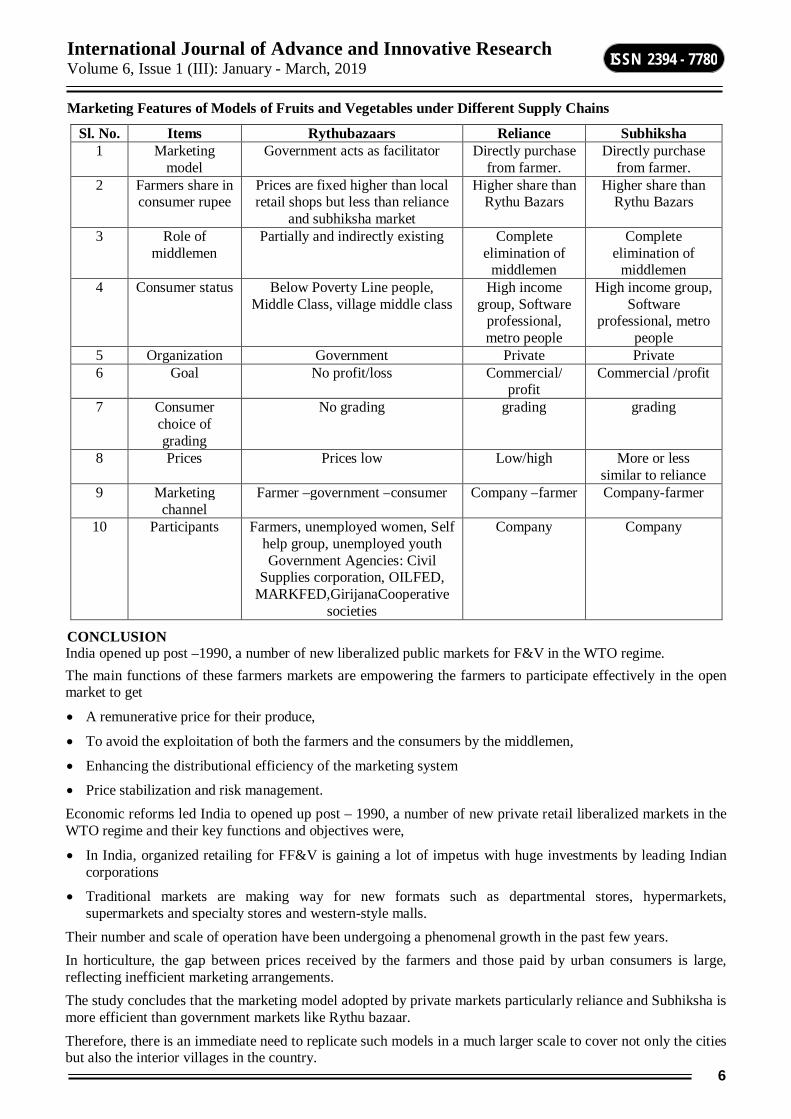
Marketing Features of Models of Fruits and Vegetables under Different Supply Chains
Sl. No. Items Rythubazaars Reliance Subhiksha 1 Marketing
model Government acts as facilitator Directly purchase
from farmer. Directly purchase
from farmer. 2 Farmers share in
consumer rupee Prices are fixed higher than local retail shops but less than reliance
and subhiksha market
Higher share than Rythu Bazars
Higher share than Rythu Bazars
3 Role of middlemen
Partially and indirectly existing Complete elimination of
middlemen
Complete elimination of
middlemen 4 Consumer status Below Poverty Line people,
Middle Class, village middle class High income
group, Software professional, metro people
High income group, Software
professional, metro people
5 Organization Government Private Private 6 Goal No profit/loss Commercial/
profit Commercial /profit
7 Consumer choice of grading
No grading grading grading
8 Prices Prices low Low/high More or less similar to reliance
9 Marketing channel
Farmer –government –consumer Company –farmer Company-farmer
10 Participants Farmers, unemployed women, Self help group, unemployed youth Government Agencies: Civil
Supplies corporation, OILFED, MARKFED,GirijanaCooperative
societies
Company Company
CONCLUSION India opened up post –1990, a number of new liberalized public markets for F&V in the WTO regime. The main functions of these farmers markets are empowering the farmers to participate effectively in the open market to get
A remunerative price for their produce,
To avoid the exploitation of both the farmers and the consumers by the middlemen,
Enhancing the distributional efficiency of the marketing system
Price stabilization and risk management. Economic reforms led India to opened up post – 1990, a number of new private retail liberalized markets in the WTO regime and their key functions and objectives were,
In India, organized retailing for FF&V is gaining a lot of impetus with huge investments by leading Indian corporations
Traditional markets are making way for new formats such as departmental stores, hypermarkets, supermarkets and specialty stores and western-style malls.
Their number and scale of operation have been undergoing a phenomenal growth in the past few years. In horticulture, the gap between prices received by the farmers and those paid by urban consumers is large, reflecting inefficient marketing arrangements. The study concludes that the marketing model adopted by private markets particularly reliance and Subhiksha is more efficient than government markets like Rythu bazaar. Therefore, there is an immediate need to replicate such models in a much larger scale to cover not only the cities but also the interior villages in the country.
International Journal of Advance and Innovative Research Volume 6, Issue 1 (III): January - March, 2019
7
ISSN 2394 - 7780
The study suggests that it is necessary to amend outdated laws restricting the establishment of markets to allow cooperatives and private entrepreneurs to set up modern markets.
REFERENCES 1. Acharya, S. S., & Agarwal, N. L. (2011). Agricultural Marketing in India (Fifth). New Delhi: Oxford & IBH
Publishing Company Pvt. Ltd.
2. Dastagiri M.B., Immanuelraj T.K :(2012), “Supermarket Supply Chains in Horticulture in India: The Novel Marketing Models, Effects and Policies”, Agrotechnol S11:001. doi:10.4172/2168-9881.S11-001.
3. Governance Knowledge Centre. Direct Agricultural Marketing?: Rythu Bazar in Andhra Pradesh , India (2011). Retrieved from http://indiagovernance.gov.in/files/gkc_oneworld_rythu_bazaar.pdf
4. Gujarat State Agricultural Marketing Board. (2014). Contract Farming. Retrieved June 27, 2017, from https://gsamb.gujarat.gov.in/contract-farming.htm
5. http://www.ncap.res.in/upload_files/annual_report/2010_2011.pdf
6. Kasabe, N. (2016, July 30). Maharashtra govt APMC move shows results, paves way for private markets. The Financial Express. Pune. Retrieved from http://www.financialexpress.com/market/commodities/maharashtra-govt-apmc-move-showsresults-paves-way-for-private-markets/333315/
7. Murthy,D.S., T.M Gajanana, M Sudha and V Dakshinamoorthy: (2007), “Marketing losses and their impacts on marketing margins: a case study of banana in Karnataka”, Agricultural Economics Research Review. Vol 20. pp 47-60.
8. USDA, Foreign Agriculture Service (2006) Updated from various reports
9. World Bank (2007) Agriculture for Development. World Development Report 2008: Washington, DC

International Journal of Advance and Innovative Research Volume 6, Issue 1 (III): January - March, 2019
8
ISSN 2394 - 7780
DIGITAL MARKETING OF MUTUAL FUNDS: A DEMOGRAPHIC APPROACH
Madhukar S M and Dr. M G Krishnamurthy
ABSTRACT The technological innovations have blurred many obstacles in the way of business not only for the companies but also for the consumers in making their shopping experience much smoother. The advent of digital marketing in financial service industries has made it easier for the mutual fund firms to reach a larger investor base and also made it very handy for the prospective investors with regard to information availability. With this backdrop the main objective of this paper is to understand the role of Digital Marketing in Mutual Fund Investment Decisions of the investors and thereby identify the most important demographic factors which influence online investments.
Keywords: Digital Marketing, Consumer Behaviour, Mutual Fund Investments
INTRODUCTION The rapid technological advancements have geared up the digital space for almost all the industries and financial service industry is no exception to this. It is imperative for a mutual fund industry to go digital in order to gain edge over its competitors. With customer retention being the key of every business, it becomes very much necessary to give smooth and hassle free service by providing valuable information with just a click of a button. The mutual fund firms have to leverage the digital media marketing in promoting its financial products through content marketing on social media sites like face book, tweeter, Google plus etc in order to have real time marketing with reduced cost and time.
REVIEW OF LITERATURE ON DIGITAL MARKETING The significance of internet technology for marketing of products or services largely depends on the nature of business carried on by the organization and its target market. But in the recent times digital media is being preferred by almost all product and service categories especially the financial services. Even though online channel is not suitable to sell a particular product it is largely used to create awareness and brand building through third-party sites. Applications based on internet technology is considered to be the most important channel for marketing and distribution of products and services (Kotzab & Madlberger, 2006).“The term ‘Internet Marketing’ is used to refer to the external perspective of how the Internet can be used in conjunction with traditional media to acquire and deliver services to customers”(Chaffey & Chadwick, 2006). Alternatively, e-marketing or electronic marketing can be used to refer to a broader perspective including digital media like e-mail, web etc.,.(Chaffey & Chadwick, 2006).
The e-marketers uses a wide range of access platforms like PCs, PDAs, mobile phones and interactive digital TV etc., and communications tools such as web sites, portals, search engines, blogs,e-mail, SMS etc., to communicate with its customers according to customers’ preferences (Svennevig, 2004); (Chaffey & Chadwick, 2006). Internet market differs significantly from traditional marketing and (McDonald and Wilson, 1999) has identified 6I’s of e-marketing mix namely Interactivity, Intelligence, Individualization, Integration, Industry restructuring and Independence of location as a strategic analysis tool to analyze the practical aspects like personalization, direct response and marketing research and also to address the strategic issues of industry restructuring and integrated channel communications (Chaffey & Chadwick, 2006).It is said that increased levels of interactivity may allow consumers using an online shopping environment to gain greater control of their shopping experience (Ballantine, 2005).
Studies reveal that search engine optimization is gaining considerable attention as it is more concerned with its usage rather than technology itself (Thakor, Borsuk, & Kalamas, 2004). in their study explored that search engines with their “favorite bars” are very significant in understanding the searching behaviour of a customer particularly experiential searches. The marketer can improve the web design in order to coordinate text search and display ads (Richardson, 2007) and also enhance the visitation to the online store of the retailer as a result of search engine optimization (Papatla & Liu, 2009)
The social media like Facebook, YouTube,LinkedIn, Instagram and Twitter are considered as the most effective marketing tools and the e-retailers are developing strategies to reach their target customersby focusing mainly on these social media tools. These tools are also helping consumers to reform their beliefs, attitudes, and perception through dynamic interactions(Saravanakumar.M &SuganthaLakshmi.T, 2012). Due to the gaining importance of social media consumers are positively influenced and motivated with the presence of large number of social groups (Assaad, Gómez, & Ossietzky, 2011) and this shift in the digital revolution has brought
International Journal of Advance and Innovative Research Volume 6, Issue 1 (III): January - March, 2019
9
ISSN 2394 - 7780
in new dimensions and has led to greater reliance on opinion leaders, social interactions, reference groups in making a purchase decision.
OBJECTIVES OF THE STUDY 1. To understand the role of Digital Marketing in Mutual Fund Investment Decisions.
2. To explore the Demographic Factors Influencing Online Mutual Fund Investments.
RESEARCH METHODOLOGY The detailed questionnaire on Demographic Approach towards Digital Marketing of Mutual Funds was administered to a total of 100 respondents from Dakshina Kannada district based on convenience sampling method. Of the 100 responses only 94 were completely filled by the respondents. The statistical techniques such as ANOVA and descriptive analysis are used to analyze the responses.
RESULTS AND ANALYSIS The responses of the respondents are analyzed based on the descriptive techniques and also with the help of ANOVA to understand if demographic profile of the respondents influences the online mutual fund buying behavior. The results and analysis of the tests are shown below:
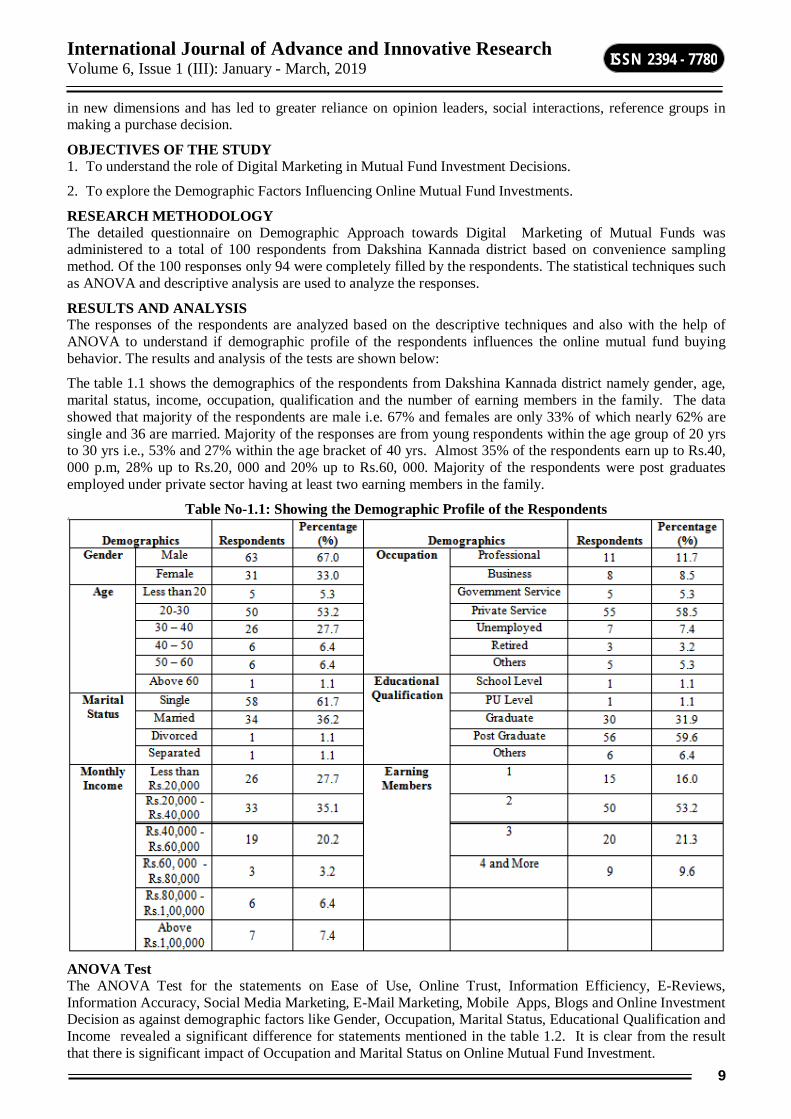
The table 1.1 shows the demographics of the respondents from Dakshina Kannada district namely gender, age, marital status, income, occupation, qualification and the number of earning members in the family. The data showed that majority of the respondents are male i.e. 67% and females are only 33% of which nearly 62% are single and 36 are married. Majority of the responses are from young respondents within the age group of 20 yrs to 30 yrs i.e., 53% and 27% within the age bracket of 40 yrs. Almost 35% of the respondents earn up to Rs.40, 000 p.m, 28% up to Rs.20, 000 and 20% up to Rs.60, 000. Majority of the respondents were post graduates employed under private sector having at least two earning members in the family.
Table No-1.1: Showing the Demographic Profile of the Respondents
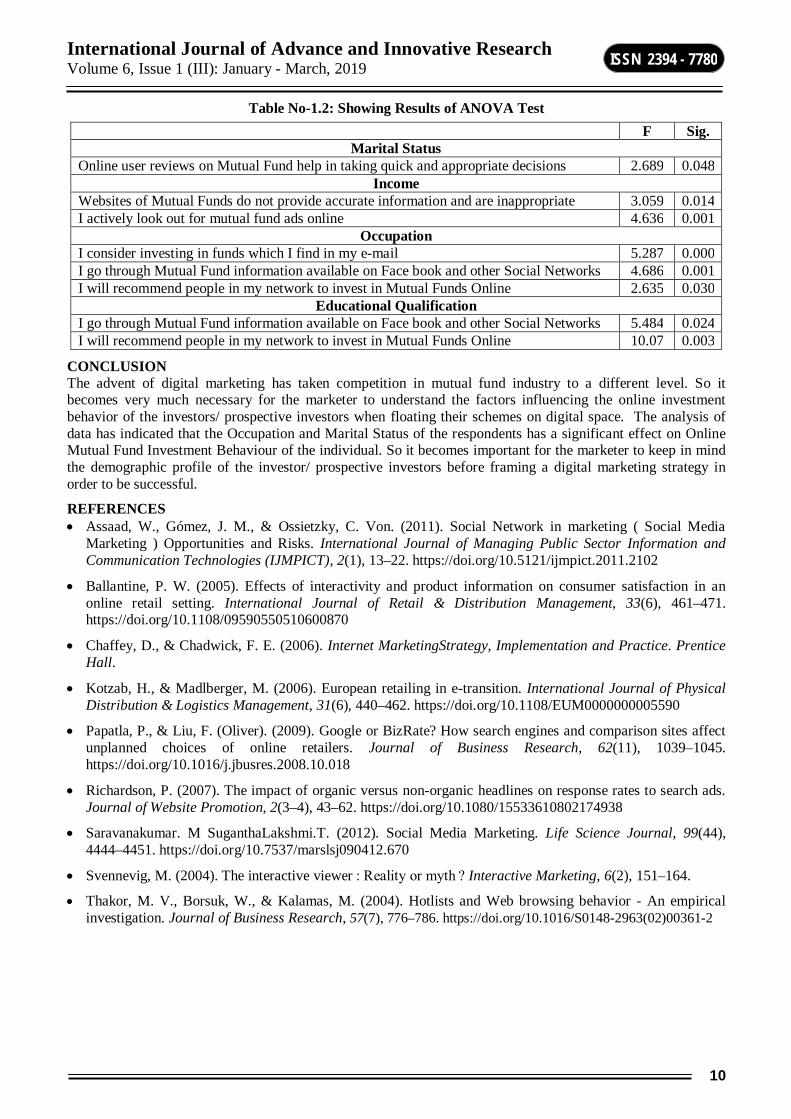
ANOVA Test The ANOVA Test for the statements on Ease of Use, Online Trust, Information Efficiency, E-Reviews, Information Accuracy, Social Media Marketing, E-Mail Marketing, Mobile Apps, Blogs and Online Investment Decision as against demographic factors like Gender, Occupation, Marital Status, Educational Qualification and Income revealed a significant difference for statements mentioned in the table 1.2. It is clear from the result that there is significant impact of Occupation and Marital Status on Online Mutual Fund Investment.
International Journal of Advance and Innovative Research Volume 6, Issue 1 (III): January - March, 2019
10
ISSN 2394 - 7780
Table No-1.2: Showing Results of ANOVA Test
CONCLUSION The advent of digital marketing has taken competition in mutual fund industry to a different level. So it becomes very much necessary for the marketer to understand the factors influencing the online investment behavior of the investors/ prospective investors when floating their schemes on digital space. The analysis of data has indicated that the Occupation and Marital Status of the respondents has a significant effect on Online Mutual Fund Investment Behaviour of the individual. So it becomes important for the marketer to keep in mind the demographic profile of the investor/ prospective investors before framing a digital marketing strategy in order to be successful.
REFERENCES Assaad, W., Gómez, J. M., & Ossietzky, C. Von. (2011). Social Network in marketing ( Social Media
Marketing ) Opportunities and Risks. International Journal of Managing Public Sector Information and Communication Technologies (IJMPICT), 2(1), 13–22. https://doi.org/10.5121/ijmpict.2011.2102
Ballantine, P. W. (2005). Effects of interactivity and product information on consumer satisfaction in an online retail setting. International Journal of Retail & Distribution Management, 33(6), 461–471. https://doi.org/10.1108/09590550510600870
Chaffey, D., & Chadwick, F. E. (2006). Internet MarketingStrategy, Implementation and Practice. Prentice Hall.
Kotzab, H., & Madlberger, M. (2006). European retailing in e-transition. International Journal of Physical Distribution & Logistics Management, 31(6), 440–462. https://doi.org/10.1108/EUM0000000005590
Papatla, P., & Liu, F. (Oliver). (2009). Google or BizRate? How search engines and comparison sites affect unplanned choices of online retailers. Journal of Business Research, 62(11), 1039–1045. https://doi.org/10.1016/j.jbusres.2008.10.018
Richardson, P. (2007). The impact of organic versus non-organic headlines on response rates to search ads. Journal of Website Promotion, 2(3–4), 43–62. https://doi.org/10.1080/15533610802174938
Saravanakumar. M SuganthaLakshmi.T. (2012). Social Media Marketing. Life Science Journal, 99(44), 4444–4451. https://doi.org/10.7537/marslsj090412.670
Svennevig, M. (2004). The interactive viewer : Reality or myth ? Interactive Marketing, 6(2), 151–164.
Thakor, M. V., Borsuk, W., & Kalamas, M. (2004). Hotlists and Web browsing behavior - An empirical investigation. Journal of Business Research, 57(7), 776–786. https://doi.org/10.1016/S0148-2963(02)00361-2
F Sig.
Marital Status Online user reviews on Mutual Fund help in taking quick and appropriate decisions 2.689 0.048
Income Websites of Mutual Funds do not provide accurate information and are inappropriate 3.059 0.014 I actively look out for mutual fund ads online 4.636 0.001
Occupation I consider investing in funds which I find in my e-mail 5.287 0.000 I go through Mutual Fund information available on Face book and other Social Networks 4.686 0.001 I will recommend people in my network to invest in Mutual Funds Online 2.635 0.030
Educational Qualification I go through Mutual Fund information available on Face book and other Social Networks 5.484 0.024 I will recommend people in my network to invest in Mutual Funds Online 10.07 0.003
International Journal of Advance and Innovative Research Volume 6, Issue 1 (III): January - March, 2019
11
ISSN 2394 - 7780
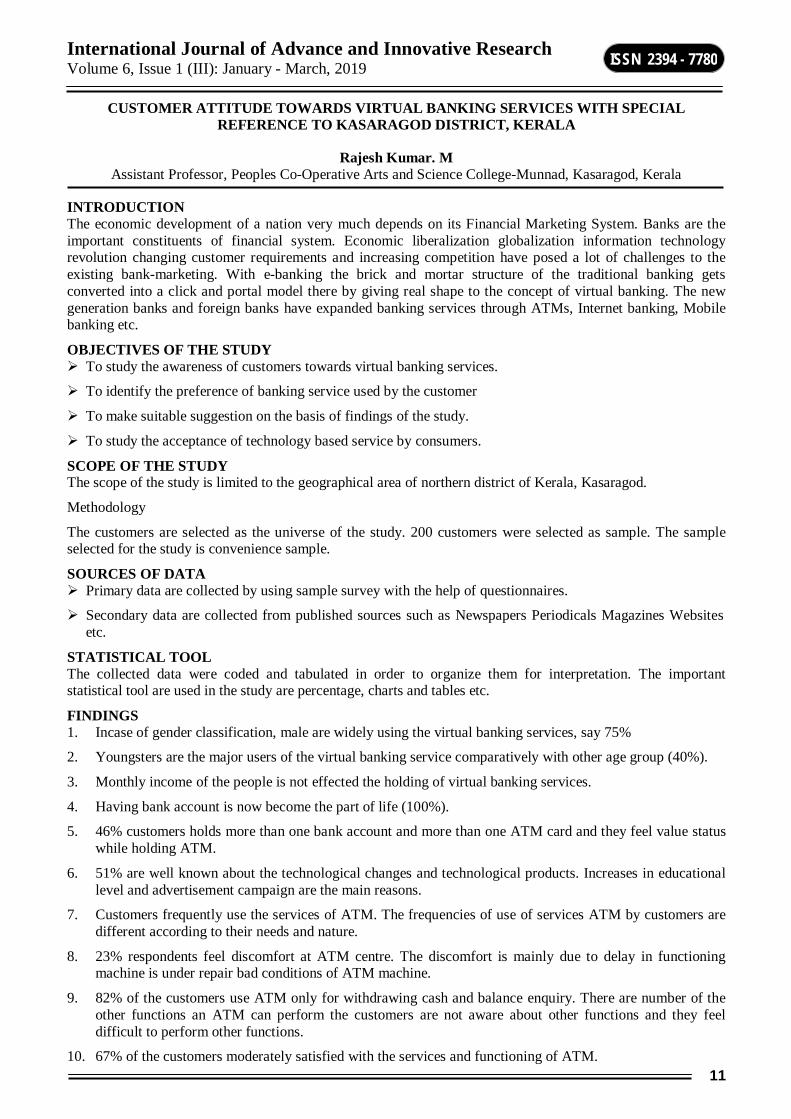
CUSTOMER ATTITUDE TOWARDS VIRTUAL BANKING SERVICES WITH SPECIAL REFERENCE TO KASARAGOD DISTRICT, KERALA
Rajesh Kumar. M Assistant Professor, Peoples Co-Operative Arts and Science College-Munnad, Kasaragod, Kerala
INTRODUCTION The economic development of a nation very much depends on its Financial Marketing System. Banks are the important constituents of financial system. Economic liberalization globalization information technology revolution changing customer requirements and increasing competition have posed a lot of challenges to the existing bank-marketing. With e-banking the brick and mortar structure of the traditional banking gets converted into a click and portal model there by giving real shape to the concept of virtual banking. The new generation banks and foreign banks have expanded banking services through ATMs, Internet banking, Mobile banking etc.
OBJECTIVES OF THE STUDY To study the awareness of customers towards virtual banking services.
To identify the preference of banking service used by the customer
To make suitable suggestion on the basis of findings of the study.
To study the acceptance of technology based service by consumers.
SCOPE OF THE STUDY The scope of the study is limited to the geographical area of northern district of Kerala, Kasaragod.
Methodology
The customers are selected as the universe of the study. 200 customers were selected as sample. The sample selected for the study is convenience sample.
SOURCES OF DATA Primary data are collected by using sample survey with the help of questionnaires.
Secondary data are collected from published sources such as Newspapers Periodicals Magazines Websites etc.
STATISTICAL TOOL The collected data were coded and tabulated in order to organize them for interpretation. The important statistical tool are used in the study are percentage, charts and tables etc.
FINDINGS 1. Incase of gender classification, male are widely using the virtual banking services, say 75%
2. Youngsters are the major users of the virtual banking service comparatively with other age group (40%).
3. Monthly income of the people is not effected the holding of virtual banking services.
4. Having bank account is now become the part of life (100%).
5. 46% customers holds more than one bank account and more than one ATM card and they feel value status while holding ATM.
6. 51% are well known about the technological changes and technological products. Increases in educational level and advertisement campaign are the main reasons.
7. Customers frequently use the services of ATM. The frequencies of use of services ATM by customers are different according to their needs and nature.
8. 23% respondents feel discomfort at ATM centre. The discomfort is mainly due to delay in functioning machine is under repair bad conditions of ATM machine.
9. 82% of the customers use ATM only for withdrawing cash and balance enquiry. There are number of the other functions an ATM can perform the customers are not aware about other functions and they feel difficult to perform other functions.
10. 67% of the customers moderately satisfied with the services and functioning of ATM.
International Journal of Advance and Innovative Research Volume 6, Issue 1 (III): January - March, 2019
12
ISSN 2394 - 7780
11. 48% of the respondents holds three to four credit card and they feel value status state holding credit card..
12. 12 36% of the customers the credit card getting discount during shopping and make convenient payments.
13. 79% of customers agree that services of credit card are reliable to an extent and also they feel enjoyment while using credit card.
14. 73% of customers agree that security level of using credit card is fair.
15. 24% are not aware of internet banking services. Because they prefer personal human relation than electronic relation.
16. 49% of customers use internet banking service only for paying title and a saving. There are no of other functions internet banking can perform but the customers are not aware about other functions.
17. 56% customers agree that security level of among, internet banking are not at all secured.
18. Impersonality of service and lack of assistance are the two major advantages faced by the customers while operating on online to use internet.
19. Single and convenience are the two main factors promoting to use internet banking services.
20. 47% of customers use Tele banking services for payment of bills and balance enquiry.
21. Impersonality of service and lack of assistance are the two major disadvantages faced by the customers by using Tele banking service. Most of customers opinion that no disadvantages in Tele banking.
22. 82% of customers are aware of mobile banking service.
23. Paying utility bills mobile banking service the major purpose of using mobile banking service.
24. 29% people not aware of mobile banking service because they prefer personal human relation.
25. Customers aware the mobile banking services from various sources. Media friends etc are the major source of information.
26. Physical security of money, lower transaction cost etc. is the main advantages of using mobile banking services.
27. 27% Customers feel difficult at bank counter and they have the opinion that withdraw money using new banking service is fast when compared personal banking.
28. Customers have less aware about internet banking. Because they do not trust internet banking while manage money.
SUGGESTIONS 1. Youngsters are mostly used the new banking services, so the bank should take awareness programs about the
virtual banking services to other age groups. 2. The bank-marketing should advertise their technological products and use of such products through media,
newspapers, magazines etc. 3. Introduce easier functioning of new banking service to avoid dependency of others. 4. Undertake the programs to educate the customers about all available new banking services. 5. Popularize new banking service in rural area. 6. The banker should keep new banking services perfect every time for that proper supervision and maintain is
necessary and all initiatives must take in this area. 7. Should improve its service quality in terms of communication, reliability and understanding. 8. Should provide more service through internet banking for popularizing internet banking services. 9. Emphasize more on popularizing internet usage by customers where result into improvement in customer
satisfaction and cost reduction. CONCLUSION The technological development as part of these policies as prominent role in the changing banking scenario. Customer is the king of the present day banking. Since the banks are providing tailor made services to the change in needs of the ultra-modern customer to face this stiff competition from rivals.
International Journal of Advance and Innovative Research Volume 6, Issue 1 (III): January - March, 2019
13
ISSN 2394 - 7780
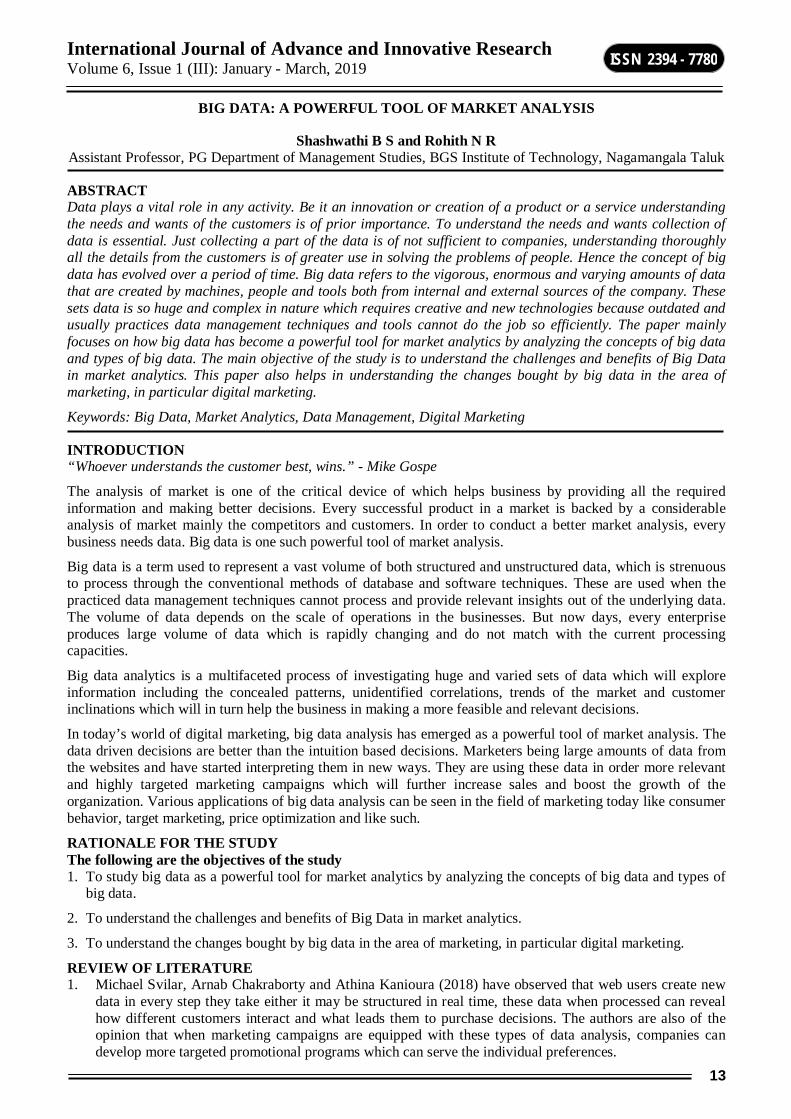
BIG DATA: A POWERFUL TOOL OF MARKET ANALYSIS
Shashwathi B S and Rohith N R Assistant Professor, PG Department of Management Studies, BGS Institute of Technology, Nagamangala Taluk
ABSTRACT Data plays a vital role in any activity. Be it an innovation or creation of a product or a service understanding the needs and wants of the customers is of prior importance. To understand the needs and wants collection of data is essential. Just collecting a part of the data is of not sufficient to companies, understanding thoroughly all the details from the customers is of greater use in solving the problems of people. Hence the concept of big data has evolved over a period of time. Big data refers to the vigorous, enormous and varying amounts of data that are created by machines, people and tools both from internal and external sources of the company. These sets data is so huge and complex in nature which requires creative and new technologies because outdated and usually practices data management techniques and tools cannot do the job so efficiently. The paper mainly focuses on how big data has become a powerful tool for market analytics by analyzing the concepts of big data and types of big data. The main objective of the study is to understand the challenges and benefits of Big Data in market analytics. This paper also helps in understanding the changes bought by big data in the area of marketing, in particular digital marketing.
Keywords: Big Data, Market Analytics, Data Management, Digital Marketing
INTRODUCTION “Whoever understands the customer best, wins.” - Mike Gospe
The analysis of market is one of the critical device of which helps business by providing all the required information and making better decisions. Every successful product in a market is backed by a considerable analysis of market mainly the competitors and customers. In order to conduct a better market analysis, every business needs data. Big data is one such powerful tool of market analysis.
Big data is a term used to represent a vast volume of both structured and unstructured data, which is strenuous to process through the conventional methods of database and software techniques. These are used when the practiced data management techniques cannot process and provide relevant insights out of the underlying data. The volume of data depends on the scale of operations in the businesses. But now days, every enterprise produces large volume of data which is rapidly changing and do not match with the current processing capacities.
Big data analytics is a multifaceted process of investigating huge and varied sets of data which will explore information including the concealed patterns, unidentified correlations, trends of the market and customer inclinations which will in turn help the business in making a more feasible and relevant decisions.
In today’s world of digital marketing, big data analysis has emerged as a powerful tool of market analysis. The data driven decisions are better than the intuition based decisions. Marketers being large amounts of data from the websites and have started interpreting them in new ways. They are using these data in order more relevant and highly targeted marketing campaigns which will further increase sales and boost the growth of the organization. Various applications of big data analysis can be seen in the field of marketing today like consumer behavior, target marketing, price optimization and like such.
RATIONALE FOR THE STUDY The following are the objectives of the study 1. To study big data as a powerful tool for market analytics by analyzing the concepts of big data and types of
big data.
2. To understand the challenges and benefits of Big Data in market analytics.
3. To understand the changes bought by big data in the area of marketing, in particular digital marketing.
REVIEW OF LITERATURE 1. Michael Svilar, Arnab Chakraborty and Athina Kanioura (2018) have observed that web users create new
data in every step they take either it may be structured in real time, these data when processed can reveal how different customers interact and what leads them to purchase decisions. The authors are also of the opinion that when marketing campaigns are equipped with these types of data analysis, companies can develop more targeted promotional programs which can serve the individual preferences.
International Journal of Advance and Innovative Research Volume 6, Issue 1 (III): January - March, 2019
14
ISSN 2394 - 7780
2. Daniil Tykheev (2018) has observed that big data serves as a major tool for marketers by providing higher quality of decision making by significant increase of better technology in the processes. The author is of the opinion that the biggest advantage of big data for marketers is it provide enhanced knowledge about the customers.
3. Ayeisha Collymore, Francisco J. Rosado and Angel Ojeda (2017) have observed that big data serves as an important tool which improves the competitive advantage and performance of the organizations. The authors have also scrutinized that big data is such a versatile tool that acts a supplementary tool of gaining better consumer insights, better process effeciencies and enhanced customer experiences.
4. Uthayasankar Sivarajah, Muhammad Mustafa Kamal, Zahir Irani and Vishanth Weerakkody (2016) have remarked that big data is being adopted by many of the organizations for the purpose of drawing valuable insights which can in turn increase the operational efficiency through its strategic potential.
5. Cristina Stoicescu (2015) is of the opinion that big data acts as a suitable tool of analyzing the consumer behavior and big data analysis will be a necessary for firms in this competitive era hence there is a need to adapt to this tool in order to survive in the digital markets.
6. Jafar Raza Alam, Asma Sajid, Ramzan Talib, Muneeb Niazhave (2014) have reported that big data will be a significant way of improving organization’s skills, leadership, structures and technologies but the implication of big data faces certain challenges such as security and privacy, misuse of data, data management and like such.
7. Zilong Fang, Pengju Li (2014) has pointed that through the application of big data in a company’s marketing strategies customers will get more relevant recommendations about the products and also extends the choices available to them. The author has also stated that consumers will be able to do better evaluation during the pre-purchase stages by the availability of post purchase analysis of other consumers through recommendations available.
8. Ruby Roy Dholakia and Nikhilesh Dholakia (2014) have observed that the major challenge of dealing with big data is to understand, explain and predict the consumer behavior by the large set of data points available and hence there is a need to develop methods which may be based on statistics, artificial intelligence, machine learning, algorithms or any other way suitable in order to detect useful insights from this large source.
9. Rob Salkowitz (2014) has remarked that big data gives marketers a more clearer picture about the customers from the varied digital sources like social media platforms, mobiles, search engines, sensors, wearable devices and so on, in turn this integrated data helps in better targeting, conversion, measurement and forecasting.
10. K. Grishikashvili (2014) has remarked that advances in technology has made a significant changes in the field of marketing and its practices and technology has created more better opportunities in capturing the better consumer data, increased focus on relationship with customers, rise of customer insights and CRM. The author is also of the opinion that in order to process big data it requires more professional people who have skills to understand market dynamics and draw useful insights.
CHARACTERISTICS OF BIG DATA The following are the characteristics of Big Data a. Variety: Big Data are available at varied forms. These are raw, structured, semi-structured, unstructured
which are gathered from various sources. Data is collected from sources such as collecting cookies, user behaviors, emails, web posts, and videos
b. Velocity: The speed at which the data is collected in the real time is called as Velocity. The data collected in the big data sources gets generated rapidly at every click of the user.
c. Volume: As the name says, big data are very large in volume. These data collected from the varied sources are stored in the data warehouses.
d. Veracity: Veracity can be termed as Data in doubt. The data becomes uncertain due to data inconsistency, incompleteness, ambiguities, latency, deception and model approximations.
TYPES OF BIG DATA The following are the types of Big Data
i. Structured: Big Data may be structured which means organized, stored and retrieved in particular format. These are handy and effortlessly stored in the common databases.
International Journal of Advance and Innovative Research Volume 6, Issue 1 (III): January - March, 2019
15
ISSN 2394 - 7780
ii. Unstructured: Big data may be in a raw form. They lack any specific format or structure. They need to be processed and also requires particular technical facilities. Its time consuming to bring it into a format and make it usable.
iii. Semi-structured: It refers to data in both the structured and unstructured forms. They are not particularly stored in a database but also
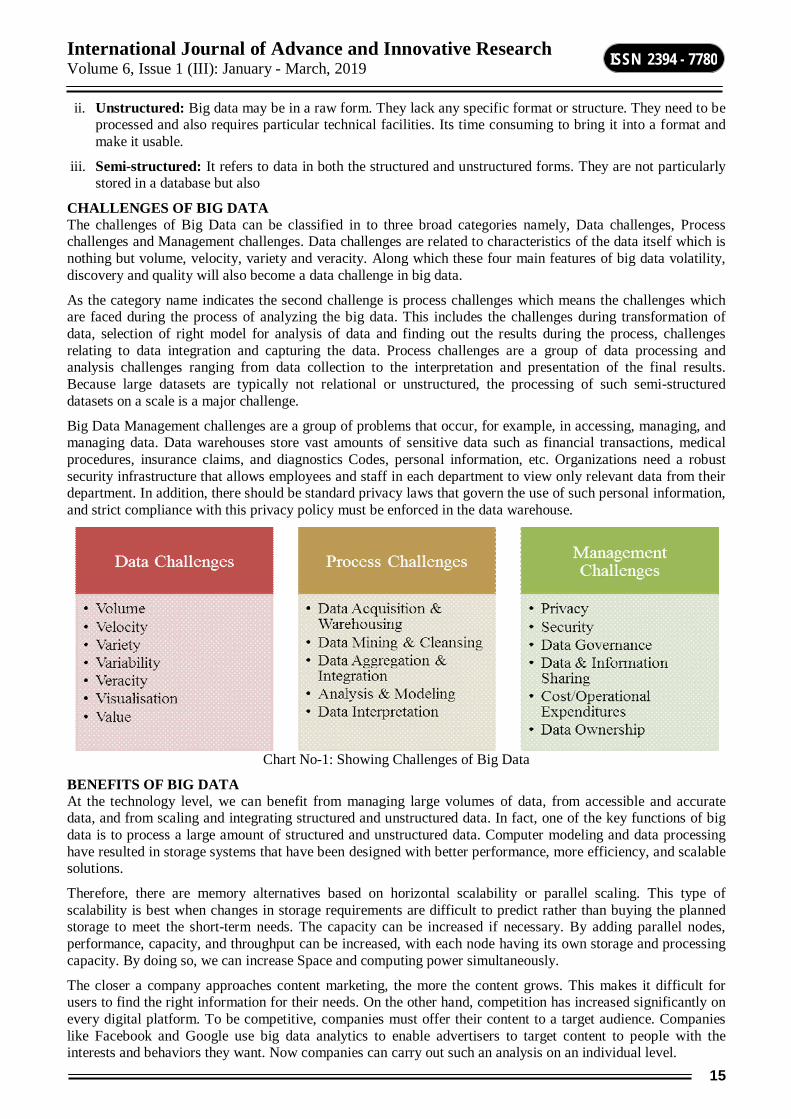
CHALLENGES OF BIG DATA The challenges of Big Data can be classified in to three broad categories namely, Data challenges, Process challenges and Management challenges. Data challenges are related to characteristics of the data itself which is nothing but volume, velocity, variety and veracity. Along which these four main features of big data volatility, discovery and quality will also become a data challenge in big data.
As the category name indicates the second challenge is process challenges which means the challenges which are faced during the process of analyzing the big data. This includes the challenges during transformation of data, selection of right model for analysis of data and finding out the results during the process, challenges relating to data integration and capturing the data. Process challenges are a group of data processing and analysis challenges ranging from data collection to the interpretation and presentation of the final results. Because large datasets are typically not relational or unstructured, the processing of such semi-structured datasets on a scale is a major challenge.
Big Data Management challenges are a group of problems that occur, for example, in accessing, managing, and managing data. Data warehouses store vast amounts of sensitive data such as financial transactions, medical procedures, insurance claims, and diagnostics Codes, personal information, etc. Organizations need a robust security infrastructure that allows employees and staff in each department to view only relevant data from their department. In addition, there should be standard privacy laws that govern the use of such personal information, and strict compliance with this privacy policy must be enforced in the data warehouse.
Chart No-1: Showing Challenges of Big Data
BENEFITS OF BIG DATA At the technology level, we can benefit from managing large volumes of data, from accessible and accurate data, and from scaling and integrating structured and unstructured data. In fact, one of the key functions of big data is to process a large amount of structured and unstructured data. Computer modeling and data processing have resulted in storage systems that have been designed with better performance, more efficiency, and scalable solutions.
Therefore, there are memory alternatives based on horizontal scalability or parallel scaling. This type of scalability is best when changes in storage requirements are difficult to predict rather than buying the planned storage to meet the short-term needs. The capacity can be increased if necessary. By adding parallel nodes, performance, capacity, and throughput can be increased, with each node having its own storage and processing capacity. By doing so, we can increase Space and computing power simultaneously.
The closer a company approaches content marketing, the more the content grows. This makes it difficult for users to find the right information for their needs. On the other hand, competition has increased significantly on every digital platform. To be competitive, companies must offer their content to a target audience. Companies like Facebook and Google use big data analytics to enable advertisers to target content to people with the interests and behaviors they want. Now companies can carry out such an analysis on an individual level.
International Journal of Advance and Innovative Research Volume 6, Issue 1 (III): January - March, 2019
16
ISSN 2394 - 7780
Big Data offers a solution to this problem by using the Market Mix modeling technique. Modeling the market composition provides insight into the current landscape of marketing activities and the potential future impact of marketing campaigns on ROI, profit, and revenue. This gives you predictive information about the profitability of campaigns before they run. This allows you to pinpoint the channels that can increase profits and invest accordingly.
By analyzing large data, this data can be analyzed on a large scale. With attribution modeling, it is possible to map the entire customer journey and to assign certain weightings to different contact points depending on their role in sales. Not only does this help you better allocate marketing resources, it also improves the effectiveness of data-driven decision-making campaigns.
CONCLUSION Big data is gaining its importance in today’s business world. Many of us have to understand that big data will change the way of understanding the business and way of doing the business. Most of the large scale organizations and Multinational Companies are boosting the marketing departments to integrate the big data analytics in to their daily business activities. Analyzing the benefits of using big data analytics in business one can say the gaining competitive advantage will be of ease. However the challenges and hindrances faced by the usage of big data will always advise the researches and users to develop a complex and effective model of big data for a particular area of business. One needs to focus on the technological advancements which are happening in the world before going for any implications and modifications.
BIBLIOGRAPHY K. Grishikashvili, S. Dibb, M. Meadows, “Investigation into Big Data Impact on Digital Marketing” -
International Conference on Communication, Media, Technology and Design, 24 - 26 April 2014, Istanbul – Turkey
Rob Salkowitz, “FROM BIG DATA TO SMART DATA”: Using data to drive personalized brand experiences, January 22, 2014
Zilong Fang, Pengju Li, “The Mechanism of Big Data Impact on Consumer Behavior” American Journal of Industrial and Business Management, 2014, 4, 45-50 Published Online January 2014
Cristina Stoicescu, “ Big Data, the perfect instrument to study today’s consumer behavior” Database Systems Journal vol. VI, no. 3/2015
Uthayasankar Sivarajah Muhammad Mustafa Kamal, Zahir Irani, Vishanth Weerakkody “Critical analysis of Big Data challenges and analytical methods” Journal of Business Research 70 (2017) 263–286
Daniil Tykheev, “Big Data in marketing”, Thesis 2018,
Michael Svilar, Arnab Chakraborty and Athina Kanioura, “Data Analytics in Marketing” ORMS, Public Articles, October, Volume 40, Number 5
Ruby Roy Dholakia and Nikhilesh Dholakia, “Scholarly Research in Marketing: Trends and Challenges in the Era of Big Data, Working Paper Series, 2013/2014 No.10
Jafar Raza Alam et al, “A Review on the Role of Big Data in Business”, International Journal of Computer Science and Mobile Computing, Vol.3 Issue.4, April- 2014, pg. 446-453 © 2014, IJCSMC
Ms. Ayeisha Collymore, Mr.Francisco J. Rosado-Muñoz and Dr. Angel Ojeda-Castro, “Big Data Analytics, Competitive Advantage And Firm Performance”, International Journal of Information Research and Review, Vol. 04, Issue, 02, pp.3599-3603, February, 2017
Alexandra Amadoa, Paulo Cortezb, Paulo Ritac,d, Sérgio Morob, “Research trends on Big Data in Marketing: A text mining and topic modeling based literature analysis”, European Research on Management and Business Economics 24 (2018) 1–7
Milan Kubinaa, Michal Varmusa, Irena Kubinova, “Use of big data for competitive advantage of company”, 4th World Conference on Business, Economics and Management, WCBEM, Procedia Economics and Finance 26 (2015) 561 – 565
International Journal of Advance and Innovative Research Volume 6, Issue 1 (III): January - March, 2019
17
ISSN 2394 - 7780
CONSUMER AWARENESS AND ATTITUDE FOR GREEN MARKETING AND GREEN PRODUCTS
Chetana Bhat1 and Amruta Anant Hegde2 Lecturer1, Department of Commerce, LB and SBS College Sagara, Shivamogga
Student2, K. H. Srinivasa Institute of P. G. Studies Sagara, Shivamogga
ABSTRACT In present business scenario environmental issues plays an important role in business. Customer’s attitudes are changing towards the environment to encourage innovation for conservation and the benefits from this source of innovation are certain to outlive our current generation. Consumers and manufacturers have directed their attention towards environment friendly products that are presumed to be “green” or environment friendly like organic foods, lead free paints, recyclable paper. Research has given good insights for marketers of the green products and suggests the need of designing the marketing communication campaigns promoting green products due to high green value among the consumers. Results of regression analysis reveals the view that overall green values, awareness about green products and practices and the perception regarding seriousness of marketing companies towards green marketing had positive significant impact on consumer persuasion to buy and prefer green products over conventional products. . Most of the studies on green marketing have been done in developed countries but such studies remain conspicuously absent in the context of emerging and developing economies like India. An attempt has been made in this paper to study the behaviour and challenges and make suggestions for using green marketing to gain sustainable competitive edge.
Keywords: Green marketing, Recycle, Sustainable Competitive, Green Product. Customer's attitude
INTRODUCTION Everyone believes a green life is a better and healthier life for present and future generations. Most consumers spending pattern shows that they have a desire for brands that go green. Consumers not only want to buy green products but are also willing to pay a little more for it. They are motivated to buy from companies that are eco-friendly in production. Green marketing is also termed as environmental marketing or ecological marketing. The concept of green or ecological marketing calls upon businesses to follow ethical and green practices while dealing with customers, suppliers, dealers, and employees. Companies have started marketing themselves as green companies. . Even the Public Sector Units and state governments are now paying a lot of attention towards environmental issues such as global warming, pollution, or water contamination and have started taking steps to prevent environmental pollution. According to American Marketing Association, marketing of products that are presumed to be environmentally safe is called as Green Marketing. Thus wide range of activities are covered under green marketing, which includes modifying the product, making changes in the production process and packaging, as well as modifying advertising or removing any activity that impacts the environment in negative way. Today, the Earth faces more environmental issues than ever before, hence it is imperative for companies to make and market themselves as environment friendly. Green marketing is emerging as a popular promotional strategy owing to increased consumer awareness and concerns.
REVIEW OF LITERATURE As defined by Tapan K. Panda “Green or Environmental Marketing consists of all activities designed to generate and facilitate any exchange intended to satisfy human needs or wants such that the satisfaction of these needs and wants occurs with minimal detrimental impact on natural environment”. Green Marketing has been defined by American Marketing Association as “The study of the positive and negative aspects of marketing activities on pollution, energy depletion and non-energy resource depletion”. The study by Moloy Ghoshal (2011) examined that green marketing was still in infancy. In the perception of marketing scholars, green marketing refers to The eco-level and market segmentation and the role of structural factors and economic incentives in influencing consumer behavior. The green marketers must understand to satisfy two objectives: improved environmental quality and customer satisfaction. The study by Murugesan (2008) underlined that firms may use green marketing as an attempt to address cost or profit related issues. Disposing of environmentally harmful bye products, such as poly-chlorinated contaminated oil are becoming increasingly costly and the firms that can reduce harmful wastes may incur substantial cost savings. Cateora Graham, in International Marketing has drawn a parallel line between green marketing and product development. The author has cited a variety of examples where the importance of green marketing has been laid focus on. Green marketing is a term used to identify concern with the environmental consequences of a variety
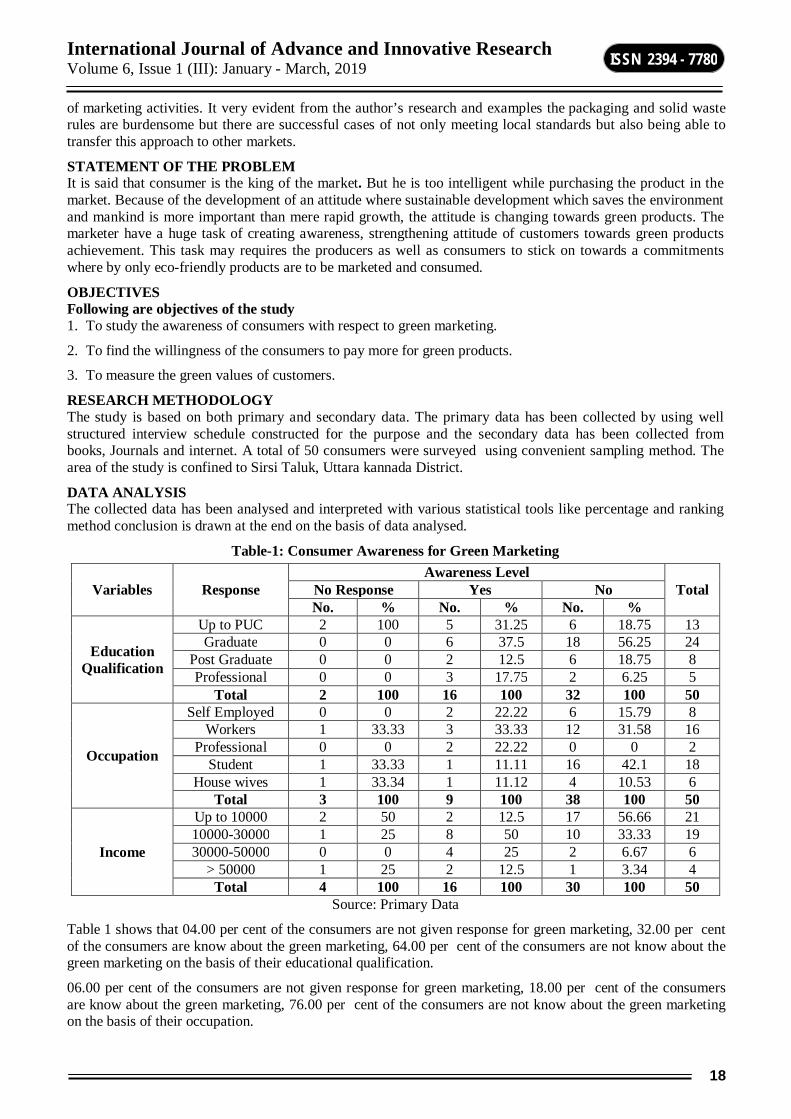
International Journal of Advance and Innovative Research Volume 6, Issue 1 (III): January - March, 2019
18
ISSN 2394 - 7780
of marketing activities. It very evident from the author’s research and examples the packaging and solid waste rules are burdensome but there are successful cases of not only meeting local standards but also being able to transfer this approach to other markets.
STATEMENT OF THE PROBLEM It is said that consumer is the king of the market. But he is too intelligent while purchasing the product in the market. Because of the development of an attitude where sustainable development which saves the environment and mankind is more important than mere rapid growth, the attitude is changing towards green products. The marketer have a huge task of creating awareness, strengthening attitude of customers towards green products achievement. This task may requires the producers as well as consumers to stick on towards a commitments where by only eco-friendly products are to be marketed and consumed.
OBJECTIVES Following are objectives of the study 1. To study the awareness of consumers with respect to green marketing.
2. To find the willingness of the consumers to pay more for green products.
3. To measure the green values of customers.
RESEARCH METHODOLOGY The study is based on both primary and secondary data. The primary data has been collected by using well structured interview schedule constructed for the purpose and the secondary data has been collected from books, Journals and internet. A total of 50 consumers were surveyed using convenient sampling method. The area of the study is confined to Sirsi Taluk, Uttara kannada District.
DATA ANALYSIS The collected data has been analysed and interpreted with various statistical tools like percentage and ranking method conclusion is drawn at the end on the basis of data analysed.
Table-1: Consumer Awareness for Green Marketing
Source: Primary Data
Table 1 shows that 04.00 per cent of the consumers are not given response for green marketing, 32.00 per cent of the consumers are know about the green marketing, 64.00 per cent of the consumers are not know about the green marketing on the basis of their educational qualification.
06.00 per cent of the consumers are not given response for green marketing, 18.00 per cent of the consumers are know about the green marketing, 76.00 per cent of the consumers are not know about the green marketing on the basis of their occupation.
Variables Response Awareness Level
Total No Response Yes No No. % No. % No. %
Education Qualification
Up to PUC 2 100 5 31.25 6 18.75 13 Graduate 0 0 6 37.5 18 56.25 24
Post Graduate 0 0 2 12.5 6 18.75 8 Professional 0 0 3 17.75 2 6.25 5
Total 2 100 16 100 32 100 50
Occupation
Self Employed 0 0 2 22.22 6 15.79 8 Workers 1 33.33 3 33.33 12 31.58 16
Professional 0 0 2 22.22 0 0 2 Student 1 33.33 1 11.11 16 42.1 18
House wives 1 33.34 1 11.12 4 10.53 6 Total 3 100 9 100 38 100 50
Income
Up to 10000 2 50 2 12.5 17 56.66 21 10000-30000 1 25 8 50 10 33.33 19 30000-50000 0 0 4 25 2 6.67 6
> 50000 1 25 2 12.5 1 3.34 4 Total 4 100 16 100 30 100 50
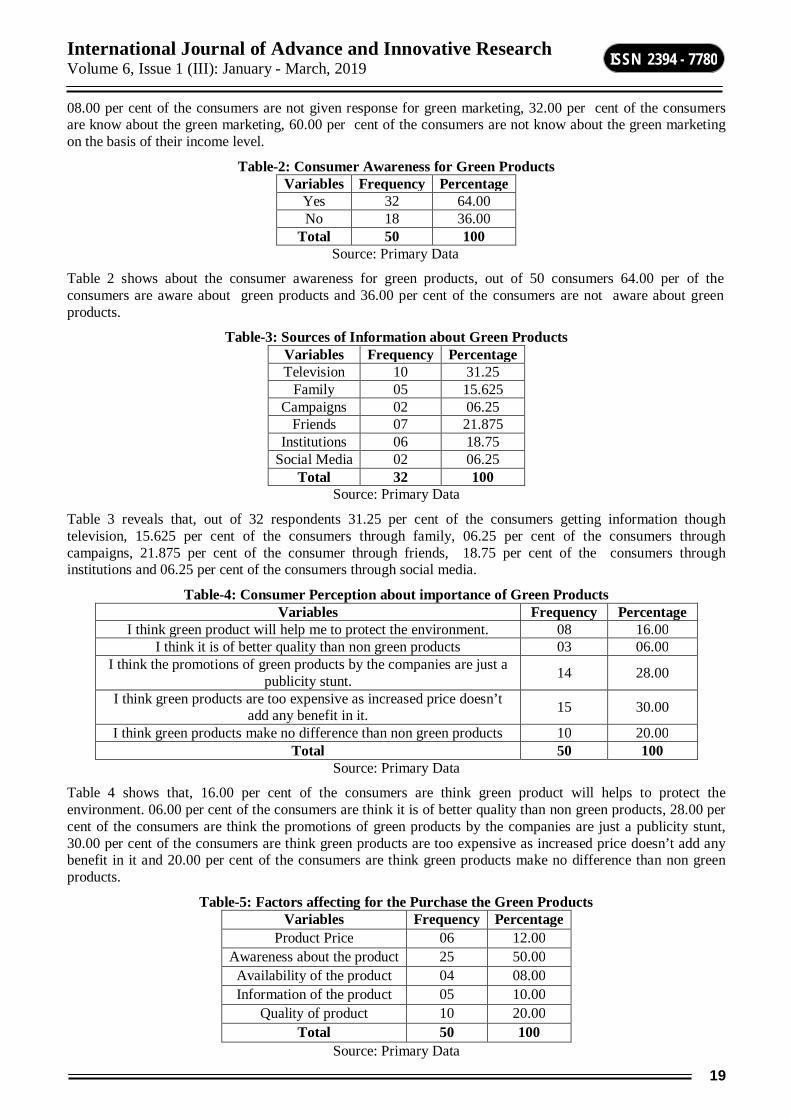
International Journal of Advance and Innovative Research Volume 6, Issue 1 (III): January - March, 2019
19
ISSN 2394 - 7780
08.00 per cent of the consumers are not given response for green marketing, 32.00 per cent of the consumers are know about the green marketing, 60.00 per cent of the consumers are not know about the green marketing on the basis of their income level.
Table-2: Consumer Awareness for Green Products Variables Frequency Percentage
Yes 32 64.00 No 18 36.00
Total 50 100 Source: Primary Data
Table 2 shows about the consumer awareness for green products, out of 50 consumers 64.00 per of the consumers are aware about green products and 36.00 per cent of the consumers are not aware about green products.
Table-3: Sources of Information about Green Products Variables Frequency Percentage Television 10 31.25
Family 05 15.625 Campaigns 02 06.25
Friends 07 21.875 Institutions 06 18.75
Social Media 02 06.25 Total 32 100
Source: Primary Data
Table 3 reveals that, out of 32 respondents 31.25 per cent of the consumers getting information though television, 15.625 per cent of the consumers through family, 06.25 per cent of the consumers through campaigns, 21.875 per cent of the consumer through friends, 18.75 per cent of the consumers through institutions and 06.25 per cent of the consumers through social media.
Table-4: Consumer Perception about importance of Green Products Variables Frequency Percentage
I think green product will help me to protect the environment. 08 16.00 I think it is of better quality than non green products 03 06.00
I think the promotions of green products by the companies are just a publicity stunt. 14 28.00
I think green products are too expensive as increased price doesn’t add any benefit in it. 15 30.00
I think green products make no difference than non green products 10 20.00 Total 50 100
Source: Primary Data
Table 4 shows that, 16.00 per cent of the consumers are think green product will helps to protect the environment. 06.00 per cent of the consumers are think it is of better quality than non green products, 28.00 per cent of the consumers are think the promotions of green products by the companies are just a publicity stunt, 30.00 per cent of the consumers are think green products are too expensive as increased price doesn’t add any benefit in it and 20.00 per cent of the consumers are think green products make no difference than non green products.
Table-5: Factors affecting for the Purchase the Green Products Variables Frequency Percentage
Product Price 06 12.00 Awareness about the product 25 50.00
Availability of the product 04 08.00 Information of the product 05 10.00
Quality of product 10 20.00 Total 50 100
Source: Primary Data
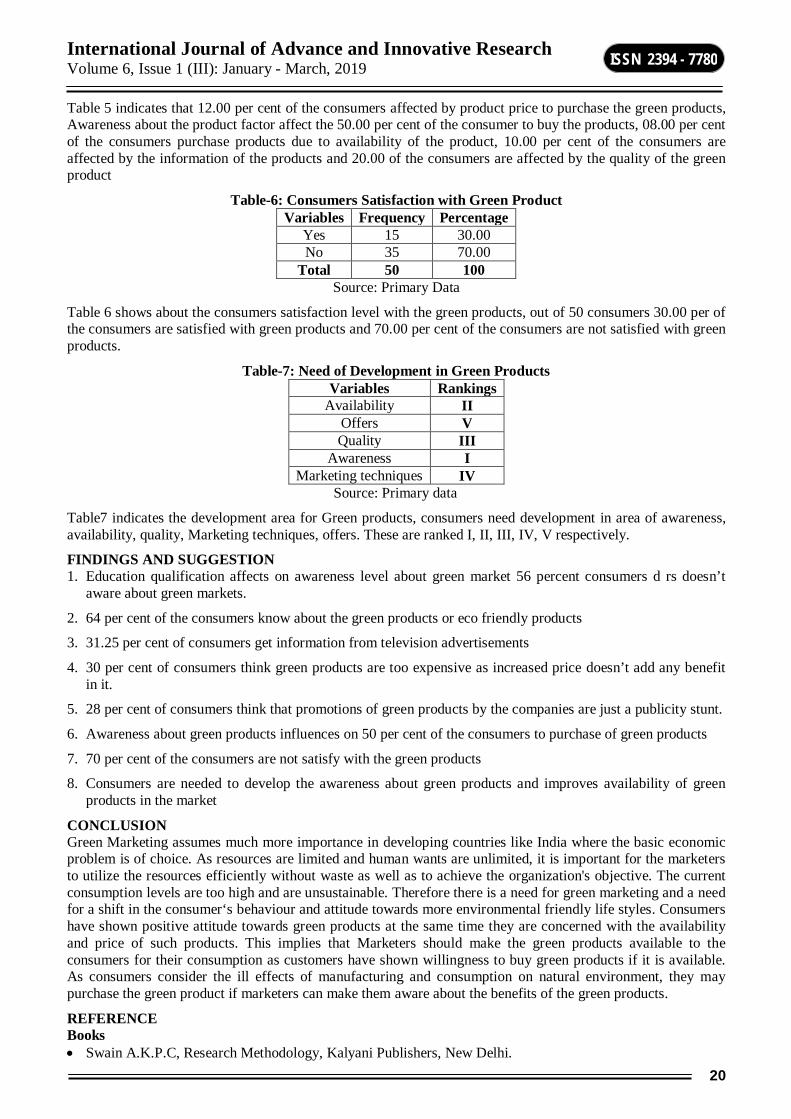
International Journal of Advance and Innovative Research Volume 6, Issue 1 (III): January - March, 2019
20
ISSN 2394 - 7780
Table 5 indicates that 12.00 per cent of the consumers affected by product price to purchase the green products, Awareness about the product factor affect the 50.00 per cent of the consumer to buy the products, 08.00 per cent of the consumers purchase products due to availability of the product, 10.00 per cent of the consumers are affected by the information of the products and 20.00 of the consumers are affected by the quality of the green product
Table-6: Consumers Satisfaction with Green Product Variables Frequency Percentage
Yes 15 30.00 No 35 70.00
Total 50 100 Source: Primary Data
Table 6 shows about the consumers satisfaction level with the green products, out of 50 consumers 30.00 per of the consumers are satisfied with green products and 70.00 per cent of the consumers are not satisfied with green products.
Table-7: Need of Development in Green Products Variables Rankings
Availability II Offers V Quality III
Awareness I Marketing techniques IV
Source: Primary data
Table7 indicates the development area for Green products, consumers need development in area of awareness, availability, quality, Marketing techniques, offers. These are ranked I, II, III, IV, V respectively.
FINDINGS AND SUGGESTION 1. Education qualification affects on awareness level about green market 56 percent consumers d rs doesn’t
aware about green markets.
2. 64 per cent of the consumers know about the green products or eco friendly products
3. 31.25 per cent of consumers get information from television advertisements
4. 30 per cent of consumers think green products are too expensive as increased price doesn’t add any benefit in it.
5. 28 per cent of consumers think that promotions of green products by the companies are just a publicity stunt.
6. Awareness about green products influences on 50 per cent of the consumers to purchase of green products
7. 70 per cent of the consumers are not satisfy with the green products
8. Consumers are needed to develop the awareness about green products and improves availability of green products in the market
CONCLUSION Green Marketing assumes much more importance in developing countries like India where the basic economic problem is of choice. As resources are limited and human wants are unlimited, it is important for the marketers to utilize the resources efficiently without waste as well as to achieve the organization's objective. The current consumption levels are too high and are unsustainable. Therefore there is a need for green marketing and a need for a shift in the consumer‘s behaviour and attitude towards more environmental friendly life styles. Consumers have shown positive attitude towards green products at the same time they are concerned with the availability and price of such products. This implies that Marketers should make the green products available to the consumers for their consumption as customers have shown willingness to buy green products if it is available. As consumers consider the ill effects of manufacturing and consumption on natural environment, they may purchase the green product if marketers can make them aware about the benefits of the green products.
REFERENCE Books Swain A.K.P.C, Research Methodology, Kalyani Publishers, New Delhi.
International Journal of Advance and Innovative Research Volume 6, Issue 1 (III): January - March, 2019
21
ISSN 2394 - 7780
Sontakki C.N, Marketing Research, Himalaya Publishing House, Mumbai.
Grant John (2007), The green Marketing Manifesto, John Wiley and Sons Ltd accessed via internet on 14th Jan 2011.
Ottman Jacquelyn. A. (2007) Green Marketing: Opportunity for Innovation’ Book Surge LLC accessed via internet on 15th Jan’ 2011.
Ottman Jacquelyn. A (2011) The New Rules of Green Marketing: Strategies, Tools, and Inspiration for Sustainable Branding accessed via internet on 15th Jan 2011.
Panda Tapan, (2007) Marketing Management- Text and Cases, Indian Context, Excel Books, New Delhi. P. 287 – 290.
Suja r. nair, Marketing Research, Himalaya Publishing House, Delhi.
Websites www.sbinfocanada.about.com/cs/environmentbiz/a/sustaindevelop.htm
www.coolavenues.com/mba-journal/marketing/green-marketing-opportunities-challenges?page=0,1
www.indianmba.com/Faculty_Column/FC623/fc623.html
www.usatoday.com/money/advertising
http://e-articles.info/e/a/title/Green-Marketing/
www.businesspundit.com-
International Journal of Advance and Innovative Research Volume 6, Issue 1 (III): January - March, 2019
22
ISSN 2394 - 7780
AN INTRODUCTION TO DATA MINING
Vinay1 and Dr. Archana2 Student1 and Assistant Professor2, Department of Management Studies, VSK University, Ballari
ABSTRACT With the proliferation of technology, the data collection and handling methods have undergone a tremendous change. There are numbers of data repositories such as databases, data marts, data warehouses all over the world. Data Mining plays a key role in digital marketing decisions as it converts the data into information and the same is analysed to draw interpretations and conclusions about the product. Without data mining, it becomes extremely difficult to extract the hidden or complex pattern. Data Mining tools sieves through volumes and varieties of data to generate market research reports and patterns. Hence, an attempt is made in this paper to understand the importance of data mining, identify the different tools and techniques available for mining the data.
Keywords: Data Mart, Database, Data Mining, Patterns.
1. INTRODUCTION Data Mining in simple term refers to extracting of meaningful information from huge amount of data. Data Mining is synonymously known as knowledge mining, knowledge extraction, data analysis, and data archaeology. In this data driven world, analyzing, classifying, tabulating and summarizing the data is a tedious task. Data Mining plays a key role in digital marketing decisions as it converts the data into information and the same is analysed to draw interpretations and conclusions about the product.
There has always been search for useful information in the field of knowledge. The roots of collecting data and analysing traces back to 17th century where Baye’s theorem was used, followed by regression analysis and discriminant analysis was used. With the proliferation of technology, the data collection and handling methods have undergone a tremendous change. There are numbers of data repositories such as databases, data marts, data warehouses all over the world. If the data is not analyzed to find out the interesting patterns, then the data would become data tombs. Data miners have to seek for the pearl in the sea of data. A data mining system helps to generate lots of patterns. Such patterns will help marketers and producers understand the trend, interest and preferences of customers. Without data mining tools, it becomes extremely difficult to extract the hidden or complex pattern. Data Mining tools sieves through volumes and varieties of data to generate market research reports and patterns. Data patterns may be mined from text, multimedia, web and other databases. Data mining facilitate management in decision making.
2. OBJECTIVES To understand the importance of data mining To identify the different areas and applications of data mining To study various data mining tools 3. DIFFERENT AREAS OF DATA MINING Web Mining –Web mining is one such data mining techniques that is used to extract the information from
the web. The contents of the web are fast updating and at the same time dynamic. Web mining includes, finding documents and retrieving selective information, generalization of patterns from various sites, analysing and interpreting the patterns for its significance meaning. Web mining may be divided into Web Structure, Web Contents, and Web Access Patterns.
Text Mining –Text Mining involves retrieving text related information such as text categorization, clustering, finding patterns and sequential patterns in texts, computational linguistics, and association discovery.
Spatial Data Mining – This retrieves the data based on location. The explosion of geographically related data for rapid development of IT, digital mapping, remote sensing, GIS demands for developing databases for spatial analysis and modelling. Spatial data description, classification, association, clustering, trend, and outlier analysis are the main components for spatial data mining.
Multimedia Data Mining – Multimedia data mining explores the interesting patterns from databases related to multimedia that manages a large collection of multimedia objects. Multimedia objects include audio, video, image, sequence data and hypertext data containing text, text mark-ups, and linkages. Multimedia data research focuses on content-based retrieval, similarity search, association, classification and prediction analysis.
International Journal of Advance and Innovative Research Volume 6, Issue 1 (III): January - March, 2019
23
ISSN 2394 - 7780
Time Series Database – A time series database changes its values and events with respect to time such as stock market data, business transaction data, dynamic production data, medical treatment data, web page access sequence and so on. The time series research involves issues related to similarity search, trend analysis, mining sequential and periodic patterns in time-related data.
Biological Data Mining – There is a large storage of clinical and biological data from DNA microarray data, genomic sequences, protein interactions as well as sequences, electronic health records, disease pathways, biomedical images and the list goes on. In the clinical context, biologists are trying to find the biological processes that are the cause of a disease. There are some issues related to these high-dimensional biological data. These matters include noisy and incomplete data, integrating various sources of data and processing computer intensive tasks. Biologists as well as clinical scientists used a variety of data mining tools to discover interesting and meaningful observations from a large number of heterogeneous data from different biological domains.
Educational Data Mining – Educational Data Mining (EDM) is an emerging research area concerned with the unique types of data that come from educational settings, and using those methods to better understand students. Educational Data Mining focuses on developing new tools and algorithms for discovering data patterns. EDM develops methods and applies techniques from statistics, machine learning, and data mining to analyze data collected during teaching and learning. New computer-supported interactive learning methods and tools have opened up opportunities to collect and analyze student data, to discover patterns and trends in those data, and to make new discoveries and test hypotheses about how students learn. Data collected from online learning systems can be aggregated over large numbers of students and can contain many variables that data mining algorithms can explore for model building. Different student models are used for prediction of future learning behaviour of the students. Computational models are used based on the student domain and pedagogy.
Ubiquitous Data Mining (UDM) – The data miners have a new challenge in the form of the ubiquitous access by using wearable computers, palmtops, cell phones, laptops. To extract hidden information from these devices requires advanced analysis. In the world of UDM, communication, computation, security, etc. are some of the factors. The one of the objectives of the UDM is to extract interesting patterns while minimizing the additional cost of the computing due to the above-cited factors. To implement data mining tasks like classification, clustering, associations, etc. are difficult for ubiquitous devices. Small display areas, data management in mobile are some of the challenges in this regards. The key issues are the advanced algorithm for mobile and distributed computing, data management issues, data representation techniques, integration of these devices with database applications, UDM architecture, software agents, agent interaction and applications of UDM.
Constraint-based Data Mining – Constraint-based data mining is one of the developing areas where the data miners use the constraint for better data mining. One of the applications of constraint-based data mining is Online Analytical Mining Architecture (OALM) designed for multi dimensional as well as constraint based mining based on database sand data ware houses. Usually, data mining techniques lack user control. One form of data mining is where the human involvement is there in the form of constraints. There are various types of constraints with their own characteristics and purpose. They are knowledge type, data, dimension/level, interestingness, rule constraints.
4. DATA MINING TOOLS The following are the popular data mining open source tools Rapid Miner – Rapid Miner is capable of handling various tasks like statistical modelling, predictive
analytics and visualization apart from data mining tasks. Rapid Miner provides learning schemes, models and algorithms from WEKA and R scripts that make it more powerful. This open source is distributed under the AGPL open source license and it can be downloaded from Source Forge. It is one of the best business analytics software.
WEKA: This was originally developed for analyzing agricultural data. It is a powerful tool for different data mining applications like predictive modelling and data analysis. This software is free under the GNU General Public License, which is a big advantage compared to Rapid Miner. It can be customized by the users. Most of the data mining jobs are supported by this tool. Its graphical user interface makes it a better-sophisticated tool for data mining process. Therefore, it has become one of the most powerful open source data mining software.
International Journal of Advance and Innovative Research Volume 6, Issue 1 (III): January - March, 2019
24
ISSN 2394 - 7780
R-Programming – Project R, which is a GNU project, is written in C, FORTRAN and R Language. R language is used for writing lots of modules of the software itself. R programming software is free, and it is also used for statistical computing and graphics. Data miners use R for developing statistical packages and analyzing the data. In recent years the popularity of R has increased owing to its ease of use and extensibility. R provides different statistical techniques that include linear and nonlinear modelling; data mining processes i.e. classification, clustering, time series analysis and others.
Orange – Orange, a Python-based, powerful and open source tool for data mining users for the purpose of knowledge extraction. It has powerful visual programming and Python scripting attached to it. It can be used for machine learning as well as bioinformatics and text mining by adding add-ons. It’s packed with features for data analytics. Orange has specialized add-ons like Bio orange for bio-informatics.
KNIME – KNIME is capable of performing three main tasks in data pre-processing. They are extraction, transformation, and loading. The data processing is done by allowing the assembly of nodes. It is an integration platform with strong data analytics and reporting. KNIME used modular data pipelining concept for machine learning and data mining. It is used for business intelligence as well as financial data mining. KNIME is easily extendible and can be added a plug-in for specific jobs. Its research area not only includes pharmaceutical research but also business data, financial intelligence and CRM customer data.
NLTK - When it comes to language processing tasks, NLTK is one of the major players. NLTK is used for machine learning, data mining, sentiment analysis and data scraping. It is also extensively used for language processing. Because it’s written in Python, one can build applications on top of it, customizing it for small tasks. NLTK played a major role as a teaching tool, study tool, prototyping and can be used as a platform for high-quality research.
5. DATA MINING TECHNIQUES Several data mining techniques are used in data mining tasks. Association, classification, clustering, prediction, sequential pattern mining, etc. are data mining techniques.
Classification – Classification finds rules that partition data into some groups. The input for the classification is the training set. The training set’s class labels are already known. Classification assigns class labels to unlabelled records based on a model that acquires knowledge from the training datasets. Such classification is known as supervised learning as the class labels are known. There are several classification models. Some of the common classification models are decision trees, neural networks, genetic algorithms, support vector machines, Bayesian classifiers. The application includes credit risk analysis, fraud detection, banking and medical application.
Clustering – Clustering is a method of grouping data so that data within the cluster have high similarity and dissimilar to data in other groups. Clustering algorithms may be used for organizing data, categorize data for model construction and data compression, outlier detection, etc. Many clustering algorithms were developed and are categorized as partitioning methods, hierarchical methods, density based and grid based methods. The datasets may be numerical or categorical. K-Means, hierarchical, DBSCAN, OPTICS and STING are some of the well-known data clustering algorithms.
Association Rule Mining – Association rule mining is a well-researched method for discovering interesting relations between variables in large databases. The main objective is to discover all the rules that have support and confidence greater than or equal to minimum support or confidence in a database. Support means that how often X and Y occurs together as a percentage of total transactions. Confidence means that how much a particular item is dependent on another. There is no significance for the patterns with low confidence and support. The users can extract useful and interesting information from the patterns with intermediate values of confidence and support. The association rule mining algorithms include Apriori, AprioriTid, Apriori hybrid and Tertius algorithms.
Neural Networks – Neural networks are new computing paradigm that is inspired by the biological nervous system, such as the brain, to process information. It involves developing mathematical structures with ability to learn. The Neural networks have the ability to extract meaningful and useful patterns and trends from the complex data. It is applicable to real world problems especially in case of industry. As the neural networks are good at identifying patterns or trends, they may be applicable for prediction or for ecasting needs. The system is composed of highly interconnected processing elements (neurons) working together to solve a specific problem. Artificial neural network (ANN) learns by example. ANN is configured for specific application as classification, pattern recognition etc., through a learning process. It may also be used for
International Journal of Advance and Innovative Research Volume 6, Issue 1 (III): January - March, 2019
25
ISSN 2394 - 7780
three-dimensional object recognition, hand-written word recognition, face recognition, etc. Neural networks have the drawback of not explaining the derived results. Another problem is that it suffers from long learning times. As the data grows, the situation becomes worse for that problem.
Support Vector Machines – Support vector machines (SVM) belong to a new class of machine learning algorithms and are based on statistical learning theory. The main concept is to non-linearly map the data set into a high dimensional feature space and use a linear discriminator for classification of data. It is basically used for regression, classification and decision tree construction. SVM has been used in many applications including face detection, handwritten character and digits recognition, speech recognition, image and information retrieval.
Genetic Algorithms – Genetic algorithms are a new paradigm in computing. A population of the individual with possible solution to a problem is created initially at random. Then the crossover is done by combining pairs of individuals to produce offspring of next generation. A mutation process is used to modify the genetic structure of some members of new generation randomly. The algorithm searches for a solution in the successive generation. When an optimum solution is found or some fixed time is elapsed, the process comes to an end. Genetic algorithms are widely used in problems where optimization is required.
6. CONCLUSION Data mining is the need of the hour and has become inevitable. Data Mining helps retrieve and analyse variety of data. Though it is useful in many areas, but there are certain challenges with it too such as unauthentic data on the web, sampling errors, calculation errors. Apart from it, the tools and techniques used for data mining need some kind of hands on experience for the users.
REFERENCES Fayyad,Usama;Piatetsky-Shapiro, Gregory; Smyth, Padhraic (1996), From Data Mining to Knowledge
Discovery in Databases, American Association for Artificial Intelligence, Fall AI Magazine.
Goebel, Michael; Gruenwald, Le (June 1999), A Survey of Data Mining and Knowledge Discovery Software Tools, SIGKDD Explorations, Vol 1 (1), pp 20–33.
Han, Kamber, Pei, Jaiwei, Micheline, Jian (2011), Data Mining: Concepts and Techniques, 3rd edition, Morgan Kaufmann.
Kantardzic, Mehmed (2003), Data Mining: Concepts, Models, Methods, and Algorithms, John Wiley & Sons.
Lovell, Michael C. (1983), Data Mining, The Review of Economics and Statistics, Vol 65 (1), pp 1–12.

International Journal of Advance and Innovative Research Volume 6, Issue 1 (III): January - March, 2019
26
ISSN 2394 - 7780
ROLE OF BIG DATA IN BANKING SECTOR
Asha S1, Dr. Srikant G Sugur2 and Dr. A Venkatraju3 Research Scholar1 and Assistant Professor2, JNN College of Engineering, Shimoga
Professor & Director3, Kadidal Manjappa National Institute of Post-Graduate Studies, Shimoga
ABSTRACT ‘Big Data’ is the buzzword spoken by everybody nowadays. It is omnipresent, omnipotent and omniscient. Considered as oil of 21st century, ‘Big Data’ is a raw material for today’s business and a tool of competitive advantage. It has helped to merge unlikely streams like computation, statistics, processing and storage into a new area of study. Emergence of ‘Big Data’ has made information look feeble and data without analysis has just been relegated to opinion. ’Big Data’ has also helped to coin phrases like ‘Data rich, information poor’. Consumerism without doubt is the offshoot of globalization has put forth huge expectations like real-time contextual solutions, simplicity, transparency of products and pricing and outstanding service to customers and banking sector is no exception. None of these can be achieved without a commitment to using all the data at an organization’s disposal, and the application of advanced analytics to provide a differentiated customer experience. For surviving the competition posed by non banking channels, banks are forced to mend their ways and become customer friendly. The attempt has been made in the present paper, to provide a conceptual overview of big data and the role of big data in banking sector
Keywords: Big Data, Analytics, Internet of Things, Social Media, Fintech, Bigtech, Consumers, Automation, Data Warehouse, Data Lake
INTRODUCTION With the turn of century one can observe hyperbolisation in three sectors viz Finance, Technology and Consumerism. Although it looks like the three are variables, they are interwoven. Marketers were the first to observe such dependencies, who explored the interwoven factors in these variables and the net result are ‘Big Data’. It is projected that about 5 zettabytes (or 1021 bits) of digital data are being generated each year by everything from retail transactions to underground physics experiments to global positioning systems to the ‘Internet of Things’. At the beginning of the 21st century the growing volumes of data presented a seemingly insoluble problem; storage and central processing unit (CPU) technologies were overwhelmed by the terabytes of data being generated. (Tien, 2014). With the growth in technology, the cost of data storage has reduced and made it easier and less expensive to store more data. Today, ‘Big data’ has become capital for many tech companies, analysts, statisticians to leverage it and create a value from it.
The term Big Data applies to datasets whose size exceeds the capacity of available tools to perform acquisition, access, analytics, and/or application in a reasonable amount of time. “Data rich, information poor” (DRIP) problems have been pervasive since the advent of large scale data collections or warehouses, but somewhat mitigated by the Big Data approach, which supports informed (’though not necessarily defensible or valid) decisions or choices. Big Data are useful for decision making only to the extent that they are analyzed or processed to yield critical information (Tien, 2014). The present study focuses on, conceptual framework of the big data and role of big data in banking sector. The study is relevant because of shifting of consumers from traditional bank branches for the primary services to alternative services providers.
LITERATURE REVIEW In the article ‘Big Data Analytics Enabled Smart Financial Services: Opportunities and Challenges (Ravi, 2017) has observed that both financial service provider and the customer are going through a digital evolution. Their concentration is in particular to banking industry which has evolved from just journal and ledger entry paradigm to data and analytics driven banking operations, which subsumes online as well as offline customer behavior. The paper highlights the potential benefits, of the new age technologies with a particular emphasis on the banking industry.
A white paper published by EVRY (Yook Pei Shee, 2017) titled ‘Big data in banking for marketers: How to derive value from big data’ has shown how Big Data can do to improve business value and which Big Data applications marketers should consider to invest both their time and money in. it has comprehensive list of data driven use cases and their value, which are deployed by successful marketing teams today. Such cases are chosen for its relevancy to the banking sector and are backed by case studies from real organizations.
Viktor Mayer-Schönberger and Kenneth Cukier in their book Big Data: A Revolution that Will Transform how We Live, Work, and Think (Viktor Mayer-Schönberger, 2013) has extensively dealt with various aspects of Big
International Journal of Advance and Innovative Research Volume 6, Issue 1 (III): January - March, 2019
27
ISSN 2394 - 7780
data with examples from Google and Farecast. It narrates the origin of ‘Big Data’ in America, initial problems faced by analysts and growth of big data analysis.
‘Big Data in Banking’ a book by Patrick Ranzijn demonstrates how to build and execute an effective Big Data strategy in the context of finance data analytics (Ranzijn, 2018). It contains a wealth of information into a non-technical overview of the issues and opportunities Big Data brings to the banking industry. It not only gives the possibilities and potential pitfalls, but also an in-depth understanding of the economics and technology behind Big Data applications in finance, investments, wealth and asset management. It helps you develop a robust strategy for realizing the potential while avoiding the problems.
DEFINITION AND ORIGIN OF BIG DATA Oxford English dictionary defines ‘Big data’ as ‘Data of a very large size, typically to the extent that its manipulation and management present significant logistical challenges’. Investopedia defines ‘Big Data’ as to the growth in the volume of structured and unstructured data, the speed at which it is created and collected, and the scope of how many data points are covered. ‘Big Data’ often comes from multiple sources and arrives in multiple formats.
Data that is unstructured or time sensitive or simply very large cannot be processed by relational database engines. This type of data requires a different processing approach and is called ‘Big Data’. They use massive parallelism on readily available hardware. (Technopedia)
Though the concept of ‘Big Data’ itself is relatively new, the origins of large data sets go back to the 1960s and '70s when the world of data was just getting started, with the first data centers and the development of the relational database. It was only in 2013 Mayer-Schönberger and Cukier gave a historical perspective on the birth and evolution of ‘Big Data’. (Viktor Mayer-Schönberger, 2013)
Today, ‘Big Data’ is a competitive advantage. Enterprises are developing and using ‘Big Data’ tools to explore their data troughs, to discover insights that could help them develop better relationships with their customers, to identify new areas for business opportunities, and to better manage their supply chains, all in an increasingly competitive business environment. ‘Big Data’ critically affect decisions, risk, informatics, services, goods, and customization or personalization. In short, ‘Big Data’ can be used to improve services, products, and processes, especially by supporting timely decisions.
CHARACTERISTICS OF BIG DATA At the beginning ‘Big data’ was originally associated with only three key concepts: ‘volume, variety, and velocity’ (coined by Doug Laney, VP and Distinguished Analyst with Gartner's). As more data poured in, it was expanded to five key concepts with the addition of ‘veracity and value’. (Sathi, 2012) After further collection, now experts identify ten characteristics and properties in ‘Big Data’. It is termed as the ‘10 Vs of Big Data’. (Firican, 2017). They are presented below
1. Volume: It is nothing but the amount of data. This can be of unknown value which is derived from sources such as social media data feeds, click streams on a webpage or a mobile app, or sensor enabled equipment. For some organizations this might be tens of terabytes of data, for others it may be hundreds of yottabytes (10008 bits).
2. Variety: ‘Big Data’ deals with variety of sources for real time analytics and decision making including analysis of call center conversations and their correlation with emails, trouble tickets (mechanism used in an organization to track the detection, reporting, and resolution of some type of problem) and social media blogs. The data includes unstructured text, sound video in addition to structured data.
3. Velocity: Velocity is the rate at which the data is received and acted on. There are two aspects to velocity, one representing the throughput of data and the other representing latency. (Sathi, 2012) Throughput of data (maximum rate of production or process) represents data moving in the pipes. When the amount of data is large and growing the analytics infrastructure demands bigger pipes and latency represents the reporting environment which now analyses the data in motion with reduced latency.
4. Veracity: Usually as ‘Big Data’ comes from sources outside the control, the problem of truthfulness and accuracy always exists. Veracity represents both the credibility of the data source as well as the suitability of the data for the target audience.
5. Value: When large amount of data is collected, it becomes useless unless it creates some value. The most important part of ‘Big data’ initiative is to understand the costs and benefits of collecting and analyzing such data to ensure that ultimately the data so collected can be monetized.
International Journal of Advance and Innovative Research Volume 6, Issue 1 (III): January - March, 2019
28
ISSN 2394 - 7780
6. Variability: Variability in ‘Big Data’ context refers to a few different things. One is the number of inconsistencies in the data. Inconsistencies need to be found by anomaly and outlier detection methods in order for any meaningful analytics to occur. It is also variable because of the multitude of data dimensions resulting from multiple types and sources. Variability can also refer to the inconsistent speed at which big data is loaded into your database
7. Validity: Validity which is similar to veracity refers to how accurate and correct the data is for its intended use. According to Forbes, an estimated 60 percent of a data scientist's time is spent cleansing their data before being able to do any analysis. The benefit from ‘Big Data’ analytics is only as good as its underlying data, so you need to adopt good data governance practices to ensure consistent data quality, common definitions, and metadata.
8. Vulnerability: Accumulation of ‘Big Data’ brings in security concerns. Data breach with big data is always prime news. Unfortunately there have been many big data breaches. Hence ‘Big Data’ accumulators should make proper arrangements to safeguard data.
9. Volatility: This refers to the property of ‘Big Data’ which is needed to be considered before it becomes irrelevant, historic, or not useful any longer. In other words it is time duration of data to be stored. Before ‘Big Data’, organizations tended to store data indefinitely as a few terabytes of data might not create high storage expenses; it could even be kept in the live database without causing performance issues. Due to the velocity and volume of ‘Big Data’ being generated, its volatility needs to be carefully considered. Rules need to be established for data currency and availability as well as rapid retrieval of information when required. It should be made sure that these are clearly tied to business needs and processes. With ‘Big Data’ the costs and complexity of a storage and retrieval process are magnified.
10. Visualization: Data stored has to be plotted to understand it. Another characteristic of ‘Big Data’ is how challenging it is to visualize. ‘Big Data’ visualization faces technical challenges because of limitations in memory technology, poor scalability, functionality, and response time. Traditional graphs when trying to plot a billion data points, so you need different ways of representing data such as data clustering or using tree maps, sunbursts, parallel coordinates, circular network diagrams, or cone trees.
DRIVERS OF BIG DATA As the developed economies use data intensive technologies, more and more people become technology savvy which leads to information growth. With the arrival of new millennium, three factors are found to be the creators of ‘Big Data’. They are ‘Consumers’, ‘Automation’ and ‘Monetization’. (Sathi, 2012) In case of consumers, with the advent of the ‘Internet of Things’ (IoT), more objects and devices are connected to the internet, gathering data on customer usage patterns and product performance, has paved way for creation of information. Along with this the growth of tools and techniques has created a marketplace to analyze such information. At the beginning, information was created only through text messages. Now its nature has expanded rapidly including clips, photos and videos. Such analysis has been aided by growth in automation sector. Interactive voice response (IVR), mobile devices, chats and call centres etc. are some of the avenues where ‘Big Data’ is created. (Sathi, 2012) Such data can now be analyzed and organized. The biggest change is our ability to modify the customer experience using such data. Monetization is nothing but the analytics of ‘Big Data’ which is creating a new market place. Such information created from one industry can be synthesized, categories and packed for reuse of another.
OBJECTIVES OF THE STUDY The objectives set for the study are as follows 1) To present a conceptual overview of big data.
2) To analyze the role of big data in banking sector.
METHODOLOGY The study is descriptive in nature. To accomplish the objective of the study, the secondary data has been collected from various books, journals, RBI and Fintech Firm’s Reports. The study is based on secondary data only.
BIG DATA IN BANKING SECTOR The banking industry has been in comfortable position for decades with low customer turnover, almost no regional competition, good personal relationships and trust as selling points and now much intervention from regulators. Staying ahead of the curve was easy and there was no pressure to change

International Journal of Advance and Innovative Research Volume 6, Issue 1 (III): January - March, 2019
29
ISSN 2394 - 7780
The explosion of information technology has appropriated banks to serve the customers ‘anywhere anytime banking’. The growth of ATMs, electronic payments, digital wallets, net banking and credit and debit cards are fueled by the growth of information technology and country is moving towards cashless economy. “Global economy is transforming into a digital economy, thanks to development of cutting edge technologies in digital space, machine learning, artificial intelligence, internet of things, 3D printing and the like. Initiatives such as Digital India, Start Up India, and Make in India would help the country to establish itself as a knowledge and digital society. NITI Aayog will initiate a national program to direct our efforts in the area of artificial intelligence, including research and development of its applications,” (Jaitley, 2018). Under Such circumstances ‘data source’ plays a very crucial role in Marketing. . With appropriate use of information technology financial service providers has an opportunity to compound their performance through better understanding of customers. This leads to business efficiency which can also improve their margins and revenue growth. It also leads to manage their risk efficiently. Banks are the generators of huge data which can be tool for better decision making if properly analysed. The special lecture entitled ‘Big Data in a Small World’ delivered by Dr. David Bholat, who is an Analyst in the Statistics and Regulatory Data Division in Bank of England and a visiting fellow at the Newcastle University, in itself is the proof of the volume of data generated. He emphasises the use of ‘Big Data’ analytics in specific areas by the Bank of England for enabling efficient policy decisions. ‘Big Data’ could be used to analyse emerging macroeconomic issues ranging from asset quality of banks to the threat of deglobalisation. He described the suitability of text data, social media feeds and granular-level data as new-age enabler for advanced analytics and data visualisation. Nowadays, it is believed that banking will not be just about saving, spending or servicing transactions. It will be about banks acting as the alter ego of their customers, aiming to maximize their wealth and meet their financial needs seamlessly. Financial advisory, Investment Management, facilitating commerce on both borrower and lender side will take center stage and, taking a futuristic view, the entire value chain will be about “Automation, (Block chain, Robotics Process Automation), Experience, (Artificial Intelligence, NLP & Language support) and Assistance. (Humanoids, Holographic Banking & Robo-advisory). (Report of the Working Group on FinTech and Digital Banking, 2017) Now competitors from adjacent industries and financial technology startups are flooding the market with innovative technology, drives deviation from the traditional banking model. ‘Fintech’ and ‘Bigtech’ firms are capturing more and more of the banking value chain, providing services such as payments, checking and even saving accounts. The new entrants pose a threat to banks by raising service expectations and coming between banks and their customers. (Fergus Gordon, 2013) And to add insult to injury, customer’s attitudes have fundamentally changed. They are making decisions much faster and have access to plethora of offers, leaving financial institutions struggling for customer loyalty. (Fergus Gordon, 2013) The future of the banking ecosystem will look much different from today and extend beyond core financial services. They could erode much of the traditional bank revenues in the foreseeable future. (Marous, 2018) Nowadays, banking industry possess large of amount of veracious data. Most banks have failed to utilize this data. However, banks of late have started analyzing this data to reach their main objectives of marketing. By using this data, banks would be able to reach their customers. Globally, generation Y, account for 27% (17.76 billion) of the world’s total population. In India, they are 34% (0.44 billion) of the country’s total population accounts for nearly half of the working age population. Most of the monthly income of generation Y is spent on essentials, entertainment and eating out. This is an indication of shifting of economy towards consumption rather than savings. By spending around 17 hours a week on the internet, generation Y use technology to connect with the world around them. They prefer online mode, rather than offline because of its convenience and wider options. ‘We have to be where our customers are’ should be the best way to reach them. The use of communication channels of their choice and social media is in the top of the agenda for this tech savvy generation. These young customers offer a huge value proposition. Social media presence is no longer an option, but a business imperative. It is nobody’s case that brick and mortar would disappear. (Social Media Framework for Indian Banking Sector, 2013)
From the above the first step in improving and increasing the convenience and value for the customers is technology enabled banking services through mobile apps, e-wallet solutions and personal finance management tools (mTrakr) which are accepted by the customers. Other solutions such as AI, video and chat functions for advisory services, crowd funding (RangDe,Milaap), P2P lending, social investing are acknowledged but in nascent stage. (Fergus Gordon, 2013)
The world has entered what some regard as an era of ‘Digital Darwinism, a time where technology and society are evolving faster than many organizations can adapt to the changes. The emergence of the digital five ‘social’,
International Journal of Advance and Innovative Research Volume 6, Issue 1 (III): January - March, 2019
30
ISSN 2394 - 7780
‘mobile’, ‘analytics’, ‘cloud’ and ‘internet of things’ is creating new and valuable sources of business information, ways to interpret data and the means to do so cost-effectively. (India's Top Banks, 2017)
The drastic technological changes are demanding the banking sector to rethink of customer relationships and the method of delivering value to meet customer needs in order to stay ahead of competition. Banks that leverage agile technology will be able to bring products to market quickly and efficiently and also offer these products via channels with which customers are most comfortable. Therefore, the clear prognosis is that the banks of the future are not going to be the banks of yesterdays and today. (India's Top Banks, 2017)
IMPACT OF BIG DATA ANALYTICS ON THE BANKING INDUSTRY There are 291 million urban mobile internet users and 187 million rural users as on December 2017. (The Internet & Mobile Association of India (IAMAI) )The Central bank of the country is finalizing regulatory framework to push internet banking. Adding fuel to this is encouraging internet population who are using internet banking services. There lies a unique opportunity for the banking sector which has to be capitalized. RBI proposes to implement a Central Information and Management system CIMS) comprising of Data Warehouse (DW) and Data Lake (DL) which would include:
Seamless data collection from regulated entities by creating system-to-system interface
System driven data validation and data review
Flexible and scalable data repository including DL
Providing a state of the art data dissemination platform
Big data analytics enable businesses to access and analyze multiple data sources with rapid speed, improve decision making, develop tailored services that meet consumer needs, and obtain better judgment of lending activities thus minimizing losses. (McMalcolm, 2015) Using big data analysis could assist banking sector to obtain competitive advantage in multiple ways.
First, it could provide tools and methods for banks to access data and perform analytics in minimum amount of time and easy processes. (Manyika, 2011)
Second, big data analytics could enhance the predictive accuracy of future business plan outcomes by using historical data. (Groenfeldt, 2016)
Third, big data analytics allows banks to innovate tailored products that could meet the changing requirements of customers through understanding of specifics of customer behaviours and patterns. (Manyika, 2011)
Fourth, as the market and consumer behaviors involve many uncertainties, banks could use big data analytics to track consumer transactional behaviors and manage risks of default. (Guo, 2016)
Finally, ‘Big Data’ analytics can act as cost saving way to banking sector by tracking and monitoring consumers’ information and reduce potential losses from defaulting. (Keshetri, 2016) Particularly with the help of Big Data analytics, banking sector can transform the semi structured and unstructured data into structured data using algorithms and then analyze it for business performance improvements. In this way, banks can segment data and track typical customers’ financial transaction behaviors across various segmentations to provide personalized services, and build and maintain loyal customer base.
CONCLUSION Banks generate data through multiple channels, such as offline consumption and online transactions. Banking sector of the country is the mainstream of the economy and boosts financial deepening by providing more services and better access for different socio-economic groups. With government initiatives like ‘Digital India’ and Jan Dhan, vast amount of data is generated with banks and other government bodies. With the government initiative for providing digital platform, more and more people have come under the umbrella of digital world. The banking sector could generate more of data by its integration with other government departments, could help banking firms for analysis of the data. Thus baking firms can change their strategy for creating customer relationship and design products for satsfying customers needs.
REFERENCE Fergus Gordon, J. D. (2013). Banking in a Digital World. New York: A. T. Kearney.
Firican, G. (2017, February 8). twdi.org. Retrieved November 21, 2018, from https://tdwi.org/articles/2017/02/08/10-vs-of-big-data.aspx
International Journal of Advance and Innovative Research Volume 6, Issue 1 (III): January - March, 2019
31
ISSN 2394 - 7780
Groenfeldt, T. (2016, March 28). Big Data in Finance Can Improve Retention and Returns. Retrieved November 22, 2018, from Insights: https://insights.samsung.com/2016/03/28/big-data-in-finance-can-improve-retention-and-returns/
Guo, S. Y. (2016). Big Data Concepts, Theories, and Applications. Basel: Springer.
India's Top Banks. (2017). Mumbai: Dun and Bradstreet Information Services India Limited.
Jaitley, A. (2018, February 01). Budget Speech. Delhi, Delhi, India: Government of india.
Jiwat Ram, H. Y. (2017 ). EXAMINING IMPACTS OF BIG DATA ANALYTICS ON CONSUMER FINANCE: A CASE OF CHINA. International Journal of Managing Information Technology (IJMIT) Vol.9, No.3, , 13-22.
Keshetri. (2016). Big data’s role in expanding access to financial services in China. International Journal of Information Management , 297-308.
Manyika, J. C. (2011). The next frontier for innovation, competition and productivity. Mckinsey.
Marous, J. (2018, November 25). The Future of Banking Extends Beyond Financial Services. Brecksville, Ohio, USA.
McMalcolm, J. (2015, April 27). Is Big Data Helping Improve Consumer Finance?
Ranzijn, P. (2018). Big Data in Banking: With Applications in Finance, Investment, Wealth and Asset Management. Wiley.
Ravi, K. &. (2017). Big Data Analytics Enabled Smart Financial Services: Opportunities and Challenges. Springer International Publishing , 15-39.
(2017). Report of the Working Group on FinTech and Digital Banking. Mumbai: RBI.
(2001). Report on Internet Banking. Mumbai: Reserve Bank of India.
Sathi, D. A. (2012). Big Data Analytics: Disruptive Technologies for Changing the Game. Boise: IBM Corporation.
(2013). Social Media Framework for Indian Banking Sector. Hyderabad: Reserve Bank of India.
Technopedia. (n.d.). Retrieved November 20, 2018, from Technopedia: https://www.techopedia.com/definition/27745/big-data
The Internet & Mobile Association of India (IAMAI) . (n.d.). Retrieved November 21, 2018, from https://www.iamai.in/
Tien, J. M. (2014, Winter). Overview of Big Data A US Perspective. The Bridge , pp. 12-19.
Viktor Mayer-Schönberger, K. C. (2013). Big Data: A Revolution that Will Transform how We Live, Work, and Think. New York: Houghton Milfflin Harcourt .
Yook Pei Shee, D. C. (2017). Big data in banking for marketers. Fornebu: EVRY.
International Journal of Advance and Innovative Research Volume 6, Issue 1 (III): January - March, 2019
32
ISSN 2394 - 7780
A CONCEPTUAL STUDY ON E-COMMERCE AND E-MARKETING WITH REFERENCE TO AMAZON
K. Umesh Shetty1 and Bhanuprakash2 Dean1, Faculty of Commerce
Lecturer2, Alva’s College, Moodubidire (D.K)
ABSTRACT This paper aims to build a structured literature review to the field of E-Commerce and E-Marketing. Electronic Commerce, commonly written as e-commerce, is the trading or facilitation of trading in products or services using computer networks, such as the Internet, Electronic commerce draws on technologies such as mobile commerce, electronic funds transfer, supply chain management, Internet marketing, online transaction processing, electronic data interchange (EDI), inventory management systems, and automated data collection systems. Modern electronic commerce typically uses the World Wide Web for at least one part of the transaction’s life cycle, although it may also use other technologies such as e-mail. This study is conducted so see how the consumers’ brand perception and purchasing decisions are influenced by different online marketing tools used across the industries such as Word of Mouth, online chat assistance and Email advertising. Generally speaking the trend of e-commerce has been increased rapidly in the recent years with the development of internet and due to the easy accessibility of internet usage. Easy access to internet has driven consumers to shop online. In fact, according to the University of California, Los Angeles communication policy (2001), online shopping is the third most popular activity on the internet after email using and web browsing. Globally more than 627 million people have done online shopping so far. World’s biggest online shoppers include Germans and British. Books, airline tickets/reservations, clothing/shoes, video games and other electronic products are the most popular items purchased on the internet. To this paper both primary data and secondary data were used. Primary data were collected through structured questionnaire and for secondary data referred various online journals, internet and company website. Keywords: E-Commerce, E-Marketing, Company strategies, Technology
1. INTRODUCTION Through electronic marketing and internet communication, business firms are coordinating different marketing activities such market research product development, inform customers about product features, promotion, customer services, customer feedback and so on. Online shopping is used as a medium for communication and electronic commerce, it is to increase or improvise in value, quality and attractiveness of delivering customer benefits and better satisfaction. That is why online shopping is more convenient and day by day increasing its popularity. Not only benefits but also risk is associated with online shopping. Generally speaking internet users avert online shopping because of credit-card fraud, lack of privacy, non-delivery risk, lack of guarantee of quality of goods and services. Concerned authorities are devising policies to minimize the risk involved in e-business. E-Commerce - E-commerce is the activity of buying or selling of products on online services or over the Internet. Electronic commerce draws on technologies such as mobile commerce, electronic funds transfer, supply chain management, Internet marketing, online transaction processing, electronic data interchange (EDI), inventory management systems, and automated data collection systems. Modern electronic commerce typically uses the World Wide Web for at least one part of the transaction's life cycle although it may also use other technologies such as e-mail. Typical e-commerce transactions include the purchase of online books (such as Amazon) and music purchases (music download in the form of digital distribution such as iTunes Store), and to a less extent, customized/personalized online liquor store inventory services. There are three areas of e-commerce: online retailing, electric markets, and online auctions. E-commerce is supported by electronic business. E-Marketing- Email marketing is the act of sending a commercial message, typically to a group of people, using email. In its broadest sense, every email sent to a potential or current customer could be considered email marketing. It usually involves using email to send advertisements, request business, or solicit sales or donations, and is meant to build loyalty, trust, or brand awareness. Marketing emails can be sent to a purchased lead list or a current customer database. The term usually refers to sending email messages with the purpose of enhancing a merchant's relationship with current or previous customers, encouraging customer loyalty and repeat business, acquiring new customers or convincing current customers to purchase something immediately, and sharing third-party ads. Email marketing has evolved rapidly alongside the technological growth of the 21st century.
International Journal of Advance and Innovative Research Volume 6, Issue 1 (III): January - March, 2019
33
ISSN 2394 - 7780
The Amazon company was founded as a result of what Jeff Bezos called his "regret minimization framework", which described his efforts to fend off any regrets for not participating sooner in the Internet business boom during that time. In 1994, Bezos left his employment as vice-president of D. E. Shaw & Co., a Wall Street firm, and moved to Seattle, Washington, where he began to work on a business plan for what would become Amazon.com.
Product list provided by Amazon • Clothing
• Footwear
• Mobile and accessories
• Computers
• Watches, bags and wallets
• Camera
• Books
• Home and kitchen appliances
• Beauty and health care
• Pens and stationery
• Games
• TV, videos and audios
• Toys
• Music, movies and posters
• Baby care
• Sports and fitness, etc.
II. OBJECTIVES OF THE STUDY The purpose of this study is to synthesize the representative existing literature on consumer online shopping attitudes and behaviour based on an analytical literature view. In doing so, this study attempts to provide a comprehensive picture of the status of this subfield and point out limitations and areas for future research. The purpose of this research study is to investigate online consumer behaviour, which in turn provides E-marketers with a constructional framework for fine-tuning their E-businesses’ strategies.
The specific objectives of this research are • To understand the concepts of e-commerce and e-marketing. • To know the process of e-commerce and e-marketing. • To know the benefits of e-commerce and e-marketing. • To understand the factors this will influence the purchase intention in online shopping. • To study the customer’s level of satisfaction with regard to online shopping. • To learn how the delivery is made from retailer to consumer. • To examine whether customers prefer online shopping to physical stores. III. RESEARCH METHODOLOGY This paper is based on conceptual study. For this purpose the primary data is collected from the respondents. A total of 150 respondents were selected through simple random sampling random sampling method from all over Karnataka state. The data used in the paper are both primary data as well as secondary data. With regard to the sampling plan, the convenience sampling is used for the purpose of collecting the data. The primary data collected was done with the help of unstructured questionnaire. The secondary data were collected from reports, research journals, company website and surfing on the Net.
IV. ANALYSIS OF DATA AND FINDINGS Simple percentage analysis was used to analyses, the collected data. It states the frequency and percentage of the profile, attitude and opinion regarding the people.
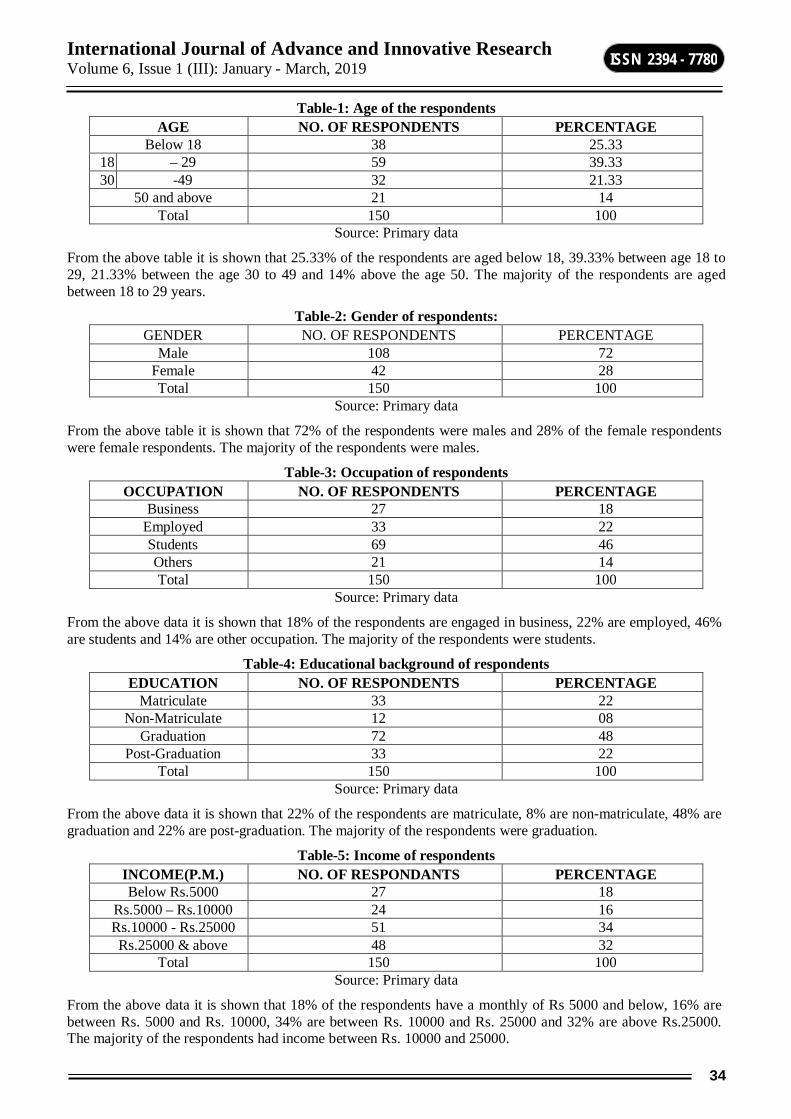
International Journal of Advance and Innovative Research Volume 6, Issue 1 (III): January - March, 2019
34
ISSN 2394 - 7780
Table-1: Age of the respondents AGE NO. OF RESPONDENTS PERCENTAGE
Below 18 38 25.33 18 – 29 59 39.33 30 -49 32 21.33
50 and above 21 14 Total 150 100
Source: Primary data
From the above table it is shown that 25.33% of the respondents are aged below 18, 39.33% between age 18 to 29, 21.33% between the age 30 to 49 and 14% above the age 50. The majority of the respondents are aged between 18 to 29 years.
Table-2: Gender of respondents: GENDER NO. OF RESPONDENTS PERCENTAGE
Male 108 72 Female 42 28 Total 150 100
Source: Primary data
From the above table it is shown that 72% of the respondents were males and 28% of the female respondents were female respondents. The majority of the respondents were males.
Table-3: Occupation of respondents OCCUPATION NO. OF RESPONDENTS PERCENTAGE
Business 27 18 Employed 33 22 Students 69 46 Others 21 14 Total 150 100
Source: Primary data
From the above data it is shown that 18% of the respondents are engaged in business, 22% are employed, 46% are students and 14% are other occupation. The majority of the respondents were students.
Table-4: Educational background of respondents EDUCATION NO. OF RESPONDENTS PERCENTAGE
Matriculate 33 22 Non-Matriculate 12 08
Graduation 72 48 Post-Graduation 33 22
Total 150 100 Source: Primary data
From the above data it is shown that 22% of the respondents are matriculate, 8% are non-matriculate, 48% are graduation and 22% are post-graduation. The majority of the respondents were graduation.
Table-5: Income of respondents INCOME(P.M.) NO. OF RESPONDANTS PERCENTAGE Below Rs.5000 27 18
Rs.5000 – Rs.10000 24 16 Rs.10000 - Rs.25000 51 34 Rs.25000 & above 48 32
Total 150 100 Source: Primary data
From the above data it is shown that 18% of the respondents have a monthly of Rs 5000 and below, 16% are between Rs. 5000 and Rs. 10000, 34% are between Rs. 10000 and Rs. 25000 and 32% are above Rs.25000. The majority of the respondents had income between Rs. 10000 and 25000.
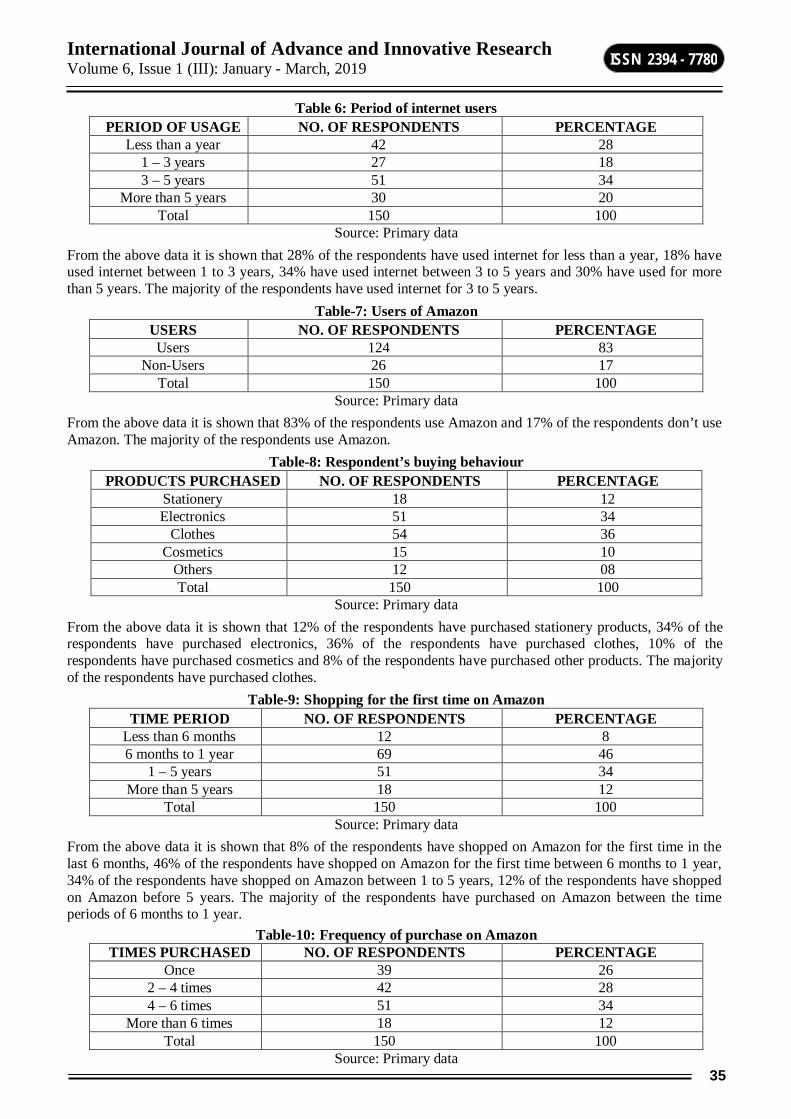
International Journal of Advance and Innovative Research Volume 6, Issue 1 (III): January - March, 2019
35
ISSN 2394 - 7780
Table 6: Period of internet users PERIOD OF USAGE NO. OF RESPONDENTS PERCENTAGE
Less than a year 42 28 1 – 3 years 27 18 3 – 5 years 51 34
More than 5 years 30 20 Total 150 100
Source: Primary data From the above data it is shown that 28% of the respondents have used internet for less than a year, 18% have used internet between 1 to 3 years, 34% have used internet between 3 to 5 years and 30% have used for more than 5 years. The majority of the respondents have used internet for 3 to 5 years.
Table-7: Users of Amazon USERS NO. OF RESPONDENTS PERCENTAGE Users 124 83
Non-Users 26 17 Total 150 100
Source: Primary data From the above data it is shown that 83% of the respondents use Amazon and 17% of the respondents don’t use Amazon. The majority of the respondents use Amazon.
Table-8: Respondent’s buying behaviour PRODUCTS PURCHASED NO. OF RESPONDENTS PERCENTAGE
Stationery 18 12 Electronics 51 34
Clothes 54 36 Cosmetics 15 10
Others 12 08 Total 150 100
Source: Primary data From the above data it is shown that 12% of the respondents have purchased stationery products, 34% of the respondents have purchased electronics, 36% of the respondents have purchased clothes, 10% of the respondents have purchased cosmetics and 8% of the respondents have purchased other products. The majority of the respondents have purchased clothes.
Table-9: Shopping for the first time on Amazon TIME PERIOD NO. OF RESPONDENTS PERCENTAGE
Less than 6 months 12 8 6 months to 1 year 69 46
1 – 5 years 51 34 More than 5 years 18 12
Total 150 100 Source: Primary data
From the above data it is shown that 8% of the respondents have shopped on Amazon for the first time in the last 6 months, 46% of the respondents have shopped on Amazon for the first time between 6 months to 1 year, 34% of the respondents have shopped on Amazon between 1 to 5 years, 12% of the respondents have shopped on Amazon before 5 years. The majority of the respondents have purchased on Amazon between the time periods of 6 months to 1 year.
Table-10: Frequency of purchase on Amazon TIMES PURCHASED NO. OF RESPONDENTS PERCENTAGE
Once 39 26 2 – 4 times 42 28 4 – 6 times 51 34
More than 6 times 18 12 Total 150 100
Source: Primary data
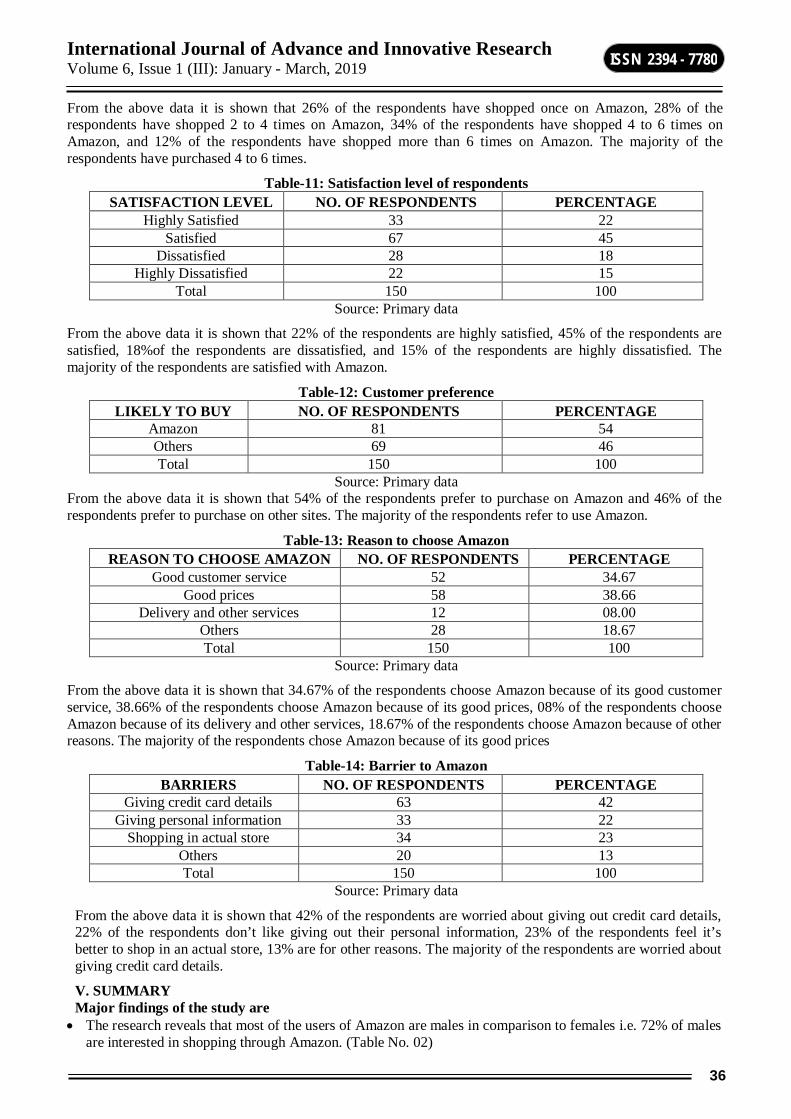
International Journal of Advance and Innovative Research Volume 6, Issue 1 (III): January - March, 2019
36
ISSN 2394 - 7780
From the above data it is shown that 26% of the respondents have shopped once on Amazon, 28% of the respondents have shopped 2 to 4 times on Amazon, 34% of the respondents have shopped 4 to 6 times on Amazon, and 12% of the respondents have shopped more than 6 times on Amazon. The majority of the respondents have purchased 4 to 6 times.
Table-11: Satisfaction level of respondents SATISFACTION LEVEL NO. OF RESPONDENTS PERCENTAGE
Highly Satisfied 33 22 Satisfied 67 45
Dissatisfied 28 18 Highly Dissatisfied 22 15
Total 150 100 Source: Primary data
From the above data it is shown that 22% of the respondents are highly satisfied, 45% of the respondents are satisfied, 18%of the respondents are dissatisfied, and 15% of the respondents are highly dissatisfied. The majority of the respondents are satisfied with Amazon.
Table-12: Customer preference LIKELY TO BUY NO. OF RESPONDENTS PERCENTAGE
Amazon 81 54 Others 69 46 Total 150 100
Source: Primary data From the above data it is shown that 54% of the respondents prefer to purchase on Amazon and 46% of the respondents prefer to purchase on other sites. The majority of the respondents refer to use Amazon.
Table-13: Reason to choose Amazon REASON TO CHOOSE AMAZON NO. OF RESPONDENTS PERCENTAGE
Good customer service 52 34.67 Good prices 58 38.66
Delivery and other services 12 08.00 Others 28 18.67 Total 150 100
Source: Primary data
From the above data it is shown that 34.67% of the respondents choose Amazon because of its good customer service, 38.66% of the respondents choose Amazon because of its good prices, 08% of the respondents choose Amazon because of its delivery and other services, 18.67% of the respondents choose Amazon because of other reasons. The majority of the respondents chose Amazon because of its good prices
Table-14: Barrier to Amazon BARRIERS NO. OF RESPONDENTS PERCENTAGE
Giving credit card details 63 42 Giving personal information 33 22
Shopping in actual store 34 23 Others 20 13 Total 150 100
Source: Primary data
From the above data it is shown that 42% of the respondents are worried about giving out credit card details, 22% of the respondents don’t like giving out their personal information, 23% of the respondents feel it’s better to shop in an actual store, 13% are for other reasons. The majority of the respondents are worried about giving credit card details.
V. SUMMARY Major findings of the study are The research reveals that most of the users of Amazon are males in comparison to females i.e. 72% of males
are interested in shopping through Amazon. (Table No. 02)
International Journal of Advance and Innovative Research Volume 6, Issue 1 (III): January - March, 2019
37
ISSN 2394 - 7780
About 83% of the respondents use Amazon. (Table No. 7)
Majority of the users of Amazon are 46% that are students. (Table No. 3)
From the study it is evident that 83% of the respondents prefer Amazon over other sites. (Table No. 12)
It is found 38.66% respondents that prefer Amazon for its good prices. (Table No.13)
It is found that 36% of the respondents are interested in purchasing clothes on Amazon. (Table No. 8)
From the study it is found that 34% of the respondents have purchased more than 4 to 6 times from Amazon. (Table No. 10)
It explains that about 45% of the respondents are satisfied with the facilities of Amazon. (Table No. 11)
It is found that 42% of the respondents fear giving out their credit card details. (Table No. 14)
VI. LIMITATIONS The instruments used for this study need to be subjected to more statistical tests in order to establish a more robust validity and reliability. Due to the time constraints, the researcher has not made use of statistical tool. One of the main limitations of this study is security. In most cases, people are hesitant to provide their personal and financial details
VII. CONCLUSION The study conclude that majority of the customer prefer shopping through Amazon rather than other. Considering the fact that there are many of middle class less educated people in India Amazon although has many of impact on middle class people but it should think about less educated people as now only educated people are using the Amazon. Amazon should increase the variety of products and they should go with qualitative products so as to satisfy the people who are willing to purchase through Amazon despite of this Amazon is providing less cost products which helps to serve middle as well as other relevant people of the society.
REFERENCES 1. Modern Marketing-B.S Raman
2. Laudon Kenneth C. and Carol Guercio Traver (2002) E-Commerce: Business Technology, Society. (New Delhi: Pearson Education).
3. Awad Elias M. (2007), Electronic Commerce: From vision to fulfilment (New Delhi: Pearson Education).
4. https://youtu.be/HAYYzA8IIKo
5. https://www.aboutamazon.com
6. Alan L.Montgomery, Interfaces (Mar.-Apr,. 2001), Applying Quantitative Marketing Techniques to the internet, Journal of Marketing, Vol.31, No.2, pp.90-108.
International Journal of Advance and Innovative Research Volume 6, Issue 1 (III): January - March, 2019
38
ISSN 2394 - 7780
AN EMPERICAL STUDY ON TECHNOLOGICAL IMPACT ON CUSTOMER RETENTION
Rajani Talikoti1, Anuradha C. K.2 and Dr. P. S. Subhadra3 Assistant Professor1, SDM, Dharwad
Assistant Professor2,3, JNN College of Engineering, Shimoga
ABSTRACT Customer retention is a vital part of any business’s success. And there are some very good reasons for that. Did you know that increasing customer retention rates by 5% can increase profits 25-95%. Customers would benefit if brands delivered deals and coupons to their mobile devices. This practice is becoming more and more targeted and sophisticated. Purchase histories allow you to send promotions on products or services you know a customer likes. In fact, most Millennials have their smartphones with them at all times, and, not coincidentally, Millennials also represent the second-highest tier of mobile payment spending, with 23% of them using mobile pay at least once a week, according to Fortune. Company that’s already learned how to leverage mobile pay for customer service is Starbucks. They managed to boost customer use of mobile pay through their mobile app by offering special offers and discounts for purchasing through the app. In this attempts to identify the importance of technological platforms in customer retentions strategies followed by different policies.
Keywords: Customer retention, technological platforms, Millennials, Mobile payments.
I. INTRODUCTION The customer retention strategies adopted by the Corporate Sector., there is a huge requirement of understanding the whole cycle of customer retention strategies. It could be helpful in developing the intellect about the fact that how a company reached the stage of customer retention and most importantly the significance of customer retention strategies could also be identified. Here, at the same juncture, it is essential to understand that through customer retention the company can ensure that they have loyal customers but the loyalty of customers can never be developed or gained in just one or two transactions.
It is a continuous process, and before customer retention strategies there are lots of other elements that come into the picture. The cycle of customer retention starts from the customer perception that is very stage to reach customer retention. The customers gathered information about the product or can get information from various sources. Thus, it is something that helps them in creating their perception towards the product by information gathered by them. The customer perception could also be established as the image of the company among the society and common people. It is something that lay down the foundation of customer retention could take place or not. Ahead, another stage is related to customer experience. This is a stage that comes after the customer perception. Once, if the customer found the product or services, then it could be purchased or used by them. Thus, here the positive stimuli have already been established. It is very significant that what company has presented and what they have delivered both must be same from customer’s point of view. The difference between the customer experience and customer perception is something that put adverse impact on the brand value of the company. It is to acknowledge that it is a very common scenario that if the company is not able to fulfil their promises, then it affects their name negatively .
The 106 promises and claims that have been made by the company must be fulfilled under any circumstances. However, on the failure of such aspects, the connections among the companies will be disconnected. On the contrary, if the company can fulfil their promises then it can help on the ground of reaching the next stage of reaching towards the customer retention. The next stage is related to immense customer satisfaction. If the experience of using the product or service is positive, then it can enable them to focus on the attainment of customer satisfaction. It is most crucial stage that must be achieved by the organisations.
The Corporate Sector has to ensure that their business practices, product portfolio and service quality must have the potential to satisfy the customers. The customer satisfaction proves that company can achieve their objectives and goals. However, it is just a starting off building a long-term relationship with the customers. After the positive experience and customer satisfaction, the customers will be inclined towards the repetition of purchase.
They will become the regular customers for the company, and thus, the company is required to manage their reputation on the regular basis. It is a process that must be repeated for sufficient amount of time. The purchase repetition and customer satisfaction both should come into existence. It develops the confidence of the customers, and after some time, they become the loyal customers for the organisation. Customer loyalty is just a
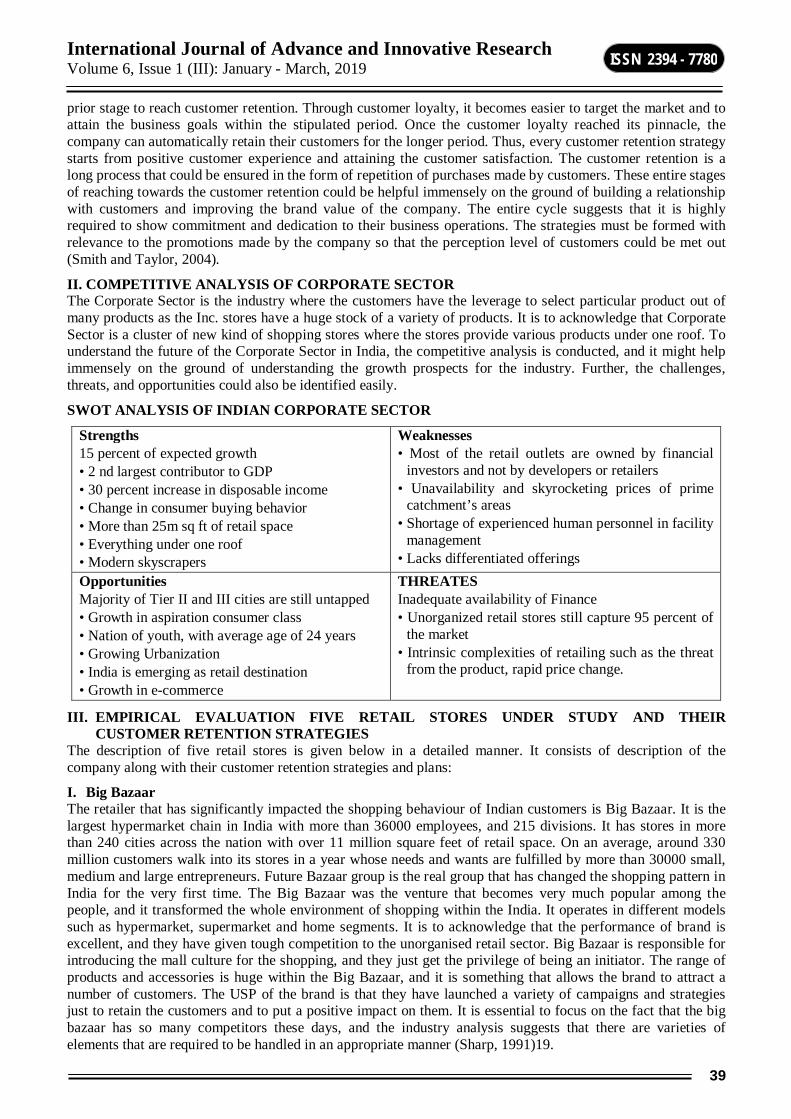
International Journal of Advance and Innovative Research Volume 6, Issue 1 (III): January - March, 2019
39
ISSN 2394 - 7780
prior stage to reach customer retention. Through customer loyalty, it becomes easier to target the market and to attain the business goals within the stipulated period. Once the customer loyalty reached its pinnacle, the company can automatically retain their customers for the longer period. Thus, every customer retention strategy starts from positive customer experience and attaining the customer satisfaction. The customer retention is a long process that could be ensured in the form of repetition of purchases made by customers. These entire stages of reaching towards the customer retention could be helpful immensely on the ground of building a relationship with customers and improving the brand value of the company. The entire cycle suggests that it is highly required to show commitment and dedication to their business operations. The strategies must be formed with relevance to the promotions made by the company so that the perception level of customers could be met out (Smith and Taylor, 2004).
II. COMPETITIVE ANALYSIS OF CORPORATE SECTOR The Corporate Sector is the industry where the customers have the leverage to select particular product out of many products as the Inc. stores have a huge stock of a variety of products. It is to acknowledge that Corporate Sector is a cluster of new kind of shopping stores where the stores provide various products under one roof. To understand the future of the Corporate Sector in India, the competitive analysis is conducted, and it might help immensely on the ground of understanding the growth prospects for the industry. Further, the challenges, threats, and opportunities could also be identified easily.
SWOT ANALYSIS OF INDIAN CORPORATE SECTOR
Strengths 15 percent of expected growth • 2 nd largest contributor to GDP • 30 percent increase in disposable income • Change in consumer buying behavior • More than 25m sq ft of retail space • Everything under one roof • Modern skyscrapers
Weaknesses • Most of the retail outlets are owned by financial
investors and not by developers or retailers • Unavailability and skyrocketing prices of prime
catchment’s areas • Shortage of experienced human personnel in facility
management • Lacks differentiated offerings
Opportunities Majority of Tier II and III cities are still untapped • Growth in aspiration consumer class • Nation of youth, with average age of 24 years • Growing Urbanization • India is emerging as retail destination • Growth in e-commerce
THREATES Inadequate availability of Finance • Unorganized retail stores still capture 95 percent of
the market • Intrinsic complexities of retailing such as the threat
from the product, rapid price change.
III. EMPIRICAL EVALUATION FIVE RETAIL STORES UNDER STUDY AND THEIR CUSTOMER RETENTION STRATEGIES
The description of five retail stores is given below in a detailed manner. It consists of description of the company along with their customer retention strategies and plans:
I. Big Bazaar The retailer that has significantly impacted the shopping behaviour of Indian customers is Big Bazaar. It is the largest hypermarket chain in India with more than 36000 employees, and 215 divisions. It has stores in more than 240 cities across the nation with over 11 million square feet of retail space. On an average, around 330 million customers walk into its stores in a year whose needs and wants are fulfilled by more than 30000 small, medium and large entrepreneurs. Future Bazaar group is the real group that has changed the shopping pattern in India for the very first time. The Big Bazaar was the venture that becomes very much popular among the people, and it transformed the whole environment of shopping within the India. It operates in different models such as hypermarket, supermarket and home segments. It is to acknowledge that the performance of brand is excellent, and they have given tough competition to the unorganised retail sector. Big Bazaar is responsible for introducing the mall culture for the shopping, and they just get the privilege of being an initiator. The range of products and accessories is huge within the Big Bazaar, and it is something that allows the brand to attract a number of customers. The USP of the brand is that they have launched a variety of campaigns and strategies just to retain the customers and to put a positive impact on them. It is essential to focus on the fact that the big bazaar has so many competitors these days, and the industry analysis suggests that there are varieties of elements that are required to be handled in an appropriate manner (Sharp, 1991)19.

International Journal of Advance and Innovative Research Volume 6, Issue 1 (III): January - March, 2019
40
ISSN 2394 - 7780
The big bazaar was founded in the year 2001 with the tagline of “iss se sasta aur acha kuch nahin” and till now located more than 100 locations all over the India. It is one of the most successful hypermarket chains or retail store in India. The tagline of the group was appealing, and the brand has justified with the same ivarious ways. The tagline itself suggests that the group is aiming to reshape the shopping aspects within the India by providing the daily items at a cheaper rate. The business strategy of Big Bazaar was very much clear that they have divided the market into the three segments so that they can implement their strategies in an appropriate manner. Ahead it is also clear that the cluster of these three theories or facts allows them to get a hold on the Indian market and to capture the maximum market share. The very first theory suggests that the maximum population of the India belongs to the upper middle class and lower middle class that become the targeted segment of the Indian market. It becomes the basis of their strategies, and entire plan revolves around the same (Lamb, Hair and McDaniel, 2011)20.
II. Wal-Mart In world’s retail sector the name of Wal-Mart is huge, and they have transformed the entire industry by their exceptionally well strategies and business operations. Wal-Mart can create their huge market share with the help of unique business idea and excellent execution of the plans and business trajectories. The company is based in America and has its operations all around the world. The retail giant operates the hypermarkets, departmental stores, and grocery stores. The company was founded by Sam Walton in the year 1962, and since then it has its operations in various parts of the world. The count of stores for the country is 11598 stores, and they have their stores in approx 30 countries. In India, the retailer operates as Best Price Stores with 20 stores across 8 states. By revenue generation capacity, the cited organisation has surpassed all other organisations and has witnessed the huge success in the field of retail industry. They have done the partnerships with so many other companies that allow them to diversify into various fields and most importantly the expansion has also done extensivelyThe Indian customers also appreciate the presence of cited company into their region. However, the operations of a retail giant within India are very restrictive and limited to certain cities. The expansion is in the planning phase but still the response is very good and strong. The entry of Wal-Mart is quite surprising as they started their business at very late phase and in very limited way. The company enters into the Indian market with the potential of growing as generating revenues the Indian market is immense. In India, the company starts its operations in the year 2007 when they come into a joint venture with Bharti Enterprises. It was very crucial for the India retail sector.
III. Easy Day Out of various renowned names into the retail industry within the India, one of the major names is the Easy Day. The brand name is very popular in India and deals with the departmental stores. It is owned by the Bharti Enterprises Limited and has its operations in the various states of India. The customer base for the brand is very huge, and they commenced their business in the year 2007, and the first store was opened in the year 2008 in Punjab. One of the most significant aspects is that Future group and the Bharti Enterprises has come up with the merger in which both the organisations started to work with each other. Big Bazaar and the Easy day has become the combined unit, and it makes the retail chain as India’s biggest retail chain. Now the number of stores is 570 stores in more than 250 cities in India and now the Easy day operates under the brand Big Bazaar. Here, it is to acknowledge that the brand value of the Easy Day is not very much huge, and it just faces tough competition from the competitors. The position of Easy Day is weaker than other retail companies (Plant, 2000)28. Further, the threat of unorganised retail stores could be witnessed immensely upon the operations of Easy Day. It is clear that the presence of the brand is not so impressive, and they need to work hard on their brand recognition to put the huge impact in the mindset of customers. The retail store struggled a lot with their operations, supply chain and logistics. The impact of these elements could be realised in their services as well. It is to acknowledge that the Easy Day is associated with one of the very big brands, but the execution of the strategies is not so proper. Innovation is something that lacks into the business plans of the cited organisation. However, there are certain aspects that are required to be analysed that enable them to focus on improving their position in the Indian market.
IV. Reliance Mart The stores of Reliance Mart are owned by one of the most influencing and conglomerates company Reliance Industries. The Reliance Mart operates under a subsidiary of Reliance Industries named Reliance Retail. It was founded in the year 2006 and till now operates into the various cities of India, and the number of stores is around 2000. The Reliance Retail deals in a variety of items by the name of a variety of stores. One is the reliance fresh where the food and vegetables sold to the people. Another retail outlet is completely dedicated to the electronic items and white goods. Ahead, the Reliance footwear sold the footwear to the customers. Same wise the Reliance Retail has so many stores where they sold the specialised category of items and products.
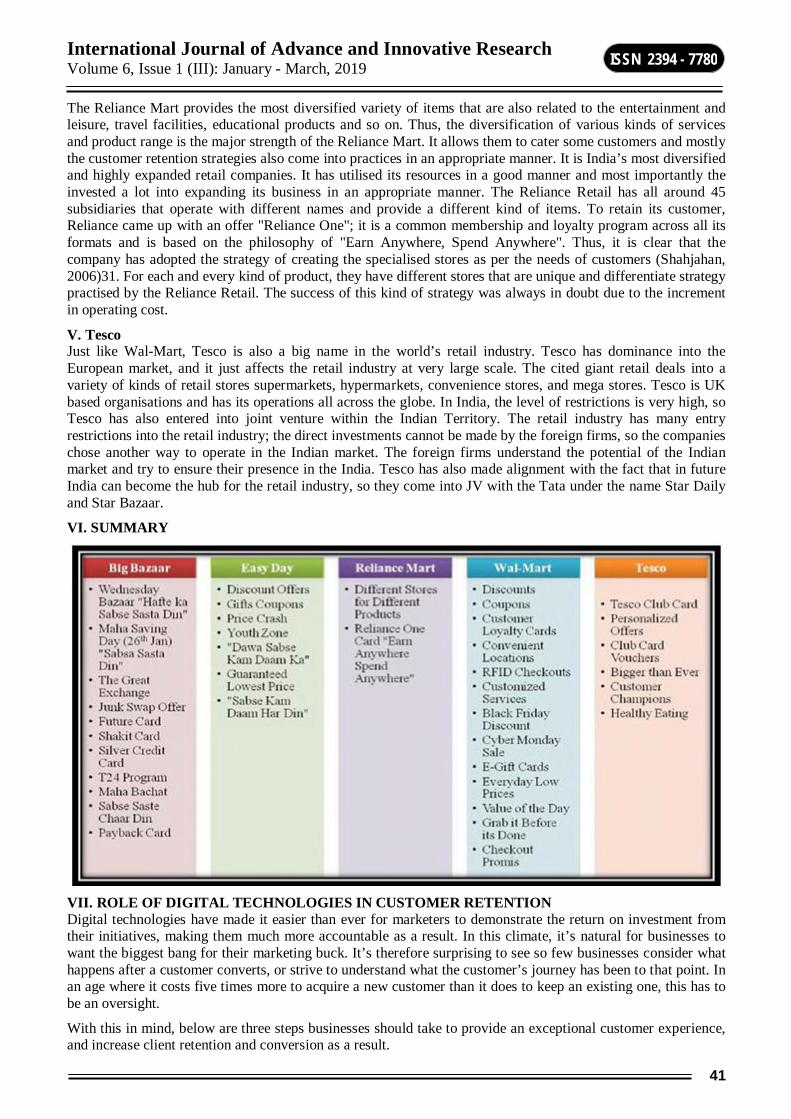
International Journal of Advance and Innovative Research Volume 6, Issue 1 (III): January - March, 2019
41
ISSN 2394 - 7780
The Reliance Mart provides the most diversified variety of items that are also related to the entertainment and leisure, travel facilities, educational products and so on. Thus, the diversification of various kinds of services and product range is the major strength of the Reliance Mart. It allows them to cater some customers and mostly the customer retention strategies also come into practices in an appropriate manner. It is India’s most diversified and highly expanded retail companies. It has utilised its resources in a good manner and most importantly the invested a lot into expanding its business in an appropriate manner. The Reliance Retail has all around 45 subsidiaries that operate with different names and provide a different kind of items. To retain its customer, Reliance came up with an offer "Reliance One"; it is a common membership and loyalty program across all its formats and is based on the philosophy of "Earn Anywhere, Spend Anywhere". Thus, it is clear that the company has adopted the strategy of creating the specialised stores as per the needs of customers (Shahjahan, 2006)31. For each and every kind of product, they have different stores that are unique and differentiate strategy practised by the Reliance Retail. The success of this kind of strategy was always in doubt due to the increment in operating cost.
V. Tesco Just like Wal-Mart, Tesco is also a big name in the world’s retail industry. Tesco has dominance into the European market, and it just affects the retail industry at very large scale. The cited giant retail deals into a variety of kinds of retail stores supermarkets, hypermarkets, convenience stores, and mega stores. Tesco is UK based organisations and has its operations all across the globe. In India, the level of restrictions is very high, so Tesco has also entered into joint venture within the Indian Territory. The retail industry has many entry restrictions into the retail industry; the direct investments cannot be made by the foreign firms, so the companies chose another way to operate in the Indian market. The foreign firms understand the potential of the Indian market and try to ensure their presence in the India. Tesco has also made alignment with the fact that in future India can become the hub for the retail industry, so they come into JV with the Tata under the name Star Daily and Star Bazaar.
VI. SUMMARY
VII. ROLE OF DIGITAL TECHNOLOGIES IN CUSTOMER RETENTION Digital technologies have made it easier than ever for marketers to demonstrate the return on investment from their initiatives, making them much more accountable as a result. In this climate, it’s natural for businesses to want the biggest bang for their marketing buck. It’s therefore surprising to see so few businesses consider what happens after a customer converts, or strive to understand what the customer’s journey has been to that point. In an age where it costs five times more to acquire a new customer than it does to keep an existing one, this has to be an oversight.
With this in mind, below are three steps businesses should take to provide an exceptional customer experience, and increase client retention and conversion as a result.
International Journal of Advance and Innovative Research Volume 6, Issue 1 (III): January - March, 2019
42
ISSN 2394 - 7780
1. Focus on the customer experience One of the best ways to keep users coming back for more is to ensure that every aspect of their experience with a brand is of the highest standard possible. This might sound obvious, but many businesses still don’t place enough importance on what is known as the ‘customer experience’ (CX). Advances in technology are central to this discussion and an increasing diversity of platforms has both made customer journeys more complex and afforded users evermore choice in how and where they interact with organizations online. Increased innovation has raised the bar too, as particularly forward-thinking competitors (within and outside their own sector) raise customer expectations even further. So, while the customer experience is now more important than ever, it has simultaneously become more difficult to manage. Organisations can tackle this challenging landscape via activities such as customer experience mapping, ensuring that all digital platforms work together to meet the needs of the consumer and that the appropriate messages are delivered at the right time to achieve maximum impact.It’s also important of course that CX is continually reviewed and refined through usability testing and usability reviews, to ensure it remains on track for success.
2. Simplify the customer experience While digital technologies have introduced challenges to delivering exceptional customer experiences, they can of course also be used to support this.
For example, with a greater number of channels available, it becomes possible to make content more accessible – something which has become particularly important as users increasingly search for information on the move. Content can even be tailored according to different device capabilities and user motivations if using a ‘create once, publish everywhere’ model.
Customers want a pain-free way to be able to access the information that they need, and websites with self-service capabilities can both improve the ease with which users can complete this task, and encourage them to engage more deeply with an organisation. It’s an approach that applies beyond e-commerce too. A Box UK client for example, TBC Bank, has given its customers better access to their financial information (and driven up adoption for mobile banking) by enabling them to analyse their finances in detail through sophisticated personal finance management (PFM) applications.
3. Personalizes the customer experience Alongside self-service tools, there are a number of other ‘delighters’ that businesses can introduce into their digital strategy to make sure the experience users have is one they’ll want to repeat. Just as with traditional physical interactions, these often relate to the quality of service being delivered and encompass everything from the smallest micro interaction right through to the processes and strategies at the very heart of the organisation. Once the basic functionality of a website is completed, web designers must focus on the elements that, when put together, help to enhance CX – reliability, usability, proficiency and finally, creativity. Furthermore, if organisations take a structured approach to the collection, processing, storage and analysis of customer data, using this to personalise the content delivered, the relevance and impact of their business messaging will increase.And when data is truly aligned with business goals, the reward is deep insight into individual user behaviour and profiles, which can be used to further develop the effectiveness of personalisation efforts.
Seamless, streamlined and special Following the best practice highlighted above is a great way to get started with a customer retention strategy. However, the initiatives that make an audience stay and encourage them to keep coming back will always depend on the specific circumstances and requirements of each business. In today’s landscape of limitless choice and limited attention spans, businesses need to deliver a customer experience that’s seamless, streamlined and special in order to succeed – but the benefits that they stand to gain make it an approach that is worthy of pursuit.
VIII. CONCLUSION The aim of this research is to examine the impact of IT enabled factors or process on customer satisfaction and retention. After the analysis of the result, this research concluded the following This research found that cost reduction has a significant and positive impact on customers’ satisfaction. This means that information technology had enabled reduce its product prices and helped customers to reduce their cost, as such, reduction in customers cost satisfies. However, this research found that, cost reduction does not have impact on customers’ retention. Therefore IT enabled cost reduction has a significant and positive impact on customer satisfaction but not on customer retention. It was found in this study that speedy process has a significant and positive impact on customers’ satisfaction. Similarly, this research also found that speedy process has significant and positive impact on customers’ retention.
International Journal of Advance and Innovative Research Volume 6, Issue 1 (III): January - March, 2019
43
ISSN 2394 - 7780
According to the findings of this research, communication and relationship has a significant and positive impact on customers’ satisfaction. This shows that information technology enhanced the communication and relationship between companies and its customers’ through the use of facebook and twitter that enables customers’ on recent activities and promotions and the e-customers service center that helps customers’ with shopping issues.
IX. REFERENCES 1. Alexander, N. and Doherty, A. (2010). International retail research: focus, methodology and conceptual
development. International Journal of Retail and Distribution Management. 38(12). pp. 928-942.
2. Barney, J. (1991). Firm resources and sustained competitive advantage.Journal of Management. 17(1). pp. 99-120.
3. Bhatia, S. (2008). Retail Management. Atlantic Publishers & Dist. Pp.8-16.
4. Blumentritt, T. (2006). Integrating strategic management and budgeting. Journal of Business Strategy. 27(6). pp. 73-79.
5. Cole, A. G. (2003). Strategic Management. Cengage Learning EMEA. pp. 254-269.
6. Hunger, J. and Wheelen, T. (2000). Strategic management. Prentice Hall. pp. 159-189.
7. Fernie, J. (2009). Logistics and Retail Management: Emerging Issues and New Challenges in the Retail Supply Chain. Kogan Page Publishers. pp. 147-159.
8. KPMG. (2014). Indian Retail: The Next Growth Story. [pdf]. Available through: < https:// www.kpmg.com/ IN/en/ IssuesAndInsights/ ArticlesPublications/Documents/BBG-Retail.pdf>. [Accessed on 23rd December, 2015].
9. Jain, N. (2008). Retail Management: A Realistic Approach. Global India Publications. pp. 123-125.
10. Jeffs, C. (2008). Strategic Management. SAGE. pp. 189-201.
11. Shimp, A. T. (2013). Advertising Promotion and Other Aspects of Integrated Marketing Communications. 9th ed., Cengage Learning. pp. 163-196.
12. Smith, R. P. and Taylor, J. (2004). Marketing Communications: An Integrated Approach. Kogan Page Publishers. pp. 25-68.
13. Werbach, A. (2009). Strategy for Sustainability: A Business Manifesto. Harvard Business Press. pp. 156-187.
14. Yaprak, A. and Sheldon, K. (2000). Political Risk Management in Multinational Firms: An Integrative Approach. Management Decision. 22(6). pp. 53-67.
15. Woodcock, C. P. Beamish, P. W. and Makino, S. (1994). Ownership-based entry mode strategies and international performance. Journal of International Business Studies. 25. pp. 253-273.
16. Wu, Y. (2000). Measuring the performance of foreign direct investment: a case study of China. Economic Letters. 66. pp. 143-150.
17. Vieceli, J. and Valos, M. (2000). Marketing Management. Atlantic Publishers & Distri. pp. 65-86.
18. Srinivasan, R. (2014). Case Studies in Marketing: The Indian Context. PHI Learning Pvt. Ltd. pp. 48-56.
19. Sharp, B. (1991). Competitive Marketing Strategy: Porter Revisited. Marketing Intelligence and Planning. 9(1). pp. 4-10.
20. Lamb, C. Hair, J. and McDaniel, C. (2011). Essentials of Marketing. Cengage Learning. pp. 69-89.
21. 21.Evans, J. and Lombardo, G. (1993). Marketing Strategies for Mature Brands. Journal of Product & Brand Management. 2(1). pp. 5-19.
22. Froot, K. (2008). Foreign Direct Investment. University of Chicago Press. pp. 146-158.
International Journal of Advance and Innovative Research Volume 6, Issue 1 (III): January - March, 2019
44
ISSN 2394 - 7780
PROBLEMS AND PROSPECTS OF DIGITAL MARKETING IN RURAL TOURISM WITH SPECIAL REFERENCE TO KARNATAKA STATE, INDIA
Dr. Vikrama D K Assistant Professor, Department of Management Studies, JNN College of Engineering, Shivamogga
ABSTRACT In the present competitive world marketing of any product or service with our digital platform is not practically possible. Success of tourism is also not excluded in the scenario. Rural tourism enterprises are also focusing on e-marketing and ICT (Information and communication Technology). Web based promotion, Social media marketing and e-payment in now common in rural tourism. This paper tries to find out what are the problems and prospects of rural tourism in Indian in general and in Karnataka in particular.
Keywords: Rural tourism, e-payment,
INTRODUCTION (UNWTO), Defines "Tourism is a collection of activities, services and industries which deliver a travel experience comprising transportation, accommodation, eating and drinking establishments, retail shops, entertainment businesses and the hospitality services provided for individuals or groups traveling away from home."
As one of the world’s largest economic sectors, Travel & Tourism creates jobs, drives exports, and generates prosperity across the world. In our annual analysis of the global economic impact of Travel & Tourism, the sector is shown to account for 10.4% of global GDP and 313 million jobs, or 9.9% of total employment, in 2017. (WTTC, 2018)
GDP: DIRECT CONTRIBUTION The direct contribution of Travel & Tourism to GDP was USD2,570.1bn (3.2% of total GDP) in 2017, and is forecast to rise by 4.0% in 2018, and to rise by 3.8% pa, from 2018-2028, to USD3,890.0bn (3.6% of total GDP) in 2028.(WTTC, 2018)
GDP: DIRECT CONTRIBUTION The total contribution of Travel & Tourism to GDP was USD8,272.3bn (10.4% of GDP) in 2017, and is forecast to rise by 4.0% in 2018, and to rise by 3.8% pa to USD12,450.1bn (11.7% of GDP) in 2028.(WTTC, 2018)
EMPLOYMENT: DIRECT CONTRIBUTION In 2017 Travel & Tourism directly supported 118,454,000 jobs (3.8% of total employment). This is expected to rise by 2.4% in 2018 and rise by 2.2% pa to 150,139,000 jobs (4.2% of total employment) in 2028.(WTTC, 2018)
EMPLOYMENT: TOTAL CONTRIBUTION In 2017, the total contribution of Travel & Tourism to employment, including jobs indirectly supported by the Visitor exports generated USD1,494.2bn (6.5% of total exports) in 2017. This is forecast to grow by 3.9% in 2018, and grow by 4.1% pa, from 2018-2028, to USD2,311.4bn in 2028 (6.9% of total). (WTTC, 2018).
Definition of Rural Tourism: Rural Tourism is any form of tourism that showcases the rural life, art, culture and heritage at rural locations, thereby, benefiting the local community economically and socially, as well as enabling interaction between the tourists and the local community for a more enriching tourism experience.(MoT, 2003)
LITERATURE REVIEW (San Martín & Herrero, 2012) their study explores the process of adoption of new information technologies by the users of rural tourism services and, more concretely, the underlying psychological factors of individuals that explain their intentions to make bookings or reservations directly through the websites of the rural accommodations (online purchase intentions). Based on the Unified Theory of Acceptance and Use of Technology (UTAUT), this study establishes a theoretical model that includes five explanatory variables of the online purchase intention: performance expectancy, effort expectancy, social influence, facilitating conditions, and innovativeness.
(Law, Qi, & Buhalis, 2010) in their article analyzes the initial work and continues up to recent developments in website evaluation. In general, prior research can be divided into five evaluation approaches: counting,

International Journal of Advance and Innovative Research Volume 6, Issue 1 (III): January - March, 2019
45
ISSN 2394 - 7780
automated, numerical computation, user judgment, and combined methods. The strengths and weaknesses of each method are examined. Research gaps and opportunities for future studies are discussed.
(So & Morrison, 2004) Despite the increasing importance of the Internet as a marketing tool among national tourism organizations (NTOs) and the importance of tourism in the East Asia region, relatively few studies have been done on measuring the marketing effectiveness of NTO Websites and this exploratory study was designed to fill this gap. It included an extensive content analysis to compare NTO Websites in the East Asia region and identify their Internet marketing strengths and weaknesses. The results indicated that all of the NTOs in the East Asia region were not fully utilizing their Websites.
(Beldona & Cai, 2006)An evaluation of 50 rural tourism websites in the United States was undertaken using 23 parameters of stickiness drivers. The parameters measured the websites' effectiveness in the three areas of content, interactivity, and promotional value. The study found that rural tourism websites were largely driven by vertical contents, demonstrated poor interactivity, and had only marginal promotional value in them. Results indicate the need for rural destination-marketing organizations to work closely with neighboring destinations to enhance horizontal content, so that they improve the drawing power of their websites.
(Beeton, 2004) in their article Mr. Beeton mentioned that in Australia marketing and promotion of rural tourism gaining popularity in web based platform. Rural tourism seekers try to visit service providers’ web site first and then they want to visit those destination if they feel good.
(Gonzalo, 2016) in his web article he clearly mentioned that tourism marketing now focusing three parameters, that are optimized search engine and responsive design website. Relationship marketing like email, SMS newsletter regularly sent to the respondents and social media like twitter and facebook.
RESEARCH METHODOLOGY 1. Statement of the problem: From the observation of factual data reviewed and published research articles
and, it is observed that research on marketing of rural tourism in Karnataka state, Indi is very low. There is a lack of knowledge about most of the rural tourism service providers about how effectively use digital marketing tool for development of Rural tourism. Hence, researcher designed the statement of the problems as below .
“Problems and Prospects of Digital marketing in Rural Tourism with special reference to Karnataka State, India.”
2. Objectives of the study a. To assess various problems of digital marketing in rural tourism
b. To assess various prospects of digital marketing in rural tourism
3. Scope of the study: Scope of the study is limited to selected rural tourism destinations of Karnataka state, India.
4. Pilot Study: A structured questionnaire is prepared and it discussed with academic experts, officials of tourism department and selected rural tourism service providers. Their opinions are incorporated in the questionnaire. Before conducting the final survey the questionnaire is given to few service providers and rural tourists in Shivamogga district and their opinions are incorporated in the final questionnaire.
5. Research Design: For this research, researcher used descriptive research design.
6. Area of The Study: Area of the study is limited to selected rural tourism destination in the Karnataka State, India.
7. Nature And Collection of Data: To collect primary data researcher used structured questionnaire and to collect secondary data various research publication are used.
8. Sampling Method: For this research, researcher used convinces sampling techniques is used.
9. Limitations
a. Research is conducted in only selected areas of rural tourism in Karnataka state.
b. Due to limitation of time the number of respondents are limited to 200only.
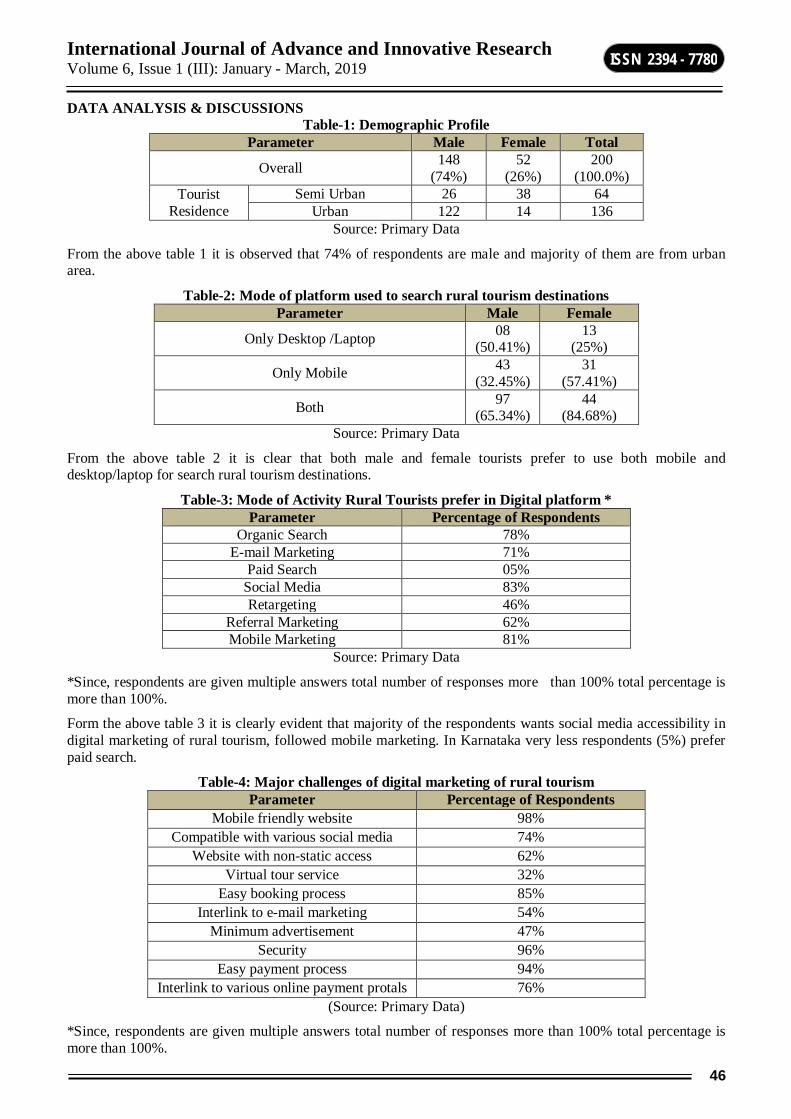
International Journal of Advance and Innovative Research Volume 6, Issue 1 (III): January - March, 2019
46
ISSN 2394 - 7780
DATA ANALYSIS & DISCUSSIONS Table-1: Demographic Profile
Parameter Male Female Total
Overall 148 (74%)
52 (26%)
200 (100.0%)
Tourist Residence
Semi Urban 26 38 64 Urban 122 14 136
Source: Primary Data
From the above table 1 it is observed that 74% of respondents are male and majority of them are from urban area.
Table-2: Mode of platform used to search rural tourism destinations Parameter Male Female
Only Desktop /Laptop 08 (50.41%)
13 (25%)
Only Mobile 43 (32.45%)
31 (57.41%)
Both 97 (65.34%)
44 (84.68%)
Source: Primary Data
From the above table 2 it is clear that both male and female tourists prefer to use both mobile and desktop/laptop for search rural tourism destinations.
Table-3: Mode of Activity Rural Tourists prefer in Digital platform * Parameter Percentage of Respondents
Organic Search 78% E-mail Marketing 71%
Paid Search 05% Social Media 83% Retargeting 46%
Referral Marketing 62% Mobile Marketing 81%
Source: Primary Data
*Since, respondents are given multiple answers total number of responses more than 100% total percentage is more than 100%.
Form the above table 3 it is clearly evident that majority of the respondents wants social media accessibility in digital marketing of rural tourism, followed mobile marketing. In Karnataka very less respondents (5%) prefer paid search.
Table-4: Major challenges of digital marketing of rural tourism Parameter Percentage of Respondents
Mobile friendly website 98% Compatible with various social media 74%
Website with non-static access 62% Virtual tour service 32%
Easy booking process 85% Interlink to e-mail marketing 54%
Minimum advertisement 47% Security 96%
Easy payment process 94% Interlink to various online payment protals 76%
(Source: Primary Data)
*Since, respondents are given multiple answers total number of responses more than 100% total percentage is more than 100%.
International Journal of Advance and Innovative Research Volume 6, Issue 1 (III): January - March, 2019
47
ISSN 2394 - 7780
CONCLUSION From the above research it is clear evident that majority of the tourists and rural tourism service providers felt implementation of digital marketing tools and techniques are very essential. In the current scenario majority of the rural tourism service seekers are tech-savvy. They information in mobile platform and through social media.
BIBLIOGRAPHY Beeton, S. (2004). Rural tourism in Australia — has the gaze altered? Tracking rural images through film
and tourism promotion. International Journal of Tourism Research, 6(3), 125–135. https://doi.org/10.1002/jtr.479
Beldona, S., & Cai, L. A. (2006). An Exploratory Evaluation of Rural Tourism Websites. Journal of Convention & Event Tourism, 8(1), 69–80. https://doi.org/10.1300/J452v08n01_04
Definintion of Tourism (UNWTO Definition of Tourism) / What Is Tourism ? - Tugberk Ugurlu’s Blog. (n.d.). Retrieved December 19, 2018, from http://www.tugberkugurlu.com/archive/definintion-of-tourism-unwto-definition-of-tourism-what-is-tourism
Gonzalo, F. (2016). The Challenges of Travel Marketing in the Digital Era. Retrieved December 19, 2018, from http://fredericgonzalo.com/en/2016/10/03/the-challenges-of-travel-marketing-in-the-digital-era/
Law, R., Qi, S., & Buhalis, D. (2010). Progress in tourism management: A review of website evaluation in tourism research. Tourism Management, 31(3), 297–313. https://doi.org/10.1016/J.TOURMAN.2009.11.007
MoT. (2003). Rural Tourism. Retrieved from https://incredibleindia.org/lang/images/docs/trade-pdf/product/rural-tourism/rural-guideline.pdf
San Martín, H., & Herrero, Á. (2012). Influence of the user’s psychological factors on the online purchase intention in rural tourism: Integrating innovativeness to the UTAUT framework. Tourism Management, 33(2), 341–350. https://doi.org/10.1016/j.tourman.2011.04.003
So, S.-I. A., & Morrison, A. M. (2004). Internet Marketing in Tourism in Asia: An Evaluation of the Performance of East Asian National Tourism Organization Websites. Journal of Hospitality & Leisure Marketing, 11(4), 93–118. https://doi.org/10.1300/J150v11n04_07
WTTC. (2018). Economic Impact 2018 Indonesia. Retrieved from https://www.wttc.org/-/media/files/reports/economic-impact-research/regions-2018/world2018.pdf
International Journal of Advance and Innovative Research Volume 6, Issue 1 (III): January - March, 2019
48
ISSN 2394 - 7780
OPPORTUNITIES AND CHALLENGES OF SOCIAL MEDIA MARKETING IN INDIA – A STUDY
Ravi I A1 and Dr. Sudharshan G M2 Assistant Professor1, Adichunchangiri Institute of Technology, Chikkamagaluru
Associate Professor2 & Head, PES Institute of Technology and Management, Shivamogga
ABSTRACT The market is witnessed by the revolution in the Internet technology, it has revolutionized the way people communicate, interact, and share information has radically changed the way customers search for and buy products. Social media are a means for consumers to share text, images, audio and video information with each other and with companies and vice versa. Therefore, business must learn how to use social media in a way that is consistent with their business plan. This is especially true for companies striving to gain a competitive advantage. The popularity of social media for marketing purposes can be attributed to a number of advantages associated with social media when compared to traditional marketing channels. Today’s social media helps in connecting themselves with social networking sites through which now people can stay far and yet remain connected. India is in transition stage we are moving from traditional marketing tools like TV, Radio, Magazine etc to modern marketing tools i.e. social media tools Face book, corporate blogs, video channels, banners as on social net thus which requires more employees. The trend of online marketing is increasing all over the world as well as in India also.
Keywords: Media Tools, Modern Marketing, Online Marketing, Social Media
1. INTRODUCTION Social media are a means for consumers to share text, images, audio, and video information with each other and with companies and vice versa. Social media allow marketers to establish a public voice and presence on the web and reinforce other communication activities. Because of their day-to-day immediacy, they can also encourage companies to stay innovative and relevant. Therefore; business must learn how to use social media in a way that is consistent with their business plan. This is especially true for companies striving to gain a competitive advantage. The popularity of social media for marketing purposes can be attributed to a number of advantages associated with social media when compared to traditional marketing channels. 92% of marketers declared that social media marketing plays a vital role for their business. 97% of marketers are showing interest by participating social media (Report by social media examiner). 62% of the marketers said Social media played dynamic role in marketing past 6 months (State of Inbound marketing, 2012).
2. ROLE OF SOCIAL MEDIA IN MARKETING Social media is now increasingly becoming an important aspect of political campaigns, national defense strategies, public policy, public relations, brand management and even intra company communication. Since the major task of marketing as tool used to inform consumers about the company’s products, hence social media marketing plays an important role in marketing. Social media can be used to provide an identity about the companies and the products or services that they offer.
Social media helps in creating relationships with people who might not otherwise know about the products or service or what the companies represent.
Social media makes companies "real" to consumers. If they want people to follow them
They need not just talk about the latest product news, but share their personality with them.
Social media can be used to associate themselves with their peers that may be serving the same target market.
Social media can be used to communicate and provide the interaction that consumers Look for. 3. LITERATURE REVIEW W.Glynn Mangold, David J Faulds(2009), In their study entitled “Social Media: The New Hybrid Element of the Promotion Mix” revealed that, the emergence of internet based social media has made it possible for a person to communicate with hundred or even thousands of other people about the products and companies that provide them .thus the impact of consumer to consumer communication has magnified in the market place .this article reveals that how nontraditional media communicates to the customers
Neti, Sisira (2011) in her study entitled “Social Media and its Role in Marketing “According to this article Social Media is the most important means for all the brands to establish the connectivity with prospective
International Journal of Advance and Innovative Research Volume 6, Issue 1 (III): January - March, 2019
49
ISSN 2394 - 7780
consumers. These new media win the trust of consumers by connecting with them at a deeper level. Social media marketing is the new mantra for several brands since few year.
M. Nick Hajli Birkbeck (2014) in his study entitled “A study on the Impact of Social Media on Consumers’ ‘Social media have provided new opportunities to consumers to engage in social interaction on the internet. Consumers use social media such as online communities to generate content and to network with other users. A multidisciplinary model is used in this article. This model has been validated by SEM-PLS, demonstrating the role of social media in the development of e-commerce into social commerce.
Ghulam Rasool Madni (2014) in his study entitled “Consumer’s behaviour and Effectiveness of Social Media”Consumers began using more online sources now a days, because of rapid developmentof technology and communication channels. The most important of these tools are social media. Consumers access to the information they need about goods and services which will be awarded through social media dramatically.
Harshini C S (2015) in her study entitled “The Social media is changing traditional marketing communication”. Consumers are increasingly using social media to search for information and turning away from traditional media such as television, magazines, radio. Companies, therefore, need to create effective online advertising strategies to capitalize on current market segment by incorporating effective features in online advertising, especially in social media. This study offers theoretical contributions and conceptual model to existing research on Social Media Ads and Consumer’s purchase Intention.
4. OBJECTIVES 1. To know the reasons for the growth of Social Media Marketing in India
2. To know the opportunities and challenges of social media marketing in India.
5. RESEARCH METHODOLOGY This is conceptual based research. In order to achieve the research objectives data is collected from the secondary data. The data has been collected from various sources like websites, newspapers and reputed journals and magazines
6. OPPORTUNITIES OF SOCIAL MEDIA MARKETING IN INDIA 1. Advanced Targeting: The exact audience that your business is targeting is on social media. Company can find them based on what they are talking about and the data that is associated with their profiles. This is a huge advantage for brands with a niche or local market. Use social media as a way to find customers and solve any needs or problems they may have. 2. Direct Access to Customers: Social media allows the company’s to connect with their target market, prospects, and customers at any time. In fact, some platforms allow company to import your contacts into your account to connect with them. 3. Brand Awareness – Social media allows the company to market your business to thousands of people around the world at any moment. There is no limit to the demographic, location, or type of consumer that the brand can touch. Every time someone shares one of company’s post, your reach grows larger. 4. Lower Advertising Cost –It cost more too print flyers than to make a post on social media. There are Facebook ad campaigns that reach more people than billboards. YouTube, which is the second largest search engine in the world, can be more cost efficient than network TV ads. Social media allows brands to be laser focused and spend less on advertising. 5. Increase Relationship Capital – For the first time in history, brands have the opportunity to build relationships online through social media. For brands on social media, it means to build a bond within the market the companies are targeting. People tend to buy from brands they know and trust. You must first look to connect with your customers on a personal level and look to sell lasts. 6. Unbiased Reviews on Brand, Product, or Service – Consumers today are leaving more online reviews than ever before. They will either show their love or hate for your product or service. Either way, it provides honest feedback for the brand to consider. Whether good or bad, by monitoring what is being said about your business is a great way to improve.
7. Build a Community – With social media you are able to build an entire community around the brand... It would take years to win them over. Now, your brand has the opportunity to create that same sense of brand loyalty and community.

International Journal of Advance and Innovative Research Volume 6, Issue 1 (III): January - March, 2019
50
ISSN 2394 - 7780
8. Word of Mouth: Social media can be a great tool to create massive word of mouth about the brand. Great content can go viral in reach millions fast. Also, the right promotions and contests can get the word out pretty quick.
10. Increase Leads & Sales – Yes. Social media marketing can increase sales. There are people who are tweeting right now about a specific need they have. Brands who engage with this audience daily may can convert leads. A percentage will turn into sales and the source will be apparent. Perhaps you have a great website, but you just need qualified traffic to convert them into sales. Social media can help generate the traffic you need.
7. CHALLENGES OF USING SOCIAL MEDIA MARKETING IN INDIA In social media it involves high budget to promote product effectively.
Ignorance of advertisements from customers in social media to save time.
Faceless relationships with customers.
Fake news and false promises in social media leads to decrease in reputation of organization
Can be reachable only to those customers who uses social media sites
8. FINDINGS Organization in order to save their budget they should promote their products and services on one proper
channel, which is used by majority of the people.
Advertisements should be designed in an effective manner in social media.
By providing quick response to the customers can build strong relationships.
Social media is a backbone of marketing to create brand image.
Social media is responsible for the development of online applications.
Social media acts as the root cause for the development of media richness.
Social media marketing helps to promote sales effectively.
Social media marketing provides a good platform to communicate with large number of customers at a time.
9. SUGGESTIONS By using innovative advertisements we can attract more customers.
Organization should choose one popular channel to promote their products and services which in turn increases reputation of company.
The company should choose the brand ambassador who is very active and who has more followers in social networks (Facebook, twitter).
The company must promote products as according to the present trend which leads to stand in the competition.
10. CONCLUSION Social media marketing is emerging rapidly to promote the products and services in online through various social networks like LinkedIn, Facebook, twitter, Instagram etc. Major benefit of social media marketing, which results in increasing profit of your company, is improving sales, regardless if you own an online shop or you want to encourage people to visit your business a specific location. So basically the organizations must adopt social media strategies to sustain in the market. A job in social media is likely to fast-paced and challenging, but any company can take the benefit by designing effective social media marketing strategies
REFERENCES 1. Abzari Mehdi, Ghassemi, Reza Abachian, and Vosta, Leila Nasrolahi, 2014, analysing the effect of social
media on brand attitude and purchase intention: the case of Iran Khodro Company, Procedia-Social and Behavioral Sciences. 143: pp. 822-826.
2. Al-Dhuhli Israa and Ismael, Sara, 2013, the Impact of Social Media on Consumer Buying Behaviour.
3. Alsubagh Helal, 2015, The Impact of Social Networks on Consumers' Behaviors, International Journal of Business and Social Science. 6(1).
International Journal of Advance and Innovative Research Volume 6, Issue 1 (III): January - March, 2019
51
ISSN 2394 - 7780
4. Farhangi Ali Akbar, et al., 2014, Analyzing the impact of social media on consumer attitudes toward the brand and their intention to purchase, Global Media Journal: Persian Edition. 9(2).
5. Hajli M Nick, 2014, A study of the impact of social media on consumers, International Journal of Market Research. 56(3): pp. 387-404.
6. Harshini Cs, 2015, Influence of Social Media Ads on Consumer’s Purchase Intention, International Journal of Current Engineering and Scıentific Research. 2(10,110-115).
7. Iblasi Walid Nabil, Bader, Dojanah Mk, and Al-Qreini, Sulaiman Ahmad, The Impact of Social Media as a Marketing Tool on Purchasing Decisions (Case Study on SAMSUNG for Electrical Home Appliances).
8. Jang Soocheong Shawn and Namkung, Young, 2009, Perceived quality, emotions, and behavioral intentions: Application of an extended Mehrabian–Russell model to restaurants, Journal of Business Research. 62(4): pp. 451-460.
9. Kianª Tan Pei, et al., 2017, Factors That Influence the Consumer Purchase Intention in Social Media Websites, PROCEEDING OF ICARBSS 2017 LANGKAWI, MALAYSIA. 2017(29th): pp. 214.
10. Laksamana Patria, 2018, Impact of Social Media Marketing on Purchase Intention and Brand Loyalty: Evidence from Indonesia’s Banking Industry, International Review of Management and Marketing. 8(1): pp. 13-18.
11. Madni Ghulam Rasool, 2015, Consumer’ s Behavior and Effectiveness of Social Media, Global Journal of Management And Business Research.
12. Mangold W Glynn and Faulds, David J, 2009, Social media: The new hybrid element of the promotion mix, Business horizons. 52(4): pp. 357-365.
13. Motwani Dharmesh, Shrimali, Dr, and Agarwal, Khushbu, 2014, Customer's attitude towards social media marketing.

International Journal of Advance and Innovative Research Volume 6, Issue 1 (III): January - March, 2019
52
ISSN 2394 - 7780
THE VALUE OF MOBILE MARKETING: A LITERATURE REVIEW
Dr. U Bhojanna1 and P. Archana2 Professor1 and Assistant Professor2, Department of MBA, RNS Institute of Technology, Bengaluru
ABSTRACT Purpose: In this review mobile device shopping, consumers' use of mobile devices while shopping is assumed to be an extension of consumers' shopping behaviors developed on internet connected desktop and laptop computers (PC). The purpose is to describe existing knowledge on how mobile marketing can increase value for consumers and retailers, enabling more precise research and development of managerial concepts and tools, providing both managers and academics with increased understanding of mobile marketing and it's outcome value for retailers. Methodology/Approach: The review is based on a qualitative content analysis of 64 selected peer-reviewed articles presenting empirical results. The results are categorized based on research themes, and then discussed within and between categories.
Keywords: Mobile marketing, mobile device shoppers, mobile advertising, m-advertising, in-store mobile marketing, internal mobile marketing, mobile customer relationship management, m-CRM, mobile marketing integration, mobile marketing implementation, mobile marketing metrics, retailing.
INTRODUCTION In retailing internet created consumer surplus decreasing consumer search costs, making it easier and less costly for consumers finding products or services, making prices more transparent, (Bakos, 1997, Lynch & Ariely, 2000), increased the variety of products offered and lowered prices (Brynjolfsson & Smith, 2000). Consumers were empowered by internet increasing the relationship with the purchased brand after purchase, 60% of consumers of facial skin care products conducted online research after purchase (Court, Elzinga, Mulder et al, 2009, Edelman, 2010). But internet fell short of expectations when consumers wanted experiences, a product trial,in-store atmosphere, or interacting with a salesperson (Daugherty, Li & Biocca, 2008). Recently, mobile de- vices offer opportunities combining information search, use and exchange while shopping in-store or experiencing a product. A mobile device is a constant companion to the consumer, a gateway to a relationship between the consumer and the retailer, making it an ideal supplementary channel for distance selling and physical retailing (Shankar, Venkatesh, Hofacker et al, 2010). An industry study showed half of US mobile consumers being mobile device shoppers, 10 percent heavy and 40 percent light users (Leo Burnett & Arc Worldwide, 2011). But mobile devices were different from desktop and laptop computers (PC) due to limited key board and screen size (Mahmoud & Yu, 2006), while offering functions as camera, scanners and Global Positioning System (GPS). This makes mobile marketing potentially different from PC internet and traditional marketing. The Mobile Marketing Association definition of mobile marketing is “a set of practices that enables organizations to communicate and en- gage with their audience in an interactive and relevant manner through any mobile device or network”
In conceptual studies the additional value created by mobile services for consumers derived from being accessible independent of time and place (Balasubramanian, Peterson & Jarvenpaa, 2002, Che&Nath, 2004), and customized based on time, location and personal profile (Figge, 2004), self ascribed roll and the stance (Dholakia & Dholakia, 2004). Ac- cording to Kumar and Zahn (2003) the real business drivers for mobile technology were customer interaction and operational efficiency, potentially increasing retailer effectiveness and efficiency. Conceptual studies presented suggestions on mobile marketing value chains consisting of several activities performed by multiple actors (Barnes, 2002, Buellingen & Woerter, 2004), improving communication and sales (Mamaar, 2003, Shankar & Balasubramanian, 2009).
Based on the above there are some concerns that need to be discussed. Unexplored questions are; who are the mobile device shoppers, what is the value of mobile marketing for retail consumers, what is the value of mobile marketing for retailers, and how can potentials in mobile marketing be realized by retailers? To gain knowledge about these issues, the purpose of this study is to describe existing knowledge on how mobile marketing can increase value for consumers and retailers. Value for consumers is assumed to drive adoption, use and loyalty to retailers mobile marketing applications and recruitment and loyalty to retailers. These factors are creating the foundation of competitiveness of retailers (Porter, 1985). This paper will proceed as follows: the methodology is presented followed by the literature review. Next, the findings are discussed. Fi nally, conclusions, managerial implications and implications for further research are presented.
International Journal of Advance and Innovative Research Volume 6, Issue 1 (III): January - March, 2019
53
ISSN 2394 - 7780
METHODOLOGY A preliminary literature search was conducted during April 2010 using the ISI Web of Knowledge database. The literature search was limited to peer-reviewed journals and was based on keywords as: “mobile marketing”, “m-marketing”, “mobile commerce”, “m- commerce”, “mobile advertising”, “m-advertising”,“mobile loyalty” and “m-loyalty”. The 50 most cited articles were selected (cited five times or more). Sever- al conceptual studies and some best demonstrated practice/output value covered topics as mobile value creation and mobile value chains, while a limited number of studies were related to consumer perceived value in mobile contexts. A complementary literature search was conducted during September and October 2011, using the ISI Web of Knowledge database with the above search words in combination with “value”, “value chain”, “strategy” and “perceived value”. A search was also conducted in International Journal of Mobile Marketing and International Journal of Mobile Communications, as the majority of articles covering mobile marketing were published in these journals (Varnali & Toker, 2010). Assuming differences in consumer behavior on a more general technology level (devices and services) com- pared to the specific mobile marketing level, the search was expanded due to the low number of studies. Search words of closely related constructs to perceived value as “attitude”, “perceptions”, “satisfaction” and “trust” were used in combination with the search words from the 2010 search. In total 16 studies of consumer per- ceived value in the mobile contexts were identified, 7 about mobile marketing and 9 about mobile services or devices, while 32 other studies of consumer adoption, use or loyalty of mobile marketing were identified. The search also identified 16 empirical studies related to mobile marketing value creation in firms. A total of 64 empirical studies were selected for a qualitative content analysis, categorized based on research themes, and then discussed within and between categories.
LITERATURE REVIEW In this review value creation in mobile contexts are described from both a consumers' and retailers' perspective in chapters as, the value of mobile marketing for consumers, and the value of mobile marketing for retailers. The value of mobile marketing for consumers is further divided into mobile device shoppers and consumer perceived value benefits and sacrifices of mobile marketing. The value of mobile marketing for retailers is divided into the improved value of mobile market- ing, and realizing potential value in mobile marketing.
THE VALUE OF MOBILE MARKETING FOR CONSUMERS Value is the benefits offered by the product or service compared to customer sacrifices for acquisition and use of the product and service relative competition (de Chernatony, Harris & Dall’Olmo Riley, 2000, Ulaga, 2003, Walter, Ritter & Gemu¨nden, 2001, Zeithaml, 1988), and differed based on consumer product experi- ences (Parasuraman, 1997). Consumer perceived value effected acceptance and use of mobile technology, ser- vices and marketing (Constantinou, Papazafeiropoulou&Vendelø, 2009, Constantinou & Mahnke, 2010, Dai &Palvia, 2009, Kim, Chan & Gupta, 2007, Kim & Hwang, 2006, Kleinen, de Reuter & Wetzels, 2009, Laukkanen, 2007, Mahatanankoon, Wen, & Lim, 2005, Park & SuJin, 2006, Turel, Serenko & Bontis, 2007, Xu, Oh & Teo, 2009, Xu, Lou, Carroll et al, 2011, Yang and Jolly, 2006), and loyalty to mobile services and marketing (Deng, Lu, Wei et al, 2010, Lin & Wang, 2006, Pilström & Brusch, 2008). But the path between perceived value and retailers' outcome value was not verified.
In several studies related to mobile marketing value for consumers, perceived value was not explicitly measured. But the majority of the studies measured benefits and sacrifices components. Studies of consumer mobile marketing adoption used the Technology Acceptance Model (TAM) by Davis (1989, the Theory of Reasoned Action (TRA) by Fishbein and Ajzen (1975), the Theory of Planned Behavior (TBP) by Fishbein and Ajzen (1975), and Rogers (1995) innovation attributes. Studies of consumers' mobile advertising use were mainly based on Media Gratification Theory (Atkin, 1973), adopted to mobile media (Tsang et al, 2004) and affect- ing attitudes, mobile media behavioral intent and behavior. The TBP model included evaluations of bene- fits and perceived risk, media uses and gratifications theory (Okazaki, 2007:2) included media benefits and perceived irritation. In some perceived value studies a similar construct to ease of use in the TAM model was used as a sacrifice construct (Kleijnen et al, 2009).
The most influential studies of consumer adoption of mobile device and service were highlighting the im- portance of utilitarian benefits and hedonic constructs of fun (Bruner and Kumar, 2005, Nysveen et al, 2005) and expressiveness (Nysveen et al, 2005). Lately a lim- ited number of studies of mobile marketing adoption were presented (Alda´s-Manzano, Ruiz-Mafe´ & Sanz- Blas, 2009, Amin, 2008, Kim, Ma & Park, 2009, Lu & Su, 2008, Muk, 2008, Roach, 2008, Zhang & Mao, 2008). Mobile push advertising use, as Short Media Service (SMS) and Multimedia Service (MMS), were studied by Barutcu (2007), Bauer, Reichardt, Barnes et al (2005), Carroll, Barnes, Scornavacca et al (2007), Cheng, Blankson, Wang et al (2009), Choi, Hwang & McMillan et al
International Journal of Advance and Innovative Research Volume 6, Issue 1 (III): January - March, 2019
54
ISSN 2394 - 7780
(2008), Chowdhury, Parvin, Weitenberner et al (2006), Gao, Rau & Salvendy (2009), Jayawardhena, Kuckertz and Karjaluoto et al, (2009), Moynihan, Kabadayi & Kaiser (2010), Peters, Amato & Hollenbeck (2007), Rau, Zhang, Shang et al (2011), Tsang, Ho and Liang (2004), Wais and Clemons (2008), Wang and Acar (2006), Xu (2006), and mobile coupons (Dickinger & Kleijnen, 2008). Mobile pull advertising as mobile internet advertising were studied by Gao, Rau and Salvendy (2009), Haghirian and Inoue (2007), Okazaki (2007:1), Oka- zaki (2007:2), Okazaki et al (2007), Okazaki and Hi- rose (2009). Benefit or quality dimensions affect on loyalty to mobile services and marketing were studied by Chae, Kim, Kim et al (2002), Choi, Seol, Lee et al (2008), Cyr, Head and Ivanov (2006). Utilitarian and hedonic value tendencies affect on perceptions of ser- vice quality were studied by Kim and Hwang (2006).
MOBILE DEVICE SHOPPERS Two studies from the Japanese market revealed segments of mobile internet and mobile device shoppers (Okazaki, 2007:2, Okazaki & Romero, 2010). Okazaki (2007:2) suggested that Japanese mobile internet users can be classified into three segments in terms of their demographics and life-styles: Housewives' and female part-timers' (Cluster 1) primary motives to positively perceive wireless advertising were fun and relaxation. Mobile con- tent was perceived neither as an alternative channel, nor as a credible source of advertising in the traditional sense.
Middle-aged male managerial, administrative, freelance, and self-employed workers (Cluster 2) have low mobile internet service penetration, though expected to have of high levels of adop- tion .Students and young, unmarried office workers (Cluster 3) exhibited higher usage of mobile internet, using mobile pull advertising to a higher degree to search for new information. Growth of mobile internet owed much to unmarried women, living with their parents rent-free, using their en- tire salary as spending money.
Though the study identified different usage level segments of mobile pull advertising users, it revealed limited knowledge about mobile device shopping behaviors. Mahatanankoon et al (2005) identified valuable m-commerce operation modes and potential consumer- based applications. Applications of a certain interest for mobile device shoppers seemed to be content delivery (searching and receiving information about retailers, assortments, brands, prices etc), transaction based (order and payment services), location based (receiving personalized, location based and time sensitive offers, advertising, map and route to closest store, finding products in-store and usage instructions). Other mobile functions potentially valuable for mobile device shoppers may be memory support (shopping lists, pictures of products and brands and bookmarks on web browsers), administration of loyalty benefits, and sharing of information and content.
Mobile device shoppers had higher knowledge and self-efficacy (Moynihan et al, 2010). As consumers they had an exploratory search behavior (Wang & Acar, 2006), and were more involved and/or more price- conscious, and had higher education and income (Barutcu, 2007). Their use of mobile services and mar- keting seemed to have high compatibility with previous behaviors (Alda's-Manzano et al, 2009, Roach, 2009), especially with PC internet or other mobile experiences (Alda's-Manzano et al, 2009, Deng et al, 2010, Kleinen et al, 2009, Lin & Wang, 2006, Lu & Su, 2008, Oka- zaki, 2007:1). Okazaki and Romero (2010) also identified segments of dual internet media user. Four different internet user segments on the Japanese market were identified:
1. Segment 1 (29% of sample) included marginal fixed internet users with moderate mobile internet usage.
2. Segment 2 (28% of sample) were heavy users of both fixed and mobile internet. They were likely to spend more time on their information searches in both media. They were also likely to seek in- formation regarding specific content in both online venues.
3. Segment 3 (23% of sample) consisted of heavy fixed internet users who seldom accessed the mo- bile internet.
4. Segment 4 (20% of sample) consisted of heavy mobile internet users who used fixed internet only moderately.
The results also indicated that PC internet may be used for recruitment of mobile device shoppers on markets with high fixed internet penetration and high fractions of dual media users. A higher percentage of segment 2 (dual media users) and 4 (mobile internet users) con- sisted of females (63 and 66 percent, respectively). In contrast fixed internet users were predominantly men, but the primary adopters of the mobile internet were female office and administrative employees (Okazak &Romero, 2010). The literature revealed that differences in perceptions, social influence and behavior intent towards mobile services and marketing were affected by gender (Constantinou & Mahnke, 2010, Deng et al, 2010, Okazaki, 2007:1), age (Barutcu, 2007, Deng et al, 2010), and cultural differences (Choi et al, 2008, Constantinou et al, 2009, Dai & Palvia, 2009, Muk, 2007).
International Journal of Advance and Innovative Research Volume 6, Issue 1 (III): January - March, 2019
55
ISSN 2394 - 7780
CONSUMER PERCEIVED VALUES, BENEFITS AND SACRIFICES OF MOBILE MARKETING Results from several studies verified mobile service values as functional or utilitarian (quality, performance, usefulness or convenience value), emotional, social (social approval, enhanced social self-concept by ser- vice use, or feelings of being connected to others by using a product or a service) and monetary value (Kim et al, 2007, Pilström & Brusch, 2008, Turel et al, 2007,
Yang & Jolly, 2006). Utilitarian (Alda´s-Manzano et al, 2009, Amin, 2008, Kim et al, 2009, Lu & Su, 2008, Zhang & Mao, 2008) and emotional benefits (Kim et al, 2009, Lu & Su, 2008) were verified to affect behav- ioral intentions for mobile marketing, while social ben- efits impacted on utilitarian benefits (Zhang & Mao, 2008). Benefits affecting mobile media use could also be classified as utilitarian based on several studies (Bauer et al, 2005, Cheng et al, 2009, Choi et al, 2008, Chowdhury et al, 2006, Gao et al, 2009, Haghirian & Inoue, 2007, Okazaki, 2007:2, Peters et al, 2007, Tsang et al, 2004, Xu, 2006), emotional or entertainment (Bauer et al, 2005, Choi et al, 2008, Haghirian & In- oue, 2007, Okazaki, 2007:2, Tsang et al, 2004, Xu, 2006), and socialization (Peters et al, 2007). A few comparative studies revealed results about which per- ceived values that affect consumer preferences for mo- bile media (Okazaki & Hirose, 2009, Okazaki & Romero, 2010) and mobile channels (Laukkanen, 2007, Kleinen et al, 2009) compared to PC internet. As mobile services were used in time and location specific contexts, epistemic value (novelty value) and conditional value (situational value) affected perceived val- ue. Results showed that conditional value affected convenience, emotional, social and monetary value, while epistemic value only affected emotional and social value for both information and entertainment services, and monetary value for information services (Pilström & Brusch, 2008).
PERCEIVED UTILITARIAN VALUES AND BENEFITS The major, but not always the dominating importance of utilitarian values in mobile contexts were shown in several studies contributing to the adoption and use of mobile devices, services and marketing (Kim et al 2007, Kleinen et al, 2009, Park & SuJin, 2006, Turel et al, 2007, Yang and Jolly, 2006). Similar results showed that utilitarian benefits had a strong affect on adoption of mobile marketing (Alda´s-Manzano et al, 2009, Amin, 2008, Kim et al, 2009, Lu & Su, 2008). Instead, utilitarian values had a more dominating affect on consumer loyalty than hedonic values (Deng et al, 2010). Especially for information services convenience value was more important for repurchase intentions (Pilström &Brusch, 2008). Convenience value was also important for use of utilitarian mobile retail categories as financial services (Kleinen et al, 2009, Laukkanen, 2007). The importance of customization in mobile con- texts were highlighted in a few studies. Customization increased convenience value (Xu et al, 2011), content relevance, adoption, use (Peters et al, 2007, Xu, 2006), purchase intentions (Xu et al, 2009), making mobile services and marketing less cumbersome for consumers to use. According to these results, retailers use of personal profiles or consumer databases with mobile marketing may increase convenience value, and potentially increase the competitiveness of retailers mobile marketing over time. Another example of simplification of data input methods is Japanese firm’s adoption of quick response industrial codes (QR codes). By scanning this code, consumers could automatically jump to a target mobile web site without typing in the full web address (Okazaki & Romero, 2010).For mobile push advertising credibility was the most important utilitarian benefit affecting adoption and use (Bauer et al, 2005, Choi et al, 2008, Chowdhury et al, 2006, Tsang et al, 2004, Xu, 2006), with less important weight on content relevance (Rau et al, 2011), content (Peters et al, 2007) or information (Bauer et al, 2005). Information and credibility were the most important benefits affecting use of mobile pull advertising (Haghirian & Inoue, 2007, Okazaki, 2007:2). Content reliability and quality also had a strong affect on loyal- ty to mobile services and marketing (Chae et al, 2002, Choi, Seol, Lee et al, 2008). The importance of credibility on consumer use of mobile advertising, created advantages for well known brands (Carroll et al, 2007), and in existing consumer relationships (Peters et al, 2007).
PERCEIVED EMOTIONAL VALUES AND BENEFITS The major importance of emotional values in mobile contexts were highlighted in several studies affecting adoption and use of mobile services and devices (Kim et al 2007, Kim & Hwang, 2006, Park & SuJin, 2006, Turel et al, 2007, Yang and Jolly, 2006), and loyalty to entertaining and enjoying mobile services (Cyr et al, 2006, Pilström & Brusch, 2008). The relative importance of entertainment benefits on adoption and use were verified for mobile pull advertising in several studies (Bauer et al, 2005, Choi et al, 2008, Chowdhury et al, 2006, Tsang et al, 2004, Xu, 2006), and for mobile web shopping (Lu & Su, 2008) and mobile fashion shopping (Kim et al, 2009). But entertainment benefits were not as important for mobile pull media (Haghirian & Inoue, 2007, Okazaki, 2007:2), though interactive and/or multimedia advertising were perceived as more informative, entertaining and less irritating (Cheng et al, 2009). The importance of emotional values seemed to be consumer segment specific. Consumers' product experiences affected the relative importance of hedonic val- ues; novice consumers rated the importance of hedonic values higher than experienced consumers (Park & SuJin, 2006).
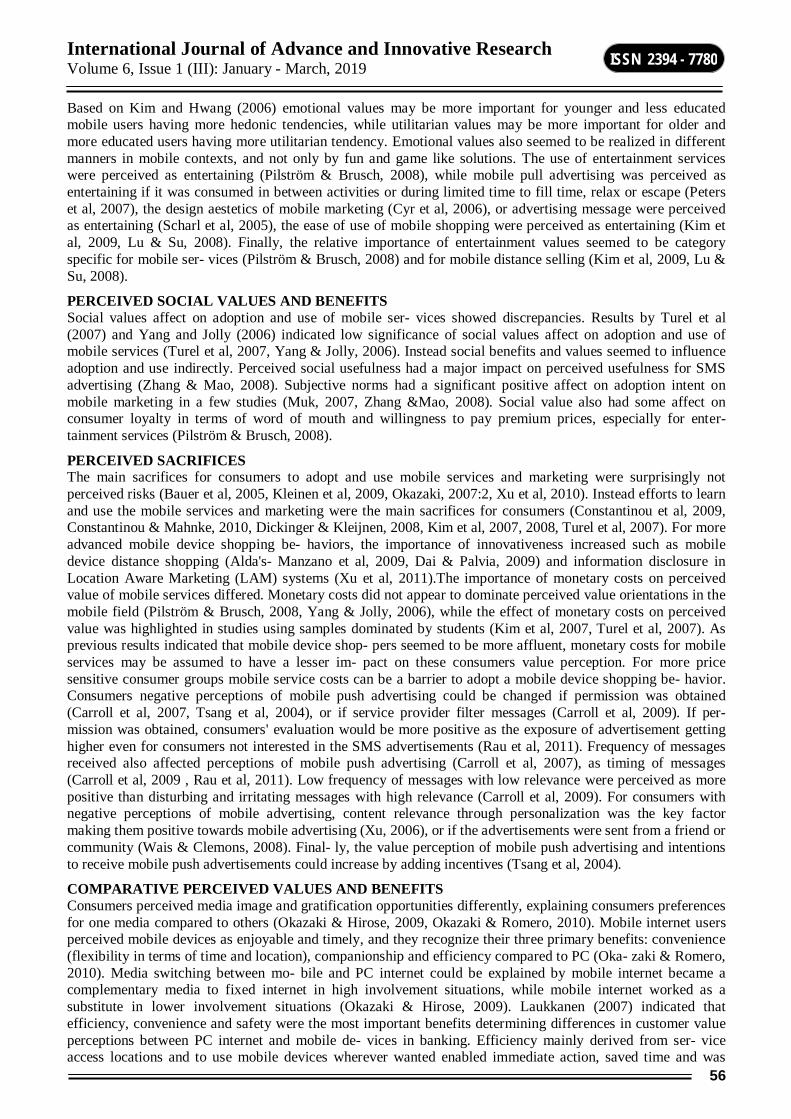
International Journal of Advance and Innovative Research Volume 6, Issue 1 (III): January - March, 2019
56
ISSN 2394 - 7780
Based on Kim and Hwang (2006) emotional values may be more important for younger and less educated mobile users having more hedonic tendencies, while utilitarian values may be more important for older and more educated users having more utilitarian tendency. Emotional values also seemed to be realized in different manners in mobile contexts, and not only by fun and game like solutions. The use of entertainment services were perceived as entertaining (Pilström & Brusch, 2008), while mobile pull advertising was perceived as entertaining if it was consumed in between activities or during limited time to fill time, relax or escape (Peters et al, 2007), the design aestetics of mobile marketing (Cyr et al, 2006), or advertising message were perceived as entertaining (Scharl et al, 2005), the ease of use of mobile shopping were perceived as entertaining (Kim et al, 2009, Lu & Su, 2008). Finally, the relative importance of entertainment values seemed to be category specific for mobile ser- vices (Pilström & Brusch, 2008) and for mobile distance selling (Kim et al, 2009, Lu & Su, 2008).
PERCEIVED SOCIAL VALUES AND BENEFITS Social values affect on adoption and use of mobile ser- vices showed discrepancies. Results by Turel et al (2007) and Yang and Jolly (2006) indicated low significance of social values affect on adoption and use of mobile services (Turel et al, 2007, Yang & Jolly, 2006). Instead social benefits and values seemed to influence adoption and use indirectly. Perceived social usefulness had a major impact on perceived usefulness for SMS advertising (Zhang & Mao, 2008). Subjective norms had a significant positive affect on adoption intent on mobile marketing in a few studies (Muk, 2007, Zhang &Mao, 2008). Social value also had some affect on consumer loyalty in terms of word of mouth and willingness to pay premium prices, especially for enter-tainment services (Pilström & Brusch, 2008).
PERCEIVED SACRIFICES The main sacrifices for consumers to adopt and use mobile services and marketing were surprisingly not perceived risks (Bauer et al, 2005, Kleinen et al, 2009, Okazaki, 2007:2, Xu et al, 2010). Instead efforts to learn and use the mobile services and marketing were the main sacrifices for consumers (Constantinou et al, 2009, Constantinou & Mahnke, 2010, Dickinger & Kleijnen, 2008, Kim et al, 2007, 2008, Turel et al, 2007). For more advanced mobile device shopping be- haviors, the importance of innovativeness increased such as mobile device distance shopping (Alda's- Manzano et al, 2009, Dai & Palvia, 2009) and information disclosure in Location Aware Marketing (LAM) systems (Xu et al, 2011).The importance of monetary costs on perceived value of mobile services differed. Monetary costs did not appear to dominate perceived value orientations in the mobile field (Pilström & Brusch, 2008, Yang & Jolly, 2006), while the effect of monetary costs on perceived value was highlighted in studies using samples dominated by students (Kim et al, 2007, Turel et al, 2007). As previous results indicated that mobile device shop- pers seemed to be more affluent, monetary costs for mobile services may be assumed to have a lesser im- pact on these consumers value perception. For more price sensitive consumer groups mobile service costs can be a barrier to adopt a mobile device shopping be- havior. Consumers negative perceptions of mobile push advertising could be changed if permission was obtained (Carroll et al, 2007, Tsang et al, 2004), or if service provider filter messages (Carroll et al, 2009). If per- mission was obtained, consumers' evaluation would be more positive as the exposure of advertisement getting higher even for consumers not interested in the SMS advertisements (Rau et al, 2011). Frequency of messages received also affected perceptions of mobile push advertising (Carroll et al, 2007), as timing of messages (Carroll et al, 2009 , Rau et al, 2011). Low frequency of messages with low relevance were perceived as more positive than disturbing and irritating messages with high relevance (Carroll et al, 2009). For consumers with negative perceptions of mobile advertising, content relevance through personalization was the key factor making them positive towards mobile advertising (Xu, 2006), or if the advertisements were sent from a friend or community (Wais & Clemons, 2008). Final- ly, the value perception of mobile push advertising and intentions to receive mobile push advertisements could increase by adding incentives (Tsang et al, 2004).
COMPARATIVE PERCEIVED VALUES AND BENEFITS Consumers perceived media image and gratification opportunities differently, explaining consumers preferences for one media compared to others (Okazaki & Hirose, 2009, Okazaki & Romero, 2010). Mobile internet users perceived mobile devices as enjoyable and timely, and they recognize their three primary benefits: convenience (flexibility in terms of time and location), companionship and efficiency compared to PC (Oka- zaki & Romero, 2010). Media switching between mo- bile and PC internet could be explained by mobile internet became a complementary media to fixed internet in high involvement situations, while mobile internet worked as a substitute in lower involvement situations (Okazaki & Hirose, 2009). Laukkanen (2007) indicated that efficiency, convenience and safety were the most important benefits determining differences in customer value perceptions between PC internet and mobile de- vices in banking. Efficiency mainly derived from ser- vice access locations and to use mobile devices wherever wanted enabled immediate action, saved time and was
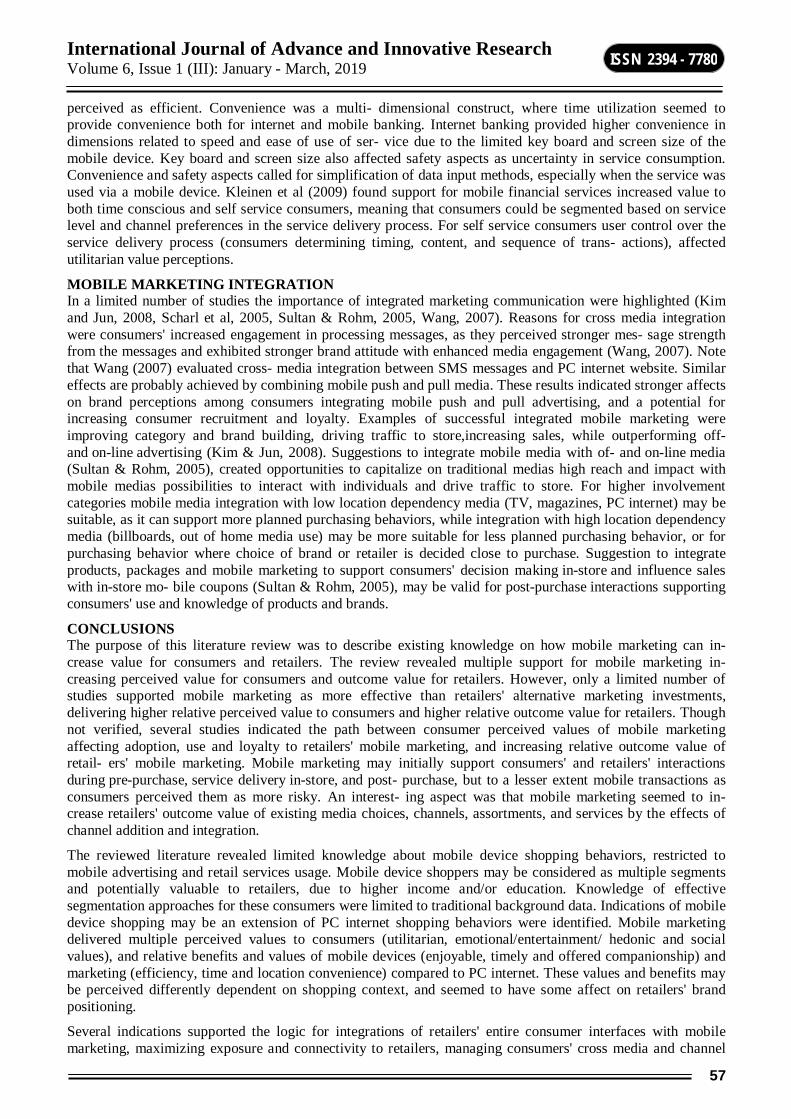
International Journal of Advance and Innovative Research Volume 6, Issue 1 (III): January - March, 2019
57
ISSN 2394 - 7780
perceived as efficient. Convenience was a multi- dimensional construct, where time utilization seemed to provide convenience both for internet and mobile banking. Internet banking provided higher convenience in dimensions related to speed and ease of use of ser- vice due to the limited key board and screen size of the mobile device. Key board and screen size also affected safety aspects as uncertainty in service consumption. Convenience and safety aspects called for simplification of data input methods, especially when the service was used via a mobile device. Kleinen et al (2009) found support for mobile financial services increased value to both time conscious and self service consumers, meaning that consumers could be segmented based on service level and channel preferences in the service delivery process. For self service consumers user control over the service delivery process (consumers determining timing, content, and sequence of trans- actions), affected utilitarian value perceptions.
MOBILE MARKETING INTEGRATION In a limited number of studies the importance of integrated marketing communication were highlighted (Kim and Jun, 2008, Scharl et al, 2005, Sultan & Rohm, 2005, Wang, 2007). Reasons for cross media integration were consumers' increased engagement in processing messages, as they perceived stronger mes- sage strength from the messages and exhibited stronger brand attitude with enhanced media engagement (Wang, 2007). Note that Wang (2007) evaluated cross- media integration between SMS messages and PC internet website. Similar effects are probably achieved by combining mobile push and pull media. These results indicated stronger affects on brand perceptions among consumers integrating mobile push and pull advertising, and a potential for increasing consumer recruitment and loyalty. Examples of successful integrated mobile marketing were improving category and brand building, driving traffic to store,increasing sales, while outperforming off- and on-line advertising (Kim & Jun, 2008). Suggestions to integrate mobile media with of- and on-line media (Sultan & Rohm, 2005), created opportunities to capitalize on traditional medias high reach and impact with mobile medias possibilities to interact with individuals and drive traffic to store. For higher involvement categories mobile media integration with low location dependency media (TV, magazines, PC internet) may be suitable, as it can support more planned purchasing behaviors, while integration with high location dependency media (billboards, out of home media use) may be more suitable for less planned purchasing behavior, or for purchasing behavior where choice of brand or retailer is decided close to purchase. Suggestion to integrate products, packages and mobile marketing to support consumers' decision making in-store and influence sales with in-store mo- bile coupons (Sultan & Rohm, 2005), may be valid for post-purchase interactions supporting consumers' use and knowledge of products and brands.
CONCLUSIONS The purpose of this literature review was to describe existing knowledge on how mobile marketing can in- crease value for consumers and retailers. The review revealed multiple support for mobile marketing in- creasing perceived value for consumers and outcome value for retailers. However, only a limited number of studies supported mobile marketing as more effective than retailers' alternative marketing investments, delivering higher relative perceived value to consumers and higher relative outcome value for retailers. Though not verified, several studies indicated the path between consumer perceived values of mobile marketing affecting adoption, use and loyalty to retailers' mobile marketing, and increasing relative outcome value of retail- ers' mobile marketing. Mobile marketing may initially support consumers' and retailers' interactions during pre-purchase, service delivery in-store, and post- purchase, but to a lesser extent mobile transactions as consumers perceived them as more risky. An interest- ing aspect was that mobile marketing seemed to in- crease retailers' outcome value of existing media choices, channels, assortments, and services by the effects of channel addition and integration.
The reviewed literature revealed limited knowledge about mobile device shopping behaviors, restricted to mobile advertising and retail services usage. Mobile device shoppers may be considered as multiple segments and potentially valuable to retailers, due to higher income and/or education. Knowledge of effective segmentation approaches for these consumers were limited to traditional background data. Indications of mobile device shopping may be an extension of PC internet shopping behaviors were identified. Mobile marketing delivered multiple perceived values to consumers (utilitarian, emotional/entertainment/ hedonic and social values), and relative benefits and values of mobile devices (enjoyable, timely and offered companionship) and marketing (efficiency, time and location convenience) compared to PC internet. These values and benefits may be perceived differently dependent on shopping context, and seemed to have some affect on retailers' brand positioning.
Several indications supported the logic for integrations of retailers' entire consumer interfaces with mobile marketing, maximizing exposure and connectivity to retailers, managing consumers' cross media and channel
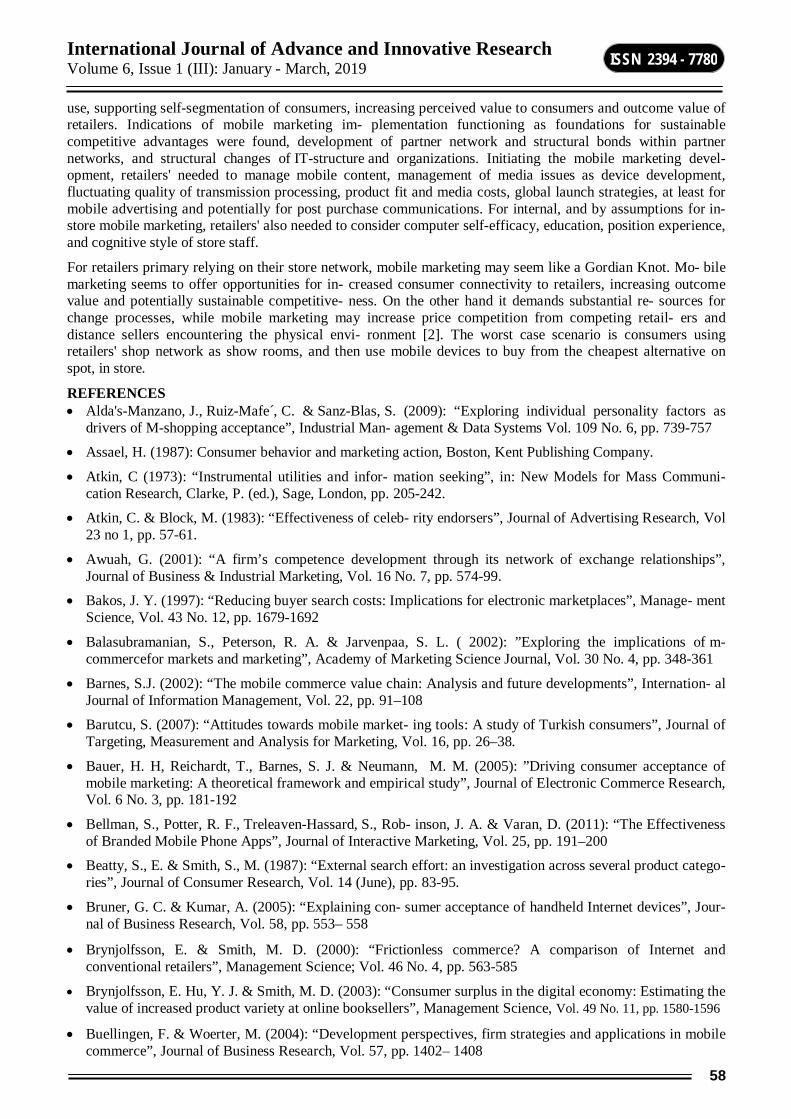
International Journal of Advance and Innovative Research Volume 6, Issue 1 (III): January - March, 2019
58
ISSN 2394 - 7780
use, supporting self-segmentation of consumers, increasing perceived value to consumers and outcome value of retailers. Indications of mobile marketing im- plementation functioning as foundations for sustainable competitive advantages were found, development of partner network and structural bonds within partner networks, and structural changes of IT-structure and organizations. Initiating the mobile marketing devel- opment, retailers' needed to manage mobile content, management of media issues as device development, fluctuating quality of transmission processing, product fit and media costs, global launch strategies, at least for mobile advertising and potentially for post purchase communications. For internal, and by assumptions for in-store mobile marketing, retailers' also needed to consider computer self-efficacy, education, position experience, and cognitive style of store staff.
For retailers primary relying on their store network, mobile marketing may seem like a Gordian Knot. Mo- bile marketing seems to offer opportunities for in- creased consumer connectivity to retailers, increasing outcome value and potentially sustainable competitive- ness. On the other hand it demands substantial re- sources for change processes, while mobile marketing may increase price competition from competing retail- ers and distance sellers encountering the physical envi- ronment [2]. The worst case scenario is consumers using retailers' shop network as show rooms, and then use mobile devices to buy from the cheapest alternative on spot, in store.
REFERENCES Alda's-Manzano, J., Ruiz-Mafe ,́ C. & Sanz-Blas, S. (2009): “Exploring individual personality factors as
drivers of M-shopping acceptance”, Industrial Man- agement & Data Systems Vol. 109 No. 6, pp. 739-757
Assael, H. (1987): Consumer behavior and marketing action, Boston, Kent Publishing Company.
Atkin, C (1973): “Instrumental utilities and infor- mation seeking”, in: New Models for Mass Communi- cation Research, Clarke, P. (ed.), Sage, London, pp. 205-242.
Atkin, C. & Block, M. (1983): “Effectiveness of celeb- rity endorsers”, Journal of Advertising Research, Vol 23 no 1, pp. 57-61.
Awuah, G. (2001): “A firm’s competence development through its network of exchange relationships”, Journal of Business & Industrial Marketing, Vol. 16 No. 7, pp. 574-99.
Bakos, J. Y. (1997): “Reducing buyer search costs: Implications for electronic marketplaces”, Manage- ment Science, Vol. 43 No. 12, pp. 1679-1692
Balasubramanian, S., Peterson, R. A. & Jarvenpaa, S. L. ( 2002): ”Exploring the implications of m-commercefor markets and marketing”, Academy of Marketing Science Journal, Vol. 30 No. 4, pp. 348-361
Barnes, S.J. (2002): “The mobile commerce value chain: Analysis and future developments”, Internation- al Journal of Information Management, Vol. 22, pp. 91–108
Barutcu, S. (2007): “Attitudes towards mobile market- ing tools: A study of Turkish consumers”, Journal of Targeting, Measurement and Analysis for Marketing, Vol. 16, pp. 26–38.
Bauer, H. H, Reichardt, T., Barnes, S. J. & Neumann, M. M. (2005): ”Driving consumer acceptance of mobile marketing: A theoretical framework and empirical study”, Journal of Electronic Commerce Research, Vol. 6 No. 3, pp. 181-192
Bellman, S., Potter, R. F., Treleaven-Hassard, S., Rob- inson, J. A. & Varan, D. (2011): “The Effectiveness of Branded Mobile Phone Apps”, Journal of Interactive Marketing, Vol. 25, pp. 191–200
Beatty, S., E. & Smith, S., M. (1987): “External search effort: an investigation across several product catego- ries”, Journal of Consumer Research, Vol. 14 (June), pp. 83-95.
Bruner, G. C. & Kumar, A. (2005): “Explaining con- sumer acceptance of handheld Internet devices”, Jour- nal of Business Research, Vol. 58, pp. 553– 558
Brynjolfsson, E. & Smith, M. D. (2000): “Frictionless commerce? A comparison of Internet and conventional retailers”, Management Science; Vol. 46 No. 4, pp. 563-585
Brynjolfsson, E. Hu, Y. J. & Smith, M. D. (2003): “Consumer surplus in the digital economy: Estimating the value of increased product variety at online booksellers”, Management Science, Vol. 49 No. 11, pp. 1580-1596
Buellingen, F. & Woerter, M. (2004): “Development perspectives, firm strategies and applications in mobile commerce”, Journal of Business Research, Vol. 57, pp. 1402– 1408
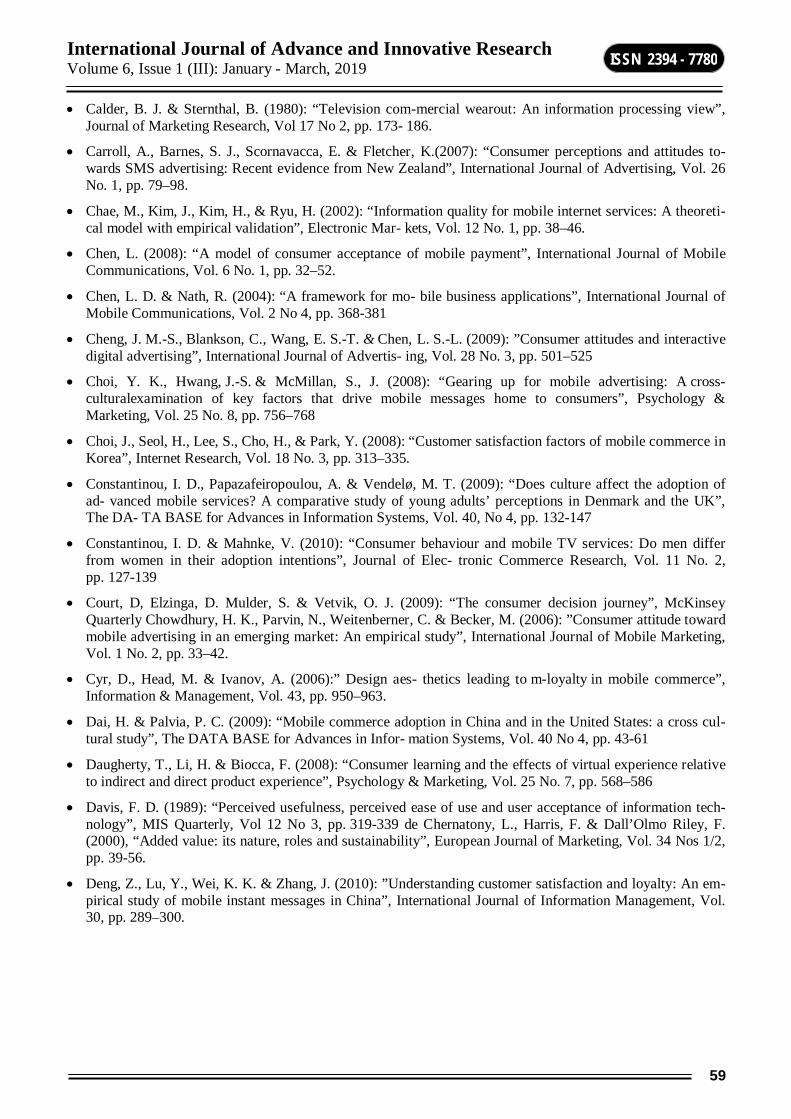
International Journal of Advance and Innovative Research Volume 6, Issue 1 (III): January - March, 2019
59
ISSN 2394 - 7780
Calder, B. J. & Sternthal, B. (1980): “Television com-mercial wearout: An information processing view”, Journal of Marketing Research, Vol 17 No 2, pp. 173- 186.
Carroll, A., Barnes, S. J., Scornavacca, E. & Fletcher, K.(2007): “Consumer perceptions and attitudes to- wards SMS advertising: Recent evidence from New Zealand”, International Journal of Advertising, Vol. 26 No. 1, pp. 79–98.
Chae, M., Kim, J., Kim, H., & Ryu, H. (2002): “Information quality for mobile internet services: A theoreti- cal model with empirical validation”, Electronic Mar- kets, Vol. 12 No. 1, pp. 38–46.
Chen, L. (2008): “A model of consumer acceptance of mobile payment”, International Journal of Mobile Communications, Vol. 6 No. 1, pp. 32–52.
Chen, L. D. & Nath, R. (2004): “A framework for mo- bile business applications”, International Journal of Mobile Communications, Vol. 2 No 4, pp. 368-381
Cheng, J. M.-S., Blankson, C., Wang, E. S.-T. & Chen, L. S.-L. (2009): ”Consumer attitudes and interactive digital advertising”, International Journal of Advertis- ing, Vol. 28 No. 3, pp. 501–525
Choi, Y. K., Hwang, J.-S. & McMillan, S., J. (2008): “Gearing up for mobile advertising: A cross-culturalexamination of key factors that drive mobile messages home to consumers”, Psychology & Marketing, Vol. 25 No. 8, pp. 756–768
Choi, J., Seol, H., Lee, S., Cho, H., & Park, Y. (2008): “Customer satisfaction factors of mobile commerce in Korea”, Internet Research, Vol. 18 No. 3, pp. 313–335.
Constantinou, I. D., Papazafeiropoulou, A. & Vendelø, M. T. (2009): “Does culture affect the adoption of ad- vanced mobile services? A comparative study of young adults’ perceptions in Denmark and the UK”, The DA- TA BASE for Advances in Information Systems, Vol. 40, No 4, pp. 132-147
Constantinou, I. D. & Mahnke, V. (2010): “Consumer behaviour and mobile TV services: Do men differ from women in their adoption intentions”, Journal of Elec- tronic Commerce Research, Vol. 11 No. 2, pp. 127-139
Court, D, Elzinga, D. Mulder, S. & Vetvik, O. J. (2009): “The consumer decision journey”, McKinsey Quarterly Chowdhury, H. K., Parvin, N., Weitenberner, C. & Becker, M. (2006): ”Consumer attitude toward mobile advertising in an emerging market: An empirical study”, International Journal of Mobile Marketing, Vol. 1 No. 2, pp. 33–42.
Cyr, D., Head, M. & Ivanov, A. (2006):” Design aes- thetics leading to m-loyalty in mobile commerce”, Information & Management, Vol. 43, pp. 950–963.
Dai, H. & Palvia, P. C. (2009): “Mobile commerce adoption in China and in the United States: a cross cul- tural study”, The DATA BASE for Advances in Infor- mation Systems, Vol. 40 No 4, pp. 43-61
Daugherty, T., Li, H. & Biocca, F. (2008): “Consumer learning and the effects of virtual experience relative to indirect and direct product experience”, Psychology & Marketing, Vol. 25 No. 7, pp. 568–586
Davis, F. D. (1989): “Perceived usefulness, perceived ease of use and user acceptance of information tech- nology”, MIS Quarterly, Vol 12 No 3, pp. 319-339 de Chernatony, L., Harris, F. & Dall’Olmo Riley, F. (2000), “Added value: its nature, roles and sustainability”, European Journal of Marketing, Vol. 34 Nos 1/2, pp. 39-56.
Deng, Z., Lu, Y., Wei, K. K. & Zhang, J. (2010): ”Understanding customer satisfaction and loyalty: An em- pirical study of mobile instant messages in China”, International Journal of Information Management, Vol. 30, pp. 289–300.
International Journal of Advance and Innovative Research Volume 6, Issue 1 (III): January - March, 2019
60
ISSN 2394 - 7780
EFFECTIVENESS OF WEB ANALYTICS, SEO AND PPC OVER OTHER COMPONENTS OF DIGITAL MARKETING IN THE VIRTUAL MARKET
Karthik Guptha1, Shivaprasad B S2 and Dr. Srikant C3 Research Scholar1, 2 and Associate Professor3, JNN College of Engineering, Shimoga
ABSTRACT The world is becoming the revolutionary change in the present context. Any business, concepts or people require a platform to exhibit them to achieve success in the market. Creation of Awareness is the groundwork for success. Promotion is the effective tool to create the awareness among the people. Nowadays the world is depending more on digital promotional strategies to connect the mass audience and individual compared to traditional promotional strategies. According to the data provided by Wikipedia in 2017, among the total world population, 48% of population is of internet users and in the developed countries, 81% are the internet users and in developing countries, 41.3% are of internet users. This data exhibits that almost half of world population can be tapped using internet. This study comprises about the effectiveness of web analytics, SEO and PPC over the other components of digital marketing. These mentioned categories are the backbone of many digital promotional strategies. It clearly describes the requirements of White hat and Black hat SEO. It clearly provides the information about the costing of PPC and the effect of PPC in the virtual market. This is a conceptual study made by referring many articles related to digital marketing.
Keywords: Digital Promotion, SEO, Web Analytics and PPC
DIGITAL MARKETING Digital Marketing is the technological platform that reaches the ideas or the concepts to the people in many forms of digital media. It is the subcategory of marketing, making a great impression on the consumers in many forms. Every determinant of the digital marketing is having its own significance in the marketing era. This is a revolutionary model that changed the structure of traditional marketing. According to Wikipedia, in 2017, the internet users in our country is only 29.55% of the total population, but with respect to number of users it is 39, 12, 92, 635 members and stands second in the ranking list next to china and it is a huge market that can be tapped very easily over few techniques. And one of the major benefits is our Indians spend approximately 70% of mobile internet they invest for social media like facebook, whatsapp, music and other entertainment applications. And the average time spent by Indian watching videos online has grown to 52 minutes per day in 2018 from a mere two minutes per day in 2012. It is expected to increase further to 67 minutes per day by 2019, according to a report by media agency Zenith. That indicates, our people prefer video contents in the internet, so it is easy to pass the massage to the majority of internet users in India at their one click through digital mode.
Nowadays, this strategy is preferred more to reach the target market in an effective form. Every practices listed below of this strategy has its own significance in the present market scenario.
Websites: over 1.7 billion websites are in the world and pout of that over 200 million websites are active, websites are the best tool to do business in the virtual market and many people prefer website to create awareness and to market them in the market. With respect to advertisement displaying of different varieties of advertisements like Static Banner ads, Flash Banners, Animated GIF Banners, Video and Audio ads, Cinematic ads, Text ads etc… can be made and websites can also be promoted through Google ads, in YouTube, through directly communicating with the website owners for displaying free or paid ads.
Blog posts: It is a discussion forum or the platform to express the opinions of the people. Anybody can create their own blogs. Many paid and free ads can be published in the blogs. According to statistica.com, there were 441.4 million blogs were there till October 2018. This indicates the market strength in digital market through blog spots.
EBooks and Whitepapers: Many readers prefer Virtual books, Whitepapers and online platform to boost up their acquaintance. EBooks and Whitepapers are also accessible in PDF Formats. Most of the readers are depended on this format of reading. This is one of the best tools to be used to display ads to reach target customers.
Infographics: Are also called as Information Graphics. It is a representation of information in a graphic format designed to make the data easily understandable at a glance. People use infographics to quickly communicate a message, to simplify the presentation of large amounts of data.
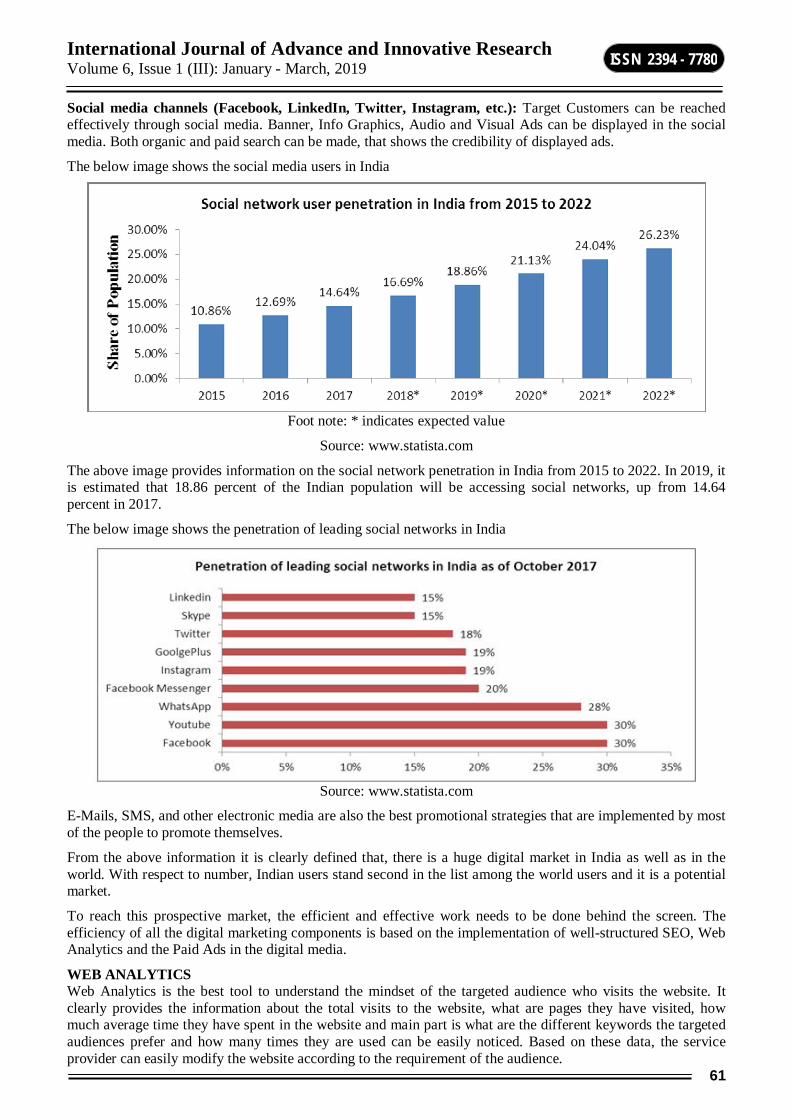
International Journal of Advance and Innovative Research Volume 6, Issue 1 (III): January - March, 2019
61
ISSN 2394 - 7780
Social media channels (Facebook, LinkedIn, Twitter, Instagram, etc.): Target Customers can be reached effectively through social media. Banner, Info Graphics, Audio and Visual Ads can be displayed in the social media. Both organic and paid search can be made, that shows the credibility of displayed ads.
The below image shows the social media users in India
Foot note: * indicates expected value
Source: www.statista.com
The above image provides information on the social network penetration in India from 2015 to 2022. In 2019, it is estimated that 18.86 percent of the Indian population will be accessing social networks, up from 14.64 percent in 2017.
The below image shows the penetration of leading social networks in India
Source: www.statista.com
E-Mails, SMS, and other electronic media are also the best promotional strategies that are implemented by most of the people to promote themselves.
From the above information it is clearly defined that, there is a huge digital market in India as well as in the world. With respect to number, Indian users stand second in the list among the world users and it is a potential market.
To reach this prospective market, the efficient and effective work needs to be done behind the screen. The efficiency of all the digital marketing components is based on the implementation of well-structured SEO, Web Analytics and the Paid Ads in the digital media.
WEB ANALYTICS Web Analytics is the best tool to understand the mindset of the targeted audience who visits the website. It clearly provides the information about the total visits to the website, what are pages they have visited, how much average time they have spent in the website and main part is what are the different keywords the targeted audiences prefer and how many times they are used can be easily noticed. Based on these data, the service provider can easily modify the website according to the requirement of the audience.
International Journal of Advance and Innovative Research Volume 6, Issue 1 (III): January - March, 2019
62
ISSN 2394 - 7780
The main aim of web analytics is to identify the reachability of the content of the website. Some of the web analytics tools are
Alexa
FoxMetrics
Matomo
Zap
Charbeat
Others
Web Analytics helps to identify the total traffic generation guides to make a proper decision and provides an insight over the data and can estimate the public opinion about the website. Even though there are many advantages from web analytics, there are many drawbacks in it.
Many people doesn’t want all the tools to analyze
Many times it misguides the users
When the target audience is less in number, users cannot rely upon ranks of the website, traffic congestion etc…
Customisation of tools in the analytics cannot be done.
The ranks of the website are not based on organic search
All the above drawbacks are very minor compare to its advantage. So many social media and search engines provide their own analytical tool for the ads what user are going to display in it.
If the service provider wants to reach the users, then they need to analyse the user opinion about the content of the site, design, information, user friendliness, complexity of the site, how much time they spend in the site, which webpage they prefer more. Based on these data, we can analyse the targeted audience mindset.
SEO Even though the web analytics may be power full tool, it is useful only when there are many hits and traffic is generated by the website. Traffic can be generated in an organic manner using Search Engine Optimization (SEO).
SEO is the best tool to display the content in the top ranking of the search engines. SEO is an algorithm implemented in site to display the content in the search engine whenever the users search for the information. The search engines are going to display the websites based on mainly three factors that is quality, trustworthy and authority.
SEO provides better results for the snipet formatted sites. Snipet format code needs to be written in required webpages in the website. Snipet format code is easy to make for static data. Compared to dynamic and search engine robots that are called searchbots or crawlers recognizes the snipet code in the website and displays in search engine websites. This snipet attracts the users to visit the site.
Few years ago SEO was working based on keywords and in the recent trend it works based on word count it works for both static and dynamic.
According to data provided by Doron Wolffberg on January 2018, the top 9 Google Ranking factors for 2018 was
1. Content
Content quality
Content Length
Pro – Tip
2. Back Links
International Journal of Advance and Innovative Research Volume 6, Issue 1 (III): January - March, 2019
63
ISSN 2394 - 7780
3. Mobile First
4. Page Speed
5. Schema Code
6. Brand Power and Social Signals
7. Domine Power
8. HTTPS
9. User Experience.
The major categories of SEO are On the Page SEO or On – Site Optimization, Off the Page SEO or Off – Site Optimization and Violations.
On – Site Optimization is the key factor while developing SEO. It deals with mainly Title tag, Meta description or data description under the title, site maps or internal links.
Off – Site Optimization is very much necessary in the present scenario, it deals with Social network, Blogs, Articles, Posts, Online answers, Videos, Events etc…
These two major types of SEO is done to promote the websites easily to the targeted audience.
The SEO is generally bifurcated in to two types, that is
White hat SEO
Black hat SEO
White hat SEO is the legal type of coding the webpages to be displayed on the search engines. The displayed static and dynamic content of the webpages in the website is recognized by the search engine and displayed on the search engine site. But the major drawback is most of the times, the popular keyword are not present in the webpages, that results low ranking or search engine does not display the website in their search engines. Black hat SEO is an illegal type of optimization of content in the website. Even though the content is not available, black hat SEO makes the search engine to list the name of the website in its search engine. This leads to the bringing down the quality of the search engine, listing out the inappropriate content and acquiring others opportunities leads to unethical practices and violations of rules. Because of Black hat SEO; the website may lose its display in the Google search engine which is having a market share of 92.74%. And this can become the major disaster for the website. According to the data provided by Pat Ahern is a partner at Junto - the digital marketing agency that is powered by vetted freelancers from across the world, 93% of online experiences begin with a search engine. 57% of B2B marketers stated that SEO generates more leads than any other marketing initiative. 81% of people perform some type of online research before making a large purchase. 72% of online marketers describe content creation as their most effective SEO tactic. 61% of internet users do research on a product online before making a purchase. Leads from search engines have a 14.6% close rate, while outbound leads (ex. cold-calling, direct mail, etc.)
have a 1.7% close rate. 70-80% of people ignore paid search results, choosing to only click on organic listings. PPC Pay Per Click (PPC) is the tool used to advertise the website or product or content in the search engine. The cost of these advertisements is based on views and clicks that the user make in the search engine. The costs of the clicks are most considerable in search engine. These advertisements are displayed on the top of the search engine. But the sad part is according to the above mentioned data only 20% – 30% searchers go with paid listings. To generate traffic in the initial stages, this PPC methodology is very much required.
The PPC works on bidding system, considering Google, we need to invest minimum Rs. 32.89 (average per day) to maximum Rs. 2072.37 (average per day) to obtain 154 clicks – 258 clicks per month to 9725 clicks – 16209 clicks per month respectively.
International Journal of Advance and Innovative Research Volume 6, Issue 1 (III): January - March, 2019
64
ISSN 2394 - 7780
FaceBook provides many other options like promote your page, contact us button, boost a post, Get more leads, Get more Website Visitors and Website purchase. FaceBook provides the option to target the audience based on the demographic traits. With Rs. 35.30 investment, we can run the ad in the FaceBook per day.
All the social media sites and search engines provides these type of platform to promote our website or content or ideas. And this is the best method to generate traffic in the initial stages.
The PPC works effectively based on the keywords that are linked in the promotional tool. And ads will be displayed based on the usage of keywords by the users. The entire promotional tool provides a dashboard to analyze the promotions that are made in the search engine. It provides an individual analytical platform to analyse the performance of ads.
The PPC ads pack more punch when it comes to reaching your target audience.
According to SocialMediaToday, more than 7 million advertisers invested a total of $10.1 billion in PPC ads just during 2017.
EMarketer reports that Facebook’s ad revenues are set to eclipse the entire print industry in 2019. As a result, marketers who invest in these advertisements are on the right track to reap benefits.
Other social media platforms are also expected to continue to grow with regard to advertising revenues (EMarketer).
Google reports that search ads can boost brand awareness by as much as 80 percent, making consumers more likely to remember your brand and interact.
Google Ads alone reaches a network of more than $2 million websites and applications (Google).
Consumers make more than 160 billion searches per month on Google alone (Statista).
For every $1 spent on Google Adwords, businesses earn an average revenue of $2 (Google).
Ad spending is increasing. According to SocialMediaToday, 72 percent of marketers are spending more on social ads in 2018 and 60 percent of marketers are spending more on text ads and mobile ads in 2018.
40 percent of brands want to increase their PPC budget, indicating that this is an effective and lucrative tool for marketers (SocialMediaToday).
According to Formstack, PPC ads are one of the top three generators of on-page conversions.
65 percent of all clicks made by users who intend to make a purchase go to paid ads (Wordstream).
New Media Campaigns reports that paid search results gain 1.5 times as many conversions from click throughs as organic search results.
PPC ads can put you on the first page for a given search term within a day (New Media Campaigns).
Many consumers are unable to tell the difference between paid ads and other content. According to ScienceDaily, less than one in five users is able to accurately identify native advertisements.
PPC visitors are 50 percent more likely to make a purchase than organic visitors (Unbounce).
PPC statistics are easier to measure than SEO statistics, making it easier for marketers to track ROI and manage budgets (Unbounce).
PPC is more effective when used in conjunction with SEO (New Media Campaigns).
The average click-through rate across all industries on Google AdWords in 2018 is 3.17 on the search network.
The highest average click-through rate in Google AdWords is found in the dating and personals industry, while the lowest click-through rate is found in the legal industry.
The average cost-per-click across all industries in Google AdWords on the search network is $2.69. The highest cost-per-click is found in the legal industry, while the lowest cost-per-click is found in the dating and personals industry.
International Journal of Advance and Innovative Research Volume 6, Issue 1 (III): January - March, 2019
65
ISSN 2394 - 7780
The average conversion rate across all industries in Google AdWords on the search network is 3.75 percent. Conversion rates are highest in the dating and personals industry at over 9 percent. Conversion rates are lowest in the advocacy industry at 1.96 percent.
The average cost-per-action across all industries in Google AdWords on the search network is $48.96. Cost-per-action is highest in the technology industry at over $133. Cost-per-action is lowest in the auto industry at $33.52.
CONCLUSION Digital market is the part of every body’s life. Some way or other, all of us are related to digital market. This paper clearly describes the present market condition and how the components of digital marketing are performing in the market. This paper clearly describes the backhand requirement of every type of promotion activity that is made through digital platform. The Web Analytics, SEO and PPC are the three major backbone of every promotion that is made in the virtual platform. The impact of PPC, SEO web Analytics are clearly explained and because of these tools, it is easy to reach the target audience. So it is clearly defined that SEO, Web analytics and PPC are ruling the digital marketing industry.
BIBLIOGRAPHY 1. “Effectiveness of Digital Marketing in the Challenging Age: An Empirical Study” International Journal of
Management Science and Business Administration; Volume 1, Issue 5, April 2015, Pages 69-80, Literature Available at URL: https://researchleap.com/wp-content/uploads/2015/04/6.-Effectiveness-of-Digital-Marketing-in-the-Challenging-Age-An-Empirical-Study1.pdf
2. “List of countries by number of Internet users”, Wikipedia: Free Encyclopedia, Literature Available at URL: https://en.wikipedia.org/wiki/List_of_countries_by_number_of_Internet_users
3. “Penetration of leading social networks in India as of 3rd quarter 2017”, Statistica: The Statistics Portal, Literature Available at URL: https://www.statista.com/statistics/284436/india-social-network-penetration/
4. “Social network user penetration in India from 2015 to 2022”, Statistica: The Statistics Portal, Literature Available at URL: https://www.statista.com/statistics/240960/share-of-indian-population-using-social-networks/
5. Shalina Pillai, “Indians spend 70% of mobile internet time on social media, entertainment”, updated 19 – 12 – 2017, (Blog), Literature Available at URL: https://timesofindia.indiatimes.com/business/india-business/indians-spend-70-of-mobile-internet-time-on-social-entertainment/articleshow/62125840.cms
6. Lata Jha, “Indians spending more time watching online videos”, updated 17 – 07 - 2018, (Blog), Literature Available at URL: https://www.livemint.com/Consumer/IbdTyfGeqmLR73zj4zTXBN/Indians-spending-more-time-watching-online-videos.html
7. “Total number of Websites”, Literature Available at URL: http://www.internetlivestats.com/total-number-of-websites/
8. “Cumulative total of Tumblr blogs from May 2011 to October 2018 (in millions)”, Statistica: The Statistics Portal, Literature Available at URL: https://www.statista.com/statistics/256235/total-cumulative-number-of-tumblr-blogs/
9. Matt McGee, “As Google Analytics Turns 10, We Ask: How Many Websites Use It? Updated 12 – 11 – 2015, (Blog), Literature Available at URL: https://marketingland.com/as-google-analytics-turns-10-we-ask-how-many-websites-use-it-151892
10. “Types Of Search Engine Success Factors”, Search Engine Land, Literature Available at URL: https://searchengineland.com/guide/seo/types-of-search-engine-ranking-factors
11. Garima Kakkar, “Learn How SEO Works in 5 Simple Steps”, updated 10 – 05 – 2017, (Blog), Literature Available at URL: https://www.digitalvidya.com/blog/how-seo-works/
12. Doron Wolffberg, “Top 9 Google ranking Factors for 2018”, updated 01 – 01 – 2018, (Blog), Literature Available at URL: https://yellowheadinc.com/blog/google-ranking-factors/
13. Pat Ahern, “25 Mind-Bottling SEO Stats for 2017 and 2018”, Updated on 26 – 10 – 2018, (Blog), Literature Available at URL: https://junto.digital/blog/seo-stats-2017/

International Journal of Advance and Innovative Research Volume 6, Issue 1 (III): January - March, 2019
66
ISSN 2394 - 7780
14. “Search Engine Market Share Worldwide”, Updated on October 2018, Literature Available at URL: http://gs.statcounter.com/search-engine-market-share
15. Ryan Melby, “2018 PPC Statistics – A Comprehensive List of Pay-Per-Click Stats”, Updated 2018, (Blog), Literature Available at URL: https://valveandmeter.com/pay-per-click-statistics/
International Journal of Advance and Innovative Research Volume 6, Issue 1 (III): January - March, 2019
67
ISSN 2394 - 7780
GREEN MARKETING-ISSUES AND CHALLENGES AND ITS INFLUENCE ON BUYING BEHAVIOUR OF CONSUMERS
Bharmappa T and Dr. Raghunandan G Faculty, DOS in Commerce, Jnana Sahyadri Kuvempu University, Shankaraghatta
ABSTRACT Concerns have been expressed by manufacturers and customers about the environmental impact of products during recent decades. Environmental issue is a sizzling topic nowadays as almost every country’s government and society has started to be more aware about these issues. This leads to a trend of green marketing used by the firm as one of the strategies in order to gain profit and protect the environment. This paper will be discussing the green marketing and its sustainability as well as the tools and marketing mix of green marketing. Other than that, the green consumer and branding will be discussed in further in this paper as this will attract more consumers. Lastly, firm will be benefited once green marketing strategy is applied.
Keywords: Green marketing, characteristics of green product, challenges and opportunities, influencing factors.
INTRODUCTION Businesses need to constantly assess the latest and most attractive marketing trends. Marketing trends can be found out by continually researching about the changes in consumer behaviour in the marketplace. By identifying the changes in the consumer behaviour, the businesses can modify their offering to the consumers. Consumers today are more concerned about environmental degradation and negative impact of their uses of product and services on environment. The reason for this concern could be visible climatic changes, global warming and increasing air and water pollution. Thus using Green marketing by the organizations not only provides an opportunity to meet consumer expectations and address their environmental concerns, but also to gain a competitive advantage and a strong consumer base. Green marketing is also termed as environmental marketing or ecological marketing. According to American Marketing Association, marketing of products that are presumed to be environmentally safe is called as Green Marketing. Thus wide range of activities are covered under green marketing, which includes modifying the product, making changes in the production process and packaging, as well as modifying advertising or removing any activity that impacts the environment in negative way. Today, the Earth faces more environmental issues than ever before, hence it is imperative for companies to make and market themselves as environment friendly. Green marketing is emerging as a popular promotional strategy owing to increased consumer awareness and concerns. The concept of green or ecological marketing calls upon businesses to follow ethical and green practices while dealing with customers, suppliers, dealers, and employees. Companies have started marketing themselves as green companies. Even the Public Sector Units and state governments are now paying a lot of attention towards environmental issues such as global warming, pollution, or water contamination and have started taking steps to prevent environmental pollution. In a recent survey conducted by National Geographic Society and the international polling firm Globes can (2010) to determine consumers’ green attitude called “Consumer Greendex”, the top scoring consumers were in the developing economies of India, Brazil and China while industrialized countries ranked at the bottom. Consumers showing the largest increase in environmentally sustainable behavior were in India, Russia and the United States (Howe et al., 2010). A company to be successful in green marketing requires to be committed to operate in environmentally friendly ways. Green Marketing is: - Retailing Definition: “The marketing of products that are presumed to be environmentally safe”. Social Marketing Definition: “The development and marketing of products designed to minimize negative effects on the physical environment or to improve its quality”. Environmental Definition: “The efforts by organizations to produce, promote, package, and reclaim products in a manner that is sensitive or responsive to ecological concerns”. Thus green marketing incorporates a broad range of activities, including product modification, changes to the production process, packaging changes as well as modifying advertising. Thus “green Marketing” refers to holistic marketing concept where in the production, Marketing consumption an disposal of products and services happen in a manner that is less detrimental to the environment with growing awareness about the implications of global warming, non-biodegradable solid waste, harmful impact of pollutants etc., both marketers and consumers are becoming increasing sensitive to the need for switch in to green products and services. While the shift to “green” may appear to be expensive in the short term, it will definitely prove to advantageous, cost-wise too, in the long run.

International Journal of Advance and Innovative Research Volume 6, Issue 1 (III): January - March, 2019
68
ISSN 2394 - 7780
REVIEW OF LITERATURE Moloy Ghoshal (2011), his Article on Green Marketing- A Changing Concept in Changing Time, he stated that The rising price, growing pollution and resource consumption in Asia and political pressure to address climate change are driving innovation toward healthier, more-efficient, high performance products. In shorts all marketing will incorporate elements of green marketing. At the same time to avoid green marketing myopia, the future success of product dematerialization i.e. shift from “sales of goods” to the “sales of services”, and more sustainable services will depend on credibly communicating and delivering consumer desired value in the market place. Only then, product dematerialization will steer business on to a more sustainable path.
Yeow Kar Yan & Rashad Yazdanifard (2014), they made study on The Concept of Green Marketing and Green Product Development on Consumer Buying Approach, they told that, Green marketing and product development have been deemed the best ways forward for a business to be able to conform with new rulings from the government, and also to be able to comply with the behavior of consumers from field studies in to the wants and needs
Gaikwad and Ingavale, they made study on A study of Consumer Awareness for Green Marketing, they concluded that, Consumers who are aware of eco-friendly products and have a preference for eco friendly products are not willing to buy expensive eco-friendly products.
Maheshwari (2014), he was study on Awareness of Green Marketing and Its Influence on Buying Behavior of Consumers, it is clear that the Indian market for greener products is under-exploition by marketers within consumer groups with pro-environmental values. This finding suggests the there is greater use of marketing brands to sell green products that are genuinely environmentally friendly.
FuiYeng & Yazdanifard (2015), Green Marketing: A Study of Consumers’ Buying Behavior in Relation to Green Products, they told that marketers should adopt a suitable single green marketing mix and strategy corresponding to company in which they conduct and target consumers’ demands and personality. In addition, companies that carry out green marketing in the right place and on the right person may support the company to achieve their competitive advantage.
Jain and Amit (2013), Green Marketing: A Study of Consumer Perception and Preferences in India, It was found that the percentage of people who buy only green products is very low and marketers need to take this as an opportunity to build their product portfolios and promote themselves as green.
NEED FOR THE STUDY Green marketing has now evolved as one of the major area of interest for marketers as it may provide competitive advantages. However it requires investment in terms of technology enhancement, process modification, communicating benefits to customers etc. Many of the companies in India have now started marketing themselves as green organizations due to certain government regulations and shift in the preference of the consumers worldwide. However, not much research with respect to green marketing has been done in In dia and there is question about the awareness of green products among consumers. The attitude of Indian consumers towards green products and the relationship between the attitude and behavior is also questionable. As green marketing is different from the m arketing in traditional way, marketers need to know the factors that persuade the consumer to buy the green products.
OBJECTIVES 1. To identify the brands, consumer associate with green marketing practices.
2. To identify the factors that influences the customer persuasion to buy green Products.
3. To understand the issues and challenges of green marketing practices
CHARACTERISTICS OF GREEN PRODUCTS Green Products are those which are manufactured by using green technology and that also do not have any negative impact on the environment. Green products have following characteristics:-
1. Products those are grown originally.
2. Products those are recyclable and reusable.
3. Products with natural ingredients.
4. Products which are having recycled contents and non-toxic chemical elements.
5. Product content under approved chemical.
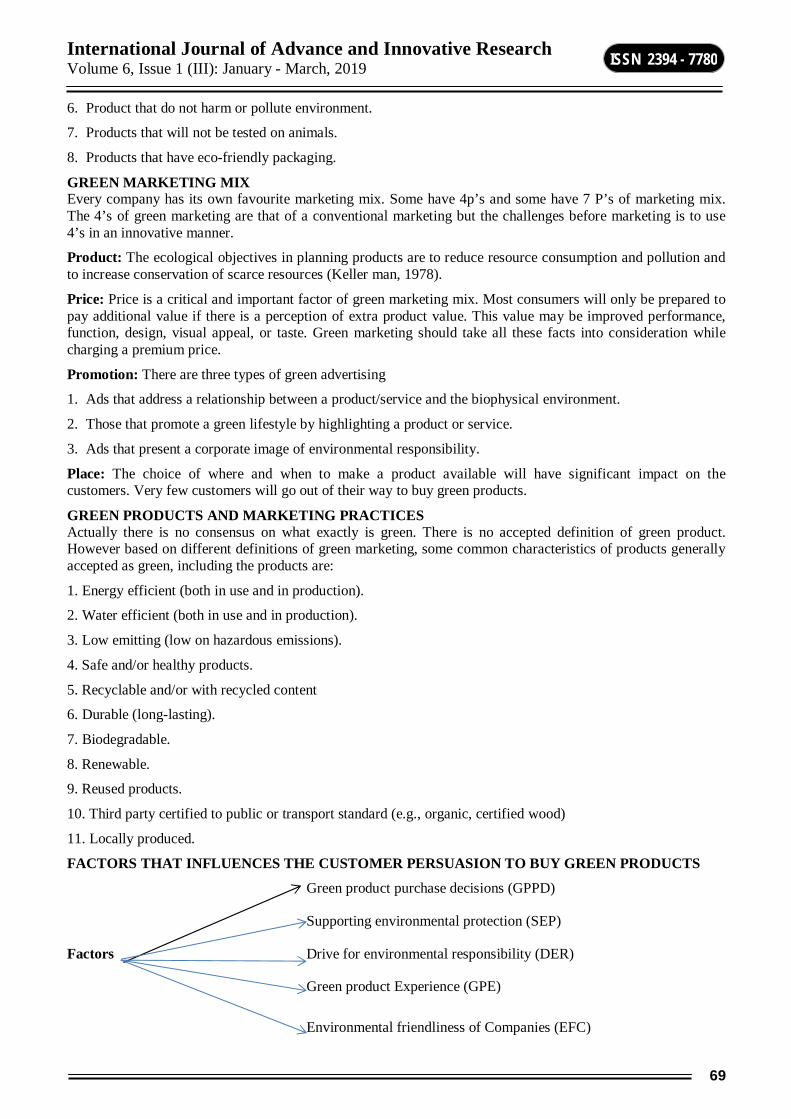
International Journal of Advance and Innovative Research Volume 6, Issue 1 (III): January - March, 2019
69
ISSN 2394 - 7780
6. Product that do not harm or pollute environment.
7. Products that will not be tested on animals.
8. Products that have eco-friendly packaging.
GREEN MARKETING MIX Every company has its own favourite marketing mix. Some have 4p’s and some have 7 P’s of marketing mix. The 4’s of green marketing are that of a conventional marketing but the challenges before marketing is to use 4’s in an innovative manner.
Product: The ecological objectives in planning products are to reduce resource consumption and pollution and to increase conservation of scarce resources (Keller man, 1978).
Price: Price is a critical and important factor of green marketing mix. Most consumers will only be prepared to pay additional value if there is a perception of extra product value. This value may be improved performance, function, design, visual appeal, or taste. Green marketing should take all these facts into consideration while charging a premium price.
Promotion: There are three types of green advertising
1. Ads that address a relationship between a product/service and the biophysical environment.
2. Those that promote a green lifestyle by highlighting a product or service.
3. Ads that present a corporate image of environmental responsibility.
Place: The choice of where and when to make a product available will have significant impact on the customers. Very few customers will go out of their way to buy green products.
GREEN PRODUCTS AND MARKETING PRACTICES Actually there is no consensus on what exactly is green. There is no accepted definition of green product. However based on different definitions of green marketing, some common characteristics of products generally accepted as green, including the products are:
1. Energy efficient (both in use and in production).
2. Water efficient (both in use and in production).
3. Low emitting (low on hazardous emissions).
4. Safe and/or healthy products.
5. Recyclable and/or with recycled content
6. Durable (long-lasting).
7. Biodegradable.
8. Renewable.
9. Reused products.
10. Third party certified to public or transport standard (e.g., organic, certified wood)
11. Locally produced.
FACTORS THAT INFLUENCES THE CUSTOMER PERSUASION TO BUY GREEN PRODUCTS
Green product purchase decisions (GPPD)
Supporting environmental protection (SEP)
Factors Drive for environmental responsibility (DER)
Green product Experience (GPE)
Environmental friendliness of Companies (EFC)
International Journal of Advance and Innovative Research Volume 6, Issue 1 (III): January - March, 2019
70
ISSN 2394 - 7780
GREEN PRODUCT PURCHASE DECISIONS (GPPD) Green consumerism is the base for making green purchase decisions (Essoussi and Linton, 2010). Consumers considering environmental concerns while making purchase decisions are sighted to be involved in green purchases. Researches have mentioned that green consumers are those who evaluate materials and ingredients of products before purchase, so they can support the environmental benefits by having less lethal and recyclable products (Essoussi and Linton, 2010). Such consumers give importance to the environment in their buying decisions. In this way, they get information about the beneficial effects of green products (Gadenne et al., 2011). Furthermore, researches have argued that green products are those that have less impact on environment and use ecofriendly contents. Green behavior is incorporated in the procurement choices of consumers (Shrum et al. 1995). Companies concerning about environmental issues are much supported by the consumers (Bansal, 2005; Barnet, 2007). Past studies explained that green purchase decision means to support green companies, address environmental issues to buy green products and social conformity (Albayrak et al., 2013; Schlegelmilch et al., 1996). Furthermore, green purchase decision is influenced by the values, attitudes, information, need, stimulus and beliefs (Kumar & godeswar, 2015). Two aspects are found to be important in the purchase decision. One is the internal that include environmental responsibility, eco-friendly behavior, green experience and environmental knowledge. Likewise, external factors involve social status and features of products like material, performance, quality and price of products (Vermeir & Verbeke, 2004). Many studies have discussed purchase intentions and green behavior of consumers but it is less explored that how consumer takes purchase decision when they consider the environmental responsibility and protection important factors. The intension of consumers to support the environment leads towards the green purchase decisions.
SUPPORTING ENVIRONMENTAL PROTECTION (SEP) Supporting environmental protection refers to carry attitude of environment friendliness and consciousness for sustainability of the natural environment (Barr & Gilg, 2006). Consumers who are concerned for environmental protection, evaluate the products on the environmentally supporting parameters (Lee, 1990). The choice of their purchase is based upon environmental friendliness of products. They look for the products which are less harmful for atmosphere or have significant impact on environment (Escalas and Bettman, 2005). This element of environmental protection remains present in product from usage of raw material to the production of final good (Jain and Kaur, 2004). Such consumers assess functions of product, recyclable ingredients, packaging etc. for the enhancement of eco system (Forkink 2010; Luchs et al. 2010). These consumers compare the prices of products with their eco-friendly features. The theory of planned behavior states that beliefs of people make them to show particular behavior. Thus, consumers who have preference toward green products actually purchase environmental friendly product.
DRIVE FOR ENVIRONMENTAL RESPONSIBILITY (DER) Individual’s inner standpoints and personal thoughts that one can contribute to the protection of natural resources, environment and other species is the factor of drive for environmental responsibility (Gadenne et al., 2011). Consumers who feel their selves accountable in regard of ecological concerns adopt behavior of purchasing those products that are not harmful for living things (D'Souza et al. 2006). Several studies have explored that inside commitment to atmosphere enhances positive behavior towards green purchases. They feel that their activities can be added to protection of their surroundings (Lee, 2008, 2009). Their inner enthusiasm leads them towards behaving environmentally friendly to guard against dangers faced by the entire planet (Griskevicius et al., 2010). Many researchers have found that how demographics influence the environmental conscious behavior of consumers but it is not evident that how demographics are related to drives that form environmental responsibility in consumers (D'Souza et al. 2007). In the past, researchers designed the studies on environmental consciousness and antecedents of environmental responsibility but the impact of drives that form individual’s behavior has been ignored (Kilbourne and Pickett, 2008; Zuraidah et al., 2012). The beliefs, consideration and environmental involvement of green consumers make them adopt environmentally pleasant activities.
GREEN PRODUCT EXPERIENCE (GPE) Green products mean those products which are not destructing in nature for environment, use less toxic ingredients, recycled packaging and material that is not damaging for the globe (Gurau and Ranchhod, 2005). Green products give consumer a favorable experience regarding environmental friendliness features of products which turns their purchase behavior towards such products (Zhao et al., 2014; Barber et al., 2009). Consumers having such encounter inclined toward gaining more familiarity with the products having green ingredients. Consumers who have more knowledge about green products are sighted to be indulged more in green purchase behavior (Laroche et al., 2001). Researchers have found a positive relationship between environmental knowledge and purchase decisions. Consumers gain knowledge about the economic benefits, reduced negative

International Journal of Advance and Innovative Research Volume 6, Issue 1 (III): January - March, 2019
71
ISSN 2394 - 7780
environmental and health damages for purchase of green products (CegarraNavarro andMartinez, 2010). Green consumers share this knowledge with their social circle to promote consumption of such products and learn from their experiences (Khare, 2014; Cheah and Phau, 2011). They further compare the value paid for product with their environmental benefits and pay premium price for eco-friendly products. Many studies have argued aspect of knowledge gaining related to green products but aspects of knowledge sharing and learning from other’s experience related to green product has been ignored. Furthermore, the past experience regarding green products also make people purchase green. In the same sense, green product experience form emotional commitment (Zhao et al., 2014; Barber et al., 2009). People with high environmental consciousness and beliefs are more engaged in green purchase behavior.
ENVIRONMENTAL FRIENDLINESS OF COMPANIES (EFC) In this era, global warming consumers environmental awareness is increasing that creates an obligation on the organizations to produce the products that are not damaging to the environment and also satisfy consumers demand accurately (Chen, 2008a). Companies’ performance regarding environmental consciousness contribute to image of green products in mind of consumers (Ambec and Lanoie, 2008; Hart, 1995; Porter and Van der Linde, 1995; Trung and Kumar, 2005). Customers demand the organizations to be indulged in green activities. Environmentally friendly organizations make sure their manufacturing processes, ingredients and products address the environmental concerns (Gadenne et al., 2011). Therefore, companies improve to be busy in fulfilling their environmental responsibilities (Jain and Kaur, 2004). Companies comply with the legislation made by Government for the protection of eco system. In the same way, environmental issues are important part of their corporate strategies (Papadopoulos et al., 2010). They use less toxic material, do not use excess of natural resources and introduce recycled packaging and ingredients. Eco friendliness of companies appears to be an important factor in the purchase decision of consumers (Kumar & Godeswar, 2015). Their preference inclined towards those companies that address environmental issues. Environmental friendliness of companies is promoted though green marketing (Ottman, 1992; Peattie, 1992, 1995; Vandermerwe and Oliff, 1990). Thus, companies thought that environmental awareness will turn the behavior and attitude of consumers in their favor. These companies communicate their activities regarding environmental concern through labeling, advertising and other kinds of promotions. Green consumers first evaluate ingredients of products for taking purchase decision (Laroche et al., 2001). Past studies have addressed impact of environmental friendliness of companies in different countries but literature lacks in context of Pakistan. As the theory of planned behavior explains that beliefs are linked to behaviors, in the same way consumers refuse those companies that are involved in such activities that are hurtful for environment. Sometimes the companies try to get extra advantage by advertising that they do some activities for the betterment of environment, such companies are also punished by green consumers.
SOCIAL APPEAL (SA) Consumers purchase decision is predisposed by opinion of other people in their social circle (Bearden and Rose, 1990). People have concerns about how others think of them on the basis of their purchase decisions. Customer collaboration and relationship has an influence on behavior (Escalas and Bettman, 2005). Similarly, opinion of others about a brand and world are very important in one’s evaluation of the world. Consumers give meaning to products based on the knowledge shared by reference groups and their own understanding of product on the basis of this knowledge (Dholakia et al., 2004). People also choose the same products as chosen by others to show conformity. On the other hand, people also consider their choices important because it reveals their personality (Lee, 2008). While living in the society, people want to be considered by others so they use such products that can give them a position of recognition (Sen et al., 2001). Consumers feel that use of green products gives them this recognition. View point of peer group influences boycotting decision. Past researches states that reference groups create social and cultural belief, attitudes and behaviors of people (Ozaki and Sevastyanova, 2011). Literature suggests that people will evaluate the products. Distinctive place in society is also an influential factor for product choices. Selection of products reveals personality. Social status is a point of difference that motivates green purchases and consumer prefers to go green to be perceived as an environmental friendly (Grier and Deshpande, 2001). Engaging in green purchase behavior gives a strong position in public. Sometimes consumers give up their main need related product and concentrate more on environmental aspect to earn a rank of reliability and socially conscious person.
GREEN MARKETING AND SUSTAINABLE DEVELOPMENT The American Marketing Association (AMA) defines green marketing as marketing of products that are believed to be environment-friendly, which organizes into various activities such as product adjustment, modification of production processes, packaging, labelling, advertising strategies as well as increases awareness on compliance marketing amongst industries (Yazdanifard, 2011). According to Business Dictionary, the

International Journal of Advance and Innovative Research Volume 6, Issue 1 (III): January - March, 2019
72
ISSN 2394 - 7780
definition of green marketing is promotional exercises intended at taking benefits of shaping consumer behaviour towards a brand. These adjustments are progressively being affected by a company’s practices and policies that influence the characteristic of the environment and indicate the standard of its concern for the community. On the other hand, it can be recognized as the promotion of environmentally-secure or advantageous goods (Yazdanifard, 2011). According to the World Commission on Environmental Development (1978), Sustainable Development defines “meeting the needs of the present without compromising the ability of the future generations to meet their own needs” (p.134). The typical idea during the whole of this strategy of sustainable development is the desire to merge economic and ecological developments in decision making by constructing policies that conserve the standard of agricultural advancement and environmental conservation. The environment conservation for the current and the future generation is what the outcome product of green marketing is. (Vandhana, Karpagavalli, & Ravi, 2013).
WHY IT’S TIME FOR BUSINESS TO GO GREEN:- Today, most, if not all, business recognise that climate change is a problem, some are marking attempts to solve the problem, resulting in a wave of sustainability, climate change, and environment projects.
To examine this issue in detail, MIT conducted a one year inquiry that involved in depth interview with fifty global leaders, followed by a survey of more than 1500 executives and managers worldwide. The survey respondents cited the impact on company’s image and brand as its paramount reasons for addressing sustainability.
Here are the drivers for addressing suitability, listed in order of importance. 1. Company or brand image
2. Cost savings
3. Competitive advantage
4. Employees satisfaction, moral or retention
5. Product ,service or market innovation
6. Business or process innovation
7. New source of revenue or cash flow
8. Effective risk management
9. Shareholder relationship
CHALLENGES IN GREEN MARKETING 1) Need for standardization: Only 5%of marketing messages are entirely true from the ‘Green’ company and
there is problem of lack of standardization to authenticate these claims. It is very difficult to certify a product as a green or organic product because there is no standardization. Unless some regulatory bodies are involved and they certify or prove. A standard quality control board needs to be in place for such labelling and licensing.
2) New concept: In India more educated and urban consumers are getting aware about the benefits of the green products. But still less literature is available. Consumers needs to be educated and made aware of the environment concepts .The new green movements needs to reach the masses and that will take a lot of time and effort. By India’s ayurvedic heritage, Indian consumers do appreciate the importance of using natural and herbal beauty products. Indian consumer is exposed to healthy living lifestyles such as yoga and natural food consumption. In those aspects the consumer is already aware and will be inclined to accept the green products.
3) Patience and Perseverance: The investors and corporate need to view the Environment as a major long term Investment opportunity, the marketers need to look at the long-term benefits from this new green movement. It will require a lot of patience and no immediate results. Since it is a new concept and idea, it will have its own acceptance period.
4) Some other Challenges Green products require renewable and recyclable material which is costly.
Requires a technology, which requires huge investment in R and D.
Water treatment technology is too costly.
International Journal of Advance and Innovative Research Volume 6, Issue 1 (III): January - March, 2019
73
ISSN 2394 - 7780
Majority of the people are not aware of green products and their uses.
Majority of the people are not willing to pay a premium for green products
OPPORTUNITIES It appears that all types of consumers, both individual and industrial are becoming more concerned and aware about environment. In 1992 study of 16 countries, more than 50% of consumers in each country other than Singapore indicated they were concerned about the environment (Ottman19930. A study in Australia found that 84.6% of the sample believed all individuals had a responsibility to care for the environment. A further 80% of this sample indicates d that they had modified their behaviour, including their purchasing behaviour, due to environment reasons (EPA-NSW1994). As demand changes, many firms see these changes as an opportunity to be exploited. Given these figures, it can be assumed that firms marketing goods with environmental characteristics will have a competitive advantage over firms marketing non environmentally responsible alternatives.
There are numerous examples of firms who have strived to become more environmentally responsible, in an attempt to better satisfy their consumer needs.
1. McDonald's replaced its clam shell packaging with waxed paper because of increased consumer concern relating to polystyrene production and Ozone depletion [Gifford 1991, Hume 1991].
2. Tuna manufacturers modified their fishing techniques because of the increased concern over driftnet fishing, and the resulting death of dolphins [Advertising Age 1991].
3. Xerox introduced a "high quality" recycled photocopier paper in an attempt to satisfy the demands of firms for less environmentally harmful products.
4. Coca-Cola pumped syrup directly from tank instead of plastic which saved 68 million pound/year.
5. Badarpur Thermal Power station of NTPC in Delhi is devising ways to utilize coal-ash that has been a major source of air and water pollution.
6. Barauni refinery of IOC is taken steps for restricting air and water pollutants.
METHODOLOGY The study is based upon the secondary data. Extant literature related to the Green Marketing-Issues and challenges are available from websites and other available sources that are collected from different books, journals, research papers, and other media. This study represented the Green Marketing issues and challenges.
CONCLUSION As environmental issues continue to affect human activities, society is now regards them with much concern. Most firms have started using sustainable development framework which is known as green marketing and most of the organizations have acknowledged green products which are environmentally friendly. Marketing managers can use green marketing to earn profits. In addition, green marketing is able to preserve the environment while satisfying customers’ needs. Therefore, green marketing is a tool now used by many companies to increase their competitive advantage as people is presently very concerned about environmental issues. In the time applying green marketing, the companies have to comply with the consumers’ needs and wants. Consumers want to recognize themselves with companies that are green compliant and are willing to pay more for a greener life style. For this reason, green marketing is not only an environmental protection tool but also a marketing strategy (Yazdanifard, 2011). Other than that, marketers can provide training to their employees, especially sales representative. This is to give them knowledge on how to promote the green product effectively by clearly presenting the main message to the consumers. Green marketing covers a wide range of business activities and it is similar to marketing mix. Therefore, marketers should adopt a suitable single green marketing mix and strategy corresponding to company in which they conduct and target consumers’ demands and personality. In addition, companies that carry out green marketing in the right place and on the right person may support the company to achieve their competitive advantage.
REFERENCE 1. Adkins, S. 2004. Cause Related Marketing: Who Cares Wins. Oxford: Elsevier Butterworth-Heinemann.
2. Moloy Ghoshal (2011), Green marketing- A changing concept in changing time. BVIMR, Management Edge. 4(1), 82-92.
3. Gaikwad. and Ingavale, A study of Consumer Awareness for Green Marketing.

International Journal of Advance and Innovative Research Volume 6, Issue 1 (III): January - March, 2019
74
ISSN 2394 - 7780
4. Maheshwari (2014), AIMA Journal of Management & Research, February 2014, Volume 8 Issue 1/4, ISSN 0974 – 497
5. Albayrak, T., Aksoy, S. and Caber, M. (2013), “The effect of environmental concern and scepticism on green purchase behaviour”, Marketing Intelligence and Planning, Vol. 31 No. 1, pp. 27-39.
6. Ambec S, Lanoie P (2008). Does it pay to be green? A systematic overview. Acad. Manage. Perspect., 22(4): 45-62.
7. Bansal P (2005). Evolving sustainably: a longitudinal study of corporate sustainable development. Strateg. Manage. J. 26(3): 197-218.
8. Barber, N., Taylor, C. and Strick, S. (2009), “Wine consumers’ environmental knowledge and attitudes: influence on willingness to purchase”, International Journal of Wine Research, Vol. 1 No. 2, pp. 59-72.
9. Barr, S. and Gilg, A. 2006. Sustainable Lifestyles: Framing Environmental Action in and Around the Home. Geoforum 37: 906–920.
10. Barnet ML (2007). Stakeholder influence capacity and the variability of financial returns to corporate social responsibility. Acad. Manage. Rev., 33(3): 794-816.
11. Bearden, W.O. and Rose, R.L. (1990), “Attention to social comparison information: an individual difference factor affecting consumer conformity”, Journal of Consumer Research, Vol. 16 No. 4, pp. 461-471.
12. Cegarra-Navarro, J.G. and Martinez, A.M. (2010), “Managing environmental knowledge through learning processes in spanish hospitality companies”, The Spanish Journal of Psychology, Vol. 13 No. 2, pp. 827-840.
13. Cheah, I. and Phau, I. (2011), “Attitudes towards environmentally-friendly products – the influence of ecoliteracy, interpersonal influence and value orientation”, Marketing Intelligence and Planning, Vol. 29 No. 5, pp. 452-472.
14. Sarkar, A. N. (2012). Green branding and eco-innovations for evolving a sustainable green marketing strategy. Asia-Pacific Journal of Management Research and Innovation, 8(1), 39-58. doi: 10.1177/2319510X1200800106
15. Prothero, A. (1998). Green Marketing: The 'Fad' That Won't Slip Slide Away. Journal of Marketing Management, 14(6), July, pp. 507-513.
16. Sharma D.D. (2008), ―Marketing Research: Principle Application & Casesǁ N. Delhi, Sultan Chand & Sons
17. Unruh, G. And Ettenson, R. (2010, June). Growing Green; Three smart paths to developing sustainable products.
18. Harvard Business Review. Vol. 5(6). Boston.
19. Ottman, Jacquelyn. 1993. Green Marketing: Challenges and Opportunities for the New Marketing Age. Lincolnwood, Illinois: NTC Business Books.
20. Kotler, Philip. Marketing Management – The Millennium Edition Prentice Hall of India Private Limited, New Delhi.
21. Green Marketing” (2010, March 29). Journal: Business Practices. 6. J.A Ottman,. et al, "Avoiding Green Marketing Myopia", Environment, Vol-48, June-2006
22. Mathur, L.K., Mathur, I. (2000).An Analysis of the wealth effect of green marketing strategies, Journal of Business Research, 50(2), 193-200
International Journal of Advance and Innovative Research Volume 6, Issue 1 (III): January - March, 2019
75
ISSN 2394 - 7780
DIGITAL MARKETING – TRENDS, OPPORTUNITIES AND CHALLENGES
Dr. Archana H. N. Assistant Professor, Department of Studies in Business Administration, VSK University, Ballari
ABSTRACT Digital Marketing is becoming an integral part of life as digital platforms are increasingly incorporated into businesses. Digital marketing embodies an extensive selection of service, product and brand marketing tactics which mainly use Internet as a core promotional medium in addition to mobile and traditional TV and radio. Firms have been developing and adopting various digital marketing strategies to sustain in the hyper competitive and dynamic markets. Hence, an attempt is made in this paper to understand the pivotal role played by digital marketing in the arena of business. It also aims to identify the different digital marketing strategies adopted by firms to enhance their sales apart from highlighting the advantages and challenges of employing digital marketing.
Keywords: Internet, Promotion, Digital Marketing Strategies, Search Engine Optimisation, Email
INTRODUCTION Digital Marketing is becoming an integral part of life as digital platforms are increasingly incorporated into businesses. Standout and effectual experiences have become the norm and more critical than ever in today’s market landscape. It is ubiquitous and efficient way of selling goods/services in today’s world. Digital Marketing can be broadly defined as “Promoting of products and/or services using digital technologies such as mobile phones, display advertising, electronic devices and any other digital medium. In other words, it can also be described as various promotional techniques employed by businesses to reach customers via digital technologies. Dave Chaffey (2002) defines digital marketing as “application of digital technologies to marketing activities aimed at achieving profit acquisition and customers retention by improving customer knowledge and further delivering integrated communications and online services that match customers’ individual needs”. Digital marketing embodies an extensive selection of service, product and brand marketing tactics which mainly use Internet as a core promotional medium in addition to mobile and traditional TV and radio.
Digital marketing methods such as search engine optimization (SEO), search engine marketing (SEM), content marketing, influencer marketing, content automation, campaign marketing, data-driven marketing, e-commerce marketing, social media marketing, social media optimization, e-mail direct marketing, display advertising, e–books, and optical disks and games are increasing owing to advancement in technology. With the advancement of digital media, buyers have access to information 24/7 (any time) and 3600 (any place). Digital media helps consumers to spread word of mouth about the product or service. With this, a good product gets promoted and sold more easily in comparision with the inferior product. The consumers will be able to follow the media, view the reviews of friends, associations and peers.
Marketers increasingly bring brands closer to consumers’ everyday life. Prahalad and Ramaswamy (2004) emphasize that the changing role of customers as co producers of value is becoming increasingly important. Khan and Mahapatra (2009) remarked that technology plays a vital role in improving the quality of services provided by the business units. According to Hoge (1993), electronic marketing (EM) is a transfer of goods or services from seller to buyer involving one or more electronic methods or media. The prime advantage of digital marketing is reduced costs and enhanced reach. The cost incurred in digital marketing is typically lower than other marketing platforms such as face-to-face sales or sales with a help of middlemen or distributors. In addition to this, digital marketing also allows firms to reach buyers who have no access owing to temporal and locational limitations of existing distribution channels. According to Watson et al (2002), Sheth & Sharma (2005), Digital marketing enable the companies to increase reach and reduce costs. Digital marketing encourages customer communications on company’s own website or through its social presence (Chaffey, 2011). Businesses use digital marketing as a social media form to distribute their messages to their target audience without paying for the publishers or distributor (which is a typical characteristic of traditional marketing).
TRADITIONAL MARKETING VERSUS DIGITAL MARKETING Traditional marketing (offline marketing) is the most decipherable form of marketing. Traditional marketing is a non-digital way that is used to promote the product or services of business entity. On the other hand, digital marketing is the marketing of products or services using digital channels to reach consumers.
International Journal of Advance and Innovative Research Volume 6, Issue 1 (III): January - March, 2019
76
ISSN 2394 - 7780
Traditional Marketing includes print, broadcast, direct mail, and telephone. There is minimum or almost no interaction with the audience. advertising campaigns are planned over a long period of time and it also prevails for a longer time, this is an expensive and time-consuming process. The results of traditional marketing can be easily measured. The success of traditional marketing strategies can be celebrated if the firm can reach large local audience. However, it lacks year-round exposure, has no ability to go viral and it is a one way conversation.
Digital marketing includes online advertising, email marketing, social media, text messaging, affiliate marketing, search engine optimization, pay per click. Advertising campaigns are planned over short period of time. It is reasonably cheap and rapid way to promote the products or services. Campaigns can be easily changed with ease and innovations can be introduced within any campaign. Digital Marketing will enable wider reach to the customer because of the use of various customers technology. 24/7 year-round exposure is possible and has the ability to go viral. It has two ways conversation
Advertising mediums that might be used as part of digital marketing strategy of a business could include promotional efforts made via Internet, social media, mobile phones, electronic billboards, as well as via digital television and radio channels. Digital marketing is a sub branch of traditional marketing and uses modern digital channels for the placement of products e.g. downloadable music, primarily for communicating with stakeholders e.g. customers and investors about brand, products and business progress.
OBJECTIVES OF THE STUDY 1. To understand the importance of digital marketing in this contemporary competitive world.
2. To identify the different techniques of digital marketing
3. To study the opportunities and challenges of digital marketing
DIFFERENT TECHNIQUES OF DIGITAL MARKETING 1. Search Engine Optimisation (SEO) - It is the “process of getting traffic from the free, organic, editorial or
natural search results on search engines.” In other words, SEO affects the visibility of a website or a web page in a search engine’s natural or un-paid search results. The web page that is browsed by large number of people (frequency) is ranked as high, and, appears in the search result list. The more visitors will receive from the search engine users. SEO may target different kinds of search which includes content search, visual search, video search, news search, financial data search, and industry-specific vertical search engines.
2. Affiliate Marketing – Also known as Performance Based Marketing. Here, there are four key players: the merchant/retailer/brand, the network, the publisher (known as the affiliate) and the customer. Generally, the Affiliate markets the products/services on behalf of the firm and hence the company rewards the publisher/affiliate for every customer they bring. Today, it’s not just affiliate marketing, we see the emergence of next tier of players such as affiliate management agencies, super-affiliates and specialized third party vendors. There are two ways to approach affiliate marketing: Company can offer an affiliate program to others or it can sign up to be another business’s affiliate. If company wants to drive an affiliate program, then, the company owner has to pay affiliates a commission fee for every lead or sale they drive to company’s website. Company’s main goal here is to find affiliates who can reach untapped markets.
3. Social Media Marketing – It is basically a network of people who create and exchange ideas, information, images and many more things. There are several networks available today in the cyber space, each one catering to different segments/group of people. For instance, Facebook is predominantly used to promote events concerning product and services, run promotions that comply with the Facebook guidelines and explore new opportunities. Apart from this, it is also viewed as a social site where people exchange information. On the other hand, LinkedIn is a professional networking site, where people write their profile and share information with others to enhance their job seeking opportunity.
4. Online Advertising – Also known as internet advertising. Internet-based advertising provides the content and ads that best matches to consumer interests. Publishers put about their products or services on their websites so that consumers or users get free information. Advertisers place information in a more effective manner which grabs the attention of the customers. Online advertising helps the firm to cut down its cost of advertising/promotional activities.
5. Email Marketing – Email marketing has long been a pillar for any business attempting to generate sales via the internet. It provides direct contact with clients and allows you to drive prospective customers to your

International Journal of Advance and Innovative Research Volume 6, Issue 1 (III): January - March, 2019
77
ISSN 2394 - 7780
website. It is the most simple form of digital marketing, takes a few minutes to send updates/news/information etc.
6. Pay Per Click (PPC) Marketing - Pay-per-click marketing is a way of using search engine advertising to generate clicks to your website rather than “earning” those clicks organically. Pay per click is good for searchers and advertisers. It is the best way for company’s ads since it brings low cost and greater engagement with the products and services.
ADVANTAGES OF DIGITAL MARKETING Owing to technological inventions and innovations, there has been a massive transformation in the marketing and buying process. Digital marketing has changed customers buying behaviour. It has brought various advantages to the consumers such as
Timely updates - Digital marketing technologies allow the consumers to stay updated with the latest information about products, services, brand and such other news.
Greater Engagement – Consumers engagement with the firm gets augmented as they visit company’s website, read information about the products or services and make purchases online and provide feedback.
Accurate Information – Digital Marketing provides a comphrensive picture about a product or a service. Consumers can take a review about the same through the internet. There is very little chance of misinterpretation of the information about the product.
Serves Comparision - Since many companies are trying to promote their products or services using digital marketing, it is becoming the greatest advantage for the customer in terms that customers can make comparison among products or services by different suppliers in cost and time friendly way. Customers don’t need to visit a number of different retail outlets in order to gain knowledge about the products or services. They can also compare prices and features.
One Stop Shop (Convenience) - Customers enjoy shopping all that they need at one stop which is virtual. They can shop 24/7 at any place for any thing.
DISADVANTAGES OF DIGITAL MARKETING There isn’t anything without being a challenge. The same is true with technology as well. There are a few disadvantages with digital marketing such as Driving the customers away – A large number of firms producing substitute or complementary goods and
services use the same digital marketing strategies and therefore has every opportunity to drive the customers from one firm to the other. Customers cannot be loyal to a particular product or service.
Pseudo Portyal - Some firms can be represented negatively by customers so that their brand gets damaged. Consumers may lack trust online due to the amount of advertising that appears on websites and social media which can be considered as frauds.
Doppleganger - Generally brand creates images for itself to emotionally appeal to their customers. It is possible that individual or small group of people can harm image of an established brand.
Limited segment of goods can be marketed digitally CONCLUSION Digital Marketing has become an essential and an integral strategy of every firm. Firms use devices such as smart phones, tablets, laptops, televisions, digital billboards, web pages, networking sites and media such as social media, SEO (search engine optimization), videos, content, e-mail and lot more to promote company itself and its products and services. Digital Marketing can reach umpteen numbers of people as there are no boundaries that confine it. Companies should create innovative customer experiences and specific strategies for media to identify the best path for driving up digital marketing performance.
REFERENCES Dave Chaffey (2002), “E-Business and E-Commerce Management - Strategy, Implementation and Practice”,
Prentice Hall Publications, 4th Ed. C.K. Prahalad and Venkat Ramaswamy,(2004), "Co‐creating unique value with customers", Strategy &
Leadership, Vol. 32(3), pp.4-9. Khan, M.S., Mahapatra, S.S. and Sreekumar (2009), ‘Service quality evaluation in internet banking: an
empirical study in India’, Int. J. Indian Culture and Business Management, Vol. 2, No. 1, pp.30–46.

International Journal of Advance and Innovative Research Volume 6, Issue 1 (III): January - March, 2019
78
ISSN 2394 - 7780
Hoge, S, Cecil C. (1993), The Electronic Marketing Manual, ABA Journal, Vol. 22, pp. 175-185.
Watson, R.P., Leyland, F.P., Berthon, P. and Zinkham, G. (2002), U-commerce: expanding the universe of marketing. Journal of the Academy of Marketing Science, Vol. 30 (4), pp. 333-47.
Sheth, J.N., Sharma, A. (2005), “International e-marketing: opportunities and issues, International Marketing Review, Vol. 22 (6), pp. 611-622
International Journal of Advance and Innovative Research Volume 6, Issue 1 (III): January - March, 2019
79
ISSN 2394 - 7780
VIRTUAL REALITY TECHNOLOGY IN THE EDUCATION SECTOR – A HOLISTIC PERSPECTIVE
Avishek Mukhopadhyay1 and Dr. Pankajakshi R.2 Research Scholar1 and Associate Professor2, Visvesvaraya Technological University, Belgaum
ABSTRACT Virtual Reality (VR) as a technology has been in popular consciousness ever since the decade of 1980s where gaming consoles started becoming popular. VR brings in a concept called immersion where the user becomes an active participant in a simulated environment completely removed from reality. This state of suspended disbelief is even more engaging than other media like a cinema or video game; these features make VR applications extremely effective in areas such as training, learning, customer engagement and virtual entertainment.
In this paper, the authors have endeavoured to present the characteristics of a Virtual Reality solution on a holistic basis with special emphasis on their applicability in education sector, starting from a historical perspective. The idea of Virtual Reality solution was first conceived around 90 years ago, the paper traces the journey of this technology and considers its impact on mainstream society. The typical characteristic of a VR platform is defined along with an analysis of key areas where VR solutions have been successfully implemented in industry.
The core of the paper analyses feasibility and potential of implementing VR solutions for the education industry. In addition the paper carries a detailed literature research on successful implementation of VR solutions in educational institutions over the course of last 20 years. The authors in the paper have also discussed the challenges which engulfs implementation of VR solution in education sector, with a special focus on feasibility of VR applications in Indian educational context. Through this detailed analysis the authors have come to a conclusion that undoubtedly virtual reality applications holds a lot of promise but in the current Indian educational context it is not feasible for deployment due to high costs, complex technical requirements, and inadequate staff knowledge. The authors look forward to in the near future when these barriers are broken so that Indian students can benefit from this cutting edge technology
Keywords: Virtual Reality, Digital Tools in Education Sector, Immersive Experience, Head Mounted Device, Virtual Reality Platforms, Oculus Rift
INTRODUCTION Virtual Reality has captured popular imagination for the last 30 years or so, however the technology has been confined largely to widespread usage in gaming related applications. During the 1990’s and ensuing decades gaming consoles brought virtual reality into the drawing rooms of the middle class. The technology also inspired Hollywood science fictions, books and music videos. Facebook’s acquisition of virtual reality handset (Oculus Rift) in 2016 re-ignited the interest among the masses. Aside from gaming there are many other areas where virtual reality applications have been put to good use. The ‘Immersion Effect’ which a VR solution creates for its users increases attention and retention capability because it allows the user to learn by being part of a virtual environment. At the same time there are some serious challenges like high cost and technical requirements which limits the use of VR to a large extent especially in developing countries like India. In this paper the authors aim is to present a holistic perspective of virtual reality solutions with a special emphasis on its applicability and effectiveness in the education sector.
HISTORY AND DEVELOPMENT OF VIRTUAL REALITY As far back as the year 1935, American science fiction writer Stanley G Weinbaum talked about the concept of Virtual Reality in a short story called Pygmalion’s Spectacles. In the story the main character meets a professor Albert Ludwig who invents a pair of goggles which enables one to watch a movie – a movie which gives one sight and sound, taste, smell and even touch; where one can be in the story speaking to characters who reply to the viewer. Since the days of Ludwig’s magic spectacles, there have been decades of experimentation around virtual reality. It started from head-mounted VR system in the late 1960s to the first commercial products in the 1980s. In the year 1992 Virtual Reality was brought into mainstream awareness by a movie known as The Lawnmower Man, in this movie a dumb gardener was turned into a super intelligent human being by a scientist using repeated Virtual Reality experiments. The movie has gained cult following ever since its launch. Virtual reality technology had a relatively quiet period during the next 20 years leading many experts to write off the technology as mere vapourware.
International Journal of Advance and Innovative Research Volume 6, Issue 1 (III): January - March, 2019
80
ISSN 2394 - 7780
The resurgence of virtual reality began in 2010, when American teenager Palmer Luckey developed the first prototype of a VR headset that would eventually evolve into the iconic device Oculus Rift. A couple of years later, he launched a crowdfunding campaign to commercialise it which brought the technology world’s attention back to Virtual Reality. In 2014, Facebook’s founder Mark Zuckerberg likes the Oculus Rift so much that he bought the company for a whopping 2.4 billion US dollars. In the last decade Virtual Reality applications has found uses across a range of industries ranging from healthcare to defence.
VIRTUAL REALITY: AN OVERVIEW Virtual Reality (VR) can be defined as a simulated three-dimensional environment that is conventionally generated by a computing device. In a virtual reality simulation a computer creates an environment through which one can interact with digital objects and people. A virtual environment is developed as a three-dimensional world which aims to replicate the real world both in appearance and in the manner that objects behave.
One of the distinct advantages of virtual environments is that they can be used to create unrealistic or uncommon scenarios, which is particularly useful for conducting trainings. VR is mostly experienced through a headset with a built-in screen, which delivers audio and visual stimuli to the user. According to research there will be at least 50 million virtual reality devices used across the world. Here are the dictionary definitions of Virtual Reality
Merriam-Webster Dictionary: “An artificial environment which is experienced through sensory stimuli (as sights and sounds) provided by a computer and in which one’s actions partially determine what happens in the environment.”
Oxford Dictionary: “Computer generated simulation of three dimensional image or environment that can be interacted within a seemingly real or physical way by a person using special electronic equipment like a helmet with a screen inside or gloves fitted with sensors”
VIRTUAL REALITY IS CHARACTERISED BY THREE DEFINING FACTORS 1. Immersive - In virtual reality we often come across the term known as “immersion”. Immersion is a concept
where one is involved in an activity with such a high focus that it causes a lack of awareness of time and of the real world , as well as a sense of “being” in the simulated environment. The perception of immersion is created by surrounding one in an absorbing environment which keenly engages the sense of sight and hearing. This in turn gives a feeling of being physically present in an artificial digital environment.
2. Spatial - Virtual reality is spatial, i.e the experience provided by objects and the environment can be represented in three dimensions. Spatial immersion in a virtual reality application is a perception of being present in an artificial digital world surrounded by virtual people and objects.
3. Instant Feedback - Virtual reality provides real time multi-sensory feedback on an action initiated by the user. This feature is especially useful for gaming applications.
THE TOOLS WHICH PROVIDE A VR ENVIRONMENT ARE a) CAVE (Cave Automatic Virtual Environments) – where the user is within a room; all the walls as well as
floors are simulated as projection or display screens. User can wear 3D glass and feels as floating in the projected world. CAVE environments are rather expensive; they need to have specific designated space and cannot be moved easily. However they can support multiple users once set up.
b) HMD (Head Mounted Displays) – VR glasses or other head mounted displays which are used typically with headphones can produce the visceral feeling of actually being present in an artificial world. Facebook’s Oculus Rift is an example of HMD.
THE VIRTUAL REALITY DEVICES AVAILABLE IN THE MARKET: a) Oculus Rift – Developed by Palmer Luckey, it was the first relatively affordable VR head mounted device
which was developed as a crowdfunded project (in Kickstarter). The device was sold to Facebook for an amount of $2.4 billion in 2014.
b) Samsung Gear VR – Is a smartphone assisted head mounted virtual reality device that uses the Oculus platform. A Samsung phone across a range of models supports this VR device.
c) HTC Vive – Is a computer assisted head mounted Virtual Reality device which provides a panoramic (360 degree) immersive experience which uses laser position sensors to track movement.
d) Google Cardboard – It is a VR platform developed by Google in 2014 for providing immersive experience. It is made of cardboard (or plastic), because of its affordable price, it enables virtually anyone with a
International Journal of Advance and Innovative Research Volume 6, Issue 1 (III): January - March, 2019
81
ISSN 2394 - 7780
smartphone to dive into the world of virtual reality. Google cardboard can be used along with the other popular google apps like Google Earth, Google Street View and Google expedition apps.
APPLICATIONS OF VIRTUAL REALITY IN INDUSTRY Over the course of last two decades virtual reality technology has been used with good effect across span industries. Though the focus of this paper is on education, here is a brief overview of VR applications which have been used with relatively high success across the industry landscape.
Industry Application(s) Healthcare Application of Virtual Reality technologies in healthcare sector is changing the way
patients are diagnosed and treated. Virtual reality applications have been used for restoring low vision, enhancing care for the elderly, aid in the recovery process post traumatic brain injury, watch surgical procedures for training and in autism therapy.
Music Virtual Reality Music applications give the listeners a real-life concert experience while being at the comfort of their homes. A simulated reality can make one feel that they have a front-row seat or even a special place on-stage during a concert of their favourite band or rock star, without being at the show in person.
Retail Virtual reality is created to enhance shopping experience, which can be both in-store or within the walls of a consumer’s home. For eg. while buying outdoor apparel, VR handset can simulate the environment of a hiking trail or being in a national park. VR applications are also used for simulating home settings for prospective buyers of furniture; say for example how a new couch will look in the living room of a buyer.
Sports VR in sports is used to train sports professionals, umpires and referees. Eye tracking data recorded in a virtual reality experiments are used to analyse performance and injury related data. Virtual lessons for fans are also enabled through this technology. Broadcasters sell virtual tickets to games which the viewer can watch from their home using a VR handset (similar to the example of music concert)
Travel Google Street view which uses virtual reality enables one to have a realistic 3 dimensional view of any place in the world from the confines of a home. Hotel related VR applications enables prospective visitors to get a real life experience of the hotel rooms, views outside the window, room’s facilities and hotel’s other entertainment related facilities before making a selection.
Media and Entertainment
VR is used to create more engaging experiencing during the consumption of a media. VR apps can transport a viewer within a movie to create an unmatched experience. Viewers can become virtual guests during their favourite TV shows or get virtually transported to areas from where news is being reported. Advertisers are able to create more meaningful and personalised content by tracking the head movement of viewers watching an ad through a VR headset.
Museum and Theme-parks
VR has great applications in areas such as museums and theme-parks. Theme park VR apps enable visitors to have a surreal experience in line with the theme, like shooting aliens or riding with prehistoric creatures like dinosaurs. Museum related VR solutions can create an experience of visiting a medieval town or getting transported to prehistoric era.
Automobile Marketing
Virtual Reality is transforming the way people interact with automobile dealers. VR Handsets are used to let prospective buyers take a virtual test drive. It can simulate different environments like mountainous terrain, seaside drives, and drive across countryside to give the buyers a realistic feel. They can also simulate unrealistic scenarios like a high speed drive which is not quite possible during a routine test drive.
Gaming Gaming is by far the most advanced industry as far as usage of Virtual reality technology is concerned. VR provides an entirely absorbing experience by creating a connection between the game and its players. The immersive experience creates an illusion that the player is within a game controlling situations within it. Top electronics players like Samsung, Sony, Microsoft, HTC and Google are still investing heavily in device and content in this area. VR headsets related to gaming are growing at a rate of
International Journal of Advance and Innovative Research Volume 6, Issue 1 (III): January - March, 2019
82
ISSN 2394 - 7780
more than 25%. According to estimates, today around 60% of all virtual revenue comes from gaming industry.
Military and Defence
Virtual reality in military is used to simulate combat situations. The technology is used to train soldiers in dangerous situations which are risky to recreate in real training situations like for eg mine detection. Another use is combat visualisation in which soldiers equipped with virtual reality glasses create a 3D depth of illusion of simulated battlefield terrains.
VIRTUAL REALITY IN EDUCATION SECTOR Virtual environment are more effective than other digital media because the brain recognises virtual world as real and processes information much faster than other digital media. This facilitates transfer of knowledge with much greater efficiency and enhances ability of acquiring knowledge, especially practical knowledge. Virtual environments are used most successfully in areas which require rapid prototyping, design, training and education. The focus of this paper is on understanding the prevalent applications, potential and challenges of implementing VR solutions in the education sector
Virtual Reality is a powerful medium in education because it provides an environment that allows the student to experience scenarios and situations rather than merely imagining them. In traditional instructional environments which have been followed since time immemorial, students learn by assimilation, in most cases by listening to an instructor explaining a subject. Modern educational thinking proposes that students are able to grasp, retain, and master new knowledge in a learning-by-doing situation. Virtual environments have been valued as engaging and motivating for learners especially those who have an inclination for non-traditional learning styles (Bricken M, 1991)
The experiential nature of virtual reality aligns with a constructivist approach to learning. Constructivism is a philosophy of learning that states that humans acquire knowledge by learning from their experiences. The theory states that the learner attempts to assimilate new experiences within a framework of their already established world model. If the learner cannot successfully assimilate new information they modify their existing world view to accommodate the new experience. This can be contrasted with the traditional view which follows the convention that makes learning a passive accumulation or acceptance of facts, through a one way method of communication from a teacher. Education through virtual and immersive learning is most favourable in this this philosophy of learning. Constructivism mode of learning is moving towards a radically new approach where a whole curriculum is reinvented by students through a gently guided discovery method of learning.
The experience brought by virtual reality applications in classrooms is unparalleled and has the potential to create a tectonic shift in the way students have been taught over the course of last 300 years or so. Through a VR application, a student can experience standing on an asteroid, witness a historic battle, go inside an atom’s nucleus or flow through our blood stream to see the inner workings. VR can be taught in situations where learning can be dangerous or impossible due to geographical constraints. VR also offers the possibility to train several people at the same time with less tutoring efforts. VR can improve education by
a. Reducing the attention gap (typically we forget around 80% of what we hear within a day but remember 90% of what we do in a real or simulated environment)
b. Increased student attention and motivation
c. Improved and instant reward mechanism with a focus on positive stimulation
d. Inspire creative pedagogy as opposed to learning by rote and greater collaboration by providing an integrated environment.
LITERATURE RESEARCH OF APPLICATION OF VR IN EDUCATION VR in education sector have focused on the huge potential of immersive displays which makes the user interface for learner natural and seamless to use. The introduction of projection based VR systems as opposed to one person VR (most often with bulky HR sets) has made it possible to simulate displays for multiple students simultaneously. There have been quite a few VR Research endeavours which have been conducted mainly with an intention to test the potential of virtual reality as a medium of education and its corresponding efficiency in learning. In this section the paper provides a literature survey covering areas where VR technology has been successfully applied in the education sphere over the course of last two decades.
International Journal of Advance and Innovative Research Volume 6, Issue 1 (III): January - March, 2019
83
ISSN 2394 - 7780
David M. Markowitz, Rob Laha, Brian P. Perone, Roy D. Pea, Jeremy N. Bailenson Stanford University, (2018): In a study, published in Nov 2018, in Frontiers in Psychology, researchers at Stanford and the University of Oregon discovered that VR can be a powerful tool for creating awareness and changing attitudes/behaviours on environmental changes. In one such test, concerning high school students in a marine biology class at Sacred Heart Preparatory School in Atherton, California, each student took on a virtual identity of a pink coral living on a rocky underwater reef throbbing with a diverse marine life comprising of urchins, snails and other sea creatures. The end of this simulation fast-forwarded to what the reef will look like after 100 years as a result of ocean acidification caused by environmental pollution. The (100 year) future ocean environment simulated a situation where the brilliantly varied and colourful species have disappeared. They have been replaced by slimy green algae and silver Salema Porgy -- a fish which is likely to thrive in acidic waters. Eventually, the viewer's virtual coral skeleton disintegrates as a result of manmade ocean acidification. The researchers found that experiencing a simulation of ocean acidification's effects spurred meaningful gains in people's understanding and retention of the issue.
Stojsic, Dzigurski, Maricic, Vivic and Vuckovic, University of Novi Sad, (2017): The paper presented applications of Virtual Reality mobile apps that can be used together with Google Cardboard head mounted displays for teaching geography to students. Due to its relatively lower cost, mobility and simplicity to use, Google cardboard as a VR platform was proposed for teaching geography to children over the age of 7. Some of the common google applications that were used for this purpose were a) cardboard application b) Google street view applications c) mobile apps like Titans of Space d) cardboard camera app and e) Google expedition apps (as part of expedition pioneer programs) for taking virtual tours. The authors concluded that the use of such immersive applications increased interest and learnability of students in geography, as opposed to traditional method of imparting knowledge in a classroom setting.
Chun Yu, Sahami K, Denn, Sahami V, Sessions Larry, State University of Denver, (2016): In order to understand the impact of immersive experience learning, a pre and post-test effectiveness study was conducted on 781 college students of lectures on moon systems of the solar system. The students were divided into a group who received lectures in an immersive environment (a full dome planetarium) and a control group who received classroom based lectures. After the experiment it was found that those who learned in an immersive environment in the planetarium had a much higher retention rate than the control group who received lecture in a regular classroom.
Casu, Spano, Sorrentino, Scateni, University of Cagliary, (2015) The researchers measured the efficacy of learning Art-History by introducing a VR tool which was named as RiftArt. Through this device teachers could configure virtual museum rooms with artworks models inside and make enhancements on them. The application was visible both on large screen displays as well as head mounted devices. The researchers established that this methodology advanced the learning (as opposed to traditional methods) and also increased motivation of students to study Art-History
Ali, Ullah, Alam, Aftab and Jamal, (2014) The researchers developed a 3D interactive virtual chemistry laboratory (VCL) for conducting chemistry experiments for high school students. The aim of VCL was to provide an immersive environment to users by using 3D interaction with chemistry related items and to simulate their high school chemistry experiments in a virtual setting. The research revealed that students found VCL useful and efficient for practical learning of chemistry. The VCL also aided in greater collaboration among students. The researchers proposed that VCL is ideally suited for those educational institutions which do not have adequate funds to set up a full scale chemistry laboratory.
N Sala, (2001) At the Faculty of Architecture at University of Lugano (Mendrisio, Switzerland), a course name Mathematical Thought introduced basic concepts of geometry and mapped it to architectural concepts (e.g., symmetry, proportions, the golden ratio, fractal geometry and their complexity in the study of the urban landscape). Virtual reality, multimedia and graphics was used to explain concepts of complex architectural shapes like hypersurfaces; most of these concepts were much easier to grasp when viewed in a virtual setting as 3 dimensional models.
Foundation of Hellenic World (FHW), (2000), is a cultural heritage institution located in Athens, its mission is to preserve and disseminate Hellenic culture and create an awareness of the contribution of ancient Greece in development of modern civilisation. FHW cultural centre’s design, architectural and electronics displays are one of the most advanced in the world. The site housed two projection based immersive VR systems which act as educational tool as well as an instrument for historic research, simulation and reconstruction. In the ancient city of Miletus, reconstructed virtually in a digital environment participants can walk through virtual public
International Journal of Advance and Innovative Research Volume 6, Issue 1 (III): January - March, 2019
84
ISSN 2394 - 7780
buildings, explore the city over 3000 years old, view the architectural glories of the past and explore life from the eyes of the city’s denizens –their customs, habits and way of life.
Youngblut, (1998) Conducted extensive research on educational uses of Virtual Reality in the decade of 1990s. He found that Virtual Reality presents unique capabilities and is perfectly useful in aspects related to constructivist learning. The role of a teacher is changed to facilitator in VR environments and at the same time students also enjoyed them more than conventional way of being taught through lectures. He also found potential opportunities for increasing educational effectiveness for special needs students.
Dede C Salzman, Loftin RB, 1996 (Maxwell World VR Application) – An application developed for children aged 9-15 years by Dede and co-workers. A small scale VR application occupying around 1 meter cube in area, the application taught students about electrostatic forces and electrical fields. The virtual space was provided using a head mounted device having in-built menus. Students were able to position electric charges within the space; view and interact with resultant electromagnetic field. Other similar VR applications developed by the same team taught concepts of physics like Newtonian mechanics, atomic and molecular structures.
THE CHALLENGES IN IMPLEMENTING VR APPLICATIONS IN INDIAN EDUCATION SECTOR Cost: The cost of virtual reality infrastructure (Head mounted device or Virtual environments) are very high
even by western standards. In India, only the most elite private schools can even think of affording high quality VR systems accompanied with infrastructure and content. The high end technical colleges (like IIT’s, National Institute of Technologies) which are funded generously by government of India may afford the budget for running VR systems for one or two select courses at most. The cost of VR can only reduce when there is mass adoption (like what happened for smartphones) but the current trend of global adoption does not indicate that.
Content: VR needs engaging and compelling content to be effective to leaners. Resources to build such highly engaging content are extremely rare; most of them are employed by gaming companies where they earn astronomical sums of money. Such talents in India can be only found in metropolitan cities employed by corporates. It is almost impossible to acquire such talent from the meagre budgets and low margins on which Indian schools and colleges operate.
Technology is Out of Reach: Virtual Reality applications need high end graphics in the computer on which it runs, it is estimated that only 1% of the computers in the whole world has graphics which will allow a virtual reality application to run on it effectively. In India the percentage is likely to be far lower. Oculus Rift recommends a video card in the computer which is available only in very few select high end stores in only the big metropolitan cities of India. Such high requirements of accompanying technology in order to run a virtual reality platform drastically reduce its changes of being introduced in Indian educational institutes.
Bandwidth: Virtual Reality needs a fully functional 5G speed for its optimal use. India does not have 5G network yet which makes VR solution virtually infeasible to be implemented here. Though India has one of the highest coverage of 4G LTE network in the world (at 84%), it is right at the bottom in terms of download speed. VR applications rely heavily on simulated digital environment, with low download speeds user will get distracted and the immersion effect which is crucial for a virtual reality experience will not happen.
Teacher awareness/Educator training: Most Indian teachers are yet to adopt digital training methods in their classroom. There is a lack of awareness, training as well as a problem of mind-set in adopting to new methods of education. A few private schools in metropolitan cities have made digital education a priority by introducing smartphone apps, tablets, e-learning, mobile and video based learning in their pedagogy; however a vast majority of India still relies on age old method of one way lecture within the confines of a classroom. Mass scale adoption of technology as radical as VR is still decades away in Indian context.
Students Exposure: There is lack of awareness and exposure to the new methods of education among the students. In India one can find that students are exposed to different medium of learning. The content of the syllabus such as ICSE, CBSE, State Board is different. In this context the exposure of students and the availability of infrastructure facilities related to digital education is limited and not available in most of the rural areas.
Operations and Maintenance: Unless India makes indigenous Virtual Reality equipment’s, we still have to import the devices and associated infrastructure. Apart from high implementations costs, it requires resources with knowledge for maintenance, operations, storage and upgradation. Those resources are not available in the country because of extremely low adoption rates of virtual technology platforms, only a
International Journal of Advance and Innovative Research Volume 6, Issue 1 (III): January - March, 2019
85
ISSN 2394 - 7780
handful of them may be employed in corporate sector (mostly engaged in developing gaming related applications).
CONCLUSION In this paper, the authors have endeavoured to bring out the aspects of the technology of Virtual Reality from a holistic perspective. The idea of VR roughly started nearly 90 years ago and again appeared in mainstream society before firmly establishing itself in multiple industries ranging from retail to healthcare. Additionally the paper also analyses the applicability of virtual reality in the education sector and carries out a literature research on successful implementation of VR in educational institutions over the course of last 20 years or so. The authors also tried to bring out the factors which pose a serious challenge to large scale adoption of VR in Indian educational context. Based on this comprehensive analysis, the authors believe that Virtual Reality applications in Indian educational context will require some time before being adopted on a mass scale. However there is no denying to the fact the virtual reality as a medium is much more effective than traditional method of pedagogy followed in classrooms because it gives one an immersion effect which increases attention and retention. The authors look forward to a near future when high costs of VR applications will come down and consequently Indian students and teacher community benefit from Virtual Reality technology.
SELECTED REFERENCES 1. Ali, Numan & Ullah, Sehat & Alam, Aftab & Rafique, Jamal. (2014). 3D Interactive Virtual Chemistry
Laboratory for Simulation of High School Experiments.
2. Casu, Andrea et al. “RiftArt: Bringing Masterpieces in the Classroom through Immersive Virtual Reality.” Eurographics Italian Chapter Conference (2015).
3. Chun Yu, Sahami K, Denn, Sahami V, Sessions Larry, 2016- Immersive Planetarium Visualizations For Teaching Solar System Moon Concepts To Undergraduates, Journal of Astronomy & Earth Sciences Education, Volume 3, No 2, Dec 2016
4. David M. Markowitz, Rob Laha, Brian P. Perone, Roy D. Pea, Jeremy N. Bailenson. Immersive Virtual Reality Field Trips Facilitate Learning About Climate Change. Frontiers in Psychology, 2018; 9 DOI: 10.3389/fpsyg.2018.02364
5. Dede C Salzman, M C & Loftin RB (1996), The development of a virtual world for learning Newtonian mechanics. In P Brusilovsky, P Kommers, and N Streitz. Multimedia, Hypermedia and Virtual Reality. (pp 87-106), Berlin : Springer/Verlag
6. English Oxford Living Dictionaries, Available at url -https://en.oxforddictionaries.com/ definition/virtual_reality
7. Hollywood Flashback : “The lawnmower Man” Explored Virtual Reality in1992, published in www.hollywoodreporter.com on 22nd March , 2018. ( URL - https://www.hollywoodreporter.com/ news/26-years-lawnmower-man-explored-virtual-reality-1992-1095678)
8. India has among the Top 4G LTE Coverage at 84 percent, but ranks 109 in terms of download speeds in the world – Aditya Madanapalle, published in www.firstpost.com on Dec 14, 2017( URL https://www.firstpost.com/tech/news-analysis/india-has-among-the-top-4g-lte-coverage-but-among-the-slowest-download-speeds-in-the-world-4256183.html)
9. Lartigue, J., Scoville, T. & Pham, M. (2014). Promoting K-8 Learning using Oculus Rift: Employing Virtual Reality to Increase Learning Outcomes in Elementary Biology. In T. Bastiaens (Ed.), Proceedings of World Conference on E-Learning (pp. 1100-1105). New Orleans,
10. Merriam Webster (2015) Online English Dictionary. Available at http://www.merriam-webster.com/ dictionary/virtualreality
11. M Bricken, Virtual Reality Learning Environments; Potentials and Challenges, Computer Graphics, vol 25, pp 178-184, 1991
12. N. Sala, Teaching mathematics using the new media, Proceedings CIEAEM53: Mathematical Literacy in the Digital Era, Ghisetti e Corvi Editori, Verbania, Italia, 2001, 56 – 63
13. Pygmalion’s Spectacles – Probably the First Comprehensive and Specific Fictional Model for Virtual Reality, published in www.historyofinformation.com (URL - http://www.history of information.com/detail.php?entryid=4543)
International Journal of Advance and Innovative Research Volume 6, Issue 1 (III): January - March, 2019
86
ISSN 2394 - 7780
14. Roussou Maria (2000), Immersive Interactive Virtual Reality and Informal Education, Foundation of the Hellenic World. Published in proceedings of i3 Spring Days 2000. (Workshop on Interactive Learning Environments for Children)
15. Stojšić, Ivan & Ivkov-Dzigurski, Andjelija & Maričić, Olja & Ivanović Bibić, Ljubica & Đukičin Vučković, Smiljana. (2017). Possible Application of Virtual Reality in Geography Teaching. Journal of Subject Didactics. 1. 83-96. 10.5281/zenodo.438169.
16. The Complete Guide to Virtual Reality- everything you need to get started. Published in The Guardian, November 2016, (URL : https://www.theguardian.com/technology/2016/nov/10/virtual-reality-guide-headsets-apps-games-vr)
17. Virtual Reality Fastest Growing Media and Entertainment Category- by Chuck Martin (Staff Writer) published in www.mediapost.com (Connected Thinking). On June 7, 2018 (URL -https://www.mediapost.com/publications/article/320398/virtual-reality-fastest-growing-media-and-entertai.html
18. Virtual Reality Still has 5 Big Problems to Overcome – by Kayla Mathews in www.makeuseof.com (Technology Explained Section), published on June 8, 2016. (URL -https://www.makeuseof.com/ tag/virtual-reality-still-5-big-problems-overcome/)
19. Youngblut C, 1997. Educational Uses of Virtual Technology, Executive Report, Reprinted from Educational Uses of Virtual Technology, Alexandria, VA. Institute for Defence Analysis, 1998. VR in the Schools, 3 (1)
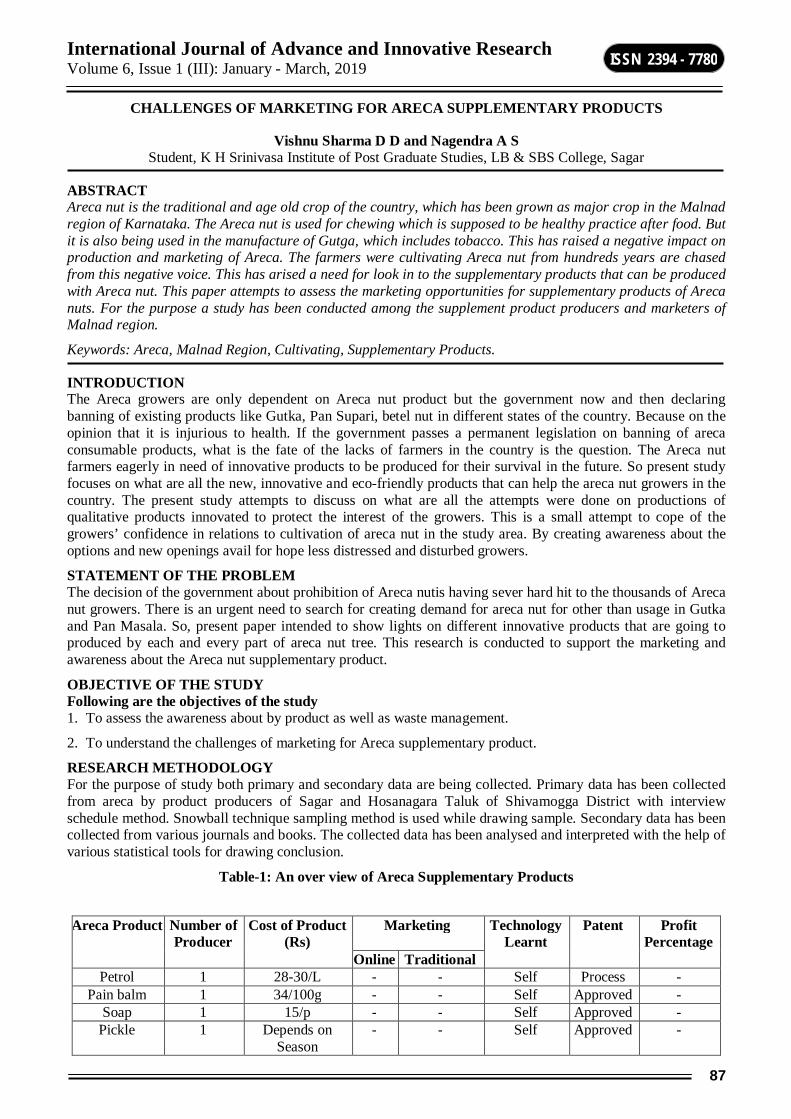
International Journal of Advance and Innovative Research Volume 6, Issue 1 (III): January - March, 2019
87
ISSN 2394 - 7780
CHALLENGES OF MARKETING FOR ARECA SUPPLEMENTARY PRODUCTS
Vishnu Sharma D D and Nagendra A S Student, K H Srinivasa Institute of Post Graduate Studies, LB & SBS College, Sagar
ABSTRACT Areca nut is the traditional and age old crop of the country, which has been grown as major crop in the Malnad region of Karnataka. The Areca nut is used for chewing which is supposed to be healthy practice after food. But it is also being used in the manufacture of Gutga, which includes tobacco. This has raised a negative impact on production and marketing of Areca. The farmers were cultivating Areca nut from hundreds years are chased from this negative voice. This has arised a need for look in to the supplementary products that can be produced with Areca nut. This paper attempts to assess the marketing opportunities for supplementary products of Areca nuts. For the purpose a study has been conducted among the supplement product producers and marketers of Malnad region.
Keywords: Areca, Malnad Region, Cultivating, Supplementary Products.
INTRODUCTION The Areca growers are only dependent on Areca nut product but the government now and then declaring banning of existing products like Gutka, Pan Supari, betel nut in different states of the country. Because on the opinion that it is injurious to health. If the government passes a permanent legislation on banning of areca consumable products, what is the fate of the lacks of farmers in the country is the question. The Areca nut farmers eagerly in need of innovative products to be produced for their survival in the future. So present study focuses on what are all the new, innovative and eco-friendly products that can help the areca nut growers in the country. The present study attempts to discuss on what are all the attempts were done on productions of qualitative products innovated to protect the interest of the growers. This is a small attempt to cope of the growers’ confidence in relations to cultivation of areca nut in the study area. By creating awareness about the options and new openings avail for hope less distressed and disturbed growers.
STATEMENT OF THE PROBLEM The decision of the government about prohibition of Areca nutis having sever hard hit to the thousands of Areca nut growers. There is an urgent need to search for creating demand for areca nut for other than usage in Gutka and Pan Masala. So, present paper intended to show lights on different innovative products that are going to produced by each and every part of areca nut tree. This research is conducted to support the marketing and awareness about the Areca nut supplementary product.
OBJECTIVE OF THE STUDY Following are the objectives of the study 1. To assess the awareness about by product as well as waste management.
2. To understand the challenges of marketing for Areca supplementary product.
RESEARCH METHODOLOGY For the purpose of study both primary and secondary data are being collected. Primary data has been collected from areca by product producers of Sagar and Hosanagara Taluk of Shivamogga District with interview schedule method. Snowball technique sampling method is used while drawing sample. Secondary data has been collected from various journals and books. The collected data has been analysed and interpreted with the help of various statistical tools for drawing conclusion.
Table-1: An over view of Areca Supplementary Products
Areca Product Number of Producer
Cost of Product (Rs)
Marketing
Technology Learnt
Patent Profit Percentage
Online Traditional Petrol 1 28-30/L - - Self Process -
Pain balm 1 34/100g - - Self Approved - Soap 1 15/p - - Self Approved -
Pickle 1 Depends on Season
- - Self Approved -
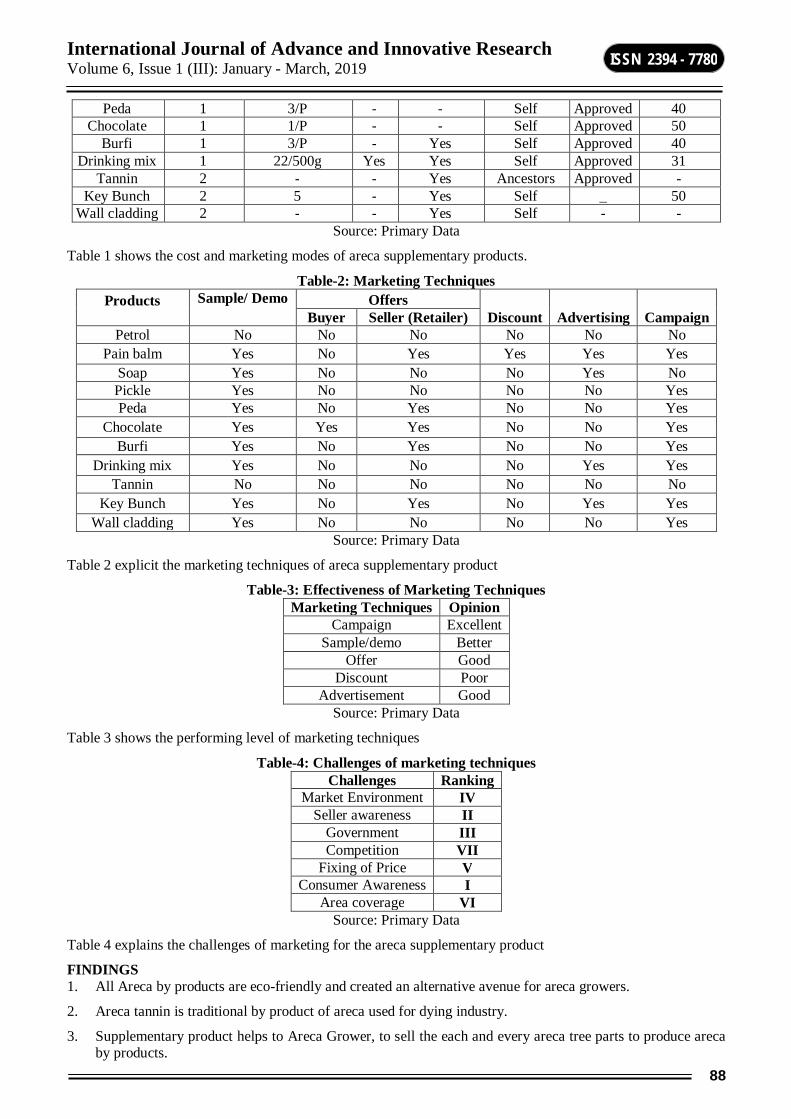
International Journal of Advance and Innovative Research Volume 6, Issue 1 (III): January - March, 2019
88
ISSN 2394 - 7780
Source: Primary Data
Table 1 shows the cost and marketing modes of areca supplementary products.
Table-2: Marketing Techniques Products
Sample/ Demo Offers
Discount Advertising Campaign Buyer Seller (Retailer) Petrol No No No No No No
Pain balm Yes No Yes Yes Yes Yes Soap Yes No No No Yes No Pickle Yes No No No No Yes Peda Yes No Yes No No Yes
Chocolate Yes Yes Yes No No Yes Burfi Yes No Yes No No Yes
Drinking mix Yes No No No Yes Yes Tannin No No No No No No
Key Bunch Yes No Yes No Yes Yes Wall cladding Yes No No No No Yes
Source: Primary Data
Table 2 explicit the marketing techniques of areca supplementary product
Table-3: Effectiveness of Marketing Techniques Marketing Techniques Opinion
Campaign Excellent Sample/demo Better
Offer Good Discount Poor
Advertisement Good Source: Primary Data
Table 3 shows the performing level of marketing techniques
Table-4: Challenges of marketing techniques Challenges Ranking
Market Environment IV Seller awareness II
Government III Competition VII
Fixing of Price V Consumer Awareness I
Area coverage VI Source: Primary Data
Table 4 explains the challenges of marketing for the areca supplementary product
FINDINGS 1. All Areca by products are eco-friendly and created an alternative avenue for areca growers.
2. Areca tannin is traditional by product of areca used for dying industry.
3. Supplementary product helps to Areca Grower, to sell the each and every areca tree parts to produce areca by products.
Peda 1 3/P - - Self Approved 40 Chocolate 1 1/P - - Self Approved 50
Burfi 1 3/P - Yes Self Approved 40 Drinking mix 1 22/500g Yes Yes Self Approved 31
Tannin 2 - - Yes Ancestors Approved - Key Bunch 2 5 - Yes Self _ 50
Wall cladding 2 - - Yes Self - -

International Journal of Advance and Innovative Research Volume 6, Issue 1 (III): January - March, 2019
89
ISSN 2394 - 7780
4. Areca petrol is in introduction stage so there is no market. Its cost of productions will be estimated Rs.28 to 30. The government of India granted patent to this product.
5. Areca pain balm also in research stage with the patent ownership. The cost of production is forecasted Rs.34per 100grams.
6. Areca soap is ready for launching in the market.
7. Areca pickles already accepted by the customers and cost of production depend on season.
8. Areca peda and burfi have a huge demand in the market.
9. Areca drinking mixavailablein online & offline markets.
10. Areca wood artistic works are attracting customers.
11. All areca supplementary products are introduced in market by giving sample and showing demo
12. For some products like peda, bufri, pain balm producers giving offers for retails to display and sell in their outlets
13. Producers of areca supplementary products selecting the way of campaign to create awareness and market.
14. Biggest challenge for marketing is awareness in consumer and sellers.
15. Government support and Dynamic Environment of market creating an obstacle of promotion.
16. It is a waste management technique which generates revenue and future prospects for areca growers.
SUMMARY AND CONCLUSION They Areca nut producers are facing severe volatility in the prices of Areca as it has been used traditionally to chew with tobacco. The area which has also got somemedicinal value as well as the characters which can be consume for various purposes. After invention of areca tea, a revolution is taking place in identification of different usurer of areca. The bye products or supplementary productsof areca are not having any ill effects as it has no linkage with tobacco. For several and prosperity of areca nut grower, there is an urgent need of creating a market for these supplementary products. Various marketing associations of areca which have establish them self strongly in the state of Karnataka needs to emphasise their marketing strategies towards these supplementary products. Modern innovations need help in the areas of technological support, finance and marketing institutions. There is an urgent need of research and technical support from the government, Areca co-operative marketing society and institution like CFTRI (Central Food Technological Research Institute) to invest the positive uses of Areca nut and the opportunity of discovering supplementary products of areca.
REFERENCES https://www.nature.com/articles/
http://www.arecacapitol.com
Mohan kumar G. C. “ A study of short areca Fibber Rain force PF composites”, WCE 2008,ISBN:978-988-17012-3-7.
Satyanarayana K. G., Sukumaran K, MukherjeeR. S, Pavithran C. and PiUaiS. G. K. 1990, “Natural fiber-polymer composites” cement and concrete composites 12,pp.117-136.

International Journal of Advance and Innovative Research Volume 6, Issue 1 (III): January - March, 2019
90
ISSN 2394 - 7780
A REVIEW ON EVOLUTION OF TECHNOLOGY ADOPTION THEORIES AND MODELS
Aishwarya V. Hittanagi1 and Dr. K. S. Habeebur Rahman2 Assistant Professor1 and Associate Porofessor2, JNN College of Engineering, Shimoga
ABSTRACT This paper contributes to the existing literature by comprehensively reviewing the concepts, applications and development of technology adoption models and theories based on the literature review. Research in this domain has evolved over time by conceptualizing new factors which can better explain the phenomena of technology adoption resulting in development of several theories and models. This process of evolution has been primarily driven by rapidly changing technology scenario and has led to new factors which are grounded in theory from other disciplines. In this paper, we strive to trace the evolution of various theories and models of technology adoption over the years with the objective of presenting an overview of this important domain to the researchers who intend to apply these models in their research. We also look at need for identification of new factors in the technology adoption models in wake of rapid technology changes in future. The models reviewed in this paper are Diffusion of Innovation Theory, Theory of Reasoned Action (TRA), Theory of Planned Behaviour (TPB), The Social Cognitive Theory (SCT), Technical Adoption Model (TAM), The Motivational Model and the UTAUT model.
These reviews will shed some light and potential applications for technology applications for future researchers to conceptualize, distinguish and comprehend the underlying technology models and theories that may affect the previous, current and future application of technology adoption.
Technology adoption is one of the mature areas of is research. Research in this domain has evolved over time by conceptualizing new factors which can better explain the phenomena of technology adoption resulting in development of several theories and models. This process of evolution has been primarily driven by rapidly changing technology scenario and has led to new factors which are grounded in theory from other disciplines. In this paper, we strive to trace the evolution of various theories and models of technology adoption over the years with the objective of presenting an overview of this important domain to the researchers who intend to apply these models in their research. We also look at need for identification of new factors in the technology adoption models in wake of rapid technology changes in future.
Keywords: technology adoption models, TRA, TBP, SCT, TAM, and UTAUT.
1. INTRODUCTION Technology adoption is one of the mature area of research in information systems. Carr (1999) has defined technology adoption as the 'stage of selecting a technology for use by an individual or an organization'. With rapid strides being made in technology innovations in every conceivable domain, the issues related to technology adoption have gained increasing prominence in recent times. Huge investments are made by organizations and governments for introducing new technologies that have the potential of bringing a paradigm shift in the life-style of the users. However, these investments may not yield results if the innovations are not adopted by the intended users. Initial failure of diffusion of Electronic Health Record (EHR) systems in US (Simon et al. 2007) and Enterprise Resource Planning (ERP) systems (Addo & Helo 2011) are some of the examples of the technologies that failed to take off in spite of promising start. More recent examples are that of cloud computing (Low et al. 2011) and e-Government (Venkatesh et al. 2012) that were promising in respect of the advantages they offered to the users but still have not been adopted by the users to the extent expected.
Several studies have revealed that technology adoption is not related to the aspects of technology alone but has evolved as a much more complex process involving dimensions of user attitude and personality (Venkatesh et al. 2012), social influence (Ajzen and Fishbein 1975), trust (Gefen et al. 2003) and numerous facilitating conditions (Thompson et al. 1991). It is necessary to understand the evolution of this research area in Information Systems and look at future research opportunities.
In this study, we trace the evolution of research in the area of technology adoption over the years by means of a review of the existing literature on the subject. The study is undertaken with two objectives. The first objective of this paper is to present an overview of this important domain to the researchers who intend to apply these models in their research. Second objective of the study is to look at the need to identify new constructs that may possibly be used in explaining adoption of emerging technologies such as e-government, cloud computing, mobile government etc. and further build the theoretical foundations of the existing body of knowledge.
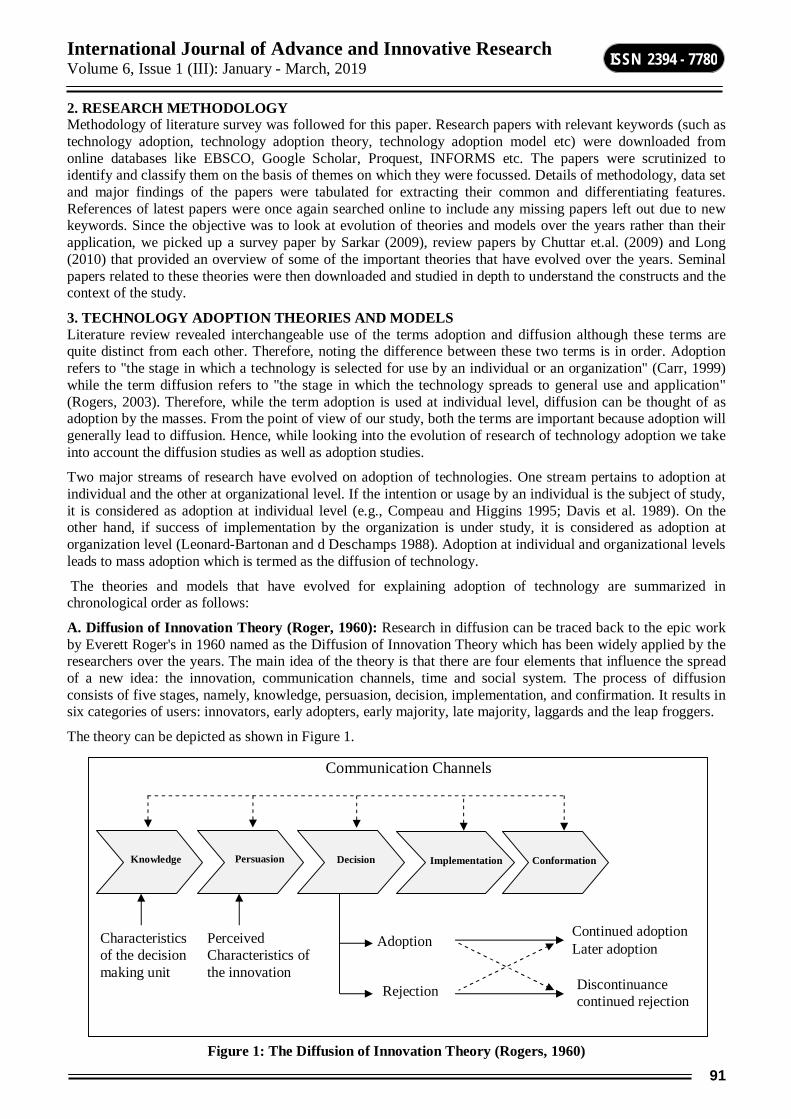
International Journal of Advance and Innovative Research Volume 6, Issue 1 (III): January - March, 2019
91
ISSN 2394 - 7780
2. RESEARCH METHODOLOGY Methodology of literature survey was followed for this paper. Research papers with relevant keywords (such as technology adoption, technology adoption theory, technology adoption model etc) were downloaded from online databases like EBSCO, Google Scholar, Proquest, INFORMS etc. The papers were scrutinized to identify and classify them on the basis of themes on which they were focussed. Details of methodology, data set and major findings of the papers were tabulated for extracting their common and differentiating features. References of latest papers were once again searched online to include any missing papers left out due to new keywords. Since the objective was to look at evolution of theories and models over the years rather than their application, we picked up a survey paper by Sarkar (2009), review papers by Chuttar et.al. (2009) and Long (2010) that provided an overview of some of the important theories that have evolved over the years. Seminal papers related to these theories were then downloaded and studied in depth to understand the constructs and the context of the study.
3. TECHNOLOGY ADOPTION THEORIES AND MODELS Literature review revealed interchangeable use of the terms adoption and diffusion although these terms are quite distinct from each other. Therefore, noting the difference between these two terms is in order. Adoption refers to "the stage in which a technology is selected for use by an individual or an organization" (Carr, 1999) while the term diffusion refers to "the stage in which the technology spreads to general use and application" (Rogers, 2003). Therefore, while the term adoption is used at individual level, diffusion can be thought of as adoption by the masses. From the point of view of our study, both the terms are important because adoption will generally lead to diffusion. Hence, while looking into the evolution of research of technology adoption we take into account the diffusion studies as well as adoption studies.
Two major streams of research have evolved on adoption of technologies. One stream pertains to adoption at individual and the other at organizational level. If the intention or usage by an individual is the subject of study, it is considered as adoption at individual level (e.g., Compeau and Higgins 1995; Davis et al. 1989). On the other hand, if success of implementation by the organization is under study, it is considered as adoption at organization level (Leonard-Bartonan and d Deschamps 1988). Adoption at individual and organizational levels leads to mass adoption which is termed as the diffusion of technology.
The theories and models that have evolved for explaining adoption of technology are summarized in chronological order as follows:
A. Diffusion of Innovation Theory (Roger, 1960): Research in diffusion can be traced back to the epic work by Everett Roger's in 1960 named as the Diffusion of Innovation Theory which has been widely applied by the researchers over the years. The main idea of the theory is that there are four elements that influence the spread of a new idea: the innovation, communication channels, time and social system. The process of diffusion consists of five stages, namely, knowledge, persuasion, decision, implementation, and confirmation. It results in six categories of users: innovators, early adopters, early majority, late majority, laggards and the leap froggers.
The theory can be depicted as shown in Figure 1.
Figure 1: The Diffusion of Innovation Theory (Rogers, 1960)
Communication Channels
Knowledge Persuasion Decision Implementation Conformation
Characteristics of the decision making unit
Perceived Characteristics of the innovation
Adoption
Rejection
Continued adoption Later adoption
Discontinuance continued rejection
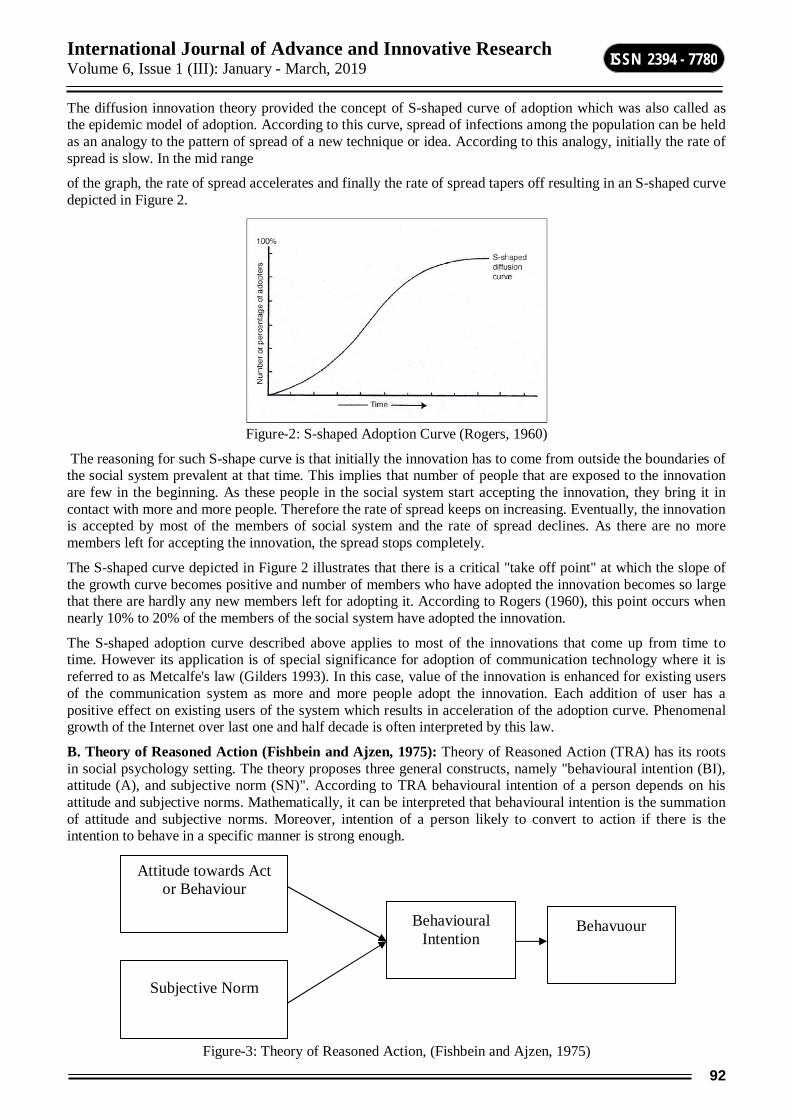
International Journal of Advance and Innovative Research Volume 6, Issue 1 (III): January - March, 2019
92
ISSN 2394 - 7780
The diffusion innovation theory provided the concept of S-shaped curve of adoption which was also called as the epidemic model of adoption. According to this curve, spread of infections among the population can be held as an analogy to the pattern of spread of a new technique or idea. According to this analogy, initially the rate of spread is slow. In the mid range
of the graph, the rate of spread accelerates and finally the rate of spread tapers off resulting in an S-shaped curve depicted in Figure 2.
Figure-2: S-shaped Adoption Curve (Rogers, 1960)
The reasoning for such S-shape curve is that initially the innovation has to come from outside the boundaries of the social system prevalent at that time. This implies that number of people that are exposed to the innovation are few in the beginning. As these people in the social system start accepting the innovation, they bring it in contact with more and more people. Therefore the rate of spread keeps on increasing. Eventually, the innovation is accepted by most of the members of social system and the rate of spread declines. As there are no more members left for accepting the innovation, the spread stops completely.
The S-shaped curve depicted in Figure 2 illustrates that there is a critical "take off point" at which the slope of the growth curve becomes positive and number of members who have adopted the innovation becomes so large that there are hardly any new members left for adopting it. According to Rogers (1960), this point occurs when nearly 10% to 20% of the members of the social system have adopted the innovation.
The S-shaped adoption curve described above applies to most of the innovations that come up from time to time. However its application is of special significance for adoption of communication technology where it is referred to as Metcalfe's law (Gilders 1993). In this case, value of the innovation is enhanced for existing users of the communication system as more and more people adopt the innovation. Each addition of user has a positive effect on existing users of the system which results in acceleration of the adoption curve. Phenomenal growth of the Internet over last one and half decade is often interpreted by this law.
B. Theory of Reasoned Action (Fishbein and Ajzen, 1975): Theory of Reasoned Action (TRA) has its roots in social psychology setting. The theory proposes three general constructs, namely "behavioural intention (BI), attitude (A), and subjective norm (SN)". According to TRA behavioural intention of a person depends on his attitude and subjective norms. Mathematically, it can be interpreted that behavioural intention is the summation of attitude and subjective norms. Moreover, intention of a person likely to convert to action if there is the intention to behave in a specific manner is strong enough.
Figure-3: Theory of Reasoned Action, (Fishbein and Ajzen, 1975)
Attitude towards Act or Behaviour
Subjective Norm
Behavioural Intention
Behavuour
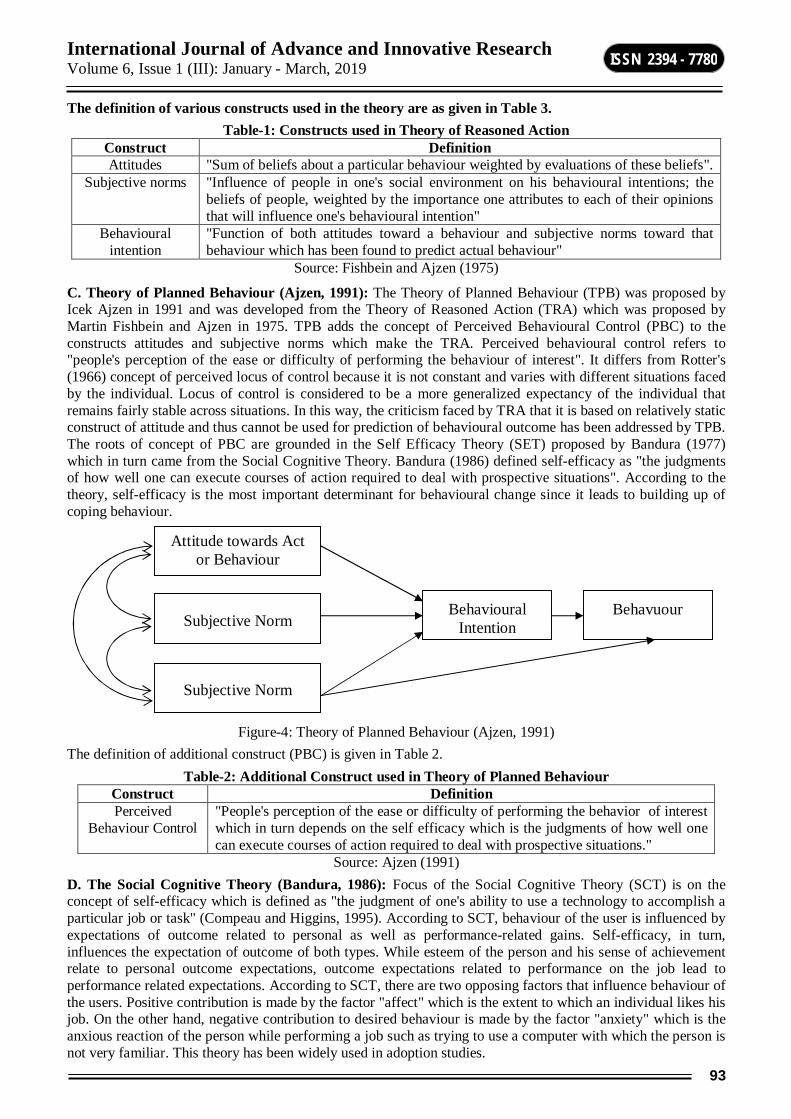
International Journal of Advance and Innovative Research Volume 6, Issue 1 (III): January - March, 2019
93
ISSN 2394 - 7780
The definition of various constructs used in the theory are as given in Table 3. Table-1: Constructs used in Theory of Reasoned Action
Construct Definition Attitudes "Sum of beliefs about a particular behaviour weighted by evaluations of these beliefs".
Subjective norms "Influence of people in one's social environment on his behavioural intentions; the beliefs of people, weighted by the importance one attributes to each of their opinions that will influence one's behavioural intention"
Behavioural intention
"Function of both attitudes toward a behaviour and subjective norms toward that behaviour which has been found to predict actual behaviour"
Source: Fishbein and Ajzen (1975)
C. Theory of Planned Behaviour (Ajzen, 1991): The Theory of Planned Behaviour (TPB) was proposed by Icek Ajzen in 1991 and was developed from the Theory of Reasoned Action (TRA) which was proposed by Martin Fishbein and Ajzen in 1975. TPB adds the concept of Perceived Behavioural Control (PBC) to the constructs attitudes and subjective norms which make the TRA. Perceived behavioural control refers to "people's perception of the ease or difficulty of performing the behaviour of interest". It differs from Rotter's (1966) concept of perceived locus of control because it is not constant and varies with different situations faced by the individual. Locus of control is considered to be a more generalized expectancy of the individual that remains fairly stable across situations. In this way, the criticism faced by TRA that it is based on relatively static construct of attitude and thus cannot be used for prediction of behavioural outcome has been addressed by TPB. The roots of concept of PBC are grounded in the Self Efficacy Theory (SET) proposed by Bandura (1977) which in turn came from the Social Cognitive Theory. Bandura (1986) defined self-efficacy as "the judgments of how well one can execute courses of action required to deal with prospective situations". According to the theory, self-efficacy is the most important determinant for behavioural change since it leads to building up of coping behaviour.
Figure-4: Theory of Planned Behaviour (Ajzen, 1991) The definition of additional construct (PBC) is given in Table 2.
Table-2: Additional Construct used in Theory of Planned Behaviour Construct Definition Perceived
Behaviour Control "People's perception of the ease or difficulty of performing the behavior of interest which in turn depends on the self efficacy which is the judgments of how well one can execute courses of action required to deal with prospective situations."
Source: Ajzen (1991) D. The Social Cognitive Theory (Bandura, 1986): Focus of the Social Cognitive Theory (SCT) is on the concept of self-efficacy which is defined as "the judgment of one's ability to use a technology to accomplish a particular job or task" (Compeau and Higgins, 1995). According to SCT, behaviour of the user is influenced by expectations of outcome related to personal as well as performance-related gains. Self-efficacy, in turn, influences the expectation of outcome of both types. While esteem of the person and his sense of achievement relate to personal outcome expectations, outcome expectations related to performance on the job lead to performance related expectations. According to SCT, there are two opposing factors that influence behaviour of the users. Positive contribution is made by the factor "affect" which is the extent to which an individual likes his job. On the other hand, negative contribution to desired behaviour is made by the factor "anxiety" which is the anxious reaction of the person while performing a job such as trying to use a computer with which the person is not very familiar. This theory has been widely used in adoption studies.
Attitude towards Act or Behaviour
Subjective Norm
Behavioural Intention
Behavuour
Subjective Norm
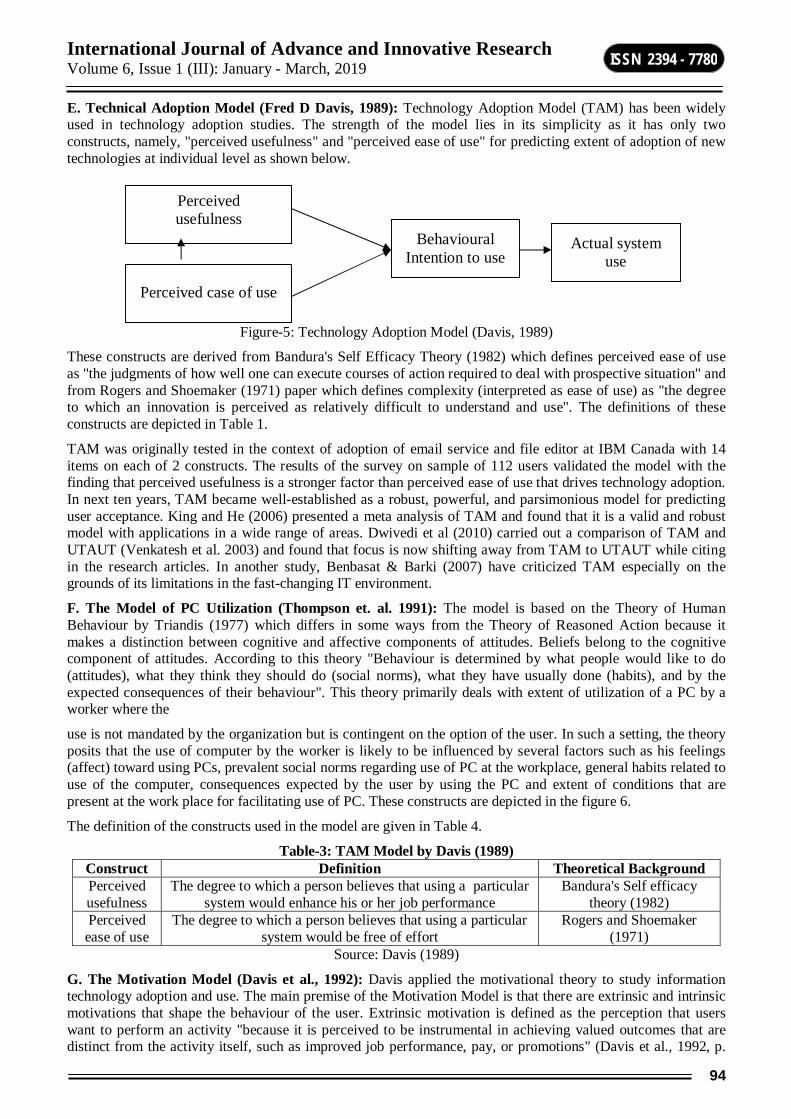
International Journal of Advance and Innovative Research Volume 6, Issue 1 (III): January - March, 2019
94
ISSN 2394 - 7780
E. Technical Adoption Model (Fred D Davis, 1989): Technology Adoption Model (TAM) has been widely used in technology adoption studies. The strength of the model lies in its simplicity as it has only two constructs, namely, "perceived usefulness" and "perceived ease of use" for predicting extent of adoption of new technologies at individual level as shown below.
Figure-5: Technology Adoption Model (Davis, 1989)
These constructs are derived from Bandura's Self Efficacy Theory (1982) which defines perceived ease of use as "the judgments of how well one can execute courses of action required to deal with prospective situation" and from Rogers and Shoemaker (1971) paper which defines complexity (interpreted as ease of use) as "the degree to which an innovation is perceived as relatively difficult to understand and use". The definitions of these constructs are depicted in Table 1.
TAM was originally tested in the context of adoption of email service and file editor at IBM Canada with 14 items on each of 2 constructs. The results of the survey on sample of 112 users validated the model with the finding that perceived usefulness is a stronger factor than perceived ease of use that drives technology adoption. In next ten years, TAM became well-established as a robust, powerful, and parsimonious model for predicting user acceptance. King and He (2006) presented a meta analysis of TAM and found that it is a valid and robust model with applications in a wide range of areas. Dwivedi et al (2010) carried out a comparison of TAM and UTAUT (Venkatesh et al. 2003) and found that focus is now shifting away from TAM to UTAUT while citing in the research articles. In another study, Benbasat & Barki (2007) have criticized TAM especially on the grounds of its limitations in the fast-changing IT environment.
F. The Model of PC Utilization (Thompson et. al. 1991): The model is based on the Theory of Human Behaviour by Triandis (1977) which differs in some ways from the Theory of Reasoned Action because it makes a distinction between cognitive and affective components of attitudes. Beliefs belong to the cognitive component of attitudes. According to this theory "Behaviour is determined by what people would like to do (attitudes), what they think they should do (social norms), what they have usually done (habits), and by the expected consequences of their behaviour". This theory primarily deals with extent of utilization of a PC by a worker where the
use is not mandated by the organization but is contingent on the option of the user. In such a setting, the theory posits that the use of computer by the worker is likely to be influenced by several factors such as his feelings (affect) toward using PCs, prevalent social norms regarding use of PC at the workplace, general habits related to use of the computer, consequences expected by the user by using the PC and extent of conditions that are present at the work place for facilitating use of PC. These constructs are depicted in the figure 6.
The definition of the constructs used in the model are given in Table 4.
Table-3: TAM Model by Davis (1989) Construct Definition Theoretical Background Perceived usefulness
The degree to which a person believes that using a particular system would enhance his or her job performance
Bandura's Self efficacy theory (1982)
Perceived ease of use
The degree to which a person believes that using a particular system would be free of effort
Rogers and Shoemaker (1971)
Source: Davis (1989)
G. The Motivation Model (Davis et al., 1992): Davis applied the motivational theory to study information technology adoption and use. The main premise of the Motivation Model is that there are extrinsic and intrinsic motivations that shape the behaviour of the user. Extrinsic motivation is defined as the perception that users want to perform an activity "because it is perceived to be instrumental in achieving valued outcomes that are distinct from the activity itself, such as improved job performance, pay, or promotions" (Davis et al., 1992, p.
Perceived usefulness
Perceived case of use
Behavioural Intention to use
Actual system use

International Journal of Advance and Innovative Research Volume 6, Issue 1 (III): January - March, 2019
95
ISSN 2394 - 7780
1112). Examples of extrinsic motivation are perceived usefulness, perceived ease of use, and subjective norm. On the other hand, if performing an activity leads to a feeling of pleasure and results in satisfaction for the individual, such behaviour can be classified as intrinsic motivation. (Vallerand, 1997). Users want to perform an activity "for no apparent reinforcement other than the process of performing the activity per se" (Davis et al., 1992, p. 1112). An examples of intrinsic motivation is the extent of enjoyment that a person derives from playing with a computer (Davis et al., 1992; Venkatesh, 2000).
Figure-6: The Model of PC Utilization (Thompson et al. 1991)
Table-4: Constructs used in the Model of PC Utilization (Thompson et al. 1991) Construct Definition
Job-fit "The extent to which an individual believes that using a technology can enhance the performance of his or her job."
Complexity "The degree to which an innovation is perceived as relatively difficult to understand and use."
Long-term consequences
"Outcomes that have a pay-off in the future."
Affect Towards Use "Feelings of joy, elation, or pleasure, or depression, disgust, displeasure, or hate associated by an individual with a particular act."
Social Factors "Individual's internalization of the reference group's subjective culture, and specific interpersonal agreements that the individual has made with others, in specific social situations."
Facilitating "Provision of support for users of PCs may be one type of facilitating condition that can Conditions influence system utilization."
Source: Thompson et al. (1991)
H. Extended TAM2 model (Venkatesh and Davis, 2000): Venkatesh & Davis modified TAM to include additional key determinants of TAM's perceived usefulness and usage intention constructs in their extended TAM model. The additional constructs included social influence processes (subjective norm, voluntariness and image) and cognitive instrumental processes (job relevance, output quality, result demonstrability and perceived ease of use) which are depicted in Figure 7.
Figure-7: Extended Technical Adoption Model (Venkatesh & Davis, 2000)
Complexity Job-fit
Long term consequences
Affect towards use PC Utilization
Social Factors
Facilitating Conditions
Subjective Norm
Image
Job relevance
Output quality
Result Demonstrability
Perceived usefulness
Perceived usefulness
Intention to use
Usage Behaviour

International Journal of Advance and Innovative Research Volume 6, Issue 1 (III): January - March, 2019
96
ISSN 2394 - 7780
The definitions and theoretical basis of the constructs are summarized in Table 5. I. Unified Theory of Acceptance and Use of Technology (Venkatesh, 2003): This theory, popularly referred as UTAUT was postulated in 2003 by Venkatesh et.al. by a systematic review and consolidation of the constructs of earlier eight models (TRA, TAM, MM, TPB, TAM2, DOI, SCT and model of personal computer use). It is meant to serve as a comprehensive model that can be applied across a range of applications. It has four key constructs namely "performance expectancy, effort expectancy, social influence and facilitating conditions" which are depicted in Figure 8.
For developing the unified model, the authors have compiled and tested all the constructs that were used in previous models and theorized that out of the seven constructs used earlier, four constructs shown above are most significant as determinants of intention to use information technology. They have hypothesized that remaining three constructs, namely, attitude toward using technology, self efficacy, and anxiety are theorized not to be the direct determinants of intention as they are fully mediated by ease of use which has been considered in the unified model as performance expectancy. Therefore, these three constructs have been removed from the UTAUT model. The constructs in the unified model are defined as in table 6.
The unified theory is proposed to be superior as it is able to explain 70% of the variance while the earlier theories were explaining only 30-40% variance in the adoption behaviour (Venkatesh et al. 2003). However, it is criticized on the grounds of being overly complex, not being parsimonious in its approach and its inability to explain individual behaviour (Casey & Wilson-Evered 2012; Van Raaij & Schapers 2008). A comprehensive review of 450 articles that have cited UTAUT was carried out by Williams et al (2011) and they found that only a small number of articles have actually used the constructs of UTAUT in their studyrather, it has been used more for theory-building. J. Model of Acceptance with Peer Support, (MAPS, Sykes et al., 2009): Model of Acceptance with Peer Support (MAPS) provides an integration of earlier research that was focussed on individuals with relevant constructs of social network in a way that
helps to extend the scope of earlier theories. The authors propose that there are two types of social ties. First tie between employees relates to obtaining help from employees that can result in extension of knowledge for using the system. Another kind of tie between employees is related to providing assistance and help to co-workers for enabling better understanding of configuration and deployment of the system. These ties are labelled as "get-help" and "give help" ties. The authors propose two new constructs, namely, "network density" and "network centrality" that relate to the concept of "get-help" and "give-help" respectively. The theoretical backing for these constructs is drawn from earlier research carried out in social network and are posited as key predictors of system use. These constructs are further extended as "valued network density" and "valued network centrality" by taking into account the extent of the resources, information and knowledge available in the system. It is inferred that these constructs can act as additional predictors.
Table-5: Extended TAM Model by Venkatesh and Davis (2000) Construct Definition Theoretical Background
Subjective Norm Person's perception that most people who are important to him think he should or should not perform the behaviour in question".
Theory of Reasoned Action (Fishbein and Ajzen 1975) and the subsequent Theory of Planned Behaviour (Ajzen 1991).
Voluntariness and Compliance
with Social Influence.
Voluntariness is the extent to which potential adopters perceive the adoption decision to be non-mandatory.
Hartwick and Barki (1994) found that even when users perceive system use to be organizationally mandated, usage intentions vary because some users are unwilling to comply with such mandates.
Image Moore and Benbasat (1991) define image as "the degree to which use of an innovation is perceived to enhance one's . . . status in one's social system".
Moore and Benbasat (1991)
Job relevance Defined as an individual's perception regarding the degree to which the target system is applicable to his or her job. Regarded as cognitive judgment that exerts a direct effect on perceived usefulness, distinct from social influence processes.
Cognitive instrumental theoretical underpinnings come from three main areas: work motivation theory (e.g., Vroom 1964), action theory from social psychology (e.g., Fishbein and Ajzen 1975), and taskcontingent decision making from behavioral decision theory (e.g., Beach and Mitchell 1978).
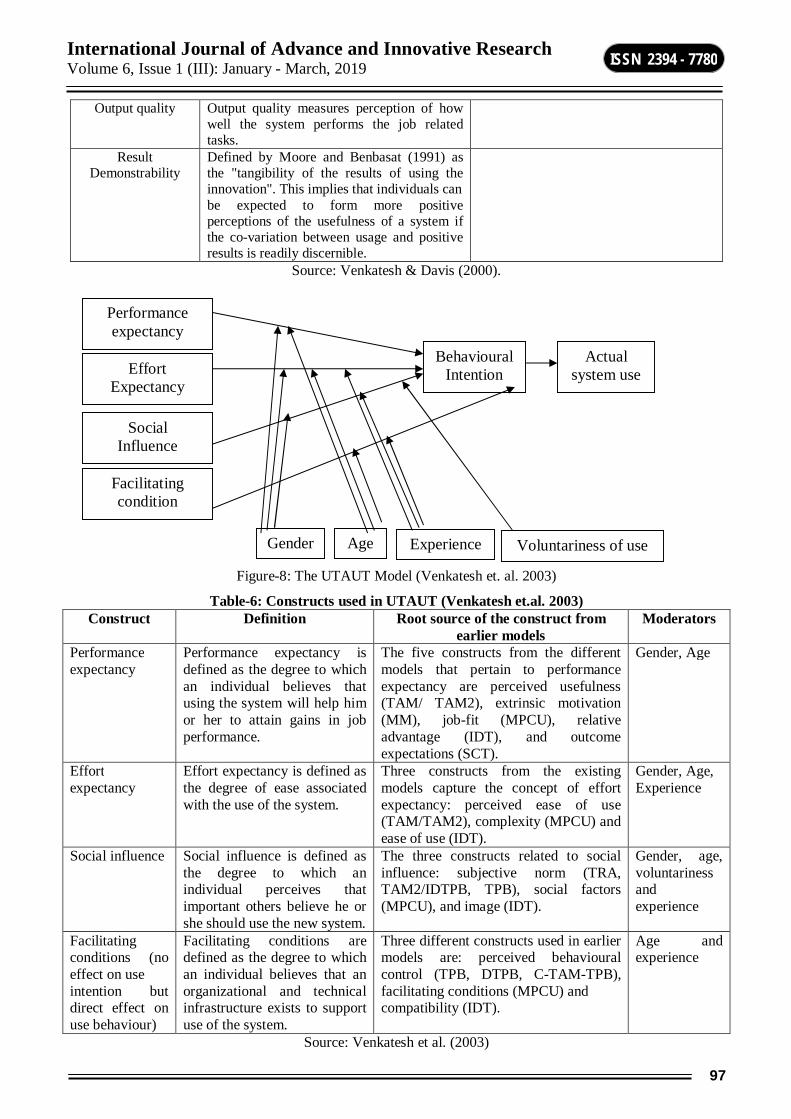
International Journal of Advance and Innovative Research Volume 6, Issue 1 (III): January - March, 2019
97
ISSN 2394 - 7780
Output quality Output quality measures perception of how well the system performs the job related tasks.
Result Demonstrability
Defined by Moore and Benbasat (1991) as the "tangibility of the results of using the innovation". This implies that individuals can be expected to form more positive perceptions of the usefulness of a system if the co-variation between usage and positive results is readily discernible.
Source: Venkatesh & Davis (2000).
Figure-8: The UTAUT Model (Venkatesh et. al. 2003)
Table-6: Constructs used in UTAUT (Venkatesh et.al. 2003) Construct Definition Root source of the construct from
earlier models Moderators
Performance expectancy
Performance expectancy is defined as the degree to which an individual believes that using the system will help him or her to attain gains in job performance.
The five constructs from the different models that pertain to performance expectancy are perceived usefulness (TAM/ TAM2), extrinsic motivation (MM), job-fit (MPCU), relative advantage (IDT), and outcome expectations (SCT).
Gender, Age
Effort expectancy
Effort expectancy is defined as the degree of ease associated with the use of the system.
Three constructs from the existing models capture the concept of effort expectancy: perceived ease of use (TAM/TAM2), complexity (MPCU) and ease of use (IDT).
Gender, Age, Experience
Social influence Social influence is defined as the degree to which an individual perceives that important others believe he or she should use the new system.
The three constructs related to social influence: subjective norm (TRA, TAM2/IDTPB, TPB), social factors (MPCU), and image (IDT).
Gender, age, voluntariness and experience
Facilitating conditions (no effect on use intention but direct effect on use behaviour)
Facilitating conditions are defined as the degree to which an individual believes that an organizational and technical infrastructure exists to support use of the system.
Three different constructs used in earlier models are: perceived behavioural control (TPB, DTPB, C-TAM-TPB), facilitating conditions (MPCU) and compatibility (IDT).
Age and experience
Source: Venkatesh et al. (2003)
Performance expectancy
Effort Expectancy
Behavioural Intention
Actual system use
Social Influence
Facilitating condition
Gender Age Experience Voluntariness of use
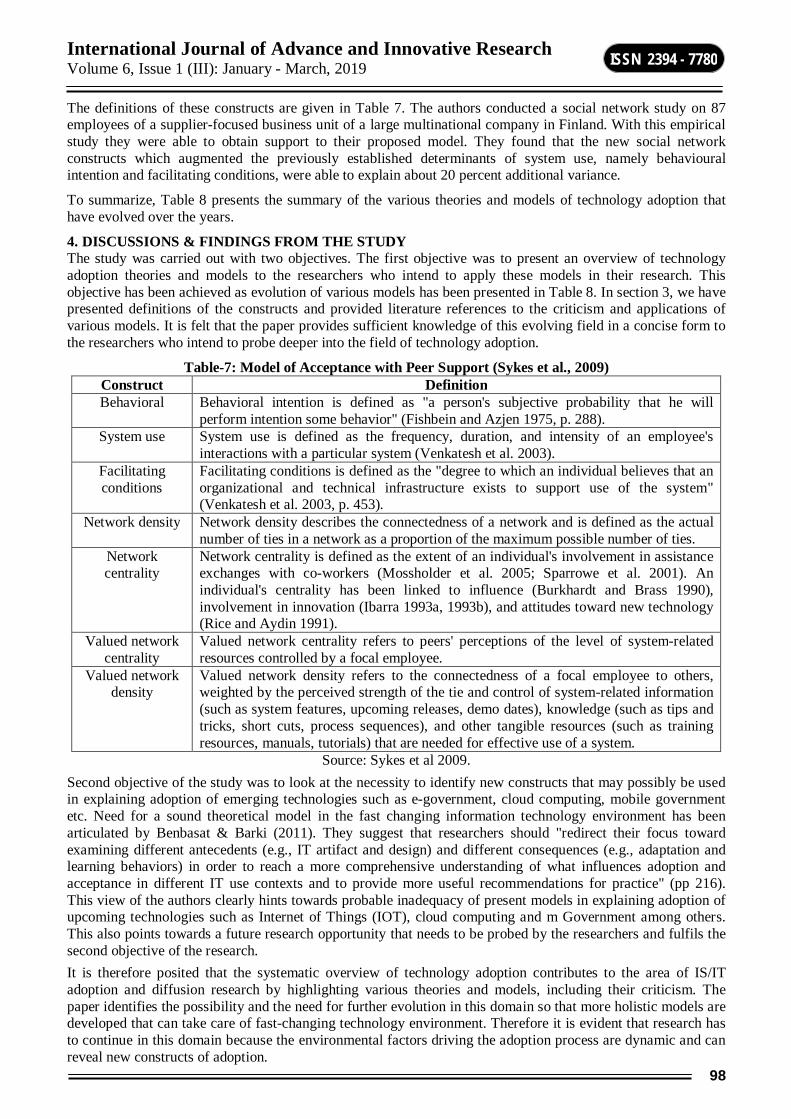
International Journal of Advance and Innovative Research Volume 6, Issue 1 (III): January - March, 2019
98
ISSN 2394 - 7780
The definitions of these constructs are given in Table 7. The authors conducted a social network study on 87 employees of a supplier-focused business unit of a large multinational company in Finland. With this empirical study they were able to obtain support to their proposed model. They found that the new social network constructs which augmented the previously established determinants of system use, namely behavioural intention and facilitating conditions, were able to explain about 20 percent additional variance.
To summarize, Table 8 presents the summary of the various theories and models of technology adoption that have evolved over the years.
4. DISCUSSIONS & FINDINGS FROM THE STUDY The study was carried out with two objectives. The first objective was to present an overview of technology adoption theories and models to the researchers who intend to apply these models in their research. This objective has been achieved as evolution of various models has been presented in Table 8. In section 3, we have presented definitions of the constructs and provided literature references to the criticism and applications of various models. It is felt that the paper provides sufficient knowledge of this evolving field in a concise form to the researchers who intend to probe deeper into the field of technology adoption.
Table-7: Model of Acceptance with Peer Support (Sykes et al., 2009) Construct Definition Behavioral Behavioral intention is defined as "a person's subjective probability that he will
perform intention some behavior" (Fishbein and Azjen 1975, p. 288). System use System use is defined as the frequency, duration, and intensity of an employee's
interactions with a particular system (Venkatesh et al. 2003). Facilitating conditions
Facilitating conditions is defined as the "degree to which an individual believes that an organizational and technical infrastructure exists to support use of the system" (Venkatesh et al. 2003, p. 453).
Network density Network density describes the connectedness of a network and is defined as the actual number of ties in a network as a proportion of the maximum possible number of ties.
Network centrality
Network centrality is defined as the extent of an individual's involvement in assistance exchanges with co-workers (Mossholder et al. 2005; Sparrowe et al. 2001). An individual's centrality has been linked to influence (Burkhardt and Brass 1990), involvement in innovation (Ibarra 1993a, 1993b), and attitudes toward new technology (Rice and Aydin 1991).
Valued network centrality
Valued network centrality refers to peers' perceptions of the level of system-related resources controlled by a focal employee.
Valued network density
Valued network density refers to the connectedness of a focal employee to others, weighted by the perceived strength of the tie and control of system-related information (such as system features, upcoming releases, demo dates), knowledge (such as tips and tricks, short cuts, process sequences), and other tangible resources (such as training resources, manuals, tutorials) that are needed for effective use of a system.
Source: Sykes et al 2009. Second objective of the study was to look at the necessity to identify new constructs that may possibly be used in explaining adoption of emerging technologies such as e-government, cloud computing, mobile government etc. Need for a sound theoretical model in the fast changing information technology environment has been articulated by Benbasat & Barki (2011). They suggest that researchers should "redirect their focus toward examining different antecedents (e.g., IT artifact and design) and different consequences (e.g., adaptation and learning behaviors) in order to reach a more comprehensive understanding of what influences adoption and acceptance in different IT use contexts and to provide more useful recommendations for practice" (pp 216). This view of the authors clearly hints towards probable inadequacy of present models in explaining adoption of upcoming technologies such as Internet of Things (IOT), cloud computing and m Government among others. This also points towards a future research opportunity that needs to be probed by the researchers and fulfils the second objective of the research. It is therefore posited that the systematic overview of technology adoption contributes to the area of IS/IT adoption and diffusion research by highlighting various theories and models, including their criticism. The paper identifies the possibility and the need for further evolution in this domain so that more holistic models are developed that can take care of fast-changing technology environment. Therefore it is evident that research has to continue in this domain because the environmental factors driving the adoption process are dynamic and can reveal new constructs of adoption.
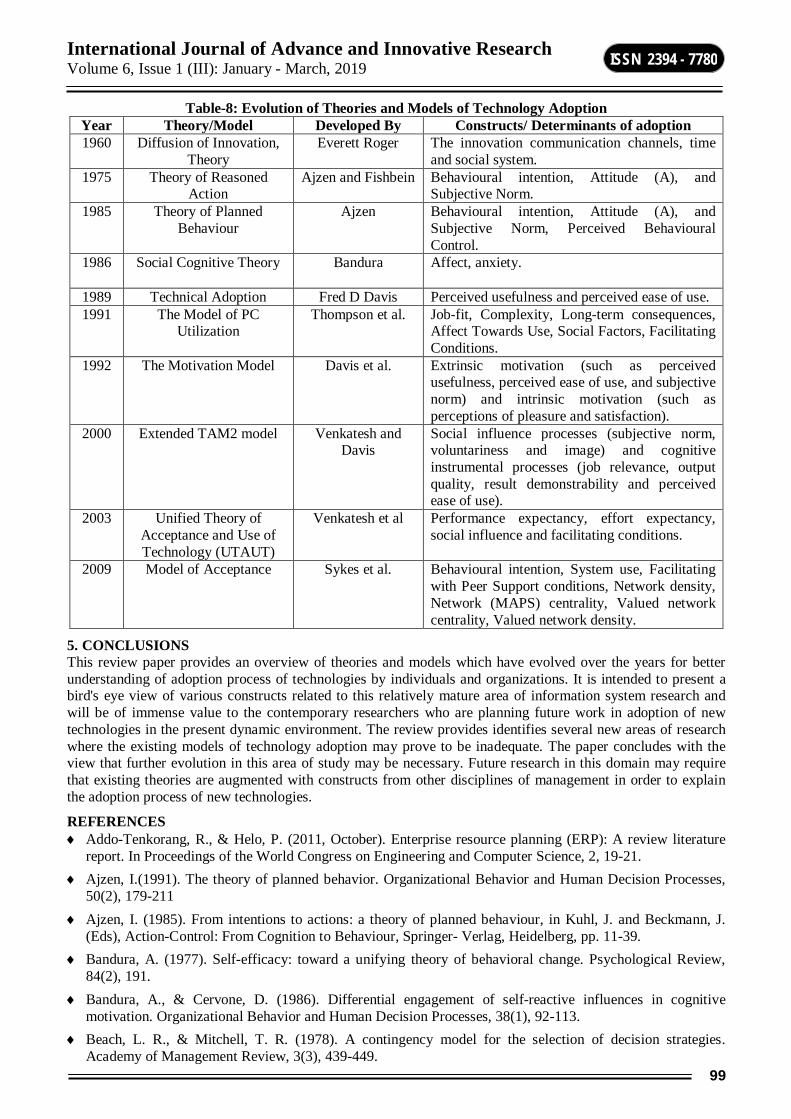
International Journal of Advance and Innovative Research Volume 6, Issue 1 (III): January - March, 2019
99
ISSN 2394 - 7780
Table-8: Evolution of Theories and Models of Technology Adoption Year Theory/Model Developed By Constructs/ Determinants of adoption 1960 Diffusion of Innovation,
Theory Everett Roger The innovation communication channels, time
and social system. 1975 Theory of Reasoned
Action Ajzen and Fishbein Behavioural intention, Attitude (A), and
Subjective Norm. 1985 Theory of Planned
Behaviour Ajzen Behavioural intention, Attitude (A), and
Subjective Norm, Perceived Behavioural Control.
1986 Social Cognitive Theory Bandura
Affect, anxiety.
1989 Technical Adoption Fred D Davis Perceived usefulness and perceived ease of use. 1991 The Model of PC
Utilization Thompson et al. Job-fit, Complexity, Long-term consequences,
Affect Towards Use, Social Factors, Facilitating Conditions.
1992 The Motivation Model Davis et al. Extrinsic motivation (such as perceived usefulness, perceived ease of use, and subjective norm) and intrinsic motivation (such as perceptions of pleasure and satisfaction).
2000 Extended TAM2 model Venkatesh and Davis
Social influence processes (subjective norm, voluntariness and image) and cognitive instrumental processes (job relevance, output quality, result demonstrability and perceived ease of use).
2003 Unified Theory of Acceptance and Use of Technology (UTAUT)
Venkatesh et al Performance expectancy, effort expectancy, social influence and facilitating conditions.
2009 Model of Acceptance Sykes et al. Behavioural intention, System use, Facilitating with Peer Support conditions, Network density, Network (MAPS) centrality, Valued network centrality, Valued network density.
5. CONCLUSIONS This review paper provides an overview of theories and models which have evolved over the years for better understanding of adoption process of technologies by individuals and organizations. It is intended to present a bird's eye view of various constructs related to this relatively mature area of information system research and will be of immense value to the contemporary researchers who are planning future work in adoption of new technologies in the present dynamic environment. The review provides identifies several new areas of research where the existing models of technology adoption may prove to be inadequate. The paper concludes with the view that further evolution in this area of study may be necessary. Future research in this domain may require that existing theories are augmented with constructs from other disciplines of management in order to explain the adoption process of new technologies.
REFERENCES Addo-Tenkorang, R., & Helo, P. (2011, October). Enterprise resource planning (ERP): A review literature
report. In Proceedings of the World Congress on Engineering and Computer Science, 2, 19-21. Ajzen, I.(1991). The theory of planned behavior. Organizational Behavior and Human Decision Processes,
50(2), 179-211 Ajzen, I. (1985). From intentions to actions: a theory of planned behaviour, in Kuhl, J. and Beckmann, J.
(Eds), Action-Control: From Cognition to Behaviour, Springer- Verlag, Heidelberg, pp. 11-39. Bandura, A. (1977). Self-efficacy: toward a unifying theory of behavioral change. Psychological Review,
84(2), 191. Bandura, A., & Cervone, D. (1986). Differential engagement of self-reactive influences in cognitive
motivation. Organizational Behavior and Human Decision Processes, 38(1), 92-113. Beach, L. R., & Mitchell, T. R. (1978). A contingency model for the selection of decision strategies.
Academy of Management Review, 3(3), 439-449.
International Journal of Advance and Innovative Research Volume 6, Issue 1 (III): January - March, 2019
100
ISSN 2394 - 7780
Benbasat, I., & Barki, H. (2007). Quo vadis TAM?. Journal of the Association for Information Systems, 8(4), 7. Carr Jr, V. H. (1999). Technology adoption and diffusion. The Learning Center for Interactive Technology.
Casey, T., & Wilson-Evered, E. (2012). Predicting uptake of technology innovations in online family dispute resolution services: An application and extension of the UTAUT. Computers in Human Behavior, 28(6), 2034-2045.
Chuttur M.Y. (2009). Overview of the Technology Acceptance Model: Origins, Developments and Future Directions, Indiana University, USA. Sprouts: Working Papers on Information Systems, 9(37). http://sprouts.aisnet.org/9-37
Compeau, D. R., & Higgins, C. A. (1995). Computer selfefficacy: Development of a measure and initial test. MIS quarterly, 19(2), 189.
Davis, F. A.(1989). Perceived usefulness perceived ease of use and user acceptance of information technology, MIS Quarterly, 8, 318-339.
Davis, F. D., Bagozzi, R. P., & Warshaw, P. R. (1992). Extrinsic and intrinsic motivation to use computers in the workplace1. Journal of Applied Social Psychology, 22(14), 1111-1132.
Dwivedi, Y. K., Mustafee, N., Carter, L. D., & Williams, M. D. (2010). A Bibliometric Comparision of the Usage of Two Theories of IS/IT Acceptance (TAM and UTAUT). In AMCIS (p. 183).
Fishbein M., Ajzen, I.(1975). Belief, Attitude, Intention, and Behavior: An Introduction to Theory and Research, Addison-Wesley, Reading, MA.
Gallivan, M.J.(2001). Organizational adoption and assimilation of complex technological innovations: development and application of a new framework, The DATABASE for Advances in Information Systems, 32(3), 51-85.
Gefen, D., & Straub, D. W. (1997). Gender Differences in the Perception and Use of E- Mail: An Extension to the Technology Acceptance Model. MIS quarterly, 21(4), 389.
Gefen, D., Karahanna, E., & Straub, D. W. (2003). Trust and TAM in online shopping: an integrated model. MIS quarterly, 27(1), 51-90.
Gilder, G. (1993). Metcalfe's law and legacy. Forbes ASAP,13.
Igbaria, M., & Parasuraman, S. (1989). A path analytic study of individual characteristics, computer anxiety and attitudes toward microcomputers. Journal of Management, 15(3), 373-388.
King, W. R., & He, J. (2006). A meta-analysis of the technology acceptance model. Information & Management, 43(6), 740-755.
Leonard-Barton, D., & Deschamps, I. (1988). Managerial influence in the implementation of new technology. Management Science, 34, 1252-1265.
Low, C., Chen, Y., & Wu, M. (2011). Understanding the determinants of cloud computing adoption. Industrial Management & Data Systems, 111(7), 1006-1023.
Moore, G., & Benbasat, I.(1991). Development of an instrument to measure the perceptions of adopting an information technology innovation. Information Systems Research, 2(3) 192-222.
Rogers, E. M. (2003) Diffusion of Innovations, Free Press, New York, Fifth Edition 2003.
Rogers, E. M., & Shoemaker, F. F. (1971). Communication of innovations: A cross- cultural approach. Free Press, New York.
Rotter, J. B. (1966). Generalized expectancies for internal versus external control of reinforcement. Psychological Monographs: General and Applied, 80(1), 1.
Sarkar, J. (1998). Technological diffusion: alternative theories and historical evidence. Journal of economic surveys, 12(2), 131-176.
Simon, S., Kaushal, R., Cleary, P., Jenter, C., Volk, L., Poon, E., Oray, E.,Lo, H., Williams, D.& Bates, D. (2007). Correlates of electronic health record adoption in office practices: a statewide survey. Journal of the American Medical Informatics Association, 14(1), 110-117.
International Journal of Advance and Innovative Research Volume 6, Issue 1 (III): January - March, 2019
101
ISSN 2394 - 7780
Sykes, T. A., Venkatesh, V., & Gosain, S. (2009). Model of acceptance with peer support: A social network perspective to understand employees' system use. MIS quarterly, 33(2), 371-393.
Thompson, R. L., & Higgins, C. A. (1991). Personal Computing: Toward a Conceptual Model of Utilization. MIS quarterly, 15(1), 125.
Vallerand, R. J. (1997). Toward a hierarchical model of intrinsic and extrinsic motivation in Advances in Social Psychology (29), M. Zanna (ed.), Academic Press, New York,, pp 271-360.
Van Dijk, J., & Hacker, K. (2003). The digital divide as a complex and dynamic phenomenon. The Information Society, 19(4), 315-326.
Van Raaij, E. M., & Schepers, J. J. (2008). The acceptance and use of a virtual learning environment in China. Computers & Education, 50(3), 838-852.
Venkatesh V., & Davis F. (2000). A theoretical extension of the technology acceptance model: four longitudinal field studies. Management Science, 46(2), 186-204.
Venkatesh, V., Morris, M. G., Davis, G. B., & Davis, F. D. (2003). User acceptance of information technology: Toward a unified view. MIS Quarterly, 27(3), 425-478.
Venkatesh, V., Sykes, T. A., & Venkatraman, S. (2014). Understanding e-Government portal use in rural India: role of demographic and personality characteristics. Information Systems Journal, 24(3), 249-269.
Williams, M. D., Rana, N. P., Dwivedi, Y. K., & Lal, B. (2011, June). Is UTAUT really used or just cited for the sake of it? a systematic review of citations of UTAUT's originating article. In ECIS.
Yousafzai, S. Y., Foxall, G. R., & Pallister, J. G. (2007). Technology acceptance: a meta- analysis of the TAM: Part 1. Journal of Modelling in Management, 2(3), 251-280.

International Journal of Advance and Innovative Research Volume 6, Issue 1 (III): January - March, 2019
102
ISSN 2394 - 7780
IMPACT OF SOCIAL MEDIA ADVERTISEMENTS ON CONSUMER BEHAVIOUR
Anjan A. Kaikini1 and Shreelakshmi Shreepada Bhat2
Assistant Professor1, K H Srinivasa Institute of Post Graduate Studies, LB and SBS College, Sagara Lecturer2, Government First Grade College, Sagara
ABSTRACT In recent years, social media has become ubiquitous and most important for social networking, content sharing and online accessing. Social media is the medium to socialize. Due to its reliability, consistency and instantaneous features, social media opens a wide place for business such as online marketing. Social media had become really important gradient in today's marketing mix in general and in promotion mix in particular. This paper aims to understand which consumers are mostly influenced by online purchasing, reasons that motivate consumer to purchase online, types of product that are mostly purchased using social media and types of social media that are mostly used by consumers.
Keywords: social media, social networking, content sharing, online accessing, marketing mix, promotion mix.
INTRODUCTION The presence of internet based social media has made it possible for one person to communicate with the 100 or even thousands of people around the world. Social media has exploded as a category of online discussion where people create content, share it, bookmark it and network at vast rate. Social media is a platform that lets us participate in social networking. Today it is the best source for news updates, marketing, education and entertainment. The social media are increasingly influencer and changing the way the consumer behaviour how they make the decisions to buy.
The meaning of the term ‘social media’ can be derived from two words which constitute it. Media generally refers to advertising and the communication of ideas or information through publications/channels. Social implies the interaction of individuals within a group or community. Taken together, social media simply refers to communication/ publication platforms which are generated and sustained by the interpersonal interaction of individuals through the specific medium or tool.
According to Wikipedia, social media is internet-based tools for sharing and discussing information among human beings. Social media is all about networking and networking in a way that espouses trust among parties and communities involved. Any website which allows user to share their content, opinions, views and encourages interaction and community building can be classified as a social media. Some popular social media sites are: Facebook, YouTube, Twitter, Digg, MySpace, StumbleUpon, Delicious, Scribd, Flickr etc.
Social media uses the “wisdom of crowds” to connect information in a collaborative manner. Social media can take many different forms, including Internet forums, message boards, weblogs, wikis, podcasts, pictures, and video.
Social Media seems to be a new trend, but its roots stretch to the beginning of computer era. What we see today is the result of centuries-old social media development. Usernets, which was launched in 1979, was the first progenitor of Social media, and the journey from Usernets to Facebook is a long one. Usernets allowed users to post on newsgroups. It was followed by bulletin board systems (BBS) which allowed users to login and interact. Online services like progidy were the precursors to BBS. After online services, internet relay chat came into light which gave way to instant messaging.
In the 90s, dating sites and forums were on peak, which led to the development of social networks. But they did not let users make friend lists. Six degrees launched to overcome this feature. It allowed profile creation and listing pears. It was purchased and shut down after playing for a decade. Blogging emerged in this phase, creating a sensation in social media. It is popular even today. Other sites like BlackPlanet (African-American Social Website) and MiGente (Latino) cropped up having provision to create profiles and add friends.
Modern social networks came into picture post 2000. Apple launched its Friendster in 2002. It has millions of users. Hi5 and Linkedin were launched in 2003. Linkedin is a ground for professionals to reach out to one another. MySpace also originated in 2003 and became well known by 2006. Similarly Facebook was launched in 2004 and surpassed MySpace, Orkut, Multiply, etc., and is still expanding. This decade also conceived media sharing platforms like photobucket, flicker, youtube, instagram, revver, etc., along with news and bookmarking platforms like Digg and Delicious. Since 2000, Social Media has bloomed to horizon and is still expanding limitlessly. Along with media sharing, many other portals that provide real-time updates were introduced, for example, Twitter, Posterous, Tumbler, etc. In 2007, Facebook launched its advertising system.

International Journal of Advance and Innovative Research Volume 6, Issue 1 (III): January - March, 2019
103
ISSN 2394 - 7780
Consumer behavior: Consumer behavior involves the way individuals, groups or organizations select, buy, and use products, services, ideas and experiences, to satisfy their needs and desires. It is a complex and dynamic process. As a result of globalization and technology development, the way the consumers behave and think is rapidly and continuously changing.
FIVE STAGES OF CONSUMER DECISION MAKING PROCESS ARE 1) Need/problem recognition, which occurs whenever the consumer sees a significant difference between his or her current state of affairs and some desired or ideal state. Today people are very Concerned of how they are seen by others, a phenomenon recognized as “social identity” . That is whys social media content motivates new consumer needs. Every photo, video, comment, review, and other content posted on social media, to which consumers are exposed, plays the role of stimulus (incentives) of recognizing a new need.
2) In-formation search is the process by which the consumer surveys his or her environment for appropriate data to make a reasonable decision. Nowadays, Internet is among the most commonly used sources of information search, causing revolution in this stage of consumer decision making process. "Googlization of search" is called the phenomenon of searching information in the search engine Google, which is the first and most used source of information. Another important and very credible source, are considered reviews on social media.
3) Alternative evaluation: today, almost everyone searches for online reviews, and gets more detailed, accurate and reliable information, because those information are from people who have already tried those alternatives. In this way, consumers ponder the positive and negative sides of each alternative, and decide easier for the best one to buy.
4) Buying: different attractive social media content and positive reviews of others, very often impact the buying to be emotional, rather than rational, recognized as “spontaneous shopping”. Studies show that reviews of others tend to change consumers mind regarding a product, and push them to buy or not to buy something.
5) Post-purchase: social media provides different alternatives for people to react in case of dissatisfaction after purchase, for example: writing messages to the company, posting on the social media companies ac-counts, commenting in public posts, and writing negative reviews. Conventional marketing wisdom long held that a dissatisfied customer tells ten people. But in the new age of social media, he or she has the tools to tell ten million.
STATEMENT OF THE PROBLEM The introduction of the Internet has changed the way organizations promote their products and services and products as well as the channels of communication between them and their customers. This is seen in the way they market and communicate their brands and products, which has become a challenging project. Customers are overwhelmed by marketing commercials and promotional events. The sensitivity of customers to get excited is fading out on promotional events and consumers are beginning to resist the effect of some companies at marketing them. It is now on record that as the Internet is fast advancing across the global marketplace, the effectiveness of traditional mass media is fast on the decline. On this background the study is conducted to know the impact of social media on consumer behaviour.
OBJECTIVES OF THE STUDY Following are the objectives of the study
1. To assess the impact of social media advertisement on Consumer Behaviour.
2. To understand the satisfaction level of purchasing influenced by social media advertisement.
METHODOLOGY For the purpose of study both primary and secondary data are being collected. Primary data has been collected from 50 individuals of Sagara City of Shivamogga district in Karnataka with the help of an interview schedule constructed the purpose. Convenient sampling method is used while drawing the sample.
Secondary data has been collected from various websites, journals and books. The collected data has been analyzed and interpreted with the help of various statistical tools for drawing conclusion.
LIMITATIONS OF THE STUDY 1. The study is limited to only to Sagara city. 2. Only 50 respondents are interviewed for the purpose of study. 3. The survey is subjected to the bias and prejudices of the respondents. Hence 100Percent accuracy can’t be
assured.

International Journal of Advance and Innovative Research Volume 6, Issue 1 (III): January - March, 2019
104
ISSN 2394 - 7780
4. The researcher was carried out in a short span of time, where in the researcher could not widen the study.
Table-1: Socio Economic Profile of Respondents Variable Classification of VariableResponse Percentage
Gender Male 25 50.00
Female 25 50.00 Total 50 100.00
Age
< 25 10 20.00 25-35 25 50.00 35-45 10 20.00 >45 05 10.00
Total 50 100.00
Education
SSLC 04 08.00 Under Graduation 20 40.00 Post Graduation 15 30.00
Other 11 22.00 Total 50 100.00
Occupation
Student 10 20.00 Business men 04 08.00
Government Employee 10 20.00 Private Employee 10 20.00
Professional 06 12.00 Job Seeker 03 06.00 House Wife 05 10.00
Other 02 04.00 Total 50 100.00
Area of Residence
Rural 15 30.00 Urban 25 50.00
Semi –Urban 10 20.00 Total 50 100.00
Monthly Income
<50000 20 40.00 50000-100000 15 30.00 100000-150000 10 20.00
>150000 05 10.00 Total 50 100.00
Source: Primary Source
Table 1 showing the socio economic profile of respondents. 50 respondents are interviewed from different socio economic background.
Table-2: Opinion of Consumers towards Social Media Advertisements Variables Classification of Variables Responses Percentage
Social Media Account Yes 45 90.00 No 05 10.00
Total 50 100.00
Social Media Account in
Facebook 35 77.77 LinkedIn 15 33.33 Google+ 20 44.44 Twitter 08 17.77
Instagram 30 66.67 WhatsApp 45 100
Usage Daily 30 66.67 2-3 Days 06 13.33
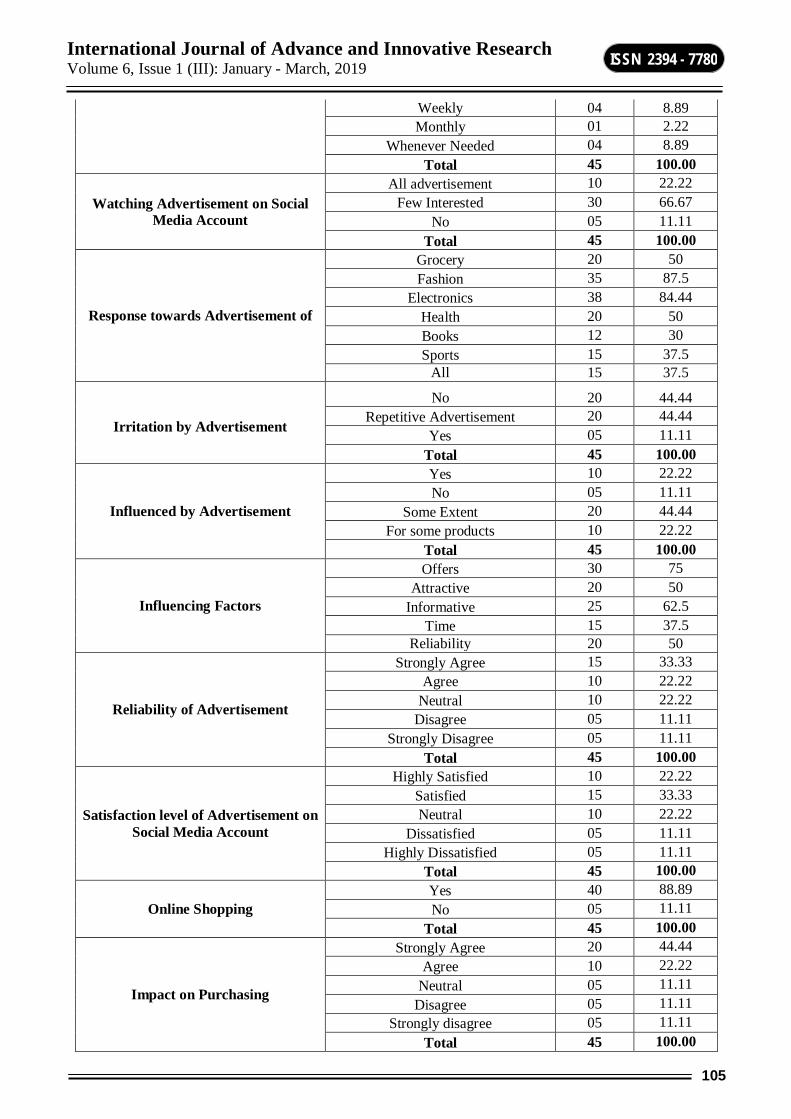
International Journal of Advance and Innovative Research Volume 6, Issue 1 (III): January - March, 2019
105
ISSN 2394 - 7780
Weekly 04 8.89 Monthly 01 2.22
Whenever Needed 04 8.89 Total 45 100.00
Watching Advertisement on Social Media Account
All advertisement 10 22.22 Few Interested 30 66.67
No 05 11.11 Total 45 100.00
Response towards Advertisement of
Grocery 20 50 Fashion 35 87.5
Electronics 38 84.44 Health 20 50 Books 12 30 Sports 15 37.5
All 15 37.5
Irritation by Advertisement
No 20 44.44 Repetitive Advertisement 20 44.44
Yes 05 11.11 Total 45 100.00
Influenced by Advertisement
Yes 10 22.22 No 05 11.11
Some Extent 20 44.44 For some products 10 22.22
Total 45 100.00
Influencing Factors
Offers 30 75 Attractive 20 50
Informative 25 62.5 Time 15 37.5
Reliability 20 50
Reliability of Advertisement
Strongly Agree 15 33.33 Agree 10 22.22
Neutral 10 22.22 Disagree 05 11.11
Strongly Disagree 05 11.11 Total 45 100.00
Satisfaction level of Advertisement on Social Media Account
Highly Satisfied 10 22.22 Satisfied 15 33.33 Neutral 10 22.22
Dissatisfied 05 11.11 Highly Dissatisfied 05 11.11
Total 45 100.00
Online Shopping Yes 40 88.89 No 05 11.11
Total 45 100.00
Impact on Purchasing
Strongly Agree 20 44.44 Agree 10 22.22
Neutral 05 11.11 Disagree 05 11.11
Strongly disagree 05 11.11 Total 45 100.00
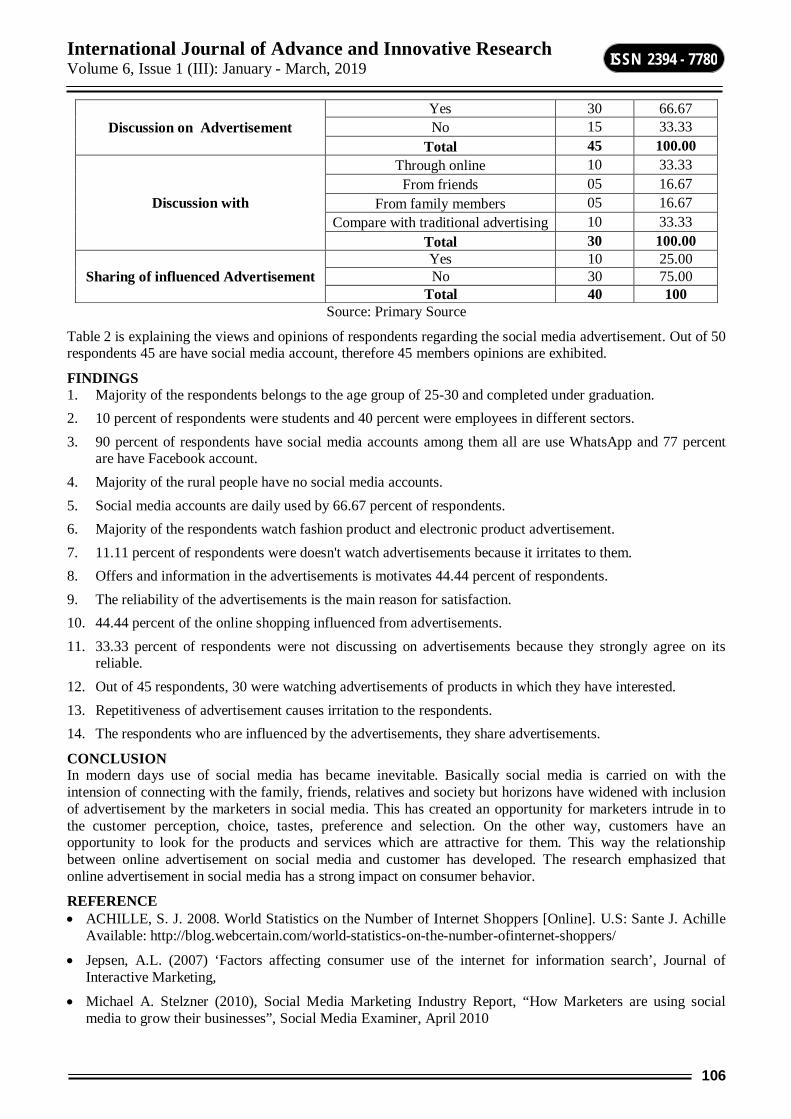
International Journal of Advance and Innovative Research Volume 6, Issue 1 (III): January - March, 2019
106
ISSN 2394 - 7780
Discussion on Advertisement Yes 30 66.67 No 15 33.33
Total 45 100.00
Discussion with
Through online 10 33.33 From friends 05 16.67
From family members 05 16.67 Compare with traditional advertising 10 33.33
Total 30 100.00
Sharing of influenced Advertisement Yes 10 25.00 No 30 75.00
Total 40 100 Source: Primary Source
Table 2 is explaining the views and opinions of respondents regarding the social media advertisement. Out of 50 respondents 45 are have social media account, therefore 45 members opinions are exhibited.
FINDINGS 1. Majority of the respondents belongs to the age group of 25-30 and completed under graduation. 2. 10 percent of respondents were students and 40 percent were employees in different sectors. 3. 90 percent of respondents have social media accounts among them all are use WhatsApp and 77 percent
are have Facebook account. 4. Majority of the rural people have no social media accounts. 5. Social media accounts are daily used by 66.67 percent of respondents. 6. Majority of the respondents watch fashion product and electronic product advertisement. 7. 11.11 percent of respondents were doesn't watch advertisements because it irritates to them. 8. Offers and information in the advertisements is motivates 44.44 percent of respondents. 9. The reliability of the advertisements is the main reason for satisfaction. 10. 44.44 percent of the online shopping influenced from advertisements. 11. 33.33 percent of respondents were not discussing on advertisements because they strongly agree on its
reliable. 12. Out of 45 respondents, 30 were watching advertisements of products in which they have interested. 13. Repetitiveness of advertisement causes irritation to the respondents. 14. The respondents who are influenced by the advertisements, they share advertisements.
CONCLUSION In modern days use of social media has became inevitable. Basically social media is carried on with the intension of connecting with the family, friends, relatives and society but horizons have widened with inclusion of advertisement by the marketers in social media. This has created an opportunity for marketers intrude in to the customer perception, choice, tastes, preference and selection. On the other way, customers have an opportunity to look for the products and services which are attractive for them. This way the relationship between online advertisement on social media and customer has developed. The research emphasized that online advertisement in social media has a strong impact on consumer behavior.
REFERENCE ACHILLE, S. J. 2008. World Statistics on the Number of Internet Shoppers [Online]. U.S: Sante J. Achille
Available: http://blog.webcertain.com/world-statistics-on-the-number-ofinternet-shoppers/
Jepsen, A.L. (2007) ‘Factors affecting consumer use of the internet for information search’, Journal of Interactive Marketing,
Michael A. Stelzner (2010), Social Media Marketing Industry Report, “How Marketers are using social media to grow their businesses”, Social Media Examiner, April 2010

International Journal of Advance and Innovative Research Volume 6, Issue 1 (III): January - March, 2019
107
ISSN 2394 - 7780
PARSON, A. 2013. How Does Social Media Influence the Buying Behavior of Consumers? [Online]. BUSINESS & ENTREPRENEURSHIP. Available: http://yourbusiness.azcentral.com/social-media-influence-buying-behavior-consumers17017.html
Social Media in India – An Overview by techiedevil on June 11, 2010 in Social Media http://www.internetmarketingjournal.org/social-media-india/
http://www.analectic.org/social-media-marketing-brands-india/
http://www.mediameasurement.com/mapping-influenceon-social-media/ Accessed 2 April2013.https://www.socialquickstarter.com/content/10310_facts_about_consumer_behavior_on_facebook.
International Journal of Advance and Innovative Research Volume 6, Issue 1 (III): January - March, 2019
108
ISSN 2394 - 7780
A PRAGMATIC ASSESSMENT OF DIGITIZATION OF EDUCATION
Dr. M. B. Srinidhi and Girish Karanth Assistant Professor, Sahyadri Commerce and Management College, Shimoga
ABSTRACT Digitization has already enriched the teaching material and new teaching methods are being used. While developments in learning analytics and digital learning methods will not be able to restore the master-trainee relationship, they do facilitate personalized education, which takes greater account of the individual student. Thanks to concepts such as flipping the classroom and blended learning with a mix of online and offline courses, there is more room for interaction between students and lecturers.
The traditional education system was based on the concept of 'knowledge transfer' - the age old guru shisha parampara - which established a clear teacher taught relationship. However, the digital media and the internet have ushered in a democracy of knowledge where education has become a collaborative, self-driven enterprise. Today there are tools available to transform learning from an academic exercise to an engaging experience in imaginative and experiential learning.
Education has reached most parts of the world and ICT has become an integral part of human life. This paper describes the process of generation, creation and acquisition of knowledge through the technology. The use of ICT to manage and organise explicit knowledge is highlighted. The paper also describes how technology is used to access and apply such knowledge. The paper relates how these technologies have been used in education and its impact in general. Using examples the paper highlights some of the changes that has taken placed in the Indian education sector.
Keywords: Digital, Higher Education
I. INTRODUCTION “The only constant is change and mankind is in a period of rapid technologically driven change”
The fundamental purpose behind receiving numerous advances is inspirational, to exploit the Interest of students. Twitter™ can be utilized for education yet how much significant learning can be stuffed in 140 characters or less! What society and people require is trust, not publicity!
India is a huge nation with much decent variety – in culture, dialect, legacy and so on as is its education framework. We have schools with all digitized cooled classrooms and additionally the transportation; there are schools which put stock in stressing on esteem education by following Guru Kul framework where understudies are instructed under the trees regardless of having world-class foundation. In the meantime there are schools which stress on books and physical advancement of understudies by directing in-house exercises though others can manage the cost of universal trade programs and have possessed the capacity to send their understudies even to NASA. In the meantime we have schools where understudies battle for books.
India holds an essential place in the worldwide education industry. The nation has more than 1.4 million schools with more than 227 million understudies selected and in excess of 36,000 advanced education organizations. India has one of the biggest advanced education frameworks on the planet. Be that as it may, there is still a great deal of potential for further advancement in the education framework.
India's online education showcase estimate is required to contact US$ 40 billion by 2019. A RNCOS report titled, Booming Distance Education Market Outlook 2018 expects the separation education showcase in India to develop at a compound yearly development rate (CAGR) of around 34 percent amid 2013-14 to 2017-18. In addition, the point of the legislature to raise its present gross enrolment proportion to 30 percent by 2020 will likewise support the development of the separation education in India.
The education part in India is ready to observe significant development in the years to come as India will have world's biggest tertiary-age populace and second biggest alumni ability pipeline comprehensively before the finish of 2020. Starting at now the education advertise is worth US$ 100 billion. As of now, advanced education contributes 59.7 percent of the market measure, school education 38.1 percent, pre-school fragment 1.6 percent, and innovation and multi-media the staying 0.6 percent.Higher education system in India has undergone rapid expansion. Currently, India‘s higher education system is the largest in the world enrolling over 70 million students while in less than two decades, India has managed to create additional capacity for over 40 million students. At present, higher education sector witnesses spending of over Rs 46,200 crore (US$ 6.96 billion), and

International Journal of Advance and Innovative Research Volume 6, Issue 1 (III): January - March, 2019
109
ISSN 2394 - 7780
it is expected to grow at an average annual rate of over 18 per cent to reach Rs 232,500 crore (US$ 35.03 billion) in next 10 years.India‘s IT firms are working with academic institutions and setting up in-house institutes to groom the right talent as these companies move to Social media, Mobility, Analytics and Cloud (SMAC) technologies.
REVIEW OF LITERATURE: Researchers have different viewpoints about cloud learning in education sector Bo,Dong et al (7) has presented an e-learning frame work called blue-sky cloud framework in which
physical machines have been virtualized and allocated on demand for e-learning systems.It also solves the challenges faced by e-learning systems. It also consists of three layers such as the virtual infrastructure, capability and data caching layer. It improves the availability performance and scalability of e-learning system.
Madhumathi, (2)―cloud computing based e-learning provides anywhere, anytime and any device learning. Cloud learning will be beneficiated by every students, faculties, administrators and research scholars. This framework addresses the services and deployment of cloud in a new dimension and each layer specifies the essential components neededto construct an academic cloud in a universityǁ.
Prof.Abu El- Ala,cloud computing for solving e-learning problems. He proposed environment focuses on designing and monitoring educational enviroment based on reusing the existing web tools, techniques and services to provide browser- based application.
Deepanshu, Institute of technology India, focused on e-learning application model based on cloud computing will not stop its pace to proceed. As the cloud computing technologies become more sophisticated and the applications of cloud computing becomes increasingly widespread, e-learning will certainly usher in a new era of cloud computing.
II. INDIAN ETHOS IN EDUCATION Education has always seen the heavy hand of the whimsical nature of time, when considering a nation with a turbulent history as that of India. Education has been the most opted avenue of expressing freedom of will while inculcating the spirit of thought and moral conscience to a more transcending level. In spite such rich connotations, the current educational system seems to be handicapped of this very essence, resorting to mindless acquisition of knowledge to suit vocational pursuits.
It is seen that the present day society, which nurtures the younger generation, faces serious shortcomings in terms of moral, ethical, spiritual and Dharmik values. Parental pressures on children are increasing at an alarming rate, with stress to focus on the competitive examinations alone, taking a greater toll on the young mental framework. Children are getting alienated from the crucial aspect of personality development through moral and ethical training. The pointless pressure has taken the reallocation of educational parlance from a holistic approach towards education to farcical rote learning. Unfortunately, the standard of education has drastically detoriated in the last couple of decades due to lack of infrastructure and degradation of moral capacities. In result, both teaching personnel and the students have been completely deprived of the exceptional amenities that could foster the better living standards.
Students need to have supple minds that are capable of analytical thinking, while integrating complex core concepts that aid them to evolve as human beings. They need to build an infallible foundation of scientific and technology knowledge, while staying true to their roles in the planet. This is possible through deep levels of determination, focus and concentration, that is enshrined in Gurukul learning. This is the reason why Gurukul systems are considered to be the best places to facilitate a sound learning environment.
III. GURUKUL SYSTEMS The kernel in Gurukul system of education is intrinsically based on time tested values and principles. It envisions its strength in developing a native sense of concentration and interest while enhancing a child’s knowledge and development of the brain. The wards in the Gurukul are oblivious of outer distractions, living in close proximity of a teacher, where greater emphasis is laid on student’s mental, cognitive, spiritual and physical wellness. The system functions on the well-rounded holistic development of a child, enshrining values such as discipline, self- reliance, right attitude, empathy, creativity, and strong moral beliefs. Initiating children into such an enriching atmosphere in the early stages helps them whet their perceptive skills and critical thinking from a tender age, arming them with an advantage over competitors early.
International Journal of Advance and Innovative Research Volume 6, Issue 1 (III): January - March, 2019
110
ISSN 2394 - 7780
AMBIENCE Often, Gurukuls are located at picturesque places enmeshed in absolute serenity, far from the hustle and bustle of city life. It is here that tender minds are encouraged to have a balanced, analytical vision, ensuring an ambience where education is objective yet rewarding. Location plays a central role- being ensconced amidst nature, devoid of any worldly distractions, builds an environment which is most conducive to learning.Self reliance is one of the most crucial values that one imbibes from this isolation- one of the greatest principles to learn as a human being. The serene ambience of such schools is ideal for education and holistic growth.
MODERN INFRASTRUCTURE Gurukul systems have a vibrant significance in Indian history, holding prominence over the sheer quality of education disseminated. At present, age-old concepts have amalgamated with modern culture to smoothen the progress of an enlivening learning environment for students. Traditionally, Gurukuls have always emphasised on the importance of practical knowledge. Similarly, Gurukul systems today believe that bookish knowledge and rote learning are mere tools of time, not sufficient enough to show the true value of human existence. Gurukuls provide practical knowledge under modern infrastructure including practical laboratories with state-of-the-art facilities and technology. The curriculum prepares student to excel in all fields of life, creating a perfect blend of academics and extra-curricular activities, making the educational journey remarkable.
IV. DIGITAL EDUCATION Printing press changed the world of education forever. Six centuries later we are undergoing another transformation and this time everything is going digital. Leading this second wave of technology backed empowerment; Educomp has taken education from the paper to the pixel.As a pioneer in bringing digital education to the Indian classroom, Educomp has brought about a radical change in the traditional ways of teaching with its exemplary innovations in the digital space.Educomp takes pride in having a legacy of introducing latest technology based solutions to the schools. As a thought leader in some of the products designed for schools, Educomp products like the smartclass have become iconic and often synonymous with digital classrooms. Educompsmartclass is known to have brought about a radical change in the traditional ways of teaching with its exemplary innovations in the space of digital content usage in the classroom. Science at senior grades can now become even more exciting with atoms bursting at an arm length with Educomp‘s 3D Lab. Keeping in mind the need for a global proficiency in English, the Educomp English Mentor Lab has been specially designed to combine a unique methodology with language learning tools that enable students to internalise sentence patterns and practice reading, writing and verbal skills on their own. Educomp Smart Schools form the next generation of Educomp‘s learning suite of products. The first of its kind in the world, it offers a bouquet of education solutions that comprehensively assist schools to leap frog towards an enhanced paradigm of teaching and learning. The quality of education and increasing learning outcomes are the offshoot of amalgamation of never before features, allowing the schools to integrate, nourish, create and enhance a 360 degree relationship with all stakeholders while keeping the student at the center of the learning experience. With League India Schools, educomp soared further with not just a basket of best in the class education solutions but also transformational best practices that allow schools to adopt ―The League Indiaǁ stamp. As a value added distributor to fliplearn.com, Educomp is on a firm straddle of the 21st Century learning platform marking the future of Education, with ubiquitous flip from traditional to digital tools that seamlessly hop from mobiles to laptops and tablets.
Here‘s a bouquet of product offerings for Schools to take the big Leap EducompSmartclass English Mentor EducompSmartclass 3d Lab Educomp Insight Educomp Smart School League India Uniclass Gurukul education system provides students the knowledge about Hindu religion, brings close to nature,
yogasanas, knowledge about practical situations of life etc. Digital Education provides knowledge about technology, electronic systems, latest gadgets etc. which is better for the students?
In India, lack of education in a huge number of individuals has turned the dreams of 'Education for All' into empty dreams. Mainly, population explosion has put an overwhelming weight on its available infrastructure
International Journal of Advance and Innovative Research Volume 6, Issue 1 (III): January - March, 2019
111
ISSN 2394 - 7780
and resources. India has the world's biggest populace of illiterates. As indicated by 2011 evaluation, literacy rate has gone just up to 74% from 65%. For guys, it has ascended to 82% from 75%, for females to 65% from 54%. In absolute terms, the figure is disturbing. No country can stand to have an expansive number of its populace to stay uneducated, insensible and incompetent. It is the reason that questions and debates have been taking place on the type of education systems that the country has had and the one that it currently has.
Gurukul Education System
In ancient India, education was imparted through the gurukul system. It was also known as the Guru- Shishya Parampara. The objectives of this form of education were:
1. Discretion
2. Improvement of character
3. Generation of friendliness or social mindfulness
4. Fundamental personality development
5. Proliferation of virtue
6. Conservation of learning and culture
V. DIGITIZATION OF INDIAN EDUCATION PROCESS: A HOPE OR HYPE Previously, when a male brahmana tyke was seven or eight years of age, he was sent to Gurukul where he concentrated on and lived with the educator. The period of going to Gurukul was decided by the varna of the youngster The customary educators were not delegated by an outside power as instructors. They imparted the education because it was their dharma, the preeminent obligation of their life and there was no other ulterior intention included. The understudies had an inclination to a particular occupation, or varna character, which was characteristic in their genes (or nature). This inclination was not an outside burden on them, so in this way, it was extremely common for them to take after this pre-arranged framework.
MERITS OF GURUKUL SYSTEM The Gurus had colossal information and knew how to instruct the most burdensome of the things.
This Parampara used to take as much time as is needed and because of this, the students used to turn out in a meticulous form.
They used to acquire a particular style and inculcated high levels of efficiency. The student used to have a high regard for the Guru and discipline was sought after. Much of the teaching was practical and there was parcel of advantages of this style of education. The environment given to the student ensured he would turn into an artisan or an accomplished person in his
field of interest. FAULTS OF GURU SHISHYA PARAMPARA The student did not get much exposure as he was under the tutelage of a single Guru. There was no day and age designated for the course. The understudy needed to rely upon the educator
entirely. The old framework did not engage the hypothetical aspect of art. The student additionally needed to perform everyday house chores for the master. VI. GURUKUL SYSTEM VERSUS DIGITAL EDUCATION SYSTEM Digital Education System has evolved with time and has been influenced by the western system. It has been
affected by the changes and advances in technology. The education system has incorporated technologies like ebooks, video lectures, distance learning through video chat, demonstrations through 3-D imagery, etc. There is no doubt that the system has evolved to incorporate the technological developments. These have helped the students in grasping better knowledge through visual aids that help in increasing retention. Teaching methods are continuously upgraded as per advanced research and developments.
The only drawback is when the emphasis is on the theoretical part rather than the practical part. No one can deny that Digital Education is more effective when it comes to retention, understanding, and opportunities. The system should be made available to everyone so that each and every one can access it as per his or her interest.
International Journal of Advance and Innovative Research Volume 6, Issue 1 (III): January - March, 2019
112
ISSN 2394 - 7780
We need an amalgamation of both
One needs to comprehend the reason for Gurukul: how it worked, what society resembled in the past and how the objective of Gurukul training can be accomplished in the present day setting. It is not just a case of copying the past. There must be an adjustment and a mix of both cutting edge instruction and convention if the gurukul framework is to survive and affect today's general public. The objective of the new age gurukul education should be to prepare students in a manner that they do not just have the learning of the current training framework, but also beyond that. Gurukul graduates should not feel substandard compared to their peers.
VII. CONCLUSION Today‘s educational technology has almost forced a greater engagement between faculty and students and among students. It is helping faculty to focus more on the learning environment for their students. But it has also changed the way colleges do business. we moved away from in-person registration lines to phone-in registration—and then, in the 1990s, to online registration. But are we ready for this where we focus more on ranks in university than what we actually know and can deliver. Indian education regulatory system puts a limitation on the scope of digital education. Students are worried about their grades and restrict themselves to the prescribed curriculum, faculties are in hurry to complete the syllabus, management concern is to secure top ranks in the university. Online education in India has another major challenge that there is no proper grooming of the students on soft skill and personality development due to which it has less preference in job market
The proponents of technology have not gone far enough. Education cannot change by getting individual instructors to adopt any technology. Individual instructors are frozen by curriculum, work load and regulatory agencies. They must always balance the equation of deeper learning versus time consumed. The rationale for the impact of digital technology on teaching and learning needs to be clear:
1. Will learners work more efficiently, more effectively, more intensively? Will the technology help them to learn for longer, in more depth, more productively? Or will the teacher be able to support learners more efficiently or more effectively?
2. The role of technology in learning should be identified: Will it help learners gain access to learning content, to teachers or to peers? Will the technology itself provide feedback or will it support more effective feedback from others, or better self-management by learners themselves?
3. Technology should support collaboration and effective interaction for learning: The use of computer and digital technologies is usually more productive when it supports collaboration and interaction, particularly collaborative use by learners or when teachers use it to support discussion, interaction and feedback.
4. Teachers and/or learners should be supported in developing their use of digital technology to ensure it improves learning. Training for teachers (and for learners), when it is offered, usually focuses on technology skills in using the equipment. This is not usually sufficient to support teachers and pupils in getting the best from technology in terms of their learning. On-going professional development and support to evaluate the impact on learning is likely to be required.
5. Identify what learners and teachers will stop doing: The use of digital technology is usually more successful as a supplement rather than as a replacement for usual teaching. Technology is not introduced into a vacuum. It is therefore important to identify carefully what it will replace or how the technology activities will be additional to what learners would normally experience.
Hence to meet the requirements of Indian students we propose hybrid model where there should be a combination of physical presence of the teacher and technology.
REFERENCES 1. https://www.ncsl.org/portals/1/documents/educ/item013161.pdf
2. http://eprints.ioe.ac.uk/628/1/Laurillard2008Digital_technologies.pdf
3. http://www.greenbaypressgazette.com/story/money/2014/10/21/technologys-impact-higher-education/17693719/
4. Https/ Indian express/ can digital educate India Written by Maya Escueta Updated: Aug 17, 2015.
5. KiranYadav, Role of cloud computing in education, ―International journal of innovation research in computer and communication engineeringǁ.

International Journal of Advance and Innovative Research Volume 6, Issue 1 (III): January - March, 2019
113
ISSN 2394 - 7780
6. A.S. Sathish Kumar, emerging Technology on smart Class teaching in school education A literature review –IJSR Vol 3,issue8 Aug 2014.
7. International journal on recent and innovation trends in computing and communication volume3, issue2.
International Journal of Advance and Innovative Research Volume 6, Issue 1 (III): January - March, 2019
114
ISSN 2394 - 7780
DIGITAL SOLUTION USING PROCESS AUTOMATION AND ANALYTICS FOR NPA IN INDIA
Shyam S Bhat and R. Jagdeesh Faculty, ATNNCE, Shimoga
ABSTRACT Accumulated non-performing assets (NPAs) in the Indian banking system, specifically in the public sector banks (PSBs), have adverse effects on credit disbursement. An increasing amount of bad loans have prompted the banks to be extra cautious, which has dried the credit channel. It explores alternative modes of financing that should help create a 'new-age' finance institution for big development projects.
Digital technologies today are disrupting and repositioning the lives of every banker and customer. Digital platforms and digital interfaces are ubiquitous. Data and analytics is used for greater customer experience, driving revenues, engaging customers, increasing productivity and making on the go offers of new banking products and services. The power of technology, especially the open source ones, analytics tools like Hadoop, faster and easy to deploy artificial intelligence. As these issues are waiting for resolution, probably with significant systemic and social costs, there is a silver lining. Robotic process automation (RPA) and data analytics could be used to improve the deficiencies of the banking sector and control the shenanigans of the borrowers. Established used cases from retail and consumer banking could be utilized without large investments and IT change. This paper attains find various digital marketing tools like Mobile Banking, internet banking, satellite banking to minimize probable NPA.
Keywords: Banks, Technology, financial system
I. INTRODUCTION In the past decade, disruptive technologies have shrunk the world leading to location agnostic production and consumption of services. This has transformed the banking industry to a great extent, altering the way the business is conducted.
Banks have created digital infrastructure to offer various solutions like mobile banking, e-wallets and virtual cards, for successfully fulfilling the changing needs of the modern-day customer. Wholesale banking is also catching on this trend of designing and delivering the right mix of products and services to corporate customers, harnessing digital technologies.
Banks have adopted the SMAC technologies – Social, Mobile, Analytics and Cloud – very innovatively.
Social media has become integral in the daily routine of a large number of human beings across the globe. Banks have used the reach of social media to spread awareness of their products to potential customers. Social media has also helped to assess the public sentiment about the functioning of a bank. Some banks have also been offering a few products through social medial platforms.
Mobile payments have transformed financial services, with customers now expecting to make transfers and transact through their phones as first choice. Multiple stakeholders are coming out with various innovative products to make mobile banking useful and exciting.
Analytics, along with big data, has become part of banking lingo. Banks are making all efforts to put in place analytics infrastructure – both in terms of technology and human resources. The banks which could achieve a fair degree success in implementation of analytics based solutions are reaping benefits in terms of better CRM, risk profiling and fraud analytics.
Cloud technology has matured and banks have been finding suitable adoption models in terms of private, public and hybrid clouds for varying requirements. Some of the banks, including urban cooperative banks (UCBs) have been using the Indian Banks Community Cloud (IBCC) a unique community cloud experiment initiated by IDRBT.
While the SMAC technology developments will continue to be exploited by banks, there are several new technologies emerging in the realm of quantum computing, high speed networks, biometrics, machine learning, robotics and smart wearables.
Among them, the four key technologies we identified to be having a great impact on banking are FABS – Five G, Artificial Intelligence, Blockchain and Smart things. We feel that in the next decade, Banking will witness a continued trend of reinventing itself, riding on FABS in addition to SMAC.

International Journal of Advance and Innovative Research Volume 6, Issue 1 (III): January - March, 2019
115
ISSN 2394 - 7780
II. 5G TECHNOLOGY The next generation telecom network (5G), an evolution of broadband technology having disruptive capabilities, is expected to be in place by 2020. The Tokyo Olympics in 2020 are supposed to present the very first showcase of the full range of what 5G technology can offer. Banking and financial services in India and across the world benefitting from 5G. Some of the possible use cases are:
Low latency and ultra-reliability lead to revisit the need of near shore DCs.
Better control of fraud detection and other monitoring activities.
ATM monitoring can help in further reducing the transaction failure rates. Financial inclusion.
Biometric based authentication.
Better connectivity to remote banks / branches and deeper coverage for rural banking.
Enhanced customer experience through Omni- channel implementation
AR and VR based banking, reducing to a greater extent the need for visiting branches for KYC, issuing clarifications and providing personalized attention.
IoT related use cases including usage of drones for monitoring fields, capturing images of accident sites for genuine insurance claim settlement etc.
Artificial intelligence and Robo-advisors in the branches.
Mobile trading
III. ARTIFICIAL INTELLIGENCE AI though several decades old, is marching fast with many innovations in the recent past. Some of the applications of AI include understanding natural language, speech recognition and translation, vision systems, intelligent robots, expert systems, chatbots, game playing etc. Organisations and countries are now vying for control and are investing money, time, and energy to advance in AI. A recent McKinsey report says that Alphabet invested roughly $30 billion in developing AI technologies, and that Baidu invested $20 billion in AI last year. It is reported that China is planning to build a $1 trillion AI industry by 2030.
Some AI applications in China being used by Ali Baba, as per the report are T-mall Smart Selection: This AI-powered algorithm backed by deep learning and natural language
processing helps recommend products to shoppers and then notifies the retailers to increase inventory to keep up with the demand.
Dian Xiaomi: This AI-powered chatbot can understand more than 90 percent of customer’s queries according to Alibaba and serves more than 3.5 million users a day. The latest version of the chatbot can understand a customer’s emotion and can prioritize and alert human customer service agents to intervene.
Robots to pack, drones to deliver: More than 200 robots in automated warehouses can process 1 million shipments each day. In some cases, their efficiency allowed same-day shipment. Alibaba also used drones for some deliveries.
Fraud detection.
NPA analysis.
Detection of suspicious transactions.
Personalized customer interaction through chatbots.
Efficient credit assessment.
IV. BLOCKCHAIN TECHNOLOGY Block chain is a type of decentralized distributed database that is spread across multiple computers in a network. Its decentralized nature eliminates the need for an intermediary to process, validate or authenticate transactions. Each computer keeps its own copy of all transactions on the network, and works directly with other computers to check a new transaction’s validity through a process called consensus. Each of these transactions is encrypted and sent to every computer on the network to be verified and grouped into a time stamped block of transactions. The new block is chained to the previous block, forming a “Block chain” an immutable / tamper-resistant record of historical transaction data.
International Journal of Advance and Innovative Research Volume 6, Issue 1 (III): January - March, 2019
116
ISSN 2394 - 7780
KEY BENEFITS OF BLOCK CHAIN TECHNOLOGY Disintermediate
Secure
Immutable
Trade Finance
Cross-border Payments
KYC
Securities Servicing
Loan Syndication
Supply Chain Financing
Consortium Accounts
Transparency
Efficiency
Cost Savings
V. SMART THINGS Smart things are electronic appliances and other physical objects enriched with smartness – ability to operate interactively and to an extent autonomously. Examples include smart phones, watches, bands, key chains and speakers.
According to the Harvard Business Review article, smart things have three primary components; physical, smart, and connectivity.
Physical – made up of mechanical and electrical parts
Smart – made up of sensors, microprocessors, data storage, controls, software, and an embedded operating system with enhanced user interface
Connectivity – made up of ports, antennae, and protocols
Lending
Transaction services
Risk management
Fraud analysis
Assess creditworthiness
Monitor debts
Micropayments
Recordkeeping
VI. CONCLUSIONS With the pace of events in technology in the recent past, it is becoming extremely difficult to forecast the technology developments even in the short run. While certain technology innovations are too short lived to have an impact, certain innovations re-emerge after a long gap. In such an uncertain setting, based on our experience and understanding of banking and banking technology, we identified the FABS technologies as having great potential for a meaningful impact on the banking sector in the next decade. These are also in line with the predictions of some recent studies including the 2018 INSA report.
REFERENCES 5G Infrastructure Association (5G IA). “5G Vision”. 2015. https://5g-ppp.eu/wp-content/
uploads/2015/02/5G-Vision-Brochure-v1.pdf
International Telecommunication Union. “IMT Vision – Framework and overall objectives of the future development of IMT for 2020 and beyond”. 2015. https://www.itu.int/dms_pubrec/itu-r/rec/ m/R-REC-
International Journal of Advance and Innovative Research Volume 6, Issue 1 (III): January - March, 2019
117
ISSN 2394 - 7780
M.2083-0-201509-I!!PDF-E.pdf
McKinsey Global Institute. “Artificial Intelligence The Next Digital Frontier?”. Discussion Paper. 2017. https://www.mckinsey.com/~/media/ McKinsey/Industries/Advanced%20Electronics/ Our%20 I n sigh t s/ How%2 0art ific ial%2 0 intelligence%20can%20deliver%20real%20 value%20to% 20companies/MGI-Artificial- Intelligence-Discussion-paper.ashx https://www.cnbc.com/2018/05/04/china-aims- to-steal-us-a-i-crown-and-not-even-trade-war- will-stop-it.html
https://www .forbes.com/sites/ be r n a r dm a r r / 2 0 1 8 / 0 7 / 2 3 / t h e - a m a z in g- ways-chinese-tech-giant-alibaba-uses-artificial-intelligence-and-machine- learning/#ea77722117a9
Gartner. “Top 10 Strategic Technology Trends for 2018”. 2017. https://www.gartner. com/smarterwithgartner/gartner-top-10- strategic-technology-trends-for-2018/?utm_ source=social&utm_campaign=sm-swg&utm_ medium=social
Accenture. “Building the Future-Ready Bank - Banking Technology Vision 2018”. 2018. https:// www.accenture.com/gb-en/_acnmedia/PDF-78/
International Journal of Advance and Innovative Research Volume 6, Issue 1 (III): January - March, 2019
118
ISSN 2394 - 7780
IMPACT OF DIGITAL TECHNOLOGY IN COOPERATIVE BANKS
Praveen Kumar B H1, Manjunatha. M. G2 and Dr. Ravisha N. S3 Research Scholar1, 2 and Assitant Professor3, Jawaharlal Nehru National College of Engineering, Shimoga
INTRODUCTION Originated in the last decades first banks were The General Bank of India, which started in 1786, and Bank of Hindustan, which started in 1770; both are now defunct. The oldest bank in existence in India is the State Bank of India, which originated in the Bank of Calcutta in June 1806, which almost immediately became the Bank of Bengal. This was one of the three presidency banks, the other two being the Bank of Bombay and the Bank of Madras, all three of which were established under charters from the British East India Company. For many years the Presidency banks acted as quasi-central banks, as did their successors. The three banks merged in 1921 to form the Imperial Bank of India, which, upon India's independence, became the State Bank of India in 1955.
KARNATAKA SOUHARDA SAHAKARI ACT, 1997 The Karnataka Souharda Sahakari Act was enacted in the year 1997, framed on the lines of the model Act
given by Sri Choudhary Brahamaprakash committee. The Act came into force from January 1, 2001. Till date more than 350 cooperative are registered under this Act. Karnataka Souharda Federal Cooperatives Ltd, the statutory regulatory body under the Act, is also functioning since ten years. Recently both houses of legislature of Karnataka have passed some amendment to the Karnataka Souharda Sahakari Act, 1997, by Karnataka Souharda Sahakari (Amendment) Act, 2004. Following are salient features of this Act:
Removes all kinds of restrictions that have come to clog the free functioning of the co-operatives and controls the interference by the Government except registration and cancellation,
Formation of Co-operatives on the basis of self-help and mutual aid,
Economic Enterprise guided by Co-operative Principles,
More responsibility and freedom of business for the Co-operatives,
Inclusion of internationally accepted Co-operative Principles in the Act,
Promotes subsidiary organizations, partnership between co-operatives and also collaboration between co-operatives and other institutions.
PROFILE OF SRI RAMA ARYA VYSYA CREDIT COOPERATIVE BANK The organization started in the year 21/02/2005 as a credit cooperative society in Durgigudi Shimoga City. The organization has mutual status, which means they are owned by and run for the benefits of its members with total deposits of Rs.628.41 lakhs, and net income Rs7.11 lakhs and serving to more than 1662 members in Shimoga city.
Sri Rama Arya Vysya Credit Cooperative Bank has been rendering various financial services to its needy members. Standing strong with more than 12 years of experience and expertise, looking after the interest of its members they intend, they intend to deliver great value and better quality services to its members as modern society. The Sri Rama Arya Vysya Credit Cooperative Bank is registered under the cooperative society act.
The Sri Rama Arya Vysya Credit Cooperative Bank is one of the leading society in Shimoga, The bank function keeping in mind the latest development and reforms in the banking sector. Banking operation will be fully computerized to give fast and accurate service to the member.
Table Showing Key Peoples Assiciated with Ramanuja Credit Cooperative Ltd are
NAME OF PERSON DESIGNATION Ramaswamy Iyengar President
D.S Ananthramu CEO B.S Ashwath Chairperson Ramanujayya Vice chairperson
S.G Gopal Director Srihari A.S Director
International Journal of Advance and Innovative Research Volume 6, Issue 1 (III): January - March, 2019
119
ISSN 2394 - 7780
LITERATURE REVIEW 1. Dubhashi P.R. (1969) in his study “Strategies of Cooperative Development”, he focused on development
process of Indian economy. The progress of the cooperative movement in India measured with the increasing number of cooperative societies. On the contrary, in Western countries the progress of cooperative movement is measured by the reduction in numbers of cooperative societies by consolidation into bigger units with greater strength.
2. Datar D.R. (1969) in his paper “Place of Cooperation in India’s Economy”, opinioned that, Cooperative movement in India since independence has made a remarkable progress and it became the backbone of rural economic activities. The researcher also made available statistical information for different years and for some of the sectors of cooperative activities such as credit, marketing, processing, sugar production, consumer and industrial cooperation, etc.
3. Batra M.L. (1972) in his study on “Forms of Assistance to Cooperatives” found that the Government has recognized cooperation as a better instrument for the social and economic improvement of the weaker section of the society. For this, the cooperative deserves the Government assistance in the initial stage of its growth. He advocates this policy would help in the establishment of a genuine cooperative movement.
4. Dubhashi P. R. (1972) in his study on “State and Cooperative Development” discussed the relationship between State and Cooperatives. He felt that it depends on the attitude of the State towards Cooperative movement and Cooperative movement towards State. While concluding he conveys the Cooperative movement should be strengthened and enriched to the extent of which both parties are able to promote and enrich a creative reciprocal collaboration.
5. Avinash V Raikar (2006) has analysed the issues, proplems and prospects of Cooperative Credit Institutions in his research paper entitled “Cooperaive Credit Institutions in India – An over view”. He has found that the major problem of the cooperative credit Institutions are dual control, high over dues and low resource base. He concludes that future survival of these institutions would be determined by its ability to technology modernize themselves, innovation of new products and its reach among to urban and rural population.
6. Vinayagamurthy A. and Vijay Pithaia (2007) in their work entitled “Globalisation and Cooperative sector in India” - have observed that considerably the low living standard of common man, incomplete and imperfect markets and other socio political considerations is the primary duty of the Government to ensure that its citizens have easy access to cooperative credit. They have concluded that the future vision of cooperative movement will have to be based on efficiency parameters relating to promotion of excellenced, improvement of operational efficiency and strengthening of financial resource base.
STATEMENT OF PROBLEM Primary use of financial statements are calculating past performance and forecasting the future performance and both of these are facilitated by comparison. The financial strength in terms of liquidity, leverage and profitability are the main goal of an organization. The analysis in this angle draw meaningful conclusion, so as to take right decision analytical techniques are required. The study is undertaken to process the financial data. The topic chosen for the study is “IMPACT OF DIGITAL TECHNOLOGY IN COOPERATIVE BANKS”.
OBJECTIVES OF THE STUDY 1. To observe the liquidity & profitability of cooperative society.
2. To examine the growth rate for various loans and advances.
3. To Study the overall financial position of the through financial statement analysis.
4. To make suggestions to the company in the light of the finding.
SCOPE OF THE STUDY The study is intended to evaluate the money related performance of The Sri Rama Arya Vysya Credit Cooperative Bank, Shimoga through present day devices and plans of financial examination. The present review is comprised from 2010-11 to 2018-19.
The study is based on the financial statements and financial data such as performance highlights of the cooperative societies. The Sri Rama Arya Vysya Credit Cooperative Bank, financial statement analysis with comparison of financial statement of 08 years.
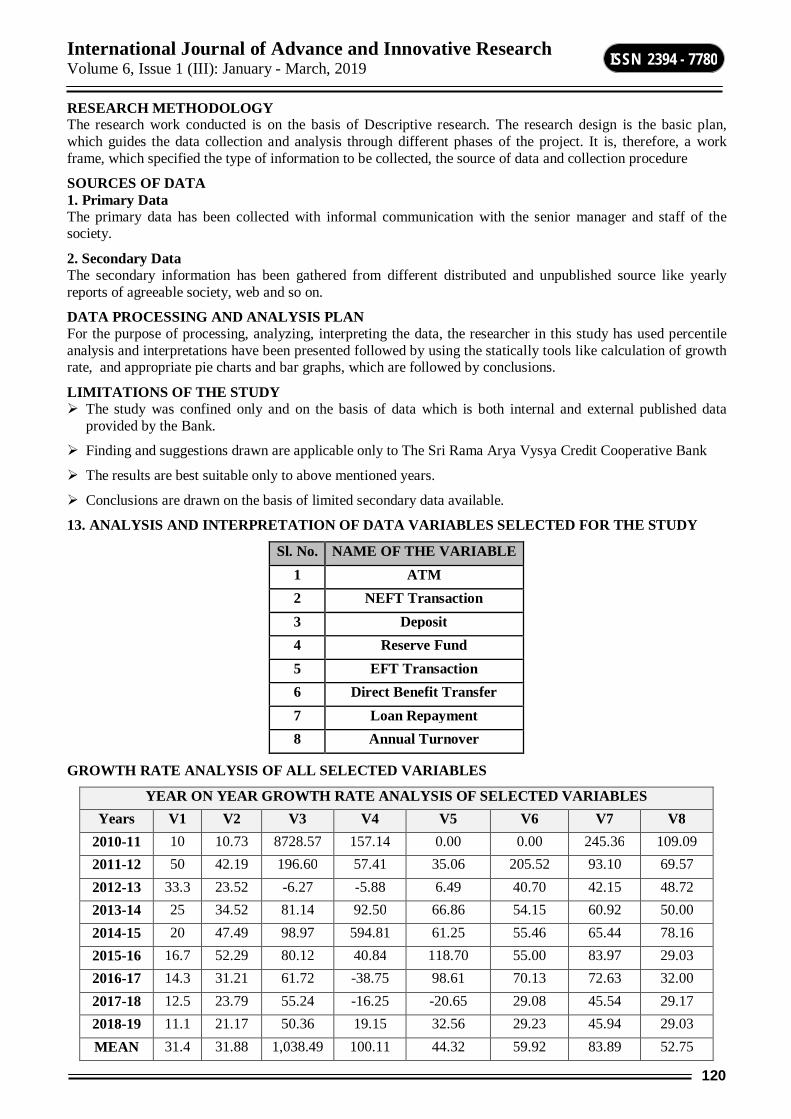
International Journal of Advance and Innovative Research Volume 6, Issue 1 (III): January - March, 2019
120
ISSN 2394 - 7780
RESEARCH METHODOLOGY The research work conducted is on the basis of Descriptive research. The research design is the basic plan, which guides the data collection and analysis through different phases of the project. It is, therefore, a work frame, which specified the type of information to be collected, the source of data and collection procedure
SOURCES OF DATA 1. Primary Data The primary data has been collected with informal communication with the senior manager and staff of the society.
2. Secondary Data The secondary information has been gathered from different distributed and unpublished source like yearly reports of agreeable society, web and so on.
DATA PROCESSING AND ANALYSIS PLAN For the purpose of processing, analyzing, interpreting the data, the researcher in this study has used percentile analysis and interpretations have been presented followed by using the statically tools like calculation of growth rate, and appropriate pie charts and bar graphs, which are followed by conclusions.
LIMITATIONS OF THE STUDY The study was confined only and on the basis of data which is both internal and external published data
provided by the Bank.
Finding and suggestions drawn are applicable only to The Sri Rama Arya Vysya Credit Cooperative Bank
The results are best suitable only to above mentioned years.
Conclusions are drawn on the basis of limited secondary data available.
13. ANALYSIS AND INTERPRETATION OF DATA VARIABLES SELECTED FOR THE STUDY
Sl. No. NAME OF THE VARIABLE 1 ATM 2 NEFT Transaction 3 Deposit 4 Reserve Fund 5 EFT Transaction 6 Direct Benefit Transfer 7 Loan Repayment 8 Annual Turnover
GROWTH RATE ANALYSIS OF ALL SELECTED VARIABLES
YEAR ON YEAR GROWTH RATE ANALYSIS OF SELECTED VARIABLES Years V1 V2 V3 V4 V5 V6 V7 V8
2010-11 10 10.73 8728.57 157.14 0.00 0.00 245.36 109.09 2011-12 50 42.19 196.60 57.41 35.06 205.52 93.10 69.57 2012-13 33.3 23.52 -6.27 -5.88 6.49 40.70 42.15 48.72 2013-14 25 34.52 81.14 92.50 66.86 54.15 60.92 50.00 2014-15 20 47.49 98.97 594.81 61.25 55.46 65.44 78.16 2015-16 16.7 52.29 80.12 40.84 118.70 55.00 83.97 29.03 2016-17 14.3 31.21 61.72 -38.75 98.61 70.13 72.63 32.00 2017-18 12.5 23.79 55.24 -16.25 -20.65 29.08 45.54 29.17 2018-19 11.1 21.17 50.36 19.15 32.56 29.23 45.94 29.03 MEAN 31.4 31.88 1,038.49 100.11 44.32 59.92 83.89 52.75
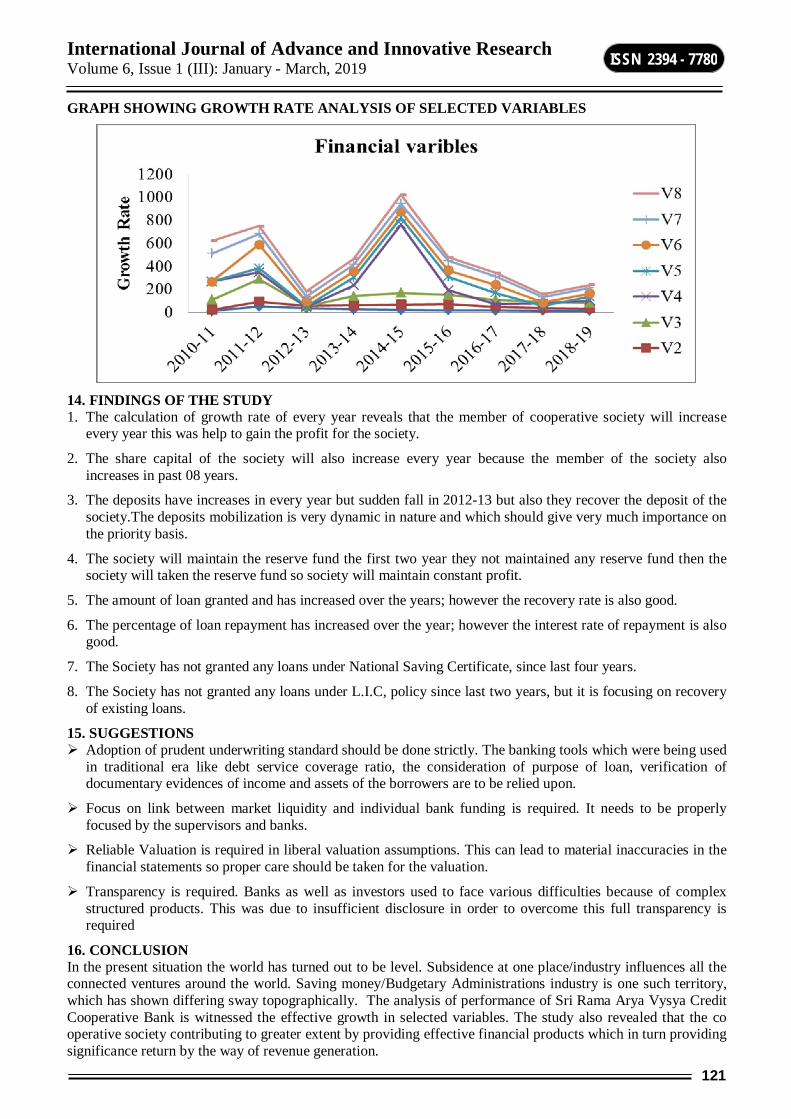
International Journal of Advance and Innovative Research Volume 6, Issue 1 (III): January - March, 2019
121
ISSN 2394 - 7780
GRAPH SHOWING GROWTH RATE ANALYSIS OF SELECTED VARIABLES
14. FINDINGS OF THE STUDY 1. The calculation of growth rate of every year reveals that the member of cooperative society will increase
every year this was help to gain the profit for the society.
2. The share capital of the society will also increase every year because the member of the society also increases in past 08 years.
3. The deposits have increases in every year but sudden fall in 2012-13 but also they recover the deposit of the society.The deposits mobilization is very dynamic in nature and which should give very much importance on the priority basis.
4. The society will maintain the reserve fund the first two year they not maintained any reserve fund then the society will taken the reserve fund so society will maintain constant profit.
5. The amount of loan granted and has increased over the years; however the recovery rate is also good.
6. The percentage of loan repayment has increased over the year; however the interest rate of repayment is also good.
7. The Society has not granted any loans under National Saving Certificate, since last four years.
8. The Society has not granted any loans under L.I.C, policy since last two years, but it is focusing on recovery of existing loans.
15. SUGGESTIONS Adoption of prudent underwriting standard should be done strictly. The banking tools which were being used
in traditional era like debt service coverage ratio, the consideration of purpose of loan, verification of documentary evidences of income and assets of the borrowers are to be relied upon.
Focus on link between market liquidity and individual bank funding is required. It needs to be properly focused by the supervisors and banks.
Reliable Valuation is required in liberal valuation assumptions. This can lead to material inaccuracies in the financial statements so proper care should be taken for the valuation.
Transparency is required. Banks as well as investors used to face various difficulties because of complex structured products. This was due to insufficient disclosure in order to overcome this full transparency is required
16. CONCLUSION In the present situation the world has turned out to be level. Subsidence at one place/industry influences all the connected ventures around the world. Saving money/Budgetary Administrations industry is one such territory, which has shown differing sway topographically. The analysis of performance of Sri Rama Arya Vysya Credit Cooperative Bank is witnessed the effective growth in selected variables. The study also revealed that the co operative society contributing to greater extent by providing effective financial products which in turn providing significance return by the way of revenue generation.

International Journal of Advance and Innovative Research Volume 6, Issue 1 (III): January - March, 2019
122
ISSN 2394 - 7780
REFERENCE Dubhashi P.R. (1969) – Cooperation – An Interdisciplinary Approach”. Edited by Dubhashi P.R., Director,
Published by Vaikunta Meheta National Institute of Cooperative and Management (UMNICOM), Pune-1969.
Datar D.R. (1969) – Place of Cooperation in India‟s Economy”. Paper presented at Vaikunta Meheta National Institute of Cooperative Management Approach”
Batra M.L. (1972) – “Forms of Assistance to Cooperative”. Bombay Allied Publications.
Dubhashi P.R, (1972) – “State and Cooperative Development An overview” – International Cooperative alliance. Bombay Allied Publishers.
Fujisawa k. (1972) – “The concept of Autonomy as applied to the Cooperative Movement in Developing Countries”- Bombay Alllied Publications.
Deshpande S.H. (1977) – “Some Problems of Cooperative Forming” – Bombay Himalaya Publishing House.

International Journal of Advance and Innovative Research Volume 6, Issue 1 (III): January - March, 2019
123
ISSN 2394 - 7780
DIGITALIZATION- A WAY OF CREATING DIGITAL ECONOMY FOR HEALTH CARE SECTOR
Roshan K Assistant Professor, JSS Academy of Higher Education and Research, Mysore
ABSTRACT In the present century it’s witnessed that man is growing his relation with machines to achieve efficiency in this context a new concept developed called digital economy which is also called as internet economy. Which means process and products are produced and delivered through web or with help of internet. When we inspect this concept of digital economy it can be concluded that it has grown in almost all the sphere of mans activity. This paper tries to highlight the growth and uses of digital economy in health care sector which is thriving for quality in delivery and efficiency in health care service.
Keyword: Digital economy, technologies, India .healthcare
INTRODUCTION The adoption of IT in healthcare systems has, in general, followed the same pattern as other industries. In the 1950s, when institutions began using new technology to automate highly standardized and repetitive tasks such as accounting and payroll, healthcare providers and other industry stakeholders also began using IT to process vast amounts of statistical data. Twenty years later, the second wave of IT adoption arrived. It did two things: it helped integrate different parts of core processes (manufacturing and HR, for example) within individual organizations, and it supported B2B processes such as supply-chain management for different institutions within and outside individual industries. As for its effects on the healthcare sector, this second wave of IT adoption helped bring about, for example, the electronic health card in Germany. It was also a catalyst for the Health Information Technology for Economic and Clinical Health Act in the United States—an effort to promote the adoption of health-information technology—and the National Programme for IT in the National Health Service in the United Kingdom. Regardless of their immediate impact, these programs helped create an important and powerful infrastructure that certainly will be useful in the future.
Now that patients around the world have grown more comfortable using digital networks and services, even for complex and sensitive issues such as healthcare, we believe the time has come for healthcare systems, providers, and providers to go “all in” on their digital strategies. The question is, where should they start?
1.1 WHAT IS DIGITAL ECONOMY Digital economy refers to an economy that is based on digital computing technologies. The digital economy is also sometimes called the Internet Economy, the New Economy, or Web Economy. Increasingly, the "digital economy" is intertwined with the traditional economy making a clear delineation harder.
1.2 WHAT IS DIGITAL ECONOMY IN HEALTHCARE SECTOR? Digital health is the convergence of digital and genomic technologies with health, healthcare, living, and society to enhance the efficiency of healthcare delivery and make medicines more personalized and precise. The discipline involves the use of information and communication technologies to help address the health problems and challenges faced by patients. These technologies include both hardware and software solutions and services, including telemedicine, web-based analysis, email, mobile phones and applications, text messages, and clinic or remote monitoring sensors. Generally, digital healthcare is concerned about the development of interconnected health systems to improve the use of computational technologies, smart devices, computational analysis techniques and communication media to aid healthcare professionals and patients manage illnesses and health risks, as well as promote health and wellbeing. Digital health is a multi-disciplinary domain which involves many stakeholders, including clinicians, researchers and scientists with a wide range of expertise in healthcare, engineering, social sciences, public health, health economics and management.
1.3 DIGITAL ECONOMY IN HEALTHCARE SECTORS INCLUDES Electronic Health Records(EHR)
Medical Imaging
Tele Health And Tele Medicine
Online Appointment
Online Consultation
International Journal of Advance and Innovative Research Volume 6, Issue 1 (III): January - March, 2019
124
ISSN 2394 - 7780
M –Health (Mobile Health)
Application Program Interference (API)
Robotic Operations And Nursing
Cloud Computing
Health ATM
1.3.1 Electronic Health Records (EHR) An Electronic Health Record (EHR), or Electronic Medical Record (EMR), refers to the systematized collection of patient and population electronically-stored health information in a digital format. These records can be shared across different health care settings. Records are shared through network-connected, enterprise-wide information systems or other information networks and exchanges. EHRs may include a range of data, including demographics, medical history, medication and allergies, immunization status, laboratory test results, radiology images, vital signs, personal statistics like age and weight, and billing information.
EHR systems are designed to store data accurately and to capture the state of a patient across time. It eliminates the need to track down a patient's previous paper medical records and assists in ensuring data is accurate and legible. It can reduce risk of data replication as there is only one modifiable file, which means the file is more likely up to date, and decreases risk of lost paperwork. Due to the digital information being searchable and in a single file, EMR's are more effective when extracting medical data for the examination of possible trends and long term changes in a patient. Population-based studies of medical records may also be facilitated by the widespread adoption of EHR's and EMR's.
1.3.2 Medical Imaging Medical Imaging is the technique and process of creating visual representations of the interior of a body for clinical analysis and medical intervention, as well as visual representation of the function of some organs or tissues (physiology). Medical Imaging seeks to reveal internal structures hidden by the skin and bones, as well as to diagnose and treat disease. Medical Imaging also establishes a database of normal anatomy and physiology to make it possible to identify abnormalities. Although Imaging of removed organs and tissues can be performed for medical reasons, such procedures are usually considered part of pathology instead of medical Imaging.
As a discipline and in its widest sense, it is part of biological imaging and incorporates radiology which uses the Imaging technologies of X-ray radiography, magnetic resonance imaging, medical ultrasonography or ultrasound, endoscopy, elastography, tactile imaging, thermography, medical photography and nuclear medicine functional imaging techniques as positron emission tomography (PET) and Single-photon emission computed tomography (SPECT).
Measurement and recording techniques which are not primarily designed to produce images, such as electroencephalography (EEG), magnetoencephalography (MEG), electrocardiography (ECG), and others represent other technologies which produce data susceptible to representation as a parameter graph vs. time or maps which contain data about the measurement locations. In a limited comparison these technologies can be considered as forms of medical Imaging in another discipline.
Up until 2010, 5 billion medical Imaging studies had been conducted worldwide.[1] Radiation exposure from medical Imaging in 2006 made up about 50% of total ionizing radiation exposure in the United States.
1.3.3 Tele Health and Tele Medicine Tele Health involves the distribution of health-related services and information. Distribution is via electronic information and telecommunication technologies. It allows long distance patient/clinician contact and care, advice, reminders, education, intervention, monitoring and remote admissions. As well as provider distance-learning; meetings, supervision, and presentations between practitioners; online information and health data management and healthcare system integration. Tele Health could include two clinicians discussing a case over video conference; a robotic surgery occurring through remote access; physical therapy done via digital monitoring instruments, live feed and application combinations; tests being forwarded between facilities for interpretation by a higher specialist; home monitoring through continuous sending of patient health data; client to practitioner online conference; or even videophone interpretation during a consult.
As the population grows and ages, and medical advances are made which prolong life, demands increase on the healthcare system. Healthcare providers are also being asked to do more, with no increase in funding, or are
International Journal of Advance and Innovative Research Volume 6, Issue 1 (III): January - March, 2019
125
ISSN 2394 - 7780
encouraged to move to new models of funding and care such as patient-centred or outcomes based, rather than fee-for-service. Some specific health professions already have a shortage (i.e. Speech-language pathologists). When rural settings, lack of transport, lack of mobility (i.e. In the elderly or disabled), decreased funding or lack of staffing restrict access to care, Tele Health can bridge the gap.
1.3.4 Online appointment is an online medical care scheduling service, providing free of charge medical care search facility for end users by integrating information about medical practices and doctors' individual schedules in a central location. Provides a scheduling system on paid subscription basis for medical personnel. The scheduling system can be accessed by subscribers both as an online service and via the deployed office calendar software, or integrated with their websites. The subscriber's schedules are available to the patients.
The end user-searchable database includes specialties, range of services, office locations, photographs, personnel educational background and user-submitted reviews. For each doctor the users are able to review the free slots in the schedule and make appointments for specific time slots.
1.3.5 Online consultation In the 2000s, many people came to treat the internet as a first, or at least a major, source of information and communication. Health advice is now the second-most popular topic, after pornography that people search for on the internet. With the advent of broadband and videoconferencing, many individuals have turned to online doctors to receive online consultations and purchase prescription drugs. Use of this technology has many advantages for both the doctor and the patient, including cost savings, convenience, accessibility, and improved privacy and communication.
In the US, a 2006 study found that searching for information on prescription or over-the-counter drugs was the fifth most popular search topic, and a 2004 study found that 4% of Americans had purchased prescription medications online. A 2009 survey conducted by Geneva-based Health on the Net Foundation found one-in-ten Europeans buys medicines from websites and one-third claim to use online consultation. In Germany, approximately seven million people buy from mail-order pharmacies, and mail-order sales account for approximately 8–10% of total pharmaceutical sales. In 2008, the Royal Pharmaceutical Society of Great Britain reported that approximately two million people in Great Britain were regularly purchasing pharmaceuticals online (both with a prescription from registered online UK doctors and without prescriptions from other websites). A recent survey commissioned by Pfizer, the Medicines and Healthcare products Regulatory Agency, RPSGB, the Patients Association and HEART UK found that 15% of the British adults asked had bought a prescription-only medicine online.
In developed countries, many online doctors prescribe so-called ‘lifestyle drugs’, such as for weight loss, hair loss or erectile dysfunction. The RPSGB has identified the most popular products prescribed online as Prozac (an antidepressant), Viagra (for erectile dysfunction), Valium (a tranquiliser), Ritalin (a psychostimulant), Serostim (a synthetic growth hormone) and Provigil (a psychostimulant). A study in the USA has also shown that antibiotics are commonly available online without prescription.
1.3.6 M –health (mobile health) M-Health (also written as m-health) is an abbreviation for mobile health, a term used for the practice of medicine and public health supported by mobile devices. The term is most commonly used in reference to using mobile communication devices, such as mobile phones, tablet computers and PDAs, for health services and information, but also to affect emotional states. The M-Health field has emerged as a sub-segment of E-Health, the use of information and communication technology (ICT), such as computers, mobile phones, communications satellite, patient monitors, etc., for health services and information. M-Health applications include the use of mobile devices in collecting community and clinical health data, delivery of healthcare information to practitioners, researchers, and patients, real-time monitoring of patient vital signs, and direct provision of care (via mobile telemedicine).
While M-Health certainly has application for industrialized nations, the field has emerged in recent years as largely an application for developing countries, stemming from the rapid rise of mobile phone penetration in low-income nations. The field, then, largely emerges as a means of providing greater access to larger segments of a population in developing countries, as well as improving the capacity of health systems in such countries to provide quality healthcare. Within the M-Health space, projects operate with a variety of objectives, including increased access to healthcare and health-related information (particularly for hard-to-reach populations); improved ability to diagnose and track diseases; timelier, more actionable public health information; and expanded access to ongoing medical education and training for health workers.
International Journal of Advance and Innovative Research Volume 6, Issue 1 (III): January - March, 2019
126
ISSN 2394 - 7780
According to an analyst firm, around 2.8 million patients worldwide were using a home monitoring service based on equipment with integrated connectivity at the end of 2012. The figure does not include patients that use monitoring devices connected to a PC or mobile phone. It only includes systems that rely on monitors with integrated connectivity or systems that use monitoring hubs with integrated cellular or fixed-line modems. It forecast that the number of home monitoring systems with integrated communication capabilities will grow at a compound annual growth rate (CAGR) of 26.9 percent between 2011 and 2017 reaching 9.4 million connections globally by the end of the forecast period. The number of these devices that have integrated cellular connectivity increased from 0.73 million in 2011 to about 1.03 million in 2012, and is projected to grow at a CAGR of 46.3 percent to 7.10 million in 2017. A growing percentage of health-related smart phone applications are available, and some estimates predict 500 million patients will be using such apps by the year 2015. There are concerns about the accuracy and unregulated status of health apps. 1.3.7 Application Program Interference (API) In a world of growing apps and cloud based computing, expectations as to how information is accessed and how programs function have changed quite a bit over the last few years, prompting a market demand that is synchronously being driven by government forces, encouraging EHR vendors to develop platforms that promote the free exchange of information through open API’s.
Many industries have fully embraced the open API — or application program interface. Open API’s provide developers with programmatic access to software applications, which in turn allows third parties to build in additional functionality, custom tailored to the end-user’s specifications, hence promoting the free exchange and access of information.
Yet, healthcare has lagged behind other industries in this area. For example, “The most valued patient data resides in the EHR, yet EHRs are architected to perpetuate data silos. Because of the lack of interoperability, healthcare providers can’t achieve true care coordination (Healthcare IT News). There has, however, been much evidence in 2015 that several healthcare verticals, including both EHR and Payers, may be on their way to catching up with the pack.
APIs can be used to track important data or electronic health records (EHRs), such as patient insurance coverage, personal information, and payment procedures (Forbes). There is significant potential for business growth driven by open APIs. The platforms can be used for clinical data visualization, decision support and data integration with outside sources like HIEs. All parties using EHRs could see increasing opportunity to find the ideal customers and open new revenue streams. “For the smaller, specialized EHR vendors, the business case is obvious – whole new markets will be opened to them.” according to M-Health News editor, Eric Wicklund (Healthcare IT News).
1.3.8 Robotic Operations and Nursing Robotic surgery, computer-assisted surgery, and robotically-assisted surgery are terms for technological developments that use robotic systems to aid in surgical procedures. Robotically-assisted surgery was developed to overcome the limitations of pre-existing minimally-invasive surgical procedures and to enhance the capabilities of surgeons performing open surgery.
In the case of robotically-assisted minimally-invasive surgery, instead of directly moving the instruments, the surgeon uses one of two methods to control the instruments; either a direct tele-manipulator or through computer control. A tele-manipulator is a remote manipulator that allows the surgeon to perform the normal movements associated with the surgery whilst the robotic arms carry out those movements using end-effectors and manipulators to perform the actual surgery on the patient. In computer-controlled systems the surgeon uses a computer to control the robotic arms and its end-effectors, though these systems can also still use tele-manipulators for their input. One advantage of using the computerised method is that the surgeon does not have to be present, but can be anywhere in the world, leading to the possibility for remote surgery.
In the case of enhanced open surgery, autonomous instruments (in familiar configurations) replace traditional steel tools, performing certain actions (such as rib spreading) with much smoother, feedback-controlled motions than could be achieved by a human hand. The main object of such smart instruments is to reduce or eliminate the tissue trauma traditionally associated with open surgery without requiring more than a few minutes' training on the part of surgeons. This approach seeks to improve open surgeries, particularly cardio-thoracic, that have so far not benefited from minimally-invasive techniques.
Robotic surgery has been criticized for its expense, by one estimate costing $1,500 to $2000 more per patient.
International Journal of Advance and Innovative Research Volume 6, Issue 1 (III): January - March, 2019
127
ISSN 2394 - 7780
1.3.9 Cloud Computing Cloud Computing is a type of Internet-based computing that provides shared computer processing resources and data to computers and other devices on demand. It is a model for enabling ubiquitous, on-demand access to a shared pool of configurable computing resources (e.g., computer networks, servers, storage, applications and services), which can be rapidly provisioned and released with minimal management effort. Cloud computing and storage solutions provide users and enterprises with various capabilities to store and process their data in either privately owned, or third-party data centres that may be located far from the user–ranging in distance from across a city to across the world. Cloud computing relies on sharing of resources to achieve coherence and economy of scale, similar to a utility (like the electricity grid) over an electricity network.
Advocates claim that cloud computing allows companies to avoid up-front infrastructure costs (e.g., purchasing servers). As well, it enables organizations to focus on their core businesses instead of spending time and money on computer infrastructure. Proponents also claim that cloud computing allows enterprises to get their applications up and running faster, with improved manageability and less maintenance, and enables Information technology (IT) teams to more rapidly adjust resources to meet fluctuating and unpredictable business demand. Cloud providers typically use a "pay as you go" model. This will lead to unexpectedly high charges if administrators do not adapt to the cloud pricing model.
In 2009, the availability of high-capacity networks, low-cost computers and storage devices as well as the widespread adoption of hardware virtualization, service-oriented architecture, and autonomic and utility computing led to a growth in cloud computing. Companies can scale up as computing needs increase and then scale down again as demands decrease. In 2013, it was reported that cloud computing had become a highly demanded service or utility due to the advantages of high computing power, cheap cost of services, high performance, scalability, accessibility as well as availability. Some cloud vendors are experiencing growth rates of 50% per year, but being still in a stage of infancy, it has pitfalls that need to be addressed to make cloud computing services more reliable and user friendly.
1.3.10 Health ATM Health ATMs, with a stock of drugs and other medical essentials, can soon become a reality in rural parts of India with some state governments mulling setting up such kiosks through the public-private partnership mode.
The Wish India Foundation, an NGO working in innovations in health, will soon begin a project in Rajasthan through which it will set up health ATMs in the countryside in partnership with the state government.
“While the Rajasthan project would begin from January, talks to begin such initiatives in Odisha and Madhya Pradesh are at an advanced stage,” said Wish Foundation CEO Soumitra Ghosh.
“We feel that primary health care is the main link in the country. We have a data base of innovators in the health care sector and try to implement their ideas after thorough laboratory checking,” he said.
Ghosh said the initiative first involved talking to the governments and identifying their needs and then showing them innovations according to the demands.
Health ATMs, automatic kiosk-type diagnostic centres and urine analysers, are among the several new health care innovations whose introduction was discussed at a special meet held earlier in the day.
Over 200 thought leaders from the government and private sector discussed the potential for bringing innovations in health care.
Sponsored by the Wish India Foundation, the initiative – with active support from Deloitte Touche Tohmatsu India – is aimed at helping the poor derive benefits from specially designed low-cost glucometers, urine analysers, tele-connected Health ATMs and other devices.
The foundation has also committed to raise Rs.600 crores for healthcare innovations, ecosystem and knowledge hub to support the underprivileged sections in India.
“This shall help almost 100 innovators which they have identified through a study in joint collaboration with Deloitte in the healthcare sector in the next decade,” said Sunil Wadhwani, co-founder and co-chairman of IGATE Corporation.
“The fund will be raised by us and core partners such as large foundations initially and then others would add to it,” Wadhwani said.
International Journal of Advance and Innovative Research Volume 6, Issue 1 (III): January - March, 2019
128
ISSN 2394 - 7780
1.4 ADVANTAGES Innovations in the area of tele-health and telemedicine have helped overcome the tyranny of distance, making
it possible to provide rudimentary care to patients in remote locations, and to save costs by outsourcing some activities such as diagnostics to lower-cost locations (tele-diagnostics).
The internet has also allowed consumers (patients) to mitigate the very real information asymmetries that exist in this sector, making readily available information on such things as medical conditions, the availability and cost of treatments.
Wearable make it possible to track and monitor important health parameters like sleeping patterns, daily exercise regimes, and weight gain or loss
Downloadable apps make it possible to schedule appointments, claim reimbursements, and the like using mobile smart-phone platforms.
1.5 MYTHS People don’t want to use digital services for healthcare
Only young people want to use digital services
Mobile health is the game change
Patients want innovative features and apps
A comprehensive platform of service offerings is a prerequisite for creating value
1.6 FUTURE RISKS AND OPPORTUNITIES Data localization obligations
Local content requirements
Mandatory source code sharing
Calls to include mandatory backdoors
Subsidy and state aid programs
These are just some of the many restrictions policymakers in many countries are implementing that represent very real risks to the continued development of the digital economy.
Data localization obligations
Local content requirements
Mandatory source code sharing
Calls to include mandatory backdoors
Subsidy and state aid programs data and privacy are key.
This is an area where we are likely to see breakthrough innovation only if the most innovative players in the ecosystem can gain access to medical data in a more comprehensive way, either by partnering with those stakeholders holding it, or by obtaining permission to access such data from the data subjects directly.
CONCLUSION Patients today are willing and able to become more invested in their health care. Physicians have access to better information on both individual patients and broader populations to drive decision-making. Technology allows for devices that monitor and report critical health information. Healthcare companies are responding in ways both basic and complex, from scheduling appointments to saving lives.
REFERENCES http://indianexpress.com/article/lifestyle/health/health-atms-can-be-a-reality-soon/ http://searchcio.techtarget.com/definition/digital-economy http://www.mckinsey.com/industries/healthcare-systems-and-services/our-insights/healthcares-digital-future https://integratedmedicaldata.com/api-the-future-of-the-healthcare-digital-economy/ http://www.digitalistmag.com/iot/2017/04/04/internet-of-things-for-business-05008279

International Journal of Advance and Innovative Research Volume 6, Issue 1 (III): January - March, 2019
129
ISSN 2394 - 7780
http://www.digitalistmag.com/digital-economy/2016/06/20/future-of-healthcare-relies-on-digital-transformation-04273543
http://www.unescap.org/sites/default/files/Session-3The%20Digital%20Economy Mega%20Regionals%20and%20Health%20Care.pdf
The Digital Economy: Promise and Peril In The Age of Networked Intelligence Paperback – May 1, 199 by Don Tapscott

International Journal of Advance and Innovative Research Volume 6, Issue 1 (III): January - March, 2019
130
ISSN 2394 - 7780
E-TAILING SUPERSEDES OVER BRICK-AND-MORTAR, E-COMMERCE IN INDIA AND THE FUTURE GROWTH
Dr. V. Vikram Assistant Professor, Department of MBA, JNN College of Engineering, Shimoga
ABSTRACT By 2020, e-commerce will be the dominant “organized” retail channel in the top 75 Indian cities. If, retailing in India is to be seen from the consumer’s perspective, then “anytime/anywhere” will be the haunting desire of the majority of urban consumers in the years to come. As much as 30 to 35 per cent of merchandise sales by value will come from those cities. E-channel could account for as much as 20 per cent of merchandise sales by value. E-commerce will quickly be larger than brick-and-mortar in India and the trend has already begun. Traditional, small, independent retail outlets will continue to account for a significant 35 to 40 per cent of total merchandise sale in the top 75 cities and closer to 50 to 55 per cent in urban India. Organized “brick-and-mortar” channel sales will be limited to between 25 and 35 per cent share in top 75 cities and between 20 and 25 per cent for all of urban India as a whole. One of the major challenges being faced by “brick-and-mortar” is the space constraint, beyond the availability of space; the numerous challenges for “brick-and-mortar” retailing in India include the existence of very old and tedious laws that can be different even from city to city, and certainly state to state. The laws are also different for various product categories being retailed, so the opening of every physical format stores could imply between 30 and 50 different permissions and licenses besides making each outlet vulnerable to regular harassment from an army of inspectors. With all these challenges for brick-and-mortar retailers, and in the backdrop of the various fundamental changes in Indian consumer behavior, e-commerce is likely to emerge as the most attractive retail channel for corporatized retail.
Keywords: E-commerce, Bric-and-mortar, Brick-and-click, E-channel
OVER VIEW OF THE INDIAN E-COMMERCE INDUSTRY The e-commerce market in India was estimated at USD27.5 billion in 2016, and is expected to grow at a CAGR of 31 per cent to touch USD80 billion by 2020. The online travel segment comprises about 61 per cent of the e-commerce industry in India, including travel and e-ticketing websites. Ticketing accounts for the largest share of the online travel market, with domestic air ticketing driving growth.
E-commerce retail companies continuously work to introduce innovative business models and technology-driven approaches. Convenient payment options, customer-friendly policies, speedy deliveries and easy returns drive customers to online channels. Further, concepts such as ‘online and application (app) only’ sales, ‘by invite only’ discounts, special discount coupons, cash-back policies and special online festivals continue to drive customers to shop online.
The state-owned Indian Railway Catering and Tourism Corporation (IRCTC) has emerged as one of the largest online sites, with the website itself, attracting about 45 per cent of all visitors to travel websites in India and 19 per cent of the total internet audience. The below graph furnishes the category wise growth rate in the year 2015. The major growth has come from Travel (16.8) followed by E-commerce retail (6.7 billion), Financial services (1.7 billion), others (1.4 billion) and classifieds (1.1 billion).
Source: KPMG in India analysis, based on industry observations and discussions, 2016 Note: Growth rate for
categories, up to 2020
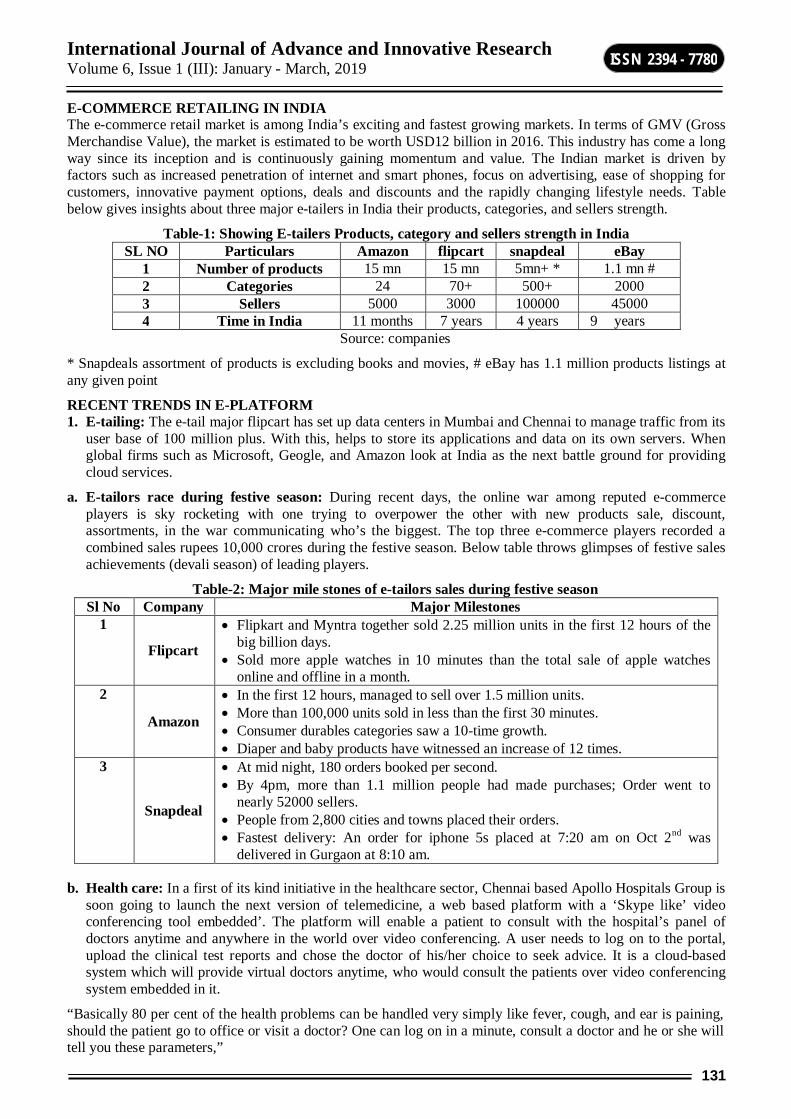
International Journal of Advance and Innovative Research Volume 6, Issue 1 (III): January - March, 2019
131
ISSN 2394 - 7780
E-COMMERCE RETAILING IN INDIA The e-commerce retail market is among India’s exciting and fastest growing markets. In terms of GMV (Gross Merchandise Value), the market is estimated to be worth USD12 billion in 2016. This industry has come a long way since its inception and is continuously gaining momentum and value. The Indian market is driven by factors such as increased penetration of internet and smart phones, focus on advertising, ease of shopping for customers, innovative payment options, deals and discounts and the rapidly changing lifestyle needs. Table below gives insights about three major e-tailers in India their products, categories, and sellers strength.
Table-1: Showing E-tailers Products, category and sellers strength in India SL NO Particulars Amazon flipcart snapdeal eBay
1 Number of products 15 mn 15 mn 5mn+ * 1.1 mn # 2 Categories 24 70+ 500+ 2000 3 Sellers 5000 3000 100000 45000 4 Time in India 11 months 7 years 4 years 9 years
Source: companies
* Snapdeals assortment of products is excluding books and movies, # eBay has 1.1 million products listings at any given point
RECENT TRENDS IN E-PLATFORM 1. E-tailing: The e-tail major flipcart has set up data centers in Mumbai and Chennai to manage traffic from its
user base of 100 million plus. With this, helps to store its applications and data on its own servers. When global firms such as Microsoft, Geogle, and Amazon look at India as the next battle ground for providing cloud services.
a. E-tailors race during festive season: During recent days, the online war among reputed e-commerce players is sky rocketing with one trying to overpower the other with new products sale, discount, assortments, in the war communicating who’s the biggest. The top three e-commerce players recorded a combined sales rupees 10,000 crores during the festive season. Below table throws glimpses of festive sales achievements (devali season) of leading players.
Table-2: Major mile stones of e-tailors sales during festive season Sl No Company Major Milestones
1
Flipcart
Flipkart and Myntra together sold 2.25 million units in the first 12 hours of the big billion days.
Sold more apple watches in 10 minutes than the total sale of apple watches online and offline in a month.
2
Amazon
In the first 12 hours, managed to sell over 1.5 million units. More than 100,000 units sold in less than the first 30 minutes. Consumer durables categories saw a 10-time growth. Diaper and baby products have witnessed an increase of 12 times.
3
Snapdeal
At mid night, 180 orders booked per second. By 4pm, more than 1.1 million people had made purchases; Order went to
nearly 52000 sellers. People from 2,800 cities and towns placed their orders. Fastest delivery: An order for iphone 5s placed at 7:20 am on Oct 2nd was
delivered in Gurgaon at 8:10 am.
b. Health care: In a first of its kind initiative in the healthcare sector, Chennai based Apollo Hospitals Group is soon going to launch the next version of telemedicine, a web based platform with a ‘Skype like’ video conferencing tool embedded’. The platform will enable a patient to consult with the hospital’s panel of doctors anytime and anywhere in the world over video conferencing. A user needs to log on to the portal, upload the clinical test reports and chose the doctor of his/her choice to seek advice. It is a cloud-based system which will provide virtual doctors anytime, who would consult the patients over video conferencing system embedded in it.
“Basically 80 per cent of the health problems can be handled very simply like fever, cough, and ear is paining, should the patient go to office or visit a doctor? One can log on in a minute, consult a doctor and he or she will tell you these parameters,”
International Journal of Advance and Innovative Research Volume 6, Issue 1 (III): January - March, 2019
132
ISSN 2394 - 7780
A ‘virtual’ team of doctors and nurses would be based at the medical call centre attached to any of its chain of hospitals. They will be backed by executives of a decision support group (DSS). The moment a patient logs on, DSS executives will engage with them to understand the concern areas and brief the doctors so that they will be able to ask the right question to the patients. The DSS team will also advise the patients if they are required to consult a specialist or to visit the hospitals in person. As it is a web-based application, the specialist doctors can log on from anywhere, using the password given to them.
Apollo is also planning to launch electronic intensive care units (eICU) across India. These will be small nursing homes, where the ICUs will be linked with the hospitals’ central monitoring station. Doctors sitting in a city hospital or some other nursing home can remotely monitor the eICU patients.
c. Home-and-furniture category: The Indian home and furnishing market is pegged at about $20 billion (1.2 lakh crore), of which the furniture segment accounts for about half. As about 90 per cent of the market is unorganized, it is an attractive avenue for online players. Online retailers are becoming increasingly active in the home-and-furniture segment. To name few, Swedish furniture major IKEA, German Rocket Internet sponsored FabFurnish, and Norwest venture partners funded pepperfry are known players in the online platform. Margins in business stand at 10 to 25 per cent, making it competitive and on par with the apparel space. In relatively developed markets such as China and Brazil, the share of the home-and-furniture category in the overall e-commerce space is estimated at 15-20 per cent, it’s an encouraging numbers for Indian e-tailers to enter the market.
d. Online laundries: Online laundry market was Rs 17,400 crore businesses in India in 2012, and is expected to grow to Rs 48,900 crore by 2018. Major players in the online laundry like; pickmylaundry, Laundrywala, Dirk Da Dhobi, wassup, Mywash and Laundry Basket are doing well for the past two to three years. The sector is fragmented with 7,76000 establishments, 98% micro-sized laundries with fewer than 10 workers. Unlike other home delivery services, laundry faces unique challenges. In the past few years, Indian strat-ups have experimented with both the asset light aggregator model and with heavy investments in processing units or tie-ups with institutional laundries.
e. Online education: Coursera an online management education has partnered Stanford University and edX (a non-profit organization created by Harvard and MIT), which offer free mass online courses. A Chenni-based Swaminathan K, a serial entrepreneur who has founded and exited half a dozen businesses in a little over a decade has started many online educations (all started between the years 2000 and 2011). The first was eGurucool.com (India’s first low cost e-learning portal), and it was followed by Aspire Learning, SuperKidz, Scholars League, smartlearnwebtv.com, and myBskool.com His goal is to make “premium” educational courses affordable.
FLIP SIDE OF ONLINE BUSINESS 1. Online versus offline battle: Retail sector already seems to be facing the heat from the much smaller
ecommerce segment, the present size of which, excluding online travel, is a mere $3.1 billion (Rs18,600 crore). Few companies, in to manufacturing of technology product, like Lenovo India issued an advisory to its buyers against doing business with e-retailers, has put a notice on its website urging consumers to buy products only from its exclusive stores or its own e-commerce portal.
2. Predatory pricing: Retail associations across the country held a meeting with the hardware manufacturers industry body (MAIT) to raise the issue of undercutting prices. Director of MAIT, said products were being bought from retail channel and sold online at a much lower price; this was creating problems for offline retailers. The question has been raised about online retailing “whether business ethics being maintained or not”?
CONCLUSION In terms of industry size, ecommerce is still small at $1.5 billion, out of the organized retail pie of $37 billion. The total retail market in India, most of which is unorganized, is pegged at around $500 billion. However, with 40 per cent of the e-commerce traffic coming from mobile phones, online retailers are hoping to compete hard with brick-and-mortar retailers.
India is likely to see the emergence of tens of thousands of “ultra specialty” and “specialty” e-businesses (to add to the several million independent brick-and-mortar outlets) focused on supplying a very narrow range of products to a relatively small group of customers either in a small geographical cluster or spread nationally and even internationally.
International Journal of Advance and Innovative Research Volume 6, Issue 1 (III): January - March, 2019
133
ISSN 2394 - 7780
The central and the state governments still have to understand the scope of modern retailing and are grappling with the challenge of coming out with pragmatic policies and regulations that can modernize India’s obsolete and inefficient retail ecosystem, there is a retail revolution in the making through the emergence of e-tailing.
E-commerce can successfully ease several of India’s infrastructural constraints such as the lack of availability of legitimate, affordable retail space; can offer much better convenience and value to hundreds of millions of time, inflation-ravaged consumers; improve tax compliance; and give an extraordinary fillip to millions of micro and small (manufacturing) entrepreneurs who can find access to hundreds, thousands, tens of thousands, and even millions of consumers directly or through some of the so-called “market-places” such as Flipkart, eBay, Amazon, Jabong, , and many others.
BIBLIOGRAPHY 1. KPMG. (2016). Fulfil ed ! Retrieved from kpmg.com/in
2. Business standard. (2016, October 2). E-tailers festive sales, p. 9.
3. Singhal, A. (2013). Why e-tailing scores over brick & mortar Space constraints and pernicious laws restrict traditional retailing formats from efficiently serving the Indian consumer, 2013.
4. Soni, A. (2017). Furniture category set to expand in e-commerce, 70.
5. Business standard. (2016, November). Aiming for bigger market share, online laundries head for shake-up.
6. Business standard. (2017, February). Tech brands lock horns with e-com firms over “predatory” pricing.
7. Business standard. (2014, October). Making online management education affordable, p. 2014.
8. Business standard. (2016, October). Apollo readies higher dose of telemedicine.
9. Business standard. (2013). E-commerce firms start to beat brick-n-mortar in segments.
International Journal of Advance and Innovative Research Volume 6, Issue 1 (III): January - March, 2019
134
ISSN 2394 - 7780
HUMAN RESOURCE ANALYTICS (HR ANALYTICS) –A DIGITAL PATHWAY FOR ORGANIZATIONAL PERFORMANCE & SUCCESS
Dr. Meera Uday1 and C. N. Udayashankar2 Professor1, Don Bosco Institute of Technology, DBIT, Bangalore
Lean Consultant and Trainer2
ABSTRACT “An ounce of performance is worth pounds of promises”-Mae West Business Organization relentlessly strive for Success, Revenues, profits and to dominate the market for centuries together. To achieve this success, a sound organization with dynamic strategies are essential. The organization must be constituted with proactive and performance oriented Professionals. The performance of employees need to be measured periodically and the performance metrics requires a detailed analysis.
Consequently, Analytics related to HR details gains importance and therefore HR Analytics is in vogue nowadays.
Human resource analytics (HR analytics) is an area in the field of analytics that refers to applying analytic processes to the human resource department of an organization in the hope of improving employee performance and therefore getting a better return on investment. HR analytics does not just deal with gathering data on employee efficiency. Instead, it aims to provide insight into each process by gathering data and then using it to make relevant decisions about how to improve these processes.
HR analytics correlates business data and people data, which provides insights into business HR analytics is to provide data on the impact the HR department has on the organization as a whole. Establishing a relationship between what HR does and business outcomes – and then creating strategies based on that information – is what HR analytics is all about.
HR has core functions that can be enhanced by applying processes in analytics. These are acquisition, optimization, paying and developing the workforce of the organization. HR analytics can help to dig into problems and issues surrounding these requirements, and using analytical workflow, guide the managers to answer questions and gain insights from information at hand, then make relevant decisions and take appropriate actions.
INTRODUCTION WHAT ARE HUMAN RESOURCES ANALYTICS? Human resources (HR) analytics refers to a process where techniques of data mining and business analytics (BA) are used for processing HR data. It is sometimes also referred to as talent analytics. Furthermore, data mining in this context refers to the practice of studying established databases in order to create new information.
There are two main purposes for HR analytics: providing insights and identifying key data.
The first purpose aims to provide the organization information on its own operations, which can help with the effective management of employees. These insights can then ensure business goals are reached efficiently within a certain timeframe.
The second key function of HR analytics helps to identify the data the organization should capture. Furthermore, it provides the models for predicting the different ways the organization is able to receive an optimal return on investment (ROI) on its human capital.
Overall, HR analytics is focused on making the most of the vast amounts of HR data most organizations have gathered. Companies often have plenty of data on things such as employee demographics, training records and so on, but it is the analysis of the data HR analytics can help with.
WHY SHOULD YOUR ORGANISATION FOCUS ON HR ANALYTICS? HR decisions are often based on professional instinct and the gut feeling. Recruitment, for example, often relies in the personal connection recruiters make with the candidate. The problem of relying on this gut instinct is that it can normalize bad practices. Common workplace injustices can therefore go unnoticed. The pay gap between men and women is a solid example of this. Promotions and rewards might be provided to male employees due to gut instinct, instead of relying on cold data on performance, for instance. Organizations might even consider they are paying the same, unless they study the actual data.
International Journal of Advance and Innovative Research Volume 6, Issue 1 (III): January - March, 2019
135
ISSN 2394 - 7780
HR analytics can help boost the performance and predict the models, which lead to better success. It removes more of the human error from decision-making. For instance, improvements in workload management can be more effective when data is used to show which departments or teams are bearing the burden and which can afford to take on more responsibilities.
Perhaps more importantly, HR analytics has been proven to improve company growth. Training Zone reports on the findings of performance boost for one company, which used HR analytics to improve its recruitment process. Through data analysis, the company noticed the traditional key metrics of education and reference quality didn’t have a big impact on the candidate’s performance in sales productivity. In fact, it was metrics such as experience in big-ticket sales and the ability to perform in unstructured circumstanced which drove better sales performance. When the company implemented these HR analytic findings to recruitment, the company’s sales grew by $4 million the following year.
Other surveys have had similar findings in terms of the importance of HR analytics to overall company performance. A survey by MIT and IBM discovered that higher level of HR analytics use had the potential to:
Provide 8% higher sales growth
Generate 24% higher net operating income
Produce 58% higher sales per employee
KEY WAYS TO USE HR ANALYTICS The applications of HR analytics are vast and the important metrics to an organization depend on the industry, as well as the nature of the business.
A couple of the key HR metrics to analyze include Resignation rate
Time to recruit to hire
Turnover rate for different staff groups (first year, five year, etc.)
Revenue per FTE
Performance appraisal participation rate
The above metrics and other such data can be used to boost business performance. The key areas where HR data can help are:
Recruitment – HR analytics can provide answers for finding the ideal candidates to help the business succeed. For example, as the above example of the company showed, data can be used to identify the candidate qualities that yield better results. We can compile data of candidates who end up staying with the company and find the common denominators among them.
Health and safety – HR analytics can better locate the problem areas when it comes to health and safety related issues. Data can point out the roles, the job locations and other such factors that have the highest rates of accidents.
Employee retention – We can also learn more about employee retention through data. We can use HR analytics to discover the aspects, which increase employee engagement.
Talent gaps – Data can reveal whether there are talent gaps within the organization. For example, certain departments might have higher skilled workers to others and this could hinder the overall performance of the company.
Sales performance – HR analytics can help provide details on how sales targets can be exceeded. You can notice how specific talent helps employees perform better or that certain training programs yielded immediate returns in terms of sales.
THE 8 HR ANALYTICS EVERY MANAGER SHOULD KNOW ABOUT It goes without saying that people are vital to the success of any company. There’s no doubt that any business which can attract the right competencies, manage talent effectively, utilize capacity efficiently, and retain employees is setting itself up for long-term success.
HR departments are generating more data than ever before but at the same time they often struggle to turn their data into valuable insights. Based on the work I do with companies all over the globe I have identified some of

International Journal of Advance and Innovative Research Volume 6, Issue 1 (III): January - March, 2019
136
ISSN 2394 - 7780
the most important analytics managers can use to better understated the people-related side of their business. This post builds on my article on the key business analytics tools, which might make good additional background reading. Here is my list of HR analytics every manager should know about:
1. Capability analytics The success of your business depends on the level of expertise and skill of your workforce. Capability analytics is a talent management process that allows you to identify the capabilities or core competencies you want and need in your business. Once you know what those capabilities are you can compare them to the capabilities you have in place at the moment to see if you have any gaps.
Tip: Capabilities are not just about qualifications and skills; they can also include capabilities that may not be formally recognized, such as the ability to develop and maintain relationships.
2. Competency acquisition analytics Talent matters, and the acquisition and management of talent is often a critical factor in business growth. Competency acquisition analytics is the process of assessing how well or otherwise your business acquires the desired competencies. You need to start by identifying the core competencies your business requires now and in the future. Then assess the current levels of these competencies within your business and identify any gaps. You can then monitor how effective you are at developing these competencies in-house or spotting and recruiting candidates with those competencies.
Tip: Key to effective competency acquisition analytics is focusing on a small set of core competencies.
3. Capacity analytics Capacity affects revenue. Capacity analytics seeks to establish how operationally efficient people are in a business, e.g. are people spending too much time on admin and not enough on more profitable work, or are individuals stretched far too thin? It also allows businesses to establish of how much capacity they have to grow?
Tip: The tricky part is establishing a system to track capacity without creating huge administrative burdens and without alienating employees with a ‘big-brother’ approach. Big data and sensor system can be very effective here.
4. Employee churn analytics Hiring employees, training them and then integrating them into the business costs time and money. Employee churn analytics is the process of assessing your staff turnover rates in an attempt to predict the future and reduce employee churn. Historical employee churn can be identified through traditional KPIs such as the employee satisfaction index, employee engagement level and staff advocacy score. Surveys and exit interviews are also useful tools.
Tip: Always remember that some employee churn can be desirable. It is important to identify a healthy level of churn and develop system to pinpoint the ‘regrettable’ churn.
5. Corporate culture analytics Culture is notoriously difficult to pin point and even harder to change. It is essentially the collective (often unspoken) rules, systems and patterns of behavior that embody your business. Corporate culture analytics is therefore the process of assessing and understanding more about your corporate culture or the different cultures that exists across your organization. This then allows you to track changes in culture you would like to make, understand how the culture is changing, create early warning systems to detect toxic cultures in their development and ensure you are recruiting people that don’t clash with the corporate culture.
Tip: One way to assess culture is through the analysis of customer service conversations, which can provide a rich vein of data to assess corporate culture.
6. Recruitment channel analytics Employees represent the greatest cost and greatest opportunity in most businesses. Recruitment channel analytics is the process of working out where your best employees come from and what recruitment channels are most effective. Recruitment channel analytics will involve some historical assessment of employee value using KPIS such as human capital value added and return per employee. Surveys and entry interviews are also useful sources of data.
Tip: Aggregator sites like glassdoor.com operate like Trip Advisor for recruitment and can provide companies with independent reviews of their recruitment process.
International Journal of Advance and Innovative Research Volume 6, Issue 1 (III): January - March, 2019
137
ISSN 2394 - 7780
7. Leadership analytics Poor leadership, whether of a business, division or team costs money and prevents a business from fulfilling its potential. Leadership analytics unpacks the various dimensions of leadership performance via data to uncover the good, the bad and the ugly. Data about leadership performance can be gained through the use of surveys, focus groups, employee interviews or ethnography.
Tip: It is advisable to make the data collection anonymous, so that employees can really open up and provide useful information. Few employees would feel confident or safe talking about their leader or manager if they knew that person could or may have access to their opinion.
8. Employee performance analytics Your business needs capable high-performing employees to survive and thrive. Employee performance analytics seeks to assess individual employee performance. The resulting insights can identify who is performing well and who may need some additional training or support in order to raise their game. Today, we have many innovative ways of collecting and analyzing performance, from crowdsourced performance assessments to big data analytics.
Tip: I advise companies to move away from the classic and outdated performance reviews. With modern data capture techniques it is possible to analyze performance more holistically and less focused on specific parts of a job that might cause employees to skew their behavior.
Human resources have come a long way from the traditional focus on collecting and tracking information on employees to the modern focus of using the data to make deeper analytical connections across the business.
FIVE CHALLENGES TO HR ANALYTICS Before we look at the starting steps for implementing HR analytics, it’s worth examining some of the main challenges the application of the process creates. It’s essential to find ways to manage the below five challenges when establishing HR analytics within your organization.
Challenge 1: Data deluge The more data your organization gathers the harder it can become to use if appropriately. Big Data doesn’t automatically generate good results. You must be able to implement the right data analytics to succeed.
If your HR department just gathers a lot of data without proper implementation of analytics, you’ll end up with bloated data. The more bloated the data, the harder it is to make valuable assumptions.
For example, all the metrics you gather should be properly defined and categorized. You must define the questions you want to solve with your data, not simply gather it for the sake of having data.
As well as focusing on gathering the right amount of data, you also need to ensure you focus on data quality. Data deluge can quickly lead to poor quality data, as you aren’t creating meaningful connections between different data sets.
It is essential to guarantee data quality by focusing on ensuring data integrity and security. The problem for many organizations is that the data used in HR analytics can come from different departments within the organization and therefore lead to issues. Certain data can be ignored, dropped, lost or the data sets cannot be joined, which can result in inadequate analysis.
Challenge 3: Low analytical skills in most HR departments For HR analytics to succeed, the team behind it must have knowledge in both, human resources as well as data analysis. But finding HR leaders who are also competent in data analytics can be difficult.
According to Elizabeth Craig, a research fellow at Accenture Institute for High Performance, there is scarcity to finding the right talent for HR analytics. Furthermore, Craig told Data Informed certain data analytics tool require special IT skills which add extra pressure on finding the right people to take care of the process.
The problem is further expanded by findings that only 6% of global HR teams feel confident about their skills in using analytics. In addition, just 20% thought the data usage in their organization was credible and reliable enough to make decisions.
HR analytics has not yet become the mainstream process for many companies and there is often a lack of executive support. But for the process to work, HR departments must be able to convince the executive leaders on the benefits of using analytics.
International Journal of Advance and Innovative Research Volume 6, Issue 1 (III): January - March, 2019
138
ISSN 2394 - 7780
Executive support is important as it provides access to better resources, as implementation of a proper HR analytics system is not cheap. It can also provide better access to data across different departments. In order to convince the executives, HR departments must focus on highlighting the possibilities of a strong ROI with the initial investment.
Challenge 5: HR analytics costs a lot and ROI is often not visible Finally, organizations must be aware of the cost challenge. The price range of HR analytics tools is as varied as the availability of tools. According to the Data Informed article, the platform costs can range from “$400,000 to $1,5 million for a company with 5,000 full-time employees”.
Furthermore, the cost estimation doesn’t include the increase costs organizations might face in terms of hiring new staff to implement the programs or training existing staff in the use of analytics.
In addition, the ROI for HR analytics isn’t the most visible. This is because the benefits can be shown across different departments and over a longer period. For example, improvements in employee retention won’t become evident until later.
The challenge becomes from the realization that aiming for cheaper HR analytics platform doesn’t necessarily yield bigger savings. Insufficient software and tools can lead to inefficient and incomplete results, which in result won’t create high enough ROI to justify the investment.
Learn from Google’s VP of People Analytics and Compensation how to make better people decisions using human resource analytics.
https://youtu.be/KY8v-O5Buyc
THREE NEW FRAMEWORKS DRIVING HR TRANSFORMATION: In response to these changes, the Human Resources profession is tasked with transforming the way it applies these systems through process innovation and applied data science. (Bersin 2013)(Braund 2014) We are witness to three core areas of transformation: Talent Systems, Workforce Analytics, and Collaborative Innovation. Each a new framework that requires HR professionals to adapt their skills and capabilities to improve productivity:
Talent Systems: HR providers are continuously developing new, holistic workforce management software to optimize people data and process.
Workforce Analytics: HR practioners need to understand key talent management measures and consult stakeholders using data science.
Agile Leadership: Social computing and ‘Agile’ development methods being used to rapidly publish, iterate and refine solutions at the client level.
As some of you may know, I recently returned to school to work on my MsPA (Masters of Science in Predictive Analytics) at Northwestern University. In many ways the curriculum is inspiring my posts, by providing content and context. The program is forcing me to find practical examples of predictive analytics in HR. Over the next month I will be researching these specific examples further, and will share my findings with you. Let me know in the comments if you have some good examples to share!
5 CASE STUDIES – PREDICTIVE MODELING IN HR 1) Predictive Retention at HP Perhaps the most famous example so far, HP used data science to determine create a ‘flight risk’ indicator for its employees. (Siegel 2014) The program is described to have identified opportunities to save $300M, but there was also a lot of negative fallout in the PR department once employees realized what was happening. A good example of the potential of using predictive modeling, but also in the sensitivity of working with people analytics.
2) Predictive Hiring at AMC Theatres The most critical aspect to providing superior customer experience is the staff that help make that experience happen. AMC used workforce analytics and employee profiling to identify the core traits of superior customer service representatives, and re-modeled their hiring and interview process to predict successful hires. The result: increased employee engagement, lower turnover, and improved client satisfaction. (Kruse 2013)
3) Predictive Hiring at Google Google applies its proprietary predictive modeling to the field of recruitment as well. They have learned not to rely on traditional performance indicators like school or GPA, which prove to not have much predictive value.

International Journal of Advance and Innovative Research Volume 6, Issue 1 (III): January - March, 2019
139
ISSN 2394 - 7780
Instead they use five key, measurable attributes that correlate with successful hires: coding ability, cognitive skills, leadership, humility & ownership. (Friedman 2014)
4) Workforce Planning and Leadership at Kaiser Permanente Two major projects at KP helped them to close anticipated gaps in their service delivery: (Shen 2011)
Supply and Demand Forecasting: prediction of future critical business drivers in relation to anticipated market forces such as: process improvements, anticipated market size, changes in technology and changes in healthcare delivery. Comparison to current skills and capacity.
Leadership behavior modeling: regression analysis of high performance team indicators: quality, safety, delivery performance, & innovation were correlated with the following leader behaviors: new hire orientation, setting clear expectations, coaching and using lean tools.
5) Workforce Planning at IBM In 2010, a team of IBM researchers from the Watson laboratory were awarded with the Daniel H. Wagner prize in Excellence in Operations Research Practice for a project called OnTheMark (OTM), applied stochastic modeling and supply chain techniques to workforce planning. (Butler 2011) The presentation of the project introduced three core modelling techniques (Squillante 2010):
Demand Forecasting: probability modeling of sales opportunities, likely revenue and skills needed to deliver opportunity based on historical operations data comparisons.
Risk based capacity planning: Optimization models map current available skills, utilization to maximize productivity, and opportunity loss risked if under staffed.
Supply evolution & optimization: accounts for time variables in supply and the human nature of the service product. This step takes into account hiring, promotion, skills acquired over time, and attrition over the entire ecosystem over time.
WHAT IT ALL MEANS These five examples of applied analytics in the field of Human Resources are only a small set of a much broader movement in the profession. As a new generation of HR data scientists emerges, and improved optimization methods are discovered, it is becoming more and more common to see organizations move to data driven HR decision models. As I research these case studies, I will share with you more about the models themselves, and how you might be able to apply similar methods to your work as an HR professional.
HR ANALYTICS IN INDIA Talent Analytics are the future of HR in India finds TimesJobs
65% Indian Companies aim to embrace predictive talent analytics in next one year reveals TJinsite from timesjobs.
Predictive Talent Analytics (PTA) are being used to optimize HR functions by predicting employee performance, attrition and cost using Big Data analysis. HR metrics such as turnover rates, cost per hire, time to hire, sourcing channel, open vacancies vs positions filled, offer to acceptance ratios, etc. are some data points that are used in PTA.
"Predictive Talent Analytics is basically the practical application of Big Data tools to HR processes. Globally, HR departments are tapping the potential of PTA to identify high performers, reduce attrition, predict performance, cut costs and improve the company’s bottom line. The ability to move from gut-based judgments to data-driven decision-making is what makes PTA the future of HR in India." explains Vivek Madhukar, COO, TimesJobs.com.
But how is HR in Indian companies faring in using PTA and the possibilities of data in predicting how a new hire or a potential candidate will perform? How far up the ladder are they in using predictive models?
A new TJinsite survey from TimesJobs.com across industries revealed interesting results. While 90% of the companies that took part in the survey say predictive analytics is the future of talent hunting, only 7% employ it to find the right hire.
Surprisingly, nearly 55% of all the organizations say they only use this data reactively and not to forecast for future plans. However, 65% plan to employ predictive talent analytics in the next one year the TimesJobs survey revealed. Of the remaining, nearly 18% plan to climb the maturity curve in the next six months while
International Journal of Advance and Innovative Research Volume 6, Issue 1 (III): January - March, 2019
140
ISSN 2394 - 7780
12% think it will take more than a year to progress to predictive analytics. Only about 5% of the organizations said they have no such plans on the cards in the long run, showed the survey.
IT & HEALTHCARE SECTORS LEAD IN USING ANALYTICS The Indian IT sector has emerged as a pioneer in using data analytics in recruitment in the survey. Over 80% of IT organizations stated they have a robust analytics process in place, finds the TimesJobs study.
Healthcare organizations come next, with 72% of them submitting to widely using HR data analytics in recruitment and engagement of their personnel.
Also, almost 70% representative organizations from the IT, ITeS, BFSI and Healthcare industries plan to make predictive analytics a fundamental aspect of their engagement and recruitment strategies in the next one year, according to the TimesJobs study.
BENEFITS OF TAPPING DATA Over 55% of organizations feel that an effective HR data analytics practice helps secure quality hires and nearly 22% of the respondents think the use of data helps improve recruitment turnaround time.
With changing business dynamics and the accelerating pace of growth and competition, predictive analytics can be a game-changer for successful organizations. As an overwhelming 90% of the surveyed organizations state that predictive analytics is the future of talent hunt.
However, most organizations feel they are still using data analytics on an ad hoc basis. At a recent TimesJobs Boardroom Dialogue, HR leaders conceded to lagging behind in using the full potential of data analytics. They said data analytics were never sought as an expectation from HR. In addition, HR never realized how much data they had that they could tap into for information and insights.
Overall, the HR experts agreed that predictive analytics was a vital tool that can help HR forecast and establish future needs so that the organization has a robust talent pipeline and one’s talent hunt is successful every time.
HR ANALYTICS IN INDIA: TRENDS AND PRACTICES Advent of HR Analytics on Indian landscape: Is it good or bad? HR Analytics refers to the implementation of technology solutions that enable companies to optimise their human resource capabilities.
Terms like analytics, intelligence tends to be associated with tech companies with deep pockets. Moreover, these terms are perceived to be exclusive domains of organisational functions like marketing and business development. But that is not the case so.
Cloud based technologies are making it easier for even small organisations to adopt intelligence and analytics solutions, and no, they are not confined to front-line functions. HR Analytics is a buzzword among Indian companies, both small and large.
What is HR Analytics? HR Analytics refers to the implementation of technology solutions that enable companies to optimise their
human resource capabilities. This is achieved by linking HR metrics with quantifiable outcomes
For instance, why does a higher number of candidates from a particular institute perform better in the field of sales? Or what makes a particular sales person rake in more revenues than the others?
HR Analytics thus can improve the efficiency of an organisation by optimising hiring processes, enhancing employee engagement and productivity, reducing attrition and ultimately attaining financial goals of the organisation.
Replacement of HR sub-functions/ role with digital platforms HR Analytics certainly has annoyed the interest of companies in India. While globally, as well as in India, there is an obvious move towards digitisation, so far it has mostly been creation of digital platforms and replacement of HR sub-functions/ role with digital platforms. This move towards automation has had a direct impact on further need for HR Analytics. In the current scenario, there is a lack of capability and most companies irrespective of their level of digitisation lack the ability to carry out advanced analytics on their own. There is also a lack of pure-play HR Analytics firms who provide data backed analytics and use them for better HR Advisory.
International Journal of Advance and Innovative Research Volume 6, Issue 1 (III): January - March, 2019
141
ISSN 2394 - 7780
EARLY ADOPTERS OF HR ANALYTICS Irrespective of these roadblocks, companies in India, especially those in Finance, Retail, Healthcare, High-Tech and Manufacturing industries are emerging as the early adopters of HR Analytics. More than 50 per cent of the companies are in the process of or are willing to leverage HR Analytics.
Besides ease of adoption, a major factor why HR Analytics is gaining grip is its capability to provide insights on talent acquisition and retention.
WAR FOR TALENT ACQUISITION IN INDIA Though India produces millions of graduates every year, even 80 per cent employability of this fresh out of
college workforce is questionable. Thus, a war for talent acquisition is ongoing
Even if an organisation manages to hire the right people, retaining them for a long term is a huge struggle. High attrition can significantly affect the goals of a company in short as well as long term
The writing is there on the wall - if companies in India have to attain their growth targets, compete with multinationals, and thrive in an immensely competitive market, they need to optimize their workforce.
And HR Analytics can pave the way for them.
AUTHORED ARTICLE BY SHIV AGARWAL, MD, ABC CONSULTANT The Role of analytics in Predicting Employee Performance –by Archana Jerath January 10, 2018 Human capital forms the foundation of any organization, and employee performance has a significant impact on the bottom line. In fact, research indicates that a five per cent increase in employee engagement is linked to a three percent growth in revenues in the subsequent year. Yet, most HR departments struggle in the management of employee performance.
Employees often perceive performance reviews as a process that inclines heavily towards traditional practices (Bell Curve Method), is subjective and consumes time. If they are not satisfied with outcomes, their morale, productivity and performance may plunge. Consequently, it may lead to high turnover. However, it is an important exercise given that it creates a high-performing culture and motivates top-performing employees. It enables the organization to identify skill gaps, develop learning and development programs, retain employees and do succession planning.
Most organizations have realized that conventional performance review systems are outdated, do not capture real-time performance, and fail to provide timely feedback and improvement opportunities to employees. According to the Randstad India HR Game Changers 2016 Survey, 28% of HR leaders feel employee performance methods need to undergo a significant structural change and evolve into something more transparent. In fact, a PwC report titled ‘Performance Management in India – A Change Beckons’ highlights that 52 percent of organizations have made or are planning to make changes to employee performance in the near future.
For example, India’s leading IT services companies, Tata Consultancy Services and Infosys, have shifted to a continuous performance system. By doing so, these two organizations believe that they will be able to monitor employee performance at regular intervals and predict their behavior, which could affect their engagement levels.
Technology is being touted as a key enabler that HR is now considering to predict employee performance. A survey titled ‘State of Performance Management System in India’ conducted by Salto Dee Fe Consulting Service, reiterates that digital tools could improve the performance of employees. Analytics is one such tool that can help organizations predict employees’ performance based on historical and real-time data. It provides both retrospective as well as forward-looking analysis.
Predictive analytics can be applied to the workforce to identify traits/patterns that account for bad or good performance on an individual and team basis. Since analytics is an amalgamation of powerful mathematical algorithms, it also gives objective insight into their work preferences and the factors that drive their performance. An article published in The Times of India talks about a case study on how analytics helped a manufacturing firm predict what was wrong with employee performance. Using analytics, this company discovered that morale of ten employees was down due to their issues with manager. The management quickly stepped in to resolve the situation and take preventive measures before the employee performance deteriorated further.
Adani Group has hired an analytics startup firm Vahanalytics, which uses machine learning for driver profiling, behavior and performance. The startup will track the vehicles deployed at Adani Group’s Mundra Port and
International Journal of Advance and Innovative Research Volume 6, Issue 1 (III): January - March, 2019
142
ISSN 2394 - 7780
capture information on whether drivers have been speeding, taking sharp turns or not following driving norms. These reports will help Adani Group to predict the performance factors of drivers and make timely innervations in regards to their training.
With the help of analytics, HR can also identify engagement activities which have the maximum and minimum impact on employee performance. This exercise has two-fold advantages. One, an organization can direct their investment towards initiatives that generate the highest interest in the engagement levels. Two, an organization can define measurable metrics that co-relate engagement and performance.
Since organizations usually review employee performance annually, it leaves little time for HR to act on possible flight risks. However, performance analytics gives real-time information to take timely decisions. HR can recognize red flags of performance and predict which employees fall in the highest flight risk category. It can then either discuss the matter directly with the employees or implement tailor-made retention programs to re-engage them. When HR can gauge employee performance from analytics, succession planning also becomes easier. It can anticipate promotions, transfers and firing in advance. Accordingly, it can forecast workforce requirements and work towards filling the open positions.
HR is also discovering advantages of analytics in predicting employee performance and improving quality of hiring during recruitment. Analytics can mine data on candidate’s personality, behavioral traits and skills to throw useful insights into whether he or she would be the right fit for the organization. In a TJinsite Survey from TimesJobs.com, 90 percent of companies agree that predictive analytics is a promising hiring tool and could be the future of talent hunting. However, only seven percent of companies are using it for performance assessment during hiring.
Take the energy and automation conglomerate Schneider Electric India for example. It uses predictive analytics in addition to psychometric assessments, behavioral event interviews, PAPI (Personality and Preference Inventory) and Hogan assessments to avoid gut-based recruitment. Analytics helps it to prioritize and target only those candidates who are most qualified for a specific role or position. The company’s CHRO Rachna Mukherjee says, “The use of data and predictive analytics can impact the manner in which companies interact with customers, besides transforming how they search for, discover and retain promising talent.”
The Indian arm of the multi-level marketing company Amway has also been using analytics to identify the right-fit candidates from internal job postings. In fact, it was able to hire a candidate who was two levels below in the organizational hierarchy for a desired position. Apparently, his behavioral and performance indicators showed him a perfect fit, so he was promoted.
With business dynamics changing swiftly, real-time talent decisions are the need of the hour. There is no scope for taking a backward approach to analyzing employee performance. Or else, organizations stand a high risk of losing the business advantage. What better tool than analytics to peek into the future? There is no doubt that analytics can be a powerful data-driven tool for organizations to anticipate performance outcomes and develop pro-active strategies for people management.
CONCLUSION HR analytics is an essential part of data management and its implementation can yield positive returns for any organization. But as the above has shown, the management, analysis and interpretation of data isn’t always straightforward and organizations need to approach HR analytics one step at a time.
The key to successful HR analytics relies on the understanding that the size of the measured data isn’t the key to success, but rather, the impact the data can have on decision-making in the organization. HR analytics shouldn’t be seen as influential only in the HR department, but rather as something that has the potential to create value throughout the organization.
REFERENCES 1. https://www.cipd.co.uk/Images/case-study-coca-cola_tcm18-19987.pdf
2. http://www.opttek.com/sites/default/files/Workforce%20Analytics%20Case%20Study.pdf
3. http://www.talentrics.com/case_studies/
4. https://www.peoplematters.in/article/talent-assessment/talent-analytics-are-future-hr-india-finds-timesjobs-12018?utm_source=peoplematters&utm_medium=interstitial&utm_campaign=learnings-of-the-day
5. https://www.indiatoday.in/education-today/jobs-and-careers/story/hr-analytics-1031416-2017-08-25

International Journal of Advance and Innovative Research Volume 6, Issue 1 (III): January - March, 2019
143
ISSN 2394 - 7780
6. https://www.shrm.org/shrm-india/pages/the-role-of-analytics-in-predicting-employee-performance.aspx
7. http://www.cityinstitution.com/understanding-the-adoption-of-hr-analytics-in-indian-corporations/
8. https://www.indiatoday.in/education-today/jobs-and-careers/story/hr-analytics-1031416-2017-08-25
9. https://www.forbes.com/sites/bernardmarr/2016/03/01/the-8-hr-analytics-every-manager-should-know-about/#6ba9434a788f
10. https://www.cleverism.com/beginners-guide-hr-analytics/
11. https://www.techopedia.com/definition/28334/human-resources-analytics-hr-analytics

International Journal of Advance and Innovative Research Volume 6, Issue 1 (III): January - March, 2019
144
ISSN 2394 - 7780
RETAILER’S SATISFACTION TOWARDS EXTENDED P’S OF E-COMMERCE COMPANIES
Dr. Somashekhar I. C1 and Dr. Hema Patil2 Assistant Professor1, Department of Business Administration, Vidyavardhaka College of Engineering, Mysuru
Associate Professor2, Department of studies in Business Administration, Centre for Post Graduate Studies, Visvesvaraya Technological University, Mysuru
ABSTRACT World is moving more and more into the digital realm every day. E-Commerce is the commercial transactions conducted electronically on the internet. These business transactions occur either as business-to-business, business-to-consumer, consumer-to-consumer or consumer-to-business. In e-commerce, exchanges occur between two parties over some electronic medium, typically the Internet. The purpose of this study was to examine the relationship between Extended services marketing mix (People, Process, Physical evidence) on retailer satisfaction towards E-Commerce companies. Retailer satisfaction is one of the essential factors for the success of a company. In order to achieve the high customer satisfaction companies must know when and how their customers are satisfied about the products and services through the retailers. Retailers are expecting best possible support & services from the supplier i.e. e-commerce company. In this research factor analysis was used for studying retailer’s satisfaction. With the growing impact of the digital community affecting the way business is done, now is the time to start thinking about an e-Commerce solution. The study was done to identify the extended P’s of service mix for retailer’s satisfaction. The results reveal that People i.e., company representative are discharging responsibilities well, Ordering is easy. There is good policies and processing order is easy. Ambiance and website are attractive. Mobile application is flexible and document for every transaction is provided Keywords: Extended P’s, E-Commerce companies, Retailers satisfaction, Factor analysis.
INTRODUCTION India has an internet users base of about 475 million as of July 2018, about 40% of the population. Despite being the second-largest userbase in world, only behind China (650 million, 48% of population), the penetration of e-commerce is low compared to markets like the United States (266 million, 84%), or France (54 M, 81%), but is growing at an unprecedented rate, adding around 6 million new entrants every month. The industry consensus is that growth is at an inflection point. Along with the development of electronic commerce, e-consumers have become more important than ever before, requiring retailing marketers to appeal to this target group (Wang and Le, J Stock Forex Trad, 2015). Ecommerce, also known as electronic commerce or internet commerce, refers to the buying and selling of goods or services using the internet, and the transfer of money and data to execute these transactions. Ecommerce is often used to refer to the sale of physical products online, but it can also describe any kind of commercial transaction that is facilitated through the internet. The examination of consumer satisfaction in an e-commerce context follows the growing consensus that in Internet retailing, as in traditional retailing, consumer satisfaction is not only a critical performance outcome, but also a primary predictor of customer online purchase intention (Afshan, Azam, FuQiangand Muhammad Ibrahim Abdullah, 2012). The most experienced and successful e-commerce companies are beginning to realize that key determinants of success or failure are not merely web presence or low price but delivering the high customer satisfaction. Research shows that price and promotion are no longer the main draws for customers to make a decision on a purchase. Customer satisfaction has a significant impact on loyalty, retention and purchase decisions and even on company’s financial performance. Thus, to build customer trust and loyalty, and customer retention, e-tailers must shift the focus to e-satisfaction (Afshan Azam, FuQiangand Muhammad Ibrahim Abdullah, 2012). LITERATURE REVIEW However, the 4Ps of the marketing mix have been criticized by a number of services marketing scholars from different perspectives (Booms and Bitner, 1981; Judd, 1987; Gummesson, 1991; Gronroos, 1996; Gombeski, 1998; O`Malley and Patterson, 1998; Day and Montgomery, 1999; Kotler, 1999; Zeithaml and Bitner, 2000; McDonald, 2002). Booms and Bitner (1981) forwarded the most intense criticism related to the 4Ps marketing mix paradigm. They argued that the traditional marketing mix model is inadequate for services marketing context especially with the existence of the unique characteristics of services. Booms and Bitner (1981) had modified and expanded the traditional marketing mix elements from 4Ps to become 7Ps by adding another three new Ps which are “people”, “process” and “physical evidence”.
International Journal of Advance and Innovative Research Volume 6, Issue 1 (III): January - March, 2019
145
ISSN 2394 - 7780
Collier (1991) argued that the 4Ps traditional model should be expanded to become the 7Ps services management. These 7Ps can be used to formulate a marketing strategy by which a service company can achieve a competitive advantage. Each one of the 7Ps of the service management paradigm can be viewed as an opportunity to gain competitive advantage and define business strategy.
Generally, the service organizations are different from manufacturing occupations in many cases. Also, a various way is needed to plan and execute marketing strategies. So, the service marketing mix as 7P is used to consider the service marketing (Mehrdad Alipour, Elham Darabi 2011). Bomz and Bitner differentiated the service marketing or 7P that is related to different decisions rather than the goods. In their mix, 3P’s includes personnel, physical assets and processes (Lovelock, 1382, Dargy, 1384). For services businesses, the traditional marketing mix framework should be expanded to include the other 3Ps (people, process and physical evidence) as strategic elements, which affect companies’ performance (Mamoun N. Akroush , 2011).
Md. Farijul Islam and Md. Mostafizur Rahman (2015) quotes that the service marketing mix is an amalgamation of the different components of services marketing that companies blends together and use to communicate their services, organizational and brand messages to customers. The mix consists of the seven P’s for instance, Product, Pricing, Place, Promotion, People, Process and Physical Evidence. The service marketing mix, also renamed as the extended marketing mix, treats the service that the business offers just as it would treat as a product. Due to the intangible nature of services products, tangiblising them becomes indispensable.
People: Due to the inseparability of the nature of service marketing, to get the optimum benefits from service both the service providers and service takers must perform together that implies people from both sides are responsible for smooth functioning of service (Md. Farijul Islam and Md. Mostafizur Rahman 2015). The service providers is defined as the extent to which a service organization is customer oriented in practicing its business; putting the customer at the heart of business activities (Drucker, 1968; Zeithaml et al., 1985; Narver and Slater, 1990; Deshpande et al., 1993; Slater and Narver, 1994; Chang and Chen, 1998; Doyle, 1999).
Service Process: is defined as the extent to which a service organisation has set a customer oriented and systematic procedure for a successful service delivery process. The process dimension refers to the actual procedures, mechanisms and flow of activities by which the offering is delivered (Booms and Bitner, 1981, p.48). In the arena of service marketing, process of service is meant how efficiently and effectively services are delivered to the ultimate customers at hand, is an essential aspect of service blueprint and need to emphasize on setting up a process for doing so (Md. Farijul Islam and Md. Mostafizur Rahman 2015). It is operationally defined based on (Cowell, 1984; Shostack, 1984; Zeithaml et al., 1988; Danaher and Mattsson, 1994; Kasper et al., 1999; Verma, 2000).
Service Physical Evidence: is defined as the extent to which a service organization is interested in creating a customer friendly atmosphere in their working environment (Booms and Bitner, 1981; Bitner, 1990, 1992; Kasper et al., 1999). (Md. Farijul Islam and Md. Mostafizur Rahman 2015).
RESEARCH METHODOLOGY The study uses both exploratory and descriptive research design to get clarity of research problem. The research tool used is Likert Scale and the statistical tool used is Factor Analysis. The sample size was finalized using the formula 푛 = 푧2휎2/ e2 with 95% confidence level and 0.05 level of significance. The sample size finally obtained was 102 and area is Mysuru city, Karnataka (state), India. The sampling technique used to select respondents (retailers) was Simple random sampling. The primary data was collected with the help of a structured questionnaire using survey method from the retailers of Mysuru city. A total of 102 retailers from Mysuru were contacted and aptly filled questionnaires were obtained. The respondents were given a list of statements that measured their extent of agreement towards the variables. The items were measured on a five point Likert scale with 1 representing low score (Strongly dis agree) and 5 representing a high score (strongly agree). These statements were selected with the factor loadings above 0.70. For the reliability of the research tool Cronbach alpha test was performed, and obtained the alpha value of 0.789, 0.908, 0.785 respectively towards people, process, physical evidence. this shows the tool is reliable.
OBJECTIVES The objectives of the research is as follows To understand retailer’s satisfaction towards People
To identify retailer’s satisfaction towards process
To Analyze retailer’s satisfaction towards physical evidence
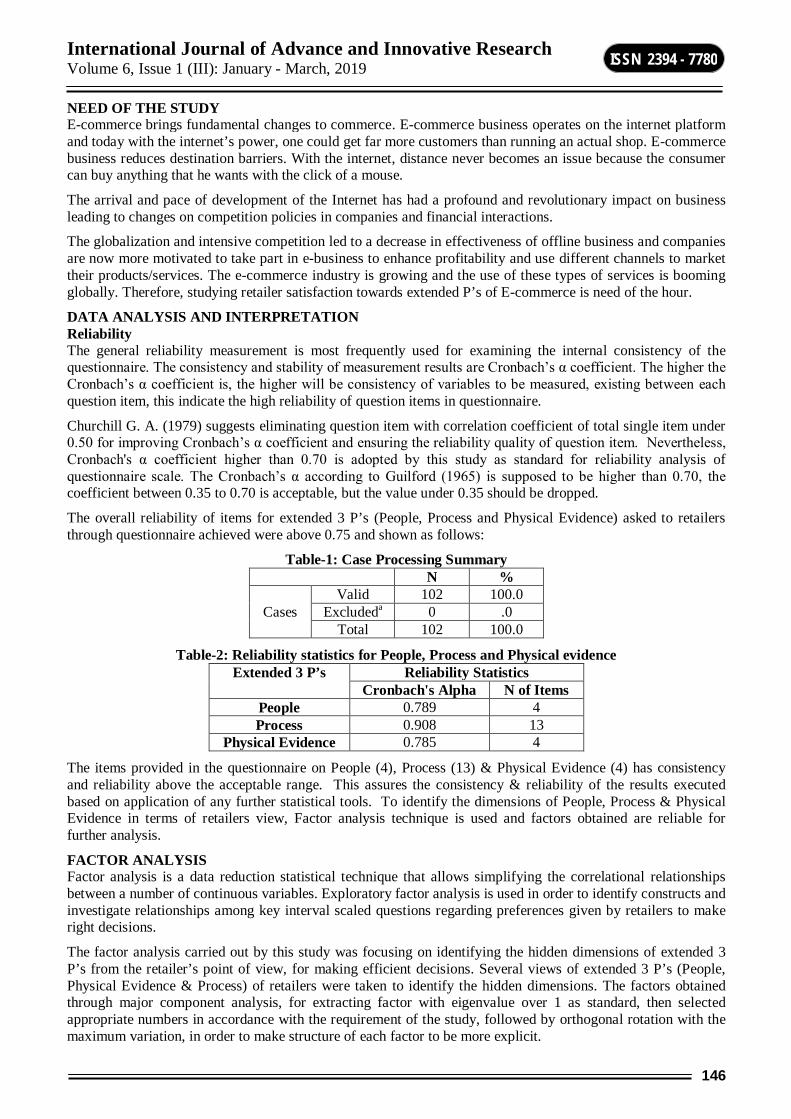
International Journal of Advance and Innovative Research Volume 6, Issue 1 (III): January - March, 2019
146
ISSN 2394 - 7780
NEED OF THE STUDY E-commerce brings fundamental changes to commerce. E-commerce business operates on the internet platform and today with the internet’s power, one could get far more customers than running an actual shop. E-commerce business reduces destination barriers. With the internet, distance never becomes an issue because the consumer can buy anything that he wants with the click of a mouse.
The arrival and pace of development of the Internet has had a profound and revolutionary impact on business leading to changes on competition policies in companies and financial interactions.
The globalization and intensive competition led to a decrease in effectiveness of offline business and companies are now more motivated to take part in e-business to enhance profitability and use different channels to market their products/services. The e-commerce industry is growing and the use of these types of services is booming globally. Therefore, studying retailer satisfaction towards extended P’s of E-commerce is need of the hour.
DATA ANALYSIS AND INTERPRETATION Reliability The general reliability measurement is most frequently used for examining the internal consistency of the questionnaire. The consistency and stability of measurement results are Cronbach’s α coefficient. The higher the Cronbach’s α coefficient is, the higher will be consistency of variables to be measured, existing between each question item, this indicate the high reliability of question items in questionnaire.
Churchill G. A. (1979) suggests eliminating question item with correlation coefficient of total single item under 0.50 for improving Cronbach’s α coefficient and ensuring the reliability quality of question item. Nevertheless, Cronbach's α coefficient higher than 0.70 is adopted by this study as standard for reliability analysis of questionnaire scale. The Cronbach’s α according to Guilford (1965) is supposed to be higher than 0.70, the coefficient between 0.35 to 0.70 is acceptable, but the value under 0.35 should be dropped.
The overall reliability of items for extended 3 P’s (People, Process and Physical Evidence) asked to retailers through questionnaire achieved were above 0.75 and shown as follows:
Table-1: Case Processing Summary N %
Cases Valid 102 100.0
Excludeda 0 .0 Total 102 100.0
Table-2: Reliability statistics for People, Process and Physical evidence Extended 3 P’s Reliability Statistics
Cronbach's Alpha N of Items People 0.789 4 Process 0.908 13
Physical Evidence 0.785 4
The items provided in the questionnaire on People (4), Process (13) & Physical Evidence (4) has consistency and reliability above the acceptable range. This assures the consistency & reliability of the results executed based on application of any further statistical tools. To identify the dimensions of People, Process & Physical Evidence in terms of retailers view, Factor analysis technique is used and factors obtained are reliable for further analysis.
FACTOR ANALYSIS Factor analysis is a data reduction statistical technique that allows simplifying the correlational relationships between a number of continuous variables. Exploratory factor analysis is used in order to identify constructs and investigate relationships among key interval scaled questions regarding preferences given by retailers to make right decisions.
The factor analysis carried out by this study was focusing on identifying the hidden dimensions of extended 3 P’s from the retailer’s point of view, for making efficient decisions. Several views of extended 3 P’s (People, Physical Evidence & Process) of retailers were taken to identify the hidden dimensions. The factors obtained through major component analysis, for extracting factor with eigenvalue over 1 as standard, then selected appropriate numbers in accordance with the requirement of the study, followed by orthogonal rotation with the maximum variation, in order to make structure of each factor to be more explicit.
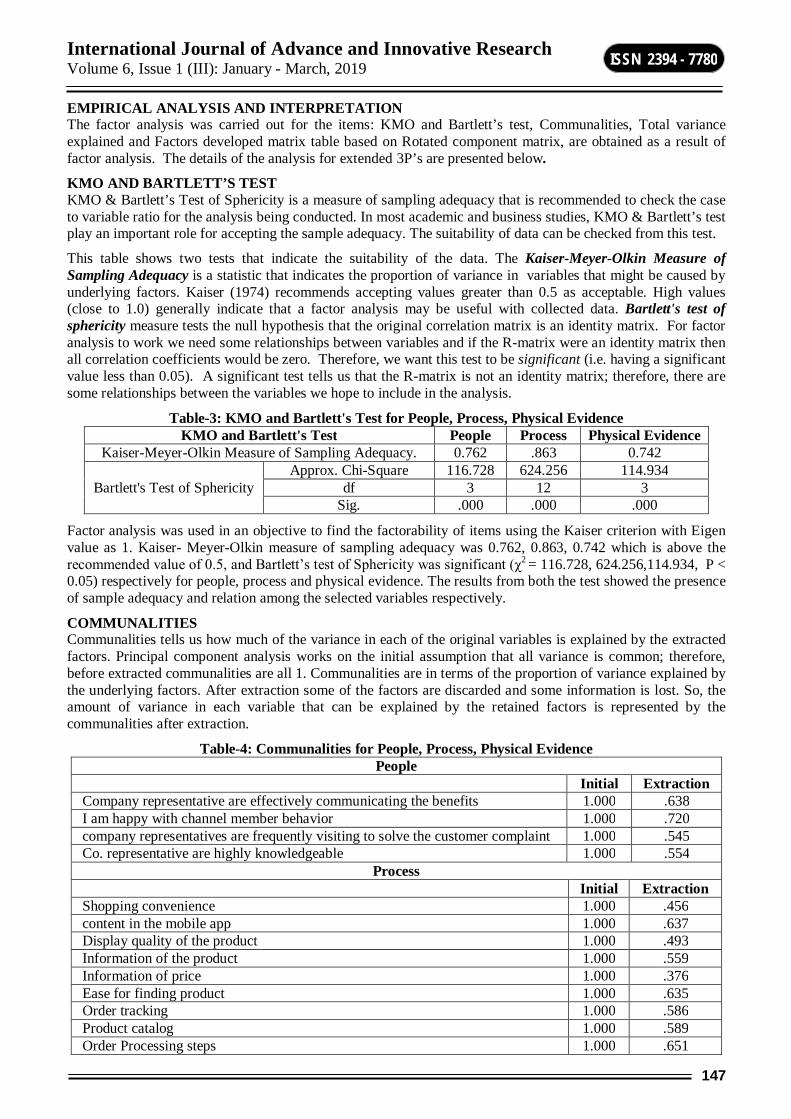
International Journal of Advance and Innovative Research Volume 6, Issue 1 (III): January - March, 2019
147
ISSN 2394 - 7780
EMPIRICAL ANALYSIS AND INTERPRETATION The factor analysis was carried out for the items: KMO and Bartlett’s test, Communalities, Total variance explained and Factors developed matrix table based on Rotated component matrix, are obtained as a result of factor analysis. The details of the analysis for extended 3P’s are presented below.
KMO AND BARTLETT’S TEST KMO & Bartlett’s Test of Sphericity is a measure of sampling adequacy that is recommended to check the case to variable ratio for the analysis being conducted. In most academic and business studies, KMO & Bartlett’s test play an important role for accepting the sample adequacy. The suitability of data can be checked from this test.
This table shows two tests that indicate the suitability of the data. The Kaiser-Meyer-Olkin Measure of Sampling Adequacy is a statistic that indicates the proportion of variance in variables that might be caused by underlying factors. Kaiser (1974) recommends accepting values greater than 0.5 as acceptable. High values (close to 1.0) generally indicate that a factor analysis may be useful with collected data. Bartlett's test of sphericity measure tests the null hypothesis that the original correlation matrix is an identity matrix. For factor analysis to work we need some relationships between variables and if the R-matrix were an identity matrix then all correlation coefficients would be zero. Therefore, we want this test to be significant (i.e. having a significant value less than 0.05). A significant test tells us that the R-matrix is not an identity matrix; therefore, there are some relationships between the variables we hope to include in the analysis.
Table-3: KMO and Bartlett's Test for People, Process, Physical Evidence KMO and Bartlett's Test People Process Physical Evidence
Kaiser-Meyer-Olkin Measure of Sampling Adequacy. 0.762 .863 0.742
Bartlett's Test of Sphericity Approx. Chi-Square 116.728 624.256 114.934
df 3 12 3 Sig. .000 .000 .000
Factor analysis was used in an objective to find the factorability of items using the Kaiser criterion with Eigen value as 1. Kaiser- Meyer-Olkin measure of sampling adequacy was 0.762, 0.863, 0.742 which is above the recommended value of 0.5, and Bartlett’s test of Sphericity was significant (χ2 = 116.728, 624.256,114.934, P < 0.05) respectively for people, process and physical evidence. The results from both the test showed the presence of sample adequacy and relation among the selected variables respectively.
COMMUNALITIES Communalities tells us how much of the variance in each of the original variables is explained by the extracted factors. Principal component analysis works on the initial assumption that all variance is common; therefore, before extracted communalities are all 1. Communalities are in terms of the proportion of variance explained by the underlying factors. After extraction some of the factors are discarded and some information is lost. So, the amount of variance in each variable that can be explained by the retained factors is represented by the communalities after extraction.
Table-4: Communalities for People, Process, Physical Evidence People
Initial Extraction Company representative are effectively communicating the benefits 1.000 .638 I am happy with channel member behavior 1.000 .720 company representatives are frequently visiting to solve the customer complaint 1.000 .545 Co. representative are highly knowledgeable 1.000 .554
Process Initial Extraction Shopping convenience 1.000 .456 content in the mobile app 1.000 .637 Display quality of the product 1.000 .493 Information of the product 1.000 .559 Information of price 1.000 .376 Ease for finding product 1.000 .635 Order tracking 1.000 .586 Product catalog 1.000 .589 Order Processing steps 1.000 .651
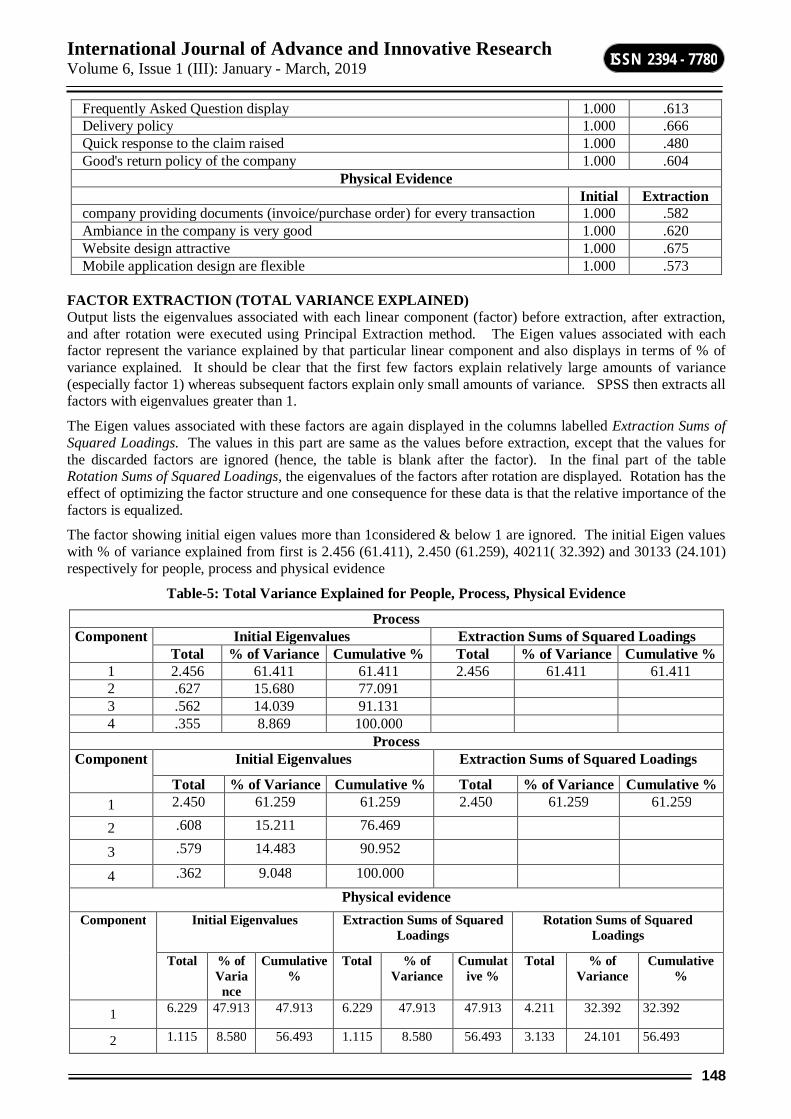
International Journal of Advance and Innovative Research Volume 6, Issue 1 (III): January - March, 2019
148
ISSN 2394 - 7780
Frequently Asked Question display 1.000 .613 Delivery policy 1.000 .666 Quick response to the claim raised 1.000 .480 Good's return policy of the company 1.000 .604
Physical Evidence Initial Extraction company providing documents (invoice/purchase order) for every transaction 1.000 .582 Ambiance in the company is very good 1.000 .620 Website design attractive 1.000 .675 Mobile application design are flexible 1.000 .573
FACTOR EXTRACTION (TOTAL VARIANCE EXPLAINED) Output lists the eigenvalues associated with each linear component (factor) before extraction, after extraction, and after rotation were executed using Principal Extraction method. The Eigen values associated with each factor represent the variance explained by that particular linear component and also displays in terms of % of variance explained. It should be clear that the first few factors explain relatively large amounts of variance (especially factor 1) whereas subsequent factors explain only small amounts of variance. SPSS then extracts all factors with eigenvalues greater than 1.
The Eigen values associated with these factors are again displayed in the columns labelled Extraction Sums of Squared Loadings. The values in this part are same as the values before extraction, except that the values for the discarded factors are ignored (hence, the table is blank after the factor). In the final part of the table Rotation Sums of Squared Loadings, the eigenvalues of the factors after rotation are displayed. Rotation has the effect of optimizing the factor structure and one consequence for these data is that the relative importance of the factors is equalized.
The factor showing initial eigen values more than 1considered & below 1 are ignored. The initial Eigen values with % of variance explained from first is 2.456 (61.411), 2.450 (61.259), 40211( 32.392) and 30133 (24.101) respectively for people, process and physical evidence
Table-5: Total Variance Explained for People, Process, Physical Evidence
Process Component Initial Eigenvalues Extraction Sums of Squared Loadings
Total % of Variance Cumulative % Total % of Variance Cumulative % 1 2.456 61.411 61.411 2.456 61.411 61.411 2 .627 15.680 77.091 3 .562 14.039 91.131 4 .355 8.869 100.000
Process Component Initial Eigenvalues Extraction Sums of Squared Loadings
Total % of Variance Cumulative % Total % of Variance Cumulative % 1 2.450 61.259 61.259 2.450 61.259 61.259
2 .608 15.211 76.469
3 .579 14.483 90.952
4 .362 9.048 100.000 Physical evidence
Component Initial Eigenvalues Extraction Sums of Squared Loadings
Rotation Sums of Squared Loadings
Total % of Varia
nce
Cumulative %
Total % of Variance
Cumulative %
Total % of Variance
Cumulative %
1 6.229 47.913 47.913 6.229 47.913 47.913 4.211 32.392 32.392
2 1.115 8.580 56.493 1.115 8.580 56.493 3.133 24.101 56.493
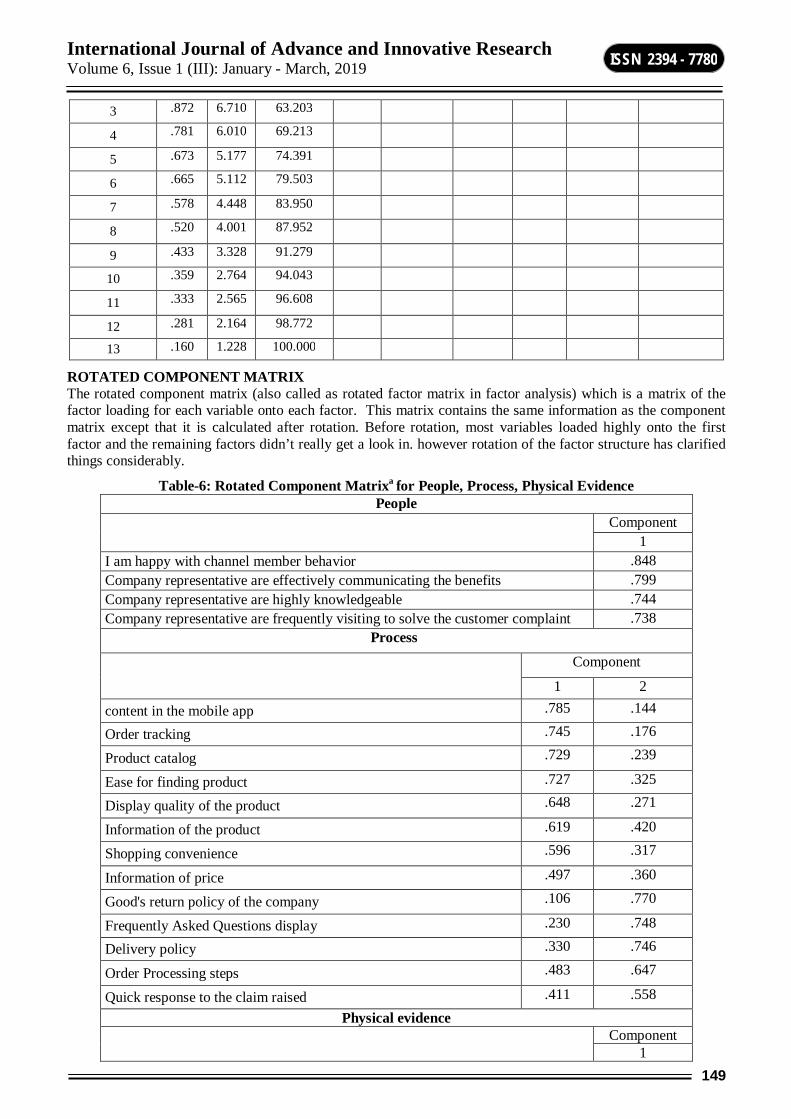
International Journal of Advance and Innovative Research Volume 6, Issue 1 (III): January - March, 2019
149
ISSN 2394 - 7780
3 .872 6.710 63.203
4 .781 6.010 69.213
5 .673 5.177 74.391
6 .665 5.112 79.503
7 .578 4.448 83.950
8 .520 4.001 87.952
9 .433 3.328 91.279
10 .359 2.764 94.043
11 .333 2.565 96.608
12 .281 2.164 98.772
13 .160 1.228 100.000
ROTATED COMPONENT MATRIX The rotated component matrix (also called as rotated factor matrix in factor analysis) which is a matrix of the factor loading for each variable onto each factor. This matrix contains the same information as the component matrix except that it is calculated after rotation. Before rotation, most variables loaded highly onto the first factor and the remaining factors didn’t really get a look in. however rotation of the factor structure has clarified things considerably.
Table-6: Rotated Component Matrixa for People, Process, Physical Evidence People
Component 1
I am happy with channel member behavior .848 Company representative are effectively communicating the benefits .799 Company representative are highly knowledgeable .744 Company representative are frequently visiting to solve the customer complaint .738
Process Component
1 2
content in the mobile app .785 .144
Order tracking .745 .176
Product catalog .729 .239
Ease for finding product .727 .325
Display quality of the product .648 .271
Information of the product .619 .420
Shopping convenience .596 .317
Information of price .497 .360
Good's return policy of the company .106 .770
Frequently Asked Questions display .230 .748
Delivery policy .330 .746
Order Processing steps .483 .647
Quick response to the claim raised .411 .558 Physical evidence
Component 1
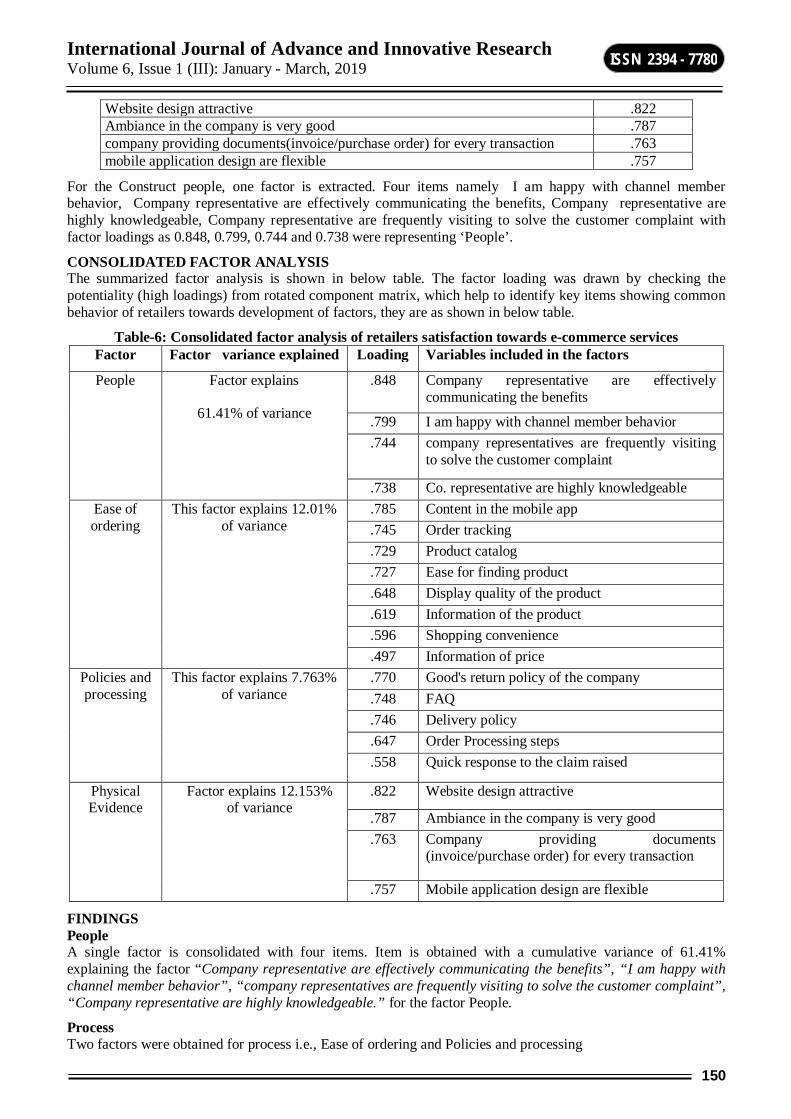
International Journal of Advance and Innovative Research Volume 6, Issue 1 (III): January - March, 2019
150
ISSN 2394 - 7780
Website design attractive .822 Ambiance in the company is very good .787 company providing documents(invoice/purchase order) for every transaction .763 mobile application design are flexible .757
For the Construct people, one factor is extracted. Four items namely I am happy with channel member behavior, Company representative are effectively communicating the benefits, Company representative are highly knowledgeable, Company representative are frequently visiting to solve the customer complaint with factor loadings as 0.848, 0.799, 0.744 and 0.738 were representing ‘People’.
CONSOLIDATED FACTOR ANALYSIS The summarized factor analysis is shown in below table. The factor loading was drawn by checking the potentiality (high loadings) from rotated component matrix, which help to identify key items showing common behavior of retailers towards development of factors, they are as shown in below table.
Table-6: Consolidated factor analysis of retailers satisfaction towards e-commerce services Factor Factor variance explained Loading Variables included in the factors
People Factor explains
61.41% of variance
.848 Company representative are effectively communicating the benefits
.799 I am happy with channel member behavior
.744 company representatives are frequently visiting to solve the customer complaint
.738 Co. representative are highly knowledgeable Ease of ordering
This factor explains 12.01% of variance
.785 Content in the mobile app
.745 Order tracking
.729 Product catalog
.727 Ease for finding product
.648 Display quality of the product
.619 Information of the product
.596 Shopping convenience
.497 Information of price Policies and processing
This factor explains 7.763% of variance
.770 Good's return policy of the company
.748 FAQ
.746 Delivery policy
.647 Order Processing steps
.558 Quick response to the claim raised
Physical Evidence
Factor explains 12.153% of variance
.822 Website design attractive
.787 Ambiance in the company is very good
.763 Company providing documents (invoice/purchase order) for every transaction
.757 Mobile application design are flexible
FINDINGS People A single factor is consolidated with four items. Item is obtained with a cumulative variance of 61.41% explaining the factor “Company representative are effectively communicating the benefits”, “I am happy with channel member behavior”, “company representatives are frequently visiting to solve the customer complaint”, “Company representative are highly knowledgeable.” for the factor People.
Process Two factors were obtained for process i.e., Ease of ordering and Policies and processing
International Journal of Advance and Innovative Research Volume 6, Issue 1 (III): January - March, 2019
151
ISSN 2394 - 7780
EASE OF ORDERING Eight items are obtained with a cumulative variance of 32.39% explaining the factor “Content in the mobile app”, “Order tracking”, “Product catalog”, “Ease for finding product”, “Display quality of the product”, “Information of the product”, “Shopping convenience”, Information of price”, for the factor ease of ordering.
POLICIES AND PROCESSING A single factor is consolidated with five items are obtained with a cumulative variance of 24.10% explaining the factor “Good's return policy of the company”, “FAQ”, “Delivery policy”, “Order Processing steps”, “Quick response to the claim raised”, for the factor policies and processing
PHYSICAL EVIDENCE Four items are obtained with a cumulative variance of 61.259% explaining the factor “Website design attractive”, “Ambiance in the company is very good”, “Company providing documents (invoice/purchase order) for every transaction”, “Mobile application design are flexible”, for the factor physical evidence.
CONCLUSION Company representative are highly knowledgeable, they effectively communicating the benefits and they frequently visiting to solve customers complaints. Retailers are happy with channel members behavior, Co. representative are highly knowledgeable. It is easy to order because: It is convenient to shop online, there is good content in the mobile app, it is easy to track order and price information is provided. Product catalog is provided, display is good and it is easy to find the product. Policies and processing: Company has Good's return policy, delivery policy. It has displayed answers to frequently asked questions. It has easy steeps for order processing and the company respond quickly to the claims raised. Ambiance in the company is very good It is providing documents (invoice/purchase order) for every transaction. Company website design is attractive and its mobile application design are flexible. SCOPE FOR FURTHER RESEARCH This research is focused mainly of retailers satisfaction towards extended P’s of marketing mix. It would be complete if all the seven P’s are taken together for the study. Similarly end retailers satisfaction towards online company can be studied. Service quality dimension study can be carried out. Service provider gap study can be conducted.
REFERENCES 1. Bitner, M. 1990. Evaluating Service Encounters: The Effects of Physical Surroundings and Employee
Responses, Journal of Marketing, 54(2):69-82. 2. Booms, B., and Bitner, M. 1981. Marketing Strategies and Organization Structures for Service Firms’, In
Marketing of Services: 1981 Special Educators’ Conference Proceedings, James Donnelly and William George, (Eds), Chicago, American Marketing Association, 46-51.
3. Chang, T. and Chen, S. 1998. Market Orientation, Service Quality and Business Profitability: A Conceptual Model and Empirical Evidence, Journal of Services Marketing, 12(4)):246-264
4. Chongqing University, P.R.China, (2012), “E-satisfaction in Business-to-Consumer Electronic Commerce”, TheBusiness&ManagementReview,Vol.3 Number1,November2012, P:15-26.
5. Churchill, Gilbert A., Jr., A Paradigm for Developing Better Measures of Marketing Constructs, Journal of Marketing Research, 16 (February): 64-73, 1979.
6. Collier, D. 1991. New Marketing Mix Stresses Service, The Journal of Business Strategy, 12(2):42-45. 7. Cowell, D. 1984. The Marketing of Services’, Heinemann Professional Publishing Ltd. 8. Danaher, P. and Mattsson, J. 1994. Customer Satisfaction during the Service Delivery Process’, European
Journal of Marketing, 28(5):5-16. 9. Dargy, Parviz, article marketing mix design, (1384), Tadbir Magazine, 161. 10. Day, G. and Montgomery, D. 1999. Charting New Direction for Marketing’, Journal of Marketing, 63
(Special Issue):3-13. 11. Doyle, P. 1999. Managing the Marketing Mix’, in Baker Michael J (ED), The Marketing Book, Fourth
Edition, Butterworth-Heinemann:301-313.
International Journal of Advance and Innovative Research Volume 6, Issue 1 (III): January - March, 2019
152
ISSN 2394 - 7780
12. Drucker, P. 1968. The Practice of Management’, Pan Books Ltd.
13. Gombeski, W. 1998. Better Marketing through A Principles-Based Model’, Marketing Health Services, 18(3):43-48.
14. Gronroos, C. 1996. Relationship Marketing: Strategic and Tactical Implications’, Management Decision, 34(3):514.
15. Guilford, J. P., Fundamental Statistics in Psychology and Education, 4th ed., New York: McGraw- Hill, 1965.
16. Gummesson, E. 1991. Marketing—Orientation Revisited: The Critical Role of the Part-Time Marketer’, European Journal of Marketing, 25(2), pp.60-75.
17. Judd, V. 1987. Differentiate With the 5th P: People’, Industrial Marketing Management, 16:241-247.
18. Kasper, H, Helsdingen, P. and Vries, W. 1999. Services Marketing Management: An International Perspective’, John Wiley & Sons Ltd.
19. Kasper, H, Helsdingen, P. and Vries, W. 1999. Services Marketing Management: An International Perspective’, John Wiley & Sons Ltd.
20. Kotler, P. 1999. Kotler on Marketing: How to Create, Win and Dominate Markets’, New York, Press Free.
21. Lovelock, Christopher and Wright, McLaren. Principles of services marketing. Tajzadeh Namin, A., (1382), Tehran, publisher side.
22. Mamoun N. Akroush (2011), “The 7Ps Classification of the Services Marketing Mix Revisited: An Empirical Assessment of their Generalizability, Applicability and Effect on Performance - Evidence from Jordan’s Services Organizations”, Jordan Journal of Business Administration, Volume 7, No. 1, 2011
23. McDonald, M. 2002. Marketing Plans: How to Prepare them, How to Use them’, Fifth Edition, Butterworth Heinemann.
24. Md. Farijul Islam and Md. Mostafizur Rahman (2015) “Service marketing mix and their impact on bank marketing performance: A case study on”, Journal for world wide holistic sustainable development, Janata Bank Limited, Bangladesh”, issue 1, volume 1: January 2015, ISSN: 2409-9384, P:16-31
25. Mehrdad Alipour, Elham Darabi (2011), “ The Role Of Service Marketing Mix And Its Impact On Marketing Audit In Engineering And Technical Service Corporations”, Global Journal of Management and Business Research, Volume 11 Issue 6 Version 1.0, PP:68-77
26. Narver, J. and Slater, S. 1990. The Effect of a Market Orientation on Business Profitability’, Journal of Marketing, October:20-35.
27. O’Malley, L. and Patterson, M. 1998. Vanishing Point: The Mix Management Paradigm Re-Viewed’, Journal of Marketing Management, 14:829-851.
28. Shostack, L. 1984. Designing Service that Deliver’, Harvard Business Review, 62(1): 133-139.
29. Verma, R. 2000. An Empirical Analysis of Management Challenges in Service Factories, Service Shops, Mass Services and Professional Services’, International Journal of Service Industry Management, 11. No. 1):8-25.
30. Wang and Le, J Stock Forex Trad 2015, “Customer Satisfaction towards Online Shopping at Electronics Shopping Malls in Vietnam- A Conceptual Model to Enhance Business Success through Efficient Websites and Logistics Services” Journal of Stock & Forex Trading, Volume 5 • Issue 1, SSN: 2168-9458 JSFT, p:1-10
31. Zeithaml, V, Parasuraman A. and Berry, L. 1985) Problems and Strategies in Services Marketing, Journal of Marketing, 49, (Spring):33-46.
32. Zeithaml, V. and Bitner, M. 2000) Services Marketing: Integrating Customer Focus Across the Firm, Second Edition, Irwin McGraw-Hill.
33. Zeithaml, V., Berry, L. and Parasuraman, A. 1988. Communication and Control Processes in the Delivery of Service Quality, Journal of Marketing, 52 (April):3548.
International Journal of Advance and Innovative Research Volume 6, Issue 1 (III): January - March, 2019
153
ISSN 2394 - 7780
TRANSFORMATION OF TOURISM THROUGH DIGITALIZATION, A CASE STUDY OF KARNATAKA
Dr. Srinivasa Murthy B. V1, Dr. Noor Afza2 and Dr .Venkatesh3 Assistant Professor1, Jawaharlal Nehru National College of Engineering, Shimoga
Chairman2, DOS & Research in Business Administration, Tumkur University, Tumkur HOD3 of Economics, DVS Arts and Science College, Shivamogga
ABSTRACT Tourism is the fastest growing industry in the world. According to the latest issue of the UNWTO (United Nation World Tourism Organization) World Tourism Barometer, International tourist arrivals grew by 7% in 2017 (to 280 million), driven partly by a strong rise in numbers in key emerging markets in the same year. UNWTO forecasts international tourist arrivals to grow by 3% to 4% annually. With International travelers projected to almost double by 2020, the most significant increases are expected to take place in markets like China, India and destinations in South-East Asia. China registered 1.6 billion trips and India registered 861 million – tourist (2017) is a proof of their long term importance for international tourism.
Tourism is a growing service industry which earns a substantial foreign exchange in many parts of the world. In India, Karnataka is one of the important destinations for the international tourists with its unique and enchanting land abounding in scenic beauty, rich in flora and fauna. It has pomp and pageantry of glorious traditions and marvels of modern engineering and technology. To make the tourism a great success one has to take advantage of the modern technology to full extent. Karnataka is also travelling in the same way. The Karnataka Government Tourism Department have offer several tourism services through on-line and government claim that they offer better services than the others. So it is very important to know whether the tourists are satisfied or not. In this research focuses on the tourists perception of the Karnataka Tourism website services as well as to know the Information technology has any significant role in Karnataka tourism industry.
Keyword: Tourism, Technology
INTRODUCTION The Indian tourism and hospitality industry has emerged as one of the key drivers of growth among the services sector in India. Tourism in India has significant potential considering the rich cultural and historical heritage, variety in ecology, terrains and places of natural beauty spread across the country. Tourism is also a potentially large employment generator besides being a significant source of foreign exchange for the country. During January-October 2018 FEEs from tourism increased 8.30 per cent year-on-year to US$ 23.54 billion.
KARNATAKA TOURISM Karnataka has emerged as one of the most sought after tourism destinations in the country and also created a space for itself in the international tourism circuit. As of 2017, the State was ranked as the fourth preferred destination among domestic tourists and ranked third with regard to attracting investments in the tourism sector. According to the Fundación Orange study on Digital transformation in the tourism and hospitality sector, “the tourism and travel sector makes extensive use of both information and transactions in all stages of the value chain.” Consumers search for information before a trip, they compare and check opinions of other travellers, and then they reserve tickets, hotels, and even tickets for shows and museums. During the trip, from online check-in to looking up information about restaurants and leisure activities. After travelling, they add their review to the information that other travelers will consult. All of this is done on a mobile device in more than 50% of cases. REVIEW OF LITERATURE Leung and Law (2005, 2007) observed IT-related articles published in six leading hospitality and tourism journals over the past 20 years and identified that the largest number of articles were about general business applications. Due to the increasing popularity of the Internet, publications on networking showed the highest growth rate in the most recent decade. The rapid development of IT in the past couple of decades has underscored the importance of understanding historical patterns and predicting future trends. Knowing what has occurred in the past few years can help researchers better predict and plan for future development.
Aullana Poon (1987) conducted a study on Information Technology and Innovation in International Tourism-Implications for the Caribbean tourist industry. The objective of this research is to assess the possibilities for Caribbean Islands' future survival and competitiveness in international tourism.
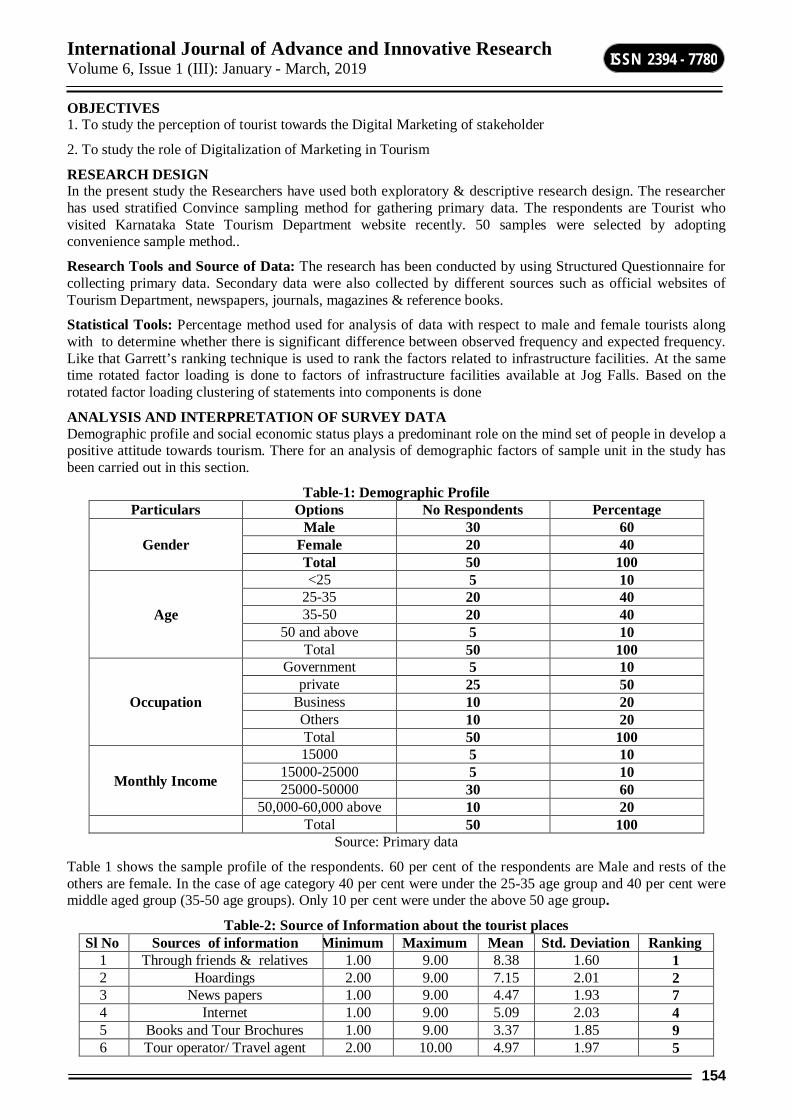
International Journal of Advance and Innovative Research Volume 6, Issue 1 (III): January - March, 2019
154
ISSN 2394 - 7780
OBJECTIVES 1. To study the perception of tourist towards the Digital Marketing of stakeholder
2. To study the role of Digitalization of Marketing in Tourism
RESEARCH DESIGN In the present study the Researchers have used both exploratory & descriptive research design. The researcher has used stratified Convince sampling method for gathering primary data. The respondents are Tourist who visited Karnataka State Tourism Department website recently. 50 samples were selected by adopting convenience sample method..
Research Tools and Source of Data: The research has been conducted by using Structured Questionnaire for collecting primary data. Secondary data were also collected by different sources such as official websites of Tourism Department, newspapers, journals, magazines & reference books.
Statistical Tools: Percentage method used for analysis of data with respect to male and female tourists along with to determine whether there is significant difference between observed frequency and expected frequency. Like that Garrett’s ranking technique is used to rank the factors related to infrastructure facilities. At the same time rotated factor loading is done to factors of infrastructure facilities available at Jog Falls. Based on the rotated factor loading clustering of statements into components is done
ANALYSIS AND INTERPRETATION OF SURVEY DATA Demographic profile and social economic status plays a predominant role on the mind set of people in develop a positive attitude towards tourism. There for an analysis of demographic factors of sample unit in the study has been carried out in this section.
Table-1: Demographic Profile Particulars Options No Respondents Percentage
Gender Male 30 60
Female 20 40 Total 50 100
Age
<25 5 10 25-35 20 40 35-50 20 40
50 and above 5 10 Total 50 100
Occupation
Government 5 10 private 25 50
Business 10 20 Others 10 20 Total 50 100
Monthly Income
15000 5 10 15000-25000 5 10 25000-50000 30 60
50,000-60,000 above 10 20 Total 50 100
Source: Primary data
Table 1 shows the sample profile of the respondents. 60 per cent of the respondents are Male and rests of the others are female. In the case of age category 40 per cent were under the 25-35 age group and 40 per cent were middle aged group (35-50 age groups). Only 10 per cent were under the above 50 age group.
Table-2: Source of Information about the tourist places Sl No Sources of information Minimum Maximum Mean Std. Deviation Ranking
1 Through friends & relatives 1.00 9.00 8.38 1.60 1 2 Hoardings 2.00 9.00 7.15 2.01 2 3 News papers 1.00 9.00 4.47 1.93 7 4 Internet 1.00 9.00 5.09 2.03 4 5 Books and Tour Brochures 1.00 9.00 3.37 1.85 9 6 Tour operator/ Travel agent 2.00 10.00 4.97 1.97 5
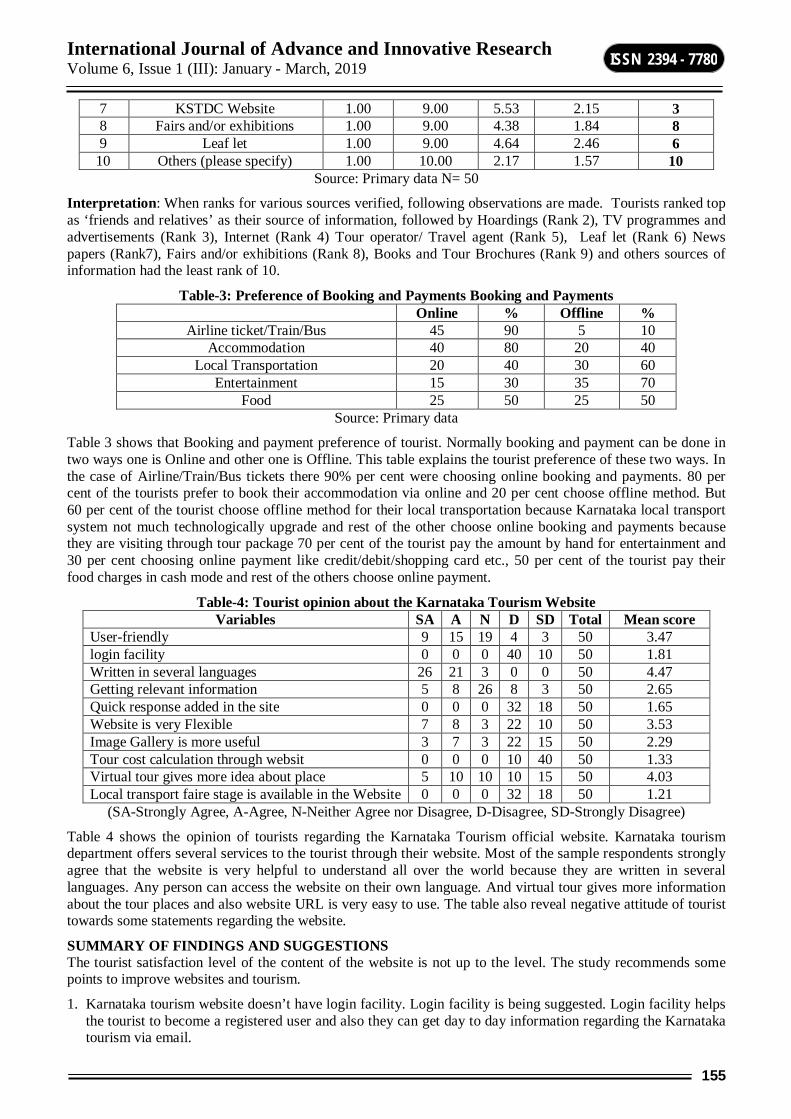
International Journal of Advance and Innovative Research Volume 6, Issue 1 (III): January - March, 2019
155
ISSN 2394 - 7780
7 KSTDC Website 1.00 9.00 5.53 2.15 3 8 Fairs and/or exhibitions 1.00 9.00 4.38 1.84 8 9 Leaf let 1.00 9.00 4.64 2.46 6
10 Others (please specify) 1.00 10.00 2.17 1.57 10 Source: Primary data N= 50
Interpretation: When ranks for various sources verified, following observations are made. Tourists ranked top as ‘friends and relatives’ as their source of information, followed by Hoardings (Rank 2), TV programmes and advertisements (Rank 3), Internet (Rank 4) Tour operator/ Travel agent (Rank 5), Leaf let (Rank 6) News papers (Rank7), Fairs and/or exhibitions (Rank 8), Books and Tour Brochures (Rank 9) and others sources of information had the least rank of 10.
Table-3: Preference of Booking and Payments Booking and Payments Online % Offline %
Airline ticket/Train/Bus 45 90 5 10 Accommodation 40 80 20 40
Local Transportation 20 40 30 60 Entertainment 15 30 35 70
Food 25 50 25 50 Source: Primary data
Table 3 shows that Booking and payment preference of tourist. Normally booking and payment can be done in two ways one is Online and other one is Offline. This table explains the tourist preference of these two ways. In the case of Airline/Train/Bus tickets there 90% per cent were choosing online booking and payments. 80 per cent of the tourists prefer to book their accommodation via online and 20 per cent choose offline method. But 60 per cent of the tourist choose offline method for their local transportation because Karnataka local transport system not much technologically upgrade and rest of the other choose online booking and payments because they are visiting through tour package 70 per cent of the tourist pay the amount by hand for entertainment and 30 per cent choosing online payment like credit/debit/shopping card etc., 50 per cent of the tourist pay their food charges in cash mode and rest of the others choose online payment.
Table-4: Tourist opinion about the Karnataka Tourism Website Variables SA A N D SD Total Mean score
User-friendly 9 15 19 4 3 50 3.47 login facility 0 0 0 40 10 50 1.81 Written in several languages 26 21 3 0 0 50 4.47 Getting relevant information 5 8 26 8 3 50 2.65 Quick response added in the site 0 0 0 32 18 50 1.65 Website is very Flexible 7 8 3 22 10 50 3.53 Image Gallery is more useful 3 7 3 22 15 50 2.29 Tour cost calculation through websit 0 0 0 10 40 50 1.33 Virtual tour gives more idea about place 5 10 10 10 15 50 4.03 Local transport faire stage is available in the Website 0 0 0 32 18 50 1.21
(SA-Strongly Agree, A-Agree, N-Neither Agree nor Disagree, D-Disagree, SD-Strongly Disagree)
Table 4 shows the opinion of tourists regarding the Karnataka Tourism official website. Karnataka tourism department offers several services to the tourist through their website. Most of the sample respondents strongly agree that the website is very helpful to understand all over the world because they are written in several languages. Any person can access the website on their own language. And virtual tour gives more information about the tour places and also website URL is very easy to use. The table also reveal negative attitude of tourist towards some statements regarding the website.
SUMMARY OF FINDINGS AND SUGGESTIONS The tourist satisfaction level of the content of the website is not up to the level. The study recommends some points to improve websites and tourism.
1. Karnataka tourism website doesn’t have login facility. Login facility is being suggested. Login facility helps the tourist to become a registered user and also they can get day to day information regarding the Karnataka tourism via email.
International Journal of Advance and Innovative Research Volume 6, Issue 1 (III): January - March, 2019
156
ISSN 2394 - 7780
2. Also include quick response facility in the website. Quick response is a pre-defined software and they immediately response the queries of the registered user. There is no need to extra cost and employee for this programme.
3. The study also suggested including Local transport faire stage. Auto rickshaw charges (Night and day), Bus charge, taxi fare (Night and day) etc. It will help the tourist to avoid exploitation
4. The website doesn’t have the Tour cost calculator and Foreign exchange calculator, the study recommend for including that facility. This will helps the tourist to plan their tour trip and select appropriate tour packages.
5. Should include chatting room in the website for registered user. It will helps the people to interact with each other and also able to get information about the tourist place.
CONCLUSION The study reveals that Digital marketing has significant role in Karnataka tourism industry. The tourist visit Karnataka tourism website before planning their tour and they can also get several information about the different tourist places in Karnataka. The respondents opine that Karnataka government provides lots of facilities through their website, but they also opined that website is not much developed. Respondents give average rating scale about the Karnataka tourism official website. In this new globalised world majority of the people see the world through the Internet. If they want to get some information, immediately they search in the Google or some other search engines. So the information technology plays a vital role in development of tourism sector. People are more eager to know about the world and world changes. They want information’s. The study summarized that information technology and tourism are very closely related one can’t survive without the other
SELECTED REFERENCES 1. Ganapathy Subramaniam, Tourism Industry Aims Global Tie- ups to boost Brand India”, Times News
Network, Chennai, December, 8, 2010.
2. Charles P. Kindleberger and Bruce Herrick, Economic Development.
3. Poon, A.,Tourism, technology and competitive strategies, CAB International, Oxford, 2010.
4. Hopper, L., Rattling SABRE-New ways to compete on information, Harvard Business Review, 1999 68(3), 118-125.
5. Cooper, C., and Buhalis, D., The future of tourism, in Cooper, C., Fletcher, J., Gilbert, D., and Wanhill, S., (eds), Tourism: principles and practice, Pitman Publishing, London, 1993, 265-277.
6. Indian Tourism Business, A legal perspective by Gyan Books, Ansari Road. New Delhi.
7. Encylopedia of Indian Tourism Resources : volume I, II, III by Gyan Books, Ansari Road, New Delhi.
8. Tourism Growth Management and Incentives by Kalpaz Publication, New Delhi
International Journal of Advance and Innovative Research Volume 6, Issue 1 (III): January - March, 2019
157
ISSN 2394 - 7780
IMPACT OF DIGITAL MARKETING ON RURAL MARKETING - OPPORTUNITIES AND CHALLENGES
Vinutha P. Shenoy and Eshwar S M Lecturer, NES Institute of Advanced Studies, JNNCE Campus, Shimoga
ABSTRACT Indian economy is one of the fast growing economies of the world. Majority of Indian economy depends on rural economy. It is worthwhile to note that more than 70% of Indian population is located in rural areas. Major population of any country determines the success or failure of any brand of commodity or services. The importance of Rural Marketing should not be under estimated. The growth in technology has been impacting rural India over the few years. Most of the companies and marketers have focused on rural markets along with the perspective of development of rural people. Technology has made huge difference to the way we look at rural India. Rural marketing results in overall balanced economical and social development. It turns beneficial to a business unit, people residing in rural areas, people residing in urban areas and to the entire nation.
This paper focuses on the impact of digital marketing on rural markets and the challenges and opportunities available in the Rural marketing.
Keywords: Technology, digital marketing, challenges and opportunities, economic development.
INTRODUCTION Meaning of rural market: The rural market is an area of darkness to Indian entrepreneurs. An area which is vast in size but amorphous in detail. An area where communications are poor and the population poorer because their operations are small scale and inadequate, therefore inefficient. An area which cuts off from the nation’s economy because its own is not fully monetized.
And yet, the rural market represents the largest potential market in the economy. It encompasses over 70% of population. Its primary activities-agriculture, animal husbandry, fisheries, forestry-account for half of the national income. Rural assets also amount to more than 50% of country’s tangible wealth. However, compared to the urban sector with 20% of the population and 50% of the income, money must be spread thinly. Yet there are pockets of wealth which urban entrepreneurs can tap.
DIGITAL MARKETING Digital marketing means to promote the product and service offered by the use of digital technologies. Most common platform is the internet; mobile and television are also the prime platform examples. 10 years ago televisions were the primary source of digital advertising. Currently digital marketing is referred as the online marketing because of techniques like Search Engines Marketing (SEM), pop up advertisements, E-Commerce, E-Mail marketing , content marketing and social Media Marketing(SMM).
OBJECTIVES To understand Rural Marketing
To identify the challenges the Rural Markets are facing
To study the opportunities of Rural marketing
To study the impact of Digital marketing on rural marketing.
SCOPE The study is undertaken to understand the impact of digital marketing on rural markets and the challenges and opportunities available in rural markets.
METHODOLOGY The study is conducted purely on the basis of secondary data which is collected from various books, websites, journals and research papers.
Rural market is growing faster than urban. Rural marketing results into overall balanced economical and social development. It turns beneficial to business units, people residing in urban areas and to the entire nation. The following are the ways through which growth and development of rural marketing contribute to overall prosperity and welfare.
1) Reduced burden on urban population:
2) Rapid economic growth
International Journal of Advance and Innovative Research Volume 6, Issue 1 (III): January - March, 2019
158
ISSN 2394 - 7780
3) Employment generation
4) Improved standard of living
5) Development of Agro-based industries
6) Optimum utilization of Rural untapped resources
7) Easy marketability of Agricultural Produces
8) Improved Rural Infrastructures
9) Price stability
10) Balanced industrial growth.
FEATURES OF RURAL MARKETING The main reason why the companies are focusing on rural market 1. Large and scattered population: about 70% of Indian population resides in rural areas. It is increasing at a
higher rate than the urban population.
2. High purchasing power: most of the companies have identified the potentiality of rural population and they have been concentrating in supplying the products demanded by the rural customers at right time.
3. Market growth: the rural market is growing steadily. People have stated using the variety of products in their day today activities.
4. Low standard of living: the people living in the rural areas have low standard of living due to the lack of education, low income and social backwardness.
5. Traditional outlook: rural people give much importance to the values of their tradition and culture. But with the development in technology, rural people are being attracted towards the branded products and now the demand pattern is changing.
CHALLENGES OF RURAL MARKETING There is absolutely no doubt about the huge potentials of rural market due to its vast population and growing disposal income and a new clan of ‘rural rich consumers’ in many states of India. However, it is a strategy and market for companies who have time, funds and patience. The major problems faced by marketing companies are described below:
Problem of huge distance and inadequate outlets
Underdeveloped population and market
Low per capital income
Poor communication
Large diversity in language and dialects
Inadequate credit facilities
Lack of logistics, Storage, godown, local transport, roads and connectivity
Unavailability of trained manpower
Inadequate media coverage.
Packaging
Warehousing problems
OPPORTUNITIES OF RURAL MARKETING The government of India has planned various initiatives to provide and improve the infrastructure in rural
areas which can have multiplier effect in increasing the movement of goods and services. This in turn is improving the consumption capacity of rural people.
Corporate players and entrepreneurs are joining in the effort of government of India to educate the rural population and to provide them proper training.
International Journal of Advance and Innovative Research Volume 6, Issue 1 (III): January - March, 2019
159
ISSN 2394 - 7780
Most of the E-Commerce players have joined their hands with the government to reach the nook and corners of rural areas.
Banks are trying to reach the rural people by providing them ATM facilities and credit facilities.
Rural consumers are better networked. They are better connected in digital sense as compared to earlier. Technological developments have reshaped the life style of rural people.
Infrastructure is also developing fast, leading to the better connectivity by road, by phone and access to mass media through television.
Rural incomes are growing due to green revolution, rise in agri-produce prices, skilled India programmes and consumers are buying variety of goods such as mobile phones television sets and two wheelers.
The increasing penetration of DTH, mobile phone and mobile internet in rural India is breaking all the traditional consumer connect models. It has brought a paradigm shift in rural marketing. Speaking on this silent revolution taking place in the hinterland, Mr.Pradeep Lokhande founder and CEO, Rural relation said “Every month 4.5 lakh DTH are being installed in Rural India. In the near future every Indian will have an android phone. That is the communication push taking place in Rural India.
Now it is the turn of marketers’ top re- plans their strategies accordingly. Due to this, irrespective of their cast and religion, the rural youth have similar aspiration like their counter parts in the urban area.
The mobile communication in rural India has changed the marketing strategy of many of the big companies. Now a day the biggest nightmare for companies is to know what consumers want. They are completely dependent on the information collected by the research.
Rural India is moving at a place beyond the imagination. With the deep penetration of mobile and internet in the rural sector, the rural people are aware about the type of product and the quantity of sale. This has helped them to provide feedback about the service and the products.
Digital media is immensely educating and creating awareness among rural consumer. Through, digital identification or E-KYS, it has become easier for banks and NBFCs (Non banking financial institution) to identify and finance the consumers. It has increased opportunities for the sale of variety of goods and service in rural area.
IMPROVEMENTS IN RURAL INDIA With the improvement in infrastructure, villages came closer to cities. Mobile and to some extent internet bought villages closer to urban population further and hence rural India became familiar to urban lifestyle.
HOW WILL DIGITAL MARKETING HELP BUSINESS? Few years back, it was very difficult to get mobile network in rural India. with rising competition in telecom industry, need of increasing customer base and high band width, mobile usage has grown in village. Number of mobile usage in rural India has gone up. Social media tools like face book. YouTube have started gaining momentum.
Rural markets bring lot of demand for consumer products. The rural industry has been growing at a high speed. Income in rural India is growing steadily and most of the companies are finding it difficult to grab the available market. In such cases, digital is a good option as people using internet will become influencers in most of the villages as they are using smart phone and internet.
BENEFITS FROM DIGITAL Flow of information to rural people becomes easier.
Information regarding weather, daily rate of crops, milk and milk products, can be trade available on mobile phone either by Government of NGP’s
It will increase the farm efficiency and also the market understanding of farmer.
Training on advanced farming techniques and use of proper fertilizers can be done across many villages at a time.
Okhai is one such initiative is TATA trust to connect Guajarati rural women with cities where rural products can be sold directly.
International Journal of Advance and Innovative Research Volume 6, Issue 1 (III): January - March, 2019
160
ISSN 2394 - 7780
CONCLUSION Prima facie, the rural markets appear to be the virgin lands for the marketers on the move. Getting into rural markets and getting sizeable share for their products and services is not an easy task. These rural markets have to be identified, problems in each area of marketing are to be traced and innovative solutions are to be found to get the fruits. In spite of all the challenges and opportunities and the hinderances, the efforts made by government and the corporate companies to digitalize the rural markets is getting a positive response from the rural people and they have been showing the keen interest to learn the modern technology in their daily business. This has improved their standard of living to some extent.
In long term, digital will help to increase the consumption of rural India and will also create employment opportunities; thereby increasing disposable income. This in turn will have positive effect on economic growth of the country.
BIBLIOGRAPHY Marketing management in the Indian background- C.N.Sontakki
Marketing management –Dr. C.B.Guptha and Dr. N.Rajan Nair
Marketing management – varshney
Article from the journal-imperial journal of interdisciplinary research –Punit Kumar &Amit Verma
Rural marketing-opportunitie and challenges-Dr. Y.M.Gosavi & Prof.Vishal Balakrushna Samudre
https:/www.researchgate.net>publication
https://www.marketingmind.in>challenge...
www.iosrjournals.org
http://www.onlinejournal.in

International Journal of Advance and Innovative Research Volume 6, Issue 1 (III): January - March, 2019
161
ISSN 2394 - 7780
MARKETING IN DIGITAL WORLD VIRAL/BUZZ MARKETING
Vinay H B and Gururaj N Lecturer, NES Institute of Advanced Studies, Shivamogga
ABSTRACT In digital environment, consumers can send to each other marketing messages like “viruses”. Marketing messages can be forwarded quickly at low costs to a great number of acquaintances, friends and even to complete strangers. Simplicity, the speed of messaging, great coverage, trust is only a couple of the characteristics that influence the importance of viral marketing. The focus of viral marketing – the process of creating, receiving, sending, and forwarding “virus”- marketing messages. Model 5C is represented according to which the passing on of viral marketing messages depends on consumers, category, company, content and context. Viral messages can be created by both the representatives of a company and consumers, but they are being passed on by consumers. When a company creates a viral message, it is only necessary to create “the right marketing message” (with the right content) – with a viral potential – virus and pass it on to the right users consumers in the right context. Since the users of digital media and/or consumers also create and pass on messages, company has to check and direct viral communications in a desired direction.
Keywords: Viral marketing, viral communication, viral messages, 5C model.
INTRODUCTION The emergence of "viral marketing” as an approach to advertisement, has been tied to the popularization of the notion that ideas spread like viruses. The field that developed around this notion, memetics, peaked in popularity in the 1990s. As this then began to influence marketing gurus, it took on a life of its own in that new context. Viral Marketing is an attempt to deliver a marketing message that spreads quickly and exponentially among consumers. Today, this often comes in the form of an email message or video. Contrary to alarmists’ fear, viral isn’t evil. It isn’t dishonest or unnatural. At its best, it is word of mouth enabled, and at its worst, it’s just another interruptive marketing message.
Viral marketing is an idea that spreads and an idea that while it is spreading actually helps market your business or cause. A good advertising campaign is one that engages with your audience enough for them to think “I want to pass this on”. The effect is that a simple message can be passed through a demographic of peers quickly.
VIRAL MARKETING Viral marketing or viral advertising is a business strategy that uses existing social networks to promote a product. Its name refers to how consumers spread information about a product with other people in their social networks, much in the same way that a virus spreads from one person to another. It can be delivered by word of mouth or enhanced by the network effects of the Internet and mobile networks. The concept is often misused or misunderstood as people apply it to any successful enough story without taking into account the word "viral".
Viral Marketing is so successful because it creates the curiosity and desire needed to generate the demand for a product or service. It is designed to generate excitement over nothing. It builds upon itself by word of mouth and it is so important today in all areas of business.
The term refers to the techniques that seek to exploit pre-existing social networks to produce exponential increases in brand awareness. It's primary use is to harness the network effect of the Internet to reach a large number of people very quickly. Viral advertising only succeeds if the original email campaign element is compelling and worth sending on.
VIRAL COMMUNICATION Viral advertising is personal and, while coming from an identified sponsor, it does not mean businesses pay for its distribution. Most of the well-known viral ads circulating online are ads paid by a sponsor company, launched either on their own platform (company webpage or social media profile) or on social media websites such as YouTube. Consumers receive the page link from a social media network or copy the entire ad from a website and pass it along through e-mail or posting it on a blog, webpage or social media profile. Viral marketing may take the form of video clips, interactive Flash games, advergames, ebooks, brandable software, images, text messages, email messages, or web pages. The most commonly utilized transmission vehicles for viral messages include: pass-along based, incentive based, trendy based, and undercover based. However, the creative nature of viral marketing enables an "endless amount of potential forms and vehicles the messages can utilize for transmission", including mobile devices.
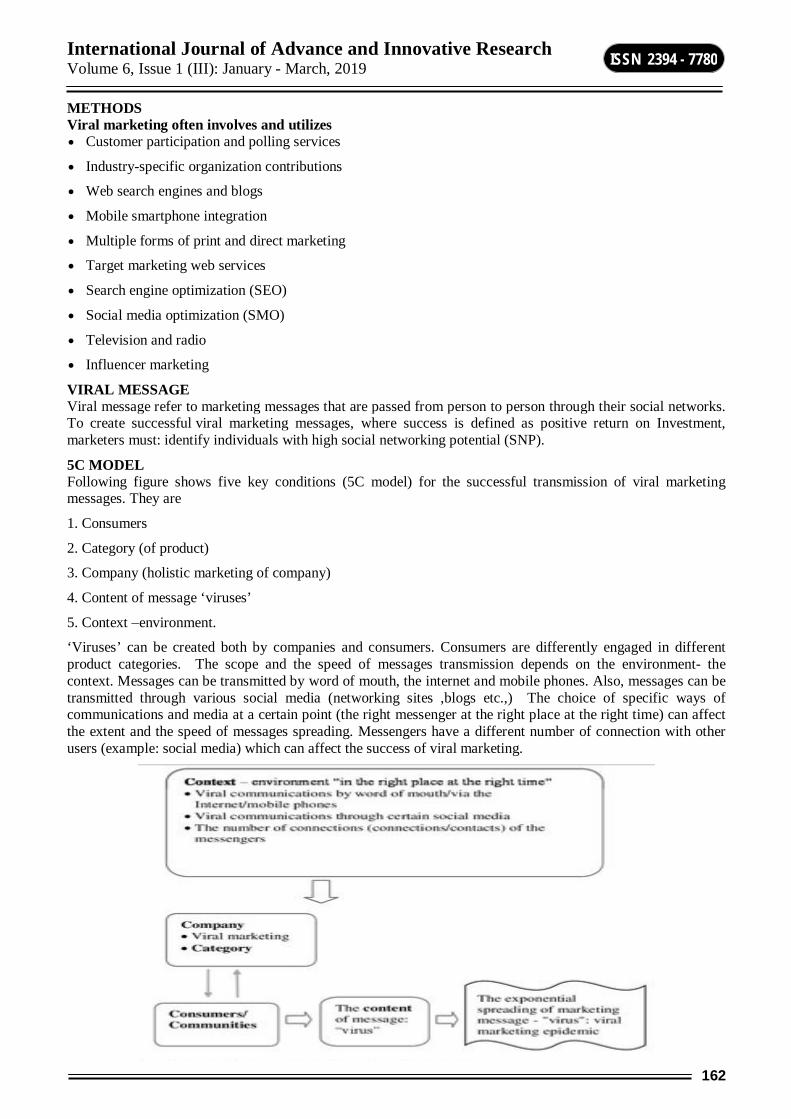
International Journal of Advance and Innovative Research Volume 6, Issue 1 (III): January - March, 2019
162
ISSN 2394 - 7780
METHODS Viral marketing often involves and utilizes Customer participation and polling services
Industry-specific organization contributions
Web search engines and blogs
Mobile smartphone integration
Multiple forms of print and direct marketing
Target marketing web services
Search engine optimization (SEO)
Social media optimization (SMO)
Television and radio
Influencer marketing
VIRAL MESSAGE Viral message refer to marketing messages that are passed from person to person through their social networks. To create successful viral marketing messages, where success is defined as positive return on Investment, marketers must: identify individuals with high social networking potential (SNP).
5C MODEL Following figure shows five key conditions (5C model) for the successful transmission of viral marketing messages. They are
1. Consumers
2. Category (of product)
3. Company (holistic marketing of company)
4. Content of message ‘viruses’
5. Context –environment.
‘Viruses’ can be created both by companies and consumers. Consumers are differently engaged in different product categories. The scope and the speed of messages transmission depends on the environment- the context. Messages can be transmitted by word of mouth, the internet and mobile phones. Also, messages can be transmitted through various social media (networking sites ,blogs etc.,) The choice of specific ways of communications and media at a certain point (the right messenger at the right place at the right time) can affect the extent and the speed of messages spreading. Messengers have a different number of connection with other users (example: social media) which can affect the success of viral marketing.

International Journal of Advance and Innovative Research Volume 6, Issue 1 (III): January - March, 2019
163
ISSN 2394 - 7780
CONCLUSION The ultimate goal of marketers interested in creating successful viral marketing programs is to create viral messages that appeal to individuals with high social networking potential (SNP) and that have a high probability of being presented and spread by these individuals and their competitors in their communications with others in a short period of time.
The term "viral marketing" has also been used pejoratively to refer to stealth marketing campaigns-marketing strategies that advertise a product to people without them knowing they are being marketed to.
BIBLIOGRAPHY Service management – Gorden and Natrajan
Marketing Management – K.D Basava
Wikipedia
International Journal of Advance and Innovative Research Volume 6, Issue 1 (III): January - March, 2019
164
ISSN 2394 - 7780
GREEN MARKETING
Baibhab Sur and Mbanthaipou Ngaomei MBA Department, Don Bosco Institute of Technology, Bangalore
ABSTRACT Increasing awareness on the various environmental problems has led a shift in the way consumers go about their life. There has been a change in consumer attitudes towards a green lifestyle. People are actively trying to reduce their impact on the environment. However, this is not widespread and is still evolving. Organizations and business however have seen this change in consumer attitudes and are trying to gain an edge in the competitive market by exploiting the potential in the green market industry. In the modern era of globalization, it has become a challenge to keep the consumers in fold and even keep our natural environment safe and that is the biggest need of the time. Green marketing is a phenomenon which has developed particular importance in the modern market and has emerged as an important concept in India as in other parts of the developing and developed world, and is seen as an important strategy of facilitating sustainable development. In this research paper, main emphasis has been made of concept, need and importance of green marketing. Data has collected from multiple sources of evidence, in addition to books, journals, websites and news papers. It explores the main issues in adoption of green marketing practices. The paper describes the current Scenario of Indian market and explores the challenges have with green marketing.
Keywords: Green Marketing, Environment, Traditional Marketing, Consumer, Marketer.
WHAT IS GREEN MARKETING? Green marketing refers to the process of selling products or services based on their environmental benefits. Such a product or service may be environmentally friendly in itself or produced in an environmentally friendly way, such as:
Being manufactured in a sustainable fashion
Not containing toxic materials or ozone-depleting substances
Able to be recycled and/or is produced from recycled materials
Being made from renewable materials (such as bamboo, etc.)
Not making use of excessive packaging
Being designed to be repairable and not "throw-away"
EVOLUTION OF GREEN MARKETING Green marketing term was first discussed in a seminar on ―Ecological Marketingǁ organized by American Marketing Association (AMA) in 1975 and took its place in the literature. The term green marketing came into prominence in the late 1980s and early 1990s. The first wave of green marketing occurred in the 1980s. The tangible milestone for the first wave of green marketing came in the form of published books, both of which were called Green Marketing. They were by Ken Pattie (1992) in the United Kingdom and by Jacquelyn Ottman (1993) in the United States of America. According to Peattie (2001), the evolution of green marketing has three phases.
1. First phase was termed as "Ecological" green marketing, and during this period all marketing activities were concerned to help environmental problems and provide remedies for environmental problems.
2. Second phase was "Environmental" green marketing and the focus shifted on clean technology that involved designing of innovative new products, which take care of pollution and waste issues.
3. Third phase was "Sustainable" green marketing. It came into prominence in the late 1990s and early 2000concerned with developing good quality products which can meet consumers need by focusing on the quality, performance, pricing and convenience in an environment friendly way.
CHARACTERISTICS OF GREEN PRODUCTS We can define green products by following measures 1. Products those are originally grown.
2. Products those are recyclable, reusable and biodegradable.
3. Products with natural ingredients.
International Journal of Advance and Innovative Research Volume 6, Issue 1 (III): January - March, 2019
165
ISSN 2394 - 7780
4. Products containing recycled contents and non toxic chemical.
5. Products contents under approved chemicals.
6. Products that do not harm or pollute the environment.
7. Products that will not be tested on animals.
8. Products that have eco-friendly packaging i.e. reusable, refillable containers etc.
WHY ARE FIRMS USING GREEN MARKETING? While looking through the literature there are several suggested reasons for firms increased use of Green Marketing. Five possible reasons cited are:
1. Organizations perceive environmental marketing to be an opportunity that can be used to achieve its objectives.
2. Organizations believe that they have a moral obligation to be more socially responsible.
3. Governmental bodies are forcing firms to become more responsible.
4. Competitors environmental activities pressurize firms to change their environmental marketing activities.
5. Cost factors associated with waste disposal or reductions in material usage forces firms to modify their behavior.
Opportunity In India, around 25% of the consumers prefer environment friendly products, and around 28% may be considered health conscious. Therefore, green marketers have diversified to fairly sizeable segment of consumers to cater to.
Social Responsibility Many companies have started realizing that they must behave in an environment friendly fashion. They believe both in achieving environmental objectives as well as profit related objectives respecting the principle of Extended Producer Responsibility (EPR).
Governmental Pressure Various regulations are framed by the government to protect consumers and the society at large. The Indian government too has developed a framework of legislations to reduce the production of harmful goods and by-products. These reduce the industry's production and consumer‘s consumption of harmful goods, including those detrimental to the environment; for example, the ban of plastic bags, prohibition of smoking in public areas, etc.
Competitive Pressure Another major force in the environmental marketing area has been firms' desire to maintain their competitive position. In many cases firms observe competitors promoting their environmental behaviors and attempt to emulate this behavior. In some instances this competitive pressure has caused an entire industry to modify and thus reduce its detrimental environmental behavior.
Cost Reduction Reduction of harmful waste may lead to substantial cost savings. Sometimes, many firms develop a symbiotic relationship whereby the waste generated by one company is used by another as a cost-effective raw material.
GREEN CODE G: Generalizes with care. Consumer behavior will not necessarily be consistent across different product types,
and particular market segments may respond to certain issues on the green agenda but not others.
R: Remembers, the validity of a piece of market research is not related to the degree to which it supports your preferred option.
E: Explores the context from which market research data comes. Be clear on the nature of the sample used, the questions asked, the way in which responses were recorded and the time and place from which the responses come.
E: Ensures that where market research is crossing international borderlines, that the terminology and interpretation remains consistent. Terms like ‘environment’, ‘green’ and‘conservation’ do not always translate precisely between languages.
International Journal of Advance and Innovative Research Volume 6, Issue 1 (III): January - March, 2019
166
ISSN 2394 - 7780
N: Neutrality is important. Ensure that when you pose questions to consumers, that they can make any response without being made to feel guilty or uncomfortable, and ensure that your own preconceptions about the green agenda (such as an assumption that green products will cost extra) are not encoded within the questions
GOLDEN RULES OF GREEN MARKETING 1. Know your Customer Make sure that the consumer is aware of and concerned about the issues that your product attempts to address.
2. Educating your customers It is not just a matter of letting people know, whatever you're doing is to protect the environment, but also a matter of letting them know why it matters.
3. Being Genuine & Transparent a) You are actually doing what you claim to be doing in your green marketing campaign
b) The rest of your business policies are consistent with whatever you are doing that's environment friendly.
4. Reassure the Buyer Consumers must be made to believe that the product performs the job , in this fim should not forgot product quality in the name of the environment.
5. Consider Your Pricing If you are charging a premium for your product and many environmentally preferable products cost more due to economies of scale and use of higher-quality ingredients make sure those consumers can afford the premium and feel it's worth it.
THE FOUR PS OF GREEN MARKETING I. Product Entrepreneurs wanting to exploit emerging green market either by identifing customer‘s environmental needs or by developing environmentally responsible products to have less impact than competitors. The increasingly development of :
1. Products that can be recycled or reused. Efficient products, which save water, energy or gasoline, save money and reduce environmental impact.
2. Products with environmentally responsible packaging. McDonalds, for example, changed their packaging from polystyrene clamshells to paper.
3. Products with green labels, as long as they offer substantiation.
4. Organic products — many consumers are prepared to pay a premium for organic products, which offer promise of quality. Organic butchers, for example, promote the added qualities such as taste and tenderness.
5. A service that rents or loans products –such as toy libraries.
6. Certified products, which meet or exceed environmentally responsible criteria.
II. Price Pricing is a critical element of the marketing mix. Most customers are prepared to pay a premium if there is a perception of additional product value. This value may be improved performance, function, design, visual appeal or taste. Environmental benefits are usually an added bonus but will often be the deciding factor between products of equal value and quality. Environmentally responsible products, however, are often less expensive when product life cycle costs are taken into consideration, for example fuel-efficient vehicles, water-efficient printing and non-hazardous products.
III. Place The choice of where and when to make a product available has a significant impact on the customers being attracted. Very few customers go out of their way to buy green products merely for the sake of it. Marketers looking to successfully introduce new green products should, in most cases, position them broadly in the market place so they are not just appealing to a small green niche market. The location must also be consistent with the image which a company wants to project. The location must differentiate a company from its competitors. This can be achieved by in-store promotions and visually appealing displays or using recycled materials to emphasize the environmental and other benefits.
International Journal of Advance and Innovative Research Volume 6, Issue 1 (III): January - March, 2019
167
ISSN 2394 - 7780
IV. Promotion Promoting products and services to target markets includes paid advertising, public relations, sales promotions, direct marketing and on-site promotions. Smart green marketers will be able to reinforce environmental credibility by using sustainable marketing and communications tools and practices. For example, many companies in the financial industry are providing electronic statements by email, e-marketing is rapidly replacing more traditional marketing methods, and printed materials can be produced using recycled materials and efficient processes, such as waterless printing. Retailers, for example, are recognizing the value of alliances with other companies, environmental groups and research organizations when promoting their environmental commitment. To reduce the use of plastic bags and promote their green commitment, some retailers sell shopping bags, under the banner of the Go Green Environment Fund. The key to successful green marketing is credibility. Never overstate environmental claims or establish unrealistic expectations, and communicate simply and through sources that people trust. Promote your green credentials and achievements. Publicize stories of the company‗s a environmental awards programs to profile environmental credentials to customers and stakeholders.
GREEN MARKETING: SWOT ANALYSIS Strengths Marketers get access to new markets and gain an advantage over competitors that are not focusing on
“greenness”.
Marketers can charge a premium on products that are seen as more eco-responsible.
Organizations that adopt green marketing are perceived to be more socially responsible.
Green marketing builds brand equity and wins brand loyalty among customers
E.g. research and development capabilities for clean processes and green products and human resources committed to environmental protection.
Weakness Most customers choose to satisfy their personal needs before caring for environment.
Overemphasizing greenness rather than customer needs can prove devastating for a product.
Many customers keep away from products labeled “Green” because they see such labeling as a marketing gimmick, and they may lose trust in an organization that suddenly claims to be green.
E.g. products cannot be recycled, and hazardous wastes of a company.
Opportunities Marketing to segment which are becoming more environmentally aware and concerned. These consumers
are demanding products that conform to these new attitudes.
Organizations perceive green marketing to be a competitive advantage, relative to the competitors. Firms, therefore, strive to improve upon their societal awareness. This complements the increase in consumers’ socially conscious behavior and will therefore give them an advantage over competitors who do not ad dress these issues.
E.g. offering an environmental friendly product and saving resources, and relating them.
Threats Uncertainty as to the environmental impact of present activities, including that is perceived to be less
environmentally harmful.
Uncertainty as to which green marketing activities are acceptable from a government perspective.
The possibility of a backlash from consumers or government based on existing green marketing claims, threat one and two above may cause backlash to arise.
E.g. competitors gain market shares with green products and increased environmental regulations).
10 WAYS TO GO GREEN 1. Unplug when not in use.
2. Use less water, every drop counts.
3. Switch to compact fluorescent light bulbs.
International Journal of Advance and Innovative Research Volume 6, Issue 1 (III): January - March, 2019
168
ISSN 2394 - 7780
4. Choose products with less packaging.
5. Buy organic and local food.
6. Drive less that saves fuel.
7. Walk more.
8. Recycle more.
9. Switch to green power, use non conventional energy like solar power etc.
10. Spread the world about green, live green, stay green.
GREEN MARKETING- CHALLENGES Although a large number of firms are practicing green marketing, it is not an easy job as there are a number of problems which need to be addressed while implementing Green marketing. The major challenges which Green marketing have to be faced are:
1. New Concept Indian literate and urban consumer is getting more aware about the merits of Green products. But it is still a new concept for the masses. The consumer needs to be educated and made aware of the environmental threats. The new green movements need to reach the masses and that will take a lot of time and effort.
2. Cost Factor Green marketing involves marketing of green products/services, green technology, green power/energy for which a lot of money has to be spent on R&D programmes for their development and subsequent promotional programs which ultimately may lead to increased costs.
3. Convincing customers The customers may not believe in the firm‘s strategy of Green marketing, the firm therefore should ensure that they undertake all possible measures to convince the customer about their green product, the best possible option is by implementing Eco-labeling schemes. Sometimes the customers may also not be willing to pay the extra price for the products.
4. Sustainability Initially the profits are very low since renewable and recyclable products and green technologies are more expensive. Green marketing will be successful only in long run. Hence the business needs to plan for long term rather than short term strategy and prepare for the same, at the same time it should avoid falling into lure of unethical practices to make profits in short term.
5. Non Cooperation The firms practicing Green marketing have to strive hard in convincing the stakeholders and many a times it may fail to convince them about the long term benefits of Green marketing as compared to short term expenses.
6. Avoiding Green Myopia Green marketing must satisfy two objectives: improved environmental quality and customer satisfaction. Misjudging either or overemphasizing the former at the expense of the latter can be termed green marketing myopia.
7. Some Other Challenges Ahead In Green Marketing Are: Green products require renewable and recyclable material, which is costly
Requires a technology, which requires huge investment in R & D
Water treatment technology, which is too costly
Majority of the people are not aware of green products and their uses
Majority of the consumers are not willing to pay a premium for green products.
SUGGESTION Green marketing is still in its infancy and a lot of research is to be done on green marketing to fully explore its potential. There are some suggestion that an organizations should implement for catering challenges of green marketing and successful exploitation of green marketing. Those are: Consumer needs to be made more aware about the merits of Green products. It is still a new concept for the masses. The consumer needs to be educated and made aware of the environmental threats. It should be made sure that the consumer is aware of and
International Journal of Advance and Innovative Research Volume 6, Issue 1 (III): January - March, 2019
169
ISSN 2394 - 7780
concerned about the issues that your product attempts to address. Green Marketing campaign and green advertising is good step toward it. Consumers must be motivated to switch brands or even pay a premium for the greener alternative.
Make sure that consumer feel that they can make a difference. Make sure that consumer feel that they can make a difference. This is called “empowerment” and due to this main reason consumers will buy greener products. Further steps should be taken to control false promise and claim by the marketer to maintain legitimacy and trustworthiness of green products. Consumers must be made to believe that the product performs the job it’s supposed to do-they won’t forego product quality in the name of the environment.
For effective and efficient implementation of this concept of Green Marketing the factor that plays a major role is the Government. Unless the government creates specific and stringent laws and utilizes its authority to implement them the concept cannot be conceptualized. If the Consumer, the Organization and the Government work in unison towards the common goal of minimizing the detrimental environmental impact of their activities, then they can surely save this environment and make this world a better place to live in. Thus leading brands should recognize that consumer expectations have changed. It is not enough for a company to green its products; consumers expect the products at they purchase pocket friendly and also to help reduce the environmental impact in their own lives too. Today’s consumers are becoming more and more conscious about the environment and are also becoming socially responsible. Therefore, more companies should become responsible to consumers’ aspirations. Many companies want to have an early mover advantage as they have to eventually move towards becoming green. Green marketing is very low on the agenda of most businesses and therefore its still an underleveraged USP (Unique Selling Proposition). Therefore, effective green marketing targeted at the right audience will make a difference.
CONCLUSION Green marketing is a tool for protecting the environment for future generation. It is not going to be an easy concept. The firm has to plan and then carry out research to find out how feasible it is going to be. Green marketing has to evolve since it is still at its infancy stage. Adoption of Green marketing may not be easy in the short run, but in the long run it will definitely have a positive impact on the firm. Green Marketing is still in the stage of childhood in the Indian companies. Lots of opportunities are available. Now this is the right time to select Green Marketing globally. It will come with drastic change in the world of business if all nations will make strict rules because green marketing is essential to save world from pollution. From the business point of view because a clever marketer is one who not only convinces the consumer, but also involves the consumer in marketing his product. Green marketing should not be considered as just one more approach to marketing, but has to be pursued with much greater vigor, as it has an environmental and social dimension to it. With the threat of global warming looming large, it is extremely important that green marketing becomes the norm rather than an exception or just a fad. Recycling of paper, metals, plastics, etc., in a safe and environmentally harmless manner should become much more systematized and universal. It has to become the general norm to use energy efficient lamps and other electrical goods. Indian market Customers too are ready to pay premium price for green products. One thing that is being reiterated is that the current consumption levels are too high and are unsustainable. Therefore there is a need for green marketing and a need for a shift in the consumer‘s behavior and attitude towards more environment friendly life styles. Ultimately green marketing requires that consumers want a cleaner environment and are willing to pay for it, possibly through higher priced goods, modified individual lifestyles, or even governmental intervention. Until this occurs it will be difficult for firms alone to lead the green marketing revolution. An environmental committed organization may not only produce goods that have reduced their detrimental impact on the environment, they may also be able to pressure their suppliers to behave in a more environmentally responsible fashion. Final consumers and industrial buyers also have the ability to pressure organizations to integrate the environment into their corporate culture and thus ensure all organizations minimize the detrimental environmental impact of their activities.
REFERENCES 1) http://www.managementparadise.com
2) http://www.businessworld.in
3) http://www.outlookindia.com
4) http://en.wikipedia.org
5) http://www.business-standard.com
6) http://www.encyclopedia.com

International Journal of Advance and Innovative Research Volume 6, Issue 1 (III): January - March, 2019
170
ISSN 2394 - 7780
7) “Marketing Management”, N. Delhi, Prentice-Hall of India . – Kotler P.
8) Marketing Research: Principle Application & Casesǁ N. Delhi, Sultan Chand & Sons – Sharma D.D.

International Journal of Advance and Innovative Research Volume 6, Issue 1 (III): January - March, 2019
171
ISSN 2394 - 7780
A STUDY ON USAGE OF DIGITAL MARKETING TOOLS BY SMES, OPPORTUNITIES AND CHALLENGES
Ashwini H A1 and Dr. M G Krishnamurthy2 Assistant Professor1, Government Firs Grade College, Holehonnur, Shimoga
Professor2, Department of Management Studies, JNN College of Engineering, Shimoga
ABSTRACT The prominence of Small and Medium Scale Enterprises (SME’s) is evident as they are allied with the balanced growth of Indian Economy, playing a vital role through contribution to Gross Domestic Product (GDP) and employment generation. The success of these SME’s in the newly emerging Digital Economy relies upon how well they market their products. Effective marketing strategies ensure greater visibility, increased sales and higher levels of income. The aim of this paper is to provide the insights into the digital marketing tools used by SME’s , utilization and goals of digital marketing, examine the factors that influence the adoption of digital marketing channels in SME’s and challenges faced by SME’s in adopting digital marketing strategies. The study reveals that the SME’s seem not to make use of the full potential of the new digital tools and so are not deriving benefit from the opportunities they provide.
Keywords: GDP, SME’s, Digital Marketing, Marketing Channels
1. INTRODUCTION SME’s are integral part of the economy of any country. In India too the contribution of SME’s to the development of the economy is notable over the decades. According to the estimates of the Ministry of MSME, Government of India, the sector generates around 100 million jobs through over 46 million units situated throughout the geographical expanse of the country. With 38% contribution to the nation’s GDP and 40% and 45% share of the overall exports and manufacturing output respectively, it is easy to comprehend the important role they play in social and economic restructuring of India. The unique characteristics of SMEs like less capital- intensity and high labor-absorbance, their ability of being established in small towns and cities with less requirement of infrastructure and small size of management, SMEs have proven to be the strength of our country. Recognizing the contribution of the SME’s to our economy the government too since long has taken steps to provide the SME’s with various facilities and support. However, the statistical data of the past few years indicates that the share of MSMEs in GDP, manufacturing output and exports has been slowly declining over the years. To revitalize the bearish sentiments in manufacturing sector, government has triggered the “Make in India” campaign to boost manufacturing sector, aiming to redesign manufacturing sector as a key engine for India’s economic growth.
In spite, of the various policy initiatives of the government the SMEs have been facing several challenges for their successful operations like lack of infrastructure, lack of professional management and the most important being the lack of adequate finance, and problems relating to marketing of their products in domestic and international markets.
The SME’s are now using digital marketing techniques to sell their products and services in the domestic and international markets.
2. WHY DIGITAL MARKETING FOR SMES? The growing use of technology has led the SMEs to think about use of technology in selling its product and services. In the digital era having an online presence for a business is a critical requirement. Though the traditional methods of selling through advertising on Bill Boards, newspapers and TV are still available, the business can gain momentum only through going online. It is critical for SMEs to understand the changes happening in the economy where the market is moving towards a digital market the SMEs also need to change in this direction.
3. OBJECTIVES OF THE STUDY: 1. To identify the important Digital Marketing tools used by SME’s
2. To understand the benefits of the Digital Marketing tools to SME’s
3. To understand the challenges faced by SME’s in using Digital Marketing techniques.
4. DIGITAL MARKETING TOOLS USED BY SMES Digital marketing is a new approach to marketing, not just traditional marketing boosted by digital elements. It has its own characteristics and dynamics, which should be understood in order to be able to select effective
International Journal of Advance and Innovative Research Volume 6, Issue 1 (III): January - March, 2019
172
ISSN 2394 - 7780
marketing tactics and strategies.Digital Marketing in SME’s refers to the use of Website, e-portals and online methods to market their products and services. The important digital marketing tools used by SMEs examined are websites, Email newsletters, online directories, banner advertising, company generated blogs and Company’s own communities.
Company Website and Email: A company’s website can be described as the home of the brand in the online environment. Email can be used for various marketing purposes including sharing information, promotion, building and maintaining relationships, and guiding customers to websites .Although email is a two-way communication channel in its nature, it is often used as aone-way channel to deliver newsletters or advertisements. These two basic forms of digital marketing are often used in SMEs. . However, many of the SMEs were at an early stage of digital channel utilization and that their usage of the more advanced digital channels remained low.
Online directories: where a company buys its listing for a certain period, and online advertising, can also be considered digital mediums that can be used by the SME’s
Search Engine optimization: Search engine optimization (SEO),the process of improving the website’s search engine rank in organic search results, and search engine advertising (SEA), paid advertisements on a search engine’s results page related to some keywords, are both one-way communication channels. Their purpose is to inform people of the products or services available, and they are crucial to a company’s visibility on the web. Both SEO and SEA are commonly used among larger firms.
Social Media: The rise of social media has turned the marketer-customer relationship upside down; in so far as the power has shifted from marketers to customers The essential nature of social media requires company marketing to take the form of two-way communication with customers instead of monologues from the company. Naturally, in social media channels the company has less control over its brand. In social media, audiences do not expect sales pitches and marketing messages but real information generated by conversations around the brand , and they expect authentic stories to be told. It has been stated that post-internet branding is about ‘soft selling’, co-creating value and managing customer relationships not attempting to directly drive sales. Social media has become an important part of an organization’s marketing communications and branding. For example Facebook has become an important channel in engaging consumers and creating brand awareness.
Blogging: Blogging is said to be a good relationship tool for both marketing and Public Relations and many large companies have adopted blogging as part of their routines. Blogging is great way to create content on the web although it requires that one has something important to say and the ability to express it. It is also a form of social media where the company retains a relatively high level of control since the blog usually resides on the company’s own website allowing, the content to be edited and the comments monitored and filtered.
5. IMPORTANCE OF DIGITAL MARKETING TO SMES: Flexible Markets: The use of the digital marketing techniques have helped the SMEs to search for more
flexible market potential in the global scenario which would directly affect their sales and profit in an affirmative manner. The SMEs situated in various parts of the country are now able to access a global market.
Cost effective Method: It is considerd to be the most cost effective method to reach out the targeted potential methods as most of the digital marketing techniques offer free services
No long term commitments: There is no need for long term commitments. The leading digital marketing campaigns like CPC ( Cost per Click) or PPC ( Pay per Click) modes can be utilized greatly to achieve the desired results and enhanced profits for the SMEs
Enhanced profits: The SMEs can also come in direct contact with the experts of this field who are in constant touch with the recent updates or the advancements. By doing this, they can assure themselves of the optimum ROI(Return on Investment)
Rapid changes: With the use of effective digital marketing techniques, the SMEs are also given the freedom to make the necessary changes or reforms in their ongoing online marketing campaigns as the need would arise.
International Journal of Advance and Innovative Research Volume 6, Issue 1 (III): January - March, 2019
173
ISSN 2394 - 7780
6. CHALLENGES FACED BY SMES IN USING DIGITAL MARKETING TECHNIQUES Unfamiliar technology : Unfamiliarity with the technology is one important cause discouraging the SMEs
from using Digital marketing techniques. The technology is very vital in every sector like selling in an online market place, pre and post sales support and inventory management. SMEs do not give technology adoption the attention that it deserves. SMEs are not enough convinced about the return on investment in technology and cost is the biggest obstacle.
Lack of awareness: Lack of awareness of Benefits is also another factor preventing the SMEs from using digital marketing techniques. The SMEs fail to understand the benefits provided by the digital marketing tools and the exposure they provide to the business.
Technology upgradation: Not staying with changing technology also prevents SMEs from using digital marketing tools. rapidly changing technology demands SMEs to use technology devices to promote their sales. Because of budget constraints the SMEs cannot upgrade technology frequently, hence technology budgeting is one of the biggest challenge for SMEs.
7. CONCLUSION The rapid chanages technology and technology driven buying behaviours of the society has forced the SMEs also to adpot the digital markentig techniques. The SMEs are lately realising the benefits offered by digital marketing, however the special features and challenges of SMEs particularly the limited presence of these units in terms of geographical area, cost constraints and lack of access to technology have prevented the SMEs to use Digital marketing techniques. These techniques have not been exploited by SMEs to the fullest extent. However, the growing digital presence of other companies have forced the SMEs also to adopt to these techinques and it is vital for SMEs to now realize that Digital Marketing is the need of the hour and future of selling and marketing.
REFERENCE Barney, J. (1991), “Firm resources and sustained competitive advantage”, Journal of Management, Vol. 17,
pp.99-120.
Bharadwaj, P.N., Soni, R.G. (2007), “E-commerce usage and perception of e-commerce issues among small firms: results and implications from an empirical study”, Journal of Small Business, Vol. 45 No.4, pp.510-521.
Bordonaba-Juste, V., Lucia-Palacios, L., Polo-Redondo, Y. (2012), “The influence of organizational factors on e-business use: analysis of firm size”, Marketing Intelligence & Planning, Vol. 30 No.2, pp.212-229.
Bruhn, M., Schoenmueller, V., Schäfer, D.B. (2012), “Are social media replacing traditional media in terms of brand equity creation?” Management Research Review, Vol. 35 No.9, pp.770-790.
Carroll, W.R., Wagar, T.H. (2010), “Is there a relationship between information technology adoption and human resource management?”,Journal of Small Business and Enterprise Development, Vol. 17 No.2, pp.218-229.
Chao, C-A., Chandra, A. (2012), “Impact of owner's knowledge of information technology (IT) on strategic alignment and IT adoption in US small firms”, Journal of Small Business and Enterprise Development, Vol. 19 No.1, pp.114-31.
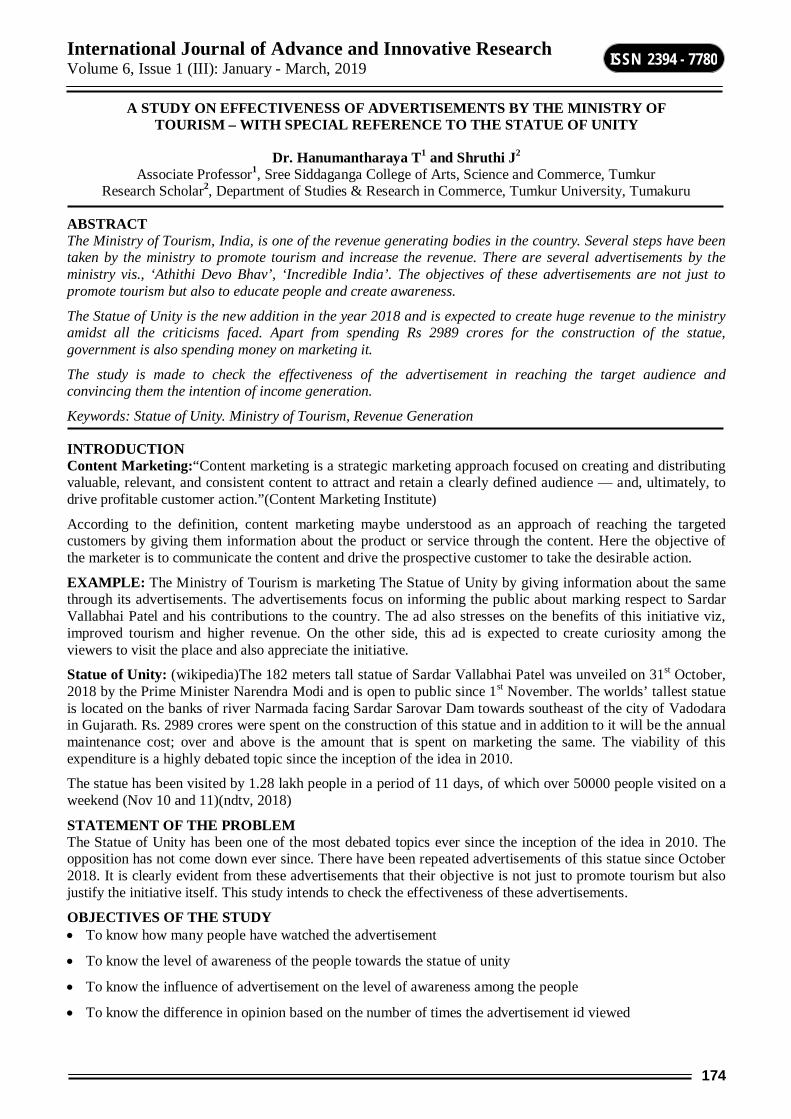
International Journal of Advance and Innovative Research Volume 6, Issue 1 (III): January - March, 2019
174
ISSN 2394 - 7780
A STUDY ON EFFECTIVENESS OF ADVERTISEMENTS BY THE MINISTRY OF TOURISM – WITH SPECIAL REFERENCE TO THE STATUE OF UNITY
Dr. Hanumantharaya T1 and Shruthi J2 Associate Professor1, Sree Siddaganga College of Arts, Science and Commerce, Tumkur
Research Scholar2, Department of Studies & Research in Commerce, Tumkur University, Tumakuru
ABSTRACT The Ministry of Tourism, India, is one of the revenue generating bodies in the country. Several steps have been taken by the ministry to promote tourism and increase the revenue. There are several advertisements by the ministry vis., ‘Athithi Devo Bhav’, ‘Incredible India’. The objectives of these advertisements are not just to promote tourism but also to educate people and create awareness.
The Statue of Unity is the new addition in the year 2018 and is expected to create huge revenue to the ministry amidst all the criticisms faced. Apart from spending Rs 2989 crores for the construction of the statue, government is also spending money on marketing it.
The study is made to check the effectiveness of the advertisement in reaching the target audience and convincing them the intention of income generation.
Keywords: Statue of Unity. Ministry of Tourism, Revenue Generation
INTRODUCTION Content Marketing:“Content marketing is a strategic marketing approach focused on creating and distributing valuable, relevant, and consistent content to attract and retain a clearly defined audience — and, ultimately, to drive profitable customer action.”(Content Marketing Institute)
According to the definition, content marketing maybe understood as an approach of reaching the targeted customers by giving them information about the product or service through the content. Here the objective of the marketer is to communicate the content and drive the prospective customer to take the desirable action.
EXAMPLE: The Ministry of Tourism is marketing The Statue of Unity by giving information about the same through its advertisements. The advertisements focus on informing the public about marking respect to Sardar Vallabhai Patel and his contributions to the country. The ad also stresses on the benefits of this initiative viz, improved tourism and higher revenue. On the other side, this ad is expected to create curiosity among the viewers to visit the place and also appreciate the initiative.
Statue of Unity: (wikipedia)The 182 meters tall statue of Sardar Vallabhai Patel was unveiled on 31st October, 2018 by the Prime Minister Narendra Modi and is open to public since 1st November. The worlds’ tallest statue is located on the banks of river Narmada facing Sardar Sarovar Dam towards southeast of the city of Vadodara in Gujarath. Rs. 2989 crores were spent on the construction of this statue and in addition to it will be the annual maintenance cost; over and above is the amount that is spent on marketing the same. The viability of this expenditure is a highly debated topic since the inception of the idea in 2010.
The statue has been visited by 1.28 lakh people in a period of 11 days, of which over 50000 people visited on a weekend (Nov 10 and 11)(ndtv, 2018)
STATEMENT OF THE PROBLEM The Statue of Unity has been one of the most debated topics ever since the inception of the idea in 2010. The opposition has not come down ever since. There have been repeated advertisements of this statue since October 2018. It is clearly evident from these advertisements that their objective is not just to promote tourism but also justify the initiative itself. This study intends to check the effectiveness of these advertisements.
OBJECTIVES OF THE STUDY To know how many people have watched the advertisement
To know the level of awareness of the people towards the statue of unity
To know the influence of advertisement on the level of awareness among the people
To know the difference in opinion based on the number of times the advertisement id viewed
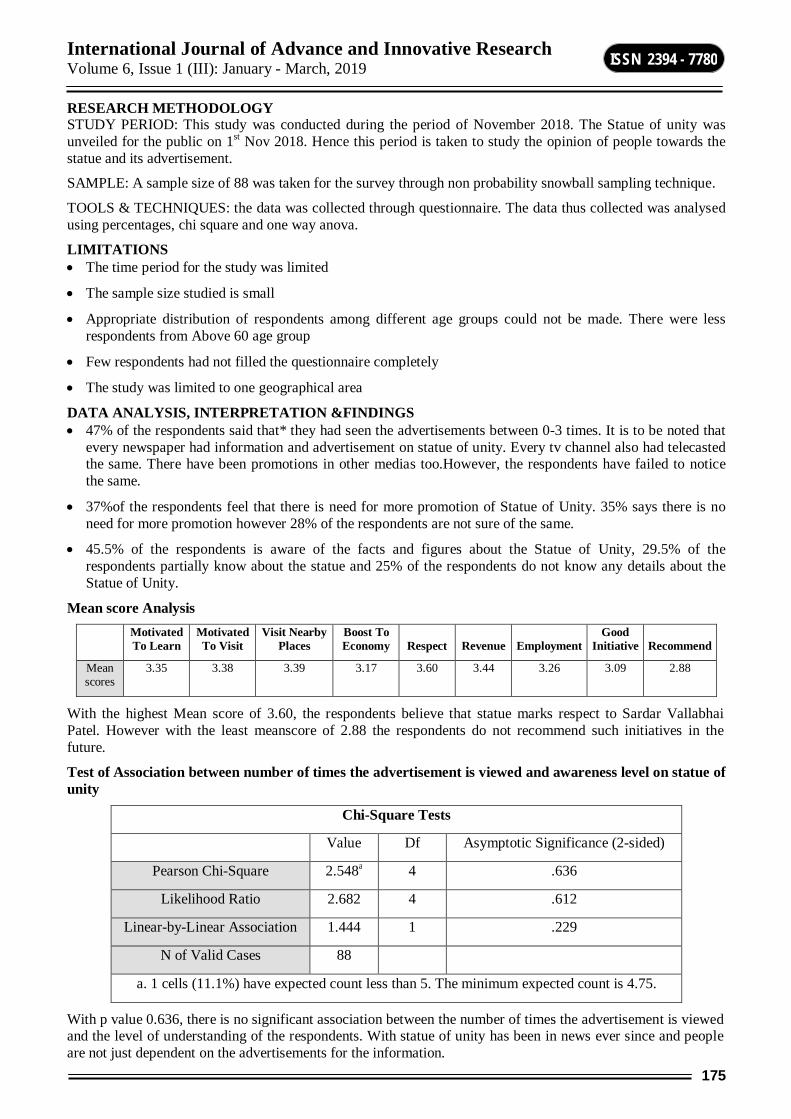
International Journal of Advance and Innovative Research Volume 6, Issue 1 (III): January - March, 2019
175
ISSN 2394 - 7780
RESEARCH METHODOLOGY STUDY PERIOD: This study was conducted during the period of November 2018. The Statue of unity was unveiled for the public on 1st Nov 2018. Hence this period is taken to study the opinion of people towards the statue and its advertisement.
SAMPLE: A sample size of 88 was taken for the survey through non probability snowball sampling technique.
TOOLS & TECHNIQUES: the data was collected through questionnaire. The data thus collected was analysed using percentages, chi square and one way anova.
LIMITATIONS The time period for the study was limited
The sample size studied is small
Appropriate distribution of respondents among different age groups could not be made. There were less respondents from Above 60 age group
Few respondents had not filled the questionnaire completely
The study was limited to one geographical area
DATA ANALYSIS, INTERPRETATION &FINDINGS 47% of the respondents said that* they had seen the advertisements between 0-3 times. It is to be noted that
every newspaper had information and advertisement on statue of unity. Every tv channel also had telecasted the same. There have been promotions in other medias too.However, the respondents have failed to notice the same.
37%of the respondents feel that there is need for more promotion of Statue of Unity. 35% says there is no need for more promotion however 28% of the respondents are not sure of the same.
45.5% of the respondents is aware of the facts and figures about the Statue of Unity, 29.5% of the respondents partially know about the statue and 25% of the respondents do not know any details about the Statue of Unity.
Mean score Analysis
Motivated To Learn
Motivated To Visit
Visit Nearby Places
Boost To Economy Respect Revenue Employment
Good Initiative Recommend
Mean scores
3.35 3.38 3.39 3.17 3.60 3.44 3.26 3.09 2.88
With the highest Mean score of 3.60, the respondents believe that statue marks respect to Sardar Vallabhai Patel. However with the least meanscore of 2.88 the respondents do not recommend such initiatives in the future.
Test of Association between number of times the advertisement is viewed and awareness level on statue of unity
Chi-Square Tests
Value Df Asymptotic Significance (2-sided)
Pearson Chi-Square 2.548a 4 .636
Likelihood Ratio 2.682 4 .612
Linear-by-Linear Association 1.444 1 .229
N of Valid Cases 88
a. 1 cells (11.1%) have expected count less than 5. The minimum expected count is 4.75.
With p value 0.636, there is no significant association between the number of times the advertisement is viewed and the level of understanding of the respondents. With statue of unity has been in news ever since and people are not just dependent on the advertisements for the information.

International Journal of Advance and Innovative Research Volume 6, Issue 1 (III): January - March, 2019
176
ISSN 2394 - 7780
Test of difference between number of times advertisement is viewed and opinion about the initiative
ANOVA Sum of Squares df Mean Square F Sig.
Visitnearbyplaces Between Groups 24.574 2 12.287 7.340 .001 Within Groups 142.289 85 1.674
Total 166.864 87 Motivatedtolearn Between Groups 5.310 2 2.655 1.387 .256
Within Groups 162.769 85 1.915 Total 168.080 87
Motivatedtovisit Between Groups 23.782 2 11.891 7.176 .001 Within Groups 140.843 85 1.657
Total 164.625 87 Boosttoeconomy Between Groups 3.046 2 1.523 .683 .508
Within Groups 189.397 85 2.228 Total 192.443 87
Respect Between Groups 17.488 2 8.744 4.048 .021 Within Groups 183.592 85 2.160
Total 201.080 87 Revenue Between Groups 9.754 2 4.877 2.559 .083
Within Groups 161.962 85 1.905 Total 171.716 87
Employment Between Groups 26.500 2 13.250 7.795 .001 Within Groups 144.489 85 1.700
Total 170.989 87 Good initiative Between Groups 17.228 2 8.614 4.022 .021
Within Groups 182.044 85 2.142 Total 199.273 87
Further Recommendation
Between Groups 6.309 2 3.155 1.359 .262 Within Groups 197.316 85 2.321
Total 203.625 87
From the above table, we can conclude that there is a significant difference of number of times the advertisement is viewed on the dimension of visiting the statue of unity and the nearby places, on the dimension that marks respect to Sardar Vallabhai Patel, on the dimension that it provides employment and the dimension that it is a good initiative.
CONCLUSION Since there is no significant association between the number of times the ad is seen and the knowledge of the people on the statue of unity. This shows that people do not depend on the advertisements to know about it. Though majority of the respondents agree it marks respect to Sardar Vallabhai Patel, people do not recommend more of such initiatives in the country. This shows that the ads have not been able to convince people enough to accept the initiative whole heartedly.
SUGGESTION A brand ambassador may increase the effectiveness of the advertisements. In Indian market, the celebrity endorsers become opinion makers. Hence it helps people to remember the ad better.
BIBLIOGRAPHY ndtv. (2018, November 12). Retrieved November 18, 2018, from https://www.ndtv.com/india-news/in-11-
days-over-1-28-lakh-tourists-visit-statue-of-unity-1945761
Content Marketing Institute. (n.d.). Retrieved November 16, 2018, from https://contentmarketinginstitute.com/ what-is-content-marketing/
wikipedia. (n.d.). Retrieved November 16, 2018, from https://en.wikipedia.org/wiki/Statue_of_Unity
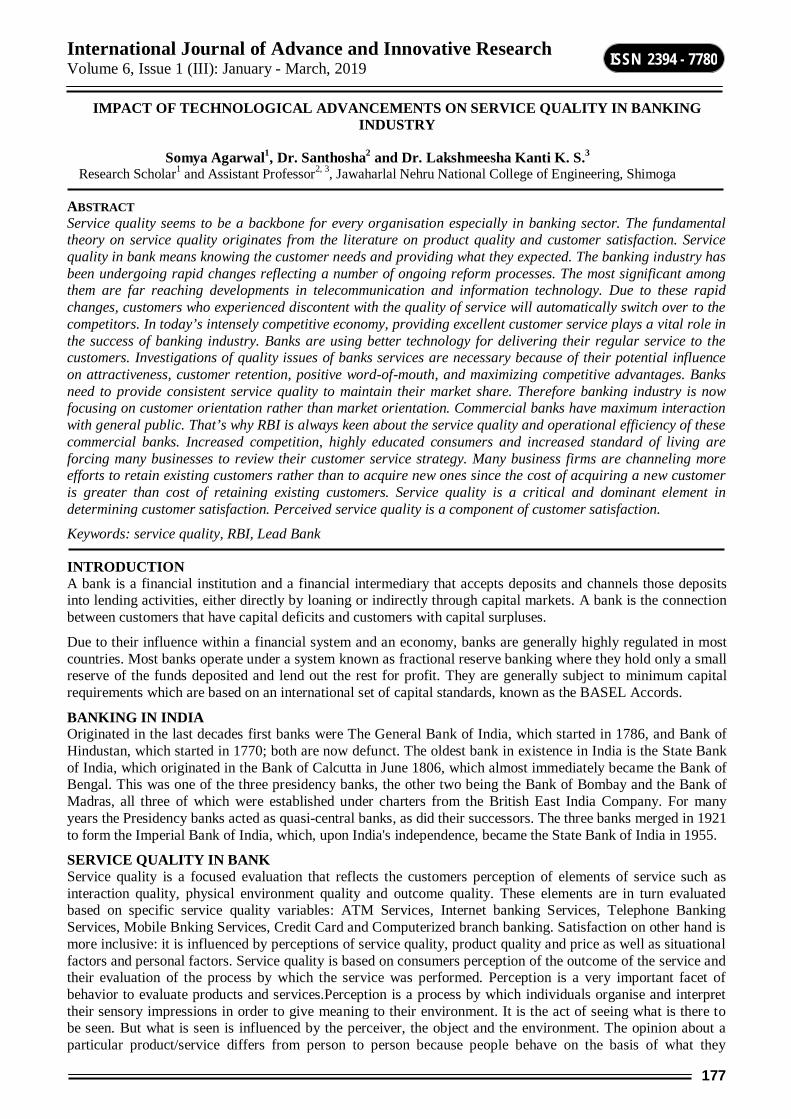
International Journal of Advance and Innovative Research Volume 6, Issue 1 (III): January - March, 2019
177
ISSN 2394 - 7780
IMPACT OF TECHNOLOGICAL ADVANCEMENTS ON SERVICE QUALITY IN BANKING INDUSTRY
Somya Agarwal1, Dr. Santhosha2 and Dr. Lakshmeesha Kanti K. S.3 Research Scholar1 and Assistant Professor2, 3, Jawaharlal Nehru National College of Engineering, Shimoga
ABSTRACT Service quality seems to be a backbone for every organisation especially in banking sector. The fundamental theory on service quality originates from the literature on product quality and customer satisfaction. Service quality in bank means knowing the customer needs and providing what they expected. The banking industry has been undergoing rapid changes reflecting a number of ongoing reform processes. The most significant among them are far reaching developments in telecommunication and information technology. Due to these rapid changes, customers who experienced discontent with the quality of service will automatically switch over to the competitors. In today’s intensely competitive economy, providing excellent customer service plays a vital role in the success of banking industry. Banks are using better technology for delivering their regular service to the customers. Investigations of quality issues of banks services are necessary because of their potential influence on attractiveness, customer retention, positive word-of-mouth, and maximizing competitive advantages. Banks need to provide consistent service quality to maintain their market share. Therefore banking industry is now focusing on customer orientation rather than market orientation. Commercial banks have maximum interaction with general public. That’s why RBI is always keen about the service quality and operational efficiency of these commercial banks. Increased competition, highly educated consumers and increased standard of living are forcing many businesses to review their customer service strategy. Many business firms are channeling more efforts to retain existing customers rather than to acquire new ones since the cost of acquiring a new customer is greater than cost of retaining existing customers. Service quality is a critical and dominant element in determining customer satisfaction. Perceived service quality is a component of customer satisfaction.
Keywords: service quality, RBI, Lead Bank
INTRODUCTION A bank is a financial institution and a financial intermediary that accepts deposits and channels those deposits into lending activities, either directly by loaning or indirectly through capital markets. A bank is the connection between customers that have capital deficits and customers with capital surpluses.
Due to their influence within a financial system and an economy, banks are generally highly regulated in most countries. Most banks operate under a system known as fractional reserve banking where they hold only a small reserve of the funds deposited and lend out the rest for profit. They are generally subject to minimum capital requirements which are based on an international set of capital standards, known as the BASEL Accords.
BANKING IN INDIA Originated in the last decades first banks were The General Bank of India, which started in 1786, and Bank of Hindustan, which started in 1770; both are now defunct. The oldest bank in existence in India is the State Bank of India, which originated in the Bank of Calcutta in June 1806, which almost immediately became the Bank of Bengal. This was one of the three presidency banks, the other two being the Bank of Bombay and the Bank of Madras, all three of which were established under charters from the British East India Company. For many years the Presidency banks acted as quasi-central banks, as did their successors. The three banks merged in 1921 to form the Imperial Bank of India, which, upon India's independence, became the State Bank of India in 1955.
SERVICE QUALITY IN BANK Service quality is a focused evaluation that reflects the customers perception of elements of service such as interaction quality, physical environment quality and outcome quality. These elements are in turn evaluated based on specific service quality variables: ATM Services, Internet banking Services, Telephone Banking Services, Mobile Bnking Services, Credit Card and Computerized branch banking. Satisfaction on other hand is more inclusive: it is influenced by perceptions of service quality, product quality and price as well as situational factors and personal factors. Service quality is based on consumers perception of the outcome of the service and their evaluation of the process by which the service was performed. Perception is a very important facet of behavior to evaluate products and services.Perception is a process by which individuals organise and interpret their sensory impressions in order to give meaning to their environment. It is the act of seeing what is there to be seen. But what is seen is influenced by the perceiver, the object and the environment. The opinion about a particular product/service differs from person to person because people behave on the basis of what they
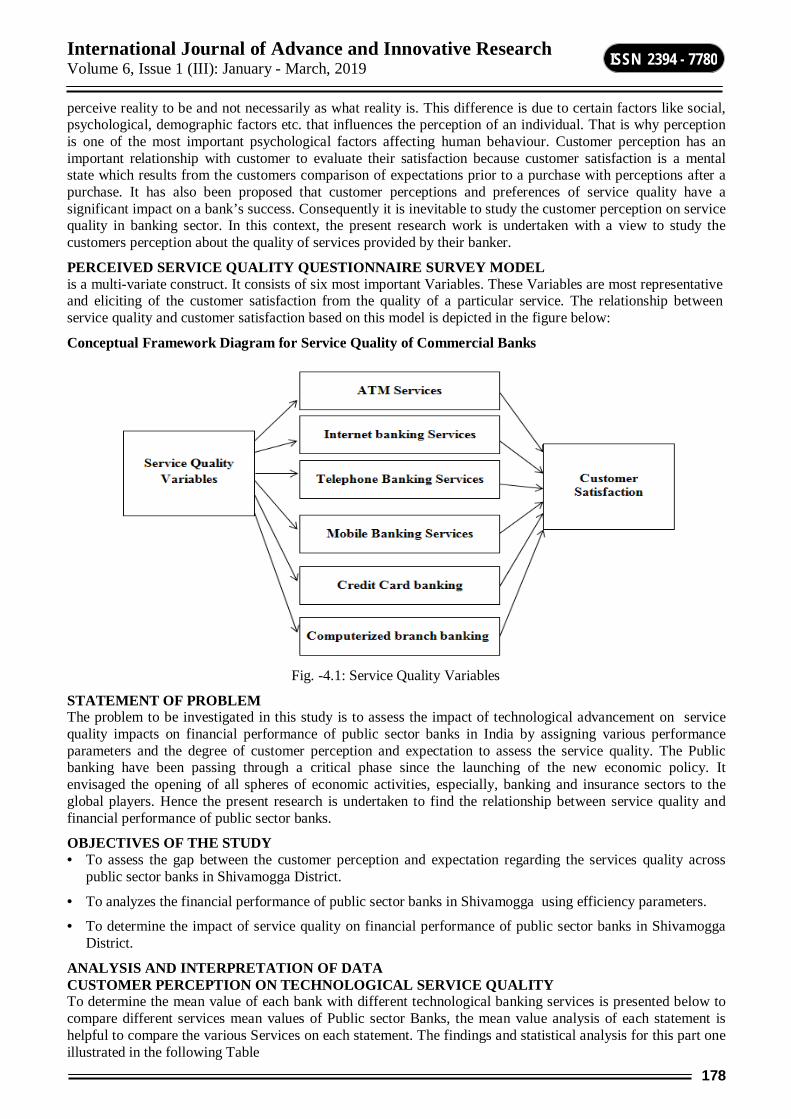
International Journal of Advance and Innovative Research Volume 6, Issue 1 (III): January - March, 2019
178
ISSN 2394 - 7780
perceive reality to be and not necessarily as what reality is. This difference is due to certain factors like social, psychological, demographic factors etc. that influences the perception of an individual. That is why perception is one of the most important psychological factors affecting human behaviour. Customer perception has an important relationship with customer to evaluate their satisfaction because customer satisfaction is a mental state which results from the customers comparison of expectations prior to a purchase with perceptions after a purchase. It has also been proposed that customer perceptions and preferences of service quality have a significant impact on a bank’s success. Consequently it is inevitable to study the customer perception on service quality in banking sector. In this context, the present research work is undertaken with a view to study the customers perception about the quality of services provided by their banker.
PERCEIVED SERVICE QUALITY QUESTIONNAIRE SURVEY MODEL is a multi-variate construct. It consists of six most important Variables. These Variables are most representative and eliciting of the customer satisfaction from the quality of a particular service. The relationship between service quality and customer satisfaction based on this model is depicted in the figure below:
Conceptual Framework Diagram for Service Quality of Commercial Banks
Fig. -4.1: Service Quality Variables
STATEMENT OF PROBLEM The problem to be investigated in this study is to assess the impact of technological advancement on service quality impacts on financial performance of public sector banks in India by assigning various performance parameters and the degree of customer perception and expectation to assess the service quality. The Public banking have been passing through a critical phase since the launching of the new economic policy. It envisaged the opening of all spheres of economic activities, especially, banking and insurance sectors to the global players. Hence the present research is undertaken to find the relationship between service quality and financial performance of public sector banks.
OBJECTIVES OF THE STUDY • To assess the gap between the customer perception and expectation regarding the services quality across
public sector banks in Shivamogga District.
• To analyzes the financial performance of public sector banks in Shivamogga using efficiency parameters.
• To determine the impact of service quality on financial performance of public sector banks in Shivamogga District.
ANALYSIS AND INTERPRETATION OF DATA CUSTOMER PERCEPTION ON TECHNOLOGICAL SERVICE QUALITY To determine the mean value of each bank with different technological banking services is presented below to compare different services mean values of Public sector Banks, the mean value analysis of each statement is helpful to compare the various Services on each statement. The findings and statistical analysis for this part one illustrated in the following Table
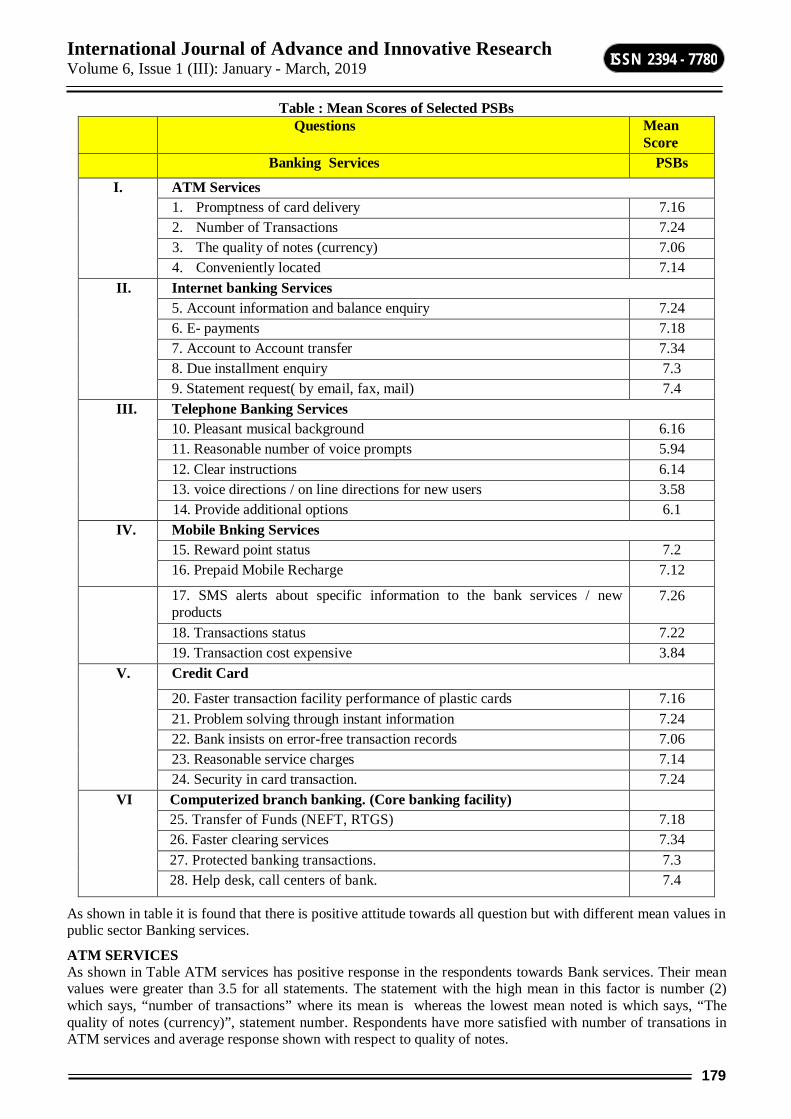
International Journal of Advance and Innovative Research Volume 6, Issue 1 (III): January - March, 2019
179
ISSN 2394 - 7780
Table : Mean Scores of Selected PSBs Questions Mean
Score Banking Services PSBs
I. ATM Services 1. Promptness of card delivery 7.16 2. Number of Transactions 7.24 3. The quality of notes (currency) 7.06 4. Conveniently located 7.14
II. Internet banking Services 5. Account information and balance enquiry 7.24 6. E- payments 7.18 7. Account to Account transfer 7.34 8. Due installment enquiry 7.3 9. Statement request( by email, fax, mail) 7.4
III. Telephone Banking Services 10. Pleasant musical background 6.16 11. Reasonable number of voice prompts 5.94 12. Clear instructions 6.14 13. voice directions / on line directions for new users 3.58
14. Provide additional options 6.1 IV. Mobile Bnking Services
15. Reward point status 7.2 16. Prepaid Mobile Recharge 7.12
17. SMS alerts about specific information to the bank services / new products
7.26
18. Transactions status 7.22 19. Transaction cost expensive 3.84
V. Credit Card
20. Faster transaction facility performance of plastic cards 7.16 21. Problem solving through instant information 7.24 22. Bank insists on error-free transaction records 7.06 23. Reasonable service charges 7.14 24. Security in card transaction. 7.24
VI Computerized branch banking. (Core banking facility) 25. Transfer of Funds (NEFT, RTGS) 7.18 26. Faster clearing services 7.34 27. Protected banking transactions. 7.3 28. Help desk, call centers of bank. 7.4
As shown in table it is found that there is positive attitude towards all question but with different mean values in public sector Banking services.
ATM SERVICES As shown in Table ATM services has positive response in the respondents towards Bank services. Their mean values were greater than 3.5 for all statements. The statement with the high mean in this factor is number (2) which says, “number of transactions” where its mean is whereas the lowest mean noted is which says, “The quality of notes (currency)”, statement number. Respondents have more satisfied with number of transations in ATM services and average response shown with respect to quality of notes.
International Journal of Advance and Innovative Research Volume 6, Issue 1 (III): January - March, 2019
180
ISSN 2394 - 7780
INTERNET BANKING SERVICES As shown in Table there exist a positive attitude in the respondents towards the internet banking services because their means are greater.The statement with the high mean in this factor is number which says, “Statement request”. The mean value of banks being , which indicate statement request facility is more useful to the respondents and bank provide the same to the respondent with convenient manner. Whereas the lowest mean was in statement number , it has to improving in this respective statement.
TELEPHONE BANKING SERVICES As shown in Table, in the factor telephone banking services, there exists a volatile attitude in the respondents towards different varialble in telephone banking services as mean score between statements varied.The statement with the highest mean in this factor is number (10) which says, “Pleasant musical background”. Its mean is in Public Sector Banks.Whereas the lowest mean of is in case of statement number which said “voice directions / on line directions for new users”. In this bank need to improvised to strong this variable.
MOBILE BANKING SERVICES As shown in Table there exists a positive attitude in the respondents towards first for statements as mean score more than but fifth variable shows the lowest mean score in all the questions under this factor.
CREDIT CARD As shown in Table there exists a positive attitude in the respondents towards credit card services as mean score more than 3.5 in all statement in this respective services. The statement with the high mean in this factor is number which says, “Problem solving through instant information and Security in card transaction”. Where the mean values is.Whereas the lowest mean was in statement number 24 which said “Bank insists on error-free transaction records”.
COMPUTERIZED BRANCH BANKING (CORE BANKING FACILITY) As shown in Table there exists a positive attitude in the respondents towards Core banking facility as mean score more than 3.5. The statement with the high mean in this service is number 28 which says, “Help desk, call centers of bank.” where its mean has reached , which indicate bank has proper Help desk service which satisfied customer requirement. Whereas the lowest mean is , statement number 19 which said, “Transfer of Funds (NEFT, RTGS)”, need to concentrate to improve the same.
FINDINGS OF THE STUDY 1. Number of ATMs for one lakh customer which are in actual number it is converted into decimal to retain the
relative number and the hypothesis testing among all the financial variables witnessed the positive correlation except Profit per Employee (In Crores), Spread per Branch (In Crores), Spread per Employee (In Crores) which indicates that more and more ATMs will affect the labor force of banks.
2. Number of credit cards for one lakh customers which are in actual number it is converted into decimal to retain the relative number and the hypothesis testing among all the financial variables witnessed the positive correlation except Profit per Employee (In Crores), Spread per Branch (In Crores), Spread per Employee (In Crores) which indicates that the volume of credit cards generated by the banks will affect the normal banking system in bringing down the bank officials day to day tasks.
3. Number of Computerized braches on percentage of total branches which are in actual number it is converted into decimal to retain the relative number and the hypothesis testing among all the financial variables witnessed the positive correlation except Profit per Branch (in crores), Profit per Employee (In Crores) Spread per Branch (In Crores), Operating Profit (In Crores) which can be understand profit for traditional banks will be decreased if it emphasis on the computer based branches.
4. Number of Tele banking as a percentage of total branches which are in actual number it is converted into decimal to retain the relative number which indicated the negative correlation among the all variables which indicated that the banks which are selected for the study failed to reap the benefits of tele banking services.
Hence, Null hypothesis is rejected because majority of information technology and financial performance factors come under the p value of 0.05. It means that there is positive relationship between Information Technology enabled products and financial variables.
CONCLUSION The analysis and interpretation done using various statistical tools in SPSS 16.0 version and SEM are calculated. As the broad objective of the present study is to find out whether the select financial parameters are aligned with technological index or not, the study results clearly revealed that there is significant relationship
International Journal of Advance and Innovative Research Volume 6, Issue 1 (III): January - March, 2019
181
ISSN 2394 - 7780
between all the technological index and customer perception. Another important objective of the present study was to test the conceptual model developed by the researcher.
The model is found to be fit, which tells that service related factors contributing to technical index customer satisfaction and eventually lead to better financial performance. As a result services satisfaction and to improve financial performance, thus achieving overall excellence.
REFERENCE Dubhashi P.R. (1969) – Cooperation – An Interdisciplinary Approach”. Edited by Dubhashi P.R., Director,
Published by Vaikunta Meheta National Institute of Cooperative and Management (UMNICOM), Pune-1969.
Datar D.R. (1969) – Place of Cooperation in India‟s Economy”. Paper presented at Vaikunta Meheta National Institute of Cooperative Management Approach”
Batra M.L. (1972) – “Forms of Assistance to Cooperative”. Bombay Allied Publications.
Dubhashi P.R, (1972) – “State and Cooperative Development An overview” – International Cooperative alliance. Bombay Allied Publishers.
Fujisawa k. (1972) – “The concept of Autonomy as applied to the Cooperative Movement in Developing Countries”- Bombay Alllied Publications.
Deshpande S.H. (1977) – “Some Problems of Cooperative Forming” – Bombay Himalaya Publishing House.
International Journal of Advance and Innovative Research Volume 6, Issue 1 (III): January - March, 2019
182
ISSN 2394 - 7780
THE IMPACT OF BIG DATA AND PAID SEARCH IN THE VIRTUAL MARKET
Arunkumar M.S1 and Srihari S. V2 Lecturer2, NES Institute of Advanced Studies, Shivamogga
Guest Faculty1, GFGC, Holehonnur, Shivamogga
ABSTRACT The collection of data and maintain of data base is the major aspect of business in every market. Virtual market is the one place, where all the demographic people are easily available and their behavior can be easily understood by some of the techniques available in the analytics tool. The data collection is the major task in the present scenario. The data collection can be done through different forms of data mining and promoting the products or services in the digital platform in many forms.Cloud computing also plays a vital role in data collection, database management and data retrieval. This paper deals with the impact of big data in the virtual market, with respect to Data collection, Data base management and Data Security, and its opportunities; it aids to understand the preferences of all the demographic and geographic people.
To collect the big data and to reach the mass audience, paid search also plays a vital role. Even though, 70% - 80% of the people depend on organic search, to create traffic in the network, paid search is very important and its gives a path to increase the traffic through organic search in the later part. This paper clearly describes how the big data and paid search are going to make an impact on the service providers and the business people in the virtual market.
Keywords: Big Data, Paid Search, Database Management, Data Privacy, Data Mining, Cloud computing
INTRODUCTION The term Big Data refers to collection of all variety of large volume data that includes both structured and unstructured data. Proper collection of data provides the scope for a proper analysis of the data which gives a great insight over the data helps to take the strategic decisions in every field. The current world is based on how we deal with the data. In the olden days, the data is of only numeric and alphabetic and now it is of lot of varieties like audio, video, stock ticker and many more. Security and privacy is also maintained for all the variety of data. Many tools and techniques are available to maintain the copyrights and to prove the originality of the data. Nowadays, the data is received from various sources that contain all the types of data with lot of complexities. The speed of storing and retrieval of data from databases also plays a vital role in data collection. The data collection is used in all the areas in the world.
The big data not only deals with data collection from various sources, the main objective of data collection is to reduce the cost, to enhance the business, to reduce the usage of time, to make strategic decision and helps to analyze the behavior of all the demographics and geographies. The best used terminology to collect the data in the present scenario is data mining. Data mining includes all the forms of data collection. The big data can be collected or achieved over the organic search or paid search in the virtual market and in the initial stages, organic search does not provide traffic and paid search is the only option to make our site appear in the top search results. It also provide the option to make the analysis of the visitors of ads displayed through paid search option and helps to take strategic decision over the nature of different demographics and geographies.
DATA COLLECTION The first phase of the paper deals with data collection that is data mining. Data mining includes all forms of data collection. Data mining is the process of getting insight of new knowledge through various methods. It is the process that targets the required data among the bunch of data. Targeted data is preprocessed and transformed in to several patterns and this process is called data mining. After formation of patterns, those are interpreted and the outcome is the knowledge. Data mining is done in both ethical and unethical form. Unethical form of data collection is also called as unethical hacking. Data can be hacked while transferring of data in the network. Data can also be hacked on the browser and webpage also. Many times, the hacked data are sold for the needy people for the good price. The ethical way of data mining is collection the information from the information providers by seeking their permission.
The main purpose of data mining is done to understand the behavior of customer in the virtual market. What type of products and services they prefer and how many times they search for the similar products and so on. Usually data mining is done through the web analytics.If the web analytics has to be used in an optimum manner, then more number of users and traffic need to be generated. In the initial stages, it is very difficult to do so. To achieve this objective, paid search plays a vital role, through that process, more traffic can be generated.
International Journal of Advance and Innovative Research Volume 6, Issue 1 (III): January - March, 2019
183
ISSN 2394 - 7780
The top used social media networks like, Facebook, twitter, YouTube etc…also provides this platform called paid search to enhance the traffic.
Data Mining is also a part of Big Data analytics that gives an insight over the nature of viewers of website or product or services in the virtual platform. Big Data Analytics comprises of various technologies like, Data Mining, Hadoop, Text Mining and Predictive Analytics. The major benefits of Big Data Analytics are it is mainly implemented in large scale industries like E – Commerce, Education sector, Health sector, Tourism industry etc… these are the major areas, where many audience visit the site in the virtual market. Based on their frequency of visits, the nature of consumer can easily understand and analyzed. This makes the service provider to take strategic decision and helps to analyzed the future trends in the market.
Advertisements in the social media networks and other sites are created a virtual world to create the awareness among the people. And nowadays, based on the Big Data, Push Notifications marketing tool can be implemented in the virtual platform. Push notifications are the most efficient type of marketing tool and many people are attracted to it. Web based and mobile based push notifications are the popular tools to create the awareness among the people. The success of push notification is based on big data.
DATA STORAGE AND RETRIEVAL Data Base Management Systems is the one concept provides the platform for data storage and data retrieval. Most of the parameters need to be considered while creating the data base.
To create the data base, there should be good knowledge about static and dynamic data. The vulnerability of the data may leads to major changes in the data base structure, increase of cost and wastage of time. There should be given equal importance for unstructured data along with the structured data. For the efficiency of data base, the redundancy of the data needs to be avoided. And the best thing is to have the best back up plan in the storage system. The best strategy to store and maintain the data is in cloud computing. Cloud computing is the web services to store the same data in multiple servers with high security and having high privacy. The present world is based on the cloud computing. Public cloud, private cloud and hybrid cloud are the three forms of cloud computing available in the market and based on the users’ requirement, the above mentioned forms are preferred. Cost reduction, speed of data retrieval, productivity, performance and availability to large scale of audience are the major benefits of cloud computing.
According to Statista, the Statistical Portal, there were 2.4 billion consumers of cloud computing services in the worldwide in 2013 and there is an increase of 50% consumers in 2018 that is increased to 3.6 billion. Within a span of 5 years, there is a major increase in this sector. This indicates that many users are moving towards, that type of services. By 2021, the market revenue is forecast to exceed 278.3 billion U.S. dollars. So dependency over this type of services also increases in the coming years.
The maintenance of big data virtually is the complex scenario. One should have a proper knowledge over Hierarchical databases, Network databases, Relational databases and Object-oriented databases. A good programmer deals with all these issues and can provide better service related to storage and retrieval of data.
SECURITY AND PRIVACY: There is a threat while transferring of data in the network, related to security, many measures will be taken while transferring of data in the network like, and they work over security issues in their network systems that are with respect to security in data, security related to transport issues and security related to network issues. And these are automated in nature and even though there is a security over the above mentioned issues, there is a huge threat over the data in the network that threat can be avoided by using the most accepted tool in the world is encryption.
According to Top Ten Reviews, the most secured encryption types are • AES • 3DES • Twofish • RSA With respect to the websites security, the https sites are the secured sites, than http sites.Https is prolonged as Hyper Test Markup Language Secured. This is a secured line to transfer of data.Https is a secured line and converts every bit of data into 256 bits of data and it is very difficultto decrypt the encrypted code.
Phishing, fraudsters operators, counterfeit/fake website are the major types of security threats, related to website service providers and one should be very careful related to their terms of service and security related policy. As the security maintains, it leads to privacy also. Privacy of data is based on the service provider, in the secured

International Journal of Advance and Innovative Research Volume 6, Issue 1 (III): January - March, 2019
184
ISSN 2394 - 7780
lines, the data will be secured and only way of leaks of data is with respect to service providers. Their privacy policy over the data and measures what they take against data downloads should be strong and adhere over it.
PAID SEARCH All the above mentioned concepts work when there is a traffic generated sites, or platform. This can be done through organic search and paid search. Organic search takes lot of time to reach the required number of traffic and many times it ends up with failure also. To avoid these drawbacks, and to remind the viewers about our existence, the paid search is the only tool and it is also used to advertise in the internet through some of the search engines and social networks. It also helps in making the analytics over the published ads. The paid search provide platform to understand the nature of different demographics and geography people. This is the ethical tool one can adopt to improve their virtual existence. Almost 80% of the total Population depends on Google and Google Ad ‘Words is the service provided by the Google in paid search platform and it is contribution over 70% of Google revenue. Google Ad words make the site to appear in the top search results.
CONCLUSION The current world is moving based on data; the economy of the country is also based on how we deal with data. Many people purchase the data to enhance their service and to generate good business. Data collection, Data management with security is the key parameter to sustain in this virtual market. The above parameters can be achieved through traffic generation. Paid search is the only option to generate the traffic in the initial stages and within a less period of time. This paid search option is also used to remind our existence in the virtual market.
BIBLIOGRAPHY 1. “Big Data”, SAS The Power to Know, Literature Available at URL: https://www.sas.com/en_us/
insights/big-data/what-is-big-data.html
2. “Big Data: Survey, Technologies, Opportunities, and Challenges”, The Scientific World Journal Volume 2014, Literature Available at URL: https://www.hindawi.com/journals/tswj/2014/712826/
3. Margaret Rouse, “Data Mining”, Updated on March 2017, (Blog), Literature Available at URL: https://searchsqlserver.techtarget.com/definition/data-mining
4. “Big Data Analytics”, EDUCBA, Literature Available at URL: https://www.educba.com/what-is-big-data-analytics/
5. “Push Notifications Explained:, Urban Airship, Literature Available at URL: https://www.urbanairship.com/push-notifications-explained
6. Jennifer Lon off Schiff, “14 Things You Need to Know About Data Storage Management”, Updated on 11 – 09 – 2013, (Blog), Literature Available at URL: https://www.cio.com/article/2382585/virtualization/14-things-you-need-to-know-about-data-storage-management.html
7. “What is cloud computing? A beginner’s guide”, Microsoft Azure, Literature Available at URL: https://azure.microsoft.com/en-in/overview/what-is-cloud-computing/
8. Arjun Pan war, “Types of Database Management Systems”, Updated on 22 – 05 – 2017, (Blog), Literature Available at URL: https://www.c-sharpcorner.com/UploadFile/65fc13/types-of-database-management-systems/
9. “Which Types of Encryption are Most Secure?”, Top Ten Reviews, Literature Available at URL: https://www.toptenreviews.com/software/articles/secure-encryption-methods/
10. “What is HTTPS?”, Instant SSL by COMODO Certification Authority, Literature Available at URL: https://www.instantssl.com/ssl-certificate-products/https.html
11. “Privacy Policy”, Bankers bliss, Literature Available at URL: https://bbankersbliss.com/policy
12. Ramona Suk raj, “What Is the Difference Between Organic Search vs Paid Search in 2018”, Published on 20 – 04 – 2017, (Blog), Literature Available at URL: https://www.impactbnd.com/blog/organic-search-vs-paid-search
International Journal of Advance and Innovative Research Volume 6, Issue 1 (III): January - March, 2019
185
ISSN 2394 - 7780
IMPACT OF DIGITAL MARKETING ON BRAND MANAGEMENT
Chandan U. A and Mala V Lecturer, NES Institute of Advanced Studies, JNNCE Campus, Shimoga
ABSTRACT Social media is an online media, where the users can easily participate, share and create any content such as banner, posters, videos and advertisement. Many companies use these social media as a tool to promote their products and make customers aware with their brand. On the other hand, not all companies succeed to market their products and make their products are at their customer’s awareness. The purpose of this study is to examine how social media can be used for branding purposes and find the impact of social media on the brand image. It is important to know how significantly social media activities may affect brand equity and brand image, so companies can allocate to it accordingly. The result of this study is to show that marketing communication in a company has an impact on company’s brand awareness.
Keywords: social media, branding and brand image, brand awareness.
INTRODUCTION Meaning of Brand, Branding and Brand marketing A brand is the idea or image of specific product or service that consumers connect with, by identifying the name, logo, slogan or design of the company who owns the idea or image. It reflects a company’s identity. Branding is the concept of fixing a brand to the product or is a set of marketing and communication methods that help to distinguish a company or products from competitors, aiming to create a lasting impression in the minds of customers. Brand marketing is the theory and tactics to make a strong brand. The theory of brand marketing involves brand awareness. Brand marketing is an approach to communications, sales, product, and service that grows the asset of brand equity.
Features of Branding Targetability: Branding should be planned according to the targeted audience. No business firm can target
the entire population. Business owners should identify the type of people who are buying their products and services
Awareness: Brand awareness shows the mass of population who are aware of a particular brand. Loyalty: Brand loyalty is the highest achievement or apex of any company. A customer who buys the
product of a particular company extensively is known as a brand loyalist. Consistency: consistency in Brand management is very essential to make the customers addict to a
particular brand and retain them for a long time. Digital marketing Digital marketing is a form of marketing that exists online, which means promotion of products or brands via one or more forms of electronic media such as internet, social media, mobile phones etc. It is one of the tactics and channels used by the companies to connect with customers where they spend much of their time. It is in fact, internet usage among adults increased by 5% in just last three years, which results in increase of digital marketing.
Digital marketing as part of Brand image perception Digital marketing in the era of internet and digital revolution is an important tool for the development of modern organization. Digital marketing today is more than just an advertising.
For the marketer, the digital way is most important way for direct interaction with customers.
OBJECTIVES OF THE STUDY To understand Brand Marketing To identify the challenges of company brands in traditional Marketing. To study the opportunities of Brand marketing in social media. To study the impact of Digital marketing on brand marketing. SCOPE The study is undertaken to understand the impact of digital marketing on Brand marketing and the challenges and opportunities available.
International Journal of Advance and Innovative Research Volume 6, Issue 1 (III): January - March, 2019
186
ISSN 2394 - 7780
METHODOLOGY The study is conducted purely on the basis of secondary data which is collected from various books, websites, journals and research papers.
In the modern world, media and digital marketing is an instrument on correspondence, similar to a daily paper or a radio, so social networking would be a social instrument of communication. Social media or networking is turning into an indispensable part of life, online as social sites and applications are receiving more and more attention by the people every day. Most conventional online media incorporate social parts, for example, remark fields for clients. In business, social networking is utilized to market items, especially advanced brand products.
In a battle for supremacy, traditional marketing is falling further and further behind. But that doesn’t mean that it’s down and out. The business still needs real world promotions to succeed. The trick is to spend more on social marketing, now that it’s been proven to be more effective now days.
TRADITIONAL MARKETING Traditional marketing refers to those old media that existed before the advent of the internet. Over the years traditional advertising channels have been used in promotions, marketers have used traditional forms of marketing such as, sales promotion, media advertising, public relations and direct marketing to encourage prospects to take action or persuade existing customers to continue buying their products/ services. This has been done with an aim of increasing sales through branding. In fact, according to Jaffe, these traditional advertising channels are dead but not buried. This because some of these traditional channels are still effective and this argument is supported by Calde et al.
CHALLENGES OF TRADITIONAL MARKETING IN BRAND MANAGEMENT Identifying the right technologies: In traditional marketing for the companies it was very difficult to
market and manage their Brands because of lack of right and proper technology.
Managing the website: as the companies were not updated in online market of their brand, some time it was difficult for them to manage the website.
Brand positioning: company should think well in advance regarding the offerings and the image to occupy a distinct place in the mind of targeted market. This will create a bond between customer and business, which will have long term impact on the survival of the company.
Training the team: proper training should be provided as per the new technology to the employees which intern will help the company to create awareness regarding the brand at the right time to the ultimate consumers.
SOCIAL MEDIA Social media has gained a lot of popularity over the past few years and as a result of this popularity, other traditional Media have experienced decline in both business and popularity. Palmer and Lewis (2009) argued that the main stream media channels have faced many challenges in recent times that have led to closure with TV facing down turn in their profits levels. Palmer and Lewis are correlating the performance of these traditional channels to the rise of social media in marketing and brand management. As a result of completion and tough economic environment, companies have tightened their budgets especially advertising budgets which have shifted to online channels.
ADVANTAGES OF DIGITAL MARKETING OVER TRADITIONAL MARKETING Low cost: Marketing and advertising cost is one of the biggest financial burdens that businesses have to bear
and that is difficult for small business. Hence Marketing via digital platforms offers a more affordable alternative to the traditional method. They create as much impact yet costing way less.
Huge return on investment: Nothing matters more to a business than the return on the investment it makes. Digital marketing offers a substantial return especially for small investments.
Easy to measure: The success or otherwise of a digital campaign can easily be ascertained. Compared to traditional method where you have to wait weeks or months to evaluate the veracity of a campaign of a company brand, with a digital campaign you can know almost immediately how an brand is performing.
Brand development: Businesses can use their digital platforms to build their company’s brand and reputation more effectively than traditional way. A well-developed website, a blog featuring quality and useful articles, a social media channel that is highly interactive are some of the ways by which a business can build its brand.
International Journal of Advance and Innovative Research Volume 6, Issue 1 (III): January - March, 2019
187
ISSN 2394 - 7780
Easy to share: Most digital marketing channels feature sharing capabilities which allow campaigns and articles to be shared with multiple followers. This helps to create a multiplier effect and has the capacity to tremendously improve sales results.
Global: The world, they say, has turned into a global village. This has been made possible via digitization. Digital marketing allows the brand campaigns to be visible in any part of the world. This gives small start-ups the rare opportunity to go global via the immense exposure provided.
Segmenting, targeting and positioning: Not only does marketing over digital platforms allow campaigns to be targeted at specific customers, it also allows for customer segmentation and also positioning the brand image in the minds of targeted customer in a short span of time effectively.
Greater options: The cyber world is getting noisier by the day, and any product or service that a business offers is most likely also being offered by thousands of other businesses. The average bounce rate on websites increased and the attention span of visitors is dropping. When visitors to a website do not immediately find what they are looking for, they leave for an alternative.
CONCLUSION However, the consensus is that today with the development of social media phenomenon and the power of the internet, the traditional marketing of brands are not very effective unless they are supplemented with the power of online channel.
After the review of the above study, we therefore proposed a theoretical framework that the two competing media environments are shown i.e. digital or social media environment and the offline which is the traditional media environment that comprises channels such as TV, radio and Print to reach out to customers.
Emergence and popularity of the digital marketing have forced business whether small or big to implement social media strategies with most businesses initiating their own online communities to drive their brand awareness and management. and it is proposed that as the popularity of digital market networks rises, the environment and influence of the traditional media channels decreases and that’s the reason the shaded part of the traditional media have grown small, whereas the social media networks shaded sections increases. Companies interact with online communities to achieve a variety of benefits, including spreading positive word of mouth that help them increase brand awareness and also gathering insights about consumers‟ needs and preferences for segmentation purposes.
BIBLIOGRAPHY 1. Marketing management –Dr. C.B.Guptha and Dr. N.Rajan Nair
2. Marketing management in the Indian background- C.N.Sontakki
3. Article from the journal-imperial journal of interdisciplinary research –Punit Kumar &Amit Verma
4. Brand marketing-opportunities and challenges - wikipedia
5. https://www.marketingprofs.com
6. www.iosrjournals.org
7. http://www.onlinejournal.in
International Journal of Advance and Innovative Research Volume 6, Issue 1 (III): January - March, 2019
188
ISSN 2394 - 7780
A STUDY ON DIGITAL SHOPPING BEHAVIOUR AND WORK LIFE BALANCE OF BANKING EMPLOYEES IN TIER -2 CITIES IN KARNATAKA: A STUDY WITH SPECIAL REFERENCE TO
SHIMOGA DISTRICT
Dr. Subhadra P. S, C. K Anuradha and Aishwarya V. Hittanagi Assistant Professor, Department of Management Studies, JNNCE, Shivamogga
ABSTRACT In this digital era the life of an individual has become easier and independent with the use of online shopping practices. It is helping manage the work as well as life demands very effectively hence leading to effective work-life balance. Work Life Balance in its broadest sense, is defined as a satisfactory level of involvement or ‘fit’ between the multiple roles in a person’s life. Work life balance is defined as accomplishment of role-related expectations that are negotiated and shared between an individual and his or her role-related partners in the work and life domains. Work life Balance is a concept that supports the efforts of employees to split their time and energy between work and the other important aspects of their lives. Work-life balance is a daily effort to make time for family, friends, community participation, spirituality, personal growth, self care, and other personal activities, in addition to the demands of the workplace.
INTRODUCTION In the era of digitization of the world, of business on line shopping is gaining greater importance in serving its ultimate consumers in all the parts of the country. Marketing professionals must gain understanding of how consumer behaviour is affected by thoughts, feelings, actions and environment, in order to figure out consumers´ meaning of products and brands when carried out digitally. This is also helpful in understanding consumer behaviour in relation to consumer shopping, purchase and consumption habits. By comprehending the interactions´ impact on individual consumers especially w.r.to Work life balance, similar target markets and society, marketers can better satisfy needs and wants, subsequently creating value for consumers. In summary, understanding of consumer behaviour contributes to organisational success in many respects especially in employee satisfaction.
STATEMENT OF THE PROBLEM Lack of flexibility, high work pressure, hectic working hours, work exhaustion and stress out the bank employees, result in reduced job performance and deteriorating the social and family life. Hence there is a growing concern for quality of life and work is deteriorating. Employees in banking sector are one among the hardest working people that involves a high level of intensity and risk in the execution of tasks and responsibilities. The atomization and advancements in information technology have reduced the size of the manpower in banks drastically. When it comes to the shopping practices, a significant number of employees are depending on online services for various products and services to be procured.
NEED FOR THE STUDY Work Life balance has been one of the critical factors in establishing and sustaining a satisfactory and fulfilling life and productive work culture in an organisation. There is evidence to show that the activities outside work positively influence the productivity and creative potential of employees. Hence, it has been found that work life balance is not only the source of care and concern, but also a major source of personal and job satisfaction. In the process of attaining preset targets, work schedules creates more burden, stress and strain to the employees to imbalance their work and family life and even creates fear and frustration. There is a great need for examining whether online shopping practices of the bank employees have any significant impact on determining their work life balance.
CONCEPTUAL FRAMEWORK Online shopping is one of the most popular ways to make purchases, but it's not something that everyone is comfortable doing. As with most things, there are positives and negatives associated with this approach to shopping. Consider the advantages and disadvantages carefully so one can make an informed decision about what's best for them. E-shopping is a recent occurrence in the field of e-business and is definitely going to be the future of shopping. Most of the companies are running their on-line portals to sell their products/services on-line. Online shopping is very common outside India, its growth in Indian Market, which is a large consumer market, is still not in line with the global market. The growth of on-line shopping has triggered on-line shopping phenomena in India.
Digital Shopping performance refers to the mental and emotional processes and the observable behaviour of consumers during searching for, purchasing and post consumption of a product or service bought online.
International Journal of Advance and Innovative Research Volume 6, Issue 1 (III): January - March, 2019
189
ISSN 2394 - 7780
Shopper’s behaviour has two aspects: the final purchase activity which is noticeable by us and the decision process which may involve the interaction of a number of complex variables not visible to us. In fact, purchase behaviour is the end result of a long process of consumer decision-making. The study involves what working women as consumers buy online, why they buy it online, how they buy it online, when they buy it online, where they buy it online, how frequently they buy it online and what is the impact of online shopping on Work Life Balance.
Work Life Balance Work-life balance, in its broadest sense, is defined as a satisfactory level of involvement or ‘fit’ between the multiple roles in a person’s life. Work life balance is defined as accomplishment of role-related expectations that are negotiated and shared between an individual and his or her role-related partners in the work and family domains. The study of work life balance involves the examination of person’s ability to manage simultaneously the multi-faceted demands of life. Although work-life balance has traditionally been assumed to involve the devotion of equal amounts of time to paid work and non-work roles, more recently the concept has been recognized as more complex and has been developed to incorporate additional components. Three aspects of work-life balance are
1. Time balance- the amount of time given to work and non-work roles.
2. Involvement balance- the level of psychological involvement or commitment to work and non-work roles.
3. Satisfaction balance- the level of satisfaction with work and non work roles.
LITERATURE REVIEW Selected appropriate articles are cited and reviewed pertaining to understanding of the concept of Work Life Balance and work life balance among the bank employees and about on line shopping practices.
Anu Shelle (2012) in her Ph. D thesis “Effeteness of HRM Practices in Banking Organizations” found that a high level of responsiveness towards the change and adaptability was found. The banking organizations are able to strategically predict the changes and respond to them. The research also focuses on the need for improved level of credibility among the employees at banks.
Mita Sengupta(2015) in her study “A critical Analysis of gender perception work life balance in the service sector in Pune.” having the objective of exploring the gender differences in the perception of work life balance conducted a study of respondents form retail industry, health industry, IT industry, ITES industry, education, Banking, financial services etc. The study found that work life balance problem equally affects male and female respondents .The study also found that the working mothers with young children are found to experience the maximum negative impacts of work life imbalance. The recommendations include emphasis on planning and organizing activities, time management, creation of boundaries between work life and rest of life self discipline, etc.
In a study, "Work-life Balance in Employees", Shiney Chib (2011)deliberated on the concept of work life that includes proper prioritizing between 'work'( career and ambition) on the one hand and life ( pleasure, leisure, and spiritual development) on the other. He also discussed on the pros and cons of working. He also discusses on the pros and cons of working extra hours and also fatigue, family, friends, expectations etc. Four aspects of Work life balance such as self health and care, family and friend relationship with colleagues and management, working environment and finally, the strategies adopted by the organizations are considered.
Ashok Kumar P., Sundar K. (2012) in their study “Problems Faced by Women Executives Working in Public Sector Banks in Puducherry” attempted to explore and identify the factors preventing women employees from aspiring for higher post and problems faced by women executives in public sector banks related to work performance. Further the aimed also at finding out the organizational support for women employees to achieve higher post. The variable stress resulting from Physical strain involved was identified as a prime factor of problems to women executives in public sector commercial banks. One more major factor namely exploitation due to submissive nature of women executives has been discriminated as second important factor. The third factor dealing with ignorant customers confronting women executives. All the three factors were highly responsible for the problems experienced by the women executive in public sector commercial banks.
Goyal and Aggarwal (2009) examined the relative importance of the various products purchased at organized retail outlets and the choice of format, the consumer has when purchasing a product. The results of the study depict that food and grocery; clothing, apparels and accessories; catering services; health and beauty; pharmaceuticals, watches; mobile, accessories and services; books, music and gifts; footwear and entertainment
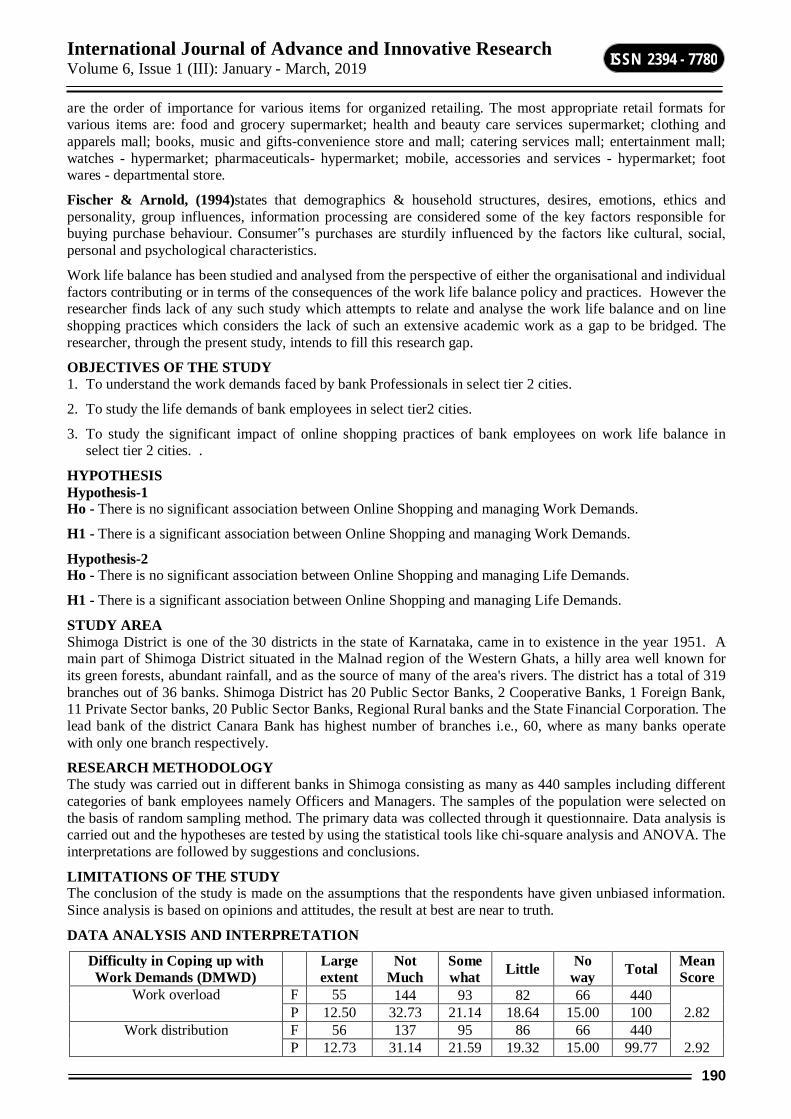
International Journal of Advance and Innovative Research Volume 6, Issue 1 (III): January - March, 2019
190
ISSN 2394 - 7780
are the order of importance for various items for organized retailing. The most appropriate retail formats for various items are: food and grocery supermarket; health and beauty care services supermarket; clothing and apparels mall; books, music and gifts-convenience store and mall; catering services mall; entertainment mall; watches - hypermarket; pharmaceuticals- hypermarket; mobile, accessories and services - hypermarket; foot wares - departmental store.
Fischer & Arnold, (1994)states that demographics & household structures, desires, emotions, ethics and personality, group influences, information processing are considered some of the key factors responsible for buying purchase behaviour. Consumer‟s purchases are sturdily influenced by the factors like cultural, social, personal and psychological characteristics.
Work life balance has been studied and analysed from the perspective of either the organisational and individual factors contributing or in terms of the consequences of the work life balance policy and practices. However the researcher finds lack of any such study which attempts to relate and analyse the work life balance and on line shopping practices which considers the lack of such an extensive academic work as a gap to be bridged. The researcher, through the present study, intends to fill this research gap.
OBJECTIVES OF THE STUDY 1. To understand the work demands faced by bank Professionals in select tier 2 cities.
2. To study the life demands of bank employees in select tier2 cities.
3. To study the significant impact of online shopping practices of bank employees on work life balance in select tier 2 cities. .
HYPOTHESIS Hypothesis-1 Ho - There is no significant association between Online Shopping and managing Work Demands.
H1 - There is a significant association between Online Shopping and managing Work Demands.
Hypothesis-2 Ho - There is no significant association between Online Shopping and managing Life Demands.
H1 - There is a significant association between Online Shopping and managing Life Demands.
STUDY AREA Shimoga District is one of the 30 districts in the state of Karnataka, came in to existence in the year 1951. A main part of Shimoga District situated in the Malnad region of the Western Ghats, a hilly area well known for its green forests, abundant rainfall, and as the source of many of the area's rivers. The district has a total of 319 branches out of 36 banks. Shimoga District has 20 Public Sector Banks, 2 Cooperative Banks, 1 Foreign Bank, 11 Private Sector banks, 20 Public Sector Banks, Regional Rural banks and the State Financial Corporation. The lead bank of the district Canara Bank has highest number of branches i.e., 60, where as many banks operate with only one branch respectively.
RESEARCH METHODOLOGY The study was carried out in different banks in Shimoga consisting as many as 440 samples including different categories of bank employees namely Officers and Managers. The samples of the population were selected on the basis of random sampling method. The primary data was collected through it questionnaire. Data analysis is carried out and the hypotheses are tested by using the statistical tools like chi-square analysis and ANOVA. The interpretations are followed by suggestions and conclusions.
LIMITATIONS OF THE STUDY The conclusion of the study is made on the assumptions that the respondents have given unbiased information. Since analysis is based on opinions and attitudes, the result at best are near to truth.
DATA ANALYSIS AND INTERPRETATION
Difficulty in Coping up with Work Demands (DMWD)
Large extent
Not Much
Some what Little No
way Total Mean Score
Work overload F 55 144 93 82 66 440 2.82 P 12.50 32.73 21.14 18.64 15.00 100
Work distribution F 56 137 95 86 66 440 2.92 P 12.73 31.14 21.59 19.32 15.00 99.77
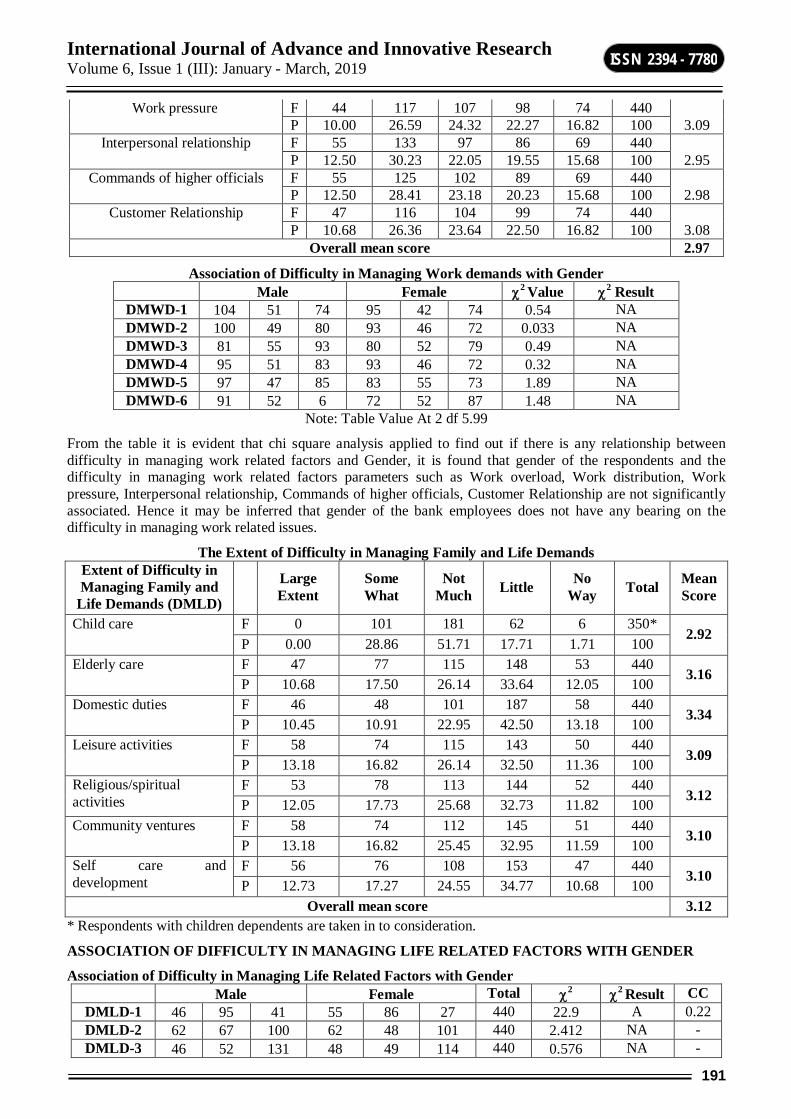
International Journal of Advance and Innovative Research Volume 6, Issue 1 (III): January - March, 2019
191
ISSN 2394 - 7780
Work pressure F 44 117 107 98 74 440 3.09 P 10.00 26.59 24.32 22.27 16.82 100
Interpersonal relationship F 55 133 97 86 69 440 2.95 P 12.50 30.23 22.05 19.55 15.68 100
Commands of higher officials F 55 125 102 89 69 440 2.98 P 12.50 28.41 23.18 20.23 15.68 100
Customer Relationship F 47 116 104 99 74 440 3.08 P 10.68 26.36 23.64 22.50 16.82 100
Overall mean score 2.97
Association of Difficulty in Managing Work demands with Gender
Male Female 2 Value 2 Result
DMWD-1 104 51 74 95 42 74 0.54 NA DMWD-2 100 49 80 93 46 72 0.033 NA DMWD-3 81 55 93 80 52 79 0.49 NA DMWD-4 95 51 83 93 46 72 0.32 NA DMWD-5 97 47 85 83 55 73 1.89 NA DMWD-6 91 52 6 72 52 87 1.48 NA
Note: Table Value At 2 df 5.99
From the table it is evident that chi square analysis applied to find out if there is any relationship between difficulty in managing work related factors and Gender, it is found that gender of the respondents and the difficulty in managing work related factors parameters such as Work overload, Work distribution, Work pressure, Interpersonal relationship, Commands of higher officials, Customer Relationship are not significantly associated. Hence it may be inferred that gender of the bank employees does not have any bearing on the difficulty in managing work related issues.
The Extent of Difficulty in Managing Family and Life Demands Extent of Difficulty in Managing Family and
Life Demands (DMLD) Large Extent
Some What
Not Much Little No
Way Total Mean Score
Child care F 0 101 181 62 6 350* 2.92
P 0.00 28.86 51.71 17.71 1.71 100 Elderly care F 47 77 115 148 53 440
3.16 P 10.68 17.50 26.14 33.64 12.05 100
Domestic duties F 46 48 101 187 58 440 3.34
P 10.45 10.91 22.95 42.50 13.18 100 Leisure activities F 58 74 115 143 50 440
3.09 P 13.18 16.82 26.14 32.50 11.36 100 Religious/spiritual activities
F 53 78 113 144 52 440 3.12 P 12.05 17.73 25.68 32.73 11.82 100
Community ventures F 58 74 112 145 51 440 3.10
P 13.18 16.82 25.45 32.95 11.59 100 Self care and development
F 56 76 108 153 47 440 3.10
P 12.73 17.27 24.55 34.77 10.68 100 Overall mean score 3.12
* Respondents with children dependents are taken in to consideration.
ASSOCIATION OF DIFFICULTY IN MANAGING LIFE RELATED FACTORS WITH GENDER
Association of Difficulty in Managing Life Related Factors with Gender
Male Female Total 2 2 Result CC
DMLD-1 46 95 41 55 86 27 440 22.9 A 0.22 DMLD-2 62 67 100 62 48 101 440 2.412 NA - DMLD-3 46 52 131 48 49 114 440 0.576 NA -
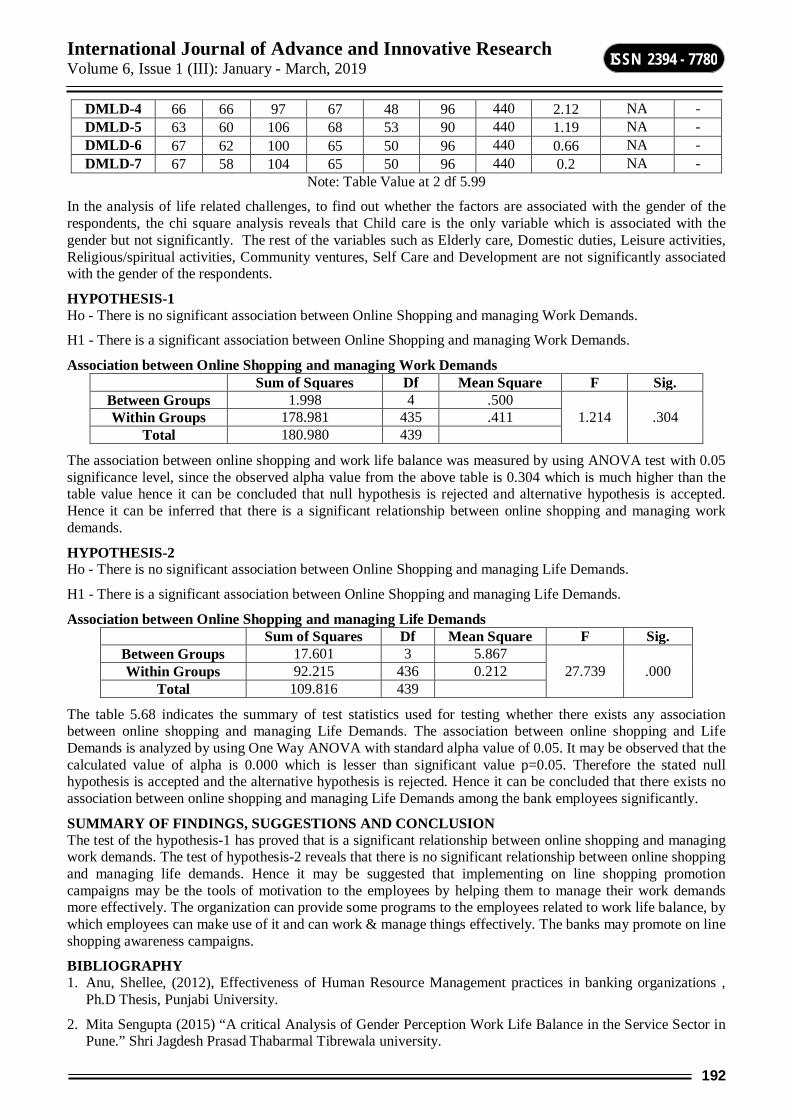
International Journal of Advance and Innovative Research Volume 6, Issue 1 (III): January - March, 2019
192
ISSN 2394 - 7780
DMLD-4 66 66 97 67 48 96 440 2.12 NA - DMLD-5 63 60 106 68 53 90 440 1.19 NA - DMLD-6 67 62 100 65 50 96 440 0.66 NA - DMLD-7 67 58 104 65 50 96 440 0.2 NA -
Note: Table Value at 2 df 5.99
In the analysis of life related challenges, to find out whether the factors are associated with the gender of the respondents, the chi square analysis reveals that Child care is the only variable which is associated with the gender but not significantly. The rest of the variables such as Elderly care, Domestic duties, Leisure activities, Religious/spiritual activities, Community ventures, Self Care and Development are not significantly associated with the gender of the respondents.
HYPOTHESIS-1 Ho - There is no significant association between Online Shopping and managing Work Demands.
H1 - There is a significant association between Online Shopping and managing Work Demands.
Association between Online Shopping and managing Work Demands Sum of Squares Df Mean Square F Sig.
Between Groups 1.998 4 .500 1.214 .304 Within Groups 178.981 435 .411
Total 180.980 439
The association between online shopping and work life balance was measured by using ANOVA test with 0.05 significance level, since the observed alpha value from the above table is 0.304 which is much higher than the table value hence it can be concluded that null hypothesis is rejected and alternative hypothesis is accepted. Hence it can be inferred that there is a significant relationship between online shopping and managing work demands.
HYPOTHESIS-2 Ho - There is no significant association between Online Shopping and managing Life Demands.
H1 - There is a significant association between Online Shopping and managing Life Demands.
Association between Online Shopping and managing Life Demands Sum of Squares Df Mean Square F Sig.
Between Groups 17.601 3 5.867 27.739 .000 Within Groups 92.215 436 0.212
Total 109.816 439
The table 5.68 indicates the summary of test statistics used for testing whether there exists any association between online shopping and managing Life Demands. The association between online shopping and Life Demands is analyzed by using One Way ANOVA with standard alpha value of 0.05. It may be observed that the calculated value of alpha is 0.000 which is lesser than significant value p=0.05. Therefore the stated null hypothesis is accepted and the alternative hypothesis is rejected. Hence it can be concluded that there exists no association between online shopping and managing Life Demands among the bank employees significantly.
SUMMARY OF FINDINGS, SUGGESTIONS AND CONCLUSION The test of the hypothesis-1 has proved that is a significant relationship between online shopping and managing work demands. The test of hypothesis-2 reveals that there is no significant relationship between online shopping and managing life demands. Hence it may be suggested that implementing on line shopping promotion campaigns may be the tools of motivation to the employees by helping them to manage their work demands more effectively. The organization can provide some programs to the employees related to work life balance, by which employees can make use of it and can work & manage things effectively. The banks may promote on line shopping awareness campaigns.
BIBLIOGRAPHY 1. Anu, Shellee, (2012), Effectiveness of Human Resource Management practices in banking organizations ,
Ph.D Thesis, Punjabi University.
2. Mita Sengupta (2015) “A critical Analysis of Gender Perception Work Life Balance in the Service Sector in Pune.” Shri Jagdesh Prasad Thabarmal Tibrewala university.

International Journal of Advance and Innovative Research Volume 6, Issue 1 (III): January - March, 2019
193
ISSN 2394 - 7780
3. Shiney Chib, (2011) “Work life Balance in Employees” “Personnel Today” Vol XXX11, pp 281-285.
4. Ashok Kumar P., K. Sundar (2012), “Problems Faced by Women Executives Working in Public Sector Banks in Puducherry” IRJC International Journal of Marketing, Financial Services & Management Research Vol.1 Issue 7, pp 222-231
5. David Clutterbuck, (2003), Managing Work Life Balance: A Guide for HR in Achieving Organisational and Individual Change by Chartered Institute of Personnel and Development, London
6. Organized Retailing in India - An Empirical Study of Appropriate Formats and Expected Trends
International Journal of Advance and Innovative Research Volume 6, Issue 1 (III): January - March, 2019
194
ISSN 2394 - 7780
A STUDY ON RECENT TRENDS IN RURAL MARKETING IN INDIA
Madhuri P. A.1 and Praveen D. P.2 Lecturer1, NES Institute of Advance Studies College, Shivamogga
Lecturer2, Mandara PU (Ind) College, Shivamogga
ABSTRACT Rural markets have become integral part of global market. The rural markets are growing at above two times faster pace than urban markets; not surprisingly .The marketers in recent years are thus facing an extremely difficult and challenging tasks of catering to the rural sector, which is now almost impossible to ignore because of its rising income, population growth rate and government thrust on primary sector growth in its current five years plan. The paper describes the challenges and strategies of rural marketing in India and present scenario of rural market in India.
Keywords: Rural: Marketing: Challenges and strategies: emerging trend
INTRODUCTION Rural India with its traditional perception has grown over the years, not only in terms of income, but also in terms of thinking. The rural markets are growing at above two times faster pace than urban markets; not surprisingly, Rural India accounts for 60% of the total national demand. Organizations need to sustain and grow in the market; therefore, they adopted newly marketing trends for retaining the existing customers and targeting new customers to increase the market share. Organizations need to sustain if effective network is available to adopt neo-marketing strategies to tap such markets available in rural and for flung areas where more than 65% population is residing with large untapped consumer potential. These recently developed trends also facilitate the organization to reach the target customers in minimum possible time. An organization selects new marketing trends on the basis of nature and usage of products. Such marketing is a process that involves carefully designing, implementing and controlling formulated strategies to facilitate the exchange of goods and services between organizations and customers. It helps an organization in identifying needs and wants of the customers and delivering products that satisfy those needs and wants.
Indian Rural economy emerging as biggest contributor to economic growth of India it is estimated that it will be around 45% of GDP by 2020. The rural economy has provided a cushion to the Indian economy. Indian economy is able to sustain in spite of all the crisis happened in other parts of the world is because of the backup of rural market. Rural consumers, who were on the receiving end so far, are now slowly getting into position to dictate the terms for the first time.
OBJECTIVE To study the needs of rural marketing in India.
To study the present scenario of rural market in India.
To study the trends in rural marketing
To study the challenges and strategies in rural marketing.
METHODOLOGY The Research design in this study is Descriptive research design. The data used is secondary in nature and has been collected from various websites and reputed journals.
PRESENT SCENARIO IN RURAL MARKETING As we know Indian economy comprising of both urban sector as well as rural sector. And concept of rural marketing in Indian economy has always played an influential role in the lives of people. In India, leaving out a few metropolitan cities, all the districts and industrial townships are connected with rural markets. The rural market in India is not a separate entity in itself and it is highly influenced by the sociological and behavioral factors operating in the country. The Indian rural markets with its vast size and demand base offer great [email protected], www.anveshanaindia.com 102 opportunities to marketers. About 68.84% of the consumers live in rural areas and more than half of the national income is generated from rural areas. Of the 121 crore Indians, 83.3 crore live in rural areas while 37.7 crore stay in urban areas, Our nation is distributed approximately in 6,30,000 villages which can be sorted in different parameters such as literary levels, accessibility, income level, penetration, distance from nearest town etc. It is only natural that rural India occupies an important position in the marketing strategies both in the narrower and broader spectrum.
International Journal of Advance and Innovative Research Volume 6, Issue 1 (III): January - March, 2019
195
ISSN 2394 - 7780
Rural marketing in Indian economy can be classified under two broad categories. These are (a) the markets for consumer goods that comprise of both durable and non-durable goods, and (b) the markets for agricultural inputs that include fertilizers, pesticides, seeds, and so on.
The concept of rural marketing in India is often been found to form ambiguity in the minds of people who think rural marketing is all about agricultural marketing. However, rural marketing determines the carrying out of business activities bringing in the flow of goods from urban sectors to the rural regions of the country as well as the marketing of various products manufactured by the non-agricultural workers from rural to urban areas.
NEEDS OF RURAL MARKETING There are many reasons that have urged the Indian companies to enter the rural India. Some of them are discussed below: 1. Rapid growth in service industries
2. Rise in demanding consumers: The purchasing power in rural India is on steady rise and it has resulted in the growth of the rural market
3. Increase of rural literacy: Literacy level among the rural mass is increasing day by day. Rural consumer can understand the message given by the producers in the advertisements.
4. Global integration: Global Research Company McKinsey had referred to India as the “Bird of Gold” in its report titled .The Bird of Gold: The Rise of India’s Consumer Market. Consumer product makers and analysts now believe that this bird is ready to fly with wings wide spread in the global sky. Rural consumers increasing their appetite for better products and high-standard services.
5. Increase in rural population: Over the past few years rural India has witnessed an increase in the population with much more pace than of urban population and as far as total [email protected], www.anveshanaindia.com 104 population size in concern rural population size is more than two times of urban population.
TRENDS IN RURAL MARKETING The companies should start selling the concept of quality with proper communication. Their main focus is to change the Indian customer outlook about quality. With their promotion rural customer asks for value for money.
1. Large population: The Indian rural market with its vast size and demand offers great opportunity to marketers. Our national is classified in around 450 districts & approx. 6, 30,000 villages. Indian rural market is huge in size because rural population accounts for almost 70% of Indian population as the recent Census 2011, 833 million live in rural India, 33% of rural population includes youth, number of households increased from 25 to 33 crore. The rural market is currently worth approximately USD$ 10 billion in consumer spending in the FMCG market annually. Food categories are currently driving the bulk of the additional USD$ 90 billion into the marketplace by 2025.
2. Green revolution: The vision of Dr. Swami Nathan, the father of the green revolution to achieve self-sufficiency in food grain production in 1995, gave a major breakthrough in food grain production by the use of scientific methods in agriculture. At present, Rural India generates 299 million tons annually. The substantial attention accorded to agriculture during the successive five-year plans has helped in improving agricultural productivity. Adoption of new agronomic practices, selected mechanisation, multiple cropping, inclusion of cash crops and development of allied activities like dairy, fisheries and other commercial activities have helped in increasing disposable income of rural consumers. By observing this scenario, India‟s one of the biggest giant Hindustan Lever Ltd. has entered into rural market for more penetration through the operation „Bharat‟.
3. Smart phones penetrating into rural India: 320 million are rural mobile phone users i.e. roughly 38 per cent of the rural population, which includes children and senior citizens. The actual benefit of technology positively impacting rural economy will be seen when data communication is used effectively.
4. Increased level of education and employability of rural youth: Villagers realized their children education is the first priority. Most of the rural youth especially teenagers are [email protected], www.anveshanaindia.com 105 well aware of products due to their school education and media exposure. Significant progress on literacy levels – 90% of the villages have a primary school within a 1 km walk. Private school enrolment in rural India has enhanced by 5.5% points over past six years. The literacy rate has also gone up by 68.91% in rural India. This enhanced the employability of rural youth they are not sitting idle in villages they are motivated to go to nearby towns to find the jobs.
International Journal of Advance and Innovative Research Volume 6, Issue 1 (III): January - March, 2019
196
ISSN 2394 - 7780
5. Increased purchasing power: Rural purchasing power has grown faster than urban in the recent years. Rural Indian economy is highly supported by increasing disposable income, Government initiatives and schemes and favorable demographics. As a result, the rural segment of the Indian economy is growing at a pace of 8-10% per annum. Government spending in rural India has tripled over the last four years and is now translating into higher consumer spending. Therefore, rural consumers are consuming more premium and convenience oriented categories that are typical of their urban counterparts. “Policy measures like the waiver of agricultural loans around US$ 13.9 billion and the National Rural Employment Guarantee Scheme, which guarantees 100 days of employment to one member of every rural household (NREGS), the Bharat Nirman program with an outlay of US$ 34.84 billion for improving rural infrastructure etc helped the rural economy.
6. Government Incentives and polices: The government’s stress on self-sufficiency resulted in various schemes like Operation Flood (White Revolution), Blue Revolution, Yellow Revolution, etc. resulted in the production of 15 million tons of milk per annum. The Indian Government launched a number of schemes like IRDP (Integrated Rural Development Programmed) and REP (Rural Electrification Program me) in the 1970‟s, which gave a boost to the agrarian economy. This resulted in changes in people’s habits and social life. REP gave impetus to the development of consumer durable industry.
7. Media: Mass Media has created increased demand for goods and services in rural areas. Smart marketers are employing the right mix of conventional and non-conventional media to create increased demand for products. The role cable television has been noteworthy in bringing about the change in rural people’s mind set and influencing their lifestyles.
8. IT penetration in rural India: Today's rural children and youth will grow up in an environment where they have 'information access' to education opportunities, exam results, career counseling, job opportunities, government schemes and services, health and legal advice and services, worldwide news and information, land records, mandi prices, weather forecasts, bank loans, livelihood options. If television could change the language of brand communication in rural India, affordable Web connectivity through various types of communication hubs will surely impact the currency of information exchange .As the electronic ethos and IT culture moves into rural India, the possibilities [email protected], www.anveshanaindia.com 106 of change are becoming visible. Products developed for rural marketing are Philips develop a tv “vardaan” and free power radio for rural markets, ICICI rural ATMS, Bhumiheen credit cards by bank of India, E-choupal by ITC.
9. Better credit facilities through banks: With co-operative banks taking the lead in the rural areas, every village has access to short, medium, long-term loans from these banks. The credit facilities extended by public sector banks through Kisan Credit Cards help the farmers to buy seeds, fertilizers and every consumer goods on installments.
10. Brand conscious: The rural market in India is not separate entity in itself and it is highly influenced by the sociological and behavioral factors operating in the country. Spending on FMCG products especially in the rural areas is showing an increasing tendency.
CHALLENGES AND STRATEGIES IN RURAL MARKET Delivering to the rural markets is a real challenge to many marketers. In fact, the whole dynamics of rural markets are so unique that one has to look at beyond traditional marketing mix with advanced mix containing the 4A‟s instead of the traditional 4P‟s of marketing: Acceptability – develop what the consumer wants, Affordability – Make an affordable product, Availability – product made available at villages and Awareness - Don’t promote the brand, demonstrate the product. Most of the marketers look at rural market as an extension of existing urban market hence they simply dump their existing product which is out-dated in urban market into rural market. Hence marketers fail to penetrate into rural market in big way. Though rural consumers attracted towards urban life styles their dynamics are differ from urban consumers. Similarly rural marketing strategies are also significantly different from the marketing strategies aimed at an urban consumer.
STRATEGIES FOR RURAL MARKETING The past practices of treating rural markets as appendages of the urban market is not correct, since rural markets have their own independent existence, and if cultivated well could turn into a generator of profit for the marketers. But the rural markets can be exploited by realizing them, rather than treating them as convenient extensions of the urban market.
A. Marketing Strategy: Marketers need to understand the psychology of the rural consumers and then act consequently. Rural marketing involves more exhaustive personal selling efforts compared to urban marketing. Firms should abstain from designing goods for the urban markets and subsequently pushing them
International Journal of Advance and Innovative Research Volume 6, Issue 1 (III): January - March, 2019
197
ISSN 2394 - 7780
in the rural areas. To effectively tap the rural market, a brand must associate it with the same things the rural folks do. This can be done by utilizing the various rural folk media to reach them in their own language and in large numbers so that the brand can be associated with the myriad rituals, celebrations, festivals, "melas", and other activities where they assemble.
B. Distribution Strategy: One of the ways could be using company delivery van which can serve two purposes - it can take the products to the customers in every nook and corner of the Market, and it also enables the firm to establish direct contact with them, and thereby facilitate sales promotion. Annual "melas" organized are quite popular and provide a very good platform for distribution because people visit them to make several purchases. According to the Indian Market Research Bureau, around 8000 such melas are held in rural India every year. Rural markets have the practice of fixing specific days in a week as Market Days called "Haats' when exchange of goods and services are carried out. This is another potential low cost distribution channel available to the marketers. Also, every region consisting of several villages is generally served by one satellite town termed as "Mandis" where people prefer to go to buy their durable commodities. If marketing managers use these feeder towns, they will easily be able to cover a large section of the rural population.
C. Promotional Strategy: Marketers must be very careful while choosing the mediums to be used for communication. Only 16% of the rural population has access to a vernacular newspaper. So, the audio visuals must be planned to convey a right message to the rural folk. The rich, traditional media forms like folk dances, puppet shows, etc., with which the rural consumers are familiar and comfortable, can be used for high impact product campaigns. Radio is also very popular source of information and Entertainment, Adds on radio can also be a helpful tool for marketers.
CONCLUSION India’s rural market could have been stronger than the present position, if Indian policymakers have made adequate infrastructure for rural India. Rural markets, as part of any economy, have untapped potential. Thus looking at the challenges and the strategies which rural markets offer to the marketers it can be said that the future is very promising for those who can understand the dynamics of rural markets and exploit them to their best advantage.
REFERENCE http://www.ibef.org/industry/indian-rural-market
http://www.inianmba.com/Faculty_Column/Fc875.html
http://www.cpuh.in/academics/pdf/Rajat_Rural_Marketing
http://indianresearchjournals.com/pdf/APJMMR/2013/Julay/4
http://publications.anveshanaindia.com
Special Issue SACAIM 2016 Nafeesa Fareeda and Swathi
MANUSCRIPT SUBMISSION
GUIDELINES FOR CONTRIBUTORS 1. Manuscripts should be submitted preferably through email and the research article / paper
should preferably not exceed 8 – 10 pages in all.
2. Book review must contain the name of the author and the book reviewed, the place of publication and publisher, date of publication, number of pages and price.
3. Manuscripts should be typed in 12 font-size, Times New Roman, single spaced with 1” margin on a standard A4 size paper. Manuscripts should be organized in the following order: title, name(s) of author(s) and his/her (their) complete affiliation(s) including zip code(s), Abstract (not exceeding 350 words), Introduction, Main body of paper, Conclusion and References.
4. The title of the paper should be in capital letters, bold, size 16” and centered at the top of the first page. The author(s) and affiliations(s) should be centered, bold, size 14” and single-spaced, beginning from the second line below the title.
First Author Name1, Second Author Name2, Third Author Name3 1Author Designation, Department, Organization, City, email id 2Author Designation, Department, Organization, City, email id 3Author Designation, Department, Organization, City, email id
5. The abstract should summarize the context, content and conclusions of the paper in less than 350 words in 12 points italic Times New Roman. The abstract should have about five key words in alphabetical order separated by comma of 12 points italic Times New Roman.
6. Figures and tables should be centered, separately numbered, self explained. Please note that table titles must be above the table and sources of data should be mentioned below the table. The authors should ensure that tables and figures are referred to from the main text.
EXAMPLES OF REFERENCES All references must be arranged first alphabetically and then it may be further sorted chronologically also.
Single author journal article: Fox, S. (1984). Empowerment as a catalyst for change: an example for the food industry. Supply Chain Management, 2(3), 29–33.
Bateson, C. D.,(2006), ‘Doing Business after the Fall: The Virtue of Moral Hypocrisy’, Journal of Business Ethics, 66: 321 – 335
Multiple author journal article: Khan, M. R., Islam, A. F. M. M., & Das, D. (1886). A Factor Analytic Study on the Validity of a Union Commitment Scale. Journal of Applied Psychology, 12(1), 129-136.
Liu, W.B, Wongcha A, & Peng, K.C. (2012), “Adopting Super-Efficiency And Tobit Model On Analyzing the Efficiency of Teacher’s Colleges In Thailand”, International Journal on New Trends In Education and Their Implications, Vol.3.3, 108 – 114.
Text Book: Simchi-Levi, D., Kaminsky, P., & Simchi-Levi, E. (2007). Designing and Managing the Supply Chain: Concepts, Strategies and Case Studies (3rd ed.). New York: McGraw-Hill.
S. Neelamegham," Marketing in India, Cases and Reading, Vikas Publishing House Pvt. Ltd, III Edition, 2000.
Edited book having one editor: Raine, A. (Ed.). (2006). Crime and schizophrenia: Causes and cures. New York: Nova Science.
Edited book having more than one editor: Greenspan, E. L., & Rosenberg, M. (Eds.). (2009). Martin’s annual criminal code:Student edition 2010. Aurora, ON: Canada Law Book.
Chapter in edited book having one editor: Bessley, M., & Wilson, P. (1984). Public policy and small firms in Britain. In Levicki, C. (Ed.), Small Business Theory and Policy (pp. 111–126). London: Croom Helm.
Chapter in edited book having more than one editor: Young, M. E., & Wasserman, E. A. (2005). Theories of learning. In K. Lamberts, & R. L. Goldstone (Eds.), Handbook of cognition (pp. 161-182). Thousand Oaks, CA: Sage.
Electronic sources should include the URL of the website at which they may be found, as shown:
Sillick, T. J., & Schutte, N. S. (2006). Emotional intelligence and self-esteem mediate between perceived early parental love and adult happiness. E-Journal of Applied Psychology, 2(2), 38-48. Retrieved from http://ojs.lib.swin.edu.au/index.php/ejap
Unpublished dissertation/ paper: Uddin, K. (2000). A Study of Corporate Governance in a Developing Country: A Case of Bangladesh (Unpublished Dissertation). Lingnan University, Hong Kong.
Article in newspaper: Yunus, M. (2005, March 23). Micro Credit and Poverty Alleviation in Bangladesh. The Bangladesh Observer, p. 9.
Article in magazine: Holloway, M. (2005, August 6). When extinct isn't. Scientific American, 293, 22-23.
Website of any institution: Central Bank of India (2005). Income Recognition Norms Definition of NPA. Retrieved August 10, 2005, from http://www.centralbankofindia.co.in/ home/index1.htm, viewed on 7. The submission implies that the work has not been published earlier elsewhere and is not
under consideration to be published anywhere else if selected for publication in the journal of Indian Academicians and Researchers Association.
8. Decision of the Editorial Board regarding selection/rejection of the articles will be final.