Volume 6, Issue 1 (XXIV): January – March 2019 - Advance ...
469
Volume 6, Issue 1 (XXIV) ISSN 2394 - 7780 January - March 2019 International Journal of Advance and Innovative Research (Conference Special) Indian Academicians and Researchers Association www.iaraedu.com
-
Upload
khangminh22 -
Category
Documents
-
view
0 -
download
0
Transcript of Volume 6, Issue 1 (XXIV): January – March 2019 - Advance ...

Volume 6, Issue 1 (XXIV) ISSN 2394 - 7780 January - March 2019
International Journal of
Advance and Innovative Research (Conference Special)
Indian Academicians and Researchers Association
www.iaraedu.com

International Conference
On
Innovation, Growth & Sustainability
8th & 9th March 2019
ORGANIZED BY
SASMIRA’s INSTITUTE OF COMMERCE AND SCIENCE Worli, Mumbai
Premier Sponsor Other Sponsors
Publication Partner
Indian Academicians and Researcher’s Association

SASMIRA’s INSTITUTE OF COMMERCE AND SCIENCE
Mumbai
Affiliated to University of Mumbai

About SASMIRA The Synthetic & Art Silk Mills Research Association (SASMIRA) a Research Association registered under The Societies Registration Act XXI of 1860 and Bombay Public Trust Act, 1950 and having its registered office at Sasmira Marg, Worli, Mumbai 400030, Maharashtra, India, linked to the Ministry of Textile, Government of India established on 12th January 1950 under Registration No. 2505 of 1949-1950. It is a cooperative venture set up by the man-made textile industry of India after independence as a multi- functional institute to serve its scientific and technological needs. It is the Premier Research and Development Organization and Centre of Excellence in Agro-tech with facilities for demonstration, product development, incubation, testing & certification and training in textiles.
SASMIRA has multifaceted development activities including R & D, Testing and Technical Services, Skill Development. The major areas of functioning of SASMIRA are:
Research & Development Testing Services
Technical Services and Consultancy Services to Decentralized Sector
Textile Instrument Development Educational Activities Publication Knowledge Dissemination
About SICS “Sasmira Institute of Commerce & Science (SICS)” is an Institute located at Worli, Mumbai. It is affiliated to University of Mumbai and offering the Undergraduate Courses in Management and Science. It is an initiative of SASMIRA (The Synthetic & Art Silk Mills' Research Association), started in Year 2016 to impart quality education in the field of Commerce and Science.
SASMIRA as Parent Body Linked to the Ministry of Textile, Govt. of India was established on 12th January 1950 under Registration No. 2505 of 1949-1950 granted under Societies Act XXI of 1860 and is a cooperative venture set up by the Man-Made Textile industry of India after independence as a multi-functional institute to serve its scientific and technological needs.
About IARA Indian Academicians and Researchers Association ( IARA ) is an educational and scientific research organization of Academicians, Research Scholars and practitioners responsible for sharing information about research activities, projects, conferences to its members. IARA offers an excellent opportunity for networking with other members and exchange knowledge. It also takes immense pride in its services offerings to undergraduate and graduate students. Students are provided opportunities to develop and clarify their research interests and skills as part of their preparation to become faculty members and researcher. Visit our website www.iaraedu.com for more details.

A BRIEF ABOUT ORGANIZING COMMITTEES
Chief Patrons Shri. Maganlal H. Doshi
President, SASMIRA
Shri. Mihir R. Mehta Vice- President, SASMIRA
Chairpersons Dr. U. K. Gangopadhyay Executive Director, SASMIRA
Dr. Kamal Tandon Director-Education, SASMIRA
Advisory Committee Dr. D. Y. Patil
Director-Guru Nanak Institute of Management Studies (GNIMS), Mumbai
Dr. Dinesh D. Harsolekar IES Management College & Research Centre, Mumbai
Dr. G. K. Gupta Principal, Seva Sadan College, Mumbai
Dr. Hiren Dand Head of Dept-IT, Mulund College of Commerce, Mumbai
Dr. Manisha Mathur Deputy Director, SASMIRA
Dr. Mohan Lal Agrawal Director, MENA College of Management (MCM), Dubai
Dr. Rosemary Ekechukwu Associate Dean, University of Port Harcourt, Nigeria
Dr. Elez Osmanovic Director, Institute of Scientific Research & Development, Montenegro
Prof. Takim Asu Ojua Head-Dept. of Social Work, University of Calabar, Nigeria

Convener Dr. Ritu Bhattacharyya
Principal, Sasmira’s Institute of Commerce & Science, Mumbai
Co-Convener Mr. Sampurna Mehta
Registrar, Sasmira’s Institute of Commerce & Science, Mumbai
Conference Organizing Committee Mr. Tripurari Jha
Mr. Sachin Mandle Ms. Bhavana Solanki
Ms. Pooja Tiwari Ms. Vidya Pawar
Ms. Vaishali Kothiya
Mr. Satyendra Pal Ms. Farhat Maniyar
Ms. Jalpa Dave

Message from the President
Sasmira’s Institute Commerce & Science (SICS) has always aimed at excellence and in their endeavor to continue with their motto, they are organizing their first International Conference on “Innovation, Growth & Sustainability”. A better theme could not have been selected because as a Country we are growing by leaps and bounds this is because of the Youth of the country who are constantly thinking out of the box and Innovating. The two day of the Research Conference will see a lot of Research Scholars, Teachers, Students and Industry professionals who will come together and share their ideas and finding on the theme. This will be a very good platform for deliberations and further research. I congratulate the Research team and would like to see many more such intellectual deliberations at SASMIRA.
Shri. Maganlal H. Doshi
President, SASMIRA

Message from the Vice President
Sasmira’s Institute of Commerce and Science (SICS) is organizing its first International Conference which is a Research based event on Innovation, Growth & Sustainability. I would like to congratulate the team at SICS for taking this imitative. Research on the above topics is very relevant and required to today’s business and social world. If we do not innovate, we do not grow; we do not move ahead and decline in today’s extremely competitive and scientific world. I wish the two days of Conference leads to a lot of deliberations and throws up intellectually stimulating body of information, research and learning for the students and the researchers. I wish the Research Team all the best.
Shri. Mihir R Mehta Vice-President, SASMIRA
Message from the Executive Director
SASMIRA has always aimed at providing intellectual platforms for the best quality of education and research encompassing all the sub domains of industry. SICS (Sasmira’s Institute Commerce & Science ) is organising its first International Conference. The main objective of which is to provide a platform to research scholars, faculties, students and Industry professionals to ponder over Innovations, Growth and Sustainability factors in varied fields.
I am sure there will be a great gathering of intellectuals who will meet for the two days and share a vast body of knowledge which will give rise to several fruitful discussions and further research.
Dr. U.K. Gangopadhyay
Executive Director, SASMIRA

Message from the Principal
Sasmira’s Institute of Commerce and Science (SICS), affiliated to University of Mumbai, is a young institute with a vast body of work. Since our inception in 2016, we have tried to excel in all forms of intellectual activities be it for the students or faculty. Continuing out tradition, we are organizing our 1st International Conference on “Innovation, Growth & Sustainability”. India is a young country and Innovation stems from the youth, all innovation must lead to growth and once growth come in the country should be able to sustain the growth for generations to enjoy. I am sure that there will be high level of deliberation and panel discussions on the theme, and there will be learning for all who are part of this Conference. We are pleased that several research scholars, teachers, students and industry professionals have shown interest in our conference and contributed to the same. I am thankful to each of them for taking interest in the conference and helping in our mission of intellectual development
Dr. Ritu Bhattacharyya Principal, SICS

International Journal of Advance and Innovative Research Volume 6, Issue 1 (XXIV): January - March 2019
Editor- In-Chief Dr. Tazyn Rahman
Members of Editorial Advisory Board
Mr. Nakibur Rahman Ex. General Manager ( Project ) Bongaigoan Refinery, IOC Ltd, Assam
Dr. Mukesh Saxena Pro Vice Chancellor, University of Technology and Management, Shillong
Dr. Alka Agarwal Director, Mewar Institute of Management, Ghaziabad
Dr. Archana A. Ghatule Director, SKN Sinhgad Business School, Pandharpur
Prof. (Dr.) Sudhansu Ranjan Mohapatra Dean, Faculty of Law, Sambalpur University, Sambalpur
Prof. (Dr.) Monoj Kumar Chowdhury Professor, Department of Business Administration, Guahati University, Guwahati
Dr. P. Malyadri Principal, Government Degree College, Hyderabad
Prof. (Dr.) Baljeet Singh Hothi Professor, Gitarattan International Business School, Delhi
Prof.(Dr.) Shareef Hoque Professor, North South University, Bangladesh
Prof. (Dr.) Badiuddin Ahmed Professor & Head, Department of Commerce, Maulana Azad Nationl Urdu University, Hyderabad
Prof.(Dr.) Michael J. Riordan Professor, Sanda University, Jiashan, China
Dr. Anindita Sharma Dean & Associate Professor, Jaipuria School of Business, Indirapuram, Ghaziabad
Prof.(Dr.) James Steve Professor, Fresno Pacific University, California, USA
Prof. (Dr.) Jose Vargas Hernandez Research Professor, University of Guadalajara,Jalisco, México
Prof.(Dr.) Chris Wilson Professor, Curtin University, Singapore
Prof. (Dr.) P. Madhu Sudana Rao Professor, Mekelle University, Mekelle, Ethiopia
Prof. (Dr.) Amer A. Taqa Professor, DBS Department, University of Mosul, Iraq
Prof. (Dr.) Himanshu Pandey Professor, Department of Mathematics and Statistics Gorakhpur University, Gorakhpur
Dr. Nurul Fadly Habidin Faculty of Management and Economics, Universiti Pendidikan Sultan Idris, Malaysia
Prof. (Dr.) Agbo Johnson Madaki Faculty, Faculty of Law, Catholic University of Eastern Africa, Nairobi, Kenya
Dr. Neetu Singh HOD, Department of Biotechnology, Mewar Institute, Vasundhara, Ghaziabad
Prof. (Dr.) D. Durga Bhavani Professor, CVR College of Engineering, Hyderabad, Telangana

Prof. (Dr.) Shashi Singhal Professor, Amity University, Jaipur
Prof. (Dr.) Aradhna Yadav Professor, Krupanidhi School of Management, Bengaluru
Prof. (Dr.) Alireza Heidari Professor, Faculty of Chemistry, California South University, California, USA
Prof.(Dr.) Robert Allen Professor Carnegie Mellon University, Australia
Prof. (Dr.) A. Mahadevan Professor S. G. School of Business Management, Salem
Prof. (Dr.) S. Nallusamy Professor & Dean, Dr. M.G.R. Educational & Research Institute,Chennai
Prof. (Dr.) Hemant Sharma Professor, Amity University, Haryana
Prof. (Dr.) Ravi Kumar Bommisetti Professor, Amrita Sai Institute of Science & Technology, Paritala
Dr. C. Shalini Kumar Principal, Vidhya Sagar Women’s College, Chengalpet
Dr. Syed Mehartaj Begum Professor, Hamdard University, New Delhi
Prof. (Dr.) Badar Alam Iqbal Adjunct Professor, Monarch University, Switzerland
Dr. Darshana Narayanan Head of Research, Pymetrics, New York, USA
Prof.(Dr.) D. Madan Mohan Professor, Indur PG College of MBA, Bodhan, Nizamabad
Dr. Rosemary Ekechukwu Associate Dean, University of Port Harcourt, Nigeria
Dr. Sandeep Kumar Sahratia Professor Sreyas Institute of Engineering & Technology
Dr. P.V. Praveen Sundar Director, Shanmuga Industries Arts and Science College
Dr. S. Balamurugan Director - Research & Development, Mindnotix Technologies, Coimbatore
Dr. Manoj P. K. Associate Professor, Cochin University of Science and Technology
Dr. Dhananjay Prabhakar Awasarikar Associate Professor, Suryadutta Institute, Pune
Dr. Indu Santosh Associate Professor, Dr. C. V.Raman University, Chhattisgath
Dr. Mohammad Younis Associate Professor, King Abdullah University, Saudi Arabia
Dr. Pranjal Sharma Associate Professor, Department of Management Mile Stone Institute of Higher Management, Ghaziabad
Dr. Kavita Gidwani Associate Professor, Chanakya Technical Campus, Jaipur
Dr. Lalata K Pani Reader, Bhadrak Autonomous College, Bhadrak, Odisha
Dr. Vijit Chaturvedi Associate Professor, Amity University, Noida
Dr. Pradeepta Kishore Sahoo Associate Professor, B.S.A, Institute of Law, Faridabad
Dr. Marwan Mustafa Shammot Associate Professor, King Saud University, Saudi Arabia
Dr. R. Navaneeth Krishnan Associate Professor, Bharathiyan College of Engg & Tech, Puducherry

Dr. Mahendra Daiya Associate Professor, JIET Group of Institutions, Jodhpur
Dr. G. Valarmathi Associate Professor, Vidhya Sagar Women's College, Chengalpet
Dr. Parbin Sultana Associate Professor, University of Science & Technology Meghalaya
Dr. M. I. Qadir Assistant Professor, Bahauddin Zakariya University, Pakistan
Dr. Kalpesh T. Patel Principal (In-charge) Shree G. N. Patel Commerce College, Nanikadi
Dr. Brijesh H. Joshi Principal (In-charge) B. L. Parikh College of BBA, Palanpur
Dr. Juhab Hussain Assistant Professor, King Abdulaziz University, Saudi Arabia
Dr. Namita Dixit Assistant Professor, ITS Institute of Management, Ghaziabad
Dr. V. Tulasi Das Assistant Professor, Acharya Nagarjuna University, Guntur, A.P.
Dr. Nidhi Agrawal Associate Professor, Institute of Technology & Science, Ghaziabad
Dr. Urmila Yadav Assistant Professor, Sharda University, Greater Noida
Dr. Ashutosh Pandey Assistant Professor, Lovely Professional University, Punjab
Dr. M. Kanagarathinam Head, Department of Commerce Nehru Arts and Science College, Coimbatore
Dr. Subha Ganguly Scientist (Food Microbiology) West Bengal University of A. & F Sciences, Kolkata
Dr. V. Ananthaswamy Assistant Professor The Madura College (Autonomous), Madurai
Dr. R. Suresh Assistant Professor, Department of Management Mahatma Gandhi University
Dr. S. R. Boselin Prabhu Assistant Professor, SVS College of Engineering, Coimbatore
Dr. V. Subba Reddy Assistant Professor, RGM Group of Institutions, Kadapa
Dr. A. Anbu Assistant Professor, Achariya College of Education, Puducherry
Dr. R. Jayanthi Assistant Professor, Vidhya Sagar Women's College, Chengalpattu
Dr. C. Sankar Assistant Professor, VLB Janakiammal College of Arts and Science
Dr. Manisha Gupta Assistant Professor, Jagannath International Management School
Copyright @ 2019 Indian Academicians and Researchers Association, Guwahati All rights reserved. No part of this publication may be reproduced or transmitted in any form or by any means, or stored in any retrieval system of any nature without prior written permission. Application for permission for other use of copyright material including permission to reproduce extracts in other published works shall be made to the publishers. Full acknowledgment of author, publishers and source must be given. The views expressed in the articles are those of the contributors and not necessarily of the Editorial Board or the IARA. Although every care has been taken to avoid errors or omissions, this publication is being published on the condition and understanding that information given in this journal is merely for reference and must not be taken as having authority of or binding in any way on the authors, editors and publishers, who do not owe any responsibility for any damage or loss to any person, for the result of any action taken on the basis of this work. All disputes are subject to Guwahati jurisdiction only.


International Journal of Advance and Innovative Research Volume 6, Issue 1 (XXIV) : January – March 2019
CONTENTS
Research Papers
RETAILERS USED VISUAL MERCHANDISING AS A SUSTAINABLE PRACTICE IN THE ORGANISED RETAIL. A CASE STUDY OF FEW SELECTED ORGANISED RETAIL STORES IN PATNA
Dr. James Hussain
1 – 10
INNOVATIVE PRACTICES AND APPLICATION IN ICT - USES IN EDUCATION
Shraddha Prasad Kokate and Dr. Pradhnya M Wankhade
11 – 16
THE SKILL DEVELOPMENT ECOSYSTEM IN INDIA
Dr. Suryakant Ratan Chaugule
17 – 25
THE POPULARITY OF SMALL - SIZED PACKS OF CONSUMABLE PRODUCTS: AN IMPACT OF ON-THE-GO LIFESTYLE
Dr. Sameer Kulkarni
26 – 30
THE INFLUENCE OF CULTURE ON CONSUMER BEHAVIOR
Sagar Karkhanis
31 – 33
IMPACT OF POINT OF SALE PROMOTION ON CIGARETTE CONSUMPTION
Chetan Jagtap and Dr. Shreedharan Menan
34 – 39
SUSTAINABLE CONSUMPTION AMONG CHILDREN-THE ROLE OF PARENTS
Dr. Ritu Bhattacharyya
40 – 45
INNOVATIVE PRACTICES FOR AUTOMATED BILLING SYSTEM IN RETAIL SECTOR
Sampurna Nand Mehta
46 – 51
TECHNOLOGY INNOVATION FOR SUSTAINABILITY: A CASE OF TRUCKING INDUSTRY IN INDIA
Dr. Mahendra Parihar
52 – 57
ENTREPRENEURSHIP: CHALLENGES FACED BY ENTREPRENEURS
Tejas Dhamnaskar and Diksha Shukla
58 – 63
ROLE OF ICT IN IMPROVING QUALITY OF EDUCATION
Yogita Sawant
64 – 66
FAMILY MANAGED BUSINESSES (FMBs): IMPERATIVE FOR NATION’S GROWTH AND DEVELOPMENT
Dr. Girish Bagale and Prof. Seema Mahajan
67 – 69

BUDDY - AN OFFLINE SMARTPHONE TRACKER
Rohini Desai and Aasha Chavan
70 – 72
A STUDY ON DIGITAL MARKET AND ITS IMPACT
Sweta Gupta and Shailu Dubey
73 – 77
RADIATION DETECTOR
Sirija Christopher, George Kennedy and Prachi Mahajan
78 – 84
CORPORATE SOCIAL RESPONSIBILITY (CSR): AN EMERGING OPPORTUNITY OR A FORCED LIABILITY
Kuldeep Singh and Dr. Madhvendra Misra
85 – 94
VARIANCE–COVARIANCE (DELTA NORMAL) APPROACH OF VAR MODELS: AN EXAMPLE FROM BOMBAY STOCK EXCHANGE
Prof. Raghavendra S Bendigeri and Dr M.G Shirahatti
95 - 100
CORPORATE FRAUDS AND ITS IMPACT ON ORGANISATIONS
Awaneesh K Srivastava
101 – 104
PERCEPTION OF INTERNATIONAL TOURISTS ON INDIA AS A TOURIST DESTINATION
Prof. Priya Ramesh Yeole
105 – 108
INNOVATION, GROWTH AND SUSTAINABILITY
Prof. Sabir N. Mujawar and Prof. Swantika Kaushik
109 – 111
TO STUDY ON THE CONCEPT OF GREEN MARKETING
Saurabh Ashok Patil
112 – 114
A STUDY ON IMPACT OF DEMOGRAPHICS ON CUSTOMER’S EVALUATION OF E-COMMERCE SITES IN INDIA
Prof. Rohita Dwivedi and Prof. Dr. Vaishali Patil
115 – 125
ROLE OF ICT BASED LEARNING IN DIGITAL EDUCATION
Prof. Sunitha N Joshi
126 – 130
A STUDY OF DIFFERENCE IN CONSUMER BEHAVIOR IN THE MALLS BASED ON OCCUPATION
Dr. Uma Durgude
131 – 136
IMPACT OF SKILL BASED TRAINING ON RURAL INDIA
Akshatha Jain and Leena Jadhav
137 – 139
PERCEPTION ABOUT “MAKE IN INDIA” AND “SKILL INDIA” AMONG PEOPLE
Manasi Sandesh More and Anuja Shripad Padhye
140 – 146

MOVING BEYOND HUMAN RESOURCE DEVELOPMENT (HRD) TO HUMAN DEVELOPMENT RESOURCING (HDR) WITH SPECIAL EMPHASIS ON MENTAL HEALTH
Arun Sekhri
147 – 153
ONLINE GROCERY STORES SUSTAINABILITY: A STUDY ON VARIOUS DIMENSIONS INFLUENCING CONSUMER FOR PURCHASING ONLINE GROCERY
Dr. Ankita Srivastava and Shobha Premaram
154 – 161
A STUDY ON CONSUMER BEHAVIOUR TOWARDS BUYING THE PRODUCT ONLINE THANT TRADITIONAL METHOD IN THANE REGION
Ritesh Ashok Jaiswal, Sachin Omprakash Chourasiya and Dr. Shraddha Mayuresh Bhome
162 – 165
INFLUENCE OF MASTERY ORIENTATION ON INNOVATIVE WORK BEHAVIOUR – MODERATION BY CLIMATE FOR INNOVATION
Prof. (Dr.) Yogesh Upadhyay and Dharmendra Kumar
166 – 172
REVIEWING INVESTMENT TRENDS &ROI OF DIGITAL MARKETING CHANNELS IN NEW AGE MARKETING
Sodi Jasbir Kaur
173 – 176
A STUDY ON CHANGING PRIORITIES AMONG PEOPLE IN RURAL INDIA FOR PURCHASE OF LIFE INSURANCE PRODUCTS
Vivek Gupta
177 – 181
A STUDY ON THE IMPACT OF QUALITY OF WORK LIFE ON PERFORMANCE OF BPO EMPLOYEES IN MUMBAI
Ashwini Arte and Dr. D. Henry
182 – 185
A STUDY ON IMPACT OF ORGANIZATIONAL FACTORS ON JOB SATISFACTION AMONG DOCTORS OF TEACHING HOSPITALS
Monika Khanna and Dr. D. Henry
186 – 190
A STUDY OF IMPACT OF TAX BENEFITS ON INVESTMENT HABITS OF TAXPAYERS
Prof. Tripurari Jha
191 – 194
SMART SANITATION MONITORING
Sonia P. Sawant, Tanmaye B. Talekar and Seema Vishwakarma
195 – 199
BANKING SUPERVISORY ADOPTION WITH BAZEL AGREEMENT CRITERIA
Dr. Arjeta Hallunovi and Prof.(Dr.) Elez Osmanoviq
200 – 202
SOCIAL ENTREPRENEURSHIP & MARGINALIZED WOMEN EMPOWERMENT A CASE STUDY OF SHRI MAHILA LIJJAT GRIHA UDYOG
Dr. Amee Vora
203 – 208
PURA VILLAGE CLUSTER AN ALTERNATE SOLUTION FOR SUSTAINABLE DEVELOPMENT OF TEXTILE INDUSTRY IN ICHALKARANJI AREA
Gajanan J. Salunkhe
209 – 212

A STUDY ON MICROFINANCE AND ITS FACILITIES: AWARENESS LEVEL OF PEOPLE IN MUMBAI CITY
Vaishali Kothiya
213 – 216
PLASTIC BAN: EFFECTS & ALTERNATIVES
Akhil Shah
217 – 224
CASHLESS ECONOMY: AN INNOVATION FOR THE SUSTAINABLE ECONOMIC DEVELOPMENT
Dr. Rupali Vilas Jadhav
225 – 232
SKILL DEVELOPMENT AND EMPLOYABILITY
Prof. Chetna Panchal
233 – 235
A STUDY ON THE ECONOMICS OF FESTIVALS WITH SPECIAL REFERENCE TO CONSUMER’S PERCEPTION AND SPENDING BEHAVIOR
Ayushi Modi
236 – 243
DISABLED FRIENDLY LIBRARIES- CURRENT STATUS, DISCUSSIONS AND SUGGESTIONS
Arpita Baijal, Kanchana Sattur and Dr. Vinita Pimpale
244 – 249
TO STUDY IMPACT OF INNOVATIONS IN TECHNOLOGY ON MANAGEMENT EDUCATION
Rajshree Srivastava and Patil Sahil Sharad
250 – 253
DIGITAL MARKETING AND ITS IMPACT ON CONSUMER BEHAVIOUR
Dr. Rinkesh Chheda
254 – 257
A STUDY ON EFFECTIVENESS OF PROMOTION TECHNIQUES OF APP-BASED FOOD DELIVERY SERVICE COMPANIES WITH SPECIAL REFERENCE TO STUDENTS IN VASHI
Shradha Sahu and Kavita Pawar
258 – 266
TO STUDY THE AWARENESS OF THE INDIAN INVESTORS IN INDIAN CAPITAL MARKETS WITH RESPECT TO MUMBAI
Amina Momin and Dr. Menon Sreedharan
267 – 269
STUDY OF CONSUMER BUYING BEHAVIOUR AND IMPACT OF SALES PROMOTION IN QUICK SERVICE RESTAURANTS IN NAVI MUMBAI CITY WSRT VASHI
Vinayak Parshuram Karande and Dr. Vinita K. Pimpale
270 – 273
IMPACT OF E-COMMERCE SITES ON CONSUMER BUYING BEHAVIOR
Maulik R Shah
274 – 280
ADOPTION OF E-WALLETS (INNOVATIVE MODE OF PAYMENTS) AMONGST POST GRADUATION STUDENTS IN NAVI MUMBAI
Prof. Amrita S. Thakkar
281 – 283
PURA VILLAGE CLUSTER AN ALTERNATE SOLUTION FOR SUSTAINABLE DEVELOPMENT OF TEXTILE INDUSTRY IN ICHALKARANJI AREA
Gajanan J. Salunkhe
284 – 287

CONSUMER BEHAVIOUR WITH SPECIAL REFERENCE TO FACTORS AFFECTING WHILE SHOPPING ONLINE
Aanchal Jain and Dr. Rinkesh Chheda
288 – 290
A STUDY ON MICROFINANCE AND ITS FACILITIES: AWARENESS LEVEL OF PEOPLE IN MUMBAI CITY
Vaishali Kothiya
291 – 294
INTRAPRENEURSHIP AS AN EFFECTIVE ORGANIZATIONAL STRATEGY- AN ANALYSIS IN INDIAN PERSPECTIVE
Prof. Umadevi Lalit Kokku
295 – 299
A NEED FOR INNOVATIVE TECHNIQUES OF LEARNING FOR IMPROVEMENT IN SKILL DEVELOPMENT PROGRAM AND EMPLOYABILITY FOR SUSTAINABLE GROWTH
Prof. J. K. Mahida
300 – 304
REVIEW OF SHIFT FROM COMMERCE TO E-COMMERCE IN INDIA
Rajshree Srivastava and Dr. Girish Santosh Bagale
305 – 309
A STUDY ON THE AWARENESS OF VARIOUS ICT TOOLS AT HIGHER EDUCATION FOR TEACHING
Beena Kapadia
310 – 314
AN ANALYTICAL STUDY OF ROLE OF CLOUD ERP IN RURAL URBAN DEVELOPMENT IN INDIA, WITH SPECIAL REFERENCE TO RURAL AREAS IN MAHARASHTRA
Dr. M A Khan, Prof. Ansari Md. Nasir and Prof. Shaikh Ahtesham Arif
315 – 320
A STUDY OF STUDENT’S PERCEPTION WHILE SHOPPING GOODS WITH REFERENCE TO THANE DISTRICT
Dr B. S. Gite and Soni R. Hasija
321 – 323
EFFECTS OF E-COMMERCE ON CONSUMER BUYING BEHAVIOR
Pankaj Keswani, Rishav Raj and Rahul Meher
324 – 327
IMPACT OF SURROGATE ADVERTISEMENT ON CONSUMER BEHAVIOUR
Dr. Seema Laddha and Dhruvin Iyer
328 – 332
PYTHON LIBRARIES FOR GEOSPATIAL ANALYSIS
Pooja Tiwari
333 – 335
SUSTAINING LOCAL SUPPLY OF LEADERSHIP IN THE UAE: A CASE EXPERIENCE OF EMIRITIZATION
Dr. Mohan Lal Agarwal, Dr. Sayel Sabha and Dr.Muhammad Masroor Alam
336 – 341
AN ANALYSIS ON IMPACT OF DIGITALIZATION ON EDUCATION SECTOR IN INDIA
Dr. Rinkesh Chedda and Puja Prempal Ahuja
342 – 344
AGRO TEXTILE –A NEW INNOVATION FOR CROP MANAGEMENT
Prof. Sachin A. Mandle
345 – 351

PREDICTIVE IMPACT ASSESSMENT OF CLIMATE CHANGE ON CROP YIELD USING SEMI PARAMETRIC NEURAL NETWORK
Sandeep Vishwakarma
352 – 354
A STUDY ON ‘PERCEPTION OF FACULTY MEMBERS OF DEGREE COLLEGES IN MUMBAI TOWARDS USE OF ICT IN TEACHING’
Vishwanath Vinod Acharya
355 – 359
CONTROLLED RAMIFICATION OF FORESTS USING IOT
Sandeep Vishwakarma
360 – 362
INVESTMENT PATTERN AND PERCEPTION OF CRYPTO CURRENCY
Sharayu Mahesh Kadam
363 – 368
IMPACT OF TECHNOLOGY ON ORGANIZATIONAL DEVELOPMENT AND EMPLOYABILITY
Dr. Savitri Dholey
369 – 371
ARTIFICIAL INTELLIGENCE: IS IT PLANET SAVING TECHNOLOGY?
Divya Thakur
372 – 375
PERFORMANCE ANALYSIS OF THE PUBLIC AND PRIVATE INSURANCE COMPANIES WSRT BAGALKOT DISTRICT
Dr. S. S. Aralelimath and Chetan B Daga
376 – 380
FACTORS INFLUENCING DISTRIBUTION PLANNING
Vibhuti Save
381 – 388
A CRITICAL STUDY OF THE PERFORMANCE OF PRIVATE INDIAN BANKS POST INITIAL PUBLIC OFFERING: (From the year 2005 TO 2010)
Dipti Periwal
389 – 394
AN EMPIRICAL STUDY ON FINANCIAL LITERACY AMONG COLLEGE STUDENTS WITH SPECIAL REFERENCE TO "FINANCIAL SERVICES"
Kiran Gajjar
395 – 400
AN ETHICAL BEHAVIOUR AND IMPLICATIONS FOR ACCOUNTANTS
Dr. Hema S. Dhaware
401 – 405
A STUDY OF IMPACT WHAT IS MORE IMPORTANT: PROFESSIONAL QUALITIES OR FITTING PERSONALITY? IN TODAY’S CORPORATE WORLD
Farhat Maniyar
406 – 409
MICROBES ON DIFFERENT PANT FABRIC
Chetali Pandekar and Minakshi Gurav
410 – 413
A STUDY ON GREEN HRM PRACTICES IN AN ORGANISATION
Vijay K Vishwakarma
414 – 420

GREEN MARKETING STRATEGY: OPPORTUNITIES AND CHALLENGES FOR MARKETERS
Dr. Niyat Shetty
421 – 425
AN EMPIRICAL STUDY OF PREFERNECE OF INVESTMENT OF WORKING PEOPLE IN MUMBAI
Bhavana B. Solanki
426 – 432
A SURVEY ON GREEN CLOUD COMPUTING: AN APPROACH FOR CARBON FOOTPRINT REDUCTION
Satyendra Pal and Alok Singh
433 – 437
A STUDY ON CUSTOMER KNOWLEDGE AND EAGERNESS TO ACQUIRE KNOWLEDGE VIZ HEALTH BENEFITS OF HEALTH SUPPLEMENTS
Ankita Tekwani and Dr. Ritu Bhattacharyya
438 – 441
INFRASTRUCTURE STRUCTURE DEVELOPMENT AND ITS EFFECT ON SMALL BUSINESS IN THE AREA, A STUDY BASED IN MUMBAI
Harshita Bhargava and Dr. Ritu Bhattacharya
442 - 445

International Journal of Advance and Innovative Research Volume 6, Issue 1 (XXIV): January - March, 2019
1
ISSN 2394 - 7780
RETAILERS USED VISUAL MERCHANDISING AS A SUSTAINABLE PRACTICE IN THE ORGANISED
RETAIL. A CASE STUDY OF FEW SELECTED ORGANISED RETAIL STORES IN PATNA
Dr. James Hussain
NET-MANFJRF, Department of Applied Economics & Commerce, Patna University, Patna
ABSTRACT
In the Dynamic World, the Sustainable Approach has been Increasing in Various Business Areas. In current
Years, Merchandiser are Using Sustainable Development as a Strategy to Meet the Needs of Organisation while
Protecting Natural Resources through Sustainable Visual Merchandising Practices.
The aim of the Study is to ascertain the Attitude of Consumer Buying Behaviour towards Sustainable Visual
Merchandising Practices. Different Hypotheses Formulated during the Period of Study. The Period of Study is
Six months (From April 2018 to Sep 2018). The Deductive Research Approach & Quantitative Research
Approach used for the study. The Primary Data were collected from different Organised Retail Outlets of
Patna. The Survey of 375 respondents of Different Outlets of the Organized Retail Sector through a
Questionnaire. The Samples of the research Collected through the Simple Random Sampling Technique. For the
Describing & Analysing the Result, used Descriptive & Inferential Statistics to Arrive at Conclusion. The Data
were analysed by Linear Regression Analysis, Centre tendency, Pie charts, Frequency, Standard Deviation,
Graph, Cross Tabulation, Percentage, Correlation to Summarize the Data. The Cronbach’s Alpha Statistics
used for Reliability Test to find out the Internal Consistency of Score. Validity Test is used to Analyse the
Assumption Supported by the Finding or not. The Research Exhibits that Sustainable Visual Merchandising
Practices Influence the Consumer Buying Behaviour.
Keywords: Visual Merchandising, Sustainable Practices, Attitude of Consumer
1. INTRODUCTION
During Current years, Sustainability has gained Significantly Importance in Various Field. Retailers are Facing
lots of challenges for Sustainable Behaviour and Considering their key Role as Gatekeeper. Sustainability deals
with an Organisation must Follow such Business Strategies that meets the requirement of an Organisation and
its Investors while Sustaining, Protecting and Increasing Natural Resources and Human Resources. So that
which can be used by Future Generation. In fast Moving World, Retailers can Survive for a long term by
Adapting the Sustainable Store Design, Eco-friendly Fixture, Recyclable Window Display. Shoppers Expected
Retailers to Change Stores into Eco-Friendly Design and used Recyclable Merchandise. as Shoppers are
Becoming more conscious of Eco-Friendly Design. (Martin .M.Pegler, 2012). These days, Shoppers are
preferring to pay for Eco-friendly products and love to shop in Green Stores.
2. REVIEW OF LITERATURE
There is three Bottom Line mode which has been created for adopting sustainability to the business
environment. (Elkington, 1998), classified three dimensions such as the social, environmental and economic
dimensions. Institute explained that it is an activity that fulfills the needs of an organisation and its stakeholders.
It protects the environment, sustaining and elevate the human and natural resources that can be used in the
future. (International Institute for Sustainable Development, 1992, p. 11). Merchandiser facilitates their
customers to behave more sustainably through understanding specific requirements, considering the market
situation and the wants & desire of their customers. (Wiese et al., 2012b) They defined that through the
sustainable visual merchandising practices, the merchandiser can expect enhanced patronage intention from
environmentally sensitive consumers (Baker, Parasuraman, Grewal, & Voss, 2002). He defined that Eco-
friendly design enhances revenue in the long term (Badding, 2011). Ajzen & Fishbein, 1980 explained that
affluent consumers' loyalty to retailers might be predicted via their intention toward sustainable visual
merchandising practices, attitudes which influence behavioural intentions.
3. PROBLEM OF THE STUDY
The Retailers are Facing Cut-Throat Competition After the Globalization of Market. There are so many
Retailers in Dilemma about Sustainability Because they don't know about Consumer Attitude towards
Sustainable Visual Merchandising Practices. As we know that, there is a Huge Amount of Money and Time
Invested by the Retailers to Attract the Attention of the Consumer. The Aim of the Study is to Find out
Consumer Attitude Towards the Sustainable Visual Merchandising Practices.

International Journal of Advance and Innovative Research Volume 6, Issue 1 (XXIV): January - March, 2019
2
ISSN 2394 - 7780
4. GAP IN KNOWLEDGE
The Review of Literature Shows that there are Various Research Papers from the Sustainable Visual
Merchandising Practices Sector in the Different States of India but there is no Research Work done yet on
various Organised Retail Stores of Patna to See the Impact of Sustainable Visual Merchandising Practices on
Consumer Buying Behaviour.
5. OBJECTIVE OF THE STUDY
1. To Find the Role of Visual Merchandising as Sustainable Practices on Consumer buying Behaviour.
2. To Ascertain the Effect of Visual Merchandising as Sustainable Practices on Perspectives of Consumer
Buying Behaviour
6. RESEARCH METHODOLOGY
The Research Design is a Descriptive in nature. The Research Methodology is Designed to Investigate the
Influence of Impact of Sustainable Visual Merchandising Practices on the Attitude of Consumer Buying
Behaviour. The Research Approach is Deductive and Quantitative in Nature. The Primary Data used for the
Study.
6.1 Data Collection and Sampling In order to Investigate the Sustainable Visual Merchandising Practices on the Attitude of the Consumer within
the age group of 15 years to 60 years and above were selected. The Primary Data were Collected from different
Organised Retail Outlets of Patna through a questionnaire. There are 375 Samples of the Study Which Collected
through Various Organised Outlets of Patna.
6.2 Research Hypotheses
H1: There is a Significant Relationship between Energy Efficient Light Bulbs & Attitude of Consumer Buying
Behaviour.
H2: Eco-Friendly Fixture has a Significant impact on Attitude of Consumer Buying Behaviour.
H3: Recyclable Mannequin has a Significant Impact on Attitude of Consumer Buying Behaviour.
H4: Eco-friendly Window Display has a Significant Impact on Attitude of Consumer Buying Behaviour.
6.3 Variable Framewoke of the Study
How Variable of the Sustainable Visual Merchandising Practices Influences the Attitude of Consumers Buying
Behaviour
Figure-1: Variable Framework of the Study

International Journal of Advance and Innovative Research Volume 6, Issue 1 (XXIV): January - March, 2019
3
ISSN 2394 - 7780
SELF - GENERATED
Table-1: Frequencies Statistics of Variable of the Study
From the above table, Frequencies Statistics Table shows that Mean, Median, Mode and Standard Deviation of
each Variable of the Study.
7. RELIABILITY ANALYSIS QUESTIONNAIRE
Table-2: Reliability Test of Study
Variable Variance Alpha value
Energy Efficient Lighting 18.140 0.969
Eco -Friendly Fixture 18.586 0.971
Recyclable Mannequin 18.584 0.968
Eco-friendly Window display 19.409 0.975
From the above table, the reliability test for all four variables was carried out using SPSS22.0. The Cronbach’s
Alpha of the reliability test was 0.969 for Energy Efficient lighting, 0.971 for the Eco -Friendly fixture, 0.968
for Recyclable mannequin and 0.975 for Eco-friendly Window display. It means questionnaire is reliable.
8. HYPOTHESES TESTING (INFERENTIAL STATISTICS)
Hypothesis 1
H0: There is not a Significant relationship between Energy efficient Light Bulbs & Consumer Buying
Behaviour.
H1: There is a Significant relationship between Energy Efficient Light Bulbs & Consumer Buying Behaviour.
Table-3: Model Summary of Energy Efficient lighting
Model R R Square Adjusted R Square Std. Error of the Estimate
1 .935a .874 .874 .177
a. Predictors: (Constant), Energy Efficient lighting
From the above table, the adjusted R-square (coefficient of determination) value is 0.874 as shown, is close to 1
(its maximum value). It shows that This model is 87% fits for data.
Table 4. Coefficientsa of Linear Regression Test of Energy Efficient lighting
Model
Unstandardized Coefficients
Standardized
Coefficients
t Sig. B Std. Error Beta
1 (Constant) .569 .020 28.755 .000
Energy Efficient
lighting .303 .006 .935 50.974 .000
a. Dependent Variable: Attitude of Consumer Buying Behaviour
From the above table, The P-value of Energy Efficient lighting is .000 which is less than 0.05. It means that the
variable Energy Efficient lighting is positively contributing towards attitude of consumer buying behaviour (P-
value = 0.000 < 𝛼 = 0.05, 0.10).So as per the result, Hypothesis H0 is rejected and H1 is accepted that attitude
of consumer buying behaviour is significantly influenced by Energy Efficient lighting.
Hypothesis 2
H0 : Eco-Friendly Fixture is not a significant impact on attitude of consumer buying behaviour.
H1: Eco-Friendly Fixture is a significant impact on attitude of consumer buying behaviour.
Energy Efficient
Lighting
Eco -Friendly
Fixture
Recyclable
Mannequin
Eco-friendly Window
Display
N Valid 375 375 375 375
Missing 0 0 0 0
Mean 2.95 2.82 3.21 3.31
Median 2.00 2.00 4.00 4.00
Mode 2 2 4 4
Std. Deviation 1.539 1.494 1.481 1.412

International Journal of Advance and Innovative Research Volume 6, Issue 1 (XXIV): January - March, 2019
4
ISSN 2394 - 7780
Table-5: Model Summary of Eco-Friendly Fixture
Model R R Square Adjusted R Square Std. Error of the Estimate
1 .916a .840 .839 .200
a. Predictors: (Constant), Eco Friendly Fixture
From the above table, it exhibits that This model is 84% fits for data.
Table-6: Coefficientsa of Linear Regression Test of Eco- Friendly Fixture
Model
Unstandardized Coefficients
Standardized
Coefficients
t Sig. B Std. Error Beta
1 (Constant) .599 .022 27.053 .000
Eco- Friendly Fixture .306 .007 .916 44.203 .000
a. Dependent Variable: Attitude of Consumer Behaviour
From the above table, The P-value of Eco-Friendly Fixture is .000 which is less than 0.05. It means that the
variable Eco-Friendly Fixture is positively contributing towards attitude of consumer buying behaviour. (P-
value = 0.000 < 𝛼 = 0.05, 0.10).
So as per the result, Hypothesis H0 is rejected and H1 is accepted that attitude of consumer buying behaviour is
significantly influenced by Eco Friendly Fixture.
Hypothesis-3 H0 : Recyclable Mannequin is not a significant impact on attitude of consumer buying behaviour.
H1: Recyclable Mannequin is a significant impact on attitude of consumer buying behaviour.
Table-7: Model Summary of Recyclable Mannequin
Model R R Square Adjusted R Square Std. Error of the Estimate
1 .820a .673 .672 .286
a. Predictors: (Constant), Recyclable Mannequin
Based on the above table, the adjusted R-square (coefficient of determination) value is 0.673 It reveals that, this
model is 67% fits for data.
Table-8: Coefficientsa of Linear Regression Test of Recyclable Mannequin.
Model
Unstandardized Coefficients
Standardized
Coefficients
t Sig. B Std. Error Beta
1 (Constant) .576 .035 16.336 .000
Recyclable Mannequin .277 .010 .820 27.696 .000
a. Dependent Variable: Attitude of Consumer Behaviour
Based on the above table, The P-value of Recyclable Mannequin is .000 which is less than 0.05. It means that
the variable Recyclable Mannequin is positively contributing towards attitude of consumer buying behaviour.
(P-value = 0.000 < 𝛼 = 0.05, 0.10).
So as per the result, Hypothesis H0 is rejected and H1 is accepted that attitude of consumer buying behaviour is
significantly influenced by Recyclable Mannequin.
Hypothesis 4
H0 : Eco Friendly Window Display is not a significant impact on attitude of consumer buying behaviour.
H1: Eco Friendly Window Display is a significant impact on attitude of consumer buying behaviour.
Table-9: Model Summary of Eco-Friendly Window Display
Model R R Square Adjusted R Square Std. Error of the Estimate
1 .770a .593 .592 .319
a. Predictors: (Constant), Eco Friendly Window Display
Based on the above table, the adjusted R-square (coefficient of determination) value is 0.593. It exhibits that
this model is 59% fits for data.

International Journal of Advance and Innovative Research Volume 6, Issue 1 (XXIV): January - March, 2019
5
ISSN 2394 - 7780
Table 10. Coefficientsa of Linear Regression Test of Eco-Friendly Window Display
Model
Unstandardized
Coefficients
Standardized
Coefficients
t Sig. B Std. Error Beta
1 (Constant) .563 .042 13.400 .000
Eco Friendly Window Display .272 .012 .770 23.323 .000
a. Dependent Variable: Attitude of Consumer Behaviour
Based on the above table, The P-value of Eco-Friendly Window Display is .000 which is less than 0.05. It
means that the variable Eco-Friendly Window Display is positively contributing towards attitude of consumer
buying behaviour. So as per the result, Hypothesis H0 is rejected and H1 is accepted that attitude of consumer
buying behaviour is significantly influenced by Eco-Friendly Window Display.
8. a SUMMARY OF HYPOTHESES TESTING
Table-11: Summary of Hypotheses Testing
Hypothesis
R Square
P-value Asymp.
Sig. P<.05
Result
Conclusion
H1. Energy
Efficient
Lighting
.874
.000 Accepted Attitude of Consumer Buying
Behaviour influenced by Energy
Efficient Lighting
H2. Eco
Friendly
Fixture
.840 .000 Accepted Attitude of Consumer Buying
Behaviour influenced by Eco-Friendly
Fixture
H3 Recyclable
Mannequin
.673 .000 Accepted Recyclable Mannequin influenced the
Attitude of Consumer Buying
Behaviour
H4 Eco-Friendly
Window display
.593 .000 Accepted Eco-Friendly Window display
influenced the Attitude of Consumer
Buying Behaviour
From the above table, the R-square (coefficient of determination) value of Energy Efficient Lighting, Eco
Friendly Fixture, Recyclable Mannequin & Eco-Friendly Window display is 0.874,.840,.673& .593
respectively. It shows that all the model is fits for data. The P-value of all variables are .000 which is less than
0.05. It means that the all Variables are positively Influenced towards attitude of consumer buying behaviour.
9. VALIDITY TEST OF THE STUDY
Table-12: Correlations between Sustainable Visual Merchandising Practices and Attitude of
Consumer Buying Behaviour.
Sustainable VM Practices
Attitudes of consumer Buying
Behaviour
VM Pearson Correlation 1 .814**
Sig. (2-tailed) .000
N 375 375
sale Pearson Correlation .814** 1
Sig. (2-tailed) .000
N 375 375
**. Correlation is significant at the 0.01 level (2-tailed).
Based on the above table shows, the significant value is r = 0.814** So, it can be said that if the sustainable
visual merchandising practices level will increase, then the attitudes of consumer buying behaviour will also
increase with 81%. It means when the Sustainable Visual Merchandising will increase, then Attitudes of
Consumer Buying Behaviour will also increase in the shop.

International Journal of Advance and Innovative Research Volume 6, Issue 1 (XXIV): January - March, 2019
6
ISSN 2394 - 7780
10. DATA ANALYSIS
Table-13: Demographic Profile of Respondents
Particular Category Frequency %
Gender Male 201 53.6%
Female 174 46.4%
Age 15-30 206 55%
31-45 131 35%
46-60 22 6%
60 and above 16 4%
Educational Qualification Non-Matric 20 5.33%
Intermediate 44 11.73%
Graduation 150 40%
Post-Graduation 105 28%
Professionals 53 14.13
Income Up to 2 lac 140 37.33%
200001-4 lac 126 33.6%
400001-6 lac 86 22.93%
600001 and above 23 6.13%
Occupation Business Executives 60 16%
Service Officer 90 24%
Students 135 36%
Homemakers 52 13.8%
Other 38 10.13%
Based on the above table summary of respondents’ demographic profile, majority of respondents are male with
significant percentage of 53.6 % compared to the female respondents which only consist of 46.68%.
11.1. IMPACT OF VISUAL MERCHANDISING ON GENDER
Table-14: The percentage of the respondent based on Gender
Gender Category Frequency %
Male 201 53.6
Female 174 46.4
Total 375 100.0
Source-Sample Survey 2018
Graph-1: The percentage of the respondent based on Gender
Analysis: Based on the figure above, majority of the survey’s respondent are male with 54.6% while the
remaining with 46.4% is female. The purpose of the study to know the impact sustainable visual merchandising
practices on attitude of Consumer Buying Behaviour.

International Journal of Advance and Innovative Research Volume 6, Issue 1 (XXIV): January - March, 2019
7
ISSN 2394 - 7780
11.2. Does Energy Efficient Lighting influence the attitude of Consumer Behaviour?
Table-15: The percentage of the Respondents’ Attitude of Consumer Behaviour by energy efficient
lighting
Frequency Percent Valid Percent Cumulative Percent
Valid strongly agree 79 21.1 21.1 21.1
agree 121 32.3 32.3 53.3
neutral 10 2.7 2.7 56.0
disagree 70 18.7 18.7 74.7
strongly disagree 95 25.3 25.3 100.0
Total 375 100.0 100.0
Source-Sample Survey 2018
Graph-2: The percentage of the respondent’s Attitude of Consumer Behaviour by energy efficient
lighting
Analysis: From the above table, It can be observed that 21.1% of the sample of strongly agree & 37% of
sample agreed with energy efficient lighting. But 18.7% of sample and 25.3% of sample did not agree with
energy efficient lighting.it can be said that more than 53 % consumer believed that attitudes of consumer buying
behaviour is influenced by Energy Efficient Lighting.
11.3 Does Eco-Friendly Fixture influence the attitude of Consumer Behaviour?
Table-16: The Percentage of the Respondents’Attitude of Consumer Behaviour by Eco-Friendly Fixture.
Frequency Percent Valid Percent Cumulative Percent
Valid strongly agree 90 24.0 24.0 24.0
agree 116 30.9 30.9 54.9
neutral 9 2.4 2.4 57.3
disagree 90 24.0 24.0 81.3
strongly disagree 70 18.7 18.7 100.0
Total 375 100.0 100.0
Source-Sample Survey 2018
Graph-3: The percentage of the respondent’s Attitude of Consumer Behaviour by Eco-Friendly Fixture

International Journal of Advance and Innovative Research Volume 6, Issue 1 (XXIV): January - March, 2019
8
ISSN 2394 - 7780
Analysis: From the above table, it can be observed that 24% of the sample of strongly agree & 30.9 % of
sample agreed with Eco-Friendly Fixture. But 24% of sample and 18.7% of sample did not agree with Eco-
Friendly Fixture.it can be said that more than 54 % consumers believed that attitudes of consumer buying
behaviour is influenced by Eco-Friendly Fixture.
11.4 Does Recyclable Mannequin influence the attitude of Consumer Behaviour?
Table-17: The Percentage of the Respondents’Attitude of Consumer Behaviour by Recyclable Mannequin
Frequency Percent Valid Percent Cumulative Percent
Valid strongly agree 70 18.7 18.7 18.7
agree 80 21.3 21.3 40.0
neutral 16 4.3 4.3 44.3
disagree 120 32.0 32.0 76.3
strongly disagree 89 23.7 23.7 100.0
Total 375 100.0 100.0
Source-Sample Survey 2018
Graph-4: The percentage of the respondent’s Attitude of Consumer Behaviour by Recyclable Mannequin
Analysis: From the above table, it can be observed that 18.7% of the sample of strongly agree & 21.3 % of
sample agreed with Recyclable Mannequin. But 32% of sample and 23.7% of sample did not agree with
Recyclable Mannequin.It can be concluded that more than 40 % consumers believed that attitudes of consumer
buying behaviour is influenced by Recyclable Mannequin.
11.5 Does Eco-Friendly Window Display influence the attitude of Consumer Behaviour?
Table-18: The Percentage of the Respondents’Attitude of Consumer Behaviour by Eco-Friendly Window
Display
Frequency Percent Valid Percent Cumulative Percent
Valid strongly agree 60 16.0 16.0 16.0
agree 70 18.7 18.7 34.7
neutral 22 5.9 5.9 40.5
disagree 140 37.3 37.3 77.9
strongly disagree 83 22.1 22.1 100.0
Total 375 100.0 100.0
Source-Sample Survey 2018
Graph-4: The percentage of the respondent’s Attitude of Consumer Behaviour by Eco-Friendly Window
Display

International Journal of Advance and Innovative Research Volume 6, Issue 1 (XXIV): January - March, 2019
9
ISSN 2394 - 7780
Analysis: From the above table, it can be observed that 16% of the sample of strongly agree & 18.7 % of
sample agreed with Eco-Friendly Window Display. But 37.3% of sample and 22.1% of sample did not agree
with Eco-Friendly Window Display.It can be concluded that more than 34 % consumers believed that Attitudes
of Consumer Buying Behaviour is influenced by Eco-Friendly Window Display.
12. FINDINGS
The Most Impactful Sustainable Visual Merchandising Practices element according to customers are Energy
Efficient lighting, Eco-Friendly Fixture, Recyclable Mannequin and Eco-Friendly Window display.
There is deeply influence of Sustainable Visual Merchandising Practices on the Attitude of Consumer
Buying Behaviour.
Most of the Customers visit here (about 47.12%) are having annual income up to 2 lac
Most of the customer (about 36%) of organised outlets belongs to students.
Most of the visitors of outlets (about 55. %) are belong to 15-30 age group.
13. CONCLUSION
The study is conducted to know the attitude of consumer behaviour towards the Sustainable Visual
Merchandising Practices,
The Study revealed that the attitude of consumer behaviour significantly influenced by Sustainable Visual
Merchandising Practices.
It shows that if the retailers would use the Energy Efficient Lighting, Eco Friendly Fixture, Recyclable
Mannequin, Eco Friendly Window Display, then Consumer would purchase because Consumers are
Becoming more Conscious about Environment for Future Generation.
The study showed that Customers will agree to pay for Recyclable Merchandise and want to shop in Green
Stores.
14. RECOMMENDATION
As per the Result, there is Positive Relationship between Attitude of Consumer Buying Behaviour and
Sustainable Visual Merchandising Practices.
The Study is Suggested that Retailers should Practice of Sustainable Visual Merchandising because it
influences Buying Attitude of Consumer Behaviour.
The Study Reveals that the use of Energy Efficient Lighting, Eco-Friendly fixture, Recyclable Mannequin &
Eco-friendly Design, it would not only Minimize the Indirect Cost of the store but also increase the
Profitability of Store.
The Study is Suggested that Retailers can Survive for long term by adapting Sustainable Visual
Merchandising Practices as Strategies that Meet the Need of Organised Retail and its Stakeholders while
Protecting, Sustaining and Escalating the Human and Natural Resource that can be used by Future
Generation.
15. LIMITATION OF THE STUDY
Time Frame and Resource for the study was a constraint.
The Study was Confined in Patna.
Respondents were Resisting to fill the Questionnaire
Apart from Visual Merchandising, there is the influence of other mediums like television, newspaper, and
radio used for communicating the Discount and scheme.
16. CONTRIBUTION TO ADVANCEMENT OF EXISTING KNOWLEDGE
The Research Findings contribute to a better understanding of sustainable visual merchandising practices
and its influence on Attitude of consumer behaviour and sale,
It breaks the dilemma of Retailers in term of Sustainable Visual Merchandising Practices.
This Study reveals that the Sustainable Visual Merchandising Practices have huge influences on buying
behaviour and it has stimulated sale in Organised Retail sector.
The study helps retailers to survive for a long term.

International Journal of Advance and Innovative Research Volume 6, Issue 1 (XXIV): January - March, 2019
10
ISSN 2394 - 7780
It helps to maximize the profit of a firm without harming the environment and its natural resources. It assists
retailers to grab the attention of consumer by offering Eco-friendly Merchandising.
The study enables retailers to gain competitive advantages by adopting Sustainable Strategy
17. SCOPE FOR FURTHER STUDY This Study Examined limited factors of Sustainable Visual Merchandising Practices affecting the Attitude of
Consumer Buying Behaviour. Further Research can be done on the impact of other elements of Sustainable
Visual Merchandising Practices such as Eco-Friendly Store Design, Recyclable Merchandise, Eco Friendly
design layout, product display, and Eco-Friendly Paper Bags, Cleanliness etc., Associated with the Attitude of
Consumer Buying Behaviour in the Indian context as well as International Context.
18. REFERENCE
1. Pegler, M. M. (2012). Visual Merchandising & Display. New York, NY: Fairchild Books Thomas .C.
George, Research Methodology & Scientific Writing,ane books Pvt.Ltd
2. Elkington, J. (1998), Cannibals with Forks – The Triple Bottom Line of 21st Century Business, New
Society, Stony Creek, CT
3. International Institute for Sustainable Development (1992), Business Strategy for Sustainable
Development, Leadership and Accountability for the ’90s, International Institute for Sustainable
Development, Winnipeg
4. United Nations Environment Programme (2003), “Shopping for a better world: facts and figures”, Industry
and Environment, Vol. 26 No. 1, pp. 4-6
5. Wiese, A., Kellner, J., Lietke, B., Toporowski, W. and Zielke, S. (2012a), “Sustainability in retailing – a
summative content analysis”, International Journal of Retail & Distribution Management, Vol. 40 No. 4,
pp. 318-335
6. Badding, S. (2011). Sustainable change: knowledge absorption as a factor of absorptive capacity theory
among green industry consultants. (Master’s thesis). Colorado State University, USA.
7. Baker, J., ParasuramanA., Grewal, D., & Voss, G.B. (2002). The influence of multiple store environment
cues on perceived merchandise value and patronage intentions.Journal of Marketing. 66(2), 120-142.
8. Ajzen, I., & Fishbein, M. (1980). Understanding attitudes and predicting social behavior. Englewood
Cliffs, NJ: Prentice-Hall.
9. Extracted from https://www.emeraldinsight.com/doi/full/10.1108/IJRDM-02-2015-0024
10. Extracted from https://lib.dr.iastate.edu/cgi/viewcontent.cgi?article=1167&context=undergradresearch_
symposium
11. Bezawada, R. and Pauwels, K. (2013), “What is special about marketing organic products? How organic
assortment, price, and promotions drive retailer performance”, Journal of Marketing, Vol. 77 No. 1, pp. 31-
51
12. Chen, S.-M. and Huddleston, P. (2009), “A comparison of four strategies to promote fair trade products”,
International Journal of Retail & Distribution Management, Vol. 37 No. 4, pp. 336-345
13. Connelly, B.L., Ketchen, D.J. and Slater, S.F. (2011), “Toward a ‘theoretical toolbox’ for sustainability
research in marketing”, Journal of the Academy of Marketing Science, Vol. 39 No. 1, pp. 86-100
14. Anne Wiese, Stephan Zielke, Waldemar Toporowski, (2015) "Sustainability in retailing – research streams
and emerging trends", International Journal of Retail & Distribution Management, Vol. 43 Issue:
4/5, https://doi.org/10.1108/IJRDM-02-2015-0024
15. World Commission on Environment and Development (1987), Our Common Future, Oxford University
Press, New York, NY
16. Ytterhus, B.E., Arnestad, P. a

International Journal of Advance and Innovative Research Volume 6, Issue 1 (XXIV): January - March, 2019
11
ISSN 2394 - 7780
INNOVATIVE PRACTICES AND APPLICATION IN ICT - USES IN EDUCATION
Shraddha Prasad Kokate and Dr. Pradhnya M Wankhade
Department of Information Technology, J. E. S College of Commerce, Science & Information Technology,
Jogeshwari
ABSTRACT
ICT is technology that supports activities involving information. Such activities include gathering, processing,
storing and presenting data. Increasingly these activities also involve collaboration and communication. Hence
IT has become ICT: information and communication technology. Here are the some underlying principles
where Technology does not exist in isolation. ICT contributes at various points along a line of activity.
ICT is used in activities – the ICT use depends on the activities
The key outputs of educational activities are context are knowledge, experience and products.
The output should be useful to the users (self and others)
Information and communications technology (ICT) refers to all the technology used to handle
telecommunications, broadcast media, intelligent building management systems, audiovisual processing and
transmission systems, and network-based control and monitoring functions.
Although ICT is often considered an extended synonym for information technology (IT), its scope is more broad.
ICT has more recently been used to describe the convergence of several technologies and the use of common
transmission lines carrying very diverse data and communication types and formats. This paper tries to brings
various uses of ICT in different field. New technology and its concepts that make things easier , flexible,
understandable and comfortable.
Keywords: ICT in education, objectives, change process, virtual labs, remote labs, teleconferencing ,
Innovation, applications, technology, practices
Theme: Innovative Practices and application in ICT – uses in Education
1. INTRODUCTION
Information and Communication Technology is an extensional term for Information Technology that stresses
the role of unified communication an integration of telecommunication and computer , as well as necessary
enterprise software , middleware , storage and audio visual systems , that enable user to access data , store data
and update the data…
ICT is technology that supports activities involving information. Such activities include gathering, processing,
storing and presenting data. Increasingly these activities also involve collaboration and communication. Hence
IT has become ICT: information and communication technology. Some underlying principles Technology
does not exist in isolation ICT contributes at various points along a line of activity. ICT is used in activities –
the ICT use depends on the activities
The key outputs of educational activities are context are knowledge, experience and products
The output should be useful to the users (self and others)
Information and communications technology (ICT) refers to all the technology used to handle
telecommunications, broadcast media, intelligent building management systems, audiovisual processing and
transmission systems, and network-based control and monitoring functions.
Although ICT is often considered an extended synonym for information technology (IT), its scope is more
broad.ICT has more recently been used to describe the convergence of several technologies and the use of
common transmission lines carrying very diverse data and communication types and formats.
A good way to think about ICT is to consider all the uses of digital technology that already exist to help
individuals, businesses and organisations use information. ICT covers any product that will store, retrieve,
manipulate, transmit or receive information electronically in a digital form. For example, personal
computers, digital television, email, robots.
Information and communication technology, or ICT, is defined as the combination of informatics technology
with other, related technologies, specifically communication technology. In this book, these three definitions
have been collapsed into a single, all encompassing, definition of ICT. This definition implies that ICT will be

International Journal of Advance and Innovative Research Volume 6, Issue 1 (XXIV): January - March, 2019
12
ISSN 2394 - 7780
used, applied, and integrated in activities of working and learning on the basis of conceptual understanding and
methods of informatics.
The 21st century is already the age of knowledge, the knowledge society and the educational age. The
educational industry will be the industry of the 21st century. It is only natural that new technologies, ICT
(Information and Communication Technology) above all, are in the focus of those who are contemplating the
novelties in education. ICT has brought a range of new terms in the education like: e-learning, distance
education, virtual classrooms, etc. While new terminology is being defined and redefined, hundreds of pioneers
experiment with the usage of ICT in education.
The strategists of education, politicians and decision makers on the national and international level are
prophesying, proposing, planning and talking about major benefits from ICT implementation in education.
2. AIM
An aim on which change agents, implementers and all other players could keep an eye while embarking on this
exciting journey of fundamentally changing the activity which makes humans essentially different from all
other species .This aim could be surprisingly simple. It is to move ICT from labs, experimental institutions and
pilot projects to every days practices in a broad number of activities in majority of schools , colleges, offices .
ICT also include improvement in all aspects in other fields also like arts, science ,commerce, engineering ,fine
arts….
3. THE HOPES
The most important benefit from ICT in education it is hoped for is improved learning outcomes. It would
provide necessary skilled workforce for the knowledge society while boosting cost/benefit ratio. No less
important is hope to speed up learning process making it in average much faster than today. Democracy would
get to its full potential by democratization of learning, lowering all sorts of boundaries between students and
knowledge while bringing knowledge to all students and unlimited number of them. This hope is combined with
already an urban legend that ICT will make learning and teaching much cheaper. Finally, while quality learning
does require substantial effort from students and teachers, the process itself could be much easier and more
pleasant.
4. THE VISION
Based on proliferating use of ICT in almost every aspect of modern life, almost universally shared vision is
created. This vision believes that overall human knowledge (already mostly is, but certainly) soon will be fully
digital and available to any student globally for whatever purpose. The world where a student is restricted to
locally available teacher is the past and we see the world in which student and teacher are globally matched and
paired for a specific learning activity based on desired outcome, psychology, timing, cost, and multiple other
factors. It is envisioned that students will learn anytime when their need and ability meet, at the pace that best
suites them. Finally, it is clearly seen that education process will be freed from non-educational activities like:
administration, support, organization, etc. They will be minimized, automated, reprogrammed, asynchronous
and delegated.
5. THE REALITY
While an army of researchers are seeking technical and organizational solutions, while pioneers all over the
world already for more than a decade experiment “in vitro” implementing those solutions and while politicians
talk and beehive as if they single handedly created the vision and bore solutions for it and as if the vision is
already implemented and realized, the reality is quite different.
ICT is still far from the mainstream of education. It is predominantly in hands of pioneers and early adopters,
still on the margins of early majority.
The furthest most “mainstream educators” came is to publish “digital photocopies” of their educational
materials. They simply switched media leaving materials in the form of “paper age”.
Even worse, e-learning is still mostly illegal. Not that someone will be prosecuted for doing it, but in the sense
that only minority of educational institutions recognize e-learning as their regular way of teaching and learning
and even smaller number makes it their strategy and priority.
The whole initiative is operating in an organizational vacuum in most educational institutions, globally. The
expectations form ICT leverage are greatly exaggerated while not being properly planned for and without or
with only symbolic financing. The key problem are missing and unassigned responsibilities in the envisioned
change process.

International Journal of Advance and Innovative Research Volume 6, Issue 1 (XXIV): January - March, 2019
13
ISSN 2394 - 7780
Those visions are nothing more than dreams tending to become illusions. So, what can be done to change that
situation? The first thing to look at are the forces to change. Without a change driver there won’t be any change.
The forces in any process come from the customer, internally and from the environment.
The ultimate customer of the educational industry is the one who uses skilled professionals: the industry. The
industry is already demanding well educated highly skilled professionals. There is increased demand for
customized education targeted at specific subset of knowledge or tailored for a specific project [9]. Another
demand from industry is globally standardized certification of knowledge and skills.
Internal change forces are students and teachers. Because of the industry demands, students need customized
education, now and fast and they do not want to waste time on any kind of overhead: administrative,
organizational or any other. Teachers want to reach every student globally available in order to maximize the
gain from their investment in designing educational materials, tools and processes. They too want to reduce
overhead in order to boost their own productivity.
The globalization process creates pressure from the environment creating competition where there wasn’t any
and bringing it from sources unknown till now. For example, globally available virtual labs and remote labs
compete with physical facilities at local school. Competitors are no longer only other local or national schools
not even well established and recognized schools from the world. Competition today comes from countries and
institutions one barely heard of or even from industrial education facilities whose educational certificates are
globally recognized and demanded (Cisco, Microsoft, LPI, ECDL, …). Finally, the process of decoupling
teaching from certification (ECDL, LPI, …) is a force in itself that will irreversibly change the landscape of
traditional educational institution we all are familiar with.
6. USES AND APPLICATIONS OF ICT
The most important benefit from ICT in education it is hoped for is improved learning outcomes. It would
provide necessary skilled workforce for the knowledge society while boosting cost/benefit ratio. No less
important is hope to speed up learning process making it in average much faster than today. Democracy would
get to its full potential by democratization of learning, lowering all sorts of boundaries between students and
knowledge while bringing knowledge to all students and unlimited number of them. This hope is combined with
already an urban legend that ICT will make learning and teaching much cheaper. Finally, while quality learning
does require substantial effort from students and teachers, the process itself could be much easier and more
pleasant.
7. OBJECTIVES
This paper’s scope is to propose one possible set of objectives that could realize above defined aim. For each
objective a set of applications, change drivers, requirements and possible leaders will be identified.
Education processes differ among themselves because of the subject of learning, required learning outcomes,
previous knowledge, learning styles, culture, industry and many other factors. On the other hand, ICT can be
used in a variety of ways in any traditional or new activity.
These two factors combined derive numerous activities in educational process in which ICT is or can be
implemented. In order to streamline them and to try to identify some common points and shared resources, it is
proposed to group them in three sets of objectives:
Support functions: administrative, technical and supportive functions ,
Learning assistance: assistance and support for learning and teaching,
New learning: new teaching and learning methods, techniques and tools.
Using this aim as an orientation point, a way towards it needs to be designed. The way is a stepwise process to
be followed both globally and in each segment of the way or specific activity. It needs to: define objectives, for
each objective identify: change drivers, players, resources, outcomes, leaders ,set the infrastructure, plan,
publicize.
The first step is to define objectives. Objectives are clearly defined realistic goals to be accomplished. In the
next step, for each objective change drivers, players, available and needed resources as well as measurable
expected outcomes need to be identified. Leaders are those who initiate and sustain the change process.
The third step calls for setting the infrastructure. It encompasses everything that will be used in the change
process or that will support it: strategies, materials, equipment, money, time, people, education, consultants, …

International Journal of Advance and Innovative Research Volume 6, Issue 1 (XXIV): January - March, 2019
14
ISSN 2394 - 7780
With infrastructure set, a change plan consisting of sets of well documented procedures needs to be designed.
Finally, the players in the change process need to become informed and familiarized with all this through
extensive and continuous process of publicizing.
8. ANALYSIS
Support functions
Support functions are all those administrative, technical and supportive functions that are (considered to be)
necessary in today’s educational processes but which do not increase the knowledge or skills of students by
themselves. In particular they are: enrolment to courses and programs, certification (a formal and administrative
process as opposed to knowledge verification) and payment. They are also: scheduling of classes, exercises and
exams; attendance granting and monitoring; resource allocation and usage monitoring and billing. Surveys,
statistics and reports belong here, too. Supplemental functions are provision and usage of libraries and info
services, counseling and student assistance. Finally, the mere physical presence at the premises of a school is a
support function, as well,
Today, a substantial amount of student’s and teacher’s time is used for those functions. By intensive, extensive
and proper use if ICT all mentioned functions can be reduced, automated, asynchronized or avoided at all.
The goals should be to avoid (the need for) physical presence for all administrative activities and for all those
learning activities where possible. The data which a user (student or teacher) enters into the system should be
available system wide and should never be entered again. Every function that can be described by rules and
programmed should be performed by computers, automatically, not requiring human effort. The communication
among all players in the educational system should be available on-line 24 hours a day 365 days a year using
the variety of communication techniques (phone, Internet …) preferably asynchronous ones: SMS, IM, e-mail.
This means that administrative information systems, automated information systems and digital libraries should
be built. Teleconferencing should be routinely used. Virtual communities need to be established providing legal
assistance, support groups etc. Finally, virtual and remote labs should be designed.
All the technologies exist, applications have been tested world wide and concepts proved in practice. So, what
needs to be done in order to implement them on the broader scale?
The change drivers fall in two categories: financial pressure and market competition. The need for
administrative cost reduction and efficient resource usage make financial pressure on school administrations.
Market competition in form of increased offer from other educational institutions and new players from the
industry will result in increased demand from both students and teachers to reduce non-educational burden on
their time.
In order for those changes to take place, certain requirements need to be met: educational institutions need to be
(at least partially) cost based instead of fixed budget, students need to be empowered and reputational
framework in place supporting remote work and education in general.
Finally, the leaders of change need to be identified. In this case these are students, their organizations and
leaders and leaders from administration (school, local, or national)
Learning assistance
Learning assistance are all those functions that provide assistance and support for learning and teaching. They
are closely related or bound to learning content and process but do not directly increase student’s knowledge or
skills in the learning domain. They are comprised of resources and systems that make learning and teaching
faster, easier, better focused, broader and deeper thus enhancing the understanding and mastering domain
knowledge and skills. They are also systems that continuously improve teacher’s competences [4] as well as
student’s knowledge and skills outside (but in “neighborhood”) of the learning domain.
The goals within this objective are to provide students with all necessary and desired information and
knowledge and to do so in digital form suitable for any type of processing and manipulation they deem
desirable. A goal is also to further physically and temporally decouple student from any other individual,
resource or process required or desired in learning. Assumed goal is that all necessary resources are available to
a student as well as training and support to efficiently use them. An important resource in learning process are
centers of excellence: points of referral when in doubt or need for clarification and assistance.
These goals can be accomplished by digitizing all existing learning and teaching materials and making them
available on-line, by establishing and opening digital libraries and opening all relevant digital collections and
International Journal of Advance and Innovative Research Volume 6, Issue 1 (XXIV): January - March, 2019
15
ISSN 2394 - 7780
libraries world-wide to students while learning. Archives of student’s results from previous generations as well
as their questions and answers to them are invaluable source and aid in learning process. E-mail communication
with teachers and other students, virtual (global) working groups, distance asynchronous teaching, live
streaming and recordings of lectures, exercises and events greatly enhance and simplify learning process.
Computers, communications and SW tools per se but also as means to access and use other resources should be
treated as resources and readily, presently available to students. Training and assistance for their usage are
natural part of those resources.
In order to create described learning assistance, change forces can come from three sources. Students will
demand them as market competition increases and competitors start creating their own market advantage
offering such assistance. Professional educational standards could come from teachers professional associations
and education industry as the changing force. Educational community (such as university) could create “service
level” requirements within themselves thus creating internal change force. Obvious but serious obstacles in this
process area associated cost and huge effort required from all involved in providing education and traditional
inertia of large systems.
In order for these changing forces to succeed there are requirements to be fulfilled. Above all it is necessity to
honestly, substantially recognize the (importance of) teaching quality and achievement. Currently there are only
few instances where a regulation would prevent development of learning by means of ICT, but significant
changes in regulation are a must in order to foster it. Market competition of education providers is single most
important factor that needs to be established in order to “wake up giants”. When all this is set, the infrastructure
that will support e-learning needs to be in place, too. Large financial investment is inevitable in every
educational system.
The final question is: who can lead the change? In part that can be students demanding resources. Majority of
burden still lies on educational authorities and governance. However, teachers and their associations cannot
avoid their responsibility in this change
9. RECOMMENDATION
New learning is a joint name for new methods, techniques and tools in teaching and learning that substantially
change the outcomes, the way and the experience of learning. They do so in the way which would be
impossible, impractical or prohibitively expensive without the use of ICT.
Since this is a very innovative field of ICT leverage it is difficult to set fixed goals, but on the general terms it is
about full adjustment of learning process to needs and abilities of the student. It is focused on understanding and
mastering knowledge modules of sustainable importance. Above all it is about putting full control of learning
process in student’s hands, making learning process as transparent as possible with ample reference points
enabling students to measure their progress, asses acquired skills and knowledge and find their way forward in
every learning situation.
These goals can be accomplished through ICT implementation in several ways. One of most innovative ways is
by means of virtual laboratories in which students can perform endless experiments at no additional cost,
dangerous or unethical (on simulations of human body) experiments, impossible experiments (temperatures
close to absolute zero or no-gravitation environment) or experiments with compressed or elongated time line.
Virtual working groups and faculty staff would add to student’s ability to truly understand and grasp learning
concepts. Self examination tools are those that will provide students with orientation points for their own path
and milestones along it. Self paced integrated adaptive learning materials are the ultimate goal. They are as
close to the real teacher silicone technology will ever get. They will liberate teachers from tedious and routine
work and concentrate their skills and energy to providing teaching, mentoring and coaching only human can.
Simultaneously, students will be able to learn in the way best suits them, aiming to the goals tailored to their
needs, in the process optimized to their abilities while keeping the control in their own hands.
The major driver that will force change in the learning process itself is market competition. Once students
experience new, enhanced learning they will demand it from all educators. Since the major burden of changing
the learning process is on teachers, market competition will result in pressure from educational employers who
will require teachers to improve and develop the learning process. In addition, teacher’s professional
associations may come forward with new set of professional teaching standards which could serve as an
auxiliary change driver.
As with other objectives, market competition should not only be waited for but should be proactively created by
national governments, educational communities, international associations and industry at large. Strong

International Journal of Advance and Innovative Research Volume 6, Issue 1 (XXIV): January - March, 2019
16
ISSN 2394 - 7780
recognition of quality (in) teaching is a must for the changes to become sustainable. It has to be understood that
new learning requires more effort on side of teachers and students likewise, plenty of time and a lot of money.
In addition, since teachers and students alike are walking on a completely new path they need strong support. In
such an innovative process it is very difficult to precisely plan for required infrastructure and even more
difficult to optimize its use. Therefore a state-of-the-art, abundant infrastructure needs to be provided to all
players.
Crucial point to understand is that innovative teachers are pioneers in this process, not leaders. Leaders can be
only those who can (inter)connect ideas, pilots and new achievements, obtain resources and start the change
process. In general, those are decision makers at the highest level.
10. CONCLUSION
Proposed set of objectives, goals, drivers, requirements and leaders is not the only one possible but could be
used as an orientation point or guiding principle to design a similar one for the educational change desired.
It is important to identify, define and design all components and put them in operation because they are all
crucial. For example, even ample resources and detailed plan will bear no results if they are missing a change
force or are trying to engage the wrong one. Similarly, without the proper leader there will be no sustainability
and no focus in the process and thus desired results cannot be achieved.
However, if all elements are in place and are applied over the appropriate period of time, they will result in
expected outcomes.
Leading authors on change in educational systems agree that the major changing force are teachers. Students
have very important role, too. All others are “merely” in a support function but their role is therefore not less
important and their responsibility cannot be circumvented. Indeed, support functions in education like decision
makers, regulators and financiers are those with the major responsibility to design the change process properly
and keep it in motion.
11. REFERENCES
Basset, P. (March 2005): Seven surprises for school leaders, Education Week
Bates, A.W. (1995): Technology, Open Learning and Distance Education, Routledge, New York
Bates, A.W.; Poole, G. (2003): Effective Teaching with Technology in Higher Education, Jossey-Bass, San
Francisco
Elmore, R.; Burney, D. (1999): Investing in teacher learning, in Teaching as the learning profession, 236-91
, Jossey-Bass, San Francisco
Fullan, M. (1993): Change forces, RoutledgeFarmer, London
Fullan, M. (2001): The new meaning of educational change, Teachers College Press, New York
Fullan, M. (2004): Leadership and sustainability: Systems thinkers in action, Corwin Press, Thousand Oaks,
Hargreaves, A. (2003): Teachers in a knowledge society, Teachers College Press, New York
Pfeffer, J.; Sutton, R. (2000): The knowing-doping gap: How smart companies turn knowledge into action,
Harvard Business School Press, Bost

International Journal of Advance and Innovative Research Volume 6, Issue 1 (XXIV): January - March, 2019
17
ISSN 2394 - 7780
THE SKILL DEVELOPMENT ECOSYSTEM IN INDIA
Dr. Suryakant Ratan Chaugule
Assistant Professor, Department of Commerce, Jalna Education Society’s, R. G. Bagdia Arts, S. B. Lakhotia
Commerce & R. Bezonji Science College, Jalna
INTRODUCTION Skill development and entrepreneurship efforts across the country have been highly fragmented so far. As per
the NSSO, 2011-12 (68th round) report on Status of Education and Vocational Training in India, among
persons of age 15-59 years, about 2.2% reported to have received formal vocational training and 8.6% are
reported to have received non-formal vocational training. There is a need for speedy reorganization of the
ecosystem of skill development and entrepreneurship promotion in the country to suit the needs of the industry
and enable decent quality of life to its population.Currently, over 40 skill development Programmes (SDPs) are
being implemented by over 20 Ministries/Departments of the Government of India. However, there are gaps in
the capacity and quality of training infrastructure as well as outputs, insufficient focus on workforce
aspirations, lack of certification and common standards and a pointed lack of focus on the unorganized sector.
Recognizing the need and urgency of quickly coordinating the efforts of all concerned stakeholders in the field
of Skill Development and Entrepreneurship, according to the needs of the industry, the Government of India
notified the formation of the Department of Skill Development and Entrepreneurship on 31st July, 2014. The
department was subsequently upgraded to a full-fledged Ministry of Skill Development and Entrepreneurship
on 9th November, 2014.
Education, vocational training and lifelong learning are central pillars of employability, employment of workers
and sustainable enterprise development”.Skill development is critical for economic growth and social
development. The demographic transition of India makes it imperative to ensure employment opportunities for
more than 12 million youths entering working age annually. It is estimated that during the seven-year period of
2005-2012, only 2.7 million net additional jobs were created in the country. To enable employment ready
workforce in the future, the youth need to be equipped with necessary skills and education. The country
presently faces a dual challenge of severe paucity of highly-trained, quality labour, as well as non-employability
of large sections of the educated workforce that possess little or no job skills. The skill development issue in
India is thus pertinent both at the demand and supply level. To meet the demand side challenge, consistent
efforts are being made towards expansion of economic activities and creation of large employment
opportunities. On the supply side, a simple look at the projected youth population provides a fair reason to
believe that India has the strength to cater to this demand. However, the employability quotient is questionable
and remains a major area of concern. Already huge gaps exist between the industry requirements and the level
of skills of workers due to varied reasons including inadequate training infrastructures, inappropriate mix of
skills and education, outdated curricula, limited industry interfaces, limited standards, etc.
The skill development ecosystem in India is skewed towards a formal education system with limited vocational
training. While the vocational training is in a dismal state both qualitatively and quantitatively, the higher
education system itself is grappling with issues related to scale and quality.Moreover, there is a disconnect
between the formal education system and work requirements, compounding the challenges related to the skill
gap. A concerted action is thus required on the supply side to ensure sustained employability of the Indian
youth. Extensive efforts to skill the workforce are required, both in quantity and quality. Transforming the skill
development ecosystem and making it responsive to needs of both industry and citizensrequires a scalable,
efficient and comprehensive vocational training ecosystem to meet future requirements.There is a need to assess
the traditional approach of skill development delivery in India in light of the successful models and best
practices in other economies. The learning’s can be imbibed and custom adopted to address the skill
development challenges of India. This is one of the key objectives of the study presented.
SKILL DEVELOPMENT ECOSYSTEM IN INDIA
The skill development ecosystem in India is complex, large and diverse, providing varied levels of skills across
an extremely heterogeneous population. Skill development in India can be broadly segmented into Education
and Vocational Training. The exhibit below presents the broad framework of Skill Development in India.
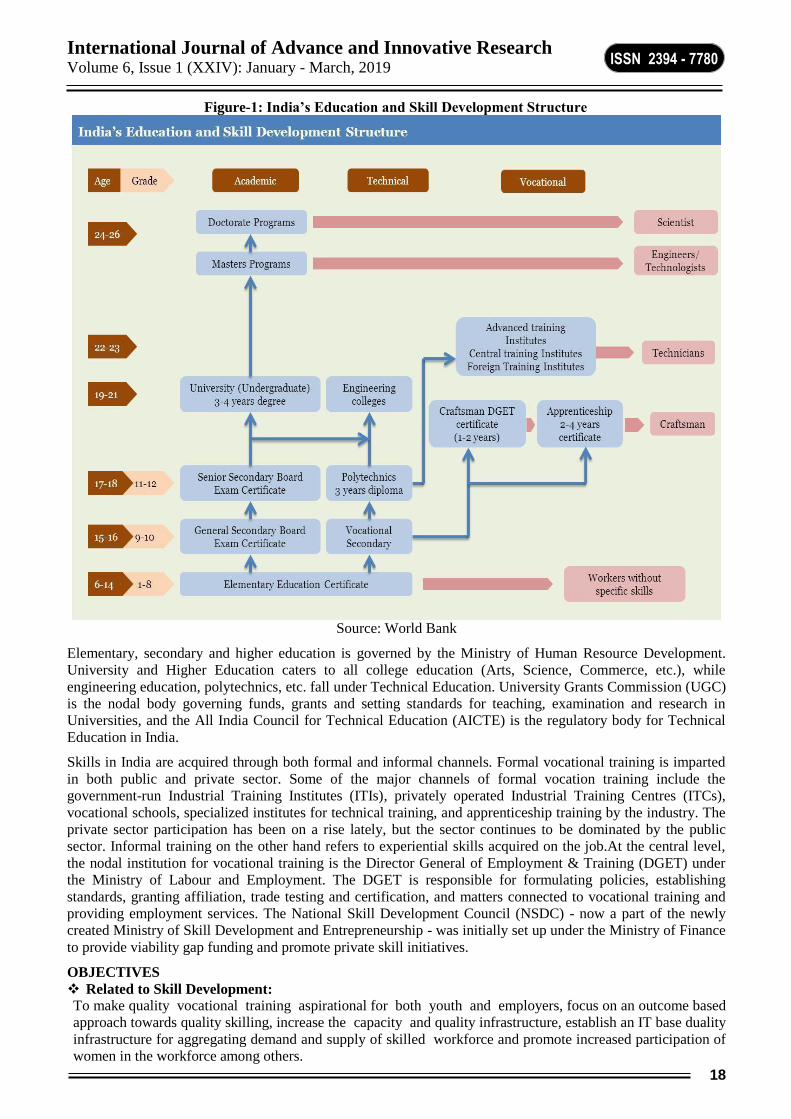
International Journal of Advance and Innovative Research Volume 6, Issue 1 (XXIV): January - March, 2019
18
ISSN 2394 - 7780
Figure-1: India’s Education and Skill Development Structure
Source: World Bank
Elementary, secondary and higher education is governed by the Ministry of Human Resource Development.
University and Higher Education caters to all college education (Arts, Science, Commerce, etc.), while
engineering education, polytechnics, etc. fall under Technical Education. University Grants Commission (UGC)
is the nodal body governing funds, grants and setting standards for teaching, examination and research in
Universities, and the All India Council for Technical Education (AICTE) is the regulatory body for Technical
Education in India.
Skills in India are acquired through both formal and informal channels. Formal vocational training is imparted
in both public and private sector. Some of the major channels of formal vocation training include the
government-run Industrial Training Institutes (ITIs), privately operated Industrial Training Centres (ITCs),
vocational schools, specialized institutes for technical training, and apprenticeship training by the industry. The
private sector participation has been on a rise lately, but the sector continues to be dominated by the public
sector. Informal training on the other hand refers to experiential skills acquired on the job.At the central level,
the nodal institution for vocational training is the Director General of Employment & Training (DGET) under
the Ministry of Labour and Employment. The DGET is responsible for formulating policies, establishing
standards, granting affiliation, trade testing and certification, and matters connected to vocational training and
providing employment services. The National Skill Development Council (NSDC) - now a part of the newly
created Ministry of Skill Development and Entrepreneurship - was initially set up under the Ministry of Finance
to provide viability gap funding and promote private skill initiatives.
OBJECTIVES
Related to Skill Development: To make quality vocational training aspirational for both youth and employers, focus on an outcome based
approach towards quality skilling, increase the capacity and quality infrastructure, establish an IT base duality
infrastructure for aggregating demand and supply of skilled workforce and promote increased participation of
women in the workforce among others.

International Journal of Advance and Innovative Research Volume 6, Issue 1 (XXIV): January - March, 2019
19
ISSN 2394 - 7780
Related to Entrepreneurship
To promote entrepreneurship culture and make it aspirational, enhance support for potential entrepreneurs
through mentorship and networks and integrate entrepreneurship education in the formal education system
among others.
Policy Framework for Skill Development The framework outlines the following eleven major paradigms and enablers to achieve the objectives of the
policy.
Aspiration and Advocacy A National Campaign will be launched within three months to create awareness and a positive proskilling
environment.
SKILL DEVELOPMENT AND ENTREPRENEURSHIP The creation of the first-ever separate Ministry of Skill Development and Entrepreneurship was announced by
Prime Minister in June 2014. It is conceived to encompass all other ministries to work in a unified way, set
common standards, as well as coordinate and streamline the functioning of different organizations working for
skill development. The Ministry of Skill Development and Entrepreneurship is entrusted to make broad policies
for all other ministries’ skill development initiatives and National Skill Development Corporation (NSDC).
Mapping and certifying skills, market research and designing curriculum, encouraging education in
entrepreneurship, make policies for boosting soft skills and computer education to bridge the demand and
supply gaps are among the other goals.
Figure 2: Skill Development Eco-System in India
Key Bodies
Enablers
Implementing
Beneficiaries
Bodies
• Ministry of Skill • State Skill • it is • Marginalized
Development & Development • Training Providers Societies
Entrepreneurship Mission (SSDM) • Captive Training by • Unemployed youth
• MHRD • NSDC Employers • Low income Group
• Ministry of Rural • NSDA • Schools • School & College
Development • SSCs • Universities Students
(MoRD) • NCVT • Assessment
• Other Central • SCVT Companies
Ministries
• Labour Laws
• Minimum Wages Act
• Financial
Institutions
• Apprenticeships Act
MHRD The Ministry of Human Resource and Development (MHRD) governs the polytechnic institutions offering
diploma level courses under various disciplines such as engineering and technology, pharmacy, architecture,
applied arts and crafts and hotel management. MHRD is also involved in the scheme of Apprenticeship
Training. Apart from this, MHRD has also introduced vocational education from class IX onwards, and
provides financial assistance for engaging with industry/SSCs for assessment, certification and training.There
are 21 Ministries under the central government who are also working for the purpose of skill development.
There are two approaches that these Ministries have: one approach is setting up training centres of their own for
specific sectors . The second approach is in the form of Public Private Partnership (as adopted by Ministry of
Rural Development, Ministry of Women and Child Development, etc.).
Break up of Incremental Human Resource Requirement across 24 Sectors
(Estimates in millions)
Sl.
No
Sector
Human Resource
Requirement Incremental Human
Estimates Resource Requirement
2017 2022 (2017-2022)

International Journal of Advance and Innovative Research Volume 6, Issue 1 (XXIV): January - March, 2019
20
ISSN 2394 - 7780
1 Agriculture 229 215.5 -13.5
2 Building Construction & Real Estate 60.4 91 30.6
3 Retail 45.3 56 10.7
4 Logistics, Transportation & Warehousing 23 31.2 8.2
5 Textile & Clothing 18.3 25 6.7
6 Education & Skill Development 14.8 18.1 3.3
7 Handloom & Handicraft 14.1 18.8 4.7
8 Auto & Auto Components 12.8 15 2.2
9 Construction Material & Building Hardware 9.7 12.4 2.7
10 Private Security Services 8.9 12 3.1
11 Food Processing 8.8 11.6 2.8
12 Tourism, Hospitality & Travel 9.7 14.6 4.9
13 Domestic Help 7.8 11.1 3.3
14 Gems &Jewellery 6.1 9.4 3.3
15 Electronics & IT Hardware 6.2 9.6 3.4
16 Beauty and Wellness 7.4 15.6 8.2
17 Furniture & Furnishing 6.5 12.2 5.7
18 Healthcare 4.6 7.4 2.8
19 Leather & Leather Goods 4.4 7.1 2.7
20 IT &ITeS 3.8 5.3 1.5
21 Banking, Financial Services & Insurance 3.2 4.4 1.2
22 Telecommunication 2.9 5.7 2.8
23 Pharmaceuticals 2.6 4 1.4
24 Media and Entertainment 0.7 1.3 0.6
Total 510.8 614.2 103.4
Source: Environment Scan Report, 2016 (NSDC)
Incremental Human Resource Requirement across States (2013-22)
(in lakh)
Sl. No. State Incremental HR Requirements
1 Andhra Pradesh 108.71
2 Arunachal Pradesh 1.47
3 Assam 12.34
4 Chhattisgarh 30.43
5 Delhi 63.41
6 Goa 2.27
7 Gujarat 57.57
8 Haryana 34.84
9 Haryana 0.93
10 Himachal Pradesh 12.06
11 Jammu and Kashmir 11.22
12 Jharkhand 44.52
13 Karnataka 84.77
14 Kerala 29.57
15 Madhya Pradesh 78.16
16 Maharashtra 155.22
17 Manipur 2.33
18 Meghalaya 2.49
19 Mizoram 1.40
20 Nagaland 0.97
21 Odisha 33.45
22 Punjab 28.99
23 Rajasthan 42.42
24 Sikkim 147.82
25 Tamil Nadu 135.52

International Journal of Advance and Innovative Research Volume 6, Issue 1 (XXIV): January - March, 2019
21
ISSN 2394 - 7780
26 Tripura 2.59
27 Uttar Pradesh 110.11
28 Uttarakhand 20.61
29 West Bengal 93.42
Grand Total 1,203.34
NATIONAL SKILL DEVELOPMENT CORPORATION (NSDC) NSDC is a one of its kind Public Private Partnership in India that aims to promote skill development by
catalyzing creation of large, quality, for-profit vocational institutions.NSDC is a not-for-profit company set up
by the Ministry of Finance, under Section 25 of the Companies Act, 1956 corresponding to Section 8 of the
Companies Act, 2013. The present equity base of NSDC is Rs.10 crore, of which the Government of India
through the Ministry of Skill Development & Entrepreneurship (MSDE) holds 49%, while the private sector
has the balance 51%.
In its efforts to scale up skill development efforts, the NSDC strives towards the following
Develop low cost, high-quality, sustainable business models.
Attract significant private investment.
Ensure that its funds are largely re-circulating; i.e., loan or equity rather than grant.
Focus on quality assurance, information systems and high-quality vocational training through partnerships.
Create leverage for itself.
To ensure superior decision-making with speed and scale, the NSDC has a structure and governance model that
provides it with autonomy, stature and continuity. Thus, the organization has a tiered decision-making structure
comprising of the Board of Directors, Board Sub Committees, Proposal Approval Committee, Proposal
Evaluation Committee and Restructuring Evaluation Committee. The NSDC has provision for a 15-member
Board of Directors with 6 from the Central Government (including Chairman) and 9 (including the MD &
CEO) from the private sector.
NATIONAL LABOUR MARKET INFORMATION SYSTEM (N-LMIS) NSDA has developed a single window platform to aggregate supply and demand trends in the Indian
vocational education and training space, referred to as the National Labour Market Information System
(LMIS). The portal was formally launched by President of India on the 15th of July, 2016. It is now known as
Skill Exchange - A Labour Market Information System.LMIS is an integrated set of institutional arrangements,
procedures, mechanisms and data systems designed to produce labour market information as per global
standards and best practices. The system brings together statistical (quantitative) and non-statistical
(qualitative) information concerning labour market actors and their environment and generate key analysis and
reports which can be used for various policy interventions by different government stakeholders, as well as by
the industry at large.The data on the National LMIS is displayed in the form of ten National Repositories
namely Certified Candidates, Trainers, Training Centres, Training Providers, Assessors, Assessment Agencies,
Employers, Courses and Prospective Candidates. Each repository contributes in building a holistic picture of
the skill ecosystem in the country. Data of 82 lakh certified candidates is being reflected on the National LMIS.
S. No. Name of Ministry Name of Scheme
1 Ministry of Skill Development & Skill Development Initiative Scheme (SDIS)
Entrepreneurship (MSDE) Schemes under National Council for Vocational Training
Standard Training Assessment and Reward (STAR)
PradhanMantriKaushalVikasYojana (PMKVY 1.0)
2 Ministry of Micro, Small and Medium MSME-Advanced Training Institutes
Enterprises (MSME)
MSDE Development Institutes
MSME-Tool Room
3 Ministry of Minority Affairs SeekhoAurKamao
4 Ministry of Housing & Urban Affairs
(Earlier known as MoHUPA)
Employment through Skill Training & Placement (ES&TP)
under DAY-NULM component.
5 Ministry of Textile Integrated Skill Development Scheme

International Journal of Advance and Innovative Research Volume 6, Issue 1 (XXIV): January - March, 2019
22
ISSN 2394 - 7780
NSDA is developing a roadmap for integrating all remaining data sources including States, Central Ministries
and other agencies working in the skill development space. The first step in this direction is to undertake a
scoping study of all skill development MIS systems in the country. Following this study, the NSDA will
develop an action plan for state integration and roll out which will include strengthening of state and
institutional MIS systems in a systematic phase wise approach.The employment linkage on the LMIS has been
facilitated through integration with the National Career Services Portal maintained by the Ministry of Labour
and Employment. Through this integration, candidates trained and certified through Government Schemes and
programs will reflect as potential job seekers on the NCS portal.LMIS is envisioned as a system that provides a
consolidated and unified view of various stakeholders at any given point of time and empowers the
Government and other agencies to take informed decisions by providing intelligent and insightful reports, as
required.Also, stakeholders can access key analytics, and trends, including skilling and employment
opportunities through various channels.The LMIS is an evolving process. In practice it can always be
improved. A snapshot at any particular time can detect areas for improvement. Currently the areas needing
improvement can be summarized under a number of headings.
SKILL REQUIREMENTS BY 2022 The quantitative as well as qualitative skill gaps can further widen going forward if there are no or limited
efforts towards addressing the key supply related issues. As per the skill gap study conducted by the National
Skill Development Cooperation over 2010 - 2014, there is an additional net requirement of 109.73 million
skilled manpower by 2022 across twenty four key sectors.As India strengthens its base as a knowledge
economy, there would be additional requirements to the highly skilled workforce in sectors like financial
services, IT/ITeS, Bio-technology, Healthcare and Pharmaceuticals. Further, with value added industries being
given a policy push under the ‘Make in India’ initiative, highly skilled workforce would also be required in
high-end industries.
Incremental Training Need across 34 Sectors (2017 to 2022)
(in lakhs)
Sl. No. Sector
Incremental Human Resource
Requirement and Training Need
1 Agriculture 24.5
2 Animal Husbandry 18
3 Fertiliser 1
4 Textile Handloom and Handicraft 60
5 Automotive, Auto Components & Capital Goods 41*
6 Gems &Jewellery 35
7 Food Processing 33.7
8 Leather 25
9 Pharmaceuticals 14
10 Chemicals & Petrochemicals 12
11 Steel 7.5 (by 2025)
12 Rubber Manufacturing 6.7
13 Road Transport & Highways 62.2**
14 Ports & Maritime 25
15 Aviation & Aerospace 14.2
16 Railways 0.12 (by 2018)
17 Power 15.2
18 Oil & Gas 7.3
19 Renewable Energy 6
20 Coal & Mining 2.6
21 Construction 320**
22 Furniture & Fittings 52.6
23 Paints & Coatings 9
24 Electronics and IT-ITeS 69 #
25 Telecom 38.6
26 Retail 107**
27 Beauty & Wellness 82
28 Media & Entertainment 13

International Journal of Advance and Innovative Research Volume 6, Issue 1 (XXIV): January - March, 2019
23
ISSN 2394 - 7780
29 Tourism & Hospitality 49
30 Banking, Financial Services and Insurance (BFSI) 12
31 Logistics 42.9**
32 Healthcare 32 (by 2025)
33 Security 31
34 Media & Entertainment 13
Total 1,282.12
Source: Ministry of Skill Development & Entrepreneurship
AWARENESS, MINDSET AND PERCEPTION ISSUES Skill development in India is way below the requirements due to a lack of awareness on the type of courses as
well as information on the ensuing career prospects. More importantly, there is limited acceptance of skill
development courses as a viable alternative to formal education. Skilling is often viewed as the last resort meant
for those who have not been able to progress in the formal academic system. This is partly to do with the lack of
integration between the two options and also due to rising aspirations for white collar jobs which necessitate
higher qualifications. Moreover, skill development is often associated with blue collar jobs, which is largely
perceived to be of low dignity and provides low wages/salaries.The perceived 'stigma' associated with skill
development has resulted in low enrolments in vocational education courses. The aspirational mismatch that
exists in India can be gauged from the example of the construction sector, which has a huge requirement of
workforce with low level skills. For instance, the construction sector in Punjab faces a shortage of workers
locally, and depends on the migrant workforce from Uttar Pradesh, Bihar and Jharkhand.
PROPOSED SCHEME ON ENTREPRENEURSHIP DEVELOPMENT
An entrepreneurship development scheme is currently being developed by Ministry of Skill Development and
Entrepreneurship. The scheme will be designed around the following major elements:
EDUCATE AND EQUIP POTENTIAL AND EARLYST A GEEN ENTREPRENEUR INDIA
In partnership with experts, a world class entrepreneurship education curriculum will be developed. This
curriculum will be delivered to all aspiring entrepreneurs at no cost. Leveraging online learning,
entrepreneurship courses can be taken as and when needed by students and business people alike through
Massively Open Online Courses (MOOCs). In addition, entrepreneurship education will be integrated into the
mainstream curriculum in 3,000 colleges around India. Entrepreneurship education courses will also be
delivered in approximately 325 industrial clusters across the nation. Through 50 nodal Entrepreneurship Hubs
(E-Hubs) set up across all states, existing and potential entrepreneurs will be targeted for entrepreneurship
education modules that suit their need.
CONNECT ENTREPRENEURS TO PEERS, MENTORS, and INCUBATORS
To support young entrepreneurs, a web and mobile based platform connecting the entire entrepreneurial
ecosystem will be established. Platform members will access content online, including information on
government services and special packages offered by service providers. The creation of new incubators will be
encouraged and a national network of incubators and accelerators established to support young entrepreneurs. A
national network of high quality, screened mentors will also be created, leveraging existing networks and
successful local entrepreneurs where possible. Entrepreneurship activities in innovative and cutting edge
technology areas will be aligned with initiatives such as Atal Innovation Mission (AIM) and Self Employment
Talent Utilization (SETU).
SUPPORT ENTREPRENEURS THROUGH ENTREPRENEURSHIP HUBS (E-HUBS)
Support to entrepreneurs, including coordinated delivery of national and state government entrepreneurship
programs and access to enabling resources, a national network of Entrepreneurship Hubs (E-Hubs) will be
established. One national, 30 state, 50 Nodal and 3,000 college based E-Hubs will be set up to deliver support.
These E-Hubs will, collectively, cover the entire nation.
CATALYSEA CULTURE SHIFT TO ENCOURAGE ENTREPRENEURSHIP
To promote entrepreneurship, state and national level interactions with stakeholders will be convened.
International linkages will be established through internship opportunities and exchange trips to global
entrepreneurship hubs such as Silicon Valley and Israel. To build awareness, national brand ambassadors will
be created to champion entrepreneurial culture in India. Awards will be instituted for young achievers and a
National Entrepreneurship Day will be celebrated.

International Journal of Advance and Innovative Research Volume 6, Issue 1 (XXIV): January - March, 2019
24
ISSN 2394 - 7780
ENCOURAGE ENTREPRENEURSHIP AMONG UNDER REPRESENTED GROUPS
Special focus will be given to the inclusion of scheduled castes & scheduled tribes, minorities, differently abled,
etc., and regionally under-represented areas including large part of Eastern and North Eastern India in
entrepreneurship programs. Special efforts will also be made to enrol incubators and mentors catering to these
groups will in the national entrepreneurial ecosystem.
PROMOTE ENTREPRENEURSHIP AMONGST WOMEN
Focus will also be placed on encouraging women entrepreneurs through appropriate incentives for women
owned businesses under the public procurement process. It will also be ensured that gender neutral incubation/
accelerator, network of mentors, industry, resource centres and credit institutes are developed to facilitate
Women Entrepreneurs. Priority will be given for mentorship and support system for women entrepreneurs in
existing business centres and incubators. Steps will also be taken to assemble gender disaggregated data.
FOSTERSOCIAL ENTREPRENEURSHIP AND GRASSROOTS INNOVATIONS Universities and academic institutions will be encouraged to launch a course on ‘Social Entrepreneurship’,
including through online distance education, to actively promote social entrepreneurship in the country.
Additional support, including through fiscal incentives and incubation, will also be considered.To foster grass-
roots innovation, a focus on innovations in hubs, collaborations with organizations such as the National
Innovation Foundation and promotion of Intellectual Property Rights will also be encouraged.
TRAINING PROGRAMMES
Financial Year Programme Participants
1994-95 43 1168
1995-96 47 1523
1996-97 32 782
1997-98 39 857
1998-99 59 1556
1999-00 69 2306
2000-01 79 2297
2001-02 72 2069
2002-03 97 2914
2003-04 120 4019
2004-05 130 4644
2005-06 155 5278
2006-07 225 9111
2007-08 214 7788
2008-09 255 12939
2009-10 297 12024
2010-11 556 16837
2011-12 815 26584
2012-13 1461 44287
2013-14 501 23359
2014-15 822 27629
2015-16 153 5230
2016-17 185 6398
2017-18 133 5426
Total 6353 218879
NATIONAL SKILL DEVELOPMENT FUND
The National Skill Development Fund was set up in 2009 by the Government of India for raising funds from
Government and Non-Government sectors for skill development in the country. The fund is contributed to by
various Government sources, and other donors/contributors to enhance, stimulate and develop the skills of
Indians. A public trust set up by the Government of India is the custodian of the fund. The trust accepts
donation and contribution in cash or kind from contributors for furtherance of objectives of the fund. The fund
is operated and managed by the Board of Trustees. The Chief Executive Officer of the trust is responsible for
day-to-day administration and management of the trust.The fund meets its objectives through the National Skill
Development Corporation (NSDC) which is an industry led not-for-profit company set up for building skill
International Journal of Advance and Innovative Research Volume 6, Issue 1 (XXIV): January - March, 2019
25
ISSN 2394 - 7780
development capacity and forging strong linkages with the market. The NSDC acts as a catalyst in skill
development by providing funding to enterprises, companies and organizations that provide skill training. It
also develops appropriate models to enhance, support and coordinate private sector initiatives. Till January,
2018, the NSDF has released over Rs. 5,638 crores to the NSDC towards skill development programmes
including STAR, PMKVY 1.0 & 2.0, and UDAAN Scheme.As on 31st December, 2017, the NSDC with 354
training partners and 6,004 training centres has trained around 1.01 crore persons across India.
Accounts of the trust are subject to CAG audit and are also audited by a Chartered Accountant for every
financial year and in such manner as may be directed by GOI. The trust has engaged SBICAP, a wholly owned
subsidiary and the investment banking arm of the State Bank of India (SBI), the largest commercial bank in
India, for providing micro prudential oversight on the implementing partners and monitoring the interests of the
trust.The National Skill Development Fund has been incentivized by the Government through various tax and
non-tax policies. It is registered under section 80G of the Income Tax Act. This allows the trust to work more
effectively in the skill development sector by allowing tax incentives to donor. Further, NSDF is exempted
from FCRA regulations to accept funds from foreign sources. Secretary, MSDE is the trustee of the NSDF
while JS, MSDE (handling NSDF) is the CEO.
CONCLUSION There is a need for speedy reorganization of the ecosystem of skill development and entrepreneurship
promotion in the country to suit the needs of the industry and enable decent quality of life to its
population.Currently, over 40 skill development Programmes (SDPs) are being implemented by over 20
Ministries/Departments of the Government of India. However, there are gaps in the capacity and quality of
training infrastructure as well as outputs, insufficient focus on workforce aspirations, lack of certification and
common standards and a pointed lack of focus on the unorganized sector. The skill development ecosystem in
India is skewed towards a formal education system with limited vocational training. While the vocational
training is in a dismal state both qualitatively and quantitatively, the higher education system itself is grappling
with issues related to scale and quality.Moreover, there is a disconnect between the formal education system
and work requirements, compounding the challenges related to the skill gap. A concerted action is thus required
on the supply side to ensure sustained employability of the Indian youth. Extensive efforts to skill the workforce
are required, both in quantity and quality. Transforming the skill development ecosystem and making it
responsive to needs of both industry and citizensrequires a scalable, efficient and comprehensive vocational
training ecosystem to meet future requirements.There is a need to assess the traditional approach of skill
development delivery in India in light of the successful models and best practices in other economies.
REFERENCES
1. Government of India (2013-14). Education, Skill Development and Labour Force, Volume-3. New Delhi:
Labour Bureau, Ministry of Labour& Employment.
2. Government of India (2013). (NSS 66thRound), Status of Education and Vocational Training inIndia. New
Delhi: NSSO, Ministry of Statistics and Programme Implementation.
3. Government of India and Institute of Applied Manpower Research. Understanding SkillDevelopment and
Training in China: Lessons for India. New Delhi: Planning Commission.
4. Government of India (2012-13). Seizing the Demographic Dividend- Chapter 2, Economic Survey. New
Delhi: Ministry of Finance.
5. Government of India (2013). Twelfth Five Year Plan (2012-2017) Social Sectors, volume 3. New Delhi:
Planning Commission.
6. Athena Infonomics India Private Ltd. Skill Development in India: Challenges and Opportunities.
7. Vogler-Ludwig, Kurt, Helene Giernalczyk, Luisa Stock, Paul Drake and Debra Dhillon (2012): International
approaches to the development of intermediate level skills and apprenticeships-Case Study Report. UK
Commission for Employment and Skills and Economix Research andConsulting.
8. ANNUAL REPORT-, Ministry of Skill Development and Entrepreneurship-2017-18.
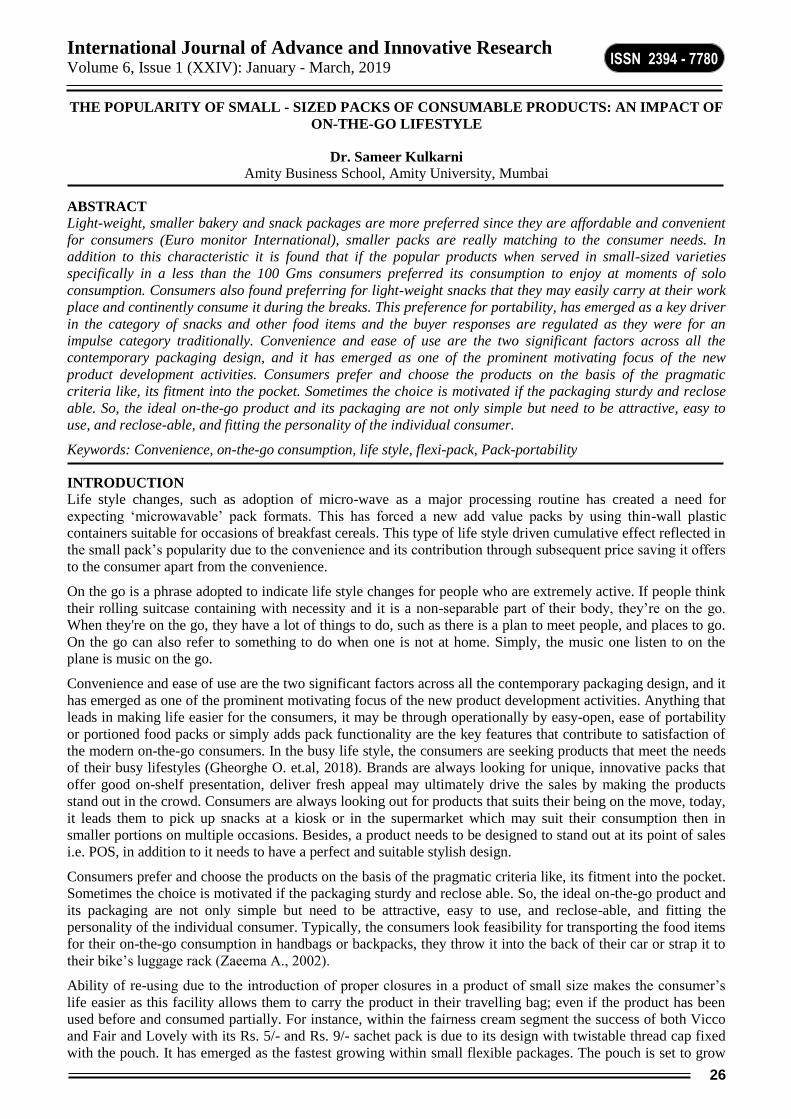
International Journal of Advance and Innovative Research Volume 6, Issue 1 (XXIV): January - March, 2019
26
ISSN 2394 - 7780
THE POPULARITY OF SMALL - SIZED PACKS OF CONSUMABLE PRODUCTS: AN IMPACT OF
ON-THE-GO LIFESTYLE
Dr. Sameer Kulkarni
Amity Business School, Amity University, Mumbai
ABSTRACT
Light-weight, smaller bakery and snack packages are more preferred since they are affordable and convenient
for consumers (Euro monitor International), smaller packs are really matching to the consumer needs. In
addition to this characteristic it is found that if the popular products when served in small-sized varieties
specifically in a less than the 100 Gms consumers preferred its consumption to enjoy at moments of solo
consumption. Consumers also found preferring for light-weight snacks that they may easily carry at their work
place and continently consume it during the breaks. This preference for portability, has emerged as a key driver
in the category of snacks and other food items and the buyer responses are regulated as they were for an
impulse category traditionally. Convenience and ease of use are the two significant factors across all the
contemporary packaging design, and it has emerged as one of the prominent motivating focus of the new
product development activities. Consumers prefer and choose the products on the basis of the pragmatic
criteria like, its fitment into the pocket. Sometimes the choice is motivated if the packaging sturdy and reclose
able. So, the ideal on-the-go product and its packaging are not only simple but need to be attractive, easy to
use, and reclose-able, and fitting the personality of the individual consumer.
Keywords: Convenience, on-the-go consumption, life style, flexi-pack, Pack-portability
INTRODUCTION
Life style changes, such as adoption of micro-wave as a major processing routine has created a need for
expecting ‘microwavable’ pack formats. This has forced a new add value packs by using thin-wall plastic
containers suitable for occasions of breakfast cereals. This type of life style driven cumulative effect reflected in
the small pack’s popularity due to the convenience and its contribution through subsequent price saving it offers
to the consumer apart from the convenience.
On the go is a phrase adopted to indicate life style changes for people who are extremely active. If people think
their rolling suitcase containing with necessity and it is a non-separable part of their body, they’re on the go.
When they're on the go, they have a lot of things to do, such as there is a plan to meet people, and places to go.
On the go can also refer to something to do when one is not at home. Simply, the music one listen to on the
plane is music on the go.
Convenience and ease of use are the two significant factors across all the contemporary packaging design, and it
has emerged as one of the prominent motivating focus of the new product development activities. Anything that
leads in making life easier for the consumers, it may be through operationally by easy-open, ease of portability
or portioned food packs or simply adds pack functionality are the key features that contribute to satisfaction of
the modern on-the-go consumers. In the busy life style, the consumers are seeking products that meet the needs
of their busy lifestyles (Gheorghe O. et.al, 2018). Brands are always looking for unique, innovative packs that
offer good on-shelf presentation, deliver fresh appeal may ultimately drive the sales by making the products
stand out in the crowd. Consumers are always looking out for products that suits their being on the move, today,
it leads them to pick up snacks at a kiosk or in the supermarket which may suit their consumption then in
smaller portions on multiple occasions. Besides, a product needs to be designed to stand out at its point of sales
i.e. POS, in addition to it needs to have a perfect and suitable stylish design.
Consumers prefer and choose the products on the basis of the pragmatic criteria like, its fitment into the pocket.
Sometimes the choice is motivated if the packaging sturdy and reclose able. So, the ideal on-the-go product and
its packaging are not only simple but need to be attractive, easy to use, and reclose-able, and fitting the
personality of the individual consumer. Typically, the consumers look feasibility for transporting the food items
for their on-the-go consumption in handbags or backpacks, they throw it into the back of their car or strap it to
their bike’s luggage rack (Zaeema A., 2002).
Ability of re-using due to the introduction of proper closures in a product of small size makes the consumer’s
life easier as this facility allows them to carry the product in their travelling bag; even if the product has been
used before and consumed partially. For instance, within the fairness cream segment the success of both Vicco
and Fair and Lovely with its Rs. 5/- and Rs. 9/- sachet pack is due to its design with twistable thread cap fixed
with the pouch. It has emerged as the fastest growing within small flexible packages. The pouch is set to grow

International Journal of Advance and Innovative Research Volume 6, Issue 1 (XXIV): January - March, 2019
27
ISSN 2394 - 7780
further in many categories as a functional packing solution, being perceived as convenient as and safer to carry
than conventional tube and more portable than thin wall plastic containers.
The influence of packaging is seen in all of the product categories. For bakery and snacking products, for
example, flexible packaging has creating a new trend and it would contribute the category to grow as a
dominate on-the-go consumption food category. With this category, for hard shaped products like, biscuits,
however, folding cartons has become a common solution for primary packaging, while as pouches will continue
to be used for bigger quantities in sizes. The packaging in pouch format offers the consumers a format
specifically when it is intended to share with many.
LITERATURE REVIEW
It is found that life style has made peoples’ eating routines less fixed than in it was in the past. Many people opt
to skip breakfast to go to the gym or for a few extra minutes to spend at their bed. This means that, many people
now have their first meal of the day while they are probably when they are on-the-going. They are also
increasingly likely to have their snack between lunch and dinner. The rise of this being at out-of-the home, on-
the-go consumption occasions leads in creating specific demand for packages that are comfortable to hold, have
re-sealable caps, and fit in their handbags and backpacks. So, the industry is forced to translate these needs into
specific and concrete innovations, in the formats which were able to be easily separating ability for several
single portion consumption, easy to open and re closable packaging solutions.
The multi-cavity pack design allows the on-the-go snacking market, offering the option to snap off one of many
individually wrapped cavities or trays as required, while keeping the remaining trays or cavities sealed for later
consumption, it gives the consumers the ability to consume the snack as well as it allows them to exercise
portion control indirectly. The tray also keeps the contents fresher for longer and can help to reduce food waste
also. Products specifically the liquid food producers need to be served in the packages those were easy to use
when opening, handling and pouring, together with its unique ability to be microwaved, attracts consumers
(Malcolm McDonald and Ian D., 2010).
The change in life style is forcing consumers to derive smarter ways for maximizing their time. Consumer’s
expectation is reaching a new high called as hyper-convenience. If they found a product or service isn’t easy to
use, it is simply recognized as not worth for the time to investment for its consumption. So, to stay relevant, the
brands must adopt a new way of seamlessly fitting into people’s busy on-the-move lives and assuring them to
provide a fuss-free experience. It brings all together new products with smart channels of distribution, ensuring
that a product is exactly where the consumer is, whenever they want it.
Convenience food are those eatable or edible items which do not require much time (often need less than five
minutes) and efforts for both in its preparation and serving or consumption are convenience foods. Some
convenience foods can be consumed instantly or some after the addition of some water, heating or thawing. The
demand for convenience foods is growing at a faster pace due to changes in social and economic patterns, as
well as socio demographical characteristics such as increase in urbanization, changes in the buying power and
awareness about healthiness of food items (Mahera M, et.al 2015), Some predominant changes in the traditional
meal pattern and food habit and the execution of hedonic motive of desire to taste new products are some of the
dominant drivers cartelizing the demand of the convenience food items in India. They are making these
convenience food items extremely popular especially among the working-class people, teenage children, and
people living in hostels, bachelors, and so on. These items are usually found cheap due to its size, barring some
specific healthy choices are expensive (Kacey Culliney, 2014), The popular examples of such convenience
category of food items include candy, beverages, frozen pizza, cake mixes, microwaveable items, canned soup
or pastas, masala oats, chocolate bars, shrikhand, yogurt, fruits drinks, are some of the nutritious examples of
convenience foods.
CONSUMER CHARACTERISTICS
Some of the peculiar socio demographic characters of the Indian consumers leading in the rise of market of
convenience food items includes their age most of them are belonging to a class category of youngers, more
than 50% Indian consumer base is in the age category of below the age of 30 years. They are high income
earners, there is a change in consumption patterns due to rising of families with dual income sources in a family
unit. Indian economy is expected to triple in the next decade. This resultant income growth would lead to a rise
in middle class customers, as per the BCG report – The New Indian (March 2017). It is expected that the share
of this middle class (strivers and seekers) would increase from 14% in 2017 to46% in 2030 (MOFPI, Report
2017). Their aspirations are up worldly mobile, and they are looking for better standard of living articulated in
measurable characteristics such as quality, variety, choices and convenience. The general awareness has

International Journal of Advance and Innovative Research Volume 6, Issue 1 (XXIV): January - March, 2019
28
ISSN 2394 - 7780
advanced in the areas of health and they are becoming hygiene conscious. There is a visible shift in the demand
and consumption for protein rich and organic food items, (Chairman & Managing Director - Nestlé India
Limited – Annual report 2016-17). On the social front this young generation is internet savvy and prefers
shopping online for convenience and monetary discounts are not ignored by them.
MARKET FOR CONVENIENCE FOODS
The size of the foods and beverages sector in India today is nearly Rs 3,350 billion. Of this, the semi-processed
and RTE packaged foods segment constitutes only 2%, however, growing at 20%. Globally, 65% of the
consumers buy ready to eat i.e. RTE meals for their convenience either frequently (20%) or occasionally (45%).
The US is the largest market for convenience foods in the world and the emerging markets of Asia-Pacific,
Middle-East and Latin America would fuel the future growth of the same. The global ready-to-eat food market
is expected to grow at a 21.5% CAGR during the forecast period 2017-2022.
According to Indian census data (2011), more than 70% of families in Indian society today are nuclear and 11%
are single members. Lack of time for food preparation due to shift of their lifestyle from a traditionally being
slow pace into a pre-occupied with many priorities becoming a high pace busy lifestyle. This change in lifestyle
is leading a change in the consumption patterns and ultimately contributing in an increase in the demand for
convenience foods as its result.
In India, the convenience food market is about to reach Rs 1,580 billion by the end of 2017, with a penetration
in 30 million households which accounts for 32% of the industry. Among convenience foods, the market for
ready-to-eat foods is about Rs 2,900 cores in financial year 2016. Three main factors viz. acceptability,
affordability and availability drive such an enormous growth in the convenience food sector. India is supposed
to experience a double-digit growth rate through the 2017–2022 in several categories of convenience foods.
RESEARCH METHODOLOGY This paper specifically looks into preferences for small pack sizes of eatable items by the Indian consumers and
their demographic characteristics related with respect to their on-the -go life-style. These demographic
characteristics will allow the marketers to estimate the demand for products in small packs. For this study the
sample collected on the basis of a qualification criterion of their being purchased an eatable or drinkable food
item in small size. Small pack preferable 30-60 grams in weight or 60-100 ml in case of liquid product, in the
last seven days.
RESEARCH INSTRUMENT
The consumer responses were collected on 5-Point Likert-type scales. Statistical analyses were conducted using
the SPSS software version 22. Descriptive statistics was used to describe respondent characteristics and their
socioeconomic profiles. Based on the results of the pilot study, 7statementsregarding the perceived benefits and
perceived obstacles were selected to measure the attitude along with the factors influencing the attitudes
towards the small packs eatable or consumable item purchase. The respondents were asked to evaluate each
statement on perceived benefits regarding their own attitudes on a 5-point Likert scale. A score of 1 was
assigned as “I strongly disagree” and 5 for indicating “I strongly agree.”
SAMPLING
Participants were considered eligible if they were 16 years of age or elder than that and were excluded if they
were not willing to participate. A total 1212 number of respondents were collected for this study. The data had
been collected at all major railway stations located on the three main local railway lines such as Central,
Western and Harbor, during March, 2018 to July, 2018. Trained research scholars had collected the data. The
details of the sample and their first choice for buying eatable and consumable items in small packs has as
described in Table No.1 above.
SCOPE OF RESEARCH (DV and IVs)
Attitudes towards small packs were evaluated. Attitudes towards the 3 main categories available in small size
formats e.g. 1) Liquid carton with twisted cap 2) Snacks sachet with zip lock, and 3) Spread pack with cap.
The on the go life style characteristics were measured by four demographic characteristics such as, age, gender,
income level, education level, with seven life style indicating statements (independent variables) such as, their
span of time of job, nature of accompanying at living, preferred food preparation method, distance of work
place from residence, mode of travelling, working nature of partner, inclination for wellness.
SAMPLE DETAILS
Table No.1 : Describe the sample collected for this study.

International Journal of Advance and Innovative Research Volume 6, Issue 1 (XXIV): January - March, 2019
29
ISSN 2394 - 7780
Demographic Characteristics Frequency Percent
Age
Up to 25 Years 262 21.6
26-35 Years 385 31.8
36-45Years 401 33.1
46 Plus 164 13.5
Education
Up to High school 358 29.5
College Attended/ Graduate 408 33.7
Graduate 446 36.8
Income
Up to Rs. 30,000 552 45.5
30,000 to 40,000 84 6.9
40,000 to 50,000 433 35.7
50,000 Above 143 11.8
Gender Male 790 65.2
Female 422 34.8
Product
Pichku 152 12.5
Tropicana Juice 147 12.1
Snacks 239 19.7
Fair & Lovely 277 22.9
Hand wash 232 19.1
Close-up Toothpaste 165 13.6
Source: Primary data
DATA ANALYSIS
The respondents were asked to express, their opinion, about how appropriate they were about the sourcing
regarding the purchase of a product with inbuilt facility of re-usage and easiness of carrying in its design. A
score of 1 was given for “not preferred at all” and 5 for “always preferred.” The research was aimed to associate
life style related specific demographic factor which significantly influences the attitude about the three reusable
facilities in its package. The reliability of the answers on the benefits and disadvantages were estimated, and the
Cronbach’s alpha was determined (benefits alpha=0.76), indicating the reliability values were satisfying. A
discriminant analysis had been conducted to arrive at conclusions.
A linear regression analysis was conducted using a stepwise method to measure the effect of correlating factors
on willingness to purchase medications online.
RESULTS
Table No.1shows the results of tests of equality of group means for preferring the products under study by the
subjects. The results indicated that only one life style indicating reason had established a strong association with
buying of such products. This reason is the working nature of the partner. This parameter has the least ‘F’ test
value i.e. 1.735. The similar values of all lifestyle measures shows the equal spread of data.
Table No-1: Results of Tests of Equality of Group Means
Lifestyle measurement Wilks' Lambda F df1 df2 Sig.
Span of Job 0.980 4.921 5 1206 0.000
Living Alone 0.989 2.602 5 1206 0.024
Avoid Food Preparation 0.990 2.360 5 1206 0.038
Distance of Job 0.980 4.921 5 1206 0.000
Mode of daily Travelling 0.989 2.602 5 1206 0.024
Working partner 0.993 1.735 5 1206 0.124
Wellness Preference 0.988 2.886 5 1206 0.013
Source: Primary data
These results were further analysed by applying a categorical regression by manipulating subjects’ individual
four demographic variables and the specific lifestyle reason which has established as significant for buying of
such packs, as indicated in table No.1.
Table No.2 described the ANOVA results of the regression model summery. The less than 0.05 significance
level indicated fitment of explanation of variance through the proposed predicative model.

International Journal of Advance and Innovative Research Volume 6, Issue 1 (XXIV): January - March, 2019
30
ISSN 2394 - 7780
Table No.2 ANOVA Results
Sum of Squares df Mean Square F Sig.
Regression 82.277 4 20.569 21.976 0.000
Residual 1129.723 1207 0.936
Total 1212.000 1211
Dependent Variable: Working partner
Predictors: Age Group Education Level Income Group Gender
(Source: Primary data)
Table No.3 contains the coefficients of regression, for the purchase of re-usable product by the subjects if their
partners are working. The model also indicated that among the four demographic characteristics income level
and gender remained non influential and remaining two viz. age and education showed a significant influence in
predicting the preference for products served in convenient packing features.
Table No-3: Coefficients
Standardized Coefficients df F Sig.
Beta Bootstrap Estimate of Std. Error
Age Group -0.040 0.047 1 0.734 0.392
Education Level 0.021 0.059 1 0.132 0.716
Income Group -0.247 0.034 1 53.595 0.000
Gender -0.078 0.027 1 8.458 0.004
Dependent Variable: Buying if Working partner
FINDINGS
Only one lifestyle reason had established significant association with buying of products in re-usable packing.
The preference had been insignificant with respect to buyers’ income levels and their gender.
SUGGESTIONS
Marketing practitioners need to design their strategies keeping all income segments and both the male as well as
female in focus. The negative co efficient values for age, income and gender indicate a negative relationship
since gender was coded as male one and female as two less preferred by females than males, this was specificity
with respect to the working nature of their partners.
Further step wise entry and elimination process may be applied to locate the situational impact for designing of
marketing strategies.
REFERENCES
1. BCG report – The New Indian (March 2017)
2. Euro monitor International, (June-2018)
3. Gheorghe O, Anca F. C, Cristina T. B. and Raluca-Giorgiana C, (2018), “Consumers’ Behavior Concerning
Sustainable Packaging: An Exploratory Study on Romanian Consumers,” Sustainability 2018, 10, 1787; doi:
10.3390/su10061787” accessed on 1st Feb, 2019.
4. Indian census data (2011),
5. Kacey Culliney, (2014), “The smaller, the smarter: Small-sized packs hit on convenience and price”,
accessed on 5th Feb, 2019, https://www.bakeryandsnacks.com/Article/2014/12/15/Small-sized-packaging-
hits-on-convenience-price?utm_source=copyright&utm_medium=OnSite…
6. Mahera M, Sayeda D, Bhutto S, Muhammad M., (2015), “Impact of Product Packaging on Consumers
Buying Behavior: Evidence from Karachi”, Journal of Marketing and Consumer Research, Vol.16, pp.35-42.
7. Market Segmentation How to do it How to profit from it, Malcolm McDonald and Ian D. Good fellow
Publishers Limited, Woodeaton, Oxford, OX3 9TJ, 2010 Edition.
8. Speech facts, Chairman & Managing Director - Nestlé India Limited – Annual report 2016-17
9. Zaeema A. (2002), “Effect of Lifestyle on Consumer Decision Making: A Study of Women Consumer of
Pakistan,” Journal of Accounting, Business and Finance Research, Vol. 2, No. 1, pp. 12-15

International Journal of Advance and Innovative Research Volume 6, Issue 1 (XXIV): January - March, 2019
31
ISSN 2394 - 7780
THE INFLUENCE OF CULTURE ON CONSUMER BEHAVIOR
Sagar Karkhanis
Assistant Professor, Department of BMM, JVM’s Mehta College, Navi Mumbai
ABSTRACT
Culture is a complex system of laws, values, beliefs and morals where each of the laws, values, beliefs and
morals are associated with a range of acceptable behaviors. It includes knowledge, belief, art, morale, law,
customs and all other habits acquired by man as a member of society. An accepted concept about culture is that
includes a set of learned beliefs, values, attitudes, habits and forms of behavior that are shared by a society and
are within that society. Culture influences consumers that is why understanding of culture enables marketers to
interpret the reactions of consumers to alternative marketing strategies.
Keywords: consumer behavior, culture, family, subculture
INTRODUCTION We all are consumer. In our daily life we are buying and consuming variety of goods and services. However, we
all have different tastes, preferences, consumption and buying pattern. These all things plays vital role in the
present highly competitive and consumer- oriented marketing. Consumers behavior is the outcome re result of
various external factors. Such factors include economic, social, cultural, psychological and personal. Of these
cultural factors highly influences on buying behavior of the consumer. Cultural factors include values, beliefs,
faith and traditions accepted willingly by buyers or specific class of buyers. A marketer needs to be aware of
these cultural influences on buyer behavior while promoting, advertising different products.
OBJECTIVES OF THE STUDY
The objectives of this study are
1. To understand the characteristics of culture.
2. To analyze the role of culture in consumer’s decision making process.
3. To discuss the sub-cultural influences on individuals
RESEARCH METHODOLOGY
The research is mainly based on the secondary data. The secondary data has been collected from various
reference books, research papers, articles and websites.
CULTURE - MEANING Culture can be defined as the sum total of learned beliefs, values and customs of a society that is transmitted
from generation to generation. Culture is the uniqueness and knowledge of a particular group of people defined
by everything from language, religion, cuisine, social habits, music and arts. Culture is an external influence
that affects the consumers. Culture teaches an individual about the acceptable norms of society and tell him the
right and wrong. The use of colors, symbols, language and message reflect culture. Thus, culture is a set of
socially acquired values that society accepts and transmits it to members through language and symbols.
Understanding of cultural properties in the analysis of consumer behavior has been an important variable in
marketing especially in market segmentation.
CHARACTERISTICS OF CULTURE 1. Culture is invented - Culture is invented by the society and developed through generation by customs, rites,
rituals, belief, value etc.
2. Culture is learned - Culture is learned through formal and informal and technical learning. The marketing
messages increase informal learning by providing people with a model of behavior to imitate. Many
practices are learned from the environment of which an individual is a by-product.
3. Culture is Shared - Culture is viewed as customs that link together the members of the society. It means
people within a cultural group share common culture. Common religion and languages is most important for
shared culture. Social institutions that transmit culture and share culture are
a) Family - Primary agent for learning your culture
b) Educational Institutions - Imparts learning skills, history, patriotism, citizenship etc.
c) Religious Institutions - Provides spiritual and moral guidance
d) Mass Media - Agent for learning wide range of culture values and different cultures.

International Journal of Advance and Innovative Research Volume 6, Issue 1 (XXIV): January - March, 2019
32
ISSN 2394 - 7780
American pop culture is shared by no of other countries through the availability of products like coke,
McDonalds etc.
4. Satisfies Needs - Culture is also associated with what a society’s members consider to be a necessity and
what they view as luxury. In US owing a car may be a necessity but in India it may be a status symbol.
5. Culture is Dynamic - It is never static. Member of a society keep having new experience and the members
are do not remain fixed. New generations are brought in. With mobility of members and younger people
joining the group, cultures expand, dilute subdivide and change. Some cultures are slow to change while
some are receptive to change and they adapt other culture easily. Culture is continuously changing due to
influence of other cultures. Change can only be gradual. In recent times, cultural changes are taking place at
a rapid due to exposure to other cultures through mass media.
6. Every culture has some core values - In the context of consumer behavior core values are determined on
the basis of -how they are accepted by a majority of people in a society, how lasting they are and how they
related to consumption behavior.
7. Culture helps in adaptation -When marketers sell their products, they have to adapt to meet cultural
standards of a society otherwise they cannot succeed in business e.g. McDonald's sells meat burgers all over
the world but in India its Mac Aloo Tikki burger is very popular. Marketer must study the specific culture of
their target market to determine whether their products will be acceptable. Also how they will communicate
the features of their products to persuade the target market to buy.
8. Culture is differential -Culture is not universally uniform. Culture is different in every country and in every
society. Strong differences exists because of the practices followed in different societies. Marketers must
understand these differences if they want to succeed in business. Once they understand these differences,
they can communicate well and sell their products properly
CULTURAL INFLUENCE ON CONSUMER BEHAVIOR
Culture is greatly influence on buying behavior of consumer. It influences the living pattern, consumption
pattern and decision-making process of consumer. Also culture is closely associated with certain nationality or
religious identity of an individual. For example women in some Arab countries are not allowed to show their
faces, in some countries men wear tie and in some other countries men wear turban. Many brands associate their
message with country’s culture. Hence, cultured messages are too obvious in marketing products and services
e.g. Honda a Japanese brand communicates Indianess by using the brand logo in Mehendi (Henna).
Culture directly affects consumption habits e.g. Frenchmen use double the cosmetics as compared to women
and Italian children like to eat a bar of chocolate between slices of bread as a snack.
There are large areas where individuals are conditioned by culture, most important being food and clothing,
media habits. Food habits are conditioned to a large extent by culture. Avoidance of beef by Hindus and Sikhs,
avoidance of pork by Muslims, vegetarian food is a large sub culture in India, sea food is foe subcultures along
the coast. Fast foods like McDonalds are to be modified according to Indian Cultural values and habits.
Clothing is usually conditioned by climate but also depends upon culture and inherited. For example saris by
south Indians and salwar kameez by north Indians, dhoti in the south etc. Cross cultural influences however
have influence on clothing habits of people who are exposed to mass media. For example jeans, branded
designer clothes etc.
In India we find change in consumer behavior as a result of gradual cultural changes. This is largely due to
impact of mass media on consumer attitude and lifestyle. Technological advances that take place globally find
their way into our country very quickly through mass media. Mass media has shrunk the world into a global
village. People are today interested in luxury goods and comfort products. International brands are available
today freely and people are adapting to the brand culture e.g. People have become brand conscious like Nike,
Reebok etc.
Today as more and more women are joining the work force and there is an increasing demand for products that
help lighten and relieve the daily household chores, and make life more convenient. For example washing
machines, microwaves, pressure cookers, mixer-grinders, food processors, frozen food etc.
People in our society would like to improve their career prospects and also they wish to acquire relevant
education and skills. So obviously many professional, career oriented educational centers are started.
Today all are conscious about the good health, physical fitness and smart appearance. Thus, many slimming
centers and beauty parlors are opened in all major cities of the country. Cosmetics products (for both women
and men) are rapidly sold out in the market.

International Journal of Advance and Innovative Research Volume 6, Issue 1 (XXIV): January - March, 2019
33
ISSN 2394 - 7780
SUB-CULTURAL INFLUENCES ON INDIVIDUALS
Sub culture is a distinct cultural group that exists as an identifiable segment within a larger, more complex
society e.g. nationality, social class, language etc. Sub - cultural analysis enables the marketers to finalize
market segmentation. In doing so marketers must remember to respect beliefs, values and customs of the sub-
culture. Sub-culture can be identified on the following basis.
A. Social Class: It is a hierarchical division of society with respect to education, status, wealth, values etc.
Consumer behavior and needs change with social class. Three types of social classes are - 1. Upper Class 2.
Middle Class 3. Lower Class
B. Age: It is an important sub culture. A consumer’s buying behaviors lifestyle and consumption pattern
changes with his age. There are main four age trends - Baby, Youth, Middle-aged, Elderly.
C. Gender: The subculture based on male female divide is called gender subculture. The needs and preferences
of men and women are different.
D. Geographical Location: within a country there are various geographical locations, states, regions etc. which
have different climatic conditions. Individuals living in various regions have different lifestyles, because of
differences in climate, culture, and ethnic mix of people. This lead to need for different products. For
example in hilly areas there is need foe sweaters and warm cloths. South Indians prefer Idili, while north
Indians prefer poori Bhaji. People belonging to a region prefer a particular food, have same kind of interests,
wear same type of clothes.
FINDINGS
Culture has a strong influence in a consumer’s decision making.
The silent language of gesture, posture, food and drink preference, clothing preference, different taboos,
ritualistic activities etc. all these have a great impact in consumer behavior.
Culture provides direction and guidance in all phases of human problem solving by offering reliable and
dependable methods to satisfy personal, physiological and social needs.
CONCLUSION
Cultural factors plays an important role in influencing consumer behavior. Culture is important part of society;
it greatly influences an individual’s wants and behavior. So before entering a market, a marketer needs to
carefully study the culture of the country so that he can satisfy the needs of the people. A marketer can’t ignore
the cultural factor as it puts maximum influence on business activities; business depends on society for its
survival, growth and prosperity. So it needs to fulfil the expectation of the society. Proper understanding of
culture enable the marketer to interpret the reaction of consumers to alternative marketing strategies.
REFERENCES 1. Cele C. Otnes, ‘Gender, Culture and Consumer Behavior’, Routledge Taylor & Francis Group, New York,
London, 2012
2. Leon.G.Schiffmon, Leslie Lazar &Kanok, ‘Consumer Behavior’ , Prentice Hall, 2014.
3. Marieke de Mooij, ‘Consumer behavior and culture’, SAGE publication, New Delhi, 2011
4. Max Sutherland & Alice K Sylvester, ‘Advertising & the mind of the consumer’, Kroger Page, 2000
5. N. Ramya, Dr.SA Mohamed Ali, ‘Factors affecting consumer buying behavior’, International journal of
applied research, Vol.2, 2016
6. Ogden, D.O., ‘Exploring the impact of culture and acculturation on consumer purchase’, Academy of
marketing science review, 2004
7. S.Ramesh Kumar, ‘Consumer Behaviour & Branding’, Pearson Education India. 2009.
8. S. Ramesh Kumar, ‘Consumer Behavior - The Indian Context’, Person India Education Services Pvt. Ltd.,
UP, 2017
9. Sharon Ng and Angela Y. Lee, ‘Handbook of Culture and consumer behavior, Oxford university press,
New York, 2015
10. Sinha Dheeraj, ‘Consumer India - Inside the Indian Mind and Wallet’, WILEY Publication, 2011

International Journal of Advance and Innovative Research Volume 6, Issue 1 (XXIV): January - March, 2019
34
ISSN 2394 - 7780
IMPACT OF POINT OF SALE PROMOTION ON CIGARETTE CONSUMPTION
Chetan Jagtap and Dr. Shreedharan Menan
Oriental Institute of Management
ABSTRACT
India is a major market for cigarette in the world but per capita consumption of cigarette in India is very low
compare to the global standard. Though the sale of legal cigarette in the country is declining over the period of
time.However cigarette marketers have managed to adopt such activites which ultimately resulted in more
quantity of cigarette being sold and growing number of smokers in the country.Even the number of youth and
females resorting to smoking show a rising trend.The present paper attempts to find out how the marketers have
managed to retain their market and what is the role of point of sale on the consumption of cigarette in the city
of Mumbai.The research is based on primary as well as secondary data.primary data was collected from a
sample of 100 consumers who smoke cigarette.The survey was conducted with the help of a structured
questionnaire which was convassed among the consumers.The main objective of the research was to find out the
effect of point of sale on consumption of cigarette.Point of sale is one innovative tool used by the marketers to
increase the sale of the products and this has nullified the control measures adopted by the government from
time to time.The government also adopted statutory warnings and pictoral warnings to prevent the consumption
of cigarette but marketers have managed to overcome these restrictions and promote the harmful products more
effectively.The findings of the research revealed that majority of the consumers donot bother about the statutory
warnings and pictoral warnings and consume cigarette as per their needs and requirements.The point of sale
attracts consumer to the purchase of cigarette and smoking as consumer feel that they consume out of choice
and not chance. Thus marketers have succeeded in marketing the harmful products through point of sale and
retaining their customers and the market.Marketers have succeded in selling the products at the strategic
locations through innovative means including the point of sale and encouraging impulsive buying of the
products.
Keywords: Consumption, Advertising, Marketing, Visual display, Point of sale
INTRODUCTION
India is the one of the important country in the world for tobacco production as well as consumption. It is an
important market for cigarette sale. India ranks second in the world in tobacco production (i.e. 800 million kgs.)
after China which ranks first in the world (i.e. 2800 million kgs.). Tobacco consumption in India has increased
over the period of time even though the share of legal cigarette has declined from 21% in 1981-82 to 11% in
2015-16. The per capita consumption of cigarette in India is 96 cigarettes per person per annum.
Cigarette is the only product marketed legally all over the world which kills six million people every year. The
government all over the world has taken various measures to restrict the advertisement & publicity, display of
tobacco pictorial warning so that consumption of cigarette can be controlled. Despite these restrictions tobacco
manufacturers have managed to promote cigarette consumption using innovative methods of marketing &
promotion. One such method is Point of sale (POS). It is a place in wholesale or retail business where cigarette
products sold. Point of Sale advertising weakens the effectiveness of tobacco control low. It promotes the
consumption of cigarette through higher product visibility and attraction. This has helped cigarette companies to
promote their products & create conditions demand for the product.
In all countries of the world there is common practice of printing warning messages on packet of cigarette. This
will create greater awareness among the people about the dangerous smoking. Australia was the first country in
the world to introduce plain tobacco packages. In most countries of the world there are legal restrictions on the
product display, advertising & promotion of cigarette. Some counties have imposed pictorial warning on
tobacco products. Many countries have adopted maximum percentage of cigarette packets to be used for
pictorial warnings. India comes under the top 10 countries in this respect. Nepal ranks first with 90% space to
be used for pictorial warning. India has 85% space for the same. Thus India is in the top 10 countries of the
world in terms of imposing pictorial warnings whether this has any effect on cigarette consumption is to be
analysed.
REVIEW OF LITERATURE
Different promotional strategies
Patel S. Rendell & others (2013) conducted research on the subject of point of sale with adverting and
promotion of tobacco products in the city of Mumbai. The research concerned 125 establishments using display

International Journal of Advance and Innovative Research Volume 6, Issue 1 (XXIV): January - March, 2019
35
ISSN 2394 - 7780
boards for the promotion of cigarettes. It was observed that majority of establishments (85%) violate the
placement of board. The display board was placed above the shop. The display board was oversized and the
advisements were highlighted with backlights. Thus marketers adopt different promotional strategies to attract
consumers. Thus the board were placed on the top of the shop to ensure greater visibility and attraction. In some
cases two boards were placed next to each other with common background. In most of cases the health warnings
were in the same colour as the background brand image, hence marking the effect of warnings. Most of the
shops had visible promotions in the form of stickers & danglers. Promotion in the form of pictures was also
common.
Tools for marketing tobacco & cigarette products
Sinha & others (2014) conducted research on the influence of tobacco industry advertisement & promotions on
tobacco use in the country. The findings of research revealed that sellers adopt different tools for marketing
tobacco & cigarette products such as advertising, point of sale, discounted prices, free coupons, surrogated
adverting etc. This results in higher tobacco consumption among adults. Thus there is direct correlation between
higher direct & indirect exposure of advertisement, promotion and higher consumption of tobacco & cigarette
products.
Sophisticated marketing programmes
Bansal and others (2015) analysed the marketing strategies adopted by cigarette companies in the city of
Mumbai. The findings of the study revealed that cigarette adverting was ubiquitous in the environment, present
in the news & in the films, magazines. However cigarette advertisement was not printed in women magazines &
even women were not show smoking but seen in the advertisement. Thus cigarette companies have developed
sophisticated marketing programmes targeting men, women & children in different socio-economic groups to
promote the sale of cigarettes.
Advertisement about Tobbaco prevention
Sajjan Shetty Malikargun (2014) undertook research to find out the effectiveness of tobacco warning labels in
communicating health risks among bus drivers in Karnataka State Road Transport corporation Mangalore. The
findings revealed that a higher number of respondents who noticed advertisement about the danger of smoking
thought about the risks of smoking and were inclined to think about quitting smoking. Thus continues exposure
of tobacco warning labels helps to educate smoker about health hazards & risks of smoking.
Motivational activities of smoking
Ash fact sheet (2017) analysed the impact of point of sale display on consumption of cigarette. The findings
revealed that it has a direct impact on young smokers in increasing the rate of cigarette consumption. It acts as a
motivator for smoking. Tobacco companies have succeeded in creating point of sale exposure of their products
by developing multiple products and brands of cigarette.
Display of statutory warning and enforcement of smoking
Karibasappa& others (2011) conducted study to assess the awareness and impact of pictorial warnings on
tobacco product among younger people of 15 years & above in Davangre city of Karnataka. The findings of the
study revealed that majority of participants (72%) were aware of the statutory & pictorial warnings but only
50% of the respondents pointed that these warnings influenced them to quit smoking. Further pictorial warnings
were more effective than statutory warnings.
Sales of tobacco and adolescents addiction
Janine Paynter (2009) evaluated the impact of tobacco promotion at the point of sale. The research revealed that
tobacco promotion in any form will have positive impact on smoking especially among adolescents. It is for this
reason that tobacco manufacturer or seller focuses on point of sale promotions. The findings revealed that there
is statistically significance association between exposure to tobacco promotion at the point of sale & cigarette
consumption. Such promotion also leads to impulse purchasing of cigarette & tobacco products. Thus tobacco
companies are using point of sale promotions to encourage children to smoking. Such promotion should also be
banned to control the consumption of cigarette.
Increased sales of tobacco products among adolescents
Lindsay Robertson (2016) conducted research to evaluate the impact of point of sale promotion among children
& adolescent. The findings revealed that point of sale promotion of cigarette will have 1.6 times higher chances
of young & adolescents to smoking as compare to those who are less frequently exposed to point of sale
promotion. Thus there is need to enact some low to ban point of sale promotion of tobacco products.

International Journal of Advance and Innovative Research Volume 6, Issue 1 (XXIV): January - March, 2019
36
ISSN 2394 - 7780
Impact of E cigarette on control of smoking
Montey, Pasch & others (2017) analysed the impact of cigarette advertising on smoker behaviour. The findings
revealed that e cigarette adverting will have positive impact on the use of e cigarette& this in turn may reduce
the consumption of other cigarette & tobacco products, e cigarette is more useful in controlling the adverse
effects of normal cigarettes smoking.
Monshower&Verdumen (2014) conducted research on point of sale of tobacco products in Netherland. The
findings of research revealed that there is multiplicity of sources from where people can buy tobacco products.
The density & proximity of this point of sale influence the smoking behaviour of the people. These people are
less likely to travel far places for the purchase of cigarette. A higher density & proximity of tobacco point of
sale gives higher exposure to the youth. It also results in stiff competition among the seller which results in
lowering of prices to induce more customers.
Further there are large variety of sources from which consumer can buy cigarettes which include grocery,
stores, gas station, newspaper stand, outside the country, KIOS, duty free shops, vending machines, Bar &
Restaurants etc. Majority of the young people in the age group less than 16 years the main source of purchase is
gas station and for other young people of age group 16-19 years the main source is grocery store.
Netherland has 60,000 POS while Norway has 15,000 POS, France 27,000 POS, England has 56,000 POS,
Ireland 13,000 POS, and Hungary has 6,500 POS, and so on. In Netherland 95% of consumers buy cigarette
from 23,000 POS.
Thus higher density of POS may influence the behaviour of smokers by making higher access, higher exposure
to smoking cues, greater acceptability of smoking in the society and higher competition among the outlet.
RESEARCH OBJECTIVE [1] To study the impact of advertising point of sale on cigarette consumption
[2] To analyse the effect of statutory warnings/ pictorial warnings of on cigarette consumption.
Research Area: At the site of outlet of Pan Shop, Mall, Collage Premises, Railway stations South Mumbai and
Mumbai Suburb
iii] Dependent & Independent Variables
The research design included dependent & Independent Variables were cigarette consumption and independent
Variables which are as below:
Dependent Variable: Cigarette Consumption
Independent Variables: Point of sale Promotion, Statutory warning & Pictorial warnings
[C] Research Methodology: A brief description of research methodology can be seen below.
[i] The nature of research& Research Design
The present research is descriptive as well as exploratory research. It attempts to examine the role of POS
promotion on cigarette consumption. The research design is descriptive research design.
[ii] Sampling methods & Sample size
The method of sampling was mainly Non Random sampling which include convenience sampling method. The
size of sample was 100 Consumers which included male & female smokers from different age group.
[iv] Questionnaire A structured questionnaire was prepared from 100 respondents in a 1 – 5 rating scale using
Likert rating scale
[D] Data Analysis:The following section covers analysis of demographic profile of the respondents and the
impact of point of sale promotion on cigarette consumption.
[i] Sample Size & Distribution: The size of sample was 100 consumers & the distribution can be seen as below.
Statistics tools
The statistical tools used were simple percentage for descriptive statistics and Spearman Rank Correlation for
inferential Statistics

International Journal of Advance and Innovative Research Volume 6, Issue 1 (XXIV): January - March, 2019
37
ISSN 2394 - 7780
DATA ANALYSIS & INTERPRETATION
Gender Distribution: The gender distribution of the respondents can be represented as follows:
Table-1: Gender of the respondents
Gender No. of Respondents Percentage
Male 95 95
Female 05 05
Total 100 100
Inference: Majority of the respondents were male accounting for for 95% of the total female smokers were only
5% of the total.
[ii] Age Distribution: The age distribution of the respondents can be seen as below.
Table-2: The age of the respondents.
Age No. of Respondents Percentage
Less than 20 50 50
20 to 30 years 20 20
30 to 40 years 20 20
Above 40 years 10 10
Total 100 100
About 70% of the consumers in the age group less than 30 years & remaining 30% were above the age of 30
years.
[iii] Educational Qualification: The distribution of sample according to education can be seen as below.
Table-3: Educational Qualification of the respondents
Qualification No. of Respondents Percentage
SSC/ Non SSC 20 20
Under Graduate 10 10
Graduate 30 30
Post Graduate 20 20
Others 10 10
Total 100 100
Majority of the consumers were graduate& post graduates accounting for the 50% of the total.
[iv] Occupational Distribution: The distribution of sample population according to occupation can be seen as
below.
Table-4: Educational Qualification of the respondents
Occupation No. of Respondents Percentage
Private Services 60 60
Government Service 20 20
Professionals 10 10
Others 10 10
Total 100 100
Majority of consumers were in private services/jobs accounting for 60% of the total.
[v] Income distribution: The distribution of sample according to income distribution can be seen as below.
Table-5: Income of the respondents
Income No. of Respondents Percentage
Less than Rs.2 Lakh 50 50
Less than Rs.2 Lakh – Rs. 4 Lakh 20 20
Less than Rs.4 Lakh – Rs. 6 Lakh 20 20
Above Rs. 6 Lakh 10 10
Total 100 100
Majority of respondents (ie.50%) were in the income bracket less than Rs.5 lakh per annum. Only 10% were
above Rs.10 lakh per annum.
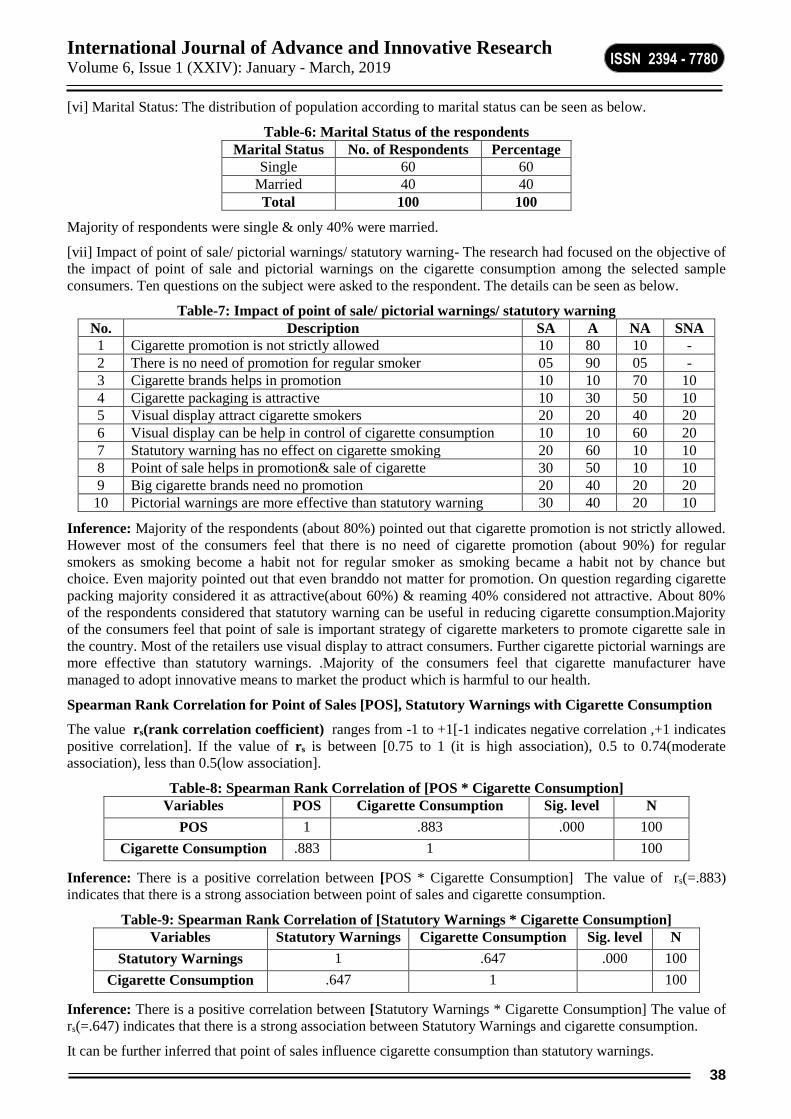
International Journal of Advance and Innovative Research Volume 6, Issue 1 (XXIV): January - March, 2019
38
ISSN 2394 - 7780
[vi] Marital Status: The distribution of population according to marital status can be seen as below.
Table-6: Marital Status of the respondents
Marital Status No. of Respondents Percentage
Single 60 60
Married 40 40
Total 100 100
Majority of respondents were single & only 40% were married.
[vii] Impact of point of sale/ pictorial warnings/ statutory warning- The research had focused on the objective of
the impact of point of sale and pictorial warnings on the cigarette consumption among the selected sample
consumers. Ten questions on the subject were asked to the respondent. The details can be seen as below.
Table-7: Impact of point of sale/ pictorial warnings/ statutory warning
No. Description SA A NA SNA
1 Cigarette promotion is not strictly allowed 10 80 10 -
2 There is no need of promotion for regular smoker 05 90 05 -
3 Cigarette brands helps in promotion 10 10 70 10
4 Cigarette packaging is attractive 10 30 50 10
5 Visual display attract cigarette smokers 20 20 40 20
6 Visual display can be help in control of cigarette consumption 10 10 60 20
7 Statutory warning has no effect on cigarette smoking 20 60 10 10
8 Point of sale helps in promotion& sale of cigarette 30 50 10 10
9 Big cigarette brands need no promotion 20 40 20 20
10 Pictorial warnings are more effective than statutory warning 30 40 20 10
Inference: Majority of the respondents (about 80%) pointed out that cigarette promotion is not strictly allowed.
However most of the consumers feel that there is no need of cigarette promotion (about 90%) for regular
smokers as smoking become a habit not for regular smoker as smoking became a habit not by chance but
choice. Even majority pointed out that even branddo not matter for promotion. On question regarding cigarette
packing majority considered it as attractive(about 60%) & reaming 40% considered not attractive. About 80%
of the respondents considered that statutory warning can be useful in reducing cigarette consumption.Majority
of the consumers feel that point of sale is important strategy of cigarette marketers to promote cigarette sale in
the country. Most of the retailers use visual display to attract consumers. Further cigarette pictorial warnings are
more effective than statutory warnings. .Majority of the consumers feel that cigarette manufacturer have
managed to adopt innovative means to market the product which is harmful to our health.
Spearman Rank Correlation for Point of Sales [POS], Statutory Warnings with Cigarette Consumption
The value rs(rank correlation coefficient) ranges from -1 to +1[-1 indicates negative correlation ,+1 indicates
positive correlation]. If the value of rs is between [0.75 to 1 (it is high association), 0.5 to 0.74(moderate
association), less than 0.5(low association].
Table-8: Spearman Rank Correlation of [POS * Cigarette Consumption]
Variables POS Cigarette Consumption Sig. level N
POS 1 .883 .000 100
Cigarette Consumption .883 1 100
Inference: There is a positive correlation between [POS * Cigarette Consumption] The value of rs(=.883)
indicates that there is a strong association between point of sales and cigarette consumption.
Table-9: Spearman Rank Correlation of [Statutory Warnings * Cigarette Consumption]
Variables Statutory Warnings Cigarette Consumption Sig. level N
Statutory Warnings 1 .647 .000 100
Cigarette Consumption .647 1 100
Inference: There is a positive correlation between [Statutory Warnings * Cigarette Consumption] The value of
rs(=.647) indicates that there is a strong association between Statutory Warnings and cigarette consumption.
It can be further inferred that point of sales influence cigarette consumption than statutory warnings.

International Journal of Advance and Innovative Research Volume 6, Issue 1 (XXIV): January - March, 2019
39
ISSN 2394 - 7780
SUMMARY & CONCLUSION
1. India ranking in the world in tobacco production & consumption is next to China and it is an important
market for cigarette.
2. Per capita consumption of cigarette is very low in India as compare to global standard and the sale of legal
cigarette in the country has declining over the period of time.
3. Governments all over the world have taken sufficient measures to control the consumption of cigarette &
harmful products by way of pictorial warnings & printing of warning messages on the packet of cigarette.
There are restrictions on advertisement and publicity & sale of cigarette at public places.
4. Despite these restrictions the cigarette manufacturers have adopted various innovative marketing strategies
to boost the sale of their products. One such tool is the point of sale. It is the place in the wholesale or retail
outlets where cigarettes are sold. Point of sale promotion weakens the restrictions imposed by the
government on cigarette sale.
5. The findings of the survey revealed that the majority of the smokers (90%) do not bother about cigarette
promotion as they are smokers by choice & not by chance. Majority feel that point of sale is an important
strategy adopted by cigarette marketers. Further cigarette pictorial warnings are more effective than statutory
warnings. Even cigarette packages are more effective & colourful. There is direct correlation between
cigarette display and cigarette consumption.
The results of the survey revealed that point of sales influence cigarette consumption than statutory warnings
REFERENCES
1. Patel S. Rendell & others. (2013). Tobacco Industry tactics with Advertisement at the point of sale
Mumbai.Indian Journal of cancer ,Vol 50 (3 ).
2. Sinha& others .(2014) . Influence of tobacco Industry .Advertisement & promotion on tobacco
use . India Journal of Cancer , Vol 51 .
3. Bansal and others . (2015). Cigarette adverting in Mumbai :Centre for Tobacco control & Research
University of California San Francisco, USA (2015).
4. Sajjan Shetty Malikargun. (2014). Role of tobacco warning labels:Tobacco Advertising & Promotion.
AsianPacific Journal of Cancer Prevention, Vol 15 [5] .
5. Karibasappa& others .(2011).Assessment of Awareness about of pictorial warnings on tobacco products.
India Journal Stomatol.
6. Janine Paynter& Richard Edwards. (2009).The impact of tobacco promotion at the point of sale.Nicotin &
Toabacco Research .Vol 11 ( 1 ).
7. Lindsay Robertson .(2016). Point of sale Tobacco promotion & youth smoking. Tobacco Control, Vol 25
(2).
8. Montey, Pasch, Loukas.Nov (2017). Exposure to POS Marketing of cigarette & E cigarette. Nicotin
Tobacco Research.
9. Monshower & Verdumen.(2014). Point of sale of tobacco products in Netherland Institute of Mental Health
& Addiction

International Journal of Advance and Innovative Research Volume 6, Issue 1 (XXIV): January - March, 2019
40
ISSN 2394 - 7780
SUSTAINABLE CONSUMPTION AMONG CHILDREN-THE ROLE OF PARENTS
Dr. Ritu Bhattacharyya
Principal, Sasmira’s Institute of Commerce and Science, Mumbai University, Mumbai
ABSTRACT
Any discussion on Commerce is related with the consumption of goods and services that an economy produces.
For the last couple of decades we as an economy have been consuming goods very mindlessly, this has led to a
lot of destruction to the eco system of the country. Thus the need for sustainable consumption becomes very
important. Few point about Sustainable consumption to ponder are :
Sustainable consumption does not mean that the consumer does not consume
Sustainable consumption emphasizes that the quality of goods and services must improve and thus help
improve the quality of life.
Sustainable consumption does not mean reduction in production.
Sustainable consumption focuses on minimizing use of natural resources and toxic material – production
should support use of bio-degradable and man made material instead of natural resources
Sustainable Consumption aims at consumption of goods that do not create waste and pollution either at the
time of production or use
Sustainable consumption stresses that the needs of the future generation should be paramount.
The paper aims to study the role that Parents play in teaching the next generation about sustainable
consumption habits.
Keywords: Consumption patterns; Sustainable consumption; children; role of parents.
INTRODUCTION
Sustainable consumption is the use of products and services that have a minimal impact on the environment so
future generations can meet their needs. To produce goods and services raw material is drawn from the
environment, such as water, timbers and fossil fuels. Therefore, meeting the desires of the consumer for more
goods and services can lead to depletion of resources and increased pollution.
Children are the future of the world and they are also huge influencers in purchase policy of families, at the
same time they are not very savvy regarding the effect of their consumption on the environment. Thus if any
substantial change has to be brought about in the consumption patterns, education and involvement of children
is a must. The consumption patterns of children have changed steadily over the past decade, this is evident
from the bags, water bags, tiffin and other accessories they carry to school a far cry from what children used
even a decade ago, every thing is branded and latest in the market. Every urban child above 10 years of age has
a pocket money, which may remind you of your first salary and they are free to spend it without any supervision
from parents. The demands of some pre-teeners are so absurd that one wonders whether the goods demanded
by them are specific to their age.
The consumption patterns of most kids are defined by what they see at home and the society they move in or at
school. Most schools are very strict in allowing kids to get high end gadgets or high end accessories to school
and thus they do their jobs in controlling peer pressures and undue consumptions at school. The next biggest
influencers are the parents and their immediate social contacts that the child is exposed to. This is where
children actually learn what they must buy, how they must use goods and how much of what they must
consume. The societal structure of our country has changed in the last two decades, young parents are better
educated and skilled than their parents and the growing economy has offered them goods jobs with good pay
packages. Most families have both parents working thus they are able to have a disposable income which they
spend freely. Most of these young parents were bought up in small towns with parents having limited incomes,
thus when they have money to spare they go about buying all the gadgets and other products that they dreamt of
when they were going up, thus setting a bad example to their kids . Another aspect that leads to children buying
a consuming goods that are not necessary is the guilt factor among parents who are unable to devote time to
their kids and feel that they can buy gratification and thus put their children into habits of high consumption.
Excessive use of gadgets not only takes children away from the outer world but also has ill effects on their
health as most of them are not into physical games but only into virtual games. The constant need for up
gradation of gadgets also leads to a lot of e-waste which can create a lot of ill effect to the environment.

International Journal of Advance and Innovative Research Volume 6, Issue 1 (XXIV): January - March, 2019
41
ISSN 2394 - 7780
OBECTIVE OF STUDY
The main objective of study is to find how parents influence consumption patterns of children and whether they
can convince children towards sustainable consumption
HYPOTHESIS
H1 – Parents at home do not have a significant influence on consumption habits of children.
SAMPLE SELECTION
The aim is to find out how parents influence the consumption patterns of children. For this purpose 200 school
going children in the age bracket of 5 to 19 were studied in the areas of Mumbai; Navi Mumbai and Thane.
RESEARCH METHODOLOGY
A structured questionnaire was administered to respondents. This was done through a personal interview
method. The researcher contacted the respondents personally. The questionnaire was divided into two parts.
Part one is respondents profile and Part two was the main survey. Two different questionnaires were prepared
one for the Parents and other for the children .The sample to which the questionnaire was administered was
based on convenience sampling techniques. The sample distribution was as under:
Table-1
Sr. No. Sample Gender Sample Sample Size
a) Parents Male
Female
84
116
200 nos.
2. Children Male
Female
124
76
200 nos.
Source: Primary Data
Table 2
Age Parents Number in sample House Income(per month) Parents
27-30 40 50,000-75,000 20
31-35 30 75,001-100,000 50
36-40 47 100,001-125,000 56
41-45 43 125,000-150,000 40
46-50 30 150,001-200,000 20
>50 20 >200,000 14
Source: Primary Data
Table 3
Age Children Pocket Money- pm Children
5-7 40 00 16
8-10 32 1000-2000 26
11-13 28 2001-4000 62
14-16 56 4001-6000 54
17-19 44 6001-10000 22
>10000 20
Primary Data
Primary data was collected randomly through the structured questionnaire in Mumbai, Navi Mumbai & Thane
District using convenience based random sampling.
Sample Size
The study was limited to those participants who willingly elected to complete the instruments in their entirety.
There were a total of 200 children and 240 parents as respondents.
Sample Design
The researcher relied upon convenience based random sampling technique, considering the research
methodology and research type as per guidelines. A caution was exercised during the study that the respondents
who did not show inclination to be a part of the study were not covered.
Area of Research Mumbai, Navi Mumbai & Thane District.

International Journal of Advance and Innovative Research Volume 6, Issue 1 (XXIV): January - March, 2019
42
ISSN 2394 - 7780
Secondary Data
The secondary information or data was collected from published sources such as journals, magazines,
newspapers, government reports, internet and other sources.
Research Instruments
A summated closed end questionnaire was used with different viewpoints of customers.
Statistical Analysis
Efficient and effective data analysis is the result of effective data preparation. This was found to be very crucial
between the completion of the field work and the statistical processing of the collected data. Data preparation
involved transferring the questionnaire into an electronic format which allowed and facilitated subsequent data
processing. Data sheet was prepared directly at Statistical Program for Social Sciences (SPSS) software for
further analysis. Code was assigned to each response for data entry and data record. Transcribed data sheet was
prepared for data analysis. On the basis of data sheet, tables and graphs were prepared for the analysis.
Limitations
Time and area are a major constraint in the study.
This research reflects opinion and responses of individuals only where by findings and suggestion given on
the basis of this research cannot be extrapolated (applied) to the entire population.
Area of research is also a major constraint.
ANALYSIS:
In order to study the influence that parents have on the consumption habits of children the children were asked
questions on consumption of electronic and other goods and on food and food habits and the children were also
asked question on spending habits of their parents
CHILDREN’S RESPONSE
Consumption Habits Of Clothes, Accessories And Gadgets
a) Do you feel that your parents are trendy vis. They have the latest clothes, accessories and other
possessions
Children’s Age Yes No
5-7 40 00
8-10 32 00
11-13 20 08
14-16 43 13
17-19 27 17
Source: Primary Data
b) Do you feel proud, among your peers on account of your parents appearance and possessions
Children’s Age Yes No
5-7 40 00
8-10 32 00
11-13 28 00
14-16 45 11
17-19 30 14
The above data proves that children are happy by the possessions that their parents have and it makes them feel
good among their peers.
c) Do you and your parents possess the latest and high end e devices like smart phones, laptops, game
consoles smart TV’s etc
Age Children No
5-7 40 00
8-10 30 02
11-13 20 08
14-16 42 14*
17-19 28 16*
Source: Primary Data

International Journal of Advance and Innovative Research Volume 6, Issue 1 (XXIV): January - March, 2019
43
ISSN 2394 - 7780
*Most of the time it is seen that the mother, if she is a house wife may not posses the latest device
d) Do your parents give you the latest gadgets and fulfill your demands
Age Yes No Sometimes
5-7 40 00 00
8-10 30 00 02
11-13 21 01 06
14-16 39 05 12
17-19 26 04 14
Source: Primary Data
The data above proves that most of the time parents themselves are giving the children the latest gadgets and
very rarely are they refusing what their children demand.
Food Consumption Habits
a) How often is your demand for junk food or eating out entertained by your parents
Children’s Age Always Often Sometimes Seldom Never
5-7 30 06 04 00 00
8-10 18 08 06 00 00
11-13 19 06 03 01 00
14-16 31 14 06 03 02
17-19 18 15 06 02 03
Source: Primary Data
b) How often have you been allowed to leave food cooked at home and go out to eat or call for a take
away meal if you don’t like what is cooked?
Children’s Age Always Often Sometimes Seldom Never
5-7 00 29 08 01 02
8-10 00 19 08 02 03
11-13 00 12 09 04 03
14-16 00 32 18 02 04
17-19 00 18 22 01 03
Source: Primary Data
c) What happens to the food not consumed?
Children’s Age Consumed later Discarded
5-7 02 38
8-10 04 28
11-13 02 24
14-16 06 50
17-19 04 40
Data proves that children are allowed to consume junk food or leave food if they do not like it and most of the
time the food is discarded this obviously does not teach the child good food habits and there is a lot of wastage.
d) How often do you carry a tiffin box for lunch to school/college
Children’s Age Always Often Sometimes Seldom Never
5-7 40 00 00 00 00
8-10 18 08 06 00 00
11-13 11 09 05 03 00
14-16 13 22 14 06 01
17-19 05 08 06 12 13
Source: Primary Data

International Journal of Advance and Innovative Research Volume 6, Issue 1 (XXIV): January - March, 2019
44
ISSN 2394 - 7780
e) How often is the food that you carry in your tiffin junk (only for those children who carry a tiffin even
occasionally)
Children’s Age Always Often Sometimes Seldom Never
5-7 03 04 16 12 05
8-10 07 09 06 08 02
11-13 07 15 11 04 01
14-16 15 26 10 04 00
17-19 10 08 08 05 00
Source: Primary Data
Data proves that parents themselves are giving children junk food thus there is no way for the children to learn
good food habits.
Children’s Opinion On Their and Their Parent’s Consumption Habits
a) Do you feel that your parents are right in buying the latest clothes and accessories and gadgets for
themselves and you?
Children’s Age Yes No Don’t Know
5-7 25 00 15
8-10 32 00 00
11-13 20 06 02
14-16 34 12 10
17-19 38 06 00
Source: Primary Data
Most children feel that there is nothing wrong in their parents spending constantly on new gadgets and clothes.
Reuse or use till wareout do not seem to be necessary.
b) Have your parents ever told you that it is wrong to buy new things when the earlier things are still
good
Children’s Age Yes No Sometimes
5-7 04 32 02
8-10 02 26 04
11-13 02 16 12
14-16 06 26 24
17-19 16 12 16
Source: Primary Data
Parents have never told children that they should consume cautiously and therefore they do not feel that their
consumption habits lead to wastage
c) Who spends more money on gadgets and eating out
Children’s Age Me My Parents
5-7 00 40
8-10 01 31
11-13 03 25
14-16 06 50
17-19 04 40
Source: Primary Data
d) Do you feel your parents are wasteful in their expenditure
Children’s Age Yes No
5-7 00 40
8-10 00 32
11-13 03 25
14-16 07 49
17-19 06 38
Source: Primary Data

International Journal of Advance and Innovative Research Volume 6, Issue 1 (XXIV): January - March, 2019
45
ISSN 2394 - 7780
The above analysis proves that the Hypotheses is rejected because parents have a huge role to play in how
children perceive their consumption habits. If parents replace their gadgets and other possessions quickly even
if they are properly functional then the children also do not feel that it is wrong. Young parents themselves
have very poor consumption habits and thus the children follow them in their though process as well as
consumption.
FINDINGS
The major findings of the study are that children are what their parents make them. Children know how far they
can push their parents for what they want and they will do it. Parents have the biggest role to play in
consumption patterns of the children. They are very important in making the child realize what is essential and
how much is essential. Good habits and owning of responsibility towards themselves, the society, the country
and the world as a whole has to be taught at the family level. Parents have to exhibit healthy consumption and
use habits which can then be imbibed into children. The study shows that most urban parents do not follow and
teach their children smart consumption and disposal habits thus creating very poor consumption habits where
children and parents are consuming more than is good and especially the e-disposal is creating very toxic and
bad environment.
It is very difficult for children to have self-actualization because they are seeing their parent perpetually indulge
in unhealthy consumption of goods and services. In fact schools are trying very hard to teach children
sustainable consumption and many times from their learning in schools children have been able to restrain their
parents from unhealthy consumption. Parents above the age of 45 have been found to be more responsible but
the young parents have been found to be most irresponsible in their consumption habits as well as in fulfilling
the demands of their children for goods and services that need not be used children.
BIBLOGRAPHY
Brundtland, G. H. (1994). The challenge of sustainable consumption. Natural Resources Forum, 18(4),
29–45.
Campbell, C. (1994). Consuming goods and the good of consuming. Critical Review, 8, 503–521.
Durning, A. T. (1994). How much is enough? the consumer society and the future of the
earth Earthscan.
Fedrigo, J. Hontelez Sustainable consumption and production: an agenda beyond sustainable consumer
procurement J. Ind. Ecol., 14 (2010), pp. 10-12
D. Fuchs, S. LorekSustainable consumption governance: a history of promises and failures
J. Consum. Policy, 28 (2005), pp. 261-288
L. Lebel, S. LorekEnabling sustainable production-consumption systems
Annu. Rev. Environ. Resour., 33 (2008), pp. 241-275
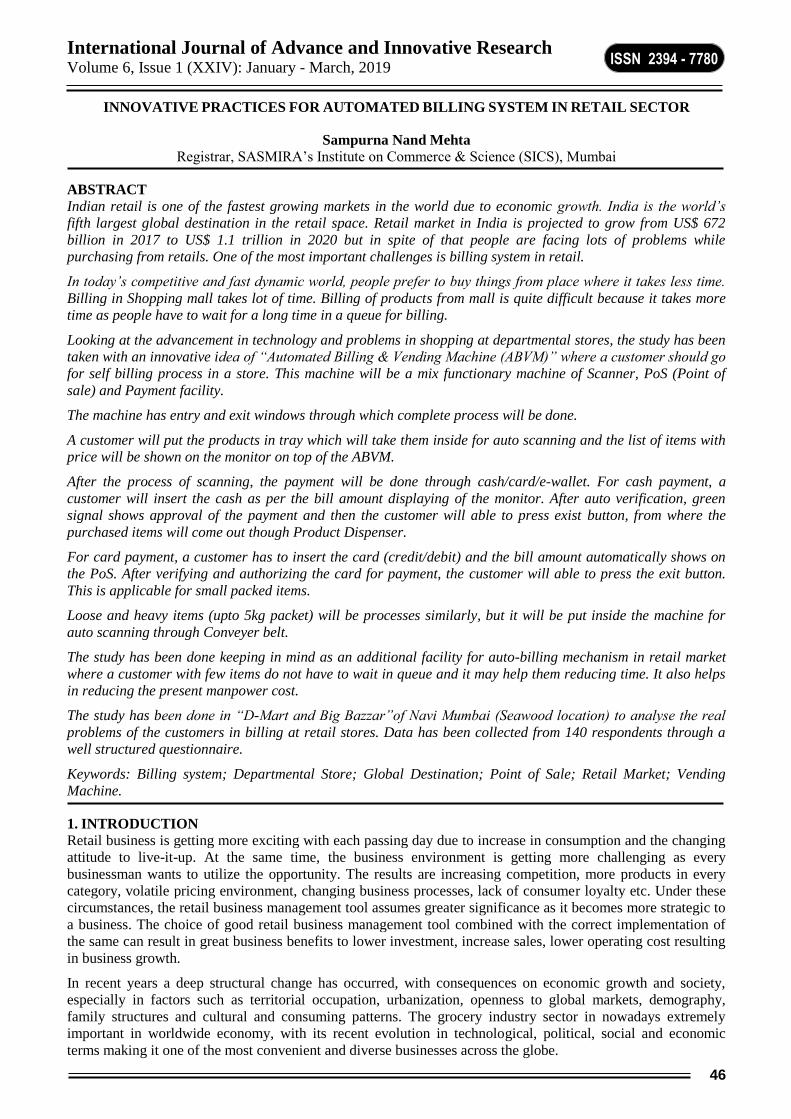
International Journal of Advance and Innovative Research Volume 6, Issue 1 (XXIV): January - March, 2019
46
ISSN 2394 - 7780
INNOVATIVE PRACTICES FOR AUTOMATED BILLING SYSTEM IN RETAIL SECTOR
Sampurna Nand Mehta
Registrar, SASMIRA’s Institute on Commerce & Science (SICS), Mumbai
ABSTRACT
Indian retail is one of the fastest growing markets in the world due to economic growth. India is the world’s
fifth largest global destination in the retail space. Retail market in India is projected to grow from US$ 672
billion in 2017 to US$ 1.1 trillion in 2020 but in spite of that people are facing lots of problems while
purchasing from retails. One of the most important challenges is billing system in retail.
In today’s competitive and fast dynamic world, people prefer to buy things from place where it takes less time.
Billing in Shopping mall takes lot of time. Billing of products from mall is quite difficult because it takes more
time as people have to wait for a long time in a queue for billing.
Looking at the advancement in technology and problems in shopping at departmental stores, the study has been
taken with an innovative idea of “Automated Billing & Vending Machine (ABVM)” where a customer should go
for self billing process in a store. This machine will be a mix functionary machine of Scanner, PoS (Point of
sale) and Payment facility.
The machine has entry and exit windows through which complete process will be done.
A customer will put the products in tray which will take them inside for auto scanning and the list of items with
price will be shown on the monitor on top of the ABVM.
After the process of scanning, the payment will be done through cash/card/e-wallet. For cash payment, a
customer will insert the cash as per the bill amount displaying of the monitor. After auto verification, green
signal shows approval of the payment and then the customer will able to press exist button, from where the
purchased items will come out though Product Dispenser.
For card payment, a customer has to insert the card (credit/debit) and the bill amount automatically shows on
the PoS. After verifying and authorizing the card for payment, the customer will able to press the exit button.
This is applicable for small packed items.
Loose and heavy items (upto 5kg packet) will be processes similarly, but it will be put inside the machine for
auto scanning through Conveyer belt.
The study has been done keeping in mind as an additional facility for auto-billing mechanism in retail market
where a customer with few items do not have to wait in queue and it may help them reducing time. It also helps
in reducing the present manpower cost.
The study has been done in “D-Mart and Big Bazzar”of Navi Mumbai (Seawood location) to analyse the real
problems of the customers in billing at retail stores. Data has been collected from 140 respondents through a
well structured questionnaire.
Keywords: Billing system; Departmental Store; Global Destination; Point of Sale; Retail Market; Vending
Machine.
1. INTRODUCTION
Retail business is getting more exciting with each passing day due to increase in consumption and the changing
attitude to live-it-up. At the same time, the business environment is getting more challenging as every
businessman wants to utilize the opportunity. The results are increasing competition, more products in every
category, volatile pricing environment, changing business processes, lack of consumer loyalty etc. Under these
circumstances, the retail business management tool assumes greater significance as it becomes more strategic to
a business. The choice of good retail business management tool combined with the correct implementation of
the same can result in great business benefits to lower investment, increase sales, lower operating cost resulting
in business growth.
In recent years a deep structural change has occurred, with consequences on economic growth and society,
especially in factors such as territorial occupation, urbanization, openness to global markets, demography,
family structures and cultural and consuming patterns. The grocery industry sector in nowadays extremely
important in worldwide economy, with its recent evolution in technological, political, social and economic
terms making it one of the most convenient and diverse businesses across the globe.

International Journal of Advance and Innovative Research Volume 6, Issue 1 (XXIV): January - March, 2019
47
ISSN 2394 - 7780
INDIAN RETAIL INDUSTRY ANALYSIS
India has occupied a remarkable position in global retail rankings; the country has high market potential, low
economic risk and moderate political risk
India is expected to become the world's third-largest consumer economy, reaching US$ 400 billion in
consumption by 2025, according to a study by Boston Consulting Group
India is ranked first in the Global Retail Development Index 2017, backed by rising middle class and rapidly
growing consumer spending
India’s retail market witnessed investments worth US$800 million by Private Equity (PE) firms and wealth
funds in 2017.
In spite of growth in retail sector, customer are facing problem while billing the products. They have to wait in
queue for long time for their chance. In such situation, automated billing system with scanning facility helps
them to overcome the problems.
2. LITERATURE REVIEW TO FIND THE GAP
Many researchers have been carried out on retails sectors, but not on Automatic Billing system which includes
scanning of the items alongwith the payment facility. The gap exist which can be remove by practicing the
Innovations as found during the study.
Thakur, 2017 highlights on the automated trolley used while purchasing in departmental store. Here a customer
will put the items required for purchasing in trolley which will be will bill the amount through RFID. No
research has been done where automated payment system alogwith payment of the items.
Siras Dr Manmeet kumar, 2012 indicates about the challenges in retails sector. The automated scanning and
payment required to be
“Udita Gangwal, Sanchita Roy, Jyotsna Bapat” proposed a system of smart shopping cart for automated billing
purpose using wireless sensor networks. In this paper authors describing the implementation of a reliable, fair
and cost efficient shopping card using wireless sensor networks.
“Kalyani Dawkar, Shraddha Dhomae, Samruddhi Mahabaleshwarkar” ” proposed a model of electronic
shopping cart for effective shopping based on RFID in which a system consist of smart trolley will have RFID
reader, lcd display. When the person puts a product in trolley it will scan and the cost, name and expiry date of
the product will be displayed.
3. PROBLEM DEFINITIONS
In retail store, sometimes standing in queue for Billing of products is Time Consuming.
While purchasing, person having few items has to be queue for long time and wait for his chance, if anyone
with more items will be in same queue ahead.
Being manual operation for billing and scanning at Billing Counter, errors may happen in amount and
double scanning of same product.
4. OBJECTIVES
To study how fully automated physical shopping reduce purchasing time.
To study if self Billing system will reduce manpower cost to the retail shop.
To study if self billing system helps in enhancing cashless markets.

International Journal of Advance and Innovative Research Volume 6, Issue 1 (XXIV): January - March, 2019
48
ISSN 2394 - 7780
5. RESEARCH METHODOLOGY Methods- the study was descriptive and analytical, so a Survey method was used by using wells structured
Questionnaire. Questionnaires were divided into three sections. First two sections consist of Personal and
Demographical details of respondents’ while the third section consists of the research questions.
Data were collected from both Primary and Secondary sources.
Primary data were collected from customers at D-Mart and Big Bazaar (Seawoods location) in Navi Mumbai.
Secondary data were collected from different relevant websites, newspapers, magazines, and research articles.
SAMPLING
a) Universe- Customers of Departmental store D-Mart and Big Bazaar, at Seawood in Navi Mumbai.
b) Sample Distribution
Customers- 140
Gender wise Store Total
D-Mart Big Bazaar
Gender Male 35 28 63
Female 45 32 77
Total 80 60 140
Table-1: Source-Primary Data
Age wise Store Total
D-Mart Big Bazaar
Age
Less than 20 years 1 2 3
20-30 years 25 8 33
30-40 years 22 26 48
40-50 years 22 16 38
Above 50 years 10 8 18
Total 80 60 140
Table-2: Source-Primary Data
Annual income wise Store Total
D-Mart Big Bazaar
Annual Family Income
Not Sure 1 3 4
Less than 2 Lakh 3 1 4
2-4 Lakh 15 8 23
4-6 Lakh 37 31 68
Above 6 Lakh 24 17 41
Total 80 60 140
Table-3: Source-Primary Data
Techniques of Selection- Simple Random sampling were used for the study.
Location of Study- Navi Mumbai
Analysis Method- The data collected for study was carefully validated and uploaded on SPSS software for
Analysis. Excel was also used for analysis of the data.
7. ANALYSIS & FINDINGS OF THE STUDY
The Study includes the analysis on Time consumption during payment for the products at the Billing Counter in
Departmental stores, separately on weekdays and weekends during evening time. It has been also reflects on the
preference of customer for selecting mode of payment.

International Journal of Advance and Innovative Research Volume 6, Issue 1 (XXIV): January - March, 2019
49
ISSN 2394 - 7780
I) MODE OF PAYMENT
Graph-1: Source-Primary Data
Refer Graph 1: Graph 1 reflects that 18% of respondents of Age above 50 years prefer to use Cash rather than
credit or debit card for purchasing. They were afraid of being fraud or security means, do not want to disclose
any financial details.
37% of the respondents of age bracket of 40-50 years were using Credit card whereas 47% respondents were
using Debit card for purchasing. During the study it has been found that few of the people using the Debit Card
were pessimist type and believe on own money. It also found that few f the people were not able to get the
credit card because of their low income.
57% of the respondents were found using e-wallet for purchasing: the new payment gateway. Few of the
respondents told that its easy to purchase using single mobile Apps. Also they are able to get lots of offers in
terms of cash back or discounts during purchasing through e-wallet.
Most of the respondents in the age bracket of 20-30 years were not holding the Credit Card being low salary
income, but managing their purchase through smart phone using e-wallets.
II) TIME CONSUMPTION AT BILLING COUNTER IN DEPARTMENT STORE
Graph-2: Source-Primary Data
Refer Graph 2: Graph 2 reflects that 43% & 36% of the respondents agreed on the facts the average timing for
billing procedure5-10 minutes and 10-15 minutes respectively on weekdays (Monday to Friday) during evening
time, whereas its more than1 5 minutes on weekends (Saturday & Sunday) during evening time. Few of the
respondents also agreed that because of the more time consuming on weekends at cash/billing counter, they
prefer to buy few products from local retail shops. They prefer to visit departmental stores once or twice in a
month to buy the grocery for whole month, because of availability of varieties in products at discounted rate.

International Journal of Advance and Innovative Research Volume 6, Issue 1 (XXIV): January - March, 2019
50
ISSN 2394 - 7780
III) COMPARISON OF TIME CONSUMPTION AT BILLING COUNTER IN D-MART & BIG BAZAAR
Graph-3: Source-Primary Data
Refer Graph 3; Graph 3 reflects on the facts that billing time at both D-Mart and Big Bazaar were
approximately the same. 43% of the respondents at D-Mart and Big Bazaar agreed on the facts the consumption
time is approximately 5-10 minutes at billing counters on weekdays, where more than 45% of the respondents
both at D-Mart and Big Bazaar agreed that average billing time is more than 15 minutes on weekends.
8. IMPLICATIONS OF THE STUDY
The Study conclude that the young generations in the age brackets 20-40 years are using credit card or debit
card for purchasing. They also prefer to use e-wallet, because of many offers in getting cash backs or discounts
during shopping. Today in competitive and dynamic world, people are more time conscious and prefer shopping
from the place where they save because of the Infrastructure and facilities of the store.
In such situation, suggest having hybrid methodology by using Scanner, PoS and Payment gateway together in
single Automated Billing Machine. The consumer themselves can operate the machine for billing and payment
procedure. It will save time to the customer and especially to those customers who have small items to
purchase.
It will also help the departmental store to reduce the cost of manpower deputed at the billing counter. It will be
additional facilities may be recommended to use in Departmental Stores to reduce the time at billing counter.
Flow chart of Operations of Automated Billing Machine

International Journal of Advance and Innovative Research Volume 6, Issue 1 (XXIV): January - March, 2019
51
ISSN 2394 - 7780
Step 1- Customer has to insert his/her mobile number before accessing the machine. After that Input Tray will
come out on which they put the products one by one.
Step 2 to 4-the Tray will go inside and with the help of Bar Coding system, the rate and quantity of the products
will display on the monitor attached to the machine on the top front.
Step 5-Payment System-After getting the bill amount, customer will select any of the payment mode on the
screen of the monitor.
Option I- Cash- The cash amount will put inside the window open after selecting this choice. It will be
conditional basis, restricted to certain denomination of the notes only.
Option 2- Using Credit or Debit Card- Customer has to insert the card on the PoS and verify the auto generated
amount of purchase on it. They put the Password of the card and make the payment.
Option 3- Using e-wallet- Department stores tie-up with various e-wallet service provider companies. E-wallet
will be access by using Purchase Scan Code or OTP which they will get after selecting the payment option.
Step 6-After confirmation of the payment, green light will show and Dispenser Window will open from where
the purchased products will come out. These products will go inside the bag/basket attached from outside.
9. LIMITATIONS OF THE STUDY
i. Area of research is a major constraint. The biggest limitation of the study is that it has been done in two
departmental Stores of Navi Mumbai in Maharashtra only and may not give an overall picture of India.
ii. The study has been taken for 2 months May & June 2018, so it may affects on buying behavior being
vacation and holidays.
iii. It will not be applicable for store of electronic items.
iv. The Innovations as suggested is not applicable for any type of Coupons like Meal Coupons, Sodexo etc.
v. This study reflects the opinion and responses of individuals only where by findings and suggestion given
on the basis of this research cannot be extrapolated (applied) to the entire population.
BIBLIOGRAPHY
Galande Jayashree, Rutuja Gholap, Priti Yadav (2015) “RFID based Automatic billing trolley” ,publication-
IJETAE
S Sainath, K. Surendra, V.Vikram, Arvind (2014) “Automated smart trolley integrates Raspberry Pie
embedded chip with two barcode scanners used in supermarket”, publication-ICCCMIT
Thakur Prerana, (2017), IJDER, Vol 5 Issue, Issue 2, ISSN: 2321-9939
Yathisha L, Abhishek A, Harshit R, Drashal Koundinya (2015) “Automation of shopping cart to ease queue
in malls by using RFID”, publication- IRJET
WEBSITE
https://techzoneindia.com/enterprise-business-solutions/retail-business-management-system.html
https://blog.magestore.com/how-pos-system-works
https://justbilling.in/modern-billing-software/
http://fashionretailfuture.com/the-automated-airport-store/
www.ibef.org

International Journal of Advance and Innovative Research Volume 6, Issue 1 (XXIV): January - March, 2019
52
ISSN 2394 - 7780
TECHNOLOGY INNOVATION FOR SUSTAINABILITY: A CASE OF TRUCKING INDUSTRY IN
INDIA
Dr. Mahendra Parihar
HOD & Associate Professor, Department of Economics, Manipal University Jaipur
ABSTRACT
An economic system well supported by technological advancement via innovation on a regular basis with steady
progress in production and productivity always have more chances of success in short as well as long run as far
as sustainability is concern. Many economies of the world have attained the status of developed economy only
on the basis of technological developments in almost all the segments of their economy. The countries with
either low technological progress or technological backwardness are still underdeveloped or in developing
stages. The economies with lesser technological advancement are paying cost in terms of high cost of
production and underutilization of capacity or resources i.e. using more resources with less output, and this is
raising a big question mark for sustainable development of those economies. This is because especially in case
of non-renewable resources, if the economy will continue with same diseconomies i.e. no increase in
productivity of same non-renewable resource per unit of output, with the use of same resource in more quantity
the output still remains low; it will have huge cost to the nation in many ways via direct and indirect impact.
Further, having look at Indian Economy with reference to crude consumption especially diesel by various
sectors and sub-sectors, it seems that one of the segments of our economy i.e. trucking industry, where
consumption of diesel is maximum and still going to increase in future too. Even in the total cost of trucking
operation in India the cost of diesel is highest for the trucking operators. Therefore, the need of hour is to
reduce the level of consumption of diesel by this segment without deteriorating the performance, productivity
and efficiency of trucking industry in India.
Thus, in this paper an attempt has been made to understand the nature trucking industry in general and level of
technology in particular over period of time to analyse its impact on trucking productivity with reference to
improvement in mileage of trucks. Also, the aim is to look at the impact of change in mileage on import bill with
reference to crude bill and its impact on currency value at international level. This paper also attempts to
understand the consumption pattern/trend of crude for trucking industry with its price.
Keywords: Innovation, Industry, Technology, Resource, Fuel, Transport.
1. INTRODUCTION
Transport in general and road transport in particular plays an important role in sustainable economic growth of
any nation and especially economy like ours. Road transport also supports in growth of trade at national and
international level through activity of movement of goods at various places. The share of transport sector in our
Nation’s GDP is around 6.41%. GoI Report suggests that road transport amongst other modes of transport has
emerged as dominant segment in India with a share of 4.7% in India’s GDP when we compare it with railway
which has a mere 1% share (GoI 2012). Road transport is considered as the most efficient mode for short and
intermediate haul with high as well as low value commodity. Road transport industry has certain inherent
features which provide certain advantageous position to this mode as compare to other modes. The share of road
transport in terms of freight movement has been increased from less than 15% during early 1950s to around
70% in recent times (Parihar M & Sharma R, 2016). Further, according to Transport Vision 2020 (GoI 2002),
given the present GDP growth rate and anticipated 8% - 10% in future, the freight traffic will be 5000 – 7000
BTKM and the model share would be 15% - 20% of Rail and 80% - 85% of Road. It shows that there would be
growth of Rail freight traffic by 3 folds whereas Road freight traffic by 5 folds under the assumptions that there
would be positive impact of NHDP (National Highway Development Program) and PMGSY (Pradhan Mantri
Gram Sadak Yojana) along with other developmental schemes of the government on road freight transport. .
Given below in the Table 1 the growth of truck population in India due to increase in demand for freight
handled by road transport in India:
Table-1: Growth of Trucking Industry in India
Year Truck Population(in Thousand)
2001 2948
2002 2974
2003 3492
2004 3749

International Journal of Advance and Innovative Research Volume 6, Issue 1 (XXIV): January - March, 2019
53
ISSN 2394 - 7780
2005 4031
2006 4436
2007 5119
2008 5601
2009 6041
2010 6432
2011 7064
2012 7658
2013 8307
2014 8698
2015 9344
Source: Transport Research Wing, Ministry of Shipping, Road Transport and Highways.
Thus, with the increase in demand for trucking industry, the number of trucks has also increased as shown in
Table 1. However, this ever increasing truck population required more and more fuel in absolute terms. This is
again very important because the data given below in the Table 2 indicates that the addition of number of trucks
in existing trucking population every year is significantly high.
Table-2: Domestic Sales Trends of Commercial Vehicles in India
Year Commercial Vehicles
2012-13 793211
2013-14 632851
2014-15 614948
2015-16 685704
2016-17 714082
2017-18 856453
Source: Society of Indian Automobile Manufacturers (12th January, 2019)
Again, with growth of trucking industry, making available the required fuel to trucking industry and other
segments of our economy is a challenging task especially when most of our demand are being met by import of
such products. Fluctuation in prices and high prices of those products further add to the challenges to our
economy. This challenge become worse especially when our economy is growing in absolute term with
reference to agricultural and industrial segment that has resulted into demand of more trucking services for
freight handling. Given in Table 3 the freight handled by road transport and its growth over period of time.
Table-3: Freight Handled by Road Transport in India (Billion Tonne Kilometer)
Year Freight Handled
2001 515
2004 646
2008 1021.6
2012 1508
2015* 1975
Source: Road Transport Year Book 2015
*ICIEM 2018 (Parihar M. 2018)
Given in Table 3 the freight handled by road transport is higher than even projection of Working Group Report
of 12th Five Year Plan on Road Transport which is given below in Table 4. This simply indicates that there
would be more demand for trucks in future too.
Table-4: Projection of Freight Traffic during 12th 5 Year Plan
Year Projected Freight Traffic (BTKM)
2012-13 1315
2014-15 1553
2016-17 1835
Source: Working Group Report on Road Transport 12th 5 Year Plan.
Further, this growth of trucking population especially with reference to goods movement has also placed the
need for more fuel requirement for Indian economy in general and trucking sector in particular (Parihar M &
Sharma R, 2016). Some of the recent past data given below in Table 5 itself indicates that the crude oil
consumption in India has increased more specially after economic reforms in India.

International Journal of Advance and Innovative Research Volume 6, Issue 1 (XXIV): January - March, 2019
54
ISSN 2394 - 7780
Table-5: India’s Crude Oil Consumption (‘000 Barrel Per Day)
Year Consumption
1980 643
1985 894
1990 1168
1995 1654
2000 2147
2005 2550
2010 3115.40
2013 3509
Source: United States Energy Information Administration
2. METHODOLOGY
The methodology includes review of literature to gather insights and secondary data use. The study also
attempted a critical understanding about the trucking industry in India with reference to its growth via number
of trucks, its share in freight movement, fuel consumption and level of technology being used in trucks in terms
of mileage having considered the role played by trucking industry in India in many ways. Again, given the
importance of trucking industry in economic growth of our nation, the significance of our study can be
considered from a future policy framework perspective. This has been sought to be examined with the help of
secondary data and econometric analysis fitting log-log regression model which has provided some basis for the
study.
3. OBJECTIVES
To understand the kind of technology being used and nature of trucking industry in India.
To examine the impact of technological advancement in trucking operations on Indian economy in general
and truck operators in particular, especially small operators..
To suggest policy guidelines and recommendations on the basis of the study.
4. TECHNOLOGY INNOVATION AND TRUCKING INDUSTRY IN INDIA
Transport sector in India with consumption of large volume of total commercial energy of country and nation’s
petroleum product as well, it has become one of the fastest growing energy demand sector in the country.
Moreover, India’s critical cause of concern is that it imports 84% of the crude oil processed in the country and
indicates the gap of almost 4-5 times between production and import (TERI 2014 and I. V. Rao 2013). Thus,
having energy security problem, any resulting bottlenecks in meeting the demand of energy for transport could
be detrimental for the Nation’s growth. Hence, it has been assumed that through technological advancement
especially with reference to trucking industry, fuel efficiency can be improved resulting into substantial saving
of fuel via increase in productivity in terms of mileage which ultimately will have positive impact on nation’s
economy in general and trucking industry in particular.
However, having look at Indian Economy which has witnessed the technological advancements and innovation
over period of time via various policies and plans under five year plan regime, almost in all the sectors, may not
be with uniformity but yes it has taken place in one or the other way. Various governments at different-different
times tried their best to bring and usage of latest technology for increase in production and productivity in
various sectors or sub sectors of our economy. However, despite of various levels of technological
advancements and innovation in various components/sectors of our economy, still there exists certain segments
of our economy (for example transport sector especially road goods transport industry-Trucking industry) which
majorly depends on non-renewable resources like crude oil and so, where technological advancement has not
reached fully (especially with reference to mileage of truck), irrespective of the importance of road freight
transportation industry to our economy. This may have happened because of many reasons. One specific reason
might be the market competition with reference to number of firms in market and their market concentration.
Thus, in order to maintain their monopoly, it might have been possible that they would have influenced the
political willingness to make more money, by not making or framing those kinds of rules and regulations via
legislative or regulatory regimes by government which can be forced or pressurized to adopt new technology
especially in making of trucks and using new kind of technology which can really increase the productivity of
fuel consumption via increase in mileage of trucks, over period of time. Although some marginal improvement
has been taken place but lot more has to be done in this regard.

International Journal of Advance and Innovative Research Volume 6, Issue 1 (XXIV): January - March, 2019
55
ISSN 2394 - 7780
Further, it has been observed that for quite some time, given regulatory and legislative regimes in our country,
there were some barriers for new entry in truck manufacturing market. However, in recent some time given
reforms in regulatory and legislative measures to some extent especially for truck manufacturing industries, we
have seen that many new entry i.e. truck manufacturing companies, has been taken place resulting into increase
in supply of trucks in the market with some good modifications (related to carrying capacity via axle load,
comfort to drivers through cabins etc.), but despite of this the changes or improvement is very marginal in
context of mileage of trucks.
Moreover, in case of trucking industry in India despite of some development via technology innovation and its
usage especially with reference to load carrying capacities i.e. axle, the trucks with multi-axle features has
increased but with reference to mileage of trucks per litre of crude oil (i.e. productivity with reference to
operation), it is still struggling at same level or marginally more since last so many years (i.e. 3.5 km/lit to
4km/lit). On the other hand if one can look at passenger car/vehicles, it has changed drastically in last 10-15
years i.e. given better technological innovation, the mileage of passenger cars have reached almost double or
more. Further, the most important thing to be noted here is that due to low productivity (with reference to
mileage) of trucks in India, the demand for crude and its consumption is increasing at an alarming rate with
increase in truck population. As we know that the major proportion of our import bill is of crude and road
transport is one of the major consumers of this crude in terms of direct consumption, it is now necessary and
urgent for our government to look into this matter and take necessary steps before it gets delayed. This is
because any economic disturbances at international level with reference to exchange rate due to high import bill
resulting into weakening of our currency at Global level will have negative impact on our economy internally
too. Again it has been observed that the fuel cost is highest amongst total cost of operation for truck operator
due to low mileage.
Further, having look at kind of technology with reference to engines being used in trucks right from the
beginning in Indian commercial vehicles have completely different story to tell. If one can go back prior to 1965
we can find engines in trucks being used called Dodge, Perkish, Hindustan, Bedford, Chevrolet, Shaktiman, etc.
Whereas, from 1965 onwards engines in trucks being called STAR ENGINE provided by TATA and Mercedes
with the mileage around 3 to 3.5 kilometres per litre. However, after the entry by ASHOK LEYLAND in the
trucking market and started manufacturing trucks Indian economy got another manufacturer resulted into supply
of more trucks in market. But the market was dominated in one or another way by TATA trucks only. Over
period of time TATA especially introduced various truck models with improved functioning with reference to
carrying capacity but nothing much was done with reference to mileage improvement, as taken place in Car
segment. For example, TATA in 1969 introduced truck namely Model 1210 and 1210 LPT, in 1971 Model
1210 DI, in 1975 Model 1210 S and in 1979 Model SE. Currently, TATA is using Cummins-China and
Cummins-German engines but still the mileage is 3.5 to 4 kilometres per litre only. On the other hand, ASHOK
LEYLAND by Hinduja Group also using Cummins engines in their Model No. 2518 and 3118 with carrying
capacity 28000 Kgs. And 35000 Kgs. GVW (Gross Vehicle Weight) respectively.
However, given the development in the number of truck models by different-different truck manufacturers, it is
being observed that no substantial development has been achieved or no substantial efforts being putted for
development of mileage. Even, in latest scenario in India with reference to the number of truck manufacturers in
India which has increased substantially after New Economic Policy of Liberalisation, Privatization and
Globalization since 1991. Toady apart from TATA trucks and ASHOK LEYLAND trucks we can find trucks
from Bharat Benz, Eicher, Mahindra, AMW, etc. on Indian roads. But the story remains the same i.e. despite of
more truck manufacturers in India with all kind of development in truck manufacturing system, no substantial
improvement in mileage of trucks, one can finds that even today also the mileage is around 4 kilometres per
litre only. The situation is again not favourable in case of trailer-truck where mileage is only around 2.5 to 3
kilometres per litre.
Therefore, given the growth in GDP along with increase in production of agricultural and industrial sector in
absolute terms, the demand for trucks will further rise. This simply indicates that there would be more demand
for non-renewable resources like petroleum and crude oil product. This is because the growth of trucks in India
is having positive correlation with growth in GDP and freight handled by surface transport i.e. road transport. It
can be seen with the help of result obtained from econometric analysis fitting log-log regression model to check
the relationship between GDP and Truck Population as well as Freight Handled and Truck Population (2000-
2001 to 2013-2014).
The Model is:

International Journal of Advance and Innovative Research Volume 6, Issue 1 (XXIV): January - March, 2019
56
ISSN 2394 - 7780
Υᵢ = βᵢ + β₂ Xᵢ + β3 X2 + Uᵢ
Whereas,
Υᵢ = Truck population, βᵢ------β3 = parameters to be estimated and Xᵢ = GDP Growth and X2 = Freight Handled
by Road Transport.
Thus on the basis of applying the data in given model for estimation to analyse the impact of growth in GDP
and Freight Handled, the hypothesis constructed i.e. the first hypothesis states that there is no significant
relation between truck population growth and GDP growth, and second hypothesis states that there is no
significant relation between truck population growth and Freight Handled. Further, the result in Table 6 shows
that:
(a) As per First Hypothesis: The value of R2 (preparation of variances in the dependent variable that can be
explained by the independent variables) is 0.99 which indicates that GDP growth explains 99% of the
variability of the truck population. In other words, there is a strong impact of GDP growth on truck
population. Thus, the result is statistically significant at 5% level of significance. Therefore, the hypothesis
(there is no significant relation between truck population and GDP growth) is rejected.
(b) As per Second Hypothesis: The value of R2 (preparation of variances in the dependent variable that can be
explained by the independent variables) is 0.99 which indicates that Freight Handled by Road Transport
growth explains 99% of the variability of the truck population. In other words, there is a strong impact of
Freight Handled growth on truck population. Thus, the result is statistically significant at 5% level of
significance. Therefore, the hypothesis (there is no significant relation between truck population and
Freight Handled growth) is rejected.
Table-6: Truck Population Growth
GDP Growth Freight Handled
Elasticity 1.18 0.86
Intercept -4.10 1.12
R2 0.99 0.99
Standard Error 0.013 0.01
t-stat 42.80 49.21
Source: Our Analysis
Thus, on the basis of given result it is observed that in future the truck population is going to increase and
accordingly the demand for petroleum products and crude oil will also increase drastically which may have
adverse impact on our import bills and exchange rates too.
Further, with reference to trucking industry, the fuel cost is one of the major cost in trucking operation.
Therefore, it is need of hour to take upon a call to improve the mileage component of trucks with technological
advancement favourably. Current study is under opinion that if the mileage will improve from 3 or 4 kilometres
per litre to around 9 or 10 kilometres per litre, the scenario would be completely different and it will have
positive impact in many respects through multiplier impact. This is because the trucking industry not only help
the logistic industry but certainly a backbone for the country’s economy because nearly 70% or more of the
cargo is transported along the roads making trucks a very important part of the economy. Today, Indian trucking
industry has around more than 90 lakhs vehicles (Trucks of all categories) on the road.
5. CONCLUSION
The study conclude that despite of improvements in trucking manufacturing systems in many ways nothing
much have been done from enhancement in mileage component of trucking industry, which still effecting
trucking industry in multiple ways. However, no concrete efforts being putted for bringing kind of technology
on line with Car segment in our economy for trucking industry so the mileage can go upto atleast double given
in development in road network in our economy from quality and quantitative perspective, despite the fact that
trucking industry serves as a backbone of our economy. The study also conclude that positive correlation
between GDP growth and trucking population as well as growth in freight handled and trucking population the
demand for trucking services also increasing and thus, the number of trucks. Further, this will create demand for
more fuel especially non-renewable, which is already limited in availability. However, with improvement in
technology with reference to increase in mileage of trucks, it is going to cost our economy internally as well as
externally in multiple ways. Therefore, the study suggests that Government should intervene as regulator and
provide necessary support to the truck manufacturers and compile them to come up with technological

International Journal of Advance and Innovative Research Volume 6, Issue 1 (XXIV): January - March, 2019
57
ISSN 2394 - 7780
innovation which will increases the mileage of trucks. This is necessary because the trucking industry is not
able to get complete gains from improved road infrastructure in our country. Government should motivate and
encourage truck manufacturers through various incentive programme to come forward and undertake research
and development relating to this. However, it is not as simple as it seems because it involve financial
obligations. Thus, in this regard a detailed study is called for.
6. REFERENCE
Government of India, (1980). Report of the National Transport Policy Committee. New Delhi: Planning
Commission, Government of India.
Government of India, (2002). Vision 2020 Transport. New Delhi: Planning Commission, Government of
India.
Government of India, (2012). Working Group Report on Road Transport for 12th Five Year Plan. New
Delhi: Planning Commission, Government of India.
Parihar, M. (2015). Employment Potential in Road Goods Transport Industry in India, Supply Chain Pulse,
ITM Centre for Supply Chain and Logistics Research, Navi Mumbai V.5, Issue 2.
Parihar, M. & Sharma, R. (2016). Economics of Energy and Infrastructure: A Case of Road Goods
Transport Industry in India, Excel India Publishers, New Delhi.
Parihar, M. (2016). Scarcity of Drivers in Road Goods Transport Industry in India: A Challenge to India’s
Trade at National and International Level, Business Sandesh International Journal of Multidisciplinary
Research, V. 2, Issue 1.
Parihar, M. (2019). Pradhan Mantri Kaushal Vikas Yojana and Trucking Industry in India: A Way Ahead for
Betterment, International Journal of Advance and Innovative Research, Volume 6, Issue 1, January-March
2019, UGC Journal No. 63571.
Policy Document-Pradhan Mantri Kaushal Vikas Yojana (PMKVY), Government of India, 28th April, 2015.
Rao, I.V. (2013). Car Fuel Economy: Automobile Industry Perspective, presentation during Workshop
Series on Transport and Climate, New Delhi, 24th July, 2013.
Sriraman, et al, (2006). Competition Issues in the Road Goods Transport Industry in India with special
reference to The Mumbai Metropolitan Region. New Delhi: Competition Commission of India (CCI).
TERI, (2014). Development pathways for Fuel Efficiency Improvements in HDV Sector in India, The Energy
and Resource Institute (TERI), New Delhi.
Customer-tailored services, door-to-door services, easy availability, smaller cargo acceptance, and many
more.
MOSPI (2013): Energy Statistics 2013, New Delhi. Ministry of Statistics and Program Implementation.
User Guideline for India’s 2047 Energy Calculator: Transport Sector.
Parihar, M. (2019).

International Journal of Advance and Innovative Research Volume 6, Issue 1 (XXIV): January - March, 2019
58
ISSN 2394 - 7780
ENTREPRENEURSHIP: CHALLENGES FACED BY ENTREPRENEURS
Tejas Dhamnaskar and Diksha Shukla
Thakur College of Science and Commerce, Thakur Village, Mumbai
ABSTRACT
Entrepreneurship is the process of designing, launching and running a new business, which is often initially a
small business. The people who create these businesses are called entrepreneurs. Entrepreneurship has been
described as the capacity and willingness to develop, organize and manage a business venture along with any
of its risks in order to make a profit. A nation how so ever rich in natural resources, cannot prosper if its
resources are not put to some productive use, for this purpose, enthusiastic entrepreneurs are needed who can
contribute effectively for national prosperity. The only solution is promotion and development of
Entrepreneurship, as entrepreneurship focuses on making an individual a job provider and not a job seeker. So,
this paper examines main challenges of entrepreneurs which entrepreneurs face while starting their business.
The pivotal problems faced by the entrepreneurs are financial problems, labour problems, production and
government related problems.
Keywords: Challenges of Entrepreneurs, Labour problems, Financial problems, Enthusiastic Entrepreneurs.
INTRODUCTION
Entrepreneurship is the practice of forming a new business or commercial enterprise, usually in an industry or
sector of the economy with a large capacity for growth. Entrepreneurship is generally synonymous with
resourcefulness, ingenuity, and the ability to take calculated risks in order to introduce a new, untested product
or service into the marketplace. These traits are often referred to collectively as the “entrepreneurial spirit”.
Entrepreneurship is driven by the entrepreneur, a person who launches and oversees the operations of a new
business venture. The entrepreneur is generally self-employed, self-motivated, and ambitious and is willing to
take chances to meet his or her goals. Unlike the capitalist, a business person who generally limits his or her
role to financing commercial ventures, the entrepreneur is the driving force behind the formation of a new
business and asserts a great deal of control over the key management decisions. Many entrepreneurs also
assume responsibility for hiring and managing employees. Successful entrepreneurs tend to be highly skilled at
organizing and motivating their employees. In some cases, the entrepreneur invents or develops a new product
or service, which then forms the core of his or her new business. In other cases, however, the entrepreneur
simply discovers a new way to market and sell an existing product or service. The risks undertaken by the
entrepreneur are often considerable. Some entrepreneurs invest everything they own into their new enterprise,
with no guarantee that the business will succeed. Other times a successful businessman will risk his reputation
on a new idea, the failure of which could potentially jeopardize his entire career. Because of the high level of
risk involved in entrepreneurial endeavours, the entrepreneur generally hopes to earn a high rate of return in the
venture.
According to many twentieth-century economists, entrepreneurship is an indispensable aspect of capitalism.
Capitalism is an economic system characterized by free markets (situations in which goods and services are
bought and sold, with competition determining the prices), private or corporate ownership of the means of
producing and distributing goods and services, and minimal government regulation of business practices. In a
capitalist economy prosperity is driven by economic growth. Entrepreneurship helps promote such growth by
continually providing the economy with new ideas that ultimately lead to more efficient and profitable business
models.
When Did it Begin
While qualities of entrepreneurship have undoubtedly played an important role in business innovation since the
earliest days of commerce, the concept of entrepreneurship is relatively new. According to economic historian
Fritz Redlich (1892–1978), entrepreneurship first emerged in the sixteenth century, when German military
officers regularly recruited mercenaries for armed expeditions throughout Europe.
The word entrepreneur was first introduced by the Franco-Irish economist Richard Cantillon (1680–1734), who
coined the term in his landmark work Essay on the Nature of Commerce in General. Although Cantillon wrote
the book just before his death in 1734, it was not published until 1755. In the early nineteenth century, French
political economist Jean-Baptiste Say (1767–1832) was among the first to argue that the entrepreneur played an
indispensable role in promoting economic growth.
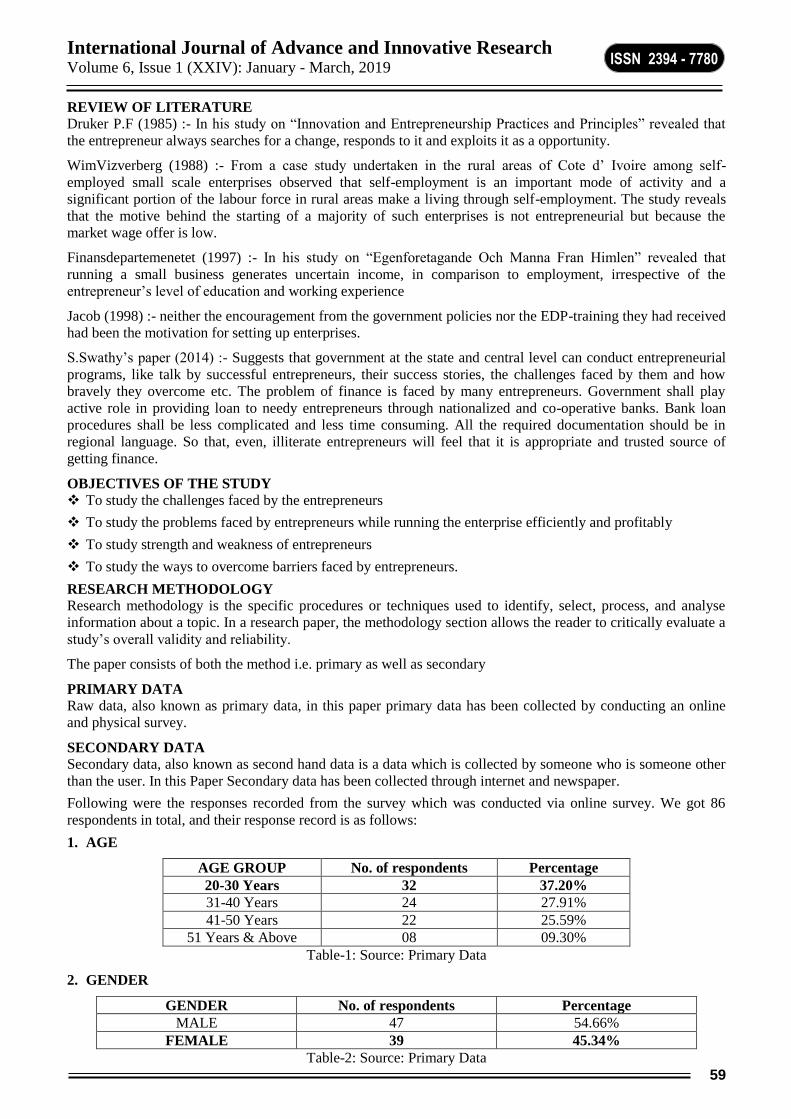
International Journal of Advance and Innovative Research Volume 6, Issue 1 (XXIV): January - March, 2019
59
ISSN 2394 - 7780
REVIEW OF LITERATURE
Druker P.F (1985) :- In his study on “Innovation and Entrepreneurship Practices and Principles” revealed that
the entrepreneur always searches for a change, responds to it and exploits it as a opportunity.
WimVizverberg (1988) :- From a case study undertaken in the rural areas of Cote d’ Ivoire among self-
employed small scale enterprises observed that self-employment is an important mode of activity and a
significant portion of the labour force in rural areas make a living through self-employment. The study reveals
that the motive behind the starting of a majority of such enterprises is not entrepreneurial but because the
market wage offer is low.
Finansdepartemenetet (1997) :- In his study on “Egenforetagande Och Manna Fran Himlen” revealed that
running a small business generates uncertain income, in comparison to employment, irrespective of the
entrepreneur’s level of education and working experience
Jacob (1998) :- neither the encouragement from the government policies nor the EDP-training they had received
had been the motivation for setting up enterprises.
S.Swathy’s paper (2014) :- Suggests that government at the state and central level can conduct entrepreneurial
programs, like talk by successful entrepreneurs, their success stories, the challenges faced by them and how
bravely they overcome etc. The problem of finance is faced by many entrepreneurs. Government shall play
active role in providing loan to needy entrepreneurs through nationalized and co-operative banks. Bank loan
procedures shall be less complicated and less time consuming. All the required documentation should be in
regional language. So that, even, illiterate entrepreneurs will feel that it is appropriate and trusted source of
getting finance.
OBJECTIVES OF THE STUDY
To study the challenges faced by the entrepreneurs
To study the problems faced by entrepreneurs while running the enterprise efficiently and profitably
To study strength and weakness of entrepreneurs
To study the ways to overcome barriers faced by entrepreneurs.
RESEARCH METHODOLOGY
Research methodology is the specific procedures or techniques used to identify, select, process, and analyse
information about a topic. In a research paper, the methodology section allows the reader to critically evaluate a
study’s overall validity and reliability.
The paper consists of both the method i.e. primary as well as secondary
PRIMARY DATA
Raw data, also known as primary data, in this paper primary data has been collected by conducting an online
and physical survey.
SECONDARY DATA
Secondary data, also known as second hand data is a data which is collected by someone who is someone other
than the user. In this Paper Secondary data has been collected through internet and newspaper.
Following were the responses recorded from the survey which was conducted via online survey. We got 86
respondents in total, and their response record is as follows:
1. AGE
AGE GROUP No. of respondents Percentage
20-30 Years 32 37.20%
31-40 Years 24 27.91%
41-50 Years 22 25.59%
51 Years & Above 08 09.30%
Table-1: Source: Primary Data
2. GENDER
GENDER No. of respondents Percentage
MALE 47 54.66%
FEMALE 39 45.34%
Table-2: Source: Primary Data

International Journal of Advance and Innovative Research Volume 6, Issue 1 (XXIV): January - March, 2019
60
ISSN 2394 - 7780
3. EDUCATIONAL QUALIFICATION OF ENTREPRENEURS
QUALIFICATION No. of respondents Percentage
ILLITERATE 11 12.80%
HIGH SCHOOL 26 30.23%
UNDER GRADUATE 28 32.56%
POST GRADUATE 21 24.41%
Table-3: Source: Primary Data
4. OWNERSHIP OF BUSINESS
OWNERSHIP No. of respondents Percentage
SELF-OWNED 23 26.75%
PARTNERSHIP 16 18.60%
SHARE HOLDERS 19 22.09%
JOINT VENTURE 28 32.56%
Table-4: Source: Primary Data
5. HOURS SPENT ON BUSINESS
HOURS No. of respondents Percentage
UP TO 4 HOURS 17 19.77%
4 TO 8 HOURS 26 30.23%
8 TO 12 HOURS 32 37.20%
12 HOURS 11 12.80%
Table-5: Source: Primary Data
6. STRENGTH OF THE RESPONDENTS
STRENGTHS No. of respondents Percentage
FAMILY 14 16.27%
PARTNERS 16 18.61%
SELF-CONFIDENCE 29 33.73%
OTHERS 27 31.39%
Table-6: Source: Primary Data
7. WEAKNESS OF THE RESPONDENTS
WEAKNESSES No. of respondents Percentage
LACK OF EDUCATION 11 12.80%
LACK OF ENTREPRENEURIAL SKILLS 14 16.27%
FEAR OF FAILURE 32 37.20%
LACK OF MANAGEMENT SKILLS 29 33.73%
Table-7: Source: Primary Data
8. MOTIVATION FOR STARTING A BUSINESS
MOTIVATING FACTORS No. of respondents Percentage
SELF-CONFIDENCE 29 33.73%
TRADITION 15 17.44%
INTEREST 31 36.04%
OTHERS (e.g. Schemes by Govt.) 11 12.79%
Table-8: Source: Primary Data
9. INITIAL SOURCE OF FUNDING FOR BUSINESS
SOURCE OF FUND No. of respondents Percentage
LOANS 39 45.34%
SEEKING FINANCIAL HELP FROM
FRIENDS & RELATIVES
14 16.27%
PERSONAL SAVINGS 17 19.78%
OTHERS 16 18.61%
Table-9: Source: Primary Data

International Journal of Advance and Innovative Research Volume 6, Issue 1 (XXIV): January - March, 2019
61
ISSN 2394 - 7780
10. INTERNAL FACTORS AFFECTING THE BUSINESS
FACTORS AFFECTING (INTERNAL) No. of respondents Percentage
FINANCE RELATED ISSUES 19 22.09%
LACKING EXCEPTIONAL LEADERSHIP
QUALITIES
27 31.39%
POOR SELF IMAGE 29 33.73%
LACKING MOTIVATION AND
CONFIDENCE
11 12.79%
Table-10: Source: Primary Data
11. EXTERNAL FACTORS AFFECTING THE BUSINESS
FACTORS AFFECTING (EXTERNAL) No. of respondents Percentage
LACKING INFORMATION 29 33.72%
OPPORTUNITIES FOR TRAINING 18 20.93%
LACKING TECHNICAL SKILLS 17 19.77%
INFRASTRUCTURE RELATED ISSUES 22 25.58%
Table-11: Source: Primary Data
12. CHALLENGES RELATED TO BUSINESS
CHALLENGES No. of respondents Percentage
LABOUR PROBLEM 16 18.62%
PRODUCTION PROBLEM 14 16.27%
MARKET CONDITIONS 17 19.77%
LEGAL CONDITIONS 13 15.11%
FINANCE RELATED ISSUES 26 30.23%
Table-12: Source: Primary Data
13. LACKING EDUCATION ADVERSELY AFFECTS ENTREPRENEURSHIP?
RESPONSE No. of respondents Percentage
YES 47 54.66%
NO 39 45.34%
Table-13: Source: Primary Data
14. WAYS TO OVERCOME THE BARRIERS IN ENTREPRENEURSHIP
WAYS No. of respondents Percentage
PRECISE BUSINESS PLAN 27 31.39%
PRACTICAL BASED KNOWLEDGE 31 36.04%
GOOD MANAGEMENT 12 13.96%
PROPER POLICY IMPLEMENTATION 16 18.61%
Table-14: Source: Primary Data
15. QUALITIES NECESSARY TO BE SUCCESSFUL IN AN ENTERPRISE
QUALITIES No. of respondents Percentage
ADAPTABILITY 28 32.56%
INNOVATION 31 36.04%
OPEN MINDED / POSITIVE 13 15.11%
WIDE KNOWLEDGE BASE 14 16.27%
Table-15 Source: Primary Data
DATA INTERPRETATION
There are 37.20% people who belong to the age group that is between 20-30 years as per Table 1.
There are 45.34% Female respondents as per Table 2.
There are 32.56% people who are under graduates as per Table 3.
There are 26.75% people having self-owned business as per Table 4.

International Journal of Advance and Innovative Research Volume 6, Issue 1 (XXIV): January - March, 2019
62
ISSN 2394 - 7780
There are 37.20% people who spent between 8-12 Hours of their time on their business as per Table 5.
There are 33.73% people who have self-confidence as their strength as per Table 6.
There are 37.20% people who have fear of failure as their weakness as per Table 7.
There are 36.04% people who have Interest as their motivation to start business as per Table 8.
There are 45.34% people who took loan to satisfy the requirement of initial capital to start with business as
per Table 9.
There are 22.09% people who face finance related issues as their internal affecting factors for business as per
Table 10.
There are 25.58% people who face Infrastructure related issues as their external affecting factors for business
as per Table 11.
There are 18.62% people who face labour problem as their challenges related to business as per Table 12.
There are 54.66% respondents who says “YES” Lacking education adversely affects entrepreneurship as per
Table 13.
There are 31.39% people saying that a precise business plan can one of the ways to overcome the barriers in
entrepreneurship as per Table 14.
There are 36.04% people saying that Innovation is one of qualities necessary to be successful in an enterprise
as per Table 15.
ANALYSIS
Shortage of working capital is the finance related problem such problems are faced by the entrepreneurs who
are starting with their enterprise that too on frequent basis. This problem also comes under the internal
affecting factors of business.
Government Department are not co-operative, such cases fit under the category of government related
problems, this problem is also bothering many entrepreneurs who are into entrepreneurship.
Respondents also face labour related issues as the problem in production unit
Many respondents have fear of failing in the line of entrepreneurship i.e. they feel that they may fall prone to
heavy losses and end up losing business related property as well as private property.
As per the online survey, Interest among the Enthusiastic Entrepreneurs. For entrepreneurship acts as a major
motivating factor to start with an enterprise.
Practical Knowledge as well as Precise business plan are majorly favoured by the respondents, in order to
overcome the barriers related to entrepreneurship.
SUGGESTIONS
Entrepreneurs should be fortified to start their business venture in joint stock companies rather than as a
partnership concern and sole trading concern, so that they can avail the major advantages of large scale
operations.
Financial issues are faced by many entrepreneurs, some people drop the idea of entrepreneurship just
because they fail to arrange initial finance that they need in order to give a start to their business idea. Here
Government shall play vital role in providing loan to deprived entrepreneurs via nationalized and
cooperative banks. Bank Loan procedures and other related formalities shall be less complicated and less
time consuming. All the required documentation and other paper work should be in regional language, so
that even, illiterate entrepreneurs will feel that it is suitable and totally trustworthy source of getting finance.
It should be ensured that maximum number of entrepreneurs and aspirants who wish to start their own
enterprise could know about the schemes that are provided by the government, and the procedures and
formalities to avail these benefits should be simplified to the extent possible.
Awareness programs should be conducted so that large number of population gets idea about the schemes
that are provided by governments.
Sufficient amount of data regarding marketing situation should be made available in hand to the
entrepreneurs.

International Journal of Advance and Innovative Research Volume 6, Issue 1 (XXIV): January - March, 2019
63
ISSN 2394 - 7780
CONCLUSION
In today’s modern age entrepreneurs are becoming a major need to society in order to grow the economic value
of any country and also to provide jobs to young youth. Entrepreneurs should be positive and enough open
minded as well and even he or she who aspires to be entrepreneur should have adequate amount of knowledge
regarding business. Information related to marketing and technology should be regularly updated, doing this
may help entrepreneurs to be successful enough in their business venture.
People who aspire to be an Entrepreneur usually face various problems while starting an business venture. But
with every problem, there comes a solution too. But knowing solution to every problem doesn’t mean that
entrepreneurs will never face any kind of problems. Finance is the extensive problem faced by many of
entrepreneurs while starting with their business venture. Either by getting loan from bank or by personal
savings, or by getting subsidies from government this problem can be sorted out. There are ‘n’ number of
challenges that an entrepreneur has to face while doing business, so to face them entrepreneur must have
enough strength. Only by this he or she can get the desired level of success in his or her business.
According to this study, it has been concluded that the dominant challenges faced by the entrepreneurs are
financial challenges, labour related issues, marketing challenges etc. The way which they used to overcome the
barriers are through applying practical based knowledge and precise business plan in the business venture. The
main strength of entrepreneurs is self-confidence and main weakness is the fear of failing which they have at the
moment when they start with their business venture. Thus, they have confidence within them and a capacity to
take practical steps so that they can attain their goals and prosper in their enterprise.
REFERENCES
1. https://www.encyclopedia.com/finance/encyclopedias-almanacs-transcripts-and-maps/introduction-
entrepreneurship
2. https://blog.hotmart.com/en/entrepreneur-challenges/
3. https://en.m.wikipedia.org/wiki/Entrepreneurship

International Journal of Advance and Innovative Research Volume 6, Issue 1 (XXIV): January - March, 2019
64
ISSN 2394 - 7780
ROLE OF ICT IN IMPROVING QUALITY OF EDUCATION
Yogita Sawant
Assistant Professor, BMS, JVM’s Mehta College, Navi Mumbai
ABSTRACT
ICT’s are potentially commanding tool for extending educational opportunities. It is predicted that there will be
many benefits for both the learner and the teacher, including the promotion of collaborative learning and
radical new ways of teaching and learning. ICT will also modify the role of a teacher who will have other skills
and responsibilities other than classroom teaching. The paper mainly focuses on the role of Information
Communication Technology (ICT) in improvement of quality of education.
Keywords: ICT, Learning, Computer, Global, students
INTRODUCTION
Today, 24×7 we are surrounded by the technology. Radio, television, computers, mobiles, android gadgets etc
have become a part and parcel of our daily life. Sometimes we are so much engrossed in these technologies that
we completely forget what is happening in our surroundings. These technologies are nothing but media. All
these media comes under the overall umbrella of what is known as today’s ICT. Knowing and using ICT is
important in today’s fast changing and knowledge oriented globalized society, but we are very often confused
about what these technologies are. Communication Technology and Information technology have thin line
between them but can’t do without each other. When these technologies are used in the field of education, it is
called as ICT in education. In the era of the computer technology the term ICT mainly focuses on the
infrastructure, devices and sources of computer technology.
OBJECTIVES OF THE STUDY
The objectives of this study are
1. To understand the purpose of Education
2. To analyze the relationship between ICT aids and education
3. To discuss the role of ICT in improving quality of education
RESEARCH METHODOLOGY
The research is mainly based on the secondary data. The secondary data has been collected from various
reference books, research papers, articles and websites.
WHAT IS EDUCATION?
Education is a broad term that can have many meanings, but it is generally defined as the process of learning
and acquiring information. Formal learning in a school or university is one of the most common types; though
self - teaching and so - called ‘life experience’ can also qualify. Education is a process which draws from
within. Each child has unique identity, qualities, aptitude, different IQ levels. Education can use their qualities
and developed them self according to their nature in a free and uncontrolled environment. It is a continues
process of growth and development.
INFORMATION AND COMMUNICATION TECHNOLOGY
ICT means all devices, tools, content, resources, forums and services, digital and those that can be converted
into or delivered through digital forms, which can be deployed for realizing the goals of teaching learning and
enhancing access of resources. The concept of ICT is not limited to hardware devices connected to the
computers and software applications but also it covers interactive digital content, internet and other satellite
communication devices like radio and television services and web based content repositories. Now the advance
technology has paved the way for content designing, knowledge management and most important in distance
learning for rural India. This development witnessed various changes in government approach and
understanding.
ICT AND EDUCATION In the education system information and communications technology (ICT) use to support, enhance and
optimize the delivery of information. According to Worldwide research ICT based education can improve
students’ learning process and better teaching methods. Now days the mobile learning arises as a form of e-
learning where the education has outgrown the physical constrains of the classrooms and acquired mobility. In
the ICT based education students can easily get information (whenever and wherever) which they want and

International Journal of Advance and Innovative Research Volume 6, Issue 1 (XXIV): January - March, 2019
65
ISSN 2394 - 7780
institutions can also provide such advanced technological terrain. ICT in education can help the students to be a
part of skilled workforce in the global economy. Through massive open online courses (MOOC) we can reach
more students and facilitate social mobility. To promote and improve the digital culture in schools and colleges
the government has given the National Award for innovative use of ICT and it will be motivation for the
teachers as well as students for innovative use of ICT in teaching learning.
ROLE OF ICT IN IMPROVING QUALITY OF EDUCATION
In a developing country like India role of ICT in improving quality of education is very important, especially to
provide the educational facilities to the rural masses. The role ICT in improving quality of education is as
following:
1. Improvement of Education Curricula
Education system had long supported and emphasized upon the importance of content. A curriculum was
centered on text and teachers taught through lectures which were further interspersed with tuitions and learning
activities designed to consolidate and rehearse content. ICT integration has redesigned curricula that promote
performance and competence. It is more concerned about how the information is used instead what the
information is. The proliferation and widespread use of ICTs have removed many restrictions and impediments.
Their availability has made sharable resources accessible both to the students and the teachers.
2. To improve Quality of Distance Education
A large number of distance education universities and programmes use ICT to support the print content that
they deliver to the students. These includes broadcast audios and videos such as radio and television
programmes, audio and video tapes delivered to students as part of a learning kit and in more recent times,
multimedia content such as lessons which are delivered offline, i.e. on CDs/DVDs.
3. Motivates students
ICT based education makes students feel that they can control of what they learn. Teachers publish educational
instructions on classroom blogs or they design research work via email, and this gives a student time to study on
their own and have no fear of making mistakes during the process of learning. To increase interest of students in
education teachers can use different tools during the lectures. For example educational puzzles, PPT, Short
Films, Documentaries etc. it will be helpful for students to understand the topic easily.
4. Improves students Writing and Learning Skills
ICT aids helps many students to write well composed sentences and paragraphs. Students can use computers
word processing applications to take notes in the classroom, these word processing applications have built - in
dictionaries which help students auto-correct spelling errors and also correct their grammar in a sentence.
Teachers can encourage their students to create personal blogs using free blog publishing sites. Students can
used this platform to express themselves and share with friends.
5. Increase students innovation and creativity
Many teachers have discovered that integrating technology in their classroom increase student’s engagement in
the classroom. Teachers can give different tasks to students. They can organize various competitions related to
technology like making smart pens, mobile applications and much more. These technological competitions can
increase the level of creativity and innovation among students.
6. Simplifies Access of Educational Resources
Technology helps students to easily access the open educational resources. These resources are kept under the
public domain and rare freely available to anyone over the world wide web (WWW). These educational
resources include e-books, pod-casts, digital libraries, educational games, educational videos and instructions,
tutorials and much more. Through digital platform like teachers can upload the recorded lectures and it will be
helpful for students those who missed lectures can access them from anywhere.
7. Virtual Learning
It is a platform with the aim of supporting learning and teaching activities across the internet. A VL is an
education system based on web that models the real world education with virtual classes test etc… A virtual
learning environment (VLE) allows online interactions of various kinds to take place between tutors and
learners making use of computer and internet. Typically Web-based, VLEs provide an integrated set of internet
tools, enable easy upload of materials and offer a consistent look and feel that can be customized by the user.
CONCLUSION
ICTs have greatly impacted on educational system. Now days ICT has become a strong agent for change among
many educational practices. The continuous use and development of ICTs within education will have a strong

International Journal of Advance and Innovative Research Volume 6, Issue 1 (XXIV): January - March, 2019
66
ISSN 2394 - 7780
impact on learning and teaching. All the ICT based activities are very useful for educational institutions to
improve the quality of education. To ensure the opportunities and the advantages of ICT, it will be important as
it is in every other walk of life to ensure the education research and development is sustained so that education
at large can learn from within and that experiences and activities in different institutions and sectors can inform
and guide others without the continual need for reinvention of the wheel.
REFERENCES
1. Ahmed, S. and Singh, M., Multimedia in Teaching Education Empowering Accessible, Flexible and
Innovation Learning, Shikshak Shodh Patrika, Vol (04)
2. Ghosh P.P., Modern Education Technologie, Avishkar Publishers, Jaipur
3. Kaur G.S., Integration of ICT in Teacher Education, The Centre for sustainable development
4. Mikra, F.(july2011),The role of Information Communication Technology in Education
5. International Journal of u- and e- Service, Science and Technology Vol. 3, No. 4, December, 2010
37”ONLINE EDUCATIONAL SYSTEM (e- learning)”
6. Virtual Learning Environments Ros OÕLeary and Andy Ramsden, University of Bristol Edited by Dr Peter
Davies, University of Staffordshire
7. Virtual Learning Environments for European Schools: A Survey and Commentary, European School Net,
January 2003. Available at http://insight.eun.org

International Journal of Advance and Innovative Research Volume 6, Issue 1 (XXIV): January - March, 2019
67
ISSN 2394 - 7780
FAMILY MANAGED BUSINESSES (FMBs): IMPERATIVE FOR NATION’S GROWTH AND
DEVELOPMENT
Dr. Girish Bagale1 and Prof. Seema Mahajan2
Associate Professor1 and Director2, University of Mumbai, Mumbai
ABSTRACT
The family businesses are Imperative for the Nation’s economy. So, it is interesting to know what are the
contributions made by these family businesses to the world as well as to the big nation like India.
Keywords: family managed Business and family owned business
1. INTRODUCTION
Family business is; one of the oldest form of the business in the world. Their continued existence is critical to
the sustainability of the Nation’s Growth and Development. In spite of facing numerous day-to-day
management concerns and challenges, they are managing many issues that are specific to their status in order to
grow since global economy is constructed around family businesses. In the views of Pearl Initiative & PWC
(2012), many of the largest MNCs began as family businesses, and around 90% of the world’s businesses can
be defined as family managed businesses, both in developed, developing and emerging markets with the
majority are small and medium-sized enterprises (SMEs), but some are very large companies (Sarbah, A. and
Xiao, W.,2015).
2. FAMILY OWNED/MANAGED BUSINESS (FOBs/FMBs)
A family business can be described as a system that encompasses of three independent but coinciding
subsystems which can impact each other. These subsystems are business, ownership and family and are
depicted in the Three-Circle model (Figure 1) of Gersick et al. (1997). The three circles divide the entire figure
in seven segments. Any individual in a FMB has one location in this model, depending on the connection that
person has with the organization. Number 1 refers to the family members who are not involved in the business.
Number 2 are non-family owners of the business. Then number 3 are non-family members working for the
company. Next, number 4 are family members not working in the enterprise but are owner of the firm. Number
5 are non-family owners who work in the business. Number 6 are family members who work in the business but
are not owners and finally number 7 who are family members working in the business and are owners of the
business (Jeroen Verbruggen, 2012).
Fig-1: Three-Circle Model (Gersick et al., 1997)

International Journal of Advance and Innovative Research Volume 6, Issue 1 (XXIV): January - March, 2019
68
ISSN 2394 - 7780
2.2 Importance of family businesses to the World Economy
According to Ward (1991), family businesses, over the world, represent a dominant and noticeable form of
enterprise in the economic and social landscape. Some researchers estimate that, today, family-owned
businesses(FOBs/FMBs) comprise over 95% of all business establishments in the worldwide(Litz,1995).
Studies in the developed countries suggest that FMBs account for the majority of the businesses and have a
major influence on the progress of the national economies (Poutziouris et. al.,1997, Sarbah, A. and Xiao,
W.,2015).
According to the Family Firm Institute Inc.,(2019) internationally, family businesses represent:
85.4% of China’s private enterprises are family owned (2010)
60% of all European companies are family owned (2013)
79% of all private sector employment in India is through FMBs (2013)
25% of the total United Kingdom GDP is generated through family firms (2012)
Over 80% of all businesses of businesses in the Middle East are either family-run or controlled (Family Firm
Institute,2019)
According to the Pat Soldano (Family Enterprise USA Board Member-2019) says “Family businesses in
America generate 50% of the jobs, 64% of GDP and account for 61% of all privately owned businesses. While
family businesses are critical to the economic growth of our country, they are not given proper consideration
when new laws, regulations and restrictions are imposed by legislators and other government bodies.”
Family businesses have been an integral part of any country's economy and society. The story is not different in
India. These businesses, whether large conglomerates or medium and small enterprises, have contributed
significantly to nation building, employment generation and overall wealth creation. Family owned businesses
have played a crucial role in the economy of most the countries. Much of the retail trade, the small scale
industry, and the service sector are run by family businesses. Further, family managed businesses employ half
the world’s workforce and generate well over half of the world’s GDP. With time, the contribution of family
businesses has gone beyond simply paying taxes and employing people (Family Firm Institute,2019).
3. CONCLUSION
With the increasing number of family members which are involved in the business, the more complex issues
within the family can arise, which can harm the business. In this case as a society; it is our duty to provide them
enough support and credit backing for their survival and existence.
REFERENCES
1. Neubauer, F. and Lank, A. (1998) The Family Business: Its Governance for Sustainability. MacMillan
Press Ltd., Houndmills, 65-67.
2. Sarbah, A. and Xiao, W. (2013) Corporate Governance Practices in Ghanaian Family Businesses: A
Conceptual Framework. International Journal of Advancements in Research & Technology, 3, 100-115.
3. The Pearl Initiative & PricewaterhouseCoopers (2012) Family Matters Governance Practices in GCC
Family Firms. http://www.pwc.com/en_M1/m1/ publications/documents/pipwc-report.pdf
4. Ward, J.L. (1991) Creating Effective Boards for Private Enterprises: Meeting the Challenges of Continuity
and Competition. Jossey-Bass, San Francisco.
5. Litz, R.A. (1995) The Family Business: Toward Definitional Clarity. Family Business Review, 8, 71-81.
http://dx.doi.org/10.1111/j.1741-6248.1995.00071.x
6. Poutziouris, P., O’Sullivan, K. and Nicolescu, L. (1997) The [Re]-Generation of Family-Business
Entrepreneurship in the Balkans. Family Business Review, 10, 239-261. http://dx.doi.org/10.1111/j.1741-
6248.1997.00239.x
7. Gersick, K.E., Lansberg, I., Desjardins, M., Dunn, B. (1999). Stages and transitions: Managing change in
the family business. Family Business Review, 12, 287–297.
8. Gersick, K. E., Davis, J. A., Hampton, M. M., Lansberg, I. (1997). Generation to generation: Life cycles of
the family business. Boston: Harvard Business School press.
9. Hall, A., Melin, L., Nordqvist, M. (2001). Entrepreneurship as radical change in the family Strategic
Entrepreneurship in family businesses: Exploring the role of cultural patterns. Family Business Review,
14(3), 193–208.

International Journal of Advance and Innovative Research Volume 6, Issue 1 (XXIV): January - March, 2019
69
ISSN 2394 - 7780
10. Millet-Reyes, B., Zhao, R. (2010). A Comparison Between One-Tier and Two-Tier Board Structures in
France. Journal of International Financial Management & Accounting, 21(3), 279–310.
11. Klein, S. B. (2010). Corporate Governance, family business complexity and succession. Transfer of
Ownership in Private Businesses, 1–20
12. Flören, R, L. Uhlaner and M. Berent-Braun, (2010) Family business in the Netherlands characteristics and
success factors, A Report for the Ministry of Economic Affairs.
13. Jeroen Verbruggen (2012), Corporate Governance Within Family-Owned Businesses, M.Sc,Thesis,
Wageningen
14. Sarbah, A. and Xiao, W. (2015) , Good Corporate Governance Structures: A Must for Family Businesses.
Open Journal of Business and Management, 3, 40-57. http://dx.doi.org/10.4236/ojbm.2015.31005
15. https://ffipractitioner.org/research-gives-family-businesses-a-voice-on-capitol-hill/ (Accessed on
14/2/2019)
16. Girish Bagale, Seema Mahajan (2018), Family Managed Business(FMB): A Review, International Journal
of Management, Technology and Engineering, 8(12), 4339-4342.

International Journal of Advance and Innovative Research Volume 6, Issue 1 (XXIV): January - March, 2019
70
ISSN 2394 - 7780
BUDDY - AN OFFLINE SMARTPHONE TRACKER
Rohini Desai and Aasha Chavan
Assistant Professor, Vidyalankar School of Information Technology, Mumbai
ABSTRACT
The paper is based on improvement in the current smartphone tracking systems. In this paper we are presenting
a prototype of an android application that will solve the problem of tracking a smartphone’s location without
internet. It works based on GPS and Mobile Tower Location. The current system compromises of Tracking with
GPS which can only be made Online i.e with the help of internet. Many apps have also been develop which use
A-GPS (Assisted GPS ) that actually costs data bandwidth.
The proposed system will make use of advanced technology that will help in making tracking of Smartphones
online as well as offline thereby making the tracking procedure easy and efficient.
1. Smartphone models need not be upgraded.
2. By means of Sensors (GPS/A-GPS, GSM/CDMA modem and WiFi modems) and Mobile Network, the
smartphone on receiving a text message regarding being lost or stolen would automatically send the
location co-ordinates as a text message to the numbers specified in the system application. We hope that the
implementation of this concept in the Smartphones in future will add to the security and reliability of the
data which is present on the smartphone.
Keywords: GPS (Global Positioning System), A-GPS (Assisted Global Positioning System), GSM (Global
System for Mobile Communications), CDMA (Code division multiple access), Wi-Fi (Wireless Fidelity).
INTRODUCTION
In Mumbai alone, the number of smartphones active today exceeds the number of people living in the city and
big corporates give their employees smartphones in order to be able to work from anywhere in the world. The
Smartphones carry personal as well as professional data and hence the data present is bound to be very
confidential. So, the security of the smartphone itself becomes a critical issue. Many measures however are
taken in-order to secure the network channels but least amounts of measurements are taken in-order to prevent
or stop stealing a smartphone. Many a times people lose their smartphones in public thereby losing the
confidentiality of the data present in them. Globally 60% of the people own a smartphone. Most of these
smartphones come around 150-400$ price bracket. Each smartphone contains personal, professional and
confidential data of its owner. Losing a smartphone results in loss of confidentiality and security of the data
present in the smartphone.
India ranks 3rd in the World for Smartphone usage numbers published on the Internet. Around 240 million
people own a smartphone in India. Smartphones essentially make our lives easy with their features and are
always used as a companion device to store personal and professional data onto it. They’re primitive use is to be
a way of communicating to other people throughout the country and to store essential information regarding
them and the user.

International Journal of Advance and Innovative Research Volume 6, Issue 1 (XXIV): January - March, 2019
71
ISSN 2394 - 7780
Following is the survey and data collected after observation regarding the penetration of the smartphone
market.:
METHODOLOGY
The User would enter 3 safety numbers as trusted contacts within the app and then would save them. A service
would constantly check for messages regarding Keyword messages from any of the safety numbers. As soon as
any Keyword message arrives, the appropriate location service would be started and an SMS along with an
email (if data connectivity is available) would be sent to all the three safety numbers. The Keywords are:
LOCATE_ME: Locates the current position of the user *requires internet* and shows the current location in a
text message or in a Google Map.
LOCATE: Locates the approximate position of the smartphone and sends a message to all 3 safety numbers.
RING: Rings the smartphone to its fullest volume irrespective of the profile set in it.
LOCK: Locks the smartphone with a special pin and sends the pin as an email to the user.
ERASE: Erases everything presents on the phone via Android Device Manager login.
NOTICE: The smartphone won’t be tracked after this has been used and it requires internet.
A. The Parameters calculated by the Message Service
Mn
Message number to check if it matches
the safety number
Mc Message Content to start the appropriate
service
B. The Parameters calculated by the location Service
Lt Latitude co-ordinates Lg Longitude Co-ordinates
EXPECTED OUTCOME
By the means of GPS/A-GPS, WiFi modem and GSM and/or CDMA modem, the smartphone will lock, erase,
locate itself as soon as the keyword message arrives from any of the specified safety number. If Data
Connectivity is available then there will be hardly any delay in terms of response message from the smartphone.
In the case of Offline tracking there may be a delay of 5-7 minutes for the response message.
CONCLUSION
This proposal shows an evolutionary idea of tracking the approximate location of a smartphone device. Using
GPS system, we will be able to build a smart app which would be efficient and safe for the smartphone users. It
will help in providing security to its users even when there is no access to the internet.
APPLICATION
Using this offline tracking app will help in controlling mobile thefts. It will add to more control over the
smartphone even if it is lost or stolen and more also it would add to the security of the smartphone and would
help to locate the device a lot faster than the traditional way.
FUTURE ASPECTS The project is proposed to design a technology that can track and provide an approximate location of the
smartphone without any access to the internet which would help millions who either don’t have access to high
speed internet or aren’t in a high-speed internet coverage area.

International Journal of Advance and Innovative Research Volume 6, Issue 1 (XXIV): January - March, 2019
72
ISSN 2394 - 7780
LINKS AND REFERENCES
1. Mobile Positioning and Tracking: From Conventional to Cooperative Techniques
2. Google, Wikipedia
3. https://developers.google.com/android/
4. www.youtube.com/user/androiddevelopers
5. Headfirst Android – O’Riley
International Journal of Advance and Innovative Research Volume 6, Issue 1 (XXIV): January - March, 2019
73
ISSN 2394 - 7780
A STUDY ON DIGITAL MARKET AND ITS IMPACT
Sweta Gupta and Shailu Dubey
Student, Thakur College of Science and Commerce, Mumbai
ABSTRACT
Digital marketing is the marketing of products or services using digital technologies, mainly on the Internet, but
also including mobile phones, display advertising, and any other digital medium. The prime motto of digital
marketing is concerned with consumers and let the customers to intermingle with the product by virtue of digital
media. This paper focuses on the immensity of digital promotion for customers as well as the marketers. The
conclusion for this study is derived on the basis on responses collected from 90 respondents. Primary data
collection method is used along with secondary as well, just to get the clear picture about the current study.
Keywords: Digital Marketing, Digital technologies, Promotion, commune.
INTRODUCTION
We live in a super-connected world these days and as such, advertising and marketing are no longer the same
animals they once were. This is especially true due to the rise of social media, which has changed how
businesses communicate with potential and existing clients. Digital Marketing is the term used for the targeted,
measurable, and interactive marketing of products or services using digital technologies to reach the viewers,
turn them into customers, and retain them. Digital marketing’s development since the 1990’s and 2000’s has
changed the way brands and businesses use technology for marketing. As digital platforms are increasingly
incorporated into marketing plans and everyday life, and as people use digital devices instead of visiting
physical shops, digital marketing campaigns are becoming more prevalent and efficient.
Digital marketing has become so powerful network of advertising, that with the introduction of “Double click”
strategy of Google for internet, the world has become very close linking to each and every place conveniently.
With the help of digital marketing, campaigns for promoting any product through internet has become very cost
effective and convenient.
With the feature digital technology, in digital marketing, the advertiser easily comes to know how many times
and how long the campaign has been showed on internet, also it comes to know how many people have seen
this campaign, how many responses have received, and how many purchases have been made through online
mode.
With this fast-end technology, marketing of any particular products becomes easier, the consumer’s
convenience become possible and the organization makes huge profits, too.
Digital marketing became more sophisticated in the 2000s and the 2010s, when the proliferation of devices'
capable of accessing digital media led to sudden growth. Statistics produced in 2012 and 2013 showed that
digital marketing was still growing. With the development of social media in the 2000s, such as LinkedIn,
Facebook, YouTube and Twitter, consumers became highly dependent on digital electronics in daily lives.
Therefore, they expected a seamless user experience across different channels for searching product's
information. The change of customer behaviour improved the diversification of marketing technology. Digital
marketing is also referred to as 'online marketing', 'internet marketing' or 'web marketing'. The term digital
marketing has grown in popularity over time. In the USA online marketing is still a popular term. In Italy,
digital marketing is referred to as web marketing. Worldwide digital marketing has become the most common
term, especially after the year 2013.
History of Digital Marketing
The development of digital marketing is inseparable from technology development. One of the key points in the
start of was in 1971, where Ray Tomlinson sent the very first email and his technology set the platform to allow
people to send and receive files through different machines. However, the more recognisable period as being the
start of Digital Marketing is 1990 as this was where the Archie Search engine was created as an index for FTP
sites. In the 1990’s the term Digital Marketing was first coined, with the debut of server/client architecture and
the popularity of personal computers, the Customer Relationship Management (CRM) applications became a
significant part of marketing technology.
REVIEW OF LITERATURE
Fawad Khan: in his paper based on the study of perception and effectiveness of digital marketing amongst the
marketing professionals suggests that “professionals are skeptical about the usage and benefits of digital

International Journal of Advance and Innovative Research Volume 6, Issue 1 (XXIV): January - March, 2019
74
ISSN 2394 - 7780
marketing and have been classified as Skeptical. They do consider it as an important tool for promotion but at
the same time concerned about the issues of privacy and misleading of information of digital marketing”
Afrina Yasmin (April 2015): in her study based on “Effectiveness of Digital Marketing in the Challenging Age:
An Empirical Study” says that “Digital channel in marketing has become essential part of strategy of many
companies. Nowadays, even for small business owner there is a very cheap and efficient way to market his/her
products or services”.
Holly Paquette (2013) in his paper based on Social Media as a marketing tool suggests that retailers can
increase awareness of their brand by being creative when engaging customers on social media sites “As more
shoppers are using social media (e.g. Twitter, Facebook, MySpace, and LinkedIn) and rely on them for
marketing shopping decisions, promotion through these media has become important”.
Javier A. Silva (May 2011): in his study based on perception of digital marketing and its Implementation
concluded that SEO is still not fully understood by most companies. However, its relevance is clear. It relays the
importance of content to overall web presence just as Garzotto et al (2010) identified value driven content in
driving the brand experience.
In recent year’s academics have gained more interest in social media as a subject of academic research. Some
concentrate on specific sides of the overall digital media’s impact on businesses and marketing. Webster’s
(2010) study of how social media shapes patterns of consumption is a great example of this.
OBJECTIVE OF STUDY
To Recognize the level of usefulness of digital marketing in the competitive market.
To study the impact of digital marketing on consumer purchase.
To study the difference between traditional marketing and digital marketing.
Traditional Marketing V/s Digital Marketing:
Table-1: The following table lists a few points that differentiate Digital marketing from Traditional
marketing
Traditional Marketing. Digital Marketing
Communication is unidirectional. Means, a
business communicates about its products or
services with a group of people.
Communication is bidirectional. The customer also can
ask queries or make suggestions about the business
products and services.
Medium of communication is generally phone
calls, letters, and Emails.
Medium of communication is mostly through social
media websites, chat, and Email.
Campaigning takes more time for designing,
preparing, and launching.
There is always a fast way to develop an online
campaign and carry out changes along its development.
With digital tools, campaigning is easier.
It is carried out for a specific audience
throughout from generating campaign ideas up
to selling a product or a service.
The content is available for general public. It is then
made to reach the specific audience by employing
search engine techniques.
It is conventional way of marketing; best for
reaching local audience.
It is best for reaching global audience.
It is difficult to measure the effectiveness of a
campaign.
It is easier to measure the effectiveness of a campaign
through analytics.
Table 1, Source: Secondary Data
RESEARCH METHODOLOGY
The methodology is the general research strategy that outlines the way in which research is to be undertaken
and, among other things, identifies the methods to be used in it. These methods, described in the methodology,
defines the means or modes of data collection or, sometimes, how a specific result is to be calculated. In this
paper, primary data collection as well as secondary data collection method has been used.
PRIMARY DATA
Raw data, also known as primary data is the first hand information which is collected by investigator him/her
self. In this paper primary data is gathered through observation and collection of data via questionnaire using
online response collection technique.
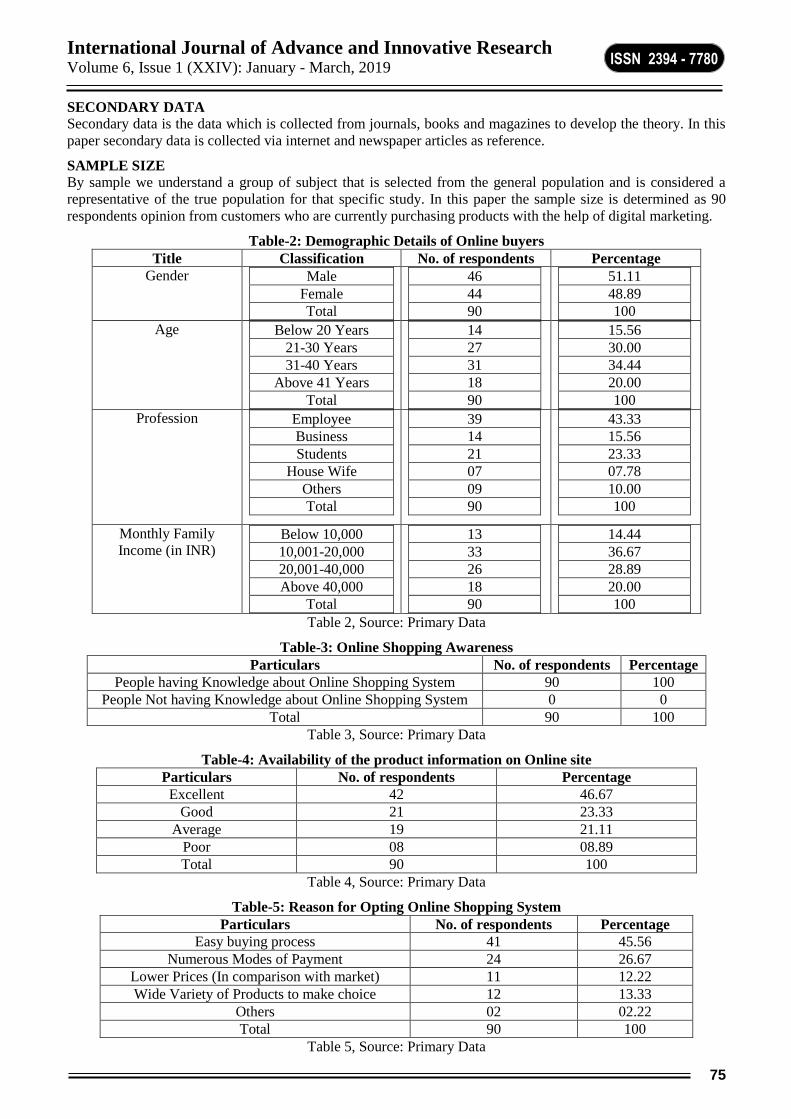
International Journal of Advance and Innovative Research Volume 6, Issue 1 (XXIV): January - March, 2019
75
ISSN 2394 - 7780
SECONDARY DATA
Secondary data is the data which is collected from journals, books and magazines to develop the theory. In this
paper secondary data is collected via internet and newspaper articles as reference.
SAMPLE SIZE
By sample we understand a group of subject that is selected from the general population and is considered a
representative of the true population for that specific study. In this paper the sample size is determined as 90
respondents opinion from customers who are currently purchasing products with the help of digital marketing.
Table-2: Demographic Details of Online buyers
Title Classification No. of respondents Percentage
Gender Male
Female
Total
46
44
90
51.11
48.89
100
Age Below 20 Years
21-30 Years
31-40 Years
Above 41 Years
Total
14
27
31
18
90
15.56
30.00
34.44
20.00
100
Profession Employee
Business
Students
House Wife
Others
Total
39
14
21
07
09
90
43.33
15.56
23.33
07.78
10.00
100
Monthly Family
Income (in INR) Below 10,000
10,001-20,000
20,001-40,000
Above 40,000
Total
13
33
26
18
90
14.44
36.67
28.89
20.00
100
Table 2, Source: Primary Data
Table-3: Online Shopping Awareness
Particulars No. of respondents Percentage
People having Knowledge about Online Shopping System 90 100
People Not having Knowledge about Online Shopping System 0 0
Total 90 100
Table 3, Source: Primary Data
Table-4: Availability of the product information on Online site
Particulars No. of respondents Percentage
Excellent 42 46.67
Good 21 23.33
Average 19 21.11
Poor 08 08.89
Total 90 100
Table 4, Source: Primary Data
Table-5: Reason for Opting Online Shopping System
Particulars No. of respondents Percentage
Easy buying process 41 45.56
Numerous Modes of Payment 24 26.67
Lower Prices (In comparison with market) 11 12.22
Wide Variety of Products to make choice 12 13.33
Others 02 02.22
Total 90 100
Table 5, Source: Primary Data

International Journal of Advance and Innovative Research Volume 6, Issue 1 (XXIV): January - March, 2019
76
ISSN 2394 - 7780
Table-6: Frequency of Making Purchases via Online Shopping System
Particulars No. of respondents Percentage
Purchasing Once Annually 12 13.33
2-5 Times Annual Purchase 34 37.78
6-10 Times Annual Purchase 28 31.11
11 & above times purchase annually 16 17.78
Total 90 100
Table 6, Source: Primary Data
DATA INTERPRETATION
There are 51.11% Males from the total sample size which is 90 as per Table 2
There are 30.00% People who belong to the age group 21-30 Years as per Table 2
There are 43.33% People who come under the category of employee as their profession as per Table 2
There are 20.00% people who belong to the income group of INR40,000 & Above (on monthly basis) as per
Table 2
There are 100% people of the total sample size being aware about the online shopping system as per Table 3.
There are 46.67% people who say that availability of the product information on Online site is excellent as
per Table 4.
There are 45.56% people who say that reason for opting online shopping system is that the process of buying
any product via online marketing sites is quite simple and consumer friendly as well as per Table 5.
There are 37.78% people who purchase products via online sites that too 2-5 times annually as per Table 6.
FINDINGS
Digital marketing have substantial future in the present market
Consumers are satisfied with the current digital marketing purchasing system.
People think that buying online products is trustworthy and safe as well.
Ratio of Males Customers over Female Customers is very high in online shopping i.e. 51.11%
Awareness about shopping via online websites is 100% among the respondents.
Income level of respondents majorly falls in the range of INR10,001-20,000 i.e. 36.67%
Most No. of respondents i.e. 45.56%, feel that online shopping system is very much sorted as the buying
procedures are very much easy and customer friendly. While others feel that it has numerous modes of
payment, have lower prices in comparison to market prices, they have wide variety of products to choose.
Employees of various organizations are purchasing more in comparison to others i.e. 43.33%
SUGGESTIONS
1. Collect the valuable feedback of the existing as well as new customers and try to implement the feedback in
a right way.
2. Awareness about digital marketing should be ensured among the general public.
3. Proper after sales service should be provided by the online vendor.
4. Technical Advancements should be improved in order to do promotion of digital market in effective manner.
CONCLUSION
Digital Marketing, after conducting this study, has turned out to be a crucial part of approach of many
organizations. In current time, Small business proprietor have an inexpensive and competent technique i.e.
using of digital marketing to market their products and services to others i.e. customers. E.g. (GoDaddy.com).
Such medium of marketing products and services has no restrictions. Company can utilize any devices like T.V,
Tablets, Laptop, Media, Social Media and lot other so as to support the company and its products & Services.
Digital Marketing may achieve more and more if it gives consumers desires as a top priority.

International Journal of Advance and Innovative Research Volume 6, Issue 1 (XXIV): January - March, 2019
77
ISSN 2394 - 7780
REFERENCES
https://www.google.com/amp/s/researchleap.com/effectiveness-of-digital-marketing-in-the-challenging-age-
an-empirical-study/amp/
https://www.ukessays.com/essays/marketing/the-concept-of-the-digital-marketing-marketing-essay.php
https://www.tutorialspoint.com/pinterest_marketing/digital_marketing_introduction.htm

International Journal of Advance and Innovative Research Volume 6, Issue 1 (XXIV): January - March, 2019
78
ISSN 2394 - 7780
RADIATION DETECTOR
Sirija Christopher1, George Kennedy2 and Prachi Mahajan3
Student1, 2 and Assistant Professor3, Vidyalankar School of Information Technology, Mumbai
ABSTRACT
Electronic devices that have become a necessity in today’s life, emit a certain amount of radiation. This
radiation many a times goes undetected. Radiation is a slow poison which slowly damages the human body.
Prolonged exposure even to minor amounts of radiation can lead to serious consequences later. Through this
paper we propose an app that helps the user easily detect the level of radiation in the commonly used electronic
devices. It also highlights the harmful effects and suggests ways to reduce usage of devices thereby reducing the
exposure to this radiation. The proposed app is user friendly and detects three types of radiation namely
Electromagnetic, Particle and Acoustic Radiation. It makes use of the inbuilt hardware namely the
Magnetometer, Ambient, Mic sensors present in all latest android mobiles.
1. INTRODUCTION
Exposure to radiation leads to serious consequences like cancer, damage to eardrum, skin rashes etc. We are
exposed to radiation in our regular life through electronic devices like Mobile Phone, Laptop etc. If people
could be alerted to the level of radiation transmitted by a device, then people may limit the use of the device or
come up with alternatives. Through this paper we propose a mobile app called ‘Radiation Detector’ that will
easily detect the radiations emitted by the electronic devices frequently used by us in our daily life and alert the
person using the device. This app will alert when the level of radiation exceeds the normal range. The app will
be supported in Android 4.0 and above.
2. NEED OF STUDY
Radiation is an emission or transmission of energy in the form of waves or particles through space or through a
material medium or Radiation is the emission of energy as electromagnetic waves or as moving subatomic
particles, especially high-energy particles which cause ionization[1]. Exposure to different types of radiation
can lead to serious consequences, resulting in severe damage or diseases. The apps currently available detect
only one type of radiation namely Electromagnetic Radiation. As the diseases caused vary depending on the
type of radiation, there is a need to sense and detect the other types of radiation such as Acoustic and Particle
Radiation.
3. FEASIBILITY STUDY
The proposed app overcomes the limitations of the existing apps. This app will detect three types of radiations
(Electromagnetic Radiation, Particle Radiation and Acoustic Radiation) using in-built Magnetometer Sensor,
Ambient Sensor and Microphones in the latest android mobile phones. The app thus does not need any
additional hardware for implementation. It only makes an efficient and effective use of the existing hardware.
4. OBJECTIVES
The app aims to increase awareness about radiation emission even by regularly used electronic devices. The app
aims to alert the user about above normal levels of radiation from these devices. It also suggests some simple
solutions to overcome the bad effects of the mentioned types of radiation.
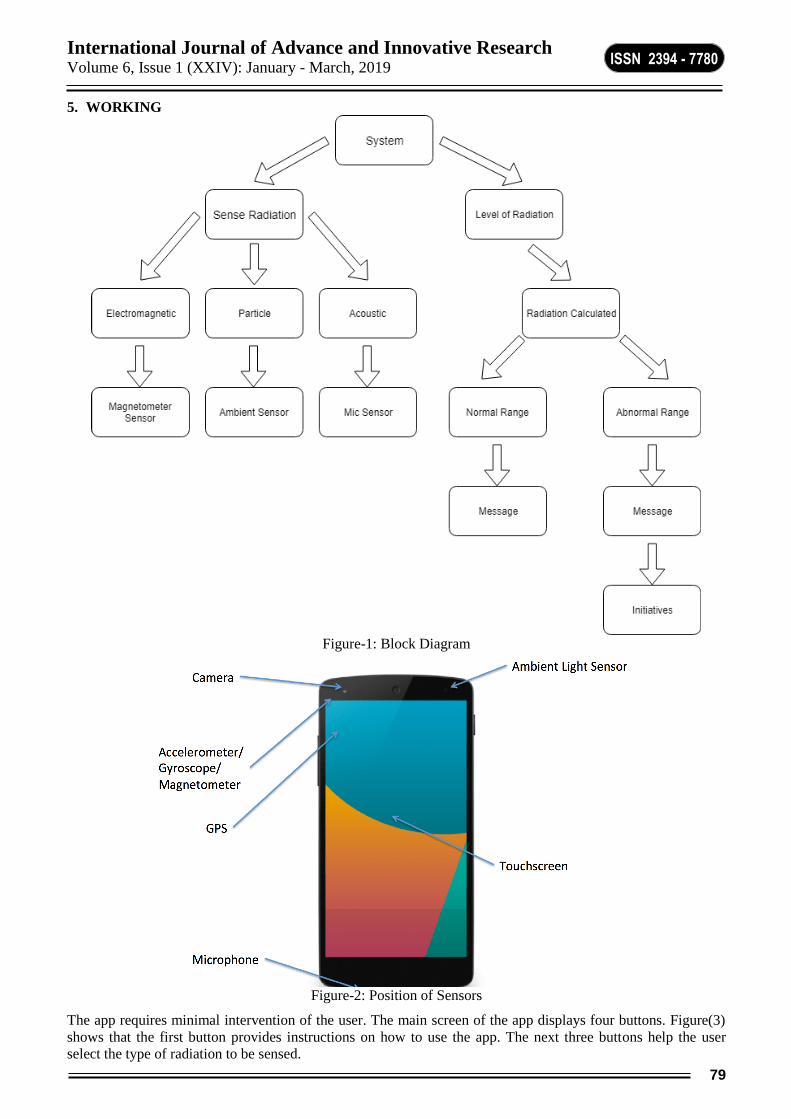
International Journal of Advance and Innovative Research Volume 6, Issue 1 (XXIV): January - March, 2019
79
ISSN 2394 - 7780
5. WORKING
Figure-1: Block Diagram
Figure-2: Position of Sensors
The app requires minimal intervention of the user. The main screen of the app displays four buttons. Figure(3)
shows that the first button provides instructions on how to use the app. The next three buttons help the user
select the type of radiation to be sensed.

International Journal of Advance and Innovative Research Volume 6, Issue 1 (XXIV): January - March, 2019
80
ISSN 2394 - 7780
Figure-3: Instruction Screen
5.1 Sensing the type of radiation
The second button directs the user to the screen where Electromagnetic Radiation is sensed. The third button
directs the user to the screen where Particle Radiation is sensed. The fourth button directs the user to the screen
where Acoustic Radiation is sensed.
Figure-4: Home Screen
5.2 Detection of Level of Radiation
The level of radiation is detected for the type of radiation chosen. The level is displayed graphically. The app
gives out a beep if the level of radiation exceeds the normal range. Additionally, the user is prompted with a
button which directs him to the screen of Initiatives, that displays information about the harmful effects of the
particular type of radiation as well as suggests ways to minimize the emission of that radiation.
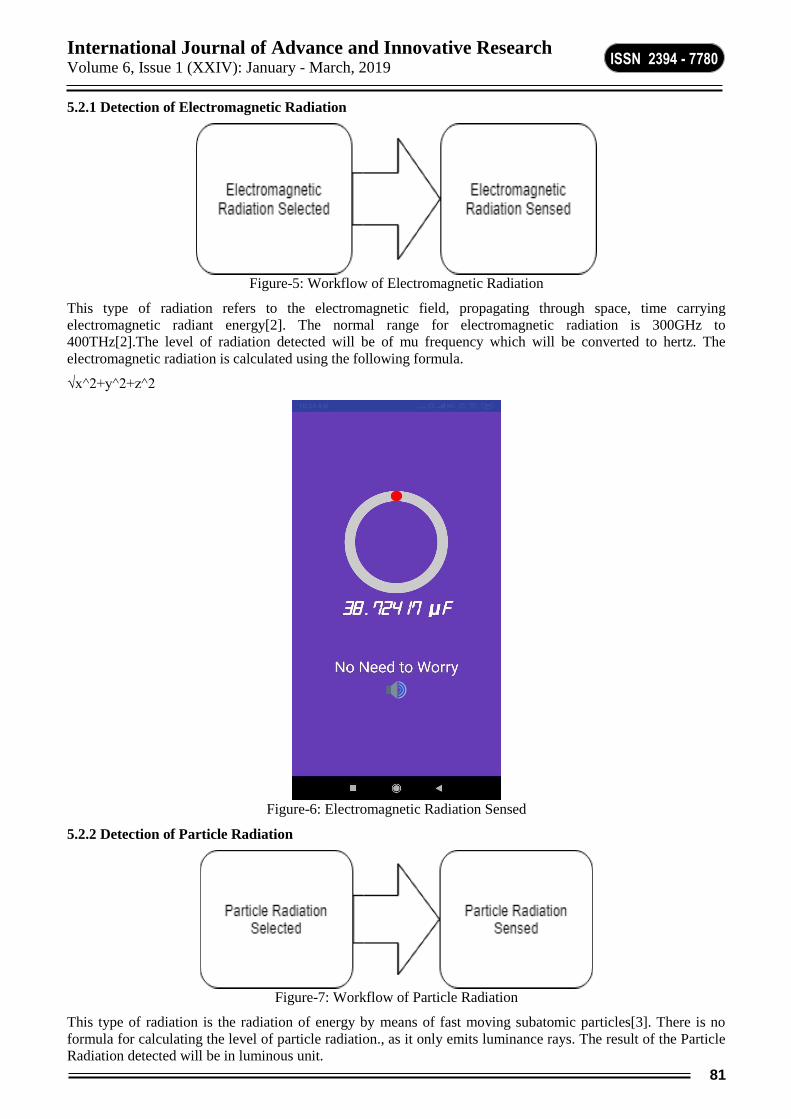
International Journal of Advance and Innovative Research Volume 6, Issue 1 (XXIV): January - March, 2019
81
ISSN 2394 - 7780
5.2.1 Detection of Electromagnetic Radiation
Figure-5: Workflow of Electromagnetic Radiation
This type of radiation refers to the electromagnetic field, propagating through space, time carrying
electromagnetic radiant energy[2]. The normal range for electromagnetic radiation is 300GHz to
400THz[2].The level of radiation detected will be of mu frequency which will be converted to hertz. The
electromagnetic radiation is calculated using the following formula.
√x^2+y^2+z^2
Figure-6: Electromagnetic Radiation Sensed
5.2.2 Detection of Particle Radiation
Figure-7: Workflow of Particle Radiation
This type of radiation is the radiation of energy by means of fast moving subatomic particles[3]. There is no
formula for calculating the level of particle radiation., as it only emits luminance rays. The result of the Particle
Radiation detected will be in luminous unit.

International Journal of Advance and Innovative Research Volume 6, Issue 1 (XXIV): January - March, 2019
82
ISSN 2394 - 7780
Figure 8: Particle Radiation Level Exceeded
5.2.3 Detection of Acoustic Radiation
Figure-9: Workflow of Acoustic Radiation
Acoustic Radiation is the branch of physics that deals with the study of all mechanical waves in gases, liquids
and solids including topics such as vibration, sound, ultrasound and infrasound[4]. There is no formula for
calculating the level of acoustic radiation.,as it only emits decibel waves. The normal range for acoustic
radiation is 20Hz to 20KHz[4]. The level of radiation detected will is in decibel unit which will be converted to
hertz.
Figure-10: Acoustic Radiation Detected

International Journal of Advance and Innovative Research Volume 6, Issue 1 (XXIV): January - March, 2019
83
ISSN 2394 - 7780
5.2.4 Suggestions to minimise Radiation
Figure-11: Workflow of Initiatives
Figure-12: Initiatives Screen
6. APP BASED BUSINESS
The app is innovative as it covers three types of radiation against only one type covered in existing apps. The
app is easily sustainable as it works on mobile phones with Android 4.0 and above, so the app will be
compatible with almost all the current and future mobile phones. Additionally, the app uses all the built-in
sensors in the mobile, hence has no adverse impact on the environment. The app is scalable and can be
enhanced further. The current version of the app will be available free of cost on the play store. The subsequent
versions as mentioned in future scope will be charged.
7. CONCLUSION
This app can be used by the user as well as by the companies to rate the devices used or designed by them. This
will help the user (consumer) choose a device wisely. The app will make the user aware about the harmful
radiation and will provide the initiatives to minimise the radiation caused by the device. We provide some
initiatives like avoiding Bluetooth, Headsets, Overuse of Network Connectivity as a solution when the range
exceeds the limit.
8. FUTURE SCOPE
We can enhance the app by collecting the total value of radiation emitted by a device in a day. In additional we
can give the user the statistics of the radiation they are exposed to. With the help of this statistics we can find
the health of the device and represent it graphically. Which will be useful for the user to decide to change the
device or not. We can even enhance this app to control the opposite device process and minimise the radiation
emitted.

International Journal of Advance and Innovative Research Volume 6, Issue 1 (XXIV): January - March, 2019
84
ISSN 2394 - 7780
9. REFERENCES
1. https://en.wikipedia.org/wiki/Radiation
2. https://en.wikipedia.org/wiki/Electromagnetic_spectrum
3. https://en.wikipedia.org/wiki/Particle_radiation
4. https://en.wikipedia.org/wiki/Sound

International Journal of Advance and Innovative Research Volume 6, Issue 1 (XXIV): January - March, 2019
85
ISSN 2394 - 7780
CORPORATE SOCIAL RESPONSIBILITY (CSR): AN EMERGING OPPORTUNITY OR A
FORCED LIABILITY
Kuldeep Singh1 and Dr. Madhvendra Misra2
Research Scholar1, Associate Professor2, Department of Management Studies, Indian Institute of Information
Technology, Allahabad
1. ABSTRACT
A significant number of studies have been conducted on Corporate Social Responsibility (CSR) and its impact
on different business organizations. However, no such study has been witnessed so far that could explain the
nature of the amount involved in the CSR spending. The main purpose of the study is to analyze the viewpoint of
different organizations that how they consider this CSR spending. In a current scenario, organizations have
failed to take responsibility for what they are operating, so it is needed to consider the real cost of their
functioning which brings a focus toward the environmental and social concerns. On the other hand, CSR also
became legitimate spending stipulated in the Indian companies act, 2013. According to the act, every business
organization is a responsible player to build an equitable society and for that CSR should be a part of the DNA
of every organization. Through this paper, we made an attempt to see the nature of CSR adopted by different
organizations, whether it is voluntary or mandatory. We reviewed some survey reports made on CSR before and
after the Indian companies act, 2013. These reports provide a perspective on CSR perceptions of different
business organizations. For empirical analysis, we have analyzed 100 listed companies’ financial reports to
know whether CSR mandate impact their performance or not. Using a difference-in-difference approach, we
found that before the legitimation of CSR the performance found to be better than post CSR legislation. This
paper is also an attempt to present a conceptual analysis of the CSR spending before and after its legitimation
in India which will help us to determine whether it should be treated as an investment opportunity or a forced
liability.
Keywords: Corporate Social Responsibility (CSR), Legitimation, Investment, Expenditure, India.
JEL: M10, M14, O16, L21
2. INTRODUCTION
2.1 Attention towards CSR
In the earlier decades, many organizations found to incorporate social and environmental considerations into
their investment decisions (El Ghoul et al., 2011). The ongoing attention on CSR from organizations perspective
has raised the question of its financial nature; either it should be treated as an investment opportunity or a forced
expenditure. The theoretical point of view says that a good CSR policy may increase the organization's
performance in terms of productivity and return (Waddock and Graves, 1997). Also it implies a good relation
with stakeholders, provides a competitive advantage, increasing innovation ability and also creates value by
developing goodwill (Hart, 1995; Porter and Linde, 1995; Russo and Fouts, 1997).
When the awareness of CSR is increasing to the stakeholders, an organization can make a reputational capital
and enhance their social legitimacy, which can lead to higher revenues and also increase customer’s loyalty
(Saeed & Arshad, 2012). These theoretical views indicate CSR as an investment decision. On the other side,
many leaders have viewed CSR as just another source of pressure or passing fad. As per Windsor (2001), the
relationship between business firms and society are based on corporate interests, not societal interests. As per
these views, this form of CSR favors a reactive approach and not a proactive approach (Matten & Moon, 2008).
Apart from this organizational view, some scholars have also considered the stakeholders and society to place
more importance on CSR (Carroll, 1999; Waddock, 2018; Park, & Ghauri, 2015). As per this view different
executives have started to treat it as a creative opportunity to strengthen their organizations through contributing
to the society. CSR also works as a central approach to the managements’ overall strategies for helping them to
address any key business issue (Keys, Malnight, & Van, 2009). The Indian Companies Act, 2013 contains
different provisions regarding CSR. As per Section 135 of Companies Act, 2013 every company having any of
the three:
a) The net worth of Rs. 500 crore or more.
b) The turnover of Rs. 1,000 crore or more.
c) The net profit of Rs. 5 crore or more.

International Journal of Advance and Innovative Research Volume 6, Issue 1 (XXIV): January - March, 2019
86
ISSN 2394 - 7780
It is mandatory to spend at least 2% of its average net profits during the last three financial years on CSR
activities.
Now the question is being raised that after the legitimation whether the CSR is being really observed by the
companies as an opportunity or it is creating any forced liability on them? If CSR spending provides
unpredictable returns in the foreseeable future, then it can be considered as an Investment opportunity. On the
other side if a business organization thinks that it’s better to retain such outgoings in the organization, then they
would consider this spending as a forced liability (Al‐ Hadi. et al., 2017).
3. HISTORICAL PERSPECTIVE
The concept of CSR is not new in India. It can be seen as a well-established tradition in a number of business
organizations, particularly family based corporations with a strong community ethos (Sundar 2000, Shrivastava
and Venkateswaran 2000). Some earlier studies present evidences that CSR reduces idiosyncratic risk (Bassen
et al., 2006; Boutin-Dufresne and Savaria, 2004; Sharfman and Fernando, 2008; Vanhamme and Grobben,
2009).
CSR also help the business organizations to generate positive reputation and moral capital among the society
(Godfrey, 2005; Godfrey, Merrill, and Hansen, 2009). Each kind of these firms found to be less vulnerable in
the event of a public crisis (Peloza, 2006). For example, corporations which implement CSR practices are likely
to invest in equipment which enables greater product safety and environmental protection. Organizations which
invest in CSR activities can more easily reconstruct their corporate and social image compared to organizations
without having such policies (Bhattacharya and Sen, 2004).
Earlier studies also make a focus on CSR disclosures, firm’s performance, and the relationship between CSR
and various characteristics of the business firm. In these studies, CSR in India was found to be far below than the
global norms, and there was no significant change in the approach of Indian corporates towards CSR (Cheung et
al. 2009). In starting CSR has been seen as a configuration of principles of responsibilities, and different social
activities. As time passed these activities lead to a reputation for CSR (Peloza and Shang, 2011).
The social and cultural base of India encourages CSR practices that differ from many other nations. In general
terms, research shows that if an organization invests in CSR activities, then this investment provide cushion
against negative events which may affect the reputation of the business. India can be seen as the world’s richest
tradition of CSR (Dhanesh, 2015). Though the term CSR could be new, the concept behind this dates back over
a hundred years. Its legislation history also can be seen back to 11th five year plan 2007, which committed to
growth as an essential part of country’s development.
Source: Author
In 2009, the Ministry of Corporate Affairs, India had issued “Voluntary Guidelines on Corporate Social
Responsibility,” which was the first step towards mainstreaming the concept of corporate responsibilities. These
guidelines were further extended in 2011 as “National Voluntary Guidelines on Social, Environmental and
Economic Responsibilities of Business.” In 2013 the Indian Companies Act mandated every company which
qualifies under section 135 (1), to make a statutory disclosure of CSR in their annual reports.
4. DATA AND METHODOLOGY
We analyze different survey reports which have been organized on CSR before and after its legitimation in
India. We use Indian Institute of Management, Bangalore 2001 survey report to know how organizations
perceived this CSR spending in the earlier period when there was no any legal provision for CSR
(Balasubramanian and Kimber 2005). To analyze the present scenario about CSR spending, we use KPMG CSR

International Journal of Advance and Innovative Research Volume 6, Issue 1 (XXIV): January - March, 2019
87
ISSN 2394 - 7780
survey report, 2015 and FICCI CSR survey report, 2016 in which we consider both quantitative attributes as
well as qualitative trends. This paper also presents the evidence on the effect of CSR mandate on firms’
performance. We have analyzed the experiences of 100 listed Indian companies among which 50 companies are
those who never dealt in any CSR activity (control group) and another 50 companies who practiced CSR before
as well as after the law has been enforced (treatment group). Comparisons of return on asset (ROA) for the
control group and treatment group before and after the companies act, 2013 offer a simple method for
evaluating the effects of CSR. In order to empirically test the research model, we used secondary data which has
been extracted from the financial statements of 100 listed Indian companies. The main part of this empirical
analysis is its difference in difference methodology. Earlier studies focusing on CSR and firm’s performance
attempts to identify CSR impact mainly through a single comparison by considering only those companies who
are dealing in CSR. All such studies argues that their single comparison supports the hypothesis that CSR
impact the firm’s performance. However, this single comparison can actually be consistent with either positive
or negative effects. The DID approach is therefore designed to overcome the probable ambiguities of the single
difference approach. It’s not only deal with the problem itself, but it also aims to improve the analysis of earlier
work. This article has four additional sections. Section 5 briefly summarizes some main aspects of IIM
Bangalore CSR Survey report, 2001. Section 6 reviews the output of KPMG CSR survey report, 2016. Section 7
highlights the findings of FMCG survey report, 2017. Section 8 outlines the difference in difference empirical
analysis. Section 9 concludes with a discussion of future research ideas.
5. IIM, BANGALORE CSR SURVEY
In 2001, the Indian Institute of Management, Bangalore organized a survey that shows results on
778 usable responses. Among which 85% respondent of the survey group was Graduate with major areas like
science, engineering, accounting, and finance discipline. Other different factors were taken as considered in
Table 1.
Table-1: IIM, Bangalore Survey - Response Factors
Tertiary Educated 96%
Male 86%
Working Personnel 64%
Unmarried 58%
Under 30 year of age 60%
Had no children 75%
Employed in Pvt. Sector 85%
Employed in Industry 60%
Source: Balasubramanian and Kimber 2005
It was the first CSR survey which was based on modern technology as it was designed through a web-based
technique and ran for approximately two months. However, the IIM, Bangalore CSR survey fails to represent
the majority of employees and leaders (Balasubramanian and Kimber 2005).
As per the survey, 70% respondents believed that Social Responsibility should not only a government initiative
but also should be adopted by corporate one. However, 17% were not agreed with this statement. 80%
respondent agreed on the codes of conduct as a necessary element to encourage accountability and transparency.
46% agreed that responsiveness for society has increased in the last five years. But surprisingly 72% stated that
CSR should be treated as an operational cost and not as an appropriation of profits. It is perhaps heartening as
responses are sensitive regarding social responsibilities.
After IIMB and before current surveys there was some other survey also administered like A CSR survey
organized by Tata Energy Research Institute (Europe) in which it was found that corporate organizations
focused on mainly “employees’ health and their safety, social relations, environmental sustainability and
accountability of stakeholders” (Kumar et al. 2001). In early 2001 a survey was undertaken by The Centre for
Social Marketing (CSM) which based on an email instrument, which sends to a cross-section of Indian industry
to get the answer of the questions like what is the meaning of corporate citizenship in case of modern Indian
businesses? What is the interpretation of this new language for Indian organizations? How are they providing
leadership and how they are responding? (Brown, 2001).
In 2003 National Stock Exchange also administered a questionnaire-based survey of top 50 companies which
were listed in the Nifty index (NSE/NIFTY 2003) The report shows how
CSR is considered and how it is implemented by these organizations (Balasubramanian and Kimber 2005).

International Journal of Advance and Innovative Research Volume 6, Issue 1 (XXIV): January - March, 2019
88
ISSN 2394 - 7780
6. KPMG CSR SURVEY
In the year 2015 KPMG India, a leading service organization represents a survey report which was made on top
100 companies. The following details have been captured from the KPMG CSR reporting survey 2015.
Table-2: KPMG Survey – No. of companies surveyed
Documents reviewed Number of companies
CSR policy 95 companies
Financial reports 92 companies
CSR disclosure (as per prescribed format) 87 companies
As of 30th September 2015, KPMG accessed CSR policies of 95 companies and financial reports of 92
companies. Out of 100 companies, eight found to follow a different cycle of the annual report (not 1st April –
31st March) and, thus, were not considered for this survey. Another five companies found not to have the
required information on CSR. Therefore KPMG made an analysis of CSR policies for 95 companies, and CSR
spending for 87 companies.
The main findings of the KPMG survey were
90.95% of companies having availability of mission/vision/philosophy in there CSR policy
79.83% CSR activities were related to the specific activities which covered in companies CSR policy. And
13.14% activities related to the Schedule VII activities. Rest 3% was not able to found as details were not
given in the companies CSR policy.
Around 63 companies mentioned that the surplus arising by dealing in CSR activities was not expected.
These companies also stated that the profit arising out of CSR activities would be transfer to the CSR fund.
However, 32 of them was not replied and remained silent.
53 companies have agreed to provide details regarding focus areas of CSR involvement in their director’s
report, and 19 have given details regarding outreach/impacted.
52 companies provided the detail of CSR spending among which 13 companies failed to spend the
prescribed amount, but they committed to carrying forward the unspent amount into next year.
Only 32 companies spent 2% or more towards CSR.
(Source: KPMG survey, 2015)
7. FICCI CSR SURVEY
In 2016, FICCI surveyed during January and February 2016. The report has covered Public sector companies,
Private sector companies as well as foreign MNCs. The result was based on about 150 responses.
79% of the companies found to have an independent director in their CSR committee.
95% respondent stated that their CSR schemes are mainly aligned with the Governments development
programs like- Digital India, Swach Bharat Abhiyan, MGNAREGA, National Health Mission, etc.
72% respondent said that the normal duration of a CSR project is less than five year and companies consider
these projects by their investment decisions.
Companies use the strategic approach to identify the projects. They engaged third-party consultancy firm for
regular community interaction, need assessment survey, etc.
77% respondents reported an increase in their CSR budget for the year 2016 as compared to last few years.
While 12% respondents declined and the other 6% cited no change. Remaining 5% reported that they had
made a CSR provision for the first time in their budget.
(Source: FICCI survey, 2016)
8. EMPIRICAL ANALYSIS: DIFFERENCE-IN-DIFFERENCES ESTIMATION
Difference in Differences is a tool for study the impact of pre and post treatment differences in the outcome of a
treatment group relative to the performance of some control group. In this study, we are interested in estimating
the effect of the treatment (legitimation of CSR) on firms’ performance. The control group shows the details
which would have happened to the treatment group in the absence of treatment (legitimation of CSR). Applied
to the concern of mandate CSR effect on firms’ performance, this approach suggests that one compare the
performance pattern among treatment group pre and post (Section 135) with the performance pattern among

International Journal of Advance and Innovative Research Volume 6, Issue 1 (XXIV): January - March, 2019
89
ISSN 2394 - 7780
control group pre and post (Section 135). To develop this empirical approach we have used difference in
difference methodology, following the detailed discussion in Meyer (1995). This suggests
Y= β0 + β1*[time] + β2*[intervention] + β3diffs-in-diffs*[time*intervention] +ε (1)
Where:
Y = Output for performance
β0 = Baseline average
β1 = Time trend in control group
β2 = Single difference between treated and control groups on the baseline
β3diffs-in-diffs = Difference in changes over time
ε = error
The difference in difference (DID) estimate (β3diffs-in-diffs) can be understood by graphical figure given below in
figure 2.
Figure-2: Difference in Differences (Graphical Approach)
β3diffs-in-diffs =( Ȳtreat, after- Ȳtreat,before) - ( Ȳcontrol, after- Ȳcontrol,before)
The whole data set from 2012 to 2017 containing information of 100 companies used for building the DID
model. The DiD regression model is proposed as follows:
Y= 1.18 + -0.01*[time] + -0.47*[intervention] + -0.07 *[time*intervention] +ε (2)
In order to deal with the main assumptions related to DiD estimation, we used descriptive statistics for
summarizing and exploring data, visual inspection for parallel trend assumption, and Wooldridge test for
autocorrelation.
Descriptive statistics of key variable (ROA)
The values of descriptive statistics for different variables are provided in Table 4 and Table 5. In these tables, it
is observed that the mean ratio of ROA for treatment group companies before the legitimation of CSR was
0.710 and after legalization, it is 0.631.

International Journal of Advance and Innovative Research Volume 6, Issue 1 (XXIV): January - March, 2019
90
ISSN 2394 - 7780
Table-3: Return on Asset (ROA) of treatment group
Table-4: Return on Asset (ROA) of control group
Table-5: Difference-In-Differences Estimation Results
This value is lower than control group companies as their mean ROA before the legitimation of CSR was 1.177
and after legalization, it is 1.168. Starting trends were very similar among companies in both groups, although
the average ROA was significantly higher in control group companies. The average ROA for treatment group
companies found to be decreased by 11 percent following the legitimation of CSR while for control group
companies the average ROA found to be decreased by 0.76 percent only.
**Inference: *** p<0.01; ** p<0.05; * p<0.1
Source (Authors’ Calculations)
Software Used: STATA 13
R-square: 0.08
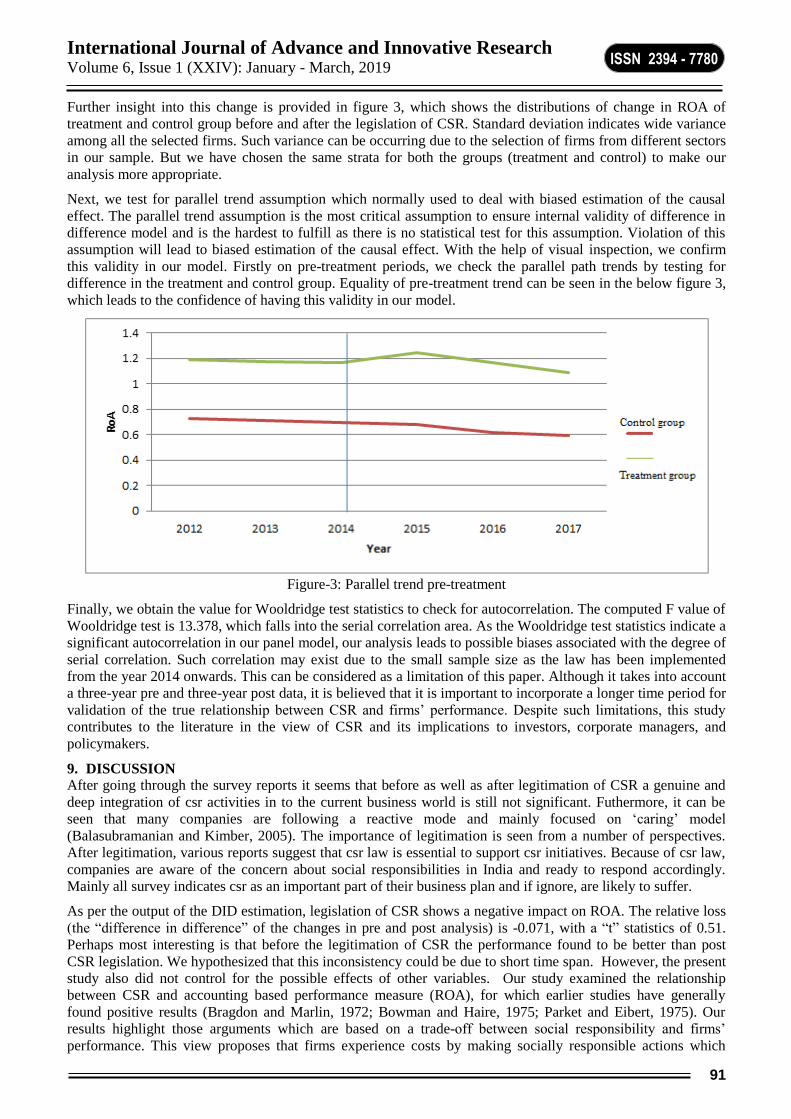
International Journal of Advance and Innovative Research Volume 6, Issue 1 (XXIV): January - March, 2019
91
ISSN 2394 - 7780
Further insight into this change is provided in figure 3, which shows the distributions of change in ROA of
treatment and control group before and after the legislation of CSR. Standard deviation indicates wide variance
among all the selected firms. Such variance can be occurring due to the selection of firms from different sectors
in our sample. But we have chosen the same strata for both the groups (treatment and control) to make our
analysis more appropriate.
Next, we test for parallel trend assumption which normally used to deal with biased estimation of the causal
effect. The parallel trend assumption is the most critical assumption to ensure internal validity of difference in
difference model and is the hardest to fulfill as there is no statistical test for this assumption. Violation of this
assumption will lead to biased estimation of the causal effect. With the help of visual inspection, we confirm
this validity in our model. Firstly on pre-treatment periods, we check the parallel path trends by testing for
difference in the treatment and control group. Equality of pre-treatment trend can be seen in the below figure 3,
which leads to the confidence of having this validity in our model.
Figure-3: Parallel trend pre-treatment
Finally, we obtain the value for Wooldridge test statistics to check for autocorrelation. The computed F value of
Wooldridge test is 13.378, which falls into the serial correlation area. As the Wooldridge test statistics indicate a
significant autocorrelation in our panel model, our analysis leads to possible biases associated with the degree of
serial correlation. Such correlation may exist due to the small sample size as the law has been implemented
from the year 2014 onwards. This can be considered as a limitation of this paper. Although it takes into account
a three-year pre and three-year post data, it is believed that it is important to incorporate a longer time period for
validation of the true relationship between CSR and firms’ performance. Despite such limitations, this study
contributes to the literature in the view of CSR and its implications to investors, corporate managers, and
policymakers.
9. DISCUSSION
After going through the survey reports it seems that before as well as after legitimation of CSR a genuine and
deep integration of csr activities in to the current business world is still not significant. Futhermore, it can be
seen that many companies are following a reactive mode and mainly focused on ‘caring’ model
(Balasubramanian and Kimber, 2005). The importance of legitimation is seen from a number of perspectives.
After legitimation, various reports suggest that csr law is essential to support csr initiatives. Because of csr law,
companies are aware of the concern about social responsibilities in India and ready to respond accordingly.
Mainly all survey indicates csr as an important part of their business plan and if ignore, are likely to suffer.
As per the output of the DID estimation, legislation of CSR shows a negative impact on ROA. The relative loss
(the “difference in difference” of the changes in pre and post analysis) is -0.071, with a “t” statistics of 0.51.
Perhaps most interesting is that before the legitimation of CSR the performance found to be better than post
CSR legislation. We hypothesized that this inconsistency could be due to short time span. However, the present
study also did not control for the possible effects of other variables. Our study examined the relationship
between CSR and accounting based performance measure (ROA), for which earlier studies have generally
found positive results (Bragdon and Marlin, 1972; Bowman and Haire, 1975; Parket and Eibert, 1975). Our
results highlight those arguments which are based on a trade-off between social responsibility and firms’
performance. This view proposes that firms experience costs by making socially responsible actions which

International Journal of Advance and Innovative Research Volume 6, Issue 1 (XXIV): January - March, 2019
92
ISSN 2394 - 7780
result into economic disadvantage compare to those firms which are less responsible (Aupperle, Carroll &
Hatfield, 1985; Ullmann, 1985; Vance, 1975). As per results, till now CSR activities are like any other activity
for firms and the firms choose those activities that maximize firm performance.
10. CONCLUSION
As per different survey reports, it seems that before legitimation of CSR companies considered it as an act of
philanthropy or just a business practice towards the society. Earlier they did not consider the actual cost which
incurred by functioning their operations in the social environment. After legitimation of CSR, it is seen that
companies are ready to invest in CSR. However, the results of the empirical analysis report negative outcomes.
This effect is larger than the 2% stipulated requirement, signifying that the relationship between CSR and firms’
performance is complicated. These findings bring new evidence over the consequences of CSR activities.
Earlier studies also found it to be difficult because it was a more complex than a simple linear relationship
(McWilliams and Siegel, 2000; Ullmann, 1985). Opposite to this, there was a significant increase in CSR
spending by treatment firms relative to control firms (Dharmapala, & Khanna, 2016). Future studies can be
made for a better understanding of the consequences revealed in this paper, by employing some other specific
variables like advertisement, firm size, government policies, etc.
REFERENCES
Al‐ Hadi, A., Chatterjee, B., Yaftian, A., Taylor, G., & Monzur Hasan, M. (2017). Corporate social
responsibility performance, financial distress and firm life cycle: evidence from Australia. Accounting &
Finance, 18(03) 2017
Aupperle, K. E., Carroll, A. B., & Hatfield, J. D. (1985). An empirical examination of the relationship
between corporate social responsibility and profitability. Academy of management Journal, 28(2), 446-463.
Balasubramanian, N. K., Kimber, D., & Siemensma, F. (2005). Emerging opportunities or traditions
reinforced?. Journal of Corporate Citizenship, (17).
Bassen, A., Meyer, K. and Schlange, J. (2006). The influence of corporate responsibility on the cost of
capital ‐ An empirical analysis. http://ssrn.com/ abstract=984406 (accessed January 10th, 2010).
Bhattacharya, C. B. and Sankar Sen. (2004). Doing Better at Doing Good: When, Why and How Consumers
Respond to Corporate Social Initiatives. California Management Review 47 (Fall): 9-25.
Boutin-Dufresne and Patrick Savaria (2004). Corporate Social Responsibility and Financial Risk. The
Journal of Investing, Spring 2004, Vol. 13, No. 1: pp. 57-66
Bowman, E. H., & Haire, M. (1975). A strategic posture toward corporate social responsibility. California
management review, 18(2), 49-58.
Bragdon, J. H., & Marlin, J. (1972). Is pollution profitable. Risk management, 19(4), 9-18.
Brown, K. (2001). Corporate social responsibility: Perceptions of Indian business. Maratha Mandir’s
Babasaheb Gawde Institute of Management Studies. Retrieved on February, 10, 2011.
Carroll, A. B. (1999). Corporate social responsibility: Evolution of a definitional construct. Business &
society, 38(3), 268-295.
Cheung Y. L., Tan, W., Ahn H. J. & Zhang, Z. (2009). Does corporate social responsibility matter in Asian
emerging markets? Journal of Business Ethics, Vol. 92(3), pp. 401-413.
Dhanesh, G. S. (2015). Why corporate social responsibility? An analysis of drivers of CSR in
India. Management Communication Quarterly, 29(1), 114-129.
Dharmapala, D., & Khanna, V. S. (2016). The impact of mandated corporate social responsibility: Evidence
from india's companies act of 2013.
El Ghoul, S., Guedhami, O., Kwok, C.C.Y., Mishra, D.R., (2011). Does corporate social responsibility affect
the cost of capital? Journal of Banking & Finance 35, 2388-2406.
FICCI (2015). FICCI Corporate Social Responsibility Survey 2015, [online] Available at:
ficci.in/Sedocument/20361/csr_survey_ficci.pdf. [Accessed 5 July, 2018].
Godfrey, P. C. (2005). The relationship between corporate philanthropy and shareholder wealth: A risk
management perspective. Academy of management review, 30(4), 777-798.
International Journal of Advance and Innovative Research Volume 6, Issue 1 (XXIV): January - March, 2019
93
ISSN 2394 - 7780
Godfrey, P. C., Merrill, C. B., & Hansen, J. M. (2009). The relationship between corporate social
responsibility and shareholder value: An empirical test of the risk management hypothesis. Strategic
management journal, 30(4), 425-445.
Hart, S. L. (1995). A natural-resource-based view of the firm. Academy of management review, 20(4), 986-
1014.
Keys, T., Malnight, T. W., & Van Der Graaf, K. (2009). Making the most of corporate social responsibility.
McKinsey Quarterly, 36, 38-44.
KPMG. (2015), KPMG Survey of Corporate Social Responsibility 2015, [online] Available at:
https://home.kpmg.com/in/en/home/media/press-releases/2015/11/india-corporate-responsibility-reporting-
survey.html. [Accessed 5 July, 2018]
Kumar, R., Balsari, V., & Murphy, D. (2002). Corporate Responsibility in India: A Changing Agenda?. The
Ethical Corporation Newsletter.
Kumar, R., Murphy, D. F., & Balsari, V. (2001). Altered images: The 2001 state of corporate responsibility
in India poll. Tata Energy Research Institute.
Matten, D. and Moon, J. (2008) ‘“Implicit” and “Explicit” CSR: A Conceptual Framework for a
Comparative Understanding of Corporate Social Responsibility’, Academy of Management Review, 33, 404–
424.
McWilliams, A., & Siegel, D. (2000). Corporate social responsibility and financial performance: correlation
or misspecification?. Strategic management journal, 21(5), 603-609.
Meyer, B. D. (1995). Natural and quasi-experiments in economics. Journal of business & economic
statistics, 13(2), 151-161.
Park, B. I., & Ghauri, P. N. (2015). Determinants influencing CSR practices in small and medium sized
MNE subsidiaries: A stakeholder perspective. Journal of World Business, 50(1), 192-204.
Parket, I. R., & Eilbirt, H. (1975). The practice of business social responsibility: The underlying
factors. Business horizons, 18(4), 5-10.
Peloza, J., & Shang, J. (2011, February). Investing in Corporate Social Responsibility to Enhance Customer
Value. In Conference Board Governance Center, Harvard Law School Forum.
Peloza, J.(2006). Using corporate social responsibility as insurance for financial performance.
California Management Review, 48(2), 52-72.
Porter, M. E., & Van der Linde, C. (1995). Toward a new conception of the environment- competitiveness
relationship. The journal of economic perspectives, 9(4), 97-118..
Russo, M. V., & Fouts, P. A. (1997). A resource-based perspective on corporate environmental performance
and profitability. Academy of management Journal, 40(3), 534-559.
Saeed, M. M., & Arshad, F. (2012). Corporate social responsibility as a source of competitive advantage:
The mediating role of social capital and reputational capital. Journal of Database Marketing & Customer
Strategy Management, 19(4), 219-232.
Sharfman, M. P., & Fernando, C. S. (2008). Environmental risk management and the cost of capital.
Strategic management journal, 29(6), 569-592.
Shrivastava, H., & Venkateswaran, S. (2000). The business of social responsibility: The why, what, and how
of corporate social responsibility in India. Egully. com.
Sundar, P. (2000). Beyond business: From merchant charity to corporate citizenship: Indian business
philanthropy through the ages. Tata McGraw-Hill Publishing Company.
Ullmann, A. A. (1985). Data in search of a theory: A critical examination of the relationships among social
performance, social disclosure, and economic performance of US firms. Academy of management
review, 10(3), 540-557.
Vance, S. C. (1975). Are socially responsible corporations good investment risks. Management
review, 64(8), 19-24.

International Journal of Advance and Innovative Research Volume 6, Issue 1 (XXIV): January - March, 2019
94
ISSN 2394 - 7780
Vanhamme, J., & Grobben, B. (2009). “Too good to be true!”. The effectiveness of CSR history in
countering negative publicity. Journal of Business Ethics, 85, 273-283.
Waddock, S. A., & Graves, S. B. (1997). The corporate social performance-financial performance link.
Strategic management journal, 303-319.
Waddock, S. (2018). Beyond CSR to System Change: Creating a New Socio-economic Narrative.
In Corporate Social Responsibility (pp. 377-401). Emerald Publishing Limited.
Windsor, D. (2001). The future of corporate social responsibility. International Journal of Organizational
Analysis, 9(3), 225–256.
International Journal of Advance and Innovative Research Volume 6, Issue 1 (XXIV): January - March, 2019
95
ISSN 2394 - 7780
VARIANCE–COVARIANCE (DELTA NORMAL) APPROACH OF VAR MODELS: AN EXAMPLE
FROM BOMBAY STOCK EXCHANGE
Prof. Raghavendra S Bendigeri1 and Dr M.G Shirahatti2
Assistant Professor1, Finance & Marketing, Oriental Institute of Management, Navi Mumbai
Former Chairman2, Ad-hoc Board of Studies in Management, University of Mumbai, Mumbai
ABSTRACT
Numerous investors are inclined to understand, the quantum of wealth or capital they can lose in a specific time
period, which could be one day or 5 days or 10 days. In this research paper, out of numerous approaches,
variance – covariance approach of VaR is discussed. This method helps in prediction of maximum loss that can
occur for a specific time period and given probability. Here in order to calculate VaR, portfolios are created,
which is followed by identification of returns distribution. Finally VaR of portfolios is calculated. Daily loss is
calculated using data for the period of 01st January 2018 to 31st December 2018 as historical data consisting of
246 days. Companies were selected from Bombay Stock Exchange (BSE). VaR has been computed for both 95%
and 99% confidence intervals for holding period of 1 day and 10 days.
Keywords: Risk & Return, VaR, Maximum Loss, Variance – Covariance approach, Correlation.
1. INTRODUCTION
The key yardsticks or benchmark for any investment happens to be Risk and Return. The primary assumption
w.r.t investors are that they want to maximize their utility and reduce risk. In other words they are risk averse.
From that perspective, risk management has emerged as a vital facet for evaluation and choice of investments.
Numerous organizations and regulatory authorities too attribute tremendous significance to analysis and
measurement of risk in the aftermath of 2008 financial crisis.
A number of methods exist to compute market risk, which primarily consists of exchange rates, interest rates
etc. Value at Risk models (VaR) have been implemented since 1994. The primary disadvantage of VaR models
is that they estimate or predict only those risks that can be quantified. Qualitative risks such as regulatory risk,
operational risk or political risks cannot be measured using this model. VaR model estimates the highest loss for
a portfolio or a stock w.r.t a given holding period and a level of confidence. This gives investors an opportunity
to know, how much they stand to lose in a particular time frame.
Different results are thrown up by different models. VaR models have both advantages as well as disadvantages.
The classification of VaR models can be parametric or non – parametric. Variance – Covariance model (also
known as delta normal) is the most widely used VaR model in finance.
The advantage of using this model is that it is very simple and straight forward to use. This model uses
covariance and correlation matrices to measure standard deviation and variance of a risky asset portfolio. This
model goes with a primary assumption that returns should follow a normal distribution.
RESEARCH OBJECTIVE
The primary objective of this paper is to elaborate on Variance – Covariance VaR method and to measure the
maximum loss that an investor can incur on a portfolio comprising of a variety of stocks. The research paper is
divided into following parts: -
A brief introduction of VaR models in given in Part 2. In Part 3, the approach of VaR – CoVaR is applied to
measure loss value. A number of statistical techniques are applied in this section. Finally the paper is concluded
in section 4.
The aim of this paper is briefly to elaborate on Variance-Covariance method and to compute maximum risk for
portfolios consisting of different stocks. The rest of the paper is organised as follows. In part 2, VaR models are
briefly introduced. In part 3, variance-covariance method is applied to calculate loss value. Many statistical
techniques are used in this section. Finally, part 4 concludes the paper.
2. VARIANCE-COVARIANCE APPROACH OF VAR METHODS
Every investor wants to earn maximum returns at minimum risk. Therefore, prediction and estimation of risk is
a very important parameter in all decisions related to investments. The investor will be willing to invest in any
portfolio or asset only if the expected return is more than its perceived cost. Normally there is a compromising
situation or a trade – off situation experienced by every investor, wherein a good but relatively small investment
in terms of money may result in an opportunity cost, however a substantially large but bad investment may lead
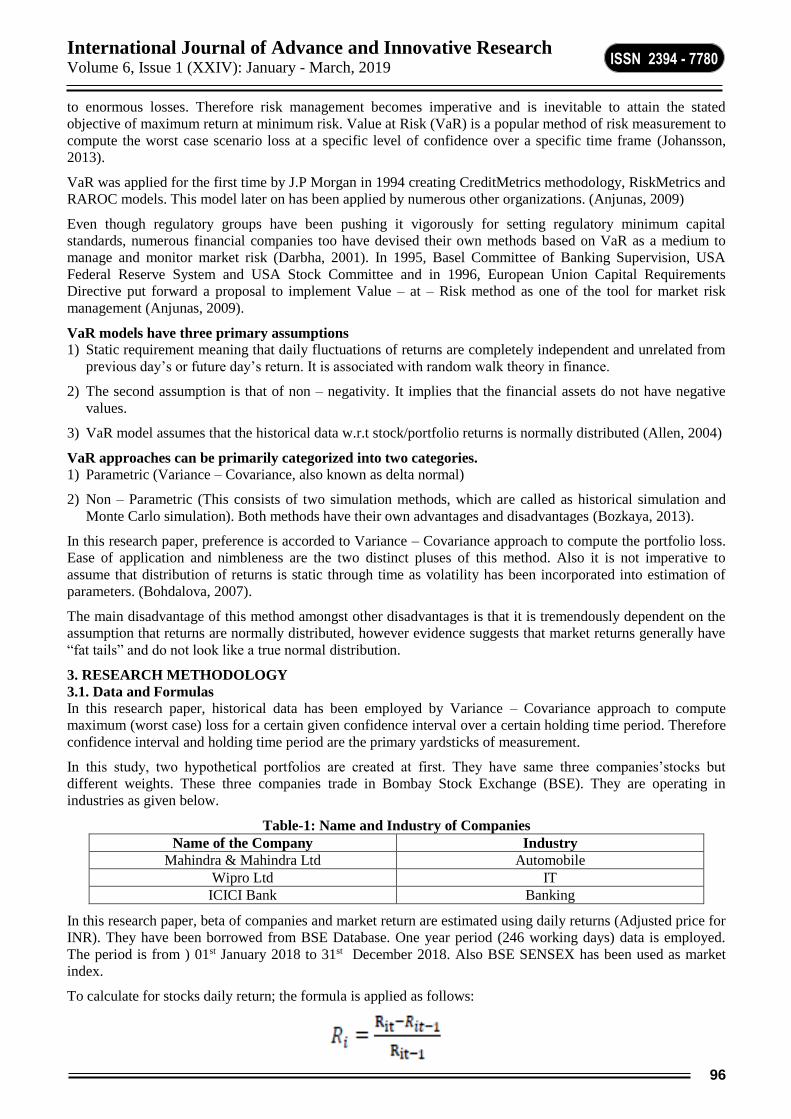
International Journal of Advance and Innovative Research Volume 6, Issue 1 (XXIV): January - March, 2019
96
ISSN 2394 - 7780
to enormous losses. Therefore risk management becomes imperative and is inevitable to attain the stated
objective of maximum return at minimum risk. Value at Risk (VaR) is a popular method of risk measurement to
compute the worst case scenario loss at a specific level of confidence over a specific time frame (Johansson,
2013).
VaR was applied for the first time by J.P Morgan in 1994 creating CreditMetrics methodology, RiskMetrics and
RAROC models. This model later on has been applied by numerous other organizations. (Anjunas, 2009)
Even though regulatory groups have been pushing it vigorously for setting regulatory minimum capital
standards, numerous financial companies too have devised their own methods based on VaR as a medium to
manage and monitor market risk (Darbha, 2001). In 1995, Basel Committee of Banking Supervision, USA
Federal Reserve System and USA Stock Committee and in 1996, European Union Capital Requirements
Directive put forward a proposal to implement Value – at – Risk method as one of the tool for market risk
management (Anjunas, 2009).
VaR models have three primary assumptions
1) Static requirement meaning that daily fluctuations of returns are completely independent and unrelated from
previous day’s or future day’s return. It is associated with random walk theory in finance.
2) The second assumption is that of non – negativity. It implies that the financial assets do not have negative
values.
3) VaR model assumes that the historical data w.r.t stock/portfolio returns is normally distributed (Allen, 2004)
VaR approaches can be primarily categorized into two categories.
1) Parametric (Variance – Covariance, also known as delta normal)
2) Non – Parametric (This consists of two simulation methods, which are called as historical simulation and
Monte Carlo simulation). Both methods have their own advantages and disadvantages (Bozkaya, 2013).
In this research paper, preference is accorded to Variance – Covariance approach to compute the portfolio loss.
Ease of application and nimbleness are the two distinct pluses of this method. Also it is not imperative to
assume that distribution of returns is static through time as volatility has been incorporated into estimation of
parameters. (Bohdalova, 2007).
The main disadvantage of this method amongst other disadvantages is that it is tremendously dependent on the
assumption that returns are normally distributed, however evidence suggests that market returns generally have
“fat tails” and do not look like a true normal distribution.
3. RESEARCH METHODOLOGY
3.1. Data and Formulas
In this research paper, historical data has been employed by Variance – Covariance approach to compute
maximum (worst case) loss for a certain given confidence interval over a certain holding time period. Therefore
confidence interval and holding time period are the primary yardsticks of measurement.
In this study, two hypothetical portfolios are created at first. They have same three companies’stocks but
different weights. These three companies trade in Bombay Stock Exchange (BSE). They are operating in
industries as given below.
Table-1: Name and Industry of Companies
Name of the Company Industry
Mahindra & Mahindra Ltd Automobile
Wipro Ltd IT
ICICI Bank Banking
In this research paper, beta of companies and market return are estimated using daily returns (Adjusted price for
INR). They have been borrowed from BSE Database. One year period (246 working days) data is employed.
The period is from ) 01st January 2018 to 31st December 2018. Also BSE SENSEX has been used as market
index.
To calculate for stocks daily return; the formula is applied as follows:

International Journal of Advance and Innovative Research Volume 6, Issue 1 (XXIV): January - March, 2019
97
ISSN 2394 - 7780
Where “Ri” is a daily return of share i, “Rit” is a closing price of share i in t date and “Rit-1” is a closing price
of share i in t - 1 date
To Calculate the index (BSE SENSEX) daily return, the following formula is applied.
RBSE = BSEt – BSEt-1
BSEt-1
Where RBSE is average return of market. BSEt is a market return in t date. BSEt-1 is a market return in t-1 date.
In order to calculate variance of stocks daily return and index return, I used the following historical volatility
formula.
Where is a variance of daily share return. Ri is a daily return of share i. Raverage is the average daily
return. N is a sample size (246) days.
To measure, how stocks vary together, standard formula for covariance can be used.
Where the sum of the difference of each value X and Y from the average is then further divided by the total
number of values minus one. The covariance calculation enables us to calculate the correlation coefficient,
shown as:
Where is the standard deviation of each asset/stock. However, if there are more than two financial assets in
the portfolio, then correlation and covariance matrices are needed to solve equations. To calculate standard
deviation of portfolio (position) the following formula is used:
Where is a standard deviation of portfolio, is a standard deviation of stocks. Wi is a weight of stocks
in a portfolio and Pij is a correlation coefficient between stocks i and j.
3.2. Analysis and Interpretation
In this study, excel functions and data solver are used for all calculation. The calculation of variance- covariance
model involves the following steps:
Step 1 – Determining period to hold and Confidence Level (table 2)
Step 2 – Determining Portfolio (table 3 and table 4)
Step 3 – Statistical Details of Returns (table 5)
Step 4 – Determining Correlations and Covariance between Assets (table 6 and table 7)
Step 5 - Calculating the Volatility of the Portfolio (table 8)
Step 6 - Calculating the VaR Estimate (table 9)

International Journal of Advance and Innovative Research Volume 6, Issue 1 (XXIV): January - March, 2019
98
ISSN 2394 - 7780
Table-2: Main Parameters of Calculations
Parameter Value
Confidence Level 95% and 99%
Time Horizon 1 Day and 10 Days
Size of Historical data 246 Days
Testing Period 01 – 01 – 2018 to 31 – 12 – 2018
Closing price (as on 31 – 12 – 2018) of stocks along with weights are given below in Portfolio 1 and Portfolio 2.
They have same stocks but different weights.
Table-3: Portfolio 1
Stocks Closing Price (31 – 12 – 2018) in Rupees Weights
M&M Ltd 803.700 33.3%
WIPRO Ltd 330.25 33.3%
ICICI Bank 360 33.3%
Table-4: Portfolio 2
Stocks Closing Price (31 – 12 – 2018) in Rupees Weights
M&M Ltd 803.700 50%
WIPRO Ltd 330.25 30%
ICICI Bank 360 20%
Table-5: Statistical Details
Variance – Covariance employs matrix calculations in order to compute Value – at – Risk for portfolios
comprising of numerous stocks/assets. As seen from Variance-covariance approach uses matrices giving chance
to measure VaR value for a portfolio consisting of hundreds of assets. As we can see from the formula for
portfolio measurement, standard deviation of portfolio calculation warrants computation of correlations of each
asset and also covariance between them. Also application of variance covariance matrices is a pragmatic
method of computing standard deviation of portfolio. In this research, the objective is to show, how the
parametric methodology utilizes variance and correlation matrices to calculate the variance, and hence standard
deviation, of a portfolio.
Table-6: Correlation Matrix
Correlation Matrix BSE SENSEX M&M Ltd WIPRO Ltd ICICI Bank
BSE SENSEX 1
M&M Ltd 0.59453 1
WIPRO Ltd 0.602216 0.441329 1
ICICI Bank 0.696572 0.392052 0.404383 1
The strength of association between two variables is computed through correlation. This tells us the quantum in
terms of percentage and direction in which the two variables move together. Volatility of a portfolio or the risk
of a portfolio is lower than its individual assets volatility or risks.
Therefore it is imperative to know the relation between variance of a portfolio and variances of assets.
Correlation always has a value between -1 and +1 (Bozkaya, 2013). As we can observe from Table 6,

International Journal of Advance and Innovative Research Volume 6, Issue 1 (XXIV): January - March, 2019
99
ISSN 2394 - 7780
correlation between stock returns of Bharti Airtel Ltd and Maruti Suzuki Ltd is higher than correlation between
HDFC Bank Ltd and Maruti Suzuki Ltd and also higher than correlation between HDFC Bank Ltd and Bharti
Airtel Ltd. But all correlations are positive.
The coefficient of correlation may be computed by employing the covariance matrix that measures how mean
returns of two companies vary or move together. Covariance matrix assists decision makers in deciding on the
assets that move in the same direction or in the opposite direction (Bozkaya, 2013).
Table-7: Covariance Matrix
Covariance Matrix BSE SENSEX M&M Ltd WIPRO Ltd ICICI BANK LTD
BSE SENSEX 6.27809E-05 7.53537E-05 2.49809E-05 8.62372E-05
M&M Ltd 7.53537E-05 0.00027773 1.89357E-05 0.000102151
WIPRO Ltd 2.49809E-05 1.89357E-05 0.000197784 3.9046E-06
ICICI BANK LTD 8.62372E-05 0.000102151 3.9046E-06 0.000388128
Covariance enables us to compute volatility of portfolios. Covariance values between stocks are multiplied by
each shares weights and then added to find volatility of portfolio.
Table-8: Standard Deviation and Variance of Portfolio 1 and Portfolio 2
Portfolio 1 Portfolio 2
Standard Deviation 0.01101243 0.0113727
Variance 0.000121 0.000129
VaR is calculated as using the following formula:
P*α*σ*sqrt(t)
Where “P” is the value of portfolio (or position), “α” is confidence level, “σ” is a volatility of portfolio and t is
a holding period. For 95% level of confidence, “α” is 1.65 and for 99% level of confidence “α” is 2.33. VaR
may be calculated for different time periods. In this research both 1 day and 10 day periods have been
considered. If someone needs to determine VaR values for more than 1 day, such as 10 days, they need to
multiply daily volatility returns by sqrt(10). Here if we consider principal value P as 1000000 (10 Lakhs), then
the VaR values are as follows:
Table-9: VaR Values of Portfolio 1 and Portfolio 2
Portfolio 1 Portfolio 2
95% 99% 95% 99%
VaR (One Day) 18170.51 25658.96 18764.9 26498.31
VaR (Ten Days) 57460.2 81140.76 59339.82 83795.02
Market risk of portfolios can be computed through VaR models. As we can see from the above table, at 95%
level of confidence and time period of 1 day, maximum loss that portfolio 1 can incur is Rs 18170.51 and
maximum loss that portfolio 2 can incur is Rs 18764.9. It indicates that there is only 5% probability that loss for
the next day will be greater than Rs 18170.51for portfolio 1 and Rs 18764.9 for portfolio 2. At Confidence level
of 95% and time period of 10 days, maximum loss will not be more than Rs 57460.2 for portfolio 1 and not
more than Rs 59339.82 for portfolio 2.
At 99% level of confidence and time period of 1 day, maximum loss that portfolio 1 can incur is Rs 25658.96
and maximum loss that portfolio 2 can incur is Rs 26498.31. It indicates that there is only 5% probability that
loss for the next day will be greater than Rs 25658.96 for portfolio 1 and Rs 26498.31 for portfolio 2. At
Confidence level of 99% and time period of 10 days, maximum loss will not be more than Rs 81140.76 for
portfolio 1 and not more than Rs 83795.02 for portfolio 2.
CONCLUSION
It is possible for investors to estimate probable loss value of their portfolios for different holding periods and
confidence level. Variance–covariance approach helps us to measure portfolio risk if returns are distributed
normally. In this study, two hypothetical portfolios to calculate potential loss with both 95% and 99%
confidence level as well one day and ten days holding periods are created. As a main conclusion, there is no
huge difference between Portfolio 1 and Portfolio 2 results. It is thought that the portfolio was not diversified
well. There were only three stocks in the portfolio but importantly their correlations were not low enough to
decrease risk adequately. Stocks have equal weights in Portfolio1 as 33.3 %. Stocks have different weights in
Portfolio 2. Thus, while risk evaluation of one stock is related with especially volatility characteristics, risk
evaluation of portfolio is related with correlation between risky assets inside the portfolio.

International Journal of Advance and Innovative Research Volume 6, Issue 1 (XXIV): January - March, 2019
100
ISSN 2394 - 7780
REFERENCES
Allen, L. J. (2004). Understanding Market, Credit and Operational Risk The Value At Risk Approach.
Blackwell Publishing.
Anjunas, P. J. (2009). Variance - Covariance Risk Value Model for Currency Market. Engineering
Economics No 1 , p. 61.
Bohdalova, M. (2007). A Comparison of Value-at-Risk methods for measurement of the financial risk
ELeader. Retrieved November 12, 2016, from http://www.g-casa.com: http://www.g-casa.com/bohdalova
Bozkaya, M. (2013, December). Comparison of Value At Risk Models and Forecasting Realized Volatility
by Using Intraday Data-An Empirical Study on American Stock Exchanges. Neoma Business School Master
of Science in Finance .
Darbha, G. (2001, December). Value - at - Risk for Fixed Income Portfolios - A Comparison of Alternative
models. National Stock Exchange Mumbai .
Johansson, A. a. (2013). A Comparison of GARCH models for VaR estimation in three different markets.
Uppsala University Department of Statistics .

International Journal of Advance and Innovative Research Volume 6, Issue 1 (XXIV): January - March, 2019
101
ISSN 2394 - 7780
CORPORATE FRAUDS AND ITS IMPACT ON ORGANISATIONS
Awaneesh K Srivastava
Head-Secretarial, Legal and Taxation, Essar Shipping Limited, Mumbai
ABSTRACT
The term Fraud can be defined as an intentional perversion of truth for the purpose of inducing another in
reliance upon it to part with some valuation thing belonging to him or to surrender a legal right.
Corporate Frauds refers to any disclosure that is omitted or improperly reported on any of the four financial
components i.e.;
Balance Sheet
Profit and Loss Statement
Cash Flow Statement, and
Shareholder’s equity
It also includes any offer document/advertisement which is used as tool to solicit the investment from general
public.
Corporate Fraud is a problem for companies regardless of its size, sector or region where they operate. Fraud
is a serious problem of a modern business. It generally arises out of auditing malpractices of the organisations.
Association of Certified Fraud Examiners (ACFE) every two years publishes a report on Occupational Fraud
and accuse. The recent report states that one-fifth of the cases causes losses bigger than USD 1 million.
Moreover a typical organisation loses on average 5% of its revenues to fraud every year and nearly half of the
victim organisations never recover any perpetrator’s takings.
Fraud committing and fraud detection levels differs from Industry to Industry e.g. fraudulent misreporting will
be concentrated in high growth industries, e.g. Stayam Computers Limited, fraud detected in year 2009.
Another reason is if investors ask/demands/ expects higher return on equity, the Companies comes under
pressure to increase the return, which may result into fudging of financial datas.
On the other hand financial frauds happen due to too much autonomy given to top management, e.g. Punjab
National Bank scam where the external server for international transaction was not connected to the internal
server of the Bank resulting into separate play room for the fraudsters where the internal management took
advantage of it.
Third type of frauds happen when the Fraudsters took advantage of loop holes of laws/grey areas of regulations
e.g. Sahara OFCDs scams or Harshad Mehata Scam. Thus we may say that Fraud is determined by some
Company’s Characteristics, such as high leverage ratios, high performance – based manager’s Compensation,
poor corporate governance, high growth and financial needs.
1- INTRODUCTION
The Association of Certified Fraud Examiners’ (ACFE) “2012 Report to the Nation” is one study that describes
the losses that an entity may experience as a result of Fraud:
A Typical organisation loses approximately 5 percent of its annual revenue to fraudulent acts (but in India it
is much more).
The median loss caused by the Frauds in the study was USD 145,000. Additionally, 22% of the cases
involved losses of at least USD 1 Million
It takes time and effort to recover the money stolen by the perpetrators and many organisations are never able to
fully do so .At the time of survey, 58% of the victim organisations had not recovered any of their losses due to
fraud, and only 40% had made full recovery.
According to the Association of Certified Fraud Examiner’s “Report to the Nations 2016” India ranks second
in terms of victim organisations reporting the cases. The study shows the imperative need for the regulators,
business as well as the investment community to asses the risks emanating in the business. Today, in an
increasingly interconnected world, digitisation enables business to be conducted in the wink of an eye. Thus, it
is time for organisations to examine the role of corporate governance, particularly of those involved in
preventing and detecting frauds.
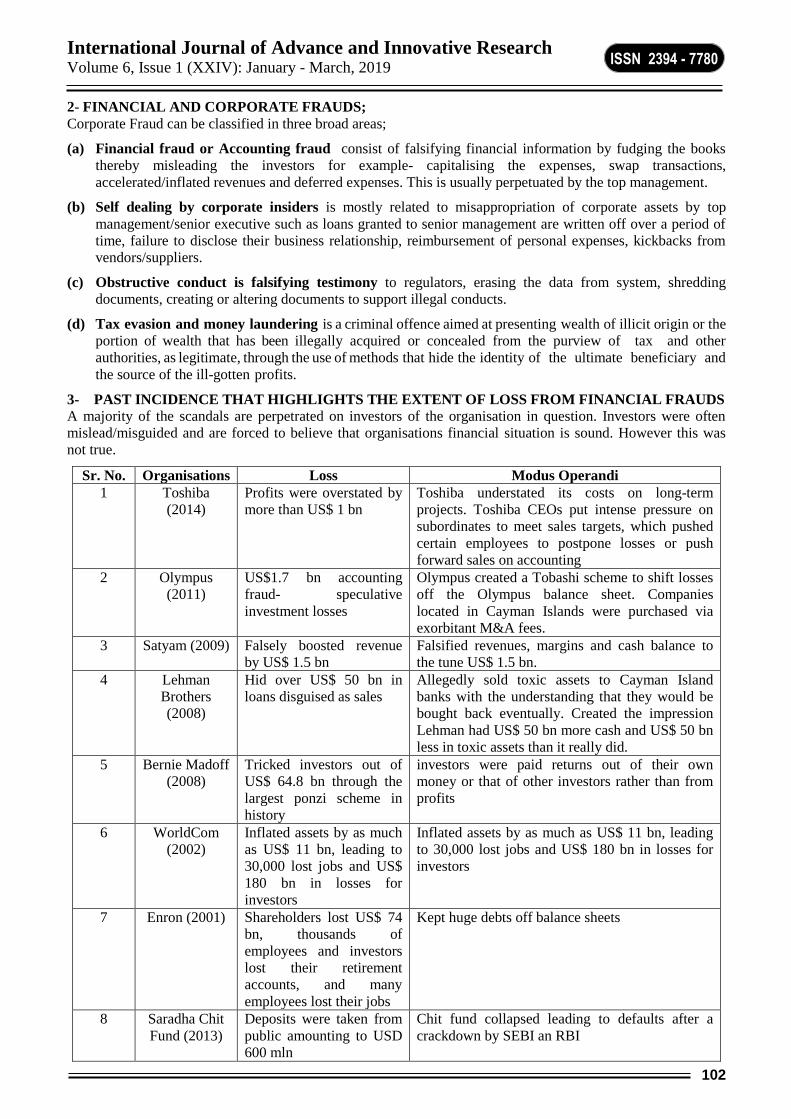
International Journal of Advance and Innovative Research Volume 6, Issue 1 (XXIV): January - March, 2019
102
ISSN 2394 - 7780
2- FINANCIAL AND CORPORATE FRAUDS;
Corporate Fraud can be classified in three broad areas;
(a) Financial fraud or Accounting fraud consist of falsifying financial information by fudging the books
thereby misleading the investors for example- capitalising the expenses, swap transactions,
accelerated/inflated revenues and deferred expenses. This is usually perpetuated by the top management.
(b) Self dealing by corporate insiders is mostly related to misappropriation of corporate assets by top
management/senior executive such as loans granted to senior management are written off over a period of
time, failure to disclose their business relationship, reimbursement of personal expenses, kickbacks from
vendors/suppliers.
(c) Obstructive conduct is falsifying testimony to regulators, erasing the data from system, shredding
documents, creating or altering documents to support illegal conducts.
(d) Tax evasion and money laundering is a criminal offence aimed at presenting wealth of illicit origin or the
portion of wealth that has been illegally acquired or concealed from the purview of tax and other
authorities, as legitimate, through the use of methods that hide the identity of the ultimate beneficiary and
the source of the ill-gotten profits.
3- PAST INCIDENCE THAT HIGHLIGHTS THE EXTENT OF LOSS FROM FINANCIAL FRAUDS
A majority of the scandals are perpetrated on investors of the organisation in question. Investors were often
mislead/misguided and are forced to believe that organisations financial situation is sound. However this was
not true.
Sr. No. Organisations Loss Modus Operandi
1 Toshiba
(2014)
Profits were overstated by
more than US$ 1 bn
Toshiba understated its costs on long-term
projects. Toshiba CEOs put intense pressure on
subordinates to meet sales targets, which pushed
certain employees to postpone losses or push
forward sales on accounting
2 Olympus
(2011)
US$1.7 bn accounting
fraud- speculative
investment losses
Olympus created a Tobashi scheme to shift losses
off the Olympus balance sheet. Companies
located in Cayman Islands were purchased via
exorbitant M&A fees.
3 Satyam (2009) Falsely boosted revenue
by US$ 1.5 bn
Falsified revenues, margins and cash balance to
the tune US$ 1.5 bn.
4 Lehman
Brothers
(2008)
Hid over US$ 50 bn in
loans disguised as sales
Allegedly sold toxic assets to Cayman Island
banks with the understanding that they would be
bought back eventually. Created the impression
Lehman had US$ 50 bn more cash and US$ 50 bn
less in toxic assets than it really did.
5 Bernie Madoff
(2008)
Tricked investors out of
US$ 64.8 bn through the
largest ponzi scheme in
history
investors were paid returns out of their own
money or that of other investors rather than from
profits
6 WorldCom
(2002)
Inflated assets by as much
as US$ 11 bn, leading to
30,000 lost jobs and US$
180 bn in losses for
investors
Inflated assets by as much as US$ 11 bn, leading
to 30,000 lost jobs and US$ 180 bn in losses for
investors
7 Enron (2001) Shareholders lost US$ 74
bn, thousands of
employees and investors
lost their retirement
accounts, and many
employees lost their jobs
Kept huge debts off balance sheets
8 Saradha Chit
Fund (2013)
Deposits were taken from
public amounting to USD
600 mln
Chit fund collapsed leading to defaults after a
crackdown by SEBI an RBI

International Journal of Advance and Innovative Research Volume 6, Issue 1 (XXIV): January - March, 2019
103
ISSN 2394 - 7780
4- HOW THE FRAUD HAS IMPACT ON THE ORGANISATIONS
Fraud has the potential to disrupt the activity of any business, be it small or big. However, smaller or a mid size
companies/organisations are usually hit harder when employees or management engage in fraudulent behaviour.
In some extreme cases, fraud can threaten the survival of the business itself by limiting the confidence partners
and clients have in it or by promoting mistrust inside the workplace. A company dealing with fraud is usually
painted in black for investors and other business associates. Bad news usually reaches the clients faster than
anything else does.
The detected/undetected fraud can have disastrous and far-reaching consequences for an organisation, some of
them are;
Financial Loses
This is most obvious consequences of detected/undetected fraud is a financial loss. Corporate books might not
balance correctly as a result of this financial loss.
Lost Inventory
Whether it is a service industry or a manufacturing industry, lost tangible goods can be a huge problem. Some
employees commit fraud by lifting merchandise and re-selling it or by faking burglaries.
Lost Productivity
When any employee/executive/top executive is involved in fraudulent activities he/she losses his/her
concentration on work resulting into loss of productivity
Legal issues
Frauds whenever get detected put the Company/organisation in a situation to face for lawsuits, legal cases etc.
Loss of Goodwill
Whenever a case of Fraud is reported in media, it directly affects the Goodwill of the company. For a listed
Company’s like Satyam the Companies’ market cap drastically got eroded in a single trading session and
second day it was about 1/20th of the previous day high.
Sustainability question
Sustainability become a big question for the companies named in Frauds e.g. after OFCDs scam of Shahara
India, the entire group is in trouble, similarly Satyam Computers. Recent case of PNB also put the company
into big trouble.
5- CHANGING REGULATORY ENVIRONMENT IN INDIA
Some of the recent incidents have resulted in the increased focus of the regulators. Regulators are proposing
companies to develop standards for fighting frauds and create framework to address fraud prevention, detection
and response.
The new Companies Act 2013 is a step towards the evolution of India’s regulatory environment. The Act
includes specific provisions to address the risk of fraud, alongside prescribing greater responsibility and increased
accountability for independent directors and auditors. It goes beyond professional liability for fraud and extends
to personal liability, prescribing penalties for directors, key management personnel, auditors and employees.
The establishment of a vigil mechanism for listed companies, and a greater degree of accountability placed on the
Board of Directors are the most effective provisions of the law.
Recently the Listing regulations have also been changed since 2015 and further amended in year 2018. The objective
of these changes are to bring more transparency on the part of Management so that Investment can be able to
understand and have catch hold of the transaction being taken place on quarterly basis e.g. disclosure of key ratios,
payment of NCDs its interest payment etc. has to be informed to the exchange on half yearly basis . In the recent
amendments, Secretarial Audit has become mandatory for the unlisted material subsidiary of the Listed entity.
Similarly there is mandatory appointment of Independent Director of Holdco. to the Board of Subsidiary Company.
5- PREVENTION AND CONTROL
In order to better manage these risk, and reduce impact of fraud and corruption on their organisation all
companies should ensure they have the following as a minimum as part of the fraud and corruption control
frame work.
1. Policies- relevant, up to the date and tailored for the organisation and the industry in which it operates.
2. Procedures- well documented, audited for complaints and actually followed by management and staff with
sanctions for failure to follow those procedures.

International Journal of Advance and Innovative Research Volume 6, Issue 1 (XXIV): January - March, 2019
104
ISSN 2394 - 7780
3. Culture- top down and bottom up, promotes transparency and rewards those that identify fraud and
corruption and protects those who come forward from adverse action.
4. Fraud and corruption control plan- which sets out the frame work for the effective management of fraud
and corruption, assigns responsibility, and outlines the obligations of key stake holders including management,
staff, internal audit, external audit and third parties.
5. Whistle blower hotline- 24/7 service which is extremely hosted and supported by a protected disclosure
policy.
6. Employment screening- robust and risk based and consistent with the principles.
7. Due diligence programmes- that covers vendors, suppliers, agents and contractors and is risk based.
8. Training- tailored and relevant and delivered not only at time of induction but on an ongoing basis. Special
training for finance professionals and top executives of the Companies.
9. Ethical Codes- The ethics code of the Company should be developed keeping in mind the size of the
organisations, the mix of employees, the number of employees, and the key risk areas.
6- CONCLUSION
Organisations will never be able to stamp out fraud and corruption, but by implementing the aforesaid controls,
they have a better chance of reducing the impact that of fraud or corruption event has on their organisation
through
The early detection of fraud, thereby limiting the size of the financial loss;
Being able to demonstrate to the regulators that they had risk based fraud and corruption control frame work
which was based on accepted best practise and
Having the ability to demonstrate the efforts the organisation took to prevent these types of incidents
occurring to key stake holders, including the media, investors and shareholders.
7- REFERENCES
Association of Certified Fraud Examiner’s ‘Report to the Nations 2016/2014”
Grant Thornton – report on Financial and Corporate Frauds July 2016
SEBI ( LODR) Regulations 2015 and Amendments 2018
A Guide to Company’s Act, by Ramaiya
Articles published by THECSCLUBINDIA
Publication of RISQ Group-Article on the real impact of Fraud and Corruption on Organisation.
www.yourbusniess.azcentral.com

International Journal of Advance and Innovative Research Volume 6, Issue 1 (XXIV): January - March, 2019
105
ISSN 2394 - 7780
PERCEPTION OF INTERNATIONAL TOURISTS ON INDIA AS A TOURIST DESTINATION
Prof. Priya Ramesh Yeole Assistant Professor, JES College of Commerce, Science & Information Technology, Mumbai
ABSTRACT
The adjudge the perception of foreign tourist about India as a tourist destination is the purpose of the study.
Many studies show that India is ranked highly for its rich art forms and culture heritage. Tourism industry is
one of those industries which are tremendously growing larger and faster day by day. Its contribution is
remarkable to increase the global GDP and employment. The performance and progress of Indian tourism
industry has a very influencing impact among the service sector of India. Tourism in India contributes to
various sectors like to generate an employment, creates a noteworthy source of foreign exchange for the
country and it also helps to improve economic activity which has direct positive impact on the life of local and
host communities. Rise in income level of citizens and their changing lifestyles, development in multiple tourism
offerings, administrative support by the government are performing a significant role in mounding the tourism
sector in India. The Indian tourism consists of many different tourism such as rural tourism, eco-tourism,
adventure tourism, cultural tourism, agro tourism, religious tourism, medical tourism and cruise tourism, etc.
However, the sector is facing many difficulties such as inadequacy ofgood quality tourism infrastructure, global
concerns regarding health and safety of tourists, and shortfall of trained and skilled manpower. For the
sustainable development and maintenance of the tourism sector of India, government, private sectors and the
community are taking great efforts collectively.
Keywords: GDP, companions, tourist destination, eco-tourism, sustainable development.
INTRODUCTION
Travel and tourism is reflector to each other in our developing world. Tourism sector is spirited and motivating
in the economic, social and environmental shifts of the times. There is reliablegrowth in the arrivals of
international tourists. In 1950 the numbers of international tourist were 25 million which has responsibly grown
up to 1.1 billion in 2014. According to the report of the WTTC Travel & TourismEconomic Impact 2015, 1 in
every 11 people worldwide is employed by the tourism sector, with the industrygenerating US$ 7.6 trillion or
10% of the global GDP in 2014.Now a days the middle class of large emerging economies arerapidly attracting
towards the international tours and vacations, its becoming a way of life. At a global scale, the sturdy economic
growth has given rise to millions of new tourist which are looking for great travel experience, it may bebusiness
or leisure, domestically, nationally , regionally or internationally and this trend is expected to continue with the
sustained momentum ,outpacing global economic growth.Over the past two decades the large urban middle
class has became the main stay of India’s tourism sector because of transformation of India economically
demographic and psycho graphically .
The planning commission of India stated in its 12th Five Year Plan that “the tourism sector has played a major
role to promote a faster, sustainable and more inclusive economic growth; it has better prospects for promoting
pro poor growth that many other sectors.”
Climate change is an occurrence that affects the tourism sector and certain destination, in particular mountain
ranges and coastal destinations which is not a remote event for the tourism sector. Climate is a crucial factor
that affects tourism especially for the beach nature and winter sport tourist segment. Change in climate and
weather patterns affects direct negatively on tourist comforts and their travel decisions. There is now urgent
need for the tourism industry and national governments and international organizations to find the different
advance techniques which will help to face the climatic difficulties and take strong and powerful actions to
prevent them from future effects and mitigate the environmental impacts of tourism contribution to climatic
change.
OBJECTIVES OF THE STUDY
1. The study the impact of tourist perceptions, destination image.
2. To analysis the attributes of the tourist perception and destination image.
3. To examine the attributes of tourist satisfaction
4. To highlights the government plans and policies for the development of tourism in India.

International Journal of Advance and Innovative Research Volume 6, Issue 1 (XXIV): January - March, 2019
106
ISSN 2394 - 7780
HYPOTHESES OF THE STUDY
The following are the hypotheses of the study
H0 – India is not ranked highly for its rich art forms and culture heritage.
H1- India is ranked highly for its rich art forms and culture heritage.
H0 – Travel and tourism is not a reflector to each other in our developing world.
H1- Travel and tourism is reflector to each other in our developing world.
METHODOLOGY
The study was based on extensive literature survey consists of secondary sources of information. It included the
books, research papers, working notes, related web sites and articles published in the leading newspaper and
information covered through various journals.
STRENGTH OF INDIA FOR TOURISM
Country of rich heritage and traditions having a vast and varied history.
Places of ancient civilization and settlements dating back to several centuries present in India.
Unity in Diversity i.e. multicultural people staying together in the same country.
One of the fastest growing economies of the world.
India has been maintaining good and cordial relationship with different countries which helps the people of
those countries to get the visas easily to visit India.
INITIATIVES TAKEN BY GOVERNMENT TO PROMOTE TOURISM INDUSTRY
In the year 2002, the Government of India announced a New Tourism Policy. The policy is built around the 7-S
Mantra of –
SWAAGAT (WELCOME)
SOOCHANAA (INFORMATION)
SUVIDHAA (FACILITATION)
SURAKSHAA (SECURITY)
SAHYOG (COOPERATION)
SANRACHNAA (INFRASTRUCTURE)
SAFAAI (CLEANLINESS).
TOURIST ATTRACTION
India is one of the greatest civilizations in the world, and is home to four great religions. It is a rich tapestry of
varied product and experience offerings across the nation’s innate strengths of culture, heritage, nature, beaches,
mountains, wild life, wellness, cuisine and other unique assets spread across different landscapes, communities
and climatic zones.
The important tourist attractions are discussed below
Heritage and Culture: India is blessed with a rich history and a vibrant heritage and culture. India has an
array of 32 cultural and natural sites inscribed on the World Heritage list of UNESCO. There are Museums
which are rich repositories of the country’s culture with explicit examples as proof of the development of the
country’s culture and heritage over a period of time. Tourism is one of the most effective instruments to give
a new lease of life to such priceless heirlooms inherited and celebrated by us.
Spirituality: India has from time immemorial been a destination that has drawn and welcomed seekers from
afar in search of enlightenment. Tourism in India has traditionally thrived upon Travellers visiting places of
spiritual interest. As the birthplace of four great religions, Hinduism, Buddhism, Jainism and Sikhism, India
can attract significant number of visitors.
Yoga: As a science that seeks to keep the body, mind and soul in concert, Yoga is India’s gift to the world
which holds the promise of self-realization. Yoga has drawn followers from all over the world over the
years. Properly marketed, Yoga has the potential to draw in significant number of long stay Travellers. India
has the potential to establish itself as the land of Yoga, leveraging this growing global interest.
International Journal of Advance and Innovative Research Volume 6, Issue 1 (XXIV): January - March, 2019
107
ISSN 2394 - 7780
Ayurveda / Holistic Health Systems / Wellness: The ancient science of Ayurveda seeks to maintain a
balance amongst the different elements in the body to maintain good health. Entirely holistic in its approach,
it has emerged as the answer to lifestyle issues that ail modern living through its detoxification and
maintenance regimens. With increasing consumer demand for wellness services and products, the global
wellness market is now worth US$3.4 trillion (Source: The 2014 Global Spa & Wellness Economy
Monitor).
Medical Tourism: India has a large medical tourism sector which is expected to grow at an estimated rate of
30% annually, to become a US$ 2 billion industry in 2015. India is placed among the top three medical
tourism destinations in Asia (with Thailand and Singapore), mainly due to the low cost of treatment, quality
healthcare infrastructure and availability of highly skilled doctors (Source: FICCI-KPMG Report on Medical
Value Travel in India).
Cruises: The Cruise sector is a fast growing component of the leisure industry, worldwide. Experience in the
Caribbean, Latin American and South-East Asian countries indicate that a huge amount of foreign exchange
can be earned and sizeable direct & indirect employment can be generated onshore by providing the right
policy environment and infrastructure for the growth of cruise shipping.
Adventure: With its diverse geographical zones India has immense potential for adventure activities
throughout the year. 73% of the Himalayas are situated in India and along with the other mountain ranges
can host a variety of activities like skiing, trekking, rock climbing, Para-gliding etc. Caravan parks and
caravan tourism can add yet another facet to the tourism product.
Wild Life/ Eco Tourism: India has ecological hotspots, which are rich in flora and fauna. While
uncontrolled tourism can harm these areas, a calibrated and meaningful approach can help in preserving
these areas with the visitors acting as a check against illegal activities.
Cuisine: Getting a taste of local cuisine has become an essential part of the travelling experience, and as
such gastronomy presents a vital opportunity to enrich the tourism offer and stimulate economic
development. India’s strongest calling card to the world is its cuisine. Indian restaurants are now running in
many parts of the world to great popularity.
Destination Weddings: India is known for its vibrant and colorful weddings and its spectacular palaces and
rituals can form an attractive proposition for destination weddings. The opportunity exists to elevate this
niche, linking together various locations and experience creators (i.e. wedding planners, tour operators, and
hoteliers etc.) to create attractive offerings, expanding our ability to tap into this unique, lucrative market.
RECOGNIZABILITY
Trust is the cornerstone on which all businesses are built. Buyers need to be reassured that what they buy is
what they get. All stakeholders within the tourism industry, whether product of service providers, need to view
themselves as part of India’s delivery of:
The Incredible India Brand promise
Exceptional traveller experience.
PROPAGANDA OF TOURISM INDUSTRY:-
The Incredible India campaign is one of the most successful projectsthat placed India on the world tourism map.
It is imperative that we build on its strength by keeping it fresh to productively engage with the audience. This
is also an excellent vehicle to project our soft power and create a positive perception about India.
There is a strong case for achieving coordination with the States while planning our publicity campaign to
achieve synergy and greater efficiencies. A consultation and co-ordination mechanism is envisaged. Our
campaigns address two kinds of audience, the international and the domestic. It is important to focus on key
markets to engage with established markets along with a few key identified emerging markets that can push our
growth and insulate us from market risks.
CONCLUSION
At the global scale the tourism industry has emerged as one of the largest and fastest growing economic sectors
globally. It has contributed to the GDP and employment generation remarkable. The tourism industry has
influence the other sectors significantly. It also helped to create employment. However, the sector is facing
challenges such as lack of good quality tourism infrastructure, global concerns regarding health and safety of

International Journal of Advance and Innovative Research Volume 6, Issue 1 (XXIV): January - March, 2019
108
ISSN 2394 - 7780
tourists, disparate passenger/road tax structures across various states and shortfall of adequately trained and
skilled manpower.
There are many initiatives taken by the government to promote the tourism industry like swagat, soochanaa, etc.
There are many things which attracts the tourist are heritage and culture, spirituality, yoga, Ayurveda, medical
tourism, cruises etc.With increasing tourist inflows over the past few years, it is a significant contributor to
Indian economy as well.
Concerted efforts by all stakeholders such as the central and state governments, private sector and the
community at large are pertinent for sustainable development and maintenance of the travel and tourism sector
in the country.
REFERENCES
Dr. T. Subash, 2015. Tourism in India: Potentials, Challenges and Opportunities, ISSN 2348 –1269.
R. Rajesh, 2013. Impact of Tourist Perceptions, Destination Image and Tourist Satisfaction on Destination
Loyalty: A Conceptual Model.
M. Chaudhary, 2000, India's image as a tourist destination - a perspective of foreign tourists.
Dr. R. R Chavarrand Dr. S SBhola, 2014, Indian tourism: a conceptual review, ISSN: 2319-9032.

International Journal of Advance and Innovative Research Volume 6, Issue 1 (XXIV): January - March, 2019
109
ISSN 2394 - 7780
INNOVATION, GROWTH AND SUSTAINABILITY
Prof. Sabir N. Mujawar and Prof. Swantika Kaushik
Assistant Professor, Chetana H. S. College of Commerce & Economics, Bandra
ABSTRACT
The development of any country’s economy depends on the performances and growth of banking sector. The
growth of banking sector depends on satisfaction of customer’s w.r.t the services provided to them. According
to the Changing perspective of the customers and their expectations, upcoming business models, growing
competition etc. all these factors are creating a pressure on the current banking system (Traditional) to initiate
new methods and new technology in their processes. Current banking system has seen huge number of changes
right from the independence till now. Majority of the banks have moved towards creating and providing more
value added services such as ATM facilities, RTGS (real time gross settlement) and NEFT (National Electronic
Funds Transfer), E-banking, Mobile banking and other facilities like travelers cheques etc. which is helping
them to create more valued customers. Inspite of these facilities there are few more innovations and techniques
which are used by the non-banking institutions and some of the foreign banks. Adapting these new innovations
and techniques may help the Indian banks to perform their day to day activities more effectively and efficiently.
So, this paper discusses the a new innovations available for banking sector
Keywords: Banking Sector, Services offered & Innovations
OBJECTIVE OF THE PAPER
To study the new innovative techniques available for the current banking sector.
To study the impact of new services offered by banks to the society is beneficial or not
Research Methodology
Available secondary data was extensively used for the study. Various Books, articles and websites were
referred.
1. BANKING SECTOR IN INDIA
The development of the banking industry took place majorly after the nationalization of Schedule banks (14
banks) in 1960’s and 80’s. In Late 90’s, the banking sector in India placed higher weightage on technology and
modernization. Current banking system is adequately capitalized and well managed by the Central bank of
India. There are almost 27 public sector banks, 21 private sector banks, 49 foreign banks, 56 regional rural
banks, 1,562 urban cooperative banks and 94,384 rural cooperative banks, in addition to cooperative banks. The
growth of Indian banking sectors appears not only more stimulating but also transmuting. Banking sector of
India could be ranked as 5th largest banking sector in the world by 2020 and 3rd largest by 2025. In coming
year’s technological engagement with Indian banking sector will make banks more versatile to develop the
services offered by them. Indian banking sector is providing technology based solutions to raise Income,
improve customer experience, improving operating & functional activities and also to mitigate risk. However,
the technology execution competencies varied across different competitors of the banking sector.
2. INNOVATION IN BANKING
There has been a constant change seen in terms of innovation in the Banking sector in recent decade as banks have
understood the necessity of digital technologies such as mobile banking, e-banking and telepresence to cope up with the
fast-changing expectations and preferences from customers. The below mentioned are some of the innovations initiated
in banking sector
2.1 Collaboration with E-wallets
Most of the leading banks have taken the initiative for startups, which has led in collaboration with the e-wallets service
providers such as Paytm, Phonepe, and Gpay, AmazonPay etc to make transactions easier, convenient and efficient.
Some of the leading banks like HDFC has come in association with PayZapp which has led the customers in smooth
functioning of the transaction at day to day basis. Many of the other leading banks and companies have collaborated
with these e-wallets service providers to make customers more reliable and dependable on these digital technology
rather than focusing on traditional banking system. Such collaborations helps banks to adapt these new innovative
technologies which provides easy access to the database.
2.2 Biometric system technology
Biometric technology is a unique identity by which a person can be identified by assessing one or more different
biological personalities. Biometric verification comprises of Fingerprints; DNA, Face, Eyes (retina) and ear features.

International Journal of Advance and Innovative Research Volume 6, Issue 1 (XXIV): January - March, 2019
110
ISSN 2394 - 7780
The benefit of biometric systems helps in reducing the problems of forgetting password and Pin Code. This system is
also supporting the initiative of One touch payment to make the transaction safer, secure and reliable
2.3 In-car apps
Some of the international bank have created a mobile banking app that can be accessed while driving using voice
control function. The benefits of these technology is that drivers can make bank balance enquires and bank transaction
(transfer of funds), the drivers can easily locate ATM branches with the help of android device.
2.4 Satellite Banking
It is one of the forthcoming innovative technology for the Indian banking system, this technology would benefit the
banks in solving the problem of weak global communication associations in many parts of the country. This technology
uses Satellites for forming connectivity between different branches which will help urban banks to expand the reach to
rural as well hilly areas in a healthier way, and offer enhanced facilities with respect to transfer of funds electronically.
The overall setup of this technology involves high cost.
2.5 SmartWatches:
Now a days banking transactions are usually done on smartwatches like Android wear, Apple watch or Samsung gear.
Same like some Global financial institutions and foreign banks Indian banks like HDFC (WatchBanking), ICICI bank
(iWear) have introduced smart watches app which helps them to use facilities like viewing information of the bank
account, recharging mobile & DTH connections, Requesting for A/C statement & Cheque book, Hotlisting of
debit/credit cards etc.
2.6 Educating Rural population
It is observed that there is a need of converting the traditional banking system and turning the cities in to cashless cities
across India, banks are imitating many different activities by associating with the Schemes like Pradhan Mantri Jan
Dhan Yojana which encourages the customers to open account with ZERO Deposit at the time of opening account i.e.
Zero balance account. Bank of Baroda and some others banks are taking initiative of conducting activities which will
help the rural areas to easily access technology. Dhasai, in Murbad taluka, Thane District became the first “cashless
Village” in Maharashtra with the help of Bank of baroda in collaboration with NGO Veer Savarkar Pratishthan.
These banks have taken the initiative of training the villagers in using digital techniques of transactions.
2.7 Smarter way of providing services for faster growth.
One of the best way to pull more customers through innovation has been the introduction of services that reduces the
time consumed in processing any request of the customer. After demonetization, the government is searching new
ways to push inexpensive digital transitions medium. Yes, banks have started the new initiative “SIMsePAY”–which
allows a consumer to transfer money, make payments of bills and some selective banking services without accessing
Internet. State bank BUDDY app eliminates the need of visiting banks. This app can be easily downloaded from Google
play store, which helps in easily opening accounts for customers.
2.8 Cryptocurrencies
It is a new medium of exchange like any other currencies which is intended for the purpose of exchanging digital
information. It is a type of digital currency which is generated through encryption methods. Some of the foreign banks
is open to cryptocurrencies and block chain, and some of other banks are also opening to cryptocurrencies.
2.9 Expansion of Open Banking
Many regulatory bodies Local as well as Globally are necessitating banks to allow customers to share their data securely
with the Third parties like PayTM, Gpay, Amazon Pay etc. which will helps to power new financial services. This
services helps by making account and payment data available through secure application programming interfaces
(APIs), customers and consumers have full freedom and control on how they interact with their financial service
providers. Expanding Open banking APIs speed up innovation and association which leads to expansion of banking
networks that could help not only by providing financial services but also helps in making consumers lifestyle easier and
better.
2.10 Cheque Truncation
It is the technique of conversion of physical cheque into electronic form for transmission to the bank making payment. It
replaces the traditional method of Cheque clearance system (physical movement, time and cost of processing the
cheque). Some of the foreign banks allow payment information to be deposited digitally using mobile
Some of the Examples of the apps launched by some Indian banks to promote going cashless
a. Axis Bank: Airtel Money, Kisan Card

International Journal of Advance and Innovative Research Volume 6, Issue 1 (XXIV): January - March, 2019
111
ISSN 2394 - 7780
b. HDFC bank: Chillar, WatchBanking
c. Saraswat Co-op bank: GoMo banking
2.11 Some of the other trends in Banking
a) Automatic Teller Machine (ATM)
b) Electronic Payment Services
c) Real Time Gross Settlement (RTGS)
d) Electronic Funds Transfer
e) Tele Banking
f) Electronic Data Interchange (EDI)
g) Customer management
CRM to customer experience
Use of alternative channels
Effective cross and upsell
3. DIGITISATION TO MOTIVATE BANK GROWTH
Fig-3.1
Source: BCG (Boston Consultancy Group)
Observation
As per the report presented by BCG –Banking system can be enhanced through digitization. It is observed (Fig.
3.1) that there is continuous growth in terms of digital banking through Smartphones.
CONCLUSION
The Indian banking system has become rigid in term of development, expansion and growth in terms of
economic and in terms of increasing the number of customers in the financial sector. The next generation plays
an important role in further solidification of the banking sector. To conclude, banks have to understand that
survival in the current digital world and e-economy depends on conveying all of their services on the internet
with the help of technology. From the above discussions it is observed that most of the foreign banks have
implemented the latest technology very earlier as compare to Indian banks. In the Indian banking system
majority of the private banks are also taking the initiative in terms of innovating banking system. The high-tech
progression in the banking sector can be made effective only when it is simple and user friendly in nature and
linked method is implemented in Indian banking system. So to meet the demands of the growing customers,
banks will need to upgrade their technology and follow digitization with greater enthusiasm and eagerness.
REFERENCE
https://en.wikipedia.org/wiki/Banking_in_India
https://www.ndtv.com/india-news/maharashtra-gets-its-first-cashless-village-1632881
https://www.pymnts.com/news/banking/2017/indias-yes-bank-debuts-phone-internet-free-mobile-banking/
https://www.sbi.co.in/buddy/#page3
https://prashantchaturvedi.com/apps-launched-by-banks-2018-pdf/
https://www.financialexpress.com/industry/banking-finance/digitisation-to-drive-bank-growth/14641/
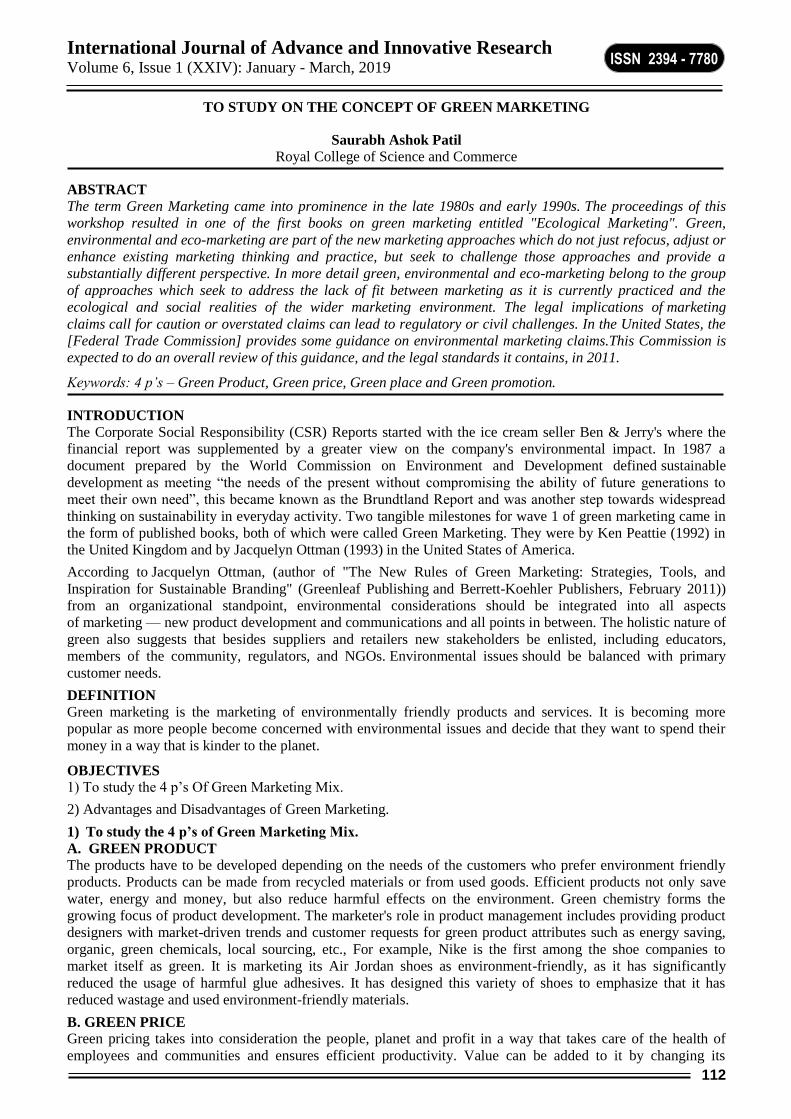
International Journal of Advance and Innovative Research Volume 6, Issue 1 (XXIV): January - March, 2019
112
ISSN 2394 - 7780
TO STUDY ON THE CONCEPT OF GREEN MARKETING
Saurabh Ashok Patil
Royal College of Science and Commerce
ABSTRACT
The term Green Marketing came into prominence in the late 1980s and early 1990s. The proceedings of this
workshop resulted in one of the first books on green marketing entitled "Ecological Marketing". Green,
environmental and eco-marketing are part of the new marketing approaches which do not just refocus, adjust or
enhance existing marketing thinking and practice, but seek to challenge those approaches and provide a
substantially different perspective. In more detail green, environmental and eco-marketing belong to the group
of approaches which seek to address the lack of fit between marketing as it is currently practiced and the
ecological and social realities of the wider marketing environment. The legal implications of marketing
claims call for caution or overstated claims can lead to regulatory or civil challenges. In the United States, the
[Federal Trade Commission] provides some guidance on environmental marketing claims.This Commission is
expected to do an overall review of this guidance, and the legal standards it contains, in 2011.
Keywords: 4 p’s – Green Product, Green price, Green place and Green promotion.
INTRODUCTION
The Corporate Social Responsibility (CSR) Reports started with the ice cream seller Ben & Jerry's where the
financial report was supplemented by a greater view on the company's environmental impact. In 1987 a
document prepared by the World Commission on Environment and Development defined sustainable
development as meeting “the needs of the present without compromising the ability of future generations to
meet their own need”, this became known as the Brundtland Report and was another step towards widespread
thinking on sustainability in everyday activity. Two tangible milestones for wave 1 of green marketing came in
the form of published books, both of which were called Green Marketing. They were by Ken Peattie (1992) in
the United Kingdom and by Jacquelyn Ottman (1993) in the United States of America.
According to Jacquelyn Ottman, (author of "The New Rules of Green Marketing: Strategies, Tools, and
Inspiration for Sustainable Branding" (Greenleaf Publishing and Berrett-Koehler Publishers, February 2011))
from an organizational standpoint, environmental considerations should be integrated into all aspects
of marketing — new product development and communications and all points in between. The holistic nature of
green also suggests that besides suppliers and retailers new stakeholders be enlisted, including educators,
members of the community, regulators, and NGOs. Environmental issues should be balanced with primary
customer needs.
DEFINITION
Green marketing is the marketing of environmentally friendly products and services. It is becoming more
popular as more people become concerned with environmental issues and decide that they want to spend their
money in a way that is kinder to the planet.
OBJECTIVES
1) To study the 4 p’s Of Green Marketing Mix.
2) Advantages and Disadvantages of Green Marketing.
1) To study the 4 p’s of Green Marketing Mix.
A. GREEN PRODUCT The products have to be developed depending on the needs of the customers who prefer environment friendly
products. Products can be made from recycled materials or from used goods. Efficient products not only save
water, energy and money, but also reduce harmful effects on the environment. Green chemistry forms the
growing focus of product development. The marketer's role in product management includes providing product
designers with market-driven trends and customer requests for green product attributes such as energy saving,
organic, green chemicals, local sourcing, etc., For example, Nike is the first among the shoe companies to
market itself as green. It is marketing its Air Jordan shoes as environment-friendly, as it has significantly
reduced the usage of harmful glue adhesives. It has designed this variety of shoes to emphasize that it has
reduced wastage and used environment-friendly materials.
B. GREEN PRICE Green pricing takes into consideration the people, planet and profit in a way that takes care of the health of
employees and communities and ensures efficient productivity. Value can be added to it by changing its

International Journal of Advance and Innovative Research Volume 6, Issue 1 (XXIV): January - March, 2019
113
ISSN 2394 - 7780
appearance, functionality and through customization, etc. Wal Mart unveiled its first recyclable cloth shopping
bag. IKEA started charging consumers when they opted for plastic bags and encouraged people to shop using its
"Big Blue Bag".
C. GREEN PLACE Green place is about managing logistics to cut down on transportation emissions, thereby in effect aiming at
reducing the carbon footprint. For example, instead of marketing an imported mango juice in India it can be
licensed for local production. This avoids shipping of the product from far away, thus reducing shipping cost
and more importantly, the consequent carbon emission by the ships and other modes of transport.
D. GREEN PROMOTION Green promotion involves configuring the tools of promotion, such as advertising, marketing materials, signage,
white papers, web sites, videos and presentations by keeping people, planet and profits in mind. British
petroleum (BP) displays gas station which its sunflower motif and boasts of putting money into solar power.
Indian Tobacco Company has introduced environmental-friendly papers and boards, which are free of elemental
chlorine. Toyota is trying to push gas/electric hybrid technology into much of its product line. It is also making
the single largest R&D investment in the every-elusive hydrogen car and promoting itself as the first eco-
friendly car company. International business machines Corporation (IBM) has revealed a portfolio of green
retail store technologies and services to help retailers improve energy efficiency in their IT operations. The
center piece of this portfolio is the IBM SurePOS 700, a point-of-sale system that, according to IBM, reduces
power consumption by 36% or more. We even see the names of retail outlets like "Reliance Fresh",
Fresh@Namdhari Fresh and Desi, which while selling fresh vegetables and fruits, transmit an innate
communication of green marketing.
2) Advantages of Green Marketing
1. A company can enter new markets when it brings attention to positive environmental impact
When a business shines light on the positive impacts their product or service brings about they have the
possibility of piercing new target markets. For example, residents that never considered the idea of using solar
power might switch to solar panels if the information is clear, concise and targets their needs.
Green marketing advantages can also include highlighting sustainable manufacturing practices, the use of eco-
friendly and organic products within the work office, composting and recycling at work, and carpooling to go to
work.
2. Gain more profit from green marketing. Sustainability is a key concern for the millennial generation. They are willing to pay more for products and
services seen as sustainable or with a positive social impact. Customers are reassured when their products are
chemical-free and made with recyclable materials that do not harm the environment.
Green marketing and awareness campaigns help customers to make informed choices potentially contributing to
environmental causes. This is a major asset, as conscious customers pay attention to the products they purchase
and use, and therefore will become more active in voicing your product, leading to an increase in sales.
3. Green marketing brings a competitive advantage When you choose green marketing, you become seen as a conscious or responsible leader in your industry. This
is true even for customers that do not prioritize environmental issues.
It also creates a wider choice of marketing points that you can promote and discuss with your customers, which
go beyond traditional strategies such as having the lowest price, durability and style. Focus on your product’s
environmental and social benefits instead of solely marketing the price and value.
4. Raise awareness on important environmental or social issues
If a company supports any causes, partnering with fellow environmental leaders can be part of its green
marketing strategy. This can bring huge momentum to a campaign, an event, a training workshop and more.
For example, Patagonia donates a portion of their sales to environmental charities and is seen as one of the most
respectable outdoor clothing lines in the world. In fact, they have an entire section on their website dedicated to
environmental and social responsibility. Whole Foods supports sustainable agriculture with its suppliers and
even created its own Eco-Scale for cleaning products sold.
These might be large-scale companies, but when it comes to green marketing advantages, the same possibilities
apply to even the smallest companies.
For example, small businesses such as consulting firms can participate in any local environmental event such
as Earth Day, which takes place on April 22. These events bring great awareness and usually have their own

International Journal of Advance and Innovative Research Volume 6, Issue 1 (XXIV): January - March, 2019
114
ISSN 2394 - 7780
activities, competitions and promotions in place. You can contact your local organizers to see if your team can
participate in any way.
DISADVANTAGES OF GREEN MARKETING
1. Change leads to costs
Changing your marketing tactics takes time and the development of a new strategy, which typically translates
into increased costs. While your sustainable efforts and practices are designed to save money, when a company
puts effort into changing their brand to be more environmentally friendly, those changes can have expensive
upfront costs.
2. Costly Green Certifications
To commercialize your products as “green”, depending on your industry you might have to go through a long
and pricey process to obtain the environmental certifications. These certifications, which the governments,
industry associations, professional associations and consumer rights groups distribute, use certain certifications
to meet industry environmental standards. This is especially true for companies operating in the fields of energy
consumption and recycling waste management.
Respecting these standards can be difficult and that is one of the main green marketing disadvantages.
Particularly because without these official standards, customers and industries will have no way of measuring
the facts of green “claims”.
4. Green washing
As green marketing brings so many advantages to a business, a lot of big companies try to look “greener” and
the majority of it is just green washing. This means a company will make something not sustainable look green
by putting all of the attention on a little detail.
For example:
Disposable water companies are extremely harmful to the environment. Yet you will see many that say “Our
packaging is 100% recyclable”, while the entire production process is so polluting that they are not a sustainable
business.
That’s why many customers have grown skeptical of seeing the word “green” stamped on products or services.
The word “green” has been vastly overused and has practically lost all of its meaning. What’s more, some
customers even see it as simply an excuse for a company to charge more for products with no environmental
benefits.
RESEARCH METHODOLOGY
Secondary Data
Collected information through internet and websites.
CONCLUSION
The maturing of greening as a consumer phenomenon, and its decided shift from the fringe into the mainstream,
changes the rules of green marketing. A new green marketing paradigm now exists. It is characterized by a keen
sensitivity for the total person who constitutes one’s consumer and his or her new needs for brands that balance
age-old benefits of performance, affordability, and convenience with minimal environmental and social impacts,
and engage their consumers in meaningful dialogue.
REFERENCES
https://en.wikipedia.org/wiki/Green_marketing.
https://www.shopify.in/encyclopedia/green-marketing.
https://blogs.siliconindia.com/nayan/marketing_mix_of_green_marketing-bid-uQo5nC9M98069957.html
https://lautrecouleur.com/green-marketing-advantages-disadvantages/
https://www.oreilly.com/library/view/the-new-rules/9781605098678/xhtml/ch10.html

International Journal of Advance and Innovative Research Volume 6, Issue 1 (XXIV): January - March, 2019
115
ISSN 2394 - 7780
A STUDY ON IMPACT OF DEMOGRAPHICS ON CUSTOMER’S EVALUATION OF E-
COMMERCE SITES IN INDIA
Prof. Rohita Dwivedi1 and Prof. Dr. Vaishali Patil2
Assistant Professor1 and Associate Dean2, L. N. Welingkar Institute of Management and Research, Mumbai
ABSTRACT
E-commerce companies are very concerned about how customers evaluate them. They are continuously seeking
their target group for better engagement. Demographic is a commonly used method to segment customers as
it’s easy to measure. With customers seeing information on multiple devices, there are higher chances of card
abandonment and the reasons can be many. Some of the reasons are content utility and consistent experience
across devices. Customer saving information available on the website as wish-list, save-list, etc. is one of the
important indicators of interest and intention to purchase. Social media has begun to play an important role in
online shopping and hence customer sharing information on social media has emerged as a very important
indicator of customer engagement. This study aimed to find out the impact of demographics on the customer
evaluation of e-commerce websites content utility, consistent experience across devices, intention to save
information from websites for future use and social media engagement. E-commerce marketers will have to find
out better ways to segment customers as demographics seems completely irrelevant.
Keywords: e-commerce site evaluation, customer demographics, website content utility
1. INTRODUCTION
As of January 2019, more than 500 million people are active internet users in India, second highest in the world
only after China (IAMAI, 2019). Customers are now more informed, they are able to compare brand price,
analyse information available from different sources, share information, post reviews and read reviews posted
by other consumers on digital and social media. Online information is playing a vital role in shaping the
consumer buying decision. Customer evaluation of e-commerce sites is a key area of concern for all marketers.
Consumers are seeking more and more information and making an informed decision. Although consumer
engagement through online content applies to both brick and mortar and online companies, it is more important
for e-commerce companies. E-commerce companies depend mainly on their content to engage customer and
give them a richer experience as compared to brick and mortar companies (Chen & Hsu, 2009).
E-commerce portals track customer’s intention to purchase through customer’s evaluation of the website
content utility, their engagement in terms of saving information available on the site for future reference, their
propensity to share product information on social media. With multiple linked devices, consistent experience
across devices has also emerged as an important parameter for customer evaluation.
A prospect consumes the content and shares it on various portals which spreads it virally even though the first
customer stops there, s/he has generated leads in the form of his/her contacts who have access to the content and
who might be in the information search stage of purchase cycle. Marketers make use of different metrics to
measure content consumption, sharing, lead generation and sales (Devaraj, Fan, & Kohli, 2002).
While 29% of shoppers browse on their smartphones daily, only 27% will complete a purchase during the
mobile site visit. But, rather than focus on the mobile conversion rate alone, retailers should look closer at Omni
channel shopper behavior. Most consumers buy across channels, so they start on mobile and they end on
desktop, or they go from mobile to tablet. A lot of retailers get very myopic and worried about mobile
conversion rate, and really, they need to look at multiple devices and the whole journey across devices. By
looking at cross-device behavior retailers are able to deliver a more relevant and personalized experience. When
consumers log in on both mobile and desktop, retailers can synch profiles across devices to deliver more
relevant remarketing ads, promotions and product recommendations (Wassel, 2018).
The increasing consumer dependence and faith in digital and electronic media has given a major boost to e-
commerce. The retail industry has seen a paradigm shift from brick and mortar to brick and click to click only
retail portals hence. These e-commerce portals are the choice of the new generation and hence have led to the
brick and mortar stores to lose their market share.
One of the biggest contributors to this change is smart phones, as of 2017; there were 4.43 billion smart phone
users in India (Satistica, 2019). In spite of the unexploited prospective, India is already second-largest online
market in the world. The bulk of India's internet users are smart phone users, who are able to avoid expensive
landline connections, desktop PCs and other infrastructure. Experts predict that there will be approximately

International Journal of Advance and Innovative Research Volume 6, Issue 1 (XXIV): January - March, 2019
116
ISSN 2394 - 7780
492.68 million mobile phone internet users by the year 2022. As of 2018, there were 120 million online
shoppers in India contributing to 115% annual growth from 2017 (ASSOCHAM, 2018). The value of e-
commerce industry in India e-commerce market is expected to grow to US$ 200 billion by 2026 from US$ 38.5
billion as of 2017 (IBEF, 2018).
What is Customer Buying Online: (Source: Satista)
2. LITERATURE REVIEW Many factors for online shopping have emerged in the recent years; some of them are: website design, easy
search, product range availability, genuine products, availability, order tracking, multiple payment options,
shipping cost clarity, coupons and discounts, cash on delivery, intimation by e-mail, package information,
supplier’s information, ratings, reviews & recommendations, return policy, price comparison across other sites,
privacy, customer support online chat, social media link, speed, guest checkout, multi device friendly website,
pop-up interference and permission marketing (NinaKoiso-Kanttila, 2004) (Piercy, 2014)( (Ramo'n & Carrio´n,
2014) (Zhang, Trusov, Stephen, & Jamal, 2017) (Bjarne & Stylianou, 2009). (Juneja & Mehta, 2017) (Kim,
2002). All these factors define content utility. Utility of content is important for customers and they value
content which is relevant, accurate and useful with respect to information search, alternative evaluation and
purchase decision. It also helps in improving the brand value of ecommerce portals (Yang, Cai, Zhou, & Zhou,
2005)
Customers can save the products of their interest in a digital cart for immediate purchase or for future purchase
consideration. For future purchase, customers can also save relevant information in various forms like wish list,
bookmark, save link, and subscriptions (Bigcommerce, 2019) (Farhang , Bentolhoda , Atefeh , & Forouz ,
2012).
A number of attempts have been made to evaluate contents of ecommerce sites. Customers are more informed
with the advent of social commerce. Social commerce equips customers to make more informed purchase
decisions. It is proved in past researches that customer generated content in the form of information shared on
their social media pages indicates higher customer engagement and interest in content (Tsai & Linjuan, 2014).
Social commerce makes use of Web 2.0 for e-transactions. It also has the potential to enhance customer
relationship, increase website traffic and maximize the effect of promotional campaigns (Safwa & Abeysekara,
2016).
Customers value consistent website experience across digital devices like smartphones, desktops, tablets and
laptops. Website is a crucial infrastructure as it’s the only company interface with the customers, it plays an
important role in image building and consistent website experience across devices gives a competitive
advantage (Borowski, 2015).
3. RESEARCH GAP & RESEARCH QUESTION
Though many studies have focused on the website content, its quality and utility to the prospective customers;
fewer studies have been found that combines content utility with consistent experience across devices,
customer’s propensity to save information for further reference and social media engagement to customer’s
evaluation criteria. Further, fewer studies have been found to have been conducted in Indian subcontinent.
The research question hence diagnosed for this study is: What are the factors under consideration for customer’s
evaluation of e-commerce sites?

International Journal of Advance and Innovative Research Volume 6, Issue 1 (XXIV): January - March, 2019
117
ISSN 2394 - 7780
4. RESEARCH OBJECTIVES
The study aimed at the following research objectives
To find out customer evaluation towards content utility provided by existing e-commerce sites for existing e-
commerce sites and demographics.
To analyze customer evaluation towards consistent experience across all digital devices for existing e-
commerce sites and demographics.
To examine customer evaluation towards interest in saving information available on e-commerce sites for
future reference and demographics.
To investigate customer evaluation towards social media engagement for existing e-commerce sites and
demographics.
5. RESEARCH HYPOTHESIS
The following hypotheses have been formulated based on the above mentioned objectives
H1: There is a significant difference in customer evaluation for e-commerce site with respect to utility, multi
device consistent experience, customers’ intention to save information for further use and social media
engagement among men and women customers.
H2: There is a significant difference in customer evaluation for e-commerce site with respect to site utility,
multi device consistent experience, customers’ intention to save information for further use and social media
engagement among customers of different age groups.
H3: There is a significant difference in customer evaluation for e-commerce site with respect to site utility,
multi device consistent experience, customers’ intention to save information for further use and social media
engagement among customers with different occupation.
H4: There is a significant difference in customer evaluation for e-commerce site with respect to site utility,
multi device consistent experience, customers’ intention to save information for further use and social media
engagement among customers of different income groups.
H5: There is a significant difference in customer evaluation for e-commerce site with respect to site utility,
multi device consistent experience, customers’ intention to save information for further use and social media
engagement among customers with different marital status.
H6: There is a significant difference in customer evaluation for e-commerce site with respect to site utility,
multi device consistent experience, customers’ intention to save information for further use and social media
engagement among customers living alone, in nuclear families and in joint families.
H7: There is statistical correlation amongst customer evaluation for e-commerce site with respect to site utility,
multi device consistent experience, customers’ intention to save information for further use and social media
engagement.
6. RESEARCH DESIGN
This study is a quantitative empirical descriptive research that aims to find out factors that are important to the
customer with respect to website content utility, multi device consistent experience, customers’ intention to save
information for further use and social media engagement. 28 parameters that have been identified by previous
researchers with respect to website content utility have been clubbed as content utility for this study. Existing
experience across all connected devices, intention to save information for further use and social media
engagement provided by the existing e-commerce sites are the other three parameters under consideration. A
cross-sectional study is administered among 150 respondents using close ended structured questionnaire.
Purposive Sampling technique was used for this study.
7. DATA ANALYSIS
7.1 Sample Description
Table 1 elaborates the sample description of this study. Men constituted 60% of the sample while women were
40%. Millennial (Gen Y) were 53% followed by Gen Z at 37% and Gen X at 10%. Baby Boomers and Silent
generation were not represented in the study. 55% of the respondents were professionals followed by 31%
students and 11% business. Very less representation is from homemakers and part-time job. 61% global Indians
followed by 19% strivers, 17% seekers and 4% aspirers contributed to this study. Deprived were missing from
this study. 66% of the respondents were singles and 29% were married. Committed constitutes just 4%. Finally
46% of the respondents are from joint family, 31% from nuclear family and 23% are living alone either in PG or
hostel.
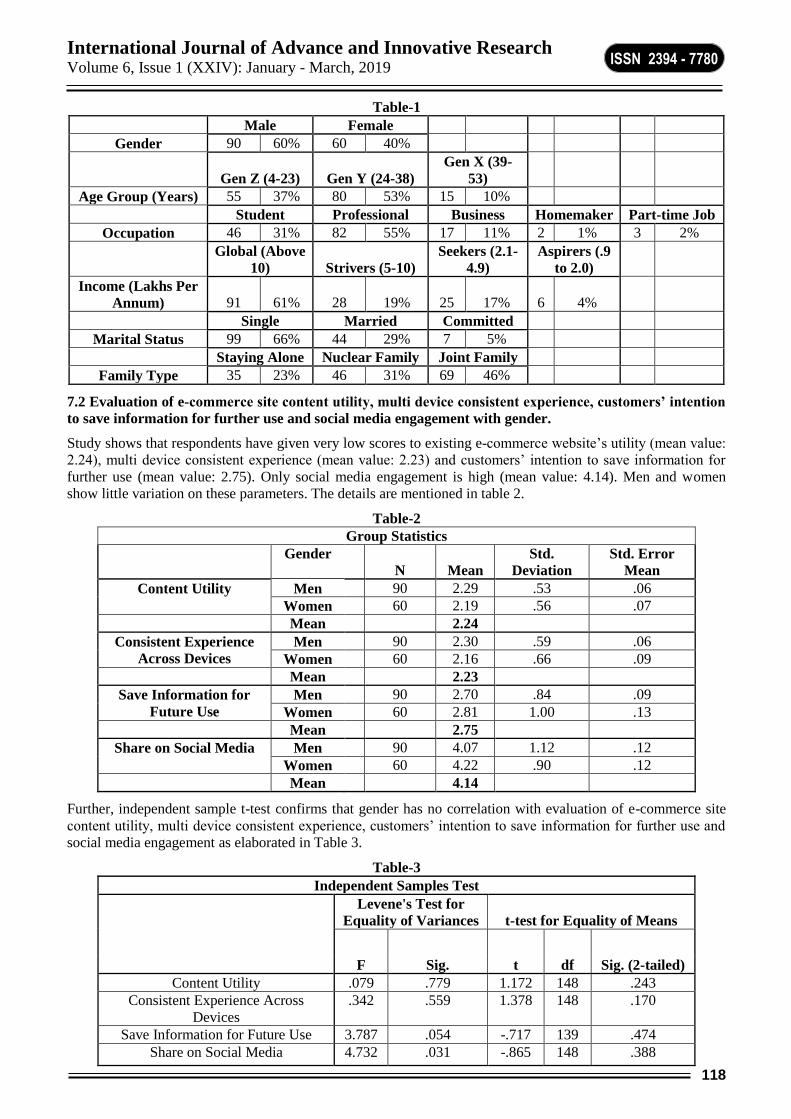
International Journal of Advance and Innovative Research Volume 6, Issue 1 (XXIV): January - March, 2019
118
ISSN 2394 - 7780
Table-1
Male Female
Gender 90 60% 60 40%
Gen Z (4-23) Gen Y (24-38)
Gen X (39-
53)
Age Group (Years) 55 37% 80 53% 15 10%
Student Professional Business Homemaker Part-time Job
Occupation 46 31% 82 55% 17 11% 2 1% 3 2%
Global (Above
10) Strivers (5-10)
Seekers (2.1-
4.9)
Aspirers (.9
to 2.0)
Income (Lakhs Per
Annum) 91 61% 28 19% 25 17% 6 4%
Single Married Committed
Marital Status 99 66% 44 29% 7 5%
Staying Alone Nuclear Family Joint Family
Family Type 35 23% 46 31% 69 46%
7.2 Evaluation of e-commerce site content utility, multi device consistent experience, customers’ intention
to save information for further use and social media engagement with gender.
Study shows that respondents have given very low scores to existing e-commerce website’s utility (mean value:
2.24), multi device consistent experience (mean value: 2.23) and customers’ intention to save information for
further use (mean value: 2.75). Only social media engagement is high (mean value: 4.14). Men and women
show little variation on these parameters. The details are mentioned in table 2.
Table-2
Group Statistics
Gender
N Mean
Std.
Deviation
Std. Error
Mean
Content Utility Men 90 2.29 .53 .06
Women 60 2.19 .56 .07
Mean 2.24
Consistent Experience
Across Devices
Men 90 2.30 .59 .06
Women 60 2.16 .66 .09
Mean 2.23
Save Information for
Future Use
Men 90 2.70 .84 .09
Women 60 2.81 1.00 .13
Mean 2.75
Share on Social Media Men 90 4.07 1.12 .12
Women 60 4.22 .90 .12
Mean 4.14
Further, independent sample t-test confirms that gender has no correlation with evaluation of e-commerce site
content utility, multi device consistent experience, customers’ intention to save information for further use and
social media engagement as elaborated in Table 3.
Table-3
Independent Samples Test
Levene's Test for
Equality of Variances t-test for Equality of Means
F Sig. t df Sig. (2-tailed)
Content Utility .079 .779 1.172 148 .243
Consistent Experience Across
Devices
.342 .559 1.378 148 .170
Save Information for Future Use 3.787 .054 -.717 139 .474
Share on Social Media 4.732 .031 -.865 148 .388
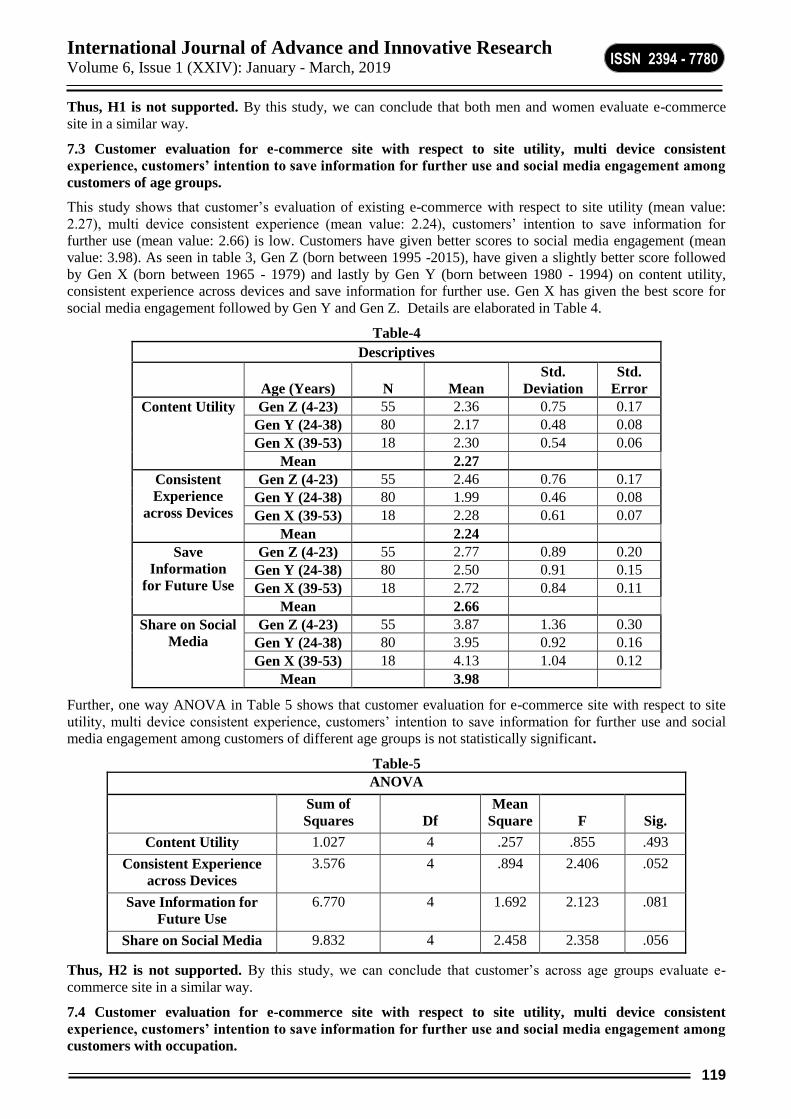
International Journal of Advance and Innovative Research Volume 6, Issue 1 (XXIV): January - March, 2019
119
ISSN 2394 - 7780
Thus, H1 is not supported. By this study, we can conclude that both men and women evaluate e-commerce
site in a similar way.
7.3 Customer evaluation for e-commerce site with respect to site utility, multi device consistent
experience, customers’ intention to save information for further use and social media engagement among
customers of age groups.
This study shows that customer’s evaluation of existing e-commerce with respect to site utility (mean value:
2.27), multi device consistent experience (mean value: 2.24), customers’ intention to save information for
further use (mean value: 2.66) is low. Customers have given better scores to social media engagement (mean
value: 3.98). As seen in table 3, Gen Z (born between 1995 -2015), have given a slightly better score followed
by Gen X (born between 1965 - 1979) and lastly by Gen Y (born between 1980 - 1994) on content utility,
consistent experience across devices and save information for further use. Gen X has given the best score for
social media engagement followed by Gen Y and Gen Z. Details are elaborated in Table 4.
Table-4
Descriptives
Age (Years) N Mean
Std.
Deviation
Std.
Error
Content Utility Gen Z (4-23) 55 2.36 0.75 0.17
Gen Y (24-38) 80 2.17 0.48 0.08
Gen X (39-53) 18 2.30 0.54 0.06
Mean 2.27
Consistent
Experience
across Devices
Gen Z (4-23) 55 2.46 0.76 0.17
Gen Y (24-38) 80 1.99 0.46 0.08
Gen X (39-53) 18 2.28 0.61 0.07
Mean 2.24
Save
Information
for Future Use
Gen Z (4-23) 55 2.77 0.89 0.20
Gen Y (24-38) 80 2.50 0.91 0.15
Gen X (39-53) 18 2.72 0.84 0.11
Mean 2.66
Share on Social
Media
Gen Z (4-23) 55 3.87 1.36 0.30
Gen Y (24-38) 80 3.95 0.92 0.16
Gen X (39-53) 18 4.13 1.04 0.12
Mean 3.98
Further, one way ANOVA in Table 5 shows that customer evaluation for e-commerce site with respect to site
utility, multi device consistent experience, customers’ intention to save information for further use and social
media engagement among customers of different age groups is not statistically significant.
Table-5
ANOVA
Sum of
Squares Df
Mean
Square F Sig.
Content Utility 1.027 4 .257 .855 .493
Consistent Experience
across Devices
3.576 4 .894 2.406 .052
Save Information for
Future Use
6.770 4 1.692 2.123 .081
Share on Social Media 9.832 4 2.458 2.358 .056
Thus, H2 is not supported. By this study, we can conclude that customer’s across age groups evaluate e-
commerce site in a similar way.
7.4 Customer evaluation for e-commerce site with respect to site utility, multi device consistent
experience, customers’ intention to save information for further use and social media engagement among
customers with occupation.

International Journal of Advance and Innovative Research Volume 6, Issue 1 (XXIV): January - March, 2019
120
ISSN 2394 - 7780
Table-6
Descriptives
Occupation N Mean Std. Deviation Std. Error
Content
Utility
Student 46 2.22 0.63 0.09
Professional 82 2.28 0.48 0.05
Business 17 2.38 0.57 0.14
Homemaker 2 1.70 0.42 0.30
Part-time Job 3 1.67 0.58 0.33
Mean 2.05
Consistent
Experience
across
Devices
Student 46 2.17 0.65 0.10
Professional 82 2.27 0.62 0.07
Business 17 2.39 0.55 0.13
Homemaker 2 2.50 0.71 0.50
Part-time Job 3 1.73 0.64 0.37
Mean 2.21
Save
Information
for Future
Use
Student 46 2.63 0.87 0.13
Professional 82 2.72 0.91 0.10
Business 17 3.19 1.03 0.28
Homemaker 2 2.42 0.59 0.42
Part-time Job 3 3.28 0.77 0.44
Mean 2.85
Share on
Social Media
Student 46 3.74 1.18 0.17
Professional 82 4.19 0.97 0.11
Business 17 4.72 0.60 0.15
Homemaker 2 4.90 0.14 0.10
Part-time Job 3 4.53 0.81 0.47
Mean 4.42
This study shows that customer’s evaluation of existing e-commerce with respect to site utility (mean value:
2.05), multi device consistent experience (mean value: 2.21), customers’ intention to save information for
further use (mean value: 2.85) is low. Customers have given better scores to social media engagement (mean
value: 4.42). Details of the scores of individual occupations are elaborated below. What comes across very
interestingly is that student community has consistently given lowest scores to the existing e-commerce sites on
all parameters.
Further, one way ANOVA shows that evaluation of e-commerce sites are significantly different for customers
from different occupation. Students score this criterion lowest, followed by professionals, part-time job doers,
business and home makers. Hence, we can conclude that H3 is partially supported.
Table-7
ANOVA
Sum of Squares df Mean Square F Sig.
Content Utility 2.011 4 .503 1.713 .150
Consistent Experience across Devices 1.622 4 .406 1.053 .382
Save Information for Future Use 4.471 4 1.118 1.373 .247
Share on Social Media 14.845 4 3.711 3.682 .007
7.5 Customer evaluation for e-commerce site with respect to site utility, multi device consistent
experience, customers’ intention to save information for further use and social media engagement among
customers of different income groups.
Table-8
Descriptives
Income (Lakh per annum) N Mean Std. Deviation Std. Error
Content Utility Aspirers (.9 -2.0) 6 2.17 0.41 0.17
Seekers (2.1 - 4.9) 25 2.17 0.54 0.11
Strivers (5-10) 28 2.43 0.54 0.10

International Journal of Advance and Innovative Research Volume 6, Issue 1 (XXIV): January - March, 2019
121
ISSN 2394 - 7780
Global (Above 10) 91 2.22 0.56 0.06
Mean
2.25
Consistent
Experience across
Devices
Aspirers (.9 -2.0) 6 2.23 0.64 0.26
Seekers (2.1 - 4.9) 25 2.26 0.63 0.13
Strivers (5-10) 28 2.33 0.68 0.13
Global (Above 10) 91 2.22 0.61 0.06
Mean 2.26
Save Information
for Future Use
Aspirers (.9 -2.0) 6 2.70 1.16 0.52
Seekers (2.1 - 4.9) 25 2.45 0.95 0.20
Strivers (5-10) 28 3.04 0.91 0.17
Global (Above 10) 91 2.73 0.87 0.09
Mean 2.73
Share on Social
Media
Aspirers (.9 -2.0) 6 3.60 1.21 0.49
Seekers (2.1 - 4.9) 25 4.14 0.98 0.20
Strivers (5-10) 28 3.87 1.23 0.23
Global (Above 10) 91 4.24 0.98 0.10
Mean 3.96
This study shows that customer’s from different income groups give low scores while evaluating existing e-
commerce with respect to site utility (mean value: 2.25), multi device consistent experience (mean value: 2.26),
customers’ intention to save information for further use (mean value: 2.73). Customers have given better scores
to social media engagement (mean value: 3.96). Details of the scores of individual income groups are elaborated
below.
Further, one way ANOVA shows that income groups have no correlation with customer evaluation. Hence H4
is not supported.
Table-9
ANOVA
Sum of Squares df Mean Square F Sig.
Overall Utility 1.163 3 .388 1.304 .275
Consistent Experience
across Devices
.268 3 .089 .228 .877
Save Information for
Future Use
4.457 3 1.486 1.838 .143
Share on Social Media 4.567 3 1.522 1.421 .239
7.6 Customer evaluation for e-commerce site with respect to site utility, multi device consistent
experience, customers’ intention to save information for further use and social media engagement among
customers and their marital status.
Table-10
Descriptives
Marital Status N Mean Std. Deviation Std. Error
Content Utility Single 99 2.24 0.58 0.06
Married 44 2.26 0.52 0.08
Committed 7 2.31 0.16 0.06
Mean 2.27
Consistent Experience
across Devices
Single 99 2.22 0.61 0.06
Married 44 2.28 0.68 0.10
Committed 7 2.40 0.48 0.18
Mean 2.30
Save Information for
Future Use
Single 99 2.73 0.89 0.09
Married 44 2.83 0.93 0.15
Committed 7 2.45 1.07 0.40
Mean 2.67

International Journal of Advance and Innovative Research Volume 6, Issue 1 (XXIV): January - March, 2019
122
ISSN 2394 - 7780
Share on Social Media Single 99 3.99 1.11 0.11
Married 44 4.39 0.85 0.13
Committed 7 4.40 0.73 0.28
Mean 4.26
The study shows that customer’s from different marital status give low scores while evaluating existing e-
commerce with respect to site utility (mean value: 2.27), multi device consistent experience (mean value: 2.30),
customers’ intention to save information for further use (mean value: 2.67). Customers have given better scores
to social media engagement (mean value: 4.26). Details of the scores of individual income groups are elaborated
below in table 10. In addition, singles gave lowest scores to all the parameters followed by committed and
married respondents have given the highest scores.
Further, one way ANOVA shows in table 11 that income groups have no correlation with customer evaluation.
Hence H5 is not supported.
Table-11
ANOVA
Sum of Squares df Mean Square F Sig.
Content Utility .038 2 .019 .063 .939
Consistent Experience
across Devices
.275 2 .137 .353 .703
Save Information for
Future Use
.936 2 .468 .565 .569
Share on Social Media 5.288 2 2.644 2.496 .086
7.7 Customer evaluation for e-commerce site with respect to site utility, multi device consistent
experience, customers’ intention to save information for further use and social media engagement among
customers living alone, in nuclear families and in joint families.
Table-12
Descriptives
Family Type N Mean Std. Deviation Std. Error
Content Utility Staying Alone
(PG/Hostel)
35 2.41 0.52 0.09
Nuclear Family 46 2.14 0.52 0.08
Joint Family 69 2.21 0.57 0.07
Mean 2.26
Consistent Experience
across Devices
Staying Alone
(PG/Hostel)
35 2.34 0.54 0.09
Nuclear Family 46 2.25 0.66 0.10
Joint Family 69 2.19 0.62 0.08
Mean 2.26
Save Information for
Future Use
Staying Alone
(PG/Hostel)
35 3.05 0.89 0.16
Nuclear Family 46 2.70 0.84 0.13
Joint Family 69 2.61 0.95 0.12
Mean 2.79
Share on Social Media Staying Alone
(PG/Hostel)
35 4.15 0.94 0.16
Nuclear Family 46 4.07 1.15 0.17
Joint Family 69 4.10 1.06 0.14
Mean 4.11
The study shows that customer’s from different family construction give low scores while evaluating existing e-
commerce with respect to site utility (mean value: 2.26), multi device consistent experience (mean value: 2.26),
customers’ intention to save information for further use (mean value: 2.79). Customers have given better scores
to social media engagement (mean value: 4.11). Details of the scores of different family types are elaborated
below in table 12.

International Journal of Advance and Innovative Research Volume 6, Issue 1 (XXIV): January - March, 2019
123
ISSN 2394 - 7780
Further one way ANOVA in table 13 shows that there is no significant correlation between customer evaluation
for e-commerce site with respect to site utility, multi device consistent experience, customers’ intention to save
information for further use and social media engagement among customers living alone, in nuclear families and
in joint families. Hence, H6 is not supported.
Table-13
ANOVA
Sum of Squares df Mean Square F Sig.
Content Utility 1.837 3 .612 2.092 .104
Consistent Experience across Devices .481 3 .160 .411 .745
Save Information for Future Use 4.250 3 1.417 1.750 .160
Share on Social Media 1.452 3 .484 .443 .723
7.8 Correlation between customer evaluation for e-commerce site with respect to site utility, multi device
consistent experience, customers’ intention to save information for further use and social media
engagement.
Table-14
Correlations
Content
Utility
Consistent
Experience
across Devices
Save
Information for
Future Use
Share on
Social Media
Content Utility Pearson
Correlation
1 .428** .101 .120
Sig. (2-tailed) .000 .232 .144
N 150 150 150 150
Consistent
Experience
across Devices
Pearson
Correlation
.428** 1 .199* .169*
Sig. (2-tailed) .000 .018 .038
N 150 150 150 150
Save Information
for Future Use
Pearson
Correlation
.101 .199* 1 .420**
Sig. (2-tailed) .232 .018 .000
N 150 150 150 150
Share on Social
Media
Pearson
Correlation
.120 .169* .420** 1
Sig. (2-tailed) .144 .038 .000
N 150 150 150 150
**. Correlation is significant at the 0.01 level (2-tailed).
*. Correlation is significant at the 0.05 level (2-tailed).
Pearson correlation test show that content utility is strongly correlated with consistent experience across
devices. Consistent experience across devices is correlated with content utility, customer intention to save
information for further use and social media engagement. Customer intention to save information for further use
is found to be correlated with consistent experience across devices and social media engagement. Finally social
media engagement of websites is correlated with consistent experience across devices and intention to save
information for further use as seen in table 14.
Hence, H7 is supported. There is statistical correlation amongst customer evaluation for e-commerce site with
respect to site utility, multi device consistent experience, customers’ intention to save information for further
use and social media engagement
8. CONCLUSION & DISCUSSION
Marketers tend to segment customers on the basis of demographics as it is easy to measure. This study
concludes that demographics may be considered as null and void method to segment customers of interest to e-
commerce sites. Psychographic, Behavioral and some others should be explored to understand e-commerce
customers.
Though many efforts are taken to make the content of the e-commerce sites relevant to its target customer,
this study shows that customers perceive the content as not so relevant. Same goes with consistent

International Journal of Advance and Innovative Research Volume 6, Issue 1 (XXIV): January - March, 2019
124
ISSN 2394 - 7780
experience that e-commerce sites are able to provide across devices. Even customer’s intention to save
information for further use has been scored very low. On the contrary, social media engagements have
scored high. This should be an eye opener to the e-commerce websites in India. Many more efforts are
required to work on providing customers with better content utility, consistent experience across devices and
to motivate customers to save information related to their products of interest for further use.
REFERENCES
ASSOCHAM. (2018, June 28). Retrieved February 17, 2019, from economictimes.com:
https://economictimes.indiatimes.com/industry/services/retail/number-of-online-shoppers-to-surpass-120-
million-in-2018/articleshow/64718407.cms
Bigcommerce. (2019). Retrieved from bigcommerce.com: https://www.bigcommerce.com/ecommerce-
answers/what-are-wish-lists-and-why-are-they-important/
Bjarne, B., & Stylianou, A. C. (2009). Factors considered when outsourcing an IS system: an empirical
examination of the impacts of organizational size, strategy and the object of a decision. European Journal of
Information Systems, 18(3), 235-248.
Borowski, C. (2015, November 9). What a Great Digital Customer Experience Actually Looks Like.
Retrieved February 17, 2019, from https://hbr.org/2015/11/what-a-great-digital-customer-experience-
actually-looks-like
Chen, Y., & Hsu, I. (2009). Website attributes that increase customer purchase intention: A conjoint
analysis. Journal of Business Research, 63(9-19), 1007-1014.
Devaraj, S., Fan, M., & Kohli, R. (2002). Antecedents of B2Cchannel satisfaction and performance:
validating e-commerce metrics. Information systems research, 13(3), 316-333.
Farhang , S., Bentolhoda , A., Atefeh , C. L., & Forouz , S. (2012). The Impact of Website Information
Convenience On E-commerce Success Of Companies. International Conference on Asia Pacific Business
Innovation and Technology Management Procedia - Social and Behavioral Sciences, 57, pp. 381-387.
IAMAI. (2019, January 24). Retrieved February 17, 2019, from emarketeducation:
https://www.emarketeducation.in/power-internet-penetration-online-india/
IBEF. (2018, December). Retrieved February 17, 2019, from ibef.org:
https://www.ibef.org/industry/ecommerce.aspx
Juneja, R. M., & Mehta, P. B. (2017). Customer satisfaction towards online shopping in Surat city.
International Journal of Academic Research and Development, 2(6), 713-717.
Kim, W. (2002). Personalization: definition, status, and challenges, ahead. Journal of Object Technology,
1(1), 29-40.
NinaKoiso-Kanttila. (2004). DigitalContentMarketing: A LiteratureSynthesis. Journal of Marketing
Management, 20, 45-65.
Piercy, N. (2014). Online service quality: Content and process of analysis. Journal of Marketing
Management, 30(7-8), 747–785.
Ramo'n, B. B., & Carrio´n, G. C. (2014). Simultaneous measurement of quality in different online services.
The Service Industries Journal, 34(2), 123 – 144.
Safwa, F. F., & Abeysekara, N. (2016). Influence of Social Media Marketing on Customer Engagement.
International Journal of Business and Management Invention, 5(12), 115-125.
Satistica. (2019). Statistica.com. Retrieved February 17, 2019, from https://www.statista.com/
statistics/255146/number-of-internet-users-in-india/
Tsai, W. S., & Linjuan, R. M. (2014). Consumer engagement with brands on social network sites: A cross-
cultural comparison of China and the USA. Journal of Marketing Communications, 1-22.
Wassel, B. (2018, March 26). Retrieved February 2019, 17, from retailtouchpoints.com:
https://www.retailtouchpoints.com/topics/e-commerce/only-17-of-consumers-browse-with-intent-to-
purchase-on-first-e-commerce-site-visit

International Journal of Advance and Innovative Research Volume 6, Issue 1 (XXIV): January - March, 2019
125
ISSN 2394 - 7780
Yang, Z., Cai, S., Zhou, Z., & Zhou, N. (2005). Development and validation of an instrument to measure
user perceived service quality of information presenting Web portals. Information & Management, 42(4),
575-589.
Zhang, Y., Trusov, M., Stephen, A., & Jamal, Z. (2017). Online Shopping and Social Media: Friends or
Foes? Journal of Marketing, 6, 24-41.

International Journal of Advance and Innovative Research Volume 6, Issue 1 (XXIV): January - March, 2019
126
ISSN 2394 - 7780
ROLE OF ICT BASED LEARNING IN DIGITAL EDUCATION
Prof. Sunitha N Joshi
Assistant Professor, Department of Information Technology, JVM’s Mehta Degree College, Airoli
ABSTRACT
This paper deals with the teacher’s role as a digital education designer and finding new innovations in teaching
learning methods. By focusing on the teacher’s role, I wish to acknowledge and further explore in what ways
and with which means teachers can apply their expertise in the design of new teaching practices; ICT-based
teaching, learning and materials; networked learning; etc. To allow students to deal with problems
independently, as educators wish and put lot of efforts on students to engage them with our subject beyond a
superficial level. By the use of the digital technology in the class room students can be engaged by creating
enthusiasm and interest in learning the concepts.
The best instructors are presently utilizing innovation to advance and help autonomous learning by the
utilization of amazing gadget in their pocket. Presently multi day's pretty much every student have the amazing
gadget called Mobile telephone in their pockets. By enabling the Students to utilize a similar gadget for picking
up, associating and appraisals it will make huge contrast in the method for instruction. The chronicle of
understudy appraisal or GD (Group discourse), making an Audio and Video are yet an alternate method for
system to draw in the Students.
Educators can assume an imperative job by enabling Students to explore new territory by the utilization of
innovation as the device will make huge premium and consideration in instructive learning. Now a day's
teachers and resources are confronting huge test with huge number of Students in a single class, progressively
assorted Students from various culture and network, additionally from industry, bosses, government requesting
greater responsibility and the comprehensive advancement of alumni who are workforce prepared or
employable and furthermore the alumni needs to adapt up extremely quick evolving innovation. To deal with
change of this nature, educators and teachers need an all around planned innovation driven stage fuse their
base of hypothesis and information that will give a strong establishment to their instructing, regardless of what
changes or weights they face.
INTRODUCTION
Instructors can take the help of advanced innovation to associate or set up a correspondence with individuals,
huge information, think about substance, assets, specialists and make new learning encounters that can engage
and motivate instructors to give progressively viable educating to all students.
Advanced Technology gives a major chance to the teachers to offer increasingly collective and broaden learning
past the classroom. Educator can assume an imperative job in formation of a network which contains Students,
co-teacher's, e-library, specialists in different subjects far and wide, couple of individuals from family and
network. This improved collaboration which is empowered by computerized innovation gives the entrance to
instructional materials, ponder material and apparatuses to make, oversee, and evaluate their quality and
handiness.
Job of the instructor as an advanced trainer: The significant job of the teacher is to have profound information
and comprehension about nature in which learning is upheld by Digital innovation. The instructor can assume
following job. Digital innovation underpins the teachers to end up co-students alongside students by building
new encounters for more profound investigation of substance. Following couple of depictions are the jobs
which Teacher can play in planning innovation based advanced instruction.
1. Using innovation Educators should plan the course which is a long ways past the dividers of their
schools/universities
By the utilization of Digital innovation, teachers are never again confined to teaming up just with different
Educators in their schools rather now they can associate with other school or school instructors and experts
crosswise over globe to extend their insight, perception, views and make new better chance to understudy
learning. Here the job of educator is to associate with community associations who are had some expertise in
explaining certifiable concerns which empower them to plan the new learning experiences that permit students o
comprehend and investigate nearby needs and their needs. These above components make classroom adapting
all the more intriguing important and credible by adding the of apparatuses, for example, video conferencing,
online talks, and social media destinations, teachers, from substantial urban to little rustic locale, can interface
and collaborate with specialists and prestigious instructors around the globe

International Journal of Advance and Innovative Research Volume 6, Issue 1 (XXIV): January - March, 2019
127
ISSN 2394 - 7780
2. Educators job in planning exceptionally fascinating and profoundly captivating learning encounters
through innovation.
To make an exceptionally very captivating, fascinating, and pertinent arrangement of lesson which empowers
the Students to utilize content information and utilize their critical thinking aptitudes, an instructor/educator can
allot the students to take care of a network issue by utilizing advanced innovation.
This empowers the students to make an online network discussion, open introduction, or call which constrain
the specialists make a move related to their proposed arrangement. They can utilize long range interpersonal
communication stages to assemble data and suggestions of assets from their contacts. Students can draft and set
up an introduction of their work by using animated introduction programming or through media organizations,
for example, recordings and online journals. This work can be par taken in virtual discourses with substance
specialists and put away in online a learning portfolio which improves science learning for schools which need
in required framework. It can empower profound adapting once Students are in the important field. Students can
collect data for their own utilization by means of cell phones and tests and synchronize their new discoveries
with those of collaborators and analysts any place on the planet to make substantial, genuine informational
indexes for future examination.
3. Educators can assume vital lead job in the assessment and usage of new innovations for learning.
Low venture cost or learning advancements makes the educator a lot less demanding to lead and create display
rehearses around assessing new devices for security. Instructors in a broad way by understanding their own
instructive innovation needs, as well as those of Students, co-teachers, can test the picked innovation with a
little set of students to rapidly survey the execution of methodology and assess whether the desired result is
conveyed or not by the chose innovation. This appraisal and assessment will build the certainty and increase
involvement in the chose innovations previously submitting whole schools or areas to actualize and utilize it.
4. Teachers job in getting to be aides, facilitators, and inspirations of students.
The utilization of innovation in picking up the data through fast Internet empowers the educators need not to be
content specialists across all conceivable subjects. Rather they need the adequate learning about controlling
Students with respect to the entrance online data, and need great abilities to engage them in simulations of
genuine occasions and furthermore they utilize the innovation for reporting their work. Instructors can relegate
certifiable issues and assess the Students about their ability of reasoning and breaking down about the answer
for the issue by applying their everything leanings. Utilizing computerized instruments, they can enable
Students to make spaces for experimentation, emphasis, and go for broke with the accessible data at their finger
steps. The spaces made by utilization of new innovation based devices can give huge focal points to the teachers
additionally explore new understandings of training which moves past a specific spotlight on what they educate
to an especially more extensive dimension of how students can learn and introduce it in deliberate way about
what they know. Instructors can assume a vital direction job by helping the Students in choosing best
apparatuses for making associations crosswise over branches of knowledge and take the choices for choosing
the best tools for gathering and displaying their learning through exercises, for example, adding to online
discussions, transferring new online courses, or distributing their discoveries to significant sites. These
instructors examine guide and encourage the students on the most proficient method to make a web based
learning portfolio to show their learning progress. Students can utilize their portfolios and add more assets to it
with the goal that they survey, investigate in increasingly more profound and complex reasoning path about a
curious issue. With such portfolios, learners can feature their voyage in the training and vocation with complex
issues or precedents as a proof of learning history about what they realized and what they are able to do.
Portfolio's can turned into their proof of accomplishment and record evidence when they go into profession and
specialized education institutions, junior colleges, and colleges or for jobs.
5. Teachers' role as co-students with students and companions.
The advanced innovation based learning devices gives instructors an opportunity of a lifetime to end up co-
students alongside their students and friends. Despite the fact that educators need not to know everything
accessible in their disciplines, instead they ought to be find out about how to model and how to utilize the
accessible apparatuses to make the leanings of substance with high interest and a make solid attitude on critical
thinking ability and how to be co-makers of information. In short, educators ought to rouse the students in their
classrooms.
6. Teachers can become catalysts to serve the underserved.
Technology provides a new opportunity for traditionally underprivileged populations to have equal access to
high-quality educational experiences. When connectivity and access are uneven among the different populations
the digital divide in education is widened which hardship the positive aspects of learning using new technology.
International Journal of Advance and Innovative Research Volume 6, Issue 1 (XXIV): January - March, 2019
128
ISSN 2394 - 7780
Here the role of the teacher is to provide all category students equal
(1) Access to the internet, high-quality content, and devices when they need them and
(2) Access to well skilled teachers who are good in teaching in a technology-enabled learning environment.
Such environment increases the showcase of skills of learners personalized learning experiences, their methods
of choosing correct tools and activities, and access to adaptive assessments that identify their individual
abilities, needs, and interests.
6. Teacher role in using power of technology to measure what matters and use assessment data to
improve learning
Instructor can assume an essential job in structuring and reclassifying understudy evaluation device by the
utilization of innovation in various distinctive ways. These tools provide estimations for students who are
structuring and assembling new products, conducting tests utilizing cell phones, and controlling parameters in
simulations. Students play out the different assignments on Problems which exist in genuine conditions, or
include multi-arrange situations that reproduce credibility and dynamic commitment with the topic. It empowers
the teachers to get to data with respect to understudy advancement and his method for learning all through the
school day, which enables them to make a lot of guidelines or direction to customize learning or mediate or
manage them to specific learning deficiencies.
The beneath are the couple of special qualities of innovation based evaluations are :
Empower enhanced Question Types: Technology-based evaluations permit the opportunity for an alternate
assortment of inquiry types past the ordinary different Choice, genuine or-false or fill-in-the-clear choices that
have portrayed conventional appraisals.
A few instances of lifted inquiry types incorporate the accompanying
Graphic reaction, which incorporates anything to which Students can react by illustration, moving,
organizing, or choosing realistic areas
Simulations, in which students can take variety of actions to test their insight in settings that which give high
devotion to genuine situations.
Equation response, in this understudy reacts by contributing a condition
Performance-based appraisals, in which Students play out a progression of complex assignments.
Measure Complex Competencies: Teacher can plan a testing apparatus program for estimating and breaking
down the unpredictable competency parameters of students, for example, inspiration, outlook, and steadiness
with an end goal to manufacture the proof base for increasingly boundless use.
Give Real-Time Feedback: Teacher can assume a vital job in building up a Digital Technology based
developmental appraisals instrument which gives continuous detailing of results, permitting stakeholders to
comprehend student’s qualities and shortcomings, control them to comprehend valid actionable understandings
of the evaluation information. Such abasements devices will empower instructors to assess and react the input to
understudy work more rapidly than can customary appraisals. Similarly, learners and their families can get to
this data nearly continuously. Innovation based aggregate evaluations will encourage quicker turnaround of
results.
Some of current innovation based appraisals give the rich assortment of methodologies to feedback than
conventional or even original online evaluations. Certain formative assessment stages empower the instructors
to give criticism to students through comments(through video, sound, or content), participate in online talks,
email input specifically to families and learners, and guide the students to get to extra assets for rehearsing
explicit aptitudes or building up the abilities.
These advances likewise can expand the proficiency of the way toward giving input, allowing educators to have
more opportunity to concentrate on regions of most noteworthy need. For instance, by having the predefined
menu of reactions instructor can give the input on areas of regular worry to use as comments, which empower
them to move the concentration to zones of criticism special to every understudy. Robotized responses can be
produced also when assignments are late or fragmented. New advances that have happened in mechanized
scoring of papers whenever implanted in criticism instrument that will make it an all the more incredible asset
to create opportune input.

International Journal of Advance and Innovative Research Volume 6, Issue 1 (XXIV): January - March, 2019
129
ISSN 2394 - 7780
Increment Accessibility
Utilizing advances in computerized innovation some exceptional highlights can be implanted in the apparatus to
build text dimensions and change shading, differentiate, content to speech, bilingual lexicons, glossaries, and
that's just the beginning. These highlights can be incorporated into assessments and can be made open to
Students, contingent upon what the appraisal is estimating and exactly perceiving student needs. Similarly,
helping innovation, for example, content to-discourse, exchange reaction frameworks, and Braille, it supports
the students having inabilities in getting to learning assets. These advances continue to advance and can make it
less demanding for students to associate with computerized learning assets in ways which is inconceivable with
standard print-based appraisals. At the point when both assistive technologies tools and evaluations successfully
associate, Students will be in better position to show what they know and how to apply this educated learning to
get the ideal result.
Adjust to Learner Ability and Knowledge
Educator can assume essential job being developed and execution of the Computer versatile testing framework
which encourages the capacity of evaluations to gauge precisely what students knows and can do over the
educational programs in a shorter testing session.
PC versatile testing utilizes diverse calculations to alter the intricacy dimension of questions throughout an
appraisal based on an understudy's reactions. For instance, if the student answers an inquiry effectively, a
marginally additionally difficult dimension is incorporated into next inquiry, and if the student answers
erroneously, the individual in question will be given another opportunity to exhibit his/her insight in a different
way.
Since in PC versatile tests, the testing target substance and test question things are in arrangement with the
students ability level, this adjustment gives increasingly exact scores for all students over the general
accomplishment level in a brief time of time. By embracing conventional paper and pencil test expects
understudy to answer wide assortment of inquiries, because of this part of instructional time gets devoured.
Then again by versatile tests appraisals gets profited because of the inter operability of the information, from
these versatile estimates the information can be maneuvered into and brought together on dashboard which
further enables the teacher to have coordinated comprehension of understudy for execution.
Implanted with the Learning Process Instructors can likewise assume enormous job being developed of implanted appraisals which are innovation
driven or essentially a piece of viable guidance, and they may show up in advanced learning devices and
recreations. Since many of these are installed in the ordinary classroom exercises these are imperceptible to the
instructional procedure. Implanted assessments have the possibility to give symptomatic knowledge in
discovering why students are confronting troubles in comprehension and acing the ideas and furthermore gives
customized criticism to address these difficulties. By building up a Game-based appraisal instrument which is
computer game plan can make new fascinating next-age learning and evaluation framework.
CONCLUSION
Utilizing ICT based innovation has never that simple to enhance learning in all dimensions and just for all
individuals of various regions. By utilization of innovation, new changes in authorized instructive assets has
enhanced, and by utilizing apparatuses it expelled troubles in unsurpassed learning process. Enhanced
classroom educating and learning norms along these lines enabling all students to get to assets with adequate
aptitude in arranging instruments to execute them completely. Instructors who are well comfortable with
encouraging learning framework can assume significantly greater job being developed of such tools. These
apparatuses will include the information, abilities, and capabilities of teachers. With help of such devices like
learning dashboards and coordinated effort and correspondence interfaces instructors and families without any
difficulty. This is conceivable just by a solid commitment and tendency to learning for change. It likewise helps
each stakeholder in the instructing and learning framework to enhance learning for students. In general the
utilization of innovation gives the great result to help in educating and learning process.
REFERENCES
1. McCaffrey, D. F., Lockwood, J. R., Koretz, D. M., & Hamilton, L. S. (2003). Evaluating value-added
models for teacher accountability. Santa Monica, CA: RAND. Retrieved from http://www.rand.org/pubs/
monographs/2004/RAND_MG158.pdf.
2. Rivkin, S. G., Hanushek, E. A., &Kain, J. F. (2005). Teachers, schools, and academic
achievement.Econometrica,73(2),417–458.Retrieved from http://www.econ.ucsb.edu/~jon/Econ230C/
HanushekRivkin.pdf.
International Journal of Advance and Innovative Research Volume 6, Issue 1 (XXIV): January - March, 2019
130
ISSN 2394 - 7780
3. Rowan, B., Correnti, R., & Miller, R. (2002). What large-scale survey research tells us about teacher
effects on student achievement: Insights from the Prospects Study of Elementary Schools. Teachers
College Record, 104(8), 1525–1567.
4. Nye, B., Konstantopoulos, S., & Hedges, L. V. (2004). How large are teacher effects? Educational
Evaluation and Policy Analysis, 26(3), 237–257.
5. Chetty, R., Friedman, J. N., &Rockoff, J. E. (2011). The long-term impacts of teachers: Teacher value-
added and student outcomes in adulthood (Working Paper 17699). Cambridge, MA: National Bureau of
Economic Research. Retrieved from http://www.uaedreform.org/wp-content/uploads/2013/08/Chetty-
2011-NBER-Long-term-impact-of-teacher-value-added.pdf.
6. PBS LearningMedia. (2013). Teacher technology usage. Arlington, VA: PBS LearningMedia. Retrieved
from http://www.edweek.org/media/teachertechusagesurveyresults.pdf.
7. Bill & Melinda Gates Foundation. (2012). Innovation in education: Technology & effective teaching in the
U.S. Seattle, WA: Author.
8. Dewey, J. (1937). Experience and education. New York, NY: Simon and Schuster.
9. Hannafin, M. J., & Land, S. M. (1997). The foundations and assumptions of technology-enhanced student-
centered learning environments. Instructional Science, 25(3), 167–202.
10. Sandholtz, J. H., Ringstaff, C., & Dwyer, D. C. (1997). Teaching with technology: Creating student-
centered classrooms. New York, NY: Teachers College Press.
11. Herrington, J., Reeves, T. C., & Oliver, R. (2014). Authentic learning environments. In J. M. Spector, M.
D. Merrill, J. Elen, & M. J. Bishop (Eds.), Handbook of research on educational communications and
technology (pp. 401–412). New York, NY: Springer.
12. Utah State University. (2005). National Library of Virtual Manipulatives. Retrieved
from http://nlvm.usu.edu/en/nav/vlibrary.html.
13. Ching, D., Santo, R., Hoadley, C., &Peppler, K. (2015). On-ramps, lane changes, detours and destinations:
Building connected learning pathways in Hive NYC through brokering future learning opportunities. New
York, NY: Hive Research Lab.
14. Kafai, Y. B., Desai, S., Peppler, K. A., Chiu, G. M., &Moya, J. (2008). Mentoring partnerships in a
community technology centre: A constructionist approach for fostering equitable service learning.
Mentoring & Tutoring: Partnership in Learning, 16(2), 191–205.

International Journal of Advance and Innovative Research Volume 6, Issue 1 (XXIV): January - March, 2019
131
ISSN 2394 - 7780
A STUDY OF DIFFERENCE IN CONSUMER BEHAVIOR IN THE MALLS BASED ON OCCUPATION
Dr. Uma Durgude
Assistant Professor, Bharati Vidyapeeth’s Institute of Management Studies & Research, Navi Mumbai
ABSTRACT
In recent times no other sector has seen growing exponentially like retailing. Many retail formats and patterns
are emerging at a rapid pace. Retailing is gaining momentum like never before in India.
Organized retailing has become the reason for euphoria amongst Indian shoppers; the sector which is
dominated by local players has got the entry of prominent corporate. As a part of the rising organised retail
modern formats of shopping have started promising and attracting. Malls are one of those new formats which
have gained momentum in numbers. Early growth of malls was found only in few metros, but now it has
extended equally to smaller towns.
Customers are getting newer and unique experience through varied services offered by malls. Shopping for food
and grocery items have shown a revolution in retail market in India with the prominent changes in the people
shopping behavior.
Malls are reshaping and rephrasing the standards and rules, developing a their own prescription and
constitution and are transforming the basic need for entertainment and shopping experience into a unique
factor or phenomenon for deciding one’s lifestyle statement. Indian middle class is now looking for facilities
like air-conditioning, spacious parking and other amenities for them.
People across geographic landscapes have inclined towards new retail formats where they can get benefits in
terms of money, time and effort. However, retaining their customers and extracting life time profit from them all
is the biggest challenge that these retail formats are facing. The focus of the study is on shopper attributes such
as education. These factors have major impact on shopping behavior especially in retail format selection of
shoppers.
The present study revealed that, Success of a mall is not just making it big and attracting foreign brands. A
refreshing and pleasant environment is expected which makes the shoppers to forget all problems of the work
and bring down their stress levels.
The study has come out with various path breaking results that propels the voluminous growth of mall culture in
Mumbai, and elaborately discussed and presented numerous academic and managerial implications of vibrant
and emerging mall culture. All the findings aroused through detailed analysis of the data followed by inferences
have been presented in the study.
Keywords: Retailing, Organized, Occupation, Occupation, demographic
1. INTRODUCTION The Journey of retailing turned out to be more organized and aided retail marketing to take a new path. Today’s
retailers are able to give range of products and services of fine quality and making it a delightful experience.
The ever increasing demand and want of newness of customers have made the retailers run on toes, they have to
anticipate and respond to the wants of consumers. It has become highly challenging to understand the consumer
through the organized market in various forms.
As the success rate of conventional outlets is limited, it is essential to know the motive of shoppers and what
attracts them. The research in this field has not progressed beyond a limit; there is a greater need to understand
the shopping habits of consumers.
The scope of research has been identified by the researcher; hence an attempt is made to identify the gaps, by
investigating the shopping behavior of consumers, with reference to the emerging retail formats. The focus is on
to the behavior a consumer exhibits in a new mall, may it be just visiting or for making purchases.
The much needed effort is to find out a base line for understanding the changing consumer attitude in future.
2. REVIEW OF LITERATURE
1. Cox and Cooke (1970) determined customer preference for shopping Centre’s and the importance of driving
time. The authors mentioned that geographic allocation and mall attractiveness are vital determinants of
consumer purchase destination preferences.

International Journal of Advance and Innovative Research Volume 6, Issue 1 (XXIV): January - March, 2019
132
ISSN 2394 - 7780
2. Dr. M. N. Malliswari (2007) in his study “Emerging trends & strategies in Indian retailing”, he found that
the customers are influenced by the west due to media & there is a clear shift from savings to spending on
life style.
3. White (2008) in his paper has elaborated that the customer and their lifestyles have changed, and with that,
shopping Centre are changing to continue to attract consumers. Entertainment destinations, centers, once of
trivial importance, are now growing in importance as an essential part of the mix,
4. Kuruvilla and Ranjan (2008) studied the behavior of Indian youth inside the mall, identified the
recreational and utilitarian orientation among Indian youth, examined gender differences in their attitude to
the malls. No major differences were observed in the attitude or motives of both genders for shopping in
malls but there was evidence to suggest that purchase of fashion differed across genders.
5. OBJECTIVES OF THE STUDY
To study the difference in consumer behavior in the malls based on Occupation.
6. RESEARCH METHODOLOGY
The initiation is done by collecting and comprehending secondary literature, followed by scope, various issues
to be studied, and formulation of research objectives and hypotheses. The research process encompasses sample
design, data collection methods, and major variables measurement. The sample size was 68 shoppers visiting
malls. The sample size was 68 shoppers visiting malls. The survey design, using a standardized questionnaire,
is considered to be most appropriate research design to collect data. As per survey method, the research design
used in the study is descriptive. It accurately and systematically describes the behaviors and characteristics of a
monitored phenomenon or a particular population. It also aids in exploring the correlations which may exist
between various phenomena.
For analysis the Statistical Package for the Social Sciences (SPSS) will be used. The techniques used are,
Correlation and other statistical techniques. The interpretation will be based on analysis, tables and other
statistical tools.
In the chosen study, the focus is to observe the customer behavior in the age of mall culture. An attempt is made
to locate the forces behind the purchases at commercial malls, perception of people about malls, the degree of
contentment towards various aspects of mall services and in all shopping behavior in malls. This can help all the
stake holders of mall management to design feasible strategies which can lead to win the confidence of shoppers
and win their trust.
Hypothesis: There is a noteworthy difference in consumer behavior in the malls based on Occupation.
DATA ANALYSIS
Among the respondents education is an important demographic variable as it indicates many factors like, quality
of response, characteristics of respondent, type of questions etc. This profile of the respondents gives researcher
to know how the Occupation affects the behavioural changes in information search, evaluation and decision
making of mall customers.
Table-1: Occupation of the respondents
Sr. No. Occupation No. of respondents Percentage
1 Student 50 14.6%
2 service 105 30.7%
3 Self-employed 67 19.6%
4 Home maker 78 22.8%
5 Retired 42 12.3%
Total 342 100.0%
Source: Primary data
Above analysis shows that. 14.5 percent respondents are students of various levels, 30.8 percent of respondents
which are maximum among all are from doing private and government services, 19.6 percent are having their
own businesses, 22.8 percent respondents are from home maker category and retired people consists of 12.3
percent least of all categories. The sample shows that all groups of people visit malls for various reasons.

International Journal of Advance and Innovative Research Volume 6, Issue 1 (XXIV): January - March, 2019
133
ISSN 2394 - 7780
Chart-1
Table-2: Analysis of variance on Consumer Behaviour in Malls on occupation
Demographic Shopping Behaviour Sum of squares df Mean square F Sig.
Occupation
Shopping day
preference 13.256 4 3.314 19.354 .000
Preferred time to visit
mall 14.523 4 3.630 25.361 .001
Mode of transport 215.369 4 53.842 7.984 .000
Distance travelled 152.236 4 38.059 58.657 .000
Number of visits per
month 98.258 4 24.564 19.658 .012
Shopping companion 41.632 4 10.408 3.698 .004
Average number of
stores visited per trip 85.236 4 21.309 1.248 .124
Average time spent
per trip 2.369 4 0.592 0.854 .001
Average amount spent
per visit 25.236 4 6.039 8.654 .000
The data collected from respondents has been presented in the form of tables and charts for analysis, simple
percentages are calculated to meet the purpose and results are shown in the charts as below.
For the research study objectives which are taken by the researcher and the associated hypothesis, the statistical
tool applied to test the hypothesis related to demographic variable occupation is ANOVA. This test was used for
comparing the difference in the average value of the dependent variable – consumer mall behavior related with
the effects of the controlled independent variables- occupation.
To find the attitude and behavior of respondents towards shopping malls keeping in mind the occupation out of
different demographics. For different gender groups the test applied is Analysis of Variance (ANOVA). The
above table gives mean ratings by different occupation groups. The last column in the table (Sig.) is P-value. If
P<= 0.05 the difference between age groups is significant.
In the above table factors- Shopping day preference (0.000), Preferred time to visit mall (.001), Mode of
transport (.000), Distance travelled (.000), Number of visits per month (.012), Shopping companion (.004),
Average number of stores visited per trip (.124), Average time spent per trip (.001), Average amount spent per
visit (.000). People’s responses for the factor ‘average number of stores visited per trip’ has no significance
difference of all the above factors among various groups as far as occupation is concerned. The significance is
tested at 5% LOS. Thus from the analysis the researcher came to a conclusion that the occupation is significant
factor that influences peoples mall behavior.

International Journal of Advance and Innovative Research Volume 6, Issue 1 (XXIV): January - March, 2019
134
ISSN 2394 - 7780
Chart-2
FINDINGS
Findings of the descriptive study are related to the consumer’s behavior in mall culture displayed in tables and
charts. The intricate analysis carried out with indication to the data collected facilitated the test broad
hypotheses.
It means present status of respondent and his major engagement or activity. It helps to understand behavioural
patterns of, students, service people, self- employed, home makers and retired people.
1. There is a noteworthy difference among various occupations concerning their purchase decision in shopping
malls. The factors like company promotion gained highest value for both professional and business class
shoppers. Whereas for service class these are lowest preference. Service class preferred salesman’s
persuasion. For all visitors of the mall factors like dealers influence, brand image, and company image
affects equally.
2. The perception of sales people behavior different among different occupations. Equal number of business
and service class rated employee behaviour low rating, whereas no professional shopper rated employee
behavior as low. However majority of retailers rated employee behavior high.
IMPLICATIONS OF THE FINIDINGS
As per Manish Gupta observations, people across geographic landscapes have disposed towards new retail
formats where they can benefit in terms of money, time and effort. However, all these retail formats are
experiencing bigger challenges of holding their customers and earning life time profit from them. The focal
point of the research is on shoppers attributes such as per capita household income, demographic attributes like
age, education, gender, family size, occupation, family type, distance and time taken to reach mall, and
psychological factors like shopping orientation, life style, and sequential attributes like , frequency of purchase
average time spent per each trip etc. These aspects have higher impact on shopping behavior specifically in
retail format selection of shoppers. This also includes determinant factors of stores such as merchandise, price,
location, pre and post purchase, atmosphere and ambience and store facilities, customer service; temporal
factors like perceived risk, task definition have their share in selection of particular retail format.
RECOMMENDATIONS
There is a significant difference among various occupations pertaining to their purchase decision in shopping
malls. The factors like company promotion have highest value for both professional and business class
shoppers. Mall management should have balancing act across all occupations.
SCOPE FOR THE STUDY Research is a never ending progressive process. Every new study creates knowledge in respective areas and also
raises new questions to be answered and investigated. Hence, it is important to every researcher to record
findings of the study and also leaves the unresolved issues to the future researchers. The scope of the future
research starts where the present research ends, following are few areas/ issues present research throws up for
future investigation.
Second Hypothesis
‘There is a significant difference in consumer behavior towards the malls based on Occupation’
has been tested and accepted.

International Journal of Advance and Innovative Research Volume 6, Issue 1 (XXIV): January - March, 2019
135
ISSN 2394 - 7780
1. Future research can be conducted to study top line and bottom line modern shopping malls and organized
retail sector as a whole.
2. A relative study of mall culture and customer behavior in Tier I and Tier II cities can also be taken up.
3. A thorough study on comparative study of the preferences of consumers for malls and other retail formats
can be undertaken.
Apart from the time and cost limitations, there were some other limitations of the present research; hopefully
future studies in this area can overcome them. The findings of current study cannot be generalized for all malls.
Indian consumer has varied temperament and emotional disposition, and consequently different buying pattern
and unique decision making approach. Findings of the present study can be considered as few inputs for future
research in different parts of the country. The findings may not be very effective for other malls. This study
certainly opens doors to many researchers interested to pursue research in mall management and customer
behavior. Deeper insights can be obtained into the retail mix, tenant mix, service quality factors, demographic
dynamism etc. Furthermore, there is a scope to study the relationship between various shopping occasions in a
year and visitors behavior in these occasions to understand the pattern of footfalls. The similar studies also can
be done on demographic characters and motivational factors for particular shoppers’ behavior.
7. IMPORTANCE OF THE STUDY
Retailers should give due importance to loyal customers as they are cheaper to serve, act as ambassadors to the
brands. Retail outlets should have membership programmes to encourage their regular customers and generate
more revenues. Theses membership cards and rewards will change customer behavior significantly in favour of
retailers. Different types of rewards offered by mall retailers are bonus points, free gifts, and providing regular
updates on promotional schemes.
8. LIMITATION OF THE STUDY
Researcher has taken all measures to ensure that the study design optimizes the ability to achieve the research
objective. However there are some factors and limitations that do not validate the study but made to be noticed.
1. This study is restricted to the city of Mumbai & Navi Mumbai only.
2. This study is conducted based on primary data produced through questionnaire and assembled from the
respondents shopping across different malls and as such its observations relied on accuracy of data.
9. CONCLUSIONS
The share of organized retailing in India so far is very low with 5 percent, whereas the share of modern retail in
total retail is much higher with 65-75 percent globally. Therefore India has huge potential to grow in organized
sector, especially through format like shopping malls. Many malls in Mumbai are doing well but for few, of
course with many challenges and perennial problems like low occupancy and lower foot falls which are
affecting the desired growth. The present study has focused on various such issues to help developers, mall
managers and retailers in capital intensive sector to stop them doing previous mistakes and explore the potential
awaiting to explore. However apart from the many aspects, study also focused on various factors that promote
loyalty behavior of mall visitors.
10. REFERENCES 1. Abhigyan Sarkar, 2008, ‘Current Trends in consumer purchase Behaviour in Lifestyle shops globally’, The
Icfaian Management Journal Vol. VII, No. 6, pp. 71-83.
2. Alexander Chernev, June 2012, ‘Customers Will Pay More for Less’ Harvard Business Review South Asia,
pp. 24-25.
3. Arora Sweta, Malhotra Vaishali, Ralhi Priya (2011). “Retail Revolution”, Indian Journal of Marketing,
Vol. XXXIV (11), November, pp 13-17.
4. Beijing / Shanghai, 6 Jun, 2012, ‘Tracking consumer purchase attitude: Increasing focus on surveys in
Thailand’, The global Times International Journal, 11.44 AM IST.
5. Bennet Jeferry, Booz Allen & Hamilton Inc. CONS-003 3/01 3M, Challenges of a changing Retailing
Industry. Vol I Issue I.
6. Bilal Mustafa Khan, 2010, ‘Brand Personality and consumer Congruity: Implications for Advertising
strategy’, The Journal of Brand Equity, Vol. VI, No. I1&2I, pp. 8-35

International Journal of Advance and Innovative Research Volume 6, Issue 1 (XXIV): January - March, 2019
136
ISSN 2394 - 7780
7. Biyani K., 2007, It Happened In India, New Delhi, Rupa & Co. Donovan A. McFarline Indian journal of
marketing (vol-43 april-2013) book review: superior shopper value: strategies for gaining and retaining
customers. pp. 59-69.
8. Gopalan K. and Ghosh A., 4th June 2006, 'Retail Rush ', Business Today, pp.96.
9. Gupta L.C., Retail Management, Delhi, Wisdom Publications.
10. Helen Woodruffe-Burton, Sue Eccles, Richard Elliott, ‘Towards a practice of buying: A comprehensive
framework’, Journal of consumer Behaviour, Vol. 2, 5 pp. 254-259.
11. Mansi Batra Patney, 2010, ‘Indian consumers and their pattern of mall patronage: Application and the
theory of defined behavior to patronage intentions’, Iowa central University Amees, Iowa, pp. 1-94.
12. Miles, 2000,Young Lifestyles in Changing World
13. Rupesh Kumar Tiwari and Anish Abraham, in the article “Understanding the consumer Behaviour
Towards Shopping Malls in Raipur City” Published in International Journal of Management & Strategy,
Vol.1,No.1, July-Dec.2010
14. Stuart Elliott, December 18, 2009, ‘1,300 Retailers Can’t Be Wrong: The Future Is in shopping Behavior’
The New York Times retailing

International Journal of Advance and Innovative Research Volume 6, Issue 1 (XXIV): January - March, 2019
137
ISSN 2394 - 7780
IMPACT OF SKILL BASED TRAINING ON RURAL INDIA
Akshatha Jain and Leena Jadhav
Assistant Professor, IT Department, VSIT, Mumbai
ABSTRACT
Rural youth are educated but not skilled unlike urban youth. Lack of new, challenging and limited job
opportunities for educated rural youth. As a result rural people are moving towards urban areas to obtain
better employment opportunities and amenities of life.
The aim of this paper is to guide rural youth in various skills that are central to improve employability and
livelihood opportunities, reduce poverty, enhance productivity, and promote environmentally sustainable
development. Coordinated efforts are needed to develop an integrated approach that improves access to
relevant, good quality education and employment to all rural women and men.
This paper focuses on the existing ecosystem for skill development in rural India and the role skill development
has to play in the future for increasing employment and entrepreneurship opportunities among the youth of
rural India.
Keywords: Skill development, Livelihood, Government Initiatives, Knowledge Based training, entrepreneurship.
1. INTRODUCTION
Rural people’s access to education and training is often limited by financial barriers (e.g. training and
transportation costs) and non-financial barriers (e.g. scarce education and training infrastructure, inflexible
training schedules). Especially for poor rural children and adults, the opportunity costs for education and
training may be too high to give up their income-generating activities and unpaid duties that help sustain their
families.
In recent years, however, the economy had moved away from older labour-intensive industries using large
quantities of unskilled labour. The industrial structure shifted towards new knowledge-based industries such as
electronic information, electrical and special purpose equipment, petroleum and chemicals, increasing the
demand for skills.
Many rural people do not have basic education. This also hampers their access to technical and vocational
training or other skills development. Unequal gender relations and traditional gender roles entail specific
difficulties for rural girls and women in accessing education and training. Education and training is often of
inadequate quality. Teachers and trainers may be unqualified, equipment and technology out-dated, and
teaching and training methods ill-suited to rural contexts. In many developing countries, training systems tend
to operate in isolation from the labour market and employers’ needs, so training does not always match skills
demand.
2. REVIEW OF LITERATURE
Rural livelihoods are becoming diversified. Agriculture is the main source of livelihoods, but an increasing
share of rural households’ income comes from non-farm activities. One in four rural workers is employed full
time in non-farm rural work. While some farmers are engaged in high-return agricultural businesses (for
example, agri-business value chain activities and export-oriented cultivations), in developing countries many
are still engaged in low-productivity subsistence farming. Education and skills increase the ability to innovate
and adopt new technologies in agriculture and enhance farmers’ performance. Evidence from Asia suggests that
better education and training increases the chances to find high-paying non-farm employment, whereas lack of
education tends to limit options to agriculture or low-wage non-farm employment. Access to training is a major
constraint among rural people in developing countries. For instance, nearly 90 per cent of agricultural workers
in India have no formal training, and a study among small scale entrepreneurs in India has indicated that over 85
percent of rural informal sector operators have no business or technical training at all. Rural girls and women
are often the most disadvantaged. The global secondary school attendance rate for rural girls is 39 per cent as
opposed to 45 per cent for rural boys and 59 percent for urban girls. Training outside the formal training system
is often the most important source of skills training in developing countries. Many rural youth face great
disadvantages when trying to enter urban labour markets because of their low level of education and lack of
relevant skills and work experience.
3. OBJECTIVE OF THE STUDY
1. To study the selected skills development programme implemented by central and state government.

International Journal of Advance and Innovative Research Volume 6, Issue 1 (XXIV): January - March, 2019
138
ISSN 2394 - 7780
2. Offer modular skill training opportunities to rural youths based on local needs.
Study says that India is growing to be the world‟s best
Recovery treatments of temporary or chronic disabilities alongside their
Holidays or other forms of tourism.
4. Need of Skill Development
Our focus was on non-cosmetic surgery and medical treatment.
Education certainly opens the doors to lead a life of liberty but skills makes that liberty meaningful by allowing
one to achieve prosperity. Education and skills increase the ability to innovate and adopt new technologies in
agriculture and enhance farmers’ performance. There is a wide gap between skills needed and available. There
is a huge gap in demand and supply market. According to a survey done by NSDC, there is a huge demand for
skilled workers at all the stages in food processing industry, especially for person with short term course
training, having education level below 10th/ 12th standard. India currently faces a severe shortage of well-
trained, skilled workers. It is estimated that only 2.3 % of the workforce in India has undergone formal skill
training as compared to 68% in the UK, 75% in Germany, 52% in USA, 80% in Japan and 96% in South Korea,
according to the recent survey. Lack of education and lack of skill is a pestilence that we need to overcome in
over current system and the faster we do this, the better for all concerned. The shape of enterprises and jobs are
being change with the development of new technology. A large section of the educated workforce has little or
no job skill, making them largely unemployable. Skilling of rural population will improve economy and growth
in GDP (Gross domestic Product) and has a cascading effect on employment opportunities for creating rural
entrepreneurship. It is necessary to train rural people for reducing rural migration rate, poverty alleviation and
unemployment eradication.
5. FINDINGS
The sixth edition of India Skill Report (2019) provides the latest view of the talent landscape on India. It covers
the trends from supply as well as from demand side of talent.
WHICH SECTORS HAVE HIRED MOST?
Year Top Sectors
2016 Retail,Transport,Healthcare
2017 Core Sector(Oil & Gas, Steel Minerals),Auto Ancilliary
2018 BFSI, Retail
2019 BFSI,Software/Hardware,Manufacturing
MEN V/S WOMEN EMPLOYABILITY
Year 2016 2017 2018 2019
Male 36.01% 40.12% 46.87% 47.39%
Female 39.95% 40.88% 38.15% 45.6%
According to the Report the different key areas for skill development are as follows
Construction
Food processing
Fisheries
Healthcare
Tourism
Beauty and Wellness
Agriculture and Horticulture.
Textiles
Art and Crafts.
6. GOVERNMENT INITIATIVES FOR SKILL DEVELOPMENT
“National Skill Development Corporation” By Government Of India.
“Indian Institute Of Skills” By Government Of India.

International Journal of Advance and Innovative Research Volume 6, Issue 1 (XXIV): January - March, 2019
139
ISSN 2394 - 7780
“Kaushal Pradarshini” By Government Of India.
“Pradhan Mantri Kaushal Vikas Yojana” By Government Of India.
“National Apprentice Promotion Scheme (N.A.P.S.)‟ By Government Of India.
“Skill India Programme‟ By Government Of India.
“Skill Knowledge Providers (S.K.P.‟S)‟ By A.I.C.T.E.
“Community College Scheme‟ By A.I.C.T.E.
“Employability Enhancement Training Programme (E.E.T.P.)‟ By A.I.C.T.E.
7. CONCLUSION
Skill development of rural population is recognized as an urgent need of the day to reduce rural migration and
achieve decent livelihood. Government has launched many strategic measures to get decent livelihood through
entrepreneurship development at rural sector but in spite of programs, schemes and vocational courses India is
considered as industrially underdeveloped country. People are not aware of these government initiatives. So it is
necessary to raise awareness among rural people regarding government schemes and programs being run for the
promotion of rural entrepreneurship. Mass media play an important role to disseminate new information among
the people. Electronic media has a vital impact on audience. But the electronic media like T.V, radio, Internet,
Mobile are not much involved to disseminate information regarding government schemes and programs to
promote rural entrepreneurship. Therefore the use of effective media for the motivation and promotion of rural
entrepreneurship should be increased. With the development of technology, the demand of technically skilled
labors is increased. Rural people are not technically skilled. So it becomes an urgent need to develop technical
skill of rural people to fill this skill gap. skill development programs must be framed innovatively such that
there is environment protection, optimal utilisation of bio-waste and earning of livelihood can happen, all at
same time.
REFERENCES
1. https://Wheebox.Com/Static/Wheebox_Pdf/India-Skills-Report-2019.Pdf
2. Ministry of Skill Development and Entrepreneurship Annual Report, 2017-18 “Progressing towards an
Empowered India”
3. https://www.skillsforemployment.org/KSP/en/Details/?dn=EDMSP1_231827
4. http://in.one.un.org/job-creation-skilling
5. www.rural.nic.in
International Journal of Advance and Innovative Research Volume 6, Issue 1 (XXIV): January - March, 2019
140
ISSN 2394 - 7780
PERCEPTION ABOUT “MAKE IN INDIA” AND “SKILL INDIA” AMONG PEOPLE
Manasi Sandesh More and Anuja Shripad Padhye
Royal College of Science and Commerce, Dombivli
ABSTRACT
Prime Minister Narendra Modi launched the “Make in India” initiative on September 25, 2014 and “Skill
India” initiative on 15th July, 2015. Make in India was launched with the primary goal of making India a global
manufacturing hub, by encouraging both multinational as well as domestic companies to manufacture their
products within the country. Skill India aims to train over 40 crore people in India indifferent skills by 2022.
Primary as well as Secondary data is practiced in the design of this work and this paper discusses about Make
in India and Skill India schemes and their perspectives among the common people.
Keywords: Make in India, Skill India, Perspectives.
INTRODUCTION In the recent few years India has witnessed a remarkable structural transformation and is one of the Fastest
growing economies in the world. India is focused to embark upon an 8-10% growth trajectory over the next
decade. Several new initiatives have been launched by the Government in the last Two years, such as ‘Make in
India’, ‘Start-up India’, ‘Skill India’, ‘Digital India etc., with an aim to make India number one destination for
global FDI and to improve ‘Ease of Doing Business’ in India.
‘Make in India’ initiative was launched on September 25, 2014 by the Government of India with the aim to
promote manufacturing in India. The program includes major new initiatives designed to facilitate investment,
foster innovation, protect intellectual property, and build best-in-class Manufacturing infrastructure. Make in
India aims at 25 economy driving sectors including Biotechnology for GDP growth of the country.
Devised to transform India into a global design and manufacturing hub, Make in India was a timely response to
a critical situation: by 2013, the much-hyped emerging markets bubble had burst, and India’s growth rate had
fallen to its lowest level in a decade.
The Indian economy stood out as the lone shining star during 2015 when countries across the world struggled to
improve or even sustain growth rates. At 7.5% rates for the financial year 2015 – 16, the GDP growth rate of
India was to be the highest in the world. And so, the I in BRICS, is much superior to the other economies like
Brazil, China, Russia and South Africa. The world sees India as a star performer.
The objective of Make in India was to promote India as the most preferred global manufacturing destination to
propel sustainable growth, facilitate investment, foster innovation, enhance skill development, protect
intellectual property, and build best in- class manufacturing infrastructure.
Further, Skill India campaign was launched by Prime Minister Narendra Modi on 15 July 2015 to train over
40 crore people in India in different skills by 2022. To achieve the vision of ‘Skilled India’, Honourable Prime
Minister Narendra Modi launched National skill development mission to not only consolidate and coordinate
skilling efforts, but also expedite decision making across sectors to achieve skilling at scale with speed and
standards.
SCHEMES FOR THE SKILL DEVELOPMENT LAUNCHED BY GOVERNMENT OF INDIA 1. Deen dayal upadhyaya Grameen Kaushalya Yojana
2. Pradhan mantri Kaushal Vikas Yojana
3. Financial Assistance for Skill Training of Persons with Disabilities
4. National Apprenticeship Promotion Scheme
5. Craftsmen Training Scheme
6. Apprenticeship training
7. Pradhan Mantri Kaushal Kendra
8. Skill development for minorities
9. Green Skill Development Programme
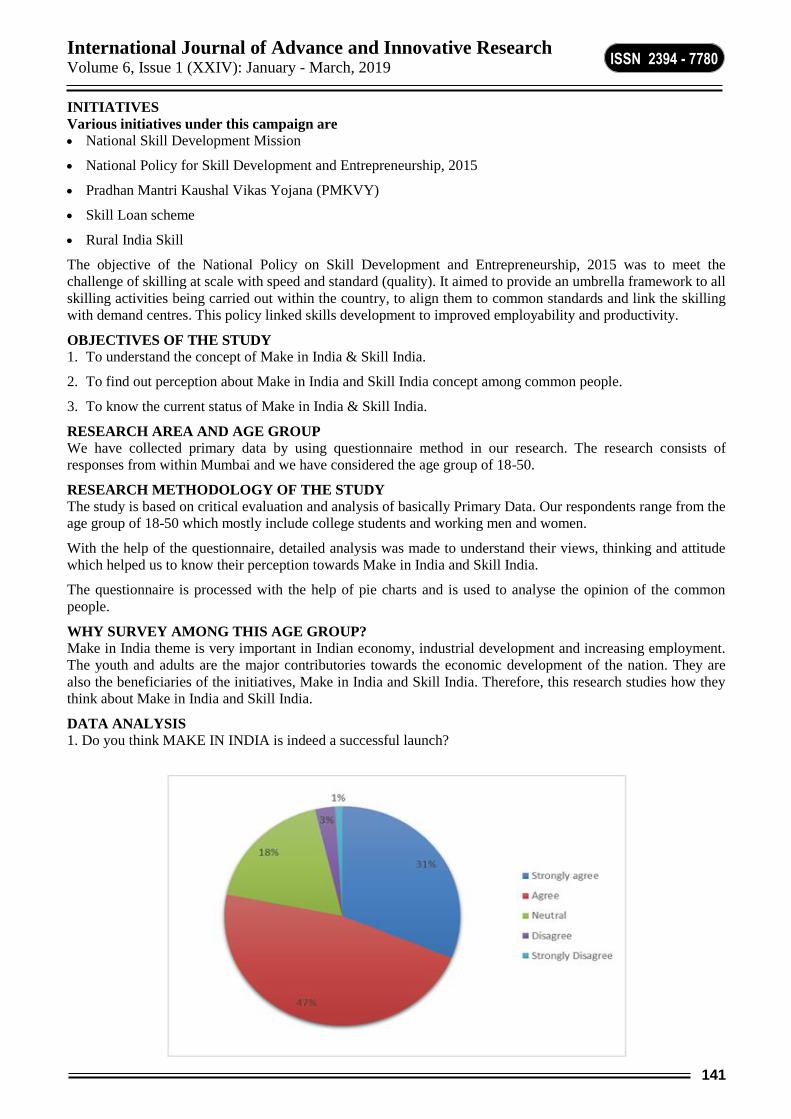
International Journal of Advance and Innovative Research Volume 6, Issue 1 (XXIV): January - March, 2019
141
ISSN 2394 - 7780
INITIATIVES
Various initiatives under this campaign are
National Skill Development Mission
National Policy for Skill Development and Entrepreneurship, 2015
Pradhan Mantri Kaushal Vikas Yojana (PMKVY)
Skill Loan scheme
Rural India Skill
The objective of the National Policy on Skill Development and Entrepreneurship, 2015 was to meet the
challenge of skilling at scale with speed and standard (quality). It aimed to provide an umbrella framework to all
skilling activities being carried out within the country, to align them to common standards and link the skilling
with demand centres. This policy linked skills development to improved employability and productivity.
OBJECTIVES OF THE STUDY
1. To understand the concept of Make in India & Skill India.
2. To find out perception about Make in India and Skill India concept among common people.
3. To know the current status of Make in India & Skill India.
RESEARCH AREA AND AGE GROUP
We have collected primary data by using questionnaire method in our research. The research consists of
responses from within Mumbai and we have considered the age group of 18-50.
RESEARCH METHODOLOGY OF THE STUDY
The study is based on critical evaluation and analysis of basically Primary Data. Our respondents range from the
age group of 18-50 which mostly include college students and working men and women.
With the help of the questionnaire, detailed analysis was made to understand their views, thinking and attitude
which helped us to know their perception towards Make in India and Skill India.
The questionnaire is processed with the help of pie charts and is used to analyse the opinion of the common
people.
WHY SURVEY AMONG THIS AGE GROUP?
Make in India theme is very important in Indian economy, industrial development and increasing employment.
The youth and adults are the major contributories towards the economic development of the nation. They are
also the beneficiaries of the initiatives, Make in India and Skill India. Therefore, this research studies how they
think about Make in India and Skill India.
DATA ANALYSIS
1. Do you think MAKE IN INDIA is indeed a successful launch?

International Journal of Advance and Innovative Research Volume 6, Issue 1 (XXIV): January - March, 2019
142
ISSN 2394 - 7780
Findings
About 47% agree that Make in India is a successful launch, while 31% are feeling very sure about success of
this launch. On the other hand, only 1% are disagree.
Therefore, we can say that this initiative is nothing less but a giant leap or the step of a lion.
2. Majority of the Indian citizens have been benefited from the SKILL INDIA initiative. How much do you
agree with this statement?
Findings
About 41% agree that Indian citizens has been benefited from the Skill India Initiative, while 25% are strongly
agree and only 3% are disagree.
Pradhan Mantri Kaushal Vikas Yojana (PMKVY) is the flagship scheme of the Ministry of Skill Development
& Entrepreneurship (MSDE). The objective is to enable a large number of Indian youth to take up industry-
relevant skill training that will help them in securing a better livelihood.
Basically, people below poverty line as well as students in private schools are invited to join PMKVY. It has a
wide course range, from hotel management to medical help etc. Some facts-
There are 12,973 training centres.
19, 72,145 candidates have enrolled.
19, 55,675 candidates have completed their training.
Therefore, it is possible that Skill India Initiative has been proved beneficial to people.
3. There was an increase in employment opportunities after the launch of this scheme. Agree?

International Journal of Advance and Innovative Research Volume 6, Issue 1 (XXIV): January - March, 2019
143
ISSN 2394 - 7780
Findings According to the diagram, 49% are agree that there is an increase in employment opportunities, while 26% are
neutral and 6% are disagree.
As per latest reports, Pradhan Mantri Kaushal Vikas Yojana (PMKVY) (2016-20), the flagship scheme of the
Ministry of Skill Development and Entrepreneurship (MSDE) registered 3,16,671 placements as on February
2018.Therefore, the statement holds true.
4. Make & Skill India initiatives have worsened India's relations with other countries. How strong do you agree
on this?
Findings
About 36% agree that the relations have worsened and about 36% disagree, on the other hand, 28% are neutral.
We can say that, India has the advantage of the young and skilled workforce over China, for e.g., which will
expectedly take Make in India to new heights in the near future. So, it is possible for the situation to become
worse among two economically growing countries.
5. Do you agree with a surge in Global Opportunity for the Indian Workforce?
Findings
According to diagram, 59% are agree that global opportunities are increasing, while 18% are neutral and 6% are
disagree.
The integration of developing economies such as China and India into the global economy in the last few
decades has helped lift millions out of poverty. The introduction of their labour forces into the global economy
increased growth and income in these economies which also resulted in a decline in global inequality. The

International Journal of Advance and Innovative Research Volume 6, Issue 1 (XXIV): January - March, 2019
144
ISSN 2394 - 7780
World Bank’s latest “Global Economic Prospects" report shows that the second wave of change in the global
labour market will play out over the next two decades, with developing economies contributing to all of the
addition in the global skilled labour force, as the number of skilled workers in advanced economies is expected
to decline. The rising level of skill and education in developing economies will also lift potential global growth
and continue to reduce global inequality.
Taking these points into consideration, we can say that there is surge in global opportunities for Indian
workforce.
6. How much do you agree with the strengthening of Indian Rupee against the domination of the US Dollar?
Findings
About 55% of the respondents agree that the Indian rupee has got strengthened, 18% disagree and 28% are
neutral.
So, we can say that, the emergence of manufacturing industries strengthened the rupee against the
Domination of the American dollar.
7. India is the agrarian country. But new developments in this scheme are service-oriented. Will it affect
agriculture of India?
Findings
As per the given diagram, 29% people are agree with this given statement, on the other hand 20% of people are
disagree with the given statement, while 25% are neutral.
Agricultural produce is the biggest resource of economic activity and development in India. Be poultry,
pisciculture, horticulture, apiculture, dairy development, etc. These activities create a big base for agricultural
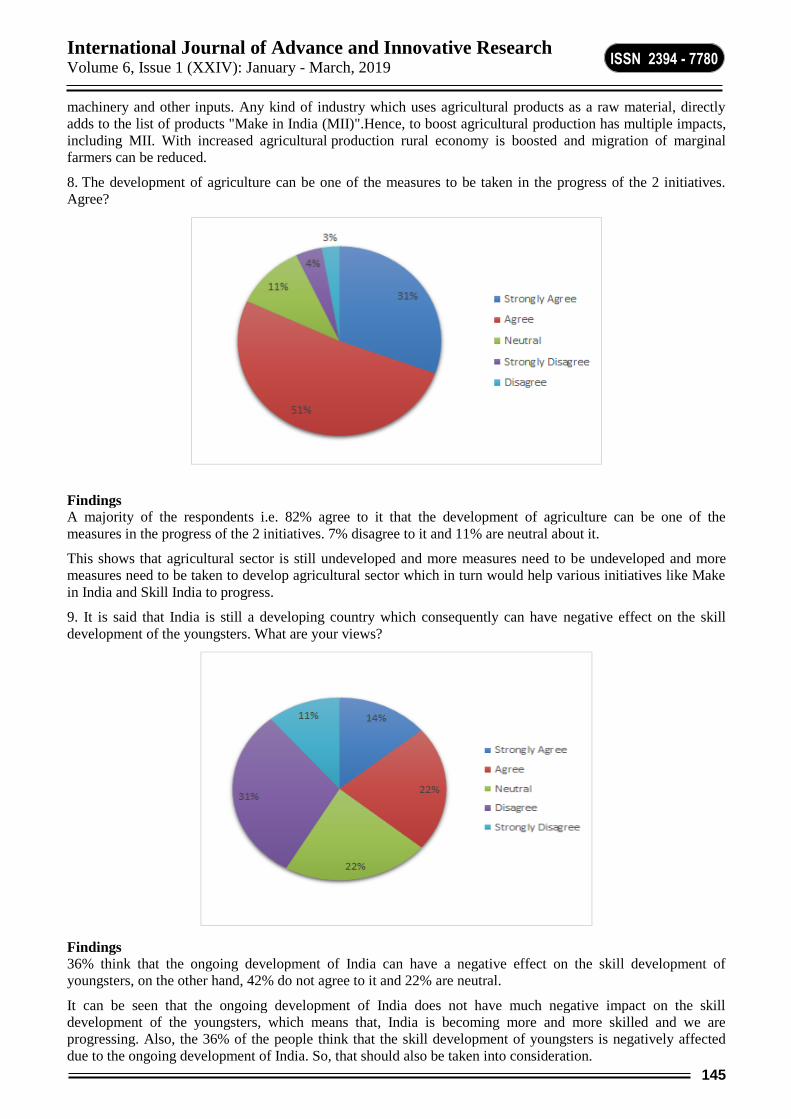
International Journal of Advance and Innovative Research Volume 6, Issue 1 (XXIV): January - March, 2019
145
ISSN 2394 - 7780
machinery and other inputs. Any kind of industry which uses agricultural products as a raw material, directly
adds to the list of products "Make in India (MII)".Hence, to boost agricultural production has multiple impacts,
including MII. With increased agricultural production rural economy is boosted and migration of marginal
farmers can be reduced.
8. The development of agriculture can be one of the measures to be taken in the progress of the 2 initiatives.
Agree?
Findings A majority of the respondents i.e. 82% agree to it that the development of agriculture can be one of the
measures in the progress of the 2 initiatives. 7% disagree to it and 11% are neutral about it.
This shows that agricultural sector is still undeveloped and more measures need to be undeveloped and more
measures need to be taken to develop agricultural sector which in turn would help various initiatives like Make
in India and Skill India to progress.
9. It is said that India is still a developing country which consequently can have negative effect on the skill
development of the youngsters. What are your views?
Findings 36% think that the ongoing development of India can have a negative effect on the skill development of
youngsters, on the other hand, 42% do not agree to it and 22% are neutral.
It can be seen that the ongoing development of India does not have much negative impact on the skill
development of the youngsters, which means that, India is becoming more and more skilled and we are
progressing. Also, the 36% of the people think that the skill development of youngsters is negatively affected
due to the ongoing development of India. So, that should also be taken into consideration.
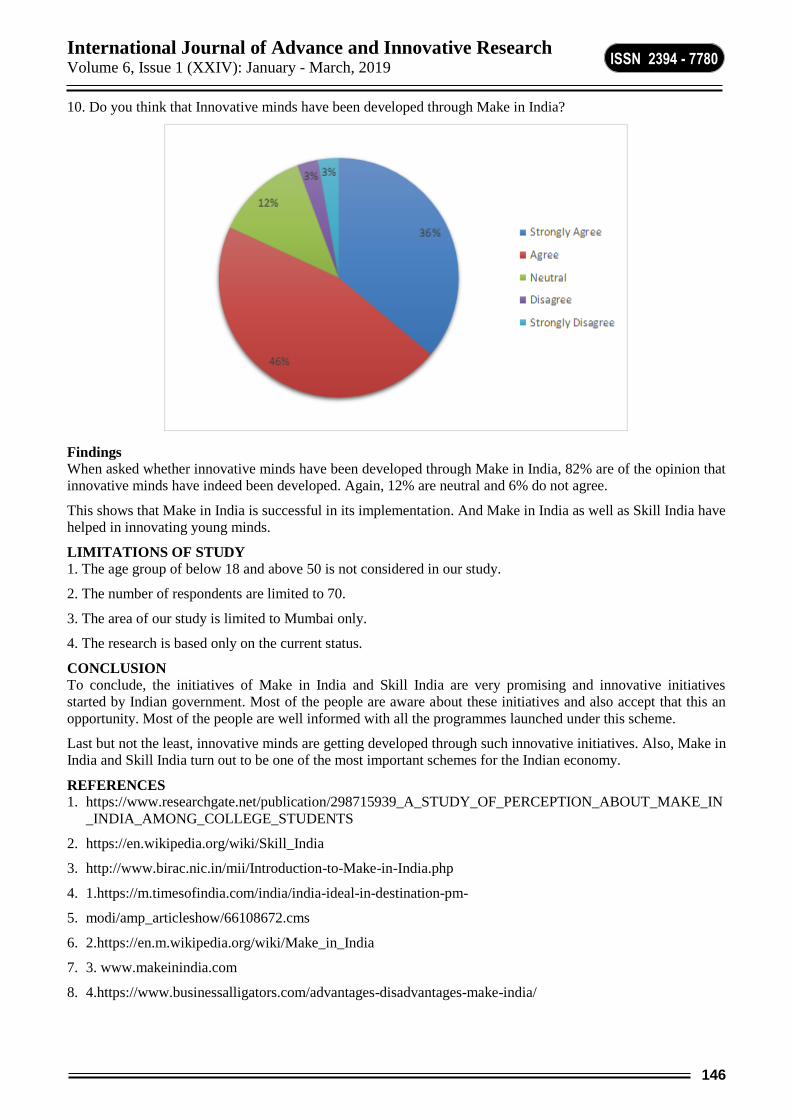
International Journal of Advance and Innovative Research Volume 6, Issue 1 (XXIV): January - March, 2019
146
ISSN 2394 - 7780
10. Do you think that Innovative minds have been developed through Make in India?
Findings
When asked whether innovative minds have been developed through Make in India, 82% are of the opinion that
innovative minds have indeed been developed. Again, 12% are neutral and 6% do not agree.
This shows that Make in India is successful in its implementation. And Make in India as well as Skill India have
helped in innovating young minds.
LIMITATIONS OF STUDY
1. The age group of below 18 and above 50 is not considered in our study.
2. The number of respondents are limited to 70.
3. The area of our study is limited to Mumbai only.
4. The research is based only on the current status.
CONCLUSION
To conclude, the initiatives of Make in India and Skill India are very promising and innovative initiatives
started by Indian government. Most of the people are aware about these initiatives and also accept that this an
opportunity. Most of the people are well informed with all the programmes launched under this scheme.
Last but not the least, innovative minds are getting developed through such innovative initiatives. Also, Make in
India and Skill India turn out to be one of the most important schemes for the Indian economy.
REFERENCES
1. https://www.researchgate.net/publication/298715939_A_STUDY_OF_PERCEPTION_ABOUT_MAKE_IN
_INDIA_AMONG_COLLEGE_STUDENTS
2. https://en.wikipedia.org/wiki/Skill_India
3. http://www.birac.nic.in/mii/Introduction-to-Make-in-India.php
4. 1.https://m.timesofindia.com/india/india-ideal-in-destination-pm-
5. modi/amp_articleshow/66108672.cms
6. 2.https://en.m.wikipedia.org/wiki/Make_in_India
7. 3. www.makeinindia.com
8. 4.https://www.businessalligators.com/advantages-disadvantages-make-india/

International Journal of Advance and Innovative Research Volume 6, Issue 1 (XXIV): January - March, 2019
147
ISSN 2394 - 7780
MOVING BEYOND HUMAN RESOURCE DEVELOPMENT (HRD) TO HUMAN DEVELOPMENT
RESOURCING (HDR) WITH SPECIAL EMPHASIS ON MENTAL HEALTH
Arun Sekhri
Director, Search Right Consultants, Mumbai
ABSTRACT
A famous comedian, 31, had everything going for him. Suddenly life stopped when he woke up one morning and
found himself in the throes of an anxiety attack. Arjun Bharadwaj's suicide at Taj Land's End is not so subtle
reminder of how a mental aberration can be so absolute. Namita, a 10th standard student, almost killed herself
when her father forced her to do engineering. Kriti, 17, committed suicide in Kota, just a day after results of
the IIT-JEE. In a note, Kriti said she was never interested in studying science. What’s going on?
Not five or ten but 15 Crores Indians from all milieus are seeking attention – a desperate cry for help.
How do we do it?
Tara Gaikwad, 32, Director – HR with a multinational company in beverage and snack food business, confided
that 6% of 60000 direct employees could be having mental health issues. It can happen to anyone of us at any
point of time, mild or severe. The question is how we create a support system for them:
And to be with them through the difficult phase of their life.
To enable them to cope with the stresses and complexities of life
And what remedial and professional assistance will be required to put their life back on track.
The organisations are very well geared to handle such issues of their people but HR, however, gets limited to
talent management, skill & competency development and employee relations.
I want to emphasise the importance of Human Development Resourcing.
Organisations need to move beyond human resource development to human development resourcing. Human
development resourcing is the process of identifying, building and sustaining resources for sustained
development of our human resource assets.
Keywords: Human Resource Development, Human Development, Resourcing, Mental Health, Anxiety, Stigma,
Suicide, Psychologist, Psychiatrist, Depression
INTRODUCTION
1. Why Human Development Resourcing?
It was at Metal Box India in 1970 at Faridabad. The company faced its one of the worst human crises coping
with fifty two cases of tuberculosis and leprosy discovered in a matter of thirty five days and half of them at the
last stage. The nearest sanatorium and skin speciality hospital was 325 kms away at Kasauli in Himachal
Pradesh. The resulting stress and the workforce pressures to ensure for quick healthcare to suffering employees
and interests of their families necessitated a long term solution to such future mishaps.
There was no fully secure and reliable system in HR to apprehend such incidents as we deal with human life
which by itself is so uncertain and unpredictable. We needed to look at human life from a different perspective.
And the new perspective was that we needed to move beyond Human Resource Development (HRD) to Human
Development Resourcing (HDR). That demanded a paradigm shift in our approach to resolve problems and
issues faced by our human resources whom we claim our scarce tangible assets.
Such serious problems we face in healthcare cannot be resolved just by admitting the sick employees in the
hospitals and then wait to see who survived and who did not. It is not only the cure or the prevention of a
disease; it is all about a bigger question “can we give our employees a disease free quality of life which they
deserve as human beings?
This shift from human resource development (HRD) to human development resourcing (HDR) brought clarity
on the issue at human resource development. Human resource development which is fundamentally an
endeavour for talent and skill development, competency and performance management and employee relations
is ineffective without resourcing. By resourcing we mean making funds available, providing infrastructure,
creating support system, hiring professionals to materialise the development of human resources which means
human resource development has to move beyond hiring and firing.

International Journal of Advance and Innovative Research Volume 6, Issue 1 (XXIV): January - March, 2019
148
ISSN 2394 - 7780
2. What is the difference Between Human Resource Development (HRD) and Human Development
Resourcing (HDR)?
A. Human Resource Development
In human resource development, we select our human resources and decide what assistance they need from us
to help them to change their vision, sharpen their competencies and skills and adapt to multi-skilling, and
betterment in leadership development, performance management, and human relations.
B. Human Development Resourcing
In human development resourcing, we first think of identifying, building and sustaining resources for sustained
development of human beings (human resources or human capital) such as financial, economic, social, mental,
psychological, spiritual and physical resources for overall sustainable human development. The development
areas include healthcare, nutrition, education, counselling, enrichment and quality of life and self-
empowerment.
3. Why Mental Health?
Sadhana, a10th standard student was diagnosed with low serotonin level causing severe anxiety disorder. A
popular film actress and a famous comedian, found themselves in the throes of an anxiety attack. Arjun
Bharadwaj's suicide at Mumbai hotel is reminder of how a mental aberration can be so absolute. Namita, a 10th
standard student, almost killed herself when her father forced her to do engineering. Kriti, 17, committed
suicide in Kota, just a day after results of the IIT-JEE because she didn’t like science.
3. Mental Health - 15 Crores Indians need Healthcare Support
Not five or ten but 15 Crores Indians from all milieus are seeking attention – a desperate cry for help.
Traditionally and for too long, mental health has been a neglected area in India’s health system. It is also well
recognised that health systems in India are weak and fragmented even though this scenario has begun to change
in recent years. Despite a growing knowledge of its relevance and importance, the neglect of mental health over
years and at all levels has resulted in an absent or limited health systems presence.
For decades, public and private sector organisations and educational institutions have overlooked this very
important segment of healthcare.
Almost 50% employees in Indian Corporate suffer from anxiety, stress and depression and hyper-tension.
4. What is Mental Health?
Mental health refers to our cognitive, behavioural, and emotional wellbeing - it is all about how we think, feel,
and behave. World Health Organization defines mental health as a state of well-being in which the individual
realizes his or her own abilities, can cope with the normal stresses of life, can work productively and fruitfully,
and is able to make a contribution to his or her community. Mental health is not just the absence of mental
disorder.
5. What is the Mental Illness?
Mental Health illness means a substantial loss of control on thinking, mood, perception, orientation or memory
that grossly impairs judgment, behaviour, capacity to recognise reality or ability to meet the ordinary demands
of life, mental conditions associated with the abuse of alcohol and drugs; acute pessimism, stress, depression,
trauma, lethargy, temper tantrum, indifference, isolation, disregard for personal appearance, poor self esteem,
obsession of failure and death, and other telltale signs of any degradation of normal behaviour.
LITERATURE REVIEW ON HUMAN DEVELOPMENT RESOURCING
The concept of Human Development Resourcing (HDR) is an inclusive and new concept. Most of the available
literature talks only about Human Development and its indexation. United Nations Development Programme
mentions the following six pillars of Human Development and quotes of world class economist are very
significant for the achievement of objectives of Human Development Resourcing:
1. Equity is the idea of fairness for every person, between men and women; we each have the right to an
education and health care.
3. Sustainability is the view that we all have the right to earn a living that can sustain our lives and have access
to a more even distribution of goods.
3. Productivity states the full participation of people in the process of income generation. This also means that
the government needs more efficient social programs for its people.
4. Empowerment is the freedom of the people to influence development and decisions that affect their lives.

International Journal of Advance and Innovative Research Volume 6, Issue 1 (XXIV): January - March, 2019
149
ISSN 2394 - 7780
5. Cooperation stipulates participation and belonging to communities and groups as a means of mutual
enrichment and a source of social meaning.
6. Security offers people development opportunities freely and safely with confidence that they will not
disappear suddenly in the future.
Mahbub ul Haqiv: Development Economist: Pioneer in Human Development Concept
In his work “Reflection on Human Development” examines that human development is more than GNP growth,
more than income and wealth and more than producing commodities and accumulating capital. A person’s
access to income may be one of the choices, but it is not the sum total of human endeavour. People are the real
wealth of nation. The basic capabilities for human development consist of health, education, access to resources
and community participation.
Raghuram Rajan: Economist and Academician Getting overly fixated with growth numbers should not be the priority. Instead the priority should be to focus on
structural reforms and ensure macro stability. Apart from that, the obvious prevarication that one can discern
over here is its inability to showcase a holistic picture of economic and human development issues like health,
education, and social inclusion
Jean Dreze and Amartya Sen: Economists
Development is equal to freedom is equal to social justice. Something must have gone terribly wrong in the last
six decades of Indian democracy, for our record in the social sector-be it healthcare, education or gender justice-
is dismal.
Simon Kuznets: Economist and Statistician:
Human development is, fundamentally, about more choice. It is about providing people with opportunities. The
process of development – human development - should at least create an environment for people, individually
and collectively, to develop to their full potential and to have a reasonable chance of leading productive and
creative lives that they value.
Joseph E. Stiglitz: Economist and Writer - Inequality is not a destiny:
Human development concerns with social innovations that start from below and that are capable of facing up to
the economic vacuum or to the inability of capitalist economy to respond to the needs of a multitude of citizens:
forms of social entrepreneurship; communities of citizens that pool together to meet new and old needs,
optimise the use of financial and human resources.
Amartya Sen: Economist:
Amartya Sen suggested that society’s standard of living should be judged not by the average level of income,
but by people’s capabilities to lead the lives they value. Nor should commodities be valued in their own right
instead, they should be seen as ways of enhancing such capabilities as health, knowledge, self-respect and the
ability to participate actively in community life. Therefore, expansion of human capabilities implies greater
freedom of choice.
Srinivasan and Verma: Economists & Sociologists:
The conceptual matrix of human development comprises three levels of development measured in terms of
aggregation of the human development and four dimensions of development in terms of economic, socio-
psychological, political and spiritual aspects.
RESEARCH METHODOLOGY
1. Target Population: Fifty Large & Medium Corporate Houses, Non Government Organisations, Trusts, CSR Initiatives.
2. Accessible Population:
Pan India large and medium size organisations in business of information technology, infrastructure, fast
moving consumer goods, pharmaceuticals, automobiles, media, and public utility, home appliances, multi-
businesses, beverages, non-government organisations and business machines.
3. Sample Size & Criteria for Sample Selection: Twenty five organisations representing above mentioned industries were selected on the basis of random
sampling as shown below in Table -1:

International Journal of Advance and Innovative Research Volume 6, Issue 1 (XXIV): January - March, 2019
150
ISSN 2394 - 7780
Table -1
Sr. No. Business of Organisations Selected No of Organisations Selected
1. IT and Business Process Outsourcing 7
2. Pharmaceuticals 3
3. Multi-Businesses 3
4. Infrastructure/Engineering 2
5. Fast Moving Consumer Goods 2
6. Home Appliances 2
7. Automobiles 1
8. Media 1
9. Public Utility 1
10. Business Machines 1
11. Beverages and Snack Foods 1
12. Non-Government Organisation 1
Total 25
Since the data was very confidential and sensitive, only those organisations were targeted which readily
provided the data on the promise of anonymity by not revealing the real names and locations of the
organisations. Therefore, the real names of organsations in this paper were substituted by certain pen names.
4. Method of Data Collection: Primary Data
A one page questionnaire was designed for collection of data. Personal meetings with HR heads of the selected
organisations were arranged who gave directions to their respective departments to provide the data after
necessary audit. Data covers people at all levels in the hierarchy of organisations. Personal data of employees
was not collected.
5. Method of Data Collection: Secondary Data
The secondary data was collected after due audit from various articles, newspaper reports and articles, journals
and books and fro internet search engines and relevant websites.
DATA ANALYSIS
Table–2: Shows percentage of employees with mental health issues corresponding with financial
funding and use of services of professionals
Sr. Name of
Company*
Business Total No of
Employees
in Lakhs
% of
Employees
with Mental
Health Issues
Financial
Funding
in Crores**
Other
Assistance*
**
1. S KT Limited Multi-Business 01.90 6.24 2.70 ***
2. TRC Limited Public Utility 14.00 11.00 2.64 NIL
3. LTTR Limited Infrastructure/Engi
neering
10.00 2.73 3.46 NIL
4. TCK Limited IT & BPO 03.71 2.54 2.00 NIL
5. ISYL Limited IT 02.25 3.67 2.00 NIL
6. PROL Limited Tech/IT 01.60 2.86 0.80 ***
7. MBT Limited Business Machines 03.80 2.80 0.20 NIL
8. WPL Limited Home Appliances 00.92 2.70 1.30 NIL
9. EFL Limited Water Purifier
Appliances
00.10 1.80 0.75 NIL
10. HINLL Limited FMCG 00.18 2.60 3.00 ***
11. GSK Limited Pharmaceutical 00.04 2.03 0.60 NIL
12. WKTC Limited Pharmaceutical 00.08 2.00 1.60 NIL
13. TIGBC Limited Media 00.12 2.60 0.80 NIL
14. PILL Limited Pharmaceutical 00.03 2.50 0.20 NIL
15. HTLC Limited IT & BPO 01.32 4.20 2.80 NIL
16. MAX Limited Automobiles 00.40 3.70 1.35 NIL
17. GTLT Limited Multi-Business 07.02 5.87 2.75 ***
18. MTTL Limited IT/BPO 00.14 6.50 2.60 ***

International Journal of Advance and Innovative Research Volume 6, Issue 1 (XXIV): January - March, 2019
151
ISSN 2394 - 7780
19. MPSS Limited IT/BPO 00.48 4.90 2.25 ***
20. TMTT Limited IT/BPO 01.14 6.40 2.00 ***
21. ABGT Limited Multi-Business 01.20 2.60 1.80 ***
22. MRCO Limited Wellness &
Beauty/FMCG
00.03 1.80 0.20 NIL
23. Mariwala Health
Initiative
Funding with
Partners for Mental
Health Awareness
and Cure
- - 2.00
Per Annum
YES
24. ALOCA
Limited
Beverages 00.25 1.50 2.10 NIL
25. LTGL Limited Infrastructure 00.05 0.05 0.05 NIL
*Sensitive Data – Real names of companies are not revealed.
**Funding: Calculated out of CSR funds.
*** Other assistance includes: Services of Psychologists/Psychiatrists/Medical & Psychiatric Social
Workers/Counsellors
Analysis of table 2
1. Percentage of employees with mental health issues/illnesses is highest in IT/BPO organisations followed by
multi-business corporate, public utility services and infrastructure companies as shown below in table -3:
Table-3: Analysis of Table-2
Shows total number of employees with mental health issues/illnesses and corresponding financial
assistance per employee is meagre considering the expensive mental healthcare.
Industry
/sector
No of
companies
Total no
of
employees
(in lakhs)
Percentage of
employees
with mental
health
issues/illnesses
No of
employees
with
mental health
issues/illnesses
Financial
Funding
2017-18
Financial
assistance per
employee with
mental health
issue (INR)
Hiring
services of
professionals
whenever
necessary
IT/BPO (7) 10.64 31.00 3,29840 12.45 3774.00 Yes
Multi-
business(3)
10.12 14.00 1,41680 07.25 5117.00 Yes
Public Utility
(1)
14.00 11.00 1,54000 02.64 1715.00 No
Infrastructure
(2)
10.05 03.00 30150 03.25 10800.00 No
Total 44.81 59.00 26,43,824 29.59 21406 Miniscule
Data Analysis-2
Table-4: shows loss of man days and loss of productivity during 2017-18
Sr. Name of
Company*
Business Designated
Mental
Health
policy
Follow up
of
Mental
Health Cases
Loss of
Mandays
2017-18
Days *
Loss of
Productivity
2017-18
(In Crores)*
1. S KT Limited Multi-Business Yes Yes 8642 11.36
2. TRC Limited Public Utility No Yes 16000 87.00
3. LTTR Limited Infrastructure/Engi
neering Yes Yes 2465 4.60
4. TCK Limited IT & BPO No Yes 1203 2.80
5. ISYL Limited IT No Yes 1560 4.60
6. PROL Limited Tech/IT No Yes 1470 2.78
7. MBT Limited Business Machines No Yes 1146 1.10
8. WPL Limited Home Appliances No Yes 0800 1.86
9. EFL Limited Water Purifier
Appliances
No Yes 0100 1.26
10. HINLL Limited FMCG Yes Yes 2040 3.40
11. GSK Limited Pharmaceutical No Yes 1260 1.88

International Journal of Advance and Innovative Research Volume 6, Issue 1 (XXIV): January - March, 2019
152
ISSN 2394 - 7780
12. WKTC Limited Pharmaceutical No Yes 0946 1.20
13. TIGBC Limited Media No Yes 1600 2.60
14. PILL Limited Pharmaceutical No Yes 0909 1.78
15. HTLC Limited IT & BPO No Yes 4530 3.40
16. MAX Limited Automobiles No Yes 1207 1.67
17. GTLT Limited Multi-Business Yes Yes 2986 4.34
18. MTTL Limited IT/BPO No Yes 7600 4.89
19. MPSS Limited IT/BPO Yes Yes 3005 3.86
20. TMTT Limited IT/BPO Yes Yes 4120 4.25
21. ABGT Limited Multi-Business Yes Yes 4760 3.79
22. MRCO Limited Wellness &
Beauty/FMCG Yes Yes 1100 1.34
23. Mariwala Health
Initiative
Funding with
Partners for Mental
Health Awareness
and Cure
- Yes NA NA
24. ALOCA
Limited
Beverages Yes Yes 3I96 2.60
25. LTGL Limited Infrastructure Yes Yes 0545 1.07
*Figures shown in these columns were provided by the respective organisations.
Table-5: Analysis of Table-4
Industry
/sector
No of
companies
Loss of
Mandays
Loss of
Productivity
(In Crores)
Cost of 1
Manday
(In
thousands)
Mental
Healthcare
Policy
Visits to
advance illness
cases
IT/BPO (7) 23488 26.58 11495 Yes -2 / No -
5
6-7
Multi-
business(3)
16388 19.49 12204 Yes Frequent - as per
the policy
Public Utility
(1)
16000 87.00
(Based on 7th
Pay
Commission
salary)
54375 No Occasionally 5-6
times
Infrastructure
(2)
3010 05.67 19930 Yes Frequently - until
recovery
Analysis: 1. One lost manday cost is enormously high in all the sectors. 2. Mental healthcare is casual
in the all the sectors. 3. Loss of revenue on account of mental illness is huge. 4. Majority
organisations don’t have designated mental healthcare policy.
Data Analysis-3
Table -6 Professional Charges
Mental Healthcare Professionals in India
Requirement and Availability
Mumbai
(in Rs)
Bengaluru
(in Rs)
Delhi
(in Rs)
Kolkata
(in Rs)
Professionals Required Available
Psychiatrists 13500 3827 2000- 4000
2500-
5500
3000-4500 1500 -3500
Clinical Psychologists 20250 898 1500-3000 2000-
4000
2500- 3500 2000-3000
Medical & Psychiatric
Social Workers
37000 850 Generally employed by hospitals
Trained Psychiatric
Nurses
3000 1500 500 -1500
Per day
500 -2000
Per day
500 -1500
Per day
500 -1500
Per day
Data provided by Ministry of Health in Lok
Sabha on February 06, 2018
Analysis: Demand and supply scenario is not going to
change soon. Corporate funding in HDR is necessary.

International Journal of Advance and Innovative Research Volume 6, Issue 1 (XXIV): January - March, 2019
153
ISSN 2394 - 7780
FINDINGS & CONCLUSIONS
Table–7: Findings & Conclusions
Areas Findings & Conclusions
Mental
Health
Policy.
1. Most of the companies don’t have designated policy and written guidelines on
mental healthcare.
2. Mental healthcare is low priority in Indian Corporate.
3. Vision, mission directions are critically missing in mental healthcare.
Human
Development
Resourcing.
1. Economic burden of mental healthcare is huge.
2. Mental healthcare financing is poor considering the expensive professional fees.
3. Hiring available professionals is inadequate.
4. Shortage of mental health specialists.
5. 150 million Indians in all milieus need assistance – fund, infrastructure and
professionals.
Human
Resource
Development
1. HRD reach is limited as it can handle only some cases.
2. It can manage spreading mental healthcare awareness about and educating
employees.
3. It can successfully help in removing stigma attached with mental illness.
Productivity
and Mandays
1.There is a huge loss of revenue to the organisations on account of loss of
mandays and low productivity on account of dismal performance in managing
mental healthcare and illness as a special and distinctive function of each
organisation in public and private sector.
REFERENCES
1. World Health Organization Mental health: facing the challenges, building solutions. Report from the WHO
European Ministerial Conference, Copenhagen, Denmark: WHO 2005.
2. Kohn R, Saxena S, Levav I, Saraceno B. The treatment gap in mental health care. Bulletin of the World
health Organization. 2004
3. Jacob KS, Sharan P, Mirza I, Garrido-Cumbrera M, Seedat S, Mari JJ, and Sreenivas V, Saxena S. Mental
health systems in countries: where are we now? Lancet. 2007
4. Saxena S, Maulik PK. Mental health services in low- and middle-income countries: An Overview- 2003
5. Murthy RS, Mental Health Care in India –Past, Present and Future. 2016.
6. Reddy GNN, Channabasavanna S M, Srinivasa, Murthy R. Implementation of National Mental Health
Programme for India. NIMHANS Journal 1986
7. Goel DS. Why mental health services in low- and middle-income countries are under-resourced,
underperforming: an Indian perspective, National Medical Journal of India. 2011.
8. References of Literature Review, UNDP (1990) “First Human Development Report”, Oxford Publication,
New York. Pulak S. P & D. K. Pant (1993): “An Alternative”
9. Kar N, Dutta S, Patnaik S. Mental health in an Indian industrial population: Screening for Psychiatric
Symptoms, Indian Journal Occupational Environment. 2002.
10. Mahbub Ul Haq (1997):”Reflection of Human Development”, Oxford University Press, India
11. Sen, Amartya (2000): “A Decade of Human Development”, Journal of Human Development, Vol. 1, No.1,
February.

International Journal of Advance and Innovative Research Volume 6, Issue 1 (XXIV): January - March, 2019
154
ISSN 2394 - 7780
ONLINE GROCERY STORES SUSTAINABILITY: A STUDY ON VARIOUS DIMENSIONS
INFLUENCING CONSUMER FOR PURCHASING ONLINE GROCERY
Dr. Ankita Srivastava1 and Shobha Premaram2
Associate Professor1 and Student2, Oakbrook Business School, Gandhinagar
ABSTRACT
The fast moving consumer goods (FMCG) segment is the fourth largest sector in the Indian economy. Growing
awareness, easier access, and changing lifestyles are the key growth drivers for the consumer market. With rise
in disposable incomes, mid- and high-income consumers in urban areas have shifted their purchasing trend
from essential to premium products. Today's consumer wants packaged goods that work better, faster, and
smarter. The “ need for speed" trend highlights the importance of speed as a potentially decisive purchase
factor for packaged goods products in a world where distinctions between products are shrinking. This brings
the importance of online shopping into picture. Through the online and mobile platforms the shopping has
become easier, faster and hassle free activity. Grocery purchase is the most time taking and less interesting type
of shopping activity. This study attempts to reveal the demographic characteristics of those users who
contribute most in the process of online purchase of grocery and the dominating factors which drive them to do
so.
Keywords: FMCG, Online buying, Consumers demographic
INTRODUCTION The fast moving consumer goods (FMCG) segment is the fourth largest sector in the Indian economy. The
market size of FMCG in India is estimated to grow from US$ 30 billion in 2011 to US$ 74 billion in 2018. Food
products are the leading segment, accounting for 43 per cent of the overall market. Personal care (22 per cent)
and fabric care (12 per cent) come next in terms of market share.
Growing awareness, easier access, and changing lifestyles are the key growth drivers for the consumer market.
The Government of India's policies and regulatory frameworks such as relaxation of license rules and approval
of 51 per cent Foreign Direct Investment (FDI) in multi-brand and 100 per cent in single-brand retail are some
of the major growth drivers for the FMCG market.
With rise in disposable incomes, mid- and high-income consumers in urban areas have shifted their purchasing
trend from essential to premium products. In response, firms have started enhancing their premium products
portfolio. Indian and multinational FMCG players are leveraging India as a strategic sourcing hub for cost-
competitive product development and manufacturing to cater to international markets. Today's consumer wants
packaged goods that work better, faster, and smarter. The “ need for speed" trend highlights the importance of
speed as a potentially decisive purchase factor for packaged goods products in a world where distinctions
between products are shrinking. This brings the importance of online shopping into picture. Through the online
and mobile platforms the shopping has become easier, faster and hassle free activity. Grocery purchase is the
most time taking and less interesting type of shopping activity. The market is flooded with such apps and
websites. To name few Grofers, Bigbasket, Reliance Fresh Direct, Zopnow, aaramshop etc.
LITERATURE REVIEW
(Shukla, August 2017) in his study a study on consumer perception toward online grocery concluded that
factors like wide variety of products, offers and discounts, free home delivery, time saving and convenience,
cost effective, easy terms and conditions, user friendliness, authenticity and genuineness, easy to order and cash
on delivery should be taken as strengths and pillars of online grocery shopping and these can be improvised or
modified to extract maximum advantage for business
(Aylott, 1999) An exploratory study of grocery shopping stressors research confirms grocery shopping to be
stressful, but time pressure was mentioned as only one factor causing shopping stress; other factors included:
crowd density, staff attitude and training, store layout/relocation, impulse purchasing pressure, location, product
assortment, music, and lighting. The article concludes by proposing a shopping stress curve for future
examination.
(S.Satiyaraj, June 2015) The major findings consumer perception toward online grocery store of the study are
29% of respondents quoted the reason for choosing the online shopping is to purchase unique and special
articles, and they want to find the best price of the product. The outcome of the research paper also revealed that
the demographic variables, such as gender, age group don’t have influence of the factors of customer
satisfaction.

International Journal of Advance and Innovative Research Volume 6, Issue 1 (XXIV): January - March, 2019
155
ISSN 2394 - 7780
(Bill Anckar, 2002) Creating customer value in online grocery shopping paper argues that there are four
different ways in which customer value can be created in electronic grocery shopping, but that the chosen
business model will set limits to whether – and to what extent – the firm will be able to offer value‐ adding
services for consumers. The relationship between business models and customer value in online grocery
shopping is exemplified, and some practical problems and opportunities in e‐ grocering are highlighted by
presenting the case of Nettimarket.com, a Finnish Internet grocery business that was founded by an entrepreneur
with no previous experience of the industry. His company is a start‐ up virtual grocery shop with a business
model unattainable by the big industry players. The paper reports on the experiences of the company and the
outlook of the entrepreneur after two and three years in business, respectively.
(Chincholkar, Mar-Apr 2016) The purpose of this paper is to identify consumer behavior towards online
grocery retailing specifically towards Localbaniya.com as a result consumer are accepting this new method of
online grocery retailing still traditional channels are more preferred. Slowly it may gain popularity among
young and working professionals.
(Blomqvist, 2015) Consumer Attitudes towards Online Grocery Shopping Thesis explains that the analyzed
empirical findings presented overall positive attitudes, as well as a strong correlation between positive attitudes
and intentions within online grocery shopping. This answers the research question and fulfils the purpose of
examining the influence that positive attitudes have on intentions within the field of online grocery shopping.
This research successfully tests the Theory of Planned Behavior and suggestions for further research are to
examine the underlying factors in a qualitative study.
(Nagendra, 2013) Survey revealed that it is the females, undergraduates and employed people who are shopping
for groceries online. The survey also revealed that nearly 87% of the respondents are open to online grocery
shopping, positive attitude towards the information is in detail with respect to groceries online and almost all the
respondents prefer to shop from a trustworthy website. The findings of the research also show that there is no
significant impact of return policy on shopping consumer attitude towards online grocery. Further, the result
shows that there is no positive influence of website design on the consumers who shop for groceries online.
OBJECTIVE OF THE STUDY
1) To study various dimension influencing consumer for purchasing online grocery
2) To explore most convincing dimension for online grocery purchase
3) To understand the establishment of demographic variables and consumer behavior for online shopping.
HYPOTHESIS
1. H0: There is no significance association between age and usage of app to purchase grocery
2. H0: There is no significance association between gender and usage of app to purchase grocery
3. H0: There is no significance association between marital status and usage of app to purchase grocery
4. H0: There is no significance association between income and usage of app to purchase grocery
5. H0: there is no association between age and frequency of ordering grocery through apps
6. H0: there is no association between gender and frequency of ordering grocery through apps
7. H0: there is no association between marital status and frequency of ordering grocery through apps
8. H0: there is no association between income and frequency of ordering grocery through apps.
RESEARCH METHODOLOGY
Research design
Our research regarding A study on various dimension influencing consumer for purchasing online grocery is a
descriptive research and quantitative because we just want to draw a picture of our topic as what are the
dimension that influence consumers to shop online
Source of data
Primary data was collected by conducting a survey. Respondents were given a structured questionnaire to
mark their preference, behavior and other related information.
Secondary data is collected through earlier studies and internet
The universe was all those who buy groceries online in Gandhinagar and Ahmedabad and the sample size was
200. Convenience Sampling method was used to make sample.

International Journal of Advance and Innovative Research Volume 6, Issue 1 (XXIV): January - March, 2019
156
ISSN 2394 - 7780
DATA ANALYSIS
Hypothesis-1
H0: there is no association between gender and usage of apps to purchase grocery online
Results
Yes No
Row Totals
Male 64 (69.52) [0.44] 15 (9.48) [3.21]
79
Female 112 (106.48) [0.29] 9 (14.52) [2.10]
121
Column
Totals 176 24
200 (Grand
Total)
The chi-square statistic is 6.0371. The p-value is .014008. The result is significant at p < .05. Hence the null
Hypothesis is rejected and we can conclude that there is an association between gender and usage of apps to
purchase grocery online
Hypothesis-2
H0: there is no association between marital status and usage of apps to purchase grocery online
Results
Yes No
Row Totals
Married 66 (59.92) [0.62] 2 (8.08) [4.57]
68
Unmarried 112 (118.08) [0.31] 22 (15.92) [2.32]
134
Column
Totals 178 24
202 (Grand
Total)
The chi-square statistic is 7.8253. The p-value is .005152. The result is significant at p < .05. . Hence the null
Hypothesis is rejected and we can conclude that there is an association between marital status and usage of apps
to purchase grocery online.
Hypothesis-3
H0: there is no association between age and usage of apps to purchase grocery online.
The chi-square statistic is 30.4915. The p-value is < 0.00001. The result is significant at p < .05. . Hence the null
Hypothesis is rejected and we can conclude that there is an association between age and usage of apps to
purchase grocery online.
Hypothesis-4
H0: there is no association between income and usage of apps to purchase grocery online
Results
Yes No
Row Totals
10000-20000 14 (15.84) [0.21] 4 (2.16) [1.57]
18
20000-30000 16 (18.48) [0.33] 5 (2.52) [2.44]
21
Results
Yes No
Row Totals
15-25 82 (94.71) [1.71] 22 (9.29) [17.41]
104
25-35 49 (45.54) [0.26] 1 (4.46) [2.69]
50
35-45 37 (34.61) [0.17] 1 (3.39) [1.69]
38
45-55 87 (80.14) [0.59] 1 (7.86) [5.98]
88
Column
Totals 255 25
280 (Grand
Total)

International Journal of Advance and Innovative Research Volume 6, Issue 1 (XXIV): January - March, 2019
157
ISSN 2394 - 7780
30000-40000 24 (23.76) [0.00] 3 (3.24) [0.02]
27
40000-50000 42 (37.84) [0.46] 1 (5.16) [3.35]
43
50000 above 80 (80.08) [0.00] 11 (10.92) [0.00]
91
Column
Totals 176 24
200 (Grand
Total)
The chi-square statistic is 8.3866. The p-value is .0784. The result is not significant at p < .05. Hence the null
Hypothesis is accepted and we can conclude that there is an no association between income and usage of apps
to purchase grocery online.
Hypothesis-5
Ho: there is no association between gender and frequency of ordering grocery through apps.
The chi-square statistic is 4.5553. The p-value is .336038. The result is not significant at p < .05. Hence the null
Hypothesis is accepted and we can conclude that there is no association between gender and frequency of
ordering grocery through apps.
Hypothesis-6
Ho: there is no association between marital status and frequency of ordering grocery through apps.
The chi-square statistic is 4.823. The p-value is .305947. The result is not significant at p < .05. . Hence the null
Hypothesis is accepted and we can conclude that there is no association between marital status and frequency of
ordering grocery through apps.
Hypothesis-7
Ho: there is no association between age and frequency of ordering grocery through apps.
Results
Daily Weekly Monthly Not fixed Fortnightly Row Totals
15-25 1 (4.75) [2.96] 20 (18.99) [0.05] 15 (18.99) [0.84] 41 (32.77) [2.07] 8 (9.50) [0.24] 85
25-35 2 (2.74) [0.20] 8 (10.95) [0.79] 13 (10.95) [0.38] 21 (18.89) [0.24] 5 (5.47) [0.04] 49
35-45 6 (2.07) [7.48] 11 (8.27) [0.90] 9 (8.27) [0.06] 6 (14.26) [4.79] 5 (4.13) [0.18] 37
45-55 1 (0.45) [0.68] 1 (1.79) [0.35] 3 (1.79) [0.82] 1 (3.08) [1.41] 2 (0.89) [1.37] 8
Column
Totals 10 40 40 69 20
179 (Grand
Total)
The chi-square statistic is 16.3452. The p-value is .037698. The result is significant at p < .05. . Hence the null
Hypothesis is rejected and we can conclude that There is association between age and frequency of ordering
grocery through apps.
Results
Daily Weekly Monthly Not fixed Fortnightly Row Totals
Male 6 (3.32) [2.17] 15 (15.12) [0.00] 15 (14.75) [0.00] 22 (25.81) [0.56] 8 (7.01) [0.14] 66
Female 3 (5.68) [1.27] 26 (25.88) [0.00] 25 (25.25) [0.00] 48 (44.19) [0.33] 11 (11.99) [0.08] 113
Column
Totals 9 41 40 70 19
179 (Grand
Total)
Results
Daily Weekly Monthly Not fixed Fortnightly Row Totals
Married 4 (3.27) [0.16] 19 (14.89) [1.14] 16 (14.53) [0.15] 19 (25.42) [1.62] 7 (6.90) [0.00] 65
Unmarried 5 (5.73) [0.09] 22 (26.11) [0.65] 24 (25.47) [0.09] 51 (44.58) [0.92] 12 (12.10) [0.00] 114
Column
Totals 9 41 40 70 19
179 (Grand
Total)

International Journal of Advance and Innovative Research Volume 6, Issue 1 (XXIV): January - March, 2019
158
ISSN 2394 - 7780
Hypothesis-8
Ho: there is no association between income and frequency of ordering grocery through apps.
Results
Daily Weekly Monthly Not fixed Fortnightly Row Totals
10000-
20000 1 (0.70) [0.12] 2 (3.21) [0.45] 4 (3.13) [0.24] 5 (5.40) [0.03] 2 (1.56) [0.12] 14
20000-
30000 3 (0.80) [5.99] 3 (3.66) [0.12] 2 (3.58) [0.69] 4 (6.17) [0.76] 4 (1.79) [2.74] 16
30000-
40000 1 (1.31) [0.07] 3 (5.96) [1.47] 2 (5.81) [2.50] 10 (10.02) [0.00] 10 (2.91) [17.33] 26
40000-
50000 2 (2.16) [0.01] 12 (9.85) [0.47] 11 (9.61) [0.20] 15 (16.58) [0.15] 3 (4.80) [0.68] 43
50000
above 2 (4.02) [1.02] 21 (18.32) [0.39] 21 (17.88) [0.55] 35 (30.84) [0.56] 1 (8.94) [7.05] 80
Column
Totals 9 41 40 69 20
179 (Grand
Total)
The chi-square statistic is 43.7196. The p-value is .000218. The result is significant at p < .05. . Hence the null
Hypothesis is rejected and we can conclude that there is association between income and frequency of ordering
grocery through apps.
FACTOR ANALYSIS
Reliability Statistics
Cronbach's Alpha NO of Items
.913 24
KMO and Bartlett's Test
Kaiser-Meyer-Olkin Measure of Sampling Adequacy. .878
Bartlett's Test of
Sphericity
Approx. Chi-Square 2.893E3
df 276
Sig. .000
Communalities
Initial Extraction
VAR00001 1.000 .831
VAR00002 1.000 .853
VAR00003 1.000 .840
VAR00004 1.000 .801
VAR00005 1.000 .638
VAR00006 1.000 .698
VAR00007 1.000 .614
VAR00008 1.000 .746
VAR00009 1.000 .718
VAR00010 1.000 .703
VAR00011 1.000 .731
VAR00012 1.000 .629
VAR00013 1.000 .521
VAR00014 1.000 .734
VAR00015 1.000 .629
VAR00016 1.000 .691

International Journal of Advance and Innovative Research Volume 6, Issue 1 (XXIV): January - March, 2019
159
ISSN 2394 - 7780
VAR00017 1.000 .685
VAR00018 1.000 .584
VAR00019 1.000 .623
VAR00020 1.000 .750
VAR00021 1.000 .734
VAR00022 1.000 .667
VAR00023 1.000 .665
VAR00024 1.000 .664
Extraction Method: Principal Component Analysis.
Total Variance Explained
Com
pone
nt
Initial Eigenvalues
Extraction Sums of Squared
Loadings
Rotation Sums of Squared
Loadings
Total
% of
Variance
Cumulative
% Total
% of
Variance
Cumulative
% Total
% of
Variance
Cumulative
%
1 8.554 35.643 35.643 8.554 35.643 35.643 4.502 18.760 18.760
2 4.074 16.975 52.618 4.074 16.975 52.618 3.650 15.207 33.966
3 1.648 6.866 59.484 1.648 6.866 59.484 3.235 13.480 47.446
4 1.292 5.384 64.868 1.292 5.384 64.868 2.886 12.025 59.471
5 1.181 4.919 69.787 1.181 4.919 69.787 2.476 10.315 69.787
6 .988 4.116 73.903
7 .815 3.396 77.298
8 .698 2.910 80.209
9 .506 2.106 82.315
10 .481 2.005 84.320
11 .433 1.806 86.126
12 .403 1.681 87.806
13 .392 1.631 89.438
14 .352 1.469 90.906
15 .343 1.429 92.336
16 .297 1.238 93.573
17 .288 1.199 94.772
18 .251 1.047 95.819
19 .232 .965 96.784
20 .201 .836 97.621
21 .190 .793 98.413
22 .145 .605 99.018
23 .132 .552 99.570
24 .103 .430 100.000
Extraction Method: Principal
Component Analysis.
Total Variance Explained
Com
pone
nt
Initial Eigenvalues
Extraction Sums of Squared
Loadings
Rotation Sums of Squared
Loadings
Total
% of
Variance
Cumulative
% Total
% of
Variance
Cumulative
% Total
% of
Variance
Cumulative
%
1 8.554 35.643 35.643 8.554 35.643 35.643 4.502 18.760 18.760
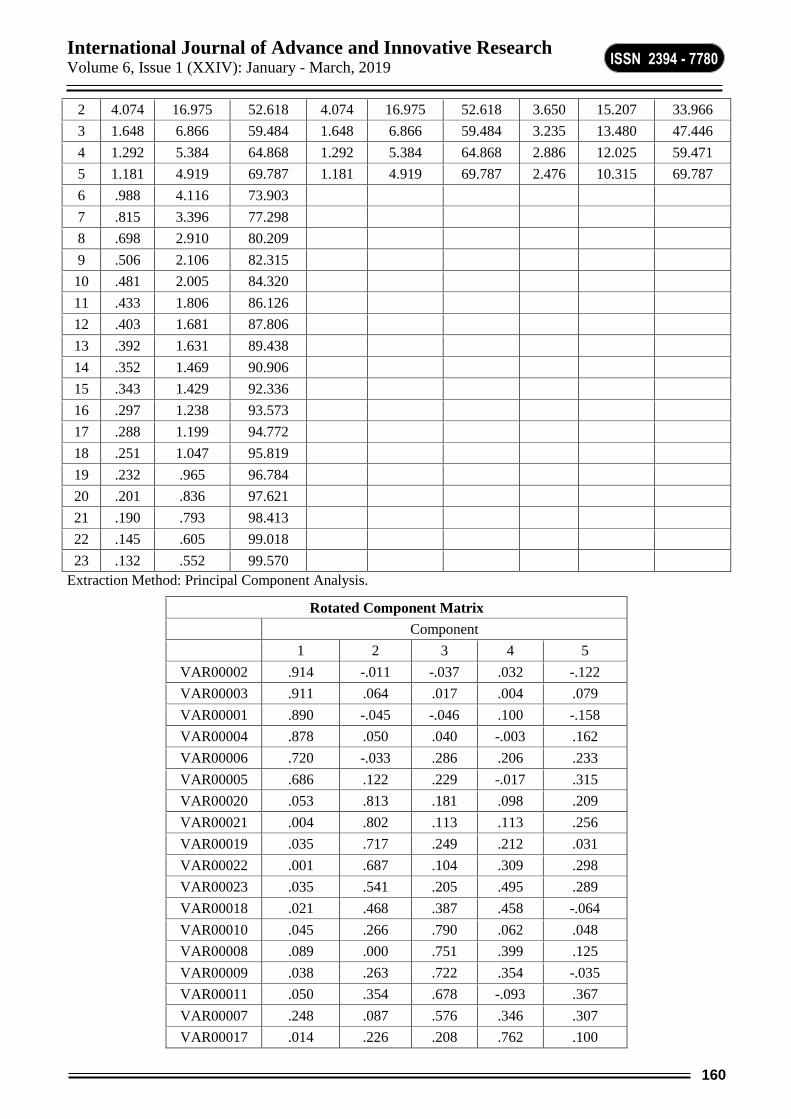
International Journal of Advance and Innovative Research Volume 6, Issue 1 (XXIV): January - March, 2019
160
ISSN 2394 - 7780
2 4.074 16.975 52.618 4.074 16.975 52.618 3.650 15.207 33.966
3 1.648 6.866 59.484 1.648 6.866 59.484 3.235 13.480 47.446
4 1.292 5.384 64.868 1.292 5.384 64.868 2.886 12.025 59.471
5 1.181 4.919 69.787 1.181 4.919 69.787 2.476 10.315 69.787
6 .988 4.116 73.903
7 .815 3.396 77.298
8 .698 2.910 80.209
9 .506 2.106 82.315
10 .481 2.005 84.320
11 .433 1.806 86.126
12 .403 1.681 87.806
13 .392 1.631 89.438
14 .352 1.469 90.906
15 .343 1.429 92.336
16 .297 1.238 93.573
17 .288 1.199 94.772
18 .251 1.047 95.819
19 .232 .965 96.784
20 .201 .836 97.621
21 .190 .793 98.413
22 .145 .605 99.018
23 .132 .552 99.570
Extraction Method: Principal Component Analysis.
Rotated Component Matrix
Component
1 2 3 4 5
VAR00002 .914 -.011 -.037 .032 -.122
VAR00003 .911 .064 .017 .004 .079
VAR00001 .890 -.045 -.046 .100 -.158
VAR00004 .878 .050 .040 -.003 .162
VAR00006 .720 -.033 .286 .206 .233
VAR00005 .686 .122 .229 -.017 .315
VAR00020 .053 .813 .181 .098 .209
VAR00021 .004 .802 .113 .113 .256
VAR00019 .035 .717 .249 .212 .031
VAR00022 .001 .687 .104 .309 .298
VAR00023 .035 .541 .205 .495 .289
VAR00018 .021 .468 .387 .458 -.064
VAR00010 .045 .266 .790 .062 .048
VAR00008 .089 .000 .751 .399 .125
VAR00009 .038 .263 .722 .354 -.035
VAR00011 .050 .354 .678 -.093 .367
VAR00007 .248 .087 .576 .346 .307
VAR00017 .014 .226 .208 .762 .100

International Journal of Advance and Innovative Research Volume 6, Issue 1 (XXIV): January - March, 2019
161
ISSN 2394 - 7780
VAR00016 .065 .153 .192 .737 .288
VAR00024 .176 .453 .170 .599 .201
VAR00014 .098 .254 .093 .194 .783
VAR00015 .101 .224 .076 .384 .645
VAR00012 4.159E-5 .343 .399 .026 .593
VAR00013 .386 .193 .059 .360 .449
Extraction Method: Principal Component Analysis.
Rotation Method: Varimax with Kaiser Normalization.
a. Rotation converged in 6 iterations.
Dominant Factors under the Study
1 Convenience
2 Reasonably Priced Wide Merchandise
3 Detail Labeled Healthy Products
4 User friendly apps and Promotion
5 Hassle free Comparison of Products
CONCLUSION
The study produces interesting results which is very helpful for online grocery players for designing their
strategies ti sustain in the market. The study reveals that Females are the heavy buyer of groceries online
specially those who are married they uses these apps more frequently. Study also reveals that those females who
are b/w the age group of 15-35 years having the qualification of Graduation and above are the frequent buyers.
So the main segment to be targeted for online groceries should be Married Females b/w 20 to 35 years age
having good qualification like graduation and above. The study also unfolds the dominating factors which are
contributing most in the online purchase decision. And the factors are Convenience, Availability of Reasonably
Priced Wide Merchandise, Detail Labeled Healthy Products, User friendly apps and Promotion, Hassle free
Comparison of Products. In order to sustain in the market, online marketers must provide the delighting
experience to the customers this will motivate customers to be stick on the specific portal for the purchase.
BIBLIOGRAPHY
Aylott, R. (1999). An Exploratory Study Of Grocery Shopping Stressors. British Food Journal.
Bill Anckar, P. W. (2002). Creating Customer Value In Online Grocery Shopping. International Journal of
Retail & Distribution Management.
Blomqvist, A. (2015). Consumer Attitude Towards Online Grocery Shopping.
Chincholkar, S. (Mar-Apr 2016). Consumer Behaviour Toward Online Grocery Retailing. International
Journal of Research In Management & Technology.
Nagendra, C. A. (2013). An Exploratory Study On Consumer Attitude Towards Online Shopping.
S.Satiyaraj, A. k. (June 2015). Consumer Perception Towards Online GroceyStores, Chennai. International
Journal Of Multidisciplinary Research.
Shukla, S. M. (August 2017). A Study On Consumer Perception Towards Online Grocery Shopping:
Challenges and Prospects.

International Journal of Advance and Innovative Research Volume 6, Issue 1 (XXIV): January - March, 2019
162
ISSN 2394 - 7780
A STUDY ON CONSUMER BEHAVIOUR TOWARDS BUYING THE PRODUCT ONLINE THANT
TRADITIONAL METHOD IN THANE REGION
Ritesh Ashok Jaiswal1, Sachin Omprakash Chourasiya2 and Dr. Shraddha Mayuresh Bhome3
Student1, 2 and Assistant Professor3, Satish Pradhan Dnyasadhana College, Thane
ABSTRACT
Internet has developed in new delivery channels. Outcome of electronic transaction is increasing rapidly this
need has arisen to understand how perceive directly to buy consumer most of the people who use the internet to
purchase a product online, but that there still some reasons for which consumers are reluctant to buy a online a
consumer purchase in the interactive age will be marketing ability to deliver pure and relevant information. this
is new environment has changed the traditional marketing process into a more customers intiatied and
controlled process . tradional marketing is aimed a passive audience while E marketing is targeting consumers
that actively seek information and thus single handedly screen or the unwanted information.The attitude of
people toward the purchase online are different in everywhere in India and across india The main objective of
this research is to study on consumer behaviour towards buying the product online than traditional method in
thane region.
First of all, we would like to express appreciation to our academic tutors, Olga Sasinovskaya and Maya
Paskaleva, for providing valuable feedback and guidance on our work. We would also like to thank Robert
Bengtsson, CEO at MindValue AB in Gothenburg, Sweden, for supporting us throughout the research by
sharing ideas and vital information concerning the marketing industry on the Internet, as well as the operations
of MindValue AB itself. We would further like to take the opportunity to send gratitude to the interviewees
making it possible for us to retrieve the information essential for conducting this study. Finally, our thanks goes
to Carl Emil Svedin, legal counsel at Saab AB in Linköping, Sweden, for taking his time to validate the
credibility of our translations made of the transcripts from the interviews.
Keywords: Purchase online, consumer behaviour, delivery channels.
INTRODUCTION
A online shopping a product refers to the shopping behaviour of consumer in an online store or a website used
for online purchasing purpose . online shopping has experienced a rapid growth during the recent year due to its
unique advantages of both the consumers and retailer , such as shopping at round the clock facilities ,
decreasing dependence to store visits , saving travel cost , increasing market area , decreasing over head
expenses and offering a wide range of product however the internet which is rather new type of digital
interactive media , an electronic channel of communication , where actors can take parts actively and instantly
has
However, the Internet which is a rather new type of digital interactive media, an electronic channel of
communication where actors can take part actively and instantly (Arens, 2004), has given rise to a new
marketplace, and a new form of commerce called e-commerce. To conduct e-commerce on the Internet is to
buy, sell, transfer, or exchange products, services, or information (Turban, Leidner, McLean & Wetherbe,
2006b). As explained by Cross and Smith (1996), the key selection criteria for consumers‟ purchases in the
interactive age will be the marketers ability to deliver pure and relevant information. This new environment has
changed the traditional marketing process into a more customer initiated and controlled process. Traditional
marketing is aimed at a passive audience while e-marketing is targeting consumers that actively seek
information and thus single-handedly screen out the unwanted information (Kotler et al., 2005). The business-
to-consumer interaction has clearly increased with the development of the Internet where online consumers are
in many cases not only consumers but also creators of information. This is the reason why companies regard
„word-of-mouth‟ of high importance. Online consumers‟ creativity and information-sensitivity has brought up
the use of „word-of-Web‟ or „word-of-mouse‟. As the creativity rises among consumers, so should the
approaches used by marketers and companies in order to fully exploit the Internet as a marketplace (Kotler et
al., 2005). The main reason for the great interest within this field is the authors‟ belief that the Internet will
develop even further, and perhaps one day, when our world only inhabits people from the Internet generation
(see definitions in section 1.5), it might end up being the marketplace where the majority of commerce will take
place. But to reach there, and for entrepreneurs to understand how to act properly towards their consumers on
the Internet, they have to be aware of what features people value in the traditional marketplace in order to be
able to incorporate these in online market and thereby optimise it.

International Journal of Advance and Innovative Research Volume 6, Issue 1 (XXIV): January - March, 2019
163
ISSN 2394 - 7780
THE RESEARCVHERS FINDS SOME PROBLRM IN THIS TOPIC
The internet explosion has shifted some of the traditional shopping to the online shopping environment
The internet has also divided consumers into two distinctively characterised groups, namely traditional and
consumer.
Too much clutter on the website.
Possibility of forgery.
A buying a product online physical examination of product is impossible while traditional physical is there
REVIEW OF LITERATURE
Li and Zhang (2002)examined the representative existing literature on consumer online shopping attitudes and
behaviour based on an analytical literature review. In doing so, this study attempts to provide a comprehensive
picture of the status of this subfield and point out limitations and areas for future research. They decided to
restrict their search of research articles to the period of January 1998 to February 2002. The other two criteria
for selection are the articles are empirical in nature, and the articles measure at least one of the identified factors
in our taxonomy they searched three primary IS conference proceedings volumes: International Conference on
Information Systems (ICIS), Americas Conference on Information Systems (AMCIS), and Hawaii International
Conference on Systems Science (HICSS). They also checked the reference sections of the selected articles to
identify and include additional prominent articles in this area. Three out of the five dependent variables
(consumer attitudes, intentions, and purchasing behaviour) and three out of the five independent variables
(personal characteristics, vendor/service/product characteristics, website quality) receive the most attention.
This seems to constitute the main stream of research in this area. It is found that personal characteristics,
vender/service/product characteristics, and website quality significantly affect online shopping attitudes,
intention, and behaviour. The direct implication of these findings is that targeting more appropriate consumer
groups, improving product and/or service quality, and improving website quality can positively influence
consumer attitudes and behaviour, possibly leading to increasedfrequency of early purchase and replication
purchases on the part of customers. This methodological matter wants to be addressed in upcoming research so
that a validated instrument can be developed for evaluating consumer online shopping approaches and behavior.
Danaher et.al (2003) focused on the loyalty of the 100 brands over the online shopping and offline shopping of
19 product of the grocery. They compared the grocery items of both the shopping with starting model which is a
new segmented of Dirichlet model, this model has very dominant features which gives the exact classes for the
brand choice and also gives the 14 real model for the purchasing behaviour. The outcome of the study revealed
that the reality of the high brands by the high market shares bought the online shopping much greater than the
expected. But in case of the small share brand it is just reversed. However in the traditional shopping the
expectations and the observations is not at all links to the brand share.
OBJECTIVES OF THE STUDY
To understand the issue in online shopping compare to traditional method
To find out the problems in online shopping and traditional method
To know the difference between online shopping and traditional method
HYPOTHESIS OF THE STUDY
RESEARCH METHODOLOGY
For the research we have taken a thane region and we have get a result positive in thane region. As shown in
table we have taken a research universe as Thane region. No of people responded on our sample research are 60.
In thane region with the help of Google Form we have taken a convenience sampling by questioner method. In
this we have used a primary & secondary data and to represent the all the question (?) in graph and percentage
method as data analysis techniques.
RESEARCH UNIVERSE THANE REGION
SAMPLE SIZE 60
METHOD OF SAMPLING CONVENIENCE SAMPLING
METHOD OF DATA COLLECTION QUESTIONNAIR
METHOD OF DATA PRIMARY & SECONDARY
DATA ANALYSIS TECHNIQUES GRAPH & PERCENTAGE METHOD

International Journal of Advance and Innovative Research Volume 6, Issue 1 (XXIV): January - March, 2019
164
ISSN 2394 - 7780
ANALYSIS & INTERPRETATION OF DATA
1. Are You Aware About Online Buying of Product?
As we have taken a sample survey we found that the 10% of people are not aware about ONLINE BUYING.
But the 90% of people are aware about they are aware about online shopping. As we have shown in chart the
blue color contain yes we aware about and orange color contain we not aware about online shopping it means
that 10% of people is shopping through traditional method.
2. Do You Say Online Purchasing is Better Choice than Traditional Purchasing?
As we have taken sample survey we found that 15% of people are said that traditional method is more
comfortable while going to online but 50% of people said that online purchasing is better than traditional and
35% of people said that may be
3. Which of the Website is More Use to Purchase Online Product?
As we have taken sample survey that which websites are more useful we found that 6o% of people using
amazon and 25% of using paytm ,5% of people big basket 5% OF PEOPLE flipkart 5% of people snapdeal this
is are the websites using by the public in thane region
As we can see there is more use of amazon just because of this is the only website which we can operate at low
internet only and it is very safe and easy to operate.

International Journal of Advance and Innovative Research Volume 6, Issue 1 (XXIV): January - March, 2019
165
ISSN 2394 - 7780
4. Type of advertisement mostly attracts shop offline Source
Survey Data and Author’s calculation There are various reasons why people are attracted to shop offline- most
prominent reasons are discounts ads, sales ads, festive ads and other miscellaneous ads attracts customers to
shop offline. India where festivals are regarded as mostauspicious moments, ads play important role in
promoting offline shopping. festive ads plays the major role with 38% in attracting the customers to go for
offline shopping, followed by sales ads with 36% this type of ads are great events to attract customers by
showing ads to customers abo ut sales for a limited period of time. The discount ads which covers up 23 %
comes next to sales ads in 41 attracting customer for offline shopping, While remaining 3% are other
miscellaneous ads such as off season etc. Also somewhat attracts people.
FINDING AND CONCLUSIONS
The study reveals that the male are less doing the online shopping than female. The female are more into online
shopping because they enjoy doing shopping whether it is traditional shopping or e-shopping. The young
generation are more often purchasing from online sites because of the revolution in the technology among the
youth population and they are able to use this technology for their well-being more than other age group
category. Flipkart is the shopping site which is more preferable by the youngster. There are increasing demand
of online shopping because the variety of options for the consumers to choose and that to at a reasonable price
and sometime even less price than the market. Electronic items were less demanded from the e-shopping but
clothes are much more demanded by the consumers. There are several products which are not delivered by the
shopping sites in the preferable area, it is seen that with the advancement of the technology the preference of the
online shopping increases. Earlier people more uses the traditional shopping. Now also people who are not
aware of the several shopping sites and not that technically advanced are less into internet for shopping.
This study advanced an ideal that uses consumer value perceptions to increase our thoughtful of channel choice.
Earlier work verified the key effect of perceived value has on purchase intentions, but merely concentrated on
product or store value insights. This paper extends the studies while asking the questions from the consumer
who are into online shopping as well as traditional shopping to rate both the channels in the terms of
performance, products, time of delivery, quality and other related aspects of online and offline shopping. By
accepting this approach, investigators and experts can gain valuable insights into the motivations to adopt a
definite channel for shopping. A cluster of all customer communication with products, services or persons that
is specific. Another concern was that the conceptual model, a theoretical context for the study of the theoretical
basis of all the research on it is placed. Customer behaviour is a process of discussions with investors to buy
consumer goods and consumer behaviour suggestions of the process.
REFERENCES
Aron M.Levin ,Irvin P.levin &Joshua A.Weller . (2005). A Multi-Attribute Analysis of Preference For
Online and Offline Shopping : Difference Across Products,Consumer,and Shopping states: Journal of
electronic commerce Research , Vol.6, No.4
Aron M.Levin, Irvin. P. Levin & C Edward Heath. (2003). Product Category Depends Consumer Preference
for Online and Offline Shopping Features and their Influence of Multi-Channel Retail Alliance. Journal of
Electronic commerce research, Vol.4, No.3.
Chanaka Jayawardhana Len Tui Wright. (2009). An Empirical Investigation into E-shopping Excitement :
Antecdents and effects: European Journal of Marketing,Vol.43 Issue 9/10 pp.1171- 1187.

International Journal of Advance and Innovative Research Volume 6, Issue 1 (XXIV): January - March, 2019
166
ISSN 2394 - 7780
INFLUENCE OF MASTERY ORIENTATION ON INNOVATIVE WORK BEHAVIOUR –
MODERATION BY CLIMATE FOR INNOVATION
Prof. (Dr.) Yogesh Upadhyay1 and Dharmendra Kumar2
Head and Research Scholar, School of Studies in Management, Jiwaji University, Gwalior
ABSTRACT
The present work investigates the moderating influence of climate for innovation on the relationship between
mastery orientation and innovative work behaviour. The study was conducted on 150 employees used standard
scales. It was proposed that the employees with a mastery orientation significantly contribute to innovative
work behaviour. Further, such contribution can be further scales with the intervention of climate for innovation.
The study suggests significant moderation by climate for innovation on the relationship between mastery
orientation and innovative work behaviour.
Keywords: Mastery Orientation, Climate for Innovation, Innovative Work Behaviour.
INTRODUCTION
Employees have long been considered a source of competitive advantage. So much so, that most of the time the
difference between a successful and not so successful business organization are their employees. Business
organization are investing billions of dollars in grooming them and aligning them towards their goals. In the
same vein, innovation has proved to be one of the major ingredients of the sustainability recipe for long. The
lifespan of business organizations offering ‘me-too’ products and services is fairly short and challenging.
Innovation is defined as “the process of bringing any new problem-solving idea into use…it is the generation,
acceptance, and implementation of new ideas, processes, products, or services” (Kanter, 1984, p. 20). As
obvious, innovation is about generation, acceptance and implementation of new ideas. One of the key internal
sources of ideas is employees as well. Additionally, their role, not limited to, is the acceptance and
implementation of new ideas irrespective of the source. Therefore, employees have a key role in keeping an
organization competitive and relevant. As a result, organizations work towards promoting innovative work
behaviour of employees. Innovative work behaviour may be referred as the dispositions of individuals
possessing effective abilities and skills with intrinsic motivation in varying behaviours with respect to the
associated work processes (Amabile, 1983). Since innovative work behaviour is considered to be discretional
work behaviour, therefore, it is out of a normal reward system of the organization (Janssen, 2000).
Increasingly organizations are creating systems where employees can showcase their innovation capabilities,
and also participate in embracing and implementing them. Researchers have worked intensely over the decades
to uncap the competitive advantage and sustainability that can be attained through innovative behaviour
(Agarwal, Datta, Blake-Beard, & Bhargava, 2012; Amabile, 1988, 1996; Amabile & Conti, 1999; Delmas
&Pekovic, 2018; Laukkanen, Siimekselä, Leavengood, & Hansen, 2017; Mogstad, Høiseth, & Pettersen, 2018;
Papa, Dezi, Gregori, Mueller, &Miglietta, 2018; Sung, Du, & Choi, 2018; Theurer, Tumasjan, &Welpe, 2018;
Wang, Tsai, & Tsai, 2014; Xu, Zhao, Li, & Lin, 2017).
Employees striving for ‘competence’ have been analyzed from the perspective of ‘social-cognitive’
achievement goal approach (Elliot & Church, 1997). This approach pins down employees’ approach towards
competence as ‘demonstration of competence’ i.e. performance orientation, vis-à-vis ‘development of
competence’, mastery-orientation (C. S. Dweck, 1986; Elliot & Church, 1997; Nicholls, 1984). Juxtaposed to
‘performance orientation’, where the approach is simply achievement of goals, employees with ‘mastery
orientation’ aims for ‘mastery’ in their respective domain. This difference in their approach is reflects the way
they handle the task. Employees with mastery orientation show resilience in the face of adversities, considers
work as fun, demonstrate high work engagement and are not let down by failures (Ames, 1995; Ames & Archer,
1988; C. S. Dweck & Leggett, 1988; Nerstad, Roberts, & Richardsen, 2013; Nicholls, Patashnick, Cheung,
Thorkildsen, & Lauer, 1989). Given its nature, mastery orientation is considered one of one of the significant
contributor towards innovative work behaviour of employees (Gong, Huang, & Farh, 2009; Hirst, Van
Knippenberg, & Zhou, 2009; Janssen & Van Yperen, 2004; Nerstad et al., 2013).
Innovation in its broad sense is also seen as the culture or environment prevailing in an organization where
value creation is at the core (Buckler, 1997). Supportive climate for innovation has been considered a major
ingredient for breeding innovation for long (Ahmed, 1998). There exists a considerable support for the influence
of supportive climate for innovation (Abbey & Dickson, 1983; Anderson & West, 1998; Shanker, Bhanugopan,

International Journal of Advance and Innovative Research Volume 6, Issue 1 (XXIV): January - March, 2019
167
ISSN 2394 - 7780
van der Heijden, & Farrell, 2017). In his seminal work (Scott & Bruce, 1994) segregated climate for innovation
into two factors viz., support for innovation and resource supply.
The present work, observing scant research on the connect between mastery orientation and innovative work
behaviour, attempts to do the same. Additionally, it also investigates the moderating role of climate for
innovation on the suggested connect.
HYPOTHESES DEVELOPMENT
Mastery Orientation & Innovative Work Behaviour
Mastery orientation influences creative behaviour of employees at workplace (Amabile & Pratt, 2016). Also,
mastery orientation is the inclination of an employee to gain competencies and expertise on the task by
involving consistent emphasis on work (Dweck & Molden, 2000; Dweck, 2013). Social cognitive theory also
recommended that employees may gain mastery exposure by observing their superiors as their role models
deeply (Bandura, 1999). Mastery orientation is found to be influencing significantly positively and also
displaying mediating influence towards innovative work behaviour in a highly recognized investigative study
done by Janssen & Van Yperen (2004). Gong, Huang, & Farh (2009) discussed that tendency of employees to
gain more learning leads them to attain mastery in work which further leads to attain innovative behaviour at
work. Therefore, it is proposed that
Hypothesis 1: Mastery orientation will be positively related to innovative work behaviour.
Hypothesis 2: Climate for Innovation will be positively related to innovative work behaviour.
Climate for Innovation, Mastery Orientation & Innovative Work Behaviour
Climate for innovation has been defined as the shared pattern of work environment where individuals regularly
interact collectively and mutually to work together and perform work related tasks (Mathisen, Torsheim, &
Einarsen, 2006). The climate for innovation has been found to exert significant positive influence on
innovative work behaviour (Anderson & West, 1998; Bawuro, Danjuma, & Wajiga, 2018; De Jong & Den
Hartog, 2007; Moolenaar, Daly, & Sleegers, 2010; Sung et al., 2018). Hsu & Chen (2017) found a positive
association between climate for innovation and employees’ innovative work behaviour. A 38 item inventory for
assessment of a team’s climate of innovations was developed by Anderson & West (1998) which can be used to
measure the innovative work behaviour of a work group. Climate for innovation plays an important role in idea
support and debate (Janssen, 2000). An investigative study conducted by Jaiswal & Dhar, (2015) on 372
employees and their supervisors of hotel industry in India revealed that climate for innovation enhances
employee creativity. It is believed that climate for innovation moderates the role of mastery orientation on
innovative work behaviour of employees. Therefore, it is proposed that
Hypothesis 3: Climate for Innovation will moderate the influence of mastery orientation on innovative work
behaviour.
The proposed model which encapsulates are propositions is given below:
Figure 1: Proposed Model
METHOD
Sample Design
A cross-sectional study was conducted targeting service industry located in Delhi/NCR chosen at random, and
data was collected from their 150 employees who agreed to participate in the study. The questionnaires with
missing responses were returned to the respondents and appropriate explanation was given corresponding to the
questions by the investigator on request. Finally, we could secure complete questionnaire from the respondents.
Out of the total respondents, 95 percent were males and 5 percent were females. Further, 49 percent were
graduates or below and 51 percent were postgraduate or above.

International Journal of Advance and Innovative Research Volume 6, Issue 1 (XXIV): January - March, 2019
168
ISSN 2394 - 7780
Measures
Mastery Orientation was measured using 8 items scale of mastery orientation developed by (Spence, 1983).It
is a 7 point scales ranging from strongly agree to strongly disagree.
Innovative work behaviour was assessed with the help of an adapted 9 item scale (Janssen, 2000; Kleysen &
Street, 2001; Scott & Bruce, 1994). The scale ranged from 1 (strongly disagree) to 5 (strongly agree).
Climate for Innovation was measured using employee rated 4 items scale developed by Scott & Bruce, (1994).
IWB, CI and MO Scales exhibited adequate reliabilities respectively as, .91, .71 and .79, which are above the
set threshold of 0.70 (Nunnally, 1967).
DATA ANALYSIS
The data collected and synthesized in analytical form was analyzed through Statistical Package for Social
Sciences (SPSS 25.0) and PROCESS script by Hayes (2012).
RESULTS
Hierarchical regression analysis was conducted to test whether the impact of mastery orientation and climate for
innovation on innovative work behaviour and further, to investigate the moderating influence of climate for
innovation, if/any. Multicollinearity diagnostics were assessed and were within an acceptable range (i.e., VIF
less than 10 and Tolerance more than .10). See Table 1 for correlations among variables. In the first step,
innovative work behaviour was regressed on mastery orientation and climate for innovation. Both the variables
accounted for a significant amount of variance innovative work behaviour, R2 = .325, F(2, 149) = 8.68, p = .001.
Specifically, mastery orientation b = 0.17, t(148) = 3.58, p = .001 and climate for innovation b = 0.22, t(148) =
2.50, p = .013, were significant predictors of innovative work behaviour. Therefore, the results support
hypotheses 1 and 2.
In the second and final step of hierarchical regression analysis, an interaction term, created by centering and
multiplying both the variables, was entered into the equation. The interaction term accounted for a significant
proportion of the variance in innovative work behaviour, ΔR2 = .05, ΔF(1, 146) = 8.241, p = .005, b = .13,
t(148) = 2.88, p = .005.
Table - 1: Results of Hierarchical Regression Analysis –Model Summary
Model R R
Square
Adjusted
R
Square
Std.
Error of
the
Estimate
Change Statistics
R
Square
Change
F
Change df1 df2
Sig. F
Change
1 .325a 0.106 0.094 1.05190 0.106 8.685 2 147 0.000
2 .392b 0.153 0.136 1.02691 0.048 8.241 1 146 0.005
a. Predictors: (Constant), Mastery Orientation, Climate for innovation
b. Predictors: (Constant), Mastery Orientation, Climate for innovation, Interaction between Climate for
Innovation and Mastery Orientation
To further investigate the impact of moderator on effect of mastery orientation on innovative work behaviour,
pick-a-point approach (Aiken, West, & Reno, 1991; Rogosa, 1980) was used. Under the approach, climate for
innovation and mastery orientation are is divided into three levels, viz. mean, one standard deviation above and
below the mean. As is visible in the Table 3 and Figure – 1, when the climate for innovation is below average,
there is no significant change in innovative work behaviour in spite of higher levels of mastery orientation. On
the other hand, when the climate of innovation changes from low to medium and high, effect on innovative
work behaviour becomes significant.
Table - 2: Results of Hierarchical Regression Analysis - Detailed
Model
Unstandardized
Coefficients
Standardized
Coefficients T Sig.
B Std.
Error Beta
1
(Constant) 1.801 0.399 4.516 0.000
Climate for Innovation 0.223 0.089 0.196 2.501 0.013
Mastery Orientation 0.166 0.046 0.281 3.581 0.000

International Journal of Advance and Innovative Research Volume 6, Issue 1 (XXIV): January - March, 2019
169
ISSN 2394 - 7780
2
(Constant) 1.926 0.392 4.917 0.000
Climate for Innovation 0.215 0.087 0.189 2.469 0.015
Mastery Orientation 0.147 0.046 0.249 3.211 0.002
Interaction term (CI X MO) 0.131 0.046 0.221 2.871 0.005
Note: MO - Mastery Orientation, CI – Climate for Innovation
Table - 3: Conditional effects of the mastery orientation at values of the climate for innovation
Climate for
Innovation Effect Se t p LLCI ULCI
-.9717 .0837 .1220 .6862 .4937 -.1574 .3248
.0000 .2966 .0798 3.7167 .0003 .1389 .4543
.9717 .5095 .1060 4.8046 .0000 .2999 .7190
Figure 1- Pick-a-Point
DISCUSSION
The results of the analysis were consistent with the hypotheses proposed. Mastery orientation and climate for
innovation has exhibited significant influence on innovative work behaviour. Further the investigation also
supports moderating influence of climate for innovation on the relationship of mastery orientation and
innovative work behaviour. At the low level of climate for innovation, hardly any traction is visible in the
innovative work behaviour of employees. Whereas, as the climate of innovation score scales, the relationship
becomes master orientation and innovative work behaviour becomes significant. The study offers clear evidence
of the moderating impact of climate for innovation on the relationship between mastery orientation and
innovation work behaviour. Broadly, any amount of intrinsic motivation, read mastery orientation, shall fail to
deliver innovative work behaviour in organizations where the climate for innovation is not supportive.
Therefore, positive climate for innovation offers a suitable echo system to employees laden with intrinsic
motivation for showing innovativeness at the work place. Finding significant influence of mastery orientation
on innovative work behaviour has found support from many earlier research works (Amabile & Pratt, 2016;
Dweck & Molden, 2000; Dweck, 2013; Gong et al., 2009; Janssen & Van Yperen, 2004). Additionally, the
moderating influence of climate for innovation too finds its findings vindicated by similar other studies
(Anderson & West, 1998; Bawuro et al., 2018; De Jong & Den Hartog, 2007; Hsu & Chen, 2017; Janssen,
2000; Moolenaar et al., 2010; Sung et al., 2018). Also, the present study offers an insight into the relationship of
the selected variables in Indian context since the majority of the other studies has been conducted in other
cultures (Amabile & Pratt, 2016; Bandura, 1999; Janssen & Van Yperen, 2004; VandeWalle, Brown, Cron, &
Slocum Jr, 1999).
IMPLICATIONS & FUTURE DIRECTIONS
The present research successfully affirms the influential relationship ofmastery orientation, climate for
innovation and innovative work behaviour. An important insight for future research is to a conduct longitudinal
research study to further evaluate the influences of mastery orientation and innovative climate on innovative

International Journal of Advance and Innovative Research Volume 6, Issue 1 (XXIV): January - March, 2019
170
ISSN 2394 - 7780
work behaviour, as these aspects vary with time and the present study is only cross-sectional in nature.
Additionally, the work can further be extended to include more mediating and moderating variables related to
job, team, individual and organization. Finally, to understand the causal nature of the variables the study needs
to be conducted in an experimental environment. The present work has useful implications for industry leaders
as it supports the association of mastery orientation, innovative climate and innovative work behaviour. The
industry leaders can use to capitalize orientations of employees to further innovative ideas, their implementation
and acceptance by offering correct blend of supportive climate to them. Broadly, the study helps to understand
the mode via which the intrinsic motivation of employees can be taken to its desired end i.e. innovative work
behaviour.
REFERENCES
Abbey, A., & Dickson, J. W. (1983). R&;d Work Climate and Innovation in Semiconductors. Academy of
Management Journal, 26(2), 362–368.
Agarwal, U. A., Datta, S., Blake-Beard, S., & Bhargava, S. (2012). Linking LMX, innovative work
behaviour and turnover intentions: The mediating role of work engagement. Career Development
International, 17(3), 208–230.
Ahmed, P. K. (1998). Culture and climate for innovation. European Journal of Innovation Management,
1(1), 30–43.
Aiken, L. S., West, S. G., & Reno, R. R. (1991). Multiple regression: Testing and interpreting interactions.
Newbury Park, CA: Sage.
Amabile, T. M. (1983). The social psychology of creativity: A componential conceptualization. Journal of
Personality and Social Psychology, 45(2), 357.
Amabile, T. M. (1988). A model of creativity and innovation in organizations. Research in Organizational
Behavior, 10(1), 123–167.
Amabile, T. M. (1996). Creativity in context: update to the social psychology of creativity. Hachette UK.
Amabile, T. M., & Conti, R. (1999). Changes in the work environment for creativity during downsizing.
Academy of Management Journal, 42(6), 630–640.
Amabile, T. M., & Pratt, M. G. (2016). The dynamic componential model of creativity and innovation in
organizations: making progress, making meaning. Research in Organizational Behavior, 36, 157–183.
Ames, C. 1995. Achievement goals, motivational climate, and motivational processes. In G. C. Roberts
(Ed.), Motivation in sport and exercise: 161–176. Champaign, IL: Human Kinetic Books.
Ames, C., & Archer, J. (1988). Achievement goals in the classroom: Students’ learning strategies and
motivation processes. Journal of Educational Psychology, 80(3), 260.
Anderson, N. R., & West, M. A. (1998). Measuring climate for work group innovation: development and
validation of the team climate inventory. Journal of Organizational Behavior: The International Journal of
Industrial, Occupational and Organizational Psychology and Behavior, 19(3), 235–258.
Bandura, A. (1999). Social cognitive theory: An agentic perspective. Asian Journal of Social Psychology,
2(1), 21–41.
Bawuro FA, Danjuma I, Wajiga H. Factors (2018). Influencing innovative behaviour of teachers in
secondary schools in the north east of Nigeria. Path Sci Int Electr Sci J. 4. 1007–1017.
Buckler, S. A. (1997). The spiritual nature of innovation. Research-Technology Management, 40(2), 43–47.
De Jong, J. P., & Den Hartog, D. N. (2007). How leaders influence employees’ innovative behaviour.
European Journal of Innovation Management, 10(1), 41–64.
Delmas, M. A., & Pekovic, S. (2018). Corporate Sustainable Innovation and Employee Behavior. Journal of
Business Ethics, 150(4), 1071–1088.
Dweck, C., & Molden, D. C. (2000). Self theories. Handbook of Competence and Motivation, 122–140.
Dweck, C. S. (1986). Motivational processes affecting learning. American Psychologist, 41(10), 1040-1048.
International Journal of Advance and Innovative Research Volume 6, Issue 1 (XXIV): January - March, 2019
171
ISSN 2394 - 7780
Dweck, C. S. (2013). Self-theories: Their role in motivation, personality, and development. Psychology
press.
Dweck, C. S., & Leggett, E. L. (1988). A social-cognitive approach to motivation and personality.
Psychological Review, 95(2), 256.
Elliot, A. J., & Church, M. A. (1997). A hierarchical model of approach and avoidance achievement
motivation. Journal of Personality and Social Psychology, 72(1), 218.
Gong, Y., Huang, J.-C., & Farh, J.-L. (2009). Employee learning orientation, transformational leadership,
and employee creativity: The mediating role of employee creative self-efficacy. Academy of Management
Journal, 52(4), 765–778.
Hayes, A. F. (2012). Process: A versatile computational tool for observed variable mediation, moderation,
and conditional process modeling.
Hirst, G., Van Knippenberg, D., & Zhou, J. (2009). A cross-level perspective on employee creativity: Goal
orientation, team learning behavior, and individual creativity. Academy of Management Journal, 52(2), 280–
293.
Hsu, M. L. A., & Chen, F. H. (2017). The Cross-Level Mediating Effect of Psychological Capital on the
Organizational Innovation Climate–Employee Innovative Behavior Relationship. The Journal of Creative
Behavior, 51(2), 128–139.
Jaiswal, N. K., & Dhar, R. L. (2015). Transformational leadership, innovation climate, creative self-efficacy
and employee creativity: A multilevel study. International Journal of Hospitality Management, 51, 30–41.
Janssen, O. (2000). Job demands, perceptions of effort-reward fairness and innovative work behaviour.
Journal of Occupational and Organizational Psychology, 73(3), 287–302.
Janssen, O., & Van Yperen, N. W. (2004). Employees’ goal orientations, the quality of leader-member
exchange, and the outcomes of job performance and job satisfaction. Academy of Management Journal,
47(3), 368–384.
Kanter, R. M. (1984). The change masters: Innovations for productivity in the American corporation. New
York: Simon and Schuster.
Kleysen, R. F., & Street, C. T. (2001). Toward a multi-dimensional measure of individual innovative
behavior. Journal of Intellectual Capital, 2(3), 284–296.
Laukkanen, V., Siimeksela, M., Leavengood, S., & Hansen, E. (2017). Best practices in capturing employee
creativity: forest sector firms in the USA and Finland. International Wood Products Journal, 8(1), 10–17.
Mathisen, G. E., Torsheim, T., & Einarsen, S. ale. (2006). The team-level model of climate for innovation: A
two-level confirmatory factor analysis. Journal of Occupational and Organizational Psychology, 79(1), 23–
35.
Mogstad, A., Hoiseth, M., & Pettersen, I. N. (2018). Co-creation in Public Service Innovation: A review of
how to encourage employee engagement in co-creation. DS 91: Proceedings of Nord Design 2018,
Linkoping, Sweden, 14th-17th August 2018.
Moolenaar, N. M., Daly, A. J., & Sleegers, P. J. (2010). Occupying the principal position: Examining
relationships between transformational leadership, social network position, and schools’ innovative climate.
Educational Administration Quarterly, 46(5), 623–670.
Nerstad, C. G., Roberts, G. C., &Richardsen, A. M. (2013). Achieving success at work: development and
validation of the Motivational Climate at Work Questionnaire (MCWQ). Journal of Applied Social
Psychology, 43(11), 2231–2250.
Nicholls, J. G. (1984). Achievement motivation: Conceptions of ability, subjective experience, task choice,
and performance. Psychological Review, 91(3), 328.
Nicholls, J. G., Patashnick, M., Cheung, P. C., Thorkildsen, T. A., & Lauer, J. M. (1989). Can achievement
motivation theory succeed with only one conception of success? In F. Halisch & J. H. L. van den Bercken
(Eds.), International perspectives on achievement and task motivation (pp. 187-208). Lisse, Netherlands:
Swets & Zeitlinger Publishers.
International Journal of Advance and Innovative Research Volume 6, Issue 1 (XXIV): January - March, 2019
172
ISSN 2394 - 7780
Nunnally, J.C. 1967. Psychometric theory. New York: McGraw-Hill.
Papa, A., Dezi, L., Gregori, G. L., Mueller, J., & Miglietta, N. (2018). Improving innovation performance
through knowledge acquisition: the moderating role of employee retention and human resource management
practices. Journal of Knowledge Management.
Rogosa, D. (1980). Comparing nonparallel regression lines. Psychological Bulletin, 88(2), 307.
Scott, S. G., & Bruce, R. A. (1994). Determinants of innovative behavior: a path model of individual
innovation in the workplace. Academy of Management Journal, 37(3), 580–607.
Shanker, R., Bhanugopan, R., van der Heijden, B. I. J. M., & Farrell, M. (2017). Organizational climate for
innovation and organizational performance: The mediating effect of innovative work behavior. Journal of
Vocational Behavior, 100, 67–77.
Spence, J. T. (1983). Achievement and achievement motives: Psychological and sociological approaches.
WH Freeman and Company. 75-146..
Sung, S. Y., Du, J., & Choi, J. N. (2018). Cognitive pathways of team climate for creativity: Implications for
member creativity and job performance. Human Performance, 31(4), 197–215.
Theurer, C. P., Tumasjan, A., & Welpe, I. M. (2018). Contextual work design and employee innovative
work behavior: When does autonomy matter? PloS One, 13(10), e0204089.
VandeWalle, D., Brown, S. P., Cron, W. L., & Slocum Jr, J. W. (1999). The influence of goal orientation
and self-regulation tactics on sales performance: A longitudinal field test. Journal of Applied Psychology,
84(2), 249.
Wang, C.-J., Tsai, H.-T., & Tsai, M.-T. (2014). Linking transformational leadership and employee creativity
in the hospitality industry: The influences of creative role identity, creative self-efficacy, and job complexity.
Tourism Management, 40, 79–89.
Xu, B.-D., Zhao, S.-K., Li, C.-R., & Lin, C.-J. (2017). Authentic leadership and employee creativity: testing
the multilevel mediation model. Leadership & Organization Development Journal, 38(3), 482–498.

International Journal of Advance and Innovative Research Volume 6, Issue 1 (XXIV): January - March, 2019
173
ISSN 2394 - 7780
REVIEWING INVESTMENT TRENDS &ROI OF DIGITAL MARKETING CHANNELS IN NEW
AGE MARKETING
Sodi Jasbir Kaur
Assistant Professor, Department of Commerce, H. R. College of Commerce & Economics
ABSTRACT
Digital marketing dominates marketing budgets of firms in new age marketing since last one and half decade. It
has also become the area of increasing importance for the researchers in the world as everyone is keen to know
the benefits and ROI of digital marketing in increasing the revenues of the firm. A marketer presses on the need
for digital marketing as they observe the phenomenal growth in social media, mobile and tablet usage. However
the studies conducted in the past have shown that equal growth is not reflected in the commitment to purchase
after visiting the website. The reasons for this can be many like price comparison, changes in user behavior,
convergence of online and offline world trending in the marketing. With the emergence of digital world, digital
marketing is the core and cannot be eliminated but it has tremendously added to the cost of marketing budgets
of the firms. Marketers are strategizing on reducing the cost of digitalization to match up with the purchase
decisions of the user so as to optimize the overall marketing expenses. This article is an attempt to understand
the role and returns on investment (ROI) aspects of digital marketing in new age marketing. It was found that
the digital marketing expenditure forms a major portion of marketing budgets and is on increasing trend over a
period of time. However its contribution to increase the sales is not equally reflected as compared to its
increasing overlay in most of the cases. In other cases the investment in the online channels has tremendously
contributed to the increase in sales. Hence the variability of the research findings can be attributed more to the
capabilities of the marketers in planning and implementing the ad campaigns.
Keywords: ROI, Digital Marketing, Social Media, Marketing, Sales, Online
INTRODUCTION
Digitalization is a key in today’s businesses. In order to keep pace with the evolving behavior and the market
landscape, there is a greater pressure on marketing operations – supportive technologies, skilled people , efficient
processes and all other that are going to connect with customers and convert them into brand loyal. When done
efficiently marketing operations provide improvement to in marketing effectiveness upto the extent of 15 to 25%.
When done well, we’ve seen marketing operations provide a 15 to 25 percent improvement in marketing effectiveness,
as measured by return on investment and customer-engagement metrics. Yet achieving that level of improvement is
elusive for many. While marketers are embarking on a wide array of “digital transformations” to reshape their
operations and business models, many of these efforts are stymied by marketing’s difficulty in delivering on its
aspirations. As per one of the survey conducted recently, it was found that 84% of marketers are unplanned in having
their formal content strategy and for their marketing channels and also lack in any formally managed content supply
chain but still their content budgets is on rise which can obviously due to lack of planning. (Source:
www.mckinsey.com)
REVIEW OF LITERATURE
The increasing digitalization leads to important challenges for marketing executives. Marketers are faced with
increasing complexities and challenges of changing markets which are beyond their control. As a result firms
have comprehended these changes to cope with the same. (Day, 2011). Facebook is used by more than one
billion active users throughout the world. Two years of its inception Facebook was actively used by 50 million
users. (Fisch, 2010). In countries such as Brazil, India, USA, Europe more than 70% of population is the
member of at least one social media network. (Van Belleghem, Eenhuizen, &Veris, 2011). More than 50% of
the social media users and companies are increasingly following social media since 2011 which has made it
necessary for marketers to spend more on social networking sites throughout the world and the spending has
reached to around USD 4.3 billion (Williamson, 2011). Some of the research studies suggest that more than
90% of customers read and go through online reviews before buying products and 67% of purchasers in all are
based on user generated content. Four reviews are approximately considered by purchaser before buying any
product. (Godes & Silva, 2012; Kee, 2008). These reviews play a significant role in purchase decision (Godes
& Silva, 2012; Kee, 2008). However it is clear that social media content led by customers reviews is more
important then the advertiser to gain the customers and hence it involves customer engagement as a necessary
orientation in marketing campaigns. (van Doorn et al., 2010). Various social media channels are actively used
by customers in interacting with each other regarding the products and the services they use. Blogs, reviews of
products and services, groups, product rating etc are important sources of information for customer insights and

International Journal of Advance and Innovative Research Volume 6, Issue 1 (XXIV): January - March, 2019
174
ISSN 2394 - 7780
is used for making purchase decision. Hence it can be said that social media plays an important role in
influencing consumer behavior and also in post purchase behavior. (Mayzlin &Yoganarasinhan, 2012; Onishi
&Manchanda, 2012)
RESEARCH OBJECTIVES
Research aims at understanding the role of digital marketing and social media in marketing operations with
reference to its cost effectiveness.
To understand the importance of digital marketing and social media in marketing.
To understand the effectiveness of digital marketing in increasing the revenues.
To assess the cost effectiveness of using digitalization in marketing operations
RESEARCH METHODOLOGY
Research data was collected from various surveys published online. The research also includes opinions of
some of the experts in the field of marketing.
RESEARCH FINDINGS
Investments in traditional advertising have dropped consistently over a period of half decade by single digit
percentages each year. Comparatively digital marketing spend has increased by double digit year after year.
Marketing trends have been largely shifted to social media channels whatever used to be spent traditionally on
television, newspapers, radio and etc are being spent on search, social media and email marketing. The trend is
believed to be continued in the future. Digital spending is one part of marketing budgets. Businesses that rely
heavily on the internet for their sales (e.g. an ecommerce business), invest a greater percentage of their
marketing budget towards digital. One of the research conducted by Forrester reflects that digital marketing
spending will make up to 44% of all ad spend and also this can vary depending on various factors depending on
industry, local markets, growth plans etc. there is a need for the healthy mix of market investment across
various social media channels especially in case of business who heavily rely on offline and online activities for
their reaching their sales targets. However it is observed that traditional channels have lost grounds and digital
marketing budgets have increased consistently over a decade. This trend is indicated by one of the survey
conducted in 2018 by CMO survey (Link shared in references). The research respondents have said that 12%
will be spend more comparatively in 2019 on digital marketing by their companies. There will be overall
increase of approx... 7.5% in the marketing spend in coming year. However in some cases it was observed that
marketers reports average or below average contribution by mobile and social media investments in company’s
performance which may probably be due to the reason that marketers needs more work and maturity in digital
marketing efforts. If not done well there are chances of thinking about series of ongoing campaign which may
not yield the expected results.
MARKETING BUDGET ANALYSIS
Categories Marketing Budget to
Company’s revenue (%)
Marketing Budget to
Firms total Budget (%)
B2B Product 6.3 9.2
B2B Services 6.9 8.9
B2C Product 9.6 16
B2C Services 11.8 14.9
Source: Compiled by researcher from the CMO survey 2018
Overall spending on marketing operations is reasonable across B2B and B2C products and services as
the approx. 12% of the spending on marketing operations is desirable. So far as B2C is concerned the
marketing operations can be further strategized by proper planning. The marketing budget as compare d
to firms’ total budget has been fairly variable across B2B products and services and has reached up to
16% so far as B2C products and services are concerned. However marketers have further reported
increase in the budgets of the same in the next 12 months. 54% of the organizations generates approx... 20%
of their overall revenue through email marketing. (Source: DMA "National Client Email Report", 2013) Another
study showed that Email marketing still leads the digital marketing with the highest percentage (72% of the
companies) rated email excellent and good ROI results. (Source: Econsultancy "Email Marketing Census
2011")
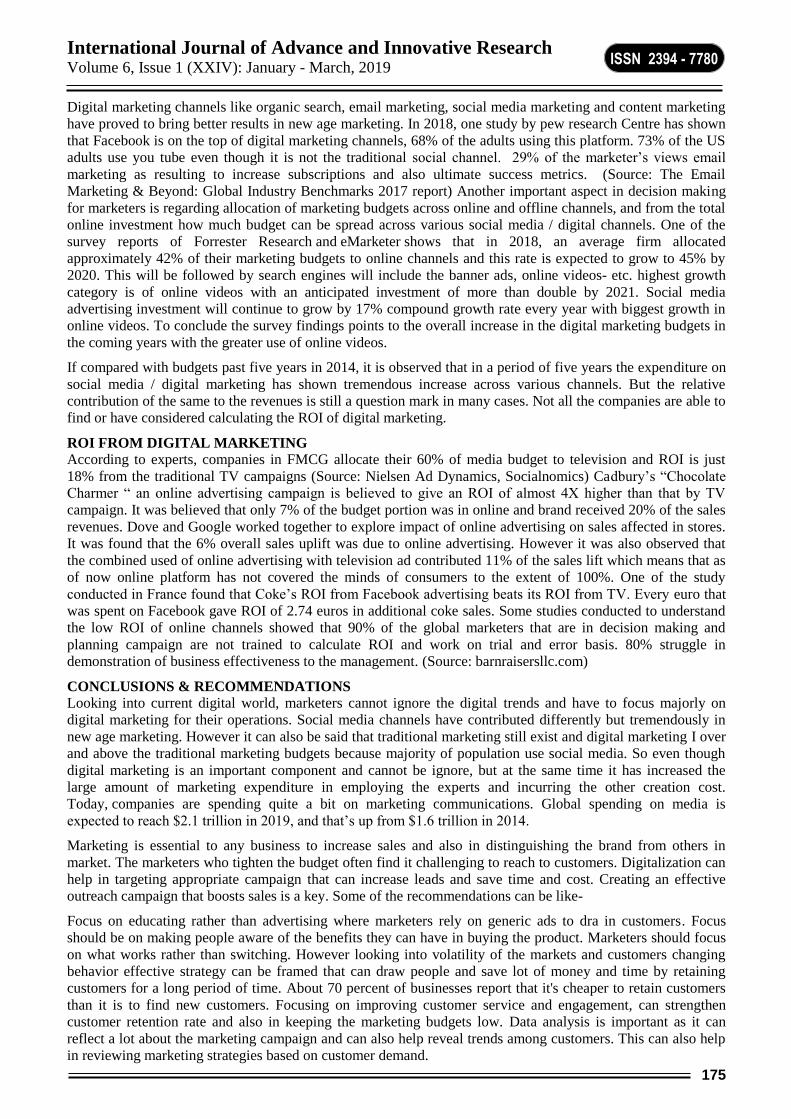
International Journal of Advance and Innovative Research Volume 6, Issue 1 (XXIV): January - March, 2019
175
ISSN 2394 - 7780
Digital marketing channels like organic search, email marketing, social media marketing and content marketing
have proved to bring better results in new age marketing. In 2018, one study by pew research Centre has shown
that Facebook is on the top of digital marketing channels, 68% of the adults using this platform. 73% of the US
adults use you tube even though it is not the traditional social channel. 29% of the marketer’s views email
marketing as resulting to increase subscriptions and also ultimate success metrics. (Source: The Email
Marketing & Beyond: Global Industry Benchmarks 2017 report) Another important aspect in decision making
for marketers is regarding allocation of marketing budgets across online and offline channels, and from the total
online investment how much budget can be spread across various social media / digital channels. One of the
survey reports of Forrester Research and eMarketer shows that in 2018, an average firm allocated
approximately 42% of their marketing budgets to online channels and this rate is expected to grow to 45% by
2020. This will be followed by search engines will include the banner ads, online videos- etc. highest growth
category is of online videos with an anticipated investment of more than double by 2021. Social media
advertising investment will continue to grow by 17% compound growth rate every year with biggest growth in
online videos. To conclude the survey findings points to the overall increase in the digital marketing budgets in
the coming years with the greater use of online videos.
If compared with budgets past five years in 2014, it is observed that in a period of five years the expenditure on
social media / digital marketing has shown tremendous increase across various channels. But the relative
contribution of the same to the revenues is still a question mark in many cases. Not all the companies are able to
find or have considered calculating the ROI of digital marketing.
ROI FROM DIGITAL MARKETING
According to experts, companies in FMCG allocate their 60% of media budget to television and ROI is just
18% from the traditional TV campaigns (Source: Nielsen Ad Dynamics, Socialnomics) Cadbury’s “Chocolate
Charmer “ an online advertising campaign is believed to give an ROI of almost 4X higher than that by TV
campaign. It was believed that only 7% of the budget portion was in online and brand received 20% of the sales
revenues. Dove and Google worked together to explore impact of online advertising on sales affected in stores.
It was found that the 6% overall sales uplift was due to online advertising. However it was also observed that
the combined used of online advertising with television ad contributed 11% of the sales lift which means that as
of now online platform has not covered the minds of consumers to the extent of 100%. One of the study
conducted in France found that Coke’s ROI from Facebook advertising beats its ROI from TV. Every euro that
was spent on Facebook gave ROI of 2.74 euros in additional coke sales. Some studies conducted to understand
the low ROI of online channels showed that 90% of the global marketers that are in decision making and
planning campaign are not trained to calculate ROI and work on trial and error basis. 80% struggle in
demonstration of business effectiveness to the management. (Source: barnraisersllc.com)
CONCLUSIONS & RECOMMENDATIONS
Looking into current digital world, marketers cannot ignore the digital trends and have to focus majorly on
digital marketing for their operations. Social media channels have contributed differently but tremendously in
new age marketing. However it can also be said that traditional marketing still exist and digital marketing I over
and above the traditional marketing budgets because majority of population use social media. So even though
digital marketing is an important component and cannot be ignore, but at the same time it has increased the
large amount of marketing expenditure in employing the experts and incurring the other creation cost.
Today, companies are spending quite a bit on marketing communications. Global spending on media is
expected to reach $2.1 trillion in 2019, and that’s up from $1.6 trillion in 2014.
Marketing is essential to any business to increase sales and also in distinguishing the brand from others in
market. The marketers who tighten the budget often find it challenging to reach to customers. Digitalization can
help in targeting appropriate campaign that can increase leads and save time and cost. Creating an effective
outreach campaign that boosts sales is a key. Some of the recommendations can be like-
Focus on educating rather than advertising where marketers rely on generic ads to dra in customers. Focus
should be on making people aware of the benefits they can have in buying the product. Marketers should focus
on what works rather than switching. However looking into volatility of the markets and customers changing
behavior effective strategy can be framed that can draw people and save lot of money and time by retaining
customers for a long period of time. About 70 percent of businesses report that it's cheaper to retain customers
than it is to find new customers. Focusing on improving customer service and engagement, can strengthen
customer retention rate and also in keeping the marketing budgets low. Data analysis is important as it can
reflect a lot about the marketing campaign and can also help reveal trends among customers. This can also help
in reviewing marketing strategies based on customer demand.

International Journal of Advance and Innovative Research Volume 6, Issue 1 (XXIV): January - March, 2019
176
ISSN 2394 - 7780
To conclude marketing should not be considered as an expense driver but a profit driver and all aspects of
marketing, including content and social media, are important are also showing no signs of slowing
down. Companies shouldn’t be afraid to invest in their own marketing strategies, in the right ways.
REFERENCES
1. Day, G. S. (2011). “Closing the marketing capabilities gap”. Journal of Marketing, 74(5), 183–195.
2. Fisch, K. (2010). Did you know 3.0? March 2, 2010; accessed January 19, 2013; [WWW.page].URL
http://www.youtube.com/watch?v=jp_oyHY5bug.
3. http://www.pewinternet.org/2018/03/01/social-media-use-in-2018/
4. https://cmosurvey.org/results/
5. https://www.webstrategiesinc.com/blog/how-much-budget-for-online-marketing-in-2014
6. Mayzlin, D., &Yoganarasinhan, H. (2012). Link to success: How blogs build an audience by promoting
rivals. Management Science, 58(9), 1651–1668
7. Onishi, H., &Manchanda, P. (2012).Marketing activity, blogging and sales. International Journal of
Research in Marketing, 29(3), 221–234.
8. Van Belleghem, S., Eenhuizen, M., Veris, V. (2011).Social media around the world 2011, InSites
Consulting.
9. Van Doorn, J., Lemon, K. N., Mittal, V., Nass, S., Pick, D., Pirner, P., &Verhoef, P. C. (2010). Customer
engagement behavior: theoretical foundations and research directions. Journal of Service Research, 13(3),
253–266
10. Williamson, D.A. (2011). Worldwide social network ad spending: A rising tide. eMarketer.com.
11. Williamson, D.A. (2011). Worldwide social network ad spending: A rising tide. eMarketer.com.

International Journal of Advance and Innovative Research Volume 6, Issue 1 (XXIV): January - March, 2019
177
ISSN 2394 - 7780
A STUDY ON CHANGING PRIORITIES AMONG PEOPLE IN RURAL INDIA FOR PURCHASE OF
LIFE INSURANCE PRODUCTS
Vivek Gupta
Assistant Professor, VSIT, Mumbai
ABSTRACT
Life of people in rural India is changing, changing fast and for the better, they are now much more aware about
the happenings around them and hence in a better position to take informed decision. With the changing times
and rise in education levels coupled with ever changing preferences, the reason for which people buy life
insurance is also changing. This paper tries to find out the reasons for the purchase of life insurance products
by people in rural India. Primary data was collected from people residing in Rural arears across Thane district,
a total of 600 respondents were interviewed across 7 talukas in Thane district. Henry Garret ranking method
was used to rank various reasons for which people buy Life insurance products
Keywords: Changing preferences, life insurance, Rural India
INTRODUCTION
The life insurance industry of India consists of 24 insurance companies; Life Insurance Corporation (LIC) is the
sole public sector company. Government's policy of insuring the uninsured has gradually pushed insurance
penetration in the country and proliferation of insurance schemes. Gross premiums written in India in FY18
from Life insurance industry reached Rs 4.58 trillion (US$ 71.1 billion) Overall insurance penetration
(premiums as % of GDP) in India reached 3.69 per cent in 2017 from 2.71 per cent in 2001.In FY19 (up to
August 2018), premium from new life insurance business increased 6.20 per cent year-on-year to Rs 755.88
billion (US$ 11.28 billion).However this seems to only be the one side of a coin as Life Insurance Industry for
the past two decades has been trying hard to penetrate in rural Indian market, especially after privatisation of
Life insurance sector in early 2000’s, but success has eluded the life Insurance industry mainly because the
people in rural India failed to understand the complex product offered by most of the players in the Industry.
The only bit of success industry received is by selling bundled life cover products along with loans disbursed by
Micro finance institutes. Life insurance industry as a whole has failed to meet the expectations of the people in
rural India and no genuine efforts are made to understand the requirements of the people in rural India. This
paper tries to find out the reasons for which the people in rural India have previously purchased life insurance
policies and also makes an attempt to understand the priorities which will drive the future sales
LITERATURE REVIEW
Tripathy, N. P. (2006). After the privatization of insurance market, there are many innovative customized
products available today. By analyzing the recent trends, increasing customer orientation of insurance industry
can be studied. The author makes an attempt to identify five key factors which are responsible for customer
preference for insurance products in India and recommend insurers to design future products based on these key
factors that influence consumers more while making purchase decisions. Chruchill, C. (2006).The CGAP
Working Group on Micro insurance launched a project in 2003 to research the experiences of Micro insurance
operations globally and identify various good and bad practices, it suggested strategies which are required to
achieve proper balance between costs, price and coverage and provides future outlook of Micro insurance
developments. S, G., Acosta, A. G., & Ballesteros, L. F. (2008). Given the various issues in financial
inclusion, the author attempts in analyzing effectiveness of Micro insurance in backward communities and
resource poor geographies. The author studied the understanding of the concept of Micro Insurance among the
potential as well as the actual clients. The survey reported that most of the households understood the concept of
health micro insurance but the micro life insurance policies are not well known. Venkata Raman Rao (2008)
Rao in his article has pointed out at the lack of preparedness by Industry to cater to the increase in demand after
a successful marketing campaign. According to him any marketing campaign will start yielding results probably
after 3 months and the marketer has to be ready for the increased demand or else the service quality will
diminish as the processing time will go up adversely affecting the Brand
Gopinath, K.(2009) in his research highlighted the requirement of conducting a initial pilot study to understand
the requirements of the target audience before launching its product in the rural market. He concluded that it is
important to analyse and understand the mind-set of the people living in rural areas before marketing the actual
products as the same will help them to reach the untapped market. Gupta, A. K. (2014). In comparison to
general insurance products which are brought due to compulsions under law or as a requirement from financiers
who require insurance as collateral security, life insurance has fewer such compulsions. The general attitude of

International Journal of Advance and Innovative Research Volume 6, Issue 1 (XXIV): January - March, 2019
178
ISSN 2394 - 7780
people is to defer the decision of buying life insurance products. In case of rural India, the possibility of death is
ignored and attitude of people is that they can never fall victim to destiny. Most people in rural India are
without life insurance cover. and rural population is also subject to weaker pension systems with little income
security in old age. This acts as an indicator that potential for growth is immense in the insurance sector in rural
India.
Overall selling of Insurance products especially Life Insurance products still remains a challenge as it tends to
be a push product rather than a pull product. Most of the earlier studies have indicated about the strong demand
for Life Insurance products in rural India, some studies have also highlighted the initiatives taken by Life
insurance industry to penetrate deep in the rural market over the past one decade. All the initiatives have hardly
had any meaningful impact, as the life Insurance Industry has completely failed to understand the requirements
of people in rural India and continue to offer the same products which were offered a decade ago. The priorities
of the prospective customers are completely ignored as the industry tries to sell whatever is available rather than
what is required
RESEARCH METHODOLOGY
Research Objective
The purpose of this study is to find out the priorities among people in rural India for purchase of Life Insurance
products and analyse the changes in priorities if any over the past decade.
Data Description
Primary data from 600 randomly selected respondents representing 24 villages through a field survey across all
the seven talukas of Thane district has been collected.
Cluster Taluka
Municipal
Council/Corporations/
Towns
Villages Total
Population
No. of
villages
selected Sample
1 Ambarnath 3 71 565,340 4 100
2 Bhiwandi 14 210 1,141,386 4 100
3 Kalyan 3 85 1,565,417 4 100
4 Shahpur 6 221 314,103 4 100
5 Murbad 1 206 1,565,417 4 100
6* Thane 3 14 3,787,036 2 50
Ulhas nagar 1 - 506,098 2 50
Table - 1 : Number of respondent selected across 7 talukas of Thane district
*Thane and Ulhasnagar are clubbed into one cluster because of lack of rural population in the taluka. Thane
taluka has only 14 villages where as Ulhasnagar taluka has 0 village.
Research Design
To find out the most significant factor which influences the respondent, Garrett’s ranking technique was used.
As per this method, respondents have been asked to assign the rank for all factors and the outcome of such
ranking have been converted into score value with the help of the following formula:
Percent position = 100 (Rij – 0.5)Nj
Where
Rij = Rank given for the ith variable by jth respondents
Nj = Number of variable ranked by jth respondents
With the help of Garrett’s Table, the percent position estimated is converted into scores. Then for each factor,
the scores of each individual are added and then total value of scores and mean values of score is calculated.
The factors having highest mean value is considered to be the most important factor.
The research paper tries to find out the reason for the purchase of life insurance policies. For this purpose, the
respondents were divided into two groups
1. Who have already purchased life Insurance policy
2. Who are planning to purchase life insurance

International Journal of Advance and Innovative Research Volume 6, Issue 1 (XXIV): January - March, 2019
179
ISSN 2394 - 7780
The respondents were ask to rank their priority among the following given options
Financial Security of family after death of earning member
Investment for Future
To be used as Collateral security
Children education
Marriage
Henry Garret ranking method is used to rank the reason for which people in Rural India purchase life Insurance
products. The rank of both the groups was compared to find out the changes in propriety for purchase of life
Insurance products if any.
DATA ANALYSIS AND FINDINGS
Garret ranking for people who have already purchased Life insurance policies
Reason Total Score Avg Score Rank
Financial Security after death of earning member 6390 65 1
Investment for future 3765 38 5
To be used as Collateral security 4920 50 2
Children Education 4670 48 4
Children Marriage 4755 49 3
Table - 2: Garrett Ranking – Reasons for purchase of Life Insurance ( Existing customers)
Chart 1: Reason for purchase of Life Insurance ( existing customers )
From the above analysis it is clear that the people who have already purchased life insurance have done it
primarily for protecting themselves against the financial uncertainties in case of death of the earning member
from their family.
Garret ranking for people who are willing to purchase Life Insurance policies in the future
Reason Total Score Avg Score Rank
Financial Security after death of earning member 23930 48.05 4
Investment for future 26890 54.00 1
To be used as Collateral security 22535 45.25 5
Children Education 25865 51.94 2
Children Marriage 25030 50.26 3
Table - 3: Garrett Ranks -Reason for purchase of Life Insurance ( Prospective customers )
Chart - 2: Reason for purchase of Life Insurance ( Prospective customers )

International Journal of Advance and Innovative Research Volume 6, Issue 1 (XXIV): January - March, 2019
180
ISSN 2394 - 7780
As it can be observed that the people planning to purchase life insurance policies in the near future consider
investment for future in general as their first priority followed by Children education & child marriage
Comparative rank of the reasons for purchase of Life Insurance products ( existing as well as prospective
customers )
Reason Rank
Already Purchased Planning to purchase
Financial Security after death of earning member 1 4
Investment for future 5 1
To be used as Collateral security 2 5
Children Education 4 2
Children Marriage 3 3
Table - 4: Garret comparative rank for existing and prospective customers
Chart - 3: Comparative analysis for reasons for purchase of Life Insurance ( existing & prospective customers )
A clear shift of preferences for purchase of life Insurance products can be observed in the above comparative
rank table which coincides with the hypothesis, hence it can be confidently concluded that the hypothesis that
“There has been a drastic shift in the priorities of the people in Rural India, they will no longer purchase life
Insurance products for the reasons for which they have been doing it for the last two decades” is true
CONCLUSION
From the above analysis it is clear that there is a shift in the purpose of people willing to buy life insurance as
against people who have already purchased life insurance. It can be observed that from negative reasons such as
Death and Mortgages, people are moving to positive reasons such as Investment for future in general and Child
education & marriage in particular. It is very important for the life Insurance industry to acknowledge these
changing preferences and come out with innovative products to take care of the ever growing aspirations of the
people in rural India
SUGGESTIONS
Life insurance Industry has to learn from its previous experience when it achieved some success in penetrating
the rural India during the later part of the last decade and early part of the present decade via selling Group
protection plans as bundled products through micro finance institutes. Group Savings Plans on the lines of
Group Protection plans are the need for the day as they are not only simple to understand for the primarily less
educated rural Indian population but are also easy to sell for the intermediaries due to limited documentation
involved on top of it they can be the most cost effective product which can be sold to the rural Indian
population, hence Group savings plan presenta win win situation for all the stake holders.
REFERENCES
Research papers
Chruchill, C. (2006). Protecting the Poor A Micro insurance compendium. ILO & Munich Re Foundation
Report
Gupta, A. K. (2014) Life Insurance Market: The Rural India Connect. Management Insight, School of
Management Studies, Varanasi, 10(1), 82-86
Kabeer Naila.(2005). ‗Is Microfinance a Magic Bullet for Women‘s Empowerment? Analysis of Findings
from South Asia.‘ Economic and Political Weekly, 4709 -4717

International Journal of Advance and Innovative Research Volume 6, Issue 1 (XXIV): January - March, 2019
181
ISSN 2394 - 7780
Mathur, S. (2010). Micro Insurance- A Powerful Tool to Empower Poor.Management Insight, School of
Management Studies, Varanasi, VI(2),1-77
Pitt Mark, Brown Uni, SR Khandkar.(1998). ‗The impact of group based credit programmes on poor
households in Bangladesh: Does the gender of the participant matter?‘ World Bank Journal of Political
Economy vol.106,no5.958 -997
S, G., Acosta, A. G., & Ballesteros, L. F. (2008). Innovating at the BoP: Delivering Micro insurance in
Kalahandi and Beyond,1-55
Venkata Raman Rao (2008)“Life Insurance Awareness in Rural India: Micro Insurance Lessons to Learn
and Teach”, BIMAQUEST, Vol.8, No.8,17-19
International Journal of Advance and Innovative Research Volume 6, Issue 1 (XXIV): January - March, 2019
182
ISSN 2394 - 7780
A STUDY ON THE IMPACT OF QUALITY OF WORK LIFE ON PERFORMANCE OF BPO
EMPLOYEES IN MUMBAI
Ashwini Arte1 and Dr. D. Henry2
Research Scholar1 and Guide2
Faculty of Management, Pacific Academy of Higher Education and Research University, Udaipur
ABSTRACT
Quality of Work Life (QWL) is an important factor that has an impact of an employee’s life. A good Quality of
Work Life will encourage the employee to perform better and also to lead a better personal life. Many
researchers have studied the positive impact that QWL has on the performance of employees in various
industries. Business Process Outsourcing (BPO) is an industry which is on the rise in India and a majority of
the youth in India are joining this industry. Hence it has become important to study the impact of QWL on
various aspects of life of these employees. The current study is an effort to study how QWL has an impact on the
performance of the employees of BPO industry in the Mumbai region
Keywords: QWL, BPO, Employee performance, Mumbai
INTRODUCTION
Employee performance is an important construct in an organization. Any rational organisation endeavors to
select from a given pool of candidates, such a candidate whose performance will be better on the job. Various
tests and assessments are conducted to find the strengths and weaknesses of the incumbents so that those most
likely to perform better will be selected. Training programs are designed in order to enhance the performance of
employees. Performance appraisals and feedback systems are linked to increments and merit pay systems in
order to enhance the performance of employees. Organisations and researchers have tried to identify the various
factors that have a positive impact on employee performance in order to enhance employee productivity which
directly results in the increase of organizational productivity
One such factor is Quality of Work Life (QWL). The American Society of Training and Development defines
Quality of Work Life as “QUALITY OF WORK LIFE is a process of work organisations which enable its
members at all levels to actively participate in shaping the organizations environment, methods and outcomes.
This value based process is aimed towards meeting the twin goals of enhanced effectiveness of organisations
and improved quality of life at work for employees”. The definition according to Fred Luthans is, “The
overriding purpose of QUALITY OF WORK LIFE is to change the climate at work so that the human-
technological-organizational interface leads to a better quality of work life”.
Various researchers have tried to find the relation between quality of work life (QWL) and employee
performance. This study intends to find the relation between QWL and employee performance in the Business
Process Outsourcing sector. The study targets women employees in the BPO sector in Mumbai
LITERATURE REVIEW
QWL as a concept has been studied by different scholars since 1972 and the importance of the concept
experienced after 90s. Researchers have identified this as one of the important tool for overall satisfaction of
employees and discussed various models of Quality of working life which include a wide range of factors. Here,
studies at different sectors of industry are reviewed
Ayesha Tabassuma, Tasnuva Rahmanb and Kursia Jahanc (2011)1 conducted a study of private commercial
banks of Bangladesh. They concluded that among the male employees and of the female employees, the overall
QWL of varies significantly. They found that the male employees have a better QWL
Muftah (2011)2 opined that QWL is a philosophy that considered people as the most important recourses in the
organization. According to him, it views people as an “asset” to the organization rather than as “costs”. The
organizations that are concerned about developing their human resources and gaining a competitive advantage
in the marketplace should attend to their human resources
(Chandranshu Sinha, 2012)3 stated that the core pillar of QWL is to create a work environment in which
employees can work cooperatively with each other so as to achieve to organization objectives.
Aketch et al, in the paper published in September 2012 in Current Research Journal of Social Sciences4
conclude that there is a strong relationship between employees’ well-being at work and performance of
organizations. The summaries of Quality of Work Life variables they have captured are applicable to almost all
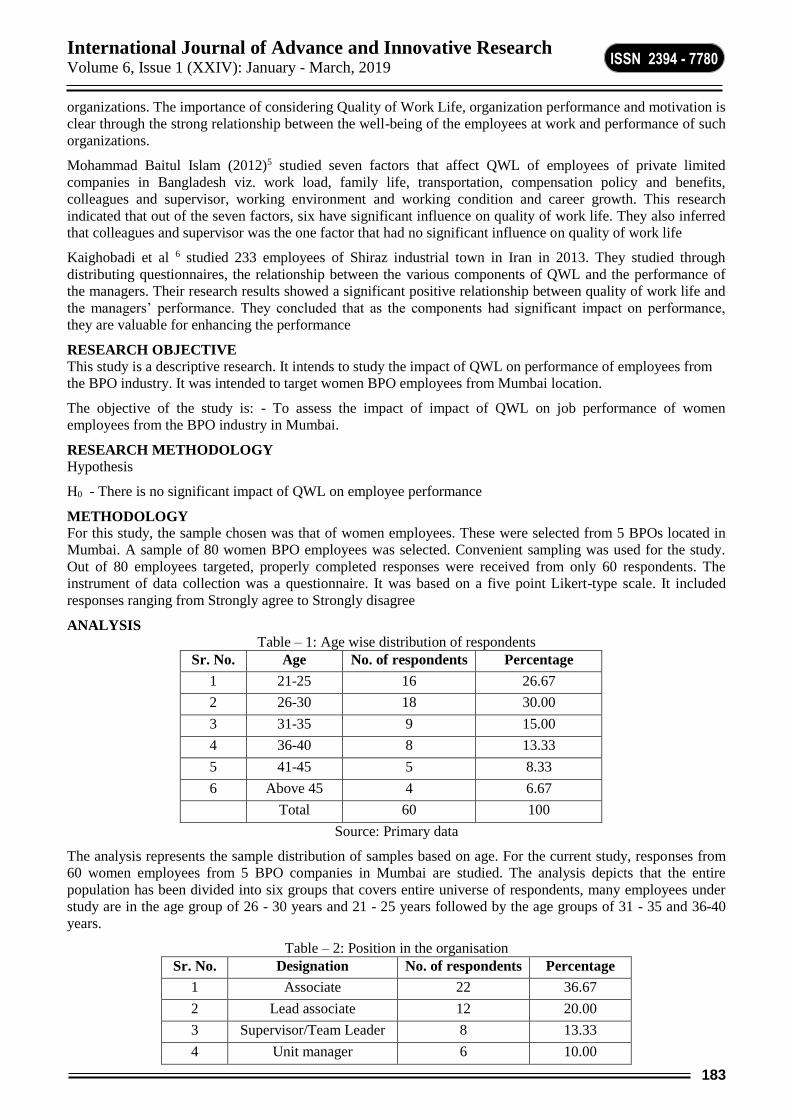
International Journal of Advance and Innovative Research Volume 6, Issue 1 (XXIV): January - March, 2019
183
ISSN 2394 - 7780
organizations. The importance of considering Quality of Work Life, organization performance and motivation is
clear through the strong relationship between the well-being of the employees at work and performance of such
organizations.
Mohammad Baitul Islam (2012)5 studied seven factors that affect QWL of employees of private limited
companies in Bangladesh viz. work load, family life, transportation, compensation policy and benefits,
colleagues and supervisor, working environment and working condition and career growth. This research
indicated that out of the seven factors, six have significant influence on quality of work life. They also inferred
that colleagues and supervisor was the one factor that had no significant influence on quality of work life
Kaighobadi et al 6 studied 233 employees of Shiraz industrial town in Iran in 2013. They studied through
distributing questionnaires, the relationship between the various components of QWL and the performance of
the managers. Their research results showed a significant positive relationship between quality of work life and
the managers’ performance. They concluded that as the components had significant impact on performance,
they are valuable for enhancing the performance
RESEARCH OBJECTIVE
This study is a descriptive research. It intends to study the impact of QWL on performance of employees from
the BPO industry. It was intended to target women BPO employees from Mumbai location.
The objective of the study is: - To assess the impact of impact of QWL on job performance of women
employees from the BPO industry in Mumbai.
RESEARCH METHODOLOGY
Hypothesis
H0 - There is no significant impact of QWL on employee performance
METHODOLOGY
For this study, the sample chosen was that of women employees. These were selected from 5 BPOs located in
Mumbai. A sample of 80 women BPO employees was selected. Convenient sampling was used for the study.
Out of 80 employees targeted, properly completed responses were received from only 60 respondents. The
instrument of data collection was a questionnaire. It was based on a five point Likert-type scale. It included
responses ranging from Strongly agree to Strongly disagree
ANALYSIS
Table – 1: Age wise distribution of respondents
Sr. No. Age No. of respondents Percentage
1 21-25 16 26.67
2 26-30 18 30.00
3 31-35 9 15.00
4 36-40 8 13.33
5 41-45 5 8.33
6 Above 45 4 6.67
Total 60 100
Source: Primary data
The analysis represents the sample distribution of samples based on age. For the current study, responses from
60 women employees from 5 BPO companies in Mumbai are studied. The analysis depicts that the entire
population has been divided into six groups that covers entire universe of respondents, many employees under
study are in the age group of 26 - 30 years and 21 - 25 years followed by the age groups of 31 - 35 and 36-40
years.
Table – 2: Position in the organisation
Sr. No. Designation No. of respondents Percentage
1 Associate 22 36.67
2 Lead associate 12 20.00
3 Supervisor/Team Leader 8 13.33
4 Unit manager 6 10.00
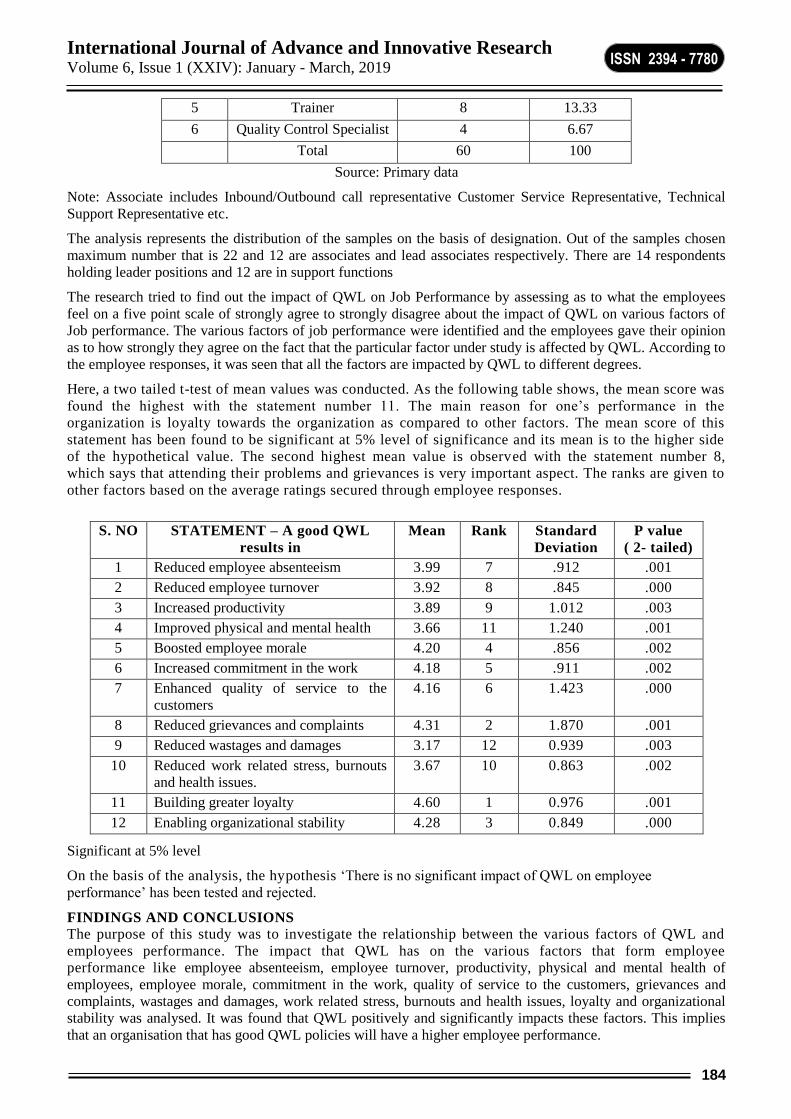
International Journal of Advance and Innovative Research Volume 6, Issue 1 (XXIV): January - March, 2019
184
ISSN 2394 - 7780
5 Trainer 8 13.33
6 Quality Control Specialist 4 6.67
Total 60 100
Source: Primary data
Note: Associate includes Inbound/Outbound call representative Customer Service Representative, Technical
Support Representative etc.
The analysis represents the distribution of the samples on the basis of designation. Out of the samples chosen
maximum number that is 22 and 12 are associates and lead associates respectively. There are 14 respondents
holding leader positions and 12 are in support functions
The research tried to find out the impact of QWL on Job Performance by assessing as to what the employees
feel on a five point scale of strongly agree to strongly disagree about the impact of QWL on various factors of
Job performance. The various factors of job performance were identified and the employees gave their opinion
as to how strongly they agree on the fact that the particular factor under study is affected by QWL. According to
the employee responses, it was seen that all the factors are impacted by QWL to different degrees.
Here, a two tailed t-test of mean values was conducted. As the following table shows, the mean score was
found the highest with the statement number 11. The main reason for one’s performance in the
organization is loyalty towards the organization as compared to other factors. The mean score of this
statement has been found to be significant at 5% level of significance and its mean is to the higher side
of the hypothetical value. The second highest mean value is observed with the statement number 8,
which says that attending their problems and grievances is very important aspect. The ranks are given to
other factors based on the average ratings secured through employee responses.
Significant at 5% level
On the basis of the analysis, the hypothesis ‘There is no significant impact of QWL on employee
performance’ has been tested and rejected.
FINDINGS AND CONCLUSIONS
The purpose of this study was to investigate the relationship between the various factors of QWL and
employees performance. The impact that QWL has on the various factors that form employee
performance like employee absenteeism, employee turnover, productivity, physical and mental health of
employees, employee morale, commitment in the work, quality of service to the customers, grievances and
complaints, wastages and damages, work related stress, burnouts and health issues, loyalty and organizational
stability was analysed. It was found that QWL positively and significantly impacts these factors. This implies
that an organisation that has good QWL policies will have a higher employee performance.
S. NO STATEMENT – A good QWL
results in
Mean Rank Standard
Deviation
P value
( 2- tailed)
1 Reduced employee absenteeism 3.99 7 .912 .001
2 Reduced employee turnover 3.92 8 .845 .000
3 Increased productivity 3.89 9 1.012 .003
4 Improved physical and mental health 3.66 11 1.240 .001
5 Boosted employee morale 4.20 4 .856 .002
6 Increased commitment in the work 4.18 5 .911 .002
7 Enhanced quality of service to the
customers
4.16 6 1.423 .000
8 Reduced grievances and complaints 4.31 2 1.870 .001
9 Reduced wastages and damages 3.17 12 0.939 .003
10 Reduced work related stress, burnouts
and health issues.
3.67 10 0.863 .002
11 Building greater loyalty 4.60 1 0.976 .001
12 Enabling organizational stability 4.28 3 0.849 .000

International Journal of Advance and Innovative Research Volume 6, Issue 1 (XXIV): January - March, 2019
185
ISSN 2394 - 7780
LIMITATIONS OF THE STUDY
This study has a few limitations. It is a study of a small sample size and is related to the BPO industry.
Different industry may produce different results. It was a study of Mumbai region. Different
geographical locations could have provided different results.
REFERENCES
1. Tabassum, A., RAhMAN, T., & Jahan, K. (2011). Quality of work life among male and female employees of
private commercial banks in Bangladesh.International Journal of Economics and Management, 5(1), 266-
282
2. Al Muftah, H., & Lafi, H. (2011). Impact of QWL on employee satisfaction case of oil and gas industry in
Qatar. Advances in management and applied economics, 1(2), 107
3. Sinha, C. (2012). Factors affecting quality of work life: empirical evidence from Indian
organizations. Australian Journal of Business and Management Research, 1(11), 31-40.
4. Aketch, J. R., Odera, O., Chepkuto, P., & Okaka, O. (2012). Effects of quality of work life on job
performance: theoretical perspectives and literature review. Current Research Journal of Social
Sciences, 4(5), 383-388.
5. Islam, M. B. (2012). Factors affecting quality of work life: an analysis on employees of private limited
companies in Bangladesh. Global Journal of Management and Business Research, 12(18).
6. Kaighobadi, S., Esteghlal, A., & Serajoddin, M. (2014). The relationship between quality of work life and
performance of the managers of SMEs of Shiraz Industrial Town: Case study in Iran. European journal of
business and management, 6(23), 220-228

International Journal of Advance and Innovative Research Volume 6, Issue 1 (XXIV): January - March, 2019
186
ISSN 2394 - 7780
A STUDY ON IMPACT OF ORGANIZATIONAL FACTORS ON JOB SATISFACTION AMONG
DOCTORS OF TEACHING HOSPITALS
Monika Khanna1 and Dr. D. Henry2
Research Scholar1 and Guide2
Faculty of Management, Pacific Academy of Higher Education and Research University, Udaipur
ABSTRACT
Job satisfaction has different perspectives. Considering the point of view of an employee, it reveals the benefits
people might be looking for while taking the job. And these benefits are agreed by the employer considering
their own strategies, benefits and profits. Moreover organizational factors that affect their satisfaction
articulate employees’ aspiration to utilize their potential to make a valuable and meaningful contribution
towards fulfilling their individual goals. From an organization’s point of view, they take up people to perform
explicit jobs in order to achieve their business goals. A win -win situation happens when the organization finds
people who are ready to work for the required business goals happily. In medical profession, the level of job
satisfaction of doctors directly affects their attitudes towards the colleagues, students and above all the patients.
This paper highlights the impact of organizational factors on job satisfaction among the doctors in teaching
hospitals and also suggests job satisfaction should be recognized as a measure, must to be included in quality
improvement programmes and institutions must realize the importance of having satisfied employees.
Keywords: job satisfaction, teaching hospitals, doctors
INTRODUCTION
Job satisfaction has been defined as a pleasurable emotional state resulting from the evaluation of one’s job; an
affective reaction to one’s job; and an attitude towards one’s Job. In other words it describes how satisfied an
individual is with his job. Job satisfaction has many variables. One may be content with one factor of job but at
the same time might not be satisfied with other factor related to the same job. For example a doctor may be
satisfied with his designation but may not be satisfied with work load.
Job satisfaction of a doctor has an effect on his behavior with co-workers, seniors and particularly the patient
care. Quality of medical care and doctor-patient relationship is beyond doubt reliant on the level of job
satisfaction. In general doctor’s effectiveness includes timely treatment, availability, the way he communicates
and explains the treatments and tests to the patients and their relatives. Several studies have been taken by
different researchers and it was seen doctor’s performance and behavior in the organization is related to job
satisfaction. It has also been seen if the employee is satisfied with his job, organization can expect better
performance from him. In case of a teaching hospital, other than all these behaviors the dissatisfaction of a
doctor may extent to the point where it might affect their teaching quality and present a negative impression to
the students and the new recruits under him.
LITERATURE REVIEW
Job dissatisfaction and stress among doctors affect the quality of health care.
The area under discussion of job
satisfaction is of great concern due to the fact that organizational and employees’ health and welfare lies a great
deal on job satisfaction (Adams et al, 2000). Various studies have ascertained that dissatisfaction with one’s job
may upshot employee turnover, absenteeism, sluggishness and grievances. Improved job satisfaction, on the
other hand, results in increased productivity (White, 2000). Satisfied employees tend to be more productive and
committed to their jobs (Al-Hussami, 2008). In a healthcare industry, employee satisfaction has been found to
be positively related to quality of service and patient satisfaction (Tzeng, 2002). Various factors that lead to
dissatisfaction in doctors are average number of working hours, work environment and salary( Kaur S. et al
2011), work load, system of promotion( Sultana A. etal 2009). Another study found perks, conductive working
environment, job security, insolent behaviour, undue interference, personal protection due to law and order
situation and biased attitude etc, are some of causes of their uneasiness (Aijaz A. Sohag 2012). Singh Rajkumar
G. (2013) stated that positive performance of employee in the organization is result of his pleasing job
experience. He also found Pay and compensation factors were the most important factors positively correlated
with employee job satisfaction.
RATIONALE OF PROPOSED INVESTIGATION
A number of studies have addressed job satisfaction among health care professionals. Indian studies are limited
to nurses and other individual professions. Given the noticeable lack of studies addressing job satisfaction
among doctors in teaching hospitals of Navi Mumbai, this study will attempt to address the gap in the literature.
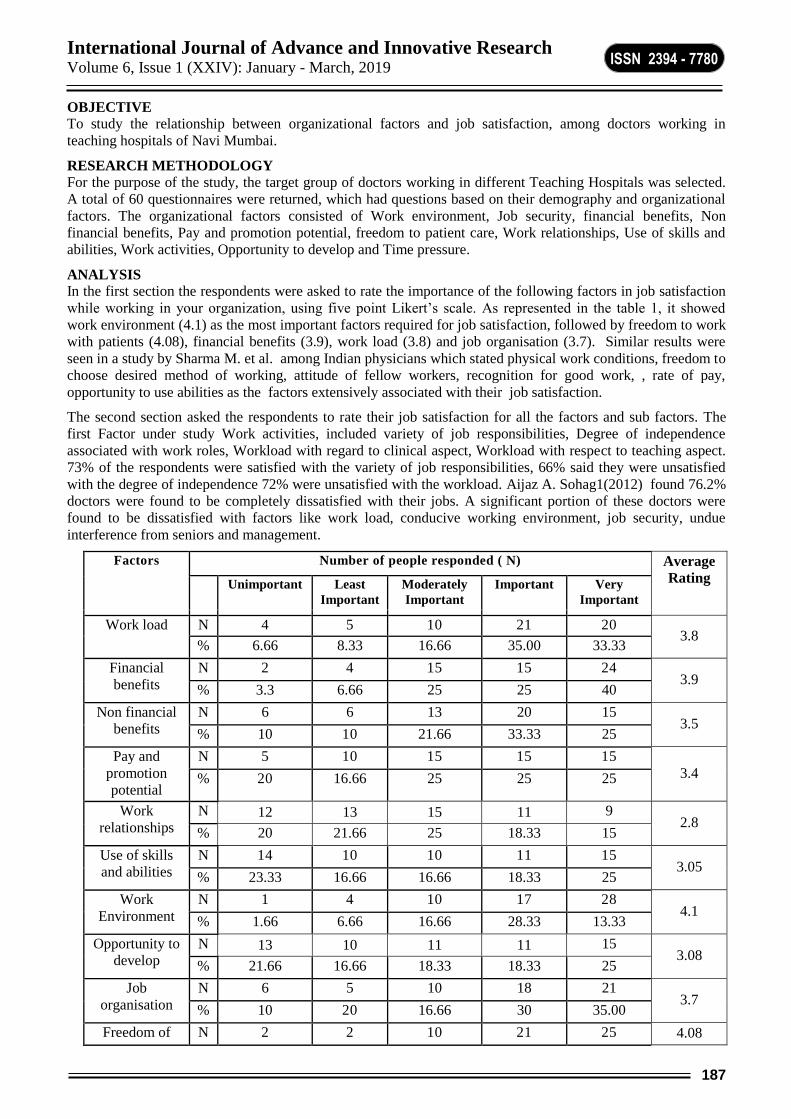
International Journal of Advance and Innovative Research Volume 6, Issue 1 (XXIV): January - March, 2019
187
ISSN 2394 - 7780
OBJECTIVE
To study the relationship between organizational factors and job satisfaction, among doctors working in
teaching hospitals of Navi Mumbai.
RESEARCH METHODOLOGY For the purpose of the study, the target group of doctors working in different Teaching Hospitals was selected.
A total of 60 questionnaires were returned, which had questions based on their demography and organizational
factors. The organizational factors consisted of Work environment, Job security, financial benefits, Non
financial benefits, Pay and promotion potential, freedom to patient care, Work relationships, Use of skills and
abilities, Work activities, Opportunity to develop and Time pressure.
ANALYSIS
In the first section the respondents were asked to rate the importance of the following factors in job satisfaction
while working in your organization, using five point Likert’s scale. As represented in the table 1, it showed
work environment (4.1) as the most important factors required for job satisfaction, followed by freedom to work
with patients (4.08), financial benefits (3.9), work load (3.8) and job organisation (3.7). Similar results were
seen in a study by Sharma M. et al. among Indian physicians which stated physical work conditions, freedom to
choose desired method of working, attitude of fellow workers, recognition for good work, , rate of pay,
opportunity to use abilities as the factors extensively associated with their job satisfaction.
The second section asked the respondents to rate their job satisfaction for all the factors and sub factors. The
first Factor under study Work activities, included variety of job responsibilities, Degree of independence
associated with work roles, Workload with regard to clinical aspect, Workload with respect to teaching aspect.
73% of the respondents were satisfied with the variety of job responsibilities, 66% said they were unsatisfied
with the degree of independence 72% were unsatisfied with the workload. Aijaz A. Sohag1(2012) found 76.2%
doctors were found to be completely dissatisfied with their jobs. A significant portion of these doctors were
found to be dissatisfied with factors like work load, conducive working environment, job security, undue
interference from seniors and management.
Factors Number of people responded ( N) Average
Rating
Unimportant Least
Important
Moderately
Important
Important Very
Important
Work load N 4 5 10 21 20 3.8
% 6.66 8.33 16.66 35.00 33.33
Financial
benefits
N 2 4 15 15 24 3.9
% 3.3 6.66 25 25 40
Non financial
benefits
N 6 6 13 20 15 3.5
% 10 10 21.66 33.33 25
Pay and
promotion
potential
N 5 10 15 15 15
3.4
% 20 16.66 25 25 25
Work
relationships
N 12 13 15 11 9 2.8
% 20 21.66 25 18.33 15
Use of skills
and abilities
N 14 10 10 11 15 3.05
% 23.33 16.66 16.66 18.33 25
Work
Environment
N 1 4 10 17 28 4.1
% 1.66 6.66 16.66 28.33 13.33
Opportunity to
develop
N 13 10 11 11 15 3.08
% 21.66 16.66 18.33 18.33 25
Job
organisation
N 6 5 10 18 21 3.7
% 10 20 16.66 30 35.00
Freedom of N 2 2 10 21 25 4.08

International Journal of Advance and Innovative Research Volume 6, Issue 1 (XXIV): January - March, 2019
188
ISSN 2394 - 7780
Patient care % 3.3 3.3 16.66 35.00 41.66
Time pressure N 2 4 12 20 22 3.9
% 3.3 6.66 20 33.33 36.66
Table - 1
Second factor under consideration was ‘Financial benefits’ and it includes salary in comparison to other
organizations, Annual increments, other benefits like provident fund, gratuity and provision for leave
encashment. 68% of the respondents rated themselves as highly unsatisfied with the salary followed by 63% for
the annual increments and leave encashment. Cozen 2001 reported that different attractions regarding job
satisfaction in terms of financial gain motivates doctors at tertiary care hospital especially as it characterized by
high degree of independence in work planning and decision making. Similar results were seen in a study by
Tran BX etal. 2013 who investigated factors associated with job satisfaction among commune health workers.
The results demonstrated that respondents were least satisfied with the salary and incentives, followed by
benefit packages, equipment, and environment. Wu D. et al. 2014 also found factors which contributed most to
low job satisfaction were low income and long working hours.
‘Non financial benefits’ refers to other benefits your employer offers - flexible working hours, Insurance, health
care, child care etc, recognition by the superiors, and reward for research work. 61% of the respondents were
very highly unsatisfied with their work recognition. 74% of them were unsatisfied with the rewards for the
research work. Selebi C., & Minnar A. (2007) conducted a survey in South Africa and found that all doctors
experienced low satisfaction with responsibility, opportunity for creativity and innovation, independence, and
recognition. Another study by M I Rehman, R Parveen (2008) among teachers of Bangladesh found the areas of
pay, promotion and recognition from authority were the major characteristics of the job satisfaction profiles of
dissatisfied faculty members.
‘Pay and promotion potential’, the next factor consisted of Salary, Opportunities for Promotion, promotion
transparency, fairness of the salary package, Incentives for high achievements. 72% of the total respondents
were unsatisfied with the opportunities for promotion followed by transparency of the system, where 70% of the
respondents were unsatisfied. The results coincided with the results of the study by Bhatnagar K., & Srivastava
K. (2011) to measure job satisfaction status of medical teachers. Poor utilization of skills, poor promotional
prospects, inadequate pay and allowances combined with work conditions were the factors contributing toward
job dissatisfaction. Sultana A. et al. 2009 also found most of the respondents were not satisfied with system of
promotion.
‘Work relationships’ consisted of variables like relationships with employers, relationships with seniors and
colleagues, participation in decision making, colleagues support, Professional stimulation. 63% of the
respondents were satisfied with their relation with their colleagues and 61% of the same said they can depend
on the colleagues for support. But 68% said they were not involved in the decision making. Persefoni Lambrou
et al. (2010) investigated motivation and job satisfaction among medical and nursing staff in a Cyprus public
general hospital. The survey revealed achievements, remuneration, co-workers and job attributes as the four
main motivators. Different studies by M. Willis etal. (2008) and L. Fogarty 2014 reported similar results in low-
and middle-income countries. In addition it was also observed that acknowledgment for work and relationships
with colleagues have a high impact on job satisfaction directing to more positive work environment.
Next factor under study was ‘Use of skills and abilities’ and had variables, scope to practice and learn new
skills, freedom to decide the work, freedom to initiate changes. Majority of the respondents were not satisfied
with the use of skills and abilities. Similar results were seen in different studies conducted by Cozens 2001 and
Bhatnagar K. & Srivastava K. (2011) which indicated that job satisfaction level which was mostly found as “not
satisfied” was related with non-availability of facilities for the improvement of qualifications or poor utilization
of skills. 61% of the respondents were satisfied with the freedom to decide the work. Abida S. et al. 2009
found 64.6% respondents in Rawalpindi Medical College and teaching hospitals were satisfied with the freedom
to choose their method of work.
Next factor labeled as ‘Work Environment’ consisted of variables including safety of working place,
infrastructure, satisfaction over communication channel, resources adequacies, volume, variety and quality.
Among these 68% of the respondents were highly unsatisfied with the infrastructure and majority of them
mentioned this hindered the delivery of health care.73% of the respondents were satisfied with the volume and
variety of work. Around 58% were not satisfied with the communication channels being used. A similar result
was seen in a study conducted in Tanzania by Leshabari M. T et al (2008), which reported poor job satisfaction

International Journal of Advance and Innovative Research Volume 6, Issue 1 (XXIV): January - March, 2019
189
ISSN 2394 - 7780
in their health system due to poor rewards system, discouraging working environment and weak
communications in the staff. Cozen 2001 found inadequate resources at doctor’s disposal might be one of the
factors causing ‘dissatisfaction. Madaan (2008), explored Job Satisfaction among the medical faculties and
residents of a tertiary care hospital, and revealed that salary, lack of incentives, poor working environment
followed by inadequate infrastructural facilities were the major reasons dissatisfaction among doctors.
‘Opportunity to develop’’ consisted of variation in work, Support for additional training and education,
financial assistance to attend academic conferences. 71% of the respondents were not satisfied with the
opportunities provided to them. Nirpuma Madaan (2007), in her survey found Nearly 2/ 3rd of the responding
doctors are happy with their jobs, but would appreciate a raise in salary and the availability of greater
opportunity to grow for a more fulfilling professional life. Sharma M. et al. (2012) fund opportunity to use
abilities was one of the factors extensively associated with job satisfaction of physicians.
‘Job organisation’ consisted of variables including shift length, Job description, Organisation structure, and
satisfaction over call procedure. 68% of the respondents were highly unsatisfied with the length of the work
shifts. Similar results were seen in a study conducted in a tertiary hospital in Delhi by Kaur S. etal. 2009 and
another study by Taha N. and Amal S. 2013 in Al-Kadhimiya Teaching Hospital’s where nearly 50% doctors
indicated dissatisfaction with the average number of working hours per day. In the current study 66% were not
satisfied with the job description given to them. 63% of the respondents, majority of which were residents, were
unsatisfied with the call rotation procedure. ‘Freedom to Patient care’ which included freedom to handle
patient, sufficient time for each patient, physical and staff resources to take care of patients. 61% of them were
satisfied with the freedom to handle patient but said they do not sufficient time for each patient. 59% responded
that they were unsatisfied with the physical and staff resources available to them. In his study Deshwal, P.
(2011) also suggested medical faculty members should get freedom in their work as it was a big cause of
dissatisfaction among the doctors in the medical colleges of different universities in Uttar Pradesh. Abida S et
al. 2009 found 64.6% were satisfied with the freedom to choose their method of work. Bjorvell (2002) studied
job satisfaction of 153 hospital staff members including physicians, registered nurses, nurse assistants and aides,
which revealed them as less satisfied with help received from superiors and sufficient time for patient care.
‘Time pressure’ consisted of many non-clinical tasks that need to do spend more time doing documentation and
paperwork and sufficient time to sleep. 66% of the respondents reported unsatisfied with time pressure, and
majority of them said they were spending lot of time for non clinical tasks and documentation. Mosadeghrad
AM et al (2011) found too much of work, shortage of staff, time pressure, were the major factors with which the
respondents were dissatisfied with. Different studies by (Fanny 2012, 2013) found more than half of the doctors
reported disturbed work-life balance, reduced productivity, work quality, and prolonged fatigue level, sleepiness
and extreme tiredness.
CONCLUSION
The study reveals doctors have low job satisfaction overall. Doctors play the major role in health care industry
and are the first ones who are thought about when we talk about health care and thus it is necessary that their
needs have to be taken care and a better working environment is created for them to work with utmost job
satisfaction and content, the result of which would be a high quality care. It is suggested to that teaching
hospitals need to improve infrastructure, develop a fixed criteria based and transparent promotion policy, raise
their salaries and create opportunities for their medical professionals as it would also lead to raise Job
satisfaction of young entrants making the way for effective delivery of health care.
REFERENCES
Abida Sultana, Rizwana Riaz, Maqsood Hayat, Syed Arshad Sabir Level of Job Satisfaction in Doctors ,
Journal of Rawalpindi Medical College (JRMC); 2009;13(2):95-97 95
Amel Abdalrahim Suliman1, Maha Eltom2, Wadie M. Elmadhoun3, Sufian K. Noor4, Ahmed O.
Almobarak5, Meissa M. Osman6, Heitham Awadalla7, Mohamed H. Ahmed8, Factors affecting job
satisfaction among junior doctors working at teaching hospitals in River Nile State, Sudan , Public Health
Emerg 2017;1:79
Bhatnagar K, Srivastava K. Job satisfaction in health-care organizations. Ind Psychiatry J [serial online]
2012 [cited 2019 Feb 22];21:75-8. Available from: http://www.industrialpsychiatry.org/text.asp?
2012/21/1/75/110959
Deshwal, P. (2011). Job Satisfaction: A Study of those who mould the future of India. In Global Conference
on Innovations in Management London, UK.

International Journal of Advance and Innovative Research Volume 6, Issue 1 (XXIV): January - March, 2019
190
ISSN 2394 - 7780
First-Cozens J. The psychological problems of doctors. In: First- Cozens J, Payne R. Stress in health
professionals: Psychological and organizational causes and interventions. London: Wiley. 2001;15(2)171-
177. 17
Imran N, Haider I, Iqtidar S, Bhatti MR. Unhappy doctors in Pakistan: what are the causes and what can be
done? Pak J Med Sci 2011;27(2):244-247.
Kaur, S., Sharma, R., Talwar, R., Verma, A. and Singh, S. (2009) A study of job satisfaction and work
environment perception among doctors in a tertiary hospital in Delhi. Indian Journal of Medical Sciences,
63, 139-144. doi:10.4103/0019-5359.50762
Leshabari MT, Muhondwa EP, Mwangu MA, Mbembati NA. Motivation of health care workers in Tanzania:
A case study of Muhimbili National Hospital. East Afr J Public Health 2008;5:32-7
Madaan N. Job satisfaction among doctors in a tertiary care teaching hospital. JK Sci. 2008;10:81–3.
Mosadeghrad AM (2013). Healthcare service quality: Towards a broad definition. International Journal of
Health Care Quality Assurance, 26(3): 203–219. [PubMed]
Ritu Narang and Alka Dwivedi(2010), “Managing The Job Satisfaction Of Knowledge Workers: An
Empirical Investigation” Asia Pacific Journal of Business and Management, Volume 1 (1), 1-14
Selebi C, Minnaar A (2007) Job Satisfaction among Nurses in a Public Hospital in Gauteng. Curationis
30(3): 1-9.
Sharma M, Goel S, Singh SK, Sharma R, Gupta PK. Determinants of Indian physicians' satisfaction &
dissatisfaction from their job. Indian J Med Res. 2014;139(3):409-17.
Sohag AA, Memon S, Mahmood-ur-Rahman, Rao MH. A comparative study on factors causing job
dissatisfaction among serving doctors at teaching hospitals of Hyderabad, Pakistan. Pak J MedSci
2012;28(4):710-715
Suminder Kaur, Rahul Sharma, Richa Talwar, Anita Verma, Saudan Singh 2009,A study of job satisfaction
and work environment Perception among doctors in a Tertiary Hospital in Delhi
Syed Shakir Ali Ghazali, Ijaz Ahmad Shah, Syed Arif Ahmed Zaidi, M. H. Tahir J 2007; 19(3),Job
Satisfaction Among Doctors Working At Teaching Hospital Of Ahawalpur, Pakistan, Ayub Med Coll
Abbottabad
Taha N. Sadeq MBChB MSc, Amal S. Khudair 2013, Job Satisfaction among Al-Kadhimiya Teaching
Hospital’s Medical Doctors
International Journal of Advance and Innovative Research Volume 6, Issue 1 (XXIV): January - March, 2019
191
ISSN 2394 - 7780
A STUDY OF IMPACT OF TAX BENEFITS ON INVESTMENT HABITS OF TAXPAYERS
Prof. Tripurari Jha
Assistant Professor & HOD-BAF, SASMIRA’s Institute of Commerce & Science, Mumbai
ABSTRACT
The Income tax act 1961 and the amendments brought in by the central government every year through finance
act, popularly known as budget provides for several tax benefits to help taxpayers develop investment habits,
ensure financial security of their family, build a corpus for their post retirement life and help in capital
formation for economy. This paper seeks to examine the impact of tax exemptions and deduction made available
through various sections of income tax act, on investment habits of taxpayers.
1. INTRODUCTION
Poet Kalidas wrote of a king in Raghuvansha: “It was only for the good of his subjects that he collected taxes
from them, just as the sun draws moisture from the earth to give it back a thousand times.”
According to Kautilya, some linkage between the ability to pay (i.e. provision of a safety net to the poor, old
and the sick) and the benefit principle may be better than the current approaches, which treat the ability to pay
and the expenditure side of the taxation separately.
The above two thoughts of two historical stalwarts are testimony to the fact that Indians had most refined and
objective understanding of taxation even thousands of years ago, but the tax administration and practices had
been varying from time to time, at certain point of times in history it had been most humane and at some other
point of time it had been most brutal and inhuman. Even when dictatorships and monarchies were long gone and
India witnessed dawn of democracy, direct taxes had been at times up to 97.50% of income in decades of sixties
and seventies, even the champions of democracy failed to understand and appreciate the objective and logic of
direct taxes.
The earner is the most qualified, the most informed, the most authentic and the most suitable person to decide
about spending his earnings for his or her wellbeing and in a welfare state the government must not take away a
single penny as long as the money can be better utilized in the hands of earner.
A case for taxation arises only when state can deliver something to the citizens, which they cannot achieve on
their own that is law and order, administration of justice and security of borders, any taxes beyond this must be
against measurable and verifiable deliverables and that too by gently and softly nudging the tax payers by
providing different sops and incentives.
It is on these lines of thinking that a basket of deductions have been provided under section 80C to 80TTA of
Income tax act 1961 and a study is imperative to find out the impact of such incentives in achieving its
objectives.
2. LITERATURE REVIEW
There is lots of literature on this subject within India and also out of India, in form of research papers, articles,
books, magazines, publications in business news papers, financial journals etc.
Kandpal & Kavidayal -2014, studied the impact of tax incentives on FDI, they observed that tax incentives has
helped spur the FDI and which has helped to raise output, productivity and employment in service sector in
India.
GODFREY BIMANYWARUGABA-2015, studied the impact of tax incentives on investment decisions of
large private sector companies, he concluded that tax incentives do not significantly affect the investment in
human capital or inventories large private sector companies, though it may impact the gross investment to some
extent.
3. OBJECTIVES OF STUDY
i. To find out the impact of tax benefits on investment habits.
ii. To understand the Investment habits at SASMIRA.
4. RESEARCH QUESTION
i. Tax benefits under section 80C and its utilization by taxpayers.
ii. Tax benefits under section 80D and its utilization by taxpayers.
International Journal of Advance and Innovative Research Volume 6, Issue 1 (XXIV): January - March, 2019
192
ISSN 2394 - 7780
iii. Tax benefits under section 80DD and its utilization by taxpayers.
iv. Tax benefits under section 80E and its utilization by taxpayers.
v. Tax benefits under section 80U and its utilization by taxpayers.
vi. Tax benefits under section 80TTA and its utilization by taxpayers.
5. DATA ANALYSIS
The respondents were sent an online questionnaire through Google Form and requested to respond to the
questions therein, the questionnaire is designed to cover the demographic aspect and also the awareness of tax
incentives and its usage among the respondents.
5.1 Hypothesis
i. Awareness and utilization of tax benefits under section 80C amongst taxpayers is significantly high.
ii. Awareness and utilization of tax benefits under section 80C amongst taxpayers is very low.
iii. Awareness and utilization of tax benefits under section 80D amongst taxpayers is significantly high.
iv. Awareness and utilization of tax benefits under section 80D amongst taxpayers is very low.
v. Awareness and utilization of tax benefits under section 80DD amongst taxpayers is significantly high.
vi. Awareness and utilization of tax benefits under section 80DD amongst taxpayers is very low.
vii. Awareness and utilization of tax benefits under section 80E amongst taxpayers is significantly high.
viii. Awareness and utilization of tax benefits under section 80E amongst taxpayers is very low.
ix. Awareness and utilization of tax benefits under section 80U amongst taxpayers is significantly high.
x. Awareness and utilization of tax benefits under section 80U amongst taxpayers is very low.
xi. Awareness and utilization of tax benefits under section 80TTA amongst taxpayers is significantly high.
xii. Awareness and utilization of tax benefits under section 80TTA amongst taxpayers is very low.
5.2 Primary Data
Primary data was collected randomly through a structured online questionnaire in western suburbs of Mumbai
city and specifically the Kandivali, Borivali, Dahisar, Mira road and Bhayander area.
5.3 Sample size
The study was limited to those participants who willingly chose to be part of this study, a Google form link was
sent to about 500 people out of which 181 people responded and thus the sample size of this study is limited to
181.
5.4 Sample design
A convenience based random sampling technique was applied. A caution was exercised during the sampling
that only those who were inclined to be part of this study were included.
5.5 Sample selection
i. Only respondents with taxable income were included in study.
ii. Only the people in age group of 18 to 62 to be part of study.
5.6 Secondary Data
The secondary data was collected from published sources like books, magazines, periodicals and online sources.
5.7 Statistical Analysis
Microsoft excel was used for tabulation of data and further analysis of data for testing the hypothesis was also
done with the help of same application, as sample size was small the use of advanced software like SPSS, R and
Python etc. was not required.
Table - 1: Sample Demographics
Age Male Female Total
18 - 22 5 8 13
23 - 27 11 14 25

International Journal of Advance and Innovative Research Volume 6, Issue 1 (XXIV): January - March, 2019
193
ISSN 2394 - 7780
28 - 32 12 9 21
33 - 37 14 18 32
38 - 42 17 13 30
43 - 47 11 4 15
48 - 52 14 3 17
53 - 57 8 7 15
58 - 62 9 4 13
Total 101 80 181
Source - Primary Data

International Journal of Advance and Innovative Research Volume 6, Issue 1 (XXIV): January - March, 2019
194
ISSN 2394 - 7780
6. CONCLUSION
A simple perusal of positive and negative responses to a set of questions reveals that the tax payers have
comprehensive knowledge of tax benefits available and they are making extensive use of these benefits, and tax
saving is the key factor pushing the tax payers towards investment in eligible avenues. Many investors would
not have made any investment in absence of tax benefits.
7. RECOMMENDATION
The tax saving investment avenues had remained stagnant over a decade now, apart from a few cosmetic
changes especially in election year. There had been no fundamental breakthrough in tax rates or tax slabs. No
new investment avenue with lucrative feature had been added. Too much of government resources in terms of
men power are engaged in harassing and intimidating honest and small salaried class people therefore very little
workforce are left for focusing on big fish and many are going scot free. In the light of above I recommend the
following –
i. The basic exemption limit must be set at Rs6,00,000.
ii. Total expenditure bill on education, training & development, healthcare, recreation, inland and foreign
tourism etc. must be allowed as deduction for salaried class.
iii. The sections 80C, 80CCC, 80CCD, 80D, 80DD, 80E, 80U and 80TTA should substituted for total
expenditure on valid payment proof basis.
REFERENCES
1. https://www.academia.edu/14475231/THE_EFFECT_OF_TAX_INCENTIVES_ON_INVESTMENT_DECI
SIONS
2. https://www.academia.edu/8610961/A_review_of_Tax_Incentives_and_its_impact_on_Foreign_Direct_Inve
stment_in_India
3. www.google.com
4. www.yahoo.com
International Journal of Advance and Innovative Research Volume 6, Issue 1 (XXIV): January - March, 2019
195
ISSN 2394 - 7780
SMART SANITATION MONITORING
Sonia P. Sawant1, Tanmaye B. Talekar2 and Seema Vishwakarma3
Student1,2 and Assistant Professor3, Vidyalankar School of Information Technology, Mumbai
ABSTRACT
The sanitation in India has always been a major problem. This is because no proper planning is done, people
migrate from one place to another, lack of space and sometimes due to scarcity of water. Most part of rural
India still do not have proper toilets and sanitation. It’s been 4 years of Swachh Bharat Abhiyan and
government of India has been able to build toilets in every state of India. It has covered maximum portion of the
stated work, but the issue that arises is the maintenance of toilets on a regular basis. The ideology behind this
paper is to trace and maintain cleanliness and hygiene for public toilets. The paper proposes a system which
will help to overcome this issue. The proposed system can also contribute to achieve the goals of Swachh India
project. The proposed system tackles the issue of keeping the toilets clean on regular interval, checking the
activity of the cleaner appointed and monitoring the usage of the toilet for future use. This is achieved by using
IOT concept with a user interface to create smart toilet monitoring and management system.
Keywords: Sanitation, toilets, Swachh Bharat, hygienic, India
INTRODUCTION
The toilet management in India is in poor condition. According to multiple surveys, many public toilets are not
as clean and maintained as they need to be. Also many people in India lack knowledge of using toilets which
leads to various diseases such as Malaria, Typhoid, Cholera and Flu etc. as the defecate in open environment
.Hence to overcome this issue we introduce a concept through this paper of ‘Toilets Cleanliness Monitoring
System’. The system is based on IoT concept which makes use of various sensors and components with
combination of a user interface help to track the activities inside the toilet. The system is introduced to maintain
the toilets in the clean and hygienic way.
PROBLEM DEFINATION
The public toilets in most of the urban as well as rural areas in India are not maintained properly resulting into
many health problems and affecting the environment. The maintenance of these toilets is done manually and
needs more of human work, the staff appointed to look after the toilets are inconsistent and most of the work is
neglected. Also there is no involvement of higher authority to keep track regarding the regular cleanliness
taking place throughout the day. All these factors leads to improper management of the toilet which results in
unhygienic toilets and difficult for a human to use them.
The unhygienic environment due to improper management of the cleaning staff results into many health issues
and public problems in India. According to our research we came to know that the toilets are sufficient for the
people to use but they are not maintained and taken care of on regular basis. We visited public toilets in our
locality as well as the toilets of the nearby railway station wherein we came to know that the staff appointed to
do the respective work is not been doing his duty properly which results into contaminated toilets as well as the
affected environment. The cleaning of these toilets is done twice a day which is not sufficient for the public
toilets as they are visited by huge number of people making them more dirty and stinky if not maintained
properly and at regular interval of time. Also the higher authority do not keep a track on the work done by the
appointed staff at these toilets. Also people working at some public toilets ask for money when we use toilet,
which is not worth to pay for the service that these toilets provide. Many of the toilets don’t have water supply
which becomes difficult for the people to the toilet. We asked the regular commuters at railway station about the
condition of toilets and what they want to change about them, we got negative reviews from the people and also
the stated problems mentioned above as the answers from them. So taking all these problems into picture we
came up with the concept of Toilets Cleanliness Monitoring System which may help to overcome the issues and
provide healthy and hygienic through its functionality.
WORKING PRINCIPLE
The system proposed in this paper is a combination of various sensors that gather the relevant data and give the
desired outcomes by their working. As urine contains ammonia in it, the air quality sensor will be used to
collect the ammonia present in the environment. If high amount of ammonia is detected which makes toilet
unclean and unbearable to smell, it will generate an alert by buzzing the buzzer in the toilet to make the cleaner
aware about his duty and simultaneously a message will be sent to higher authority using GSM module
notifying that toilet was not clean for particular period of time. An IR sensor will be used to keep the count of

International Journal of Advance and Innovative Research Volume 6, Issue 1 (XXIV): January - March, 2019
196
ISSN 2394 - 7780
people entering into the toilets. All the data captured by the sensors will be routed on to the website using Wi-Fi
module which will be displaying all the details such as ammonia count, people count and at what time the
buzzer was buzzed. All the data available on website will be monitored by the respective authority and it would
help to give an idea about how much the toilet is used , how many time does it needs to be cleaned and when
reconstructed what changes to be done in the toilets.
The working of the system from its initial stage up to the function it will be performing throughout the process
is been explained using modules in following way:
Module-1: Connecting all the sensors to Arduino UNO board
The sensors used for gathering the required data will be connected to the Arduino board and it will be used to
process the functioning of these sensors.
Figure-1: Arduino Uno board
Ref: https://boutique.semageek.com/en/68-arduino-uno-smd-r3.html
Module-2: Sensing the ammonia present in the toilet
The ammonia present in the toilet will be sensed using MQ-135 Gas sensor to detect the ammonia level. The
sensing of ammonia will be continuous process.
Module-3: Detecting the access amount of ammonia
The ammonia detected will be computed with the reference values of ammonia level that are specified in the
program to check whether the ammonia is present in high amount or it is in balanced state
Figure-2: MQ 135 gas sensor
Ref: https://potentiallabs.com/cart/air-quality-control-gas-sensor-mq135
Module-4: Buzzer buzzed when access amount of ammonia is detected..
When the ammonia detected by the sensor meets the certain specification of reference values where it is found
to be high, the buzzer will be buzzed to make the cleaner aware that he needs to clean the toilet. After few
minutes it will stop buzzing.
Figure-3: Buzzer
Ref: https://www.prayogindia.in/product/buzzer/
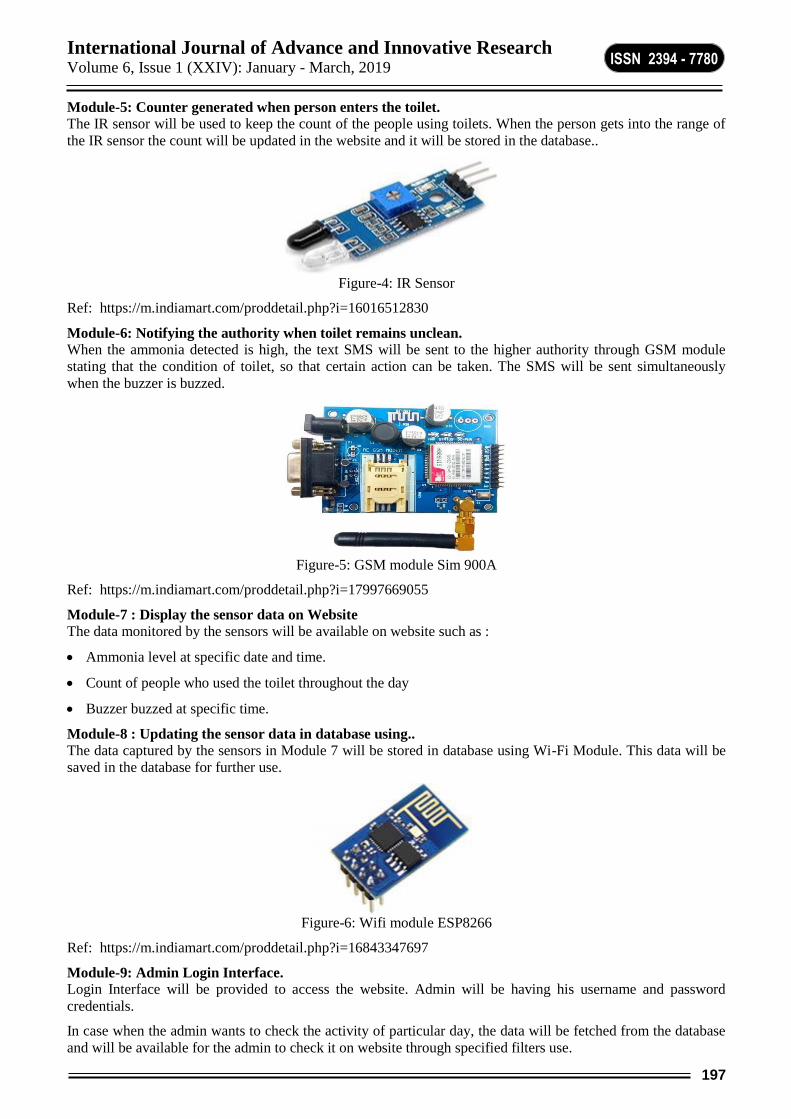
International Journal of Advance and Innovative Research Volume 6, Issue 1 (XXIV): January - March, 2019
197
ISSN 2394 - 7780
Module-5: Counter generated when person enters the toilet.
The IR sensor will be used to keep the count of the people using toilets. When the person gets into the range of
the IR sensor the count will be updated in the website and it will be stored in the database..
Figure-4: IR Sensor
Ref: https://m.indiamart.com/proddetail.php?i=16016512830
Module-6: Notifying the authority when toilet remains unclean.
When the ammonia detected is high, the text SMS will be sent to the higher authority through GSM module
stating that the condition of toilet, so that certain action can be taken. The SMS will be sent simultaneously
when the buzzer is buzzed.
Figure-5: GSM module Sim 900A
Ref: https://m.indiamart.com/proddetail.php?i=17997669055
Module-7 : Display the sensor data on Website
The data monitored by the sensors will be available on website such as :
Ammonia level at specific date and time.
Count of people who used the toilet throughout the day
Buzzer buzzed at specific time.
Module-8 : Updating the sensor data in database using..
The data captured by the sensors in Module 7 will be stored in database using Wi-Fi Module. This data will be
saved in the database for further use.
Figure-6: Wifi module ESP8266
Ref: https://m.indiamart.com/proddetail.php?i=16843347697
Module-9: Admin Login Interface.
Login Interface will be provided to access the website. Admin will be having his username and password
credentials.
In case when the admin wants to check the activity of particular day, the data will be fetched from the database
and will be available for the admin to check it on website through specified filters use.

International Journal of Advance and Innovative Research Volume 6, Issue 1 (XXIV): January - March, 2019
198
ISSN 2394 - 7780
Figure-7: Interface of website
Figure-8: Architecture of proposed system
CONCLUSION
The proposed system will help to overcome the issues faced by the people when they are using public toilets.
The staff appointed for maintenance purpose of the toilet will be monitored well so that they wont neglect work
and responsibilities assigned to them. Since the toilets will be cleaned, hygenic and well maintained more and
more people would be encouraged to use toilets, which will ultimately reduce the number of people defecating
in open. Higher authorities will be alerted by the proposed system to take measures if the number of people
using toilets are more and not maintained properly. As an enhancement the system can be added with modules
to reduce the wastage of water in the toilets. It can also be added with modules for rating the toilets after use
with a feedback buttons.

International Journal of Advance and Innovative Research Volume 6, Issue 1 (XXIV): January - March, 2019
199
ISSN 2394 - 7780
REFERENCES
[1] Jalpa Shah, Biswajit Mishra (2016). International Conference on Internet of Things and Applications
(IOTA)
[2] https://www.ncbi.nlm.nih.gov/m/pubmed/17003100/
[3] https://www1.agric.gov.ab.ca/$department/deptdocs.nsf/all/agdex8271
[4] https://www.google.co.in/amp/s/www.thebetterindia.com/100243/feedback-device- swachh-bharat-
restrooms-sanitation/amp/
[5] Water efficient toilet: Setting a suitable automatic flushing duration by Klaiwad Boonyakan ;
Naratsaporn Heamra ; Attawit Changkamanon
[6] Configurable automatic smart urinal flusher based on MQTT protocol by Kitisak Osathanunkul, Kittikorn
Hantrakul, Part Pramokchon, Paween Khoenkaw and Nasi Tantitharanukul
[7] opment of the smart toilet equipment with measurements of physiological parameters by Ji-Jer Huang,
Sheng-I Yu, and Hao-Yi Syu
[8] Reclamation of Zero Discharge System with CDTS Technology bySanjeev Singh Verma and Abhinav
Singh
[9] Design and Development of the Red Cross Mobile Flush Toilet toward the Smart Design Shelter by
Yasuhiro SOSHINO, Akinori KURODA, Akira MIYATA, Koji KURAYAMA
[10] Modern Sanitation Technologies for Smart Cities by Ravi Kishore Kodali and Siva Ramakrishna P

International Journal of Advance and Innovative Research Volume 6, Issue 1 (XXIV): January - March, 2019
200
ISSN 2394 - 7780
BANKING SUPERVISORY ADOPTION WITH BAZEL AGREEMENT CRITERIA
Dr. Arjeta Hallunovi1 and Prof Dr. Elez Osmanoviq2 1University Aleksander Moisiu Durres,
2University of Shkodra “Luigj Gurakuqi”, Albania
ABSTRACT
Within the scope of this paper, banking supervision has been analyzed as an essential aspect of modern
financial systems, demanding crucially to monitor the risk assumed by commercial banks in order to protect
depositors, the network of government security and the economy overall against systemic banking failure. This
paper examines with theoretical arguments, the banking supervision mission to all financial institutions
licensed by central banks, in order to guarantee the well-being of their business.The focus is on the analysis of
the albanian banking system, citing the shocks caused during the years and the current situation, with the help
of the Basel Committee's rules.
Keywords: Albania, Bazel Agreement Criteria, Banking Systems, Banking Supervisory
INTRODUCTION
Banking supervision is the process of monitoring the state of a bank, and through this, the entire banking system
(Akerlof, 1970). This process that begins with the establishment of normative and regulatory allowed standards,
with the assessment of the granting of the right to operate as a bank, continues with the bank's assessment of the
on-site and off-site examinations and, where necessary, involves taking corrective measures in in order to
ensure law enforcement and the creation of a sound banking industry (Diamond, 1984). Because of the special
role played by banks, the first task for banking supervision is to reduce as much as possible the risk of losing
depositors (Hefferman, 2005). By doing so, every bank has achieved stability in the banking system as a whole
(Alderweireld, Garcia and Leonard, 2006).
Since the banking system plays a key role in the economy of a country, poor quality in supervision this system
may have serious consequences for the banking system and the economy of any country (Davies, 2002). The
goal of each country is to have an efficient supervision of commercial banks by the regulatory authorities,
respectively the Central Bank, the banking system may fall prey to an excessive risk, such as moral hazard and
corruption (Caouette, Altman and Narayanan, 1998).
Effective supervision based on the Basel Committee's regulatory, laws and regulations adopted by the BoA, for
regulation and supervision is done to ensure the stability of the financial system and through it to influence the
continuation of economic growth (Andreau and Lloyd, 1999).
The supervision is focused on the underlying issues of the banking system: Do commercial banks have adequate
capital according to the rules? Do they have liquid assets for the development of future activities? What are the
risk specifics within the banking industry? Why are supervion models needed within the financial industry?
What are the weaknesses of Basel II and the advantages of Basel III? The implementation of Basel III
regulation is a new field of study and investment and resources need to be invested in the development of this
process in the banking system, making it a very interesting field for study (Eakins and Mishkin, 2012).
ARGUMENTATION There are several banking supervision roles, but some of the are most important of which include securing
stability in the banking system, protecting the interests of depositors and the public, providing a sound banking
system whose activity is transparent and led to the economy market, enhancing investor and depositor
confidence by supporting the development of the banking industry and its effectiveness (Boot and Thakor,
1991).
As a result of changes in the world economy and financial markets, the responsible authorities have seen it
necessary to adjust the financial indicators used continuously to control the smooth running of the financial
intermediaries, and especially to commercial banks (BIS, 2015). This has also been the reason why new
improved deals have been drafted (Buzzell, 2004).
The Basel I agreement had positive and negative sides (BCBS, 2006). Some of its positive effects were the
significant increase in capital adequacy ratios for banks operating in the international market, the relatively
simple structure of capital management, the establishment of competitive equality between banks active in the
international market, the establishment of unique standards and greater discipline in capital management, etc.
(Mills and Presley, 1999). But since the international market became more complicated over the years, new

International Journal of Advance and Innovative Research Volume 6, Issue 1 (XXIV): January - March, 2019
201
ISSN 2394 - 7780
rules had to be drafted, as due to capital liberalization, globalization, high interdependence in the international
banking system, high exposures to stocks were growing (Bessis, 2003).
Basel I was also criticized for seeking more capital for positions that are designed to reduce the risk (Eubanks,
2006). The agreement was only designed for major international banks within the G-10 countries. In addition to
a limited requirement to publish information about banks' exposure and capital quality, the deal was not
sufficient to secure financial stability (Balin, 2008).
It was explained that the biggest news in Basel II, compared with Basel I, was the IRB approach that leaves
banks using their own equity settlement methods. This is the method that has received more criticism for Basel
II (Greenspan, 2011). Also, it was explained that it was risky to leave banks to develop their credit risk models
because the recognition of credit risk models had not yet spread. Greenspan (2011) raises the question of
reliability of bank models by presenting five issues with regard to credibility. First, it is the question of model
assumptions. If these are not good the model cannot be good. Secondly, it is difficult to test these models
because test data did not exist when Basel II was developed. Thirdly, correlations between variables could not
be captured correctly in models. Fourthly, it is important to note that bank failures and crises are events that are
likely to be found in the tail of the models, which are important to catch them in a better way. Fifthly, credibility
comes from the fact that not all risks come from outside. Risks may even come from the banks themselves and
this can not be reflected in the models.
Even before Lehman Brothers collapsed in September 2008, the need for fundamental strengthening of the
Basel II framework had become apparent. The banking sector had entered the financial crisis with many
installments and inadequate liquidity coverage. These defects are associated with poor governance and risk
management, as well as inadequate stimulus structures (Weatherford, 1998).
The dangerous combination of these factors has been demonstrated by abuses of credit and liquidity risk as well
as excessive credit growth. The financial crisis of 2008 highlighted some real problems in the regulatory and
supervisory framework of the financial system and in particular in banking system.
In July 2009, the Basel Committee issued a further package of documents to strengthen the Basel II capital
framework. These improvements were part of a wider effort to strengthen the regulation and supervision of
active banks in international markets in light of weaknesses discovered by the financial market crisis. In
September 2010, the group of governors and supervisory chairpersons declare higher global minimum capital
standards for commercial banks. This followed an agreement reached in July regarding the overall design of the
capital and liquidity reform package, now referred to as "Basel III". In November 2010, new capital and
liquidity standards were adopted at the G20 summit in Seoul, and then agreed at the Basel Committee meeting
in December 2010. Today the implementation of the new regulation has sparked numerous debates over
whether to implement Basel III. There are two views about Basel III:
1. The first view points out that with the increase in capital demand the Leverage Ratio decreases and the
bankruptcy risk rises. This is considered to be one of the main factors of the financial crisis that began in 2008.
Even when banks have a high leverage ratio, a small asset depletion may bother these institutions over potential
insolvency. For banking supervisory authorities, it was a major reason to decide on the application of the
tougher banking regulation where the benefits of taxpayers would be:
Increased capital demand will reduce the probability of failure, because the bank's capital coverage may also
accept a substantial reduction in assets without causing any failure or loss
If necessary for an action plan to escape the situation, the amount of capital required will be lower as a large
part of the losses will be absorbed by equity.
2. The second view argues that high capital growth requirements will directly impact the increase in the cost of
capital financing, which affects the slowdown in lending growth, interest rate rise and reduced profitability of
banks. The increase in capital demand by arguments criticized by Basel III is a non-committed source of capital
which directly has negative macroeconomic impacts. High capital requirements as a non-committed source
removes part of it that would be involved in the process of manufacturing goods and services in the economy.
This non-engagement of capital has a negative impact on economic growth, as these resources can only be
committed if it does not have the effects of the crisis or after the shocks of the crisis pass. In conclusion, high
capital requirements lead to such a kind of social costs that mitigate the scolding balance of banks that are not
available to finance the increase in capital investment productivity, affecting the reduction of the standard of
living of the population (Greenspan, 2011).

International Journal of Advance and Innovative Research Volume 6, Issue 1 (XXIV): January - March, 2019
202
ISSN 2394 - 7780
CONCLUSIONS
The shocks that have passed the banking system in Albania should serve as precedents from which the BoA
should draw lessons. This conclusion is important as the source of the three biggest shocks of the banking
system has been different. In the period 1996-1997 the source was out of the financial system and was assisted
by the lack of proper legal basis for the functioning of the banking system. If the institutions were consolidated,
this crisis could have been avoided.
Although the banking system trend is positive, Bank of Albania should continue to monitor and co-operate with
the commercial banks. In recent years, the banking system in Albania has generally been healthy even when
compared with the Balkan countries, which as well as our country are candidates or potential candidates for EU
accession.
Increasing the qualification of human resources within the banking system is also a factor to be seen. The
growth of the banking system is closely related to the qualification of people working in the banking sector. The
counterpart of banking supervision specialists needs to be developed, requiring an increase in the level of
qualification and the implementation of the most advanced practices in supervisory processes.
Relationships with other foreign supervisory authorities should also be reviewed. The banking system in
Albania is dominated by subsidiaries of foreign bank groups. Affiliates depend heavily on capitalization and
transfer from their centers of expertise and technology. Under these conditions, the establishment and expansion
of relations with the supervisory authorities of the countries of origin of these banks or banking groups are of
particular importance.
REFERENCES
Alderweireld, T., Garcia, J., and Leonard, L. (2006). A practical operational risk scenario analysis
quantification. Risk. 19(2), 93–95.
Andreau, J. and Lloyd, J. (1999). Banking and business in the roman world (Key themes in ancient
history). Cambridge University Press. Cambridge.
Akerlof, G. (1970). The market for ‘lemons’: Quality uncertainty and the market mechanism. Quarterly
Journal of Economics. 84. 488– 500.
Buzzell, D.H. (2004). Principles of banking. American Bankers Association. Washington. DC.
Boot, A. and Thakor, A. (1991). Moral hazard and secured lending in an infinitely repeated credit market
game. International Economic Review. 35. 899–920.
Bessis, J. (2003). Risk management in banking (2nd edn). Wiley. Chichester.
Basel Committee on Banking Supervision. (2006). International Convergence of Capital Measurement and
Capital Standards. A Revised Framework. Technical report. Bank for International Settlements. Basel.
BoA. (2016). Financial Stability Report.
BIS (2015). A brief history of Basel Comimttee.
Caouette, J., Altman, E., and Narayanan, P. (1998). Managing credit risk: the next great financial challenge,
John Wiley & Sons, Inc., New York.
Diamond, D. (1984). Financial intermediation and delegated monitoring. Review of Economic Studies, 51,
393–414.
Davies,G. (2002). A history of money from ancient times to the present day (3rd edn). University of Wales
Press. Cardiff.
Eakins, S. G. and Mishkin, F. S. (2012): Financial Markets and institution. Seventh edition. Pearson
Education Limited. Harlow.
Greenspan, A. (2011): Regulators must risk more, intervene less. Financial Times.
Grier, W.A. (2001). Credit analysis of financial institutions. Euromoney Books, London.
Hefferman, S. (2005). Modern banking. John Wiley & Sons, Hoboken, New Jersey.
Mills, P.S. and Presley, J.R. (1999). Islamic finance: theory and practice. Palgrave, Hampshire, New
York.
Weatherford, J. (1998). The history of money. Three Rivers Press, New York.

International Journal of Advance and Innovative Research Volume 6, Issue 1 (XXIV): January - March, 2019
203
ISSN 2394 - 7780
SOCIAL ENTREPRENEURSHIP & MARGINALIZED WOMEN EMPOWERMENT
A CASE STUDY OF SHRI MAHILA LIJJAT GRIHA UDYOG
Dr. Amee Vora
ABSTRACT
Social Entrepreneur and Social Entrepreneurship emerged into common parlance in the early 1980s, when Bill
Dreyton identified this process as a form of entrepreneurship, which tried to find solutions to varied problems
of humankind, especially the poor and the marginalized, in the entrepreneurial way. Social enterprises aim
their efforts toward improving the general welfare of society and they apply market‐based strategies to achieve
a social purpose. Shri Mahila Lijjat Griha Udyog (Lijjat ) started in 1959 by seven women in Mumbai with a
seed capital of only Rs.80, has grown to an annual turnover of more than Rs. 800 Crore in 2018. It provides
employment to 43,000 marginalized poor women across the country and emerged as a progress oriented
voluntary organization engaged in marginalized women empowerment. This Case study would intensively study
the efforts of the Lijjat as a model Non- Government Organization (NGO) engaged in social innovation,
marketing and organizational strategies and women empowerment in the society.
Keywords: Social Entrepreurship, Women empowerment, Non-government Organizations, Lijjat, Innovation
I. INTRODUCTION
Social impact and entrepreneurship are deeply rooted in the Indian ethos. The social and economic hardships in
India can be overcome through the innovation and promotion of best practices and positive models as well as by
spreading good examples of social entrepreneurship and social responsibility. In order for a society to boost
social entrepreneurship, it needs a specific environment where such ideas can emerge and develop into an active
business models. Cooperative and community-owned business models like Lijjat which have existed in India
since the 1960s, though the term ‘social entrepreneur’ gained popularity in 1981. This study of Lijjat attains
significance now, since its product mix, marketing strategy and organizational development has undergone
changes in the recent years.
LIJJAT : A PROFILE
Shri Mahila Lijjat Griha Udyog (Lijjat) is a women’s organization of the women , by the women and for the
women. Lijjat was started in 1959 with 7 female members from the economically and socially marginalized
class of society with a borrowed sum of Rs.80/- at Girgaum in Mumbai , the commercial capital of India. The
turning point of the institution was in 1966 when it was registered under the Bombay Public Trusts Act 1950
and registered under Societies Registration Act, 1860 and obtained recognition under Khadi & Village
Industries Commission (Govt. of India ) as a village industry. Since then , Lijjat has grown over the years
and today it has emerged as a Pan India organization with 82 branches in 17 states of Andhra Pradesh,
Bihar, Delhi, Gujarat, Haryana, Jharkhand, Jammu and Kashmir, Karnataka, Kerala, Madhya
Pradesh, Maharashtra, Odisha , Punjab, Rajasthan, Tamil Nadu, Uttar Pradesh, and West Bengal. Along with
the Lijjat Pappad , the institution produces other products like Masala spices powder , Gehu Atta, Chapaties ,
Appalam , Detergent powder & Laundry soap . Lijjat provides self –employment opportunities to about 45,000
sister members all over India. A chart depicting Strengths, Weaknesses, Opportunities & Challenges (SWOC )
is provided below:
Strengths Weaknesses
- Organization providing sustainable livelihood
and wellbeing for its members
- Quality and hygiene for the products as the
vital standards
- Membership for women irrespective of
religion , community , caste ,or class
originating from ‘Sarvodaya Movement ‘
- Transparency in operations and a non-
hierarchical structure
- organizational accountability among member
sisters
- Unsuccessful ventures such as cottage leather,
matches, and agarbatti (incense sticks).
- tax exemption from Sales tax was initially
provided for all products and later withdrawn
in the states of Punjab , Maharashtra

International Journal of Advance and Innovative Research Volume 6, Issue 1 (XXIV): January - March, 2019
204
ISSN 2394 - 7780
Opportunities Challenges
- economic opportunities through a domestic
activity
- highly enterprising, responsible, and
experienced member sisters climb the
administrative ladder
- informal work environment
- innovative organization with new products
evolving over the years of growth & progress
- Competition from Multinational
Conglomerate(like ITC, Unilever) , local
manufacturers /cooperatives for some
products like Detergents , Agarbattis , leather
articles etc.,
- Financial difficulties in some states like
Jammu & Kashmir, Bihar
MAIN OBJECTIVES AND SCOPE
Main objectives of the research paper are expressed as below:
(i) To understand the progress of Lijjat which has emerged as a model of Non Government
Organization(NGO) committed to providing self employment and livelihood for the women from low
economic and socially marginalized classes of society
(ii) To assess the impacts and lessons of governance & developmental performance of Lijjat
The scope of the research was extended to evaluation of Lijjat as an All India organization, as per the
organizational policy of Lijjat which does not allow the access the data on performance of its individual
branches /centres of activities as it was originally intended. Meetings with Smt. Swati R. Paradkar (President )
and other colleagues were undertaken for research and data collection and analysis was done . Authenticity and
awareness of the impacts of developmental activities had been enhanced the discussions with Lijjat officials.
II. Organizational Philosophy, Structure & Development
Lijjat believes in the philosophy of sarvodaya and collective ownership. It accepts all its working members as
the owners and an equal partaker in both profit and loss. The members are co-owners and secularly referred to
as "sisters". All the decisions are based on consensus and any member-sister has the right to veto a
decision. Men can only be salaried employees (accountants, drivers or security guards), and not the members of
the organisation (i.e. they are not the owners). The administration of the organisation is entrusted to a
Managing Committee of twenty-one members, including the President, the Vice-President, two secretaries, and
two treasurers. Sanchalikas are in-charge of various branches and divisions. The office bearers of the managing
committee and the sanchalikas are chosen from among the member-sisters on the basis of consensus every three
years. Each branch has a committee of eleven member-sisters, again chosen by consensus.
The central office at Mumbai previously coordinated the activities of various branches. But, as the organisation
grew, the authority was decentralised in terms of work and sharing of profits at the branch level. However,
the sanchalikas still need the managing committee's approval before they undertake any new project or activity.
All the branches follow the same set of instructions and have similar accounting system. To co-ordinate various
branches in a region or state, there are branch co-ordination committees and area meetings of the various
branches in a state. The annual general meeting is attended by member-sisters representing branches and
divisions from all over India.
Separate allocations in the Corpus of funds have been allowed periodically to compensate for inflationary
escalations in the costs of operations and fluctuations in the prices of raw materials and Sales Tax
exemptions which have been disallowed by the State Governments of Punjab & Maharashtra in the
recent years. Although Goods & Service Tax has come into effect from July 1, 2017, Lijjat Pappad has been
exempted under GST notification No.2/2017 dated June 28, 2017 issued by Govt. of India. As an institution
recognized by KVIC, Lijjat has made representations to the concerned authorities for exemption on all products,
raw materials /packing materials, branch transfers to outstation branches as was existing under the earlier
legislations.
The merging of ownership with membership has encouraged uniform and sustained organizational growth. The
central office of Lijjat in Mumbai previously coordinated the activities of all the branches, but with the
increasing number of outlying branches, authority was decentralized in terms of routine work and sharing of
profits at the branch level.

International Journal of Advance and Innovative Research Volume 6, Issue 1 (XXIV): January - March, 2019
205
ISSN 2394 - 7780
The sisters are free to choose their activities, such as making the masala (blend of multiple spices), pounding
the flour, weighing the flour, preparing the dough, rolling papads, receiving papads after weighing, checking the
papads, packing the papads, distributing wages, and handling the accounts. Each activity is given equal
importance, and sisters perform these activities with mutual cooperation and consent. When a new branch of
Lijjat opens, a neighbouring Lijjat branch helps it by guiding and training new members. Leaving the
organization is voluntary. A member can ask an employee to quit without specifying the reason, but no
employee can ask a member to quit. However, a member can be asked to quit by another member (or members)
if found to be involved in false practices or misconduct No member sister can be asked to leave unless or until
she goes against the organizational principles. Lijjat has set aside Rs.2700 lacs out of its corpus of funds to be
utilised for the welfare of its members and incentives based on higher productivity of individual members has
been allowed by Lijjat (Annual Accounts 2016-17). Lijjat also provides scholarships and awards to support and
encourage the education of sisters’ children, especially the daughters. Meritorious sons / daughters of members
are encouraged by Lijjat annually for their proficiency in academic excellence.
Lijjat follows its own financial accountability principle; for instance, there is only a 0.5 rupee margin between
the production cost and selling price of a 200-gram papad pack. Profits and losses are shared equally among the
members of a given branch. Account books are easily accessible, ensuring transparency in Lijjat’s working. The
cost of national level advertising is borne by all branches and divisions, depending on their individual
production abilities. The polypropylene division provides money for advertisements and recovers it through
additional charges on the bags that it supplies to the branches and divisions across India. In this way, Lijjat
represents a model for organizational accountability and transparency.
The lives of Lijjat’s member sisters have changed considerably since joining the organization. A home-like
working atmosphere and the practice of considering only women for membership have solved the problem so
many Indian women face of reluctance to work for fear of their families’ and society’s reactions. The member
sisters can enjoy social independence while working freely in a male-dominated society. They have become
aware of new opportunities and are able to live independently. The sisters who were deprived of education
during childhood can now attain literacy while working, and lead their life in a better way. They are no longer
dependent on others for a host of tasks, such as writing a letter, maintaining a bank account, or teaching their
children. In most families of Lijjat members, the wives’ monthly earnings are a valuable addition to the total
family income, and this has enhanced their status and power within the family. They are started to have a
greater say in how money should be spent for the health and education of their children.
III. Product Quality, Marketing & Distribution
The quality of papads can vary due to quality of water used in various parts of India. To avoid any
inconsistencies, the final products are tested in the Lijjat's laboratory in Mumbai. In the monthly meetings, the
quality issue and modifications are tested. The central office purchases and distributes all ingredients to
maintain the quality of the final product. For example, the urad dal is imported from Myanmar, asafoetida is
imported from Afghanistan, and black pepper comes from Kerala. The committee often makes surprise visits to
various branches to assure that production conditions are hygienic. When a new branch of Lijjat opens, a
neighbouring Lijjat branch helps it by guiding and training new members. The trade mark of Lijjat is
represented by its logo given herewith.
On successive failures of a branch to abide by the organisation's philosophy of consistent quality and production
of papads, the central committee reduces the ‘Vanai’ (daily wages) of its members by 1 rupee. The member-
sisters are also rewarded for extra effort. For instance, in 2002, the member-sisters at the Rajkot branch received
Rs. 4,000 each as bonus, while the member sisters at Mumbai and Thane branches received a 5-gram gold coin
as an incentive in addition to the Vanai they received. Several issues of Lijjat Patrika enumerate the names of
the names/numbers of the member-sisters, who were rewarded with the cash or gold, for their extra efforts. In

International Journal of Advance and Innovative Research Volume 6, Issue 1 (XXIV): January - March, 2019
206
ISSN 2394 - 7780
1998, Lijjat also entered the soap market with Sasa detergent and soap. Lijjat faced competition from
multinational FMCG companies / other local producers. In export market it had to compete with products
produced by other exporters in the export markets. Sales of Lijjat products in the recent period of 2013-14 to
2017-18 is given below:
Financial Year Domestic Sales
(Rs.Lakh)
Exports
(Rs.Lakh)
Total Sales
(Rs.Lakh)
2013 – 14 105157 4524 109681
2014 – 15 125294 4425 129719
2015 – 16 148449 6325 154774
2016 – 17 151527 6685 158212
2017 - 18 129934 6069 136003
Note: Data on sales include inter-branches / division transfers.
Source : Lijjat Patrika
Lijjat also exports its products with the help of merchant importers in the United Kingdom and other European
countries, the United States, the Middle East, Thailand, and other countries. Sometimes Lijjat had to face the
problem of fake Lijjat papads being introduced in the market. In June 2001, three persons were arrested in this
connection in Bihar, but the threat exists in the global market also. Lijjat’s Website
(http://www.Lijjat.com/new.htm) tries to explain the identification features of original Lijjat papads, but even
with technological advancements, it is difficult to guarantee the original product. Besides papads, Lijjat has
initiated some unsuccessful ventures such as cottage leather, matches, and agarbatti (incense sticks). However,
by the end of 1978, Lijjat had flourmills, spices, printing, and polypropylene divisions of its own and in 1979
began manufacturing bakery products as well. In 1966, Lijjat was recognized under the Khadi and Village
Industries Act, and it obtained exemption from income and sales taxes and could get loans at lower interest
rates. Currently, the state governments of Punjab and Mumbai have withdrawn the sales tax exemption on
Lijjat’s Sasa detergent because Lijjat has already grown into a sizeable Organization. Lijjat faced by the
problem of competition in sales of their SASA Detergent from existing established brand i.e. Nirma. The lack of
advertising may be one of the reasons of this problem. So, there is an urgency to increase in advertising and
direct selling for Lijjat.
The Lijjat also face the problem of drying papads in monsoon season. Because it is difficult to dry the papads
outdoor and the sister members have not enough space to dry papads indoors in rainy season which affect the
Lijjat’s export business in monsoon. To overcome this problem in monsoon season Lijjat should hire an
additional space which will be near to depots with Kerosene lamps where sister members can come and dry the
papads.
While calculating the price of its products, the following expenses are taken into consideration:
- Cost of Raw material
- Rolling Charges
- Packaging Costs

International Journal of Advance and Innovative Research Volume 6, Issue 1 (XXIV): January - March, 2019
207
ISSN 2394 - 7780
- Transport
- Selling Expenses
- Administrative expenses
A certain mark-up is then added to these costs to account for the profits. They do not have individual door-to-
door salesmen or women selling from homes -- only the appointed distributor for the area. The same system is
followed for other products, but they may have different distributors and depots for different products. Shri
Mahila Griha Udyog Lijjat Papad has a policy of not allowing any sales to be made on credit terms. All sales
are made on cash-at-delivery or advance payment basis.
A Flow chart of distribution pathway of Lijjat is presented below
Source : Lijjat
IV. Key Elements of Women Empowerment & Emancipation
With increasing business and other advances, the need for information dissemination and communication
among member sisters at various branches has increased. The monthly regional meetings, annual general
meetings, and All-India conventions of branches are held to keep the members aware of organizational activities
and strategies, and to discuss issues such as quality maintenance, production rates, the handling of accounts, and
everyday problems to assure a better work environment. Lijjat Patrika, the in-house magazine, is published and
circulated for a nominal rate to those interested in the activities of Shri Mahila Grih Udyog. Lijjat Patrika has
emerged as a strong mode of communication for information related to significant events and initiatives at
Lijjat, in addition to presenting articles on women. Initially most sisters were uneducated, but realized the
importance of education for their children, especially daughters.Besides other interactive and information-based
activities, participation in various trade fairs and exhibitions held across India contributed to the popularity of
the Lijjat brand. Such participation also builds self-confidence, through exposure and training opportunities, for
the member sisters who play a significant role in the overall functioning of Lijjat.
The combination of inclusion and the active participation of women have been endured over the six decades of
its existence as Lijjat’s backbone . The interests of all sisters are treated equally, because they sisters form the
Lijjat family. Any woman, irrespective of her religion, caste, or class, can become a member after signing a
pledge of devotion, which is her assurance for earning an honest income through cooperative work. Member
sisters across all branches of Lijjat recite an all-religion prayer before beginning their daily activities. Because
of Lijjat’s main motive of generating self-employment for women, no machinery is used at the production level,
and everything is done manually. However, computers are now being used in some of the Mumbai branches for
accounts and administration

International Journal of Advance and Innovative Research Volume 6, Issue 1 (XXIV): January - March, 2019
208
ISSN 2394 - 7780
Lijjat became a formally complete organization by the seventh year of its existence, and afterward was
recognized as a public trust. Initially, Lijjat’s activities were limited to the former Bombay, but in 1966 it started
to establish centers in neighbouring urban areas, followed by branches in other states such as Gujarat, Andhra
Pradesh, Punjab, and Madhya Pradesh. After continued success and phenomenal growth during the last four
decades, Lijjat has been able to make its presence felt worldwide. A number of people, including officials from
countries such as Israel, the United Kingdom, Sri Lanka, Sudan, Iran, and Uganda, have visited India to see
Lijjat’s methods of operation. They occasionally promote similar organizations in their own countries.
CONCLUSION
Over nearly six decades of its operations, Lijjat has become one of the most successful
business venture that is own by women for women empowerment. It helps women not willing to work
outside their homes to contribute to family income. Because of how it values its people it has developed a
sustainable business model. With its ever growing market, thanks to quality affordable products in addition
to a rapid expansion it is safe to say that the future of Lijjat Papad can only be brighter. The fact that it is
tailor made for women has helped it gain entrepreneurship and emancipation for women from all
communities, caste and classes of the society.
Lijjat has protected its sister-members from joblessness. These women also work from their homes, where
help from other family members not only adds up to the income but also makes the work more enjoyable
and income generating. At the workplace they are self-respecting, hard-working and sisterly to one another.
Transparency in operations and a non-hierarchical structure has helped in establishing organizational
accountability among member sisters. Calling the members “sisters” creates an informal work environment.
Frequent meetings, open interaction, and consensual distribution of tasks reduce the possibility of disputes
resulting from communication gaps and help work to go smoothly and in flexible manner.
ACKNOWLEDGEMENT
Author thank Smt . Swati R. Paradkar , President , Lijjat and her officials for valuable information and
insights provided during the research study.
REFERENCES
Shri Mahila Grih Udyog Lijjat Papad Press. In Quest of Sarvodaya. Mumbai, India.
———. (1998). Women Power Behind a Success Story. Mumbai, India, November
———.( 1998). Magic Behind Success Story. Mumbai, India, November
———. (1998). Basic Philosophy and Practices of our Organization. Mumbai, India, November
———. (1999). For Better Administration and Management of the Trust of Shri Mahila Grih Udyog Lijjat
Papad. Mumbai, India, May.
———. (2000–2018). Lijjat Patrika,. Mumbai, India, October 2000 to October 2018
Bhatnagar, Deepti, and M.R. Dixit. (1993). “Case study on Shri Mahila Grih Udyog Lijjat Papad.” Indian
Institute of Management (IIMA).
SWISSnex India (2015) “Social Entrepreneurship in India” Bangalore
Web References
Ramanathan, Malathi, “Grassroots Developments in Women’s Empowerment in India:
Case Study of Shri Mahila Griha Udyog Lijjat Papad (1959–2000).” URL:
<http://www.pcr.uu.se/myrdal/pdf/Malathi_Ramanathan.pdf>.
The Tribune (India). 2002. “Reflecting women’s real strength”. Editorial. URL:
<http://www.tribuneindia.com/2002/20020919/edit.htm>.
The Economic Times, India. 2002. “In Papadom, They Like It Hot ‘N’ Crackling.”
September. URL: <http://www.propoor.org/news/xar0909.asp>.

International Journal of Advance and Innovative Research Volume 6, Issue 1 (XXIV): January - March, 2019
209
ISSN 2394 - 7780
PURA VILLAGE CLUSTER AN ALTERNATE SOLUTION FOR SUSTAINABLE DEVELOPMENT
OF TEXTILE INDUSTRY IN ICHALKARANJI AREA
Gajanan J. Salunkhe
Assistant Director & Assistant Professor, Yashwantrao Chavan School of Rural Development, Shivaji
University, Kolhapur
ABSTRACT PURA (Providing Urban Amenities in Rural Area) is a model concept developed by Dr.A.P.J.Abdul Kalam for
rural development which is a Socio-economic system of sustainable Growth. It is meant to ensure better life for
millions of Indians in Rural regions. PURA is a well-planned drive towards achieving an inclusive and
integrated Human Resource Development and sustainable development. Ichalkaranji one of the fastest growing
industrial areas in Maharashtra Termed as the “Manchester of Maharashtra” The city's economy driven
predominantly by the Textile industry . The textile industry Present Scenario facing crises due to Imbalance of
Resources and non-planned activities. These imbalances of resource and lack of planning is threatening the
survival of Textile industry. PURA as a socio economic system of sustainable growth model could provide
sustainable solution for this industry and also it could help for Rural Human Resource Development. The
socio economic system of rural development is termed as “Providing Urban Amenities in Rural Areas”
(PURA) is consist of four connectivity’s; physical, electronic, knowledge and economic connectivity to
achieve inclusive and integrated development. All the four connectivity’s will bring socio economic
development through Plain PURA Type which is type of PURA.
Keywords: PURA, Sustainable Development, Textile Industry
INTRODUCTION India is having second largest population in world 1,21,05,69,573 According to census of India 2011. This
Population in terms of Human resource is still not fully utilized. The reason behind it is India’s major
population 83, 34, 63,448 live in rural area which is engaged in Traditional Economical activities for their
survival. After the New economic policy Country faced the demographic problem of migration which in turn
led to many problems for the Human resource Development. This Migration was forced for the Rural Human
resource for their survival. But after 3 decades of adoption of new economic policy it has been realized the
growth achieved by country is not enough, not sustainable and also featured with regional imbalance. This has
created the divide between Rural and urban India. Urban India rapidly grown in terms of economical advantages
of Market where as Rural India lacked the pace due to over dependence on traditional economical activities.
Additionally there was lack of involvement amongst stakeholders in rural development.
Government of India and Government of Maharashtra undertook many programs for Textile industry in
Ichalkaranji area. Despite the efforts by government the lack of understanding of demand supply equation and
imbalance of resources are leading again and again this industry in trouble in Ichalkaranji area. The imbalance
of resources includes raw material availability, Human Resource availability, Energy Resources, Capital
Mobilization, Environmental degradation and other issues of Resources. These problems could be solved and
the industry could achieve sustainable growth by applying PURA model that is what researcher proposes in this
research paper.
Dr. A. P. J. Abdul Kalam Proposed PURA (Providing Urban Amenities in Rural Area) model. PURA
(Providing Urban Amenities in Rural Area) model is Socio-economic system of sustainable Growth. It is meant
to ensure better life for millions of Indians of Rural regions. A well-planned drive towards achieving an
inclusive and integrated Human Resource Development.
Ichalkaranji is one of the rapidly growing industrial areas in Maharashtra. This City Termed as the “Manchester
of Maharashtra”. The city's economy driven predominantly by the Textile industry. The textile industry Present
Scenario facing the problem in terms Imbalance of Resources. The Present research Paper attempt to apply
PURA model for providing solution to textile industry. This application of PURA model will boost the rural
development & Human Resource Development in area.
OBJECTIVES OF THE STUDY
• To analyze the Problems being faced by Textile industry in Ichalkaranji city
• To propose potentiality of PURA Cluster village Model for providing solution to the problems of Textile
industry in Ichalkaranji city

International Journal of Advance and Innovative Research Volume 6, Issue 1 (XXIV): January - March, 2019
210
ISSN 2394 - 7780
RESEARCH METHODOLOGY
The present research is based on secondary data only in which the data is obtained by various co-operative
organizations, Government websites, newspaper articles and books. The secondary data obtained is put in
organized format to evaluate and classify the problems faced by industry and propose the potentiality of PURA
application as a solution to solve those problems.
Profile of Textile Industry in Ichalkaranji Area
Industry profile
Sale of the textile products: More than Rs.150 billion
Per capita income of Ichalkaranji : Rs.1,16,472,
Fabric Manufacturing units: More than 5,000
Power looms: 120,000
Auto looms : 80000
Employees/ Workers: 99,152
A daily turnover of nearly: Rs.500 million
Sizing : 175 sizing units,
Process: 62 units
Warehouses : 187 units
Co-operative Spinning Mills 5
Sources: All above data collected from various sources which are mentioned in References
STATEMENT OF THE PROBLEM
Problem of Fabric Manufacturers
Dependence of fabric manufacturers on commission agents & yarn traders for entire Production process. This
problem is due to the lack of capacity to buy yarn in bulk. The issue is related with raw material procurement, as
the units of power loom are small scale the entrepreneurs are having inability to buy yarn in bulk from co-
operative spinning mills. If they even wish to buy it in bulk it would lead to unnecessary capital allocation
which will lead to inefficiency. Hence in this context it is necessary to have yarn supplying units which will
produce yarn as per requirement of raw material.
Fabric manufacturers get less share of profit which in turn reduces their ability to pay. This problem is related
with above problem as yarn agents does not share profit with the fabric manufacture instead they give them
labor charges which reduce yarn manufacturers’ ability to pay. This leads to capital shortage as such less
Working capital, in consistent payment to labor resulting in employee turnover, labor shortage, employee
absenteeism, strikes for wages salary and bonus
Problem of employees / workers
The labors are having inconsistent wages it is resulting due to yarn manufacturers’ in ability to pay
inconsistency in wages is due to another reason of absence of government regulation. This inconsistency in
wages leading the workers to face the problems of Increased cost of living, Poor health & safety, Job security,
non-fixed wages
Problem of sustainability
The textile industry technological up gradation has pulled excessive use of chemical products which are
damaging Natural Resources & climatic condition. Apart from this Noise pollution, Water pollution are the
other environmental issues.
These environmental issues are coupled with Drain of work force and Poor Quality of work-life
Proposed Application of PURA Model to Textile Industry in Ichalkaranji Area
Physical & Electronic connectivity
Development of Rail Freight corridor from Cotton producing areas of Vidarbha Region of Maharashtra to
Ichalkaranji: This will help for transportation of required Raw Material directly in the hands of Manufacturer.
As a part of direct transaction the Raw Material producer and the Manufacturer both will be benefited. Farmers

International Journal of Advance and Innovative Research Volume 6, Issue 1 (XXIV): January - March, 2019
211
ISSN 2394 - 7780
who are the raw material Producers will get the good Price for their Produce and Manufacturer will get the
cotton at low cost.
Setting up of warehouses at the two rail stations Rukadi & Hatkanangale which are catering the needs of this
area: These two villages will have additional economic activity of warehousing and Transportation apart from
traditional activities. Also it will create the surplus availability of raw Material which will be Helpful for raw
Material Procurement according to Requirement.
Micro Spinning Mills need to be established in the areas between the warehouses & Sizing Industry: As logistic
activities suggest the processing of product will be held after the formation of product. It will create the strong
supply chain and logistic.
Sizing Industry should be moved to villages which are on the banks of river: The water Resource will be
available for these units. Primary need of sizing industry is water which is not easily available in city area it is
better to move these sizing units in river side rural area so the water availability problem will be solved.
A common drain from these units should be developed to connect CETP plants at Shiradwad, Takawade: The
sizing units will pollute the water this water could be recycled for agriculture irrigation purpose. This step will
manage the balance of Environment.
Establishment of few more industrial areas in villages: The current Problem of Labor supply will be solved with
this initiation. If new industrial areas are established for entire process of the Textile Manufacturing labor
availability will be as per demand of industry. This industrial area will cater the need for fabric manufacturing
units, Processing Units & Packaging of finished product
Knowledge Connectivity
Setting up Educational Institutions which are Textile industry centered. Introducing Textile industry centered
Industrial Training Institutes. Setting up Research and Design centers for the Textile Industry. Human Resource
Requirements of industry in all three levels of hierarchy will be fulfilled by Means of these Knowledge hubs.
Implications of PURA Cluster Village
Development of Entrepreneurial Activities at various villages
Employment generation in Rural area
It will stop migration from Rural areas
Self reliability for fabric manufacturers on production process
Increased profit share for each level of production process
Increase in ability to pay
Availability of Consistent Labor supply for Production Process
Fixed wages, job security, sustainable livelihood, Quality of work life
Pollution control due to recycling facilities & decentralization
Preservation of climatic condition and natural resources
Extra income generated will be utilized for capacity building of workforce
CONCLUSION
If the proposed model of PURA with all four connectivity applied to Textile industry in Ichalkaranji area it will
lead to increase in entrepreneurial activities and Rise in income of yarn manufacturers along with workers
which will solve all the labor problems. This increased income will force these individuals to demand better
food and nutrition services thus the availability of increased quality of service will be in PURA complex of
Ichalkaranji. This income augmentation and enhanced service utilization will upgrade and enhance production.
This in totality will lead to human resource development and sustainable development of the Textile Industry.
REFERENCES
Association, T. i. (2012, December). The ichalkarnji Powerloom Association. Register of Powerloom
owners. Ichalkaranji, Maharashtra, India: The ichalkarnji Powerloom Association.
Association, t. s. (2012, December). Document of Autoloom owners. Ichalkaranji, Maharashtra, India: the
shuttleless loom association.

International Journal of Advance and Innovative Research Volume 6, Issue 1 (XXIV): January - March, 2019
212
ISSN 2394 - 7780
Association, Y. M. (2012). Sizing & Process Directory. Ichalkaranji, Maharashtra, India: Yarn Merchant &
Traders Association.
Deshpande, A. ( 2013., March 2). "Textile mill owners yield to striking workers’ demands". The Hindu. .
http://cpcbenvis.nic.in/ar2001/annual_report2000-01-20.htm. (2000, September). Retrieved June 12, 2013,
from http://cpcbenvis.nic.in: http://cpcbenvis.nic.in/ar2001/annual_report2000-01-20.htm
http://www.ichalkaranjitextilecetp.com/process-details.aspx. (2013, March 12). Retrieved June 5, 2013, from
www.ichalkaranjitextilecetp.com: http://www.ichalkaranjitextilecetp.com/process-details.aspx
http://www.maheshwarisamajichalkaranji.org/ichi.pdf. (2012, january).
http://www.maheshwarisamajichalkaranji.org/ichi.pdf. Retrieved june 18, 2013, from
www.maheshwarisamajichalkaranji.org: http://www.maheshwarisamajichalkaranji.org/ichi.pdf
MORD. (2011, dec 23). pura.net.in. Retrieved june 2, 2013, from pura.net.in: http://pura.net.in/
Singh, A. K. (2011). Target 3 Billion. In A. K. Singh, Target 3 Billion (pp. 24-96). New Delhi: Penguin
Groups.
Wadaje, P. R. (2011). Powerloom economics: Trader vs Weaver. Indian textile journal.

International Journal of Advance and Innovative Research Volume 6, Issue 1 (XXIV): January - March, 2019
213
ISSN 2394 - 7780
A STUDY ON MICROFINANCE AND ITS FACILITIES: AWARENESS LEVEL OF PEOPLE IN
MUMBAI CITY
Vaishali Kothiya
Assistant Professor, Sasmira’s Institute of Commerce & Science, Mumbai
ABSTRACT
Microfinance is a financial service/ product designed to cater to the underprivileged segment of India. It aims
to provide a wide range of financial services like loans, insurance, payment services, etc. to the people with low
income in order to enable them to venture into small businesses & raise their standard of living. Microfinance
Institutions (MFIs) have evolved as precursors of the agricultural thrift credit market in the Asian nations. In
the current scenario, MFIs are seen to be shifting to urban areas. The wide spread slums being the significant
part of the urban population, the metros are proving to be cost-effective markets for MFIs over the remote
locales of the rural. The urban markets have witnessed a simple fraction of MFIs gross loan portfolio unfreeze
in a short span of 5 years. And over next 3 years, a magnitude relation is expected to vary to 50:50. Although,
MFIs supposed service specialization lies with low-income population from the rural areas, it has show
relatively higher success recently with the urban population and hence is heavily inclined towards urban
markets. The study focuses on the awareness of Microfinance amongst the low-income population in the urban
cities and services offered by MFIs in Mumbai city.
INTRODUCTION
India has witnessed a significant GDP rate over the years. However, the growth story is quite ironic.
Employment opportunities in the private, public and government sectors are limited and available to the
educated population only. On the other hand, informal economy is seen to grow at a faster rate, employing
about 93% of the labour force across the country. These informal economy workforce contribute to 63% of the
GDP. However, they cannot benefit from the additional wealth they have contributed to generate. The reason
being, they do not have access to the credit facilities to gain advantage from the economic opportunities.
However, if demographic and poverty trends in the country are to be considered, then the issue at hand looks
even more complex. About one third of world’s poor population reside in India; the youth of 15 to 34 years of
age constitute to over one third of India’s total population. The unemployment ratio amongst the youth is the
highest in the country, especially in the urban areas. The amalgamation of poverty and youth employment
indicates towards the socio-economic crisis.
According to a research conducted in 2004, about 60% of the youth population in the urban areas of India were
unemployed. The pressing issue is required to be addressed and policy makers must devise alternative sources
of employment for those left out of the bounds of the formal economy. In such a scenario, Microfinance plays
an important role in providing sustainable livelihoods by stimulating small & micro businesses.
According to the Consultative Group to Assist the Poor - an International Consortium of Development
Agencies, people who have access to credit, insurance, savings and other financial services are seen to be more
resilient and able to cope better with day-to-day crisis. Despite the fact, only 0.01% of the urban population
from the poor socio-economic background have banking relationships. The outreach of MFIs to the rural areas
is seen at 95% and the cities remain unserved. Moreover, the lack of access to trading space and livelihood
training in the urban areas push the further the poor into poverty.
According to the Economic Census 1998, banks and financial institutions directly financed 2.8 percent of
enterprises and 1.9% received finance linked to the poverty alleviation schemes, accounting to only 4.7% of
enterprises, rural & urban to receive formal finance. A large number of underprivileged rely on the informal
credit from moneylenders, pawnbrokers and relatives to manage their cash flow. However, the model is not
sustainable for them as it often traps them in a longer debt period. This presents a big opportunity for MFIs to
serve the low-income segment in the urban areas.
However, the dynamics and challenges for MFIs in the urban areas are different than those faced in rural areas.
As a special case research conducted by an NGO in Delhi, there were very few microfinance institutions
working in the Delhi slums and resettlement colonies, despite the huge demand for microfinance. The institution
named Satin working in the region, estimated the number of people living on a daily earning of up to US$2 in
Delhi and the National Capital Region at about two million. Considering the facts, a Microfinance pilot project
was initiated in Delhi. A study was conducted on the profiles of customers, their needs and sources of financing
in the slum areas and resettlement colonies of Delhi, which helped in outlining People Group Model for

International Journal of Advance and Innovative Research Volume 6, Issue 1 (XXIV): January - March, 2019
214
ISSN 2394 - 7780
microfinance operations. People Group Model mandates a ‘group guarantee’ to available the financial loan
services under microfinance. Loans can be availed in groups, wherein, all the members of the group must
provide mutual guarantee for each other and are jointly liable to repay the loan amount in case one or more
members of the group fail to do so. The model enables customers to build financial, physical and social capital
in terms of group cohesiveness, extending support to each other and develop business networking, thereby,
creating a social network in the local community.
The scheme enabled youth from poor socio-economic background to avail a credit of up to Rs. 10,000/-,
training in acquiring business-oriented skills and insurance for life. Over 100 borrowers in East Delhi region,
availed a combined loan of Rs. 1 million who could set up their businesses in various sectors like small
transports, repair shops, readymade garments, internet parlors, etc. Customers have overwhelmingly proved
that reliable sources of credit provide a fundamental basis for planning and expanding business activities.
RESEARCH METHODOLOGY
Objectives of the Study
1. To study the level of awareness among people about Microfinance
2. To study the level of awareness among the low income segment people about Microfinance and its various
schemes
The study shall concentrate and highlight the level of awareness among people about the various schemes under
Microfinance. It shall also provide elaboration on these services and schemes and the benefits that urban poor
can avail.
Following is the hypothesis which have been formulated for this study
● Lower socio-economic class of urban population are aware about Microfinance
● People of Mumbai city are aware about various schemes under micro finance
DATA COLLECTION
Primary Data Collection
● A questionnaire is being designed to collect the information from the people below poverty line and people
earning just above the poverty line residing in Mumbai city according to the sample size
Population of the Study
Urban Poor of Mumbai City
Sample Size
75 People in random and 75 People who are associated to various SHGs operating in the Mumbai City. Total
Number of Respondents is 150.
Originality
1. This study includes primary as well as secondary data.
2. The research has been extended to cover every part of the city to take the sample.
3. Some part of the theory has been referred from the published data from various institutes.
LITERATURE REVIEW
A research report by Prof. Dr. Hans Dieter Seibel, University of Cologne, between 1960s and 1970s the
agricultural and rural development faced challenges in production for various reasons. Microfinance for
agricultural played a pivotal role in facilitating their growth. However, later with the rise in population in the
rural, there were other micro businesses springing up, giving rise a huge demand for microfinance for micro
enterprises.
As per the NABARD Report of 2003 - 04 on Self Help Bank Linkage, SHG credit expansion and the higher
recovery rate raised a lot of optimism amongst the poor. However, there remains a significant gap between the
demand and the actual per capita credit being provided to the poor.
A research report by Srinivasan published in 2009 says that the number of microfinance customers in India
were 54 million in 2008. While SHG model served about 39.9 million customers, 14.1 million customer’s needs
were met by MFI model. The total outreach exhibited by SHG model was 77%; however, the growth rate
remained lower at 15% in 2007-2008 as compared to MFI model which showed a higher growth rate of 40%.
The model has shown a sustained growth with estimated 86.2 million customers and total loans outstanding of

International Journal of Advance and Innovative Research Volume 6, Issue 1 (XXIV): January - March, 2019
215
ISSN 2394 - 7780
Rs. 351 billion in March 2009. This accounts for only 6% approx of the commercial banks’ overall credit
outstanding in the rural and semi-urban areas in 2008 (RBI, 2009). A study carried out by Intellecap - ‘Inverting
the Pyramid’ suggested that there’s a huge scope of growth.
Anyanwu, 2003; Lawson, 2007: Many studies have underlined the lack of finance as one of the major issues
that poses as a challenge to the SMEs growth. This is in spite of the potential of SMEs.
Idowu Friday Christopher (2010) carried out a research in order to gain an insight on the Impact of
Microfinance on Small and Medium Sized Enterprises in Nigeria. The study reveals that SMEs have received
positive support from MFIs and which has fueled their growth rate and enhanced their market share as well.
Sam Afrane (2002) researched on Impact Assessment of Microfinance Interventions in Ghana & South Africa.
Hi case studies revealed that the interventions of microfinance have accomplished greater growth. This is
accounted by the enhanced improved lifestyle, increased business incomes, , empowered enterprises and people,
etc.
These studies provides a concrete references and evidence about the success of Microfinance in India and
worldwide.
DATA ANALYSIS & INTERPRETATION
Hypothesis 1: Low-income segment People in the Urban is aware about Microfinance Concept
DISCUSSION
Item 9 of the questionnaire is about the awareness of microfinance.
Question 9 tests of the respondents have come to know about the small scale account.
Analysis: 90.6% of the respondents have gained knowledge about small scale money.
Question 11 is the extension of 9 and attempts to uncover the source of knowledge of the respondents on small
scale accounts.
Analysis: 38.9% respondents had gained knowledge from their companions and 34.7% from their neighbors.
From the above analysis, it can be concluded that Speculation 1 is approved.
Hypothesis 2: People of Mumbai city are Aware about various schemes under micro finance
RESULT: This hypothesis is validated.
Dialog: Question 10, attempted to discover the mindfulness level about the different plans accessible in the
platter of Small scale money. Among it, sparing plans was the most prominent one with 55%.
From the above analysis, it can be concluded that Hypothesis 2 is validated.
MAJOR FINDINGS
At the commencement of analysis, objectives were defined which were accepted by the analysis as furnished
below:
1. Abstraction has focused on the awareness of microfinance. The abstraction reveals that the advised sample
acquainted to micro accounts is 92%.
2. Abstraction also reveals that the low-income segment population of Mumbai city got acquainted by
Microfinance through assorted sources. About 4% got the information from their relatives, 35% from
friends, 37% from neighbors, 20% from SHG assembly and 4% from other sources
3. Abstraction also studied the awareness of Microfinance schemes amongst the poor. The analysis shows that
only 21% of the sample study were acquainted with the micro schemes, whereas, 13% knew about the
allowance schemes, 16% about application schemes and 50% about the extenuative schemes.
4. Abstraction also throws light on the fact that besides the knowledge of micro extenuative schemes, poor
population of Mumbai also are aware of other autonomous options
5. Micro accounts are alone accustomed to the poor affiliated women for starting their own business or for
costs the absolute business. As well assorted extenuative schemes are getting provided to the consumers.
Consumers are as well getting provided with loans for acquirement of bartering cars and claimed two
wheelers.
6. The top akin of acquaintance has been accepted in the city-limits of Mumbai about micro financing.

International Journal of Advance and Innovative Research Volume 6, Issue 1 (XXIV): January - March, 2019
216
ISSN 2394 - 7780
RECOMMENDATIONS
1. The humans should be accustomed added opportunities for accommodation attainment.
2. Absorption amount should be decreased so that added and added applicants can account microfinance
facilities.
3. If microfinance is to be fabricated an acknowledged accumulation movement, the operations charge to be
fabricated streamlined, amount able and transparent.
4. Accommodation admeasurement should be added abundant to accommodated the requirements of
borrowers.
5. MFI should acknowledge able absorption amount to the borrowers. Hiding able absorption amount to poor
and benighted borrowers by application ―creative‖ accounting practices is awful immoral. The poor
borrowers accept a appropriate to apperceive the accurate allurement amount of the micro accommodation
in anatomy of able anniversary absorption rate, so that, they can yield appropriate borrowing decisions.
6. The government should accommodate the basal infrastructural accessories such as acceptable roads,
schools, hospitals, connected ability accumulation etc in the accompaniment to accredit individuals
accomplish the allowances of microfinance.
7. The akin of bribery in our country should be arrested to anticipate the antedate of microfinance funds to the
easily of the politicians in the society.
8. The Abjection Alleviation Programme should be restructured to accommodated the needs of the beneath
advantaged associates of the association mostly the women that are in austere charge for microfinance.
9. The government should abode able administration and adjustment of a lot of of the microfinance institutions
in the country to anticipate the collapse of such institutions as witnessed in the accomplished in some
regions.
REFERENCES
https://www.business-standard.com/article/finance/mfis-shift-focus-to-urban-areas-114082700018_1.html
https://www.downtoearth.org.in/blog/urban-poor-need-microfinance-for-livelihoods-6729
https://www.sciencedirect.com/science/article/abs/pii/S0305750X10000951?via%3Dihub
www.worldbank.org/gender/prr/engendersummary.pdf
http://www.iosrjournals.org/iosr-jef/papers/SIFICO/Version-2/6.51-61.pdf
http://www.sksindia.com/faq.php
http://swayamsiddhafoundation.org/

International Journal of Advance and Innovative Research Volume 6, Issue 1 (XXIV): January - March, 2019
217
ISSN 2394 - 7780
PLASTIC BAN: EFFECTS & ALTERNATIVES
Akhil Shah
Student, M. Com (E-commerce)
ABSTRACT
This research throws light on the recent ban imposed by the Government of Maharashtra on plastic materials.
This ban on plastic came into effect from 23rd June 2018 vide a notification passed on 23rd March 2018 which
clamped down on the use of plastic in a bid to fight pollution caused due to its extensive use. The research tries
to analyze the effectiveness of the ban, how and to what extent it will go in curbing the pollution. The research
also tries to evaluate the ban on the basis of inconvenience caused to the vendors and people in general.
Further its impact on business and economy is analyzed and suitable alternatives to plastic have been
suggested.
RATIONALE OF THE STUDY
Pollution and the resultant climate change and global warming have become a matter of concern for the
governments and citizens all over the world. As a result the governments are forced to take steps to curb this
growing menace. One such measure has been taken by the Government of Maharashtra by deciding to impose
ban on use of plastic materials. The Maharashtra government banned the manufacture, usage, sale, transport,
distribution, wholesale and retail sale and storage, import of plastic bags with or without handle and disposable
products made out of plastic. Plastic bags tend to disrupt the environment in a serious way they get into soil and
slowly release toxic chemicals and eventually break down into the soil, with the unfortunate result being that
animals eat them and often choke and die.
SCOPE OF THE STUDY
The study intends to evaluate the ban, its impact, extent to which it will help in curbing the pollution and its
effect on other factors like economy and different industries.
HYPOTHESIS
Plastic without any doubt is hazardous for environment and Maharashtra has become the 18th state in India to
impose ban on its use. However this issue of plastic ban is much debatable. Those from the plastic industry are
frowning upon the state's decision to implement the ban, citing that in the 50,000 crore industry, lakhs of people
of Maharashtra will be rendered jobless. However, environmentalists and NGOs that work to eliminate these
synthetic vices advocate the move and suggest plastic industries to find alternatives to manufacture, that do not
harm the environment. Not just plastic manufacturing companies, but also every industry that relies on some or
the other form of plastic use will suffer from the move for eg the food delivery milk selling sector etc.
OBJECTIVE OF THE STUDY
To find out the status of awareness of the health hazards associated with the usage of plastic bags among
people and their perception towards the legislation prohibiting the usage of plastic bags.
To study the problems faced by Vendors and different industries after the imposition of ban.
To study suitable alternatives of plastic for different industries.
To study measures taken by the state government to address the problems faced by different industries.
To study the status and effectiveness of similar plastic bans in other states.
RESEARCH METHODOLOGY
Survey was conducted for the purpose of analyzing people’s perspective towards the plastic ban. The sample
space included public at general and industry specific people who are affected by the plastic ban. Efforts are
made to understand their awareness level and perspective about the ban through questionnaire, their problems
and apprehensions regarding the ban are analyzed.
INTRODUCTION
Plastic industry is one among the rapidly growing industries in India. The production of plastics has reached
12.5 million tons in 2018 with a growth rate of 8% over the previous five years. The growth rate is expected to
be 10% over the next five years. The reasons for popularity for using the plastic bags are light weight, resistance
to degradation (by chemicals, sunlight and bacteria), durability and above all low cost.

International Journal of Advance and Innovative Research Volume 6, Issue 1 (XXIV): January - March, 2019
218
ISSN 2394 - 7780
While these conveniences are benefitting individual users, the problems and the cost of disposal of plastic items
would burden the entire society. After their entry to environment, plastics take anywhere from 15 to 1000 years
to biodegrade. It poses a risk to human health and environment. In addition to problems like choking the drains,
the littered plastic bags are breeding ground for mosquitoes when rain water gets collected in them. This could
worsen the situation of malaria in a highly endemic area like Mumbai city.
Plastic bag packing for hot edible items causes migration of harmful chemicals to food items. These include
Styrene which is carcinogenic, Phthalates and Bisphenol A which causes diabetes and diseases of the heart and
liver. Therefore, it is high time we switch over to alternative materials for packing and transportation.
“The Plastic Manufacture, Sale and Usage Rules 1999, amended in 2003 under the Indian Environment
(Protection) Act of 1986 prohibit manufacture, stocking, distribution or sale of carry bags made of virgin or
recycled plastic and prohibits littering of plastic items”.
However, studies on consumer preferences revealed that large proportion of people do not value environmental
aspect. Moreover, poor enforcement of the legislation has made the ban towards plastic bags usage largely
ineffective. The result being plastic bags have been used widely by small business owners like hawkers, retail
shops and in shopping malls. With this background, this community based study was done in Mumbai city to
find out the pattern of usage of plastic bags on a daily basis and to analyze the reasons for popularity of plastic
bags among users. The study also assessed the awareness about the health hazards associated with plastic bag
usage among the people and their perception towards the legislation banning the usage of plastic bags in
Maharashtra.
On March 23, 2018, the government of Maharashtra issued a notification banning the manufacture, use,
transport, distribution, sale, storage and import of plastic bags sighting the pollution caused due to it and the
underlying stress it has on environment.
Items included in Ban
1. All kinds of plastic bags.
2. Plastic tea cups, glasses.
3. Thermocol glasses.
3. Thermocol used for decoration.
4. Plastic items used in hotels to parcel food like boxes, spoons.
Items excluded from Ban:
The exemptions have been made to minimise discomfort to businesses till the time alternatives have a strong
presence in the market.
1. Plastic and thermocol used by manufacturing companies.
2. Plastic and thermocol used to package appliances.
3. Plastic raincoats.
4. Plastic bags for storing food grains.
5. Plastic bags used for packaged food items like chips, biscuits, etc.
6. Plastic items used in hospitals like saline bottles.
7. Thermocol boxes used to store medicines.
8. Plastic pens.
9. Milk pouches that are above 50 microns in thickness.
10. Plastic pouches used in plant nurseries.
PENALTY ON VIOLATION
As per the notification, those found violating the ban would be penalized Rs 5,000 for the first time offense and
Rs 10,000 for violation the second time. While beyond the second chance, the repeat offenders would have to
shell out as much as Rs 25,000 and may also face imprisonment for up to three months.

International Journal of Advance and Innovative Research Volume 6, Issue 1 (XXIV): January - March, 2019
219
ISSN 2394 - 7780
BAN ADMINISTRATION
Since the fine is applicable to almost every one, whether a consumer, vendor or a manufacturer most of the
officials of the government departments, including municipal commissioners, shops and establishment officers,
sanitary or health inspectors, district collectors, sub-divisional officers, police officials, officers of Maharashtra
Pollution Control Board, Maharashtra Tourism Development Corporation, Forest Department, to name a few,
have been authorized to implement the plastic ban regulations.
GOVERNMENT MEASURES
As a substitute for plastic carry bags, the state government is trying to produce more and more environment-
friendly cloth bags, and is taking a number of initiatives to make people aware about the available alternatives
to plastics. As part of this exercise, the Brihanmumbai Municipal Corporation (BMC) has organized a three-day
exhibition (June 22 – 24) at the National Sports Club Of India, Worli, where around 60 organizations displayed
eco-friendly products ranging from eco-friendly cutlery to a recycled nursery for the plant lovers and cloth bags.
The government has collaborated with various women self-help groups to produce such alternatives.
FINDINGS
Method’s used: This study was conducted in Mumbai city in August 2018. Data was collected by conducting a
survey to know people’s perception and their general awareness regarding ban further interviewing different
vendors were interviewed to know the problems they have faced due to the ban.
RESULTS
Fig-1: Associating the awareness on hazards due to the usage of plastic bags with various socio-
demographic variables.
Age Group In favour of ban Not in favour Total X2 value, DF, p-
value
≤ 20 years 7 2 9
21-30 years 27 18 45
31-40 years 28 9 47
>40 years 28 6 34 7.56, 3, 0.056
Gender
Male 36 25 61
Female 54 20 74 0.859, 1, 0.354
Educational status
SSC 6 2 8
HSC 11 4 15
Graduate 53 34 87
Post Graduate 20 5 25 0.084, 2, 0.959
Mean age of the 150 participants was 32.8years. Majority 94(62.6%) were females educated up to
undergraduate level or above. Among the participants 127(84.6%) were aware of the health hazards associated
with the use of plastic bags. Awareness was significantly more amongst females, well-educated participants and
among professionals and semi-professionals. There were 30(20%) participants reusing plastic bags for shopping
Age Group Aware (%) Not aware (%) Total X2 value, DF, p-
value
≤ 20 years 18(75) 6(25) 24
21-30 years 60(89.5) 7(10.5) 67
31-40 years 36(85.7) 6(14.3) 42
>40 years 13(76.47) 4(23.53) 17 3.64,3,0.303
Gender
Male 45(80.35) 11(19.65) 56
Female 85(90.4) 9(9.6%) 94 4.9,1,0.027
Educational status
SSC 8 4 12
HSC 21 5 26
Graduate 78 9 87
Post Graduate 23 2 25 13.1, 3, 0.004
International Journal of Advance and Innovative Research Volume 6, Issue 1 (XXIV): January - March, 2019
220
ISSN 2394 - 7780
after initial usage. The cloth bags were used for shopping in place of plastic bags by 20(13.33%) participants.
Among the participants 135(90%) were aware of the legislation banning the use of plastic bags and out of which
90(67%) were in its favour. Semi-professionals and students favored the ban on plastic bags whereas unskilled
and semiskilled workers were against the ban .
EFFECTS ON DIFFERENT INDUSTRIES
Plastic, an item that had become an integral part of a consumer’s lifestyle, is no longer a legal item in India’s
second most populous state. Even if not in totality, the ban does aim to target a large chunk of the usage in the
form of bags (under 50 microns), spoons, forks, cups, glasses, plastic pouches for liquid, plastic packaging food
items, plastic and thermocol decorations and therefore repercussions are bound to occur.
Let us have a look at the problems faced by different business and their apprehensions regarding it.
1. Sabzi Mandis (Wholesale Vegetable Markets) In terms of business, the ban on polythene bags has affected the vegetable and fruit sellers the most considering
the volumes of bags they buy everyday from retailers to give out their products. Mumbai’s famous Dadar
market, which opens around 5AM in the morning, used nearly 1 tonne of plastic bags on a daily basis. Nearly
700 vegetable vendors sit at the humongous market, with per vendor using atleast 1,200 bags every day.
After surveying it was found that the vendors have switched to cloth and jute bags. However they are not happy
with the ban since the cost of cloth and jute bags is thrice that of polythene and also cloth bags are not strong
enough to hold more than 5kgs. Some of the vendors have stopped providing bags and are asking customers to
carry their own bags.
2. Street Hawkers
After talking with some individual street hawkers it was found that there was mixed response amongst the
hawker’s community.
42 years old Manvinder Singh in Vile Parle owns a owns a popular street food joint that offers delicacies like
chat, sandwiches, Pizzas, etc. For years, he has been using cutlery including plastic spoons, cups, glasses, plates
to give out food. Though he has not yet ditched plastic completely, the process has begun.
“I have stopped giving plastic bags for take-aways and instead of plastic plates I serve the food on newspaper
sheets now. But I do not know the alternatives to disposable spoons and cups. I had even asked the municipal
officers to suggest options but there was no response,” Says Manvinder.
Similarly, the juice centres are also facing the brunt of the ban, “After the civic officials warned us, we started
to use glass. We have to wash them every now and then which means paying extra to buy additional water. I
have compensated that by increasing the juice rates,” says Maganlal who own a juice stall in Andheri.
3. Restaurants/Food Chains
Restaurants and food chains have started adapting eco-friendly cutleries and bio-degradable straws.
American fast food company McDonald’s is in the transition phase. Except the plastic lid, all the other plastic
items have been replaced. It has been more than a month since wooden spoons and forks, straws made from
corn starch and paper cups to serve soft drinks were introduced by the franchise. And as for the take ways they
have always used paper bags.
Family restaurant Shiv Sagar near Juhu is not give out plastic bags to the customers post June 23. The take-way
food are being packed in plastic containers, though they have been banned, “We are in the process of finding an
alternative to plastic containers but till we do, we will give the food in plastic containers,” says the Manager of
the hotel.
Many other restaurants are still using plastic containers for take-away’s
Plastic Manufacturing units
According to the All India Plastics Manufacturers’ Association (AIPMA), more than 4 lakh workers, male and
female, were employed by about 2,150 manufacturing units in the state.
While many workers who had migrated from states such as Uttar Pradesh returned to their native places, others
have taken up odd jobs elsewhere. The rest are still unemployed.
The ban has equally affected owners and traders. The data from AIPMA revealed that 10% of the total plastic
goods had been banned, which means that products worth Rs5,000 crore have wiped off from the market.

International Journal of Advance and Innovative Research Volume 6, Issue 1 (XXIV): January - March, 2019
221
ISSN 2394 - 7780
Alternatives to plastic: Plastics are all around us, inside nearly every product that we come into contact with in
our daily lives. Manufacturers favor this material because it can last for years and is easy to mold into
practically any form. Despite these benefits, however, plastic can also harm the environment. Not only is it
created from fossil fuels, but it is also difficult to recycle much of the time. As a result, researchers have begun
to develop sustainable alternatives that will reduce our dependence on traditional plastic. Read on to learn more
about seven of the best plastic substitutes.
1. Liquid wood
A unique type of biopolymer (also known as bioplastic), liquid wood offers both the appearance and function of
traditional plastic, but without the harmful environmental effects. The base of this material is lignin, a byproduct
that comes from paper mills. To create liquid wood, manufacturers take lignin and combine it with water before
placing it in an environment with extreme heat and pressure. This transforms the lignin into a composite
substance that is flexible enough for the manufacturer to form into any shape, but also highly durable. Already,
scientists from Germany have used liquid wood to create children’s toys and containers for speakers.
Perhaps the biggest benefit of liquid wood, however, is that it is completely biodegradable. It is also easy to
recycle, since it is made from wood byproducts. As such, liquid wood is quickly becoming the go-to alternative
for many traditional petroleum-based plastics.
2. Silicone
Some companies are also using silicone in lieu of plastic when looking to create more eco-friendly products.
Much like rubber, silicone shares many of the same characteristics of plastic, including its pliability and
capability to resist both heat and water. However, it boasts a durability that is far greater than plastic, which
makes it excellent for numerous applications, particularly in the healthcare field and in manufacturing.
Silicone can also make an excellent alternative for household plastics such as plastic wrap. One company,
Lekue, uses silicone to create a range of sustainable food storage lids. These products maintain their flexibility
across multiple uses and do not absorb food odors. Silicone can substitute for numerous other plastic-based
products, including baby bottle nipples and insulation.
3. Glass
In the past, most people used glass containers to hold their drinks and food products. Though the world has
moved on in favor of plastic, glass remains the more sustainable alternative. As opposed to plastic, glass is
made from sand, which makes it free of potentially harmful chemicals. Moreover, glass can undergo the process
of recycling an infinite number of times. This makes it easy for manufacturers to turn old glass into new bottles
and other products. In addition, people can easily reuse glass bottles and containers for any number of purposes.
Glass products may cost more than their plastic counterparts, but they last longer and have a smaller
environmental footprint.
4. Starch-based plants
Over the years, starchy plants have become another popular source for sustainable plastics. The most commonly
used material is corn, which manufacturers can process into a polyester called polylactic acid (PLA). As its
name suggests, this material is made from the lactic acid produced when corn undergoes wet milling. Using
PLAs, manufacturers can create virtually any product or packaging that would normally be made of plastic.
These polymers are particularly beneficial because of their ability to fully biodegrade within a span of 47 days
under industrial composting conditions. They also do not let off toxic fumes when they burn.
Corn is not the only starch-based plant that can create effective plastic substitutes. Over the years, researchers
have developed polymers out of sugarcane, beets, and potatoes.
5. Milk protein
Taking a cue from the starch-based plastic alternatives, a team of researchers from the US Department of
Agriculture has developed a method for creating a unique film out of milk proteins. In particular, they are
focusing on the protein casein, which is found in abundance in milk. Though casein-based plastics have existed
for more than 100 years, these materials have been far too fragile to serve as more than a substitute for rare
jewelry components such as ivory.
By adding citrus pectin and glycerol to casein, however, the USDA researchers have been able to develop a
sturdy, but fully biodegradable plastic alternative. Moreover, this material is edible, which means that
packaging made from it could be entirely removed from the waste stream.
6. Chicken feathers

International Journal of Advance and Innovative Research Volume 6, Issue 1 (XXIV): January - March, 2019
222
ISSN 2394 - 7780
Chicken feathers may seem like an unlikely plastic substitute, but US researchers have developed a means of
transforming them into fully biodegradable plastics. In order to reduce billions of pounds of chicken feathers
going to landfills each year, the research team sought to amplify the durability of the keratin in the feathers.
When combined with methyl acrylate, keratin transformed into a plastic-like substance that was virtually tear-
proof. Fully biodegradable and taken from a renewable source, chicken feather plastics are one of the most eco-
friendly plastic substitutes.
7. Biodegradable plastics
There are also a number of biodegradable plastics available that are helping to reduce the world’s dependence
on traditional plastics. One such product is made by Tipa Corp, which took inspiration from the orange peel in
their quest to create sustainable packaging. Looking to create a packaging solution that mirrored the
biodegradability and protective nature of the orange skin, the company used a unique blend of polymers and
other bio-materials to make a flexible, compostable plastic substitute.
Steps taken by Maharashtra Government for industries adversely affected by the ban
The Maharashtra government on June 27 relaxed its stringent ban on plastic usage by allowing small retailers to
use plastic bags for packaging for the next three months. The relaxation is applicable for plastic bags above 50
microns. The new announcement came within four days of imposing the ban on single-use plastic across the
state. The relaxation granted to small retailers is on the lines of a similar exception already available for branded
products. The state has also allowed ecommerce companies to use plastic packaging for three more months.
Who manages the plastic ban in Maharashtra?
State government's role The state government led by Devendra Fadnavis had given manufacturers, distributors, and consumers three
months to dispose their stock since it last announced the ban in March.The state has also formed an association
comprising stakeholders including plastic manufacturers of Maharashtra, ministry officials and environmental
experts to ensure that the ban is implemented effectively.
Pollution Board's role Officials from Maharashtra Pollution Control Board (MPCB) and district and local administration have been
authorized to implement this ban.
Tourism Board's role For regulating this law at tourist locations, tourism police, or Maharashtra Tourism Development Corporation
has been made responsible.
Municipal Board's role The Brihanmumbai Municipal Corporation (BMC) has deployed 250 inspectors to penalize violators. The
corporation has also installed 37 collection bins at various municipal markets to collect plastic trash.
Status of the ban
Maharashtra has become the 18th state in India to enforce a complete ban on plastic bags, but will the ban really
work on the ground? Many environmentalists are not very optimistic, given the poor history of implementing
similar plastic bans in 17 other states and Union Territories so far.
Maharashtra is India’s biggest generator of plastic waste, producing more than 4.6 lakh tonnes of waste every
year. A large proportion of the waste comprises polythene bags below 50 microns in thickness, which the Union
government had banned across the country in 2016 because of the threat they pose to the ecology. Despite this
nationwide ban, these thin plastic bags that cannot be disposed of or recycled continue to choke drains and
waste management systems across India.
In fact, a 2016 report by the Central Pollution Control Board indicated that most Indian states have not yet
implemented the Plastic Waste Management Rules of 2011, which mandate proper systems to ensure the
segregation and disposal of plastic waste as well as crackdowns on unregistered plastic manufacturing units.
According to the report, “plastic bags are stocked, sold and used indiscriminately” even in those 17 states and
Union Territories where they are completely banned.
Given this state of affairs, even environmentalists who have welcomed Maharashtra’s proposed plastic ban are
skeptical about whether it can actually be implemented.
Facts and Figures
Everything from bottles to money is now plastic. But the magic material has a flipside plastics do not
decompose naturally. Its pervasive dominance means that it is now embedded in, quite literally, every habitat in
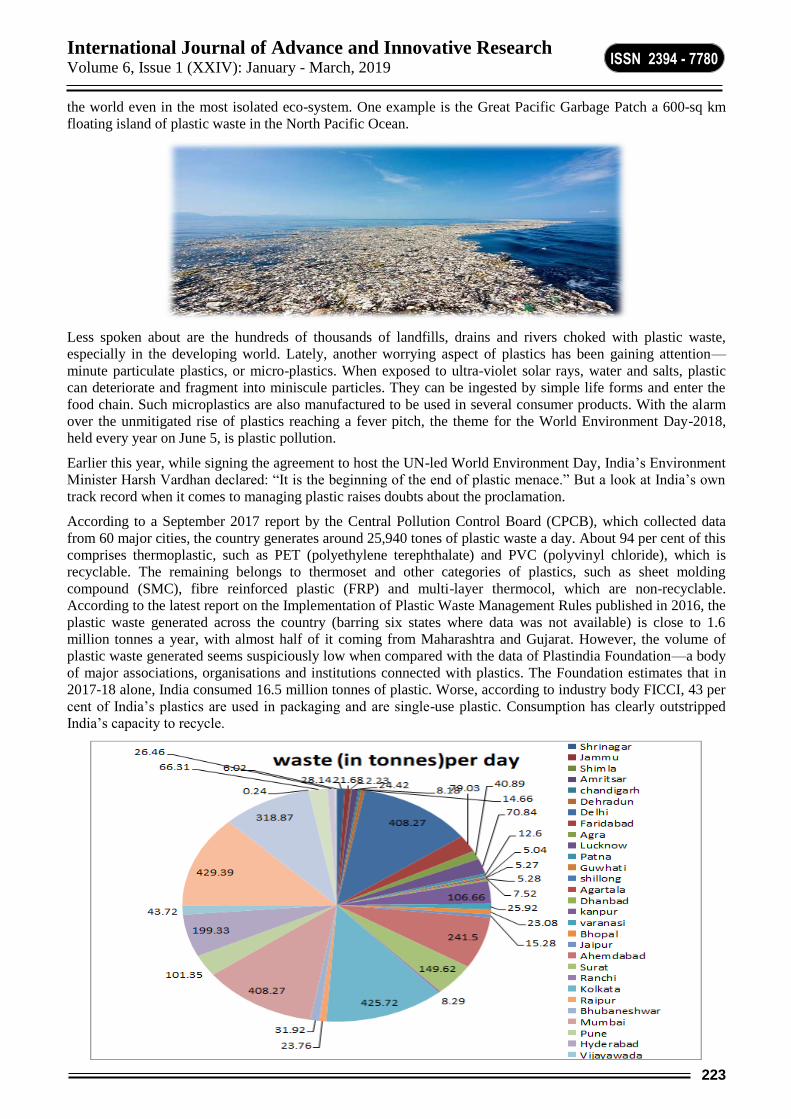
International Journal of Advance and Innovative Research Volume 6, Issue 1 (XXIV): January - March, 2019
223
ISSN 2394 - 7780
the world even in the most isolated eco-system. One example is the Great Pacific Garbage Patch a 600-sq km
floating island of plastic waste in the North Pacific Ocean.
Less spoken about are the hundreds of thousands of landfills, drains and rivers choked with plastic waste,
especially in the developing world. Lately, another worrying aspect of plastics has been gaining attention—
minute particulate plastics, or micro-plastics. When exposed to ultra-violet solar rays, water and salts, plastic
can deteriorate and fragment into miniscule particles. They can be ingested by simple life forms and enter the
food chain. Such microplastics are also manufactured to be used in several consumer products. With the alarm
over the unmitigated rise of plastics reaching a fever pitch, the theme for the World Environment Day-2018,
held every year on June 5, is plastic pollution.
Earlier this year, while signing the agreement to host the UN-led World Environment Day, India’s Environment
Minister Harsh Vardhan declared: “It is the beginning of the end of plastic menace.” But a look at India’s own
track record when it comes to managing plastic raises doubts about the proclamation.
According to a September 2017 report by the Central Pollution Control Board (CPCB), which collected data
from 60 major cities, the country generates around 25,940 tones of plastic waste a day. About 94 per cent of this
comprises thermoplastic, such as PET (polyethylene terephthalate) and PVC (polyvinyl chloride), which is
recyclable. The remaining belongs to thermoset and other categories of plastics, such as sheet molding
compound (SMC), fibre reinforced plastic (FRP) and multi-layer thermocol, which are non-recyclable.
According to the latest report on the Implementation of Plastic Waste Management Rules published in 2016, the
plastic waste generated across the country (barring six states where data was not available) is close to 1.6
million tonnes a year, with almost half of it coming from Maharashtra and Gujarat. However, the volume of
plastic waste generated seems suspiciously low when compared with the data of Plastindia Foundation—a body
of major associations, organisations and institutions connected with plastics. The Foundation estimates that in
2017-18 alone, India consumed 16.5 million tonnes of plastic. Worse, according to industry body FICCI, 43 per
cent of India’s plastics are used in packaging and are single-use plastic. Consumption has clearly outstripped
India’s capacity to recycle.
International Journal of Advance and Innovative Research Volume 6, Issue 1 (XXIV): January - March, 2019
224
ISSN 2394 - 7780
Delhi, Chennai, Mumbai, Bangalore and Kolkata alone contribute around 40% of total waste generated per day
in the country.
OTHER FINDINGS
People’s perception of the ban:
To understand how the ban was perceived by the public in general and to know the problems they have faced
and their apprehensions regarding ban, a survey was conducted with the help of questionnaire distributed. Their
responses have been analyzed and efforts have been made to draw conclusions and notions based on it.
When asked if plastic ban had caused any inconvenience, around 73% of people surveyed affirmed that they
faced inconvenience when buying things like milk and vegetables from the market in the initial days of the
ban but the problem eased up later when government announced relaxation.
When asked if they felt the decision was taken in haste and more time was required to phase out plastic,58%
felt that government should have given more time and remaining were of the view that it didn’t matter it had
to happen sooner or later and ban was already anticipated
When asked about the awareness of plastic that fell in purview of ban and types which were exempted, it
was clearly found that there was lack of awareness regarding what is included and what is exempted,
government needs to create awareness about it.
When asked if they still see plastic being used by businesses, it was surprising because 54% people said they
still see rampant use of plastic although banned and majority of them observed it was being used by
restaurants and food joints.
When asked about the overall perception of the ban, there was a mixed response. People support the ban but
also feel that government is discriminating as only small scale industries are suffering and big companies
either fall under exemption or have availed some exemption through lobbying.
LIMITATIONS
The finding of this study is limited to one ward and only one city and hence cannot be generalized to entire
Maharashtra State.
CONCLUSION
More than 20 states in India have imposed a ban/partial-ban on plastic including the capital city of Delhi.
Monitoring and sustaining the plastic ban is something that most of the states have failed in. In order to ensure
that Maharashtra doesn’t fall prey to the same issues, the state government has placed a hefty fine that goes up
to Rs 25,000 in case of violations but even after placing such hefty fine it is still being used by people. The
plastic manufacturers are already up in arms and have gone to court against the ban. Unless a proper suitable
alternative which is both feasible and eco-friendly is found it will be difficult to realize the benefits of ban.
ACKNOWLEDGEMENTS
I would like to thank my professor Dr Rakhi Bhattacharya Ma’am for her constant guidance & help throughout
this research study. Without her guidance it wouldn’t have been possible for me to complete this research
project successfully.
BIBLIOGRAPHY AND REFERENCES
Singh MK, Devi SR. Hazards of Plastic Bags to the ecosystem.
http://www.freepatentsonline.com/article/Abhigyan/192438179.html.
Rajkumar P. A Study on the Plastic Waste and Environmental Degradation.

International Journal of Advance and Innovative Research Volume 6, Issue 1 (XXIV): January - March, 2019
225
ISSN 2394 - 7780
CASHLESS ECONOMY: AN INNOVATION FOR THE SUSTAINABLE ECONOMIC DEVELOPMENT
Dr. Rupali Vilas Jadhav
ABSTRACT
Government of India launched Digital India programme as well as banned on the old currency notes of Rs.500
and Rs.1000 to bring all the transactions under scanner and thereby eradicate corruption, money laundering,
tax evasion and block funding to terrorists. The objective of paper is to study the prevailing cashless economies
in the world.
The study is also focussed on the perspective of Indian citizens towards the cashless economy. The researcher
found that most of the Indian citizens are not ready to compromise their privacy which is the most important
factor for the success of cashless economy. Another issue is hampering this growth is senior citizens who are
unable to operate the modern instruments of payments. Therefore the researcher have provided certain
suggestions to overcome these issues in this paper.
Keywords: Cashless economy, economic growth, Sustainable development,
1. INTRODUCTION
Government of India launched Digital India programme under the reign of Prime Minister Narendra Modi with
the vision of making India cashless and paperless. It was a novel step taken by India on considering the demand
of the future.
Another strong step was taken by the Indian government was banning of old currency notes Rs.500 and Rs.1000
denominations as on 8th November 2016. This step had been taken to eradicate corruption, money laundering,
block funding to terrorists, avoiding tax evasion and bring transparency in financial transactions. It was a loud
and clear message given by the authorities that the country is trying to slowdown the cash transactions by
following in the footsteps of Canada, Sweden, United Kingdom (U.K.), France, United States of America
(U.S.A.), Australia, China etc.
Cashless economy is not a new for human society. It came into existence from time memorial. Earlier it was
known as Barter exchange where things were exchanged for things.
India is at the inception stage. India has yet to go a long way and observe the future implications of cashless
economy on the country’s sustainable economic development. Therefore this study is undertaken to analyse the
different prevailing cashless economies in the world and their impact on such countries as well as in India.
II. CONCEPTUAL FRAMEWORK
Cashless economy
Cashless economy refers to the use of electronic instruments to exchange the information between the parties in
place of physical notes and coins for implementing financial transactions.
Sustainable development
Sustainable development is the economic and social development of the current generations without affecting
future generations.
III. OBJECTIVES OF THE STUDY
Cashless economy has been initiated by our Prime Minister Narendra Modi to bring more transparency in the
financial transactions. With the introduction of advanced technology in the area of finance the world has been
moving to touch the new heights of development. Therefore it is a demand of time to deeply understand this
system. Following are the objectives of study.
1. To get acquainted with the benefits and drawbacks of cashless economy.
2. To study the status of cashless economy in different countries.
3. To understand the factors contributed in the success of cashless system.
4. To study the approach of Indian citizens towards cashless economy and thereby achieve the sustainable
economic development.
IV. SCOPE OF THE STUDY
Since our country has just begun with the cashless economy. Yet we have to observe the repercussions of such
initiatives. The study will help to get a deeper insight into the different cashless economies prevailing in the
world.
International Journal of Advance and Innovative Research Volume 6, Issue 1 (XXIV): January - March, 2019
226
ISSN 2394 - 7780
The study will help to understand various impacts of cashless economy and thereby realize the contribution of
cashless economy in any country’s growth. The researcher also wants to understand the perspective of Indian
citizens towards cashless economy which decides the future of generations.
V. HYPOTHESIS OF THE STUDY
The statement of hypothesis for the study is “The age of citizens has an impact on the success of sustainable
cashless economy in India”.
VI. RESEARCH METHODOLOGY
The researcher has made an attempt to study the cashless economies prevailing in the world. The study is based
on the primary as well as secondary data. The secondary data for the research purpose is collected from the
different books, journals, websites etc.
A well-structured questionnaire is used by the researcher to collect the primary data. Convenience sampling
technique is used to collect the data from 118 respondents which help to understand the future of cashless
economy in India. The data is analysed with the help of ANOVA test. The graphs and tables are also used to
present and study the data in a systematic manner.
VII. REVIEW OF LITERATURE
Anjali and Agarwal Harshita review the prevailing cashless movement as well as study the available non-cash
payment methods in the country. The researchers also analyse the usage rate of electronic instruments for
undertaking financial transactions. They found that a country with cashless economy moves leaps and bounds.
But this is not so in rural areas as broadband facilities is not up to the mark which is needed to undertake
cashless transactions smoothly.
Ahmed waqar and Yadav Anju study a comparative study of cashless economy of world with India. They
observed that demonetization prepared a roadmap for cashless economy. Cashless economy will certainly help
to capture black money, help to Reserve Bank of India to prepare monetary policy as well. They concluded that
at present India is not at the position to go for complete cashless economy. Gradually we should make changes
in our structure to go for complete cashless.
VIII. RESEARCH GAP ANALYSIS
Though India has just initiated towards the cashless economy, this has been followed in various countries from
many years. It motivated the researcher to study the success of cashless economy in different countries as well
as study is much needed to understand the journey of cashless economy in India and the support of citizens to
this system which decides the future of cashless economy.
IX. BENEFITS AND DRAWBACKS OF CASHLESS ECONOMY
Benefits of cashless economy
Avoid shadow economic situation In shadow economy all the financial transactions and activities are not coming into the light which greatly
affect the economy. It leads to evasion of taxes and no record of financial transactions. To bring every
transaction into light cashless economy is the only solution.
Reduce operating charges Processing fees for handling cash transactions and cheques are higher than the card transactions. Maintenance
cost of Automated Teller Machine (ATM) centre is also high. It increases the operating charges.
Support to business firms Small size of firms are in support of the cash and debit card based transactions as it causes lower costs to them.
But for large firms dealing with cash transactions require more processing fees and cash in banks blocks their
working capital as well.
Avoid chances of burglary Cashless economy helps to reduce the problems related to carrying cash. It avoids the risk of burglary and theft.
Sustainable economic development
Due to cashless economy there is less usage of papers and inks which help the environment.
Drawbacks of cashless economy
Problem to the old The old people are unable to handle the different cashless instruments properly like smart phones etc. They are
not trained to operate the advanced technology. So it is very difficult for them to accept such changes.

International Journal of Advance and Innovative Research Volume 6, Issue 1 (XXIV): January - March, 2019
227
ISSN 2394 - 7780
Risks of cyber attacks In digital age there is a major concern about privacy and safety of personal information of customers. Online
transactions are prone to be hacked by the cyber attackers. The personal as well as financial data of customers
might be exposed during the payment process. Recently Facebook had shared its millions of users’ personal
data with other tech firms.
Risks of telecommunication and electronic system breakdown Cashless economy is totally dependent on the electronic and telecommunication system. Breakdown of
electricity might create hurdles in smooth functioning of cashless transactions.
X. CURRENT SCENARIO OF CASHLESS ECONOMIES IN THE WORLD
According to research conducted by Forex Bonuses in 2017 Canada, Sweden, United Kingdom, France, United
States of America are the five best cashless economies in the world.
In Canada 70.7 per cent of personal consumption expenditures are card based. The mode of payment is a credit
card, debit card, prepaid card, mobile phones etc. The success of cashless system in Canada is purely because of
the strong broadband and network infrastructure. About 48 per cent people have agreed to sacrifice their privacy
to undertake the cashless transactions which is another key factor for going cashless.
Becoming a birth place of high tech and innovative technologies like Skype etc. Sweden is embracing cashless
economy. The success of cashless economy depends upon various factors such as card payment, strong internet
infrastructure, mobile payment app, proper legal framework and unwillingness to go for cash transactions. It is
predicted that the country could stop using cash by 2023.
In 2017 the United Kingdom has observed 15 per cent declined in cash transactions. Most of the citizens are
getting rid of cash as it is prone to burglary and support to criminal activities.
With rapidly growing digital technology and expansion of internet, France has made available to its citizens a
number of different cashless payment instruments. Over 11 billion transactions were done by cards payments in
2016 which clearly shows the popularity of cashless instruments in France.
The fast growing usage of apps like Venmo, PayPal, Apple Pay, Google Wallet etc. for making payments have
indicated that U.S.A. has been moving to cashless economy. Card payment is famous among all generations for
keeping track on expenses, managing their budgets as well as earning reward points.
To eliminate the illegal activities related to cash transactions China has introduced cashless payments. About 10
per cent of payments in retail sales was made in cash in 2016. Growing usage of mobile apps has been observed
in China for making payments. Alipay and Wechat pay is famous among the citizens.
Since 2010 cash transactions have reduced from 60 to 40 per cent in Australia.
Japan has been gradually moving to cashless economy as wants to reduce the increasing burden of printing the
bills, transporting the banknotes, expenses for the employees’ handling cash.
Definitely with the cashless instruments businesses and consumers have saved lots of time. It has been observed
that cash based crimes have reduced. Beside these advantages cashless economies have created numbers of jobs
opportunities, increased salaries and employees’ productivity.
Due to cashless economies many countries have faced various problems such as non-suitability for older people,
over dependence on electronic gadgets and sacrifice of privacy etc.
Although the cashless economy has certain problems, people are accepting this system gradually. They are
ready to sacrifice their privacy for bringing revolutionary changes in countries as it is a need of time.
XI. FACTORS CONTRIBUTING IN THE SUCCESS OF DIFFERENT CASHLESS ECONOMIES IN
THE WORLD
Willingness to sacrifice of privacy
Cashless transactions demands sharing of private information with the service providers. It makes citizens
reluctant to accept the cashless system. Due to electronic mode of payment each and every transaction is
coming under the scanner. Nothing is hidden in case of financial transactions. The success of cashless
economy depends on the readiness of citizens to share their private information.
Openness to accept changes
The success of cashless economy depends on the openness of citizens to accept the changes. Now the
traditional mode of payments are replaced with cashless instruments. The hard cash payment which has been
followed by the world for many years, becomes difficulty for them to get rid of their old habits.

International Journal of Advance and Innovative Research Volume 6, Issue 1 (XXIV): January - March, 2019
228
ISSN 2394 - 7780
Strong infrastructure and broadband
Strong infrastructure and broadband is another requirement to undertake the cashless transactions smoothly. For
undertaking the transactions quickly there is a need of fast broadband services and proper electronic system.
Trust in government and banking system
Having trust in prevailing government’s policies and banking system is the key for the growth of any country.
Without the support of citizens government can’t implement their plans successfully.
Approach of citizens towards sustainable cashless economy As we have seen the success of cashless economy depends upon willingness to share the private information,
openness to accept changes and support of citizens to government. It indicates that human beings are the key
contributors in the success of cashless economy without their support it is very difficult to be successful.
Therefore it is important to study the perspectives of citizens towards the cashless economy, a new innovation
which will decide the sustainable development of economy.
XII. APPROACH OF INDIANS TOWARDS CASHLESS ECONOMY
With the introduction of programmes like Digital India and Demonetization, India made a move towards the
cashless economy. But the question is are these efforts sufficient to lead us towards sustainable cashless
economy? The researcher observed that the human support is the greatest contributor in the success of cashless
economies. Therefore the researcher has analysed the approach of Indian citizens towards cashless economy to
understand the prospects of this system.
To understand the approach of citizens clearly the researcher decided to study the age wise views of
respondents. As age has a great impact on the thinking power of human beings it is required to know the age
groups of respondents.
Table-1: Age of citizens
Age group Frequency Per cent
18-40 71 60 %
41-60 28 24 %
61 and above 19 16 %
Total 118 100 %
Source: Compiled from the primary study.
Graph-1: Age of citizens
It is observed from Table 1 that 60 per cent respondents are from 18-40 age group, 24 per cent citizens are
between 41 to 60 age and 16 per cent are above 60 years.
Most of the respondents are young citizens. As the youth carries the responsibility of future their views are more
important to assess. Middle aged and the older people are the support pillars of these people so their views are
also important.
In today’s world men and women are equally important as they carry the responsibilities equally. Therefore it is
important to divide the respondent gender wise.

International Journal of Advance and Innovative Research Volume 6, Issue 1 (XXIV): January - March, 2019
229
ISSN 2394 - 7780
Table-2: Gender of citizens
Gender Frequency Per cent
Male 46 39 %
Female 72 61 %
Total 118 100 %
Source: Compiled from the primary study.
Graph-2: Gender of citizens
From Table 2 it is seen that 61 per cent respondents are female and 39 per cent citizens are male. It shows that
the result of study has a lot of influence of female respondents.
Income level of respondents have direct impact on spending habits of respondents. It is essential to study the
income status of the respondents which influences the cashless economy.
Table-3: Income status of citizens
Income status of citizens Frequency Per cent
0-20000 12 10 %
20001-40000 61 52 %
40001-60000 36 30 %
60001 and above 9 8 %
Total 118 100 %
Source: Compiled from the primary study.
Graph-3: Income status of citizens

International Journal of Advance and Innovative Research Volume 6, Issue 1 (XXIV): January - March, 2019
230
ISSN 2394 - 7780
From the table 3 it is exhibited that 10 per cent respondents are from 0-20000 group, 52 per cent are belonged to
20001-40000 income category, 30 per cent respondents are from 40001-60000 income level and 8 per cent
citizens are belonged to the category of 60001 and above.
It shows that the major proportion of respondents earns quite good so they are able to spend money for personal
consumption.
Before understanding the age wise differences in thinking of citizens the researcher has made an attempt to
understand how many citizens are in favour of following factors which help in the success of cashless economy.
Some of the factors are given below.
Table-4: Factors contributing in the success of sustainable cashless economy
Particulars Frequency
Sacrifice of privacy 45
Trust in banking and government system 105
Openness to accept changes 36
Ability to operate advanced technology 52
Source: Compiled from the primary study.
Graph-4: Factors contributing in the success of cashless economy
It has been observed from table 4 that 45 respondents are ready to sacrifice their personal information, 36
citizens are flexible enough to accept the changes in their lifestyle and 52 respondents are able to
operate advanced technology which show that a major proportion of population is not accepting the conditions
required for the sustainable cashless economy. About 105 respondents are having the trust in governments’ and
bank’s rules and regulations which is the only criteria satisfied by the respondents.
Though the numbers in favour of cashless economy are not satisfactory, it is a good sign that the country is
gradually moving towards the sustainable cashless economy by reducing the more usage of papers in dealings
and bringing more and more transactions in light.
Testing of hypothesis
As different people have the different point of views it is interesting to understand the perspective of different
age groups people about the cashless economy.
Table-5: The age of Indian citizens has an impact on the success of sustainable cashless economy
Particulars ANOVA test Accepted/Rejected
Sacrifice of privacy 0.000 Rejected
Trust in banking and government system 0.002 Rejected
Openness to accept changes 0.068 Accepted
Ability to operate advanced technology 0.474 Accepted
Source: Statistical analysis of data compiled from field survey.

International Journal of Advance and Innovative Research Volume 6, Issue 1 (XXIV): January - March, 2019
231
ISSN 2394 - 7780
The results of one way ANOVA test, at 5 per cent level of significance show that there is no significant
difference in opinion of different age groups people in case of sacrifice of privacy and trust in government and
banking system with the significance level 0.000, 0.002 respectively. The significance level 0.068, 0.474 which
are more than 0.05 indicate that the age has an impact on citizens’ views about openness to accept changes and
ability to operate advanced technology.
It concludes that irrespective of age of respondents they have agreed to share personal data as well as they trust
Indian government and banking system. According to age of citizens their ability to accept changes and operate
advanced technology may differ. As people grow older their willingness to accept new things get reduced. The
electronic instruments are new for the old. So they find a little bit difficult to cope up with the advanced
technology.
XIII. FINDINGS OF THE STUDY
1. About 60 per cent respondents are from 18-40 age group, 24 per cent citizens are between 41 to 60 years and
16 per cent respondents are above 60 years. Most of the respondents are young citizens.
2. It is seen that 61 per cent respondents are female and 39 per cent citizens are male. It shows that the result of
a study has a lot of influence of female respondents.
3. The results have exhibited that majority of the respondents i.e. 52 per cent citizens are belonged to 20001-
40000 income group, 10 per cent respondents are from 0-20000 income level, 30 per cent respondents are
from 40001-60000 category and 8 per cent citizens have earned more than 60000. It shows that the majority
of citizens are able to spend on their personal consumption.
4. It has been observed that 45 respondents are ready to sacrifice their personal information, 36 citizens are
flexible enough to accept the changes in their lifestyle and 52 respondents are able to operate advanced
technology which is not a major proportion of population. Most of the respondents i.e. 105 have faith in
governments’ and bank’s rules and regulations.
5. The results of one way ANOVA test, at 5 per cent level of significance show that there is no significant
difference in opinion of different age groups people in case of sacrifice of privacy and trust in government
and banking system with the significance level 0.000, 0.002 respectively. The significance level 0.068, 0.474
which are more than 0.05 indicate that the age has an impact in case of openness to accept changes and
ability to operate advanced technology.
XIV. CONCLUSIONS OF THE STUDY
Prime Minister Narendra Modi remarked that the cashless transaction is the only way to curb corruption. To
make the country strong we will have to go cashless. Following his voice India has initiated its journey to
become the sustainable cashless economy. The success of leading cashless economies is possible due to the
great support of its citizens. But the question is can Indians support their government?
Though Indian citizens have trust in government and banking system most of them are not ready to share their
personal data which is the key of success of cashless economy. It is very difficult for the old Indian citizens to
adapt the advanced technology and break their traditional life style.
More the usage of electronic instruments in dealings more country will contribute in the sustainable economic
growth because it reduces the usage of papers, ink etc. and making payment process more transparent.
Ultimately it is a joint effort of government and citizens to accept the cashless economy as it is indispensable for
the sustainable economic growth of countries.
XV. SUGGESTIONS OF THE STUDY
1. As mentioned above it is a joint effort of government and citizens, the government should make an effort to
develop the trust of citizens in electronic ways of payment.
2. Since senior citizens are unable to handle technology government should arrange training programmes for
them. Therefore they can be confident to handle electronic instruments and gradually accept it.
3. Before initiating any innovations government authorities should give enough time to get mentally prepared
for such changes.
4. Being a citizen of India it is our primary duty that not only should have the trust in our authorities but also
show the willingness to accept new changes and sacrifice certain privacy. Thus our economy will be the
most successful sustainable economy in the world.

International Journal of Advance and Innovative Research Volume 6, Issue 1 (XXIV): January - March, 2019
232
ISSN 2394 - 7780
BIBLIOGRAPHY
Anjali and Agarwal Harshita, India’s road to a cashless economy, IOSR Journal of Business and
Management.
Ahmed Waqar and Yadav Manju, Cashless economy: A comparative study of world regarding India,
International Journal of Allied Practices, Research and Review, Vol. IV, Issue VIII, August 2017, pp. 1-8.
http://www.telegraph.co.uk/money/future-of-money/10-cashless-countries-world-uk-rank/nd Lothe, S.
(1999), “Environmental initiatives in the retailing sector: an analysis of supply chain pressures and
partnerships”, Eco-Management and Auditing, Vol. 6 No. 4, pp. 181-188
Zielke, S. (2014), “Shopping in discount stores: the role of price-related attributions, emotions and value
perception”, Journal of Retailing and Consumer Services, Vol. 21 No. 3, pp. 327-338
Thomas .C. George, Research Methodology & Scientific Writing,ane books Pvt.Ltd
Chawla Deepak,Sondhi Neena, Research Methodology Edition 2, Vikas publishing house Pvt. Limited

International Journal of Advance and Innovative Research Volume 6, Issue 1 (XXIV): January - March, 2019
233
ISSN 2394 - 7780
SKILL DEVELOPMENT AND EMPLOYABILITY
Prof. Chetna Panchal
Assistant Professor, Gurukul College of Commerce
ABSTRACT
Concept of Skill Development: A growing number of countries have achieved the goal of universal primary
education and others are moving closer to this goal. Young people who expect to pursue further education and
training to improve their chances for employment and higher earnings get benefited from these goals.
Skill: A skill is the learned ability to carry out a task with pre-determined results often within a given amount of
time, energy, or both. In other words the abilities that one possesses. Different types of skills are needed to be
developed in an individual in order to meet lifestyle and industrial needs. A few can be named as Labor Skill,
Life Skill, People Skill, Social skill, soft skill, hard skill, etc. Realisation of type of skill required for a specific
job or task is an essential need of the hour. The government has taken several measures to decrease the gap in
the unemployment and to give the training of the skills required in the corporate world and also to provide the
capital for the startups business.
Keywords: Skill Development, Employment,growth, schemes.
OBJECTIVES
3. To propose a structured and pragmatic solution to address the lack of relevant skills amongst the current and
potential workforce if India.
4. To deliver a structured, sustainable and scalable framework to impart skills to the unemployed,
underemployed, uncertified workers.
INTRODUCTION
Skill development is necessary for the growth and development of the Employees and nation. To enable the
employment ready work force in the future, the youth need to be equipped with necessary skills and education.
The country presently faces a dual challenge of severe paucity of highly-trained, quality labour, as well as non-
employability of large sections of the educated workforce that possess little or no job skills. To overcome this
obstacle our government has introduced the mission of Skill India So that each and every one those who are
unemployed can go for training and can be employed.
DISCRIPTION
There are huge number of people who are uneducated and unemployed in India. To overcome this obstacle our
government has introduced various other schemes for the growth and development of the nation. They have
focused mainly on the skills and the startup businesses through which the employment can be generated.
The government of India has introduced various schemes to increase the under skilled workforce and to develop
various employment opportunities. Its main aim is to train over 40 crore people in different skills by 2020. The
main goal of the programme is to create opportunities and scope for developing the potential talent and skills of
the youth and enhance their capacity to be either employed or self-employed.
It includes the following government initiatives
1. National Skill Development Mission
The mission has been development to create convergence across sectors and states in terms of skill training
activities.
2. National Policy for Skill Development and Entreprenureship, 2015:
The objective of this policy is to meet the challenges of the implementing Skill India initiative.
3. Pradhan Mantri Kaushal Vikas Yojana
This is a scheme for skill training of youth to be implemented by the ministry of skill development and
entrepreneurship through the national skill development corporation. Recently SIEMENS India has inaugurated
a nw "SIEMENS Technical Academy" at Airoli, Mumbai for students who want to make a career in technical
area and technology. This is one of the latest initiative under this scheme of the government.
4. Skill loan scheme
The skill was launched in 2015 to support youth who wish to go through skill training programme in the
country.

International Journal of Advance and Innovative Research Volume 6, Issue 1 (XXIV): January - March, 2019
234
ISSN 2394 - 7780
In the first phase of the skill india initiatives, around 1.97 million people were trained against the target of 2.4
million. In order to speed up the training activities, the government introduced quarterly review of outcomes.
Projected growth and sector demand
In its Twelfth Five Year Plan, India has set a tough challenge in the field of vocational education and training in
its approach paper. It aims to increase the percentage of workforce with formal skills to 25% at the end of the
plan.
It is estimated that 50–70 million jobs will be created in India over the next five years and about 75%–90% of
these additional employment avenues will require some vocational training.
The following table presents the projected employment in the various sectors of economy for diverse growth
scenarios till 2017.
Year GDP growth
rate
Projected employment (in million)
Agriculture Industry Services Total
2011–12 9% 229.2 105 153.5 487.7
7% 225.4 102 149 476.4
5% 221.5 99.1 144.6 465.2
2016–17 9% 240.2 126.2 189.5 555.9
7% 232 116.8 174.8 523.5
5% 224 108.1 161.2 493.3
Source: NSDC
The chart below shows the employment rates in India in both direct and indirect way, which has shown
the progress in the 12th year plan
There has been great employment opportunities in various sectors due to the training and development centres
established all over India. Following is the list of fields of sectors that may create great employment
opportunities:
1. Sectors that will create large employment
Textiles and Garments
Leather and Footwear
Gems and Jewelry
Food Processing Industries
Handlooms and Handicrafts

International Journal of Advance and Innovative Research Volume 6, Issue 1 (XXIV): January - March, 2019
235
ISSN 2394 - 7780
2. Sectors that will depend technology capabilities in Manufacturing
Machine tools
IT Hardware and Electronics
3. Sectors that will provide Strategic Security
Telecommunication equipment
Aerospace
Shipping
Defense Equipment
4. Manufacturing Technology Sectors for Energy Security
Solar Energy
Clean Coal Technologies
Nuclear power generation
5. Capital equipment for India's Infrastructure Growth
Heavy electrical equipment
Heavy transport, earth moving and mining equipment
6. Sectors where India has competitive advantage
Automotive Sectors
Pharmaceuticals and Medical Equipment
7. Micro Small and Medium Enterprises Sector - The base for the Manufacturing Sector - employment
and enterprise generation.
CONCLUSION
India being a labour rich country, and with a majority of its people in the youth category displays immense
potential from employment and skill development. Along with the government playing a catalyst in making
people job makers, the direct and indirect employment is also portraying a subsequent upward trend.
REFERENCES
www.skilldevelopment.gov.in
Ministry of Skill Development and Entrepreneurship website
Business Economics-V (Macro Economic aspects of India)
Google scholar
Www.economictimes.com

International Journal of Advance and Innovative Research Volume 6, Issue 1 (XXIV): January - March, 2019
236
ISSN 2394 - 7780
A STUDY ON THE ECONOMICS OF FESTIVALS WITH SPECIAL REFERENCE TO
CONSUMER’S PERCEPTION AND SPENDING BEHAVIOR
Ayushi Modi
Student, D. G. Ruparel College, Mumbai
ABSTRACT
Traditions are important aspect of our lives. The best way to celebrate these traditions is through celebration of
festivals. Festivals like Ganesh utsav, Holi, Diwali were initially commenced so as to bring people belonging to
different social strata together. It is been observed that during festive seasons, family expenses go high. Hence,
it is of utmost importance that we understand the economics of festivals from consumer’s view point so as to
formulate appropriate policy decisions related to their expenses in future.
This paper discusses the spending habit of consumers during festive seasons on different type of products-Local
and Branded, Utility and Luxury and also focuses on the motivational factors affecting the consumer’s buying
decision.
However, this research is not making any attempt to look into the causes leading to such behavior. For this
study, primary data is been collected from a sample of Females, Males and others. Due to time constraints, the
sample size could not exceed 111in number and analysis of data was carried out using statistical tools like
crosstabs and statistical package SPSS.
Keywords: Festival, Consumer Behavior, Product, Influencer.
INRODUCTION
India has the great cultural diversity and is called the land of festivals, temples, holistic congregations and
teerth-yatras (holistic voyage). As per the Rajya Sabha data, India celebrates 51 festivals throughout the year, of
which 17 are nationally recognized and remaining 34 are celebrated at regional level.
Besides these festivals, as per 2011 census, we have 2.1 million temples across the country which attracts
enormous stock of wealth through offerings and donations. Temples and festivals together boost-up the entire
economic senario, prosper the business and keep Indian economy vibrant through balanced expenditure.
Festivals integrate the economy and society into oneness where happiness and sustainable expenditure give the
stimulus to market forces, which keeps the economic condition of India away from being sluggish for a long
time.
Festival economy is rapidly soaring with sizable growth rate. ASSOCHAM estimates that lord Ganesh festival
generates about Rs 20,000 crore businesses across the country with 20 per cent Compound Annual Growth Rate
(CAGR), particularly in Maharashtra and Telangana. Hyderabad alone generates about Rs. 5,000 crore
businesses in nine-day Ganesh Chaturthi festival and provides employment for more than 20,000 families
throughout the year, also during peak season of Ganesh festival (July-September). Around 60,000 people get
employment opportunities in unorganized sector such as idol manufacturing sector, transportation sector, event
management, flags and apparel manufacturing activities, etc.
Like Ganesh Chaturthi, Durga Puja generates about Rs 40,000 crore business in India with 35 per cent CAGR,
particularly in West Bengal. The size of Durga Puja economy almost equals to one-third of the West Bengal’s
annual Budget. Thousands of families are traditionally involved in idol-making activity across the nation. Many
branded electronic companies are involved in sponsoring Durga Puja pandals in Kolkata and artists from
different countries, even from Pakistan, comes to Kolkata during this festival to give the decorative finishing
touches to Maa Durga. Event management companies from France and the US are engaging in Kolkata in
easing the entire activities of advertisements and cultural event programmes at Durga Puja pandals. All these
artists and event management companies from different countries are capturing the festival economy and
profiteering out of these festivals in a significant manner. During nine-day Durga Puja, food and beverages
alone generates Rs 50-60 crore business.
All the festivals in India encourage the unorganized economy in a large scale and provide massive employment
opportunities for low-skilled traditional household manufacturing sector and small micro entrepreneurs. Raksha
Bandhan festival generates about Rs 400 crore businesses and provides employment to more than 4,000 families
in Gujarat.

International Journal of Advance and Innovative Research Volume 6, Issue 1 (XXIV): January - March, 2019
237
ISSN 2394 - 7780
During Diwali, electronics, automobiles and apparel dominate the lion’s share of business. 52 per cent of the
apparel products sales take place during this auspicious festival and every individual spends 20 per cent
additional expenditure for various reasons. According to Tamil Nadu Fireworks and Amorces Manufacturers
Association (TNFAMA), crackers industry plays a dominant role with Rs 10,000 crore businesses and provides
employment to thousands of families in Sivakasi of Tamil Nadu.
India celebrates kite festival during Uttarayanam period and this festival generates about Rs 500 crore
businesses in the country particularly in Gujarat, Uttar Pradesh and Delhi. Kite industry is traditionally a
household occupation which provides employment to more than 6,000 families of Gujarat. By considering the
due potential of kite industry in terms of business and employment, then Chief Minister of Gujarat Narendra
Modi promoted this festival as an International Kite Festival through Vibrant Gujarat Programme.
The festive season generates as much as 30% of yearly sales for sectors such as consumer durables. For
categories like salons and travel too, there is a spike of over 20%.
China overruns luminous lightings and fireworks during the festival of Diwali. According to the TNFAMA and
Industry executives, out of Rs 10,000 crore businesses of fireworks, 40 per cent of the market is captured by
Chinese firework products, adversely affecting about 2.5 lakh Indian artisans who earn a chunk of their total
income during Diwali days.
Apart from crackers, Chinese toys are also impacting the Indian toy industry. According to the ASSOCHAM,
the Indian market is full of Chinese toys. Nearly 40 per cent of Indian toy companies have been closed in the
last five years, and rest 20 per cent are struggling for the break-even level. Cheap Chinese products have
become the reason for the shutdown of nearly 60 per cent of the industrial units in Bhiwandi and Thane.
With the ever growing competition, in present time, it is very important to consider the consumer’s needs and
wants while making different promotional strategies. This is because consumers want to maximize their
satisfaction and minimize their pain that is; they wish to attain maximum satisfaction while paying the
minimum cost. An understanding of consumer’s behavior will help analysts to prepare for better promotional
activities so as to maximize their company’s profits while catering to the needs of consumers. No doubt that
during festivals the consumers spending does augment, yet most of the local sellers do not make enough profit
so as to sustain their basic daily needs.
This survey aims to help all those who wish to increase their sales during festival season by taking into account
consumer’s perception of festival expenditure. For this purpose, Random sampling through structured
questionnaire was done.
LITERATURE REVIEW
Festival is “an event, a social phenomenon, encountered in virtually all human cultures” (Falassi, 1987, p.1).
Handelman (1998) uses the concept “events” to encompass the variety of social situations and power
relationships that are expressed through festivity. He states that events are the “out of the ordinary occasions of
display, through ceremony, procession and the like, which provide focal points for consumption by an ‘outside’
audience’” (p. 41).
Getz (1997) argues that festivals are one of the most common forms of cultural celebrations; although many are
traditional and have long histories, the majority was created in recent decades. While satisfying the needs of
community members in participating and sharing the important moments of the community life, such
celebrations frequently involved, and focused upon, travelers, as naive and willing observers (Arnold, 2000).
Falassi (1987, p.1) also argues that “the colorful variety and dramatic intensity of the festivals’ dynamic,
choreographic and aesthetic aspects, the signs of deep seated meaning, and the historical roots and the
involvement of the ‘natives’ often attract the attention of casual visitors”. Historically, the celebrations of
various festivals have always provided points of meaningful connectivity and spectacle to visitors (Picard &
Robinson, 2004).
The literature review suggests that there is no single method of market segmentation (Kotler et al., 2010). It has
been argued that different approaches can be used to satisfy researchers’ requirements. For example, many
academics claim that participants should be categorized based on their motives, since this approach can explain
why the participants chose to attend an event (Reisinger and Park, 2009; Allen et al., 2008; Getz, 2007).
Researchers also focus on different characteristics such as age, income, place of origin and consumption
patterns because these provide a participant profile synopsis to organizers.

International Journal of Advance and Innovative Research Volume 6, Issue 1 (XXIV): January - March, 2019
238
ISSN 2394 - 7780
In a visitor market, the fundamental variable in any profitability analysis is the visitor expenditure (Aguilo &
Juaneda, 2000; Chhabra et al., 2002; Poon, 1993). As understanding festival participants and delivering
demand-related products is important under the increasingly competitive festival market conditions, it is natural
that festival researchers have recognized that visitor expenditures are the key variables in the economic-impact
measurements associated with festival development.
Previous research has shown that visitor’s expenses are affected by a wide range of variables. For example Gyte
and Phelps’s (1989) research indicated that repeat visitors spent more money than first time visitors, and later
studies highlighted the indirect correlation between expenses and number of visits. Expenditure is affected by
visitor’s age, motivation and frequency of visits. This highlights low, medium and high expenditure patterns
associated with visitors’ profiles. High expenditure consumers are more likely to be women; extremely
spendthrift consumer patterns are more likely in women in a family group who at the same time have shopping
as their main visit motivation (Mok and Iverson, 2000).
Lehto et al. (2004) also found that a previous visit to the destination led to a cost reduction, due to the visitors’
increased awareness of the destination while Jang et al. (2009) found that the frequency of visit was a factor
affecting the interpretation of visitors' expenses. For example: First-time 12 Logos Verlag Berlin - Academic
Books for Sciences and Humanities visitors spends more money than repeat visitors because the latter were
more familiar with the destination, therefore they were more able to manage and reduce their travel costs.
Moreover, visitors who traveled in a group (friends, family, etc.) seemed to spend more money than those who
traveled alone.
As expected, an important factor in defining expenditure patterns was income. Davies and Morgan (1996)
analyzed family budgets in the UK, desiring to investigate income effects on accommodation and holiday travel
costs, and confirmed the relationship between them. Agarnal and Yochum’s study (2000) for overnight visitors
in Virginia Beach, USA, showed that expenses are positively associated with income, as well as visit length,
group size, number of children, and the group leader’s age. Downward and Lumsdon (2000) researched
determining factors of consumption and pointed out that group composition and duration of stay were more
influential variables than group size.
Lehto, X., Cai, L., O'Leary, J., Huan, T. (2004), concluded that there seems to be a strong relationship between
some of the demographic characteristics and expenditure patterns. Age seems to be a significant variable
affecting spending patterns at the cultural festival. Retired attendees seem to affect spending in a positive way at
the festival (retired visitors are the ones most likely to over-spend, as compared to everyone else). Hence,
managers, practitioners, policy makers and organizers should aim to target their audience more effectively.
Education seems to exhibit an unexpected impact on festival spending (the highly educated are less likely to
exhibit high spending patterns).
According to Kim, Prideaux, and Chon (2010), the income from festival visitors can generate a range of
economic and non-market benefits that enhance the local economy. Usually, the economic benefits include
revenue generation and job creation
There is a growing stream of research focusing on the motivations of festival attendees (e.g., Backman et al.,
1995; Crompton & McKay, 1997; Formica & 3 Uysal, 1996, 1998; Lee et al., 2004; Schneider & Backman,
1996; Scott, 1996; Mohr, Backman, Gahan, & Backman, 1993; Uysal, Gahan, & Martin, 1993), as studying
festival and event motivation is increasingly being seen as “a key to design special offerings” (Crompton &
McKay, 1997, p. 426) for festival visitors and a way to enhance the local festival economy.
PROBLEM STATEMENT
As it is been observed that celebrations in India (Festive seasons) bring about a huge turn over in the said
economic conditions, it is essential for the businesses to understand Consumers buying and spending behavior
to formulate appropriate strategies.
OBJECTIVES
The aim of this research paper is
1. To study the spending habits of consumers during festive season
2. To understand the factors influencing consumers decisions and purchase behavior during festive seasons.
HYPOTHESIS H1. Ganpati celebration is the most popular festivals of all others in Maharashtra.
H2. Majority of the unemployed consumers spend most on utility and necessity goods during festival season.

International Journal of Advance and Innovative Research Volume 6, Issue 1 (XXIV): January - March, 2019
239
ISSN 2394 - 7780
H3. Traditions are the motivating factor which drives consumers to buy more during festival season.
H4. Consumers prefer buying necessary branded low-cost goods than buying luxurious branded high-cost goods
during festive seasons.
H5. Consumers often spend more when they shop with their families.
RESEARCH METHODOLOGY
This research is both Primary and Secondary in nature.
Type of research: Exploratory in nature
Sampling method: Simple Random sampling
Sampling place: Mumbai and Navi Mumbai
Respondents category: Females, Males and others
Number of respondents: 111
Data collection method: Structured questionnaire
Tool used for analysis: Excel and SPSS (Crosstabs)
ANALYSIS
1. The most popular festival and the spending of the same
Chi-Square Tests
Value df Asymp sig 2 sided
Likelihood ratio
Pearson chi-square
N of valid cases
14.579
13.345
111
4
4
.006
.010
INTERPRETATION: From the above bar chart, it can be observed that, Diwali is the festival in which people
spend the most, followed by Ganpati, Eid, Christmas and Holi. Once again, in terms of popularity, diwali
outranged all other festivals because people spend more during this festival than any other festival. This shows
that Diwali is the most celebrated festival.
The chi-square table indicates that, there exists a significant difference among the expenditure and popularity of
different festivals. Since the Significance value is less than .05;
Thus the hypothesis,
H1: Ganpati celebration is the most popular of all festivals in Maharashtra is REJECTED.

International Journal of Advance and Innovative Research Volume 6, Issue 1 (XXIV): January - March, 2019
240
ISSN 2394 - 7780
The alternate is true that is,
Ha: Ganpati celebration is not one of the most popular of all festivals in Maharashtra.
2. Unemployed consumer’s spending
Chi-Square Tests
Value df Asymp. Sig.
(2-sided)
Exact Sig. (2-
sided)
Exact Sig. (1-
sided)
Pearson Chi-Square .430a 1 .512
Continuity Correctionb .199 1 .655
Likelihood Ratio .432 1 .511
Fisher's Exact Test .538 .329
N of Valid Cases 111
a. 0 cells (0.0%) have expected count less than 5. The minimum expected count is 14.57.
b. Computed only for a 2x2 table
INTERPRETATION: The above bar chart demonstrates the type of products that are usually bought by
people. For the ease of research, people are divided according to their employment status. It can be clearly seen
that, employed as well as unemployed consumers buy more of necessity and utility goods during festivals. Yet,
unemployed consumers buy luxury and comfort goods more than the employed consumers.
Since the Significance value is greater than .05;
The hypothesis,
H2: Majority of the unemployed consumers spend the most on utility and necessity goods during festival season
is ACCEPTED.
3. Reason following the purchase during festivals

International Journal of Advance and Innovative Research Volume 6, Issue 1 (XXIV): January - March, 2019
241
ISSN 2394 - 7780
INTERPRETATION: The above bar chart shows the reasons which support consumer’s spending during
festival season. The reasons or motivations like surge in disposable income or bonus, traditions and discounts
are taken into consideration. From the above it can be seen that, people who spend more during festivals do so
in order to follow their traditions. This indicates that, people though living in urban areas do necessarily follow
their traditions. On the same lines, consumers who currently do not spend more during festival season would
also have wanted to spent money to follow their traditions. Various kinds of discounts offered seem to be the
second factor motivating consumers to spend more.
Since the Significance value is greater than .05;
Thus the hypothesis,
H3. Traditions is the motivating factor that drives consumers to buy more during festival season is
ACCEPTED.
4. Buying local low-cost (necessity) or branded high-cost (luxuary) goods
INTERPRETATION: The bar chart above represents the quality of product preferred by consumers in
accordance to the cost of the product. It is observed that, necessary and utility goods top consumer’s
preferences. While almost all consumers prefer buying necessary goods during festival season, they at the same
time buy branded low cost necessity goods showing their proclivity to purchase branded goods to local goods.
Significance value is more than .05,
Thus the hypothesis,
H4. Consumers prefer buying necessary branded low-cost goods than buying luxurious branded high-cost goods
is ACCEPTED.
5. Surge in consumer’s spending
Chi-Square Tests
Value df Asymp. Sig. (2-sided)
Pearson Chi-Square 1.434a 2 .488
Likelihood Ratio 1.652 2 .438
N of Valid Cases 111
a. 1 cells (16.7%) have expected count less than 5. The minimum expected count is 2.45.
Chi-Square Tests
Value df Asymp. Sig. (2-sided)
Pearson Chi-Square 1.162a 3 .762
Likelihood Ratio 1.149 3 .765
N of Valid Cases 111
a. 1 cells (12.5%) have expected count less than 5. The minimum expected count is 3.68.

International Journal of Advance and Innovative Research Volume 6, Issue 1 (XXIV): January - March, 2019
242
ISSN 2394 - 7780
INTERPRETATION: The bar chart above bifurcates people on the basis of their marital status. It can be seen
that, people of varied status have shown an accretion in shopping with their family than when they are shopping
alone. In fact, surprisingly most of the single consumers have reported an increase in shopping when they shop
with their families. Hence, it can be inferred that, family is a strong influencer which affects the amount of
shopping done by an individual.
The chi-square table demonstrates that there exists not much significant difference among the marital status of a
consumer when he/she shops with his/her family.
Thus the hypothesis,
H5. Consumers often spend more when they shop with their families is ACCEPTED.
CONCLUSION Festivals occupy an important part of lives. Most of the people on an average celebrate anywhere between 4 to 8
festivals per year while there are quite a few (almost 30%) who celebrate at the most 4 festivals a year.
According to the analysis, the percentage of consumers who spend 0 to 20,000 or more varies greatly though
their proportion remains more or less the same.
Most of the consumer’s expenses proliferate during festive season. This surge in spending is backed by
following of traditions. Hence tradition is the motivational factor driving consumers to spend more during
festivals season.
In Maharashtra, consumers have noted that they spend the most in diwali than in any other festival. Also, diwali
has been recorded as the most popular festival of Maharashtra.
It has also been indicated by the survey that, consumers prefer buying Necessity branded low-cost utility goods
than buying Luxurious branded high-cost goods. Similarly, they have recorded purchasing goods physically
than buying them online during festivals.
Majority of people have said that they tend to shop more when they are with their families than when they shop
alone. Also, they have mentioned that, they do postpone the purchase of some items in order to buy some other
items during festival season. This implies that, there is a significant amount of opportunity cost involved in
buying of items during festive season, hence almost 50% of consumers feel that they should reduce their festival
expenditure.
In order to add some flavor to the original traditions, 91% of consumers said that they would love to celebrate
the festivals with the unprivileged section of the society.
SUGGESTIONS
Following suggestions are drawn to the marketers:
It is been observed and studied that consumers (all demographics) celebrate festivals (Diwali in Mumbai) as one
of their favorite festivals. Spending pattern and purchasing power goes high during this period (2 weeks). Based
on their needs, likes and dislikes, the marketers have a wider scope to effectively increase their sales.
LIMITATION
The study has following limitation:
The number of respondents could not exceed 111.
The respondents belong to Maharashtra.
The study does not take into account the reason behind consumer’s choices.
REFERENCES
Agarnal, B., Yochum, R. (2000), Determinants of tourist spending, in: Woodside A.G., Crouch, I., Mazanec,
A., Oppermann, M., Sakai, Y. (Eds.), Consumer Psychology of Tourism, Hospitality and Leisure, 1,
Wallingford: CABI Publishing
Chi-Square Tests
Value df Asymp. Sig. (2-sided)
Pearson Chi-Square 1.480a 3 .687
Likelihood Ratio 1.813 3 .612
N of Valid Cases 111
a. 4 cells (50.0%) have expected count less than 5. The minimum expected count is .36.

International Journal of Advance and Innovative Research Volume 6, Issue 1 (XXIV): January - March, 2019
243
ISSN 2394 - 7780
Agarnal, B., Yochum, R. (2000), Determinants of tourist spending, in: Woodside A.G., Crouch, I., Mazanec,
A., Oppermann, M., Sakai, Y. (Eds.), Consumer Psychology of Tourism, Hospitality and Leisure, 1,
Wallingford: CABI Publishing
Aguilo, E., Juaneda, C. (2000). Tourists expenditure for mass tourism markets. Annals of Tourism Research,
27(3), 624-637.
Allen, J., O’Toole, W., Harris, R., McDonnell, I. (2010), Festival and Special Event Management, London:
Wiley Australia Tourism Series.
Arnold, N. (2000). Festival tourism: Recognizing the challenges – link multiple pathways between global
villages of the new century. In B. Faulkner, G. Moscardo, & E. Laws (Eds.), Tourism in the 21st Century –
Lessons from Experience (pp. 130-162). London & New York: Continuum.
Backman, K. F. Backman, S. J. U., Uysal, M., & Sunshine, K. M. (1995). Event tourism and examination of
motivations and activities. Festival Management & Events Tourism, 3, 15-24.
Chhabra, D., Sills, E., & Rea, P. (2002). Tourist expenditures at heritage festivals. Event Tourism, 7, 221-
230.
Crompton, J. L., & McKay, S. L. (1997). Motives of visitors attending festival events. Annals of Tourism
Research, 24(2), 425-439.
Davies, B., Morgan, J. (1996), Family expenditure on hotels and holidays, Annals of Tourism Research,
19(4): 691-699
Downward, P., Lumsdon, L. (2000), the demand for day-visits: an analysis of visitor spending, Tourism
Economics, 6(3): 251- 261. Downward, P., Lumsdon, L. (2003), Beyond the demand for day-visits: an
analysis of visitor spending, Tourism Economics, 9(1): 67-76.
Falassi, A. (1987). Festival: Definition and morphology. In A. Falassi, (Eds.) Time Out of Time: Essays on
the Festival (pp.1-10). Albuquerque: University of New Mexico Press.
Getz, D. (2008), Event tourism: Definition, evolution and research, Tourism Management, 29(3): 403-428.
Gyte, D., Phelps, A. (1989), Patterns of destination repeat business: British tourists in Mallorca, Spain,
Journal of Travel Research, 28(1): 24-28.
Jang, S., Ham, S. (2009), a double–hurdle analysis of travel expenditure: Baby boomer seniors versus older
seniors, Tourism Management, 30(3): 372-380.
Lehto, X., Cai, L., O'Leary, J., Huan, T. (2004), Tourist shopping preferences and expenditure behaviors:
The case of the Taiwanese outbound market, Journal of Vacation Marketing, 10(4): 320-332.
Mok, C., Iverson, T.J. (2000), Expenditure-based segmentation: Taiwanese tourists to Guam, Tourism
Management, 21(3): 299-305
Picard, D. Robinson & Long, P. (2004). Festival tourism: Producing, translating, and consuming expressions
of culture(s). Event Management, 8, 187-189.

International Journal of Advance and Innovative Research Volume 6, Issue 1 (XXIV): January - March, 2019
244
ISSN 2394 - 7780
DISABLED FRIENDLY LIBRARIES- CURRENT STATUS, DISCUSSIONS AND SUGGESTIONS
Arpita Baijal1, Kanchana Sattur2 and Dr. Vinita Pimpale3
Research Scholar1,2 and Associate Professor3, R. A. Podar College of Commerce and Economics
ABSTRACT
Library is one of the necessities for students. However, not all students are equally fortunate. There is a section
of students that are not able to take advantage of library facilities due to various limitations. This paper aims to
identify better management practices that may help all the students, which includes physically unfit students to
utilize the resources of libraries. The suggested model can be adopted by libraries for better management and
placement of equipment and resources.
Keywords: Library, disable students, Layout
INTRODUCTION
Education and access to education is one of the fundamental rights of human being. But availing this
fundamental right is very difficult for a section of persons, namely disabled persons. In a country like India,
disabled persons are the most ignored section of society. Availing education and access to information is a
daunting task for disabled persons. But now this situation is undergoing change. One area which is undergoing
change is library services for disabled persons. An ideal library can be described as a facility where every
member of community without discrimination is offered access to the latest and any kind of information. But
libraries have been criticized on the grounds that people with disability are not provided for by the libraries.
The research focuses on library services and facilities available for disabled persons. Research also includes
University Grants Commission guidelines for disabled persons, PWD Act 1995. Researchers have also studied
how disabled friendly are the library services in colleges under University of Mumbai. This paper also suggests
a list of good practices for library services with respect to disabled persons.
OBJECTIVES OF THE RESEARCH
To understand the UGC guidelines with respect to library facilities for disabled students
To understand the PWD Act guidelines with respect to disabled persons
To study the library facilities available for disabled students across different colleges under University of
Mumbai.
To design ideal model of library services with respect to layout and facilities for disabled students
RESEARCH METHODOLOGY
This research is Exploratory research.
Exploratory research (ER) is an examination into a subject in an attempt to gain further insight.
With Exploratory Research, we as researchers started with a general idea and used research as a tool to identify
issues that could be the focus of future research.
Primary Data
Questionnaire: Self completion online questionnaire was developed and distributed to college librarians.
Mailed to 800. Responses-20.
Personal visit: Personal visit to various colleges to get first-hand information was also undertaken
Secondary Data
Data has been collected from various research papers, articles, journals and institutional websites
Limitation Limited to University Of Mumbai
Less time
Small Sample
RELEVANCE OF STUDY Aims at improving facilities for disabled students.
Relevant – in present times as Government is working on it.
International Journal of Advance and Innovative Research Volume 6, Issue 1 (XXIV): January - March, 2019
245
ISSN 2394 - 7780
OBJECTIVE-1: UNIVERSITY GRANTS COMMISSION (UGC GUIDELINES)
HIGHER EDUCATION FOR PERSONS WITH SPECIAL NEEDS (HEPSN)
The Persons with Disabilities Act 1995 indicates that differently-abled persons should have access to education
at all levels. In the higher education sector, the University Grants Commission (UGC) is supporting universities
and colleges in the country to involve in special education activities to empower differently-abled persons. The
UGC had started the scheme of assistance to universities/colleges for Higher Education for Persons with Special
Needs (Differently- abled Persons) (HEPSN) during the Ninth Five-Year Plan, which continued in the Tenth
Plan. The HEPSN scheme is basically meant for creating an environment at the higher education institutions to
enrich higher education learning experiences of differently-abled persons. Creating awareness about the
capabilities of differently-abled persons, construction aimed at improving accessibility, purchase of equipment
to enrich learning, etc., are the broad categories of assistance under this scheme.
OBJECTIVES OF HEPSN
The specific objectives of the HEPSN Scheme are as follows
1. To provide equal educational opportunities to differently-abled persons in higher education institutions.
2. To create awareness among the functionaries of higher education about the specific educational needs of
differently-abled persons.
3. To equip higher education institutions with the facilities to provide access to differently-abled persons.
4. To provide special devices to higher education institutions that will augment the learning experiences of
differently-abled persons.
5. To monitor the implementation of all existing and future legislation and policies, which are pertaining to
higher education of differently-abled persons.
PROVISION OF FACILITIES AND FINANCIAL ASSISTANCE
The HEPSN scheme has three components. They are enumerated as follows:
Component 1 - Establishment of Enabling Units for differently- abled persons
Component 2 - Providing Access to Differently-abled persons
Component 3 - Providing Special Equipment to augment Educational Services for Differently-abled Persons
Objective 2-PWD ACT, 1995
This Act may be called the Persons With Disabilities (Equal Opportunities, Protection of Rights and Full
Participation) Act, 1995. There has been an increasing recognition of abilities of persons with disabilities and
emphasis on mainstreaming them in the society on the basis of their capabilities. The Government of India has
enacted this Act for persons with disabilities which provides for education, employment, creation of barrier free
environment, social security, etc. It extends to the whole of India except the State of Jammu and Kashmir.
The Act defines “Disability” as means
Blindness
Low vision
Leprosy-cured
Hearing impairment
Loco motor disability
Mental retardation
Mental illness;
The Act has also given guidelines with respect to provisions for disabled people to be followed by institutions.
Some of the guidelines are as follows:
Installation of auditory signals at red lights in the public roads for the benefit of persons with visually
handicap;
Causing curb cuts and slopes to be made in pavements for the easy access of wheel chair users;
Engraving on the surface of the zebra crossing for the blind or for persons with low vision;

International Journal of Advance and Innovative Research Volume 6, Issue 1 (XXIV): January - March, 2019
246
ISSN 2394 - 7780
Engraving on the edges of railway platforms for the blind or for persons with low vision;
Devising appropriate symbols of disability;
Warning signals at appropriate places.
Ramps in public buildings;
Braille symbols and auditory signals in elevators or lifts;
Braille symbols and auditory signals in elevators or lifts;
Ramps in hospitals, primary health centers and other medical care and rehabilitation institutions.
OBJECTIVE-3-: TO STUDY THE LIBRARY FACILITIES AVAILABLE FOR DISABLED
STUDENTS ACROSS DIFFERENT COLLEGES UNDER UNIVERSITY OF MUMBAI
DATA ANALYSIS
Analysis of Data collected through questionnaire has been analysed and presented in form of graphs and pie
chart.
Increased library usage by disabled students
60% of respondents believe that library
usage by disabled students have increased
Increase in enrollment of disabled students in last five years
Half of the respondents believe that there is an increase in
enrollment of disabled students in last 5 years
Elimination of physical barriers for disabled students
85% of sample colleges have worked for elimination
of physical barriers for disabled students
Libraries providing special service or adaptive
equipment’s for disabled students
50% of sample colleges are providing special
services for disabled students
Improvements made for disabled students
This chart represents the improvement in infrastructure facilities in the sample colleges for disabled
students

International Journal of Advance and Innovative Research Volume 6, Issue 1 (XXIV): January - March, 2019
247
ISSN 2394 - 7780
Disability catered to
Services/assistance provided for disabled students
This graph represents different services provided for disabled students by sample colleges
Hardware/Software provided
Dedicated staff members to coordinate with disabled students
85% of sample colleges have dedicated staff members to co-ordinate with disabled students
Colleges providing special training to staff members

International Journal of Advance and Innovative Research Volume 6, Issue 1 (XXIV): January - March, 2019
248
ISSN 2394 - 7780
Libraries having written policy for disabled
students
85% of sample colleges have written policy for
disabled students
Colleges having designated area for disabled
students in library
40% of colleges have designated areas for disabled
students in Library
Resource or other constraints faced
Non availability of adequate funding
Limited availability of sophisticated equipments
Organisational barriers
Less number of students
RESEARCH FINDINGS
SUGGESTIONS
1. EASY ACCESSIBILITY- PHYSICAL ACCESS
Ramps, Automatic doors
Lift alternative access
Separate issue and enquiry counters
Switch board levels
Flooring – Non slippery
Appropriate furniture
Adjustable desks and chairs
Hearing systems
Signage & Acoustics
Printed and Electronic Information
Accessibility of equipments
2. DEDICATED LIBRARY SERVICES
Staff with dedicated time
Book retrieval facilities
Easy photocopying facilities
Inter library loans
Magnifiers
Dedicated computers
Separate and dedicated sitting area
Home delivery on request
Online book renewals
Electronic enquiry services
3. HARDWARE & SOFTWARE FACILITIES
Braille typewriter and printer
Compact Disks
Computers with screen reading software and Audio
systems
Internet facilities
Low vision aids
CCTV’s
4. STAFF & HUMAN FACTORS
Responsible staff
Adequate training to staff
Dedicated staff
IDEAL DISABILED FRIENDLY LIBRARY LAYOUT
Explanation of model- Libraries should be at ground floor or proper elevation facility. Entrance should have a
ramp with automated doors. There should be wheelchair facility at the entrance with non-slippery floor. Next to
the door should be dedicated staff counter for disabled students. Special dedicated spaces for disabled students
with Spacious and easy movement and low racks in the book section. Braille book section should also be there.
Emergency room should be made with a separate room for deaf students and blind students with special
equipments. This model will make library access very easy for disabled students. This will promote use of
library and research facilities.

International Journal of Advance and Innovative Research Volume 6, Issue 1 (XXIV): January - March, 2019
249
ISSN 2394 - 7780
CONCLUSION
Persons/students with disability face major constraints in using library services and facilities
Most of the colleges in Mumbai lack facilities and services for disabled students
Some colleges have taken a step towards making their libraries disabled friendly.
Steps are being taken by Government and Educational Regulatory bodies to bring in needed changes for
disabled persons and students at different areas.
Educational institutes need to take into consideration the needs of disabled class of students
REFERENCES
The Rights of Persons with Disabilities Bill, 2014. (2018, Feb. 8). Retrieved from
http://www.prsindia.org/billtrack/the-right-of-persons-with-disabilities-bill-2014-3122
Guidelines for Persons with Disabilities Scheme in Colleges XII Plan (2012-2017). Retrieved from
http://www.ugc.ac.in/pdfnews/5471032_person-with-disabilities.pdf
BirgittaIrvall and GydaSkat Nielsen (6 Feb 2018). Access to libraries for persons with disabilities –
CHECKLIST, Series: IFLA Professional Reports 89. Retrieved from http://www.ifla.org/publications/ifla-
professional-reports-89
Suzanne Heaven (2004). The provision made by higher education library services for people with
disabilities, Library & Information Research (LIR) Volume 28 - Number 90 - Winter 2004 ISSN 0141 –
6561. Retrieved from http://ww.lirgjournal.org.uk/lir/ojs/index.php/lir/article/viewFile/169/216
Linda Robertson. Access for library users with disabilities. Retrieved from http://www.sconul.ac.uk/
sites/default/files/documents/access_disabilities_0.pdf
S.D. Vyas. Best Practices in Academic Libraries in India: A Study. ICAL 2009 – management models and
framework.Retrieved fromhttp://www.libsys.co.in/download/bestpractices_in_india_libraries.pdf
http://www.ugc.ac.in/pdfnews/5471032_person-with-disabilities.pdf
"Library Services for People with Disabilities Policy", American Library Association, (December 4, 2006).
Retrieved from http://www.ala.org/ascla/resources/libraryservices
Library Services for Students with Disabilities- Policy Document-Galway Campus. Retrieved from
http://library.gmit.ie/screens/ilupolicydocument.pdf

International Journal of Advance and Innovative Research Volume 6, Issue 1 (XXIV): January - March, 2019
250
ISSN 2394 - 7780
TO STUDY IMPACT OF INNOVATIONS IN TECHNOLOGY ON MANAGEMENT EDUCATION
Rajshree Srivastava1 and Patil Sahil Sharad2
Faculty1 and Student2, IMCOST, Thane
ABSTRACT
In this paper we will discuss the current status of technological innovations in Management education, as
an example of innovations in management education; we will highlight online learning and time efficiency of
learning using accelerated and intensive approaches. This paper contributes to focus on impact of innovations
in technology on management education. This paper tries to depict how digital technology empowers
management students towards holistic education for training and development and how it bridges the gap
between classroom and self learning as a weapon for faculties to be more expressive. It discusses some
pertinent issues and concerns in digital technology and its impact in the current management educational
scenario in India. The study was conducted in Mumbai region & data was collected with the help of structured
questionnaire for students and faculty, analyzed using simple percentage method to find out the impact of
innovative technology on management education sector. Technology has already proved its effectiveness in
many sectors, though it has also been serving the educational sector since many years, but how far has it
progressed in the management education sector will be analysed through this paper.
Keywords: Technology, Innovations, Management Education, Online, Digital, Holistic education.
INTRODUCTION
Digital innovation has become the boom in every sector. Management education has been witnessing the digital
revolution since many years, but it’s difficult to predict how far this change is progressing and benefitting the
sector. Management education is that part of education sector which generates and gives birth to future
managers. Future or success of any organization is dependent upon a successful and smart managers, be it a
field of finance, marketing or human resource. Now days it can be seen that every sector is opening its gateway
towards some or the other management programs be it, software, logistics, hospitality or whatsoever, it is
because majority of the departments needs to be run by the managers and mangers should learn about the new
approaches and strategies of how to manage.Technovation has provided an opportunity to each and every sector
to enter into management education. Management education previously focused more on talk and chalk method
and not much of practicality was practiced with the theories. Theories given by Fayol, Taylor, Kotler etc, was
merely practiced in classes all had a theoretical viewpoints. Now the technological innovations has provided
platform for the students and the faculties too of the management field to apply those theories tactically into the
theoretical session in a way which is more practical and to know its relevance in this era.(Rajshree,2018)
MANAGEMENT EDUCATION
Education in management comprises of studies which focuses on teaching the managerial aspects of business to
students by the faculties who have already experienced the same theories into the market. Management is that
field or stream of education which gives the organizations their capable managers. It is the curriculum in
management education which prepares the base of future managers by teaching them the management theories
which can be applied in organization practically. Now this field of management education has become a
diversified field which guides the students in different areas i.e. HR, Marketing, Finance Media, Insurance etc,
so that they learn management concepts and principles.
INNOVATIONS IN TECHNOLOGY
To innovate is to step beyond what we have been currently doing and to develop a creative thought that
helps us to do our job in a more innovative way. The rationale of any invention, therefore, is to create
something diverse from what we have been already doing. (Peter Serdyukov, 2017) Innovations in
technology have lead the foundation for new prospects in the education sector. Innovations like Laptop, i -
pads, Kindler, Mobile phones, etc. has reached to a level which have played a greatest resource of
technovations in education. Internet, world-wide-web is driving the students towards a new revolution.
Technovations has rewarded the education sector with many online and offline tools to make the work
more innovative. Video conferencing, web chats, webinars, web messaging, research tools and
software’etc are the innovations which is guiding the world.
IMPACT OF INNOVATIONS IN TECHNOLOGY ON MANAGEMENT EDUCATION
Technology consists of the use of, tools, techniques, materials and sources of power to make life endurable or
more pleasurable and work more efficient.

International Journal of Advance and Innovative Research Volume 6, Issue 1 (XXIV): January - March, 2019
251
ISSN 2394 - 7780
OBJECTIVES
1. Study of innovations in technology on management education
2. Study of Impact of innovations in technology on management students.
3. To evaluate the factors leading to innovations in technology in education with reference to faculties and
students.
REVIEW OF LITERATURE
Education is sometimes perceived as a sector which is resistant to change, while at the same time it faces a crisis
of productivity and efficiency. Innovation could help improve the quality of education, as well as provide more
“bang for the buck” in times of budget pressures and rising demand- Innovating Education and Educating for
Innovation the Power of Digital Technologies and Skills, OECD, 2016.
G.N. Wikramanayake, 2014, in research work has reported that Paradigm shifts in today’s world have
acknowledged the Machine / Industrial era being substituted by Technology / Information era. Similarly
production process has moved from Products to Knowledge, Workplace has shifted from Physical to Virtual
and its focus has changed from Worker to Customer.
Janni Nielsen, 2018, has supported in the project that aims to contribute significantly to higher education by
proposing a specific master’s degree program to develop innovative managers, researchers, and local developers
as well as provide a direct link between industry and society using a framework of blended learning approach.
The birth of digital and conversational technologies has brought forth the new concept of secondary orality
(Ong, 1982). This terminology highlights that learning and teaching should go beyond printed notes and
materials towards a greater stress on group work, promoting student communities, and encouraging student
participation. The concept encourages a greater sense of interaction with and “ownership” of knowledge,
emphasizing self-awareness and expression, and effectively using electronic tools in the education (Gronbeck,
Farrell, & Soukup, 1991)
RESEARCH METHODOLOGY
Type: Empirical Research
Data Type: Combination of Primary as well as Secondary data
Instrument: Survey Instrument is used in this project.
Method used: Quantitative statistical analysis.
Findings from survey and analysis (Student)
Figure no-1 Figure no-2
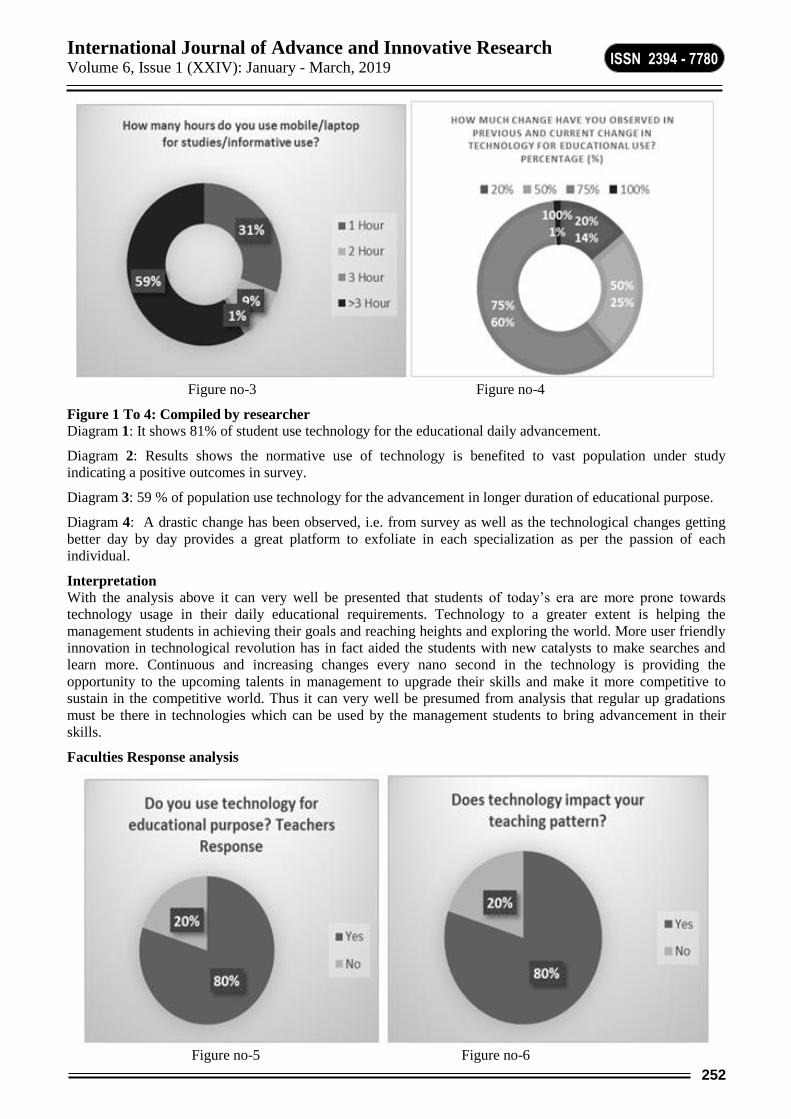
International Journal of Advance and Innovative Research Volume 6, Issue 1 (XXIV): January - March, 2019
252
ISSN 2394 - 7780
Figure no-3 Figure no-4
Figure 1 To 4: Compiled by researcher
Diagram 1: It shows 81% of student use technology for the educational daily advancement.
Diagram 2: Results shows the normative use of technology is benefited to vast population under study
indicating a positive outcomes in survey.
Diagram 3: 59 % of population use technology for the advancement in longer duration of educational purpose.
Diagram 4: A drastic change has been observed, i.e. from survey as well as the technological changes getting
better day by day provides a great platform to exfoliate in each specialization as per the passion of each
individual.
Interpretation
With the analysis above it can very well be presented that students of today’s era are more prone towards
technology usage in their daily educational requirements. Technology to a greater extent is helping the
management students in achieving their goals and reaching heights and exploring the world. More user friendly
innovation in technological revolution has in fact aided the students with new catalysts to make searches and
learn more. Continuous and increasing changes every nano second in the technology is providing the
opportunity to the upcoming talents in management to upgrade their skills and make it more competitive to
sustain in the competitive world. Thus it can very well be presumed from analysis that regular up gradations
must be there in technologies which can be used by the management students to bring advancement in their
skills.
Faculties Response analysis
Figure no-5 Figure no-6

International Journal of Advance and Innovative Research Volume 6, Issue 1 (XXIV): January - March, 2019
253
ISSN 2394 - 7780
Figure no-7
Figure 5 To 7: Compiled by researcher
Diagram 5: 80% of faculties use technology for teaching purpose.
Diagram 6: Adequate impact is observed in teaching as far as the technology is consider in same from survey.
Diagram 7: 60 % of faculty population adhere to creative teaching via technology, whereas 20-20% emphasis
on teaching methodology wherein creativity is essential to limited constrains.
Other findings from survey: Frequency of faculties using technology for educational purpose was reviewed and
observed that faculties often consider e-media a compact tool for enhancing teaching methodology.
Interpretations
From the above analysis it has been evaluated that majority of the faculties are exercising digital tools to
conduct teaching in a more innovative way and they are using these technologies not only to teach but more to
update themselves or their area of knowledge with the current trends and issues. Faculties are adapting new
technology in teaching methodologies so as to create an impact and create the interest of students towards more
technological revolution.
CONCLUSIONS
The face of education, whether online, hybrid, or classroom, is constantly changing, and it is important for
educators to stay abreast of the many opportunities and possibilities that are available. The technology hasn’t
reached the rural areas as far as the innovation is concern, it is the need of today to have vast spread over in
each area of country. In return will provide the learner and the instructor a base for exploring new passion in
their respective field. The further elastration from the research states that the variant of subject or field, the
contents may differ and thereby giving equally content of information through technology becomes a great
challenge. The content drafting in educational field is it’s a complicated task.
LIMITATIONS FOR RESEARCH
Adequate response from the respondents.
Time constraints
Study is based on limited sample size hence cannot be generalized with huge set of population in the society
Possibility of peripheral feedback
Open ended questions are respondent in different set of manner by each individual.
REFERENCES
1. Jeffrey Hsu, Innovative Technologies for Education and Learning: Education and Knowledge-Oriented
Applications of Blogs, Wikis, Podcasts, and More, International Journal of Information and Communication
Technology Education, 2007
2. Janni Nielsen, Technology and Innovation Management In Higher Education—Cases From Latin America
and Europe, ADMSCI, 2018
3. G.N. Wikramanayake, Impact Of Digital Technology on Education, Researchgate.2005
4. Preeti Singh, Digital Technology - Issues and Challenges for Management Education in India, ISBN 978-1-
943295-00-5, 2015
5. Rajshree.S, to study the impact of innovations in education, IJARIIT, ISSN-2454-132X, Volume-4, June
2018.
6. Jaraji Kikula, the Impact of Technology and Innovation (Technovation) in Developing Countries: A Review
of Empirical Evidence, Journal of Business and Management Sciences, 2017.

International Journal of Advance and Innovative Research Volume 6, Issue 1 (XXIV): January - March, 2019
254
ISSN 2394 - 7780
DIGITAL MARKETING AND ITS IMPACT ON CONSUMER BEHAVIOUR
Dr. Rinkesh Chheda
Assistant Professor, BMS Department, SIES College of Commerce & Economics, Mumbai
ABSTRACT Marketers are faced with new challenges and opportunities within this digital age. Digital marketing is the
utilization of electronic media by the marketers to promote the products or services into the market. The main
objective of digital marketing is attracting customers and allowing them to interact with the brand through
digital media.
The buying pattern of consumer is changing at a faster rate in the customer oriented market environment.
Consumer behaviour differs when it comes to the product, price, features, quality, packaging, buying behaviour,
status, generation; age of the customer etc. however, youth is the most complicated group to correspond with.
The changing preferences of the present day youth affects the buying pattern because they mostly follow the
rhythm of fashion and taste according to the changing time. Therefore, Marketers spend crores of rupees and
invest too much time on market research every year to identify and predict the changing youth behaviour. Now
digital marketing has posed many challenges to the marketer in the retail segment. The present generation is
more fascinated.
Online Marketing refers to a set of powerful tools and methodologies used for promoting products and services
through the Internet. Online Marketing is also known as Internet Marketing, Web Marketing, Digital Marketing
and Search Engine Marketing (SEM). Online Marketing is the exchanging values between the seller and buyer
and it is done online. Businesses are spending more on and partaking in online marketing than ever before, the
world over. Understanding the consumer behavioural factors that influence e-marketing effectiveness is crucial.
Keywords: Digital Marketing, Consumer Behaviour, Online Marketing
INTRODUCTION Digital marketing is one type of marketing being widely used to promote products or services and to reach
consumers using digital channels. Digital marketing extends beyond internet marketing including channels that
do not require the use of Internet. It includes mobile phones (both SMS and MMS), social media marketing,
display advertising, search engine marketing and many other forms of digital media. Digital Marketing is
defined as buying and selling of information, products, and services via computer networks or internet. Internet
and electronic commerce technologies are transforming the entire economy and changing business models,
revenue streams, customer bases, and supply chains.
Marketing parallels other business functions such as production, research, management, human resources and
accounting. As a business function, the goal of marketing is to connect the organization to its customer’s.
Marketing as a process of managing the flow of products from the point of conception to the point of
consumption. Although the basic process of marketing has not changed. Through digital media, consumers can
access information any time and any place where they want. With the presence of digital media, consumers do
not just rely on what the company says about their brand but also they can follow what the media, friends,
associations, peers, etc., are saying as well. Digital marketing is a broad term that refers to various promotional
techniques deployed to reach customers via digital technologies.
Online retailers are now pushing a larger number of categories such as electronics and white goods. In these
emerging models, intangible assets such as relationships, knowledge, people, brands, and systems are taking
center stage. India is the world’s 3rd largest internet population. After the proliferation of Internet, Marketing
strategy has taken an off root to reach out to the public. The tremendous growth that digital marketing has
shown cannot be match up with any other strategy Buying behaviour of an individual plays a predominant role
in the consumer behavior in general and among the youth in particular. Buying behaviour marketing is a process
of establishing relationships between products offered in the market and targeted buying behaviour groups. It
involves segmenting the market on the basis of buying behaviour dimensions, positioning the product in a way
that appeals to the activities, interests and opinions of the targeted market and undertaking specific promotional
campaigns which exploit buying behaviour appeals to enhance the market value of the offered product
OBJECTIVES OF THE STUDY
The main objective of this paper is to identify the effectiveness of digital marketing in the competitive market.
The supportive objectives are following:

International Journal of Advance and Innovative Research Volume 6, Issue 1 (XXIV): January - March, 2019
255
ISSN 2394 - 7780
1. To show the various elements of digital marketing;
2. To focus on the basic comparison between traditional and digital marketing;
3. To identify the factors influencing the changing buying behavior of the youth
4. To state the benefits and limitations of online marketing
LITERATURE SURVEY
According to Hoge (1993), electronic marketing (EM) is a transfer of goods or services from seller to buyer
involving one or more electronic methods or media. E-Marketing began with the use of telegraphs in the
nineteenth century. With the invention and mass acceptance of the telephone, radio, television, and then cable
television, electronic media has become the dominant marketing force. McDonald’s uses online channel to
reinforce brand messages and relationships. They have built online communities for children, such as the Happy
Meal website with educative and entertaining games to keep customers always close to themselves (Rowley
2004).
According to Chaffey (2011), social media marketing involves “encouraging customer communications on
company’s own website or through its social presence”. Social media marketing is one important technique in
digital marketing as companies can use social media form to distribute their messages to their target audience
without paying for the publishers or distributor that is characteristic for traditional marketing.
According to Gurau (2008), online marketing environment raises a series of opportunities and also challenges
for social media marketing practitioners.
Sathish and A. Rajamohan (2012), In their study Consumer behaviour and buying behaviour marketing, a
general approach of consumer is taken. A consumer’s buying behaviour is seen as the sum of his interactions
with his environment. Buying behaviour studies are a component of the broader behavioural concept called
psychographics.” Harold W. Berkman and Christopher Gilson define buying behaviour as “unified” patterns of
behaviour that both determine and are determined by consumption. The term “unified patterns of behaviour”
refers to behaviour in its broadest sense. Attitude formation and such internal subjective activities may not be
observable, but they are behaviour nonetheless.
RESEARCH METHODOLOGY
In this paper, an attempt is made to understand the role of consumer behaviour with reference to digital
marketing, as to how a marketer is using a modern tool of communication to attract the customers and how this
tool is giving benefits to the customers in buying, at the same time what are the problems a marketer faces when
using this tool to connect with its customers.
LIMITATIONS
The limitations of this study results into the following
1. The tastes and preferences of the consumers are also changing at a rapid rate. The marketers are finding it
difficult to cope up with the changing need of the customers.
2. The buying behaviour of younger generation not only influences their individual buying behavior, but also it
influences the buying behavior of the family
3. Digital Marketing is expensive to maintain it as lot of companies don’t invest too much funds in this
platform
4. Still lot of customers don’t prefer things to buy from this tool as they consider to be not genuine products
FINDINGS & DISCUSSIONS
Traditional marketing is the most recognizable form of marketing. Traditional marketing is non-digital way
used to promote the product or services of business entity. On the other hand, digital marketing is the marketing
of products or services using digital channels to reach consumers.
TRADITIONAL MARKETING
Traditional marketing includes print, broadcast, direct mail, and telephone,No interaction with the audience
,Results are easy to measure ,Advertising campaigns are planned over a long period of time ,Expensive and
time-consuming process , Success of traditional marketing strategies can be celebrated if the firm can reach
large local audience, One campaign prevails for a long time
Limited reach to the customer due to limited number of customer technology , 24/7 year-round exposure is not
possible ,No ability to go viral ,One way conversation , Responses can only occur during work hours

International Journal of Advance and Innovative Research Volume 6, Issue 1 (XXIV): January - March, 2019
256
ISSN 2394 - 7780
DIGITAL MARKETING Digital marketing includes online advertising, email marketing, social media, text messaging, affiliate
marketing, search engine optimization, pay per click, Interaction with the audience, Results are to a great extent
easy to measure, Advertising campaigns are planned over short period of time, Reasonably cheap and rapid way
to promote the products or services, Success of digital marketing strategies can be celebrated if the firm can
reach some specific number of local audience ,Campaigns can be easily changed with ease and innovations can
be introduced within any campaign , Wider reach to the customer because of the use of various customers
technology 24/7 year-round exposure is possible ,Ability to go viral ,Two ways conversation ,Response or
feedback can occur anytime
ADVANTAGES DIGITAL MARKETING BRINGS TO CUSTOMERS
With rapid technological developments, digital marketing has changed customers buying behavior. It has
brought various advantages to the consumers as given below:
a. Stay updated with products or services: Digital marketing technologies allow the consumers to stay with the
company information updated. Nowadays a lot of consumer can access internet any place anytime and
companies are continuously updating information about their products or services.
b. Greater engagement: With digital marketing, consumers can engage with the company’s various activities.
Consumers can visit company’s website, read information about the products or services and make
purchases online and provide feedback.
c. Clear information about the products or services: Through digital marketing, consumers get clear
information about the products or services. There is a little chance of misinterpretation of the information
taken from sales person in a retail store. However, Internet provides comprehensive product information
which customers can rely on and make purchase decision.
d. Easy comparison with others: Since many companies are trying to promote their products or services using
digital marketing, it is becoming the greatest advantage for the customer in terms that customers can make
comparison among products or services by different suppliers in cost and time friendly way. Customers
don’t need to visit a number of different retail outlets in order to gain knowledge about the products or
services.
e. 24/7 Shopping: Since internet is available all day long, there is no time restriction for when customer wants
to buy a product online.
f. Share content of the products or services: Digital marketing gives viewers a chance to share the content of
the product or services to others. Using digital media, one can easily transfer and get information about the
characteristics of the product or services to others.
g. Apparent Pricing: Company shows the prices of products or services through digital marketing channel and
this makes prices very clear and transparent for the customers. Company may regularly changes the prices or
gives special offers on their products or services and customers are always in advantages by getting informed
instantly by just looking at any one mean of digital marketing.
h. Enables instant purchase: With traditional marketing, customers first watch the advertisement and then find
relevant physical store to purchase the products or services. However, with digital marketing, customers can
purchase the products or services instantly.
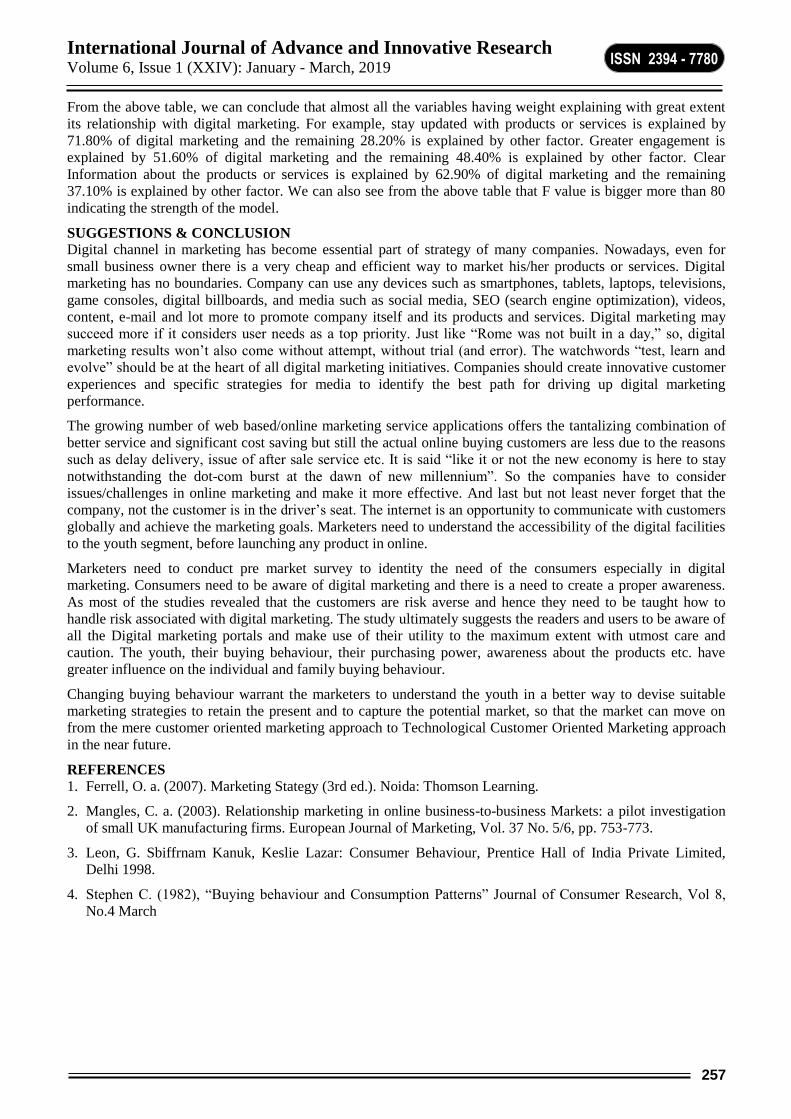
International Journal of Advance and Innovative Research Volume 6, Issue 1 (XXIV): January - March, 2019
257
ISSN 2394 - 7780
From the above table, we can conclude that almost all the variables having weight explaining with great extent
its relationship with digital marketing. For example, stay updated with products or services is explained by
71.80% of digital marketing and the remaining 28.20% is explained by other factor. Greater engagement is
explained by 51.60% of digital marketing and the remaining 48.40% is explained by other factor. Clear
Information about the products or services is explained by 62.90% of digital marketing and the remaining
37.10% is explained by other factor. We can also see from the above table that F value is bigger more than 80
indicating the strength of the model.
SUGGESTIONS & CONCLUSION
Digital channel in marketing has become essential part of strategy of many companies. Nowadays, even for
small business owner there is a very cheap and efficient way to market his/her products or services. Digital
marketing has no boundaries. Company can use any devices such as smartphones, tablets, laptops, televisions,
game consoles, digital billboards, and media such as social media, SEO (search engine optimization), videos,
content, e-mail and lot more to promote company itself and its products and services. Digital marketing may
succeed more if it considers user needs as a top priority. Just like “Rome was not built in a day,” so, digital
marketing results won’t also come without attempt, without trial (and error). The watchwords “test, learn and
evolve” should be at the heart of all digital marketing initiatives. Companies should create innovative customer
experiences and specific strategies for media to identify the best path for driving up digital marketing
performance.
The growing number of web based/online marketing service applications offers the tantalizing combination of
better service and significant cost saving but still the actual online buying customers are less due to the reasons
such as delay delivery, issue of after sale service etc. It is said “like it or not the new economy is here to stay
notwithstanding the dot-com burst at the dawn of new millennium”. So the companies have to consider
issues/challenges in online marketing and make it more effective. And last but not least never forget that the
company, not the customer is in the driver’s seat. The internet is an opportunity to communicate with customers
globally and achieve the marketing goals. Marketers need to understand the accessibility of the digital facilities
to the youth segment, before launching any product in online.
Marketers need to conduct pre market survey to identity the need of the consumers especially in digital
marketing. Consumers need to be aware of digital marketing and there is a need to create a proper awareness.
As most of the studies revealed that the customers are risk averse and hence they need to be taught how to
handle risk associated with digital marketing. The study ultimately suggests the readers and users to be aware of
all the Digital marketing portals and make use of their utility to the maximum extent with utmost care and
caution. The youth, their buying behaviour, their purchasing power, awareness about the products etc. have
greater influence on the individual and family buying behaviour.
Changing buying behaviour warrant the marketers to understand the youth in a better way to devise suitable
marketing strategies to retain the present and to capture the potential market, so that the market can move on
from the mere customer oriented marketing approach to Technological Customer Oriented Marketing approach
in the near future.
REFERENCES
1. Ferrell, O. a. (2007). Marketing Stategy (3rd ed.). Noida: Thomson Learning.
2. Mangles, C. a. (2003). Relationship marketing in online business-to-business Markets: a pilot investigation
of small UK manufacturing firms. European Journal of Marketing, Vol. 37 No. 5/6, pp. 753-773.
3. Leon, G. Sbiffrnam Kanuk, Keslie Lazar: Consumer Behaviour, Prentice Hall of India Private Limited,
Delhi 1998.
4. Stephen C. (1982), “Buying behaviour and Consumption Patterns” Journal of Consumer Research, Vol 8,
No.4 March

International Journal of Advance and Innovative Research Volume 6, Issue 1 (XXIV): January - March, 2019
258
ISSN 2394 - 7780
A STUDY ON EFFECTIVENESS OF PROMOTION TECHNIQUES OF APP-BASED FOOD
DELIVERY SERVICE COMPANIES WITH SPECIAL REFERENCE TO STUDENTS IN VASHI
Shradha Sahu and Kavita Pawar
ICLES’ Motilal Jhunjhunwala College, Navi Mumbai
ABSTRACT
Food delivery applications are designed to save time from waiting in restaurants or in front of the food
counters. This research paper has analysed the promotion techniques which are used by these food delivery
companies to attract the population (students). The study also focuses on the students’ awareness about the food
delivery applications and the factors encouraging them towards the use of these food delivery applications. In
order to verify the objectives and test the stated hypothesis, descriptive and inferential analysis techniques are
used. The research also lays down certain recommendations for these companies that could help them to
understand the consumer behaviour better.
Food app, delivery, promotion, students’.
INTRODUCTION
The only true love in this world is the love for the food. Food comes at the bottom of the pyramid and an
important part of everyone’s life. It is not only a basic need but has taken many forms with time. One cannot
think well and sleep well if one has not dined well.
With the development of technology, people use mobile applications for every work from paying online bills to
buying grocery products, everything today is ordered through mobile apps. With increasing number of young
professionals in the big cities, people do not get much time to prepare food. Hence Food Delivery apps make the
job easy.
It requires few steps like downloading the apps from play app stores, register into the app, selecting the menu to
place food delivered to your doorstep. Most of the young IT professionals and other office going people found
this method too easy to place a food order online which saves their time. Online food delivery websites and
mobile applications are most popular in Indian cities like Bangalore, Chennai, Hyderabad, Pune and Mumbai.
With a large number of young audience in various cities, food delivery apps in India has become instant popular
among users. People have a wide variety of choices to select among the apps to compare and pay with offer
price from online food delivery app.
India’s food delivery industry is estimated at around $700 million.
10 most popular mobile apps for food delivery in India that are helping to serve tastier food at home:
1. Swiggy
2. Zomato order
3. Uber eats
4. Foodpanda
5. Dominos
6. Pizzahut
7. Faasos
8. Just eat
9. Tasty khana
10. Food mingo
REVIEW OF LITERATURE
In order to understand the subject and to find the research gap following literature was studied-Tandon,
Suneerin (2018), in her article has explained about the popularity of food delivery applications. According to
her, besides urban dining habits, food aggregator’s apps are even transforming restaurant chains view of their
own businesses.

International Journal of Advance and Innovative Research Volume 6, Issue 1 (XXIV): January - March, 2019
259
ISSN 2394 - 7780
For instance, in July, tea retailer Chai Point launched a new café in Bengaluru with a layout unlike any till now:
It has an area demarcated for food-delivery apps, personnel. The chain now plans to replicate this design, laying
emphasis on delivery aggregators, at most of its new outlets. “the level of participation is growing at a faster
rate” said Amuleek Singh Bijral, co-founder and CEO, Chai Point.Global food brands like McDonalds and
Kentucky Fried Chicken, too, are bolstering their tie ups with food aggregator startups like Zomato and Swiggy,
even setting up separate teams to manage these platforms.
D’souza, Vanita (2019) in her article has explained about food tech start ups are raising funds. According to her
foodtech in India is one of the hottest space. Startups like Zomato, Swiggy and UberEats have changed urban
India’s food consumption pattern- all thanks to the heavy discounts and ease of ordering food online.
In a tight tug war to win the number one place in the foodtech segment,Zomato has raised $40 million from US
investor Glade Brooke Private investors, according to documents accessed from business intelligence platform
Paper.vc.
According to an Indian newspaper, the Economic Times, Zomato is planning to raise between $500-1 billion to
compete against its arch-rival Swiggy.
Roy, Madhurima(2019) in her article has explained about Indian food apps that gained popularity. According to
her India is channelizing more and more of its focus on career. Everyone is precisely focused on shaping their
career have little or no spare time to regularly indulge in three course homemade and healthy meals. The
hiccups of daily cooking get even more challenging for professionals and students, who are moving out of their
homes and residing in a different state and city. Making lives easier for the busy bees came in several food tech
startups with their apps that respond to your hunger growls, no-cooking and sick days.
The easiest and faster ways that all the food tech start-ups adopted to become household names are through
appealing offers, discounts, cash back, flexible payment modes and fastest deliveries. But which are the ones ,
which have made it big in the food tech industry? Her is the list of few of the top food techstartups that are
taking the Indian market by storm.
Swiggy
Average rating on app store:4.3
Zomato
Average rating on app store:4.3
Fresh menu
Average rating on app store:4.2
Box8
Average rating on app store:4.2
Faasos
Average rating on app store:4.1
Kerkar, Pramod (2018) in his article has explained about how food apps can be useful. According to him with a
lot of increasing health awareness all around, the latest approach is to remain fit, healthy and smart. While in
today's world, smart phones are used for almost everything, they can also be your lead when it comes to
maintaining your diet and nutrition. There are a host of nutrition apps, diet trackers, calories counters and many
such food apps that you can use for your benefit.
Most of these food apps can be easily downloaded and applied to your health regime. There are various
categories based on their use that range from being nutrition guide to exploring healthy recipe ideas.
Here are some of the ways in which foods apps can be made to work for your better nutrition, health and fitness.
Smart Shopping: There are food apps specifically designed to aid you in your shopping venture;
Healthy Eating: You may have planned a weight loss diet or may be simply maintaining your health; foods
apps are the best for all.
Exploring Recipes: When it comes to finding new or healthy recipes, food apps are a great resource;
Restaurant Eating: With the foods apps in your smart phones, you can smartly eat outside. When you are out
for restaurant eating; keep your food apps at hand.

International Journal of Advance and Innovative Research Volume 6, Issue 1 (XXIV): January - March, 2019
260
ISSN 2394 - 7780
OBJECTIVES
1. To study the customer behaviour towards use of app based food delivery services.
2. To study the effect of individual promotion techniques on the basis of customer behaviour.
3. To study the media used to communicate these promotional offers.
HYPOTHESIS
H01: There is no difference between gender and use of app based food delivery app.
H11: There is a difference between gender and use of app based food delivery app.
H02: There is no difference between family income and choice of promotional offers and Pocket money
H12: There is difference between family income and choice of promotional offers and Pocket money
H03: There is no difference between age and exposure to media used for promotion.
H13: There is difference between age and exposure to media used for promotion.
RESEARCH METHODOLOGY
Sr. No. Elements Methods
1. Population Students
2 Area of study Vashi
3 Sample size 87
4 Sampling method Non-Random/non-probability-Convenience sampling
5 Organisation tools Pie-charts, bar graphs, histogram, tables
6 Software used SPSS
7 Time of study 1 month-January-February,2019
8 Sampling tools Online questionnaire through google form
9 Test Chi square test to study difference between two nominal variables
10 Variables of hypothesis Independent- Gender, Age, Pocket money
Dependent Variables-Use of application, Choice of promotional
offers, exposure to media used
DATA ANALYSIS
Objective Verification
1. To study the customer behaviour towards use of app based food delivery services.
How many of the students have ordered food through food delivery application?
From the above piechart on the basis of our survey we found that majority of the students order food through
food delivery apps that is 86.3% .

International Journal of Advance and Innovative Research Volume 6, Issue 1 (XXIV): January - March, 2019
261
ISSN 2394 - 7780
Frequency of using food applications (Customer)
From the above count of frequency graph on the basis of our survey we found that the frequency of using the
food app by the students is occasionally and not on a regular basis.
The food applications which the students prefer the most.
From the above count of which app students prefer to use graph on the basis of our survey we found that the
food application which is used in majority by the students is swiggy > foodpanda > zomato > others.
Does the preferred application of food delivery charges any cost?
The above piechart shows that as per the gathered information only 29.5% of the food delivery applications
charges any delivery cost. It means majority of the food applications does not charge delivery charges and give
free delivery.

International Journal of Advance and Innovative Research Volume 6, Issue 1 (XXIV): January - March, 2019
262
ISSN 2394 - 7780
Packaging of the food according to students feedback
The data shows that the majority of students are satisfied with the packaging service given by the food delivery
applications.
2. To study the effect of individual promotion techniques on the basis of customer behaviour
The offers that attract students the most.
The above offers graphs shows that get ‘50% off on first order’ is the most popular offer that attracts the
students to use food delivery applications.
What encourages the students to buy food through the food app?
Discounts/offers
From the above bar we can find that all of the students say yes to discounts/offers i.e. they like to buy food
through these apps if it provides discounts and offers.

International Journal of Advance and Innovative Research Volume 6, Issue 1 (XXIV): January - March, 2019
263
ISSN 2394 - 7780
Ease to use app
From the above bar graph it can be identified that almost majority of the students are able to use the food
application easily.
Quick delivery
From the above piechart 84.6 % of the quick delivery service does not encourage them to use these apps i.e. it is
not the motivating factor.
Tracking
From the above piechart 84.6% of the students happy with the tracking services with the food delivery
application provide. Thus, they are encouraged to buy through these apps if it provide tracking services.

International Journal of Advance and Innovative Research Volume 6, Issue 1 (XXIV): January - March, 2019
264
ISSN 2394 - 7780
Good staff
From the above pie diagram 74.4% of the students say that the food delivery applications are providing good
staff which encourages the students to use the food applications.
So from all the above charts it is found that the discounts /offer encourage the students most towards the food
delivery applications. This allows them to use the application more and more.
3. To study the media used to communicate these promotional offers.
How did you get to know about promotional offers?
The above graph shows that majority of the student get promotional offers through notification and social media
as there is a very slight difference between the choice of two medium.
Ratings of students on the basis of their food app.
On the basis of the histogram by the survey on rate the experience on food applications, it was found that
students have given 4-5 rate majority. Which shows that the students are highy satisfied with the services of
such apps.

International Journal of Advance and Innovative Research Volume 6, Issue 1 (XXIV): January - March, 2019
265
ISSN 2394 - 7780
HYPOTHESIS TESTING
H01: There is no difference between gender and use of app based food delivery app.
H11: There is a difference between gender and use of app based food delivery app.
Preferred App * Gender Cross tabulation
Count
Gender
Total Female male
Preferred App
29 13 42
Swiggy 12 13 25
Zomato 3 3 6
Foodpanda 5 4 9
5 1 1 2
Total 50 34 84
Chi-Square Tests
Value df
Asymp. Sig.
(2-sided)
Pearson Chi-Square 3.319a 4 .506
Likelihood Ratio 3.337 4 .503
N of Valid Cases 84
a. 5 cells (50.0%) have expected count less than 5. The minimum expected count is .81.
Since significance level is not less than 0.05 we accept null hypothesis i.e the difference is not significant but
near significant. So we can say that different gender groups have different choice of food delivery apps.
H02: There is no difference between family income and choice of promotional offers and Pocket money
H12: There is difference between family income and choice of promotional offers and Pocket money
PocketMoneyPersonalIncome * Types Crosstabulation
Count
Types
Total use code
and get
upto Rs
.100 off
Get
50%off
on first
order
order 2
combo
meal and
get 20% off
Buy 1
Get 1
free
Discount
on next
offer
Cashback
Pocket Money / Personal
Income
500-
1000 4 8 4 8 1 6 31
1001-
2000 1 1 1 0 0 0 3
2001-
3000 0 0 0 0 1 0 1
>3000 2 1 1 1 0 0 5
Total 7 10 6 9 2 6 40
Chi-Square Tests
Value df Asymp. Sig. (2-sided)
Pearson Chi-Square 25.265a 15 .046
Likelihood Ratio 13.894 15 .534
N of Valid Cases 40
a. 21 cells (87.5%) have expected count less than 5. The minimum expected count is .05.
Since significance level is less than 0.05 we reject null hypothesis and accept alternate hypothesis. So we can
say the students getting different pocket money or personal income are attracted towards different type of
promotional offers as highlighted in cross tabulation table.
H03: There is no difference between age and exposure to media used for promotion.
H13: There is difference between age and exposure to media used for promotion.

International Journal of Advance and Innovative Research Volume 6, Issue 1 (XXIV): January - March, 2019
266
ISSN 2394 - 7780
Medium * Age Cross tabulation
Count Medium
Age
Total 15-17 18-20 21-23 >23
friend 0 7 2 4 13
Pamlets, Newspapers, TV, Radio 0 3 0 1 4
Social media 5 15 4 0 24
App agents / Restaurants 0 0 0 1 1
Total 5 25 6 6 42
Chi-Square Tests
Value df
Asump. Sig.
(-sided)
Pearson Chi-Square 16.798a 9 .052
Likelihood Ratio 19.722 9 .020
Linear-by-Linear Association 4.350 1 .037
N of Valid Cases 42
a. 14 cells (87.5%) have expected count less than 5. The minimum expected count is .12.
Since significance level is not less than 0.05 we accept null hypothesis the difference is not significant but near
significant. So we can say the choice is different but not significantly different as we can see through cross
tabulation.
RECOMMENDATION
Food apps like zomato, foodpanda, box8 should study the promotional techniques of swiggy which is
leading the race of food delivery application on the basis of customer satisfaction.
The companies of food delivery apps should promote their food apps more on social media as the new
generation spends most of the time on social networking sites.
They should set different notification tones for a particular new offer or discount, so that the customer will
be easily be able to get in touch which the current offers beforehand.
The company should work on the ease of using the preferred food application for the customer.
The company should use new techniques of promotion ,
For example: 1. By making zingles related to a particular offer.
2. Use sandwitchmen, etc
CONCLUSION
According to the research we found that the population (students) are more likely to use food delivery
applications rather than going out to restaurants or any food counters. They prefer the food delivery applications
as it saves their time and they can easily get the food have at whatever place they want with a click. The social
media has played a very important role to create awareness among students about these applications. So in
today’s fast and furious world where the technology has played different roles in different fields, it has also
influenced the food delivery services through the applications. So the study shows, promotion techniques of app
based food delivery are effective to promote such services among the population (students).
BIBLIOGRAPHY
C R Kothari, G. G. (2017). Research Methodology Methods & Techniques. New delhi: New Age
International (P) Ltd.
D'souza, V. (2019). Food tech startups are rising funds, but what about making some profits? Retrieved
February 2019, from Entrepreneur: https://www.entrepreneur.com/article/327648
kerkar, P. (2018). How food applications be useful?
Panneerselvam, R. (2011). Research Methodology. Sonipat: PHI learning pvt. ltd.
Roy, M. (2019). food apps that gained popularity and won big funding retrieved https://www.franchiseindia
.com/restaraunt/indian-food-apps-that gained-popularity-and-won big-funding.12554
Tandon, S. (2018). Popularirity of food delivery apps is making India's restaurants think differently.
Retrieved February 2019, from https://scroll.in/article/903509/the-popularity-of-indias-food-delivery-apps-
is-making-indias-restaurants-think-differently

International Journal of Advance and Innovative Research Volume 6, Issue 1 (XXIV): January - March, 2019
267
ISSN 2394 - 7780
TO STUDY THE AWARENESS OF THE INDIAN INVESTORS IN INDIAN CAPITAL MARKETS
WITH RESPECT TO MUMBAI
Amina Momin1 and Dr. Menon Sreedharan2
Research Scholar1 and Director2 and Research Guide, Mumbai University, Mumbai
ABSTRACT
The study deals with the various investment instruments available to the investor in Mumbai. Investment
planning is a well carved strategy to choose the most appropriate investment portfolio that will help the investor
to achieve their financial goals but within a particular period of time. There lies both the positive externalities
to investments which benefits the society and the investor as well. The Marginal social benefits of investments
are more than the Private Social benefits. The study focuses on the behavioral aspects of the investor when he is
exposed to various investment instruments
INTRODUCTION
Investopedia defines investment as an asset or item that is purchased with the hope that it will generate income
or will appreciate in the future. In an economic sense, an investment is the purchase of goods that are not
consumed today but are used in the future to create wealth.
The major reason for investments are the prospects of not having to work your entire life! Bottom line, there are
only two ways to make money either by working and/or by having your assets work for you.
Investments instruments vary from riskless to risky. One can invest in FDs PPF, stocks and bonds, Mutual
funds, derivatives, precious metals and commodities. Even real estate is regarded as one of the preferred
investment destination in the Capital
Where the objective is the same to make investments that will generate more cash for you in the future. The
research focuses on the savings and the saving instruments that an investor seeks and prefers for investments.
The study also looks into the motivational factors for investing. The investments in Mumbai are particularly
driven by the Tax exemption opportunities that the instrument provides.
The study directs to the riskiness of the financial instruments and the behavior of the investor which becomes
unpredictable and uncertain depending upon the knowledge and the influence of various determinants have on
the investor.
LITERATURE REVIEWS
There has to be strategy for investments. The principle of investments are simple and clear. The investment has
to be long term, proper allocation of funds, the investment basket should be well diversified, the risk return
profile has to be quantified. Moreover, an individual investor has to be aware of demographics, lifestyle and
investment psychology. The age income, educational qualification and the investor choice affected by his
overconfidence, reference group also has an effect on The knowledge of all investment decisions these aspects
is imperative for all progressive investors, researchers, financial consultants, academicians, students and the
marketer of the financial product.
(Dr. (Mrs.) Sushant Nagpal, 2007, Psychology of Investments and Investor's Preferences)
In this paper he discusses the basic of investment and need for investment. Investments have a lot spill over
benefits on the society. It helps the economy to grow and the mature and finally lead to modern capitalism. In
the long term, the current investment determines the economy's future capacity and, ultimately improves the
standard of living. By increasing personal wealth, investing can contribute to higher overall economic growth
and prosperity.
(Dr.A.P.Dash, Sr.Faculty, PMI, Basics Of investment)
The retail investor in India is witnessing a slow growth, bearish markets, low ROIs, scams and scandals fictious
accounting practices which deters him from making a bold investment decision The Capital markets in India are
driven by emotions rather than fundamental growth . These misleads the analysts. Improper flow of information
, untimely information’s are hurdles from the market being efficient .In spite of the Indian companies growing
with good fundamentals the improper flow of information deters the investor Moreover the retail investor is risk
averse, and the financial jargons make him week prompting him to take irrational decisions.
(Ms.M.Kothai Nayaki &Mrs.P.Prema, A Study on Indian Individual Investors' Behavior.)

International Journal of Advance and Innovative Research Volume 6, Issue 1 (XXIV): January - March, 2019
268
ISSN 2394 - 7780
Investments are the drivers for social wealth. Investors' behavior is characterized by over excitement and
overreaction in both rising and falling stock markets. Most of the investments and financial theories
(Steinbacher, 2008) are based on the idea that everyone takes careful account of all available information before
making investment decision. This research is conducted to analyse the factors influencing the behavior of
investors in capital market. Empirical evidence suggests that demographic factors influence the investors'
investment decisions. This research article also investigates how investor interprets and acts on various capital
market information to make informed investment decisions. (V. Shanmugasundaram and V. Balakrishnan,
2011, Investment decision-making - A Behavioral Approach)
RESEARCH METHODOLOGY
The research of Primary data collected from the respondents using questionnaire. This primary data helps to
understand the objectives of savings, different investment instruments preferred by the investor and the
motivational factors that influences the decisions of the investors. And so the study primarily becomes
Descriptive in nature
The secondary research derived from journals, magazines and other sources helps to study the different
financial instruments available to the investors
OBJECTIVES
1. To study the objective of savings.
2. To study the savings rate and the investment opportunities
3. To study correlation between age & Income
4. To study the preferred investment instruments by the retail investor
5. To study the motivational factors investors are motivated to invest in various financial instruments.
SAMPLE DESIGN
Sample Size: 100 respondents
Sample respondents: Mumbai City
Sample Design: Convenience Sampling
The questionnaire was directed to people convenient enough to respond.
DATA COLLECTION
Primary: data collected from 100 respondents using questionnaire
Secondary: data regarding investment avenues and instruments collected from Journals, books, newspaper
articles
Statistical Tool : Percentage analysis, Chi square Test and Co relation analysis
LIMITATION OF THE STUDY
The study is confined to the financial Capital of the country, Mumbai
The income and the attitude of the respondents may be biased due to the questionnaire
DATA ANALYSIS
The study shows that the major respondents fall into the age group of 25-35 around 55%, 25% into the age
group of 35-45 and 15% from 45-55 and only 5% above 55 years
The analysis results into the gender profile where the men are 65% and women respondents are 45%
The relation between Qualification and Investments is studied using correlation analysis. The study shows that
the education qualification of the investors where the major chunk around 70% are post graduates 25% rare
graduates and only 5% are undergraduates
The analysis showed that 58% of the respondents are salaried, 24% are self-employed 15% are retired and 3%
are others The analysis shows that the yearly income of 20% of the respondents is above 25 lakhs, 25% is from
15-25 lakhs 40% is from 5 to 15 lakhs 15% is below 5 lakhs
The research shows that 32% are in the beginning stage of investments i.e. no investment experiences 42% are
in moderate stage of investments (FDs, Mutual Funds, Public provident funds) 20% are comfortable in investing
in equities and only 6% are into advanced financial instruments like Commodities and derivatives

International Journal of Advance and Innovative Research Volume 6, Issue 1 (XXIV): January - March, 2019
269
ISSN 2394 - 7780
The study shows that 38% of the respondents are saving 0-10% of their monthly income, 33% of respondents
are saving 10-20% of their monthly income, 20% of the respondents are at 20-30% of their monthly income and
9% of the respondents are at 30% above of their monthly income.
The above analysis shows that 16% of respondents got the information of investment from newspaper and
banners, 28% of respondents got the information of investment from news channels and media analysis, 3% of
respondents got the information of investment from investment magazines, 24% of respondents got the
information of investment from investment advisors, 36% of respondents got the information of investment
from family & friends and only 3% conducts their own study before investing.
The study helps to assess the objectives of investing. The investor has more than one objective of investing and
are looking for considerable returns where the major objective is for tax exemption 87% of the investors invest
to save tax and that 28% of respondents invest their money for children’s education, 32% of respondents for
retirement, 48% of respondents for home purchase, 6% of respondents for children’s marriage & 6% for other
reasons
The investment destinations and instruments also play a major where the FDs and PPF are major destination
both giving riskless returns and tax exemptions. The moderately risky investor also looks upto mutual funds for
both returns and tax exemption properties
Unpredictable markets and Capital gain tax deters the investors from investing into capital markets

International Journal of Advance and Innovative Research Volume 6, Issue 1 (XXIV): January - March, 2019
270
ISSN 2394 - 7780
STUDY OF CONSUMER BUYING BEHAVIOUR AND IMPACT OF SALES PROMOTION IN
QUICK SERVICE RESTAURANTS IN NAVI MUMBAI CITY WSRT VASHI
Vinayak Parshuram Karande1 and Dr. Vinita K. Pimpale2
Assistant Professor1, Department of Commerce, ICLES’ Motilal Jhunjhunwala College, Vashi, Navi Mumbai
Associate Professor2, Department of Commerce, R. A. Podar College of Commerce & Economics, Matunga
ABSTRACT
Consumer buying behaviour has always been a matter of concern for marketers across all industry. Sales
promotion has somehow helped brands and companies to sustain and flourish in the competitive environment,
but not all sales promotion tools fetch similar results. In this study authors have attempted to analyse consumer
behaviour in Quick Service Restaurants on the basis of demographic variables vis-a-vis promotional tools used
for sales promotion in the said industry. This study is based on literature review, and has tested hypothesis
which paves the way for future research.
Keywords: Promotion, Buying behaviour, BOGO.
JEL Classification – M31
1. INTRODUCTION
Consumer buying behaviour; as compared to other field of studies is relatively new topic. Consumer behaviour
is a part of marketing which gained momentum after the industrial revolution. It started with Production era,
sales era and till holistic marketing era. (CLUB, 2016). Consumer is the final user of any product. It involves
study of what, why, when, from where and from whom, how much and how often does the consumer purchases
a product (Jain, 2013). Consumers’ behaviour diverges from categories of products, whether goods or service,
Low contact and high contact products, luxury products, daily use products etc. It also varies on the basis of
factors like gender, education, income, age, religion etc. “Consumerism” is the new term that has emerged in
recent times considering rising importance of consumers. (Mohammad A. Ashraf1 and Sharmin Akhter2, 2014).
Consumer buying behaviour has direct impact on productivity therefore the marketing mix used by them must
satisfy customers. Whereas all the promotion tools directly or indirectly push customer to “BUY”, sales
promotion thrusts on “BUY NOW”. Sales promotion provides motivation to customers or to channel partners to
fuel response for a product. Sales Promotion is an instrument that is used by the sellers & marketers to offer
consumers to buy now & buy more. The effect of SP can be seen in the form of increased quantity and
frequency of purchase by existing customers & adding new customers to the list (Aurangzeb Mughal, 2014).
Sales promotion can be classified into two types 1) Consumer sales promotion and 2) Intermediaries,
Distributors, Sales person etc. As this research focuses on Sales promotion for consumers, following are the
sales promotion tools available with marketers.
1. Money off coupons.
2. Competition / contest.
3. Discount offers.
4. Free gifts.
5. Point of sale materials.
6. Merchandising.
7. Samples.
8. Easy finance options / EMI’s.
9. BOGOF (Buy one get one free).
10. LTO (Limited time offers).
11. Freebies / Quantity deals.
12. In-product promotion.
13. Out-product promotion.
14. Loyalty cards etc.
15. Collectibles

International Journal of Advance and Innovative Research Volume 6, Issue 1 (XXIV): January - March, 2019
271
ISSN 2394 - 7780
The quick service restaurant industry is aimed at providing fast and convenient eating experiences at a
comparatively low price. Quick Service Restaurant also known as (aka) fast food restaurant is witnessing
substantial growth in the Global restaurant industry. It is one of the very rapidly developing types of food
consumption (Verma, 2008). It now contributes to partial income of all restaurants revenue in advanced
economies; however faster growth is taking place in developing economies where there is drastical change in
eating habits of people. They prefer QSR’s for its affordability, convenience, ease of procuring and the manner
in which it is promoted. The entry of international fast food chain restaurants has set the new rules of game in
terms of menu and overall marketing strategy for Indian & International, organised & unorganised sellers. Many
other factors like increased woman employment, people staying alone etc. are also influential in rapid growth of
QSR’s. Increased sale of ready cooked food is one of the effects of urban development (Tabassum,
December2012 ). Food provided by QSR’s is from a limited menu; prepared in advance in large quantities;
served hot; always available to eat in or as a take away (MinalKashyap1, 2013) QSR is such a sector that has
managed to keep its consistency even during economic slowdowns or demonetization. The consumption of fast
food in QSR’s is not limited to any age group, everyone from school kids to senior people are customers to
QSR’s. QSR’s have slowly become way of life and a status symbol and it is here to stay.
2. LITERATURE SURVEY
Certain research papers are reviewed for the purpose of this paper which involves studies on Consumer buying
behaviour and Sales Promotion in some parts of the country and world. The study done on effect of sales
promotion on consumer buying behaviour in Pakistan discovered that there was an insignificant relationship
between coupons and buying behaviour. On the other hand the buy-one-get-one free, Physical surrounding has a
significant relationship with the buying behaviour. (Aurangzeb Mughal, 2014) In another study it was seen that
sales promotion is used to influence consumer’s buying decision for white goods like refrigerator. Sales
promotion provides competitive advantage to companies over their competitors to increase sales. Data was
analysed using multiple regression technique and results showed that offer, premium and contest are most
influential in influencing consumer buying decision. (Manoj2). In one more study conducted in Gujarat on
FMCG sector highlighted that impact of sales promotion strategies is less significant on sales, number of
customers, overall profitability and business performance in FMCG sector. (Sindhu) In another study to assess
the impact of sales promotion tools like coupons, sample, price discount and buy one get one free on consumer
buying behaviour in the light of brand switching and consumer loyalty. (Shamout)
3. OBJECTIVES OF STUDY
To study buying behaviour of residents in Navi Mumbai towards quick service restaurants.
To assess the impact of sales promotion on consumer buying behaviour in quick service restaurant industry.
4. HYPOTHESIS OF STUDY
H01 - There is no difference between Male & Female frequency of visit to Quick Service Restaurant.
H11 - There is a difference between Male & Female frequency of visit to Quick Service Restaurant.
H02 - There is no difference between Male & Female frequency of ordering food at home from Quick Service
Restaurant.
H12 - There is a difference between Male & Female frequency of ordering food at home from Quick Service
Restaurant.
H03 - There is no relation between Promotion activity availed and frequency of visit to Quick Service
Restaurant.
H13 - There is a relation between Promotion activity availed and frequency of visit to Quick Service Restaurant.
5. SIGNIFICANCE OF THE STUDY
The purpose of this paper is to inspect the influence of various sales promotion tools such as: coupons, sample,
price discount and buy one get one free on consumer buying behaviour. This study will be significant in
deciding & selecting the right promotional tools for products and services offered by the quick service
restaurants operators in Navi Mumbai. This study would also be important to companies in the service industry
to determine the numerous issues that impact the consumer’s buying choices, to empower them fine-tune their
strategies. It will also benefit the organizations to accurately employ their resources, increase their profitability
and growth.

International Journal of Advance and Innovative Research Volume 6, Issue 1 (XXIV): January - March, 2019
272
ISSN 2394 - 7780
6. RESEARCH METHODOLOGY
6.1 Variables
Gender.
Frequency of visit to QSR.
Frequency of ordering food as home delivery from QSR.
Promotional activity availed.
6.2 Population Customers who visit Quick Service Restaurants.
6.3 Sampling size 60 Customers
6.4 Sampling method Non-Probability sampling
6.5 Organisation tools Pie charts & Bar diagram
6.6 Tests applied Mann-Whitney U-test & Chi-square test
6.7 Area of study Vashi, Navi Mumbai, Thane, Maharashtra, India.
6.8 Sampling tool Questionnaire
7. ANALYSIS & INTERPRETATION H01 - There is no difference between Male & Female frequency of visit to Quick Service Restaurant.
H11 - There is a difference between Male & Female frequency of visit to Quick Service Restaurant.
Test Statisticsa
Frequency of visit to QSR
Mann-Whitney U 315.000
Wilcoxon W 1095.000
Z -1.604
Asymp. Sig. (2-tailed) .109
Because significance level is greater than 0.05 and mean ranks are close there is no difference between Male &
Female & their frequency of visit to QSR. We are rejecting the alternate hypothesis and accepting null
H02 - There is no difference between Male & Female frequency of ordering food at home from Quick Service
Restaurant.
H12 - There is a difference between Male & Female frequency of ordering food at home from Quick Service
Restaurant.
Test Statisticsa
Frequency of ordering food as home delivery
Mann-Whitney U 390.000
Wilcoxon W 621.000
Z -.313
Asymp. Sig. (2-tailed) .754
Because significance level is greater than 0.05 and mean ranks are close there is no difference between Male &
Female & their frequency of ordering food at home. We are rejecting the alternate hypothesis and accepting
null.
H03 - There is no relation between Promotional activity availed (BOGO, LTO, Discount, Rewards) and
frequency of visit to Quick Service Restaurant.
H13 - There is a relation between Promotional activity availed (BOGO, LTO, Discount, Rewards) and
frequency of visit to Quick Service Restaurant.
BOGO LTO Discount Rewards
Chi-square value (promotional tool) 22.800b 14.000b 12.000b 17.333b
Chi-square (frequency of visit) 48.833a 48.833a 48.833a 48.833a
df (frequency of visit) 4 4 4 4
df (promotional tool) 3 3 3 3
Significance (frequency of visit) .000 .000 .000 .000
Significance (promotional tool) .000 .003 .007 .001
We are accepting the alternate hypothesis and rejecting the null.

International Journal of Advance and Innovative Research Volume 6, Issue 1 (XXIV): January - March, 2019
273
ISSN 2394 - 7780
8. CONCLUSION As the research study reveals that the data collected has more number of female respondents but after doing
detailed data analysis in statistical software it was found that there is there is no difference between frequencies
of Male & Female gender in visiting personally to the Quick Service Restaurants or even ordering as home
delivery. There is a relation between the promotional activities used by the QSR’s and their frequency of visit to
QSR’s. As per the Chi-square values there is strong relation between promotion offers like BOGO (Buy One
Get One free) followed by LTO (Limited Time offer), Discounts & Rewards. Hence, it can be recommended
that QSR companies can work out to plan more sales promotion activities like BOGO and related.
WORKS CITED
Aurangzeb Mughal, A. M. (2014). The Impact of Promotional Tools on Consumer Buying Behavior: A
Study from Pakistan. Journal of Public Administration and Governance, 402-414.
CLUB, T. M. (2016, OCTOBER 25). http://www.trianglemarketingclub.com. Retrieved NOVEMBER 11,
2018, from http://www.trianglemarketingclub.com/the-evolution-of-marketing/:
http://www.trianglemarketingclub.com/the-evolution-of-marketing/
Darko, E. (n.d.). THE INFLUENCE OF SALES PROMOTION ON CONSUMER BUYING BEHAVIOUR
IN THE TELECOM INDUSTRY; THE CASE OF VODAFONE GHANA.
Jain, N. (2013). Consumer buying behaviour with regard to branded and traditional jewellery with special
reference to Jaipur jewellery market. In N. Jain, Consumer buying behaviour with regard to branded and
traditional jewellery with special reference to Jaipur jewellery market (pp. 1-62). Jaipur: Shodhganga.
Manoj2, S. N. (n.d.). Impact of Sales Promotion Tools on Consumer’s Purchase Decision towards White
Good (Refrigerator) at Durg and Bhilai Region of CG, India. Research Journal of Management Sciences.
MinalKashyap1, K. D. (2013). A Study of Growth of Fast Food Industry with Reference to Shift in
Consumer’s Buying Habits in Nagpur City. International Journal of Application or Innovation in
Engineering & Management (IJAIEM).
Mohammad A. Ashraf1 and Sharmin Akhter2, S. I. (2014). Consumer Behavior in Fast Food Marketing in
Bangladesh. IISTE, 34-44.
Shamout, M. D. (n.d.). The Impact of Promotional Tools on Consumer Buying Behavior in Retail Market.
International Journal of Business and Social Science.
Sindhu, A. (n.d.). Sales Promotion Strategy of Selected Companies of FMCG Sector in Gujarat Region.
Synopsis.
Tabassum, R. (December2012 ). A Study On Factors Governing Consumers Choice Of Fast Food –A
Multivariate Approach. Journal of Marketing & Communication, 25-31 Vol. 8 Issue 2.
Verma, P. T. (2008). Consumer Perception About Fast Food in India: An Empirical Study of Dehradun City.
The Icfai University Press, 80-91.

International Journal of Advance and Innovative Research Volume 6, Issue 1 (XXIV): January - March, 2019
274
ISSN 2394 - 7780
IMPACT OF E-COMMERCE SITES ON CONSUMER BUYING BEHAVIOR
Maulik R Shah
Assistant Professor & Research Scholar, Oakbrook Business School
ABSTRACT
The development of the web, revolutionized the thought of the conventional way of shopping. A buyer is not
concerned about the timings or particular location of the stores; buyer can be active at essentially all the time
and can buy anything from anywhere. The impact of electronic commerce (e-commerce) on obtainment,
shopping, trade collaboration and client services as well as on conveyance of different services is so emotional
that nearly exaction is influenced. As the online shopping is getting worthiness, it would be critical to know the
shopper behavior towards the electronic commerce particularly online shopping. In this report, the recognition
of the shopper with respect to the Online Shopping, the level of fulfillment of respondents who are utilizing
Online Shopping is studied are distinguished employing a little study. The ponder conclude that Online
advertising is fair starting to root itself within the trade world of INDIA since of which not all the products are
accessible. Indeed popular brands put as it were specific things online and thus there are fewer choices
accessible on the web. Since it’s a unused concept individuals are still not completely utilized to it since of
which they feel awkward shopping online. They feel that the item would be altered with and the quality wouldn’t
be the same. India may be a creating country where major chunk of its population live in provincial ranges and
thus don't have had to the web. By this a major parcel of the target advertises is misplaced. Individuals in India
lean toward progressing to the shopping centers and looking, touching different things some time recently
obtaining them. They are not very willing to provide upon shopping physically so indeed in the event that they
have get to the web.
Keywords: Consumer Behavior, E-commerce, online selling, online shopping.
1.1 INTRODUCTION
The development of the web has changed the thought of the conventional way of shopping. A buyer is now not
bound to opening times or particular areas of the retail outlets; he can end up dynamic at essentially any time
and put and can buy items and services. The web gives a medium for communication and data exchange and the
number of web users is expanding driving to the development of the online shopping trend. E-commerce is
broadly considered as the buying and offering of items over the internet, but any exchange that's completed
exclusively through electronic measures can be considered as ecommerce. E-commerce is subdivided into three
categories: business to business or B2B (Cisco), business to customer or B2C (Amazon), and consumer to
customer or C2C (eBay) conjointly called electronic commerce. E-commerce is targeting the mass at time and
is giving ultimate options to buyers which none other media can give. Few features make it more helpful for
shopping, just like the capacity to see and buy the items any time, visualize their needs with the items, and
examine items with other shoppers. Most of users tend to buy online because of its buying ease. Previously, the
cost factor was considered but now ease of buying has replaced it. Now-a-days the most trending concept is of
mobile commerce or M-commerce because of its utilities and cost benefits and recognizes that the exchanges
may be conducted utilizing mobile phones, individual artificial assistants and other handheld gadgets that have
Web access.
“There’s no question that mobile commerce is developing at a quick clip,” said e Advertiser foremost analyst
Jeffrey Grau, creator of an imminent report on mobile buying. “And mobile acts as a motor of by and large e-
commerce development, by changing over potential brick-and-mortar deals to digital deals as shoppers utilize
their Smartphone’s whereas shopping in-store.” Presently, in order to have an effect on the buyers and being
able to hold them in such a competitive and effortlessly open market, the primary step is to recognize the
viewpoints that impact the clients while purchasing online. The issue here is that there are millions of
individuals online at any time and almost each of them may be a potential client for a company that provides
online retailing. And presently with the added ease and other benefits of m-commerce, that's curious about
offering its items online will need to constantly look for distinctive ways in which it can offer its services to the
buyers.
1.2 E-COMMERCE
Electronic commerce (e-commerce) is buying and selling utilizing an electronic medium. It is accepting credit
and payments over the net, doing banking exchanges utilizing the Web, selling commodities or data utilizing
the World Wide Web and so on. Turban et al. characterize e-commerce as the method of buying, offering,
exchanging, or trading items, services, and/or data through computer systems, counting the Web. A few

International Journal of Advance and Innovative Research Volume 6, Issue 1 (XXIV): January - March, 2019
275
ISSN 2394 - 7780
analysts see e-commerce in terms of Web applications, such as the intranet, extranet, site, and mail. Others see
e-commerce as a combination of trade forms and Web advances such as intuitive with clients and suppliers.
Indeed in spite of the fact that there's no agreement on the definition of e-commerce, there's common
understanding among analysts that the most components of e-commerce incorporate: site, e-mail, intranet,
extranet, LAN and remote zone arrange (Faded). We have embraced the over definitions and portrayals of e-
commerce.
1.3 IMPACT OF INTERNET ON CONSUMER BEHAVIOR
The impacts on shopper behavior are regularly made between outside and inside components. Outside
components are come from the natural conditions; inner variables are ordinarily from the consumer’s intellect.
There are numerous variables may impact consumer’s behaviors. Agreeing to Warner, the outside impacts
might separate into five segments: Socioeconomics, socio-economics, innovation and open approach; culture;
sub-culture; reference bunches; and promoting. The inner impacts are an assortment of mental forms, which
incorporate states of mind, learning, recognition, inspiration, self image, and semiotics (Malcolm). In expansion
to these, (N., 1983)also proposed that the customers have two sorts of thought processes while shopping, which
is utilitarian and non-functional. The utilitarian thought processes are generally about the time, shopping place
and consumer’s needs, which may well be like one-stop shopping to save time, the nature of shopping put such
as free parking place, lower fetched of items and accessible to select from broadly run of items. The non-
functional thought processes are more related to culture or social values, such as the brand title of the store. The
conventional shopping is essentially about the client to buy their needs. This behavior will be impacted by the
seller’s publicizing and promotion which draws in clients goes there and buys products, a short time later a
portion of modern items will be taken home and be utilized.
1.3.1. Internet Shopping Web shopping and conventional shopping are sharing numerous similitude’s, at the same time, it still exists a
few contrasts between them, such as the Web shopping may give comfort and intuitively services, and the
conventional shopping might allow clients more comfortable shopping environment and great quality of items
(Lee K. and Chung N., 2000). Both viewpoints of shopping centers are attempting to progress their services by
learning commutatively from each other, such as conventional shopping centers give more parking spaces,
more counters, and closer to private region in arranges to progress services in comfort; Web shopping centers
receive virtual reality and 3D methods to move forward the introduction of items.
Within the following areas, the study would give the nature of web shopping at, to begin with, at that point the
E-commerce web location will be demonstrated to comprehend the substance of web shopping, after that,
online security, protection, and belief will be talked about. All of these common outlines and talks
approximately the web shopping will give a foundation to the think about and offer assistance to building the
establishment of scholarly inquires about.
1.3.2. Convenience
Most of the clients and analyst found that web gives the most ease of buying online (Wolhandler, 1999). Due to
the inclusion of Web, it permits the client to shop online anytime and anyplace, which implies clients can
browse and shop online 24-hours a day, 7 days a week from home or office, which pulls in a few time-starved
customers come to Web for save time to looking items in. Also, the Web offers a few great ways to save cash
and time. For case, customers don't require go out to the physical store and thus there's no transportation
fetched. Compare with the conventional shopping, there's no waiting line for customers on the Web, and a few
customers reported that they feel pressure from the deals individuals now and then, but Web offers them more
pleasant while shopping online.
1.3.3 Technology The comfort based on Web is primarily agreeing to the innovation improvement, and which plays a key part
amid the advancement of Web shopping. Within the final decade, organizations have realized that the unused
innovation seems to affect on Web shopping profoundly, and in this way, there are numerous imperative
innovations like virtual reality and 3D procedures have embraced to pick up enormous competitive preferences
(Clark, 1989). Information technology has utilized within the frame of the Web moved forward way better
quality of item data, which offer assistance shopper’s choice making (White, 1997). Through the wide extent of
studies almost the Web utilize, the development of Web and the rate of growth of Web utilization have been
fast expanded within the final decade. Concurring to the BMRB Worldwide (2004) and GVU’s WWW 9th
Client Studies (1998), the number of Web clients in Awesome Britain has expanded to 22.7 million among
48.4% of the grown-up populace and around 53% of web clients have detailed that shopping may be a essential
utilize of the Internet. Additionally, a factual report on the Web Improvement in China from CNNIC (China

International Journal of Advance and Innovative Research Volume 6, Issue 1 (XXIV): January - March, 2019
276
ISSN 2394 - 7780
Internet Network Data Middle) have released in July 2006. From this report, within the viewpoint of Web
shopping, there are 30 million users often shopping online, and close 1/4 Web clients have online shopping
encounter. Both studies appears that increasingly Web clients lean toward online payment while they shopping,
in this way the security of online payment certainly will become a noteworthy figure to impact the Web
shopping (Universal, 2004).
1.4. CONSUMER TRUST IN INTERNET SHOPPING
Individuals buy items and administrations are the foremost based on their level of belief in this item or
services, and vendors either within the physical store or online shops. Online believe is the fundamental and
basic component for building a relationship with clients. Present research appears that online belief is lower
level than the face-to-face intuitive within the physical store, and the result appears that dependability of Web
shipper (seen judgment, seen competence, and seen security control) and outside environment (third-party
acknowledgment and lawful system) have an impressive effect on customer belief in Web shopping. The
dependability of E-commerce web location is exceptionally depending on how much security can be given.
For example, an exceedingly specialized competence can be a figure to impact the dependability. As said over
that the net dealer can give third-party confirmation to E-commerce web location, and whereas this protection
and security strategies are used, customers will think their E-commerce transactions through Internet are
secure and thus the site is more reliable to them. Beside this point, if the Ecommerce web site can provide the
information about their customer services, location of the office, contact telephone number, and a help button
on the web site, customers could also increase their trustiness as they can feel that the online retailers is truly
exist.
2. LITERATURE REVIEW
The Internet is a part of the day-to-day life of the majority of the world, and within this environment, a new
form of communication has gained importance in recent years; Social networking sites. It is one of the most
effective and significant business development tools in the 21st century because of its ability to connect
individuals with others (Vinod S. chandwani & Dr. Shradha Bhome, 2004). Technology gives consumer the
power to investigate products to label them and criticize them in equal measure, and more. Therefore many
companies today have pages on social networks to complement the information held about products, held by
the feedback of consumers about products and tend to relate more to a company after reading various reviews
(Elisabeth Ioanas & Inova Stoica, 2014)
On an everyday premise in present-day, 100,000 tweets are sent, 684,478 pieces of substance are shared on
Facebook, 2 million search questions are made on Google, 48 hours of video are transferred to YouTube, 3,600
photographs are shared on Instagram, and 571 websites are made (James 2012). Social media presented an
unused, complex and wild component in buyer behavior displaying an unused challenge both to the scholarly
community and the marketers (Atlaf, 2014). It is evident that now day, social media components are popular
like Facebook and Twitter have got an attention to consumer markets. The results form collected data indicate
that the social media has a significant impact on consumption behavior in Pakistan (Madni, 2014). Social media
allows customers and prospects to communicate directly to your brand representative or about your brand with
their friends. However, the obvious question is: who are the people interacting online and how engaged are they
in online activities? (Simona Vinerean, Luliana Cetina, Luigi Dumitrescu & Mihai Tichinedelean, 2013). Social
Media have given plenty of opportunities to consumers in adapting different aspects in life. Facebook, Twitter
and Instagram have played significant roles in expanding consumers' online purchases (Elham Al-Mukhaini,
Israa Al-Dhuhli & Sara Ismael, 2013). As the usage o f the social media has become more popular, these tools
are perceived as a source by consumers to search information about the products during their buying decision
process (Ozer, 2012).
The growth of online social networks around the world has created a new place of interaction and
communication among people. Individuals can share their knowledge, opinions, and experiences with one other
due to the online social networks provided features and may have an impact on people’s behavior in terms of
communication and purchasing (Ayda Darban, & Wei Li, 2012). The larger part of the populace nowadays may
be a client of online shopping, and after the development of e-commerce, presently M-commerce is coming into
the spotlight. Different ponders appear that m-commerce has numerous points of interest that make the
consumers prefer m-commerce over e-commerce. Information mining could be a semi-automatic disclosure of
designs, affiliations, changes, inconsistencies and factually noteworthy structures and occasions in information
(Pahwa, 2015). As per the study results indicate that social media tools create a statistically significant
difference on purchasing behaviors of consumers according to age groups and educational status of them
(Ankara, 2013). A sample of social media users who are familiar with these online ads were drawn from a

International Journal of Advance and Innovative Research Volume 6, Issue 1 (XXIV): January - March, 2019
277
ISSN 2394 - 7780
public university in Ghana. The findings reveal that social media users perceive online ads, especially pop-up
ads as intrusive and ineffective. Also the study establishes that pop-up ads have little impact on the purchase
behavior of social media users since a negative attitude has been formed towards pop-up ads. Based on the
findings of the study, it is recommended, among other things, that advertisers should design pop-up ads that are
user friendly and less intrusive (Le Wang, Lei Xu, Flora Ampiah, Xiaoshu Wang, 2014)
3. OBJECTIVES
To study the customer perception regarding the buying Products Online.
To study the satisfaction level of the users who are into Online Shopping.
4. RESEARCH METHODOLOGY
This research is descriptive type of research. We require both primary as well as secondary data for the analysis.
Primary data is collected with the help of online questionnaire. Secondary data is collected from various e-
sources as well as from various journals and digital marketing books. We have targeted the people of Kutch,
Gujarat to study the impact on Online buying behavior. We have used convenience sampling method to reach
150 respondents from the targeted population. And we used SPSS as statistical tool to analyze the data
collected.
HYPOTHESIS
1. H0: There is no significant association between which E-Commerce site attract the most and its
trustworthiness.
H1: There is significant association between which E-Commerce site attract the most and its
trustworthiness.
2. H0: There is no significant association between which E-Commerce site attract the most and its Quality
H1: There is significant association between which E-Commerce site attract the most and its Quality
3. H0: There is no significant association between which E-Commerce site attract the most and its Price
H1: There is significant association between which E-Commerce site attract the most and it’s Price
5. FINDINGS AND RESULTS
Questionnaire was prepared for conducting surveys and a sample size of 150 respondents were taken. The Data
interpretation is done below:
SPSS TEST
1. H0: There is no significant association between which E-Commerce site attract the most and its
trustworthiness.
H1: There is significant association between which E-Commerce site attract the most and its trustworthiness.
Which E - Commerce site attract you most? * Are E - Commerce sites trustworthy? Cross tabulation
Count
Are E - Commerce sites trustworthy?
Total Yes No
Which E - Commerce site
attract you most?
Flipkart 58 0 58
Amazon 85 1 86
Snapdeal 5 0 5
Shop Clues 0 1 1
Total 148 2 150
Symmetric Measures
Case Processing Summary
Cases
Valid Missing Total
N Percent N Percent N Percent
Which E - Commerce site attract you
most? * Are E - Commerce sites
trustworthy?
150 100.0% 0 .0% 150 100.0%

International Journal of Advance and Innovative Research Volume 6, Issue 1 (XXIV): January - March, 2019
278
ISSN 2394 - 7780
Value Approx. Sig.
Nominal by
Nominal
Phi .706 .000
Cramer's V .706 .000
N of Valid Cases 150
Interpretation: Reject the Null hypothesis.
The Value of Cramer V is 0.000, the relationship is strong.
This means there is strong relationship between E-Commerce site attract the most and its trustworthiness.
As Cramer V value is less than significance value 0.05, null hypothesis will be rejected
2. H0: There is no significant association between which E-Commerce site attract the most and its Quality
H1: There is significant association between which E-Commerce site attract the most and its Quality
Case Processing Summary
Cases
Valid Missing Total
N Percent N Percent N Percent
Which E - Commerce site attract you
most? * Does E - Commerce sites satisfy
you by their quality?
150 100.0% 0 .0% 150 100.0%
Which E - Commerce site attract you most? * Does E - Commerce sites satisfy you by their quality?
Cross tabulation
Count
Does E - Commerce sites satisfy you by their quality?
Total Yes No May Be
Which E - Commerce site
attract you most?
Flipkart 36 5 17 58
Amazon 59 9 18 86
Snapdeal 3 0 2 5
Shop Clues 0 0 1 1
Total 98 14 38 150
Symmetric Measures
Value Approx. Sig.
Nominal by Nominal Phi .187 .510
Cramer's V .132 .510
N of Valid Cases 150
Interpretation: Accept the Null hypothesis.
The Value of Cramer V is 0.51, the relationship is weak.
This means there is weak relationship between which E-Commerce site attract the most and it’s Quality
As Cramer V value is more than significance value 0.05, null hypothesis will be accepted
3. H0: There is no significant association between which E-Commerce site attract the most and its Price
H1: There is significant association between which E-Commerce site attract the most and it’s Price
Case Processing Summary
Cases
Valid Missing Total
N Percent N Percent N Percent
Which E - Commerce site attract you
most? * Does E - Commerce sites satisfy
you by their price?
150 100.0% 0 .0% 150 100.0%

International Journal of Advance and Innovative Research Volume 6, Issue 1 (XXIV): January - March, 2019
279
ISSN 2394 - 7780
Symmetric Measures
Value Approx. Sig.
Nominal by Nominal Phi .223 .280
Cramer's V .158 .280
N of Valid Cases 150
Interpretation: Accept the Null hypothesis.
The Value of Cramer V is 0.280, the relationship is weak.
This means there is weak relationship between which E-Commerce site attract the most and it’s Price
As Cramer V value is more than significance value 0.05, null hypothesis will be accepted
6. CONCLUSION
It is found that since online promoting may be an unused concept it'll take time for individuals to believe these
sorts of shopping exercises. At present individuals feel that there are major security concerns in online
exchanges and don't feel comfortable doing the shopping online. They feel that there are tall dangers of
extortion and hoax in online commerce. Online promoting is fair starting to root itself within the trade world of
INDIA since of which not all the items are accessible. Indeed popular brands put as it were particular things
online and thus there are less choices accessible on the web. Since it’s a unused concept individuals are still not
completely utilized to it since of which they feel awkward shopping online. They feel that the item would be
altered with and the quality wouldn’t be the same. India may be a creating nation where major chunk of its
populace live in country regions and subsequently don't have got to the web. By this a major parcel of the target
advertises is misplaced. Individuals in India favor reaching to the shopping centers and looking, touching
different things before acquiring them. They are not very willing to give up on shopping physically so indeed in
the event that they have access to the web.
REFERENCES
Ankara, G. U. (2013). A Study on teh effects of social media on young consumers' buying behaviors.
Atlaf, N. (2014). Impact of Social Media on Consumers Buying Decisions.
Ayda Darban, & Wei Li. (2012). The Impact of online social networks on consumers purchase decision.
Elham Al-Mukhaini, Israa Al-Dhuhli & Sara Ismael. (2013). Sultan Qaboos University College of
Economics & Political Science.
Elisabeth Ioanas & Inova Stoica. (2014). Social Media and Its Impact on Conusmer Behavior.
International, B. (2004). BMRB International. London: Hadley /house.
Le Wang, Lei Xu, Flora Ampiah, Xiaoshu Wang. (2014). The Influenc of Pop-up Advertising on Consumer
Purchasing Behavior.
Lee K. and Chung N. (2000). Effects of virtual reality-driven shopping mall and consumer's purchase
intention. Korean Management Review, 377-405.
Madni, G. R. (2014). Consumer's Behavior and Effectiveness of Social Media.
Which E - Commerce site attract you most? * Does E - Commerce sites satisfy you by their price? Cross
tabulation
Count
Does E - Commerce sites satisfy you by their
price?
Total Yes No May Be
Which E - Commerce site
attract you most?
Flipkart 43 1 14 58
Amazon 65 5 16 86
Snapdeal 5 0 0 5
Shop Clues 0 0 1 1
Total 113 6 31 150

International Journal of Advance and Innovative Research Volume 6, Issue 1 (XXIV): January - March, 2019
280
ISSN 2394 - 7780
N., S. J. (1983). An integrative theory of patronage preference and behaviour. Patronage behavior and retail
managemetn, 9-28.
Ozer, S. (2012). Comsumer buying decision making in new era. Ireland: National College of Ireland .
Pahwa, B. (2015). Data mining and consumer buying behavior. International conference on technologies for
sustainability - Engineering, Information Technology, Managemetn and Environment.
Simona Vinerean, Luliana Cetina, Luigi Dumitrescu & Mihai Tichinedelean. (2013). Social media
marketing. International Journal of Business and Management.
Vinod S. chandwani & Dr. Shradha Bhome. (2004). A study on impact of social networks on consumer
behavior.

International Journal of Advance and Innovative Research Volume 6, Issue 1 (XXIV): January - March, 2019
281
ISSN 2394 - 7780
ADOPTION OF E-WALLETS (INNOVATIVE MODE OF PAYMENTS) AMONGST POST
GRADUATION STUDENTS IN NAVI MUMBAI
Prof. Amrita S. Thakkar
Assistant Professor, MGM IMSR
ABSTRACT Governments Initiative for making Digital India coupled with Demonetization has transformed India into a
cashless economy. Online transactions become popular then. Amongst the various online payment modes like
payment through net banking, Debit cards, credit cards etc, E-Wallets started gaining popularity. But in India,
accepting digitalization where money is involved it is difficult to fasten the pace of innovation diffusion such as
E-Wallets (Kunal Taheam, 2016). E-wallets have shown a very high acceptance level among the urban youth
who have bank accounts with around 89% of the people surveyed saying that they use mobile wallets of some
form or the other and only 8% of the consumers saying that they use bank-led wallet applications in a YouGov-
Bernstein Proprietary Survey. This generates research interest to study the alacrity of youths to use E-Wallets
and factors influencing the adoption of E-Wallets including the factors discouraging the usage of it in amongst
the post graduation students residing in Navi Mumbai
Keywords: Mobile wallets, Mode of payment, Digitalization, Online Transactions
INTRODUCTION
Penetration of smart phones has increased tremendously in India with increasing accessibility of internet. Other
than basic function of communication, Smart phones are used for plenty of services a smart phone provides.
These services includes entertainment (music, movies, games etc.), socialization (social networking applications
like facebook, twitter, instagram and instant messaging services like whatsapp, messenger), internet access
services and even payment services. For using payment services on smart phones, an application for the same is
required to be installed in it. This application is called the digital wallet or electronic wallet or mobile wallet. Its
functions of keeping and paying the currency are same as of traditional leather wallet with the only difference of
performing the same digitally and more number of parties directly or indirectly involved in performing the same
on digital platform. For using E-Wallets service customer needs to register him with that E-Wallets and preload
a certain amount of money in it which can be used for shopping, recharge, utility bill payments etc. Obviously it
does not depend only on the smart phone and E-Wallets installed in it. The entire process of sending and
receiving money requires a complex network of intermediaries including banks, payment gateways and mobile
network operators. As per the “Master Circular-Policy Guidelines of Issuance and Operation of Prepaid
Payment Instruments in India” published on RBI website E-wallets are one of the prepaid payment instruments
other being smart cards, magnetic stripe cards etc. There are three types of E- Wallets -
Closed wallet – A closed wallet is a wallet that will allow you to make purchase exclusively at specific
company or retailer. These type of wallet is offered by Flipkart, Jabong ola money etc.
Semi Closed wallets- A semi-closed wallet allows you to make purchase and payments at multiple places. Such
type of wallets is part of payment instruments which can be used for purchasing goods and services only from
selected merchants. Cash withdrawal or redemption cannot be performed using semi closed wallets. All these
wallets are approved by RBI. Examples are-Paytm wallet, PayU Money, Mobiquick
Open wallets- Open wallets are part of Open System Payment Instruments and can be used for purchasing
goods and services including financial services and also allow customers to withdraw cash at ATMs/BCs. Such
type of wallets can only be jointly launched with a bank. M-pesa by Vodafone is an example of such type of
wallets. SBI buddy and HDFC chillar are an example of Open wallet.
RESEARCH METHODOLOGY
This research paper is aimed at examining the adoption of E-wallets as a Innovative mode of payment amongst
post graduation students in Navi Mumbai and to ascertain the factors encouraging and discouraging the usage of
E-wallets, problems faced by students while using E-wallets etc. Study is based on primary data collected
through a structured questionnaire which was filled by 50 respondents
OBJECTIVES
To study the factors influencing the adoption of E-Wallets as a mode of payment amongst post graduation
students in Navi Mumbai

International Journal of Advance and Innovative Research Volume 6, Issue 1 (XXIV): January - March, 2019
282
ISSN 2394 - 7780
To study factors refraining the usage of E-Wallets as a mode of payment amongst post graduation students
in Navi Mumbai
To study the problems faced while using E-Wallets as a mode of payment in amongst post graduation
students in Navi Mumbai
DATA ANALYSIS AND INTERPRETATION
Usage of E-Wallets
Use of E-wallet Frequency Percentage
Yes 36 72
No 14 28
Total 50 100
The above table shows that 72 % of respondents are already using E wallets, which shows high rate of adoption
amongst post graduation students.
NON USERS PERCEPTION
Reasons for not using
Reasons for Not Using Frequency Percentage
Security and Privacy 0 0
No Internet Access 0 0
Not much Techno
friendly 2 14.28
Prefer using other
Modes of Payment 12 85.71
Not User friendly 0 0
Total 14 100
The above table shows that the main reason for not using E-wallets amongst post graduation students is that
they “prefer using other modes of payments” such as cash and debit cards followed by “Not much Techno
friendly”
USERS PERCEPTION
Frequency of using E-wallets
Frequency of Using Frequency Percentage
Once a month 8 22.22
Once a fort night 2 5.55
Once a week 10 27.77
Two or three times a
week 12 33.33
Daily 4 11.11
Total 36 100
The above table shows that there is broad based usage of E-wallets amongst post graduation students on routine
bases as majority users are using E-wallets “two or three times a wee with 33.33% followed by “Once a week”
with 27.77% and “Once a week with” 22.22%
TYPES OF PAYMENTS
Types of Payments Frequency Percentage
Mobile recharge 20 25.31
Payment of bills 26 32.9
Online Shopping 10 12.6
Online ticket bookings 8 10.1
Money transfers 15 18.98
Total 79 100
The above table shows that E-wallet is preferred mode of payment amongst post graduation students for
“payment of bills “with 32% followed by Mobile recharge with 25% and Money transfers with 19%. Still for
shopping of goods and ticket bookings there is no wide spread usage of E-wallets.

International Journal of Advance and Innovative Research Volume 6, Issue 1 (XXIV): January - March, 2019
283
ISSN 2394 - 7780
FACTORS DRIVING USE OF E-WALLETS
Attributes Frequency Percentage
Security 10 4.6
Privacy 8 3.7
Benefits for getting Transaction History 22 10.18
Ease of Use and Convenience 30 13.88
Easy Refunds 12 5.55
Can avail cash back 16 7.40
Discount offers 35 16.20
Trendy to use and because my friends use it 28 12.96
E-wallets are almost supported by every e-commerce site 16 7.40
Can be access anytime, fro anywhere 39 18.05
Total 216 100
From the above table it is observed that factors such as “access from anywhere & anytime”, “Discounts offers”
and “Ease of use” encourage usage of E-wallets amongst post graduation students followed by “Trendy to use
and because my friends use it”, “Benefits for getting Transaction History”, “supported by every e-commerce
site”, and “Easy Refunds” while security and privacy still remains concern of users
PROBLEMS FACED WHILE USING E-WALLETS
When respondents where asked to motion 3 major problems faced while using E- wallets, top three problems
listed were Transaction failure, Long Processing time and Delay in payment
MOST PREFERRED 3 E- WALLET BRANDS
When respondents where asked to list down 3 most preferred E-wallets Brands, Paytm, Google pay and
Phonepe where mentioned.
FINDINGS
There is high rate i.e. 72 % of adoption of E-wallets among the post graduation students.
The significant reason for Non-users not using E-wallets is still they prefer other mode of payments i.e.
Debit card followed by cash
There is broad based usage of E-wallets amongst post graduation students on routine bases as majority
users are using E-wallets “two or three times a week”
The most preferred payments by post graduate students via E-wallets are payments of bills, mobile
recharge and money transfers
Three main factors for encouraging adoption of E-wallets among the post graduation students are “access
from anywhere & anytime”, “Discounts offers” and “Ease of use”
The major problems frequently encountered by the respondents while using E-wallet are transaction
failure, long transaction time taken by E-wallet for processing the transaction, and delay in payment.
Paytm and Google pay are most used and trusted brands of E-wallets amongst the post graduate students
CONCLUSION
From this study we found that future of E- wallets is very promising amongst postgraduate students residing in
area of Navi Mumbai. E-wallets have already gained acceptance from younger generation as a mainstream
mode of payment and in near future it will garner significant share as a mode of payment for sure going online
as well as offline business.
REFERENCES
Kunal Taheam, R. S. (2016, January). Drivers of Digital Wallet Usage: Implications for Leveraging Digital
Marketing. IJER Serial Publications, 13 (1), 175-187.
Sardar R. ,2016 : Preference Towards Mobile wallets Among Urban Population of Jalgaon City, retrieved
from http://www.iaeme.com/jom/issues.asp?JType=JOM&VType=3&IType=2 on 28th August 2017.
Shailendra Singh Rana, a study of preference towards the mobile wallets among the university students in
lucknow city, Scholedge International Journal of Management & Development, ISSN 2394-3378, Vol.04,
Issue 06 (2017) Pg 46-57.

International Journal of Advance and Innovative Research Volume 6, Issue 1 (XXIV): January - March, 2019
284
ISSN 2394 - 7780
PURA VILLAGE CLUSTER AN ALTERNATE SOLUTION FOR SUSTAINABLE DEVELOPMENT
OF TEXTILE INDUSTRY IN ICHALKARANJI AREA
Gajanan J. Salunkhe
Assistant Professor, Yashwantrao Chavan School of Rural Development, Shivaji University, Kolhapur
ABSTRACT PURA (Providing Urban Amenities in Rural Area) is a model concept developed by Dr.A.P.J.Abdul Kalam for
rural development which is a Socio-economic system of sustainable Growth. It is meant to ensure better life for
millions of Indians in Rural regions. PURA is a well-planned drive towards achieving an inclusive and
integrated Human Resource Development and sustainable development. Ichalkaranji one of the fastest growing
industrial areas in Maharashtra Termed as the “Manchester of Maharashtra” The city's economy driven
predominantly by the Textile industry . The textile industry Present Scenario facing crises due to Imbalance of
Resources and non-planned activities. These imbalances of resource and lack of planning is threatening the
survival of Textile industry. PURA as a socio economic system of sustainable growth model could provide
sustainable solution for this industry and also it could help for Rural Human Resource Development. The
socio economic system of rural development is termed as “Providing Urban Amenities in Rural Areas”
(PURA) is consist of four connectivity’s; physical, electronic, knowledge and economic connectivity to
achieve inclusive and integrated development. All the four connectivity’s will bring socio economic
development through Plain PURA Type which is type of PURA.
Keywords: PURA, Sustainable Development, Textile Industry
INTRODUCTION India is having second largest population in world 1,21,05,69,573 According to census of India 2011. This
Population in terms of Human resource is still not fully utilized. The reason behind it is India’s major
population 83, 34, 63,448 live in rural area which is engaged in Traditional Economical activities for their
survival. After the New economic policy Country faced the demographic problem of migration which in turn
led to many problems for the Human resource Development. This Migration was forced for the Rural Human
resource for their survival. But after 3 decades of adoption of new economic policy it has been realized the
growth achieved by country is not enough, not sustainable and also featured with regional imbalance. This has
created the divide between Rural and urban India. Urban India rapidly grown in terms of economical advantages
of Market where as Rural India lacked the pace due to over dependence on traditional economical activities.
Additionally there was lack of involvement amongst stakeholders in rural development.
Government of India and Government of Maharashtra undertook many programs for Textile industry in
Ichalkaranji area. Despite the efforts by government the lack of understanding of demand supply equation and
imbalance of resources are leading again and again this industry in trouble in Ichalkaranji area. The imbalance
of resources includes raw material availability, Human Resource availability, Energy Resources, Capital
Mobilization, Environmental degradation and other issues of Resources. These problems could be solved and
the industry could achieve sustainable growth by applying PURA model that is what researcher proposes in this
research paper.
Dr.A.P.J. Abdul Kalam Proposed PURA (Providing Urban Amenities in Rural Area) model. PURA (Providing
Urban Amenities in Rural Area) model is Socio-economic system of sustainable Growth. It is meant to ensure
better life for millions of Indians of Rural regions. A well-planned drive towards achieving an inclusive and
integrated Human Resource Development.
Ichalkaranji is one of the rapidly growing industrial areas in Maharashtra. This City Termed as the “Manchester
of Maharashtra”. The city's economy driven predominantly by the Textile industry. The textile industry Present
Scenario facing the problem in terms Imbalance of Resources. The Present research Paper attempt to apply
PURA model for providing solution to textile industry. This application of PURA model will boost the rural
development & Human Resource Development in area.
OBJECTIVES OF THE STUDY
To analyze the Problems being faced by Textile industry in Ichalkaranji city
To propose potentiality of PURA Cluster village Model for providing solution to the problems of Textile
industry in Ichalkaranji city

International Journal of Advance and Innovative Research Volume 6, Issue 1 (XXIV): January - March, 2019
285
ISSN 2394 - 7780
RESEARCH METHODOLOGY
The present research is based on secondary data only in which the data is obtained by various co-operative
organizations, Government websites, newspaper articles and books. The secondary data obtained is put in
organized format to evaluate and classify the problems faced by industry and propose the potentiality of PURA
application as a solution to solve those problems.
PROFILE OF TEXTILE INDUSTRY IN ICHALKARANJI AREA
Industry profile
Sale of the textile products: More than Rs.150 billion
Per capita income of Ichalkaranji : Rs.1,16,472,
Fabric Manufacturing units: More than 5,000
Power looms: 120,000
Auto looms : 80000
Employees/ Workers: 99,152
A daily turnover of nearly: Rs.500 million
Sizing : 175 sizing units,
Process: 62 units
Warehouses : 187 units
Co-operative Spinning Mills 5
Sources: All above data collected from various sources which are mentioned in References
STATEMENT OF THE PROBLEM
Problem of Fabric Manufacturers
Dependence of fabric manufacturers on commission agents & yarn traders for entire Production process. This
problem is due to the lack of capacity to buy yarn in bulk. The issue is related with raw material procurement, as
the units of power loom are small scale the entrepreneurs are having inability to buy yarn in bulk from co-
operative spinning mills. If they even wish to buy it in bulk it would lead to unnecessary capital allocation
which will lead to inefficiency. Hence in this context it is necessary to have yarn supplying units which will
produce yarn as per requirement of raw material.
Fabric manufacturers get less share of profit which in turn reduces their ability to pay. This problem is related
with above problem as yarn agents does not share profit with the fabric manufacture instead they give them
labor charges which reduce yarn manufacturers’ ability to pay. This leads to capital shortage as such less
Working capital, in consistent payment to labor resulting in employee turnover, labor shortage, employee
absenteeism, strikes for wages salary and bonus
Problem of employees / workers
The labors are having inconsistent wages it is resulting due to yarn manufacturers’ in ability to pay
inconsistency in wages is due to another reason of absence of government regulation. This inconsistency in
wages leading the workers to face the problems of Increased cost of living, Poor health & safety, Job security,
non-fixed wages
Problem of sustainability
The textile industry technological up gradation has pulled excessive use of chemical products which are
damaging Natural Resources & climatic condition. Apart from this Noise pollution, Water pollution are the
other environmental issues.
These environmental issues are coupled with Drain of work force and Poor Quality of work-life
PROPOSED APPLICATION OF PURA MODEL TO TEXTILE INDUSTRY IN ICHALKARANJI AREA
Physical & Electronic connectivity
Development of Rail Freight corridor from Cotton producing areas of Vidarbha Region of Maharashtra to
Ichalkaranji: This will help for transportation of required Raw Material directly in the hands of Manufacturer.
As a part of direct transaction the Raw Material producer and the Manufacturer both will be benefited. Farmers
who are the raw material Producers will get the good Price for their Produce and Manufacturer will get the
cotton at low cost.
Setting up of warehouses at the two rail stations Rukadi & Hatkanangale which are catering the needs of this
area: These two villages will have additional economic activity of warehousing and Transportation apart from
traditional activities. Also it will create the surplus availability of raw Material which will be Helpful for raw
Material Procurement according to Requirement.
International Journal of Advance and Innovative Research Volume 6, Issue 1 (XXIV): January - March, 2019
286
ISSN 2394 - 7780
Micro Spinning Mills need to be established in the areas between the warehouses & Sizing Industry: As logistic
activities suggest the processing of product will be held after the formation of product. It will create the strong
supply chain and logistic.
Sizing Industry should be moved to villages which are on the banks of river: The water Resource will be
available for these units. Primary need of sizing industry is water which is not easily available in city area it is
better to move these sizing units in river side rural area so the water availability problem will be solved.
A common drain from these units should be developed to connect CETP plants at Shiradwad, Takawade: The
sizing units will pollute the water this water could be recycled for agriculture irrigation purpose. This step will
manage the balance of Environment.
Establishment of few more industrial areas in villages: The current Problem of Labor supply will be solved with
this initiation. If new industrial areas are established for entire process of the Textile Manufacturing labor
availability will be as per demand of industry. This industrial area will cater the need for fabric manufacturing
units, Processing Units & Packaging of finished product
Knowledge Connectivity
Setting up Educational Institutions which are Textile industry centered. Introducing Textile industry centered
Industrial Training Institutes. Setting up Research and Design centers for the Textile Industry. Human Resource
Requirements of industry in all three levels of hierarchy will be fulfilled by Means of these Knowledge hubs.
IMPLICATIONS OF PURA CLUSTER VILLAGE
Development of Entrepreneurial Activities at various villages
Employment generation in Rural area
It will stop migration from Rural areas
Self reliability for fabric manufacturers on production process
Increased profit share for each level of production process
Increase in ability to pay
Availability of Consistent Labor supply for Production Process
Fixed wages, job security, sustainable livelihood, Quality of work life
Pollution control due to recycling facilities & decentralization
Preservation of climatic condition and natural resources
Extra income generated will be utilized for capacity building of workforce
CONCLUSION
If the proposed model of PURA with all four connectivity applied to Textile industry in Ichalkaranji area it will
lead to increase in entrepreneurial activities and Rise in income of yarn manufacturers along with workers
which will solve all the labor problems. This increased income will force these individuals to demand better
food and nutrition services thus the availability of increased quality of service will be in PURA complex of
Ichalkaranji. This income augmentation and enhanced service utilization will upgrade and enhance production.
This in totality will lead to human resource development and sustainable development of the Textile Industry.
REFERENCES
Association, T. i. (2012, December). The ichalkarnji Powerloom Association. Register of Powerloom
owners. Ichalkaranji, Maharashtra, India: The ichalkarnji Powerloom Association.
Association, t. s. (2012, December). Document of Autoloom owners. Ichalkaranji, Maharashtra, India: the
shuttleless loom association.
Association, Y. M. (2012). Sizing & Process Directory. Ichalkaranji, Maharashtra, India: Yarn Merchant &
Traders Association.
Deshpande, A. ( 2013., March 2). "Textile mill owners yield to striking workers’ demands". The Hindu. .
http://cpcbenvis.nic.in/ar2001/annual_report2000-01-20.htm. (2000, September). Retrieved June 12, 2013,
from http://cpcbenvis.nic.in: http://cpcbenvis.nic.in/ar2001/annual_report2000-01-20.htm

International Journal of Advance and Innovative Research Volume 6, Issue 1 (XXIV): January - March, 2019
287
ISSN 2394 - 7780
http://www.ichalkaranjitextilecetp.com/process-details.aspx. (2013, March 12). Retrieved June 5, 2013, from
www.ichalkaranjitextilecetp.com: http://www.ichalkaranjitextilecetp.com/process-details.aspx
http://www.maheshwarisamajichalkaranji.org/ichi.pdf. (2012, january).
http://www.maheshwarisamajichalkaranji.org/ichi.pdf. Retrieved june 18, 2013, from
www.maheshwarisamajichalkaranji.org: http://www.maheshwarisamajichalkaranji.org/ichi.pdf
MORD. (2011, dec 23). pura.net.in. Retrieved june 2, 2013, from pura.net.in: http://pura.net.in/
Singh, A. K. (2011). Target 3 Billion. In A. K. Singh, Target 3 Billion (pp. 24-96). New Delhi: Penguin
Groups.
Wadaje, P. R. (2011). Powerloom economics: Trader vs Weaver. Indian textile journal.

International Journal of Advance and Innovative Research Volume 6, Issue 1 (XXIV): January - March, 2019
288
ISSN 2394 - 7780
CONSUMER BEHAVIOUR WITH SPECIAL REFERENCE TO FACTORS AFFECTING WHILE
SHOPPING ONLINE
Aanchal Jain1 and Dr. Rinkesh Chheda2
Assistant Professor1, Anna Leela College of Commerce and Economics 2JJTU University, Rajasthan
ABSTRACT
A huge percentage of the population today is internet literate, with increase in online literacy the outlook of
online marketing too is increasing. There are millions of people online at a given point of and they all are a
potential consumer in the online market. In today’s age there are so many suppliers and providers of a variety
of products and services. Since there are so many providers, the most important thing for organizations in this
competitive business environment is to understand what are the consumer wants and needs, their taste and
preferences. Customer buying behaviors are influenced by different factors such as their culture, social class,
references group, family, income, age, occupation, gender, lifestyle etc. These influences make each customer
behave differently from the other. These studies shows the consumer buying behavior while online shopping.
Keywords; online retailing, consumer Behaviour
INTRODUCTION
Online retailing is a type of electronic commerce, which allows consumers to buy goods or services directly
from a seller without any intermediary, over the internet. To put it in a simple language it is the sale of goods
online.
The companies to first create online retail industry by putting the entire customer experience, from browsing
products to placing orders to pay for purchases on the Internet were amazon and Dell. The success of these
companies motivated store based retailers to create an online presence for their store.
This sweeping way of selling goods services and ideas has also gained immense popularity in India in the recent
years
The ever increasing use of devices like smartphones, tablets, laptops, and access to the Internet through
broadband, 3G, etc. apart from the growing usage of internet in India has contributed to the rapid growth of the
online consumer base and has developed a prospect for traditional retailers to augment their products and
services online
A consumer is an individual who purchases goods and services from the market for his/her personal use.
Consumer Behaviour is the study of individuals, groups, or organizations and all the activities associated with
their purchase, use, maintenance and disposal of goods and services, including the consumer's emotional,
mental and behavioral responses that he goes through while buying a particular good or service. No longer can a
consumer be taken for granted, various factors such as family influence, consumers emotional mental and
behavioral response to a good or service, his culture, influence of advertising , income occupation, lifestyle etc.
has to be taken into account while offering a consumer any product or service.
REVIEW OF LITERATURE
1. Solomon (1998) studied the Consumer Behaviour and stated that consumer behavior is the processes in
which individual selects, purchases, uses or disposes of products, services, ideas, or experiences to satisfy needs
and desires. In view for the Internet to spread out as a retail channel, it is necessary to perceive the consumer’s
way of thinking , aim and conduct in light of the online buying practice.
2. Donthu and Garcia (1999) proposed that risk aversion, innovativeness, brand consciousness, price
consciousness, importance of convenience, variety-seeking propensity, impulsiveness, attitude toward
adverting, attitude toward shopping, and attitude toward direct marketing would influence online shopping
behavior.
3. Schiffman, Scherman, & Long(2003) researched that “yet individual attitudes do not, by themselves,
influence one’s intention and/or behavior. Instead that intention or behavior is a result of a variety of attitudes
that the consumer has about a variety of issues relevant to the situation at hand, in this case online buying. Over
time the Internet buyer, once considered the innovator or early adopter, has changed. While once young,
professional males with higher educational levels, incomes, tolerance for risk, social status and a lower

International Journal of Advance and Innovative Research Volume 6, Issue 1 (XXIV): January - March, 2019
289
ISSN 2394 - 7780
dependence on the mass media or the need to patronize established retail channels (Ernst & Young, 2001;
Mahajan, Muller & Bass, 1990),
4. Sultan and Henrichs (2000) in his study concluded that the consumer’s willingness to and preference for
adopting the Internet as his or her shopping medium was also positively related to income, household size, and
innovativeness.
5. Vijay, Sai. T. & Balaji, M. S. (May 2009), revealed that Consumers, all over the world, are increasingly
shifting from the crowded stores to the oneclick online shopping format. However, in spite of the convenience
offered, online shopping is far from being the most preferred form of shopping in India. A survey among 150
internet users, including both users and non-users of online shopping, was carried out to understand why some
purchase online while others do not. The results suggested that convenience and saving of time drive Indian
consumers to shop online; while security and privacy concerns dissuade them from doing so.
6. Kim and Park (2005) U.S. samples suggests that their positive attitudes as well as willingness to search for
pre-purchase information leads to a strong likelihood that they will buy online. Online shoppers, are required to
have computer skills in order to use the Internet for shopping. Hence, those who are not comfortable with using
the computer, will likely do their shopping at the traditional store, modern shop, or discount store because it
will be faster shopping there than in the Internet shop.
OBJECTIVE
To study the consumer Behaviour towards online retailing
To study the factors motivating consumer behavior
RESEARCH METHODOLOGY
This research is based upon both primary and secondary data.
Primary data was collected through a questionnaire from individuals in the city of Mumbai. The sample size is
72
Secondary data was taken from research papers, reference books and websites
DATA ANALYSIS
1. Age
Out of the total respondents 0.40% are below the age 12, 60.20% are between the age 12 to 20 14% are
between the age 20 to 35, 1.20 % are between the age 30 to 50 and 24.20% are 50 and above
2. Gender
Out of the total respondents 23.4 % are women and 76.6% of the population are men.
3. Income
Out of the total respondents 24.7% earn an income of below 20000, 16.20% earn an income of range between
20000 to 40000, 32.60 % earn an income between 4000 to 60000, 12.4 % earn an income between 60000 to
80000 and 14.1 % earn an income above 80000
4. Occupation
Out of the total respondents 26.7% are students, 30.1% are professionals, 15% are freelancers and 28.2% are
business persons
5. Frequency of purchase from online platform
Out of the total respondents not a single person has not purchased from the online platform, 7.4% rarely
purchase from the online platform, majority of them (84.5%) purchase quite frequently and 8.1 always purchase
6. Factors motivating to purchase online
For 24.4 % of the respondents convenience mattered while for 36.2% it saved their time, 45.4 % found the price
attractive while 56.6% were attracted by various discounts and offers, for 14.2% it enabled product comparison
and for 41.1% variety of goods and services was the motivational factor.
7. Kinds of goods purchased online
Majority of the respondents(82.40 %)shop for apparel and fashion accessories , 34.4% shop for consumer
electronics, 16.2% shop for books and magazines, 8.2% shop for furniture, 22.1% shop for gifts and 7.2% shop
for stationary and 43.2 shop for home utility items

International Journal of Advance and Innovative Research Volume 6, Issue 1 (XXIV): January - March, 2019
290
ISSN 2394 - 7780
8. Method used for online payment
Cash on delivery is used by 67.6% of the respondents, none of the respondent’s use NEFT, PayPal is used by
8.10%, debit card is used by 24.20% and 16.6% use credit card.
9. Amount spent on a single purchase
16.4% of the respondents shop for items less than 500 in a single purchase,
Between 500 to 1000 32.4% of the respondents shop, 23.4% shop between 1000 – 3000
Between 3000- 50000 25.6% shop and 18.7% shop for items 5000 and above
10. Satisfaction level from shopping on the online platform
32.40% of the respondents are highly satisfied, 41.6 % are moderately satisfied, 23.4 % are neutral, 1.95% are
moderately dissatisfied and 0.72% are completely dissatisfied
FINDINGS
Online retailing has picked up substantially over the years. Not a single person amongst the respondents have
not shopped online in fact majority of them purchase quite frequently from the online platform
Majority of the respondents get attracted to shop online due to the various offers and discounts offered on the
products and the prices as well as the vast variety of options to choose from
Majority of the respondents are frequent purchasers of apparels and fashion products like shoes, bags, belts,
accessories etc.
Majority of the respondents prefer cash on delivery mode of payment over any other medium
Most of the respondents spend between 500 to 1000 during a single purchase
Most of the purchasers of online shopping are moderately satisfied with purchasing online while an
insignificant no. of purchasers are highly dissatisfied
RECOMMENDATIONS
Online sellers should aim to increase their penetration to the semi urban as well as rural areas
Online sellers should try to remove the dissatisfaction of consumers by upping their after sales service and
quality of products
Online sellers should come up with schemes to encourage consumers to make advance payment for the products
they make and pay through mediums other than cash on delivery
CONCLUSION
Indian retail sector is observing vigorous alterations over the years. . Online retail has witnessed a growth rate in
the past years thereby making a noteworthy contribution to the retail industry and the economy of our country.
It was found that Price, offers and discounts and Convenience were factors that are considered vital when a
consumer decides to purchase online, however the matter to be seen is whether these factors are perceived
equally between all consumers of the same income, occupation and lifestyle and across both genders.
BIBLIOGRAPHY
Brassington, F. and Pettitt, S. (2000),Principles of Marketing,(2nd edn),Edinburgh Gate, Pearson Education
Limited.
Kotler, P. and Armstrong, G. (2007)Principles of Marketing,(12th edn),Upper Saddle River, Prentice Hall.
Constantinides, E. (2004) ‘Influencing the online consumer’s behavior: theWeb experience’, Internet
Research14: 2, 111-126
Svatošová Veronika, Motivation of Online Buyer BehaviorZhou L., Dai, L. and Zhang, D. (2007) “Online
shopping acceptance model – a critical survey of consumer factor

International Journal of Advance and Innovative Research Volume 6, Issue 1 (XXIV): January - March, 2019
291
ISSN 2394 - 7780
A STUDY ON MICROFINANCE AND ITS FACILITIES: AWARENESS LEVEL OF PEOPLE IN
MUMBAI CITY
Vaishali Kothiya
Assistant Professor, Sasmira’s Institute of Commerce & Science
ABSTRACT
Microfinance is a financial service/ product designed to cater to the underprivileged segment of India. It aims
to provide a wide range of financial services like loans, insurance, payment services, etc. to the people with low
income in order to enable them to venture into small businesses & raise their standard of living. Microfinance
Institutions (MFIs) have evolved as precursors of the agricultural thrift credit market in the Asian nations. In
the current scenario, MFIs are seen to be shifting to urban areas. The wide spread slums being the significant
part of the urban population, the metros are proving to be cost-effective markets for MFIs over the remote
locales of the rural. The urban markets have witnessed a simple fraction of MFIs gross loan portfolio unfreeze
in a short span of 5 years. And over next 3 years, a magnitude relation is expected to vary to 50:50. Although,
MFIs supposed service specialization lies with low-income population from the rural areas, it has show
relatively higher success recently with the urban population and hence is heavily inclined towards urban
markets. The study focuses on the awareness of Microfinance amongst the low-income population in the urban
cities and services offered by MFIs in Mumbai city.
INTRODUCTION
India has witnessed a significant GDP rate over the years. However, the growth story is quite ironic.
Employment opportunities in the private, public and government sectors are limited and available to the
educated population only. On the other hand, informal economy is seen to grow at a faster rate, employing
about 93% of the labour force across the country. These informal economy workforce contribute to 63% of the
GDP. However, they cannot benefit from the additional wealth they have contributed to generate. The reason
being, they do not have access to the credit facilities to gain advantage from the economic opportunities.
However, if demographic and poverty trends in the country are to be considered, then the issue at hand looks
even more complex. About one third of world’s poor population reside in India; the youth of 15 to 34 years of
age constitute to over one third of India’s total population. The unemployment ratio amongst the youth is the
highest in the country, especially in the urban areas. The amalgamation of poverty and youth employment
indicates towards the socio-economic crisis.
According to a research conducted in 2004, about 60% of the youth population in the urban areas of India were
unemployed. The pressing issue is required to be addressed and policy makers must devise alternative sources
of employment for those left out of the bounds of the formal economy. In such a scenario, Microfinance plays
an important role in providing sustainable livelihoods by stimulating small & micro businesses.
According to the Consultative Group to Assist the Poor - an International Consortium of Development
Agencies, people who have access to credit, insurance, savings and other financial services are seen to be more
resilient and able to cope better with day-to-day crisis. Despite the fact, only 0.01% of the urban population
from the poor socio-economic background have banking relationships. The outreach of MFIs to the rural areas
is seen at 95% and the cities remain unserved. Moreover, the lack of access to trading space and livelihood
training in the urban areas push the further the poor into poverty.
According to the Economic Census 1998, banks and financial institutions directly financed 2.8 percent of
enterprises and 1.9% received finance linked to the poverty alleviation schemes, accounting to only 4.7% of
enterprises, rural & urban to receive formal finance. A large number of underprivileged rely on the informal
credit from moneylenders, pawnbrokers and relatives to manage their cash flow. However, the model is not
sustainable for them as it often traps them in a longer debt period. This presents a big opportunity for MFIs to
serve the low-income segment in the urban areas.
However, the dynamics and challenges for MFIs in the urban areas are different than those faced in rural areas.
As a special case research conducted by an NGO in Delhi, there were very few microfinance institutions
working in the Delhi slums and resettlement colonies, despite the huge demand for microfinance. The institution
named Satin working in the region, estimated the number of people living on a daily earning of up to US$2 in
Delhi and the National Capital Region at about two million. Considering the facts, a Microfinance pilot project
was initiated in Delhi. A study was conducted on the profiles of customers, their needs and sources of financing
in the slum areas and resettlement colonies of Delhi, which helped in outlining People Group Model for

International Journal of Advance and Innovative Research Volume 6, Issue 1 (XXIV): January - March, 2019
292
ISSN 2394 - 7780
microfinance operations. People Group Model mandates a ‘group guarantee’ to available the financial loan
services under microfinance. Loans can be availed in groups, wherein, all the members of the group must
provide mutual guarantee for each other and are jointly liable to repay the loan amount in case one or more
members of the group fail to do so. The model enables customers to build financial, physical and social capital
in terms of group cohesiveness, extending support to each other and develop business networking, thereby,
creating a social network in the local community.
The scheme enabled youth from poor socio-economic background to avail a credit of up to Rs. 10,000/-,
training in acquiring business-oriented skills and insurance for life. Over 100 borrowers in East Delhi region,
availed a combined loan of Rs. 1 million who could set up their businesses in various sectors like small
transports, repair shops, readymade garments, internet parlors, etc. Customers have overwhelmingly proved
that reliable sources of credit provide a fundamental basis for planning and expanding business activities.
RESEARCH METHODOLOGY
Objectives of the Study
3. To study the level of awareness among people about Microfinance
4. To study the level of awareness among the low income segment people about Microfinance and its various
schemes
The study shall concentrate and highlight the level of awareness among people about the various schemes under
Microfinance. It shall also provide elaboration on these services and schemes and the benefits that urban poor
can avail.
Following is the hypothesis which have been formulated for this study -
● Lower socio-economic class of urban population are aware about Microfinance
● People of Mumbai city are aware about various schemes under micro finance
DATA COLLECTION
Primary Data Collection
● A questionnaire is being designed to collect the information from the people below poverty line and people
earning just above the poverty line residing in Mumbai city according to the sample size
POPULATION OF THE STUDY
Urban Poor of Mumbai City
SAMPLE SIZE
75 People in random and 75 People who are associated to various SHGs operating in the Mumbai City. Total
Number of Respondents is 150.
ORIGINALITY
4. This study includes primary as well as secondary data.
5. The research has been extended to cover every part of the city to take the sample.
6. Some part of the theory has been referred from the published data from various institutes.
LITERATURE REVIEW
A research report by Prof. Dr. Hans Dieter Seibel, University of Cologne, between 1960s and 1970s the
agricultural and rural development faced challenges in production for various reasons. Microfinance for
agricultural played a pivotal role in facilitating their growth. However, later with the rise in population in the
rural, there were other micro businesses springing up, giving rise a huge demand for microfinance for micro
enterprises.
As per the NABARD Report of 2003 - 04 on Self Help Bank Linkage, SHG credit expansion and the higher
recovery rate raised a lot of optimism amongst the poor. However, there remains a significant gap between the
demand and the actual per capita credit being provided to the poor.
A research report by Srinivasan published in 2009 says that the number of microfinance customers in India were
54 million in 2008. While SHG model served about 39.9 million customers, 14.1 million customer’s needs were
met by MFI model. The total outreach exhibited by SHG model was 77%; however, the growth rate remained
lower at 15% in 2007-2008 as compared to MFI model which showed a higher growth rate of 40%. The model
has shown a sustained growth with estimated 86.2 million customers and total loans outstanding of Rs. 351

International Journal of Advance and Innovative Research Volume 6, Issue 1 (XXIV): January - March, 2019
293
ISSN 2394 - 7780
billion in March 2009. This accounts for only 6% approx of the commercial banks’ overall credit outstanding in
the rural and semi-urban areas in 2008 (RBI, 2009). A study carried out by Intellecap - ‘Inverting the Pyramid’
suggested that there’s a huge scope of growth.
Anyanwu, 2003; Lawson, 2007: Many studies have underlined the lack of finance as one of the major issues
that poses as a challenge to the SMEs growth. This is in spite of the potential of SMEs.
Idowu Friday Christopher (2010) carried out a research in order to gain an insight on the Impact of
Microfinance on Small and Medium Sized Enterprises in Nigeria. The study reveals that SMEs have received
positive support from MFIs and which has fueled their growth rate and enhanced their market share as well.
Sam Afrane (2002) researched on Impact Assessment of Microfinance Interventions in Ghana & South Africa.
Hi case studies revealed that the interventions of microfinance have accomplished greater growth. This is
accounted by the enhanced improved lifestyle, increased business incomes, , empowered enterprises and people,
etc.
These studies provides a concrete references and evidence about the success of Microfinance in India and
worldwide.
DATA ANALYSIS & INTERPRETATION
Hypothesis 1: Low-income segment People in the Urban is aware about Microfinance Concept
DISCUSSION
Item 9 of the questionnaire is about the awareness of microfinance.
Question 9 tests of the respondents have come to know about the small scale account.
Analysis: 90.6% of the respondents have gained knowledge about small scale money.
Question 11 is the extension of 9 and attempts to uncover the source of knowledge of the respondents on small
scale accounts.
Analysis: 38.9% respondents had gained knowledge from their companions and 34.7% from their neighbors.
From the above analysis, it can be concluded that Speculation 1 is approved.
Hypothesis 2: People of Mumbai city are Aware about various schemes under micro finance.
RESULT: This hypothesis is validated.
Dialog: Question 10, attempted to discover the mindfulness level about the different plans accessible in the
platter of Small scale money. Among it, sparing plans was the most prominent one with 55%.
From the above analysis, it can be concluded that Hypothesis 2 is validated.
MAJOR FINDINGS
At the commencement of analysis, objectives were defined which were accepted by the analysis as furnished
below:
7. Abstraction has focused on the awareness of microfinance. The abstraction reveals that the advised sample
acquainted to micro accounts is 92%.
8. Abstraction also reveals that the low-income segment population of Mumbai city got acquainted by
Microfinance through assorted sources. About 4% got the information from their relatives, 35% from
friends, 37% from neighbors, 20% from SHG assembly and 4% from other sources
9. Abstraction also studied the awareness of Microfinance schemes amongst the poor. The analysis shows that
only 21% of the sample study were acquainted with the micro schemes, whereas, 13% knew about the
allowance schemes, 16% about application schemes and 50% about the extenuative schemes.
10. Abstraction also throws light on the fact that besides the knowledge of micro extenuative schemes, poor
population of Mumbai also are aware of other autonomous options
11. Micro accounts are alone accustomed to the poor affiliated women for starting their own business or for
costs the absolute business. As well assorted extenuative schemes are getting provided to the consumers.
Consumers are as well getting provided with loans for acquirement of bartering cars and claimed two
wheelers.
12. The top akin of acquaintance has been accepted in the city-limits of Mumbai about micro financing.

International Journal of Advance and Innovative Research Volume 6, Issue 1 (XXIV): January - March, 2019
294
ISSN 2394 - 7780
RECOMMENDATIONS
1. The humans should be accustomed added opportunities for accommodation attainment.
2. Absorption amount should be decreased so that added and added applicants can account microfinance
facilities.
3. If microfinance is to be fabricated an acknowledged accumulation movement, the operations charge to be
fabricated streamlined, amount able and transparent.
4. Accommodation admeasurement should be added abundant to accommodated the requirements of
borrowers.
5. MFI should acknowledge able absorption amount to the borrowers. Hiding able absorption amount to poor
and benighted borrowers by application ―creative‖ accounting practices is awful immoral. The poor
borrowers accept a appropriate to apperceive the accurate allurement amount of the micro accommodation in
anatomy of able anniversary absorption rate, so that, they can yield appropriate borrowing decisions.
6. The government should accommodate the basal infrastructural accessories such as acceptable roads, schools,
hospitals, connected ability accumulation etc in the accompaniment to accredit individuals accomplish the
allowances of microfinance.
7. The akin of bribery in our country should be arrested to anticipate the antedate of microfinance funds to the
easily of the politicians in the society.
8. The Abjection Alleviation Programme should be restructured to accommodated the needs of the beneath
advantaged associates of the association mostly the women that are in austere charge for microfinance.
9. The government should abode able administration and adjustment of a lot of of the microfinance institutions
in the country to anticipate the collapse of such institutions as witnessed in the accomplished in some
regions.
REFERENCES
https://www.business-standard.com/article/finance/mfis-shift-focus-to-urban-areas-114082700018_1.html
https://www.downtoearth.org.in/blog/urban-poor-need-microfinance-for-livelihoods-6729
https://www.sciencedirect.com/science/article/abs/pii/S0305750X10000951?via%3Dihub
www.worldbank.org/gender/prr/engendersummary.pdf
http://www.iosrjournals.org/iosr-jef/papers/SIFICO/Version-2/6.51-61.pdf
http://www.sksindia.com/faq.php
http://swayamsiddhafoundation.org/

International Journal of Advance and Innovative Research Volume 6, Issue 1 (XXIV): January - March, 2019
295
ISSN 2394 - 7780
INTRAPRENEURSHIP AS AN EFFECTIVE ORGANIZATIONAL STRATEGY- AN ANALYSIS IN
INDIAN PERSPECTIVE
Prof. Umadevi Lalit Kokku
Assistant Professor, S. I. E. S College of Arts, Science and Commerce, Sion (West) Mumbai
ABSTRACT
The contemporary economic environment is getting progressively more competitive, demanding and
challenging for most organizations in India. Organizations currently perceive a substantial rise in globalization
trends and revolutionary changes in technologies. This gives rise to several organizational complexities and in
order to survive and be successful, organizations need to tackle them by constantly working on their products,
services and business models to maintain a competitive advantage. Intrapreneurship as an organizational
concept has evolved substantially over the years. It can be defined as a tactic employed by people to ensure that
others, especially employees, are making the most out of their commercial or industrial talent. When this is
done, employees are better facilitated to work to their best capacity and therefore ensure that the company
develops better and more successful products. An innovation culture attained through such intrapreneurial
initiatives can lead to considerable organizational development in terms of firm performance, innovativeness,
profitability and competitiveness. This paper attempts to study the evolution of concept of intrapreneurship in
India and discusses how intrapreneurship can be an effective strategy for managing innovative development in
different organizations and thereby resolving a range of such complexities.
Keywords: Current economic environment, intrapreneurship, organizational strategy, Indian perspective
INTRODUCTION
The first written use of the terms ‘intrapreneur’, ‘Intrapreneuring,’ and ‘intrapreneurship’ date from a paper 1
written in 1978 by Gifford Pinchot III and Elizabeth Pinchot. Later the term was credited to Gifford Pinchot III
by Norman Macrae in the April 17, 1982 issue of The Economist.2 The first formal academic case study of
corporate entrepreneurship or intrapreneurship was published in June 1982, as a Master's in Management thesis,
by Howard Edward Haller, on the intrapreneurial creation of PR1ME Leasing within PR1ME Computer
Inc. (from 1977 to 1981). This academic research was later published as a case study by VDM Verlag
as Intrapreneurship Success:A PR1ME Example. The American Heritage Dictionary of the English
Language included the term 'intrapreneur' in its 3rd 1992 Edition, and also credited3 Pinchot as the originator of
the concept. The term "intrapreneurship" was used in the popular media first in February 1985
by TIME magazine article "Here come the Intrapreneurs" and then the same year in another major popular
publication was in a quote by Steve Jobs, Apple Computer’s Chairman, in an interview in the September
1985Newsweek article, which quotes him as saying, "The Macintosh team was what is commonly known as
intrapreneurship; only a few years before the term was coined—a group of people going, in essence, back to the
garage, but in a large company."The Globalization effect brought the world together and India was no exception
to it. Indian economy welcomed the MNCs in the development process and thus a need to exhibit a competitive
edge arise.
In India, most of the companies operate stable businesses quite efficiently, but what is lacking is developing a
new business from its idea stage through to research and development and successful commercialization. The
organization’s capacity to innovate is greatly diminished because of the failure to identify, support and
encourage innovative ideas which can be turned out to successful commercial products and services. With India,
becoming a preferred destination of MNC’s, and the economy expanding, attracting and retaining talent is a
source of competitive advantage. The need of the hour is for people who are creators rather than followers. One
feature of the organization that promotes intrapreneurship is that it encourages and successfully implements
enough creative ideas to make a surplus of fruitful opportunities for all its employees. Thus Intrapreneurship is a
relatively recent concept that focuses on employees of a company that have many of the attributes of
entrepreneurs. An intrapreneur is someone within a company that takes risks in an effort to solve a given
problem. Through much research it is becoming well understood how important intrapreneurs are to a
successful company.

International Journal of Advance and Innovative Research Volume 6, Issue 1 (XXIV): January - March, 2019
296
ISSN 2394 - 7780
LITERATURE REVIEW
1. Pinchot 1985, p .ix, in: Sharma & Chrisman, 1999,stated that Intrapreneurs are … ‘dreamers who do’; those
who take hands-on responsibility for creating innovation of any kind within an organization; they may be the
creators or inventors but are always the dreamers who figure out how to turn an idea into a profitable
reality”.
2. Stevenson and Jarillo (1990: 23)* define Intrapreneurship as “a process by which individuals … inside
organizations pursue opportunities independent of the resources they currently control”.
3. Venkatraman et. al (1992) stated that due to the rigid hierarchies which impede innovation and lack of
appropriate incentives new ideas require strong organisational advocates
4. Seshadri D.V.R. & Arabinda Tripathy (2006) concluded that sustained efforts at encouraging innovation and
intrapreneurs play a key role in keeping employees motivated and open new avenues for them to bring their
vision and creativity into reality for the benefit of the organization.
5. Piramal, Bartlett and Ghosal, (2002) opined that in today’s context where the source of power is knowledge,
harnessing the full potential of the workforce is absolutely vital for a company’s success.
6. Luchsinger, V and Bagby, D R (1987) found that intrapreneurial organisations can be distinguished by their
focus on results, team work orientation, rewards for innovation and risk taking, tolerance for mistakes and
the ability to learn from them and flexibility.
7. Mathew, J. Manimala, Jose, P.D., and Raju Thomas (2006), suggested that in view of the inherent
disabilities of large public sector organizations in developing countries to promote innovations, it is essential
for such organizations to develop a deliberate strategy for innovation and align it with their corporate
strategy. Scholars and practitioners have recognized that intrapreneurship can have beneficial effects on the
revitalization and performance of small and medium sized enterprises
OBJECTIVES
1) To study the evolution of Intrapreneurship in Indian economic environment
2) To review the role of intrapreneur in achieving competitive advantage for the organization
3) To analyse intrapreneurship as an organizational strategy for managing innovative growth in Indian context
Scope: This paper discusses the evolution of the concept of intrapreneurship, the need for intrapreneurship, the
benefits of intrapreneurship to the company and employees, few examples of successful intrapreneurship in
organisations and the intrapreneurial scenario in the Indian context.
Research Methodology: The concept of intrapreneurship is still in its embryonic stage in the Indian corporate
sector. A descriptive study is conducted to understand the nuances of the concept. Data for the study has been
collected from secondary including journals, magazines, books on the subject and internet sources.
Evolution of intrapreneurship in India: In the present century, Indian corporates have entered the global
market on the large scale .The IT industry took the lead in this exercise. This industry has exhibited
entrepreneurship to the point that it is a role model for the other industries mostly run on management style.
Innovation at every level and of every kind can be seen in IT industry. Traditionally, Indian economy supported
entrepreneurship. The Indian mindset has cultural advantage, which is evident from the following. 'Artisans –
system’ was a well –known practice in India. Generation after generation, the artisans developed their
profession and made it richer in skills and knowledge by continuously innovating, experimenting and
expanding. Mentoring and counseling is part of Indian social system.
Intrapreneurship is of special significance to Indian organizations since they are beset by resource constraints,
infrastructural deficiencies, commoditization of brands and services, rapid rate of obsolescence, weak work
ethic and turbulent industrial relations. Some of the corporates have realized the potential of intrapreneurship in
generating new ideas, creating new business models as well as in talent recognition and retention. For instance:
In Zensar technologies, one of the teams developed a new solution pattern departing considerably from the old
one. It was highly successful and today, at least 60 per cent of the company’s work is done through it. At
Kinetic India, the model Zing, was an idea that came from one of their employees. who suggested that the
mobike should have a mobile charger. Since the idea was both innovative and satisfied a latent need, it was
incorporated into the product, and was one of the prime reasons for the product’s success. Forbes Marshall has
implemented a work practice called the ‘sunset clause’, which stipulates that any idea given by an employee has
to be screened by the end of the following day. If not, the manager has to necessarily back the idea. This ensures
International Journal of Advance and Innovative Research Volume 6, Issue 1 (XXIV): January - March, 2019
297
ISSN 2394 - 7780
that managers take an active role in generating and screening of business ideas as well as become champions of
viable and feasible ideas. Texas Instruments (TI), Bangalore encourages its engineers to have an intrapreneurial
mindset. A single-chip solution for ultra-low-cost handsets is just one example of TI’s many innovative
products in making communications easier and affordable. Within the company, the company has introduced a
‘technical ladder’ which encourages small teams of engineers with an ‘intrapreneurial’ mindset to work on
creative ideas. Getting into the technical ladder is not just challenging but also a rewarding experience for
young engineers. Due to its focus on promoting intrapreneurship, TI which was the first multinational company
in the technology domain that began operations in India in 1985 has a record of 500 patents filed from India. In
India, most of the companies operate stable businesses quite efficiently, but what is lacking is developing a new
business from the idea stage through to research and development and successful commercialization.
Role of intrapreneur in achieving competitive advantage for the organization 1. Intrapreneurs are major contributors to increases in productivity within companies. Like entrepreneurs,
intrapreneurs take risks and find more effective ways to accomplish tasks. An intrapreneur, in the most
basic sense, is a skilled problem solver that can take on important tasks within a company.
2. Intrapreneurs are the drivers of innovation within companies. In a similar role to that of entrepreneurs,
intrapreneurs seek to provide solutions to unique market driven problems. They seek policies, technologies
and application that resolve a barrier to productivity increases. Like the entrepreneur who starts a company
with the goal of providing a good or service, the intrapreneur takes on a task within the company to
increase the capacity of the company.
3. A successful intrapreneur understands trends; they see where the company needs to go before anyone else.
Any successful company must have a number of intrapreneurs to see future trends and meet them before
their competitors do. In this respect good intrapreneurs are the most important asset a company has.
4. Intrapreneurs will become the building blocks of a company's executive teams and leaders. They are the
driving force that moves a company forward and they will inevitably rise to the top of the company as they
understand the company from all levels. Starting from the bottom, they will see the company as a set of
processes in which every process must evolve.
5. Unlike employees who are simply with a company to get a paycheck, intrapreneurs should be viewed as
part of the company. They do more than just commit their time to a company, as they also invest their
skills. Intrapreneurs see the ability to grow personally along with the company and in this sense, should be
seen as investors in a company, rather than just employees. An intrapreneur is someone who grows with the
company; it is a symbiotic relationship as the company helps them and they, in turn, help the company.
6. A company grows when you find the virtuous cycle of entrepreneurs hiring intrapreneurs. A good
entrepreneur recognizes talented intrapreneurs and as they are promoted they intern recognize good
intrapreneurs below them. In this fashion a company culture is constructed where talented innovators teach
and foster the growth of other talented innovators. This cycle continues and the company will become a
truly innovative leader.
7. The distinction between entrepreneurs and intrapreneurs can be seen as a difference in the level of focus.
While an entrepreneur should see the company as a vision from starting point to end; the intrapreneur is a
facet of this broader vision. The intrapreneur works within the company to solve a specific problem. Thus
intrapreneurs should have more directly applicable skills for a given task. The intrapreneur will take risks,
but within the context of their job in the company. The intrapreneur, unlike the entrepreneur, is not focused
on the entire company, but rather processes within it.
Intrapreneurship as an organizational strategy for managing innovative growth in Indian context: When
a company uses intrapreneurial techniques as their corporate or organizational strategy, they encourage their
employees to take initiative and therefore give them a sense of decision making. When an employee is given
this responsibility, they treat it with respect and try their best to ensure that they do not let down the firm. The
firm encourages this and therefore empowers its employees to bring forth new ideas and facilitate their
implementation.
When creating a corporate strategy, firms should create an environment where employees are not afraid to bring
good ideas to the table. Once the ideas have been brought forth, decisions should be made to ensure that no
good idea is ignored or lost. The company should be willing to spare resources to ensure that ideas from
employees are discussed and considered. Therefore, one of the most important factors to consider is creating an

International Journal of Advance and Innovative Research Volume 6, Issue 1 (XXIV): January - March, 2019
298
ISSN 2394 - 7780
environment where employees are free to bring forth good business ideas and ensuring that the ideas, if viable,
are implemented and incorporated into the running of the business.
Another important factor to consider is the process of decision making. This should be expedited to ensure that
ideas do not wear off before they are implemented. Employers should set aside resources to ensure that all good
ideas are implemented. Other than that, the company should be willing to break tradition and embrace new ideas
that might change the work environment for the better. Research shows that intrapreneurship thrives more on
freedom and initiative as opposed to traditional policies. When this is done, companies are more open to new
business ideas and therefore business growth and development.
FINDINGS AND SUGGESTIONS
1. Intrapreneurship is an organizational strategy to motivate and retain innovative employees.
2. Intrapreneurship helps in achieving competitive edge for both the organisation and the employees.
3. Organisations need to create an open culture which promotes innovation and risk taking behaviour among
employees.
4. The organisational network is a key factor in promoting intrapreneurship and the enterprise should create
awareness and ensure an enabling environment.
5. In Indian enterprises, the practice of intrapreneurship is still in its budding stage and many organisations
have lost their key employees with innovative ideas because they did not create the required eco system for
intrapreneurship.
CONCLUSION
With India, becoming a preferred destination of MNC’s, and the economy expanding, attracting and retaining
talent is a source of competitive advantage. The need of the hour is for people who are creators rather than
followers. To succeed organizations need to direct change, create the future and learn from it. One feature of the
organization that promotes intrapreneurship is that it encourages and successfully implements enough creative
ideas to make a surplus of fruitful opportunities for all its employees. Organizations which see things in new
ways, respond to evolving needs of customers by changing the ways things are done would be the leaders in the
new environment. Over the time, companies lose employees because they feel creatively suppressed and
ignored. Companies are no longer competing with each other to offer a better product, but to employ better
staff. If companies would value the opinions and ideas of their employees and provide them opportunities to
innovate by, rather than just hire new people, it would result in a mutually beneficial relationship for both
parties. Opportunities for intrapreneurship would create an enterprise where people would love to come to work,
because the work spot is where they can fully actualize their potential. Many firms not only empower managers,
but also enable employees to become more innovative and flexible even in the course of their daily activities
and routine tasks. Through empowerment, employees become owners of their tasks. For creating sustained
value through building intrapreneurship into the organization, a strong management commitment is essential.
The management of the firm is eventually responsible for providing the conditions that facilitate individual
intrapreneurial attitude with the aim of opening the employee’s minds
REFERENCES
1. Robert D. Hisrich & Michael P. Peters. (2002), Entrepreneurship. US: Tata McGraw Hill.
2. Robert E. Kelley. (1985). The Gold Collar worker: Harnessing the Brainpower of the New Work force.
US: Perseus Publishing.
3. Robinson. (2001). The Ten Commandments of Intrapreneurs. Management, 95-97.
4. Seshadri, D.V.R., & Arabinda Tripathy. (2006). Innovation through Intrapreneurship: The Road Less
Travelled. Vikalpa, 31, 17-29.
5. Stopford, J.M., & Badenfuller C.W.F. (1994). Creating corporate entrepreneurship. Strategic Management
Journal, 15, 521-536.
6. Venkataraman, S., Macmillan I.C., & Mc.Grath, R.G., (1992). Progress in research on corporate venturing.
In D.L.Sexton & J.D.Kasarda (Eds). The state of the art of entrepreneurship. (pp.487-519), Boston MA;
PWS-Kent Publishing Company.
7. Nielsen, R.P., Peters, M.P., & Hisrich, R.D. (1985).Intrapreneurship strategy for internal markets;
Corporate, non-profit and government institution cases. Strategic Management Journal, 6, 181-189.
International Journal of Advance and Innovative Research Volume 6, Issue 1 (XXIV): January - March, 2019
299
ISSN 2394 - 7780
8. Pinchot, G. (1985). Intrapreneuring: why you don’t have to leave the corporation to become an
entrepreneur. New York : Harper & Row
9. Pinchot, G. (1987), Innovation through Intrapreneuring, Research Management 13 (2), 14-19.
10. Sarasvathy, S.D., N. Dew and S.R. Velamuri and S. Venkataraman (2003), three views of entrepreneurial
opportunity, in: D.B. Audretsch and Z.J. Acs (eds.), Handbook of Entrepreneurship Research,
Boston/Dordrecht: Kluwer Academic Publishers, 141-160.
11. Seshadri, D.V.R., & Arabinda Tripathy. (2006). Innovation through Intrapreneurship: The Road Less
Travelled. Vikalpa, 31, 17-29.
12. Dr. C. Barathi., Dr. C. D. Balaji., Dr. CH. Ibohal Meitei, Volume-II Issue-6, Sept. 2011 Intrapreneurship
As Competitive Strategy For Talent Retention – Facilitating Factors And The Indian Context
13. Macrae, Norman (April 17, 1982) Intrapreneurial Now The Economist
14. 1992 Intrapreneur The American Heritage Dictionary of the English Language. 3rd ed. Boston: Houghton

International Journal of Advance and Innovative Research Volume 6, Issue 1 (XXIV): January - March, 2019
300
ISSN 2394 - 7780
A NEED FOR INNOVATIVE TECHNIQUES OF LEARNING FOR IMPROVEMENT IN SKILL
DEVELOPMENT PROGRAM AND EMPLOYABILITY FOR SUSTAINABLE GROWTH
Prof. J. K. Mahida
Department of Accountancy & Commerce, ICLES’ Motilal Jhunjhunwala College of Arts, Science and
Commerce, Vashi, Navi Mumbai
ABSTRACT
The purpose of this paper is to study that there is a strong need for innovative techniques of learning for
improvement in skill development program and how to bring employability for sustainable growth in India. The
earlier system of Gurukul education has been replaced by modern means of education. For making the students
more knowledgeable and employable, governments has been launching Skill Development Programs. However,
there are certain weaknesses which can be overcome by taking proper measures through reforming this skill
development program. India has tremendous and highest young human resources in the world. For India to
transform from developing country into a developed nation, there is a strongly requirement of improvement in
the skill development program by integrating it in the education system.
Keywords: Education, Skill Development Program, Weaknesses, Measures and Innovative Techniques.
INTRODUCTION
India is a developing country since many years. However, by looking at the rest of the developing countries of
the world, it is prima facie evident that it has been emerging as a giant global leader among them in the recent
years. But now there is a strong need of transition period for India to become a developed country from a
developing country. The reason behind this is its highest existing human resources which has tremendous
potentiality if trained properly through right skill development programs. The transformed and innovative
techniques of learning via education and other means can bring the desirable and favorable changes which can
provide the sustainable growth in the long term. The review and analytical study reveals lot of improvement in
the education as well as other systems in society as well like politics and social concern.
EARLIER SITUATIONS
The earlier system of education in India, i.e. Guru Kul, was value based and ethics oriented. The students were
taught the skills of socialization, economics, politics, etc. The system was best suited due to monarchy and also
for limited population.
With the passage of time the ancient system disappeared and replaced by schooling system of education where
different subjects were taught but still the idea behind imparting knowledge was just to make them to
understand the life and values only.
During the British Reign, Lord Macaulay recommended 10 + 2 + 3 in India and it is still prevailing till the date.
This system imparted knowledge but only the basic which helps the person to meet his bread and butter and
which were useful up to the limits of government job.
RECENT DEVELOPMENTS During the 21st Century, the globalization and the rising population forced the government to think in the
direction of reforming the knowledge of the learners. To enhance their levels, the government came up with the
idea of skill development programs. The earlier governments introduced it under the name of National Skill
Development Corporation Limited, National Skill Development Fund and National Skill Development Agency
and which were consolidated as Skill India, National Skill Development Corporation Limited by the latest
Government.
Based on the functions and class of the society. The various types of skill development programs and schemes
are launched by the Government from time to time. These schemes include mainly:
Deen Dayal Upadhyaya Grameen Kaushalya Yojana.
Pradhan Mantri Kaushal Vikas Yojana.
Financial Assistance for Skill Training of Persons with Disabilities.
National Apprenticeship Promotion Scheme.
Craftsmen Training Scheme.
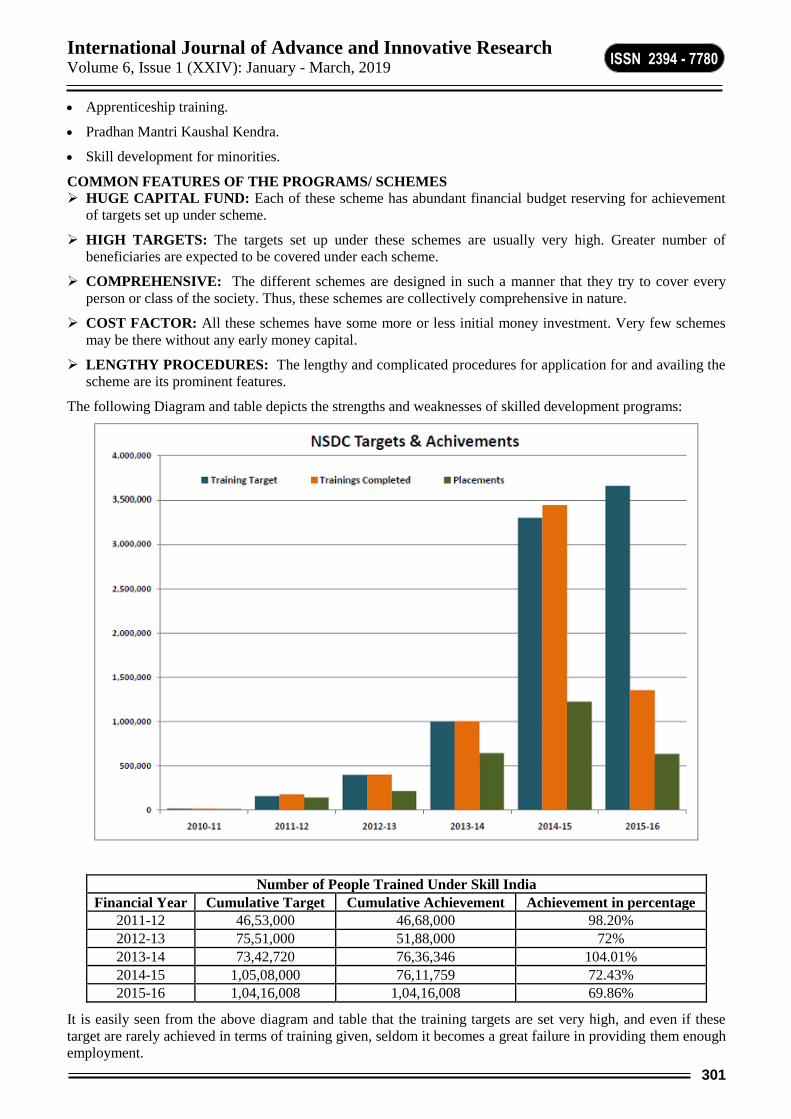
International Journal of Advance and Innovative Research Volume 6, Issue 1 (XXIV): January - March, 2019
301
ISSN 2394 - 7780
Apprenticeship training.
Pradhan Mantri Kaushal Kendra.
Skill development for minorities.
COMMON FEATURES OF THE PROGRAMS/ SCHEMES HUGE CAPITAL FUND: Each of these scheme has abundant financial budget reserving for achievement
of targets set up under scheme.
HIGH TARGETS: The targets set up under these schemes are usually very high. Greater number of
beneficiaries are expected to be covered under each scheme.
COMPREHENSIVE: The different schemes are designed in such a manner that they try to cover every
person or class of the society. Thus, these schemes are collectively comprehensive in nature.
COST FACTOR: All these schemes have some more or less initial money investment. Very few schemes
may be there without any early money capital.
LENGTHY PROCEDURES: The lengthy and complicated procedures for application for and availing the
scheme are its prominent features.
The following Diagram and table depicts the strengths and weaknesses of skilled development programs:
Number of People Trained Under Skill India
Financial Year Cumulative Target Cumulative Achievement Achievement in percentage
2011-12 46,53,000 46,68,000 98.20%
2012-13 75,51,000 51,88,000 72%
2013-14 73,42,720 76,36,346 104.01%
2014-15 1,05,08,000 76,11,759 72.43%
2015-16 1,04,16,008 1,04,16,008 69.86%
It is easily seen from the above diagram and table that the training targets are set very high, and even if these
target are rarely achieved in terms of training given, seldom it becomes a great failure in providing them enough
employment.

International Journal of Advance and Innovative Research Volume 6, Issue 1 (XXIV): January - March, 2019
302
ISSN 2394 - 7780
COMMON WEAKNESSES
OVER TARGETING : While setting up the target, in the short term, annual as well as in the long term, the
governments keep it very high, seldom within the reach every time. This in turn, always proves them as
inefficient, which may not be so always.
POOR IMPLEMENTATION: One of the common weak point of all schemes are its poor implementation.
No single scheme is put to its fullest use in practice for cent per cent implementation, resulting into its actual
effectiveness.
LACK OF AWARENESS: It is agreed and accepted that many schemes have been launching from time to
time. But the bitter truth prevails, it is that the actual awareness of the understanding of the scheme in its
entirety is never reached to the common man in the way it should be. People are aware of the name of the
scheme but don’t have idea what is the scheme of that particular scheme.
LACK OF INNOVATION: On one hand, we are talking about innovative practices for developing the skill
of Indian youth but on the other hand, it is found that there is lack of innovative techniques. The jobs
provided are still traditional in maximum areas. In addition to that all sectors of employment, at all levels,
are not covered. Only lower categories of people are given training. Highly paid jobs are not still fully
considered.
CORRUPTION: The corruption dwells everywhere and so lies in the various schemes also. Many
middlemen convict the ignorant people by fraudulent means and make the money in the name of the
schemes. Similarly, the unused money projected for the schemes are not properly accounted for nor the
collected money from the scheme are totally reported at. Sometimes, irregularities forced the government to
put the stay on the procedures of these schemes.
FALLACY OF SUCCESS: Since the inception of each schemes it is assumed and later on claimed that it is
continuously functioning successfully In addition, governments claim very high about its success ratio which
is a mere a meager contribution to our second populous country of the world. Also the fact remains intact,
that most of the schemes become outdated or just on the paper in the end. If at all they are in progress, their
pace is the lowest. (Diagram)
LACK OF SUSTAINABILITY: It is naked truth that many of the schemes are put on shelves either due to
the change in the government or due to their improper functioning. No scheme has its sustainable impact to
last longer. For example,
LOW EMPLOYABILITY: The schemes empower the youth for skill development but overall ratio for
their employability is very low. This schemes lack the teaching of basic skills like ethics, communication,
teamwork, IT knowledge and critical or analytical thinking. The government tries to create jobseekers, by
skill India training but simultaneously not so much equally successful in creating jobs also.
ABSENCE OF PUBLIC FAITH: One of the alarming reason behind not successful of these schemes are
lack of faith or confidence of the people in the government scheme. Most of these people are not fully aware
of these schemes and even if they know them, they feel it is only for the namesake, and not going to get any
desirable benefits. Though to some extent they are either self-experienced or they have observed the fruitless
efforts of someone else.
NO LINKAGE TO EDUCATION: The last but not the least, is that, every such skill of government, has
hardly any linkage to the education. All such schemes are not provided simultaneously along with education.
They are meant only for them who either completed education or who has been dropped out from the
education. Hardly any linkage is found between the education and the practicing/working of the schemes.
LACK OF WIDE AND SPEEDY COVERAGE: Tall claims are made by the governments that 1 crore
youth are getting trained or employed every year under skill development programs. It is accepted as the
truth. However, the unfortunate fact is that out of around 65% of the total population forming youth alone in
our country, this coverage is so less that it will take still many years for attaining full employability.
INNOVATIVE TECHNIQUES / MEASURES
SKILL DEVELOPMENT AT EDUCATIONAL LEVEL
The most important thing which is must needed is to develop those skills which are needed for
employability of the youth and for sustainable growth is to introduce them at the educational level as an
additional curriculum. It will not only enhance the knowledge and experience of the student but also will
make him perfect match for the industry in which he has to plunged into. This will help to generate self-
confidence as well as self-responsibility in the students which in turn useful to the nation as a whole.

International Journal of Advance and Innovative Research Volume 6, Issue 1 (XXIV): January - March, 2019
303
ISSN 2394 - 7780
INDUSTRIAL PARTNERSHIP/INTERNSHIP Though there are many MOUs are signed between the governments and other Universities or some giant
corporates, there is a need to have compulsory linkage between all schools or colleges or educational
institutions to provide such industrial partnership or internship or apprenticeship to the limited extent Part
Time) to provide training to the students before the entry level. Later, it can be developed into long term
full-fledged training.
EARLY AGE TRAINING When the world is transforming into the techno center, it is equally necessary to apply the most innovative
techniques to educate and train the youth of the country. This may include
Early Involvement: There is need of Involvement of the student at the time of manufacturing the product in
its basic or raw form as a part of education. And its finishing touch should be given by the regular Trainer-
Employees to maintain the quality of the product.
Earning & Learning: The students should be given minimum wages for their contribution while they will
be learning to make the product. Hence their cost contribution to the product will be minimum and total cost
will also be reduced. This will reduce the selling price and in turn will give this benefit to the customers, i.e.
back to the society.
Entrepreneurship Project: should be introduced at the UG level to inculcate the skill of business
administration.
Practical Study: For each subject, actual practice should be made necessary for each students so that it will
enable the students to understand the basics of the subject properly and he would be able to find him
perfectly employable in the industry afterwards.
100% AWARENESS Like the basic needs of life, all people should be made fully aware of the existing schemes for its complete
success. Like Ration Card or Aadhaar Card, connectivity to all should be brought into practice. Then only
the benefits of the schemes will reach unto the last person of the country.
MAJOR ROLE OF CORPORATES The Corporates should be encouraged to utilize their Corporate Social Responsibilities in sponsoring and
providing certain students in the educational institutions. This will ensure them placements in their own
Companies.
LEARNING FROM DEVELOPED COUNTRIES There is a strong need to learn from the models of developed countries in respect of skill development
programs and the way of their working. Countries like Germany, France, USA, etc. should be kept in front
of our sight, to attain sustainable growth through learning as well as in skill development.
FOREIGN COLLABORATION/JOINT VENTURES
In order to take the benefits of advanced techniques of the foreign countries it is also necessary to enter into
more and more joint ventures with them. International exposure should be given to the domestic students by
assisting them financially as well as strategically.
CONCLUSION
Thus, it is concluded that if the skill development programs are introduced in the education itself, the young
generation will become skilled and employable during their learning stage itself. It will save the government
from allocating huge amount of budget for skill development programs separately. If these schemes are fully
made applicable via wide coverage, the ratio of employment, income, growth and sustainability will
automatically increase the GDP of the country and the standard of living of educated class will be awesome.
This will enable our country to enter into the race of Developed countries.
RECOMMENDATIONS
From all above, it is recommended that there is a strong need of introducing skill development programs in the
education level itself. The more refined programs along with the foreign collaboration or joint venture will
make the students better skilled more knowledgeable. So that, these programs will make them better employable
in the corporates at home as well as in the abroad. This will pave a way for the country to become a Developed
Nation in the years to come.

International Journal of Advance and Innovative Research Volume 6, Issue 1 (XXIV): January - March, 2019
304
ISSN 2394 - 7780
REFERENCES
https://indianexpress.com/article/india/india-news-india
https://www.msde.gov.in/assets/images/budget
https://www.msde.gov.in/budget.html
https://www.businesstoday.in/current/economy-politics/union-budget-2019
https://openbudgetsindia.org/dataset/download/ministry-of-skill-development-and-entrepreneurship.pdf

International Journal of Advance and Innovative Research Volume 6, Issue 1 (XXIV): January - March, 2019
305
ISSN 2394 - 7780
REVIEW OF SHIFT FROM COMMERCE TO E-COMMERCE IN INDIA
Rajshree Srivastava and Dr. Girish Santosh Bagale
Assistant Professor and Professor
ABSTRACT Integration of business deals with the technology has brought the revolution in the trading sector. Traditional
aspects of doing businesses have been transformed into e-commercial sector. Todays, E-commerce has entirely
revolutionized the conventional thought of business, supported by huge internet users & android mobile phones;
Indian e-commerce has been witnessing remarkable growth and gradual advancement in the last few years.
Considering India’s demographic variable & growing internet accessibility, the sector is expected to scale
greater heights. Commercial sector is quickly transforming into e-commercial now. This paper tries to portray
the present scenario and facilitators of E-Commerce and the phases of transformation from conventional
commerce to technologically advanced E-commerce.
Keywords: Business, Technology, Mobile Phones, Internet, Commercial.
INTRODUCTION India has emerged as one of the major players on the new international business prospect. Its relentless
economic development since reforms in 1991 has become the focus of concentration for researchers in the field
of international business and management. The year 1991 illustrated a new episode in the history of the internet
world where e-commerce became a sizzling option amongst the online commercial users. It was difficult for the
millennial to predict that online trading will become a trend in the world and India will contribute to a good
proportion of this success. Commerce has altogether revolutionized the lives of people around the world and its
growth in India is remarkable which is difficult to show any signs of decline in near future. Trading of goods
and services with the help of electronic channels and internet is termed as E-commerce. E-business is a route to
conducting traditional form of business in an innovative way with the help of the internet network and by using
Electronic Data Interchange as the means. E-Commerce relates to the website of the vendor or retailer, who
sells products or services directly to the customer from the gateway using a digital shopping cart and allows
payment through the usage of plastic money or electronic fund transfer payments. E-commerce has not only
provided platform for the customers to transact online but has provided the opportunity to the retailers and many
manufacturers to showcase their products online without any intermediaries.
OBJECTIVES OF STUDY
1. To evaluate the present trends of e-commerce in India
2. To evaluate the growth factors responsible for e-commerce in India
REVIEW OF LITERATURE 1) Abhijit Mitra, (2013) in his article “E-Commerce in India-A review “an attempt is made to analyse the
present status and facilitators of E-Commerce in India, In this study it has been found that, there has been a
tremendous increase in the number of companies opting for E-Commerce. In his study he has focussed on
barriers which the E-commerce companies are facing.
2) Madhukar Sarode, (2015) in his paper concluded that ecommerce has become the future of shopping for
consumerism and the gap between manufacturer and consumer has been reduced due to e-commerce. There
is vast scope for e-commerce in India but due to weak cyber law, people are facing challenges in India.
3) Rajendra Madhukar Sarode, (2015) E-commerce is altering the way of buying & selling of product &
services in India. The growth of e-commerce has been extended in rural as well as urban area at reasonable
cost, due to which more people are getting connected with e-commerce & the ratio of that is getting
increasing day by day.
4) Rajasekar and Agarwal, (2016) in their study of impact on India's e-commerce revealed that success of
E-commerce depends to a greater extent on effective IT systems for which it is necessary to strengthen the
technological developments. Many organizations, and communities in India are investing a lot to take
advantage of the potential of ecommerce, there needs to be some provisions to overcome the challenges
before e-commerce would become a practice for common people.
5) Mita Mehta, (2016) purpose of this study reveals consumer behaviour and their preference towards adopting
mobile marketing as a revolution towards new shift in the rapidly developing e-Commerce segment. It has
been analysed that convenience factor has become one of the major reasons for the consumers to go online.

International Journal of Advance and Innovative Research Volume 6, Issue 1 (XXIV): January - March, 2019
306
ISSN 2394 - 7780
RESEARCH METHODOLOGY The study is based on secondary data that has been collected from various articles, journals, books, websites etc,
and literature review of researcher’s previously worked in this field. The research is used to study the
evaluation, conceptual framework, present trends or scenario, growth facilitators and challenges faced by e-
commerce. The study includes current data available to make the work more effective and the analysis of the
same has been interpreted. The paper is mostly comprises of secondary base & proper references have been
given wherever necessary.
COMMERCE TO E-COMMERCE
It all started with barter system and the progress continues. Previously transactions were done which involved
goods in exchange of goods and then evolved the currency and the transactions were in cash denominations.
Traditionally before revolution into the commercial sector, commerce meant trading of goods and services.
Business during Gen X was like a physical commercial activity with involvement of many intermediaries to sell
or exchange the goods and services. People had the psyche of cash transactions. Format of business was a risky
venture due to lot of uncertainty. Now with the revolution in the commercial sector came up a new era of
business known as E-Commerce, currencies took the new form of plastic money and electronic fund transfer.
With the initiative of Indian government to provide ease to the customers, firstly E-commerce services were
provided by IRCTC and the story began.
EMERGENCE OF E-COMMERCE
E-COMMERCE
E-Commerce market is a digital commerce market in India. It is an innovation which has shifted the traditional
way of doing businesses in a innovative way. E-commerce is the buying and selling of goods and services, or
the transfer of funds or data, over an electronic system, primarily the Internet. These business deals are
business-to-consumer, business-to-business, consumer-to-consumer or consumer-to-business. It has become an
online platform for the retailers, manufacturers, wholesalers and consumers to trade online easily and
conveniently. E-commerce in India has got a remarkable growth because of the technological revolution and its
adaptation into commercial sector. Growth of E-commerce in India has been backed by innumerable mobiles
users and wide connectivity of internet. E-Commerce has occupied the major market share in India’s shoppers
mind. ( Dr. Rajasekar, 2016)
FACILITATORS OF E-COMMERCE IN INDIA
Since its evolution there have been number of facilitators or divers which has been contributing continuously in
the growth of E-Commerce market. A large market size, young and aspirational consumer base, ever increasing
digital revolution, and adoption of new age technology are some of the factors adding to this line-up. Below are
the major contributors for the change, (Source. Kya Zoonga).
1. Increasing income levels
Increasing purchasing power of people
Increasing disposable income of the urban youth

International Journal of Advance and Innovative Research Volume 6, Issue 1 (XXIV): January - March, 2019
307
ISSN 2394 - 7780
2. Changes in socio-economic environment
Rising middle class incomes
Changing demographics (approx 50 % of the population is below 25 years of age)
Reach to global brands
3. Change in technological landscape
Rise in internet usage and 4G penetration
Increasing smart phone users with wide availability of internet on mobile phones
Delivering high quality user experience
4. Changing Patterns of Consumer Behaviour
Less time to spend in travelling to places and shopping
Increase in expenditure for luxury items
Increased population of Brand Conscious consumers
5. Changing mindset and outlook of Indian customers
Indians becoming more aware and embracing the idea of online shopping
Growing share of E-Commerce market has witnessed the increased share of digital buyers through online
transactions, below graph shows the increasing trend of Digital buyers from the year 2014 to the forecast till the
year 2020(in millions) and this increase has led to the development of major e-commerce market.
E-COMMERCE TRENDS
E-commerce has approached a long way since its foundation and is only getting bestest day by day. As
technology continues to cultivate swiftly, e-commerce retailers are adopting innovative techniques to ease
sellers and buyers to buy and sell online more effectively, all credit to ever dropping charges of internet surfing
both for web and mobile interfaces – which is complimenting to the soaring population of internet users. It has
been the major source of driving the trend for ecommerce. The growth of social platforms through internet and
huge adoption of smart phones is acting as a vehicle to accelerate this drive further, shaping the e-commerce
trends for the Indian market. According to a report by India brand equity foundation, Dec 2018,E-Commerce
market has been propelled by increasing smart phone penetration, the launch of 4G networks and increasing
consumer affluence, the Indian e-commerce market is expected to grow to US$ 200 billion by 2026
Flipkart, after its acquisition by Wal-Mart for US$ 16 billion, is expected to start more offline retail stores in
India to encourage private brands in segments such as fashion and electronics. In September 2018, Flipkart
acquired Israel based analytics start-up Upstream Commerce that will facilitate the firm in pricing and
positioning its products in an efficient way.
Paytm has launched its bank - Paytm Payment Bank, Paytm bank is India's first bank with zero charges on
online transactions, no minimum balance requirement and free virtual debit card.
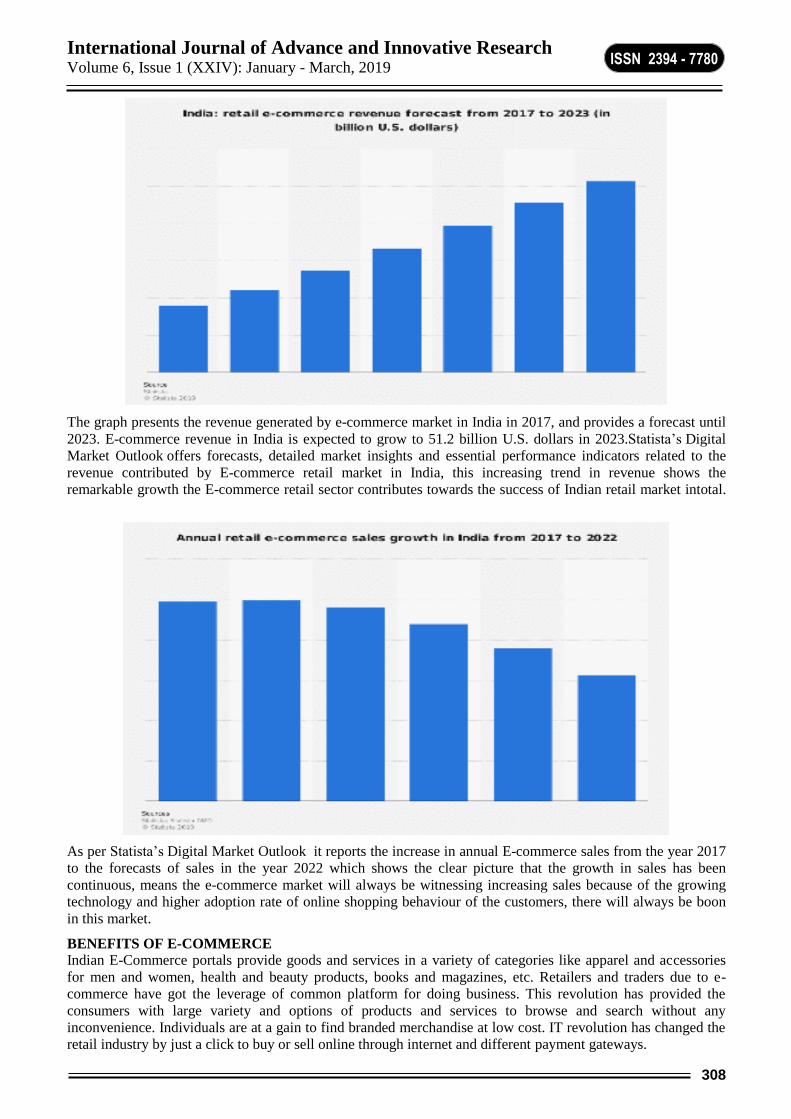
International Journal of Advance and Innovative Research Volume 6, Issue 1 (XXIV): January - March, 2019
308
ISSN 2394 - 7780
The graph presents the revenue generated by e-commerce market in India in 2017, and provides a forecast until
2023. E-commerce revenue in India is expected to grow to 51.2 billion U.S. dollars in 2023.Statista’s Digital
Market Outlook offers forecasts, detailed market insights and essential performance indicators related to the
revenue contributed by E-commerce retail market in India, this increasing trend in revenue shows the
remarkable growth the E-commerce retail sector contributes towards the success of Indian retail market intotal.
As per Statista’s Digital Market Outlook it reports the increase in annual E-commerce sales from the year 2017
to the forecasts of sales in the year 2022 which shows the clear picture that the growth in sales has been
continuous, means the e-commerce market will always be witnessing increasing sales because of the growing
technology and higher adoption rate of online shopping behaviour of the customers, there will always be boon
in this market.
BENEFITS OF E-COMMERCE
Indian E-Commerce portals provide goods and services in a variety of categories like apparel and accessories
for men and women, health and beauty products, books and magazines, etc. Retailers and traders due to e-
commerce have got the leverage of common platform for doing business. This revolution has provided the
consumers with large variety and options of products and services to browse and search without any
inconvenience. Individuals are at a gain to find branded merchandise at low cost. IT revolution has changed the
retail industry by just a click to buy or sell online through internet and different payment gateways.

International Journal of Advance and Innovative Research Volume 6, Issue 1 (XXIV): January - March, 2019
309
ISSN 2394 - 7780
CHALLENGES
Though India has been witnessing growth but it’s still faces some challenges due to India being still a
developing country and its rural areas still being underdeveloped .Multiple issues of trust in e-commerce
technology and lack of widely accepted standards, lack of payment gateways, privacy of personal and business
data connected over the Internet, no assurance for security and non confidentiality of data and non maintenance
of IT Infrastructure. Lack of technical skills of consumers to operate the smart phones has also become a
challenge for E-commerce market.
CONCLUSION
A developing country shall attempt to be modernized and advanced if it introduces e-commerce effectively and
efficiently, this would increase its productivity and make it competitively more challenging. Digital revolution
has uplifted ecommerce worldwide. With the expansion of internet connectivity through mobile devices like
Smartphone and tablets, millions of consumers are making decisions online and in this way enterprises can
build the brand digitally and enhance productivity but government support and initiatives must ensure the cost
effective methods/solutions. E-commerce has not only progressed in retail sector but also has resulted in the
growth and advancement of the economy.
REFERENCES
1. Dr. Rajasekar, S. A Study on Impact of E-Commerce on India’s Commerce, International Journal Of
Development Research, ISSN: 2230-9926, 2016
2. Mita Mehta, Paradigm Shift in Mobile Marketing and E-Commerce: The Indian Perspective, International
Journal of Management and Applied Science, Issn: 2394-7926 Volume-2, Issue-6, Jun.-2016
3. Abhijit Mitra “E-Commerce in India-A Review”, International Journal Of Marketing, Financial Services
And Management Research, 2013.
4. Rajasekar and Agarwal (2016) “A Study of Impact of India-Commerce on India’s Commerce” Indian
Journal of Development and Research, Vol. 6, Issue 03, , ISSN -7253-7256, March, 2016
5. Rajendra Madhukar Sarode, Future of E-Commerce in India Challenges & Opportunities, International
Journal of Applied Research 2015, ISSN: 2394-7500
6. Madhukar Sarode, Rajendra, Future of E-Commerce in India Challenges and Opportunities, International
Journal of Applied Research, Vol. I (12), 646-650. 2015
7. https://www.ibef.org/IndiaNowMagazine_eVersions/IndiaNow_Vol4_Issue5/files/assets/downloads/page00
64.pdf
8. Sayani Coomar, 2mita Mehta, 3arti Chandani, Paradigm Shift In Mobile Marketing And E-Commerce:The
Indian Perspective International Journal Of Management And Applied Science, ISSN: 2394-7926,2016.

International Journal of Advance and Innovative Research Volume 6, Issue 1 (XXIV): January - March, 2019
310
ISSN 2394 - 7780
A STUDY ON THE AWARENESS OF VARIOUS ICT TOOLS AT HIGHER EDUCATION FOR
TEACHING
Beena Kapadia
Assistant Professor, I. T. Department, Vidyalankar School of Information Technology, Wadala-East, Mumbai
ABSTRACT
This paper is divided into two parts. The first part is all about various ICT (Information and Communication
Technology) tools like internet, projector, e-reader, flipped classroom, e-book, MOOC courses like Spoken
Tutorials and Swayam NPTEL for teaching process and in the second part, the research is done on how many
professors apply which ICT tools for teaching. Data is collected from IT professors as well as non-IT
professors. Various age groups are also taken into consideration.
Keyword: ICT tools, Internet, projector, e-reader, flipped classroom, e-book, MOOC courses like Spoken
Tutorials, Swayam NPTEL, teaching process
INTRODUCTION
ICT consists of various tools and techniques that can be applied by capable and creative teachers to improve
teaching process. It is defined as all devices, tools, content, resources and services of the educational system.
These will not only include hardware devices connected to computers, and software applications, but also
interactive digital content, internet and other satellite communication devices, web-based content repositories
etc. [1] Computer technologies and other aspects of digital culture have changed the ways people live, work,
play and learn around the world.
OBJECTIVES OF STUDY
This study aims to find various ICT tools available for teaching process and to find whether all professors apply
the available tools for teaching considering the age factor and the IT or non-IT disciplines.
RESEARCH METHODOLOGY
The data is collected using google-form for survey. The basic research question is how the age factor and the IT
or non-IT professors (discipline) affect the awareness of ICT tools for teaching.
Various ICT tools are collected based on the theoretical literature as well as day to day experience.
The answers can be easily processed and due to graphs, the results are comparable. 34 people responded to the
survey out of which 28 are IT professors and 6 are non-IT professors. I think that based on the number and
composition of the sample the author got a realistic picture of the current issues. Considering the nature of my
research it is both general and specific. It gives a clear picture of the nature of higher education and ICT factors
in the current situation, and more specifically – it is looking for answers to defined questions, particularly with
respect to the age and non-IT professors. Processing of the coded data was done using Excel graphs.
In this paper, I prepared questionnaires and examined the answers sent to me by google form.
SOME COMMON EDUCATIONAL APPLICATIONS OF ICT INCLUDE Internet: Teachers use ICT to find educational resources, participating in webinar, online conference etc.
Source: https://www.informationq.com/internet-and-www/

International Journal of Advance and Innovative Research Volume 6, Issue 1 (XXIV): January - March, 2019
311
ISSN 2394 - 7780
Projectors: well prepared power point presentation can be displayed using projector via which a teacher can
explain the content. In turn, if detail explanation still demanded by students, then only a teacher can make
use of chalk and board.
Source: https://www.indiamart.com/proddetail/business-projector-13329559697.htm
E-readers: E-readers are electronic devices that can hold hundreds of books in digital form, and they are
increasingly utilized in the delivery of reading material. Students—both skilled readers and reluctant
readers—have had positive responses to the use of e-readers for independent reading. Features of e-readers
that can contribute to positive use include their portability and long battery life, response to text, and the
ability to define unknown words. Additionally, many classic book titles are available for free in e-book
form.[1]
Interactive White Boards or Smart Boards: Interactive white boards allow projected computer images to
be displayed, manipulated, dragged, clicked, or copied. Simultaneously, handwritten notes can be taken on
the board and saved for later use. Interactive white boards are associated with whole-class instruction rather
than student-centred activities. Student engagement is generally higher when ICT is available for student use
throughout the classroom.[1]
Source: https://www.youtube.com/watch?v=0U05WeXPGlk
Flipped Classrooms: The flipped classroom model, involving lecture and practice at home via computer-
guided instruction and interactive learning activities in class, can allow for an expanded curriculum. There is
little investigation on the student learning outcomes of flipped classrooms. Student perceptions about flipped
classrooms are mixed, but generally positive, as they prefer the cooperative learning activities in class over
lecture.[1]
Source: https://fltmag.com/the-flipped- classroom/

International Journal of Advance and Innovative Research Volume 6, Issue 1 (XXIV): January - March, 2019
312
ISSN 2394 - 7780
MOOC courses by IIT: IIT has started various massive open online courses – Spoken Tutorial [2]and
Swayam[3]. It is a free Web-based online learning program that is designed for the participation of large
numbers of geographically dispersed students. A MOOC may be patterned on a college or university course
or may be less structured.
E-book: An electronic book, also known as an e-book or eBook, is a book publication made available in
digital form, consisting of text, images, or both, readable on the flat-panel display of computers or other
electronic devices. [4]
Source: https://en.wikipedia.org/wiki/E-book
DATA ANALYSIS AND INTERPRETATION Data is collected from 34 professors working in different colleges of Mumbai. Out of 34 professors, 28 are IT
professors whereas 6 are non-IT professors.
The data collection values are shown in the table 1.1 and 1.2.
Age group Total
Professors Internet Projector E-readers
Spoken
Tutorial
Swayam-
NPTEL E-book
Age < 30 12 12 12 7 1 2 10
30<=Age < =40 9 8 6 3 1 3 9
41<Age < =50 7 7 7 3 6 3 4
Total 28 27 25 13 8 8 23
Table-1.1 Awareness of ICT Tools in IT Professors
Graph-1.1 Awareness of ICT Tools in IT Professors

International Journal of Advance and Innovative Research Volume 6, Issue 1 (XXIV): January - March, 2019
313
ISSN 2394 - 7780
Graph-1.2 Awareness of ICT Tools in IT Professors – age-wise
Age group Total
Professors Internet Projector E-readers
Spoken
Tutorial
Swayam-
NPTEL E-book
30 < Age< 40 3 2 1 0 1
1
Age>50 3 3 2 0
6 5 3 0 1
1
Table-1.2: Awareness of ICT Tools in IT Professors
Graph-1.3: Awareness of ICT Tools in non-IT Professors
Graph-1.4: Awareness of ICT Tools in non-IT Professors- age-wise

International Journal of Advance and Innovative Research Volume 6, Issue 1 (XXIV): January - March, 2019
314
ISSN 2394 - 7780
FINDINGS AND CONCLUSION The analysis shows that it takes time in adopting the new ICT tools compare to what we are use from last many
years. May be sometimes the cost of new tools are too high like the cost of smart board or we are not used to
with the techniques like Flipped classrooms. Also compare to non-IT professors, IT professors adopts the
change in the technology faster.
Another aspect is the age factor. What any human learns in the young age, may continue to use it but learning
something new at the later age becomes difficult and people generally don’t intend to implement it at work.
REFERENCES
1) National Policy on Information and Communication Technology (ICT) In School Education, 23 March,
2012.
2) https://www.spoken-tutorial.org
3) https://www.swayam.gov.in
4) https://en.wikipedia.org/wiki/E-book
5) https://www.informationq.com/internet-and-www/
6) https://www.indiamart.com/proddetail/business-projector-13329559697.htm
7) https://www.youtube.com/watch?v=0U05WeXPGlk
8) https://fltmag.com/the-flipped-classroom/
9) https://en.wikipedia.org/wiki/E-book

International Journal of Advance and Innovative Research Volume 6, Issue 1 (XXIV): January - March, 2019
315
ISSN 2394 - 7780
AN ANALYTICAL STUDY OF ROLE OF CLOUD ERP IN RURAL URBAN DEVELOPMENT IN
INDIA, WITH SPECIAL REFERENCE TO RURAL AREAS IN MAHARASHTRA
Dr. M A Khan1, Prof. Ansari Md. Nasir2 and Prof. Shaikh Ahtesham Arif3 1CEO, Hajj Committee of India
2HOD IT, K P B Hinduja College of Commerce 3HOD, IT, Anjuman-i-Islam’s Akbar Peerbhoy College
ABSTRACT
Public administration is an enormous and continuous evaluation process and requires long time sustainable
strategic action plan with in depth analysis. Today, usage of technology like computer, mobile, networking,
internet etc. has connected peoples beyond geographical, social and economical barriers. When compared to
olden days we have ultra modern technologies today. Use of technology in public administration plays a pivotal
role for growth and sustainability. ERP and Cloud brings every processing system for an organization under
one umbrella right from the requirement of an individual to the entire management system. Cloud provides a
powerful horizontal base foundation and ERP adds vertical height in management.
Cloud computing delivers IT resources in terms of Hardware and supporting infrastructure (IaaS), software
(SaaS) and application development platform (PaaS) on demand service fully managed by the cloud service
provider.
ERP is an integrated enterprise wide software solution. It is not just software; it covers mission, attitude,
values, operating style, planning, and distribution to cover every area of an enterprise. It serves an important
function of integrating all organizational units into single system. It provides techniques of integrated
management for effective management resources. Cloud ERP implementation reduces the in-house
infrastructure, software server, network cost and space management and maintenance from the organization.
Hardware, software and platform licenses upgrades and renewal not required by organization. Switching from
one hardware, software or platform to another is like switching from one TV cable operator or a mobile device
or a mobile operator to another.
E-governance has already strengthened its roots in many developing countries including India. E-panchayat, e-
choupal, e-post, e-seva, lokvani, gyandoot and many such projects have been developed to streamline operation
and improve efficiency through workflow automation and knowledge management in public administration in
India. The study aims to correlate technological and implementation of Cloud ERP based e-governance
system with special reference to rural development.
Keywords: E-Governance, Cloud ERP, G2C
LITERATURE REVIEW AND GAP ANALYSIS
Land marks in e-governance development in India
1970 – Government established Department of Electronics to become a part of a new revolutionary change
in field of Computer and Electronic data processing.
1977 – Establishment of National Informatics Center (NIC) brought Information and Communication in
focus.
1980 – Rise in the usage of computers at government offices for data processing.
1987 – Launch of NICNET – a satellite based computer network.
1990 – NICNET spread to cover all district headquarters.
1998 – National Task Force in Information Technology and Software Development.
1999 – Creation of Union Ministry for Information Technology.
2000 – A 12 point minimum agenda was identified by Govt. of India for implementation in all the Union
Government Ministries / Departments.
2015 – Hon. Prime Minister Narendra Modi launched Digital India with a motto “Power to Empower” on 2nd
July.

International Journal of Advance and Innovative Research Volume 6, Issue 1 (XXIV): January - March, 2019
316
ISSN 2394 - 7780
SOME SUCCESSFUL E-GOVERNANCE INITIATIVES
Maharastra online: -www.maharastra.gov.in is a bilingual (English and Marathi) to provide multiple
government services through multiple channels, anytime and anywhere to citizens for government policies
and businesses through a single window, redefining government to citizen (G2C) and government to
business (G2B) interface. Also supported by e-governance initiatives like SETU, Koshvani, , Online
Complaint Management System Mumbai
APonline: -www.aponline.gov.in is a digital gateway of Andhra Pradesh(now Coastal Andhara & Telangana
states).
Bhoomi: - A project in Karnataka for online Delivery of Land records.
Gyandoot: - is an Intranet-based Government to citizen (G2C) service delivery initiative in Madhya
Pradesh.
E-Choupal: - An ITC initiative for precision farming techniques, weather forecasting, crop insurance, etc.
Sampark: - An initiative by UT of Chandigarh for services such as Payment of Taxes, Payment of Water,
Sewerage, and Electricity Bills, Payment of Sticker/Postal Challan, Issue of Bus Passes, Issue of Senior
Citizen Cards, Issue of Births and Death Certificates, Passport Applications, and selected Telephone Bills
under a single roof thereby reducing costs and saving time of the customers there being no jurisdiction
limitations. Thus, these centers ushers into the anytime, anywhere, and non-stop governance concept.
OBJECTIVE AND HYPOTHESIS
I. To study various parameters affecting implementation of e-governance projects in rural areas of
Maharashtra.
II. To find out the impact of Environment and social parameters such as lack of IT awareness, resistance to
change in rural societies, and impact of linguistic and geographical barriers on the implementation of e-
governance projects in rural areas of Maharashtra.
III. To find out the impact of Economical factors such as implantation cost and affordability of users on the
implementation of e-governance projects in rural areas of Maharashtra.
IV. To find out the impact of Technical factors such as selection of cloud type, selection ERP Modules,
Scalability and bandwidth usage and Multimodality, on the implementation of e-governance projects in
rural areas of Maharashtra.
V. To find out latest trend in the implementation of e-governance projects in rural areas of Maharashtra.
VI. And finally based on the findings make suggestions for on the implementation of e-governance projects in
rural areas of Maharashtra.
A. Hypothesis I: Environmental and social parameters such as lack of IT awareness, resistance to change in
rural societies, and impact of linguistic and geographical barriers have impact on the implementation of e-
governance projects in rural areas of Maharashtra.
B. Hypothesis II: Economical factors such as implantation cost and affordability of users have impact on the
implementation of e-governance projects in rural areas of Maharashtra.
C. Hypothesis III: Technical factors such as selection of cloud type, selection ERP Modules, Scalability,
bandwidth usage and Multimodality have impact on the implementation of e-governance projects in rural
areas of Maharashtra.
METHODOLOGY AND SAMPLE SIZE
The research will be conducted by gathering information secondary sources of information collected through
the reports, research work, charts, index, journals, and annual report from various government and non
government and private agencies.
Once the data are collected it will be classified, coded and tabulated for further analysis. The data so collected
was analyzed using appropriate and suitable statistical tool.
DATA ANALYSIS AND FINDINGS OF THE STUDY
1) Environmental and social
E-Governance initiatives provide support to improve IT awareness in rural areas. Also helps people
understand the role of e-governance in inclusive growth. Cloud based ERP assist in selecting e-governance
software / modules which are more user-friendly and reachable in remote rural areas of Maharashtra.

International Journal of Advance and Innovative Research Volume 6, Issue 1 (XXIV): January - March, 2019
317
ISSN 2394 - 7780
Accessibility: In the era of technology, mostly number of people using internet via computers and mobile
phones. In the context of India, there is still gap arising between users and nonusers; it is because of
language barrier, inadequate infrastructure in rural areas, etc.
Usability: Users of e-governance may be literate or illiterate. Any technology or software to be used as user
friendly to greater extent, only then, citizens could use it as smoothly as possible.
Use of local languages: India’s population is second next to china, over 65 % only literate citizens are there;
rest of population cannot understand the English language. Therefore, govt. should make it more comfort by
translating this language into their regional languages for the sake of benefit of e-services.
Awareness about e-governance: Number of people in the country has not been aware of it, on account of
illiteracy, non-accessibility of internet in rural areas, lack of will using internet services, etc. Therefore,
educated citizens, concerned institution and dept. should come forward to get rural people benefited by e-
services.
2) Economical
It is very important to select the right ERP package on suitable and economical cloud model like SAAS,
PAAS, IAAS and Public, Private or Hybrid Cloud model. Helps to select a channel or agency at optimum
cost to be affordable by rural citizens based on average per capita income.
Cost: It is one of the economic issues, implementation of e-governance operations and maintenance of
services fetch huge cost to govt.
Reusability: Any models developed by government, must be reusability. E-governance is being national
plan, what it incorporates any software or modules should be used by other administrations.
Maintainability: Maintenance should be given due importance. Because, IT ministry has been continuously
developing new soft ware’s in order to fill the current needs of citizens. Consequently, govt. launched new
projects for example, digital India.
Portability: The primary requisite for portable applications is independence of components from hardware
and software platforms in order to help in possible reuse by administrations.
Because of the digital revolution and its global impact, rural India has seen a significant diversion from old
traditional system to the new ultra modern service delivery model for Government services. SCA Performance
Assessment and CSC survey in Maharashtra Report say that 65% citizen requires government services in every
six month. Also the Ratio of visitors visiting the services has been reduced to just 4%, which indicates the
critical success factor of how Citizen Services are one of the mandatory requirement in rural areas.
Source: SCA Performance Assessment & CSC Survey in Maharashtra
This can also been seen as the rural citizens in Maharashtra have to travel 3 to 6 KM to reach the Service
Center. Amravati rural area citizens recorded the highest distance of 6 KM with an average travel time of 38
Minutes. Also the citizen has to spend on average of 20/- on travel to avail services, Pune and Amravati are
the highest among the state.

International Journal of Advance and Innovative Research Volume 6, Issue 1 (XXIV): January - March, 2019
318
ISSN 2394 - 7780
Source: SCA Performance Assessment & CSC Survey in Maharashtra
The report also says that 45% of citizens availing services at Citizen Service Centers in Maharashtra belong to
very low income group which is as low as 3000/- per month. Majority of the rural population frequently
require services related to Ration Card, view/update 7-12 Performa, ADHAR related services, Property related
services, Grievances and others.
Source: SCA Performance Assessment & CSC Survey in Maharashtra
The average travel time is 19 min approx, the waiting time is 13 min approximate, Services are completed in 3
days, a rural Citizen Service Center at Ratnagiri recorded the longest service time of 9 days to get all the nods.
Source: SCA Performance Assessment & CSC Survey in Maharashtra

International Journal of Advance and Innovative Research Volume 6, Issue 1 (XXIV): January - March, 2019
319
ISSN 2394 - 7780
3) Technical
Help in selection of appropriate Cloud type/model and selection of ERP packages/ modules. Helps in
defining server, software and network scalability & bandwidth usage. Helps in selecting proper channel /
kiosk / device model like video conferencing, Wi-Fi hotspot, mobile interface etc. for access.
Interoperability: It is one of the critical issues of e-governance. Interoperation among ministries and
departments is difficult, and it became hurdle for processing and sharing data. In other words, web based
data how to be captured and in which format these seem to be major issues of e-governance.
Security: Now days, security of online transaction is becoming big issue; insurance, banking, utility bill
payments, all these services done by e-governance. In fact, there is still discontent to citizens on availing
government services due to lack of security.
Privacy: This is another key issues of e-governace.any information provided by citizens should be ensured
by govt. otherwise, any person or institution may misuse the valuable information.
Authentication: It is very important to know the right user of the services or it may be misused by private
competitors. Meanwhile, the digital signature plays major role in providing authenticity. In fact, it is
expensive and causes for frequent maintenance.
India has rising levels of urbanization, rapid growth in its citizen service base, and one of the most youthful
demographic profiles worldwide. The population’s median age is 25.1 years, which is among the lowest in the
world, and 58 percent of the population is under 30 years of age. The urban population is already sizable, at 307
million in 2018, or 31 percent of India’s total population. By 2020, India is likely to have acquired an additional
112 million urban residents, and an urbanization ratio of 36.4 percent
CONCLUSION
India’s fast growing internet market relies to a greater degree on mobile telephony than in other countries. The
rapid decrease in the cost of smart devices, the increasing availability of 3G/4G/5G infrastructures, and the
sharply declining cost of high speed access are providing strong momentum to the emergence of India’s Internet
user base. Cloud ERP based E-Governance offers a fast, easy and multi mode connectivity and interoperability
with different types of devices like mobile, laptops, IVRS, GPS, IP phones/cameras, help kiosk and other
related devices. Efforts for establishing strong and convenient connectivity through self service kiosks, free wi-
fi zones are being taken in major cities and state capitals; similar efforts should be take for rural customers /
consumers. National Optical Fiber Network (NOFN) intends to connect grampanchayats, will provide a base
will future strengthen E-Governance Platform in reach extremely remote rural parts of Maharashtra.
REFERENCE
1) A Comparative Study of Cloud based ERP systems with Traditional ERP and Analysis of Cloud ERP
implementation - International Journal Of Engineering And Computer Science ISSN : 2319 - 7242
Volume 2
2) Analysis of cyber attack on cloud – Research Dimension Volume V 309-315 (2015) Issue II January
2015. ISSN – 0976 - 8564
3) Oracle White paper – SAP ERP on Cloud, Oracle Corporation Ltd.
4) Enterprise Resource Planning, Alex Leon, Tata McGraw Hill India Ltd.
5) ERP- A Managerial Perspective, S. Sadagopan, Tata McGraw Hill India Ltd
6) e-Governance Project Lifecycle Participant Handbook Course V
7) Digital Governance Models: moving towards good governance in developing countries, by Vikas Nath,
Inlaks Fellow (LSE) Policy Analyst, UNDP
8) http://www.digitalgovernance.org
9) http://www.maharastra.gov.in
10) eGovernance Policy for the State of Gujarat (2014-2019) – Department of Science and Technology
Government of Gujrat – November 2014.
11) Towards an ideal e-Governance scenario in India – TCS white paper
12) e-Governance 2020 – FICCI – Ernst & Young report on emerging themes for e-governance in India.

International Journal of Advance and Innovative Research Volume 6, Issue 1 (XXIV): January - March, 2019
320
ISSN 2394 - 7780
13) E-GOVERNANCE IN INDIA – PROBLEMS AND ACCEPTABILITY - Dr. Sanjay Kumar Dwivedi,
Ajay Kumar Bharti, Journal of Theoretical and Applied Information Technology
14) SCA Performance Assessment & CSC Survey in Maharashtra Shri. Rajesh Aggarwal IAS, Shri. Virendra
Singh IAS, Shri Nikhil Pande.

International Journal of Advance and Innovative Research Volume 6, Issue 1 (XXIV): January - March, 2019
321
ISSN 2394 - 7780
A STUDY OF STUDENT’S PERCEPTION WHILE SHOPPING GOODS WITH REFERENCE TO
THANE DISTRICT
Dr B. S. Gite1 and Soni R. Hasija2
Assistance Professor1, K K M College, Manwat, Prabani
Assistance Lecturer2, Neral Vidya Mandir, Neral
ABSTRACT
Retailing is a one area of broader term of E commerce. Retailing is the buying and selling both goods and
consumer services. After leading IT, India is poised to grow as a retail hub. Only after 1991 opening up of
economy and due to liberalization the organised sector has become the light and presently it exist and various
formats which are also known as supermarkets, hypermarkets, departmental stores. This paper studies about
the perception of students in Thane District. As the retail market structure entirely change due to the perception
of the customers. Nowadays students are the major area for the Retail Industry. In this study we are going to
compare the unorganised sector and organised sector with online shopping. The object of this study finds the
success or failure of retail sector in Thane District. The finding so obtained would certainly help to understand
the perception of students regarding particular product that influence the Retail Industry nowadays.
Keywords: Perception, Structure, liberalisation.
INTRODUCTION
Thane is one of the 36 districts in Maharashtra that district is on western Coast and falls under the Konkani
division of the state. According to the 2011 census report Thana head population of 11,060,148. Retailing in
India is gradually increasing its own way and becoming next boom. Retailers in India are now experimenting
with several new formats experimenting with several new formats, more or less similar to those existing in
developed Nations such as cash and carry stores, discount stores, hypermarkets, speciality stores, etc. Such
stores have already captured the developed the nations and now the attention have shifted to developing country
like India. Organised Store format is the mixture of variables that retailers used nowadays to develop their
business strategies.
Unorganised sector referred as traditional form of low cost retailing. Thana is a classical example of this new
retail development and it is interesting to study and assess the phenomena of development of malls in Thane.
Retail activity in Thane is growing thick and fast almost all major retailers’ examples Reliance, Lifestyle,
Raheja, R City, Big Bazaar, D Mart etc has set up their shops and plan major expansion in the Thane district.
Internet has become an integral part of our life .Which has no longer restriction to networking and social media
but it also exist in online shopping .Which changed the way of students for buying. Today students are more
attract towards the internet for all their shopping needs and wants. In the last few decades the internet has
developed into a vast Global village. E-Commerce provides wide range of goods and services to the customers.
The study about the India's E-commerce business reached 80% in the 2014 and in 2017 it is about 69 million
consumers purchased online. It may be expected to cross 100 million be expected to cross hundred million near
future. India may become the second largest ecommerce market in the world in 2034. It is studying that various
factors of online like security, privacy, brand name, word of mouth, good online experience and quality of
information affect the buying behaviour of the students. Retail industry stimulates the students and accelerates
their buying intention towards particular product by using their marketing strategies .
OBJECTIVES
1 To study the existing retail sector in Thane District.
2 To compare student behaviour towards organised retail sector, unorganised retail sector with online
shopping.
3 To study the students perception towards online shopping.
HYPOTHESIS
1 Students attract towards the online shopping product and services.
2 Developments of Malls has created an impact on the shopping behaviour of the students.
3 Organised retail outlets attract more students than unorganised shops.

International Journal of Advance and Innovative Research Volume 6, Issue 1 (XXIV): January - March, 2019
322
ISSN 2394 - 7780
LITERATURE REVIEW
Luick and Zeigler (1968) explained that sales promotion included those activities to support the mass selling
and personal selling which help to co-ordinate the entire promotional mix.
Thomson and chen (1998) The study suggest that application of means end methodology used in retail
environment and result provides a platform for fashion store image and positioning strategies. The value of
enjoyment and happiness and quality of life were found in the terminal values most considered by consumers in
Association with the store image.
Da Sliva and Syed Alwi (2008) The purpose of this paper is to look into the relationship between the physical
aspect of retail store personal attention of customers. This paper argues that physical aspect of retail store
product related attraction and personal interaction with customers will have a significant and positive impact on
the offline brand image while there was no significant connection between reliability and corporate brand
image.
Nema (2012) This paper analyse the effectiveness of the sales promotion on buying decision and found that it
varies across different customers and buying stages.
Goodwin 1991The paper explain that trust encourages online shopping as a large number of customers avoid
online shopping because they do not trust most web sellers.
Laroche (1996) The study found that the customer trust towards buying particular brand may be considered as
the measure to know the purchasing intention of the customers. Although number of online customer is
increasing the consideration of the perception online trust. The number uses of internet explorer growth of
Smartphone users and evolution are set up like Amazon, Jabong, Make My Trip, etc are some of the key drivers
in the Indian e-business
Bala (2012)The purpose of this paper is to develop a forecasting model for retailers based on customer
segmentation. Retailers can make use of the proposed model proposed model for demand forecasting to
improve the Inventory performance and profitability of operations.
SIGNIFICANCE OF RESEARCH
The aim of this study is to evaluate and understand the comparison of unorganised sector, organised retail sector
and online shopping perception of students in Thane Distinct.
SCOPE OF THE STUDY This topic covers the study of retail management in Thane District to know the perception of students. The
study was conducted in Thana multiple formats operators like departmental stores and hypermarkets and also
Thane college’s students to know their perception while shopping.
DATA AND METHODOLOGY
The study involved to survey conduct across Thane District. The survey data was collected at Thane colleges.50
students are selected for the study. Primary data was collected around the Thane District colleges like Brila
College, Agarwal College, CHM College, etc. The survey was conducted involving 50 responses during the
month of January 2019. However various products were selected for the questionnaires to test the perception of
the perception of the students.
Table-1: Comparision of various factors.
Factors Unorganised sector Organised sector online
books 61 22 16
Bags 44 33 23
clothes 39 45 16
footwear 50 39 11
mobile 16 22 62
laptop 28 28 44
accessories 56 17 27
watches 33 33 34
gifts 56 39 15
Goggles 27 44 29
In table number 1,it represent the study of while shopping students will prefer to shop from various sector
.According to their preference they choice to buy the product where they find more comfortable and convince
budget and time.

International Journal of Advance and Innovative Research Volume 6, Issue 1 (XXIV): January - March, 2019
323
ISSN 2394 - 7780
Figure-1: Graph of various products.
Figure number 1, it indicate exact percent of unorganised, organised sector and online.
CONCLUSION From the above discussion we are getting the result and relationship between the unorganised sector, retail
sector and online shopping. It is clearly seen that the perception of the student merely existence of the product
variety, ambience and convenience is not sufficient to attract the customers. However, online shopping retailers
also need to increase the security and privacy of the customers. No doubt unorganised retail sector has still
successful business in India. It is the most traditional method of retailing where the customers believe on the
seller and change their perception.
Here students prefer to buy mobile and laptop from online, books from retail stores. Clothes they would like to
buy malls, bags from retail shops, accessories and gifts from retail shops, goggles from well organised sector
.but for watches there would equal number of rating found.
LIMITATIONS
The study considered only the students for finding the comparison between unorganised, organised and online
shopping although the sample size of 50 is accepted, yet this paper pose a problem in finding to the entire retail
customers of Thane District.
DIRECTION FOR FUTURE RESEARCH
In future researcher may increase the sample size or increase the geographical area with the implication of
psychological factor. The present study is the perception of students in a particular area. Future studies may be
work in different directions.
REFERENCES BOOKS AND PAPERS
1. Cough an, Principles of Retailing, New York, McMillan, 2001.
2. Emery, Marketing, Maidenhead-McGraw Hill, 2004.
3. Anesbury Z. Dawes J. Kennedy R and Nenyez Thiel M (2012), Supermarket Shelving: A conceptual Paper
on the Value of Shelf Position, Australia and New Zealand Marketing Academy.
4. Nema G Nagar D and Shah M (2012) ,”Impact of Sales promotion Techniques on Consumers Buying
Decision with Respect to Personal Care Products Among College, Teachers of Indore: , Arash a Journal of
ISMDR,Vol.12,No 1, pp.29-3.
5. Heilman C M, Nakamoto K and Roa A G (2012), “Pleasant Surprises: Consumer Response to Unexpected
In-Store Coupons”, Journal of Marketing Research.
6. Kacen Jacquelin J and Lee Julie Anne (2002), “The Influence of Culture on consumer impulse buying
behaviour”, journal of consumer psychology.
7. Zhou I. And Wong A (2004), “Consumer Impulse Buying and In-store Stimuli in Chinese Supermarkets”,
journal of International Consumer Marketing.
8. Dr Kaneez Fatima and Arif khan (2016) ,”Retail Management ”, Himalaya Publication House ,ISO 9001-
2008.
9. Riaz Arika and Raman S (2015),”The Emerging Trends Of Online Shopping, A Literature Review”,
International Journal of Accounting, Business and Management, Vol. No 1, pp.1-8.

International Journal of Advance and Innovative Research Volume 6, Issue 1 (XXIV): January - March, 2019
324
ISSN 2394 - 7780
EFFECTS OF E-COMMERCE ON CONSUMER BUYING BEHAVIOR
Pankaj Keswani, Rishav Raj and Rahul Meher
ABSTRACT
E-Commerce, also known as electronic commerce denotes the buying and selling of goods or services using the
internet. In this paper the perceptions of consumer regarding the online shopping, the level of satisfaction of the
respondents who are indulge in online shopping are studied and examined. The paper is based on the relevant
literature and at the same time examines consumer behavior by questionnaires. The results of the responses got
from the survey are analyzed and studied using various data analysis techniques. This paper also tells about the
issues associated with the internet shopping. Consumer trust and security concerns are the main factors
influencing the online shopping. The paper also tells about the various demographic factors which affect the
buying behavior of the consumers. This paper also suggests some measures to make online shopping more
effective and efficient for the consumers as well as the businesses.
Keywords: Consumer behavior, Online Shopping, Consumer trust
OBJECTIVE OF THE STUDY
This research paper emphasizes on the study of consumer insights and behavior towards online shopping.
GENERAL REVIEW
Online shopping is a type of Electronic commerce or e-commerce which includes buying and selling of goods
and services on the internet. Moreover consumers use internet as a source of medium to look at the newest
products with specifications and features before making an online or offline purchase. They can differentiate
prices across regions and also find out the about the alternate products. The influence of e-commerce on
shopping, customer service or businesses is affecting every organization. Other names are: e-shop, e-store,
Internet shop, web-store, virtual store and online store. An online shop stimulates the physical resemblances of
buying products as well as services from internet shop and this procedure of shopping is called business-to-
consumer online shopping.
Internet has grown into a new distributive channels for many products. Using the internet to shop online has
become a main reason to use the internet, combined with searching of products and finding information about
them. Therefore internet have evolved a highly competitive market, where the competition over consumers is
brutal. In some social networking site like E Bay, e- shopping is being done, where some retail online shops are
available. The use of Internet in India offers a growing vision for e- shopping.
If E-customers know the elements that affect online behavior, and the relationships between these elements ,
further they can develop their new marketing strategies to convert probable customers into lively customers,
Consumer behavior is treated as an pragmatic discipline because some decisions knowingly affects
customers behavior and expected actions. The two main views that seek solicitation of its consciousness are
societal and micro. Internet has transformed the way of consumer’s store, and has rapidly emerged into a global
perspective.
Most companies started using online shopping with the objective of reducing marketing costs, that will
lead to reduce the price of their products in order to stay ahead in very highly competitive markets.
Companies also use the internet in order to deliver, connect and distribute information and products. Today in
the digital world, customer uses the Internet not only for buying the products, but also to compare product
structures, prices, warrantees and delivery services. Many specialists are optimistic about the future of online
marketing business.
In addition to the wonderful capability of the E- market, the Internet provides a unique and different
opening for companies to efficiently reach existing and possible customers. Although maximum and the
major part of the income of online dealing comes from business-to-business trade ( B2B) , the experts of
business-to-consumer ( B2C) trade should not lose their confidence. Researchers and practitioners of e-
commerce provide constant effort to develop an improve division into consumer behavior. Along with the
development of E-retailing, scholars continue to explain E-consumers’ behavior from different perspective.
Most of the studies have norms which are based on classical models of consumer behavior, and then study
the power of E-marketing.

International Journal of Advance and Innovative Research Volume 6, Issue 1 (XXIV): January - March, 2019
325
ISSN 2394 - 7780
METHODOLOGY
Consumer buying behavior
The study consists of both Primary Data and Secondary Data. The primary data is accumulated by circulating a
form online to 100 people. The form has various demographic factors like age, gender, marital status mentioned
in it. Other aspects like trust and security are also considered for analysis. 5 point Likert scale is used in the
form.
The secondary data is compiled from various sources like articles, books research papers and magazines. The
citation is done as and when the information is used and some other sources are mentioned in the Reference.
The data gathered will be analyzed through data analysis techniques and tools like SPSS/ Excel.
LITERATURE REVIEW
1. FORBES
When consumers do online shopping, many things are going on around them and therefore E-Commerce is
most of the times done on mobile devices. It is necessary for the brands to design a better site so as to
improve the throughout experience of the consumers. More than 55% of online shoppers shop while they
are at work. The main reason is the lack of free time which they have because of their busy schedule and
hence they prefer do online shopping at work. More than 85% consumers states that the clear product
images provided on the websites provides them with great shopping experience. Also the reviews below
each product is as important as the product description. Shipping and other extra charges which gets added
at the time of checkout are something which they do not like at all but if the products are worthy then they
are ready to pay them. Consumer behaviors are changing as fast as the mobile technology is growing.
2. ONLINE SHOPPING VS OFFLINE SHOPPING
Online Shopping includes something which we buy online through our electronic devices i.e. phones,
laptops or computers through different mediums like online portal, website, E-Commerce sites or app. On
the other hand offline shopping includes the ordinary old trend of stepping in the market and choosing
anything of your interest physically. Online shopping has grown by more than eight times in the last four
years. Online shopping has the advantages like there are options to see various products at a time. Also easy
return policies and paying after receiving products or EMI’s are some of the factors which the consumers
like. The discounts and offers which are provided throughout the year give consumers the freedom to shop
almost at any time of the year. Considering this, even offline stores are trying to upgrade their game by
bringing up their online presence in order to compete with the changing scenario. But it is also seen that
consumers have more trust in offline businesses because they can see the quality before purchasing and
hence increasing the satisfaction.
3. Various demographic factors like age, gender, marital status, education, has an impact on consumer
behavior. In the year 2000 the major and the main online holiday season buyer were the women. According
to the Internet and Mobile Association of India (IAMAI) 2006, as much as 55% visitors to e-commerce sites
have adopted internet as shopping medium out of which 25% of regular shopper are in the 18-25 age group,
while 46% are in 26-35 age group and 18% in the 35-45 age group.
HYPOTHESIS
Hypothesis 1: Demographic factor like age, gender, marital status have an impact on the consumer buying
behavior
Age group are considered from 15 years to 65 years and is divided into group of 10 according to the Likert 5
Point type Scale. Marital Status and gender are also the demographic factors which are mentioned in the online
form.
Hypothesis 2: Whether consumer trust and security are the main factor for influencing the online shopping
Trust based companies have higher customer retention and more stable revenues generally. The general forecast
is that trust-based business will, in the end have higher sales volumes and lower marketing costs than companies
that endure on push-based marketing strategies. Online shopping have become more and more common but
threat from hackers during payment or buying plays an important role in the behavior pattern of the consumer.
Hypothesis 3: Cash on delivery is one of the most used payment methods.
The way that a buyer chooses to compensate the seller of a good or services that is also acceptable to the seller.
Typical payments include cash, credit or debit, bank transfers, money orders, and online payment services as
Paypal.

International Journal of Advance and Innovative Research Volume 6, Issue 1 (XXIV): January - March, 2019
326
ISSN 2394 - 7780
Hypothesis 4: No travel to shop is the most important motivational factor to buy the product from internet
A buying motive gives the reason why actually consumer or buyer buys the product. So, motive refers to
thought, Urge, feeling, emotion, and drive which make the buyer to purchase.
Hypothesis 5: Online Shopping is better than Physical store
Online shopping is better than traditional shopping according to the major tests reports. Few people say that
online shopping makes life easier, convenient and fast. While some people also think in the reverse way. The
people say that offline shopping gives you in hand experience which in online does not happing.
Hypothesis 6: Significant relationship exist between brand quality and the consumer buying behavior
The relationship between the brand and the consumers is known to produce positive outcomes for both partners.
The consumer - brand relationship process is proposed and insights for further research are provided.
FINDINGS
1. According to the survey most of the online shoppers were between 15-35 age groups out of which they
comprised of both the genders i.e. males and females in close ratios. Therefore age group has an impact on
consumer buying behavior whereas gender doesn’t.
2. The survey made it quite evident that not only consumer trust and security are the main factor for influencing
the online shopping. Other factors like price discounts and convenience are also the reasons for which the
consumers prefer online shopping.
3. According to respondents, 60% of consumers opted online shopping but offline shopping was also preferred
by them as it comprised of 40%
4. During the conduction of the survey we also found out that cash on delivery was the most preferred method
for payments. Also a good amount of consumers opted credit/debit/ATM cards for payments.
5. No travelling to shops is not the biggest motive to shop online. Consumers preferred to shop online because
of the wide range of products available there and also they can easily compare the prices of products.
6. Also the survey made it quite clear that the main reason for choosing a brand was the quality along with
trust. Therefore we can say that a significant relationship exist between brand quality and the consumer
buying behavior.
CHALLENGES
Online shopping has changed the way of shopping but there are lot of issues faced by customers in online
shopping such as fake products, hidden costs etc. Though online shopping is easy and convenient but still there
are lot of issues faced by consumers.
Logistics related problems
Another problem faced in online shopping is issues with delivery and logistics. Products are often lost or
damaged while in transit and order tracking systems are unable to accurately locate the product. According to
Forbes several consumers do not purchase the product online because they believe or perceive that by buying
the product online they will not get the product on stimulated time.
Hidden costs
E-Commerce marketplaces often charge hidden costs after the purchase is finalized by the consumer. Websites
hide tax charges, additional shipping from consumers till buyer buys and finalizes the product.
Payment issues
According to Myadvo report, there are lot of customers who become victims to online payment issues. Even
though there are several methods like Net Banking, credit or debit card paymets and even cash-on-delivery,
there are payment failures due to websites server error, payment gateways error.
Ambiguous websites Policies
Online shopping websites have no websites policies at all or have unclear and confusing user, return policy.
Good consumer court lawyers can help you in filling a complaint with the appropriate consumer court at
district, state or national level.
RECOMMEDATIONS
1. Recreating the touchable shopping experience: It has been noted that customers choose earlier if they can
touch, feel, sense, see the product. They basically want to experience the realness of the product. Therefore

International Journal of Advance and Innovative Research Volume 6, Issue 1 (XXIV): January - March, 2019
327
ISSN 2394 - 7780
one should provide detailed product pictures from all the side and also provide information on model’s size
and measurements.
2. Availability of online shop assistants: The customer generally feel very good if they are assist by someone.
According to Metrillo report customer will purchase the product faster if they are aware of the product and
know what exactly the product offers and what they need, therefore there should be an expert ready to help
them that makes choosing more comfortable.
3. Sites should load quickly: There should be an aim to keep the online websites loading time as minimum as
possible. According to Gabriel A. Mays founder of the Just Add Content (a website platform for business),
“The biggest threat in the digital marketing world is not the competitor but it’s the back button”. If the
websites load too slowly then it’s very natural that customers will not wait around. They will go elsewhere.
REFERENCES
https://www.forbes.com/sites/richardkestenbaum/2018/05/24/this-is-what-consumers-do-while-theyre-
shopping-online/#1f06db7a12b9
https://www.cio.com/article/2914780/e-commerce
https://www.metrillo.com/blog/improve-online-shopping-experience
https://www.myadvo.in/blog
https://retail.economictimes.indiatimes.com

International Journal of Advance and Innovative Research Volume 6, Issue 1 (XXIV): January - March, 2019
328
ISSN 2394 - 7780
IMPACT OF SURROGATE ADVERTISEMENT ON CONSUMER BEHAVIOUR
Dr. Seema Laddha and Dhruvin Iyer
SIES College of Management Studies
ABSTRACT
Does surrogate advertising increase the overall level of consumption? Alcohol, Cigarette advertisements have
been banned in India since 1995 due to direct influence on consumers’ purchasing behaviour gradually adopted
surrogate advertisements.
The objective of this research is to evaluate the influence of surrogate advertisement on consumers buying
decision and to understand the consumer perception towards surrogate advertisements and its products.
This study was conducted to know the knowledge and perception of customers about surrogate advertisements
& analyses the factors for knowing the surrogate advertisement have any impact on the consumers buying
behavior for surrogate products. Study concluded that surrogate advertisements are only successful in creating
brand recall of the hidden product in the advertisement.
Keywords: Surrogate Advertisement, Consumer Behaviour, brand recall, perception of customers
INTRODUCTION
Alcohol and tobacco consumption has been a controversial topic in India for very long. According WHO’s
Global status report on alcohol consumption says that about 33 % of the country’s population consumes alcohol
on a regular basis. Average consumption rate is 6.2 litres per annum . Average rural consumption habit for
alcohol is 11.4 litres. One in ten people who are consuming alcohol suffers negative health and an estimated
100,000 premature deaths per year. Consumption of tobacco is result in critical diseases. The World Health
Organization predicts that tobacco deaths in India may exceed 1.5 million annually by 2020.
There have been a number of empirical studies on the effects of tobacco and alcohol advertising. Researchers
study the effects of tobacco and alcohol advertising because the consumption of these substances is known to
have potentially adverse health consequences.
Alcohol and cigarette advertisements were found to have severe impact on people due to increased consumption
rate. Therefore Indian government banned alcohol and cigarette advertisements in 1995 (Nathwani 2016). This
gave birth to the rise of surrogate advertisements in India.
Surrogate advertisement is a form of advertisement used to advertise banned products by replacing them with a
surrogate product. In India we can find many surrogate advertisements like Bacardi using music CD’s,
McDowell’s and Bagpiper using soda water as surrogate to promote its alcoholic products. The purpose of this
study This research study is significant as it enables to find the people's perception of surrogate advertisements
and their impact on customer’s buying decision.
LITERATURE REVIEW
Singh, Chandrashekhar. "Evaluation Of Surrogate Advertising And Its Legal Measures With Special Reference
To India." Management Insight 11.1 (2015). Surrogate Advertisement Means The Method Of duplicating the
brand image of a particular product extensively for the promotion of another product of the same brand. It is
generally done when the advertisement of one product is not allowed in a particular country. Singh (2015)
reported the various industries which uses the surrogate advertisement method for their ads and promotions and
their surrogate product through which they promote it. It also stated the various laws and regulation which are
there which forces these industries for the use of surrogate but it neither reported the consumer’s perception of
these advertisement methodologies.
Dr. S. G. KhawasPatil [YeshwantMahavidyalaya, Nanded] and Laxmikant S. Hurne [YeshwantMahavidyalaya,
Nanded] in their study titled " Surrogate Advertising : A Successful Marketing Strategy for Liquor, Whisky
products" conducted to know the effectiveness of surrogate advertisements, whether the products shown in
advertisement are sold or not and customers awareness about surrogate advertisements, concluded that
maximum respondents can tell intention behind surrogate advertisements. Surrogate advertisement is a
successful strategy because maximum respondents are changing their purchase decision.
Ms Kirti Singh Dahiya and Ms kirti Miglani started their research study "Emergence of surrogate
advertisement" to check whether surrogate advertisements provide high brand recall or not, has found that
Surrogate advertisements are only successful in creating brand recall of the hidden product in the advertisement.
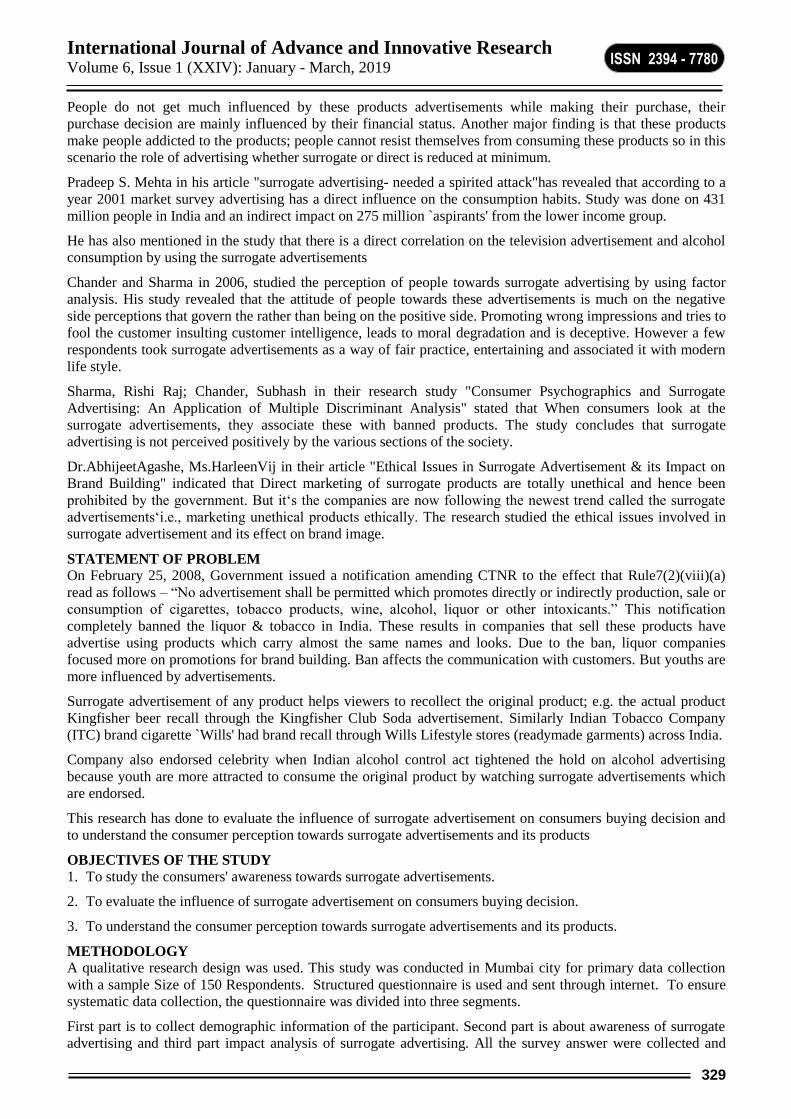
International Journal of Advance and Innovative Research Volume 6, Issue 1 (XXIV): January - March, 2019
329
ISSN 2394 - 7780
People do not get much influenced by these products advertisements while making their purchase, their
purchase decision are mainly influenced by their financial status. Another major finding is that these products
make people addicted to the products; people cannot resist themselves from consuming these products so in this
scenario the role of advertising whether surrogate or direct is reduced at minimum.
Pradeep S. Mehta in his article "surrogate advertising- needed a spirited attack"has revealed that according to a
year 2001 market survey advertising has a direct influence on the consumption habits. Study was done on 431
million people in India and an indirect impact on 275 million `aspirants' from the lower income group.
He has also mentioned in the study that there is a direct correlation on the television advertisement and alcohol
consumption by using the surrogate advertisements
Chander and Sharma in 2006, studied the perception of people towards surrogate advertising by using factor
analysis. His study revealed that the attitude of people towards these advertisements is much on the negative
side perceptions that govern the rather than being on the positive side. Promoting wrong impressions and tries to
fool the customer insulting customer intelligence, leads to moral degradation and is deceptive. However a few
respondents took surrogate advertisements as a way of fair practice, entertaining and associated it with modern
life style.
Sharma, Rishi Raj; Chander, Subhash in their research study "Consumer Psychographics and Surrogate
Advertising: An Application of Multiple Discriminant Analysis" stated that When consumers look at the
surrogate advertisements, they associate these with banned products. The study concludes that surrogate
advertising is not perceived positively by the various sections of the society.
Dr.AbhijeetAgashe, Ms.HarleenVij in their article "Ethical Issues in Surrogate Advertisement & its Impact on
Brand Building" indicated that Direct marketing of surrogate products are totally unethical and hence been
prohibited by the government. But it‘s the companies are now following the newest trend called the surrogate
advertisements‘i.e., marketing unethical products ethically. The research studied the ethical issues involved in
surrogate advertisement and its effect on brand image.
STATEMENT OF PROBLEM
On February 25, 2008, Government issued a notification amending CTNR to the effect that Rule7(2)(viii)(a)
read as follows – “No advertisement shall be permitted which promotes directly or indirectly production, sale or
consumption of cigarettes, tobacco products, wine, alcohol, liquor or other intoxicants.” This notification
completely banned the liquor & tobacco in India. These results in companies that sell these products have
advertise using products which carry almost the same names and looks. Due to the ban, liquor companies
focused more on promotions for brand building. Ban affects the communication with customers. But youths are
more influenced by advertisements.
Surrogate advertisement of any product helps viewers to recollect the original product; e.g. the actual product
Kingfisher beer recall through the Kingfisher Club Soda advertisement. Similarly Indian Tobacco Company
(ITC) brand cigarette `Wills' had brand recall through Wills Lifestyle stores (readymade garments) across India.
Company also endorsed celebrity when Indian alcohol control act tightened the hold on alcohol advertising
because youth are more attracted to consume the original product by watching surrogate advertisements which
are endorsed.
This research has done to evaluate the influence of surrogate advertisement on consumers buying decision and
to understand the consumer perception towards surrogate advertisements and its products
OBJECTIVES OF THE STUDY
1. To study the consumers' awareness towards surrogate advertisements.
2. To evaluate the influence of surrogate advertisement on consumers buying decision.
3. To understand the consumer perception towards surrogate advertisements and its products.
METHODOLOGY
A qualitative research design was used. This study was conducted in Mumbai city for primary data collection
with a sample Size of 150 Respondents. Structured questionnaire is used and sent through internet. To ensure
systematic data collection, the questionnaire was divided into three segments.
First part is to collect demographic information of the participant. Second part is about awareness of surrogate
advertising and third part impact analysis of surrogate advertising. All the survey answer were collected and

International Journal of Advance and Innovative Research Volume 6, Issue 1 (XXIV): January - March, 2019
330
ISSN 2394 - 7780
compiled together for analysis. Each data point was systematically examined for patterns and trends to study the
effect of the surrogate advertising on Indian Consumers. Secondary data is collected by using various surveys
done on the topic.
DATA ANALYSIS
Demographic Analysis of consumer
Age & Gender
16Yrs-20Yrs 8 5%
21Yrs-40Yrs 111 74%
41Yrs-70Yrs 31 21%
TOTAL 150 100%
Majority of the Respondents belong to the age group of 21-40Yrs (74%),where as 21% belonged to the age
group of 41-70Yrs, and the remaining 5% were of 16-20 Yrs of age. Out of 150 Respondents, 92 were Male
(61%) and 58 were Female (39%)
Analysis of participants who are aware of Surrogate advertising
Now among the sample size of 150 people it was found that 76 are not aware about the surrogate advertisement.
Only 74 were aware about the advertisements. After considering the people who are aware about it among them
it was found that the 57% of them find it misguiding .And 21% of them believe that it increases the
consumption of alcohol.
When it comes to understanding on banning of advertisement, 56% don’t know that ads for these products
are banned, rest 44% are aware of it.
Types of Media Used for Advertisements
Out of 150 respondents, majority of them (49%) are not sure whether surrogate ads are required or not, 46%
agree that they are not necessary, whereas only 5% feel that it is required.
67% of the people watch advertisements through Internet, 18% use Television, rest 10% and 5% see by the
means of print media and mobile respectively. Effective means of media advertising through which television
advertising is more reachable than other media.
Category of Advertisement
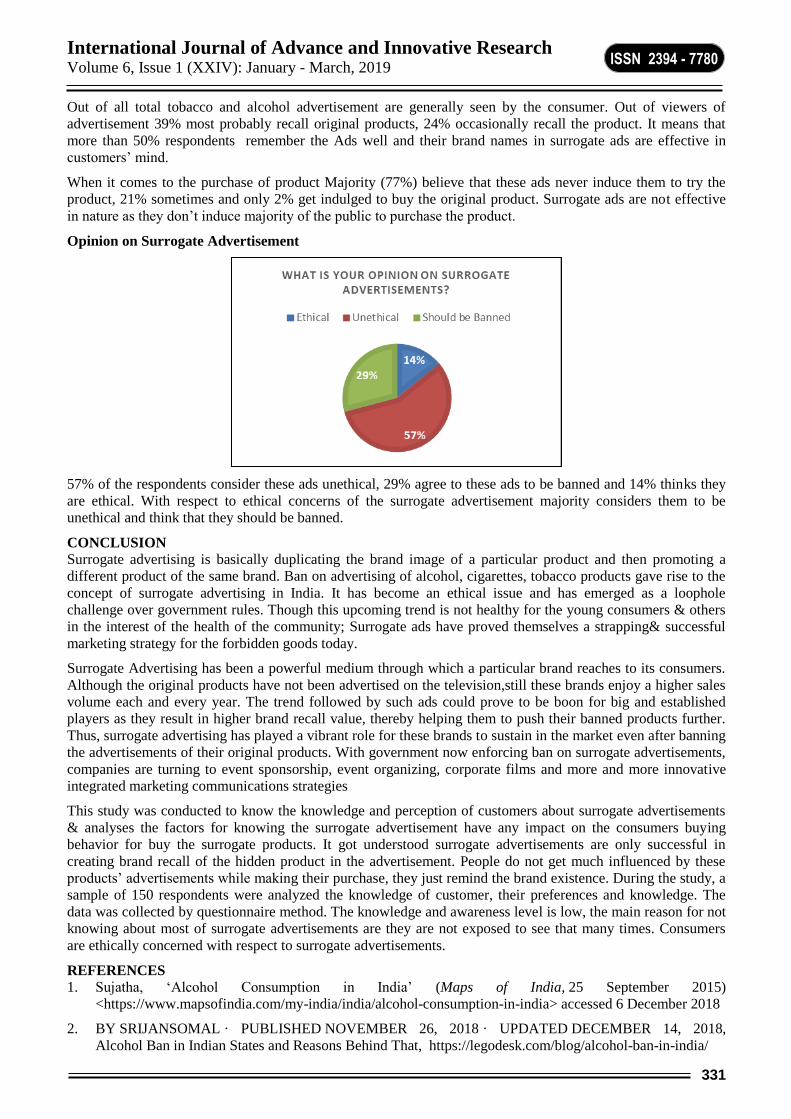
International Journal of Advance and Innovative Research Volume 6, Issue 1 (XXIV): January - March, 2019
331
ISSN 2394 - 7780
Out of all total tobacco and alcohol advertisement are generally seen by the consumer. Out of viewers of
advertisement 39% most probably recall original products, 24% occasionally recall the product. It means that
more than 50% respondents remember the Ads well and their brand names in surrogate ads are effective in
customers’ mind.
When it comes to the purchase of product Majority (77%) believe that these ads never induce them to try the
product, 21% sometimes and only 2% get indulged to buy the original product. Surrogate ads are not effective
in nature as they don’t induce majority of the public to purchase the product.
Opinion on Surrogate Advertisement
57% of the respondents consider these ads unethical, 29% agree to these ads to be banned and 14% thinks they
are ethical. With respect to ethical concerns of the surrogate advertisement majority considers them to be
unethical and think that they should be banned.
CONCLUSION
Surrogate advertising is basically duplicating the brand image of a particular product and then promoting a
different product of the same brand. Ban on advertising of alcohol, cigarettes, tobacco products gave rise to the
concept of surrogate advertising in India. It has become an ethical issue and has emerged as a loophole
challenge over government rules. Though this upcoming trend is not healthy for the young consumers & others
in the interest of the health of the community; Surrogate ads have proved themselves a strapping& successful
marketing strategy for the forbidden goods today.
Surrogate Advertising has been a powerful medium through which a particular brand reaches to its consumers.
Although the original products have not been advertised on the television,still these brands enjoy a higher sales
volume each and every year. The trend followed by such ads could prove to be boon for big and established
players as they result in higher brand recall value, thereby helping them to push their banned products further.
Thus, surrogate advertising has played a vibrant role for these brands to sustain in the market even after banning
the advertisements of their original products. With government now enforcing ban on surrogate advertisements,
companies are turning to event sponsorship, event organizing, corporate films and more and more innovative
integrated marketing communications strategies
This study was conducted to know the knowledge and perception of customers about surrogate advertisements
& analyses the factors for knowing the surrogate advertisement have any impact on the consumers buying
behavior for buy the surrogate products. It got understood surrogate advertisements are only successful in
creating brand recall of the hidden product in the advertisement. People do not get much influenced by these
products’ advertisements while making their purchase, they just remind the brand existence. During the study, a
sample of 150 respondents were analyzed the knowledge of customer, their preferences and knowledge. The
data was collected by questionnaire method. The knowledge and awareness level is low, the main reason for not
knowing about most of surrogate advertisements are they are not exposed to see that many times. Consumers
are ethically concerned with respect to surrogate advertisements.
REFERENCES
1. Sujatha, ‘Alcohol Consumption in India’ (Maps of India, 25 September 2015)
<https://www.mapsofindia.com/my-india/india/alcohol-consumption-in-india> accessed 6 December 2018
2. BY SRIJANSOMAL · PUBLISHED NOVEMBER 26, 2018 · UPDATED DECEMBER 14, 2018,
Alcohol Ban in Indian States and Reasons Behind That, https://legodesk.com/blog/alcohol-ban-in-india/
International Journal of Advance and Innovative Research Volume 6, Issue 1 (XXIV): January - March, 2019
332
ISSN 2394 - 7780
3. M Rani, S Bonu, P Jha, S N Nguyen, L Jamjoum, Tobacco use in India: prevalence and predictors of
smoking and chewing in a national cross sectional household survey,
https://www.ncbi.nlm.nih.gov/pmc/articles/PMC1747786/pdf/v012p000e4.pdf
4. Saffer is a Research Associate in the NBER's Program on Health Economics and a Professor of economics
at Kean University.
5. H. Saffer and D. Dave, "Alcohol Advertising and Alcohol Consumption by Adolescents," NBER Working
Paper No. 9676, May 2003.
6. H. Saffer, "Alcohol Advertising and Motor Vehicle Fatalities," Review of Economics and Statistics, 79 (3)
(August 1997).
7. H. Saffer, "Alcohol Advertising Bans and Alcohol Abuse: An International Perspective," Journal of Health
Economics, 10 (1991).
8. H. Saffer and D. Dave, "Alcohol Consumption and Alcohol Advertising Bans," Applied Economics, 34
(11) (July 2002).
9. H. Saffer and F. Chaloupka, "The Effect of Tobacco Advertising Bans On Tobacco Consumption," Journal
of Health Economics, (19) (2000).
10. H. Saffer, "The Control of Tobacco Advertising and Promotion" in Tobacco Control Policies in
Developing Countries, P. Jha and F. Chaloupka, eds., New York: Oxford University Press, 2000.
11. Singh, Chandrashekhar. "EVALUATION OF SURROGATE ADVERTISING AND ITS LEGAL
MEASURES WITH SPECIAL REFERENCE TO INDIA." Management Insight 11.1 (2015).
12. Barcelona Panda “Surrogate Advertisements: India’s response towards International Regulations” (2011)
PL April S-12 Today

International Journal of Advance and Innovative Research Volume 6, Issue 1 (XXIV): January - March, 2019
333
ISSN 2394 - 7780
PYTHON LIBRARIES FOR GEOSPATIAL ANALYSIS
Pooja Tiwari
Assisant Professor, Sasmira Institute of Commerce & Science
ABSTRACT
PySAL, the Python spatial analysis library, is an open source cross-platform library for geospatial data
analysis. It is used for analyzing geospatial vector data. PySAL library is written in Python. In this paper
various features of PySAL and its uses in spatial analysis is discussed. PySAL supports the development of high
level application for spatial analysis. The study has been done to find out the mechanism to analyzing spatial
data using python.
Keywords: ESDA; Python; STARS; GeoDA; Spatial Analysis; High Performance
1. INTRODUCTION
1.1 HISTORY
PySAL has been developed by Luc Anselins research group at UIUC and Sergio group previously located at the
University of Illinois, Champaign-Urbana, and Serge Rey who was at San Diego State University.[1] It is the
outcome of collaborative effort of two project PySpace and STAR(Space Time Analysis of Regional
Systems).[2]PySAL supports next generation of spatial analysis application. PySAL, is an open source cross-
platform library for spatial analysis written in the Python.[3]
PySAL is substance of software development projects tools to develop prototypes plan state of the method, and
to protect the community of open source software library for geospatial analysis.[4] New advanced technologies
have been generated for geospatial data. The art of analyzing live data streams and dashboard systems to
visualize patterns of the streams not only define the new technological structure in smart popular cities but have
also become more common in many countries. It combines with live data analysis, visualization libraries and
decision support tools to be part of end-to-end application from data to analysis and visualization to generate a
result in a real-time more modular and useable spatial analysis of software libraries. These can be easily
integrated. There are more software for analyzing the geospatial data to make sense of patterns in these rapid
application development software environments.[5]
Python generated code is to be the most efficient, it is very easy to understand and it can be executed very
quickly. Python is the fastest programing language. Python is especially excellent support for Python
Cartographic Library, It is a scripting language among other programming languages. Python also supports
spatial analysis of Geospatial data. In 2008 PySAL pass to the GeoDa Center for Geospatial Analysis and
Computation at Arizona State.
1.2 FEATURE
PySAL supports the high level application for analyzing Geospatial analysis, i.e
1. To determine spatial data, clusters, hot-spots and outliers.
2. Make the graph using spatial data
3. Using Geographical network analysis spatial regression and statistical modeling
4. Spatial econometrics
1.3 SCOPE
It is significant to understand what PySAL can do and cannot do as per its design. First of all, PySAL is a
complete library in itself. Developers are looking for a suite of a spatial analysis method that they can include
into application development using PySAL. Geospatial analysis may include defining research project
requirement, customizing, and scripting, extensive simulation of the spatial analysis.Users are looking for a user
friendly platform, graphical user interface for spatial analysis of dataset will not move directly to PySAL instead
we directly used a project like STARS(Space-Time Analysis of Regional Systems) and GeoDaX other software
product which convert PySAL features in Graphical user interface. We assume that with the development of
python programming language the users can access the PySAL uses will be large in the future.[5]

International Journal of Advance and Innovative Research Volume 6, Issue 1 (XXIV): January - March, 2019
334
ISSN 2394 - 7780
1.4 DESIGN
Component of PySAL
PySAL is a consolidated collection of a unit with a specific focus on vector-based spatial data. The weight
module is used to retrieve and manipulate data and convert the spatial weight that is key to many types of
spatial analysis.[6] There are many different way to define the neighbor relations, the weights unit pillars are
1. Contiguity Based
2. Spatial Econometrics
3. Cluster
4. Spatial Dynamics
Data investigation is protected by the collecting and ESDA (Exploratory Spatial Data Analysis) unit. The group
of unit applies a range of recall methods that can be used to clarify the data and give other operations. They also
start the fundamental creation of other spatial weights structures. The ESDA unit contains a non-identical
procedure to apply the well-ordered of rates also quality LISA features such as the local Moran and Gi Statistics
[7].
Spatial modeling is applied in the spatial dynamics and also spatial econometrics unit. It contains a many tools
to trace the changes over time of spatial structure, developed application studies of geographical economic
combination. It incorporates spatial Markov analysis plus spatial theta.
1.5 PySAL FUNCTIONALITIES
PySAL library provides some important functionality such as Data analytic functions and Modeling Functions.
File Input and Output, Map calculation, Computational Geometry, Spatial Weights are elements of ESDA.
Spatial Autocorrelation and spatial Regression are modeling functionalities provided by PySAL library.
1.6 ADVANTAGES AND LIMITATION OF PySAL
PySAL provide time management, it offers fast collection of data, it has accurate and better analysis of data.
Pysal is open source cross platform library for geospatial data analysis. It supports the development of high
level application for spatial analysis.[9][13]
Disadvantage
PySAL executes with the help of interpreter rather than a compiler. Which make it slow down; due to
compilation and execution it runs normally. It has many design restrictions and it requires more testing time to
run the application.[9][11][12]
1.7 OTHER LIBRARIES
Apart from PySAL there are other libraries for spatial analysis some of they are Grass GIS is open source free
software for analysis of spatial data, FDO(Feature data object),Geo Tools,OSGeo4W.[10][14]
1.8 CONCLUSION
In this research paper, we have introduced an open source, cross-platform PySAL library. PySAL is a popular
library for spatial analysis Geographical Information System. PySAL is a python library which provides various

International Journal of Advance and Innovative Research Volume 6, Issue 1 (XXIV): January - March, 2019
335
ISSN 2394 - 7780
tools to facilitate geospatial analysis. Future work will learn PySAL with alternative front-ends including jython
(Pedroni and Rappin2002), RPy (Moriera and Warnes 2004), and ArcGIS.
These applications help expand the impact of methods and tools developed within the university on
analysts and policy-relevant challenges in other domains. These applications help expand the impact of
methods and tools developed within the university on analysts and policy-relevant challenges in other
domains.
REFERENCES
1. Rey, S. J., & Anselin, L. (2009). PySAL: A Python Library of Spatial Analytical Methods. Handbook of
Applied Spatial Analysis,175-193. doi:10.1007/978-3-642-03647-7_11
2. Vermeulen, A. F. (2018). Data Science Technology Stack. Practical Data Science,1-13. doi:10.1007/978-
1-4842-3054-1_1
3. Notebook on nbviewer. (n.d.). Retrieved from https://nbviewer.jupyter.org/github/pysal/esda/blob/master/
notebooks/Spatial Autocorrelation for Areal Unit Data.ipynb
4. Rey, S., Anselin, L., Li, X., Pahle, R., Laura, J., Li, W., & Koschinsky, J. (2015). Open Geospatial
Analytics with PySAL. ISPRS International Journal of Geo-Information,4(2), 815-836.
doi:10.3390/ijgi4020815
5. Pausewang, G. (1974). Notizen: Ammoniumperoxofluorometallate (NH4)3M(O2)2F4 der 5. Nebengruppe
/ Compounds (NH4)3M(O2)2F4 (M = V,Nb,Ta). Zeitschrift Für Naturforschung B,29(3-4), 272-273.
doi:10.1515/znb-1974-3-433
6. Pysal. (n.d.). Retrieved from https://pypi.org/project/pysal/1.4.1/
7. Corbin, C. C., & White, J. (1978). Technical report : Illinois natural areas inventory / by the Department of
Landscape Architecture, Univeristy of Illinois, Urbana-Champaign, and the Natural Land Institute,
Rockford, Illinois. doi:10.5962/bhl.title.15190
8. KDnuggets. (n.d.). Retrieved from https://www.kdnuggets.com/2018/06/top-20-python-libraries-data-
science-2018.html
9. GIS Data ( Geographic Information Systems ) uses , advantages and disadvantages. (2018, June 21).
Retrieved from https://www.online-sciences.com/technology/gis-data-geographic-information-systems-
uses-advantages-and-disadvantages/
10. Libraries. (n.d.). Retrieved from https://www.osgeo.org/choose-a-project/development/libraries/
11. Spatial analysis. (2019, February 18). Retrieved from https://en.wikipedia.org/wiki/Spatial_analysis
12. Python, A., & Brandsch, J. (2019). A Case Study of Spatial Analysis: Approaching a Research Question
With Spatial Data. doi:10.4135/9781526467454
13. Python Language advantages and applications. (2017, October 23). Retrieved from
https://www.geeksforgeeks.org/python-language-advantages-applications/
14. Wang, X., Jian, H., Liu, Z., Ni, Q., Gui, L., & Tang, L. (2008). Assembly molecular architectures based on
structural variation of metalloligand [Cu(PySal)2] (PySal=3-pyridylmethylsalicylideneimino).
Polyhedron,27(12), 2634-2642. doi:10.1016/j.poly.2008.05.005
15. Wright, D. J. (n.d.). Data Integration. Encyclopedia of Geographic Information Science.
doi:10.4135/9781412953962.n36

International Journal of Advance and Innovative Research Volume 6, Issue 1 (XXIV): January - March, 2019
336
ISSN 2394 - 7780
SUSTAINING LOCAL SUPPLY OF LEADERSHIP IN THE UAE: A CASE EXPERIENCE OF
EMIRITIZATION
Dr. Mohan Lal Agarwal1, Dr. Sayel Sabha2 and Dr.Muhammad Masroor Alam3 Professor1 and Associate Professor2, 3, MENA College of Management, Dubai
ABSTRACT
The United Arab Emirates (UAE) became a country in 1971 as a constitutional federation of seven emirates.
Dubai is its most prominent city and Emirate of the seven Emirates.
Among the relatively new counties, the UAE has made a model progress in leveraging its natural petrochemical
resources, created a strong public sector employment and entreprneprurship opportunities for all especially in
attracting private sector though the expatriates. Once a miniscule number, the local population also known as
Emiraties, have now expanded to become an approximately 12% segment of the UAE population.
A growing number of Emiraties are now armed and market ready with higher college and university degrees
and international education experiences and now want to continue to work for the government services and the
public sector of the UAE. However, their supply is getting to be far greater than the job openings and
opportunities in the government services and public sector.
It has created an unfamiliar challenge before the UAE government. The government must need to develop,
encourage and mandate a strong and attractive private sector with similar working condition as they are used
to in working with the government services and the public sector.
This entire campaign is branded and executed as Emiratization- the implementation of which is proving quite
challenging and testing the economic a political realities of the job market in the UAE.
The research paper, formatted as a research case and based on a variety of sources published and suitably
cited sources, other secondary data and supplementary insights documents this very scenario and presents the
concept of Emiratization, participation and response of the private and public sector, model cases of the private
companies that have responded to the call for Emiratization and the continuing challenges.
We expect the case when published to serve as a handy and valuable learning resource for business training
and academic learning programs.
Keywords
1. UAE Vision 2021
2. Emiratization
3. The UAE Labour Market
4. Employer and employee compatibility
THE UNITED ARAB OF EMIRATES (UAE)
The United Arab Emirates (UAE) is a constitutional federation of seven emirates with Abu Dhabi as the capital
and was formed in 1971. The seven emirates are Abu Dhabi, Dubai, Sharjah, Ras Al Khaima, Ajman, Umm Al
Quwain, and Fujairah. The H. H. late Sheikh Zayed bin Sultan Al Nahyan was the first President of the UAE
and is known as the Father of the Nation. The population of the UAE in 2018 was 9.6 million approximately
and the Gross domestic Product in real prices rose to US dollars: 435.70 billion, giving per capita income of
about US$45,000. 1
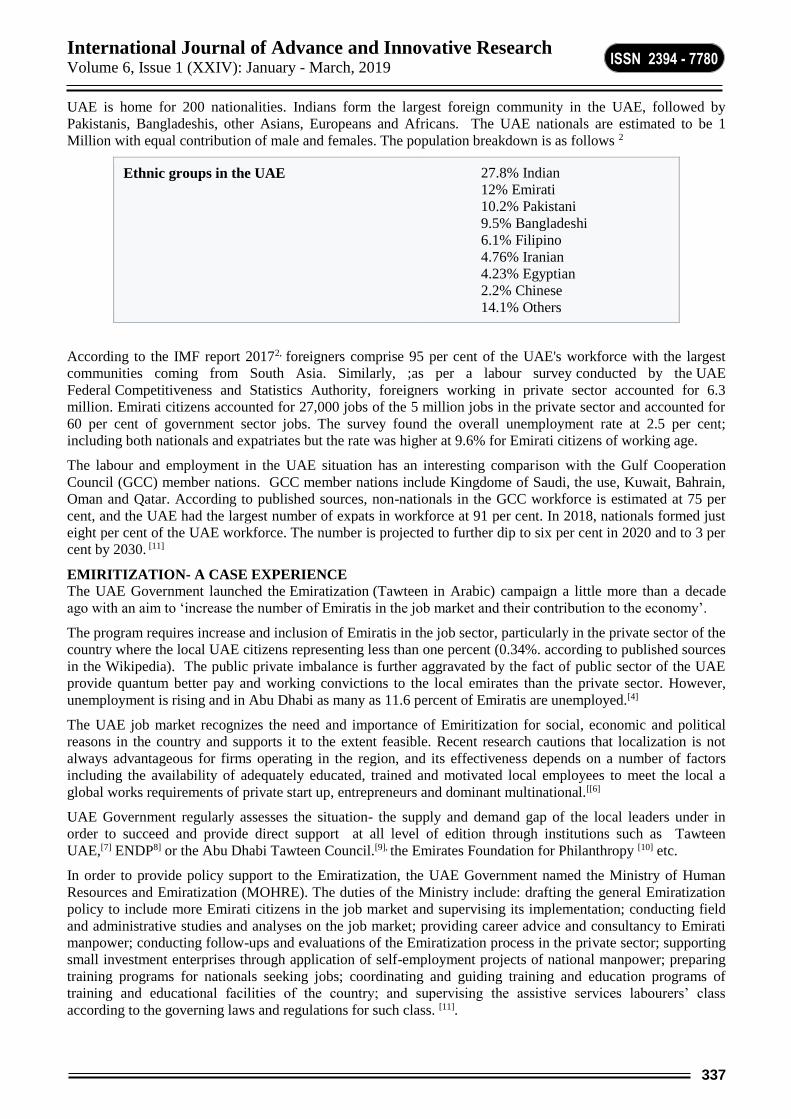
International Journal of Advance and Innovative Research Volume 6, Issue 1 (XXIV): January - March, 2019
337
ISSN 2394 - 7780
UAE is home for 200 nationalities. Indians form the largest foreign community in the UAE, followed by
Pakistanis, Bangladeshis, other Asians, Europeans and Africans. The UAE nationals are estimated to be 1
Million with equal contribution of male and females. The population breakdown is as follows 2
Ethnic groups in the UAE 27.8% Indian
12% Emirati
10.2% Pakistani
9.5% Bangladeshi
6.1% Filipino
4.76% Iranian
4.23% Egyptian
2.2% Chinese
14.1% Others
According to the IMF report 20172, foreigners comprise 95 per cent of the UAE's workforce with the largest
communities coming from South Asia. Similarly, ;as per a labour survey conducted by the UAE
Federal Competitiveness and Statistics Authority, foreigners working in private sector accounted for 6.3
million. Emirati citizens accounted for 27,000 jobs of the 5 million jobs in the private sector and accounted for
60 per cent of government sector jobs. The survey found the overall unemployment rate at 2.5 per cent;
including both nationals and expatriates but the rate was higher at 9.6% for Emirati citizens of working age.
The labour and employment in the UAE situation has an interesting comparison with the Gulf Cooperation
Council (GCC) member nations. GCC member nations include Kingdome of Saudi, the use, Kuwait, Bahrain,
Oman and Qatar. According to published sources, non-nationals in the GCC workforce is estimated at 75 per
cent, and the UAE had the largest number of expats in workforce at 91 per cent. In 2018, nationals formed just
eight per cent of the UAE workforce. The number is projected to further dip to six per cent in 2020 and to 3 per
cent by 2030. [11]
EMIRITIZATION- A CASE EXPERIENCE
The UAE Government launched the Emiratization (Tawteen in Arabic) campaign a little more than a decade
ago with an aim to ‘increase the number of Emiratis in the job market and their contribution to the economy’.
The program requires increase and inclusion of Emiratis in the job sector, particularly in the private sector of the
country where the local UAE citizens representing less than one percent (0.34%. according to published sources
in the Wikipedia). The public private imbalance is further aggravated by the fact of public sector of the UAE
provide quantum better pay and working convictions to the local emirates than the private sector. However,
unemployment is rising and in Abu Dhabi as many as 11.6 percent of Emiratis are unemployed.[4]
The UAE job market recognizes the need and importance of Emiritization for social, economic and political
reasons in the country and supports it to the extent feasible. Recent research cautions that localization is not
always advantageous for firms operating in the region, and its effectiveness depends on a number of factors
including the availability of adequately educated, trained and motivated local employees to meet the local a
global works requirements of private start up, entrepreneurs and dominant multinational.[[6]
UAE Government regularly assesses the situation- the supply and demand gap of the local leaders under in
order to succeed and provide direct support at all level of edition through institutions such as Tawteen
UAE,[7] ENDP8] or the Abu Dhabi Tawteen Council.[9], the Emirates Foundation for Philanthropy [10] etc.
In order to provide policy support to the Emiratization, the UAE Government named the Ministry of Human
Resources and Emiratization (MOHRE). The duties of the Ministry include: drafting the general Emiratization
policy to include more Emirati citizens in the job market and supervising its implementation; conducting field
and administrative studies and analyses on the job market; providing career advice and consultancy to Emirati
manpower; conducting follow-ups and evaluations of the Emiratization process in the private sector; supporting
small investment enterprises through application of self-employment projects of national manpower; preparing
training programs for nationals seeking jobs; coordinating and guiding training and education programs of
training and educational facilities of the country; and supervising the assistive services labourers’ class
according to the governing laws and regulations for such class. [11].

International Journal of Advance and Innovative Research Volume 6, Issue 1 (XXIV): January - March, 2019
338
ISSN 2394 - 7780
APPLICATION OF EMIRATIZATION [11].
The UAE encourages the public and private sectors to implement Emiratization policies at all levels through the
establishment of a special department, quota and incentives.
Establishment of a special department
Federal Law No. 8 of 1980 also known as the Labour Law as amended mentions in its Article 10 that MoHRE
will have a special department dedicated to find adequate job opportunities for nationals. The department must
assist employers in fulfilling their need of national workers whenever needed.
Quota and incentives
Ministerial Orders 41, 42 and 43 of 2005 impose on private sector employers a quota system, whereby every
company with more than 100 employees is obliged to recruit (and retain on the payroll) the stipulated number of
UAE nationals to ensure the minimum percentage of participation of Emiratis in the workforce. Companies with
lower grading are required to file mandatory financial guarantees, the amount of which will depend on the
category of the employer (as set out in the relevant Order).
Localisation of jobs
Following a strategic plan to promote Emiratization, MoHRE decided to localise more jobs in the private sector.
Starting from 2017, companies that are registered with Tas'heel's online services and that employ over 1000
workers would be required to hire Emirati citizens for the data entry positions. MoHRE decided that all
construction facilities with a workforce of 500 or more employees must appoint at least one Emirati
occupational health and safety officer from 2017.
LOCAL LEADERSHIP DEVELOPMENT IN THE UAE
The Father of the UAE as a nation Sheikh Zayed bin was very supportive of the happiness of the fellow
Emiraties. He said, "Money is not useful if it is not dedicated to serving the people." [11].

International Journal of Advance and Innovative Research Volume 6, Issue 1 (XXIV): January - March, 2019
339
ISSN 2394 - 7780
Accordingly he set out on a new era of development in various fields. Petroleum dollars were utilized for
launching hundreds of mega infrastructure, education, health, and other projects that would set the UAE, and
her people on the road to progress and economic prosperity. The transformation included the construction of
houses, modern residential compounds, hospitals, clinics, schools, universities, institutes, colleges as well as a
significant expansion of infrastructure, including roads, bridges, electricity, water, communication, and
transportation. This was all in order to build a modern country, and provide a better and more fulfilling life for
the citizens of the UAE.
With a view to continue the citizen happiness and local leadership, the UAE Government incorporated
Emiratization campaign among the national Agenda for the vision 2121. Building a competitive knowledge
economy is one of the six pillars of National Agenda in line with Vision 2021. The UAE aims to achieve this by
unlocking the potential of citizens and enabling them to be a driving force of the UAE's economic development.
Emiratization is among the national agenda and the strategic priority for the vision 2121. [10]
The UAE Cabinet also has approved the UAE Model for Government Leadership which is based on three pillars
including leadership spirit, future outlook, accomplishment and influence. The Model highlights the criteria
required for the 21st century leaders, which was launched by His Highness Sheikh Mohammed bin Rashid Al
Maktoum, the Vice President, Prime Minister and Ruler of Dubai, in 2015, and aims to streamline efforts of
UAE Government to achieve UAE Centennial 2071 strategy.
"The UAE journey towards the future requires continuous development efforts that focus on UAE nationals,
build their capabilities, enhance their skills, and equip them with the right tools to face the future challenges,"
Sheikh Mohammed said. "We approved the UAE Model for Government Leadership as a new addition to the
government efforts to prepare leaders and build capabilities of cadres and national competencies. We want to
develop government work process to be in line with our efforts in building future governments," Sheikh
Mohammed said. [17]
And yet in a survey study by Korn Ferry, 2018, “as many as 60 percent of business leaders in the UAE predict a
talent deficit to hit the Gulf country in as early as 2020, and that companies need to update labour skills to
prepare them for jobs of the future and avoid a gap in talent. Areas where a gap currently exists range from
information security to digital product development and big data analytics.
A CASE EXAMPLE OF EMIRATIZATION AT STANDARD CHARTERED BANK [18]
The banking and finance industry in the UAE has a regulatory Emiratization ratio requirement of 40%, Standard
Charter Bank in Dubai has not only complied with ti but also exceeded it in many cases. Accordingly to Ms
Jane Siney, head of HR – UAE & Middle East: “At the heart of our Emiratization programme is our aspiration
to be recognised as an employer of choice for local talent and driving sustainable business growth. We drive
through the mission based on the following three levers:
Developing world class leaders to create an engaged and productive workforce
Becoming the industry leader in developing and retaining talent
Achieving an integrated talent pool that reflects the demographics of the local market

International Journal of Advance and Innovative Research Volume 6, Issue 1 (XXIV): January - March, 2019
340
ISSN 2394 - 7780
Standard Chartered bank firmly believes that employing nationals not only fulfils Emiratization requirements, it
also makes good business sense. “Employing UAE nationals helps international organisations like ours build a
sustainable pipeline of local talent, enhances the employer branding proposition and employee engagement
through diversity and social inclusion, and helps achieve external legitimacy and social acceptance in the
UAE,”.
Through its Emiratization strategy, Siney explains that the bank has been able to create a more diverse
workforce that matches the demographics of the local market and their customer base. “We have learnt that to
remain competitive we need to regularly review our strategy on attraction, retention and development – we have
a forum in which we do this with the most senior members of our UAE business,” she concluded”
CONCERNS AND CHALLENGES FOR SUSTAINABILITY
As described before, the public sector has traditionally been, and remains, the employment market of choice for
Emiratis, Wherever appropriate skills and expertise was unavailable, they hired expatriates.
The working conditions in the UAE Public sector followed many practices from more economically developed
nations to promote harmonious working conditions that would be satisfactory to UAE. For instance, the
practices of five-day working week, generous leave allowances, employment protection and structured
advancement processes were adopted among others.
The UAE’s public-sector employment market operated with a focus on efficient governance of the UAE, social
integration of UAE citizens into a young and rapidly growing nation and the redistribution of oil revenues to
Emiratis and the UAE economy. The employment market evolved in consultation with its citizen stakeholders,
to the benefit of employee and employer.
The UAE private-sector employment market, on the other hand, was almost exclusively focused on economic
development and profit. Consequently a very liberal regulatory framework was applied for their business
mission of getting the job done at the lowest cost with the highest profit margin. The power in the employment
relationship rested almost exclusively with the employer, with the employee having signed a contract and come
to the UAE in a very weak position. Despite the improving and evolving employment legislation, there still
exists a significant imbalance of power in the UAE private sector employer-employee relationship.
All this has made private sector generally unattractive destination for seeking employment in the Pirate sector of
the use and has a huge transformational task ahead for t=all the three stakeholders I.e., the UAE government,
the private sector and the local citizens. It requires both time and I collusion of the UAE government in closing
the unfavourable gap of working conditions and attraction in the private as compared to emiratis working in the
public sector.
The UAE Government is quite anxious that the country remains strong in Emiratization. According to Dr Jasim
Al Ali, deputy CEO for shared services, Dubai Media Incorporated, ‘2030 is going to be a 'catastrophic' year.
It's high time that nationalisation policy gets the attention. The GCC countries and private sector companies
have made this a top priority. However, the obstacles related to organisational inefficiencies, failure of
leadership, and management style in both the public and private sector have resulted in the ineffectiveness of
the nationalisation policy. We are talking about nationalisation for the last three decades but so far we have
failed to increase the number of nationals in the public and private sector [11]
REFERENCES
1. https://www.government.ae/en/about-the-uae/fact-sheet
2. https://en.wikipedia.org/wiki/United_Arab_Emirates
3. Gulf News - New Emiratization drive Archived 2009-02-03 at the Wayback Machine
4. Gulf News - Call for cautious Emiritization Archived 2009-03-16 at the Wayback Machine
5. Kerr, S. and A. England (2009). UAE to safeguard jobs of nationals. Financial Times. London
6. "Emiritization won't work if people don't want to learn - The National". Retrieved 23 February 2017.
7. Mellahi, K. (2007). The effect of regulations on HRM: private sector firms in Saudi Arabia. International
Journal of Human Resource Management, 18(1): 85-99.
8. Forstenlechner, I. (2010). "Workforce localization in emerging Gulf economies: the need to fine-tune
HRM." Personnel Review 39(1): 135-152.
9. ": Emirates Nationals Development Programme:” Retrieved 23 February 2017.

International Journal of Advance and Innovative Research Volume 6, Issue 1 (XXIV): January - March, 2019
341
ISSN 2394 - 7780
10. http://www.tawteencouncil.ae Archived 2011-06-28 at the Wayback Machine
11. "Welcome to Emirates Foundation". Retrieved 23 February2017
12. https://www.government.ae/en/information-and-services/jobs/vision-2021-and-emiratisation
13. https://www.mohre.gov.ae/en/about-us/about-mohre.aspx)
14. https://www.government.ae/en/information-and-services/jobs/vision-2021-and-emiratisation
15. https://www.khaleejtimes.com/nation/abu-dhabi/91-expats-in-uae-workforce-experts-call-for-
emiratisation--
16. https://www.mofa.gov.ae/EN/DiplomaticMissions/Embassies/Cairo/AboutUAE/Pages/UAELeadership.asp
x
17. https://www.emirates247.com/news/emirates/uae-cabinet-approves-uae-model-for-government-leadership-
2018-10-02-1.673820
18. https://www.arabianbusiness.com/politics-economics/407975-60-of-business-leaders-predict-talent-deficit-
to-hit-uae-in-2020
19. https://www.changeboard.com/article-details/15919/leveraging-local-talent/
20. https://www.thenational.ae/business/unique-challenges-face-emiratisation-in-private-sector-1.240807
21. https://gulfnews.com/lifestyle/community/emiratisation-rethinking-the-process-1.1456743
NB1: The case material was drawn from a variety of secondary data and published sources and which have been
appropriately cited and referenced.
NB 2. All images used in the tests are sourced from Google images courtesy free publications used only with an
aim to quicken comprehension of the text. No copyrights.

International Journal of Advance and Innovative Research Volume 6, Issue 1 (XXIV): January - March, 2019
342
ISSN 2394 - 7780
AN ANALYSIS ON IMPACT OF DIGITALIZATION ON EDUCATION SECTOR IN INDIA
Dr. Rinkesh Chedda1 and Puja Prempal Ahuja2
Research Guide1
Lecturer2, Department of Economics, Guru Nanak College of Arts, Science and Commerce, Mumbai
ABSTRACT
Literacy in layman words refers to the ability to read and write. An individual is considered as illiterate if
he/she doesn’t know to read and write. On the other hand, Digitalization refers to converting audio, visual into
computerized form. Digital Literacy terms to be the Convergence of both teaching and computer world. In the
era of digitalization, even the education sector is left out of the standards of digitalization. Education sector has
expanded and innovated its ways of teaching and reaching students in various ways. Digitalization of education
sector is one very integral step towards not only a successful mindset of the students but also a skilful growth of
their talents.
Keywords: Digitalization, Education sector, growth, mindset
INTRODUCTION
Digital Literacy has become one of the main components of the current educational sector as it provides the
educator with the view-point of excellence as well as growth of skills. The term Digital Literacy is so broad that
it covers a lot of concepts under one umbrella. One of the main aspects of Digital literacy is that of the content.
Digital content plays an integral role in upliftment of the study. Finding and then enhancing of the data is
another challenge for the digital content creator. Some researchers even consider Digital content to be same as
E-reading and it does not enhance the ability of the student in anyway. Whereas, some researchers contradict
this conclusion by adding certain hyperlinks, videos can be uploaded in online content which cannot be done
with paperback books. Digital Literacy also enhances the student’s research ability with the help of research
engines so that students can enter keywords and navigate the results of the research. Digital content creation for
students also includes blogs, email, tweets, videos etc. Youtube videos also are a main part of digital era as
students learn a lot of things from watching audio-visual clips. The process in itself is a creative and
collaborative effort of both the content created by teachers and video makers to make it more interesting and
informative for the students. Important role of Information technology is in enhancing the learning ability of the
students.
Information and communication technologies (ICTs) have penetrated all areas of contemporary life. In this
context, digital literacy has become much more than the ability to handle computers – just like traditional
literacy and numeracy, it comprises a set of basic skills which include the use and production of digital media,
information processing and retrieval, participation in social networks for creation and sharing of knowledge,
and a wide range of professional computing skills. Digital literacy improves employability because it is a gate
skill, demanded by many employers when they first evaluate a job application. It also works as a catalyst
because it enables the acquisition of other important life skills. The origin of the word literacy refers to the
ability to read and write. Early descriptions of computer-related literacy’s also focus on the acquisition of sets of
rules and technical capabilities. However, by the end of the 20th century, this definition had expanded
considerably.
Digital literacy is an umbrella concept for important skill clusters whose names are often used as synonyms;
their content, however, is not exactly the same. ICT literacy refers to a set of user skills that enable active
participation in a society where services and cultural offerings are computer-supported and distributed on the
internet. Technological literacy (previously called computer literacy) entails a deeper understanding of digital
technology and comprises both user and technical computing skills. Information literacy focuses on one of the
key aspects of our Knowledge Society: the ability to locate identifies, retrieve, process and use digital
information optimally. In this paper, we will employ the term digital literacy because it retains a close
connection with other basic literacy’s (e.g. reading and writing, mathematical competence) that are integral
parts of education.
In seven out of the sixteen literacy indicators, digital literacy plays a central role. In the last century, the shift
from the manufacture of goods to the provision of services has resulted in an economy based on information
and knowledge. Computers substitute for workers who perform routine physical and cognitive tasks, but they
complement workers who perform non-routine problem solving tasks. Modern organizations and companies
have been facing a restructuring of work, which means flatter organizational structures, decentralized decision

International Journal of Advance and Innovative Research Volume 6, Issue 1 (XXIV): January - March, 2019
343
ISSN 2394 - 7780
making, widely shared information, flexible work arrangements and collaboration in project teams. Companies
applying these changes in organizational structures and business practices require new skills, as wells as an
increased role of ICT in the work place for communication, information sharing, and simulation of business
processes.
Both educational theorists and practitioners agree that digital literacy has to be defined and developed in
relation to general educational objectives: if ICT use is a basic skill, it must be included in all areas of school
instruction. Digital literacy seems to have a beneficial effect on basic skills and competences. There is a
growing body of national and international evidence demonstrating the positive impact of digital technologies
on measurable learning outcomes as well. A study implemented by the British Educational Communications
and Technology Agency (Becta) reveals that the integrated use of technology enables a range of positive
outcomes for children and young people, including improved progress for both girls and boys in Key Stages 1
and 2 (age groups: 5–10 years). In Key Stage 1, students talented in math progressed much faster when their
digital literacy was developed and when mathematics and science was taught using ICT tools and resources.
Especially impressive gains in knowledge and learning motivation were found in English at Key Stage 2. The
impact on attainment found in secondary school was also impressive. At the General Certificate of Secondary
Education (GCSE) examinations, students with well-developed digital literacy skills scored better in all areas.
Classes that were taught completely online or in a blended learning environment on average produce better
learning results than those classes teaching face-to-face alone.
Digital literacy has positive effects on skills important for successful learning also. Students can access
information more easily, as a growing amount of data is available in digital repositories that are much easier to
access than traditional, paper-based resources for learning. Managing information is a digital literacy
component that students acquire and use in their private lives when joining online communities and keeping up
with the diverse networks they are a part of. Integrating and evaluating information, on the other hand, are skills
that have to be taught in the classroom, with the teacher acting as an expert in evaluating information, showing
students the differences between reliable and useless digital resources. The most important components of
digital literacy are common for future computer users and ICT professionals: accessing, managing, evaluating,
integrating, creating, and communicating information individually or collaboratively in a networked, computer-
supported, and web-based environment for learning, working, or leisure. These skills are directly related to
basic competences; therefore, digital literacy is as relevant as traditional literacy’s – such as reading and
writing, mathematics, or the management of social behaviour. Below is an overview of the relationships of
digital literacy components and basic competences. information, defined as identifying information sources as
well as having the techniques for collection and retrieval of such information, is a basic component of all
literacy’s. Digital literacy significantly broadens the scope of potential sources of knowledge. However,
information search in this area requires more sophisticated information management skills than traditional
literacy’s that use resources whose validity and authenticity is relatively easier to assess. When using an
Internet-based knowledge portal, applying an existing organizational or classification scheme to evaluate its
content is not always possible. Books and journals, for example, may be validated by the reputation of their
publishers; most web sites, however, do not bear the label of a well-known institution. Evaluating information
(making judgements about its adequacy, currency, usefulness, quality, relevance, or efficiency) comes to play
here. Being able to determine the authority or time of the information retrieved online requires digital literacy
skills that only the expertise and experience of education may furnish individuals
The present paper will discuss the different aspects of Digital Literacy in Education sector and it’s Significance.
Digital content enhances teaching-learning abilities of both teachers and students.
Digital Content is time-saving for the educator as well as for the students.
Information technology both Teacher and Student friendly.
ICT builds a parity of theoretical and practical aspect of the study.
The use of ICT helps to explain complex concepts in a simple format.
The Audio-Visual impact of concept will remain engraved in the minds of students for a longer period of
time.
CONCLUSION
Digital child and youth art – a new, ICT-embedded developmental model for the visual language development
of an ICT-literate generation – invites us to reconsider traditional ideas about the artistic development of

International Journal of Advance and Innovative Research Volume 6, Issue 1 (XXIV): January - March, 2019
344
ISSN 2394 - 7780
children and young people. Similar developments in music or design education may lead to a new, creativity-
oriented digital literacy. Creativity as a major component of digital literacy will probably characterise ICT use
in the 21st century, just as consuming information was relevant in the last decades of the 20th century. If digital
literacy will involve the development of creativity, educational methods are bound to change. The effects of the
social web on the way we learn inside and outside of school may also shed new light on the contents of digital
literacy. Web 2.0 applications – blogs, wikis, social networking sites, micro-blogging, or social bookmarking —
are likely to have a profound effect on the way we construct and extract knowledge. The effects these media
have on our lives are widely published, but, even today, they are rarely used in education. Creating and
communicating information are skills of growing importance as digital tools develop and make high-quality
creative experiences available for increasingly broader user groups. Collaborative applications increase the
importance of social skills in the learning process at all levels: young learners, adult learners, and teachers. In
the new digital literacy framework of the 21st century, communication and creation in the digital media will
take centre stage.

International Journal of Advance and Innovative Research Volume 6, Issue 1 (XXIV): January - March, 2019
345
ISSN 2394 - 7780
AGRO TEXTILE –A NEW INNOVATION FOR CROP MANAGEMENT
Prof. Sachin A. Mandle
Sasmira’s Institute of Commerce and Science, Worli, Mumbai
ABSTRACT
In India population is increasing at rapid rate. Population explosion in India causes many consequences.
Overpopulation has increased huge pressure on agricultural land. It also increases crop consumption as more
population means more burden on agricultural land to produce more food. It is necessary to increase the crop
yield and to maintain the quality of agricultural products. To increase the agricultural productivity and to
prevent the losses of natural resources like water and soil there is a need of technological innovation and the
answer is Agro-textile.
Agro-textile is a growing sector among all the sectors of technical textiles. When technical textiles are used for
agricultural purpose they are known as “Agro-textile”. India is a leading player for production, usage and
export of Agro-textile. In India out of total technical textile production Agro-textile accounts for about 1.6%
and it is estimated to increased demand for Agro-textile products globally. Agro-textile is an essential
innovation for agriculture modernizing. Agro-textile useful for various applications like agriculture, forestry,
horticulture landscape gardening. An intention of this study is to aware and provide knowledge about Agro
textile innovation for crop management. To encourage industrialists, entrepreneurs for the investment in this
growing sector
Keywords: Agriculture, Agro textile, Population, Crop management
INTRODUCTION
India is known as country of farmers. Agriculture is the main source of occupation for majority of India’s
population. Agriculture is the backbone of Indian economy. Agriculture in our country realized an importance
for everyone when our 2nd Prime Minister Mr.Lal Bahadur Shastri gave the slogan “JAI JAWAN JAI KISAN”.
India’s Agriculture contributes over 16% of country’s GDP and provides employment for about 50% of the total
workforce. India is 2nd largest populous country in the world with the population of 1.3 billion. It is expected
that India will become most populous country in the world by the year 2030. This population rise putting
pressure on land use and degrading forest and water resources due to overexploitation by the population. This
put more pressure on agricultural crops to satisfy the food requirement of people. India is facing big issue of
food shortage and crop management. Indian field of Agriculture and Horticulture realized the importance of
new technology for crop management. Agro textile is the new innovation developed for climate control and
crop management.
REVIEW OF LITERATURE
Dr V Subramaniam, G R Poongodi and V Veena Sindhuja conducted study in the year 2009. The purpose of the
study was to understand production, properties and potential of Agro textiles. Secondary data was used by
researcher referred from various publications, books and websites. A study was done to find out the role of
textiles in agriculture and how the technology and textile will contribute to nation’s economy.
Research article written by Dr.Prerna Kapila from Punjab Agricultural University, Ludhiana in the year 2017.
Article written about how crop management can be done through Agro textiles. Author concluded that with
latest developments in Agro textiles it is possible to improve crop yield which helps for crop management.
The study was conducted by Mr. Sunil K.Agrawal in the year 2013. The purpose of the study was to understand
the various applications of textiles in agriculture. Research was based on secondary data. Researcher discussed
about how agro textiles plays vital role in increasing crop production and environment control.
M. Saravanan studied role of textiles in agriculture field. The study was done in the year 2017.Secondary
data was collected from various research journals and websites. Researcher explained huge scope of textiles
in agriculture. Researcher also explained how Agro textiles can give multidimensional solutions to all the
problems of agriculture.
AGRO TEXTILE-DEFINITION
Agro textiles are special textiles intended for use in agriculture, horticulture, fisheries and forestry in order to
boost production, quality and protection from adverse climatic conditions.
Agro textiles are application of textile materials in the agriculture field.

International Journal of Advance and Innovative Research Volume 6, Issue 1 (XXIV): January - March, 2019
346
ISSN 2394 - 7780
Agro textiles are technical fabrics for agriculture, horticulture, gardening and construction.
Textiles used in Agriculture are termed as agro textiles.
Agro textiles can be defined as textiles prepared by woven, knitted or non-woven technique especially to be
used for controlling and preserving environment and resources for various applications like agriculture, forestry,
horticulture or landscape gardening.
HISTORY OF AGRO TEXTILES Farming is the primary source and Textile is the secondary source of India from ancient times. Textile has been
used in agricultural field since centuries. From 18th to 19th century textiles have been used widely for food
production, horticulture and fishing. Different types of fabrics are used for the production of Agro textiles.
CLASSIFICATION OF AGRO TEXTILES
Types of Agro textile on the basis of application
Agro textile products for crop production
Agro textile products for packing
Agro textile products for horticulture
Agro textile products for floriculture
Agro textile products for animal husbandry
Agro textile products for fishing
Agro textile products for aquaculture
Agro textile products for forestry
FIBRES USED TO PRODUCE AGRO TEXTILES Agro textiles can be made with both natural as well as man made fibers. Natural fibres based agro textiles are
not effective as compared to man made based agro textiles because they are degradable after some years. On the
other hand men made based agro textiles are long durable and strong, easy for transportation.
Following are the various fibers used to produce Agro textiles
Coir
Flax
Jute
Nylon
Polyester
Polyethylene
Polypropylene
Wool
METHODS OF AGRO TEXTILES PRODUCTION There are various methods of producing Agro textiles. Most commonly used methods are as follows:
Woven
These types of products are produced with the help of weaving machines. Most commonly it can be done by
Sulzer projectile weaving machines. These machines are available in the width range of 540- 846 cm.

International Journal of Advance and Innovative Research Volume 6, Issue 1 (XXIV): January - March, 2019
347
ISSN 2394 - 7780
Non Woven
There are many methods are available for producing Non-Woven Agro textile products. Needle-punched and
Spun bonding are two mainly used methods. A fabric made by spun bonded method has a high tensile strength.
Knitting
These are produced on raschel machines. In this individual yarn systems are converted into fabrics. This
method used to make protective nets.
ESSENTIAL CHARACTERISTICS REQUIRED FOR AGRO TEXTILES
Resistance to solar radiation-Immediately after planting or sowing it is necessary to spread agro textiles on
cultivated land so that it can protect the land from solar radiation.
Resistance to ultraviolet radiation- Polyethylene is a kind of fiber which has UV stabilizing property that
convert the UV radiation into thermal radiation. It reduced harmful impact of UV radiation on plants and
increased rate of photosynthesis.
Resistance to abrasion-Shade nets made by agro textiles has good abrasion resistance. It will not allow pest
and animals to attack on the surface of crops.
Biodegradable- Man made fiber based agro textiles are much biodegradable than natural fiber based agro
textiles.
Water retention- Agro textiles are super-absorbers which allow retain much water.
Tensile strength-Agro textiles are highly stretchable hence show long term durability.
Protective-Being stiff, flexible and biodegradable agro textiles are highly protective from wind, high
temperature and bad climate.
Lightweight- Weight of agro textiles are light so that it will easily bare by crops and plants.
APPLICATIONS OF AGRO TEXTILES
Sunscreen Nets
Sunscreen nets with open mesh are useful to protect land and greenhouses from harmful solar radiation. These
nets allow air flow freely so that it will not built up excess heat.
Mostly used color is black as it assures dark shade. It is available in multiple colors like black, white, dark or
light green.

International Journal of Advance and Innovative Research Volume 6, Issue 1 (XXIV): January - March, 2019
348
ISSN 2394 - 7780
Plant Nets
Polyolefin fiber used for this. It is useful for fruits which grow near the ground need to kept away from damp
soil to allow them grow and minimize the amount of decayed fruit.
Bird Protection Nets
It is basically open knitted net designed to protect seed, crop and fruits from attack of birds and pests. Due to
open mesh net fabric it make air flow free that allow sufficient shading and flourish the plants.
Ground Cover
It is very unique kind of product designed for landscaping and horticulture purpose. It is helpful for long-term
weed control, to maintain moisture. It also helps to protect plants from UV rays.
Wind Protection Nets-
These are mainly used in fruit plantation area to protect from wind damage. It also protects plants from being
cooled by excessive wind. It also protects the soil of plantation area from erosion.

International Journal of Advance and Innovative Research Volume 6, Issue 1 (XXIV): January - March, 2019
349
ISSN 2394 - 7780
Root Ball Net
It is designed to protect root system of plants. A cloth used to wrap root balls of plants so that it will protect
from damage and help for speedy growing of younger plants.
Anti-hailstone Nets
These nets are from polyethylene monofilaments. These are used to protect from hailstones damage.
Mulch Mat
These are useful for prevention of weed growth. It helps to reduce the use of herbicides. These are available in
both degradable and non-biodegradable forms.
Monofil Nets
They are designed tough and knitted monofil nets to protect young branches, flowers from damage and leaf
from tear due to bad weather.

International Journal of Advance and Innovative Research Volume 6, Issue 1 (XXIV): January - March, 2019
350
ISSN 2394 - 7780
Insect Meshes
The fine woven nets designed to protect plants from insect attack. They are strong and durable.
Harvesting Net
These specialized nets either spread on ground or tied under the trees so that fruits will not fall directly on the
ground. It is helpful to protect fruits from fall damage.
ADVANTAGES OF AGRO TEXTILES
Helps in increase crop production
Protect soil from dry out
Reduce use of herbicides, pesticides and fertilizers
Increase crop yield
Protect plants from climatic changes
Helps to reduce harvest damage of fruits and flowers
Helpful for early maturing of crops and non seasonal plants.
RESEARCH METHODOLOGY
Research methodology is systematic way to solve research problem. It is a process of studying research
scientifically. In any research paper methodology section enables the reader to evaluate overall reliability and
validity of study. Methodology section mainly answer to questions i.e. how was the data collected how was the
data analyzed?
Secondary data means data which is already available. Secondary data may be published or unpublished data.
Published data means data which can be collected from Indian government or private journals even from
foreign journals. Books, magazines or news papers can be refer.
DATA COLLECTION
Secondary data collected from various books, journals and previous research studies related to research topic.
Internet plays an important role in collection of secondary data. Before collecting secondary data Researcher
need to check reliability, suitability, and adequacy of data.
FINDINGS AND OBSERVATIONS
Out of total agro textile consumption maximum contribution comes from fishing nets i.e. 632cr by 2018. It is
estimated that this significant growth is expected from other agro textiles product categories like shade nets,
mulch mats, bird nets and hailstorm nets by 2020. Agro textile export also raised about 113 cr and expected to
grow up to 120 cr by 2020.
Agro-textile market at globally growing from an average growth rate of 3.9% per annum. A huge demand for
agro textiles is expected in developing countries like Brazil, China and India. In terms of volume Asia
contributes about 60% of the total agro textiles.

International Journal of Advance and Innovative Research Volume 6, Issue 1 (XXIV): January - March, 2019
351
ISSN 2394 - 7780
FUTURE PREDICTIONS ABOUT AGRO TEXTILES
In the year 2016 global agro textile demand was 1489 kilo tons and expected to grow with CAGR of 4.4%
from 2017-2025.
In 2016, global demand for mulch mats was above 185 kilo tons and expected to grow by 190 kilo tons by
2025.
In India, fishing net market is estimated to grow net worth of USD 1.54 billion by 2025.
In terms of revenue aquaculture will become fastest growing market with CAGR of 5% from 2017-2025.
CONCLUSION
At present India ranked 2nd largest food producer in the world and estimated to be 1st very soon. Food
processing industry is one of the largest industries of India. At the same time population of our country is
increasing at rapid rate. This rapid growth of population putting pressure on agricultural crop production. Hence
it is necessity to increase the crop yield and crop management. It is not possible only with traditional way by
using pesticides and herbicides. The agriculture and horticulture industries realized this and used various
technologies and innovation to increase crop yield and quality. This is best achieved by applications of textiles
in agricultural practice and name of this innovation is none other than Agro-textiles.
We can conclude that Agro textile plays a significant role in crop production and crop management. It is the
need of tomorrow to utilize this innovation to solve problems faced by agro industry. Cost of agro textile
products is less than herbicides and pesticides hence it is cost-effective innovation. It is expected that the next
green revolution is possible with effective application of agro textile innovation. As per projected rise in global
population and demand for better quality crop agro textile sectors is expected to be strongest growing sector. So
now it is our responsibility to utilize this novel innovation of agro textile for the country’s
economy.Governmemnt,industrialists and entrepreneurs need to come forward to promote this innovation of
agro textile for better future of nation’s agricultural growth.
BIBLIOGRAPHY
K. (2017, December 18). Crop management through Agro Textiles. Retrieved February 1, 2019, from
http://www.textilevaluechain.com/index.php/article/technical/item/1625-crop-management-through-agro-
textiles
Agrotextiles: A Growing Field. (2015, September 1). Retrieved January 20, 2019, from
https://www.textileworld.com/textile-world/nonwovens-technical-textiles/2005/09/agrotextiles-a-growing-
field/
S. S. (n.d.). Textile in Agriculture. Retrieved January 17, 2019, from http://textilelearner.blogspot.com
/2014/04/applications-of-agro-textiles.html
Agro textiles: A novel application. (n.d.). Retrieved February 10, 2019, from https://www.fibre2
fashion.com/industry-article/71/agro-textiles-a-novel-application
Agrawal, M. K. (2013, July 7). APPLICATION OF TEXTILE IN AGRICULTURE. Retrieved January 1,
2019, from http://www.ijarse.com/images/fullpdf/1373424521_APPLICATION_OF_TEXTILE_IN_
AGRICULTURE.pdf
Beg, M. L. (2015, March 13). Application of Textiles in Agriculture. Retrieved January 5, 2019, from
https://www.slideshare.net/88azmir/agrotextile
STUDY ON DEVELOPING MEASURES TO PROMOTE THE USE OF AGROTEXTILES IN INDIA
UNDER THE TECHNOLOGY MISSION ON TECHNICAL TEXTILES (TMTT). (2013, December).
Retrieved February 8, 2019, from http://www.technotex.gov.in/Agrotextiles/Study on Developing Measures
to Promote Use of Agrotextiles in India.pdf
S. P., & N. D. (2017, July). Technical Textiles for Agricultural Applications. Retrieved February 5, 2019,
from http://www.iijsr.org/data/frontImages/gallery/Vol._3_No._1/1._1-8.pdf
Role of textiles in agriculture field. (2017, January 13). Retrieved January 5, 2019, from
https://www.chemarc.com/content/article/role-of-textiles-in-agriculture-field/58786cf37eb5593bf5d22afc
Agrotextiles: A growing landscape with huge potential. (n.d.). Retrieved January 17, 2019, from
https://www.technical-textiles.net/shop/agrotextiles-growing-landscape-huge-potential-pdf-format
International Journal of Advance and Innovative Research Volume 6, Issue 1 (XXIV): January - March, 2019
352
ISSN 2394 - 7780
PREDICTIVE IMPACT ASSESSMENT OF CLIMATE CHANGE ON CROP YIELD USING SEMI
PARAMETRIC NEURAL NETWORK
Sandeep Vishwakarma
Assistant Professor, Department of IT, Chandrabhan Sharma College of Arts, Science & Commerce, Mumbai
ABSTRACT
Crop yields are critically dependent on weather. A growing empirical literature models this relationship in
order to project climate change impacts on the sector. We describe an approach to yield modeling that uses a
semi parametric variant of a deep neural network, which can simultaneously account for complex nonlinear
relationships in high-dimensional datasets, as well as known parametric structure and unobserved cross-
sectional heterogeneity. Using data on corn yield from the US Midwest, we show that this approach
outperforms both classical statistical methods and fully-nonparametric neural networks in predicting yields of
years withheld during model training. Using scenarios from a suite of climate models, we show large negative
impacts of climate change on corn yield, but less severe than impacts projected using classical statistical
methods. In particular, our approach is less pessimistic in the warmest regions and the warmest scenarios.
INTRODUCTION
Climate change is an important geographical phenomenon that affect crop production of any geographical area
adversely. Climate change is a long-term change in weather patterns that characterize the geographical regions
of the world. The term "weather" refers to the short-term (daily) changes in temperature, wind, and/or
precipitation of a region. In the long term, the climatic change could affect agriculture in several ways such as
quantity and quality of crops in terms of productivity, growth rates, photosynthesis and transpiration rates,
moisture availability etc. Climate change is likely to directly impact food production across the globe. In this
proposed research work the researcher propose a Machine Learning approach to develop a predictive model for
impact assessment of climate change on crop yield in the state of Maharashtra. The motivation to undertake this
research work is high sensitivity of climate change in Maharashtra on the yield of major crops.
OBJECTIVE
The Objective of the research work is to develop a predictive model for climate change impact assessment on
Yield of major crops in Maharashtra.
HYPOTHESIS
(H0) Climate change adversely affect crop yield.
LITERATURE REVIEW
Crane-Droesch, Andrew. (2018) has surveyed various Machine Learning Methods that can be potential
candidates to conduct a study on impact of climate change on crop yield. Andrew said that Semi Parametric
Neural Network(SNN) is most suitable for conducting an analysis on panel data that is collected over several
years and is multidimensional having many parameters such as temperature, precipitation, humidity etc.
Joerding, W. H., Li, Y., & Young, D. L. (1994)- In their paper Feedforward Neural Network Estimation of a
Crop Yield Response Function. Journal of Agricultural and Applied Economics,26(01), 252-263 studied
possible application of feedforward Neural Network.
Capobianco E. (1997)-in their paper Semiparametric Artificial Neural Networks. In: Ellacott S.W., Mason J.C.,
Anderson I.J. (eds) Mathematics of Neural Networks. Operations Research/Computer Science Interfaces Series,
vol 8. Springer, Boston, MA elaborated the nature and importance of semi parametric Artificial Neural
Network.
In [12][13][14] Daniel J Henderson, Raymond J Carroll, and Qi Li., Stefan Hoderlein and Halbert White and
Cong Li and Zhongwen Liang Has studied Nonparametric estimation and testing of fixed effects panel data
models, Nonparametric identification in non-separable panel data models with generalized fixed effects and
asymptotic for nonparametric and semiparametric fixed effects panel models. Their works provide a base to
conduct a research work of impact assessment of climate change on crop yield using SNN.
DATA AND METHODOLOGY (SEMI PARAMETRIC NEURAL NETWORK)
Our study makes use of state-level data on seasonal crop yields for 5 major Indian crops - rice, wheat, sorghum,
cotton, and sugarcane - during the period from 1990 to 2015, obtained from the secondary data sources. All
available data will be used for the development of predictive model for impact assessment of climate change on

International Journal of Advance and Innovative Research Volume 6, Issue 1 (XXIV): January - March, 2019
353
ISSN 2394 - 7780
crop yield. To estimate how climate trends have affected crop yields in India, we model the effects of
temperature and precipitation on yields across all regions of Maharashtra for the 15 -year period.
For each region-season-crop combination (the yield model). We will separately estimate how climate conditions
changed over time and construct a de-trended set of climate data that preserves the variance of the original data,
but keeps climate conditions constant, on average, over the period of our study (the climate change model). We
then compare the yields that were observed in the data with counterfactual yields that would have been observed
in the absence of climate trend by setting the de-trended set of climate data to our yield model.
Machine Learning methodologies involves a learning process with the objective to learn from “experience”
(training data) to perform a task. The performance of the ML model in a specific task is measured by a
performance metric that is improved with experience over time. To calculate the performance of ML models
and algorithms, various statistical and mathematical models are used. After the end of the learning process, the
trained model can be used to classify, predict, or cluster new examples (testing data) using the experience
obtained during the training process. Figure 1 shows a typical ML approach. metric that is improved with
experience over time. To calculate the performance of ML models and algorithms, various statistical and
mathematical models are used. After the end of the learning process, the trained model can be used to classify,
predict, or cluster new examples (testing data) using the experience obtained during the training process. Figure
1 shows a typical ML approach.
Neural network some time also referred to as deep learning are the current state-of-the-art in machine learning
and artificial intelligence. They have been successfully applied to tasks ranging from computer vision, natural
language processing, self-driving cars, and quantitative finance.
We will use the panel neural net to the prediction of agricultural yields from weather data. This problem is
relevant for short-term economic forecasts as well as for longer-range climate change impact assessment. It is
also a natural use-case for a semi-parametric panel data model. First, weather data over an entire year is high-
dimensional. While there is only one outcome per year in our setting, the explanatory variables come in the
form of several weather variables over hundreds of days of the growing season. Models that penalize high-
dimensional covariate sets can help avoid overfitting.
We will develop a Semi Parametric Neural Network (SNN) model to estimate impact of climate change on crop
yield since it is better than another published model. It offers following advantages: Unlike many
methodologies from the machine learning literature, this approach is suitable for longitudinal/panel data. It
provides unbiased estimation of the parametric component of the model, with associated confidence intervals
that have near-nominal coverage rates. Simulations demonstrate (1) efficiency, (2) that parametric estimates are
unbiased, and (3) coverage properties of estimated intervals. By using prior knowledge about important
phenomena and the functional forms relating them to the outcome, the SNN substantially improves statistical
efficiency over typical neural networks. By augmenting a parametric model with a neural network, it captures
dynamics that are either absent or imperfectly specified in parametric models.
OUTCOME
A predictive model based on semi parametric neural network to be used for impact of climate change on
agriculture productivity at all levels that is district, region and state.
CONCLUSION
The development of parametric model will facilitate accurate prediction of crop yield and impact of climate
change on crop yield for specified region. Secondly our study will enable us to advise farmers to change their
farming practices as per the changing climate. Farmers may adapt to both short- and long-term changes in
climate conditions, when choosing crops and production technologies.

International Journal of Advance and Innovative Research Volume 6, Issue 1 (XXIV): January - March, 2019
354
ISSN 2394 - 7780
REFERENCES
1. Crane-Droesch, Andrew. (2018). Machine learning methods for crop yield prediction and climate change
impact assessment in agriculture. Environmental Research Letters. 13. 10.1088/1748-9326/aae159.
2. http://iopscience.iop.org/article/10.1088/1748-9326/aae159
3. Joerding, W. H., Li, Y., & Young, D. L. (1994). Feedforward Neural Network Estimation of a Crop Yield
Response Function. Journal of Agricultural and Applied Economics,26(01), 252-263.
doi:10.1017/s1074070800019349
4. Capobianco E. (1997) Semiparametric Artificial Neural Networks. In: Ellacott S.W., Mason J.C., Anderson
I.J. (eds) Mathematics of Neural Networks. Operations Research/Computer Science Interfaces Series, vol
8. Springer, Boston, MA
5. Joerding, W. H., Li, Y., & Young, D. L. (1994). Feedforward Neural Network Estimation of a Crop Yield
Response Function. Journal of Agricultural and Applied Economics, 26(01), 252-263.
doi:10.1017/s1074070800019349
6. Yann LeCun, Yoshua Bengio, and Geoffrey Hinton. Deep learning. Nature, 521(7553):436–444, 2015.
7. Leo Breiman. Random forests. Machine learning, 45(1):5–32, 2001.
8. Stefan Wager, Trevor Hastie, and Bradley Efron. Confidence intervals for random forests: The jackknife
and the infinitesimal jackknife. Journal of Machine Learning Research, 15(1): 1625–1651, 2014.
9. Stefan Wager and Susan Athey. Estimation and inference of heterogeneous treatment effects using random
forests. arXiv preprint arXiv:1510.04342, 2015.
10. Hui Zou and Trevor Hastie. Regularization and variable selection via the elastic net. Journal of the Royal
Statistical Society: Series B (Statistical Methodology), 67(2):301–320, 2005.
11. Trevor J Hastie and Robert J Tibshirani. Generalized additive models, volume 43. CRC Press, 1990.
12. Daniel J Henderson, Raymond J Carroll, and Qi Li. Nonparametric estimation and testing of fixed effects
panel data models. Journal of Econometrics, 144(1):257–275, 2008.
13. Stefan Hoderlein and Halbert White. Nonparametric identification in nonseparable panel data models with
generalized fixed effects. Journal of Econometrics, 168(2):300–314, 2012.
14. Cong Li and Zhongwen Liang. Asymptotics for nonparametric and semiparametric fixed effects panel
models. Journal of Econometrics, 185(2):420–434, 2015.

International Journal of Advance and Innovative Research Volume 6, Issue 1 (XXIV): January - March, 2019
355
ISSN 2394 - 7780
A STUDY ON ‘PERCEPTION OF FACULTY MEMBERS OF DEGREE COLLEGES IN MUMBAI
TOWARDS USE OF ICT IN TEACHING’
Vishwanath Vinod Acharya
Assistant professor, Department of Commerce (Accounting & Finance), Chandrabhan Sharma College of Arts,
Commerce & Science, Powai, Mumbai
ABSTRACT
Advances in technology have shaped and changed our world in ways that no one could have ever predicted.
Business, recreation, and yes even education, have been deeply impacted by things like the internet, cell phones,
and computers.
The use of ICT in teaching-learning process is a relatively new phenomenon and it has been the educational
researchers' primary focus. The effective integration of this technology into classroom practices poses a
challenge to lecturers and administrators. This study aims at finding out the factors influencing the use of ICT
to make teaching learning more effective in higher institutions of learning in Mumbai and identifying the
distinctive innovations that ICT has brought into teaching-learning process. The paper also addresses the
opportunities and challenges posed by integration of ICTs in teaching learning process in the present scenario.
Keywords: Information and Communication Technology (ICT), ICT in Higher Education, Teaching-learning
process.
INTRODUCTION
Introduction to Information and Communication Technology (ICT),:
ICTs stand for Information and Communication Technologies and are defined, for the purposes, as a “diverse
set of technological tools and resources used to communicate, and to create, disseminate, store, and manage
information.” These technologies include computers, the internet, broad casting technologies (radio and
television), and telephone.
Whether you are starting as an elementary student or are going to a college for higher education, use of ICT as a
new mode of classroom teaching has emerged as an advantage. For teachers in particular, this mode of teaching
has proved to be helpful since students have found it far more interesting as compared to the conventional
techniques. With access to various interactive and appealing technologies, education has become entertaining.
ICT as a new means of learning when applied in the right manner in teaching lessons, comes out to be the most
effective technique in teaching the students along with motivating them. Students can now easily get over with
or find answers to their queries via direct interaction with different modes of ICT teaching. The several benefits
of use of ICT in teaching makes it extremely necessary for teachers to adopt this innovative technique in their
pedagogy.
OBJECTIVE OF THE STUDY
The specific objectives of the study are listed below
a) To understand the importance of use of ICT in Teaching-Learning process.
b) To collect data from the faculty members regarding their perception towards use of ICT teaching techniques.
c) To know the factors which motivates faculty members to take up ICT tools to supplement their pedagogy.
d) To understand the factors which makes some faculty members reluctant to adopt ICT in their teaching.
RESERCH METHODOLOGY
The current study is based on above mentioned objectives as to answer the questions like What is ICT based
teaching? What are benefits of using ICT in teaching? What are factors which influence teachers in deciding
whether to use ICT in teaching or not.
To answer the objectives of the study & questions as quoted above, the necessary data has been gathered both
Primary Data sources as well as from Secondary data sources.
a) Primary Data Sources: Prepared a Questionnaire in Google Forms and circulated among Faculty members
from different colleges randomly. The Questionnaire consists of mainly close ended questions which includes
MCQs, Yes/No type questions, agree/disagree matrix questions, and three open-ended questions whereby
respondents are asked to open up and give their views. The data is collected from 35 Respondents (faculty
members) from different streams for the study purpose.
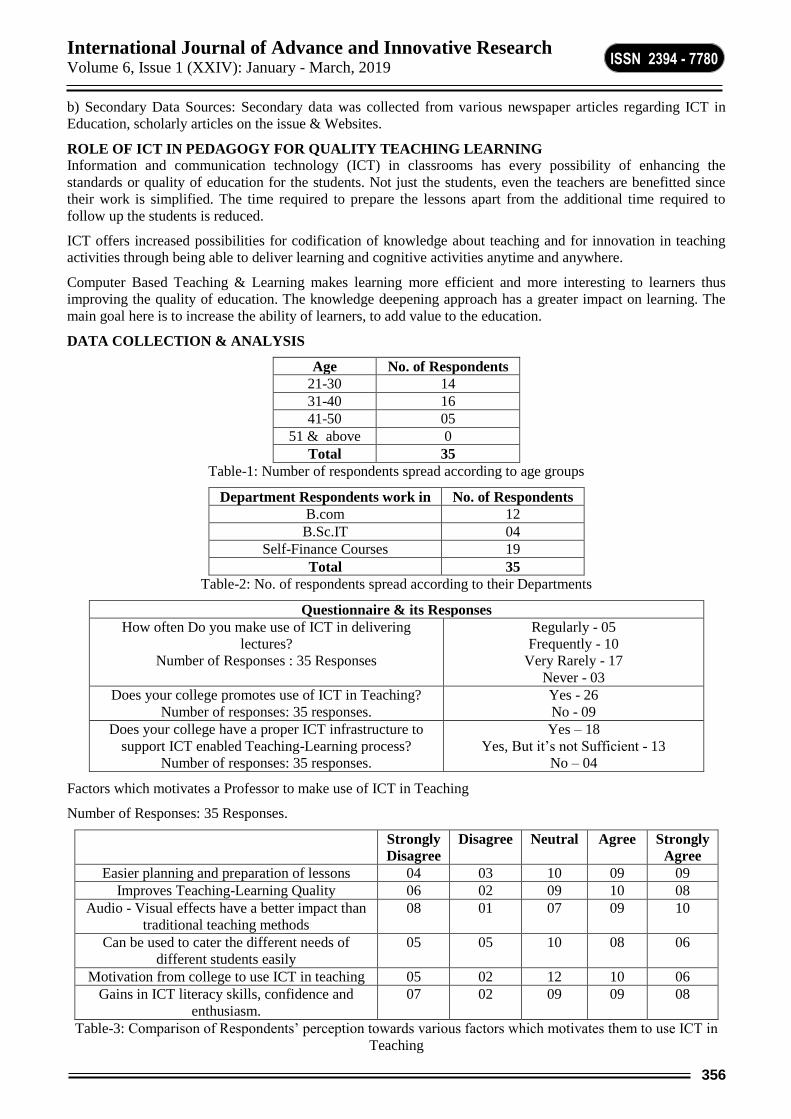
International Journal of Advance and Innovative Research Volume 6, Issue 1 (XXIV): January - March, 2019
356
ISSN 2394 - 7780
b) Secondary Data Sources: Secondary data was collected from various newspaper articles regarding ICT in
Education, scholarly articles on the issue & Websites.
ROLE OF ICT IN PEDAGOGY FOR QUALITY TEACHING LEARNING
Information and communication technology (ICT) in classrooms has every possibility of enhancing the
standards or quality of education for the students. Not just the students, even the teachers are benefitted since
their work is simplified. The time required to prepare the lessons apart from the additional time required to
follow up the students is reduced.
ICT offers increased possibilities for codification of knowledge about teaching and for innovation in teaching
activities through being able to deliver learning and cognitive activities anytime and anywhere.
Computer Based Teaching & Learning makes learning more efficient and more interesting to learners thus
improving the quality of education. The knowledge deepening approach has a greater impact on learning. The
main goal here is to increase the ability of learners, to add value to the education.
DATA COLLECTION & ANALYSIS
Age No. of Respondents
21-30 14
31-40 16
41-50 05
51 & above 0
Total 35
Table-1: Number of respondents spread according to age groups
Department Respondents work in No. of Respondents
B.com 12
B.Sc.IT 04
Self-Finance Courses 19
Total 35
Table-2: No. of respondents spread according to their Departments
Questionnaire & its Responses
How often Do you make use of ICT in delivering
lectures?
Number of Responses : 35 Responses
Regularly - 05
Frequently - 10
Very Rarely - 17
Never - 03
Does your college promotes use of ICT in Teaching?
Number of responses: 35 responses.
Yes - 26
No - 09
Does your college have a proper ICT infrastructure to
support ICT enabled Teaching-Learning process?
Number of responses: 35 responses.
Yes – 18
Yes, But it’s not Sufficient - 13
No – 04
Factors which motivates a Professor to make use of ICT in Teaching
Number of Responses: 35 Responses.
Strongly
Disagree
Disagree Neutral Agree Strongly
Agree
Easier planning and preparation of lessons 04 03 10 09 09
Improves Teaching-Learning Quality 06 02 09 10 08
Audio - Visual effects have a better impact than
traditional teaching methods
08 01 07 09 10
Can be used to cater the different needs of
different students easily
05 05 10 08 06
Motivation from college to use ICT in teaching 05 02 12 10 06
Gains in ICT literacy skills, confidence and
enthusiasm.
07 02 09 09 08
Table-3: Comparison of Respondents’ perception towards various factors which motivates them to use ICT in
Teaching

International Journal of Advance and Innovative Research Volume 6, Issue 1 (XXIV): January - March, 2019
357
ISSN 2394 - 7780
Factors which makes a Professor reluctant to use ICT in teaching on regular basis
Number of Responses: 35 Responses.
Strongly
Disagree
Disagree Neutral Agree Strongly
Agree
Time Consuming 08 08 09 07 02
Lack of Adequate ICT facilities in
institution
07 06 09 07 06
Lack of Motivation from college 05 06 09 09 06
Lack of formal training to use ICT in
teaching
04 05 08 13 05
Limited options especially while teaching
Practical subjects
04 06 10 08 07
Limited Computer literacy 05 05 09 11 05
Table-4: Comparison of Respondents’ perception towards various factors which makes them reluctant to use
ICT in Teaching
Which of the following Innovative ICT enabled instruments/techniques you have used at least once in teaching.
[Multiple selections were allowed]
No. of Responses
Power Point Presentations (PPT) 32
Excel Sheets 12
Video Lectures 16
Interactive boards 04
Internet - Websites, Blogs 17
Movies, Short Films, Videos etc. 13
Table-5: No. or Respondents using ICT enabled instruments or techniques in teaching.
DISCUSSION
Factors influencing use of ICT to make teaching-learning effective
Increased Knowledge retention
It can be seen from Table 3. As many as 29% Respondents strongly agreed that the Audio - Visual effects have
a better impact as compared to traditional teaching methods. Students who are engaged and interested in things
they are studying, are expected to have a better knowledge retention.
Improves Teaching-Learning process
Almost 23% respondents strongly agreed that using ICT in teaching makes Teaching-learning process more
effective. With the help of ICT enabled teaching, interest of the students can be maintained in the lessons which
otherwise are boring and considered as one way traffic. ICTs are also transformational tools which, when used
appropriately, can promote the shift to a learner-centred environment.
Benefits for teachers
Not only using ICT in teaching can help students, but it can also benefit the teachers. The teachers who make
use of ICT were of that opinion that they gain confidence & find new enthusiasm while teaching. They are able
to keep themselves up to date with the latest technology & it improves their skills.
Motivation from institute
One - third of the respondents couldn’t really decide their stand on level of motivation from their institution for
promoting use of ICT in teaching. They decided to stay neutral as far as this factor is concerned. Nonetheless,
the fact that strong motivation from their college can influence teachers to use ICT in their lectures was agreed
by good number of respondents.
Easier Planning & Preparations of lessons
More than 50% of the respondents cumulatively agreed that with the help of ICT, lectures planning &
preparations have become far easier and very effective. ICT facilitates sharing of resources, expertise and
advice & allows greater flexibility in planning lessons.

International Journal of Advance and Innovative Research Volume 6, Issue 1 (XXIV): January - March, 2019
358
ISSN 2394 - 7780
Factors which makes a Professor reluctant to use ICT in teaching on regular basis
Lack of formal training to use ICT in teaching-learning process:
Nearly 51% of the respondents were of the opinion that the teachers lack the kind of formal training required to
make best use of ICT facilities in teaching-learning process. This makes teachers difficult to opt ICT techniques
in their teaching.
Lack of technical skills
Many respondents were of the opinion that, the lack of technical skills & knowhow to use ICT as a tool in
teaching is one of the major factor that makes one to reluctant to use it. Teachers feel reluctant to use computer
if they lack confidence. Fear of failure and lack of ICT knowledge have been cited as some of the reasons for
teachers lack of confidence for adopting and integrating ICT into their teaching.
Lack of motivation from college :
As many as 43% responded that they do not get motivation as such to use ICT in teaching. This hampers their
willingness to take up challenge of incorporating technology in their pedagogy.
Limited utility of using ICT in teaching :
Surprisingly many faculties of the opinion that ICT has limited use in teaching especially in case of practical
subjects like mathematics, accounts etc. where they feel traditional chalk & talk method is more useful. Again
Cellphone based learning tools like Apps can distract students’ attention from their teacher & lesson, to
whatever they are looking at, playing or doing some other things on their phones.
Lack of proper ICT infrastructure within institution :
Today the educational institutions are required to have a proper ICT infrastructure in order to reap the benefits
of ICT in teaching-learning process. Nearly 37% of the respondents noted that the available ICT infrastructure
in their college is not up-to the mark & hence it is not possible for them to make use of ICT in teaching on
regular basis.
FINDINGS
From the present study it is being noted that decisions made by the teachers about the use of information and
communication technologies in the classroom is likely to be influenced by multiple factors including:
demographic factors (like age, educational background); accessibility of infrastructure; experience in use of
instructional technology, perception about usefulness, creativity in the subject and interest of the students, ease
of use, motivation from college etc.
Some of the other key findings of the studies are enumerated as follow
Nearly 49% of the faculties use ICT in teaching very rarely which needs to be addressed in order to make
teaching-learning process effective in today’s digitalized world.
It is noteworthy that 75% of the respondents recorded that their institution does promote use of ICT in
Teaching-Learning process.
Power Point Presentations (PPTs) is the most utilized ICT teaching tool as table 5 shows that it is being used
by all the 32 respondents who have used ICT tools at least once (91%) to supplement their teaching. Use of
video lectures and websites, blogs etc. in ICT based teaching has got over 50% response from the faculty
members. Movies, Short Films, Videos etc. have been used successfully as a new innovative tool in teaching
by almost 40% of the faculty members along with other tools like excel sheet (33%) & interactive boards
(12%). It is worth noting that the teachers taking Mass-Media subjects are using movies, short films etc. at
large to make students understand the concepts effectively.
SUGGESTIONS FOR INCREASING THE USE OF ICT IN TEACHING
In order to promote use of ICT in teaching, the present study, based on analysis of data collected, proposes
following suggestions which if implemented in right spirit could influence & motivate more number of teachers
to embrace technology in their teaching methods which would help make the teaching-learning process more
effective.
Motivation by the Colleges & Universities to the faculties in taking up ICT in their teaching methods is
extremely required in the present context.
Regular Seminars, Workshops should be conducted by University to give formal training to the faculties to
hone their technical skills.
More faculties should take up Orientation Programmes, Refresher Courses and other Short Term
Programmes conducted by University of Mumbai aligning with UGC HRDC.

International Journal of Advance and Innovative Research Volume 6, Issue 1 (XXIV): January - March, 2019
359
ISSN 2394 - 7780
The educational institutions must upgrade their ICT infrastructure to the latest standards so as to make it
accessible to both teachers & students.
As a matter of Academic policy, colleges should support the use of ICT as an integral part of the provision
of quality education for all. They should promote the use of ICT in education as a key modern aid to
teaching and learning. Ensure free access for all teachers and learners to high quality dedicated ICT
facilities.
Make a provision of Awards for rewarding the teachers using ICT for Innovation in Education.
CONCLUSION
The rapid growth in ICT has brought tremendous changes in the twenty-first century, as well as affected its
adoption and integration by teachers in teaching-learning process. The effective integration of technology into
classroom practices poses a challenge to teachers and administrators. The findings of this study indicate that
teachers have strong craving for the integration of ICT into education but they run into many barriers to it.
These findings therefore have implications for training the teachers to become consistent users of ICT focusing
on acquiring basic ICT skills. Mere learning ICT skills is not sufficient, but using ICT to improve the teaching
and learning is the crucial for pedagogy-technology integration
Given the size of investment being made in incorporating technology in education, it seems reasonable to
explore the integration of technology into teaching and learning. Although most of the teacher’s community has
adopted information and communication technologies like power point slides and internet into their teaching,
they are still unwilling to adopt more complex computer-based activities or other teaching pedagogy
innovations, such as active learning techniques involving video-conferencing lectures.
For successful incorporation of ICT into teaching-learning process, it can be concluded that the factors that
positively inclined teachers’ use of ICT in education should be promoted at large. The presence of all factors as
discussed earlier in study, increases the likelihood of excellent integration of ICT in teaching-learning process.
Therefore, the training of teachers in the pedagogical issues should be increased if teachers are to be convinced
of the importance of using ICT in their teaching-learning process.
REFERENCES
[1.] Soni Srivastava : ICT implementation for Education and Learning. IOSR Journal of Research & Method
in Education (IOSR-JRME) e-ISSN: 2320–7388,p-ISSN: 2320–737X Volume 6, Issue 4 Ver. IV (Jul. -
Aug. 2016), PP 40-44
[2.] Ajit Mondal, & Dr. Jayanta Mete : ICT in Higher Education: Opportunities and Challenges , University
of Kalyani, Kalyani, West Bengal
[3.] http://ict-adv-disadv.blogspot.com/
[4.] https://www.webanywhere.co.uk/blog/2016/02/top-6-benefits-technology-classroom/
[5.] https://mhrd.gov.in/ict_overview
[6.] https://miraesiwinaya.wordpress.com/2010/01/22/the-advantages-and-disadvantages-of-using-ict-for-
teaching-and-learning/
International Journal of Advance and Innovative Research Volume 6, Issue 1 (XXIV): January - March, 2019
360
ISSN 2394 - 7780
CONTROLLED RAMIFICATION OF FORESTS USING IOT
Sandeep Vishwakarma
Assistant Professor, Department of IT, Chandrabhan Sharma College of Arts, Science & Commerce, Mumbai
ABSTRACT
Experts in favor of letting natural forest fires burn unchecked argue that fire suppression disrupts the natural
forest cycle and endangers the livelihoods of people who depend on the forest, and the wellbeing of the plants
and animals living there. Advocates for controlling forest fires note that unchecked flames often result in
property damage, injury and even death, making fire suppression essential.
The debate came to the forefront recently as areas of the United States and Canada have been devastated by
forest fires. California’s Thomas Fire is now 100 percent controlled, and has become the largest and most
destructive wildfire in the state’s history. The fire burned nearly 282,000 acres of Southern California and
destroyed more than 1,000 buildings. It is responsible for at least one death. The fire, which stripped hillsides of
vegetation, also was a factor in the devastating January 9 mudslides, which are responsible for at least 17
deaths in Santa Barbara County, California (as of January 12).
Across North America, hundreds of thousands of citizens have faced similar catastrophic forest fires that have
cost billions of dollars to combat. British Columbia made history after nearly 3 million acres burned (as of
November 30, 2017), the largest total area affected in one season; the more than 1,300 wildfires forced the
evacuation of more than 65,000 residents. Significant fires also hit Colorado, Oregon, Washington and
Montana.
Keywords
Ramification
Forests
Iot
Forests fire
INTRODCTION
The havoc due to forest fire has caused serious environmental problems and devastation of flora and fauna.
Within the current turbulent global economic, demographic, social and ecologic context, governments, local
administrative authorities, researchers and commercial companies or even individuals have to recognize the
importance of the resources contained in the forest environment - not only from the perspective of the
biodiversity, but also from the point of view of the economic resources which forests enclose. Therefore, any
major threat posed to this essential component of the environment should be identified, studied and fought
through the most efficient and modern economic policies and technological means. One of the most dangerous
phenomena, which jeopardize forests, is represented by forest fires.
COMPONENTS REQUIRED FOR IMPLEMENTATION
Arduino UNO Microcontroller
Receiver and Transmitter
Gas Sensor
Temperature Sensor
Ethernet Shield
LCD
PCB (Printed Circuit Board)
Buzzer

International Journal of Advance and Innovative Research Volume 6, Issue 1 (XXIV): January - March, 2019
361
ISSN 2394 - 7780
GENERAL BLOCK DIAGRAM OF DETECTION OF FOREST FIRE
WORKING Temperature sensor and smoke sensor are employed that need to be placed at certain distances so that a look can
be kept on the entire forest area in order to detect the ignition alarming temperature and the level of carbon
dioxide gas (CO2). These sensors will send the signal or the information to the microcontroller. These will all
sense changes in the environment and react automatically in the event of an emergency.
Temperature sensor and smoke sensor are employed that need to be placed at certain distances so that a look can
be kept on the entire forest area in order to detect the ignition alarming temperature and the level of carbon
dioxide gas (CO2). These sensors will send the signal or the information to the microcontroller. These will all
sense changes in the environment and react automatically in the event of an emergency.
On receiving the data from the controller, transmitter transmits the data to a certain range where the receiver
station is optimized to be employed. Microcontroller is the central part of the hardware circuit; it controls and
enables the functioning of the entire circuit, on receiving the data from the transmitter circuit, the receiver sends
the data to the controller IC of the attached Arduino Uno embedded in the receiver circuit in digital form
making the controller possible to do the programmed actions for the monitoring of temperature level and CO2
level for fire detection.

International Journal of Advance and Innovative Research Volume 6, Issue 1 (XXIV): January - March, 2019
362
ISSN 2394 - 7780
STAGES OF DESIGNING
The whole designing of this IoT enabled forest fire detection and monitoring system
interfacing and programming of LCD with Arduino
Interfacing and programming of Receiver and transmitter with Arduino
Interfacing of Ethernet Shield with Arduino
Connecting of sensors with transmitter
CONCLUSION
Forest fires have proven to be a massive form of destruction for humankind, especially when not countered
through appropriate measures and strategies.
Therefore, an IoT-based Forest fire detection system is proposed to detect the fire by monitoring the values of
CO2 level and temperature. we can build fire detector using Arduino Uno which is interfaced with a
temperature sensor, a smoke sensor and buzzer. The temperature sensor senses the heat and smoke sensor
senses any smoke generated due to burning or fire. Buzzer connected to Arduino gives us an alarm indication.
Whenever fire triggered, it burns objects nearby and produces smoke.
With the help of IoT technology, we can try to make it smarter by connecting the whole monitoring process to
the webpage naming “Fire Security System “controlled by the Arduino programming done in the software-
REFERENCE
1. https://www.sciencedirect.com/topics/earth-and-planetary-sciences/forest-fire
2. https://www.ncbi.nlm.nih.gov/pmc/articles/PMC3142402/

International Journal of Advance and Innovative Research Volume 6, Issue 1 (XXIV): January - March, 2019
363
ISSN 2394 - 7780
INVESTMENT PATTERN AND PERCEPTION OF CRYPTO CURRENCY
Sharayu Mahesh Kadam
Assistant Professor, Computer Science & Information Technology, JVM’s Mehta College, Navi Mumbai
ABSTRACT
Because of fast improvement in information technologies, many events in our day to day life have been
combined online and they turn out to be more adaptable and more active. A vast growth in number of online
users has motivated simulated word concepts and formed an innovative business miracle which is crypto
currency to enable the economic events such as purchasing, retailing and exchanging. Crypto currency
represents respected and imperceptible items which are used electronically in different applications and
networks such as online common networks, online common games, simulated worlds and point to point
networks. The practice of simulated money has become general in many different systems in current years. This
paper studies the user’s opportunities to coming further years of crypto currency. It also travels the user’s
assurance of selling with crypto currency in a time that using such simulated money is not fully organized and
controlled. Also, the paper is designed to measure the range of crypto currency use to have a clear picture from
the hands-on view. The paper also examines the way in which 21 different countries have replied in terms of
rules & principles towards crypto currencies to progress a clear picture of its effect on several laws in
India in order to control it. There are two hypotheses is conducted as there is no significance difference in
working experience and year of investment as H0 and there is significance difference in working experience and
year of investment as H1 and second hypothesis is there is no significant difference in option and investment in
crypto currency as H0 and is there is significant difference in option and investment in crypto currency as H1.
The alternate hypothesis is accepted in both the cases with chi-square test at the significance of 0.000 i.e. 0.1%
respectively. The use of correlation is done for testing the significance.
Keywords: Crypto currency, Block Chain, Bit coins
INTRODUCTION
Crypto currency is computerized cash also known as virtual money or cash intended to fill in as a medium of
trade. It utilizes crypto currency to secure and confirm exchange and additionally to control the making of new
units of a specific crypto currency. It works much like standard money, empowering users to give virtual
payment to goods and service free of a central authority. Crypto currencies are a special blend of three
properties they give secrecy they are autonomous of central authority and they give insurance from double
spending attack. The crypto currency market has developed unpredictably and at exceptional speed through the
span of its short life expectancy. Since the arrival of the pioneer anarchic crypto currency is still rare. Its larger
part is uniquely centered on bit coin as opposed to a more assorted spread of crypto currencies and is
relentlessly being out place by fluid industry improvement, including new coin, innovative movement and
expanding government regulation of the market. In December Income Tax authorities directed on premise
inquiries of nine bit coin trades looking for data customers who executed on their platform. Following the
quests, the Information Technology office served notification to 100000 individuals accepted to have made high
volume exchange. In India most banks including SBI and private sector banks, for example HDFC, Kotak,
Citibank and ICICI have suspended exchanging accounts of bit coin trades. Internationally banks like JP
Morgan Chase, Bank of America and Citigroup stopped buy of crypto currencies in February on credit card
fearing defaults on reimbursement because of the dropping estimation of the virtual cash. All inclusive bit coin
has lost the greater part of it since December 2017 when it achieved an unsurpassed high of $19535. To place
this in context three month prior the market capitalization of bit coin alone was $332 billion. Presently the
combined market capitalization of the main 1562 crypto currencies is $334 billion with bit coin market
capitalization down to $140 billion. Shaken by the rising vulnerability, trades like BTCX India and ETHEX
India have quit exchanging picking rather to stick around for their opportunity and sit tight for clarity in
regulation.
OBJECTIVE
To understand the investment pattern of individual.
To determine the awareness of crypto currency among people.
To know the perception of individuals towards crypto currency.
HYPOTHESIS
1. Ho: There is no significant difference in working experience and years of investment

International Journal of Advance and Innovative Research Volume 6, Issue 1 (XXIV): January - March, 2019
364
ISSN 2394 - 7780
Ha: There is a significant difference in working experience and years of investment
2. Ho: There is no significant difference in opinion and investment in crypto currency
Ha: There is a significant difference in opinion and investment in crypto currency
RESEARCH METHODOLOGY Research design: Cross sectional descriptive research.
Sampling Unit: Investor of different financial products and have knowledge about crypto currency.
Sampling Size: 97
Method of Data Collection: Primary Data and Secondary Data
ANALYSIS
Hypothesis test
Ho: There is no significant difference in working experience and years of investment
Ha: There is a significant difference in working experience and years of investment
Pearson, Likelihood Ratio and Linear-by-linear show significant value of 0.000, i.e. 0.01%.
Pearson correlation shows a value of 0.718 and significant level at 0.001.
Spearman correlation coefficient shows a value of 0.696 and significant level at 0.001.

International Journal of Advance and Innovative Research Volume 6, Issue 1 (XXIV): January - March, 2019
365
ISSN 2394 - 7780
Hypothesis test
Ho: There is no significant difference in opinion and investment in crypto currency
Ha: There is a significant difference in opinion and investment in crypto currency
Pearson and Likelihood Ratio shows significant value of 0.000, i.e. 0.1% and Linear-by-linear shows significant
value of 0.008, i.e. 0.8%
Pearson correlation shows a value of 0.272 and significant level at 0.007.
Pearson correlation shows a value of 0.260 and significant level at 0.010.

International Journal of Advance and Innovative Research Volume 6, Issue 1 (XXIV): January - March, 2019
366
ISSN 2394 - 7780
Interpretation
From the above graph we see that 51.55% respondents have monthly investment of 0-5,000, 22.68%
respondents have monthly investment of 5,001-10,000, 5.15% respondents have monthly investment of 10,001-
15,000, 5.15% respondents have 15,001-20,000 and 15.46% respondent have 20,001 & above
Interpretation
From the above graphs we see that 31.96% respondents are aware of crypto currency from past 3 months,
30.93% respondents are aware of crypto currency from past 3 to 6 months, 11.34% respondents are aware of
crypto currency from past 6 to 9 months and 25.77% respondents are aware of crypto currency from past 9
months

International Journal of Advance and Innovative Research Volume 6, Issue 1 (XXIV): January - March, 2019
367
ISSN 2394 - 7780
Interpretation
From the above chart we see that 20.62% respondents have would likely to invest in crypto currency, 46.39%
respondents will not invest in crypto currency and 32.99% respondents may invest in crypto currency.
FINDING
Chi-square test shows that the significant value is 0.001 which means there is only 0.1% error in the
research. Pearson correlation shows that the relationship between working experience and years of
investment is strong and in positive direction. The relationship is directly proportionate. Confidence level is
99%. Spearman correlation coefficient shows that the relationship is moderate and in positive direction.
Confidence level and relationship is also directly proportionate same as Pearson.
Chi-square test shows that the significant value is 0.001 which means there is only 0.1% error in the
research. Pearson correlation shows that the relationship between Opinion and investment in crypto currency
is weak and in positive direction. The relationship is directly proportionate. Confidence level is 99%.
Spearman correlation coefficient shows that the relationship is also weak and in positive direction.
Confidence level and relationship is also directly proportionate same as Pearson.
Crypto currency is coming at last. Individuals are aware of crypto currency from past 3 months. Most
respondents have heard of bit coin rather than other crypto currencies.
Large numbers of individuals are neutral perception that crypto currency diminishes its value that they
perceive about it.
CONCLUSION
Both hypothesis testing resulted in accepting the alternative hypothesis. Relationship of working experience and
years & opinion and investment in crypto currency was done to meet the objectives of the research. Sampling
unit was less because of lack of awareness of crypto currency among individuals. It is observed that youth
knows about crypto currency as compared to matured. It was also reflected in our research as majority of
respondents are from 18 to 25. Because of young population, majority of annual income is from 2,50,000-
5,00,000 and have a monthly investment of 0-5,000.
Still a majority of young age group, fixed deposit is still considered as safe and sound investment for them.
Whereas crypto currency is unsafe because it still can’t be understood and required deep learning. As crypto
currency was mention in the union budget 2018, in which is declared illegal tender in India, majority of the
respondents came to know at that point of time. That why large number of respondents answered that they have
heard about it in less than 3 months. Crypto currency and bit coin was created by one person. After creating
crypto currency model, the inventor created the first crypto currency. That’s why major part of crypto currency
is taken by bit coin. As being popular enough, majority of individuals knows about it rather than other crypto
currencies. As there is still ambiguity in understanding the crypto currency, large numbers of respondents have
gave an “It’s OK” opinion about it.

International Journal of Advance and Innovative Research Volume 6, Issue 1 (XXIV): January - March, 2019
368
ISSN 2394 - 7780
As mentioned about ambiguity, major respondent have neutral approach that crypto currency diminish its value
that they perceive about it. They agree that bank should discontinue the operation of crypto currency as there is
lot more to research on it. First, the crypto currency is to be understood and then investment is to be done. As
crypto currency carry a high value, i.e. the price of one bit coin is very high, respondents agrees to that it is
commodity. Crypto currency is highly volatile in nature.
REFERENCES
Farell, R. (2015). An Analysis of the Crypto currency Industry. Wharton Research Scholar. Page No. 16
Bouoiyour, J. & Selmi R. (2016). Bit coin: A beginning of a new phase?. Economic Bulletin. Page No. 7-8
Kumar, S.K, Krishna, Nisar, N. & Raina, Er. C. K. (2017). Survey Paper on Crypto currency.
International Journal of Scientific Research in Computer Science, Engineering and Information Technology.
Page No. 309-310
Retrieved from
https://economictimes.indiatimes.com/industry/banking/finance/banking/bank-crackdown-takes-a-toll-on-bit
coin-trading/articles how/63324854.cms
http://www.ycomaadya.in/index.php/AADYA/article/view/122061/83918
http://www.bit coinprice.com/predictions/

International Journal of Advance and Innovative Research Volume 6, Issue 1 (XXIV): January - March, 2019
369
ISSN 2394 - 7780
IMPACT OF TECHNOLOGY ON ORGANIZATIONAL DEVELOPMENT AND EMPLOYABILITY
Dr. Savitri Dholey
Assistant Professor, Department of BMM, JVM’s Mehta College, Airoli, Navi Mumbai
ABSTRACT
Technology refers to the tools, machinery, modification, arrangements and procedures that help to solve a
problem, improve a pre-existing solution to a problem, achieve a goal, or perform a specific function.
Technological environment has a considerable impact on the business. The pace of change in technology in a
particular industry influences the firms working and technology development. There are certain industries like
information and technology and information and technology enabled Services, Electronics etc. where
technology changes very fast. Even though the firm is into consumer Durables segment or manufacturing Fast
Moving Consumer Goods (FMCG), they also innovate and try to offer something new to retain the customers.
Keywords: Technology, Economy, Change, Capital Investment, Employees
INTRODUCTION
Technology is a complex set of knowledge, ideas and methods and is likely to be the result of a variety of
activities - both internal and external. Technological process tends to be a gradual process consisting of a small
increments lying along a continuous path. Technology plays an important role in economic and social
development of a society. The purpose of technology is to intervene in the world to produce something new. It
achieve this through intellectual and design based practices that involve multiple sources of input (natural,
conceptual, emotional, imagined, etc.) In technology the most observed quality is taking good decisions based
on incomplete data and approximate models. Technology affects industry in many ways. It can intensify
competition in an industry and can also erase competitive advantage of well - established firms. It can change
industry structure or create completely new industries.
OBJECTIVES OF THE STUDY
The objectives of this study are
4. To understand the importance of technology based Society
5. To analyze the role of technology in economic development
6. To discuss the technological plant level changes
RESEARCH METHODOLOGY
The research is mainly based on the secondary data. The secondary data has been collected from various
reference books, research papers, articles and websites.
Impact of Technology on Organizational Development and Employability
We can trace the impact of technology on organizational development and employability in following three
broad ways:
A) Importance of technology based Society
1. Technology reaches to people through business Technology helps in innovations and new discoveries, which is converted into goods and services through
business. Every organization strives to make better products and improve its service offering. This could be
possible only due to technology. The economic growth of many countries depends on technology like of
USA, UK, Germany, France and Japan.
2. Complex System
Technology has resulted in complexity sophisticated and modern machines do work faster and better than
human beings. But if they fail, then the functioning of the entire organization gets affected. There is also an
interdependence of systems. For example, failure of power supply will affect every other function like
television and radio broadcasting, production, working of machines, consumer service and so on. It is
therefore necessary to keep the whole system working all the time.
3. Increased Consumers Expectations
Technology has contributed to the emergence of well heeled societies. People want not only more of same
things but also newer things. There is expectation of getting new product options, better quality, safety,
comfort and regular supply of the product. This leads to increased investment in Research and development.
High consumer's expectations pose a challenge as well as an opportunity to the business organizations.

International Journal of Advance and Innovative Research Volume 6, Issue 1 (XXIV): January - March, 2019
370
ISSN 2394 - 7780
4. Social Change Technological changes create new jobs and make old jobs irrelevant. Employees have to cope up with the
new skills and new jobs. People shift from one place to another in search of better jobs. This results in new
geographical distributions of population. Technology helps to iron out social differences but it has created
status difference. People working in multinational corporations behave like a class apart . such people are
better paid than local companies. They enjoy high standard of living and connect themselves with western
culture.
B) Role of Technology in Economic Development
1. Increased Productivity Technology has contributed to increased productivity in terms of more production at Lower cost.
Manufacturing concerns are now capable of producing goods in a shorter period of time and with fewer
defects. quality control programmes like "six sigma" are designed to improve quality and to eliminate
defects. Improvement in productivity has led to increase in real wages of employees and reduced product
prices.
2. Allocation of funds to R&D Research and development (R&D) assume considerable importance in organizations as technology
advances. In this context, firm is required to decide about- the allocation of resources to R&D ,transfer of
technology from the laboratory to the market place, replacement of the old technology with new, time factor
and decision about its own R&D or to outsource technology. In present world product life cycles have
become shorter, organization prefer to use technologies that are commonly available so may prefer to
outsource R&D.
3. Jobs become Intellectual In this technological era jobs are to become more intellectual. Introduction of new technology dislocated
some workers unless they are well-trained to work on new machines. This puts obligation on organizations
to retain its employees and equip them with technical advancement. Along with, upgrading jobs skills,
technology has highly affected on human relations.
4. Problem in employee's retention Techno structure has created the problem of employees retention. The traditional incentives fail to motivate
highly skilled workers. They are instead motivated by opportunities which offer challenges or growth and
achievements. Retaining such employees for long is a difficult task. These professional employees are
known for organizational rootlessness and job- hopping.
5. Increased capital investment Technology demands huge investment of capital.It necessities massive investment in acquiring, discovering
new ideas and their adoption, educating, training and retaining the managers and other related areas. This
needs efficient financial management. These is need for qualified and competent financial managers who can
assume responsibility in financial management and can use technology in managing finances.
6. Impact on products Products has a life cycle of its own. A typical product is subject to introductory, growth, maturity, decline
and abandonment stage. The products which may be in vogue today may become obsolete tomorrow due to
pace of technical changes. For example pager, transistor, radio, telegrams all have been things used in the
past and replaced by smart phones, laptops, home theaters etc.
C) Role of Technology in Plant level changes
1. Influence Organization Structure Technology has considerable influence on organization structure, chain of command and span of control of
managers. Matrix organisation structure is more common in companies where technology is fast changing.
Besides technology, there are other factors which influence organisation structure like history and
background of a company, vision and Misson, top level management value system, nature of product, scale
of operation etc.
2. Increased Risks Organizations invest time and financial resources in developing technology. If the pace of change in
technology is very fast then it may be difficult to reap benefits of the investment made. Too much reliance
on critical staff also increases business risk. In case they leave the organization and join competitors, then
organization may find difficult to cope up with such situations.

International Journal of Advance and Innovative Research Volume 6, Issue 1 (XXIV): January - March, 2019
371
ISSN 2394 - 7780
3. Growth of E-Business E-Business through Internet is made possible through technology. E-Business emphasizes integration of
systems, processes, organizations, value chains and markets. The integration operates through Internet and
build new relationships between businesses and customers. E-business provides convenience in conducting
business worldwide, efficiency in distribution, advertising and sales promotion.
4. Impact on Marketing Technological changes have drastically changed the way goods are being marketed . due to E-commerce,
entire world has become one market. The way companies manage to attract customers online to place order
and efficiency with which they manage their supply chain is greatly influenced by technology.
CONCLUSION Technology is a high-risk, costly and uncertain activity. The world has reached a stage in which many of the
inventions and discoveries in various areas have already taken place. To achieve major breakthrough which
have social relevance and profit potential for the firm, increased investment in research must be made. There are
also constraints on the technological growth like leads to pollution, depletion of non-renewable resources and
social institutions impede technology. For success and social acceptance any organization cannot overlook these
constraints.
REFERENCES 1. Campbell David and Tom Craig, ‘Organizations and Business Environment’ Linacre House, 2005
2. Chandan, J.S., Organizational Behavior’, Vikas Publishing House, 1996
3. Elearn, ‘Business Environment’, Pergamon Flexible Learning, UK, 2005
4. Moorhead, Gregory and Giffin, W. Ricky, Organizational Behaviour : Managing People and Organizations,
AITBS Publisher, New Delhi, 1999
5. Pailwar Veena, ‘Business Environment’, PHI Learning Pvt.Ltd., Delhi, 2014
6. Paul Justin, ‘Business Environment text and cases’, Tata McGraw-Hill Publishing Company LTD, New
Delhi, 2008

International Journal of Advance and Innovative Research Volume 6, Issue 1 (XXIV): January - March, 2019
372
ISSN 2394 - 7780
ARTIFICIAL INTELLIGENCE: IS IT PLANET SAVING TECHNOLOGY?
Divya Thakur Assistant Professor, SIES College of Commerce & Economics, Sion (East), Mumbai
ABSTRACT Technologies have long been seen as effective vehicles of growth, but the impact of recent forms like
digitization, now morphing into artificial intelligence (AI), have been subject to debate. Driverless cars.
Advanced medical diagnosis. 3D printing. Artificial intelligence is playing an increasing role in the economy
today, and it can fundamentally reshape global and local economies in the years to come.
What we still don’t know yet is how far the development of AI will go, and ultimately how successful it will be in
becoming a generalised, human-like intelligence. The field of AI is rapidly evolving. It holds enormous potential
to be used for both positive or negative purposes.
This paper deals to consider how artificial intelligence could help achieve economic growth and reduce
inequalities. Also how artificial intelligence could be harnessed for sustainability goals. What are the
challenges the human are facing about AI that are hard to understand and, therefore, hard to trust. This
viewpoint won’t prevail for long, as powerful new tools are being deployed for explaining and understanding
the complex AI models thus “Crossing the AI Chasm”
Keywords: AI, computing, algorithms, data, crossing the AI Chasm, algorithm, IT
INTRODUCTION During World War 2, the first computer was invented. It cracked the German communication code and ensured
Normandy landing. The father behind this unprecedented machine Alan Turing wrote the paper “Computing
Machinery and Intelligence” in the year 1950. And the paper opens with the words I propose to consider the
question “Can Machines Think?”
Well today inspired by his thoughtful questions let’s try to answer the following….
How can we create an intelligent computer and what will the future look like with intelligent machine.
AI is the answer to Everything. It has been growing exponentially and touching our lives in ways and means we
might not notice.
For Example when you go to Google search engine some kind of AI is used to show you the best results.
Everytime you ask Siri a question, natural language processing and speech recognition is been used.
RESEARCH METHODOLOGY The present research is descriptive type and purely based on secondary data collection from various internet
readings, different articles, newsletters, related research in journals.
WHAT IS ARTIFICIAL INTELLIGENCE (AI)? Your question did not ask, what is natural intelligence? Probably because you know what natural intelligence
is. Technically speaking, artificial intelligence is a copy of natural intelligence, for better or worse.
When someone mentions “artificial intelligence” (AI), what is the first thing that comes to your mind? Most of
us imagine an army of human-like robots rebelling against humanity, while a few—folks from a more positive
thinking community—are envisioning a bright future where AI serves them in all possible ways from walking a
dog early in the morning when the weather is unpleasant to peeling oranges at Christmas.
While the second scenario is certainly fun, it is a utopia per se. A reality with robots rising up against people,
however, is a much more probable event. This means it is high time to finally understand what AI is all about.
Artificial intelligence (AI) is an area of computer science that emphasizes on the creation of intelligent
machines that work and reacts like humans. Some of the activities computers with artificial intelligence are
designed for include:
Speech recognition
Learning
Planning
Problem solving

International Journal of Advance and Innovative Research Volume 6, Issue 1 (XXIV): January - March, 2019
373
ISSN 2394 - 7780
Spotify, Pandora, and Apple Music are some other touching points between AI and you. These services are
capable of recommending music based on your interests. These apps monitor the choices you make, insert them
into a learning algorithm, and suggest music you are most likely to enjoy. This particular use of AI is probably
one of the simplest among all, but it does a good job helping us discover new songs and artists.
Thanks to the AI, our ad blocker is able to detect ads just like a human does. This means identifying and
blocking ads regardless of their placement, size, type, and format. Furthermore, we sometimes use AI to
conduct our own investigations.
How to cross the AI chasm?
Fig-1: Geoffrey Moore’s Chasm model
We’ve past the Innovator phase (Ref fig 1. above), which means that AI products must now be designed and
marketed with this Early Majority in mind. Applying the lessons of Crossing the Chasm, three very clear
principles emerge for AI product :
Demonstrate ROI (business impact that is both measurable and tactile) that the Early Majority can feel
Drive predictions through to actions
Provide clear user controls
In general for AI: Data is the holygrail. So take care about how to collect the enough but the right data. In
other words conversational and cognitive artificial intelligence with the right metrics is the way to cross the
product AI chasm.
Human-AI interaction
Humans are complicated. So when they interact with AI, it presents new challenges that don’t arise when
dealing with data sets in a lab. Be aware that customers won’t use an AI-powered product if they don’t trust it.
And while you can try to build trust by showing how accurate a predictive model is, most consumers can’t
really relate to robust scientific metrics.
Logically human assisted artificial intelligence may solve this problem. Also an intelligent authentication and
security will gain trust of the user. The truth is, crossing the AI chasm doesn’t have to be intimidating. Just be
sure you approach it with a well-formed plan that keeps you looking ahead instead of down. And remember that
to be AI-first, your company also has to be customer-first.
Will AI Take Over? Some people claim that AI is still in its infancy. Others assure us that we are only a few years away from AI
gaining control over humanity. The truth, however, lies somewhere in between. According to the most
trustworthy forecasts out there, AI will outsmart humans at virtually everything in the following 45 years.
Obviously, this won’t happen overnight. Industries will be falling under AI’s spell one-by-one.
Experts predict that within the next decade AI will outperform humans in relatively simple tasks such as
translating languages, writing school essays, and driving trucks. More complicated tasks like writing a
bestselling book or working as a surgeon, however, will take machines much more time to learn. AI is expected
to master these two skills by 2049 and 2053 accordingly.

International Journal of Advance and Innovative Research Volume 6, Issue 1 (XXIV): January - March, 2019
374
ISSN 2394 - 7780
It looks like those who understand the full potential of AI are more scared of it than those who only know the
basics. A recent scandal between Google’s executives and employees may serve as a proof. In April, employees
of Google demanded the company to stop working on a so-called “Pentagon Project” as they were afraid of
being involved in the business of war. The project officially known as “Project Maven” is meant to use AI to
make it easier to classify images of people and objects shot by drones. The potential danger is that the life-or-
death, decisions of what needs to be bombarded and what doesn’t will be made without human’s involvement.
Given that lives of people might be at stake, however, can these tasks even be called tedious? And there’s
another critical question. In a world like this, who will bear the blame of killing innocent people?
It is a widespread point of view that one day not only will AI exceed human performance but it will also extend
beyond human control. With so many fearful articles out there, questions like “is artificial intelligence safe?” or
“is artificial intelligence bad for people?” should come as no surprise. AI is obviously exciting but
simultaneously warrants caution.
FINDINGS AND SUGGESTIONS What is remarkable (and a little scary) about assistants like SIRI, Alexa is that they continuously learn about
their users until the point at which they are able to accurately anticipate users’ needs.
How are governments responding? Recognising the importance of AI – and the speed at which the field is
progressing – the governments of Canada, the United States, the United Kingdom, China, and Japan have all
introduced national AI development plans. In January 2017, the UK established an All-Party Parliamentary
Group on AI where members from all sides of Parliament meet regularly to explore the impact and implications
of AI.
THE CHALLENGE OF SUSTAINABILITY Today we are faced with the monumental challenge of sustainability. By the middle of this century, the United
Nations predicts the earth will be inhabited by more than 10 billion people. This high rate of population growth
puts serious pressures on ecosystems, both wild and agricultural. One example of how our population strains
resources is the increase, nearly 100%, in our grain demand. To accommodate such growth, humans must be
able to manage their interaction with the ecosystems in sustainable ways. Artificial intelligence (AI) could be
the way to solve the wicked challenge of sustainability.
The ecosystem is very complex; everything interacts with everything. We do not know exactly what the
consequences of what we do. Machine learning (subset of AI) helps us automate the discovery by learning from
the existing knowledge, fill in the gaps, and systematically reduce uncertainties. We already have computer
models of specific components of the ecosystem, such as the model of ocean currents, atmospheric models, or
models of animal diseases. However, we still lack a great way to combine these specific components into a
holistic model. AI, especially through machine learning approach, can help us combine individual models into a
more holistic ecosystem model (Ref Fig 2). An example is what Triana did in Lower Arkansas River Basin
where he simulated the effects of agricultural practice scenarios to the sustainability of the irrigation valley by
utilizing machine learning techniques for coupling groundwater and stream water models
We had fears of strange and powerful things until we eventually managed to tame them and utilize them to
achieve our objectives. Now, we are going to do the same and use AI to solve the wicked challenge of
sustainability.
Fig-2: Computational Sustainability

International Journal of Advance and Innovative Research Volume 6, Issue 1 (XXIV): January - March, 2019
375
ISSN 2394 - 7780
So what do we mean when we speak of AI and how can it apply to sustainability? The full spectrum of
technologies covers things like:
Automated intelligence systems that take repeated, labour-intensive tasks requiring intelligence, and
automatically complete them. For example, a robot that can learn to sort recycled household materials.
Assisted intelligence systems that review and reveal patterns in historical data, such as unstructured social-
media posts, and help people perform tasks more quickly and better by using the information gleaned. For
example, techniques such as deep learning, natural language processing, and anomaly detection can uncover
leading indicators of hurricanes and other major weather events.
Augmented intelligence systems that use AI to help people understand and predict an uncertain future. For
example, AI-enabled management simulators can help examine scenarios involving climate policy and
greenhouse gas emissions, as pioneered by MIT's John Sterman.
Autonomous intelligence systems that automate decision-making without human intervention. For
example, systems that can identify patterns of high demand and high cost in home heating, adapting usage
automatically to save homeowner money.
CONCLUSION So far, one thing remains perfectly clear: creating AI is one of the most remarkable events for humankind. After
all, AI is considered a major component of 4th Industrial Revolution, and its potential socioeconomic impact is
believed to be as huge as the invention of electricity once had.
In light of this, the smartest approach would be keeping an eye on how the technology evolves, taking
advantage of the improvements it brings to our lives, and not getting too nervous at the thought of machine
takeover. If you ask an AI who knows how to play Chess to play Poker it wouldn’t be able to do so because
these two are completely different tasks. That means regardless of the fact that AI can solve complex
Algorithm, they won’t be able to solve things we do without thinking like the natural vision, motions,
perception something which is very impossible to teach AI to do because these are the skills we cannot define in
ones and zeros. They only seem natural to us because we as humans got that as a gift over thousands of years of
human evolution.
AI will not replace biological intelligence yet it will enhance our lives it would enhance our future and I believe
that most AI researchers out there will agree with me on that so after all you and I and all of us are on this
journey together. All of us have the chance to witness and also decide how artificial intelligence will shape our
future. Recent advances in AI also create enormous opportunities for having deeply beneficial influences on
society (healthcare, education, sustainability, etc.)
REFERENCES 1. Bostrom, Nicholas. (2014). Superintelligence: Paths, Dangers, Strategies.
2. Brynjolfsson, Erik, and McAfee, Andrew. (2011). Race Against the Machine.
3. Brynjolfsson, Erik, and McAfee, Andrew. (2014). The Second Machine Age.
4. Midgley G, Reynolds M (2004) Systems/operational research and sustainable development: towards a new
agenda. Sustain Dev 12(1):56–64.
5. Frame B, Brown J (2008) Developing post-normal technologies for sustainability. Ecol Econ 65:225–241
6. Domingos, Pedro. The master algorithm: How the quest for the ultimate learning machine will remake our
world. Basic Books, 2015
7. Scerri, P., Pynadath, D. V. and Tambe, M., Towards adjustable autonomy for the real world, Journal of
Artificial Intelligence Research, Vol. 17, pp.171-228, 2002
8. https://www.businessgreen.com/bg/news/3031932/-planettech-ai-for-sustainability

International Journal of Advance and Innovative Research Volume 6, Issue 1 (XXIV): January - March, 2019
376
ISSN 2394 - 7780
PERFORMANCE ANALYSIS OF THE PUBLIC AND PRIVATE INSURANCE COMPANIES WSRT
BAGALKOT DISTRICT
Dr. S. S. Aralelimath1 and Chetan B Daga2
Associate Professor1, SSS Samiti’s M. P. Mirji College of Commerce, Belagavi
Assistant Professor2, Department of Commerce, MKKP Government First Grade College, Hulsoor
ABSTRACT
Though the insurance industry is in existence since long, the level of awareness towards the rights and duties
regarding insurance is negligible. The study tries to understand the awareness of the people towards the rights
and duties towards life insurance products after the privatization of the insurance sector with special reference
to Indian insurance sector. To actually understand this, a primary research was conducted to find out the level
of awareness towards the rights and duties of the policy holders across demographic profiles and about the
level of awareness towards life insurance policies prevailing in the Indian market. The study totally
concentrates on the individual behavior, attitudes and also crating the awareness regarding their contribution
on Indian insurance sector.
Keywords: Awareness; Insurance; Investments; Policy Holder; Rights
INTRODUCTION Life Insurance is a contract for payment of a sum of money to the person assured (or failing him/her, to the
person entitled to receive the same) on the happening of the event induced against. Usually the contract
provides for the payment of an amount on the date of maturity or at specified dates at periodic intervals or at
unfortunate deaths, if it occurs earlier. Among other things, the contract also provides for the payment of
premium periodically to the company by the assured. Life Insurance is universally acknowledge being an
institution which eliminates 'risk', substituting certainty for uncertainty and comes to the timely aid of the family
in the unfortunate event of the death of the breadwinner. By and large, Life Insurance's civilization's partial
solutions to the problems caused by death. Life Insurance, in short, is concerned with two hazards that stand
across the life-path of every person; that of dying prematurely leaving a dependent family to fend for itself and
that of living to old age without visible means of support. The fundamental needs of insurance are as follows
and the identified needs of individuals will be proximate of the following. Identification is important because it
makes the process easier as one can choose from the spread the right product. The list is as Viz. security of
family in case of death or disability, security of any loans on the assets in case of death and disability, children
higher education, money saving for special future events and security for excess long ability. These are some
fundamental insurance needs these are subjected to change in many customized deals. Awareness is the corner
stone of sound information, for it makes the individual more effective and intelligent. Awareness is a vital
necessity, because it enables the individual to develop and to rise on the society and increase their efficiency,
through this awareness the individual thinking power increases.
REVIEW OF LITERATURE In order to find out the gaps in research, the literature already available pertaining to the problem is to be
reviewed. The literature on life insurance industry in India includes books, compendia, theses, dissertations,
study reports and articles published by academicians and researchers in different periodicals. The review of this
literature gives an idea to concentrate on the unexplored area and to make the present study more distinct from
other studies. The literature available is presented below:
1. Mishra, K.C. and Simita Mishra (2000) in their article on “Insurance Industry: Recipe for a Learning
Organization” say that like any other industry, insurance industry in India suffers from one challenge
repeatable a hundred times, that is the constraints of infrastructure.
2. Balasubramanian, T.S. and Gupta, S.P. (2000) in their book on “Insurance Business Environment” explain
at length the global and Indian pictures of Insurance systems. The impact of globalization and also
liberalization on Insurance business environment is also discussed analytically to have a clear
understanding of the challenges faced by the insurance industry.
3. Mitra Debabrata (2000) in the thesis entitled “Employees and the PSU: A Study of their Relationship with
Special reference to Jalpaiguri Division of the Life Insurance Corporation of India” opines that the State-
owned Undertakings provide all sorts of facilities and amenities to employees along with usual
emoluments. But, their productive rate is low when compared it with the private sector undertakings. In the

International Journal of Advance and Innovative Research Volume 6, Issue 1 (XXIV): January - March, 2019
377
ISSN 2394 - 7780
Jalpaiguri Division, the employee relationship with the LIC is clearly discussed and some suggestions are
also given in the thesis.
4. Wadikar Ashok Laxaman (2001) in his thesis on “Innovativeness in the Insurance Industries”, Ph.D. Thesis
submitted to the Department of Management, University of Pune, Pune, 2001. Confirms a general opinion
that innovativeness in every activity alone rules and dominates the industry. But, at the same time, the
practicality and economic justification of that innovativeness are also to be analysed.
5. BalachandWran, S. (2001) in his book on “Customer Driven Services Management” concludes that the
insurance industry is fast growing and mostly becoming a customer driven and customer centric one. He
also advocates that when the insurance products are attractive to the customers, then only the insurance
industry flourishes in the market and serves its purpose of profit earning and also income generation.
6. Srivastava, D.C. and Srivastava, S. (2001) in their book on “Indian Insurance Industry–Transition and
Prospects” discuss analytically the financial significance of insurance industry, its contribution to Indian
economy and alsothe transitory prospects and challenges of insurance industry due to liberalization and the
opening up of the sector to private players.
7. Mark S. Dorfman (2002) in his book on “Introduction to Risk Management and Insurance” reviews the
salient features of the insurance industry and also the role played by the private enterprise. The different
types of insurance intermediaries are also discussed at length with suitable illustrations incorporated
wherever necessary.
8. Charles P Jones (2002) in his book on “Investment Analysis and Management” explains clearly about the
framework for evaluating portfolio performance through return and risk considerations. The Risk-Adjusted
measures of performance and also the problems associated with Portfolio Measurement are also discussed.
9. Ajay Mahal (2002) in his article on “Assessing Private Health Insurance in India–Potential Impacts and
Regulatory Issues” asserts that the entry of private health insurance companies in India is likely to have an
impact on the costs of health care, equity in the financing of care and the quality and cost-effectiveness of
such care. However, he mentions that an informed consumer and a well-implemented insurance regulation
regime in many cases eliminate some of the bad outcomes.
10. Dan Segal Leonard N. Stern School of Business New York University “An Economic Analysis of Life
Insurance Company Expenses” has analysed the expenses of the Life Insurance Companies.
ANALYSIS AND INTERPRETATION WITH RESPECT TO BAGALKOT DISTRICT
Table-1: Believe in Money Planning
S.NO Opinion No of respondents Percentage
1 YES 92 92
2 NO 8 8
Total No of respondents 100 100
Interpretation It is observed that 92% of the respondents believe in money planning and rest which is 8% they don’t believe in
money planning.
Table-2: Various Type of Money Planning
S.NO Opinion No of respondents Percentage
1 savings 35 35
2 Fixed Deposit 15 15
3 Insurance 28 28
4 PPF 7 7
5 Others 15 15
Total No of respondents 100 100
Interpretation From the above data collected 35% respondents believe in savings, 15% in fixed deposits, 28% in insurance,
7% in provident fund and other 15% in other money planning.

International Journal of Advance and Innovative Research Volume 6, Issue 1 (XXIV): January - March, 2019
378
ISSN 2394 - 7780
Table-3: Planning For Retirement
S.NO Opinion No of respondents Percentage
1 YES 74 74
2 NO 26 26
Total No of respondents 100 100
Interpretation It is concluded that from the above data 74% of the respondents make their money plan for their retirement and
26% doesn’t have any money plan for retirement.
Table-4: Production after Retirement
S.NO Opinion No of respondents Percentage
1 savings 29 29
2 Fixed Deposit 7 7
3 Insurance 20 20
4 PPF 29 29
5 Others 15 15
Total No of respondents 100 100
Interpretation It is found that people are mostly aware about life insurance is through any other means of Promotion, next
highest is the awareness through Friends, the third position is occupied by promotion through News Paper Ads
followed by Campaigning. It is concluded that maximum people opt for savings and provident fund, then it is
for insurance and lastly for fixed deposit.
Table-5: Important For Education Fund
S.NO Opinion No of respondents Percentage
1 Very Important 57 57
2 Important 29 29
3 Not Important 14 14
Total No of respondents 100 100
Interpretation It is observed that 57% thinks that insurance is very important for Education fund another 29% said it is
important and remaining 14% said it is not important.
Table-6: Importance for Marriage Fund
S.NO Opinion No of respondents Percentage
1 Very Important 48 48
2 Important 30 30
3 Not Important 22 22
Total No of respondents 100 100
Interpretation It is observed that 48% thinks that insurance is very important for Marraige fund another 30% said it is
important and remaining 22% said it is not important.
Table-7: Aware of Life Insurance
S.NO Opinion No of respondents Percentage
1 YES 89 89
2 NO 11 11
Total No of respondents 100 100
Interpretation From the above collected data of the respondents 89% are aware of insurance and 11% of the respondents are
not aware of insurance, it is conclude that most of them know about insurance

International Journal of Advance and Innovative Research Volume 6, Issue 1 (XXIV): January - March, 2019
379
ISSN 2394 - 7780
Table-8: Insurance is needed for Your Family
S.NO Opinion No of respondents Percentage
1 YES 73 73
2 NO 27 27
Total No of respondents 100 100
Interpretation In my survey 73% of the respondents said that they need insurance for their family and the remaining 27% think
it is not necessary.
Table-9: Number of Policy Holders in Different Life Insurance Companies
S.NO Opinion No of respondents Percentage
1 YES 60 60
2 NO 40 40
Total No of respondents 100 100
Interpretation It is observed that 60% of the respondents are insured and remaining 40% of them are not insured. There are yet
40% of people who are not insured. It shows that still the number is very large.
Table-10: Importance of Insurance Policy
S.NO Opinion Percentage
1 Protection for Dependents 32.3
2 Protection for Education 26.4
3 Protection for Marriage 17.6
4 Protection for Estate Duties 7.3
5 Others 16.4
Total No of respondents 100
Interpretation From the above data 33% of the policy holders take the policy to protect his/her dependents, 26% of them
protection for education fund, 18% of them protection for marriage fund, 7% of them protection for Estate
duties and remaining for other facilities.
Table-11: Attraction For Taking The Policy
S.NO Opinion No of respondents Percentage
1 Interest & Dividends 29 42.6
2 Customer Service 8 11.7
3 Various plans 18 26.4
4 Others 12 19.3
Total No of respondents 100 100
Interpretation From the above data the percentage of respondents are attracted by seeing interest and dividend are 43%
customer service 12% various plans 18% and other reasons 18%.
CONCLUSION
It is concluded that maximum individuals believe in money planning, wherein 35% go for savings. The ¾ part
of the respondants i.e., about 75% plan their money and invest for their retirement. It is concluded that
maximum people opt for savings and provident fund, then it is for insurance and lastly for fixed deposit.The
individuals in this fast growing era opting for high educational values which are also very costlier to afford for a
middle class person, the respondants thinks that inveting in the insurance funds is important for Education
followed by marriage. It was also found that 89% of the population is aware of the insurance funds. Finally the
insurance funds are chosen by individuals to fulfill their family needs than their personal needs
REFERENCES
1. Schiffman Lenon G., & Kanuk Leslie Lazar (2006). Consumer Behaviour. Prentice Hall of India.
2. Philip Kotler, (2000, 2002 and 2008). Marketing Management. Prentice Hall of India.
3. Lovelock, C. H. (2010). Services Marketing. Pearson Education.

International Journal of Advance and Innovative Research Volume 6, Issue 1 (XXIV): January - March, 2019
380
ISSN 2394 - 7780
4. L.M.Bhole & Jitendra Mahakud, (2009). Financial Institutions and Markets (Fifth ed). Tata McGraw-Hill.
WEBSITES
www.irda.com
www.insuranceindia.com
www.conind.com

International Journal of Advance and Innovative Research Volume 6, Issue 1 (XXIV): January - March, 2019
381
ISSN 2394 - 7780
FACTORS INFLUENCING DISTRIBUTION PLANNING
Vibhuti Save
Assistant Professor, Dr. V. N. Bedekar Institute of Management Studies
ABSTRACT
An analysis of supply chain system could become more complex when the network system should cover widely
dispersed locations. This could happen in a case where a product must be delivered using long distribution
channel. By reviewing literatures over the last decade, this paper aims to identify and to gain more
comprehensive understanding of the problems related to the long distribution channel’s characteristics. The
term ‘long distribution channel’ refers to a
Multi-tiers in the distribution stages where each tier commonly contains more than one site. The result shows
that in order to design an optimum long distribution channel, some prominent problems that impact on both
distribution costs and delivery times need to be considered. The problems encompass variability, bottleneck,
bullwhip effect, high transportation and logistics costs.
Following customer centric focus, supply chain management plays a vital role in success of an organization. To
meet customer demand on or before time is becoming primary motto of each organization. Hence distribution
planning process is important in success of Supply Chain Planning.
Below are various factors that play an important role in distribution planning studied in this paper,
i) Demand at depots/ warehouse
ii) Stock on hand at each node
iii) Short term firmed production plan
iv) Safety stock requirement at each node
v) Various costs: storage cost, safety stock violation cost, transportation cost, demand lost cost
vi) Storage space at each node
vii) Detention issue at any node
viii) Government factors
ix) Role of information systems
Keywords: distribution planning, supply chain management
I. INTRODUCTION
Over the last few years, the demand placed on the distribution and logistics departments of manufacturing and
marketing organizations has been continuously intensifying due to pressures from increased competition,
introduction of new manufacturing methods, and increased expectations from partners and consumers in terms
of low price and high service levels. Corporations are looking to increase their customer service levels, while
reducing inventory, working capital requirements and distribution costs.
While distribution and logistics planning is gaining importance within corporations, distribution planners and
supply chain managers are still struggling to come to terms with the increased expectations. The bulk of their
time is still spent on short-term operational problems related to meeting immediate demand requirements,
without much consideration for longer-term costs or strategic issues.
In the recent past, organizations have realized that the real competition is not between the organizations in a
supply chain but rather between one supply chain and the other. High competition, global market place and
market maturity are some of the factors that have forced organizations to rethink the way they do business. A
critical rethinking paved the way for organizations to embrace the paradoxical concept of integration within the
business and between businesses, popularly known as supply chain integration. Christopher (2000) clearly
explained that true supply chain integration seeks to achieve linkage and coordination between processes of
other organizations in the supply chain and the organization itself.
A basic assumption in any transportation problem is that the cost of transportation is directly proportional to the
number of units transported (Diaby 1991). Such approaches consider the total cost of distribution as purely

International Journal of Advance and Innovative Research Volume 6, Issue 1 (XXIV): January - March, 2019
382
ISSN 2394 - 7780
quantity dependent and proportional to the amount transported between a source and a destination. Trip wise
transportation costs were also considered by researchers.
The complexity of today’s supply chain requires manufacturers and distributors to search for new methods to
reduce costs, increase efficiencies, reinvent channel models, engineer collaborative relationships, and span
functional, cultural, and personal boundaries (Harsono, 2013)
Smith and Agarwal (2000) develop a base-stock inventory model with stock-out based substitution that
determines the optimal assortment to be carried as well as inventory levels subject to a service level constraint.
II. OBJECTIVES OF THE STUDY
Based on the research problem indicated above, the objectives of the study are the following:
1. To study the impact of inventory Management on distribution Process
2. To study the impact of distribution strategy on distribution process
3. To study the impact of transportation management on the efficiency of distribution process
III. SHORT CONCEPT EXPLANATION
Distribution process is a path through which particular product travels from producer to final consumer. This
path in distribution process is nothing but Distribution Channel.
Physical distribution is the set of activities concerned with efficient movement of finished goods from the end of
the production operation to the consumer. Physical distribution takes place within numerous wholesaling and
retailing distribution channels, and includes such important decision areas as customer service, inventory
control, materials handling, protective packaging, order procession, transportation, warehouse site selection, and
warehousing.
A distribution strategy is a plan that leads to obtaining an ideal channel. It means ideal from the producer point
of view. The physical distribution is a process consisting of various activities responsible for efficient
movement of finished product within individual firms and through distribution channels. Moreover increasingly
the term physical distribution is being used to describe a total and integrated process Including transportation,
storage and warehousing, inventory control and closely related activities. This refers to the whole gamut of
transferring produce to the end user.
TYPES OF DISTRIBUTION
a) Physical Distribution
In order to maintain freshness of the product efficient physical distribution is necessary for the industry.
Keeping in mind the rail road and air line facilities the manufactures has to manage production and its
distribution. The raw material supply to a larger extent depends upon the efficient transportation warehousing
and inventory carrying etc. Perishable nature of fruits necessitates careful handling at each and every step.
Normally cold storage facility is needed for processed products in order to increase the shelf life. The public
warehouse and private warehousing facility can be hired in case own storage facility is not available. Inventory
carrying cost may increase if proper assessment of demand is not made. The choice of transportation carriers
affect the pricing of the products, on time delivery performance, and the condition of the goods when they
arrive all of which will affect customer satisfaction.
Physical distribution is part of a larger process called “distribution,” which includes wholesale and retail
marketing, as well the physical movement of products. Physical distribution activities have recently received
increasing attention from business managers, including business owners
This is due in large part to the fact that these functions often represent almost half of the total marketing costs of
a product. In fact, research studies indicate that physical distribution costs nationally amount to approximately
20 percent of the country’s total gross national product (GNP).
An efficient physical distribution system includes the following activities: Transportation, Storage, Inventory
Control, Order Processing, and Material Handling System.
b) Channels of Distribution
Distribution channels are the set of marketing institutions participating in the marketing activities involved in
the movement or the flow of goods or services from the primary producer to the ultimate consume. The
selection of channels of distribution are affected by following factors: The target consumer, the product, the
producers status & objective, and the middlemen's status & objective

International Journal of Advance and Innovative Research Volume 6, Issue 1 (XXIV): January - March, 2019
383
ISSN 2394 - 7780
The first channel is the longest in that it includes all four, from producer to the end consumer. The wine and
adult beverage industry is a perfect example of this long distribution channel. In this industry, thanks to laws
born out of prohibition, a winery cannot sell directly to a retailer. It operates in what is known as the three-
tier system, meaning the winery is required by law to first sell its product to a wholesaler, who then sells to a
retailer. The retailer, in turn, sells the product to the end consumer.
The second channel is one where the producer sells directly to a retailer, who then sells the producer's
product to the end consumer. This means the second channel contains only one intermediary. Dell, for
example, is large enough where it can sell its products directly to reputable retailers such as Best Buy.
The third and final channel is a direct to consumer model where the producer sells its product directly to the
end consumer. Amazon, using its own platform to sell Kindles to its customers, is an example of a direct
model, which is the shortest distribution channel possible.
Independent Channel
o Independent Channel has “conventional” distribution arrangement, a channel member negotiates deals
with others that do not result in binding relationships
Dependent Channel
o Dependent Channel, also called “vertical marketing system”, a channel member feels tied to one or more
members of the distribution channel
IV. RESEARCH METHODOLOGY
The type of the topic researched is mainly the quantitative research method, with the study being descriptive
and contextual in nature.
The research methods utilized in this study included: Convenience sampling as a non-probability sampling
method; a self-administered questionnaire as the measuring instrument to measure the study variables; and
statistical methods to analyze the data collected. The target population of the study comprised of manufacturing
& third party logistic companies are involved in the distribution of products. The total of 20 dispatch executives
was participated in the survey Therefore; the sample size was restricted to the 20 dispatch executives working in
the Thane, Navi Mumbai district.
The final questionnaire consisted of a total of 14 close ended & 12 open-ended questions. The open ended
questions were structured in such a manner that the researcher could review the opinions of the respondents for
each of the variables to address the purpose of the study. After designing the questionnaire, it was pre-tested.
Two types of validity are applicable to this study, namely content validity and face validity. Content validity
refers to the extent (adequacy) to which the measuring instrument (a questionnaire in this case) measures the
actual concepts related to the topic. Face validity refers to the fact that the questions are unambiguous to the
respondents and therefore the gathered information will be valid (De Vos et al. 2011, p. 167).
V. DATA ANALYSIS AND INTERPRETATION
This section presents the observed findings of the study with the aid of Pie cart. The charts are based on the
summaries of the questionnaire responses and presented in terms of the study objectives and the lay-out of the
questionnaire used in the study. Of the sample size of 20 possible respondents identified, 21 responded, giving a
response rate of 100%. Based on the empirical results,
We have considered companies having annual turnover more than Rs. 1 Crore.

International Journal of Advance and Innovative Research Volume 6, Issue 1 (XXIV): January - March, 2019
384
ISSN 2394 - 7780
Company plant locations: Mumbai and Navi Mumbai
Distribution Network from plant: 47% in Mumbai and Navi Mumbai and 53% Pan India
Products distribution is a key objective.
Scale-1 Strongly Agree, 2 –Agree, 3 –Neutral, 4 – Disagree, 5 –Strongly Disagree

International Journal of Advance and Innovative Research Volume 6, Issue 1 (XXIV): January - March, 2019
385
ISSN 2394 - 7780
Products distribution system in our organization is reliable.
Scale-1 Strongly Agree, 2 –Agree, 3 –Neutral, 4 – Disagree, 5 –Strongly Disagree
Specify to whom you sell your products as a percentage of total sales
a. Directly to the customer ( )Yes ( ) No
b. Direct to the small, medium, large retailers ( )Yes ( ) No
c. Direct to the factory ( )Yes ( ) No
d. Through an agent ( )Yes ( ) No
e. Through a consortium with other manufacturers ( )Yes ( ) No
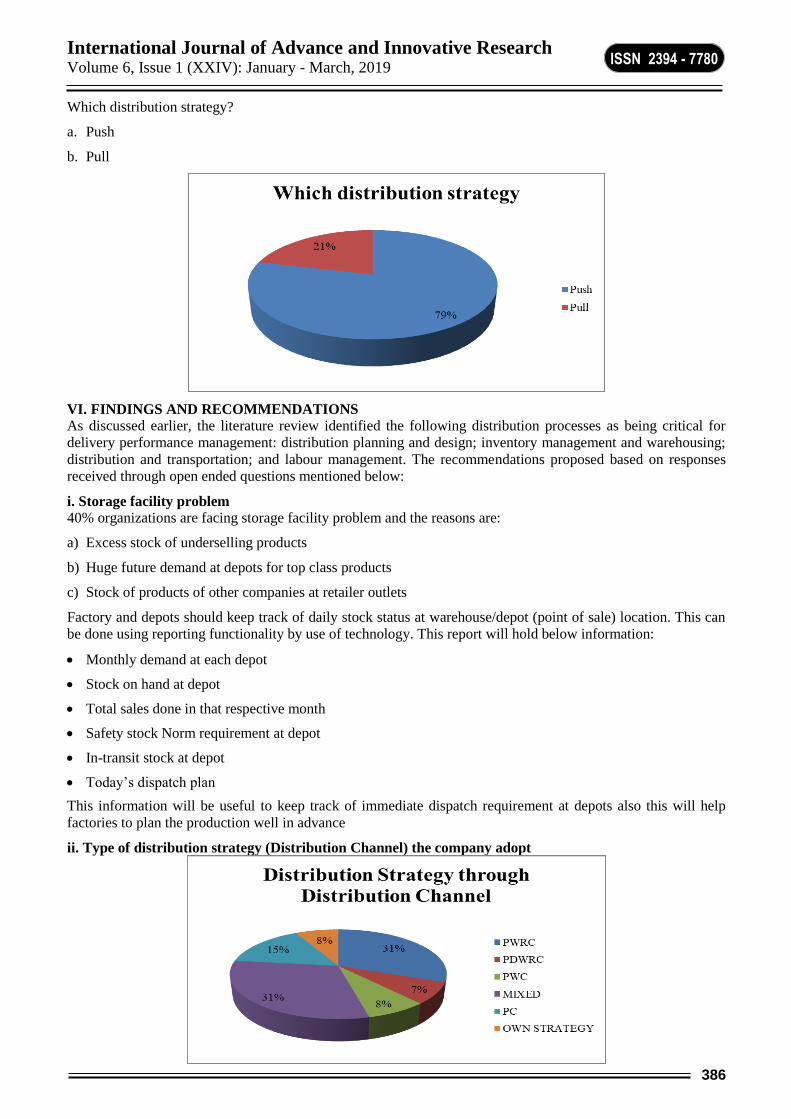
International Journal of Advance and Innovative Research Volume 6, Issue 1 (XXIV): January - March, 2019
386
ISSN 2394 - 7780
Which distribution strategy?
a. Push
b. Pull
VI. FINDINGS AND RECOMMENDATIONS
As discussed earlier, the literature review identified the following distribution processes as being critical for
delivery performance management: distribution planning and design; inventory management and warehousing;
distribution and transportation; and labour management. The recommendations proposed based on responses
received through open ended questions mentioned below:
i. Storage facility problem
40% organizations are facing storage facility problem and the reasons are:
a) Excess stock of underselling products
b) Huge future demand at depots for top class products
c) Stock of products of other companies at retailer outlets
Factory and depots should keep track of daily stock status at warehouse/depot (point of sale) location. This can
be done using reporting functionality by use of technology. This report will hold below information:
Monthly demand at each depot
Stock on hand at depot
Total sales done in that respective month
Safety stock Norm requirement at depot
In-transit stock at depot
Today’s dispatch plan
This information will be useful to keep track of immediate dispatch requirement at depots also this will help
factories to plan the production well in advance
ii. Type of distribution strategy (Distribution Channel) the company adopt
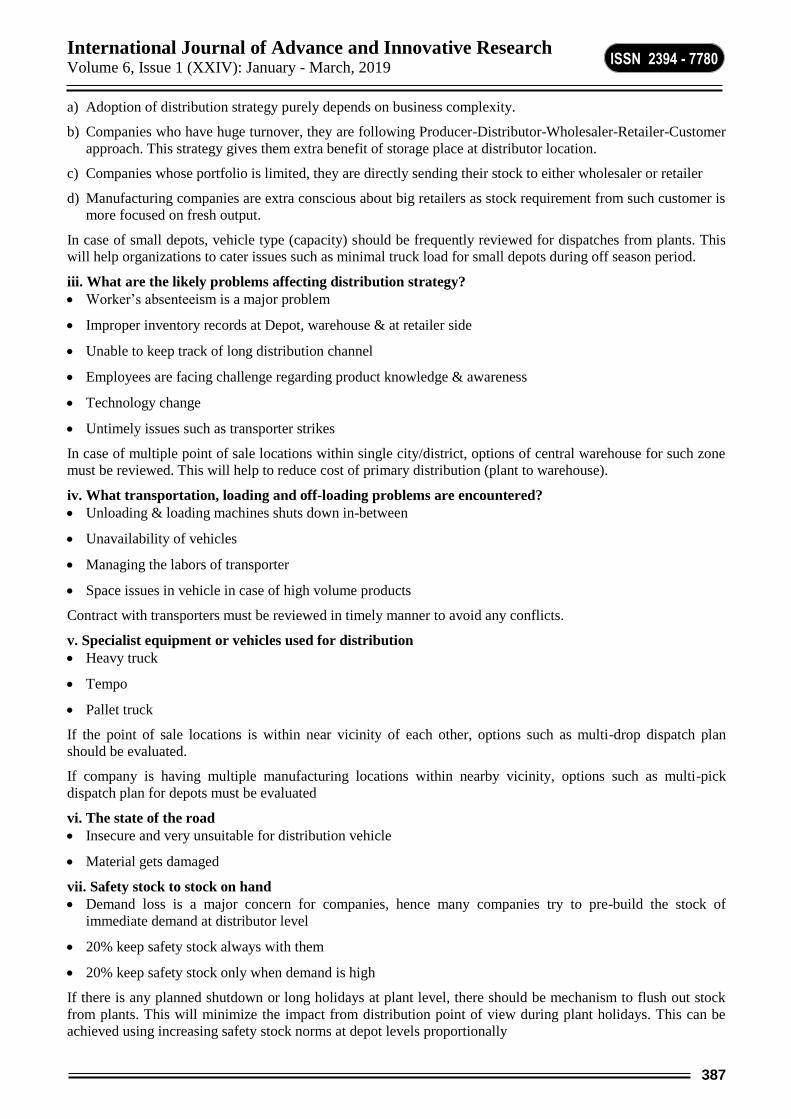
International Journal of Advance and Innovative Research Volume 6, Issue 1 (XXIV): January - March, 2019
387
ISSN 2394 - 7780
a) Adoption of distribution strategy purely depends on business complexity.
b) Companies who have huge turnover, they are following Producer-Distributor-Wholesaler-Retailer-Customer
approach. This strategy gives them extra benefit of storage place at distributor location.
c) Companies whose portfolio is limited, they are directly sending their stock to either wholesaler or retailer
d) Manufacturing companies are extra conscious about big retailers as stock requirement from such customer is
more focused on fresh output.
In case of small depots, vehicle type (capacity) should be frequently reviewed for dispatches from plants. This
will help organizations to cater issues such as minimal truck load for small depots during off season period.
iii. What are the likely problems affecting distribution strategy?
Worker’s absenteeism is a major problem
Improper inventory records at Depot, warehouse & at retailer side
Unable to keep track of long distribution channel
Employees are facing challenge regarding product knowledge & awareness
Technology change
Untimely issues such as transporter strikes
In case of multiple point of sale locations within single city/district, options of central warehouse for such zone
must be reviewed. This will help to reduce cost of primary distribution (plant to warehouse).
iv. What transportation, loading and off-loading problems are encountered?
Unloading & loading machines shuts down in-between
Unavailability of vehicles
Managing the labors of transporter
Space issues in vehicle in case of high volume products
Contract with transporters must be reviewed in timely manner to avoid any conflicts.
v. Specialist equipment or vehicles used for distribution
Heavy truck
Tempo
Pallet truck
If the point of sale locations is within near vicinity of each other, options such as multi-drop dispatch plan
should be evaluated.
If company is having multiple manufacturing locations within nearby vicinity, options such as multi-pick
dispatch plan for depots must be evaluated
vi. The state of the road
Insecure and very unsuitable for distribution vehicle
Material gets damaged
vii. Safety stock to stock on hand
Demand loss is a major concern for companies, hence many companies try to pre-build the stock of
immediate demand at distributor level
20% keep safety stock always with them
20% keep safety stock only when demand is high
If there is any planned shutdown or long holidays at plant level, there should be mechanism to flush out stock
from plants. This will minimize the impact from distribution point of view during plant holidays. This can be
achieved using increasing safety stock norms at depot levels proportionally

International Journal of Advance and Innovative Research Volume 6, Issue 1 (XXIV): January - March, 2019
388
ISSN 2394 - 7780
viii. Impact of underselling at depot on distribution process?
Increase in inventory
Increase in inventory carrying cost
Product expiry concern in case of perishable goods
Stock on hand status must be reviewed daily at depots. In case of underselling, immediate dispatches from plant
for the same product must be discontinued temporarily. This information should be shared with plant and as
well as with other depots. If other depots have enough space and short term demand for such products, it can
help in stock shift between depots.
ix. What is impact of overselling at depot on distribution process?
Problems occur in transportation and at production
Due to less vehicles there is load on distribution
Demand prioritization needs to be done for overselling depots.
In such case, companies try to meet the demand at depot level by doing transfer of stocks between depots. This
helps them to minimize the impact on production at plant
VII. CONCLUSION
a) In today’s challenging business environment, every company focuses that their customer demand should be
fulfilled well in time. Hence distribution planning holds the same importance as that of production and
demand planning in supply chain framework.
b) Unplanned incidence such as underselling and overselling create extra pressure on distribution channel
c) Transporter contracts must be revised frequently to avoid any legal issues
d) Use of technology in dispatch planning will play vital role
VIII. REFERENCES
Christopher, M. (2000), “The agile supply chain – competing in volatile markets”, Industrial Marketing
Management, Vol. 29 No. 1, pp. 37-44.
Diaby, 1991, Successive linear approximation procedure for generalized fixed-charge transportation
problems. Journal of Operational Research Society. v42 i11. 991-1001.
Alexander Harsono,(2013),“ How Wal-Mart Can Enhances Supply Chain Management With CPFR
Initiatives”,
https://www.academia.edu/27115941/How_Walmart_Can_Enhances_Supply_Chain_Management_With_C
PFR_Initiatives
Smith, S. A., and N. Agrawal. 2000. Management of multi-item retail inventory systems with demand
substitution. Operations Research 48 (1): 50–64.
Axsater, S. (2006). “Inventory Control”, Springer’s International Series, 2nd edition. Barratt, M. (2004).
Understanding the meaning of collaboration in supply chain. Supply Chain Management: An International
Journal, 9 (1), 30-42.
Borowiec and Liedberg, (2009). “Benefits and challenges with coordinated inventory control at Volvo
Parts”, Department of Industrial Management and Logistics, Lund Institute of Technology. Bowen, G. N.
(2003). Outsourced ASP/VMI Platform Appeals to Chicago Rawhide's Manufacturing Clients. BPO
Outsourcing Journal. Everest Partners, L.P., September.
http://researchguides.library.yorku.ca/scm/distributioncustomer
Case studies in Sales AND Distribution Management – The ICFAI Centre for Management Research
Michel T. Etzel, Brace J. Walker, William J. Stanton, Ajay Pandit-Marketing Concepts and cases-
Theodore Sarah, Jan 2006, New strategies for distribution Beverage Industry; 97, 1; ABI/INFORM
Collection pg. 4

International Journal of Advance and Innovative Research Volume 6, Issue 1 (XXIV): January - March, 2019
389
ISSN 2394 - 7780
A CRITICAL STUDY OF THE PERFORMANCE OF PRIVATE INDIAN BANKS POST INITIAL
PUBLIC OFFERING: (From the year 2005 TO 2010)
Dipti Periwal
Assistant Professor, Bedekar Institute of Management Studies
1. INTRODUCTION
1.1 Indian Banking - IPO Market.
The banking sector constitutes a crucial component of any economy. With respect to lending and borrowing, it
is the most important intermediary. With the ushering of economic liberalization (1992), the banking sector had
undergone several changes in line with Narasimham Committee recommendations. The reforms helped in
improvising efficiency and transparency. The ultimate aim was allowing the public sector banks to go for IPOs,
which would dilute the government ownership and bring these banks under market discipline.
As banking sector plays a vital role in any country’s economic growth and evidences of underperformance of
the IPOs in general, this research will focus on detailed analysis of IPO from the banking sector. The banking
sector reform initiated in 1992 sought to improve the bank efficiency through entry deregulation, branch deli
censing, deregulation of interest rate and allowing the public & private sector banks to raise the equity capital
from the capital market. One of the major reasons for banks to enter stock market was catering to the need of re-
capitalization. The Reserve Bank of India had estimated that based on extent of capital adequacy norms and
growth rate of the economy the public sector banks would need Rs.100 billion of additional capital in the
coming five years (Jalan 2000). The two possible sources of capital infusion are by governmental infusion of
funds and/or allowing the banks to access the capital market. With the need felt for fiscal consolidation,
subscription to banks’ capital cannot be regarded as a priority claim on the budgetary resources. So, the
Narasimham Committee Report encouraged Public Sector Banks to access the capital market at home and
abroad to meet their re-capitalization.
2. LITERATURE REVIEW
This is a well-researched topic throughout the world. But almost in all such studies the focus remained only on
underbracing of the stocks. Here the focus is on public and private sector bank IPOs.
Barth et al. (2004) have revealed that regulatory and supervisory practices promote bank performance and
stability. Within this context, it is also expected that aspects such as bank activity restrictiveness and regulatory
requirements regarding the amount of capital may influence the change in return after the IPO.
The study by Reilly and Hatfield (1969) reported underbracing to the extent of 11% from their study of the
IPOs in US during the period 1963-65. Other studies by Ibbotson (1975), Reilly (1977), Aggarwal and Rivoli
(1989), Ritter (1991), Loughran and Ritter (1995), Ritter and Welch (2002), Ljungqvist and Wilhelm
(2003) all document underbracing in the U.S. market. Jog and Riding (1987) reported the same for the
Canadian market and then Ljungqvist (1997) for the German market, and Gong and Sekhar (2001) for the
Australian market also report underbracing. Others studies which reported underbracing are Wong and Chiang
(1986) for the Singapore market; Chen et al (2004) for the Chinese market and Yong and Isa (2003) provide
evidence on under-pricing of IPOs in the Asian markets. The study by Shah (1995) provides evidence on the
short run performance of 2056 new listings over the period January 1991 to May 1995 and documents a
phenomenal 105.6% excess return over the offer price. In another study, MadhusoodananandThiripalraju
(1997) based on IPOs offered on BSE during the period 1992 to 1995 show that underbracing was higher than
the international experiences in the short run and inthelong run too they yield higher returns compared to the
negative returns recorded from the international markets. Similarly, Krishnamurti and Kumar (2002) working
on asample of IPOs that hit the market between 1992 and1994demonstrate that the under pricing is to the extent
of72.34% (market adjusted returns). Alanazi and Liu (2013) broke down the 52 IPOs in the area of Gulf
Cooperating Council in 2003– 2010. The outcomes demonstrated that IPO execution decays in the wake of
opening up to the world.
As indicated by the creators the execution decay is related with the firm progress from private into open
proprietorship because of expanding office cost. This exploration in return loans support to the window-dressing
clarification of IPO performance.
Ahmad (2011) directed an investigation identified with financial proficiency of Malaysian organizations
entering the general population advertise.

International Journal of Advance and Innovative Research Volume 6, Issue 1 (XXIV): January - March, 2019
390
ISSN 2394 - 7780
The creator reasoned that the operational exercise after the IPO unmistakably indicates decay.
Kurtaran and Bünyamin (2008) contemplated the recorded organizations in Turkey and they thought about
the ROA for the year going before the IPO with ROA three years after the IPO. They demonstrated that ROA
three years after the IPO tumbled from 9% to - 32.7%. The decline in ROA was consistent and persistent.
Barth et al. (2004) have uncovered that administrative and supervisory practices advance bank execution and
security. Inside this unique situation, it is additionally expected that viewpoints, for example, bank movement
limitation and administrative necessities with respect to the measure of capital may impact the adjustment
consequently after the IPO.
Aharony et al. (2000) who contemplated that the ROA of organizations in the time of the first sale of stock and
the year after that, In the time of the first sale of stock they found that the normal ROA of organizations got its
pinnacle, at that point fell. This decline was essentially lower in the organizations in the segments bolstered by
the administration, i.e. fuel, crude materials
Jay R. Ritter (1991) was the first to report confirmations of underperformance as another exact peculiarity
exhibit in the IPO advertise. Utilizing a specimen of 1526 organizations that opened up to the world in U.S.A.
amid 1975 to1984, he demonstrated that over the longhaul IPO firms essentially failed to meet expectations
when contrasted with the effectively recorded firms. Ritter utilized an arrangement of practically identical firms
coordinated by measure (advertise capitalization) and industry as benchmarks. By long keep running under-
execution the writer implied that a venture of one dollar in an IPO toward the finish of first day's open
exchanging and holding it for the following three years would yield the financial specialist a lower return when
contrasted with the interest in an officially recorded coordinating firm. Ritter utilized two measures to assess
long run execution. He ascertained aggregate normal returns of the recently recorded organizations and thought
about them utilizing different lists as benchmarks. He additionally utilized three years purchase and hold returns
for the two IPOs and an arrangement of coordinating firms. Ritter reported that little and youthful organizations
and firms that opened up to the world in the substantial volume years performed more terrible (by and large)
when contrasted with an arrangement of effectively recorded organizations.
Loughran and Ritter (1995) endeavoured to address the uncertain issues of Ritter's (1991) paper and shed all
the more light on the Issueof long keep running under-execution of IPOs by taking a more drawn out time
skyline (1970-90) and discovered confirmations of unreasonable underperformance on the premise of stock
returns.
Jain and Kini (1994), then again, focused on bookkeeping information of IPO firms to assess their post
Issueworking execution. They found that IPO firms show considerable decrease in the post Issueworking
execution over a time of six years (reaching out from the year preceding the IPO). The creators utilized working
pay as the proportion of Profit before Dividend and Tax to Total Assets (PBDT/TA). The working income was
computed as the proportion of the benefit before profit and assessment (net of capital consumption) to add up to
resource (PBDT-Capital Expenditure/TA). Utilizing these as measures of working execution they discovered
crumbling in the IPO organizations' execution in the reseller's exchange time frame.
Another study by Mikkelson et al. (1997) considered an example of 283 U.S. Initial public offerings in the
years 1980-83. Their investigation additionally bolstered the prior discoveries and demonstrated that working
execution of the IPO firms crumbled in the initial ten years subsequent to opening up to the world. Poor
working execution of the recently recorded firms were related with the example of little and youthful
organizations. The expansive and old organizations showed an abnormal state of execution before opening up to
the world, and lower, yet non-negative execution a short time later. The writers contended that the poor
execution of the little and youthful firms may be a result of high introductory working expense or potentially
forceful evaluating system taken after by officially settled firms.
Various investigations have been led every now and then to comprehend the distinctive angles identifying with
essential market and vendor keeping money exercises in India. In any case, the greater part of them has cantered
upon the essential market in India as it were. Research in the region of dealer saving money in India and its part
in the essential market is exceptionally constrained and that too is illustrative in nature and manages procedural
perspectives, association and administration and promoting parts of shipper brokers.
Verma (1990) directed research on shipper banks in India with the reason to investigate their association
structure and administration design and to survey their appropriateness for medium and little size corporate and
non-corporate ventures. The reasonableness of vendor saving money benefits in lessening financial specialists'

International Journal of Advance and Innovative Research Volume 6, Issue 1 (XXIV): January - March, 2019
391
ISSN 2394 - 7780
hazard and corporate capital structure has additionally been analysed. The data was gathered from an example
of 32 shipper brokers through poll and the examination secured the period 1978 to 1984.
All such studies agree that IPOs tend to be profitable only during short term period since IPO’s are under-
priced. Since 1998 onwards Indian IPO market has witnessed hangs that tend to focus on better realization to
the issuers of stocks and better stocks for the investing public. So, this research study has undertaken to find the
extent of under-pricing in Indian IPOs across different sectors, over different timeframes.
2.1. Defining of IPO
“As per SEBI IPO can be defines as Initial public offer (IPO): When an unlisted company makes either a fresh
issue of shares or convertible securities or offers its existing shares or convertible securities for sale or both for
the first time to the public, it is called an IPO. This paves way for listing and trading of the issuer’s shares
orconvertible securities on the Stock Exchanges”.
3. OBJECTIVES OF STUDY
i. To study correlation between profitability of banks and market price of shares at the time of IPO and after 5
years of IPO.
4. HYPOTHESIS OF STUDY
H01: There is no relationship between profitability of banks and market price at the time of IPO and after 5 years
of IPO.
H11: There is relationship between profitability of banks and market price of share at the time of IPO and after 5
years of IPO.
5. RESEARCH DESIGN (METHODOLOGY):
Ratios used to study performance of banks:
For the said study secondary data will be collected. Financial ratios will be obtained to study performance of
bank. Following financial factors are considered for the study.
Using above information financial ratios will be obtained
1. Net Profit Margin
2. Return on Equity
3. Return on Assets
Study consists of four different years. These four years are defined as follows.
N is year of IPO
(n + 1) is first year post IPO.
(n + 2) is second year post IPO.
(n + 3) is third year post IPO.
(n + 4) is fourth year post IPO.
(n + 5) is fifth year post IPO.
Performance of bank will be studied for these two years.
Data Collection Secondary source will be used to collect financial information for different time zones. For
analysis Multiple regression was used with beta co-efficient.
Period under study- The period from 2005 to 2010 is taken into consideration. The performance of public and
private sector bank IPO will be studied in preceding year of the IPO, succeeding year of IPO and after 5 years
of IPO.
Sample – All banks listed under the period of study has been considered.
Variables Independent/Dependant
1. Total Shareholder’s Equity Independent
2. Total Assets- Independent
3. Net Profit Independent
4. Market price of share. Dependant

International Journal of Advance and Innovative Research Volume 6, Issue 1 (XXIV): January - March, 2019
392
ISSN 2394 - 7780
Bank taken under consideration for the study
All 04 banks are considered for the study. Financial data of all FOUR banks will be considered.
6. ANALYSIS
ICICI BANK LTD
Model Summary
Model R R Square
Adjusted R
Square
Std. Error of
the Estimate
Change Statistics
R Square
Change F Change df1 df2
Sig. F
Change
1 .901a .813 .750 177.25552 .813 13.004 1 3 .037
a. Predictors: (Constant), ICICINETPROFIT
Coefficientsa
Model
Unstandardized
Coefficients
Standardized
Coefficients
t Sig.
95.0% Confidence Interval
for B
B Std. Error Beta
Lower
Bound Upper Bound
1 (Constant) 2434.481 456.148 5.337 .013 982.813 3886.149
ICICINETPROFIT -107.674 29.859 -.901 -3.606 .037 -202.699 -12.649
a. Dependent Variable: ICICISHAREPRICE
Excluded Variablesb
Model Beta In t Sig.
Partial
Correlation
Collinearity
Statistics
Tolerance
1 ICICIROA 2.757a 3.995 .057 .943 .022
ICICIROE .201a .720 .546 .454 .951
a. Predictors in the Model: (Constant), ICICINETPROFIT
b. Dependent Variable: ICICISHAREPRICE
DCB Bank Ltd
Coefficientsa
Model
Unstandardized
Coefficients
Standardized
Coefficients
t Sig.
95.0% Confidence Interval
for B
B Std. Error Beta Lower Bound Upper Bound
1 (Constant) 94.071 9.165 10.264 .002 64.904 123.239
DCBROE 1.361 .398 .892 3.423 .042 .096 2.626
a. Dependent Variable: DCBSHAREPRICE
Model Summary
Model R R Square
Adjusted R
Square
Std. Error of
the Estimate
Change Statistics
R Square
Change F Change df1 df2
Sig. F
Change
1 .892a .796 .728 17.10934 .796 11.719 1 3 .042
a. Predictors: (Constant), DCBROE
Sr. No Bank Year Of IPO
01. Yes Bank 2005
02. South Indian Bank 2001
03 Development Credit Limited 2006
04. ICICI Bank 2007

International Journal of Advance and Innovative Research Volume 6, Issue 1 (XXIV): January - March, 2019
393
ISSN 2394 - 7780
YES Bank Ltd
Model Summary
Model R
R
Square
Adjusted R
Square
Std. Error of the
Estimate
Change Statistics
R Square
Change
F
Change df1 df2
Sig. F
Change
1 .820a .673 .346 22.88315 .673 2.060 2 2 .327
a. Predictors: (Constant), YESROE, YESNETPROFIT
Coefficientsa
Model
Unstandardized
Coefficients
Standardized
Coefficients
t Sig.
95.0% Confidence Interval for
B
B Std. Error Beta Lower Bound Upper Bound
1 (Constant) 68.042 22.114 3.077 .091 -27.107 163.191
YESNETPROFIT 2.259 1.814 1.208 1.246 .339 -5.544 10.062
YESROE -1.274 2.742 -.451 -.465 .688 -13.074 10.526
a. Dependent Variable: YESSHAREPRICE
South Indian Bank Ltd
Model Summary
Model R R Square
Adjusted R
Square
Std. Error of
the Estimate
Change Statistics
R Square
Change F Change df1 df2
Sig. F
Change
1 .879a .772 .088 35.56902 .772 1.129 3 1 .584
a. Predictors: (Constant), SIBROE, SIBROA, SIBNETPROFIT
Coefficientsa
Model
Unstandardized
Coefficients
Standardized
Coefficients
t Sig.
95.0% Confidence Interval
for B
B Std. Error Beta Lower Bound Upper Bound
1 (Constant) -13.339 121.948 -.109 .931 -1562.841 1536.162
SIBNETPROFIT -122.631 178.451 -7.302 -.687 .617 -2390.073 2144.810
SIBROA 474.983 684.017 2.891 .694 .614 -8216.272 9166.238
SIBROE 64.543 90.463 5.268 .713 .605 -1084.905 1213.990
a. Dependent Variable: SIBSHAREPRICE
7. RESULTS AND CONCLUSION
With respect to ICICI Bank it was observed that net profit margins have a negative and significant impact on
the market price of the share. The regression equation is share price= 2434.481=(-107.674) Net profit +
Error
With respect to DCB Bank it was observed that Return on Equity has significant impact on market price of
the share. The regression equation is 94.071= (1.361) ROE =Error, at 90% confidence level Return on Assets
also has significant impact on market price of the share.
With respect to YES bank and South Indian Bank, no impact of independence variable was found on the
market price of the share.
8. LIMITATIONS OF THE STUDY
i. External factors such as change in international economic policies and Indian economic policies are not
considered. These factors are considered as constants.
ii. Only secondary data will be used for the purpose of the study.
BIBLIOGRAPHY
Green William H (2000): “Econometric Analysis”. Forth Edition, Prentice Hall International, Inc, New York
University.

International Journal of Advance and Innovative Research Volume 6, Issue 1 (XXIV): January - March, 2019
394
ISSN 2394 - 7780
Joshi and Joshi (2002), Managing Indian Banks: The Challenges Ahead, Second Edition, Response Books, A
Division of Sage Publications- New Delhi, pp.109-110
Jain, Bharat A.; Kini, Omesh (1994): “The post Issue operating performance of IPO firms”, Journal of
Finance; 49(5), pp-1699-1726.
Kumbhakar. C. S &SarkarSubrata(2002), “Deregulation, ownership and productivity growth in the banking
industry: evidences from India”, Forthcoming
Loughran, Tim, Jay R. Ritter, (1995): “The new issues puzzle”, Journal of Finance; 50(1), March, pp-23-51.
Mikkelson, Wayne H., Partch, M. Megan and KshitijShah(1997): “Ownership an operating performance of
companies that go public”, Journal of Financial Economics; 44(3), June, pp-281-307.
Narasimham. M (1998), “Report of the committee on banking sector reform”, Ministry of Finance,
Government of India.
Bandgar& Atul Rawal (2012) Indian Banking Sector -Initial Public Offering Scenario and its Impact
Published by THE INSTITUTE OF COMPANY SECRETARIES OF INDIA.
Ritter, Jay R (1991): “The long run performance of initial public offerings”, Journal of Finance; 46, pp-3-
27.
“Securities and Exchange Board of India:
bseindia.com
https://www.bseindia.com/markets/PublicIssues/IPOIssues_new.aspx?expandable=4&id=1&Type=p

International Journal of Advance and Innovative Research Volume 6, Issue 1 (XXIV): January - March, 2019
395
ISSN 2394 - 7780
AN EMPIRICAL STUDY ON FINANCIAL LITERACY AMONG COLLEGE STUDENTS WITH
SPECIAL REFERENCE TO "FINANCIAL SERVICES"
Kiran Gajjar
Bunts Sanghas Anna Leela College
ABSTRACT
Financial literacy gained importance in modern days because increasing complexity and diversity in financial
products as well as services available. Financial literacy refers to the ability to gain information to take
decisions relating to use of money. It helps individuals to improve their future plans. The objective of this study
is to understand the level of financial literacy prevail among the students. The resolution of this study is to
scrutinize the issues controlling the financial literacy among university of Mumbai students. The data for the
research was collected through a well-structured questionnaire and distributed to the students by adopting
convenient sampling method. A total of 82 completed and usable questionnaires have been collected.
Percentage, Chi Square test were used to find significance difference between gender and their knowledge
towards financial services. Observed results show that there is a significant relationship between gender and
awareness regarding financial services viz, short term financing, venture capital, life insurance products, etc. It
leads to growth of our economy in a speedy manner. This paper also seeks to need of Financial Literacy
program in developing the financial knowledge among the college students.
Keywords: Financial Services, Financial Literacy
Financial literacy was defined by Noctor, Stoney and Stradling (1992) as ‘the ability to make informed
judgements and to take effective decisions regarding the use and management of money’. Being financially
literate would mean that an individual would benefit from a palette of abilities and attitudes such as a
comprehension of money management concept, knowledge of financial institutions and attitudes which enable
effective and responsible management of financial affairs. These benefits was previously identified by Schagen
and Lines (1996, p. 91).
Moreover, students are poised to have a spending behaviour similar to their family, thus one of the financial
socialization agents. They grow up in a certain environment depending on the family background where they
have this benchmark set by their parents. They will be automatically influenced by how their respective parents
manage and spend their money as they will grow up with the same culture and principle. The degree of financial
literacy of the family will eventually have an impact on the student at an early stage and it is up to the family to
foster this literacy to their underlings. Another motivator of financial literacy of students will be the attitude
towards money.
This factor will differentiate each students corresponding to the degree they deem money to be important.
Individuals will want to be financially literate depending on how much they value mone
INTRODUCTION
The Financial literacy defined as 'The ability to make informed judgments and to take effective decisions
regarding the use and management of money'. If a person is financially literate it means that it would advantage
of individual abilities and attitudes such as a understanding of money management concept, knowledge of
financial institutions and attitudes which authorize operative and accountable management of financial
activities. Further, students are composed to have a spending habit as per their family, so that one of the
financial socialization agents. Financial literacy is deliberated an imperative assistant for the promotion of
financial inclusions and eventually financial steadiness. When College students go to the college they not only
learn the subject but also learn all those things which are needed for the survival of the improved life. To run
their life in a superior way they should retain awareness about the administration of finance. Financial literacy is
supportive to the students to timetable their daily expenses, encourage them to save their additional wallet
money, technique to benefit and pay back educational loans and giving complete bases for tomorrow's
investment arrangement. With the growing cost of a college education students find themselves in unwarranted
fiscal situations.
Most students can't open a savings account which is meant for tuition fees, books and other educational
expenses. Due to ignorant of financial management, people feel about how they are going to sustenance
themselves and their families members while registered in higher education. Government and the commercial
banks are ready to provide financial assistance to the students for productively complete the education. Despite
the fact, most of the students are facing numerous distinctive financial problems due to lack of financial

International Journal of Advance and Innovative Research Volume 6, Issue 1 (XXIV): January - March, 2019
396
ISSN 2394 - 7780
understanding.
SCOPE OF THE STUDY
The aim of the study is to find out the financial literacy level among the college students related to financial
services in the city of Mumbai.
STATEMENT OF THE PROBLEM
Financial Literacy hints to hold the understanding, abilities and self-assurance to make answerable financial
decisions. Students acquire financial information and information offhandedly - from friends, family, neighbors
or the media. Financial literacy research, exercise and strategy were outlined to give the financial knowledge to
the young Indian for supporting day to day Socio- economic difficulties.
There is no such thing as being flawlessly economically well-educated and all individuals have a need for
continuing learning on personal finance. The study tries to answer the following questions.
Does financial literacy reaching to particular the target group?
Does the financial literacy attain the expected level of financial knowledge that is expected?
Does financial literacy produce complete knowledge towards financial decision?
OBJECTIVES OF THE STUDY
To study the socio economic background of the college student
To measure financial literacy among college students with special reference to financial services
To offer suggestions and findings of the study.
HYPOTHESIS
1. H0: There is no significance difference between gender and their knowledge towards financial services
2. H1: There is significance difference between gender and their knowledge towards financial services
METHODOLOGY
The data have been collected through both primary and secondary data. The sources of primary data have been
collected through a pre tested and a well-structured questionnaire by adopting convenient sampling method and
82 respondents were selected for the study. The statistical tools percentage and chi Square test were used to
analyze the data.
ANALYSIS AND INTERPRETATION
Frequency Table
Table-1: Age
Frequency Percent Valid Percent Cumulative Percent
Valid 15-17 4 4.9 4.9 4.9
18-20 69 84.1 84.1 89.0
21-24 7 8.5 8.5 97.6
25-28 2 2.4 2.4 100.0
Total 82 100.0 100.0
In total 82 students were surveyed, 4 students were between age group of 15-17 which is 4.9 % of the total,
69 students between 18-20 years of age which is 84.1 % of the total, 7 students were between age group of
21-24 which is 8.5% of the total and only 2 students were between age group of 25-28 which is 2.4% of the
total percentage
Table-2: Gender
Frequency Percent Valid Percent Cumulative Percent
Valid Male 39 47.6 47.6 47.6
Female 43 52.4 52.4 100.0
Total 82 100.0 100.0
Out of the total participant, 47.6 % were Male and 52.4 % Female

International Journal of Advance and Innovative Research Volume 6, Issue 1 (XXIV): January - March, 2019
397
ISSN 2394 - 7780
Table-3: Reliability Statistics
Cronbach's Alpha N of Items
.736 12
A reliability analysis was carried out on the perceived task values scale comprising 12 items. Cronbach’s
alpha showed the questionnaire to reach acceptable reliability, α = 0.736.
Testing of Hypothesis
Table-4: I am aware about Various Financial Products
Chi-Square Tests
Value df Asymp. Sig. (2-sided)
Pearson Chi-Square 4.606a 4 .330
Likelihood Ratio 4.697 4 .320
Linear-by-Linear Association .203 1 .652
N of Valid Cases 82
a. 4 cells (40.0%) have expected count less than 5. The minimum expected count is 1.43.
Interpretation: Since the P-value (0.330) is more than the significance level (0.05), we accept the null
hypothesis. Thus, we conclude that there is no relationship between gender and awareness regarding
various Financial Products.
Table-5: I am aware about Mutual Funds
Chi-Square Tests
Value df Asymp. Sig. (2-sided)
Pearson Chi-Square 2.078a 4 .721
Likelihood Ratio 2.101 4 .717
Linear-by-Linear Association .418 1 .518
N of Valid Cases 82
a. 4 cells (40.0%) have expected count less than 5. The minimum expected count is 1.43.
Interpretation: Since the P-value (0.721) is more than the significance level (0.05), we accept the null
hypothesis. Thus, we conclude that there is no relationship between gender and awareness regarding
Mutual Funds
Table-6: I am knowledge of Bill Discounting
Chi-Square Tests
Value df Asymp. Sig. (2-sided)
Pearson Chi-Square .666a 4 .955
Likelihood Ratio .672 4 .955
Linear-by-Linear Association .089 1 .766
N of Valid Cases 82
a. 6 cells (60.0%) have expected count less than 5. The minimum expected count is 1.43.
Interpretation: Since the P-value (0.995) is more than the significance level (0.05), we accept the null
hypothesis. Thus, we conclude that there is no relationship between gender and awareness regarding
Bill Discounting
Table-7: I am knowledge of Short Term Financing
Chi-Square Tests
Value df Asymp. Sig. (2-sided)
Pearson Chi-Square 11.734a 4 .019
Likelihood Ratio 12.437 4 .014
Linear-by-Linear Association 1.708 1 .191
N of Valid Cases 82
a. 0 cells (0.0%) have expected count less than 5. The minimum expected count is 5.23.
Interpretation: Since the P-value (0.019) is less than the significance level (0.05), we cannot accept
the null hypothesis. Thus, we conclude that there is a relationship between gender and awareness
regarding Short Term Financing

International Journal of Advance and Innovative Research Volume 6, Issue 1 (XXIV): January - March, 2019
398
ISSN 2394 - 7780
Table-8: I am knowledge of Bank Guarantee
Chi-Square Tests
Value df Asymp. Sig. (2-sided)
Pearson Chi-Square 1.457a 4 .834
Likelihood Ratio 1.464 4 .833
Linear-by-Linear Association .661 1 .416
N of Valid Cases 82
a. 2 cells (20.0%) have expected count less than 5. The minimum expected count is 4.28.
Interpretation: Since the P-value (0.834) is more than the significance level (0.05), we accept the null
hypothesis. Thus, we conclude that there is no relationship between gender and awareness regarding
Bank Guarantee
Table-9: I am aware about Leasing
Chi-Square Tests
Value df Asymp. Sig. (2-sided)
Pearson Chi-Square 6.384a 4 .172
Likelihood Ratio 6.953 4 .138
Linear-by-Linear Association .570 1 .450
N of Valid Cases 82
a. 4 cells (40.0%) have expected count less than 5. The minimum expected count is 3.80.
Interpretation: Since the P-value (0.172) is more than the significance level (0.05), we accept the
null hypothesis. Thus, we conclude that there is no relationship between gender and awareness
regarding Leasing
Table-10: I am aware about Life Insurance Products
Chi-Square Tests
Value df Asymp. Sig. (2-sided)
Pearson Chi-Square 11.734a 4 .018
Likelihood Ratio 12.437 4 .014
Linear-by-Linear Association 1.708 1 .191
N of Valid Cases 82
a. 0 cells (0.0%) have expected count less than 5. The minimum expected count is 5.23.
Interpretation: Since the P-value (0.018) is less than the significance level (0.05), we cannot accept
the null hypothesis. Thus, we conclude that there is a relationship between gender and awareness
regarding Life Insurance products
Table-11: I have Knowledge of Letter of Credit
Chi-Square Tests
Value df Asymp. Sig. (2-sided)
Pearson Chi-Square 9.812a 4 .044
Likelihood Ratio 10.272 4 .036
Linear-by-Linear Association .836 1 .361
N of Valid Cases 82
a. 0 cells (0.0%) have expected count less than 5. The minimum expected count is 6.66.
Interpretation: Since the P-value (0.044) is less than the significance level (0.05), we cannot accept the
null hypothesis. Thus, we conclude that there is a relationship between gender and awareness
regarding Letter of credit
Table-12: I have Knowledge of Hire Purchase
Chi-Square Tests
Value df Asymp. Sig. (2-sided)
Pearson Chi-Square 1.457a 4 .834
Likelihood Ratio 1.464 4 .833

International Journal of Advance and Innovative Research Volume 6, Issue 1 (XXIV): January - March, 2019
399
ISSN 2394 - 7780
Linear-by-Linear Association .661 1 .416
N of Valid Cases 82
a. 2 cells (20.0%) have expected count less than 5. The minimum expected count is 4.28.
Interpretation: Since the P-value (0.834) is more than the significance level (0.05), we accept the null
hypothesis. Thus, we conclude that there is no relationship between gender and awareness regarding
Hire purchase
Table-13: I have Knowledge of Global Depositary Receipts
Chi-Square Tests
Value df Asymp. Sig. (2-sided)
Pearson Chi-Square 6.384a 4 .173
Likelihood Ratio 6.953 4 .138
Linear-by-Linear Association .570 1 .450
N of Valid Cases 82
a. 4 cells (40.0%) have expected count less than 5. The minimum expected count is 3.80.
Interpretation: Since the P-value (0.173) is more than the significance level (0.05), we accept the null
hypothesis. Thus, we conclude that there is no relationship between gender and awareness regarding
GDR
Table-14: I have Knowledge of Venture Capital
Chi-Square Tests
Value df Asymp. Sig. (2-sided)
Pearson Chi-Square 11.734a 4 .019
Likelihood Ratio 12.437 4 .014
Linear-by-Linear Association 1.708 1 .191
N of Valid Cases 82
a. 0 cells (0.0%) have expected count less than 5. The minimum expected count is 5.23.
Interpretation: Since the P-value (0.019) is less than the significance level (0.05), we cannot accept the
null hypothesis. Thus, we conclude that there is a relationship between gender and awareness
regarding Venture Capital
Table-15: I have Knowledge of Securitization
Chi-Square Tests
Value df Asymp. Sig. (2-sided)
Pearson Chi-Square 9.812a 4 .042
Likelihood Ratio 10.272 4 .036
Linear-by-Linear Association .836 1 .361
N of Valid Cases 82
a. 0 cells (0.0%) have expected count less than 5. The minimum expected count is 6.66.
Interpretation: As the P-value (0.042) is less than 0.05 (significance level), reject the null hypothesis.
It concluded that there is a relationship between gender and awareness regarding Securitization.
CONCLUSION
Overall, this research achieved its objective which is to examine the financial literacy level among college
students related to financial services. Five point likert scales were deployed to know the financial literacy
among the college students in the city of Mumbai. From the study it can be determined that, Since the P-value
(0.019) in case of Short Term financing, (0.018) in case of Life insurance products, (0.044) in case of letter of
credit, (0.019) in case of venture capital and (0.042) in case of securitization is less than the standard level
(0.05), null hypothesis is rejected. It is conclude that there is a relationship between gender and awareness
regarding financial services. : Indoctrinating the financial literacy among college student’s overlays a way to
embellishment the knowledge of financial product in the middle among general public. It leads to growth of our
economy in a speedy manner
International Journal of Advance and Innovative Research Volume 6, Issue 1 (XXIV): January - March, 2019
400
ISSN 2394 - 7780
REFERENCES
1. Noctor, M., Stoney, S., & Stradling, R. (1992). Financial Literacy. A report prepared for the National
Westminster
2. Bank, London
a. Noctor, M., Stoney, S., & Stradling, R. (1992). Financial Literacy. A report prepared for the National
Westminster Bank, London
b. Schagen, S., & Lines, A. (1996). Financial Literacy in Adult Life: A Report to the NatWest Group
Charitable Trust.
c. Slough, Berkshire: National Foundation for Educational Research.
d. Schagen, S., & Lines, A. (1996). Financial Literacy in Adult Life: A Report to the NatWest Group
Charitable Trust. Slough, Berkshire: National Foundation for Educational Research.
e. Staten, M. E., Elliehausen, G., & Linquist, E. C. (2002). The impact of credit counseling on subsequent
borrower credit usage and payment behaviour, Monograph #36. Washington, DC: Georgetown
University, Credit Research Center. Retrieved October 20, 2010, from http://www.msb.georgetown.
edu/prog/crc/pdf/M36.pdf
f. Sobhesh Kumar Agarwalla, Samir Barua, Joshy Jacob and Jayanth R. Varma (2008), A Survey of
Financial Literacy among Students, Young Employees and the Retired in India, IIMA, study supported
by citi foundation, June
g. http://www.archive.india.gov.in/business/business_financing/goverment_fund.php
h. https://accountingtheory.weebly.com/compare-and-contrast.html
i. https://www.researchgate.net/publication/275410347_Determinants_of_the_Financial_Literacy_among_
College_Students_in_Malaysia
j. http://www.treasury.gov.za/twinpeaks/Conduct%20of%20Financial%20Institutions%20Bill.pdf
k. https://en.wikipedia.org/wiki/History_of_money
International Journal of Advance and Innovative Research Volume 6, Issue 1 (XXIV): January - March, 2019
401
ISSN 2394 - 7780
AN ETHICAL BEHAVIOUR AND IMPLICATIONS FOR ACCOUNTANTS
Dr. Hema S. Dhaware
Head, Department of Accountancy, ICLES Motilal Jhunjhunwala College of Arts, Science and Com., Vashi
INTRODUCTION
The fraud of Rs.11, 400 crores committed by Nirav Modi in Punjab National Bank come out as one of the most
ill-famous scam in the country. It took manipulative bank officials and a deeply compromised banking system.
Up till now it is considered as a one of the biggest banking fraud, in our nation.
This fraud reminds us about the Harshad Mehta and Ketan Parekh scams of frauds.After finding the loopholes
of the banking system and misusing that is not a new thing in our country. RBI report says during 2012 to 2017
altogether 8,670 loan fraud cases.
The Times of India based on the Reserve Bank of India Report revealed that One bank official is held for fraud
every four hours in a public sector bank (PSB).Over 5200 0fficials were held for fraud in PSB between 1st Jan,
2015 to 31st March 2017.
Hence ethical behaviour by employees is important to the practicality of all organisations. “Doing what is
Right” matters to the company, their employees, stakeholders and society as a whole. Unethical behaviour by
employee can affect individual, organisation and even the entire standards of ethics and social behaviour and
public accounting.
The purpose of this paper is to deal extensively with the concept of Ethical Behaviour and its implications for
Accountants
MEANING OF ETHICAL BEHAVIOUR
Ethics is a rational term resulting from the Greek word "ethos" meaning personality or practice based on values.
Behaviour of individual which is good or bad, an act whether legal or an illegal is based on ethics. Unethical
behaviour in the professional world is not acceptable. Financial officers, accountants and auditors have a greater
influence on stakeholders when these individuals perform dishonestly. A very important feature of the
accountancy profession is duties based on responsibility to take decisions or act in the benefit of the society.
Therefore, a professional accountant has to satisfy the needs of an individual client stakeholder and employer.
Definition 1
Behavioral ethics is a new field of social scientific research that seeks to understand how people actually
behave when confronted with ethical dilemmas. It refers to behaviour that is judged according to generally
accepted norms of behaviour.
Definition 2
Behavioral ethics is a new field to determine the reason that make people take the ethical decision, both good
and bad and that they do using behavioural psychology, cognitive science and related fields.
What is Ethical Behaviour?
What is ethical behaviour? Is it based on faith or is it rooted only in the non-spiritualor physical world? Let’s
look at some definitions from various sources.
Dictionary.com defines ethics as: a system of moral principles: the ethics of a culture. The rules of
conduct recognized in respect to a particular class of human actions or a particular group, culture, profession
etc.: medical ethics; Christian ethics, etc.
So according to the dictionary, ethics are not automatically based on religion but can be based there. Certainly
different faiths, whether one is Jewish, Christian or Islam or some other faith there are beliefs in moral
principles that could be considered ethical behaviour.
Aristotle defined ethics as “practical wisdom”. Why practical? Because it involves an action both at the
individual and societal as well as corporate level. He also said “we are not studying ethics in order to know
what benefit is, but to become decent, for otherwise there would be no profit in it.” In other words, we have to
“practice” it for absence of a better term. It requires action on our part.
The Link between the Law, Corporate Governance responsibility and ethics
What we should understand the word or think about ‘ethics’ as a responsible individual? Is it a just grade of
rules that one must follow in one’ practiced life? Is it a set of principles – honest or else that you believe in? Is it
being rational and true with others, either personally or professionally?
International Journal of Advance and Innovative Research Volume 6, Issue 1 (XXIV): January - March, 2019
402
ISSN 2394 - 7780
Is it only succeeding the letter of the law? Does doing that create individual ethical? It is also possible that one
can be within the rule and not act morally. It is a mixture of all of these and more.
The term “ethic” is frequently used in the tax and legal worlds. There is a positive stroke experiment that one
can use to decide what is and is not suitable for ethical behaviour?
When we think about the words like integrity, moral obligation, individual and corporate responsibility, truth
comes to our mind. Ethics are not only apply at the individual level but it apply to organizations and groups
such as cultures, societies, professions, corporations, among others
Numerous professional organizations suggest ethical codes for their members – professional journalists, CPA’s,
Attorneys, Engineers, Medical Professionals, Human Resources professionals, government related offices,
Taxpayer Bill of Rights and Justice in Tax out Administration, members of Federal, State and Local legislative
bodies etc.
Many establishments (including governments) have what could be careful ethical codes, which are normally
called a “Code of Conduct” for their employees.
Implications of Unethical Behaviour for Financial Reports
Unethical Behaviours by Financial Reporters:
There are different types of unethical behaviours by financial reporters which are as under:
Monetary satisfaction: Under this the management offers money or ordinary gift items to financial reporters in
order to have a complimentary report.
Sexual harassment: This is one of the wicked behaviours on the part of the top management who harassed
their female staff sexually for the male financial reporters so as to make a positive report as per the requirement.
Sales of occupation to staffs: Applicants who has not performed well in their interview dialogue always pay
specific amount of money to some officers who use employment process for making money.
Very poor availability of financial records: Financial records are not correctly kept in the organization which
leads to inadequate financial report. Less qualified accounting staff to maintain the financial records. It gives the
reasons for Behaving Unethically
There are multiple reasons for which one might consider acting unethically when preparing financial
information as follows:
Embezzlement of funds: An accountant recorder may embezzle funds from his or her employer for financial
gain. The Financial Officer of a publicly related may prepare financial statements which shows the company is
performing very well than it really is, because he or she wants their standard to increase.
An accountant may feel stressed from client to report false information. Financial officer is facing stress for
enhancements of reports from the board of directors, the company’s president, owners, or stockholders in fear of
losing his job.
An accountant working in a company where there is struggle of interest. If the accountant is owed money or has
a significant importance in a firm, this individual is not ideal to prepare certain companies’ financial statements.
The failure from the part of the accountant to conduct in-depth analysis while preparing and revising the
financial information is not acceptable when we expected from him to perform in a professional manner.
Company Codes of Ethics
This Code is based on the following basic assumptions:
Ethics amongst shareholders, owners, directors and management are a necessary element for companies to
sufficiently meet their goals. Ethics are a key in assuring and harmonising the rights and benefits of all stakeholders
involved: employees, clients, shareholders, suppliers and business partners and the society as a whole.
Ethics assume to be the obedience in and by the company with appropriate legislation, with the Articles of
Incorporation and Regulations for internal actions, where they exist.
Ethics are requiring so that shareholders and owners become guarantors for fulfilment of the obligations for
directors and management.
This code has been created with the purpose of being applicable to all companies; it should also be understood
within an overall and basic framework subject to adaptation to the specific situation of each business so that the

International Journal of Advance and Innovative Research Volume 6, Issue 1 (XXIV): January - March, 2019
403
ISSN 2394 - 7780
principles of ethics and maintainable development achieve the specific activity of the company involved.
The Board of Directors is responsible for application of Code of Ethics for the company. The Board also
proceed with support and choice must be approved by the Shareholders ’Meeting.
Shareholders and Owners
In the exercise of their ownership rights, they should:
Constitute the company in a such a manner where it will create wealth, maximise the profit with sustainable
growth, environmentally as well as socially by carrying out all activities in an ethical and responsible
manner.
Long-term enrichment by the company, and not negotiating its permanency through for the interest in short-
term fulfilment.
Implementation of voting rights at the General Shareholders’ responsible basis and, for demanding the
ethical behaviour from the company
Keep the balance between wealth and effort, so that salaries, workers receive consideration of their work.
To do the appointment of as directors and management persons who make the provisions regarding
acceptable training and experience, and convey the management functions in an expert, moral and
accountable way.
Express and protect the values of the company in accordance with its Code of Ethics.
Directors and Management
In the exercise of their administrative and management functions, they should:
A) In relation to Management functions
Perform their duties in a professional, ethical and account able manner.
Fulfil the Code of Ethics of the company. Create proper systematic application and Ethics Committee, with
persons with proper power to relate the Code.
Notify owners or shareholders regularly as per the circumstances of and point of view for the company.
Promotion of the maximum participation of the shareholders at the General Meetings, specifically for voting
rights during the meeting.
Fulfilment of the generally accepted accounting standards and principles, for the establishment of the
internal and external management with proper control systems according to the type of the company.
To maintain proper accounting records and books and ledgers, to maintain books of accounts in a proper and
accurate manner to avoid the inconvenience for decision making.
There is a need to provide the required official and legal information to both internal as well as external
auditors to complete their work as per the requirement to avoid the further delays.
There is a need of proper allocation of work with transparency to get the maximum benefit of division of
work.
Avoid the conflict between the interests of the company and the individual interests of the various
administrative positions.
Need of the Control over remuneration so that it is assured to be appropriate to their level of responsibility
and performance.
Maintenance of confidential data and documents for which they have access by virtue of their functions in the
company.
By making the payment to comply with debts of the company and collection on balances due with the
business required.
Prepare and maintain the main ideas within the company, to safeguard the stability of the company. This
does not be contingent by the presence of any given director or manager.
Choose the co-workers and assistants on the basis of merit and capacity needed to fulfil the benefits of the
company.
International Journal of Advance and Innovative Research Volume 6, Issue 1 (XXIV): January - March, 2019
404
ISSN 2394 - 7780
In relation to suppliers and clients of the Company:
Maintain moral and legal relationships with dealers of goods and services.
Maintain the relations with those suppliers, whose business practice respect social dignity.
Select suppliers on the basis of the suitability products or services, as well as the prices, delivery conditions
and quality.
Get the excellence in the goods and services of the company to maintain consumer’s satisfaction.
Give the assurance of the products and services of the company efficiently with consumer and user claims, to
achieve satisfaction.
B) In relation to Competitors of the Company
No misuse of a dominant or honoured market position.
Competition in good faith with other companies to achieve a permitted market based on common respect
between competitors.
No dealing with the clients of other competitors using the unethical methods.
In relation to employees of the Company:
Considering the different culture and religions all the employees should be treating with the dignity, due respect
and justice.
No discrimination against employees on the basis of race, religion, age, nationality, sex or any other personal
or social conditions.
Say “No” to any form of violence, harassment or exploitation at the workplace.
Classify the rights of association, union association and collective negotiation.
Encourage the professional development, exercise and up gradation of employees.
Connect the pay hikes and remuneration on the basis of the up gradation of employees on the basis of their
service conditions by considering the merits and capacity to work.
Need to establish and communicate the prepare criteria and rules which maintain a balance between the
rights of the company employees and those are in the hiring processes.
Give the assurance of health and safety on the job to prevent any type of risk.
Maintain the balance between the official working life with personal and family life of employees.
Express to achieve the work-related incorporation of persons with inabilities or handicaps, to remove the
barriers of all kinds in the territory of the company the work.
Enable the participation of employees in the community deed programmes of the company.
C) In relation to the Communal Society
Maintain human rights and democratic organisations, and encourage it wherever possible.
Maintaining the principle of political objectivity, without relating politically for carrying out their activities,
also as a demonstration for the different opinions and sympathies the people related to the company.
Maintainlegalandrespectfulrelationshipswithpublicauthoritiesandinstitutions, without giving or accepting gifts
or commission in cash or in kind.
Give helps to political parties or public organisations only as per the existed legislation for the guaranteeing
transparency.
Cooperate with Public Bodies and non-governmental bodies and associations devoted to improving levels of
community attention for deprived persons..
REFERENCES
• Chakraborty S.K. Values and Ethics for Organizations:”Theory and Practice
• Charraborty S.K.,Wisdom Leadership: Dialogues and Reflections
• Nielsen Richard P. –Changing Unethical Organizational Behavior”

International Journal of Advance and Innovative Research Volume 6, Issue 1 (XXIV): January - March, 2019
405
ISSN 2394 - 7780
• Padtin Mark “Ethics as an integrated Force in Management”
• Anuja Saxena - Business Ethics
• D C Chakroborty –Human Values and Ethics

International Journal of Advance and Innovative Research Volume 6, Issue 1 (XXIV): January - March, 2019
406
ISSN 2394 - 7780
A STUDY OF IMPACT WHAT IS MORE IMPORTANT: PROFESSIONAL QUALITIES OR
FITTING PERSONALITY? IN TODAY’S CORPORATE WORLD
Farhat Maniyar
Faculty, SASMIRA’s Institute of Commerce and Science, Worli, Mumbai
ABSTRACT
The study analyses the major question of what are more important Professional qualities or fitting personality?
More often it has been realized that, talent by itself doesn’t get the job cultural compatibility is a basic trait to
fit into a situation – also known in the industry as “Cultural Fit or Fitting Personality” is also important. It is
hard to explain why someone doesn’t fit in, or that gut feeling one have that the talent doesn’t suit the team.
However, in today times of digitization and increasing complexity it is important for companies to interrelate
employees, tasks and the respective environment and to promote creativity, inventiveness, self - initiative and
change - competence.
The study aims to find out an importance of the persons skill sets and behavior impact on their sustainability
and career growth/development in organization due to their behavioral nature and understanding of job
compatibility with respect to organizational behavior.
Keywords: Professional qualities, Fitting Personality.
1. INTRODUCTION
Corporate world is the place where the professional qualities is the most important but from last few years
corporate world have seen different human cultures which had given a new aspect due to globalization the
culture matter more now, as world has become small and well connected, for better results one needs to be more
socially connected as we are social creatures, and a deeper understanding of which we and others have can
provide a valuable tool for understanding, pleasing, cajoling, reprimanding, rewarding, and loving others so
fitting personality is now the matter of consent too. Now the question arising for HR recruiter is not only to see
the employee’s professional qualities but also the fitting personality. However ones come in the corporate
world, his main consent is to be more sustainable and try to stick to it there the personality come in to the
picture how one is deciding to be in. He is more into his professional qualities or just tries to be fit in.
More or less aim of the employees is not only to sustain in the organization by also to be successive in their
careers, which is the basic consent of every employee.
In today’s corporate world fitting personality is important to be sustainable and consistence in organization but
most of the person with sharp professional qualities has to be seen more successful in their careers. Which has
raised question what is important professional qualities or fitting personality?
2. LITERATURE REVIEW
A Human behavior is a complex phenomenon and is affected by a large number of factors – psychological,
social, cultural etc. Organization studies individual behavior in respect of these factors at four levels.
a. Individual level: individual behavior
b. Interpersonal level: behavior with other people.
c. Group level: behavior in a group.
d. Intergroup level: interaction between two groups.
Raymond B. Cattell, (1950) –Here Mr. Cattel defined personality as the traits that which permits a prediction
of what a person will do in a given situation. Cattel 16 primary traits have a direct impact on the person’s
durability – as locus of control which refers internal external locus of control to the degree of which one
believes that has direct impact on the results that decides the consequences. Persona with internal locus
believe that they are masters of their own fate, the control the events, seek challenging tasks, require
initiatives, handle stressful situations, advance more quickly whereas external locus of control people events
occur purely by chance or because of factors beyond their own control, they remain inactive, willing to
follow orders, tend to do routine jobs.
Machiavellianism is the tendency to manipulate the situation for attaining power and fulfilling personal
goals, by any means of justification as long as it helps to achieve ends, they have high mach scale, to be
logical in assessing the situation, to twist and turn facts to influence others, try to gain control over others,

International Journal of Advance and Innovative Research Volume 6, Issue 1 (XXIV): January - March, 2019
407
ISSN 2394 - 7780
they never allows their heart over their head and skilled to make alliance with others for their advantage and
sustainability in the organization. He concludes with the concept that a person with fitting personality will
adjust as per the situation and effective for his /her job.
Gordon W. Allport, 1961- by Gordon the dynamic organization is within the individual of those
psychophysical systems that determine his characteristic behavior and thought that is their professional
qualities.
Funder, 2001- define personality as patterns of thought, emotion, behavior, and all together with the
psychological mechanisms which tries to hid or not behind these patterns which make them a Fitting
Personality in organization.
Feist and Feist, 2009 – says that there is no single definition for all the personality theorists one can say that
personality is a pattern of relatively permanent traits and unique characteristics that give both consistency to
fit in the culture and individuality to a person skills set.
Meyer Friedman and Ray Rosenman have identified the Type A and Type B. here Type A personality is
more aggressive, ambitious, hard working, set very high standards for themselves, try to do more in less
time, workaholic and guilty of relaxing but lack with interpersonal skills of getting along with others. Type
B personality is patient, cool, composed, concerned with quality, plan for enjoying life and relaxation,
unpredictable, and steadier pace rather than working against the clock.
The professional qualities of a person are as a sunrise: they first appear on the horizon and spread warmth and
light, and create growth persistently not only for them but to all.
To start with defining professional qualities of a person is mastery of the knowledge, expertise competent and
skilled in a particular activity is absolutely essential for professionalism that is technical expertises. All the same
time, technical expertise is not enough. Qualities to distinctive attributes like honesty, punctuality, a spirit of
service, the ability to meet deadlines and etc. are also essential.
3. OBJECTIVE OF STUDY
i. To find out level of career growth and sustainability through professional qualities of employees in today’s
corporate world.
ii. To find fitting personality of employees gives them the sustainability and career growth in today’s
corporate world.
iii. To find which aspect has more impact on future goal/successful career.
4. RESEARCH METHODOLOGY
4.1. Research Design
The research method used in this is through informal meet and references of HR manager, corporate
professionals, and students. Their insights and suggestions on the topic were obtained. The information obtained
was basically through the HR manager, professional and students perception for futures leadership, career
growth and development who gave their recommendations and suggestions on the following questions asked to
them:
How one can grow in their career?
What could be done to be more sustainable in the organization and how career growth and successful future
can be attained them in the organization?
What is more important to be in organization: professional qualities or fitting personality?
4.2. Data Collection
The data for all the study is collected by means of observation and informal interview. The secondary data is
collected by means of exploring various published and unpublished paper and electronic sources.
The present study is based upon secondary data. Information about fitting personalities & professional
quality of a person is how important in today corporate world for being sustainable, successful and more
career growth & development is gathered from magazines, journals, newspapers and relevant websites.
A random of 33 corporate professional peoples along with the manager and around 63 students of
management course from all the semester gave their insights on the topic.

International Journal of Advance and Innovative Research Volume 6, Issue 1 (XXIV): January - March, 2019
408
ISSN 2394 - 7780
5. LIMITATIONS OF THE STUDY
This project had several limitations.
The limitations of the project were as follows:
No direct access of employees without any internal reference.
Research is prepared on a general topic on importance of professional qualities or fitting personality and thus
it is not focused on a specific industry/sector.
The information collected from source was limited as it was through reference and informal meet.
The secondary also had certain limitation as the concept was not researched by authors on what has more
impact on employee’s growth & development with regards to their fitting personality or professional
qualities so there was no benchmarking for this project.
6. FINDINGS
There were no such findings on the research as it was totally based on exploratory concept and only feedbacks
and suggestions from the corporative professional’s & management students related to the topic it could be
taken sectors/industry for the present scenario to make the study more reflective.
From the student point of view of the topic is that person should be skillful which have sharp professional
qualities and the view point of professional corporate people does consider persons fitting nature one has to be
fitting personality so can be sustainable in organization. But more or less observation and discussion state the
findings as the person with professional qualities is been seen more successful in their career then the person
with fitting personality still fitting personality have good sustainability in organization.
7. CONCLUSION/SUGGESTION
The above study has thrown up a point that what is more important: professional qualities or fitting personality
for ones career growth and development. This research concludes with the help of the Mc Gregor’s theory of
Theory X & Theory Y which is an integration of assumptions, generalizations and hypothesis relating to human
tendencies towards work. Where theory X is a negative assumptions as person inherently dislike work and try to
avoid it, coerced to perform under supervision, deter from taking responsibilities, need for directions, little
ambitious and want security. Theory Y is positive assumptions as person consider work as natural as rest or
play, self direction and self control in attaining goals, committed, self actualization and self esteem. Approach
for theory Y are employee centered, general supervision, support and consideration, reward based
performances, growth opportunities, self control and participative. By this theory and above research conclude
that person with more professional qualities are more opportunity seekers and grow with their skill sets these
kind of people maybe or may not be an introverts but they are excellent in their work and performances, are
goal oriented and conscious about their growth and development.
As the study is on secondary data the suggestion as per the discussion is with the reference of William Ouchi
Theory Z which takes into account both Japanese Management and American management it’s a mixed idea of
sustaining in organization with attaining growth and development.
For better results one should have both professional qualities and fitting personality, a professional, no matter
how talented is will find it difficult to work with others, this at the end may waste his skills. Therefore qualities
are qualities of the person help themselves in all aspects of the person’s activities. To be a successive
professional, then, a person needs to acquire both the technical expertise that is professional qualities as well as
a fitting personality.
In today corporate world there are some sector which promote professional qualities as IT sector where their
skills are more into acceptance and fitting personality does not exist as there do not need to be more in to
interaction because of their work type, even sectors like automobile, textile, banking, logistic etc are a
sector/industry ever fitting personality hardly matter due to their work type whereas BPO’s , MNC’s etc are the
places where both qualities as well as fitting nature has to be there for future sustainability and growth.
8. REFERENCE
1. Allport, G.. W. (1974). The Psychology of Participation. Psychological Review, 52,117-132.
2. Schimmack, U., Oishi, S., Furr, R. M., & Funder, D. C. (2004). Personality and Life Satisfaction: A Facet-
Level Analysis. Personality and Social Psychology Bulletin, 30(8), 1062-1075.
doi:10.1177/0146167204264292

International Journal of Advance and Innovative Research Volume 6, Issue 1 (XXIV): January - March, 2019
409
ISSN 2394 - 7780
3. Komarraju, M. (2006). The relationship between the Big Five personality traits, Cultural Tendencies, and
Spirituality. PsycEXTRA Dataset. doi:10.1037/e588322007-001
4. Moor, L., & Anderson, J. R. (2019). A systematic literature review of the relationship between dark
personality traits and antisocial online behaviours. Personality and Individual Differences, 144, 40-55.
doi:10.1016/j.paid.2019.02.027
5. Křeménková, L. (2019). The Relationship Between Personality Traits And Anxiousness.
doi:10.15405/epsbs.2019.01.17

International Journal of Advance and Innovative Research Volume 6, Issue 1 (XXIV): January - March, 2019
410
ISSN 2394 - 7780
MICROBES ON DIFFERENT PANT FABRIC
Chetali Pandekar and Minakshi Gurav
Department of Zoology, D. G. Ruparel College of Arts, Science and Commerce, Mumbai
ABSTRACT
Clothing is in immediate contact with our skin for most of the time and hence it is one of the important aspects
while studying skin problems. Fabric acts as a reservoir for the transmission of micro-organisms. Most of our
everyday microorganisms are non-pathogenic but can become opportunistic pathogens under certain
conditions. Fabrics made from Natural fibers consist of porous hydrophilic structure which retains water,
oxygen and nutrients thereby providing perfect environment for microbial growth. Fibers made from synthetic
polymers like acrylic, nylon, polyester, polyethylene and polypropylene show resistance towards the microbes
because of its hydrophobic nature. Clothing with tight fitting such as Denims, Jeggings and leggings are used
on large scale. Aspects like non suitability of clothing towards our hot and humid climate are not considered
while following the fashion trends. Microbial growth of Bacteria and fungi on different Pant fabrics are
monitored in this study. Tight fitting pants like Jeans (Denims), Trousers, Jeggings and Leggings were chosen.
The Bacterial assay was done by using principles of Nephelometry. Colorimetric estimation was done at 530 nm
after the incubation period of 6 hours at 37o C. The fungal assay was done by using settle plate method and
observation of the plates was done after 6 days. The bacterial growth was least observed in Leggings and most
observed in trousers. Maximum fungal growth was seen on Trousers material whereas Jeans (denim) showed
maximum resistance towards the fungal growth.
Keywords: Bacteria, Fungi, antimicrobial treatment, settle plate method, aeroflora
INTRODUCTION Clothing being in immediate contact with our skin for most of the time, it is an important and relevant aspect
while studying skin problems. Microbes can be carried by and even multiply on textiles (Freney and Renaud,
2012). Fibres are classified depending upon their source. Natural Fibres are obtained from plant or animal
origin and Fibres which are obtained using chemical treatment in laboratories are termed as Man-Made fibres.
Cotton and linen are Cellulosic fibre as they are from plant origin. Wool and Silk are Protein fibres as they are
of animal origin. Regenerated and Synthetic are the two types of Man-Made fabrics. Regenerated fibres are
made from extremely small cotton fibres or any other fibre source such as wood pulp, milk protein, etc.
Chemicals are used to dissolve these and the solution is then converted into solid fibres. Examples- Rayon.
Synthetic fibres such as nylon, acrylic and polyester are made using various petrochemical products. Fabric acts
as a reservoir for the transmission of micro-organisms. Microbial activity is enhanced when provided with
favourable environment. Natural fibres are susceptible to microbial activity than Man-Made fibres because their
porous hydrophilic structure retains water, oxygen and nutrients, providing perfect environments for bacterial
growth. Fibres made from synthetic polymers like acrylic, nylon, polyester, polyethylene, and polypropylene
fibre are very resistance to attack by micro-organisms. The resistance provided by such fabrics towards the
microbes is probably because of the hydrophobic nature of the polymer (Paul, 1997).
Microbes are microscopic organisms which are not seen by naked eyes and include a variety of creatures like
fungi, bacteria, algae and viruses. When provided with the favourable condition like warmth and moisture, they
multiply and grow rapidly. Some specific types of bacteria are pathogenic and cause cross infection. Fungi,
mold are complex organisms with slow growth rate. They are part of our everyday life and found everywhere in
the environment and on our bodies. Most of these microorganisms are non-pathogenic but can become
opportunistic pathogens under certain conditions (Vidushi et al., 2011).
LITERATURE REVIEW
Transmission of micro-organisms from a person to the fabrics and then to another person is the ability of that
microbe to survive on that surface of the fabric. After investigation, researchers confirmed survival of
microorganisms from days to months on the fabric. Thus, Fabric acts as a reservoir for these microbes. The
spread of HIV and hepatitis viruses by contact of contaminated materials has created increase pressure for
protection of personnel with functional clothing (Deepti, 2001). There are studies indicating the survival and
growth of bacteria on the fabric of the health care personnel. Neely (2000) sought to determine the length of
survival of various Gram-negative bacteria on fabrics and plastics commonly used in hospitals. Wilson et al.,
(2007) studied recent advance in laundry technology and processes to determine the role of apparels of
healthcare workers as a reservoir of pathogen.

International Journal of Advance and Innovative Research Volume 6, Issue 1 (XXIV): January - March, 2019
411
ISSN 2394 - 7780
Study by Susan Lang (2001) suggested that clothing, particularly cotton, worn by both visitors and patients in
hospitals are a leading source of transmission of spores of Aspergillus fungus. Callewaert (et al., 2014) studied
microbial odor profile of polyester and cotton clothes after a fitness session.
From the existing literature it is seen that most of the studies emphasis on the medical clothing and the study on
day to day apparels is yet ignored. Tight fitting clothing such as figure hugging Denims, Jeggings and Leggings
are preferred by youngster’s on large scale. Enough importance is not given to aspects like non-suitability of
clothing towards our hot and humid climate. Therefore, there is need to do research in the area so as to find out
how the material and style are linked to the health of the people. The study thus conducted focuses to monitor
the growth of Bacteria and fungi on different Pant fabrics. Tight fitting pants like Jeans (Denims), Trousers,
Jeggings and Leggings were chosen for the study.
METHODOLOGY
The study was empirical and comprises bacterial and fungal assay to see how the fabric of the different pant
materials is prone to the microbial attack. The fabrics are treated with antimicrobial agents during
manufacturing which is lost after several washings. Without considering this aspect, the clothes are wore till
they are torn. There, the sample chosen in the study are the materials of used pants which had undergone several
washes. However, the material was washed and sterilized before use. The four fabrics chosen were of the day to
day clothing styles viz. jeans (denim), leggings, jeggings and trouser.
For the microbial assay the fabric from different pant materials was cut into 6cm X 6cm square and was
autoclaved. This ensures that the fabric is free from microbes. Nutrient Broth and Potato Dextrose Agar was
used as nutrient media for Bacteria and Fungi respectively.
The Bacterial assay was done by using principles of Nephelometry..
The turbidity obtained in the suspension is directly proportional to the bacterial growth.
Side-arm conical flasks consisting of 100 ml nutrient broth was autoclaved. One flask was kept as control
having only the nutrient broth. Out of remaining 8 flasks, 4 flasks were kept as blank consisting of nutrient
broth and a piece of sterile fabric of Jeans, Trousers, Jeggings and Leggings respectively. Other 4 flasks were
subjected to the nutrient broth along with the fabric piece which was first autoclaved and then exposed to
aeroflora for 15 minutes. The piece of fabric for test as well as control was introduced into the side-arm conical
flak aseptically and was incubated at 37oC. The optical density of all the flask were measured after 6 hours.
Colorimetric estimation was done at 530 nm. The results were estimated from the readings.
The fungal assay was done by settle plate method. Sterilized petriplates were poured with Potato dextrose agar.
Ampicillin was added into the autoclaved potato dextrose agar for creating antibacterial environment. The fabric
pieces which were first sterilized are placed on the PDA plates aseptically. The plates were exposed to aero
flora for 15 minutes. The plates were incubated at 37o C for 6 days. Further observation and analysis of the
fungal plates were done.
Both assays were done in triplicate.
RESULT AND DISCUSSION
Bacterial Assay As the bacterial growth goes on increasing the solution in the flasks starts to get more turbid. The level of
turbidity directly reflects the level of bacterial growth in the solution. Greater optical density indicates greater
bacterial growth. The result indicated leggings with the lowest optical density (1200 X 10 9 number of
bacteria/ml) followed by jeggings ( 2100 X 10 9 number of bacteria/ml), jeans stood third in the list (2250 X 10
9 number of bacteria/ml) and trousers with highest optical density (3225 X 10 9 number of bacteria/ml).
Leggings showed least bacterial growth as compared to rest of the pant fabrics. Jeggings and denim showed
moderate bacterial growth. Trousers showed maximum bacterial growth. The trend of the density of the bacteria
was as follows
Leggings < Jeggings < Jeans < Pants/Trousers
The research by Callewaert et al., (2014) showed an overall enrichment of micrococci on the synthetic fabrics
after the fitness session and incubation period. However, from the present study such inference can not be
drawn since leggings and jeggings which mainly comprises spandex, a man-made firbre showed minimal
growth of microbes compared to the jeans which is made of cotton and trouser material which is again man-
made fibre but does not comprise spandex.
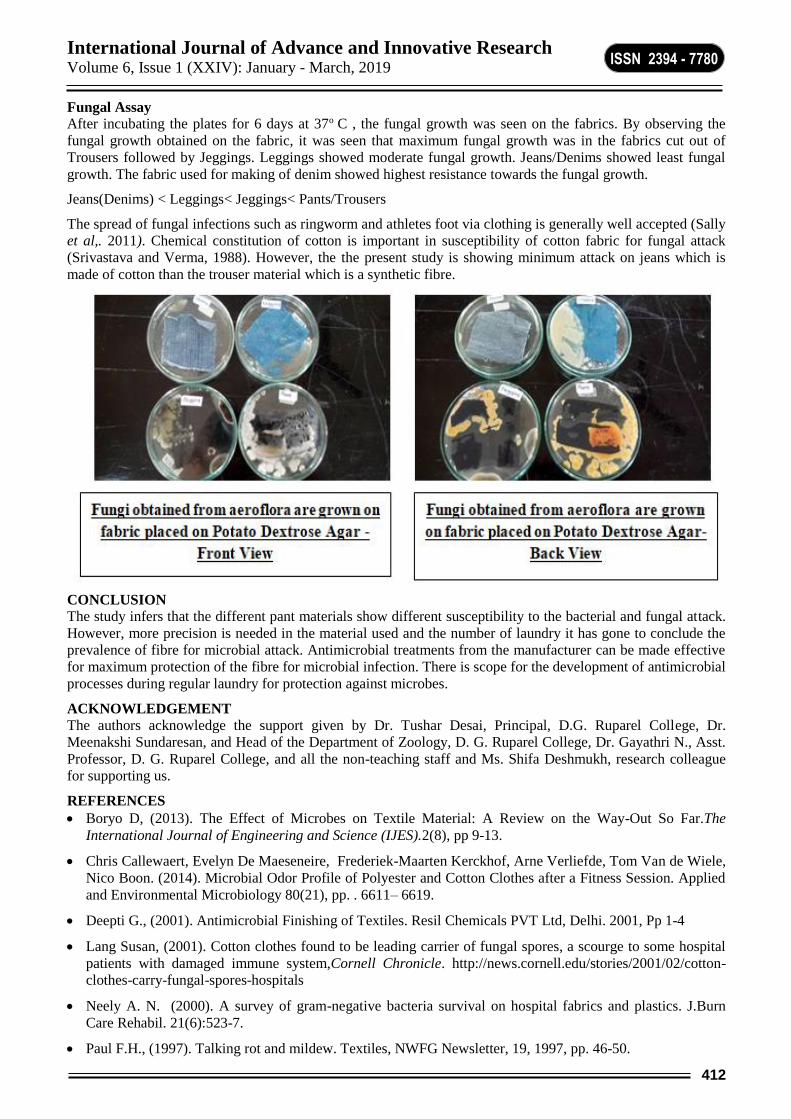
International Journal of Advance and Innovative Research Volume 6, Issue 1 (XXIV): January - March, 2019
412
ISSN 2394 - 7780
Fungal Assay After incubating the plates for 6 days at 37o
C , the fungal growth was seen on the fabrics. By observing the
fungal growth obtained on the fabric, it was seen that maximum fungal growth was in the fabrics cut out of
Trousers followed by Jeggings. Leggings showed moderate fungal growth. Jeans/Denims showed least fungal
growth. The fabric used for making of denim showed highest resistance towards the fungal growth.
Jeans(Denims) < Leggings< Jeggings< Pants/Trousers
The spread of fungal infections such as ringworm and athletes foot via clothing is generally well accepted (Sally
et al,. 2011). Chemical constitution of cotton is important in susceptibility of cotton fabric for fungal attack
(Srivastava and Verma, 1988). However, the the present study is showing minimum attack on jeans which is
made of cotton than the trouser material which is a synthetic fibre.
CONCLUSION
The study infers that the different pant materials show different susceptibility to the bacterial and fungal attack.
However, more precision is needed in the material used and the number of laundry it has gone to conclude the
prevalence of fibre for microbial attack. Antimicrobial treatments from the manufacturer can be made effective
for maximum protection of the fibre for microbial infection. There is scope for the development of antimicrobial
processes during regular laundry for protection against microbes.
ACKNOWLEDGEMENT
The authors acknowledge the support given by Dr. Tushar Desai, Principal, D.G. Ruparel College, Dr.
Meenakshi Sundaresan, and Head of the Department of Zoology, D. G. Ruparel College, Dr. Gayathri N., Asst.
Professor, D. G. Ruparel College, and all the non-teaching staff and Ms. Shifa Deshmukh, research colleague
for supporting us.
REFERENCES
Boryo D, (2013). The Effect of Microbes on Textile Material: A Review on the Way-Out So Far.The
International Journal of Engineering and Science (IJES).2(8), pp 9-13.
Chris Callewaert, Evelyn De Maeseneire, Frederiek-Maarten Kerckhof, Arne Verliefde, Tom Van de Wiele,
Nico Boon. (2014). Microbial Odor Profile of Polyester and Cotton Clothes after a Fitness Session. Applied
and Environmental Microbiology 80(21), pp. . 6611– 6619.
Deepti G., (2001). Antimicrobial Finishing of Textiles. Resil Chemicals PVT Ltd, Delhi. 2001, Pp 1-4
Lang Susan, (2001). Cotton clothes found to be leading carrier of fungal spores, a scourge to some hospital
patients with damaged immune system,Cornell Chronicle. http://news.cornell.edu/stories/2001/02/cotton-
clothes-carry-fungal-spores-hospitals
Neely A. N. (2000). A survey of gram-negative bacteria survival on hospital fabrics and plastics. J.Burn
Care Rehabil. 21(6):523-7.
Paul F.H., (1997). Talking rot and mildew. Textiles, NWFG Newsletter, 19, 1997, pp. 46-50.

International Journal of Advance and Innovative Research Volume 6, Issue 1 (XXIV): January - March, 2019
413
ISSN 2394 - 7780
Sally F. Bloomfield, Martin Exner, Carlo Signorelli , Kumar Jyoti Nath, Dr Elizabeth A. Scott (2011). The
infection risks associated with clothing and household linens in home and everyday life settings, and the role
of laundry. A review prepared by the International Scientific Forum on Home Hygiene (IFH)
Vidushi B., Shailendra B, Jha M.K., Dey A., Ghosh S., (2011). Microbial Adherence On Textile Material: A
Review. Journal of Environmental Research and Development, pp: 5, 3.
Wilson J, Loveday H, Hoffman P, Pratt R. (2007). Uniform: an evidence review of the microbiological
significance of uniforms and uniform policy in the prevention and control of healthcare-associated
infections. Report to the Department of Health (England). J Hosp Infect. Vol. 66, No. 4, Pages 301-307.

International Journal of Advance and Innovative Research Volume 6, Issue 1 (XXIV): January - March, 2019
414
ISSN 2394 - 7780
A STUDY ON GREEN HRM PRACTICES IN AN ORGANISATION
Vijay K Vishwakarma Research Scholar, JJTU
ABSTRACT
Green HRM is the cutting-edge in an organizations today. Green practices are being accepted and corporations
today are developing human resource policies for encouraging environment management initiatives.
Organizations must try to consider the social and environmental factors to encourage the organization and
thereby focusing on wealth maximization. This paper is an endeavor to study some of the GHRM practices in a
few selected Indian organizations today. The paper also highlights the impact Green HR has created and the
advantage these companies have over their counterparts due to these practices. This study comes at an
opportune time as there is a great deal of increase in the level of environmental pollution and waste emerging
from industries which has resulted in increase in implementation of policies by governmental and private sector
with the aim of reducing the rapid destruction to the non-renewable resources and the ultimate negative impact
it would have on societal consequences. Researcher has tried to gather information from various HR in terms of
Green HRM.
Keywords: Green HRM, Environment management, HR
OBJECTIVES
To study about GREEN HRM in today’s organization.
To identify the perspective of Green HRM of HR
INTRODUCTION
In this global market, there are number of challenges which are related to human activity in terms of sustainable
development in developed as well as developing countries. There is a need to prevent and take precautions for
the development of economy in this civilized economy. According to the World Commission on Environment
and Development, sustainable development satisfies the needs of the present generation without endangering the
ability of future generations to satisfy theirs. All these development are intelligent, environmentally-friendly,
based on the effective use of resources, knowledge and innovation. There are three elementary magnitudes of
sustainable development ecological, economic and social.
Defining Green HRM
Green HRM as a term is used to all possible HR policies that could contribute to an organization’s
environmental agenda.
Green HRM was coined as a term almost 10 years ago by Renwick, D.W.S. Redman, T. and Maguire, S. (2008
– Green HRM: A Review, Process Model, and Research Agenda, ) as “the integration of corporate
environmental management into human resource management”.
Btw, the notion of Employee ‘Green Discipline Management’ is even older – probably from the mid- 80s / early
90s.
Some Green HRM Industry Studies Employees are willing to work in a organization only when they feel it adds to their value profile (Dechant
and Altman (1994)
In 2009 Hewitt Associates found out that: “86% of employees at organizations with high engagement agreed
that they worked for an employer that was socially and environmentally responsible”
Same 2009 Study also found out that: “Green HR practices contribute to positive organizational reputation,
higher or sustained employee engagement and eliminating waste/reducing their impact on the environment”.
Recent studies have also supported the same conclusions.
Green Staffing is “in”- it involves hiring individuals with Environment Management skills, mindsets, and
behaviour). We at HIREghana do promote Green Staffing
Rewards do motivate and do increase commitment from workers to be environmentally responsible (Daily
&Huang, 2001).
Furthermore, rewards sensitize employees to environmental consciousness; and discourage undesired
behaviours while reinforcing preferred ones

International Journal of Advance and Innovative Research Volume 6, Issue 1 (XXIV): January - March, 2019
415
ISSN 2394 - 7780
REVIEW OF LITERATURE
Edyta Bombiak; et.al (2018) has stated about in today’s scenario Green HRM supports pro-environmental
corporate management. The main aim of the research was to analyses the pro-environmental HR practices used
by young polish enterprises. A survey was conducted using a random population of 150 young enterprises. It
will help in increasing the ecological awareness which will help in sustainable development. An empirical
research was conducted under polish conditions by using a representative sample of young polish enterprises.
For increasing the competiveness, Green HRM will help in increasing satisfaction, loyalty and motivation level
of the employees.
Douglas W.S. Renwick ; et.al (2012) has identified various literature on Environment Management and listed
out the main cause of environment problems and how to cope up with these issues. There are number of
initiatives started by organizations and various managerial heads to understand EM issues. Researcher has tries
to find out GHRM practices i.e. skill development, motivation and participation of employees.Emplyees must
be involved in various EM initiatives. It is the latest variant of manager interest in EI. Researcher has tried to
find out the positive impact of EI in EM with various evidence.GHRM will help in understanding the potential
benefits for both organization and employee’s also. It also states that better financial position of the organization
result into better environment performance. GHRM practices helps to improve well-being of the employees in
the workplace and improving the working environment and satisfying the needs of a balance workplace.
Renwick, D;et.al (2008) has suggested
Recruitment
- Green job descriptions for employees (and green goals included into managerial job descriptions)
- Graduate perceptions of Green practises (applicants use green criteria)
- Green job candidates
- Recruitment of employees who are ‘Green aware’ becomes part of the interview schedule
- Green employer branding (green employer of choice)
- Green aspects introduced to the induction process (familiarisation)
Performance Management
- Green performance indicators into performance management system, and appraisals (PMA)
- Communication of Green schemes to all levels of staff through PMA scheme, establishing firm-wide
dialogue on green matters
- Managers are set green targets, goals and responsibilities
- Roles of managers in achieving Green outcomes included in appraisals
- Writing & integrating green criteria in appraisals
Training and Development
- Introduce training on EM, & processes/material use
- EM training needs analysis
- Integrating training on instruction and generation of eco-values
- Development of employee skills, and competence building in EM
- Socialisation in Green values/management
- Use of Green teams in EM
- Train staff to produce green analysis of workspace
- Job rotation to train green managers of the future
- Integrating training to increase staff knowledge
- Training in EM aspects of safety, energy efficiency, waste management, and recycling
Employment Relations
- Employee involvement & participation (EI&P) in Green suggestion schemes, & problem-solving circles

International Journal of Advance and Innovative Research Volume 6, Issue 1 (XXIV): January - March, 2019
416
ISSN 2394 - 7780
- Staff independence to form & experiment with green ideas
- Integrate staff EI&P into maintenance (cleaning)
- Employee help-line for guidance in green matters
- Tailor Green EI scheme to industry/company standards
- Increase line/supervisory support behaviours in EM
- Unions negotiating Green workplace agreements
- Training of union representatives in EM
- Green elements into the health and safety process
- Encouraging employees to use green forms of transport
Pay and Reward
- Green pay/reward system
- Tailor packages to reward green skills acquisition
- Use of monetary-based EM rewards (bonuses, cash, premiums)
- Use of non-monetary based EM rewards (sabbaticals, leave, gifts)
- Use of recognition-based EM rewards (awards, dinners, publicity, external roles)
-Develop negative reinforcements in EM (criticism, warnings, suspensions for lapses)
- Develop positive rewards in EM (feedback)
- Establish PRP for all to gain green stewardship / citizenship (esp. seniors)
Exit
- Staff de-briefings in EM in cases of dismissal
- Managers to ask if Green issues are reasons for resignations (moving to a more Green employer)
- Role of exit interviews to gauge perceptions of firm Green-ness
- Whistle-blower accounts on state of firm Green-ness
- Legal protection for green whistle-blowers
RESEARCH METHODOLOGY
The two methods of collecting the data have been used such as primary data and secondary data.
• Primary data • Secondary data
Primary data is the first hand information that is collected during the period of research. Primary data has been
collected through discussion held with the customers who are using online shopping. Some information was
gathered through conversation with some respondents.
Secondary data means data already available for the researcher, which is already, exists. According to my study,
secondary data is collected with the help of referring books and journals for the study purpose. Some
information are gathered and referred with the help of internet browser
Sample Size
Sample size determination is the act of choosing the number of observations or replicates to include in a
statistical sample. The sample size is the important feature of any empirical study in which the goal is to make
inferences about a population from a sample. For the purpose of the study, researcher has chosen the size of 100
samples for the collection of the data.
DATA ANALYSIS AND INTERPRETATION
Following are the responses received circulated to 100 HR employees of different organisations.
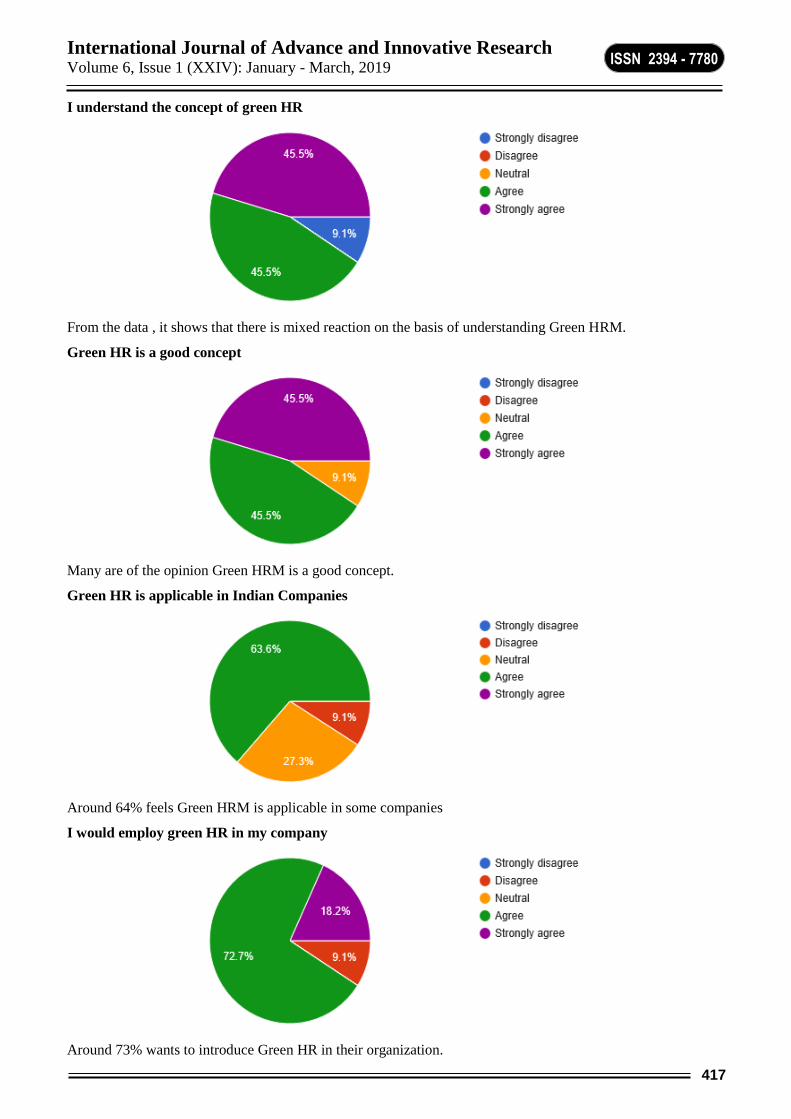
International Journal of Advance and Innovative Research Volume 6, Issue 1 (XXIV): January - March, 2019
417
ISSN 2394 - 7780
I understand the concept of green HR
From the data , it shows that there is mixed reaction on the basis of understanding Green HRM.
Green HR is a good concept
Many are of the opinion Green HRM is a good concept.
Green HR is applicable in Indian Companies
Around 64% feels Green HRM is applicable in some companies
I would employ green HR in my company
Around 73% wants to introduce Green HR in their organization.

International Journal of Advance and Innovative Research Volume 6, Issue 1 (XXIV): January - March, 2019
418
ISSN 2394 - 7780
Green HR increases productivity
46% are agreeing that GREEN HR will increase productivity.
This concept will decrease unemployment rate.
Around 55% are of the opinion that Green HRM will decrease unemployment rate.
All round training should be given.
Around 64% feels training will improve the efficiency level .
This increases job flexibility.
This is very dicey as Green HRM may or may not increase JOB flexibility

International Journal of Advance and Innovative Research Volume 6, Issue 1 (XXIV): January - March, 2019
419
ISSN 2394 - 7780
Unethical employee should be laid off.
Around 60% feels Green HRM will help in laying off unethical employees.
Younger employees should be laid off.
Around 20% are strongly opposing that younger employees to be laid off.
Younger employees will have more opportunities.
Around 55% feels younger employees will have more opportunities
Culture should be considered.
Around 55% feels culture must be considered in Green HRM.

International Journal of Advance and Innovative Research Volume 6, Issue 1 (XXIV): January - March, 2019
420
ISSN 2394 - 7780
I would consider Green HR in my company.
Around 10% don’t want to introduce Green HRM in their organization and rest other wants to introduce.
Green HR is an applicable concept.
As per the data it is quite interesting that many feels to introduce Green HRM in their organization.
CONCLUSION
Thus with the application of GREEN HRM it will help the organizations to control the cost and invest in their
assests i.e. on their employees and thinking about the environment.Organisations can gain Customer loyalty by
adopting GREEN HRM in the organization.Organisation must try to invest heavily in training the employees in
maintaining the environment performances. The application of Green HRM will create a competitive edge in
this competitive scenario.
LIMITATIONS AND FUTURE RESEARCH
Due to insufficient primary data only some organizations are practicing Green HRM. Some of them are not
aware of Green HRM also. Due to time and money constraint researcher has not extended in various
dimensions. Researcher can take this ahead and research on various dimensions. Future researcher can come up
with number of factors in maintaining the performance of the environment. Also it can be also compared with
developed and developing companies.
REFERENCES
1. Lather, Anu & Garg, Shalini & Vikas, Sona. (2014). Green HRM Practices – A Case Study of a Few
Selected Indian Companies presented at National Conference on Organizational Re-engineering: New Age
Tool for Competitive Advantage.
2. Renwick, Douglas & Redman, Tom & Maguire, Stuart. (2012). Green Human Resource Management: A
Review and Research Agenda. International Journal of Management Reviews. 15. 10.1111/j.1468-
2370.2011.00328.x.
3. Aazhvaar, Vijai. (2018). 7. A STUDY ON GREEN HRM PRACTICES IN AN ORGANIZATION. 2. 34-37.
4. 4. Edyta Bombiak ID and Anna Marciniuk-Kluska (2018). Green Human Resource Management as a Tool
for the Sustainable Development of Enterprises: Polish Young Company Experience. Sustainability 2018,
10, 1739; doi: 10.3390/su10061739 .www.mdpi.com/journal/sustainability.
5. Jabbar, Hassan & Abid, Muhammad. (2015). A Study of Green HR Practices and Its Impact on
Environmental Performance: A Review. MAGNT Research Report. 3. 142-154.
6. https://www.modernghana.com/news/810878/what-is-green-hr.html
7. https://doi.org/10.1080/23311975.2015.1030817
8. Renwick, D, Redman, T, Maguire, S (2008), Green HRM: A Review, Process Model, and Research Agenda,
Discussion Papers
9. http://www.sheffield.ac.uk/content/1/c6/08/70/89/2008-01.pdf

International Journal of Advance and Innovative Research Volume 6, Issue 1 (XXIV): January - March, 2019
421
ISSN 2394 - 7780
GREEN MARKETING STRATEGY: OPPORTUNITIES AND CHALLENGES FOR MARKETERS
Dr. Niyat Shetty
Assistant Professor, Sasmira’s Business School
ABSTRACT
Environmental issues have gained importance in business as well as in public life throughout the world. It is not
like that a few leaders of different countries or few big renowned business houses are concerned about the day
to day deterioration of oxygen level in our atmosphere but every common citizen of our country and the world is
concerned about this common threat of global warming. So in this scenario of global concern, corporate houses
has taken green-marketing as a part of their strategy to promote products by employing environmental claims
either about their attributes or about the systems, policies and processes of the firms that manufacture or sell
them.
Clearly green marketing is part and parcel of overall corporate strategy; along with manipulating the
traditional marketing mix (product, price, promotion and place), it require an understanding of public policy
process. So we can say green marketing covers a broad range of activities. This research article introduces the
trends of green marketing existing today and the examples of various corporate employing green marketing
strategies to build its overall goodwill and brand image.
Keywords: Green marketing, sustainable marketing, corporate social responsibility, green products
INTRODUCTION
Terms like "Green Marketing" and "Environmental Marketing" appear frequently in the popular press. Many
governments around the world have become so concerned about green marketing activities that they have
attempted to regulate them. Other similar terms used are Environmental Marketing and Ecological Marketing.
American Marketing Association Define: - Green marketing is the marketing of products that are presumed to
be environmentally safe.
Thus green marketing incorporates a broad range of activities including:
Product modification,
Changes to the production process,
Packaging changes,
As well as modifying advertising
To succeed, any green strategy must fulfill three criteria:
Firstly, it must be a sustainable and credible programmed, which brings real benefits to the environment.
Secondly, it must deliver sound economic ROI and competitive advantage to the business.
Thirdly, it must be supported by relevant green messages, which resonate with customers and prospects.
Significance of Green Marketing for Organizations in Current Scenario
As firms face limited natural resources, they must develop new or alternative ways of satisfying these unlimited
wants. Ultimately green marketing looks at how marketing activities utilize these limited resources, while
satisfying consumers wants, both of individuals and industry, as well as achieving the selling organization's
objectives. When looking through the literature there are several suggested reasons for firms increased use of
Green Marketing. Five possible reasons cited are:
Organizations perceive environmental marketing to be an opportunity that can be used to achieve its
objectives.
Organizations believe they have a moral obligation to be more socially responsible.
Governmental bodies are forcing firms to become more responsible.
Competitors' environmental activities pressure firms to change their environmental marketing activities.
Cost factors associated with waste disposal, or reductions in material usage forces firms to modify their
behavior.

International Journal of Advance and Innovative Research Volume 6, Issue 1 (XXIV): January - March, 2019
422
ISSN 2394 - 7780
CHALLENGES FACED BY MARKETERS IN GREEN MARKETING
1. Need For Standardization
It is found that only 5% of the marketing messages from “Green” campaigns are entirely true and there is a lack
of standardization to authenticate these claims. There is no standardization to authenticate these claims. There is
no standardization currently in place to certify a product as organic. Unless some regulatory bodies are involved
in providing the certifications there will not be any verifiable means. A standard quality control board needs to
be in place for such labeling and licensing.
2. New Concept
Indian literate and urban consumer is getting more aware about the merits of Green products. But it is still a new
concept for the masses. The consumer needs to be educated and made aware of the environmental threats. The
new green movements need to reach the masses and that will take a lot of time and effort. By India’s Ayurvedic
heritage, Indian consumers do appreciate the importance of using natural and herbal beauty products. Indian
consumer is exposed to healthy living lifestyles such as yoga and natural food consumption. In those aspects the
consumer is already aware and will be inclined to accept the green products.
3. Patience and Perseverance
The investors and corporate need to view the environment as a major long-term investment opportunity, the
marketers need to look at the long-term benefits from this new green movement. It will require a lot of patience
and no immediate results. Since it is a new concept and idea, it will have its own acceptance period.
4. Avoiding Green Myopia
The first rule of green marketing is focusing on customer benefits i.e. the primary reason why consumers buy
certain products in the first place. Do this right, and motivate consumers to switch brands or even pay a
premium for the greener alternative. It is not going to help if a product is developed which is absolutely green in
various aspects but does not pass the customer satisfaction criteria. This will lead to green myopia. Also if the
green products are priced very high then again it will lose its market acceptability.
BENEFITS OF GREEN MARKETING
Today’s consumers are becoming more and more conscious about the environment and are also becoming
socially responsible. Therefore, more companies are responsible to consumer’s aspirations for environmentally
less damaging or neutral products. Many companies want to have an early mover advantage as they have to
eventually move towards becoming green.
Some of the advantages of green marketing are
It ensures sustained long term growth along with profitability.
It saves money in the long run, though initially the cost is more.
It helps the companies market their products and services keeping the environment aspects in mind.
It helps in accessing the new markets and enjoying the competitive advantage.
Most of the employees also feel proud and responsible to be working for an environmentally responsible
company.
REVIEW OF LITERATURE
Certain research papers have been written on the topic of Green Marketing which has helped the researcher in
gaining some perspective about the topic. According to Deepa Ingavale and Anuradha Gaikwad , in their paper
“Study of Awareness about Green Marketing”, consumers are willing to pay more to buy a “green” product as
compared to normal products, which relates to the increasing demand of the Organic food industry which is
growing exponentially over the last few years. This positive trend is driving more and more corporate to go for
green marketing strategy to woo customers worldwide.
Dr.Rashid Yazdhanifard further re-instates this fact in his paper, that companies use Green Marketing strategies
not only to provide environment protection but to use it as a marketing tool to enhance its corporate brand.
Every company employing green company logo stands apart from its competitors and gets a slight competitive
edge in the market. Thus, whether in packaging, or product composition or any other activities related to
environment protection , companies are going green serving their corporate social responsibility function
towards the community.
Shruti Maheshwari sees Green Marketing as a challenge to marketers, as she opines in her research paper that
consumers are not aware of the Green Marketing process and it becomes a task of the marketer to educate their

International Journal of Advance and Innovative Research Volume 6, Issue 1 (XXIV): January - March, 2019
423
ISSN 2394 - 7780
consumers about the benefits and importance of using Green products. Influencing consumer behavior towards
using of Green products must be done through different medium of communication, digital marketing and social
media marketing being the most important tool as youth connects through these medium very effectively. Thus,
Green marketing strategy should be integrated with other marketing tools like advertising, digital marketing and
social media marketing so as to get the most desiring results.
Mayank and Amit in their research paper conclude that by effective marketing campaigns highlighting the value
of green products can help companies build goodwill. Additionally, green products can invite premiums as
people, especially in India, are willing to pay more to buy organic products. Thus, the main link in this whole
marketing process is the communication part. An effective promotion strategy communicating the effectiveness
of green products can help a marketer to penetrate and identify their target markets and sell effectively. This
relates to the ever growing demand of green products like low power consuming (energy-efficient) electrical
appliances, organic foods, lead free paints, recyclable paper, and phosphate free detergents.
RESEARCH METHODOLOGY
The research methodology includes secondary data and observation method to identify and analyze the green
marketing concepts applied practically in the current Indian scenario by major companies. The researcher has
gone through various literatures like research papers and articles pertaining to Green Marketing. He also
observed and identified several cases where Green marketing has been implemented practically to gain effective
results. The findings and observations are duly reported in this paper.
DATA ANALYSIS AND MAJOR FINDINGS OF THE STUDY
The data analysis has been formulated and documented according the opinion of the researcher. This opinion
has been created after going through lot of literature review and personal observation. The researcher was able
to identify certain real time cases where the concept of Green Marketing has been implemented. The findings of
the article are that according to the researcher, the Green marketing strategies are being adopted by the
companies for Five Major Reasons which has been explained below:
1) Opportunities - As demands change, many firms see these changes as an opportunity to be exploited and
have a competitive advantage over firms marketing non-environmentally responsible alternatives. Some
examples of firms who have strived to become more environmentally responsible, in an attempt to better satisfy
their consumer needs are:
McDonald's replaced its clam shell packaging with waxed paper because of increased consumer concern
relating to polystyrene production and Ozone depletion.
Tuna manufacturers modified their fishing techniques because of the increased concern over driftnet fishing,
and the resulting death of dolphins.
Xerox introduced a "high quality" recycled photocopier paper in an attempt to satisfy the demands of firms
for less environmentally harmful products.
2) Governmental Pressure - As with all marketing related activities, governments want to "protect" consumers
and society; this protection has significant green marketing implications. Governmental regulations relating to
environmental marketing are designed to protect consumers in several ways:
Reduce production of harmful goods or by-products.
Modify consumer and industry's use and/or consumption of harmful goods.
Ensure that all types of consumers have the ability to evaluate the environmental composition of goods.
Governments establish regulations designed to control the amount of hazardous wastes produced by firms. ITC
has been 'Carbon Positive' three years in a row (sequestering/storing twice the amount of CO2 than the
Company emits). It has been 'Water Positive' six years in a row (creating three times more Rainwater
Harvesting potential than ITC's net consumption). ITC was also consistently close in achieving 100% solid
waste recycling.
3) Competitive Pressure - Another major force in the environmental marketing area has been firms' desire to
maintain their competitive position. In many cases firms observe competitors promoting their environmental
behaviors and attempt to emulate this behavior. In some instances this competitive pressure has caused an entire
industry to modify and thus reduce its detrimental environmental behavior.

International Journal of Advance and Innovative Research Volume 6, Issue 1 (XXIV): January - March, 2019
424
ISSN 2394 - 7780
For example, it could be argued that Xerox's "Revive 100% Recycled paper" was introduced a few years ago in
an attempt to address the introduction of recycled photocopier paper by other manufacturers. In another
example when one tuna manufacture stopped using driftnets the others followed suit.
4) Social Responsibility- Many firms are beginning to realize that they are members of the wider community
and therefore must behave in an environmentally responsible fashion. This translates into firms that believe they
must achieve environmental objectives as well as profit related objectives. This results in environmental issues
being integrated into the firm's corporate culture. There are examples of firms adopting both strategies.
Organizations like the Body Shop heavily promote the fact that they are environmentally responsible. While this
behavior is a competitive advantage, the firm was established specifically to offer consumers environmentally
responsible alternatives to conventional cosmetic products. This philosophy is directly tied to the overall
corporate culture, rather than simply being a competitive tool.
An example of a firm that does not promote its environmental initiatives is Coca-Cola. They have invested large
sums of money in various recycling activities, as well as having modified their packaging to minimize its
environmental impact. While being concerned about the environment, Coke has not used this concern as a
marketing tool. Thus many consumers may not realize that Coke is a very environmentally committed
organization. Another firm who is very environmentally responsible but does not promote this fact, at least
outside the organization, is Walt Disney World (WDW). WDW has an extensive waste management program
and infrastructure in place, yet these facilities are not highlighted in their general tourist promotional activities.
5) Cost or Profit Issues - Firms may also use green marketing in an attempt to address cost or profit related
issues. Disposing of environmentally harmful by-products, such as polychlorinated biphenyl (PCB)
contaminated oil are becoming increasingly costly and in some cases difficult.
Therefore firms that can reduce harmful wastes may incur substantial cost savings. When attempting to
minimize waste, firms are often forced to re-examine their production processes. In these cases they often
develop more effective production processes that not only reduce waste, but reduce the need for some raw
materials. This serves as a double cost savings, since both waste and raw material are reduced.
Coca-Cola pumped syrup directly from tank instead of plastic which saved 68 million pound/year. Badarpur
Thermal Power station of NTPC in Delhi is devising ways to utilize coal-ash that has been a major source of air
and water pollution
CONCLUSIONS
As the demand for green products undoubtedly exists, Green Marketing provides an opportunity to the
companies to increase their market-share by introducing eco friendly products. Stricter environmental
regulations across the world, growing consumer preference for eco-friendly companies, and the inherent cost
advantages in lowering toxic waste, are encouraging industries big and small to clean up.
Though it’s the responsibility of the firm to produce products, which are having minimum impact on the
environment, but ultimately it’s the consumer who is having responsibility to use eco friendly products.
Consumers are not too much concerned about the environment but as they have become more sophisticated,
they require clear information about how choosing one product over another will benefit the environment.
Consumer education results in their empowerment. Empowered consumers choose environmentally preferable
products when all else is equal.
Ultimately green marketing requires that consumers ‘Think Green, Think clean, Think Eco-friendly’ i.e. they
want a cleaner environment and are willing to "pay" for it, possibly through higher priced goods, modified
individual lifestyles, or even governmental intervention. Until this occurs it will be difficult for firms alone to
lead the green marketing revolution.
REFERENCES
Agrawal R (2000): Green Marketing: An Emerging Trend (PJMR, Vol. 5, April 2000)
Bhatia M, Jain A (2013): Green Marketing: A Study of Consumer Perception and Preferences in India,
UCLA Library, Electronic Green Journal, Volume 1, Issue 36
Ingawale D, Gaikwad A (2011): A Study of Awareness for Green Marketing, National Conference on
Business Strategies for Emerging Markets, SIBACA, Lonavala.
Kotler Philips & G. Armstrong. Principles of marketing. New Delhi, Prentice Hall.

International Journal of Advance and Innovative Research Volume 6, Issue 1 (XXIV): January - March, 2019
425
ISSN 2394 - 7780
Maheshwari , S (2014): Awareness of Green Marketing and its influence on Buying behavior of Consumers
, AIMA Journal of Management & Research, February 2014, Volume 8 Issue 1/4, ISSN 0974 – 497
Yazdanifard R, Mercy IE (2011) : The impact of Green Marketing on Customer satisfaction and Envi-
ronmental safety, International Conference on Computer Communication and Management, Proc .of CSIT
vol.5 , IACSIT Press,
Websites
www.ecomall.com
www.greenmarketingcorner.com
www.greenpeace.org
www.ecoindia.com
www.useecofriendlyproducts.com
www.greenproducts.com

International Journal of Advance and Innovative Research Volume 6, Issue 1 (XXIV): January - March, 2019
426
ISSN 2394 - 7780
AN EMPIRICAL STUDY OF PREFERNECE OF INVESTMENT OF WORKING PEOPLE IN MUMBAI
Bhavana B. Solanki
Faculty, Sasmira’s Institute of Commerce and Science
ABSTRACT
Investment plays a crucial role in the growth of any country. For this in India there are various investment
avenues are available in which investor can invest their money. But many of the time because of unawareness
among the people they do not get attraction towards investment in all the existing alternatives. So it is the main
duty of all related group to create awareness among the people for different investment avenues. Especially the
working class people so that they can plan their investment properly with proper market knowledge. For this
the researcher focusing more on south Mumbai working people as sample and collected the data through
questionnaire.
Keywords: Investments, working people, Investors, Preferences.
INTRODUCTION
In the development of the country's financial condition, the Investors play very important role. So in this
research paper main focus is on the preference of investment in different avenue available in the market by
working people with special reference to Mumbai. As equity markets play very important role growth in
developing economy like India. The investor's confidence in securities is crucial for the smooth, steady
performance of the stock market in any country.
The regulators of the stock market should take care of the behavior of investors so that they get faith in
investing in security market without any hesitation. This research had kept more focus at understanding the
demographic and its influence on the investment behavior of individual investor in the security market with
special reference to Mumbai.
This research is mainly focusing on individual investors in Mumbai as this city is mainly popular for the
financial, commercial and entertainment city of India. The city is having important financial institutions like the
Reserve Bank of India, the Bombay Stock Exchange, the National Stock Exchange of India, SEBI and corporate
headquarters of many Indian companies and multinational corporations. Hence as research point of view
Mumbai is a main city of maximum population and investors to understand their demographic, preference
towards investment and saving.
Equity market A market that gives companies a way to raise main capital and gives investors an opportunity for gain by
allowing those companies equity shares to be traded.
In other words equity market is the place where securities can be sold and purchased at an agreed price.
National Stock Exchange of India
The NSE was established in 1992 as the first demutualized electronic exchange in the country. It was the first
exchange in the country to gave a modern, fully automated screen-based electronic trading system which
offered easy trading facility to the investors.
National Stock Exchange has a whole market capitalization of more than US$2.27 trillion, creating it the
world's 11th- major stock exchange as of April 2018. NIFTY 50, the 50 stock index is used extensively by
investors in India.
Bombay Stock Exchange
It was established in 1875 which is Asia's first stock exchange. The BSE is the world's 10th largest stock
exchange has a whole market capitalization of more than $2.3 trillion on as of April 2018.
Securities and Exchange Board of India
SEBI is the regulatory authority of Indian share market. The main Functions of SEBI are to give protection to
investors and safeguard their rights, to regulate brokers and sub brokers, to prohibit the unfair practices in equity
market.
Saving
Saving mean keeping money aside for future consumption. Saving can be done for many reasons like: child's
marriage, education, buying of house, for growing wealth etc,

International Journal of Advance and Innovative Research Volume 6, Issue 1 (XXIV): January - March, 2019
427
ISSN 2394 - 7780
Investment
In the current study, investment refers to financial savings in the form of Shares, Mutual Funds and Bank
deposits. The goal of working people of Mumbai may be current income, capital appreciation or an acceptable
balance.
REVIEW OF LITERATURE
An empirical study of "Indian Individual Investors Behavior" by Syed Tabassum Sultana (2010) was an attempt
to know the outline of the investors and also to know their personality so as to know their preference with
respect to their investments. The study also tried to unknot the influence of demographic factors like gender and
age on risk tolerance level of the investors.
Bhardwaj Rajesh, Raheja Rekh and Priyanka (2011), propounded in their study that saving and investment
pattern of working class school teachers of govt. and private schools has depended upon income and they both
obtain salary but the scale of the salaries are varied and saving patterns that's why is so different. Govt. teachers
like better to invest the money for emergency purposes and private teacher's stress on children marriage and
education. Dr. S. Mathivannan and Dr. M. Selvakumar (2011) examined the saving and investment patterns of
working teachers of Sivakasi Taluk, Tamilnadu and they established that there is great importance of money and
money's value for them and they are frequently preparing budgets for expenditures and compare it with the
actual expenditure and take necessary actions if there are Dr. Dhiraj Jain and Parul Jain (2012)concluded that
the majority of the teachers the money plays a large role and they initiated to prepare budgets and future
forecasting for income and expenditure and there is evaluation between future and Standard budgets to find out
the deviations to meet certain money constraints It has been obvious from the study that most of the school
teachers are saving their money for the reason of their children's education, marriage and as security after
retireme.
Gina Chowa, Mat Despard & Isaac Osei-Akoto (2012) in their paper ‘Youth saving patterns and performance in
Ghana’ attempted to discover whether the youth will contribute in savings via official financial services if given
the chance. The study found that most youth in the sample, put to one side money regularly, hold onto their set
aside money for short periods of time and use it frequently for short-term consumptive purposes. The study
concluded that, youth of a developing country have a high tendency to save but, not have of proper knowledge
and Information limited the youth from venturing out into the area formal savings and investments.
RESEARCH DESIGN AND METHODOLOGY
Objectives of the study
1. To examine the awareness level of investors about investment avenues.
2. To study the preferences of investors in choosing the investment avenues.
3. To analyze the factors consider by the investors to make investment.
4. To know their long term financial goals.
5. To find out whether the working investors are looking for long term growth or risk or return or liquidity.
SCOPE OF THE STUDY
The study is focused on the analysis of socio-economic background of 50 respondents. Further, this study
examines the awareness level of respondents about the investment avenues and their preferences on selecting
the investment avenues. As well, the researcher has highlighted the reasons for selecting the investment avenues
by the respondents. For this purpose, the information regarding their awareness about investment, factors
considered for choosing an investment avenues and reasons for choosing a particular investment avenues were
composed through the questionnaire.
STATEMENT OF THE PROBLEM
Investment activity of working people is preceded by timely pooling of the right amount of savings essentially
from their occupational earnings. The nature of occupation, position held, duration of service, family size,
commitments of family etc., will decide their income and savings. By considering the amount of savings and
their investment motives, the working people plan their selection of assets, pattern, duration of investment etc.,
The investment decision of working people mainly influenced by their investment preferences among the
available investment avenue such as most preferred and the least preferred avenues. Today, the investors shift
their interest towards the various investment avenues offered by various institutions. An investor can choose
from a variety of funds to suit his risk tolerance, investment horizon and objective. Accordingly, an empirical
study in this regard is carried out by focusing on the working people of Mumbai.
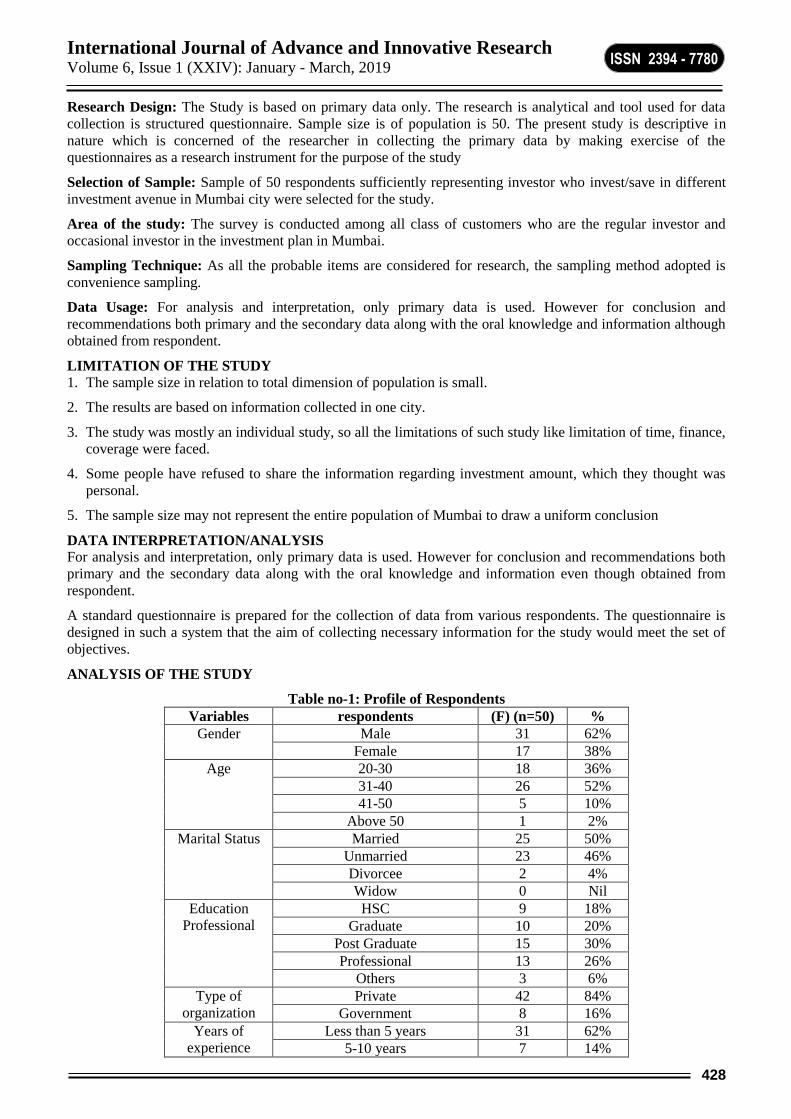
International Journal of Advance and Innovative Research Volume 6, Issue 1 (XXIV): January - March, 2019
428
ISSN 2394 - 7780
Research Design: The Study is based on primary data only. The research is analytical and tool used for data
collection is structured questionnaire. Sample size is of population is 50. The present study is descriptive in
nature which is concerned of the researcher in collecting the primary data by making exercise of the
questionnaires as a research instrument for the purpose of the study
Selection of Sample: Sample of 50 respondents sufficiently representing investor who invest/save in different
investment avenue in Mumbai city were selected for the study.
Area of the study: The survey is conducted among all class of customers who are the regular investor and
occasional investor in the investment plan in Mumbai.
Sampling Technique: As all the probable items are considered for research, the sampling method adopted is
convenience sampling.
Data Usage: For analysis and interpretation, only primary data is used. However for conclusion and
recommendations both primary and the secondary data along with the oral knowledge and information although
obtained from respondent.
LIMITATION OF THE STUDY 1. The sample size in relation to total dimension of population is small.
2. The results are based on information collected in one city.
3. The study was mostly an individual study, so all the limitations of such study like limitation of time, finance,
coverage were faced.
4. Some people have refused to share the information regarding investment amount, which they thought was
personal.
5. The sample size may not represent the entire population of Mumbai to draw a uniform conclusion
DATA INTERPRETATION/ANALYSIS
For analysis and interpretation, only primary data is used. However for conclusion and recommendations both
primary and the secondary data along with the oral knowledge and information even though obtained from
respondent.
A standard questionnaire is prepared for the collection of data from various respondents. The questionnaire is
designed in such a system that the aim of collecting necessary information for the study would meet the set of
objectives.
ANALYSIS OF THE STUDY
Table no-1: Profile of Respondents
Variables respondents (F) (n=50) %
Gender Male 31 62%
Female 17 38%
Age 20-30 18 36%
31-40 26 52%
41-50 5 10%
Above 50 1 2%
Marital Status Married 25 50%
Unmarried 23 46%
Divorcee 2 4%
Widow 0 Nil
Education
Professional
HSC 9 18%
Graduate 10 20%
Post Graduate 15 30%
Professional 13 26%
Others 3 6%
Type of
organization
Private 42 84%
Government 8 16%
Years of
experience
Less than 5 years 31 62%
5-10 years 7 14%

International Journal of Advance and Innovative Research Volume 6, Issue 1 (XXIV): January - March, 2019
429
ISSN 2394 - 7780
10-15 years 10 20%
More than 15 years 2 4%
Nature of
organization
Service 15 30%
Education 11 22%
Finance/Banking 15 30%
Others 9 18%
Level of
Designation
Top level 15 30%
Middle level 21 42%
Lower level 14 28%
Monthly
Income
Less than Rs. 10,000 8 16%
10,000-30,000 19 38%
30,000-50,000 13 26%
Above 50,000 10 20%
Source: Primary Data
Interpretation
From the above table 1, it is clear that 62% of the respondents are male and 38% of the respondents are female.
After dividing the respondents on the basis of gender, they are further divided according to their age. In this, it
is found that out of total respondents 36% are between 20-30 years old, 52% age between 31-40, 10% belongs
to the age group of 41-50 and 2% are above 50 years. 20% and 30% of respondents are graduates and post
graduates respectively. 84% 0f respondents are in private organization. 62% respondents are having less than 5
years of experience.30% respondents are working in service and finance sector and maximum respondents are
of middle level.16% of respondents are in the income level of below Rs 10,000, 38% of respondents are in the
income level of Rs 10,000-30,000, 26% of respondents are in the income level of 30,000-50,000 and 20%
respondents are above the income level of Rs 50,000.
Chart no-3: Respondents objectives of the Investment
Sr. No Factors No. of Respondents Percentage
1. Good Returns 25 50%
2. Future Security 10 20%
3. Liquidity 6 12%
4. Capital Appreciation 2 4%
5. Tax Savings 5 10%
6. Children Career 2 10%
Total 50 100%
The major objectives of investors are good returns followed by future security on investments as percentages
are 50% and 20% respectively.
Chart no-4: Respondents opinion regarding the preference of investment vehicle.
Source: Primary Data

International Journal of Advance and Innovative Research Volume 6, Issue 1 (XXIV): January - March, 2019
430
ISSN 2394 - 7780
According to above chart no.4 it can be concluded that34% respondents are giving preference to invest in equity
shares, 30% respondents are giving preference to invest in mutual funds.14 % respondents are giving preference
to bank deposits.
Table no-3: Respondents opinion regarding the percentage of income they invest in investment
Source: Primary Data
From above table no. 3 it is conclude that 64% respondents are saying that they invest less than 25% of their
income. 30% are comes under the level between 25-50%. 6% respondents prefer to invest between 50-75% of
their income.
Chart no-4: Respondents opinion regarding the sources of information for investment
Source: Primary Data
From above chart 4. it is cleared that 32% respondents are saying that they get information about investment
from their friends. 20% respondents are getting information from newspaper and 24% respondents are getting
information from consultants.
FINDINGS
It is clear that 62% of the respondents are male investors and 38% of the respondents are female investors.
Maximum investors comes between age of 31-40 years.
84% 0f respondents are in private organization
62% respondents are having less than 5 years of experience.
38% of respondents are in the income level of Rs 10,000-30,000
The major objectives of investors are good returns followed by future security on investments as percentages
are 50% and 20% respectively.
34% of respondents mentioned their investing response in equity shares because Equity shares of reputed
company and financial institutions regulated by SEBI (Security Exchange Board of India) are very
secure and considered as one of the safest investment methods.

International Journal of Advance and Innovative Research Volume 6, Issue 1 (XXIV): January - March, 2019
431
ISSN 2394 - 7780
30% respondents mentioned their investing response in Mutual funds in terms of long-term concerned and
high return. There is vagueness in the midst of investors, but they remain a bit of Secrecy to many. Even if
such products can help individuals to attain their financial goals, lack of information on these products may
impact their capability to achieve these goals later on.
14% respondents mentioned their investing response in Fixed deposits earn fixed interest rates for their
entire term, which is typically compounded quarterly. So, those who want an income on a usual basis can
invest into fixed deposits and use the interest rate as their income. This makes a fixed deposit very accepted
way of investing money for retirees as Fixed deposits save tax and give high returns on invested money. As
100% respondents are having saving accounts in banks, it indicates that people static believe in bank saving
in spite of the class they belong to. It reveals that people still have confidence in traditional way of saving.
64% respondents are saying that they invest less than 25% of their income.
32% respondents are saying that they get information about investment/saving from their friends
CONCLUSIONS AND RECOMMENDATIONS
Safety and security is main important reason for investing money by working people. Fixed deposits are not a
very attractive investment option for working people these days. Tax saving also influence working people to
invest more in Mumbai. As traditional saving schemes do not give any tax benefits so people try to avoid in
investing in tradition schemes. Mutual funds are becoming more popular among the working people. Hence
educating investors is much more necessary to influence them towards investing money in different investment
avenue which can help them to get good returns. Media can also generate information through newspaper
columns, which would encourage more participants in the capital market from working group of Mumbai.
REFERENCES
1. Geetha N. and Ramesh M. (2011), "A Study on People's Preferences in Investment Behaviour",
International Journal of Engineering and Management Research, November 2011, Vol. 1, No. 6.
2. Natarajan.L, "Investment Management" Margham Publications, Chennai, 2011
3. Preeti Singh, "Investment Management", Himalaya Publishing House, New Delhi, Seventh revised edition,
2009.
4. www.investoropedia.com
5. Bandgar, P.K. (1999), "A Study of Middle Class Investors' Preferences for Financial Instruments in
Greater Bombay", Finance India, Vol XIV, No.2, June, 2000, Pp. 574-576.
6. Ch. Kirshnudu, B. Krishna reddy and G. Rama Krishna reddy (2005), "Investment behavior and risk
management".
7. Darshana.P (2008) "A Study on Retail Investor's Preference towards Various Investment Avenues".8.
Dr.Mathivannan.S&Dr.M.selvakumar (2011), Indian Journal of Finance-"Savings and Investment
Patternof School Teachers - A Study with Reference to SivakasiTaluk, Tamil Nadu", Vol 5, No 4, April
2011,Pp.12-26. Various Investment Avenues".
8. Dr.Mathivannan.S&Dr.M.selvakumar (2011), Indian Journal of Finance-"Savings and Investment
Patternof School Teachers - A Study with Reference to SivakasiTaluk, Tamil Nadu", Investment Patternof
School Teachers - A Study with Reference to SivakasiTaluk, Tamil Nadu", Vol 5, No 4, April 2011,Pp.12-
26.
9. Dutta, Abhijit (2000), "Investors Reaction to Good and Bad News in Secondary Market: A Study Relating
to Investor's Behavior", Finance India, Vol. XV, No.2, June 2001, Pp. 567-576.
10. Gupta, L.C. (1987), "Shareholders Survey-Geographic Distribution", ICICI and SCMRD, New Delhi.
11. Mudra-Samir's (1992), survey on "Working women's awareness and attitude toward various saving
avenues" Economic Times, 2 September.
12. Narayana, D. L. (1976), "Income, Saving and Investment of Household Sector in Chittor District",
S.Chand& Co. Ltd., New Delhi, Pp. 1-187.
13. Rajarajan, V. (2003), "Investors Demographics and Risk Bearing Capacity", Finance India, Vol. XVII,
No.2, June, Pp.565-576.

International Journal of Advance and Innovative Research Volume 6, Issue 1 (XXIV): January - March, 2019
432
ISSN 2394 - 7780
14. Sridhar.R (2008). "Investment Practices of Investors in Equity Market".
15. https://en.wikipedia.org/wiki/Securities_market
16. https://en.wikipedia.org/wiki/Bombay_Stock_Exchange
17. https://en.wikipedia.org/wiki/National_Stock_Exchange_of_India
18. https://www.sebi.gov.in/

International Journal of Advance and Innovative Research Volume 6, Issue 1 (XXIV): January - March, 2019
433
ISSN 2394 - 7780
A SURVEY ON GREEN CLOUD COMPUTING: AN APPROACH FOR CARBON FOOTPRINT
REDUCTION
Satyendra Pal1 and Alok Singh2
Assistant Professor1, SASMIRA Institute of Commerce, and Science, Sasmira road, Worli, Mumbai
Assistant Professor2, Chandrabhan Sharma College of Arts, Science and Commerce, Powai, Mumbai
ABSTRACT
Cloud Computing Technology is very much popular and attraction of the people towards services of cloud
because of low cost and high services. Hence the demand of cloud infrastructure has increased. Every data
centers which are hosting the applications has consumed more energy, which create a big issue of high
operational cost and high emission of carbon footprint in the environment. Therefore, the need of
implementation of Green Cloud Computing to reduce the operation cost and emission of carbon footprint.
Green cloud computing is an effective approach to save our environment from carbon footprint.
Researcher appreciate the need of cloud computing technology. However, everyone must be aware about the
impact of carbon footprint on environment. In this paper researcher discuss the possible steps and measures to
reduce carbon footprint through Green Cloud Computing, which is new technique in the field of Information
Technology
Keywords: Green Cloud Computing, Carbon footprint, emission
INTRODUCTION
In this research paper, researcher analyze cloud computing technology and its use in reducing the carbon
footprint.
The aim of green technology is to reduce the environmental impact of industrial processes with the growth in
population resulting in new technologies. The efficient use of computers and its effect is the main concern of
this paper. The bottom line considers social responsibility, economic viability and the impact on the
environment. The point of research is testing and applying alternative non-hazardous materials in the products’
manufacturing process.
The uses of cloud computing have made a great impact on the industries of information technology over the
past few years, where big companies such as Google, Amazon and Microsoft are providing more powerful,
reliable and cost-efficient cloud platforms, and business enterprises seek to reshape their business models to
earn benefit from this new infrastructure and paradigm. The cloud computing is providing a powerful service.
Cloud Computing is basically internet based computing where resources are u utilizing on internet.
[A] There are basically three types of cloud
i) Private Cloud: One client, full control over data and quality of services
ii) Public Cloud: A cloud which are accessed by everyone from everywhere.
iii) Hybrid Cloud: It includes both private and public cloud with multiple providers.
[1][Source: Google]

International Journal of Advance and Innovative Research Volume 6, Issue 1 (XXIV): January - March, 2019
434
ISSN 2394 - 7780
[B]Cloud Architecture
The goal of cloud computing is to apply for supercomputing and high-performance computing power, normally
used by Defence, Business purpose and many more trillions of computations per second. [6] In consumer
oriented applications such as deliver personalized information, to provide data storage or to power large,
financial portfolios and immersive online computer games.
The Cloud Computing framework is designed such that it keeps track of overall energy consumption of serving
a user request. It has two main components, Carbon Emission Directory and Green Cloud offers, which keep
track of energy efficiency of each Cloud provider and also give incentive to Cloud providers to make their
service as Green Cloud Computing. From user side, the Green Broker plays a crucial role in monitoring and
selecting the Cloud services based on the user requirements, and it ensure that the minimum carbon emission for
every services.
There are three types of services (SaaS, PaaS, and IaaS), and therefore process of serving them should also be
energy efficient.
1] SaaS Level: Software as a Service(SaaS) providers mainly offer software installed on their own data centers.
The SaaS model provides the facility to ensure the energy efficiency of their software design, implementation,
and deployment.
The SaaS provider selects the data centers which are not only energy efficient but also very near to users. The
minimum number of copies of user’s confidential data should be maintained using energy-efficient storage.
2] PaaS level: Platform as a Service (PaaS) providers deals in general the platform services for application
development. The platform simplifies the development of applications which ensures energy efficient system.
This can be done by inclusion of various energy profiling tools such as Joule Sort It is a software energy
efficiency benchmark that measures the energy required to perform an external sort. In accumulation, platforms
itself can be designed to have various code level optimizations which can cooperate with underlying complier in
energy efficient execution of applications. Here the Cloud platforms also allow the deployment of user
applications on Hybrid Cloud except than the development of Application. Here to achieve maximum energy
efficiency, the platforms profile the application and decide which portion of application or data should be
processed in house and in Cloud.
3] IaaS level: Infrastructure as a Service(IaaS) Providers in this layer plays most essential role in the success of
whole Green Cloud Computing Architecture, since IaaS level not only offer self-governing infrastructure
services but also support other services offered by Clouds. They use modern technologies for Cloud Computing
and cooling systems to save energy and make efficient infrastructure. By using virtualization, energy
consumption is reduced by switching-off unused servers. There are various energy meters and sensors are
installed to calculate the current energy efficiency of each IaaS providers and their sites. The information,
regarding the energy efficiency is advertised regularly by Cloud providers in Carbon Emission Directory. The
various green scheduling and resource provisioning policies will ensure minimum energy usage. The Cloud
provider plans various green offers and pricing schemes for providing incentive to users to use their services
during off-peak or maximum energy-efficiency hours. [7]
(Source: www.google.com)[1]

International Journal of Advance and Innovative Research Volume 6, Issue 1 (XXIV): January - March, 2019
435
ISSN 2394 - 7780
GREEN CLOUD ARCHITECTURE
Motivation: To explore the possibilities and various methods such as using Green Cloud Computing to reduce
the carbon footprint.
Objectives
i) To study theory and practices of Green Cloud Computing
ii) Reducing carbon footprint using cloud computing.
iii) Approaches of the Green Cloud Computing.
iv) To study the effectiveness of Green Cloud Computing.
Hypothesis
Carbon footprint can be reduced effectively using the cloud computing technology.
RESEARCH METHODOLOGY
i) Research Papers
ii) Magazines
iii) Websites
iv) Books
According to Webster and Watson [4], reviewing the literature is important for creating a reliable foundation for
advancing knowledge. In order to obtain a sense of the current state of green cloud computing studies, we
surveyed both the academic literature and non-academic studies. In the former case, we put information from
conference papers, journal papers, technical reports, and some authors research and books from the Association
for Computing Machinery (ACM) Digital Library, IEEE Computer Science, Scopus, and Science Direct. These
databases allow access to leading computer science journals and high-quality peer-reviewed computer science
conference publications [5].
LITERATURE SURVEY
Liang Hu and Jia Zhao , Gaochao Xu in their research work “A survey on green computing based on cloud
environment” introduced some cloud computing technologies aimed at energy efficiency without computing the
performance the objectives. They said that energy efficiency would also load to better environmental
sustainability. According to them cloud computing and virtualization provide energy efficient and environment
sustainable green computing. In their work they highlighted that idle power wastage is one of the measure
cause of energy inefficiency with the server running at a low utilization data centers equipped with high
performance infrastructure where much energy and increase co2 emission and contribute to carbon footprint.
The Green Cloud Computing is reducing energy consumption while ensuring the acceptable performance level.
They concluded that some techniques on hardware systems and solutions on software framework can lead
towards energy efficiency and Green Computing.
They discussed current state of energy efficiency in computer system and reviewed some existing approaches
such as Dynamic voltage frequency scaling(DVFS), Dynamic Component deactivation, Advanced Configure
and Power Interface (ACPI), Self-aware runtime adaptation, Heterogeneous server clustering, Power and
Migration cost aware application placement in Virtualized Systems, pMapper architecture that minimizes
energy consumption optimal power allocation in server forms and energy aware consolidator for cloud
computing.
Chowdhury, Chatterjee etal., in their research work, “A comprehensive study on Cloud Green Computing: To
reduce carbon footprints using clouds” appreciate that the future trends of ICT will be more towards cloud
computing and Green Computing. They analyzed energy consumption of cloud computing by studying the
clouds of different organizations and observing the energy benefits they derive.
They study different ways to decrease energy consumption of cloud computing and thereby helping to reduce
the carbon footprint. In their work they pointed out techniques such as resource virtualization.
The authors concluded that cloud computing is how developing fast and efficient Hardware, Software and
Server provisioning make the cloud most energy efficient platform for computing.
Singhal M, Dhurkari A, Iha M have discussed about the optimization of energy use and reduction of carbon
footprint in their paper “Comparative Study on Cloud Computing in carbon cost and Energy Consumption”.
They disagree many energy efficient solutions.

International Journal of Advance and Innovative Research Volume 6, Issue 1 (XXIV): January - March, 2019
436
ISSN 2394 - 7780
Laura- Diana Radu concluded a Literature survey in their paper “Green Cloud Computing: A Literature
Survey”. In this survey they reviewed the main achievements of Green Cloud Computing, first they provided
on overview on cloud computing, then they summarized recent studies and development and finally they
presented future research direction and open problems in Green Cloud Computing.
The authors have shown the studied by the different researches in the followings table
Comparison of Various cloud data centers in 2012 and 2016 [ 8]
Data Centers G PUEx GPUE %ENERGY
Google, Lenoir 1.63 1.21 1.97 50.5% Coal, 38.7
% Nuclear
Google , Dallas 1.490 1.2 1.79 34% Coal, 3.3%
Nuclear
Apple, North Carolina
1.630
1.5
2.44 50.5% Coal, 38.7%
Nuclear
Green Qloud, Iceland
1.021
1.1 1.12 70% Hydro, 30%
Geo
Microsoft, Chicago
1.819
1.22
2.22 72.8% Coal, 22.3%
Nuclear
Microsoft, San Antonio 1.936
132 2.32 37.1% Coal
Yahoo, Lockport
1.497
1.16 1.74 21.0% Coal, 27.0%
Nuclear
Yahoo, La Vista
1.834
1.5
2.75
73.5% Coal, 14.6%
Nuclear
The PUE(Power usage effectiveness) is the ratio of total amount of power used by a computer data centers.
The PUE is defined as
PUE = Total Facility power / IT Equipment power
The Green Power usage effectiveness (GPUE) mathematically defined as
GPUE = G * PUEx
G can be defined as
G= ∑ (% Energy Source *(1+Weight))
In the above table that PUEx is not a good enough metric because Microsoft datacenters have low value of
PUEx and GPUE is much higher than Google or Green Qloud Iceland data centers. Due to the fact that
Microsoft data centers rely more on electricity generated by coal than other non-renewable sources.
Thus, GPUE has been established as a very good metric for measuring the greenness of data centers.
DISCUSSION AND ANALYSIS
Interest in studying the influence of cloud computing on environments is on the rise due to the report published
by Gartner [3], which estimated that the global ICT industry accounted for approximately 2% of global CO2.
We identified five categories of green cloud computing studies: models and methods, architectures,
frameworks, algorithms, and general issues. These studies analyse and propose solutions for the following
environmental issues: improving energy efficiency, efficient management of data center resources (hardware
and software), reducing operational costs, and reducing carbon emissions. Some authors present their proposals
and solutions for two or more environmental issues and some studies could fall into two of the categories
mentioned above, e.g., frameworks and algorithms, models and/or methods and architectures or models and/or
methods and algorithms.
Efficient resource management will improve cloud computing performance by reducing energy consumption, e-
waste, and costs. In green cloud computing, resource management means using heterogeneous and
geographically distributed resources to meet clients’ requests with the minimum negative effect on the
environment. Fortunately, some factors which benefit cloud computing providers also bring benefits for the
environment. For example, reducing energy consumption will cut providers’ costs, but will also result in
reduced CO2 emissions.

International Journal of Advance and Innovative Research Volume 6, Issue 1 (XXIV): January - March, 2019
437
ISSN 2394 - 7780
CONCLUSION AND FUTURE WORK
Cloud computing can effectively reduce carbon footprint. The primary limitation of this research is that
researcher have taken data from secondary sources and limited research paper to study survey.
Future work more number of research papers of different researcher available in the field of study can be done.
Primary data can be collected through survey interviews, Questionnaires, on site visit and experiment can be
used to conduct empirical study.
REFERENCES
1. www.google.com
2. Kumar, S., & Buyya, R. (2012). Green Cloud Computing and Environmental Sustainability. Harnessing
Green It,315-339. doi:10.1002/9781118305393.ch16
3. Mingy, S. Green IT: The New Industry Shock Wave. 2007. Available online: http://www.ictliteracy.info/rf.
pdf/Gartner_on_Green_IT.pdf (accessed on 18 July 2017).
4. Webster, J.; Watson, R.T. Analyzing the past to prepare for the future: Writing a literature review. Manag.
Inf. Syst. Q. 2002, 26, xiii–xxiii.
5. El-Gazzar, R.F. A Literature Review on Cloud Computing Adoption Issues in Enterprises. In Creating Value
for All Through IT, Proceedings of the International Working Conference on Transfer and Diffusion of IT,
2–4 June 2014, Aalborg, Denmark; Bergvall-Kåreborn, B., Nielsen, P.A., Eds.; Springer: Berlin, Germany,
2014; pp. 214–242. [CrossRef]
6. De, D. (2016). Mobile cloud computing: Architectures, algorithms and applications. Boca Raton: CRC
Press/Taylor & Francis Group, a CRC title, part of the Taylor & Francis CRC Press is an imprint, of the
Taylor & Francis Group, an informa business, A Chapman & Hall Book.
7. Dahiyasachin007. (n.d.). In cloud computing the word cloud also phrased as the cloud is used as a. Retrieved
from https://www.coursehero.com/file/p7n4dea/In-cloud-computing-the-word-cloud-also-phrased-as-the-
cloud-is-used-as-a/
8. Chiranjeeb Roy Chowdhury1 , Arindam Chatterjee2 , Alap Sardar3 , Shalabh Agarwal4 , Asoke Nath5;
International Journal of Advanced Computer Research (ISSN (print): 2249-7277 ISSN (online): 2277-7970)
Volume-3 Number-1 Issue-8 March-2013

International Journal of Advance and Innovative Research Volume 6, Issue 1 (XXIV): January - March, 2019
438
ISSN 2394 - 7780
A STUDY ON CUSTOMER KNOWLEDGE AND EAGERNESS TO ACQUIRE KNOWLEDGE VIZ
HEALTH BENEFITS OF HEALTH SUPPLEMENTS
Ankita Tekwani1 and Dr. Ritu Bhattacharyya2
Student1 and Mentor2, Sasmira’s Institute of Commerce and Science, Mumbai
ABSTRACT
People are getting unhealthy faster than before the reason is the lifestyle, stress and the type of food available
and consumed. This is a vicious cycle and because people are too busy to eat in time and even if they are
careful the food available today is mass produced and therefore does not have the necessary nutrients. In order
to bridge the gap of the need for nutrition and availability health supplements have become very popular. The
study aims to find out if people are aware of health supplements and their benefits and do they find out the
benefits before consuming them
Keywords: Health, Fitness, Health supplements
INTRODUCTION
“What you find at the end of your fork is more powerful than anything you find at the bottom of the pill bottle”-
Dr Mark Hyman
Or as Hippocrates said- “Let your food be your medicine”
The World Health Organization (WHO) defines Health as “a state of complete physical, mental and social well-
being and not merely the absence of disease or infirmity”. It is the ability to adapt and manage the physical and
mental changes. Human health is dependent on various factors such as genetics, lifestyle, environment, personal
health practices etc. Human well-being and happiness is dependent on health. A healthy person is more
productive. Staying healthy has a lifelong effect. One can maintain their health through healthy eating, physical
activities and stress management.Nowadays lifestyle is more stressful. People have a disproportionate diet
pattern which causes possible health issues. Also, among teenagers there is a myth of developing better
physique or an ideal body hence consumption of dietary supplements has become common amongst everyone.
Health supplements
Health supplements are consumed to complement the diet in the form of capsule, pills, tablets or liquid. It can
provide required nutrients which are either extracted from various food sources or synthetically. Vitamins,
minerals, fiber, fatty acids, amino acids, proteins form a part of nutrient compounds. Multivitamins and dietary
supplements are consumed most commonly.
Uses of Health supplements
Supplements may have a value for those who fail to consume a balanced diet. Intake of supplements is
recommended if nutritional deficiency is detected. Most of the time the adolescents don’t take the supplements
under proper guidance or don’t research about the product well. This may lead to various negative side effects.
Consumers mostly don’t consult a nutritionist or a doctor before consuming supplements, they usually follow
their peers, family members or advertisements. Based on the issues mentioned above, the objective of the study
is to find out about the Study on Customer knowledge and eagerness to acquire knowledge viz health benefits of
health supplements.
RESEARCH QUESTIONS
1. Do customers pay attention to health benefits?
2. What are the ways health supplements can be a part of healthy diet?
3. Why is it essential for the consumer to acquire knowledge about benefits of health supplements?
RESEARCH OBJECTIVES
1. To study customer’s level of attention for benefits of health supplements.
2. To analyse the different ways of including health supplements as a part of health diet.
3. To study the importance of knowledge about the benefits of health supplements to the customers.
HYPOTHESIS
H01 - Consumer’s level of awareness is not significantly high for the benefits of health supplements
HA1 - Consumer’s level of awareness is significantly high for the benefits of health supplements.

International Journal of Advance and Innovative Research Volume 6, Issue 1 (XXIV): January - March, 2019
439
ISSN 2394 - 7780
H02 – Health supplement may not significantly bridge the deficit in nutrition left by regular food.
HA2 - Health supplement may significantly bridge the deficit in nutrition left by regular food.
H03 – There is no or little attention paid by consumers on the benefits of health supplements.
HA3 - There is a little attention paid by consumers on the benefits of health supplements.
LITERATURE REVIEW
Snehal Chincholkar March 2016 - Nutraceutical industry in India is growing rapidly. Change in lifestyle pattern
is boosting this industry. Multivitamins, protein bars, etc are some basic types of supplements. Demographic
factors and awareness about nutrition also affect the consumption of supplements.
Shereen Lehman January 2019 - Health supplements are safe as long as the instructions are followed, otherwise
it may have adverse effects. Overdose can lead to major harm. When your diet is lacking certain nutrients,
health supplements can provide them. A supplement is not required unless a deficiency is detected.
Bethany Hope Brown - Usually a good portion of college students engage in health supplements. They are
influenced by the information received from their family or friends. Very few of them actually consult a
dietician or a nutritionist before consuming any health supplement.
Caroline Yu March 2011 - One should maintain a quality diet rather than taking any supplements. Majority of
teenagers consume supplements such as dietary supplements or protein supplements to gain an ideal body or in
order to maintain the nutrition. Adults and adolescents with poor nutrition level have a high consumption of
supplements. Men tend to consume protein while women most likely consume multiovitamins.
ANALYSIS
Age vs Gender
Gender
Total Female Male
Age 18-25 14 20 34
26-35 2 3 5
Total 16 23 39
Source: Primary Data
There are 20 males in the age group 18-25 and 3 males in the age group 26-35;
14 females in the age group 18-25 and 2 females in the age group 26-35 in the above sample who have been
studied for the purpose of knowing their knowledge on health supplements
Health issues due to hectic schedules
Frequency Percent
Valid Yes 15 38.5
No 24 61.5
Total 39 100.0
Source: Primary Data
From the sample studied it has been found that 38.5% people suffer from health issues due to their hectic
schedules and stress associated with day to day life.
Do Anything to keep yourself fit
Frequency Percent
Valid Yes 30 76.9
No 9 23.1
Total 39 100.0
Source: Primary Data
From the sample studied it has been found that 76.9% people perform various activities to keep themselves fit.
They are aware of the benefits to stay fit.

International Journal of Advance and Innovative Research Volume 6, Issue 1 (XXIV): January - March, 2019
440
ISSN 2394 - 7780
Been recommended any health supplement * Tried any supplements Crosstabulation
Count
Tried any supplements
Total Yes No
Been recommended any
health supplement
Yes 13 3 16
No 5 18 23
Total 18 21 39
Source: Primary Data
From the sample studied 39 people 18 have tried consuming health supplements out of which 13 were
recommended to take supplements and 5 were not. This shows that people do consume supplements without
recommendations which could be dangerous
Out of the rest 21 people which have not tried any supplement 3 were recommended and 18 were not. This
shows that inspite of recommendation some people don’t take any supplements which can have adverse effects
on their health.
Symmetric Measures
Value Asymp. Std. Errora Approx. Tb Approx. Sig.
Interval by Interval Pearson's R .587 .129 4.412 .000c
Ordinal by Ordinal Spearman Correlation .587 .129 4.412 .000c
N of Valid Cases 39
a. Not assuming the null hypothesis.
b. Using the asymptotic standard error assuming the null hypothesis.
c. Based on normal approximation.
Source: Primary Data
Reason for taking supplement
Frequency Percent
Valid Medical deficiency 3 7.7
Inadequate diet 4 10.3
Support immune system 4 10.3
To provide energy 10 25.6
To increase strength/power 8 20.5
Total 29 74.4
Missing System 10 25.6
Total 39 100.0
Source: Primary Data
7.7% people take supplements due to medical deficiency.
10.3% people take supplements due to inadequate diet and to support their immune system.
25.6% people take supplements for energy.
20.5% people take supplements to increase strength/power.
Read the instructions on label before consuming
Frequency Percent
Valid Yes 18 46.2
No 7 17.9
Total 25 64.1
Missing System 14 35.9
Total 39 100.0
Source: Primary Data
From the sample studied we come to know that 46.2% people do check the instructions on the label before
consuming the health supplements while 17.9% people don’t. This shows the awareness of people regarding the
consumption of supplements. Labels provide information about the contents present in the supplements which
when ignored can have harmful effects.

International Journal of Advance and Innovative Research Volume 6, Issue 1 (XXIV): January - March, 2019
441
ISSN 2394 - 7780
Decision on whether a supplement is safe to use
Frequency Percent
Valid Check the label 6 15.4
Consult a doctor 19 48.7
Own research about the product 10 25.6
Total 35 89.7
Missing System 4 10.3
Total 39 100.0
Source: Primary Data
15.4% people check the label to decide whether a supplement is safe to use.
48.7% people consult a doctor regarding the safety of the supplements.
25.6% people conduct their own research to check on the safety of health supplements.
CONCLUSION
Large number of people are aware of importance of staying fit as they perform various activities to maintain
their fitness.
A number of people use health supplements in order to maintain the nutrition which they miss through their
normal diet or to boost their strength and power
Awareness on using the supplements is not present in everyone. There are very few people who use the
supplements recommended by doctors or research well about the product before using it
People are not too careful when it comes to reading the labels of the supplements which can have negative side
effects on them in future. They must be check the label to get the information about the components present
inside so they know what they are consuming.

International Journal of Advance and Innovative Research Volume 6, Issue 1 (XXIV): January - March, 2019
442
ISSN 2394 - 7780
INFRASTRUCTURE STRUCTURE DEVELOPMENT AND ITS EFFECT ON SMALL BUSINESS IN
THE AREA, A STUDY BASED IN MUMBAI
Harshita Bhargava1 and Dr. Ritu Bhattacharya2
Student1 and Mentor2, Sasmira’s Institute of Commerce ans Science, Mumbai
ABSTRACT
Mumbai is one of the fast growing metropolitan regions in India. With infrastructure growth at its peak, the city
faces its negative impacts during the process. Congestions, delays and diversion are some of the hurdles that
the citizens of Mumbai face on a daily basis due to the metro construction. This results in an immense impact on
the small business.
Keywords: Metro construction, immense impact, small business, hurdles
INTRODUCTION
In many developing countries like India, infrastructure has been experiencing continued growth and change.
Enabling change is complex and has its ramifications which need optimization and balance for promoting
sustainable growth. In order to facilitate rapid change and development, high quality infrastructure for
transportation is required. It guarantees effective mobility of goods and people. The proposed objective seeks to
achieve these goals, there are many challenges that slow it down, the most significant being the issues faced by
people during the development of the infrastructure and the losses that occur due to this development..
The development of infrastructure that is taking place in the city of Mumbai, has its own challenges. One of the
largest project today in Mumbai is the Metro construction. This project aims to make commuting for people of
Mumbai hassle free.
There are several problems that have made this project a bone for many.The biggest problem being that a lot of
major roads are dug up which leads to problems like traffic jams and very high levels of pollution. The
construction itself has created hassles of noise and dust pollution. Mumbai due to its geographical setup cannot
have several ring roads like Delhi thus the congestion on the roads cannot be managed. Added to this is the
delay of metro construction.
When we look at the transport planning and decision making strategies of cities of developing countries most of
the times, planning decisions are made based on pure speculation and it is hard to explain how decisions are
made that affect the road network plan. Due to this fact cities grow in uncontrolled manner and evolve into
more and more inefficient transport networks. It is clear that these cities need a strategic plan that deals with the
overall structural and capacity of the road network and with the transport land use interaction in urban areas
METHODOLOGY
Research problem
Various challenges faced by small businesses in Mumbai in the process of Metro construction.
Objectives
1. To find out the sales of small businesses due to metro construction
2. To determine the effect on working class due to metro construction
3. To identify potential travel demand and current network.
4. To find out the rate in productivity with increase in time consumption on travelling
Sample selection
Area
1. Shiv sena Bhavan to Portuguese church
2. Mahim ( stmichel church)
3. Mumbai central
4. Grant road(w)till Girgaon
Hypothesis
H01Development of Metro may not affect thehealth(noise and pollution) on people
HA1 Development of Metro may affect the health(noise and pollution) on people

International Journal of Advance and Innovative Research Volume 6, Issue 1 (XXIV): January - March, 2019
443
ISSN 2394 - 7780
H02Time spent in travelling may not increase due to Metro construction
HA2 Time spent in travelling may increase due to Metro construction
H03Metro construction might not affect the levels of pollution
HA3 Metro construction might affect the levels of pollution
ANALYSIS
Age v/s Gender
Gender
Total male Female
Age 18-20 3 0 3
21-30 9 1 10
31-40 18 1 19
41-50 14 1 15
51-60 6 1 7
<60 9 4 13
Total 59 8 67
Source: Primary Data
The sample consists of 59 males and 8 females out of the sample of 67 business individuals, where in the age
group 18-20 are 3 males and nil females. Between ,21-30 there are 9 males and 1 female. 31-40 are 18 males
and 1 female, 41-50 are 14 males and 1 female, 51-60 are 6 males and 1 female, above the age of 60 there are 9
males and 4 females.
People running small businesses travelling to work
Frequency Percent
Valid Yes 36 53.7
no 31 46.3
Total 67 100.0
Source: Primary Data
53.7% people travel to work and remaining 46.3% live nearby in the locality and do not travel to work.
Mode of transport used by people to commute
Frequency Percent
Valid Personal vehicle 12 17.9
cabs 1 1.5
bus 6 9.0
Trains 17 25.4
walking 31 46.3
Total 67 100.0
Source: Primary Data
From the above sample selected those who travel to work have used the below mentioned mode
17.9% of people use their personal vehicle to travel to work, 25.4% travel by trains ,46.3% walk to their work
place.
Traffic situations worsen in the area
Frequency Percent
Valid Mornings(8:00-11:59) 19 28.4
Afternoon(12:00-4:59) 4 6.0
Evenings(5:00-8:00) 29 43.3
Night(8:01-12:00) 2 3.0
No effect 13 19.4
Total 67 100.0
Source: Primary Data
A majority of people who stay around the project and travel to work feel that traffic has worsen

International Journal of Advance and Innovative Research Volume 6, Issue 1 (XXIV): January - March, 2019
444
ISSN 2394 - 7780
28.4% face traffic snarls in the morning, 43.3% face traffic congesion in the evenings,19.4% people do not
have any effect since the entire road is occupied for metro construction.
Pollutions affected the people running small businesses
Frequency Percent
Valid Highly affected 40 59.7
affected 20 29.9
Neutral; 5 7.5
disaffected 2 3.0
Total 67 100.0
Source: Primary Data
People have been affected with the increase in pollution due to the metro construction in their locality. 59.7%
are highly affected with the levels of pollutions ,29.9% are affected with the levels of pollutions.
Noise pollution increased in the area
Frequency Percent
Valid Highly increased 36 53.7
Increased 25 37.3
Neutral 3 4.5
No effect 3 4.5
Total 67 100.0
Source: Primary Data
Because of Metro construction happening in the business locality, a majority of people have been affected by
noise pollution. 53.7% have face a high increase in the levels of noise pollution, 37.3%people have face
increased in the levels of noise.
Other polluting factors than noise
Frequency Percent
Valid Air pollution 15 22.4
Dust pollution 48 71.6
Water pollution 2 3.0
No effect 2 3.0
Total 67 100.0
Source: Primary Data
Other than noise pollution , small businesses have been affected by Air and dust pollution in their locality
because of the Metro Project coming up. 22.4% people are facing problems because of air pollution, 71.6%
people are suffering from dust pollution.
Does Infrastructure growth helps business grow
Frequency Percent
Valid yes 46 68.7
no 21 31.3
Total 67 100.0
Source: Primary Data
From the above sample: 68.7%people agree that infrastructure growth helps business grow
31.3% people disagree that infrastructure growth helps business grow
Are Customers facing difficulty in reaching the business
Frequency Percent
Valid yes 64 95.5
no 3 4.5
Total 67 100.0
Source: Primary Data

International Journal of Advance and Innovative Research Volume 6, Issue 1 (XXIV): January - March, 2019
445
ISSN 2394 - 7780
95.5% businesses have faced issues in customers reaching them
4.5% business have not faced issues in customers reaching them
Change in Income due to metro construction in the locality
Frequency Percent
Valid yes 57 85.1
no 10 14.9
Total 67 100.0
Source: Primary Data
From the above sample, small businesses income has been changed with the metro construction coming up in
their locality. 85.1% peoples income have been affected due to Metro construction. 14.9% peoples income have
not been affected due to Metro construction
LITERATURE REVIEW
Feasibility Study Of Metro Transport: byS.M.SubashK.Chandrabose--U.Umamaheshwari--T.Maharajan . The
growing demand for public transport in cities has serious effects on urban ecosystems,especially due to the
increased atmospheric pollution and changes in land use patterns. An ecologically sustainable urban transport
system could be obtained by an appropriate mix of alternative modes of transport resulting in the use of
environmentally friendly fuels and land use patterns. Transport, because of its pervasive nature, occupies a
central position in the fabric of modern urbanized society. (2013)
Impact of Metro Rail Construction Work Zone on Traffic Environment Ravi Bhutania ,Dr.Sewa Rama,
Dr.Kayitha Ravinder . Long term work zones on urban roads lead to many problems such as reduction in
capacity , increase the travel time delays, queue length, fuel consumption, number of forced merges, and
roadway accidents which lead to unaccounted economic losses.(2014)
Metro Rails in Indian Cities--Rahul Goel—GeetamTiwari . The main negative externalities include: injuries
during construction, the displacement of households due to land requirements for the construction of the Delhi
Metro, as well as the related emissions and impact on the environment during the construction, operation,
maintenance of metro operations and production of the attributed electricity. (2014)
As Metro work progresses in Mumbai, businesses take a hit--Benita Chacko,Sailee Dhayalkar . Mumbai is
witnessing wide-ranging impact of the unprecedented digging and construction activity on everyday lives, from
pollution to real estate markets. a two-part It has been that seen at least a 10 per cent dip in sales since the
construction.Not only has the barricade reduced the width of the footpath by more than half, it has also created a
dead end at shops. Customers do not want to walk through the whole mess to access the shop. (2018)
Mumbai Metro work hits vendors hard-UrvashiValecha . Barricades in green and blue cover the front of shops
along the roads in Mumbai. The construction of Metro Line 3 which will connect Colaba-Bandra – Seepz has
left one side of the moderately wide lane blocked, not only congesting the road but also hampering local
businesses.A small crowd of vendors discuss their problems while struggling to make themselves audible
against the loud drilling noise coming from the site Many vendors have been forced to move out. My business
volume has come down by half. With metro barricades masking an array of shops complain about the lack of
visibility of their shops.
CONCLUSION
The study clearly shows that infrastructural projects inconvenience the small businessmen of the area because of
the large scale disruptions in the area. They also lead to a lot of problems in traveling due to the breakdown of
the existing roads and diversions created. In a city like Mumbai where traffic jams are a big problem projects
like the metro construction has added to the situation and make the life of commuters very tough. In spite of all
the hardships faced by the people of Mumbai they are optimistic that when the metro services start it will
benefit them and therefore they are ready to undergo the difficulties that they face in the mean time.

MANUSCRIPT SUBMISSION
GUIDELINES FOR CONTRIBUTORS 1. Manuscripts should be submitted preferably through email and the research article / paper
should preferably not exceed 8 – 10 pages in all.
2. Book review must contain the name of the author and the book reviewed, the place of publication and publisher, date of publication, number of pages and price.
3. Manuscripts should be typed in 12 font-size, Times New Roman, single spaced with 1” margin on a standard A4 size paper. Manuscripts should be organized in the following order: title, name(s) of author(s) and his/her (their) complete affiliation(s) including zip code(s), Abstract (not exceeding 350 words), Introduction, Main body of paper, Conclusion and References.
4. The title of the paper should be in capital letters, bold, size 16” and centered at the top of the first page. The author(s) and affiliations(s) should be centered, bold, size 14” and single-spaced, beginning from the second line below the title.
First Author Name1, Second Author Name2, Third Author Name3 1Author Designation, Department, Organization, City, email id 2Author Designation, Department, Organization, City, email id 3Author Designation, Department, Organization, City, email id
5. The abstract should summarize the context, content and conclusions of the paper in less than 350 words in 12 points italic Times New Roman. The abstract should have about five key words in alphabetical order separated by comma of 12 points italic Times New Roman.
6. Figures and tables should be centered, separately numbered, self explained. Please note that table titles must be above the table and sources of data should be mentioned below the table. The authors should ensure that tables and figures are referred to from the main text.
EXAMPLES OF REFERENCES All references must be arranged first alphabetically and then it may be further sorted chronologically also.
Single author journal article: Fox, S. (1984). Empowerment as a catalyst for change: an example for the food industry. Supply Chain Management, 2(3), 29–33.
Bateson, C. D.,(2006), ‘Doing Business after the Fall: The Virtue of Moral Hypocrisy’, Journal of Business Ethics, 66: 321 – 335
Multiple author journal article: Khan, M. R., Islam, A. F. M. M., & Das, D. (1886). A Factor Analytic Study on the Validity of a Union Commitment Scale. Journal of Applied Psychology, 12(1), 129-136.
Liu, W.B, Wongcha A, & Peng, K.C. (2012), “Adopting Super-Efficiency And Tobit Model On Analyzing the Efficiency of Teacher’s Colleges In Thailand”, International Journal on New Trends In Education and Their Implications, Vol.3.3, 108 – 114.

Text Book: Simchi-Levi, D., Kaminsky, P., & Simchi-Levi, E. (2007). Designing and Managing the Supply Chain: Concepts, Strategies and Case Studies (3rd ed.). New York: McGraw-Hill.
S. Neelamegham," Marketing in India, Cases and Reading, Vikas Publishing House Pvt. Ltd, III Edition, 2000.
Edited book having one editor: Raine, A. (Ed.). (2006). Crime and schizophrenia: Causes and cures. New York: Nova Science.
Edited book having more than one editor: Greenspan, E. L., & Rosenberg, M. (Eds.). (2009). Martin’s annual criminal code:Student edition 2010. Aurora, ON: Canada Law Book.
Chapter in edited book having one editor: Bessley, M., & Wilson, P. (1984). Public policy and small firms in Britain. In Levicki, C. (Ed.), Small Business Theory and Policy (pp. 111–126). London: Croom Helm.
Chapter in edited book having more than one editor: Young, M. E., & Wasserman, E. A. (2005). Theories of learning. In K. Lamberts, & R. L. Goldstone (Eds.), Handbook of cognition (pp. 161-182). Thousand Oaks, CA: Sage.
Electronic sources should include the URL of the website at which they may be found, as shown:
Sillick, T. J., & Schutte, N. S. (2006). Emotional intelligence and self-esteem mediate between perceived early parental love and adult happiness. E-Journal of Applied Psychology, 2(2), 38-48. Retrieved from http://ojs.lib.swin.edu.au/index.php/ejap
Unpublished dissertation/ paper: Uddin, K. (2000). A Study of Corporate Governance in a Developing Country: A Case of Bangladesh (Unpublished Dissertation). Lingnan University, Hong Kong.
Article in newspaper: Yunus, M. (2005, March 23). Micro Credit and Poverty Alleviation in Bangladesh. The Bangladesh Observer, p. 9.
Article in magazine: Holloway, M. (2005, August 6). When extinct isn't. Scientific American, 293, 22-23.
Website of any institution: Central Bank of India (2005). Income Recognition Norms Definition of NPA. Retrieved August 10, 2005, from http://www.centralbankofindia.co.in/ home/index1.htm, viewed on 7. The submission implies that the work has not been published earlier elsewhere and is not
under consideration to be published anywhere else if selected for publication in the journal of Indian Academicians and Researchers Association.
8. Decision of the Editorial Board regarding selection/rejection of the articles will be final.