January - July 2017 Vol.8 Issue 1 ISSN 0975-3532 - PSG ...
57
& Indexed in Google Scholar, Open Access, Academic Keys, SJIF*, Scientific Indexing Services, GIF*, Directory of Research Journal Indexing, Index Copernicus International, Indian Citationindex Research bible, January - July 2017 Vol.8 Issue 1 ISSN 0975-3532
-
Upload
khangminh22 -
Category
Documents
-
view
3 -
download
0
Transcript of January - July 2017 Vol.8 Issue 1 ISSN 0975-3532 - PSG ...

January - June 2017Vol.8 Issue 1
&
http://www.oajournals.com
Indexed in Google Scholar, Open Access, Academic Keys, SJIF*, Scientific Indexing Services,
GIF*, Directory of Research Journal Indexing, Index Copernicus International, Indian Citationindex
Research bible,REVIEW ARTICLE
Retrospective Review on Hyperhidrosis: Etiopathology and Its Treatment 01
Vignesh Balaji.E, *A.Tamil Selvan, K.Ragavan
Clinical Review on Anemia: Prevention and Management in Community Care Practice 07
M. S. Umashankar*, K.S.Lakshmi, V.Sankar, A.Bharath kumar, A.Porselvi
RESEARCH ARTICLE
A Correlative Study of Lipid Profile in Diabetic Dyslipidemic Patients with Hyperuricemia 18
Amala Thaha*, Anil Babu A, Deepthi S, Manjusha K, Nayana Thankachan, Shafeeq Mattummal
Formulation and Evaluation of Bi-Layer Tablet Containing Nimesulide with Calcium For 23Rheumatoid Arthritis
Saravanan S and Saba Maanvizhi*
Synthesis and Characterization of New Benzotriazole Derivatives for Possible CNS Activity 31
P. Swarnalatha, G.Sridhar Babu, L.Srikanth*, P. S. Malathy, B.Srinivas, J. Venkateshwar Rao
Isolation, Screening and Characterization of Antibiotic-Producing Actinomycetes from 37Rhizosphere Region of Different Plants from a Farm of Sungai Ramal Luar, Malaysia
Ng Zoe Yi and Amsaveni Selvaraj*
Instructions to Authors 47
Indexed in Google Scholar, Open Access, Academic Keys, SJIF*, Scientific Indexing Services, Research bible, GIF*,
Directory of Research Journal Indexing, Index Copernicus International, Indian Citationindex
January - July 2017Vol.8 Issue 1 ISSN 0975-3532

CHIEF EDITOR
Sri. L. GopalakrishnanManaging trusteePSG & Sons’ CharitiesCoimbatore, Tamilnadu, India.
Principal cum Professor of PharmacologyDr. M. Ramanathan
PSG College of Pharmacy
EDITOR
ASSOCIATE EDITOR
Dr. Khadar BhatchaProf. of Pharmacognosy
Mrs. P. RamaAsst. Prof. Dept of Pharmacy Practice
PATRON
PUBLICATION COMMITTEE
Dr. Sivaram HariharanProf. Pharmaceutical Chemistry
1. Dr. K. Umaa Prof. Pharmaceutical Chemistry
2. Dr. G. SyamalaAsso. Prof, Dept of Pharmacognosy
REVIEW COMMITTEE
3. Dr. K.Y. KavithaAsso. Prof, Dept of Pharmaceutical Analysis
4. Dr. S.M. Habibur RahmanAsso. Prof, Dept of Pharmaceutics
5. Dr. S. SubramanianAsso. Prof, Dept of Pharmaceutics
6. Mrs. AndhuvanAsso. Prof, Dept of Pharmacy Practice
7. Dr. Prudence A RodriguesAsso. Prof, Dept of Pharmacy Practice
8. Dr. V. SivakumarAsst. Prof, Dept of Pharmacy Practice
Dr. V. SankarVice Principal cum Prof. of Pharmaceutics
Mr. G. VenkateshAsst. Prof. Dept of Pharmacology
Dr. A. NagarajanProf. of PharmacognosyDept
9. Mr. S. KarthikeyanAsst. Prof, Dept of Pharmaceutics
SI.No.
Name Institution PlaceSI.No.
Name Institution Place
1. Dr. N. Udupa Manipal College of Manipal
Pharmaceutical Sci.
2. Dr. R. Manavalan Annamalai University Chidambaram
3. Dr. K. Kannan Annamalai University
4. Dr. K.P. Mohankumar IICB Kolkata
5. Dr. R Padma Sahasra Institute of Warangal
Pharmaceuticals
6. Dr. Tuhinadri sen Jadavpur Kolkata
7. Dr. Narayana Charyulu NGSM Institute of Manglore
Pharmaceutical science
8. Dr. Molly Matthew Malik Deenar College of Kasaragod.
Pharmacy
9. Dr. Sreenivas Reddy Manipal College of Manipal
Pharmacy
10. Dr. K. Gowthamarajan JSS College of Pharmacy Ooty
11. Dr. Joyamma Vargees Trivandrum Medical college Trivandrum.
12. Dr. A. Abdul Hassan Madurai medical College Madurai
13. Prof. A.J. Chacko MG University Kottayam
14. Dr. C Vijaya Ultra College of Pharmacy Madurai
15. Dr. A.Rajasekaran KMCH College of Pharmacy Coimbatore
16. Dr. N Nagaraj Sri Padmavathi Mahila Tirupathi
visva Vidyalaya
17. Dr. K. Ruckmani Anna University Tiruchy
18. Dr. S. Mohan Karpagam Coimbatore
College of Pharmacy
19. Prof. K.S. Lakshmi SRM University Chennai
20. Dr. H.G. Shivakumar JSS College of Pharmacy Mysore
21. Dr. T.K. Ravi College of Pharmacy
SRIPMS Coimbatore
Chidambaram
Mrs. R. NithyaAsst. Prof. Dept of Pharmaceutics
SJIF*, Scopus*, GIF* - Under evaluation
(An ISO 9001:2008 Certified Institution)
Accredited with 'B' Grade by NAAC (1st Cycle)
Coimbatore - 641 004. Tamilnadu, India
1. Dr. Imran Amad JINA, Pharmaceutical Inc USA .
Illinois
2. Dr. Paul Heng National University of Singapore
Singapore
3. Dr. Ibrahim A Alsarra King Saudi University Saudi Arabia
4. Dr. Sanjay Sehgal Aexelar Regulatory USA
Experts
5. Prof. Oluwatoyin. A University of Ibadan Nigeria.
Adeku
6. Dr. AJM Christeena Taylors University Malaysia
7. Dr. Jay Ramapuram AUBURN University Auburn
8. Dr. Sathis V Kamath New Product USA.
development
9. Dr. B. Raj kapoor Sebha University Libya
10. Dr. Syed AzharSyed Penang Malaysia.
Sulaiman
11. Dr. Arun Shirwaikar Gulf Pharmacy College Ajman, UAE

1
International Journal of Pharma Research - Volume 8 : 1 January - June 2017
REVIEW ARTICLE
Retrospective Review on Hyperhidrosis: Etiopathology and its Treatment
¹Vignesh Balaji.E, *A.Tamil SelvanDepartment of Pharmacology
PSG College of Pharmacy, Peelamedu, Coimbatore- 641004.
*Corresponding Author: [email protected]
Received Date: 19.05.2017 Accepted Date: 30.06.2017
ISSN 0975-3532
INTRODUCTIONSweating is necessary to control body temperature during times of exercise and in warm/hot surrounding, and is a normal response to a arise in temperature or anxiety. Sweating is regulated by the sympathetic nervous system1. In about 1% o the population, this system is revved-up and works at a very high level, causing sweating to occur at inappropriate times, far in excess of the amount necessary to maintain normal body temperature. It can occur in many different areas of the body, and condition is known as hyperhidrosis, which means ‘excessive sweating’. It affects both the sexes equally and all races2.
ABSTRACT
Hyperhidrosis or excessive sweating is a common disorder which produces a lot of unhappiness. An estimated 2-3% of people suffer from excessive sweating of the underarms or of the palms and soles of the feet. Underarm problem tend to start in late adolescence, while palm and sole sweating often begin earlier, around age 13. Untreated, these problems may continue through out life. This article reviews about the hyperhidrosis pathophysiology, causes and detailed treatment available for the improvement of the life style of the peoples affected with this disease.
Key words: Hyperhidrosis, Botulinum toxin injection, Iontophoresis, topical agents, oral agents, anti-cholinergic drugs, thyroid function test, 24hours urine test, Iodine- starch test.
Fig no: 1 visual scale for the quantification of hyperhidrosis
Hyperhidrosis is not a temporary condition. Many people who suffer from it have suffered for many years, often from childhood or sometimes from adolescence. Hot/cold, sweating is constant and the impact of hyperhidrosis can be severe. Primary or focal hyperhidrosis most commonly affects hands ( palmer hyperhidrosis), feet (planter hyperhidrosis) and underarms(axillae),but can also affect other areas like face and scalp, back neck etc., Although it is not temporary, it can sometimes improve with age3. Approximately half a million people in the UK are affected. Secondary hyperhidrosis (generalized hyperhidrosis) can affect the whole body or specific areas, or it may only affect one side of the body. People with secondary hyperhidrosis often sweat while asleep. It can be caused by illness or infection, obesity, or hormonal conditions such as an over-active thyroid, the menopause or diabetes. It can also be side effect of certain medications, including SSRI anti- depressants such as Prozac4.
In a majority of cases, the cause of hyperhidrosis is unknown. Primary hyperhidrosis starts in childhood and affects 0.6-1% of the population5. A familial variant with
Indexed in Google Scholar, Open Access, Academic Keys, SJIF*, Scientific Indexing Services, Research bible, GIF*, Directory of Research Journal Indexing, Index Copernicus International, Indian Citationindex

2
International Journal of Pharma Research - Volume 8 : 1 January - June 2017
autosomal dominant inheritance is now recognized with some families linked to an abnormality of chromosome. One epidemiologic survey in 2004 estimated that as many as 0.5% of the US population may be suffering from the debilitating effect of hyperhidrosis with major interference in daily activities. The objective of this article is to provide a comprehensive review of hyperhidrosis providing information on anatomy, physiology, pathophysiology and current treatment methods.
Anatomy and Physiology
Fig no: 2 Anatomical representation of sweat gland
Fig no: 3 A cross section of human skin, with the sweat gland labeled at the bottom
Hyperhidrosis occurs as a primary process of autonomic neuronal dysfunction. This dysfunction tends to occur in areas where there is a higher concentration of eccrine glands such as the palms, soles and axillae, which are sweat producing glands. Less common sites are scalp or face. The nerves that innervate sweat glands are sympathetic, postganglionic and have acetylcholine as their primary neuro transmitter6. These fibers consist of unmyelinated class C fibers. Norepineprine and vasoactive intestinal peptide (VIP) may play a role, but neither of these amplifies cholinergic sweat secretion. A central sudomotor efferent pathway is suggested for hyperhidrosis with the following connections: Cerebral cortex to hypothalamus, Hypothalamus to medulla, Fibers crossing in the medulla oblongata and travelling to the lateral horn of the spinal cord, 1) The lateral horn to sympathetic ganglia, 2) Sympathetic ganglia to sweat glands as post ganglionic C fibers. Because the sympathetic fibers arising from the hypothalamus cross mostly at the level of the pons, and most of this crossing is completed in the medulla oblongata, lesions in the medulla may cause altered sweating, such as the ipsilateral anhidrosis seen in Horner’s syndrome7.
Types of Hyperhidrosis
Sweat glands on the palms and soles alone are activated mostly by emotional stimuli. Frontal and pre-motor projection to hypothalamus probably promotes sweating during enhanced emotions. It is believed the hypothalamic sweat center, which is in charge of the palms, soles, and in some individuals the axilla, is distinct from the other hypothalamic sweat centers and id actually under exclusive control of the cortex, with no input from the thermo sensitive elements. Because emotional sweating does not occur during sleep or sedation, one of the criteria for primary hyperhidrosis is that the individuals do not experience sweating during sleep. Sympathetic cholinergic nerves activate both thermoregulatory and emotional sweating and are controlled by different CNS neurons. It is possible that primary hyperhidrosis is due to abnormal central control of emotional sweating given that it affects the same body areas as those affected in emotional sweating (hands, feet and axillae).

3
International Journal of Pharma Research - Volume 8 : 1 January - June 2017
Pathophysiology
Hyperhidrosis is a pathological, excessive sweating that can be either generalized or localized. Focal hyperhidrosis occurs most often on the palms, soles, face, scalp and axillae. Hyperhidrosis is usually brought on by emotional or thermal stress, but it can also occur or with little to no stimulus8. Local (or asymmetrical) hyperhidrosis is said to be caused by problem in the sympathetic nervous system: either lesions or nerve inflammation. Hyperhidrosis can be caused by trench foot or encephalitis.
Miliaria rubra is also called prickly heat. Miliaria rubra is the rupture of sweat glands and migration of sweat to other tissues. In hot environments, the skin’s horny layer can expand due to sweat retention, blocking the ducts of eccrine sweat glands. The glands, still stimulated by high temperature, continue to secrete. Sweat builds up in the duct, causing enough pressure to rupture the duct where it meets the epiderimis.Sweat also escapes the duct to adjacent tissues (a process called miliaria).
Osmidrosis often called bromhidrosis, especially in combination with hyperhidrosis. Osmohidrosis is excessive odor from apocrine sweat glands (which are overactive in the axillae). Osmidrosis is thought to be caused by changes in the apocrine gland structure rather than changes in the bacteria that act on sweat.
Symptoms of Hyperhidrosis
Clammy or wet palms of the hands, Clammy or wet soles of the feet, Frequent sweating, Noticeable sweating that soaks through clothing. People with hyperhidrosis might experience the following: 1. Irritating and painful skin problems, such as fungal or bacterial infections, 2. Worrying about having stained clothing 3.Reluctant to make physical contact 4. Self-conscious 5. Socially withdrawn, sometimes leading to depression 6. Select employment where physical contact or human interaction is not a job requirement 7. Spend a large amount of time each day dealing with sweat, such as changing clothes, wiping, placing napkins or pads under the arms, washing, wearing bulky, or dark clothes 8. Worry more than other people about body odor9.
Causes of Hyperhidrosis
The causes of primary hyperhidrosis are not well understood on the other hand, secondary hyperhidrosis has a long list of known cause. People used to think that primary hyperhidrosis was linked to the patient’s mental and emotional state, that the condition was psychological and only affected stressed, anxious or nervous individuals. However, recent research has demonstrated that individuals with primary hyperhidrosis are no more prone to feelings of anxiety, nervousness, or emotional stress than the rest of the population when exposed to the same triggers10. In fact, it is the other way round-the emotional and mental feelings experienced by many
Fig no: 4 Etiology of hyperhidrosis
Fig no: 4 Etiology of hyperhidrosis

4
International Journal of Pharma Research - Volume 8 : 1 January - June 2017
patients with hyperhidrosis are because of the excessive sweating. Studies have also shown that certain genes play a role in hyperhidrosis, making it look more likely that it could be inherited. The majority of patients with primary hyperhidrosis have a siblings or parent with the condition. Causes of Secondary Hyperhidrosis : 1) Spinal cord injury, 2) Alcohol abuse, 3) Anxiety 4) Diabetes, 5) Gout, 6) Heart disease, 7) Hyperthyroidism, 8) Obesity, 9) Parkinson’s disease, 10) Some infections- HIV, Malaria, Tuberculosis.
Clinical Test for Hyperhidrosis
A number of tests11, 12 are available to pinpoint the areas of sweating and estimate the severity of your condition these include: 1] Iodine-starch test 2] Thermoregulatory sweat test 3] Thyroid function test 4] 24 hours urine test 5] Volumetric test 6] Skin conductance
Iodine-starch test: Alcoholic iodine solution is placed upon the skin of the underarms and then starch is sprinkled onto the area. In areas where the skin is dry, the starch stays white. In areas that sweat is being produced, the starch turns black. In this way, we are able to identify exactly the distribution of the eccrine sweat glands that need treatment.
Thermoregulatory sweat test: A powder which is sensitive to moisture is applied to the skin. When excessive sweating occurs at room temperature, the powder changes color. The patient is then exposed to high heat and humidity in a sweat cabinet, which triggers sweating throughout the whole body. When exposed to heat, people who do not have hyperhidrosis tend not to sweat excessively in the palms of their hands, but patients with hyperhidrosis do. This test also helps the doctor determine the severity of the condition.
Thyroid function test: This is a sample blood test, where a syringe of blood is taken from the arm and sends to a special laboratory. The laboratory measures the level of thyroid hormone and also the level of the hormone that controls the thyroid hormone. By looking at the blood levels, it can be determined whether the patient has an overactive thyroid gland causing the hyperhidrosis.
24 hours urine test: Very uncommonly, if after talking to the patient and examining them the doctor feels that
is a risk of a problem called phaeochromocytoma or even a carcinoid syndrome, then a 24hours urine test can be performed. This test measures for the breakdown products of excessive adrenaline a noradrenalin if a phaeochromocytoma is suspected, or the breakdown products of a chemical produced by carcinoid if that is suspected. Urine tests can be influenced by what we eat and so if this is ordered, a special dietary sheet is also issued.
Treatment and Drugs
Today, many treatment13 options have improved, and new approaches are being developed all the time. Most suffers now find that, with perseverance, a treatment can be found that will control their symptoms to an acceptable level and allow a better quality of life.
1] Topical agents, 2] Oral agents 3] Iontophoresis 4] Anti-cholinergic drugs 5] Botulinum toxin injection 6] Nerve Surgery
Topical agents: Aluminium salts are the main topical agents for hyperhidrosis. Their mechanism of action as attributed to either an interaction between aluminium chloride and keratin in the sweat ducts (duct closure) or to a direct action on the excretory eccrine glands epithelium. They are only effective in milder cases of hyperhidrosis, and duration of effect is often limited to 48 hours. The most common side effects are skin irritations, likely related to high salt concentration.
1] Topical aluminium chloride hexahydrate 25% ethanol. 2] Topical glycopyrrolate 3] Topical 2% Diphemanil methysulfate. Topical agents have been studied for use in all forms of hyperhidrosis (axillary, palmoplanter and gustatory).Although more commonly used for axillary and palmer hyperhidrosis, double blind studies available in the literature and presented in this paper focus on gustatory hyperhidrosis.
Oral agents: Anticholinergics agents (glycopyyrolate, menthatheline bromide, oxybutynin) and alpha-adrenergic agonists (clonidine) are most commonly used in clinical practice. Anticholinergic agents work by competitive inhibition of acetylcholine at muscarinic receptors. Optimum doses for each of these agents are still under study; however the following doses are often clinically practiced: glycopyyrolate 1-2mg twice a day, oxybutynin 5-7.5mg twice a day and methantheline

5
International Journal of Pharma Research - Volume 8 : 1 January - June 2017
Fig no: 5 Machine of Iontophoresis
Fig no: 6 Diagram courtesy of Mr Mark Whiteley
bromide 50mg twice a day. Side effects can be very disabling and include dry mouth, blurring of vision, urinary hesitancy, dizziness, tachycardia and confusion. Contraindications include: myasthenia gravis, pyrolic stenosis, narrow angle glaucoma and paralytic illeus.
Iontophoresis:
Iontophoresis is defined as the introduction of an ionized substance through applications of a direct current on intact skin. Though the exact mechanism of action is unknown, these techniques facilitate transdermal movement of solute ions by generation of an electrical potential gradient. Penetration of neutral compounds is also facilitated. Tap water, anticholinergic agents (glycopyyrolate) and BoNTs are candidates for use in iontophoresis. The latter are less often used due to their large molecular size, which poses a challenge. Tap water iontophoresis must be performed initially every tow-three days until therapeutic effect is achieved. Once therapeutic effect is achieved for two weeks, treatment can be done once every two-three weeks. Duration of effect is only few days with tap water and anticholinergic iontophoresis; however iontophoresis with BoNTs may provide relief for three months. Out of 27 patients who underwent iontophoresis with BoNTs, 100% were found to have statistically improvement in sweating via gravimetry.
Botulinum toxin injection: Botulinum toxin, commonly known as ‘BOTOX’, is a treatment given by injection into skin. It is licensed in UK for treating localised hyperhidrosis of the armpits(axillae). This drug had used for many years to treat muscle spasms affecting the face, eyes, neck and for foot problems in children with cerebral palsy. It is also used widely for cosmetic purposes. Botox is a preparation of protien which, when small doses are injected into the skin, blocks the nerves
that supply the eccrine glands; this prevent the glands from producing sweat. The treatment is not a cure for hyperhidrosis-it only provide temporary relief. It needs to be repeated every three to six months for maximum effect. BoNTs block the release of acetylcholine and a number of other neurotransmitter from presynaptic vesicles by deactivating SNARE proteins. Four types of BoNTs are approved by FDA for clinical use in the USA. 1] OnabotulinumtoxinA 2] IncobotulinumtoxinA 3] Abobotulinum toxinA 4] Rimabotulinum toxinA. These toxins use different presynaptic proteins for their site of action. The site may be a little painful and small bruises can form, but these symptoms go away within a day or two. Many patients experience muscle weakness when they have had botox, some patients have experienced an increase in sweating in another part of the body. Botox treatment can often cause flu-like symptoms, tiredness and blurred vision, possibly arm and neck ache for those who have injection in their armpits. These are all temporary symptoms and should disappear in a few days, not everyone experiences them.
Nerve surgery:
Surgical approaches range from local excision of the gland to sympathectomy. Local excision of the gland or subcutaneous curettage is peformed for axillary hyperhidrosis and can be done under local anesthesia. Long-term follow-up in a large number of patient is not available. The established approach, especially for palmer hyperhidrosis, is endoscopic transthoracic sympathectomy (ETS) with resection at T2 and T3 levels commonly used.
Conclusion
In practise, most adults with AH or PH endure the pain of injection and find the benefits out weighing the discomfort. In teenagers (who constitute a sizeable
6
International Journal of Pharma Research - Volume 8 : 1 January - June 2017
number of patients with primary hyperhidrosis)however, pain is often not acceptable and the return rate of treatment is low, the new data with iontophoresis are encouraging and may particularly prove useful for young individuals with this condition. Unfortunately, the magnitude of the response with iontophoresis is still suboptimal and less than that with the injection technique (only 30%-35% sweat reduction beyond two weeks). Refinement of the iontophoresis technique may lengthen the duration of response in AH and PH and prove to be especially helpful in young patients.
REFERENCES1. Amanda-amrita D.Lakraj, Narges Moghimi and
Bahman Jabbari. Hyperhidrosis with detailed study of anatomy, pathophysiology and treatment with emphasis on the role of botulinum toxins.
2. Shavitri Mahendiran, Craig N.Burkhart and Craig G. Burkhart. Hyperhidrosis: A Review of a medical condition.
3. Joanne L.atkins and Peter E.M. Butler. Hyperhidrosis: A review of current management.
4. Naumann, M.K.; Hamm, H.; Lowe, N.J. Botox hyperhidrosis clinical study group. Effect of botulinum toxin type a on quality of life measures in patients with excessive axillary sweating.
A randomized controlled trial. Br.J.Dermatol. 2002,147, 1218, 1226.
5. Adar, R.Palmer hyperhidrosis and its surgical treatment: A report of 100 cases. Ann. Surg.1977, 186, 34.
6. Julie Halfords, specialist nurse, adviser, Laura Hunt, patient, George Millington, consultant dermatologist.
7. DermNet NZ (http://dermnetnz.org/hair-nails-sweat/hyperhidrosis.html)- A company run by the New Zealand Dermatology Society that provides high quality information for patients and clinicians on a wide range of dermatological conditions, including hyperhidrosis.
8. http://www.hyperhidrosis.org/treatment-options/affected-areas.html
9. http://www.thewhiteleyclinic.co.uk/conditions/hyperhidrosis/test/
10. http://www.mayoclinic.org/diseases-conditions/hyperhidrosis/basics…
11. http://www.hyperhidrosis.org/treatment-options.html
12. http://www.hyperhidrosis.org/treatment-option/botox.html
13. http://www.hyperhidrosisuk.org/

7
International Journal of Pharma Research - Volume 8 : 1 January - June 2017
INTRODUCTIONAnemia is a disease condition that develops when blood lacks enough healthy red blood cells or hemoglobin. Hemoglobin is a main part of red blood cells which binds oxygen. If the red blood cells are abnormal which leads to insufficient hemoglobin and the cells of the body lacks enough oxygen supply. Anemia, a condition characterized by an insufficient ability to oxygenate the body, is one of the most common blood disorders in the world1. In healthy individuals, oxygen is adequately transported throughout the body via hemoglobin (Hgb). Hemoglobin is a hemeprotein found in red blood cells (RBCs). RBCs require several nutrients to function
which include iron, folate and vitamin B12. A deficiency in any of these nutrients, alteration of morphology of the cell, increased RBC destruction or excessive blood loss can lead to anemia. There are numerous reasons for anemia including malnutrition, chronic conditions, pregnancy and drug-induced anemia2. Additional risk factors for anemia include folic acid deficiency, vitamin B12 and autoimmune disorders. Patient with acute anemia may acquire tachycardia or hypotension, while chronic conditions often induces more generalized symptoms like fatigue, weakness or pale skin.
Clinical Review on Anemia: Prevention and Management in Community Care Practice
M. S. Umashankar*1, K.S.Lakshmi2, V.Sankar3, A.Bharath kumar4, A.Porselvi5
1,2,4,5SRM College of Pharmacy, SRM University, Kattankulathur, TamilNadu.3PSG College of Pharmacy, Peelamedu, Coimbatore 641004.
*Corresponding author : [email protected]
ABSTRACT
Anemia is a disease condition having abnormal hemoglobin count associated with destruction of red blood cells. Anemia has the hemoglobin level of less than 13.5 grams males and in women as hemoglobin of less than 12.0 gram. Anemia affects 24.8 percent of the world's population. It is the world’s second most leading and serious global public health problems. Anemia is associated with several risk factors includes infections, auto immune diseases disorder, abnormalities in clotting factors and pregnancy. Iron is an essential element of the hemoglobin considered as important macromolecules required for energy production, respiration, nucleic acid synthesis and metabolism. The reticulo endothelial system regulates the formation of new hemoglobin in the body. In the food iron is present in Ferric (Fe3+) form and as ferric hydroxide which breaks down into free ions or loosely bound organic iron in the acidic medium of the stomach and its absorption takes place in the intestine. Lake of iron in the body causes anemia, the symptoms of includes paleness, shallow skin, rapid heartbeat, headache, brittle nails, soreness and jaundice. Community pharmacist Interventions services for the anemia is an essential element since awareness of the disease is not much amongst the population. The community patient couselling programs can be initiated at various community setups to implement effectively the advices and necessary awareness of the disease which provide necessary motivation on prevention of anemia by proper nutrition intake and the importance of the iron supplements, vitamin B12, folic acid and minerals for sufficient red blood cell production. Special community care for women and young children to take sufficient amounts of iron and folic acid by the community pharmacist is very essential. Advice during pregnancy and after pregnancy to eat iron rich food in order to prevent the anemia can also be provided. The pharmacist’s intervened counseling proves to be more efficient in the treatment of anemia.
Key words: Anemia, Auto immune disease, Awareness, Community pharmacist.
REVIEW ARTICLE
Received Date: 19.06.2017 Accepted Date: 30.06.2017
ISSN 0975-3532
Indexed in Google Scholar, Open Access, Academic Keys, SJIF*, Scientific Indexing Services, Research bible, GIF*, Directory of Research Journal Indexing, Index Copernicus International, Indian Citationindex

8
International Journal of Pharma Research - Volume 8 : 1 January - June 2017
Etiology:
The etiology of the anemic disorder necessitates a thorough checkup to make out the reason of the disease because there are many different causes of anemia4 it is important to identify the origin of the disorder so that it can be appropriately treated with proper prevention. Diagnosis of anemia includes a clear evaluation on the detailed history of the patient, information on diet and lifestyle, medical history, family history, medications and religious practices which also may have the influence on their dietary habits. Necessary physical examination is performed and required laboratory tests are to be completed for the confirmation of the disease.
Laboratory tests for the anemia diagnosis:
Complete blood count (CBC), iron studies, and serum nutrient levels are the common laboratory tests used to diagnose anemia5. There are three categories of anemia which are distinguished by their mean cell volume (MCV) which measures the size of the RBCs. The depicted normal values for MCV range from 80-100 fL/ cell.
Iron absorption and its relation to anemia:
Iron present in the food in ferric form and it is bound to organic molecules. In stomach, the pH is lower than 4 causes the ferric form to dissociate and react with low molecular compounds like fructose, ascorbic acid, citric acid, and amino acids to form a metal complex making ferric form soluble at neutral pH in the small intestine. The mucosa cells of the small intestine absorbs iron bonded to the heme which then break down and get releases the iron. The non-heme iron gets absorbed in ferrous form by the duodenum cells, which gets rapidly oxidized to ferric form Fe3. This carrier transfers ferric form of iron Fe3 to mitochondria and then it is transported to apoferritin of apotransferrin. Apotransferrin bind two atoms of iron and it is called transferrin. Transferrin is a real carrier of iron whereas in the plasma it is the β-globulin. Iron is transported to the bone marrow and e liver in the form of Fe(III) bound to transferrin, located in the plasma. Ferritin form of reticulo endothelial system is suitable for iron storage3. The plasma does not contain ferritin, but it possess apoferritin and this indicate the amount of iron stored in reticuloendothelial system. Apoferitin now acts as ferrooxidase and it oxidize Fe(II) into Fe(III), which is then tightly binds to ferritin and release from ferritin iron and get reduced to Fe (II).
Table 1 : Risk factors for Anemia
Crohn’s disease Liver disease Thyroid disease
Rheumatoid arthritis NSAIDS Lactation
Cancer Poor diet Malnutrition
Auto immune disease Pregnancy Infection
Vitamin B12 deficiency Folic acid deficiency Painful menstruation
Table 2 : Clinical symptoms of Anemia
Tachycardia Palpitations Angina
Hypotension Fatigue Light headedness
Headache Coldness Sensitivity to cold
Shortness of breath Pale and yellow colour skin Whooshing

9
International Journal of Pharma Research - Volume 8 : 1 January - June 2017
Classification of anemia
Macrocytic anemias, also known as megaloblastic anemias, have a MCV level greater than these values, and include folic acid deficiency anemia6, vitamin B12
deficiency anemia and pernicious anemia. Microcytic anemias have decreased MCV values and include iron deficiency anemia. Finally, normocytic anemias have MCV values that are within normal limits, and the RBCs of these patients remain unaffected. These anemias are caused by acute blood loss or abnormal blood cell production, such as aplastic anemia or anemia from chronic renal disease.
Common types of Anemia are:
• Iron deficiency anemia
• Thalassaemia
• Aplastic anemia
• Haemolytic anemia
• Sickle cell anemia
• Pernicious anemia
• Fanconi anemia
Hypochromic, microcytic anemia which includes
• Iron deficiency anemia
• Thalassemia
Iron deficiency anemia, a microcytic anemia is the most common type of anemia recognized in the world. Iron deficiency anemia is the result of insufficient iron in the blood7. There are various causes for iron deficiency, such as insufficient consumption of iron in the diet, malabsorption, heavy menstruation, pregnancy, dialysis and gastrointestinal inflammatory disorders etc. On appearance, this type of anemia may distinguish from others with specific signs and symptoms. The signs include tongue soreness or smooth appearance, pica, phagophagia, and/or dry mouth. Suspicion of iron deficiency anemia is verified via analysis of iron indices and of other labs studies. Patients with iron deficiency anemia will have decreased serum iron, ferritin and transferrin saturation levels and an increased total iron-
binding capacity (TIBC).Furthermore, patients with anemia often prove hemoglobin levels below 13 g/dL in men and 12 g/dL in women. There are several methods of treatment following the diagnosis of iron deficiency anemia can be attempted. Generally, mild iron deficiency can be treated on an outpatient basis with oral iron replacement therapy, with a goal of 200 mg of elemental iron supplements on per day basis8.
There are at present four oral iron supplements available in the market for treatment like ferrous gluconate, ferrous sulfate, ferrous fumarate, and polysaccharide iron complex. Ferrous sulfate is prescribed most commonly for oral therapy made available in the community pharmacies. Regimens of iron supplements should be divided into two to three doses daily. These supplements should be taken on an empty stomach, an hour before meals or two hours following a meal. Oral iron has been found to have increased absorption when taken with ascorbic acid, so it is often recommended that these supplements should be taken with a glass of orange juice. Oral iron therapy ensue side effects of occurs on the gastrointestinal (GI) tract, and include abdominal pain, nausea, constipation, heartburn and dark stools. It is because of this GI upset that one-time daily dosing should be avoided. If the patient gets GI side effects that are intolerable, it is recommended that the supplements should be taken with orange juice and/or food9.
Thalassemia
Thalassemia is an inherited blood disorder in which the body makes an abnormal form of hemoglobin. Hemoglobin is the protein molecule present in red blood cells and carries oxygen. Thalassemia is inherited disease in which least one of parents must be a carrier of the disease. Thalassemia minor is a less serious form of the disorder. Alpha thalassemia has atleast one abnormally mutated alpha globin genes. In beta thalassemia, the beta globin genes are affected. Some of the most common symptoms include paleness, tiredness, muscle weakness, lightheadedness, lack of appetite, dark urine, jaundice, slow growth and delayed puberty, bone deformities in the face, abdominal swelling, delayed growth and development. There are three main types of thalassemia are Beta thalassemia, which includes the subtypes major and intermedia10. Alpha thalassemia,

10
International Journal of Pharma Research - Volume 8 : 1 January - June 2017
which includes the subtypes hemoglobin H and hydrops fetalis. Beta thalassemia occurs when body is unable to produce beta globin. It is caused by two genes one from each parent and inherited to make beta globin. Alpha thalassemia occurs when the body is unable to make alpha globin, in order to make alpha globin, four genes two from each parent is needed. Hemoglobin H is a moderate to severe form of alpha-thalassemia which develops when a person lacks three alpha globin genes. Hydrops fetalis is an extremely severe form of thalassemia that occurs before birth. Most individuals with this condition are either stillborn or die shortly after being born. This condition develops when all four alpha globin genes get altered. The complications lead to Iron over loading problem, Infections, Bone deformities, Splenomegaly, Slowed growth rates and heart problems. The treatment for thalassemia depends on the type and severity of disease Involved. Some of the treatments includes are blood transfusions, bone marrow transplantation, medications, possible surgery to remove the spleen or gallbladder and iron chelation therapy by deferoxamine Folic acid is a B vitamin that helps to build healthy red blood cells11,12. A blood and marrow stem cell transplant replaces faulty stem cells with healthy ones from another person. Stem cells are the cells inside bone marrow produces red blood cells and other types of blood cells.
Cytometric classification comprises Normochromic, Normocytic anemia, which includes chronic anemias like Normochromic, macrocytic anemia which include
• Vitamin B12 deficiency
• Pernicious Anemia
• Folate deficiency
Vitamin B12 deficiency anemia, a macrocytic anemia, is one of the most common type of anemia occur world wide13.Deficiency of vitamin B12 can be caused by several factors, including diet, malabsorption, alcoholism, or decreased stomach acidity.Certain medications can also lead to deficiency such as proton pump inhibitors and metformin. A severe form of vitamin B12 deficiency is called pernicious anemia. Pernicious anemia is a specific type of anemia that is caused by autoimmune destruction of gastric parietal
cells. In healthy individuals these cells produce intrinsic factor (IF) which is required to bind and absorb dietary vitamin B12. When autoimmune destruction of the gastric parietal cells takes place, vitamin B12 absorption get affected leading to deficiency14,15. Specific signs and symptoms differentiate these two types of anemia from each other like numbness, parasthesias and gait disturbances. Development and myelination of the central nervous system requires vitamin B12. Thus, severe deficiency can result in the presence of debilitating neurologic complications. Laboratory findings of these types of anemias reveals decreased serum vitamin B12 levels and IF, normal folate levels, and increased serum methylmalonic acid and total homocysteine levels. Once vitamin B12 deficiency anemia is confirmed, early treatment is important since neurological sequelae can be irreversible if not treated promptly.
Treatment includes replacement therapy, most commonly with intramuscular or oral formulations. Parenteral replacement therapy is the most favored method since approximately 10% of the doses are absorbed as compared to only 0.5-4% of oral doses.Due to this reason lower doses of vitamin B12 can be given when administered intramuscularly, for more effective oral therapy high doses can be given. Lab values and symptoms should be monitored to determine response to the therapy16,17. Neurological symptoms and megaloblastic cells should resolve within a few days, in general. An increase in H/H should be noted after about one to two weeks of therapy. Replacement therapy is a long term for patients without pernicious anemia and those diagnosed with pernicious anemia, lifelong therapy must be given. CBC and serum vitamin B12 levels should be monitored over time, at least 1-2 months after initiation of therapy and 3-6 months thereafter. Side effects of replacement therapy include dizziness, headache, anxiety or nausea. Increased consumption of foods rich in vitamin B12 like meat, fish, poultry, eggs and dairy products can help alleviate deficiency and prevent future episodes18,19. However for vegetarian an alternative prophylactic dietary supplementation can be recommended.
Folic Acid deficient Anemia:
Folic acid deficiency anemia is another common type of anemia. This macrocytic anemia is caused

11
International Journal of Pharma Research - Volume 8 : 1 January - June 2017
due improper diet, alcoholism, during pregnancy and lactation and dialysis. Folic acid deficiency occur also due to drug-induced like sulfasalazine, methotrexate, phenytoin, triamterene, or trimethoprim. Unique signs and symptoms of folic acid deficiency are irritability, personality changes, and memory impairment20,21. Lab values show decreased folate levels, and normal vitamin B12, IF and methylmalonic acid levels. Treatment of this anemia is usually accomplished with oral replacement therapy. Replacement therapy show some side effects like mild malaise, rash and flushing. Folate rich dietary supplements are green leafy vegetables, citrus fruits, dairy and grains22,23.
Normocytic Anemias
Acute Blood Loss Anemia: Hemorrhage and acute blood loss results in anemia due to RBC volume depletion. Acute blood loss can occur by gastrointestinal bleeding, trauma or surgery. Symptoms of acute blood loss are rapid blood pressure decline and dizziness. This is categorized as a normocytic anemia because the existing RBCs are largely unaffected. Hemoglobin and Hematocrit (H/H) are surrogate makers for this type of anemia24,25. An elevated reticulocyte count is also noted in the affected patients. Treatment for acute blood loss anemia is blood transfusion, if the loss is substantial, in addition to stopping the source of the bleed. Chronic Blood loss anemia due to chronic blood loss results from a slow downward development of RBC volume. Conditions such as stomach ulcers26,27, diverticulitis, cancers or heavy menstrual bleeding are associated with this type of anemia. This anemia shows fatigue, shortness of breath or paleness. Lab values are similar to those of acute blood loss and display decreased H/H values. Blood transfusions for this type of anemia are not indicated however supplementation with iron therapy for a long period may be used for the treatment of this anemia28,29.
Aplastic Anemia:
Aplastic anemia occurs due the disorder of the bone marrow causing decreased production of RBCs. Additional causes of this anemia are radiation and chemotherapy, exposure to toxins, autoimmune disorders, HIV, Epstein-Barr virus, parvo and pregnancy30,31. Medications also sometimes cause aplastic anemia like
phenytoin, carbamazepine, chloramphenicol, felbamate and quinine. Aplastic anemia show symptoms which include fatigue, rapid or irregular heart rate, frequent infections, unexplained bruising, nosebleeds and bleeding gums, and rash. Lab values for aplastic anemia show decreased reticulocyte count, white blood cells (WBCs) and platelets. However, bone marrow biopsy test show confirmation of aplastic anemia. Blood transfusions, stem cell transplant or pharmacotherapies can be used for treatments of anemia. Immuno suppressants such as cyclosporine, methylprednisolone, or antithymocyte globulin can also give better treatment results32,33. Bone marrow stimulants like filigrastim and epoetin alfa can also be used as adjunctive therapy with immune suppressants. Antivirals and antibiotics can be used to prevent infections in the vulnerable patients34,35.
Anemia of Chronic Disease Conditions:
Patients suffering from chronic kidney disease get affected with anemia due to decreased production of erythropoietin by the kidneys36,37. These patients suffer from weakness, inability to concentrate, chest pain, fatigue, and headache. Heart failure and tachycardia are common complications of this type of anemia. Decreased reticulocyte count and normal or increased WBCs and platelets are often seen in affected patient. Additional testing may include H/H, ferritin and TSAT levels. Common treatments involve erythropoietin, iron supplementation, blood transfusions, and vitamin B12 and folate supplementation.Anemia of chronic disease also called “anemia of inflammation”, this disorder is due to conditions such as rheumatoid arthritis, lupus, cancer, HIV, and inflammatory bowel disease38,39. In due course of time, this type of anemia resembles iron deficiency anemia with increased level of cytokines, decreased MCV and TIBC, increased TSAT, and normal/elevated serum iron and ferritin. Blood transfusions, erythropoietic agents and iron therapy for its deficiency can given for the treatment.
Hemolytic Anemia:
Red blood cells have the important mission of carrying oxygen from lungs to heart and throughout body. Hemolytic anemia can be extrinsic or intrinsic. Extrinsic hemolytic anemia is also known as autoimmune hemolytic anemia40,41. This type of anemia develops when

12
International Journal of Pharma Research - Volume 8 : 1 January - June 2017
the spleen traps and destroys healthy red blood cells. It can also come from red blood cell destruction due to infection, tumors, autoimmune disorders, leukemia and lymphoma. The common symptoms includes paleness of the skin, fever, fatigue, confusion, dizziness, dark urine, jaundice, enlarged spleen and enlarged liver. Hemolytic anemia treatment includes blood transfusion. Intravenous immunoglobulin, corticosteroids drugs and surgery. Blood transfusion can be given to increase the red blood cell count to replace ruptured red blood cells with new ones. Intravenous Immunoglobulin (IVIG), A low blood cell count can negatively affect the immune system which fights against the infection. Immunoglobulin is intravenously administered to improve the immune system function of the affected patient42,43.
Sickle cell Anemia:
Sickle cell anemia is a genetic disease of the red blood cells. Red blood cells are discs shaped cells which enables flexible movement of the cells through smallest blood vessels. This disease is so called hence the red blood cells get changed into crescent shape which resembles a sickle. The sickle shaped red blood cells becomes sticky, rigid and easily get trapped within small blood vessels, which ultimately blocks the flow of blood to reach different parts of the body. Types of sickle cell anemia include hemoglobin sickle cell disease, it is the most common type of sickle cell disease. The inherit copies of the hemoglobin S gene from both parents44. This forms hemoglobin known as Hb SS. Hemoglobin sickle cell + (beta) thalassemia. It affects beta globin gene production45. The size of the red blood cell is reduced because less beta protein is made. If inherited with the Hb S gene may have hemoglobin S beta thalassemia. Hemoglobin sickle cell beta and zero thalassemia, Sickle beta-zero thalassemia is the fourth type of sickle cell disease. It also involves the beta globin gene. It has similar symptoms to sickle cell anemia46,47. However, sometimes the symptoms of beta zero thalassemia are more severe. It is associated with a poorer prognosis. Patient with inherited mutated gene from one parent are said to have sickle cell trait. Sickle cell anemia causes breaking apart of red blood cells is called chronic hemolysis. Red blood cells normally live about 120 days. Sickle cells live for a maximum
of 10 to 20 days. Various other complications includes Hand-foot syndrome occurs when sickle shaped red blood cells block blood vessels in the hands or feet. This causes the hands and feet to swell and cause leg ulcers. Splenic sequestration is a blockage of the splenic vessels by sickle cells. It causes a sudden, painful enlargement of the spleen. Some sickle cell patients will sustain enough damage to their spleen that it becomes shrunken and ceases to function. Delayed growth often occurs in people with the disease. Children are generally shorter but regain their height by adulthood. This happens because sickle cell red blood cells unable to supply enough oxygen and nutrients. Neurological complications like seizures, strokes, or even coma can result from sickle cell disease. It is caused by brain blockages48,49. Eye problems blindness is caused by obstructions in the vessels supplying the eyes which can damage the retina.Skin ulcers in the legs can occur due to blockade of small blood vessels. The sickle cell anemia interferes with blood oxygen supply, it can also cause heart problems which can lead to heart attacks, heart failure, and abnormal heart rhythms. Damage to the lungs over time related to decreased blood flow can result in high blood pressure in the lungs and scarring of the lungs. Priapism is a lingering, painful erection seen in some men with sickle cell disease due to blockade of blood vessels supplying the penis. Gallstones are one of the complications which are not caused by a vessel blockage, instead they are caused by the breakdown of red blood cells. A byproduct of this breakdown is bilirubin, high levels of bilirubin can lead to gallstones. Sickle chest syndrome is a severe type of sickle cell crisis. It causes severe chest pain and is associated with symptoms such as cough, fever, sputum production, shortness of breath, and low blood oxygen levels.
The diagnosis of sickle cell anemia are blood test to check the shape of the red blood cells, blood counts test which reveal an abnormal hemoglobin level in the range of 6 to 8 grams per deciliter, blood films show RBCs that appear as irregularly contracted cells. Hemoglobin electrophoresis also done to confirm the diagnosis of sickle cell disease50. Treatments for sickle cell disease are rehydration with intravenous fluids helps red blood cells return to a normal state, blood transfusions improve transport of oxygen and nutrients as needed,

13
International Journal of Pharma Research - Volume 8 : 1 January - June 2017
supplemental oxygen through mask to make breathing easier and improve oxygen levels in the blood. Hydroxy urea helps to increase production of fetal hemoglobin, antibiotics, usually penicillin, are commonly given to infants and young children, as well as adults, to help prevent infections. Pain relief medication ranging from nonprescription non steroidal anti-inflammatory drugs to Opiods are given to control pain.51,52 Blood transfusions may be used either as treatment for specific episodes or as chronic transfusion therapy to prevent life-threatening complications like acute chest syndrome, stroke, widespread infection and multi organ failure51,52. Bone Marrow or Stem Cell Transplantation, the bone marrow stem cells, which are early cells that mature into red and white blood cells and platelets. By destroying the sickle cell patient's diseased bone marrow and stem cells and transplanting healthy bone marrow from a genetically-matched donor, normal hemoglobin may be produced. Other preventive measures of sickle cell anemia includes folic acid supplements, eating fruits, vegetables, and whole-wheat grains, sufficient water intake also reduces the risk of sickle cell crises.
Community Pharmacist Intervention Services:
The pharmacist has a critical role in the treatment of patients with anemia. Diagnosis, therapy and together with pharmacist counselling care will be the ultimate requirement for the complete prevention and management of the prevalence of anemia. Pharmacists can assist patients with therapy management, particularly on oral iron therapy, medication counseling by the community pharmacist should be performed53. There are several drug-drug interactions of oral iron supplements, counselling on drug interactions with oral iron that the pharmacist should be cautious on such prescriptions. To assess response to oral iron therapy labs will need to be monitored. Reticulocyte count, an assessment of the production of new RBCs, should increase within seven to ten days. Hemoglobin (Hgb) and hematocrit (Hct) should also be tracked with an expected increase in Hgb of 1g/dL per week and at least 2g/dL total by three weeks of therapy. Parenteral iron therapy can be recommended in severe cases of iron deficiency anemia, if the patient is unable to tolerate oral therapy or if there is an inadequate response to oral therapy.The four parenteral iron products used are iron dextran,
iron sucrose and sodium ferric gluconate and ferric carboxymaltose and medications54. The pharmacist’s intervened counseling proves to be more efficient in such treatments on parenteral iron therapy that can exacerbate conditions exhilarating the risk of anaphylaxis with iron dextran. Due to this high risk, a test dose is required prior to administering iron dextran. Other adverse effects of intravenous iron include arrhythmias, arthralgia, hypotension, flushing and prurtitis. Two formulations, iron sucrose and sodium ferric gluconate, are only FDA approved for the treatment of anemia associated with chronic kidney disease55.
Educating on dietary recommendations of various dietary sources rich in iron is an important intervention for both treatment of deficiency and for preventing future occurrence of anemia. Meat is a good source of iron, including red meat, chicken, fish and organ meats like liver. Vegetables sources of iron include beans, green leafy vegetables and cereals. These non-meat sources contain “non-heme” iron, which have a lower rate of absorption than “heme” iron found in meat56,57. However, it is often difficult for vegetarians to achieve recommended levels of iron, hence necessary supplementary diet can be advised. As pharmacists should be aware of the signs and symptoms of anemia in order to assess efficacy of treatment and to refer those patients who need to have proper medical attention eventually the anemia can be prevented. Both Community pharmacists and clinical pharmacist should utilize their counselling skills with extensive pharmacological knowledge so that an increased positive outcomes can be achieved in the prevention and management of the anemia.

14
International Journal of Pharma Research - Volume 8 : 1 January - June 2017
Pharmacotherapy for management of Anemia
Table 3 : Parentral Iron products
Supplement Recommended dosage regimen
Iron sucrose51-54 200 mg administered on 5 different occasions within 14 daystotaling 1000 mg in 14 days.
Iron dextranDose (mL) = 0.0442 (desired Hgb - observed Hgb) x LBW + (0.26 x LBW), with desired hemoglobin at 14.8 g/dL and LBW= lean body weight; test dose of 0.5 ml should be given.
Sodium ferric gluconate125 mg elemental iron per dialysis session. Most patients will require acumulative dose of 1 g elemental iron over approximately 8 sequential dialysis treatments to achieve a favorable response58,59.
Ferric carboxymaltose <50 kg: 15 mg/kg elemental iron on day 1; repeat dose after at least 7 days(maximum: 1500 mg elemental iron per course).
Table 4 : Oral iron products
Iron products Dose Ferrous gluconate 300 – 325 mgFerrous sulfate 300 – 325 mgFerrous fumarate 100 mgPolysaccharide-iron complex 150 mg
Table 5: Doses of folic acid and vitamin B12
Vitamin agents Dose Oral B12 1000-2000 mcg/dayVitamin B12 injections59,60 doses of 1000 mcg several
times 1 weekFolic acid61 0.4 mg/day
Conclusion
Anemia is caused due to the defective red blood cell formation and destruction of red blood cells which is responsible for altered iron turnover in the body. Anemia is the most common form of nutritional deficiency. Its prevalence is highest among young children and pregnant women. Improving the management of anemia represents greater effective pharmacological and non pharmacological therapies which could improve the patient’s treatment outcomes and reduce the health related economic burden. The anemia can be managed through adequate iron supplements, vitamins, folic acid, blood transfusions and bone marrow transplantations. Early detection and diagnosing the anemia and effective implementation of treatment strategies will ultimately
reduce further development of anemia62 complications in the community. To address the changing epidemiology of iron deficiency through effective implementation of awareness programmes in the community by the community pharmacist intervention program can aim to prevent the occurrence of anemia to a greater extent.
Acknowledgement
We would like to thank Dr. K.S. Lakshmi, Dean, SRM College of Pharmacy, SRM University for her valuable support.
Conflict of interest : We declare that no conflict of interest.
REFERENCES 1. Berglund S, Westrup B, Domellöf M. Iron
supplements reduce the risk of iron deficiency anemia in marginally low birth weight infants. Pediatrics. 2010;126(4).
2. Sankar MJ, Saxena R, Mani K, Agarwal R, Deorari AK, Paul VK. Early iron supplementation in very low birth weight infants a randomized controlled trial. Acta Paediatr. 2009 : 98(6):953–8.
3. Ziegler EE, Nelson SE, Jeter JM. Iron supplementation of breastfed infants from an early age. Am J Clin Nutr. 2009 : 89(2):525–32.
4. Barroso F, Allard S, Kahan BC, Connolly C, Smethurst H, Choo L, et al. Prevalence of maternal

15
International Journal of Pharma Research - Volume 8 : 1 January - June 2017
anaemia and its predictors: a multi centre study. Eur J Obstet Gynecol Reprod Biol. 2011;159(1):99–105.
5. Kroot JJC, Tjalsma H, Fleming RE, Swinkels DW. Hepcidin in Human Iron Disorders: Diagnostic Implications. Clin Chem. 2011: 57(12):1650–1669.
6. Milman N. Prepartum anaemia: prevention and treatment. Ann Hematol. 2008;87(12):949–959.
7. Pasricha S-R. Should we screen for iron deficiency anaemia. A review of the evidence and recent recommendations. Pathology. 2012;44(2):139–147.
8. Schneider JM, Fujii ML, Lamp CL, Lönnerdal B, Dewey KG, Zidenberg-Cherr S. Anemia, iron deficiency, and iron-deficiency anemia in 12–36-mo-old children from low-income families. Am J Clin Nutr. 2005;82(6):1269–75.
9. Baker RD, Greer FR; Committee on Nutrition American Academy of Pediatrics. Diagnosis and prevention of iron deficiency and iron-deficiency anemia in infants and young children (0-3 years of age). Pediatrics. 2010;126(5):1040–50.
10. Lozoff B, De Andraca I, Castillo M, Smith JB, Walter T, Pino P. Behavioral and developmental effects of preventing iron-deficiency anemia in healthy full-term infants. Pediatrics. 2003;112(4):846–54.
11. Greenberg PL, Sun Z, Miller KB, et al. Treatment of myelodysplastic syndrome patients with erythropoietin with or without granulocyte colony-stimulating factor: results of a prospective randomized phase 3 trial by the Eastern Cooperative Oncology Group (E1996), Blood 2009; 114:2393–2400.
12. Azzarà A, Carulli G, Galimberti S, et al. High-dose (40,000 IU twice/week) alpha recombinant human erythropoietin as single agent in low/intermediate risk myelodysplastic syndromes: a retrospective investigation on 133 patients treated in a single institution. Am J Hematol 2011; 86:762–767.
13. Evens AM, Bennett CL, Liminari S. Epoetin-induced pure red-cell aplasia (PRCA): preliminary results from the research on adverse drug events and reports (RADAR) group. Best Prac Res Clin Haematol 2005; 18:481–489.
14. McKoy JM, Stonecash RE, Cournoyer D, et al. Epoetin-associated pure red cell aplasia: past, present, and future considerations.Transfusion 2008; 48:1754–1762.
15. Bastit L, Vandebroek A, Altintas S, et al. Randomized, multicenter, controlled trial comparing the efficacy and safety of darbepoetin alfa administered every 3 weeks with or without intravenous iron in patients with chemotherapy-induced anemia. J Clin Oncol 2008; 26:1611–1618.
16. World Health Organization, Iron Deficiency Anemia Assessment Prevention and Control: A Guide for Program Managers, World Health Organization, Geneva, Switzerland, 2001.
17. L. Reveiz, G. M. Gyte, and L. G. Cuervo, “Treatments for iron-deficiency anaemia in pregnancy,” Cochrane Database of Systematic Reviews, no. 2, Article ID CD003094, 2007. View at Google Scholar · View at Scopus
18. World Health Organization, The Prevalence of Anaemia in Women: A Tabulation of Available Information (WHO/MCH/MSM/92), WHO, Maternal Health and Safe Motherhood Programme, Division of Family Health, Geneva, Switzerland, 1992.
19. L. P. McMahon, “Iron deficiency in pregnancy,” Obstetric Medicine, vol. 3, pp. 17–24, 2010.
20. B. Brabin, “Haematological profiles of the people of rural southern Malawi: an overview,” Annals of Tropical Medicine and Parasitology, vol. 98, pp. 71–83, 2004.
21. L. M. Bodnar, A. M. Siega-Riz, L. Arab, K. Chantala, and T. McDonald, “Predictors of pregnancy and postpartum haemoglobin concentrations in low-income women,” Public Health Nutrition, vol. 7, no. 6, pp. 701–711, 2004.
22. Nassar AH, Naja M, Cesaretti C, Eprassi B, Cappellini MD, Taher A. Pregnancy outcome in patients with beta-thalassemia intermedia at two tertiary care centers, in Beirut and Milan. Haematologica. 2008;93:1586–1587. doi: 10.3324/haematol.13152.

16
International Journal of Pharma Research - Volume 8 : 1 January - June 2017
23. Aessopos A, Farmakis D, Deftereos S, Tsironi M, Tassiopoulos S, Moyssakis I, Karagiorga M. Thalassemia heart disease: a comparative evaluation of thalassemia major and thalassemia intermedia. Chest. 2005;127:1523–1530.
24. Aessopos A, Farmakis D, Loukopoulos D. Elastic tissue abnormalities resembling pseudoxanthoma elasticum in beta thalassemia and the sickling syndromes. Blood. 2002;99:30–35
25. B. Chigbu, S. Onwere, C. I. Kamanu, C. Aluka, O. Okoro, and E. Adibe, “Pregnancy outcome in booked and unbooked mothers in South Eastern Nigeria,” East African Medical Journal, vol. 86, no. 6, pp. 267–271, 2009.
26. M. Van Eijk, H. M. Bles, F. Odhiambo et al., “Use of antenatal services and delivery care among women in rural western Kenya: a community based survey,” Reproductive Health, vol. 3, article 2, 2006.
27. Baltussen B, Knai C, Sharan M (2004) Iron fortification and iron supplementation are cost-effective interventions to reduce iron deficiency in four sub regions of the world. J Nutr 134: 2678-2684.
28. World Health Organization (2010) Malaria in the greater Mekong subregion: regional and country profiles. Manila, Philippines: Western Pacific Regional Office of the World Health Organization.
29. DeMaeyer E, Adiels Tegman M (1985) The prevalence of anemia in the world. World Health Stat Quart 38: 302-316.
30. Shojaeazadeh D. A study of knowledge, attitude and practice of secondary school girls in Qazvin on Iron Deficiency Anemia. Iranian J. Publ. Health. 2001;30(1-2):53–5
31. Black MM, Squiggle AM, Hurley KM, Pepper MR (2011) Iron deficiency and iron-deficiency anemia in the first two years of life: Strategies to prevent loss of developmental potential. Nutr Rev 69: S64–S70.
32. Rusmussen KM. Deficiency or Iron Deficiency Anemia and weight at birth, length of gestation and perinatal mortality. J Nutri. 2001;131:590–603.
33. Lynch SR (2011).Why nutritional iron deficiency persists as a worldwide problem. J Nutr 141: 763S-768S.
34. World Health Organization. Iron Deficiency Anemia-Assessment, prevention and control a guide for programme managers. 2001. p. 15.
35. Beard J. Iron deficiency alters brain development and functioning. J Nutr. 2003;133:1468S–1472S.
36. World Health Organization. World wide prevalence of anaemia 1993-2005. WHO, 2008.
37. American Society of Hematology. Anemia. Education in blood disorders for patients. Retrieved at: http://www.hematology.org/Patients/Anemia/. Accessed 2014 Jul 5.
38. Little DR. Ambulatory management of common forms of anemia. Am Fam Physician. 1999;59(6):1598-604.
39. National Institute of Health. What are the signs and symptoms of iron deficiency anemia? National Heart, Lung and Blood Institute. Retrieved at: http://www.nhlbi.nih.gov/health/health-topics/topics/ida/signs.html#. Accessed 2014 Jul 7.
40. Merck manuals. Home health handbook. Overview of anemia.Retrieved at: http://www.merckmanuals.com/home/blood_disorders/anemia/overview_of_anemia.html.Accessed 2014 Jul 7.
41. Goddard AF, James MW, McIntyre AS et al. Guidelines for the management of iron deficiency anaemia. Gut. 2011;60:1309-1316.
42. Clark S. Iron deficiency anemia: Diagnosis and management. CurrOpin in Gastroenterol. 2009;25:122-8.
43. Snow CF. Laboratory diagnosis of vitamin B12 and folate deficiency.Arc Intern Med. 1999;159:1289-1298.
44. Rumsey SE, Hokin B, Magin PJ, Pond D. Macrocytosis--an Australian general practice perspective. Aust Fam Physician. 2007 Jul;36(7):571-2.
45. Kaferle J, Strzoda CE. Evaluation of macrocytosis. Am Fam Physician.2009;79(3):203-208.

17
International Journal of Pharma Research - Volume 8 : 1 January - June 2017
46. National Kidney and Neurologic Diseases Information Clearinghouse.Kidney and urologic diseases A-Z list of topics and titles. Anemia in chronic kidney disease. Retrieved at:http://kidney.niddk.nih.gov/kudiseases/pubs/anemia/#sec5. Accessed 2014 Aug 7.
47. Mayo Clinic. Diseases and conditions. Aplastic anemia. Retrievedat: http://www.mayoclinic.org/diseases-conditions/aplastic-anemia/basics/definition/con-20019296. Accessed 2014 Aug 7.
48. Ferrous fumarate [monograph]. In: Lexicomp Online [online database].Hudson, OH: Lexi-Comp.Accessed 2014 Jul 12.
49. Ferrous sulfate [monograph]. In: Lexicomp Online [online database].Hudson, OH: Lexi-Comp. Accessed 2014 Jul 12.
50. Ferrous gluconate [monograph]. In: Lexicomp Online [online database].Hudson, OH: Lexi-Comp. Accessed 2014 Jul 12.
51. Polysaccharide-iron complex [monograph]. In: Lexicomp Online[online database]. Hudson, OH: Lexi-Comp. Accessed 2014 Jul 16.
52. Dipiro JT, Talbert RL, Yee GC et al. Pharmacotherapy: A pathophysiologic approach. 8th ed. China: McGraw-Hill. 2011.
53. Iron dextran complex [monograph]. In: Lexicomp Online[online database]. Hudson, OH: Lexi-Comp. Accessed2014 Jul 12.
54. Iron sucrose [monograph]. In: Lexicomp Online [onlinedatabase]. Hudson, OH: Lexi-Comp. Accessed 2014 Jul 12.
55. Ferric gluconate [monograph]. In: Lexicomp Online[online database]. Hudson, OH: Lexi-Comp. Accessed2014 Jul 12.
56. Ferric carboxymaltose [monograph]. In: Lexicomp Online[online database]. Hudson, OH: Lexi-Comp. Accessed2014 Jul 12.
57. Stabler SP. Clinical practice. Vitamin B12 deficiency. NEngl J Med. 2013 Jan 10;368(2):149-60.
58. Skerrett PJ. Vitamin B12 deficiency can be sneaky,harmful. Harvard Health Publications. 2013 Jan 10. Retrievedat www.health.harvard.edu/blog/vitamin-b12-deficiency-can-be-sneaky-harmful-201301105780. Accessed2014 Juyl 8.
59. Oh R, Brown D. Vitamin B12 deficiency. Am Fam Physician.2003;67:979-86.
60. Cyanocobalamin [monograph]. In: Lexicomp Online[online database]. Hudson, OH: Lexi-Comp. Accessed2014 Aug 7.
61. Folic acid [monograph]. In: Lexicomp Online [onlinedatabase]. Hudson, OH: Lexi-Comp. Accessed 2014 Aug 7.
62. Weiss G & Good nough LT. Anemia of chronic disease.N Engl J Med 2005;352:1011-23.

18
International Journal of Pharma Research - Volume 8 : 1 January - June 2017
A Correlative Study of Lipid Profile in Diabetic Dyslipidemic Patients with Hyperuricemia
Amala Thaha¹*, Anil Babu A1, Deepthi S¹, Manjusha K¹, Nayana Thankachan¹, Shafeeq Mattummal2
National College of Pharmacy, Manassery P.O, Kozhikode, Kerala2KMCT Medical College Hospital, Manassery P.O, Kozhikode, Kerala
*Corresponding Author: [email protected]
ABSTRACT
Lipoprotein metabolism disorder is most common in type 2 diabetic patients and is known as diabetic dyslipidemia. It is characterized by increased total cholesterol, increased triglycerides (TG), increased low density lipoprotein cholesterol (LDL-C) and decreased high density lipoprotein cholesterol (HDL-C). It has been suggested that hyperuricemia in diabetic dyslipidemic patients lead to cardiovascular complications. Aim of the study was to analyze the correlation between various lipid parameters and uric acid level among patients with diabetic dyslipidemia.Study was conducted as a prospective observational study among 165 patients with diabetic dyslipidemia who attended the cardiology clinic from January-June 2016 in a tertiary care teaching hospital. Out of 165 patients, 103 were selected as case group and 62 as control group randomly. Uric acid level and lipid profile was determined according to standard procedure. Pearson correlation was used to assess the association of uric acid with lipid parameters. The TG, HDL-C and LDL-C values showed a more significant association with uric acid levels in cases when compared with control. From this study, it is concluded that increased levels of serum uric acid are associated increased levels of TG, LDL-C and decreased levels of HDL-C.
Key words: Lipid profile, Diabetic dyslipidemia, Uric acid, Triglycerides
INTRODUCTION
Hyperuricemia and dyslipidemia are associated with increased risk in cardiovascular patients with type 2 diabetes mellitus. Uric acid is recognized as one of the major risk factor in the development of metabolic syndrome, coronary artery disease and diabetes mellitus1. It was since 1950s; a strong association between uric acid levels and cardiovascular diseases has been reported. This association has further made it difficult to understand whether uric acid had a causal role in these conditions or was it a marker for those individuals who are at risk. There are several studies showing the association between different lipid parameters and serum uric acid levels but there are only few studies from India. Hyperuricemia is a proinflammatory endocrine imbalance mediator in the adipose tissues leading to atherogenesis2. Hyperuricemia and cardiovascular disease arise through the non-causal relationship with
the insulin resistance syndrome. LDL oxidation is a key process in atherosclerosis, which is promoted by uric acid by stimulating granulocyte adhesion to endothelium. Non enzymatic glycosylation of LDL is promoted by increased glycaemia which in turn is phagocytosed into the arterial wall. Phagocytosed uric acids can transverse through to dysfunctional endothelium leading to plaque formation3. It is also observed that in insulin resistant individuals, hyperinsulinaemia imposes an antiuricosuric effect on the kidney. The aim of this study was to assess the correlation between uric acid and different lipid parameters in type 2 diabetic dyslipidemic patients which might pave the way for an intervention at modifying the lipid parameters and uric acid levels to reduce further cardiovascular complications.
Received Date: 15.06.2017 Accepted Date: 30.06.2017
ISSN 0975-3532RESEARCH ARTICLE
Indexed in Google Scholar, Open Access, Academic Keys, SJIF*, Scientific Indexing Services, Research bible, GIF*, Directory of Research Journal Indexing, Index Copernicus International, Indian Citationindex

19
International Journal of Pharma Research - Volume 8 : 1 January - June 2017
Methodology
This is a prospective observational study which was conducted in cardiology department of a tertiary care teaching hospital after getting the IEC approval (NCP/IEC/2016/NO.021) from a period of six months (January-June 2016). A total number of 165 patients with diabetic dyslipidemia were enrolled in the study based on predetermined inclusion and exclusion criteria. Cardiovascular disease patients aged 30 years or more who were diagnosed to have both diabetes and dyslipidemia including those newly diagnosed with dyslipidemia and who are already on hypolipidemia therapy with a lipid profile of LDL-C >100mg/dl, total cholesterol >200mg/dl, HDL-C <40mg/dl and >60mg/dl and serum triglycerides >150mg/dl or change in any one of the above lipid parameters, as per NCEP ATP III guidelines. Pregnant women and lactating mothers and mentally retarded were excluded from the study. All the required study materials (informed consent document, patient information sheet, patient information leaflet and data entry form) were designed. Out of 165 patients, 103 were selected as case and 62 as control randomly. Uric acid level and lipid profile were determined and correlated using Pearson coefficient test. The correlation analysis was done for calculating the association between various lipid parameters and uric acid level. The correlation coefficient and its p value were found out.
Results
In our study 165 patients were enrolled as per inclusion and exclusion criteria. After statistical analysis of the collected data, the following results were obtained.
Age and gender wise categorization:
Table no: 1 - Frequency and percentage distribution of gender and age
AGE (Years)
CASE CONTROL
MALE FEMALE MALE FEMALE
30-39 0 (0%) 1 (0.97%) 1 (1.6%) 0 (0%)40-49 10 (9.7%) 1 (0.97%) 4 (6.45%) 1 (1.6%)50-59 18 (17.47%) 7 (6.79%) 11 (17.7%) 5 (8.06%)60-69 25 (24.27%) 9 (8.73%) 16 (25.8%) 7 (11.3%)70-79 15 (14.56%) 10 (9.7%) 8 (12.9%) 4 (6.45%)80-89 4 (3.88%) 3 (2.9%) 2 (3.22%) 2 (3.22%)90-99 0 (0%) 0 (0%) 0 (0%) 1 (1.6%)
The above table depicts shows the frequency and percentage distribution of age and gender in both case and control. The age was categorized in to 7 groups ranging from 30-39yrs, 40-49yrs, 50-59yrs, 60-69yrs, 70-79yrs, 80-89yrs and 90-99yrs. When we consider the case group, the maximum number of patients were males found in an age group between 60 and 69yrs. In the case of females, the maximum number of patients were found to be in an age group between 70 and 79yrs. In an age group between 90 and 99yrs, the least number of patients were found. When we consider the control group, the maximum number of patients were males found in an age group between 60-69yrs, followed by maximum number of females in the same age group. In the age groups 30-39yrs and 90-99yrs, the least number of patients were found.
Mean values of lipid levels and uric acid:
Table no: 2 - Mean values of lipid levels and uric acid
In our study 165 patients were enrolled as per inclusion and exclusion criteria. After statistical analysis of the collected data, the following results were obtained.
Age and gender wise categorization:
Table no: 2 - Mean values of lipid levels and uric acid
MEAN VALUES CASE GROUP CONTROL GROUP
TG 156.59±40.77mg/dL 106.82 ±20.6mg/dL
TC 186.64±50.81mg/dL 184.85±54.51mg/dL
HDL - C 31.78±8.26mg/dL 31.28±7.77mg/dL
LDL - C 164.83±38.47mg/dL 144.95±25.88mg/dL
URIC ACID 8.85±0.54mg/dL 6.73±0.64mg/dL
From the above table the mean values of lipid parameters and the serum uric acid level in both case and control group are evident . When we consider the case group, the mean TG, TC HDL-C, LDL-C and uric acid levels were found to be as 156.59±40.77mg/dL, 186.64±50.81mg/dL, 31.78±8.26mg/dL, 164.83±38.47mg/dL and 8.85±0.54mg/dL respectively. When we consider the control group, the mean TG, TC HDL-C, LDL-C and uric acid levels were found to be as 106.82 ±20.6mg/dL, 184.85±54.51mg/dL, 31.28±7.77mg/dL, 144.95±25.88mg/dL and 6.73±0.64mg/dL respectively.
20
International Journal of Pharma Research - Volume 8 : 1 January - June 2017
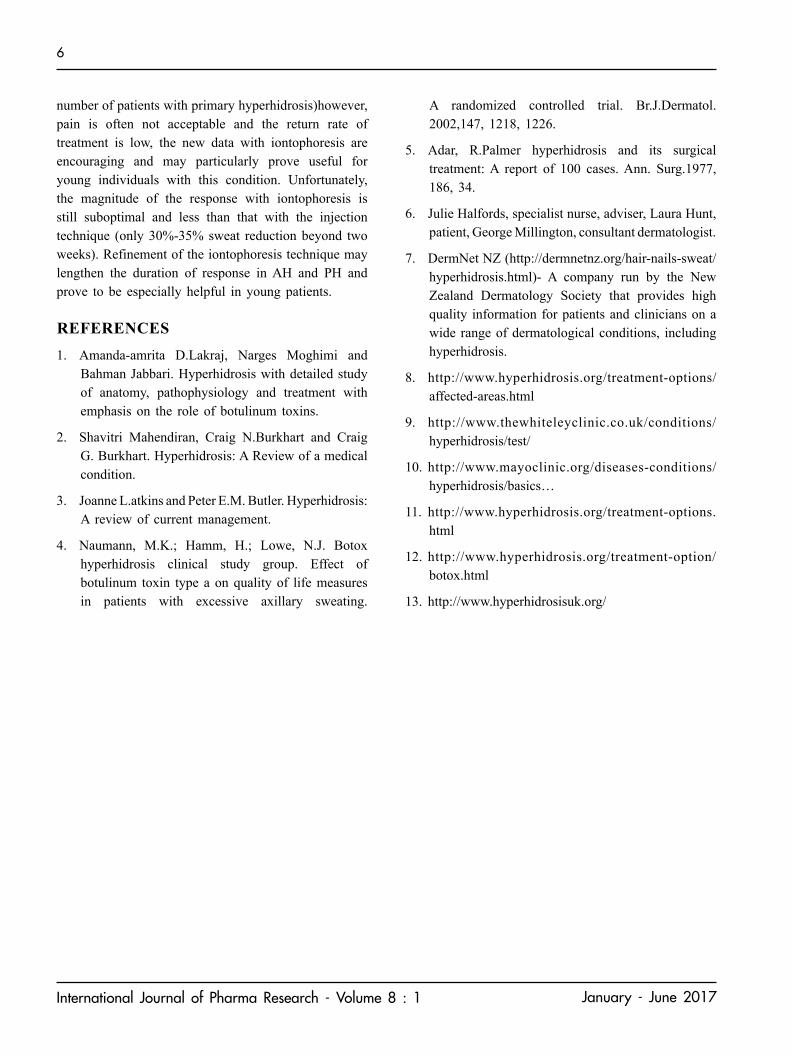
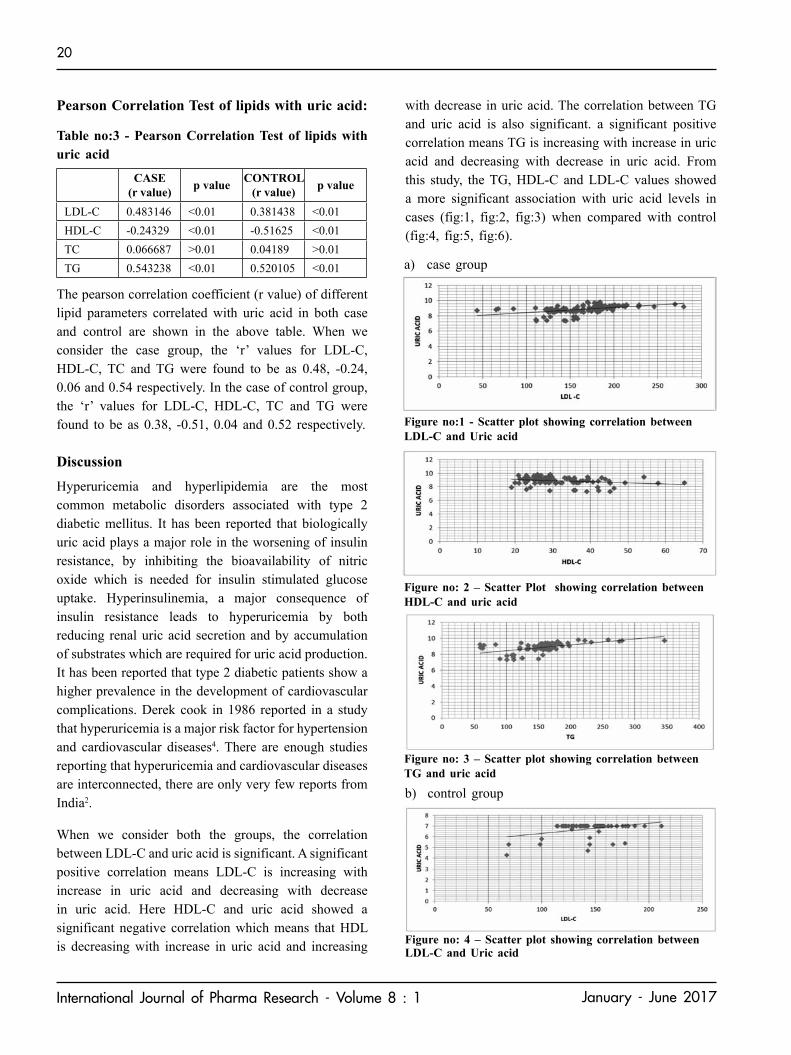
Pearson Correlation Test of lipids with uric acid:
Table no:3 - Pearson Correlation Test of lipids with uric acid
CASE (r value) p value CONTROL
(r value) p value
LDL-C 0.483146 <0.01 0.381438 <0.01HDL-C -0.24329 <0.01 -0.51625 <0.01TC 0.066687 >0.01 0.04189 >0.01TG 0.543238 <0.01 0.520105 <0.01
The pearson correlation coefficient (r value) of different lipid parameters correlated with uric acid in both case and control are shown in the above table. When we consider the case group, the ‘r’ values for LDL-C, HDL-C, TC and TG were found to be as 0.48, -0.24, 0.06 and 0.54 respectively. In the case of control group, the ‘r’ values for LDL-C, HDL-C, TC and TG were found to be as 0.38, -0.51, 0.04 and 0.52 respectively.
Discussion
Hyperuricemia and hyperlipidemia are the most common metabolic disorders associated with type 2 diabetic mellitus. It has been reported that biologically uric acid plays a major role in the worsening of insulin resistance, by inhibiting the bioavailability of nitric oxide which is needed for insulin stimulated glucose uptake. Hyperinsulinemia, a major consequence of insulin resistance leads to hyperuricemia by both reducing renal uric acid secretion and by accumulation of substrates which are required for uric acid production. It has been reported that type 2 diabetic patients show a higher prevalence in the development of cardiovascular complications. Derek cook in 1986 reported in a study that hyperuricemia is a major risk factor for hypertension and cardiovascular diseases4. There are enough studies reporting that hyperuricemia and cardiovascular diseases are interconnected, there are only very few reports from India2.
When we consider both the groups, the correlation between LDL-C and uric acid is significant. A significant positive correlation means LDL-C is increasing with increase in uric acid and decreasing with decrease in uric acid. Here HDL-C and uric acid showed a significant negative correlation which means that HDL is decreasing with increase in uric acid and increasing
a) case group
Figure no:1 - Scatter plot showing correlation between LDL-C and Uric acid
Figure no: 2 – Scatter Plot showing correlation between HDL-C and uric acid
Figure no: 3 – Scatter plot showing correlation between TG and uric acid
b) control group
Figure no: 4 – Scatter plot showing correlation between LDL-C and Uric acid
with decrease in uric acid. The correlation between TG and uric acid is also significant. a significant positive correlation means TG is increasing with increase in uric acid and decreasing with decrease in uric acid. From this study, the TG, HDL-C and LDL-C values showed a more significant association with uric acid levels in cases (fig:1, fig:2, fig:3) when compared with control (fig:4, fig:5, fig:6).

21
International Journal of Pharma Research - Volume 8 : 1 January - June 2017
Many Previous studies also had reported similar results. A study which was conducted to understand the relationship between Hyperuricemia and Dyslipidemia in type 2 diabetes mellitus patients reported a significant positive association between TG,LDL-C with uric acid and negative correlation with HDL-C and uric acid4. There are reports that in diabetic group, a direct association exist between TG and uric acid and an inverse association with HDL-C and uric acid. Multiple regression analysis were also further performed by adjusting the age, sex and BMI. The significant positive association between TG and uric acid level and the significant negative correlation between HDL-C and uric acid levels were retained5. A study which was conducted to verify the association of uric acid level with lipid profile reported a significant positive correlation between uric acid with TG and LDL and a significant negative correlation between uric acid and HDL2. There are also reports of hypertriglyceridemia in hyperuricemic patients. There are various studies that proved HDL-C is inversely correlated and LDL-C is directly correlated with uric acid levels resulting in major cardiovascular events6. A study aimed at estimation of lipid profile in assamese population also reported a significant positive correlation between uric acid and TG, uric acid and LDL-C and a significant negative correlation between HDL-C and uric acid level7. A study conducted on determining the prevalence of hyperuricemia and its correlation with different cardio vascular risk factors
Figure no: 5 – Scatter plot showing correlation between HDL-C and uric acid
Figure no: 6 - Scatter plot showing correlation between TG and uric acid
reported an increased the positive significant correlation between LDL-C and uric acid, TG and uric acid but a negative significant correlation between HDL-C and uric acid in cases when compared to control group. As uric acid possess antioxidant activity in the serum, its level rises as a compensatory mechanism in case of an increased oxidative stress under atherosclerosis or metabolic syndrome8. There are similar findings suggesting that the association between uricemia and lipid ratios is a useful marker for assessing the progress of cardiovascular diseases. It was reported that serum uric acid levels were significantly increased in those patients with coronary artery disease in comparison with healthy controls. A positive correlation was found between uric acid levels and coronary artery disease. It was also found that for those patients suspecting CAD, who had undergone coronary angiography, the serum uric acid levels were above the normal range (7mg/dl) which is in association with stable plaques. This confirms that uric acid is a good marker for ruling out atherosclerosis9. HDL-C which is considered as the protective factor for CAD risk is inversely associated with serum uric acid levels, whereas the relation between TG and uric acid levels were found to be linear owing to genetic predisposition. There are studies suggesting that many pathophysiological mechanisms are associated with the risk of CVD. This might be increased by elevated uric acid levels. The study also concluded that high preference should be given for the monitoring of lipid disorders and uric metabolism in patients with multiple risk factors for CVD10. Hypertriglyceridemia and hyperuricemia are associated with insulin resistance syndrome. This is a complicated association and many studies have been conducted to find the mechanisms of this syndrome. Uric acid production is related to Glycolysis which is controlled by insulin Phosphoribosylpyrophosthate(PPRP) it's an important metabolite whose De novosynthesis is accelerated by Tg synthesis through the common metabolic pathway of NADP-NADPH resulting in increase uric acid production. The availability of PPRP depends on ribose-5-phosphate(R5P) and the production is controlled by Glycolytic flux. when there is a diversion of Glycolytic intermediate towards R5P, PPRP and uric acid will follow when there is a reduce activity of GA3PDH(Glyceraldehyde 3 phosphate dehydrogenase), which intern is regulated by

22
International Journal of Pharma Research - Volume 8 : 1 January - June 2017
insulin. an accumulation of Glycerolphosphate may also increase SerumTG. thus, the association between insulin resistance, Hyperuricemia and Hyperpriglyceridemia is explained by the defect and lose of responsiveness of GA3PDH insulin. The association of HDLC with uric acid level is also due to insulin resentence syndrome11,12.The sample size as well as study period of the present study was small, declining the multivalent approach for including additional factors and comorbidities that modify the serum uric acid and lipid levels.
ConclusionHyperuricemia and dyslipidemia are significantly associated with type 2 diabetes mellitus. It has been found that the lipid parameters such as LDL-C and TG showed a significance increase and HDL-C showed a significant decrease in hyperuricemic condition. Hyperuricemia is an indicator of oxidative stress in the body.This study concluded that routine monitoring of lipid profile and uric acid level is needed in diabetic dyslipidemic patients to reduce future cardiovascular complications.
AcknowledgementI thank Dr. Anil Babu A and Dr.Shafeeq Matummal for their encouragement and support in the execution of this study. I also thank my co authors who helped me with the data collection, editing of this paper and other activities, all the staffs of cardiology department who helped us throughout the conduct of the study and our beloved patients for their cooperation.
REFERENCES1. Devi Manjula A.J, Sridevi S. Correlation between
serum uric acid levels and non HDL cholesterol in type II diabetes mellitus- An observation study. International Journal of Pharma and Bio Sciences. April 2014;5(2):696-701
2. SarmahDevajit, Sharma Booloo. A correlative study of uric acid with lipid profile. Asian Journal of Medical Science 2013;4(2):8-14
3. H. ElabidEldienBadr, Ahmed. M. Samia, H. Elhassan Salma, Yousif. O. Sara. Plasma uric acid and lipid profile among Sudanese with type 2 diabetes in Khartoum state, Sudan. European International Journal of Science and Technology. April 2014;3(3):1-6
4. K S Suryawanshi, Dr. P E Jagtap, Dr. G J Belwalkar, Dr. S P Dhonde,Dr. V P Mane, Dr. S J More. SSRG International Journal of Medical Science May 2015;2(5):3-10
5. Kim Hyun Eui et al, Bae Hyun Kwi et al, Jeon Han Jae et al, Choi Kyung Yeon et al, Kim Kyung Mi et al, Kim Soon Hye et al. Relation between uric acid and lipid profiles in patients with type 2 diabetes.18th European Congress of Endocrinology.28-31 May 2016. Munich, Germany
6. Bendek TG. Correlation of serum uric acid and lipid concentrations in normal, gouty and atherosclerotic men. Ann Int Med.1967;66:851-861
7. Das Madhumita, Saikia M. Estimation of lipid profile in Assamese population. Indian Journal of Clinical Biochemistry. 2009;24(2):190-193
8. El- Yassin D Hedef, Al-Sharifi A Zainab, Al-JebuoriSuhair. Prevalence of hyperuricemia and its correlation with cardiovascular risk factors in Iraqi subjects of Karbalaa city. Fac Med Baghdad. 2012;54(1):83-87
9. Sathiya R et al, VeluKuzhandai V et al, Niranjan G et al, Srinivasan A R et al, Amritha B Ganesh et al, Ramesh R et al. A comparative study of serum uric acid levels and lipid ratios in coronary artery disease patients. International Journal of Biomedical Science. June 2014;10(2):124-128
10. Peng Chun Tao et al, Wang Chung-Ching et al, Kao Tung-Wei et al, Chan Yi-Hsin James et al, Yang Ya-Hui et al, Chang Yaw-wen et al. Relationship between hyperuricemia and lipid profiles in US adults. Biomed Research International. 2015. Article ID 127596. http://dx.doi.org/10.1155/2015/127596
11. Chen li-ying et al, Zhu wen-hua et al, Chen zhou-wen et al, Ren jing-jing et al. Relationship between hyperuricemia and metabolic syndrome. Journal of Zhejiang University science B. August 2007;8(8)593-598
12. Nejatinamini sara et al, Ataie-jafari afal et al , Qorbani mostafa et al, Nikoohemat shideh et al. Association between serum uric acid level and metabolic syndrome components. Journal of diabetics' and metabolic disorders 14;70

23
International Journal of Pharma Research - Volume 8 : 1 January - June 2017
Formulation and Evaluation of Bi-Layer Tablet Containing Nimesulide with Calcium for Rheumatoid Arthritis
Saravanan S and Saba Maanvizhi*Faculty of Pharmacy, Sri Ramachandra University, Porur, Chennai - 600 116.
*Correspondence to : [email protected]
ABSTRACT
Rheumatoid arthritis is type of autoimmune disorder that causes chronic inflammation of the joints and other areas of the body. The objective of this present work was to design and develop an optimized oral solid dosage form of double layer or bi-layer formulation especially for rheumatoid arthritis using nimesulide and calcium by direct compression method. In this work, nimesulide and calcium carbonate (equivalent to calcium) were formulated as immediate release bi-layer tablet. The physicochemical parameters of the formulated bi-layer tablets were carried out as per standard procedure. FTIR study was conducted to know about drug-polymer interaction and it was found that there was no interaction was observed between polymer and drug. USP dissolution apparatus-I (basket method) using pH 7.4 phosphate buffer, were used to carry out the In vitro dissolution studies. The batch which showed a release rate of more than 90% was considered as optimized bi-layer formulation.
Key words: Bi-layer, nimesulide, calcium carbonate, rheumatoid arthritis.
INTRODUCTION
Nimesulide is cyclooxygenase enzyme-II (COX-II) selective inhibitor, nonsteroidal anti-inflammatory drug (NSAID) with antipyretic and analgesic properties. Nimesulide, is a pharmaceutical favored drug of choice for rheumatoid arthritis. Calcium is essential for bodies for overall nutrition and maintenance of health mainly for proper bone formation and it keeps bones strong, thereby supporting skeletal structure, and functions. Usually calcium supplement pill provides 200 to 400 mg of calcium, with starting dose of 500 mg a day for a week and then further dose can be increased if required. Roughly it is around 71mg per day, but in this formulation 50 mg equivalent dose from calcium carbonate is taken as a starting dose, later if necessary it can be added more. Suitable method to prepare bi-layer tablet is direct compression method because it have several merits such as (i) Direct compression method was suitable for heat sensitive, moisture sensitive APIs (Active Pharmaceutical Ingredient). (ii) It facilitates the formulation of tablet by eliminating wetting and drying step. Poorly soluble API formulated by direct compression process, the API particle adhered on the
surface of excipient so it’s directly comes into contact with dissolution fluid and facilitate faster drug release compared to tablet formulated by wet granulation process. Starch was usually sued in tablet formulation by wet granulation technique, starch was modified in the form starch phosphate. Modified form of starch phosphate was also reported as promising directly compressible vehicle in direct compression method [1]
[2] [3] [4].
The objective of this study was to design immediate release bi-layer tablet for rheumatoid arthritis using nimesulide and calcium by direct compression methods.
2. Materials and methods:
Materials
Nimesulide (NMS) was a gift samples from Intermed Pharmaceuticals, Chennai. All the materials used in the study were procured from commercial sources. All the reagents & chemicals used in this study were of analytical and pharmaceutical grade.
Received Date: 22.11.2016 Accepted Date: 30.06.2017
ISSN 0975-3532 RESEARCH ARTICLE
Indexed in Google Scholar, Open Access, Academic Keys, SJIF*, Scientific Indexing Services, Research bible, GIF*, Directory of Research Journal Indexing, Index Copernicus International, Indian Citationindex

24
International Journal of Pharma Research - Volume 8 : 1 January - June 2017
Formulation of the bi-layer tablets
Bi-layer tablet was formulated by the direct compression method as per the formula given in Table No. 1. Initially the drug and polymers for both layers were passed through sieve # 40 and then all the excipients and API were taken in a closed polyethylene bag except magnesium stearate. The ingredients were mixed thoroughly up to 15 minutes in a poly bag, after mixing magnesium stearate were added and powder was lubricated, required quantity of blend sample were taken for blend analysis and the remaining blends were loaded into the compression machine. The lubricated blend were compressed into a bi-layer tablet on a tablet compression machine (Invika tablet compression machine (Jaguar, India)) by feeding the blend in a hoper, using 10.5 mm concave punches [5][6][7[8].
Evaluation of pre compression parameters of the lubricated blend:
Angle of repose (AOR):
Angle of repose used to measure the flow behavior of powder to enhance the proper filling of die cavity in tablet compression process, improper filling causes the weight variation, hardness, and thickness problem.
The AOR was calculated by using the formula given below [9] [10] [11].
AOR = tan-1 (height of pile / radius of the base of the pile)
Bulk density and Tapped density:
The volume before tapping was used to determine the bulk density while the volume after tapping was
Table No. 1 - Material used per tablet
S.No. Nimusulide layer Quantity used Calcium layer Quantity
used1. Nimusulide 100 mg Calcium carbonate (Equivalent to calcium) 50 mg2. Microcrystalline cellulose powder 30 mg Microcrystalline cellulose powder 20 mg3. Stearic acid 1.5mg Stearic acid 10mg4. Starch 24 mg Starch 13 mg5. Magnesium stearate 0.5 mg Magnesium stearate 1 mg6 Sunset red q.s
Theoretical calculation :Average weight of tablet : 250 mgAverage weight of nimesulide layer : 156 mg Average weight of calcium layer : 94 mg
employed to determine the tap density mathematically. Weighted quantity of blend was transferred into 100 ml glass measuring cylinder, volume (ml) occupied by powders was noted down. Bulk density can be calculated by dividing the weight of granules (g) by bulk volume (cm3) using the following formula [12] [13].
Bulk Density = Weight of powders (g) / Volume (cm3/ml/cc)
Then cylinder was subjected to 500/750 taps in tapped density tester. Tapped density was calculated using below formula
Tapped Density = Weight of powders (g) / Tapped volume (cm3/ml/cc)
Specific bulk volume (bulkiness):
Specific bulk volume is the reciprocal of bulk density and it is expressed by cm3/g. It is an important consideration in the packaging of powders and calculated by below formula
Bulkiness = 1/Bulk density
Compressibility index (CI) and Hausner’s ratio (Hrs):
The CI of the powder blend was determined by calculation. The Hausners ratio is a number that is correlated to the flow ability of a powder/granular material CI & Hausners ratio was very popular as well as fast methods to predict the characteristics of lubricated blend. The data of tapped density and bulk density were used to

25
International Journal of Pharma Research - Volume 8 : 1 January - June 2017
calculate the CI & the Hrs to provide a measure of the flow properties and compressibility of the powders [14] [15].
Hausner’s ratio (Hrs) = tapped bulk density / untapped bulk density
Carr’s CI can be calculated by
CI (%) = bulk density (tapped) – bulk density (untapped) / bulk density (tapped) x 100
The pre-compression parameters of the lubricated blends of bi-layer formulations clearly presented in Table No. 2.
Table No. 2 - Flow property characterizationS.No. Characterization Results
1. Angle of repose of nimesulide layer 25.5
2. Angle of repose of calcium layer 27.9
3. Bulk density (gms/ml) 0.4953
4. Tap density (gms/ml) 0.5946
5. Bulkiness(ml/gms) 1.9788
6. Hausner’s ratio 1.2190
7. Compressibility index (%) 16.6668
8. Flow character Fair
Evaluation of post compression parameters of the powder tablet:
The tablets were evaluated for various parameters such as friability, hardness, shape, appearance of bi-layer, drug content uniformity, weight variation etc. Nearly 10 times all the parameters were evaluated to get accurate results.
General Appearance: The visual identity & overall “elegance” is important of tablet formulation to prevent patient compliance. Nimesulide is dull in color so to promote the appearance of nimesulide layer sunset red mixed with nimesulide layer blend and formulated. The pictorial representation of general appearance of tablet was shown in Figure 1 & 2.
Shape & Size: The shape & size of the tablet can be dimensionally described and visualized.
Weight variation:From the formulation 20 tablets were individually weighed and weight was noted and weight of tablets 20 tablets was noted to calculate average weight. Weight variation was calculated by data of individual weight was compared with average weight data. The percentage (%) difference in the weight variation should be within the acceptable limits (±7.5%). The percentage (%) deviation was calculated using the following formula.
Negative deviation = Miw – Aw x 100 Aw
Positive deviation = Maw - Aw x 100 Aw
Where Miw = Minimum weight, Aw = Average weight, Maw = Maximum weight
Tablet thickness: Tablet thickness plays an important role in tablet packing and transportation, tablet with less thickness cause the tablet shacking inside of packing results may be damage or breaking of tablets and uneven thickness of tablet results cannot fit into the packing cavity. Randomly Ten tablets were taken from formulation and their thickness was measure using screw gauge and noted in millimeter (mm).
Hardness test (Crushing strength):
Tablets were taken randomly and the crushing strength of ten tablets was checked using the Monsanto hardness tester. The results were expressed as average values in kg/cm2 [16] [17] [18] [19].
Friability:
Friability is the one of quality test where the solid substance of tablet break into a smaller pieces under specified distance. As per USP the tablets equivalent to 6.5 gram subjected into friability test. Friability of tablet was determined by Rocha friability tester. A sample of pre-weighed tablets was placed in friabulator. The friabulator apparatus was operated for 100 revolutions. After operation the tablet were de-dusted by lint free cloth and reweighed [20] [21] [22]. Friability values were determined and reported in Table No. 3. Figure: 1 Figure: 2

26
International Journal of Pharma Research - Volume 8 : 1 January - June 2017
Table No. 3 -Bi-layer tablet characterization
S.No. Average weight (mg)
Weight variation(mg) Thickness (mm) Hardness
(kg/cm2)Friability
(%)Disintegration
Time (Minutes)1. 251.6
250±3.56
7.14 6.5 0.35 5 min 16 sec2. 248.4 7.19 7.0 0.15 5 min 47 sec3. 246.9 7.05 6.5 0.20 6 min 06 sec4. 253.6 7.24 8.0 0.31 6 min 23 sec5. 254.5 7.06 6.0 0.27 6 min 37 sec6. 251.4 7.17 8.0 0.29 5 min 49 sec7. 254.9 7.07 6.5 0.15 5 min 07 sec8. 247.5 7.16 7.5 0.19 5 min 45 sec9. 253.5 7.24 8.0 0.27 5 min 41 sec10. 249.8 7.07 6.5 0.24 6 min 06 sec
The percentage friability was determined by the following formula:
% friability = Wbt –Wat x 100 Wbt
Wbt = Weight of tablet before test, Wat = Weight of tablet after test,
Disintegration time: This test is used to assure whether the formulated tablet is disintegrating with the prescribed time when placed in a liquid medium. One tablet was placed in each tubes of the disintegration test basket and assembly was suspended in the water maintained at 37±20C. The apparatus was operated till all residue passes through the mesh and the time taken values was noted down. he time taken should not be more than 15 minutes. If the tablet adheres to disk, the test should be repeated omitting the disk [23] [24] [25].
In vitro drug release study:Apparatus : USP dissolution apparatus I (basket type)Temperature (0C) : 370C ±20CRPM : 50 rpmDissolution media : Phosphate buffer pH 7.4Media volume : 900 ml
UV- Spectrophotometer condition (for nimesulide): Blank : pH 7.4 phosphate bufferDetection : 230 nmCell : 10 mm
The prepared bi-layer tablets were placed in 900 ml of dissolution media and the temperature of the medium was maintained at 370±20C. Dissolution study was carried out for 45 minutes. 20 ml of sample solution were taken from the dissolution jar at each sampling point and 20 ml of pH 7.4 phosphate buffer of dissolution media was replaced in a dissolution jar in order to maintain sink condition. Final solution was filtered by using whatmann filter paper and absorbance was measured at 230 nm using UV spectrophotometer. Percentage (%) drug release of nimesulide was calculated using standard graph and the data plotted for the percentage of drug release Vs time is depicted in Figure: 4.
Figure: 4 – Dissolution Profile for the best formulation of Nimesulide bilayer tablet

27
International Journal of Pharma Research - Volume 8 : 1 January - June 2017
Study of Dissimilarity (f1) and Similarity (f2) Factors:
It is the statistical comparison of dissolution data was carried out using dissimilarity (f1) and similarity (f2) factors. The comparison of in vitro dissolution profiles of formulation with innovator was calculated and it was shown in Table No. 5.
Table No. 4 – Standard Curve of nimesulide in pH 7.4 phosphate buffer
Concentration Absorbance5 0.17548 0.27969 0.309110 0.309111 0.346912 0.379015 0.5210
Table No. 5 - Dissolution profile of NimesulideS.No. Time in minutes Percentage drug release
1. 5 13.72. 10 45.83. 15 78.64. 20 94.25. 30 98.66. 45 98.9
f1 2.83f2 77.17
In this formulation, calcium was added as a food grade to the patients so no need to estimate it separately [26]
[27] [28] [29].
Assay:
Preparation of standard solution:
20 mg of nimesulide were dissolved with acetone up to 50 ml in a volumetric flask and filtered and estimated in an UV spectrophotometer at a wavelength of 230 nm.
Preparation of test solution:20 tablets were taken randomly and crushed in dried mortar to a fine powder. Powder equivalent to 20 mg of nimesulide was taken out from the mortar and dissolved in 50 ml of acetone in a volumetric flask, up to 60% of flask volume was taken initially and kept in a sonicator
for 5 minutes and then final volume was made with acetone in a standard flask, finally the solution was centrifuged and the supernatant solution was used for the estimation of nimesulide in a spectrophometer at a wavelength of 230 nm [30] [31] [32].
3. Results and Discussion
In the present work, an attempt had been made to design and develop an immediate release tablet using nimesulide with calcium for rheumatoid arthritis (150mg together). The results expressing that optimized batch lubricated blend exhibited fair flow characteristics. The formulated tablets were evaluated for post compression parameters and all the studies were expressed in triplicate. Appearance of bi-layer tablet was presented in Figure:1 & Figure:2 and it clearly indicates that the bi-layer was white in color in one side and another side was slightly reddish-orange in color with good appearance and smooth surface of the bi layer tablet indicating particles size of excipients was distributed uniformly in the formulation. The weight variation results present in the range of 249 mg to 270 mg for bi-layer tablets indicating that the percentage(%) deviation in weight variation from average value for the formulated tablet were within limit. The thickness (mm) of the formulated bi-layer tablet were found in range of 7.05 mm and 7.24 mm. The crushing strength test was carried out using monsanto hardness tester. The crushing strength of the formulated tablets was found to be uniform and moreover within acceptance limit (6-8 kg/cm2) the results indicates that the formulated bi-layer tablets are mechanically stable. Friability was performed and results was found to be less than 1% and within specified limits, and it ensures that the ability of tablet to withstand shocks and also suitable for better shipment and transport. Disintegration data was displayed in Table No: 4 indicated that the formulated tablet has fast disintegration release and complies within standard limits. The in vitro drug release profiles of prepared bi-layer tablet are displayed in Table No: 5 and clearly depicted in the form of figure 4. It was shown that the maximum drug was released at the 15 minutes. 98% and 102% of API (nimesulide) was found in the formulation and it showing ±3% variation and this value ensures good uniformity of the API content in the tablets.

28
International Journal of Pharma Research - Volume 8 : 1 January - June 2017
4. ConclusionCombined drug therapy (CDT) is favoring for most of the treatment and the goal of the therapy is to decrees or reduce dose dependent adverse drug reactions (ADR) and side effects. Patients who may have swallowing difficulties for that patients CDT is additional benefits of fewer pills for older adults. The present work an attempt to design bi-layer tablet for arthritics patients using nimesulide and calcium. Nimesulide is to treat pain during arthritics and calcium necessary mineral here calcium plays a role as essential nutrient for human and to keep bones strong. Bi-layer tablet of nimesulide and calcium was formulated with suitable excipients by direct compression method. Formulated bi-layer tablet were looking circular flat faced, one layer was off white and another layer was orange coloured with smooth surface,. Physicochemical parameters of bi-layer tablets were performed and it has shown a good drug release profile. The work reveals that the nimesulide and calcium are a good candidate for lowering the pain in rheumatoid arthritics, Osteoarthritis, & other severe pain syndromes patients when given in combination with minimal dose. Pattern like one layer of the formulation as immediate release to get quick relief from the pain and second layer to deliver the essential minerals without forming complex with API is unique and it is well achieved and helped to reduce patient compliance. However, stability studies and further clinical trials are needed to improve the tablet formulation by quality wise as well as efficacy wise.
REFERENCES
1. Polidori G, Titti G, Pieragosti P, Comito A, Scaricabrozzi I. A comparison of nimesulide and paramcetamol in the treatment of fever due to inflammatory disease of the upper respiratory tract in children. Drugs. 1993:46; 231-3.
2. Cunietti E, MontiM,Viganoa A, D’Aprile E, Saligari A, Scafuro E, Scaricabrozzi I. Nimesulide in the treatment of hyperpyrexia in the aged. Double-blend comparison with paracetamol.Arzneimittelforschung. 1993 Feb: 43;160-1
3. Ijaz H, Qureshi J, Danish Z, Zaman M, Abdel-Daim M, Hanif M, Waheed I, Mohammad IS. Formulation
and in-vitro evaluation of floating bilayer tablet of lisinopril maleate and metoprolol tartrate. Pak J Pharm Sci. 2015 Nov; 28(6):2019-25.
4. Abebe A, Akseli I, Sprockel O, Kottala N, Cuitiño AM. Review of bilayer tablet technology.Int J Pharm. 2014 Jan 30; 461(1-2):549-58.
5. Dey S, Mahanti B, Khila S, Mazumder B, Gupta SD. Formulation development and optimization of bilayertablets of aceclofenac. Expert Opin Drug Deliv. 2012 Sep; 9(9):1041-50.
6. Oh JH, Eun Lee J, Jeong Kim Y, Oh TO, Han S, JeonEK, Shin K, Kim DH, Hye Park C, Lee YJ. Designing of the fixed-dose gastroretentivebilayer tablet for sustained release of metformin and immediate release of atorvastatin. Drug DevInd Pharm. 2016; 42(2):340-9.
7. Ryakala H, Dineshmohan S, Ramesh A, Gupta VR. Formulation and in vitro evaluation of bilayer tablets of nebivolol hydrochloride and nateglinide for the treatment of diabetes and hypertension. J Drug Deliv. 2015; 2015:827859.
8. Okunlola A. Design of bilayertablets using modified Dioscorea starches as novel excipients for immediate and sustained release of aceclofenac sodium. Front Pharmacol. 2015 Jan 12; 5:294.
9. Busignies V, Mazel V, Diarra H, Tchoreloff P. Development of a new test for the easy characterization of the adhesion at the interface of bilayertablets: proof-of-concept study by experimental design.Int J Pharm. 2014 Dec 30; 477(1-2):476-84.
10. He W, Huang S, Zhou C, Cao L, Yao J, Zhou J, Wang G, Yin L. Bilayer matrix tablets for prolonged actions of metformin hydrochloride and repaglinide.AAPSPharmSciTech. 2015 Apr; 16(2):344-53.
11. He W, Li Y, Zhang R, Wu Z, Yin L. Gastro-floating bilayertablets for the sustained release of metformin and immediate release of pioglitazone: preparation and in vitro/in vivo evaluation.Int J Pharm. 2014 Dec 10;476(1-2):223-31.

29
International Journal of Pharma Research - Volume 8 : 1 January - June 2017
12. Eisenacher F, Garbacz G, Mader K. Physiological relevant in vitro evaluation of polymer coats for gastroretentive floating tablets.Eur J Pharm Biopharm. 2014 Nov88(3):778-86.
13. Tiwari R, Gupta A, Joshi M, Tiwari G. Bilayer Tablet Formulation of Metformin HCl and Acarbose: A Novel Approach To Control Diabetes. PDA J Pharm Sci Technol. 2014 Mar-Apr; 68(2):138-52.
14. Dey S, Chattopadhyay S, Mazumder B. Formulation and evaluation of fixed-dose combination of bilayergastroretentive matrix tablet containing atorvastatin as fast-release and atenolol as sustained-release. Biomed Res Int. 2014; 2014:396106.
15. Khaled SA, Burley JC, Alexander MR, Roberts CJ. Desktop 3D printing of controlled release pharmaceutical bilayertablets.Int J Pharm. 2014 Jan 30; 461(1-2):105-11.
16. Franck J, Abebe A, Keluskar R, Martin K, Majumdar A, Kottala N, Stamato H. Axial strength test for round flat faced versus capsule shaped bilayertablets. Pharm Dev Technol. 2015 Mar; 20(2):139-45.
17. Busignies V, Mazel V, Diarra H, Tchoreloff P. Role of the elasticity of pharmaceutical materials on the interfacial mechanical strength of bilayertablets.Int J Pharm. 2013 Nov 30; 457(1):260-7.
18. Yang YP, Wang MY, Chang JB, Guo MT. Effect of release of hydroxyl propylmethyl cellulose on single and bilayer sustained-release matrix tablets. Beijing Da XueXueBao. 2013 Apr 18; 45(2):291-6. Chinese.
19. Klinzing G, Zavaliangos A. Understanding the effect of environmental history on bilayer tablet interfacial shear strength. Pharm Res. 2013 May; 30(5):1300-10.
20. Sohn Y, Lee SY, Lee GH, Na YJ, Kim SY, Seong I, Lee BJ, KuhHJ, Lee J. Development of self-microemulsifyingbilayertablets for pH-independent fast release of candesartan cilexetil.Pharmazie. 2012 Nov; 67(11):917-24.
21. Ranade AN, Wankhede SS, Ranpise NS, Mundada MS. Development of bilayer floating tablet of amoxicillin and Aloe vera gel powder for treatment of gastric ulcers.AAPSPharmSciTech. 2012 Dec; 13(4):1518-23.
22. Shirsand S, Suresh S, Keshavshetti G, Swamy P, Reddy PV. Formulation and optimization of mucoadhesive bilayerbuccaltablets of atenolol using simplex design method.Int J Pharm Investig. 2012 Jan; 2(1):34-41.
23. Kottala N, Abebe A, Sprockel O, Bergum J, Nikfar F, Cuitiño AM. Evaluation of the performance characteristics of bilayertablets: Part I. Impact of material properties and process parameters on the strength of bilayertablets.AAPSPharmSciTech. 2012 Dec; 13(4):1236-42.
24. Kottala N, Abebe A, Sprockel O, Bergum J, Nikfar F, Cuitiño AM. Evaluation of the performance characteristics of bilayertablets: Part II. Impact of environmental conditions on the strength of bilayertablets.AAPSPharmSciTech. 2012 Dec; 13(4):1190-6.
25. Kottala N, Abebe A, Sprockel O, Akseli I, Nikfar F, Cuitiño AM. Influence of compaction properties and interfacial topography on the performance of bilayertablets.Int J Pharm. 2012 Oct 15; 436(1-2):171-8.
26. GattaniSG, Khabiya SS, Amrutkar JR, Kushare SS. Formulation and evaluation of bilayertablets of metoclopramide hydrochloride and diclofenac sodium. PDA J Pharm Sci Technol. 2012 Mar-Apr;66(2):151-60.
27. Yang MY, Wang YL, GuoJF, Shan L, Li Y, BaiXQ, Fan YZ, Gao CS.Comparison of pharmacokinetics in beagle dogs of nimesulide bilayertablets with dispersible tablets. Drug DevInd Pharm. 2013 Jan; 39(1):156-61.
28. Yedurkar P, Dhiman MK, Petkar K, Sawant K. Mucoadhesive bilayerbuccal tablet of carvedilol-loaded chitosan microspheres: in vitro, pharmacokinetic and pharmacodynamic investigations. J Microencapsul. 2012; 29(2):126-37.
30
International Journal of Pharma Research - Volume 8 : 1 January - June 2017
29. Bi M, Kyad A, Alvarez-Nunez F, Alvarez F. Enhancing and sustaining AMG 009 dissolution from a bilayer oral solid dosage form via microenvironmental pH modulation and supersaturation.AAPSPharmSciTech. 2011 Dec; 12(4):1401-6.
30. Sousa e Silva JP, Lobo JS, BonifacioMJ, Machado R, Falcao A, Soares-da-Silva P. In-vivo evaluation of prolonged release bilayertablets of anti-Parkinson drugs in Gottingenminipigs. J Pharm Pharmacol. 2011 Jun; 63(6):780-5.
31. Podczeck F. Theoretical and experimental investigations into the delamination tendencies of bilayertablets.Int J Pharm. 2011 Apr 15; 408(1-2):102-12.
32. Chaudhary A, Tiwari N, Jain V, Singh R. Microporousbilayer osmotic tablet for colon-specific delivery.Eur J Pharm Biopharm. 2011 May; 78(1):134-40.

31
International Journal of Pharma Research - Volume 8 : 1 January - June 2017
Synthesis and Characterization of New Benzotriazole Derivatives for Possible CNS Activity
P. Swarnalatha1, G.Sridhar Babu2, L.Srikanth3*, P. S. Malathy1,B.Srinivas1, J. Venkateshwar Rao1
1Department of Pharmaceutical Chemistry, Talla Padmavathi College of Pharmacy, Warangal.2Department of Pharmaceutical Chemistry, Pragathi Pharmacy College, Jangaon, Warangal.3Department of Pharmaceutical Chemistry, Vikas College of Pharmacy, Jangaon, Warangal.
*Correspondence to : [email protected]
ABSTRACT
In view of the biological prominence of benzotriazole derivatives, it is planned to synthesize new benzotriazole derivatives. So, some new 2-(1H-benzo[d][1,2,3]triazol-1-yl)-N'-(2-substituted benzylidene) acetohydrazides (Va-Vg) have been synthesized as depicted in scheme-I. The intermediates and final compounds were purified and their chemical structures have been confirmed by IR, 1H NMR, Mass and by elemental analysis. All the newly synthesized compounds were screened for their CNS activity (Gross behavioral studies and Locomotor activity). Among the compounds tested, compound Vb with 4-Chloro substitution on the phenyl ring showed more promising depressant activity among all the test compounds followed by Vg and Ve.
Key words: Benzotriazole moiety, CNS activity, Gross behavioral studies, Locomotor activity.
INTRODUCTION
A heterocyclic is an organic compound with a ring containing one or more carbons and at least one other element, namely O, S, N. About half of the known organic compounds contain at least one heterocyclic component, thus heterocyclic compounds are very widely distributed in nature. Their functions are often of fundamental importance to living systems as they play a vital role in the metabolism of all living cells1.
Benzotriazole is a benzofused triazole moiety. Benzotriazole containing compounds have been found to possess varied applications in organic synthesis in medicines and industry as biologically active systems, as dye stuffs and fluorescent compounds, as corrosion inhibitors, as photostabilizers2. They show anticancer, antimicrobial, antifungal, anticonvulsants and antinociceptive activity. The fungicides containing triazoles are known germicides absorbed inside by plants basing on the high efficiency and the qualities of disinfecting the plants, the triazolone, triazolol have become important type of fungicides3.
A survey of literature reveals that the benzotriazole nucleus is found to have various pharmacological activities like anti-inflammatory4, antimicrobial5, antifungal6, anticancer activities7. It is also known from the literature that molecules containing benzotriazole nucleus possess CNS activity and various other pharmacological activities8. It has been considered as prime importance to take up such synthesis of new compounds containing benzotriazole nucleus with a view to get more potent compounds and screen them for CNS activity. In view of these valid observations in our present study, we reported the synthesis and screening of 2-(1H-benzo[d][1,2,3]triazol-1-yl)-N'-(2-substituted benzylidene) acetohydrazide.
Materials and methods:
The chemicals and solvents used for the experimental work were commercially procured from E. Merck, India, S.D. Fine Chem, India and Qualigens, India. Silica gel G used for analytical chromatography (TLC) was obtained
Received Date: 10.12.2016 Accepted Date: 30.06.2017
ISSN 0975-3532 RESEARCH ARTICLE
Indexed in Google Scholar, Open Access, Academic Keys, SJIF*, Scientific Indexing Services, Research bible, GIF*, Directory of Research Journal Indexing, Index Copernicus International, Indian Citationindex

32
International Journal of Pharma Research - Volume 8 : 1 January - June 2017
from S.D. Fine Chem, India. Melting points were determined in an open glass capillary using a Kjeldahl flask containing liquid paraffin and are uncorrected. The proton magnetic resonance spectra (1H NMR) were recorded on a Bruker 300 MHz instrument (Bruker, Germany) in DMSO/CDCl3 using TMS as internal standard. Chemical shifts (δ) are expressed in ppm. The infrared spectra of compounds were recorded in KBr on a FTIR- -8400S, Fourier Transform (Shimadzu), Japan infrared spectrophotometer. Mass spectra were recorded on LC-MS/MS (API-4000 TM), Applied BioSystems, MDS SCIEX (Canada).Scheme-1
Experimental
Synthesis of Benzotriazole (II) :
A mixture of O-phenylenediamene (10.8g, 0.1 mol), glacial acetic acid (11.5 ml, 0.2 mol) and 30 ml of water was taken in a 250 ml beaker. The mixture was heated slightly. The clear solution of sodium nitrite was added. The reaction mixture became warm and within 2 – 3 minutes reached a temperature of about 85oC. after cooling the resulting pale brown compound was filtered and washed thoroughly with ice-cold water9. The compound was purified by recrystallization using boiling water, m.p.; 99oC - 100oC.
Synthesis of Ethyl 2-(1H-benzo[d][1,2,3]triazol-1-yl)acetate (III) :
A mixture of benzotriazole (II, 0.01 mol), anhydrous potassium carbonate (0.02 mol) and ethylchloroacetate
(0.01 mol) in dry acetone was stirred on a magnetic stirrer for 20 hrs. The inorganic solids were filtered and solvent was removed on a rotavapour. The residue was poured onto crushed ice.
The compound thus separated was washed with cold water and recrystallized from ethanol, m.p.; 72oC, yield; 50%.
Synthesis of 2-(1H-benzo[d][1,2,3]triazol-1-yl) acetohydrazide (IV) :
A mixture of Ethyl 1H-benzotriazol-1-yl acetate (III, 0.01 mol) in ethanol (75 ml), and hydrazine hydrate (0.02 mol, 99%) was refluxed for 1.5 hrs. After cooling the resulting solid was filtered, washed thoroughly with cold water, dried and recrystallized from ethanol, m.p.; 170oC - 172oC, yield; 60%. IR (KBr)(cm-1): 3373(N-H2 str.), 3202(N-H str.), 3155 (Ar-H str.), 1687 (C=O str.), 1650-1540 (C=C str.). H1 NMR (DMSO-d6): δ 9.6, (s, 1H, CONH), 8.1-7.3 (m, 4H, Ar-H), 5.4 (s, 2H, -CH2-), 4.4 (s, 2H, -NH2). EI-MS: m/z = 191(M+).
Synthesis of 2-(1H-benzo[d][1,2,3]triazol-1-yl)-N'-(2-substituted benzylidene) acetohydrazide (Va - Vg):
Amixture of an appropriate aromatic aldehyde (0.01 mol) and 2-(1H-benzo[d][1,2,3]triazol-1-yl) acetohydrazide (IV, 0.01 mol) in methanol (50 ml) containing 3-4 drops of glacial acetic acid was refuxed on a water bath for about 30 min. and cooled. The crystalline solid which separated out during raction was filtered and recrystallized from suitable solvent(s). The products were characterized by TLC & spectral data. Seven new compounds were prepared by following the above detailed procedure and their physical data is presented in Table-1.
Physical data of 2-(1H-benzo[d][1,2,3]triazol-1-yl)-N' - (2-substituted benzylidene) acetohydrazide (Va - Vg) :

33
International Journal of Pharma Research - Volume 8 : 1 January - June 2017
Table-1
Sl.No. Compound Substituents (R)
Molecular Formula
Molecular Weight
Melting Point oC Yield %
1 Va -H C15H13N5O 281 232-234 652 Vb 4-Cl C15H12N5OCl 313 236-238 703 Vc 4-OCH3 C16H15N5O2 311 220-222 654 Vd 3-OCH3 4-OH C16H15N5O3 325 210-212 705 Ve 4-N(CH3)2 C17H18N6O 322 224-226 706 Vf 2-OH C15H13N5O2 295 218-220 607 Vg 2-Cl C15H12N5OCl 313 230-232 75
Spectral data of 2-(1H-benzo[d][1,2,3]triazol-1-yl)-N'-(phenylmethylidene) acetohydrazide (Va): m.p.; 232oC - 234oC, yield; 65%. IR (KBr)(cm-1): 3228 (N-H str.), 3142 (Ar-H str.), 1673 (C=O str.), 1623-1558 (C=C str.), 1543 (C=N str.). H1 NMR (DMSO-d6): δ 10.8, (s, 1H, NH acid hydrazide), 8.2-6.9 (m, 10H, Ar-H including benzylidine proton), 6.1 (s, 2H, -CH2-). EI-MS: m/z = 281(M+).
Spectral data of (E)-N'-(4-chlorobenzylidene)-2-(1H-benzo[d][1,2,3]triazol-1-yl)acetohydrazide (Vb) : m.p.; 236oC - 238oC, yield; 70%. IR (KBr)(cm-1): 3235 (N-H str.), 3148 (Ar-H str.), 1662 (C=O str.), 1635-1560 (C=C str.), 1540 (C=N str.), 765 (C-Cl). H
1
NMR (DMSO-d6): δ 10.2, (s, 1H, NH acid hydrazide), 8.4-7.1 (m, 9H, Ar-H including benzylidine proton), 5.8 (s, 2H, -CH2-). EI-MS: m/z = 313(M+).
Spectral data of (E)-N'-(4-methoxybenzylidene)-2-(1H-benzo[d][1,2,3]triazol-1-yl)acetohydrazide (Vc) : m.p.; 220oC - 222oC, yield; 65%. IR (KBr)(cm-1): 3230 (N-H str.), 3140 (Ar-H str.), 1660 (C=O str.), 1639-1568 (C=C str.), 1547 (C=N str.). H1 NMR (DMSO-d6): δ 10.4, (s, 1H, NH acid hydrazide), 8.6-7.4 (m, 9H, Ar-H including benzylidine proton), 5.8 (s, 2H, -CH2-), 4.4 (s, 3H, OCH3). EI-MS: m/z = 309(M+).
Spectral data of (E)-N'-(4-hydroxy-3-methoxybenzylidene)-2-(1H-benzo[d][1,2,3]triazol-1-yl)acetohydrazide (Vd) : m.p.; 210oC - 212oC, yield; 70%. IR (KBr)(cm-1): 3415 (OH str.), 3275 (N-H str.), 3152 (Ar-H str.), 1665 (C=O str.), 1630-1560 (C=C str.), 1541 (C=N str.). H1 NMR (DMSO-d6): δ 10.6, (s, 1H, NH acid hydrazide), 8.5-7.2 (m, 8H, Ar-H including benzylidine proton), 5.6 (s, 2H, -CH2-), 4.9 (s, 1H, OH), 4.1 (s, 3H, OCH3). EI-MS: m/z = 325(M+).
Spectral data of (E)-N'-(4-(dimethylamino)benzylidene)-2-(1H-benzo[d][1,2,3]triazol-1-yl)acetohydrazide (Ve) : m.p.; 224oC - 226oC, yield; 70%. IR (KBr)(cm-1): 3264 (N-H str.), 3137 (Ar-H str.), 2920 (CH3 C-H), 1658 (C=O str.), 1628-1569 (C=C str.), 1547 (C=N str.). H1 NMR (DMSO-d6): δ 10.1, (s, 1H, NH acid hydrazide), 8.4-7.1 (m, 9H, Ar-H including benzylidine proton), 5.3 (s, 2H, -CH2-), 3.8 (s, 6H, N(CH3)2). EI-MS: m/z = 322(M+).
Spectral data of (E)-N'-(4-(dimethylamino)benzylidene)-2-(1H-benzo[d][1,2,3]triazol-1-yl)acetohydrazide (Vf) : m.p.; 218oC - 220oC, yield; 60%. IR (KBr)(cm-1): 3428 (OH str.), 3258 (N-H str.), 3124 (Ar-H str.), 1652 (C=O str.), 1621-1563 (C=C str.), 1549 (C=N str.). H1 NMR (DMSO-d6): δ 10.6, (s, 1H, NH acid hydrazide), 8.2-6.8 (m, 9H, Ar-H including benzylidine proton), 5.2 (s, 2H, -CH2-), 4.6 (s, 1H, OH). EI-MS: m/z = 295(M+).
Spectral data of (E)-N'-(4-(dimethylamino)benzylidene)-2-(1H-benzo[d][1,2,3]triazol-1-yl)acetohydrazide (Vg) : m.p.; 230oC - 232oC, yield; 75%. IR (KBr)(cm-1): 3351 (N-H str.), 3135 (Ar-H str.), 1650 (C=O str.), 1625-1569 (C=C str.), 1545 (C=N str.), 762 (C-Cl). H1 NMR (DMSO-d6): δ 10.2, (s, 1H, NH acid hydrazide), 8.2-7.1 (m, 9H, Ar-H including benzylidine proton), 5.1 (s, 2H, - CH2-). EI-MS: m/z = 313(M+).
Biological EvaluationAction on Central nervous system - Gross behavioral studies :Materials : 0.1% Sodium CMC, Test compoundsInstruments : SonicatorAnimals : Mice

34
International Journal of Pharma Research - Volume 8 : 1 January - June 2017
All the seven newly synthesized compounds were screened for gross behavioral changes, continuously for 5 hrs at 1 hr interval after administration of the compounds. There after the observations were recorded intermittently for 24 hrs and compared with that of control group10.
In the behavioral profile, the animals have been observed for changes in their
I) AWARENESS• Alertness• Visual Placing• Stereotype• Passivity• Writhing
Table -2
CompoundsTime Awareness Mood
(hrs) Alertness Visual Placing Stereotype Passivity Writhing Grooming Vocalization Restlessness Irritability
Va
½ - - - + - + - - -
1 - - - + - - - - -
2 - - - + - - - - -
3 + - - + - - - - -
4 + + - + - - - - -
5 + + - - - - - - -
24 + + - - - - - - -
Vb
½ - - - + - - - - -
1 - - - + - + - - -
2 - - - + - - - - -
3 - - - + - - - - -
4 - - - - - - - - -
5 + - - - - - - - -
24 + - - - - - - - -
Vc
½ - + - + - - - - -
1 - - - + - - - - -
2 - - - + - - - - -
3 - - - - - - - - -
4 + - - - - - - - -
5 + - - - - - - - -
24 + - - - - - - - -
II) MOOD• Grooming • Vocalization• Restlessness• Irritability
The results are presented in Table-2.Gross Behavioral Studies of 2-(1H-benzo[d][1,2,3]triazol-1-yl)-N'-(2-substituted benzylidene) acetohydrazide (Va - Vg) :

35
International Journal of Pharma Research - Volume 8 : 1 January - June 2017
CompoundsTime Awareness Mood
(hrs) Alertness Visual Placing Stereotype Passivity Writhing Grooming Vocalization Restlessness Irritability
Vd
½ - + - + - - - - -
1 - - - + - - - - -
2 + - - - - - - - -
3 + - - - - - - - -
4 + - - - - - - - -
5 + - - - - - - - -
24 + - - - - - - - -
Ve
½ - + - + - - - - -
1 - - - + - - - - -
2 - - - + - - - - -
3 - - - - - - - - -
4 + - - - - - - - -
5 + - - - - - - - -
24 + - - - - - - - -
Vf
½ - + - + - - - - -
1 - - - + - - - - -
2 + - - - - - - - -
3 + - - - - - - - -
4 + - - - - - - - -
5 + - - - - - - - -
24 + - - - - - - - -
Vg
½ - - - + - - - - -
1 - - - + - + - - -
2 - - - + - - - - -
3 - - - + - - - - -
4 - - - - - - - - -
5 + - - - - - - - -
24 + - - - - - - - -
Locomotor Activity: Materials : 0.1% Sodium CMC, Test compounds.Instruments : Sonicator and ActophotometerAnimals : Mice
The locomotor activity was studied by using actophotometer, which operates on photoelectric cells, which are connected in circuit with a counter. When
animals cut off beam of light falling on the photocells, a count was recorded. Healthy male mice weighing between 20-25 gm were used. Animals were fasted for overnight and divided into groups of six animals in each group. The test compounds suspended in 0.1% Sodium CMC are administered at a dose of 100 mg/kg body weight i.p. The response (counts) was recorded after 30 min. of administration of drug or test compound11.

36
International Journal of Pharma Research - Volume 8 : 1 January - June 2017
Results and Discussion :
All the compounds 2-(1H-benzo[d][1,2,3]triazol-1-yl)-N'-(2-substituted benzylidene) acetohydrazide (Va - Vg) were schematically synthesized as planned and were authentically identified by their physical and spectral data.
Gross Behavioral Studies
All the newly synthesized compounds were screened for gross behavioral studies. The gross behavioral studies of the test compounds revealrd that all the test compounds exhibited central nervous system depression in the mice.
Table-2 pertaining to the gross behavioral studies of 2-(1H-benzo[d][1,2,3]triazol-1-yl)-N'-(2-substituted
Table -3
Sl.No. Compound Substituents (R)
Locomotor activity (scores) in 10 min, n = 6 % Change in
Activity(↓)BeforeAdministration
AfterAdministration
1 Va -H 408 177 56.62 Vb 4-Cl 397 86 78.343 Vc 4-OCH3 429 184 57.164 Vd 3-OCH3 4-OH 373 171 54.275 Ve 4-N(CH3)2 306 95 68.956 Vf 2-OH 387 180 53.487 Vg 2-Cl 420 115 72.61
n = number of animals*The compounds were tested at a dose of 100 mg/kg (I.P)
The animals were placed in actophotometer for 10 min. and scores were recorded and the results were compared with the control. The results are presented in Table-3.
Locomotor activity of 2-(1H-benzo[d][1,2,3]triazol-1-yl)-N'-(2-substituted benzylidene) acetohydrazide (Va - Vg):
benzylidene) acetohydrazide (Va - Vg) shows that all the compounds did not show alertness. Among the test compounds, Vb, Vg and Ve showed more depressant activity than the rest of the compounds.
Locomotor Activity
Table -3 pertaining to the results of the locomotor activity of the 2-(1H-benzo[d][1,2,3]triazol-1-yl)-N'-(2-substituted benzylidene) acetohydrazide (Va - Vg) in mice showed that all the test compounds reduced the locomotor activity. The locomotor activity was studied by actophotometer. The compound Vb (R = 4-Cl ) exhibited more effect among all the compounds with 78.34% reduction activity. The compound Vg (R = 2-Cl) reduced the locomotor activity by 72.61% and the compounds Ve, Vc, Va, Vd and Vf were next in the order of reduction of locomotor activity.
Conclusions :
The proposed 2-(1H-benzo[d][1,2,3]triazol-1-yl)-N'-(2-substituted benzylidene) acetohydrazide (Va - Vg) derivatives were synthesized successfully as per the planning and as such in all the reactions carried, the expected compounds were obtained with good yield. From the gross behavioral studies and locomotor activity, all the newly synthesized compounds showed CNS depressant activity in mice. The compound Vb with 4-Chloro substitution on the phenyl ring showed more promising depressant activity among all the test compounds.

37
International Journal of Pharma Research - Volume 8 : 1 January - June 2017
Acknowledgements :
The authors are thankful to the Directors and Principals of Talla Padmavathi College of Pharmacy, Warangal, Pragathi Pharmacy College and Prasad Institute of Pharmaceutical Sciences, Warangal, for providing laboratory facilities and financial support.
REFERENCES
1. Gitanjali K. Patil, Harshada C. Patil, Indira M. Patil, Prof. S. L. Borse and Dr. S. P. Pawar. Benzotriazole – The molecule of diverse biological activities. World Journal of Pharmacy and Pharmaceutical Sciences, 2015; 4(05): 532-548.
2. Liang-Zhong Xu, Fang-Fang Jian, Jian-Gang Shi and Lin Li. Synthesis, structure and biological activities of novel triazole compounds containing 4,6-dimethyl-pyrimidin-2-ylthio group. Chinese Journal of Chemistry, 2004; 22(11): 1308–1312.
3. J.J.Vora, S.B.Vasava, Asha. D. Patel, K.C.Parmar, S.K.Chauhan and S.S Sharma. Synthesis, Characterization and Antibacterial Activity of a New Series of s-Triazines Derived with Quinolines. E-Journal of Chemistry, 2009; 6(1): 201-206.
4. Dawood KM. Synthesis and anticonvulsant, antinociceptive and anti-inflammatory activity of some 1, 2 – substituted 1 – (2- benzofuryl ) – 2 – (1 – benzotriazolyl) – ethanone derivatives. BioOrg.Med.Chem. 2006; 14: 672-3680.
5. Yoshikawa T, Mine Y, Morikage K and Yoshida N. Pharmacological profile of AS-9705, a novel benzotriazole carboxamide derivative, as a gastroprokinetic agent with potent anti-emetic activity. Arzneimittelforsch, 2003; 53: 98–106.
6. Augustynowicz-Kopec EWA. Synthesis and antimycobacterial activity of m. tuberculosis. Acta Poloniae Pharmaceutica-Drug Research. 2008; 65(4): 435 -439.
7. Yu Ren, Ling Zhang, Cheng-He Zhou and Rong-Xia Geng. Recent Development of Benzotriazole-based Medicinal Drugs, Med chemVolume, 2014; 4(9): 640-662.
8. Osama I. El-Sabbagh and Sameh M. El-Nabtity. Synthesis and Pharmacological Studies for New Benzotriazole and Dibenzodiazepine Derivatives as Antipsychotic Agents. Bull. Korean Chem. Soc., 2009; 30(7): 1445.
9. Budde Srujana, Elsani Madan Mohan, Bonagiri Pochaiah, Pogula Swarnalatha, Chinnala Krishna Mohan. Synthesis of some novel benzotriazole-1-yl-acetic acid substituted aryl hydrazide derivatives as anti convulsant agents. Int J of Ad Biomed & Pharm Res., 2012; 1(1): 11-20.
10. D.Kumudha, R.R.Reddy, T.Kalavathi. Synthesis and evaluation of some 1, 3, 4 -thiadiazoles having substituted 1, 2, 4 - triazole moiety for anticonvulsant and CNS depressant activity. World Journal of Pharmacy and Pharmaceutical Sciences, 2014; 3(9): 728-740.
11. Mirko Tomic, Marija Kundakovic, Biljana Butorovic, Branka Janac, Deana Andric, et al., Pharmacological evaluation of selected arylpiperazines with atypical antipsychotic potential. Bioorganic & Medicinal Chemistry Letters. 2004; 14(16): 4263–4266.

38
International Journal of Pharma Research - Volume 8 : 1 January - June 2017
Isolation, Screening and Characterization of Antibiotic-Producing Actinomycetes From Rhizosphere Region of Different Plants
From A Farm of Sungai Ramal Luar, MalaysiaNg Zoe Yi and Amsaveni Selvaraj*
Faculty of Applied Sciences, UCSI University, Kuala Lumpur Campus, No.1, Jalan Menara Gading,*Correspondence to : [email protected]
ABSTRACT
A total of 25 soil samples were collected from rhizospehere regions of different plants from a farm in Sungai Ramal Luar, Malaysia. These samples were divided into two sets for the isolation of actinomycetes: one receiving the treatment with calcium carbonate and other set without calcium carbonate. A total of 300 actinomycetes isolates with different morphology were obtained. Of 50 fast-growing isolates, four potential antibiotic producing isolates were obtained by employing primary and secondary screening. The antibacterial activity of crude compounds extracted from the actinomycetes was tested against Bacillus subtilis, Staphylococcus aureus, Salmonella sp. and Serratia sp. Two actinomycete cultures, LM1A and MG1A that antagonized most bacteria with largest inhibition zones (B. subtilis: 20.5 mm, Salmonella sp.: 13.0 mm, Serratia sp.: 13.0 mm, S. aureus: 19.0 mm) during screening were selected for further study. Both of the isolates were found to be growing at pH and temperature ranges of 5.0-9.0 and 30-37°C respectively and tolerated NaCl concentrations as high as 7%. Further, the isolates were presumed as Streptomyces sp.
Key words: actinomycetes, antibiotic, isolation, screening, antagonistic, antibacterial
INTRODUCTION
The discovery and application of antibiotics in the treatment of bacterial diseases had been a noteworthy medical success of the 20th century. However, gradual emergence and spreading of antibiotics resistance among bacterial population due to misuse or overuse of antibiotics has had led to the development of public health problems. Antibiotic resistance in bacterial isolates was recorded since the first use of antibacterial agents. Penicillin-resistant Escherichia coli were the first to be discovered in 1940 to possess penicillinases that inactivated the drug penicillin, followed by discovery of penicillin-resistant S. aureus in 1944. In 2008, the NDM-1 gene, encoding novel beta-lactamase enzyme capable of hydrolyzing penicillins, cephalosporins and carbapenems was discovered in Klebsiella pneumoniae. Bacteria possessing the gene were found to be resistant for most of the tested antibacterial agents1. Although there are advances in drug discovery and development in recent years, the world is not keeping pace with bacterial ability in adapting and resisting antibiotics.
In addition, many bacteria gain resistance to the newly launched drugs that were modifications of the present antibiotics. Hence, it is highly essential to search for new antibacterial compounds particularly from microorganisms to combat the threat of increasing population of antibiotic-resistant bacteria.
Actinomycetes are filamentous bacteria belong to the phyla actinobacteria and the order actinomycetales2. Actinomycetes are known as the most invaluable prokaryotes in medical and biotechnology industries due to their ability in producing a vast number of bioactive molecules, particularly of the antibiotic compounds. Streptomyces, a representative genus of actinomycetes that is mainly of terrestrial soil origin, has accounted for the production of 60% of antibiotics which are useful in agricultural industries3,4,5,6. The wide distribution of Streptomyces in soil and their proven ability to produce novel antibiotics and non-antibiotic lead molecules had caused these bacteria to be targeted in drug screening programme. Discovery of novel
Received Date: 08.06.2017 Accepted Date: 30.06.2017
ISSN 0975-3532 RESEARCH ARTICLE
Indexed in Google Scholar, Open Access, Academic Keys, SJIF*, Scientific Indexing Services, Research bible, GIF*, Directory of Research Journal Indexing, Index Copernicus International, Indian Citationindex

39
International Journal of Pharma Research - Volume 8 : 1 January - June 2017
antibiotics from actinomycetes is important in helping to cope with the growing proportion of antibiotic-resistant bacterial infections that become untreatable. Hence, this investigation was conducted with the aim of isolating and screening for antibiotic-producing actinomycetes from rhizosphere soil. Selected antibiotic-producing actinomycetes were identified and effects of pH, temperature and concentration of sodium chloride on the growth of actinomycetes were also determined.
MATERIALS AND METHODS
Soil samples
A total of 25 soil samples, each weighing approximately 100 g was collected from rhizosphere regions of twelve different plants, including brinjal, banana, cassava plants, sapodilla, guava, ladyfinger, lemon, mango, papaya, rose apple, star-fruit and sour sop fruit. All soil samples were collected from a depth of 15 cm from a farm located at Sungai Ramal Luar, Selangor, Malaysia in December 2009. These samples were kept in plastic bags and air-dried at room temperature for 10 d and processed employing standard microbiological methods.
Culture media
Isolation of actinomycetes was carried out using starch casein agar (SCA)7. Nutrient agar (Merck, Germany) was used for primary screening of antibiotic producing actinomycetes by cross-streak method. Further, antibiotic production by the actinomycetes was checked in submerged culture using starch casein broth (SCB) with the pH adjusted to 7.27.
Test bacteria
Two Gram-positive bacteria (B. subtilis and S. aureus) and two Gram-negative bacteria (Salmonella sp. and Serratia sp.) were employed for screening of antibiotic producing actinomycetes. All test bacteria were obtained from Microbiology Laboratory, UCSI University and handled as per standard procedures.
Calcium carbonate treatment of soil samples
Exactly, 25 g of soil from each sample was mixed with 2.5 g of CaCO3 in a sterile mortar and pestle and mixed well. The mixture was transferred to a sterile Petri dish and incubated at 30°C for 7 d . Another set of each 25 g of soil was kept in sterile Petri dishes and used for isolation of actinomycetes.
Isolation and enumeration of actinomycetes
One gram of soil was taken from each CaCO3 treated and untreated soil samples and mixed with 9 ml of sterile physiological saline (9 g/l of NaCl). The mixture was allowed to settle and serial dilutions were prepared. Precisely, 100 μL of 10-3, 10-4, and 10-5 dilutions was pipetted and spread over the surface of SCA supplemented with nystatin (50 mg/ml) and rifampicin (50 mg/ml) in order to inhibit fungal and bacterial contamination respectively. All the plates were incubated at 30°C for 7-21 d and the isolation was carried out in triplicates. Actinomycetes colonies were identified morphologically and colony forming units per gram (cfu/g) of soil were calculated. All isolated colonies were subcultured onto SCA without supplementing any antibiotics for 3 times with different period of incubation: The 1st and 2nd subcultures were carried out for 14 d followed by the 3rd subculture for 7 d. Based on the growth observed in the 3rd subculture, the fast-growing strains were selected for screening of antibiotic production.
Primary screening by cross-streak method
In primary screening, all selected isolates were streaked as a single straight line across the centre of nutrient agar plates. These plates were incubated at 30°C for 6 d and the experiment was done in duplicates. On the 7th day of incubation, test bacteria were inoculated by a single streak that was perpendicular to the actinomycete growth streaked at single straight line at the centre of the plate followed by incubation at 37°C for 24 h. Inhibition zones (the distance between the edge of the test bacterial growth and the actinomycete colony) formed were measured and recorded in millimetre8.
Secondary screening by disc and well-diffusion assays
The selected actinomycetes with antibacterial activity were subjected to secondary screening by disc and well diffusion assays. All the four test bacteria were inoculated into 10 ml nutrient broth and incubated at 37°C for 2-6 h. Turbidity was standardized to 0.5 McFarland standards using sterile physiological saline, corresponding to the absorbance 0.08-0.13 at 625 nm. All active actinomycete isolates were inoculated into the flasks containing 50 ml SCB and were incubated in an orbital shaker of 200 rpm at 30°C for 6 d . At the end of incubation, the broth cultures were centrifuged at 10000 rpm for 10 min. Supernatant collected aseptically

40
International Journal of Pharma Research - Volume 8 : 1 January - June 2017
was checked for antibacterial production. Precisely, the sterile filter paper discs were placed on fresh test bacterial lawn culture on nutrient agar medium and loaded with 20 µl of actinomycete supernatant for disc-diffusion assay.
In well-diffusion assay, wells were made aseptically on nutrient agar plate containing fresh test bacterial lawn culture using cork-borer and each well was loaded with 100 µl of actinomycete supernatant. The test was duplicated for each actinomycete isolate. All plates were incubated at 37°C for 24 h and were examined for inhibition zones. Diameter of inhibition zones was measured and expressed in millimetre. Ampicillin (20 µg) and empty disc and/or well without any antibiotic or supernatant of actinomycetes were treated as positive and negative control respectively.
Antibacterial activity of crude antibiotic compounds
The isolates were inoculated into flasks containing 100 ml of SCB and incubated at 30°C in a shaker at 200 rpm for 6 d . The broth culture was filtered using Whatman No. 1 filter paper (11 µm) followed by 0.45 µm membrane filters. Organic solvent methanol was added to the filtrate in the ratio of 1:1 (v/v). The mixture was shaken vigorously for 1 hour and subsequently evaporated to dryness at 80-90°C in water bath. The residual crude extract obtained was dissolved in 2 ml of 0.2 M phosphate buffer (pH 7.0) by vortexing and preserved at 4°C. The antibacterial activity of the crude extract was determined by well-diffusion assay using 100 µl of crude extract. After 24 h of incubation at 37°C, the diameter of inhibition zones was measured as stated previously.
Characterization of actinomycetes possessing antibiotic activity
Colour of mycelium, spores as well as pigmentation of the actinomycete isolates were determined following the method described by Shirling and Gottlieb (1966)9 on oatmeal agar (ISP3 medium), whereas the structure of mycelium was observed using light microscope at 1000x magnification employing oil immersion (Lumenera, Canada) with five d old actinomycete cultures. The cultures were also stained by Gram’s staining and acid-fast staining and observations were made.
Biochemical tests that were carried out to characterize selected actinomycetes included hydrolysis of starch,
casein, urea, lipid, gelatine and tryptophan utilization, sugar fermentation, methyl red test and citrate utilization and the presence of catalase.
RESULTS AND DISCUSSION
Effect of calcium carbonate on isolation and enumeration of actinomycetes
Soil actinomycetes are distributed in both virgin and cultivated soils and over the past few years, actinomycetes have been isolated from various sources; marine sediments10, rhizosphere region of soil11, desert soil and fallen leaves12. In rhizosphere region, plants supply nutrient to actinomycetes via secretions of carbohydrates, amino acids, organic acids and other exudates as well as by sloughing root epidermal cells, whereas the actinomycetes play a major role as biocontrol agents via their antagonistic activity. At different point of soils profile, the highest number of terrestrial origin actinomycetes was isolated at a depth of 11-15 cm, where the average pH ranges from neutral to slight alkaline13.
Out of 25 CaCO3 treated soil samples subjected for isolation of actinomycetes, 18 soil samples produced higher number of actinomycetes population. The maximum and minimum number of actinomycetes produced from CaCO3 treated soil samples were 6.33×10⁷
cfu/g and 1.0×10⁵ cfu/g respectively. However, the soil samples that were not treated with CaCO3 produced a maximum of 6.7×10⁵ cfu/g and a minimum of 0.3×10⁵
cfu/g respectively (Table 1). The effect of CaCO3
treatment in stimulating isolation of soil actinomycetes was significant in rhizosphere soil samples collected from rhizosphere region of lemon tree, LM1 and ladyfinger, LF5 where, the actinomycete population had increased to the tune of 100-fold as compared with untreated soils collected from the same crops and other crops. This observation was in accordance with previous studies by El-Nakeeb and Lechvalier (1963)14
and Oskay (2009)15, who demonstrated a significant increase in the relative plate counts of actinomycetes population due to CaCO3 treatment of soil samples prior to isolation. CaCO3 is commonly employed to increase the number of actinomycete population from air-dried soils. However, the precise mechanism of CaCO3 effect is not well-studied. The increase in actinomycete population due to the addition of CaCO3
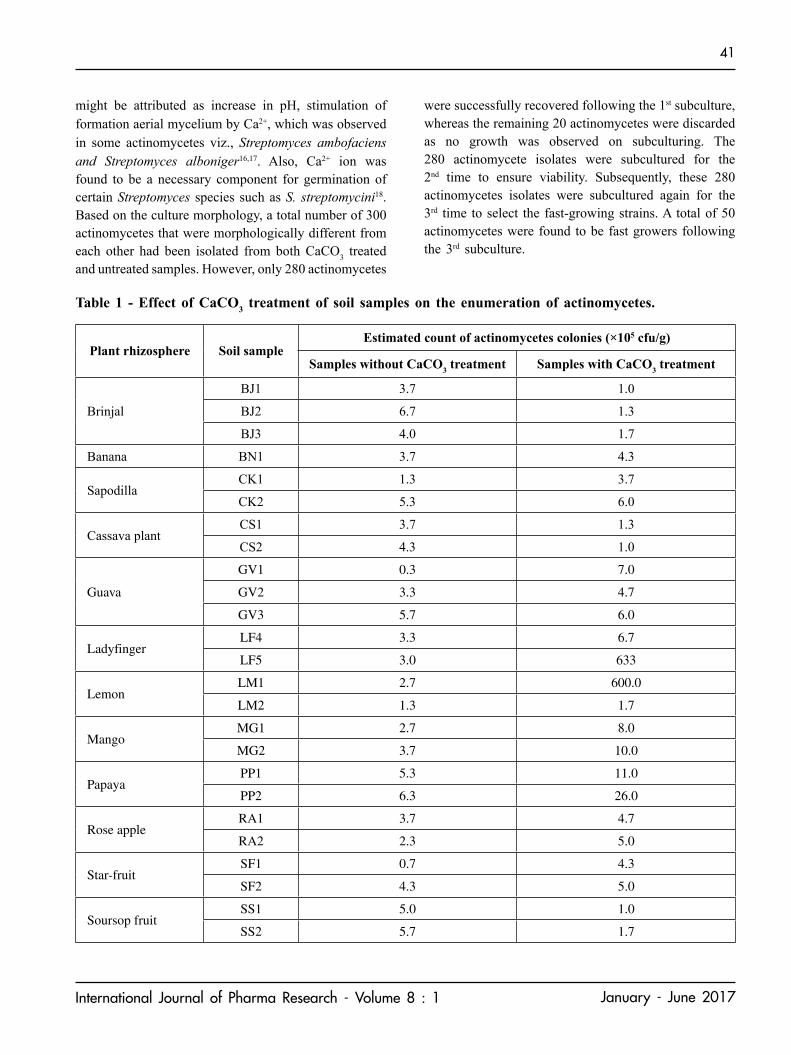
41
International Journal of Pharma Research - Volume 8 : 1 January - June 2017
might be attributed as increase in pH, stimulation of formation aerial mycelium by Ca2+, which was observed in some actinomycetes viz., Streptomyces ambofaciens and Streptomyces alboniger16,17. Also, Ca2+ ion was found to be a necessary component for germination of certain Streptomyces species such as S. streptomycini18. Based on the culture morphology, a total number of 300 actinomycetes that were morphologically different from each other had been isolated from both CaCO3 treated and untreated samples. However, only 280 actinomycetes
were successfully recovered following the 1st subculture, whereas the remaining 20 actinomycetes were discarded as no growth was observed on subculturing. The 280 actinomycete isolates were subcultured for the 2nd time to ensure viability. Subsequently, these 280 actinomycetes isolates were subcultured again for the 3rd time to select the fast-growing strains. A total of 50 actinomycetes were found to be fast growers following the 3rd subculture.
Table 1 - Effect of CaCO3 treatment of soil samples on the enumeration of actinomycetes.
Plant rhizosphere Soil sampleEstimated count of actinomycetes colonies (×105 cfu/g)
Samples without CaCO3 treatment Samples with CaCO3 treatment
Brinjal
BJ1 3.7 1.0
BJ2 6.7 1.3
BJ3 4.0 1.7
Banana BN1 3.7 4.3
SapodillaCK1 1.3 3.7
CK2 5.3 6.0
Cassava plantCS1 3.7 1.3
CS2 4.3 1.0
Guava
GV1 0.3 7.0
GV2 3.3 4.7
GV3 5.7 6.0
LadyfingerLF4 3.3 6.7
LF5 3.0 633
LemonLM1 2.7 600.0
LM2 1.3 1.7
MangoMG1 2.7 8.0
MG2 3.7 10.0
PapayaPP1 5.3 11.0
PP2 6.3 26.0
Rose appleRA1 3.7 4.7
RA2 2.3 5.0
Star-fruitSF1 0.7 4.3
SF2 4.3 5.0
Soursop fruitSS1 5.0 1.0
SS2 5.7 1.7

42
International Journal of Pharma Research - Volume 8 : 1 January - June 2017
Primary screening for antibiotic producing actinomycetesThe experimental results (Table 2) indicated that 9 out of 50 actinomycetes were found to possess antibacterial activity against test bacteria. The actinomycete isolate, MG1A was found to exhibit antagonistic activity against both Gram-positive and Gram-negative bacteria while LM1A and LF4A were inhibiting only Gram-positive test bacteria. However, other isolates including BJ3A, BJ3B, BJ3C, GV3A, RA2A and SS2A were found to inhibit certain bacterial species. Inability of the antibacterial compound to inhibit both Gram-positive and Gram-negative bacteria could be due to variation in the cell wall permeability of bacteria to different drugs19. B. subtilis was observed to be the most susceptible bacteria among the four test bacteria employed in this study to actinomycete LM1A whereas the actinomycete MG1A exhibited the strong inhibitory effect on the growth of Salmonella sp., Serratia sp. and S. aureus.
It was noticed that the Gram-positive bacteria were more susceptible to antibacterial activity of actinomycetes than Gram-negative bacteria. Ability of Gram-negative bacteria to resist antibacterial agent is attributed to cell wall structure of bacteria. The Gram-negative bacteria possess an outer membrane of lipopolysaccharide, protein and phospholipids, which is attached to thin layer of peptidoglycan. The phospholipids of outer membrane and lipopolysaccharide form a lipid bilayer that serve as barrier for antibacterial drugs19. However, some antibacterial compounds could still be effective against Gram-negative bacteria. Hydrophobic antibiotics may penetrate Gram-negative bacterial cell wall by direct solubilisation through lipid layer of outer membrane, whereas hydrophilic antibiotics may enter the cell via water-filled membrane protein porins19.
Secondary screening for antagonistic activity by disc and well-diffusion assaysA total of 9 active actinomycetes, namely BJ3A, BJ3B, BJ3C, GV3A, LF4A, LM1A, MG1A, RA2A and SS2A screened from primary screening were subjected to secondary screening. Of nine actinomycetes tested for antagonistic activity against test bacteria, two actinomycetes viz., LM1A and MG1A were observed to inhibit test bacteria when tested using disc and well-diffusion assays. Among the two actinomycetes, LM1A and MG1A that were antagonistic against test bacteria, MG1A was superior to LM1A in controlling the bacterial growth. Apart from the LM1A and MG1A, the other actinomycete cultures such as BJ3C and SS2A had also shown the inhibitory effect on B.subtilis and S.aureus respectively (Table 3). By comparing the potential of supernatant of actinomycetes with 20 µg of ampicillin, the positive control, ampicillin (20 µg) was capable of inhibiting all test bacteria. S. aureus was observed to be the most susceptible to ampicillin, followed by Salmonella sp., Serratia sp. and B. subtilis. The difference of antagonistic activity produced by ampicillin in disc and well-diffusion assays were observed to be the largest in B. subtilis plate, which was calculated as 3 mm whereas the smallest variation was given as 1 mm as observed in Salmonella plates. As observed from the result table, ampicillin produced a larger inhibition zones in disc-diffusion assay than in well-diffusion assay when the drug was tested against B. subtilis, Serratia sp. and S. aureus. However, a smaller inhibition zone was produced by ampicillin when the drug was tested against Salmonella sp. in disc-diffusion assay than in well-diffusion assay.
Loss of antibacterial activity by several actinomycetes viz. BJ3A, BJ3B, GV3A, LF4A and RA2A was
Actinomycetes isolates
Diameter of inhibition zone produced by actinomycetes (mm)B. subtilis Salmonella sp. Serratia sp. S. aureus
BJ3A 13.5 0.0 0.0 0.0BJ3B 0.0 0.0 0.0 16.0BJ3C 17.5 0.0 0.0 0.0GV3A 0.0 0.0 0.0 14.5LF4A 11.0 0.0 0.0 24.0LM1A 31.5 0.0 0.0 22.0MG1A 29.5 31.0 25.5 30.5RA2A 0.0 8.0 0.0 0.0SS2A 0.0 7.0 0.0 14.0
Table 2 - Primary screening of selected actinomycetes for antibacterial activity by cross-streak method.

43
International Journal of Pharma Research - Volume 8 : 1 January - June 2017
observed in secondary screening. The reason might be due to the culturing of actinomycetes in SCB in secondary screening whereas nutrient agar was used in primary screening. According to Shomura et al. (1979)20 and Pickup et al. (1993)21, the loss of antibiotic activity of actinomycetes was believed to be related with the fragmentation of vegetative mycelia in submerged cultures. Also, the inhibitory activity of actinomycetes against test bacteria in primary screening could be due to the combined effect of bacteriocin and other intracellular metabolites produced during the assay period. However, in secondary screening, the spent culture media of actinomycetes might not contain the metabolites released from actinomycetes22. In addition, medium composition of SCB and nutrient agar vary which might have affected the biosynthesis of antibiotics by hampering the growth, metabolic activity and expression of antibiotic-coded gene23, 24.
Antibacterial activity of crude antibiotic compounds
The colour of all the crude extracts obtained from nine actinomycete cultures were maroon and soluble in 0.2 M phosphate buffer, except for the compound isolated from LF4A, which was observed as white sticky clumps and insoluble in buffer. This was believed to be one of the reasons for the absence of antagonistic activity produced by the bioactive compound extracted from LF4A (Table 4). It was also noticed that the
compounds extracted from the actinomycetes MG1A and SS2A had not shown any inhibitory effect against the test bacteria whereas these cultures had expressed antibacterial activity in secondary screening. The loss of activity might be due to the extraction of compounds by evaporation at high temperature, which could have possibly damaged the heat-labile antibiotic compounds. Moreover, evaporation might have led to loss of analytes following partial evaporation or adsorption to the equipment. Furthermore, traces of acids and bases present in the extract might have degraded acid or basic-labile components when the solvent volume approached to dryness during evaporation25.
The bioactive compounds extracted from the isolates BJ3B, BJ3C and LM1A were capable of inhibiting test bacteria. The crude compound extracted from BJ3C was active against B. subtilis as observed in secondary screening but with the production of larger inhibition zone than in secondary screening. By contrast, the actinomycete BJ3B which had not shown any inhibitory effect against any of the test bacteria during secondary screening had expressed antagonistic activity against three of the four test bacteria tested in this experiment. The crude extract of actinomycete culture LM1A was found to be active against all the four test bacteria whereas this particular culture had inhibited only the Gram-positive bacteria when tested under secondary screening.
Table 3 Secondary screening of selected actinomycetes by disc and well-diffusion assays using cell-free supernatant
Actinomycetes
Diameter of inhibition zones produced by supernatant of actinomycetes by diffusion methods (mm)
Disc-diffusion assay Well-diffusion assay
B. subtilis Salmonella sp. Serratia sp. S. aureus B. subtilis Salmonella
sp.Serratia
sp. S.aureus
Ampicillin (positive control) 30.0 49.0 47.0 66.5 27.0 50.0 45.5 64.5
BJ3A - [a] - - - - - - -BJ3B - - - - - - - -BJ3C - - - - 8.0 - - -GV3A - - - - - - - -LF4A - - - - - - - -LM1A 16.0 - - 10.0 20.5 - - 17.0MG1A 6.0 - 8.0 14.0 14.0 13.0 13.0 19.0RA2A - - - - - - - -SS2A - - - - - - - 17.0
[a] Indicated that the test bacterium was not inhibited by cell-free supernatant of actinomycetes, characterized by the absence of inhibition zone

44
International Journal of Pharma Research - Volume 8 : 1 January - June 2017
Table 4 - Antibacterial activities of crude antibiotic compounds extracted from actinomycetes isolated from orchard soil.
ActinomycetesDiameter of inhibition zone Produced by crude extracts (mm)
B. subtilis Salmonella sp. Serratia sp. S. aureus
BJ3A - [b] - - -
BJ3B - 10.0 8.5 8.0
BJ3C 24.0 - - -
GV3A - - - -
LF4A - - - -
LM1A 9.0 10.0 9.0 25.5
MG1A - - - -
RA2A - - - -
SS2A - - - -
[b] Indicated that the test bacterium was not inhibited by the crude compounds.
Table 5 - Morphological characteristics of the actinomycetes LM1A and MG1A on oatmeal agar
Morphologicalcharacteristics
Colour changes of actinomycetes colonies
LM1A MG1A
7 d 14 d 21 d 7 d 14 d 21 d
Aerial mycelium Ash Whitish grey
Yellowish grey Pink Pinkish
grey Pinkish
grey
Substrate mycelium Yellowish orange
Yellowish orange
Yellowish orange White White White
Pigmentation Yellowish orange
Yellowish orange
Yellowish orange Light grey Light
brown Brown
Characterization of promising actinomycetesThe actinomycete cultures LM1A and MG1A were selected for characterization based on the antibacterial activity and spectrum broadness. Both actinomycete cultures produced aerial and substrate mycelia coupled with heavy spore formation on oatmeal agar. The colour of aerial mycelia was found to vary along with incubation time (Table 5). Both were capable of producing pigments on oatmeal agar and the colour of pigment was found to vary with incubation time for LM1A. Both actinomycetes LM1A and MG1A were Gram-positive but acid-fast negative bacteria due to lack of mycolic acid in the cell wall (Table 6). The mycelia
of both isolates were straight to flexible and MG1A was observed to have fragmentation of mycelium into rod-shaped elements. The isolate LM1A was able to hydrolyse starch and lipid via production of amylase and lipase, whereas MG1A was capable of hydrolysing casein by caseinase activity. Both actinomycetes were able to hydrolyse urea by urease production and were not sugar fermenter. LM1A was able to utilize citrate and MG1A was capable of degrading H2O2 via catalase action. Both actinomycetes were presumably characterized as Streptomyces sp.

45
International Journal of Pharma Research - Volume 8 : 1 January - June 2017
Table 6 - The morphology of mycelium, staining and biochemical characteristics of LM1A and MG1A.
CharacteristicsReaction of actinomycetes
LM1A MG1A
Differential staining
Gram reaction
Acid-fast reaction
+ [c]
- [d]
+
-
Mycelium
Morphology
Fragmentation
Straight to flexible
-
Straight to flexible
+Musty odor production + +
Hydrolysis tests
Starch
Casein
Urea
Lipid
Gelatin
Tryptophan
+
-
+
+
-
-
-
+
+
-
-
-
Sugar fermentation test
Slant
Butt
Hydrogen sulfide production
Gas production
Unchanged
Unchanged
-
-
Red
Red
-
-
Methyl red test - -
Citrate utilization test + -
Catalase test - +
[c] indicated a positive result and [d] indicated a negative result
ConclusionActinomycetes are Gram-positive bacteria that distributes abundantly in rhizopshere soil, given that up to 6.33 × 10⁷ cfu/g of actinomycetes had been successfully isolated from all the soil samples. In this study, CaCO3 treatment on rhizosphere soil samples was capable of encouraging isolation of actinomycetes. Among the isolated fast-growing actinomycetes, LM1A and MG1A were the two promising antibiotic-producing strains according to the results of targeted screenings against Gram-positive and Gram-negative test bacteria using disc and well-diffusion assays. This shows that
the rhizosphere region of farming soil is a rich source of clinically important microorganisms. The main limitation of this current work was that the identification of prominent actinomycetes up to species level was not performed due to lack of other confirmative tests. Both macroscopic and microscopic morphology coupled with few biochemical tests could merely provide a presumptive genus or species identification. For this reason, identification of both prominent actinomycetes LM1A and MG1A up to species level should be further

46
International Journal of Pharma Research - Volume 8 : 1 January - June 2017
studied by molecular 16S rRNA assay and cell wall component analysis.
Acknowledgement
I would like to express my sincere gratitude to Madam Chiew Koi Khon for giving me permission to collect soil samples from her farm at Sungai Ramal Luar, Kajang, Selangor, Malaysia. I wish to thank laboratory technologists, assistants and staffs for providing me the test bacteria, chemical reagents and apparatus.
REFERENCES
1. Moellering RC (2010) NDM-1- A cause of worldwide concern. N Eng J Med 363(25): 2377-2379.
2. Waksman, SA (1959) The Actinomycetes Volume 1. Lippincott Williams and Wilkins, Baltimore, pp 53, 113, 116, 117, 126, 134, 146
3. Mellouli L, Ameur-Mehdi RB, Samiha S, Mansour S., Samir B. (2003) Isolation, purification and partial characterization of antibacterial activities produced by a newly isolated Streptomyces sp. US24 strain. Res Microbiol 154:345-352. doi: 10.1016/S0923-2508(03)00077-9
4. Fguira LF, Fotso S, Ameur-Mehdi RB, Mellouli L, Laatsch H. (2005) Purification and structure elucidation of antifungal and antibacterial activities of newly isolated Streptomyces sp. strain US80. Res Microbiol 156: 341-347. doi: 10.1016/j.resmic.2004.10.006
5. Singh LS, Baruah I, Bora TC (2006) Actinomycetes of Loktak habitat: isolation and screening for antimicrobial activities. Biotechnol 5(2):217-221. doi: 10.3923/biotech.2006.217.221
6. Thakur D, Yadav A, Gogoi BK, Bora TC (2007) Isolation and screening of Streptomyces in soil of protected forest areas from the states of Assam and Tripura, India, for antimicrobial metabolites. J Mycol Med 17:242-249. doi: 10.1016/j.mycmed.2007.08.001
7. Küster E, Williams ST (1964) Selection of media of aerobic actinomycetes. Nature 202:928-929.
8. Oskay M (2009) Antifungal and antibacterial compounds from Streptomyces strains. Afr J Biotechnol 8(13): 3007-3017.
9. Shirling EB, Gottlieb D (1966) Methods for characterization of Streptomyces species. Int J Syst Bacteriol 16(3):313-340. doi: 10.1099/00207713-16-3-313
10. Sahu MK, Kumar KS, Kannan L (2005) Isolation of actinomycetes from various samples of the Vellar Estuary, southeast coast of India. Poll Res. 24:45-48.
11. Ramakrishnan J, Shunmugasundaram M, Narayanan M (2009) Streptomyces sp. SCBT isolated from rhizosphere soil of medicinal plants is antagonistic to pathogenic bacteria. IJB 7(2):75-81.
12. Tokohashi Y, Ōmura S (2003) Isolation of new actinomycetes strains for the screening of new bioactive compounds. J. Gen. Appl. Microbiol. 49:141-154.
13. Davies FL, Williams ST (1970) Studies on the ecology of actinomycetes in soil: I. The occurrence and distribution of actinomycetes in a pine forest soil. Soil Biochem 2:227-238. doi: 10.1016/0038-0717(70)90029-5
14. El-Nakeeb MA, Lechvalier HA (1963) Selective isolation of aerobic actinomycetes. Appl Microbiol 11:75-77.
15. Oskay M (2009) Comparison of Streptomyces diversity between agricultural and non-agricultural soils by using various culture media. SRE 4(10):997-1005.
16. Natsume M, Yasui K, Marumo S (1989) Calcium ions regulates aerial mycelium formation in actinomycetes. J Antibiot (Tokyo) 42(3):440-447.
17. Qin S, Li J, Chen HH, Zhao GZ, Zhu WY, Jiang CL, Xu LH, Li. WJ (2009) Isolation, diversity and antimicrobial activity of rare actinobacteria from medicinal plants of tropical rain forests in Xishuangbanna, China. Appl Environ Microbiol 75(19):6176-6186. doi: 10.1128/AEM.01034-09
18. Ensign JC (1978) Formation, properties and germination of actinomycetes spores. Annu Rev Microbiol 32:185-219. doi: 10.1146/annurev.mi.32.100178.001153

47
International Journal of Pharma Research - Volume 8 : 1 January - June 2017
19. Struelens MC (2003) The problem of resistance. In: Finch RG (ed) Antibiotic and chemotherapy: anti- infective agents and their use in therapy, 8th edn. Elsevier, London, pp 28
20. Shomura T, Yoshida J, Amano S, Kojima M, Inouye S, Niida T (1979) Studies on Actinomycetales producing antibiotics only on agar culture: screening, taxonomy and morphology- productivity relationship of Streptomyces halstedii, strain SF- 1993. J Antibiot 32(5):427- 435.
21. Pickup KM, Nolan RD, Bsuhell ME (1993) A method for increasing the success rate of duplicating antibiotic activity in agar and liquid cultures of Streptomyces isolates in new antibiotic screens. J Ferment Bioeng 76(2):89-93. doi: 10.1016/0922-338X(93)90062-D
22. Lertcanawanichakul M., Sawangnop S (2008) A comparison of two methods used for measuring the antagonistic activity of Bacillus species. Walailak J Sci & Tech 5(2):161-171.
23. Doull JL, Vining LC (1990) Physiology of antibiotic production in actinomycetes and some underlying control mechanisms. Biotechnol Adv 8:141-158. doi: 10.1016/0734-9750(90)90010-9
24. Sánchez S, Chávez A, Forero A, Garcia-Huante Y, Romero A, Sánchez M, Rocha D, Sánchez B, Avalos M, Guzmán-Trampe S, Rodríguez-Sanoja R, Langley E, Ruiz B (2010) Carbon source regulation of antibiotic production. J Antibiot 63:442-459. doi: 10.1038/ja.2010.78
25. Fletouris DJ (2007) Clean up and fractionation methods. In: Pico Y (ed) Food toxicants analysis: techniques, strategies and development. Elsevier, Oxford, pp 306

48
International Journal of Pharma Research - Volume 8 : 1 January - June 2017
INSTRUCTIONS TO AUTHORSINTERNATIONAL JOURNAL OF PHARMA RESEARCH (IJPR)
International Journal of Pharma Research (IJPR) is the research journal from PSG College of Pharmacy, Coimbatore, Tamilnadu, India. IJPR half yearly publication is devoted to publishing Reviews, Research Articles, Short Communications and Invited Articles in Pharmacy. Articles in Pharmacy. Articles from the areas of Pharmaceutical Technology, Biopharmaceutics, Pharmacokinetics, Pharmaceutical / Medical Chemistry, Computational Chemistry Molecular Drug Design, Pharmacognosy and Phytochemistry , Pharmacology, Pahrmaceutical Analysis, Pharmacy Practice, Clinical and Hospital Pharmacy, Cell Biology, Genomics and Protemics, Pharmacogenomics, Bioinformatics, Nano Technology, Phytomedicine, microbiology and Biotechnology of Pharmaceutical Interest can be sent for publication in IJPR. Soft copy manuscripts should be submitted through e-mail to [email protected] along with filled form of undertaking / Copyright Agreement of Authorship Responsibility (see www.psgpharma.com), signed by all authors of the paper.Manuscripts will be subjected to near review process to determine their suitability for publication provided they fulfill the requirements of journal. After the review, manuscript will be returned for revision along with reviewer's and / or editor's comments. One original copy of the final revised manuscript should be submitted through e-mail and in CD prepared in MS Word 2000 or XP version, for publication within two months receiving the comments.Manuscript preparationManuscript should be concisely typewritten in double spaced in A4 sized sheets, only on one side with a 2 cm margin on all sides. The manuscript shall be prepared in Times New Roman font using a font size of 12. Title shall be in a font size of 14. All section titles in the manuscript shall be in font size capitals. Subtitles in each section shall be in font size 12, bold face lower case followed by a colon. The pages shall be numbered consecutively with arabic numbers, beginning with title page, ending with the (last) page of figure legends.All the references, figures (Fig.) and tables (Table) in the test shall be numbered consecutively as they first appear.
The content of the manuscript shall be organized in the following sequence and shall start on seperate pages: title page (including at least 4 key words), text (consisting of introduction, materials and methods, result, discussion, conclusions and acknowledgement), references, figure, legends, tables and figures. Titles should be short, specific and clear beginning with the first page of text, each page should be consecutively numbered. All animal / human experimental procedure followed must be approved by appropriate ethics committee and relevant document should be furnished to IJPR. In all studies of plants or animals, specific identification should be made as to the material used, such as by citation of voucher specimen in herbarium or other collections, quoting name of collector, collection numbers (or date), place of collection, etc. Unless otherwise noted, it will be understood that such specimen will be found in the author's own collection or that of the institution at with the work was done.For the Review Articles, the author(s) is absolutely free to design the paper. The Abstract section is needed for review articles too the articles should not exceed 5 manuscript pages including figures, tables, and references. Authors are encouraged to use flow charts, boxes, cartoons for better presentation. References, figures and legends shall follow the general guidelines described below.For Short Communications, Manuscript should not be divided into sub-sections. It may have upto 1400 words with one figure and one table with the references to 6 numbers.For all other Articles, the following format shall be strictly followed.Title Page : The following information should appear : Title of article (a running title or short title of not more than 100 characters) Authors' name and last name. The author to whom all correspondence be address should be denoted by asterisk mark. Full mailing address with pin-code numbers, phone and fax numbers, and functional email address should be provided of the author for correspondence. Names of the authors should be appear as initials followed by surnames for men and one given-name followed by surname for women. Full names may be given in some instances to avoid confusion. Names

49
International Journal of Pharma Research - Volume 8 : 1 January - June 2017
should not be prefixed of suffixed by titles or degrees.Abstract: the abstract is limited to 250 words, and should describe the essential aspects of the investigation. In the first sentence the background for the work should be stated; in the second sentence the specific purpose or hypothesis shall be provided; followed sequentially by summary of methods, results and conclusions. No references should be cited. Introduction: A brief background information on what has been done in the past in this area and the importance of the proposed investigation shall be given. Introduction shall end with a statement of the purpose or hypothesis of the study. Material and Methods: This section maybe divided into subsections if it facilitates better reading of the paper. the research design, subjects, material used and statistical methods should be included. Results and discussion shall not be drawn into this section. In animal experimentation, ethical guidelines shall be acknowledged. Results: this section maybe divided into subsections if it facilitates better reading of the paper. All results based on methods must be included. Tables, graphic material and figures shall be included as they facilitate understanding of the results. Discussion: Shall start with limited backdrop information and then proceed with the discussion of the results of the investigation in light of what has been published in the past, the limitations of the study and potential directions for future research. The figures and graph shall be cited at appropriate places. Conclusion: In a separate section, the major findings of the study and their usefulness shall be summarized. This paragraph should address hypothesis or purpose stated earlier in the paper. Acknowledgements: Acknowledgements should appear on a separate page. Tables: Each table should be given on a separate page. Each table should have a short, descriptive title and numbered in the order cited in the text. Abbreviation should be defined as foot notes in italics at the bottom of each table. Tables should not duplicate data given in the text or figures. Tables should show lines separating columns with those separating rows. Units of measurement should be abbreviated and placed below
the column headings. Column headings or captions should not be in bold face. It is essential that all tables have legends, which explain the contents of the table. Tables should not be very large that they run more than one A4 size page. If the tables are wide which may not fit in portrait form of A4 size paper, then it can be prepared in the landscape form, tables should be numbered as Table No. 1- Title, Table No. 2- title, etc. Tables inserted in word document should be in tight wrapping style with alignment as centre. Figures, Photographs and Images: Graphs and bar graphs should preferably be prepared using Microsoft Excel and submitted as Excel graph pasted in Word. Photographs and photomicrographs can be submitted as 'jpeg/TIFF with a resolution of 600 dpi or more' images. Figure and table titles and legends should be typed on a separate page with numerals corresponding to the illustrations. Keys to symbols, abbreviations, arrows, numbers or letters used in the illustration should not be written on the illustration itself but should be clearly explained in the legend. In case of photomicrographs, magnifications should be mentioned either directly in them or in the legend. Symbols, arrows or letters used in photomicrographs should contrast with the background. Chemical terminology: The chemical nomenclature used must be in accordance with that used in the chemical abstracts.Symbols and Abbreviations: Abbreviation should be those well known in scientific literature. In vitro, in vivo, in situ, ex vivo, ad libitum, et al. and so on are two words each and should be written in italics. All foreign language (other than English) names and words shall be in italics as a general rule. Words such as carrageenan-included inflammation, paracetamol-included hepatotoxicity, isoproterenol-included myocardial necrosis, dose-dependent manner are all hyphenated. General Guidelines for Units and Symbols: The use of the International System of Units (SI) is recommended.Biological nomenclature:- Names of plants, animals and bacteria should be in italics.Enzyme nomenclature:- The trival names recommended by the IUPAC-IUB Commission should be used.

50
International Journal of Pharma Research - Volume 8 : 1 January - June 2017
Physical Quantity Base Unit SI Symbol
Length meter m
Mass gram g kilogram kg microgram pg
Time second s minute min hour h day d week w month mo year y
Amount of substance mole mol
Area square meter m2
Volume cubic meter m3
liter l milliliter ml microliter µl
Specification Example Correct Style
Use lowercase for Symbols or abbrevations, kilogram kg Symbols are not followed by a period, exception end of sentence meter m Do not pluralize symbols kilograms kg When numbers are printed symbols are preferred 100 meters 100 m Space between number and symbol 2mol 2 mol Place a zero before a decimal 10mg 10 mg Decimal numbers are preferable to fractions 0.75 Space used to separate long number exception four digit numbers 15000001000
Spelling:- There should be as in the Concise Oxford Dictionary of Current English.References:- Literature citations in the text must be indicated by Arabic numerals in superscript. Each reference separately in the order it appears in the text. The references should be cited at the end of the manuscript in the order of their appearance in the text. In case of formal acceptance of any article for publication, such articles can be cited in the reference as “in press”, listing all author’s involved.Format:- Authors(s) of article (surname initials). Title of article. Journal title, Year of publication; volume number (Issue number): page numbers.Standard journal article:- (If more than six authors, the first four shall be listed followed by et al.)V. Sankar. Ampicillin prodrugs: amide conjugates from aminoacids and ampicillin, pharmazle 2001, 56(7), 588.Books and other monographs:- Personal author(s): C. Vijaya Raghavan and Judith Justin. Experimental Biopharmaceutics and Pharmacokinetics. 1st Edn. India: New Century Book House Publishers: 2006.Editor(s), Compiler(s) as author:- Norman IJ, Redfern SJ, editors. Mental health care for elderly people. New York: Churchill Livingstone; 1996.Chapter in a book:- Philips SJ, Whistant JP. Hyertentsion and stroke. In: Laragh JH, Brenner BM, editors. Hypertension: pathophysiology, diagnosis,
and management. 2nd ed. New York: Raven Press; 1995.p.465-78.Conference proceedings:- K. Velayutham, V. Harikrishnan, R. Prasath. Drug Delivery and Drug Targeting Research. Proceedings of the 1st Pharm Tech IAPST International Conference; 2008 Jan 19-20; Kolkota, India.Dissertation:- KaplanSJ. Post-hospital home health care; the elderly’s access and utilization [dissertation]. St. Louis (MO): Washington Univ.; 1995.Patent:- Nilani. P, Sankar. V, Chandrasekharan. A. K. Herbal Ant Repellant. INDIA patent: 2007-09-14, filed 2004-09-29.Electronic journal articles:- Morse SS. Factos in the mergence of infectious diseases. Emerg Infec Dis [serial online] 1995Jan-Mar [cited 1996 Jun5]; L(1):[24 screens].Available from URL:- http://ccic.gov/nddod/EID/eld.htmWorld Wide Web Format:- Author/editor (surname initials). Title [online]. Year [cited year month day].Availabel from URL: World Wide Web Page:- McCook A. Pre-diabedic Condtion linked to Memory Loss [online]. 2003 [cited 2003 Feb7].All enquiries can be made through e-mail:- [email protected]

International Journal of Pharma Research - Volume 8 : 1 January - June 2017
Yes I / We wish to subscribe for IJPR
Enter my / our subscription for
For India
` 1600 per Year
For Outside India
$75 per Year
$140 per / 2 Years
Name :
Organization :
Address :
Pin code/Zip code :
Country :
Payment enclosed By Demand Draft(DD)
Details : DD should be taken in favour of The Principal, PSG College of Pharmacy, Payable at Coimbatore.
SUBSCRIPTION ORDER INTRNATIONAL JOURNAL OF PHARMACY RESEARCH
PSG COLLEGE OF PHARMACYCoimbatore - 641 004
E-mail - [email protected]


Copy Right Form
Manuscript Title : ..................................................................................................................................................................
Authors Name : ..................................................................................................................................................................
I/we certify that I/we have participated sufficiently in the intellectual content, conception and design of this work or the analysis and interpretation of the data (when applicable), as well as the writing of the manuscript, to take public responsibility for it and have agreed to have my/our name listed as a contributor. I/we believe the manuscript represents valid work. Neither this manuscript nor one with substantially similar content under my/our authorship has been published or is being considered for publication elsewhere, except as described in the covering letter. I/we certify that all the data collected during the study is presented in this manuscript and no data from the study has been or will be published separately. I/we attest that, if requested by the editors, I/we will provide the data/information or will cooperate fully in obtaining and providing the data/information on which the manuscript is based, for examination by the editors or their assignees. Financial interests, direct or indirect, that exist or may be perceived to exist for individual contributors in connection with the content of this paper have been disclosed in the cover letter. Sources of outside support of the project are named in the cover letter.
I/We hereby transfer(s), assign(s), or otherwise convey(s) all copyright ownership, including any and all rights incidental thereto, exclusively to the Journal, in the event that such work is published by the Journal. The Journal shall own the work, including 1) copyright; 2) the right to grant permission to republish the article in whole or in part, with or without fee; 3) the right to produce preprints or reprints and translate into languages other than English for sale or free distribution; and 4) the right to republish the work in a collection of articles in any other mechanical or electronic format.
We give the rights to the corresponding author to make necessary changes as per the request of the journal, do the rest of the correspondence on our behalf and he/she will act as the guarantor for the manuscript on our behalf.
All persons who have made substantial contributions to the work reported in the manuscript, but who are not contributors, are named in the Acknowledgment and have given me/us their written permission to be named. If I/we do not include an Acknowledgment that means I/we have not received substantial contributions from non-contributors and no contributor has been omitted.
Name Signature Date signed
1 ............................................................. ............................................................. .............................................................
2 ............................................................. ............................................................. .............................................................
3 ............................................................. ............................................................. .............................................................
4 ............................................................. ............................................................. .............................................................
5 ............................................................. ............................................................. .............................................................
6 ............................................................. ............................................................. .............................................................
(up to 6 contributors)

CHIEF EDITOR
Sri. L. GopalakrishnanManaging trusteePSG & Sons’ CharitiesCoimbatore, Tamilnadu, India.
Principal cum Professor of PharmacologyDr. M. Ramanathan
PSG College of Pharmacy
EDITOR
ASSOCIATE EDITOR
Dr. Khadar BhatchaProf. of Pharmacognosy
Mrs. P. RamaAsst. Prof. Dept of Pharmacy Practice
PATRON
PUBLICATION COMMITTEE
Dr. Sivaram HariharanProf. Pharmaceutical Chemistry
1. Dr. K. Umaa Prof. Pharmaceutical Chemistry
2. Dr. G. SyamalaAsso. Prof, Dept of Pharmacognosy
REVIEW COMMITTEE
3. Dr. K.Y. KavithaAsso. Prof, Dept of Pharmaceutical Analysis
4. Dr. S.M. Habibur RahmanAsso. Prof, Dept of Pharmaceutics
5. Dr. S. SubramanianAsso. Prof, Dept of Pharmaceutics
6. Mrs. AndhuvanAsso. Prof, Dept of Pharmacy Practice
7. Dr. Prudence A RodriguesAsso. Prof, Dept of Pharmacy Practice
8. Dr. V. SivakumarAsst. Prof, Dept of Pharmacy Practice
Dr. V. SankarVice Principal cum Prof. of Pharmaceutics
Mr. G. VenkateshAsst. Prof. Dept of Pharmacology
Dr. A. NagarajanProf. of PharmacognosyDept
9. Mr. S. KarthikeyanAsst. Prof, Dept of Pharmaceutics
SI.No.
Name Institution PlaceSI.No.
Name Institution Place
1. Dr. N. Udupa Manipal College of Manipal
Pharmaceutical Sci.
2. Dr. R. Manavalan Annamalai University Chidambaram
3. Dr. K. Kannan Annamalai University
4. Dr. K.P. Mohankumar IICB Kolkata
5. Dr. R Padma Sahasra Institute of Warangal
Pharmaceuticals
6. Dr. Tuhinadri sen Jadavpur Kolkata
7. Dr. Narayana Charyulu NGSM Institute of Manglore
Pharmaceutical science
8. Dr. Molly Matthew Malik Deenar College of Kasaragod.
Pharmacy
9. Dr. Sreenivas Reddy Manipal College of Manipal
Pharmacy
10. Dr. K. Gowthamarajan JSS College of Pharmacy Ooty
11. Dr. Joyamma Vargees Trivandrum Medical college Trivandrum.
12. Dr. A. Abdul Hassan Madurai medical College Madurai
13. Prof. A.J. Chacko MG University Kottayam
14. Dr. C Vijaya Ultra College of Pharmacy Madurai
15. Dr. A.Rajasekaran KMCH College of Pharmacy Coimbatore
16. Dr. N Nagaraj Sri Padmavathi Mahila Tirupathi
visva Vidyalaya
17. Dr. K. Ruckmani Anna University Tiruchy
18. Dr. S. Mohan Karpagam Coimbatore
College of Pharmacy
19. Prof. K.S. Lakshmi SRM University Chennai
20. Dr. H.G. Shivakumar JSS College of Pharmacy Mysore
21. Dr. T.K. Ravi College of Pharmacy
SRIPMS Coimbatore
Chidambaram
Mrs. R. NithyaAsst. Prof. Dept of Pharmaceutics
SJIF*, Scopus*, GIF* - Under evaluation
(An ISO 9001:2008 Certified Institution)
Accredited with 'B' Grade by NAAC (1st Cycle)
Coimbatore - 641 004. Tamilnadu, India
1. Dr. Imran Amad JINA, Pharmaceutical Inc USA .
Illinois
2. Dr. Paul Heng National University of Singapore
Singapore
3. Dr. Ibrahim A Alsarra King Saudi University Saudi Arabia
4. Dr. Sanjay Sehgal Aexelar Regulatory USA
Experts
5. Prof. Oluwatoyin. A University of Ibadan Nigeria.
Adeku
6. Dr. AJM Christeena Taylors University Malaysia
7. Dr. Jay Ramapuram AUBURN University Auburn
8. Dr. Sathis V Kamath New Product USA.
development
9. Dr. B. Raj kapoor Sebha University Libya
10. Dr. Syed AzharSyed Penang Malaysia.
Sulaiman
11. Dr. Arun Shirwaikar Gulf Pharmacy College Ajman, UAE

January - June 2017Vol.8 Issue 1
&
http://www.oajournals.com
Indexed in Google Scholar, Open Access, Academic Keys, SJIF*, Scientific Indexing Services,
GIF*, Directory of Research Journal Indexing, Index Copernicus International, Indian Citationindex
Research bible,REVIEW ARTICLE
Retrospective Review on Hyperhidrosis: Etiopathology and Its Treatment 01
Vignesh Balaji.E, *A.Tamil Selvan, K.Ragavan
Clinical Review on Anemia: Prevention and Management in Community Care Practice 07
M. S. Umashankar*, K.S.Lakshmi, V.Sankar, A.Bharath kumar, A.Porselvi
RESEARCH ARTICLE
A Correlative Study of Lipid Profile in Diabetic Dyslipidemic Patients with Hyperuricemia 18
Amala Thaha*, Anil Babu A, Deepthi S, Manjusha K, Nayana Thankachan, Shafeeq Mattummal
Formulation and Evaluation of Bi-Layer Tablet Containing Nimesulide with Calcium For 23Rheumatoid Arthritis
Saravanan S and Saba Maanvizhi*
Synthesis and Characterization of New Benzotriazole Derivatives for Possible CNS Activity 31
P. Swarnalatha, G.Sridhar Babu, L.Srikanth*, P. S. Malathy, B.Srinivas, J. Venkateshwar Rao
Isolation, Screening and Characterization of Antibiotic-Producing Actinomycetes from 37Rhizosphere Region of Different Plants from a Farm of Sungai Ramal Luar, Malaysia
Ng Zoe Yi and Amsaveni Selvaraj*
Instructions to Authors 47
Indexed in Google Scholar, Open Access, Academic Keys, SJIF*, Scientific Indexing Services, Research bible, GIF*,
Directory of Research Journal Indexing, Index Copernicus International, Indian Citationindex
January - July 2017Vol.8 Issue 1 ISSN 0975-3532