december 2021 issn: 0975-9999 (p), 2349-1655(o) - INDIAN ...
45
OCTOBER - DECEMBER 2021 ISSN: 0975-9999 (P), 2349-1655(O) SELP Journal of Social Science Volume XII, Issue 50 1 Available online @ www.iaraindia.com SELP Journal of Social Science - A Blind Review & Refereed Quarterly Journal ISSN: 0975-9999 (P) 2349-1655 (O) Impact Factor: 3.655(CIF), 2.78(IRJIF), 2.77(NAAS) VolumeXII, Issue 50 October – December 2021 Formerly UGC Approved Journal (46622), © Author A STUDY ON EMPLOYEE JOB SATISFACTION WITH SPECIAL REFERENCE TO TAMILNADU ELECTRICITY BOARD IN THIRUMAKKOTTAI, THIRUVARUR DISTRICT Dr. D. SUPULAKSHMI Assistant Professor of Commerce STET Women’s College, (Autonomous) Mannargudi. & M. JAYAPRIYA II- Mcom STET Women’s College, (Autonomous) Mannargudi. Abstract Job satisfaction refers to one’s feelings towards one’s job. If the employee’s expectations are fulfilled (or) the employees get higher than what he / she feels satisfied. if the job satisfaction increases organization commitment will increased. This results in the higher productivity. The main objectives of this paper are to assess the job satisfaction: to identify the effectiveness of job satisfaction and to find out the several factors like personal and organizational factors influencing job satisfaction of employees. This study helped in revealing the level of satisfaction of employees with reference to the various factors provided in the organization. This study clearly shows that employees under organization are more or less satisfied with the job. The organization should consider on the salary, relationship of employees and supervisors, grievance handling and give more opportunity for the new employees. Keywords:Job satisfaction, organizational factors, Employees satisfaction, productivity 1. Introduction Job satisfaction is one of the important factors which have drawn attention of managers in the organization as well as academicians. Various studies have been conducted to find out the factors which determine job satisfaction and the way it influences productivity in the organization. Though there is no conclusive evidence that job satisfaction affects productivity directly because productivity depends on so many variables, it is still a prime concern for managers.
-
Upload
khangminh22 -
Category
Documents
-
view
1 -
download
0
Transcript of december 2021 issn: 0975-9999 (p), 2349-1655(o) - INDIAN ...

OCTOBER - DECEMBER 2021 ISSN: 0975-9999 (P), 2349-1655(O)
SELP Journal of Social Science Volume XII, Issue 50
1
Available online @ www.iaraindia.com
SELP Journal of Social Science - A Blind Review & Refereed Quarterly Journal
ISSN: 0975-9999 (P) 2349-1655 (O)
Impact Factor: 3.655(CIF), 2.78(IRJIF), 2.77(NAAS)
VolumeXII, Issue 50
October – December 2021
Formerly UGC Approved Journal (46622), © Author
A STUDY ON EMPLOYEE JOB SATISFACTION WITH SPECIAL
REFERENCE TO TAMILNADU ELECTRICITY BOARD IN
THIRUMAKKOTTAI, THIRUVARUR DISTRICT
Dr. D. SUPULAKSHMI
Assistant Professor of Commerce
STET Women’s College, (Autonomous)
Mannargudi.
&
M. JAYAPRIYA
II- Mcom
STET Women’s College, (Autonomous)
Mannargudi.
Abstract
Job satisfaction refers to one’s feelings towards one’s job. If the employee’s expectations
are fulfilled (or) the employees get higher than what he / she feels satisfied. if the job
satisfaction increases organization commitment will increased. This results in the higher
productivity. The main objectives of this paper are to assess the job satisfaction: to
identify the effectiveness of job satisfaction and to find out the several factors like
personal and organizational factors influencing job satisfaction of employees. This study
helped in revealing the level of satisfaction of employees with reference to the various
factors provided in the organization. This study clearly shows that employees under
organization are more or less satisfied with the job. The organization should consider on
the salary, relationship of employees and supervisors, grievance handling and give more
opportunity for the new employees.
Keywords:Job satisfaction, organizational factors, Employees satisfaction, productivity
1. Introduction
Job satisfaction is one of the
important factors which have drawn
attention of managers in the organization
as well as academicians. Various studies
have been conducted to find out the factors
which determine job satisfaction and the
way it influences productivity in the
organization. Though there is no
conclusive evidence that job satisfaction
affects productivity directly because
productivity depends on so many
variables, it is still a prime concern for
managers.

OCTOBER - DECEMBER 2021 ISSN: 0975-9999 (P), 2349-1655(O)
SELP Journal of Social Science Volume XII, Issue 50
2
Paramasivan, C. (2011) Information
technology plays a key role in the modern
world which meets the day to day
activities of the human beings directly or
indirectly associated. Commercial
activities particularly banking and
financial sectors may not function without
proper information technology.
Job satisfaction is the mental feeling of
favourableness which an individual has
about his job. DuBrin has defined job
satisfaction in terms of pleasure and
contentment when he says:
“job satisfaction is the amount of
pleasure or contentment associated with a
job. If you like your job intensely, you will
experience high job satisfaction. If you
dislike your job intensely, you will
experience high job dissatisfaction”.1 1Andrew J. DuBrin, practice of
supervision, New Delhi: Universal, 1988,
p.58. OBJECTIVES OF THE STUDY
To study the socio-economic
characteristics of employee.
To study about the factors involved in
job satisfaction.
To study about the opinion of the
employees regarding working
conditions.
To suggest suitable measure to
increase the satisfaction level of
employees. RESEARCH METHODOLOGY
Research methodology is the
rearrangement it conditions for collection
and analysis of data in a manner that aims
to refer the research purpose with
economy in procedure.
Methodology is the systematic,
theoretical analysis of the methods applied
to a field of study, or the theoretical
analysis of the body of methods and
principles associated with a branch of
knowledge. It, typically, encompasses
concepts such as paradigm, theoretical
model, phases and quantitative or
qualitative techniques.
RESEARCH DESIGN
A research design or model indicates a
plan of action to be carried out in
connection with a proposed research work.
It provides only a guideline for the
researcher to enable him to keep track of
his actions and to know that he is moving
in the right direction in order to achieve
his goal. Research design is the plan,
structure and strategy of investigation
conceived so as to obtain answers to
research questions and to control variance.
The plan is the overall scheme of
programme of research. The research
design constitutes the blueprint for the
collection, measurement and analysis of
data. DATA ANALYSIS AND INTERPRETATION
Analysis and interpretation are
central steps in the research process.
Analysis of data means studying the
tabulated materials in order to determine
inherent facts or meaning. It involves
breaking down existing complex factors in
to simple parts and putting the parts
together in new arrangement for purpose
of interpretation. Analysis of data involves
a number of closely related operations that
are performed with the purpose of
summarizing the collected data and
organizing these in such in a manner that
the will field answer to research questions
or suggest hypotheses had initiated the
study. Table 1
Employee Job Satisfaction
Opinion No. of
Respondents
Percentage (
%)
Yes 44 55
No 36 45
Total 80 100
Highly satisfied 42 52.5
Satisfied 20 25
Dissatisfied 15 18.75
Highly dissatisfied 3 3.75
Total 80 100
Highly satisfied 16 20
Satisfied 36 45
Dissatisfied 18 22.5
Highly dissatisfied 10 12.5
Total 80 100
Source: Primary Data.

OCTOBER - DECEMBER 2021 ISSN: 0975-9999 (P), 2349-1655(O)
SELP Journal of Social Science Volume XII, Issue 50
3
Inference
55 percent of the respondents say
that they are getting salary as per their
performance and only 45% are not say No.
The above table shows that
majority i.e., 52.5% of the respondents are
highly satisfied about the relationship with
superior, 25% of the respondents are
satisfied, 18.75% of the respondents are
dissatisfied and only 3.75% of the
respondents are highly dissatisfied.
The above table shows that majority i.e.,
45% of the respondents are satisfied with
the safety measures provided by the
concern, 20% of the respondents are
highly satisfied remaining 22.5% of the
respondents are dissatisfied and only 12.5
of the respondents are highly dissatisfied.
The company provide safety measures
such as fire safety, electrical safety.
FINDINGS
Majority ( 57%) of the respondents
are satisfied with their work.
45% of the respondents are satisfied
with the company by providing safety
measures to the employees.
47% of the respondents agree with
the company supporting the team work of
the organisation.
Majority (56%) of the respondents
are highly satisfied with the overall
environmental of the organization.
52.5% of the respondents are highly
satisfied with the relationship with co-
workers.
SUGGESTIONS
As majority of respondents are
satisfied with the working condition,
salary, bonus, retirement, benefits etc., it is
clear that the organisation is running as a
model employer. So it is recommended
that the present condition may be
continued may be continued in future.
While the entire stock of officers/
officials have expressed deep satisfaction
with all the facilities provided, there has
been a smaller group which have
expressed their dissatisfaction which
obviously prevalent in all major
organizations.
Proper recruitment with proper
qualification may meet the ends of
satisfaction for both the customer and
staff.
It is generally observed that
organizations with more satisfied
employees tend to be more effective than
organizations with fewer satisfied
employees. The most important thing
managers can do to raise employee
satisfaction is to focus on the intrinsic
parts of the job, such as making the work
challenging and interesting.
CONCLUSION
This study was conducted mainly to reveal
the satisfaction level of employees, about
their job in TNEB, Thirumakkottai. They
are maintaining a good relationship with
employees with share and all the
employees are satisfied in their recruitment
procedures. I wish this organization to
continue its positive efforts to make their
employees happy and also reduce the level
of negative aspect. So it is great
opportunity for me to do this study in the
prestige company.
BIBLIOGRAPHY
Human Resource Management, 3rd
Edition, Sultan Chand &Sons, L.M.Prasad,
(2014)
Research Methodology, 3rd Edition, Sage
Publications Ltd, RanjithKumar(2011)
Personnel Management and Industrial
Relations, Tripathi P.C., Sultan Chand
&Sons, (2011).
Management Of Personnel in India, 12th
Edition, Chatterjee N.N., (2011).
Organizational Behaviour, Keith Davis,
Sultan Chand & Sons, New Delhi, (2010)
Paramasivan, C. (2011). Customer
Satisfaction through Information
Technology in commercial banks. Journal
of Commerce and Management
Thought, 2(4), 509-522

OCTOBER - DECEMBER 2021 ISSN: 0975-9999 (P), 2349-1655(O)
SELP Journal of Social Science Volume XII, Issue 50
4
Available online @ www.iaraindia.com
SELP Journal of Social Science - A Blind Review & Refereed Quarterly Journal
ISSN: 0975-9999 (P) 2349-1655 (O)
Impact Factor: 3.655(CIF), 2.78(IRJIF), 2.77(NAAS)
Volume XII, Issue 50
October – December 2021
Formerly UGC Approved Journal (46622), © Author
A STUDY ON CONSUMER SATISFACTION TOWARDS REDMI
TOUCH SCREEN MOBILE USER IN MANNARGUDI TOWN
Dr.K.VEMBU
Assistant Professor & Research Advisor
STET Women’s College, (Autonomous)
Mannargudi.
&
D.ABINAYA II- Mcom
STET Women’s College, (Autonomous)
Mannargudi.
Abstract
A Smartphone not only fulfils the calling and receiving function but also meets
various consumer needs such as internet and social networking, multimedia, selfie,
assessment of health traits, video calling etc. A great number of variables influence
Smartphone buyers’ purchasing decisions. This research describes underlying factors that
play a leading role. Smart phones range and purchase in highly competitive market.
Investigators also analyze respondent's demographic characteristics. The analysis was
conducted in Bhubaneswar district of Khurta. In this technological and competitive age,
the purpose of this study is to explore the key factors that inspire consumers to purchase
and use smartphones. Therefore, the purpose behind the use of smart phones is to
recognize the attitude of the customer towards smart phones and finally to know the
satisfaction level of the customer towards smartphones. This research is more critical for
Smartphone companies as they sell.
Keywords: Smartphone, marketing strategy, purchasing behaviour, customer perception
1. Introduction
Smart phone has many
functionalities other than contacting
different people. Until today, there is a
wide range of brands launching new apps
and updates on smart phones. Youngsters
today frequently change their mobile
phones according to the new models.
Buying smart phones from famous brands
recently is becoming trendy. Not only do
youngsters of all ages enjoy buying and
using smart phones. The development of
marketing is evolutionary rather than
revolutionary. There is no single answer to
the question of what is marketing? To
understand it may be explained in brief as
“marketing is what a marketer does”. But
this managing lack clarity in understanding

OCTOBER - DECEMBER 2021 ISSN: 0975-9999 (P), 2349-1655(O)
SELP Journal of Social Science Volume XII, Issue 50
5
the subject. The evaluation of marketing is
as oldest as Himalayas. It is one of the
oldest professions as the word. Marketing
is in deeded an accident art, it has been
practiced in one from or the others since
the days of adam and eve.
OBJECTIVES
To study the socio- demographic
factors of the respondents
To analyses the customer
satisfaction of touch screen
mobile.
To give some of the findings of
the study and suitable suggestion
for the improvement of the above
study.
SCOPE OF THE STUDY
Paramasivan, C. (2011) Information
technology plays a key role in the modern
world which meets the day to day
activities of the human beings directly or
indirectly associated. Commercial
activities particularly banking and
financial sectors may not function without
proper information technology. This
research will assist with understanding the
purchasing behavior of individual groups
of customers and help to oversee item
portfolio better. This study is an endeavor
to break down the buyer purchasing
preferences and inclinations towards the
utilization of the product and the buyer’s
level of satisfaction
RESEARCH METHODOLOGY
Both primary and secondary data
will be used for the study. Primary data
will be collected through questionnaire.
Secondary data will be collected from
internet, journals, magazines and books. A
sample of 100 people, who uses Redmi
Smartphone’s, was selected by
convenience sampling from the population
and the questionnaires were distributed to
them in order to collect information.
RESEARCH
Research is common parlance
refers to a search for knowledge.
According to Clifford woody,
“research companies defining and
redesigning problem, formulating
hypothesis are suggested solution,
collecting, organizing and evaluation data,
making deduction and researching
conclusion”.
DATA COLLECTION
There are two methods of data
collection
1. Primary data collection
2.Secondary data collection
PRIMARY DATA
Primary data are those which are
collected for the first time and are original
in character.
Hence, we collected the data directly from
the respondent through questionnaires.
SECONDARY DATA
The secondary data are those which
are collected already by someone for some
purpose and available for the present
study. For analyzing the data we used
books, journals, magazines, website etc.
DATA ANALYSIS AND
INTERPRETATION
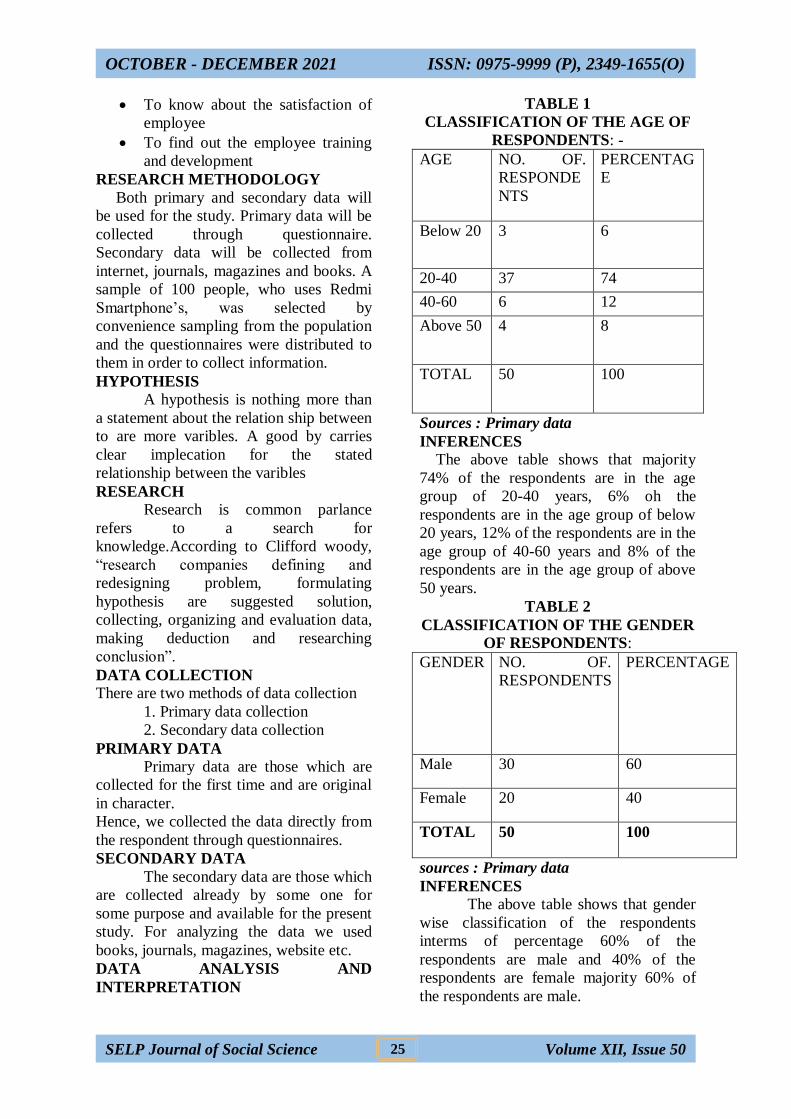
TABLE 1
CLASSIFICATION OF THE AGE OF
RESPONDENTS: -
Age No. Of.
Respondents Percentage
Below
20
3 6
20-40 37 74
40-60 6 12
Above
50
4 8
TOTAL 50 100
The above table shows that majority74%
of the respondents are in the age group of
20-40 years,6% oh the respondents are in
the age group of below 20 years,12% of
the respondents are in the age group of 40-
60 years and 8% of the respondents are in
the age group of above 50 years.
OCTOBER - DECEMBER 2021 ISSN: 0975-9999 (P), 2349-1655(O)
SELP Journal of Social Science Volume XII, Issue 50
6
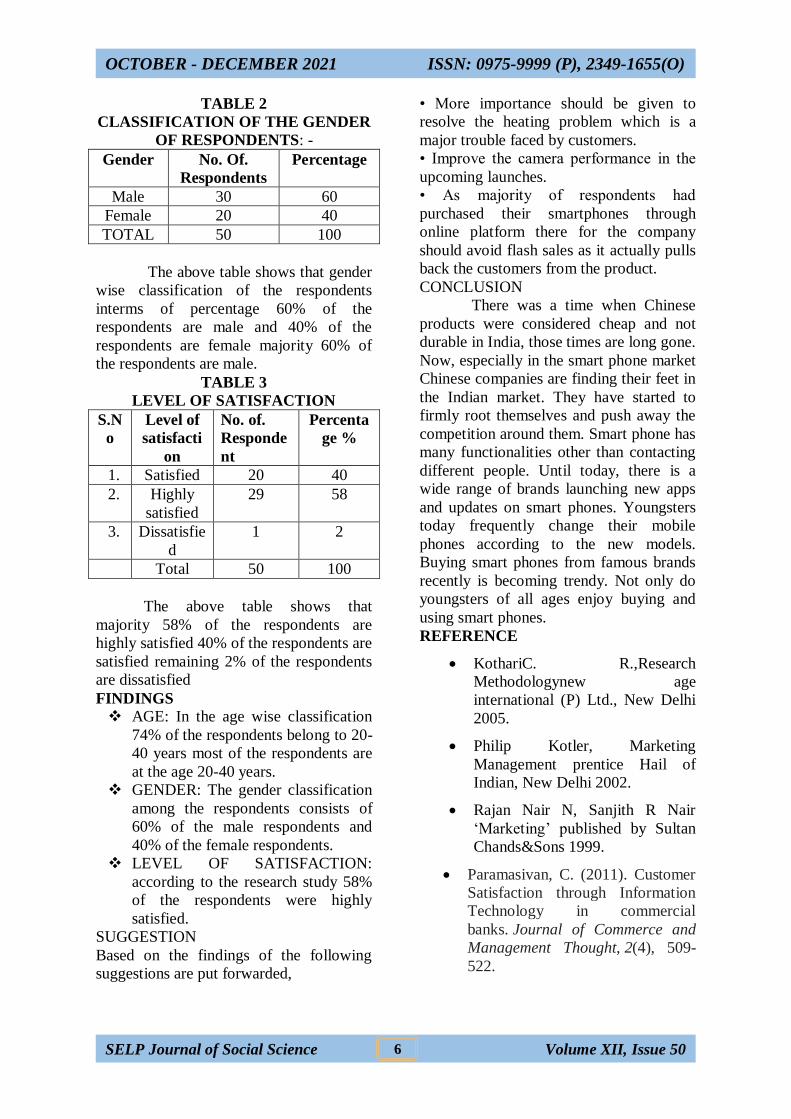
TABLE 2
CLASSIFICATION OF THE GENDER
OF RESPONDENTS: -
Gender No. Of.
Respondents
Percentage
Male 30 60
Female 20 40
TOTAL 50 100
The above table shows that gender
wise classification of the respondents
interms of percentage 60% of the
respondents are male and 40% of the
respondents are female majority 60% of
the respondents are male.
TABLE 3
LEVEL OF SATISFACTION
S.N
o
Level of
satisfacti
on
No. of.
Responde
nt
Percenta
ge %
1. Satisfied 20 40
2. Highly
satisfied
29 58
3. Dissatisfie
d
1 2
Total 50 100
The above table shows that
majority 58% of the respondents are
highly satisfied 40% of the respondents are
satisfied remaining 2% of the respondents
are dissatisfied
FINDINGS
AGE: In the age wise classification
74% of the respondents belong to 20-
40 years most of the respondents are
at the age 20-40 years.
GENDER: The gender classification
among the respondents consists of
60% of the male respondents and
40% of the female respondents.
LEVEL OF SATISFACTION:
according to the research study 58%
of the respondents were highly
satisfied.
SUGGESTION
Based on the findings of the following
suggestions are put forwarded,
• More importance should be given to
resolve the heating problem which is a
major trouble faced by customers.
• Improve the camera performance in the
upcoming launches.
• As majority of respondents had
purchased their smartphones through
online platform there for the company
should avoid flash sales as it actually pulls
back the customers from the product.
CONCLUSION
There was a time when Chinese
products were considered cheap and not
durable in India, those times are long gone.
Now, especially in the smart phone market
Chinese companies are finding their feet in
the Indian market. They have started to
firmly root themselves and push away the
competition around them. Smart phone has
many functionalities other than contacting
different people. Until today, there is a
wide range of brands launching new apps
and updates on smart phones. Youngsters
today frequently change their mobile
phones according to the new models.
Buying smart phones from famous brands
recently is becoming trendy. Not only do
youngsters of all ages enjoy buying and
using smart phones.
REFERENCE
KothariC. R.,Research
Methodologynew age
international (P) Ltd., New Delhi
2005.
Philip Kotler, Marketing
Management prentice Hail of
Indian, New Delhi 2002.
Rajan Nair N, Sanjith R Nair
‘Marketing’ published by Sultan
Chands&Sons 1999.
Paramasivan, C. (2011). Customer
Satisfaction through Information
Technology in commercial
banks. Journal of Commerce and
Management Thought, 2(4), 509-
522.

OCTOBER - DECEMBER 2021 ISSN: 0975-9999 (P), 2349-1655(O)
SELP Journal of Social Science Volume XII, Issue 50
7
Available online @ www.iaraindia.com
SELP Journal of Social Science - A Blind Review & Refereed Quarterly Journal
ISSN: 0975-9999 (P) 2349-1655 (O)
Impact Factor: 3.655(CIF), 2.78(IRJIF), 2.77(NAAS)
VolumeXII, Issue 50
October – December 2021
Formerly UGC Approved Journal (46622), © Author
A STUDY ON EMPLOYEE TALENT MANAGEMENT WITH SPECIAL
REFERENCE TO BHARATHI WOMEN DEVELOPMENT CENTRE AT
THIRUVARUR
K.KAVYA
II- Mcom
STET Women’s College, (Autonomous)
Mannargudi.
&
G.BHUVANESHWARI Assistant Professor of Commerce
STET Women’s College, (Autonomous)
Mannargudi.
Abstract
These days organization’s talent is its primary source of competitive
advantage. Performance of organization depends upon performance of its employees. If
employees of an organization possess unique competence, that will differentiate them from
their competitors. In this competitive environment retention of talented workforce is a
major task for HR managers along with acquisition. Talent management is a very complex
and critical task. Right Talent acquisition makes organization strategy more strong. The
current global economic situation has increased overall jobseekers in employment market
worldwide, but there is still notable talent shortage in different sectors and different
countries, this leads to increase the problem of “Talent Mismatch”. As today’s corporate
world requires a person with multitasking skill, talent acquisition is becoming very
difficult. As a result, finding the “right” person for a particular job is becoming more
challenging. Not only acquisition even retention of talented workforce has become
greatest challenge for organization. Today’s changing landscape of business requires its
HR to act more strategically to build employee engagement which is a great tool for talent
management. Talent Management focuses on how individuals enter; move up across or
out of the organization. Talent Management will succeed with the support of strong
organization structure. As better talent can change the future of business, Talent
Management has to be given predominant role in organization. If organization
implements talent management strategies effectively, that enhances employee’s
engagement which in turn helps to improve organization performance. Higher the
employee engagement higher the productivity. This present study aims to identify the
relationship between talent management and organization performance. This study is
based on empirical research evidence build by literature reviews carried out in this
direction. Researcher is intended to use different articles, research papers and literatures

OCTOBER - DECEMBER 2021 ISSN: 0975-9999 (P), 2349-1655(O)
SELP Journal of Social Science Volume XII, Issue 50
8
in order to identify the positive relationship between talent management and organization
performance. This empirical research paper will provide insights to HR managers to build
Talent management as a Strategic tool to build employee engagement and thereby
improving organization performance.
Keywords: Talent Management, Employee Engagement, Organization Performance,
Competencies
1. Introduction
The war of Talent management…..
“ As the name itself suggests in managing
the ability, competency and power of
employees within an organisation. The
concept is not restricted to recruiting the
right candidate at the right time but it
extends to exploring the hidden and
unusual qualities of your employees and
developing and nurturing them to get the
desired results.”
Talent management is process
where organisation management identifies,
develops, recruits, retains and deploys the
talented individuals. Talent is a primary
source of competitive advantage for
today’s corporate world. The rise in
knowledge economy has resulted in more
focus on acquiring and retaining talented
workforce.
OBJECTIVE Objective of this paper is to
understand talent management, importance
of talent management in leveraging
competitive advantage of organization.
This paper also provides insight on how
talent management initiatives can
complement organization’s recruitment
and retention policy.
To study the socio demographic
characteristics of respondents.
To enable the employee achievements and
standards of work performance.
To study the barriers to effective
performance.
RESEARCH METHODOLOGY
Research methodology
is a way to systematically solve the
research problem. It may be understand as
a science of studying how research is done
scientifically it include overall design the
sampling procedure data collection
methods of analysis.
RESEARCH HYPOTHESIS
There is a significant association
between the Educational
Qualification of the respondents and
their superior standards of work.
There is a no significant association
between the Experience of the
respondents and improve your in
Talent.
From ANOVA it was found that
there is no significant between
marital status and effective
performance.
PRIMARY DATA
The data is collected by
questionnaire or survey method.
SECONDARY DATA
The secondary data are collected
from the company records, files, interest,
journal and magazines.
SAMPLING DESIGN
The research has used simple
random sampling under probability
method for sampling to select
80respondents from “BHARATHI
WOMEN DEVELOPMENT CENTRE” at
Thiruvarur
LIMITATION OF THE STUDY
Due to work shift questionnaires
cannot be distributed to worked at
time
The period of collection the data was
shorted
The study has been limited to only a
sample of 80
The data were collected from the
respondents only during the lunch
time

OCTOBER - DECEMBER 2021 ISSN: 0975-9999 (P), 2349-1655(O)
SELP Journal of Social Science Volume XII, Issue 50
9
REVIEW OF LITERATURE
1. Hale [9] studied that 86% employers
faced difficulty in attracting employee
and 58% came across the problem to
retain their employees. Such issues
motivate organizations to focus on
talent issues.
2. Rothwell [10] suggested that if
organizations engage in strategic
practices to retain and engage
employees, it would be beneficial for
the organization. Another, study
3. Neill and Heinen [11] discussed that
successful organizations always give
importance to attracting, retaining and
developing the talent and it also
assists the organization in making the
company’s strategy that align the
business plan with skilled employees.
However, if an organization fails to
utilize human capital then the result
will be in the form of business
decline. There are different features of
talent management like recruitment,
selection, on-boarding, mentoring,
performance management, career
development, leadership development,
replacement planning, career
planning, recognition and reward [11],
[12].
4. Hughes and Rog [17] elucidated that
the CEO of the company plays an
important role in the effective
implementation of talent management.
Talent management strategy must be
integrated with all levels of
organization and its objectives must
be clear. The people assessment
system must be analytical. It must be
able to ensure that people have right
skills according to their jobs.
Managers need to enhance their ability
to translate the business need into
talent strategies for the better
performance of organization [7].
DATA ANALYSIS AND
INTERPRETATION
CLASSIFICATIONS OF THE
RESPONDENTS BY THEIR AGE
S.
N
O
AG
E
NO.OF.RESPO
NDENTS
PERCEN
TAGE
1 20-
30
40 50
2 30-
40
20 25
3 40-
50
15 19
4 Ab
ove
50
5 6
Tot
al
80 100
Source: Primary Data
INFERENCE The above table shows that 50% of
the respondents are the belongs to the age
group of 20-30 years, 19% of the
respondents belongs to 40-50 years, 5% of
the respondents belongs to above 50 years
and 15% of the respondents are belongs to
the age of 30-40 years.
0
20
40
60
80
100
120
0-5
YEA
RS
5-1
0 Y
EAR
S
10
-15
ye
ars
Ab
ove
15
yea
rs
TOTA
L
NO.OF.RESPONDENTS
PERCENTAGE

OCTOBER - DECEMBER 2021 ISSN: 0975-9999 (P), 2349-1655(O)
SELP Journal of Social Science Volume XII, Issue 50
10
CLASSIFICATION OF
RESPONDENTS BY THEIR GENDER
S.N
O
GEND
ER
NO OF
RESPOND
ENTS
PERCENT
AGE
1 Male 50 63
2 Female 30 37
Total 80 100
Source: Primary Data
INFERENCE
The above table shows that the
63% of respondents are male and 37% are
female.
CLASSIFICATION OF THE
RESPONDENTS BY THEIR
EXPERIENCE
S.
N
O
EXPER
IENCE
NO.OF.RES
PONDENTS
PERCE
NTAGE
1 0-5
YEARS
28 35
2 5-10
YEARS
22 28
3 10-15
years
20 25
4 Above
15 years
10 12
TOTAL 80 100
INFERENCE
The above table Indicates that 35%
of the respondents are 0-5 years
experience, 28% of respondents are 5-10
years experienced, 25% of respondents are
10-15 years experienced, 12% of
respondents are above 15 years
experienced about the Management.
FINDINGS
Majority (50%) of the respondents
belongs to the age group of 26-30
years.
Majority (63%) of the respondents
are male.
35% of the respondents are
experienced with the product.
CONCLUSION
Workforce challenges and rapidly
changing environment are the key causes
that banking sector need to develop
strategies about managing talent within
banks. Banks can take into consideration
different perspective on talent
management given by Blass [20]. The
practices like attraction, recruitment and
engagement plays an important role while
managing talent in the banks. To get
benefit from the competent employees and
to develop employees in banks talent
management must be taken under
consideration. Different factors like work-
life balance, learning environment and
succession planning plays an important
role in keeping the employees and utilizing
them for company’s advantage. Effective
talent management requires commitment
from all stages of organization. To reshape
the banks structure employee engagement
is important. Organizations can well-
position their place in the market by using
effective workforce performance.
0-5 YEARS
5-10 YEARS
10-15 years
020406080
100120140160180
0-5
YEA
RS
5-1
0 Y
EAR
S
10
-15
ye
ars
Ab
ove
15
yea
rs
TOTA
L
PERCENTAGE
NO.OF.RESPONDENTS
OCTOBER - DECEMBER 2021 ISSN: 0975-9999 (P), 2349-1655(O)
SELP Journal of Social Science Volume XII, Issue 50
11
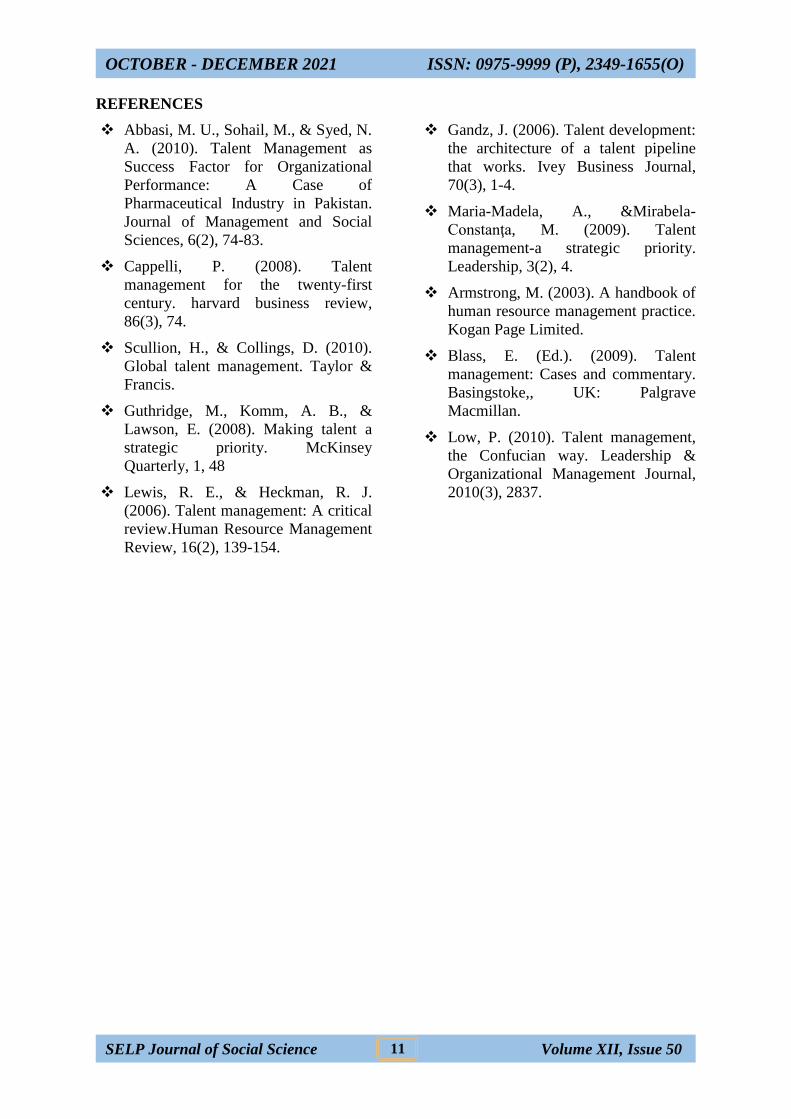
REFERENCES
Abbasi, M. U., Sohail, M., & Syed, N.
A. (2010). Talent Management as
Success Factor for Organizational
Performance: A Case of
Pharmaceutical Industry in Pakistan.
Journal of Management and Social
Sciences, 6(2), 74-83.
Cappelli, P. (2008). Talent
management for the twenty-first
century. harvard business review,
86(3), 74.
Scullion, H., & Collings, D. (2010).
Global talent management. Taylor &
Francis.
Guthridge, M., Komm, A. B., &
Lawson, E. (2008). Making talent a
strategic priority. McKinsey
Quarterly, 1, 48
Lewis, R. E., & Heckman, R. J.
(2006). Talent management: A critical
review.Human Resource Management
Review, 16(2), 139-154.
Gandz, J. (2006). Talent development:
the architecture of a talent pipeline
that works. Ivey Business Journal,
70(3), 1-4.
Maria-Madela, A., &Mirabela-
Constanţa, M. (2009). Talent
management-a strategic priority.
Leadership, 3(2), 4.
Armstrong, M. (2003). A handbook of
human resource management practice.
Kogan Page Limited.
Blass, E. (Ed.). (2009). Talent
management: Cases and commentary.
Basingstoke,, UK: Palgrave
Macmillan.
Low, P. (2010). Talent management,
the Confucian way. Leadership &
Organizational Management Journal,
2010(3), 2837.

OCTOBER - DECEMBER 2021 ISSN: 0975-9999 (P), 2349-1655(O)
SELP Journal of Social Science Volume XII, Issue 50
12
Available online @ www.iaraindia.com
SELP Journal of Social Science - A Blind Review & Refereed Quarterly Journal
ISSN: 0975-9999 (P) 2349-1655 (O)
Impact Factor: 3.655(CIF), 2.78(IRJIF), 2.77(NAAS)
VolumeXII, Issue 50
October – December 2021
Formerly UGC Approved Journal (46622), © Author
A STUDY ON CONSUMER BEHAVIOUR OF KEO KARPIN HAIR OIL IN
MANNARGUDI TOWN
D.ABINAYA
II- Mcom
STET Women’s College, (Autonomous)
Mannargudi.
&
Ms.P.SATHYA Assistant Professor & Research Advisor
STET Women’s College, (Autonomous)
Mannargudi.
Abstract
This research analysis the impact of consumer buying behavior and customer.
satisfaction for Keo -Karpin hair oil product.This study was conducted in Mannargudi
Town in Thiruvarur district and designed with the sample of 75 respondents to collect the
required information. With the help of this study the relation of consumer behavior with
the product, price, promotion etc is revealed. Thus, it is marketing mix which is
indispensable for the promotion of product in an organization.
Keywords: Keo Karpin ,consumer behaviour, brand, customer satisfaction
1. INTRODUCTION
Everybody in this world is a consumer.
We need a variety of goods and services
right from our birth to death. All
consumers are buyers and all buyers are
not consumers. The social factors includes
consumer's family, small group, social
roles and status. A buying choices are
further influenced by four major
psychological factors. motivation,
perception, learning, beliefs and attitudes.
CONSUMER BEHAVIOUR:
Consumer behaviour is an integral part of
human behaviour and cannot be separated
from it. The study of consumer behaviour
is the study of how individuals make
decisions to spend their available resources
on consumption of related items. It
includes the study of what, why, how,
when, where they buy and how often they
buy any particular product or service.
RESEARCH PROBLEM:-
A Plethora of commercial brands
use ingredients that make our hair glow,
but which also damage in the long - term,
stripping it is vital proteins and moisture
some hair oils contain heavy metals like
Pb and Cd which is carcinogenic.

OCTOBER - DECEMBER 2021 ISSN: 0975-9999 (P), 2349-1655(O)
SELP Journal of Social Science Volume XII, Issue 50
13
OBJECTIVES OF THE STUDY:-
1) To study the socio - demographic
characteristics of respondents.
2) To determine the factors to be
considered before purchasing the brand of
hair oil.
3) To study the satisfaction levels of
customer of keo karpin hair oil.
4) To analysis the attributes of keo karpin
hair oil.
SCOPE OF THE STUDY:-
The study might be helpful for the
firm to revitalize itself. And it is highly
useful to the organisation to know what
exactly the customer needs. The study
deals with various aspects of services. It
helps the organisation to know its position
in the Market.
RESEARCH METHODOLOGY :-
The Project work is based on both
primary and secondary data.
PRIMARY DATA:-
Primarily data were collected by
using questionnaire from the sample size
of 75 respondents and the data collected
were edited analysis and presented in from
the tables and charts wherever necessary.
SECONDARY DATA:-
The Secondary data was collected
from magazine, journals, etc., The
collected data our categorized, analyzed
and presented in the form to tables and
diagrams at suitable places.
SAMPLING TECHNIQUES:
The sampling techniques chosen by
the researcher is "convenience sampling".
LIMITATION OF THE STUDY:-
The study has been limited to only
a sample of 75
The study was confined only in
Mannargudi town.
The study time was limited for four
months.
COMPANY PROFILE:-
Effectiveness is goal and
Efficiency is strength. It is nothing but
social responsibility that inspired them
mostly for last five decades. Social
commitment has got priority since their
inspection. This is what motivated them to
come forward with an endeavour to
manufacture antibiotics and compete with
the multinationals.
FACTORS INFLUENCING THE
BRAND:-
Rural consumer prefer goods
having fragrance attractive packing and
color.
quality
Fragrance
Brand image
Attractive packing
small packs & low price
DATA ANALYSIS AND
INTERPRETATION
Table 1
Classification Of Respondents On The
Basis Of Age
S.N
O AGE
NO OF
RESPOND
ENTS
PERCENT
AGE
01
Below
15
Years
37 50
02 16-30
years 19 25
03 31-50
Years 11 15
04
Above
50Yea
rs
08 10
Total 75 100
source : Primary data
INFERENCE:-
From the above table it is found
that majority 50 % of the respondents are
the age group of below 15 years , 25% of
the respondents are the age group of
between 16-30 years, 15% of the
respondents are the age group of between
group of 31-50 years and only 10% of the
respondents are above 50Years

OCTOBER - DECEMBER 2021 ISSN: 0975-9999 (P), 2349-1655(O)
SELP Journal of Social Science Volume XII, Issue 50
14
Table 2
Classification Of Respondents On The
Basis Of Gender
S.
N
O
GENDE
R
NO OF
RESPONDENT
S
PERCENT
AGE
01 Male 15 20
02 Female 60 80
TOTA
L
75 100
Source : Primary Data.
INFERENCE:-
The above table shows that 80% of
the respondents are female, 20% of the
respondents are male.
Table 3
Classification Of Respondents On The
Basis Of Quality Of Product
( Keo Karpin )
S.N
O
KEO
KAR
PIN
NO OF
RESPOND
ENTS
PERCENT
AGE
01 Excell
ent 35 50
02 Very
good 26 33
03 Good 14 17
Total 75 100
Source : Primary Data
INFERENCE :-
From the above table it is found
that majority 50% of the respondents
reveals that the product is excellent. 33%
of the respondents reveals that the product
is very good and 17% of the respondents
reveal that their product is good.
Table 4
Classification of respondents
On the basis of source of awareness
S.
N
O
SOURC
E OF
AWARE
NESS
NO OF
RESPON
DENTS
PERCEN
TAGE
01 Advertise
ment 3 4.3
02 Friends 42 60
03 Relative 25 28.6
04 Others 5 7.1
Total 75 100
source: Primary data
INFERENCE:-
From the above table it is inferred
that 60% of the respondents have come to
know about the product through friends,
28.6% of the respondents have come to
know about the product through relatives
and 7.1% of the respondents have come to
know about the product through others and
4.3% of the respondents are influenced by
TV advertisements.
FINDINGS:-
i) Majority of the respondents
belong to age group of below 15 Years.
ii) 80% of the Keo-Karpin hair oil
users are female.
iii) 50% of the respondents opinion
is excellent.
iv) 70% of the keo - Karpin hair oil
users recommend the brand to others.
v) 60% of the Keo - Karpin hair oil
users came to know about the
brand . through friends.
SUGGESTION:-
Consumer is the king of the market.
so consumer satisfaction must be
preserved with care.
If the company reduces production
cost, labour cost, and overheads to
this product that will be much

OCTOBER - DECEMBER 2021 ISSN: 0975-9999 (P), 2349-1655(O)
SELP Journal of Social Science Volume XII, Issue 50
15
preferable to rating with high quality
of material with low price.
There is a need for keo karpin's
advertisement in the entire channel.
Availability of the product needs to be
increased in Tamilnadu.
More sub dealers and service points
should be allocated in all urban and
semi - urban areas for better
marketing.
CONCLUSION:-
The researcher fulfils the
objectives of this study. This project work
mainly aims to find out the consumer
behaviour towards keo karpin hair oil of
Dey's company. This report will help the
company to promote their product. The
researcher has found that most of the
consumers like keo karpin hair oil because
of quality and ingredients.
REFERENCE :-
1. Consumer behaviour David L. Loudon
and Albert J. Della Bitta fourth edition,
Tata MC graw.
2. Marketing Management B.S. Raman,
Himalaya Publication.
3. Research Methodology C.R. Kothari,
new age international publishers.
4. Statistical methods S.P. Gupta, sultan
chand and sons.

OCTOBER - DECEMBER 2021 ISSN: 0975-9999 (P), 2349-1655(O)
SELP Journal of Social Science Volume XII, Issue 50
16
Available online @ www.iaraindia.com
SELP Journal of Social Science - A Blind Review & Refereed Quarterly Journal
ISSN: 0975-9999 (P) 2349-1655 (O)
Impact Factor: 3.655(CIF), 2.78(IRJIF), 2.77(NAAS)
VolumeXII, Issue 50
October – December 2021
Formerly UGC Approved Journal (46622), © Author
A STUDY ON CHANGING ATTITUDE OF CONSUMER FROM
CHEMICAL TO HERBAL COSMETICS IN MANNARGUDI TOWN
Dr. D. SUPULAKSHMI
Assistant Professor of Commerce
STET Women’s College, (Autonomous)
Mannargudi.
&
S.KRISHNAVENI
II- Mcom
STET Women’s College, (Autonomous)
Mannargudi.
Abstract
Cosmetic products are mixture of natural substances or manufactured
substances and offered to consumer. Now a day’s cosmetics have been a parts of every
individual’s life. It was stated by associated chambers of commerce and industry of India
that the consumption pattern of cosmetics among teenagers went up substantially between
2005 and 2015 because of increasing awareness and due to the desired to look goods. The
primary diligence of this research is to understand the importance of changing consumer
behaviour of towards chemical and herbal cosmetics products. The consumer now a days
are to conscious about the products which they buy, it should be reasonable best of
quality.
Keywords: Chemical, Herbals, Cosmetics, Consumer behaviour
1. Introduction
India, with a population of over
a billion people, is country of contrasts.
India’s urban population is the main
engine that fuels the demand for various
cosmetic products. However, the market
liberalization process that began in 1991,
along with the crowning of three Indians
as Miss World and Miss Universe during
the preceding four years, have made Indian
women conscious of their appearance.
Consequently, the cosmetic consumption
patterns of Indian women have changed,
and this trend is fuelling growth in the
cosmetic sector.
During the last two decades, the
cosmetic industry has seen a magical
Metamorphosis, as far as some of the
revolutionary concepts are concerned with
regard to consumer consumption pattern
and innovation in products.
All the personal products for hair,
tooth, nail and skin are cosmetics used to
improve the appearance. When herbs are
used for their aromatic and medicinal
value in cosmetics, they are known as

OCTOBER - DECEMBER 2021 ISSN: 0975-9999 (P), 2349-1655(O)
SELP Journal of Social Science Volume XII, Issue 50
17
herbal personal care products. These day’s
people prefer to use gels, shampoos and
non greasy oils and facial packs which
should be available in the ready to use
forms.
OBJECTIVES OF THE STUDY:
To study thesocio demographic
characteristics of respondents.
To study the changing attitude of
consumer from chemical cosmetics
to herbal cosmetics.
To study the various factors
influencing the consumption pattern
of cosmetics.
To find out the reasons for selecting
the herbal cosmetics products.
RESEARCH METHODOLOGY:
“A research design is the
arrangement of conditions for
collection and analysis of data in a
manner that aims to combine
relevance to the research purpose
with economy in procedure.”
Research, consisting of the population
of respondents. The research design
was non-experimental in nature. A
cross sectional.
LIMITATIONS OF THE STUDY
The study is limited to the Mannargudi
town.
One more limitation would be that the
sample size is too small to come to any
conclusion and their may be
discrepancies in data dueto this.
DATA ANALYSIS AND
INTERPRETATION
Table 1
Reasons for selecting herbal cosmetics
S.
N
O
PREFE
RENCE
NO. OF
RESPON
DENTS
PERCENT
AGE(%)
1 Prescribe
d by
Doctor
17 23
2 Safe for
skin
48 64
3 Longer
impact
10 13
Total 75 100
SOURCE: Primary Data
INFERENCE :
The above table no 01
reveals that 64% oftherespondents are
select herbal cosmetics for safety purpose
of skin, 23% are select for the prescription
given by theirDoctor and the remaining
13% of them prefer for longer impact.
CHART – 01
REASONS FOR SELECTING
HERBAL COSMETICS
Table 2
Preference of herbal cosmetics
S
.
N
o
HERB
AL
COMP
ANY
NO. OF
RESPOND
ENTS
PERCENTA
GE(%)
1.
Dabur 20 27
2.
Emami 12 16
3.
Cavinca
re
38 51
4.
Others
5 6
TOTA
L
75 100
SOURCE :Primary Data
INFERENCE :
The above table no 02 shows that
51 % of the respondents are preferred
cavinkare company products, 27% of
them are preferred Dabur products, 16% of
them preferred Emami products and the
020406080
100120140160180200
Percentage
No.ofRespondent

OCTOBER - DECEMBER 2021 ISSN: 0975-9999 (P), 2349-1655(O)
SELP Journal of Social Science Volume XII, Issue 50
18
remaining 6% of them are preferred other
company products.
Chart – 02
Preference of herbal cosmetics
Table 03
Factor influencing for herbal cosmetics
S
.
N
o
FACTO
R
INFLU
ENCE
NO,OF
RESPON
DENTS
PERCENT
AGE(%)
1. Benefit 8 10
2. Smell 2 3
3. No side
effect
24 32
4. Brightne
ss
41 55
Total 75 100
SOURCE : Primary data
INFERENCE :
The above table 03 depicts that
55% of the respondents influences for
brightness, 32% of the respondents
influence for no side effect 10% of the
respondents influences for benefit and 3 %
of the respondents influences for smell.
Chart - 03
Factor influencing for cosmetics
FINDINGS:
Majority of the respondents (64%)
areselect herbal cosmetics for safety
purpose of skin.
Majority of the respondents (51%)
prefer Cavinkare products in herbal
cosmetics.
Majority of the respondents (55%)
say brightness is the key
factorinfluences them to select the
cosmetics.
SUGGESTIONS:
Most of the respondents consume
their cosmetics on monthly basis
because cosmetics are costly products.
Company should reduce their price
slightly so that it would helpful to
increase their usage and purchase
frequency.
Company should keep launching new
shades and fragrance and brands
preference should be created.
Company should emphasis on catchy
advertisement and brand preference
should be created through good
advertisement.
Company should be carry their public
relation plans as it
can help to increase their image .
CONCLUSION:
The increasing size of the
middle-class population in India,
representing a growth in disposable
incomes, has led to more consumers for
98%
99%
99%
100%
100%
20 12 38 5
27% 16% 51% 6%
no.of Respondent Percentage
98%
98%
99%
99%
100%
100%
2 8 24 41
3% 10% 32% 55%
No. of Respondent Percentage

OCTOBER - DECEMBER 2021 ISSN: 0975-9999 (P), 2349-1655(O)
SELP Journal of Social Science Volume XII, Issue 50
19
the cosmetics market. It has a strong
positive attitude towards herbal cosmetics.
Such consumers are more inclined to
purchase higher-priced products. Although
Indians are strongly attached and
committed to their tradition and culture,
the advent of television and the awareness
of the western world are changing the
tastes and customs of India. To generate
and obtain a commercial niche in the
international area in existing scenario
requires the formulation and execution of
pragmatic strategy by Indian players in
cosmetics industry. Thus knowledge needs
to be integrated in traditional products to
generated superior knowledge based
products.
REFERENCE :
Research Methodology Methods and
Techniques
-C.R.Kothari, New Age International
Publishers.
Modern Marketing Principles And
Practices
-R.S.N.Pillai&Bagavathi, S.Chand
and Company Ltd.,.
Marketing Management-
KathiresanDr.Radha
http://www.dabur.com
http://www.cavinkare.com
http://www.godrej.com

OCTOBER - DECEMBER 2021 ISSN: 0975-9999 (P), 2349-1655(O)
SELP Journal of Social Science Volume XII, Issue 50
20
Available online @ www.iaraindia.com
SELP Journal of Social Science - A Blind Review & Refereed Quarterly Journal
ISSN: 0975-9999 (P) 2349-1655 (O)
Impact Factor: 3.655(CIF), 2.78(IRJIF), 2.77(NAAS)
VolumeXII, Issue 50
October – December 2021
Formerly UGC Approved Journal (46622), © Author
A STUDY ON CHANGING ATTITUDE OF CONSUMER FROM
CHEMICAL TO HERBAL COSMETICS IN MANNARGUDI TOWN
E.MAHALAKSHMI
II- Mcom
STET Women’s College, (Autonomous)
Mannargudi.
&
Dr.K.GOMATHI,
Assistant Professor of Commerce
STET Women’s College, (Autonomous)
Mannargudi.
Abstract
Hand sanitizer is a supplement or altemative to hand washing with soap and
water. The production of hand sanitizers from locally grown medicinal plants namely;
wild spinach, turmeric, garlic and camphor was achieved by obtaining the plants,
grinding and performing ethanolic extraction for 72hrs on them. This ethanolic extract in
combination with glycerine and absolute ethanol were used for the final preparation.
Turmeric and garlic failed the hand sanitizer’s approval test based on their colour and
pungent smell, but wild spinach and camphor were found to be good candidates for hand
sanitizers production here in
Nigeriainclusionofsuchproductsherecouldincreasehandhygienecompliancelevels
Keywords: hand sanitizer, medicinal plants, hygiene, soap alternative
1. Introduction
India, with a population of over
a billion people, is country of contrasts.
India’s urban population is the main
engine that fuels the demand for various
cosmetic products. However, the market
liberalization process that began in 1991,
along with the crowning of three Indians
as Miss World and Miss Universe during
the preceding four years, have made Indian
women conscious of their appearance.
Consequently, the cosmetic consumption
patterns of Indian women have changed,
and this trend is fuelling growth in the
cosmetic sector.
During the last two decades, the
cosmetic industry has seen a magical
Metamorphosis, as far as some of the
revolutionary concepts are concerned with
regard to consumer consumption pattern
and innovation in products.
All the personal products for hair,
tooth, nail and skin are cosmetics used to
improve the appearance. When herbs are
used for their aromatic and medicinal
value in cosmetics, they are known as

OCTOBER - DECEMBER 2021 ISSN: 0975-9999 (P), 2349-1655(O)
SELP Journal of Social Science Volume XII, Issue 50
21
herbal personal care products. These day’s
people prefer to use gels, shampoos and
non greasy oils and facial packs which
should be available in the ready to use
forms.
OBJECTIVES OF THE STUDY:
To study thesocio demographic
characteristics of respondents.
To study the changing attitude of
consumer from chemical cosmetics
to herbal cosmetics.
To study the various factors
influencing the consumption pattern
of cosmetics.
To find out the reasons for selecting
the herbal cosmetics products.
RESEARCH METHODOLOGY:
“A research design is the
arrangement of conditions for
collection and analysis of data in a
manner that aims to combine
relevance to the research purpose
with economy in procedure.”
Research, consisting of the population
of respondents. The research design
was non-experimental in nature. A
cross sectional.
LIMITATIONS OF THE STUDY
The study is limited to the Mannargudi
town.
One more limitation would be that the
sample size is too small to come to any
conclusion and their may be
discrepancies in data dueto this.
DATA ANALYSIS AND
INTERPRETATION
Table 1
Reasons for selecting herbal cosmetics
S.
N
O
PREFE
RENCE
NO. OF
RESPON
DENTS
PERCENT
AGE(%)
1 Prescribe
d by
Doctor
17 23
2 Safe for
skin
48 64
3 Longer
impact
10 13
Total 75 100
SOURCE: Primary Data
INFERENCE :
The above table no 01
reveals that 64% oftherespondents are
select herbal cosmetics for safety purpose
of skin, 23% are select for the prescription
given by theirDoctor and the remaining
13% of them prefer for longer impact.
CHART – 01
REASONS FOR SELECTING
HERBAL COSMETICS
Table 2
Preference of herbal cosmetics
S
.
N
o
HERB
AL
COMP
ANY
NO. OF
RESPOND
ENTS
PERCENTA
GE(%)
1.
Dabur 20 27
2.
Emami 12 16
3.
Cavinca
re
38 51
4.
Others
5 6
TOTA
L
75 100
SOURCE :Primary Data
INFERENCE :
The above table no 02 shows that
51 % of the respondents are preferred
cavinkare company products, 27% of
them are preferred Dabur products, 16% of
them preferred Emami products and the
020406080
100120140160180200
Percentage
No.ofRespondent

OCTOBER - DECEMBER 2021 ISSN: 0975-9999 (P), 2349-1655(O)
SELP Journal of Social Science Volume XII, Issue 50
22
remaining 6% of them are preferred other
company products.
Chart – 02
Preference of herbal cosmetics
Table 03
Factor influencing for herbal cosmetics
S
.
N
o
FACTO
R
INFLU
ENCE
NO,OF
RESPON
DENTS
PERCENT
AGE(%)
1. Benefit 8 10
2. Smell 2 3
3. No side
effect
24 32
4. Brightne
ss
41 55
Total 75 100
SOURCE : Primary data
INFERENCE :
The above table 03 depicts that
55% of the respondents influences for
brightness, 32% of the respondents
influence for no side effect 10% of the
respondents influences for benefit and 3 %
of the respondents influences for smell.
Chart - 03
Factor influencing for cosmetics
FINDINGS:
Majority of the respondents (64%)
areselect herbal cosmetics for safety
purpose of skin.
Majority of the respondents (51%)
prefer Cavinkare products in herbal
cosmetics.
Majority of the respondents (55%)
say brightness is the key
factorinfluences them to select the
cosmetics.
SUGGESTIONS:
Most of the respondents consume
their cosmetics on monthly basis
because cosmetics are costly products.
Company should reduce their price
slightly so that it would helpful to
increase their usage and purchase
frequency.
Company should keep launching new
shades and fragrance and brands
preference should be created.
Company should emphasis on catchy
advertisement and brand preference
should be created through good
advertisement.
Company should be carry their public
relation plans as it
can help to increase their image .
CONCLUSION:
The increasing size of the
middle-class population in India,
representing a growth in disposable
incomes, has led to more consumers for
98%
99%
99%
100%
100%
20 12 38 5
27% 16% 51% 6%
no.of Respondent Percentage
98%
98%
99%
99%
100%
100%
2 8 24 41
3% 10% 32% 55%
No. of Respondent Percentage

OCTOBER - DECEMBER 2021 ISSN: 0975-9999 (P), 2349-1655(O)
SELP Journal of Social Science Volume XII, Issue 50
23
the cosmetics market. It has a strong
positive attitude towards herbal cosmetics.
Such consumers are more inclined to
purchase higher-priced products. Although
Indians are strongly attached and
committed to their tradition and culture,
the advent of television and the awareness
of the western world are changing the
tastes and customs of India. To generate
and obtain a commercial niche in the
international area in existing scenario
requires the formulation and execution of
pragmatic strategy by Indian players in
cosmetics industry. Thus knowledge needs
to be integrated in traditional products to
generated superior knowledge based
products.
REFERENCE :
Research Methodology Methods and
Techniques
-C.R.Kothari, New Age International
Publishers.
Modern Marketing Principles And
Practices
-R.S.N.Pillai&Bagavathi, S.Chand
and Company Ltd.,.
Marketing Management-
KathiresanDr.Radha
http://www.dabur.com
http://www.cavinkare.com
http://www.godrej.com

OCTOBER - DECEMBER 2021 ISSN: 0975-9999 (P), 2349-1655(O)
SELP Journal of Social Science Volume XII, Issue 50
24
Available online @ www.iaraindia.com
SELP Journal of Social Science - A Blind Review & Refereed Quarterly Journal
ISSN: 0975-9999 (P) 2349-1655 (O)
Impact Factor: 3.655(CIF), 2.78(IRJIF), 2.77(NAAS)
VolumeXII, Issue 50
October – December 2021
Formerly UGC Approved Journal (46622), © Author
A STUDY ON RECRUITMENT AND SELECTION PROCESS WITH
SPECIAL REFERENCE TO ARR PRIVATE LTD, AT KUMBAKKONAM
Ms.S.THAZAKUZHALI
Assistant Professor of Commerce
STET Women’s College, (Autonomous)
Mannargudi.
&
A.MAHESWARI
II- Mcom
STET Women’s College, (Autonomous)
Mannargudi.
Abstract
Recruitment is the process of searching for prospective employees and
simulative them to apply for job in the organization. Selection may be defined as the
process by which the organization chose from among the applicants, those people whom
they feel would best meet the job recruitment, considering current environmental
condition.
Keywords: Recruitment, process ,selection, origination
1. Introduction
Recruitments the first step in
industrial employment. The ultimate
success or failure of such employment
depends on a large measure upon the
methods and organization by means of
which, the works are brought in to the
industry. If the workers in any undertaking
are not recruited in accordance with some
systematic proper and judicious manner,
most of them are likely to be fronted in
efficient & often quits unfit for jobs
allocated to them. It will kinder production
which in turn will mean a substantial total
outputs so scientific principles of labour
administration & labour management
should be applied in recruiting the workers
in various unit of organised in industries.
Selection is the process choosing the most
suitable process out of all the applicants.
In this process relevant information their
suitability for the jobs to be filled
selection is the process of the qualification
of applicant with the job recruitment.
OBJECTIVES
To find out the socio demographic
characteristics of the respondent.
To find out the recruitment &
selection process
To study the factor affecting
recruitment and selection process
OCTOBER - DECEMBER 2021 ISSN: 0975-9999 (P), 2349-1655(O)
SELP Journal of Social Science Volume XII, Issue 50
25
To know about the satisfaction of
employee
To find out the employee training
and development
RESEARCH METHODOLOGY
Both primary and secondary data will
be used for the study. Primary data will be
collected through questionnaire.
Secondary data will be collected from
internet, journals, magazines and books. A
sample of 100 people, who uses Redmi
Smartphone’s, was selected by
convenience sampling from the population
and the questionnaires were distributed to
them in order to collect information.
HYPOTHESIS
A hypothesis is nothing more than
a statement about the relation ship between
to are more varibles. A good by carries
clear implecation for the stated
relationship between the varibles
RESEARCH
Research is common parlance
refers to a search for
knowledge.According to Clifford woody,
“research companies defining and
redesigning problem, formulating
hypothesis are suggested solution,
collecting, organizing and evaluation data,
making deduction and researching
conclusion”.
DATA COLLECTION
There are two methods of data collection
1. Primary data collection
2. Secondary data collection
PRIMARY DATA
Primary data are those which are
collected for the first time and are original
in character.
Hence, we collected the data directly from
the respondent through questionnaires.
SECONDARY DATA
The secondary data are those which
are collected already by some one for
some purpose and available for the present
study. For analyzing the data we used
books, journals, magazines, website etc.
DATA ANALYSIS AND
INTERPRETATION
TABLE 1
CLASSIFICATION OF THE AGE OF
RESPONDENTS: -
AGE NO. OF.
RESPONDE
NTS
PERCENTAG
E
Below 20 3 6
20-40 37 74
40-60 6 12
Above 50 4 8
TOTAL 50 100
Sources : Primary data
INFERENCES
The above table shows that majority
74% of the respondents are in the age
group of 20-40 years, 6% oh the
respondents are in the age group of below
20 years, 12% of the respondents are in the
age group of 40-60 years and 8% of the
respondents are in the age group of above
50 years.
TABLE 2
CLASSIFICATION OF THE GENDER
OF RESPONDENTS:
GENDER NO. OF.
RESPONDENTS
PERCENTAGE
Male 30 60
Female 20 40
TOTAL 50 100
sources : Primary data
INFERENCES
The above table shows that gender
wise classification of the respondents
interms of percentage 60% of the
respondents are male and 40% of the
respondents are female majority 60% of
the respondents are male.

OCTOBER - DECEMBER 2021 ISSN: 0975-9999 (P), 2349-1655(O)
SELP Journal of Social Science Volume XII, Issue 50
26
TABLE 3
LEVEL OF SATISFACTION
S.
N
o
Level of
satisfaction
No. of.
Responden
t
Percentag
e %
1.
Satisfied 20 40
2.
Highly
satisfied
29 58
3.
Dissatisfie
d
1 2
Total 50 100
Sources : Primary data
INFERENCES
The above table shows that
majority 58% of the respondents are
highly satisfied 40% of the respondents are
satisfied remaining 2% of the respondents
are dissatisfied
FINDINGS
AGE: In the age wise classification
74% of the respondents belong to
20-40 years most of the
respondents are at the age 20-40
years.
GENDER: The gender
classification among the
respondents consists of 60% of the
male respondents and 40% of the
female respondents.
LEVEL OF SATISFACTION:
according to the research study
58% of the respondents were
highly satisfied.
SUGESSTION
The company can be move along
with the extremal sources of recruitment as
it plays a good role at present Internet
recruitment can be additionally concern
treated so as to encourage the employee as
wells as to out the further manpower
dement with in the organization
CONCLUSION
Employee are the basic instrument
to shape the business, major concentration
can be provided in assigning right job.
This can be achieved with the help of
effective recruitment & selection.
REFERENCES
1. C. R. KOTHARI, Research
Methodology new age international (P)
Ltd.,
New Delhi 2005.
2.K. ASWATHAPPA – Human
resources and personal management,
Tata graw – Hill puplication company
ltd, new delhi.
3. John brothers & Jeffery Gold,
Human resource management theory
and practice.
4.ARUN MONAPA
&Mirzaassaitada”personal
management “tataGraw _ hill
puplication company Ltd,
Newdelhi,Second Edition

OCTOBER - DECEMBER 2021 ISSN: 0975-9999 (P), 2349-1655(O)
SELP Journal of Social Science Volume XII, Issue 50
27
Available online @ www.iaraindia.com
SELP Journal of Social Science - A Blind Review & Refereed Quarterly Journal
ISSN: 0975-9999 (P) 2349-1655 (O)
Impact Factor: 3.655(CIF), 2.78(IRJIF), 2.77(NAAS)
VolumeXII, Issue 50
October – December 2021
Formerly UGC Approved Journal (46622), © Author
A STUDY ON ORGANIZATIONAL CLIMATE WITH SPECIAL
REFERENCES TO SNP DAIRY MILK COMPANY AT MADURAI
Ms.C.VIJAYASANTHI
Assistant Professor of Commerce
STET Women’s College, (Autonomous)
Mannargudi.
&
M.NISHAMARY II- Mcom
STET Women’s College, (Autonomous)
Mannargudi.
Abstract
The idea of “organizational climate” appears to refer to an attributes, of the
work environment. The idea of a “perceived organization climate” seems ambiguous;
one can not be sure whether it implies an attribute of the organization or of the perceiving
individual. If it refers to the organization, that measures of perceived organization
climate should be evaluated in terms of the accuracy of the perceptions Organizational
climate may simply be a different name for job satisfaction or employee attitudes.
Keywords: Organization climate, Perception, Job satisfaction, Employee attitudes
1. Introduction
An organization has it own
climate or internal environment or
“personality” organizational climate is a
general concept and difficult to define
precisely. It can be likened to our
description of the weather and the way in
which the climate of a geographical region
results from the combination of
environmental forces. Some of these
forces are better understood than others.
Applied to organizations, climate can be
said to relate to the prevailing atmosphere
surrounding the organizations, to the level
of morale and to the strength of feeling of
belonging, care and good will among
members.
MEANING
Organizational climate further more
provides a useful platform for
understanding such characteristics of
organization as stability creatively and
innovation communication effectiveness.
DEFINITION
Lituin and stringer (1968)
“organizational climate as a set or
measurable properties of the work
environment that is directly or indirectly
perceived by the people who live and work
in a particular environment and is assumed

OCTOBER - DECEMBER 2021 ISSN: 0975-9999 (P), 2349-1655(O)
SELP Journal of Social Science Volume XII, Issue 50
28
to influence their motivation and
behaviour”.
OBJECTIVES
The objectives of this study were.
To study the socio-demographic
characteristics of the respondents.
To analysis the various dimension
of organizational climate.
RESEARCH METHODOLOGY
The research realized more primary
and secondary data and respondents were
selected of random sampling techniques so
as to give representation to different
classes of people. To collect the
information from the respondents,
interview schedule was used. It additional
to the supporting materials used books,
and internet were also preferred.
LIMITATIONS OF THE STUDY
Time was a big constraint
The duration for the study was
limited, so comprehensive and
eleboate study was not
undertaken.
The hesitation of the respondents
in providing information
regarding monthly income etc.,
made the researcher to feel I
convenient.
The limited to human resource
management only. No reference
is made about productivity, cost of
production, financial management
etc.
TABLE 1
DISTRIBUTION OF RESPONDENTS
BY THEIR AGE
S.NO NO.OF
RESPONDE
NTS
PREC
ENTA
GE (%)
Upto 30 years 15 18.75
31-40 years 35 43.75
41-50 years 25 31.25
50 years above 5 06.25
Total 80 100.00
Sources: Primary Data
From the above table shows that the
age group of the respondents. A sizable
proportion of the respondents 18.75% are
in the age group of up to 30 years and
43.75 are in the age group of the 31 to 40
years and 31.25% are in the age group of
the 41 to 50 years and remaining 6.25% of
the respondents are in the age of above 50.
TABLE 2
DISTRIBUTION OF RESPONDENTS
BY THEIR GENDER
S.N
O
GEND
ER
NO.OF
RESPOND
ENTS
PERCENT
AGE
1
Male 55 68.75
2
Female 25 31.25
Total 80 100.00
Source: Primary Data
INFERENCE:
From the above table it is found that
68.75%of the respondents are male and
31.25% of the respondents are female.
TABLE 3
DISTRIBUTION OF RESPONDENTS
BY THEIR MARITAL STATUS
S.N
O
MART
IAL
STAT
US
NO.OF
RESPOND
ENTS
PERCEN
TAGE
1 Married 48 60.00
2
Unmarr
ied
32 40.00
Total 80 100.00
Source: Primary Data
INFERENCE:
From the above table shares that 60% of
the respondents are married and 40% of
the respondents are unmarried.
TABLE 4
DISTRIBUTION OF RESPONDENTS
BY THEIR SATISFATION IN WORK S.
N
O
SATISFACTI
ON OF
WORK
NO.OF
RESPONDE
NTS
PERCE
NTAGE
1
Fully
satisfied
42 52.50
2 Satisfied 26 32.50
3 Not satisfied 12 15.00
Total 80 100.00
Sources: Primary Data:

OCTOBER - DECEMBER 2021 ISSN: 0975-9999 (P), 2349-1655(O)
SELP Journal of Social Science Volume XII, Issue 50
29
INFERENCE:
From the above table share that
52.5% of the respondents fully satisfied in
work, 32.5% of the respondents satisfied
in work and 15% of the respondents not
satisfied in work.
FINDINGS
Majority of the respondents
belong to the age group of 31 to
40 years (43.75%).
Majority of the respondents are
male (68.75%).
Majority of the respondents are
married (60%).
Majority of the respondents are
fully satisfied in their work
(52.5%).
SUGGESTIONS
The company has to increase the
age training programmers for
their employees based on the
latest job techniques.
It is suggested that the company
have to arrange periodic meetings
regularly for the welfare of
employees.
Encouragement of team work
may result in high productivity.
CONCLUSION
Organizational climate depends upon
various factors such as organizational
policies organizational development,
training and development, grievance
handling, job satisfaction, welfare
measures etc. From this research I
conclusion that the climate within the
organization is maintained well. The
research dearly shows that the workers are
highly satisfied with the organizational
aspects and help to motivated them to
work in the organization for more years.
Through this the productivity and good
will among customers id enhanced.
REFERENCES
Balu.V Organizational Behavior
Srinivasan Publications.
SrivastavaS.K. Organization
Behavior And Management, 1st
Edition-2005, Sarup& Sons, New
Delhi.
Ahuja.K.K Management And
Organization CBS Published And
Distributors.
Jit Chandan.S Organizational
behavior publishing house pvt.Ltd

OCTOBER - DECEMBER 2021 ISSN: 0975-9999 (P), 2349-1655(O)
SELP Journal of Social Science Volume XII, Issue 50
30
Available online @ www.iaraindia.com
SELP Journal of Social Science - A Blind Review & Refereed Quarterly Journal
ISSN: 0975-9999 (P) 2349-1655 (O)
Impact Factor: 3.655(CIF), 2.78(IRJIF), 2.77(NAAS)
VolumeXII, Issue 50
October – December 2021
Formerly UGC Approved Journal (46622), © Author
A STUDY ON STRESS MANAGEMENT WITH SPECIAL REFERENCE
TO THANJAVUR SPINNING MILL LTD
Ms.C.VIJAYASANTHI
Assistant Professor of Commerce
STET Women’s College, (Autonomous)
Mannargudi.
&
S.PAVITHRA II- Mcom
STET Women’s College, (Autonomous)
Mannargudi.
Abstract
Effective techniques for stress management are varied. They typically
include behavior that improve physical health, such as nutrition and exercise, but may
also incorporate strategies that improve cognitive and emotional functioning. The stress –
reduction approach based on mindfulness practice has recently enjoyed on explosion of
interest from a variety of healthcare and epidemiological researchers. The concept of
mindfulness, which originates from practice of buddhism, is defined as a focused
awareness of one’s experiences, and purposeful and nonjudgement focus on the present
moment. Structured interventions, such as the Mindfulness-Based Stress Reduction
(MBSR) program, provides participants with the opportunity to learn breathing
meditation, body scanning techniques, and gentle,yoga-inspired physical exercise. With
practice, individuals learn to process emotions, thoughts, and sensation as they arise.
Individuals learn to modify their reflexive conditioning from automatically reacting or
worrying about the future to a more adaptive, measured response with greater awareness
of the present moment.
Keywords: Physical health, emotional, yoga, meditation, Breathing, reflexive, Mindfulness,
nutrition, sensations
1. Introduction
Stress is a general term applied
to the pressure people fell in life. The
presence of stress at work is almost
inevitable in many jobs.Then it becomes
painful and creates many physical and
psychological problems which are
reflected in the day to day life of
organizational performances. People feel
unhappy and are dissatisfied mental

OCTOBER - DECEMBER 2021 ISSN: 0975-9999 (P), 2349-1655(O)
SELP Journal of Social Science Volume XII, Issue 50
31
disorder had to body the digestive system
and regular blood functioning and
distributed. It causes abdominal ulcer and
several diseases of the liver. Heart, kidney,
blood vessels and other parts of the body.
DEFINITION
Beehr and newman“job stress is a
condition arising from the interaction
ofpeople and their jobs and characterized
by changed within people that force them
to deviate from their normal functioning.”
FEATURES OF STRESS
Stress may be result of individual’s
interaction with environmental stimuli
such stimuli may be in any from
interpersonal interaction, event and so
on the impact of the stimuli procedure
deviation in the individual.
It is not necessary that stress isalways
functional on the contrary, there may
be some stress called unstressed like
stress for creative work,
entrepreneuractivities, keen
competitions etc.,
SYMPTOMS OF STRESS
Chronic worry
Inability to relax
Excessive use of alcohol smoking
Problems with sleeps
Incomputerate electronic- operative
attitudes
Feelings of inability to cope
Emotional instability
Digestive problems
Nuisance and tension
MAJOR APPROACH TO MANAGES
STRESS
Action- oriented:
This is approach works on solving
the problem which cause stress. It may
include either changing the environment or
the situation.
Emotional- Oriented:
Incase where it is not visible to
change the situation and the perception
about it.
Acceptance- Oriented:
When a problem cannot be solved
either by taking the right actions or by
controlling
the emotion. What is needed in the
situation to be accepted as it.
ORGANIZATIONAL FACTORS Organizational factors such as
management Labor relations working
condition resources allocation role of trade
unions, behavior of co-workers etc., are
important factors which cause stress to the
psychology of employee.
GROUP FACTORS
An organization includes group
and individuals who influence each other
and are influenced by the other.
Employees gets satisfaction of the social
level after returning from job performance
group conflict includes in compatibility of
goals and objectives performance and
rewards.
SCOPE OF THE STUDY Scope of the study is to assess and
evaluate various stress and
perception.
A study on techno stress will help
diagnosing the level of stress faced
by employees and factors affecting
the Employees job at work time.
OBJECTIVES OF THE STUDY 1. To study the socio-demographic
factors of the respondent.
2. To find out the satisfaction of
working time of employees.
3. To find out the factors that
influence stress among the
employees.
LIMITATION The study has been limited to only
a sample of 75.
The study was confirmed only to
the spinning millLtd, Thanjavur.
AREA OF THE STUDY
The area of the study based on
Thanjavur spinning Mill Ltd industries are
situated in Thanjavur. Thanjavur is a
located district of Tamilnadu covering an
area of 8212 kilometers. According to
2021 census Thanjavur town has
population of 22,10,375. This district is an
excellent area of agriculture economy for
Tamilnadu state.

OCTOBER - DECEMBER 2021 ISSN: 0975-9999 (P), 2349-1655(O)
SELP Journal of Social Science Volume XII, Issue 50
32
RESEARCH
A careful investigation on enquiry
specially through research for new facts in
any branch of knowledge.
RESEARCH METHOLODGY Research methodology is a way to
systematic solve the problem. It may be
understand as a science of studying new
researcher is done scientifically.
RESEARCH DESIGN:
Research design is the correct the
arrangement of condition for collection
and analysis of data that aim to combine to
relevance to the research purpose. The
study is carried by adoption of exploratory
and descriptive and diagnostic study.
SOURCES OF DATA
1. Primary Data
The data was collected by
questionnaire, The questionnaire is
considered as information required for the
study was directly collected from the
employees.
2.Secondary Data
The secondary data was already
collected from company records, journal
and magazines that is company records
and websites.
Table 1
Distribution of respondent by gender;
S.No.
Gender
No of
respondents
Percentage
%
1.
2.
Male
Female
32
43
42.67
57.33
Total 75 100
Source: Primary Data
Inference:
The above table shows that gender
of the respondent. In the gender majority
of the respondents are female 57.33% and
the remaining are male 42.67%.
Table 2
Relaxation Techniques Provided By
Spinning Mill
S.n
o
Technique
s
No.of.
Respondents
Percenta
ge
1
2
3
Watching
TV
Dancing
Games
32
16
27
42.67
21.33
36.00
Total 75 100
Sources: Primary Data
Inference:
42.67% of the employees use
watching TV to reduce their stress.
21.33% of the employees dancing to
reduce their stress. 36% of the employees
games to reduce their stress.
FINDINGS:
Majority 57.33% of the respondents
are female
Most of the respondents 36% have
stated job related stress stressful.
CONCLUSION Stress plays an importance role in
an Individuals work performance. The
impact of stress an individual may also
have an impact an organizations
performance. Hence individual has to
scope up with stress for his personal and
organizational growth. As most of the
workers were satisfied with there work the
company has to maintain the existing level
of job satisfaction prevailing among
employees. They can also motivate the
workers with innovative motivation tools
for their additional talents
REFERENCE
C.B.Gupta –“Human Resource
Management” Himalayan publishing
House, Seventh Edition,1999.
C.R.Kothari –“Research Metholodogy”,
Viswaprakasam publications, first edition -
1990.
Dr.Varma and Agarwal – “Organizational
behavior” King books,1997.
P.C.Tripathi – “Human resource
Management”, Sultan Chand & Sons
Thirteenth Edition, 1997.
OCTOBER - DECEMBER 2021 ISSN: 0975-9999 (P), 2349-1655(O)
SELP Journal of Social Science Volume XII, Issue 50
33
Available online @ www.iaraindia.com
SELP Journal of Social Science - A Blind Review & Refereed Quarterly Journal
ISSN: 0975-9999 (P) 2349-1655 (O)
Impact Factor: 3.655(CIF), 2.78(IRJIF), 2.77(NAAS)
VolumeXII, Issue 50
October – December 2021
Formerly UGC Approved Journal (46622), © Author
A STUDY ON HUMAN RESOURCE PLANNING WITH SPECIAL
REFERENCE TO ARR SEEVAL PRIVATE LIMITED KUMBAKONAM
MS. S. THAZHKUZHALI
Assistant Professor of Commerce
STET Women’s College, (Autonomous)
Mannargudi.
&
T. ARASUMATHI II- Mcom
STET Women’s College, (Autonomous)
Mannargudi.
Abstract
Human Resource Planning is understood as the Process of forecasing an
organizations future demand and supply of the right type of people in the right number. It
is only after this that the human resource management department can initiate the
recruitment and selection process. Human Resource planning is a sub - system in the
total organizational planning. HRP is a process of determining and assuring the
organization an adequate number of qualified persons available at proper time,
performing jobs which provide satisfaction for the individuals involved.
Keywords: Human Resource Planning, organization, Human resource development, fore
casing.
1. Introduction
Human Resource Planning is
understood as the process of forecasting an
organizations future demand and supply of
the right type of people in the Right
number. HR Planning is critical for
implementation of the organizations
strategic plan HR policies have direct
effects on profitability. Human resource
planning is a sub - system in the total
organization planning.
RESEARCH PROBLEM
Human resource planning is a
process that needs to be undertaken
meticulosusly it obtaining desirable results
is anything to go by many managers
conduct this kind of evaluation on their
employees from time to time majorly
because it is an organizational tradition or
requirement but not necessarily because of
its impact on future
REVIEW OF LITERATURE
A Study by Johne (2009) indicated
that human resource planning plays an

OCTOBER - DECEMBER 2021 ISSN: 0975-9999 (P), 2349-1655(O)
SELP Journal of Social Science Volume XII, Issue 50
34
Important role in organizational
performance by providing team players.
Charian (2011) defines HRP as the
process of fore casting demand and supply
of human resources by recruiting the right
employees, and having the right skills
according to the needs of the
organiszation.
Arsad (2012) in his study of
Manpower planning effect on
organizational performance found that
there is a positive relationship between
manpower planning on Organizational
performance.
OBJECTIVES OF STUDY
To study the socio demographic
factors of the Respondents.
To analysis the satisfaction level of
welfare facilities provided by ARR.
To Study the HRP effectiveness
and its efficiency in ARR.
SCOPE OF THE STUDY
The researcher study in on the
effectiveness of human resource planning
in ARR Ltd., This study which will be
analyse the all aspects of with regard to
human resources planning. By this study
we can be able to analyze the problems
very clearly.
RESEARCH METHODOLOGY
For the Purpose of this study
mainly " Survey method" for this
dissertation were collected from both
primary data and secondary data.
RESEARCH DESIGN
A research design is the
arrangement of condition for collection
and analysis of data in a manner that aims
to combine and relevance to research.
RESEARCH HYPOTHESIS
There is a significant association
between the locality and welfare
facilities.
There is no significant associating
between the department and safety
measures.
DATA COLLECTION
PRIMARY DATA
The data is collected by
questionnaire survey method.
SECONDARY DATA COLLECTION
Secondary data are collected from
the company records files, Internet Journal
and magazines.
LIMITATIONS OF THE STUDY
Some of the employees are not
willing to co - operate with the study as
they were busy with their work
Time was a big constraint
The respondents are hesitated to provided
reliable answers.
DATA ANALYSIS &
INTERPRETATION
TABLE 1
CLASSIFICATION OF
RESPONDENTS ON THE BASIS OF
AGE
S.N
O AGE
NO.OF
RESPON
DENTS
% OF
RESPOND
ENTS
1 BELOW
35 22 29
2 35-45 25 33
3. 45-55 15 21
4 ABOVE
55 13 17
TOTAL 75 100
Source : Primary Data
INFERENCE
From the table it is clear that 29%
of the respondents are belongs to be in the
age group of below 35 years. 33% of the
respondents are belongs to be in the age
group of 35 - 45 years, 21% of the
respondents are belongs to be in the age
group of 45-55 years, the remaining 17%
of the respondents are belong to be in the
age group of above 55 years.
TABLE 2
CLASSIFICATION OF
RESPONDENTS ON THE BASIS OF
GENDER
S.N
O
GENDE
R
NO.OF
RESPON
DENTS
% OF
RESPOND
ENTS
1 Male 54 72
2 Female 21 28
Total 75 100
Source : Primary Data.

OCTOBER - DECEMBER 2021 ISSN: 0975-9999 (P), 2349-1655(O)
SELP Journal of Social Science Volume XII, Issue 50
35
INFERENCE
The above table shows that 72% of
the respondents are male and 28% of the
respondents are female.
FINDINGS
Majority 33% of the respondents
nearly to the age group 35 -45
Years.
Majority 72% of the respondents
are Male.
SUGGESTIONS
It is suggested that the varieties of
flavors are to be introduced.
It is suggested that the organization
should introduced effectively
training and development
programmed to the employees.
CONCLUSION
HRP is a process of determining
and assuring the organization an adequate
number of qualified persons available at
proper time, performing jobs which meet
the needs of enterprise and which provide
satisfaction for the individuals involved.
Te overall finding of this research
indicates, ARR Private company
increasing their good will.
REFERENCE
C.R. KOTHARI Research
Methodology second Edition, New age
International Publishers.
Dr. C.B. Gupta - "HRM" sultan
chand and sons publishers -2001

OCTOBER - DECEMBER 2021 ISSN: 0975-9999 (P), 2349-1655(O)
SELP Journal of Social Science Volume XII, Issue 50
36
Available online @ www.iaraindia.com
SELP Journal of Social Science - A Blind Review & Refereed Quarterly Journal
ISSN: 0975-9999 (P) 2349-1655 (O)
Impact Factor: 3.655(CIF), 2.78(IRJIF), 2.77(NAAS)
VolumeXII, Issue 50
October – December 2021
Formerly UGC Approved Journal (46622), © Author
A STUDY ON SALES PROMOTION OF SRI SAKTHI TILES
MANNARGUDI TOWN
Dr. K. VEMBU
Assistant Professor & Research Advisor
Department of Commerce
STET Women’s College, (Autonomous)
Mannargudi.
&
R. AARTHI II- Mcom
STET Women’s College, (Autonomous)
Mannargudi.
Abstract
The typical roof tiles made from soil or clay will be limited because it destroyed
the farmland. On the other hand, the old tire and waste plastic increase year and year,
which bring a serious environmental problem. So the roof tiles made from old tire and
waste plastic will help a lot to decrease above environmental pressure. To get a suitable
formula of roof tiles made from waste rubber tire powder and waste plastic, the present
article studied mechanical performance of a series of composites. Then a preferred
formula was got through comparing the mechanical performance.
Keywords: Roof tiles; recycle; tire powder; rubber and plastic composite.
1. INTRODUCTION
Marketing research is the function
which links the consumer, customer and
public to the marketer through information
– Information used to identify and define
marketing opportunities and problems.
Marketing research is the systematic and
objective approach to the development and
provision of information for the marketing
management decision making process.
SALES
“Sales is helping the customers to buy”.
Helping them to make up his mind based
upon the satisfaction of his needs. Sales is
always going for “Win – Win” or “Non
Deal”. That means that it is the
salespersons responsibility to ensure that
both he and the customer wins on the deal.
SALES PROMOTION
Sales Promotion Marketing activities
other than personal selling, advertising,
and publicity that enhance consumer
purchasing and dealer effectiveness. Goal
is speeding the sales process and
increasing sales volume.

OCTOBER - DECEMBER 2021 ISSN: 0975-9999 (P), 2349-1655(O)
SELP Journal of Social Science Volume XII, Issue 50
37
Produce best results when combined
with other other marketing activities, such
as advertising. Cannot overcome poor
brand images, product deficiencies, or
poor training for salespeople.
TECHNIQUES OF SALES
PROMOTION
Coupons premiums, contests and
various other non – recurrent selling
efforts not in the ordinary routine it is a
plus ingredient in the marketing mix,
whereas advertising and personal
salesmanship, are essential and basic
Ingredients in the marketing mix.
In short sales promotion is a bridge or
a connecting link covering the gap
between advertising and personal
salesmanship, the two wings of promotion.
OBJECTIVES OF THE STUDY
To study the socio - demographic
characteristics of respondents.
To know the source of knowledge
about the sales promotional offer.
To analyze, mode of purchasing
way of the customer.
RESEARCH METHODOLOGY
Research methodology is systematic
ways to solve the research problem it may
be understand of a science of studying how
research is done scientifically, study
various steps that are generally adopt by
researches in studying his research
problem along with logic behind them. It
is necessary for the research not only the
research but also methodology.
PRIMARY DATA
Primary data re-collected through
primary sources by administering a
questionnaire.
SECONDARY DATA
Secondary data re-collected from
marketing. Training department and cost
& accounts department’.
SAMPLING TECHINQUE
For getting primary data, a
questionnaire is constructed and
distributed to the respondents.
LIMITATIONS OF THE STUDY
The sample chosen for study is only
100 respondents. From the 100
respondents device in to 4. The divisions
are stockiest 25, contractor & mason 25,
end – user 50. Because time and cost
constraints.
COMPANY PROFILE
In 1975 we started our business
with a construction material like timber,
Ac sheet, and cart board, etc.
Later ayear we extended our
business in the name of Sri Sakthi
Hardware & glass. In the 2001, we started
production brass handle Glass, Paint & etc.
In 2005 we started for tiles & pre
fittings, Cp Tap, over Head paint & etc.
We sell through direct customers and sub
dealers.
DATA ANALYSIS AND
INTERPRETATION
TABLE 1
CLASSIFICATIONS OF THE
RESPONDENTS BY THEIR AGE
S.
N
O
AGE NO.OF.RES
PONDENTS
PERCEN
TAGE
1 21-25 50 50
2 26-30 10 10
3 31-40 25 25
4 Above
40 15 15
Total 100 100
Source: Primary Data
INFERENCE
The above table shows that 50% of the
respondents are the belongs to the age
group of 21-25 years, 25% of the
respondents belongs to 31-40 years, 15%
of the respondents belongs to above 40
years and 10% of the respondents are
belongs to the age of 26-30 years.

OCTOBER - DECEMBER 2021 ISSN: 0975-9999 (P), 2349-1655(O)
SELP Journal of Social Science Volume XII, Issue 50
38
Table 2
Classification of respondents by their
gender
S.
N
o
GEND
ER
NO OF
RESPONDE
NTS
PERCENT
AGE
1 Male 70 70
2 Female 30 30
Total 100 100
Source: Primary Data
INFERENCE
The above table shows that the 70% of
respondents are male and 30% are female.
Table 3
Classification of the respondents by
their sales promotion
S.n
o Opinion
No.of.respo
ndents
Percenta
ge
1. Excellent 15 15
2. Average 35 35
3 Good 30 30
4 Poor 20 20
TOTAL 100 100
Source: Primary data
INFERENCE
The above table show that 35% of
respondents are opinion that average, 30%
of respondents are opinion that good, 20%
of respondents are opinion that poor and
15% of respondents are opinion that
excellent.
Table 4
Classification of the respondents by
their mode of purchase
S.
N
O
OPINI
ON
NO.OF.RES
PONDENTS
PERCE
NTAGE
1 Loan 20 20
2 Cash 50 50
3 Both 30 30
TOTAL 100 100
Source: Primary Data
INFERENCE
The above table shows that 50% of
respondents are cash, 20% of respondents
are loan, and 30% of respondents are both.
FINDINGS Majority (50%) of the respondents
belongs to the age group of 26-30
years.
Majority (70%) of the respondents
are male.
Majority (35%) of the Respondents
under the sales promotion offer are
of average.
50% of the respondents’ Mode of
purchase is in cash.
SUGGESTIONS
Youngsters and adult people and
male category should be the larger
to promote sales.
Advertisement like wall painting
and T.V advertisements can be
given by more extensive way by
the dealers.
CONCLUSION
Sales promotion activities are designed to
increase and expand the market. Sales
promotional activities are intended to bring
about effective transfer in ownership and
in moving good expeditiously from the
manufacture to the consumers. Sales
promotion is to attract the prospective
buyers towards the product and to include
them to buy the product at the point of
purchase.
Sales promotion in modern marketing
has increased mainly on account of its
ability in promotion sales and in preparing
the ground for future expansion. It means
clearing out some old stock or to put some
extra pressure behind a slow moving
product and the like.
REFERENCE
KothariC.R, Research
Methodology new age international
(p) Ltd., New Delhi, 2005
Varsiney R.L.S.L.Gupta Marketing
Management an Indian purpertiro,
S.Chand&Sons, New Delhi 2008
Philip Kotler, Marketing
Management prentice Hail of
Indian, New Delhi 2002

OCTOBER - DECEMBER 2021 ISSN: 0975-9999 (P), 2349-1655(O)
SELP Journal of Social Science Volume XII, Issue 50
39
Available online @ www.iaraindia.com
SELP Journal of Social Science - A Blind Review & Refereed Quarterly Journal
ISSN: 0975-9999 (P) 2349-1655 (O)
Impact Factor: 3.655(CIF), 2.78(IRJIF), 2.77(NAAS)
VolumeXII, Issue 50
October – December 2021
Formerly UGC Approved Journal (46622), © Author
A STUDY ON EMPLOYEE MOTIVATION WITH SPECIAL REFERENCE
TO TAMIL NADU ELECTRICITY BOARD, THIRUMAKKOTTAI
P. SATHYA
Assistant Professor of Commerce
STET Women’s College, (Autonomous)
Mannargudi.
&
RA. ROJAA II- Mcom
STET Women’s College, (Autonomous)
Mannargudi.
Abstract
Employees may be motivated on the job by many things, such as a sense of
achievement recognition, enjoyment of the job, promotion opportunities, responsibility
and the chance for personal growth. Employee motivation and performance are tied
directly to the style of management that applied and to principles of positive or negative
reinforcement. Employee engagement is the level of commitment and involvement an
employee has towards their organization and its values. An engaged employee is aware of
business context and works with colleagues to improve performance within the job for
benefit of the organization. It is a positive attitude held by the employee towards the
organization and its values. The paper focuses on how employees engagement is an
antecedent of job involvement and what should company do to analyze the existing
employee engaged. The study is conducted to analyze the existing employee engagement
and motivation programs for junior and middle level employees adopted in TNEB,
Thirumakkottai.
Keywords: Employee motivation, Motivation, Organization.
1. INTRODUCTION
Management is supposed to get the
work done by the subordinates towards the
attainment of the common goals this is the
most important function of the
management to inspire and stimulate the
personnel with zeal do work the
accomplishment of organization objectives
in other words, it is called motivation of
people.
Motivation is an organization life
blood. Motivation is important to
organizations in terms of both performance
and manpower retention, HR teams do
spend sleepless nights trying to identify
the right motivational tool that would

OCTOBER - DECEMBER 2021 ISSN: 0975-9999 (P), 2349-1655(O)
SELP Journal of Social Science Volume XII, Issue 50
40
inspire employees to perform better and
stay put on. If carefully analyzed it is not
about preventing demotivation, when
employees are motivated they contribute
innovative ideas and the organization
succeeds as a whole
OBJECTIVES
To study the socio demographic
characteristics of the respondents.
To analyze the motivational level of
employees.
To find the satisfaction level of
promotion system.
To analyze the training method of
employee.
To study the satisfaction level of
grievances handling procedure.
SCOPE OF THE STUDY:
The research study reflects about
employees on stress at work place towards
managing stress of Tamil Nadu
Electricity Board, Thirumakkottai. Out
of this research study, the researcher found
the various sensitive factors that influence
employee ’s related motivation.
IMPORTANCE OF THE STUDY:
The study is necessitated to evaluate
employee’s motivational factors
provided in Tamil Nadu Electricity
Board, Thirumakkottai.
This study is expected to give
details about the employee’s
motivation, that how they have to
analyze the method of motivation to
the employees.
SOURCE OF DATA:
(i)Primary data
Primary data refer to those data
collected by researcher through the study.
It is also named as first-hand information.
Since the purpose of the study is to collect
first-hand information regarding stress of
employees, much significance has been
given to primary data and its techniques.
Here the schedule is used for collecting
primary data.
The researcher has used primary
data for collecting information and the
researchers has used questionnaire as a
tool for collection.
(ii)Secondary data
Secondary data refers to those that
are collected from the organization, Books,
Internet, Publications, Journals and
Magazines.
SAMPLING PLAN:
The sampling plan that is used in
the study is probability – sampling method
in which is adopted cluster sampling
method.
LIMITATION OF THE STUDY The study has been limited to
sample size of 100.
Limited Time was one of the big
constraints.
Few respondents took more times to
answer the questionnaire.
The researcher had difficult with
more of the respondents who were
not willing to co – operate with the
study as they busy with their work.
REVIEW OF LITERATURE
BAWA (2017) Employees have
several needs which compels them to work
and that those needs are coordinated in a
hierarchical manner in such a way that
lower level needs (physiological and
safety) had to be satisfied before the next
higher level social need would motivate
employees to work hard and increase
efficiency. Motivated employees to care
about making a positive difference in other
people’s lives. I introduce a model of
relational job design to describe is
relatively silent about the sources of this
motivation existing research.
TAYLOR (2018) Motivation is
that workers are motivated by money. He
viewed employees not as individuals, but
as pieces of a larger workforce; in doing so
his theory stresses that giving employee’s
individual tasks, supplying them with the
best tools and paying based on their
productivity was the best way to motivate
them.
MUHAMMAD AMINU BAWA
(2019) This section presents a brief review
of some of the theories and empirical
evidences on the relationship between
motivation and productivity. Broadly

OCTOBER - DECEMBER 2021 ISSN: 0975-9999 (P), 2349-1655(O)
SELP Journal of Social Science Volume XII, Issue 50
41
speaking the theories of motivation can be
classified in to content theories and
process theories. The former deals with
what motivates and are concerned with
identifying people’s needs and their
relative strengths and the goals they pursue
in order to satisfy these needs.
EMPIRICAL (2020) Motivated
behaviors are deliberate choices controlled
by the individual employee.
Organizational leaders are compelled to
create a favorable environment which the
employee feels trusted and empowered to
take decisions in the organizational which
leads to enhanced motivational levels of
employees and ultimately organization
performance is enhanced.
TABLE 1
DESIGNATION OF THE
RESPONDENTS
S.
N
O
DESIGN
ATION
NO.OF
RESPON
DENTS
PERCEN
TAGE
1 Workers 60 60
2 Supervisor 10 10
3 Assistant
Manager
08 08
4 Managers 02 02
5 Others 20 20
Total 100 100
Source: Primary Data
INFERENCE:
The above table shows that 60
percent of the respondents are workers, 20
percent of the respondents are other
categories, 10 percent of the respondents
are supervisor, 8 percent of the
respondents are Assistant managers and
only 2 percent of the respondents are
manager categories.
TABLE 2
CLASSIFICATION OF THE
RESPONDENTS ON THE BASIS OF
EXPERIENCE
S.
N
O
EXPERI
ENCE
NO.OF
RESPON
DENTS
PERCEN
TAGE
1 Below 1
year
09 09
2 1-3 years 19 19
3 3-5 years 35 35
4 5-7 years 27 27
5 Above7
years
10 10
Total 100 100
Source: Primary Data
INFERENCE:
It is inferred from the above table
that 35% of the respondents are in the
experience of 3-5 years, 27% of the
respondents are in the experience of 5-7
years,19% of the respondents are in
experience of above 7 years and 9% of the
respondents are in the experience of below
1 years.
TABLE 3
CLASSIFICATION OF THE
RESPONDENTS ON THE BASIS OF
SATISFACTION LEVEL OF
MOTIVATION PROGRAMME
FEEL
ABOUT
FACILIT
IES
NO.OF
RESPONDE
NTS
PERCENT
AGE
Satisfied 40 40
Highly
Satisfied
24 24
Neutral 33 33
Dissatisfie
d
03 03
Highly
Dissatisfie
d
--- ---
Total 100 100
Source: Primary Data

OCTOBER - DECEMBER 2021 ISSN: 0975-9999 (P), 2349-1655(O)
SELP Journal of Social Science Volume XII, Issue 50
42
INFERENCE:
The table shows the satisfaction of
motivation by the company to the
employee 40% are satisfied,33% of the
respondents are neither satisfied non-
dissatisfied,24% of the respondents are
highly satisfied and 03% of the
respondents are respondents dissatisfied.
FINDINGS:
Majority 81% of the respondents
are male
Majority 44% of the respondents in
the age group of 25-30 years
Majority 60% of the respondents
are workers
35% of the respondents are
experienced on 3-5 years
35% of the respondents are the
monthly income Rs.10000 to
Rs.150000
86% of the respondents are in the
area of urban areas
Majority 67% of the respondents
are married
43% of the respondents are
satisfied the company provide the
incentives to the employees
SUGGESTIONS:
Modified work schedule and work
redesign must often be undertaken
by the organization for maximum
productivity.
The organization should
concentrate to provide the special
incentives for employees.
The organization should be
maintained proper to reward
system to each employees.
Proper recognition is to be given to
the employees based on their
knowledge and experience.
Promotion policies of this
organization must be changed
according to the performance of the
employees.
CONCLUSION
There remains much debate about
the nature of employees motivation, its
determinants and the best way to deal with
it an occupational setting. There are no
simple answers because we are dealing
with individuals and their perceptions and
feeling and there are many confounding
factors. A further complication is the rate
of change in the HR sector, making it more
difficult to make any longer term
comparisons.
BIBLIOGRAPHY
GUPTA.G. B. Human
Resource Management, Sultan Chand &
Sons, New Delhi, fifth provided edition.
ASWATHAPPA.K. Human Resource and
Personal Management, fourth edition, Tata
MC Graw Hill publishing Company
Limited,2013.
TRIPATHI.P.C. Personal Management
and Industrial Relation, Sultan Chand
&Sons, New Delhi, First edition.
Dr. M.M. VARMA & R.K. AGARWAL,
Personal Management and Industrial
Relation, Kings Book, New Delhi
C.R. KOTHARI, Research Methodology
Method Techniques, New age
International, Private Limited Publishers,
New Delhi

OCTOBER - DECEMBER 2021 ISSN: 0975-9999 (P), 2349-1655(O)
SELP Journal of Social Science Volume XII, Issue 50
43
Available online @ www.iaraindia.com
SELP Journal of Social Science - A Blind Review & Refereed Quarterly Journal
ISSN: 0975-9999 (P) 2349-1655 (O)
Impact Factor: 3.655(CIF), 2.78(IRJIF), 2.77(NAAS)
VolumeXII, Issue 50
October – December 2021
Formerly UGC Approved Journal (46622), © Author
A STUDY ON PERFORMANCE APPRAISAL WITH SPECIAL REFERENCE
TO TAMILNADU ELECTRICITY BOARD AT THIRUMAKOTTAI,
THIRUVARUR DISTRICT
Ms.S.THAZHKUZHALI
Assistant Professor of Commerce
STET Women’s College, (Autonomous)
Mannargudi.
&
M.K.POORNIMA II- Mcom
STET Women’s College, (Autonomous)
Mannargudi.
Abstract
A performance appraisal is known by other terms like employee appraisal,
performance review. It is method by which the job performance of an employee is
measured in terms of quality, quantity, cost behavior and time. It is conducted by self,
peers, seniors and juniors. But generally, in formal methods it is conducted by the
immediate manager or supervisor under whom the person in directly working. A
performance appraisal is the part of measuring, comparing, finding, guiding, correcting
and managing career development of employees. It is the process of gathering, recording
and critically analyzing information about the relative importance of employees to the
organization performance appraisal is the study of present achievement and failures,
personal, strength and weakness and suitability for incentives rewards and recognition
increased pay scale, promotion for further training. Finally, it shown the suitability of the
person at present job in the organization.
Keywords: Performance appraisal, Employee, Organization, Job.
1. INTRODUCTION
Performance appraisal may be
understand as the assessment of an
individual performance is a systematic
way the performance being measured
against such factors as job knowledge,
quantity and quality of outputs, initiative
leadership abilities, supervision
dependability co-operation. Judgement
veracity health and the like assessment
should not be confirmed to past
performance alone potential of employees
for future.

OCTOBER - DECEMBER 2021 ISSN: 0975-9999 (P), 2349-1655(O)
SELP Journal of Social Science Volume XII, Issue 50
44
DEFENTION
“ It is system evalution of an
individual with respect them performance
on the job and find and then potential for
development.”
OBJECTIVES
Performance appraisal can be done
with following objectives in mind.
1. To maintain records in order to
determine compensation packages,
wage structure, salaries raises etc.,
2. To identify the strength and
weakness of employees to place
right men on right job.
3. To maintain and assess the
potential present in a person for
further growth and development.
4. To provide feedback to employees
regarding their performance and
related status.
5. To review and retain the
promotional and other training
programs.
APPRAISAL PROCESS
Objectives of performance appraisal
Establish job expectation
Design of appraisal program
Appraisal performance
Performance interviews
Use appraisal data for appropriate purpose
LIMITATION
1) The study has been limited to
sample of 80
2) The data were collected from the
respondents only during their
lunch of during changes of shift
duty.
3) Hesitation on the part of
respondents to express the view
exact on questionnaire.
4) The study was confined only to
Thirumakottai.
5) Literacy of low level worker
increased the work burden of the
researcher in explaining the
questionnaire.
REVIEW OF LITERATURE
The amount of research regarding
the topic “performance appraisal” is so
vast. The topic is literally not new: it is as
old as theformation of the organizations.
Before the early 1980’s,majority of
theoretical studies emphasized on
revamping the rating system Within the
organization. The action were a great thing
to reduce the chaotic of employees
performance appraisal (Feldman,1981).
With the passage of the time the methods
and rating system among the employees
got enhanced and received an immense
appreciation of the employees.
RESEARCH
A careful investigation on enquiry
specially through research for new facts in
any branch of knowledge.
RESEARCH METHOLODGY
Research methodology is a way to
systematic solve the problem. It may be
understanding as a science of studying
new researcher is done scientifically.
RESEARCH DESIGN:
Research design is the correct the
arrangement of condition for collection
and analysis of data that aim to combine to
relevance to the research purpose. The
study is carried by adoption of exploratory
and descriptive and diagnostic study.
RESEARCH PROBLEM
Performance appraisal is a process
that needs to be undertaken meticulously if
obtaining describe results is aany thing to
go by. Many managers conduct this is kind
of evolution on their employees from time
to time majorly because it is organizational
traditional or requirement but not
necessary because of its impact.
STATEMENT OF THE PROBLEM
The problem oh his research is to
identify the relationship between socio
demographic
Factors and the performance appraisal
system further how it influenced on
promotion, enchancing the job skills and
qualities fixing of salary and uncorrected.

OCTOBER - DECEMBER 2021 ISSN: 0975-9999 (P), 2349-1655(O)
SELP Journal of Social Science Volume XII, Issue 50
45
Objectives of the study
The major objective of this study is
to find out the effectiveness of the
performance appraisal system with the
relevance of the socio demographic factors
of the employees.
HYPOTHESIS:
There is an association between
socio demographic factors and the overall
performance appraisal system.
SOURCES OF DATA
1.Primary Data
The data was collected by
questionnaire, The questionnaire is
considered as information required for the
study was directly collected from the
employees.
2.Secondary Data
The secondary data was already
collected from company records, journal
and magazines that is company records
and websites.
DISTRIBUTION OF RESPONDENT
BY GENDER:
S.N
O
GENDE
R
NO OF
RESPONDEN
TS
PERCENTA
GE %
1.
2.
Female
Male
32
43
42.67
57.33
Total 75 100
Source: Primary data
Inference:
The above table shows that gender
of the respondent. In the gender majority
of the respondents are male 57.33% and
the remaining are female 42.67%.
DISTRIBUTION OF RESPONDENTS
BY THEIR MARITAL STATUS S.
N
O
MARITAL
STATUS
NO OF
RESPONDE
NTS
PERCE
NTAGE
%
1.
2.
Married
Unmarried
30
45
40
60
Total 75
100
Source: Primary Data
INFERENCE The above table shows that 40% of
the respondents are married and 60% of
the respondents are unmarried.
FINDINGS
Majority 57.33% of the respondents
are male.
The majority of respondents 60%
are unmarried.
CONCLUSION
Performance appraisal plays an
importance role in an Individuals work
performance. The impact of performance
an individual may also have an impact an
organizations performance. Hence
individual has to scope up with
performance for his personal and
organizational growth. As most of the
workers were satisfied with their work the
company has to maintain the existing level
of job satisfaction prevailing among
employees. They can also motivate the
workers with innovative motivation tools
for their additional talents.
REFERENCE
C.B.Gupta–“HumanResource
Management” Himalayan
publishing House, Seventh
Edition,1999.
C.R.Kothari–“Research
Metholodogy”, Viswaprakasam
publications, first edition -1990.
Dr.Varma and Agarwal –
“Organizational behavior” King
books,1997.
P.C.Tripathi – “Human resource
Management”, Sultan Chand &
Sons Thirteenth Edition, 1997.


![IJCBS RESEARCH PAPER VOL. 1 [ISSUE 4] JUNE, 2014 ISSN:-2349–2724 Novel Formulation, Preparation and Quality Evaluation of Sweet Gourd ketchup](https://static.fdokumen.com/doc/165x107/6321140bb257cd26d003bb7a/ijcbs-research-paper-vol-1-issue-4-june-2014-issn-23492724-novel-formulation.jpg)