Interim Report January-March 2009 - IR Service
22
Interim Report January-March 2009 28.4.2009
-
Upload
khangminh22 -
Category
Documents
-
view
0 -
download
0
Transcript of Interim Report January-March 2009 - IR Service
Interim Report January-March 2009
28.4.2009
2
NESTE OIL'S INTERIM REPORT FOR JANUARY-MARCH 2009 - Comparable operating profit of EUR 56 million (Q1/2008: 119 million) First quarter in brief:
Diesel margins were down by almost 40% year-on-year Demand for transportation fuels was lower on the company’s home markets Total refining margin of USD 9.44 /bbl (1-3/08: 11.91) Comparable operating profit halved to EUR 56 million (1-3/08: 119 million) IFRS operating profit of EUR 95 million (1-3/08: 204 million) Cash flow from operations improved to EUR 17 million (1-3/08: -113 million) Major organizational restructuring initiated to improve efficiency and customer orientation and put
focus on the corporate strategy
President & CEO Matti Lievonen: “The economic recession is now clearly being reflected in lower demand for petroleum products. Oil refiners feel the impact of this clearly because the market downturn is amplified by new capacity due to come on stream this year and next year. We have seen the largest drop in demand in the diesel market, which is very much tied to industrial activity and logistics. This was especially true in March, which was a difficult month, and the market situation has not improved during April.” “Our major restructuring is, in part, a response to these challenges, as it is designed to give us a more efficient and customer-oriented structure that will enable us to implement our growth strategy more effectively. We remain very much committed to seeing through our ongoing projects to increase our NExBTL renewable diesel capacity and grow the business.” “I am happy to announce that we have recently received our first batch of RSPO-certified palm oil. This is further evidence of Neste Oil’s strong commitment to sustainable products, processes and procedures.” Further information: Matti Lievonen, President & CEO, tel. +358 10 458 11 Ilkka Salonen, CFO, tel. +358 10 458 4490 News conference and conference call A press conference in Finnish on the first quarter results will be held today, 28 April 2009, at 11:30 am EET at the company’s headquarters, Keilaranta 21, Espoo. www.nesteoil.com will feature English versions of the presentation materials. A conference call in English for investors and analysts will be held today, 28 April 2009, at 3:00 pm Finland / 1:00 pm London / 8:00 am New York. The call-in numbers are as follows: Europe: +44 (0)20 3023 4426, US: +1 866 966 5335. A webcast of the call can be found at company’s web site. Use the password: Neste Oil. An instant replay of the call will be available for one week at +44 (0)20 8196 1998 for Europe and +1 866 583 1035 for the US, using access code 725434.
NESTE OIL FINANCIAL STATEMENTS, 1 JANUARY – 31 MARCH 2009
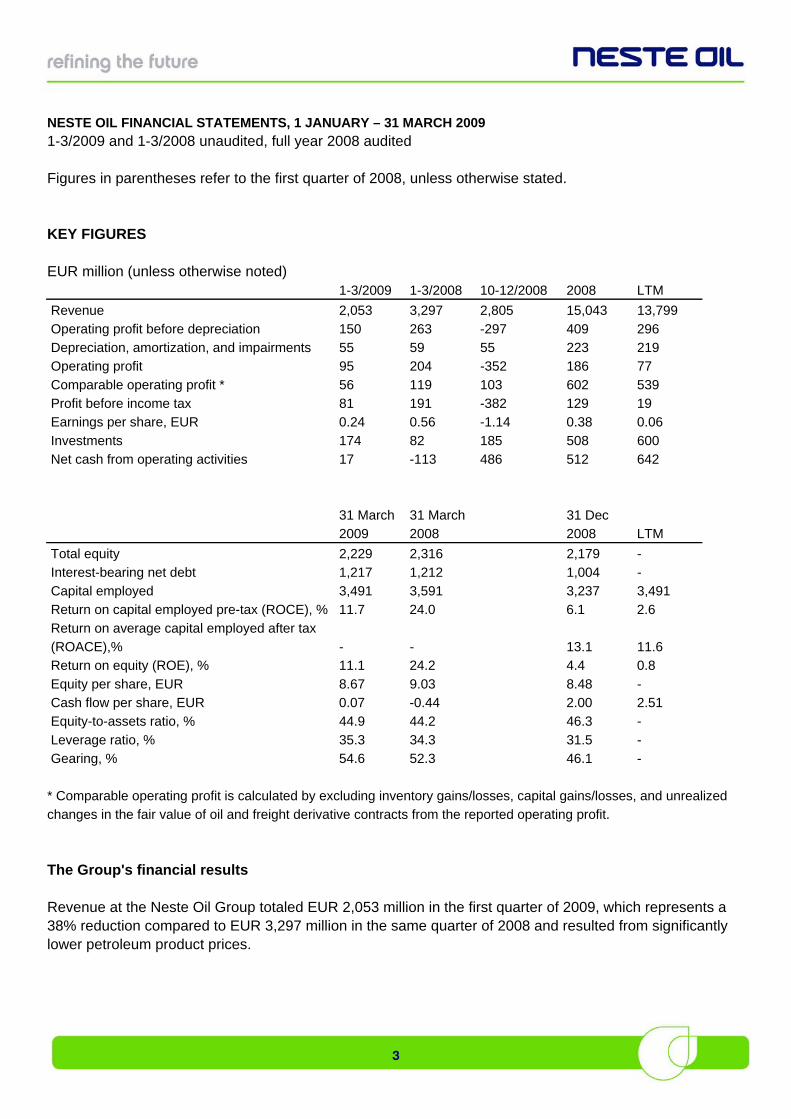
1-3/2009 and 1-3/2008 unaudited, full year 2008 audited Figures in parentheses refer to the first quarter of 2008, unless otherwise stated. KEY FIGURES EUR million (unless otherwise noted) 1-3/2009 1-3/2008 10-12/2008 2008 LTM
Revenue 2,053 3,297 2,805 15,043 13,799
Operating profit before depreciation 150 263 -297 409 296 Depreciation, amortization, and impairments 55 59 55 223 219 Operating profit 95 204 -352 186 77
Comparable operating profit * 56 119 103 602 539 Profit before income tax 81 191 -382 129 19 Earnings per share, EUR 0.24 0.56 -1.14 0.38 0.06
Investments 174 82 185 508 600 Net cash from operating activities 17 -113 486 512 642
31 March 31 March 31 Dec 2009 2008 2008 LTM
Total equity 2,229 2,316 2,179 -
Interest-bearing net debt 1,217 1,212 1,004 - Capital employed 3,491 3,591 3,237 3,491 Return on capital employed pre-tax (ROCE), % 11.7 24.0 6.1 2.6
Return on average capital employed after tax (ROACE),% - - 13.1
11.6
Return on equity (ROE), % 11.1 24.2 4.4 0.8
Equity per share, EUR 8.67 9.03 8.48 - Cash flow per share, EUR 0.07 -0.44 2.00 2.51 Equity-to-assets ratio, % 44.9 44.2 46.3 -
Leverage ratio, % 35.3 34.3 31.5 - Gearing, % 54.6 52.3 46.1 -
* Comparable operating profit is calculated by excluding inventory gains/losses, capital gains/losses, and unrealized changes in the fair value of oil and freight derivative contracts from the reported operating profit.
The Group's financial results Revenue at the Neste Oil Group totaled EUR 2,053 million in the first quarter of 2009, which represents a 38% reduction compared to EUR 3,297 million in the same quarter of 2008 and resulted from significantly lower petroleum product prices.
3
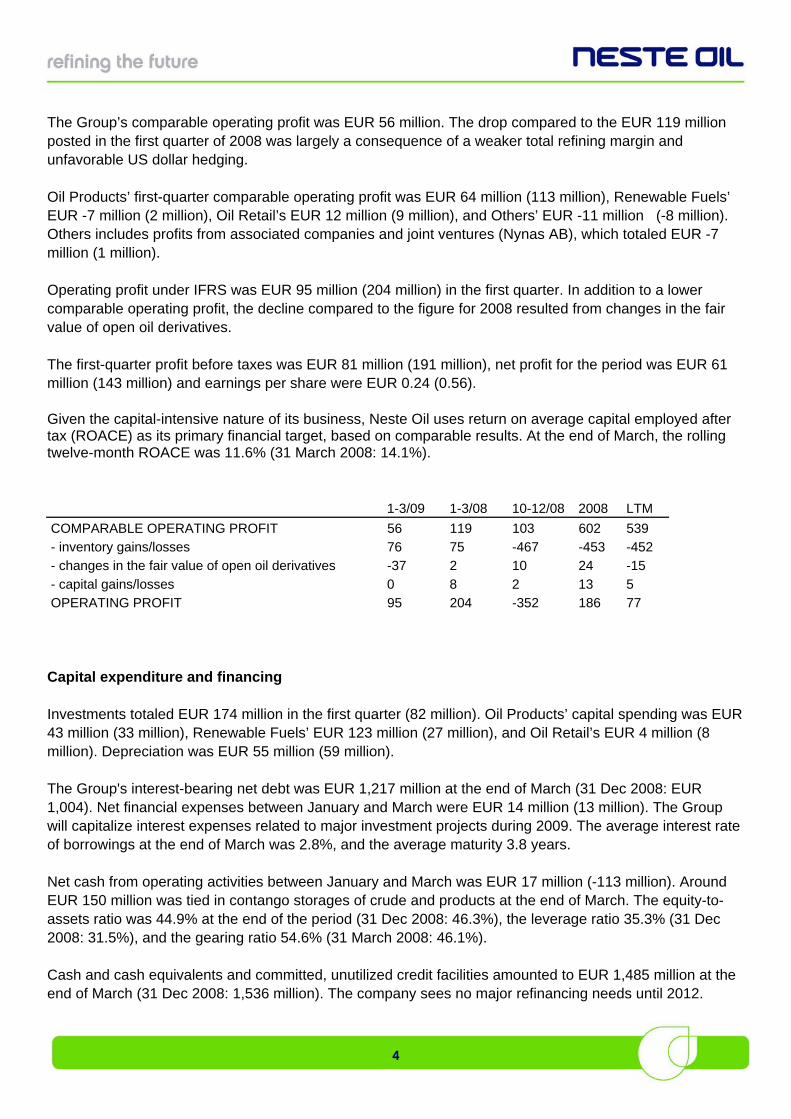
The Group’s comparable operating profit was EUR 56 million. The drop compared to the EUR 119 million posted in the first quarter of 2008 was largely a consequence of a weaker total refining margin and unfavorable US dollar hedging. Oil Products’ first-quarter comparable operating profit was EUR 64 million (113 million), Renewable Fuels’ EUR -7 million (2 million), Oil Retail’s EUR 12 million (9 million), and Others’ EUR -11 million (-8 million). Others includes profits from associated companies and joint ventures (Nynas AB), which totaled EUR -7 million (1 million). Operating profit under IFRS was EUR 95 million (204 million) in the first quarter. In addition to a lower comparable operating profit, the decline compared to the figure for 2008 resulted from changes in the fair value of open oil derivatives. The first-quarter profit before taxes was EUR 81 million (191 million), net profit for the period was EUR 61 million (143 million) and earnings per share were EUR 0.24 (0.56). Given the capital-intensive nature of its business, Neste Oil uses return on average capital employed after tax (ROACE) as its primary financial target, based on comparable results. At the end of March, the rolling twelve-month ROACE was 11.6% (31 March 2008: 14.1%). 1-3/09 1-3/08 10-12/08 2008 LTM
COMPARABLE OPERATING PROFIT 56 119 103 602 539
- inventory gains/losses 76 75 -467 -453 -452 - changes in the fair value of open oil derivatives -37 2 10 24 -15
- capital gains/losses 0 8 2 13 5 OPERATING PROFIT 95 204 -352 186 77
Capital expenditure and financing Investments totaled EUR 174 million in the first quarter (82 million). Oil Products’ capital spending was EUR 43 million (33 million), Renewable Fuels’ EUR 123 million (27 million), and Oil Retail’s EUR 4 million (8 million). Depreciation was EUR 55 million (59 million). The Group's interest-bearing net debt was EUR 1,217 million at the end of March (31 Dec 2008: EUR 1,004). Net financial expenses between January and March were EUR 14 million (13 million). The Group will capitalize interest expenses related to major investment projects during 2009. The average interest rate of borrowings at the end of March was 2.8%, and the average maturity 3.8 years. Net cash from operating activities between January and March was EUR 17 million (-113 million). Around EUR 150 million was tied in contango storages of crude and products at the end of March. The equity-to-assets ratio was 44.9% at the end of the period (31 Dec 2008: 46.3%), the leverage ratio 35.3% (31 Dec 2008: 31.5%), and the gearing ratio 54.6% (31 March 2008: 46.1%). Cash and cash equivalents and committed, unutilized credit facilities amounted to EUR 1,485 million at the end of March (31 Dec 2008: 1,536 million). The company sees no major refinancing needs until 2012.
4
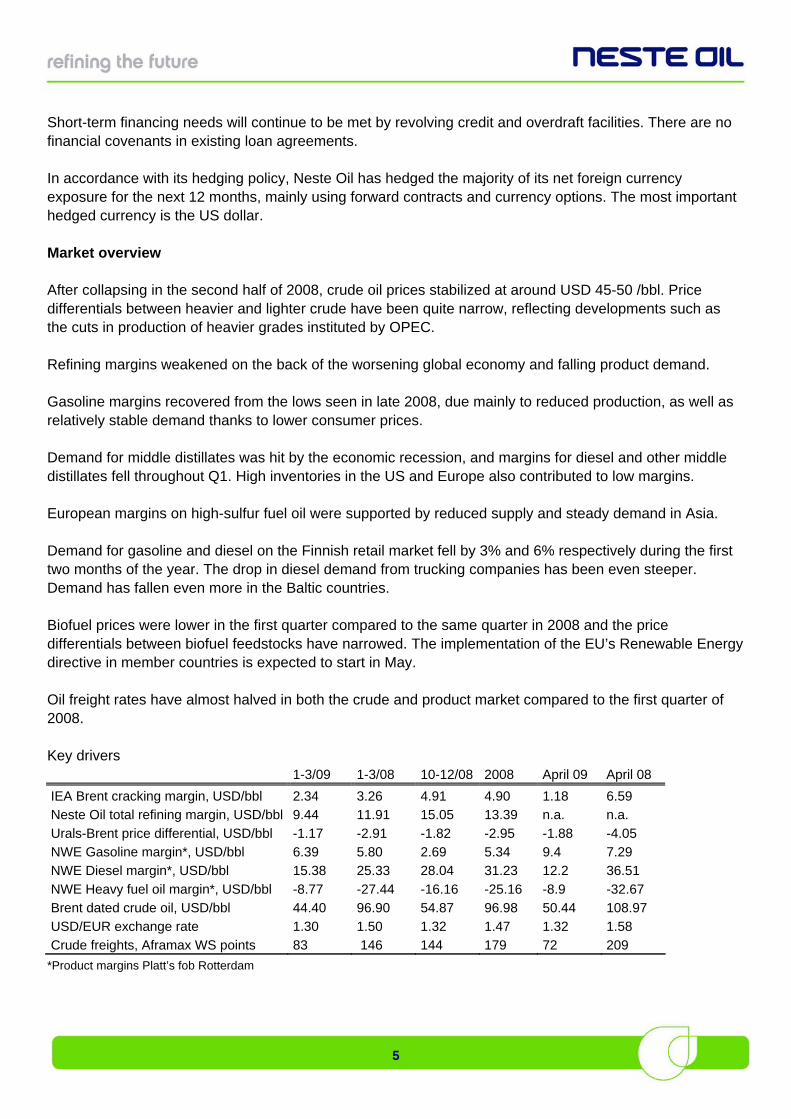
Short-term financing needs will continue to be met by revolving credit and overdraft facilities. There are no financial covenants in existing loan agreements. In accordance with its hedging policy, Neste Oil has hedged the majority of its net foreign currency exposure for the next 12 months, mainly using forward contracts and currency options. The most important hedged currency is the US dollar. Market overview After collapsing in the second half of 2008, crude oil prices stabilized at around USD 45-50 /bbl. Price differentials between heavier and lighter crude have been quite narrow, reflecting developments such as the cuts in production of heavier grades instituted by OPEC. Refining margins weakened on the back of the worsening global economy and falling product demand. Gasoline margins recovered from the lows seen in late 2008, due mainly to reduced production, as well as relatively stable demand thanks to lower consumer prices. Demand for middle distillates was hit by the economic recession, and margins for diesel and other middle distillates fell throughout Q1. High inventories in the US and Europe also contributed to low margins. European margins on high-sulfur fuel oil were supported by reduced supply and steady demand in Asia. Demand for gasoline and diesel on the Finnish retail market fell by 3% and 6% respectively during the first two months of the year. The drop in diesel demand from trucking companies has been even steeper. Demand has fallen even more in the Baltic countries. Biofuel prices were lower in the first quarter compared to the same quarter in 2008 and the price differentials between biofuel feedstocks have narrowed. The implementation of the EU’s Renewable Energy directive in member countries is expected to start in May. Oil freight rates have almost halved in both the crude and product market compared to the first quarter of 2008. Key drivers 1-3/09 1-3/08 10-12/08 2008 April 09 April 08
IEA Brent cracking margin, USD/bbl 2.34 3.26 4.91 4.90 1.18 6.59 Neste Oil total refining margin, USD/bbl 9.44 11.91 15.05 13.39 n.a. n.a.
Urals-Brent price differential, USD/bbl -1.17 -2.91 -1.82 -2.95 -1.88 -4.05 NWE Gasoline margin*, USD/bbl 6.39 5.80 2.69 5.34 9.4 7.29 NWE Diesel margin*, USD/bbl 15.38 25.33 28.04 31.23 12.2 36.51
NWE Heavy fuel oil margin*, USD/bbl -8.77 -27.44 -16.16 -25.16 -8.9 -32.67 Brent dated crude oil, USD/bbl 44.40 96.90 54.87 96.98 50.44 108.97 USD/EUR exchange rate 1.30 1.50 1.32 1.47 1.32 1.58
Crude freights, Aframax WS points 83 146 144 179 72 209
*Product margins Platt’s fob Rotterdam
5
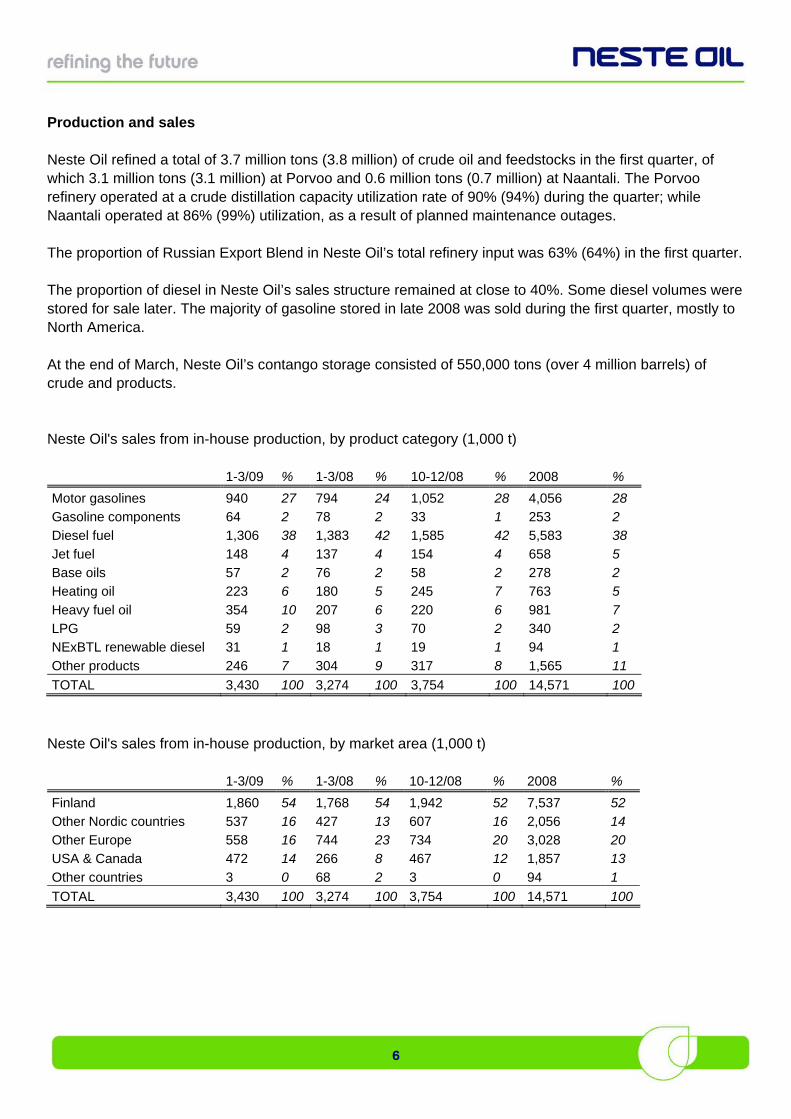
Production and sales Neste Oil refined a total of 3.7 million tons (3.8 million) of crude oil and feedstocks in the first quarter, of which 3.1 million tons (3.1 million) at Porvoo and 0.6 million tons (0.7 million) at Naantali. The Porvoo refinery operated at a crude distillation capacity utilization rate of 90% (94%) during the quarter; while Naantali operated at 86% (99%) utilization, as a result of planned maintenance outages. The proportion of Russian Export Blend in Neste Oil’s total refinery input was 63% (64%) in the first quarter. The proportion of diesel in Neste Oil’s sales structure remained at close to 40%. Some diesel volumes were stored for sale later. The majority of gasoline stored in late 2008 was sold during the first quarter, mostly to North America. At the end of March, Neste Oil’s contango storage consisted of 550,000 tons (over 4 million barrels) of crude and products. Neste Oil's sales from in-house production, by product category (1,000 t) 1-3/09 % 1-3/08 % 10-12/08 % 2008 %
Motor gasolines 940 27 794 24 1,052 28 4,056 28 Gasoline components 64 2 78 2 33 1 253 2 Diesel fuel 1,306 38 1,383 42 1,585 42 5,583 38
Jet fuel 148 4 137 4 154 4 658 5 Base oils 57 2 76 2 58 2 278 2 Heating oil 223 6 180 5 245 7 763 5
Heavy fuel oil 354 10 207 6 220 6 981 7 LPG 59 2 98 3 70 2 340 2 NExBTL renewable diesel 31 1 18 1 19 1 94 1
Other products 246 7 304 9 317 8 1,565 11
TOTAL 3,430 100 3,274 100 3,754 100 14,571 100
Neste Oil's sales from in-house production, by market area (1,000 t) 1-3/09 % 1-3/08 % 10-12/08 % 2008 %
Finland 1,860 54 1,768 54 1,942 52 7,537 52 Other Nordic countries 537 16 427 13 607 16 2,056 14 Other Europe 558 16 744 23 734 20 3,028 20 USA & Canada 472 14 266 8 467 12 1,857 13
Other countries 3 0 68 2 3 0 94 1
TOTAL 3,430 100 3,274 100 3,754 100 14,571 100
6

SEGMENT REVIEWS As of 1 April 2009, Neste Oil's businesses are grouped into four reporting segments: Oil Products, Renewable Fuels, Oil Retail, and Others. Quarterly figures for 2008 according to these segments were published on 23 April 2009. Oil Products Key figures 1-3/09 1-3/08 10-12/08 2008 LTM
Revenue, MEUR 1,582 2,715 2,221 12,641 11,508 Comparable operating profit, MEUR 64 113 154 602 553
Operating profit, MEUR 106 197 -301 183 92 Total refining margin, USD/bbl 9.44 11.91 15.05 13.39 12.69
Oil Products’ first-quarter comparable operating profit was EUR 64 million (113 million). This decrease resulted from a lower total refining margin and unfavorable US dollar hedging. Neste Oil's total refining margin was USD 9.44 /bbl during the quarter, compared to USD 11.91 /bbl in the corresponding quarter of 2008. All the main drivers affecting the total refining margin (diesel margin, price differential between Urals and Brent crude, and the IEA Brent cracking reference margin) were weaker year-on-year. Demand for base oils decreased by 25% compared to the first quarter of 2008, but this was somewhat offset by higher margins. The slight recovery seen in the US gasoline market and lower feedstock prices have helped the gasoline components business and iso-octane in particular. The fleet utilization rate remained high at 93%, but the collapse of freight rates meant that the shipping business made only a minimal contribution to the bottom line. This was further diluted by the closing of freight derivative positions, which had a EUR 3 million negative effect. Oil Products’ 12-month comparable return on net assets was 19.4% (19.8%). Renewable Fuels 1-3/09 1-3/08 10-12/08 2008 LTM
Revenue, MEUR 24 23 20 116 117 Comparable operating profit, MEUR -7 2 -10 2 -7 Operating profit, MEUR -10 1 -9 2 -9
Renewable Fuels’ first-quarter comparable operating profit was EUR -7 million (2 million). Margins for renewable diesel were lower year-on-year as a result of lower product prices and termination of fixed-priced feedstock contract. The price premium of NExBTL renewable diesel over conventional biodiesel remained healthy. The segment’s higher costs relate to expansion of the business and R&D.
7
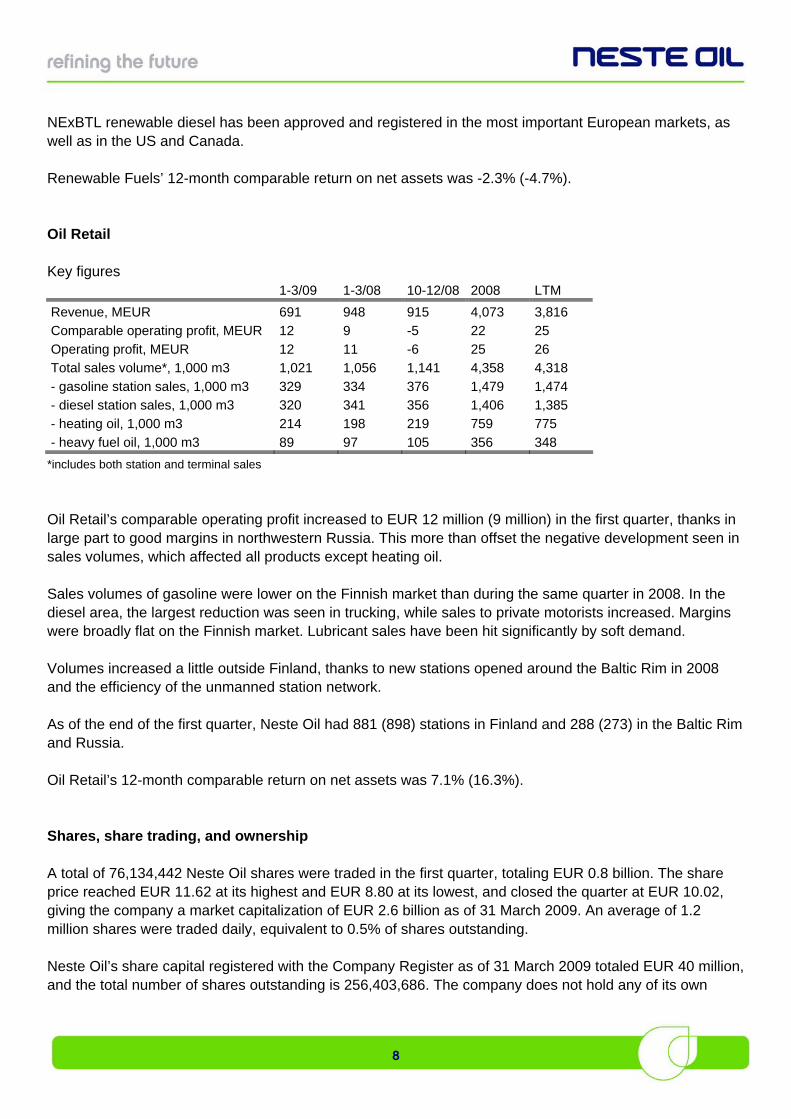
NExBTL renewable diesel has been approved and registered in the most important European markets, as well as in the US and Canada. Renewable Fuels’ 12-month comparable return on net assets was -2.3% (-4.7%). Oil Retail Key figures 1-3/09 1-3/08 10-12/08 2008 LTM
Revenue, MEUR 691 948 915 4,073 3,816 Comparable operating profit, MEUR 12 9 -5 22 25 Operating profit, MEUR 12 11 -6 25 26 Total sales volume*, 1,000 m3 1,021 1,056 1,141 4,358 4,318
- gasoline station sales, 1,000 m3 329 334 376 1,479 1,474 - diesel station sales, 1,000 m3 320 341 356 1,406 1,385 - heating oil, 1,000 m3 214 198 219 759 775
- heavy fuel oil, 1,000 m3 89 97 105 356 348
*includes both station and terminal sales
Oil Retail’s comparable operating profit increased to EUR 12 million (9 million) in the first quarter, thanks in large part to good margins in northwestern Russia. This more than offset the negative development seen in sales volumes, which affected all products except heating oil. Sales volumes of gasoline were lower on the Finnish market than during the same quarter in 2008. In the diesel area, the largest reduction was seen in trucking, while sales to private motorists increased. Margins were broadly flat on the Finnish market. Lubricant sales have been hit significantly by soft demand. Volumes increased a little outside Finland, thanks to new stations opened around the Baltic Rim in 2008 and the efficiency of the unmanned station network. As of the end of the first quarter, Neste Oil had 881 (898) stations in Finland and 288 (273) in the Baltic Rim and Russia. Oil Retail’s 12-month comparable return on net assets was 7.1% (16.3%). Shares, share trading, and ownership A total of 76,134,442 Neste Oil shares were traded in the first quarter, totaling EUR 0.8 billion. The share price reached EUR 11.62 at its highest and EUR 8.80 at its lowest, and closed the quarter at EUR 10.02, giving the company a market capitalization of EUR 2.6 billion as of 31 March 2009. An average of 1.2 million shares were traded daily, equivalent to 0.5% of shares outstanding. Neste Oil’s share capital registered with the Company Register as of 31 March 2009 totaled EUR 40 million, and the total number of shares outstanding is 256,403,686. The company does not hold any of its own
8
shares, and the Board of Directors has no authorization to buy back company shares or to issue convertible bonds, share options, or new shares. At the end of March, the Finnish state owned 50.1% of outstanding shares, foreign institutions 17.4%, Finnish institutions 20.4%, and Finnish households 12.0%. Organizational restructuring Neste Oil announced on 5 February 2009 that it intended reorganizing its operations around three business areas and seven common functions. The new structure is designed to give the company a more cost-efficient and customer-driven operating model, and one that will be better capable of implementing the corporate strategy. The new matrix organization will ensure that the best practices and know-how of business areas and functions will benefit the entire company, and that new international units, such as the renewable diesel plants currently being built, can be integrated into the Group’s operations more effectively and that reporting will be more efficient. The new organization reflecting this was introduced on 1 April 2009. The new business areas will act as profit centers and will be responsible for their customers, products, and business development. The business areas are as follows: Oil Products, Renewable Fuels, and Oil Retail. Activities outside these business areas are grouped under Others. The common functions are: Production & Logistics, Finance, Human Resources, Sustainability & HSE, Technology & Strategy, Communications, and Legal Affairs. The Specialty Products Division has been amalgamated into the Oil Products business area. Shipping operations are reported in the business areas that use them, and the Shipping business has been incorporated into Production & Logistics. As of 1 April, the Neste Executive Board (NEB) comprises the following members: Matti Lievonen, President & CEO; Matti Lehmus, Executive Vice President, Oil Products; Jarmo Honkamaa, Executive Vice President, Renewable Fuels, Deputy CEO; Sakari Toivola, Executive Vice President, Oil Retail; Ilkka Poranen, Senior Vice President, Production & Logistics; Ilkka Salonen, CFO; Hannele Jakosuo-Jansson, Senior Vice President, Human Resources, Simo Honkanen, Senior Vice President, Sustainability & HSE; Osmo Kammonen, Senior Vice President, Communications, Marketing and Public Affairs; and Lars Peter Lindfors, Senior Vice President, Technology & Strategy. Matti Hautakangas, General Counsel, acts as secretary to the NEB. The Neste Executive Management Board comprises the President & CEO, business area executive vice presidents, the CFO, and the Senior Vice President, Production & Logistics. Annual General Meeting Neste Oil’s Annual General Meeting 2009 was held after the reporting period on 3 April at the Helsinki Fair Centre. The AGM adopted the company's financial statements and consolidated financial statements for 2008 and discharged the Supervisory Board, Board of Directors, and management from liability for 2008. The AGM also approved the Board of Directors' proposal regarding the distribution of the company's profit for 2008, sanctioning payment of a dividend of EUR 0.80 per share. Payment was made on Friday, 17 April 2009.
9
In accordance with a proposal made by the AGM Nomination Committee, the AGM confirmed the membership of the Board of Directors at eight members, and the following were re-elected to serve until the end of the next AGM: Mr. Timo Peltola, Mr. Mikael von Frenckell, Mr. Michiel Boersma, Ms. Ainomaija Haarla, Ms. Nina Linander, Mr. Markku Tapio and Ms. Maarit Toivanen-Koivisto. Mr. Hannu Ryöppönen was elected as a new member. Mr. Timo Peltola will continue as Chairman and Mr. Mikael von Frenckell as Vice Chairman. The AGM decided to pay the following remuneration to the Board: Chairman EUR 66,000 a year, Vice Chairman EUR 49,200 a year, and members EUR 35,400 a year. In addition, those participating at Board meetings and meetings convened by the Board's committees will receive a payment of EUR 600 per meeting, together with their traveling costs, in accordance with the company's travel policy. A payment of double this, EUR 1,200 per meeting, will be made to Board members living outside Finland. The AGM confirmed that the Supervisory Board shall comprise eight members and the following members were elected: Ms. Heidi Hautala (Chairman), Mr. Kimmo Tiilikainen (Vice Chairman), Mr. Esko Ahonen, Mr. Mikael Forss, Mr. Timo Heinonen, Mr. Markus Mustajärvi, Ms. Jutta Urpilainen, and Ms. Anne-Mari Virolainen. Mr. Kimmo Tiilikainen was elected for the first time. Members are all Finnish Members of Parliament, with the exception of Mr. Mikael Forss, who is a Director at the Social Insurance Institution of Finland. No changes were made to the remuneration paid to the Supervisory Board, which remains as follows: Chairman EUR 1,000 a month, Vice Chairman EUR 600 a month, and members EUR 500 a month. In addition, those participating at Supervisory Board meetings receive a payment of EUR 200 per meeting. In accordance with a proposal by the Board of Directors, Ernst & Young Oy, Authorized Public Accountants, were appointed as the company's Auditor, with Authorized Public Accountant Anna-Maija Simola as Responsible Auditor, until the end of the next AGM. Payment for their services shall be made in accordance with their invoice that is accepted by the company. Following a proposal by the Prime Minister's Office, representing the Finnish State, the AGM decided to establish a Nominations Committee to prepare proposals covering the members of the Board of Directors and their remuneration for consideration by the next AGM. The Nomination Committee comprises representatives of the Company's three largest shareholders and shall also include, as expert members, the Chairman of the Board, together with one member elected by the Board from among its members unaffiliated with any of the Company's major shareholders. The right to appoint the shareholder representatives on this Committee will lie with the three shareholders holding the largest number of votes associated with all the company's shares on 2 November preceding the AGM. In the event that a shareholder does not wish to exercise his right to appoint a representative, this right shall pass to the next-largest shareholder. The company's largest shareholders shall be determined on the basis of the information on holdings registered in the book-entry system, with the proviso that the holdings of a shareholder required under securities legislation to flag certain changes in his holdings, and with shares spread across a number of funds, for example, shall be combined if the shareholder informs the company of his wishes to this effect in writing by 30 October 2009. The Chairman of the Board of Directors will be responsible for convening the Committee, and the Committee's members will appoint a Chairman from among themselves. The Nominations Committee will present their proposal to the Board of Directors by 1 February prior to the AGM at the latest. Convening after the Annual General Meeting, Neste Oil's Board of Directors elected the members of its two Committees. Timo Peltola was elected Chairman and Michiel Boersma, Mikael von Frenckell, and Ainomaija Haarla as members of the Personnel and Remuneration Committee. Nina Linander was elected
10
Chairman and Hannu Ryöppönen, Markku Tapio, and Maarit Toivanen-Koivisto as members of the Audit Committee. Personnel Neste Oil employed an average of 5,252 (4,912) employees in January-March period. At the end of March, the company had 5,264 employees (31 March 2008: 5,114). Health, safety, and the environment The indicator for safety performance used by Neste Oil – total recordable injury frequency (TRIF, number of cases per million hours worked) for all work done for the company, combining the company's own personnel and contractors – stood at 2.9 (5.2) at the end of March 2009. The target for 2009 is below 4. The lost workday injury frequency (LWIF) stood at 2.0. The target is below 2. Strategy implementation Neste Oil’s current capital projects consist of new plants designed to increase production of renewable diesel and high-quality base oil. Strategic projects Construction of the renewable diesel plants in Singapore and Rotterdam has proceeded according to plan. Mechanical completion of the plant is expected to be achieved in summer 2010. The start-up is scheduled for the third quarter of 2010. The project is proceeding in line with its original budget of EUR 550 million. The Rotterdam plant is scheduled for completion in the first half of 2011. The project is proceeding according to schedule and its original budget of EUR 670 million. A joint venture between Neste Oil and the Bahrain Petroleum Company (Bapco) has started construction of a high-quality lubricant base oil plant in Bahrain. The plant will have an annual capacity of 400,000 tons of VHVI (Very High Viscosity Index) base oil for use in blending top-tier lubricants. Completion is scheduled for the end of 2011. Neste Oil’s share of the JV is 45% and its estimated share of the investment cost is EUR 115–135 million. Construction of an isomerization unit at the Porvoo refinery has been postponed. Potential short-term and long-term risks The oil market has been very volatile. Oil refiners are exposed to a variety of political and economic trends and events, as well as natural phenomena that affect the short- and long-term supply of and demand for the products that they produce and sell.
11
The largest uncertainty here continues to be the slowdown of the world economy, which is likely to reduce the demand for petroleum products. This has already materialized during the last couple of quarters and has now extended to demand for diesel, which is Neste Oil’s most important product. The problems on the international financial market have also increased the level of uncertainty. As a consequence, managing customer receivables risks has become even more important. Sudden and unplanned outages at Neste Oil's production units or facilities continue to represent a short-term risk. Rapid and large changes in feedstock and product prices may lead to significant inventory gains or losses, or change in working capital that may have a material impact on the company’s IFRS operating profit and net cash from operations. Over the longer term, access to funding and rising capital costs, as well as challenges in procuring and developing new competitive and reasonably priced raw materials, may impact the company's growth plans.
The implementation of biofuel legislation in the EU and other key market areas may influence the speed at which the demand for these fuels develops.
The key market drivers for Neste Oil’s financial performance continue to be international refining margins, the price differential between Russian Export Blend (REB) and Brent crude, and the USD/EUR exchange rate. For more detailed information on Neste Oil's risks and risk management, please refer to the company's Annual Report and Financial Statements for 2008. Outlook The outlook for the global economy has not improved during the first months of 2009, and oil demand forecasts have been revised down continuously. In April, the International Energy Agency forecasted that oil demand is likely to decrease globally by 2.8% and in OECD countries by 4.9% in 2009. This reduction in demand will coincide with new refining capacity coming on stream, which will put further pressure on refining margins. Together with a lower level of economical activity, this has already had a negative impact on diesel margins, which are expected to stay well lower compared to those seen in previous years. A modest recovery is expected in the US gasoline market, and slightly better gasoline margins are now expected compared to the previous outlook published in February. Demand for base oils is likely to stay weaker compared to 2008, due to the soft market for lubricants. As a result, Neste Oil will shut down its PAO plant in Beringen, Belgium in May for four weeks and make temporary lay-offs. Freight rates for oil tankers look set to remain very weak throughout the year. The Renewable Fuels segment is unlikely to report positive results in 2009, due to increasing costs linked to the expansion of the business. This is despite the second facility at Porvoo coming on stream in the third quarter of 2009. Low demand will continue to be reflected in Oil Retail’s sales volumes and margins. The devaluation of local currencies in some countries is likely to put pressure on operations outside of Finland.
12
13
Despite planned maintenance at some units, operational performance at Neste Oil’s refineries should be better in 2009 than in 2008. A planned two-month maintenance and process improvement shutdown started on Production Line 4 at Porvoo in mid-April to enhance the line’s productivity. As already disclosed in the Financial Statements for 2008 in February, the Group will continue to address its fixed costs. Results from this will be discussed in the second half of 2009. The Group’s investments are estimated to be around EUR 890 million in 2009, which is lower than the previous forecast of EUR 950 million published in February. Maintenance investments will account for around EUR 160 million (previously 180 million), productivity investments around EUR 40 million (previously 60 million), and strategic investments around EUR 690 million (previously 710 million). Reporting date for the second-quarter 2009 results Neste Oil will publish its second-quarter results for 2009 on 30 July 2009 at approximately 9:00 a.m. EET. Espoo, 27 April 2009 Neste Oil Corporation Board of Directors The preceding information contains, or may be deemed to contain, “forward-looking statements”. These statements relate to future events or our future financial performance, including, but not limited to, strategic plans, potential growth, planned operational changes, expected capital expenditures, future cash sources and requirements, liquidity and cost savings that involve known and unknown risks, uncertainties, and other factors that may cause Neste Oil Corporation’s or its businesses’ actual results, levels of activity, performance or achievements to be materially different from those expressed or implied by any forward-looking statements. In some cases, such forward-looking statements can be identified by terminology such as “may,” “will,” “could,” “would,” “should,” “expect,” “plan,” “anticipate,” “intend,” “believe,” “estimate,” “predict,” “potential,” or “continue,” or the negative of those terms or other comparable terminology. By their nature, forward-looking statements involve risks and uncertainties because they relate to events and depend on circumstances that may or may not occur in the future. Future results may vary from the results expressed in, or implied by, the forward-looking statements, possibly to a material degree. All forward-looking statements made in this report are based on information presently available to management and Neste Oil Corporation assumes no obligation to update any forward-looking statements. Nothing in this report constitutes investment advice and this report shall not constitute an offer to sell or the solicitation of an offer to buy any securities or otherwise to engage in any investment activity.
14
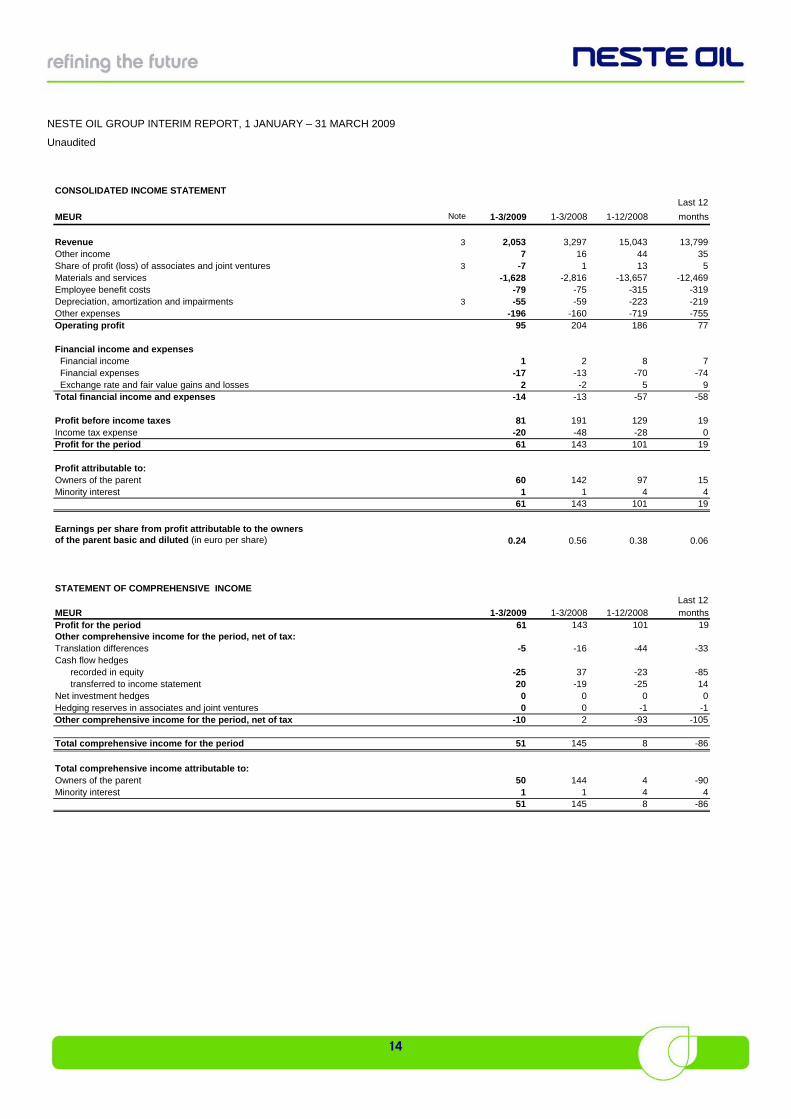
NESTE OIL GROUP INTERIM REPORT, 1 JANUARY – 31 MARCH 2009
Unaudited
CONSOLIDATED INCOME STATEMENTLast 12
MEUR Note 1-3/2009 1-3/2008 1-12/2008 months
Revenue 3 2,053 3,297 15,043 13,799Other income 7 16 44 35Share of profit (loss) of associates and joint ventures 3 -7 1 13Materials and services -1,628 -2,816 -13,657 -12,469Employee benefit costs -79 -75 -315 -Depreciation, amortization and impairments 3 -55 -59 -223 -Other expenses -196 -160 -719 -755Operating profit 95 204 186 77
Financial income and expenses Financial income 1 2 8 7 Financial expenses -17 -13 -70 -74 Exchange rate and fair value gains and losses 2 -2 5 9Total financial income and expenses -14 -13 -57 -58
Profit before income taxes 81 191 129 19Income tax expense -20 -48 -28 0Profit for the period 61 143 101 19
Profit attributable to:Owners of the parent 60 142 97 15Minority interest 1 1 4 4
61 143 101 19
Earnings per share from profit attributable to the ownersof the parent basic and diluted (in euro per share) 0.24 0.56 0.38 0.06
STATEMENT OF COMPREHENSIVE INCOMELast 12
MEUR 1-3/2009 1-3/2008 1-12/2008 monthsProfit for the period 61 143 101 19Other comprehensive income for the period, net of tax:Translation differences -5 -16 -44 -33Cash flow hedges
recorded in equity -25 37 -23 -85transferred to income statement 20 -19 -25 14
Net investment hedges 0 0 0 0Hedging reserves in associates and joint ventures 0 0 -1 -Other comprehensive income for the period, net of tax -10 2 -93
Total comprehensive income for the period 51 145 8 -86
Total comprehensive income attributable to:Owners of the parent 50 144 4 -90Minority interest 1 1 4 4
51 145 8 -86
5
319219
1-105
15
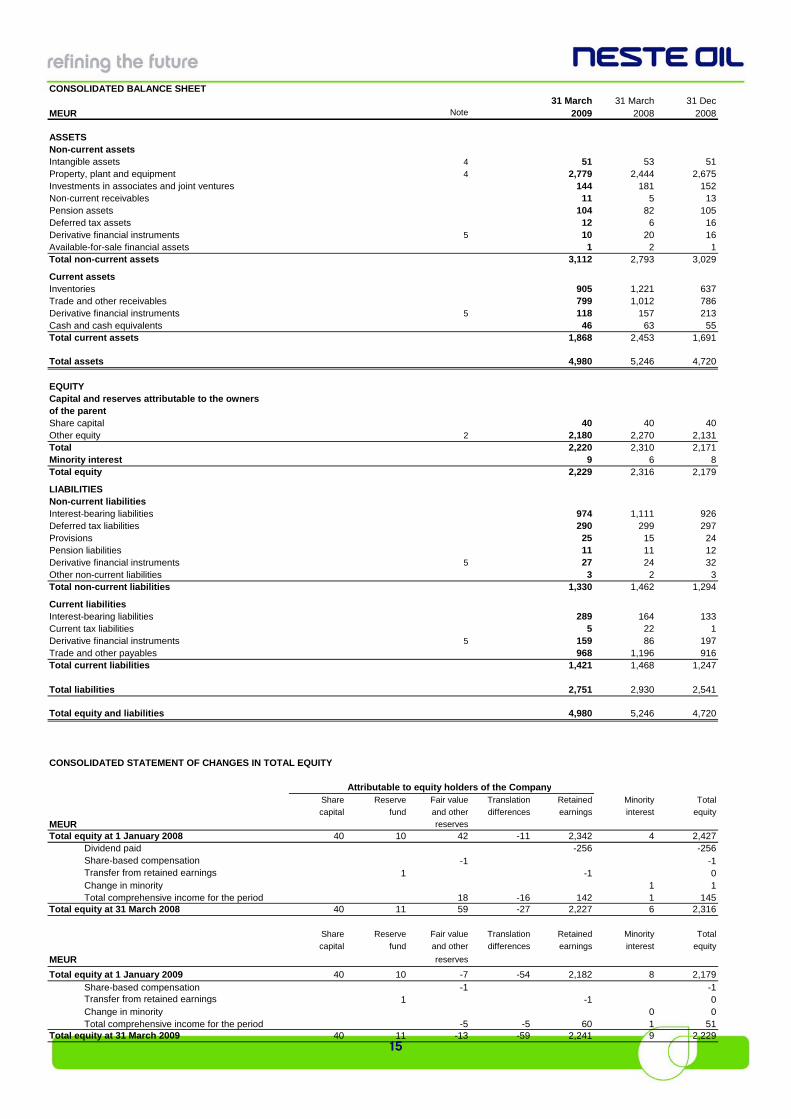
CONSOLIDATED BALANCE SHEET31 March 31 March 31 Dec
3
6
MEU
R Note 2009 2008 2008
ASSETSNon-current assetsIntangible assets 4 51 53 51Property, plant and equipment 4 2,779 2,444 2,675Investments in associates and joint ventures 144 181 152Non-current receivables 11 5 1Pension assets 104 82 105Deferred tax assets 12 6 1Derivative financial instruments 5 10 20 16Available-for-sale financial assets 1 2 1Total non-current assets 3,112 2,793 3,029
Current assetsInventories 905 1,221 637Trade and other receivables 799 1,012 786Derivative financial instruments 5 118 157 213Cash and cash equivalents 46 63 55Total current assets 1,868 2,453 1,691
Total assets 4,980 5,246 4,720
EQUITYCapital and reserves attributable to the ownersof the parentShare capital 40 40 40Other equity 2 2,180 2,270 2,131Total 2,220 2,310 2,171Minority interest 9 6 8Total equity 2,229 2,316 2,179
LIABILITIESNon-current liabilitiesInterest-bearing liabilities 974 1,111 926Deferred tax liabilities 290 299 297Provisions 25 15 24Pension liabilities 11 11 12Derivative financial instruments 5 27 24 32Other non-current liabilities 3 2 3Total non-current liabilities 1,330 1,462 1,294
Current liabilitiesInterest-bearing liabilities 289 164 133Current tax liabilities 5 22 1Derivative financial instruments 5 159 86 197Trade and other payables 968 1,196 916Total current liabilities 1,421 1,468 1,247
Total liabilities 2,751 2,930 2,541
Total equity and liabilities 4,980 5,246 4,720
CONSOLIDATED STATEMENT OF CHANGES IN TOTAL EQUITY
Attributable to equity holders of the CompanyShare Reserve Fair value Translation Retained Minority Total
capital fund and other differences earnings interest equity
MEUR reserves
Total equity at 1 January 2008 40 10 42 -11 2,342 4 2,427Dividend paid -256 -256Share-based compensation -1 -1Transfer from retained earnings 1 -1Change in minority 1 1Total comprehensive income for the period 18 -16 142 1 145
Total equity at 31 March 2008 40 11 59 -27 2,227 6 2,316
Share Reserve Fair value Translation Retained Minority Total
capital fund and other differences earnings interest equity
MEUR reserves
Total equity at 1 January 2009 40 10 -7 -54 2,182 8 2,179Share-based compensation -1 -1Transfer from retained earnings 1 -1Change in minority 0 0
0
0
Total comprehensive income for the period -5 -5 60 1 51Total equity at 31 March 2009 40 11 -13 -59 2,241 9 2,229
16
1
2
1.6
.51
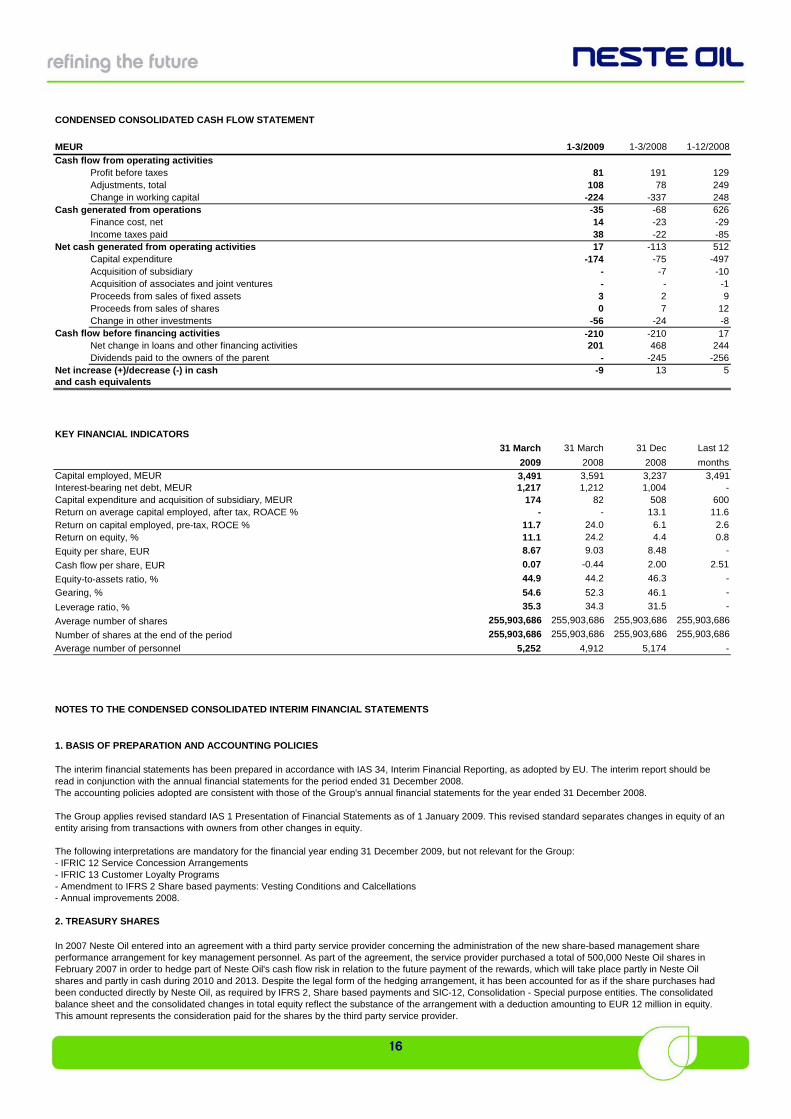
CONDENSED CONSOLIDATED CASH FLOW STATEMENT
MEUR 1-3/2009 1-3/2008 1-12/2008
Cash flow from operating activitiesProfit before taxes 81 191 129Adjustments, total 108 78 249Change in working capital -224 -337 248
Cash generated from operations -35 -68 626Finance cost, net 14 -23 -29Income taxes paid 38 -22 -85
Net cash generated from operating activities 17 -113 512 Capital expenditure -174 -75 -497
Acquisition of subsidiary - -7 -10Acquisition of associates and joint ventures - - -Proceeds from sales of fixed assets 3 2 9Proceeds from sales of shares 0 7 1Change in other investments -56 -24 -8
Cash flow before financing activities -210 -210 17 Net change in loans and other financing activities 201 468 244
Dividends paid to the owners of the parent - -245 -256Net increase (+)/decrease (-) in cash -9 13 5and cash equivalents
KEY FINANCIAL INDICATORS
31 March 31 March 31 Dec Last 12
2009 2008 2008 monthsCapital employed, MEUR 3,491 3,591 3,237 3,491Interest-bearing net debt, MEUR 1,217 1,212 1,004 -Capital expenditure and acquisition of subsidiary, MEUR 174 82 508 600Return on average capital employed, after tax, ROACE % - - 13.1 1Return on capital employed, pre-tax, ROCE % 11.7 24.0 6.1 2.6Return on equity, % 11.1 24.2 4.4 0.8
Equity per share, EUR 8.67 9.03 8.48 -
Cash flow per share, EUR 0.07 -0.44 2.00 2
Equity-to-assets ratio, % 44.9 44.2 46.3 -
Gearing, % 54.6 52.3 46.1 -
Leverage ratio, % 35.3 34.3 31.5 -
Average number of shares 255,903,686 255,903,686 255,903,686 255,903,686
Number of shares at the end of the period 255,903,686 255,903,686 255,903,686 255,903,686
Average number of personnel 5,252 4,912 5,174 -
NOTES TO THE CONDENSED CONSOLIDATED INTERIM FINANCIAL STATEMENTS
1. BASIS OF PREPARATION AND ACCOUNTING POLICIES
The following interpretations are mandatory for the financial year ending 31 December 2009, but not relevant for the Group:- IFRIC 12 Service Concession Arrangements- IFRIC 13 Customer Loyalty Programs- Amendment to IFRS 2 Share based payments: Vesting Conditions and Calcellations- Annual improvements 2008.
2. TREASURY SHARES
The interim financial statements has been prepared in accordance with IAS 34, Interim Financial Reporting, as adopted by EU. The interim report should be read in conjunction with the annual financial statements for the period ended 31 December 2008.
In 2007 Neste Oil entered into an agreement with a third party service provider concerning the administration of the new share-based management share performance arrangement for key management personnel. As part of the agreement, the service provider purchased a total of 500,000 Neste Oil shares in February 2007 in order to hedge part of Neste Oil's cash flow risk in relation to the future payment of the rewards, which will take place partly in Neste Oil shares and partly in cash during 2010 and 2013. Despite the legal form of the hedging arrangement, it has been accounted for as if the share purchases had been conducted directly by Neste Oil, as required by IFRS 2, Share based payments and SIC-12, Consolidation - Special purpose entities. The consolidated balance sheet and the consolidated changes in total equity reflect the substance of the arrangement with a deduction amounting to EUR 12 million in equity. This amount represents the consideration paid for the shares by the third party service provider.
The accounting policies adopted are consistent with those of the Group's annual financial statements for the year ended 31 December 2008.
The Group applies revised standard IAS 1 Presentation of Financial Statements as of 1 January 2009. This revised standard separates changes in equity of an entity arising from transactions with owners from other changes in equity.
17
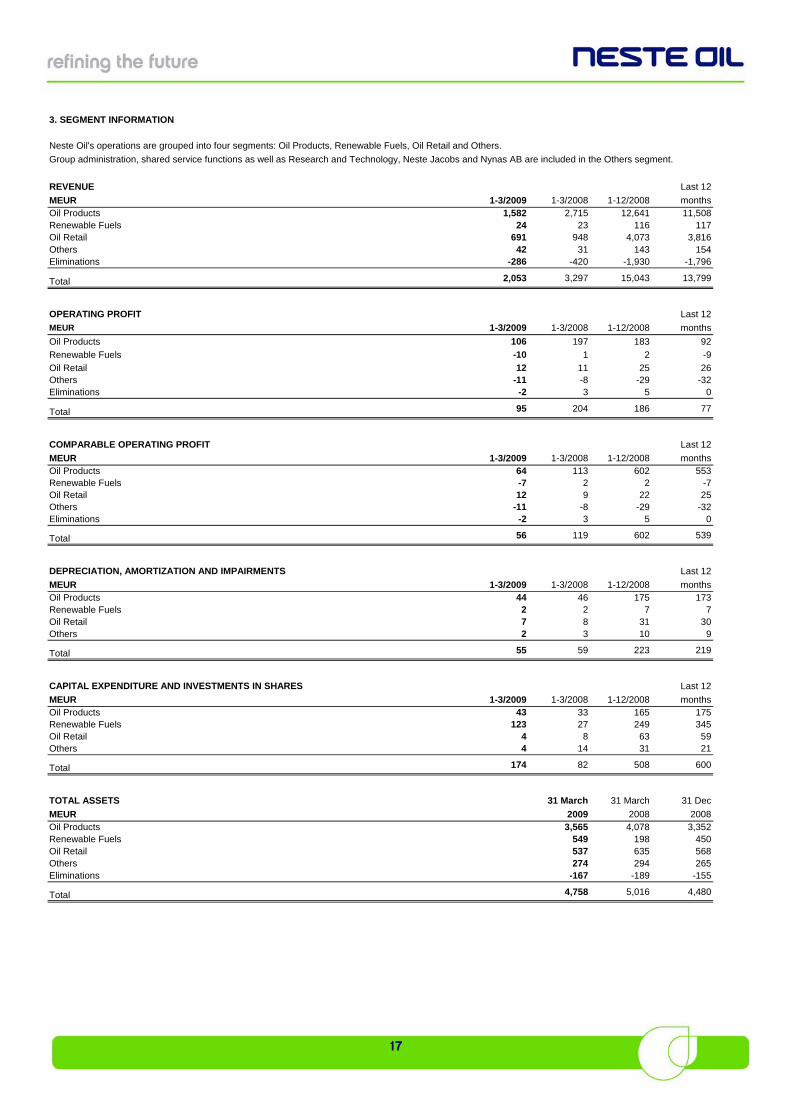
3. SEGM
ENT INFORMATION
Neste Oil's operations are grouped into four segments: Oil Products, Renewable Fuels, Oil Retail and Others.
Group administration, shared service functions as well as Research and Technology, Neste Jacobs and Nynas AB are included in the Others segment.
REVENUE Last 12
MEUR 1-3/2009 1-3/2008 1-12/2008 monthsOil Products 1,582 2,715 12,641 11,508Renewable Fuels 24 23 116 117Oil Retail 691 948 4,073 3,816Others 42 31 143 154Eliminations -286 -420 -1,930 -1,796
Total 2,053 3,297 15,043 13,799
OPERATING PROFIT Last 12
MEUR 1-3/2009 1-3/2008 1-12/2008 months
Oil Products 106 197 183 92
Renewable Fuels -10 1 2
Oil Retail 12 11 25 26Others -11 -8 -29 -32Eliminations -2 3 5
Total 95 204 186 77
COMPARABLE OPERATING PROFIT Last 12
MEUR 1-3/2009 1-3/2008 1-12/2008 monthsOil Products 64 113 602 553Renewable Fuels -7 2 2Oil Retail 12 9 22 2Others -11 -8 -29 -32Eliminations -2 3 5
Total 56 119 602 539
DEPRECIATION, AMORTIZATION AND IMPAIRMENTS Last 12
MEUR 1-3/2009 1-3/2008 1-12/2008 monthsOil Products 44 46 175 173Renewable Fuels 2 2 7Oil Retail 7 8 31 3Others 2 3 10
Total 55 59 223 219
CAPITAL EXPENDITURE AND INVESTMENTS IN SHARES Last 12
MEUR 1-3/2009 1-3/2008 1-12/2008 monthsOil Products 43 33 165 175Renewable Fuels 123 27 249 345Oil Retail 4 8 63 5Others 4 14 31 21
Total 174 82 508 600
TOTAL ASSETS 31 March 31 March 31 Dec
MEUR 2009 2008 2008Oil Products 3,565 4,078 3,352Renewable Fuels 549 198 450Oil Retail 537 635 568Others 274 294 265Eliminations -167 -189 -155
Total 4,758 5,016 4,480
-9
0
-75
0
709
9
18
183
83
28
Total 174 185 131 110 82
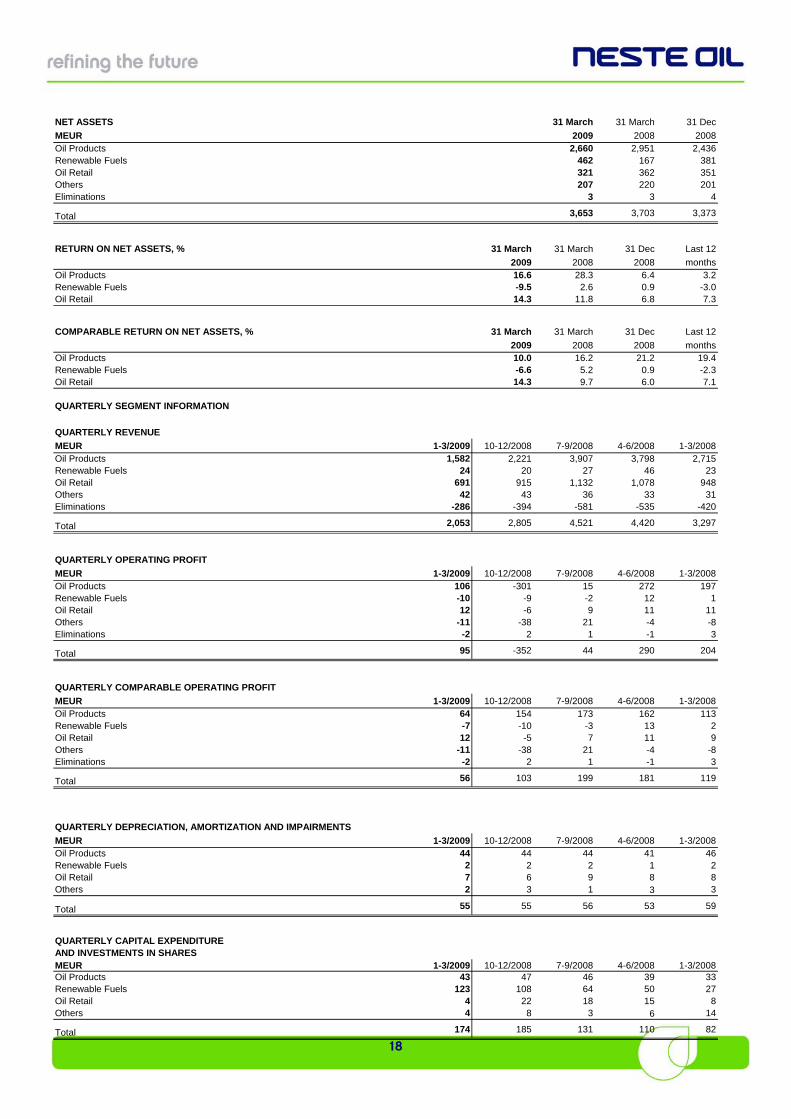
NET ASSETS 31 March 31 March 31 Dec
MEUR 2009 2008 2008Oil Products 2,660 2,951 2,436Renewable Fuels 462 167 381Oil Retail 321 362 351Others 207 220 201Eliminations 3 3 4
Total 3,653 3,703 3,373
RETURN ON NET ASSETS, % 31 March 31 March 31 Dec Last 12
2009 2008 2008 monthsOil Products 16.6 28.3 6.4 3.2Renewable Fuels -9.5 2.6 0.9 -3.0Oil Retail 14.3 11.8 6.8 7.3
COMPARABLE RETURN ON NET ASSETS, % 31 March 31 March 31 Dec Last 12
2009 2008 2008 monthsOil Products 10.0 16.2 21.2 19.4Renewable Fuels -6.6 5.2 0.9 -2.3Oil Retail 14.3 9.7 6.0 7.1
QUARTERLY SEGMENT INFORMATION
QUARTERLY REVENUE
MEUR 1-3/2009 10-12/2008 7-9/2008 4-6/2008 1-3/2008Oil Products 1,582 2,221 3,907 3,798 2,715Renewable Fuels 24 20 27 46 23Oil Retail 691 915 1,132 1,078 948Others 42 43 36 33 31Eliminations -286 -394 -581 -535 -420
Total 2,053 2,805 4,521 4,420 3,297
QUARTERLY OPERATING PROFIT
MEUR 1-3/2009 10-12/2008 7-9/2008 4-6/2008 1-3/2008Oil Products 106 -301 15 272 197Renewable Fuels -10 -9 -2 12 1Oil Retail 12 -6 9 11 1Others -11 -38 21 -4 -Eliminations -2 2 1 -1
Total 95 -352 44 290 204
QUARTERLY COMPARABLE OPERATING PROFIT
MEUR 1-3/2009 10-12/2008 7-9/2008 4-6/2008 1-3/2008Oil Products 64 154 173 162 113Renewable Fuels -7 -10 -3 13 2Oil Retail 12 -5 7 11 9Others -11 -38 21 -4 -Eliminations -2 2 1 -1
Total 56 103 199 181 119
QUARTERLY DEPRECIATION, AMORTIZATION AND IMPAIRMENTS
MEUR 1-3/2009 10-12/2008 7-9/2008 4-6/2008 1-3/2008Oil Products 44 44 44 41 46Renewable Fuels 2 2 2 1Oil Retail 7 6 9 8Others 2 3 1 3 3
Total 55 55 56 53 59
QUARTERLY CAPITAL EXPENDITUREAND INVESTMENTS IN SHARESMEUR 1-3/2009 10-12/2008 7-9/2008 4-6/2008 1-3/2008Oil Products 43 47 46 39 33Renewable Fuels 123 108 64 50 27Oil Retail 4 22 18 15 8Others 4 8 3 6 14
19
4. C
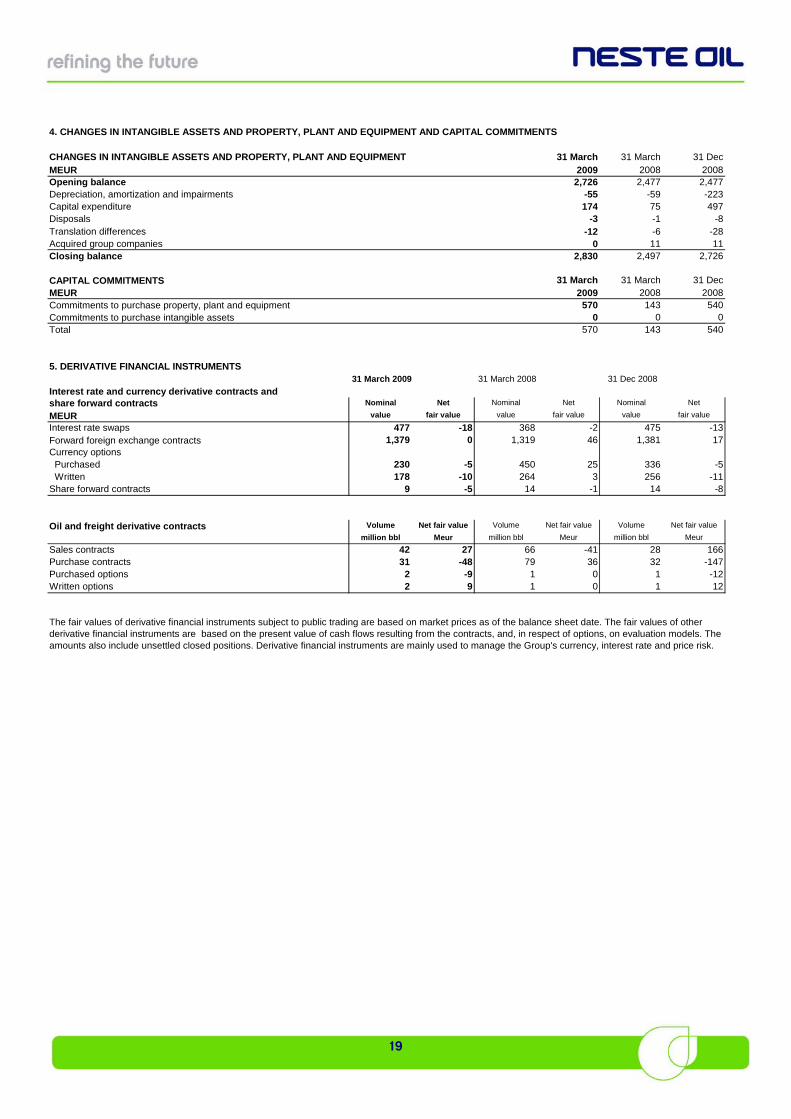
HANGES IN INTANGIBLE ASSETS AND PROPERTY, PLANT AND EQUIPMENT AND CAPITAL COMMITMENTS
CHANGES IN INTANGIBLE ASSETS AND PROPERTY, PLANT AND EQUIPMENT 31 March 31 March 31 DecMEUR 2009 2008 2008Opening balance 2,726 2,477 2,477Depreciation, amortization and impairments -55 -59 -223Capital expenditure 174 75 497Disposals -3 -1 -8Translation differences -12 -6 -28Acquired group companies 0 11 11Closing balance 2,830 2,497 2,726
CAPITAL COMMITMENTS 31 March 31 March 31 DecMEUR 2009 2008 2008Commitments to purchase property, plant and equipment 570 143 540Commitments to purchase intangible assets 0 0 0Total 570 143 540
5. DERIVATIVE FINANCIAL INSTRUMENTS 31 March 2009 31 March 2008 31 Dec 2008
Interest rate and currency derivative contracts and share forward contracts Nominal Net Nominal Net Nominal Net
MEUR value fair value value fair value value fair value
Interest rate swaps 477 -18 368 -2 475 -13Forward foreign exchange contracts 1,379 0 1,319 46 1,381 17Currency options Purchased 230 -5 450 25 336 -5 Written 178 -10 264 3 256 -11Share forward contracts 9 -5 14 -1 14 -8
Oil and freight derivative contracts Volume Net fair value Volume Net fair value Volume Net fair value
million bbl Meur million bbl Meur million bbl Meur
Sales contracts 42 27 66 -41 28 166Purchase contracts 31 -48 79 36 32 -147Purchased options 2 -9 1 0 1Written options 2 9 1 0 1
The fair values of derivative financial instruments subject to public trading are based on market prices as of the balance sheet date. The fair values of other derivative financial instruments are based on the present value of cash flows resulting from the contracts, and, in respect of options, on evaluation models. The amounts also include unsettled closed positions. Derivative financial instruments are mainly used to manage the Group's currency, interest rate and price risk.
-1212
20
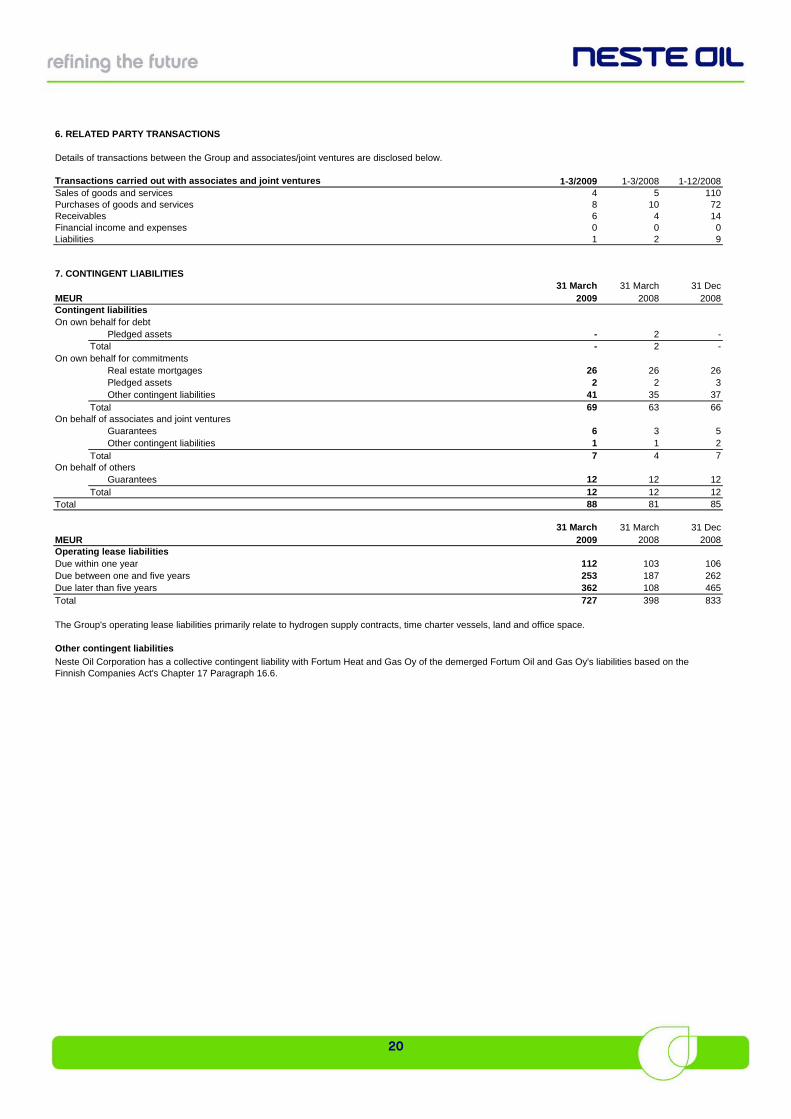
6. RELATED PARTY TRANSACTIONS
Details of transactions between the Group and associates/joint ventures are disclosed below.
Transactions carried out with associates and joint ventures 1-3/2009 1-3/2008 1-12/2008Sales of goods and services 4 5Purchases of goods and services 8 10Receivables 6 4Financial income and expenses 0 0 0Liabilities 1 2 9
7. CONTINGENT LIABILITIES31 March 31 March 31 Dec
MEUR 2009 2008 2008Contingent liabilitiesOn own behalf for debt
Pledged assets - 2 -Total - 2 -
On own behalf for commitmentsReal estate mortgages 26 26 26Pledged assets 2 2 3Other contingent liabilities 41 35 37
Total 69 63 66On behalf of associates and joint ventures
Guarantees 6 3 5Other contingent liabilities 1 1 2
Total 7 4 7On behalf of others
Guarantees 12 12 12Total 12 12 12
Total 88 81 85
31 March 31 March 31 DecMEUR 2009 2008 2008Operating lease liabilitiesDue within one year 112 103 106Due between one and five years 253 187 262Due later than five years 362 108 465Total 727 398 833
The Group's operating lease liabilities primarily relate to hydrogen supply contracts, time charter vessels, land and office space.
Other contingent liabilities
Neste Oil Corporation has a collective contingent liability with Fortum Heat and Gas Oy of the demerged Fortum Oil and Gas Oy's liabilities based on the Finnish Companies Act's Chapter 17 Paragraph 16.6.
1107214
21
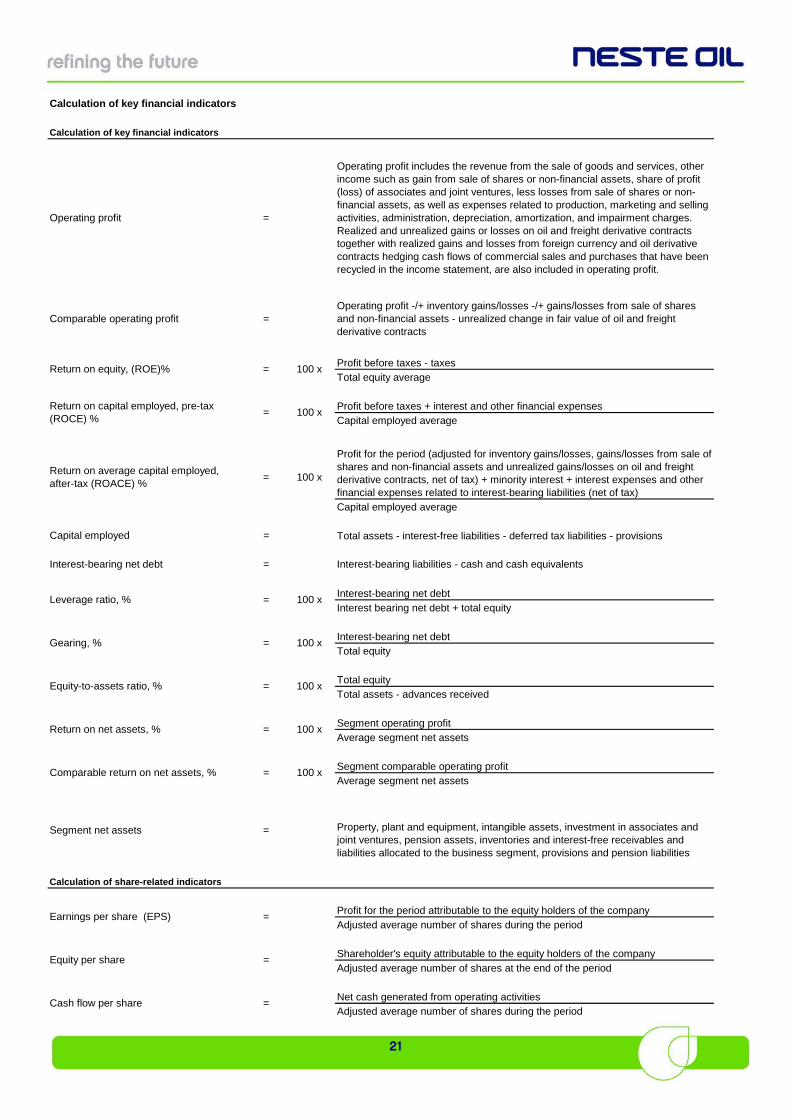
Calculation of key financial indicators
Calculation of key financial indicators
Profit before taxes - taxesTotal equity average
Profit before taxes + interest and other financial expensesCapital employed average
Capital employed average
Capital employed = Total assets - interest-free liabilities - deferred tax liabilities - provisions
Interest-bearing net debt = Interest-bearing liabilities - cash and cash equivalents
Interest-bearing net debtInterest bearing net debt + total equity
Interest-bearing net debtTotal equity
Total equityTotal assets - advances received
Segment operating profitAverage segment net assets
Segment comparable operating profitAverage segment net assets
Calculation of share-related indicators
Profit for the period attributable to the equity holders of the companyAdjusted average number of shares during the period
Shareholder's equity attributable to the equity holders of the companyAdjusted average number of shares at the end of the period
Net cash generated from operating activitiesAdjusted average number of shares during the period
Property, plant and equipment, intangible assets, investment in associates and joint ventures, pension assets, inventories and interest-free receivables and liabilities allocated to the business segment, provisions and pension liabilities
Earnings per share (EPS) =
Cash flow per share =
Equity per share =
100 x
Return on net assets, % = 100 x
100 x
Comparable return on net assets, % = 100 x
= 100 x
Gearing, % = 100 x
Equity-to-assets ratio, %
Comparable operating profit =
Return on capital employed, pre-tax (ROCE) %
=
Return on average capital employed, after-tax (ROACE) %
=
Segment net assets =
=
100 x
Leverage ratio, %
Operating profit includes the revenue from the sale of goods and services, other income such as gain from sale of shares or non-financial assets, share of profit (loss) of associates and joint ventures, less losses from sale of shares or non-financial assets, as well as expenses related to production, marketing and selling activities, administration, depreciation, amortization, and impairment charges. Realized and unrealized gains or losses on oil and freight derivative contracts together with realized gains and losses from foreign currency and oil derivative contracts hedging cash flows of commercial sales and purchases that have been recycled in the income statement, are also included in operating profit.
Operating profit =
Operating profit -/+ inventory gains/losses -/+ gains/losses from sale of shares and non-financial assets - unrealized change in fair value of oil and freight derivative contracts
Return on equity, (ROE)% = 100 x
Profit for the period (adjusted for inventory gains/losses, gains/losses from sale of shares and non-financial assets and unrealized gains/losses on oil and freight derivative contracts, net of tax) + minority interest + interest expenses and other financial expenses related to interest-bearing liabilities (net of tax)

22