FORFU Ti IR
206
FORFU Ti IR •) USARTL-TR-78-11 <4 ENGINE/AIRFRAME/DRIVE TRAIN DYNAMIC INTERFACE C. DOCUMENTATION D. A. Richardson J. R. Alwang Boeing Vertol Company P.O. Box 16858 Philadelphia, Pa. 19142 DCD LU J April 1978 SFinal Report I Approved for public release; distribution unlimited. I Prepared for APPLIED TECHNOLOGY LABORATORY U. S. ARMY RESEARCH AND TECHNOLOGY LABORATORIES (AVRADCOM) Fort Eustis, Va. 23604 8 0626 011
-
Upload
khangminh22 -
Category
Documents
-
view
3 -
download
0
Transcript of FORFU Ti IR

FORFU Ti IR•) USARTL-TR-78-11
<4 ENGINE/AIRFRAME/DRIVE TRAIN DYNAMIC INTERFACEC. DOCUMENTATION
D. A. RichardsonJ. R. Alwang
Boeing Vertol CompanyP.O. Box 16858Philadelphia, Pa. 19142 DCD
LU J
April 1978
SFinal Report
I Approved for public release;distribution unlimited. I
Prepared for
APPLIED TECHNOLOGY LABORATORY
U. S. ARMY RESEARCH AND TECHNOLOGY LABORATORIES (AVRADCOM)
Fort Eustis, Va. 23604
8 0626 011

APPLIED TECHNOLOGY LABORATORY POSITION STATEMENT
This report provides the details of a program that is part of a largereffort designed to provide a complete report of past and presentengine/airframe/drive train dynamic interface problems. The problemsof vibration related interface compatibility in engine/drive systeminstallations are usually complicated by the inherent coupling of thethree major multi-degree-of-freedom systems, i.e., engine, airframeand drive train. The result of this effort is a report documentingdynamic interface problems associated with the CH-46, CH-47, HeavyLift Helicopter (HLH), and the YUH-61A. The ultimate benefit willbe the accumulation of data that will eventually lead to a solutionof generic problems of this type. This report is one of five reportsresulting from engine/airframe/drive train dynamic interface docu-mentation efforts funded by the Applied Technology Laboratory. Therelated reports and their final report numbers are: Boeing -Vertol,
,F USARTL-TR-78-11; Hughes Helicopters, USARTL-TR-78-12; SikorskyAircraft, USARTL-TR-78-13; Kaman Aerospace, USARTL-TR-78-14: andBell Helicopter, USARTL-TR-78-15.
Mr. Allen C. Royal, Propulsion Technical Area, Technology ApplicationsDivision, served as the Project Engineer for this effort.
DISCLAIMERS
The findings in this report are not to be construed a an official Department of the Army position uples sodesignated by other authorized documents.
When Government drawings, specifications, or other data we used for any purpose other than in connectionwith a definitely related Government procurement operation, the United States Government thereby Incurs noresponsibility nor any obligation whatsoever; and the fact thst the Government may have formulated, furnished,or in any vwy supplied the said drawings, specifications, or other date is not to be regarded by implication orotherwise as in any manner licensing the holder or any other person or corporation, or conveying any rights orpermission, to manufacture, use, or sell any patented Invention that may in any way be related thereto.
Trade names cited in this report do not constitute en official endorsement or approval of the wse of suchcommercial hardware or sofltwre.
DISPOSITION INSTRUCTIONS
Destroy this report when no longer needed. Do not return it to the orginator. 7

UNCLASS IFIED
EPQ 9 DOCIU.MDCLENTFIATIONP G RA IN OWNU RAIINSSCEFULECOPEIGFR
16. DISTRIB O STTEEN (ofT ACCESIO ROeport)' ATLO UME
ApprovLE(ad Sutire publicQ release; distribtionunimited
17. DISTIUIN STATERMENTDIV (o h bTRAc ~trIN. BlocN20,IfC~fr fo eo
IS.SUPEMAENTR NOTUES TTO-NNME
helicoptrs aredesried The70:7 inesiato lain 9o4h
9PEFORMIN O473AEIZTION NAME ANOV6 ADSRESSOLT UN0LA SRGA LMN, RJTS
SECRIT C A REFI ATIO WORK UNIS P UMBE RShuDaeEt

TABLE OF CONTENTSPage
LIST OF ILLUSTRATIONS ................ ................. 4
LIST OF TABLES ................... ..................... 8
INTRODUCTION ............... ..................... 9
DESCRIPTION OF THE PROBLEMS, INVESTIGATIONS AND SOLUTIONS
CH-46Engine Vibration ....... ................ .. 11Excessive Torque during Rotor Startup ... . .... 41
CH-47Torque Oscillation ....... .............. 49Cracking of Engine Inlet Housing .......... .. 63
HLHDemonstration of the Engine Control Rotor DriveSystem Dynamic Stability .... ............ .. 77HLH/DSTR Torque Oscillation ... .......... .. 116
YUH-61AEngine Mounting ....... ................ 138Nonsynchronous Whirl ...... ............. 159Engine Stall. ............................ 168Slow Return from Overspeed .............. .... 185Rotor Speed Excursion in Maneiqvers not RequiringCollective Pitch Chan:es .... ............ .. 186Lack of Precise Hover Height Control ......... 158Fuel Control Dynamics ..... ............. .. 191
A FORECAST OF POTENTIAL FUTURE DYNAMIC INTERFACING PROB-LEMS AND RECOMMENDATIONS FOR INVESTIGATION/ANALYTICALTESTING EFFORT TO ACHIEVE AN IMPROVED UNDERSTANDING OFTHE PROBLEMS AND POTENTIAL SOLUTIONS ................. 196
RECOMMENDATIONS FOR ENGINE/AIRFRAME/DRIVE TRAIN SPECI-FICATIONS GOVERNING DYNAMIC INTERACTION ...... .. 203
SUMMARY OF PROBLEMS LISTED CHRONOLOGICALLY ...... .. 204
BIBLIOGRAPHY ............. ..................... .. 205
SYMBOLS AND ABBREVIATIONS ...... ....... 206
3IL -, .7i

LIST OF ILLUSTRATIONS
Figure Page
1 Engine Drive Shaft Assembly .... ........... .. 12
2 Aft Pylon Test Rig ........ ............... .. 14
3 Drive System Schematic ...................... .. 14
4 Engine Mount Bearing Locations ... ......... .. 15
5 0% Torque Location 1-Amplitude and Phase ofShaft Response .............................. .. 18
6 0% Torque Location 2-Amplitude and Phase ofShaft Response ........... ................. .. 19
7 0% Torque Location 3-Amplitude and Phase ofShaft Response ............ ................. .. 20
8 0% Torque Location 4-Amplitude and Phase ofShaft Response ........... ................. .. 21
9 0% Torque Location 5-Amplitude and Phase ofShaft Response ............ ................. .. 22
10 High Speed Shaft Mode Shape .... ........... ... 23
11 Impedance Change with Frequency ............ .. 24
12 Frequency Shift of Points of Maximum Responsewith Increased Torque ......... ............. .. 25
13 Frequency Shift with Increased Torque ....... .. 26
14 Impedance Change with Frequency ............ .. 27
15 Engine Lateral Acceleration .... ........... .. 29
16 Torque Tube Lateral Acceleration ............ .. 30
17 Engine Crotch Lateral at 325 Hz ............ .. 31
18 Aft Torque Tube Lateral - 325 Hz ............ .. 32
19 Engine Crotch Lateral - 325 Hz ............ ... 33
20 Aft Torque Tube Lateral - 325 Hz ............ .. 34
21 Coupling Bolt Torque Effect. .......... 35
22 Coupling Bolt Torque Effect ...... ........... 36
23 Curvic Coupling Tip vs Vibration ............ .. 37
24 Spacer Evaluation ........ ................ .. 39
25 Curvic Spacer Evaluation ..... ............ .. 40
26 Rotor Startup .......... .................. ... 42
4

LIST OF ILLUSTRATIONS
Figure Page
27 Rotor Startup, 30OF ....... .............. ... 45
28 Peak Engine Torque ..... .............. ... 47
29 Drive System/Fuel Control/Engine Schematic . . 54
30 Lag Damper Characteristics .... ......... ... 54
31 Fuel Control Frequency Response ........... ... 56
32 Engine Droop Schedule ..... ............. ... 57
33 Lag Damper Schematic . ...... .... ............ 61
34 Engine Mount Schematic .... ............ ... 64
35 Baseline Engine Vibration .... ........... ... 66
36 Yaw Mode .......... ................... ... 66
37 Pitch Yaw Mode ...... ................ ... 67
38 T55-11 Compared to T55-11A ... .......... ... 69
39 Effect of Drag Link Bolt Torque ........... ... 69
40 Effect of Drag Link Stiffness ... ........ .. 70
41 Configuration Effect on Yaw Frequency ........ 71
42 Baseline 3/Rev Stress Vs RPM ........... ... 73
43 Inlet Housing Stress ..... ............. ... 74
44 Lateral 3/Rev Engine Vibration .......... ... 75
45 Engine to Simulation Comparison .... ....... 73
46 Response to 10% Rotor Load Change ........ .. 80
47 Response to Collective Pitch Input ........ .. 81
48 Response to Beeper Input .... .......... ... 83
49 Temperature Limiting ..... .............. . 84
50 Power Management Control Effect ....... ... 85
51 System Response to Collective .......... .. 87
52 Effect of Control Lag ..... ............. ... 88
53 Power Variation Effect ..... .............. 9054 Linedr Simulation Block Diagram ............. 91
55 Lag Damper System ...... ................. 92
56 Lag Damper Equations and Constants ........ .. 93
57 Lag Damper Response - 100 Ft-Lb Toique Input 94
5

LIST OF ILLUSTRATIONS
Figure Page58 Lag Damper Response - 300 Ft-Lb Torque Tnput. . 95
59 Lag Damper Valve Characteristics ........... .. 97
60 Standard Day Lag Damper Effect - Response toLoad Change ............. ............. 98
61 Cold Day Lag Damper Effect - Response toLoad Effect ........ ...................... 99
62 Simulation Transient, Effect of IsochronousGoverning ............ .................... .101
63 Master Beeper Transient Baseline IsochronousGoverning ........ .................... . 102
64 Master Beeper Transient - Isochronous GoverningOff ............ ......................... 104
65 Master Beeper Transient, Baseline (T3 =.5 sec) . 106
66 Master Beeper Transient, Reduced Lag (T3=.15sec) Compensation ...... .................. 107
67 Isochronous Governing Switch Off Transient,Reduced Lag (T 3 =.15 sec) Compensation .. . i
68 Effect of Compensation on Open Loop FrequencyResponse .......... ................. . . 109
69 Notch Filter Compensation Frequency Response . 111
70 Master Beeper Transient, 3.0 Hz Notch FilterCompensation. . . ............... 112
71 Master Beeper Transient, 2.2 Hz Notch FilterCompensation ........ ................... . 113
72 Master Beeper Transient, 4.0 Hz Notch FilterCompensation ........ ................... . 114
73 DS'"R Engine Fuel System ..... ............ .. 117
74 DSTR Torsional Model ........ ............. .119
"75 Residua' Torque vs Frequency .... ......... .. 121
76 DSTR Torsional Analysis - Mode Shapes ....... .. 122
77 Natural Frequency vs Turbine Spring Pate. . 123
78 DSTR Engine Engagement and Torque Spike . . . 124
79 DSTR Clutch Disenqagement and Overspeed . . .. 125
80 DSTR Torque Oscillation with One and Two Engines126
81 DSTR Torque Oscillation without Accumulator . 128
6

LIST OF ILLUSTRATIONS
Figure Page
82 DSTR Torque Oscillation Investigation with15-Cubic-Inch Accumulator ..... ............ .. 129
83 15-Hz Oscillation DSTR Control with DST" Pump. . 132
84 DSTR Control with Flight Engine Pump anidPlumbing .............. .................... .. 133
85 Flight Engine Control with Flight EnginePump and Plumbing ......... ............... .. 134
86 Flight Engine Control with Flight Engine Pumpand Plumbing ............ .................. .. 135
87 Alternating Input at High Power - Flight EngineControl, Pump and Plumbing .... ............ . 136
88 Alternating Inputat Idle Flight Engine Control,Pump and Plumbing ........ ............... .137
89 YUH-61A/T700-GE-700 Engine Mount Configuration . 143
90 Engine Mount Analysis ...... .............. .. 144
91 Engine Shake Test Mode Shapes .... .......... .. 147
92 Engine Mount Stiffness ..... ............. .. 150
93 GTV Engine Shake Test Baseline vs Final . . ... 151
94 Spectral Analysis ........ ................ .. 152
95 Effect of Mount Change on 4/Rev Vibration. . . ]53
96 Effect of Vibration Treatment on EngineVibration (4/rev) ........... ................ .155
97 Effect of Vibration Treatment on EngineVibration (4/rev) ......... ................ .. 156
98 Engine Vibration Survey (1/rev) ............ .. 157
99 Engine Vibration Survey (8/rev) ............ .. 158
100 Effect of Exhaust Duct Configuration!Weighton 240 Hz Response ..... ............... 165
101 Quill Shaft Location ...... .............. .. 166
102 No. 1 Engine Maximum Inlet Temperature RiseEncountered During IGE Decelerations ......... ..172
103 No. 2 Engine Maximum Inlet Temperature RiseEncountered During IGE Decelerations ........ .. 173
104 Sumnary of ]:nlet Temperature Rises Encounteredin No. 1/No., 2 Engines ..... ............. .. 174
7

LTST OF ILLUSTRATIONS
Figre Page
105 Engine Torque and Inlet Temperature TimeHistory During Stall Event .... ........... ... 175
106 Compressor Stall Line and Paths ... ....... ... 177
107 Test Cell Engine Stall Results ............ ... 178
108 Effects of Fuselage Angle and Rotor Heighton Ingestion .......... ................. ... 180
109 Effect of Engine Exhaust Velocity on Ingestion. 181
110 Effect of Airspeed on Ingestion ... ........ .. 182
I11 Gain and Lag vs Frequency .... ........... ... 184
112 Effect of Control Gain ..... ............. ... 187
113 Fuel Control Schematic ..... ............. ... 189
LIST OF TABLES
Table Page
1 Measured System Tolerances .... ........... ... 16
2 Summary of Drive System Torsional NaturalFrequencies .......... .................. .. 118
3 GTV Engine Shake Test ConfigurationsEvaluated .......... ................... ... 149
4 Mounting Springs ........ ............... .. 149
5 Comparison of GTV and Test Cell Data ........ .. 162
6 Comparison of Vibration Characteristics ofEight Duct Configurations .... ........... ... 163
7 Electronic Control Unit Comparison ......... ... 194
8

INTRODUCTION
This document describes engine/airframe/drive train dynamicinterface problems experienced by the Boeing Vertol Company inthe past decade. The problems are grouped in sections by heli-copter model.
The CH-46 and CH-47 are tandem rotor twin-engine helicopters.The former uses General Electric T58 engines and the latterT55 Lycoming engines. The YUH-61A is a single main rotor heli-copter powered by two General Electric T700 engines.
The HLH (Heavy Lift Helicopter) program was a technologydevelopment of components of a large tandem rotor helicopter.Some of these components were combined to make a dynamic sys-tem test rig (DSTR) which consisted of three Detroit DieselAllison Division of General Motors Corporation (DDA) 501-M62Bfree turbine engines, driving a 92-foot-diameter aft rotorthrough a combining transmission and aft transmission withinterconnecting shafting. These components were mounted on aboiler plate framework not simulating flight airframe dynamics.A power absorber was provided to permit simulation of the powerabsorption of the forward rotor. The integration of thesecomponents provided the means to evaluate the engine drivetrain/rotor interfaces.
The engine control system for the DSTR is composed of threemain units: a single power management control serving thethree engines and an engine electronic control, and a hydro-mechanical fuel control for each engine. The power managementcontrol incorporates isochronous or constant rotor speed gov-erning and automatic load sharing between the engines andprocesses torquemeter signals for output display. The engineelectronic control provides proportional power turbine speedgoverning, power turbine inlet temperature and overspeedlimiting, automatic start sequencing, and gas generator speedsignal ccnditioning. The hydromechanical fuel control sched-ules gas generator speed, compressor variable geometry, andacceleration and deceleration transients. This unit alsolimits fuel flow and gas generator speed and includes bothmechanical and electrical fuel shutoff.
The electronic portions of the control system were designedspecifically for the DSTR engines and are functionally similarto HLH prototype hardware.
9

While all the problems described were resolved, their solu-tion involved significant expenditures by the Government, theBoeing Vertol Co.-pany, and the three engine manufacturers.In an effort to use this past experience to prevent or reiucecost of resolution of future problems, a section is includedforecasting future dynamic interfacing problems and suggest-ing efforts that may lead to a better understanding of thedynamic interfaces.
10

CH-46
PROBLEM - ENGINE VIBRATION
Engine vibration at power turbine/drive shaft frequency(19,500 rpm or 325 Hz) exceeded allowable limits with newlyinstalled shafts on numerous occasions. An investigation wasundertaken in 1967.
Description of the Problem
The drive system of the CH-46 helicopters includes two high-speed engine drive shafts shown in Figure 1. One of theseshafts is connected between each engine and the combiningtransmission or mixbox. The General Electric T58 engine hastho output shaft connected to the engine coupling adapter.A set of Thomas coupling plates, whose function is to correctfor misalignment, joins the engine coupling adapter to thesplihed adapter. The main shaft body has a male spline at oneend which is inserted in the female counterpart of the spltiedadapter and terminates with a curvic coupling. The use ofthe spline provides for the freedom of longitudinal motion.A curvic coupling adapter joins the shaft through another setof Thomas coupling plates to the mixbox input pinion adapter.The curvic coupling is provided to facilitate engine or trans-mission changes. The "balanced shaft assembly" consists ofthe engine coupling adapter through and including the Thomascoupling plates at the mixbox end of the shaft.
The engine has the following high frequency vibration limits:maxi_.,u total vibratory displacementI uiils double amplitude,at frequencies above 50 ips - 3 mils up to 20,000 rpm '333 cps)decreasinq linearly to 1.5 milza at 26,800 rpm (447 cps). Themeasurement locations specified by General Electric are atengine stAtions 200.00, 232.00, and 239.75. These correspondgenerally to tle engine forward mounting pad, power turbineflange, and the torque tube to engine attachment flange. Thetorque tube to engine attachment flange is usually referredto as the engine crotch and is the normal vibration monitorlocation. The 3-mil double amplitude is 2quivalent to + 16 gat standard shaft operating speed of 325 ;ps. In order tominimize the possibility of high vibration, certain toleranceshave been established which would ensure that vibration levelsare acceptable. Prior to installation in an aircraft, theshaft assembly is balanced on a Gisholt Masterline balancingmachine. The balance tolerance is given as 0.01 in-oz at9000 rpm. This results in 6.7 lb of unbalance at the opera-ting speed of 19,476 rpm.
11
CCURVIC COUPLING ADAPTER
THOMAS PLATEASSEMBLY
CONNECTS TO ADAPTER-PART OF MIXBCX INPUTPINION ASSEMBLY
SCOUPLING ADAPTER TER
CONNECTS TO POLYGON COUPLING
Figure 1. Engine Drive Shaft Assembly.
12

Despite the care taken in balancing the shaft components andassembly, when the shafts were installed in the aircraft therewere numerous instances when the 16g limit was exceeded; therewas no straightforward procedure for correcting the condition.
Investigation Leading to a Solution
A laboratory test was undertaken to determine the cause(s)of the problem and to establish corrective measures.
The aft section of the fuselage of a CH-46A was mounted onan I-beam support structure as shown in Figures 2 and 3. A75-hp electric motor with a variable speed capability and a40-hp hydraulic motor mounted in series were used to drivethe transmission through the synchronizing shaft which nor-mally drives the forward rotor (Figure 2 ).
The synchronizing shaft drove through the mixbox to motor theengine drive shaft and engine power turbine. In order todrive through the overrunning clutch, the system was rotatedopposite to the aircraft rotational direction. GeneralElectric balanced the power turbine rotor prior to the testseries. The compressor rotor and gas generator rotor werefixed and nonrotating throughout the testing. In order torestrict airflow through the engine and, thus, reduce thedrive power requirements, the intake of the engine was covered.Since there was no rotor load on the aft transmission, thesystem torque amounted to only about 1% of the normal opera-ting value.
Prior to the start of testing, tolerance measurements weremade on engine mount bearing wear, mixbox input pinion totalindicator reading (TIR) and perpendicularity, and polygoncoupling TIR and perpendicularity. An optional check on theengine to mixbox alignment was also performed. The resultsof these measurements, along with the allowable tolerances,are shown in Table 1. Figure 4 shows the location of all theengine mount bearings with the same numbering system employedin Table 1.
The nonrotating shake test was performed to determine thefirst natural lateral bending frequency and the mode shape ofthe high-speed shaft assembly as installed in the test article.The test was accomplished by attaching a shaker with an outputof +50 lb at the midpoint of the shaft. The attachment of theshaker to the shaft increased the shaft weight by 0.5 lb.
13

T8AFT TRANSMISSION
75 HP' MOTOR- /
WITH VARIDRIVE MIXBOX
MOST AFT SYNCHRONIZING
Figure 2. Aft Pylon Test Rig.
ENGINE DRIVE SHAFT
FWD TRANSMISSIONON
MIXBOX
0 'SIMULATION
/SYNCHRONIZINGSHAFT-- --
TS8 ENGINES
ENS jFT TRANSMISSION
Figure 3. Drive System Schematic.
14

BEARING NO. 1BEARING NO. 6
A-' NG BEARING NO. 5CBLL
V EARING1~ NO. 2 BEARING NO. 7 -
A1 B2
BEARING NO. 10
iLOAD CELLBEARING NO. 3
BEARING NO: 9.
+ I I BEARING NO,.11
\BEARING NO. 4 BEARING NO. 8
SECTION A-A SECTION B-B
Figure 4. Engine Mount Bearing Locations.
15

TABLE .MEASURED SYSTEM TOLERANCES
ENGINE MOUNT BEARINGS (SEE FIG. 4 FOR BEARING LOCATIONS)
BRG NO. ALLOW-It ACTUAL BRG NO. ALLOW-IN ACTUAL
1 .005 .000 7 .005 .000
2 .005 .000 8 .005 .001
3 .005 .000 9 .005 .000
4 .005 .000 10 .005 .Ol
5 005 .001 11 .005 .dlo
6 005 .000
MIXBOX INPUT PINION
T.I.R. IN. PERPENDICULARITY
ALLOW ACTUAL ALLOW ACTUAL
.003 .0011 None -0000
ENGINE COUPLING ADAPTER
T.I.R. IN. PERPENDICULARITY
ALLOW ACTAL ALLOW ACTUAL
.0043 CO16 None .0010
ENGINE TO MIXBOX ALIGNMENT
ALIGNMENT
ALLOW ACTUAL
0 00- 24' 00- 14'
16

A strain-gaged force link connected the shaker to the shaft.With the force held constant, a logarithmic frequency sweepwas made from 35 cps to 750 cps. The shaft response wasmeasured by accelerometers on the force link and on the shaft.The accelerometer outputs went directly and also through aphase meter to a plotter so that amplitude and phase wererecorded. Figures 5 through 9 show the results. Figure 10shows the locations used for the accelerometer and the modeshapes at amplitude data. In addition, a velocity mechanicalimpedance plot was generated where the impedance is simply theinput force divided by the velocity of response (if the inputforce is constant this is equal to a const:ant divided by thevelocity). This confirmed the selection of 190, 290, and 425as the significant frequencies (Figure 11).
The powcr turbine was restrained and a static torque wasapplied to the shaft. An accelerometer was attached to theshaft near the midpoint. The static torque was applied inincrements of about 5% with a frequency sweep from 35 to 350cps made at each torque setting. Figure 12 shows the accel-erations measured. Figure 13 is a plot of the peak accelera-tions identified on Figure 12 as "A", "B", or "C".
This shows significant "stiffening" effect of torque. Limi-tations of the test equipment prevented going to torquesgreater than 30%. Since it was not possible to mount a pick-up on the shaft during the rotating portion of the test, astatic position must bp selected to monitor shaft responsewith the response of the static position closely matchingthat of the shaft itself. A velocity transducer was mountedat the engine crotch in the lateral direction, the normal GEmonitor position. With a static torque of 5%, a frequencysweep was made and the velocity response at the engine crotchwas recorded. From this, a velocity impedance plot was gen-erated (Figure 14) and compared with the shaft response. Theengine crotch response compares favorably with the shaftresponse; therefore, during the rotating portion of the test,the engine crotch pickup was the primary reference of shaftbehavior. The torque on the shaft during all tests withrotation was less than 10% of normal operating torque.
The imbalance in the shaft assembly as installed in the testrig was minimized. This was done by measuring the effect ofa known weight and location on the azimuth and magnitude ofthe shaft motion, making a vector plot, and determining thecorrect weight and location for balance. This balancing wasdone at the normal rpm (19,500) at each end of the shaft.
17

SII20 .. 200 0 400.... . . ,
36 .....
o. 10........ .0 I 0 .. . . . .. . . .. . . . . . . . . . . . . .. . . . . . . ÷ . . . . . . . . . . . . . . . . .
H .... ' . .
*8 . .. . . . . . .
.) . . . . .
•-4 , -4
U• 0 p ,
4) 100 200 300 400 500 600
FREQUENCY - CPS
360 .~.....i........;.. ... ~.4. . ..•.9.......
Figu. '... . .L t 1 ...... ..4 . . . ,"-.4.I. ...... ....... L ........... " ".t.'.. . . . , . . . .o i . . . . . . . ., . . . .
18o .. ... .. . .. . ... . . . ... . .. ..-
. . . ... . . . . :1. . . . . . .; . . . ...1 . ./t! . . .... ...... , ... . .4: :
of S.., • 4..n.s ...... .:::1
S• " •, _" t .. , - "". . . 1. . .. 9 j ; . , . , . :
So o " : - oo o . . '. 0. .. . . O - "•4i " (
FRQUNC -. CP
Figure 5~~. 0%Tru4oain1- mltd n hs
of Shft Reponse
.. . . . . . . . .
-- i ill ii l ll)l i i i II I.il l ~ i l ii . .I . . i I. .I i 1 ii I I l

20 77 :T 7i7
z~ 10
0 ,, .... . ... I.....~ .
300 400 500 600
FR~EQUENCY -CPS
360 .. ... .....
. .... ....
210 . . .......... . .
... ... .... ...... . .. ......
. . . . .. .... . . . . .
90.W . . . . .... .
V --- ---10. 0 10O0 200 300 400 500 600
1'...
S................ ,.... .4,, ,: i
(. .D . . . . . + . . . I " " ' I . . . . , . .
S... / I. . ....... t......i .... • .. • .. • -.......
S.. . i, !• 4 ..... . ... ::..................:.. .. ... .. .............. ~... -.... :. .......
FREQUENCY - CPS
Figue 6.0% Torque Location 2 -Amplitude and Phaseof Shaft Response.
19

40 T~
0 ....
101
30---. .1:... ...
00 100 200 300 400 500 600
FREQUFNCY -CPS
270.
4 1
Fiur 7. 0% ToqeLcto9-Amltd n hs
20 2 00 0 0 0

- - - * • I - >20
. .. *.. •, • °20
0
10 . . .
. . . . . . ..,
0 100 200 300 400 500 600
FREQUENCY - CPS
270 . ... .. .. .* . . . .. . .. " .
* . . . ., . . - ,
180 . * ... *. . ..
u. . . . . . . . ..: .
0 0 100 200 300 400 500 600
FREQUENCY - CPS
Figure 8. 0% Torque Location 4 - Amplitude and Phaseof Shaft Response.
21

20 -
100H
U 0 100 200 300 400 500 600U
FREQUENCY -CPS
360 "
270
180
80 . ....... ...... . . -
o100 200 300 400 500 600
FREQUENCY CPS
Figure 9. 0% Torque Location 5 - Amplitude and Phaseof Shaft Response.
22

1 2 345
f = 190 cps0% Torque
f = 290 cps0% Torque
f = 400 cps0% Torque
Figure 10. High Speed Shaft Mode Shape,
23

9%
H~ .-
z 4..
tl 3
zI,
H - ,i , 1 ... .j K _, j ]2 -
100 200 300 zLO0 500 600 70080090o
FREQUENCY- CPS
VARIATION IN MECHANICAL IMPEDANCE.Zv, WITHCHANGES IN FREQUENCY
0% TORQUE LOCATION 3
Figure 11. Impedance Change with Frequency.
24

32 A 30%
28
10 7
161
124
-~-7 , =, -7-.---i
200 225i Z5U .1 300 325
FREQUENCY - CP'S
Figure 12. Frequency Shift of Points of Maximum Responsewith Increased Torque.
25

340
300 _____:.. .
4 .. . . .. . . . ... ... . . . . ...
U
. .÷ . . . .
220 ..... ... .....
180 ... 1
140 20 40.60S............
:•'r~ t: :.- -.---- . .. .
100 0 20 4 0 60 80 100
PERCENT TORQUE
100% Torque = Max. single-engine torque T58CE-10
Frequency of points of maximum response
O Peak A
3 Peak B
A Peak C
"Figure 13. Frequency Shift with Increased Torque,
26

500 -
400 .
300
cJ~ 200 -
U)4
1900 .-
II 90 .
70 - ---- 4---.
60 .. ,
50 .- : -- *-----
40 .. . . -
I -1---;30 --- -
20 --
FREQUENCY - CPS
IMPEDANCE VARIATION WITH FREQUENCY CHANGEAT 5% TORQUE AS MEASURED AT THE ENGINE CROTCH
Figure 14. Impedance Change with Frequency.
27

The effect of mass imbalance was then measured. Weights wereadded to the input pinion adapter curvic coupling and enginecoupling bolts. Each location was evaluated separately withincreasing weight added in the same azimuthal location onsuccessive runs.
With the balanced shaft, the lateral responses at the engineand at the transmission were + lg and + .5g. Vertical responseat both locations was + .25g. The effects at the engine andat the transmission of unbalancing the shaft at the trans-mission are shown in Figures 15 and 16. Similar data onunbalance at the engine end of the shaft and at the curviccoupling are shown in Figures 17, 18, 19 and 20. Unbalanceat the curvic coupling produced higher "g" levels than un-balance at the other locations.
There are five sets of bolts which are part of the rotatingshaft assembly: engine coupling adapter to Thomas coupling,Thomas coupling to splined adapter, curvic coupling, curviccoupling adapter to Thomas coupling, and Thomas coupling toinput pinion adapter (Figure 1). The investitation of theeffect of improper torque applied to some of these bolts con-stituted the succeeding portion of the test program. Havingeither one or two of the input pinion adapter bolts under-torqued by 50% had no effect on shaft vibration level asmreasured at the engine crotch and aft torque tube.
A similar test with undertorqued bolts at the engine adapteralso had no effect on shaft vibration.
Unlike the previous couplings, the curvic coupling proved tobe very sensitive to changes in bolt torque and torquingsequence. Numerous combinations of torque were evaluated inan attempt to correlate bolt torque with crotch acceleration.Figures 21 and 22 show the results. This one variable canbe responsible for the total allowable "g" level.
It was presumed that the torque variations were causing thecurvic coupling to cock. If this were true, the TIR asmeasured at the ourvic coupling should be related to thevibration level. Since the TIR at each condition had beenrecorded, the data %as reviewed from this aspect.
A plot of the TIR of the curvic coupling compared with crotchacceleration measured at operating speed is shown in Figure23. It can be seen that there is a linear relationship, allow-ing for some degree of scatter, between the vibration andTIR. A TIR of .005 or .006 in. would be sufficient to causethe GE limit to be exceeded. The tolerance at the time ofthe balancing operation is .004 in.
28

I G.E. LIT
012 0
-BALANCE TOLERANCE
z °I
o . 00 I0
I ,4
0 0.1 0.2 0.3 0.4 0.5
UNBALNCE - IN-OZ
ADDED TO INPUT PINION ADAPTER
ENGINE CROTCH LATERAL ACCELERATION WITHINCREASED UNBALANCE AT INPUT PINION ADAPTER
325 CPS
Figure 15. Engine Lateral Acceleration.
29

16 .....
I .-.
BALANCE TO ERANCE
12
It ..... 0
00
I 00
0 0
I O A 0
00 0.1 0.2 0.3 0.4 0.5
UNBALANCE - IN-OZADDED TO INPUT PINION ADAPTER
AFT TORQUE TUBE LATERAL ACCELERATION
WITH INCREASED UNBALANCE AT INPUT PINION ADAPTER325 CPS
Figure 16. Torque Tube Lateral Acceleration.
30

16 TI_
12 BALANCE TOLEMANCE'
0) 0 ;...
4 I
0
0 0.10.2. o 0
I II . ... . . . 1 _ _ _ _ _ _ _
0 .. 0. . 0.4 0.
UI4BALANCE-IN-OZADDED TO ENGINE COUPLING ADAPTER
Figure 17. Engine Crotch Lateral at 325 Hz.
31

12
8
4-)C. 4 . ...-
0 00 0.0
00
0 0.1 0.2 0.3 0.4 0.5
UNBALANCE IN-OZADDED TO ENGINE COUPLING ADAPTER
"Figure 18. Aft Torque Tube Lateral - 325 Hz,
32

24
"I-1":...I....-.... ..... "-
I20
G.4. LIMIT
16
I .ALA-CE TOLER.AN
0 0
8C.,
0t
8.......0- .> ... -- 2 .- <
I I '.
0 0.1 0.2 0.3 0.4 0.5
UNBALANCE-IN-OZADDED TO CURVIC COUPLING
Figure 19. Engine Crotch Lateral - 325 Hz.
33

16
0I
12
I. . ..
8
12 ... ... ... . . . . . . ... .....
* ,. ,4
•I .. . . _ *
0 0.1 0.2 0.3 0.4 0.5
UNBALANCE-IN-OZADDED TO CURVIC COUPLING
Figure 20. Aft Torque Tube Lateral - 325 Hz.
34

Two at 110-IN-LB Two at 180-IN-LB
PIE., LtIKI G.E. LIMIjT
20 20
1i0 ... I- 0C)C
$,4 101
00
00 200 400 0 200 400
Torque on One Bolt-IN-LB Torque on One Bolt-IN-LB
Two at 220-IN-LB Two at 3 3 0-IN-LB
G t. LI.T G.E.20---------- --- 20-
0 fO
0 0
0 0 00 200 400 0 200 400
Torque on One Bolt-IN-LB Torque on One Bolt-IN-LB
CURVIC COUPLING BOLT rORQUE EFFECT ON ENGINE CROTCH VIBRATION
TWO BOLTS HELD CONSTANT
Figure 21. Coupling Bolt Torque Effect,
35

One at l10-IN-LB One at 180-IN-LB
G.E. IMIT G.E I20 .. . ... 20 . ... . tL"
0
00
00 0 0 00 00
0 200 400 0 200 400Torque on Two Bolts-IN-LB Torque on Two Bolts-.IN-LB
One at 220 IN-LB One at 330 IN-LB
0. .. • 2 , G.E. LIMIT
20 20 0--- -- --
o"+- - - . 00
-A w4--• - 0
0o
-4• - 4 -•
04
0 . 0
0 200 400 0 200 400
Torque on Two Bolts-IN-LB Torque on Two Bolts-IN-LB
CURVIC COUPLING BOLT TORQUE EFFECT ON ENGINE CROTCH VIBRATION
ONE BOLT HELD CONSTANT
"Figure 22. Coupling Bolt Torque Effect,
36

30
,G.E. LIMIT 0
20 . .
z 000
100000
0
Sio
09
.005 .010 .01S
TIR- IN
.010 20I --.....-- I
P. -
• • - * -, ..- ----.. . . -- - . .- - -....... o*
*.. . . . . . . . . . . ... , I . - - - - . . . . . - i .0 100 200 0 100 200
A,- TORQUE A- TORQUE
0 Two Bolts at 110 in-lb 0 T1wo Bolts at 220 in-lbA~ Two Bolts at 180 in-lb 0 Two Bolts at 330 in-lb
CURVIC COUPLING TIR RELATED TOENGINE CROTCH VIBRATION
"! ~Figure 23. Curvic Coupling TIR vs Vibration.
.7 37
• i ii0I 0n• l I IN II I I I II

Description of the Solution
To eliminate the cocking of the curvic coupling, a washer withadjustable thickness was placed inside the curvic coupling.The outside diameter of this washer just fitted inside thethree bolts which clamp the curvic coupling halves together.This was adjusted so that the halves of the coupling bottomedon the washer when the curvic teeth were fully engaged andwas intended to keep the curvic coupling halves parallel
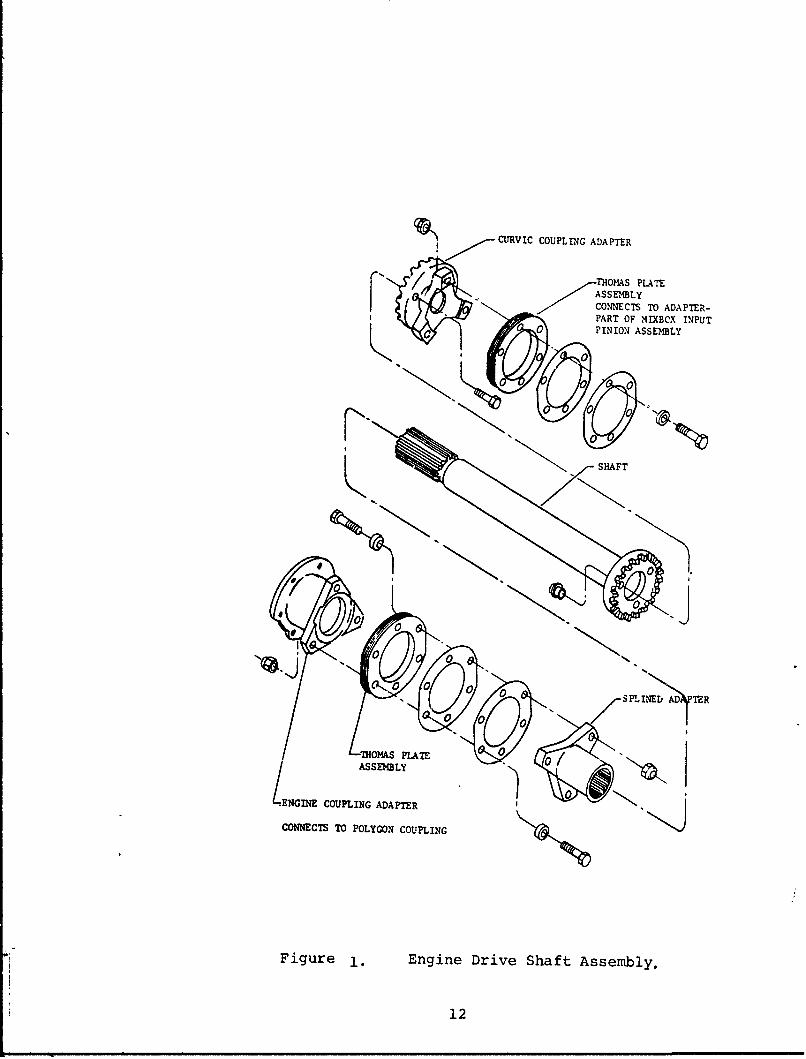
This arrangement was evaluated on the GISHOLT balance machineand found to be less sensitive to bolt torque, as shown inFigure 24. This was confirmed by tests in the test rig andby ground tests in a flight aircraft (Figure 25).
To further investigate the problem, the effect of worn bearingsin the engine mount was evaluated. There was no change invibration level due to worn bearings.
Limitations Associated with the Solution
After the washer was installed in service aircraft, fieldreports showed that 90% of the shaft order vibration problemswere eliminated. Since a supercritical shaft is relativelysensitive, small asymmetric desultory variations which ha enot been defined could still be present which unbalance theshaft.
38

ONE BOLT AT 330 IN-LB
-- WITOT ,SPACE.
0.10 . -10.. 1,----/ . ......... .
z
0 fl_• BA L A N C E 4 rO L E R A •4 C E C
0 100 200 300 400 500
TORQUE ON TWO BOLTS
TWO BOLTS AT 330 IN-LB
0.0.. ...... ....... ..... -....
0.10 - 40 .... 4
0 00 200 300 -4O0 500
TORQUE ON ONE BOLT
CURVIC COUPLINC SPACER EVALUATIONBA.LiMCE MACHINE INVESTIIGATION
WITH AND W1IHOUT SPACER
Figure 24. SpaceN P Evaluation N
39
One Bolt at 330-IN-LB
30
WITHItJT SPhL2ERII
o 20 ---*-- STATICTEST
U I RIG
1 0.
,) --. oz.
0 200 400 620
Torque on Two Bolts-IN-LB
One Bolt at 330-IN-LB
20 _All with spacer
0
".... GROUND RUN
1l0 - IN FLIGHT
S .. AIRCRAFT
0 2001 40
Torque on Two Bolts-IN-;B
Figure 25. Curvic Spacer Evaluation.
40

PROBLEM - EXCESSIVE TORQUE DURING ROTOR STARTUP
Description of the Problem
Dur.ing a twin-engine rotor start, three lag dampers weredamaged due to overstressing. This occurred in 1975 afterinstalling higher power engines.
Investigation Leading to a Solution
The allowable torque which the articulated rotor can withstandis a function of rotor speed, since centrifugal forces on theblade provide a relieving moment about the lag hinge andthereby decrease the amount of torque which must be absorbedby the lag damper acting as a stop during rapid low rotorspeed accelerations.
The engine fuel control has a control shaft (designated AM).The position of this shaft has essentially a linear relation-ship to torque from ground idle to maximum power during'steady state operation. During transient, engine-dynamiceffects, various limiting functions within the control, andthe required switchover from gas generator power control topower turbine speed governing tend to affect the apparentsystem linearity. As the requested power turbine speed isreached, engine output torque is reduced by the governingsystem, and will be increased only if the speed decreasesbecause of power demand or if the requested speed (beep) isincreased.
Each AM is positioned by a quadrant (condition lever) in thecockpit which is connected electrically to an electromechanicalactuator mechanically attached to the AM lever.
A startup transient during which the condition lever isadvanced from ground idle (GI) to FLY in about 15 seconds isdescribed on Figure 26. The AM position was stepped from 160to 340 because of a nonlinearity within the quadrant, render-ing low power modulation ineffective. The engine accelerationcharacteristic provides very little torque for about 4 secondsfollowing a condition lever advance, as shown in the samefigure. This typical lack of response off GI indicates thereis no need for modulation between GI and minimum speed gov-erning power, since during the 4-second deadzone the conditionlevers would have most likely been advanced through the 160to 340 range.
41

I40-
x~ 09
.0I
I I I ! I I I I I _0 2 4 6 8 10 12 14 16 18 20
Time - Sec.
67 0 F 15 Sec Ramp
Figure 26. Rotor Startup.
42

x~ 24
40
s-.! .> . -' _ ........................
0 2 4 6 8 10 12 14 16 18 20
T ime -Sec.
670 15 Sec Ramp
Figure 26. Continued -Rotor Startup.
43

When the minimum power turbine governing speed (about 85%) isreached, the engines cut back in power. This creates anundesirable second deadband with no engine response to condi-tion lever inputs prior to the increase in speed request from72' to 1200 AM position.
An AM lever of 340 is adequate to accelerate the rotors atflat pitch to minimum governing speed on a standard day withtwo engines. Any additional AM input increases the engineoutput and decreases the time to operating speed. The projectpilot indicated that this sensitivity was unacceptable, inthat he had very little control of the torque peak, with ahigh probability of exceeding 120%. This situation is aggra-vated by the 4-second deadzone in initial engine output.
Figure 27 shows a rapid rotor startup transient during whichthree lag dampers were damaged.
The very fast condition lever increase (up to the FLY detentin less than 5 seconds) coupled with the low ambient temp-erature (30*F) and the low initial rotor speed (10%) contrib-uted to the failure.
Solution to the Problem
It was decided to provide a detent, or gate, between the GIand FLY positions to enable the pilot to accurately dwell ata safe engine power setting, and thereby reduce the possi-bility of an overtorque. From the data presentation (Figure28), a detent set at 40* AM position will maintain torquebelow the continuous twin-engine transmission torque limitof 100% down to 00F ambient.
In addition, it was required that the rotors be at a speed of80 rpm (30%) prior to advancing the condition levers fromthe GI detent. This ensures that the blades develop suffi-cient CF to eliminate the possibility of overstressing thelag dampers when rotor shaft torque is applied.
Limitations Associated with the Solution
Originally both a modification to the fuel control and a newactuator system were planned.
The second deadband which occurs when the minimum governingspeed is reached could be significantly reduced by revisingthe fuel control Ng request cam to increase the quadrant
44

'40
S4'
,
t I I J I i , I J0 2 4 6 8 10 12 14
Time- Sec
30OF
Figure 27. Rotor StartUp,300 F.
45

2O _
0 2 4 6 8 10 12 14
Time - Sec
30°F
Figure 27. continued - Rotor Startul 30°F.
46

140
dP QUADRANT1120 DETENT / +670F
o , /0 /
w i 0 0 T R Uz ESTIMATED /
S OOF TORQUE
• /~80 /
1-4~
- +370F /
40 1 1 I I
20 30 40 50 60 70
AM FINAL VALUE - deg
PEAK ENGINE TORQUE RESULTING FROM
RAPID ADVANCE FROM GROUND IDLE
Figure 28. Peak Engine Torque.
47

travel and controllability of start. This would decrease thegain of the cam from ground idle (160) to 600, then increasethe gain to FLY.
A revision to the aircraft quadrant schedule could provideresults similar to those noted above. Bending the straightline schedule of AM position with condition lever travel toallow greater AM movement prior to attaining governed speedwill decrease the second deadband.
These modifications were not incorporated because of costconsiderations.
48

CH-47
PROBLEM - TORQUE OSCILLATION
Description of the Problem
Starting in 1969, when CH-47 C-model helicopters (with T55-L-7C engines) were converted to the full "C" model by incorpora-ting T55-L-II engines, variations in engine and rotor shafttorque were observed. These torque oscillations, at a fre-quency of 4.1 cycles per second (dual engine) and 4.7 cps(single engine), were audible and disconcerting to the pilotand crew. The significant differences between the -7C and-11 engines were a 50% increase in inertia and a new fuelcontrol configuration. Figure 29 shows a schematic of thedrive/fuel control/engine arrangement.
Investigation Leading to a Solution
This problem was first discovered due to the magnitude ofthe noise associated with the oscillations. The forwardtransmission sounded like it was loading and unloading.Oscillations were evidept on the ground and in hover, androtor speed fluctuations -.f + 2 rpm were noted during theoscillations. Recorded data indicated large rotor shafttorque oscillations (forward and aft hubs in phase) at thesame frequency as engine fuel flow fluctuations.
The next several flights and ground runs were an investigationto determine the cause of the torque oscillation. Engineinlet screens were removed with no effect on torque oscilla-tion. Circuit breakers were pulled deactivating the N2 speedsetting actuator, but the oscillations continued. Oscilla-tion frequency was 4.05 cps dual engine and 4.7 cps singleengine.
The fuel control on No. 1 engine was changed between groundruns. Both of these were unmodified production fuel controls.Testing revealed that there was no audible torque oscillationwhen operating on No. 1 engine. The oscillation was presentwith both engines operating or during No. 2 engine operationonly. Replacement of the No. 2 fuel control, however, did noteliminate the oscillation when operating on No. 2 engine.These fuel controls were removed from the aircraft, function-ally checked by the engine manufacturer, and found to bewithin specification limits. The only difference between the"C"-model prototypes experiencing oscillation and the "C"model which exhibited no perceptible oscillation was theincorporation of the -11 engines, with significantly higherinertia and a more responsive fuel control than the -7C engine.
49

Approximately 1 month after the torque oscillation was dis-covered, a CH-47C was ferried to Eglin Air Force Base foiclimatic hangar testing. No torque oscillation occurred untilthe third test in the hangar (at 70'F) when operating on theNo. 1 engine alone. During the dual-engine operation thatfollowed the oscillation also occurred.
Elimination of the N2 (powei turbine speed) governing wasevaluated. Rotor speed was set at 240 rpm, and rotor thrustwas increased causing a drop in rotor rpm at this toppinglevel, which in effect removed the N2 governor from the powercontrol system. Under these conditions, power oscillationscould nct be induced; hence, the problem was not in the N1(gas producer speed) governing.
An attempt was made to change the engine response character-istics and hence eliminate torque oscillation by installing anaccumulator in the fuel pressure manifold. However, torqueoscillaticns were undiminished dur'ig testing with theaccumulatoi.
Torque oscillations were also present when the hangar tempera-ture was reduced to -25'F. Oscillations were present oneither single- or dual-engine operation. A reduced gain fuelcontrol was shipped from Lycoming and installed on No. 1engine. At -25*F, torque oscillation could not be inducedduring No. 1 engine operation; however, No. 2 engine and dual-engine operation were still unstable. A reduced gain fuelcontrol was sent to Eglin by Lycoming for the No. 2 engine.It was installed and tested at -45*F. No. 2 engine experi-enced no torque oscillations; however, oscillations were nowobserved during No. 1 engine operation.
During the first and second tests at -65 0 F, no evidence of anytorque oscillation was observed. However, as hangar tempera-ture rose to -35*F, a torque oscillation was again in evidenceon No. 1 engine. An investigation into lag damper operationin cold temperatures, begun after climatic hangar tests, ledto the conclusion that the damper effectiveness was signifi-cantly reduced below 00 F. This was the apparent cause oftorque oscillations in the climatic hangar even with thereduced gain fuel controls.
Further testing at Boeing Vertol was done with a CH-47C withproduction fuel controls with a nominal steady-state droop ofapproximately 7.0% and time constants of roughly .03 second.
50
Data was taken during a ground run with these fuel controlsand standard lag dampers. The following were the results.
a. Audible torque oscillation observed during No. 1 enginetesting above 80% torque, No. 2 engine at all percentstorque. Oscillation also observed in dual-engineoperation.
b. Oscillation of up to + 2 rpm in rotor speed noted oncockpit tachometer during occurrence of oscillation.
c. Oscillation frequency during single-engine operationwas 4.7 cps; during dual-engine operation, frequencywas 4.1 cps.
d. Recorded data revealed oscillations as high as+ 135,600 in-lb on the forward rotor shaft, + 116,700in-lb on the aft rotor shaft, + 12.6% torque on theNo. 1 engine, and + 13.4% torque on the No. 2 engine.
e. There was no substantial rpm effect in single-engineoperation from 235 to 250 rpm.
f. Alternating shaft torques were slightly higher at245 rpm during dual-engine operations; 245 rpm (4.08cps) is near the dual-engine resonance of approximately4.1 cps.
g. Removal of N2 system circuit breakers did not stoposcillation, eliminating N2 actuator hunting as acause.
h. Oscillation was only slightly less severe with cyclictrim fully extended.
i. Upon switching from N2 to N1 governing, oscillationceased, indicating problem is not in N1 gov(rning.
j. Since self-sustained oscillation frequency was 4.7 cpssingle engine, one per rev forcing vibration waseliminated as a cause of oscillation.
A typical torque oscillation of the forward rotor was+ 116,000 in-lb while the engine torque was + 7.6% of maximumtorque (1300 ft-lb = max torque), and fuel fl-ow fluctuationswere + .455 gallon per minute (or 8.95% of maximum fuel flow).Fuel flow was approximately 1800 out of phase with both rotorand engine torque, while engine and rotor torque fluctuationswere in phase.
51
Fluctuations in compressor discharge pressure (P3) were 90'out of phase with fuel flow, while fuel pressure was in phasewith fuel flow.
The forward rotor lag damper load reached its peaks at maximumrotor shaft deflection, indicating that the damper was actingas a spring rather than a viscous damper. The maximum peakload at the torque oscillation frequency was + 2800 lb andsome blade motion was evident at 1.6 Hz (the blade lag naturalfrequency). The torques of both rotor shafts' and both turbineswere in phase, with fuel flow out of phase. It is importantto note that fuel flow (as well as other fuel control para-meters) followed along closely with the torque oscillations.For example, No. 2 engine fuel flow fluctuations of + .39gal/min were experienced. Since maximum fuel flow is about5.1 gal/min, this represents a variation in fuel flow of + 7.7%.No. 2 engine torque fluctuations are + 6.9%. No. 1 enginefuel flow fluctuations of + .33 gal/min (6.5%) are experienced,compared with engine torque oscillations of 8.3%. Thus, itappears that the No. 2 fuel control was slightly more respon-sive than the No. I control, since it produced a larger changein fuel flow for the same change in rotor speed (or torque).We kniow this was true since the No. 2 engine was susceptibleto torque oscillation at all torque levels and the No. 1 engineonly at the higher torques.
Operating one engine at a time showed that during No. 1 engineoperation, fluctuations of + 77,500 in-lb in forward rotorshaft torque and + 4.6% in engine torque were experienced,with accompanying fuel flow variations of + .27 gal/min (5.3%).No. 2 operation shows forward shaft oscillations of + 106,500in-lb torque, enginc torque variations of + 4.5%, and fuelflow fluctuations of + .49 gal/min (9.4%). Clearly, originalproduction fuel controls provide no attenuation of any torquefluctuation at these frequencies.
During the development of the fuel control for the T55-L-llengine, the engine manufacturer performed simulations of thecombined CH-47C/T55-L-Il dynamic system to insure controlstability.
An economical approach was taken in which the dual-rotor,dual-engine system was simplified to a single-rotor, single-engine arrangement. This was justifiable since in the modeof interest (3-4 Hz), both rotors and both engines are inphase. The turbine-to-hub system has been simplified to asingle inertia (equal to the sum of turbine and transmissioninertias) and a single spring (equal to the aft rotor shaftstiffness , which is the "softest" spring in the system when
52

referred to turbine speed). The rotor system itself is simu-lated by a single blade inertia (equivalent to three timesthe inertia of on? blade), the rotor hub, the blade centrifugalspring at a given rotor speed, and a nonlinear viscous damperin parallel with the centrifugal spring.
These studies showed a stable system with a .03 time constantand 7.5% droop. Shortly after the oscillation was observedon the aircraft, efforts were made to duplicate the oscilla-tion on the computer simulation. A parametric study was madeduring which various system parameters, such as rotor shaftspring rate, turbine inertia, hub inertia, centrifugal spring,and engine gain, were varied in an attempt to reproduce thceoscillation. It was found that the only parameter changethat could induce a significant oscillation was an increasein the preload slope of the lag damper force-velocity curve.The damper was now represented by a spring and dampcr inseries. The hub and turbine inertia and the shaft spring ratewere adjusted to yield the 4.0 Hz frequency. This simulationnow duplicated the aircraft oscillation.
A ground run was made to investigate the effect of a "softer"lag damper on torque oscillation. Torque instability wasreproduced on the computer analysis only by "stiffening" thedamper by reducing the preload breakout 17elocity. Hence, itseemed feasible that a "softer" damper, i.e., one with a higherbreakout velocity or a shallower preload slope, might be aneffective torque oscillation fix. The standard productiondampers reach breakout force at approximately .50 inch persecond; the dampers tested in ground ran 12 attained breakoutforce at 1.25 ips (see Figure 30). This was accomplished bymeans of a small orifice directly across the piston to increaseleakage. The pertinent findings from ground running are asfollows:
a. No torque oscillation was evident audibly or onrecorded data.
b. From recorded data, large blade motion at 1.6 cps(blade lag natural frequency) was evident throughoutthe run.
c. Flights (at 41,500 lb GW) and ground runs (at 52,000lb) with these modified dampers showed ground insta-bility neutral padding throughout the range of collec-tive pitch settings, rotor rpm, and engine torqueconditions tested.
53

RRorot
•~AFT
Ro-ros
AC'T"UAL A• FUEL
RPM FLOW
DESIRED _.RPM
FULEL CONTROL
Figure 29. Drive System/Fuel Control/Engine Schematic.
DAMPER FORCE-VELOCITY CURVES
5000
4000
.0
3 .."-. DAMPmul ST'IFPeNID TO 49TOSCILLATION W1 00INALcca-. 1~ .~/u BULwj. 3 DAMkq Rpaam w~s
2000
I• ~I f L'lOuib'rtTI DAMPU tjI 4.OQIpaPwbt-o mll 4 tow.&:
It I
0 1.0 2.0 3.0 4,0 5.0Piston Velocity -In/Sec
Figure 30. Lag Damper Characteristics.
54

d. Therefore, the "soft" lag damper fix for torque oscil-lation is unacceptable due to the degradation of ground,ctability characteristics.
Since data from tests with original production fuel controlshc.d shown fuel flow fluctuations commensurate with engineshaft torque oscillation, an improvement in fuel control atten-uation was considered the most likely torque oscillation fix.Any variation in rotor speed or rotor shaft torque is sensedat the fuel control as an instantaneous change in power turbinespeed %N2). The fuel control compares the actual rpm with thedesired rpm, and varies fuel flow (and hence engine torque)to compensate for the speed error.
The actual change in fuel flow per unit change in power turbinespeed depends on the frequency of the speed variation, thefuel control steady-state "gain", and the response "breakfrequency". This is shown on the frequency response plot(Figure 31). For the original production fuel control, itcan be sepn that at the dual engine resonance (4.1 cps), thefuel flow change per unit change inN2 is stilJ quite high;hence, we may say there i-, little fuel control "attenuation"at this frequency.
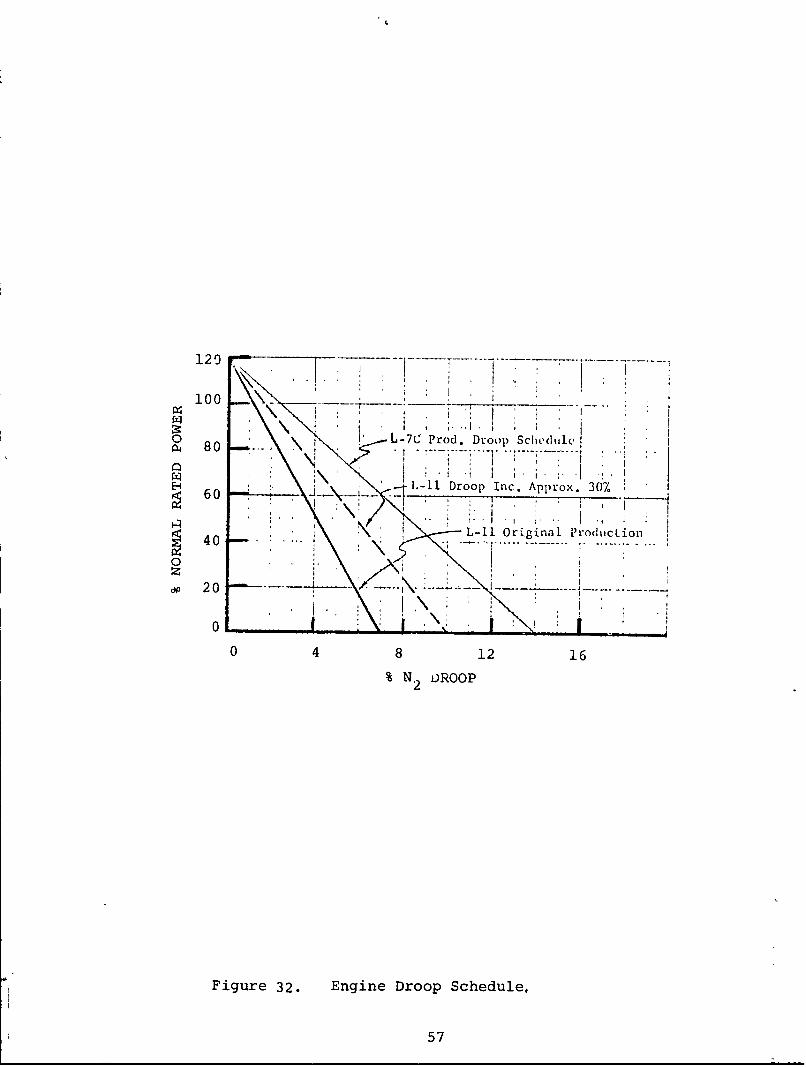
One way to improve attenuation would be to simply reduce thechange in fuel flow per unit change in N2 at all frequencies.As shown in Figure 31, this amounts to a frequency responsecurve parallel to the curve of the original fuel control.Asstming a steady-state gain of unity for the original control,a 30% reduced gain control would have a steady-state gain ofaround .77 hence, for most normal maneuvers, engine 2-esponseis slightly degraded. Changing fuel control gain has aneffect on the engine droop rates, as showi, in Figure 32.Engine droop is defined as the reduction in power turbine speedaccompanying an increase in engine power. Steady-state droopis defined as the percent reduction in N2 as power is increasedfrom zero to maximum power. Original production fuel controlsyielded a steady-state droop of approximately 7.5%. Reducingthe fuel control gain by 30% has the effect of increasingsteady-state droop to approximately 10%.
55

ORIGINAL PROD (.03 sec T/C)
"' 5 30% Reduced Gain
FINAL FIX-..
(.4 1 se TC-%. I= 13 % _-Increased Time Constw (.10 sec TIC/ . =,"• _*•-
S30% Red Gain) (1I
.2 %
1 3 4 5 6 7 80$0 20 30
Frequency- CPS
Figure 31. Fuel Control Frequency Response.
56
120 , I I
100
0 L-7C Prod. Droop ScheduleS8 : - - - .. . .. . .t . . .. .V "
E-60 Li Droop Inc. Approx. 307'
6 01
' 1 0L-ll Original ProducLion40
0 i ,\ ....d 2 0 . . J - - -
0 4 8 12 16
% N2 VROOP
Figure 32. Engine Droop Schedule.
57

An aircraft with controls set at 70% gain was ground and flighttested with these results:
a. No torque oscillations were observed audibly or oncockpit instrumentation on any of the flights andground runs.
b. Engine response was satisfactory to Army pilots.
c. Intermittent small amplitude oscillations were observedon recorded data at various conditions during theflights and ground runs. Maximum alternating torquesnoted were + 40,100 in-lb rotor shaft torque and+ 3.1% engine torque.
d. Pilot comment revealed that engine response character-istics had not noticeably deteriorated due to droopschedule change.
e. As far as engine performance and torque oscillationare concerned, the aircraft with nominal 30% reducedgain fuel controls is acceptable at the ambient temp-eratures experienced (35-401F).
Another method of improving attenuation is by lowering thefuel control response break frequency, or, equivalently, byincreasing the control time constant. With this method ofattenuation, steady-state gain is relatively unaffected, butthe frequency at which the control may follow has been reducedsignificantly, hence reducing the effective gain at 4.1 cps.The time constant is defined as the inverse of two times pitimes the response break frequency. Therefore, the originalcontrol, with a break frequency in the area of 5.3 cps, hasa time constant of .03 second. A response curve is shown(Figure 31 ) for a control with a .0-second time constant(1.6 cps break frequency). Attenuation at 4.1 cps is evensuperior to the reduced gain control. Even further attenua-tion is possible with combinations of reduced gain and increasedtime constants.
The updated simulation showed that the aircraft with fuelcontrols with 30% reduced gain and increased time constantswould be stable.
58

The effect of this increased time constant (.10 sec) wasevaluated (without any gain change) during a ground run. Thisshowed:
a. No torque oscillation was evident audibly or oncockpit instrumentation.
b. Oscillation could not be induced with collectivepitch pulses.
c. Intermittent oscillations in rotor shaft and enginetorque were seen occasionally on recorded data. Theseoscillations were of small amplitude and damped outquickly.
d. No noticeable degradation in engine response was feltby the pilot with the "slowed-down" controls.
Another ground test was run with fuel controls having 70% ofthe original production gain and a time constant increasedfrom the original .03 to .05. Results were as follows:
a. No torque oscillation was evident audibly.
b. A very low frequency + NR oscillation (lLter identi-fied as bleed band oscillation) was observed atapproximately 33% torque and 87% Nl.
c. Engine response to rapid collective pitch pull-up wasjudged normal by pilot comment.
d. Intermittent small amplitude oscillations were notedon recorded data. Maximum alternating torque notedwas + 40,000 in-lb rotor shaft torque and + 2.6%engine torque.
In order to evaluate the problem at lower temperatures sinceEglin testing had indicated a temperature sensitivity, testingwas continued at the Boeing facility at Arnprior, Canada.
59

The fuel controls had 70% gain and a time constant of .11sec. The results were:
a. No torque oscillation was evident audibly or on cock-pit instrumentation.
b. Maximum alternating torques were + 41,500 in-lb rotorshaft torque and + 3.4% engine torque.
c. Rotor speed droop during jump takeoff was 5 rpm.
d. Average temperature during flight was -4*C (251F).
Since the low temperature test conditions did not materialize,testing was resumed at Philadelphia.
An investigation into the cold temperature operation of thelag damper showed that the decrease in damper force outputwas apparently due to cavitation caused by flow of hydraulicfluid from the damping chamber into the reservoir, with noreplenishing flow of fluid from the reservoir back to thedamping cavity. Fluid flow t3 the reservoir was decreasedby plugging one Lee jet and d'ecreasing the diameter of theremaining two, and fluid flow back to the damping chamberwas improved by reducing the cracking pressure of the tworeplenishing check valves from 5 psi to 3 psi. The resultingdamper configuration provided satisfactory damping outputdown to -65OF (see Figure 33).
Description of the Solut-ion
A set of fuel controls with 70% gain and .10 sec time constantwere flown with lag dampers which incorporated these lowtemperature modifications.
a. No torque oscillation was audible to the pilot orcrew. Recorded data showed that maximum alternatingtorques were + 1.8% on No. 1 engine and + 2.0% onNo. 2 engine.
b. Vigorous collective pitch pulses yielded alternatingtorques of + 4% on both engines, which were quicklydamped.
c. A rotor speed droop of 4 rpm was experienced duringrapid collective inputs.
60

A.0
to 1
4, 04.X
A.4 >
4, >
Cdr
Cd CN
Cd-4
610

T°
Limitations Associated with the Solution
The reduced gain/increased time constant fuel control fix pro-vided satisfactory torsional stability for the CH-47C produc-tion fleet. However, several early production aircraftreported instances of a "pseudo-torque oscillation". Thisphenomenon is a torque split, followed by a low amplitudetorque oscillation of the high torque engine. The problem wastraced to high levels of vibration affecting the internal work-ings of the fuel control. Vibration at cross shaft frequencycaused an instantaneous increase in the effective gain of thecontrol, increasing its torque output with respect to theother engine and making it susceptible to torsional instability.The problem was resolved by closely monitoring cross shaftvibration, and with minor fuel control component modifications.
62

PROBLEM - CRACKING OF ENGINE INLET HOUSING
Description of the Problem
Field service reports had indicated increased engine failuressince the introduction of the T55-L-II and -IIA engines in theCH-47C helicopter. Engine inlet housing fatigue cracks hadoccurred and engine mounting system components wore and failed.
Investigation Leading to a Solution
In August through October 1970, a flight vibration and strainsurvey of the engine was conducted. A CH-47C engine wasinstrumented with accelerometers and strain gages. Rpm andspeed sweeps were made in the basic configuration and withmodifications. The engine mount (Figure 34) consists of twoforward engine mounts, both of which react vertical and longi-tqdinlal loads (one of which also reacts lateral loads), and avertical link at the aft end which reacts vertical loads only.To brace the forward outboard engine mount support, a linkconnects the forward outboard engine mount to the fuselagestructure aft of the forward mounts.
From the minimum gross weight flown to 140% of that value,helicopter order (iQ, 3Q, 6Q) data did not show any signifi-cant change in stress level or accelerometers for the sameairspeeds. (The helicopter airspeed limit was lower for thehigher gross weights.) At fixed gross weight, there wereusually higher accelerations and stresses at the higher air-speeds.
The rotor rpm sweeps showed no specific trend in accelerationsor stresses except that the No. 1 engine draq link 3/rev loadsnearly doubled in going from 230 to 250 rpm.
Because of this large change, it was felt that a change instiffness might be significant. The production drag link ismade from aluminum alloy. It was replaced with a steel link.This resulted in nearly halving the No. 1 engine drag linkload at high airspeeds (the No. 2 engine link load which waslow with the aluminum link did not change).
63

AFT VERTICAL MOUN
ENGINE (
./ \\-
CROSS SHAFT I-I \
64 0

The effect of worn engine mounts was explored. Simulated wornforward mounts were installed on engine No. 1, while a looseaft engine mount was evaluated on engine No. 2. Neither the3/rev or 6/rev levels of stress or vibration were affected.Frequency (engine order) vibrations were also explored(15,000 rpm), and the cross shaft balance was investigated, asits speed is 81% of the engine power turbine speed.
Cross shaft and power turbine 1/rev were the only predominanthigh frequency engine excitations. Neither excitation wassignificantly affected by gross weight, steel drag links, orloose engine mounts. Cross shaft spline wear could increasevibration (measured on the engine) up to 300%. Low enginetorque conditions (starts -, partial power descents, singleengine, and autorotations) also produced an increase in crossshaft 1/rev (of up to 100%). The largest measured engineresponse to cross shaft vibration was 4.Og (No. 2 diffuser,worn shaft).
Cross shaft unbalance tests show the No. 2 diffuser locationto be the most sensitive to cross shaft excitation.
Power turbine 1/rev vibration is most sensitive to rotor rpm(N2 speed). High rpm (250) produces 1Og at the aft end of theengine (fuel manifold), but the corresponding stress levels onpower turbine nozzles are less than 1500 psi.
This flight vibration/strain survey revealed that althoughmeasured stresses were not clearly sufficient to cause inlethousing cracks, the most significant portion of the stresswas at the rotor 3/rev frequency.
The investigation was pursued further by conducting a groundengine shake test in July 1971.
Lateral shaking forces were applied to an engine installed ina CH-47 helicopter. The engine responded as a rigid bodyat 14.2 Hz causing high inlet housing strains near the enginemounting pads where the service revealed cracks had occurred.Figure 35 shows frequency sweep results in accelerations at thefuel manifold and the strain at the inlet housing.
The engine yaw mode exhibits motions similar to the inflight3/rev response (Figure 36).
Vertical excitation at the nose box excites a pitch/yaw modeat 25.5 Hz in addition to the 14.22 Hz yaw mode (Figure 37 ).
65

1.0 FUEL MANIFOLD RING LATERALINE OSG
fill 200
.4 10 014 41
.2IN4JJ111
10 ~15 20 30-0 i20 0Freq.- Hz Freq - Hz
Figure 35. Baseline Engine Vibration,
Yaw Mode
Engine Support Yoke ---- Support ;h
Figure 36. Yaw Mode.
66

FUEL MANIFOLD RING LATERAL
II I4T
9 HI- Pithaw Moe
A0
Shaker Force
Figure 37. Pitch Yaw Mode,
67

Growth of the -13 engine to the -11A configuration increasesthe engine weight 40 pounds. The effect of additional weightand inertia on the yaw mode is to lower the natural frequency0.39 Hz. Moving the yaw mode closer to Yuhe 3/rev frequencyresults in a significant increase in the inlet housing strains(Figure 38).
Lowering of the drag link bolt torques from specificationvalues to below 100 in/lb causes a significant reduction inthe yaw mode frequency (Figure 39).
The combination of -11A engine weight and loosening or wearof drag link bolts could lower the engine yaw mode frequencycoincident with the rotor 3/rev frequency. Engine inlethousing cracks could result, since inlet housing stresslevels are predominantly 3/,rev.
Several engine mounting system changes were designed to reducethe 3/rev inlet housing stresses by shifting the engine yawmode frequency away from the 3/rev excitation range.
Reducing drag link stiffness can lower the yaw mode frequencywell belol, 3/rev. With no drag link the frequency drops to7.5 Hz. A large stiffness increase with a steel drag linkraises the modal frequency only slightly (Figure 40).
Several fixes to increase mounting system stiffness wereevaluated. A vertical strut to the engine mount yoke, framestiffening and expandable drag link bolts showed only smallincreases in natural frecuency and slight decreases in 3/revinlet housing stresses. Even the combined effect of all thechanges is little different from the individual changes.
Lateral stiffening of the aft link raised the natural fre-quency a substantial amount and reduced the inlet housing3/rev stresses to an acceptable level. This change was deemedimpractical since it would require redesign of the aft linklower support and the engine connection, with subsequentengine requalification.
Graphic presentation of the engine yaw mode frequencies,inlet housing strains and drag link loads shows the basiclevels, the increase in loads with loose parts, the moderatereduction i, strains with engine mount stiffening, and thedramatic reduction in levels with the removal of the draglink (Figure 41).
68

INLET INBD MT LONG
S10Inlet Housi~ng -11 @ -11A @N. 1~ ~Mount 3/rev
100 Outbd Long. 30p 7 1 in364--Outbd 450 30 I 70
41Outbd Vert. 5 j 2550s Inbd Long. 15s 40
gInbd 450 25 I 604,,Inbd Vert. 10 j 25
S010 15 20 30Freq -Hz
*T55-11A ENGINE WEIGHS 40 POUNDS MORETHAN THE T55-11.
Figure 38. T55-1.1 Compared to T55-11A.
~ngifl .:~ ~ 1n7able Boltsr
Figur 39Efc of rg ikBotToqe
69

N%
14 R cdl ~i
> Excitation0,
.A lb/i-6 Lat 0 Diffuserr o *VBert # Nose Box
Drag Link Stiffness - lb/in x 10
Figure 40. Effect of Drag Link Stiffness.
70

Dr g i 111L 1 1,I11
4- +4 t
00
I In
I H - +1 1
U))
710

During the flight vibration/stress survey there were signifi-cant differences in the vibration/stress levels between the twoengines. Figure 42 shows a comparison in the baseline con-figuration.
Since each engine has a right angle gearbox mounted on itsforward end, with the shaft running inward toward the fuselagecenterline, the torque reactions of the engines are in oppo-site directions. This places typically a 500-pound compressionload in the aft engine mount link of the No. 1 engine and a500-pound tension load in the No. 1 engine aft mount link.An engine right angle transmission was locked internally sothat a static torque in the cross shaft would be reacted bythe engine mounts.
Static torques were applied to the cross shaft to place theaft engine mount link in 500 pounds compression, 500 poundstension and to unload the link. Frequency sweeps showed nochange in engine response between the compression or tensionload; but with no load in the aft engine support link, theresonant frequency was decreased from 14.2 Hz to 13.7 Hz asmeasured by the strain gages on the inlet housing. However,the drag link load did not change in frequency or amplitude.
Th:s work led to the conclusion that the approach which wouldyield the most favorable results was to "soften" the-draglinik. The drag strut was needed to assure cross shaftalignment in severe maneuvers; therefore, it could not beeliminated. However, it was found that the alignment condi-tions could be met if the hole in one end were elongated toa slot wLich would permit a total motion of .145 inch rela-tive to the mating fitting.
Description of the Solution
A set of these slotted drag struts was evaluated in a flightprogram. The results are shown in Figures 43 and 44. TheNo. 1 engine inlet housing 3/rev stress levels, the primecomponent of the absolute stresses, show as much as a 90%reduction at the higher rotor speeds with the installation ofthe slotted drag strut. The slotted drag strut does notproduce increases in vibration from other prime rotor har-monics (1, 6, 9, 12/rev). The 7.5 Hz yaw mode does not pro-duce any significant 3/rev engine response during start pro-cedure (150 rpm). No rise in stresses occurred when theslot bottomed. (Probably no severe bottoming occurred.) Theslotted drag strut eliminates yaw mode effect on 3/rev engineresponse.
72

800 0
/fro~~OO /20
b-o,easoe eii 601ce V
.7.04
'U I.
$TlZ~Apr
lADLr h$'shy5 AWL r;~ Amoosr
V1 :4 .
23' 2440 2~0 1o .240 2s5
.230 L240 aro72oo oom~
FLIGHT DATA ENGINE NO. 1 COMPARED TO ENGINE NO. 2GROSS WEIGHT =35,500 POUNDS, SPEED = 151 KTAS
Figure 42. Baseline 3/Rev Stress vs RPM,
73

4 INBOARD LONG. GAGE OUTBOARD 450 GAGE
Q 40 IN-LBS. TORQUE ...--
E-4'-" O0 "'""TORQUE 20
100010 0C
220 230 240 250 220 20.240,20
ROTOR RPM ROTOR RPM
NO. 1 ENGINE INLET HOUSING
140 KNOTS
"Figure 43. Inlet Housing Stress.
74

.245 RPM 140 KT
STANDARD STRUT SLOTTED STRUT
NO. 1 ENGINE MODE SHAPE
Figure 44. Lateral 3/Rev Engine Vibration.
75

The No. 2 engine inlet housing stresses were generally lessthan with standard struts.
The life improvement was calculated using a conservative inlethousing stress reduction of 30%. A normalized mean -3a S/Ncurve for cast magnesium was used to construct a curve of lifefactor vs actual stress to endurance limit ratio for a 30%stress reduction. (The S/N curve included a correction forthe operating temperature of the magnesium.)
Using this curve and a 30% reduction in stress, a fivefoldincrease in life is obtained at a stress level over endurancelimit of two. This applies to the No. 1 engine. The maximumNo. 2 engine inlet housing stress level measured is at theelevated temperature mean -3a endurance level so that itshould not fail. The slotted strut has been installed inproduction.
Limitations Associated with the Solution
The absolute life will only be established by field experience,since the strain measurement with the slotted drag link waslimited to one CH-47C. Currently, no failures have occurredsince the slotted strut was incorporated.
76

HLH
PROBLEM - DEMONSTRATION OF THE HLH ENGINE CONTROL ROTOR DRIVESYSTEM DYNAMIC STABILITY
Description of the Problem
The problem was to demonstrate a stable system. To do thisrequired that the analytical model be compared to test data.Then modifications or corrections could be made to improve thevalidity of the model, and finally an analyis could be madeto recommend changes to the hardware characteristics to cor-rect any problems that were uncovered.
Investigation Leading to a Solution
A first step was taken in March 1974 when an assessment of thetorsional stability of the HLH system, including the engines,engine controls, rotors, and drive train, was completed. Theanalysis utilized a dynamic digital computer simulation pre-pared by Detroit Diesel Allison (DDA) capable of describingthe transient performance of the HLH system. The simulationincluded detailed mathematical models of three T701-AD-700engines, each with an electronic and hydromechanical fuelcontrol, in addition to one power management control and therotor rive system. DDA employed a simplified rotor dynamicmodel within the simulation to facilitate program operation.From previous effort, DDA had determined that this simplifica-tion results in a model dynamically similar in the frequencyrange of concern to the Boeing Vertol 12 mass/ll springrepresentation.
The simplified model was reviewed and found to be adequate forthe scope of this program. Because of the relative magnitudeof the shaft constants, the overall spring rate is determinedprimarily by the centrifugal spring with the others more thanan order of magnitude greater. This allows the model to berepresented by a 3 mass/4 spring system. In addition, theeffect of the lag damper was included as a series spring-mass-damper combination with the damper characteristics pre-sented as a function of the damper velocity.
Considerable effort at DDA was required to correlate theengine simulation with actual engine test data. This simula-tion validation activity was to lead to improvements to matchboth frequency response and transient characteristics. Thelimited amount of engine transient data available, as well asthe fixed nature of the engine section of the computer program,restricted correlation efforts at Boeing Vertol. A decelera-tion transient of the 501-M62B engine was compared to thesimulation; the results are shown on Figure 45. The good
77

CONDITIONLEVER ANGLE oi-..............
COMPRE SSOR�v~DISCHARGE - ----
PS IA
RPM -3o---
- -- ~ViiL-i --- FUEL____ ___ [email protected]
-77
ENGINE --- ---
SHP _
TIME-SECDECELERATION
Figure 45. Engine to Simulation Comparison.
78

correspondence between the two decelerations is evident,especially with respect to the rate of change of each signi-ficant engine parameter. However, the tendency of the simula-tion to continue to zero power while the actual engine hangsup after 0.5 sec required investigation.
Stability was evaluated through observation of transientsresulting from small inputs in rotor load, collective pitch,and rotor speed selected. Various flight conditions andoperational modes were also reviewed.
The operation of the propulsion/rotor system was analyzedconsidering small, rapid changes in power required by therotor at both high and low power levels. Figure 46 describesthe time transient resulting from this disturbance and showsthe well-damped, stable charactcristic of the speed governingsystem with no collective anticipation. A sudden 10% rotorpower change causes a peak power turbine speed deviation ofless than 0.25%. The system has essentially returned to theselected speed within 5.0 sec with no tendency to overshootor oscillate.
Although Figure 46 describes response for sea level, standardday conditions, analysis has shown that these basic stablecharacteristics are experienced throughout the flight enveiope,from -65OF to + 125 0 F and up to 10,000 feet. In addition,stable performance with one engine inoperative was demon-strated, with the power turbine speed variation being abouttwice that with all engines operating'
The degree of stability was determined by evaluating tran-sients with higher proportional power turbine speed governorgains. This analysis showed that the control gain could beincreased by a factor of 8.0 with no significant increase inthe tendency of the system to sustain oscillations. A satis-factory gain margin of at least 18 dB was exhibited. Since itwas not considered necessary at the time to decrease the tran-sient rotor droop, no change was recommended.
The stability of the system following collective pitch inputswas evaluated, and typical results are given on Figure 479The initial power turbine speed increase immediately after acollective pull was the result of the anticipation or compen-sation directly affecting fuel flow and engine powez. Thisspeed change was seen only at the power turbine; no impulsewas noted at the rotor because of shaft flexibility. Theeffectiveness of this anticipation toward improving transient
79

E- W le00HIGH POWER-*0 U)
t 37S, --
- LOW POWER
O P4E 34oo -
* 185co
TIME SEC
3 ENGINES SLS 590F
Figure 46. Response to 10% Rotor Load Change.
80
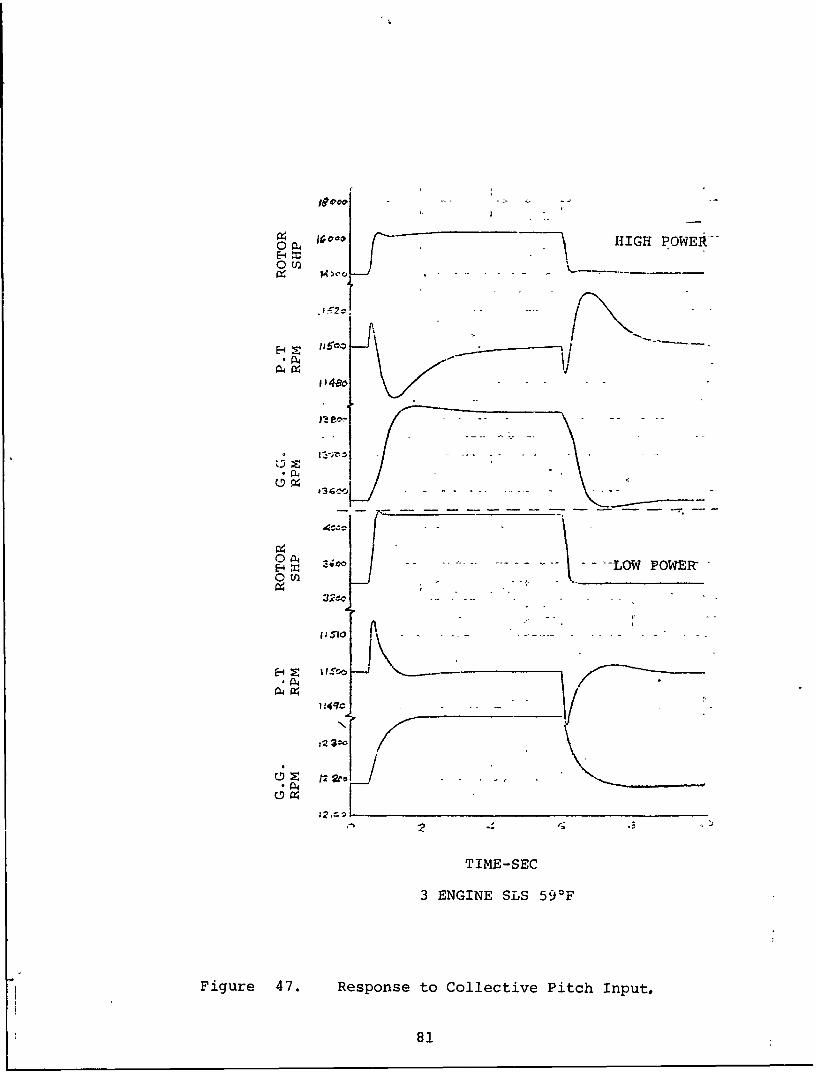
0 a4 HIGH POWEIU_~~• %Ow
P4
P .oo .. . . --LOW POWE•R
~P42; - . --- -
/22
TIME-SEC
3 ENGINE SLS 59OF
Figure 47. Response to Collective Pitch Input,
81

response was demonstrated ny comparison of the estimated speeddroop with and without anticipation (Figures 47 and 46respectively); a load change of 16% yields the same transientaroop as a 10% lzoad change with no anticipation. Good sta-bility characteristics were exhibited with relatively smallpower turbine speed deviations and rapid recovery to theselected speed.
Evaluation of the system operating with Dne and two erginesalso showed acceptable rotor speed variations.
Response t, a power turbinc speed select or master beep inputis depicted on Figure 48, which illustrates the reaction todepressing the increase and decrease speed beeper switchesfor 1.0 sec. Excellent transient behavior to the 2% speedrequest change is exhibited. Power turbine speed closelyfollows the input range with a minimal overshoot of less than0.1% at both high and low power.
The temperature limiting function of the engine electroniccontrol was investigated to determir, a system characteristicswhile operating on the power turbine inlet temperature (MGT)limiter. Figure 49 gives an axample of a collective pitchpowe: transient with two engines which would exceed the limitof 21'tu0R (893WC). The transient results ir, a momentary over-shoot of 19'R above the set point but essentially settles outto tl-e limited value within 1.0 sec. The system was consideredto be satisfactory, demonstrating stable and well-dampedoperation.
The transicnt operation of the power management system isdescribed on Figure 50 by a comparison of response to anengine disturbance with power management selected "ON" and"OFF". A condition lever cutback was input to one engine,reducing the power requested from that engine by about 35%.With the power management inoperative, a laige engine outputpower split of greater than 50% and a power turbine speeddecrease of about 50 rpm resulted from the lever input whileoperating on the individual proportional governors only. Withthe power management activated, the load sharing and iso-chronous governing functions were demonstrated. A rapidreaction to the large input disturbance is exhibited; theengine torlues are matched to within 5% in 1.0 sec. Addi-tionally, the isochronous governor maintained power turbinespeed within 8 rpm and gradually returned it to the selectedvalue after about two oscillations.
82

0 w FIGH POWER
E-1 POWE
0 w2
1383

H
E-4
U
"E-4 C4o
Z E-4
OH
S2oo
* '
:E o 148c
P-4Z
I I-qf,, o
Jsqoo
04 V- 9- .t
TIME SEC
2 ENGINE SLS 590 F
Figure 49. Temperature Limiting,-
84

z L0 0
HE-4 -Z z
S0 H44)
I Ii
000
4-3
Z I z
I .5o
o.)
•' I 0, I• U
S• o
V I °f-I
0 Ho
0 0 . O• iS r 0
P4
H 4
0- z- j: z 0 4)a
wg w, A4E E
85

These transients demonstrated that the system was very respon-sive and well damped in both modes of operation.
The effect of the lag damper on system torsional stability wasstudied primarily to evaluate the validity of the dampersimulation. The curves on Figure 51 illustrate the systemdynamic response to a collective pitch input with and withouta lag damper. The response of the system with no damping wasunstable and demonstrates a continuous limit cycle oscilla-tion. Because the validity of tiie simple lag damper repre-sentation was uncertain and the damper was shown to be acritical element of system stability, it was concluded that amore detailed model of the lag damper was required.
By April 1974, the need for a reevaluation of the transientdeck became apparent from several observations made duringthe computer analysis. The results of a stability and tran-sient study showed the response to be unusually good with avery large prototype system gain margin of +18 dB. Thisled to additional investigations using a simplified linre.rmodel which exhibited a much greater tendency to oscillate.Further comparison between the linear and nonlinear simulationuncovered a programming error in the rotor routine signifi-cantly af.ecting stability. By including this revision inthe nonlinear digital simulation program, very good dynamiccorrelation between both models was achieved.
Using the revised simulation and modifying it for DSTR opera-tion, the requirement to improve system stability was demon-strated as illustrated in Figure 52. A power turbine speedrequest step change was input into the system at a total rotorpower of about 7000 hp and standard day conditions. Con-sidering the current system characteristics, Figure 52ashows a sustained oscillation at about 3.0 Hz. The additionof a lag in the speed governing loop was studied as a possiblesolution to the problems, and its effect is described on Figur:e
52. Increasing the lag to 0.5 sec provides a system which isadequately damped at this power condition. Although someresonance at the rotor-drive natural frequency remains and alow frequency (0.6 Hz) damped oscillation, caused by theincreased phase shift at low frequency, is introduced, theoverall characteristic is satisfactory.
Additional analyses were made to evaluate stability while con-sidering the range of DSTR operation and variations in lagdamper characteristics to account for temperature and manu-facturing tolerance effects. The influence of power level on
86

W tooU
H
rz ,04
0 0
o ~ ~I ,' j** O
Loo
dp
• \.~ - STANDARD LAG DAMPER
--- NO LAG DAMPER
0 00Z, ,.
44P 40
a 3. Z . 4.
TIME- SEC
EFFECT OF LAG DAMPER
Figure 51. System Response to Collective.
87

LAG -
- I-- Aiflf\If\SEC4460 7 a) .0
1404-
14 ItreQ
-T r
+1 OE UBN LPE RQETVSE
FigureiI~ 52 feto CnrlLg
r~x~ -4

system stability with a .5-sec power turbine governor lagis shown on Figure 53 with a three-engine low power case oncurve (e); a three-engine cold day, high power case oncurve (b) ; and a two-engine high power case on curve(c). At low power, Figure53 (a) exhibits a low frequencywell-damped oscillation wbich rapidly decays after two cycles.The increased system gain at high power with three enginesoperating, Figure 53 (b), picks up the power train resonantfrequency which settles out in about 2.0 sec but has a fairlyoscillatory characteristic. With two engines operating athigh power, the reduced loop gain caused by using two engineshas improved stability and results in a very satisfactorysystem as illistrated on Figure 53(c).
The effect of the lag damper characteristic has been shownto be important through analysis using a linearized programwith two engines operating at maxinuwn power. A decrease inthe damping rate degrades the stability to the point where,if the dampers are one-half as stiff as normal, limit cyclingcould occur with three engines at high power. However, thisreduced damping level was considered unlikely within DSTRoperation.
By July 1974, a simplified engine/control and rotor/drive trainsimulation with a detailed nonlinear representation of the lagdamper had been developed for dynamic analysis of the HLH drivesystem. This digital computer program was generated (1) toevaluate the iag damper effect on torsional stabiliLy, (2) tooptimize the engine-control stabilizing compensation for goodresponse characteristics, and (3) to provide verification ofthe large-scale model being completed at Detroit DieselAllison.
Revisions to the dynamic simulation had a major impact onestimated overall system stability. Incorporation of adetailed lag damper math model and continued correlationeffort leading to several changes to the original program weremainly responsible for the variation in results from thosepreviously presented.
For this analysis, use wa3 made of a computer simulationdeveloped to include linear modeling of the engines, enginecontrols, and rotor system in conjunction with an existingnonlinear program for the lag dampers. A block diagram of thesimulation is given on Figure 54. Figures 55 and 56 definethe lag damper representation.
The open loop operation of the dampers and rotor is demon-strated on Figures 57 and 58 which show the response of thesystem to step inputs in driving torque of 100 and 300 ft-lbs
89

(a) 1000 HP/ENG 3 ENG+ 59OF
(b) 4000 HP/ENG 3 ENG+ 20OF
(c) 6100 HP/ENG 2 ENG+20OF
E-4
TIME - SEC
POWER TURBINE SPEED REQUEST STEP INCREASE
Figure 53. Power Variation Effect.
90

z
zaz
z 00
ul us.0
oQ
04
0m
00
zzt
19
00
0u 0 Z
IL I
& z
Wcz0140
0 10- 2 wL
IL0 z + zlz0

X0 2 x 1 1
, X, F
MAINLOADVALVE
AL2 AU-O -AO
QR2 (L2 QL1 ORI
AR2 ARI CHECK VALVES
P0
OILRESERVOIR
AIR
Figure 55. Lag Damper System,
92

LAG DAMPER EQUATIONS
Force
F = (P 1-P2)Ap (Damper Force)
Flow
Qp = f (P 1 -P 2 ) (Main Load Valve)
QLl = K ALl (P 1-Po)l/ 2 (Bleed Orifice)
QL2 = K AL 2 (Po-P 2 )I/ 2 (Bleed Orifice)
QRI = K ARl (Po-Pl-Pc) 1 / 2 [if (P o-P)>Pc (Check Valve)[if (P o-Pl1)<_P c]
QR2 K AR 2 (Po-P 2 -P") 1 /2[if (Po-P 2 )>Pc] (Check Vaive)[if (Po -P2)<Pc
Continuity
P1 = B(ApX-Qp-QLl-QRI)/[Ap(X01-X) + V1 ] (Damping Chamber)
P2 = B p(-ApX + Qp+QL2 +QR2)/[Ap (X o2+X)+V 2 ] %Damping Chamber)
LAG DAMPER CONSTANTS
2 (Damper Piston Area)A = in. (aprPso raP
ALl = AL 2 in. 2 (Bleed Area)
ARl A R2 in.2 (Check Valve Open Area)
X01 = 02 in. 2 (Chamber Length)3
V1 = V2 in. (Effective Volume)
P = psig (Reservoir Pressure)0
Pc = psid (Check Valve Crack Pressure)
B = psi (Bulle Modulus)
K = in. 2 /sec/b (Flow Coefficient, + 80°F)K (Flow Coefficient, - 65°F)
Figure 56. Lag Damper Equations and Constants.
93

z
9000 HP 31 ENGINE, 1150 RP
14g --:- 5 ..' La Dape Rep eiQ FtL ToqeIpt
941

H
E-40
E-4
aa
TIME-SEC
9000 HP, 3 ENGINES, 11,500 PT RPM
Figure 58. Lag Damper Response - 300 Ft-Lb Torque Input.
95

respectively. For the nominal or current design, this inputresults in a relatively undamped power turbine-rotor systemwith a considerable tendency to oscillate and a very longdamper recovery .time. A significant residual damper forceremains after 5.0 sec. By revising the main load valvecharacteristics to allow flow at low differential pressures,as described on Figure 59, a more damped transient returningquickly to null is exhibited.
The lag damper, while providing very little damping during lowmagnitude transients, effectively acts as a spring with a ratedetermined primarily by the fluid compressibility. Thischaracteristic is caused by the load value overlap whichresults in a deadzone or zero flow until a damper pressuredifference of 300 psi is exceeded. The fluid is therebytrapped in the damping chambers.
The effect of the damper on overall power turbine speed loopstability at high power is demonstrated on Figure 60 for astandard day and Figure 61for a cold day. Small 1.0% stepchanges in rotor load torque were applied to the system. Forthe nominal damper, a continuous oscillation or limit cycleat a frequency of 5-6 Hz is observed at both conditions. Themodel exhibits a greater tendency toward instability at lowtemperatures with a significantly greater limit cycle magni-tude. It has been assumed for this analysis that damper flowvaries inversely with viscosity; therefore, the effect of oiltemperature may be included as a viscosity variation. Thisassumption is valid since the Reynold's numbers within thedamper a~e relatively low and the flow is laminar.
An increase in the damping flow at low force levels improvesthe stability and completely damps the limit cycling on bothstandard and cold days. Since the oscillation is basicallycaused by the spring rate and low damping effectiveness of thelag dampers, it is apparent that the dampers should be altered.The proposed modification consisted of a constant equivalentmain load valve area of .00167 in 2 between 300 and 600 psi and areduction in area below 300 psi as given on Figure 59.
As a result of these analyses, the engine controls were modi-fied to include a nominal lag of .5 sec to provide acceptabletransient behavior. The blade lag dampers were modified toprovide additional leakage across the piston at low force levelsto provide damping to eliminate oscillations.
96
96

(a) NORMAL
(b) .000613 IN 2
VALVE AREA AT300 PSI
(c) .001871 IN 2
VALVE AREA AT300 PSI
4
z I/
2 /0/O /
0x // I•. . . .
::~ 00 200 400 600
PRESSURE DROP-PSI
Figure 59.Lag Damper Valve Characteristics,
97

TORQUE %
LAG
S--- INCREASED DAMPINGS~.00167 INz AT 300
POWER
RPM •
TIME - SEC
18,000 HP, 3 ENGINE, 11,500 RPM Np, STD DAY
Figure 60. Standard Day Lag Damper Effect - Response
to Load Change.
98

ROTORLOADTORQUE
LAGDAMPERFORCE
. INCREASED2 DAMPING.00167 INz AT 300 PSI
POWERTURBINERPM
TIME - SEC
18,000 NP, 3 ENGINE, 11,500 RPM COLD DAY
Figure 61. Cold Day Lag Damper Effect-Response to
Load Effect,
99

In May ]974, the DSTR was operated with the rotor and threeengines iunning for the first time. In December 1974, theinitial governing and load stand tests were completed.
DSTR operations demonstrated that the power turbine speed con-trol system had a tendency toward low amplitude oscillationswhich were somewhat more pronounced when operating in the iso-chronous governing mode. The magnitude of these fluctuationswas very low, not exceeding + 100 ft-lb (2.7% of intermediaterated torque) at a frequency between 0.3 and 0.6 Hz. Althoughthese oscillations were not considered serious, they did pre-sent an annoyance in accurately setting steady state points.A program was undertaken to improve the system in this area.
The most convenient method of effecting a change to closedloop stability was located in the isochronous governing sectionof the power management control. Since testing had shown thatstability on proportional governing only was good and, inaddition, that stability during engine Oevelopment testing wasimproved by lowering the isochronous gain, revision to thisfunction was analyzed.
The configuration considered during this analysis was threeengines at 2400 hp each with nominal lag compensation andoriginal parameter values.
Results of the analysis to determine a value for the integralgain, which will provide better stability while maintaininggood response characteristics, are given on Figure 62. Theunderdamped nature of the original system and the possibleimprovememt are demonstrated. Selection of isochronous gov-erning "off" significantly increases the effective dampingratio and causes rapid settle-out at a frequency of about 0.6Hz closely agreeing with test data. Reduction in isochronousgain by a factor of three yields a system which exhibits tran-sient response with a considerably higher damping character-istic. This is the value of gain change incorporated in theDSTR system for June 1975 testing.
This revision was partially effective in steadying the rotorspeed during endurance running. However, the results shownon Figure 63 indicate the need for reviewing and optimizingthe isochronous gain selected for the prototype to reduce therelatively large excursions caused by the dynamic mismatchbetween the proportional and isochronous governors. Althoughthe steady-state stability was improved by the decrease inisochronous gain, response during large master beeper increase/decrease transients deteriorated.
100

10101Z 3 ENGIRES ON LINE, 7200 SHP ATORQUE, T i
-1 00 1I~
20.. T%_
POWER ~~~NOIN._ALP RATIO .05IOCHRONOIJS GAIVERNI/3
SPED.SIPHASE MARGIN - 2
CRSSVE FREQ 3. 1 AGSE
ANP
-RPM ML 4E
ioJR . bl.DMPN RATIO - .128IL PARSE MARGIN1li C CRSSOVER PAMO- 3. 7 AD/SVC0RNj (.i9 NO)
10I V

r4
a)
0
0
u0(o
H
o ~r-
,1)
'-4
1021
UU
a (U
,,,= t i ,,
I -,-
(U1
S102

The effect of the gain mismatch becomes apparent when thesystem with no isochronous governor (Figure 64) is comparedto the reduced gain system (Figure 63). With isochronousgoverning disabled, a significantly faster and more stabletransient is exhibited. The need for optimizing the iso-chronous-proportional gain ratio considering both stabilityand transient effects is clearly shown.
Special engine transient testing was performed to determinesystem dynamic characteristics regarding torsional stability,to develop stabilizing compensation requirements, and to demon-strate the effectiveness of compensation. During the testing,dynamic data was obtained to permit a comparative evaluation ofclosed-loop system stability with various types of engineelectronic control compensation circuitry. Substantiation ofsimulation analysis, through correlation of natural frequenciesand relative stability levels using the test data, was com-pleted. Subsequent analytical extrapolation to the prototypesystem was then undertaken.
The DSTR engine control system included a relatively longlag or time constant in the power turbine speed proportionalgoverning loop to provide stable operation as previously dis-cussed. The lag value of T3 = 0.5 sec (see Figure 62) ade-quately reduces the gain in the area of rotor/drive trainresonance (3-4 Hz) so that oscillations in this frequency rangeare eliminated. However, because of the additional phase shiftassociated with this lag au lower frequencies, there is atendency toward slow response and fluctuations at about 0.3 Hzas shown on Figure 64.
In order to improve system response and stability character-istics, compensation in the form of a second order lead overa second order lag transfer function, or notch filter, wasselected, as shown on Figure 54. The concept of using anotch filter to counteract the drive system torsional resonancehas been demonstrated analytically, but had not previouslybeen run as hardware in a dynamic helicopter environment. TheDSTR was able to provide an excellent proving ground for thistechnique.
The program for investigation of stabilizing network require-ments was twofold: First, reduce the long tixne constant inclu-ded in the DSTR engine electronic control to the point whereoscillations are experienced in order to determine systemfrequencies and second, incorporate various notch filter con-figurations in the control to verify their capacity to stabilizeover an adequate frequency band. All engine electronic con-trol variant testing was accomplished with two engines on-line,
103

DSTR TRaNSIENT4 JUNE 1975; 10:10 AMMASTER DEEPER INCREASE/DECREASE2 ENGINES; LOW POWERISOCH. GOV. OFF
Q--.40
Figure 64. Master Beeper Transient-Isochronous Governing- ",
Off.
104

since only two spare controls were available for revision.Also, isochronous governing was selected "off", as describedin the previous section.
A master beeper increase/decrease transient, with the T3=0.5sec lag compensation baseline DSTR system at high power, ispresented on Figure 65. The relatively slow oscillatorynature of the transient at about 0.4 Hz is apparent.
The lag compensation in the engine electronic controls waschanged from 0.5 sec to 0.15 sec to increase the loop gain inthe vicinity of rotor/drive natural frequency and reduce sta-bility. This resulted in a tendency to oscillate at about 3Hz during a master beeper transient as depicted on Figure 66.Triggering the system with a sudden control input by switchingisochronous governing off, a limit cycle instability of+ 175 ft-lb torque and + 100 rpm power turbine speed at thesystem frequency of 3.1Hz is encountered as shown on Figure6 7. This continuous cycling is indicative of a system withneutral torsional stability or zero gain margin. The sus-tained oscillations are eliminated by reducing engine power,and thereby lowering speed loop gain.
The previously described simulation model was used to demon-strate the effect of stabilizing compensation through theuse of open loop frequency responses using classical methods.Figure 43 shows the Bode plots for a system with no compensa-tion, first order lag compensation, and second order notch-filter compensation.
The uncompensated configuration exhibits a high gain peak atthe principal rotor drive natural frequency, resulting ina negative gain margin of -6.0 dB, and consequent instabilityat phase crossover, 3.7 Hz. Reduction in gain is one possiblestabilizing technique; however, the magnitude of the neces-sary reduction would result in an unacceptably slow, inaccuratesystem.
First order lag compensation of 0.5 sec can adequately reducethe gain near rotor drive resonance to a peak of -16 dB asshown in Figure 68. But the additional phase shift at gaincrossover associated with this lag, reducing the phase marginto 30 degrees, causes a tendency toward slow response andunderdamped low frequency fluctuations (0.47 Hz).
105

DSTR TRANSIENT4 June 1975; 10:20 AMMaster Beeper Increase/Decrease2 Engines On-linel High PowerIsoch. Gov OFFBaseline E.E.C (T3-0.5 sec)
- - - - o _________, w
-4 I-.b see
Figure 65. Master Beeper Transient, Baseline
(T3 = .5 Sec).
106

4 June 1975; 11:25 AMMantcr Bccper incrcase/Decrease2 OS:~ n-lin~e, uic! Power
:-o E -,V.Dr
CbA V' 5 # -6
Figure 66. Master Beeper Transient, Reduced Lag
(T .15 Sec) Compensation.
107

DSTR TRANSIENT4 June 1975; 11:28 AMIsochronous Gov. Switch O0?2 Engine3 On-line; High PowerRevised (t3-0.15 sec)
Of*n"OV A A1
*~ OW r2.L~l' ~I
Figure 67. Isochronous Governing Switch Off
Transient, Reduced Lag (T 3 = .15 sec)Compensation*
108

0)0
- $-ZLw
001
oz 0
I 02Z 0)
- 0_ -? z_ 0 44L Uw,
41 a
at~)
/u 0. U
- 1 - ___ uz ci
I Izm CA
E* --T-
0J 0
80 - NIVO 1A -£ INS 3qvmd
109

To improve system dynamic characteristics, control systemnotch-filter compensation in the form of an underdamped secondorder lead over a second order lag transfer was analyzed.This means of compensation counteracts the drive system tor-sional resonance without introducing excessive phase shift atthe gain crossover frequency. Figure 69illustrates the typi-cal frequency response of a 3.0-Hz notch filter with a reduc-tion of 20 dB at the tuned frequency. The value of this typeof compensation is apparent by noting the significant improve-ment in system torsional stability margin for a 4.0 Hz filteras shown on Figure 68. The torsional open loop gain marginis increased to +12 dB while maintaining a 62-degree phasemargin at gain crossover. Based on these results, a testprogram was undertaken to test several stabilizing compensationnetworks.
Modifications were made to two engine electronic controls toinclude notch filter-type compensation set at w = 3.0 Hz toapproximately correspond to the system frequency determinedpreviously. The lead quadratic term has a damping ratio(pi on Figure 54) of 0.15 and a lag damping ratio (Pn) of 1.5.Figure 70 demonstrates the response of this system to a masterbeeper input at high power. Stability is very good with nodiscernible system frequency and fast, well-damped transientbehavior. The tendency to overshoot and wander is significantlyless than the baseline configuration, clearly describing thepotential value of the selected compensation. These resultsaxe also typical of transients at low power and those initiatedby step control inputs.
In order to determine the effect of system frequency variationwhich may be introduced by parameters such as number of engineson-line, power level and lag damper variables, the naturalfrequency of the notch filter was altered. A low frequencyvalue of 2.2 Hz with lead damping ratio of .107 and lag dampingof 1.07 was considered with results depicted on Figure 71.These damping values were determined by parts available duringthe testing. The master beeper increase caused a very lightlydamped transient oscillation at about 4.4 Hz and required 10sec to settle out. For the DSTR rotor/drive, this compensationis somewhat below the acceptable range since the system is closeto exhibiting sustained oscillations.
Figure 72 shows a master beeper transition with the notchcompensation tuned at a frequency of 4.0 Hz. Stability isgood and compares favorably with the 3.0-Hz configuration.There is, however, a slight tendency to oscillate at about 3.0Hz, indicating that this compensation is approaching theupper allowable limit.
110

ci)_ _ _ -0
_ _ _ _ _ _>1
FX4
0
LU f
L 0
00
Z U))(
4 40Z + + co7 n
0 _
Ze e
>.o . _ 01Z__
CI-
01~
sa- NIVO 93- 14lNS 3SVHd r
1r11

DSTR TRANSIENT5 June 1975s 10:08 AMMaster Beeper Increase/Decrease2 Engines On-line; High PowerIsoch. Gov. OFFRevised E.E.C (3.0 Hz Notch Filter)
T°
I- U
•!--A I4. -w-.ow
------------...........
Figure 70. Master Beeper Transient, 3.0 Hz
Notch Filter Compensation.
112

DSTR TRAMSIE14T5 June 1975; 12:45 PMMaster Beeper Increase/Decreaso2 Engines On-line; High PowerIsoch. Gov. OFFRe vised E.E.C (2.2 H% Notchx Filter)
-- -- --- -
Figure 71. Master Beeper Transient, 2.2 Hz NotchFilter Compenisation.
113

DSTR TRANSIENT5 June 1975; 2:10 PMMaster Beeper Increase/Decrease2 Engines On-line; High PowerIsoch. Gov. OFFRevised E.E.C (4.0 Hz Notch Filter)
S.- ?- • • • -- --' ' - - '-'- -- , - - J : : -- - .- -- --
Figure 72. Master Beeper Transient, 4.0 Hz Notch
Filter Compensation,
114

Description of the Solution
In summary, the solution was to modify the blade damper(Figure 59) and incorporate the 3-Hz notch filter.
Limitation of the Solution
Since the DSTR had different dynamic characteristics (singlerotor) than the HLH flight vehicle (two rotors), the detailvalue for the DSTR would not be optimum for the HLH. However,the simulation had been proven and the stabilizing techniqueswhich are applicable to the flight vehicle demonstrated.
115

PROBLEM - HLH/DSTR TORQUE OSCILLATION
Description of the Problem
During the DSTR test program, a 17 to 20 Hz alternating torqueoscillation was observed. On August 30, 1974, a sprag clutchmalfunctioned, allowing an engine to overspeed.
Investigation Leading to a Solution
Prior engine development testing had indicated low level torquefluctuations in conjunction with fluctuations in fuel manifoldpressure at low power. This testing showed a 14-18 Hz fuelmanifold pressure fluctuation with a maximum amplitude of 12psi peak-to-peak and a pump discharge pressure variation of45 psi peak-to-peak. The corresponding torque variation was40 lb-ft peak-to-peak. At gas generator speeds above 13,000rpm (3500 hp at sea level standard conditions), all fluctua-tions disappeared. The fuel pressure fluctuation emanatingfrom the fuel control was thought to be caused by a fuelpump/control instability associated with an interactionbetween the bypass valve, AP pilot valve (maintains constantpressure drop across metering valve), pump, and line volumecharacteristics. Figure 73 is a schematic of this section ofthe fuel system. This system had a resonant frequency varyingfrom 14 to 18 Hz between ground idle and 13,000 rpm gas. genera-tor speed. As a result of these engine test stand observations,a test was conducted to determine the effect of a 15-cubic-inchaccumulator in the pump discharge line. The accumulator hadthe effect of reducing test stand torque fluctuations to anegligible level. However, since the magnitude of thesefluctuations (basic configuration) was only 60% of that allowedby the engine specification, the delivered engines were con-figured without an accumulator.
As a result of the DSTR torque oscillation in September 1974,additional propulsion system torsional analyses were conducted.Results of the analysis for the basic configuration and a num-ber of variations are summarized in Table 2. The basic analy-tical model is shown in Figure 74.
Since the frequency of interest lies between the first andsecond blade flexible lag modes, both flexible modes have beenincluded in the rotor effective inertia.
116

zo
zcu
w 4.3>1
Ui)
10000 40 rtI
ig w a)
A >-
r
4P
wx 0.
atm
500SO Sheet
231
I"
117

z C;rx I in I H- .-4 in Nl 0 i
N w 1 10 M '.0 in cq i 1 4
xz 0 C 4~ to r4 N~ %P. (n mH
E-4
z 0l rs 0 OD 0 W) In 0 '.0 Mq is0'
VE I '00i 0 0v r4 NH ý 0 0 Cl
r- H -H4 H N Cl co) C
0H-
0
Nz ow H H 9C
0s 0q H4 N' H A Cl C n
Hl 0% 1-- 0 0 i N CV)i 00'
0 40 0% b H q H c" C'' Win
> 0rOh -4 C' C.4 '0 ' WN C ". In
H 0 tn 'o ,- ') r,, H a0 o '
rt4 q 0'. C4 rS H 4- 4" l
a H Hj rc N" 0 0 - )I -
M4 *o.C '. 4' o - N' H (na
C4 H l " '.. c
C44
118

MIXA
EQUIVALENT INERTIAS AND SPRING RATES AT TURBINE SPEED
INERTIA SPRING RATES
IT = 3.4 IN-LB-SEC 2 (2) KT = 197000. IN-LB/RAD
,MIX = 15. KAT = 346000.
(1) IAT = 10.4 KAR = 56000.
(1) PEP ENGINE-
(2) SERIES SUM OF TURBINE, TORQUE SENSOR, CLUTCH AND DRIVESHAFT SPRING RATES
ROTOR EFFECTIVE INERTIA
IAR= 156.55 - 154.12 Wn2 - .3825 Wn2
Wn2 -20.852 wn2 - 614d.
'0cA.8 @I e i - .2131 wn2
(0s. 12.OS) Wn2 - 38428.
WHERE: Wn SYSTEM NATURAL FREQUENCY
Figure 74. DSTR Torsional Model,
119II
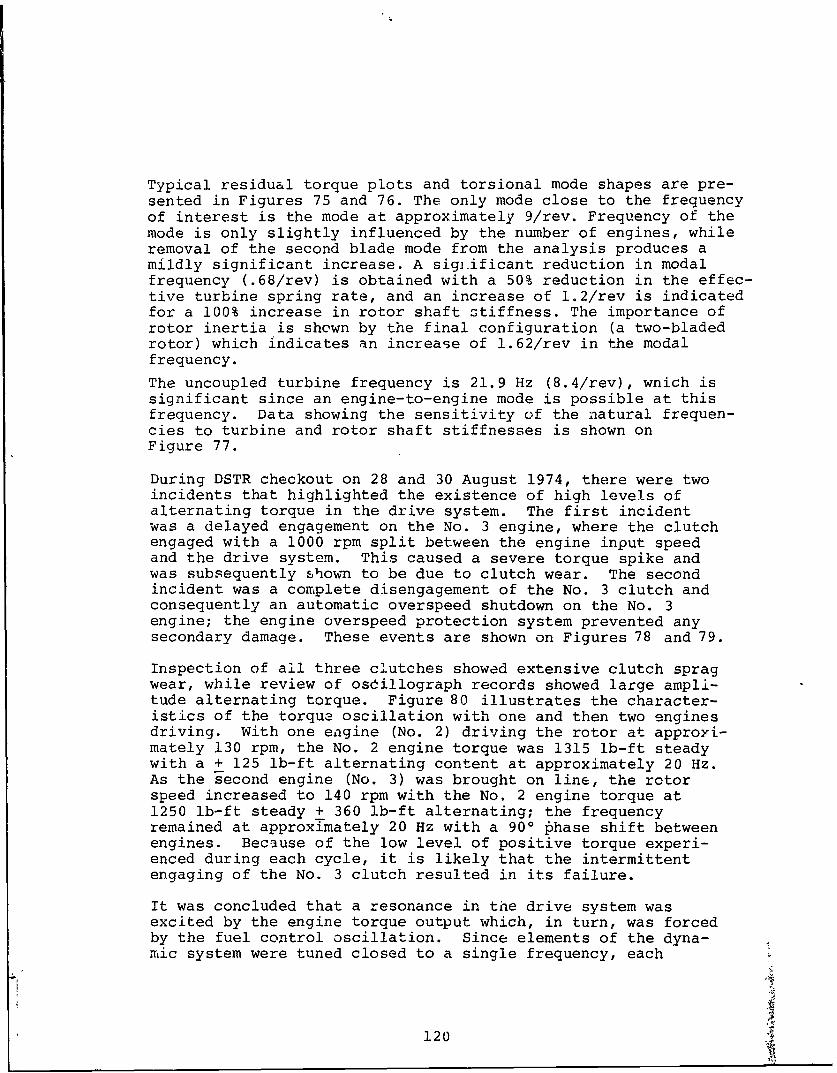
I
Typical residual torque plots and torsional mode shapes are pre-sented in Figures 75 and 76. The only mode close to the frequencyof interest is the mode at approximately 9/rev. Frequency of themode is only slightly influenced by the number of engines, whileremoval of the second blade mode from the analysis produces amildly significant increase. A sigi.ificant reduction in modalfrequency (.68/rev) is obtained with a 50% reduction in the effec-tive turbine spring rate, and an increase of 12/rev is indicatedfor a 100% increase in rotor shaft stiffness. The importance ofrotor inertia is shown by the final configuration (a two-bladedrotor) which indicates an increase of 1.62/rev in the modalfrequency.The uncoupled turbine frequency is 21.9 Hz (8.4/rev), wnich issignificant since an engine-to-engine mode is possible at thisfrequency. Data showing the sensitivity of the natural frequen-cies to turbine and rotor shaft stiffnesses is shown onFigure 77.
During DSTR checkout on 28 and 30 August 1974, there were twoincidents that highlighted the existence of high levels ofalternating torque in the drive system. The first incidentwas a delayed engagement on the No. 3 engine, where the clutchengaged with a 1000 rpm split between the engine input speedand the drive system. This caused a severe torque spike andwas subsequently shown to be due to clutch wear. The secondincident was a complete disengagement of the No. 3 clutch andconsequently an automatic overspeed shutdown on the No. 3engine; the engine overspeed protection system prevented anysecondary damage. These events are shown on Figures 78 and 79.
Inspection of all three clutches showed extensive clutch spragwear, while review of osdillograph records showed large ampli-tude alternating torque. Figure 80 illustrates the character-istics of the torque oscillation with one and then two enginesdriving. With one engine (No. 2) driving the rotor at approyi-mately 130 rpm, the No. 2 engine torque was 1315 lb-ft steadywith a + 125 lb-ft alternating content at approximately 20 Hz.As the second engine (No. 3) was brought on line, the rotorspeed increased to 140 rpm with the No. 2 engine torque at1250 lb-ft steady + 360 lb-ft alternating; the frequencyremained at approximately 20 Hz with a 900 phase shift betweenengines. Because of the low level of positive torque experi-enced during each cycle, it is likely that the intermittentengaging of the No. 3 clutch resulted in its failure.
It was concluded that a resonance in the drive system wasexcited by the engine torque output which, in turn, was forcedby the fuel control oscillation. Since elements of the dyna-mic system were tuned closed to a single frequency, each
120

M
Ln
-n H7-- E,.
i~ -_ ' F
. .. .. .. L..
Er
4--
1F$~ q~ 11-tt
cn
:IP~ PhHnw gam 0
4 4 C~) 44
121

.12. t __ ____ _____ ___,.___
'44
Ito
jj S g .12. ji.i +I0
' I i I "I n I
4 I I A II I LflOTOr, ...j
EN& .l AFT
86K AOMSOJ
3 ENGINES
K TURBINE = 13,1550 IN-LB RAD
Q = 156 RPM
Figure 76 DSTR Torsional Analysis - Mode Shapes.
122

zz
* fif~- AT~ 4Iýd - 6
123L4 T

I, -' G , " * , ' I ,+ - ' " - "g-- r . .. .. a• -i _.. . . . I N 1 . ..
, , , ,e ll+ , , I ,, li ,i
eI, eeIl, e I . , II , , I e:: II I Il 1 1 ' I ' • I I r I .+
~W 3
N H J .i:: :~ I: I
-N 2 ::vla, ;
g : I: iSP:IKE.
I * I llegal I I en j III * I I I I.I I .
legI ItI11 + II I 11 1 H IIIIII, I * a ,I l 11111:1 111111I i, I latallel ee*, lllglleglI e gaI let II, I a aele g 'gll t l e, *e a,,, * Jtae .e ' ' I
I a lg e, I e lla II I I ..11 1 1 I. ..... ,. I. l l . .... a I I
PegaaI I e ne l le i e l h . I red I ailt l IrII*I I a -- I ja 1 . e I I I g ee l I1 i , .I.lllIJ4 I, a ta Il I algI l I II I I I I ea a I e lle a I I IIIII Il
-ale IIII I , I IIj Iee e e e I e late Il IIIIII Ieeeal gIe l lan ll g, , eeI I I I tI
a a * tl •Iee le • I•I I tl I hI I JIJ H r I e e I I e Ill II Ill I I te
1, 11 .I:I I I I l .7 - M .a
l.. .. .e.... I t.... I 111,, 1 ........ ....a .. ..... ........l .. .... . ..alle II I l ll lI I I lett~ II Ialag ! 1.II I I ilIl II l llal ll I , aa ge le ala aI ll i ga1 l all a1 I II I drllll I 1 III I ::: I:~ llIt i , I n!III I I III e el l e l IIat' I IIa il a I aIII I I llaleleI ,, , II . .... ll Ia,, lagat ,I r al It a e .. . ... .II . . . . . .. . . .i I +I aIlII II I llal l I I ii , + ,141 ii a1
,e l I lg l Qi i I 'I I
ll !-1 I II 1i 1 IItI jllll
Iw aw ,
MI Il :: Wii W IW W 41.I' , i ii
a - •.tl -• , '' ........ I.. .... . . ..I.. .
.1 ' II, l~ee le e 1111 te leal glee.l I ci ,+ lea, I I lI V i, 1111 -llle +gleglg
eee I1 III II .1, 1,1 II I II aI l 1111 gal lt' gg lelIegl aIIIl tl
-A H-10-SEC,
Figure 78. DSTR Engine Engagement and Torque Spike,
124

N125

N 2-
N 3
S. - 7 . ..-
-- -S
Figure 80. DSTR Torque Oscillation with One and
Two Engines.,
126

component tended to oscillate at an amplitude greater than itwould as a separate unit due to the magnification effect atresonance and various direct and indirect feedbacks.
A DSTR test program was conducted to obtain comprehensive datarequired for a detailed system evaluation of the alternatingtorque characteristics. This test included recording of drivesystem and engine parameters at various power levels and speedsand included recording of torque and fuel manifold pressure.Testing was initiated on 10 September with No. 1 engine drivingand No. 2 and No. 3 engines at ground idle (not engaged).Engine output torque variation was + 170 lb-ft at a power levelof 2030 hp (1087 lb-ft torque) and a frequency of 19.5 Hz.Observed fuel manifold pressure was 204 psi with a + 21 psicontent at 195 Hz clearly demonstrating the link between thetorque oscillation and the engine fuel system. Gas generatorspeed did not vary because of its relatively slow response atthe high frequency; torque variation was attributed to com-bustor temperature and pressure varying with fuel flow andsubsequent conversion to power/torque at the power turbine(i.e., at constant pressure ratio, power output is directlyproportional .to turbine inlet temperature). Figure 81 is anoscillograph recording of this condition. This test alsoshowed that the oscillation frequency was non-rotor-order anddid not vary with main rotor speed.
Further DSTR testing on 11 September was directed toward eval-uating the effectiveness of an accumulator in the fuel pumpdischarge to damp the torque oscillations to a level acceptablefor continued DSTR operations. The 15-cubic-inch flow-throughaccumulator tested during engine development was installed onNo. 1 engine. The results (Figure 82) showed that the 17-20 Hzoscillation was effectively eliminated, though fuel manifoldpressure did show a + 12 psi high frequency content (approxi-mately 230 Hz) corresponding to 1/rev of the gas generator.Maximum torque variation was + 15 lb-ft and was random at apower outuput of 3370 hp (1753 lb-ft torque).
As a result, accumulators were installed in each engine posi-tion with satisfactory results. It was found that it wasnecessary to maintain the charge pressure on the accumulatorat close to the recommended 275 psi; otherwise, the torqueoscillation would reappear.
127

1'-p
"-I
7- Q :1 1 7
1-0-SE
Fiue8. TT Toqu Osilato WithoFuELPESR~ s14 Accumulator.SI
128

.. ~.....1. O-SEC-. * .
/FUEL PRESSURE
Figure 82. DSTR Torque Oscillation Investigation with15-Cubic-Inch Accumlulator.
129
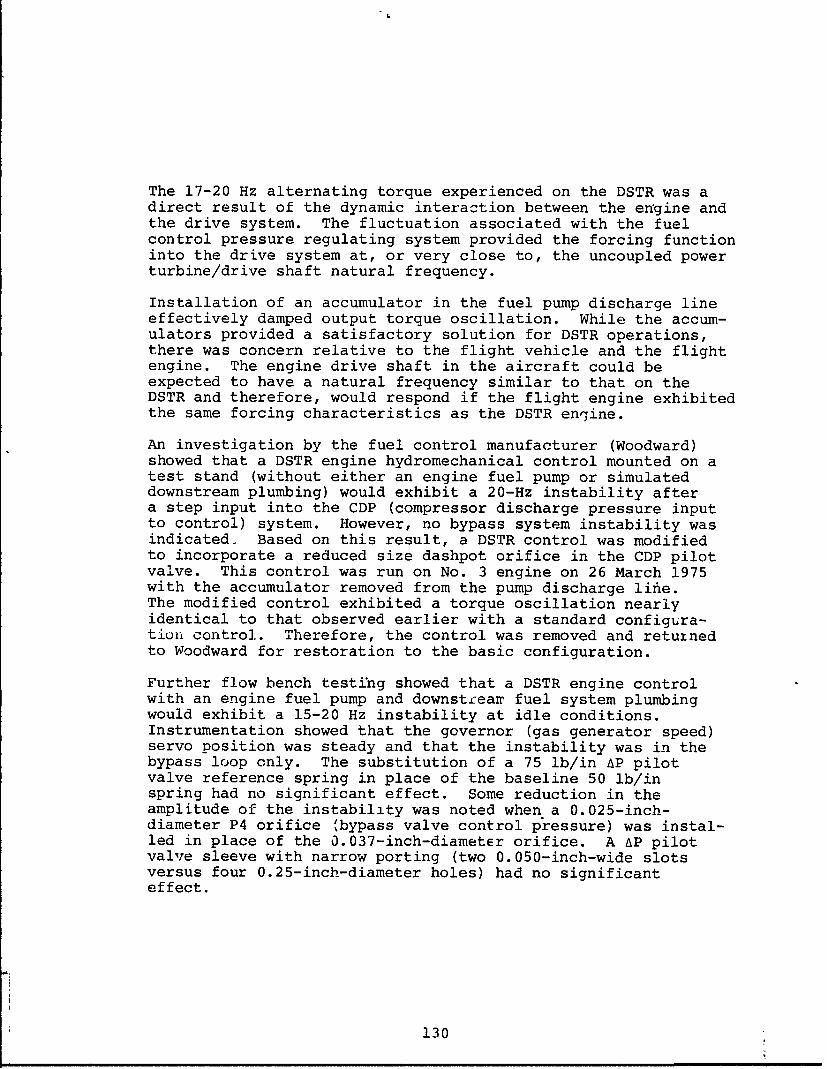
The 17-20 Hz alternating torque experienced on the DSTR was adirect result of the dynamic interaction between the engine andthe drive system. The fluctuation associated with the fuelcontrol pressure regulating system provided the forcing functioninto the drive system at, or very close to, the uncoupled powerturbine/drive shaft natural frequency.
Installation of an accumulator in the fuel pump discharge lineeffectively damped output torque oscillation. While the accum-ulators provided a satisfactory solution for DSTR operations,there was concern relative to the flight vehicle and the flightengine. The engine drive shaft in the aircraft could beexpected to have a natural frequency similar to that on theDSTR and therefore, would respond if the flight engine exhibitedthe same forcing characteristics as the DSTR enqine.
An investigation by the fuel control manufacturer (Woodward)showed that a DSTR engine hydromechanical control mounted on atest stand (without either an engine fuel pump or simulateddownstream plumbing) would exhibit a 20-Hz instability aftera step input into the CDP (compressor discharge pressure inputto control) system. However, no bypass system instability wasindicated. Based on this result, a DSTR control was modifiedto incorporate a reduced size dashpot orifice in the CDP pilotvalve. This control was run on No. 3 engine on 26 March 1975with the accumulator removed from the pump discharge lihe.The modified control exhibited a torque oscillation nearlyidentical to that observed earlier with a standard configura-tion control. Therefore, the control was removed and retuinedto Woodward for restoration to the basic configuration.
Further flow bench testing showed that a DSTR engine controlwith an engine fuel pump and downstcean fuel system plumbingwould exhibit a 15-20 Hz instability at idle conditions.Instrumentation showed that the governor (gas generator speed)servo position was steady and that the instability was in thebypass loop only. The substitution of a 75 lb/in AP pilotvalve reference spring in place of the baseline 50 lb/inspring had no significant effect. Some reduction in theamplitude of the instability was noted when a 0.025-inch-diameter P4 orifice (bypass valve control pressure) was instal-led in place of the 0.037-inch-diameter orifice. A AP pilotvalve sleeve with narrow porting (two 0.050-inch-wide slotsversus four 0.25-inch-diameter holes) had no significanteffect.
130

The substantiation of a flight engine control into the system(with DSTR engine pump and fuel system plumbing) showed littledifference between DSTR and flight engine controls. It wasnoted that the flight development engines had not shown anytendency toward torque oscillation on the engine test stand.Measurements showed that control inlet flow and pressure wereapproximately 50 degrees out of phase at the instability fre-quency and suggested the possibility of an adverse effect ofupstream plumbing.
The significance of upstream plumbing to system stability wasdemonstrated by testing both a flight engine control and aDSTR control with a flight engine configured fuel system onthe bench. In the flight engine configuration, the fuel con-trol is mounted directly onto the fuel pump, decreasing thevolume associated with the pressure regulating system andincreasing the hydraulic natural frequency beyond the responsecapability of the bypass valve, thereby eliminating theresonance. No 20-Hz oscillations were observed during testsof this configuration.
Figure 83 shows that a DSTR control plus DSTR pump exhibits15 Hz oscillation, while Figure 84 shows that a DSTR controlwith a flight engine pump and plumbing is stable.
A flight engine control pump and plumbing give stable opera-tion (Figures 85 and 86). In Figure 86, enrichment solenoidinputs provided a 45% fuel flow forcing function while at idle.Figures 87 and 88, both with flight engine control, pump, andplumbing, show stable operation at high power setting withtrim motor inputs providing + 11% fuel flow forcing function,and at idle setting with trim motor inputs providing + 30%fuel flow, forcing function.
It was concluded that in the flight engine configuration withreduced volume in the plumbing, the hydraulic natural fre-quency was sufficiently high to avoid resonance with the bypassvalve.
Description of the Solution
For the DSTR, an accumulator provided the solution for thenon-flight controls. For the flight vehicle, the flightengine pump and flight plumbing were demonstrated by benchtest to be stable.
Limitation of the Solution
None.
131

,,-,S, • - - -; - -- -.- -- .--- ---•�--... - - : :- ---
BY-PASS ,OV O_---VALVE
POSITIONNINCHES ..............
GOVERNOR E4 --- --- ------ ~-- -__
VALVE 0 . .. _ . . .____ _.... . .......... _ _POSITION lz-i-----
PU M4P so .. .. . .. . .. . . . . . . . .. .DISChARGE 600 -
PRZSSURE -0 - -- -- ---- ----- . . .---- -400
p-PSI 200 - ---- s-- -.-- ~
204 - --
CONTROL 184 - - - - _ - --
DISCHARGE 1 6 4PRESSURE... . .. ..... ,..
144-- --
-,PSI 124--------- ------
CONTROL]-----, ,
OUTLET 720 -- --FUEL
.. PPH - --80-- --- - -
WOODWARD GOVERNOR COMPAN4Y 5-4
OUT 3840 ---
FUEL --AFLOW 3720 -3600 -_- ~ ,-- ....... _--------.-
-__
-PPN
IDLE RPM
Figure 83-. 15-Hz Oscillation DSTR Control with DSTR
Pump,
132

BY-PASS ~-VALVEPOSITION -
-'INCHES _ _ _ _ -
GOVERNOR -
POSITION ~ J -
-4--INCHES
1000 -- ----PUMP Boo ------ 1-DISCHARGE60 i 1 - -
PRE~SSURE60
200 -'- I , . -...........
200
CONTROL 720
1133

BY-PASSVALVEPOSITION
S__C -SI ___--____ _______ _:___ _ _,,#INCHES
.. . . ..... ..N
OISHARE48 - .- 2- i"_1 --- [...-_ __,_ __-__•_'__---
GOVERNOR !POSITION M-
RINCHES 440 - - - . . . ..- -
-....... .. .. -.. . . ... . . . p_-- -
DISC 3RGE4
10 -- - - ............- ....S440 --_ __ _------------, -_. .. . ----- _ __
PSI 400360-
CONTROL 310--
DISCHARGE 23 0_- oI W S S --PRESSURE --- -- - -10- --
1134
CONTROL 780OUTLET ___I UILFUELFLOW
ePPH M3 -
WOODWARD GOVERNOR COM4PANY 5-16-75 -
'NO OSCILLATIONS EVEN WHEN DISTUR3Ak1CES AMEMADE TO TRY TO INITIATE OSCILLATIONS.
TRIM TORQUEMETER STEPPED
Figure 85. Flight Engine Control and Flight Engine
Pump and Plumbing.
134

Forcing Function Provided by Enrichment Solei.oid
ENRICHMMENT VALVE : .ý q 14.4 :1,710 OID STEPPED-
CONTROL 2-1 -OUTLET 620FUEL = ETFLOW 53oPPH Wj W____ 17,
440
1 C.
M'dr-1 1 q;
BY_1ASsVALVEPOSITION
,41NCRES
!It 1-J 'I,_7
300
LCONTROLDISCHARGE 200PRESSURE
100 f 11
WOODWARD GOVERNOR CCOMMP -6-75*NO OSCILLATIONS EVEN WHZN DISTURBANCES ATU MADEETO TRY TO INITIATE OSCILLATIONS._F
7
GOVERNORVALVEPOSITION
-INCHES
ALTERNATING INPUT AT IDLE
Figure a6. Flight Engine Control with Flight EnginePump and Plumbing,
135

-NO OSCILLATIONS*
6130 jRPM--TRI.M MOTCR TRIM TORQUEMOTOR STEPP~ED*INPUT AT +80 NA
High Power Operation
CONTROL 2550 'OUTLET --- F I
?LW 2330 21=~
-PPH 2110
BY-PASS
POSITION
INCHEST
Figue 87 Alerna ng npu at iglowe Figh
Engie Cotrol Pum andP~u~bing
136T

IDLE RPM
TRIM TORQUEMO'rOR STEPPED*
FUELFLWW
-PPH
BY-PASSVALVEPOSITION
-INCHES5
CObITROLDISCHARGE 200 -PRESSURE
"-PSI 10
GOVERNORVALVEPOSITION
Figure 88. Alternating Input at Idle Flight EngineControl, Pump and Plumbing,
137

PROBLEM - YUH-61A ENGINE MOUNTING
The mounting of an engine in a helicopter requires a relativelyrigid system to prevent excessive shaft misalignment and at thesame time, limit the velocities and accelerations of the enginein response to rotor and shaft excited frequencies. The mountstudy began in 1972.
The following description covers the engine vibration treatmenton the YUH-61A. The treatment of a high frequency (240 Hz)vibration is covered under a separate section entitled "non-synchronous whirl". It is not included here, since the enginemounting system was not involved in its cause or solution.
Description of the Problem
The engine manufacturer established upper limits of vibrationfor the engine; these weie specified on the T700-GE-700 instal-lation drawing as follows;
"Vibration Pickup Locations and Limits:
Vibration pickups are to be oriented within 50 of the ver-tical, lateral, or radial lines. The pickup mount locationsare to be as follows:
Location 1 Sta. 200.00 Main FrameVHI Lateral V1 or V3VVI Vertical V2 or V4 (Alt. Sta. 195.31)VAl Axial Vl or V3
Location 2 Sta. 217.85 MidframeVH2 Lateral V6VV2 Vertical V5
Location 3 Sta. 231.82 Exhaust FrameVR31 Radial V9VR32 Radial V
Location 4 Sta. 203.50 Accessory GearboxVV4 Vertical C.0
HIGH FREQUENCY LIMITS FOR ENGINE AFTER INSTALLATION ATLOCATIONS 1 AND 3 FOR VERTICAL, LATERAL AND RADIAL.
Maximum total vibratory Maximum total transientvelocity (ir/sec) single vibratory velocity (in/amplitude peak at fre- sec) single amplitudequencies above 50 Hz peak of less than 5 secgenerated by engine duration.rotors and airframecomponents
2.5 3.5
138

LOW FREQUENCY LIMITS FOR ENGINE AFTER INSTALLATION (SEENOTE 53)Location Maximum total vibratory Maximum tota± transient
1 velocity (in/sec) singlE vibratory velocity (in/2 amplitude peak at fre- sec) single amplitude3 quencies below 50 Hz peak of less than 5 sec4 generated by airframe duration.5 rotors or components.
Airframe induced engine response in the range of25-50 Hz shall not exceed 50% of overall levelspermitted in the 4-50 Hz band.
NORMAL VIBRATION LIMITS (See Note 53A)
VERTICAL, LATERAL 5.0 in/sec 7.0 in/secAND RADIALAXIAL 2.5 in/sec 5.0 in/sec
EXTENDED VIBRATION LIMITS (See Note 53B)
VERTICAL, LATERAL 7.0 in/sec 12.0 in/secAND RADIAL AXIAL 5.0 in/sec 7.0 in/sec
NOTE 52 INTERPRETATION OF HIGH FREQUENCY VIBRATION LIMITS
A) Maximum total vibratory ve±ocity (in/sec) singleamplitude peak is the overall velocity of variouscomponents above 50 Hz.
B) An averaging type velocity meter CEC 1-167 or theequivalent is to be used for real time measurementof the maximum total vibratory velocity.
C) The maximum total vibratory velocity recorded duringa vibration survey is to be determined by measuringthe maximum single peak velocity of the complex waveon an oscillograph trace.
D) To indicate high frequency vibration levels, the vibra-tion signal is to be passed through a 70 Hz high-passfilter during uninstalled testing and through a 90 Hzhigh-pass filter during installed testing. The filterroll-off is to be 18 dB per octave.
139

NOTE 53 INTERPRETATION OF LOW FREQUENCY VIBRATION LIMITS
A) Normal vibration level shall apply during the followingflight conditions:
1) Takeoff, hovering, and landing.
2) Level flight up to the maximum speed attainablewith intermediate rated power.
3) Pullups, climbs, pushovers, descents, and turnswith accelerations between Og and 1.75g or up to450 of bank angle.
B) Extended vibration limits shall apply to flight maneu-vers not specifically defined in note 53A and whichcan occur for no more than 5% of the total engineoperating time.
C) Steady state vibration is the cyclic vibration per-sisting for more than 5 seoonds and normally occurringduring a sustained flight condition.
D) Transient vibration is the occasional excursion invibration level persisting for no more than 5 secondsand usually occurring during some aircraft flight-maneuver.
E) Maximum total single amplitude peak is either thearithmetic sum of the velocity components read on aspectral analyzer or the maximum velocity of thecomplex wave as recorded on an oscillograph."
The problem was to select an engine mounting system whichprovided the lowest vibration environment for the enginewhich entailed avoidance of any resonance of the engineon its mounts in any mode at the exciting frequencies ofthe rotor(s), shafting, etc. The levels must be belowthe levels specified above.
140

The chronological order of events for the selection and evalua-tion of the engine mounts is:
Sept. 1972 to Detail analysis and design of engine mounts;Dec. 1973 mounts selected.
January 1974 GE abusive vibration test successfully com-
pleted with the engine mounts.
May 1974 Final design of the engine mounts completed.
June 1974 YUH-61A Static Test Article (STA). Hungshake test defined coupled engine/airframenatural frequencies.
January to Flight test results on YUH-61A aircraftApril 1975 001 and 002.
April 1975 Shake test of ground test vehicle (GTV) atGrumman Aerospace Corporation, CalvertonTest Facility, to define engine natural fre-quencies with rotor and adopt an enginemount configuration for better engine modeplacement.
April 1975 Initial flight results of "improved" enginemount on A/C 002.
October 1975 Flight results of final vibration configura-tion on A/C 002.
The installed engine vibration levels for the GE T700 engineare broken into two frequency domains: low frequency below3000 rpm (50 Hz) and high frequency above 3000 rpm. Whilethese specs are expressed in velocity, most of the data reportedherein is in acceleration g's. Therefore, the following tableis provided:
141

STEADY STATE
NR = 286 rpm
EQUIVALENT OFGE SPEC UTTAS GE SPEC
VELOCITIES MAIN ROTOR ACCELERATIONSDIRECTION (IN/SEC)(1) FREQUENCIES - g (2)
Vertical or 5.0 1/rev .39Lateral 4/rev 1.55
8/rev 3.10
Longi- 1.2 1/rev .093tudinal 4/rev .37
8/rev .74
Notes: Transient specification levels are somewhathigher.
(1) Total of low frequency velocities(2) Assumes all vibration at the one frequency
The YUH-61A engines are mounted to the aircraft at four loca-tions as shown in Figure 89. The mounts were provided withthe spring rates as shown to detune the coupled engine/air-frame natural frequencies from the important potential rotorforcing frequencies of the YUH-61A. These frequencies for theYUH-61A are 4/rev of the main rotor at 19.1 Hz, 8/rev at38.2 Hz, and 1/rev at 4.77 Hz with NR at 286 rpm.
The analytical results for the initial flight configurationare shown in Figure 90. These frequencies were well placed,relative to the potential forcing frequencies, with assuranceof dynamic amplification of less than 2.0. This fact, coupledwith the low airframe vibration levels required for the cabinof the YUH-61A, assured low engine vibratibn levels in flighton the YUH-6!A. Mounts were therefore procured with thefollowing spring rates:
Mount Spring Rate* Residual
Fwd Bottom 45,000 lb/in 2000 lb/inFwd Side 45,000 lb/in 2000 lb/inAft Bottom 23,000 lb/in 0Aft Side 11,000 lb/in 0
*This is the rate for the main load path axially; the "resid-ual" refers to the radial load path.
142

0.1i4-)-
0S" .,-I-)
0
004 I°'00
St'0
oco
S-a
o0/H amE-4H CA
0 0r4 UW~ E-1 CZ4
U2 H 0
zz
143

-, - -
ZH-E*LZ IHSA
HH
ZH-T9 Liio C TzK~ atX E
Un
ZH-9V* _DNrr
144

A powered vibration survey was then conducted. For this vibra-tion test, the engine was supported by YUH-61A mounts on ashake table. The shake table was mounted on four air bags.Vibratory excitation of the shake table was provided by meansof three vertical electrohydraulic actuators, one beneath theaft mount plane in the center of the table, the other two atthe forward end of the shake table, on each side of the table.This shaker configuration was designed because of concern overpossible rolling of table during operation of the shakers dueto the center of gravity being to the right of table center(aft looking forwari); the Boeing Vertol mount supportingstructure and rotary actuator (see below) were mounted on theright side of the table. The shake table was quite stable,however, and only the aft vertical shaker was used thioughouLthe test. Power is supplied to the YUH-61A main rotor trans-mission through a cross sbaft connected to the right anglenose gearbox which is mounted on the T700 engine outputdrive pad flange. For this vibration test, i,. was the intentto simulate the nose gearbox weight, center of cfravity, andcross shaft torque. The simulation was accomplished by mount-ing a "nose gearbox mounting adapter" to the engine outputdrive pad to which was mounted a water brake. The water brakewas used as the power absorber. The "nose gearbox mountingadapter" incorporated a pad to which a simulated cross shaftwas mounted, at the correct orientation. The other end ofthe simulated cross shaft was mounted to a torque producingrotary actuator. The rotary actuator was mounted to the shaketable. Flexible couplings, identical to the YUH-61A crossshaft flexible couplings, were mounted on each end of the sim-ulated cross shaft. These couplings permit relative motionbetween the powerplant and the aircraft main rotor transmission.Thus, engine power turbine torque was counteracted by thewater brake and YUH-61A nose gearbox cross shaft steady statetorque was applied by the rotary actuator, resulting in theproper loading on the engine output drive pad and the remainderof the engine. The only deficiency in the simulation was thatsince the engine used did not produce engine specificationpower (900 hp vs required 1536 hp), the engine power turbinetorque was not as large as will be experienced in actualservice. The predominant loading on the engine output drivepad is the pitch moment component of the nose gearbox torque,however, and the deficiency does not significantly affect theresults of this test.
The test consisted of starting the engine to idle and acceler-ating the engine to power. This provided the engine signaturewith Boeing Vertol hardware in a simulated YUH-61A installa-tion. The electrohydraulic shakers were then turned on andshaker sweeps were conducted wherein the frequency of the
145

shaker was varied from 5 up to 76 Hz. This was done to obtaina more realistic assessment of the powerplant resonances andresponses than the static shake test because of the higherinput level possible with the electrohydraulic shakers.
The isolator mount stiffness decreases with increased dynamicinput, and as a result, the powerplant resonances decrease infrequency. Therefore, the powerplani resonances obtained inthe static shake test are not realistic. The powerplant pitch-ing resonance occurred at 10-15 Hz and the powerplant verticaltranslation at 23-20 Hz.
The next step in determining where the engine/fuselage naturalfrequencies were in the YUH-61A was the shake test performedon the STA with "dummy" engines but actual mount flight hard-ware, completed well ahead (June 19/4) of first flight. Theresults of this testing are shown in Figure 91 and are com-pared to the original analysis.
MODE ANALYSIS STA SHAKE TEST
Longitudinal 7.46 11.7Pitch 11.5 14.5Yaw 13.7 15.5Roll 16.1 18.5 4/revVertical 27.2 23.9 19.67 Hz atLateral 29.6 29.6 295 rpm
This comparison indicates several significant differences be-tween the original analytical modes and the shake test derivedmodes. These differenceg are essentially caused by the actual"residual" spring rates of the engine mounts, which control thelongitudinal and roll modes, and the initial estimate ofengine mount backup stiffness used for the analysis. Theengine modes, however, relative to the prime forcing frequency(4/rev), were still well placed.
After initial flight testing was underway, a shake test wasperformed on the GTV to determine if the engine response at4/rev could be reduced. This test consisted of running theGTV at various power levels and shaking the engine with anexternal shaker through a frequency range of 8 to 35 Hz todefine the installed engine natural frequencies with the rotortuning. These results indicated that the engine roll mode wascloser to 4/rev than desired. Several configurations of enginemount stiffness were shake tested on the GTV to define a bettermount configuration. The choice of mount stiffnesses to testwas guided by a 6-degree-of-freedom analysis of the engine/airframe installation.
146

YloA - tS.S p4 JTOL-- f8.5&•
MIN GROSS WEIGHT
100 LB FORCE
50% ROTOR MASS
Figure 91. ENGINE SHAKE TEST MODE SHAPES.
147

Description of the Solution
The combination of mounts tested for both engines is shown inTable 3. The initial configuration mount springs and the testderived mount arrangement are compared in Table 4 and Figure
92. Frequency sweeps of one engine for the front frame verti-cal pickup are shown for the baseline and final configurationin Figure 93. These results indicated a mode right at 4/revfor the baseline configuration. A significant improvement inthe response at 4/rev is shown with the test derived mountarrangement, in fact, a reduction of about 75% was attainedby going to the "current" engine mount stiffness shown inFigure 92.
The flight development program of the final engine mount con-figuration was completed.
In general, the predominant forcing frequency in the YUH-61Aairframe from the main rotor is 4/rev. Therefore, the enginemount design is configured to provide low transmissibilityfor that excitation. Figure 94 shows a spectral analysis ofthe No. 1 engine transmission (or nose box) during a typical150-knot level flight condition. This figure indicates thatthe primary engine response is at main rotor 4/rev and is at alevel of .7g. The sum of 1/rev, 2/rev, 3/rev1 4/rev, 5/rev,8/rev and 12/rev converted to velocity is 4.1 in/sec asstimingall frequencies to be in phase. This compares with a GE limitof 5.0 in/sec.
As previously described, the engine mount configuration wasmodified as a result of an engine shake test on the GRV. Toassess the effect of this on engine vibration, an aircraftwas flomn with the "new" engine mounts without any aircraftvibration reduction devices (i.e., pendulum rotor absorbersor airframe fixed tune absorbers). This was done to determineif the engine vibration levels were reduced by the percentages(75%) indicated by the GTV testing.
Figure 95 sncws a comparison of the engines before and afterthe engine mount '-hange. While the data is somewhat limited(due to limited instzlumentation on the early baseline flightof A/C 002), an improvemtzDt in the engine vibration levels isshown.
148

TABLE 3
GTV ENGINE SHAKE TEST
CONFIGURATIONS EVALUATED
NO. 1 FWD FWD AFT AFT
GR BOTTOM SIDE BOTTOM SIDE
Baseline 82 45000 lb/in 45000 23000 1100083 Link 45000 23000 1100084 Link 45000 7000 i100085 7000 45000 7000 1100086 Link 45000 Rigid 1100087 Link 7000 Rigid 11000
NO. 2
Baseline 90 45000 45000 23000 P-00089 Link 7000 Rigid Ii00088 45000 7000 Rigid 11000
TABLE 44OUNT ING SPRINGS
FWD FWD AFT AFTBOTTOM SIDE BOTTOM SIDE
MAIN BASELINE 45000 45000 230C0 11000LOAD CURRENT 45000 7000 RIGID 11000PATH RESIDUAL 2000 2000 0 0
149

R/H ENGINE SHOWN 11000 LB/IN(L/H SAME)•I•Ni'/
45000 2300 LB/IS4d•/ • •• • 23000 LB/IN
FWD.
45000 LB/IN
iCURRENT FLIGHT CONFIGURATIONDERIVED FROM GTV
ENGINE SHAKE TEST 11000 LB/IN
• / / S •>RIGID
FwD. • \_"" 45000
LB/IN
747
Figure 92. Engine Mount Stiffness,
150

4P-jN-t6 co-
do-Lr
Z Hn
012w 1
> dP
~0 0
L512
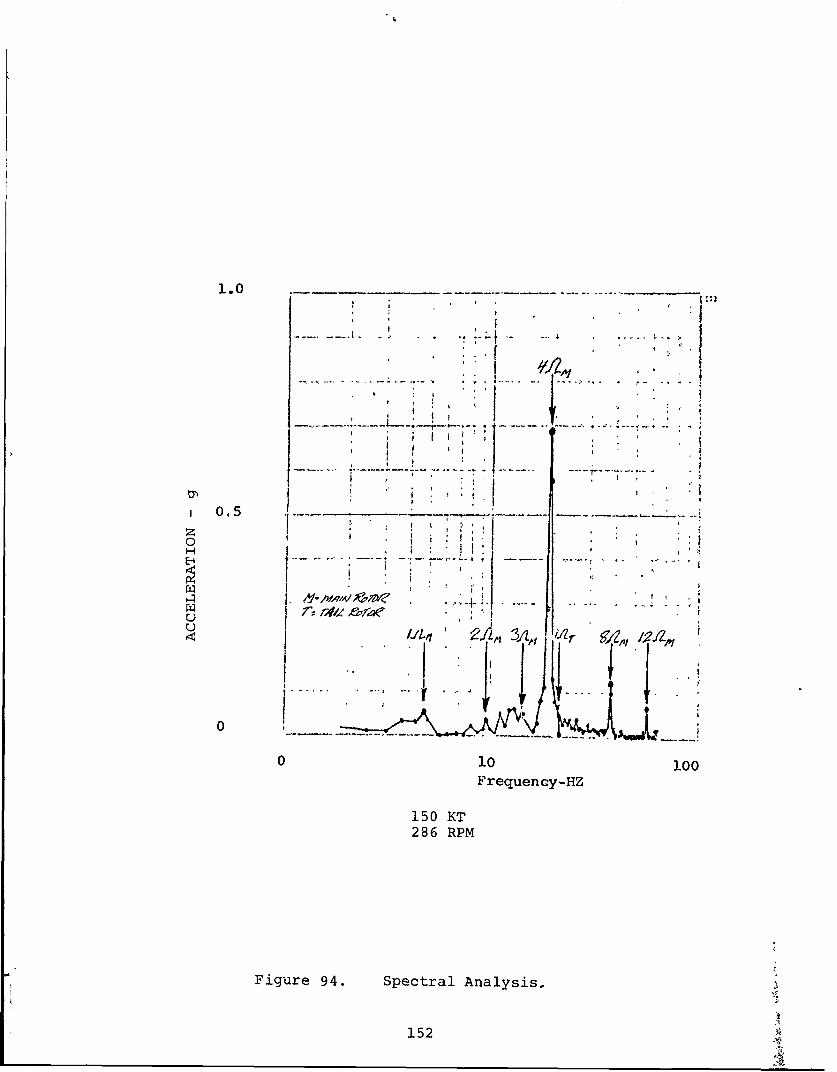
1.0* 3
.... .......-...
' ''1 *.'I i i , 't
.. ... , _ . .. -..... ...- - -
E ,0.5 , i_0 , I
I
0 I V
U
0 10 100
Frequency-HZ
150 KT286 RPM
Figure 94. Spectral Analysis,
152

1.8
~1.6 -
1 .4 .... ...
U1.0 ... K-16)
>
* u : .. : RI1o Z om•_
- -' - - -\ - - - --- - ,.... I -- -4 .- - - .. .-. .I .8t.k ; . I , I . ' I :
.8
0 .2
0 20 40 60 80 100 120 140 160 180
AIRSPEED - KT
Figure 95- Effect of Mount Change on 4/Rev Vibration,
153

As indicated, both mount systems had levels below the enginespec of 1.6 g, but the trend of the original mount data at only110 knots was toward exceeding the spec at higher speed. Also,both of these flights had no 4/rev vibration treatment in theaircraft. However, data shown in the following section, tomuch higher airspeeds, does have vibration treatment devicesinstalled.
A check was made of airframe vibration levels before and afterthe engine mount change to determine if the engine mountingadversely affected airframe vibration. It was found not tohave any adverse influences.
The aircraft 4/rev vibration configuration was being updatedand modified to improve the airframe vibration levels at4/rev. These levels serve as input to the engines at themounting locations so that where possible, the instrumentationon each engine was monitored to determine engine vibrationlevels.
Figures 96 and 97 show 4/rev vibration data for several signi-ficant flights of aircraft 002 during this development phase.The locations shown on each engine cover all areas: frame,mid-frame vertical, lateral and roll; auxiliary gearbox onengine; and engine transmission (nose box) accelerometer.Note that the airspeeds flown were increasing, as time pro-gressed, and that all data was not available for all flightsdue to instrumentation malfunctions. Figures 96 and 97indicate that when vibration treatment to the airframe is used,as on flights X-110, 124 or 198, the vibration levels on allengine pickups run from 0.4g to 0.8g.
For completeness, Figures 98 and 99 show that while providinglow vibrations at 4/rev, the levels at 1/rev and 3/rev werealso low.
Limitation of the Solution
Thera were no limitations associated with the solutiondescribed here.
I14

NO. 1 ENGINE NO. 2 ENGINE
VERTICAL
FRONT FRAME
Mz- -
Z/,
2"0 6'0 100 140 20 60 1: 14
01
20 60 -100 140 2014
1---.~..- - .
20 60 100 140 20 60 110 140
AIRSPEED -KT
Figure 96. Effect of Vibration Treatment on EngineVibration (4/rev)..
155

NO. 1 ENGINE NO. 2 ENGINE
LATERAL
FRONT FRAME
,/• -- - -_
I , 77]I
20 60 100 140 20 60 100 140
MID FRAME
S....F'-. ..
20 60 100 140 20 60 100 140
ROLL
MID FRAME
E- . ..1-d
018- -
20 60 100 140 20 60 100 140
AIRSPEED - KT
Figure 97. Effect of Vibration Treatment on EngineVibration (4/rev),
156

I Jc- _- &&•B ___•.-° • •
0 -
E -4
I ---- . . . ..----- : L L
' I ... :. .. .... ..- : -•-F--" - :....
20 60 100 140 20 6u 100 140
, 2. 0 "'-t ý 0 140 . t • .- -- • - -.-- - -
AIRPEE KTo__.~_.\e
-- . i " -- :.- "• V r=: '--_ -- "_
'-I'---- 2 - 2:,:::
F g.-.. ;n i. V v ..- - - " - - -- " - 1 -5. . . .. .
U -' -' : m . L .. _ .. .. ... . ,0 ' - . - - -... • - ° - . .. . , . .. "
20 bU, 10 140 20•o 6u 100-• "140-•m -- o--- ° o-
AIRSPEED-- KT
F~igue9. Egn irtouvy(/e)
r41157

, .o -_ ._ _. . . -_ ... __ . _ ____. .o__- ___- - - __-_' . . 1-J . _ ._ .
U -_- ____.- _- . -_.. . --• --. . - ..- z._ _ : -- -i-
20 60 100 140 20 60 100 140
!2o I•T.oiE•-.:T----.--.4-_•.--_-
.-• • - • -. __..-_7_ ... -_. -
0 - . - -.... 5____. • -- ___ __ .. .= _____ _." = ____--
20 60 100 14 0 20' 6•--
~ " " : "-
t-o - -0"• -. -'. ....- '. "". . .. .. .. . .- --.. . . "- -.- - _
00 L
20 60 100 140 20 60 100 140
AIRSPEED - KT
Figure 99. Engine Vibration Survey (8/rev).
158

PROBLEM - NONSYNCHRONOUS WHIRL
The problem described here is of particular interest since theoriginal manifestation of the problem led to extensive testingand modifications of a component (exhaust duct) because it wasbelieved that it was failing due to the duct resonating. Thesolution was not fully achieved until the source of the exci-tation was discovered and corrected.
The powerplant package abusive vibration test described inthis report was an all-encompassing test to provide confidencein the suitability of many components; however, in this reportcomments have been limited to those procedures and datarelated to this problem.
Description of the Problem
Early in the testing of the ground test vehicle (GTV), exhaustducts cracked. In addition, the vibzation level at the exhaustframe of the engine exceeded the engine manufacturer's limitof 2.5 in/sec at high frequencies (above 50 Hz).
Investigation Leading to a Solution
In February and March 1974, a set of then-current design air-frame engine nacelle components were installed on an engineat the engine manufacturer's facility and a vibration test wasconducted. The test consisted of a qtatic shake test and apowered abusive vibration test. The static shake test used asmall shaker attached to the center of the shake table to whichthe powerplant package was mounted through the airframe/enginemount isolators. A frequency sweep from 10 to 1000 Hz was con-ducted at a constant force of 2.1 lb and the resonances of theentire powerplant .;ere determined. The shaker was then attachedindividually to the airframe hardware (ducts, fairings, etc.),and their responses measured. No exhaust frame or exhaustduct resonances were detected.
For the abusive vibration test, the engine was supported byYUH-61A mounts on a shake table. The shake table was mountedon fou2 air bags. Vibratory excitation of the shake table wasprovided by means of three vertical electrohydraulic actuators,one beneath the aft mount plane in the center of the table,the other two at the forward end of the shake table, on eachside of the table. This shaker configuration was designedbecause of concern over possible rolling of table duringoperation of the shakers due to the center of gravity beingto the right of table center (aft looking forward); the
159

Boeing Vertol mount supporting structure and rotary actuator(see below) were mounted on the right side of the table. Theshake table was quite stable, however, and only the aft verti-cal shaker was used throughout the test. The shakers selectedwere capable of inputting two frequencies plus 2X the funda-mental (which would be used to simulate 4/rev NR + 8/rev NRfor a four-bladed rotor or 1/rev NR + 2/rev NR or 2/rev NR +4/rev NR for a two-bladed rotor) or a fundamental frequencyplus 4 X the fundamental frequency (which would be used tosimulate 1/rev NR + 4/rev NR for a f-ur-bladed rotor). Theactuators were capable of maintain ..g a steady load of up to2500 pounds each while providing a dynamic load sufficient toproduce 5 in/sec of dynamic motion from 0-100 Hz. The phasebetween the components in the complex input wave was variableas well as the phase between shakers.
Power is supplied to the YUH-61A main rotor transmissionthrough a cross shaft connected to the right angle nose gear-box which is mounted on the T700 engine output drive padflange. For this vibration test it was the intent to simulatethe nose gearbox weight, center of gravity, and cross shafttorque. The simulation was accomplished by mounting a nosegearbox mounting adapter to the engine output drive pad towhich was mounted a water brake. The water brake was used asthe power absorber. The nose gearbox mounting adapter incor-porated a pad to which a simulated cross shaft was mounted, atthe correct orientation. The other end of the simulated crossshaft was mounted to a torque producing rotary actuator. Therotary actuator was mounted to the shake table. Flexiblecouplings identical to the YUH-61A cross shaft flexible coup-lings were mounted on each end of the simulated cross shaft.These couplings permit relative motion between the powerplantand the aircraft main rotor transmission. Thus, engine powerturbine torque was counteracted by the water brake and YUH-61Anose gearbox cross shaft torque was a~nlied by the rotaryactuator, resulting in the proper loaui.ng on the engine outputdrive pad and the remainder of the engine. The only deficiencyin the simulation was that since the engines used did not pro-duce engine specification power (900 hp vs required 1536 hp),the engine power turbine torque was not as large as experiencedin actual service. The predominant loading on the engine out-put drive pad is the pitch moment component of the nose gearboxtorque, however, and the deficiency does not significantlyaffect the results of this test. The predicted fluctuatingnose gearbox cross shaft torque was not simulated and therewas no deliberate unbalance in the quill shaft between theengine output drive shaft and the water brake.
160

The vibration survey portion of the abusive test consisted ofstarting the engine to idle and accelerating the engine topower. This provided the engine signature with Boeing Vertolhardware in a simulated YUH-61A installation. The electro-hydraulic shakers were then turned on and shaker sweeps wereconducted wherein the frequency of the shaker was varied from5 up to 76 Hz. This was done to obtain a more realisticassessment of the powerplant resonances and responses thanthe static shake test because of the higher input level possi-ble with the electrohydraulic shakers. The shakers were thenincreased in input until engine vibration/stress limits werereached at each of the fundamental aircraft main rotor excita-tion frequencies (1/rev NR - 4.9 Hz, 4/rev NR - 19.7 Hz, 8/revNR - 39.4 Hz). No exhaust frame or exhaust duct resonanceswere detected.
During the abusive vibration endurance testing, the shakerinputs used were: at 4/rev NR (19.7 Hz) .25g + 0.20g = 0.32gor 1.0 in/sec and at 8/rev NR (39.4 Hz) 0.20g + 0.10g = 0. 2 2gor 0.4 in/sec. The test was run for a total of 50 hours.All but the last hour of the abusive test was conducted at20,000 rpm Np speed, the last hour being run at 21,000 rpm Npspeed.
As part of the post-test inspection, the exhaust duct wasexamined. A crack was found. This was felt to be a result ofthe wall statics which were applied between the vibration testand the cooling test. Specifically, the horizontal seam sep-arated from the aft end of the duct forward to the most aftwall static. From the wall static, a crack was evident run-ning forward and upward from this boss.
In November 1974, during the first 50 hours of testing theground test vehicle (GTV), the exhaust ducts on each enginecracked. From January 1975 through 1975, both Boeing Vertol'sand the engine manufacturer's exhaust ducts were vibrated atthe engine manufacturer's facility by mounting the exhaustduct under study on an engine exhaust frame which was mountedto a shake table and vibrated at 4gs. In February the follow-ing was reported:
2 nodal diameter (4 node) resonance at 158 Hz3 nodal diameter (6 node) resonance at 239 Hz
A cold engine shake test showed the exhaust duct resonanceat 168 Hz. Correcting for temperature effects on modulus, thefrequency would be lower. In operating an engine in a testcell with an unstiffened Boeing Vertol exhaust duct, a markedresponse was observed at the second Np critical during start-ing and showed an increase in overall level above Np = 20,000rpm when making Np sweep at IRP.
161

There were components at 122 and 225 Hz not present elsewhere,and the increase in overall vibration was in response to theappearance of these nonsynchronous frequencies. A back-to-back test was run using the same engine(s) in a test cell andon the GTV. The data is given in Table 5.
TABLE 5
COMPARISON OF GTV AND TEST CELL DATA
GE TEST CELL GTV RETEST IN GE TEST CELL79_%/_ WEEK OF 11I/0/4 12/74
BV TAILPIPE GE TAILPIPE
0/A NSV O/ V-HZ 0/A NSV 0/A NSV_0r_-_ _- 12o--1"3i6 -- _
XT ENGINE 113
IRP 0.6 NONE 1.7 1.2 1.5 1.1 .9 - 0.5 NONE2.5 - 2.2 1.2 1.0 .3
2ND NP CRITICAL 0.3 @ 12.9K RPM 1.7 @ 13.5K RPM 2.0 @ 13.8K RPM 0.3 @ 12.5K RPM
XT ENGINE 101 4/25/74 "/75 2/75
IRP 1.0 NONE UNKNOWN 2.5 2.0 0.6 NONE2.5 - 2.0
2ND NP CRITICAL 0.4 @ 15.0K RPM UNKNOWN 2.4 @ 14.0K RPM 0.5 @ 13.0K RPM
NOTES:
ALL VIBRATION DATA IN INCHES/SECOND.
O/A MEANS OVERALL ABOVE 50 HZ AS READ ON A METER.
NSV MEANS NON-SYNCHRONOUS VIBRATION.
ENGINE 113 DATA ON GTV WEEK OF 11/10/74 IS NOT CLEAR AS TO WHETHER STIFFENED OR UNSTIFFENEDBV TAILPIPE WAS INSTALLED.
ENGINE 113 DATA IN LYNN 12/74 WAS WITH UNSTIFFENED BV TAILPIPE INSTALLED.
ENGINE 101 DATA IN LYNN 2/75 WAS WITH STIFFENED BV TAILPIPE INSTALLED.
TAILPIPE WEIGHTS: BV 3.20 - GE 16.5#
A variety of ducts were tested on the shake table over aperiod of time. The data is given in Table 6.
162
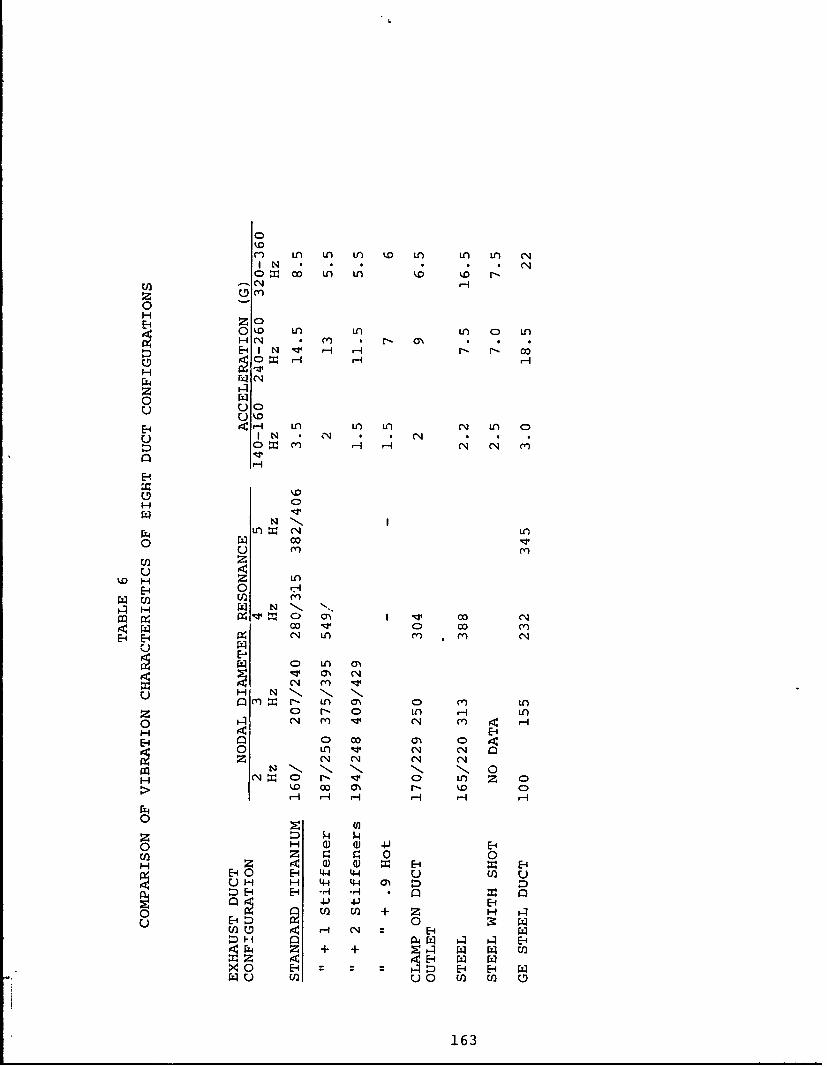
(*j LA U) LA) kD LO LA LA ('4
0 0 LA LO
H
0 Lo LA LA) LA C0 LnH(' N m * N ON
g5. 0 r r4 'i4-
o zz00
H: riH LA LA) LA (4 LA 0I N * N% * * ('o~ H H r- ( N (N (')
0 0014
E-4 0 AC4L
CO HO LA
[zI N'. ". 1- -
z 0 r- 0 ('4-I Lf
E-4 LA 00 m C
0 N N 0)v 1 CNl L
H N C)r 0 L A
0~ ul
z '4 P' ' '
H H' 3 0 LA 4 0-
E-1 0 ~ H' 044 U() H H 44 H- H
ýD E- -1 -I -1 :o H 4J 41) E-
HU 0) E- H1
HO H E-4 W- UOH H E-1 :-4 E-4 E4
EnH 0 (n
163

A variety of configurations of exhaust ducts, both titaniumand steel (and no tailpipe), were evaluated on the GTV fortheir effect on the 240-Hz nonsynchronous whirl vibration.These data (Figure iQO) show that solutions to the problem ofexceeding the engine vibration limits were achieved by theaddition of weight/stiffeners to either the steel titaniumexhaust ducts.
The durability of the duct had been improved much earlierwhen a stiLffening band was added to the exhaust end of thetailpipes.
Although the problem was "solved" the cause of the excitationhad not been identified; the source was believed to be theengine power turbine's shaft second critical, shown in theengine manufacturer's engine installation manual (dated May1972) to be 12200/12300 rpm (203/205 Hz). This was calculatedby the system vibration aid static analysis (VAST) computerprogram. Later tests of the engine under load showed thismode to oc-cur at 14,400 rpm (240 Hz).
The connection between the engine shaft and the helicoptertransmission was through a short (6.69 inches long) "quill"shaft with male splines on both ends of the shaft. Thesesplines mate with corresponding female splines in the endsof the engine shaft and the transmission input pinion(Figure 101).
The quill shaft splines used were side fit splines with arout clearance of .005 in and .0082 in/side in the enginespline and .025-0331 in/side in the transmission. Thisarrangement das used because of good experiance with a similarquill shaft arrangement used to couple an engine to a trans-mission in another helicopter although the GE installationdrawing recommended OD piloting.
However, because of known problems with nonsynchronous whirlexcited by shaft spline misalignment or eccentricity, aninvestigation was initiated to determine whether the quillshaft was invclved.
Figure 101 shows the splined quill drive shaft which connectsthe engine transmission spiral bevel pinion to the outputshaft of the engine. The drive splines are case hardenedand ground.
164

0mi + + -I~CI2
0x 0 U) E-o Ft4 Z Z Z H
HE +z MH *H H E1C
H E0 F4 E-1
SN 0 HCN C U Uz flB BH• H- N0
Z•
Ut E-1 H- H- UE-4E-1P P&iH H H ::
H ~U )U UC2 Ený M +
on mX HQ H H E-HE1H:4E- -4 a
W - -1E1Pu ui2 mU 0 0 ~ H4 E-4
+ -H
1651
4 . . . . .. . . . .. .
X~~~U 0HHH~ .r ~~~~~ ~ ý uHHC~fm)c~t
-4- ~c~0~4J
44)
C ) (
L4I0
(%J
ZH-OV IV aS/N-AlI~rU)
OOLI
165

ENGINE TRANSMISSION
ENGINEENGINE TRANSMISSION
ENGINE MOUNTING FLANGE
ENGINE TRANSMISSIONINPUT PINION GEAR
Figure 101. Quill Shaft Location,
166

The T700 engines provide an oil flow to lubricate the engineend of the quill shaft spline and a dual O-ring seal to iso-late the engine and transmission lubrication system.
Split rings with minimum clearances were fitted to an existingquill shaft in two of the 0-ring grooves. This provided apilot within the engine and transmission shafts to reducepossible eccentricities between the quill shaft and the engine.Transmission shaft testing with this arrangement clearly indi-cated that the quill shaft was involved.
The next experiment was to coat the splines of existing quillshafts with nylon to permit a custom fit of the quill shaftsplines to the mating splines. Measurements were made on theflight aircraft (six engines) fitted with these tightly fittedquill shafts in coiabination with the steel exhaust ducts withstiffeners. During 17 flights, no 240 Hz was observed. (Theengines had vibration pickups at the exhaust frame. Thedata reduction was done on a Ubiquitous spectral analyzer.)
This pinpointed the source of the vibration and a method ofsuppression. The nylon coating is not a satisfactory produc-tion solution, since it does wear. However, it permitted thecompletion of the aircraft test program without incurring thelengthy delay that would have been required if new quill shaftswith close outer diametral fits were required for piloting.The transmission splined component would also have to bereplaced since this internal spline h~as a full radius which isunsuitable for use as a pilot.
Limitation Associaced with the Solution
The nylon coated splines did not have adequate life for aproduction solution. A step toward a production configurationquill shaft which provided improved centering of the quillshaft was tested. The quill shaft splines at the engine endwere increased In diameter at their mid lengthpand at thetrdnsmission end, the diametral clearance of the lands at theC-ring was decreased.
Insufficient time was obtained on these pieces to determineif they would demonstrate whirl-free excitation for the mini-mum of 3000 hours required for a production solution.
No analytical work was done. Williams and Trent* showanalytically that for a particular configuration, spline fric-tion as well as unbalance could excite a nonsynchronous whirlcondition.
* Williams, R., Jr., and Tcent, R., "The Effects of Non-linear Asymmetric Supports on Turbine-Engine RotorStability", 1970 SAE Transactions, Vol. 79, Sec. 2,Paper No. 700320.
167

PROBLEM - ENGINE STALL
Description of the Problem
During the YUH-61A flight test program and the subsequentGovernment Competitive Test (GCT), there were a number ofengine stalls. These usually occurred during a flare to cometo hover.
Investigation Leading to a Solution
The first stall occurred on 20 September 1975 and by 16 Novem-L,:r 1975, nine stalls occurred. General Electric hass-immarized the available data as follows.
"Stall No. 1 - Narrative - 9/20/75 - A/C 001 - #1Engine 208
During flight X-217, while decelling from 40 knots inproparation for landing, at approximately 30 knots,"bang" was heard. After quick look to see that air-craft was okay, pilots looked at instruments and sawnothing wrong. (T4.5s were around 7600, torque 75%).Quick landing was made, all appeared to be normal,aircraft was shut down. Wind was a 10 knot head wind.
Stall No. 2 - Narrative - 10/30/75 - A/c 001 - #2Engine 230
Aircraft was being "yanked" into a 10-foo+ hover witha very rapid collective input. The maneuver wasaccomplished and aircraft stabilized approximately1/2 minute at 90% dual engine torque when bang washeard. Aircraft was nose into a 20 knot wind.
Stall No. 3- Narrative - 11/7/75 - A/C 002 - #2Engine 217 (X-280)
The No. 2 engine experienced a ripple stall during flight(X-280) on Friday, 11/7/75. The stall-occurred at alow power setting, the No. 2 was at ground idle toreset from lockout operation. As the No. 2 ECL wasadvanced and Ng was just above G.I. speed, theripple (3 pops) were heard. Wind was 8 knots.
168

Stall No. 4 - Narrative - 11/8/75 - A/C 002 - #2Engine 217 (X-281)
The aircraft stabilized at the following condition:5 ft. hover (Tethered) matched torques at 95%. The a/chad been stabilized at this condition for 3 minutes whenthe stall occurred, OAT = 19'C, PI 0 = 29.92". Wind wasa 10 knot head wind.
Stall No. 5 - Narrative - 11/12-75 - Stall event onengine 206 in A/C 002 (X-289)
The aircraft was in level flight at 30 knots in groundeffect. OAT was 161C and barometer was 30.00. The windwas nose on from 400 to right of nose at 8 knots.
The No. 2 engine was in lockout at 30% torque. The No.1 engine was in fly and at 70% torque.
As the pilot began a deceleration and flare to hover,he advanced the No. 2 engine slightly. Immediatelyafter movement of the ECL, a loud bang occurred whichthe pilot says came from the No. 1 engine. He estimatesairspeed at the time to be between 10 and 30 knots.
Stall No. 6 - Narrative - 11/12/75 - Stall event on engine217 in A/C 002 (X-239)
The aircraft was in level flight at 5000 feet and 80knots. The No. I engine was at GI and the No. 2 enginewas in fly at °0-75% torque. The pilot began to retardthe ECL on the No. 2 engine in preparation for a failedengine demonstration of autorotation entry. As soon ashe began moving the ECL back, he heard 6-7 "pops" fromthe No. 2 engine. He reports that when he ceased movingthe ECL, the "pops" terminated. Both this event andStall No. 5 occurred on the same flight.
Stall No. 7 - Narrative - 11/14/75 - Stall event on engine206 in A/C 002 (X-291)
The aircraft was decelling from 40 knots for hover andlanding. The No. 1 enqine at 30% torque, throttle re-tarded, and the No. 2 engine at 70% torque. The ECL onthe No. 1 engine was being advanced when a bang occurredat 35% torque. The aircraft was in ground effect approxi-mately 10 feet. Wind was 12 knots.
169

Stall No. 8 - Narrative - 11/14/75 - Stall event on engine206 in A/c 002 (X-291)
The aircraft was in a flare hover at 10 feet. The air-craft was simulating a single engine landing with theNo. 2 engine at 30% torque and the No. 1 engine at 90%torque when the stall occurred, a total of 6 loud bangswere heard with 6 to 7 more stalls continued until air-craft landed and the No. 1 engine shut down, indicatingan unrecoverable stall event. Pilot reported the air-craft pitched and rolled and felt the situation critical.Engine 207206 was removed and returned to Lynn for inves-tigation. This stall occurred on the same flight asstall #7, X-291. The No. 2 engine inlet was instrumentedduring this flight - no events occurred on the No. 2engine. Wind was 12 knots.
Stall No. 9 - Narrative - A/C 002 - #2 Engine 217 (X-293)
This event occurred following a day-long attempt to obtaina stall on this engine by repeating aircraft decelerationsfrom 40 knots to hover. These attempts included variouspower settings, wind directions, yaw angle, pitch anglesand altitudes. The stall was achieved during a decelfrom 40 knots at 10-15 knots airspeed and 5-7 feet AGL.The No. 1 engine was at 30% Q and the No. 2 engine was at90% Q. Wind was 16-20 knots coming from 450 to the leftrear. Aircraft altitude was approximately 70 nose up and100 nose left. The engine had temperature and pressureinstrumentation in the inlet at stations 2, 2.5 and 3.0."
Investigation Leading to a Solution
GE took immediate steps to increase the stall margin and Boeingundertook flight test and wind tunnel testing to establisn theinfluence of flight conditions and the airframe configuration.
Flight testing using smoke in the exhaust to display the injec-tion visually clearly showed that a horseshore vortex createdby interaction of the ground and the rotor captured the engineexhaust and circulated the exhaust to the inlet.
The temperature rises causing the stall have been shown to bemost critical during in-ground-effect deceleration of the air-craft. The flight test vehicle was instrumented and testedwith high response (time constant = 0.15 sec) thermocouplesand in a separate test with high response pressure transducersand lower response thermocouples. About 110 representative
170

decelerations from 40 or 50 knots to hover were performedutilizing helicopter heights from about 3 to 10 feet, with windvelocities from 0 to 28 knots. The engine power (singe engine)typically varied from around 20% to near 100% through themaneuver. These tests indicated that the instantaneous pres-sure distortion defined as PTMaX-PTMin did not exeed 5-7% and,
PTAveragealthough probably contributory, was not a major factor ininducing surge, since the engine should be capable of 10% with-out stall. However, the temperature transients determined withthe high response thermocouples were as high as 601C and weredetermined to be the major factor. The rate of rise was ashigh as 120°/sec.
Figures 102 and 103 present the maximum inlet temperature risesfor the No. 1 and No. 2 engines as a function of wind andflight direction. Analysis of the data indicated that enginepower setting had very little effect on maximum temperaturereached in the inlet, but helicopter height above the groundhad a fairly large effect, with greater heights showinglesser temperatures. Wind direction had a fairly strongoverall effect on a given engine inlet temperature rise. Notethat the critical wind direction for a given engine is withthe wind from the side opposite the engine but is fairly insen-sitive for that engine over a 90 ° sector. A summary of thestatistical distribution of the recorded temperature risesabove ambient is shown in Figure 104. A typical inlet temp-erature transient which induced a surge is shown in Figure105.
The actual occurrence of a surge due to reingestion on anyparticular in-ground-effect deceleration depends on whethera maximum temperature ingestion occurs and on whether itoccurs when the engine is operating at a condition where thestall margin is small.
The axial compressor stalled first (as recorded by the highresponse transducer at the axial compressor discharge plane).
Stalls were recoverable and manifested themselves to observersas two bangs about 1/2 second apart with flame from the engineexhaust. Typical T700 stall frequency is 5 to 6 pops/sec onthrottle stalls and 10/sec on decel stalls.
171

AIRCRAFTHEADING
HEADWIND I12 KT
CROSSWIND
60' -Q 30 20 10'~NLET ýTEMPERATURE RISý *C~\
//
//\
, LEFT T A R /
CROSSWIND12 KT/
N /
CAILNIND-212 KT
Figure 102. No. 1 Engine Maximum Inlet Temperature
Rise Encountered During IGE Decelerations,
172

tAIRCRAFT
HEADWIND EADING
H NCROSSWI
6( LE30ERTR, 2ISE 1 C
CROSSWIND
Figure 103.No. 2 Engine Maximum Inlet Temperature RiseEncountered During IGE Decelerations,
173

C EAPLE:
96% OF THE EVENTS HAVELESS THAN A 40 0 C TEMP•• B / 1RISE.
UH60
H
2
9
0
4
E174
zw
>
S20-
0
0 to 4b ý0 86INLET TEMPERATURE RISE "- C
SFigure 104. Sumary of Inlet Temperature RisesEncountered in Number 1/Number 2 Engines.
174

400-
PZ4 300-
200-
0100"
SURGE -i
60-
0U0 40-
H -
020 -
S60-
Z 40 -
H 0
0
60-
040-
0~0 20
0 -
0 1 2 3 4 5TIE - SEC
Figure 105. Engine Torque and Inlet TemperatureTime History during Stall Event.
175

The stall is caused by the entrainment of hot gases resultingin a rapid decrease in engine corrected speed (Nq/,) eventhough engine mechanical speed is constant or increasing.
The increase in inlet temperature (and decrease in correctedspeed) occurs more rapidly than the inlet temperature sensor(T2 ) can detect the change and adjust the axiý_ guide vanes(VG) to match the flow conditions. The T2-sensor time con-stant was approximately 25 seconds. Consequently, the T2-sensor cannot respond fast enough to the increase in inlettemperature, which occurs over an interval ot 2 seconds orless. The resulting mismatch is greater than can be acceptedas angle of attack on the blading and results in flow break-down or "surge". The path followed by a compressor operatingpoint on the compressor performance map, corresponding to aconstant variable jeometry excursion, is shown in Figure ]96.
In order to provide immediate relief, General Electric intro-duced a T2 sensor bias which offset the variable stators by+20 0 F. Since transient compensation is complicated, thissimple and quick across-the-board method was selected to pro-vide the stators with a "head start" on the transient inlettemperature use. Flight testing, however, produced additionalstall events and so a 30°F T2 sensor steady-state bias wasintroduced along with an increase in the stage 1 turbinenozzle diaphragm area. The turbine area increase reduced thecompressor operating line and provided still more stall mar-gin. Flight testing of this configuration produced stalls atvery much reduced frequencies compared to the previous con-figurations. While chese changes reduced horsepower margin,and required a higher gas generator speed of the engine toproduce a given horsepower, guarantee horsepower levels wereunaffected.
For production, the engine manufacturer has decreased theaxial compressor operating line while introducing centrifugalcompressor configuration changes to maintain overall com-pressor pressure ratio. The result of this program has beena marked increase in stall margin and a small efficiencyincrease. The production engine configuration has not beentested in the YUH-61A aircraft, but factory testing showsthis improvement and also shows that the production configura-tion exceeds the requirement for deceleration stall marginwhich was added to the engine PIDS in collaboration withBoeing to handle the reingestion problem.
Figure 107 shows the throttle stall margin for the YT, MQTand production engines.
176

VG\
PRESSURERATIO
STALLMARGIN
STALL
N =CONSTANT
VG' S= CONSTANT
Z4//-, DECRrASIINGg (DrcIJL 17.ARGIN)
VG'S = CONSTANT
AI RFLOW
Fig"ure 106. Compressor Stall Line and Paths,
177
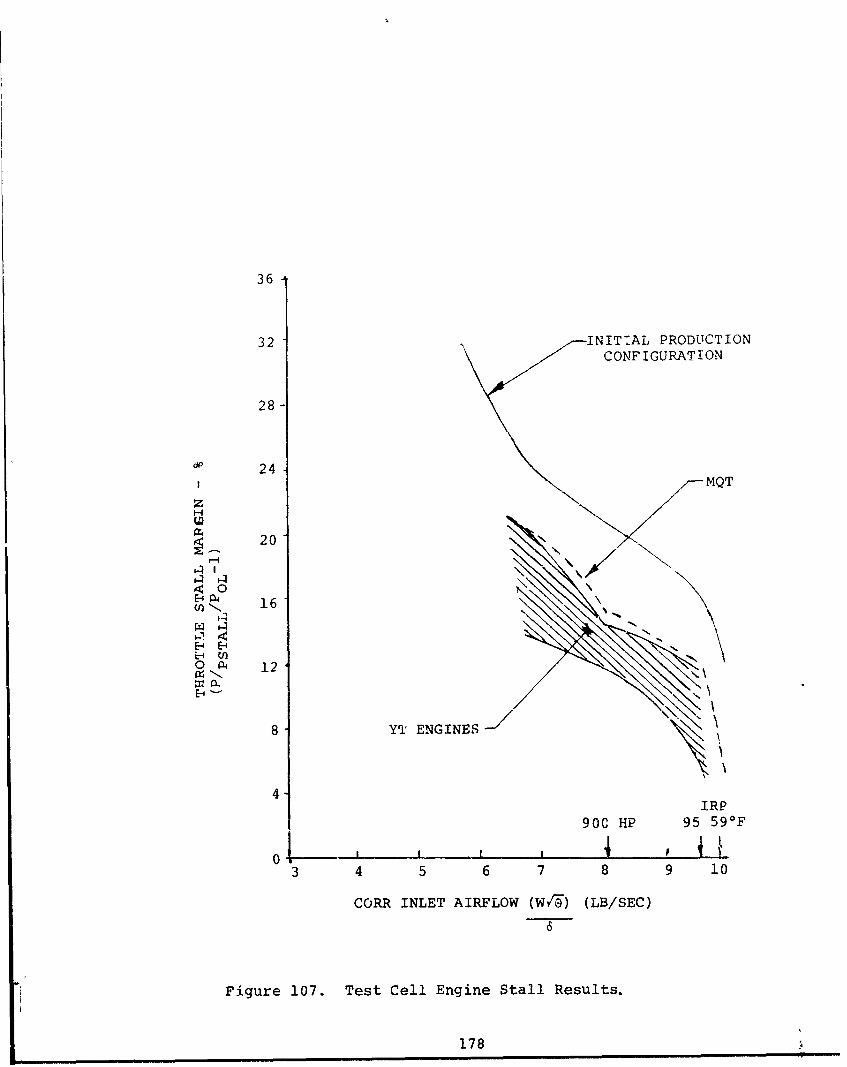
36
32 INIT:AL PRODUCTIONCONFIGURATION
28 -
d 24I- /-MQT
z
20
4 0
P a4n 16
P E-1
127
8- YT ENGINES
41 9 IRP
900 HP 95 590F
013 4 5 6 7 8 9 10
CORR INLET AIRFLOW (W/rD) (LB/SEC)
Figure 107. Test Cell Engine Stall Results.
178

In August 1976, testing of the 1/4.9 scale wind tunnel modelbegan. This testing explored the effects of fuselage angle ofattack, forward speed, yaw angle, distance above the ground,exhaust velocity, and exhaust duct anqle on the amount ofingestion
For expediency, the reingestion was simulated by injectinq afixed flow rate of helium as a tracer in the exhaust ductsof the model. Measurements of the concentration of the heliumin the inlet duct were then taken and used to quantify theingesticn. No attempt was made to correlate the helium con-centration to full-scale aircraft delta inlet temperatures.
These data obtaiin.ed from the wind tunnel test are shown inFigures 108, 109 and 110. Flight tests generally confirmthat the airspeed at which heavy ingestion occurs is from 20to 35 knots as shown by the wind tunnel data in Figure 110.Flight test did not confirm that doubling the exhaust velocitywould give a 6 to 1 reduction in ingestion as indicated inFigure 159.
Limitations Associated with the Solution
Engines with the rema'ched compressor were not flight testedto demonst-ate that no stall would occur in the most adversecondition.
An analytical method or wind tunnel test method to quanti-tatively predict inlet ingestion is lacking.
179

0 00H- H .1H
0i 0C) )cz z
4-)
(N OD z
)24
z 0H 0
o z
0 40z
H U)
rz~~ U)M 44
4-4
0
4.)
4-404-4
0ý
-al VIGl HI0O.L/JHoIaH -
F4)
180

DESIGN EXHAUST"4 vLOC-TY 140 FPS"0 II
•' X V 3?2KNOTS 0
UIESIGN EXHAUST
0 OL •OIT -• 2C 0
1" Ao0 10 2;0 300 400
EXHALIST VELOCITY - FPS
figure 109. Effect of Engine Exhaust Velocityon Ingestion,
181

GROUND VORTEXtNDULýD fNGESTIONiN FLARE
REFLECTED DOWNWASHS INDUCED !NGIESTION4 NEAR HOVER
0x 4
>0
o _ ___ __ ..... "-,___ __, .0 10 20 30 40 50
AIRSPEED - KT
Figure 110. Effect of Airspeed on Ingestion,
1 2 2

PROBLEM - ENGINE CONTROL/AIRFRAME DYNAMIC INTERFACE
In the area of engine controls, there were no problems withstability with the T700 engines in the YUH-61A helicopter.Figure 111 shows representative phase margins and gain. How-ever. obtaining the desired response required modificationof the airframe to the engine control and within the enginecontrol.
The T700 engines used in the YUH-61A aircraft were developedfollowing a technology demonstratcr program. The engine wascontracted for in the first quarter of 1972; the first "XT"engine was delivered in the first quarter of 1974 with firstrunning in the YUH-61A ground test vehicle in August 1974 andfirst flight in Novembec 1974.
Problems discussed in this section were uncovered inflight testing.
183

~GAIN
18 dB20
Hm
40
0
100___ _
PHASEw ZMARGINOl H40 200
1.0 10. 100
FREQUENCY - RAD/SEC
SLS 2 ENGINES
Figure 111. Gain and Lag vs Frequency.
184 'VA
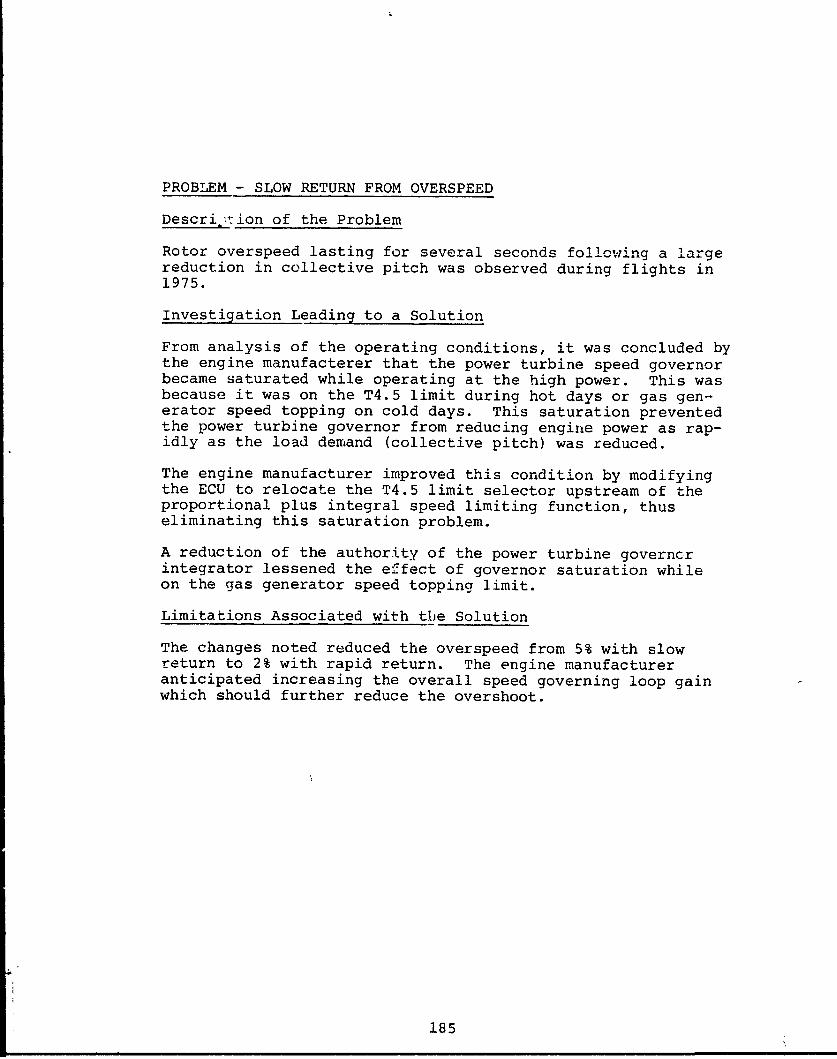
PROBLEM - SLOW RETURN FROM OVERSPEED
Descri,5Aion of the Problem
Rotor overspeed lasting for several seconds following a largereduction in collective pitch was observed during flights in1975.
Investigation Leading to a Solution
From analysis of the operating conditions, it was concluded bythe engine manufacterer that the power turbine speed governorbecame saturated while operating at the high power. This wasbecause it was on the T4.5 limit during hot days or gas gen-erator speed topping on cold days. This saturation preventedthe power turbine governor from reducing engine power as rap-idly as the load demand (collective pitch) was reduced.
The engine manufacturer improved this condition by modifyingthe ECU to relocate the T4.5 limit selector upstream of theproportional plus integral speed limiting function, thuseliminating this saturation problem.
A reduction of the authority of the power turbine governorintegrator lessened the effect of governor saturation whileon the gas generator speed topping limit.
Limitations Associated with thje Solution
The changes noted reduced the overspeed from 5% with slowreturn to 2% with rapid return. The engine manufactureranticipated increasing the overall speed governing loop gainwhich should further reduce the overshoot.
185

PROBLEM - ROTOR SPEED EXCURSION IN MANEUVERS NOT REQUIRING
COLLECTIVE PITCH CHANGES
Investigation Leading to a Solution
Load anticipation by use of a collective pitch input to thefuel control will of course not function when the rotor loadis changed without a collective pitch input. Therefore thespeed excursions are a function of the power turbine govern-ing gain and effective time constants.
An analysis was made in 1976 to show the effect of increasedgain. The results are shown in Figure 112 for a 1.5g cyclicpullup. It can be seen that by a threefold increase ingain, the speed error is reduced to less than one half.
Limitations to the Solution
No limitations are anticipated.
186

IORMAL GAINr 102
W 100
nz
S98
0 3 TIMES GAIN
]20
E-- 100r:L1 w
CA 8GCo
S60
40
0 2 4 6
TIME - SEC
SIMULATION MANEUVER FIXED COLLECTIVE PITCH
Figure 112. Effect of Control Gain.
187

PROBLEM - LACK OF PRECISE HOVER HEIGHT CONTROL
Description of the Problem
When the pilot of the helicopter made small correction in col-lective pitch to accurately position and hold the helicopterat the desired distance above the ground, there was a lagbetween his collective pitch input and the new stabilizedthrust. This resulted in a tendency for the pilot to over-correct. This was found in flight tests in 1976.
Investigation Leading to a Solution
A load demand system had been provided by connecting thecollective pitch control to the LDS (load demand spindle) ofthe HMU (hydromechanical unit) of the engine fuel controlas shown in Figure 113.
This provides an anticipatory signal of torque demand whenevercollective pitch control movements are the source of changesin the rotor torque. Without this input, the fuel controlmust wait for the rpm change to provide an error signal inthe ECU (electrical control unit) and then, through the torquemotor, reset fuel.
The engine governing system senses power turbine speed .whichis compared to the set reference turbine speed. The differ-ence between the actual and desired speed forms the errorsignal which is processed in the ECU. The resulting ECUcommand is made up of a gain proportional to speed error andthe integral of the error. The integral gain makes the systemisochronous.
If the collective pitch to load demand spindle was exactlythe correct relationship, the qoverninq system would have nocorrections to make and rapid rpm control would be provided.
In investigating this problem (lack of precise hover control),examination of flight data showed that on most instances thepeak of engine torque lagged the collective pitch input by 1to 1.5 seconds and appeared to be responding primarily torotor rpm variations from the selected rpm. However, on arun with a large collective pitch change, the engine torquefollows collective almost immediately without this lag.
188
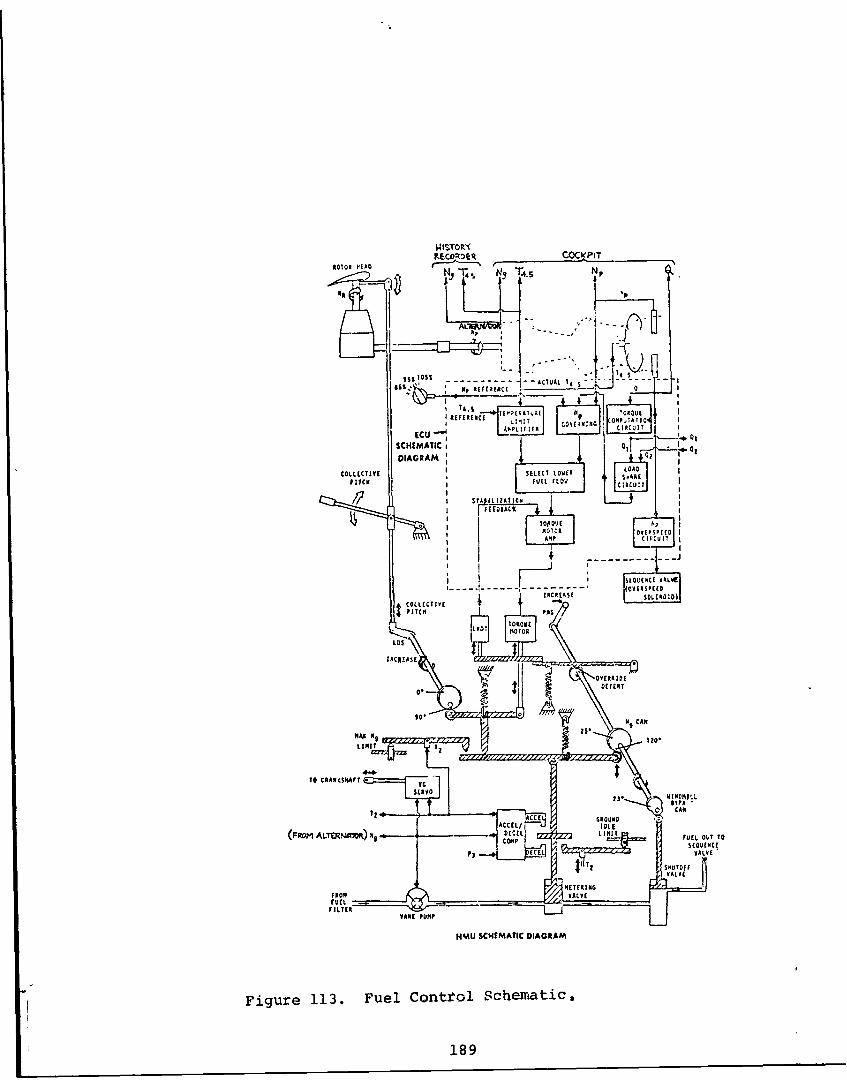
WISTOR*(PKE.CjD~t ' C..OrIKP I T
40101 HEADr
NA pT4.. D-
IZ$ TX )'R..~ EEVEACE0
II~u
SCHEMATIC I S
COLLECTIVESELEC LOVER NING OU
SCHEMAUETIC ~SCHEMA0
ECU...LOUT
COLCIE CAGLCRA ~SLEAO
FEt[ 1C WE
IINCRZATE
FF EI OA
1899

The variations in engine torque and collective pitch becomemore iapid as the pilot hovers closer to the ground. Thismay be expected, as the pilot tries to maintain altitude moreaccurately the closer he is to the ground. In doing so, heuses smaller and more frequent inputs to increase his accuracy.
It appeared from the records that the engines were not respond-ing immediately to small collective pitch motions. Thereforean investigation was made into the mechanical characteristicsof the collective pitch to LDS linkage. A test on an aircraftrevealed that the linkage to one engine had a deadband ofapproximately 1.10 of collective pitch (220 hp) and the dead-band to the other engine was 1.50 or equivalent to appcoxi-mately 300 hp.
The design of the IDS linkage used controlex cable which hadseveral bends to make it fit through available spaces betweenthe collective pitch control attachment and the engine LDS.
These bends caused backlash which produced deadbands. Thismeans that for the small collective pitch changes requiredto ac,-rately c'irntrol altitude, the LDS may not have moved.Torque adjustment then was dependent on the governing systemin the ECU to pfovide the adjustment which results in a lag.
Description of the Solution
The flight program was crmpleted before corrective action wasimplemented. However, planned corrective action was to changethe mechanical advantage so that a given an.ount of backlashwould represent a smaller amount of colleccive pitch andreroute the control to reduce the bends and subsequentbacklash.
In addition, the engine manufacturer planned to increasethe ECU governing gain, thereby decreasing the time to correcta speed error.
190

PROBLEM - FUEL CONTROL DYNAMICS
Description of the Problem
In the testing of the T700-GE-700 engine in the YUH-61A, aseries of problems were uncovered and improvements were madeas fixes to the prototype engine controls or were planned forproduction controls. Two of these have been discussed (pages185 and 186). A summary of the problems and the changes plannedfor production fuel controls were contained in GE "Change inDesign" dated 18December 1977. Sections dealing with dynamicinterface problems are reproduced on the pages following.
DESCRIPTION TAKEN FROM GE CHANGE IN DESIGN DATED 12/18/77
"Flight testing of YT700 and Maturity engines with varicusElectrical Control Units (ECUs) showed a need to furtherimprove the engine/AVM rotor system dynamics primarily inthe area of engine transient response and stability.
This CID proposes -introduction oý an improved ECU to improveengine transient response and stability.
The following changes are primarily aimed at improvingpower turbine (rotor) speed governing and operation onT4.5 limiting. The differences can be grouped into threemajor changes as follows:
a. Simplify Isochronous Governing
The G07 ECU has two separate integrators for isochronousgoverning; one in the Np governor circuit and one in theT4.5 limiter circuits. The selector circuit determineswhich circuit should be in control and switches to theoutput from the appropriate integrator. When not incontrol, an integrator generates larger and largererror signals until it saturates at some extreme value.Thus, when the selector first switches to an integratorthat has not been in control for a while, it allows avery large, irrelevant error signal into the hMU. Thelarge, irrelevant error signal takes time to be correc-ted. This results in large Np or T4.5 transients andslow engine cut bac1z when T4.5 exceeds the limitervalue.
191

One of the integrators was eliminated by relocating theselection function of the integration circuit. Sincethe one remainiig integrator is always functioning inthe circuit, it only saturates when a large correctionis really necessa-y.
In addition to smooth conversion from one control modeto another, compromising the design to reduce the trans-fer transients that result from switching between Npgoverning and T4.5 limiting is no longer necessary. TheT4.5 limiter circuit can now be optimized for stability.
Further improvements in response are possible by allow-ing for two upper saturation levels of the integrator,one defined for single engine operation and the otherdefined for dual engine operations. Figure 114 showsthe separate upper isochronous governing limits(integrator saturation levels). The reduced (relativeto G07) twin engine limit together with the singleintegrator minimizes transient overshoot on load chop,from maximum power.
The increased (relative to G07) single engine limitallows for isochronous governing at flat pitch (LDS =0).
Duringisingle engine operation, with the new limit,isochronous governing can be maintained over the fullpower range.
b. Tailor Control Gain to Load Inertia
Helicopter engines operate at the extremes of rotorsystem inertia. During autorotation, the equivalentload inertia is very small ( 0.062 slug-ft 2 ). With therotor system engaged (as in powered flight), the loadinertia increases by a factor of 10 to 20, and theincrease appears as a step change to the engine whenthe overrunning clutch engages or disengages.
The G07 ECU compromised the N governor so that a singleset of dynamics satisfied both extremes of load inertia.In the production ECU, two levels of control gain areavailable. Each one is selected for one of the extremesof load inertia. The control switches to the approp-riate governor dynamics depending on engine outputtorque. Low engine output torque (less than 20 ft-lbs)implies the helicopter is in autorotation and needs alow gain; higher values of torque imply engaged rotorand the need for high gain.
192

The low gain switch is also used to further enhanceengine response during a burst out of autorotation.During autorotation the power turbine stays near ref-erenced Np (usually 100%) and the rmain rotor is allowedto accelerate to a higher speed (around 105%). Ascollective is pulled, the main rotor slows down due tothe increased load. The collective pull also signalsthe engine to accelerate in anticipation of the impend-ing load. However, the Np governor wants to cut backon fuel flow to hold N at the reference speed. Byreducing the gain of the governor in autorotation, theNp governor does not reduce fuel flow and the engine isallowed to continue accelerating to pick up the rotcrload much faster and with less droop in Np. As therotor torque exceeds 20 ft- lbs., the control switchesto the high gain for engaged rotor operation.
c. Control Dynamic Changes
By reshaping the dynamic characteristics, it is possibleto improve the response of the system to slow changesin load demand (less than .4 cps) such as wind gusts,while increasing phase margin in the same frequencyrange to improve stability. In the high frequencyrange (>2 cps), the good attenuation of rotor systemdisturbances remains the same.
d. Table 7
Lists the characteristics which have been improved alongwith the degree of improvement expected. This measureof improvement is based on the usual set of transientsto allow G07 to proposed ECU comparisons. Other tran-sients may result in different responses, but the deltaimprovement will be comparable. Also shown is the changewhich has been the major contributor to the improvement.
Limitations
No limitations are anticipated.
193

~>
U)U
0 UW a)i U)En2 toi cci H LA0o dP d134 o 0 o LO 00o 0 'c~ 4-) * IPý r-- H- UJ2 +1
4-' 4.1
OP u-I
01 00
4-) ~ I 0 0r0d -fd C) rU -4 a% P I+
"PrI r-I En r--io
H7) H zOC i 0 (0- Cci 4J
W~ P4 a f~) 0)( s
0 00r~
Q 4 HW- C4-W0) 0W4 ~ UEA U)-i- CQ U j 0 0 04) ~
U Ur-~~ I ~ ~ 00 p rq t d 0)u ~ ~4J 4J0 0 Ln 0 Wp 4 0J p 14J10 4 X Cl4 0 4Jr7 04- d flu)
H . aU))4 4. E1 E~QU TI 0 -I4 U rL
E-1 0 P t:;4) c I 4 1~ > 0~4 a).-H a)J
H a)$4r p~-U 0.IJ r4d 002 -W - a
0 ~ 04Jt rz; -51 0 ( : .ulu o*E- P' 00'4JJr- 09 4-) 14
U) 9U) 4J 0 U) 0 OW 4J- Q) 4 rU4A ) -1Q FA -i 040 r u a04) .C421 P -r t A 4-)4)0 4 o to ro iH>a) H :3 Qdu 0- pa 024 0 - 41rO 0 04c
*o p .jU 4 .0 Uw p 0-H 4J LA4) 4 l100
E-i 0 0 ý4 -4 4 ((% 4J 4 - - 1 a

>0 P 14C
C4 :) 0) 01 0 m
H:1 H
Pi- 4-)~C 4Jk 4 U dPf)2~ I C'N Q 134 0
H H
(aM4J r-j
0U) O4
H Ot -4 tCd
0 4 rq .i rci) ý 4Wd 13 44- 0) a) tp
m04-) H bCi)4 End 1-r P a) 4- 04 u : r-I 4 4 44 >1 CI)ý
E-H1 dr-i ro Q) 4J -0 Uj)a)m0 (a I roý0 m 0
U r n0 E-1 aI) a )Er4 0 H- 0 c m4 1 0 4-
:1 ) (d 4J 4 0 41 r4H)r- IH H- - 4J) 4-) d 0
* r4.H C- d 0 1 (n2 *ri )t3 m 0 z _ H -14-i 04 ý4 0 p M4J 04$4I ý4>i .,-1 0 01 . 0 4J 0 4J (d 0
(a C0 tp -r p qH ý4 4 -H -H4-)P 4J co $ r: 9. ~ 0 w
4J) m -4 rOJ; a)p( Q -iPý>1 >1ir rd 4iJ(d r- HQ r-0 J0
*,.H ri-H >i (0 4J :1 -HI Q) P ) ý4H- HHi- 4J) a) -r-i o" 0J4 0) 4J t ()
"A - C U HH -I(D4-i 0 Q4 1 4 r,Q 9 rIa H *HddH COO.iý4M) En) P0 U) a
(d (o dd r-144-)(d (dH H- r- p0 i4J4J A d$4 (d *-i 0 04 4 ~ j0 Q) rd
to En) w21 CO 0 -r - o. 4 004rH 4IJ .41 -r4W to U)C (o- H00"Hl r.4-)H rI a cI) a) 4.i.4-) 4-1 Z a) (d ý4 4fto0co 0li 0 0 d ý4 d En 0 Cd 4' Q
H H Q)) to ) r- 00 0 0 (d $4 U >I ty
4J 4-i-H ) p ( 0l ~-HU) .4 tp- 4-J 0 0Wz Cd U~ C4 d tr-r 4 TI
t dH U)l Uil Um 41 wU)H- P -4.i -r4 Q) 0 $ -ri (dH- -P 0Q 0 44-0 U) U) P > -1C M ) ý:0 >i ý-i 4J-) r
ý44 0l4 >I~i- 0 Pi >0 0 o~ rd U)ý ).0 dlZd HO r- W0)4-) Hr 0 H 4J Q) (a a) 0 t)0 (4J U)-J Cd rd H E (1)0 H U) U) 4-JH-A - rH4-)
0 r Cd 4-4 0 ~C! Al 04) Q) 240 to04 4P.) -- ~ H (1) HU 4- 0 4 EO 4- J Z 44 x-4 U) Ul l( 44 I-> 104
195

A FORECAST OF POTENTIAL FUTURE DYNAMIC INTERFACING PROBLEMSAND RECOMMENDATIONS FOR INVESTIGATION/ANALYTICAL TESTINGEFFORT TO ACHIEVE AN IMPROVED UNDERSTANDING OF THE PROBLEMSAND POTENTIAL SOLUTIONS
PROBLEM - ENGINE RESPONSE
Reason Problem Will Occur in the Future
MIL-E-8593A, para. 3.2.1.5.6.1, dated October 1975 states thatthe requirement on a standard day (with no customer powerextraction bleed or engine anti-icing air bleed) for time toaccelerate from no load to 95% intermediate power shall notexceed 5 seconds at sea level to 9843 feet, and 10 seconds ataltitudes above 9843 feet with a power lever movement in .5second or less. Times shall not exceed 125% of these timeswith power extraction, bleed, anti-icing, distortion.
The specifying of a time interval does not provide a trueidentification of the power transient capability of an engine.An engine which at low powers can generate only relativelysmall accelerating torques can meet the time interval by gen-erating very large accelerating torques at modes or highpower. These characteristics would be beneficial for maneuv-ers which require high power levels; but when required to gofrom low power to high power, the grossly diverse acceleratingtorques invite a large underspeed followed by an overtorque.
Large rotor speed droop associated with a maneuver is unde-sirable and can even be unsafe. It will result in flightpatn degradation, since during a maneuver the pilot must givehis attention to providing multiple corrections to collectivepitch and or cyclic pitch to limit both the underspeed andthe overtorque which usually occur when the engine controlcorrects for the underspeed. This action distracts the pilot'sattention from other essential tasks.
The reasons for limiting torque are:
1. To keep stress levels of the transmission systemwithin the limits required for ldng life.
2. To maintain the directional control power of a single-rotor helicopter, which is degraded when the mainrotor is overtorqued and is below normal rpm.
196

Electrical generating systems have a minimum rpm at which theywill drop off the line. A time delay is usually provided whichwill permit further underspeed for a short period withoutdropping off. However, frequent large underspeeds increasethe exposure to a malfunction of these devices.
Helicopter vibration is limited by tuning the hel 4 ccpterstructure, absorbers, and isolation mounts to be o-i-"um atthe normal rotor speed. Excursions from that speeu i, •Jt inincreased vibration.
Recommended Program
It is recommended that a study be made to quantify the effectof engine response on helicopter rotor speed droop duringmaneuvers using collective pitch changes and those wherecollective is held constant.
The collective pitch anticipatory signal and the use of othersignals which anticipate torque changes (such as pitch ratex airspeed) and rotor rpm differences from enginu rpm (forautorotational recovery) would be evaluated. This would showthe effect of optimum airframe generated signals in providingminimum rpm excursions during changing flight conditions.
The engine control would be examined to show what can beaccomplished by use of high gain (proportional to signalerror) plus rate of change of error processed to match theengine characteristics. Shaping or filters would improvestability to permit the high gains.
The analysis would establish the relationship betweenacceleration schedule, engine control characteristics, andhelicopter maneuver requirements.
The advanced analytical tools available today use compressorand turbine maps, heat transfer data (for thermal lag), ductand nozzle characteristics, bleed and cooling flow effects,and inertias to accurately simulate transient conditions.
To verify this, the accuracy of the Boeing analytical program(General System Analysis) will be demonstrated using flighttest records from a CH-47 program currently in progress.Engines with three different response times are being flownand for each of the two engines, the following are continuouslyrecorded: Nl speed, N2 speed, engine PTIT, engine torque,engine flow, engine fuel press, engine fuel temp, compressordischarge press, N2 lever position, rotor speed and thrustlever positions.
197

The study would provide a fundamental base for establishingresponse characteristics and the effectiveness of controlsystem features over a range of helicopter/engine parameters.It would establish the range of helicopter parameters thatcould be handled by a specific engine control configuration.The study would also provide the data for an updating of theengine power transients specification.
198

PROBLEM - ENGINE DRIVE SHAFT EXCITATION
Reason Problem Will Occur in the Future
Engine output drive shafts that operate at supercriticalspeeds are commonly used.
These shafts, since they pass through a critical speed andthe damping may be small, are easily excited by alternating1/rev forces or moments which originate in the coupling fromthe transmission to the engine. If a splined quill shaft isused the spline friction and eccentricity of the shaft cangenerate moments and forces. Flexible discs cr laminatedrings of couplings can produce excitations. Theshaft vibra-tions can persist at operating speeds when the spread betweenshaft frequency and operating speed and or the damping aresmall.
Recommended Program
It is recommended that an analysis be developed to calculatethe forces and moments developed by typical couplings andtheir effect on representative supercritical engine driveshafts.
The results will provide a method of evaluating drive shaftsand couplings during the design phase to determine if sus-tained vibrations or whirl will occur and require the redesignof the coupling or shaft system. Bench testing would beconducted to verify the analysis.
199
PROBLEM - ACCEPTABLE TORSIONAL OSCILLATION LIMITS CANNOT
BE DEFINED
Reason Problem will Occur in the Future
MIL-E-8593A, para. 3.2.1.5.5, allows power fluctuations up to+1% of maximum continuous horsepower.
Whether this oscillation will be satisfactory when the engineis installed in a helicopter depends on the response of thetotal engine/airframe drive system to the particular frequencyand the nature of the forcing function and the characteristicsof components in the drive system.
For multienqine helicopters, the engines are usually gearedto the mbin rotors symmetrically with the output to the rotor(s)connected at the middle or combining gear. Therefore, avibratory mode exists with a node at the connection to therotors and the engines oscillating phased 1800 with respectto each other. Since the helicopter rotor(s) do not oscillate,no damping is provided by the rotor(s). Therefore nominallysmall engine torque fluctuations of the proper frequency cancause large oscillations.
One component whose performance is sensitive to torsionaltorque fluctuations is the ove-running clutch, since it, cancreep, slip, or jam depending on the level of torqueoscillations.
No satisfactory analytical program exists to describe theoperation of an overrunning clutch under steady plus alter-nating torques.
Recommended Program
A dynamic analysis should be developed to describe the opera-tion of overrunning clutches while transmitting unsteadytorques. This analysis should be supported by bench-testingto verify the accuracy of the analysis.
This program would then provide the tool for es'ablishingacceptable torque fluctuation limits for overruaning clutches.
200

PROBLEM - ENGINE STALL
Reason Problem Will Occur in the Future
No criteria exist for the stall margin that should be providedin the engine. A margin has been provided to cover enginemanufacturing variations, and degradation in service plus someallowance for distortion due to installation in an aircraftand for engine transients.
Helicopters during close to the ground decelerations canentrain the engine exhaust in the rotor vortex which carriesthe hot gases forward to the engine inlet. This results ina large rapid inlet temperature rise transient which can pro-duce stall in some engine/helicopter configurations.
There can be a steady state inlet pressure distortion causedby shafting, transmissions or other items which intrude onthe inlet flow path. This distortion is included in the normalinlet analysis and test. However, there is a dynamic pressuredistortion caused by unsteady rotor flow, particularly tipvortices; this has not been analyzed and tested either sepa-rately or in conjunction with the steady state pressure dis-tortion. No method exists for estimating these transients.
Recommended Program
The U.S. Army has initiated a program to measure inlet temp-eratures and pressures on the CH-47 during maneuvers whichproduce the maximum effect. Rapid response thermocouples andpressure transducers will be used since this is a dynamiccondition being investigated. This work should be extendedto other helicopters. In addition, wind tunnel tests shouldbe conducted to develop a technique that will simulate flighttest results so that the helicopter configuration may then bevaried to determine what parameters influence the ingestiontransient and how it can be reduced.
From these programs, margin requirements and required enginedemonstration tests can be established with a minimum penaltyto the engine or the aircraft. In addition, a guide couldbe provided to minimize ingestion on new designs ofhelicopters.
201

PROBLEM - HIGH TRANSMISSIBILITY OF ENGINE MOUNTING SYSTEM
Reason Problem Will Occur in the Future
Engine mounts (isolators) cannot permit sufficient enginemotion to obtain reductions in transmissicn of airframevibrations to the engine.
This motion limitation is imposed by the state of the art of
high speed shaft couplings.
Recommended Program
AMCP 706-202 (Engineering Design Handbook Part 2) para 403.2.1reviews the current choices of couplings with their limita-tions. A service-free redundant or fail-safe lightweightcoupling which can provide the freedom for a "soft" mountedengine is not available. Both the engine mount arrangementand the shaft to engine geometry affect the amount of angularand axial motion required to achieve a specific low level ofrotor-induced vibration at the engine. However, a couplingwhich permits greater motion than current couplings withoutsignificant penalties in size, cost, weight, and safetywould permit improved engine mounting systems. A search forcoupling concepts with potential should be undertaken andthe more promising designs selected for detailed analysisand testing.
202

RECOMMENDATIONS FOR ENGINE/AIRFRAME/DRIVE TRAIN SPECIFICATIONS
GOVERNING DYNAMIC INTERACTION
MIL-E-8593 should be modified as follows:
1. It should include a requirement that all power turbinetorsional frequencies experienced during testing beincluded (tabulated) in the engine specification even whenthey are less than the acceptable value. Analyses wouldthen be made to determine whether the installed enginewould exhibit excessive oscillations.
2. It should include vibration (engine shake) test with arange of flight weight airframe components (inlet,exhaust, plumbing, etc.) mounted on the engine to searchfor resonances. This same test should include a searchfor vibration-induced abnormalities in the operation of
the engine fuel control. Frequencies of resonances/abnormalities should be tabulated in the enginespecification.
3. It should specify the minimum. stall margins from idleto max power.
4. Para. 3.2.1.5.6 should be updated to specify accelerationcharacteristics which will limit rotor speed droop toacceptable values and provide satisfactory rotor starts.
The airframe Prime Item Development Specification (PIDS) shouldrequire an engine/airframe interface document which wouldinclude:
1. Analysis to demonstrate engine/airframe drive systemstability. This would also determine whether there isamplification of any engine oscillation experienced inengine testing. This must include examination of engine-to-engine modes for multiengined helicopters.
2. An engine/rotor response analysis to show rotor speeddroop/torque excursions during maneuvers.
3. The unbalanced moments and forces at the drive system/engine connection and the response to these unbalances.
These analyses should be reviewed at design reviews specifiedin the AQS required by AMCP706-203.
203

SUMMARY OF PROBLEMS LISTED CHRONOLOGICALLY
AIRCRAFTYEAR OR SYSTEM PROBLEM
1967 CH-46 Engine vibration caused by high speeddrive shaft unbalance.
1969 CH-47 Torque oscillation.
1970 CH-47 Inlet housing cracking.
1972- YUH-61A Engine mount selectiorn.1975
1974 YUH-61A Nonsynchronous whirl caused by quillshaft eccentricity.
1974 HLH/DSTR Torsional stability.
1974 HLH/DSTR Oscillating torque excited by fuelpressure fluctuation.
1974- YUH-61A Engine stall caused by exhaust1975 ingestion.
1975 CH-46 Rotor overtorque on rotor start.
1975 YUH-61A Slow return from overspeed.
1976 YUH-61A Rotor speed excursions in maneuvers notrequiring collective pitch changes.
1976 YUH-61A Lack of precision height control.
204

BIBLIOGRAPHY
1. "Factors Affecting Fuel Control Stability of a TurbineEngine/Helicopter Rotor Drive System" by C. Fredrickson,K. Rumford, and C. Stephenson, presented at the 27thAnnual Forum of American Helicopter Society, May 1971.
2. "Engine Control Stabilizing Compensation-Testing andOptimization" by J. R. Alwang and C.A. Skarvan, Journalof the American Helicopter Society, Vol. 22, No. 3,July 1977.
3. "Engine Airframe Integration, Current Practices and FutureRequirements for Army Aircraft" by J. Acurio, V. Edwards,and N. Kailos, presented at the Project Squid Workshop,U.S. Naval Academy 11, 12 May 1977.
4. "The Effects ofl Nonlinear Asymmetric Supports on Turbine-Engine Rotor Stability" by R. Williams, Jr. and R. Trent,1970 SAE Transactions, Volume 79, Section 2, Paper No.700320.
205