Virtualised load management algorithm to reduce CO2 emissions in the data centre industry
18
Int. J. Global Warming, Vol. 7, No. 1, 2015 3 Copyright © 2015 Inderscience Enterprises Ltd. Virtualised load management algorithm to reduce CO 2 emissions in the data centre industry Mueen Uddin* Department of Information Systems, Kulliah of Information Communication Technology, International Islamic University Malaysia, P.O. Box 10, 53100 Kuala Lumpur, Malaysia and Department of Information Systems, Faculty of Computing, Universiti Teknologi Malaysia (UTM), Skudai, 81310, Malaysia Fax: (006)-07-5537811 Email: [email protected] *Corresponding author Jamshed Memon and Mohd Zaidi Abd Rozan Department of Information Systems, Universiti Teknologi Malaysia (UTM), Skudai, 81310, Malaysia Fax: (006)-07-5537811 Email: [email protected] Email: [email protected] Raed Alsaqour School of Computer Science, Faculty of Information Science and Technology, University Kebangsaan Malaysia, Bangi, 43600, Selangor, Malaysia Email: [email protected] Amjad Rehman MIS Department, College of Business Administration, Salman Bin Abdul Aziz University Alkharj, P.O. Box: 11942, Kingdom of Saudi Arabia, Email: [email protected] Abstract: The environmental footprint of ICT continues to increase. Data centres are key contributors of greenhouse gas emissions that pollute the environment and cause global warming. All data centres are overwhelmed with
-
Upload
effatuniversity -
Category
Documents
-
view
1 -
download
0
Transcript of Virtualised load management algorithm to reduce CO2 emissions in the data centre industry
Int. J. Global Warming, Vol. 7, No. 1, 2015 3
Copyright © 2015 Inderscience Enterprises Ltd.
Virtualised load management algorithm to reduce CO2 emissions in the data centre industry
Mueen Uddin* Department of Information Systems, Kulliah of Information Communication Technology, International Islamic University Malaysia, P.O. Box 10, 53100 Kuala Lumpur, Malaysia and Department of Information Systems, Faculty of Computing, Universiti Teknologi Malaysia (UTM), Skudai, 81310, Malaysia Fax: (006)-07-5537811 Email: [email protected] *Corresponding author
Jamshed Memon and Mohd Zaidi Abd Rozan Department of Information Systems, Universiti Teknologi Malaysia (UTM), Skudai, 81310, Malaysia Fax: (006)-07-5537811 Email: [email protected] Email: [email protected]
Raed Alsaqour School of Computer Science, Faculty of Information Science and Technology, University Kebangsaan Malaysia, Bangi, 43600, Selangor, Malaysia Email: [email protected]
Amjad Rehman MIS Department, College of Business Administration, Salman Bin Abdul Aziz University Alkharj, P.O. Box: 11942, Kingdom of Saudi Arabia, Email: [email protected]
Abstract: The environmental footprint of ICT continues to increase. Data centres are key contributors of greenhouse gas emissions that pollute the environment and cause global warming. All data centres are overwhelmed with
4 M. Uddin et al.
numerous servers as the major components of processing. These servers and other equipment consume high amounts of power, thereby emitting CO2. In an average server environment, 30% of the servers are ‘dead’ and only consume energy, but such servers are not properly utilised, in which their utilisation ratios range from 5% to 10%. This paper proposes a new algorithm to manage and categorise the workload of different underutilised volume servers properly to increase their utilisation capacity. The proposed algorithm helps apply server consolidation methodology and increases the utilisation ratio of underutilised servers by up to 50%, thereby saving high amounts of power and reducing greenhouse gas emissions by up to 88%.
Keywords: server virtualisation; greenhouse gas; GHG; server consolidation; workload management; energy-efficient data centre; global warming.
Reference to this paper should be made as follows: Uddin, M., Memon, J., Abd Rozan, M.Z., Alsaqour, R. and Rehman, A. (2015) ‘Virtualised load management algorithm to reduce CO2 emissions in the data centre industry’, Int. J. Global Warming, Vol. 7, No. 1, pp.3–20.
Biographical notes: Mueen Uddin is a Post-Doctoral Research Fellow at International Islamic University Malaysia. He received his PhD from Universiti Teknologi Malaysia UTM in 2012. His research interests include green IT, energy efficient data centres, green metrics, global warming effects, virtualisation, cloud computing, digital content protection and deep packet inspection, intrusion detection and prevention systems, and MANET routing protocols. He received his BS and MS degrees in Computer Science from Isra University Pakistan with specialisation in information networks. He has published more than 28 international journal papers in indexed and reputed journals.
Jamshed Memon is a PhD Fellow at Universiti Teknologi Malaysia. His research interests include network security, intrusion detection and prevention systems, green IT, virtualisation and eco-friendly technologies. He received his MS in Information Security from Greenwich University UK in 2009. He has published seven international journal papers.
Mohd Zaidi Abd Rozan received his BSc (hons.) in Physics and Comp w. Ed., and MSc in IT from Universiti Teknologi Malaysia (UTM), Malaysia. He received his Doctorate of Engineering (DEng) in Information Science and Control Engineering from Nagaoka University of Technology, Japan. He is also a PRINCE2 Certified and Registered Project Management Practitioner, a Microsoft Certified Technology Specialist (MCTS), a Microsoft Certified Professional and a Herbalife Health Wellness Supervisor and Coach. Currently, he is the head in the Department of Information Systems, Faculty of Computer Science and Information Systems, Universiti Teknologi Malaysia (UTM) and an active researcher for the Information Service Systems & Innovation (ISSI) Research Group, UTM. His research interests are IT project management, profiling and data mining utilising multivariate approach and technopreneurship. He holds a radio amateur licence with callsign 9W2DZD.
Raed Alsaqour is an Assistant Professor in the School of Computer Science, Faculty of Information Science and Technology, Universiti Kebangsaan Malaysia, Malaysia. He received his BSc in Computer Science from Mu’tah University, Jordan, in 1997, MSc in Distributed System from University Putra Malaysia, Malaysia, in 2003 and PhD in Wireless Communication System from Universiti Kebangsaan Malaysia, Malaysia, in 2008. His research interests include wireless network, ad hoc network, vehicular network, routing
Virtualised load management algorithm to reduce CO2 emissions 5
protocols, simulation, network performance evaluation, and green IT. He also has a keen interest in computational intelligence algorithms (fuzzy logic and genetic) applications and security issues (intrusion detection and prevention) over network.
Amjad Rehman obtained his PhD in Document Image Processing and Information Management from the Faculty of Computing Universiti Teknologi Malaysia. During his PhD, he proposed novel techniques for offline cursive script segmentation and recognition. He is the author of several papers published in journals of high impact. His research activities include document information security, machine learning, and writer identification and business intelligence. Currently, three PhD and five Master’s by research students are conducting research under his supervision.
1 Introduction
With significant advances in information and communications technology (ICT) and e-businesses for the last few decades, computing technology ranks the fifth among various utilities, including water, electricity, gas, and telephony. Organisations and business firms have devoted efforts to implement the latest computing technologies such as cloud computing, grid and utility computing, and virtualisation. One of the most important technologies considers the need for green sustainable practices. Current financial, environmental, and energy crises as well as urgency in business firms and societies have prompted businesses, governments, and non-profit organisations worldwide to consider incorporating greener, ecofriendly, and sustainable practices in society. Such practices should originate from environmentally friendly movement toward more effective and efficient organisational as well as national strategies and policies worldwide (Thatcher and Pingry, 2007).
Issues on environmental sustainability have attracted the attention of businesses and scientific communities. Market forces, legislation, and ethical issues have also influenced organisations to minimise activities that harm the environment such as global warming. According to a report released by the International Data Corporation (IDC) in 2008, almost half of the 459 European companies focused on green IT and cost-efficient strategies to attain sustainable businesses and societies (IDC, 2008). Today, organisations are faced with conflicting goals and challenges. For instance, these organisations operate in geographically distributed workforces, headquarters, data centres, branch offices, and mobile workers. Members of such organisations should access e-mails, shared files, and mission-critical applications, but the speed of access is directly associated with an employee’s productivity. For this reason, computing resources have been widely deployed in many locations to provide local workers with the most efficient service delivery possible. However, this approach requires additional hardware and software systems to meet increasing demands.
Data centres comprise high amounts of digital electronics and computer technologies, in which higher quality and more reliable electric power are required than in most commercial buildings. Furthermore, these data centres are buildings equipped with air-conditioning systems to maintain optimum operating temperatures for equipment, including computers, power supplies, power-conditioning equipment, control electronics,
6 M. Uddin et al.
and backup power systems (Kant, 2009). The use of data centres has become common as the processing power required by businesses continuously exceeds the maximum level that can be maintained in their own corporate infrastructures. Thus, data centres have been established to function as large servers scaled to enhance economies and provide more efficient computation and storage resources for several businesses (Gartner, Inc., 2008). However, physical infrastructures in data centres have been oversized to support IT load. Such oversized infrastructures have a very negative impact on overall data centre efficiency, resulting in carbon footprint. Data centres have also been oversized to allow a fat margin of error in terms of estimating data centre capacity. As a result, IT equipment is underutilised.
Carbon and energy issues have been frequently emphasised in international headlines. Governments, non-profit organisations, and corporations conduct studies regularly to analyse their carbon footprint. This initiative aims to determine the impact of their activities on global warming and establish action plans that reduce carbon emissions. With the increasing awareness on environmental issues such as global climate change, organisations have realised the importance of sustainability and green practices. For instance, data centres are a major consumer of energy in terms of overall operations. To manage the amounts of current data, data centres should use additional power and servers; however, these factors have caused data centres to become larger, denser, and hotter. Such data centres also entail higher operational costs. Although these centres constitute one area of IT businesses in which environmental sustainability has become increasingly important, environmental issues have become a serious industrial concern as prompted by local and global initiatives (Uddin et al., 2011).
The Environmental Protection Agency (EPA) report has estimated that data centres in the USA consume approximately 1.5% of the total electricity consumption that costs approximately $4.5 billion. Energy costs of data centres are predicted to increase substantially to 1,600% between 2005 and 2025. For instance, electricity consumption doubled in 2000 to 2006 and was expected to double again to more than 100 billion kWh corresponding to $7.4 billion of annual electricity costs in 2011 (Brown et al., 2007; Uddin and Rahman, 2010). In 2006, data centres in the USA consumed approximately 61 billion kWh or 1.5% of the total electricity consumption (about 4 trillion kWh) and is equal to the amount of energy used by 5.8 million average US households (5% of the total households). Furthermore, such power has released 37 million metric tons of CO2 (MMT CO2) or 6% of the total amount of CO2 emissions (5.9 billion metric tons) from several sources worldwide. This electricity costs US $4.5 billion and requires a peak load capacity of approximately 7 GW, which is more than twice the total consumption in 2000. Peak load capacity was also expected to double again to 12 GW in 2011, thereby requiring ten additional 500 MW power plants. Nevertheless, Koomey (2008) and EIA (2010) emphasised a significant progress in data centre industry, in which approximately 70 billion kWh of power was consumed in 2008, and such consumption corresponds to the amount of fossil carbon released ~1.21013 g of fossil carbon (or 42 Mt/y of CO2) per average carbon intensity of 160 g C/kWh.
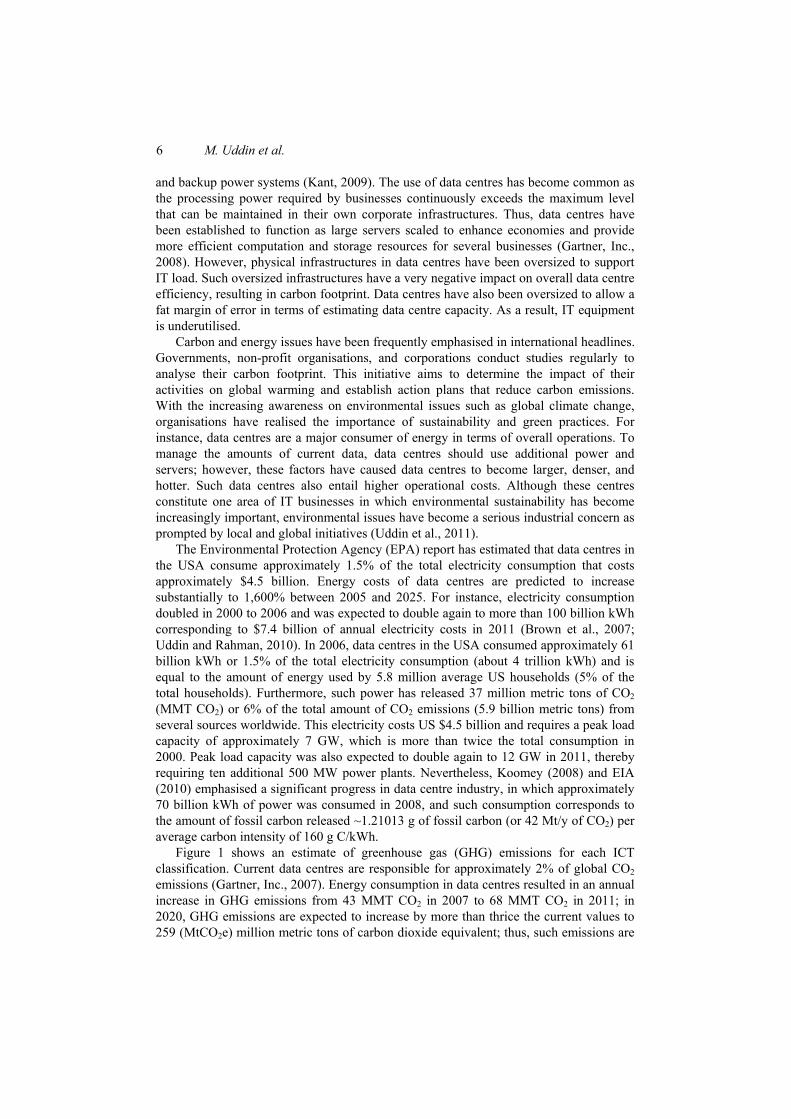
Figure 1 shows an estimate of greenhouse gas (GHG) emissions for each ICT classification. Current data centres are responsible for approximately 2% of global CO2 emissions (Gartner, Inc., 2007). Energy consumption in data centres resulted in an annual increase in GHG emissions from 43 MMT CO2 in 2007 to 68 MMT CO2 in 2011; in 2020, GHG emissions are expected to increase by more than thrice the current values to 259 (MtCO2e) million metric tons of carbon dioxide equivalent; thus, such emissions are
Virtualised load management algorithm to reduce CO2 emissions 7
considered as the fastest growing contributor at 8% p.a. (Climate Group, 2008). A data centre comprises of numerous servers and uses the same amount of energy that a small city consumes (EPA, 2009). Data centres are predominantly occupied by high-cost, underutilised volume servers called x-86 servers as the major component to perform different processes and provide services for end users (Rivoire et al., 2007). These servers consume large amounts of energy and power, thereby generating excessive CO2 that is very hazardous to environmental health and contributes greatly to global warming. In an average data centre, 30% of the servers are ‘dead’, only consuming power and generating GHGs with a utilisation ratio of 5% to 10% (Uddin et al., 2012). Thus, organisations should outline strategies to address such increasing energy consumption and GHG emission (Greenberg et al., 2006). Energy security and availability have become an issue for data centre operators because the prediction of energy availability and cost has become difficult as a result of combined pressures of fossil fuel availability, generation and distribution infrastructure capacity, and environmental energy policy (Brill, 2007).
Figure 1 Estimated ICT CO2 emissions (see online version for colours)
Source: Kumar and Mieritz (2007)
The Climate Group and GeSI (Global e-Sustainability Initiative, 2008) analysed the impacts of CO2 emissions. Global data centre footprints, including equipment used and embodied carbon, is predicted to increase to more than 259 million tons in 2020, almost thrice the amount of 76 million tons of equivalent CO2 emissions in 2002. These emissions correspond to approximately 14% and 18%of the total ICT-related emissions in 2002 and 2020, respectively. Equivalent ICT-related CO2 emissions are approximately 2% of the global total emissions, and data centres account for approximately 0.3% of the global CO2 emissions (Info-Tech Research Group, 2008).
An increase in GHG emissions in data centre industries has resulted in the gradual rise in the average surface temperature of the Earth. Over time, the rising temperatures are expected to produce climate change and variations in weather patterns, sea levels, and storm severity. Data centres consume electricity when IT and physical infrastructure
8 M. Uddin et al.
loads use power to process information or when complex cooling systems remove heat from data centres to maintain stable temperatures. Therefore, energy efficiency and environmental performance of data centres should be improved to achieve ‘green’ information technology (Koomey, 2007). Efforts have been devoted to create more useful and energy-efficient techniques and opportunities for these servers (Uddin and Rahman, 2010). However, only a few studies have been conducted to determine and improve operational efficiency and effectiveness of data centre industries particularly in determining carbon footprints (Brown et al., 2007). Environmental issues such as pollution and CO2 emissions have become increasingly important social concerns. The reduction in power consumption can result in corporate goodwill, motivate environmentally conscious employees, and helps provide brand distinction.
In this paper, a new virtualised load management algorithm is proposed to categorise data centres in different measuring resource pools and determine the overall utilisation and carbon footprints. The proposed algorithm possibly helps classify servers according to their workload and power consumption. Volume servers are categorised in three resource pools and CO2 emissions are calculated depending on the power they consume. This technique reduces the number of servers by consolidating the load of multiple servers to one server. This research aims to identify and compile emerging trends and best practices in a set of practically recommended modifications that may achieve lower carbon emissions when such technique is applied in enterprise data centres. This study also focuses on specific changes that are practically implementable in existing facilities rather than change process management. Data centre managers are also provided with ways to adjust to new world orders of green IT and global warming, thereby reducing overall CO2 (carbon footprints) emissions that are very hazardous to environmental sustainability.
2 Life cycle of data centre carbon footprints
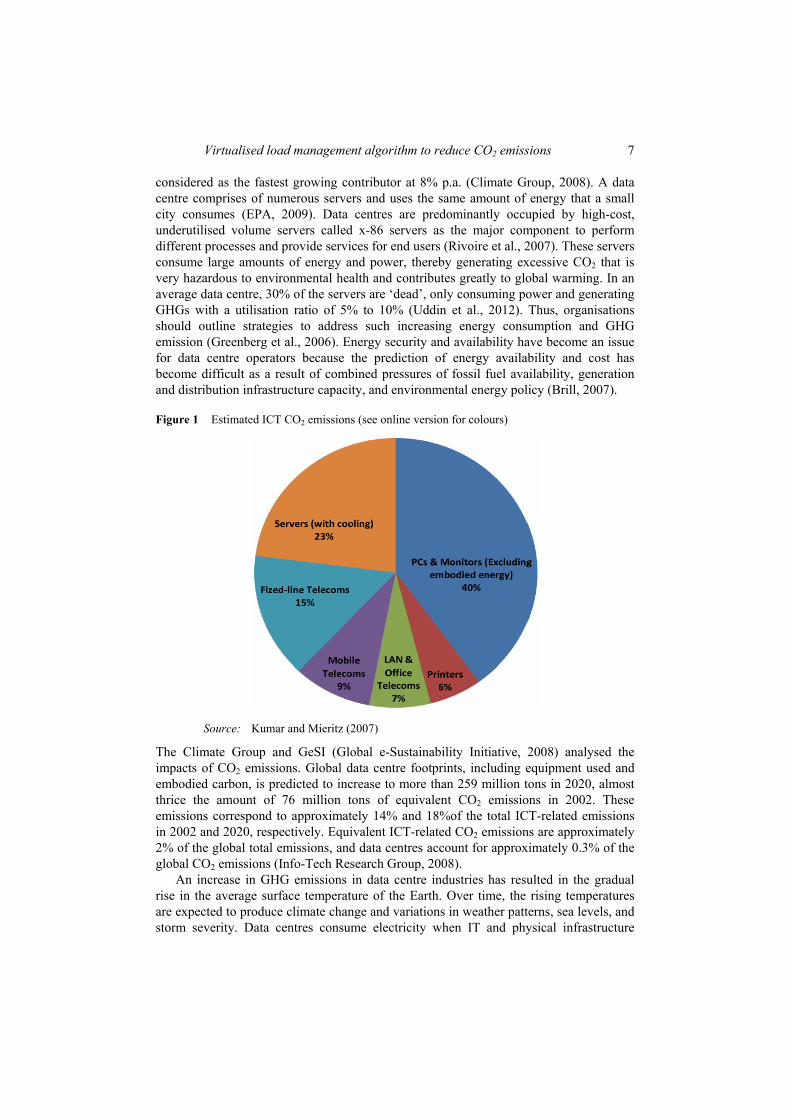
The total electrical energy consumption of data centres, servers, and computers has continuously increased globally. Such increase in energy consumption results in increased GHG emissions as burning coal, oil, and gas generate most of the electricity (Figure 2). Numerous old computers and other electronic hardware contain toxic materials that are discarded in a couple of years after purchase, end up in landfills, pollute the earth, and contaminate water. The environmental impact of such increased number of computers in use and frequent replacements has become a major concern of IT (Lefurgy et al., 2003). The following formula is used to calculate the total carbon emissions from electric power consumption:
T E I= × (1)
where T is the total emission, E is the power consumed, and I is the GHG emission intensity of the energy used. E can be obtained directly from an electricity meter in a data centre, whereas I can be calculated by a power supplier (power company) as an average value based on the sources of fuel providing power to the data centre. Environmental stewardship includes the balancing of current resource consumption with resource requirements of future generations. For example, Brundtland’s landmark report in
Virtualised load management algorithm to reduce CO2 emissions 9
1987 defined sustainable development as meeting “the needs of the present without compromising the ability of future generations to meet their own needs” (Sovacool and Brown, 2010). A green energy-efficient and environmentally friendly policy helps reduce total emissions by improving the power consumption rate and by increasing the productivity and utility of already installed equipment as I is maintained at a constant level. Renewable power generation sources can be used and focuses exclusively on the use of lower emission-clean fuels such as wind, solar, biomass, or hydroelectric fuels that reduce T by reducing I as the rate of E is maintained (Uddin and Rahman, 2011).
Figure 2 Life cycle of data centre carbon footprints (see online version for colours)
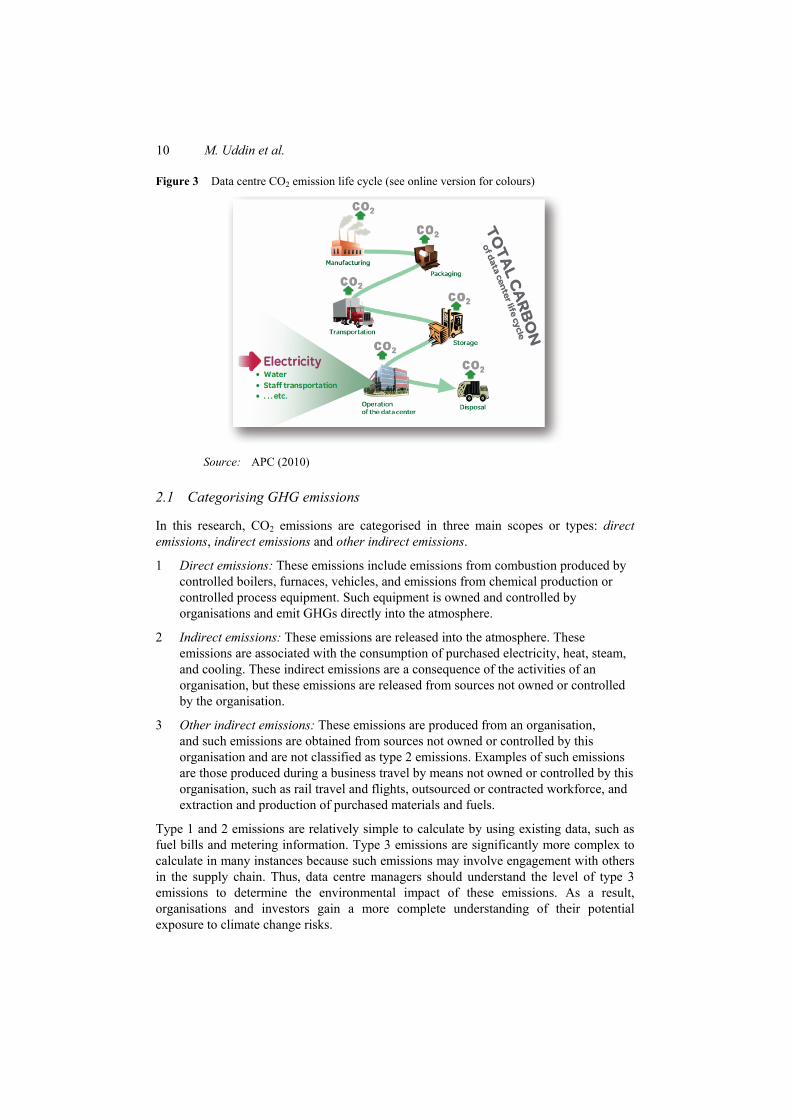
Global warming is a major global concern. Individuals, organisations, and governments have devoted efforts to control global warming and sustain the living conditions on Earth. Information technology and telecom/data networks can be equally important strategies to solve this problem on global warming. Many technologies have been invented and other technologies should be developed or fine tuned to prepare the use to reduce GHG emission in the atmosphere (Jacobson, 2009). From an overall data centre lifecycle perspective, the general term ‘carbon emissions’ includes CO2 emitted during the manufacturing process of components that populate a data centre (servers, UPS, building shell, cooling, etc.). This aspect of carbon emissions can be termed ‘embedded carbon’. The term carbon emissions also include CO2 emitted during the operation of the data centre (in terms of electricity consumed), the maintenance of the data centre (i.e., replacement of consumables such as batteries, capacitors, etc.), and the disposal of data centre components at the end of the lifecycle (Figure 3).
10 M. Uddin et al.
Figure 3 Data centre CO2 emission life cycle (see online version for colours)
Source: APC (2010)
2.1 Categorising GHG emissions
In this research, CO2 emissions are categorised in three main scopes or types: direct emissions, indirect emissions and other indirect emissions.
1 Direct emissions: These emissions include emissions from combustion produced by controlled boilers, furnaces, vehicles, and emissions from chemical production or controlled process equipment. Such equipment is owned and controlled by organisations and emit GHGs directly into the atmosphere.
2 Indirect emissions: These emissions are released into the atmosphere. These emissions are associated with the consumption of purchased electricity, heat, steam, and cooling. These indirect emissions are a consequence of the activities of an organisation, but these emissions are released from sources not owned or controlled by the organisation.
3 Other indirect emissions: These emissions are produced from an organisation, and such emissions are obtained from sources not owned or controlled by this organisation and are not classified as type 2 emissions. Examples of such emissions are those produced during a business travel by means not owned or controlled by this organisation, such as rail travel and flights, outsourced or contracted workforce, and extraction and production of purchased materials and fuels.
Type 1 and 2 emissions are relatively simple to calculate by using existing data, such as fuel bills and metering information. Type 3 emissions are significantly more complex to calculate in many instances because such emissions may involve engagement with others in the supply chain. Thus, data centre managers should understand the level of type 3 emissions to determine the environmental impact of these emissions. As a result, organisations and investors gain a more complete understanding of their potential exposure to climate change risks.
Virtualised load management algorithm to reduce CO2 emissions 11
3 Problem statement
Data centres comprise numerous servers that perform processing for end users to facilitate and accomplish business goals. With the rapid growth in businesses particularly e-businesses, large and complex data centres are needed. However, approximately 90% of the servers in data centres remain idle most of the time, merely consume high amounts of energy, and simultaneously generate high amounts of CO2 that threaten environmental sustainability and exacerbate global warming. A mechanism that properly utilises server resources should be implemented to eliminate idle servers and ultimately reduce energy consumption.
4 Proposed solution
Virtualisation technology provides a great potential to increase the utilisation in currently installed server equipment, thereby reducing energy, hardware costs, and environmental footprint by properly implementing server consolidation at different levels in data centres (Carter and Rajamani, 2010). This strategy also provides an easy way to shift the load of multiple underutilised physical servers on fewer server machines, thereby allowing multiple applications to run individually on a single server. Furthermore, the utilisation ratio of different servers is increased by ≥50% and saves high amounts of energy. Thus, virtual technology helps implement green data centres to ensure that IT infrastructure contributes as little as possible to GHG emissions and helps regain power and cooling capacity, recapture resilience, and remarkably reduce energy costs and the total cost of ownership.
4.1 Virtualised load management algorithm
With expanding data centre footprints and increasing energy consumption, organisations have been pressured to report and reduce the environmental impact of such issues as well as reduce operational costs. Governments and corporations worldwide should determine carbon footprints of services and products. A networked, transparent, and integrated solution is needed when complex, long-term, and critical issues such as energy efficiency and climate change are dealt with. Businesses should continue to improve sustainability efforts. These businesses should also recognise that a GHG evaluation or an environmentally healthy and safe system is only the first step in this evolutionary process.
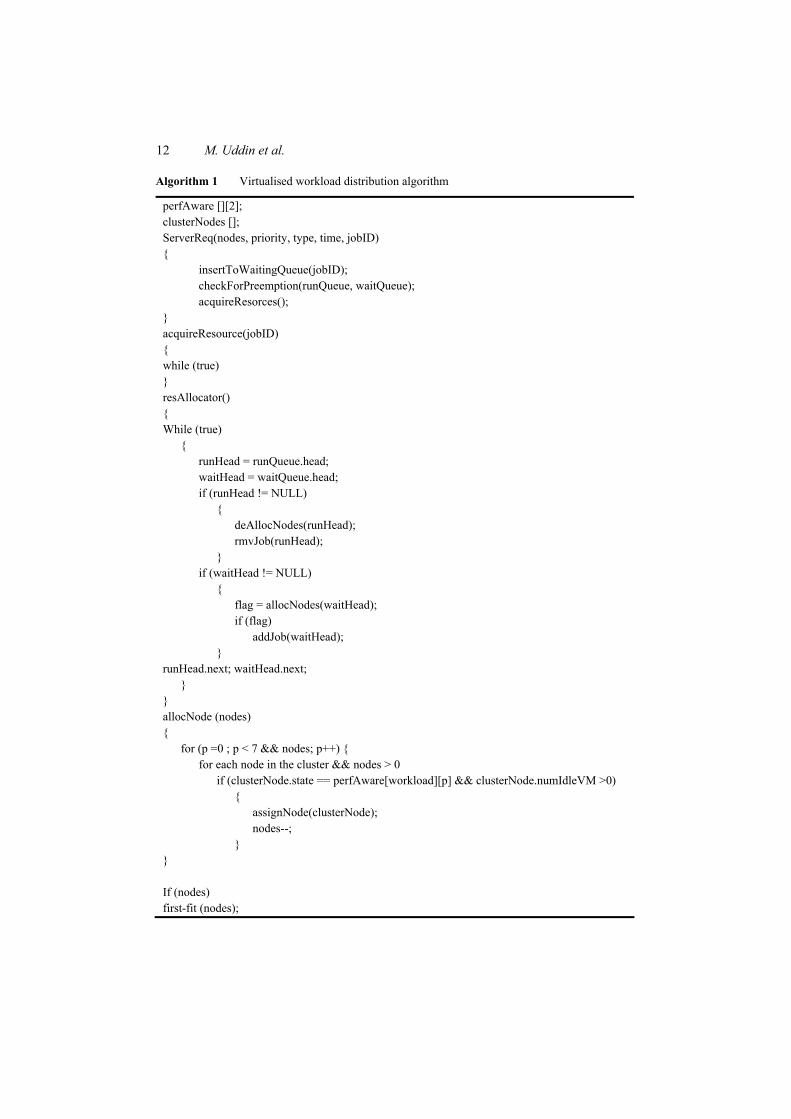
The virtual workload placement algorithm (Algorithm 1) aims to determine cluster servers to guarantee minimum power penalty and increase the overall resource utilisation of a given cluster server. The decision logic also reduces the total energy consumption of the data centre by activating the minimum required cluster servers to support the new incoming job. To achieve optimal packing, we defined a two-dimensional matrix in which the search is performed as a physical machine is simultaneously selected to distribute new virtual machines.
12 M. Uddin et al.
Algorithm 1 Virtualised workload distribution algorithm
perfAware [][2]; clusterNodes []; ServerReq(nodes, priority, type, time, jobID) { insertToWaitingQueue(jobID); checkForPreemption(runQueue, waitQueue); acquireResorces(); } acquireResource(jobID) { while (true) } resAllocator() { While (true) { runHead = runQueue.head; waitHead = waitQueue.head; if (runHead != NULL) { deAllocNodes(runHead); rmvJob(runHead); } if (waitHead != NULL) { flag = allocNodes(waitHead); if (flag) addJob(waitHead); } runHead.next; waitHead.next; } } allocNode (nodes) { for (p =0 ; p < 7 && nodes; p++) { for each node in the cluster && nodes > 0 if (clusterNode.state == perfAware[workload][p] && clusterNode.numIdleVM >0) { assignNode(clusterNode); nodes--; } } If (nodes) first-fit (nodes);
Virtualised load management algorithm to reduce CO2 emissions 13
The workload that should be consolidated and characterised before server virtualisation is considered. The type of servers, their current status (whether idle or busy), the cost to implement server consolidation, the type of technology needed to achieve the service levels required, and the security/privacy objectives should be determined. Data centre managers should check whether or not the necessary infrastructure is needed to manage the increased power and cooling densities because of the implemented virtualisation. The failure of single consolidated server should also be considered because this server manages the workload of multiple applications.
The results of this study are obtained from a case study performed in one of the tier level data centre in Malaysia. The case study results describe this data centre as highly loaded. The proposed algorithm can restrict the number of active cluster servers to reduce the total energy consumption, but this algorithm increases the total energy consumption by deploying new jobs on a loaded server for many cases, thereby increasing the total execution time compared with the use of an idle machine. We modified our algorithm to overcome this shortcoming by redefining the preferred order matrix to search for IDLE server machines initially instead of conducting a search as the last option. Furthermore, the decision logic allocates the remaining servers by using the first-fit algorithm if the search defined by preference order cannot provide the required servers. This modification helps us achieve two major objectives:
1 low-performance penalty for new and already running jobs
2 reduction of the total energy consumption required to execute the given set of jobs.
This paper defines the carbon footprint of a data centre as the carbon emissions equivalent to the total amount of electricity that a particular data centre consumes. To determine whether or not a carbon footprint of a data centre is reduced, energy consumption should initially be determined. Three key variables have a major impact on data centre power consumption: data centre location, IT load, and electrical efficiency. The method proposed in this paper combines the workload of multiple servers in fewer servers and then properly utilises efficiencies, i.e., hardware and software efficiencies. This strategy helps implement green data centres to ensure that IT infrastructure contributes minimum GHG emissions. Furthermore, this strategy helps regain power and cooling capacity, recapture resilience, and remarkably reduce energy costs and the total cost of ownership.
4.2 Server categorisation (server consolidation)
The demand on utility power is lower when the electrical consumption of a data centre is reduced, thereby preventing carbon emissions and reducing carbon footprints. If this power reduction lowers the use of peaker plants, the amount of carbon that is not released into the atmosphere is increased. Data centre IT equipment consists of many individual devices such as storage devices, servers, chillers, generators, and cooling towers among others. Servers are the leading consumer of IT power in any data centre. Data centres contain numerous underutilised servers consuming high amounts of energy and generating GHGs (Gartner, Inc., 2009). Servers are the main components used to perform most of the processing in data centres where numerous servers consume high amounts of energy and the number of such servers continuously increases as the size of data centres increases. As new servers are added continuously without considering the proper
14 M. Uddin et al.
utilisation of already installed servers, an unavoidable increase in energy consumption and physical infrastructure, such as oversizing of heating and cooling equipment, is observed. This increased energy consumption also causes an increase in GHG emissions.
Server virtualisation is a fundamental technology that enables data centre managers to consolidate and use physical servers more efficiently, thereby creating a more flexible infrastructure. This technology increases the utilisation of expensive hardware resources, thereby reducing energy consumption and CO2 emission (Uddin and Rahman, 2012). A number of virtual server instances that reside on a smaller number of physical servers are also created. Thus, a data centre with only few physical servers can potentially have many virtual servers, which function almost similarly to physical servers. To ensure that these servers have almost the same functions, their capacities are described as less than those of the physical servers, but this situation is not a problem given that these servers are likely underutilised. The use of virtual servers allows a data centre to run with greater utilisation, indicating that lower power costs are required for both equipment and cooling. Virtual servers also permit equipment consolidation, which simply refer to the reduction in the number of equipment. If a few virtualised servers can do the job of many physical servers, then virtualisation allows data centre operators to either purchase fewer servers for new IT projects or eliminate existing servers in new data centres.
In the case of a new server for a data centre, the imbedded carbon from the server’s manufacturing and delivery process possibly add to the carbon footprint of the data centre hosting that particular server, including water consumption for cooling), electrical consumption, and smokestack operation (of raw material suppliers). Recent development and growth in e-businesses have increased the demand for large and complex data centres as the demand for storage, speed, backups, and recovery increases. Physical and IT equipment in data centres consume high amounts of energy.
The proposed Algorithm 1 helps classify underutilised volume servers in three categories based on the workload that these servers perform and applications they execute. These classifications may vary from business to business with different infrastructures and requirements as servers are generally used to create, maintain, and execute solutions on behalf of businesses, architectures, processes, and infrastructures. After such servers are categorised, server consolidation is applied on the three categories depending on the utilisation ratio of each server in a data centre. This process reduces the number of servers by consolidating the load of multiple servers on one server. It also increases the utilisation ratio of servers.
These servers are categorised as follows:
1 innovation servers
2 production servers
3 mission critical servers.
4.2.1 Innovations servers
Innovation servers are the most available servers in data centres and mostly deployed in shared computing environments, where new servers may be possibly added. The applications executed by these servers require speed and flexibility; as such, these applications should be completed quickly. These servers are also deployed at locations
Virtualised load management algorithm to reduce CO2 emissions 15
where new products are potentially invented, existing products are modified, and processes that are more competitive and productive are developed and enhanced. This location creates a space for additional servers; hence, their number increases rapidly without considering the proper utilisation of existing servers. As these servers increase in number, excessive energy is consumed and high amounts of GHGs are emitted.
4.2.2 Production servers
Production servers are more controlled and scalable servers deployed at locations where the addition of new servers is less likely possible. These servers are generally used in locations where applications and processes are tested; thus, these servers are also referred to as test, deployment, quality assurance, and volume servers. The service level requirements for different applications and servers are more important than speed and flexibility. For this reason, the number of production servers is less than innovation servers.
4.2.3 Mission critical servers
Mission critical servers are the most powerful servers in any data centre consuming more energy and power compared with other types of servers. These servers handle critical real-time jobs and applications where the loss of memory and customer loyalty likely occurs. These servers are normally small in number and have a significant impact on overall business requirements.
5 Results and discussions
Most servers in data centres operate at a utilisation rate of 5% to 10%. Thus, these servers are the major targets of efficiency improvement. Server sprawl is a term that describes an IT phenomenon in which multiple over distributed and underutilised servers entail higher operational costs than investment returns. Server sprawl causes many problems such as increased cost, maintenance and management issues, low investment returns, GHG emissions, and infrastructure and space problems. The utilisation ratio of this server indicates that these underutilised volume servers should be operated at higher utilisation rates to achieve improved performance at cost and energy efficiency levels. One of the main reasons why utilisation ratio is traditionally low in data centre operations is the lack of knowledge of a user or a manager to allocate power and the corresponding efficiency in a tier-level data centre. Hence, managers should have more control of power consumption and implement the latest emerging technologies to establish green energy-efficient data centres (Uddin et al., 2012).
Server utilisation ratio can be quantitatively defined as follows:
1
n
t
server i fraction of load on serverUtilisation ratio of single servernumber of servers=
∗=∑ (2)
Server consolidation can increase the utilisation ratios of already installed devices and equipment, thereby improving the overall efficiency of data centres.
16 M. Uddin et al.
5.1 Power savings
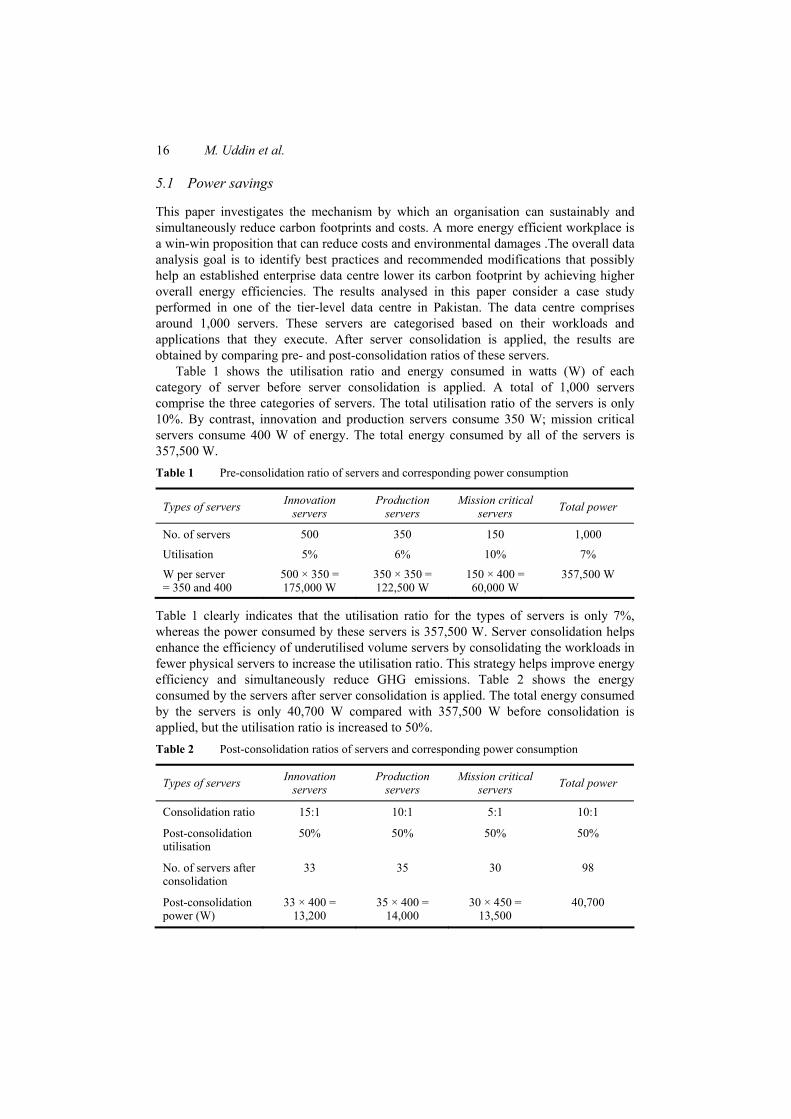
This paper investigates the mechanism by which an organisation can sustainably and simultaneously reduce carbon footprints and costs. A more energy efficient workplace is a win-win proposition that can reduce costs and environmental damages .The overall data analysis goal is to identify best practices and recommended modifications that possibly help an established enterprise data centre lower its carbon footprint by achieving higher overall energy efficiencies. The results analysed in this paper consider a case study performed in one of the tier-level data centre in Pakistan. The data centre comprises around 1,000 servers. These servers are categorised based on their workloads and applications that they execute. After server consolidation is applied, the results are obtained by comparing pre- and post-consolidation ratios of these servers.
Table 1 shows the utilisation ratio and energy consumed in watts (W) of each category of server before server consolidation is applied. A total of 1,000 servers comprise the three categories of servers. The total utilisation ratio of the servers is only 10%. By contrast, innovation and production servers consume 350 W; mission critical servers consume 400 W of energy. The total energy consumed by all of the servers is 357,500 W. Table 1 Pre-consolidation ratio of servers and corresponding power consumption
Types of servers Innovation servers
Production servers
Mission critical servers Total power
No. of servers 500 350 150 1,000
Utilisation 5% 6% 10% 7%
W per server = 350 and 400
500 × 350 = 175,000 W
350 × 350 = 122,500 W
150 × 400 = 60,000 W
357,500 W
Table 1 clearly indicates that the utilisation ratio for the types of servers is only 7%, whereas the power consumed by these servers is 357,500 W. Server consolidation helps enhance the efficiency of underutilised volume servers by consolidating the workloads in fewer physical servers to increase the utilisation ratio. This strategy helps improve energy efficiency and simultaneously reduce GHG emissions. Table 2 shows the energy consumed by the servers after server consolidation is applied. The total energy consumed by the servers is only 40,700 W compared with 357,500 W before consolidation is applied, but the utilisation ratio is increased to 50%. Table 2 Post-consolidation ratios of servers and corresponding power consumption
Types of servers Innovation servers
Production servers
Mission critical servers Total power
Consolidation ratio 15:1 10:1 5:1 10:1
Post-consolidation utilisation
50% 50% 50% 50%
No. of servers after consolidation
33 35 30 98
Post-consolidation power (W)
33 × 400 = 13,200
35 × 400 = 14,000
30 × 450 = 13,500
40,700
Virtualised load management algorithm to reduce CO2 emissions 17
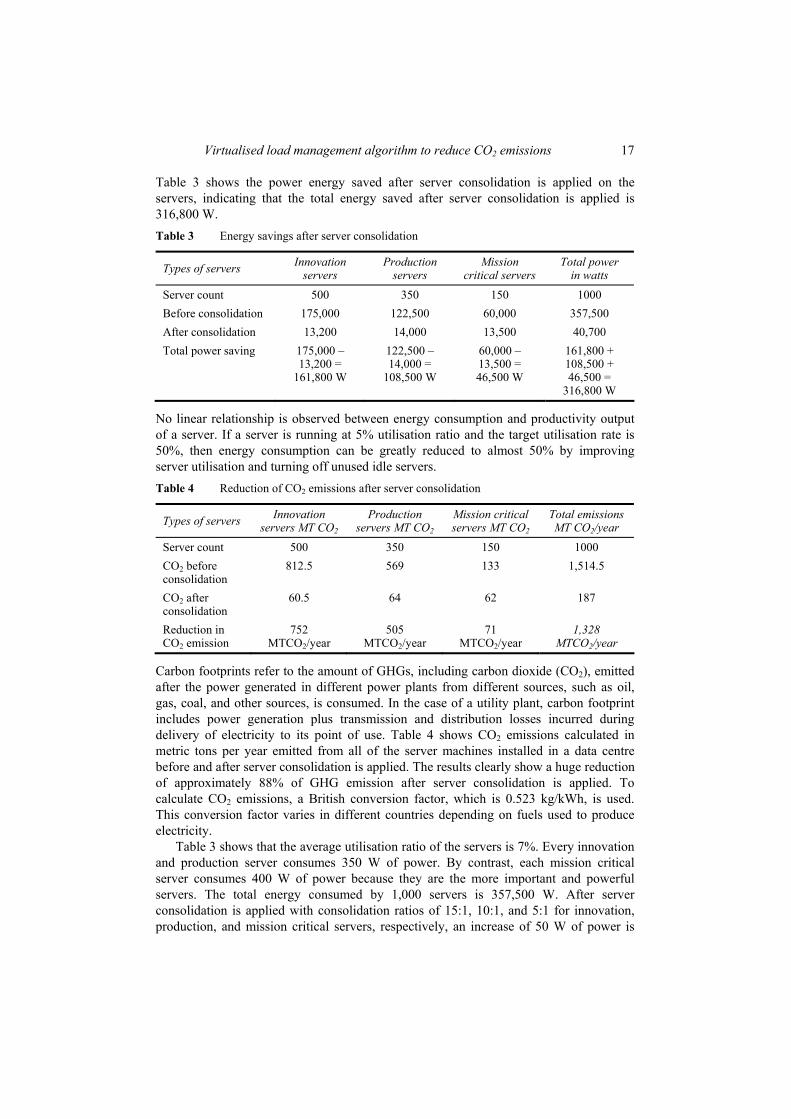
Table 3 shows the power energy saved after server consolidation is applied on the servers, indicating that the total energy saved after server consolidation is applied is 316,800 W. Table 3 Energy savings after server consolidation
Types of servers Innovation servers
Production servers
Mission critical servers
Total power in watts
Server count 500 350 150 1000 Before consolidation 175,000 122,500 60,000 357,500 After consolidation 13,200 14,000 13,500 40,700 Total power saving 175,000 –
13,200 = 161,800 W
122,500 – 14,000 =
108,500 W
60,000 – 13,500 = 46,500 W
161,800 + 108,500 + 46,500 =
316,800 W
No linear relationship is observed between energy consumption and productivity output of a server. If a server is running at 5% utilisation ratio and the target utilisation rate is 50%, then energy consumption can be greatly reduced to almost 50% by improving server utilisation and turning off unused idle servers. Table 4 Reduction of CO2 emissions after server consolidation
Types of servers Innovation servers MT CO2
Production servers MT CO2
Mission critical servers MT CO2
Total emissions MT CO2/year
Server count 500 350 150 1000 CO2 before consolidation
812.5 569 133 1,514.5
CO2 after consolidation
60.5 64 62 187
Reduction in CO2 emission
752 MTCO2/year
505 MTCO2/year
71 MTCO2/year
1,328 MTCO2/year
Carbon footprints refer to the amount of GHGs, including carbon dioxide (CO2), emitted after the power generated in different power plants from different sources, such as oil, gas, coal, and other sources, is consumed. In the case of a utility plant, carbon footprint includes power generation plus transmission and distribution losses incurred during delivery of electricity to its point of use. Table 4 shows CO2 emissions calculated in metric tons per year emitted from all of the server machines installed in a data centre before and after server consolidation is applied. The results clearly show a huge reduction of approximately 88% of GHG emission after server consolidation is applied. To calculate CO2 emissions, a British conversion factor, which is 0.523 kg/kWh, is used. This conversion factor varies in different countries depending on fuels used to produce electricity.
Table 3 shows that the average utilisation ratio of the servers is 7%. Every innovation and production server consumes 350 W of power. By contrast, each mission critical server consumes 400 W of power because they are the more important and powerful servers. The total energy consumed by 1,000 servers is 357,500 W. After server consolidation is applied with consolidation ratios of 15:1, 10:1, and 5:1 for innovation, production, and mission critical servers, respectively, an increase of 50 W of power is
18 M. Uddin et al.
observed as the load on these servers is increased. Thus, the average power consumed by innovation and production servers is increased to 400 W per server compared with 350 W before server consolidation is applied. The power consumption of mission critical servers is increased from 400 W to 450 W before consolidation. The total power consumed by the servers after consolidation is only 40,700 W compared with 357,500 W before server consolidation is applied, in which a total saving of 316,800 W of power is achieved. Furthermore, only 500 W of energy is possibly consumed by every server if the utilisation ratio is increased to 100%; thus, an increase in power consumption of 100 and 150 W per server is observed with the utilisation ratio of 100%. This strategy helps to reduce CO2 emissions.
These results clearly show that energy consumption of ten servers with 400 W (mission critical) per server is considerably reduced when the servers are consolidated to an average ratio of 10:1, thereby consuming a total of 4,000 W. However, the load of these ten servers on one server with a power consumption of only 450 W and a utilisation ratio of 50% saves approximately 3,550 W or 87% of total energy after consolidation.
4,000 W – 450 W 3,550 W=
Thus, the power utilisation ratio is less than the processor utilisation ratio. By decreasing the number of physical servers, energy consumption is reduced and exhibits a great impact on the overall data centre heating requirements and cooling load. Such decrease also increases UPS backup time. Furthermore, performance efficiency is increased, generator backup times are prolonged, and IT configuration of different interconnecting devices is reduced. GHG emissions are also reduced, and such emissions have become a warning because data centres are one of the main contributors of GHG emissions, generating approximately 2% of the world’s CO2.
6 Conclusions
Direct and indirect cost savings and environmental benefits of hardware-based server virtualisation provide the possibility of consolidating underutilised servers in virtual servers that run on a smaller number of physical servers. This strategy results in a reduced physical data centre carbon footprint, significant cost savings in electricity, and numerous indirect benefits from these factors, such as increased access to high quality talent, flexibility of location and increased potential to locate near mass transit, and possibility of determining facilities located away from low density and other environmentally sensitive land. Each of these factors also improves businesses. Considering that each of the cost factors likely continues to increase in the future as developing countries with large populations continue to develop rapidly and compete for natural resources, the savings possibly increase yearly.
This paper proposes a new algorithm to categorise server workloads and helps categorise such servers in three categories depending on their workloads and applications they perform. Server consolidation is applied on all of the servers to remove underutilised servers and reduce power consumption. The results show that approximately 150,460 W of energy is saved and a utilisation ratio of 50% is achieved. Power savings help reduce carbon footprints from 1,514.5 MT CO2/year to only 187 MT CO2/year for 1,000 servers; hence, a total savings of approximately 1,328 MT CO2/year is achieved.
Virtualised load management algorithm to reduce CO2 emissions 19
Acknowledgements
This study was funded in part by the University Kebangsaan Malaysia under Grant Nos. UKM-GUP-2012-089 and FRGS/1/2012/SG05/UKM/02/7.
References APC (Ed.) (2010) Estimating a Data Center’s Electrical Carbon Footprint [online]
http://www.idgconnect.com/view_abstract/6438/estimating-data-center-electrical-carbonfootprint? region=asia (accessed 6/15/2012).
Brill, K.G. (2007) The Invisible Crisis in the Data Center: The Economic Meltdown of Moore’s Law, White paper, Uptime Institute.
Brown, R., Masanet, E., Nordman, B., Tschudi, B., Shehabi, A., Stanley, J., Koomey, J., Sartor, D., Chan, P., Loper, J., Capana, S., Hedman, B., Duff, R., Haines, E., Sass, D. and Fanara, A. (2007) ‘Report to congress on server and data center energy efficiency’, Public Law, pp.109–431, Lawrence Berkeley National Laboratory, Berkeley, CA, LBNL-363E.
Carter, J.B. and Rajamani, K. (2010) ‘Designing energy-efficient servers and data centers’, Computer, Vol. 43, No. 7, pp.76–78.
Climate Group (Ed.) (2008) Smart 2020: Enabling the Low Carbon Economy in the Information Age [online] http://www.smart2020.org/_assets/files/02_Smart2020Report.pdf (accessed 8/25/2012).
EIA (Ed.) (2010) Emissions from Energy Consumption at Conventional Power Plants and Combined-Heat-and-Power Plants, Energy Information Administration, Independent Statistics and Analysis, USA.
EPA (Ed.) (2009) EPA ENERGY STAR Program Requirements for Computer Systems, Draft 4, Environmental Protection Agency, Washington, DC.
Gartner, Inc. (Ed.) (2007) Gartner Estimates ICT Industry Accounts for 2 Percent of Global CO2 Emission [online] http://www.gartner.com/it/page.jsp?id=503867 (accessed 9/10/2012).
Gartner, Inc. (Ed.) (2008) Sustainable IT, A Gartner Briefing, Gartner, Inc., Dublin. Gartner, Inc. (Ed.) (2009) Cost Optimization and Beyond: Enabling Business Change and the Path
to Growth, A Gartner Briefing, Gartner, London. Global e-Sustainability Initiative (2008) [online] http://gesi.org/ (accessed 8/12/2012). Greenberg, S., Mills, E., Tschudi, B., Rumsey, P. and Myatt, B. (2006) ‘Best practices for data
centers: lessons learned from benchmarking 22 data centers’, Proceedings of the ACEEE Summer Study on Energy Efficiency in Buildings, August, ACEEE, Asilomar, CA, Vol. 3, pp.76–87.
IDC (Ed.) (2008) IDC Predictions 2009: An Economic Pressure Cooker Will Accelerate the IT Industry Transformation [online] http://www.directionsmag.com/images/DMTV/IDC.Top10 Predictions.2010.pdf (accessed 8/9/2012).
Info-Tech Research Group (2008) If You Measure It, They Will Green: Data Center Energy Efficiency Metrics, Info-Tech Research Group, London.
Jacobson, M.Z. (2009) ‘Review of solutions to global warming, air pollution, and energy security’, Energy & Environmental Science, Vol. 2, No. 2, pp.148–173.
Kant, K. (2009) ‘Data center evolution: a tutorial on state of the art, issues, and challenges’, Computer Networks, Vol. 53, No. 17, pp.2939–2965.
Koomey, J.G. (2008) ‘Worldwide electricity used in data centers’, Environmental Research Letters, Vol. 3, No. 3, p.034008.
Koomey, J.G. (Ed.) (2007) Estimating Total Power Consumption by Servers in the US and the World, Stanford University, USA.
20 M. Uddin et al.
Kumar, R. and Mieritz, L. (2007) Conceptualizing Green IT and Data Centre Power and Cooling Issues, April, Gartner Research Paper No. G00150322.
Lefurgy, C., Rajamani, K., Rawson, F., Felter, W., Kistler, M. and Keller, T.W. (2003) ‘Energy management for commercial servers’, Computer, Vol. 36, No. 12, pp.39–48.
Rivoire, S., Shah, M.A., Ranganathan, P. and Kozyrakis, C. (2007) ‘JouleSort: a balanced energy-efficiency benchmark’, Proceedings of the 2007 ACM SIGMOD International Conference on Management of Data, pp.365–376.
Sovacool, B.K. and Brown, M.A. (2010) ‘Competing dimensions of energy security: an international perspective’, Annual Review of Environment and Resources, Vol. 35, pp.77–108.
Thatcher, M.E. and Pingry, D.E. (2007) ‘Modeling the IT value paradox’, Communications of the ACM, Vol. 50, No. 8, pp.41–45.
Uddin, M. and Rahman, A.A. (2010) ‘Server consolidation: an approach to make data centers energy efficient and green’, International journal of Scientific and Engineering Research (IJSER), Vol. 1, No. 1, pp.1–7.
Uddin, M. and Rahman, A.A. (2011) ‘Techniques to implement in green data centres to achieve energy efficiency and reduce global warming effects’, International Journal of Global Warming, Vol. 3, No. 4, pp.372–389.
Uddin, M. and Rahman, A.A. (2012) ‘Energy efficiency and low carbon enabler green IT framework for data centers considering green metrics’, Renewable and Sustainable Energy Reviews, Vol. 16, pp.4078–4094.
Uddin, M., Rahman, A.A. and Memon, J. (2011) ‘Carbon sustainability framework to reduce CO2 emissions in data centres’, International Journal of Green Economics, Vol. 5, No. 4, pp.353–369.
Uddin, M., Talha, M., Rahman, A.A., Shah, A. and Ahmed, J. (2012) ‘Green information technology (IT) framework for energy efficient data centers using virtualization’, International Journal of Physical Sciences, Vol. 7, No. 13, pp.2052–2065.