
Combining Neural Networks and Genetic Algorithms to Predict and Reduce Diesel Engine Emissions
10
This article has been accepted for inclusion in a future issue. IEEE TRANSACTIONS ON EVOLUTIONARY COMPUTATION 1 Combining Neural Networks and Genetic Algorithms to Predict and Reduce Diesel Engine Emissions José M. Alonso, Fernando Alvarruiz, José M. Desantes, Leonor Hernández, Vicente Hernández, and Germán Moltó Abstract—Diesel engines are fuel efficient which benefits the re- duction of released to the atmosphere compared with gaso- line engines, but still result in negative environmental impact re- lated to their emissions. As new degrees of freedom are created, due to advances in technology, the complicated processes of emis- sion formation are difficult to assess. This paper studies the feasi- bility of using artificial neural networks (ANNs) in combination with genetic algorithms (GAs) to optimize the diesel engine set- tings. The objective of the optimization was to find settings that complied with the increasingly stringent emission regulations while also maintaining, or even reducing the fuel consumption. A large database of stationary engine tests, covering a wide range of ex- perimental conditions was used for this analysis. The ANNs were used as a simulation tool, receiving as inputs the engine operating parameters, and producing as outputs the resulting emission levels and fuel consumption. The ANN outputs were then used to evaluate the objective function of the optimization process, which was per- formed with a GA approach. The combination of ANN and GA for the optimization of two different engine operating conditions was analyzed and important reductions in emissions and fuel consump- tion were reached, while also keeping the computational times low. Index Terms—Diesel engines, emission regulations, genetic algo- rithms (GAs), neural networks. I. INTRODUCTION O VER THE LAST few decades, the industrial and eco- nomic expansion of developed countries has involved a sharp increase in vehicle production and transport volume. En- vironmental concerns such as global warming, greenhouse ef- fects, acid rain, and air pollution problems related to the emis- sions of carbon dioxide (CO ), nitrogen oxides (NOx), partic- ulate matter (PM), carbon monoxide (CO), and unburned hy- drocarbons (HC), together with the consumption of fossil fuels, combine to create serious problems at a global level [1]. In that sense, the exhaust emission regulatory bodies around the world have been simultaneously reducing the admissible limits on exhaust emissions over the last decades, while the Manuscript received August 6, 2004; revised July 19, 2005 and November 23, 2005.This work was supported in part by the Plan Valenciano de Investi- gación Científica, Desarrollo Tecnológico e Innovación from the Conselleria de Empresa, Universidad y Ciencia of the Generalitat Valenciana, Spain, under Project CITDIB/2002/34. J. M. Alonso, F. Alvarruiz, V. Hernández, and G. Moltó are with the High Performance Networking and Computing Group, Universidad Politécnica de Valencia, Valencia 42022, Spain (e-mail: [email protected]; fbermejo@ dsic.upv.es; [email protected]; [email protected]). J. M. Desantes is with the CMT-Thermal Engines Group, Universidad Politécnica de Valencia, Valencia 46022, Spain (e-mail: [email protected]). L. Hernández is with the Departamento de Ingeniería Mecánica y Construc- ción, Universitat Jaume I, Castellón de la Plana 12071, Spain (e-mail: lher [email protected]). Digital Object Identifier 10.1109/TEVC.2006.876364 market has also been striving to maintain or even reduce fuel consumption [2]. In order to comply with these regulations, the diesel engine industry has undergone a great technological development in the last few years, creating a high number of new strategies such as electronic control, new injection systems allowing higher pressures, different injection events, etc., [3]–[6]. As a result, the problem of optimizing the engine management in order to simultaneously comply with emission regulations and fuel economy requirements has become a difficult task, especially due to the increased number of degrees of freedom in the engine operating parameters. This optimization process is carried out during the development of a new engine, and is usually known in the mechanical engineering field as engine calibration. Although calibrations were in the past based en- tirely on empirical results, the development in technology has incorporated new model-based techniques [7]–[12]. The formation of the different kinds of pollutants in diesel engines as a result of combustion is a complex process that de- pends on local variables, and is also highly dependent on the engine settings, influences, and interconnections. Physical and chemical models have been proposed but a general solution has not yet been found [13]–[16]. Computational fluid dynamic codes require detailed unknown local data and also imply large calculation times [17]. Artificial neural networks (ANNs) are an emerging tool of artificial intelligence, which have been shown to be effective in solving a wide range of problems, including many applications to engine modeling [18]. The structure of ANNs enables them to model complex nonlinear multiple problems, which makes them a well-suited method for pollutant modeling. In addition, an ANN can produce fast prediction responses, which represent an important advantage in comparison with alternative mod- eling techniques, such as physical and chemical models. As a first objective in this paper, ANN modeling was used to predict diesel NOx, PM, CO, HC exhaust emissions, and brake specific fuel consumption (BSFC) in terms of engine oper- ating parameters. The working operation of the engine is defined by the combination of the engine operating parameters values, which in turn determine the engine exhaust emission levels and fuel consumption. The number of operating parameters has in- creased in the last few years due to the engine development, making it difficult to directly combine them to comply with dif- ferent constraints. The second main objective of the study was to define an op- timization process that, using the ANN predictions, could find combinations of operating parameters that simultaneously mini- mize fuel consumption, while also keeping the overall emissions 1089-778X/$20.00 © 2006 IEEE
-
Upload
independent -
Category
Documents
-
view
5 -
download
0
Transcript of Combining Neural Networks and Genetic Algorithms to Predict and Reduce Diesel Engine Emissions
This article has been accepted for inclusion in a future issue.
IEEE TRANSACTIONS ON EVOLUTIONARY COMPUTATION 1
Combining Neural Networks and Genetic Algorithmsto Predict and Reduce Diesel Engine EmissionsJosé M. Alonso, Fernando Alvarruiz, José M. Desantes, Leonor Hernández, Vicente Hernández, and
Germán Moltó
Abstract—Diesel engines are fuel efficient which benefits the re-duction of CO2 released to the atmosphere compared with gaso-line engines, but still result in negative environmental impact re-lated to their emissions. As new degrees of freedom are created,due to advances in technology, the complicated processes of emis-sion formation are difficult to assess. This paper studies the feasi-bility of using artificial neural networks (ANNs) in combinationwith genetic algorithms (GAs) to optimize the diesel engine set-tings. The objective of the optimization was to find settings thatcomplied with the increasingly stringent emission regulations whilealso maintaining, or even reducing the fuel consumption. A largedatabase of stationary engine tests, covering a wide range of ex-perimental conditions was used for this analysis. The ANNs wereused as a simulation tool, receiving as inputs the engine operatingparameters, and producing as outputs the resulting emission levelsand fuel consumption. The ANN outputs were then used to evaluatethe objective function of the optimization process, which was per-formed with a GA approach. The combination of ANN and GA forthe optimization of two different engine operating conditions wasanalyzed and important reductions in emissions and fuel consump-tion were reached, while also keeping the computational times low.
Index Terms—Diesel engines, emission regulations, genetic algo-rithms (GAs), neural networks.
I. INTRODUCTION
OVER THE LAST few decades, the industrial and eco-nomic expansion of developed countries has involved a
sharp increase in vehicle production and transport volume. En-vironmental concerns such as global warming, greenhouse ef-fects, acid rain, and air pollution problems related to the emis-sions of carbon dioxide (CO ), nitrogen oxides (NOx), partic-ulate matter (PM), carbon monoxide (CO), and unburned hy-drocarbons (HC), together with the consumption of fossil fuels,combine to create serious problems at a global level [1].
In that sense, the exhaust emission regulatory bodies aroundthe world have been simultaneously reducing the admissiblelimits on exhaust emissions over the last decades, while the
Manuscript received August 6, 2004; revised July 19, 2005 and November23, 2005.This work was supported in part by the Plan Valenciano de Investi-gación Científica, Desarrollo Tecnológico e Innovación from the Conselleriade Empresa, Universidad y Ciencia of the Generalitat Valenciana, Spain, underProject CITDIB/2002/34.
J. M. Alonso, F. Alvarruiz, V. Hernández, and G. Moltó are with the HighPerformance Networking and Computing Group, Universidad Politécnica deValencia, Valencia 42022, Spain (e-mail: [email protected]; [email protected]; [email protected]; [email protected]).
J. M. Desantes is with the CMT-Thermal Engines Group, UniversidadPolitécnica de Valencia, Valencia 46022, Spain (e-mail: [email protected]).
L. Hernández is with the Departamento de Ingeniería Mecánica y Construc-ción, Universitat Jaume I, Castellón de la Plana 12071, Spain (e-mail: [email protected]).
Digital Object Identifier 10.1109/TEVC.2006.876364
market has also been striving to maintain or even reduce fuelconsumption [2].
In order to comply with these regulations, the diesel engineindustry has undergone a great technological development inthe last few years, creating a high number of new strategiessuch as electronic control, new injection systems allowinghigher pressures, different injection events, etc., [3]–[6]. Asa result, the problem of optimizing the engine managementin order to simultaneously comply with emission regulationsand fuel economy requirements has become a difficult task,especially due to the increased number of degrees of freedomin the engine operating parameters. This optimization processis carried out during the development of a new engine, and isusually known in the mechanical engineering field as enginecalibration. Although calibrations were in the past based en-tirely on empirical results, the development in technology hasincorporated new model-based techniques [7]–[12].
The formation of the different kinds of pollutants in dieselengines as a result of combustion is a complex process that de-pends on local variables, and is also highly dependent on theengine settings, influences, and interconnections. Physical andchemical models have been proposed but a general solutionhas not yet been found [13]–[16]. Computational fluid dynamiccodes require detailed unknown local data and also imply largecalculation times [17].
Artificial neural networks (ANNs) are an emerging tool ofartificial intelligence, which have been shown to be effective insolving a wide range of problems, including many applicationsto engine modeling [18]. The structure of ANNs enables themto model complex nonlinear multiple problems, which makesthem a well-suited method for pollutant modeling. In addition,an ANN can produce fast prediction responses, which representan important advantage in comparison with alternative mod-eling techniques, such as physical and chemical models.
As a first objective in this paper, ANN modeling was usedto predict diesel NOx, PM, CO, HC exhaust emissions, andbrake specific fuel consumption (BSFC) in terms of engine oper-ating parameters. The working operation of the engine is definedby the combination of the engine operating parameters values,which in turn determine the engine exhaust emission levels andfuel consumption. The number of operating parameters has in-creased in the last few years due to the engine development,making it difficult to directly combine them to comply with dif-ferent constraints.
The second main objective of the study was to define an op-timization process that, using the ANN predictions, could findcombinations of operating parameters that simultaneously mini-mize fuel consumption, while also keeping the overall emissions
1089-778X/$20.00 © 2006 IEEE

This article has been accepted for inclusion in a future issue.
2 IEEE TRANSACTIONS ON EVOLUTIONARY COMPUTATION
under certain limits. The correct definition of the objective func-tion, exactly reproducing the requirements, was considered animportant step in the optimization process.
Classical methods for optimization, based on numerical tech-niques, have been applied to the optimization of diesel enginesin different publications. In [19] and [20], a simple gradientmethod is used, where only one parameter is changed in eachiteration. In [9], [21], and [22], a steepest descent method isfollowed, while [23] employs a sequential quadratic program-ming approach. However, numerical methods for optimizationpresent some limitations, such as the difficulty to escape fromlocal minima, and therefore the dependence of the performanceon the initial value chosen. Moreover, these methods are onlyapplicable to continuous differentiable functions.
As an alternative to numerical optimization methods, geneticalgorithms (GAs) are less likely to get trapped in local minima,and are not restricted by continuity or differentiability require-ments on the objective function. As a drawback, the computa-tional time may be larger than that of numerical methods. Takingthis into account, GAs were used as the optimization techniquein the work described in this paper.
The overall objective raised in this study integrates a problemof complex modeling together with an optimization processcharacterized by a high number of variables to be simul-taneously modified and a high number of constraints to besatisfied. The scope of this paper is to evaluate the suitability ofcombining both ANN and GA techniques in this difficult andimportant task.
II. EXPERIMENTAL SETUP
The engine used to conduct the experiments was a light duty(LD) four-cylinder direct injection diesel engine (turbochargedand aftercooled) that was equipped with a common rail system.The engine was fully instrumented, and connected to a data ac-quisition system, so that many different operating parameterscould be measured and precisely controlled.
The electronic control unit (ECU) controlled all the en-gine electronic equipment. Its hardware (sensors, actuators,and regulators) monitored different variables and its softwarecontrolled the engine according to the registered signals andthe integrated cartographies. The cartographies are a set ofdifferent lookup tables that, for each couple of measured enginespeed and fuel mass injected variables (that define an enginecondition), impose the values of each of the engine operatingparameters. Each engine includes its own original cartography,which has been previously defined by the engine manufacturerand that is considered as the nominal combination of operatingparameters for each engine condition. The communicationbetween the ECU and the test cell system made it possibleto modify the original cartographies and to fix the desiredoperating conditions to be established.
The exhaust stream of the engine was diverted to a Horiba7100 analyzer from which NOx, CO, HC emissions weremeasured. Smoke emissions were evaluated with an Avl 415Variable Sampling Smoke Meter, which estimates the opacityof a filter through which the exhaust gases have been drawn.These measurements are reported as filter smoke number(FSN). The experimental FSN values can be transformed into
TABLE IRANGE OF VARIATION COVERED BY THE DIFFERENT OPERATING PARAMETERS
WITHIN THE EXPERIMENTAL STUDY
dry soot mass emissions by means of the correlation proposedby Christian et al. [24]. The emission regulations related to PMrequire the interaction of the exhaust gases with the ambientenvironment to be taken into account, as the dry soot mass willadsorb hydrocarbon compounds and small amounts of sulfates,metals and ash in this process, increasing the mass of the finalPM obtained [25]. Considering the large number of experi-mental tests necessary for this study and that the application ofthe prediction and optimization method presented in this workremains valid, the direct FSN measurement was selected.
III. EXPERIMENTAL DATABASE
The selection of the experimental test cases to be measuredfor an empirical model such as ANN is of great importance,due to the fact that the database determines the applicability, therange of valid predictions, and also the quality of the predictions.In this sense, the experimental database must be broad, presentlow noise levels, and also be representative of the problem to bemodeled.
The experimental database in this study was developed understationary conditions. A total number of 19 engine conditionswere selected in order to cover a wide range of situations in theengine working area. These 19 engine conditions were selectedfrom different areas: full load, conditions covering the Europeantransient cycle [26], and other areas where the emissions are lessrestricted. This classification has been also important in the def-inition of the allowed limits for emissions and fuel consumptionin the optimization procedure.
As mentioned in the previous section, each engine conditionis defined by the values of two operating parameters, namely, en-gine speed (n) and fuel mass injected (Mf). There are seven addi-tional operating parameters, the values of which are determined,for each engine condition by the engine cartography. These ad-ditional operating parameters are: air mass (Ma), exhaust gasrecirculation (EGR), injection pressure (IP), start of pilot injec-tion (SOIp), start of main injection (SOIm), intake temperature(Tint), and water temperature (Tw). Table I shows the completelist of operating parameters.
The experimental database was generated by taking each ofthe 19 engine conditions, and producing different variations forvalues of the seven additional operating parameters. Startingfrom the nominal values of these parameters for each enginecondition, independent variations of each parameter at threeor four levels were established. In this way, a total number of
This article has been accepted for inclusion in a future issue.
ALONSO et al.: COMBINING NEURAL NETWORKS AND GAS TO PREDICT AND REDUCE DIESEL ENGINE EMISSIONS 3
440 test cases, representative of the LD engine and close to themanufacturer cartography, were obtained.
All nine operating parameters were used as the inputs to theANN, considering that the empirical model is only able to pre-dict trends in emissions and fuel consumption that have beenintegrated into the test cases used as training patterns. As pre-dictions and optimization were integrated together in this study,the definition of the inputs in the ANN also determined the vari-ables to be modified in the optimization process.
Another important feature of the experimental database fromthe point of view of ANN and optimization development was therange of variations of the operating parameters, as the validityof the predictions and the range of variation in the optimizationwere restricted for those values. The ranges of variation coveredby the different operating parameters within this experimentalstudy are presented in Table I.
The quality of the ANN predictions, due to the empirical na-ture of the model, is highly dependent on the experimental noisein the measurements. The noise in the experimental data comesfrom different sources: first of all, it is influenced by the mea-suring devices accuracy (which can be obtained from the man-ufacturer), secondly, it depends on the experimental measuringmethodology and mainly on the engine and measuring devicesstability with time.
The Horiba manufacturer ensures a precision of % for theemission measurements. Later, experimental studies performedin single-cylinder engine showed poorer accuracy, lowering thevalue to % [27]. The resolution for the particulate estima-tion device (Avl 415) assures 0.05 FSN of repetitivity for valueswithin 0.5 and 6 [28]. The BSFC was derived from two mea-surements: fuel mass (obtained with an Avl S733 gravimetricbalance with % of accuracy [27]) and torque (measuredwith load cell Zöllner A-350/AE with an accuracy of Nm[27]).
The measuring protocol and methodology, including the post-processing of the measured data, was defined to reduce to theminimum the sources of error obtained during the experimentalstudy. A global maintenance test was carried out for most ofthe devices employed for the variables used as inputs/outputs tothe ANN. Daily calibration and purging between test cases wereperformed in the emission equipment. Large stabilization timeswere considered before measuring each stationary test, in whichthe variables were averaged during 30 seconds. As the measure-ment of the large experimental test matrix extended for months,all the emissions as well as the fuel consumption were correctedtaking into account atmospheric conditions, as described in theEuropean legislation [26]. All the experimental data were ad-ditionally put under a quality control, in which anomalous datawere detected and the measurements repeated when necessary.
The experimental dispersion observed in the dependentvariables integrated the accuracy of the devices, the measuringmethodology considered, and the deviation of the engine andmeasuring devices equipment with time. This dispersion wasevaluated comparing the same reference test case repeated everymeasuring day. The reference test case was a nominal operatingcondition from the manufacturer cartography that belonged tothe area where the EGR is present, i.e., the European transientcycle area [26]. Up to 40 repetitions of the reference test case
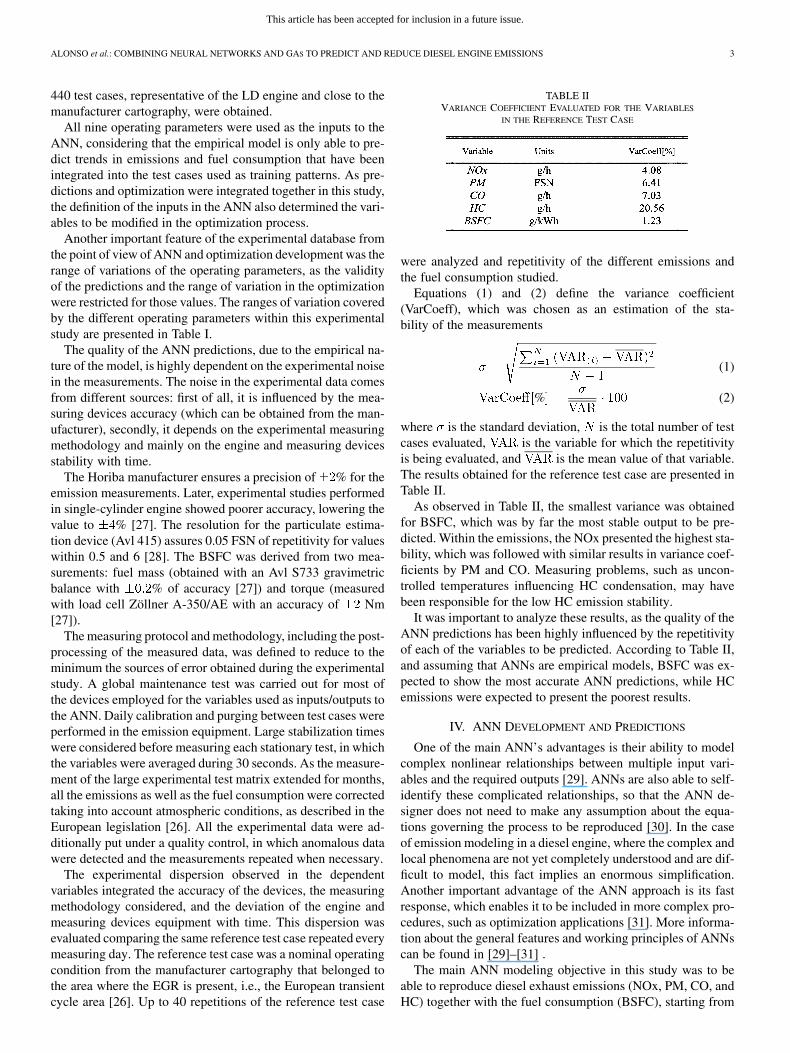
TABLE IIVARIANCE COEFFICIENT EVALUATED FOR THE VARIABLES
IN THE REFERENCE TEST CASE
were analyzed and repetitivity of the different emissions andthe fuel consumption studied.
Equations (1) and (2) define the variance coefficient(VarCoeff), which was chosen as an estimation of the sta-bility of the measurements
(1)
% (2)
where is the standard deviation, is the total number of testcases evaluated, is the variable for which the repetitivityis being evaluated, and is the mean value of that variable.The results obtained for the reference test case are presented inTable II.
As observed in Table II, the smallest variance was obtainedfor BSFC, which was by far the most stable output to be pre-dicted. Within the emissions, the NOx presented the highest sta-bility, which was followed with similar results in variance coef-ficients by PM and CO. Measuring problems, such as uncon-trolled temperatures influencing HC condensation, may havebeen responsible for the low HC emission stability.
It was important to analyze these results, as the quality of theANN predictions has been highly influenced by the repetitivityof each of the variables to be predicted. According to Table II,and assuming that ANNs are empirical models, BSFC was ex-pected to show the most accurate ANN predictions, while HCemissions were expected to present the poorest results.
IV. ANN DEVELOPMENT AND PREDICTIONS
One of the main ANN’s advantages is their ability to modelcomplex nonlinear relationships between multiple input vari-ables and the required outputs [29]. ANNs are also able to self-identify these complicated relationships, so that the ANN de-signer does not need to make any assumption about the equa-tions governing the process to be reproduced [30]. In the caseof emission modeling in a diesel engine, where the complex andlocal phenomena are not yet completely understood and are dif-ficult to model, this fact implies an enormous simplification.Another important advantage of the ANN approach is its fastresponse, which enables it to be included in more complex pro-cedures, such as optimization applications [31]. More informa-tion about the general features and working principles of ANNscan be found in [29]–[31] .
The main ANN modeling objective in this study was to beable to reproduce diesel exhaust emissions (NOx, PM, CO, andHC) together with the fuel consumption (BSFC), starting from
This article has been accepted for inclusion in a future issue.
4 IEEE TRANSACTIONS ON EVOLUTIONARY COMPUTATION
the engine setting information obtained from the experimentaltest database. In this work, both ANN implementation andtraining was developed using the neural network toolbox ofMatlab [32].
Different ANNs were built (one for each output), rather thanusing one large ANN including all the output variables. Thisstrategy allowed for better adjustment of the ANN for each spe-cific problem, including the optimization of the architecture foreach output. It was also pointed out by some authors [33] thatincluding many outputs in the same ANN causes the least accu-rate variable to drag down the prediction of the other outputs.
The ANN architecture used in this work was based on themultilayer perceptron (MLP) with only one hidden layer, asincluding more layers could increase the risk of finding localminima in the error surface, thus degrading the ANN predictionaccuracy [33]. The activation functions chosen were sigmoidsfor the hidden neurons as they allowed nonlinear relationshipsbetween inputs and outputs, and linear activation function forthe output neurons. Both types of functions complied with thedifferentiability conditions imposed by the training algorithm.
As described next, different steps were followed in the devel-opment of the ANN-based approach: training procedure, datatransformation or scaling, and ANN specific architecture defini-tion. More details about the procedure for the selection of ANNarchitecture and training can be found in previous works of theauthors [34], [35].
A. Training Procedure
One of the most relevant aspects of a neural network is itsability to generalize, that is, to predict cases that are not includedin the training set. An important concern in ANN training isthe risk of overfitting, which occurs when good predictions areachieved for the training data set, but a significantly lower suc-cess rate is achieved when predicting the test data set [31].
Due to the difficulty and the cost associated to taking mea-surements in a diesel engine, the available measurement data-base was reduced to contain only 440 patterns. In order to com-pensate for the possible problems of overfitting associated withthe small data set available, several countermeasures were ap-plied during the ANN training, as described in the followingparagraphs.
Early stopping of the ANN training procedure can be quiteeffective when dealing with this problem. It has been demon-strated [36] that there is an optimal stopping time which guar-antees generalization prior to convergence of the network on thetraining set. Nevertheless, the fact that an optimal stopping timeexists does not imply that a stopped training method will be ableto find it.
Taking this into account, the training methodology employedin this study combines cross-validation with early stopping, inorder to avoid overfitting, while being able to use all the patterns.The method consists of three stages, as described next.
The first stage randomly divided all the patterns into atraining set (90% of the patterns) and a validation set (10%remaining patterns). The neural network was trained with atraditional cross-validation scheme, and the training set errorcorresponding to the minimum validation error was stored.This process was repeated for 50 runs, randomly dividing the
patterns into the training and validation sets in each run. Next,the training errors were averaged, obtaining a mean-squaretraining error (MSTR) which was the stopping error to be usedin the second and the third phases of the training procedure.
The second stage was used as an intermediate step to eval-uate the effects of the number of neurons for the ANN predic-tions quality (see Section IV-C). At this second stage, the ANNwas initialized five times, and for each of them, ten different it-erations divided the patterns into 90% for training and 10% forANN prediction evaluation. Each ANN was only trained untilthe averaged MSTR obtained in the previous stage was reached.For each of the five iterations, the quality of the ANN predic-tions was evaluated for a matrix which only contained data notseen by the ANN during the training. The different iterations al-lowed the evaluated matrix to contain as many data as the totalexperimental patterns, which increased the statistical validity ofthe results.
In the third stage, the neural network was trained, using all thepatterns, until the training error reached the MSTR calculatedin the first phase. The training was repeated 20 times, which re-sulted in 20 different ANNs due to the randomness of the initialANN weights. As the optimization process is dependent on thespecific ANN considered, the 20 trained ANN for each outputwere assembled in an ANN committee, in order to compensatefor the differences in initialization and local minima in eachANN.
For all the stages, the Levenberg–Marquardt trainingalgorithm was employed [37], [38]. The principal ideaof the Levenberg–Marquardt algorithm is to maintain thesecond-order approach of the ANN error in order to speed upthe training (like in the Newton method), but at the same timeevaluating the Hessian matrix using an approximation (like thequasi-Newton methods).
B. Data Transformation
Large differences in the absolute values of the different in-puts can complicate the ANN learning process. To overcomethis potential problem, all the inputs and outputs were previ-ously normalized so that only relative changes in the variableswere learned by the network. In this study, the inputs and tar-gets were normalized between their minimum and maximumvalues. As the ANN predictions were to be included in the per-formance function for the optimization algorithm, a higher ac-curacy for lower levels of predictions was necessary. One possi-bility could have been to change the error to be minimized in thetraining algorithm from absolute to relative. Instead of changingthe training algorithm, the same objective was obtained by ap-plying a logarithmic scale to the input and output variables [23].Both normalization and scale transformation were applied be-fore presenting the training patterns to the ANN, and then con-verted again to obtain the results in their original levels.
C. ANN Architecture
The selection of the exact number of neurons in the hiddenlayer for each output was based on the accuracy of results, fol-lowing a trial and error procedure. This adjustment allowed thecomplexity of the modeled phenomenon to be taken into ac-count. The number of neurons evaluated ranged from 1 to 30,
This article has been accepted for inclusion in a future issue.
ALONSO et al.: COMBINING NEURAL NETWORKS AND GAS TO PREDICT AND REDUCE DIESEL ENGINE EMISSIONS 5
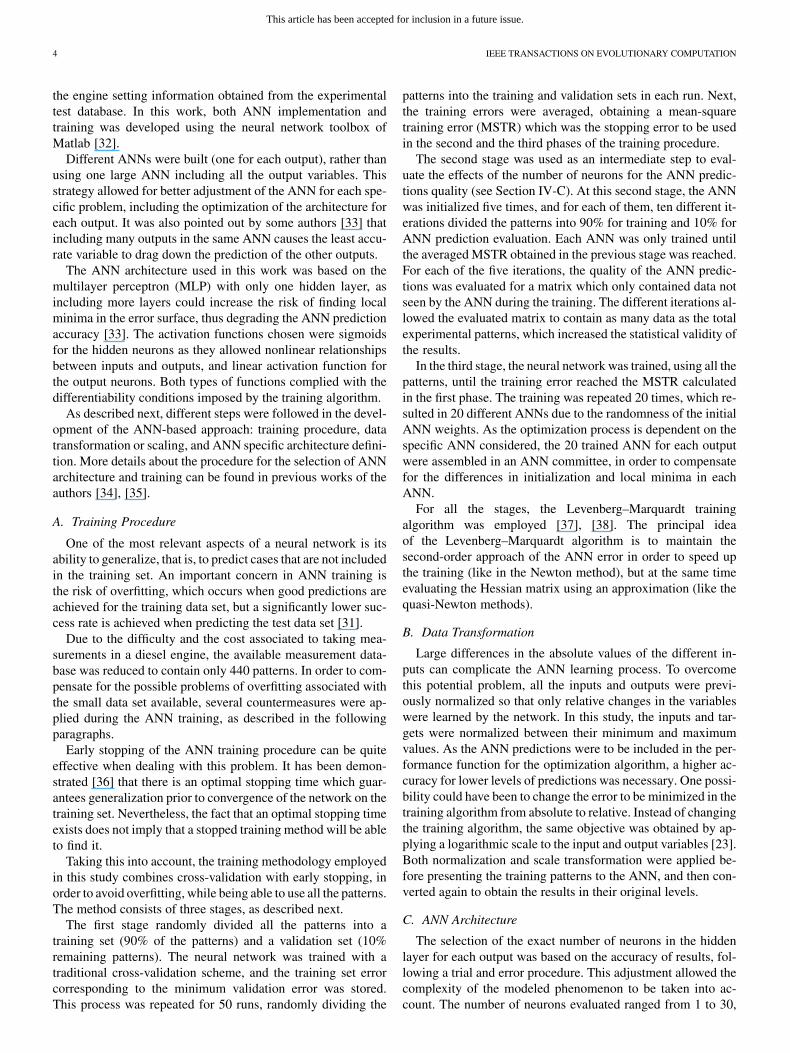
TABLE IIIOPTIMUM NUMBER OF NEURONS FOR THE ANN OF EACH OUTPUT
which avoided large number of weights to be adjusted in thetraining process for the available experimental patterns. The dif-ferent architectures derived for each output were trained fol-lowing the first and second training stages described above. Inthe trial and error procedure, the accuracy of the ANN predic-tions results was compared and the best architecture for eachoutput is presented in Table III.
From a mathematical point of view, a larger number of neu-rons implies more complex ANN relationships, which is re-quired to model more complex processes. The differences inthe optimal number of neurons for each output were in accor-dance with the diesel combustion knowledge. On the one hand,it is well known that the emission formation in diesel engines ismuch more complicated than the processes governing the fuelconsumption, which is consistent with the smaller number ofneurons required for the BSFC ANN predictions. On the otherhand, the increasing number of neurons required for the opti-mized architectures for the different emissions is in accordancewith the increasing variance coefficient shown in Table II. Thisfact may imply that the variables with less stable measurementsneed more complicated mathematical equations in the predic-tion ANN models.
D. ANN Prediction Quality
Once the different stages of the training process and the ANNarchitectures had been determined, and before the optimizationprocedure was developed, it was important to estimate the ANNprediction qualities.
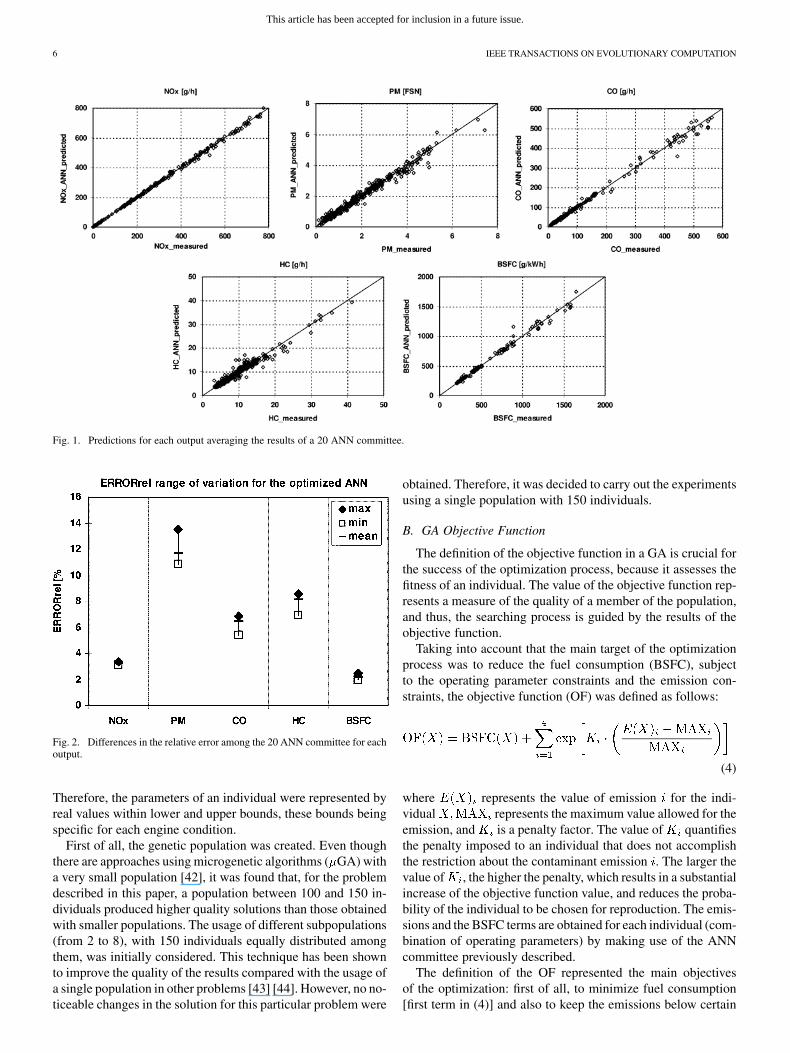
Fig. 1 presents the predictions obtained for the emissions andthe fuel consumption when averaging all the neural networksthat integrate the ANN committee. As a result of the incorpo-ration of the logarithmic scale, in most of the graphs, higheraccuracy can be observed for low levels of predictions.
In order to quantify the quality of the predictions obtainedfor each output, the average relative error [as presented in (3)]is evaluated in each case
(3)
where is the ANN predicted value, is the ex-pected value and is the total number of experimental cases tobe evaluated.
Fig. 2 analyzes the differences in relative error among the 20ANN that form the committee for each output. Different con-clusions can be derived from both figures. The best predictions,together with the lowest dispersion among ANN, were obtainedfor the BSFC case. NOx were the emissions that presented moreaccurate results. For the case of CO and HC, poorer predictions
were achieved and the dispersion within the ANN committee in-creased. A notable decrease in the quality of the PM predictionscould be observed.
As remarked previously, the complexity of the phenomenato be reproduced, together with the experimental problems an-alyzed for each output (Table II) can explain these results.
V. OPTIMIZATION PROCEDURE
It should be noted that the optimization of the whole rangeof engine operating conditions was not feasible due to thelarge number of parameters involved. Instead, this process wassimplified by optimizing only a small number of particularengine conditions (defined by engine speed and total fuelmass injected). Each of these optimization subproblems wasin charge of selecting the combination of operating parameterswhich produce the lowest fuel consumption subject to certainemission constraints.
The minimization process was subject to two different typesof constraints. On the one hand, the operating parameters werebounded by a minimum and maximum value for each enginecondition. On the other hand, different criteria were establishedfor the emission constraints depending on the engine area.
With respect to the emission constraints, the main priorityfor the operating conditions within the European transient cyclearea is the NOx emissions, so that a reduction of 20% with re-spect to the measured nominal value was imposed for this emis-sion. In the case of full load operating conditions, the selectedcriterion was to reduce the measured FSN obtained for the nom-inal test case by 10%. In both cases, the maximum limits forthe remaining emissions were set at their cartography nominallevels.
GAs have traditionally been employed for optimization prob-lems with objective functions that do not present continuity ordifferentiability properties [39]. In these algorithms, the searchfor a global minimum is performed through the application ofreproduction operators and “survival of the fittest” strategies.Moreover, the mutation operator introduces the possibility ofexploring the whole search space, an interesting ability that re-duces the risk of finding a local minimum. However, a GA doesnot guarantee that the global minimum is found.
A. GA Population
Considering that the optimization process was performed foreach engine condition, which was indicated by a combination ofengine speed (n) and fuel mass (Mf), each individual of the ge-netic population corresponded to a combination of values for theremaining seven operating parameters, namely: air mass (Ma),exhaust gas recirculation (EGR), injection pressure (IP), startof pilot injection (SOIp), start of main injection (SOIm), intaketemperature (Tint), and water temperature (Tw).
The chromosome of each individual was represented asa vector of seven real-valued elements, where each elementexpressed directly the value of a parameter, using the unitsshown in Table I. There have been studies confirming that areal-valued representation is more efficient and produces bettersolutions than binary-coded GAs [40] [41]. It is also arguedthat a real-valued representation offers enhanced precisionand more consistent results between different replications.
This article has been accepted for inclusion in a future issue.
6 IEEE TRANSACTIONS ON EVOLUTIONARY COMPUTATION
Fig. 1. Predictions for each output averaging the results of a 20 ANN committee.
Fig. 2. Differences in the relative error among the 20 ANN committee for eachoutput.
Therefore, the parameters of an individual were represented byreal values within lower and upper bounds, these bounds beingspecific for each engine condition.
First of all, the genetic population was created. Even thoughthere are approaches using microgenetic algorithms ( GA) witha very small population [42], it was found that, for the problemdescribed in this paper, a population between 100 and 150 in-dividuals produced higher quality solutions than those obtainedwith smaller populations. The usage of different subpopulations(from 2 to 8), with 150 individuals equally distributed amongthem, was initially considered. This technique has been shownto improve the quality of the results compared with the usage ofa single population in other problems [43] [44]. However, no no-ticeable changes in the solution for this particular problem were
obtained. Therefore, it was decided to carry out the experimentsusing a single population with 150 individuals.
B. GA Objective Function
The definition of the objective function in a GA is crucial forthe success of the optimization process, because it assesses thefitness of an individual. The value of the objective function rep-resents a measure of the quality of a member of the population,and thus, the searching process is guided by the results of theobjective function.
Taking into account that the main target of the optimizationprocess was to reduce the fuel consumption (BSFC), subjectto the operating parameter constraints and the emission con-straints, the objective function (OF) was defined as follows:
(4)
where represents the value of emission for the indi-vidual represents the maximum value allowed for theemission, and is a penalty factor. The value of quantifiesthe penalty imposed to an individual that does not accomplishthe restriction about the contaminant emission . The larger thevalue of , the higher the penalty, which results in a substantialincrease of the objective function value, and reduces the proba-bility of the individual to be chosen for reproduction. The emis-sions and the BSFC terms are obtained for each individual (com-bination of operating parameters) by making use of the ANNcommittee previously described.
The definition of the OF represented the main objectivesof the optimization: first of all, to minimize fuel consumption[first term in (4)] and also to keep the emissions below certain

This article has been accepted for inclusion in a future issue.
ALONSO et al.: COMBINING NEURAL NETWORKS AND GAS TO PREDICT AND REDUCE DIESEL ENGINE EMISSIONS 7
limits, controlled by the exponential terms, which significantlyincrease when the upper bounds are exceeded.
In order to weigh the different constraints in emissions, so thata final value of the OF was representative of the global compli-ance of the restrictions, an iterative process for the adjustmentof the parameters in (4) was developed. The initial valuesfor the parameters for all exponential terms were set to one.The GA was executed until convergence and, if a certain emis-sion did not comply with the maximum limit, its corresponding
value was increased. The process was repeated until all theconstraints were satisfied.
C. GA Selection and Replacement
The objective function measures the quality of the individ-uals with respect to the problem domain. In our case, the fittestindividuals had the lowest objective function values.
The selection phase determines the individuals that are goingto produce the offspring. This includes a first step of fitness as-signment, where each individual of the population receives afitness value proportional to its probability of being selected forreproduction. As the fitness value influences the offspring for thenext generation, caution should be taken so that highly fit indi-viduals do not dominate the reproduction to avoid a rapid con-vergence to a possible suboptimal solution. The second step is toselect individuals for reproduction, based on their fitness values.Stochastic Universal Sampling (SUS) [45] was employed forthis selection. With this method, the individuals are mappedone-to-one into contiguous segments of a line, where the size ofthe segment of each individual corresponds to its fitness value.Then, as many equally spaced pointers are placed along the lineas individuals are to be selected, and the number of pointers to anindividual’s segment indicates how many times that individualis selected for reproduction.
Crossover between individuals was performed using Inter-mediate Recombination [46] [47], a method that produces newoffspring around and between the values of the parents. In thismethod, which is applied to real-valued representations of theindividuals, the value of each gene in a new individual is ob-tained following the rule:
(5)
where and are the values of the same gene in the parents,and is a scaling factor chosen randomly for each gene withinan interval (typically [ ]). Another method consid-ered for crossover was Line Recombination, which is similar toIntermediate Recombination, with the difference that the samevalue of is used for all the genes in the same descendant. How-ever, we found that the choice of any of these two methods didnot affect, on average, to the quality of the solution.
Once the new offspring has been produced, a reinsertionpolicy specifies the insertion of the new individuals into thepopulation, as well as the replacement of the existing indi-viduals. Different aspects need to be taken into account here,such as which is the number of newly created individuals withrespect to the population size used, which proportion of thosenew individuals will be actually inserted in the population, and
which old individuals are to be replaced by the new ones. Afterseveral experiments, the number of individuals produced ineach generation was fixed to be equal to 80% of the populationsize, only 90% of which were inserted in the population, theremaining 10% being discarded. The corresponding old indi-viduals to be replaced were those found to be least fit (lowestfitness values). The size of the population remained constantthrough all the generations, as experimental studies showedthat an increase in the population size did not provide bettersolutions in terms of fuel consumption. This enabled to keepthe computational times low.
A high mutation rate was used for the real-valued GA imple-mented in this study. It was shown in [48] that high mutationrates combined together with nonbinary representation, used incomplex combinatorial optimization problems, gave place tosignificantly better solutions than using a typical mutation ratebetween 0.1% and 1% [49]. Applied to this particular problem,it was found that, on average, high mutation rates allowed theGA to find individuals with lower objective function value. Inparticular, a mutation rate equal to the inverse of the number ofvariables in the individuals of the population (i.e., the number ofoperating parameters defining an individual) was used, as sug-gested in [49].
No stopping condition was imposed on the algorithm, this de-cision being left to the user. Thus, the user was in charge of ob-serving periodically the evolution of the population through sev-eral graphical results that summarized the optimization process.
VI. OPTIMIZATION RESULTS
In order to assess the performance of the optimizationprocess, two different engine conditions were optimized out ofthe total 19 considered. Each engine condition belonged to adifferent area, namely European transient cycle and full load,thus covering a wide range of engine conditions where theemissions have important restrictions. All the executions wereperformed on an Intel Pentium Xeon running at 2.0 GHz with2 GBytes of RAM.
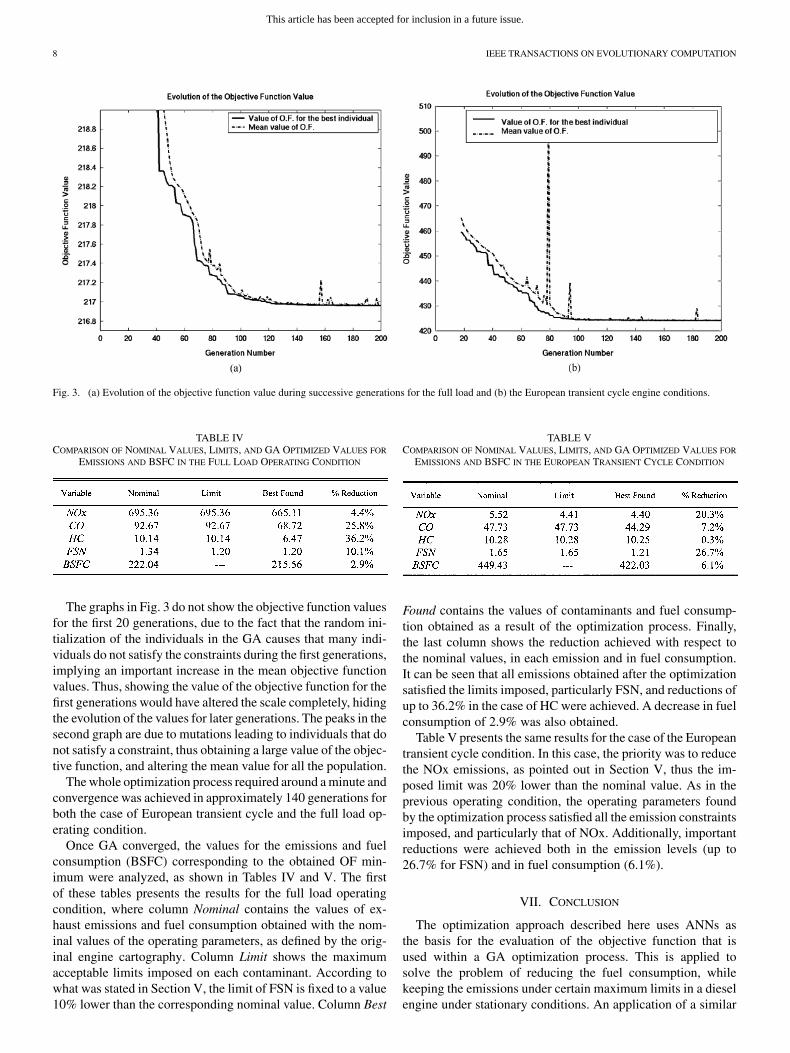
Fig. 3 shows the evolution of the objective function valueduring the optimization process for the two considered oper-ating conditions. In each graph of Fig. 3, the evolution of twoobjective function values is shown: the mean value of the objec-tive function averaged for all the individuals (dotted line) andthe value of the objective function for the best individual in eachgeneration (solid line).
The continuous approach along the consecutive generationsof both objective function values represented in the graphs,suggests that the differences among the individuals of the pop-ulation get progressively smaller. A stable objective functionvalue is reached around the 140th generation for Fig. 3(a) andaround the generation number 100 for Fig. 3(b). No furtherimprovement in the objective function is observed in the nextgenerations, indicating that no better individual is found infuture iterations and, thus, that the algorithm has converged.The corresponding operating parameters obtained at the con-vergence stage were the best combination found which allows aminimized fuel consumption, while also satisfying the imposedemission constraints.
This article has been accepted for inclusion in a future issue.
8 IEEE TRANSACTIONS ON EVOLUTIONARY COMPUTATION
Fig. 3. (a) Evolution of the objective function value during successive generations for the full load and (b) the European transient cycle engine conditions.
TABLE IVCOMPARISON OF NOMINAL VALUES, LIMITS, AND GA OPTIMIZED VALUES FOR
EMISSIONS AND BSFC IN THE FULL LOAD OPERATING CONDITION
The graphs in Fig. 3 do not show the objective function valuesfor the first 20 generations, due to the fact that the random ini-tialization of the individuals in the GA causes that many indi-viduals do not satisfy the constraints during the first generations,implying an important increase in the mean objective functionvalues. Thus, showing the value of the objective function for thefirst generations would have altered the scale completely, hidingthe evolution of the values for later generations. The peaks in thesecond graph are due to mutations leading to individuals that donot satisfy a constraint, thus obtaining a large value of the objec-tive function, and altering the mean value for all the population.
The whole optimization process required around a minute andconvergence was achieved in approximately 140 generations forboth the case of European transient cycle and the full load op-erating condition.
Once GA converged, the values for the emissions and fuelconsumption (BSFC) corresponding to the obtained OF min-imum were analyzed, as shown in Tables IV and V. The firstof these tables presents the results for the full load operatingcondition, where column Nominal contains the values of ex-haust emissions and fuel consumption obtained with the nom-inal values of the operating parameters, as defined by the orig-inal engine cartography. Column Limit shows the maximumacceptable limits imposed on each contaminant. According towhat was stated in Section V, the limit of FSN is fixed to a value10% lower than the corresponding nominal value. Column Best
TABLE VCOMPARISON OF NOMINAL VALUES, LIMITS, AND GA OPTIMIZED VALUES FOR
EMISSIONS AND BSFC IN THE EUROPEAN TRANSIENT CYCLE CONDITION
Found contains the values of contaminants and fuel consump-tion obtained as a result of the optimization process. Finally,the last column shows the reduction achieved with respect tothe nominal values, in each emission and in fuel consumption.It can be seen that all emissions obtained after the optimizationsatisfied the limits imposed, particularly FSN, and reductions ofup to 36.2% in the case of HC were achieved. A decrease in fuelconsumption of 2.9% was also obtained.
Table V presents the same results for the case of the Europeantransient cycle condition. In this case, the priority was to reducethe NOx emissions, as pointed out in Section V, thus the im-posed limit was 20% lower than the nominal value. As in theprevious operating condition, the operating parameters foundby the optimization process satisfied all the emission constraintsimposed, and particularly that of NOx. Additionally, importantreductions were achieved both in the emission levels (up to26.7% for FSN) and in fuel consumption (6.1%).
VII. CONCLUSION
The optimization approach described here uses ANNs asthe basis for the evaluation of the objective function that isused within a GA optimization process. This is applied tosolve the problem of reducing the fuel consumption, whilekeeping the emissions under certain maximum limits in a dieselengine under stationary conditions. An application of a similar

This article has been accepted for inclusion in a future issue.
ALONSO et al.: COMBINING NEURAL NETWORKS AND GAS TO PREDICT AND REDUCE DIESEL ENGINE EMISSIONS 9
approach to the case of transient engine conditions is currentlyunder study.
The ANNs have been employed as predicting tools for BSFC,NOx, PM, CO, and HC. Different quality for the predictions wasobtained for the outputs, which was strongly related to the com-plexity of the phenomena to be modeled and the experimentalrepetitivity of each variable. A committee of 20 ANNs for eachoutput was produced and integrated within the optimization pro-cedure in order to average the predictions of the different spe-cific ANN trainings.
The GA optimization was performed for two engine operatingconditions, where the limits in emissions were established ac-cording to the values in the nominal engine cartography and themain restrictions in each case. A methodology for the objectivefunction adjustment was proposed, including special penaltiesfor the more restrictive emission limits.
For the two operating conditions studied, the convergence ofthe optimization process was fast (less than a minute) and allthe constraints were satisfied in the resultant solutions. Impor-tant improvements with respect to the nominal manufacturer en-gine cartographies were observed both in terms of emissions (upto 36% reduction for HC) and fuel consumption (between 3%and 6% reduction depending on the engine condition). This hasbeen achieved in a problem of high dimensions (seven operatingparameters) and high number of constraints (four emissions).Finally, it should be noticed that the engine emission and con-sumption improvement was reached without the incorporationof any new technological device, just combining in a better waythe operating parameters that are currently considered by themanufacturer.
Additional efforts and future work will focus on experimentalconfirmation of optimized settings and also in implementationof the presented procedure for transient operation of the engine.
REFERENCES
[1] K. Mori, “Worldwide trends in heavy-duty diesel engine exhaust emis-sion legislation and compliance technologies,” SAE paper 970753,1997.
[2] F. X. Moser, T. Sams, and W. Cartellieri, “Impact of future exhaustgas emission legislation on the heavy duty truck engine,” SAE paper2001-01-0186, 2001.
[3] C. J. Morey and J. Mark, “Diesel passenger vehicles—Can they meetair quality needs and climate change goals?,” SAE paper 2000-01-1599, 2000.
[4] J. Benajes, S. Molina, and J. M. García, “Influence of pre- and post-in-jection on the performance and pollutant emissions in HD diesel en-gine,” SAE paper 2001-01-0526, 2001.
[5] P. L. Herzog, L. Buerguer, E. Winklhofer, P. Zelenka, and W. Caterl-lieri, “NOx reduction strategies for diesel engines,” SAE paper 920470,1992.
[6] C. Havenith, J. R. Needham, A. J. Nicol, and C. H. Such, “Low emis-sion heavy duty diesel engine for Europe,” SAE paper 932959, 1993.
[7] S. P. Edwards, D. M. Grove, and H. P. Wynn, Statistics for engine op-timization. London, U.K.: Professional Engineering Publishing Lim-ited, 2000, ISBN 1-86058-201-X.
[8] D. T. Montgomery and R. D. Reitz, “Optimization of heavy duty dieselengine operating parameters using a response surface method,” SAEpaper 2000-01-1962, 2000.
[9] P. K. Senecal and D. T. Montgomery, “A methodology for engine de-sign using multi-dimensional modeling and genetic algorithms withvalidation through experiments,” Int. J. Engine Research, vol. 1, no.3, pp. 229–248, 2000.
[10] H. Yun and R. D. Reitz, “An experimental study on emissions optimiza-tion using micro-genetic algorithms in a HSDI diesel engine,” SAEpaper 2003-01-0347, 2003.
[11] T. Hiroyasu, M. Miki, J. Kamiura, S. Watanabe, and H. Hiroyasu,“Multi-objective optimization of diesel engine emissions and fueleconomy using genetic algorithms and phenomenological model,”SAE paper 2001-01-2778, 2001.
[12] M. Guerrier and P. Cawsey, “The development of model based method-ologies for gasoline IC engine calibration,” SAE paper 2004-01-1466,2004.
[13] H. Hiroyasu and T. Kadota, “Models for combustion and formation ofnitric oxide and soot in direct injection engines,” SAE paper 760129,1976.
[14] J. M. Desantes, M. Lapuerta, and J. M. Salavert, “Study on indepen-dent effects of diesel engine operating conditions on nitric oxide for-mation and emissions trough schematical combustion simulation,” inProc. Instn. Mech. Engineers, Part D, J. Automobile Eng., 1996, vol.210, pp. 71–80.
[15] F. Payri, J. M. Desantes, and M. A. Lapuerta, “Phenomenologicalmodel for calculating D.I. diesel engine performance and emissions,”in Proc. Int. Congr. Calcul Scientifique et Automobile (SIA), Paris,France, 1990.
[16] S.C. Kyriatides, J. C. Dent, and P. S. Mehta, “Phenomenological dieselcombustion model including smoke and NO emission,” SAE paper860330, 1986.
[17] R.D. Reitz and R. P. Hessel, “Optimization of IC engine design forreduced emissions using CFD modeling,” in Proc. 2nd Thiesel Conf.Thermo and Fluid Dynamic Processes in Diesel Engines, 2002, pp.399–414.
[18] R.J. Howlett, M. M. Zoysa, S. D. Walters, and P. A. Howson, “Neuralnetwork techniques for monitoring and control of internal combustionengines,” in Proc. Int. Symp. Intell. Ind. Autom., 1999.
[19] D.T. Montgomery and R. D. Reitz, “Evaluation of the EGR and mul-tiple injections on particulate and NOx emissions from a D.I. dieselengine,” SAE paper 960316, 1996.
[20] A. E. Klingbeil, H. Juneja, Y. Ra, and R. D. Reitz, “Premixed dieselcombustion analysis in a heavy-duty diesel engine,” SAE paper2003-01-0341, 2003.
[21] M. P. Thiel, A. E. Klingbeil, and R. D. Reitz, “Experimental optimiza-tion of a heavy-duty diesel engine using automated genetic algorithms,”SAE paper 2002-01-0960, 2002.
[22] P. K. Senecal and R. D. Reitz, “Simultaneous reduction of engine emis-sions and fuel consumption using genetic algorithms and multi-dimen-sional spray and combustion modelling,” SAE paper 2000-01-1890,2000.
[23] L. Hernández, “Desarrollo de una metodología para la predicción y op-timización de emisiones contaminantes y consumo en motores Dieselde automoción mediante redes neuronales artificiales.,” Ph.D. disserta-tion, Valencia, Spain, 2004, (in Spanish).
[24] R. Christian, F. Knopf, A. Jasmek, and W. Schindler, “A new methodfor the filter smoke number measurement with improved sensitivity,”MTZ, vol. 54, pp. 16–22, 1993, (in German).
[25] G. G. Muntaen, “A theoretical model for the correlation of smokenumber to dry particulate concentration in diesel exhaust,” SAE paper1999-01-0515, 1999.
[26] European Directive 1999/96/CE, European Official Journal.[27] S. A. Molina, “Estudio de la influencia de los parámetros de inyección
y la recirculación de gases de escape sobre el proceso de combustión,las prestaciones y las emisiones de un motor diesel de 1.8 litros decilindrada.,” Ph.D. dissertation, Valencia, Spain, 2003, (in Spanish).
[28] “Operating Manual AVL 415. Variable Sampling Smoke Meter,” 1996,AVL List GmbH.
[29] S. Haykin, Neural Networks: A Comprehensive Foundation. Engle-wood Cliffs, NJ: Prentice-Hall, 1994, ISBN 0-13-908385-5.
[30] J. M. Zurada, Introduction to Artificial Neural Systems. Boston, MA:PWS Publishing, 1992.
[31] A. J. Maren, C. T. Herston, and R. M. Pap, Handbook of Neural Com-puting Applications. New York: Academic, 1990, Ed..
[32] H. Demuth and M. Beale, Neural Network Toolbox for Use withMatlab: User’s Guide Version 3. Natick, MA: The Mathworks,1998.
[33] G. J. Thompson, C. M. Atkinson, N. N. Clark, T. W. Long, and E.Hanzevack, “Neural network modelling of the emissions and perfor-mance of a heavy-duty diesel engine,” in Proc. Instn. Mech. Engineers,Part D, J. Automobile Eng., 2000, vol. 214(D), pp. 111–126.
[34] J. M. Desantes, J. V. Benajes, S. A. Molina, and L. Hernández, “Multi-objective optimization of heavy-duty diesel engines under stationaryconditions,” in Proc. Instn. Mech. Engineers, Part D, J. AutomobileEng., 2005, vol. 219, pp. 77–87.
This article has been accepted for inclusion in a future issue.
10 IEEE TRANSACTIONS ON EVOLUTIONARY COMPUTATION
[35] J. Galindo, J. M. Luján, J. R. Serrrano, and L. Hernández, “Combus-tion simulation of turbocharger HSDI Diesel engines during transientoperation using neural networks,” Appl. Thermal Eng., vol. 25/5-6, pp.877–898, 2005.
[36] C. Wang, S. S. Venkatesh, and J. S. Judd, “Optimal stopping and ef-fective machine complexity in learning,” in Proc. Conf. Neural Inf.Process. Syst., Denver, CO, 1993, pp. 303–310.
[37] K. Levenberg, “A method for the solution of certain non-linear prob-lems in least squares,” Quart. Appl. Math., vol. 2, pp. 164–168, 1944.
[38] D.W. Marquardt, “An algorithm for least-squares estimations of non-linear parameters,” SIAM J. Appl. Math., vol. 11, pp. 431–441, 1963.
[39] L. Davis, The Handbook of Genetic Algorithms. New York: Van Nos-trand Reingold, 1992.
[40] Z. Michalewicz, Genetic Algorithms + Data Structures = EvolutionPrograms. New York: Springer-Verlag, 1996, AI Series.
[41] A. H. Wright, “Genetic algorithms for real parameter optimization,”in Foundations of Genetic Algorithms. San Mateo, CA: MorganKauffman, 1991, pp. 205–218.
[42] D. D. Wickman, P. K. Senecal, and R. D. Reitz, “Diesel engine com-bustion chamber geometry optimization using genetic algorithms andmulti-dimensional spray and combustion modeling,” SAE 2001-01-0547, 2001.
[43] M. J. Brauer, M. T. Holder, L. A. Dries, D. J. Zwickl, P. O. Lewis,and D. M. Hillis, “Genetic algorithms and parallel processing in max-imum-likelihood phylogeny inference,” Molecular Biology and Evolu-tion, vol. 10, no. 19, pp. 1717–1726, 2002.
[44] T. Starkweather, D. Whitley, and K. Mathias, “Optimization using dis-tributed genetic algorithms,” Lecture Notes in Computer Science, vol.496, pp. 176–185, 1991.
[45] J. E. Baker, “Reducing bias and inefficiency in the selection algorithm,”in Proc. 2nd Int. Conf. Genetic Algorithms, 1987, pp. 14–21.
[46] H. Mühlenbein and D. Schlierkamp-Voosen, “Predictive models for thebreeder genetic algorithms,” Evol. Comput., vol. 1, no. 1, pp. 25–49,1993.
[47] R. Salomon, “Short notes on the schema theorem and the buildingbock hypothesis in genetic algorithms,” in Evolutionary ProgrammingVII. New York: Springer-Verlag, 1998, pp. 113–122.
[48] D. M. Tate and A. E. Smith, “Expected allele coverage and the role ofmutation in genetic algorithms,” in Proc. ICGA 5, 1993, pp. 31–37.
[49] A. Chipperfield, P. Fleming, H. Pohlheim, and C. Fonseca, Ge-netic algorithm toolbox user’s guide 1.2 Dept. Autom. ControlSyst. Eng., Univ. Sheffield. Sheffield, U.K. [Online]. Available:http://www.shef.ac.uk/content/1/c6/03/35/06/manual.pdf
José M. Alonso received the M.Sc. degree incomputer science from the Universidad Politécnicade Valencia (UPV), Valencia, Spain, in 1997. He iscurrently working towards the Ph.D. degree in thefield of parallel and grid computing in simulation ofbuilding structures at UPV
He is a member of the High Performance Net-working and Computing Group, UPV, since 1996.Since 2000, he has been an Assistant Lecturer atUPV. He has also participated in different researchprojects about the application of parallel and grid
computing techniques to several areas of engineering. Other fields of interestinclude neural networks and evolutionary computation.
Fernando Alvarruiz received the M.Sc. degree incomputer science from the Universidad Politécnicade Valencia (UPV), Valencia, Spain, in 1995. He iscurrently working towards the Ph.D. degree, relatedto the application of parallel computing to simulationand optimization processes in water distribution net-works at UPV.
Since 2000, he has been an Assistant Lecturer atUPV. Other fields of interest include neural networksand evolutionary computation.
Mr. Alvarruiz received a scholarship for postgrad-uate studies in the High Performance Networking and Computing Group, UPV.
José M. Desantes received the Degree in mechan-ical engineering from the Universidad Politécnica deMadrid, Madrid, Spain, in 1978 and the Ph.D. degreein engineering from the Universidad Politécnica deValencia (UPV), Valencia, Spain, in 1980.
Since 1984, he has been a Full Professor at theDepartment of Thermal Engines, UPV. Directorof the University Research Institute CMT-MotoresTérmicos, he has collaborated in 150 journal andconference papers related to ICE topics. He hassupervised 15 Ph.D. thesis, has collaborated in 200
research projects funded by national programs, European union programs,or directly by the industry. His research interest is on thermofluidynamicsof internal combustion engines (ICE), mainly focused in pollutant emissioncontrol and engine efficiency improvements.
Leonor Hernández received the Degree in physicsfrom the Universidad de Valencia, Valencia, Spain,in 1998 and the Ph.D. degree from the UniversidadPolitécnica de Valencia (UPV), Valencia, in 2004.
Since 2005, she holds an Assistant Lecturer posi-tion at the Universitat Jaume I, Castellón, Spain. Herresearch interests are in emission modeling and opti-mization techniques.
Vicente Hernández received the Ph.D. degree inmathematics from the Universidad de Valencia,Valencia, Spain, in 1979.
Since 1991, he has been a Full Professor in theDepartment of Information Systems and Compu-tation, Universidad Politécnica de Valencia (UPV),Valencia. Leader of the High Performance Net-working and Computing Group, he has written over220 journal and conference papers on numericalmethods, parallel computing, grid computing andtheir applications on different fields. He has super-
vised over 20 Ph.D. thesis on computational science and applied mathematics.He has acted as coordinator or main researcher in more than 30 projects fundedby national and international programs.
Germán Moltó was born in Valencia, Spain, onJanuary 6, 1979. He received the M.Sc. degree incomputer science from the Universidad Politécnicade Valencia (UPV), Valencia, Spain, in 2002. Heis currently working towards the Ph.D. degree inthe field of grid computing applied to biomedicalapplications at UPV.
Since 2002, he has been a Researcher at the HighPerformance Networking and Computing Group,UPV. In 2005, he received an Assistant Lecturerposition.