Causal Relationship among Energy Use, CO2 Emissions and Economic Growth in Bangladesh: An Empirical...
18
World Journal of Social Sciences Vol. 2. No. 4. July 2012. Pp. 273 – 290 Causal Relationship among Energy Use, CO 2 Emissions and Economic Growth in Bangladesh: An Empirical Study Sakib Bin Amin 1 , Shaikh Shahnawaz Ferdaus 2 and Aroni Kabita Porna 3 The link among energy use, economic growth and environmental quality has been a source of great controversy among the researchers for a very long time. Industrialists typically argue that environmental policies harm growth by raising production costs. Environmentalists, on the other hand, believe that environmental policies are required to reduce the usage of energy for sustainable growth. The objective of the current study is to investigate the causal relationships among energy use, economic growth and carbon dioxide (CO 2 ) emissions in Bangladesh over the period 1976-2007, using a multivariate framework. We would like to address the following questions: 1. Can Economic growth go on without deteriorating the quality of the environment in Bangladesh? 2. Which should be the optimal environmental policy in Bangladesh? To check the stationarity properties, we have employed Augmented Dickey Fuller (ADF) test and found that variables are stationary either at their level or at first differences. Using Johansen cointegration method, the empirical findings indicate that there exists long run cointegration among the variables. The study points out that there is no causal relationship between Economic Growth and CO 2 , ensuring that economic growth in Bangladesh can be achieved without degrading the quality of the environment. Moreover, as a regular economic phenomenon, energy use can lead to CO 2 emissions. Our study also reveals that in Bangladesh, growth is not energy dependent, rather economic growth is able to ensure energy consumption. Field of Research: Economic Growth, Energy Use and CO 2 Emissions 1. Introduction Climate change as a result of global warming has become one of the most important issues in the recent years. In 2007, the Intergovernmental Panel on Climate Change reported that there would be an estimated rise in the average global temperature between 1.1 and 6.4 °C within the next 100 years. It has also been predicted that a meager 2°C increase in temperature would greatly hamper many ecosystems and would cause an increase in the sea-level that would adversely impact the lives of people living in coastal zones (Lau et al., 2009). The emission of the greenhouse gases, as like 1 Senior Lecturer, Department of Economics, North South University, Dhaka Email: [email protected] 2 BSS Student, Department of Economics, North South University, Dhaka Email: [email protected] 3 Corresponding Author and BSS Student, Department of Economics, North South University, Dhaka Email: [email protected].
Transcript of Causal Relationship among Energy Use, CO2 Emissions and Economic Growth in Bangladesh: An Empirical...
World Journal of Social Sciences
Vol. 2. No. 4. July 2012. Pp. 273 – 290
Causal Relationship among Energy Use, CO2 Emissions and
Economic Growth in Bangladesh: An Empirical Study
Sakib Bin Amin1, Shaikh Shahnawaz Ferdaus2 and Aroni Kabita Porna3
The link among energy use, economic growth and environmental quality has been a source of great controversy among the researchers for a very long time. Industrialists typically argue that environmental policies harm growth by raising production costs. Environmentalists, on the other hand, believe that environmental policies are required to reduce the usage of energy for sustainable growth. The objective of the current study is to investigate the causal relationships among energy use, economic growth and carbon dioxide (CO2) emissions in Bangladesh over the period 1976-2007, using a multivariate framework. We would like to address the following questions: 1. Can Economic growth go on without deteriorating the quality of the environment in Bangladesh? 2. Which should be the optimal environmental policy in Bangladesh? To check the stationarity properties, we have employed Augmented Dickey Fuller (ADF) test and found that variables are stationary either at their level or at first differences. Using Johansen cointegration method, the empirical findings indicate that there exists long run cointegration among the variables. The study points out that there is no causal relationship between Economic Growth and CO2, ensuring that economic growth in Bangladesh can be achieved without degrading the quality of the environment. Moreover, as a regular economic phenomenon, energy use can lead to CO2 emissions. Our study also reveals that in Bangladesh, growth is not energy dependent, rather economic growth is able to ensure energy consumption.
Field of Research: Economic Growth, Energy Use and CO2 Emissions
1. Introduction Climate change as a result of global warming has become one of the most important issues in the recent years. In 2007, the Intergovernmental Panel on Climate Change reported that there would be an estimated rise in the average global temperature between 1.1 and 6.4 °C within the next 100 years. It has also been predicted that a meager 2°C increase in temperature would greatly hamper many ecosystems and would cause an increase in the sea-level that would adversely impact the lives of people living in coastal zones (Lau et al., 2009). The emission of the greenhouse gases, as like
1 Senior Lecturer, Department of Economics, North South University, Dhaka
Email: [email protected] 2 BSS Student, Department of Economics, North South University, Dhaka
Email: [email protected] 3 Corresponding Author and BSS Student, Department of Economics, North South University, Dhaka
Email: [email protected].
Amin, Ferdaus & Porna
274
CO2 is considered to be the major contributor to global warming. CO2 concentration in air is responsible for more than 60% of the greenhouse gas content. Therefore, in today’s world of rapid economic development, it is important for the researchers to find out the link concerning carbon dioxide emissions with economic growth and energy consumption. A wide range of exhaustive research has been conducted on the nexus between economic growth and environmental degradation, as well as, on economic growth and energy consumption over the past few decades. Higher emissions, which act as an indicator of the ambient quality of the environment, have been found to be a result of increased energy consumption, which in turn is thought to be the result of increased economic growth. However, the empirical evidence remains controversial and ambiguous to date. The relationship between economic growth and pollutant emissions has widely been taken into consideration. According to the Environmental Kuznets’s Curve (EKC) hypothesis, it is assumed that there exists an inverted U-shaped relationship between environmental degradation and income per capita. Grossman and Krueger (1993) was the initial proponent of this thought and then popularized this hypothesis. Their analysis showed that ambient levels of pollutants first increased along with the country’s per capita GDP but later decreased as the GDP per capita rose further. Later, Selden and Song (1994) and Grossman and Krueger (1995) obtained better results by using higher-quality data, suggesting that an inverted U-shaped relationship between income per capita and pollution (Carson, Jeon and McCubben, 1997). The relationship between energy use and output nexus suggests that economic growth is closely linked to energy use; higher economic development demands higher use of energy. On the other hand, for energy to be used efficiently, it is necessary to have a developed economy. Hence, the causality might be either way. Following the seminal study of Kraft and Kraft (1978), where they found a unidirectional Granger causality running from output to energy consumption for USA between 1947-1974, a number of studies have assessed the empirical evidence by employing Granger causality and cointegration model. Recent studies include papers by Alam et al (2011) and Kim and Baek (2011). Evaluation of the related literatures suggests that most of the studies centralize their focus on either the nexus between economic growth and environmental degradation, or on economic growth and energy consumption. However, very few studies have actually attempted to bring and validate both these nexuses under the same framework. Bangladesh is a rapidly developing country with a GDP growth rate of 6%. However, it is one of the poorest countries in the world, with per capita income of US $ 751 (Bangladesh Power Development Board, 2011). Therefore, Bangladesh can be considered to be a potential pollution haven – a country where pollution intensive firms can settle down due to the less stringent environmental standards.
Amin, Ferdaus & Porna
275
To the best of our knowledge, other than the paper by Alam and Huylenbroeck (2011), no studies have been conducted focusing on the empirical relationship among economic growth, energy consumption and carbon dioxide emissions in Bangladesh. Hence the objective of this study is to investigate the casual relationships among these three variables in Bangladesh over the period 1976-2007 by using a multivariate framework. The rest of the paper is arranged as follows: section 2 provides a review of literatures with section 3 giving an overview of the energy sector in Bangladesh. Then section 4 describes the econometric methodology used in the study followed by the results in section 5 and conclusion in section 6.
2. Literature Review The relationship among economic growth, energy use and pollutant emissions has been well documented in empirical studies. A number of studies concerning different countries, variables and methodologies have been taken into account. The results of these studies at times seem to be contradictory in nature. Some studies state that a bidirectional relationship exists between energy consumption and economic growth whereas some studies state that a unidirectional relationship exists. From the point of view of environmental economics, the relationship between these variables portrays an issue of great importance. However, as mentioned above, only a single study based on the scenario of Bangladesh has been conducted involving all three aspects; Energy use, CO2 emission and Economic growth. Alam et al. (2011) study the dynamic Granger causality relationship among energy consumption, CO2 emission and economic growth in India, using an advanced multivariate modeling approach, the Toda-Yamamoto (TY) approach and estimating the Generalized Impulse Response Function (GIRF). According to them, there is no long run causality relationship between income and CO2 emissions. They also deduce that no causal relationship between energy consumption and income exists in the long run but in the short run it does as suggested by the GIRF. On the other hand, they conclude that bidirectional causality exists between energy consumption and CO2 emissions both in the long run and in the short run, indicating that India’s energy use depends mainly on the coal dominated fossil fuels. According to Kim and Baek (2011), energy consumption has a damaging long run effect on environment for both developed and developing countries, that is, an increase in per capita energy consumption leads to environmental degradation. The paper examines the environmental consequences of economic growth in a dynamic cointegration framework by incorporating energy consumption as well as Foreign Direct Investment (FDI) using an Autoregressive Distributed Lag (ARDL) approach. Chang (2010) investigates the causality among the three variables (energy consumption, carbon dioxide emissions and GDP) in China over the period of 1981-2006. He concludes that there is bidirectional causality running from GDP to carbon dioxide emissions and
Amin, Ferdaus & Porna
276
consumption of resources (crude oil and coal) and also from GDP to electricity consumption. Apergis and Payne (2010) investigate the relationship among carbon dioxide emissions, energy consumption and real output for eleven countries of Commonwealth of Independent States. The study is carried out using a panel vector error correction model over a period of 1992-2004. The authors find that the energy consumption has a positive and significant effect on the pollutant emissions in the long run whereas the real output exhibits a quadratic relationship with the carbon dioxide emissions, associated with the Environmental Kuznets Curve (EKC) hypothesis. In the short run, both energy consumption and economic growth cause carbon dioxide emissions. Menyah and Wolde-Rufael (2010) also examine the long run and the causal relationship among these variables for the coal abundant country, South Africa. The study is carried out over the period 1965–2006 by applying a multivariate framework that include labor and capital as the additional variables. The empirical results suggest that a unidirectional causality runs from pollutant emissions to economic growth, energy consumption to economic growth and ultimately from energy consumption to carbon dioxide emissions, indicating that the country may have to forgo economic growth or energy consumption to bring down pollution. Saboori and Solaymani (2010) carry out a study on Iran over the period 1971-2007 in order to examine the dynamic relationship among carbon dioxide (CO2) emissions, economic growth and energy consumption. They employ the Autoregressive Distributed Lag (ARDL) model as the estimation method and find that energy consumption has a positive and significant impact on CO2 emissions in the long run. They point out that Iran, being a developing country and OPEC’s second largest producer and exporter has experienced a substantial rise in pollution and energy consumption in the recent years. The authors refer to the data by the International Energy Agency, mentioning that Iran’s significant carbon dioxide emission places the country among the top ten carbon dioxide emitting countries. Lean and Smyth (2009) use a panel vector error correction model for five ASEAN countries (Indonesia, Malaysia, Philippines, Singapore and Thailand) over the period 1980-2006 and find a statistically significant positive relationship existing between electricity consumption and emissions with a statistically significant non-linear relationship between CO2 emission and real output. The paper farther identifies that in the long run there is a unidirectional causality running from electricity consumption and CO2 emissions to economic growth and that in the short run, there is a unidirectional causality from emissions to electricity consumption. The study employs unit root test, cointegration method, a panel version of Dynamic Ordinary Least Squares (DOLS) and Granger causality test methods to investigate the relationship between the variables. Soytas and Sari (2009) find that for Turkey, carbon emissions seem to Granger cause energy consumption, but not the other way round. Zhang and Cheng (2009) apply the TY procedure and Generalized Impulse Response to investigate the temporal relationships among economic growth, energy consumption and carbon emissions for
Amin, Ferdaus & Porna
277
China over the period 1960-2007. They find that a unidirectional Granger causality runs from real GDP to energy consumption and that energy consumption Granger causes the carbon emissions in the long run but not vice versa. This implies that an increase in the energy consumption would lead to an increase in carbon emissions. According to the authors, the result is consistent with that of the empirical results found for the United States (Soytas et al.,2007) but varies from that of the Turkish, as found by Soytas and Sari (2009). Ang (2008) examines the long run relationship among output, pollutant emissions and energy consumption over a period of 1970-1999 in Malaysia. He finds that in the long run, energy consumption and pollutant emissions are positively related to the output with a strong causality running from economic growth to energy consumption both in the long and short run and a weak causality running from CO2 emissions to economic growth. Soytas et al. (2007) investigate the effect of energy consumption and output on carbon emissions in the United States and find that in the long run, income does not Granger cause carbon emissions but energy consumption does. Ang (2007) also examines the relationship among these three variables for France over a period of 1960-2006. According to the author, a positive relationship exists between energy use and CO2
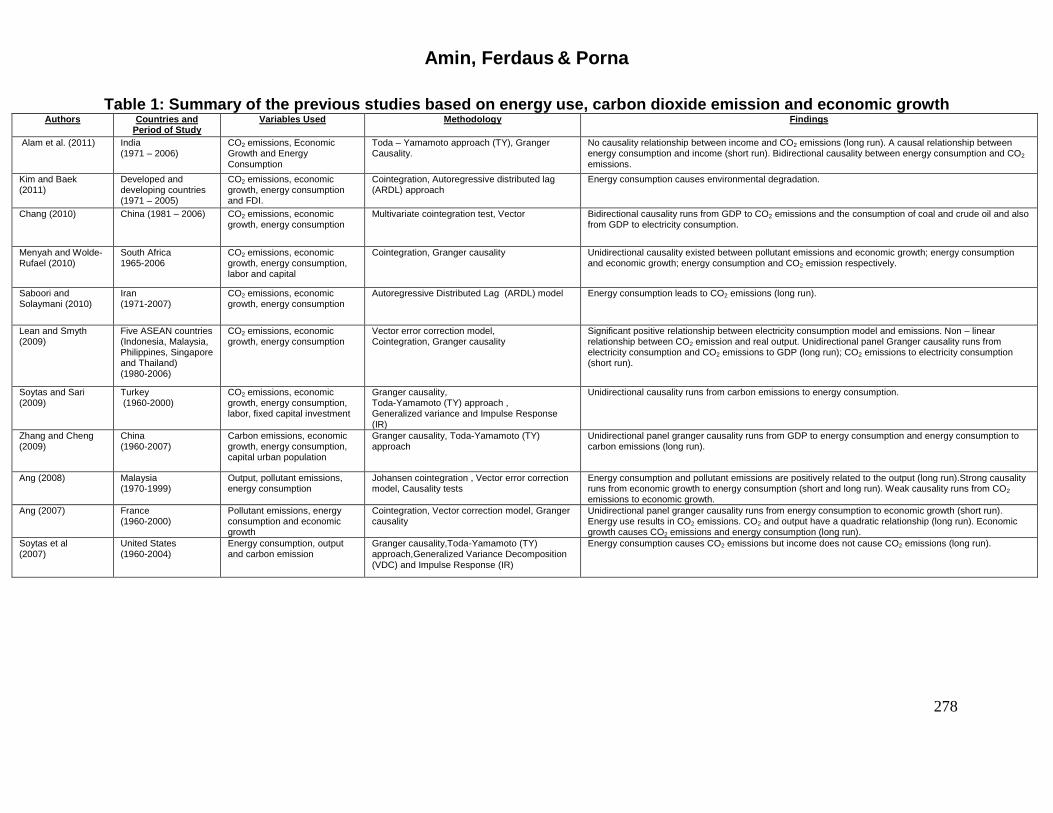
emissions with output having a quadratic relationship with CO2 emissions in the long run. It is also found that a unidirectional Granger causality runs from economic growth to energy consumption and pollution emissions in the long run. A unidirectional causality running from energy use to economic growth is also observed in the short run. We summarize the studies based on economic growth, energy use and carbon dioxide emissions discussed above in the following table.
Amin, Ferdaus & Porna
278
Table 1: Summary of the previous studies based on energy use, carbon dioxide emission and economic growth Authors Countries and
Period of Study Variables Used Methodology Findings
Alam et al. (2011) India (1971 – 2006)
CO2 emissions, Economic Growth and Energy Consumption
Toda – Yamamoto approach (TY), Granger Causality.
No causality relationship between income and CO2 emissions (long run). A causal relationship between energy consumption and income (short run). Bidirectional causality between energy consumption and CO2 emissions.
Kim and Baek (2011)
Developed and developing countries (1971 – 2005)
CO2 emissions, economic growth, energy consumption and FDI.
Cointegration, Autoregressive distributed lag (ARDL) approach
Energy consumption causes environmental degradation.
Chang (2010) China (1981 – 2006) CO2 emissions, economic growth, energy consumption
Multivariate cointegration test, Vector Bidirectional causality runs from GDP to CO2 emissions and the consumption of coal and crude oil and also from GDP to electricity consumption.
Menyah and Wolde-Rufael (2010)
South Africa 1965-2006
CO2 emissions, economic growth, energy consumption, labor and capital
Cointegration, Granger causality Unidirectional causality existed between pollutant emissions and economic growth; energy consumption and economic growth; energy consumption and CO2 emission respectively.
Saboori and Solaymani (2010)
Iran (1971-2007)
CO2 emissions, economic growth, energy consumption
Autoregressive Distributed Lag (ARDL) model Energy consumption leads to CO2 emissions (long run).
Lean and Smyth (2009)
Five ASEAN countries (Indonesia, Malaysia, Philippines, Singapore and Thailand) (1980-2006)
CO2 emissions, economic growth, energy consumption
Vector error correction model, Cointegration, Granger causality
Significant positive relationship between electricity consumption model and emissions. Non – linear relationship between CO2 emission and real output. Unidirectional panel Granger causality runs from electricity consumption and CO2 emissions to GDP (long run); CO2 emissions to electricity consumption (short run).
Soytas and Sari (2009)
Turkey (1960-2000)
CO2 emissions, economic growth, energy consumption, labor, fixed capital investment
Granger causality, Toda-Yamamoto (TY) approach , Generalized variance and Impulse Response (IR)
Unidirectional causality runs from carbon emissions to energy consumption.
Zhang and Cheng (2009)
China (1960-2007)
Carbon emissions, economic growth, energy consumption, capital urban population
Granger causality, Toda-Yamamoto (TY) approach
Unidirectional panel granger causality runs from GDP to energy consumption and energy consumption to carbon emissions (long run).
Ang (2008) Malaysia (1970-1999)
Output, pollutant emissions, energy consumption
Johansen cointegration , Vector error correction model, Causality tests
Energy consumption and pollutant emissions are positively related to the output (long run).Strong causality runs from economic growth to energy consumption (short and long run). Weak causality runs from CO2 emissions to economic growth.
Ang (2007) France (1960-2000)
Pollutant emissions, energy consumption and economic growth
Cointegration, Vector correction model, Granger causality
Unidirectional panel granger causality runs from energy consumption to economic growth (short run). Energy use results in CO2 emissions. CO2 and output have a quadratic relationship (long run). Economic growth causes CO2 emissions and energy consumption (long run).
Soytas et al (2007)
United States (1960-2004)
Energy consumption, output and carbon emission
Granger causality,Toda-Yamamoto (TY) approach,Generalized Variance Decomposition (VDC) and Impulse Response (IR)
Energy consumption causes CO2 emissions but income does not cause CO2 emissions (long run).
Amin, Ferdaus & Porna
279
3. Energy Sector in Bangladeshi
Bangladesh is a densely populated country with a per capita income of US $ 751 (FY 2010) which makes the country one of the poorest in the world. However, Bangladesh has been boasting a real GDP growth rate of 6% during the past 5 years (Asian Development Bank, 2009) and the growth is unsurprisingly accompanied by increasing demand of energy. The electricity growth in the fiscal year 2010 was 10%, with an average growth of 7% since 1990. The power generation capacity of Bangladesh, up until 31st of January 2011, was 5936 MW. Almost 49% of the population in Bangladesh has access to electricity (Bangladesh Power Development Board, BPDB, 2011). On the other hand, power outages in Bangladesh due to inadequate power generation, has been held responsible for an estimated loss of US $ 1 billion worth of annual industrial output (UK Trade & Investment, 2011). Wadud et al (2011) states that the main contributors to the total energy consumption in Bangladesh are natural gas, biomass and petroleum. The major source of energy for the rural population is biomass, which comprised one-third of the entire energy consumption of 2005. Natural Gas is said to be the apex source of commercial energy in Bangladesh, and it was responsible for almost half of the energy consumption in the same year. Petroleum, which is mostly imported from abroad, make up for one – fifth energy consumption, whereas, less than 1% of energy consumption in 2005 was in the form of coal and hydro energy (National Energy Policy-NEP, Ministry of Power, Energy and Mineral Resources, 2008). Petroleum is predominantly used in the transportation sector, although the demand of petroleum is decreasing since the Government of Bangladesh (GOB) is encouraging Compressed Natural Gas (CNG) as a substitute fuel. Around 10% of the generated electricity in 2006 & 2007 was attributed to the use of diesel and furnace oil (BPDB, 2007). Diesel is used in the agricultural sector for running irrigation pumps and kerosene is used in rural areas for lighting. Biomass energy is utilized for cooking in rural areas. In 1996, around 65% of households in Bangladesh used kerosene for lighting (Bangladesh Bureau of Statistics, BBS, 2009). The sources of biomass fuel include agricultural residues, animal wastes, scrub wood and fire wood (Miah et al., 2010). It is estimated that biomass contributed to almost 54% of primary energy consumption, which reduced to 35% just over a decade in 2005 (Wadud et al., 2011). The use of Natural Gas is more diverse, which is brought into play in the processes of heating the boilers in industries, as raw materials in fertilizer companies, as fuel in brick fields, for cooking in households etc. Several coal reserves have been discovered in the north western part of Bangladesh but the coal sector of the country still remains underdeveloped. The total coal reserve is estimated to be 1.756 Gtonne. Till today, mining work has started only at Baropukuria. Coal is primarily used in brick making factories; however, 5% of total electricity in the year 2006 and 2007 was produced by coal.
Amin, Ferdaus & Porna
280
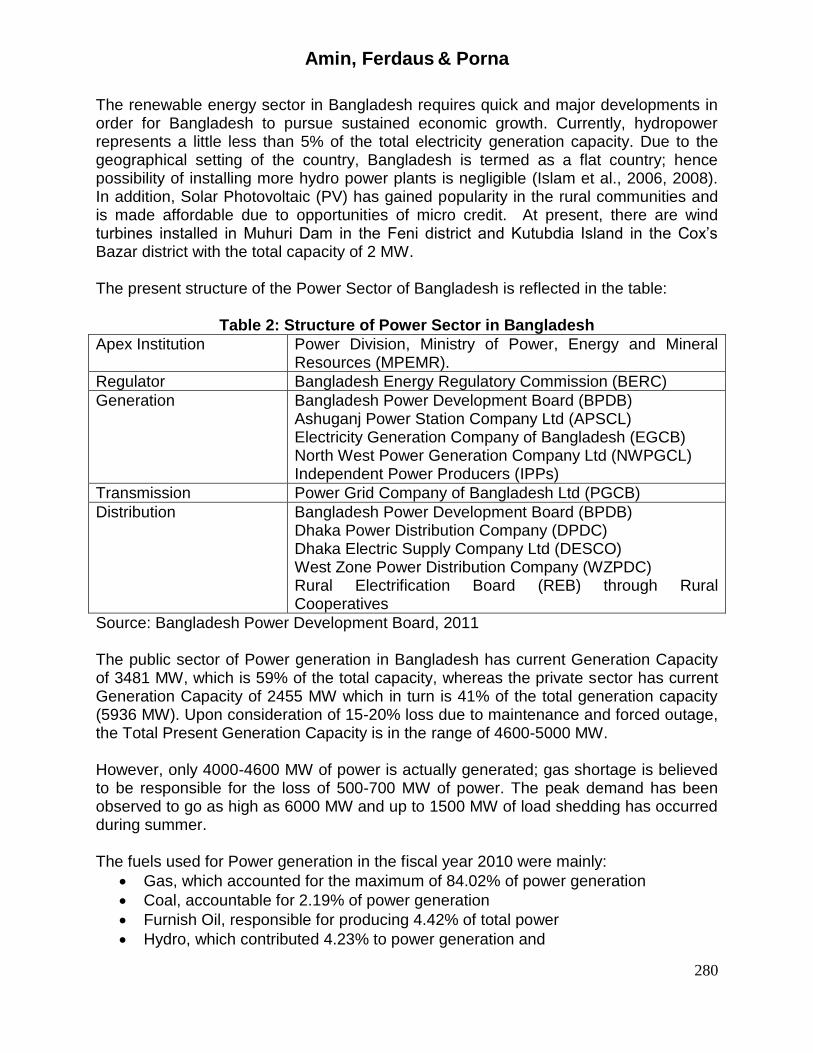
The renewable energy sector in Bangladesh requires quick and major developments in order for Bangladesh to pursue sustained economic growth. Currently, hydropower represents a little less than 5% of the total electricity generation capacity. Due to the geographical setting of the country, Bangladesh is termed as a flat country; hence possibility of installing more hydro power plants is negligible (Islam et al., 2006, 2008). In addition, Solar Photovoltaic (PV) has gained popularity in the rural communities and is made affordable due to opportunities of micro credit. At present, there are wind turbines installed in Muhuri Dam in the Feni district and Kutubdia Island in the Cox’s Bazar district with the total capacity of 2 MW. The present structure of the Power Sector of Bangladesh is reflected in the table:
Table 2: Structure of Power Sector in Bangladesh
Apex Institution Power Division, Ministry of Power, Energy and Mineral Resources (MPEMR).
Regulator Bangladesh Energy Regulatory Commission (BERC)
Generation Bangladesh Power Development Board (BPDB) Ashuganj Power Station Company Ltd (APSCL) Electricity Generation Company of Bangladesh (EGCB) North West Power Generation Company Ltd (NWPGCL) Independent Power Producers (IPPs)
Transmission Power Grid Company of Bangladesh Ltd (PGCB)
Distribution Bangladesh Power Development Board (BPDB) Dhaka Power Distribution Company (DPDC) Dhaka Electric Supply Company Ltd (DESCO) West Zone Power Distribution Company (WZPDC) Rural Electrification Board (REB) through Rural Cooperatives
Source: Bangladesh Power Development Board, 2011 The public sector of Power generation in Bangladesh has current Generation Capacity of 3481 MW, which is 59% of the total capacity, whereas the private sector has current Generation Capacity of 2455 MW which in turn is 41% of the total generation capacity (5936 MW). Upon consideration of 15-20% loss due to maintenance and forced outage, the Total Present Generation Capacity is in the range of 4600-5000 MW. However, only 4000-4600 MW of power is actually generated; gas shortage is believed to be responsible for the loss of 500-700 MW of power. The peak demand has been observed to go as high as 6000 MW and up to 1500 MW of load shedding has occurred during summer. The fuels used for Power generation in the fiscal year 2010 were mainly:
Gas, which accounted for the maximum of 84.02% of power generation
Coal, accountable for 2.19% of power generation
Furnish Oil, responsible for producing 4.42% of total power
Hydro, which contributed 4.23% to power generation and
Amin, Ferdaus & Porna
281
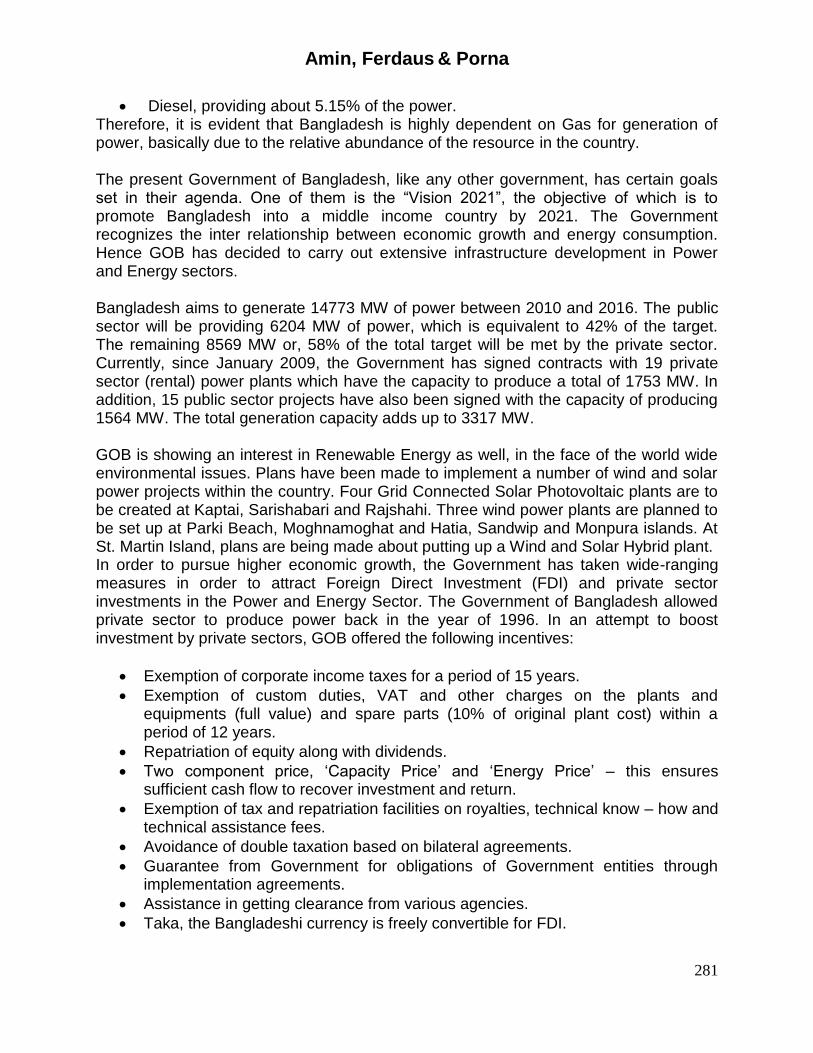
Diesel, providing about 5.15% of the power. Therefore, it is evident that Bangladesh is highly dependent on Gas for generation of power, basically due to the relative abundance of the resource in the country. The present Government of Bangladesh, like any other government, has certain goals set in their agenda. One of them is the “Vision 2021”, the objective of which is to promote Bangladesh into a middle income country by 2021. The Government recognizes the inter relationship between economic growth and energy consumption. Hence GOB has decided to carry out extensive infrastructure development in Power and Energy sectors. Bangladesh aims to generate 14773 MW of power between 2010 and 2016. The public sector will be providing 6204 MW of power, which is equivalent to 42% of the target. The remaining 8569 MW or, 58% of the total target will be met by the private sector. Currently, since January 2009, the Government has signed contracts with 19 private sector (rental) power plants which have the capacity to produce a total of 1753 MW. In addition, 15 public sector projects have also been signed with the capacity of producing 1564 MW. The total generation capacity adds up to 3317 MW. GOB is showing an interest in Renewable Energy as well, in the face of the world wide environmental issues. Plans have been made to implement a number of wind and solar power projects within the country. Four Grid Connected Solar Photovoltaic plants are to be created at Kaptai, Sarishabari and Rajshahi. Three wind power plants are planned to be set up at Parki Beach, Moghnamoghat and Hatia, Sandwip and Monpura islands. At St. Martin Island, plans are being made about putting up a Wind and Solar Hybrid plant. In order to pursue higher economic growth, the Government has taken wide-ranging measures in order to attract Foreign Direct Investment (FDI) and private sector investments in the Power and Energy Sector. The Government of Bangladesh allowed private sector to produce power back in the year of 1996. In an attempt to boost investment by private sectors, GOB offered the following incentives:
Exemption of corporate income taxes for a period of 15 years.
Exemption of custom duties, VAT and other charges on the plants and equipments (full value) and spare parts (10% of original plant cost) within a period of 12 years.
Repatriation of equity along with dividends.
Two component price, ‘Capacity Price’ and ‘Energy Price’ – this ensures sufficient cash flow to recover investment and return.
Exemption of tax and repatriation facilities on royalties, technical know – how and technical assistance fees.
Avoidance of double taxation based on bilateral agreements.
Guarantee from Government for obligations of Government entities through implementation agreements.
Assistance in getting clearance from various agencies.
Taka, the Bangladeshi currency is freely convertible for FDI.
Amin, Ferdaus & Porna
282
4. Methodology and Data Set
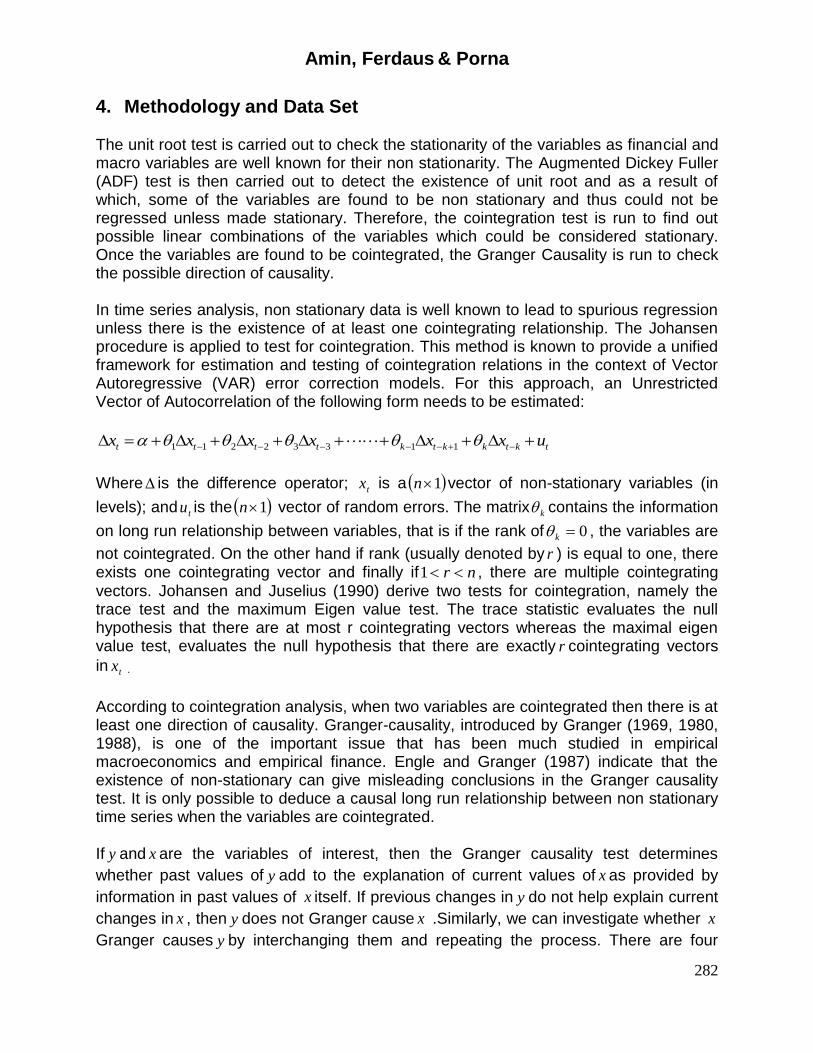
The unit root test is carried out to check the stationarity of the variables as financial and macro variables are well known for their non stationarity. The Augmented Dickey Fuller (ADF) test is then carried out to detect the existence of unit root and as a result of which, some of the variables are found to be non stationary and thus could not be regressed unless made stationary. Therefore, the cointegration test is run to find out possible linear combinations of the variables which could be considered stationary. Once the variables are found to be cointegrated, the Granger Causality is run to check the possible direction of causality. In time series analysis, non stationary data is well known to lead to spurious regression unless there is the existence of at least one cointegrating relationship. The Johansen procedure is applied to test for cointegration. This method is known to provide a unified framework for estimation and testing of cointegration relations in the context of Vector Autoregressive (VAR) error correction models. For this approach, an Unrestricted Vector of Autocorrelation of the following form needs to be estimated:
Where is the difference operator; tx is a 1n vector of non-stationary variables (in
levels); and tu is the 1n vector of random errors. The matrix k contains the information
on long run relationship between variables, that is if the rank of 0k , the variables are
not cointegrated. On the other hand if rank (usually denoted by r ) is equal to one, there exists one cointegrating vector and finally if nr 1 , there are multiple cointegrating
vectors. Johansen and Juselius (1990) derive two tests for cointegration, namely the trace test and the maximum Eigen value test. The trace statistic evaluates the null hypothesis that there are at most r cointegrating vectors whereas the maximal eigen value test, evaluates the null hypothesis that there are exactly r cointegrating vectors
in tx .
According to cointegration analysis, when two variables are cointegrated then there is at least one direction of causality. Granger-causality, introduced by Granger (1969, 1980, 1988), is one of the important issue that has been much studied in empirical macroeconomics and empirical finance. Engle and Granger (1987) indicate that the existence of non-stationary can give misleading conclusions in the Granger causality test. It is only possible to deduce a causal long run relationship between non stationary time series when the variables are cointegrated.
If y and x are the variables of interest, then the Granger causality test determines
whether past values of y add to the explanation of current values of x as provided by
information in past values of x itself. If previous changes in y do not help explain current
changes in x , then y does not Granger cause x .Similarly, we can investigate whether x
Granger causes y by interchanging them and repeating the process. There are four
tktkktktttt uxxxxxx 11332211
Amin, Ferdaus & Porna
283
likely outcomes in the Granger causality test: (1) neither variable Granger cause each other, (2) y causes x but not otherwise, (3) x causes y but not otherwise, (4)
both x and y Granger cause each other.
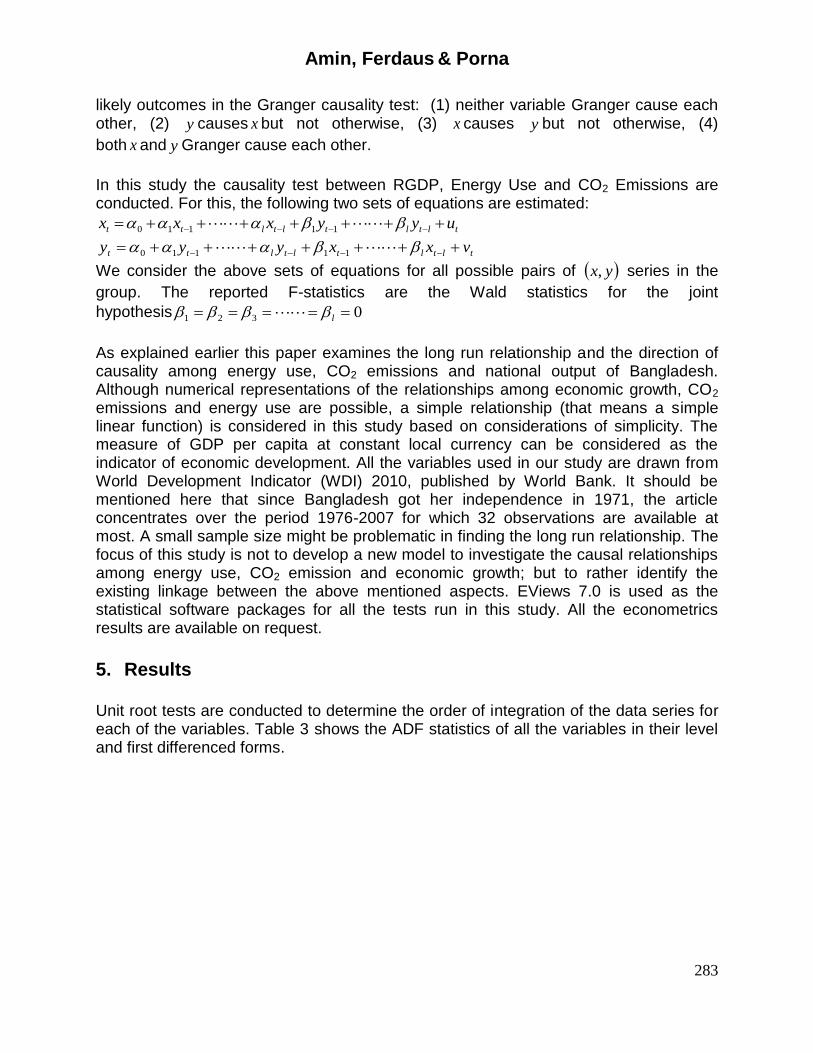
In this study the causality test between RGDP, Energy Use and CO2 Emissions are conducted. For this, the following two sets of equations are estimated:
tltltltltt uyyxxx 11110
tltltltltt vxxyyy 11110
We consider the above sets of equations for all possible pairs of yx, series in the
group. The reported F-statistics are the Wald statistics for the joint
hypothesis 0321 l
As explained earlier this paper examines the long run relationship and the direction of causality among energy use, CO2 emissions and national output of Bangladesh. Although numerical representations of the relationships among economic growth, CO2 emissions and energy use are possible, a simple relationship (that means a simple linear function) is considered in this study based on considerations of simplicity. The measure of GDP per capita at constant local currency can be considered as the indicator of economic development. All the variables used in our study are drawn from World Development Indicator (WDI) 2010, published by World Bank. It should be mentioned here that since Bangladesh got her independence in 1971, the article concentrates over the period 1976-2007 for which 32 observations are available at most. A small sample size might be problematic in finding the long run relationship. The focus of this study is not to develop a new model to investigate the causal relationships among energy use, CO2 emission and economic growth; but to rather identify the existing linkage between the above mentioned aspects. EViews 7.0 is used as the statistical software packages for all the tests run in this study. All the econometrics results are available on request.
5. Results
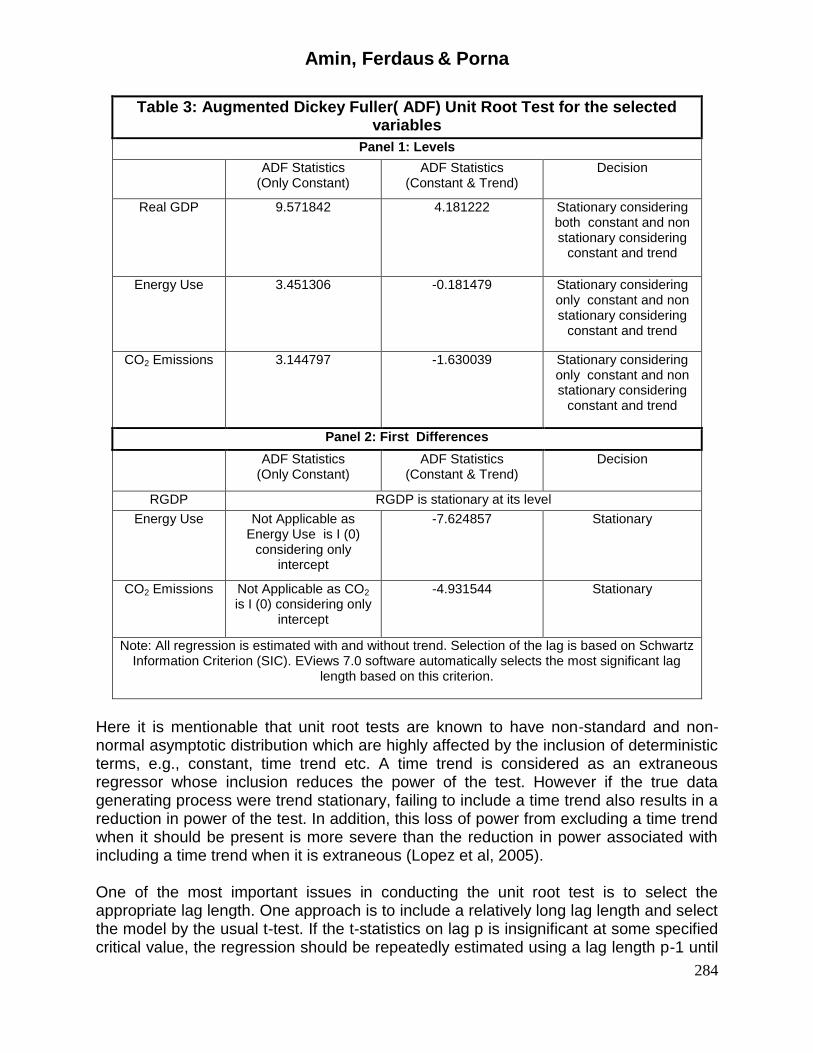
Unit root tests are conducted to determine the order of integration of the data series for each of the variables. Table 3 shows the ADF statistics of all the variables in their level and first differenced forms.
Amin, Ferdaus & Porna
284
Table 3: Augmented Dickey Fuller( ADF) Unit Root Test for the selected variables
Panel 1: Levels
ADF Statistics (Only Constant)
ADF Statistics (Constant & Trend)
Decision
Real GDP 9.571842
4.181222 Stationary considering both constant and non stationary considering
constant and trend
Energy Use 3.451306 -0.181479 Stationary considering only constant and non stationary considering
constant and trend
CO2 Emissions 3.144797 -1.630039 Stationary considering only constant and non stationary considering
constant and trend
Panel 2: First Differences
ADF Statistics (Only Constant)
ADF Statistics (Constant & Trend)
Decision
RGDP RGDP is stationary at its level
Energy Use Not Applicable as Energy Use is I (0)
considering only intercept
-7.624857 Stationary
CO2 Emissions Not Applicable as CO2 is I (0) considering only
intercept
-4.931544 Stationary
Note: All regression is estimated with and without trend. Selection of the lag is based on Schwartz Information Criterion (SIC). EViews 7.0 software automatically selects the most significant lag
length based on this criterion.
Here it is mentionable that unit root tests are known to have non-standard and non-normal asymptotic distribution which are highly affected by the inclusion of deterministic terms, e.g., constant, time trend etc. A time trend is considered as an extraneous regressor whose inclusion reduces the power of the test. However if the true data generating process were trend stationary, failing to include a time trend also results in a reduction in power of the test. In addition, this loss of power from excluding a time trend when it should be present is more severe than the reduction in power associated with including a time trend when it is extraneous (Lopez et al, 2005). One of the most important issues in conducting the unit root test is to select the appropriate lag length. One approach is to include a relatively long lag length and select the model by the usual t-test. If the t-statistics on lag p is insignificant at some specified critical value, the regression should be repeatedly estimated using a lag length p-1 until
Amin, Ferdaus & Porna
285
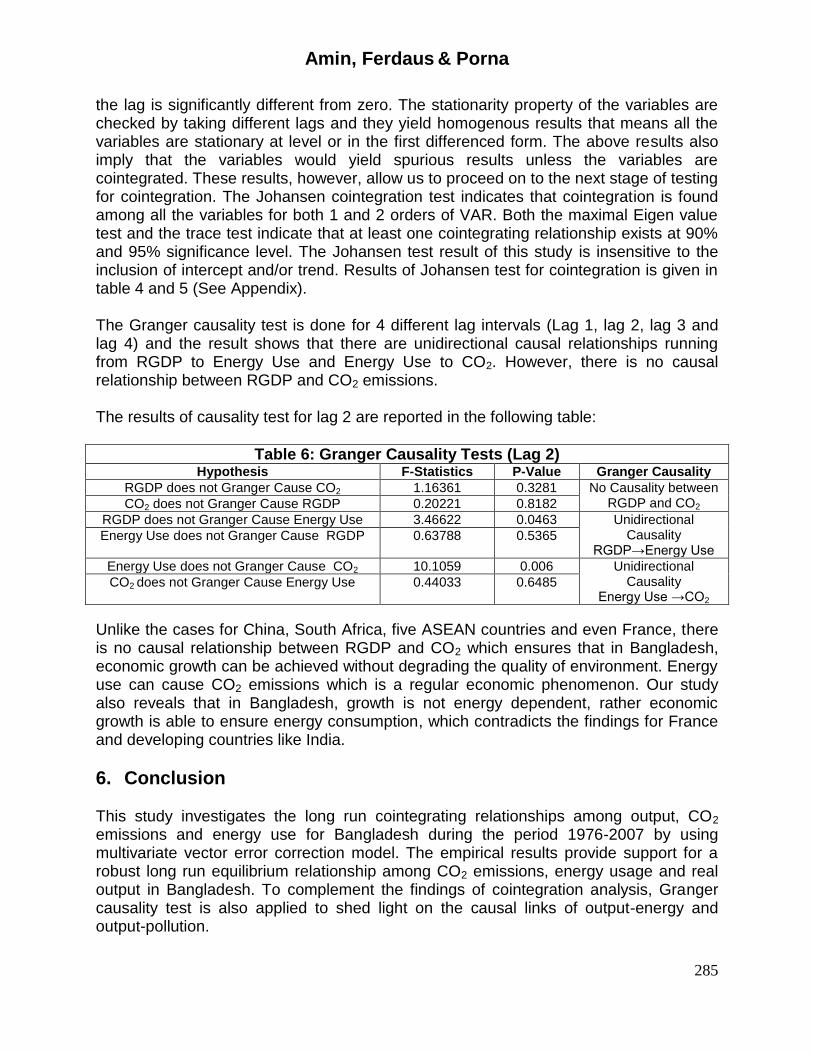
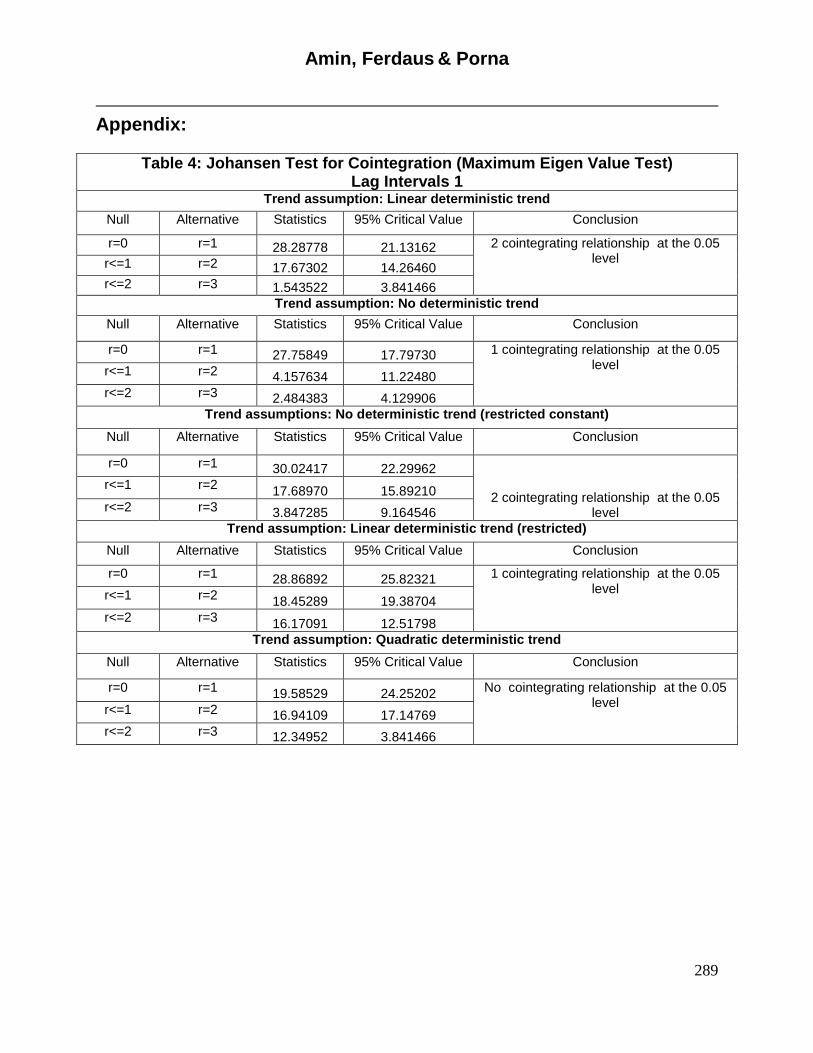
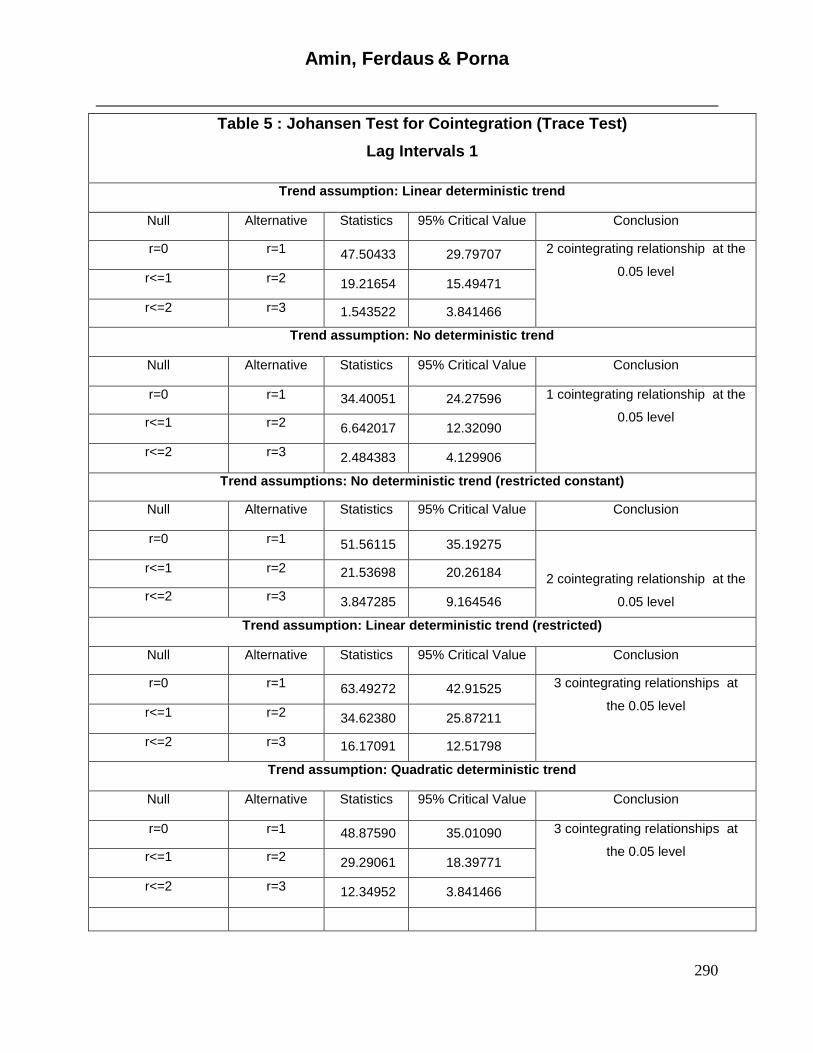
the lag is significantly different from zero. The stationarity property of the variables are checked by taking different lags and they yield homogenous results that means all the variables are stationary at level or in the first differenced form. The above results also imply that the variables would yield spurious results unless the variables are cointegrated. These results, however, allow us to proceed on to the next stage of testing for cointegration. The Johansen cointegration test indicates that cointegration is found among all the variables for both 1 and 2 orders of VAR. Both the maximal Eigen value test and the trace test indicate that at least one cointegrating relationship exists at 90% and 95% significance level. The Johansen test result of this study is insensitive to the inclusion of intercept and/or trend. Results of Johansen test for cointegration is given in table 4 and 5 (See Appendix). The Granger causality test is done for 4 different lag intervals (Lag 1, lag 2, lag 3 and lag 4) and the result shows that there are unidirectional causal relationships running from RGDP to Energy Use and Energy Use to CO2. However, there is no causal relationship between RGDP and CO2 emissions. The results of causality test for lag 2 are reported in the following table:
Table 6: Granger Causality Tests (Lag 2) Hypothesis F-Statistics P-Value Granger Causality
RGDP does not Granger Cause CO2 1.16361 0.3281 No Causality between RGDP and CO2 CO2 does not Granger Cause RGDP 0.20221 0.8182
RGDP does not Granger Cause Energy Use 3.46622 0.0463 Unidirectional Causality
RGDP→Energy Use Energy Use does not Granger Cause RGDP 0.63788 0.5365
Energy Use does not Granger Cause CO2 10.1059 0.006 Unidirectional Causality
Energy Use →CO2 CO2 does not Granger Cause Energy Use 0.44033 0.6485
Unlike the cases for China, South Africa, five ASEAN countries and even France, there is no causal relationship between RGDP and CO2 which ensures that in Bangladesh, economic growth can be achieved without degrading the quality of environment. Energy use can cause CO2 emissions which is a regular economic phenomenon. Our study also reveals that in Bangladesh, growth is not energy dependent, rather economic growth is able to ensure energy consumption, which contradicts the findings for France and developing countries like India.
6. Conclusion
This study investigates the long run cointegrating relationships among output, CO2 emissions and energy use for Bangladesh during the period 1976-2007 by using multivariate vector error correction model. The empirical results provide support for a robust long run equilibrium relationship among CO2 emissions, energy usage and real output in Bangladesh. To complement the findings of cointegration analysis, Granger causality test is also applied to shed light on the causal links of output-energy and output-pollution.
Amin, Ferdaus & Porna
286
Long run equilibrium relationship is found for linear equation which was the initial assumption of the study. Our results suggest that there is no causal relationship between output and CO2 emissions which ensures that in Bangladesh economic growth can be achieved without degrading the quality of environment. Energy use can cause CO2 emissions which is a regular economic phenomenon. Though, Bangladesh’s contribution to the global climate change is trivial in comparison to many other industrial nations. The country shares less than 0.1% of the global emissions as compared to the 24% emitted by the USA (Uddin & Taplin, 2008). One of the main objectives of our study is to focus on the economic growth-environmental pollutants nexus and be closely allied to testing the Environmental Kuznet’s Curve (EKC) hypothesis. The hypothesis states that as economy grows, pollution also grows, but after a certain income level economic growth is associated with a decline in pollution. The study reveals that EKC does not seem to hold when Greenhouse Gases (GHG) and income per capital are considered. The empirical results of our study further reveal that in Bangladesh, growth is not energy dependent, rather economic growth can ensure energy consumption. Economic growth causes expansion in the industrial and commercial sectors where energy is used as the basic input. Our findings have important policy implication, as it suggests that energy restrictions do not seem to harm economic growth in Bangladesh. Thus, in context of Bangladesh, energy efficiency and conservation can ensure better economy and environment. No existence of a causal relationship between output and CO2 emission can lead us to another policy indication. In Bangladesh, output is environment friendly the reason behind which is our high dependency on the natural gas as the source of our energy. In the Fiscal Year 2010, natural gas accounted for about 84% of the power generation in our country. So, in the short run we do not have to be concerned about the environmental pollution coming from higher economic growth. However, in the long run, if the sources of energy are changed from natural gas to alternative sources of energy, then policies need to be revised. Further research could be conducted to test the validity of the nexus between output-energy and output-pollutants in a disaggregate form in Bangladesh. A new direction for future research could be to examine the causal relationship among energy growth, pollution emission and other potentially relevant variables, such as the usage of automobile, health expenditure or urbanization. Further research could also involve in revealing the causal relationship between output-energy nexus in South Asian countries to formulate appropriate policies and procedures.
Endnotes i All the data provided in this section has been compiled from Asian Development Bank
(2009),Bangladesh Bureau of Statistics (2009), Bangladesh Power Development Board (2007,2011),
Ministry of Power, Energy and Mineral Resources (2008) and UK Trade & Investment (2011).
Amin, Ferdaus & Porna
287
References Alam, MJ, Begum, IA, Buysse, J, Rahman, S & Huylenbroeck, GV 2011, ‘Dynamic
modeling of causal relationship between energy consumption, CO2 emissions and economic growth in India’, Renewable and Sustainable Energy Review, vol.15, pp. 3243-3251.
Alam, MJ & Huylenbroeck GV 2011, ‘Energy Consumption, CO2 Emissions and
Economic Growth Nexus in Bangladesh: Cointegration and Dynamic Causality Analysis’, paper presented to the AAS-ICAS Joint Conference, Honolulu, March 31 – April 3.
Ang, JB 2007, ‘CO2 emissions, energy consumption and output in France’, Energy Policy, vol. 35, pp. 4772-4778.
Ang, JB 2008, ‘Economic development, pollutant emissions and energy consumption in Malaysia’, Journal of Policy Modeling, vol. 30, pp. 271-278.
Apergis, N & Payne, JE 2010, ‘The emissions, energy consumption, and growth nexus; Evidence from the Commonwealth of Independent States’, Energy Policy, vol. 38, pp. 650- 655.
Asian Development Bank. 2009. Asian Development Bank and Bangladesh: Fact Sheet. Philippines: Asian Development Board.
Bangladesh Bureau of Statistics, 2009. Statistical Yearbook of Bangladesh 2008. Bangladesh Bureau of Statistics, Agargaon.
Bangladesh Power Development Board, 2011. Bangladesh’s Power Supply: Investment Opportunities. London, 1st March 2011.
Bangladesh Power Development Board, 2007. Annual Report2006–07. Bangladesh Power Development Board, Dhaka.
Carson, RT, Jeon, Y & McCubbin, D 1997, ‘The relationship between air pollution and emissions: U.S. data’, Environment and Development Economics, vol. 2, pp. 433–450.
Chang, CC 2010, ‘A multivariate causality test of carbon di oxide emission, energy consumption and economic growth in China’, Applied Energy, vol. 87, pp. 3533-3537.
Engle, RF & Granger, CWJ 1987, ‘Co-integration and error correction: Representation, estimation and testing’, Econometrica, vol. 55, pp. 251-76.
Granger, CWJ 1969, ‘Investigating causal relations by econometric models and cross-spectral methods’ Econometrica, vol. 37, pp. 424–438.
Granger, CWJ 1980, ‘Testing for causality, a personal viewpoint’, Journal of Economic Dynamics and Control, vol. 2, pp. 329–352.
Granger, CWJ 1988, ‘Some recent developments in a concept of causality’, Journal of Econometrics, vol. 39, pp. 199–211.
Gene, M & Krueger, A 1993, ‘Environmental Impacts of a North American Free Trade Agreement’, in Peter M. Garber, (ed.), The Mexico-U.S. Free Trade Agreement, MA: MIT Press, Cambridge, pp. 13-56.
Grossman, G & Krueger, A 1995, ‘Economic growth and the environment’, Quarterly Journal of Economics, vol. 110, pp. 353–377.
Amin, Ferdaus & Porna
288
Islam, AKMS, Islam, M & Rahman, T 2006, ‘Effective renewable energy activities in Bangladesh’, Renewable Energy, vol. 31, pp. 677–688.
Islam, MR & Beg, MRA 2008, ‘Renewable energy sources and technology practice in Bangladesh’, Renewable and Sustainable Energy Reviews, vol. 12, pp. 299–343.
Johansen, S & Juselius, K 1990, ‘Maximum Likelihood Estimation and Inference on Cointegration – with Applications to the Demand for Money’, Oxford Bulletin of Economics and Statistics, vol. 52, pp. 169-210.
Kim, HS & Baek, J 2011, ‘The environmental consequences of economic growth revisited’, Economics Bulletin, vol. 31, no.2, pp. 1-13
Kraft, J & Kraft, A 1978, ‘On the relationship between energy and GNP’, Journal of Energy and Development, Spring, pp. 401-403.
Lau, LC, Tan, KT, Lee, KT & Mohamed, AR 2009, ‘A comparative study of the Energy policies in Japan and Malaysia in fulfilling their nations’ obligations towards the Kyoto Protocol’, Energy Policy, vol. 37, pp. 4771-4780.
Lean, HH & Smyth, R 2009, ‘CO2 emissions, electricity consumption and output in ASEAN’, Development Research Unit Discussion Paper, DEVDP, pp. 09-13.
Miah, MD, Kabir, RRMS, Koike, M, Akther, S, & Shin, MY 2010, ‘Rural household energy consumption pattern in the disregarded villages of Bangladesh’, Energy Policy, vol. 38, pp. 997–1003.
Ministry of Power, Energy and Mineral Resources, 2008 a. Draft Report. National Energy Policy, Dhaka.
Mehrara, M 2007, ‘Energy-GDP relationship for oil-exporting countries: Iran, Kuwait and Saudi Arabia’, OPEC Review, vol. 31, pp. 1–16.
Menyah, K & Wolde-Rufael, Y 2010, ‘Energy consumption, pollutant emissions and economic growth’, Energy Economics, vol. 32, no. 6, pp.1374-1382.
Pao, HT & Tsai, CM 2010, ‘CO2 emissions, energy consumption and economic growth in BRIC countries’, Energy Policy, vol. 38, pp. 7850-7860.
Sari, R & Soytas, U 2009, ‘Are global warming and economic growth combatable? Evidence from five OPEC countries’, Applied Energy, vol. 86, pp. 1887-1893.
Selden, T & Song, D 1994, ‘Environmental Quality and Development: Is There a Kuznet's Curve for Air Pollution Emissions?’, Journal of Environmental Economics and Management, vol. 27, pp. 147-162.
Soytas, U, Sari, R, & Ewing, BT 2007, ‘Energy consumption, income and carbon emissions in the United States’, Ecological Economics, vol. 62, pp. 482-489.
UK Trade & Investment, 2011. Sector Briefing: Power Sector Opportunities in Bangladesh. United Kingdom: UK trade & investment.
Wadud, Z, Dey, HS, Kabir, MA & Khan, SI 2011, ‘Modeling and Forecasting Natural Gas Demand in Bangladesh’, Energy Policy, vol. 39, pp. 7372 – 7380.
Zhang, XP & Cheng, XM 2009, ‘Energy consumption, carbon emissions, and economic growth in China’, Ecological Economics, vol. 68, no.10, pp. 2706-2712.
Amin, Ferdaus & Porna
289
Appendix:
Table 4: Johansen Test for Cointegration (Maximum Eigen Value Test) Lag Intervals 1
Trend assumption: Linear deterministic trend
Null Alternative Statistics 95% Critical Value Conclusion
r=0 r=1 28.28778 21.13162 2 cointegrating relationship at the 0.05 level r<=1 r=2 17.67302 14.26460
r<=2 r=3 1.543522 3.841466
Trend assumption: No deterministic trend
Null Alternative Statistics 95% Critical Value Conclusion
r=0 r=1 27.75849 17.79730 1 cointegrating relationship at the 0.05 level
r<=1 r=2 4.157634 11.22480
r<=2 r=3 2.484383 4.129906
Trend assumptions: No deterministic trend (restricted constant)
Null Alternative Statistics 95% Critical Value Conclusion
r=0 r=1 30.02417 22.29962
2 cointegrating relationship at the 0.05 level
r<=1 r=2 17.68970 15.89210
r<=2 r=3 3.847285 9.164546
Trend assumption: Linear deterministic trend (restricted)
Null Alternative Statistics 95% Critical Value Conclusion
r=0 r=1 28.86892 25.82321 1 cointegrating relationship at the 0.05 level
r<=1 r=2 18.45289 19.38704
r<=2 r=3 16.17091 12.51798
Trend assumption: Quadratic deterministic trend
Null Alternative Statistics 95% Critical Value Conclusion
r=0 r=1 19.58529 24.25202
No cointegrating relationship at the 0.05 level
r<=1 r=2 16.94109 17.14769
r<=2 r=3 12.34952 3.841466
Amin, Ferdaus & Porna
290
Table 5 : Johansen Test for Cointegration (Trace Test)
Lag Intervals 1
Trend assumption: Linear deterministic trend
Null Alternative Statistics 95% Critical Value Conclusion
r=0 r=1 47.50433 29.79707 2 cointegrating relationship at the
0.05 level r<=1 r=2 19.21654 15.49471
r<=2 r=3 1.543522 3.841466
Trend assumption: No deterministic trend
Null Alternative Statistics 95% Critical Value Conclusion
r=0 r=1 34.40051 24.27596 1 cointegrating relationship at the
0.05 level r<=1 r=2 6.642017 12.32090
r<=2 r=3 2.484383 4.129906
Trend assumptions: No deterministic trend (restricted constant)
Null Alternative Statistics 95% Critical Value Conclusion
r=0 r=1 51.56115 35.19275
2 cointegrating relationship at the
0.05 level
r<=1 r=2 21.53698 20.26184
r<=2 r=3 3.847285 9.164546
Trend assumption: Linear deterministic trend (restricted)
Null Alternative Statistics 95% Critical Value Conclusion
r=0 r=1 63.49272 42.91525 3 cointegrating relationships at
the 0.05 level r<=1 r=2 34.62380 25.87211
r<=2 r=3 16.17091 12.51798
Trend assumption: Quadratic deterministic trend
Null Alternative Statistics 95% Critical Value Conclusion
r=0 r=1 48.87590 35.01090 3 cointegrating relationships at
the 0.05 level r<=1 r=2 29.29061 18.39771
r<=2 r=3 12.34952 3.841466