Superior augmented reality registration by integrating landmark tracking and magnetic tracking
Tracking Industrial Energy Efficiency and CO2 Emissions
324
Tracking Industrial Energy Efficiency and CO 2 Emissions INTERNATIONAL ENERGY AGENCY In support of the G8 Plan of Action ENERGY INDICATORS Please note that this PDF is subject to specific restrictions that limit its use and distribution. The terms and conditions are available online at www.iea.org/w/bookshop/pricing.html
-
Upload
khangminh22 -
Category
Documents
-
view
1 -
download
0
Transcript of Tracking Industrial Energy Efficiency and CO2 Emissions

Tracking IndustrialEnergy Efficiency and
CO2 Emissions
I N T E R N A T I O N A L E N E R G Y A G E N C Y
In support of the G8 Plan of Action
ENERGYINDICATORS
Please note that this PDF is subject to specific
restrictions that limit its use and distribution.
The terms and conditions are available online at
www.iea.org/w/bookshop/pricing.html

INTERNATIONAL ENERGY AGENCY
The International Energy Agency (IEA) is an autonomous body which was established in November 1974 within the framework of the Organisation for Economic Co-operation and Development (OECD) to implement an inter national energy programme.
It carries out a comprehensive programme of energy co-operation among twenty-six of the OECD thirty member countries. The basic aims of the IEA are:
� To maintain and improve systems for coping with oil supply disruptions.
� To promote rational energy policies in a global context through co-operative relations with non-member countries, industry and inter national organisations.
� To operate a permanent information system on the international oil market.
� To improve the world’s energy supply and demand structure by developing alternative energy sources and increasing the efficiency of energy use.
� To assist in the integration of environmental and energy policies.
The IEA member countries are: Australia, Austria, Belgium, Canada, Czech Republic, Denmark, Finland, France, Germany, Greece, Hungary, Ireland, Italy, Japan, Republic of Korea, Luxembourg, Netherlands, New Zealand, Norway, Portugal, Spain, Sweden, Switzerland, Turkey, United Kingdom and United States. The Slovak Republic and Poland are likely to become member countries in 2007/2008. The European Commission also participates in the work of the IEA.
ORGANISATION FOR ECONOMIC CO-OPERATION AND DEVELOPMENT
The OECD is a unique forum where the governments of thirty democracies work together to address the economic, social and environmental challenges of globalisation. The OECD is also at the forefront of efforts to understand and to help governments respond to new developments and concerns, such as corporate governance, the information economy and the challenges of an ageing population. The Organisation provides a setting where governments can compare policy experiences, seek answers to common problems, identify good practice and work to co-ordinate domestic and international policies.
The OECD member countries are: Australia, Austria, Belgium, Canada, Czech Republic, Denmark, Finland, France, Germany, Greece, Hungary, Iceland, Ireland, Italy, Japan, Republic of Korea, Luxembourg, Mexico, Netherlands, New Zealand, Norway, Poland, Portugal, Slovak Republic, Spain, Sweden, Switzerland, Turkey, United Kingdom and United States.The European Commission takes part in the work of the OECD.
© OECD/IEA, 2007
International Energy Agency (IEA),Head of Communication and Information Offi ce,
9 rue de la Fédération, 75739 Paris Cedex 15, France.
Please note that this publication is subjectto specific restrictions that limit its use and distribution.
The terms and conditions are available online athttp://www.iea.org/Textbase/about/copyright.asp

FOREWORD 3
FOREWORD
Improving energy efficiency is the single most important first step toward achievingthe three goals of energy policy: security of supply, environmental protection andeconomic growth.
Nearly a third of global energy demand and CO2 emissions are attributable tomanufacturing, especially the big primary materials industries such as chemicals andpetrochemicals, iron and steel, cement, paper and aluminium. Understanding howthis energy is used, the national and international trends and the potential forefficiency gains, is crucial.
This book shows that, while impressive efficiency gains have already been achievedin the past two decades, energy use and CO2 emissions in manufacturing industriescould be reduced by a further quarter to a third, if best available technology were tobe applied worldwide. Some of these additional reductions may not be economic inthe short- and medium-term, but the sheer extent of the potential suggests thatstriving for significant improvements is a worthwhile and realistic effort. A systemsapproach is needed that transcends process or sector boundaries and that offerssignificant potential to save energy and cut CO2 emissions.
The growth of industrial energy use in China has recently dwarfed the combinedgrowth of all other countries. This structural change has had notable consequencesfor industrial energy use worldwide. It illustrates the importance of moreinternational co-operation.
The IEA has undertaken an extensive programme to assess industrial energyefficiencies worldwide. This study of industrial energy use represents importantmethodological progress. It pioneers powerful new statistical tools, or “indicators”that will provide the basis for future analysis at the IEA. At the same time it containsa wealth of recent data that provide a good overview of energy use formanufacturing worldwide. It also identifies areas where further analysis of industrialenergy efficiency is warranted.
Industry has provided significant input and support for this analysis and itspublication is intended as a basis for further discussion. I am encouraged by thestrong commitment that industry is demonstrating to address energy challenges andwelcome the valuable contributions from the Industrial Energy-Related Technologiesand Systems Implementing Agreement of the IEA collaborative network.
This book is part of the IEA work in support of the G8 Gleneagles Plan of Action thatmandated the Agency in 2005 to chart the path to a “clean, clever and competitiveenergy future”. It is my hope that this study will provide another step toward therealisation of a sustainable energy future.
This study is published under my authority as Executive Director of the IEA and doesnot necessarily reflect the views of the IEA Member countries.
Claude Mandil
Executive Director


ACKNOWLEDGEMENTSThis publication was prepared by the International Energy Agency. The work was co-ordinated by the Energy Technology and R&D Office (ETO). Neil Hirst, Director of theETO, provided invaluable leadership and inspiration throughout the project. RobertDixon, Head of the Energy Technology Policy Division, offered essential guidanceand input. This work was done in close co-operation with the Long-Term Co-operationand Policy Office (LTO) under the direction of Noé van Hulst. In particular, the EnergyEfficiency and Climate Change Division, headed by Rick Bradley, took part in thisanalysis. Also the Energy Statistics Division and the Office of Global Energy Dialogueprovided valuable contributions.
Dolf Gielen was the co-ordinator of the project and had overall responsibility for thedesign and development of the study. The other main authors were KamelBennaceur, Tom Kerr, Cecilia Tam, Kanako Tanaka, Michael Taylor and Peter Taylor.Other important contributions came from Richard Baron, Nigel Jollands, JuliaReinaud and Debra Justus.
Many other IEA colleagues have provided comments and suggestions, particularlyJean-Yves Garnier, Elena Merle-Beral, Michel Francoeur, Dagmar Graczyk, Jung-AhKang, Ghislaine Kieffer, Olivier Lavagne d’Ortigue, Audrey Lee, Isabel Murray andJonathan Sinton. Production assistance was provided by the IEA Communication andInformation Office: Rebecca Gaghen, Muriel Custodio, Corinne Hayworth, LorettaRavera and Bertrand Sadin added significantly to the material presented. SimoneLuft helped in the preparation and correction of the manuscript. Marek Sturcprepared the tables and graphics.
We thank the Industrial Energy-Related Technology Systems Implementing Agreement(IETS); notably Thore Berntsson (Chalmers University of Technology, Chair of the IETSExecutive Committee) for its valuable contributions to a number of chapters in this report.
A number of consultants have contributed to this publication: Sérgio Valdir Bajay (StateUniversity of Campinas, Brazil); Yuan-sheng Cui (Institute of Technical Information for theBuilding Materials Industry, China); Gilberto De Martino Jannuzzi (International EnergyInitiative, Brazil); Aimee McKane (Lawrence Berkeley National Laboratory, United States);Yanjia Wang (Tsinghua University, China) and Ernst Worrell (Ecofys, Netherlands).
We thank the IEA Member country government representatives, in particular theCommittee on Energy Research and Technology, the End-Use Working Party and theEnergy Efficiency Working Party and others that provided valuable comments andsuggestions. In particular, we thank Isabel Cabrita (National Institute of IndustrialEngineering and Technology, Portugal); Takehiko Matsuo (Ministry of Foreign Affairs,Japan); Hamid Mohamed (National Resources Canada) and Yuichiro Yamaguchi(Ministry of Economy, Trade and Industry, Japan).
Our appreciation to the participants in the joint CEFIC – IEA Workshop on FeedstockSubstitutes, Energy Efficient Technology and CO2 Reduction for PetrochemicalProducts, 12-13 December 2006 who have provided information and comments, inparticular Giuseppe Astarita (Federchimica); Peter Botschek (European ChemicalIndustry Council); Russell Heinen (SRI Consulting); Hisao Ida (Plastic WasteManagement Institute, Japan); Rick Meidel (ExxonMobil); Nobuaki Mita (JapanPetrochemical Industry Association); Hi Chun Park (Inha University, Korea); MartinPatel (Utrecht University); Vianney Schyns (SABIC) and Dennis Stanley (ExxonMobil).
ACKNOWLEDGEMENTS 5

6 TRACKING INDUSTRIAL ENERGY EFFICIENCY AND CO2 EMISSIONS
Also we would like to thank the members of the International Fertilizer Association(IFA) Technical Committee that participated in the joint IFA – IEA Workshop onEnergy Efficiency and CO2 Reduction Prospects in Ammonia Production, 13 March2007 that have provided information and comments, in particular Luc Maene andBen Muirhead (International Fertilizer Industry Association, France).
We appreciate the information and comments from the International Iron and SteelInstitute (IISI) and the members of its Committee on Environmental Affairs, inparticular Nobuhiko Takamatsu, Andrew Purvis and Hironori Ueno (IISI, Belgium);Karl Buttiens (Mittal-Arcelor, France); Jean-Pierre Debruxelles (Eurofer, Belgium);Yoshitsugu Iino (JFE Steel Corporation and Japan Iron and Steel Federation, Japan);Nakoazu Nakano (Sumitomo Metals, Japan); Teruo Okazaki (Nippon Steel, Japan);Toru Ono (Nippon Steel, Japan); Larry Kavanagh and Jim Schulz (American Iron andSteel Institute, United States); Verena Schulz (VoestAlpine, Germany) and GunnarStill (ThyssenKrupp, Germany).
Participants in the joint WBCSD – IEA Workshop on Energy Efficiency and CO2 EmissionReduction Potentials and Policies in the Cement Industry, 4 – 5 September 2006 andother experts provided useful information and comments, in particular Andy O’Hare(Portland Cement Association, United States); Toshio Hosoya (Japan CementAssociation); Yoshito Izumi (Taiheyo Cement Corporation, Japan and Asia-PacificPartnership on Clean Development and Climate); Howard Klee (World Business Councilfor Sustainable Development, Switzerland); Claude Lorea (Cembureau, Belgium); LynnPrice (Lawrence Berkeley National Laboratory, United States); Yuan-sheng Cui andSteve Wang (Institute of Technical Information for Building Materials, China).
In addition, we appreciate the participants in the joint World Business Council forSustainable Development – IEA Workshop on Energy Efficient Technologies and CO2Reduction Potentials in the Pulp and Paper Industry, 9 October 2006 and otherexperts that have provided information and comments, in particular Tom Browne(Paprican); James Griffiths (World Business Council for Sustainable Development,Switzerland); Mikael Hannus (Stora Enso, Sweden); Yoshihiro Hayakawa (Oji Paper,Japan;, Mitsuru Kaihori (Japan Paper Association); Wulf Killman (UN-FAO); MarcoMensink (Confederation of European Paper Industries, Brussels); Tom Rosser (ForestProducts Association of Canada); Stefan Sundman (Finnish Forest IndustriesFederation) and Li Zhoudan (China Cleaner Production Centre of Light Industry).
Chris Bayliss and Robert Chase (International Aluminium Institute, United Kingdom)are thanked for their comments and suggestions.
We thank the participants in the IEA Workshop on Industrial Electric Motor SystemsEfficiency, 15 – 16 May 2006 and other experts that have provided inputs onsystems and combined hear and power, in particular Pekka Loesoenen, EuropeanCommission (Eurostat); Simon Minett (Delta Energy and Environment); Paul Sheaffer(Resource Dynamics Corporation, United States); Loren Starcher (ExxonMobil, UnitedStates) and Satoshi Yoshida (Japan Gas Association).
Also, we thank the experts that provided data for and comments on the life cyclechapter, in particular Reid Lifset (Yale University), Maarten Neelis, Martin Patel andMartin Weiss (Utrecht University, Netherlands).
This work was made possible through funds provided by the Governments of the G7countries, which are most appreciated. We are grateful to the UK Government for itscontribution to the China analysis through its Global Opportunities Fund.

Introduction
Manufacturing Industry Energy Use and CO2 Emissions
General Industry Indicators Issues
Chemical and Petrochemical Industry
Iron and Steel Industry
Non-Metallic Minerals
Pulp, Paper and Printing Industry
Non-Ferrous Metals
Systems Optimisation
Life Cycle Improvements Options
Annexes
1
2
3
4
5
6
7
8
9
10
Tableof
Contents

8 TRACKING INDUSTRIAL ENERGY EFFICIENCY AND CO2 EMISSIONS
Foreword . . . . . . . . . . . . . . . . . . . . . . . . . . . . . . . . . . . . . . . . . . . . . . . . . . . . . . . . . . . . 3
Acknowledgements . . . . . . . . . . . . . . . . . . . . . . . . . . . . . . . . . . . . . . . . . . . . . . . . . . . 5
Table of Contents. . . . . . . . . . . . . . . . . . . . . . . . . . . . . . . . . . . . . . . . . . . . . . . . . . . . . 7
List of Figures 13List of Tables 15
Executive Summary . . . . . . . . . . . . . . . . . . . . . . . . . . . . . . . . . . . . . . . . . . . . . . . . . . 19
Chapter 1 � INTRODUCTION 31
Scope of Indicator Analysis . . . . . . . . . . . . . . . . . . . . . . . . . . . . . . . . . . . . . . . . . . . 31
Energy and CO2 Saving Potentials . . . . . . . . . . . . . . . . . . . . . . . . . . . . . . . . . . . . . 33
Next Steps . . . . . . . . . . . . . . . . . . . . . . . . . . . . . . . . . . . . . . . . . . . . . . . . . . . . . . . . . 36
Chapter 2 � MANUFACTURING INDUSTRY ENERGY USEAND CO2 EMISSIONS 39
Chapter 3 � GENERAL INDUSTRY INDICATORS ISSUES 45
Energy Indicators Based on Economic and Physical Ratios . . . . . . . . . . . . . . . . . 45
Methodological Issues 46Definition of Best Available Technique and Best Practice 48Data Issues 49
Practical Application of Energy and CO2 Emission Indicators. . . . . . . . . . . . . . . 51
Pulp, Paper and Printing 51Iron and Steel 52Cement 52Chemicals and Petrochemicals 53Other Sectors / Technologies 53
International Initiatives: Sectoral Approaches to Developing Indicators . . . . . 54
Intergovernmental Panel on Climate Change Reference Approach 54Pulp and Paper Initiatives 55Cement Sustainability Initiative 55Asia-Pacific Partnership on Clean Development and Climate 56Benchmarking in the Petrochemical Industry 56
Chapter 4 � CHEMICAL AND PETROCHEMICAL INDUSTRY 59
Introduction . . . . . . . . . . . . . . . . . . . . . . . . . . . . . . . . . . . . . . . . . . . . . . . . . . . . . . . . 60
Global Importance and Energy Use. . . . . . . . . . . . . . . . . . . . . . . . . . . . . . . . . . . . . 61
Petrochemicals Production . . . . . . . . . . . . . . . . . . . . . . . . . . . . . . . . . . . . . . . . . . . . 64
Steam Cracking: Olefins and Aromatics Production 66

Propylene Recovery in Refineries and Olefins Conversion 71Aromatics Extraction 71Methanol 72Olefins and Aromatics Processing 74
Inorganic Chemicals Production . . . . . . . . . . . . . . . . . . . . . . . . . . . . . . . . . . . . . . . 75Chlorine and Sodium Hydroxide 76Carbon Black 77Soda Ash 78Industrial Gases 80
Ammonia Production. . . . . . . . . . . . . . . . . . . . . . . . . . . . . . . . . . . . . . . . . . . . . . . . . 82
Combined Heat and Power. . . . . . . . . . . . . . . . . . . . . . . . . . . . . . . . . . . . . . . . . . . . 85
Plastics Recovery Options. . . . . . . . . . . . . . . . . . . . . . . . . . . . . . . . . . . . . . . . . . . . . 86
Energy and CO2 Emission Indicators for the Chemical andPetrochemical Industry . . . . . . . . . . . . . . . . . . . . . . . . . . . . . . . . . . . . . . . . . . . . . . . 87Energy Efficiency Index Methodology 88CO2 Emissions Index 91Life Cycle Index 93
Energy Efficiency Potential. . . . . . . . . . . . . . . . . . . . . . . . . . . . . . . . . . . . . . . . . . . . 94
Chapter 5 � IRON AND STEEL INDUSTRY 95
Introduction . . . . . . . . . . . . . . . . . . . . . . . . . . . . . . . . . . . . . . . . . . . . . . . . . . . . . . . . 96
Global Importance and Energy Use. . . . . . . . . . . . . . . . . . . . . . . . . . . . . . . . . . . . . 96
Indicator Issues . . . . . . . . . . . . . . . . . . . . . . . . . . . . . . . . . . . . . . . . . . . . . . . . . . . . . 99System Boundaries 99Product and Process Differentiation 99Allocation Issues 99Feedstock Quality Issues 101
Energy Indicators. . . . . . . . . . . . . . . . . . . . . . . . . . . . . . . . . . . . . . . . . . . . . . . . . . . 102Energy Intensity Indicators and Benchmarks 102Energy Intensity Analysis 103Efficiency Improvements 106
Coke Ovens. . . . . . . . . . . . . . . . . . . . . . . . . . . . . . . . . . . . . . . . . . . . . . . . . . . . . . . . 108Coke Oven Gas Use 111Coke Dry Quenching 111
Iron Ore Agglomeration . . . . . . . . . . . . . . . . . . . . . . . . . . . . . . . . . . . . . . . . . . . . . 113Ore Quality 115
Blast Furnaces . . . . . . . . . . . . . . . . . . . . . . . . . . . . . . . . . . . . . . . . . . . . . . . . . . . . . 116Coal and Coke Quality 119Coal Injection 120
TABLE OF CONTENTS 9

10 TRACKING INDUSTRIAL ENERGY EFFICIENCY AND CO2 EMISSIONS
Plastic Waste Use 121Charcoal Use 121Top-Pressure Recovery Turbines 123Blast Furnace Gas Use 123Blast Furnace Slag Use 124Hot Stoves 126
Basic Oxygen Furnaces . . . . . . . . . . . . . . . . . . . . . . . . . . . . . . . . . . . . . . . . . . . . . . 126
Basic Oxygen Furnace Gas Recovery 127Steel Slag Use 127
Electric Arc Furnaces . . . . . . . . . . . . . . . . . . . . . . . . . . . . . . . . . . . . . . . . . . . . . . . . 128
Cast Iron Production . . . . . . . . . . . . . . . . . . . . . . . . . . . . . . . . . . . . . . . . . . . . . . . . 131
Direct Reduced Iron Production . . . . . . . . . . . . . . . . . . . . . . . . . . . . . . . . . . . . . . 132
Steel Finishing . . . . . . . . . . . . . . . . . . . . . . . . . . . . . . . . . . . . . . . . . . . . . . . . . . . . . 135
Energy Efficiency and CO2 Reduction Potentials . . . . . . . . . . . . . . . . . . . . . . . . 136
Chapter 6 � NON-METALLIC MINERALS 139
Introduction . . . . . . . . . . . . . . . . . . . . . . . . . . . . . . . . . . . . . . . . . . . . . . . . . . . . . . . 140
Cement . . . . . . . . . . . . . . . . . . . . . . . . . . . . . . . . . . . . . . . . . . . . . . . . . . . . . . . . . . . 140
Global Importance and Energy Use 140Cement Production Process 140Energy and CO2 Emission Indicators for the Cement Industry 162
Lime. . . . . . . . . . . . . . . . . . . . . . . . . . . . . . . . . . . . . . . . . . . . . . . . . . . . . . . . . . . . . . 163
Overview 163Lime Production Process 164Energy Consumption and CO2 Emissions from Lime Production 166
Glass . . . . . . . . . . . . . . . . . . . . . . . . . . . . . . . . . . . . . . . . . . . . . . . . . . . . . . . . . . . . . 166
Overview 166Glass Production Process 167Energy Consumption and CO2 Emissions from Glass Production 168
Ceramic Products. . . . . . . . . . . . . . . . . . . . . . . . . . . . . . . . . . . . . . . . . . . . . . . . . . . 169
Overview 169Ceramics Production Process 172Energy Consumption and CO2 Emissions from Ceramics Production 173
Indicators for Lime, Glass and Ceramics Industries . . . . . . . . . . . . . . . . . . . . . . 174
Chapter 7 � PULP, PAPER AND PRINTING INDUSTRY 175
Global Importance and Energy Use . . . . . . . . . . . . . . . . . . . . . . . . . . . . . . . . . . . 176
Methodological and Data Issues. . . . . . . . . . . . . . . . . . . . . . . . . . . . . . . . . . . . . . 176

Pulp and Paper Production and Demand Drivers . . . . . . . . . . . . . . . . . . . . . . . . 178
Energy Use in the Pulp and Paper Industry . . . . . . . . . . . . . . . . . . . . . . . . . . . . . 180
Pulp Production 182Paper Production 183Printing 185
Energy Indicators. . . . . . . . . . . . . . . . . . . . . . . . . . . . . . . . . . . . . . . . . . . . . . . . . . . 187
Energy Intensity Indicators versus Benchmarking 187Energy Efficiency Index Methodology 187Expanding Indicators Analysis in the Pulp and Paper Industry 195
Combined Heat and Power in the Pulp and Paper Industry . . . . . . . . . . . . . . . 196
Paper Recycling and Recovered Paper Use . . . . . . . . . . . . . . . . . . . . . . . . . . . . . 198
Use of Technology to Increase Energy Efficiency andReduce CO2 Emissions . . . . . . . . . . . . . . . . . . . . . . . . . . . . . . . . . . . . . . . . . . . . . . 200
Differences in Energy Intensity and CO2 Emissions across Countries . . . . . . . 201
Energy Efficiency Potentials. . . . . . . . . . . . . . . . . . . . . . . . . . . . . . . . . . . . . . . . . . 204
Chapter 8 � NON-FERROUS METALS 207
Introduction . . . . . . . . . . . . . . . . . . . . . . . . . . . . . . . . . . . . . . . . . . . . . . . . . . . . . . . 207
Global Importance and Energy Use . . . . . . . . . . . . . . . . . . . . . . . . . . . . . . . . . . . 207
Aluminium Production . . . . . . . . . . . . . . . . . . . . . . . . . . . . . . . . . . . . . . . . . . . . . . 208
Copper Production. . . . . . . . . . . . . . . . . . . . . . . . . . . . . . . . . . . . . . . . . . . . . . . . . . 213
Energy Efficiency and CO2 Reduction Potentials . . . . . . . . . . . . . . . . . . . . . . . . 216
Chapter 9 � SYSTEMS OPTIMISATION 217
Introduction . . . . . . . . . . . . . . . . . . . . . . . . . . . . . . . . . . . . . . . . . . . . . . . . . . . . . . . 217
Industrial Systems . . . . . . . . . . . . . . . . . . . . . . . . . . . . . . . . . . . . . . . . . . . . . . . . . . 218
Industrial System Energy Use and Energy Savings Potential 218Motor Systems 220Steam Systems 227Barriers to Industrial System Energy Efficiency 231Effective Policies and Programmes 231
Combined Heat and Power . . . . . . . . . . . . . . . . . . . . . . . . . . . . . . . . . . . . . . . . . . 236
Benefits of CHP 238Barriers to CHP Adoption 239CHP Statistics 240Indicators for CHP Energy Efficiency Benefits 242
TABLE OF CONTENTS 11

12 TRACKING INDUSTRIAL ENERGY EFFICIENCY AND CO2 EMISSIONS
Chapter 10 � LIFE CYCLE IMPROVEMENT OPTIONS 247
Introduction . . . . . . . . . . . . . . . . . . . . . . . . . . . . . . . . . . . . . . . . . . . . . . . . . . . . . . . 247
Indicator Issues . . . . . . . . . . . . . . . . . . . . . . . . . . . . . . . . . . . . . . . . . . . . . . . . . . . . 247
Trends in the Efficiency of Materials and Product Use . . . . . . . . . . . . . . . . . . . 249
Buildings 252Packaging 252Transportation Equipment 254
Recycling and Reuse . . . . . . . . . . . . . . . . . . . . . . . . . . . . . . . . . . . . . . . . . . . . . . . . 256
Petrochemical Products 259Paper 262 Aluminium 264Steel 265
Energy Recovery . . . . . . . . . . . . . . . . . . . . . . . . . . . . . . . . . . . . . . . . . . . . . . . . . . . 268
Petrochemical Products 271Paper 273Wood 273
Annexes � Annex A • Process Integration . . . . . . . . . . . . . . . . . . . . . . . . . . . . . . . . . . . . . . . 275
Annex B • Industry Benchmark Initiatives . . . . . . . . . . . . . . . . . . . . . . . . . . . . . 283
Annex C • Definitions, Acronyms and Units. . . . . . . . . . . . . . . . . . . . . . . . . . . . 287
Annex D • References . . . . . . . . . . . . . . . . . . . . . . . . . . . . . . . . . . . . . . . . . . . . . . 303
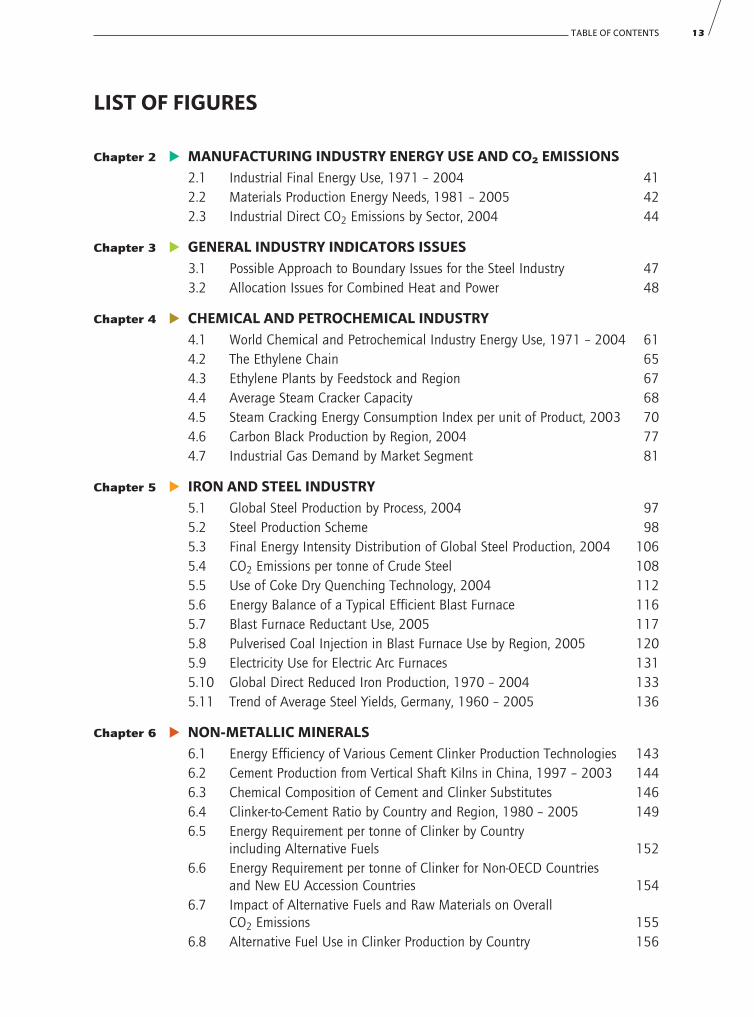
LIST OF FIGURES
Chapter 2 � MANUFACTURING INDUSTRY ENERGY USE AND CO2 EMISSIONS2.1 Industrial Final Energy Use, 1971 – 2004 412.2 Materials Production Energy Needs, 1981 – 2005 422.3 Industrial Direct CO2 Emissions by Sector, 2004 44
Chapter 3 � GENERAL INDUSTRY INDICATORS ISSUES3.1 Possible Approach to Boundary Issues for the Steel Industry 473.2 Allocation Issues for Combined Heat and Power 48
Chapter 4 � CHEMICAL AND PETROCHEMICAL INDUSTRY4.1 World Chemical and Petrochemical Industry Energy Use, 1971 – 2004 614.2 The Ethylene Chain 654.3 Ethylene Plants by Feedstock and Region 674.4 Average Steam Cracker Capacity 684.5 Steam Cracking Energy Consumption Index per unit of Product, 2003 704.6 Carbon Black Production by Region, 2004 774.7 Industrial Gas Demand by Market Segment 81
Chapter 5 � IRON AND STEEL INDUSTRY5.1 Global Steel Production by Process, 2004 975.2 Steel Production Scheme 985.3 Final Energy Intensity Distribution of Global Steel Production, 2004 1065.4 CO2 Emissions per tonne of Crude Steel 1085.5 Use of Coke Dry Quenching Technology, 2004 1125.6 Energy Balance of a Typical Efficient Blast Furnace 1165.7 Blast Furnace Reductant Use, 2005 1175.8 Pulverised Coal Injection in Blast Furnace Use by Region, 2005 1205.9 Electricity Use for Electric Arc Furnaces 1315.10 Global Direct Reduced Iron Production, 1970 – 2004 1335.11 Trend of Average Steel Yields, Germany, 1960 – 2005 136
Chapter 6 � NON-METALLIC MINERALS6.1 Energy Efficiency of Various Cement Clinker Production Technologies 1436.2 Cement Production from Vertical Shaft Kilns in China, 1997 – 2003 1446.3 Chemical Composition of Cement and Clinker Substitutes 1466.4 Clinker-to-Cement Ratio by Country and Region, 1980 – 2005 1496.5 Energy Requirement per tonne of Clinker by Country
including Alternative Fuels 1526.6 Energy Requirement per tonne of Clinker for Non-OECD Countries
and New EU Accession Countries 1546.7 Impact of Alternative Fuels and Raw Materials on Overall
CO2 Emissions 1556.8 Alternative Fuel Use in Clinker Production by Country 156
TABLE OF CONTENTS 13

14 TRACKING INDUSTRIAL ENERGY EFFICIENCY AND CO2 EMISSIONS
6.9 Electricity Consumption per tonne of Cement by Country,1980 – 2005 158
6.10 Total Primary Energy Equivalent per tonne of Cement by Country,1990 – 2004 159
6.11 CO2 Emissions from Energy Consumption (including electricity)per tonne of Cement by Country, 1990 – 2005 160
6.12 Process and Energy (including electricity) CO2 Emissionsper tonne of Cement by Country, 1990 – 2005 161
Chapter 7 � PULP, PAPER AND PRINTING INDUSTRY7.1 Energy in Pulp and Paper Production 1817.2 Pulp Production Mix in Canada, 2004 1857.3 Paper and Board Product Mix in Canada, 2004 1867.4 Number of Pulp and Paper Mills by Capacity in China 1897.5 Heat Consumption in Pulp and Paper Production
versus Best Available Technology, 1990 – 2003 1927.6 Electricity Consumption in Pulp and Paper Production
versus Best Available Technology, 1990 – 2003 1937.7 CO2 Emissions per tonne of Pulp Exported and Paper Produced,
1990 – 2003 1947.8 Waste Paper Collection Rate versus Use Rate 1997.9 World Paper Production, Processing and Recycling Balance, 2004 2007.10 Energy Consumption and CO2 Emissions Index in Japan 203
Chapter 8 � NON-FERROUS METALS8.1 Regional Specific Power Consumption in Aluminium Smelting 211
Chapter 9 � SYSTEMS OPTIMISATION9.1 Conventional Pumping System Schematic 2209.2 Estimated Industrial Motor Use by Application 2249.3 Energy Efficient Pumping System Schematic 2259.4 Steam System Schematic 2279.5 Steam System Use and Losses 2289.6 Distribution of Industrial CHP Capacity in the European Union
and United States 2399.7 Global CHP Capacity, 1992 – 2004 241 9.8 Current Penetration of Industrial CHP 244
Chapter 10 � LIFE CYCLE IMPROVEMENT OPTIONS10.1 Apparent Steel Consumption Trends per capita, 1971 – 2005 24910.2 Apparent Cement Consumption Trends per capita, 1971 – 2005 25010.3 Apparent Paper and Paperboard Consumption Trends per capita,
1971 – 2005 25110.4 Floor Area per unit of GDP for OECD Countries 25310.5 Packaging by Market Segment 253 10.6 Global Car Ownership Rates as a Function of per capita GDP, 2005 25510.7 Global Car Sales, 1980 – 2005 255

10.8 Car Weight Trends, 1975 – 2005 25610.9 World Petrochemical Mass Balance, 2004 260 10.10 World Pulp and Paper Mass Balance, 2004 26410.11 World Aluminium Mass Balance, 2004 26510.12 World Steel Mass Balance, 2005 266 10.13 Global Steel Scrap Recovery, 1970 – 2005 26710.14 Global Steel Obsolete Scrap Recovery Rate, 1970 – 2005 268
Annexes � Annex A • Process Integration
A.1 Results/Savings from Process Integration Schemes 278A.2 Savings from Process Integration Schemes by Industry 279
LIST OF TABLES
Chapter 1 � INTRODUCTION1.1 Savings from Adoption of Best Practice Commercial Technologies
in Manufacturing Industries 35
Chapter 2 � MANUFACTURING INDUSTRY ENERGY USE AND CO2 EMISSIONS2.1 Industrial Final Energy Use, 2004 402.2 Final Energy Use by Energy Carrier, 2004 43
Chapter 3 � GENERAL INDUSTRY INDICATORS ISSUES3.1 Summary of Indicators for Each Industry Sector 54
Chapter 4 � CHEMICAL AND PETROCHEMICAL INDUSTRY4.1 Energy Use in the Chemical and Petrochemical Industry, 2004 624.2 World Production Capacity of Key Petrochemicals, 2004 634.3 Energy Use versus Feedstock for Ethylene 664.4 Specific Energy Consumption for State-of-the-Art Naphtha Steam
Cracking Technologies 684.5 Ultimate Yields of Steam Crackers with Various Feedstocks 694.6 Methanol Production, 2004 734.7 Global Ethylene Use, 2004 744.8 Global Propylene Use, 2004 744.9 European Energy Use and Best Practice 754.10 Worldwide Chlorine Production, 2004 764.11 Energy Efficiency of Chlorine Production Processes 764.12 Soda Ash Production, 2004 784.13 Typical Energy Use for Energy Efficient Soda Ash Production
Using Best Available Technology 794.14 Global Soda Production Capacity, 2000 804.15 Energy Consumption in Ammonia (NH3) Production, 2005 83
TABLE OF CONTENTS 15

16 TRACKING INDUSTRIAL ENERGY EFFICIENCY AND CO2 EMISSIONS
4.16 CHP Use in the Chemical and Petrochemical Industry 864.17 Plastic Recycling and Energy Recovery in Europe 874.18 Best Practice Technology Energy Values, 2004 894.19 Indicator Use for Country Analysis of Global Chemical and
Petrochemical Industry 914.20 Carbon Storage for Plastics in Selected Countries, 2004 924.21 Total CO2 Emissions and CO2 Index, 2004 934.22 Energy Savings Potential in the Chemical and Petrochemical Industry 94
Chapter 5 � IRON AND STEEL INDUSTRY5.1 Energy and CO2 Emission Impacts of System Boundaries 1015.2 Pig Iron Production, 2005 1045.3 Steel Production, 2005 1055.4 Net Energy Use per tonne of Product 1075.5 Energy Balance of Slot Ovens for Coke Production 1095.6 Heat Recovery Options in Various Steel Production Steps 1145.7 Iron Ore Mining and Ore Quality, 2004 1155.8 CO2 Emissions of Chinese Blast Furnaces as a Function of Size, 2004 1185.9 Average CO2 Emissions from Steel Production in Brazil, 2005 1235.10 Global Blast Furnace Gas Use, 2004 1245.11 Use of Blast Furnace Slag, 2004 1255.12 Residual Gas Use in China 1275.13 Steel Slag Use 1285.14 Energy Use for Electric Arc Furnaces with Different Feed and
with/without Preheating 1295.15 Natural Gas-based DRI Production Processes 1335.16 DRI Production, 2004 1345.17 Technical Energy Efficiency and CO2 Reduction Potentials
in Iron and Steel Production 137
Chapter 6 � NON-METALLIC MINERALS6.1 Energy Use, CO2 Emissions and Short-Term Reduction Potentials
in the Chinese Building Materials Industry, 2006 1416.2 Global Cement Production, 2005 1426.3 Heat Consumption of Different Cement Kiln Technologies 1456.4 Typical Composition of Different Cement Types 1476.5 Current Use and Availability of Clinker Substitutes 1506.6 Cement Technologies and Fuel Mix by Region 1516.7 Indicators for the Cement Industry 1626.8 Typical Specific Energy Consumption for Various Types of Lime Kilns 1656.9 Energy Consumption of Main Kiln Types in the Bricks and Tile
Industry in China, 2006 1716.10 Energy Consumption per weight unit for Different Types
of Ceramic Products 173

Chapter 7 � PULP, PAPER AND PRINTING INDUSTRY7.1 Paper and Paperboard Production, 2004 1787.2 Chemical and Mechanical Wood Pulp Production, 2004 1797.3 Global Paper and Paperboard Consumption, 1961 and 2004 1807.4 Typical Energy Consumption in Paper Production for
a Non-integrated Fine Paper Mill 1837.5 Typical Electricity Consumption for the Production
of Various Types of Paper 1837.6 Breakdown of Energy Use in Paper Production in the United States 1847.7 Benchmarking Results for Canadian Pulp & Paper Industry 1867.8 Best Available Technology 1887.9 Paper Production by Type of Paper and by Country, 2004 1907.10 CHP Use in the Pulp and Paper Industry 1967.11 CHP Adjusted Energy Efficiency Indicators, 2003 1977.12 Data Required for CHP Analysis in the Pulp and Paper Industry 1987.13 Energy Savings Potential in the Pulp and Paper Industry 205
Chapter 8 � NON-FERROUS METALS8.1 Estimated Energy Consumption in Primary Non-Ferrous Metals
Production, 2004 2088.2 Regional Average Energy Use of Metallurgical Alumina Production 2098.3 Global Primary Aluminium Production, 2004 2108.4 Regional Average Energy Use for Primary Aluminium Production,
2004 2128.5 Global Primary Copper Production, 2004 2148.6 Energy Use for Copper Production in Chile 215
Chapter 9 � SYSTEMS OPTIMISATION9.1 Motor Efficiency Performance Standards and the Market Penetration
of Energy Efficient Motors 2239.2 Percent Energy Savings Potential by Compressed Air Improvement 2269.3 Percentage Steam Use by Sector – Top Five US Steam-Using Industrial
Sectors 2289.4 Steam System Efficiency Improvements 2299.5 Motor System Energy Savings Potential 2349.6 Steam System Energy Savings Potential 2359.7 Summary of CHP Technologies 2379.8 CHP Use in Selected Countries 242
Chapter 10 � LIFE CYCLE IMPROVEMENT OPTIONS10.1 Global Recycling Rates and Additional Recycling Potential 25810.2 CO2 Impacts of Plastic Waste Recovery Options versus
Land fill Disposal 26110.3 Plastic Waste Recycling by Country 26310.4 Global Incineration Rates and Additional Potential, 2004 269
TABLE OF CONTENTS 17

18 TRACKING INDUSTRIAL ENERGY EFFICIENCY AND CO2 EMISSIONS
10.5 Efficiency of European Waste Incinerators 27010.6 MSW Incineration with Energy Recovery, 2004 27110.7 Energy Needs for Fuel Preparation for Plastics Co-combustion
in Coal-fired Power Plants 272
Annexes � Annex A • Process Integration
A.1 Process Integration Survey Results 277

EXECUTIVE SUMMARY 19
EXECUTIVE SUMMARY
Introduction
At their 2005 Gleneagles Summit the Group of Eight (G8) leaders asked the IEA toprovide advice on a clean, clever and competitive energy future, including atransformation of how we use energy in the industrial sector. This study was preparedin response to that request and a complementary request from the Energy Ministersof IEA countries. The primary objective of this analysis is to develop ways to assessthe state of worldwide industrial energy efficiency today and estimate additionaltechnical savings potential.
Nearly a third of the world’s energy consumption and 36% of carbon dioxide (CO2)emissions are attributable to manufacturing industries. The large primary materialsindustries – chemical, petrochemicals, iron and steel, cement, paper and pulp, andother minerals and metals – account for more than two-thirds of this amount. Overall,industry’s use of energy has grown by 61% between 1971 and 2004, albeit withrapidly growing energy demand in developing countries and stagnating energydemand in OECD countries. However, this analysis shows that substantialopportunities to improve worldwide energy efficiency and reduce CO2 emissionsremain. Where, how and by how much? These are some of the questions this analysistries to answer.
This is a pioneering global analysis of the efficiency with which energy is used in themanufacturing industry. It reveals how the adoption of advanced technologiesalready in commercial use could improve the performance of energy-intensiveindustries. It also shows how manufacturing industry as a whole could be made moreefficient through systematic improvements to motor systems, including adjustablespeed drives; and steam systems, including combined heat and power (CHP); and byrecycling materials. The findings demonstrate that potential technical energy savingsof 25 to 37 exajoules1 per year are available based on proven technologies and bestpractices. This is equivalent to 600 to 900 million tonnes (Mt) of oil equivalent peryear or one to one and a half times Japan’s current energy consumption. Thesesubstantial savings potentials can also bring financial savings. Improved energyefficiency contributes positively to energy security and environmental protection andhelps to achieve more sustainable economic development. The industrial CO2emissions reduction potential amounts to 1.9 to 3.2 gigatonnes per year, about 7 to12% of today’s global CO2 emissions.
The estimates employ powerful statistical tools, called “indicators”, which measureenergy use based on physical production. This study sets out a new set of indicatorsthat balance methodological rigour with data availability. These indicators provide abasis for documenting current energy use, analysing past trends, identifyingtechnical improvement potentials, setting targets and better forecasting of futuretrends. The advantages of this approach include that these indicators:
1. One exajoule (EJ) equals 1018 joules or 23.9 Mtoe.

20 TRACKING INDUSTRIAL ENERGY EFFICIENCY AND CO2 EMISSIONS
� are not influenced by price fluctuations, which facilitates trend analysis. Indetail, these indicators provide a closer measure of energy efficiency.
� can be directly related to process operations and technology choice.
� allow a well-founded analysis of efficiency improvement potentials.
This study builds on other IEA work on energy indicators, a series of workshops anddialogue with experts from key industries, a comprehensive analysis of available dataand an extensive review process. The IEA Implementing Agreement on IndustrialEnergy-Related Technologies and Systems and individual experts from around theworld provided valuable input.
One important conclusion is that more work needs to be done to improve the qualityof data and refine the analysis. Much better data is needed, particularly for iron andsteel, chemicals and petrochemicals, and pulp and paper. This study is presented fordiscussion and as a prelude to future work by the IEA.
Key Trends
Overall, industrial energy use has been growing strongly in recent decades. The rateof growth varies significantly between sub-sectors. For example, chemicals andpetrochemicals, which are the heaviest industrial energy users, doubled their energyand feedstock demand between 1971 and 2004, whereas energy consumption foriron and steel has been relatively stable.
Much of the growth in industrial energy demand has been in emergingeconomies. China alone accounts for about 80% of the growth in the last twenty-five years. Today, China is the world’s largest producer of iron and steel, ammoniaand cement.
Efficiency has improved substantially in all the energy-intensive manufacturingindustries over the last twenty-five years in every region. This is not surprising. It reflectsthe adoption of cutting-edge technology in enterprises where energy is a major costcomponent. Generally, new manufacturing plants are more efficient than old ones. Theobserved trend towards larger plants is also usually positive for energy efficiency.
The concentration of industrial energy demand growth in emerging economies, whereindustrial energy efficiency is lower on average than in OECD countries means,however, that global average levels of energy efficiency in certain industries, e.g.cement, have declined less than the country averages over the past twenty-five years.
Broadly, it is the Asian OECD countries, Japan and Korea, that have the highestlevels of manufacturing industry energy efficiency, followed by Europe and NorthAmerica. This reflects differences in natural resource endowments, nationalcircumstances, energy prices, average age of plant, and energy and environmentalpolicy measures.
The energy and CO2 intensities of emerging and transition economies show amixed picture. Where production has expanded, industry may be using new plantwith the latest technology. For example, the most efficient aluminium smelters are inAfrica and some of the most efficient cement kilns are in India. However, in some

EXECUTIVE SUMMARY 21
industries and regions where production levels have stalled, manufacturers havefailed to upgrade to most efficient technology. For example, older equipmentremains dominant in parts of the Russian Federation and Ukraine. The widespreaduse of coal in China reduces its energy efficiency, as coal is often a less efficientenergy source than other fuels due to factors such as ash content and the need forgasification. In China and India, small-scale operations with relatively low efficiencycontinue to flourish, driven by transport constraints and local resource characteristics,e.g. poor coal and ore quality. The direct use of low grade coal with poor preparationis a major source of inefficiency in industrial processes in these countries.
Tracking Energy Efficiency
Basic industrial processes and products are more or less the same across the world.This enables the use of universal indicators. However, as usual, the devil is in thedetail. Comparing the relative energy performance of industries around the worldneeds to consider that individual technologies, qualities of feed stocks and productsare often different in various countries even for the same industry. In order to makeproper comparisons, system boundaries and definitions need to be uniform. Indicatorscomplement benchmarking, but they should not be used as a substitute. Industrialenergy use indicators can serve as the basis for identifying promising areas by sub-sector, region and technology to improve efficiency. This is, for example, the case forthe cement industry in China and industrial motor and steam systems worldwide,which this study shows to have significant potential for energy and/or CO2 savings.
Reliable indicators require good data. Currently the data quality is often not clear,even those from official sources. As indicators may become the basis for policydecisions with far-reaching consequences, data gaps need to be filled and the qualityof data needs to be regularly validated and continually improved.
In all countries, government and industry partnerships, incentives, and awarenessprogrammes should be pursued to harvest the widespread opportunities forefficiency improvements. New plants and the retrofit and refurbishment of existingindustrial facilities should be encouraged.
Small-scale manufacturing plants using outdated processes, low quality fuel andfeedstock, and weaknesses in transport infrastructure contribute to industrialinefficiency in some emerging economies. Policies for ameliorating these problemsshould be strongly supported by international financial institutions, developmentassistance programmes and international CO2 reduction incentives.
Energy and CO2 Saving PotentialsThis analysis estimates the technical energy and CO2 savings available in energy-intensive industries worldwide. The ranges of potential savings on a primary energybasis are shown in Table 1 in two categories, either as “sectoral improvements”, e.g.cement, or “systems/life cycle improvements”, e.g. motors and more recycling.Improvement options in these two categories overlap somewhat. As well, system/lifecycle options are more uncertain. Therefore, with the exception of motor systems,

22 TRACKING INDUSTRIAL ENERGY EFFICIENCY AND CO2 EMISSIONS
Table 1 � Savings from Adoption of Best Practice Commercial Technologies in Manufacturing Industries(Primary Energy Equivalents)
Low – High Estimatesof Technical
Savings Potential
Total Energy& Feedstock
SavingsPotentials
E J/yr Mtoe/yr Mt CO2 /yr %
Sectoral Improvements
Chemicals/petrochemicals 5.0 – 6.5 120 – 155 370 – 470 13 – 16
Iron and steel 2.3 – 4.5 55 – 108 220 – 360 9 – 18
Cement 2.5 – 3.0 60 – 72 480 – 520 28 – 33
Pulp and paper 1.3 – 1.5 31 – 36 52 – 105 15 – 18
Aluminium 0.3 – 0.4 7 – 10 20 – 30 6 – 8
Other non-metallic metalsminerals and non-ferrous
0.5 – 1.0 12 – 24 40 – 70 13 – 25
System/life cycle Improvements
Motor systems 6 – 8 143 – 191 340 – 750
Combined heat and power 2 – 3 48 – 72 110 – 170
Steam systems 1.5 – 2.5 36 – 60 110 – 180
Process integration 1 – 2.5 24 – 60 70 – 180
Increased recycling 1.5 – 2.5 36 – 60 80 – 210
Energy recovery 1.5 – 2.3 36 – 55 80 – 190
Total 25 – 37 600 – 900 1 900 – 3 200
Global improvement potential – share of industrial energy use and CO2 emissions
18 – 26% 18 – 26% 19 – 32%
Global improvement potential – share of total energy use and CO2 emissions
5.4 – 8.0% 5.4 – 8.0% 7.4 – 12.4%
Note: Data are compared to reference year 2004. Only 50% of the estimated potential system/life cycle improvements have been creditedexcept for motor systems. The global improvement potential includes only energy and process CO2 emissions; deforestation is excluded fromtotal CO2 emissions. Sectoral savings exclude recycling, energy recovery and CHP.

EXECUTIVE SUMMARY 23
only 50% of the potential system/life cycle improvements have been credited for thetotal industrial sector improvement potential shown in Table 1. The conclusionis that manufacturing industry can improve its energy efficiency by an impressive18 to 26%, while reducing the sector’s CO2 emissions by 19 to 32%, based onproven technology. Identified improvement options can contribute 7 to 12%reduction in global energy and process-related CO2 emissions.
The single most important category is motor systems, followed bychemicals/petrochemicals on an energy savings basis. The highest range of potentialsectoral savings for CO2 emissions is in cement manufacturing. The savings potentialunder the heading “system/life cycle improvements” is larger than the individualsub-sectors in part because those options apply to all industries. Another reason isthat these options have so far received less attention than the process improvementsin the energy-intensive industries. Generally, these are profitable opportunities,though they are often overlooked, particularly in the parts of manufacturing whereenergy is not a main operating cost.
The estimated savings based on a comparison of best country averages with worldaverages, or best practice and world averages. They do not consider new technologiesthat are not yet widely applied. Also they do not consider options such as CO2 captureand storage and large-scale fuel switching. Therefore, these should be consideredlower range estimates of the technical potential for energy savings and CO2 emissionsreductions in the manufacturing industry sector. These estimates do not consider theage profile of the capital stock, nor regional differences in energy prices andregulations that may limit the short- and medium-term improvement options. Theeconomic potentials are substantially lower than the technical estimates. Moreover,technology transfer to developing countries is a major challenge. Yet the sheermagnitude of the savings opportunties indicates that more effort is warranted.
Some of these savings will occur outside the manufacturing industry sector. Forexample, CHP will increase the efficiency in power generation. Energy recovery fromwaste will reduce the need to use fossil energy for power or heat generation.Increased recycling of paper leaves more wood that can be used for variousbioenergy applications. Therefore, these savings estimates are not suited to settargets for sectoral energy use due to the dynamic interaction between sectors.
About 10% of the direct and indirect industrial CO2 emissions are process-relatedemissions that are not due to fossil energy use. These CO2 emissions would not beaffected by energy efficiency measures. Another distinguishing feature of themanufacturing sector is that carbon and energy are stored in materials and products, e.g.plastics. Recycling and energy recovery make good use of stored energy and reduce CO2emissions, if done properly. Currently, these practices are not applied to their full extent.
Sectoral Results Chemical and Petrochemical
� The chemical and petrochemical industry accounts for 30% of global industrialenergy use and 16% of direct CO2 emissions. More than half of the energydemand is for feedstock use, which can not be reduced through energy efficiencymeasures. Significant amounts of carbon are stored in the manufactured products.

24 TRACKING INDUSTRIAL ENERGY EFFICIENCY AND CO2 EMISSIONS
� An indicator methodology that compares theoretical energy consumption usingbest available technology with actual energy use suggests a 13 to 16%improved energy efficiency potential for energy and feedstock use (excludingelectricity). The potential is somewhat higher in countries where older capitalstock predominates. The indicator results suggest problems with the energy andfeedstock data for certain countries.
� The regional averages for steam crackers suggest a 30% difference in energyuse between the best (East Asia) and worst (North America). Feedstock usedominates energy use in steam crackers, which can not be reduced throughenergy efficiency measures.
� Benchmarking studies suggest that potential energy efficiency improvements forolefins and aromatics range from 10% for polyvinyl chloride to 40% for varioustypes of polypropylene.
� About 1 exajoule (EJ) per year (20%) would be saved if best availabletechnology were applied in ammonia production. Coal-based production inChina requires considerably more energy than gas-based production elsewhere.
� In final energy terms, the savings potential ranges from 5 to 11 EJ per year,including process energy efficiency, electric systems, recycling, energy recoveryfrom waste and CHP.
Iron and Steel
� The iron and steel industry accounts for about 19% of final energy use andabout a quarter of direct CO2 emissions from the industry sector. The CO2relevance is high due to a large share of coal in the energy mix.
� The iron and steel industry has achieved significant efficiency improvements inthe past twenty-five years. Increased recycling and higher efficiency of energyand materials use have played an important role in this positive development.
� Iron and steel has a complex industrial structure, but only a limited numberof processes are applied worldwide. A large share of the differences inenergy intensities and CO2 emissions on a plant and country level areexplained by variations in the quality of the resources that are used and thecost of energy.
� The efficiency of a plant in the iron and steel industry is closely linked to severalelements including technology, plant size and quality of raw materials. Thispartly explains why the average efficiency of the iron and steel industries inChina, India, Ukraine and the Russian Federation are lower than those in OECDcountries. These four countries account for nearly half of global iron productionand more than half of global CO2 emissions from iron and steel production.Outdated technologies such as open hearth furnaces are still in use in Ukraineand Russia. In India, new, but energy inefficient, technologies such as coal-baseddirect reduced iron production play an important role. These technologies cantake advantage of the local low-quality resources and can be developed on asmall scale, but they carry a heavy environmental burden. In China, low energyefficiency is mainly due to a high share of small-scale blast furnaces, limited orinefficient use of residual gases and low quality ore.

� Waste energy recovery in the iron and steel industry tends to be more prevalentin countries with high energy prices, where the waste heat is used for powergeneration. This includes technology options such as coke dry quenching (CDQ)and top-pressure turbines. CDQ also improves the coke quality, compared toconventional wet quenching technology.
� The identified primary energy savings potential is about 2.3 to 2.9 EJ per yearthrough energy efficiency improvements, e.g. in blast furnace systems and useof best available technology. Other options, for which only qualitative data areavailable, and the complete recovery of used steel can raise the potential toabout 5 EJ per year. The full range of CO2 emissions reductions is estimated tobe 220 to 360 Mt CO2 per year.
Cement
� The non-metallic mineral sub-sector accounts for about 9% of global industrialenergy use, of which 70 to 80% is used in cement production.
� The average primary energy intensity for cement production ranges from 3.4 to5.3 gigajoules per tonne (GJ/t) across countries with a weighted average of4.4 GJ/t. Averages at a country level have improved everywhere, with theweighted average primary energy intensity declining from 4.8 GJ/t in 1994 to4.4 GJ/t in 2003. Much of this decline has been driven by improvements inChina, which produces about 47% of the world’s cement.
� The efficiency of cement production is relatively low in countries with old capitalstock based on wet kilns and in countries with a significant share of small-scalevertical kilns.
� In primary energy terms, the savings potential ranges from 2.5 to 3 EJ per year,which equals 28 to 33% of total energy use in this industry sector.
� Cement production is an important source of CO2 emissions, accounting for1.8 Gt CO2 in 2005. Half of cement process CO2 emissions are due to thechemical reaction in cement clinker production. These process emissions are notaffected by energy efficiency measures. Yet it might be possible to reduce clinkerproduction by 300 Mt with more extensive use of clinker substitutes which couldreduce CO2 emissions by about 240 Mt CO2 per year. Therefore the CO2reduction potential could be higher than the energy saving potential.
� The average CO2 intensity ranges from 0.65 to 0.92 tonne of CO2 per tonne ofcement across countries with a weighted average 0.83 t CO2 /t. The globalaverage CO2 intensity in cement production declined by 1% per year between1994 and 2003.
Pulp, Paper and Printing � The pulp, paper and printing industry accounts for about 5.7% of global
industrial final energy use, of which printing is a very small share. Pulp andpaper production generates about half of its own energy needs from biomassresidues and makes extensive use of CHP.
� Among the key producing countries examined, the heat consumption efficiencyin the pulp and paper sub-sector has improved by 9 percentage points from
EXECUTIVE SUMMARY 25
26 TRACKING INDUSTRIAL ENERGY EFFICIENCY AND CO2 EMISSIONS
1990 to 2003. This is a notable improvement, while an additional 14%improvement potential exists when a comparison with best available technologyis made.
� This analysis shows relatively little change in the overall energy efficiency ofelectricity consumption in pulp and paper manufacturing. The weighted averageefficiency of electricity use has improved by three percentage points from 1990to 2003. There is an additional 16% improvement potential based on acomparison with best available technology.
� Increased recycled paper use in many countries could help reduce energyconsumption. While Western Europe appears to be close to its practical limit forpaper recycling, other parts of the world, e.g. North America and parts of Asia,could benefit from more effective policies on waste disposal to encourage higherrates of recycling.
� CO2 reduction potentials in the pulp and paper industry are limited due to thehigh use of biomass. However, the more efficient use of biomass still makessense from an energy systems perspective, as it frees up scarce wood resourceswhich could provide savings elsewhere.
� In primary energy terms, the savings potential ranges from 1.3 to 1.5 EJ peryear, which equals 15 to 18% of total energy use in this sub-sector.
Aluminium
� Aluminium production is electricity intensive. Global average electricity use forprimary aluminium production is 15 300 kWh per tonne (kWh/t). This averagehas declined about 0.4% per year over the last twenty-five years. On a regionalbasis, the averages range from 14 300 kWh/t in Africa to 15 600 kWh/t inNorth America. Africa is the most efficient region due to new productionfacilities. New smelters tend to be based on the latest technology and energyefficiency is a key consideration in smelter development.
� The regional average energy use for alumina production ranges from 10 to 12.6 GJ/t.
� With existing technology, energy use in the key steps of aluminium productioncan be reduced by 6 to 8% compared with current best practice, which equals0.3 to 0.4 EJ per year in primary energy equivalents.
Other Non-Metallic Minerals and Other Non-Ferrous Metals
� This category includes a wide range of products such as copper, lime, bricks, tilesand glass.
� The resource quality and the product quality is very diverse. This complicates across-country comparison. However, the available data suggests that importantefficiency potentials remain based on options such as waste heat recovery.
� In primary energy terms, the savings potential ranges from 0.5 to 1 EJ per year.This equals approximately 13 to 25% of total energy use in these sub-sectors.

Systems Optimisation
� Based on hundreds of case studies across many countries, it is estimated thatthe improved efficiency potential for motor systems is 20 to 25% and 10 to15% for steam systems. This is 6 to 8 EJ savings in primary energy per year inmotor systems and 3 to 5 EJ in steam systems. Process integration could savean additional 2 to 5 EJ.
� Combined heat and power (CHP) is a proven industrial energy efficiencymeasure. Globally, CHP generates about 10% of all electricity today, resultingin estimated energy savings of more than 5 EJ annually. Up to 5 EJ of primaryenergy savings potential remain for CHP in manufacturing, equal to 3 to 4% ofglobal industrial energy use.
� These systems options overlap and compete with the other sectoral options andthe life cycle options. This interaction must be considered if the total industrypotential is to be accurately estimated.
Life Cycle Optimisation
� Industrial energy use is different from other end-use sectors, because importantquantities of energy and carbon are stored in the products. Therefore, it isparticularly important to consider efficiency improvement options on a life-cyclebasis including recycling, energy recovery and the efficiency of materials use.
� Countries differ vastly in their levels of recycling and energy recovery from wastematerials. Substantial amounts of waste materials are land filled. Untappedglobal recycling potential and energy recovery potential are each in the rangeof 3 to 5 EJ per year. Better materials/product efficiency and wastemanagement could cut some 0.3 to 0.8 gigatonne of CO2 emissions per year.
� Life cycle optimisation competes with the other options and this reduces thepotential for the total industry sector.
Next Steps
This study is a first attempt to provide a reliable and meaningful set of globalindicators of energy efficiency and CO2 emissions in the manufacturing industrialsector. They will be useful for industries, governments and others to improveforecasting of industrial energy use; to provide a realistic basis for target setting andeffective regulation; and to identify sectors and regions for more focused analysis ofimprovement potentials.
This study needs to be followed by more work, as further improvements are possible.Future studies could be more meaningful for the benefit of all parties, includingindustry itself, if sensitivity and confidentiality issues could be overcome to allow amore detailed, complete, timely, reliable and open database to be developed. Policymakers, industry, analysts and others are calling for more reliable estimates ofenergy savings and CO2 emission reductions potentials. This can only be achieved ifaccurate and complete energy use and efficiency data are available for the analysisof future potential based on best practices to pave the way for adoption of state-of-the-art technologies.
EXECUTIVE SUMMARY 27

28 TRACKING INDUSTRIAL ENERGY EFFICIENCY AND CO2 EMISSIONS
The methodology used here, which is often constrained by data limitations, can beimproved. Feedback will be an important component of making future analysis moreeffective. However, an improved methodology will be more beneficial only ifcompanies and countries make a concerted parallel effort to improve the quality andavailability of the manufacturing industry energy data.
Apart from the improvement of the indicators analysis, future work will focus onassessing the potential of new technologies and analysing the integrated reductionpotential by running scenarios that assess the economic potential of differenttechnologies given current energy efficiencies and technology use. This work isexpected in the first half of 2008.
Indicator and Data Issues
In most energy-intensive industrial sub-sectors, ten to twenty countries account for80 to 90% of global production and CO2 emissions from manufacturing. These arethe countries where further analysis should focus initially.
There is not a single “true” indicator of energy and CO2 intensity for an industry. Ingeneral, a number of indicators should be used to give an adequate picture of bothenergy and CO2 intensity levels of a particular industry in a country. Systemboundary and allocation issues are very important in the design of indicators andother performance measures for comparative purposes. For example, the allocationof upstream emissions, particularly for power generation, and downstream energyrecovery benefits is an element that can affect performance significantly. If indicatorsare used for policy purposes, the boundaries and allocations may affect industryoperating practices. Some choices may favour behaviour that reduce plant-specificCO2 emissions but increase emissions elsewhere. Examples include if energyintensive parts of the production are outsourced, or higher quality resources are usedsuch as a switch from iron ore to steel scrap in steel production. Indicatordevelopment for all industry sectors should be co-ordinated in order to avoid doublecounting and omissions or perverse incentives.
Product categories are of key importance. Various products in a single category mayrequire considerably different amounts of energy for their production, e.g. a coarseversus highly-refined paper. If the product mix within a category varies within oracross countries, it will affect the indicator performance measurement incomparisons.
In this study, indicators are developed on a country level. They do not account forvariations in plant performance within a country. Therefore, benchmarking and/orauditing activities are needed to complement the indicators approach to betterunderstand energy use in industry.
Some governments have successfully used international benchmarking approachesfor industrial energy efficiency targets, e.g. Belgium and the Netherlands. Detailedenergy benchmarking studies are done on a regular basis in some industries, basedon data provided by companies that operate plants. These studies are usually doneon a global basis and individual plants are not identified for antitrust reasons.

EXECUTIVE SUMMARY 29
Usually, these studies are confidential and the benchmarking activities are oftenlimited to the main producers in industrialised countries. This can create a bias infavour of the more efficient plants, which overestimates the industry’s averageenergy efficiency. Benchmarking generally focuses on plants based on the sameindustrial process and similar product quality. Benchmarking is therefore not suitedto evaluate some improvement options such as process integration, feedstocksubstitution, recycling or energy recovery from waste materials. The same caveatsapply for benchmarking and for indicators: the results are influenced bymethodological choices. Important efforts are continuing in many industries toexpand and improve international benchmarking.
Energy data availability poses a major constraint for developing meaningfulindicators. The industrial sub-sector data that countries report to the IEA are notsufficiently detailed to allow country comparisons of physical indicators at a level ofrelevant comparable physical products. Therefore, other data sources must be used.
The study therefore builds on various sources of data collected through a network ofcontacts in countries and industries. However, one of the clear outcomes of the studyis that more work needs to be done to improve the quality of the data and refine theanalysis. In many cases, data are either not available due to a lack of structure orinterest and commitment in collecting the data or for confidentiality reasons.
New government and industry co-operation schemes are evolving. For example, theAsia-Pacific Partnership plans to collect additional data on a plant level for iron andsteel, cement and aluminium for its six participating countries. Confidentiality ruleswill apply. It is recommended that such efforts be co-ordinated.
Data on the level of on-site process integration and combined heat and power arelacking, and energy efficiency performance data for actual motor and steam systemsare almost non-existent. It is recommended to strengthen the data collection systemfor such key energy saving options and develop suitable indicators, since a largebody of case studies suggests important improvement potentials based on theseexisting technologies.
In cases where energy use data are lacking, technology data can serve to estimateenergy efficiency. Unfortunately, such data are usually not available fromgovernment statistics. Capital stock vintage data also can help to determineefficiencies and potential improvements, but such data are scarce and incomplete. Insome cases, engineering companies and consultancies that serve the sector havesuch data, but access is restricted. It should be noted that technology use data canbe misleading, for example in situations where operational practices and processintegration can have an important impact on the overall industry performance.
Care should be taken when data of different quality are mixed for countrycomparisons. The quality of data is not always evident. If data are to be used forinternational agreements, a monitoring and verification system will be needed.


Chapter 1 • INTRODUCTION 31
1INTRODUCTION
The leaders of the Group of Eight (G8) countries and the governments ofInternational Energy Agency (IEA) Member countries have asked the IEA tocontribute to the Dialogue on Climate Change, Clean Energy and SustainableDevelopment.1 The aims of the G8 Dialogue and Plan of Action are to:
Promote innovation, energy efficiency, conservation, improve policy, regulatory andfinancing frameworks, and accelerate deployment of cleaner technologies,particularly lower-emitting technologies.
Work with developing countries to enhance private investment and transfer oftechnologies, taking into account their own energy needs and priorities.
Raise awareness of climate change and our other multiple challenges, and the meansof dealing with them; and make available the information which business andconsumers need to make better use of energy and reduce emissions (G8, 2005).
As part of the G8 Plan of Action in the industry sector, the IEA was asked to:
… develop its work to assess efficiency performance and seek to identify areas wherefurther analysis of energy efficiency measures by the industry sector could add value,across developed and interested developing countries.
After consultation with IEA delegations and incorporating views expressed by itsMember countries, the IEA Secretariat has extended the scope of its G8 work fromenergy efficiency to also include CO2 emissions reduction (IEA, 2005).
The IEA’s work on industry is organised into three parts:
1) An analysis of current energy efficiencies and related CO2 emissions worldwide.
2) An analysis of CO2 emission reduction potentials from technology options.
3) Identification of policies that can result in an uptake of these options.
Scope of Indicator Analysis
This analysis focuses on indicators for industrial energy efficiency and CO2 emissionsand is a contribution to part one. Historic trends and current efficiencies areconsidered. It does not consider the impacts of emerging technologies or futureenergy use and CO2 emissions. Estimates of improvement potentials are assessedbased on indicators for energy efficiency at a country level in key manufacturingindustry sub-sectors.
The present study has benefited from the input of a large number of experts fromindustry, research institutes and academia. Their contributions have been documentedin workshop presentations and proceedings. These include Ammonia (IFA, 2007),
1. Canada, Germany, France, Italy, Japan, Russia, United Kingdom and United States.

32 TRACKING INDUSTRIAL ENERGY EFFICIENCY AND CO2 EMISSIONS
Cement (IEA/WBCSD, 2006a), Chemicals and Petrochemicals (IEA/CEFIC, 2007), Ironand Steel, Pulp and Paper (IEA/WBCSD, 2006b) and Motor Systems (IEA, 2006b).While the comments and suggestions of the workshop participants provided valuableinsights and have resulted in revisions of the proposed indicators, the approachproposed in this publication is the responsibility of the IEA Secretariat. Feedback iswelcome as we proceed to refine the approach.
In order to develop useful indicators for industrial energy use and CO2 emissions, asound understanding of how energy is used by industry is needed. This studyprovides an overview of global industry energy use; a discussion of indicatormethodology issues; energy use and CO2 emissions in the chemical andpetrochemical, iron and steel, non-metallic minerals, pulp and paper and non ferrousmetals industries and assesses key systems such as motors and recycling. (Industrialprocess integration is presented in Annex A.) Key energy consuming industries are concentrated in a few countries. Current and future data collection should beconcentrated in these countries.
Apart from increased data collection for energy use in industry, this study aims toestablish relevant and valid indicators that permit analysis of the main trends on acountry level by looking at the technology mix within an industry and also allow acredible comparison of efficiency data on a sub-sector level between countries.Indicators refer to the average efficiency of a sub-sector or process operation on acountry level. Benchmarking implies the comparison of the energy efficiency and CO2emissions of individual installations based on a point reference, often “best availabletechnology” (BAT).2 (Benchmarking is discussed in Annex B) However, data forindividual facilities are often confidential because of anti–trust regulations or otherconcerns. Moreover, data collection is resource and time consuming.
Prior IEA analysis focused on industrial energy use per unit of value added (IEA,2004). This work is being updated and a publication is planned for September 2007.The analysis here takes a different approach to examine energy use per unit ofphysical production, e.g. energy use per tonne of product. As a next step, the physicalindicators analysis will be merged into the general set of IEA indicators.
Work on physical energy intensity indicators is not new. A significant body ofliterature exists and this analysis builds on it. This study uses data from openliterature, industry sources and analyses based on IEA statistics.
Significant work has been done in the United States, for example by the EnergyInformation Administration (1995 a,b), Freeman et al. (1996) and Martin et al.(1994). A large body of knowledge also exists in Canada (Canadian IndustrialEnergy End-Use Data and Analysis Centre (2002), Nanduri et al. (2002), NaturalResources Canada (2000). In Europe, considerable work has been done by UtrechtUniversity and by the European Commission research programmes, for exampleFarla et al. (2000), Phylipsen and Blok (1997), Phylipsen (2000), Worrell (1997).Also the Asia Pacific Research Centre has worked on issues of industrial energy use(APERC, 2000).
2. The term “best available technology” is taken to mean the latest stage of development (state-of-the-art) ofprocesses, facilities or methods of operation which include considerations regarding the practical suitability of aparticular measure to enhance energy efficiency.

Chapter 1 • INTRODUCTION 33
The analysis of manufacturing industry sub-sector energy intensities iscomplemented by studies focusing on CO2 emission reduction life cycle analysis,material flow analysis, process analysis, benchmarking and technology assessmentstudies. It is beyond the scope of this overview to discuss all the contributing studies,but a comprehensive set of references by chapter is provided.
An important finding is that energy use in industry is different from other sectorssince industrial processes and technologies are not very dependent on the climate,geography, consumer behaviour and income levels. This facilitates a comparisonacross countries. At the same time, certain factors such as resource availability,resource quality, production scale and age of the capital equipment stock canexplain differences in energy efficiency. Such factors are usually not governed byeconomics and should therefore be taken into account when the improvementpotential is assessed.
This study sets out a new set of indicators for country level efficiency analysis thatbalance methodological rigour with data availability. Discussions with industryexperts regarding the best approach are underway, and therefore the indicatorsshould be considered as a “work in progress”. The indicators need to be validated andtheir utility needs to be assessed.
Given the preliminary character of these energy indicators, the country comparisonsmay be of secondary importance. More refined analysis may lead to different countryrankings in the future. An important finding in this study is that the need for datadetail and the availability of data should be balanced with the new indicatorsdeveloped. The authors of this study take the view that the methodology shouldcomplement available data. If more data were available, different indicators mighthave been employed. A second important finding is that there is no single “true”indicator for energy efficiency and CO2 emissions intensity. Different indicators forthe same industry may result in a different ranking, but they may provide differentinsights regarding improvement potentials. Therefore, policy makers should not focuson the country ranking, but rather on the various improvement options that havebeen identified.
Energy and CO2 Saving Potentials
The range of potential savings on a primary energy basis are shown in Table 1.1 as“sectoral improvements”, e.g. cement, and as “systems/life cycle improvements”, e.g. motors and more recycling. Improvement options in these two categories overlapsomewhat. Also system/life cycle options are more uncertain. Therefore, with theexception of motor systems, only 50% of the potential system/life cycle improvementshave been credited for the total industrial sector improvement estimates shown inTable 1.1. The conclusion is that manufacturing industry can improve its energyefficiency by an impressive 18 – 26%, while reducing the sector’s CO2 emissions by 19 – 32%, based on proven technology. Identified improvement options can contribute7 – 12% reduction in global energy and process-related CO2 emissions.
A two-step approach was applied to develop the estimates. First, energy savingpotentials were estimated for final energy in industrial sub-sectors and for systems.
1
34 TRACKING INDUSTRIAL ENERGY EFFICIENCY AND CO2 EMISSIONS
Next the final energy savings were translated into primary energy equivalents,accounting for losses in power generation and steam generation. In addition,corrections were applied for chemicals and petrochemicals and for pulp and paper asboth industries already have a high share of combined heat and power (CHP).Moreover in both industries, CHP competes with steam saving technologies.Conservatively, CHP was excluded for both industry estimates in the primary savingspotential (while CHP is included in the final energy estimates). Recycling and energyrecovery potentials have also been excluded for all industries. This accounts for thefact that the analysis shows that the efficiency of energy recovery from waste varieswidely, and recycling energy benefits decrease as the recycling share increases. Also,electricity savings were excluded for chemicals and petrochemicals because theyoverlap with motor system savings. These corrections result in a conservativeestimate of the technical savings potential. A proper detailed analysis that accountsfor the interactions of various options will require a model that covers the full energysystem (IEA, 2006a).
Some of these savings will occur outside the manufacturing industry sector. Forexample, CHP will increase the efficiency in power generation. Energy recovery fromwaste will reduce the need to use fossil energy for power or heat generation. Increasedrecycling of pulp and paper leaves more wood that can be used for various bioenergyapplications. So these figures are not suited to set targets for sectoral energy use.
The CO2 estimates show a wider range than the energy saving potentials because inmany cases it is not clear which type of energy carrier would be saved. Particularly insituations where the savings are in electricity, the assessment is complicated. To dealwith this uncertainty, natural gas and coal have been assumed as extremes, which givealmost a factor two difference in the carbon intensity of energy. In other cases, an expertestimate of average carbon intensity has been applied that varies by industry, dependingon the global average fuel mix. For cement manufacturing, it is assumed that 300 Mtcement clinker (about 15%) can be substituted by slag, fly ash and pozzolans. Thiscontributes to the energy savings and it increases the CO2 saving potential substantially.For pulp and paper, an option such as increased recycling results in reduced total energyuse; but the savings in these cases are in bioenergy while additional fossil fuels mightbe needed. Depending on the alternative use of the saved wood, there may or may notbe a carbon saving effect. Similar contentious system boundary issues exist for energyrecovery. The CO2 figures are therefore only indicative.
The single most important category is motor systems, followed by chemicals andpetrochemicals on an energy savings basis. The highest range of potential savings forCO2 emissions is in cement manufacturing. The savings estimate under the headingsystem/life cycle improvements is larger than the individual sub-sectors in part becausethose options apply to all industries. Another reason is that these options have so farreceived less attention than the process improvements in the energy-intensive industries.
These estimated savings are based on a comparison of best country averages with world averages, or best practice and world averages. They do not consider newtechnologies that are not yet widely applied. Also they do not consider options suchas CO2 capture and storage and large-scale fuel switching. Therefore, these shouldbe considered lower range estimates of the technical potential for energy savingsand CO2 emissions reductions in the manufacturing industry sector.

Table 1.1 � Savings from Adoption of Best Practice CommercialTechnologies in Manufacturing Industries
(Primary Energy Equivalents)
Chapter 1 • INTRODUCTION 35
1
Low – HighEstimates
(Final energy, includesoverlap)
Low – High Estimates of Technical
Savings Potential (Primary energy, excludes overlap)
Total Energy & Feedstock
SavingsPotentials
EJ/yr EJ/yr Mtoe/yr Mt CO2/yr %
Sectoral Improvements
Chemicals/petrochemicals 4.0 – 11.0 5.0 – 6.5 120 – 155 370 – 470 13 – 16
Iron and steel 2.0 – 4.0 2.3 – 4.5 55 – 108 220 – 360 9 – 18
Cement 2.2 – 2.7 2.5 – 3.0 60 – 72 480 – 520 28 – 33
Pulp and paper 1.0 – 2.4 1.3 – 1.5 31 – 36 52 – 105 15 – 18
Aluminium 0.1 – 0.6 0.3 – 0.4 7 – 10 20 – 30 6 – 8
Other non-metallic minerals and non-ferrous metals
0.4 – 0.8 0.5 – 1.0 12 – 24 40 – 70 13 – 25
System/life cycle Improvements
Motor systems 2.6 6 – 8 143 – 191 340 – 750
Combined heat and power 4.5 2 – 3 48 – 72 110 – 170
Steam systems 3.3 1.5 – 2.5 36 – 60 110 – 180
Process integration 2 – 5 1 – 2.5 24 – 60 70 – 180
Increased recycling 3 – 4.5 1.5 – 2.5 36 – 60 80 – 210
Energy recovery 3 – 4.5 1.5 – 2.3 36 – 55 80 – 190
Total 25 — 37 600 — 900 1 900 — 3 200
Global improvement potential –share of industrial energy use and CO2 emissions
18 – 26% 18 – 26% 19 – 32%
Global improvement potential –share of total energy use andCO2 emissions
5.4 – 8.0% 5.4 – 8.0% 7.4 – 12.4%
Note: Data are compared to reference year 2004. Only 50% of the estimated potential system/life cycle improvements have been credited except for motor systems. The global improvement potential includes only energy and process CO2 emissions; deforestation is excludedfrom total CO2 emissions. Sectoral final savings high estimates include recycling. Sectoral primary savings exclude recycling and energyrecovery. Primary energy columns exclude CHP and electricity savings for chemicals and petrochemicals. Primary energy columns excludeCHP for pulp and paper.
3. One exajoule (EJ) equals 1018 joules.

36 TRACKING INDUSTRIAL ENERGY EFFICIENCY AND CO2 EMISSIONS
These estimates do not consider the age profile of the capital stock, nor regionaldifferences in energy prices and regulations that may limit the short- and medium-term improvement options. Further, this study does not consider process economicsexplicitly in the assessment of improvement potentials. So the economic potentialwill be substantially lower than the technical estimates. However, changing marketconditions and values for CO2 can affect the process economics significantly.Therefore, the technical potential is an important indicator. The fact that a certainprocess is economic in parts of the world is taken as an indication that the processcan be economic in real world conditions. However, this does not mean that a majorenergy efficiency improvement of a certain industry sector is economic worldwide inthe near or long term. Such analysis would require assumptions regarding futureenergy prices and CO2 policy regimes, which are beyond the scope of this analysis.
Furthermore, the analysis acknowledges the role of technology and resourcequality as key explanatory factors. The technology mix often provides importantinsights regarding industrial energy use, as a certain technology implies a certainlevel of energy efficiency. Therefore, it is proposed to use the technology mix as anadditional indicator for the energy efficiency level in cases where the actual energyuse data are not available. Moreover, efficiency estimates based on technology canserve as a valuable cross-check for indicators based on energy statistics. In anumber of cases this cross-check has resulted in the discovery of discrepancies inthe energy statistics.
This study does not consider the introduction of new technologies that are still in theresearch and development (R&D) or demonstration stage. As these options havebeen excluded, the results underestimate the long-term efficiency potentials. Theanalysis allows the identification of best practice on a technical level and the gapbetween country averages and best practice. Note that best practice reflects not onlythe level of technology, but also the energy economics of a country. In a countrywhere energy is expensive, energy efficiency will generally be higher. This study doesnot discuss the economics and past sector developments that may explain theobserved differences in energy efficiency. International competitiveness issues arenot considered in this analysis.
In certain areas this study found that the data that countries submit to the IEA donot correspond to those contained in national statistics, or they do not correspondwith industry statistics. In some cases the energy intensity per unit of physicalproduct data are evidently in error, e.g. below the theoretical minimum. The fact thatsuch statistical problems have been identified shows the usefulness of physicalindicators compared with value-added based indicators.
Next Steps
Modelling and scenario development plays an important role in the industry analysis,especially in the second part of the IEA’s programme of work. As a first response tothe G8 request, the IEA has developed new scenarios that analyse impacts oftechnology–related policies in the period to 2050. These scenarios were presented inEnergy Technology Perspectives: Scenarios & Strategies to 2050 (IEA, 2006a). Itconcluded that substantial global energy efficiency potentials remain based on

current technology and different operational techniques. The next edition of EnergyTechnology Perspectives in 2008 will contain a special chapter with industry scenarioanalysis that covers the potential of existing and emerging technologies.
The new sets of indicators presented in this study are to provide a basis for discussionfor development of meaningful indicators of energy efficiency and CO2 emissions inthe industrial sector. They can be useful for industries, governments and others toimprove forecasting of industrial energy use; provide a realistic basis for targetsetting and effective regulation and to identify sectors and regions for more focusedanalysis of improvement potentials. This study shows that the methodology can beimproved and that better data is needed. Suggested next steps in this direction are:
� IEA energy data should be validated for industrial sub-sectors and countries. Inparticular, data for developing countries and transition economies need to beimproved.
� The IEA statistics category “other industries” needs to be refined for meaningfulindicators in co-operation with the national statistical bureaus and industry.
� The treatment of combined heat and power (CHP) in IEA statistics needs to becomplemented with better data on current CHP capacity, use and generation, aswell as through improved presentation of CHP in energy balances and statistics.
� Currently the IEA collects only data of economic activity in monetary terms.Industrial physical production data should be collected by the IEA on a regularbasis, notably for energy-intensive commodities. Physical production dataalready are collected on an annual basis by other government and industrybodies. Therefore, it is a matter of improving and institutionalising the existingco-operation and exchanges.
� More detailed data for industry are needed than those available from IEAstatistics. A comprehensive framework should be developed including indicators,benchmarking, capital stock age data at a plant level and in certain cases on aprocess level. Part of these data need to be treated confidentially, but countrylevel data should be public.
� Various international data collection and analysis activities should be closely co-ordinated and be further developed into a system that allows periodic datacollection.
� An independent non-commercial trusted party should be appointed to overseethe data collection and analysis. This could be done on a sub-sector basis.
� Data regarding the technical characteristics of the industrial capital stockshould be collected on a regular basis.
� This work should be done in close collaboration with industry federations.
Chapter 1 • INTRODUCTION 37
1


Chapter 2 • MANUFACTURING INDUSTRY ENERGY USE AND CO2 EMISSIONS 33 99
2
MANUFACTURING INDUSTRY ENERGY USEAND CO2 EMISSIONS
Total global primary energy supply was about 469 exajoules (EJ) (11 213 Mtoe)in 2004.1 Industry accounts for nearly one-third of this energy use at morethan 147 EJ (3 510 Mtoe) including conversion losses from electricity and heatsupply.
Total final energy use by industry was 113 EJ in 2004 (Table 2.1).2 The data includeoil feedstocks for the production of synthetic organic products. Industry also usessubstantial amounts of wood as feedstock for the production of pulpand structural wood products. Approximately 1 000 million tonnes (Mt) of woodfeedstock used by industry, equivalent to 16 – 18 EJ of biomass, is not accounted forin these figures. The use of about 10 Mt of natural rubber is also not included, thisis equivalent to 0.3 EJ per year. If these quantities were considered, the total energydemand in the industry sector would increase further. The totals in Table 2.1 excludeenergy use for the transportation of raw materials and finished industrial products,which is important.
Most industrial energy use is for raw materials production. The sub-sectors covered inthis study are the main manufacturing industries: chemical and petrochemicals, ironand steel, non-metallic minerals, paper and pulp, and non-ferrous metals. Together,these industries consumed 76 EJ of final energy in 2004 (67% of total finalindustrial energy use). The chemical and petrochemical industry alone accounts for30% of industrial energy use, followed by the iron and steel industry with 19%. Thefood, tobacco and machinery industries, along with a large category of non-specifiedindustrial uses, account for the remaining 33% of total final industrial energy.However, some of the energy that is reported under non-specified industrial users isin fact used for raw materials production, which increases its share above two-thirdsof total industrial final energy use.
Industrial energy intensity (energy use per unit of industrial output) has declinedsubstantially over the last three decades across all manufacturing sub-sectors and allregions. In absolute terms, however, energy use and CO2 emissions have increasedworldwide. Industrial final energy use increased 61% between 1971 and 2004, anaverage annual growth of 2% (Figure 2.1). But the growth rates are not uniform. Forexample, in the chemical and petrochemical sub-sector, which is the largest industrialenergy consumer, energy and feedstock use has doubled while energy use for ironand steel production has been relatively flat, despite strong growth in globalproduction.
1. One exajoule equals 1018 joules or 23.9 Mtoe.2. Final energy is the sum of all energy carriers that are used without accounting for energy conversion losses.
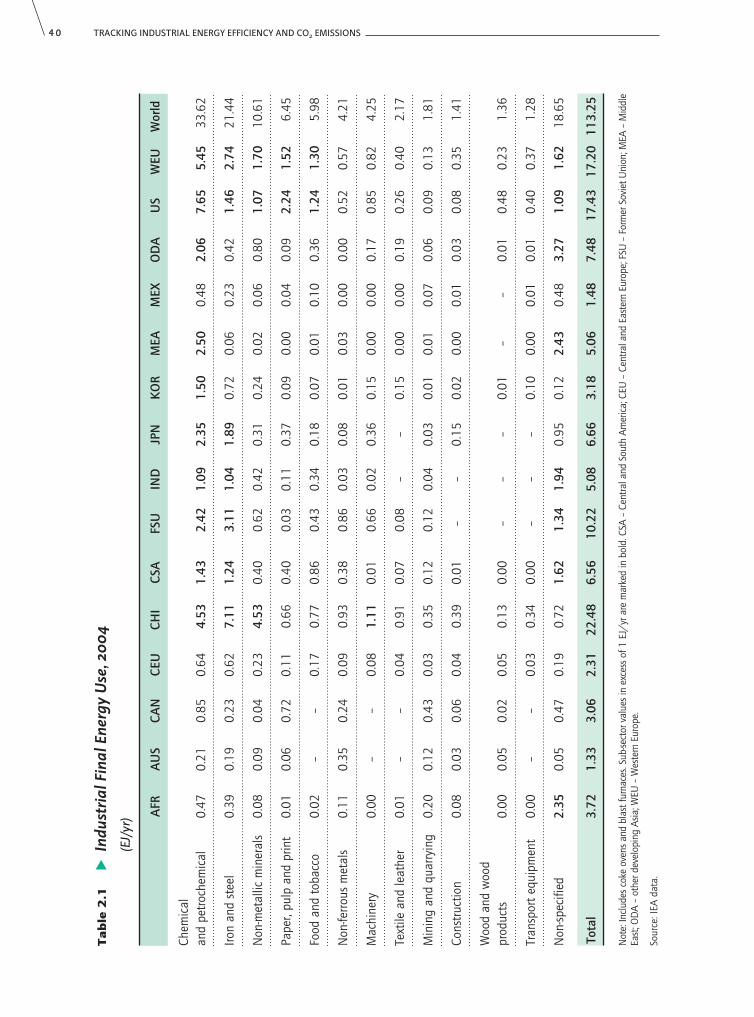
44 00 TRACKING INDUSTRIAL ENERGY EFFICIENCY AND CO2 EMISSIONS
Ta
ble
2.1
�In
dust
rial
Fin
al E
nerg
y U
se, 2
004
(EJ/
yr) A
FRA
US
CAN
CEU
CHI
CSA
FSU
IND
JPN
KO
RM
EAM
EXO
DA
US
WEU
Wor
ld
Chem
ical
and
petr
oche
mic
al0.
470.
210.
850.
644.
531.
432.
421.
092.
351.
502.
500.
482.
067.
655.
4533
.62
Iron
and
stee
l0.
390.
190.
230.
627.
111.
243.
111.
041.
890.
720.
060.
230.
421.
462.
7421
.44
Non
-met
allic
min
eral
s0.
080.
090.
040.
234.
530.
400.
620.
420.
310.
240.
020.
060.
801.
071.
7010
.61
Pape
r, pu
lp a
nd p
rint
0.01
0.06
0.72
0.11
0.66
0.40
0.03
0.11
0.37
0.09
0.00
0.04
0.09
2.24
1.52
6.45
Food
and
tob
acco
0.02
––
0.17
0.77
0.86
0.43
0.34
0.18
0.07
0.01
0.10
0.36
1.24
1.30
5.98
Non
-ferro
us m
etal
s0.
110.
350.
240.
090.
930.
380.
860.
030.
080.
010.
030.
000.
000.
520.
574.
21
Mac
hine
ry0.
00–
–0.
081.
110.
010.
660.
020.
360.
150.
000.
000.
170.
850.
824.
25
Text
ile a
nd le
athe
r0.
01–
–0.
040.
910.
070.
08–
–0.
150.
000.
000.
190.
260.
402.
17
Min
ing
and
quar
ryin
g0.
200.
120.
430.
030.
350.
120.
120.
040.
030.
010.
010.
070.
060.
090.
131.
81
Cons
truc
tion
0.08
0.03
0.06
0.04
0.39
0.01
––
0.15
0.02
0.00
0.01
0.03
0.08
0.35
1.41
Woo
d an
d w
ood
prod
ucts
0.00
0.05
0.02
0.05
0.13
0.00
––
–0.
01–
–0.
010.
480.
231.
36
Tran
spor
t eq
uipm
ent
0.00
––
0.03
0.34
0.00
––
–0.
100.
000.
010.
010.
400.
371.
28
Non
-spec
ified
2.
350.
050.
470.
190.
721.
621.
341.
940.
950.
122.
430.
483.
271.
091.
6218
.65
Tota
l3.
721.
333.
062.
3122
.48
6.56
10.2
25.
086.
663.
185.
061.
487.
4817
.43
17.2
011
3.25
Not
e: In
clud
es c
oke
oven
s an
d bl
ast f
urna
ces.
Sub-
sect
or v
alue
s in
exc
ess
of 1
EJ/
yr a
re m
arke
d in
bol
d. C
SA –
Cen
tral a
nd S
outh
Am
eric
a; C
EU –
Cen
tral a
nd E
aste
rn E
urop
e; F
SU –
For
mer
Sov
iet U
nion
; MEA
– M
iddl
eEa
st; O
DA
– ot
her d
evel
opin
g As
ia; W
EU –
Wes
tern
Eur
ope.
Sour
ce: I
EA d
ata.

Chapter 2 • MANUFACTURING INDUSTRY ENERGY USE AND CO2 EMISSIONS 44 11
China accounts for about 80% of the growth in industrial production during the pasttwenty-five years, and for a similar share in industrial energy demand growth formaterials production, about 16 EJ (Figure 2.2). Today, China is the largest producerof commodities such as ammonia, cement, iron and steel and others. The energyefficiency of production in China is generally lower than in OECD countries and it islargely coal-based.
The United States, Western Europe and China together account for half of totalglobal industrial energy use, followed by the Former Soviet Union and Japan. Ananalysis of current energy use therefore must concentrate on these regions.
No detailed statistics are available that allocate industrial energy use for the varioussteps in manufacturing. Rough estimates suggest that 15% of total energy demandin industry is for feedstock, 20% for process energy at temperatures above 400°C,15% for motor drive systems, 15% for steam at 100 – 400°C, 15% for low-temperature heat and 20% for other uses, such as lighting and transport.
2
0
20
40
60
80
100
120
1971 1975 1980 1985 1990 1995 2000 2004
EJ/y
r
Non-specified(industry)
Textile andleather
Construction
Wood andwood products
Food andtobacco
Mining andquarrying
Machinery
Transportequipment
Paper, pulpand print
Non-metallicminerals
Non-ferrousmetals
Chemical andpetrochemical
Iron and steel
Figure 2.1 � Industrial Final Energy Use, 1971-2004
Key point: Industrial final energy use increased by 61% between1971 and 2004, an average annual growth of 2%.
Note: The discontinuity around 1990 is caused by developments in Eastern Europe and the FSU that resulted in a rapid decline of industrialproduction.
Source: IEA data.

44 22 TRACKING INDUSTRIAL ENERGY EFFICIENCY AND CO2 EMISSIONS
Detailed information on energy and materials flows and on process activities are notreadily available. In many cases these data are regarded as confidential. Better dataare needed on the spread in energy efficiencies and on the age and size ofproduction equipment in all regions. The IEA Secretariat plans to commence newdata collection activities in the framework of the G8 Dialogue on Climate Change,Clean Energy and Sustainable Development. This study uses data from openliterature, industry sources and analyses based on IEA energy statistics.
The share of industrial energy used for basic materials production has been quitestable for the last thirty years, but the shares of sub-sectors have changedsignificantly. The share of crude steel production, for example, has declined from24 – 19% since 1971, while the share of ammonia, ethylene, propylene andaromatics has increased from 6 – 15% (IEA, 2006).
Table 2.2 shows a global breakdown of industrial energy use by fuel and energycarrier. The amounts of coal, gas, oil and electricity used are similar. Combustiblerenewables and waste is lower and is largely biomass use in the pulp and paperindustry.
1 800
1 600
1 400
1 200
1 000
800
600
400
200
0Mat
eria
ls p
rod
uct
ion
(M
t/yr
)
1981 2005North America
1981 2005Europe
1981 2005South Asia
1981 2005China
18
16
14
12
10
8
6
4
2
0 Ener
gy
nee
ds
for
mat
eria
ls p
rod
uct
ion
(EJ
/yr)
Aluminium Crude steel Chemical feedstocks Cement
Paper and paperboard Wood Energy
Note: North America includes Canada, Mexico and US. Europe includes EU27 excluding three Baltic States, and including Albania, Bosnia,Croatia, Iceland, Former Yugoslav Republic of Macedonia, Norway, Serbia, Switzerland and Turkey.
Source: IEA data.
Figure 2.2 � Materials Production Energy Needs, 1981 – 2005
Key point: China accounts for the bulk of energy demandgrowth for manufacturing in the past twenty-five years.

Chapter 2 • MANUFACTURING INDUSTRY ENERGY USE AND CO2 EMISSIONS 44 33
2
EJ/yr Gt CO2/yr
Coal & coal products 28.9 2.72
Natural gas 23.6 1.32
Oil & oil products 28.0 0.73
Combustible renewables & waste 7.0
Electricity 21.5 3.59
Heat 4.2 0.29
Other 0.0
Process emissions 1.08
Total 113.3 9.73
Source: IEA statistics.
Table 2.2 � Final Energy Use by Energy Carrier, 2004
In many sectors of the economy, CO2 emissions are closely related to energy use.However, in the industry sector the distribution of CO2 emissions is very differentfrom the distribution of energy demand. The main reasons are:
� Large amounts of fossil carbon are stored in petrochemical products.
� Process CO2 emissions unrelated to energy use are large in some sectors,especially in cement production.
� CO2 emissions differ by fuel, and the use of fuels is not evenly distributed acrossindustrial sub-sectors.
Total CO2 emissions from industry were 9.7 gigatonnes (Gt) in 2004 and accountedfor 36% of total global CO2 emissions.3 Three sub-sectors were responsible for 70%of the direct industrial CO2 emissions: iron and steel, non-metallic minerals, andchemicals and petrochemicals (Figure 2.3). These data exclude upstream CO2emissions from the production of electricity and downstream emissions from thewaste treatment of synthetic organic products.
It should be noted that energy use and CO2 emissions related to power generationare allocated to the electricity sector in IEA statistics. In the case of industrialcombined heat and power (CHP) plants, all fuel use and CO2 emissions are allocatedto the transformation sector, except for fuel use and emissions related to heatgeneration that is not sold, which are allocated to industrial energy use. As aconsequence, sub-sector energy use and emission data based on company emissiondata may differ from the figures in the IEA statistics.
3. This includes coke ovens and blast furnaces that are reported as part of the transformation sector in IEA statistics.It also includes CO2 emissions from power generation and process emissions.

44 44 TRACKING INDUSTRIAL ENERGY EFFICIENCY AND CO2 EMISSIONS
Another special factor is blast furnace gas that is delivered by the iron and steelindustry to power generators or that is used on-site in CHP plants. The specific CO2emission factor for blast furnace gas is very high, as this gas already containssubstantial amounts of CO2 originating from coal gasification and coal gas use inthe blast furnace. Typically, 4.8 gigajoules (GJ) of blast furnace gas is generated pertonne of hot metal. The carbon content of this gas is equivalent to 0.8 Gt CO2emissions worldwide. About 25% of the energy content of this gas was used forpower generation in 2004, the remainder was used within the iron and steel industry.Depending on the allocation approach, between 0 – 0.2 Gt of CO2 should be allocatedto power generation. Figure 2.3 allocates 60% of the CO2 emissions from blastfurnace gas use to the iron and steel industry.
Iron & steel
27%
Other
28%
Non-metallic minerals
27%
Chemicals & petrochemicals
16%
Non-ferrous metals
2%
Note: Includes coke ovens, blast furnaces and process CO2 emissions. Excludes emissions in power supply; assumes75% carbon storage for all petrochemical feedstocks.
Source: IEA statistics.
Figure 2.3 � Industrial Direct CO2 Emissions by Sector, 2004
Key point: Three sectors: iron and steel, non-metallic minerals, and chemicalsand petrochemicals account for 70% of industrial CO2 emissions.

Chapter 3 • GENERAL INDUSTRY INDICATORS ISSUES 44 55
3
GENERAL INDUSTRY INDICATORS ISSUES
Energy Indicators Based on Economic and Physical Ratios
The IEA has analysed and reported indicators of industrial energy use and CO2emissions for some time (IEA, 1997; IEA, 2004). These indicators have been basedon economic ratios as they analyse energy use or CO2 emissions per unit of value-added output. In addition, trends in energy use and emissions have beendecomposed into those changes that are due to structural effects and those relatedto energy efficiency effects, based on an analysis of developments in the industrialsub-sectors. While such indicators may be adequate to capture aggregate energy andCO2 trends, they are less suited to a detailed analysis of industrial energy efficiencydevelopments over time or across countries, or for an examination of improvementpotentials. This is because they do not take full account of product quality andcomposition, or the processing and feedstock mix, which can vary widely within asub-sector. Furthermore, indicators based on economic ratios cannot be validated bytechnological data.
This study presents new indicators for industrial energy use and CO2 emissions thatare based on physical ratios, e.g. energy use per tonne of product. These indicatorsare often called the specific or unit energy consumption. They can account forstructural differences in industries between countries and so enable a fair andconsistent comparison of energy efficiency and CO2 emissions performance. Theanalysis also uses explanatory indicators to examine some of the driving factorsbehind the patterns of energy use and emissions, such as technology differences andresource qualities. This again allows for a more robust comparison across countries.Other advantages of the approach are:
� Indicators based on physical ratios are closer to a measure of the “technicalefficiency” of an industry and hence can be linked more directly to technologyperformance. They can therefore be used to identify the potential for efficiencyimprovements through new technologies.
� They are not affected by cyclical variations in the price of industrialcommodities, as is the case with indicators that use value added and so tend tobe subject to less “noise” from economic fluctuations.
� The energy and emissions performance of specific process steps in an industrycan be separately analysed and differences in product mix between countriesand over time are more easily taken into account. The impacts of changingproduct mix need to be considered separately from technical efficiency gains,because the driving factors may change over time.
The following sections discuss the issues that need to be considered whendeveloping physical indicators of industrial energy use and CO2 emissions: theavailability and quality of energy and activity data; and the approach followed inthis study. It also briefly describes other international activities that are developingindicator-based approaches.

44 66 TRACKING INDUSTRIAL ENERGY EFFICIENCY AND CO2 EMISSIONS
Methodological Issues
Energy use in many industrial sub-sectors is complex. Even when necessary data areavailable, it is often not straightforward to calculate consistent and comparableindicators that are useful for policy analysis. Three areas in particular, require carefulconsideration: aggregation levels, boundaries and allocation.
Aggregation Levels
Energy use and CO2 indicators can be developed at different levels of aggregationdepending on the purpose for which they are to be used and the level ofinformation available. The aggregation level is very important as it determines theextent to which structural differences affect the results observed. Structuraldifferences can include:
� Availability and quality of input resources. The energy needs for someindustrial processes will depend on the quality of the natural or other resourcesavailable, e.g. ore quality. The indicators need to account for the resource qualityvariations in cross country comparisons. For example, countries with a moremature economy may have ample scrap resources available, while emergingeconomies may not have such scrap. Scrap availability can have an importantimpact on the apparent energy performance of an industry. The energy andfeedstock mix also matters. Coal-fired energy conversion processes are ofteninherently less efficient than processes that use natural gas or electricity.However, in certain cases coal is the preferred fuel for chemical conversion, forexample in iron production.
� Definition of products. Definitions require care. For example, in the case of theiron and steel industry, the choice for tonnes of iron, tonnes of crude steel ortonnes of finished steel can make a big difference. The production ratio of thesethree categories is not the same for all countries.
� Diversity of products. Industrial products are not uniform. Indicators must bedesigned in a way that the product categorisation makes sense.
To address these issues, the industry chapters present a range of indicators atdifferent levels of aggregation. In cement, for example, an indicator of total primaryenergy consumption per tonne of cement is shown, as well as more detailedindicators such as electricity use per tonne of clinker and the clinker to cement ratio.
Boundary Issues
For a consistent analysis across countries, it is necessary to use common boundarydefinitions for each sub-sector. Such boundary limits relate to:
� Production steps. Industrial production processes often consist of several steps.The processes/production steps that are included or excluded from an indicatorcan make a difference in cross country comparisons and need to be fullydescribed. The treatment of combined heat and power (CHP) is particularlyimportant for some sub-sectors (discussed under allocation). Indicators need totake into account the differences in the comprehensiveness of the process chain.

� Embodied energy and carbon. Both energy and carbon can be stored inmaterials. While energy can be recovered when materials are recycled orincinerated, any carbon stored in the products is released when they are incinerated.These factors and potentials should be assessed on a materials/product lifecycle basis, as they are not apparent from an industry sub-sector analysis.Furthermore, a lot of fossil carbon is locked into synthetic organic products andtherefore energy relevance is not equivalent to CO2 emissions relevance.
� Process emissions. A significant share of industrial CO2 emissions are processemissions, not related to the use of fossil fuels. Where important, these processemissions should be included along with those from fuel combustion.
In this analysis the following general principles have been used in setting theboundaries:
� Included in the indicators:• Energy use and CO2 emissions directly associated with the sub-sector.• Upstream (primary) energy use and CO2 emissions associated with electricity
production, but excluding mining and transportation of fuels to the electricityindustry.
� Excluded from the indicators:• Electricity, heat and other fuels, e.g. blast furnace gas, sold to a third party.
Chapter 3 • GENERAL INDUSTRY INDICATORS ISSUES 44 77
3
Primary energy&
CO2 source
Upstream emission sources
Secondary energy&
Prepared materials
System boundary
Credit
Steel Plant Energy saleoutside of plant
Direct emission sources
Source: Ono, 2006.
Figure 3.1 � Possible Approach to Boundary Issues for the Steel Industry
Allocation Issues
In addition to setting consistent boundaries, a number of important allocation issuesarise in constructing energy use and CO2 emissions indicators analysis.
� Combined heat and power. The treatment of CHP needs special considerationin those sub-sectors where it plays an important role to ensure that CO2

44 88 TRACKING INDUSTRIAL ENERGY EFFICIENCY AND CO2 EMISSIONS
emissions and efficiency gains from CHP are correctly reflected. There are a numberof elements. First is the allocation of input fuels between those used for electricityproduction and those used for heat production. Second, fuel use and electricity andheat production by CHP plants may be recorded in statistical balances as part offinal consumption in the industry sector or as part of the transformation sector, ora mixture of the two. As well, electricity and/or heat may be sold to a third partyand so not actually used in industry where the plant is located.
Figure 3.2 illustrates the approach taken in IEA energy statistics. Fuel input to CHPis allocated between heat (Fh) and electricity (Fe) based on their shares of heat andelectricity in total output. The fuel used for heat generation is then allocated to theindustrial sub-sector where the CHP plant is located (net of any fuel used to generateheat that is sold, which is accounted for in the transformation sector), while the fuelused for electricity production is assigned to the transformation sector. This approachcould lead to the potentially misleading result that most of the efficiency gains forincreased CHP use are credited to the transformation sector, rather than to theindustry sector.
��
���
�+
×=��
���
�+
×=HE
EFF
HE
HFF eh
CHPprocess
Heat (H)
Electricity (E)
Fuel (F)
Losses
Source: IEA, 2005.
Figure 3.2 � Allocation Issues for Combined Heat and Power
� Treatment of waste fuels. Industry uses large amounts of waste fuels. The CO2emissions from waste fuel use are not always significantly below those for fossilfuel use, but on an energy system basis the re-direction of waste flows fromincinerators to industrial kilns makes sense. Indicators should use an allocationsystem for waste emissions that is appropriate on a systems level.
� Auto-production of electricity. Some industries produce their own electricity. Interms of primary energy and CO2 emissions allocation, it can make a bigdifference if the indicator uses country average efficiencies and emissionsfactors for electricity production or industry specific ones.
Definition of Best Available Technique and Best Practice
One approach to compare energy use and CO2 performance of an industry acrosscountries and to estimate the improvement potential is to make a comparisonbetween the current level of energy use and what could be achieved through the use

of the best available technique (BAT).1 Defining what represents BAT is notstraightforward. It requires consideration of both technical and economic factors. Inthis study BAT designation in relation to energy efficiency in a particular industry hasbeen drawn from a range of sources, including technical documentation producedfor the European Union Directive 96/61/EC concerning integrated pollutionprevention and control (IPPC) and other technical and peer reviewed literature. Thesedata were discussed with experts as part of this study.
The European Union IPPC Directive defines best available technique as “the mosteffective and advanced stage in the development of activities and their methods ofoperation which indicate the practical suitability of particular techniques...”. This isfurther elaborated as:
� “Techniques” shall include both the technology used and the way in which theinstallation is designed, built, maintained, operated and decommissioned.
� “Available techniques” shall mean those developed on a scale which allowsimplementation in the relevant industrial sector, under economically andtechnically viable conditions, taking into consideration the costs andadvantages... as long as they are reasonably accessible to the operator.
� “Best” shall mean most effective in achieving a high general level of protectionof the environment as a whole.
In the language of the IPPC Directive, BAT associated environmental performance isusually represented with a range, instead of a single value. In general, the bestachievable performance is not included in the range, because the BAT range alsoinvolves an assessment of costs versus benefits, sustainability, etc. So the term BATneeds to be interpreted within a given context and is not as rigid as, say, a theoreticalthermodynamic minimum. Moreover, BAT will change over time as technologyimproves.
In contrast to BAT, best practice is a term that applies to technologies and processesthat are currently deployed. Best available technology could, in many cases, beidentical with best practice. In other cases, a new technology may have just emerged,but is not yet deployed. If this is the case, the BAT energy efficiency may be betterthan best practice. However, as best practice often refers to a more “proven”technology than the best available technology, it may be more policy relevant. Theterms best practice and BAT are often used interchangeably.
In this study, a third term is employed – best country average. This refers to a levelof performance that has an even higher level of feasibility, but it will by definition beequally or less efficient than BAT and best practice.
Data Issues
An accurate analysis of energy efficiencies and CO2 emissions using physicalindicators requires good quality disaggregated energy and physical production data.For energy, the data available from IEA energy statistics and national energy
Chapter 3 • GENERAL INDUSTRY INDICATORS ISSUES 44 99
3
1. Industry analysis in this study also uses the term best available technology, to examine the concept as it relatesto technological performance, rather than the wider interpretation implied by technique.

55 00 TRACKING INDUSTRIAL ENERGY EFFICIENCY AND CO2 EMISSIONS
balances are at a relatively high level of aggregation. Furthermore, the data that aresubmitted by countries to the IEA are the responsibility of the countries. The IEA cannot guarantee the quality of these data and performs limited checking, such aslooking at the overall balance of supply and demand for individual energy carrierson a country level.
Ideally, analyses of industrial energy efficiencies require more detailed data thanare available through such statistical balances. A significant effort was undertakenas part of this study to identify and obtain better sources of energy use data. Thesesources include information from national energy statistics and industryassociations, such as Stahlzentrum in Germany and the Japanese Iron and SteelFederation. Many industries also have detailed energy use data but can not sharethese because of antitrust regulations. Antitrust laws prohibit anti-competitivebehaviour and unfair business practices, which can include sharing information thatcould be used for price-fixing.
As publicly available energy data are often scarce for a particular industry sub-sector,then data availability itself creates a potential bias in the analysis. The mostcomprehensive data are often available for those companies that are well managed.These are usually the companies with relatively high energy efficiency. These dataoverestimate the energy efficiency of the industry on a global scale. This is evidentwhen the data situation on a country level is assessed. There is better data availablefor OECD countries than for non-OECD countries, while the energy efficiencypotential is higher in the latter category.
There is a clear need for the data situation to be improved, if detailed industryindicators were to be reported on an annual basis, assuming adequate resources. Forexample, this could involve a permanent working group of the IEA Secretariat andcertain key industry federations. Also the antitrust issue needs to be resolved.
Production data used in this study were taken from various sources, including the UNcommodity statistics, the US Geological Survey, the UN Food and AgricultureOrganization, industry federations such as the International Iron and Steel Institute,Cembureau and consultants.
There are also issues related to the coverage and quality of this data. Physicalproduction data are confidential for particular products because of antitrustregulations. Also data on sales and production data are sometimes not clear. Forexample, in the petrochemical industry significant amounts of intermediate productsare processed on-site, so the quantities of products traded are often much lower thanthe quantities produced. For some products, the product definition is not clear. In thecase of cement, data for cement clinker production are sometimes mixed with datafor finished cement product. The cement production of stand-alone slag grindingstations may or may not be included. Additions of cement clinker substitutes toconcrete or the use of blast furnace slag as replacement of cement binder in roadfoundations is not reported as cement production. Such accounting problems canhave a significant impact on production data.
Care also has to be taken when combining energy and production data fromdifferent sources to ensure that they have a consistent coverage of an industry orprocess. In this analysis, industrial sub-sectors have been identified based on their

Chapter 3 • GENERAL INDUSTRY INDICATORS ISSUES 55 11
economic activities as defined by the International Standard Industrial Classification(Rev 3). This classification system is commonly used for both energy statistics andproduction data, e.g. IEA energy statistics and UN commodity statistics.
A number of additional checks also have been carried out to try and eliminate majorinconsistencies in the data. First, the energy data for a given sub-sector has been cross-checked using a bottom-up calculation of the expected energy use given the technologymix, typical energy consumption per unit of output by technology and physicalproduction figures. Second, the energy indicators themselves can help identify potentialissues. For example, if the energy use per tonne of production is lower than thethermodynamic minimum, it is evident that there is a data problem. But this does notmean that values well above the thermodynamic minimum are correct. As a rule ofthumb, any country energy intensity value more than two to three times above theworld average has been treated as suspect. Both energy and production data were peerreviewed by experts, including at six industry specific workshops.
During this analysis it was found that the quality of information and the level of co-operation vary by sub-sector. The fertilizer and aluminium industries haveinternational benchmarking efforts and regional average efficiency data that arepublicly available. Adequate information was found for the cement industry. For sub-sectors such as the pulp and paper and petrochemicals industries, benchmarking isalso an accepted form of energy management effort that compares similar plantsacross countries. However, these data are confidential. The quality of the energy datais an issue, especially for the pulp and paper industry because of the complexitiesaround accounting for CHP. The iron and steel industry is the only sector for whichthere is no international benchmarking effort and the quality of the available datafrom energy statistics poses a challenge.
Practical Application of Energy and CO2 Emission Indicators
This section explains which indicators have been developed for each industry andhow they should be interpreted. It is rarely possible to define a single “true” indicatorthat satisfactorily captures all the information that needs to be conveyed aboutenergy use and CO2 emissions in a sub-sector or a process. Selecting only oneindicator for cross country comparisons can produce a misleading picture. The key isto aim for transparency in how the indicator is constructed, e.g. in relation toboundaries and allocation rules so that differences in methodology are clearlyunderstood and their impact on the results can be assessed.
Given the limitations in the datasets, the analyses presented in the followingchapters can only provide a general idea about the order of magnitude of theimprovement potentials in manufacturing industries. It is recommended that moredetailed analysis on a country-by-country level is done before such indicators couldbe considered as a basis for target setting.
Pulp, Paper and Printing
Worldwide paper and pulp is a capital intensive, high tech industry, which compriseslarge multinational players and many small companies. Most energy used in paper
3

55 22 TRACKING INDUSTRIAL ENERGY EFFICIENCY AND CO2 EMISSIONS
production is for pulping and paper drying. Ideally, separate indicators of energy useand CO2 emissions for this industry should take account of the type of pulp used(mechanical, chemical or recycled), the grade of paper and the level of integrated paperand pulp mills (since these avoid the need for pulp drying and so are more energyefficient). The need for large amounts of steam makes CHP a widely used technology,and so the way in which CHP is accounted for in energy statistics is very important.
Data limitations, particularly related to the energy use for different process steps,make it impossible to construct detailed indicators for country comparisons. So inorder to provide some indicative estimates of the relative energy performance amongcountries, the approach has been to calculate the energy consumption of the pulpand paper industry in a country relative to what it would be if best availabletechnologies were used. Different BAT assumptions were applied to steam andelectricity consumption in mechanical pulping, chemical pulping, waste paper pulpand seven different grades of paper production. Heat and electricity are treatedseparately to allow for CHP analysis.
Iron and Steel
From an indicator perspective, the most important distinction for iron and steel isbetween the two crude steel production processes, basic oxygen furnace (BOF) andelectric arc furnace (EAF). However, ideally a range of other issues need to be takeninto account including different types of finished steel products, the variability infeedstock quality and the availability of scrap steel. A further complication arisesover the complex set of energy and materials commodity flows associated with theindustry. Most of these energy and material flows can be bought from or sold tothird parties. As a consequence, the full production chain energy use and CO2emissions may be considerably higher or lower than the site or plant footprintwould suggest, which if not accounted for in a consistent way, can give misleadingresults. These flows include the possible purchase of pellets, coke, oxygen, lime,steam and electricity and the sale of coke by-products, blast furnace slag, steel slag,blast furnace gas, electricity and heat.
Given these complexities, the approach taken in this study has been to use astandardised set of comparisons with corrections for energy use and CO2 emissioneffects.
Cement
The production of cement clinker from limestone and chalk is the main energyconsuming process in this industry. There are two basic types of cement clinkerproduction processes and a number of different kiln types. Clinker production iseither “wet” or “dry”, depending on the water content of the raw materialfeedstock. The dry process avoids the need for water evaporation and is much lessenergy intensive. In a second step, cement is produced by blending clinker withadditives. The most widely used type is Portland cement, which contains 95%cement clinker.
Ideally, indicators should look at the energy used to produce a tonne of clinker andthe electricity use (for grinding) per tonne of cement production. The clinker to

Chapter 3 • GENERAL INDUSTRY INDICATORS ISSUES 55 33
3
cement ratio is a key explanatory indicator for the industry. As the cement industryuses a high proportion of alternative (waste) fuels, correctly accounting for these isa key issue (see the Cement Sustainability Initiative in the last section).
Data for the cement industry are available thanks to a number of internationalinitiatives looking at its energy performance. This has enabled the indicatorsdescribed to be developed for most producing countries. The approach taken issimilar to that being used by the Asia Pacific Partnership in their energy and CO2emissions indicators work. The IEA has used its own data on country emissionfactors and CO2 emissions factors for electricity generation or IntergovernmentalPanel on Climate Change (IPCC) defaults in the absence of data. For alternativefuels, direct emissions have been included while an analysis of their net CO2profile (whether higher or lower) has not been attempted.
Chemicals and Petrochemicals
The chemicals and petrochemicals industry is highly diverse, with thousands ofcompanies producing tens of thousands of products in quantities varying from a fewkilograms to thousands of tonnes. Because of this complexity, reliable data on energyuse are not available. In addition, more than half of the total fuel inputs to this sub-sector are accounted for by feedstocks, and so is non-energy use.
While it would be unrealistic to develop separate indicators for all chemical andpetrochemical products, it would be, in theory, possible to construct aggregateenergy indicators for the sub-sector (excluding feedstock use), together with separateindicators for key products such as ammonia, ethylene, propylene and benzene,toluene and xylene. In addition, for some products different production processes canbe used and these need to be taken into account.
However, in reality, data problems are substantial and therefore an approach similarto the paper and pulp industry has been used, with an aggregate indicatordeveloped that compares actual energy consumption with the BAT level. Due toproblems in reporting, feedstock energy use is included, but the data excludeselectricity use. Production volumes for benzene, toulene and xylene have been splitbetween production from steam cracking and naphtha extraction. This split has beencalculated based on the production volume of ethylene and is necessary due to themore energy-intensive nature of production from steam cracking versus naphthaextraction. The same split has also been applied for propylene from steam crackingand fluid catalytic cracking.
Other Sectors / Technologies
There is no established structure to assess efficiencies of motor systems, steamsystems, process integration and materials/product life cycle improvement options.Data are only available from case studies. Yet, the available data suggest that theseareas have been neglected and that there are significant efficiency gains to beachieved. Establishment of an adequate data framework is a first step to unlockingthese efficiency potentials.

55 44 TRACKING INDUSTRIAL ENERGY EFFICIENCY AND CO2 EMISSIONS
International Initiatives: Sectoral Approachesto Developing Indicators
A number of other international initiatives are developing indicator-basedapproaches to analyse the energy and CO2 emissions performance of key industries.In some cases, these initiatives have specific goals, which shape the approach that isused. This section briefly reviews selective initiatives and notes how they relate to theanalysis presented in this report. A detailed overview of benchmarking initiatives isprovided in Annex B.
Intergovernmental Panel on Climate Change (IPCC)Reference Approach
While not an indicator approach, the IPCC produces guidance on the calculation ofCO2 emissions from fuel combustion and industrial processes. Of relevance to a
Table 3.1 � Summary of Indicators for Each Industry Sector
Sector Energy Use Indicators CO2 EmissionsIndicators
ExplanatoryIndicators
Pulp and paper • Heat consumption in pulp and paperproduction vs. best available technology
• Electricity consumption in pulp and paperproduction vs. best available technology
• CO2 emissions/tonneof pulp and paperproduced
• Recovered paperuse vs. recoveredpaper ratio
Ìron and steel • Total primary and final energy use pertonne of crude steel (including finishing)
• Total primary and final energy useper tonne of blast furnace-BOF steelproduction
• Total final energy use per tonne of DRI(split gas and coal-based processes)
• Total primary and final energy useper tonne of electric arc furnace steel(excluding finishing)
• Total direct CO2 pertonne of crude steel
Non-ferrousmetals
• Specific power consumption in aluminiumsmelting
Cement • Energy requirement per tonne of clinkerincluding alternative fuels
• Electricity consumption per tonne ofcement
• Total primary energy equivalentper tonne of cement
• Process and energy (including electricity)CO2 emissions per tonne of cement
• CO2 emissions fromenergy consumption(including electricity)per tonne of cement
• Clinker-to-cementratio
• Alternative fuel usein clinker production
Chemicals andpetrochemicals
• Total energy consumption vs. bestavailable technology
• Total CO2 consumptionvs. best availabletechnology

discussion on indicators is the IPCC treatment of three key areas: combined heat andpower, waste used as a fuel and the treatment of emissions from chemical reactionsin manufacturing processes.
� Emissions from combined heat and power are attributed to the industrial branchin which the generation activity occurs, regardless of whether the electricity orheat is actually used in that branch.
� In cases where the combustion heat from waste incineration is used as energy,then this waste is treated as a fuel and the emissions are attributed to theindustrial branch where the waste incineration occurs. However, only the fossilfuel derived fraction of CO2 from waste is included in the calculation. Emissionsfrom the biomass fraction of waste are excluded.
� For emissions from gases obtained from processing feedstock and process fuels,if the emissions occur in the industrial sector which produced the gases thenthey remain as industrial processes emissions in that sector. If the gases areexported to another sector, then the fugitive, combustion or other emissionsassociated with them are reported in the other sector.
Pulp and Paper Initiatives
The International Council of Forest and Paper Associations (ICFPA), the global forumfor the pulp and paper industry has developed a CO2 calculation tool to facilitateuniform CO2 emissions reporting. The requirements in the EU emission tradingsystem have now replaced this for the European mills. Under the IEA ImplementingAgreement on Industrial Energy-Related Technologies and Systems, the pulp andpaper industry is finalising a project to harmonise the global definitions used forenergy use, energy efficiency and the different pulp and paper production processes.This project will be completed in mid 2007 and is the start of improved comparisonsof international pulp and paper industry energy data.
Cement Sustainability Initiative
Under the umbrella of the Cement Sustainability Initiative (CSI) of the WorldBusiness Council for Sustainable Development (WBCSD), a number of major cementcompanies have agreed on a methodology for calculating and reporting CO2emissions. The latest edition of the Cement CO2 Protocol was published in June2005 and is aligned with the March 2004 edition of the overarching greenhouse gasprotocol developed under a joint initiative of the WBCSD and the World ResourcesInstitute.
The Protocol provides a harmonised methodology for calculating CO2 emissions, witha view to reporting these emissions for various purposes. It addresses all direct andthe main indirect sources of CO2 emissions related to the cement manufacturingprocess in absolute as well as specific or unit-based terms. The basic calculationmethods used in this protocol are compatible with the latest guidelines for nationalgreenhouse gas inventories issued by the Intergovernmental Panel on ClimateChange (IPCC), and with the revised WRI / WBCSD Protocol. Default emissionfactors suggested in these documents are used, except where more recent, industry-specific data have become available. However, one area where the recommendations
Chapter 3 • GENERAL INDUSTRY INDICATORS ISSUES 55 55
3

55 66 TRACKING INDUSTRIAL ENERGY EFFICIENCY AND CO2 EMISSIONS
of the Cement Protocol differ from the IPCC guidelines is in allowing credits forindirect emission reductions related to use of wastes as alternative fuels and forwaste heat exports. The premise for this crediting is that the combination of directemissions impacts, indirect emission reductions, and resource efficiency makes thesubstitution of alternative fuels for conventional fossil fuels an effective way toreduce global greenhouse gas emissions and the cement industry should be able toaccount for these wider benefits.
Asia-Pacific Partnership (APP) on Clean Development and Climate
The APP is developing energy efficiency and CO2 emission indicators for the cementand iron and steel industries. In the case of cement, these indicators are aligned withthe CSI Protocol and will be used to help set benchmarks and estimate the potentialfor CO2 emissions reductions. Possible energy and CO2 emissions indicators beingconsidered include:
� Heat intensity of clinker.
� Power intensity of clinker.
� Total energy intensity of clinker.
� Power intensity of cement.
� CO2 intensity of cement.
For iron and steel, the APP proposes to develop separate indicators for steelproduction from both main types of furnaces. There is no further breakdown ofenergy use by individual processes. The approach includes energy consumption andCO2 emission from energy conversion and material preparation in upstreamprocesses off-site from the steel plant, but does not count mining and transportation.Credits for energy sold to third parties are included in the calculation.
Benchmarking in the Petrochemical Industry
Benchmarking is an approach used by a number of industries to evaluate the energyperformance of their processes in relation to best practice, usually within their ownindustry. One process in the petrochemical industry for which benchmarking iswidespread is steam crackers.
Steam cracking of hydrocarbon feedstocks, e.g. ethane, naphta, is the mostimportant source of olefins and aromatics, and as such the basis for thepetrochemical industry. The key driver for benchmarking steam crackers is thatenergy accounts for up to 60% of olefin plant operational expenses. Feedstocks andoperating conditions (pressure, temperature, and residence time) can significantlyaffect the specific energy consumption of steam crackers; a performancecomparison requires accounting for processing conditions. Solomon Associates Inc.(SAI) set up the first widely-used international benchmarking system for crackers inthe 1990s. Companies that participate in the benchmark are requested to fill adetailed survey on the performance of their units, including energy consumption ona semi-annual basis. More than half of all steam crackers in the world participate inthe survey, representing more than two-thirds of the total production capacity. SAIacts as a clearing house and provides to individual participants a comparison

between their units and a distribution of the other plants participating in thesurvey, accounting for feedstock use and operating conditions.
Benchmarking provides to the participating companies valuable indicators on theirenergy efficiencies, operating expenses, manufacturing costs, and ultimately returnon investment versus the top performing plants worldwide. However, and due toparticipation clauses to the benchmarking surveys, detailed results are confidentialand country level averages are not made public. This limits its applicability for crosscountry comparisons.
Chapter 3 • GENERAL INDUSTRY INDICATORS ISSUES 55 77
3


Chapter 4 • CHEMICAL AND PETROCHEMICAL INDUSTRY 59
4
CHEMICAL AND PETROCHEMICAL INDUSTRY
Key Findings
� The chemical and petrochemical industry accounts for more than 30% of the totalindustry energy use worldwide. More than half of it is for feedstock use, which can notbe reduced through energy efficiency measures. The CO2 emission intensity of theindustry is low because significant amounts of carbon are stored in the productsproduced. As the energy and feedstock savings potential for the industry are limited,other types of measures are needed.
� A limited number of processes and products account for the bulk of energy use in thisindustry. The processes are uniform worldwide. Therefore, it is possible to developmeaningful indicators.
� Benchmarking is widely applied in the industry. Provided that system boundaries arewell defined, benchmarking provides a useful basis for plant efficiency comparisons.The plant level results of current benchmarking studies and even the country averagesare usually confidential. Therefore, indicators on a country level can supplementbenchmarking.
� An indicator method is developed in this study that compares a theoretical sectorenergy use if best available technology were applied with actual energy use accordingto IEA statistics. Diversity of feedstock use, process configuration and data access canstrongly influence the energy performance analysis. Further work is needed toestablish regional sectoral comparisons.
� Large gains in energy efficiency for key processes such as steam crackers andammonia plants have been achieved since the 1970s.
� The regional averages for steam crackers suggest a 30% difference in energy usebetween the best (East Asia) and worst (North America) region. However, feedstockuse dominates energy use in steam crackers.
� Benchmarking studies suggest that potential energy efficiency improvements forolefins and aromatics range from 10% for polyvinyl chloride to 40% for various typesof polypropylene.
� About 1 EJ (20%) would be saved if best available technology were applied inammonia production. Coal-based production in China requires considerably moreenergy than natural gas-based production elsewhere.
� While the chemical and petrochemical industry is already one of the largest combinedheat and power users, a significant potential for expanded use remains.
� There is negligible waste in the primary production of plastics as any scrap is recycled.However, waste plastics recycling and energy recovery rates of post-consumer plasticsfrom end-of-life products are relatively low in many countries. The potential for energyand feedstock savings of increased recycling and energy recovery is between 2 and4 EJ per year.

60 TRACKING INDUSTRIAL ENERGY EFFICIENCY AND CO2 EMISSIONS
� The proposed indicator method needs to be further validated through comparisonwith bottom-up analysis of efficiency potentials for individual countries based onplant-level benchmarking. The accuracy of energy and feedstock production volumedata need to be improved. The present aggregate results are not suited for countrycomparison purposes.
� One or more life-cycle indicator(s) should be developed to give credit for the use ofrenewable feedstocks and waste plastics use for recycling or energy recovery.
� Only a small share of electricity use in the chemical and petrochemical sub-sector canbe explained based on process data. It requires further analysis.
� Based on country comparisons, improved final energy efficiency potential in thechemical and petrochemical industry is 8.5 to 11 EJ per year. This includes 4 EJ offuel savings potentials, the remainder is electricity savings, CHP, recycling and energyrecovery.
Introduction
The petrochemical industry generates products such as plastics, synthetics (fibres,rubbers), resins, elastomers, nitrogen fertilizers and detergents. It also contributes tothe production of many other products, such as pharmaceuticals, paints, adhesivesand aerosols. Basic raw materials for the petrochemical industry are fossil fuels,mainly natural gas and crude oil, but also coal.
The three principal bases for the petrochemical industry are “intermediate” chemicalproducts generated from raw materials:
� Olefins (C2-C4) – e.g., ethylene, propylene, generally obtained from hydrocarbonfeedstocks using steam cracking.
� Aromatics (C6-C8) – e.g., benzene, toluene, xylene (BTX), generated using steamcracking of catalytic reforming.
� Other intermediates which include synthesis gas (for ammonia and methanolproduction), hydrogen, carbon black and sulphur.
Ethylene is a relatively inexpensive product with a high reactivity, hence a number ofderivatives can be generated by oxidation, hydration, oligomerisation, alkylation orchlorination, making it the most used petrochemical intermediate.
Synthetic polymers represent the largest end-use of the petrochemical industry. Theyare used for materials such as plastics, rubber and fibres.
This chapter looks at energy use and CO2 emissions in the petrochemical andinorganic chemical sub-sector including global production and processes for anumber of key products. It assesses opportunities for improved efficiency.Ammonia is also analysed which accounts for 80 – 90% of fertilizer industryenergy use. Plastics recovery and the use of combined heat and power inpetrochemical and chemical production are considered. A methodology for energyand CO2 indicators is set out.

Global Importance and Energy Use
The chemical industry includes facilities that produce bulk or specialty compoundsby chemical reactions between organic and/or inorganic materials. Thepetrochemical industry includes facilities that create synthetic organic products fromhydrocarbon feedstock, oil and natural gas. The chemical and petrochemical industryconsumed 34 EJ in 2004, which was 30% of total global industry final energy use.This share has increased sharply from 15.5% in 1971, an average annual growth of2.2% (Figure 4.1). Production growth rates have generally outpaced GDP growth.The shares of the petrochemical and chemical industry (including feedstock) in totalindustrial final energy use in by region in 2004 were: North America – 41%, WesternEurope – 31%, China & India – 20%, Japan & Korea – 39%, Middle East – 20% andthe Commonwealth of Independent States (CIS) – 24% (IEA statistics).
Chapter 4 • CHEMICAL AND PETROCHEMICAL INDUSTRY 61
4
0
5
10
15
20
25
30
35
40
1971 1975 1980 1985 1990 1995 2000 2004
EJ/y
ear
0
5
10
15
20
25
30
35
40
Ener
gy
use
sh
are
%
Chemical & petrochemical feedstock use Chemical & petrochemical energy use
Manufacturing industry demand share (%)
Figure 4.1 � World Chemical and Petrochemical Industry Energy Use, 1971 – 2004
Key point: The share of chemical and petrochemical industry in total manufacturingenergy use has doubled from 15 to 30% in the past thirty - five years.
Source: IEA statistics.
The chemical industry is highly diverse, with thousands of companies producing tensof thousands of products in quantities varying from a few kilograms to thousands oftonnes. It is characteristic of the industry that energy constitutes a large portion ofthe production costs for bulk chemical manufacturing. Energy costs generallyrepresent up to 60% of the production costs and can be as high as 80% forammonia.

62 TRACKING INDUSTRIAL ENERGY EFFICIENCY AND CO2 EMISSIONS
Feedstocks account for more than half of the total energy used in this sub-sector. Mostof the carbon from oil and natural gas feedstock is “locked” into final products suchas plastics, solvents, urea and methanol. Some of the locked-in energy can berecovered when the waste product is incinerated, which results in CO2 emissions at thewaste treatment stage. Thus, if the locked-in carbon were accounted, the total wouldbe larger than its share of direct industrial CO2 emissions would suggest (16%).
Three-quarters of all feedstock is oil. It is used for the production of intermediatechemical products like olefins (ethylene and propylene) and aromatics (benzene,toluene and xylenes). These chemicals are further processed into a wide range ofplastics, rubbers, resins, solvents and other petrochemical products.
Natural gas, the other major feedstock, is used to produce ammonia, methanol andother products. Ammonia is mostly used for fertilizer production. Ethane, propaneand butane are natural gas components that are used to produce olefins.
Table 4.1 shows the energy use in the chemical and petrochemical industry, basedon a bottom-up analysis of production volumes and energy efficiencies (electricityuse is excluded.). The fossil energy use represented in the table falls short of theindustry’s total by approximately 19%, yet important conclusions still can be drawnfrom the analysis. Of primary note is that feedstock energy accounts for more thanhalf of total energy use in the industry: energy used for feedstock can not be reducedthrough energy efficiency measures.
Amount
Mt/yr
LHV
GJ/t
FeedstockEnergyNeededEJ/yr
Fuel
GJ/t EJ/yr
Total Fuel +Feedstock
EJ/yr
Ethylene 103.3 47.2 4.9 13 1.3 6.2
Propylene 65.3 46.7 3.0 13 0.8 3.9
Butadiene 9.4 47.0 0.4 13 0.1 0.6
Butylene 20.3 47.0 1.0 10 0.2 1.2
Benzene 36.7 42.6 1.6 7 0.3 1.8
Toluene 18.4 42.6 0.8 7 0.1 0.9
Xylenes 33.7 41.3 1.4 7 0.2 1.6
Methanol 34.7 21.1 0.7 10 0.3 1.1
Ammonia 140.0 21 2.9 19 2.7 5.6
Carbon black 9.0 32.8 0.3 30 0.3 0.6
Soda ash 38.0 0.0 0.0 11 0.4 0.4
Olefins processing excl. polymerization 100.0 0.0 0.0 10 1.0 1.0
Polymerisation 50.0 0.0 0.0 5 0.3 0.3
Chlorine and Sodium Hydroxide 45.0 0.0 0.0 2 0.1 0.1Total 17.0 8.2 25.2
Note: Feedstock based on lower heating value of products except for ammonia.
Source: IEA statistics and estimates.
Table 4.1 � Energy Use in the Chemical and Petrochemical Industry, 2004(Excluding Electricity)

The energy intensity of key chemicals (ammonia and petrochemicals) can be reducedby at least 20%, if current state-of-the-art technologies are applied. This potential variesfrom region to region and from plant to plant (Heinen and Johnson, 2006). A numberof consultants are carrying out benchmarking studies in the industry, for example:
� Solomon Associates – benchmarking steam crackers.
� Phillip Townsend Associates – benchmarking various polymers and elastomers.
� Plant Services International – comparing ammonia and urea units.
� Process Design Center – comparing various processes through 50 energybenchmarks (Keuken, 2006).
For a fair comparison, system boundaries, feedstock and product specifications, siteintegration and environmental issues need to be properly addressed. While detailedresults from these studies are not usually publicly available due to confidentialityconcerns and anti-trust regulations, regional and time trends can be drawn.
Another approach is the Netherlands voluntary programme which in 1999 setbenchmarks for large industrial sites with energy consumption of more than 0.5 PJ.It covers about 150 sites and 80% of the total industrial energy use. However, thesedata also are not publicly available.
The age of a plant often defines its energy efficiency: older plants generally being lessenergy efficient. However, retrofits can invalidate this rule of thumb. The Process DesignCentre’s global analysis indicates that plants built in the 1970s are the least efficient. The1950 – 60s production plants had a significant amount of upgrading, especially after the1973 oil price crisis, and show relatively good performance. Plant vintage data aretherefore unreliable substitutes for actual measured efficiency data. Analysis of actualenergy use data is needed for a proper assessment on efficiency improvement potential.
Nine processes account for 22.5 EJ of final energy use (including feedstock), whichis about 65% of global energy and feedstock use in the chemical and petrochemicalindustry:
Petrochemicals� Steam cracking of naphtha, ethane and other feedstocks to produce ethylene,
propylene, butadiene and aromatics.
� Aromatics processing.
� Methanol production.
� Olefins and aromatics processing.
Inorganic chemicals� Chlorine and sodium-hydroxide production.
� Carbon black.
� Soda ash.
� Industrial gases.
Fertilizers� Ammonia production.
Chapter 4 • CHEMICAL AND PETROCHEMICAL INDUSTRY 63
4

64 TRACKING INDUSTRIAL ENERGY EFFICIENCY AND CO2 EMISSIONS
Petrochemicals Production
The petrochemical industry commonly converts oil and natural gas feedstocks intomonomers and building blocks such as ethylene, propylene, aromatics and methanol,which are further processed into polymers, solvents and resins. Figure 4.2 shows theethylene chain, illustrating the production of intermediate and final products, e.g.diapers and tires. Large amounts of heat are used by distillation columns for productseparation and other high-temperature processes, such as steam cracking. Electricityis used for certain conversion processes such as chlorine production, and also forpumps and auxiliary processes.
The petrochemical industry produces materials such as plastics, synthetic rubbers,fibres and solvents which are used in everyday products such as packaging, clothingand plastics. Often these products generate energy savings during their use whichoutweigh the energy used to produce them, e.g., lighter materials reduce oilconsumption in transportation; insulation materials improve building efficiencies.This positive lifecycle perspective is not part of the present analysis.
Today the key producing regions are North America, Western Europe, Korea, China,Japan, and Saudi Arabia, which together represent more than 75% of globalproduction (Table 4.2). With significant investments in Saudi Arabia, Iran and China,their share will be larger in the next decade; this will also affect the age distributionof the production units.
Table 4.2 � World Production Capacity of Key Petrochemicals, 2004
Total North Western Middle Japan ASEAN* China Korea Chinese India OtherAmerica Europe East Taipei
Ethylene
(Mt/yr) 111133..00 38.7 24.0 10.3 7.6 6.1 6.0 5.9 2.9 2.9 8.6Share (%) 110000..00 34 21 9 7 5 5 5 3 3 8
PPrrooppyylleennee
(Mt/yr) 7777..33 29.0 17.3 2.5 6.3 3.7 6.1 4.1 2.1 1.5 4.6Share (%) 110000..00 38 22 3 8 5 8 5 3 2 6
BBeennzzeennee
(Mt/yr) 4433..22 12.4 9.4 2.1 5.7 1.9 2.8 3.4 1.2 0.8 3.4
TToolluueennee
(Mt/yr) 2244..77 14.4 2.6 0.7 1.7 0.7 1.1 1.9 0.1 0.3 1.2
XXyylleenneess
(Mt/yr) 3355..66 13.0 4.6 1.1 6.1 1.0 3.5 2.5 1.3 0.3 2.2
TToottaall BBTTXX
(Mt/yr) 110033..55 39.8 16.6 3.9 13.5 3.6 7.4 7.8 2.6 1.4 6.8Share (%) 110000..00 38 16 4 13 3 7 7 3 1 7
* Association of Southeast Asian Nations (ASEAN).
Source: Ministry of Economy, Trade and Industry (METI) Japan, 2006.

Chapter 4 • CHEMICAL AND PETROCHEMICAL INDUSTRY 65
4Et
hyl
ene
LDPE
,LL
DPE
HD
PE
Eth
ylen
ed
ich
lorid
eV
inyl
chlo
rid
ePV
C
Eth
ylen
eo
xid
eEt
hyl
ene
gly
col
Fib
ers
Poly
este
rre
sin
Mis
cella
neo
us
Eth
ylb
enze
ne
Styr
ene
Poly
styr
ene
resi
ns
Styr
ene
resi
ns
Len
ses,
ho
use
war
es
Styr
ene
rub
ber
Styr
ene
late
x
Lin
ear
alco
ho
ls
Vin
ylac
etat
e
Mis
cella
neo
us
Mis
cella
neo
us
Cru
de
oil/
Gas
fee
dst
ock
Ho
use
war
es,
crat
es,
dru
ms,
foo
d,
con
tain
ers,
bo
ttle
s
Au
tom
otiv
e an
tifre
eze
Car
pet
s, c
loth
ing
Bo
ttle
s, f
ilms
Sid
ing
, w
ind
ow
fra
mes
,p
oo
l lin
ers,
pip
es
Det
erg
ents
Ad
hes
ives
, co
atin
gs,
text
ile,
floo
rin
g
Tire
s, f
oo
twea
r,se
alan
ts
Car
pet
bac
kin
g,
pap
er c
oat
ing
s
Insu
latio
n c
up
s,m
od
els
Foo
d p
acka
gin
g,
film
, tr
ash
bag
s,d
iap
ers,
to
ys,
ho
use
war
es
Fig
ure
4.2�
The
Ethy
lene
Cha
in
Sour
ce: A
mer
ican
Che
mis
try
Coun
cil,
2005
.

66 TRACKING INDUSTRIAL ENERGY EFFICIENCY AND CO2 EMISSIONS
Steam Cracking: Olefins and Aromatics Production
While the petrochemical sub-sector is complex in the number of products itgenerates, the key process in the industry is steam cracking of ethane, naphtha andother feedstocks. In 2006, worldwide capacity of ethylene production was 116 Mtfrom 256 crackers (OGJ, 2006). Naphtha cracking represented 45%, ethane 35%,LPG 12%, gas-oil 5% and others 3% of this capacity.
More than 39% of the chemical and petrochemical industry's final energy use isused for steam cracking. Out of a total of 13.3 EJ, only 2.1 EJ is used for energypurposes. Steam-cracking products contain about 11.2 EJ, of which about 1.5 EJ isrecycled to the refining industry in the form of by-products for further processing intogasoline and other products.
The energy used in steam cracking depends on a number of factors. The choice offeedstock is a key element as lighter ones such as ethane are cracked at lowertemperatures. The ethylene yield decreases as feedstock molecular weight increases;at the same time, the amount of by-products increases. To produce one tonne ofethylene requires 1.25 tonnes of ethane, 2.2 tonnes of propane or 3.2 tonnes ofnaphtha. Energy consumption for different feedstocks is shown in Table 4.3.
Feedstock GJ/t ethylene GJ/t HVC*
Ethane 15 – 25 12.5 – 21
Naphtha 25 – 40 14 – 22
Gas-Oil 40 – 50 18 – 23
* High value chemicals (HVC).
Sources: European Union (EU), 2003; Conseil Européen de l’Industrie Chimique (CEFIC), 2004.
Table 4.3 � Energy Use versus Feedstock for Ethylene
Figure 4.3 shows the feedstock distribution by geographic area. There is a markeddifference between Asia-Pacific and Western Europe where naphtha crackingpredominates compared with North American plants where ethane cracking isprevalent.
Other factors that effect energy use are the severity of the cracking operation andthe furnace design/process technology employed.1 About 65% of the requiredenergy for a naphtha-fed steam cracker is consumed in the pyrolysis furnace(excluding non-energy feedstock use). Use of gaseous cracking by-products and wasteheat can provide about 95% of the process energy demand in naphtha steamcrackers. In an ethane-based cracker about 47% of the required energy is used in thepyrolysis furnace and recovering gas and waste heat can provide about 85% ofprocess energy demand.
1. The severity of the cracking operation is dependent upon the desired product ratios and is a function of thetemperature and residence time of the feedstock in the furnace.
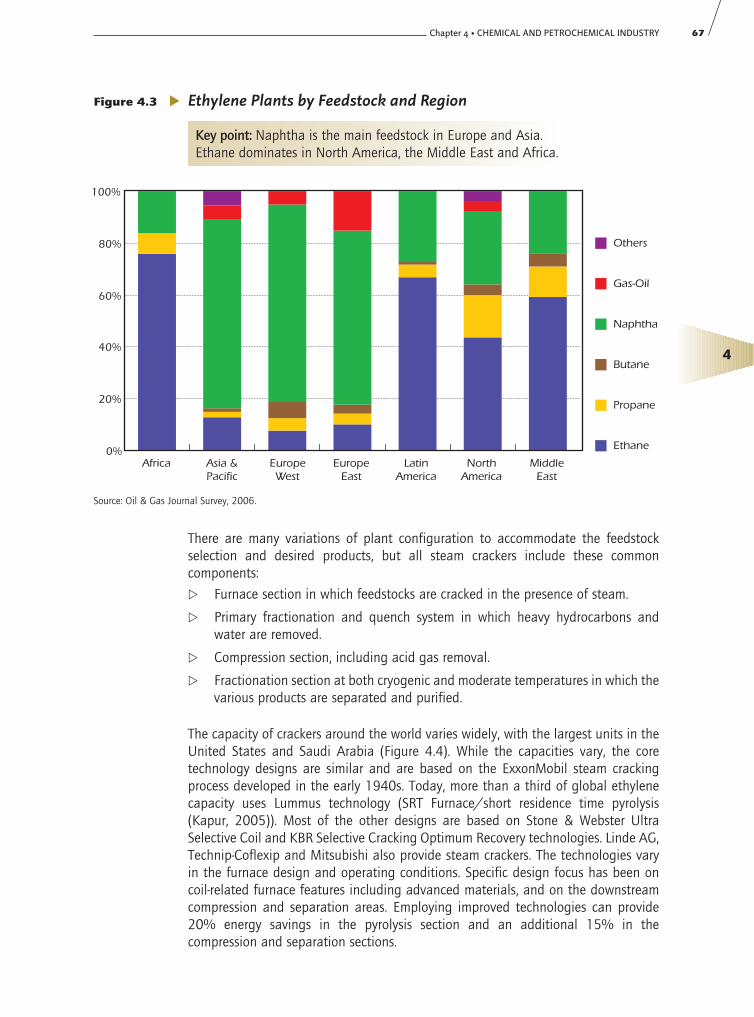
There are many variations of plant configuration to accommodate the feedstockselection and desired products, but all steam crackers include these commoncomponents:
� Furnace section in which feedstocks are cracked in the presence of steam.
� Primary fractionation and quench system in which heavy hydrocarbons andwater are removed.
� Compression section, including acid gas removal.
� Fractionation section at both cryogenic and moderate temperatures in which thevarious products are separated and purified.
The capacity of crackers around the world varies widely, with the largest units in theUnited States and Saudi Arabia (Figure 4.4). While the capacities vary, the coretechnology designs are similar and are based on the ExxonMobil steam crackingprocess developed in the early 1940s. Today, more than a third of global ethylenecapacity uses Lummus technology (SRT Furnace/short residence time pyrolysis(Kapur, 2005)). Most of the other designs are based on Stone & Webster UltraSelective Coil and KBR Selective Cracking Optimum Recovery technologies. Linde AG,Technip-Coflexip and Mitsubishi also provide steam crackers. The technologies varyin the furnace design and operating conditions. Specific design focus has been oncoil-related furnace features including advanced materials, and on the downstreamcompression and separation areas. Employing improved technologies can provide20% energy savings in the pyrolysis section and an additional 15% in thecompression and separation sections.
Chapter 4 • CHEMICAL AND PETROCHEMICAL INDUSTRY 67
4
0%
20%
40%
60%
80%
100%
Africa Asia &Pacific
EuropeWest
EuropeEast
LatinAmerica
NorthAmerica
MiddleEast
Others
Gas-Oil
Naphtha
Butane
Propane
Ethane
Figure 4.3 � Ethylene Plants by Feedstock and Region
Key point: Naphtha is the main feedstock in Europe and Asia.Ethane dominates in North America, the Middle East and Africa.
Source: Oil & Gas Journal Survey, 2006.

68 TRACKING INDUSTRIAL ENERGY EFFICIENCY AND CO2 EMISSIONS
Table 4.4 details the specific energy consumption (SEC) for state-of-the-art naphtha-based steam cracking technologies developed by the various licensors. SEC is a functionof the selected technology feedstock characteristics, its cracking conversion/selectivity,related ambient conditions and degree of upstream/downstream integration. Thesedata include fuel, steam and electricity in primary terms that are used for reactions andsubsequent processes.
Since the 1970s steam cracker design changes have led to a more than 50% decrease inSEC. These improvements include gas turbine integration, more extensive process-to-processheat recovery schemes, integral steam super-heaters, higher efficiency rotating equipment,multi-stage refrigeration schemes and integrated heat pump systems (Bowen, 2006).
182
272
478
416
274
351
712
606
0 100 200 300 400 500 600 700 800
Africa
Asia & Pacific
Europe - West
Europe - East
CIS
Latin America
North America
Middle East
kilotonnes per year
Figure 4.4 � Average Steam Cracker Capacity
Key point: The region average cracker size differs by a factor of 3 to 4.
Source: Oil & Gas Journal Survey, 2006.
Ethylene yield %
SEC GJ/t ethylene
Technip 35 18.8 – 20 or 21.6 – 25.2 (typical)
ABB Lummus 34.4 18 (with gas turbine), 21 (typical)
Linde AG 35 21 (best)
Stone & Webster n/a 20 – 25
KBR 38 no data
Source: Ren, et al., 2005.
Table 4.4 � Specific Energy Consumption (SEC) for State-of-the-Art NaphthaSteam Cracking Technologies

Depending on the feedstock, varying amounts of by-products are generated whichcan be used to fuel the process (Table 4.5). Methane and hydrogen by-products areused to fuel the cracking furnace, or separated out and used elsewhere. Pyrolysisgasoline by-product is recycled to the refinery industry. About 155 GJ of naphtha areneeded for the production of 1 tonne of ethylene. About 17% of the energy contentof naphtha (25 GJ/t of ethylene produced) is used for energy purposes. Thetheoretical minimum for this process, i.e., the energy that is needed solely for thechemical conversion, would be 5 GJ/t, or about one-fifth of what is actually used.Since the carbon and most of the feedstock energy is embedded in the products,energy-efficiency measures will not significantly reduce the required amount offeedstock. Other approaches, such as feedstock substitution, would be needed.
Chapter 4 • CHEMICAL AND PETROCHEMICAL INDUSTRY 69
4
Naphtha Gas Oil Ethane Propane Butane
High-value chemicals 645 569 842 638 635
Ethylene 324 250 803 465 441
Propylene 168 144 16 125 151
Butadiene 50 50 23 48 44
Aromatics 104 124 0 0 0
Fuel-grade products and backflows 355 431 157 362 365
Hydrogen 11 8 60 15 14
Methane 139 114 61 267 204
Other C4 components 62 40 6 12 33
C5 and C6 components 40 21 26 63 108
C7 and non-aromatic components 12 21 0 0 0
Losses 5 5 5 5 5
Source: Neelis, et al., 2005.
Table 4.5 � Ultimate Yields of Steam Crackers with Various Feedstocks(Kg of Product per tonne of Feedstock)
Early naphtha crackers consumed about 38 GJ/t ethylene (about 20 GJ/t high valuechemicals (HVC)). In the 1970s the ethylene industry went through an extensiveredesign of its flow sheet and lowered the specific energy requirements by 40 – 50%.Today, typical crackers use 18 – 25 GJ/t ethylene for the furnace and productseparation. Improvements in cracking could yield large gains in energy efficiency inthe long term. Options include higher-temperature furnaces (with materials able towithstand more than 1 100 °C), gas-turbine integration (a type of high-temperaturecombined heat and power unit that generates the process heat for the crackingfurnace), advanced distillation columns, and combined refrigeration plants. Together,

70 TRACKING INDUSTRIAL ENERGY EFFICIENCY AND CO2 EMISSIONS
these steps could result in 3 GJ/t of ethylene savings. The total potential forimproving energy efficiency from existing technology to the best technologyavailable is about 1 EJ (24 Mtoe).
Solomon Associates have benchmarked 115 olefin plants, representing 70% of theethylene-producing capacity worldwide. A trend analysis has been made of a groupof 50 olefin plants, half of which are in Europe, 27% in North America and theremaining 23% in other parts of the world. The actual data are confidential, butsome regional trends and comparisons are public.
In the 2003 Olefin Study, North America was 111% of average energy consumption,Europe was 95% and Asia was 86%. Part of this difference is due to the differentfeedstock mix. The average ethane cracker in the study consumed 124% of the studyaverage energy consumption, where the average naphtha cracker only consumed95% (Cagnolatti, 2005). This can be explained by lower heat integration of ethanecrackers due to a more simple design. However, even allowing for feedstockdifferences, average energy consumption rates are significantly higher for NorthAmerica (Figure 4.5). North American crackers use on average 32% more energy andEuropean crackers 12% more energy than Asian crackers.
The energy efficiency of European crackers improved approximately 10% from 1999to 2003. In North America, the improvement was only 3%. The average number ofcogeneration units, which produce heat for the process furnace, per plant did notchange during this period, but the average size increased by a third.
0
20
40
60
80
100
120
140
North Americalight feed
North Americaheavy feed
Europe Asia
Ener
gy
effic
ien
cy in
dex
Figure 4.5 � Steam Cracking Energy Consumption Index per unit of Product, 2003
(Corrected for Feedstock Mix)
Key point: North American crackers are 30% less efficient than Asian crackers.
Source: Cagnalotti, 2005.

The integration of gas turbines with cracking heaters reduces the specific energyfor ethylene production by about 10 – 20% of the overall energy requirements.The hot off-gas from the gas turbine is used as combustion air for the furnace.Eleven plants designed by Lummus based on the integration concept areoperating successfully.
Propylene Recovery in Refineries and Olefins Conversion
Propylene is the second largest petrochemical building block by volume, with ademand growth rate higher than ethylene. Propylene derivatives, e.g. polypropylene,are used to produce textiles, coatings, automobiles and fibres (Table 4.8). More thantwo-thirds of global production is generated by steam crackers and some 30% fromrefinery off-gases of fluidised catalytic crackers (FCC). A small percentage ofpropylene production is from methathesis/olefin conversions technology, and frommethanol and propane dehydrogenation (Berra, 2005).
Estimates for net energy use in propylene manufacturing by metathesis are: processenergy – 5.3 GJ/t, feedstock energy – 50.0 GJ/t (Energetics, 2000). The FCC processis less energy intensive because the energy used in the cracking furnace can beavoided, and product separation is simpler. Conventional FCC units yield about 5 –12% propylene in the off-gas, depending on the mode of operation. New deep-catalytic cracking processes can increase the yield to 16 – 22%, but at the expenseof naphtha and gasoline yields. These new deep-catalytic processes can be retrofittedon existing catalytic cracking units.
Aromatics Extraction
Aromatics are hydrocarbons that contain cyclic chemical structures. The mainaromatics are benzene, toluene and the xylenes. They are used as building blocks tomake products as diverse as aspirin to CD-ROMs.
The global market is about 30 Mt/ year for benzene, 14.5 Mt/year for toluene,24 Mt/year for mixed xylenes and 17 Mt/year for p-xylene. About 40% of tolueneis used to make benzene, while p-xylene production using selective toluenedisproportionation (STDP) process consumes 19%. About 75% of the mixed xyleneproduced is used to make p-xylene. Some mixed xylene is used as solvent and o-xylene is recovered for chemical processing.
Aromatics are produced from three types of resources:
� Hydro-treated coke-oven benzole.
� Hydro-treated pyrolysis gasoline from steam cracking.
� Reformate from catalytic reformers in refineries.
Currently, about 72% of all aromatics are recovered from reformate, 24% frompyrolysis gasoline and 4% from coke-oven light oil. About 39% of all benzene isrecovered from pyrolysis gasoline, 33% from reformate, 6% from coke ovens and22% from the hydrodealkylation (HDA) of heavier aromatics and toluenedisproportionation (TDP). Toluene is produced from catalytic reforming, pyrolysisgasoline and styrene production. Xylene’s sources are catalytic reforming (85%), andsteam cracking. Ethylbenzene, which is mostly used to manufacture styrene
Chapter 4 • CHEMICAL AND PETROCHEMICAL INDUSTRY 71
4

72 TRACKING INDUSTRIAL ENERGY EFFICIENCY AND CO2 EMISSIONS
monomer, is produced by liquid or gas-phase alkylation of benzene with ethylene.Liquid-phase alkylation using zeolite catalysts has been used since the mid 1990s tolower catalyst consumption.
A modern benzene extraction unit uses about 1.5 GJ/t of energy in the form of low-temperature heat. The electricity needed for p-xylene separation throughcrystallisation is about 0.8 GJ/t. If the average energy used in aromatics processingis 5 – 10 GJ/t, then aromatics production accounts for 0.4 – 0.8 EJ. The 61% offeedstock which does not derive from steam cracking accounts for another 1.7 EJ ofenergy use. Depending on the process configuration, other steps may add to theenergy consumption of an aromatics plant. Since most of the hydrocarbon ends upin the product, the potential for reducing CO2 emissions from aromatics productionprocesses is limited. Heat cascading or new separation technologies could be appliedto save process energy.
Methanol
Methanol is the simplest alcohol and is also known as methyl alcohol. It is used asantifreeze, solvent and fuel. In 2006, global methanol production was 36 Mt, ofwhich 19% was used to make methyl tertiary butyl ether (MTBE), a gasolineadditive; 10% for acetic acid and 40% for formaldehyde. About 80% of methanolproduction is natural gas-based, with the remainder being coal-based, essentially inChina. A typical methanol plant uses 30 GJ of natural gas per tonne of methanol.The latest large-scale auto-thermal reforming plants operate as low as 28.5 GJ/t(Lurgi, 2006).
The two methods to produce methanol are either high-pressure or increasinglylow-pressure synthesis gas processes. In the latter, the reaction uses a coppercatalyst at a pressure of 50 – 100 bars, and a temperature of 250 °C. Thetheoretical minimum energy use, equivalent to the lower heating value (LHV) ofmethanol, is 20 GJ/t. About 1 EJ of natural gas is used in methanol productionworldwide. The latest methanol production plants have a capacity of 1.5 Mt peryear and virtually all of them use Lurgi MegaMethanol technology (six suchplants have been built so far). Lurgi has supplied 60 – 70% of the worldmethanol production capacity.
The new standard for world-scale methanol capacity, the 1.75 million metric tonne(5 000 metric tonne per day) Atlas unit began operation in Trinidad in 2004,followed by a second one in 2005. The next unit of this size, the Zagros facility inIran was inaugurated in March 2007. At least two more units with the same capacitywill follow in 2007 – 2008 (Thomasson, 2006).
Seventeen countries represent more than 90% of global methanol production(Table 4.6). Production is shifting to countries with lower natural gas costs (MiddleEast and Russia).
Methanol production in China has expanded rapidly in recent years largely for use as a gasoline additive. China is the largest methanol producer in the world with a production capacity of 5.36 Mt in 2005 and the only country that uses coal.

Chapter 4 • CHEMICAL AND PETROCHEMICAL INDUSTRY 73
4
Table 4.6 � Methanol Production, 2004
Countries/Areas ProductionMt
Cumulative Production Share%
China 4.4 12.7
Saudi 4.2 24.8
Trinidad/Caribbean 3.6 35.0
United States 3.0 43.7
CIS 3.0 52.3
Chile 2.7 60.1
Venezuela 1.5 64.4
Germany 1.5 68.7
Canada 1.2 72.2
Iran 1.2 75.6
New Zealand 1.1 78.8
Indonesia 1.0 81.7
Norway 0.9 84.3
Qatar 0.8 86.6
Malaysia 0.5 88.0
Benelux 0.5 89.5
Argentina 0.4 90.6
Romania 0.4 91.7
Brazil 0.3 92.0
Other 1.3 100.0
Total 36.0
Sources: IEA; Chemical Markets Associates, Inc.
Coal-based methanol production in China used an average 1.2 tonne carbonequivalent/t methanol (35 GJ/t) in 2003. There was one plant with a capacity ofmore than 200 kt, eighteen plants with a capacity of 100 kt and six with a capacityof 80 kt (Yu Zunhong, et al., 2005). It should be noted that these plants are oneorder of magnitude smaller than the largest modern plants. According to incompletestatistics, current methanol production capacity under construction is nearly 9 Mt,with more than 10 Mt planned. The Chinese Government is trying to slow down theexpansion by regulating that a project should have at least 1 Mt capacity.

74 TRACKING INDUSTRIAL ENERGY EFFICIENCY AND CO2 EMISSIONS
Olefins and Aromatics Processing
Olefins are unsaturated hydrocarbons containing one or more pairs of carbon atomslinked by a double bond. They are obtained by the cracking of petroleum fractionsat high temperatures.
Share%
Polyethylene 58
Ethylene oxide 13
Ethylene dichloride 13
Ethylbenzene 7
Others 9
100
Source: Nexant, 2005.
Table 4.7 � Global Ethylene Use, 2004
Share%
Polypropylene 55.7
Acrylonitrile 11.7
Oxo-alcohols 8.2
Cumene 6.8
PO 6.9
Isopropanol 3.2
Other 7.5
100
Source: Phillips, 2006.
Table 4.8 � Global Propylene Use, 2004
The olefin components ethylene, propylene, butene and butadiene are used for theproduction of plastics and synthetic rubbers (Tables 4.7 and 4.8). In certain casesthis is a single step, in other cases an intermediate product is first produced, e.g.,vinylchloride from ethylene, or ethylbenzene from benzene and ethylene. Themonomers are polymerized to yield plastics. The quantities are significant, at about200 Mt of plastics per year. Energy use for polymerization depends on the processand the polymer type. Total primary energy use is on the order of 1 EJ per year.

Polyethylene is the world’s most widely used plastic. Linear low density polyethylene(“LLDPE”) is the fastest growing type. It is particularly well suited for making plasticfilms that are both flexible and strong, but not transparent.
Union Carbide, Dow Chemical and BP are leading developers of polyethylene reactorprocess technology. Union Carbide’s “Unipol” reactor process, in which ethylene is ingaseous state during polymerization (“gas phase”), is the most widely licensed and usedpolyethylene process in the world. BP’s “Innovene” process, also a gas-phase process, isthe only other widely licensed process for LLDPE. Dow Chemical does not license itspolyethylene reactor technology, in which ethylene is polymerized in solution. Gasphase LLDPE production is generally lower cost than solution production.
Benchmarks of European Union (EU) chemical and petrochemical facilities havebeen run by several organisations. Schyns (2006) provides a summary of weightedEU averages versus EU best practice for key olefins and aromatics. The data in Table4.9 indicate energy efficiency improvement potential in the range of 30 – 40% forLDPE, HDPE and polypropylene, and 10% for PVC.
Chapter 4 • CHEMICAL AND PETROCHEMICAL INDUSTRY 75
4
Table 4.9 � European Energy Use and Best Practice (Final Energy Units)
WeightedEU Average
GJ/t
EUBest Practice
GJ/t
LDPE High pressure processTube & batch reactors 8.53 5.96
HDPE Low pressure processSuspension, solvent & gas phase reactors 5.43 3.14
PolypropyleneSuspension & gas phase processes 3.56 2.27
PolyVinylChlorideSuspension, emulsion & mass polymerisation processes 3.80 3.40
Note: Low Density Polyethylene (LDPE); High Density Polyethylene (HDPE); Linear Low Density Polyethylene (LLDPE);Polypropylene (PP); PolyVinylChloride (PVC).
Source: Schyns, 2006.
Inorganic Chemicals Production
A number of energy-intensive inorganic chemicals are widely used. This studyexamines chlorine and sodium hydroxide, carbon black, soda ash and industrialgases. The inorganic chemicals that are of lesser relevance from an energyperspective have not been analysed in more detail in this study.

76 TRACKING INDUSTRIAL ENERGY EFFICIENCY AND CO2 EMISSIONS
Chlorine and Sodium Hydroxide
Chlorine is mainly used in the synthesis of chlorinated organic compounds, e.g. vinylchloride. Sodium hydroxide is used for the production of organic and inorganicchemical compounds that are used in the pulp and paper, textile, water treatmentand metallurgy industries.
ProductionMt
United States 11.2
Japan 4.2
Germany 4.3
France 1.3
Benelux 1.3
Rest of Western Europe 2.6
Rest of the world (Russia, China …) 15.4
Total 44.0
Source: Euro Chlor, 2006.
Table 4.10 � Worldwide Chlorine Production, 2004
World chlorine production was 44 Mt in 2004 (Table 4.10), and annual demand forchlorine is forecast to rise to 52 Mt by 2010. Salt (sodium chloride) is decomposedelectrochemically to yield sodium hydroxide and chlorine. The industry currently uses0.44 EJ of electricity per year in three production methods: mercury, diaphragm andmembranes processes.
The energy efficiency of these processes differs, depending to some extent on theprocess design (Table 4.11). The energy efficiency of current membrane cells is about63%, compared to the theoretical minimum.
Table 4.11 � Energy Efficiency of Chlorine Production Processes
ElectricityConsumption
GJel /t Cl2
SteamConsumption
GJ/t Cl2
Mercury process 11.8 0
Diaphragm process 10.0 2.2
Membrane process 8.6 – 9.2 0.6
Note: Membrane process range reflects current densities of 0.3 and 0.4 A/cm2, respectively.
Source: Gielen, 1997.

Each process generates a sodium hydroxide product of a different quality. The mercurycell produces sodium hydroxide in a 50% concentration and needs no furtherprocessing. The diaphragm process requires considerable amounts of heat to upgradethe sodium hydroxide concentration, which is initially only 12%. The membrane processproduces a 30% sodium hydroxide product which then needs to be concentrated. Thepreferred technology in new plants is the membrane cell. Total energy consumption inWestern Europe decreased from an average 13.1 GJ/t in 2001 to 12.5 GJ/t in 2004,and the objective is a further 5% decrease by 2010 (Euro Chlor, 2006).
Regional differences in production processes affect the energy savings potential. InEurope, about half of chlorine production is by the mercury cell process. In the UnitedStates, three-quarters is by the diaphragm process. In Japan, only the membrane cellprocess is used.
The main opportunity for energy savings lies in converting mercury process anddiaphragm process plants to membrane technology. New technology developments,such as the combination of an electrolytic cell with a fuel cell that uses the hydrogenby-product (from chlorine production), could significantly decrease energy use. Thistechnology, however, is unlikely to be commercially available in this decade. Thereplacement of hydrogen-evolving cathodes with oxygen-consuming cathodes canresult in additional 30% electricity savings for membrane cells, but such electrodematerials need further development.
Carbon BlackCarbon black is a form of amorphous carbon that has an extremely high surface areato volume ratio, and is one of the first nanomaterials to find common usage. Carbonblack is primarily used as reinforcement in vulcanized rubber goods. The tire industryuses around 85% of all carbon black manufactured. The other 15% is used mainlyin the paint and varnish industry and inks and plastics.
The overall global carbon black market is expected to increase by 4% per year from9 Mt/year today to a level of 9.6 Mt tons through 2008 (Freedonia, 2006). Figure 4.6shows the regional production split in 2004. Production growth over the next decadeis forecast to be three times higher in China and India than the industrialised world.
Chapter 4 • CHEMICAL AND PETROCHEMICAL INDUSTRY 77
4
North America
25%
Japan
11%
Western Europe
18%
China
11%
India
5%
Rest of the world
16%
Asia & Pacific
14%
Figure 4.6 � Carbon Black Production by Region, 2004
Key point: Carbon black production is widely dispersed globally.
Source: Freedonia, 2006.

78 TRACKING INDUSTRIAL ENERGY EFFICIENCY AND CO2 EMISSIONS
Basically, there are three different manufacturing processes: flame soot, Degussa gasblack and the furnace process. About 95% of all carbon black production is basedon the furnace process, a partial combustion process that can use coal, oil or naturalgas. The three processes result in a wide palette of black pigments, which differ inthe size of their particles, structure, surface and surface chemistry. A typical plantuses 500 kWh/t carbon black. Moreover, 33 GJ feedstock and about 30 GJ processenergy are needed (Leendertse and Veen, 2002). This results in a total global energyuse for carbon black production of 0.57 EJ per year and about 0.017 EJ of electricity.
The most significant substitute for carbon black in rubber production is precipitatedsilica. In recent years, up to 25% of carbon black production volumes have beenreplaced with silica to create what is commonly called a “green” tire, whichsignificantly reduces the rolling resistance of tires to improve traction, wear and fuelefficiency. However, the material cost of adding silica is nearly twice the cost ofcarbon black, and the cost of processing and compounding the materials is higher.Given a declining market, carbon black has not been considered in more detail.
Soda Ash
Soda ash, also known as sodium carbonate, is a sodium salt of carbonic acid. Themost important use of soda ash is in the chemical make-up of glass. It is also usedas a water softener, in detergents, photographic processes and brick manufacturing.
Country Production
Mt/yr
Share
%
CumulativeProduction Share
%
China 12.7 31.4 31.4
United States 11.0 27.3 58.7
Russia 2.6 6.5 65.2
India 1.5 3.7 68.9
Poland 1.5 3.7 72.6
Germany 1.4 3.5 76.1
France 1.0 2.5 78.6
Italy 1.0 2.5 81.1
United Kingdom 1.0 2.5 83.5
Bulgaria 0.8 2.0 85.5
Ukraine 0.7 1.6 87.1
Turkey 0.6 1.5 88.6
Spain 0.5 1.2 89.9
Japan 0.4 1.0 90.9
Others 3.6 9.1 100.0
Total 40.3 100.0
Source: United States Geological Survey (USGS), 2005.
Table 4.12 � Soda Ash Production, 2004

World consumption of soda ash was about 40 Mt in 2004, having increased by anannual average of 2.6% recent years. It is forecast to increase at a higher rate of3 – 4% per year to 2010. Glass will remain the main market for soda ash in the nearterm, consuming an estimated 16 – 17 Mt in 2004 and forecast to grow at around3% per year through to 2010, driven more by flat glass (4% per year) than containerglass (2% per year).
Consumption of soda ash in chemicals manufacture was around 8 Mt in 2004 andis forecast to grow by 2 – 3% per year. It is dominated by its use in the productionof sodium silicate and sodium tripolyphosphate (STPP) for detergents, whichaccounted for 5.0 Mt in 2004. Consumption of soda ash in the production of sodiumbicarbonate was around 1.8 Mt in 2004.
In the United States, production is based on natural soda ash deposits and sodarecovery from lakes. Elsewhere, the production is largely based on syntheticproduction. Synthetic soda ash is manufactured from common salt and limestone bythe ammonia-soda process invented by Solvay in 1865. The Solvay process initiallyproduces light ash which requires a further stage of densification. The two forms arechemically identical but dense ash is the preferred form for glass manufacture.Natural soda is produced only in dense form.
Synthetic production is more energy intensive and more costly than natural soda. TheSolvay process requires a large amount of steam, much of which is low-pressuresteam (<5 bar absolute), injected directly into the process for the recovery ofammonia (steam-stripping). So it is logical to include combined heat and power(CHP) units for steam and electricity generation in order to improve plant efficiency.
To reduce energy consumption, operators have given up the direct use of fuels(combustion) in other parts of the process where only thermal inputs are needed,e.g. the sodium bicarbonate decomposition or the sodium monohydrate drying todense soda ash. The thermal input in the form of steam has allowed maximiseduse of CHP.
With the improvement of efficiency in use of primary energy, cogeneration steam-electricity units with gas turbines have been installed in soda ash production units.The electricity generated normally exceeds the needs of the soda ash unit and isavailable to be fed into the electricity network.
Chapter 4 • CHEMICAL AND PETROCHEMICAL INDUSTRY 79
4
Table 4.13 � Typical Energy Use for Energy Efficient Soda Ash ProductionUsing Best Available Technology
Energy GJ/t soda ash (dense)
Fuels (lime kiln) 2.2 – 2.8
Fuels (soda ash), including electricity*7.5 – 10.8, 0.18 – 0.47
(50 – 130 kWh/t soda ash)
* excludes fuels for lime kilns Source: Conseil Européen de l’Industrie Chimique, 2004.

80 TRACKING INDUSTRIAL ENERGY EFFICIENCY AND CO2 EMISSIONS
Given fuel needs for the lime kiln and the energy use of 10 – 12 GJ/t soda ash andthe production process mix, global energy needs for soda production are 0.3 – 0.4 EJ.Soda ash production capacity is estimated to be about 42 Mt per year. The splitbetween processes and regions is given in Table 4.14.
In 2004, US producers exported 4.7 Mt of soda ash, about 50% of total worldexports. Total European output of 12.5 Mt in 2004 was a 5% increase on the stablelevel of the previous three years, while Russian output increased an average of 9%per year since 1998. However, there has been very little growth in soda ash demandin Europe since 2002, and this is unlikely to change significantly in the near term.
Table 4.14 � Global Soda Production Capacity, 2000 (Mt)
SolvayProcess
Sodium MineralsProcess
Others Total
EU25 7.7 0.1 7.8
Rest of Europe 6.6 0.8 7.4
North America 11.6 11.6
Latin America 0.5 0.5
Asia 9.7 0.5 3.7 13.9
Africa 0.1 0.6 0.7
Oceania 0.4 0.4
Total 25 12.7 4.6 42.3
Source: Conseil Européen de l’Industrie Chimique, 2004.
Industrial Gases
Industrial gases are used for a multitude of purposes, including energy and mining,chemical, electronic, food and beverage, healthcare, manufacturing, metals andaerospace industries (Figure 4.7). It includes gases commonly found in the air, raregases, acetylene, CO2 and hydrogen. Oxygen is used in steel manufacturing,metallurgy, chemistry (ammonia, ethylene oxide, propylene gas, coalgasification/synthesis gas, and methanol), glass and ceramics, health care, andpulp and paper industries. Some of these industries produce the oxygen they needthemselves; others buy it from supply companies. In such a case, the energy needsfor gas production are accounted for in the chemical industry. Nitrogen is widelyused in the food and beverage, glass-making, chemistry, health care, oil and gasand electronic industries. Hydrogen is used in the synthesis of polymers, solvents,ammonia and methanol, in glass making, for electronics and pharmaceuticals. Raregases are used in medicine, welding, and lighting. CO2 is used mostly in the foodand beverage, refrigeration, healthcare and oil and gas industries.

While the demand for nitrogen was practically nonexistent in 1960, by the early1990s nitrogen surpassed the sales of all other industrial gases. Together, nitrogenand oxygen sales accounted for approximately 41% of the industry’s sales in thelate 1990s. Carbon dioxide and acetylene ranked third and fourth. Becausenitrogen does not readily react with other materials, several industries use it as a“blanketing agent,” which is a compound able to prevent unwanted reactions. Forexample, when nitrogen is used as a blanketing agent with embers, it prevents themfrom igniting. Nitrogen is used to ensure product quality and improve plant safety.Oil producers use nitrogen to stimulate and pressurise wells. Nitrogen gas is alsovaluable in steel processing, food production, cooling, refrigeration and freezingsystems, solvent recovery, chemical and glass production, and the electronics andaerospace industries.
Measured in terms of sales volume, the second most significant industrial gas in thelate 1990s was oxygen, which is used to intensify or control combustion in a varietyof industries. Its other uses include speeding fermentation, providing life supportand controlling odours. Chemical manufacturers, brick makers and metal fabricatorsall rely on oxygen. Innovative uses include processes aimed at restoring ormaintaining environmental integrity. Oxygen is used in hazardous-waste cleanup,wastewater treatment facilities and coal gasification systems. One of the fastestgrowing areas of oxygen use in the late 1990s was as a replacement for chlorine inbleaching, especially by pulp and paper manufacturers because the oxygen processpollutes less.
Chapter 4 • CHEMICAL AND PETROCHEMICAL INDUSTRY 81
4
0
5
10
15
20
25
30
35
2000 2003 2008
Bill
ion
USD
Metals industryChemical industry & refining Others (food, energy, mining, ...)Electronics
Figure 4.7 � Industrial Gas Demand by Market Segment
Key point: “Other” industrial gas demand is quickly rising.
Source: BCC Research, 2003.

82 TRACKING INDUSTRIAL ENERGY EFFICIENCY AND CO2 EMISSIONS
The two largest companies by sales in 2006 were Linde AG and Air Liquide, followedby Praxair, Air Products & Chemicals and Taiyo Nippon Sanso, with total market salesof USD 49 billion in 2005. Growth rates are expected to be 6% or more per year forthe 2006 – 2010 period.
The industry uses three techniques to separate gases from the atmosphere. Cryogenicmethods, the oldest and most widely used, rely on cooling and pressurising the airuntil it becomes liquid. Oxygen, when held at a pressure of 1 013 kPa, liquefies atminus 183˚C; nitrogen liquefies at minus 196 °C. As the atmospheric gases liquefy,they are extracted by means of a distillation process. The air separation plants includeair compressors, air purifiers and heat exchangers, distillation and compression units.Large-scale air separation units produce 3 – 4 000 t/day. With the development ofapplications such as integrated gasifier combined cycle, gas-to-liquids, coal-to-liquidsand expansion of blast furnaces for the manufacturing of steel, unit capacity couldexceed 7 000 tons/day by 2012 (Frostbyte, 2005; DiZanno, 2004).
Two non-cryogenic approaches are membrane separation and pressure swingabsorption (PSA) production methods. Membrane separation uses hollow fibres,usually made of organic polymers, to recover gases such as hydrogen from oilrefineries or CO2 from natural gas supplies. A significant investment in membranetechnology development is being made by private and public private partnerships,including ion-membrane systems. Pressure swing absorption (PSA), and its lower-pressure variants vacuum swing adsorption (VSA) and vacuum pressure swingadsorption (VPSA), rely on a molecular sieve material that selectively absorbsatmospheric components at specific temperatures and pressures.
There are many variations in the air separation cycles used to make industrial gasproducts. Design choices are made depending upon how many products are desired;required product purities; gaseous product delivery pressures; and whether productswill be generated in liquid form.
Prior to the 1990s, and excluding compression and integration with turbines,electricity consumption in cryogenic air separation averaged 310 KWh/t of oxygen(1.1 GJ/t). Structured packing has been used in distillation columns since the 1990sto reduce pressure drops and improve energy efficiency by more than 30%. Givenenergy use of about 0.78 GJ/t oxygen and a global market of industrial gases atabout 100 Mt per year, represents about 0.078 EJ of electricity or 0.2 – 0.3 EJ inprimary energy terms.
Ammonia Production
Anhydrous ammonia is the source of nearly all the synthetic nitrogen fertilizersproduced in the world. Ammonia is produced by combining nitrogen with hydrogen.The nitrogen is obtained from the atmosphere, while the hydrogen is obtained fromnatural gas mainly, and to some extent from naphtha, coke-oven gas, refinery gasesand heavy oil.
Global ammonia production was 145.4 Mt in 2005. Growth is mainly concentratedin West and East Asia, which together account for almost 40% of global production(IFA, 2006). About 77% of world ammonia production is based on natural gas

steam reforming, 14% on coal gasification, mainly in China, and 9% on the partialoxidation of oil products and heavy hydrocarbon fractions, mainly in India and to alesser degree in China. A typical heavy-oil-based process uses 1.3 times as muchenergy as a gas-based process. A coal-based process uses 1.7 times more energy thana gas-based process. In 2004, total energy and feedstock use for ammoniaproduction amounted to about 4.3 EJ of natural gas, 0.6 EJ of oil and 1.2 EJ coal(Table 4.15). This is almost 20% of all the energy used in the chemical industry.A 30% decrease in energy use per tonne of ammonia has been achieved in the lastthirty years.
Chapter 4 • CHEMICAL AND PETROCHEMICAL INDUSTRY 83
4
Table 4.15 � Energy Consumption in Ammonia (NH3) Production, 2005
Region Production
MtAmmonia
Sharegas%
Shareoil%
Sharecoal%
Gas-basedGJ/tNH3
Oil- basedGJ/tNH3
Coal- basedGJ/tNH3
Energyintensity
GJ/tNH3
Fueluse
PJ/yr
Western Europe 12.2 90 10 35 35.0 427
North America 14.4 100 37.9 37.9 546
CIS 20.9 100 39.9 39.9 834
Central European countries 6.2 95 5 43.6 43.6 270
China 43.7 20 10 70 34 42 54 48.8 2 133
India 12.2 50 50 36.5 50 43.3 528
Other Asia 13.3 100 37 37.0 492
Latin America 9.0 100 36 36.0 324
Africa 4.0 100 36 36.0 144
Middle East 8.5 100 36 36.0 306
Oceania 1.2 100 36 36.0 43
World 145.4 70.5 8.5 21 41.6 6 047
Sources: IFA for type and production of feedstock, 2006; USGS, 2006; IEA data.
Natural gas costs are 70 – 90% of the production cost of ammonia. So, when naturalgas prices increase, production costs for ammonia rise. This may or may not translateinto higher ammonia prices, depending on the global supply situation. Because gasprices play such an important role, the energy efficiency of gas-based ammoniaplants tends to converge while newer plants have similar efficiencies across regions.
The Integrated Pollution Prevention and Control Directive of 2006 refers to twenty-six techniques and technologies that aim at improved energy efficiency, emissionsreduction and waste management. Technologies that can increase energy efficiencyin ammonia plants include improvements in the reforming section, such as the use

84 TRACKING INDUSTRIAL ENERGY EFFICIENCY AND CO2 EMISSIONS
of gas-heated reformers (GHR) that offer smaller surface areas and heat loss.Palladium membrane units for hydrogen separation can provide a 2 GJ/t savings.CO2 removal technologies, product ammonia separation and developments inammonia synthesis can all improve energy consumption (Rafiqul, 2005).
In most ammonia plants, CO2 is separated from hydrogen at an early stage,generally using solvent absorption. Energy savings can be achieved by using newsolvents, with a potential of up to 1.4 GJ/t. Much of the CO2 separated is used toproduce urea, a popular type of nitrogen fertilizer. It takes 0.88 tonnes of CO2 toproduce a tonne of urea.
The average natural gas steam reforming plant in the United States or Europe uses35 – 38 GJ/t ammonia; the most energy efficient technology uses 28 GJ/t (auto-thermal reforming process). The auto-thermal reforming process combines partialoxidation and steam reforming technology. According to the European FertilizerManufacturing Association (EFMA), two plants of this kind are in operation andothers are at the pilot stage (EFMA, 2000).
The theoretical minimum energy use for the production process is 21.2 GJ/tammonia, given that three atoms of hydrogen are needed per molecule of ammoniaand hydrogen has a lower heating value of 120 GJ/t. But the LHV of ammonia isonly 18.7 GJ/t. As a consequence, 2.5 GJ of residual heat is generated in theproduction process and may be used for other purposes. Given the theoreticalminimum, current natural gas-based ammonia production achieves about 60%efficiency.
The International Fertilizer Industry Association conducted an industry widebenchmarking study to compare the energy efficiency of 66 ammonia productionplants with ages from one to thirty-five years (IFA, 2006). Average energy use forammonia production of the benchmarked plants is 36.9 GJ/t, and range is from28 – 53 GJ/t of ammonia. The highest capacity plants generally had the bestefficiency. Older plants (20+ years) had energy efficiencies 8 – 10 % lower than thenewer plants. This benchmark excludes plants in China. CO2 emissions ranged from1.5 – 3.1 Mt CO2/Mt ammonia. The average CO2 emissions were 2.1 Mt CO2 /Mtof ammonia, with two-thirds process related and one-third from fuel combustion.Significant amounts are captured for the production of urea. Compared to the BATof 28 GJ/t, the energy saving potential is almost 2 EJ per year. However, this wouldimply a complete switch to natural gas feedstocks. Hence, a reduction in the energyconsumption by 40% and greenhouse gases emissions by an additional 160 Mt CO2equivalent is possible.
China and India, which account for 40% of global ammonia production, areinteresting case studies. China is the largest ammonia producer in the world andproduced 43.7 Mt in 2005, almost 30% of global production. Chinese ammoniaproduction is unique because of its feedstock mix: 70% is derived from coal, 10%from oil products and only 20% from natural gas. The coal-based production is about10% in medium-scale plants and 90% in small-scale plants. Energy efficiency relatesto feedstock type and the scale of production and in China is about 34 GJ/tammonia for gas-based, 42 GJ/t for oil-based, 55 GJ/t for medium size coal-based

and 53 GJ/t for small-scale coal-based ammonia production. The average energyuse amounted to 48.8 GJ/t ammonia in 2005. Of the coal-based production, about2.4 Mt of capacity uses western technology with a plant size of about 0.4 Mt/yr.Many more coal-based plants are planned. Higher natural gas prices may result in awider uptake of the coal-based technology. A number of Chinese plants use westerngasification technology (GE and Shell) which accounted for 2.4 Mt of ammoniacapacity in 2004. Seventeen plants with the gasification technology are plannedrepresenting 8.3 Mt of ammonia capacity.
India is the second largest ammonia producer in the world with production of12.8 Mt in 2005 (Karangle, 2007). About two-thirds of the production capacity inIndia is based on natural gas, the remainder uses naphtha and fuel oil. Gas-basedplants use on average 36.5 GJ/t ammonia, naphtha-based plants 39 GJ/t and fueloil-based plants between 48 – 87 GJ/t. The average energy consumption in Indiahas been significantly reduced from 96 GJ/t in the 1960s to 38 GJ/t today, due toa combination of feedstock changes, increased plant size and use, and processtechnology improvements.
A case study for revamping a 1980s vintage 900 Mt/day ammonia plant in India is givenby Karangle (2007). The upgrade includes modification of the primary reformer and thesteam super heaters, changes in the process air compressor, a CO2 removal system andother schemes. The plant energy consumption declines from 46.9 – 36.4 GJ/t. Suchenergy efficiency savings could generate about 130 000 Certified Emissions Reduction(CER) financial benefits from the Clean Development Mechanism (CDM) under theKyoto Protocol.
The China and India cases highlight that it is important to take into account thefeedstock situation when energy efficiencies are compared. The energy efficiency oflike installations is similar in industrialised and developing countries, and a limitednumber of equipment suppliers are responsible for most new installations. Therefore,a global technology development approach is needed for improved energy efficiencyin ammonia production.
Combined Heat and Power
The chemical and petrochemical industry is one of the largest users of combined heatand power (CHP or cogeneration), particularly since the 1980s (see Chapter 9). CHPoffers energy efficiency, economic, emission reduction and energy securityadvantages.
In the United States, 24 GW or 34% of the CHP capacity was in the chemicalindustry in 2004 (EEA, 2004). Additional technical potential in the industry in theUnited States is estimated to be more than 7.8 GW power and 0.5 EJ steam. As mostof the installed base is for large facilities, there is significant potential for smallerunits, less than 20 MW (Hedman, 2005). However, economies of scale rule againstinvestments in smaller plants.
Chapter 4 • CHEMICAL AND PETROCHEMICAL INDUSTRY 85
4

86 TRACKING INDUSTRIAL ENERGY EFFICIENCY AND CO2 EMISSIONS
ExxonMobil reports a worldwide installed cogeneration capacity of 3.7 GW in itsfacilities in 2006, equivalent to a reduction of 9 Mt of CO2 per year. The companyplans to increase that capacity 35% by 2010 (Meidel, 2006). Dow Chemicalproduces 75% of its electricity from cogeneration for a savings of 0.034 EJ in 2004(energy represents more than 50% of the total company costs) (Mills, 2006).
It is difficult to capture the various flows of CHP use in IEA statistics. For example, ifthe heat is used by the producer, part of the fuel use of the cogeneration plant isreported under industrial fuel use, rather than under CHP. Moreover, electricityproduction from CHP is not split by sector in IEA statistics. This makes it difficult totrack CHP trends. Table 4.16 is an estimate of CHP use in several key chemical andpetrochemical producing countries.
Plastics Recovery Options
Three key recovery options exist for plastics: mechanical recycling; feedstockrecycling; and energy recovery. As only 20 – 30% of plastic waste can bemechanically recycled the remainder can be used for energy recovery, for which theindustry sees large potential for energy gains. The promotion of plastics recovery isimportant to enhance the products’ sustainability. New advanced recoverytechnologies could help boost this performance (Plastics Europe, 2006).
Today, only 10 Mt of plastic waste are recycled which is less than 10% of the overallwaste generated, however with significantly higher percentages in the United States,Japan and Europe (Table 4.17). About 30 Mt of plastic waste is incinerated. Energyrecovery is approximately 500 – 750 PJ (primary energy equivalent) (3% energy usein production). Recycling of 10 Mt represents 500 PJ of energy savings.
Table 4.16 � CHP Use in the Chemical and Petrochemical Industry
Country Estimated CHP UseGW
Year
United States 24 2004
Japan 1.6 2006
Germany 2.6 2003
Netherlands 0.3 2003
Spain 0.6 2003
China 3.0 2005
Italy 0.7 2003
Russia 0.7 2004
Canada 1.7 2004
Sources: COGEN Europe; Canadian Industrial Energy End-Use Data and Analysis Centre; Energy Environment Analysis,Inc.; China Energy Conservation Investment Corporation; CENEF; IEA statistics and estimates.

The general trend is toward less land fill or incineration without energy recovery andmore recycling and energy recovery. Worldwide consumption amounts approximatelyto 235 Mt/yr and approximately half of this potential could be used for recyclingand energy recovery. Assuming energy content on the order of 30 – 40 GJ/t ofwaste, the primary energy saving potential is estimated to be 2 – 4 EJ per year.
Chapter 4 • CHEMICAL AND PETROCHEMICAL INDUSTRY 87
4
Table 4.17 � Plastic Recycling and Energy Recovery in Europe (%)
Recycling Energy Recovery Un-recovered Waste
Denmark 5.6 66.6 27.8
Netherlands 10.0 50.8 39.2
Sweden 10.1 50.2 39.7
Germany 29.9 25.4 44.7
France 7.9 33.1 59.0
Austria 18.8 21.0 60.2
Belgium 12.8 25.8 61.4
Greece 1.7 17.9 80.4
Italy 8.5 7.2 84.3
Finland 10.3 5.2 84.5
Spain 7.5 5.6 86.9
United Kingdom 6.2 5.9 87.9
Portugal 3.0 8.7 88.3
Ireland 4.1 0.0 95.9
EU Average 11.3 19.3 69.5
Sources: Ingham, 2006; Association of Plastics Manufacturers in Europe, 2001; Plastics Europe, 2004.; EPRO,2006; Ida, 2006.
Energy and CO2 Emission Indicators for the Chemicaland Petrochemical Industry
Energy indicators for petrochemicals are different than for other sectors becausemost of the carbon and a large share of the feedstock energy content are stored inthe products (Patel, 2003). A lack of energy use data on a specific product levelmakes individual process indicators infeasible. Much of the energy data necessary toperform a more detailed analysis is not available due to anti-trust issues, limitations

88 TRACKING INDUSTRIAL ENERGY EFFICIENCY AND CO2 EMISSIONS
on statistical data and site energy integration. Thus an aggregate product indicatoris proposed. Forty-nine products have been identified to be included in an aggregateindicator (Table 4.18). These products represent more than 95% of all energy usedin the chemical and petrochemical industry (Tam and Gielen, 2006). These indicatorsare intended for comparisons across different material categories; life cycle analysis(LCA) methods are better suited for such comparisons.
Energy Efficiency Index MethodologyThe proposed methodology for calculating an energy efficiency index (EEI) is:
� Use IEA energy statistics for final energy use in the chemical and petrochemicalsub-sector.
� Define a best practice technology (BPT) value for each of the 49 products.
� Multiply production volumes and BPT to calculate practical minimum energy use.
� Divide practical minimum energy use and actual energy use (final energy). Thisis the energy efficiency index.
� 1 – Energy efficiency index = improvement potential.
Feedstock energy use is included, but electricity use is excluded. The reason is thatanalysis showed that the bottom-up process data can explain only a small share oftotal electricity use. The bulk of the electricity use is accounted for by pumpingequipment for pipelines and storage tanks and auxiliary use for which no detaileddata exist. More analysis is recommended.
Production volumes for benzene, toluene and xylene (BTX) have been split betweenproduction from steam cracking and naphtha extraction. This split has beencalculated based on the production volume of ethylene and it accounts for the moreenergy-intensive nature of production from steam cracking versus naphthaextraction. The same split has also been applied for propylene from steam crackingand fluidised catalytic crackers (FCC).
Best practice technology (BPT) energy values are provided on a worldwideconsolidated basis in Table 4.18. More than 16% energy efficiency improvementscan be obtained by applying state-of-the-art technologies. This is a limitedpotential with a projected growth in chemicals and petrochemicals of more than100% over the next three decades, energy and feedstock use will increasesignificantly (IEA, 2006).
The energy efficiency analysis results are shown in Table 4.19. While the presentefficiency indicators should not be used for country comparisons, monitoring theirevolution over time provides valuable information on trends in the industry’s effortsto improve energy efficiency. The calculated BPT energy use (excluding electricity) forthe 49 products was 24 EJ compared to actual energy use (excluding electricity) of29 EJ. As the calculated BPT figure covers 95% of total energy use in the industry,an adjustment is required and hence the total BPT for the industry is estimated to be25 EJ, which represents a savings potential of 4 EJ if energy use (excludingelectricity) were based on BPT.

Chapter 4 • CHEMICAL AND PETROCHEMICAL INDUSTRY 89
4
Table 4.18 � Best Practice Technology Energy Values, 2004
2004 ProductionVolume
Ktonnes/yr
Feedstock
GJ/tonne
Heat
GJ/tonne
Steam
GJ/tonne
Energy UseExcludingElectricity
GJ/tonne
CalculatedGlobal Best
PracticeEnergy Use
PJ/year
Organic
Acetic acid 9 300 30 4.48 34.48 321
Acetone 4 942 9.77 9.77 48
Acrylonitrile 5 372 –6 –6 32
Benzene (steam cracking) 14 680 42.6 20.07 7.01 69.68 1023
Benzene (naphtha extraction) 22 020 42.6 2.4 5 50 1 101
Butadiene 9 441 6 6 57
Butylene 20 334 47 3 50 1 017
Butanol 2 791 3.27 3.27 9
Cumene 9 690 2.05 –2.8 –0.75 –7
Ethylene 103 283 47.2 12.8 60 6 197
Ethylbenzene 27 163 3.28 3.28 89
Ethylene dichloride 37 608 4.42 4.42 166
Ethylene glycol 15 251 0.94 4.37 5.31 81
Ethylene oxide 16 725 3.09 3.09 52
Formaldehyde 25 803 10 –4.77 5.23 135
Isopropyl alcohol 1 881 5.2 5.4 10.6 20
Maleic anhydride 1 441 2 2 3
Melamine 1 566 2 2 3
Metacrylate 2 636 2 2 5
Methanol 34 668 20 8.5 28.5 988
Methyl tert butyl ether 19 218 3.9 3.9 75
Phenol 7 588 9.1 9.1 69
Phthalic anhydride 3 815 20 20 76
Propylene 42 928 46.7 13.3 60 2 576
Propylene FCC 23 682 46.7 3.3 1.5 51.5 1 153
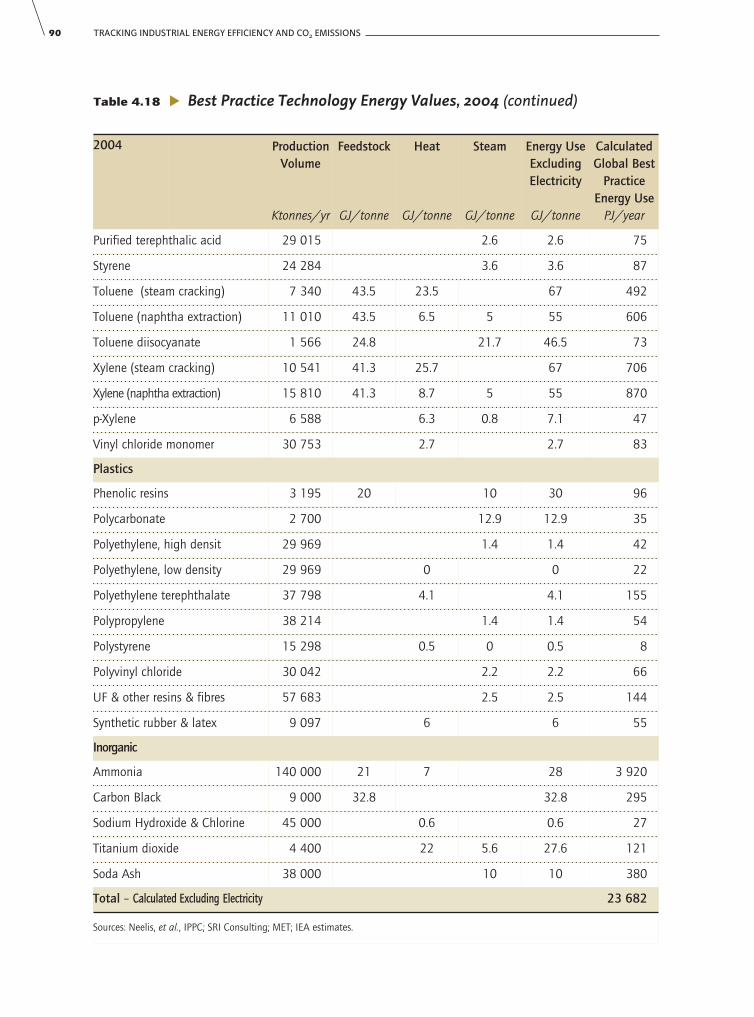
90 TRACKING INDUSTRIAL ENERGY EFFICIENCY AND CO2 EMISSIONS
Table 4.18 � Best Practice Technology Energy Values, 2004 (continued)
2004 ProductionVolume
Ktonnes/yr
Feedstock
GJ/tonne
Heat
GJ/tonne
Steam
GJ/tonne
Energy UseExcludingElectricity
GJ/tonne
CalculatedGlobal Best
PracticeEnergy Use
PJ/year
Purified terephthalic acid 29 015 2.6 2.6 75
Styrene 24 284 3.6 3.6 87
Toluene (steam cracking) 7 340 43.5 23.5 67 492
Toluene (naphtha extraction) 11 010 43.5 6.5 5 55 606
Toluene diisocyanate 1 566 24.8 21.7 46.5 73
Xylene (steam cracking) 10 541 41.3 25.7 67 706
Xylene (naphtha extraction) 15 810 41.3 8.7 5 55 870
p-Xylene 6 588 6.3 0.8 7.1 47
Vinyl chloride monomer 30 753 2.7 2.7 83
Plastics
Phenolic resins 3 195 20 10 30 96
Polycarbonate 2 700 12.9 12.9 35
Polyethylene, high densit 29 969 1.4 1.4 42
Polyethylene, low density 29 969 0 0 22
Polyethylene terephthalate 37 798 4.1 4.1 155
Polypropylene 38 214 1.4 1.4 54
Polystyrene 15 298 0.5 0 0.5 8
Polyvinyl chloride 30 042 2.2 2.2 66
UF & other resins & fibres 57 683 2.5 2.5 144
Synthetic rubber & latex 9 097 6 6 55
Inorganic
Ammonia 140 000 21 7 28 3 920
Carbon Black 9 000 32.8 32.8 295
Sodium Hydroxide & Chlorine 45 000 0.6 0.6 27
Titanium dioxide 4 400 22 5.6 27.6 121
Soda Ash 38 000 10 10 380
Total – Calculated Excluding Electricity 23 682
Sources: Neelis, et al., IPPC; SRI Consulting; MET; IEA estimates.

The results of this analysis highlight a number of issues related to data quality. BTXproduced from naphtha extraction and propylene from FCC generally are produced inrefineries which may lead to some accounting issues in IEA energy statistics as energyuse for petrochemicals produced at a refinery will likely be accounted for in the refinerycategory rather than the chemical and petrochemical category. Feedstock energy usewas reported in IEA statistics under total energy use for the sub-sector until recently,but now is excluded, which may have lead to some problems in country reporting andsubsequent analysis based on the data. In this study, energy and feedstocks areaggregated. Concerns on under-reporting arise when the EEI is found to be almost 1:United Kingdom and Italy have EEI’s above 0.9. Further analysis is recommended.
Chapter 4 • CHEMICAL AND PETROCHEMICAL INDUSTRY 91
4
Table 4.19 � Indicator Use for Country Analysis of Global Chemicaland Petrochemical Industry
ReportedEnergy Use
PJ
BPT CalculatedEnergy Use
PJ
EnergyEfficiency
Index
ImprovementPotential
%
United States 6 862 4 887 0.70 29.8
Japan 2 130 1 917 0.90 10.0
China 3 740 2 975 0.80 20.5
Saudi Arabia 1 115 917 0.82 17.8
Germany 1 157 1 044 0.90 9.8
Netherlands 618 508 0.82 17.8
France 654 582 0.88 11.0
Brazil 577 478 0.83 17.2
United Kingdom 490 460 0.94 6.2
India 1 091 910 0.84 15.8
Chinese Taipei 741 599 0.81 19.2
Italy 389 365 0.94 6.2
World 28 819 23 682 0.82 17.8
Sources: IEA statistics; SRI Consulting; METI.
CO2 Emissions Index
A CO2 emissions index has been developed that builds on the energy efficiencyindex. It covers only direct CO2 emissions and excludes emissions for powergeneration and emissions in energy recovery from petrochemical products. Theemissions have been calculated based on energy and feedstock use data from IEAstatistics. The fossil fuels have been multiplied with their carbon content and acorrection has been applied for carbon storage in synthetic organic products. Thecarbon storage has been calculated based on physical production volumes and

92 TRACKING INDUSTRIAL ENERGY EFFICIENCY AND CO2 EMISSIONS
carbon content of individual petrochemical products. Carbon storage in urea fertilizerhas not been credited due to the short life span of this application. One could arguethat this is not a direct industry emission. Worldwide about 95 Mt of CO2 are usedper year for urea production (0.88 tonnes of CO2 per tone of urea).
The CO2 emissions index compares the industry’s calculated direct CO2 emissionswith an ideal minimum based on using only natural gas for the BPT-based processsteam and heat requirements. To make this index comparable across countries,electricity related emissions have been excluded. Emissions from feedstocks arebased on actual feedstock use. Table 4.20 shows the estimates for carbon storage inplastics for the countries in this analysis.
Table 4.20 � Carbon Storage for Plastics in Selected Countries, 2004
Mt CO2 equivalent / year
United States 131.2
Japan 38.1
France 17.6
Germany 30.9
Netherlands 10.3
Italy 14.3
Chinese Taipei 36.1
United Kingdom 8.8
Saudi Arabia 15.3
Brazil 17.8
China 131.9
India 25.0
Carbon storage 477.3
Source: IEA estimates.
Some of the locked-in energy value can be recovered when the product is incinerated,which results in CO2 emissions at the waste treatment stage. The appropriate CO2credit for energy recovery from plastics waste is unclear and for simplicity energyrecovery and plastics recycling is not included in this CO2 index. Moreover, it is small,as 30 Mt is incinerated (Chapter 10): 100 Mt CO2, 1 EJ energy content. It is proposedto develop a separate life cycle CO2 index that would include waste treatment,energy recovery and recycling at a later stage.
Table 4.21 shows the total direct emissions for the key chemical and petrochemicalproducing countries. The CO2 index reflects not only CO2 savings from fuel switching,but also reductions related to improved energy efficiency if energy use was based on

BPT. As for the energy efficiency index, the results show that there are some uncertaintiesaround the quality of available statistics. For CO2 emissions an under- or over-reportingof feedstock use, which is now accounted separately, will alter the results. The results ofthe CO2 index indicate that this appears to be the case.
Chapter 4 • CHEMICAL AND PETROCHEMICAL INDUSTRY 93
4
Table 4.21 � Total CO2 Emissions and CO2 Index, 2004
Mt CO2 / yr CO2 Index
United States 275.0 0.50
Japan 120.1 0.73
France 24.3 0.70
Germany 46.8 0.62
Netherlands 22.7 0.77
Italy 10.1 0.55
Chinese Taipei 13.4 0.16
United Kingdom 19.4 0.71
Saudi Arabia 53.1 0.76
Brazil 13.6 0.43
China 117.7 0.17
India 51.0 0.68
World 1 141.8 0.68
Sources: SRI Consulting; IEA statistics and estimates.
Life Cycle Index
In addition to the energy efficiency and CO2 emissions index, a life cycle indicator isproposed to give credit for renewable feedstocks and recovery of post-consumer plasticwastes for recycling or energy recovery. The methodology proposed for this indicator is:
1) Use IEA energy statistics for final energy use in the chemical and petrochemicalsub-sector.
2) Define a best practice technology (BPT) value for each of the 49 products.
3) Multiply production volumes and BPT to calculate practical minimum energy use.
4) Account for energy and feedstock use for bio-plastics and other syntheticorganic materials from natural feedstocks
5) Add energy use for recycling to actual energy use. Subtract energy recovery(from waste plastics) from actual energy use.
6) Add energy that would have been used in primary olefins and plasticsproduction for the recycled production volume to practical minimum energy use.This is the adjusted practical minimum energy use
7) Divide adjusted practical minimum energy use and adjusted energy use (definedas the IEA energy use adjusted for recycling and waste plastic energy recovery).This is the life-cycle index.

94 TRACKING INDUSTRIAL ENERGY EFFICIENCY AND CO2 EMISSIONS
Data availability on waste plastics recovery, mechanical recycling and energyrecovery is an issue for certain countries. This methodology has been applied toJapan to show how a life cycle approach could impact this analysis. An adjustedenergy use of 2 121 PJ is calculated for Japan and an adjusted practical minimumenergy use of 1 974 PJ, which gives a life cycle index of 0.93 in 2003. When creditis given for waste plastics recovery, the efficiency potential falls from 17 – 7%.Japan’s waste plastics recovery represents an efficiency gain of 10%.
The advantage of the proposed indicator methodology presented in this chapter isthat it is feasible based on existing energy data and allows for country comparison,provided the data quality is improved. The disadvantage to this approach is that itis not suited to identify which processes to focus on efficiency gains. The list ofproducts may also be incomplete and accounting issues related to petrochemicalsproduced at the refinery may underestimate energy efficiency opportunities. Thequality of IEA energy statistics as reported by countries is not fully transparent andconstitutes a source of uncertainty.
Energy Efficiency Potential
The results of the indicators analysis show a potential savings of 4 EJ in heat use inthe chemical and petrochemical industry (Table 4.22). This analysis excludeselectricity. However, assuming a general industrial electricity savings potential of25%, there is an additional savings potential from electricity of 1 EJ for a totalprocess energy savings potential of 5 EJ. Potential savings from increased recyclingand energy recovery is estimated to be 2 – 4 EJ. Assuming that one-third of theoverall CHP potential at 5 EJ is available in the chemical and petrochemical industrysector, then an additional 1.5 – 2 EJ could be saved from more use of CHP. Totalenergy savings potential from process energy use and systems/life cycle options areestimated to be 8.5 – 11 EJ per year. This includes 1 EJ electricity so final andprimary energy saving potentials are almost equal.
Estimated SavingsEJ
Heat 4
Electricity 1
Recycling and Energy Recovery 2 – 4
CHP 1.5 – 2
Total 8.5 – 11
Note: Heat, electricity and recycling are expressed in final energy units. Energy recovery and CHP refer to theenergy content of the waste and saved fuel.
Source: IEA estimates.
Table 4.22 � Energy Savings Potential in the Chemical and Petrochemical Industry

Chapter 5 • IRON AND STEEL INDUSTRY 95
5
IRON AND STEEL INDUSTRY
Key Findings� Iron and steel has a complex industrial structure, but only a limited number of processes are
applied worldwide and they use similar energy resources and raw materials. A large shareof observed differences in energy intensities and CO2 emissions on a plant and country levelare explained by variations in the quality of the resources that are used and the cost ofenergy, which determines the cost-effectiveness of energy recovery technologies.
� The boundaries used to develop indicators of energy use in the iron and steel industry mustaccount for common practices: iron ore pellets, coke and scrap are widely tradedcommodities; blast furnace gas and coke oven gas is sold for power generation; slag by-products can be used as a substitute for cement clinker. Uniform boundaries are needed forproper comparison purposes.
� More detailed data are needed to better separate the blast, basic oxygen, electric arcfurnaces and direct reduced iron processes because a comparison of the energy efficiency ofthese fundamentally different processes is of limited value. It is not possible to developsuitable indicators for steel rolling and finishing on an aggregate level.
� On a worldwide basis, the iron and steel industry has achieved important efficiency gainsin over the last two decades. Yet the world average, however, has not improved substantiallysince most growth was concentrated in China, which has relatively low average efficiency.
� Waste energy recovery in the iron and steel industry is most common in countries with highenergy prices and ambitious efficiency policies. The waste heat is used in steel productionprocesses or for power generation.
� The energy and CO2 emission benefits of some technology options such as dry cokequenching and top pressure–turbines are viewed differently by experts particularlyconcerning the benefits on the level of the full production process or the site. The cost-effectiveness of these options depends on the local energy prices.
� The average efficiency of the iron and steel industries in China, India, Russia and Ukraineaccount for nearly half of global iron production and more than half of the industry’s CO2emissions. Their average efficiency is notably lower than in OECD countries. Outdatedtechnologies such as open hearth furnaces are still in use in Russia and Ukraine. In India,coal-based direct reduction iron production can use the local low quality resources and bedeveloped on a small scale, but such developments carry a heavy environmental burden. InChina, low energy efficiency is mainly due to a high share of small-scale blast furnaces, ahigh share of inefficient coking plants and low quality ore.
� The average efficiency of the iron and steel industries in OECD countries is close and dataare not sufficiently detailed to allow a ranking.
� Based on country comparisons with best available technology, the remaining energyefficiency potential in the iron and steel industry at today’s production level is about 2.3 to2.9 EJ per year of primary energy and 220 to 270 Mt CO2 emissions reduction. Savingeffects outside the iron and steel industry, e.g. increased recovery of steel scrap (about 0.5 EJ per year), and further potentials in the industry for which accurate data are lackingmay increase the savings to 5 EJ per year of primary energy and 360 Mt CO2 emissions.Further analysis to validate this estimate is recommended.

96 TRACKING INDUSTRIAL ENERGY EFFICIENCY AND CO2 EMISSIONS
Introduction
The manufacture of iron and steel has a complex industrial structure. Yet it only has asmall number of processes that are employed worldwide and they use similar rawmaterials and energy forms. What matters from an energy efficiency and carbondioxide (CO2) emissions perspective are the quality of the resources used and the costsof energy, which determines the cost-effectiveness of energy recovery technologies.
This chapter looks at the significance of drawing boundaries for analytical purposesfor an industry in which commodities are traded, waste heat is sold and by-productscan be useful inputs to other industries to improve efficiency and reduce CO2emissions. It describes the steps from iron ore agglomeration to making coke for thechemical reduction of the iron ore to various furnace technologies and practices tosteel finishing and their energy use. It estimates technical potential for energyefficiency gains and CO2 emission reductions based on best available technology.
Global Importance and Energy Use
According to IEA statistics, total final energy use by the iron and steel industry,including coke and blast furnaces, was 21.4 EJ in 2004. Global steel production was1 057 million tonnes (Mt) in 2004. The average energy intensity is 20.2 gigajoulesper tonne (GJ/t) of steel. Globally the iron and steel industry accounts for the highestshare of CO2 emissions from the manufacturing sector, at about 27%. This is due tothe energy intensity of steel production, its reliance on coal as the main energysource and the large volume of steel produced.
There are two basic methods for making crude steel:� Coke oven – blast furnace – basic oxygen furnace process, which uses iron ore
and scrap;
� Electric arc furnace process, which uses direct reduced iron, scrap and cast iron.
The first process uses mainly iron ore and accounts for two-thirds of steel production.The electricity arc furnace process uses mainly scrap and accounts for 34% of steelproduction. Only 3% of all steel is produced in other processes such as open-hearthfurnaces, which are out-dated.
Iron ore is used to make iron which is then converted into steel. There are two typesof iron products: pig iron and direct reduced iron (DRI). For nearly the past twentyyears, almost 60% of steel has been derived from pig iron (also called hot metal),although the share of steel produced from DRI has steadily increased. Pig iron isproduced in blast furnaces. Today, about 5% of global steel is produced from DRI,while 35% of all crude steel is derived from scrap.1 These developments areimportant because they significantly affect energy use and CO2 emissions.
1. According to the International Iron and Steel Institute (IISI), the scrap recycling rate is 42.3% (IISI, 2005). This iscalculated as the ratio of steel scrap used and crude steel produced. In this study, however, the recycling rate isdefined as the ratio of crude steel produced from scrap and total crude steel production. This results in a somewhatlower ratio because of material losses during scrap conversion into steel. The basic material flows for bothapproaches are the same. The contribution of scrap can also be calculated as the difference of total crude steelproduction and steel production from pig iron and DRI, which confirms the figures in this study. What is of mostinterest here is not the actual recycling rate, but rather the additional recycling potential.

Chapter 5 • IRON AND STEEL INDUSTRY 97
Figure 5.1 shows steel production by process. This categorisation differs from theconventional split between basic oxygen furnace (BOF) and electric arc furnace(EAF) production to allow a more detailed analysis of the importance of DRI andscrap recycling. EAFs can use scrap, DRI or pig iron. But some amounts of scrapare also recycled in BOFs (10 – 30% in some countries), and also DRI can beadded to BOFs. Total scrap consumption for steel making amounted to about 450 Mt in 2004; significant amounts of steel scrap are also used for theproduction of cast iron.
While the amount of scrap that is recycled into steel production has increasedsignificantly, its share in total steel production has decreased slightly. This is dueto rapid growth of steel production worldwide and improved plant productionyields. Another significant factor is that the growth of steel production in the lastdecade has been concentrated in China, a country without scrap reserves. Inabsolute terms, total recycling of scrap from used products for steel making hasincreased substantially from 100 Mt in 1970 to 260 Mt in 2003, as moreproducts have reached the end of their useful life and scrap recovery systemshave improved.
5
Key point: Most steel is produced from pig iron.
Steel from DRI
4.6%
Steel from pig iron
61.8%
Steel from scrap
33.6%
1 057 million tonnes of steel
Figure 5.1 � Global Steel Production by Process, 2004
Sources: International Iron and Steel Institute (IISI), 2005; IEA, 2006.
Figure 5.2 shows the steel production processes and flows. Iron ore is either directlyused or is converted into sinter and pellets. The blast furnace is fed with coke fromthe coke oven, preheated air (blast) from the hot stove and ore, sinter and/or pellets.Liquid hot metal is tapped at the bottom of the blast furnace and is further refinedinto liquid steel in the basic oxygen furnace. The liquid steel product is furtherpurified in ladle metallurgy processes and cast. The crude steel product is furtherprocessed by hot and cold rolling, tempering, annealing and coating, depending onthe desired product shape and quality.

Bas
ic o
xyg
enfu
rnac
e (B
OF)
Elec
tric
arc
furn
ace
(EA
F)U
se
Scra
p
Fin
ish
edst
eel
Scra
p
Liq
uid
stee
l
Liq
uid
stee
l
Cas
t iro
np
rod
uct
ion
Dire
ctre
du
ced
iro
n (
DRI
)p
rod
uct
ion
Sin
ter
mak
ing
Bla
stfu
rnac
e
EAF
stee
l sla
g
BO
F st
eel s
lag
Scra
p
Cru
de
stee
l
DRI
/Sp
on
ge
iron
Scra
p
Pig
iro
n/
Ho
t m
etal
Co
ke m
akin
g
Scra
p
Cas
t iro
nSc
rap
BF
slag
Ore
Pelle
t m
akin
g
Air/O
xyg
en
Ho
t st
ove
Ho
t ai
r/O
xyg
en
Co
al
Co
ke
Lad
le m
etal
lurg
y/St
eel c
astin
gSt
eel r
olli
ng
and
fin
ish
ing
Fig
ure
5.2�
Stee
l Pro
duct
ion
Sche
me
Key
poi
nt:A
ll st
eel m
akin
g pr
oces
ses
are
clos
ely
inte
rlink
ed.
98 TRACKING INDUSTRIAL ENERGY EFFICIENCY AND CO2 EMISSIONS

Chapter 5 • IRON AND STEEL INDUSTRY 99
5
Most of the energy consumption is related to the blast furnace process at about 10 – 13 GJ/t crude steel, including the hot stove. Other big uses of energy are in sintering (2 – 3 GJ/t crude steel), coke-making (0.75 – 2 GJ/t crude steel) and steel-rolling (1.5 – 3 GJ/t crude steel). Ladle metallurgy and casting is of secondaryimportance (0 to 1 GJ/t steel). Production of DRI using natural gas requiresapproximately 12 GJ/t crude steel, while electric arc furnaces use 1 – 1.5 GJ ofelectricity per tonne of crude steel. Cast iron is usually produced in small-scale blastfurnaces with a low efficiency compared to large blast furnaces for steel production.
Indicator Issues
This section discusses the methodological issues for energy indicators analysis in theiron and steel industry and the approaches taken in this study.
System Boundaries
Coke ovens and blast furnaces are reported separately in the energy transformationcategory in IEA statistics. The iron and steel industry category in IEA statisticsincludes ISIC Group 271 (manufacturing of basic iron and steel) and Class 2731(casting of iron and steel). Production of steel alloys and production of cast iron isincluded in this iron and steel industry category (UN, 2002).
Product and Process Differentiation
In order to analyse energy use in iron and steel production it needs to be clearwhether the data treat products and feedstocks equally or if they are differentiated.For example, are steel and cast iron treated as a single product category, and aresteel from ore and scrap treated as a single category? Trying to assess energy use ina production category that contains both cast iron and steel is not meaningful, asthey are quite different products.
As well, scrap availability is influenced by the maturity of the economy and tradepatterns. It is not useful to compare countries that have ample scrap to those withpoorer resources and conclude that scrap-rich countries are more energy efficient.Virtually all available scrap is recycled. So steel production from ore and scrap needsto be treated as separate processes. However, there is overlap as some 20 – 30%scrap (including about 10 percentage points in-plant scrap) is added to basic oxygenfurnaces in the ore-based blast furnace process.
Energy demand for mining and beneficiation of iron ores is not included in thisanalysis. As most iron ore pellets are produced at the mine, the energy use forpellet making is usually not accounted for in the iron and steel making category.This creates an implicit energy and CO2 “benefit” for producers that buy pellets,compared to those that use sinter, which is always produced on-site.
Allocation Issues
The iron and steel industry has complex flows of energy and materials. Most of thecommodities can be sold “over the fence” and some can be shipped long distances.

100 TRACKING INDUSTRIAL ENERGY EFFICIENCY AND CO2 EMISSIONS
As a consequence, the full production chain of energy use and CO2 emissions maybe considerably higher or lower than the site footprint would suggest. The mainissues are:
Effects that reduce CO2 emissions at the site, but increase CO2 emissions elsewhere:
� Buying pellets (pelletising);
� Buying coke (coke making);
� Higher scrap use rate for basic oxygen furnace (implies less scrap for electric arcfurnace);
� Buying direct reduced iron;
� Buying oxygen (oxygen making, often outsourced to industrial gas suppliers);
� Buying lime (used for pellet making and in blast furnaces);
� Buying steam and electricity.
Effects that do not reduce CO2 emissions at the site, but reduce CO2 emissionselsewhere:
� Selling coke by-products;
� Selling granulated blast furnace slag as cement clinker substitute;
� Selling steel slag as feedstock for cement kilns;
� Selling blast furnace gas (to power producers);
� Selling coke oven gas (to power producers);
� Selling electricity, steam and low-temperature heat;
� Selling nitrogen (a by-product of oxygen production).
While these issues can be significant at the level of individual plants, they are lessrelevant at a country level.
As the production of primary steel is the basis for steel recycling, one could arguethat steel producers that use ore could be credited with future CO2 savings from steelscrap use. Obviously such an approach would create complicated allocationproblems and would do nothing to reduce CO2 emissions in steel production. Thisapproach is not used in this study.
Table 5.1 shows the relevance of certain allocation issues, given a reasonable set ofassumptions for their relevance on a country level. The impact is calculated in threeways: at the iron and steel plant; elsewhere; and the total net impact. For example,if the coke is produced at the iron and steel plant and subsequently the companydecides to buy its coke instead, this will reduce energy use and CO2 emissions on-site,but there will be zero net effect on a global scale.
Table 5.1 suggests the impacts on energy use and CO2 emissions of various practicesdepending on the system boundary choice. Two approaches are possible: very broadsystem boundaries or standardised comparisons with corrections for energy use andCO2 emission effects elsewhere. The latter approach is used in this analysis withinthe constraints of data availability.

Chapter 5 • IRON AND STEEL INDUSTRY 101
5
Savings Steel Plant Unaccounted Elsewhere Net Effect Final
Final energyGJ/tcs
Emissionst CO2/tcs
Final EnergyGJ/tcs
Emissionst CO2/tcs
EnergyGJ/tcs
Emissionst CO2/tcs
Ore mining 0.75 0.05 0.75 0.05
Ore + coking coal transport
1 — 2 0.1 — 0.2 1 — 2 0.1 — 0.2
Buying pellets 0.55 0.03 — 0.15 0.55 0.03 — 0.15 0 0
Buying coke 1 — 1.5 0.05 — 0.1 1 — 1.5 0.05 — 0.1 0 0
Buying scrap (less scrap for EAF) (+10 percentagepoints)
1.5 0.15 1.5 0.15 0 0
Buying DRI (+10percentage points)
1.5 0.15 1.2 — 2 0.07 — 0.15 –0.3 — 0.5 –0.08 — 0
Buying oxygen 0.25 0 — 0.075 0.25 0 — 0.075 0 0
Buying lime 1 0.22 1 0.22 0 0
Selling granulated blast furnace slag
–0.7 –0.17 –0.7 –0.17
Selling steel as limestone substitute for cement kilns
0 –0.1 0 –0.1
Selling blast furnacegas (full allocation of CO2 content to user)
0 –0.4 0 –0.4 0 0
Selling electricity & heat
–1 –0.1 –1 –0.1
Selling nitrogen –0.2 0 — –0.06 –0.2 0 — –0.06 0 0
Total 5.6 — 6.1 0.14 — 0.45 5.35 — 7.65 –0.16 — 0.33 –0.25 — 1.55 –0.3 — –0.12
Note: tcs — tonne crude steel.Source: IEA estimates.
Table 5.1 � Energy and CO2 Emission Impacts of System Boundaries
Feedstock Quality Issues
Ore qualities differ in their chemical composition and iron content, which affects theenergy needed for the reduction reaction to produce iron. The iron content of the oreaffects the amount of slag by-product. The chemical composition of the gangueaffects the amount of lime and limestone that must be added to achieve basicity of

102 TRACKING INDUSTRIAL ENERGY EFFICIENCY AND CO2 EMISSIONS
the slag.2 In total these matters can make a 1 – 2 GJ/t difference in energy needsfor a blast furnace. As steel producers tend to rely on local ores, this can make animportant difference in country comparisons.
Coke quality is also important. Coal and coke are the main sources of sulphur,which must be removed with the slag. The higher the sulphur and gangue content,the more slag that will be generated. Moreover, the coke quality affects theamount of coke and coal that is needed in the blast furnace. While it affects totalCO2 emissions, it does not directly affect the net energy balance of the blastfurnace, as a higher coke use rate implies production of more blast furnace gas.The coke quality depends on the coal quality, but also on the characteristics of thecoking process. Most steel production facilities use good quality coking coal.However, in some countries, for example in India, some local coal with highgangue content is used.
Generally, it is not possible to account for differences of a few percentage points on acountry level for developing indicators of energy use. However, some indicators canidentify differences on the order of ten percent or more. Benchmarking and energy auditsat a plant level are needed to identify more accurate improvement potentials. Resultspresented in this study are not suited for short-term target setting for reasons given.
Energy Indicators
Energy Intensity Indicators and Benchmarks
A broad based comparison on total sub-sector energy use per tonne of crude steel isof limited use because the production processes are so different. The blast furnace-basic oxygen furnace (BF-BOF) and the electric arc furnace (EAF) (scrap) processesneed to be treated separately. Direct Reduced Iron (DRI) should also be treatedseparately. It is not possible to develop suitable indicators for steel finishing. Thefollowing list gives a set of ideal indicators. The data are lacking today to put thislist into practice:
� Total final energy use per tonne of crude steel (including finishing).
� Total primary energy use per tonne of crude steel (including finishing).
� Total final energy use per tonne of BF-BOF steel (excluding finishing, with 12% bought scrap/DRI use, assuming 100% own productionsinter/pellets/coke/oxygen/lime, no correction for feedstock quality).
� Total primary energy use per tonne of BF-BOF steel (excluding finishing, with default 12% bought scrap/DRI use, assuming 100% own productionsinter/pellets/coke/oxygen/lime, no correction for feedstock quality).
� Total final energy use per tonne of DRI (split gas and coal-based processes).
� Total final energy use per tonne of EAF steel (excluding finishing).
� Total primary energy use per tonne of EAF steel (excluding finishing).
2. Gangue is the waste materials left over after removing the minerals from ore.

� Total direct CO2 per tonne of crude steel (including finishing, with default 12% bought scrap/DRI use, assuming 100% own productionsinter/pellets/coke/oxygen/lime, no correction for feedstock quality).
� Total CO2 per tonne of BF steel (including correction for blast furnace slag+steel slag use, BFG counted as coal in terms of CO2 content per GJ, no correctionfor feedstock quality).3
It is recommended to improve the data collection to enable such analysis. Newinternational efforts in this area are on-going in the framework of the Asia-PacificPartnership (APP).
There is no international benchmarking activity in the iron and steel industry whereplants with different ownership are compared. However, some national and regionalcomparisons have been developed, as summarised for Canada in Box 5.1. A similarbenchmarking approach could be applied in other parts of the world. It isrecommended to expand benchmarking for the iron and steel industry.
Chapter 5 • IRON AND STEEL INDUSTRY 103
5
Box 5.1
Benchmarks in the Iron and Steel Industry in Canada
A recent benchmarking study In Canada assesses and compares four integrated steel plantsand eight electric arc furnaces (NRCAN/CSPA, 2007). It considers fifteen separate processesand compares the efficiency of the Canadian plants with the Ecotech model plant, as definedby the International Iron and Steel Institute.
The average efficiency improvement potential for the Canadian plants is 25 – 30%. The studyconcludes that the blast furnaces and electric arc furnaces are close to the Ecotech plant levelof efficiency. Further it finds that the coke oven efficiency is relatively low, but improvementswould not be economic. Other key areas for efficiency improvements include:
� Enhanced by-product gas recovery;
� Improved cogeneration from waste gas;
� Enhanced efficiency of steam use;
� Improved efficiency of slab reheating furnaces.
Sources: IISI, 1998; Natural Resources Canada/Canadian Steel Producers Association, 2007.
Energy Intensity Analysis
This analysis focuses on the key iron producing countries. The seventeen countrieslisted in Table 5.2 represent more than 90% of global pig iron production. Theanalysis also focuses on the main steel producing countries of which the twenty-twolisted in Table 5.3 represent 90% of total steel production. The lists differ somewhatbecause some countries, e.g. Turkey, Spain and the Other Asia region have a strongposition in scrap-based EAF steel production.
3. The correction factor for blast furnace slag is 0.8 t CO2/t slag; the factor for steel slag use in cement kilns is0.5 t CO2/t slag.

104 TRACKING INDUSTRIAL ENERGY EFFICIENCY AND CO2 EMISSIONS
There is considerable difference in the energy efficiency of primary steel productionamong countries and even individual plants. For the blast furnace-BOF process, thegap in energy efficiency between the top and bottom country is about 50%. This isdue to variations in plant size, level of waste energy recovery, quality of iron ore andquality control. A few plants still use outdated technologies such as open hearthfurnaces and iron-and-steel-ingot casting (Table 5.3).
Figure 5.3 shows the energy intensity distribution of global steel production. Thex-axis indicates the total final energy use and the y-axis indicates the final energyintensity, expressed in units of final energy per tonne of crude steel produced. Itincludes total energy use for steel production from coke making to furnace firingto steel finishing from IEA statistics, and divides it by total crude steel production.
Production
Mt/yr
Share
%
CumulativeProduction Share
%
China 330.4 42.1 42.1
Japan 83.1 10.6 52.6
Russia 48.4 6.2 58.8
United States 37.2 4.7 63.5
Brazil 33.9 4.3 67.9
Ukraine 30.8 3.9 71.8
Germany 28.9 3.7 75.5
Korea 27.3 3.5 78.9
India 26.1 3.3 82.3
France 12.7 1.6 83.9
Italy 11.4 1.5 85.3
Taiwan 9.4 1.2 86.5
United Kingdom 10.2 1.3 87.8
Canada 8.3 1.1 88.9
Belgium-Luxembourg 7.3 0.9 89.8
Australia 6.2 0.8 90.6
South Africa 6.1 0.8 91.4
Other 67.8 8.6 100.0
World 785.5 100.0 100.0
Source: IISI, 2006.
Table 5.2 � Pig Iron Production, 2005

Each horizontal step represents a single country. Electricity use is not corrected forthe efficiency of power generation. The graph shows a wide range of energyintensities from 4 – 40 GJ/t crude steel. However, 90% of the production is in therange of 14 – 30 GJ/t, but this is still a very wide range. The fact that primarysteel making and EAF steel recycling are combined in one graph adds to the widerange. More detailed indicators are needed for meaningful comparisons.
Chapter 5 • IRON AND STEEL INDUSTRY 105
5
Total Production
Mt/yr
Share
%
CumulativeProduction
Share%
BOF Steel
%
EAF Steel
%
Open HearthFurnace
Steel%
China 349.4 30.9 30.9 87.1 12.9
Japan 112.5 10.0 40.9 74.4 25.6
United States 94.9 8.4 49.3 45.0 55.0
Russia 66.1 5.9 55.1 61.6 16.3 22.1
Korea 47.8 4.2 59.4 55.9 44.1
Germany 44.5 3.9 63.3 69.3 30.7
Ukraine 38.6 3.4 66.7 49.9 9.8 40.2
India 38.1 3.4 70.1 52.5 44.9 2.6
Brazil 31.6 2.8 72.9 76.2 22.0
Italy 29.3 2.6 75.5 39.9 60.1
Turkey 21 1.9 77.4 29.2 70.8
France 19.5 1.7 79.1 62.5 37.5
Taiwan 18.6 1.6 80.7 53.7 46.3
Spain 17.8 1.6 82.3 24.5 75.5
Mexico 16.2 1.4 83.7 27.8 72,2
Canada 15.3 1.4 85.1 58.5 41.5
United Kingdom 13.2 1.2 86.3 79.6 20.4
Belgium 10.4 0.9 87.2 74.6 25.4
South Africa 9.5 0.8 88.0 55.4 44.6
Iran 9.4 0.8 88.9 26.2 73.8
Poland 8.4 0.7 89.6 59.1 40.9
Other 117.5 10.4 100.0
World 1 129.36 100.0 100.0
Source: IISI, 2006.
Table 5.3 � Steel Production, 2005

106 TRACKING INDUSTRIAL ENERGY EFFICIENCY AND CO2 EMISSIONS
In the IEA statistics, coke ovens, blast furnaces and other energy uses in the iron andsteel industry are reported separately. Yet, analysis reveals that this data submittedfrom national sources need to be improved. For example, in some cases energy usedto produce iron and steel is allocated and reported in the “other industry” category,which results in an under-estimation; or the use of energy by-products for powergeneration is improperly allocated to the iron and steel sector. Therefore, othersources of supplementary data were used for the detailed analysis of process energyefficiencies.
Efficiency Improvements
Worldwide the iron and steel industry has achieved important efficiency gains duringthe last twenty years. Iron and steel manufacturing in all countries have improvedtheir efficiency; however, the global average level has not improved substantially.This reflects a concentration of growth in China, which has a relatively low averageefficiency. In 2005, China accounted for 50% of global coke production, 42% of pigiron production and 31% of steel production.
The energy efficiency of BOF steel production in the United States improved 1.5%per year between from 21.2 GJ/t in 2002 to 20.3 GJ/t in 2005, according tothe American Iron and Steel Institute. Energy efficiency in EAF plants improvedfrom 5.2 GJ/t in 2002 to 4.9 GJ/tin 2005. EAF production growth was faster,contributing to an average gain of 12% during this period.
Key point: An aggregate comparison of the energy intensity of steel production based on existing energy statistics is of limited value as the wide range does not provide meaningful insights regarding actualtechnological and operational differences.
0
5
10
15
20
25
30
35
40
45
0 5 000 10 000 15 000 20 000 25 000
Ener
gy
inte
nsi
ty o
f cr
ud
e st
eel
(incl
ud
ing
fin
ish
ing
) (G
J/t)
Total final energy use (PJ/yr)
Figure 5.3 � Final Energy Intensity Distribution of Global Steel Production, 2004
Source: IEA analysis.

In Europe, the CO2 emissions per tonne of finished product showed a 58% decreasefrom 1975 to 2000 because of four factors: 20% of the reductions by improvementof material efficiency including continuous casting, quality control and processmanagement. The materials efficiency increased from 72% in 1975 to 92% in 2005;14% by increased scrap use – from 55 Mt/y in 1975 to 80 Mt/y in 2005; 18% byimprovement of blast furnace management and feedstock preparation 6% byadopting higher quality of iron ores (Debruxelles, 2006).
The energy efficiency of the Japanese iron and steel industry improved by about 20%from the 1970s to 1990, but this growth slowed to only 7% between 1990 and2005 (Nakano, 2006; Ono, 2007). This trend can be explained by the fact that majorenergy efficient technologies had been deployed prior to 1990: process continuationand integration such as continuous casting were deployed in the 1970s. CDQ, TRT,and large scale waste energy recovery facilities were introduced in the 1980s. Fromthe 1990s, the additional energy use for high value-added product andenvironmental protection was outdone by energy saving measures such as wasteheat recovery, pulverised coal injection and regenerative burners. Also use of wastematerial such as plastics and tires has contributed to a reduction of fossil fuelconsumption.
In China, the overall average energy efficiency of plants has not changed much inrecent years (Table 5.4). However, there is a gap between the average and the bestplant in China of about 20%, part of which is due to blast furnace size and the levelof heat recovery.
Scrap recycling in electricity arc furnaces (EAF) requires less energy than the blastfurnace-basic oxygen furnace (BF-BOF) process and the direct reduced iron (DRI)-EAFprocess, because the energy intensive ore reducing process can be avoided. This processrequires about 6.6 GJ of chemical energy per tonne of iron when hematite ore (the mostabundant type) is used. However scrap recycling in EAFs or BF-BOFs is limited by itsavailability. The amount of steel that is stored in capital stock is more than ten timesannual steel production and it is still increasing continuously.
Chapter 5 • IRON AND STEEL INDUSTRY 107
5
Sintering Coking BlastFurnace
BOF EAF Rolling
GJ/t GJ/t GJ/t GJ/t GJ/t GJ/t
International 1994 1.7 3.8 12.8 –0.3 5.8
China 2002 Average 2.0 4.3 13.3 0.8 6.7 3.0
China 2003 Average 1.9 4.1 14.2 0.7 6.2 2.9
China 2004 Average 1.9 4.2 13.7 0.8 6.2 2.7
China 2004 Advanced 1.5 2.6 11.6 –0.1 4.3 1.6
China 2004 Laggard 3.2 6.7 17.3 2.2 9.5 8.4
Sources: China Iron and Steel Association (CISA), 2005b; IEA data.
Table 5.4 � Net Energy Use per tonne of Product(Primary Energy Equivalents)

108 TRACKING INDUSTRIAL ENERGY EFFICIENCY AND CO2 EMISSIONS
Figure 5.4 compares the CO2 emissions for the three key processes now in general use(BF-BOF, DRI-EAF and scrap-EAF). It suggests a potential for CO2 emissions reduction of30 – 80%. However, this assumes that the processes are interchangeable, which doesnot take account of actual available options, e.g., scrap and low carbon fuels availabilityis limited. DRI process can reduce CO2 emissions by using natural gas instead of coaland coke, but generally depends on the use of low cost stranded gas which is onlyavailable in parts of the world such as the Middle East. Note that options such as CO2capture from blast furnaces are not considered here.
Key point: Crude steel production using scrap yields lower CO2 emissions than other processes, but is limited by scrap availability.
Scrap - electricarc furnace
Direct reducediron (coal) - electric
arc furnace
Direct reducediron (gas) - electric
arc furnace
Advanced blastfurnace – basic
oxygen furnace
Present averageblast furnace – basic
oxygen furnace
Limited by scrap availability
Limited by low cost DRI availability
0 500 1 000 1 500 2 000 2 500 3 000
kilograms of CO2 emissions per tonne of crude steel
Figure 5.4 � CO2 Emissions per tonne of Crude Steel
Note: The high and low-end ranges indicate CO2-free and coal-based electricity, and account for country average differences based on IEAstatistics. The range is even wider for plant based data. The product is crude steel, which excludes rolling and finishing.
Source: IEA data.
Coke Ovens
Coke is used in blast furnaces for the chemical reduction of iron ore. Coke isproduced by heating coal for several hours or days to high temperatures in apyrolysis process. According to IEA statistics, global coke production was 408.5 Mtin 2004, of which 88% is used in the iron and steel industry.
China is a key coke producer. Of the 208.7 Mt it produced in 2004, 83% was from slotovens and the remainder from beehive ovens (CISA, 2005). About 15 Mt was exported.
Coke ovens are of two general types: recovery ovens, which collect hot gas and are usuallyslot ovens; and non-recovery ovens, which are usually beehive ovens. The vast majority ofplants make coke in slot ovens (about 90% of total production). Recent developments

suggest a modest revival of modern beehive (heat recovery) ovens. The old type of beehivecoke ovens in China and charcoal ovens in Brazil are statistically significant.
To make coke, selected coals are blended, pulverised, and oiled for proper bulkdensity control and then carbonised in an oven. In slot ovens, coal is loaded from thetop and heated from the side by burning gas in flues built into the walls. Ovens aregrouped together in a battery. Gas, oils and tars are collected and further processedin a by-products plant. Slot ovens evolved for two reasons: to collect the by products;and to manufacture coke oven gas (a fuel co-product).
Beehive ovens, which date to 1735, are normally of rectangular shape with a dome.The investment and operating cost of non-recovery ovens are generally lower than forrecovery ovens and since they operate with free space above the coke-cake they canuse cheaper grades of coal. The by-products are not recovered and coke oven gas and
Chapter 5 • IRON AND STEEL INDUSTRY 109
5
German TypicalModern Plant
2003
Japan Average for all Plants
2002
ChinaEfficient Wet
Quenching Plant2004
Input
Coal 39.04 37.83
Gas 3.25 3.51
Electricity1 0.16 0.12
Steam 0.25
Other 0.53
Total input 42.7 42.0
Output
Coke 29.73
Coke oven gas 7.65
Tar 1.18
Steam
Other 0.44
Total output 39.0 37.822
Net energy consumption 3.69 3.49 4.18
Data basis: Japan: average data for all plant in financial year 2002; China: data for selected new wet quenchingplant for 2004; Germany: typical modern plant for 2003.Note: 1 This is secondary energy consumed on-site.
2 This includes the steam recovery from coke oven; conversion efficiency is not considered.
Sources: Diemer, et al. (2004); JISF communication; Wei J. (2006).
Table 5.5 � Energy Balance of Slot Ovens for Coke Production

110 TRACKING INDUSTRIAL ENERGY EFFICIENCY AND CO2 EMISSIONS
other by-products are combusted in the battery. The energy use and specific CO2emissions of non-recovery ovens are about one and a half times those of aconventional slot oven.
The production of one tonne of coke typically requires 1.25 – 1.65 tonnes of coaland generates 300 – 360 m3 of coke oven gas (6 – 8 GJ/t coke). About 10% ofthe coke product consists of fines which are not suited as blast furnace feed. Theyare mainly used for the sintering process or sold.
Coke must be cooled quickly when it leaves the oven, in order to prevent burn-off andto achieve a high mechanical stability. Rapid cooling is called quenching. There aretwo types of quenching. Water is added in wet quenching processes, while an inertgas is used for dry quenching processes.
The energy use figures for coke ovens are often less reliable because the energythroughput is much higher than the energy use and a large number of energy flowsmust be considered for proper assessment. Coal and coke energy content can varywith quality. The energy consumed for coking is about 3.5 – 5 GJ/t coke produced(Table 5.5). The most efficient coke ovens use dry quenching and may use up to 40%less energy, if the full energy content of the recovered steam is accounted for. Thereis a high share of dry coke quenching in Japan, where energy is recovered from thehot coke and used for power generation. Data from the Japanese iron and steelindustry suggest a country average of 3.5 GJ/t final energy use for coke productionin 2002. The impact of coking on the total energy use in steel production is limited,as less than half a tonne of coke is needed per tonne of crude steel.
The kind of quenching affects the coke strength. Coke dry quenching (CDQ) and a newadvanced wet quenching process (Coke Stabilization Quenching (CSQ)) may lowerenergy demand in the blast furnace. The new wet coke technology, which to date hasonly been applied in Germany (ThyssenKrupp and Hüttenwerke Krupp MannesmannGmbH), brings the coke into contact with water from both top and bottom.
The impact of the process used on coke quality and the coke use in the blast furnacealso depend on the coal quality. This may reduce coke consumption by 1 – 2%, butthe optimal system choice needs to be assessed on a case-by-case basis. Coke qualityis also related to ash content. A 1% rise in the coke ash content results in a 2%increase of coke use, as more molten slag is produced. Especially in India, use of highash coal may have a detrimental impact on energy efficiency. Given a 10% share ofcoke making in total energy use for the BF-BOF process, these seemingly secondaryeffects are relevant.
According to the China Iron and Steel Association (CISA, 2005b), the averageChinese coke making energy consumption dropped from 180 kg coal equivalent(kgce) per tonne of coke in 1995 to 166 kgce (4.9 GJ/t coke) in 2000 due to theinstallation of more than ten sets of coke dry quenching (CDQ) and new advancedwet quenching installations. From 2000 to 2004, it had decreased further to 4.2 GJ/t coke (142 kgce), which is close the level of most OECD countries.However, it should be noted that this data does not cover the outdated beehiveovens that account for a fifth of Chinese coke production. There are no reliable dataavailable for these ovens.

Coke Oven Gas Use
Coke oven gas (COG) is rich in hydrogen and therefore has a relatively high heatingvalue of 17.6 MJ/m3, compared with 3.5 MJ/m3 for blast furnace gas. About70% of COG is used in iron and steel production processes, 15% to heat cokeovens and 15% for power generation. At most steel plants, COG is used to heatthe coke oven and to fuel equipment such as boilers and reheat furnaces. Theboilers supply steam for electricity generation, turbine-driven equipment such aspumps and fans and for process heat. The overall efficiency can be improved if thecoke oven is fired with blast furnace gas and the COG is put to a higher qualityuse, e.g. power generation. Some plants convert COG to chemicals. While COG-firedsteam cycles achieve about 30% efficiency, combined-cycles can reach more than42% electric efficiency.
In China, one-third of coke production in 2005 was in integrated steel plants where97% of the COG is recovered (CISA, 2005b). Reportedly, COG is still flared fromsome coke ovens. The other two-thirds were produced by coke making enterprisesthat are located close to coal mines. Only 24% of the COG was recovered at theseplants (Zhen, 2005). This leaves 250 PJ of COG that could be recovered and used,e.g. power generation, a savings potential of 25 Mt CO2.
Coke Dry Quenching
The coke dry quenching (CDQ) process was originally developed on an industrialscale in the former Soviet Union in the early 1960s (Giprokoks process). The maindriver was that wet quenching is not suited for the cold winter conditions.
In the CDQ process the carbonised coke initially passes from the battery to thecooling unit where it is emptied through an aperture into the shaft. As the cokecolumn descends it emits its sensible heat into a largely inert, counter-flowing gas.The cooled coke is discharged at the bottom of the shaft through sluices. The gas,which is recycled by a blower, has a temperature of 750 – 800°C and is used in awaste heat boiler for steam generation.
With CDQ about 0.5 t steam (480°C, 60 bar)/t coke corresponding to 1.5 GJ/tcoke can be recovered and used for power generation. This process at the Kimitsusteelworks in Japan yields an electric efficiency of about 30%. In a recent CDQproject proposed for a Chinese plant, the efficiency of use would be 22%.
CDQ increases the quality of the coke which reduces the coke consumption in theblast furnace by about 2%. This savings affect amounts to 0.6 GJ/t coke.
Worldwide, some sixty coke oven plants employ CDQ (Figure 5.5). TheCommonwealth of Independent States countries have 25 plants with 109 units,accounting for 52% of coke production in Russia (Moscow Energy Institute, personalcommunication). In Japan, CDQ is installed at 95% of plants (20 plants with about33 units). In Korea, 90% of all plants are equipped with CDQ. In principle, CDQ canbe applied at new and retrofitted at existing plants. While CDQ is widely applied inAsia it is not applied in the United States and Canada and the use rate is below 5%in Europe.
Chapter 5 • IRON AND STEEL INDUSTRY 111
5

112 TRACKING INDUSTRIAL ENERGY EFFICIENCY AND CO2 EMISSIONS
CDQ has energy benefits compared to conventional wet quenching. However, theenergy benefits compared to advanced wet quenching (CSQ) are not so clear. Forexample, at a plant in Germany air had to be added to the CDQ cooling gas toreduce the hydrogen build-up for safety reasons. This resulted in a burn-off of about2% of the coke produced.
The only plant using CDQ in Europe is Raahe Steel in Finland. ThyssenKrupp is nolonger using the CDQ process. The German experience with the energy “costs” ofCDQ and EU environmental regulations regarding fine dust emissions have resultedin limited interest for CDQ.
The low rate of CDQ use in Europe and North America contrasted with the high ratein Japan and Korea may reflect differences in electricity price and business finance.Also ambitious energy efficiency policies have played a role in the case of Japan.Investment and operation costs are high for CDQ. Where these costs are balanced byhigh electricity prices and 10% rates of return are applied, CDQ makes sense. Inparts of the world with low electricity prices and higher rates of return, CDQ may not be economically viable. An incentive of USD 25/t CO2 will not affect theeconomics significantly (Schoenberger, 2000; Stoppa, et al., 1999).
Given about 300 Mt coke production without CDQ and a saving of 600 gCO2/kWh, the global potential for CO2 emission reductions from using coke dryquenching processes is about 25 Mt CO2.
Key point: Country average CDQ use ranges from zero to 95% of total production.
0
10
20
30
40
50
60
70
80
90
100
Japan Korea Russia China Brazil India EU US
Co
ke d
ry q
uen
chin
g s
har
e (%
)
Figure 5.5 � Use of Coke Dry Quenching Technology, 2004
Sources: IISI communication; Institute of Energy Economics Japan (IEEJ) (2006).

Iron Ore Agglomeration
Seven countries account for 85% of global iron ore mining and produced 1 342 Mtore in 2004 (Table 5.6). Iron ore in its natural state occurs as lump ore or fine ore.High quality lump ore is a suitable feed material for blast furnaces, but itsavailability is limited. Fine ore must be converted into larger aggregates for use inblast furnaces, which are often better feedstock than lump ore. Sintering andpelletising are two common ore agglomeration processes. New iron reductionprocesses that can consume fine ore have an important cost advantage in that theycan avoid the additional costs of either ore agglomeration or of the purchase of moreexpensive lump ore. A 1.5 Mt Finex plant that can use ore fines directly is due to startoperation in Korea in 2007. Other processes for ore agglomeration are underdevelopment but are not discussed in more detail here.
Lump ore requires simple crushing and screening before shipment. It must meet strictminimum chemical characteristics (62+% Fe) and physical characteristics in terms ofsize and handling as it is fed directly into the blast furnace. It commands a premiumcompared with ore fines. About 25% of all iron ore is used directly, without anagglomeration process.
Global pelletising capacity stood at 332 Mt in 2004. About 25% of all iron ore isprocessed into pellets. Most of the production serves as feed for blast furnaces andabout one-third of the pellets are used in DRI production. Pelletising is especiallysuited for certain types of low quality iron ores, e.g. ores in the United States requirepelletising because of high gangue content. Various factors such as the high capitalcost of pellet plant construction, energy costs of grinding the fine-grained ores toproduce concentrate and other process energy demands, and the stringentspecifications of feedstock required to produce a quality pellet have limited theexpansion of pellet use.
Sintering is the most efficient and effective process for making direct feed for blastfurnaces. More than 50% of all iron ore is converted into sinter. Sintering involvesthe heating of fine ore, causing it to agglomerate into larger granules. Iron ore, cokebreeze or anthracite and flux materials are mixed and fed onto a travelling grate andignited. Air is pulled through the feed to burn the mixture by down-draft combustion,creating sufficient heat to sinter the fine ore particles into porous clinker. Theincorporation of blast furnace flux in the sinter saves fuel in the blast furnace. Dataindicate 201 kg of saved coke for each tonne of limestone fed into the sinter plantinstead of in the blast furnace. Use of sized sinter further increases iron productionrates in the blast furnace.
All blast furnaces use a combination of sinter, lump and/or pellets as input (directcharge). Steel producers in the United States generally use 75+% pellets while therest of the world uses sinter feed (60+%) in blast furnaces. Increasingly steelproducers blend and mix the types of ores used as direct charge to reduce swelling,increase throughput, reduce energy cost and coke consumption and generallyimprove the production process while reducing pollution. Pre-treatment technologiesfor blast furnace feedstock are highly effective in reducing energy consumption.
Chapter 5 • IRON AND STEEL INDUSTRY 113
5

114 TRACKING INDUSTRIAL ENERGY EFFICIENCY AND CO2 EMISSIONS
Table 5.6 shows a breakdown of various heat recovery options in a blast furnace-BOFprocess, including a sintering plant. The exergy value accounts for the quality of theenergy, higher temperature being better suited for electricity generation. The sensibleheat value is a relevant indicator if low temperature steam is the main targetproduct. The values suggest a significant energy recovery potential for sintering,more important than for coke dry quenching.
Typically the sintering process requires about 1.5 – 2 GJ/t sinter. The heatconsumed for sintering reaction is about 33% of the total heat input into the plant,with about 49% released to the atmosphere. Waste heat recovery is a key strategyfor improved efficiency. One system recovers 60% of the waste heat from sintercooling gas. Another technology recirculates the waste heat to other parts of theproduction process. The heat of the circulation gas raises the sintered oretemperature to be fed to the sinter cooler and reduces the coke consumption. New
Sensible heatGJ/trs
ExergyGJ/trs
Temperature°C
Status
Coke making
Hot coke 0.24 0.14 1 100 Commercial
Coke oven gas 0.24 0.12 850 Stopped
Sintering
Cooler gas 0.97 0.28 100 — 350 Commercial
Exhaust gas 0.23 0.12 100 — 350 Commercial
Blast
Waste heatrecovery in hotstove
0.82 0.33 250 — 400 Commercial
BF Slag 0.39 0.26 1 500 Stopped
BOF
BOF gas 0.19 0.12 1 600 Commercial
BOF slag 0.02 0.01 1 600 Stopped
Casting
Cast steel slab 1.39 1.06 700 Commercial
Reheating furnace 1.04 0.62 900 Commercial
Hot Rolling mill
Total 5.53 3.06
Source: Beer, et al., 1998.
Table 5.6 � Heat Recovery Options in Various Steel Production Steps(Per tonne of Rolled Steel (trs) Product)

plant designs combine both systems. All the waste heat from both the sinteringprocess and sinter cooling gases is effectively recovered (JP Steel plantech, 2002). Nodetailed data are available regarding the efficiency of waste heat recovery fromsinter plants on a country or plant level.
Ore Quality
The chemical composition of iron ores varies. The most widely used are hematiteand magnetite. The energy needs of a blast furnace depend to some extent on thequality of the ore. The metal content is increased in the ore preparation process,using grinding and separation technologies. The higher the metal content, thelower the energy needs for iron making. A lower metal content results in more slag,a need for more limestone addition and higher energy use. Variations in thechemical composition of ore can make a difference of about 10 – 15% in blastfurnace energy use.
Chapter 5 • IRON AND STEEL INDUSTRY 115
5MiningMt/yr
MetalMt/yr
Metal Content%
Australia 231 143 62
Brazil 255 169 66
China 310 102 33
India 121 77 64
Russia 97 56 58
Ukraine 66 36 55
United States 55 34 62
Other 207 122 59
World 1 342 739 55
Source: United States Geological Survey (USGS), (2005a).
Table 5.7 � Iron Ore Mining and Ore Quality, 2004
Chinese research indicates that if the iron content of the feedstock improves by 1%,the coke use decreases by 1.5 – 2% (Yu, 2003; Wei 2006). The use of preparedburden (sinter and pellets) reduces the coke ratio substantially. Data for Europeanblast furnaces suggest that a reduction of the prepared burden ratio from 95 to 65%increases the coke ratio from 330 to 410 kg/t (Lacroix, et al., 2001). However, theimpact on the total blast furnace balance is less evident.
No detailed data are available regarding the metal content in prepared feedstock,but a typical range is 60 – 67%. Given the low metal content and special chemicalcomposition of Chinese ore (Table 5.7), more analysis of prepared feedstock qualityis recommended.

116 TRACKING INDUSTRIAL ENERGY EFFICIENCY AND CO2 EMISSIONS
Blast Furnaces
A blast furnace is the vessel where iron ore is chemically reduced and converted intoliquid hot iron metal. Coke and iron ore agglomerate are added from the top andgradually move down the vessel as the coke oxidises and the ore melts. Oxygenenriched air is heated in the hot stove and injected from the bottom of the furnace(hot blast) and pulverised coal also is injected.
Basically a blast furnace is an energy efficient reactor. The following analysis oftechnologies and practices for blast furnaces suggests that given an average savingspotential of 75 kg coal and coke per tonne of hot metal (thm), iron and steelmanufacturing has an energy efficiency improvement potential of 1.5 EJ/yr andcould reduce CO2 emissions by 150 Mt CO2 /yr. This includes measures such asclosure of inefficient small-scale blast furnaces, use of better coal, higher pulverisedcoal injection rate, wider use of top-pressure turbines and increased efficiency of hotstoves. It excludes the CO2 benefits of switching to waste plastic or charcoal.
The blast furnace has a vertical cylindrical structure externally covered with a shell ofthick steel plate and internally lined with refractories. The size range of blast furnacescovers almost two orders of magnitude, from less than 100 to more than 5 000 m3
(Nippon Steel, 2004). Larger blast furnaces have lower heat losses than smaller onesand the installation of heat recovery equipment is more cost-effective.
The practical minimum energy use for a blast furnace is 10.4 GJ/t, which is the sumof the chemical energy, the carbon content of the hot metal, the energy in the hotmetal and the energy needed for limestone calcination, if limestone is added.
About 35 – 40% of the energy content of the reducing agents is extracted from thereactor as blast furnace gas. Part of the blast furnace gas is used to heat the hotblast. The energy losses from the reactor are less than 10% of the total energy input(Figure 5.6).
Molten iron Fe: 5% C 9.8 GJSensible energy slag: 0.6 GJ
Coal 175 kg/4.9 GJ
Hot blast/3 GJ Blast furnace gas 4.8 GJ
Loss 1.2 GJ
Coke 300 kg/8.6 GJ
Figure 5.6 � Energy Balance of a Typical Efficient Blast Furnace
Key point: The heat losses of a blast furnace are small compared to the energy through-put.
Source: IEA estimate.

Blast furnaces which use injected pulverised coal have equipment for pulverising thecoal and injecting it under pressure. The amount of coal used for pulverised injectionworldwide was on average about 125 kg/t in 2005. In many OECD countries,average coal and coke use for blast furnaces is in the range of 500 – 600 kg/t.
Coke consumption of about 286 – 320 kg/tonne hot metal (thm) has been achievedin some blast furnaces by the pulverised coal injection of 170 – 200 kg/thm. A modernlarge blast furnace uses 460 – 480 kg total reductants/thm, if good quality sinter andgood quality coke are used. Furnaces can be operated in different ways. For example,the carbon rate can be lowered by using sponge iron or scrap in the burden.
Figure 5.7 shows blast furnace reductant use per tonne of hot metal in a number ofcountries and regions. The highest levels are in Ukraine, Russia and China. The differencebetween the lowest and highest country average is about 150 kg coal and coke/t hotmetal. It should be noted that this does not equate with energy efficiency, as a furnacewith a high coal and coke consumption will generate more blast furnace gas by-product.Also the quality of the iron feedstock and the coke differs. Significant amounts of naturalgas and oil are injected in some plants, but accurate data are not available. Figure 5.7contains estimates. Blast furnace size and oxygen use are also important factors andthey depend on the technology choice and business strategy.
Chapter 5 • IRON AND STEEL INDUSTRY 117
5
Key point: Country average blast furnace reductant use ranges from lessthan 500 to 700 kg/thm, with a global average of 550 kg/thm.
0
100
200
300
400
500
600
700
800
India
Ukrain
eChi
na
Russi
a
New E
U acc
essio
n co
untri
es
Afric
a, M
iddle Ea
st, Tu
rkey
US, Can
ada, M
exico
Japa
n
Sout
h Ko
rea
Sout
h Am
erica
EU15
Chine
se Ta
ipei
Germ
any
Wor
ld ave
rage
Red
uci
ng
ag
ents
co
nsu
mp
tion
(kg
/to
nn
e h
ot
met
al)
Gas Oil Coal Coke
Figure 5.7 � Blast Furnace Reductant Use, 2005
Source: Stahlinstitut VDEh, 2007.

118 TRACKING INDUSTRIAL ENERGY EFFICIENCY AND CO2 EMISSIONS
Box 5.2
The Impact of Size on the Energy Efficiency of Blast Furnaces in China
Size affects blast furnace efficiency. A larger blast furnace is usually more efficient because theheat losses are lower (lower surface/volume ratio) and it is usually more economical to installenergy efficient equipment (Table 5.8). Switching to larger blast furnaces requires moderntechnologies.
The Government policy target in China is to close all blast furnaces below 100 m3 by 2007and close all furnaces below 300 m3 by 2010. All steel making furnaces of less than 20 tonnecapacity are to be closed in 2007.
Reductant use also varies within countries. For example, in China, the coke use rateof the best producer was only 288 kg/thm in 2004. However, smaller furnaces emitup to 25% more CO2 than large furnaces (Table 5.8).
For blast furnaces of a certain size the energy efficiency is independent of theproduction capacity. There are many energy efficient mid-size blast furnaces withproductions of 3 500 – 6 500 t/day. In China and India there is a trend to use miniblast furnaces to feed electric arc furnaces. This allows small-scale steel production,which is better adjusted to local market circumstances and requires less capital.However, this results in low energy efficiency. Based on the data in Box 5.2, CO2emissions in China can be reduced by 37 Mt/yr, if all furnaces were as efficient asthe largest ones that are currently in operation.
CO2Intensityt CO2/yr
Number ofInstallations
ProductionCapacity
Mt/yr
Share
%
AnnualProduction
Mt/yr
Annual CO2
Mt/yr
Total 1.25 395 230.9 100.0 251.9 314.9
>3 000m3 1.09 6 16.6 7.1 17.8 19.4
2 000—2 999m3 1.17 28 50.9 22.0 55.5 65.0
1 000—1 999m3 1.21 39 38.3 16.6 41.8 50.6
300—999m3 1.31 231 107.8 46.7 117.6 154.1
101—299m3 1.33 82 16.5 7.1 18.0 23.9
<100m3 1.37 9 0.9 0.4 1.0 1.3
Sources: CISA, 2005(2); IEA data.
Table 5.8 � CO2 Emissions of Chinese Blast Furnaces as a Function of Size, 2004
There are considerable differences in energy efficiency within the various categoriesof blast furnaces due to the resource quality and furnace productivity. For mini blastfurnaces, an increase in the iron content of the ore from 50 – 55% reduces fuel usefrom 750 – 600 kg/thm – a 20% savings. An increase in daily furnace productivityfrom 1 – 1.5 t/m3 reduces the fuel rate from 750 – 600 kg/thm.

The quality of the iron ore and the quality of the coal influence the energy needs foriron production. A proper comparison should account for such quality differencesthat may result in up to 20% difference in energy efficiency. However, such analysiswould require more detailed data that are not readily available.
Coal and Coke Quality
The chemical reactions in blast furnaces are very complex. There are two main reactionsin the blast furnace, the “indirect reduction” with carbon monoxide between solid andgas, and “direct reduction” with carbon between solid iron oxide and solid carbon.Indirect reduction requires more carbon for the reduction, but less energy to maintainthe reaction temperature. Direct reduction requires less carbon for the reduction, butmuch more energy to maintain the reaction temperature. The blast furnace operationcontrols these two chemical reactions by controlling temperature distribution in thefurnace to maintain the equilibriums of each reaction.
Coke performs three functions in a blast furnace:
� chemical function, as reductant by providing reducing gases for iron oxidereduction;
� thermal function, as fuel for endothermic chemical reactions and to maintaingas permeability in the furnace for stable control of melting of iron and slag;
� mechanical function, as a permeable grid to provide passage of liquids andgases in the furnace, particularly in the lower part of the furnace.
When coke passes through a blast furnace to a high temperature zone, the cokedegrades and generates fines which affect bed permeability and affects the processefficiency. The rate at which coke degrades is mainly controlled by the solution lossreaction, thermal stress, mechanical stress and alkali accumulation.
Coke quality is often characterised by measuring cold and hot strength, ashcomposition and chemistry, which are largely dictated by the coal properties. A rangeof laboratory tests and procedures have been developed to characterise physical andchemical properties of coke and their potential impacts in a blast furnace. The mostoften used and well-known tests are the Coke Reactivity Index (CRI) and the CokeStrength after Reaction (CSR) developed by Nippon Steel Corporation (NSC) in Japanin the early 1970s, in order to assess the effect of CO2 reactions on coke. CSRmeasures the potential of the coke to break into small size under a high temperatureCO/CO2 environment that exists throughout the lower two-thirds of the blastfurnace. A large mean size with narrow size variations helps maintain a stable voidfraction in the blast furnace permitting the upward flow of gases and downward flowof molten iron and slag thus improving blast furnace productivity.
A CSR difference of 10% results in a 5% difference of total coke and coal injectionrate. Moreover, the pulverised coal injection rate is 50 kg higher for coal with a highCSR, which reduces coke needs and energy use for coke making (Veld, 2006).However, there is an upper limit above which the reactivity becomes too low. CSR isnot only a function of the coal characteristics, but it may also depend on the cokeoven. Tests suggest that alkali components play a key role in the coke chemistry in ablast furnace, which is not captured by the CSR/CRI test (Hilding, 2005). There areno detailed publicly available statistics on coke quality.
Chapter 5 • IRON AND STEEL INDUSTRY 119
5

120 TRACKING INDUSTRIAL ENERGY EFFICIENCY AND CO2 EMISSIONS
China represents more than half of global coke production and it is largely based onindigenous coal. Some Chinese coke is of very high quality (CSR >70%) (Valia, et al.,2004), but other coke from small coking plants is of low quality, with a CSR of 50 –60%, up to 18% water content and 16% ash content (Qian Kai, et al., 2004). In2006, 218 Mt coking coal were traded, 60% of which came from Australia from theBowen Basin in Queensland. This Australian coal reach a CSR in the 50 – 70% rangeand the ash content is low (Bistrow, 2002). Russian and US coal is generally of lowquality in terms of coke CSR, which results in a higher coke use rate.
The amount of coke and coal that is needed also depends on the ash content. A 1%rise in the coke ash content results in a 2% increase of coke use (about 1 kg/thm),as more molten slag is produced. For each percentage increase in the ash content ofinjected coal, there is a coke rate disadvantage of about 1.5 kg/thm.
Coal Injection
Worldwide, pulverised coal injection per tonne of hot metal rose from 45 kg/thm in1995 to 125 kg/thm in 2005 (Figure 5.8) (Stanlay, 2003; Stahlinstitut VDEh,2007). Several individual furnaces, however, have achieved higher injection rates,180 – 200 kg/thm. Use of coal reduces the need for coke in iron and steelproduction and reduces CO2 emissions.
Key point: Country average coal injection ranges from zero to 160 kg/thm, with a global average of 125 kg/thm.
0
20
40
60
80
100
120
140
160
180
Ukrain
e
New E
U acc
essio
n co
untri
es
Afric
a, M
iddle Ea
st, Tu
rkey
US, Can
ada, M
exico
Russi
a
Germ
any
India
Japa
nEU
15
Sout
h Am
erica
Chine
se Ta
ipei
China
Sout
h Ko
rea
Wor
ld ave
rage
Co
al in
ject
ion
(kg
/to
nn
e h
ot
met
al)
Figure 5.8 � Pulverised Coal Injection in Blast Furnace Use by Region, 2005
Sources: StahlZentrum; IEA Coal Statistics, 2005; JISF, 2006.

Low volatile coal replaces more coke than high volatile coal. For example, 150 kg oflow volatile coal reduces coke consumption by 18 – 26 kg more than the sameamount of high volatile coal.
The amount of coal that can be injected depends on the gas permeability of the coke-ore bed, which decreases as less coke is added and the pressure drops. The cokeparticle size in the lower part of the furnace is much smaller if more coal is injected.According to IISI, an increase of coal injection above 180 kg does not reduce thecoke amount, and the additional coal is just gasified and produces more top gas.Given the current world average of 125 kg/thm, however, there is still potential toincrease the rate of pulverised coal injection. If the world average was 180 kg/thm,some 10 Mt CO2 could be saved.
Plastic Waste Use
Plastic waste can also be injected into blast furnaces as a substitute for coke andcoal. The technology has been developed and applied in Germany and Japan.Plastic waste can also be added to the coke oven. About 0.4 Mt of plastic wasteis used per year in the Japanese iron and steel industry, which equals about 20 PJ/yr.
Factors that influence the increased use of plastics in blast furnaces include: theneed to control the polyvinyl-chloride content of the plastic pellets; regulations onthe use of waste as a fuel and environmental concerns; capital costs to modify thefuel injection system. The option is limited by the availability of plastic waste andby the claims of other uses, such as recycling and incineration.
Burning waste plastic releases CO2 emissions whether it is burned in a conventionalwaste incinerator or a blast furnace. However, much more energy can be recoveredby injection in blast furnaces than by conventional incineration. Moreover, coal isreplaced in a blast furnace, a fuel with high CO2 emissions. The reference primaryenergy source for power generation is in many cases less CO2 intensive. Thereforeblast furnace use reduces CO2 emissions compared to conventional wasteincinerators.
Charcoal Use
Charcoal is used in iron production only in South America, notably in Brazil. In2005, one third of Brazilian iron was produced using charcoal (Box 5.3). Charcoalhas a lower mechanical stability, much lower ash content and much highervolatile material content (20 – 35%) than coke. The use of charcoal in large blastfurnaces is limited due to its low mechanical resistance. The largest charcoal blastfurnaces are one order of magnitude smaller than the largest coke blast furnaces.Because charcoal furnaces are smaller they can operate with lumpy iron orealone, no ore preparation is needed. The slag rate in charcoal blast furnaces isusually less than 150 kg/thm. A typical charcoal use rate is less than 500 kg/thm. While charcoal use does not result in any energy efficiency gains, itreduces CO2 emissions substantially, provided that it is produced in a sustainablemanner.
Chapter 5 • IRON AND STEEL INDUSTRY 121
5

122 TRACKING INDUSTRIAL ENERGY EFFICIENCY AND CO2 EMISSIONS
Box 5.3
Energy Efficiency and CO2 Emissions in the Iron and Steel Industry in Brazil
Brazil produced 33.9 Mt of pig iron and 31.6 Mt of crude steel in 2005, of which 12.5 Mt of steel and 7.1 Mt of pig iron were exported. This pig iron trade is a uniquecharacteristic of the Brazilian industry. There were eleven companies manufacturing steelin Brazil, while pig iron had 69 independent producers (MME, 2006a). In 2005, 71% ofthe pig iron produced came from integrated steel works and the rest from independentproducers. About 83% of the output from independent producers was used for steelmaking and the rest for iron casting.
The production of both steel and pig iron consumed 731 PJ in 2005, almost 24% of total finalenergy demand in Brazil’s industry sector (MME, 2006b). About 20% came from primaryenergy sources – natural gas and coal – and 80% from secondary energy sources – coke(34.7%), charcoal (27.5%), electricity, coke oven gas, fuel oil and other fuels.
The use of significant amounts of charcoal for reducing iron ore is another specialcharacteristic of the Brazilian iron and steel industry. Blast furnaces can use either cokeand coal or charcoal. About one-third of all pig iron is produced using charcoal. The shareof charcoal has been rising in the last five years. In 2004, 1.4 Mt of integrated steelworksand 10.1 Mt of independent pig iron production were based on charcoal. Arcelor Brasil andAcesita are the main integrated steelworks that use charcoal. The independent producersoperate 153 blast furnaces that use charcoal with capacities ranging from 18 to 180 kilotonnes of pig iron per year. The average energy efficiency of charcoal making was53% in 2005, well below the efficiency of coke making from coal. Just over half of thecharcoal came from planted forests, the remainder from native forest.
The current specific consumption in the blast furnaces of integrated mills in Brazil is about 330 kg coke and 170 kg coal per tonne of pig iron, which corresponds to 15.5 GJ/t. Theindependent producers use on average 25.6 GJ charcoal/t pig iron. The most efficientcharcoal-fired blast furnace at Acesita used 16.2 GJ charcoal/t pig iron in 2004. This is closeto the figure for coke - fired furnaces.
A third special characteristic of the iron and steel industry in Brazil is that most of the pelletsproduced are exported. Of the 51 Mt of pellets produced in 2005, 47 MT were exported (MME,2006b). The energy consumed in pellet making is accounted for in the mining industry in theBrazilian statistics. Assuming a total specific final energy consumption of 1.089 GJ/t pellet,the pellet production consumed 55.54 PJ of energy in 2005, including 17 – 50 kWh/t ofelectricity (MME, 2006b). In 2003, the total production of sinter in Brazil was 28.49 Mt, withan average specific energy consumption of 1.82 GJ/t of sinter (ABM, 2004).
Table 5.9 provides an overview of the CO2 emissions in steel production in Brazil. The averageis 1.41 – 1.66 t CO2 /t of steel. This average is augmented by the high pig iron to steelproduction ratio, on the other hand it is reduced by the use of charcoal and the low CO2intensity of Brazilian electricity.
An average annual investment of USD 3.11 billion is forecast for the iron and steel industry inBrazil for the period 2006 – 2010. Production capacity is due to expand from 36.6 Mt to 50.4 Mt of crude steel per year by 2010. As a consequence, the energy intensity of the ironand steel industry in Brazil may change significantly in the coming years.

Chapter 5 • IRON AND STEEL INDUSTRY 123
5
Box 5.3 (continued)
Source: Bajay, et al., 2007.
t CO2/t steel
Mineral Coal 0.92
Charcoal from native forests 0.30 — 0.55
Limestone and dolomite 0.09
Natural gas 0.08
Fuel oil 0.01
Electricity 0.01
Total 1.41 — 1.66
Top-Pressure Recovery Turbines
Many blast furnaces are operated at high pressure to increase the furnaceproductivity. A typical pressure in the top part of such blast furnaces is about 3 bar, given a blast pressure of 4.5 bar. The pressure drop ranges from 1.25 – 1.5 bar from the bottom to the top of the blast furnace (Lacroix, et al.,2001).A top-pressure recovery turbine can be used to generate electricity from theremaining pressure in the top gas. The power output of top-pressure recoveryturbine can cover about 30% of electricity necessary for all equipment for theblast furnace including air blowers.
Top-pressure recovery turbines (TRT) use a wet or a dry system. The dry TRT systemsaves on water and electricity use, produces more power and has more favourableeconomics.
TRTs are widely used in Japan and elsewhere. In China, 66 blast furnacesrepresenting nearly half the total production capacity were equipped with TRT in2004. A TRT can produce 15 – 40 kWh/t of pig iron. If the technology wereinstalled worldwide in all furnaces that are operated at elevated pressure, it couldreduce CO2 emissions by 10 Mt.
Blast Furnace Gas Use
Blast furnace gas is a by-product of the furnace process. About 40% of the coal andcoke energy input is converted into blast furnace gas. This gas contains about 4%hydrogen, 25% carbon monoxide, 20% CO2 and the remainder is nitrogen. Theheating value of this gas is low: about 3.5 MJ/m3 while its CO2 content is high.Therefore, a minimisation of blast furnace gas production will reduce CO2 emissions.
Table 5.9 � Average CO2 Emissions from Steel Production in Brazil, 2005

124 TRACKING INDUSTRIAL ENERGY EFFICIENCY AND CO2 EMISSIONS
Global blast furnace gas use was about 3.5 EJ in 2004 (Table 5.10). Its low heatingvalue limits its use mainly for blast heating, hot mill reheating furnaces, coke ovenheating, power production, or recycled to the blast furnace. Significant amounts ofblast furnace gas are still flared during periods when supply exceeds demand. Largerstorage systems have been used, e.g. in Japan, in order to minimise flaring. There areno available data on the flaring of blast furnace gas.
Older power plants use blast furnace gas together with natural gas or oil, often in asteam cycle. In the United States, by-product gases are usually ducted to steamboilers where the gas is burned to produce steam for process needs. If there issufficient energy, steam can be produced at a sufficiently high pressure to drive anextraction or back-pressure steam turbine, generating electrical savings for the mill(an electrical efficiency of about 15%). Use of by-product gas in a dedicated steamcycle typically yields efficiencies of 30% or lower.
Combined gas turbines and steam cycles can produce electric efficiencies in excessof 42% in steel mill applications. This represents an important efficiency gain. Acritical factor is the gas turbine inlet temperature, which directly impacts the gasturbine efficiency. The latest designs operate at 1 300°C. The company MitsubishiHeavy Industries (MHI) has a 70% share of the blast furnace gas turbine market(Komori, et al., not dated).
Blast Furnace Slag Use
Blast furnace slag is a co-product of blast furnace iron production. The slag capturesall ash residues from the coal, coke and ore. There is considerable variation inindividual integrated plant practices and in the quality of ores used. Smallintegrated plants are at a disadvantage to the larger more efficient plants becausethe combination of ash from the coke and pulverised coal injection requires morelime, to meet the required lime to silica ratio. Typical blast furnace slag productionis in the range of 250 – 300 kg/thm. Higher values result if high ash coal is used,
Table 5.10 � Global Blast Furnace Gas Use, 2004
AmountPJ/yr
Share%
Power generation 602.9 17
CHP plants 376.1 10
Heat plants 97.3 3
Coke ovens 154.5 4
Blast furnaces 121.0 3
Iron and steel industry (including hot stoves) 2 066.7 58
Other 166.3 5
Total 3 584.7 100
Source: IEA data.

such as in India. Given a global iron production of 718 Mt, total slag production isin the range of 180 – 220 Mt. The current blast furnace slag production is 400 kg/tiron due to the low ore quality, and rising.
Blast furnace slag can be cooled with air or with water. If water is used, the slag isgranulated and can be a substitute for cement clinker. The use of blast furnace slagas clinker substitute results in significant CO2 emission reductions in cementmanufacturing.
Global granulated slag production increased from about 84 Mt in 2000 to 110 Mt in2005, 50 to 60% of total blast furnace slag production. Only about 60 Mt is used inthe cement industry according to Caffrey (2005). If the gap between total slagproduction and granulated blast furnace slag use for cement production is considered,the remaining potential today is about 120 – 160 Mt , which represents a 90 – 135 MtCO2 emission reduction potential. For example, Japan produced about 25 Mt of blastfurnace slag in 2004, but made use of only 9.2 Mt in cement production (JCA, 2006).Other sources quote even lower use rates (Nippon Slag Assoc., 2006).
The major uses of air-cooled slag are as aggregates for road construction and as afeed for cement kilns. Air-cooled slag also is used as an aggregate for concrete. Theenergy and CO2 benefits of air cooled slag use are limited.
Table 5.11 shows blast furnace slag use rates. Most granulated slag is used forcement production, but not all slag is granulated. In the United States, air-cooledslag is the majority of all slag. This suggests there is some additional potential forblast furnace slag use as clinker substitute, even in OECD countries. About 11 Mt ofblast furnace slag is traded internationally. Increased trade may be a way to enhancegranulated slag use for cement making (Caffrey, 2005). It should be noted thatfigures for China are uncertain. According to the China Building Materials IndustryAssociation, 110 Mt of granulated slag were used in China in 2004 (Cui and Wang,2006). This is significantly higher than the quantity reported by the China Iron andSteel Industry Association. Similar to the situation in the United States, significantamounts of GBFS are directly used for ready-mix concrete production.
Chapter 5 • IRON AND STEEL INDUSTRY 125
5
Europe Japan United States China
Mt/yr % Mt/yr % Mt/yr % Mt/yr %
Air-cooled slag 5.9 25 5.4 22 7.4 67
Granulated slag 17.6 75 19.1 78 3.6 33 75.6 100
Of which
Cement 1.2 73 14.9 61 3.6 33 49.1 65
Other 0.4 2 4 16 0 0 26.5 35
Total 23.5 100 24.5 100 11 100 75.6 100
Sources: Euroslag, 2006; Utsi, 2006; Nippon Slag, 2006; USGS, 2005; CISA, 2005c.
Table 5.11 � Use of Blast Furnace Slag, 2004

126 TRACKING INDUSTRIAL ENERGY EFFICIENCY AND CO2 EMISSIONS
Hot Stoves
In hot stoves, compressed air is blended with additional oxygen, heated to about 1 100° C and injected at the bottom of the blast furnace. The hot stove is acylindrical furnace about 12 m in diameter and 55 m in height, and has a chamberfilled with chequered silica bricks. It serves as a type of heat exchanger in which theheat produced by combustion of the blast furnace gas is stored in the chamber, afterwhich cold air is blown through the hot checker-work to produce the preheated hotair blast for the furnace. Two or more stoves are operated on alternate cycles,providing a continuous source of hot blast to the furnace.
In an integrated steel works, hot blast stoves account for 10 – 20% of the totalenergy requirement, typically 3 GJ/thm. About one-third of the energy used inmaking iron is used in pre-heating the air for the blast furnace. Therefore, improvingthe efficiency of hot blast stoves will result in substantial energy savings.
Normally, mixtures of gases are used to heat a hot blast stove. A typical mix consistsof 60% blast furnace gas and 40% coke oven gas or natural gas. The application ofgas enrichment is relatively expensive as enrichment gas is more expensive thanblast furnace gas. To minimise the costs associated with enrichment gases, wasteheat can be recovered and used for preheating the combustion gas and/orcombustion air for the stove. Besides reducing costs for enrichment gases, a wasteheat recovery unit will increase the overall stove system efficiency by up to 8 percentage points, a saving of 0.24 GJ/t HM (Celissen and Haak, 2004). Thewaste gas of the stove heating cycle could be used for preheating of the gas and airof the cold blast of another stove. On a global level, the savings potential is 0.2 EJ/yr, equivalent to about 20 Mt CO2/yr.
Basic Oxygen Furnaces
The liquid hot metal from the blast furnace is converted into steel in the basic oxygenfurnace. The main operation is adding oxygen in order to remove the carbon fromthe iron to make steel. In recent years more extensive ladle metallurgy processes havebeen developed in order to improve the steel quality. Few energy data are availablefor these operations.
Open hearth steel production (also called Martin steel production) uses about 5 GJ/t steel, compared to virtually no energy use or net energy production in caseof a basic oxygen furnace. Open hearth production is still widely used in Russia andthe Ukraine, though its share is declining. In Russia its share declined from 53% in1990 to 20% in 2005.
Similarly outdated equipment is still used in the CIS countries in other parts of thesteel industry. For example, electric arc furnaces use on average 630 kWh/t versus 400 kWh/t in OECD countries. The low efficiencies reflect traditionally very lowenergy prices and shrinking production volumes. Russian steel production in 2005was only 74% of the production volume in 1990. Production has increased in recentyears and energy prices have risen considerably. Consequently energy efficiency isimproving.

Basic Oxygen Furnace Gas Recovery
In basic oxygen furnace steel production, more than 100 m3 of by-products(converter gas) with a heat value of 8.35 MJ/m3 is generated per tonne of steelproduced (0.84 GJ/t). The gas generation will be somewhat lower if the scrap userate of the converter is high. This gas can be recovered, cleaned and used for heatingof coke ovens or for power generation. Table 5.12 shows residual gas use forintegrated plants in China.
Off-gases from the basic oxygen and electric arc furnaces are at a temperature above 1 650°C, low pressure, and can approach 6 – 8 MJ per cubic metre. They have a low fuelvalue during much of the steel making cycle. The off-gases are generated intermittently,vary greatly in temperature, carbon monoxide and nitrogen concentrations, and are verydirty. For this reason, off-gases are still flared at many sites. Yet technologies exist to usethe energy content of the gas. Larger gas storage systems can be part of the solution.Currently, some steel producers capture and reuse basic oxygen furnace gases. Higherenergy prices may make this option more attractive. The estimated saving from blastfurnace gas recovery is approximately 250 PJ and 25 Mt CO2.
Chapter 5 • IRON AND STEEL INDUSTRY 127
5
1995%
2000%
2001%
2002%
2003%
COG 98.1 98.0 96.2 97.2 96.6
BFG 88.0 91.7 90.0 92.5 91.6
BOF gas 54.7 40.7 68.8 70.0 89.0
Source: CISA, 2005b.
Steel Slag Use
About 100 – 200 kg of BOF slag is generated per tonne of liquid steel. Steel slag,which is a by-product of the steel production process, is widely used for roadconstruction. It can also be used in the cement clinker manufacturing process. Theresult is an increase in clinker production of up to 15% with no net increase in CO2emissions. More specifically, the process involves the addition of slag into the backor feed end of the kiln through a relatively uncomplicated and inexpensive deliveryand metering system. Due to the chemical composition of the slag and the energy-intensive nature of the steel production process, the material requires little or noadditional fuel to convert it into cement clinker. In addition, lower total fuel pertonne of clinker is required. The result is a net reduction in CO2 emissions per tonneof clinker produced.
Furthermore, the flexibility of this technology means that it can easily be integratedinto virtually any existing cement plant at low capital cost and provide a significantincrease in production. Other major benefits are lower CO2 emissions and reducedfuel consumption with the potential of eliminating the need for traditional raw
Table 5.12 � Residual Gas Use in China

128 TRACKING INDUSTRIAL ENERGY EFFICIENCY AND CO2 EMISSIONS
materials such as shale or clay (Perkins, 2000). The main limitation for increasedsteel slag use for cement production is its high phosphor content. Phosphor can beremoved in the ladle metallurgy process, but this is not yet widely done. Some steelslag also can directly be added as clinker substitute, but grinding of steel slag is avery energy intensive process, therefore this option is not widely applied.
Table 5.13 shows both basic oxygen and electric arc furnace slag use in Europe,Japan and the United states. Most slag is used for road construction and civil works.This application generates some CO2 benefits, but they are limited. The steel slag usefor cement production is still very limited and could be expanded significantly. Thecredits are roughly 0.6 t CO2/t clinker substitute. The total savings potential isapproximately 50 Mt CO2. The energy efficiency gains are limited.
Europe Japan United States China
Mt/yr % Mt/yr % Mt/yr % Mt/yr %
Road construction and Civil works 6.9 40 6.3 64 6.6 71 38.2 90
Internal recycling 1.5 9 2.0 20 0
Cement 0 0.3 3 0.4 4
Interim storage 1.2 7 0 0
Final deposit 6.4 37 0.1 1 0
Fertilizer 0.7 4 0.1 1 0
Hydraulic engineering 0.3 2 0 0
Other 0 1.2 12 2.2 24 3.8 10
17.2 100 10.0 100 9.2 100 42.0 100
Sources: Euroslag 2006, Nippon Slag, 2006; USGS, 2005b; CISA, 2005c.
Electric Arc Furnaces
Electric arc furnaces are used to melt scrap, direct reduced iron (DRI) or pig iron.Scrap is by far the most important resource, accounting for about 80% of all electricarc furnace metal feedstock.
Before the melting and heating operations, the furnace is charged with recycled steelscrap using a basket that has been carefully loaded. Then, the roof is closed andthree graphite electrodes are lowered towards the scrap. On contact electrical poweris transformed into heat as arcing takes place between the electrodes and the solidfeedstock. As the scrap melts, a liquid steel pool starts to form at the bottom of the
Table 5.13 � Steel Slag Use

furnace. Most electric arc furnace installations are based upon the three phase, threeelectrode design, although, because of its lower energy requirements, there isrenewed interest in the two electrode direct current arc.
As the scrap is melted, more volume is made available inside the furnace and at acertain point, the power is switched off, the furnace roof is opened and another scrapbasket is loaded into the furnace. The power is again switched on and melting of thesecond basket starts.
To melt steel scrap, it takes a theoretical minimum of 300 kWh/t. To providesuperheat above the melting point requires additional energy and for typical taptemperature requirements, the total theoretical energy required usually lies in therange of 350 – 370 kWh/t. This energy can be supplied from the electric arc, fossilfuel injection or oxidation of the scrap feedstock. The energy distribution is highlydependent on product mix, local material and energy costs and is unique to thespecific furnace operation.
Factors such as raw material composition, power input rates and operating practices,e.g., post-combustion, scrap preheating, can greatly alter the balance (Table 5.14). In
Chapter 5 • IRON AND STEEL INDUSTRY 129
5
Energy
kWh/t
ConventionalScrap
No Preheating
ShaftScrap
Preheating
EAFHBI/DRI
No Preheating
FurnaceHBI/DRIPreheating
Input
Electrical 433 358 588 488
Burners 81 81 81 81
Oxidation 189 189 220 220
Total 703 628 889 789
Output
Steel 394 394 394 394
Slag 43 43 74 74
Off-gas 120 48 119 37
Wall loss 102 103 154 140
Electric loss 26 22 35 29
Reduction 11 11 104 106
Dust 7 7 9 9
Total 703 628 889 789
Source: Honeyands and Truelove, 1999.
Table 5.14 � Energy Use for Electric Arc Furnaces with Different Feed and with/without Preheating

130 TRACKING INDUSTRIAL ENERGY EFFICIENCY AND CO2 EMISSIONS
operations using a large amount of charge carbon or high carbon feed materials, upto 60% of the energy contained in the off- gas may be calorific due to largequantities of un-combusted carbon monoxide. Recovery of this energy in the electricarc furnace could decrease energy input by 8 – 10 %.
The use of DRI or hot briquetted iron ((HBI), a solid iron product similar to DRI)increases electricity needs by 0.8 kWh per percentage point. The use of hot metaldecreases power consumption by 3.5 kWh per percentage point (Köhle, 2002). Scrappre-heating using off-gas heat reduces the electricity demand.
There are four basic types of charge pre-heating systems for the electric arc furnacecurrently in operation; bucket, twin shell, Consteel, and shaft. These systems differ inthe percentage of the charge that can be pre-heated and in the efficiency of contactbetween the off-gas and the charge.
Preheating can result in a saving of 79 kWh/t scrap. HBI and DRI have heat captureefficiency up to 25% higher than an all-scrap charge, as it can pick up sensible andchemical energy. This represents an electrical energy saving of 101 kWh/t for HBIand DRI (Honeyands and Truelove, 1999).
The electric arc furnace is most efficient when it is melting. During the flat bathperiod it is inefficient, which provides justification for secondary metallurgicalprocesses. Oxyfuel burners increase productivity and replace electricity with acheaper fuel. By using a fuel-efficient oxy-fuel flame at the beginning of the meltingprocess, a greater overall melting efficiency is achieved with a faster melt rate.Further temperature homogeneity benefits can be achieved by using the burners todirect thermal energy at cold spots caused by uneven energy distribution from theelectrode arcs. Additionally, the burners can be positioned in front of the slag doorto enable early, efficient oxygen lancing, or over the tap hole area to promote quick,trouble-free tapping. Electrical savings of 80 kWh/tonne and 20% productionincreases have been achieved. Oxygen injected in the post-combustion zone of the furnace promotes combustion of carbon monoxide inside the furnace rather than in the off-gas handling system. This reaction produces heat that is transferredto the charge, reducing energy consumption (typical electrical savings of 10 – 20 kWh/tonne) and increasing productivity by up to 4%.
The electricity use for electric arc furnaces ranges from 300 – 550 kWh/t. The average electricity use decreased by about 10% between 1990 and 1999 to425 kWh/t (Figure 5.9). Total energy into the system has declined due to increasedproductivity: better heat recovery and decreased retention time in the vessel. But theenergy efficiency gain was somewhat less because fuel injection into electric arcfurnaces increased.
Given an electricity use of about 425 kWh/t, and EAF steel production of 391 Mtin 2005, the energy use of electric arc furnace for steel production is 0.6 EJ per year.If the average electricity use could be reduced to 350 kWh/t, the level of newfurnaces, it could provide electricity savings of 0.1 EJ per year.

Cast Iron Production
Global production of cast iron is about 50 Mt, about 5% of total ferrous metalproduction. In some countries such as India, cast iron production is moreprominent as a share of total ferrous metals production. This requires anadjustment of energy use data when indicators are calculated. Cast iron is a sinkfor scrap and primary metal.
Cast iron is used for a range of applications such as engine blocks, machinery, fences,buildings and construction. Certain industry sub-sectors and countries dominate themarket in volume of production and specific type of product. For example, SpheroidalGraphite Cast Iron (SG) is widely used in the water, gas and oil industries for thetransportation purposes. Consequently, the volume of SG produced is high comparedto other cast irons and production tends to be concentrated in France, Germany,United States, South Africa, Korea and Japan.
Cast iron is made when scrap or iron is remelted in small cupola furnaces (similar to ablast furnace in design and operation) and poured into molds to make castings. Castiron contains 2 – 4% carbon and 1 – 3% silicon. Scrap iron or steel is often added.
Chapter 5 • IRON AND STEEL INDUSTRY 131
5
Key point: Global average EAF electricity consumptiondecreased about 20% between 1990 and 1999
0
20
40
60
80
100
300 325 350 375 400 425 450 475 500 525 550
Electrical energy consumption (kWh/t)
Freq
uen
cy d
istr
ibu
tion
(%
)
1999
1990
Figure 5.9 � Electricity Use for Electric Arc Furnaces
Source: IISI, 2000.

132 TRACKING INDUSTRIAL ENERGY EFFICIENCY AND CO2 EMISSIONS
Gray cast iron (gray iron) is produced when the iron in the mold is cooled slowly. Grayiron is brittle, but soft and easily machined. White cast iron (white iron) which isharder and more brittle, is made by cooling the molten iron rapidly. A malleable castiron can be made by annealing white iron castings in a special furnace. A ductile ironmay be prepared by adding magnesium to the molten pig iron; when the iron is castthe carbon forms tiny spherical nodules around the magnesium. Ductile iron isstrong, shock resistant and easily machined.
The total energy use for the iron melting is 5 – 10 GJ/t iron. The most efficient cupolasuse 3 GJ of coke per tonne of cast iron. Its relevance in energy terms on a global basisis limited at about 250 PJ coke, equal to 2% of total global coke production.
Direct Reduced Iron Production
A limited amount of steel is produced through processes other than blast, basicoxygen and electric arc furnaces. Direct reduced iron (DRI) (also called sponge iron)production is also widely used, yielding 56 Mt in 2004. In the DRI process, iron oreis reduced in its solid state (unlike in blast furnaces, where liquid iron is produced).DRI can be converted into steel in electric arc furnaces. DRI can use coal or naturalgas as feedstock, although more than 90% of the production is based on naturalgas, primarily cheap stranded gas. DRI production is widespread in the Middle East,South America, India (where it is coal-based) and Mexico. DRI fills a niche becausethe scale is smaller and less capital investment is required and some raw materialsituations make it attractive. Global DRI production has increased rapidly over thepast three decades (Figure 5.10).
The energy use of natural gas-based DRI production processes is well definedbecause two technologies (Midrex and HYLIII) constitute 83% of the market. Bothtechnologies use 10.4 GJ natural gas/t DRI produced (Table 5.15).
If natural gas is used instead of coal for DRI, CO2 emissions are much lower.Assuming 360 g CO2 /kWh of electricity, 0.77 t of CO2 is emitted per tonne of steel (with zero scrap additions when gas is used). If the average CO2 intensity of600 g/kWh is used, the CO2 emissions amount to 0.92 t/t. In cases where DRI isimported from regions with cheap stranded gas, this can reduce energy use and CO2emissions in the consuming country if it replaces production from blast furnaces. Thesignificant growth of DRI use seems likely to continue.
India is the largest DRI producer and is a special case because its production is coal-based (Table 5.16). Production in India is rapidly expanding. In 2005 – 2006, India’s206 DRI plants had a capacity of 19 Mt and produced 11.3 Mt. Today some 225 coal-based DRI plants are at various stages of commissioning and construction.Plus 77 of the existing plants are expanding production. In the very near future, Indiawill have 431 DRI plants with a production capacity of 44 Mt. About 60% of thecurrent production comes from the small-scale industry. DRI plants are relatively easyto build with the help of local fabricators and suppliers. For a 100 tonne per day(tpd) DRI, the initial investment can be recovered in 12 – 18 months. Typically theseplants use 1.2 – 1.5 t coal/t DRI, and produce 0.25 – 0.35 t of char by-product pertonne of DRI (Radikha, et al., 2006). The char may be used for energy recovery. Ore

Chapter 5 • IRON AND STEEL INDUSTRY 133
5
Key point: DRI production has grown exponentially during the past thirty-five years.
0
10
20
30
40
50
60
1970 1975 1980 1985 1990 1995 2000 2005
Dire
ct r
edu
ced
iro
n p
rod
uct
ion
(M
t)Figure 5.10� Global Direct Reduced Iron Production, 1970 — 2004
Source: MIDREX, 2005.
Process Company MarketShare2004
%
Reactor Feedstock Gas Use
GJ/t
Metallisation
%
Carbon
%
MIDREX Midrex/Kobesteel
64.1 Shaft Lump/pellets 10.4 93 1.5 — 2.5
HYL III HYLSA 18.9 Shaft Lump/pellets 10.4 94 1.5 — 4.5
FINMET Fior/Voest Alpine
2.9 Multi-Fluidised
Bed
Ore fines 12.4 92 — 93 1.8 — 2.0
Circored Lurgi <0.1 Circulatingfluid bed
Ore fines 11.5 93 0
Sources: IISI, 2000; MIDREX, 2005.
Table 5.15 � Natural Gas-based DRI Production Processes
pre-heaters that use the sensible heat from the waste gas can reduce the coalconsumption by 25%. Advanced plants use 1.05 – 1.2 t low grade coal/t DRI, whichequals 20 – 25 GJ/t DRI (Pandey, 2006).

134 TRACKING INDUSTRIAL ENERGY EFFICIENCY AND CO2 EMISSIONS
2004
Mt/yr
Share
%
CumulativeProduction Share
%
India 9.1 16.8 16.8
Venezuela 7.8 14.4 31.2
Iran 6.4 11.8 43.1
Mexico 6.3 11.6 54.7
Saudi Arabia 3.4 6.3 61.0
Russia 3.1 5.7 66.7
Egypt 3.0 5.5 72.3
Trinidad and Tobago 2.2 4.1 76.3
Argentina 1.8 3.3 79.7
Malaysia 1.7 3.1 82.8
Libya 1.6 3.0 85.8
South Africa 1.6 3.0 88.7
Indonesia 1.5 2.8 91.5
Other 4.4 8.5 100.0
World 54.1 100.0
Source: IISI, 2005.
Table 5.16 � DRI Production, 2004
The wide range of energy efficiency in India is related to the range of technologiesin use. At least six technologies can be discerned (Midrex, 2004). A generalcharacteristic is that most plants are small, with less than 0.2 Mt capacity. Thishinders the economic viability of installing energy efficiency equipment.
All the plants use a counter current rotary kiln. Because a rotary kiln is not well suitedfor heat exchange, only about 60% of the heat is used in the reduction process and40% is discharged with the kiln waste gases. This heat can be used for powergeneration. The power consumption has been reduced from 110 – 130 kWh/t DRIto 80 – 90 kWh/t DRI (Pandit, et al., 2006). After deducting the internal powerconsumption between 400 – 500 kWh/t DRI is generated, if the waste heat is usedfor power generation. Power generation from kiln off-gases is eligible for creditsunder the Clean Development Mechanism of the Kyoto Protocol and can be highlyprofitable (Tata Sponge, 2006).

The Dunswart plant in South Africa represents the world standard for DRI productionfrom coal. This plant is reported to use 15 – 19 GJ/t DRI. Thermal loads for DRIproduction facilities are linked to a large extent to the quality of coal and to a lesserdegree to the reducibility of iron ore. Non combustible constituents (ash and moisture)of the coal used in the average Indian DRI plant comprise 32% of the total constituents,compared with 16% in the Dunswart plant. Those qualities contribute significantly tothe observed differences in both electrical and thermal efficiencies (Sindwani, 2006).
Steel Finishing
Steel finishing operations use a relatively small percentage of total energy in iron andsteel production. Energy for finishing is required in many different unit operationssuch that it is difficult to identify a few technologies that will significantly impact theoverall energy and CO2 intensity. The areas of focus are the reheat furnace, hotcharging, energy recovery, scheduling, furnace design and process controls.
Today, in most steel mills the casting and rolling process is a multi-step process. Theliquid steel is first cast continuously into blooms, billets, or slabs in the continuouscasting process where liquid steel flows out of the ladle into the tundish (or holdingtank) and then is fed into a water-cooled copper mold. Solidification begins in themold, and continues through the caster. The strand is straightened, torch-cut, thendischarged for intermediate storage. Most steel slabs are reheated in reheatingfurnaces, and rolled into final shape in hot and cold rolling mills or finishing mills.
The amount of finishing energy depends on the product. Steel reinforcement barsand steel plate need only hot rolling. However, steel for cars and white goods needshot rolling and cold rolling, and often galvanizing or coating. Typical energy use forhot rolling is 2 – 2.4 GJ/t, and 1 – 1.4 GJ/t for cold rolling.
In large integrated steel plants, the hot strip rolling process is the third largest userof energy after iron and steel making. Typically, slabs are superheated in reheatingfurnaces to compensate for temperature losses (about 13%), which occur during theroughing and transfer operations prior to finish rolling. Most of the energy losses arefrom the tail ends of transfer bars due to their long exposure times on the transferroller table prior and during finish rolling. The resultant head to tail temperaturevariations together with edge temperature losses cause problems with productrolling and quality uniformity.
In the traditional steel production process, the thick slab of red-hot steel is cooled toroom temperature after it leaves the furnace. Thin slab or strip casting processes reducethe steel rolling energy needs significantly. The new technology enables fasterproduction of thin products and considerable savings in capital cost outlay, completionand delivery times and energy costs. Today, less than 10% of world production is basedon this technology, but certain companies achieve substantially higher shares.
The energy savings are in the range of 1 – 2 GJ of primary energy per tonne ofproduct. Assuming that this technology can be applied to a quarter of worldproduction, the savings potential is about 0.3 – 0.4 EJ of primary energy per year and20 – 40 Mt of CO2. This is a long-term potential, assuming gradual improvements inprocess control to maintain steel materials quality.
Chapter 5 • IRON AND STEEL INDUSTRY 135
5

136 TRACKING INDUSTRIAL ENERGY EFFICIENCY AND CO2 EMISSIONS
Loss of yield in steel finishing equates to loss of product into which a great deal ofenergy has been invested. If the waste product is allowed to oxidise, it must go backthrough the reduction process to be recycled.
Figure 5.11 shows the average steel yield in Germany, measured as the ratio of themetal sold and the metal in the pig iron and steel scrap. It increased from 65% in1960 to 87.5% in 2005. About 12.5% of all metal is still lost as oxide or in-plantoff-spec product that is recycled to an electric arc furnace or a blast furnace. Abouthalf of this amount is oxide created during the rolling process. The yield in othercountries is often considerably lower. Higher yields imply a reduced need for crudesteel production and therefore a substantial CO2 reduction potential. Residues fromsteel rolling are recycled to the blast furnace or the basic oxygen furnace, thereforethe net savings of yield gains may be 4 – 5 GJ primary energy per tonne of reducedlosses. Given a remaining potential of 2 – 4 percentage points, the total globalsavings potential may amount to 75 – 150 PJ and 10 – 15 Mt of CO2 reductions.
Key point: Steel yields in Germany have improved significantlybetween 1960 and 1990 and have stabilised at a high level.
50
55
60
65
70
75
80
85
90
1960 1965 1970 1975 1980 1985 1990 1995 2000 2005
Yiel
d (
%)
Figure 5.11� Trend of Average Steel Yields, Germany, 1960 — 2005
Source: Debruxelles, 2006.
Energy Efficiency and CO2 Reduction Potentials
Table 5.17 summarises the theoretical (physical) or technological potentialsestimated for the iron and steel industry. They take into account technologies thatare applied somewhere in the world today and assume that this best availabletechnology could be applied globally at current production levels. Economicfeasibility, transition rates, regulatory and social factors have not been included.

Some estimated potentials take place in other sectors. For example, increasing theuse of blast furnace and steel slag as a substitute for clinker in cement productioncould contribute 140 – 185 Mt CO2 reduction, which can reduce emissions forcement, but not in iron and steel production.
The total identified savings potential is 2.3 – 2.9 EJ of primary energy and a CO2emissions reduction, of 220 – 270 Mt per year. This excludes enhanced recovery ofresidual gas and higher efficiency of residual gas use for power generation. Alsoclosure of remaining outdated plants using open hearth furnace and ingot casting,more efficient operation of coke ovens, waste heat recovery from sintering plantshave been excluded. It is estimated that these options can raise the potential toabout 4.5 EJ of primary energy. Including recycling, the potential is 5 EJ of primaryenergy. Increased slag use for cement making can yield significant efficiency gains but most benefits would occur outside the iron and steel industry. The full range of CO2 emission reductions is estimated to be even broader, from around220 – 360 Mt CO2 per year.
The use of waste plastic and charcoal in iron and steel production can increase thepotential of CO2 reductions further, as would a large switch to natural gas-based DRIprocesses. Neither these options nor the use of technologies such as CO2 capture andstorage have been considered in these estimates.
Chapter 5 • IRON AND STEEL INDUSTRY 137
5
EJ/yr Mt CO2/yr
Coke making: apply coke dry quenching 0.2 — 0.3 25
Coke making: coke oven gas recovery 0.2 — 0.3 25
Blast furnace improvements 1.2 — 1.5 115 — 140
Enhanced efficiency of blast furnace gas use Not quantified Not quantified
Increased blast furnace slag/steel slag use for cement making Not quantified Not quantified
Increased basic oxygen furnace gas recovery 0.25 25
Electric arc furnace: Reduce average electricity use to 350kWh/t 0.25 15
Steel finishing improvements 0.3 – 0.4 20 — 40
Total 2.3 – 2.9 220 — 270
Note: Energy efficiency potentials are in primary energy equivalents.
Table 5.17 � Technical Energy Efficiency and CO2 Reduction Potentials in Iron and Steel Production


Chapter 6 • NON-METALLIC MINERALS 139
6
NON-METALLIC MINERALS
Key Findings
� Cement production accounts for about 8 EJ of energy or 70 to 80% of all energy usein non-metallic minerals production. It is an important source of CO2 emissions,accounting for 1.8 Gt CO2 in 2005.
� China is by far the largest cement producer with 46% of world cement production in2005. India, the second largest producer, accounts for only 6%.
� Production of cement is a relatively simple process with well defined systemboundaries and a uniform product, which makes it well suited to indicator analysis.A number of energy efficiency and CO2 indicators are proposed that will allow energyand CO2 intensity trends to be tracked over time.
� The available data are best used to track energy and CO2 intensity trends within acountry. Comparisons of absolute levels between countries are complicated byuncertainties over the consistency of data collection. Data for clinker substitutes andalternative fuels need to be improved. National data collection processes need to bechecked to ensure if electricity use for grinding stations is reported in the correctcategory.
� The country average primary energy intensity for cement production ranges from 3.4 to5.3 GJ/t. Averages at a country level have improved everywhere, with the weightedaverage primary energy intensity declining from 4.8 GJ/t in 1994 to 4.4 GJ/t in2003. Much of this decline has been driven by improvements in China. The efficiencyof cement production is relatively low in countries with old capital stock based on wetkilns and in countries with a significant share of small-scale vertical kilns.
� The country average CO2 intensity of cement ranges from 0.65 to 0.92 t CO2 /t ofcement (weighted average 0.83). The average CO2 intensity has declined at 1% per yearbetween 1994 and 2003. Half of the CO2 emissions are due to the chemical reaction inclinker production, which are not affected by energy efficiency or fuel switching.
� Indicator data for cement production suggest that fuel use could be reduced byaround 2.5 to 3 EJ if all production used the best available technology and moreclinker feedstock substitutes were used. However, this potential could not be easilyrealised in the near term without significant investment in capital stock replacement.
� It might be possible to reduce clinker production by 300 Mt if more extensive use of clinkersubstitutes such as granulated blast furnace slag, steel slag, fly and bottom ash, and naturalpozzolanas was made. This could reduce CO2 emissions by about 240 Mt CO2 per year.
� Other non-metallic mineral materials, such as lime, glass, bricks and ceramic products,account for the remaining 20 to 30% of energy use and less than 20% of CO2emissions in the sub-sector. Two-thirds of lime production is for captive use and is notaccounted for in this sub-sector. Therefore, energy use in lime production is moreimportant than the statistics suggest. CO2 process emissions occur in lime production,but most of the CO2 is captured from the atmosphere during lime use.
� Indicators could be developed for lime production. Benchmarking has been done forglass furnaces. Bricks and ceramic products are rather diverse, which affects energyuse per unit of product. Moreover, there are no good statistical data on productweight. China is the largest producer of these products. The total global savingspotential is less than 1 EJ per year for these other non-metallic minerals.

140 TRACKING INDUSTRIAL ENERGY EFFICIENCY AND CO2 EMISSIONS
Introduction
The most energy intensive part of the non-metallic minerals industry is theproduction of ceramic materials. While the energy intensity per tonne is not very highcompared to other energy intensive materials, this is the materials category with byfar the largest volume. The industry accounts for about 10% of total final industrialenergy use and has significant process CO2 emissions, notably in the production ofcement and lime. It accounts for more than a quarter of the direct CO2 emissionsfrom the manufacturing industry.
CementGlobal Importance and Energy Use
Cement accounts for about 70 – 80% of the energy use in the non-metallic mineralssub-sector, consuming 8.2 exajoules (EJ) of energy a year (7% of total industrial fueluse). Cement accounts for almost one-quarter of total direct CO2 emissions in industry.Cement is the “glue” that holds a concrete mixture together, which is used extensivelyin construction. Its stone-like qualities and ability to be poured into different formsmakes concrete an excellent construction material and it is used extensively inbuildings, bridges, walls and a multitude of other uses. In many respects it is thebackbone of modern infrastructure, in conjunction with iron and steel.
Cement is generally produced from a feedstock of limestone, clay and sand; which providethe four key ingredients required: lime, silica, alumina and iron. Mixing these ingredientsand exposing them to intense heat causes chemical reactions that convert the partiallymolten raw materials into pellets called “clinker.” After adding gypsum, the mixture isground to a fine grey powder called “Portland cement”, a key ingredient of concrete.
Global cement production grew from 594 million tonnes (Mt) in 1970 to 2 292 Mtin 2005, with the vast majority of the growth occurring in developing countries,especially China. In 2005, China accounted for 46% of global cement production,while India, Thailand, Brazil, Indonesia, Iran, Egypt, Vietnam and Saudi Arabiaaccounted for 15% (Table 6.2).
Cement Production Process
The first step in the Portland cement manufacturing process is to obtain the rawmaterial feedstocks. At the quarry, the raw materials of limestone, clay and sand arereduced by primary and secondary crushers. The primary crusher reduces the materialto about the size of baseballs, while secondary crushing reduces it to the size of gravel.
When the raw feedstock arrives at the cement plant, the materials are proportionedto create cement with a specific chemical composition. The raw materials areanalysed at the plant to make certain the chemical composition is correct, they arethen blended in the proper proportion and ground even finer. The material is groundwith heavy, wheel-type rollers that crush the materials into powder against a rotatingtable. After grinding, the material is fed into a rotating kiln, in most cases passingfirst through a pre-heater and pre-calciner, before being heated in the kiln to around

Chapter 6 • NON-METALLIC MINERALS 141
6
Box 6.1
Energy Use and CO2 Emissions in the Ceramic Building MaterialsIndustry in China
The building materials industry in China accounts for about half of global production. Theindustry used 6.6 EJ of fossil fuels and 0.8 EJ of electricity in 2006, which equals about 6%of all manufacturing industry final energy use and 23% of CO2 emissions. Cement accountsfor half of this energy use and three-quarters of CO2 emissions. The industry can reduce itsenergy use by 29% and CO2 emissions by 10%, if the government’s policy targets forintroduction of new technologies by 2010 are met (Table 6.1). It should be noted that thesavings potential for products excluding cement exceeds the reported energy use in IEAstatistics. This points to the fact that these estimates are optimistic or energy use is not fullyreported.
Table 6.1 �Energy Use, CO2 Emissions and Short-Term Reduction Potentials in the Chinese Building Materials Industry, 2006
Products Output in 2006
FuelConsump-
tion
PJ/yr
PowerConsump-
tion
TWh
Direct CO2
Emissions
Mt/yr
BAT forNear andMedium
Term
EnergySavingTarget
(in 2010)
PJ/yr
CO2 EmissionsReduction
Target
Mt/yr
Cement 1 235 Mt 3 047 123.5 986 NSP 615 105
Clay brick and tile
520 billionstandard
bricks1 319 15.9 148
Tunnel kilns
565 29
Buildingceramics
5 024million m2
967 24.2 23Roller kilns
440 1
Lime 162 Mt 791 8.9 190 Maerz kiln 164 4
Flat glass
22.75 Mt 264 10.0 7 Float process 47 0
Glass fibres
1.41 Mt 88 0.0 2Direct melt
process18 0
Sanitarywares
131 millionpieces
41 0.7 1Large batch
kiln8 0
Others — 147 40.0 30Energysaving
technologies76 3
All ceramicbuildingmaterials
— 6 645 223.2 1 387 — 1 934 142
Source: Cui, 2007.
Note: NSP= New Suspension Pre-heater.

142 TRACKING INDUSTRIAL ENERGY EFFICIENCY AND CO2 EMISSIONS
1 500°C. The kiln is a horizontally sloped steel cylinder, lined with firebrick, turningfrom about one to three revolutions per minute.
From the pre-heater or pre-calciner the raw material enters the kiln. It slides and movesdown the kiln through progressively hotter zones toward the flame. Fuels such aspulverised coal, natural gas, fuel oils and petroleum are burned to feed a flame at thelower end of the kiln that reaches about 2 000°C, allowing the materials to be heatedto around 1 500°C, where they become partially molten. The intense heat triggers thechemical and physical changes that transform the raw feedstock into cement clinker.
Table 6.2 � Global Cement Production, 2005
Production
Mt/yr
Share
%
CumulativeProduction Share
%
China 1 064 46.4 46.4
India 130 5.7 52.1
United States 99 4.3 56.4
Japan 74 3.2 59.6
Korea 50 2.2 61.8
Spain 48 2.1 63.9
Russia 45 2.0 65.9
Thailand 40 1.7 67.6
Brazil 39 1.7 69.3
Italy 38 1.7 71.0
Turkey 38 1.7 72.6
Indonesia 37 1.6 74.3
Mexico 36 1.6 75.8
Germany 32 1.4 77.2
Iran 32 1.4 78.6
Egypt 27 1.2 79.8
Vietnam 27 1.2 81.0
Saudi Arabia 24 1.0 82.0
France 20 0.9 82.9
Other 392 17.1 100.0
World 2 292 100.0
Source: US Geological Survey (USGS), 2006.

Chapter 6 • NON-METALLIC MINERALS 143
6
0
1
2
3
4
5
6
7
Ener
gy
inte
nsi
ty o
f cl
inke
r (G
J/t)
Vertical shaftkilns
Wetkilns
Long dryprocess
Dry kiln(four stagepre-heater)
Dry kiln(six stagepre-heater
and pre-calciner)
Note: For wet kilns, the arrow represents the range of energy consumption for different wet kiln types.
Source: FLSmidth, 2006.
Essentially, a series of chemical reactions converts the calcium and silicon oxidesinto calcium silicates, cement’s main constituent. The main chemical reaction is:CaCO3 →CaO + CO2. When the limestone (CaCO3) reaches about 900°C, itundergoes a chemical reaction called “calcination” whereby CO2 is released andcalcium oxide formed, before this converts to clinker. The clinker is then ground withthe appropriate additives or clinker substitutes to form cement and is ready for storageor packaging.
There are two basic types of cement production processes and a number of differentkiln types. Cement production is either “wet” or “dry”, depending on the watercontent of the raw material feedstock. The wet process allows for easier control ofthe chemistry and is better when moist raw feedstocks are available. However, it hashigher energy requirements due to the need to evaporate the 30%+ slurry waterbefore heating the raw materials to the necessary temperature for calcination. Thedry process avoids the need for water evaporation and is, as a consequence, muchless energy intensive (Figure 6.1). The other major difference is between vertical shaftkilns and their more efficient counterparts, rotary kilns.
Today’s state-of-the-art dry-rotary kilns are fairly fuel efficient. The thermodynamicminimum to drive the endothermic reactions is approximately 1.8 GJ per tonne(GJ/t) clinker for dry limestone feedstock, but is much higher for feedstocks withsignificant moisture content. The superior performance of rotary kilns makes themthe likely technology of choice for the next several decades.
Figure 6.1 � Energy Efficiency of Various Cement Clinker Production Technologies
Key point: Modern dry process cement kilns use half as much energy as the wet process to produce a tonne of cement.

144 TRACKING INDUSTRIAL ENERGY EFFICIENCY AND CO2 EMISSIONS
Box 6.2
Shaft Kilns in China
China has very high levels of cement production from relatively inefficient vertical shaft kilns,which increased 42% between 1997 and 2003. Vertical shaft kilns, of which there are threemain types, consume between 4.8 – 6.7 GJ/t clinker. A decline in production from verticalshaft kilns since 2004 (Figure 6.2) is linked to the National Development and ReformCommission’s (NDRC) 2004 plan that:
“By 2010, China’s products as a whole are expected to reach or approach the advancedinternational level of the early 1990s… by 2020 China is expected to reach or approach theadvanced international level”.
In 2006, the NDRC set specific goals for the structural adjustment of cement manufacturingbetween 2005 and 2010, including a 15% improvement in the thermal energy intensity ofclinker production and that 250 Mt of old inefficient plant should be closed (Cui, 2006; Price,2006). The plan stipulates that new construction must be dry process kilns and that there isto be no expansion of existing vertical shaft kiln plant.
The share of total production from vertical shaft kilns which was 47% in 2005 looks likely todecline. The increased share of large-scale dry process kilns will reduce the energy intensity ofcement production in China.
Figure 6.2 �Cement Production from Vertical Shaft Kilns in China, 1997-2003
0
100
200
300
400
500
600
700
1997 1998 1999 2000 2001 2002 2003 2004 2005
Ver
tical
sh
aft
kiln
cem
ent
pro
du
ctio
n (
Mt/
yr)
0
10
20
30
40
50
60
70
80
90
100
Shar
e of
cem
ent pro
duct
ion fr
om v
ertic
al s
haf
t ki
lns
(%)
Output of vertical shaft kilns Share of vertical shaft kilns
Source: LBNL; IEA data.
Key point: The share of cement production from inefficient verticalshaft kilns in China has declined since 1996, but is still high.

Chapter 6 • NON-METALLIC MINERALS 145
6
The long dry process requires around 4.6 GJ/t of clinker, while the addition of pre-heaters and pre-calciners further reduces the energy requirement for cementproduction. Table 6.3 shows the evolution of cement kiln technology options and theconsequent reduction in the energy intensity. It is unlikely that the fuel efficiency ofthe today’s dry process rotary kilns can be reduced much below their current level of2.9 – 3.0 GJ/t of clinker.
As a result of the different energy intensities of the different processes and kiln types,the energy intensity of cement production varies significantly by region dependingon whether a wet or dry process is used and on the kiln technology itself.
Process Fuel ConsumptionGJ/t clinker
Wet process 5.9 – 6.7
Long dry process 4.6
1 stage cyclone pre-heater 4.2
2 stage cyclone pre-heater 3.8
4 stage cyclone pre-heater 3.3
4 stage pre-heater+pre-calciner 3.1
5 stage pre-heater+pre-calciner 3.0 – 3.1
6 stage pre-heater+pre-calciner 2.9
Source: FLSmidth, 2006.
Table 6.3 � Heat Consumption of Different Cement Kiln Technologies
The production of cement clinker from limestone and chalk is the main energyconsuming process in the industry. Cement production is an energy-intensive processand energy typically represents 20 – 40% of total production costs. The most widelyused cement type is Portland cement, which contains 95% cement clinker. However,there is a range of other types of cement that use a variety of clinker substitutes toreduce clinker costs and CO2 emissions. These other feedstocks for cement haveproperties similar to cement and therefore can be substituted for clinker either in thecement or in the kiln as an alternative to the feedstock mix. Figure 6.3 shows thechemical composition of Portland cement and the various clinker substitutes in aternary phase diagram. A point halfway on one of the three sides consists of 50%each of the components of the adjoining angles. A point in the centre of the trianglerepresents a component with a third of each of the components. The three cornersrepresent the pure basic chemical building block of cement. Various cement typeshave a different ratio of the three building blocks and therefore different chemicalcompounds dominate.
One option for reducing the energy and process emissions from clinker production isthe direct use of steel slag in the kiln as a substitute for limestone. The process

involves adding steel slag into the back or “feed-end” of the kiln through a relativelyuncomplicated and inexpensive delivery and metering system, which can be used atvirtually all kiln types. Due to the chemical composition of the steel slag and theenergy-intensive nature of the steel production process, the material requires little orno additional fuel to convert it into cement clinker. CO2 emissions per tonne ofclinker are reduced due to lower energy needs and the avoidance of some processemissions. Fly-ash may also be used directly in the cement kiln as a substitute for clayor bauxite, also helping to reduce resource consumption and CO2 emissions. The useof alternative raw materials is increasing in Europe, from around 12 Mt in 2003 to14 Mt in 2004 (CEMBUREAU, 2006).
146 TRACKING INDUSTRIAL ENERGY EFFICIENCY AND CO2 EMISSIONS
Portland cements Alumina cements
Fly-ash
Blast furnace slag
SiO2
CaO C A3 C A12 7 CA CA2 CA6 AI O2
C AS2
Pozzolana
C S3
C S2
C S3 2
Figure 6.3 � Chemical Composition of Cement and Clinker Substitutes
Note: Acronyms refer to cement minerals with different chemical compositions.Source: CEMBUREAU, 2006.
Key point: Blast furnace slag, fly-ash and natural pozzolans canall be used as clinker substitutes.

Chapter 6 • NON-METALLIC MINERALS 147
6
The second option is to use waste products with similar properties to clinker assubstitutes. The most common clinker substitutes are waste products such as fly-ashor granulated blast furnace slag or natural pozzolana (volcanic ash).1 Producingalternative cement types including these products is far less energy intensive thanproducing normal cement and avoids the process CO2 emissions in the clinkerproduction displaced. However, the cement properties are not exactly the same andcan not therefore be used in all applications.
The typical composition of various cement types is shown in Table 6.4. Generally,cement types are defined by the quantity of clinker substitutes used by weight.Within each blended cement type, different grades are identified based on thepercentage of clinker substitutes used.2 There is no fixed proportion at which theyshould be mixed. Generally speaking, a cement type is referred to as a Portlandcement if clinker substitutes are 40% or less by weight, whereas they are identifiedby the main clinker substitute used if it exceeds that level, e.g. Portland fly-ashcement compared with blast furnace slag cement.
The availability of waste slag is limited and pozzolana can be obtained only incertain locations. This tends to limit their use, as the long distance transportation ofcement or cement feedstocks would result in significant additional energy use andcost, which is not an attractive option given the low value of the product. Fly-ash withhigh carbon content can not easily be used in cement; however, a US company hasdeveloped a technology to separate the carbon from the fly-ash. This reduces thecarbon content from 18 to 2.5% and allows it to be used as a clinker substitute.This technology is currently applied in the United Kingdom and Israel. There is anappreciable potential for clinker substitutes that is not yet fully exhausted.
Table 6.4 � Typical Composition of Different Cement Types
Cement type Portlandcement
%
Portlandfly-ashcement
%
Blast-furnacecement
%
Pozzolaniccement mixes
%
Clinker 95 – 100 65 – 94 5 – 64 45 – 89
Fly-ash – 6 – 35 – –
Blast-furnace slag – – 36 – 95 –
Pozzolana – – – 11 – 55
Additional constituents (e.g. gypsum)
0 – 5 0 – 5 0 – 5 0 – 5
Source: Based on CEN, 2000.
1. NAHB (2006).2. See CEN (2000) for a comprehensive listing of the 27 products in the family of common cements and the rangesof clinker substitutes that characterise each cement type.

148 TRACKING INDUSTRIAL ENERGY EFFICIENCY AND CO2 EMISSIONS
The use of blended cement varies widely from country to country, but it is high incontinental Europe. There is currently little use of blended cement in the UnitedKingdom and the United States. However, in the United States and China, significantclinker/cement substitutes are blended directly into the concrete at the time ofpouring; this practice is rare outside of those two countries.
Blended cement offers a major opportunity for energy savings and CO2 emissionreductions, but will depend on the availability of waste products. Granulated blastfurnace slag availability is expected to increase from about 102 Mt in 2003 to150 Mt in 2010 (Harder, 2006). The availability of fly-ash is significant and couldbe 445 Mt given current production (Smith, 2005). The availability of fly-ash couldincrease by 20% by 2010 given the current projections for coal demand growth (IEA,2006a).
In the long term, new cement types may be developed that do not use limestone asa primary resource. These new types of cement are called “geopolymers”. Thoughthey are outside the scope of this analysis, the technological feasibility, economicsand energy effects of such alternative cements remain speculative.
Clinker-to-Cement Ratio
Using clinker substitutes reduces CO2 emissions from energy consumption in the kilnand avoids the process emissions that stem from clinker production. The clinker-to-cement ratio (hereafter referred to as the “clinker ratio”) tends to vary between0.7 – 0.95 tonnes of clinker per tonne of cement, depending on the types of cementproduced. A clinker ratio of 0.95 represents 100% production of Portland cementwith 5% gypsum added, while lower values are achieved by increasing the share ofblended cement types.
The absence of clinker production data for some countries makes estimates of theclinker ratio important in estimating clinker production and energy intensity.Figure 6.4 presents estimates of the clinker ratio in a number of different countriesand regions. Significant uncertainty surrounds some of these estimates; and in manycases only a snapshot of the industry is available from the 1990s. More accuratedata for the current clinker ratio are needed if reliable projections of the clinkerproduction to meet cement demand are to be made.3
In general, there has been a gradual reduction in the clinker ratio since 1990.The only exception appears to be Brazil, but this could also be due to data issues.The decline in the weighted average clinker ratio of the countries with data availablefor 1994 – 2004 was 1.0 % per year. Much of this decline is due to the 1.3% peryear decline in the clinker ratio in China between 1994 and 2004.
Of the major cement producers, for which data is available, China appears to havehad the lowest clinker ratio in 2004. This is due to the extensive use of granulatedblast furnace slag, fly-ash, boiler bottom-ash and a variety of other substitutes.However, the data for China is uncertain as various sources give different data,
3. Although data for Canadian clinker production and imports are collected, the information for 1995 and 2000appears to identify data issues, because even pure Portland cement has a clinker ratio of 95% at most.

Chapter 6 • NON-METALLIC MINERALS 149
6
particularly for granulated blast furnace slag use, while in addition, there is noguarantee that the data collected in the study of the 1994 clinker ratio and that in2004 are consistent. China produced 330 Mt of fly-ash in 2005, of which about63% was used in cement production and 37% was disposed of in land fills (Cui andXiao, 2006). This implies that China alone uses 180 – 210 Mt of fly-ash for cementand concrete production.
An additional complicating factor is that in some countries, notably the UnitedStates, significant blending of clinker substitutes occurs when the concrete is mixed,rather than at the time of cement production. This obviously has importantimplications for any assessment of the role that clinker substitutes can play inreducing clinker production and CO2 emissions. The clinker ratio presented inFigure 6.4 for the United States has not been adjusted to take into account the useof cement substitutes that are blended directly into the concrete at the time ofpouring.
In the United States, 12.3 Mt of fly-ash and 0.3 Mt of bottom-ash were directly usedfor concrete production in 2003 (ACAA, 2003). This represents about 17% of all fly-ash and 2% of bottom-ash. It should be compared to 92.8 Mt cement production, sothis is equivalent to a lowering of the clinker/cement ratio by 12 percentage points.In the same year, 3.2 Mt of blast furnace slag were used in concrete. This is equivalent
70%
75%
80%
85%
90%
95%
100%
1980 1985 1990 1995 2000 2005
Canada
US
Japan
Korea
Mexico
India
EU15
Brazil
Thailand
Spain
Germany
Weightedaverage
Italy
China
Russia
Figure 6.4 � Clinker-to-Cement Ratio by Country and Region, 1980-2005
Note: The weighted average excludes EU15. Data for Thailand are based on Siam Cement Company only.
Sources: Soares and Tolmasquim, 2000; Dong-Woon, 2006; Worrell, et al., 2001; Siam Cement Company Ltd, 2005; CEMBUREAU, 2006;EC, 2006; AITEC, 2000 – 2005; USGS, 2006; PCA, 2005; NRCAN, 2006; Statistics Canada, various years; Japan Cement Association, 2006;Cui and Xiao, 2006; VDZ, 2006; Siam Cement Company Ltd, 2005; and Battelle, 2002.
Key point: China has achieved a significant reduction in itsclinker ratio, helping to reduce the weighted average between1995 and 2004.

150 TRACKING INDUSTRIAL ENERGY EFFICIENCY AND CO2 EMISSIONS
to the lowering of the clinker ratio by another 3 percentage points. In total, this isequivalent to a reduction of the clinker ratio by 15 percentage points to 77% in 2003.China also adds significant amounts of clinker substitutes directly into concrete. Thispractice results in important energy savings and CO2 reductions. This type of measuremust be considered when country energy efficiency and CO2 emission indicators arecompared. In the case of China it is not clear if this is accounted for in the cementproduction data. Further analysis is recommended.
Clinker substitutes are not only used in cement production. Significant amounts ofpozzolanic materials are directly used for road bases and other uses where theysubstitute for cement and concrete. Such practices reduce energy use and CO2emissions in cement production, but it does not show up when the energy use andCO2 emissions per tonne of cement are compared. However, the CO2 benefits arelower than if the same substitutes were used for cement production.
Table 6.5 presents estimates of the current global use of clinker substitutes and theiravailability. Significant quantities of fly-ash are unused, but the balance forgranulated blast furnace slag is much more in balance. In a carbon constrainedworld, using these clinker substitutes to avoid the process and energy emissions ofclinker production would probably represent their highest value use. As Figure6.4 shows, there is considerable opportunity to increase the use of clinker substitutesin many countries, perhaps by 300 Mt per year, which could reduce CO2 emissionson the order of 240 Mt per year.
Cement type Current use Mt
AvailabilityMt
Total Blast Furnace Slag n.a. 180 – 220
Granulated blast furnace slag 90 110
Fly-ash 4 222 445
Pozzolana 50 n.a.
Note: Data in Table 6.5 are consistent with data for 2004 in the Iron and Steel chapter (5), but other sourcesindicate 120 Mt of granulated blast furnace slag use in China alone in 2006 (Cui, 2007).
Sources: Harder, 2006; Japan Cement Association, 2006; Smith, 2005; IEA estimates.
Table 6.5 � Current Use and Availability of Clinker Substitutes
Technology and Fuel Consumption in Cement Production
The most widely used production process for Portland cement clinker is the relativelyenergy efficient dry process, which is gradually replacing the wet process. In the lastfew decades, pre-calcination technology has also been introduced as an energysaving measure.
4. Significant uncertainty surrounds the current availability of fly-ash in China. The estimate for China is conservative– an additional 100 Mt may be available, but its suitability for use in the cement industry due to high carboncontent is not clear.

Pre-heating also helps to reduce the energy needed in the kiln. The technology usedin the cement industry in developing countries, notably in China, differs from thatused in industrialised countries. While small-scale vertical kilns used to predominatein China, large-scale rotary kilns are now more common. Large-scale kilns areconsiderably more energy efficient.
Process types and fuel shares for the current stock of cement kilns differ considerablyby region, which affects the CO2 emissions per tonne of cement (Table 6.6).
Figure 6.5 presents the data for the average energy consumption per tonne of clinkerin some of the largest cement producing countries. Efficient dry kilns using pre-heaters use approximately 3.3 GJ/t clinker, a wet kiln uses 5.9 – 6.7 GJ/t clinker,while a dry kiln with pre-heaters and pre-calciners consumes around 2.9 GJ/t clinker(FLSmidth, 2006). In the European Union, the average energy consumption per
Chapter 6 • NON-METALLIC MINERALS 151
6
Process Type Fuel ShareDry%
Semi-dry%
Wet%
Vertical%
Coal%
Oil%
Gas%
Other1
%
United States 82 0 18 0 66 1 3 30
Canada 71 6 23 0 52 5 18 25
Europe 92 4.5 3.5 0 29 4 1 662
Japan 100 0 0 0 79 2 0 18
Australia & New Zealand 24 3 72 0 58 <1 38 4
China 50 0 3 47 94 6 <1 0
Southeast Asia 80 9 10 1 82 9 8 1
Thailand3 80 4 0 16
Brazil 98 n.a. n.a. n.a. 1 2 1 96
South Korea 93 0 7 0 87 4 0 9
India 50 9 25 16 96 1 1 2
Former Soviet Union 12 3 78 7 7 24 68 <1
Latin America 67 9 23 1 20 36 24 12
Africa 66 9 24 0 29 36 29 5
Middle East 82 3 16 0 0 52 30 4
1. Includes petroleum coke, biomass and alternative fuels. 2. 48% is petroleum coke. 3. Siam Cement Industry Company Ltd. only.
Sources: Battelle, 2002; PCA, 2005; USGS, 2006; LBNL, JCA, 2006; CEMBUREAU, 2006; Siam Cement Industry Company Ltd, 2005.
Table 6.6 � Cement Technologies and Fuel Mix by Region

152 TRACKING INDUSTRIAL ENERGY EFFICIENCY AND CO2 EMISSIONS
tonne of Portland cement is currently about 3.7 GJ/t. China, Canada and theUnited States require between 4.2 and 4.6 GJ/t of clinker. Together, these threecountries accounted for around half of total cement production. For most of the othercountries presented the range is between 3 – 4 GJ/t of clinker.
Most countries experienced a downward trend in the thermal energy intensityrequired to produce a tonne of clinker between 1990 and 2004. Generally, this hasbeen due to the increasing share of dry process cement kilns. However, manycountries that already had high shares of dry process kilns have improved theirthermal energy intensity per tonne of clinker as even more efficient dry process kilnshave been introduced. For instance, the latest six stage pre-heater and pre-calcinerkilns offer significant energy savings over earlier two stage pre-heater kilns.
Rapid economic development and demand growth for cement has provided anopportunity for some developing countries to achieve relatively high levels of energyefficiency by building efficient dry process plants. Until recently, this was not the casein China, where small-scale kilns and inefficient shaft kilns dominated production. Forinstance, in 1995 the output from dry kilns in China was only 6% of the total andlarge and medium-scale kilns accounted for only 33% of total output (Cui, 2006).
0
1
2
3
4
5
6
1990 1992 1994 1996 1998 2000 2002 2004
Ener
gy
inte
nsi
ty o
f cl
inke
r (G
J/t)
US
China
Weightedaverage
Canada
Korea
India
Brazil
Spain
Italy
Germany
Thailand
Mexico
Japan
Figure 6.5 � Energy Requirement per tonne of Clinker by Country including Alternative Fuels
Note: Care must be taken in interpreting the absolute values of data in this figure, due to the possibility that different system boundarieshave been used and that in some cases it is not clear whether LHV or HHV have been used.
Sources: Coal Statistics, India; ERI, 2004; Soares and Tolmasquim, 2000; Worrell, et al., 2001; IBGE, 2006; CEMBUREAU, 2006; EEA, 2006;AITEC, 2005; USGS, 2006; PCA, 2005; NRCAN, 2006; Japan Cement Association, 2006; OFICEMEN, 2007; Siam Cement Company Ltd,2005; INEGI, 2006; VDZ, 2006; Battelle 2002; LBNL, IEA and Tshinghua University estimates.
Key point: Japan is the most efficient clinker producer, whilemost countries have achieved only modest reductions in theenergy required to produce one tonne of clinker since 1990.

However, the situation is changing rapidly. By 2004 large and medium-scale plantsaccounted for 63% of production and that from dry kilns for around 45% of totaloutput. This means that the energy intensity per tonne of clinker has declined fromabout 5.4 GJ/t clinker in 1990 to 4.5 GJ/t clinker in 2004. Plans are that cementfrom large-scale dry kilns should reach 80% of total production by 2010 and 95%by 2030, reducing the contribution from shaft kilns to just 5%. If this is the case,then the thermal energy intensity of clinker production in China would fallaccordingly.
Japan appears to have the most efficient clinker production and is at or near thetheoretical lower limit of heat consumption for advanced dry kilns with pre-heaters and pre-calciners. China and the United States currently have the highestenergy use per tonne of clinker, although continued improvement in the thermalenergy requirement per tonne of clinker will occur if China succeeds in increasingthe share of modern large-scale dry kilns. Generally, there has been littleimprovement in the energy requirement per tonne of clinker in the last ten yearsin most countries. Over the last fifteen years, some countries have achievedmodest improvements, with significant reductions only in Canada, China, Koreaand India.
Care must be taken in interpreting the absolute levels in Figure 6.5, because not allof the results presented are based on actual energy consumption and clinkerproduction statistics. In some cases, weighted average energy requirements pertonne of clinker have been estimated based on kiln efficiency estimates for eachcountry, which could underestimate the actual energy used. If survey data are used,then this can be the case if operational characteristics differ. For instance, thefrequency of start-stop operation cycles can often differ significantly between plants,while less than optimal operating conditions are common. This can lead todifferences in energy consumption of 15% or more.
Figure 6.6 presents the energy intensity of clinker production for non-OECD regionsand new EU accession countries (plus twelve) where only a snapshot view of theirefficiency is available.5
The energy saving potential of all production using the best available technologyand the increased use of clinker feedstock substitutes in the kiln is around 2.5 – 3 EJgiven current cement production. However, this could not be achieved readilywithout significant economic costs, as it would require extensive capital stockreplacement.
One area not well covered by statistics is the potential for using waste heat for powergeneration. Although modern pre-heater and pre-calciner kilns have low useful heatoutputs due to the pre-heaters, there are still opportunities to economically produceelectricity. For instance, cement plants in Japan generate around 10% of their
Chapter 6 • NON-METALLIC MINERALS 153
6
5. Also efficiency data differ by source. For example, in the case of India, data from the Bureau of Energy Efficiencyindicate a considerably higher efficiency and a continuous efficiency improvement for the period 2003 – 2006.However, the reported thermal energy use for some kilns is well below the most efficient kilns in OECD countries,and the average efficiency exceeds that of Japan. Therefore, further analysis is needed.

electricity needs from combined heat and power (CHP) (JCA, 2006). China isalso interested in electricity generation from waste heat and estimates a potential of35 – 40 kWh/t clinker (Cui, 2006). New large-scale dry kilns with a capacity of2 000 tonnes per day or more can take advantage of CHP production. However, itappears only Japan has so far taken up a significant part of the CHP potential. Tosome extent this can be explained by high electricity prices that make such energyrecovery economical.
Alternative Fuel Use in Cement Production
The use of alternative fuels in the cement industry offers the opportunity to reduceproduction costs, dispose of waste and in some cases reduce CO2 emissions and fossilfuel use. Cement kilns are well-suited for waste combustion because of their highprocess temperature and because the clinker product and limestone feedstock act asgas-cleaning agents. Used tires, wood, plastics, chemicals and other types of wasteare co-combusted in cement kilns in large quantities. This use of waste as alternativefuel in cement kilns can contribute to lower overall CO2 emissions, if fossil fuels arereplaced with alternative fuels that would otherwise have been incinerated or landfilled (Figure 6.7).
154 TRACKING INDUSTRIAL ENERGY EFFICIENCY AND CO2 EMISSIONS
Figure 6.6 � Energy Requirement per tonne of Clinker for Non-OECD Regions and New EU Accession Countries, 2000
Key point: Energy consumption per tonne of clinker in non-OECDcountries and Eastern European Union countries ranges between4.5 and 5.5 GJ/t clinker.
0
1
2
3
4
5
6
7
SE Asia CIS New EUcountries
South & LatinAmerica
Africa Middle East
Ener
gy
inte
nsi
ty o
f cl
inke
r (G
J/t)
Source: Battelle, 2002.

Chapter 6 • NON-METALLIC MINERALS 155
6
Conventional approach Integrated approach
INCINERATIONOF WASTE
CEMENTKILNS
+
Waste
GHGemissions
CO2, SO2,NOx
Fossil fuels(coal, fuel oil,natural gas)
GHGemissions
CO2, SO2,NOx
CO-PROCESSINGOF AFR
IN CEMENT KILNS
Fossil fuels(coal, fuel oil,natural gas)
GHGemissions
CO2, SO2,NOx
AFR
Figure 6.7 � Impact of Alternative Fuels on Overall CO2 Emissions
Note: AFR = alternative fuels.
Source: CEMBUREAU, 2006.
European cement manufacturers derived 3% of their energy needs from waste fuelsin 1990 and 17% in 2005. Indications show a further increase since then(CEMBUREAU, 2006). Cement producers in Belgium, France, Germany, theNetherlands and Switzerland have reached average substitution rates from 35% tomore than 70% of the total energy used (Figure 6.8). Some individual plants have
Box 6.3
Natural Gas Use in Cement Kilns in Russia and the Former Soviet Union
Russia and to a lesser extent the rest of the Former Soviet Union (FSU) consume significantquantities of natural gas to fire their cement kilns. In 2000, an estimated 68% of fuel use inthe cement industry in Russia and the FSU was natural gas due to low gas prices. The averageindustrial and household gas price in Russia is about 15% of the average German import pricefor gas, so the incentive for energy efficiency is weak (IEA, 2006b).
As part of the European Union’s support for Russia’s bid to join the World Trade Organisation,Russia agreed in 2004 to increase natural gas tariffs in line with what had been outlined inthe Government’s Energy Strategy approved in 2003. The Russian Government has promisedto raise gas prices to industry from USD 27 per thousand m3 in 2004 to between USD 49 – 57 per thousand m3 in 2010. Domestic gas prices for industry have reached closeto USD 50 per thousand m3 in 2007 and a recent statement by the Minister of EconomicDevelopment and Trade outlined an even more ambitious plan to increase gas to more thanUSD 100 per thousand m3 by 2010.
This could lead to an increase in the use of coal at cement kilns over time and a correspondingincrease in their CO2 emissions. However, this will depend on the local availability of cheapcoal and to some extent on improvements in Russian rail infrastructure for coal deliveries.

156 TRACKING INDUSTRIAL ENERGY EFFICIENCY AND CO2 EMISSIONS
achieved 100% substitution using waste materials. However, very high substitutionrates can only be accomplished if a tailored pre-treatment and surveillance system isin place. Municipal solid waste, for example, needs to be pre-treated to obtainhomogeneous calorific values and feed characteristics. Another potential source ofenergy is carpets, the equivalent of about 100 PJ per year are disposed of in landfills and could instead be combusted in cement kilns.
Used car and truck tires represent an attractive fuel source in many regions. Thecement industry in the United States combusted 377 kilo tonne (kt) of used tires in2004, or about 12 PJ (USGS, 2006). Kilns in the United States also consumedaround 125 kt of other solid waste and 1 billion litres of liquid wastes.
The cement industry in Japan burned around 221 kt of used tires in 2004, downfrom a peak of 323 kt in 2000 (Japan Cement Association, 2006). In 2005 theJapanese industry burned around 447 kt of waste oil 2005, 340 kt of wood chipsand 302 kt of waste plastic. This is equivalent to about 35 PJ of energy fromalternative sources assuming 42.6 GJ/t for waste oil, 16.6 GJ/t of wood chips and35.6 GJ/t of waste plastic.
The cement industry in Germany burns a range of alternative fuels including wastepaper, textiles, oil, plastic and solvents; as well as animal carcasses, oil and sewagesludge and construction waste. They achieved 38% alternative fuel use in 2003(VDZ, 2006).
0%
5%
10%
15%
20%
25%
30%
35%
40%
45%
Germany France Japan United States Canada Spain Italy Korea
Figure 6.8 � Alternative Fuel Use in Clinker Production by Country(Percentage of Total Thermal Fuel Use)
Sources: VDZ, 2006; Japan Cement Association, 2006; USGS, 2006; NRCAN, 2006; AITEC, 2005; OFICEMEN, 2007; Observatoire de l’énergie,2003; and Dong-Woon, 2006.
Key point: Alternative fuel use in the cement industry has reached high levels in some European countries, but is less significant elsewhere.

In Europe, the burning of alternative fuels in cement kilns is covered by Directive2000/76/EC of the European Parliament and Council. However, in some countriestheir use is controversial, because cement kilns are not subject to emission controlsas stringent as waste incineration installations. Clear guidelines and publicinformation campaigns could help increase the use of waste in cement kilns.
Significant uncertainty surrounds the total global consumption of alternative fuels inthe cement industry. According to IEA statistics, the cement industry in OECDcountries used 66 PJ of combustible renewables and waste in 2003, about half ofit industrial waste and half wood waste. Worldwide, the industry consumed 112 PJof biomass and 34 PJ of waste. However, this is likely to be a substantialunderestimate. There is apparently little use of alternative fuels outside the OECDcountries, although the comparison of country data from various sources with IEAstatistics tends to imply that alternative fuel use is systematically under-reported.From a technical perspective, the use of alternative fuels could be increased to1 – 2 EJ per year, although there would be differences among regions due to thevarying availability of alternative fuels.
Electricity Consumption in Cement Production
Grinding is the largest electricity demand in the cement industry. Currently about100 kWh/t of cement is consumed in rotary kilns for grinding raw materials, atthe kiln and for grinding cement.6 The current state-of-the-art technologies, usingroller presses and high-efficiency classifiers, are much more efficient than previousones. Current best practice is thought to be around 80 – 90 kWh/t of clinker(Sathaye, J., et al., 2005; FLSmidth, 2006). Still, the energy efficiency of grinding istypically only 5 – 10%, with the remainder converted to heat. There can be anenormous variation in the consumption of electricity per plant, for example, cementplants in Brazil were found to consume between 90 – 200 kWh/t of cement (Soaresand Tolmasquim, 2000). Figure 6.9 presents electricity consumption for cementproduction by country.
With the exception of the United States and Canada, most countries for which datais available fall within the range of 90 – 120 kWh/t of cement. Electricityconsumption per tonne of cement has been trending downwards in many countries,although in some cases this trend is not very strong. In some countries, part ofthe decline in electricity consumption may be due to reductions in the clinker ratioand are not due to improved energy efficiency of the process. In countries whereelectricity consumption per tonne of cement declined, the rate of decline wasbetween 2.1 – 0.2% between 1990 and 2003/2004. In some cases, such as Japan,China and Mexico, electricity consumption has actually increased in recent years. InJapan, this has been due to the increased electricity used in handling alternativefuels and materials.
It is not clear if structural or operational considerations in different countries explainthe quite wide range in electricity consumption, or whether this simply reflectsdifferent electricity prices and hence incentives to minimise electricity use. One
Chapter 6 • NON-METALLIC MINERALS 157
6
6. A small amount is also used for miscellaneous utilities on-site and packing.

158 TRACKING INDUSTRIAL ENERGY EFFICIENCY AND CO2 EMISSIONS
potential source of discrepancy is that the grinding of blast furnace slag for use as aclinker substitute or in the kilns is an electricity intensive process. If this grindingtakes place at a grinding facility separate to the cement kiln, then electricity usemight be under-reported.
Total Primary Energy Consumption in Cement Production
The use of electricity in cement production is significant, totalling between 220 –265 TWh in 2004. This has notable implications for the total energy required toproduce a tonne of cement, depending on the efficiency of the production ofelectricity.
Figure 6.10 presents the total primary energy supply (TPES) equivalent consumptionper tonne of cement. This is calculated by dividing the electricity per tonne of cementby the average efficiency (including distribution losses) of electricity generation ineach country and adding this to the thermal energy required per tonne of cement,taking into account the clinker ratio.
Germany, Japan, Brazil, Italy and Spain all consume about 3.4 – 3.5 GJ/t of cementon a TPES equivalent basis. India appears to have significantly reduced the TPES
0
20
40
60
80
100
120
140
160
180
1980 1985 1990 1995 2000 2005
Elec
tric
ity in
ten
sity
of
cem
ent
pro
du
ctio
n (
kWh
/t)
US
Canada
Mexico
China
Weightedaverage
Italy
Brazil
Korea
Japan
Spain
India
Germany
Figure 6.9 � Electricity Consumption per tonne of Cement by Country, 1980-2005
Key point: Modest improvements in the electricity consumption per tonne of cement have been achieved since 1990 in many countries.
Note: Care must be taken in interpreting the absolute values of data in this figure, due to the possibility that different system boundarieshave been used and that electricity produced on-site from waste heat has not been included in the totals for some countries. For examplein Japan, about 10% of all electricity consumed is generated on-site from waste heat. If this electricity were subtracted, the electricity intensityof Japanese production would be 10% lower.
Sources: Raina, 2002; and as for Figure 6.5.

equivalent consumption per tonne of cement as the share of dry process productionincreased. However, significant uncertainty surrounds their data and there is a widevariation in the estimates.
Chapter 6 • NON-METALLIC MINERALS 159
6
0
1
2
3
4
5
6
7
1990 1992 1994 1996 1998 2000 2002 2004
Prim
ary
ener
gy
inte
nsi
ty o
f ce
men
t p
rod
uct
ion
(G
J/t) US
Canada
Weightedaverage
China
Korea
Mexico
India
Spain
Germany
Italy
Japan
Brazil
Figure 6.10� Total Primary Energy Equivalent per tonne of Cement by Country, 1990-2004
Key point: With the exception of Canada, China, India and Mexico, little improvement in the TPES equivalent per tonneof cement has been achieved since 1990.
Note: Includes impact of CHP electricity generation for Japan. Care must be taken in interpreting the absolute values of data in this figure,due to the possibility that different system boundaries have been used and that in some cases it is not clear whether LHV or HHV havebeen used.
Sources: As for Figures 6.4, 6.5, 6.8 and 6.9; IEA statistics.
The interaction between the clinker ratio, thermal energy requirements and electricityconsumption per tonne of cement and the efficiency of electricity generation lead tosome interesting results. With the exception of Canada, China, Germany, Mexico andIndia, the TPES equivalent consumption per tonne of cement has not exhibited muchof a downward trend since 1990. Despite some fluctuations it has been more or lessunchanged in the United States and Japan, while it has decreased by 1.1% per yearin Germany between 1990 and 2003 and by 1.6% per year in Mexico. Between1994 and 2004 the TPES equivalent in China fell by 1.9% per year. China is alsonot that inefficient at a TPES equivalent level, despite its high energy consumptionfor clinker production, due to its low clinker ratio. The range of TPES equivalent was3.4 – 5.3 in 2004. In some countries, part of the TPES decline can be explained bythe reduced clinker ratio, which may be considered as a structural change, notrelated to process improvements.

160 TRACKING INDUSTRIAL ENERGY EFFICIENCY AND CO2 EMISSIONS
CO2 Emissions from Cement Production
The CO2 emissions per tonne of cement produced depend on the energy andelectricity intensity of clinker and cement production, the clinker ratio, the fuel typesused at the cement kiln and the CO2 emissions profile of the electricity consumed.To this must be added the process emissions from calcination in the clinkerproduction process to arrive at a total CO2 emissions per tonne of cement.
0
0.2
0.1
0.3
0.4
0.5
0.6
kg C
O2/k
g o
f ce
men
t
US
China
Weightedaverage
India
Canada
Mexico
Japan
Germany
Italy
Brazil
Spain
Korea
1990 1993 1996 1999 2002 2005
Figure 6.11� CO2 Emissions from Energy Consumption (including electricity) per tonne of Cement by Country, 1990-2005
Key point: With the exception of China, Germany, Korea and Spain,little improvement in the CO2 intensity of cement productionfrom energy consumption has been achieved since 1990.
Note: Includes impact of CHP electricity generation for Japan.
Care must be taken in interpreting the absolute values of data in this figure, due to the possibility that different system boundaries havebeen used and that in some cases it is not clear whether LHV or HHV have been used.
Sources: As for Figures 6.4, 6.5, 6.8 and 6.9; IEA statistics.
With the exception of India, China and the United States, CO2 emissions per tonneof cement from energy consumption (including the upstream emissionsfrom electricity generation) are within a reasonably narrow band of 0.25 – 0.35 kgCO2 /kg of cement (Figure 6.11). Canada’s relatively low emissions from electricitygeneration offset its relatively high energy consumption to some extent, while theopposite is true of India.
The United States, Canada, India and Mexico have experienced little change in theirCO2 emissions per tonne of cement from energy use over the period that data areavailable. China has reduced CO2 emissions per tonne of cement from energy

consumption by 1.9% per year between 1994 and 2004, albeit from a high startingpoint. Germany achieved a reduction of 1.5% per year between 1990 and 2003, whileSpain reduced emissions by 3.5% per year between 1996 and 2004. Brazil is the onlycountry that experienced a significant increase in CO2 emissions per tonne of cementfrom energy consumption. This is primarily due to the substitution of petroleum cokefor fuel oil in kilns. However, the low CO2 emissions profile of Brazil’s electricity industrymeans their overall emissions from energy consumption are quite low.
Chapter 6 • NON-METALLIC MINERALS 161
6
1990 1993 1996 1999 2002 2005
kg C
O2/k
g o
f ce
men
t
Korea
0
0.2
0.4
0.6
0.8
1.0
1.2 US
India
Weightedaverage
China
Canada
Mexico
Japan
Germany
Brazil
Italy
Spain
Note: Includes impact of electricity generation from waste heat in Japan. Boundary definitions may differ by country.
Sources: As for Figures 6.4, 6.5, 6.8 and 6.9; IEA statistics.
Figure 6.12 presents total CO2 emissions per kilogramme (CO2 /kg) of cementincluding thermal energy, upstream electricity emissions and process emissions. Thestandard emission factor of 0.51 kg CO2 /tonne of clinker has been multiplied bythe clinker ratio in order to determine the CO2 emissions attributable to calcinationprocess. Generally, the trend in CO2 emissions per tonne of cement including processemissions is similar to the trend excluding process emissions. This is because trendsin the clinker ratio impact on the CO2 emissions related to clinker production. So partof the decline in total CO2 emissions can be explained by a reduction in the clinkerratio and are not directly related to process improvements.
Figure 6.12� Process and Energy (including electricity) CO2 Emissions per tonne of Cement by Country, 1990-2005
Key point: China, Germany, Italy, Korea and Spain have achieved significant improvements in the CO2 intensity of cement production including energy consumption and process emissions.

162 TRACKING INDUSTRIAL ENERGY EFFICIENCY AND CO2 EMISSIONS
Total CO2 emissions per tonne of cement from energy and calcination in 2003 – 2004range from about 0.65 kg CO2 /kg of cement in Spain, Brazil and Italy to 0.93 kg CO2/kg of cement in the United States. The potential CO2 emissions reduction potential inthe cement industry from the use of best available technology, the increased use ofclinker feedstock substitutes in the kiln and the use of more clinker substitutes in finishedcement is between 480 and 520 Mt CO2. However, significant uncertainty exists aroundthis figure due to the absence of comprehensive data and the problems with the qualityof the data that is available. It is also important to note that these savings could not beachieved in the short- to medium-term without significant economic costs.
Energy and CO2 Emission Indicators for the Cement Industry
The key challenge in compiling physical energy and CO2 emission indicators for thecement industry is the poor availability of data, particularly time series data. Ingeneral, national energy statistics do not include sub-sector information for the non-metallic minerals sector. The approach taken here has been to use national energyand CO2 emissions statistics for the cement industry where these are available, whilesupplementing these with survey information, data from industry associations,cement companies and academic or government studies where available.
As a result, although the information presented here is the best publicly availabledata, there are uncertainties about the accuracy of some data. Caution must thereforebe exercised in comparing the absolute level of indicators between countries giventhat the quality of data is not always the same. Despite this qualification, however,the data here are in close agreement with an industry sponsored study that was basedon a consistent approach (Battelle, 2002).7 Table 6.7 presents the indicators thathave been examined for the cement industry in this study.
IndicatorClinker ratio per tonne cement
Unit%
Energy intensity of clinker GJ/t clinker
Alternative fuel use for clinker production %
Electricity intensity of cement kWh/cement
Total energy intensity of cement GJ/t cement
Total primary energy intensity of cement (including upstream energy use in electricity)
GJ/t cement
Energy related CO2 emissions per tonne cement t CO2 /cement
Energy and process CO2 emissions per tonne cement t CO2 /cement
Table 6.7 � Indicators for the Cement Industry
7. For instance, for total CO2 emissions from cement production per tonne (including process emissions), the datacollected for this analysis differs by between 1 - 6% from the data in the Battelle report for China, Canada, India,Japan, Korea and the United States.

Other indicators are possible. For example alternative fuels can be excluded from theenergy intensity, or the electricity intensity can be corrected for auto-generation fromwaste heat. Also electricity intensity could be split into electricity use for clinkermaking and for cement grinding. However such a split requires detailed data that arenot readily available.
The development and estimation of energy and CO2 indicators for the cementindustry is aided by the clear system boundaries that can be set for clinker productionand cement production, as well as the homogeneity of the product. Another factorthat facilitates the indicator analysis is that there is currently little combined heatand power (CHP) production at cement kilns. Modern dry process plants with pre-heaters and pre-calcinators mean that the residual useful heat has dropped tobetween 270 – 300°C. In the past this has been too low to economically supportCHP applications in most countries, although this is changing to some extent.However, it is not clear that different data sources have applied the same systemboundaries. In particular, it is possible that electricity used at grinding only plantsmay not be included. In some cases, it is also not clear whether data includes orexcludes electricity generated on-site.
The approach taken here is similar to that being used by the Asia Pacific Partnership intheir indicators work in the cement industry, with the exception that the IEA does nothave any indicators covering nitrogen oxide, sulphur oxides or kiln dust emissions. TheIEA has also not attempted to separate electricity consumption for cement grinding orfrom waste heat power generation due to an absence of publicly available data. TheAsia Pacific Partnership’s work on detailed data for energy indicators in cement will bea valuable addition to research in this area when it is completed.
The approach taken here is also consistent with the World Resources Institute andWorld Business Council on Sustainable Development Cement CO2 Protocol for directand indirect emissions (WBCSD, 2005). The IEA uses its own data for emissionfactors and CO2 emissions factors for electricity generation rather than theIntergovernmental Panel on Climate Change (IPCC) defaults, although these areused in the absence of any data. For alternative fuels, direct emissions have beenincluded; an analysis of their net CO2 profile (whether higher or lower) has not beenattempted. The WBCSD Cement Sustainability Initiative is in the process of updatingdata for a new study using their CO2 Protocol which will provide a valuable updateof the 2002 Battelle study.
LimeOverview
Lime is used in a wide range of products with the largest application in the iron andsteel, pulp and paper, sugar and construction industries. Lime is also an importantmaterial in the control of sulphur dioxide emissions in power stations and as aprecipitation agent in water treatment facilities.
There are no detailed statistics on global lime production. Estimated production is120 Mt, excluding regenerated lime or captive lime production (Miller, 2003).Estimates may not give the complete picture, however, as a significant portion of
Chapter 6 • NON-METALLIC MINERALS 163
6

164 TRACKING INDUSTRIAL ENERGY EFFICIENCY AND CO2 EMISSIONS
lime is produced in captive kilns, e.g. in iron and steel, pulp and sugar industries. TheEuropean Lime Association (EuLA) estimates the total world production of lime,including captive lime at 300 Mt. Total Chinese lime production is estimated at154 Mt in 2005 (Box 6.4), about half of the global production. The largest limeproducing countries are China, United States, Japan, Russia, Germany, Mexico andBrazil.
Box 6.4
Lime Production in China
Chinese lime production was 154 Mt in 2005. About 62% is used for buildings, 23% for steelmaking and 12% for chemicals (calcium carbide, calcium hydrogen, chlorine and alkaliindustries). Coal accounts for 96% of all fuel used in China’s lime industry. The lime industryaccounts for 12% of total energy use in the Chinese building materials industry. Its relevancein CO2 terms is even higher because of significant process emissions. Lime production isprojected to grow as it is a key component for flue gas desulphurisation.
Between 2003 and 2006, energy use for lime production increased from 610 to 780 PJ, whilethe energy use per tonne of lime was constant. The average fossil fuel use is 4.5 GJ/t burnedlime. This efficiency is comparable with kilns in OECD countries. Total direct CO2 emissionsamounted to 179 Mt in 2005. About two-thirds were process emissions. A significant share ofthe process CO2 emissions are captured during the lime use stage.
The lime made from earthen kilns, an outdated technology, accounts for more than 60% ofthe total output. In order to improve the energy efficiency the use of semi-mechanised andmechanised vertical kilns should be promoted and earthen kiln should be eliminated. Thiswould result in about 20% energy efficiency gain.
Source: Shi, 2007.
Lime Production Process
Lime is produced by burning limestone or dolomite in small-scale, vertical or large-scale, rotary kilns. In most industrialised countries, the industry consists of a smallnumber of large corporations. In most developing countries, lime kilns are typicallysmall operations using local technology. However, even in industrialised countries,e.g. Greece, independent small-scale vertical kilns operate. Pulp and sugar mills mayhave captive lime production to internally regenerate lime.
The minimum energy requirement for lime production is 3.20 GJ/t. For dolomite,the minimum energy requirement is 3.02 GJ/t. Energy use is 3.6 – 7.5 GJ/t lime inthe European Union (EC, 2001), 7.2 GJ/t in Canada (CIEEDAC, 2004) and for limekilns in US pulp mills (Miner and Upton, 2002), and up to 13.2 GJ/t for smallvertical kilns in Thailand. Average energy intensities in China are estimated to varyfrom 4.2 GJ/t for large shaft kilns to 5.8 GJ/t for small-scale primitive kilns
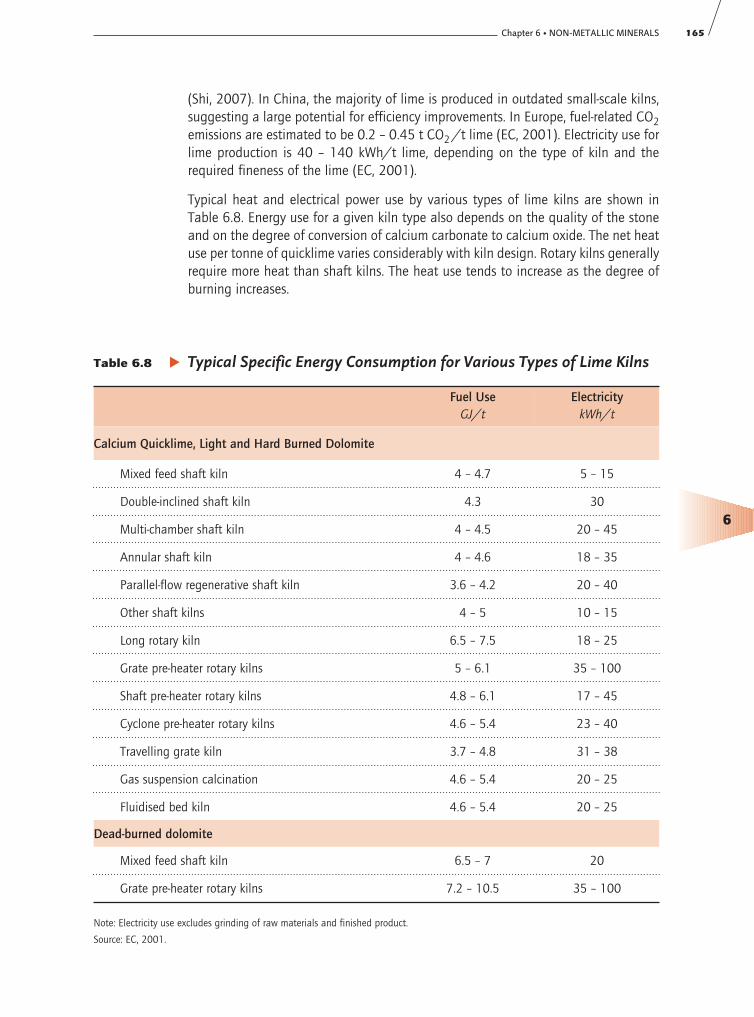
(Shi, 2007). In China, the majority of lime is produced in outdated small-scale kilns,suggesting a large potential for efficiency improvements. In Europe, fuel-related CO2emissions are estimated to be 0.2 – 0.45 t CO2 /t lime (EC, 2001). Electricity use forlime production is 40 – 140 kWh/t lime, depending on the type of kiln and therequired fineness of the lime (EC, 2001).
Typical heat and electrical power use by various types of lime kilns are shown inTable 6.8. Energy use for a given kiln type also depends on the quality of the stoneand on the degree of conversion of calcium carbonate to calcium oxide. The net heatuse per tonne of quicklime varies considerably with kiln design. Rotary kilns generallyrequire more heat than shaft kilns. The heat use tends to increase as the degree ofburning increases.
Chapter 6 • NON-METALLIC MINERALS 165
6
Table 6.8 � Typical Specific Energy Consumption for Various Types of Lime Kilns
Fuel Use GJ/t
ElectricitykWh/t
Calcium Quicklime, Light and Hard Burned Dolomite
Mixed feed shaft kiln 4 – 4.7 5 – 15
Double-inclined shaft kiln 4.3 30
Multi-chamber shaft kiln 4 – 4.5 20 – 45
Annular shaft kiln 4 – 4.6 18 – 35
Parallel-flow regenerative shaft kiln 3.6 – 4.2 20 – 40
Other shaft kilns 4 – 5 10 – 15
Long rotary kiln 6.5 – 7.5 18 – 25
Grate pre-heater rotary kilns 5 – 6.1 35 – 100
Shaft pre-heater rotary kilns 4.8 – 6.1 17 – 45
Cyclone pre-heater rotary kilns 4.6 – 5.4 23 – 40
Travelling grate kiln 3.7 – 4.8 31 – 38
Gas suspension calcination 4.6 – 5.4 20 – 25
Fluidised bed kiln 4.6 – 5.4 20 – 25
Dead-burned dolomite
Mixed feed shaft kiln 6.5 – 7 20
Grate pre-heater rotary kilns 7.2 – 10.5 35 – 100
Note: Electricity use excludes grinding of raw materials and finished product.
Source: EC, 2001.

166 TRACKING INDUSTRIAL ENERGY EFFICIENCY AND CO2 EMISSIONS
CO2 emissions arise in lime production from the decarbonisation of limestone andmagnesium carbonate, fuel combusted in the process and indirect emissions fromelectricity consumed in the process. In efficient lime kilns about 60% of theemissions are process emissions due to decarbonisation of the raw materials.
Energy Consumption and CO2 Emissions from Lime Production
No estimates of global CO2 emissions due to lime production are available. InEurope, process emissions are estimated at 750 kg CO2 /t lime (EC, 2001).Regeneration of lime in pulp and sugar mills does not necessarily lead to additionalCO2 emissions, as the CO2 is from biomass sources (Miner and Upton, 2002). Theprocess emission is the most important source of CO2 in the lime production process.However, a significant part of this CO2 is fixed when the slaked lime is subjected toair. Only in applications where lime is converted into glasslike materials, e.g. the steeland glass production processes, or into gypsum in desulphurisation processes, thisCO2 fixation will not occur.
CO2 emission reductions can be achieved by the use of more efficient kilnsand through improved management of existing kilns using similar techniques to thosein the cement industry (EC, 2001). In the United States, the National Lime Associationhas agreed to a 9% reduction of CO2 production intensity in the industry by 2012.This reduction target does not include process emissions. A higher use rate of by-product dust and higher energy efficiency will be applied. As more than 50% of thelime in China is produced in outdated kilns, a change towards large-scale shaft kilnswould result in energy savings of up to 21% (Cui, 2007). Switching to low carbon fuelscan further reduce CO2 emissions. It may also be possible to reduce the consumptionof lime in various processes, e.g. in the sugar industry (Vaccari, et al., 2005).
Glass
Overview
There are four main glass categories: container, flat, fibre (mineral wool, textile andoptical) and specialty glass. The glass industry is dominated by the production ofcontainer glass and flat glass.
Global glass production was around 130 Mt in 2005 (Wang, 2007). Container glassaccounts for about three fifths and flat glass for about one third of the production(Pilkington, 2005). Production volumes for fibre and speciality glass are small. TheEuropean Union (33 Mt), China (32 Mt) and the United States (20 Mt) account for60% of the world production (Wang, 2007). Over the past twenty years, glassdemand has grown more quickly than GDP and is still growing at nearly 4% per year.The EU25 production of container glass was 21 Mt in 2005, followed by the UnitedStates (10 Mt) and China (8.5 Mt) (Wang, 2007).
Flat glass production was about 43 Mt in 2005. Of this, around 70% is for windows,10% in glazing products for automotive applications and 20% in furniture and otherinterior applications (Pilkington, 2005). The key production route for flat glass is thefloat process, which accounted for 80 – 90% of flat glass production in 2005

(Wang, 2007). Chinas float glass output accounted for 38% of the world float glassoutput, and float glass accounted for 76% of total Chinese flat glass production. Flatglass accounts for 65% of Chinese glass production. This high share is caused by thepresent building boom.
Glass Production Process
Glass is produced by melting raw materials (mainly silica sand, soda ash andlimestone), and often cullet (recycled container glass or waste glass frommanufacturing) in glass furnaces of different sizes and technologies. There is a largevariety of glass products with varying characteristics and, hence, different productionand processing routes. Yet, the main production steps found in virtually all glassplants are:
� Raw materials selection;
� Batch preparation – weighing and mixing raw materials;
� Melting and refining;
� Conditioning and forming;
� Post-processing – annealing, tempering, polishing or coating.
More than half of energy consumption in the glass production process is for themelting process. With the exception of a few specialty glass manufacturingprocesses, continuously operated tank furnaces are commonly used for the meltingof glass.8 Common heating methods are combustion-heating (oxy-fuel, air-fuelburners) and direct electrical heating (“Joule heating”), as well as combinations ofboth (“electric boosting”). Many furnaces use electric boosting to increase productionrates, or to increase the flexibility of the furnace operation, e.g. choice of energysource and production rates. Electric boosting typically accounts for 10 – 30% of thetotal energy input.
Today, most furnaces for glass manufacturing are heated with natural gas or fuel oil.To increase fuel efficiency and reduce emissions of nitrous oxides, oxygen isincreasingly replacing combustion air. Large container glass furnaces, in particular,are using more and more oxy-fuel technology.
Float glass furnaces, the largest in the industry, have an average capacity of550 tonnes/day (t/d), but can be as large as 1 100 t/d whereas container glassfurnaces generally have a capacity of 250 – 350 t/d. Regenerative furnaces arecommon in both float and container glass production.
Air-fuel furnaces typically recover heat from exhaust gas streams with recuperativeor regenerative systems to preheat the combustion air to improve efficiency andachieve higher flame temperatures. In recuperative systems, heat is continuouslytransferred from the exhaust gases to the combustion air in a heat exchanger. Inregenerative systems, the exhaust gases stream through large chambers packedwith refractory bricks arranged to form open conduits. During the first part of thefiring cycle, flue gases pass through the conduits and heat the bricks before
Chapter 6 • NON-METALLIC MINERALS 167
6
8. All-electric, cold-top furnaces are primarily used for mineral wool type fibre glass and specialty glass production.

leaving through the stack. After a certain time, the exhaust port is closed and thefiring direction is reversed: cold combustion air is passed through the heatedbrickwork in the opposite direction, and mixed with the fuel in a combustionchamber. The cycle time is usually automatically adjusted by a control system toimprove efficiency.
Excess heat in the off-gas stream of recuperative or regenerative systems can be usedto generate steam in a waste-heat recovery boiler or to preheat cullet. Both measurescan increase the overall efficiency of the glass furnace from 40 – 50% to 50 – 65%(Whitemore, 1999). Modern glass furnace technology aims to increase the use ofoxygen as a way to increase fuel efficiency and reduce emissions of nitrogen oxides(NOx). Due to the high temperatures in the furnace, glass melting is a large sourceof NOx emissions. State-of-the-art technology aims to further reduce NOx emissions,while simultaneously reducing energy costs.
Energy Consumption and CO2 Emissions from Glass Production
About 0.5 – 0.8 EJ of energy is used for glass production worldwide. Assumingthat half of this energy is provided by natural gas and half by fuel oil, and anaverage of 7 GJ/t of product, yields an emission factor of 450 kg energy relatedCO2 /t of product. Globally, energy used in the production of container and flatglass results in emissions of about 50 – 60 Mt CO2 per year. Emissions from thedecarbonisation of soda ash and limestone can contribute up to 200 kg CO2 /tof product depending on the specific composition of the glass and the amount ofcullet used.
The theoretical minimum energy use is 2.8 GJ/t for soda-lime glass and 2.35 GJ/tfor borosilicate and crystal. The minimum energy requirement is 0.5 GJ/t forchemical reactions and 1.8 GJ/t for melting. The theoretical minimum dependsto some extent on the glass type. In practice, average energy use varies between5.75 – 9.0 GJ/t, so 2 – 4 times as high as the theoretical minimum (Levine, et al.,2004). Structural heat losses account for 20 – 25% of the energy input (0.85 MJ/t)and the losses due to the heat content of flue gases account for 25 – 35% of theenergy use (1.18 GJ/t) (Beerkens and Limpt, 2001).
A recent analysis for 123 container glass and 23 float glass furnaces in Europe andNorth America showed a wide distribution of energy intensity in glass furnaces.Beerkens and van Limpt (2001) report the energy intensity of continuous glassfurnaces in Europe and the United States as 4 – 10 GJ/t of container glass and 5 – 8.5 GJ/t of flat glass, depending on the size and technology of the furnace andthe share of cullet used. The most energy efficient furnace identified shows anenergy consumption of 3.82 – 3.85 GJ/t, based on 50% cullet and taking intoaccount the primary energy consumption for electricity generation. The analysis hasshown that there is a factor two difference between the lowest and the highestenergy users, when normalised for cullet use and size, i.e. larger furnaces are moreefficient than small ones. The difference is due to variations in the raw material mixas well as efficiency of the furnace. It has been estimated that the energy efficiencyof the melting furnaces, on average, improves by about 0.5 – 0.6% per year in thecontainer glass industry. A recent survey for 28 Chinese float glass furnaces
168 TRACKING INDUSTRIAL ENERGY EFFICIENCY AND CO2 EMISSIONS

Chapter 6 • NON-METALLIC MINERALS 169
6
(normalised for 25% cullet) resulted in an average of 7.8 GJ/t float glass, whichis 20% above the world average and 32% above the most advanced countries(Wang, 2007).
After the melting process, packaging glass is shaped and annealed. Shaping,annealing and additional processes require 0.52 GJ electricity and 0.42 GJ naturalgas. For floating glass, the energy requirements for annealing are in the range of 0.8 – 1.5 GJ/t depending on the glass thickness.
The main energy efficiency opportunities include: improved process control,increased use (up to 100%) of cullet, increased furnace size, use ofregenerative heating, oxy-fuel technology, batch and cullet pre-heating andreduction of reject rates. Oxy-fuel furnaces with cullet pre-heating now offer themost energy efficient furnace technology. The energy efficiency improvementpotential is estimated to be 30 – 40%. Research is underway on new moreefficient furnace designs that separate the chemical reactions from melting,offering the opportunity to further reduce energy use. CO2 emissions can bereduced by the use of natural gas instead of fuel oil and CO2 capture for largeoxy-fuel furnaces.
Increased recycling is one way to reduce the energy consumption, because theenergy for the chemical reactions can be saved. As a general rule, 10% extracullet results in a 2.5 – 3% reduction of the furnace energy consumption (from5.2 – 4.0 GJ/t for the range 0 – 100% cullet). Moreover, the production of sodais reduced. About 18% soda is added to sand to make new glass in order toreduce the melting temperature. Soda production requires approximately10 GJ/t. Less soda is needed when recycled glass is used as feedstock. Using10% extra cullet results in 1.0 GJ/t additional savings due to reduced sodaproduction. The current average glass recycling rate is about 50%, but varieswidely for various glass types and by country. The highest recycling rates areobtained for green and brown container glass. Higher recycling rates seemfeasible, as in some regions there is an excess availability of waste glass orrecovery rates are low.
Ceramic Products
Overview
The ceramic products industry is generally split in two parts; the heavy ceramicproducts, e.g. bricks, roof tiles, and fine ceramics, e.g. floor tiles, sanitary and tablestoneware and porcelain. Reliable international statistics on the production ofceramics products are not available. The annual per capita consumption of bricks,tiles and other ceramic products in tonne per capita per year is estimated at 1.2 inChina; 0.4 in the EU (EU-BREF Ceramics, 2005), 0.1 in the United States (USGS,2004), and 0.25, 0.12, and 0.05 for Pakistan, India and Bangladesh. This suggeststhat the global production of ceramic products exceeds 2 Gt/year. China accountsfor more than half of total world production.

170 TRACKING INDUSTRIAL ENERGY EFFICIENCY AND CO2 EMISSIONS
Bricks are the main output of the ceramics industry in weight terms. It should benoted that specifications for bricks produced in different types of kilns differ strongly,e.g. solid, hollow or perforated bricks. Industrial and small-scale producers use theenergy contained in the organic fraction of clay and shale as well as in pore formingagents, e.g. saw dust, added to the clay in the production process.
Bricks are produced in virtually every country, from the less developed countries toindustrialised countries. China is by far the largest manufacturer of bricks in theworld, producing an estimated 1.7 Gt bricks in 2005 (Box 6.5). Among IEAcountries, the major producers are in the European Union (55 Mt in 2000) and theUnited States (14.4 Mt in 2004). Bricks have many different forms andcompositions, resulting in strong variations weight and size.
The ceramic materials industry is a sub-sector where few reliable production statisticsare available, and the available data are often not in weight units. Within the fineceramics industry, floor tiles are the major product. Global floor tile production isestimated at more than 5 200 Mm2 or about 45 Mt (Ceramic World Review, 2001).The key producing countries are China (33%), Italy (12%), Spain (12%), Brazil (9%),Indonesia (4%), Turkey (3%), Mexico (3%) and India (2%). However, data areuncertain. Other sources state that the Chinese production alone amounts to morethan 5 000 Mm2, which would equal half of total world production and double totalworld production to about 100 Mt (Cui, 2007). In 2000, the EU produced about25 Mt of tiles, while the United States produced only 0.4 Mt (64 Mm2).
Sanitary stoneware production is estimated at approximately 150 million pieces in2006 (although Chinese data indicate 131 million pieces in 2006). Assuming anaverage weight of 25 – 50 kg, the total production of sanitary stoneware is 3 – 8 Mtper year. Production data for other products are not available.
The main raw materials used in the brick and ceramics industries are clay and kaolin,which are most often produced at local quarries. This has contributed to thedistribution of the production sites, e.g. near large clay reserves found near rivers,and also to the more small-scale nature of most plants. Clays and shale used inceramic production contain calcium carbonates. The presence of the carbonatesresults in different product characteristics such as colour. The carbonates are calcinedin a kiln, which is a source of process emissions. The emissions of the total ceramicindustry are estimated at more than 400 Mt CO2 per year from energy use andcalcination of carbonates.
Production technologies and energy efficiencies vary tremendously from largeindustrial operations to cottage and artisan production, which are still verycommon in many developing countries. All ceramic industries use basically thesame production route: after clay preparation, the clay is shaped automatically orby hand (as found for specialty products or in many small-scale plants indeveloping countries); bricks are dried before being baked in a kiln. There arevarious types of kilns: intermittent and continuous, e.g. tunnel and roller kiln. Thekiln and drier (if not air dried) are the main energy users in the manufacture ofceramic products.
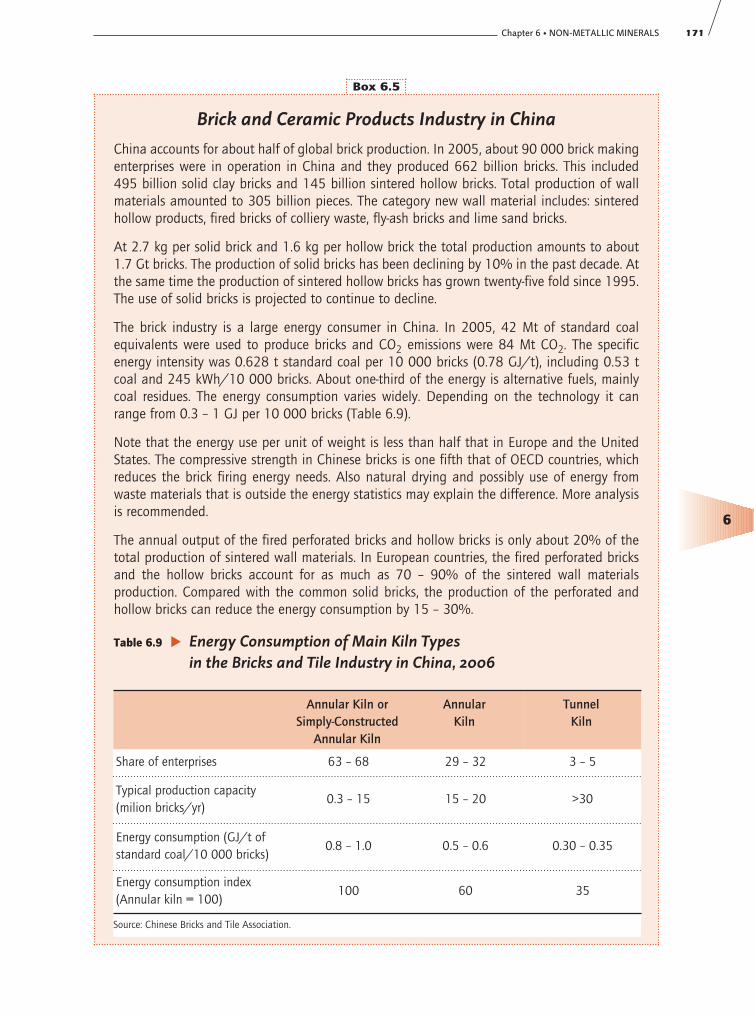
Chapter 6 • NON-METALLIC MINERALS 171
6
Box 6.5
Brick and Ceramic Products Industry in China
China accounts for about half of global brick production. In 2005, about 90 000 brick makingenterprises were in operation in China and they produced 662 billion bricks. This included495 billion solid clay bricks and 145 billion sintered hollow bricks. Total production of wallmaterials amounted to 305 billion pieces. The category new wall material includes: sinteredhollow products, fired bricks of colliery waste, fly-ash bricks and lime sand bricks.
At 2.7 kg per solid brick and 1.6 kg per hollow brick the total production amounts to about1.7 Gt bricks. The production of solid bricks has been declining by 10% in the past decade. Atthe same time the production of sintered hollow bricks has grown twenty-five fold since 1995.The use of solid bricks is projected to continue to decline.
The brick industry is a large energy consumer in China. In 2005, 42 Mt of standard coalequivalents were used to produce bricks and CO2 emissions were 84 Mt CO2. The specificenergy intensity was 0.628 t standard coal per 10 000 bricks (0.78 GJ/t), including 0.53 tcoal and 245 kWh/10 000 bricks. About one-third of the energy is alternative fuels, mainlycoal residues. The energy consumption varies widely. Depending on the technology it canrange from 0.3 – 1 GJ per 10 000 bricks (Table 6.9).
Note that the energy use per unit of weight is less than half that in Europe and the UnitedStates. The compressive strength in Chinese bricks is one fifth that of OECD countries, whichreduces the brick firing energy needs. Also natural drying and possibly use of energy fromwaste materials that is outside the energy statistics may explain the difference. More analysisis recommended.
The annual output of the fired perforated bricks and hollow bricks is only about 20% of thetotal production of sintered wall materials. In European countries, the fired perforated bricksand the hollow bricks account for as much as 70 – 90% of the sintered wall materialsproduction. Compared with the common solid bricks, the production of the perforated andhollow bricks can reduce the energy consumption by 15 – 30%.
Table 6.9 � Energy Consumption of Main Kiln Types in the Bricks and Tile Industry in China, 2006
Annular Kiln orSimply-Constructed
Annular Kiln
AnnularKiln
TunnelKiln
Share of enterprises 63 – 68 29 – 32 3 – 5
Typical production capacity(milion bricks/yr)
0.3 – 15 15 – 20 >30
Energy consumption (GJ/t ofstandard coal/10 000 bricks)
0.8 – 1.0 0.5 – 0.6 0.30 – 0.35
Energy consumption index(Annular kiln = 100)
100 60 35
Source: Chinese Bricks and Tile Association.

172 TRACKING INDUSTRIAL ENERGY EFFICIENCY AND CO2 EMISSIONS
Ceramics Production Process
Brick Production
There is a wide variety of kiln types used in brick production. In developing countriesvarious designs of intermittent kilns, e.g. flame, ring, annular or Hoffman kilns, mostlyfired with coal or biomass are used. In most industrialised countries the tunnel kiln isthe most prevalent, mostly fired with natural gas or oil. Apart from the kiln design, thebrick type is an important variable that determines the energy requirements. Thedifference is accounted for by the kiln temperature and kiln residence time. Brickquality is characterised by the design strength, water absorption rate and colour.
In intermittent kilns, the dried bricks (mostly air dried), are piled into the kiln. Thefuel can be added into the kiln chamber or through burners in the side. The chamberis then closed with a brick wall. The chambers are heated to dry the product, followedby calcination and sintering. The bricks are cooled in the chamber. Intermittent brickkilns consume between 3.4 – 10.4 GJ/t product, while tunnel kilns consumebetween 2.1 – 4.4 GJ/t. In developing countries, small-scale kilns using manuallabour are often used. Wood, agricultural residues and coal are the main fuels.Specific energy consumption varies widely between 3 – 10 GJ/t.
In tunnel kilns, the dried bricks are transported on a cart through the drier (heatedwith waste gas from the kiln), which then enter the kiln. The cart travels at a setspeed through different temperature zones of the kiln (optimised for the productioncycle): heating, calcination, sintering and a cooling zone. The improved processcontrol also warrants a consistent high product quality, resulting in energy savingsdue to lower reject rates.
Tunnel kilns represent the most widely accepted kiln type, gradually replacing oldertypes. Larger kilns use less energy per tonne of bricks than small kilns. The energyconsumption of a modern tunnel kiln (2.3 GJ/t) is approximately 20% lower thanfor the older kiln designs. In the EU15, the average energy intensity has declinedfrom 2.65 GJ/t in 1980 to 2.31 GJ/t in 2003. A further improvement to 2.0 GJ/tseems technically feasible.
Box 6.5 continued
Coal use for tile production is about 15% of that for brick production. In total, tiles and bricksaccount for 18% of coal consumption in the Chinese building materials industry, which used6.5 EJ coal in 2005. The total is dominated by energy use for cement making.
Compared to developed countries the energy saving potential in the brick and tile industry isabout 40% and CO2 emissions can be reduced by 36 Mt. Measures include a reduction of solidclay brick use to 40 – 50%, use of flue gas heat from brick kilns and closure of small-scale kilns.Also the use of waste fuels and residues should increase. Variable speed drives and properlysized motors can help to save electricity.
The government policy target is to limit the total number of solid clay bricks to 380 billion peryear by 2010. The use of clay substitutes will rise further to 230 billion of standard brickequivalents per year.

Chapter 6 • NON-METALLIC MINERALS 173
6
GJ/t
White tiles, glazed 9
Red tiles, not glazed 6
Table stoneware 10
Fine ceramics 70
Sanitary stoneware 30
Source: Gielen, 1997.
Table 6.10 � Energy Consumption per weight unit for Different Types of Ceramic Products
Fine Ceramics Production
In the production of fine ceramics similar types of kilns are used: intermittent andcontinuous, i.e. tunnel and roller kilns. Kilns vary widely in size and production rates.While intermittent kilns are more energy intensive than continuous kilns, specificenergy consumption largely depends on the product type and specifications(Table 6.10). Given global tile production of 5 – 10 billion m2, 0.4 – 1 EJ per yearare used.
Energy Consumption and CO2 Emissions from Ceramics Production
Energy efficiency and greenhouse gas mitigation options exist in all ceramicsproduction steps. Reduction of the moisture content of the clay through dry formingtechniques will result in energy savings in the drying step and the kiln. Kiln optionsare most important as it is the dominate energy use. Options in the kiln include theuse of more efficient (tunnel) kiln design (including low-thermal mass carts, burnerdesign, insulation); operating practices (process controls); fuel switching from coal tofuel oil, natural gas and biomass; waste heat recovery; and partial substitution ofclay and shale by alternative raw materials such as fly-ash.
The potential savings vary widely for each country depending on the type of brickproduced and kiln types used. It is estimated that the potential would varybetween 10% for countries with state-of-the-art tunnel kilns to more than 30% forcountries with a high number of intermittent kilns. If all Chinese brick productionshifted to efficient tunnel kilns, estimated energy savings of up to 40% wouldresult. Addition of biomass to the clay is another way to reduce the fossil energyconsumption and CO2 emissions in brick production. However, the product qualitymay be affected.
The roller kiln is an important improvement option for the fine ceramics industry,where it has been demonstrated for a wide variety of products. It is now beingdemonstrated for heavy ceramic products as well (roof tiles, bricks). The energyconsumption is lower because of a lower residence time and less materials intensive

174 TRACKING INDUSTRIAL ENERGY EFFICIENCY AND CO2 EMISSIONS
transportation systems for the bricks in the ovens. These transportation systems mustalso be heated. The roller kiln is currently used for production of sanitary stonewareproducts. Roller kilns use about 1.6 GJ/t product.
Mitigation options also include the use of alternative building materials such asconcrete or wood, as well as the use of bricks made from concrete or lime and sand.However, informed decisions will consider CO2 emissions over the whole life cycleof the products including their impact on the energy performance of the building.The current choices of building materials and kiln technologies are deeply relatedto local traditions, climate, and the costs of labour, capital, energy andtransportation, as well as the availability of alternative fuels, raw materials andconstruction materials.
Indicators for Lime, Glass and Ceramics Industries
Energy intensity (and efficiency) indicators for most non-metallic mineral productscould be devised based on the energy intensity of the overall production producedin each industry, e.g. energy use per tonne of lime. A further improvement could bemade to differentiate between the main products in the various industries, e.g.container, flat, fibre and specialty glass in the glass industry. In brick production it isimportant to distinguish the different types of bricks, e.g. varying weight and size,solid versus hollow. Some countries only report the number of bricks produced whileothers also report the volume. Using tonnage as activity indicator would be moresuitable, as it would account at least for some variation in product type. Producttypes vary widely in the ceramics industry, making it virtually impossible to devisereliable indicators that allow a comparison of energy intensity differences betweencountries.
The IEA statistics and most national statistics do not contain data on a sufficientlydisaggregated level to allow construction of such indicators. The IEA energy statisticsdo not distinguish the individual sub-sectors, while only a limited number ofcountries report on energy use for a number of industries discussed in this chapter.Hence, the construction of the indicator would need to rely on a varied set ofnational and industry sources, which are not always consistent between sources orover time, nor cover all countries. The sections discuss the main types of indicatorsthat would be useful in the selected industries and provide a range of the energyintensities found in the industries.

Chapter 7 • PULP, PAPER AND PRINTING INDUSTRY 175
7
PULP, PAPER AND PRINTING INDUSTRY
Key Findings
� The pulp, paper and printing industry consumed 6.45 EJ of final energy in 2004,accounting for 5.7% of total industry energy use. Printing represents a small share ofthe industry's energy demand. In pulp and paper production, the industry generatesabout half of its own energy needs from biomass residues and makes extensive use ofcombined heat and power (CHP) technology.
� The industry's heavy reliance on bioenergy means that the CO2 intensity inmanufacturing is not very high, and therefore CO2 reduction potentials are limited.
� An indicator method is developed in this study that compares a theoretical sectorenergy use if best available technology (BAT) were applied with actual energy useaccording to IEA statistics. The method discerns energy use for mechanical andchemical pulp, pulp from recovered paper and various paper qualities. Theseindicators are suited to identify areas where further analysis is warranted. They cansupplement benchmarking, but are not a substitute.
� This indicators analysis raises a number of issues concerning data quality which requiresfurther discussion on the availability, quality and consistency of data across countries.
� There are notable differences in energy use for pulp and paper production betweencountries, due to a range of factors such as product mix, processes used, plant size,technology, technical age, feedstock quality, fuel prices and management attentionto energy efficiency.
� Energy efficiency gains can be achieved if existing mills are retrofitted with current energyefficient technology, but investment costs and competitiveness are key determinants.
� There is potential for more use of heat recovery. Putting excess heat to use in a moreeffective way could provide savings, but the economic viability depends on the needfor low grade heat.
� Increased paper recycling and recovered paper use could help reduce energyconsumption in the industry. While Europe, Japan and Korea appear to be close to thepractical limits for paper recycling, North America and parts of Asia could benefit frommore effective policies on waste disposal to encourage higher rates of paper recycling.
� In the pulp and paper industry as a whole, the efficiency of heat consumption showedreal gains from 1990 to 2003, but there remains an improvement potential of 14%compared to energy use with BAT.
� The indicators reveal little change in the overall efficiency of electricity use from 1990to 2003. There is an estimated improvement potential of 16% compared to energyuse with BAT.
� Based on country comparisons, the remaining energy efficiency potential in the pulpand paper industry is estimated to be 1.0 EJ per year of final energy, or 1.3 to 1.5 EJin primary energy terms, depending on the efficiency for power and steam generation.If higher recycling rates and CHP were also considered, the total final savingspotential would be 2.1 to 2.4 EJ of final energy per year.

176 TRACKING INDUSTRIAL ENERGY EFFICIENCY AND CO2 EMISSIONS
Global Importance and Energy Use
The pulp, paper and printing industry is the fourth largest industrial consumer ofenergy, consuming 6.45 exajoules (EJ) of final energy in 2004 (5.7% of totalindustrial energy use). Unlike other industrial sectors, the pulp and paper industryalso produces energy as a by-product and already generates about 50% of its ownenergy needs from biomass residues. In the long term, the industry could evendevelop into a clean energy supplier if residues are used efficiently.
Most energy used in paper production is for mechanical pulping and paper drying.This is an area where further efficiency gains are available. The need for largeamounts of steam makes combined heat and power (CHP) an attractive technology.Most modern paper mills have their own CHP unit. Chemical pulp mills produce largeamounts of black liquor which is used to generate electricity at relatively lowefficiencies. New technologies that promise higher conversion efficiency could haveimportant energy benefits, particularly for electricity and possibly biofuels.
In theory, pulp and paper could be produced without CO2 emissions, providedsufficient biomass is used and black liquor is converted into electricity with sufficientefficiency. This would imply minimal recycling as waste paper is used for energyrecovery. This may not, however, be the optimal use of biomass resources. From theviewpoint of the energy and resource system as a whole, it makes more sense torecycle as much paper as possible, while using the wood surplus to produce biofuelsor electricity. Moreover, more intensive use of forests could bring furtherenvironmental degradation if the forests are not sustainably managed. The bestpathway depends therefore on system boundaries and complex trade-offs.
Methodological and Data Issues
The results of this analysis have raised a number of questions regarding theapplicability of using indicators of energy use to compare pulp and paper productionacross countries. The product mix of each country varies to a degree that may not beaccurately reflected in the current methodology and hence may result in certainbiases. Compared to the other industries analysed here, the issue of product mixappears to be much more sensitive.
Industry experts have noted that no two paper mills are identical and as a result anattempt to compare energy use even across similar mills requires strict adherence tosystem boundaries. When such an analysis is extended across countries,discrepancies in system boundaries may distort outcomes. For example, Canada andthe Nordic countries that produce large amounts of virgin pulp may be penalisedunder this methodology, while countries such as Korea, Germany and Japan, whichproduce paper and paperboard (packaging) from recycled pulp, tend to have morefavourable results.
Differences in fuel availability across countries can also skew results in energy usecomparisons. This is especially true where large pulp producing countries havegreater access to biomass than countries that are mainly paper and paperboardproducers which often rely on more costly imported fuels.

Chapter 7 • PULP, PAPER AND PRINTING INDUSTRY 177
An international effort to harmonise data collection is needed to allow for the typeof energy intensity comparisons that are the aim of this activity. The industryrecognises that there is a need for better and more comparable data. Improvinginternational data collection efforts will lead to a better understanding of energyconsumption trends and where more focused policies and practices can have thegreatest impact on reducing energy consumption and CO2 emissions.
Such an undertaking requires significant international collaboration. The businesssensitivity and confidentiality of the underlying data implies that a trusted third partywill be needed to perform the data collection and analysis. As part of the IEA IndustrialEnergy-Related Technologies and Systems (IETS) Implementing Agreement, Papricanhas been working on a benchmarking analysis that potentially could be adapted for aworldwide approach. A benchmarking methodology is being finalised that provides aprocedure for reporting energy use in a pulp and paper mill by process areas.
By reporting energy use by process area, instead of for the entire mill, meaningfulcomparisons can be made on energy use across mills and countries with widelyvarying processes and product mix. A comparison for a specific process area, such asenergy use in recycled pulp processing, can be performed with similar process areas inother mills. This methodology would then allow for country comparisons on a processlevel. Comparisons can then also be made with best available technology, (BAT).
In order to determine the energy use in a pulp and paper mill, the mill is divided intodifferent process areas and data is collected on auto-generated energy, purchasedenergy, energy sold and pulp and paper production for the mill.1 The energy data isthen allocated to the different process areas. The report being prepared by Papricanrecommends covering eleven different paper types and twenty-one different pulpmanufacturing areas.
This indicators analysis raises a number of issues concerning data quality whichrequires further discussion on the availability, quality and consistency of data acrosscountries. IEA statistics include energy use in pulp, paper and printing. Separateenergy use figures for pulp and paper production are available from some nationalstatistics offices. Detailed data on energy use by product in the pulp and paperindustry does exist among different companies, consultants, countries andassociations, but they do not provide a full picture and the data quality andconsistency differ from source to source. In addition, the data are often confidential.
How energy use is allocated in an industry with large amounts of auto-productioncan vary, particularly in accounting for energy sales to a grid and/or to districtheating systems. In IEA statistics electricity produced by auto-producers (includingCHP) is accounted for in the transformation sector and not under industry, but as IEAdata come from national sources there is concern that this may not be consistentacross all countries. A significant amount of fuel consumption, especially biomass, isreported by many countries in the “other industries” category and thus potentiallyleads to an under reporting of fuel consumption in the pulp, paper and print sub-sector. The use of wood residues and waste in boilers in the industry that is omittedin the statistics could be another cause of statistical problems.
7
1. This follows from a previous method for reporting energy use in pulp and paper mills by process area, based onthe approach developed by the International Energy Agency (IEA) Programme on Advanced Energy-EfficientTechnologies for the Pulp and Paper Industry for life cycle studies.

178 TRACKING INDUSTRIAL ENERGY EFFICIENCY AND CO2 EMISSIONS
Pulp and Paper Production and Demand Drivers
Total paper and paperboard production was 355 million tonnes (Mt) in 2004.Chemical pulp production was 128 Mt; mechanical wood-pulp production was36 Mt and non-wood pulp production was 17 Mt. Total fibre supply (pulp andwaste paper) amounted to 339 Mt. Recovered paper accounted for 159 Mt, or44% of the total fibre supply. Of the chemical pulp produced, the vast majority(121 Mt) was sulphate (Kraft) pulp. Half of the product mix is packaging,wrapping and paperboard; about one-third is printing and writing paper; and theremainder is newsprint, household and sanitary paper.
Table 7.1 � Paper and Paperboard Production, 2004
Source: Food and Agricultural Organization of the United Nations (FAO), 2006.
Paper & Paperboard
Mt
Share
%
CumulativeProduction Share
United States 83.61 23.6 23.6
China 53.46 15.1 38.7
Japan 29.25 8.3 46.9
Canada 20.58 5.8 52.7
Germany 20.39 5.8 58.5
Finland 14.04 4.0 62.4
Sweden 11.59 3.3 65.7
Korea 10.51 3.0 68.7
France 10.25 2.9 71.6
Italy 9.67 2.7 74.3
Brazil 8.22 2.3 76.6
Indonesia 7.22 2.0 78.6
Russia 6.79 1.9 80.6
United Kingdom 6.24 1.8 82.3
Spain 5.49 1.5 83.9
Norway 2.29 0.6 84.5
Portugal 1.67 0.5 85.0
Chile 1.17 0.3 85.3
Others 52.04 14.7 100.0
World 354.49
%

The United States is the world’s largest producer of paper and paperboardaccounting for 23.6% of production in 2004. The next largest producers are China(15.1%), Japan (8.3%) and Canada (5.8%). These four countries account for morethan half of all global production. The eighteen countries listed in Table 7.1 are thelargest producers of paper and paperboard and together account for 85% of worldproduction. China has shown the strongest growth with paper and paperboardproduction more than tripling from 17.41 Mt in 1990 to 53.46 Mt in 2004. Rapiddemand growth for paper and paperboard over the last two decades has led totremendous investments in the Chinese paper industry. Global demand for paper andpaperboard will be strongly influenced by demand in China.
Table 7.2 � Chemical and Mechanical Wood Pulp Production, 2004
Chapter 7 • PULP, PAPER AND PRINTING INDUSTRY 179
7
ChemicalWood Pulp
Mt
Share
%
MechanicalWood Pulp
Mt
Share
%
United States 46.11 36.3 4.21 11.6
China 1.79 1.4 0.57 1.6
Japan 9.35 7.4 1.24 3.4
Canada 13.45 10.6 12.14 33.6
Germany 0.85 0.7 1.40 3.9
Finland 7.78 6.1 4.34 12.0
Sweden 8.42 6.6 3.40 9.4
Korea 0.43 0.3 0.12 0.3
France 1.55 1.2 0.70 1.9
Italy 0.04 0.0 0.37 1.0
Brazil 8.92 7.0 0.47 1.3
Indonesia 5.21 4.1 0.00 0.0
Russia 5.01 3.9 1.26 3.5
United Kingdom 0.00 0.0 0.26 0.7
Spain 1.78 1.4 0.10 0.3
Norway 0.56 0.4 1.78 4.9
Portugal 1.95 1.5 0.00 0.0
Chile 2.83 2.2 0.51 1.4
Others 11.83 8.5 3.30 9.1
World 127.7 36.1
Source: United Nations Food and Agricultural Organization (FAO), 2006.

180 TRACKING INDUSTRIAL ENERGY EFFICIENCY AND CO2 EMISSIONS
The production of chemical and mechanical pulp is even more concentrated thanpaper and paperboard production. The nine countries shown in bold in Table 7.2represent 80% of the global chemical and mechanical pulp production.
In OECD countries, demand in the pulp and paper sub-sector is fuelled by demandfor paper for printing and writing. In contrast, in non-OECD countries, pulp and paperconsumption is concentrated in the category “other” paper and paperboard as paperconsumption is closely linked to manufacturing output. As per capita income rises, itis expected that demand increases for printing and writing paper.
Table 7.3 � Global Paper and Paperboard Consumption, 1961 and 2004
Source: Whiteman, 2005.
Table 7.3 shows that global growth in paper and paperboard consumption from1961 – 2004 was led by increased demand for printing and writing paper withannual growth of 4.6% versus 3.6% for total paper and paper board consumption.The increased use of computers and printers caused a change in consumer tasteswith higher demand for printing and writing paper. The rapid uptake of the internethas reduced the demand for newsprint as electronic media replace traditionalnewspapers and periodicals.
Higher demand for pulp for printing and writing paper and lower growth rates fornewsprint has increased demand for chemical pulp and lowered demand formechanical pulp. In non-OECD countries, such as China and India, where wood pulpis relatively scarce, other fibres make up an important share of the pulp mix. Pulpdemand has grown at a lower rate than paper demand during past decades asrecycling rates have increased.
Energy Use in the Pulp and Paper Industry
Energy use in the pulp and paper industry is divided among a number of differentpulp production and paper production processes. The main processes are:
� Chemical pulping;
� Mechanical pulping;
� Paper recycling;
� Paper production.
Global Consumption Mt
1961 Share%
2004 Share%
Average Growth Rate
Newsprint 14 19 38 11 2.4% per year
Printing and writing paper 15 20 105 30 4.6% per year
Other paper and paperboard 48 61 211 59 3.5% per year
Total 78 355 3.6% per year

Sources of energy Energy
Biofuel
Heat(steam)
WoodPaper
Fossil fuels
Fuels
Water
ChemicalsRecovered
paper
Pulp
Fuels
Rawmaterials
Biofuelswaste
Energy
Production
Electricitygrid
Energyproduction
Electricit
y
purchas
e
Electricitysa
les
Electricityvia co-generation
In 2004, according to IEA statistics, the pulp and paper industry used 2.05 EJ ofbioenergy, mainly in the form of black liquor. Actual use may be somewhat higher,as a significant amount of bioenergy is reported in IEA statistics under “non-specifiedindustry use”, part of which may actually be in pulp and paper production. Actualblack liquor use in 2004 is estimated at approximately 2.4 EJ. This means that morethan one-third of all energy is biomass.
The industry’s heavy reliance on bioenergy means that the CO2 intensity of the energyis not very high, and the CO2 reduction potentials in the pulp and paper industry arelimited. But more efficient use of bioenergy makes sense from an energy systemsperspective, as it frees up scarce bioenergy resources to replace fossil fuels elsewhere.
Figure 7.1 � Energy in Pulp and Paper Production
Key point: Pulp and paper industry generates a significant portionof its own energy needs from biomass residues.
Chapter 7 • PULP, PAPER AND PRINTING INDUSTRY 181
7
Source: Confederation of European Paper Industries (CEPI).
Figure 7.1 illustrates the uses and source of energy in the pulp and paper productionprocess. Unlike other energy intensive industries, a significant portion of the heat andelectricity required is supplied internally. Approximately two-thirds of final energyconsumption is fuel that is used to produce heat, while the remaining third iselectricity, either from the grid or produced on site.

182 TRACKING INDUSTRIAL ENERGY EFFICIENCY AND CO2 EMISSIONS
Pulp Production
Mechanical pulping uses large amounts of electricity. Chemical pulping, on theother hand, yields black liquor as a by-product, which is then incinerated in arecovery boiler to produce heat and electricity. Roughly, 22 gigajoules (GJ) ofblack liquor per tonne of pulp can be combusted. Depending on its recoveryefficiency and its configuration, a mill that uses chemical pulping can be a netenergy producer. Chemical pulp mills require less external energy than mechanicalpulp mills, but require approximately 2.2 tonnes of wood to produce a tonne ofbleached Kraft paper, as half of the wood is incinerated in the recovery boiler with1.05 – 1.08 tonnes of wood are used per tonne of mechanical grades.
The main production facilities are either pulp mills, or integrated pulp and papermills, depending on the proximity to markets and transport facilities. An integratedmill is more energy efficient than the combination of a stand-alone pulp mill with apaper mill because pulp drying can be avoided and the excess energy from thechemical pulp mill can be used efficiently in the papermaking. However, such anintegrated plant requires electricity from the grid, as well as additional fuel.
A large modern chemical pulp mill is self-sufficient in energy terms, using onlybiomass and delivering surplus electricity to the grid. Such a mill typically has asteam consumption of 10.4 GJ/air dry tonne pulp (adt) and an excess of electricityproduction of 2 GJ/adt. A future integrated chemical pulp and fine paper mill willrequire greater amounts of energy and is expected to have a typical steamconsumption of 13.6 GJ/adt paper, i.e. a small biofuel surplus, and a deficit inelectricity production of 1.8 GJ/adt paper (STFI-Packforsk, 2005).
High yield mechanical pulping processes are electricity intensive, and there has beenrelatively little progress in decreasing electricity demand in mechanical pulping sofar. Much of the improvement in energy efficiency has resulted from increased heatrecovery where the recovered steam is used to dry the pulp and paper. More than90% of the electricity used in mechanical pulping is transformed to heat. The mainsource of energy efficiency gains is heat recovery. The key question then is how tobest integrate a mill to benefit from heat recovery.
Integrated mechanical, chemical, recycled pulp and paper mills provide the bestsolution for improving efficiency, as heat recovered can be used in chemical pulp andpapermaking processes. These large integrated mills allow the maximum energyefficiency and minimise CO2 emissions. Stand-alone mechanical pulp mills offer thepotential needed to make investments in heat recovery systems attractive when thefuel prices are increasing and the excess biomass (bark) can be sold in the fuelmarket. If there is no heat recovery, then efficiency will be low.
The minimum electricity demand, in principle, to produce mechanical pulp from logsis far below actual electricity use and thus suggests that major improvements shouldbe possible. Industry experts cite that significant advances in mechanical pulpingmay be possible, but concerted efforts have not yet produced such an advance.Large investments have been made in Canada and Scandinavia to improve energyefficiency in mechanical pulping, but these savings have been primarily offset by ashift towards higher quality mechanical pulp which has a higher specific energyconsumption per tonne.

Paper Production
Paper production involves preparing the stock from pulp, forming a sheet,dewatering and drying and sometimes coating the paper. All paper machines havethree basic elements: wet end, press section and drying section. Economies of scalehave resulted in larger and faster paper machines. The latter increases electricity usehowever, there is a parallel trend toward low cost, simple, and small paper machinesfor recycled paper mini-mills in Asia. Heat (steam) is needed for the drying section.Electricity is used in all process steps.
Table 7.4 � Typical Energy Consumption in Paper Productionfor a Non-integrated Fine Paper Mill
Chapter 7 • PULP, PAPER AND PRINTING INDUSTRY 183
7
Process HeatGJ/t
Electric PowerkWh/t
Stock preparation 202
Paper machine
Coating
8.0
4
350
Total paper mill 8.0 670
Electricity kWh/t
Newsprint 500 – 650
Uncoated mechanical 550 – 800
Uncoated wood-free 500 – 650
Coated mechanical 550 – 700
Coated wood-free 650 – 900
Kraft papers 850
Tissue and specialty 500 – 3 000
Boxboard 550
Containerboard 680
Table 7.5 � Typical Electricity Consumption for the Productionof Various Types of Paper
During the production of different paper grades either virgin fibres (chemical ormechanical pulps) or recycled fibres are used as the main raw material. Today, thecomposition of raw material used for paper is influenced more than ever by the costof the individual components. The electricity use for stock preparation depends onthe paper type and may vary from 60 – 1 200 kWh/t. Table 7.5 provides anoverview of the electricity needs for the production of various types of paper.
Source: European Commission (EC), 2001.
Source: European Commission, 2001.
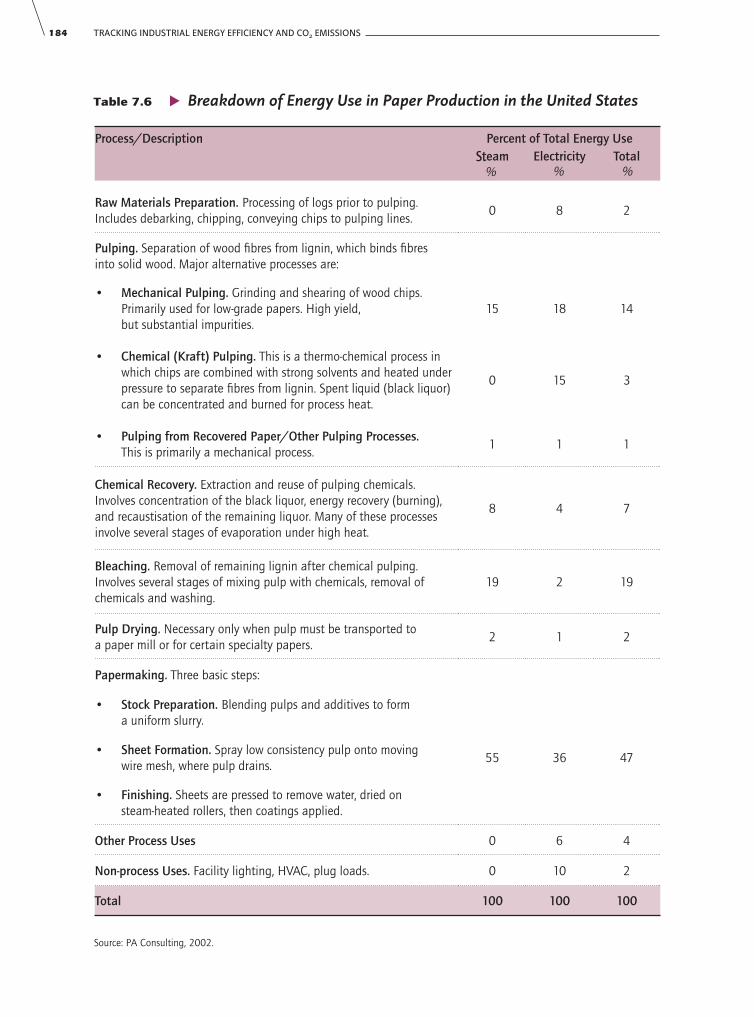
184 TRACKING INDUSTRIAL ENERGY EFFICIENCY AND CO2 EMISSIONS
Table 7.6 � Breakdown of Energy Use in Paper Production in the United States
Process/Description Percent of Total Energy UseSteam Electricity Total
Raw Materials Preparation. Processing of logs prior to pulping. Includes debarking, chipping, conveying chips to pulping lines.
0 8 2
Pulping. Separation of wood fi bres from lignin, which binds fi bresinto solid wood. Major alternative processes are:
• Mechanical Pulping. Grinding and shearing of wood chips. Primarily used for low-grade papers. High yield,but substantial impurities.
15 18 14
• Chemical (Kraft) Pulping. This is a thermo-chemical process in which chips are combined with strong solvents and heated under pressure to separate fi bres from lignin. Spent liquid (black liquor) can be concentrated and burned for process heat.
0 15 3
• Pulping from Recovered Paper/Other Pulping Processes.This is primarily a mechanical process.
1 1 1
Chemical Recovery. Extraction and reuse of pulping chemicals. Involves concentration of the black liquor, energy recovery (burning), and recaustisation of the remaining liquor. Many of these processes involve several stages of evaporation under high heat.
8 4 7
Bleaching. Removal of remaining lignin after chemical pulping. Involves several stages of mixing pulp with chemicals, removal of chemicals and washing.
19 2 19
Pulp Drying. Necessary only when pulp must be transported toa paper mill or for certain specialty papers.
2 1 2
Papermaking. Three basic steps:
• Stock Preparation. Blending pulps and additives to forma uniform slurry.
• Sheet Formation. Spray low consistency pulp onto movingwire mesh, where pulp drains.
55 36 47
• Finishing. Sheets are pressed to remove water, dried onsteam-heated rollers, then coatings applied.
Other Process Uses 0 6 4
Non-process Uses. Facility lighting, HVAC, plug loads. 0 10 2
Total 100 100 100
% %%
Source: PA Consulting, 2002.

Chapter 7 • PULP, PAPER AND PRINTING INDUSTRY 185
7
Table 7.6 provides a detailed breakdown of the energy use in the pulp and paperproduction process in the United States. Papermaking accounts for the largest share at47% of total energy use, while the pulping process, including bleaching, accounts for44%. The breakdown of energy use in other countries will vary depending on eachcountry’s production mix of pulp and paper and the different grades of paper produced.
Printing
Total energy use in printing is less than 6% of energy consumption in the industry.Approximately 350 PJ of energy are used in the printing industry worldwide andalmost all is electricity consumption. On a value-added basis, the printing industryrepresents a much larger share of GDP, but in terms of energy consumption inindustry its importance is relatively insignificant.
Box 7.1
Benchmarking Energy Efficiency Data for the Pulp and PaperIndustry in Canada
In 2004, Canada produced 12.1 Mt of mechanical pulp, 13.5 Mt of chemical pulp and 2.8 Mtof recycled pulp (Figure 7.2). Canada is the world's largest producer of mechanical pulp(33.6% of global supply) and the second largest producer of chemical pulp (10.6%). Totalpaper and paperboard production in Canada was 20.6 Mt in 2004 and represents 5.8% ofglobal production. Newsprint accounts for the largest share (40%) of paper production inCanada with 8.2 Mt produced in 2004 (Figure 7.3).
Table 7.7 shows the results of benchmarking analysis for Kraft and newsprint mills in Canada.The energy efficiency improvement potentials range from 20 – 96% for demand for steam.This result supports the IEA indicators analysis. Energy use figures for the modern mill arebased on best available technology, while energy consumption in the best mill in this analysisis well above what is possible for a modern mill.
Figure 7.2 �Pulp Production Mix in Canada, 2004
Source: FAO statistics.
Chemical pulp
49%
Recovered paper pulp
10%
Mechanical pulp
41%
Key point: Virgin pulp dominates the Canadian pulp market.
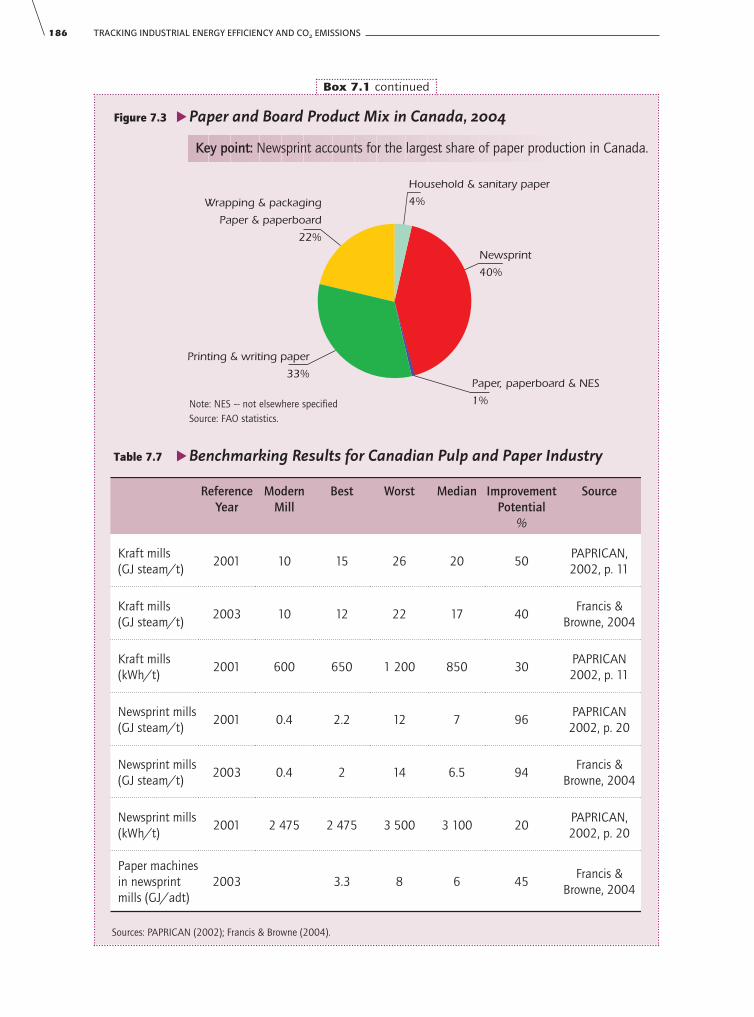
186 TRACKING INDUSTRIAL ENERGY EFFICIENCY AND CO2 EMISSIONS
Box 7.1 continued
Figure 7.3 �Paper and Board Product Mix in Canada, 2004
Note: NES –- not elsewhere specifiedSource: FAO statistics.
Table 7.7 �Benchmarking Results for Canadian Pulp and Paper Industry
Reference Year
Modern Mill
Best Worst Median Improvement Potential
%
Source
Kraft mills (GJ steam/t)
2001 10 15 26 20 50PAPRICAN, 2002, p. 11
Kraft mills (GJ steam/t)
2003 10 12 22 17 40Francis &
Browne, 2004
Kraft mills (kWh/t)
2001 600 650 1 200 850 30PAPRICAN 2002, p. 11
Newsprint mills(GJ steam/t)
2001 0.4 2.2 12 7 96PAPRICAN 2002, p. 20
Newsprint mills(GJ steam/t)
2003 0.4 2 14 6.5 94Francis &
Browne, 2004
Newsprint mills (kWh/t)
2001 2 475 2 475 3 500 3 100 20PAPRICAN, 2002, p. 20
Paper machines in newsprint mills (GJ/adt)
2003 3.3 8 6 45Francis &
Browne, 2004
Sources: PAPRICAN (2002); Francis & Browne (2004).
Newsprint
40%
Household & sanitary paper
4%Wrapping & packaging
Paper & paperboard
22%
Printing & writing paper
33%Paper, paperboard & NES
1%
Key point: Newsprint accounts for the largest share of paper production in Canada.

Energy Indicators
Energy Intensity Indicators versus Benchmarking
Benchmarking is a comparison of the competitive situation among similar types ofmills producing the same product. Benchmarking can be complemented by a rangeof country level indicators for analysis of status and trends. The goal of this indicatorsanalysis is not benchmarking on a mill or machine level, but a cross countrycomparison of energy intensity. There are a number of benchmarking studies, e.g.Paprican (Canada), Pöyry (Finland) and IETS (Canada, United States and Sweden),which look at energy consumption on a mill or machine level. Industry experts clearlyfavour the use of these benchmarks over the IEA cross country analysis for theassessment of efficiency potentials, but see the need for a first IEA reconnaissance inthis area and the limitations of existing benchmarking studies. Benchmarkingstudies, which are often confidential, can be used to validate this analysis. The IEAanalysis is intended to complement various on-going benchmarking studies and isnot intended as a substitute.
The energy indicators developed here are intended for a country comparison ofenergy intensity in the pulp, paper and printing industry and as a first indication ofpotentials. Countries presented in this analysis represent more than 80% of globalpaper and paperboard production and 90% of wood pulp production.2 The lack ofpublicly available energy use data on the level of specific products makes individualprocess indicators infeasible and thus aggregate product indicators are proposed.
Three indicators have been developed:
� energy efficiency index based on fuel use for heat;
� energy efficiency index based on electricity use;
� CO2 emissions index.
Energy Efficiency Index Methodology
The proposed methodology for calculating an energy efficiency index is as follows:
1) Use IEA energy statistics for final energy use.3
2) Define a best available technology (BAT) value for mechanical pulping,chemical pulping, waste paper pulp, de-inked waste paper pulp and sevendifferent paper grades.
3) Multiply production volumes and BAT to calculate practical minimum energy use.
4) Divide practical minimum energy use and actual energy use (final energy). Thisis the energy efficiency index.
5) One hundred minus the energy efficiency index = improvement potential.
Chapter 7 • PULP, PAPER AND PRINTING INDUSTRY 187
7
2. China, which is part of the global production, has been treated separately in Box 7.2.
3. As IEA statistics also include printing, an adjustment is made to remove energy use from printing based onavailable energy data from national sources or estimated based on countries with similar industry structure. For theUnited States, data is based on the US Energy Information Agency's MECs survey.

188 TRACKING INDUSTRIAL ENERGY EFFICIENCY AND CO2 EMISSIONS
The physical energy intensity of the pulp and paper industry in a country iscalculated based on its energy consumption relative to BAT in order to comparerelative energy intensity across countries. Various assumptions of BAT are applied toheat and electricity consumption in mechanical pulping, chemical pulping, wastepaper pulp, de-inked waste paper pulp and seven different grades of papermaking(Table 7.8). The European Commission (EC) BAT reference document was the mainsource for the BAT figures.4 While specific countries may have their own nationalfigures for BAT, the EC document is an internationally recognised and widely usedBAT reference document. Heat and electricity are treated separately to allow for CHPanalysis.
Table 7.8 � Best Available Technology
Sources: EC (2001); Finnish Forestry Industries Federation (2002); Jochem, et al., 2004.
By multiplying the BAT figures with the quantities of mechanical pulp, chemicalpulp, waste paper pulp and paper and paperboard produced by each country, yieldsthe total heat and electricity consumption if production was based on BAT. This isthen compared to the actual total energy used. Figures for heat (steam) demand ineach country are estimated based on reported fuel consumption in the industry andassume 80% efficiency.
The analysis used to compare energy intensity across different countries does notdifferentiate for integrated and non-integrated mills. Energy efficiency of integratedpulp and paper mills are approximately 10 – 50% better, depending on the grade of
HeatGJ/t
ElectricityGJ Electricity/t
Mechanical pulping 7.5
Chemical pulping 12.25 2.08
Waste paper pulp 0.50 0.36
De-inked waste paper pulp 2.00 1.62
Coated papers 5.25 2.34
Folding boxboard 5.13 2.88
Household & Sanitary paper 5.13 3.60
Newsprint 3.78 2.16
Printing & writing paper 5.25 1.80
Wrapping & packaging paper and board 4.32 1.80
Paper and paperboard not elsewhere specifi ed 4.88 2.88
4. In the EC BAT reference document, also known as IPPC BREF document, a range was often given to reflect anassessment of costs versus benefits and thus could also be considered as best practice. Where a range was given, acomparison was made with other papers to determine a suitable BAT value.

Chapter 7 • PULP, PAPER AND PRINTING INDUSTRY 189
7
Box 7.2
Pulp and Paper Industry in China
The results of an energy indicator analysis based on official energy statistics showed virtually noenergy efficiency improvement potential in the Chinese pulp and paper industry andhighlighted substantial under-reporting of energy consumption data in national accounts. Giventhe small average plant size and technology employed, one would expect the industry in Chinato be among the least efficient. Although some of the largest and most modern mills are locatedin China, the vast majority are very small mills with capacity below 10 000 tonnes (Figure 7.4).
Small mill size makes many energy efficiency solutions uneconomic. Many of the small pulp andpaper mills still use technologies from the 1960s and 1970s. In an effort to reduce the number ofsmall mills, the Chinese Government has introduced a minimum size of 34 000 tonnes for newpulp mills and announced the closure of all pulp mills with capacity of less than 10 000 tonnes.There is a push to develop large and modern mills. The enforcement of minimum plant sizes hasproven difficult on the local level and a significant portion of these small mills remain in operation.
Figure 7.4 �Number of Pulp and Paper Mills by Capacity in China
Source: China Cleaner ProductionCentre of Light Industry.
The recovered paper use rate in China has jumped from 38% in 1997 to 51% in 2004. Thischange in the production structure has had a dramatic impact on the energy intensity of theindustry as pulp from recovered paper has been used to replace non-wood fibre pulp whichrequires roughly twice the amount of energy as wood pulp and three times that of recoveredpaper pulp. In 2004, 27% of all pulp came from non-wood pulp versus 53% in 1990.
The processing of non-wood pulp or straw also differs significantly from wood pulp and theefficiency potential from heat recovery systems is not possible due to the high level of siliconpresent in the black liquor produced from non-wood pulp. The silicon deposit in boilers reducesthe recovery boiler efficiency to approximately 60 – 70%.
Based on case studies of energy use in Chinese pulp and paper plants, it is estimated that theactual energy consumption is approximately 30 – 50% greater than what is reported in currentstatistics (China State Statistical Bureau and Tsinghua University). Based on this adjustmentand using 2003 data, the adjusted EEI (heat) for China is between 86 – 73 and represents a14 – 27% energy efficiency potential, while the EEI (electricity) is 77 – 67 and represents a23 – 33% energy efficiency potential.
Key point: China is dominatedby small pulp and paper mills with capacity below 10 000 tonnes.
> 200 000 tonnes
0.8%
> 10 000 tonnes
2.8%
< 10 000 tonnes
96.2%
> 1 000 000 tonnes
0.2%

190 TRACKING INDUSTRIAL ENERGY EFFICIENCY AND CO2 EMISSIONS
paper produced, than in stand-alone mills. For example, in a stand-alone pulp mill, asignificant amount of heat is required to dry the pulp prior to transport and greateruse of heat recovery systems can be exploited by integrated mills versus stand-aloneones. An analysis of energy intensity should also take into consideration the level ofintegrated mills within the industry, but data limitations make a more detailedstructural analysis difficult at this stage. Under the current methodology, a higher EEImay indicate that a country has a higher portion of integrated mills. One could arguethat this is indeed an efficiency gain, but structural effects may limit the potential touse integrated mills.
Energy requirements for different paper grades can vary widely. The overallproduction of these higher grades of paper is in general much less than for lower tomedium grades of paper. Table 7.9 shows the paper production mix for the sevenpaper types in this analysis and the weighted BAT for all paper types by country. Thecountry weighted BAT for these seven paper types varies from 6.54 GJ in Norway to7.28 GJ in Finland. Narrowness of this range indicates that product differentiationby paper type will have a moderate impact on the overall results.
Table 7.9 � Paper Production by Type of Paper and by Country, 2004
Coated Papers
%
Folding Boxboard
%
Household + Sanitary
Paper
%
News-print
%
Printing & Writing
Paper (Non Coated)
%
Wrap + Packaging
Paper + Board
%
Paper + Paper-boardNES
%
Country Weighted BAT for All Paper Types
GJ
Brazil 6.7 6.8 8.9 1.6 22.1 48.5 5.3 6.87
Canada 6.9 5.1 3.6 39.7 27.2 16.8 0.7 6.61
China 1.8 0.0 6.9 5.5 20.4 49.3 16.2 6.77
Finland 40.9 13.0 1.3 5.2 26.5 10.9 2.3 7.28
France 19.7 4.7 7.0 10.9 14.2 39.7 3.9 6.86
Germany 22.9 7.4 5.3 11.8 15.8 29.9 7.0 6.97
Italy 24.2 7.4 14.2 2.0 8.0 38.9 5.3 7.14
Japan 23.7 6.6 5.8 12.6 9.6 35.1 6.6 6.92
Korea 16.8 11.3 3.9 16.0 6.7 38.2 7.0 6.83
Norway 5.2 0.0 1.2 37.5 36.4 17.1 2.6 6.54
Spain 10.7 7.3 9.2 5.9 12.1 45.6 9.2 6.91
Sweden 9.6 19.8 2.7 22.9 16.6 27.3 1.1 6.84
United Kingdom 11.1 3.1 12.5 17.3 12.4 34.6 8.9 6.90
UnitedStates 10.4 7.0 7.9 6.2 15.7 50.2 2.7 6.79
Note: Wrapping + packaging + paper + board category excludes folding boxboards.
NES – not elsewhere specified.
Sources: EC (2001), FAO, Finnish Forestry Industries Federation (2002), and Jochem, et al., 2004.

A country’s energy efficiency index (EEI) would be at a level of one hundred if theenergy used to produce its commodities was at the same level as BAT. Figures wellbelow one hundred indicate that energy consumption is above BAT levels andsignifies an opportunity for greater energy efficiency, if current BAT were applied.Figures above one hundred could indicate that BAT figures may be too conservative,imply accounting inconsistencies across countries or indicate a high level ofintegrated mills. Figure 7.5 shows heat consumption compared to BAT and Figure7.6 shows electricity consumption compared to BAT for the key pulp and paperproducing countries.5 Countries with more modern pulp and paper mills shouldnormally have EEI ratios close to one hundred, while those with older facilities wouldbe expected to have significantly lower figures.
Energy Efficiency Index: Heat
For heat consumption, Korea and Japan appear to be the most efficient with EEIlevels well above one hundred. Over the last decade, the Korean paper industry hasinvested heavily in relatively efficient capacity expansion. Korea’s EEI rosesubstantially, from 102 in 1990 to 145 in 2003. Korea and Japan’s EEI ratios wellabove 100 could indicate that the BAT figures are too conservative or alternativelyraise a question of data consistency and comparability across countries. Differentreporting methodologies, system boundaries, problems related to CHP accounting,high recovered paper use rate and high level of integrated mills (in the case ofJapan) could explain the unexpectedly high EEI of Japan and Korea.
Norway also appears very efficient in heat consumption, but this could be misleadingas it produces mainly mechanical pulp and relatively small quantities of paper.Mechanical pulping uses large amounts of electricity and zero or negative netquantities of steam. During the refining process, large quantities of heat can berecovered and used for paper drying.
Canada appears to be the most energy intensive with EEI heat levels of 63 in 1990and 70 in 2003. Although this does show a 7% improvement, it is still relatively lowgiven the low base at which it began. Canada’s comparatively low energy efficiencymay be attributed to the high level of energy use in newsprint mills, which accountfor more than 30% of all energy used in the pulp and paper industry. Newsprint millsin Canada use between 2.52 – 12.69 GJ/t of process heat compared to 0.64 GJ/tfor a modern newsprint mill (Francis, et al., 2002).6 The low process heat use for themodern newsprint mill is the result of significant amounts of waste heat recoveryfrom mechanical pulping. The ability to reach levels of the modern mill will dependon site specifications and implies that both mechanical pulp and newsprint are beingproduced at the mill.
Chapter 7 • PULP, PAPER AND PRINTING INDUSTRY 191
7
5. Heat consumption for each country was calculated based on total final fuel consumption assuming 80%efficiency. The pulp and paper sub-sector, especially in Europe, in many cases supplies heat to a district heatingsystem or to other industrial users and may sell surplus electricity to a grid. Sale of surplus heat and electricity cancause inconsistencies in energy data as the allocation of heat and power may be subject to different methodologieswithin and across countries. Accounting of CHP may also lead to additional inconsistencies in data.
6. The figure of 0.64 GJ/t for the modern newsprint mill implies 4.4 GJ/t of heat recovery from mechanical pulping.http://oee.nrcan.gc.ca/publications/infosource/pub/cipec/pulp-paper-industry

192 TRACKING INDUSTRIAL ENERGY EFFICIENCY AND CO2 EMISSIONS
Figure 7.5 � Heat Consumption in Pulp and Paper Productionversus Best Available Technology, 1990 – 2003
Key point: Efficiency of heat consumption showed real improvementfrom 1990 to 2003, but further improvements are possible.
Sources: United States Energy Information Agency (EIA), IEA statistics and estimates.
In the pulp and paper sub-sector as a whole, the weighted EEI heat figure for thethirteen countries analysed has risen from 77 in 1990 to 86 in 2003.7 This shows asignificant improvement in energy efficiency over this period. There remains anadditional 14% improvement potential compared to energy use based on BAT. Inthis analysis, many countries appear to have an EEI close to or above one hundredwhich raises concerns about data consistency and comparability.
Energy Efficiency Index: Electricity
Figure 7.6 shows the efficiency ratios for electricity consumption. In 2003, the bestEEI are seen in Germany at 98, France at 93 and Italy at 93. The relatively betterperformance of these countries may or may not be linked to fact that they are largepaper producing countries with very little virgin pulp making facilities. More detaileddata to compare energy use on a process level is required to better understand thestructural impacts on energy efficiency.
Contrary to seemingly good efficiency for heat use, countries such as Sweden andNorway with high proportions of mechanical pulping appear less efficient inelectricity use. Mechanical pulping is very electricity intensive. The minimumelectricity demand for mechanical pulping is well below actual levels and representsan important area for efficiency improvements.
0
20
40
60
80
100
120
140
160
1990 1995 2000 2003
Japan
Korea
Germany
Sweden
Norway
France
Spain
Finland
Brazil
Weighted averageUS
Italy
UKCanadaEf
ficie
ncy
ind
ex (
BA
T=1
00
)
7. The weighted average for the thirteen countries analysed is based on total share of production of pulp and paperand paperboard. Based on an assumption that a country could not have an EEI above one hundred, all figures thatexceed that have been adjusted to one hundred in the calculation of the weighted average EEI.

Canada and Brazil appear to be the least efficient in terms of electricity use inthe industry with EEI figures of 78 and 74 in 2003. Cheap hydroelectric powerand the use of wood waste with low efficiency ratios could explain this underperformance.
Figure 7.6 � Electricity Consumption in Pulp and Paper Production versus Best Available Technology, 1990 – 2003
Key point: Overall, there has been little improvementin the efficiency of electricity use.
Chapter 7 • PULP, PAPER AND PRINTING INDUSTRY 193
7
0
20
40
60
80
100
120
1990 1995 2000 2003
Germany
France
Italy
Sweden
Korea
Japan
Spain
Finland
Norway
Weighted average
US
Canada
Brazil
UKEffic
ien
cy in
dex
(B
AT=
10
0)
Sources: EIA; IEA statistics and estimates.
In contrast to the efficiency improvement in heat consumption, there has beenrelatively little change in the overall energy efficiency of electricity consumption in thepulp and paper industry in these thirteen key producing countries. The weightedaverage for countries remained relatively flat increasing only slightly from 81 in 1990to 84 in 2003. Only in two countries have the industries shown any significantefficiency improvement in electricity consumption with their EEI rising from 63 – 85in Norway and 89 – 98 in Germany between 1990 and 2003.
Efficiency gains from improved technology can be offset by structural changes. Forexample, higher electricity demand for faster paper machines and strong growth indemand for speciality papers, which are more energy intensive, have maskedimprovements in electricity efficiency from process and machine advances.
There are important differences in energy use patterns in the pulp and paperindustries in OECD and developing countries. Average primary energy use for paperand paperboard making in China, including pulping, is 45 GJ/t. Even higher figuresare reported for India. Small-scale plants based on second-hand equipment and theuse of coal for steam generation contributes to this very low energy efficiency.
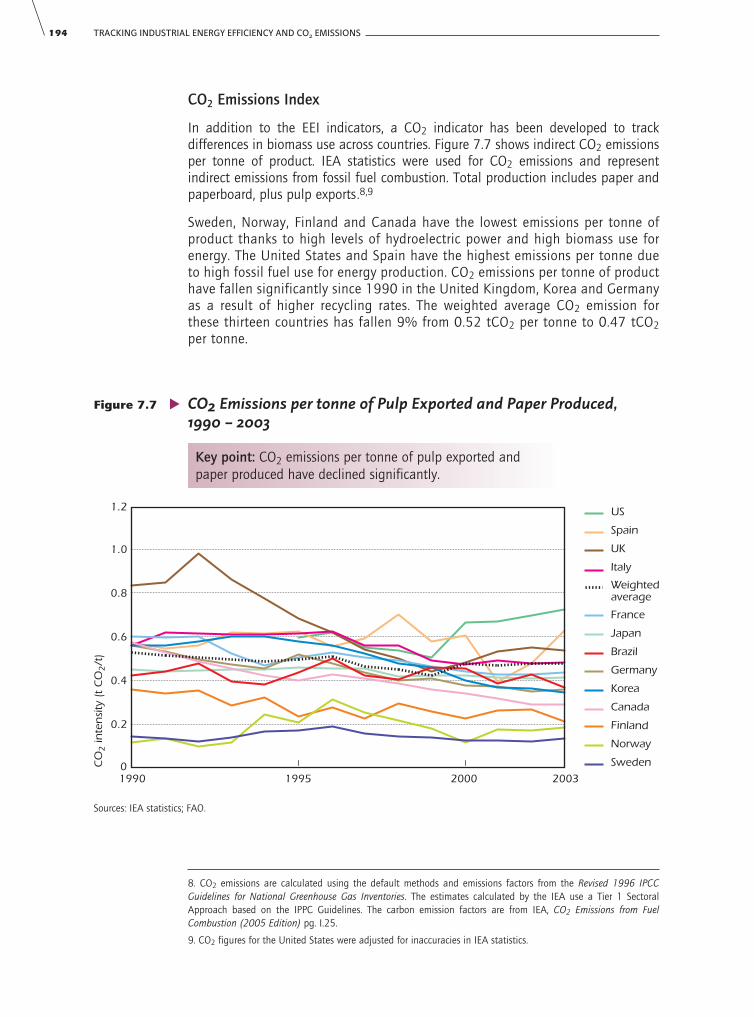
194 TRACKING INDUSTRIAL ENERGY EFFICIENCY AND CO2 EMISSIONS
CO2 Emissions Index
In addition to the EEI indicators, a CO2 indicator has been developed to trackdifferences in biomass use across countries. Figure 7.7 shows indirect CO2 emissionsper tonne of product. IEA statistics were used for CO2 emissions and representindirect emissions from fossil fuel combustion. Total production includes paper andpaperboard, plus pulp exports.8,9
Sweden, Norway, Finland and Canada have the lowest emissions per tonne ofproduct thanks to high levels of hydroelectric power and high biomass use forenergy. The United States and Spain have the highest emissions per tonne dueto high fossil fuel use for energy production. CO2 emissions per tonne of producthave fallen significantly since 1990 in the United Kingdom, Korea and Germanyas a result of higher recycling rates. The weighted average CO2 emission forthese thirteen countries has fallen 9% from 0.52 tCO2 per tonne to 0.47 tCO2per tonne.
Figure 7.7 � CO2 Emissions per tonne of Pulp Exported and Paper Produced,1990 – 2003
Key point: CO2 emissions per tonne of pulp exported andpaper produced have declined significantly.
8. CO2 emissions are calculated using the default methods and emissions factors from the Revised 1996 IPCCGuidelines for National Greenhouse Gas Inventories. The estimates calculated by the IEA use a Tier 1 SectoralApproach based on the IPPC Guidelines. The carbon emission factors are from IEA, CO2 Emissions from FuelCombustion (2005 Edition) pg. I.25.
9. CO2 figures for the United States were adjusted for inaccuracies in IEA statistics.
0
0.2
0.4
0.6
0.8
1.0
1.2
1990 1995 2000 2003
US
Spain
UK
Italy
Weighted average
France
Japan
Brazil
Germany
Korea
Canada
Finland
Norway
SwedenCO
2 in
ten
sity
(t
CO
2/t
)
Sources: IEA statistics; FAO.

The CO2 indicator does not include methane emissions from waste paper disposal inland fills, energy recovery from waste paper or CO2 emissions from CHP electricity(which are reported under transformation in IEA statistics). An additional CO2indicator could be developed that took a life cycle approach to tracking CO2emissions in the pulp and paper industry.
Expanding Indicators Analysis in the Pulp and Paper Industry
The advantage of the proposed indicator methodology is that it is feasible based onexisting energy data and allows for a country comparison of energy intensity in thepulp and paper industry. These indicators are not intended for benchmarking, whichshould be done on an individual mill or machine level. The lack of publicly availabledetailed energy production data makes process level indicators infeasible for thisanalysis. The disadvantage is that this analysis is not suited to identify which processesto focus on for efficiency improvements. The quality of IEA energy statistics is not clearand may be a source of uncertainty. It is recommended that countries collect moredetailed energy data at the process level so that future indicators in the pulp and paperindustry can be developed to compare energy intensity at the process level. It isrecommended that these indicators follow the categories outlined in Table 7.8.
The level of energy data available today differs widely across countries. Canada has themost detailed and regular reporting of energy data which is broken down into energyuse in pulp mills, newsprint mills, paper mills (except newsprint), paperboard mills,converted paper products industry and printing. Many other countries report only totalenergy use in pulp, paper and print. In order to develop more detailed processindicators, energy data needs to be collected for energy use in mechanical pulping,chemical pulping, waste paper pulp and several grades of paper and paperboard. Thecollection of this additional data is not an easy task and will require significant timeand effort from both industry and national governments.
The United Nations Food and Agricultural Organization (FAO) providescomprehensive statistics on pulp and paper production, but categories for differentpaper grades do not match what is required for a more detailed indexed comparisonof energy use by different paper grades. Categories used by various bodies are notalways comparable. This analysis breaks down paper production by seven differentpaper grades, but many experts have advocated that this should be broken downeven further. Paper production data from the FAO does not allow further breakdown,but such data are commercially available.
There is a need to collect better CHP data that account for fuel input, electricity andsteam production, and the type of technology (back-pressure turbines or combinedcycles) in the pulp and paper industry. This will result in a better assessment ofremaining CHP potentials. Different CHP accounting practices further complicate thecountry comparison.
Additional physical and energy data should also be collected on integrated versus non-integrated mills. The use of heat recovery systems plays an important role in the energyefficiency of the pulp and paper industry. The most efficient mills are integrated millsthat can benefit from extensive heat recovery systems which take advantage of wasteheat produced from different processes. Stand-alone pulp mills are inherently less energyefficient as the ability to maximise the use of waste heat within the pulp mill is limited.
Chapter 7 • PULP, PAPER AND PRINTING INDUSTRY 195
7

196 TRACKING INDUSTRIAL ENERGY EFFICIENCY AND CO2 EMISSIONS
Combined Heat and Power in the Pulp and Paper Industry
The cogeneration of steam and heat can reduce total energy needs where the energyefficiency of stand-alone electricity production and heat production is relatively low.The greatest gains come when low-temperature heat production from fossil fuels isreplaced with a CHP system.
The higher the temperature of the heat that is needed, the lower the electricity yieldand the lower the efficiency gain. Typically, the introduction of CHP results in fuelsavings of 10 – 20%. Data availability for CHP use in the pulp and paper industryin IEA statistics poses a challenge. Fuel use of CHP plants is allocated to powergeneration industry. If the heat is not sold, but used by the producer, part of the fueluse of the cogeneration plant is reported under industrial fuel use, rather than underCHP. Moreover, electricity production from CHP is not split by sector in IEA statistics.This makes it difficult to track the importance of CHP in the pulp and paper industry.Table 7.10 is an estimate of CHP use in several key pulp and paper producingcountries.
Table 7.10 � CHP Use in the Pulp and Paper Industry
Country Estimated CHP Use%
Year
Canada 19 2003
Finland 32 2003
France 18 2003
Germany 27 2003
Italy 26 2003
Spain 61 2003
Sweden 22 2003
United Kingdom 40 2003
Note: Calculated based on the percentage of total electricity demand. Sources: COGEN Europe, CIEEDAC, IEA statistics and estimates.
CHP plants can be designed to meet the heat or electricity requirement of mills. Inmost cases, when natural gas fired combined cycle systems are considered, it isdesigned to meet the electricity requirement with the remaining heat supplied by alow cost package boiler. With biomass or coal as fuel the CHP is usually designed tomatch the heat demand and additional electricity demand not met by the CHP plantis purchased from the grid. To maximise thermal efficiency; the CHP plant should bedesigned to meet heat demand with excess electricity sold to the grid, but still inmany cases this is not the most economical option as electricity prices do not justifythe additional investment cost.

A full CHP analysis is not possible at this stage due to limitations on dataavailability. However, the results shown in Table 7.11 do provide some insights intothe impact CHP can have on energy efficiency. For this analysis, a combined energyefficiency indicator for heat and electricity is used to derive an energy efficiencyindex for total energy use. To calculate a CHP adjusted energy efficiency index, thetotal amount of CHP electricity was deducted from total energy use and then dividedby the BAT energy use. This is based on the observation that electricity outputmatches primary energy savings benefit of CHP. All countries showed a significantimprovement in their energy efficiency index once this CHP adjustment was made,which illustrates the positive impact of higher CHP deployment. The UnitedKingdom, Spain and Finland appear to have the highest rates of CHP use in theindustry and as a result the adjusted CHP index appears to have had the largestimpact on these countries.
Chapter 7 • PULP, PAPER AND PRINTING INDUSTRY 197
7
Table 7.11 � CHP Adjusted Energy Efficiency Indicators, 2003
EEIElectricity & Heat
CHP AdjustedEEI
CHP ElectricityPJ/yr
Canada 72 78 39.10
Finland 87 97 29.35
France 95 101 6.83
Germany 101 111 16.66
Italy 83 90 8.53
Japan 127 131 10.17
Spain 92 113 15.16
Sweden 94 101 17.71
United Kingdom 74 88 12.73
Sources: COGEN Europe; CIEEDAC; Japan Cogeneration Centre; IEA statistics and estimates.
Compared to other industries, the use of CHP in the pulp and paper industry is veryhigh. In most large pulp and paper producing countries, it is estimated that CHP useaccounts for between 20 – 50% of electricity generation in the industry. More than50% of the CHP equipment used in the pulp and paper industry is likely to be blackliquor Tomlinson boilers.
Falling investment costs for gas turbines over the last decade has helped to boostCHP investments in the paper industry, but high gas prices could dampen this trend.Potential for further CHP use in the industry has been limited by economies of scalewhich make investments in small plants less viable. The ability to sell excess powerto the grid is also crucial in making CHP investments more attractive. The availabilityof natural gas will also have a determining factor on the up-take of CHP.

198 TRACKING INDUSTRIAL ENERGY EFFICIENCY AND CO2 EMISSIONS
Few countries have good statistics on CHP use in industry. In order to make a moredetailed analysis on CHP use in the pulp and paper industry, better data is needed.It is suggested to collect data based on the following categories:
Table 7.12 � Data Required for CHP Analysis in the Pulp and Paper Industry
Fuel inPJ
Energy OutPJ
MW
Tomlinson boilers black liquor electricity & steam out Installed capacity
Combined cycle(NGCC)
gas electricity & steam out Installed capacity
Other CHP gas, oil, coal, biomass electricity & steam out Installed capacity
Source: IEA.
In addition, it is also recommended to collect detailed data on back-pressureturbines. Unlike the three categories in the table, which have higher efficiencyratings, these turbines are added on to stand-alone steam generation units. It is alsosuggested to collect data for MW of installed capacity in pulp and paper mills, fuelin (by fuel type) for steam generation, PJ of electricity produced and PJ of steamproduced.
Paper Recycling and Recovered Paper Use
Almost half of all paper is produced from recovered paper, with recycling usuallytaking place close to where the waste paper is collected. Recycling plants tend to besmaller and more dispersed than primary paper production facilities and theirexternal energy needs for papermaking are higher. On the other hand, the energythat would have gone into pulp production is saved. This savings by far exceeds theadditional energy used. In many developed countries, paper recycling actuallyexceeds paper production from primary biomass.
Increased paper recycling is a key contributor to energy efficiency improvements inthe pulp and paper sub-sector. Each ton of recycled pulp used offers a net energysavings potential of 10.9 GJ/t (CEPI, 2006). Taking into account that some papercannot be recycled such as archives and construction materials, the maximumtheoretical recycling rate for paper is 81% (CEPI, 2006). Each 1% increase in paperrecycling would represent a total energy savings of 39.2 PJ. Although increasedrecycling does present a benefit for energy efficiency, its impact on CO2 reductions isless clear. If the increased use of recycled pulp replaces chemical pulp from modernmills this could actually cause CO2 emissions to increase as modern chemical pulpmills are CO2 neutral, while recycling mills use fossil fuels.
The leaders in paper recycling are Europe with a recycling rate of 52% (EU15excluding exports) and Japan at 60%, compared to a global rate of 45% (CEPI,2006 and METI). Theoretically, there remains a global recycling potential of 35%.

The recycling rate in Europe is defined as use of recovered paper plus exports to thirdcountries divided by the consumption of paper. The use rate is defined as the use ofrecovered paper divided by total production. A European Declaration announced in2006 aims to increase recycling rates to 66% by 2010 (ERPC, 2006). ThisDeclaration covers the EU27 as well as Norway and Switzerland.
Although the global recovered paper rate must be equal to the global use ofrecovered paper rate, rates for different countries and regions are significantlydifferent and reflect imports and exports of recovered paper. The collection rate isdefined as total recovered paper collected divided by consumption. Forecasts foradditional recovered paper will depend on future demand trends for paper as not alltypes of recovered paper can be used as recycled pulp and certain types of paperrequire higher percentages of virgin pulp.
Chapter 7 • PULP, PAPER AND PRINTING INDUSTRY 199
7
0%
20%
40%
60%
80%
100%
Use rate 1970
Use rate 2004
Collection rate 2004
Bra
zil
Can
ada
Chi
na
EU15
Fin
land
Fra
nce
Germ
any
Italy
Japa
n
Kor
ea
Nor
way
Spain
Swed
en
UK
US
Wor
ld
Figure 7.8 � Waste Paper Collection Rate versus Use Rate
Key point: The use rate for recovered paper has shown tremendous growthworldwide, and in most pulp and paper producing countries since 1970.
Sources: FAO; CEPI.
Globally the paper collection rate increased sharply from 24.3% in 1970 to 45.3%in 2004. Europe has shown the strongest increase in paper recycling; North Americais the largest exporter of recovered paper; and Asia, especially China, is the mainimporter of recovered paper. According to the FAO, urbanisation has reduced thecost of recovered paper collection and recycling; and thereby increased theavailability of recovered paper (FAO, 2005). Specific requirements from consumerson minimum recovered paper pulp content have also led to increased use rates. Thetypes of paper produced in a country also impact the collection rate and its use rate.

200 TRACKING INDUSTRIAL ENERGY EFFICIENCY AND CO2 EMISSIONS
Recovered paper supply is strongly influenced by government policies on wastedisposal and renewable energy policies. Tighter policies on waste disposal can lead tohigher recycling rates and policies promoting the use of renewable energy can causecompetition for wood and fibre and thus impact the supply of wood pulp. There isconcern among the industry that the current push towards increased use of renewableenergy would encourage the use of wood as an energy source. As higher paper recoveryrates may be exponentially more expensive to attain and depending on policies onwaste disposal in each country, the global economic potential for recovered papercollection in certain countries may not be much higher than current rates.
Chemicalpulp
128 Mt
Wood pulp176 Mt
Non wood pulp 17 Mt
Recovered paper pulpFillers, resins, etc
162 Mt
Paper & paperboard production355 Mt
Mechanicalpulp
36 Mt
Other woodpulp
12 Mt
Other paper &paperboard
211 Mt
Wrapping &packaging paper
165 Mt
Householdsanitary paper
23 Mt
Other23 Mt
Recoveredpaper
159 Mt
Printing &writing paper
105 Mt
Newsprint39 Mt
Figure 7.9 � World Paper Production, Processing and Recycling Balance, 2004(Mt/yr)
Key point: Recycling plays a key role in the global paper production balance.
Sources: FAO; CEPI.
Use of Technology to Increase Energy Efficiencyand Reduce CO2 Emissions
Technology can play an important role in increasing energy efficiency and reducingCO2 emissions in the pulp and paper industry. Energy efficiency gains from using thelatest technology differ depending on whether they are greenfield mills or retrofits.

Current pulp and paper facilities in many OECD countries are nearing the end of theiroperating life and will need to be replaced over the next ten to fifteen years. Thispresents an excellent opportunity for new technology deployment to have an impacton energy savings in the medium term. The most promising energy savingstechnologies in the industry are gasification, advanced drying technologies and hightemperature and high pressure black-liquor recovery boilers (Worrell, et al., 2001).
Energy efficiency gains can also be achieved if existing mills are retrofitted withenergy efficient technology. Potential to retrofit paper machines with energyefficiency equipment is limited by the paper machine design.
There is also significant potential for additional excess heat recovery systems. The useof available excess heat in a more consistent way could lead to substantial heatsavings. Use of recovered heat depends on the demand for lower grade heat. In coldareas, e.g. Scandinavia and Canada, heat is needed to increase the temperature ofincoming streams (water, air, raw materials), especially during the winter. In warmerareas, e.g. Asia, South America, southern United States, there is not necessarily a usefor all recovered heat. The decreased heat consumption also impacts the CHPpotential and heat savings may be unprofitable if the CHP is designed for meetingthe “old” heat demand.
Lignin removal offers interesting possibilities in cases where an excess of steam exits orcould be achieved through process integration. It can also be used for de-bottleneckingof the recovery boiler when the pulp production in a mill is to be increased.
Integrated pulp and paper mills are usually more efficient than stand-alone mills.Integration offers synergy potential, e.g. excess steam produced at the pulp mill canbe used in the integrated paper mill. A stand-alone pulp mills can be as efficient asan integrated mill if it can sell excess steam, electricity and/or lignin to the localcommunity, other industrial users or the electricity grid. However, the logistics offeedstock (wood and waste paper) and product transportation can limit the potentialto use integrated mills.
In many cases, big paper machines are more efficient than small machines. However,certain producers, notably in China and India, opt for small mills that allow moreflexibility in the product mix, which is more suited for local market circumstances. Inrecent years, several very large more efficient mills have been built in China.
Differences in Energy Intensity and CO2 Emissionsacross Countries
There are important differences in energy use for pulp and paper production betweencountries, due to a range of factors such as product mix, processes used, plant size,technology, technical age, feedstock quality, fuel prices and management attentionto energy efficiency. This analysis shows that the energy intensity of heat use acrossthe key countries varied from a remaining improvement potential of 30% for Canadato –54% for Japan compared to best available technology. For electricity, thisremaining improvement potential varied from 2% for Germany to 28% for theUnited Kingdom.
Chapter 7 • PULP, PAPER AND PRINTING INDUSTRY 201
7

202 TRACKING INDUSTRIAL ENERGY EFFICIENCY AND CO2 EMISSIONS
Canada and the United States are among the countries with the most energyintensive pulp and paper industries in the world. The average technical age of theirpulp and paper mills is perhaps the oldest. Both are rich in wood resources and aremajor virgin pulp producers with the United States the largest chemical pulpproducer and Canada the largest mechanical pulp producer.
Canada’s pulp production of 25.59 Mt in 2004 is significantly above that of itspaper and paperboard production of 20.58 Mt. With a larger portion of its pulp andpaper industry focused on the more energy intensive pulp market, Canada is perhapsless able to benefit from energy savings provided by integrated mills which canmaximise waste heat recovery systems and hence lower energy consumption.
Unlike Canada, the pulp and paper industry in the United States is dominated moreby paper and paperboard production than pulp production. Its pulp production ismore than 90% chemical pulp. Chemical pulp production uses both heat andelectricity and offers greater opportunity for energy efficiency than mechanical pulp,especially in an integrated mill.
European countries such as Germany, France and Italy are major paper andpaperboard producers, but produce relatively little pulp. They have high paperrecovery rates and use a significant amount of recovered paper as raw material fortheir paper production. The pulp and paper industry in these three countries showedsignificantly better energy efficiency indices than its North American counterparts.This may reflect very high energy prices which have led many European producers tofocus on energy efficiency to remain competitive in the market. Of the threeEuropean countries, Italy showed the greatest room for improvement in heatconsumption which may be due to its high market share of speciality papers whichhave much higher energy requirements than regular writing and printing papers.
The industry in Finland, Sweden and Norway are large producers of pulp and paper,with about equal share between pulp and paper. Finland and Sweden’s pulpproduction is dominated by chemical pulp, while in Norway pulp production leansmore towards mechanical pulping. Although no statistics are available for integratedmills, it is likely that the greater energy efficiency of the Nordic countries could beattributed to a higher degree of integrated plants together with a lower averagetechnical age compared with Canada and the United States. The industry in theNordic countries appear to have a better match in terms of absolute pulp and paperproduction which would allow for greater opportunities for integrated mills andhence higher energy efficiency. Finland appears to have the highest energy intensityin the industry of the three Nordic countries. Paper production in the Finnish industryis dominated by high grades of paper which are more energy intensive to produce.This analysis split paper production into seven products, but this may not havesufficiently reflected the energy needs of some of the high paper grades.
The pulp and paper industry in Japan and Korea appear to be the most efficient interms of heat use with an energy efficiency index above one hundred. As this indexcompares energy use to best available technology it does not seem logical to havean index greater than one hundred. Possible explanations are that the BAT figuresused are too low or energy data are not comparable across countries or are based ondifferent system boundaries. Paper plants in Korea are perhaps among the mostmodern in the world and benefit from the lowest average technical age. In Japan,

efficiency improvements are the result of a successful voluntary action plan by thepulp and paper industry. The high level of integrated pulp and paper mills (90% ofall pulp produced in Japan is from integrated mills) could explain Japan’s energyefficiency index above one hundred.
Chapter 7 • PULP, PAPER AND PRINTING INDUSTRY 203
7
Box 7.3
Pulp and Paper Industry Voluntary Action Plan in Japan
A voluntary action plan was established by the Japanese Paper Association in 1997. At theoutset its two main goals were to reduce fossil fuel consumption by 10% per unit of output from1990 levels and expand forest plantation by 550 000 hectares by 2010. These goals wererevised in 2004 and now aim to: reduce fossil fuel consumption by 13% per unit of output from1990 levels; reduce CO2 emissions per unit of output by 10% over 1990 levels and expandforest plantation by 600 000 hectares. The plan covers 88% of total paper and paperboardproduction in Japan.
Figure 7.10 shows that the target for reduced fossil fuel consumption has been met. In 2005,fossil fuel consumption per unit fell 13.5%, while the CO2 emissions reduction in 2005 was justshy of its 10% goal at 9.2%. An important result of this voluntary action has been theintroduction of biomass waste as a fuel to replace fossil fuels and hence a significant decline inboth fossil energy and CO2 emissions per tonne of paper produced. This index was produced bythe Japanese Paper Association and is specific to Japan.
Figure 7.10�Energy Consumption and CO2 Emissions Index – Japan
Source: Hayakawa (2006), Japanese Paper Association (2006).
In Japan, the trend towards lighter paper has reduced overall energy and resource needs, butincreases the energy need per tonne of product and represents a hurdle for international energyefficiency comparisons. The Japanese industry is applying a life cycle inventory method forassessment of its energy efficiency.
75
80
85
90
95
100
105
1990 1995 2000 2005
Ind
ex (
19
90
=1
00
)
Gross energy
CO2
Fossil energy

204 TRACKING INDUSTRIAL ENERGY EFFICIENCY AND CO2 EMISSIONS
Energy Efficiency Potentials
Energy costs, energy supply and climate change are among the core issues impactingon the future of the pulp and paper industry. They impact on manufacturing costs,as well as allocation of investments around the globe. The increasing focus onbiomass as an energy source may on the one hand increase wood prices for existingindustries, but on the other hand open new markets to other parts of the forestcluster. Co-production of pulp and other biomass products may result in new businessmodels and high overall energy efficiency.
This analysis of heat and electricity consumption versus best available technologyin the main pulp and paper producing countries show that there is significantroom for improvement. The market structure for the pulp and paper industry ineach country may determine or limit the degree to which these energy efficiencygains can be achieved. The industries in Korea, Japan, Finland, France andGermany have achieved sizable improvements in the efficient use of energy forheat over the last decade. Canada, China, the United Kingdom and the UnitedStates seem to have the most to gain from investing in more efficient technologiesand systems.
Increased paper recycling and recovered paper use in many countries could help tofurther reduce energy consumption in pulp and paper production. While Europe,Japan and Korea appear to be close to their practical limits for paper recycling, NorthAmerica and parts of Asia could benefit from more effective policies on wastedisposal to encourage higher recycling rates.
In theory, production of paper from pulp can use close to zero external energy in thecase of chemical pulp integrated with paperboard production. Outdated small-scalepaper plants in developing countries, notably China and India, use excessiveamounts of energy. Larger plants, upgrading of older facilities to best availabletechnology, and higher CHP use could all reduce the energy needs of pulp and paperproduction.
The results of the indicator analysis show a potential savings of 14% for heatand 16% for electricity if actual energy use was based on best availabletechnology. To calculate a potential savings, these rates have been applied tothe 2004 global energy use in the pulp and paper industry. To estimatepotential energy savings from higher recycling rates, the current 2010 Europeantarget of 66% was applied, which represents an additional 20% in global paperrecycling. An assumption could also be made for an appropriate rate of CHP usewhich could increase savings by an estimated 0.3 – 0.6 EJ. The total energysavings potential in the pulp and paper industry from increased processefficiency and systems/life cycle improvements is estimated to be in the rangeof 2.1 – 2.4 EJ. The electricity and heat savings only of 1.0 EJ per year translateinto 1.3 to 1.5 EJ in primary energy terms, depending on the efficiency for powerand steam generation.

Chapter 7 • PULP, PAPER AND PRINTING INDUSTRY 205
7
Estimated SavingsEJ/yr
Electricity 0.3
Heat 0.7
Assuming 66% global recycling rate 0.8
CHP 0.3 – 0.6
Total 2.1 – 2.4
Note: Heat, electricity and recycling are expressed in final energy units. CHP refers to the energy content of the savedfuel.
Source: IEA estimates.
Table 7.13 � Energy Savings Potential in the Pulp and Paper Industry


Chapter 8 • NON-FERROUS METALS 207
8
NON-FERROUS METALS
Key Findings
� More than half of the energy used in non-ferrous metals is for primary aluminiumproduction. Aluminium smelters used 1.7 EJ of electricity in 2004, about 3.5% ofglobal electricity consumption.
� The electricity use for aluminium smelters is an important indicator for this sub-sector.World average electricity use for primary aluminium production is 15 268 kWh pertonne. This average has declined about 0.4% per year over the last twenty-five years.On a regional basis, the averages range from 14 337 in Africa to 15 613 kWh/tin North America. Africa is the most efficient region due to new production facilities.
� The regional average energy use for alumina production ranges from 10 to 12.6 GJper tonne.
� With existing technology, energy use in the key steps of aluminium production can bereduced by 6 to 8% compared with current best practice. The potential energy savingsare on the order of 0.3 to 0.4 EJ per year on primary energy equivalent basis.
� Energy use for other non-ferrous metals production depends strongly on the orequality and the metal ore composition. Copper, chromium and manganese eachaccount for more than 0.5 EJ primary energy per tonne of metal. This warrantsfurther indicator analysis. However, there are no detailed statistics availableregarding energy use for the production of these metals. More data should becollected and indicators should be developed for these non-ferrous metals.
Introduction
Various kinds of non-ferrous metals are produced and used in a multitude ofapplications. This chapter focuses on aluminium, as it has the largest productionvolume and accounts for more than 50% of energy use in the non-ferrous metals sub-sector. It finds that the global potential of electricity efficiency improvements inprimary aluminium production to be 15% compared with current best practice. Thischapter also considers copper production in Chile as a case example and providesprimary production data for a number of non-ferrous metals, but more data andanalysis are needed to determine energy savings opportunities.
Global Importance and Energy Use
Table 8.1 provides an overview of the global primary production of key non-ferrousmetals and an estimate of the primary energy used for their production. Primaryproduction data on non-ferrous metals is available from a variety of sources,including governments, trade associations and specialised consulting companies.While the energy intensity of metals such as nickel, gold and silver is extremely high,global production is relatively small. However, in some countries, such metals are akey part of the economy, as well as national energy consumption.

Aluminium Production
Aluminium is the most relevant non-ferrous metal from an energy perspective. Itsproduction can be split into primary production and recycling. Primary aluminiumproduction is about twenty times as energy intensive as recycling. The steps forprimary aluminium production consist of bauxite mining, production of alumina frombauxite, production of carbon anodes, electrolysis and rolling.
Bauxite is found in many parts of the world. Yet, more than 80% of global bauxiteproduction is in Australia, Brazil, Guinea, Jamaica, China and India. Bauxite mininguses about 45 MJ/t of ore. Generally, the ore contains at least 40% alumina.Bauxite is processed to alumina near the bauxite mine, or shipped to alumina plantsin other parts of the world.
208 TRACKING INDUSTRIAL ENERGY EFFICIENCY AND CO2 EMISSIONS
Note that Table 8.1 presents only primary production. For some metals, e.g. lead,recycling (or secondary production) represents the largest share of global supply.Recycling is far less energy intensive than primary production due to the often lowconcentrations of the metals in the exploited ore reserves. However, data on recycledmetal production is hard to obtain and energy consumption data is even moredifficult to acquire.
Table 8.1 � Estimated Energy Consumption in Primary Non-Ferrous Metals Production, 2004
Production
Mt/yr
Final EnergyUseGJ/t
Primary EnergyIntensity
GJ/t
Primary EnergyUse
PJ/yr
Aluminium 30.2 100 175 5 285
Copper 13.8 93 1 283
Chromium 17 50 850
Manganese 11 50 550
Nickel 1.4 160 224
Zinc 8.5 50 425
Tin 0.264 50 13
Lead 2.95 20 59
Gold 0.0025 52 000 130
Silver 0.020 2 900 58
Total 8 877
Source: IEA data.

Chapter 8 • NON-FERROUS METALS 209
8
GJ/t Alumina
Africa and South Asia 12.6
North America 10.4
Latin America 10.0
East Asia and Oceania 11.9
Europe 12.4
Weighted average 11.4
Note: Oceania includes Australia and New Zealand.
Source: World Aluminium, 2006.
Table 8.2 � Regional Average Energy Use of Metallurgical Alumina Production, 2004
Virtually all alumina is produced in the Bayer process, a combination of an extraction(digestion with caustic soda) and a calcination process. Most energy consumed inalumina refineries is in the form of steam used in the main refining process. Thecalcining (drying) of the alumina also requires large amounts of high temperatureheat. Because of this high demand for steam, modern plants use combined heat andpower (CHP) systems. Electricity accounts for an average of 13% and fuel for 85%of total energy use in alumina production. Fuel consumption of a Bayer plant canvary between 10 – 15 GJ/t of alumina. Average fuel consumption in Australianplants is 11 GJ/t of alumina produced. This could be reduced to 9.5 GJ/t throughbetter heat integration and improved CHP systems (ISR Australia, 2000). The globalaverage was 11.4 GJ/t in 2004, with a range from 10 – 12.6 GJ/t (Table 8.2).Global alumina production in 2004 was 60 Mt and consumed 0.68 EJ of energy.
Best practice electricity use in an alumina plant is about 203 kWh/t of alumina.Energy use for digesting can vary between 6.3 – 12.6 GJ/t alumina, while the fuelconsumption for the calcining kiln can vary from 3.4 GJ/t for stationary kilns to4.2 GJ/t alumina for rotary kilns (Worrell and De Beer, 1991). Compared with bestpractice, the potential for energy efficiency improvement in alumina production isestimated to be 15%. However, energy efficiency improvements of this magnitudeare often found to be not cost effective in the short or medium term.
Electrolysis is the most energy intensive step in the production of aluminium. Themain producers of aluminium are located in China, North America, Latin America,Western Europe, Russia and Australia. Japan has phased-out its primary aluminiumproduction over the last thirty years and now imports most of its aluminium fromAustralia. The aluminium industry is the single largest industrial consumer ofelectricity in Australia, accounting for about 15% of industrial consumption(Department of Industry, Science and Resources Australia, 2000). The aluminiumindustry is of similar importance in other countries with low-cost electricity, such asNorway, Iceland, Canada and Russia. In recent years, several new smelters have beenbuilt in Africa, which also take advantage of electricity from hydropower. Table 8.3provides an overview of primary aluminium production.

210 TRACKING INDUSTRIAL ENERGY EFFICIENCY AND CO2 EMISSIONS
Two main types of smelters are used for the electrolysis: the Hall-Héroult system withpre-baked anodes and the older Søderberg cell with in-situ baked electrodes. Themajority of global primary aluminium production uses the pre-baked anodes. Itaccounted for 71% of global production in 2004, with 19% from Søderberg smeltersand 10% from other pre-baked cells. All new smelters use the point-fed pre-baked
Table 8.3 � Global Primary Aluminium Production, 2004
Production
Mt/yr
Share
%
CumulativeProduction Share
%
China 6.59 22.0 22.0
Russia 3.59 12.0 34.0
Canada 2.59 8.7 42.7
United States 2.52 8.4 51.1
Australia 1.90 6.3 57.5
Brazil 1.46 4.9 62.3
Norway 1.37 4.6 66.9
India 0.88 3.0 69.9
South Africa 0.86 2.9 72.8
Dubai 0.68 2.3 75.0
Germany 0.67 2.2 77.3
Venezuela 0.63 2.1 79.4
Mozambique 0.55 1.8 81.2
Bahrain 0.53 1.8 83.0
France 0.45 1.5 84.5
Spain 0.40 1.3 85.8
United Kingdom 0.36 1.2 87.0
Tajikistan 0.36 1.2 88.2
New Zealand 0.35 1.2 89.4
Netherlands 0.33 1.1 90.5
Other 2.86 9.5 100.0
Total 29.91 100.0
Source: US Geological Survey, 2006a.

technology. Electricity consumption for pre-baked smelters is in the range of 13 – 16.5 kWh/kg while Søderberg smelters use about 15 – 18 kWh/kg ofaluminium (European Commission, 2001).
The Hall Héroult electrolysis process is a mature technology, but improvements in itsproductivity and environmental performance are still possible. The difference inefficiency between the best and worst plants is approximately 20% and can beattributed to different cell types and to the size of the smelters, which is generallyrelated to the age of the plants.
Figure 8.1 depicts the specific power consumption for primary aluminium productionfor various regions. It illustrates that electricity consumption has declined in mostregions as new capacity is constructed and old capacity is retrofitted with new cells.This average has declined about 0.4% per year over the last twenty-five years. Therange across regions is relatively narrow, compared to the differences in energyefficiency that have been observed in other manufacturing industries. Africa has themost energy efficient smelters in the world. This reflects the relatively young age ofthe smelters in Africa. New smelters tend to be based on the latest technology andenergy efficiency is a key consideration in smelter development.
Chapter 8 • NON-FERROUS METALS 211
8
13 000
14 000
15 000
16 000
17 000
18 000
19 000
1980 1985 1990 1995 2000 2005
SEC
(kW
h/t
prim
ary
AI)
North America
Europe
World average
Latin America
Asia
Oceania
Africa
East Asia
Figure 8.1 � Regional Specific Power Consumption in Aluminium Smelting
Key point: Africa has the most energy efficient aluminium smelters worldwide.
Note: In this graph, Europe includes EU25 plus Iceland, Norway, Switzerland, Bosnia and Herzegovina, Croatia, Romania, Russian Federation,Ukraine, Serbia and Montenegro.
Source: International Aluminium Institute, 2003.
Primary aluminium production was 30 Mt in 2004 and consumed 1.66 EJ of electricityin smelters, about 3.5% of the world’s total electricity use. The global average electricityuse for primary aluminium production is 15 268 kWh/t (Table 8.4).

212 TRACKING INDUSTRIAL ENERGY EFFICIENCY AND CO2 EMISSIONS
kWh/t Aluminium
Africa 14 337
North America 15 613
Latin America 15 551
Asia 15 427
Europe 15 275
Oceania 14 768
Weighted average 15 268
Note: Oceania includes Australia and New Zealand.
Source: World Aluminium, 2006.
Table 8.4 � Regional Average Energy Use of Primary Aluminium Production, 2004
About 18 GJ of pitch and petroleum coke (petcoke) is needed per tonne ofaluminium for the production of the pre-baked anodes. The most efficientsmelters consume 400 – 440 kg of anode per tonne of aluminium (EuropeanCommission, 2001). Anodes are produced by heating tar pitch or coke fromrefineries at high temperatures in gas-heated furnaces. Anodes can be producedon-site at the smelter or in plants that specialise in the manufacture of carbonanodes for various industries and applications. The specific energy consumptionfor anode production is estimated to be 2.45 GJ/t anode (fuel) and 140 kWh/tanode (electricity) (International Aluminium Institute, 2003; Worrell and De Beer,1991).
In addition, 7.4 GJ of energy is consumed per tonne of aluminium for other uses inthe smelters, e.g. casting, ingot holding and rolling, which accounts for 0.8 EJ ofenergy use. This excludes the energy used to process the aluminium to final products,which most often is done at different sites or industries.
In 2005, more than 60% of the electricity consumed by aluminium smeltersworldwide was produced from hydropower plants. In addition to being a majorelectricity user (and hence a potential source of indirect CO2 emissions from powergeneration), the electrolytic smelting process is also a major source of perfluorocarbons (PFCs), which are potent greenhouse gases. The PFCs are formed dueto electrode effects; however, PFC emissions have been successfully reduced byimproved process controls. Reductions of more than 70% have been achieved atplants in the United States and Western Europe. The international aluminiumindustry has pledged a global reduction of 33% of PFC emissions by 2010 from1990 levels and a reduction in specific electricity consumption of 10% by 2010.
The lowest theoretical energy requirement for electrolysis is 6 360 kWh/t ofaluminium. However, no current cell design comes close to the thermodynamicminimum. The current best practice of Hall-Héroult electrolysis cells (using currents

of 300 – 315 kilo ampere) is estimated at 12.9 – 13 MWh/t of aluminium.1 Theglobal potential of electricity efficiency improvement with current technology isestimated to be 15%. The industry plans to retrofit or replace existing smelters inorder to reduce energy consumption to 13 kWh/kg (46.8 GJ/t) in the short termand to 11 kWh/kg (39.6 GJ/t) in the longer term, which would be based on theuse of inert cathodes and anodes. Over time, electrolysis process designs usingaluminium chloride or carbothermic processes could become the most energyefficient way to produce primary aluminium.
Copper Production
Total copper production was 15.8 Mt in 2004, of which primary copper was10.8 Mt, about 3 Mt was from copper nickel mattes and secondary production wasabout 1.9 Mt. Worldwide there are 124 smelters in operation. Production of primarycopper is concentrated in these key countries: Chile, China, Japan, Russia, Poland,United States, Canada, Kazakhstan and Australia (Table 8.5).
More than half of global copper ore is produced in open cast mines. Rich copper oreshave been depleted. Today mined copper ore reserves typically contain less than 1%copper, while some large deposits containing less than 0.3% are commerciallymined. The ore concentration and the mine type are of key importance for the energyuse in the mining step of copper production.
Most copper ores contain valuable by-products such as molybdenum, gold, silver andnickel. The molybdenum can be separated at the mine during the production of theintermediate product known as concentrate. Gold, silver and nickel follow the processand are recovered during the electrolytic refining step.
About 90% of all copper is produced from sulphidic ores and 10% from oxidic ores.This provides an advantage for the copper smelting process as there is no need forprocess fuel or carbon as a reduction agent. Instead, smelting and fire refining isfuelled by the energy provided by the sulphur within the ore. There is even an excessof energy which can be used to either melt secondary material (scrap) within thesame process or to generate heat or power for other uses.
The Outokumpu flash smelter is the most common with approximately 50% of worldproduction while the reverberatory smelter accounts for 25% and other types ofsmelters for the remaining 25%. The Outokumpu flash smelting process combinesthe conventional operations of roasting, smelting and partial converting into oneprocess. Preheated oxygen-enriched air is used to provide heat in such a manner thatadditional fuel is not required for the reactions to proceed. Copper concentrate(matte) is recovered from the slag and recycled through the smelter. The clean slagis sent for disposal. Heat and dust are recovered from the smelter gases producingdust for recycle to the smelter. The gaseous stream containing 10 – 30% of sulphurdioxide is used for production of sulphuric acid. The matte is further treated inconventional converters to obtain blister copper (98% copper). The blister is thenrefined in another furnace to 99.6% purity and cast into anodes for electro-refining.
Chapter 8 • NON-FERROUS METALS 213
8
1. Losses of rectifiers, auxiliaries and pollution control demand an additional 0.7-1 MWh/t of primary aluminium.

214 TRACKING INDUSTRIAL ENERGY EFFICIENCY AND CO2 EMISSIONS
Electro-refining removes the remaining impurities in the raw metal, either from theore or from secondary sources, to achieve the desired copper purity of 99.99%. Thisis independent of the number of use cycles that the metal has already gone through.Downstream metal processing steps include the fabrication of semi-finishedproducts, such as tube, strip, sheet, rod, wire and bars.
Theoretical energy requirements for copper production are quite low. They are actuallynegative in the case of sulphide ores whose chemical energy release of output (blister)minus input (copper ore) is approximately 2.2 MJ/kg. However, actual specific energy
Table 8.5 � Global Primary Copper Production, 2004
Production
Mt/yr
Share
%
CumulativeProduction Share
%
Chile 1.52 14.1 14.1
China 1.32 12.3 26.4
Japan 1.22 11.3 37.7
Russia 0.66 6.1 43.8
Poland 0.55 5.1 48.9
United States 0.54 5.0 53.9
Canada 0.45 4.1 58.1
Kazakhstan 0.44 4.1 62.2
Australia 0.44 4.1 66.3
Korea 0.38 3.5 69.8
Peru 0.32 3.0 72.8
Mexico 0.30 2.8 75.6
Zambia 0.28 2.6 78.2
Germany 0.28 2.6 80.7
Bulgaria 0.23 2.1 82.9
Spain 0.22 2.1 84.9
Philippines 0.22 2.0 86.9
Indonesia 0.21 2.0 88.9
Brazil 0.21 1.9 90.8
Other 0.99 9.1 100.0
Total 10.78 100.0
Source: US Geological Survey, 2006b.

consumption (SEC) is relatively high, typically 30 MJ/kg of refined copper for pyro-metallurgical processes (Table 8.6). The energy use for copper production dependsstrongly on the ore concentration. The primary energy need for copper production isabout 33 GJ/t for the smelting process at 3% copper concentration and 64 GJ/t forthe leaching process with 2% ore. Primary energy use rises to 125 GJ/t for ore thatcontains 0.5% copper (Norgate and Rankin, 2000). The bulk of the electricity use isfor crushing and grinding of the ore, while electro-refining consumes between 300 – 400 kWh/t. Declining ore grades will result in a higher energy use for primarycopper production. Increased recycling can balance this to some extent.
Statistics on energy use in copper production are scarce. Table 8.6 shows thedistribution of energy use over the different production steps, using the copperindustry in Chile as an example. Chile is the world’s largest copper producer and isresponsible for 14% of global primary copper.
Chapter 8 • NON-FERROUS METALS 215
8
Table 8.6 � Energy Use for Copper Production in Chile
Fuel Use GJ/t
Electricity UsekWh/t
Mining
Open pit 5.68
Underground 0.46
Concentration 2 029
Drying 1.13
Smelting 9.56 672
Refining
Electro-refining 1.18 341
Electro-winning 1.08 2 791
Sulphuric acid plant 141
Services 1.05 32
Others 0.38
Total (open pit mining) 20.06 6 006
Note: 1.14% copper ore grade, 30% copper content in the concentrates.Source: Alvarado, et al., 2002.
Energy use in some of the key steps has improved considerably over time in the copperindustry in Chile. For example, fuel use in smelting was reduced by 32% between 1992and 2000, while power use increased by 31% due to the introduction of new processes,e.g. Outukompu flash process, resulting in overall net energy savings of nearly 20%. Thesavings were partially offset in other production steps by changes in ore type and grades.

216 TRACKING INDUSTRIAL ENERGY EFFICIENCY AND CO2 EMISSIONS
Energy Efficiency and CO2 Reduction Potentials Further improvement of energy efficiency in the non-ferrous metal industries ispossible. With existing technology the energy use in key production steps ofaluminium production, i.e. the Bayer process and the smelter, can be reduced by15% compared with current best practice. The aluminium industry has pledged torealise 5 percentage points of this potential by 2010 (in smelting), leavingadditional potential available.
In addition to further efficiency improvements, a switch to less CO2-intensiveelectricity sources provides emission reduction opportunities for the non-ferrousmetal industries, particularly for the aluminium industry. The share of hydropower inthe electricity generation mix for the aluminium industry has gradually increasedover the past decades. However, in some regions there is still a small share ofhydropower in the fuel mix, e.g. Asia, Oceania and Africa. The share of oil and coal-fired power has slowly decreased while natural gas-fired power has increased slightly.
In the copper industry, the introduction of more efficient processes to smelt andrefine the metal is a key area for efficiency improvement. For Chile, a potential existsto reduce direct CO2 emissions by nearly 29% by switching to more efficient, virtuallyenergy-neutral process designs (Maldanado, et al., 1998). However, in the futurethese reductions may be partially offset as reduced ore concentrations result inincreased energy needs for mining.

Chapter 9 • SYSTEMS OPTIMISATION 217
9
SYSTEMS OPTIMISATION
Key Findings
� Industrial motor and steam systems can deliver substantial efficiency improvementson the order of up to 9 to 12 EJ of primary energy savings. Barriers to realising thesepotentials are largely due to a lack of awareness by industry, consultants andsuppliers that could be addressed through a combination of policy and educationalinitiatives.
� Motors and boilers can have high efficiencies. Yet today, motor and steam systemefficiencies are low in all countries. Based on hundreds of cases studies across manycountries, it is estimated that the potential for improvement is 20 to 25% for motorsystems and 10 to 15% for steam systems.
� In principle it would be possible to develop indicators for systems on a country level.However, currently there are insufficient data available to develop such indicators.
� Developing countries with emerging and expanding industrial infrastructures have aparticular opportunity to apply systems optimisation best practice in new facilities.
� Combined heat and power (CHP) is a proven industrial energy efficiency measure andone of the more attractive greenhouse gas mitigation options for industry. Globally,CHP generates about 10% of all electricity.
� CHP capacity is concentrated in a few key sectors: chemicals, forest products and oilrefining. Certain barriers exist to greater use of CHP, including the site-specific natureof the technology, rules governing the sale of power to electricity grids andenvironmental regulations. In order to increase the use of CHP issues such as gridaccess, interconnection regulations, buy-back tariffs and backup fees need to beadequately addressed.
� An agreed methodology to assess the environmental benefits of CHP is lacking. Thisanalysis proposes two indicators: one measuring the current contribution of CHP andanother to estimate CHP potential.
� Up to 5 EJ per year of primary energy savings potential remain for CHP in manu-facturing. This equals about 3 to 4% of global industrial energy use
Introduction
The first section of this chapter describes motor and steam systems, their energy useand the global energy savings potential from optimising these systems for energyefficiency. The second section examines the current and potential energy savingsfrom combined heat and power (CHP) in manufacturing industry. The barriers thatprevent optimal use of industrial systems and CHP are addressed. The motor andsteam systems discussion points out the challenges of establishing performanceindicators for motor-driven systems and steam systems. The CHP section includes anindicators analysis. Process integration is discussed in Annex A.
218 TRACKING INDUSTRIAL ENERGY EFFICIENCY AND CO2 EMISSIONS
Industrial Systems
Industrial systems contribute to production processes, including: pumping,compressed air, and fan systems (referred to collectively as motor systems), steamsystems, and process heating systems. These systems are ubiquitous in industry withapplications ranging from energy-intensive petroleum refining to less intensiveindustries such as textiles, or seasonal such as food processing. This analysis focuseson motor and steam systems. The aggregate global savings and CO2 reductionpotential from improving the energy efficiency of process heating systems are alsosubstantial; however, further discussion of these systems is deferred due to the highdegree of variability of these systems and limited availability of data. Moreover, theyhave been dealt with to some extent in the sector chapters.
Industrial systems offer substantial opportunities for improved energy efficiency.Realising this potential is hindered by barriers that are primarily institutional andbehavioural, rather than technical. The fundamental problem is lack of awareness ofthe energy efficiency opportunities by industry, consultants, and suppliers andinsufficient training on how to implement them. Even if energy efficient componentsare applied, this is no assurance of an efficient operating system. A system-wideperspective is needed.
Industrial System Energy Use and Energy Savings Potential
Motor systems are estimated to account for 15% of global final manufacturingenergy use and steam systems for 38%. Motor and steam systems globally accountfor approximately 46 EJ/year in energy use, representing 41% of total industrialenergy use. In the United States, detailed studies have resulted in estimates thatcompare quite favourably, with motor system usage estimated at 12% and steamsystem usage estimated at 35% of primary manufacturing and mining energy use.
Motor and steam systems offer a large opportunity for energy savings, a potentialthat has remained largely unrealised worldwide. While the energy efficiency ofindividual components, such as motors (85 – 96%) and boilers (80 – 85%) can bequite high, when viewed as an entire system, their overall efficiency is quite low.Motor systems lose on average approximately 55% of their input energy beforereaching the process or end-use work. For steam systems, the losses are onlymarginally better, with 45% of the input energy lost before the steam reaches pointof use (USDOE, 2004d). Some of these losses are inherent in the energy conversionprocess; for example, a compressor typically loses 80% of its input energy to lowgrade waste heat as the incoming air is converted from atmospheric pressure to thedesired system pressure (Compressed Air Challenge™, 2003). Other losses are due tosystem inefficiencies that can be avoided through the application of commerciallyavailable technology combined with good engineering practice. These improvementsin energy efficiency of existing motor and steam systems are cost-effective, with coststypically recovered in two years or less.
On a global basis, it is estimated that the energy efficiency of motor systems can beimproved by 20 – 25% using commercially available technologies and steamsystems can be improved by at least 10% (more if steam lines are uninsulated), as

documented by programme experiences in the United States, United Kingdom andChina. This represents a global final energy savings opportunity of approximately5.9 EJ/year.
At present, most markets and policy makers tend to focus on individual systemcomponents, such as motors or pumps, with an improvement potential of 2 – 5%,instead of optimising systems. Equipment manufacturers have steadily improved theperformance of individual system components, e.g. motors, boilers, pumps andcompressors, but these components only provide a service to the users’ productionprocess when operating as part of a system. Even when new technologies emerge atthe component level, such as a. 94% efficient boiler currently under development inthe United States, their significant energy efficiency advantages can be negated bya poorly configured system. Terms such as “supply side efficiency” that seek to limitthe definition of system energy efficiency to the compressor room, boiler room, orpump house are misleading in the context of system optimisation. There is littlebenefit in producing compressed air, steam, or pumped fluids efficiently only tooversupply plant requirements by a significant margin or to waste the energizedmedium through leaks or restrictions in the distribution system. System energyefficiency requires attention to the whole production scheme; otherwise the result isoften failure to realise a significant proportion of the energy savings potential.
Improved energy system efficiency can also contribute to an industrial facility’sprofitability at the same time as improving the reliability and control. Increasedproduction through better use of equipment assets is frequently a collateral benefit.Maintenance costs may decline because better matching of equipment to demandresults in less cycling of equipment operation, thus reducing wear. Optimising theefficiency of steam systems may result in excess steam capacity that can be used forCHP applications. Payback periods for system optimisation projects are typicallyshort – from a few months to three years – and involve commercially availableproducts and accepted engineering practices.
These opportunities are well documented. For example, a study of 41 completedindustrial system energy efficiency improvement projects in the United Statesbetween 1995 and 2001 resulted in an average 22% reduction in energy use. Inaggregate, these projects cost USD 16.8 million and saved USD 7.4 million and106 million kWh, recovering the cost of implementation in slightly more than twoyears (Lung, et al., 2003). A more recent series of three-day steam and processheating assessments conducted in 2006 at 200 industrial facilities by the UnitedStates Department of Energy (US DOE) through their Save Energy Now initiative,identified a total of USD 485 million dollars in annual energy savings and 52 TBtus(1.31 Mtoe) of annual natural gas savings, which, if implemented, would cut CO2emissions by 3.3 Mt. Six months after their assessments, 71 plants had reportedalmost USD 140 million worth of energy savings recommendations completed,underway or planned.1
System energy efficiency improvements can occur with little or no capitalexpenditure. For example, a Swedish mining company found after analysing aconveyance system that a 450 kW motor could be removed from service, saving
Chapter 9 • SYSTEMS OPTIMISATION 219
9
1. USDOE, http://www1.eere.energy.gov/industry/saveenergynow/

220 TRACKING INDUSTRIAL ENERGY EFFICIENCY AND CO2 EMISSIONS
EUR 105 000 annually in energy costs. A European manufacturer trimmed theimpeller on a pump, reducing the energy requirements of the pump and allowing fora smaller motor. The project recovered costs in less than four months on aninvestment of less than EUR 4 000.
Even modern, well maintained industrial systems can benefit from optimisation. Asan example, the Canadian utility, Manitoba Hydro, offers industrial facilities systemassessments through their PowerSmart programme. System optimisation projectscompleted and documented in 2004 reduced the energy requirements ofcompressed air systems at a milk plant and a garment manufacturer by more than60%. One system was only nine years old with well maintained, energy efficientequipment.2
Motor Systems
Motor-driven equipment accounts for approximately 60% of manufacturing finalelectricity use. Motor systems are made up of a range of components centred on amotor-driven device such as a compressor, pump or fan. Figure 9.1 provides aschematic of a conventional pumping system with a system efficiency of 31%.
2. http://www.hydro.mb.ca/power_smart_for_industry
Input power 100STD
Output power 31
60% of output rated flow
Conventional pumping systemsystem efficiency = 31%
Standard motorefficiency = 95%
Couplingefficiency = 98%
Pipeefficiency = 69%
Throttleefficiency = 66%
Pumpefficiency = 77%
Figure 9.1 � Conventional Pumping System Schematic
Source: Almeida, et al., 2005.
The performance of motor systems can be improved by optimising them to meet end-use requirements. The power consumption of the drive varies based on the cube ofthe motor rotation speed, while the flow varies linearly. As a result, small changes inmotor speed can yield large energy savings. Proper matching of the driven load(pumps, fans, compressors) to the system demand is essential to optimising energyefficiency. This may or may not require a speed control device, depending on thevariability of the load being served and the existing configuration and load responsecapabilities of the driven equipment.

Large savings can often be achieved by analysing and then optimising the completemotor system. Based on worldwide experience, it is estimated that industries can cost-effectively reduce the electricity use of motor systems by 20 – 25%, although thepotential will vary from plant to plant. Optimising motor systems could savesignificant amounts of energy on a continual basis. Programme experience in theUnited States, Europe and China document commercially achievable systemimprovement opportunities of 20 – 30% (McKane, et al., 2005) (Xuiying, et al., 2003).
The potential efficiency improvements are well known. They include:
� Matching the scale of the motor service to the work demand.
� Providing efficient control strategies to respond to variations in load, includingthe ability to incrementally respond to increased loads, as well as speed controldevices such as adjustable speed drives (ASDs).
� Reducing demand for energy services (e.g. substituting a blower for compressedair or turning off steam supplied to inactive equipment).
� High efficiency motors.
� Improved maintenance practices, with focus on filters, valves, system leaks, andequipment lubricants.
� High efficiency transmission systems.
� Reduced system losses (pipeline systems with lower friction that require lesspumping energy).
� Re-design of the equipment that is driven by the motor.
Energy Efficient Motors
High efficiency motors use better quality materials, are made more precisely and areabout 85 – 96% efficient, depending on size. Premium efficiency motors are the mostenergy efficient motors widely available today. Although the cost of a high efficiencymotor is 10 – 25% more than a standard motor, motor losses decrease by 20 – 30%.Depending on the hours of operation, these additional costs can be recovered in lessthan three years. A motor that costs USD 2 000 may use USD 50 000 of electricityduring its life span. In France in the early 1990s, for example, 88% of industrialcompressors, 75% of pumps and 70% of fans ran for more than 4 000 hours peryear, a rate typical for most regions (De Almeida, et al., 1998). In the United States,the average operating hours for industrial motors across all sectors is approximately5 000 hours, with motors larger than 150 kW operating 6 000 hours or more, onaverage (US DOE, 1998). While the distribution of motor sizes may vary acrosssectors and regions; it is generally true that larger motors use a high proportion ofthe industrial electricity while more numerous smaller motors offer greatercomponent level opportunities for improvements in energy efficiency. New motortechnologies, such superconductive motors, improved permanent magnet motors,copper rotor motors, switched reluctance drives and written pole motors offeradditional energy efficiency opportunities.
When a motor fails, it is usually due to stress on the equipment, which can includeoverloading, voltage fluctuations, poor maintenance practices or environmentalconditions. Motors are frequently repaired at failure instead of replaced, with the
Chapter 9 • SYSTEMS OPTIMISATION 221
9

222 TRACKING INDUSTRIAL ENERGY EFFICIENCY AND CO2 EMISSIONS
typical industrial motor repaired 3 – 5 times over its useful life. The quality of therepair is the most important factor in maintaining the efficiency of the repairedmotor. In general, quality repairs can yield 0.5% or less reduction in energyefficiency, while poor repairs can result in an efficiency degradation of 3% or more.It is usually more cost effective to replace standard motors of 30 kW or less with moreenergy efficient ones rather than repair them. For larger motors, the repair/replacedecision should address life cycle cost, which includes future operating costs.Replacing an operating motor with a more energy efficient one can also be costeffective under certain conditions (Nadel, et al., 2002).
The most effective policy for improving the energy efficiency of motors as acomponent has been shown to be minimum efficiency performance standards,commonly known as MEPS. Where standards for high efficiency motors have beenmandatory for some time, such as in the United States and Canada, the proportionof high efficiency motors is significant at about 70%. Where they are not mandatory,such as in the European Union, more than 90% of all industrial motors operate ator below standard efficiency (Table 9.1). Additionally, benchmarking of electricmotors in Asia has shown that Australia’s MEPS for electric motors has helped toprotect its market from a flood of lower efficiency imported motors from Asiansuppliers (Ryan, et al., 2005).
Table 9.1 presents a comparison of the current status of international minimumefficiency performance standards. While further efforts are needed to harmoniseinternational standards, it is possible to draw such a rough international comparisonbased on current practice.
Speed Control
Systems with varying demand loads need a method of responding effectively tomaintain energy efficiency. Depending on the characteristics of the demand and thedriven equipment (compressor, fan or pump), an adjustable speed drive (ASD) may bean appropriate solution. An ASD is a device that controls the rotational speed of motordriven equipment. Variable frequency drives (VFDs), the most common type of ASD,efficiently meet varying process requirements by adjusting the frequency and voltageof the power supplied to an AC motor to enable it to operate over a wide speed range.
ASDs are not the only method of controlling speed and should be applied withattention to issues such as the quality of the motor insulation, the typical loadingpattern for the motor (a motor/drive combination will use about 3% more energythan a motor alone at full load and torque requirements). The savings potential foran ASD application needs to be assessed for each individual motor system. Ingeneral, savings of 10 – 20% can be achieved, but savings up to 60% are possiblefor specific systems if an ASD is applied as an alternative to a poor practice such asthrottling.
Motor-driven Loads
The application part of the motor system offers by far the largest savings potential.After the motor and drive, energy is transmitted to the driven load. A third of allmotor systems use belt-drive systems. Energy efficiency can be improved by up to 4%

by replacing the belts in belt-drive systems with energy efficient belts. Care must betaken to ensure that the belt-driven processes can tolerate reduced slippage.
Air compressors, pumps and fans are the main energy consumers among industrialmotor applications (Figure 9.2)
Pumping System Energy Efficiency Opportunities
Pumps are very important in the chemical industry, where they use 37 – 76% ofmotor power, but compressor consumption varies widely from 3 – 55% (Cheek, et al.,1997). Pump systems, compressor systems and fans are often over-sized for the workrequirements. As a consequence, the driven equipment (compressors, fans, pumps)either operates at significantly less than its peak performance efficiency or is subjectto inefficient practices such as throttling, bypass or blow-off that waste the energizedfluid or gas. This results in significant efficiency losses. In industrial pumping systems,the system energy efficiency can vary 10 – 70%, depending on the design and howclosely the supply (amount of pumped fluid) is matched with the demand (US DOE,2006).
Chapter 9 • SYSTEMS OPTIMISATION 223
9
Table 9.1 � Motor Efficiency Performance Standards and the Market Penetration of Energy Efficient Motors
EfficiencyLevel*
Designations based on Test Method
Minimum Energy Performance Standards
(estimated in-country % market share)**
IEC 34 – 2 IEEE / CSA Mandatory Voluntary
Premium NEMA Premium
Australia (10%)Canada, US (16%)China – 2010
High EFF 1 EPAct, the Level, JIS C 4212
Australia – 2006Brazil – 2009Canada, US (54%)China – 2010Mexico
Australia (32%)Brazil (15%)China (1%)EU (7%)India (2%)Japan (1%)
Standard EFF 2 Standard Australia (58%)Brazil (85% >20 after 2009)China (99%)Canada, US ~30% exempt
EU (66 non-CEMEP, 85 of CEMEP agreementmembers)India (48%)Japan (99%)
Below Standard EFF 3 EU (28% non-CEMEP, 8 CEMEP)India (50%)
*Normalised, taking differences in test methods and frequencies into account.** Based on information from standards workshop and EEMODS, September 2005.Note: NEMA – National Electrical Manufacturers Association; CEMEP – European Committee of Manufacturers of Electrical Machines andPower Electronics; CSA – Canadian Standards Association, EPAct – Energy Policy Act; EEF – European efficiency levels; IEC – InternationalElectrotechnical Commission; IEEE – Institute of Electrical and Electronics Engineers; JIS – Japanese Test Standard.Source: Brunner and Niederberger, 2006.

224 TRACKING INDUSTRIAL ENERGY EFFICIENCY AND CO2 EMISSIONS
Pumping systems are the most common of the motor systems and have a widevariety of applications in industry. Because many plants have hundreds or eventhousands of pumping systems, the initial step in increasing energy efficiency is todetermine which systems merit further attention.
� Pre-screen pumping systems to identify those with the greatest opportunity forimprovement (indicators include: large size, long hours of operation,maintenance or operational issues).
� Conduct a more detailed assessment of identified pumping systems.
� Shut down unnecessary pumps; use pressure switches to control the number ofpumps in service when flow rates vary.
� Restore internal equipment clearances.
� Replace or modify over-sized pumps:
• install new properly sized pumps,
• install a pony pump to handle lower flow requirements,
• trim or change pump impellers to match the output to system requirementswhen pumping head exceeds those requirements.
� Meet variable flow rate requirements with an ASD or multiple pumparrangement instead of throttling or bypassing excess flow.
� Replace standard efficiency pump drive motors with high or premium efficiencymotors.
� Fix leaks, damaged seals and packing.
� Repair or replace valves with more energy efficient designs.
� Establish a predictive maintenance program (USDOE, 2006).
Pumping
25%
Other
4%Material processing
22%
Material handling
12%
Refrigeration
7% Fans
14%
Compressed air
16%
Figure 9.2 � Estimated Industrial Motor Use by Application
Key point: Air compressors, pumps and fans use more than half of the total energy consumed by motors.
Source: USDOE, 1998.

Figure 9.3 depicts an energy efficient pumping system performing the same work asthe system shown in Figure 9.1, but with an input power of 43 rather than 100,yielding an efficiency of 72%.
Chapter 9 • SYSTEMS OPTIMISATION 225
9
Input power 43
VSD EEMOutput power 31
60% of output rated flow
Energy efficient pumping systemsystem efficiency = 72%
Variable speed driveefficiency = 96%
Energy-efficient motorefficiency = 95%
Couplingefficiency = 99%
Low-friction pipeefficiency = 90%
More efficient pumpefficiency = 88%
Figure 9.3 � Energy Efficient Pumping System Schematic
Source: Almeida, et al., 2005.
Compressed Air System Energy Efficiency Opportunities
Of all motor systems, compressed air systems are typically the least energy efficient,with 80% of the input energy lost to the heat of compression (assuming no recoveryof the resulting low grade heat, which is typically not done). Up to half of theremaining energy is often lost to leaks and inappropriate end uses, resulting in a netsystem efficiency of 10 – 15% (CAC, 2003). These systems also require the mostsophisticated control schemes due to the dynamic nature of compressed air. Becausethe operation of these systems is often poorly understood, system designers andoperators focus on reliability, disregarding energy efficiency. Ironically, this frequentlyresults in over-sized and poorly controlled systems, unstable air pressures and excessequipment wear. Frequently, system components downstream of the compressor roomare poorly maintained and further contribute to poor operating efficiencies. The useof ASDs in compressed air systems has become increasingly popular in recent years,but misapplications are common, particularly improper sizing.
The first step in optimising the operation of a compressed air system is to identify anddetermine the load patterns of existing compressors. Once that is completed and abaseline of energy usage established, maintenance issues (worn or clogged filters,inoperable regulators, lubricators, and drains, cracked hoses, and system leaks) shouldbe addressed. Compressed air is energy intensive to produce and it is a piped servicereadily available to production processes. Misapplications are common and should bediscontinued or replaced by more energy efficient options such as blowers, mechanicaldrivers or vacuum pumps. Once demand has been reduced, compressor controlsrequire adjustment by a qualified professional. Failure to adjust controls often reducesenergy savings, sometimes substantially (Compressed Air Challenge™, 2004).
An evaluation of the Compressed Air Challenge training for US DOE identifiedparticipants taking the energy efficiency actions listed in Table 9.2.

226 TRACKING INDUSTRIAL ENERGY EFFICIENCY AND CO2 EMISSIONS
Fan System Energy Efficiency Opportunities
Fan systems have similar issues with over-sizing and poor maintenance practices aspumping and compressed air systems. They include problems with the fan/motorassembly and those associated with the system itself. The build-up of contaminantson or corrosion of fan surfaces and problems with belt drives and bearings arecommon concerns for the fan/motor assembly. System improvements for energyefficiency include:
� Correct poor airflow conditions at fan inlets and outlets.
� Repair or replace inefficient belt drives.
� Fix leaks and damaged seals.
� Replace or modify over-sized fans.
� Meet variable flow rate requirements with an ASD, variable inlet vanes ormultiple fan arrangements rather than with dampers.
� Replace standard efficiency fan drive motors with high or premium efficiencymotors, and
� Establish a predictive maintenance programme (US DOE, 2003).
Compressed Air System Improvement Option Potential Energy Savings
%
Replace current compressor with more efficient model 2
Reconfigure piping to reduce pressure loss 20
Add compressed air storage 20
Add small compressor for off-peak loads 2
Add, restore, upgrade compressor controls 30
Install or upgrade distribution control system 20
Rework or correct header piping 20
Add, upgrade or reconfigure air dryers 1
Replace or repair air filters 10
Replace or upgrade condensate drains 5
Modify or replace regulators (controls at the process) 20
Improve compressor room ventilation 1
Install or upgrade (ball) valves in distribution system 10
Note: Does not account for interactions or inappropriate use.Source: US DOE, 2004.
Table 9.2 � Percent Energy Savings Potential by Compressed Air Improvement

Motor System Opportunities
Optimisation of motor systems to save energy has received only limited attention. Incountries where government programmes on energy efficient motors have been inplace, e.g. Canada and the United States, the prevalence of energy efficient motorshas substantially increased, but the potential increase in motor system efficiencyremains largely unrealised due to the lack of national standards and policies thatencourage companies to integrate energy efficiency into their management practices.The US programme has been partially successful in building awareness throughvoluntary approaches such as training, case studies, publications and technicalassistance, but these are time intensive, plant-by-plant efforts that fall far short of thetotal savings potential (McKane, et al., 2005). Given the 5 – 10% savings potentialon total electricity use, a much more comprehensive approach is warranted.
The energy efficiency of motor-driven equipment, such as pumps, fans andcompressors, can be improved through variable speed controls capability, use ofpremium lubricants, system design optimisation, and improved management practicessuch as engineering for energy efficiency, proper sizing and operational best practices.Improvements can also be made to the controls on existing systems, for example, forcompressed air systems by combining pressure/flow controllers, dedicated storageand master controls. Sensor-based controls and advanced adjustable speed drives withimprovements like regenerative braking, active power factor correction and bettertorque/speed control can contribute to greater overall efficiency.
Steam SystemsSteam is used extensively as a means of delivering energy to industrial processes(Figure 9.4). Steam holds a significant amount of energy on a unit mass basis thatcan be extracted as mechanical work through a turbine or as heat for process use.This latent heat can be transferred efficiently at a constant temperature, an
Chapter 9 • SYSTEMS OPTIMISATION 227
9
Distribution
End use
Generation
Recovery
Economiser
Combustionair preheater
Combustiongases
Isolationvlave
Boiler
Steamtrap
Shell & tubeheat exchanger
Process heater
Pressure reducing valve
Process heater
Steamtrap
Steamtrap
Condensatereceiver tank
Condensatepump
Deaerator
Feedpump
Forceddraft fan
Figure 9.4 � Steam System Schematic
Source: US DOE, 2002.
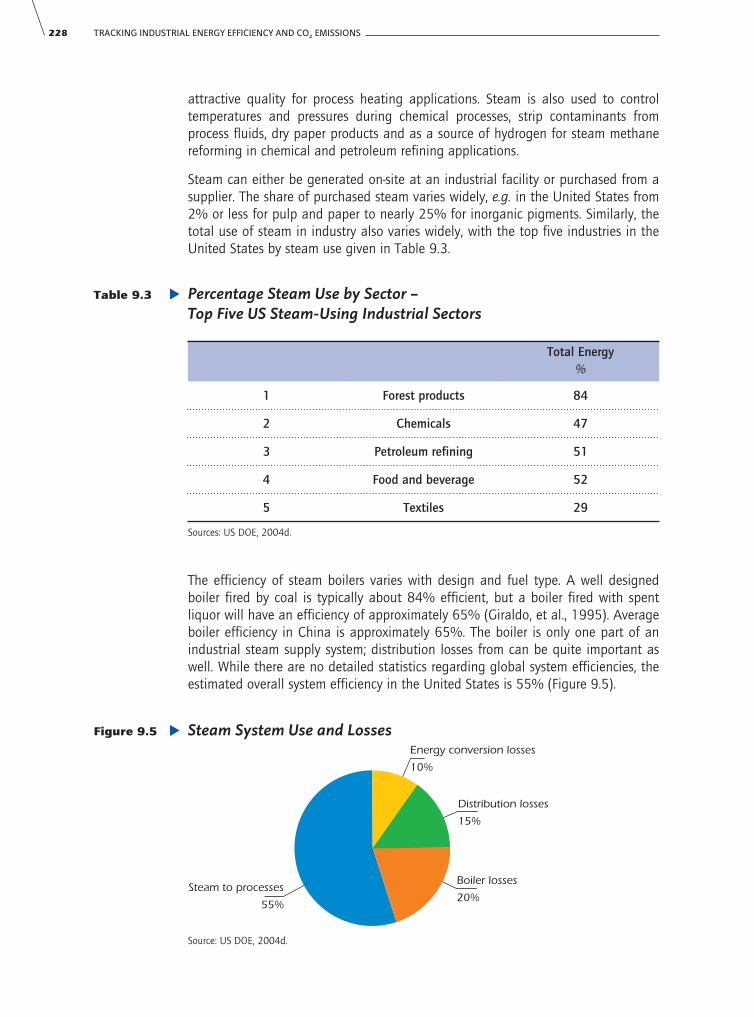
228 TRACKING INDUSTRIAL ENERGY EFFICIENCY AND CO2 EMISSIONS
Total Energy%
1 Forest products 84
2 Chemicals 47
3 Petroleum refining 51
4 Food and beverage 52
5 Textiles 29
Sources: US DOE, 2004d.
Table 9.3 � Percentage Steam Use by Sector – Top Five US Steam-Using Industrial Sectors
attractive quality for process heating applications. Steam is also used to controltemperatures and pressures during chemical processes, strip contaminants fromprocess fluids, dry paper products and as a source of hydrogen for steam methanereforming in chemical and petroleum refining applications.
Steam can either be generated on-site at an industrial facility or purchased from asupplier. The share of purchased steam varies widely, e.g. in the United States from2% or less for pulp and paper to nearly 25% for inorganic pigments. Similarly, thetotal use of steam in industry also varies widely, with the top five industries in theUnited States by steam use given in Table 9.3.
The efficiency of steam boilers varies with design and fuel type. A well designedboiler fired by coal is typically about 84% efficient, but a boiler fired with spentliquor will have an efficiency of approximately 65% (Giraldo, et al., 1995). Averageboiler efficiency in China is approximately 65%. The boiler is only one part of anindustrial steam supply system; distribution losses from can be quite important aswell. While there are no detailed statistics regarding global system efficiencies, theestimated overall system efficiency in the United States is 55% (Figure 9.5).
Energy conversion losses
10%
Distribution losses
15%
Steam to processes
55%
Boiler losses
20%
Figure 9.5 � Steam System Use and Losses
Source: US DOE, 2004d.
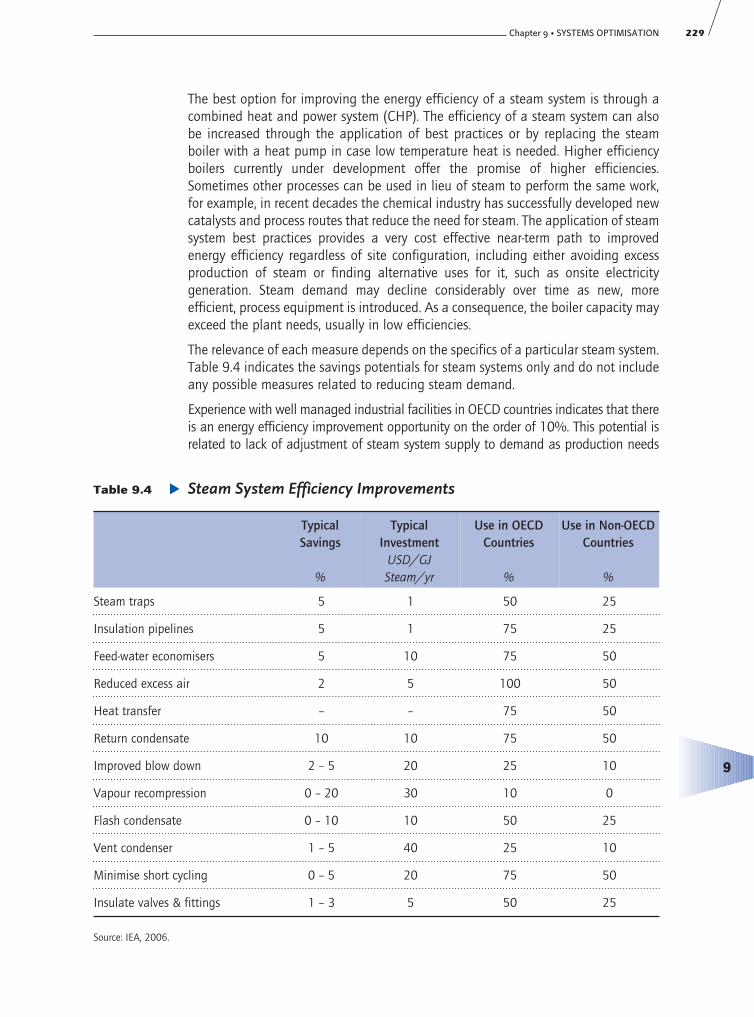
The best option for improving the energy efficiency of a steam system is through acombined heat and power system (CHP). The efficiency of a steam system can alsobe increased through the application of best practices or by replacing the steamboiler with a heat pump in case low temperature heat is needed. Higher efficiencyboilers currently under development offer the promise of higher efficiencies.Sometimes other processes can be used in lieu of steam to perform the same work,for example, in recent decades the chemical industry has successfully developed newcatalysts and process routes that reduce the need for steam. The application of steamsystem best practices provides a very cost effective near-term path to improvedenergy efficiency regardless of site configuration, including either avoiding excessproduction of steam or finding alternative uses for it, such as onsite electricitygeneration. Steam demand may decline considerably over time as new, moreefficient, process equipment is introduced. As a consequence, the boiler capacity mayexceed the plant needs, usually in low efficiencies.
The relevance of each measure depends on the specifics of a particular steam system.Table 9.4 indicates the savings potentials for steam systems only and do not includeany possible measures related to reducing steam demand.
Experience with well managed industrial facilities in OECD countries indicates that thereis an energy efficiency improvement opportunity on the order of 10%. This potential isrelated to lack of adjustment of steam system supply to demand as production needs
Chapter 9 • SYSTEMS OPTIMISATION 229
9
Table 9.4 � Steam System Efficiency Improvements
TypicalSavings
%
TypicalInvestment
USD/GJSteam/yr
Use in OECDCountries
%
Use in Non-OECD Countries
%
Steam traps 5 1 50 25
Insulation pipelines 5 1 75 25
Feed-water economisers 5 10 75 50
Reduced excess air 2 5 100 50
Heat transfer – – 75 50
Return condensate 10 10 75 50
Improved blow down 2 – 5 20 25 10
Vapour recompression 0 – 20 30 10 0
Flash condensate 0 – 10 10 50 25
Vent condenser 1 – 5 40 25 10
Minimise short cycling 0 – 5 20 75 50
Insulate valves & fittings 1 – 3 5 50 25
Source: IEA, 2006.

230 TRACKING INDUSTRIAL ENERGY EFFICIENCY AND CO2 EMISSIONS
change over time and inadequate attention to routine maintenance of steam traps,valves and heat transfer surfaces. In many developing countries, the losses from steamsupply systems are substantial. For example, pipeline insulation is often non-existent inRussia. In China, many small-scale boilers operate with considerable excess air andincomplete combustion of coal. In countries with a high reliance on poor quality coal,this can be a major contributor to poor steam system efficiency. Poor coal quality is themain cause for the low efficiency of Chinese boilers (Box 9.1).
Box 9.1
Coal-fired Boilers in ChinaThere were 526 300 industrial boilers in China in 2001. The vast majority (90%) of thecapacity burn coal as fuel, which use 400 Mt of coal per year. Of the newly installed boilers in1999, 79% were coal-fired, 16% oil and gas-fired (Energy Foundation).
Some 47% of industrial boilers are 4 t/h or smaller in size, with approximately 16% at 6 t/h,22% at 10 t/h, and the remainder 20 t/h or larger (Zhehang, 2006). The mix of boilers fromgreater to lowest frequency includes: chain boilers – 60%; reciprocating – 21%; stock – 14%;fluid bed – 4%; and other – 1%. Actual tests of boiler efficiency seem to support an averageboiler efficiency of 60 – 65%.
Overall demand for steam in China is about 5.7 EJ per year. The boilers fall into three groups,those with:
� average efficiency of 59%, which account for 47% of the boilers;
� average efficiency of 65 – 70%, which account for 28%;
� average efficiency more than 70%, which account for 25%.
Boiler efficiency in China is lower than the 80% efficiency level common in western countriesfor a number of reasons:
� Use of low quality coal in certain regions, e.g. boilers in Shanxi, have an efficiency 4 – 5%below the national average because of low quality coal use.
� High excess-air.
� High coal content in the slag (27.4%) and fly-ash (49.7%) as the result of using untreatedcoal.
Reducing the fraction of coal fines from 50 – 28% by coal washing would increase efficiencyby 14%. However, this is not feasible in the short term. It is considered feasible to increaseaverage efficiency from below 65% to between 70 – 73% by improved boiler operationpractices. The cost would be USD 3 000 per boiler, or USD 0.25 – 0.35 per GJ saved.Increasing the efficiency from 73 – 80% would require re-building the boilers.
Chinese efficiency standards set in 1999 differentiate boilers by coal quality and boilercapacity. The minimum efficiency ranges from 55 – 63% (for a capacity of less than 0.5 t/h)to 72 – 79% for boilers with a capacity of more than 20 t/h (Xiuying, 2002). A project underthe framework of the Global Environment Facility to work with Chinese boiler manufacturersto improve efficiency has been funded at USD 100 million, but has had mixed results. The newboilers achieve 80 – 85% efficiency under test conditions, but the efficiencies are much lowerunder normal conditions. Coal quality remains a critical issue. Private sector involvement, theremoval of market barriers, transfer of knowledge and local participation are vital to successto improve boiler efficiency in China (Philibert and Podkanski, 2005).

Barriers to Industrial System Energy EfficiencyThere are several factors that contribute to a widespread global failure to recognise andrealise the energy efficiency potential of optimising motor and steam systems. Theseinclude the complexity of the systems and the institutional structures within which theyoperate. These systems are ubiquitous in manufacturing, but their applications arehighly varied. They are supporting systems, so facility engineers are usually responsiblefor their operation, but production practices on the plant floor (over which the facilityengineer may have little influence) can have a significant impact on their operationalefficiency. Operational budgets are typically segregated from capital budgets inindustrial organisations, so that energy use, typically the single largest element of systemequipment life cycle cost, does not influence purchase. Without energy efficientprocurement practices, lowest cost purchase of elements in the distribution system suchas tool quick-connects and steam or condensate drain traps can result in on-going energylosses that could be avoided with a small premium at initial purchase. Without welldocumented maintenance procedures, the energy efficiency advantages of highefficiency components can be negated by clogged filters, failed traps andmalfunctioning valves.
System optimisation cannot be achieved through simplistic “one size fits all”approaches. Unlike equipment components (motors and drives, compressors, pumps,boilers), which can be seen, touched and rated, optimisation of systems requiresengineering and measurement. Further, since matching supply with demand is acritical element of optimisation, production changes over time can degrade theenergy efficiency of a system if procedures are not in place to adapt to the changes.The presence of energy efficient components, while important, provides no assurancethat an industrial system will be energy efficient. Misapplication of energy efficientequipment, such as variable speed drives, in these systems is common. Systemoptimisation requires taking a step back to determine what work needs to beperformed. Only when these objectives have been identified can analysis beconducted to determine how best to achieve them in the most energy efficient andcost effective manner (Williams, et al., 2006).
Effective Policies and ProgrammesThe challenge of industrial system optimisation is that it requires a new way of lookingat systems and corresponding changes in the behaviour of those that supply andmanage them. Industrial energy efficiency policy and programmes should aim to changetraditional operational practices and to integrate best practices into the institutionalculture of industrial companies. Effective policies to promote industrial systemoptimisation include energy management standards and related training, systemassessment protocols, capacity building of system experts through specialised traininginitiatives, training to raise awareness of plant engineers and managers, tools forassessment and documentation of system energy efficiency, case studies and technicalmaterials.
Experience in Canada, Germany, the United Kingdom and United States has shown thatthe involvement of equipment suppliers in programmes to promote greater industrialsystem energy efficiency can be a highly effective strategy. Industrial facilities typicallydevelop very close relationships with their supply chain. Suppliers can have an importantrole in introducing system optimisation concepts through their interactions with
Chapter 9 • SYSTEMS OPTIMISATION 231
9

232 TRACKING INDUSTRIAL ENERGY EFFICIENCY AND CO2 EMISSIONS
customers. Conversely, if suppliers do not identify any benefit or value from an industrialenergy efficiency programme or policy, they can have a significant negative impact(McKane, 2007).
Energy service companies (ESCOs) have experienced limited success in industrial marketsworldwide. With a few exceptions, such as industrial purchased steam or CHP, ESCOshave had little impact on the development of energy efficiency projects that involveindustrial systems. There are many reasons for this, including the high cost of opportunityidentification, limited replicability site-to-site and lack of expertise in specific industries(Elliott, 2002). ESCOs typically enter industrial markets with experience from thecommercial sector and tend to concentrate on measures such as lighting and heating,ventilating and air conditioning that are found in commercial buildings, which miss mostof the energy savings at industrial sites. In recent years, suppliers of industrial systemequipment have begun providing value-added services that may include everything froma broader range of product offerings to complete management of the industrial systemas an outsourced provider. Their success appears to be attributable to their specialisedlevel of systems skill and familiarity with their industrial customers’ plant operations andneeds (Elliott, 2002).
Programmes to promote energy efficient industrial systems can be highly cost effective.In 2004, the US DOE, through educational policies promoting system optimisation (BestPractices), generated energy savings of 21.4 PJ equal to about USD 112 million/yr.These savings resulted from a programme investment of USD 8.1 million, which yieldedabout USD 14 in benefits annually for each programme dollar spent that year, during aperiod of relatively low energy prices. Cumulative programme energy savings from 1995 – 2004, with the last few years including both motor and steam systems, are 0.7 EJ per year and USD 1.4 billion in annual energy cost savings (US DOE, 2005).
The Canadian Industry Program for Energy Conservation (CIPEC) provides technicalassistance to assist manufacturing and mining companies to attain an energy efficiencyimprovement target of 1% per year. 3
An estimated investment for an extensive motor system programme in the EuropeanUnion is about USD 500 million, with projected annual savings of USD 10 billion(Keulenaer, et al., 2004). A program in Germany, Druckluft Effizient, identified averagesavings opportunities of 20 – 30% from a sample of more than 100 compressed airassessments, depending on system size (Radgen, 2003). The European Commissionoffers technical assistance to companies seeking to improve the energy efficiency of theirelectric motor driven systems (Motor Challenge Programme).
China has begun offering technical support to improve energy efficiency at its1 000 most energy-intensive plants as part a national effort to reduce energyconsumption per unit of GDP by 20% by 2010.
A pilot programme conducted by the United Nations Industrial DevelopmentOrganization trained twenty-two engineers in system optimisation techniques. Withintwo years after completing training, these experts conducted 38 industrial plantassessments and identified nearly 40 million kWh in energy savings (Williams, et al.,2005).
3. http://cetc-varennes.nrcan.gc.ca
Chapter 9 • SYSTEMS OPTIMISATION 233
9
Box 9.2
Indicators of System Energy Efficiency
Measuring the energy efficiency of motors as a component is reasonably straightforward andwell documented. Although differences in the treatment of some losses in the measurementprocess still exist, these differences are relatively small and have narrowed in recent years asmeasurement techniques have begun to become more standardised. The same is not true inthe measurement of motor system energy efficiency, where most of the energy efficiencypotential exists. Few industrial facilities can quantify the energy efficiency of motor systemswithout the assistance of a systems expert. Even system experts can fail to identify largesavings potentials if variations in loading patterns are not adequately considered in theassessment measurement plan. If permanently installed instrumentation such as flow metersand pressure gauges are present, they are often non-functioning or inaccurate. It is notuncommon to find orifice plates or other devices designed to measure flow actually restrictingflow as they age.
Measuring the combustion efficiency of boilers is well defined, although the efficacy of testingtechniques, especially for existing boilers, can vary substantially. Measuring steam systemenergy efficiency has many of the same problems described for motor system efficiency. Inaddition, steam system efficiency must take into consideration the mix of purchased steam andsteam generated on-site.
For indicators of system energy efficiency, reasonably reliable proxies are available. Theseproxies include a set of “best practices” that have proven to be fairly accurate indicators of therelative energy efficiency of these systems. A body of literature, primarily from Canada, theUnited Kingdom and United States has been developed in the past fifteen years to identifythese best practices. The US DOE has established “energy scorecards” as a method forindustrial facilities to roughly estimate their system energy efficiency improvement potentialand is working on standardised system assessment protocols that will provide a finer grainof accuracy to these estimates. China has published a voluntary standard EconomicalOperation of Fan (Pump, Compressed Air) Systems GB/T 13466 – 2006 based on best practiceprinciples.
Best practices that contribute to optimisation are system specific, but generally include:
� Evaluating work requirements and matching system supply.� Eliminating or reconfiguring inefficient uses and practices (throttling, open blowing). � Changing or supplementing existing equipment (motors, fans, pumps, boilers,
compressors) to better match work requirements and increase operating efficiency.� Applying sophisticated control strategies and speed control devices that allow greater
flexibility to match supply with demand. � Identifying and correcting maintenance problems. � Upgrading on-going maintenance practices and documenting these practices.
The presence of an overall energy management plan at a facility or corporate level based oncontinuous improvement principles provides an excellent platform for system optimisation tooccur and is a strong indicator energy efficient performance. Yet, the presence of an energymanagement plan is no guarantee that every system in a facility will be energy efficient. Toaccomplish this, the plan must be combined with awareness of system opportunities, which canbe achieved through training and technical assistance. An effective plan should include specificsystem performance improvement goals based on incremental implementation ofrecommendations identified in system assessments.

234 TRACKING INDUSTRIAL ENERGY EFFICIENCY AND CO2 EMISSIONS
Performance Indicators
Data on global motor and steam system energy use and energy savings opportunities isbased on detailed studies conducted in the United States, some data from the EU andChina, and expert opinion applied to existing information on global industrial energyconsumption. Table 9.5 provides an estimate of motor system energy savings.
Country ManufacturingElectricity Use
EJ/yr
Motor SystemElectricity Use
EJ/yr1
Motor SystemsSavings Potential
EJ/yr 2
Argentina 0.15 0.09 0.02
Australia 0.32 0.19 0.04
Brazil 0.62 0.37 0.07
Canada 0.73 0.44 0.09
China 4.16 2.50 0.50
Chinese Taipei 0.38 0.23 0.05
France 0.48 0.29 0.06
Germany 0.84 0.50 0.10
India 0.71 0.43 0.09
Iran 0.16 0.10 0.02
Italy 0.52 0.31 0.06
Japan 1.42 0.85 0.17
Korea 0.64 0.38 0.08
Mexico 0.37 0.22 0.04
Netherlands 0.15 0.09 0.02
Norway 0.18 0.11 0.02
Poland 0.15 0.09 0.02
Russia 1.20 0.72 0.14
Spain 0.37 022 0.04
South Africa 0.40 0.24 0.05
Sweden 0.21 0.13 0.03
Thailand 0.19 0.11 0.02
Turkey 0.21 0.13 0.03
Ukraine 0.24 0.14 0.03
United Kingdom 0.42 0.25 0.05
World 21.48 12.89 2.58
Note: This is an estimate depicting magnitudes of use and opportunity and is not suited for target setting.1 Estimated at 60% of manufacturing electricity use.2 Estimated at 20% energy savings fraction.Sources: LBNL 2006; IEA data.
Table 9.5 � Motor System Energy Savings Potential(Final Energy in EJ/yr)

Chapter 9 • SYSTEMS OPTIMISATION 235
9
Country ManufacturingFossil Electricity Use
EJ/yr
Steam SystemEnergy Use
EJ/yr1
Steam SystemsSavings Potential
EJ/yr2
Argentina 0.50 0.18 0.02
Australia 0.96 0.34 0.03
Brazil 2.85 1.14 0.11
Canada 2.35 0.94 0.09
China 17.94 7.18 0.72
Chinese Taipei 0.93 0.37 0.04
France 1.55 0.62 0.06
Germany 2.22 0.84 0.09
India 4.00 1.60 0.16
Iran 1.08 0.43 0.04
Italy 1.64 0.66 0.07
Japan 4.29 1.72 0.17
Korea 1.59 0.56 0.06
Mexico 1.14 0.46 0.05
Netherlands 0.56 0.20 0.02
Norway 0.28 0.10 0.01
Poland 0.70 0.25 0.02
Russia 5.32 2.13 0.21
Spain 1.24 0.43 0.04
South Africa 0.99 0.40 0.04
Sweden 0.53 0.19 0.02
Thailand 0.90 0.32 0.03
Turkey 0.84 0.34 0.03
Ukraine 1.40 0.49 0.05
United Kingdom 1.37 0.48 0.05
United States 12.57 5.03 0.50
OECD 36.80 13.98 1.40
Non-OECD 49.38 18.76 1.88
World 86.18 32.75 3.27
Note: This is an estimate depicting magnitudes of use and opportunity and is not suited for target setting. Figuresare in final energy units.1 Steam system use is highly varied among industrial sectors. For countries with steam-intensive industries (forestproducts, chemicals, petroleum refining, food and tobacco, textiles, transport equipment, iron and steel), the steamsystem use is calculated at 40% of manufacturing energy use, while for other countries the use is calculated at 35%.This is a conservative estimate.2 Estimated at 10% energy savings fraction.Source: IEA data.
Table 9.6 � Steam System Energy Savings Potential(Final Energy in EJ/yr)

Accurate estimates for steam systems are further complicated by the use ofpurchased steam, which effectively transfers about two-thirds of the overall systemlosses to an off-site steam generation facility. Industrial facilities that purchase steamcontinue to have opportunities to improve steam system energy efficiency, but theyare limited to the distribution system. Since many countries that rely heavily onpurchased steam for industrial use also have greater than average distribution lossesdue to lack of insulation and leakage, the estimate provided conservatively assumesa potential 10% system improvement opportunity.
Improving Available Data
A better data set for system energy consumption should be developed. A series of“Energy Footprints” developed for US DOE may provide a good starting point to elicitexpert opinion (US DOE, 2004b). The resulting data could then be enhanced at thenational or regional level by information such as the percentage of purchased steam andthe prevalence of “efficiency indicators” such as the sale of VSDs, controls and otherenergy efficient components. The involvement of industrial equipment manufacturers,many of whom have global operations, as well as universities and government and non-governmental organisations would yield a more accurate result.
An opportunity exists to ensure that industrial facilities, particularly in rapidly growingeconomies, have system energy efficiency designed in from the start, rather thanrequiring more costly retrofit actions. Current design practices offer no assurance ofenergy efficiency for systems in new industrial facilities. Absent effective intervention,this new industrial infrastructure will be substantially less energy efficient than it needbe, a situation that will persist for years to come.
Combined Heat and PowerCombined heat and power (CHP), also known as cogeneration, has been used for morethan a century at industrial and municipal sites around the world. It was the foundationof the early electric power industry in some countries. CHP is used in industries that havehigh and relatively constant steam and electric demand, as well as access to by-productor waste fuels.
CHP is the sequential or simultaneous generation of multiple forms of useful energy(usually mechanical and thermal) in a single, integrated system. CHP systems consist of anumber of individual components – prime mover (heat engine), generator, heat recoveryand electrical interconnection. The type of equipment that drives the overall systemtypically identifies the CHP system. Prime movers for industrial CHP systems include steamturbines, gas turbines, combined-cycle systems and reciprocating engines, as well as microturbines and fuel cells for smaller systems. These prime movers are capable of burning avariety of fuels including natural gas, coal, oil and biomass or waste fuels to produce shaftpower or mechanical energy. Although mechanical energy from the prime mover is mostoften used to drive a generator to produce electricity, it can also be used to drive rotatingequipment such as compressors. Thermal energy from the system can be used in directprocess applications, e.g. process heating, drying, or indirectly to produce steam, hotwater, hot air for drying or chilled water for process cooling.
236 TRACKING INDUSTRIAL ENERGY EFFICIENCY AND CO2 EMISSIONS

Chapter 9 • SYSTEMS OPTIMISATION 237
9
CHP micro-turbines and fuel cells offer promise for small-scale industrial applicationsthat have not previously used CHP. For traditional CHP using sectors, research iscontributing to increased efficiencies and new applications. Table 9.7 provides asummary of the key cost and performance characteristics of the leading CHPtechnologies.
Table 9.7 � Summary of CHP Technologies
CHP System Advantages Disadvantages Available Sizes
Gas turbine High reliability.Low emissions.High grade heat available.No cooling required.
Require high pressure gas or in-house gas compressor.Poor efficiency at low loading. Output falls as ambient temperature rises.
500 kW to40 MW
Micro turbine Small number of moving parts.Compact size and light weight.Low emissions.No cooling required.
High costs.Relatively low mechanical efficiency.Limited to lower temperature CHP applications.
30 kW to350 kW
Spark ignition (SI) reciprocating engine
Diesel/compressionignition (CI)reciprocating engine
High power efficiency with part-loadoperational flexibility.Fast start-up.Relatively low investment cost.Can be used in island mode andhave good load following capability.Can be overhauled on-site withnormal operators.Operate on low-pressure gas.
High maintenance costs.Limited to lower temperature CHP applications.Relatively high air emissions.Must be cooled even if recovered heat is not used.High levels of low frequency noise.
< 5 MW
High speed (1 200 RPM) ≤ 4 MW
Low speed(60 to 275 RPM)≤ 65 MW
Steam turbine High overall efficiency.Any type of fuel may be used.Ability to meet more than one siteheat grade requirement.Long working life and highreliability.Power to heat ratio can be varied.
Slow start up.Low power to heat ratio.
50 kW to 250 MW
Fuel cells Low emissions and low noise.High efficiency over load range.Modular design.
High costs.Low durability and power density.Fuels requiring processing unless pure hydrogen is used.
200 kW to 250 kW
Source: US Environmental Protection Agency, 2005.

Benefits of CHPCHP can offer industrial plants several benefits over electric-only and thermal-onlysystems. CHP typically requires only three-quarters of the primary energy required byseparate heat and power systems. The advantages of CHP include:
� The simultaneous production of useful thermal and electrical energy in CHPsystems leads to increased fuel efficiency, resulting in cost savings and reducedfuel combustion. CHP is a key industrial CO2 emissions reduction strategy.
� CHP units can be strategically located at the point of energy use. Such on-sitegeneration avoids grid transmission and distribution losses and can offer relief inareas where the power system is congested.
� CHP is versatile and can be combined with existing and planned technologiesfor a variety of different industrial.
� CHP offers attractive energy cost savings where the spread between the costs ofpurchased natural gas (or other fuel) and electricity is sufficiently large.
Total CHP efficiency is a composite measure of the fuel conversion capability and isusually expressed as the ratio of total useful energy output to fuel consumed. Thetotal CHP efficiency for gas turbine-based systems between 1 and 40 MW, rangesfrom 70 – 75% for power-to-heat ratios between 0.5 – 1. In smaller industrialapplications, micro turbines typically achieve between 65 – 75% total CHP efficiencyfor a range of power-to-heat ratios, while natural gas spark engines ranging between100 kW to 5 MW are likely to have total CHP efficiency between 75 – 80%. Whilesteam engine performance will vary depending on the input fuel, they are likely toachieve close to 80% efficiency over a range of sizes and power-to-heat ratios. Fuelcell technologies can achieve total CHP efficiency in the 65 – 75% range.
Existing CHP capacity is concentrated in a few industries where there is a highdemand for steam and power. While CHP facilities can be found in almost allmanufacturing industries, the food, pulp and paper, chemical, and petroleumrefining sub-sectors represent more than 80% of the total electric capacities atexisting CHP installations. Figure 9.6 shows the distribution of CHP capacity in theEuropean Union and United States.
While there is large variation in electrical capacity at industrial CHP facilities, largesystems still account for the vast majority. For example, in the United States, morethan 85% of existing capacity is 50 MW and larger systems. Reciprocating enginesand smaller gas turbines dominate in the small industrial CHP applications, e.g. foodprocessing, fabrication and equipment industries, while combined-cycle and steamturbine systems dominate the larger systems.
Natural gas fuels 40% of CHP generated electricity in the EU and 72% of capacityin the United States, but coal, wood and process wastes are used extensively in manyindustries, especially in large CHP systems. As a result, combustion turbines are thedominant technology, representing 38% of CHP-based power in the EU and 67% ofinstalled capacity in the United States. Boilers and steam turbines represent 50% ofpower generated by CHP in the EU and 32% of installed CHP capacity in the UnitedStates.
238 TRACKING INDUSTRIAL ENERGY EFFICIENCY AND CO2 EMISSIONS

Chapter 9 • SYSTEMS OPTIMISATION 239
9
Shar
e o
f in
du
strial
CH
P ca
pac
ity
0%
10%
20%
30%
40%
50%
Food Textile Pulp &paper
Chemicals Refining Minerals Primarymetals
Other
EU25US
Figure 9.6 � Distribution of Industrial CHP Capacity in the European Union and United States
Key point: Industrial CHP use is concentrated in three sub-sectors: chemicals, pulp and paper, and oil refining.
Note: In Eurostat statistics, utility-owned CHP units at industrial sites are classified as public supply. This may affect the distribution ofcapacity.
Source: IEA data and statistics.
Barriers to CHP AdoptionDenmark, Finland and the Netherlands already have high penetration CHP rates, butmost countries have significant potential to expand the use of CHP. The adoption ofindustrial CHP systems is typically limited by a handful of key factors, including:
� Power grid access/interconnection regulations and utility practices (buy-backtariffs, exit fees, backup fees).
� Environmental permitting regulations and lack of an agreed methodology toassess the environmental benefits of CHP.
� Increases in natural gas prices relative to electricity prices extend paybackperiods and make them less attractive investments.
Regardless of whether industrial CHP systems want to sell power to the localelectricity grid, they must meet the procedural and technical requirements of thelocal utility and negotiate back-up and stand-by power service. The technicalrequirements are to ensure grid stability and safety. Typically, utilities establish theconditions that CHP systems must meet. A handful of jurisdictions have regulatoryoversight. These conditions include requirements that the CHP system installsafeguards or undertake grid upgrades to enable the project to interconnect. Utilitiesoften impose operating restrictions, and/or require interconnection applicationprocedures that may create barriers for some CHP projects, particularly small systems.

If interconnection procedures are overly expensive in proportion to the size of theproject, they can make it uneconomic. It is for these and other reasons that somejurisdictions are developing standardised interconnection requirements for non-traditional generation types, including CHP.
Typically regulatory authorities do not offer credit for regional emission reductionsthat can result if a more efficient CHP system replaces electricity produced from less-efficient fossil-fuel plants and transported via the electricity grid. Further, thecombined heat and power aspects have presented difficulties as CHP projectsattempt to receive favourable treatment under greenhouse gas emissions tradingschemes, since there is no agreed upon methodology to determine the environmentalbenefits of CHP.
The recent trend toward relatively higher natural gas prices has made some industrialCHP systems – typically those that seek to replace older, less efficient coal-firedboilers with a gas-fired CHP system – less economically attractive. Industrial plantsare addressing these issues by investigating the viability of expanding the use ofwaste fuels in CHP systems and by exploring coal-fired CHP systems.
CHP Statistics
Countries have incorporated CHP in various ways in energy statistics, making itdifficult to compare trends in capacity, power and heat production. The amount ofelectricity that is produced from CHP has been increasing gradually and is now morethan 6 EJ per year, more than 10% of total global electricity production. The amountof heat that is co-generated is not exactly known, but it is in the range of 5 – 15 EJper year, which represents an important share of industrial heat supply. If the heat isnot sold, but used by the producer, part of the fuel use of the CHP plant is reportedunder industrial fuel use, rather than as CHP. Most of the growth in electricityproduction from CHP since the early 1990s is in OECD countries, which account forhalf of CHP electricity production (Figure 9.7).
Table 9.8 provides key data on installed CHP capacity. Together, the selectedcountries generate about 80% of total global electricity. It also providesestimates of the total CHP contribution to power generation in those countries. Itis evident that the contribution of CHP to capacity and total generation varieswidely. Moreover, the share of industrial CHP within the total CHP capacityvaries, due to differences in a country’s economic structure, e.g. energy intensivesectors, climate, role of district heating, and the history of barriers and policies topromote CHP.
Table 9.8 shows the variability in CHP contribution to energy efficiency today indifferent nations. Only a few countries have a CHP contribution to power generationlarger than 20%. China, the EU countries, Japan, Korea, Russia and the UnitedStates show the highest estimated fuel savings from CHP. The data also show thatthe vast majority of CHP capacity is at industrial sites. The exceptions are in countriessuch as Poland or Russia, which have large district heating systems powered by CHP.
240 TRACKING INDUSTRIAL ENERGY EFFICIENCY AND CO2 EMISSIONS

Chapter 9 • SYSTEMS OPTIMISATION 241
9
0
0.5
1.0
1.5
2.0
2.5
3.0
3.5
4.0
4.5
1992 1995 2000 2004
EJ e
lect
rici
ty/y
r
Non-OECD
OECD
Figure 9.7 � Global CHP Capacity, 1992 – 2004
Key point: Global CHP use has not increased significantly in recent decades.
Source: IEA data.
The estimated savings from the use of existing CHP are 4.5 EJ and CO2 emissionreductions of 252 Mt per year.
Fuel and CO2 emission savings are estimates. For the calculation of the currentsavings from CHP, data on industrial CHP energy electricity production were used.For each country an estimate was made regarding the share of back-pressure turbinesand steam turbines in one category with an assumed electric efficiency of 18%; andsimple-cycle turbines, combined-cycle and gas engines in a second category with32% efficiency. The country average power/heat ratio across both categories wasset at 0.31. Assuming an equal share in both categories, the average overallefficiency, for electricity and heat is 80%. This was used to calculate the primaryenergy use for CHP and the energy production from CHP.
The country average efficiency of the reference electricity production was takenfrom the IEA energy statistics (average for centralised power production). Forstand-alone steam boilers, the efficiency was set at 78%. This information wasused to calculate the amount of fuel needed for a situation where electricity andsteam were generated separately. The difference in fuel use for the CHP systemand the stand-alone generation represents the energy savings. The worldaverage fuel saving is 36% and savings from CHP account for 5.4 EJ. For thecalculation of the CO2 benefits, it was assumed that all steam cycles use coaland all gas turbines use natural gas, because of a lack of better data. Theaverage CO2 intensity of the centralised electricity production was used toestimate the savings for electricity. In this approach, CHP accounts for 326 Mtof CO2 savings today.

242 TRACKING INDUSTRIAL ENERGY EFFICIENCY AND CO2 EMISSIONS
Indicators for CHP Energy Efficiency BenefitsThere are two types of indicators to calculate energy efficiency gains attributable to CHP:
� Current CHP capacity and associated energy savings and CO2 benefits.
� Forecasts of additional CHP potential.
Table 9.8 � CHP Use in Selected Countries
Country Installed CHP Capacity Share of Generation
Estimated Savingsfrom Existing CHP
TotalGW
IndustryGW
Total%
Total%
Industry%
FuelPJ
CO2Mt
Australia 2.5 2.5 5.6 5.5 5.5 111 9.4
Brazil 3.9 3.9 4.4 3.9 3.9 112 3.9
Canada 6.8 5.1 6.0 4.7 3.5 134 4.6
China 56.0 13.4 12.7 12.7 3.0 267 20.6
Denmark 5.4 0.6 42.1 50.2 6.8 14 0.9
EU25 91.6 34.1 12.2 9.9 4.6 1 129 50.8
Finland 5.8 1.7 35.1 38.0 12.8 57 2.5
France 6.5 2.8 5.6 4.0 2.0 131 2.0
Germany 26.4 13.4 20.9 9.8 4.0 207 12.1
Italy 4.4 2.2 5.6 7.4 4.1 98 6.0
Japan 9.6 7.0 3.5 5.0 3.6 316 15.7
Korea 6.1 3.9 9.4 9.0 7.1 214 11.2
Mexico 1.7 1.7 3.3 3.9 4.0 68 3.7
Netherlands 6.7 1.0 33.3 29.9 9.5 89 5.7
Poland 6.3 3.8 20.0 16.0 5.3 23 2.8
Russia 65.1 39.5 31.3 20.2 12.2 384 22.4
Spain 3.3 3.3 5.2 7.8 7.2 203 10.1
Sweden 3.2 0.9 9.6 6.8 2.9 10 0.0
Turkey 4.3 4.3 11.7 11.7 11.7 75 5.4
United Kingdom 6.3 2.7 7.9 5.4 5.0 215 12.1
United States 76.5 58.1 7.2 4.6 3.9 1 721 103.4
TOTAL 324.1 173.6 10.3 8.1 5.5 4 507 252.2
Note: Figures are from various sources and are for 2002 for EU countries and 2004 for other countries. Industryexcludes the transformation sector. Ownership may vary, making the distinction between industrial and other CHPcapacity sometimes difficult, e.g. in the Netherlands part of the other CHP capacity is operated by power companiesat industrial sites, artificially reducing the share of industrial cogeneration.

Chapter 9 • SYSTEMS OPTIMISATION 243
9
Current CHP use can be measured in terms of installed power generation capacity,steam generation capacity, electricity production or heat production. Data oninstalled generation capacity generally are available, while actual production dataare less so.
Total CHP electricity production can be tracked on a country level in IEA statistics.However, it is not possible to tell which sector uses CHP from the statistics or to trackthe total heat generated by CHP systems. Therefore, it is not possible to calculateaverage efficiencies of CHP systems.
The energy efficiency benefits of CHP depend on the type and performance of theCHP prime mover and on the characteristics of the reference energy system. The typeof CHP technology determines the ratio of electricity and heat that is produced, andthe quality of the heat. The heat quality will depend on its anticipated use: lowtemperature heat, low, medium or high temperature steam, or high-temperature off-gases, e.g. for pre-heated furnace inlet air.
The efficiency gains of installing CHP are highest if a process is replaced where fossilfuels are used to generate low-temperature heat (below 100°C). The energyefficiency gains are limited if high temperature heat is needed, as this allows for lesspower production.
The reference system is the alternatives of heat and electricity production that are usedfor comparison. The reference electricity production efficiency can vary significantlydepending on the fuel. If a gas-fired CHP system replaces a coal-fired boiler and coal-fired power plant, the efficiency gains and CO2 reductions can be substantial.However, if the reference is an efficient gas-fired combined cycle, energy savings areless. Typical gains for a gas-fired CHP system are 10%, compared to an energy efficientcombined-cycle, and 30% compared to an existing coal-fired power plant.
The actual share of CHP in power production is not a good measure of energyefficiency. Instead, the gap between actual CHP use and maximum CHPpotentials, divided by the CHP potentials, is a better estimate of remainingenergy efficiency potential from CHP. However, undertaking a CHP potentialanalysis requires detailed, sector-specific data on heat demand, as well asassumptions about the technology that will be applied. Typically, data for fuelconsumption are available, but heat demand need to be estimated. Analyses ofthe potential for CHP should also focus beyond traditional CHP systems, e.g. agas turbine with a waste heat recovery boiler, in order not to underestimateadditional potential. This is because more advanced technologies or technologieswith a higher power-to-heat ratio are available that lead to additional CHPinstallation potential.
Global estimates for the potential for CHP do not exist, though there are studiesfor some countries and regions. They may not be comparable due to differences indefinitions, methodologies, system boundaries and technology assumptions. Moststudies only include conventional CHP systems, i.e. generation of power and steamor hot water, and do not include the more advanced processes. Hence, theestimates of CHP potentials discussed are limited to these conventionalapplications.

244 TRACKING INDUSTRIAL ENERGY EFFICIENCY AND CO2 EMISSIONS
0%
20%
40%
60%
80%
100%
Austr
alia
Braz
il
Canad
a
China
Denm
ark
EU25
Finlan
d
Fran
ce
Germ
any
Italy
Japa
nKo
rea
Mex
ico
Nethe
rland
s
Polan
dRu
ssia
Spain
Swed
en
Turkey
Unite
d Kin
gdom
Unite
d Sta
tes
Aver
age
Pen
etra
tion
of
ind
ust
rial
CH
P
Figure 9.8 � Current Penetration of Industrial CHP(Share of Estimated Potential)
Key point: Many large countries have significant potentialto expand industrial CHP.
Source: IEA data and statistics.
In the United States, estimates for the additional CHP potential vary from 48 – 88 GW. The lower estimate only includes large-scale conventional systems. TheCHP potential in Europe is about twice the installed CHP capacity. Some studiesestimate a maximum potential of 252 GW in 2020, of which nearly 200 GW is inthe EU, including district heating and advanced small-scale technologies (Whiteley,2001). Other studies estimate about 150 GW of remaining CHP potential in Europe,about half of which is in manufacturing industry (Minett, 2004).
CHP potential in this analysis was calculated using an estimate for heat demand bysector (percentage of total fuel use) based on estimates of maximum shares of CHPfor a variety of sub-sectors for US industry. The power-to-heat ratios by sub-sectorwere taken from actual US experience. The savings were calculated following theapproach for Table 9.8. Using similar assumptions on share of heat demand in keyindustrial sub-sectors, maximum penetration and technology characteristics, globaltechnical potential for new CHP in industry is estimated to be nearly 160 GW,generating about 500 TWh of electricity.
The net energy savings are estimated at 4.5 EJ. The key countries and regions inwhich this potential is found are China (200 TWh), United States (108 TWh), EU(60 TWh), Brazil (30 TWh), Japan (25 TWh) and Canada (24 TWh). Figure 9.8 showsthe current CHP power production as a share of the estimated potential for CHP,

using the calculation method described. A high share means that already a largepart of the conventional CHP potential has been used, while a low share indicates alarge potential remaining.
These estimates are influenced by many factors. A key factor is the reliability of theenergy balances and data on heat use in the industrial sub-sectors. Data are morereliable for IEA countries than for others Different assumptions on efficiencies,power-to-heat ratio, and technology would result in varying estimates of CHPpotential. Hence, the indicator should be interpreted with care. It does give, however,a first indication of the differences among countries.
There are additional caveats, particularly regarding data on industrial fuel use. Forexample, data for some countries suggest that there is no additional potential forCHP; other studies suggest that there is further potential. IEA expects additional datacollection and analysis in this area would uncover additional CHP potential for theseand other countries and recently launched an initiative to address this. In addition,classification of CHP plants as either industrial or other/public, e.g. district heating,may affect the results. For example, the Netherlands has a very high degree of CHPat industrial sites, but as they are owned (or in joint ventures) with utilities, they areclassified as public CHP capacity. This shows a low penetration rate for CHP in theNetherlands when in reality, the current use is much higher than the indicatorsuggests.
Chapter 9 • SYSTEMS OPTIMISATION 245
9


Chapter 10 • LIFE CYCLE IMPROVEMENT OPTIONS 247
10
LIFE CYCLE IMPROVEMENT OPTIONS
Key Findings
� Industrial energy use is different from other end-use sectors as significant quantitiesof energy and carbon are stored in products. Moreover, materials choice affectsproduct energy use. Therefore, it is particularly important to consider efficiencyimprovement options on a life cycle basis.
� The consumption of materials for a given level of per capita GDP differs widely betweencountries. This suggests that important efficiency gains in materials use are possible.
� It is difficult to apply indicators to assess the efficiency of materials use because ofwide product diversity and the variations in materials choice, lifestyle and naturalresource endowments.
� Materials recycling and energy recovery can reduce industrial energy usesubstantially. Today there are large variations in recycling practices and energyrecovery from waste materials among countries. Substantial amounts of wastematerials are still disposed of in land fills.
� Additional energy efficiency potential in increased recycling is 3.3 to 5.1 EJ per yearand 3 to 4.5 EJ per year in energy recovery in primary energy terms. Realising thispotential could reduce CO2 emissions by 0.16 to 0.42 Gt CO2 per year, if gas or coalwere replaced on a thermal par basis. The potential for increased recovery of usedmaterials should be analysed in more detail.
Introduction
A significant share of industrial energy use is related to the production of energy-intensivematerials. Improving the efficiency with which the economy uses these materials willreduce industrial energy consumption and CO2 emissions. Ways to improve materialefficiency include material recycling, product re-use, re-design and substitution.
The full life cycle and energy and materials systems impacts need to be taken intoaccount. This chapter looks at the efficiency trends in materials and product use suchas cars and packaging. It also looks at opportunities to recycle and reuse plastics,paper, aluminium and steel, and at energy recovery from the incineration of usedmaterials. It identifies additional recycling potential in the range of 3.3 – 5.1 EJ peryear and energy recovery potential of 3 – 4.5 EJ per year. Realising this potentialcould reduce emissions by 0.16 – 0.42 Gt CO2 per year, if gas or coal were replacedon a thermal par basis.
Indicator Issues
Two types of measures are discussed in this chapter. The first one relates to theefficiency of materials and product use. The second one relates to the efficiency ofrecovery of used materials, both recycling and energy recovery.

248 TRACKING INDUSTRIAL ENERGY EFFICIENCY AND CO2 EMISSIONS
A Product Efficiency Indicator (PEI) may be relatively easy to apply, but thesimplification ignores many important aspects that influence the results. Practicalconstraints make it difficult to use PEIs to identify single numbers that can be usedto justify favouring one type of product over another or to inform the consumer. Forexample, the European Commission (EC) concludes that it currently seems neitherpossible nor appropriate to propose harmonised measures to encourage reusableconsumer beverage packaging at the Community level (EC, 2006).
Life cycle analysis (LCA) is a widely applied tool to compare products that facilitatesthe analysis of different types of materials and product use. This type of comparisonfocuses on very specific product services, which means the method is less suited tomake country comparisons in terms of their efficiency of materials use. In fact,comparative assertion is not allowed by the ISO standard for life cycle analysis.Therefore, it is not discussed further in this analysis.
Materials flow analysis (MFA) is another approach that looks at the materialsthroughput of countries. This type of indicator is of higher relevance for measuringthe indirect energy and CO2 intensity of countries related to materials consumption.However, the method as it is applied today is not specifically designed for thispurpose, e.g. Matthews, et al. (2000). As a consequence, the existing MFAapproaches are not suited for the purpose of this study. However, general conceptsof LCA and MFA such as systems approaches and allocation procedures may apply.
A more general analysis looks at the materials intensity of economic activity toprovide some insight regarding the efficiency of materials use in an economy. Theenergy use for materials production is a function of the materials volume that isproduced. Certain limitations apply. For example, the analysis is usually based onmaterials consumption data that do not account for the trade of materials in theform of products. For certain (usually small) countries, this trade can be substantialand can distort the materials intensity analysis. This type of indicator does not creditrecycling or energy recovery from waste.
Also countries rely on various materials depending on their natural resourceendowments. The most notable difference is the choice of building materials. Woodis widely used in countries with large forests and relatively low population densities,while concrete dominates in Asian countries with high population densities.Compared on such a basis, countries will look more or less materials efficient becauseof different product characteristics. One way to overcome this matter is to aggregatematerials based on average energy use and CO2 emissions not only during theirproduction, but also during their use phase.
Setting targets and enforcing them can pose problems. Compared to materialsefficiency, an assessment of recycling and energy recovery rates is morestraightforward. Recycling rates can be calculated in different ways. The bestestimate calculates the amount of recycled material as a share of the total release ofused materials. In the case of pulp and paper and petrochemicals, recycling andenergy recovery represent alternative, but not equal options. An aggregate indicatorthat credits both options appropriately provides the best estimate of recoveryefficiency. The energy recovery efficiency differs substantially depending uponwhether the waste heat is put to productive use. Ideally, this should be accounted forin the indicator analysis.

Trends in the Efficiency of Materials and Product Use
Despite the opportunities for material efficiency improvement, consumption ofenergy-intensive materials in almost all economies grows over time and mayeventually stabilise (saturate) at a certain high per capita income level. Thesepatterns can be observed for steel (Figure 10.1), cement (Figure 10.2), but are notyet evident for plastics, paper (Figure 10.3) and aluminium. If GDP were the onlyexplanatory factor, curves for different countries would overlay each other. This
Chapter 10 • LIFE CYCLE IMPROVEMENT OPTIONS 249
10
Key point: Per capita steel demand stabilises in the 400 – 600 kg range.
0
100
200
300
400
500
600
700
0 5 000 10 000 15 000 20 000 25 000 30 000 35 000
Africa Sub Sahara16 kg (2000)
Asia Pacific OECD699 kg (2005)
China268 kg (2005)
Europe 33359 kg (2005)
CIS178 kg (2004)
Latin America99 kg (2005)
North Africa and Middle East101 kg (2000)
North America488 kg (2005)
Other Asia Pacific132 kg (2005)
South Asia32 kg (2005)
Per capita GDP in 1995 USD at purchasing power parity
Per
cap
ita s
teel
co
nsu
mp
tion
(kg
)
Figure 10.1� Apparent Steel Consumption Trends per capita, 1971 – 2005
Note: Apparent consumption is production plus imports minus exports. Europe-33 consists of EU27 excluding three Baltic States, and including Albania, Bosnia, Croatia, Iceland, Former Yugoslav Republic ofMacedonia, Norway, Serbia, Switzerland and Turkey.
Source: Lysen, 2006.

250 TRACKING INDUSTRIAL ENERGY EFFICIENCY AND CO2 EMISSIONS
seems to be the case for plastics, paper and maybe aluminium. For steel, cement andammonia, the intensity levels differ considerably at a given GDP level. This intensityof GDP levels can be explained by different material choices, consumption patternsand efficiency of materials use. Trade also affects the pattern and generally is notincluded in the apparent consumption figures of materials in products. For example,it is estimated that the United States imported about 16.9 Mt of steel in products,which is equal to about 50 kg/capita, on top of the 500 kg/capita (Figure 10.1)(AISI, 2006). Material use and choice is also a function of domestic resourceavailability, affluence, culture and other factors.
0
200
400
600
800
1000
0 5 000 10 000 15 000 20 000 25 000 30 000 35 000
Per capita GDP in 1995 USD at purchasing power parity
Per
cap
ita c
emen
t co
nsu
mp
tion
(kg
)
Africa Sub Sahara37 kg (2000)
Asia Pacific OECD707 kg (2005)
China819 kg (2005)
Europe 33476 kg (2005)
CIS149 kg (2000)
Latin America215 kg (2000)
North Africa and Middle East286 kg (2000)
North America420 kg (2005)
Other Asia Pacific30 kg (2000)
South Asia103 kg (2005)
Figure 10.2� Apparent Cement Consumption Trends per capita, 1971 – 2005
Note: Apparent consumption is production plus imports minus exports. Europe-33 consists of EU27 excluding three Baltic States, and including Albania, Bosnia, Croatia, Iceland, Former Yugoslav Republic ofMacedonia, Norway, Serbia, Switzerland and Turkey.
Source: Lysen, 2006.
Key point: Per capita cement demand and growth in Chinais exceptionally high compared to per capita GDP.

The efficiency of materials and product use is a function of the product life span and thematerials use per unit of product. Both factors are, in turn, influenced by many variables.Hence, it is hard to establish a clear indicator for material efficiency. Comprehensivestudies that compare the efficiency of materials and product use in a bottom-up fashionhave not been encountered. Nevertheless, various studies have demonstrated thepotential for further material efficiency improvement. In most cases, increased materialsefficiency will reduce CO2 emissions. However, in certain applications the use of
Chapter 10 • LIFE CYCLE IMPROVEMENT OPTIONS 251
10
Key point: Paper and paperboard demand is closely connected with GDP,but tends to stagnate in recent years as digital media gain importance.
Per capita GDP in 1995 USD at purchasing power parity
Per
cap
ita p
aper
an
d c
ard
bo
ard
co
nsu
mp
tion
(kg
)
Africa Sub Sahara4 kg (2000)
Asia Pacific OECD213 kg (2005)
China45 kg (2005)
Europe 33156 kg (2005)
CIS27 kg (2005)
Latin America40 kg (2005)
North Africa and Middle East13 kg (2005)
North America301 kg (2005)
Other Asia Pacific19 kg (2005)
South Asia5 kg (2005)
0
100
200
300
400
0 5 000 10 000 15 000 20 000 25 000 30 000 35 000
Figure 10.3� Apparent Paper and Paperboard Consumption Trends per capita,1971 – 2005
Note: Apparent consumption is production plus imports minus exports. Europe-33 consists of EU27 excluding three Baltic States, and including Albania, Bosnia, Croatia, Iceland, Former Yugoslav Republic ofMacedonia, Norway, Serbia, Switzerland and Turkey.
Source: Lysen, 2006.

252 TRACKING INDUSTRIAL ENERGY EFFICIENCY AND CO2 EMISSIONS
materials affects the energy demand when the product is being used. This is particularlythe case in applications where emissions over the life of a product dwarf those of thematerial and product production and increased material use may result in net life cycleemission reductions. Only a life cycle approach would be able to determine the trade-offsbetween the two and, hence, the net impact on energy use and CO2 emissions. Yet, thevariations in country materials intensity of GDP suggests that important efficiency gainsin materials use are possible.
Three categories are of key importance for total materials consumption: buildings,packaging and transportation equipment.
Buildings
Buildings are a primary consumer of energy-intensive materials such as cement, steel,glass and bricks. Residential and other kinds of buildings each account for about halfof the material inputs. This analysis focuses on housing.
Residential building area in OECD countries grew about 50% between 1980 and2004, which required a very significant increase in the use of materials. It is theincrease of the stock that drives materials demand rather than replacements.Assuming a low estimate of 500 kg of material per square metre, the growth inhousing represents an increased stock of 6 000 Mt, or 250 Mt of materials per year.Figure 10.4 shows the trend of the building area per unit of GDP. Note that the range of housing intensities of economic activity has narrowed, measured assquare metres of dwelling area per USD 1 000 on a purchasing power parity basis(Figure 10.4). In most countries, the floor area is growing at a slightly lower rate thanGDP and the average intensity has declined from around 2.2 – 1.8 square metres perUSD 1 000 over the last twenty-four years.
The production of construction materials has increased very rapidly in China due tothe development of buildings and infrastructure. Today, China is the world’s largestproducer of steel, cement and bricks, and the specific per capita consumption ofcement in China is above that of OECD countries.
Packaging
Packaging is ubiquitous in today’s society. It has many applications and uses manydifferent materials, e.g. steel, aluminium, glass, paper and plastics. Worldwide theconsumer packaging market is estimated to be worth about USD 460 billion with5% annual growth rates. Packaging demand has grown with GDP across a widerange of income levels and regions. Europe represents the largest packaging market(30%), followed by North America (28%) and Asia (27%). Food and beverage,commercial and industrial packaging are the three largest market segments andaccount for more than 70% of the total (Figure 10.5). While the materials intensityvaries for packaging types, these market shares in monetary terms provide a firstindication of the relevance of different packaging types from a CO2 and energyperspective.

Chapter 10 • LIFE CYCLE IMPROVEMENT OPTIONS 253
10
Key point: Housing floor area is closely related to GDP andtends to converge in the range of 1.5 – 2 m2 per USD 1 000.
1.0
1.5
2.0
2.5
3.0
1985 1990 1995 2000 2004
Flo
or
area
(m
2/1
00
0 U
SD P
PP)
1980
US
Denmark
New Zealand
Sweden
Italy
Greece
Finland
Canada
Australia
Austria
Germany
Netherlands
UK
Norway
Figure 10.4� Floor Area per unit of GDP for OECD Countries
Source: IEA data.
Key point: Food and beverage, commercial and industrialpackaging account for 73% of the total packaging market.
Beauty & healthcare
6%Beverage
11%
Food
37%
Commercial & industrial
25%
Others
21%
Figure 10.5� Packaging by Market Segment
Source: Packaging Federation, 2005.

254 TRACKING INDUSTRIAL ENERGY EFFICIENCY AND CO2 EMISSIONS
Packaging is a relatively small, but still significant product and material stream. Itrepresents about 5% of total solid waste and 17% of municipal waste by weight and20 – 30% by volume for the EU15.1 The greenhouse gas emissions related topackaging consumption in the EU15 are estimated to be 80 Mt of CO2 equivalentper year. This equals around 2% of total EU15 greenhouse gas emissions in 2005.
Various studies of the potential for energy savings and CO2 emission reductionthrough material efficiency improvement have identified a wide array ofopportunities including re-use, recycling and product re-design. Most studiesfound reusable packaging to be more environmentally beneficial in situationswhere transport distances were small and return rates high, while one-waypackaging performed better in situations with generally high transport distancesand low return rates. Relatively large technical potentials, up to 40%, formaterial efficiency improvement have been identified in the studies. Realisingthese potentials, however, is a function of many factors, which can be hard toinfluence.
Transportation Equipment
Transportation equipment is a major consumer of steel, aluminium and plastics.About 55 million cars were sold worldwide in 2005, of which more than 80% werein OECD countries.2 Figure 10.6 shows car ownership as a function of GDP percapita. Clearly both are closely related. Note the very low ownership rates in Indiaand China. The ownership rates in OECD Europe, Japan and the United States aresimilar, at almost one car for every two inhabitants.
Global car sales have doubled since 1980 (Figure 10.7). In recent years, sales aregrowing even more rapidly in the emerging economies including China and India.Clearly this is the main driving factor for increased materials demand fortransportation equipment.
Along with growing sales, vehicle weight and performance features have alsoincreased. The trend to larger cars has offset efficiency gains from using lighter steeland lightweight materials such as aluminium and plastics. In fact, this developmenthas slowed fuel efficiency improvements in the United States and other industrialisedcountries. Increased car weight has also resulted in increased material demand forcar manufacturing (Figure 10.8). Today, total steel consumption for carmanufacturing amounts to approximately 100 Mt, or almost 10% of global steelproduction.
1. The EU15 includes: Austria, Belgium, Denmark, Finland, France, Germany, Greece, Ireland, Italy, Luxembourg,Netherlands, Portugal, Spain, Sweden, United Kingdom. Ten additional countries joined the European Union on 1 May 2004.
2. Cars in this study refer to light-duty vehicles which include cars, minivans, sport-utility vehicles and personal usepick-up trucks.

Chapter 10 • LIFE CYCLE IMPROVEMENT OPTIONS 255
10
Key point: Car ownership rates are closely related to income levels.
US
Canada
Mexico
Japan
Korea
Australia &New Zealand
OECD Europe
Russia
ChinaIndia
Brazil
0
100
200
300
400
500
600
0 5 10 15 20 25 30 35 40 45
Per capita GDP in 2005 USD at purchasing power parity
Car
s/1
00
0 in
hab
itan
tsFigure 10.6� Global Car Ownership Rates as a Function of per capita GDP, 2005
Source: IEA data.
Key point: Car sales have almost doubled in the past twenty-fiveyears, which has considerably increased the demand for materials.
0
10
20
30
40
50
60
70
1980 1985 1990 1995 2000 2005
Other
Japan, Korea,Australia
Europe
US, Canada, MexicoLi
gh
t-du
ty v
ehic
le s
ales
(m
illio
ns)
Figure 10.7� Global Car Sales, 1980 – 2005
Source: IEA data.
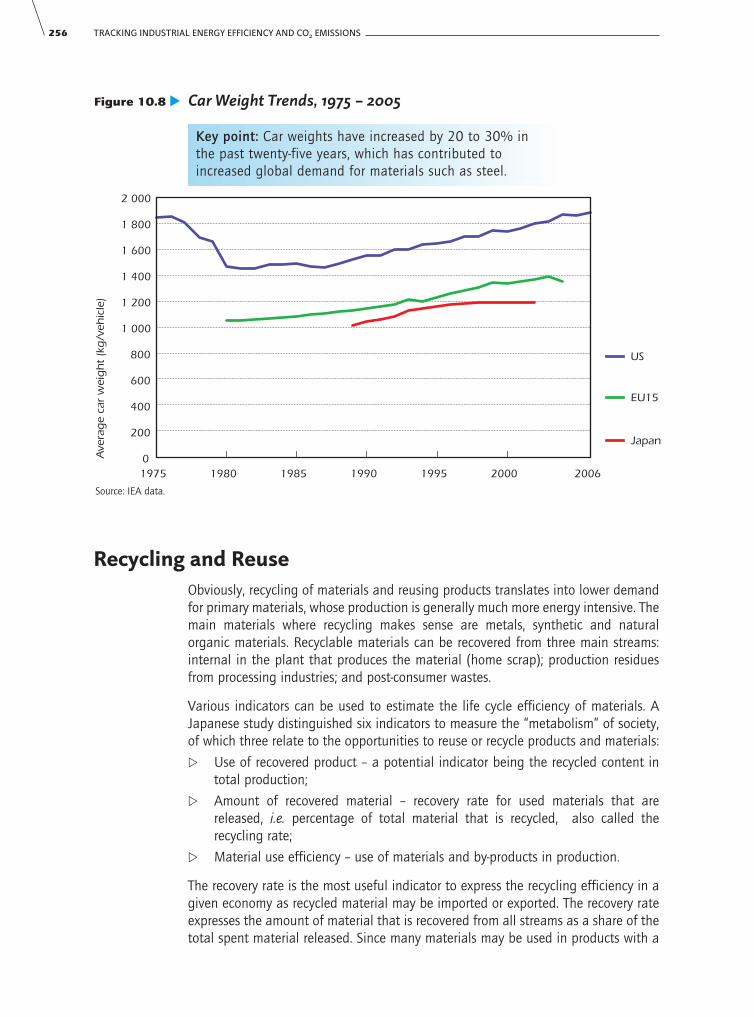
256 TRACKING INDUSTRIAL ENERGY EFFICIENCY AND CO2 EMISSIONS
Recycling and ReuseObviously, recycling of materials and reusing products translates into lower demandfor primary materials, whose production is generally much more energy intensive. Themain materials where recycling makes sense are metals, synthetic and naturalorganic materials. Recyclable materials can be recovered from three main streams:internal in the plant that produces the material (home scrap); production residuesfrom processing industries; and post-consumer wastes.
Various indicators can be used to estimate the life cycle efficiency of materials. AJapanese study distinguished six indicators to measure the “metabolism” of society,of which three relate to the opportunities to reuse or recycle products and materials:
� Use of recovered product – a potential indicator being the recycled content intotal production;
� Amount of recovered material – recovery rate for used materials that arereleased, i.e. percentage of total material that is recycled, also called therecycling rate;
� Material use efficiency – use of materials and by-products in production.
The recovery rate is the most useful indicator to express the recycling efficiency in agiven economy as recycled material may be imported or exported. The recovery rateexpresses the amount of material that is recovered from all streams as a share of thetotal spent material released. Since many materials may be used in products with a
Key point: Car weights have increased by 20 to 30% in the past twenty-five years, which has contributed toincreased global demand for materials such as steel.
0
200
400
600
800
1 000
1 200
1 400
1 600
1 800
2 000
1975 1980 1985 1990 1995 2000 2006
US
EU15
Japan
Ave
rag
e ca
r w
eig
ht
(kg
/veh
icle
)Figure 10.8� Car Weight Trends, 1975 – 2005
Source: IEA data.

long life, it is difficult to estimate the total amount of available material for recovery.Yet there are various methods to calculate the recovery rate. The volume of availablematerial in the total stream can be estimated on the basis of models (material flowanalysis), statistical data and sampling of streams to determine the materialcomposition. Depending on the method used, results may vary. For example, a studyof the European copper streams determined a recovery rate of 63 – 67%, dependingon the method used to establish the amount of available copper for recovery(Ruhrberg, 2006). Similar differences are found in other estimates of recycling ratesfor steel, paper and glass. Recycling and recovery rates in the literature need to becarefully interpreted.
There are data for most countries on quantities and types of materials that arerecycled, or for the amount of recycled materials that go into producing newproducts. What is lacking in the statistics is how much material is available from post-consumer waste. An accurate estimate of this amount is needed because the gapbetween the material that could be available and the amount that is recycled revealsthe untapped recycling potential and consequently the energy and CO2 reductionopportunities.
Reliable statistical data exist for the apparent consumption of materials, which isdefined as the production plus imports minus exports. Taking the apparentconsumption and subtracting the amount of processing residues, the stock changesand the material degradation estimates the amount of available post-consumermaterial. Stock change and the material degradation factors are often not knownprecisely. Moreover, materials are traded in the form of parts and finished products,on which where are no reliable statistics. The relevance of this issue varies bymaterials category.
As the number of houses, cars and other products grows, the materials stock expands.The boundary between stock increase and those materials becoming available for reuseis somewhat fluid and depends on the economic value of spent materials. A disusedindustrial installation that has not been dismantled is an example.
Another way to consider the material available for reuse is that it equals the amountof products that reach the end of their life span, multiplied by their materialscontent. This approach is widely used to estimate material availability. The impact ofstock changes is most significant for products with a long life span. For example,most plastics are used in packaging and have a life span of less than one year. If theamount of packaging in use grows by 2% per year, the stock change explains at mosta 2% difference between apparent consumption and spent material available. Butin the case of buildings and infrastructure, the life span may be 50 years or more. Incase the buildings and infrastructure stock grows by 1% per year, the materialarising for this product category equals only 60% of the apparent consumption. Asa consequence recycling can not exceed 60% of total supply in this product category.
The amount of material that is recycled is not equal to the amount of new materialthat is produced due to material loss in recycling processes. Waste paper, forexample, may contain plastic, fillers and water that must be removed. Steel scrapmay contain paint and zinc coatings that are removed during recycling. Importantamounts of aluminium scrap end up in the dross (solid impurities), although this isrecycled to some extent.
Chapter 10 • LIFE CYCLE IMPROVEMENT OPTIONS 257
10

258 TRACKING INDUSTRIAL ENERGY EFFICIENCY AND CO2 EMISSIONS
Table 10.1 compares the apparent consumption and the amounts of used materialsreleased (home scrap, processing and post-consumer flows). The total amount ofused materials available is considerably lower than the apparent consumption dueto the increasing product stock. The recovery rate for many materials is thereforeconsiderably higher than the recycling content. The remaining potential includesspent materials that are not, but could be, recycled. This is translated into an energysavings estimate by multiplying the remaining potential and the energy savings pertonne.
The additional recycling potential for plastics, paper and wood is limited by the spentmaterial quality. Moreover, incinerating used materials to produce energy is acompeting option. The potential for increased recovery of used materials should beanalysed in more detail, notably for steel and aluminium because of considerableuncertainties in the spent material availability data.
Year
ApparentConsumption
Mt/yr
Post-Consumer
Flows
Mt/yr
Total MaterialAvailable
Mt/yr
Additional Recycling Potential
Mt/yr
Primary Energy Saving
PotentialEJ/yr
Crude steel 2005 1 129 261 446 20 – 50 0.2 – 0.5
Aluminium 2004 44.1 7.3 13 6.7 0.9 – 1.2
Copper 2004 14.5 9 10.4 3 0.1
Plastics 2004 235 115 120 20 – 40 0.8 – 1.5
Paper & paperboard 2004 354 254 274 50 – 75 0.5 – 0.8
Wood 2004 600 284 344 50 0.5 – 1
Glass 2004 100 77 87 23 0.0
Total 3.3 – 5.1
Note: Wood materials value at heating value, which is not generally accounted for in energy statistics.
Sources: IEA data; International Iron and Steel Institute; International Aluminium Institute.
Table 10.1 � Global Recycling Rates and Additional Recycling Potential
Preliminary results suggest that the additional energy efficiency potential fromincreased recycling is 3.3 – 5.1 EJ per year (Table 10.1). This does not account forfuture increases in available materials. About 2 – 4% of all industrial energy usecould be saved if the full amount of used materials available were recycled.Aluminium, plastics, paper, paperboard and wood, in particular, show additionalpotential. Note that this analysis does not consider the economic costs of recycling.Most of the potential is related to municipal solid waste and packaging. Recovery ofmaterials from this waste stream is often not economic. For paper and paperboard,note that the biomass feedstock for primary products is not accounted for in energystatistics, so the energy saving potential is statistically smaller than indicated in the

table. However, recycling of natural fibre materials results in a surplus of primarybiomass that can be used for energy purposes and can reduce CO2 emissions, i.e. ifit substitutes for coal.
Data regarding waste release, calculated from the materials consumptioninformation, can be compared to the data on waste quantities and their composition.Global municipal solid waste amounts to 1.2 – 1.4 Gt per year (wet weight) (IEAdata; Lacoste and Chalmin, 2006). Food waste accounts for half the weight andglass, paper, paperboard, textiles, wood and synthetic organic materials account forthe remainder.
The OECD countries account for roughly half of municipal solid waste (MSW). Chinaaccounts for a quarter, but is very different because its MSW contains substantialamounts of coal ash. MSW represents only part of total post-consumer waste. About1 200 – 3 000 Mt of non-hazardous industrial waste are released each year,including construction and demolition debris most of which is concrete, bricks andother inorganic materials (Lacoste and Chalmin, 2006). Blast furnace slag, fly-ash,etc. are often included in this category. Note that the boundary and definitionbetween waste and by-products is blurred for some industrial streams. For example,blast furnace slag is a co-product with a market price that is widely used as anefficient raw material for cement production.
As materials represent an important cost component for processing industries, theytry to minimise waste. For most energy-intensive materials, the amount of industrialwaste is comparatively small. For plastics and paper it is typically less than 10% ofthe total amount of post-consumer waste.
Construction and demolition and shredder waste (from shredding used cars and thelike) are also important waste categories. While metals are recovered and recycled,this is usually not the case for plastic and wood waste. Reliable statistics forconstruction and demolition waste are not available for most countries.
Petrochemical Products
Recycling is often costly, whereas disposal via land fills and incineration arecomparatively cheap. As well, not all recycling is advantageous from an energy andCO2 perspective. That is because some recycling processes are energy intensive andthe energy used in waste collection must be taken into account. Optimal recyclingrates, in energy efficiency and CO2 emissions terms, differ depending upon eachmaterial, waste flow and region. This complex evaluation is especially needed for thediverse category of used plastic.
Figure 10.9 shows the global petrochemical mass balance. In 2004, 345 Mt of hydrocarbons (about 16 EJ heating values) were converted into 310 Mt of petrochemical products. Plastics represented 73% of the total petrochemicalproduct mix, followed by synthetic fibres, solvents, detergents and synthetic rubber.About 120 Mt were stored in increasing product stock, the remainder was releasedinto the atmosphere or as solid and liquid waste. Across the globe, the majority ofthis waste was disposed of in land fills.
Chapter 10 • LIFE CYCLE IMPROVEMENT OPTIONS 259
10

260 TRACKING INDUSTRIAL ENERGY EFFICIENCY AND CO2 EMISSIONS
Plastic is a material where recycling could have a substantial impact in terms ofenergy and CO2 emissions. Figure 10.9 shows that about 30 Mt of plastic waste isincinerated with energy recovery and about 10 Mt of plastic waste is recycled.Compared with a waste availability of about 120 Mt/yr, this represents a globalaverage recycling rate of 8%.
Several options exist for plastic waste recovery:
� Back-to-polymer;
� Back-to-monomer;
� Back-to-feedstock;
� Energy recovery.
Some technology options can be categorised either as energy recovery or feedstockrecycling. This is, for example, the case if plastic waste is used for coke or methanolproduction or injection in blast furnaces.
Key point: Recycling of petrochemical products is small comparedto primary production.
Processing
Fibres
Disposed
235 230
38
80
10
Recycled
Solvent & detergentloss 30
Incinerated
12010
30
Plastics
310
Syntheticrubber
12
Surfactants15
Solvent20
225
Hydrocarbonfeedstock260
Hydrocarbonenergy85
Oxygen, nitrogen,chlorine50
Intermediates
Processingwaste 5
Post-consumerwaste 115
Totalproducts
in use2 500 Mt
Net addition
120 Mt/yr
Figure 10.9� World Petrochemical Mass Balance, 2004
(Mt/yr)
Note: Excludes methanol, ammonia, carbon black.
Sources: Freedonia, 2003; Plastics Europe 2006, Rubber Study, 2006; Industrievereinigung Chemiefaser, 2006.

Plastics can be divided into thermoplastics and thermo sets. The thermoplastics canbe recycled though mechanical recycling, but thermo sets can not. All plastics can berecycled via back-to-polymer and back-to-feedstock technologies. Other recoverymethods can be applied for the remaining plastic waste fraction. This includes energyrecovery, back-to-monomer and back-to-feedstock technologies.
The quality of recycled plastic depends on the quality of the waste input. If the inputwaste is of low quality, costly upgrading is needed and/or the quality of the recycledplastic is not equal to the quality of primary plastic. If certain plastic products such asbottles are separated in collection or sorted, post-consumer waste can be mechanicallyrecycled. Mechanical recycling is less suited for plastics from mixed MSW.
In Europe and Japan, the countries with the most advanced recycling policies,mechanical recycling rates for post-consumer plastics range from 20 – 30%. It seemsunlikely that these rates can increase much above this level. There are manycountries where mechanical recycling rates are quite low.
Plastic and paper waste can be jointly processed into a fuel with a high calorific value,although PVC must be removed in the fuel preparation to avoid boiler corrosion anddioxin emissions. Known as refused derived fuel, it is used in the Netherlands andGermany for co-combustion in coal-fired power plants. Such fuel can also be used inother boilers and kilns, e.g. in the cement and pulp and paper industries. If the plastic-based fuel substitutes for coal on a thermal par basis, it is more efficient than MSWincineration and CO2 emissions will be reduced on the whole.
Table 10.2 compares the CO2 impacts of post-consumer plastic waste recoveryoptions versus a reference case of disposal in land fills. It considers recycling, energyrecovery in cement kilns, coal-fired power plants and incineration in MSWincinerators that produce electricity only. The CO2 impact varies for different plastictypes, but in all cases the order of preference is recycling, energy recovery in cementkilns or power plants and MSW incinerators. MSW incinerators in fact increase CO2emissions compared to land fill disposal, but they may offset fossil fuel use. It shouldbe noted that the main driver for a switch from land fill disposal to incineration isthe scarcity of land fill space, not energy or GHG policies.
Chapter 10 • LIFE CYCLE IMPROVEMENT OPTIONS 261
10
MechanicalRecycling
t CO2/t waste
Incineration Cement Kiln or Coal-Fired
Power Plantt CO2/t waste
Incineration(18% efficiency)
t CO2/t waste
High densitypolyethylene –1.50 –0.82 0.84Low densitypolyethylene –1.98 –0.82 0.84Polyethyleneterephthalate –2.49 –0.58 0.95
Note: United States power generation reference.
Sources: USEPA, 1998; EPIC, 2002.
Table 10.2 � CO2 Impacts of Plastic Waste Recovery Options versus Land Fill Disposal

262 TRACKING INDUSTRIAL ENERGY EFFICIENCY AND CO2 EMISSIONS
The net CO2 benefit of recycling and waste incineration depends also on the energyneeded for waste collection and for the recycling process, and the efficiency ofenergy recovery in the case of incineration. Typically, the net CO2 benefit ranges from50 – 80% compared with the energy use and CO2 emissions in primary production.
Product quality is also a consideration. Comparing a recycled plastic on a per-tonnebasis with primary product may be deceptive. Recycled plastic can directly substitutefor primary plastic in some applications, however, the amount of materials neededmay be higher to make up for reduced materials performance. In other applications,e.g. plastic lumber, the use of waste plastic is a new market, so comparison withprimary plastics suggests a saving that does not exist.
Table 10.3 shows plastic waste recycling data for some OECD countries.
Europe is the region with the longest experience with plastic waste recycling policies.Production of primary plastics in Western Europe was 53.5 Mt in 2004 and 19.1 Mt of plastic waste was generated. The gap between the two is due to exportsand increasing product stock. For the plastic waste, 53% (10.1 Mt) was disposed ofand 47% (8.9 Mt) was recovered for recycling or energy purposes. Use of the plasticwaste for energy recovery (5.6 Mt) took place in municipal waste incinerators (92%),cement kilns (~75 kt) and other installations such as power plants (380 kt). For theplastics recovered for recycling, about 3 Mt was mechanically recycled and 0.35 Mtwas recycled as feedstock (Plastics Europe, 2006). Mechanical recycling for plasticwaste has increased rapidly in the last decade and energy recovery has doubled. Theincrease in mechanical recycling has reduced the need for primary plastic productionby 2 Mt over the past ten years, an energy saving of about 125 PJ, or 2.5% of thetotal energy used in the European chemical and petrochemical industry.
Japan produced 14.5 Mt of plastic resins in 2004 and 10.1 Mt of plastic waste wasgenerated. More than 90% is post-consumer waste: 60% is used for recovery, while40% is land filled or incinerated without energy recovery. The recovery includes 18%material recycling, 3% recycling via liquefaction and blast furnaces, 5% use as solidfuel (refuse derived fuel) and 34% incineration with energy recovery (Ida, 2006).
The United States generated 28.9 Mt of plastic waste in MSW in 2005 (US EPA,2006). Of this amount, 1.65 Mt (5%) was recovered and 14% was incinerated. Therecycling of plastic bottles amounted to 0.87 Mt in 2004 (American Plastics Council,2004). Plastic waste recovery in the United States has stabilised over the past ten years.
Paper
In 2004, paper consumption was 354 Mt, of which about 150 Mt were recovered(Figure 10.10). Paper recycling rates (waste paper used divided by total paperproduced) are already high in many countries, varying between 30% in the RussianFederation to 64% in China. In 2005, the European paper and paperboard industryrecycled 59% of all paper consumed.
Yet opportunities for increased paper recycling and energy savings are still attractive.The recovery rate in most non-OECD countries is 15 – 30 percentage points lowerthan in OECD countries. However, the rate at which paper is actually recycled indeveloping countries is higher than the recovery rate suggests. Large amounts of

waste paper are imported from OECD countries. Between 10 – 20 GJ can be savedper tonne of paper recycled, depending on the type of pulp and the efficiency of thepulp production it replaces. The net effect on CO2 emissions is less clear, as somepulp mills use significant amounts of bioenergy, while recycling mills may use fossilfuels. Biomass that is not used for paper production could potentially be used fordedicated power generation.
Chapter 10 • LIFE CYCLE IMPROVEMENT OPTIONS 263
10
Year Total
kt/yr
PackagingHouseholds
kt/yr
TotalPlasticWaste
%
Austria 2004 18
Belgium 2003 50 14
Denmark 2004 6
Finland 2004 13 8
France 2004 184 8
Germany 2004 633 30
Greece 2004 1
Ireland 2004 3
Italy 2003 480 17
Netherlands 2004 14
Norway 2004 26 20
Portugal 2003 24 5
Spain 2003 335 285 17
Sweden 2004 4
Switzerland 2004 8
United Kingdom 2002 350 305 7
United States 2004 1.65 1 500 6
Canada 2002 85 2 2
Japan 2004 2 110 515 21
Australia 2004 191 100 13
Total 3 685
Sources: EPRO, 2006; PWMI, 2006; Simmons, et al., 2006; US EPA, 2006.
Table 10.3 � Plastic Waste Recycling by Country

264 TRACKING INDUSTRIAL ENERGY EFFICIENCY AND CO2 EMISSIONS
Paper can be recycled into a wide variety of paper and other cellulose products. Asfibres degrade during recycling, paper is generally “down graded”. Strength andquality considerations limit the recycling potential. On average, the fibre becomestoo short after six recycling steps. Certain paper categories can not be recycled.
The additional paper recycling potential is approximately 50 – 75 Mt. The energysaving potential is 0.5 – 0.8 EJ. Note that paper recycling competes with its use forenergy recovery.
Key point: Paper recycling rates are high.
Totalproducts
in use500 to
1 000 Mt
Net addition40-50 Mt/yr
Paper/BoardFinishedproducts
Processwaste 20
Post-consumerwaste
Loss 40-50
Loss 10.1
354.5 335
158.9
149.0
273.9
100.015.0
253.9
Fillers, resins etc.
Non-wood pulp
Mechanical pulp
Chemicalpulp
Recycled
Incineration Land fill
23.5
19.0
36.1
126.9
Figure10.10�World Pulp and Paper Mass Balance, 2004
(Mt/year)
Sources: UN FAO; IEA data.
Aluminium
Figure 10.11 shows the world aluminium mass balance. More than half ofaluminium metal comes from recycling, most of which is from home scrap andprocessing. The amount of finished product is about 60% of the ingot metalconsumption. The product stock is still rapidly increasing and about three-quarters ofall aluminium that is consumed remains stored in products.

Aluminium collection rates vary by region and by product category. For instance,collection rates from building and transport are high (80 – 90%), while collectionrates for flexible packaging are low.
It is not clear where about 3.3 Mt of used aluminium ends up. Part of this scrap mayend up in land fills or other sites. If this scrap could be recovered, it would allowadditional energy savings. If the total remaining recycling potential amounts to 6.7 Mt, the energy saving potential is 0.9 – 1.2 EJ per year. Further analysis isrecommended.
The aluminium recovery rate in the smelting process is about 96%, except for foilswhere the recovery amounts to only 30%. Because of the energy intensity of primaryaluminium production, increased recycling of even small amounts can havesignificant energy benefits.
Steel
Steel is the most widely recycled material in the world. In 2005, about 450 Mt ofscrap was recycled by the steel industry, compared to an apparent final steelconsumption of 1 059 Mt (IISI, 2005). In addition, about 50 Mt of scrap is used toproduce cast iron.
A better understanding of the global steel materials balance is needed in order toassess the additional recycling potentials. There are no detailed statistics. Estimatesfor the United States indicate that 9 Mt of steel scrap are lost as part of MSW (US EPA, 2006). Most of this loss is due to steel being a part of products that are not
Chapter 10 • LIFE CYCLE IMPROVEMENT OPTIONS 265
10
Recycled
Totalproductsin use
538.5 Mt
Net addition21.6 Mt/yr
Oxidised inapplication0.8 Mt/yr
Under investigation 3.3
Loss 1.1
44.1 36.3
30.2
31.5
30.4
Not recycled 3.4
Primaryaluminium
Homescrap16.5
Processing scrap7.7
Post-consumer scrap 7.3
Semi-fabricated products
Fabricated &manufactured
products
Figure10.11�World Aluminium Mass Balance, 2004
(Mt/year)
Sources: International Aluminium Institute.
Key point: The availability of aluminium scrap is much lower thanthe consumption because of the increasing stock.

266 TRACKING INDUSTRIAL ENERGY EFFICIENCY AND CO2 EMISSIONS
easily recyclable, such as discarded mattresses (springs), furniture (variety of steelproducts from hinges to support arms) and other miscellaneous steel componentssuch as nails and small appliances (US EPA, 2006).
Almost 29 Mt of steel scrap is lost in Europe (Moll, et al., 2005). The total for the USand Europe implies a lower estimate of 38 Mt loss in 2005. This is in line with theestimates of the International Iron and Steel Institute that estimates a historicalrecovery rate for obsolete (post-consumer scrap) scrap of 85%, and 46 Mt per yearof loss worldwide (Hayashi, et al., 2007). Another recent source estimates a lowerrecovery rate for obsolete scrap in the range of 50 – 70% (Neelis and Patel, 2006).The gap between the two estimates may be due to different definitions andapproaches, such as the somewhat vague boundary between product use and wasterelease for steel. For example, considerable amounts of steel are used for buildingfoundations that are not recovered but will be mostly reused when the building isreplaced. Such steel could still be recovered at a later stage, so its classification assteel stock or loss is not evident. In the International Iron and Steel Institute termsthat are used for Figure 10.12, products in use, net addition and loss figures arebased on a definition of steel in use that includes all material that is potentiallyrecoverable at a later stage as the location of the steel is known.
Finishedsteel
production
EAF
Totalproductsin use
18 400 to20 000 Mt
Netaddition
andcast iron
production694 Mt/yr
Finishedsteel
products
Homescrap 70
Processingscrap 115
Loss 46
1129 944
Post-consumerobsoletescrap 261
738
391
Scrap supply 446
1059
365
715 Fe
2281
737 FeBF BOF
Sinter/Pellets
DRI production
Fe inBF slag 1
Fe in BOF slagand dust 61
Fe inEAF slag 2156
(51 Fe)
Figure10.12�World Steel Mass Balance, 2005
(Mt/yr)
Note: BF– blast furnace; BOF – basic oxygen furnace; DRI – direct reduced iron; EAF – electric arc furnace.
Source: Hayashi, et al., 2007.
Key point: Losses from the life cycle of steel are small; net additionsto the stock constitute a major materials sink

Total scrap recovery in steel production has increased from about 325 – 450 Mt from1970 to 2005 (Figure 10.13). There are three types of scrap:
� Home scrap – arising in steel plants;
� Processing scrap – arising during the processing of finished steel into finalproducts;
� Obsolete scrap – arising after product use (post-consumer).
This increase is the net result of a decreasing amount of home scrap and an increasingamount of obsolete scrap. It should be noted that the total crude steel production isroughly twice as high as the scrap arising. This results from an expanding economywhere important amounts of steel are stored in the product stock.
Chapter 10 • LIFE CYCLE IMPROVEMENT OPTIONS 267
10
Scra
p c
on
sum
ptio
n (
Mt/
yr)
0
50
100
150
200
250
300
350
400
450
500
1970 1975 1980 1985 1990 1995 2000 2005
Obsoletescrap
Processingscrap
Home scrap
Figure10.13�Global Steel Scrap Recovery, 1970 – 2005
Source: International Iron and Steel Institute.
Key point: Obsolete scrap has grown from a quarter to more than 40% of total scrap.
The decline in the amount of home scrap represents an important efficiency gainwith fewer losses in the conversion of crude steel into finished steel products. Part ofthis reduction can be attributed to the shift from ingot casting to continuous steelcasting and to the improvements in quality control that have reduced the need forre-melting of certain products.
The home scrap ratio has declined from 24 – 6.5%. This ratio measures the amountof in-house scrap as a share of total finished steel production. The remainingpotentials to reduce home scrap are concentrated in a few countries, e.g. Russia,Ukraine, South Africa (Neelis and Patel, 2006).
Figure 10.14 shows a calculated recovery rate for obsolete scrap, based on amaterials balance for crude steel production, finished steel products and scrapconsumption. The difference between crude steel and finished steel products gives
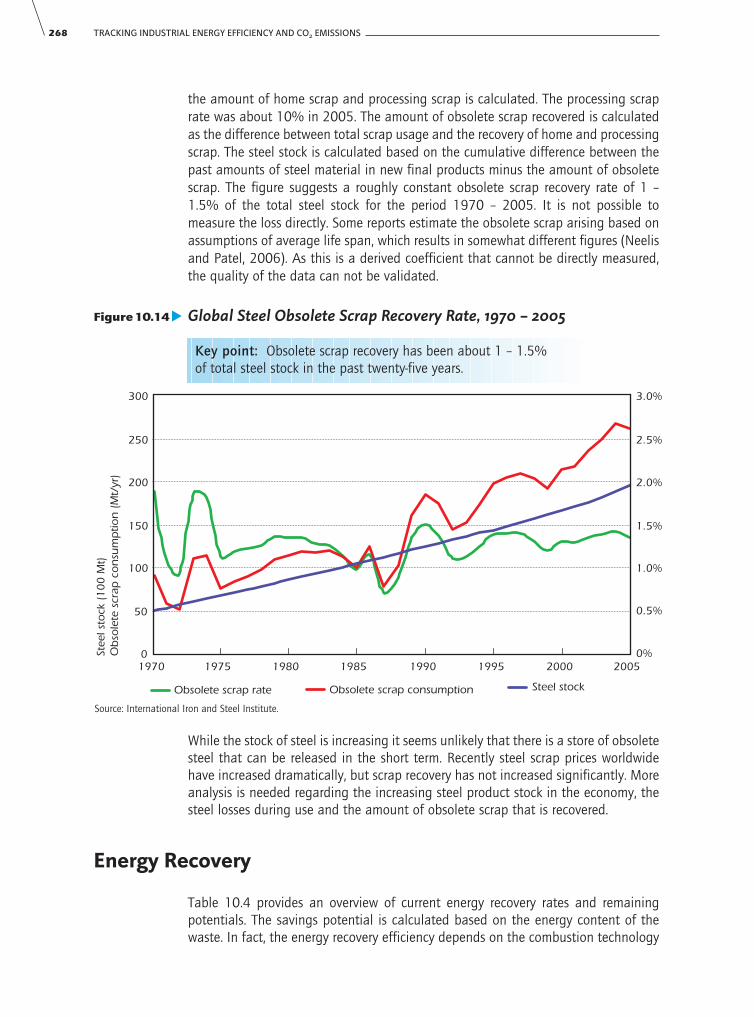
268 TRACKING INDUSTRIAL ENERGY EFFICIENCY AND CO2 EMISSIONS
the amount of home scrap and processing scrap is calculated. The processing scraprate was about 10% in 2005. The amount of obsolete scrap recovered is calculatedas the difference between total scrap usage and the recovery of home and processingscrap. The steel stock is calculated based on the cumulative difference between thepast amounts of steel material in new final products minus the amount of obsoletescrap. The figure suggests a roughly constant obsolete scrap recovery rate of 1 –1.5% of the total steel stock for the period 1970 – 2005. It is not possible tomeasure the loss directly. Some reports estimate the obsolete scrap arising based onassumptions of average life span, which results in somewhat different figures (Neelisand Patel, 2006). As this is a derived coefficient that cannot be directly measured,the quality of the data can not be validated.
0
50
100
150
200
250
300
1970 1975 1980 1985 1990 1995 2000 20050%
0.5%
1.0%
1.5%
2.0%
2.5%
3.0%
Stee
l sto
ck (
10
0 M
t)
Ob
sole
te s
crap
co
nsu
mp
tion
(M
t/yr
)
Obsolete scrap consumption Steel stockObsolete scrap rate
Figure10.14� Global Steel Obsolete Scrap Recovery Rate, 1970 – 2005
Source: International Iron and Steel Institute.
Key point: Obsolete scrap recovery has been about 1 – 1.5% of total steel stock in the past twenty-five years.
While the stock of steel is increasing it seems unlikely that there is a store of obsoletesteel that can be released in the short term. Recently steel scrap prices worldwidehave increased dramatically, but scrap recovery has not increased significantly. Moreanalysis is needed regarding the increasing steel product stock in the economy, thesteel losses during use and the amount of obsolete scrap that is recovered.
Energy Recovery
Table 10.4 provides an overview of current energy recovery rates and remainingpotentials. The savings potential is calculated based on the energy content of thewaste. In fact, the energy recovery efficiency depends on the combustion technology

and may be somewhat lower. Still, the savings potential is in the range of 2 – 3% oftotal manufacturing industry energy use, or 3 – 4.5 EJ per year in terms of energycontent of the waste materials.
Municipal solid waste (MSW) incinerators represent the bulk of global wasteincineration. But some waste is incinerated in other installations such as cement kilnsand power plants.
In the United States, 246 Mt of MSW were generated and 33 Mt were incinerated in2005 (US EPA, 2006). About 2.8 Mt of MSW were combusted in cement kilns, utilityboilers, pulp and paper mills, industrial boilers and dedicated scrap tire-to-energyfacilities, with tires contributing a majority of the total. The electricity generatingcapacity of MSW incinerators was 2.7 GW in 2004 (Themelis, 2006). In 2005, therewere 88 waste-to-energy facilities in the United States, down from 102 in 2000 (USEPA, 2006).
In Europe, 52.6 Mt of MSW were incinerated in 2003. Efficiency of European wasteincinerators is shown in Table 10.5. In Japan, virtually all MSW is incinerated, about45 Mt per year. The electricity generating capacity of MSW incinerators is 1.5 GWand the average electricity generation efficiency is 10.5%. About 7.1 TWh electricitywere generated in 2004, which equals about 0.7% of all power generation. No dataare available regarding heat generation efficiency. In China, total MSW incinerationcapacity amounted to 7 Mt in 2003, only 1.5% of all waste is incinerated(Solenthaler and Bunge, 2003).3
In recent years, methane emissions from land fills have gained increasing attention. Themethane emissions originate from biodegradable materials, mainly kitchen scrap andwaste paper. As methane is a potent greenhouse gas, incineration reduces emissionsmore significantly than energy data would suggest, if it replaces land fill disposal.
Chapter 10 • LIFE CYCLE IMPROVEMENT OPTIONS 269
10
3. Chinese MSW has a LHV of only 5 GJ/t, versus 10 – 12 GJ/t in OECD countries. This heating value is so low thatcoal must be co-combusted in special fluid-bed incinerators. However, the heating value is increasing in cities as thecoal ash share declines and more plastic waste is generated.
ApparentConsumption
Mt/yr
Post-consumerWaste
Mt/yr
Total WasteAvailable
Mt/yr
Incineration Rate
%
RemainingIncineration
PotentialMt/yr
Energy SavingPotential
EJ/yrPlastics and rubber 235 115 120 25 30 – 70 1 – 2.2Paper andpaperboard 354 254 274 8 25 – 50 0.4 – 0.8
Wood 600 284 344 25 100 1.5
Total 3 – 4.5
Source: IEA data.
Table 10.4 � Global Incineration Rates and Additional Potential, 2004

270 TRACKING INDUSTRIAL ENERGY EFFICIENCY AND CO2 EMISSIONS
The biomass fraction (kitchen waste, paper, paperboard and wood) of MSW accountsfor about half of the energy content, the other half is plastic and rubber. Accordingto IEA statistics, 409 PJ of non-renewable MSW and 441 PJ of renewable MSW wereincinerated with energy recovery in 2004, 97% of which in OECD countries. Theaverage gross electric efficiency was 20%, and the average heat efficiency was 17%.A bottom-up estimate based on waste volumes and composition results in slightlyhigher values, about 1 013 PJ (Table 10.6). Given an average energy content ofabout 10 GJ/t MSW, about 80 Mt of waste was incinerated with energy recovery.The total amount of MSW incinerated worldwide was 150 Mt in 2004, whichsuggests that about half of all waste is incinerated with energy recovery (Themelis,2003; IEA data).
The potential to use waste heat from MSW incineration depends on the proximity ofappropriate applications. In the Nordic countries, most heat is used for districtheating. Heat integration with industrial plants been successful in some cases. Thefact that waste incinerator siting is often contentious means that heat integrationpotentials are often limited.
Heat%
Electricity%
Total%
Sweden 97.7 1.7 99.4
Austria 65.1 3.4 68.6
Switzerland 51.4 13.7 65.1
Norway 58.3 1.7 60.0
Denmark 37.7 13.7 51.4
Average 27.4 10.3 37.7
France 27.4 1.7 29.1
Germany 20.6 6.9 27.4
Italy 13.7 10.3 24.0
Netherlands 0.0 17.1 17.1
Spain 0.0 17.1 17.1
United Kingdom 0.0 16.5 16.5
Portugal 0.0 16.1 16.1
Hungary 0.0 9.6 9.6
Source: Profu, 2004.
Table 10.5 � Efficiency of European Waste Incinerators

Petrochemical Products
In cement kiln incineration, plastic waste replaces coal on a thermal par basis. TheCO2 effect depends on the assumed baseline use of plastic waste. Compared withland fill disposal, where the carbon would be stored, the CO2 reduction effect ofincineration in cement kilns is the difference in CO2 content between coal andplastic, about 21 kg/GJ. The CO2 reduction effect is 0.7 t CO2/t plastic waste. For incineration without energy recovery, the CO2 saving effect is 94 kg/GJ, or about3.3 t CO2/t of plastic waste. These are two extremes.
Waste tire combustion in cement kilns is an established option. The use of plasticwaste is often more limited. The kiln technology and local opposition often poseconstraints for waste fuel use.
Some plastic waste is combusted in power plants. In 2004, about 380 kt of plasticswaste was used as alternative fuel for power generation in Europe, with theNetherlands (96 kt) and Germany (92 kt) being the largest users (Plastics Europe,2006). In the case of co-combustion in coal plants, the equivalent of about 14% ofthe energy content is needed for fuel preparation of the plastics (Table 10.7).
Chapter 10 • LIFE CYCLE IMPROVEMENT OPTIONS 271
10
FoodWastePJ/yr
Paper/Paperboard
PJ/yr
Wood
PJ/yr
Textiles
PJ/yr
Rubber/LeatherPJ/yr
Plastic
PJ/yr
Total
PJ/yr
Eastern Asia 153.4 48.0 30.6 19.2 19.8 93.2 364.2
South-Central Asia 0.0 0.0 0.0 0.0 0.0 0.0 0.0
South-East Asia 20.3 13.5 11.0 2.8 2.0 18.4 68.0
Africa 0.0 0.0 0.0 0.0 0.0 0.0 0.0
Europe 0.0 0.0 0.0 0.0 0.0 0.0 0.0
Eastern Europe 8.8 14.3 5.2 3.1 1.9 9.9 43.2
Northern Europe 4.7 13.5 4.7 0.9 11.9 7.5 43.2
Southern Europe 6.1 6.4 4.2 0.7 10.1 6.4 33.9
Western Europe 28.6 73.2 31.1 5.3 71.5 45.3 255.0
Caribbean 2.9 2.4 0.4 0.7 0.6 3.4 10.4
North America 38.1 58.6 16.6 9.9 7.3 52.2 182.7
Central America 0.0 0.0 0.0 0.0 0.0 0.0 0.0
South America 3.4 2.9 0.8 0.4 0.2 4.4 12.2
Total 266.3 232.8 104.7 43.1 125.2 240.7 1 012.8
Source: IPCC, 2006; IEA data.
Table 10.6 � MSW Incineration with Energy Recovery, 2004

272 TRACKING INDUSTRIAL ENERGY EFFICIENCY AND CO2 EMISSIONS
Based on waste amounts there is potential for an additional 80 Mt of plastic wasteincineration, however, 30 – 70 Mt seems realistic and is the basis for the estimate of1 – 2.2 EJ per year remaining potential. Moreover, the efficiency of the currentincineration processes can be improved by diverting high-calorific waste from MSWincinerators. Worldwide, the energy saving potential of improved energy recoveryfrom plastic waste is between 3 – 4 EJ per year.
%
Mechanical separation 0.7
Pellet production 9.1
Road transportation 0.8
Pulverisation/injection 3.3
Fuel Product 100.0
Source: Schoen, et al. (n.d.).
Table 10.7 � Energy Needs for Fuel Preparation for Plastics Co-combustion in Coal-Fired Power Plants
Box 10.1
Rubber Waste
About 9 Mt of natural rubber and 12 Mt of synthetic rubber were produced and consumed in2005 (Rubber Study, 2006). Given losses during use about 8 – 10 Mt of waste rubber arereleased every year, equal to 0.35 EJ.
The United States represents 30% of the global rubber market (5 Mt rubber consumption peryear, 4 Mt waste rubber). In 2003 in the United Sates, 40% of all waste tires were recycledand 45% of all scrap tires were incinerated. Of the 130 million tires that are incinerated, 53 million were incinerated in cement kilns, 26 million in pulp and paper mills, 24 million inpower plants and 27 million in other kilns (US EPA, 2006b).
Europe represents a quarter of the global rubber market. In the EU25, 3.2 Mt of waste tireswere released in 2005: 20% were exported or retreaded; 31% were used for materialsrecycling; 33% were incinerated with energy recovery, mainly in cement kilns; and 16% weredisposed of in land fills (ETRMA, 2006).
In Japan, 1.02 Mt of waste tires were released in 2005: 15% were recycled; 52% wereincinerated with energy recovery, mainly in cement kilns and pulp and paper mills; 21% wereexported and 12% were stocked or reclaimed (JATMA, 2006).
While recycling and energy recovery rates in other parts of the world may be less favourable,the available data suggest that the potential for additional energy savings and CO2 reductionsthrough waste tire treatment is limited.

Paper
About 190 Mt (wet weight) of paper waste is disposed of in land fills per year.Assuming 50% moisture content, this equals about 100 Mt air dry weight with a 25 – 50% recovery rate of about 25 – 50 Mt. The lower heating value of paper wasteranges from 12 – 16 GJ/t. This waste could replace coal on a thermal par basis, e.g. in power plants. Overall, the energy saving potential is approximately 0.4 – 0.8 EJ per year. However, if the paper waste is incinerated in MSW incinerators,the energy saving effect is lower. Improved separation techniques can provide morepaper waste for paper recycling and material use, this option therefore competeswith increased waste paper incineration for energy recovery.
Wood
About 220 Mt of used wood comes from construction and demolition waste and anestimated 80 Mt from MSW. Because of treatment with paint, pesticides and othercompounds a significant share of this wood can only be combusted in special wasteincinerators. The estimated energy savings potential is 1.5 EJ per year, althoughthere are large uncertainties in this estimate.
Chapter 10 • LIFE CYCLE IMPROVEMENT OPTIONS 273
10


Annex A • PROCESS INTEGRATION 275
ANNEX A: Process Integration
Introduction
Integration of processes in industry has been used since the late 1970s. These daysnew tools and methods identify more efficient measures and system solutions froman energy and environmental point of view. Using process integration concepts,energy savings on the order of 10 – 40% can be achieved. This means that systemsolutions are as important as new technologies for reducing energy use in industry.Unlike new technology solutions, however, process integration measures vary fromcase to case in terms of technical solutions and energy savings. Therefore, it is moredifficult to identify where and to what extent process integration tools have beenused and how much they have contributed to energy savings.
This annex presents principles and benefits of process integration, energy savings ingeneral terms, and experiences with process integration in some countries and ofindustries. It partly based on A Briefing Package on Process Integration prepared aspart of Annex 1 of the IEA Process Integration Implementing Agreement.1 A veryrough first estimate is that process integration can save 2 – 5 EJ of primary energyper year, or 5 – 10% of all fuel use in the process industries.
Definition of Process Integration
An expert meeting in Berlin (1993) defined process integration to be:
“Systematic and general methods for designing integrated production systems,ranging from individual processes to total sites, with special emphasis on theefficient use of energy and reducing environmental effects.” Its scope is much widerthan just heat recovery.
This definition points to design methods, but the term “process integration” is alsoused to describe physical arrangements such as the interconnection of equipmentand process streams in an industrial plant. While some are concerned that processintegration may cause problems for plant operation, it is a fact that many industrialprocesses today are highly integrated in order to reduce operating cost (energy andraw materials).
Process Integration Benefits and Applications
The initial focus of process integration from the early 1980s was to reduce energyconsumption. Methods were further developed during the 1990s to address
1. IEA Process Integration Implementing Agreement, (2002), A Briefing Package on Process Integration,http://www.tev.ntnu.no/iea/pi/

276 TRACKING INDUSTRIAL ENERGY EFFICIENCY AND CO2 EMISSIONS
objectives such as total annualised cost, plant operability and flexibility. Morerecently, measures such as environment and sustainability have become integralparts of process integration.
The benefits from process integration arise from using a systems approach. Most ofthe plants in the process industries are highly complex interconnections of advancedequipment and objectives related to economy, operability and environment acrossthe structure of the overall plant.
Since process integration primarily is a systems oriented methodology, the largestbenefits and savings are expected for complex processes or plants, e.g. oil refineries,chemical and petrochemical factories, pulp and paper mills. However, evenapparently small and simple processes in the food and drink industry are sufficientlycomplex to make process integration methods interesting and valuable. Otherindustries, where process integration has been successfully applied, includepharmaceutical and metal industries.
Process integration is primarily used for design (original and retrofits), but certainaspects of planning and operation can also be addressed. The methods are generalin nature and (at least some) apply to continuous, semi-batch and batch processes.The relationship between design, planning (long term) and operation (short term) isparticularly strong in batch processes.
Process integration can be used for:
� Heat integration – identify the economically optimal level of heat recovery andto design a corresponding heat exchanger network with minimum equipmentcost.
� Heat and power – identify economically optimal loads and levels for steamconsumption and/or production, and to identify opportunities for combinedheat and power systems. Thermodynamically “correct” and economically optimaluse of heat pumps can also be easily identified by using the systematic methodsof process integration.
� Plant productivity – remove bottlenecks for production throughput, e.g. wherethe energy system is limiting the mass flow through the process. This is certainlythe case in many oil refineries where furnaces operate at maximum capacity.
� Environment and sustainable development – minimise the investmentsrequired to comply with regulations and societal expectations, e.g. reduceemissions and water use.
Process Integration Methodologies
The three major features of process integration methods are the use of:
� Heuristics (rules of thumb);
� Thermodynamics;
� Optimisation techniques.
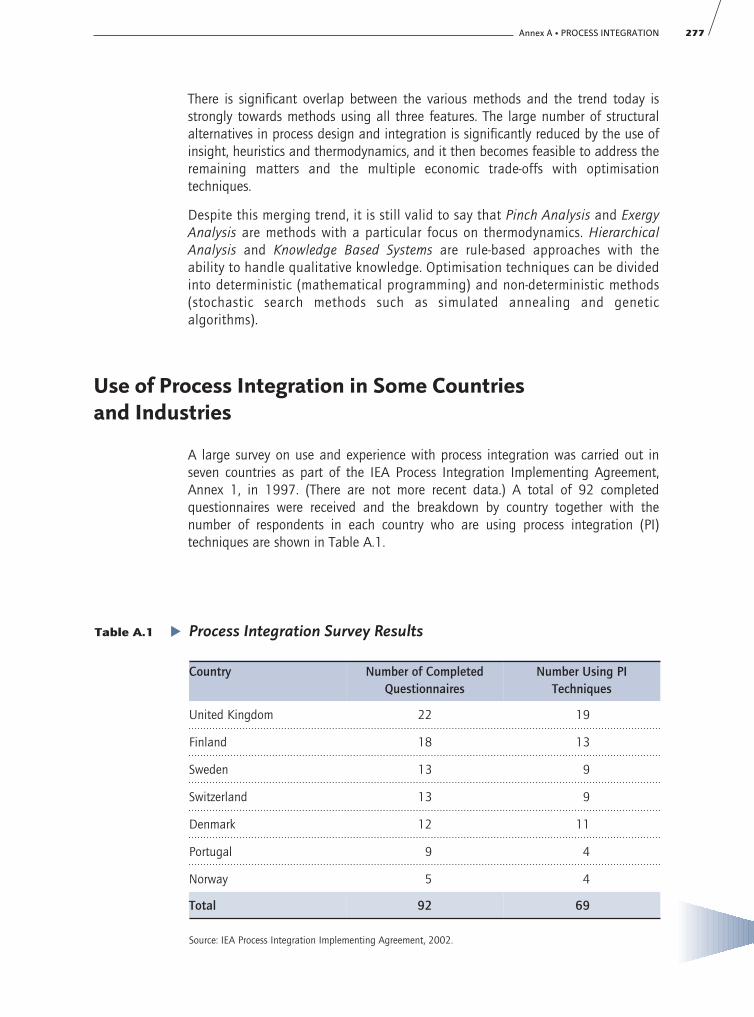
There is significant overlap between the various methods and the trend today isstrongly towards methods using all three features. The large number of structuralalternatives in process design and integration is significantly reduced by the use ofinsight, heuristics and thermodynamics, and it then becomes feasible to address theremaining matters and the multiple economic trade-offs with optimisationtechniques.
Despite this merging trend, it is still valid to say that Pinch Analysis and ExergyAnalysis are methods with a particular focus on thermodynamics. HierarchicalAnalysis and Knowledge Based Systems are rule-based approaches with theability to handle qualitative knowledge. Optimisation techniques can be dividedinto deterministic (mathematical programming) and non-deterministic methods(stochastic search methods such as simulated annealing and geneticalgorithms).
Use of Process Integration in Some Countries and Industries
A large survey on use and experience with process integration was carried out inseven countries as part of the IEA Process Integration Implementing Agreement,Annex 1, in 1997. (There are not more recent data.) A total of 92 completedquestionnaires were received and the breakdown by country together with thenumber of respondents in each country who are using process integration (PI)techniques are shown in Table A.1.
Annex A • PROCESS INTEGRATION 277
Table A.1 � Process Integration Survey Results
Country Number of CompletedQuestionnaires
Number Using PITechniques
United Kingdom 22 19
Finland 18 13
Sweden 13 9
Switzerland 13 9
Denmark 12 11
Portugal 9 4
Norway 5 4
Total 92 69
Source: IEA Process Integration Implementing Agreement, 2002.

Figure A.2 illustrates the extent to which process integration is being used indifferent industries and the level of reported success.
Pinch technology has been used in all of the cases illustrated in Figure A.2. Thecolumn indicating the number of companies reporting savings does not includestudies that are at the feasibility stage. Hence, this number has the potential toincrease significantly as companies increase their level of capital investment.
278 TRACKING INDUSTRIAL ENERGY EFFICIENCY AND CO2 EMISSIONS
Most of the responses to the questionnaire contained positive statements aboutprocess integration methods, including:
� Software is easy to use with straightforward data entry.
� Results are easy to understand and to explain to customers.
� Complex problems are simplified resulting in a better understanding of theprocess(es).
� Methods are structured and systematic.
Of those companies that have implemented the findings from process integrationstudies, most indicate that the savings have been close to predicted (Figure A.1). Thefigure shows that, in a number of cases, process integration schemes have notprogressed beyond the feasibility stage. This is due to a prevailing climate of lowcapital investment in many companies. This suggests that important potentialsavings are available.
0
4
8
12
16
20
24
28
32
Norway
Sweden
Switzerland
Portugal
Finland
Denmark
UKClose to
predictedNo schemesimplemented
Worse thanpredicted
Better thanpredicted
No savings orbenefits
Nu
mb
er o
f re
spo
nse
s
Figure A.1 � Results/Savings from Process Integration Schemes
Source: IEA Process Integration Implementing Agreement, 2002.

Annex A • PROCESS INTEGRATION 279
Experiences from Industry
Petrochemical Industry
Process integration technology has its origins in the petrochemical industry. It hasbeen applied successfully at many oil refineries and offshore installations. In general,the aim in the petrochemical sector is to reduce energy requirements. Some of theschemes implemented to achieve energy savings include:
� Heat recovery from product streams, particularly from distillation columns.
� Boiler water and feed preheating using waste heat.
� Installation of additional levels of refrigeration.
Typical savings are a 20% reduction in energy consumption with some reports ofsavings as high as 50%. Payback periods are generally less than two years and canbe as low as several months.
Chemical Industry
Process integration in the chemical industry has been used successfully for manyyears. Typical savings on the order of 20 – 50% have been reported.
An example from the United Kingdom is the use of water pinch analysis at aspeciality chemicals site. The objective of the survey was to reduce water use and
0
2
4
6
8
10
12
14
16
18
20
22
Number of replies Number using process integration Number reporting savings
Nu
mb
er o
f re
spo
nse
s
Consu
ltanc
y
Pape
r & b
oard
Contra
cting
Ener
gy su
pply
Oil/pe
troleu
m
Food
& b
ever
age
Rese
arch
Met
al m
anuf
actu
re
Min
eral
prod
ucts
Phar
mac
eutic
als
Indu
strial
gas
es
Softw
are
Efflu
ent d
ispos
al
Texti
les
Inor
gani
c che
mica
ls
Organ
ic ch
emica
ls
Figure A.2 � Savings from Process Integration Schemes by Industry
Source: IEA Process Integration Implementing Agreement, 2002.

280 TRACKING INDUSTRIAL ENERGY EFFICIENCY AND CO2 EMISSIONS
minimise the volume of wastewater requiring treatment. A number of opportunitieswere identified:
� Re-using water within processes,
� Water re-use in other processes, e.g. supplying cooling towers and water forwashing down purposes from used process water,
� Segregating and treating effluent streams separately.
Implementation of these schemes has led to a reduction in fresh water andwastewater volumes of 30% with a 76% reduction in the chemical oxygen demandof the effluent. In addition, the introduction of segregated effluent treatment meansthat only 25% of the site’s effluent requires secondary treatment. This has resultedin substantial cost savings compared with the centralised biological effluenttreatment plant being considered before the study was carried out.
Fertilizer Industry
During ammonia production significant amounts of waste heat are generated thatcan be used for other processes. As well, ammonia is further processed into varioustypes of nitrogen fertilizers, during which more heat is generated than can be used.While off-site use may be possible in some cases, important on-site opportunitiesremain. For example, a recent case study for nitric acid plants suggests that betterprocess integration can result in 30% electricity savings.2
Iron and Steel Industry
In the iron and steel industry, process integration tools have been used since 1991in Sweden, especially at SSAB. These integrated steel plants show a complex networkof energy carriers, which also include energy exchange with heat and power plantsand district heating networks in the surrounding community. Due to the complexityat SSAB Tunnplåt, mathematical programming was identified as a powerfulmethodology.
A tailor-made tool for this industry was developed and has been used frequently bySSAB. When the coke oven plant had to work on 60% production rate due torevamping, the tool was used to identify a system solution so that imbalances in thesteel plant and the CHP plant were avoided. Another example is that the tool wasused for decision making in a situation when revamping blast furnace plants orfinding another solution. These uses of the process integration tool are difficult toquantify but have substantially contributed to energy savings and rational resourceuse.
In 2006 a centre of excellence for process integration in steel production (PRISMA)was founded in Sweden.
2. Nielsen, J.S. (2007), Energy Efficiency Measures in Fertilizer Sites. Paper presented at the IFA-IEA workshop onEnergy Efficiency and CO2 Reduction Prospects in Ammonia Production, Ho-Chi Minh City, 13 March.http://www.fertilizer.org/ifa/technical_2007_hcmc/2007_tech_hcmc_papers.asp

Pulp and Paper Industry
Studies in the United States, Canada, Finland and Sweden have identified largepotentials for energy savings in the pulp and paper industry. The results from processintegration studies (mainly pinch analyses) have been implemented in more than100 mills worldwide (IEA, Process Integration Implementing Agreement, Annex 3).In chemical pulp mills with relatively high energy consumption, more efficient heatexchanger networks lead to energy savings on the order of 10 – 40 %. In energyefficient mills, novel system solutions, e.g. integration of the evaporation plant andthe secondary heat system, can lead to energy savings of 15 – 30%. In addition toenergy saving in existing mills, this tool has also proven to be powerful for analysisin connection with development of new processes or mill concepts.
Food Industry
The process integration schemes that have been proposed and partly implementedin a brewing industry case study include:
� Optimisation of the wort vapour condenser.
� Installation of additional heat transfer area in the wort cooler and adjustmentof its operating conditions.
� Improved use of hot water storage.
� Heat recovery on the keg cleaning operation.
Fossil fuel savings of 25% have been achieved with a payback period of three yearsaveraged over the various retrofit projects.
In a large Swedish study in the meat industry, process integration tools have beenused to identify energy saving opportunities.3 For example, in a case study a shaftwork targeting method identified opportunities for reducing electricity demand by10%. Process integrated heat pumps or CHP plants in the meat industry can beprofitable and environmentally good solutions.
Textile Industry
A process integration study for a textile company in Portugal has identified thefollowing energy saving opportunities:
� Use warm air from the compressors and cogeneration system instead ofpreheating fresh air.
� Increase the hot water production from the cogeneration unit and using itdirectly in the leaching and washing processes.
� Use hot water from the cogeneration unit for boiler make-up water.
Annex A • PROCESS INTEGRATION 281
3. Fritzon, A., Energy Efficiency in the Meat Processing Industry, Chalmers University, Sweden.


Annex B • INDUSTRY BENCHMARK INITIATIVES 283
ANNEX B: Industry Benchmark Initiatives
Iron and Steel
For iron and steel, the Asia Pacific Partnership (APP) proposes to develop separateindicators for steel production from basic oxygen furnaces and electric arc furnaces.There is no further breakdown of energy use by individual processes. The approachincludes energy consumption and CO2 emission from energy conversion and materialpreparation in upstream processes off-site from the steel plant, but does not includemining and transportation. Credits for energy sold to third parties are included in thecalculation.
Cement
The APP is developing energy efficiency and CO2 emission indicators for the cementindustry. These indicators for cement are aligned with the Cement SustainabilityInitiative (CSI) Protocol and will be used to help set benchmarks and estimate thepotential for CO2 emissions reductions. Possible energy and CO2 emissions indicatorsbeing considered include:
� Heat intensity of clinker (gross & net [MJ/t clinker]).
� Power intensity of clinker (production pre clinker silo inlet [kWh/t clinker]).
� Total energy intensity of clinker (gross & net* [MJ/t clinker]).
� Power intensity of cement (processes after clinker silo outlet [kWh/t cement]).
� CO2 intensity of cement (gross & net* [kg CO2 /t cement product]).
Cement Sustainability Initiative
Under the umbrella of the Cement Sustainability Initiative (CSI) of the WorldBusiness Council for Sustainable Development (WBCSD), a number of major cementcompanies have agreed on a methodology for calculating and reporting CO2emissions. The latest edition of the Cement CO2 Protocol was published in June 2005and is aligned with the March 2004 edition of the overarching greenhouse gasprotocol developed under a joint initiative of the WBCSD and the World ResourcesInstitute.
The Protocol provides a harmonised methodology for calculating CO2 emissions, witha view to reporting these emissions for various purposes. It addresses all direct andthe main indirect sources of CO2 emissions related to the cement manufacturingprocess in absolute as well as specific or unit-based terms. The basic calculationmethods used in the Protocol are compatible with the latest guidelines for nationalgreenhouse gas inventories issued by the Intergovernmental Panel on ClimateChange (IPCC), and with the revised WRI / WBCSD Protocol. Default emissionfactors suggested in these documents are used, except where more recent, industryspecific data has become available.

284 TRACKING INDUSTRIAL ENERGY EFFICIENCY AND CO2 EMISSIONS
However, one area where the recommendations of the Cement Protocol differ fromthe IPCC guidelines is in allowing credits for indirect emission reductions related tothe use of wastes as alternative fuels and for waste heat exports. The premise for thiscrediting is that the combination of direct emissions impacts, indirect emissionreductions and resource efficiency makes the substitution of alternative fuels forconventional fossil fuels an effective way to reduce global greenhouse gas emissionsand the cement industry should be able to account for these wider benefits.
Petrochemicals and Chemicals
Solomon Associates Inc. (SAI) set up the first widely used internationalbenchmarking system for ethylene crackers in the 1990s. Companies that participatein the benchmark are requested to fill a detailed survey on the performance of theirunits, including energy consumption on a semi-annual basis. More than half of allworld crackers participate in the survey, representing more than two-thirds of thetotal production capacity. SAI acts as a clearing house and provides to individualparticipants a comparison between their units and a distribution of the other plantsparticipating in the survey, accounting for feedstock use and operating conditions.More than 150 plants worldwide are tracked.
http://www.solomononline.com/data/xyli/olefins.pdf
Process Design Center
Process Design Center (PDC) has set up 50 energy benchmarks around world forpetrochemical products. The petrochemical industry is very diverse and as a resultneeds a wide range of benchmarks. Short questionnaires are used and onlyanonymous overall energy efficiency performances are disclosed. Benchmarking forcertain petrochemical products is difficult as only a couple of producers exist andeach have their own process design. PDC is providing benchmarking services to theDutch and Flemish energy efficiency initiatives.
http://www.process-design-center.com/4.2-enbenchprogr.htm
Philip Townsend Associates
Philip Townsend Associates (PTAI) performs various consulting and benchmarking inservices for the plastics industry. PTAI is working with the Dutch and Flemishgovernments on their energy efficiency initiatives. PTAI is well known in the industryfor its Performance and Cost Metrics Programs.
http://www.ptai.com/external_benchmarking/industry/index.asp
International Fertilizer Industry Association – AmmoniaBenchmarking
The International Fertilizer Industry Association has a benchmarking activity forammonia plants. The first round of benchmarking was in 2002 – 2003. Sixty-sixammonia plants participated in the effort. The next energy benchmarking survey is

planned for 2007, based on 2005 – 2006 operating data. The analysis is done byPlant Survey Inc., a US company.
http://www.fertilizer.org/ifa/technical_2007_hcmc/PDF/2007_tech_hcmc_al_ansari.pdf
Pulp, Paper and Printing
Paprican Benchmark
In 2002, Paprican completed an analysis of energy use in the pulp and paperindustry in Canada. This project surveyed 50 Canadian mills of which 45 are inoperation today. The best performing mill was two times better than the worst mill(of the 45 still in operation). The other five mills which have since closed were 3 –4 times less efficient. Higher energy prices in recent years made these millsunprofitable. Where possible, mills with multiple production lines were included inthe analysis.
The best mills are not always the newest mills. There are new mills with heat recoverysystems that were badly managed that performed worse then older well managedmills. Some of the older mills were better managed and more careful with energy usethan newer mills which, although were designed with more energy efficienttechnology, suffered from poor energy management. Therefore, technology dataalone do not suffice to assess the energy efficiency of pulp and paper plants.
Industrial Energy-Related Technologies and Systems Benchmark
The Industrial Energy-Related Technologies and Systems (IETS) ImplementingAgreement is working on an energy benchmarking project in the pulp and paperindustry. The goal is to provide a consistent reporting methodology acrossjurisdictions. The project defines: what to measure, data requirements, process areasand product grades. It is recommended that data be collected on energy and fibreproduced and consumed. Energy is then allocated to different areas and products.The IETS project aims to provide a consistent measurement and reporting method forexisting mills, not set a standard for mills to meet. Canada, Finland, Norway, Swedenand the United States are involved in this project, as well as the Confederation ofEuropean Paper Industries.
Poyry Consulting
Poyry has a database for benchmarking individual plants and paper machines. Inorder to compare energy efficiency across regions and countries, there is a need toinclude differences in the production profiles of countries. This task is furthercomplicated by the fact that there is no one reliable source of energy data for theindustry. Poyry Consulting uses technical age as a tool to evaluate (not measure)energy efficiency across countries and regions. As older technology will no longerkeep up with best available technology, this tool provides a good indicator forcomparing energy efficiency of plants and countries. It showed that the averagetechnical age of printing and writing paper plants is 18 years in North America;
Annex B • INDUSTRY BENCHMARK INITIATIVES 285

286 TRACKING INDUSTRIAL ENERGY EFFICIENCY AND CO2 EMISSIONS
15 years in Latin America and 12 – 13 years in Europe. The lower the technical age,the higher the expected energy efficiency of the region.
Aluminium
International Aluminium Association
The International Aluminium Institute benchmarks the aluminium smelters of itsmembers on an annual basis, covering about 80% of world primary aluminiumproduction. The electricity use of primary aluminium smelters and the energy use foralumina production are monitored separately. Results are publicly available on thelevel of six world regions.
http://www.world-aluminium.org/iai/stats/index.asp

Annex C • DEFINITIONS, ACRONYMS AND UNITS 287
ANNEX C: Definitions, Acronyms and Units
Chapter 1 – 3 � Asia Pacific Partnership
Asia Pacific Partnership comprising Australia, China, India, Japan, Korea, and theUnited States.
Best Available Technology
Best available technology is taken to mean the latest stage of development (state-of-the-art) of processes, facilities or of methods of operation which includeconsiderations regarding the practical suitability of a particular measure forenhancing energy efficiency.
Biomass
Biomass includes solid biomass such as wood, animal products, gas and liquidsderived from biomass, industrial waste and municipal waste.
Blast Furnace Gas
Blast furnace gas is produced in blast furnaces in the iron and steel industry. It isrecovered and used as a fuel partly within the plant and partly in other steel industryprocesses or in power stations equipped to burn it.
Clean Coal Technologies (CCT)
Technologies designed to enhance the efficiency and the environmentalacceptability of coal extraction, preparation, combustion and use.
Coal
A solid fuel with a high carbon content. In the IEA statistics, unless stated otherwise, coalincludes all coal types and coal products: both coal primary products, including hard coaland lignite (brown coal), and derived fuels, including patent fuel, coke-oven coke, gascoke, coke-oven gas and blast-furnace gas. Peat is also included in this category.
Coking Coal
In IEA statistics, coking coal refers to coal with a quality that allows the productionof a coke suitable to support a blast furnace charge. Its gross calorific value is greaterthan 23 865 kJ/kg (5 700 kcal/kg) on an ash-free but moist basis.
Coke-oven Coke
The solid product obtained from carbonisation of coal, principally coking coal, at hightemperature. In IEA statistics semi-coke, the solid product obtained from thecarbonisation of coal at low temperatures is also included along with coke and semi-coke.
Combined Heat and Power (CHP)
Combined heat and power, also called cogeneration, is a technology where electricityand steam or electricity and hot water are produced jointly. This increases theefficiency compared to separate electricity and heat generation.

288 TRACKING INDUSTRIAL ENERGY EFFICIENCY AND CO2 EMISSIONS
Energy Intensity
Energy intensity is a measure of total primary energy use per unit of gross domesticproduct or per unit of physical product.
Hard Coal
Coal of gross calorific value greater than 5 700 kcal/kg on an ash-free but moistbasis and with a mean random reflectance of vitrinite of at least 0.6. Hard coal isfurther disaggregated into coking coal and steam coal.
Heat
In the IEA energy statistics, heat refers to heat produced for sale only. Most heatincluded in this category comes from the combustion of fuels, although some smallamounts are produced from geothermal sources, electrically-powered heat pumpsand boilers.
Natural Gas
Comprises gases occurring in underground deposits whether liquefied or gaseous,consisting mainly of methane. In IEA statistics, it includes natural gas, bothassociated and non-associated as well as methane recovered from coal mines.
Naphtha
Naphtha is a feedstock destined either for the petrochemical industry, e.g. ethylenemanufacture or aromatics production, or for gasoline production by reforming orisomerisation within the refinery.
Nuclear
Nuclear refers to the primary heat equivalent of electricity produced by a nuclearplant with an assumed average thermal efficiency of 33%.
Oil
Oil includes crude oil, natural gas liquids, refinery feedstocks and additives, otherhydrocarbons, and petroleum products (refinery gas, ethane, liquefied petroleum gas,aviation gasoline, motor gasoline, jet fuel, kerosene, gas/diesel oil, heavy fuel oil,naphtha, white spirit, lubricants, paraffin waxes, petroleum coke and otherpetroleum products).
Other Asia Pacific
Afghanistan, Brunei, Cambodia, North Korea, Hong Kong, Fiji Islands, Indonesia,Kiribati, Lao, Macao, Malaysia, Mongolia, Myanmar, Philippines, PNG, Salomon,Samoa, Singapore, Taiwan, Thailand, Tonga, Vanuatu, Vietnam.
Other Petroleum Products
Other petroleum products include refinery gas, ethane, lubricants, bitumen,petroleum coke and waxes.

Other Renewables
Other renewables include geothermal, solar, wind, tide and wave energy forelectricity generation. The direct use of geothermal and solar heat is also included inthis category.
Other Transformation, Own Use and Losses
Other transformation, own use and losses covers the use of energy bytransformation industries and the energy losses in converting primary energy intoa form that can be used in the final consuming sectors. It includes energy use andloss by gas works, petroleum refineries, coal and gas transformation andliquefaction. It also includes energy used in coal mines, oil and gas extraction andelectricity and heat production. Transfers and statistical differences are alsoincluded in this category.
Power Generation
Power generation refers to fuel use in electricity plants, heat plants and combinedheat and power plants. Both public plants and small plants that produce electricityfor their own use (autoproducers) are included.
Renewables
Renewables refer to energy resources, where energy is derived from natural processesthat are replenished constantly. In the IEA statistics, they include geothermal, solar,wind, tide, wave, hydropower, biomass and liquid biofuels.
Purchasing Power Parity (PPP)
The rate of currency conversion that equalises the purchasing power of differentcurrencies, i.e. makes allowance for the differences in price levels and spendingpatterns between different countries.
Steam Coal
All other hard coal not classified as coking coal. Also included are recovered slurries,middlings and other low-grade coal products not further classified by type. Coal ofthis quality is also commonly known as thermal coal.
Synthetic Fuels
Synthetic fuel, or synfuel, is any liquid fuel obtained from coal or natural gas. Thebest known process is the Fischer-Tropsch synthesis. An intermediate step in theproduction of synthetic fuel is often syngas, a mixture of carbon monoxide andhydrogen produced from coal which is sometimes directly used as an industrial fuel.
Traditional Biomass
Traditional biomass refers mainly to non-commercial biomass use.
Total Final Consumption
Total final consumption (TFC) is the sum of consumption by the different end-usesectors. TFC is broken down into energy demand in the following sectors: industry,transport, other (includes agriculture, residential, commercial and public services)
Annex C • DEFINITIONS, ACRONYMS AND UNITS 289

290 TRACKING INDUSTRIAL ENERGY EFFICIENCY AND CO2 EMISSIONS
and non-energy use. Industry includes manufacturing, construction and miningindustries.
Total Primary Energy Equivalent
An energy measure that accounts for losses in the production of final energy carriers.
Total Primary Energy Supply
Total primary energy supply is equivalent to primary energy demand. This representsinland demand only and, except for world energy demand, excludes internationalmarine bunkers.
Chapter 4 � Aromatics
Type of petrochemicals characterised by a ring structure, that are produced inrefinery reformers and petrochemical plants. The most common are benzene, tolueneand xylenes.
Catalytic Reforming
Process where a chemical component is converted into another chemical component,using a catalyst.
Diaphragm Process
Process for chlorine and sodium hydroxide production where two compartments ofthe electrolysis cell are separated by a permeable diaphragm.
Distillation Columns
Process equipment (usually a tall cylinder) used for separation of liquid chemicalcomponents based on different boiling points.
Intermediates
Chemical components that are converted into other chemical components.
Membrane Process
Process for chlorine and sodium hydroxide production where two compartments ofthe electrolysis cell are separated by an ion-exchange membrane, allowing onlysodium ions and small water quantities to pass through it.
Mercury Process
Process for chlorine and sodium hydroxide production using a liquid mercurycathode.
Monomers
A monomer is a small hydrocarbon molecule with a double bond between carbonatoms that may become chemically bonded to other monomers to form a polymer.
Olefin
Class of unsaturated open-chain hydrocarbons that have the general chemicalformula CnH2n. The simplest olefins, ethylene, propylene and butylene are gases.

Polymerisation
Process of transforming a combination of monomers into a polymer using a chemicalreaction.
Pyrolysis Furnace Section
The high-temperature section of a steam cracker for ethylene production where themain chemical reaction takes place.
Pyrolysis Gasoline
A naphtha-range product with a high aromatic content, used either for gasolineblending or as a feedstock for a BTX extraction unit. Pyrolysis gasoline is producedin an ethylene plant that processes butane, naphtha or gasoil.
Reformate
Product from a petroleum-refinery reforming process (thermal or catalytic reforming).
Steam Cracking
A petrochemical process in which saturated hydrocarbons are broken down intosmaller hydrocarbons. It is the principal industrial method for producing the olefins(ethylene, propylene, butadiene).
Chapter 5 � Basic Oxygen Furnace
Process where liquid hot iron metal is converted into steel, using oxygen injection.
Blast Furnace
A blast furnace is a type of metallurgical furnace used for smelting. Fuel and ore arecontinuously supplied through the top of the furnace, while air (oxygen) is blown intothe bottom of the chamber, so that the chemical reactions take place throughout thefurnace as the material moves downward. The end products are usually molten metaland slag phases tapped from the bottom, and flue gases exiting from the top of thefurnace. This type of furnace is typically used for smelting iron ore to produce hot metal(pig iron), an intermediate material used in the production of commercial iron andsteel.
Coke Oven
Pyrolysis process for conversion of coal into coke.
Coke Oven Gas
Gaseous by-product of coke making.
Direct Reduced Iron
Product made through chemical reduction of iron ore pellets in their solid state.
Electric Arc Furnace
Furnace for smelting of iron scrap and other metals using electricity.
Annex C • DEFINITIONS, ACRONYMS AND UNITS 291

292 TRACKING INDUSTRIAL ENERGY EFFICIENCY AND CO2 EMISSIONS
Iron, Pig iron and Hot Metal
Iron, pig iron and hot metal refers to various mineral aggregates from which the steelmetal is obtained by the conversion of various iron ores by reduction either into pigiron (hot metal) or into a solid spongy form (sponge iron or direct reduced iron) orinto lumps by various direct reduction processes.
Quenching
Quenching is the rapid cooling of a solid to lock it into a metastable crystal structurerather than allow it to cool slowly and revert to a softer structure. It is mostcommonly used to harden steel.
Sintering
Sintering involves the heating of fine ore, causing it to agglomerate into largergranules.
Chapter 6 � Blast Furnace Slag
A by-product from the blast furnace iron production process.
Dry Kiln
A kiln that produces cement clinker using dry limestone feedstock.
Fly-Ash
A residue from coal fired power plants that can be used for cement making.
Intermittent Kilns
Kilns that operate in batch mode.
Lime Kilns
Kilns that convert limestone and dolomite into burned lime.
Oxy Fuel Furnaces
A furnace that uses oxygen or enriched air.
Portland Cement
The most common cement type that contains a high share of clinker.
Portland Fly-ash Cement
A cement type that contains fly-ash and cement clinker.
Roller Kiln
A specialty type of kiln, common in tableware and tile manufacture, is the Roller-hearth Kiln, in which ware placed on bats is carried through the kiln on rollers.
Shaft Kilns
Vertical kilns for cement making.

Tunnel Kilns
A continuously operated brick kiln in the shape of a tunnel.
Wet Kiln
A kiln that produces cement clinker using wet limestone feedstock.
Chapter 7 � Black Liquor
This is a recycled by-product formed during the chemical pulping of wood in the pulpand paper industry. In this process, lignin in the wood is separated from cellulose,with the latter forming the paper fibres. Black liquor is the combination of the ligninresidue with water and the chemicals used for the extraction of the lignin and areburned in a recovery boiler. The boiler produces steam and electricity and recoversthe inorganic chemicals for recycling throughout the process.
Chemical Pulp
This is a thermo-chemical process in which chips are combined with strong solventsand heated under pressure to separate fibres from lignin. Spent liquor (black liquor)can be concentrated and burned for process heat.
Mechanical Pulp
Grinding and sharing of wood chips. Primarily used for low-grade papers.Mechanical pulping has a high yield but results in a pulp that contains substantialimpurities that limit its use.
Chapter 8 � Bayer Process
Process for production of alumina from bauxite ore.
Electrolysis
Process for chemical conversion that uses electricity for a chemical reaction.
PFC
Perfluorocarbons, a group of potent greenhouse gases.
Chapter 9 � Exergy Analysis
Method to increase the energy efficiency of complex systems, based onthermodynamic principles.
Motor Systems
A motor system is a machine, e.g. pump, fan, compressor, that is driven by a rotatingelectrical machine (motor).
Pinch Analysis
A methodology for minimising energy consumption of chemical processes byoptimising heat exchange between various flows that need heating and cooling.
Annex C • DEFINITIONS, ACRONYMS AND UNITS 293

294 TRACKING INDUSTRIAL ENERGY EFFICIENCY AND CO2 EMISSIONS
Steam Systems
A combination of equipment that provides heat using steam.
Chapter 10 � Apparent Consumption
Apparent consumption is production plus imports minus exports.
Back-to-polymer Recycling
Process where used plastics are used for the production of plastics.
Back-to-monomer Recycling
Process where used plastics are used for the production of olefins and othermonomers.
Back-to-feedstock Recycling
Process where waste plastics are used for the production of oil-type products.
Regional Definitions
Africa
Comprises: Algeria, Angola, Benin, Botswana, Burkina Faso, Burundi, Cameroon,Cape Verde, Central African Republic, Chad, Congo, the Democratic Republic ofCongo, Cote d’Ivoire, Djibouti, Egypt, Equatorial Guinea, Eritrea, Ethiopia, Gabon,Gambia, Ghana, Guinea, Guinea-Bissau, Kenya, Lesotho, Liberia, Libya, Madagascar,Malawi, Mali, Mauritania, Mauritius, Morocco, Mozambique, Niger, Nigeria, Rwanda,Sao Tome and Principe, Senegal, Seychelles, Sierra Leone, Somalia, South Africa,Sudan, Swaziland, the United Republic of Tanzania, Togo, Tunisia, Uganda, Zambiaand Zimbabwe.
Central and South America
Comprises: Antigua and Barbuda, Argentina, Bahamas, Barbados, Belize, Bermuda,Bolivia, Brazil, Chile, Colombia, Costa Rica, Cuba, Dominica, the Dominican Republic,Ecuador, El Salvador, French Guiana, Grenada, Guadeloupe, Guatemala, Guyana,Haiti, Honduras, Jamaica, Martinique, Netherlands Antilles, Nicaragua, Panama,Paraguay, Peru, St. Kitts-Nevis-Anguilla, Saint Lucia, St. Vincent-Grenadines andSuriname, Trinidad and Tobago, Uruguay and Venezuela.
China
Refers to the People’s Republic of China.
CIS
Commonwealth of Independent States which includes: Armenia, Azerbaijan, Belarus,Kazakhstan, Kyrgyzstan, Moldova, Russia, Ukraine, Uzbekistan and Tajikistan.

Developing Countries
Comprises: China, India and other developing Asia, Central and South America,Africa and the Middle East.
EU15
Refers to the fifteen member countries of the European Union prior to the accessionof ten candidate countries on 1 May 2004. The EU15 includes: Austria, Belgium,Denmark, Finland, France, Germany, Greece, Ireland, Italy, Luxembourg, Netherlands,Portugal, Spain, Sweden and the United Kingdom.
EU25
Comprises: Austria, Belgium, Cyprus, Czech Republic, Denmark, Estonia, Finland,France, Germany, Greece, Hungary, Ireland, Italy, Latvia, Lithuania, Luxembourg,Malta, Netherlands, Poland, Portugal, Spain, Slovakia, Slovenia, Sweden and theUnited Kingdom.
Europe-33
Albania, Austria, Belgium, Bosnia, Croatia, Cyprus, Czech Republic, Denmark,Finland, France, Germany, Greece, Hungary, Iceland, Ireland, Italy, Luxembourg,Macedonia, Malta, Netherlands, Norway, Poland, Portugal, Romania, Serbia, SlovakRepublic, Spain, Sweden, Switzerland, Turkey and United Kingdom.
Former Soviet Union (FSU)
Armenia, Azerbaijan, Belarus, Estonia, Georgia, Kazakhstan, Kyrgyzstan, Latvia,Lithuania, Moldova, Russia, Ukraine, Uzbekistan, Tajikistan and Turkmenistan.
G8
Canada, France, Germany, Italy, Japan, Russia, United Kingdom and United States.
Annex I Parties to the Kyoto Protocol
Australia, Austria, Belarus, Belgium, Bulgaria, Canada Croatia, the Czech Republic,Denmark, Estonia, the European Community, Finland, France, Germany, Greece,Hungary, Iceland, Ireland, Italy, Japan, Latvia, Liechtenstein, Lithuania, Luxembourg,Monaco, Netherlands, New Zealand, Norway, Poland, Portugal, Romania, Russia, theSlovak Republic, Slovenia, Spain, Sweden, Switzerland, Turkey, Ukraine, UnitedKingdom and United States.
Middle East
Bahrain, Iran, Iraq, Israel, Jordan, Kuwait, Lebanon, Oman, Qatar, Saudi Arabia, Syria,United Arab Emirates and Yemen.
OECD Europe
Austria, Belgium, the Czech Republic, Denmark, Finland, France, Germany, Greece,Hungary, Iceland, Ireland, Italy, Luxembourg, Netherlands, Norway, Poland, Portugal,Slovakia, Spain, Sweden, Switzerland, Turkey and the United Kingdom.
Annex C • DEFINITIONS, ACRONYMS AND UNITS 295

296 TRACKING INDUSTRIAL ENERGY EFFICIENCY AND CO2 EMISSIONS
Organization of Petroleum Exporting Countries (OPEC)
Algeria, Indonesia, Iran, Iraq, Kuwait, Libya, Nigeria, Qatar, Saudi Arabia, UnitedArab Emirates and Venezuela.
Other Developing Asia
Afghanistan, Bangladesh, Bhutan, Brunei, Chinese Taipei, Fiji, French Polynesia,Indonesia, Kiribati, Democratic People’s Republic of Korea, Malaysia, Maldives,Mongolia, Myanmar, Nepal, New Caledonia, Pakistan, Papua New Guinea, thePhilippines, Samoa, Singapore, Solomon Islands, Sri Lanka, Thailand, Vietnam andVanuatu.
Western Europe
Austria, Belgium, Czech Republic, Denmark, Finland, France, Germany, Greece,Hungary, Iceland, Ireland, Italy, Luxembourg, Netherlands, Norway, Portugal, Spain,Sweden, Switzerland, Turkey and United Kingdom.
Acronyms
ADS Adjustable speed drive
Al Aluminium
Al2O3 Alumina
APME Association of Plastic Manufacturers in Europe
APP Asia Pacific Partnership
ASU Air separation units
BAT Best Available Technology
BF-BOF Blast furnace-blast oxygen furnace
BFG Blast furnace gas
BOF Basic oxygen furnace
BP British Petroleum
BREF Best Available Techniques reference document
BTF Back-to-feedstock
BTM Back-to-monomer
BTX Benzene, toulene, xylene
CAC Compressed Air Challenge
CaCO3 Calcium carbonate (limestone)
CaO Calcium oxide

CDM Clean Development Mechanism
CDQ Coke dry quenching
CEN European Committee for Standardisation
CEPI Confederation of European Paper Industries
CH4N2O Urea
CHP Combined heat and power
CI Compression ignition
CIEEDAC Canadian Industrial Energy end-Use Data and Analysis Centre
CO Carbon monoxide
CO2 Carbon dioxide
COG Coke oven gas
CRI Coke reactivity index
CSI Cement Sustainability Initiative
CSR Coke strength after reaction
CTCC Combustion turbine combined cycle
CTL Coal-to-liquids
DRI Direct reduced iron
DTI Department of Trade and Industry (UK)
EAF Electric arc furnace
EEA Environment and Energy Agency
EEI Energy efficiency index
EIA Energy Information Agency (US)
EMFA European Fertilizer Manufacturing Association
EPIC Environment and Plastics Industry Council Canada
EPRO European Association of Plastics Recycling and RecoveryOrganisations
ERPC European Recovered Paper Council
ESCO Energy service companies
ETRMA European Tyre and Rubber Manufacturers
EuLA European Lime Association
F&B Food and beverage sub-sector
Annex C • DEFINITIONS, ACRONYMS AND UNITS 297

298 TRACKING INDUSTRIAL ENERGY EFFICIENCY AND CO2 EMISSIONS
FAO Food and Agriculture Organization
FCC Fluidized catalytic crackers
FCC Fluid catalytic cracker
Fe Iron metal
Fe2O3 Hematite
FeO Iron oxide
G8 Group of 8
GBFS Granulated blast furnace slag
GE General Electric
GEF Global Environment Facility
GGBFS Ground granulated blast furnace slag
GHG Greenhouse gases
GHR Gas heated reformers
GTL Gas-to-liquids
H2 Hydrogen
HBI Hot briquetted iron
HDA Hydrodealkylation
HDPE High density polyethylene
HVC High value chemicals
IETS Industrial Energy-related Technologies and Systems(IEA Implementing Agreement)
IFA International Fertilizer Industry Association
IGCC Integrated Gasification Combined Cycle
IISI International Iron and Steel Institute
IPCC Intergovenmental Panel on Climate Change
ISO International Organization for Standardization
ISP Inline strip production
JATMA Tyre Industry of Japan
JCA Japanese Cement Association
JISF Japan Iron and Steel Federation
LCA Life cycle analysis

LDPE Low density polyethylene
LDV Light duty vehicles
LHV Low heat value
LLDPE Linear low density polyethylene
LT heat Low temperature heat
MECS Manufacturing Energy Consumption Survey
MEPS Minimum efficiency performance standards
METI Ministry of Economy, Trade and Industry (Japan)
MFA Materials flow analysis
MHI Mitsubishi Heavy Industries
MSW Municipal solid waste
MTBE Methyl tertiary butyl ether
NAFTA North American Free Trade Agreement
NaOH Sodium hydroxide
NEAT Non-energy emission accounting tables
NGCC Natural gas combined cycle
NH3 Ammonia
NOx Nitrogen oxides
NRCAN Natural Resources Canada
NSC Nippon Steel Corporation
OCT Olefin conversion technology
OGJ Oil and Gas Journal
PCI Pulverised-coal injection
PEI Product efficiency indicator
PET Polyethylene terephthalate
PFC PerFluoroCarbons
PI Process integration
PO Polyolefins
PP Polypropylene
PSA Pressure swing absorption
PVC Polyvinylchloride
Annex C • DEFINITIONS, ACRONYMS AND UNITS 299

300 TRACKING INDUSTRIAL ENERGY EFFICIENCY AND CO2 EMISSIONS
PWMI Plastics Waste Management Institute
R& D Research and development
SCORE Selective cracking optimum recovery
SEC Specific energy consumption
SG Spheroidal graphite
SI Spark ignition
STDP Selective toluene disproportionation process
Tcs Tonne of crude steel
TDP Toluene disproportionation
tHM Tonne of hot metal
TPES Total primary energy supply
TRT Top pressure recovery turbines
UEC Unit energy consumption
US DoE United States Department of Energy
USC Ultra selective coil design
USGS United States Geological Survey
VCM VinylChlorideMonomer
VFDs Variable frequency drive
VPSA Vacuum pressure swing adsorption
VSA Vacuum swing adsorption
WBCSD World Business Council on Sustainable Development
WRI World Resources Institute
UnitsMJ Megajoule = 106 joules
GJ Gigajoule = 109 joules
PJ Petajoule = 1015 joules
EJ Exajoule = 1018 joules
t Tonne = metric ton = 1 000 kilogrammes
Mt Megatonne = 103 tonnes

Gt Gigatonne = 109 tonnes
W Watt
kW Kilowatt = 103 watts
MW Megawatt = 106 watts
GW Gigawatt = 109 watts
TW Terawatt = 1012 watts
kWth Kilowatt thermal capacity
kWel Kilowatt electric capacity
bar A unit of pressure nearly identical to an atmosphere unit. 1 bar = 0.9869 atm (normal atmospheric pressure is defined as 1 atmosphere).
bbl Barrel
BOE Barrels of oil equivalent. 1 BOE = 159 litres
°C Degrees Celsius
kWh Kilowatt-hour
Nm3 Normal cubic metre. Measured at 0 degrees Celsius and a pressureof 1.013 bar.
ppm Parts per million
Pa Pascal
A Ampère
V Volt
Annex C • DEFINITIONS, ACRONYMS AND UNITS 301


Annex D • REFERENCES 303
ANNEX D: References
Chapter 1 – 2 � Asia Pacific Energy Research Centre (APERC) (2000), Energy Efficiency Indicatorsfor Industry in the APEC Region, Tokyo, Japan.
Canadian Industrial Energy End-Use Data & Analysis Centre (CIEEDAC) (2002),Development of Energy Intensity Indicators for Canadian Industry: 1990 to 2000,Burnaby, BC, Canada.
Energy Information Administration (EIA) (1995), Changes in Energy Intensity in theManufacturing Sector 1985-1991: Manufacturing Energy Consumption Survey.Washington, D.C., United States.
EIA (1995), Measuring Energy Efficiency in the United States’ Economy: A Beginning.DOE/EIA-0555(95)/2.US Energy Information Administration. Washington, D.C.,United States.
Farla, J. and K. Blok (2000), The Use of Physical Indicators for the Monitoringof Energy Intensity Developments in the Netherlands, 1980-1995, Energy 25 (7-9),pp. 609-638.
Freeman, S.L., M.J. Niefer and J.M. Roop (1996), Measuring Industrial EnergyEfficiency: Physical Volume Versus Economic Value. Pacific Northwest NationalLaboratory (PNNL-11435).
G8 (2005), The Gleneagles Communiqué, http://www.g8.gov.uk/.
International Energy Agency (IEA) (2004), Oil Crises and Climate Challenges:30 Years of Energy Use in IEA Countries, IEA/OECD, Paris, France.
IEA (2005), G8 and Governing Board Follow-Up, IEA/SLT/CERT(2005)16. 4 October2005.
IEA (2006a), Energy Technology Perspectives: Scenarios & Strategies to 2050,IEA/OECD, Paris.
IEA (2006b), Industrial Motor Systems Efficiency: Towards a Plan of Action,Proceedings of a workshop 15–16 May 2006, IEA, Paris, France.http://www.iea.org/Textbase/work/2006/motor/proceedings.pdf.
IEA/CEFIC (2007), Feedstock Substitutes, Energy Efficient Technology and CO2Reduction for Petrochemical Products, Workshop Proceedings, 12-13 December2006. IEA, Paris, France.http://www.iea.org/Textbase/work/2006/petrochemicals/proceedings.pdf.
IEA/WBCSD (2006a), Energy Efficiency and CO2 Emission Reduction Potentials andPolicies in the Cement Industry: Towards a Plan of Action, Workshop Proceedings,4–5 September 2006. IEA, Paris, France. http://www.iea.org/Textbase/work/2006/cement/proceedings.pdf
IEA/WBCSD (2006b), Energy Efficient Technologies and CO2 Reduction Potentials inthe Pulp and Paper Industry, Workshop Proceedings, 9 October 2006. IEA, Paris.http://www.iea.org/Textbase/work/2006/pulppaper/proceedings.pdf.

304 TRACKING INDUSTRIAL ENERGY EFFICIENCY AND CO2 EMISSIONS
Martin, N., et al. (1994), International Comparisons of Energy Efficiency, WorkshopProceedings, March 6-9, Lawrence Berkeley National Laboratory, Berkeley, California,United States.
Nanduri, M., J. Nyboer and M. Jaccard (2002), Aggregating Physical IntensityIndicators: Results of Applying the Composite Indicator Approach to the CanadianIndustrial Sector, Energy Policy 30, pp. 151-163.
Natural Resources Canada, Office of Energy Efficiency (NRCAN) (2000), EnergyEfficiency Trends in Canada: An Update: Indicators of Energy Use, Energy Efficiencyand Emissions, Ottawa.
Phylipsen, G.J.M., et al. (1997), International Comparisons of Energy Efficiency:Methodologies for the Manufacturing Industry, Energy Policy 25(7-9), pp. 715-725.
Phylipsen, G.J.M. (2000), International Comparisons & National Commitments:Analyzing Energy and Technology Differences in the Climate Debate, PhD Thesis,Utrecht University, Utrecht, Netherlands.
Worrell, E., L. et al. (1997), Energy Intensity in the Iron and Steel Industry:A Comparison of Physical and Economic Indicators, Energy Policy, 25 (7-9).
Chapter 3 � International Energy Agency (IEA) (1997), Indicators of Energy Use and Efficiency,Understanding the Link between Energy and Human Activity, OECD/IEA, Paris,France.
IEA (2004), Oil Crises and Climate Challenges. 30 Years of Energy Use on IEACountries, OECD/IEA, Paris, France. http://www.iea.org/textbase/nppdf/free/2004/30years.pdf.
IEA (2005), Energy Statistics Manual, OECD/IEA, Paris, France.http://www.iea.org/textbase/nppdf/free/2005/statistics_manual.pdf.
Ono, T. (2006), Boundary Definitions. The Asia-Pacific Partnership on CleanDevelopment and Climate 2nd Steel Task Force Meeting and 1st Workshop,27 September, Tokyo, Japan.
Chapter 4 � American Chemistry Council (2005), The Ethylene Chain.www.americanchemistry.com, posted 18-Sept-2005.
Business Communications Company Research Inc. (BCC) (2003), The GlobalIndustrial Gas Business. Wellesley, United States.
Berra, C. and J. Wu (2005), ABB Lummus Global Propylene Production via OlefinsConversion Technology, in Meyers, R.A. (ed.) Handbook of Petrochemical ProductionProcesses. McGraw-Hill, New York, United States .
Bowen, C. P. (2006), Development Trends for Ethylene Crackers: ExistingTechnologies and RD&D, IEA/CEFIC Workshop Feedstock Substitutes, EnergyEfficient Technology and CO2 Reduction for Petrochemical Products, 12-13 December, Paris, France.

Cagnolatti, A.A. (2005), Global Ethylene Plant Performance Comparisons. Paperpresented at the 2005 AIChE Spring National Meeting. 17th Annual EthyleneProducers Conference, April 11-14, Atlanta, Georgia, United States.
Conseil Européen de l’Industrie Chimique (CEFIC) (2004), IPPC BAT ReferenceDocument – Large Volume Solid Inorganic Chemical Family – Process Bref for SodaAsh – European Soda Ash Producers Association (ESAPA), Brussels, Belgium.
DiZanno, P. (2004), Mega Projects Deserve Large and Proven Technologies, EnergyFrontiers International, Gas-to-Market Conference, September.
Energetics (2000), Energy and Environmental Profile in the US Chemical Industry,prepared for the DOE/OIT, May 2000,http://www.eere.energy.gov/industry/chemicals/tools_profile.html.
Energy Environmental Analysis Inc. (EEA) (2004), Sector Profiles of Significant LargeCHP Market, submitted to Oak Ridge National Laboratory, March 9. Washington,D.C., United States.
Euro Chlor (2006), Chlorine Industry Review. Brussels, Belgium.
http://www.eurochlor.org/index.asp?page=696.
European Association of Plastics Recycling and Recovery Organisations (EPRO)(2006), Statistics on Plastic Waste Management in Europe. Brussels, Belgium.
http://www.epro-plasticsrecycling.org/c_81_1.html.
European Fertilizers Manufacturers Association (EFMA) (2000), Best AvailableTechniques for Pollution Prevention and Control in the European Fertilizer Industry,Booklet 1-8, European Fertilizer Manufacturing Association, Brussels, Belgium.
European Union (EU) (2003), IPPC Reference Document on BAT for Large VolumeOrganic Chemical Industry, February 2003, Brussels, Belgium.
Freedonia Market Research Group (2006), World Carbon Black to 2008.http://www.freedoniagroup.com/.
Frostbyte (2005), http://www.cryoindservice.com/downloads/frostbyte_05summer.pdf.
Gielen, D. (1997), Technology Characterization for Ceramic and Inorganic Materials,Report ECN-C-97-064. Netherlands Energy Research Foundation ECN, Petten.
Gielen, D., K. Bennaceur and C. Tam (2006), IEA Petrochemical Scenarios for 2030-2050: Energy Technology Perspectives, IEA/CEFIC Workshop Proceedings: FeedstockSubstitutes, Energy Efficient Technology and CO2 Reduction for PetrochemicalProducts, 12-13 December, Paris.
Hedman, B. (2005), CHP Market Status, presented at the Gulf Coast Road-mappingWorkshop, April. http://files.harc.edu/Sites/GulfCoastCHP/News/RoadmapWorkshop2005/GulfCoastCHPOverview.pdf.
Heinen, R. and E. Johnson (2006), Efficient Technology and CO2 Reduction forPetrochemical Products, IEA/CEFIC Workshop Proceedings: Feedstock Substitutes,
Annex D • REFERENCES 305

306 TRACKING INDUSTRIAL ENERGY EFFICIENCY AND CO2 EMISSIONS
Energy Efficient Technology and CO2 Reduction for Petrochemical Products, 12-13 December, Paris, France.
Ida, H. (2006), Current Status of Plastics Recycling in Japan, IEA/CEFIC WorkshopProceedings: Feedstock Substitutes, Energy Efficient Technology and CO2 Reductionfor Petrochemical Products, 12-13 December, Paris, France.
Ingham, J. (2006), Improving Markets for Waste Plastics, Chapter 3 in ImprovingRecycling Markets, OECD, Paris, France.
Integrated Pollution, Prevention and Control (IPPC) (2006), Integrated Pollution,Prevention and Control: Reference Document on Best Available Techniques for theManufacture of Large Volume of Inorganic Chemicals – Ammonia, Acids, andFertilizers, December 2006.
International Energy Agency (IEA) (2006), Energy Technology Perspectives, Scenarios& Strategies to 2050, OECD/IEA, Paris, France.
International Fertilizer Industry Association (IFA) (2006), Energy Efficiency inAmmonia Production: Executive Summary for Policy Makers.www.fertilizer.org.
Kapur, S. (2005), ABB Lummus Global SRT Cracking Technology for the Productionof Ethylene, in Meyers, R.A. (ed.) Handbook of Petrochemical Production Processes.McGraw-Hill, New York, United States.
Karangle, H.S. (2007), “Energy Efficiency and CO2 Emissions in the Indian AmmoniaSector”, IFA-IEA Workshop on Energy Efficiency and CO2 Reduction Prospects inAmmonia Production, 13 March, Ho Chi Minh City, Vietnam.http://www.fertilizer.org/ifa/technical_2007_hcmc/2007_tech_hcmc_papers.asp
Keuken (2006), Benchmarking of Energy Efficiency and CO2 Emissions in thePetrochemical Sector, IEA/CEFIC Workshop Proceedings: Feedstock Substitutes,Energy Efficient Technology and CO2 Reduction for Petrochemical Products, 12-13 December, Paris, France.
Leendertse, A. and J. van Veen (2002), Dutch Notes on BAT for the Carbon BlackIndustry. http://www.infomil.nl/legsys/bref/nl-carbon.pdf.
Lurgi (2006), Lurgi MegaMethanol. http://www.lurgi.com/website/fileadmin/pdfs/brochures/Br_MegaMethanol.pdf.
Meidel, R. (2006), Cogeneration, Opportunities in Today’s Power Markets,ExxonMobil Dow Chemical, IEA/CEFIC Workshop Proceedings: FeedstockSubstitutes, Energy Efficient Technology and CO2 Reduction for PetrochemicalProducts, 12-13 December, Paris, France.
Mills, R. (2006), Energy in Petrochemicals: Dow Chemical, IEA/CEFIC WorkshopProceedings: Feedstock Substitutes, Energy Efficient Technology and CO2 Reductionfor Petrochemical Products, 12-13 December, Paris, France.
Ministry of Economy, Trade and Industry (METI) (2006), World Production Capacityof Key Petrochemicals, 2004, Chemical Division, Tokyo, Japan.

Neelis, M., M. Patel and M.D. Feber (2003), Improvement of CO2 Emission Estimationfrom the Non-Energy Use of Fossil-Fuels in the Netherlands, NW&S E-2003-10, UtrechtUniversity, Netherlands.
Neelis, M., et al. (2005), Modelling CO2 Emissions from Non-Energy Use with the Non-Energy Use Emission Accounting Tables (NEAT) Model, Resources, Conservation andRecycling, (45): 226-250.
Nexant (2005), PERP Program – Ethylene – October 2005.
Oil and Gas Journal Survey (2006), Industry Survey of Ethylene from Steam Crackers,March 27, 2006.
Patel, M (2003), Cumulative Energy Demand and Cumulative CO2 Emissions forProducts of the Organic Chemical Industry, Energy Volume 28 (7), pp. 721-740.
Phillips, R. (2006), Propylene Emerges from Ethylene’s Shadow, Technon OrbiChemseminar at APIC. Bangkok, Thailand, May.
Plastics Europe (2004), Plastics in Europe: An Analysis of Plastics Consumption andRecovery in Europe, Plastics Europe Association of Plastics Manufacturers. www.plasticseurope.org.
Plastics Europe (2006), An Analysis of Plastics Production, Demand and Recovery inEurope, Plastics Europe Association of Plastics Manufacturers, Brussels, Belgium. www.plasticseurope.org.
Rafiqul, I., C. Weber, B. Lehmann and A. Voss (2005), Energy Efficiency Improvements inAmmonia Production – Perspectives and Uncertainties, Energy 30 (13), pp. 2487-2504.
Ren, T., M. Patel and Blok (2005), Olefins from Conventional and Heavy Feedstocks:Energy in Steam Cracking and Alternative Processes, Energy 31 (4), pp. 425-451.
Schyns, V. (2006), Feedstock Substitutes, Energy Efficient Technologies and CO2Reductions in Petrochemical Products, Presentation at the IEA/CEFIC workshopFeedstock Substitutes, Energy Efficient Technology and CO2 Reduction forPetrochemical Products, 12-13 December, Paris, France.
Tam, C. and D. Gielen (2006), Petrochemical Indicators, IEA/CEFIC WorkshopProceedings: Feedstock Substitutes, Energy Efficient Technology and CO2 Reductionfor Petrochemical Products, 12-13 December, Paris, France.
Thomasson, A. (2006), CMAI Completes 2007 World Methanol Analysis.http://www.cmaiglobal.com/WorldAnalysis/pdf/WMAPressRelease.pdf.
United States Geological Survey (USGS) (2005), Soda Ash Statistics and Information.http://minerals.usgs.gov/minerals/pubs/commodity/soda_ash/.
USGS (2006), Mineral Commodity Summaries. http://minerals.usgs.gov/minerals/pubs/commodity/soda_ash/sodaamcs06.pdf.
Y. Zunhong, G. Xin, W. Fuchen (2005), Coal Gasification Technology in China:Application and Development. Presentation Shanghai, January 2005.http://gcep.stanford.edu/pdfs/wR5MezrJ2SJ6NfFl5sb5Jg/9_china_wangfuchen.pdf
Annex D • REFERENCES 307
308 TRACKING INDUSTRIAL ENERGY EFFICIENCY AND CO2 EMISSIONS
Chapter 5 � ABM (2004), Anais do XXV Seminário de Balanços Energéticos e Utilidades.Brazilian Association of Metals and Materials (ABM). Florianópolis, Brazil.
Bajay, S.V., et. al. (2007), Energy Efficiency and CO2 Emissions in the Brazilian Ironand Steel Industry. April 23. Interdisciplinary Center for Energy Planning, StateUniversity of Campinas, Brazil.
Beer, J. de, E. Worrell and K. Blok (1998), Future Technologies for Energy-efficient Ironand Steel Making, Ann. Rev. Energy Environm 23, pp. 123-205.
Bistrow, N. and B. Wilson (2002), The Coking Coal Market – an AustralianPerspective, 44th Canadian Conference on Coal, 8-10 September, British Columbia,Canada. http://www.coal.ca/events/44cconf/conf/speakers/wilsonnotes.pdf.
Caffrey, R. (2005), Global Slag Conference.http://www.propubs.com/gs2006/gs05reviewed.html.
Celissen, T. and E. v/d Haak (2004), Heat Recovery for Hot Blast Stove. AISTech2004 Proceedings. American Iron and Steel Institute, Washington, DC.
China Iron and Steel Association (CISA) (2005), 2005 China Steel Industry AnalysisReport, ISBN 7-5017-7016-6, China Economic Publishing House, Beijing, China.
CISA (2005b), Iron and Steel Yearbook 2005, ISBN 1003-9368, Beijing, China.
CISA (2005c), Investigation Report on Energy Conservation and EnvironmentalProtection in Iron and Steel Sector, Beijing, China.
Cui, Y.-S. and X. Wang (2006), The State of the Chinese Cement Industry in 2005 andIts Future Prospects, Cement International 4, pp. 36-43.
Debruxelles, J.P, (2006), European Perspective Towards the CO2 Challenge,DSTI/SU/SC(2006)67, OECD Steel Committee, 7-8 November, Paris, France.
Diemer, P., et al. (2004), Potentials for Utilisation of Coke Oven Gas in IntegratedIron and Steel Works, Stahl und Eisen 124, no. 7, pp. 21-30.
Euroslag (2006), http://www.euroslag.org/pages/use.html.
Hilding, T. (2005), Evolution of Coke Properties while Descending through a BlastFurnace. http://epubl.ltu.se/1402-1757/2005/19/LTU-LIC-0519-SE.pdf.
Honeyands, T. and J. Truelove (1999), Performance of HBI in Pre-heating Systems.Presented at Scanmet I, Lulea, Sweden. http://hbia.org/Technical/openpdf.cfm?filename=Steel-ElectricArc/1999-1SE.pdf.
Institute of Energy Economics Japan (IEEJ) (2006), The New Energy and IndustrialTechnology Development Organization (NEDO), FY 2005 Report, (Ref No. 05002231-0),Tokyo, Japan.
International Energy Agency (IEA) (2005), Coal Statistics, OECD/IEA, Paris, France.
IEA (2006), Energy Technology Perspectives. Scenarios and Strategies to 2050,OECD/IEA, Paris, France.

International Iron and Steel Institute (IISI) (1998), Energy Use in the Steel Industry,Committee on Technology, Brussels, Belgium.
IISI (2000), EAF Technology. International Iron and Steel Institute, Brussels, Belgium.
IISI (2005), World Steel in Figures. International Iron and Steel Institute, Brussels, Belgium.
IISI (2006), World Steel in Figures. International Iron and Steel Institute, Brussels,Belgium.
Japan Cement Association (JCA) (2006), Cement Industry’s Status and Activities forGHG Emissions Reduction in Japan, IEA-WBCSD Workshop on Energy Efficiency andCO2 Emission Reduction Potentials and Policies in the Cement Industry, 4-5 September, Paris, France.
Japan Iron and Steel Federation (JISF) (2006), Handbook for Iron and Steel Statistics2006.
JP Steel plantech (2002), http://www.steelplantech.co.jp/cont_products/iron4.html.
Köhle, S. (2002), Recent Improvements in Modelling Energy Usage of Electric ArcFurnaces. http://www.bfi.de/de/publikationen/doc/BFI32_EAF_Energy_7EEC_2002.pdf.
Komori, T., N. Yamagami and H. Hara (n.d.), Design for Blast Furnace Gas Firing GasTurbine. Mitsubishi Heavy Industries.http://www.mhi.co.jp/power/topics/2004/nov_04b.pdf
Lacroix, P., G. Dauwels, P. Dufresne, R. Godijn, P.G. Perini, K.P. Stricker and J. Virtala.(2001), High Blast Furnaces Productivity Operations with Low Coke Rates in theEuropean Union, La Revue de Metallurgie – CIT, March, pp. 259-268.
MIDREX (2005), 2005 World Direct Reduction Statistics, MIDREX, Charlotte, NorthCarolina, United States. www.midrex.com.
Ministério de Minas e Energia (MME) (2006a), Brazilian Metallurgical Industry,Statistical Yearbook. Secretaria de Geologia, Mineração e Transformação Mineral /Ministério de Minas e Energia, Brasília, Brazil.
MME (2006b), Sinopse – Mineração & Transformação Mineral (Metálicos e Não-Metálicos), Secretaria de Geologia, Mineração e Transformação Mineral / Ministériode Minas e Energia (MME), Brasília, Brazil.
Nakano, N. (2006), Technology-base and Sector-base Approach in the Case of Japan’sSteel Industry, OECD Steel Committee, 7-8 November, Paris, France.
Natural Resources Canada (NRCAN) / Canadian Steel Producers Association (CSPA)(2007), Benchmarking Energy Intensity in the Canadian Steel Industry, Ottawa,Canada.
Nippon Slag Association (2006), Production and Uses of Blast Furnace Slag andSteel Slag. http://www.slg.jp/e/index.htm.
Nippon Steel (2004), The Latest Trend of Iron- making Technology in Japan. ReliningOita no. 2 BF. September.
Annex D • REFERENCES 309

310 TRACKING INDUSTRIAL ENERGY EFFICIENCY AND CO2 EMISSIONS
Ono, T. (2007), Challenges for GHG Reduction in Japan, 2007 RITE InternationalSymposium, 18 January 2007.http://www.rite.or.jp/Japanese/kicho/sympo07/3_ono.pdf.
Pandey, P. (2006), Monney ISPAT – Striding Ahead in Sponge Iron.http://www.simaindia.org/monnet_art.cfm.
Pandit, A., et al. (2006), Coal Based Sponge Iron Industry. A Prime Mover to EnhanceSteel Making Capacities in India? http://www.steelworld.com/coal.htm.
Perkins, S. (2000), CemStar Technology Offers Increased Productivity andEnvironmental Benefits.http://www.hatch.ca/Sustainable_Development/Projects/World%20Cement%20Paper.pdf.
Kai Q., et al. (2004), “Production of Shougang BF after Deterioration of CokeQuality”, AISTech, vol. 1, pp. 269-275, American Iron and Steel Institute.
Radikha, K. and M. Mitra (2006), Sponge Iron Industry are Killing Fields.http://www.freeindiamedia.com/environment/18_sep_06.html.
Schoenberger, H. (2000), BREF on the Production of Iron and Steel – Conclusion on BAT.http://www.ecologic-events.de/sevilla1/en/documents/Schoenberger_en.PDF.
Sindwani, A. (2006), DRI (D)estined for (R)apid (I)ncrease. http://www.simaindia.org/dri_art.cfm.
Stahl Institut VDEh (2006), Blast Furnace Reducing Agents Consumption in SelectedRegions and Countries in the World, 2005. Düsseldorf, Germany.
Stanlay, R. (2003), PCI – Current Status and Prospectus for Growth. Paper Presentedat Asia Steel International Conference, Jamshedpur, India.
Stoppa, H., et al. (1999), Costs and Environmental Impact of Dry and WetQuenching, Cokemaking International no. 1/99, pp. 65-70.
Tata Sponge (2006), http://www.tatasponge.com/Download/TSIL_shareholders_pres_160606.ppt#325,1,Slide 1.
United Nations (UN) (2002), International Standard Industrial Classification of All Economic Activities (ISIC) Revision 3.1. Department of Economic and SocialAffairs, Statistics Division, Statistical Papers Series M no. 4, rev. 3.1,ST/ESA/STAT/SER.M/4/Rev.3.1. New York, United States.
United States Geological Survey (USGS) (2005a), Iron Ore. http://minerals.usgs.gov/minerals/pubs/commodity/iron_ore/.
USGS (2005b), Iron and Steel Slag End-Use Statistics. http://minerals.usgs.gov/ds/2005/140/ironsteelslag-use.xls.
Utsi, A. (2006), Research Needs on Waste – the Eurofer Perspective. Workshop onResearch in the Waste Area – Towards FP7, February, Internet.

Valia, H.S., Y. Jiying and S. Weijie (2004), Production of Super Strength Coke fromNon-recovery Coke Making at Shanxi Sanjia, Jixiu, Shanxi Province, China, AISTechproceedings, Vol. 1, pp. 633-636.
Veld, L. de (2006), Review of the Market for Metallurgical Coal. Presentation at theMcKloskey Coal Conference, Nice, France.
Wei, J. (2006), Practices of Lowing Energy Use for Iron Making System, EnergyConservation and Environmental Protection, no. 5.
Yu, F. (2003), Technology of Mill Run Development and its Impacts on Iron Making,Proceedings of 2003 China Iron & Steel Annual Conference.
Zhen, W. (2005), Present Situation, Problem and Countermeasures for Coke-makingProduction in Our Country, Proceedings of 2005 China Iron & Steel AnnualConference, Vol. 2. pgs 131-134.
Chapter 6 � American Coal Ash Association (ACAA) (2003), Coal Combustion Product ProductionUse Survey, Aurora, Co, United States.
Associazione Italiana Tecnico Economica Cemento (AITEC) (2000 to 2005), AnnualReport, AITEC, Rome, Italy.
Battelle (2002), Toward a Sustainable Cement Industry. Climate Change, WBCSD,Geneva. http://www.wbcsd.org.
Beerkens, R.G.C., and J. van Limpt (2001), Energy Efficiency Benchmarking of GlassFurnaces, Paper presented at the 62nd Conference on Glass Problems. University ofIllinois at Urbana-Champaign, Illinois, United States.
Brasilian Institute of Geography and Statistics (IBGE) (2006), Annual Survey ofMining and Manufacturing Industries.www.ibge.gov.br.
Canadian Industrial Energy End Use Data and Analysis Centre (CIEEDAC) (2004),Development of Energy Efficiency Indicators for Canadian Industry, 1990 -2002,Burnaby, BC.
CEMBUREAU (2006), Use of Alternative Fuels and Materials in the European CementIndustry, presentation to the IEA-WBCSD Workshop “Energy Efficiency and CO2Emission Reduction Potentials and Policies in the Cement Industry”, Paris, France,September 2006. Also personal communication 16 February, 2006.
Ceramic World Review (2001), World Production and Consumption of Ceramic Tiles. http://www.ceramicworldweb.it/.
Comité Européen de Normalisation (CEN) (2000), Cement – Part 1: Compositions,Specifications and Conformity Criteria for Common Cements, EN 197-1:2000,Brussels, Belgium.
Cui, Y.-S. and X. Wang (2006), The State of the Chinese Cement Industry in 2005 andIts Future Prospects, Cement International 4/2006, pp. 36-43.
Annex D • REFERENCES 311

312 TRACKING INDUSTRIAL ENERGY EFFICIENCY AND CO2 EMISSIONS
Cui, Y.-S. (2007), Estimation of Energy Consumption and CO2 Emission in ChineseBuilding Materials Industry in 2006, Institute of Technical Information for theBuilding Materials Industry of China (ITIBMIC), Beijing, China.
Cui, Y.-S. (2007), Personal Communication.
Dong-Woon, H. (2006), Energy Efficiency Improvement Potential in the KoreanCement Industry, Korean Energy Economics Institute, KEEI/KREA Seoul Conference,September, Korea.
European Commission (EC) (2001), Reference Document on Best AvailableTechniques in the Cement and Lime Manufacturing Industries.http://www.infomil.nl/legsys/bref/cement.pdf.
EC (2006), Annual European Community Greenhouse Gas Inventory 1990–2004 andInventory Report 2006, EEA Technical Report No 6/2006, EC DG Environment,European Environment Authority, Brussels, Belgium.
EC (2006) Draft Reference Document on Best Available Techniques in the CeramicManufacturing Industry. European Commission, DG JRC. http://www.epa.ie/.
FLSMidth (2006), Cement Plant Pyro-technology, presentation to the IEA-WBCSDWorkshop “Energy Efficiency and CO2 Emission Reduction Potentials and Policies inthe Cement Industry”, IEA, Paris, France, September 2006.
Gielen, D. (1997), Technology Characterization for Ceramic and Inorganic Materials,Report ECN-C-97-064. Netherlands Energy Research Foundation ECN, Petten,Netherlands.
Harder, J. (2006), Development of Slag Use in the Cement Industry, Global SlagMagazine, Issue 6, Epsom, Surrey, United States.
International Energy Agency (IEA) (2006a), Energy Technology Perspectives.Scenarios & Strategies to 2050, IEA/OECD, Paris, France.
IEA (2006b), Optimising Russian Natural Gas, IEA/OECD, Paris, France.
Japan Cement Association (JCA) (2006), Cement Industry’s Status and Activities forGHG Emissions Reduction in Japan, presentation to the IEA-WBCSD Workshop“Energy Efficiency and CO2 Emission Reduction Potentials and Policies in the CementIndustry”, IEA, Paris, France, September.
Levine, E., M. Greenman and K. Jamison (2004), The Development of a NextGeneration Melting System for Glass Production: Opportunities and Progress. ACEEESummer Study on Energy Efficiency in Industry 2003. American Council for anEnergy Efficiency Economy, Washington, D.C., United States.
Miller, M. M. (2003), Lime, 2003 Minerals Yearbook. United States GeologicalSurvey, Reston, Virgina, United States.
Miner R. and B. Upton (2002), Methods for Estimating Greenhouse Gas Emissionsfrom Lime Kilns at Kraft Pulp Mills. Energy, the International. Journal 8 27 pp.729-738 (2002).

Natural Resources Canada (NRCAN) (2006), Energy Consumption Benchmark Guide:Cement Clinker Production, Office of Energy Efficiency, NRCAN, Ottawa, Canada.
NRCAN (various years), Canadian Minerals Yearbook. Minerals and Metals Sector,NRCAN, Ottawa, Canada.
Observatoire de l’Energie (2003), Consommation de Combustibles de Substituiondans l’ Industrie Cimentiére en 2001, Ministere de l’Économie des Finances et del’Industrie, Paris, France.
OFICEMEN (2007), Statistics of the Spanish Cement Industry. www.oficemen.com.
Pilkington (2005), Flat Glass Industry – Summary. http://www.pilkington.com/.
Portland Cement Association (PCA) (2005), North American Cement Industry AnnualYearbook 2005. Skokie, Illinois, United States.
Price, L (2006), Prospects for Efficiency Improvements in China’s Cement Sector,Lawrence Berkeley National Laboratory (LBNL), presentation to the IEA-WBCSDWorkshop “Energy Efficiency and CO2 Emission Reduction Potentials and Policies inthe Cement Industry”, IEA, Paris, France, September.
Raina, S. J. (2002), Energy Efficiency Improvement in Indian Cement Industry,National Council for Cement & Building Materials, paper prepared for IIPECProgramme.
Sathaye, J., et al. (2005), Assessment of Energy Use and Energy Savings Potential inSelected Industrial Sectors in India, Lawrence Berkeley National Laboratory, Berkeley,California, United States.
Shi Wei (2007), Potentials and Strategies for Energy-saving and CO2 EmissionReduction in the Chinese Lime Industry, Institute of Technical Information for theBuilding Materials Industry of China (ITIBMIC), Beijing, China.
Siam Cement Company Ltd. (2005), Sustainable Development Report 2005, SiamCement Company Ltd., Bangkok, Thailand.
Smith, I.M. (2005), Cement and Concrete – Benefits and Barriers in Coal AshUtilisation, IEA Clean Coal Centre, London, United Kingdom.
Soares, J.B. and M.T. Tolmasquim (2000), “Energy Efficiency and Reduction of CO2Emissions
Through 2015: The Brazilian Cement Industry”, Mitigation and AdaptationStrategies for Global Change 5, pp. 297–318, Netherlands.
Statistics Canada, Cement Statistics, various issues, catalogue number 44-001-XIB,Ottawa, Canada.
United States Geological Survey (USGS) (2004). Minerals Yearbook – 2004. www.usgs.gov.
Annex D • REFERENCES 313

314 TRACKING INDUSTRIAL ENERGY EFFICIENCY AND CO2 EMISSIONS
USGS (various years), Minerals Yearbook, USGS, Reston, Virginia, United States.
Vaccari, G., et al. (2005), Overview of the Environmental Problems in Beet SugarProcessing: Possible Solutions, Journal of Cleaner Production 13, pp.499-507.
Verein Deutscher Zementwerke e.V., Forschungsinstitut der Zementindustrie (VDZ)(2006), Verminderung der CO2-Emissionen, VDZ, Düsseldorf.
Xinchun, W. (2007), China Float Glass Sector Energy Efficiency Survey. GlassPerformance Days.www.gpd.fi.
Whittemore, O.J. (1999), Energy Use and Efficiencies in Firing Ceramics, MeltingGlass. American Ceramic Society Bulletin, July. pp. 69-71.
World Business Council on Sustainable Development (WBCSD) (2005), CO2Accounting Protocol: Calculating CO2 Emissions from the Production of Cement. http://www.wbcsd.org/.
Worrell, E., et al. (2001), Carbon Dioxide Emissions from the Global Cement Industry,Annual Review of Energy and Environment, Vol 26, 2001.
Zaiyin, Y. (2007), Energy Saving and Emission Reductions Potentials and Measures inthe Chinese Brick & Tile Industry, Institute of Technical Information for the BuildingMaterials Industry of China (ITIBMIC), Beijing, China.
Chapter 7 � Canadian Industrial Energy End-Use Data and Analysis Centre (CIEEDAC) (2006), AReview of Energy Consumption and Related Data Canadian Paper ManufacturingIndustries: 1990, 1995 to 2003, Prepared for Forest Products Association of Canada.Simon Fraser University, Burnaby, British Columba, Canada.
CIEEDAC (2006), Development of Energy Intensity Indicators for Canadian Industry1990 to 2004, Simon Fraser University, Burnaby, British Columba, Canada.
Confederation of European Paper Industries (CEPI) (2001), Special RecyclingStatistics. Brussels, Belgium.
CEPI (2006), Europe Global Champion in Paper Recycling: Paper Industries MeetAmbitious Target, Press Release July. Brussels, Belgium.
China State Statistical Bureau (various years), China Energy Statistical Yearbook,China Statistical Publishing House, Beijing, China.
COGEN Europe (2005), CHP Statistics in European Member States 2003 Data,Brussels, Belgium.
Energy Information Administration (EIA) (various years), US MECS Survey,Washington, D.C., United States.
European Commission (EC) (2001), Integrated Pollution Prevention and Control(IPPC), Reference Document on Best Available Techniques in the Pulp and PaperIndustry. http://www.infomil.nl/legsys/bref/papier.pdf.
European Recovered Paper Council (ERPC) (2006), European Declaration on PaperRecycling 2006-2010, Brussels, Belgium.
FAOSTAT (United Nations Food and Agricultural Organization Statistics) (2006),FAO Statistics Division, Rome, Italy. http://faostat.fao.org/site/381/DesktopDefault.aspx?PageID=381.
Finnish Forest Industries Federation (2002), Possibilities of Reducing CO2 Emissionsin the Finnish Forest Industry, Helsinki.
Francis, et al. (2002), Energy Cost Reduction in the Pulp and Paper Industry – AnEnergy Benchmarking Perspective, Natural Resources Canada, Ottawa, Canada.
Francis, D.W. and T.C. Browne (2004), Method for Benchmarking Energy Use in Pulpand Paper Operations, 2004 TAPPI Fall Tech. Conf., Atlanta, Georgia, United States.
Hayakawa, Y. (2006), Voluntary Efforts against Global Warming by the JapanesePulp and Paper Industry, presented at IEA-WBCSD Workshop on Energy EfficientTechnologies and CO2 Reduction Potentials in the Pulp and Paper Industry,9 October, Paris, France.
International Energy Agency (IEA) (2006), Energy Technology Perspectives: Scenarios& Strategies to 2050, IEA/OECD, Paris, France.
IEA / IETS (1999), Recommended Methods for Energy Reporting in Pulp and PaperIndustry, Summary Report, Annex XII: Assessment of Life-Cycle-Wide Energy-RelatedEnvironmental Impacts in the Pulp and Paper Industry, IEA Programme for AdvancedEnergy-Efficient Technologies in the Pulp and Paper Industry.
Japanese Paper Association (2006), The 9th Follow-up Survey of JPA’s VoluntaryAction Plan on Environment , Tokyo, Japan.
Jochem, E., et al. (2004), Werkstoffeffizienz. Einsparpotentiale bei Herstellung undVerwendung Energieintensiver Grundstoffe, Fraunhofer Informationszentrum Raumund Bau, Stuttgart, Germany.
PA Consulting (2002), Supply Channel Study – Phase 1 Evaluation Report, State ofWisconsin prepared by M. Rosenberg.
Paprican (2002), Energy Cost Reductions in the Pulp and Paper Industry, An EnergyBenchmarking Perspective, Natural Resources Canada, Ottawa, Canada.
STFI-Packforsk (2005), The Future Resource Adapted Pulp Mill, FRAM Final ReportModel Mills, Report No 70, STFI-Packforsk, Stockholm, Sweden.
Whiteman, A. (2005), Recent Trends and Developments in Global Markets for Pulpand Paper, United Nations Food and Agricultural Organization, Rome, Italy.
Worrell, et al. (2001), Opportunities to Improve Energy Efficiency in the US Pulp and PaperIndustry, Lawrence Berkeley National Laboratory, Berkeley, California, United States.
Zhuodan, L. (2006), Current Energy Efficiency in the Pulp and Paper Industry ofChina, paper presented at IEA-WBCSD Workshop on Energy Efficient Technologiesand CO2 Reduction Potentials in the Pulp and Paper Industry, 9 October, Paris,France.
Annex D • REFERENCES 315

316 TRACKING INDUSTRIAL ENERGY EFFICIENCY AND CO2 EMISSIONS
Chapter 8 � Alvarado, S., P. Maldonado, A. Barrios and I. Jaques (2002), Long Term Energy-relatedEnvironmental Issues Related to Copper Production, Energy 27, pp. 183-196.
Department of Industry Science and Resources (ISR) (2000), Energy Efficiency BestPractices in the Australian Aluminium Industry. ISBN 0 642 72041 X, Canberra,Australia.
European Commission (EC) (2001), IPPC Reference Document on Best AvailableTechniques in the Non-Ferrous Metals Industry, European Commission,Brussels/Seville, December 2001.
International Aluminium Institute (IAI) (2003), Life Cycle Assessment of Aluminium:Inventory Data for the Worldwide Primary Aluminium Industry, IAI, London, UnitedKingdom.
IAI, IAI Statistics. http://www.world-aluminium.org/iai/stats.
Maldanado, P., S. Alvarado and I. Jaques (1998), The Chilean Copper Industry andEnergy-related Greenhouse Gases Emissions, Proceedings 17th World Energy CouncilCongress, Houston, Texas, United States.
Norgate, T.E. and W.J. Rankin (2000), Life Cycle Assessment of Copper and NickelProduction, MINPREX 2000, Melbourne, pp. 133-138. The Australian institute ofMining, Carlton South, Victoria, Australia.
United States Geological Survey (USGS) (2006a), Aluminium. 2005 MineralsHandbook. http://minerals.usgs.gov/minerals/pubs/commodity/aluminum/alumimyb05.pdf
USGS (2006b), Copper. 2004 Minerals Handbook.http://minerals.usgs.gov/minerals/pubs/commodity/copper/coppemyb04.pdf.
World Aluminium (2006), Electrical Power Used in Primary Aluminium Production.http://www.world-aluminium.org/iai/stats/formServer.asp?form=7.
Worrell, E. and J.G. de Beer (1991), Energiekentallen in Relatie Tot Preventie enHergebruik van Afvalstromen: Deelrapport Aluminium (Energy Requirements inRealtion to Prevention and Re-Use of Waste Streams: Report on Aluminium, inDutch), Nationaal Onderzoeks Programma Hergebruik van Afvalstoffen,Utrecht/Bilthoven, Netherlands.
Chapter 9 � Almeida, A., F. Ferreira and D. Both (2005), Technical and Economical Considerationsto Improve the Penetration of Variable Speed Drives for Electric Motor Systems, IEEETransactions on Industry Applications, January/February 2005.
Brunner, C. and A. Niederberger (2006), Motor System Model: A Tool to SupportEfficient Industrial Motor System Policies & Programs. A+B International, Zürich,Switzerland
Canmet Energy Technology Centre, Natural Resources Canada.http://cetc-varennes.nrcan.gc.ca/en/indus.htm.

Cheek, K.F. and P. Pillay (1997), Impact of Energy Efficient Motors in thePetrochemical Industry, Electric Power Systems Research 42, pp. 11-15.
Compressed Air Challenge (CAC) (2004) Fundamentals of Compressed Air SystemsTraining, 7-Step Action Plan.http://www.compressedairchallenge.org/.
Compressed Air Challenge and the US Department of Energy (2003), ImprovingCompressed Air System Performance: A Sourcebook for Industry, prepared byLawrence Berkeley National Laboratory and Resource Dynamics Corporation,Washington, D.C., United States, DOE/GO-102003-1822.http://www1.eere.energy.gov/industry/bestpractices/techpubs_compressed_air.html
De Almeida, A. and E.L. Fagundes (1998), Energy Efficiency and the Limits of MarketForces: The Example of the Electric Motor Market in France, Energy Policy, Vol. 26, No8, pp 643-653.
Elliott, R. N. (2002), Vendors as Industrial Energy Service Providers, American Councilfor an Energy Efficient Economy, Washington, D.C., United States.
Energy Foundation, (2002), Energy Conservation Potential Analysis for EnergyIntensive Products in China, Project G-0202-6173.
Giraldo, L. and B. Hyman (1995), Energy End-Use Models for Pulp, Paper, andPaperboard. Mills, Department of Mechanical Engineering, University of Washington,Seattle, Washington, United States.
International Energy Agency (IEA) (2006), Energy Technology Perspectives. Scenariosand Strategies to 2050, IEA/OECD, Paris, France.
Keulenaer H. de, R. Belmans, E. Blaustein, D. Chapman, A. De Almeida, B. Wachterand P. Radgen (2004), Energy Efficient Motor Driven Systems. European CopperInstitute, Brussels, Belgium.
Lawrence Berkeley National Laboratory (LBNL) (2004, updated 2006), Alliance toSave Energy, and Energetics, Analysis conducted for US Department of Energy onGlobal Motor System Energy Use and Savings Opportunities.
Lung, R.B., A. McKane and M. Olszewski (2003), Industrial Motor SystemOptimization Projects in the US: An Impact Study, Proceedings of the 2003 ACEEESummer Study on Energy Efficiency in Industry, Rye Brook, NY LBNL-53053, ACEEE,Washington, D.C., United States.
McKane, A. (2005), Industrial Standards Framework Overview, Presentation atUNIDO/DIP Experts Group Meeting, Phattaya City, Thailand.
McKane, A., (2007), forthcoming, Chapter 17: Industrial Energy Efficiency, Regulationand Sustainable Energy in Africa, United Nations Industrial Development Organizationand the Renewable Energy and Energy Efficiency Partnership, Vienna, Austria.
McKane, A., et al. (2005), Creating a Standards Framework for Sustainable IndustrialEnergy Efficiency, Proceedings of EEMODS 05, Heidelberg, Germany, LBNL-58501.http://industrial-energy.lbl.gov/node/147.
Annex D • REFERENCES 317

318 TRACKING INDUSTRIAL ENERGY EFFICIENCY AND CO2 EMISSIONS
Minett, S. (2004), Chapnet CHP Strategy. http://www.chp-research.com/.
Nadel, S., et al. (2005), Energy-Efficient Motor Systems: A Handbook on Technology,Program, and Policy Opportunities, Second Edition, American Council for an Energy-Efficient Economy, Washington, D.C., United States.
Philibert, C. and J. Podkanski (2005), International Energy Technology Collaborationand Climate Change Mitigation Case Study: Clean Coal Technologies, InternationalEnergy Agency COM/ENV/EPOC/IEA/SLT (2005)4.
Radgen, P. (2003), Compressed Air System Audits and Benchmarking: Results fromthe German Compressed Air Campaign “Druckluft Effizient”, Fraunhofer ISI,Karhlsruhe, Germany.
Ryan, P., S. Holt, and B. Watkins (2005), Motor MEPS in Australia: Future Directionsand Lessons, Proceedings of EEMODS 05, Heidelberg, Germany.
United States Department of Energy (US DOE) (1998), United States IndustrialElectric Motor Systems Market Assessment Opportunities, prepared by Xenergy, Inc,Washington, D.C., United States.
US DOE (2002), Steam System Opportunity Assessment for the Pulp and Paper,Chemical Manufacturing, and Petroleum Refining Industries, prepared by ResourceDynamics Corporation, Washington, D.C., United States, DOE/GO 102002-1639.
US DOE (2003), Improving Fan System Performance: A Sourcebook for Industry,prepared by Lawrence Berkeley National Laboratory and Resource DynamicsCorporation, Washington, D.C., United States, DOE/GO-102003-1294.http://www1.eere.energy.gov/industry/bestpractices/techpubs_motors.html.
US DOE (2004a), Improving Steam System Performance: A Sourcebook for Industry,prepared by Lawrence Berkeley National Laboratory and Resource DynamicsCorporation, Washington, D.C., United States, DOE/GO-102004-1868.http://www1.eere.energy.gov/industry/bestpractices/techpubs_steam.html.
US DOE (2004b), Energy Use and Loss Footprints, prepared by Energetics, Inc.http://www.eere.energy.gov/industry/energy_systems/footprints.html.
US DOE (2004c), Energy Loss Reduction and Recovery in Industrial Energy Systems,prepared by Energetics, Washington, D.C., United States. http://www.eere.energy.gov/industry/energy_systems/analysis.html.
US DOE (2004d), Energy Use, Loss, and Opportunities Analysis: U.S. Manufacturing& Mining, prepared by Energetics and E3M, Washington, D.C., United States. http://www.eere.energy.gov/industry/energy_systems/analysis.html.
US DOE (2004e), Evaluation of the Compressed Air Challenge® Training Program,prepared by Lawrence Berkeley National Laboratory and XENERGY, Inc, Washington,D.C., United States, DOE/GO-102004-1836.http://www1.eere.energy.gov/industry/bestpractices/techpubs_compressed_air.html.

US DOE (2005), Estimation of Energy Savings Outcomes from Best PracticesActivities, Fiscal Year 2004 prepared by Oak Ridge National Laboratory (internalreport), United States.
US DOE (2006), Improving Pump System Performance: A Sourcebook for Industry,Second Edition, prepared by Lawrence Berkeley National Laboratory, ResourceDynamics Corporation, and the Alliance to Save Energy, Washington, D.C., UnitedStates. http://www1.eere.energy.gov/industry/bestpractices/techpubs_motors.html.
U.S. Environmental Protection Agency (USEPA) (2005), Catalogue of CHPTechnologies, Combined Heat and Power Partnership.http://www.epa.gov/chp.
Whiteley, M. (2001), The Future of CHP in the European Market - The EuropeanCogeneration Study. Report XVII/4.1031/P/99-169. Future Cogen/Cogen Europe,Brussels, Belgium.
Williams, R., et al. (2005), The Chinese Motor System Optimization Experience:Developing a Template for a National Program, Proceedings of EEMODS 05,Heidelberg, Germany. LBNL-58504. http://industrial-energy.lbl.gov/node/294.
Williams, R., A. McKane and R. Papar (2006), Energy Management Standards: anIncentive for Industrial System Energy Efficiency?, Co-generation and On-Site PowerProduction, Nov-Dec 2006, Volume 7, Number 6, pp.83-91.
Xiuying, L., et al. (2003), Energy Saving Potential from New Industrial EquipmentEfficiency Standards in China, Proceedings from the 2003 ACEEE Summer Study forIndustry. ACEEE, Washington, D.C., United States.
Zhehang, J. (2006), Enterprises Energy Conservation Technology, ISBN7-5025-8507-9.
Chapter 10 � American Iron and Steel Institute (AISI) (2006), Report on US Indirect Steel Trade,1999-2005. http://www.steel.org.
American Plastics Council (2004), 2004 National Post-Consumer Plastics RecyclingReport.
Environment and Plastics Industry Council Canada (EPIC) (2002), Opportunities forReducing Greenhouse Gas Emissions through Residential Waste Management.
European Association of Plastics Recycling and Recovery Organisations (EPRO)(2006), Statistics on Plastic Waste Management in Europe. Brussels, Belgium.http://www.epro-plasticsrecycling.org/c_81_1.html.
European Commission (EC) (2006), Report from the Commission to the Council andthe European Parliament on the Implementation of Directive 94/62/EC onPackaging and Packaging Waste and its Impact on the Environment, as well as onthe Functioning of the Internal Market, publication no. COM (2006) 767 final.Brussels, Belgium.
Annex D • REFERENCES 319

320 TRACKING INDUSTRIAL ENERGY EFFICIENCY AND CO2 EMISSIONS
European Tyre and Rubber Manufacturers Association (ETRMA) (2006), Scrap TyreStatistics. http://www.etrma.org/.
Freedonia (2003), World Solvents to 2007. http://www.freedoniagroup.com.
Hayashi, S., et al. (2007), Steel Recycling Circuit in the World, International Iron andSteel Institute internal presentation, February.
Ida, H. (2006), Current Status of Plastics Recycling in Japan, Presentation at theIEA/CEFIC Workshop: Feedstock Substitutes, Energy Efficient Technology and CO2Reduction for Petrochemical Products, 12-13 December, Paris, France.
Industrievereinigung Chemiefaser (2006), World Production of Man-Made Fibres byRegion. http://www.ivc-ev.de/live/index.php?page_id=87.
Intergovernmental Panel on Climate Change (IPCC) (2006), Waste Generation,Composition and Management Data. http://www.ipcc-nggip.iges.or.jp.
International Aluminium Institute (IAI) (2003), Life Cycle Assessment of Aluminium:Inventory Data for the Worldwide Primary Aluminium Industry, London, UnitedKingdom.
International Iron and Steel Institute (IISI) (2006), World Steel in Figures, Brussels,Belgium.
Japan Automobile Tire Manufacturers Association (JATMA) (2006), Tire Industry ofJapan 2006. http://www.jatma.or.jp/kankou/pdf/Tyre_industry_2006.pdf.
Lacoste, E. and P. Chalmin (2006), 2006 World Waste Survey: From Waste toResources, Economica Editions, Paris, France, ISBN 2-7178-5310-3.
Lysen, E. (ed.) (2006), Assessment of the Interaction between Economic and PhysicalGrowth, Report UCE-34, Utrecht Centre for Energy Research, Utrecht, Netherlands.
Matthews, E., et .al. (2000), The Weight of Nations: Material Outflows from IndustrialEconomies, World Resources Institute, Washington, D.C., United States.
Moll, S., J. Acosta and H. Schütz (2005), Iron and Steel - a Materials System Analysis,Pilot Study Examining the Material Flows related to the Production and Consumptionof Steel in the European Union. ETC/RWM Working Paper 2005/3. Prepared by theEuropean Topic Centre on Waste and Material Flows, European Environment Agency,Copenhagen, Denmark. http://waste.eionet.europa.eu/wp/wp3_2005.
Neelis. M. and M. Patel (2006), Long-term Production, Energy Consumption and CO2Emission Scenarios for the Worldwide Iron and Steel Industry. Utrecht University,Copernicus Institute, Utrecht, Netherlands.
Packaging Federation (2005), Packaging – a Very Productive Resource.http://www.packagingfedn.co.uk/who_we_are/reports/PF_report_4.pdf.

Plastics Europe (2006), An Analysis of Plastics Production, Demand and Recovery inEurope, Plastics Europe Association of Plastics Manufacturers, Brussels. http://www.plasticseurope.org.
Plastic Waste Management Insitute (PWMI) (2006), Plastic Products, Plastic Wasteand Resource Recovery, PWMI newsletter no. 32, Tokyo, Japan. http://pwmi.or.jp.
Projektinriktad forskning och Utveckling (Profu) (2004), Evaluating WasteIncineration as a Treatment and Energy Recovery Method from an EnvironmentalPoint of View, Study conducted for the Confederation of European Waste-to-EnergyPlants. http://www.cewep.com/storage/med/media/press/28_profuslides.pdf
Rubber Study (2006), Statistical Summary of World Rubber Situation. http://www.rubberstudy.com/statistics-quarstat.aspx.
Ruhrberg, M. (2006), Assessing the Recycling Efficiency of Copper from End-of-LifeProducts in Western Europe, Resources, Conservation & Recycling 48, pp.141-165.
Schoen, L.A.A., et al. (not dated), Mechanical Separation of Mixed Plastics fromHousehold Waste and Energy Recovery in a Pulverised Coal-fired Power Station,APME, Brussels, Belgium.
Simmons, P., N. Goldstein, S.M. Kaufman, N.J. Themelis and J. Thompson (2006), TheState of Garbage, Biocycle April, pp. 26-43.
Solenthaler, B. and R. Bunge (2003), Waste Incineration in China, Hochschule fuerTechnik Rapperswil, Switzerland.http://www.umtec.ch/dokumente/dokumente/downloads/publikationen/Waste_Incineration_China.pdf
Themelis, N. (2003), An Overview of the Global Waste-to-Energy Industry.http://www.seas.columbia.edu/earth/papers/global_waste_to_energy.html.
Themelis, N. (2006), The Role of Waste-to-Energy in the USA.http://www.cewep.com/storage/med/media/wastepol/85_ThemelisPresentation.pdf.
United Nations Food and Agricultural Organization (UN FAO) (2007) FAOSTAT –Forestry. http://faostat.fao.org/.
United States Environmental Protection Agency (US EPA) (1998), Greenhouse GasEmissions from Management of Selected Materials in Municipal Solid Waste, EPA530-R-98-013, September, US Environmental Protection Agency.
US EPA (2006), Municipal Solid Waste in the United States, 2005 Facts and Figures.http://www.epa.gov.
US EPA (2006b), Tire Derived Fuel. http://www.epa.gov/garbage/tires/tdf.htm.
Annex D • REFERENCES 321

INTERNATIONALENERGY AGENCY
In support of the G8 Plan of Action
ENERGYINDICATORS
Order from our website:
www.iea.org/booksor e-mail: [email protected]
At their Gleneagles Summit in July 2005, G8 leaders identifi ed climate
change and securing clean energy and sustainable development as key
global challenges. They agreed that we must transform the way we use
energy and that we must start now. Improved energy effi ciency is essential
to meeting this goal. Therefore, the G8 asked the IEA to provide analysis of
energy use and effi ciency developments in buildings, appliances, transport and
industry.
This publication is a response to the G8 request. By means of in-depth
energy indicators, Energy Use in the New Millennium: Trends in IEA Countries
provides important insights to policy-makers about current energy use and
CO2 emission patterns that will help shape priorities for future action.
RELEASE September 2007
Also in the same series
Energy Usein the New Millennium
Trends in IEA Countries

All IEA publications may be boughtonline on the IEA website:
You may also obtain PDFs ofall IEA books at 20% discount.
Books published before January 2006- with the exception of the statistics publications -
can be downloaded in PDF, free of charge,from the IEA website.
You may also send
your order
to your nearest
OECD sales point
or use
the OECD online
services:
www.oecdbookshop.org
CUSTOMERS INNORTH AMERICA
Turpin DistributionThe Bleachery143 West Street, New MilfordConnecticut 06776, USAToll free: +1 (800) 456 6323Fax: +1 (860) 350 [email protected]
www.turpin-distribution.com
International Energy Agency9, rue de la Fédération75739 Paris Cedex 15, France
www.iea.org/books
The Online BookshopInternational Energy Agency
CUSTOMERS INTHE REST OF THE WORLD
Turpin Distribution Services LtdStratton Business Park,
Pegasus Drive, Biggleswade,Bedfordshire SG18 8QB, UKTel.: +44 (0) 1767 604960Fax: +44 (0) 1767 604640
www.turpin-distribution.com
IEA BOOKSTel: +33 (0)1 40 57 66 90Fax: +33 (0)1 40 57 67 75
E-mail: [email protected]

IEA PUBLICATIONS, 9, rue de la Fédération, 75739 PARIS CEDEX 15
PRINTED IN FRANCE BY STEDI MEDIA
(61 2007 15 1P1) ISBN : 978-92-64-03016--9 – JUNE 2007