Assessment of CO2 emissions and resource sustainability for ...
11
.............................................................................................................................................................. ............................................................................................................................................. ................................................................................................................................................................................ Assessment of CO 2 emissions and resource sustainability for housing construction in Malaysia Yoshinori Fujita 1, * , Hiroshi Matsumoto 2 and Ho Chin Siong 3 1 Department of Architecture and Civil Engineering, Toyohashi Universityof Technology, Aichi Prefecture, Japan 2 Department of Architecture and Civil Engineering, Toyohashi Universityof Technology, Aichi Prefecture, Japan 3 Faculty of Built Environment, Universiti Teknologi Malaysia, Johor Bahru, Malaysia *Corresponding author: [email protected] Abstract Assessment of a society’s environmental load is one of the important tasks when creating a sustainable society. The authors of this paper assessed CO 2 emissions and forest resource sustainability for the housing construction taking place in Malaysia using an Input–Output analysis. Common housing types such as apartments and terraced houses were assessed. The findings showed that the main sources of CO 2 emissions during the construction phase were generated in the building components, such as building structures and foundations. The forest resource sustainability will be sustained under certain conditions, even if timber housing construction is to be promoted. This paper also discusses the methods for both CO 2 reductions and forest resource sustainability. Keywords: housing; Malaysia; life cycle assessment; input–output analysis; resource sustainability Received 7 January 2009; revised 8 January 2009; accepted 9 January 2009 1 INTRODUCTION In the IPCC Fourth Assessment Report, it was pointed out that carbon dioxide (CO 2 ) emissions arise from anthropogenic activities. Therefore, it is important for many countries to take up the urgent task of evolving into low-carbon societies. This is especially pertinent to countries of Asia and Africa, where rapid urbanization is causing a swift increase in CO 2 emissions, mainly from the housing industries owing to escalating housing demands. When comparing housing stock in Malaysia in the year 2001 with that of 2007, it can be seen that there was a 38% increase in the unit number of housing stock as shown in Figure 1 [1]. It is also found that the trend to use concrete as a structural material is becoming more common in newly con- structed urban housing in Malaysia. Subsequently, if the present trend of the housing construction in Malaysia continues, this will only contribute to the rapidly increasing CO 2 emissions. Generally speaking, timber housing construction emits less CO 2 than reinforced-concrete housing, because greater CO 2 emis- sions are generated from the production of cement as it uses calcium carbonate as a raw material. Regarding housing in Japan, compared with wooden housing, the reinforced-concrete housing emits an estimated 23% higher CO 2 content [2]. Hence, it is expected that changing the structural materials from reinforced- concrete to timber will reduce their CO 2 emissions. Malaysia being a rich forest resource country, the idea of using timber for housing construction may be able to satisfy the housing demands and achieve a reduction in CO 2 emissions; although it is important to ensure that sustainable timber usage while also maintaining the forest as a future resource. In this paper, the authors assessed disaggregated CO 2 emis- sions from housing types and structural materials used in the housing construction sector in Malaysia. The paper also assessed the impact on forest resources from increased timber housing construction. 2 METHODS 2.1 Life-Cycle Assessment data Generally, CO 2 emissions from the housing construction sector are mainly contributed by fuel combustion and cement pro- duction processes. Therefore, in the computation of the CO 2 emissions, the authors assumed that the CO 2 was generated International Journal of Low-Carbon Technologies 2009, 4, 16–26 # The Author 2009. Published by Oxford University Press. All rights reserved. For Permissions, please email: [email protected] doi:10.1093/ijlct/ctp002 Advance Access Publication 6 March 2009 16 Downloaded from https://academic.oup.com/ijlct/article/4/1/16/763682 by guest on 30 May 2022
-
Upload
khangminh22 -
Category
Documents
-
view
0 -
download
0
Transcript of Assessment of CO2 emissions and resource sustainability for ...
. . . . . . . . . . . . . . . . . . . . . . . . . . . . . . . . . . . . . . . . . . . . . . . . . . . . . . . . . . . . . . . . . . . . . . . . . . . . . . . . . . . . . . . . . . . . . . . . . . . . . . . . . . . . . . . . . . . . . . . . . . . . . . . . . . . . . . . . . . . . . . . . . . . . . . . . . . . . . .
. . . . . . . . . . . . . . . . . . . . . . . . . . . . . . . . . . . . . . . . . . . . . . . . . . . . . . . . . . . . . . . . . . . . . . . . . . . . . . . . . . . . . . . . . . . . . . . . . . . . . . . . . . . . . . . . . . . . . . . . . . . . . . . . . . . . . . . . . . . . .
. . . . . . . . . . . . . . . . . . . . . . . . . . . . . . . . . . . . . . . . . . . . . . . . . . . . . . . . . . . . . . . . . . . . . . . . . . . . . . . . . . . . . . . . . . . . . . . . . . . . . . . . . . . . . . . . . . . . . . . . . . . . . . . . . . . . . . . . . . . . . . . . . . . . . . . . . . . . . . . . . . . . . . . . . . . . . . . .
Assessment of CO2 emissions and resourcesustainability for housing constructionin Malaysia
Yoshinori Fujita1,*, Hiroshi Matsumoto2 and Ho Chin Siong3
1Department of Architecture and Civil Engineering, Toyohashi University of Technology,Aichi Prefecture, Japan2Department of Architecture and Civil Engineering, Toyohashi University of Technology,Aichi Prefecture, Japan3Faculty of Built Environment, Universiti Teknologi Malaysia, Johor Bahru, Malaysia
*Corresponding author:
AbstractAssessment of a society’s environmental load is one of the important tasks when creating a sustainablesociety. The authors of this paper assessed CO2 emissions and forest resource sustainability for thehousing construction taking place in Malaysia using an Input–Output analysis. Common housingtypes such as apartments and terraced houses were assessed. The findings showed that the main sourcesof CO2 emissions during the construction phase were generated in the building components, such asbuilding structures and foundations. The forest resource sustainability will be sustained under certainconditions, even if timber housing construction is to be promoted. This paper also discusses themethods for both CO2 reductions and forest resource sustainability.
Keywords: housing; Malaysia; life cycle assessment; input–output analysis; resource sustainability
Received 7 January 2009; revised 8 January 2009; accepted 9 January 2009
1 INTRODUCTION
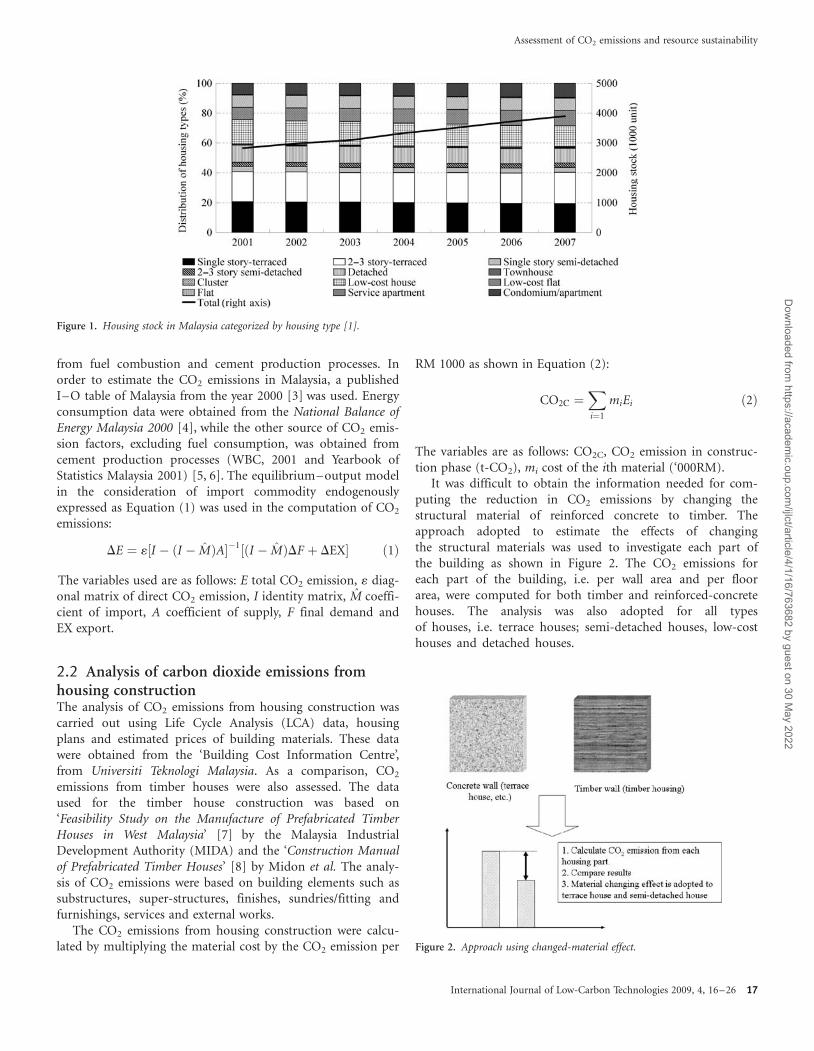
In the IPCC Fourth Assessment Report, it was pointed out thatcarbon dioxide (CO2) emissions arise from anthropogenicactivities. Therefore, it is important for many countries to takeup the urgent task of evolving into low-carbon societies. This isespecially pertinent to countries of Asia and Africa, where rapidurbanization is causing a swift increase in CO2 emissions,mainly from the housing industries owing to escalating housingdemands. When comparing housing stock in Malaysia in theyear 2001 with that of 2007, it can be seen that there was a 38%increase in the unit number of housing stock as shown inFigure 1 [1]. It is also found that the trend to use concrete as astructural material is becoming more common in newly con-structed urban housing in Malaysia. Subsequently, if the presenttrend of the housing construction in Malaysia continues, thiswill only contribute to the rapidly increasing CO2 emissions.
Generally speaking, timber housing construction emits lessCO2 than reinforced-concrete housing, because greater CO2 emis-sions are generated from the production of cement as it usescalcium carbonate as a raw material. Regarding housing in Japan,compared with wooden housing, the reinforced-concrete housing
emits an estimated 23% higher CO2 content [2]. Hence, it isexpected that changing the structural materials from reinforced-concrete to timber will reduce their CO2 emissions. Malaysiabeing a rich forest resource country, the idea of using timber forhousing construction may be able to satisfy the housingdemands and achieve a reduction in CO2 emissions; although itis important to ensure that sustainable timber usage while alsomaintaining the forest as a future resource.
In this paper, the authors assessed disaggregated CO2 emis-sions from housing types and structural materials used in thehousing construction sector in Malaysia. The paper alsoassessed the impact on forest resources from increased timberhousing construction.
2 METHODS
2.1 Life-Cycle Assessment dataGenerally, CO2 emissions from the housing construction sectorare mainly contributed by fuel combustion and cement pro-duction processes. Therefore, in the computation of the CO2
emissions, the authors assumed that the CO2 was generated
International Journal of Low-Carbon Technologies 2009, 4, 16–26# The Author 2009. Published by Oxford University Press. All rights reserved. For Permissions, please email: [email protected]:10.1093/ijlct/ctp002 Advance Access Publication 6 March 2009 16
Dow
nloaded from https://academ
ic.oup.com/ijlct/article/4/1/16/763682 by guest on 30 M
ay 2022
from fuel combustion and cement production processes. Inorder to estimate the CO2 emissions in Malaysia, a publishedI–O table of Malaysia from the year 2000 [3] was used. Energyconsumption data were obtained from the National Balance ofEnergy Malaysia 2000 [4], while the other source of CO2 emis-sion factors, excluding fuel consumption, was obtained fromcement production processes (WBC, 2001 and Yearbook ofStatistics Malaysia 2001) [5, 6]. The equilibrium–output modelin the consideration of import commodity endogenouslyexpressed as Equation (1) was used in the computation of CO2
emissions:
DE ¼ 1½I � ðI � M̂ÞA��1½ðI � M̂ÞDF þ DEX� ð1Þ
The variables used are as follows: E total CO2 emission, 1 diag-onal matrix of direct CO2 emission, I identity matrix, M̂ coeffi-cient of import, A coefficient of supply, F final demand andEX export.
2.2 Analysis of carbon dioxide emissions fromhousing constructionThe analysis of CO2 emissions from housing construction wascarried out using Life Cycle Analysis (LCA) data, housingplans and estimated prices of building materials. These datawere obtained from the ‘Building Cost Information Centre’,from Universiti Teknologi Malaysia. As a comparison, CO2
emissions from timber houses were also assessed. The dataused for the timber house construction was based on‘Feasibility Study on the Manufacture of Prefabricated TimberHouses in West Malaysia’ [7] by the Malaysia IndustrialDevelopment Authority (MIDA) and the ‘Construction Manualof Prefabricated Timber Houses’ [8] by Midon et al. The analy-sis of CO2 emissions were based on building elements such assubstructures, super-structures, finishes, sundries/fitting andfurnishings, services and external works.
The CO2 emissions from housing construction were calcu-lated by multiplying the material cost by the CO2 emission per
RM 1000 as shown in Equation (2):
CO2C ¼X
i¼1
miEi ð2Þ
The variables are as follows: CO2C, CO2 emission in construc-tion phase (t-CO2), mi cost of the ith material (‘000RM).
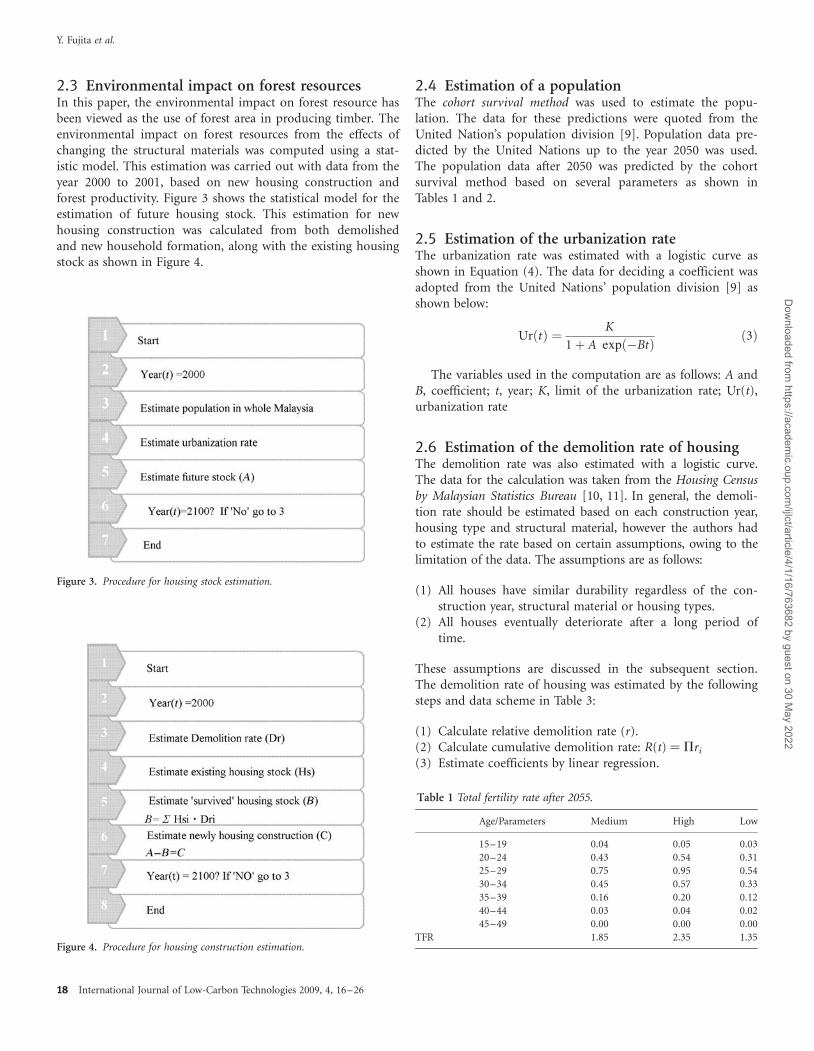
It was difficult to obtain the information needed for com-puting the reduction in CO2 emissions by changing thestructural material of reinforced concrete to timber. Theapproach adopted to estimate the effects of changingthe structural materials was used to investigate each part ofthe building as shown in Figure 2. The CO2 emissions foreach part of the building, i.e. per wall area and per floorarea, were computed for both timber and reinforced-concretehouses. The analysis was also adopted for all typesof houses, i.e. terrace houses; semi-detached houses, low-costhouses and detached houses.
Figure 2. Approach using changed-material effect.
Figure 1. Housing stock in Malaysia categorized by housing type [1].
Assessment of CO2 emissions and resource sustainability
International Journal of Low-Carbon Technologies 2009, 4, 16–26 17
Dow
nloaded from https://academ
ic.oup.com/ijlct/article/4/1/16/763682 by guest on 30 M
ay 2022
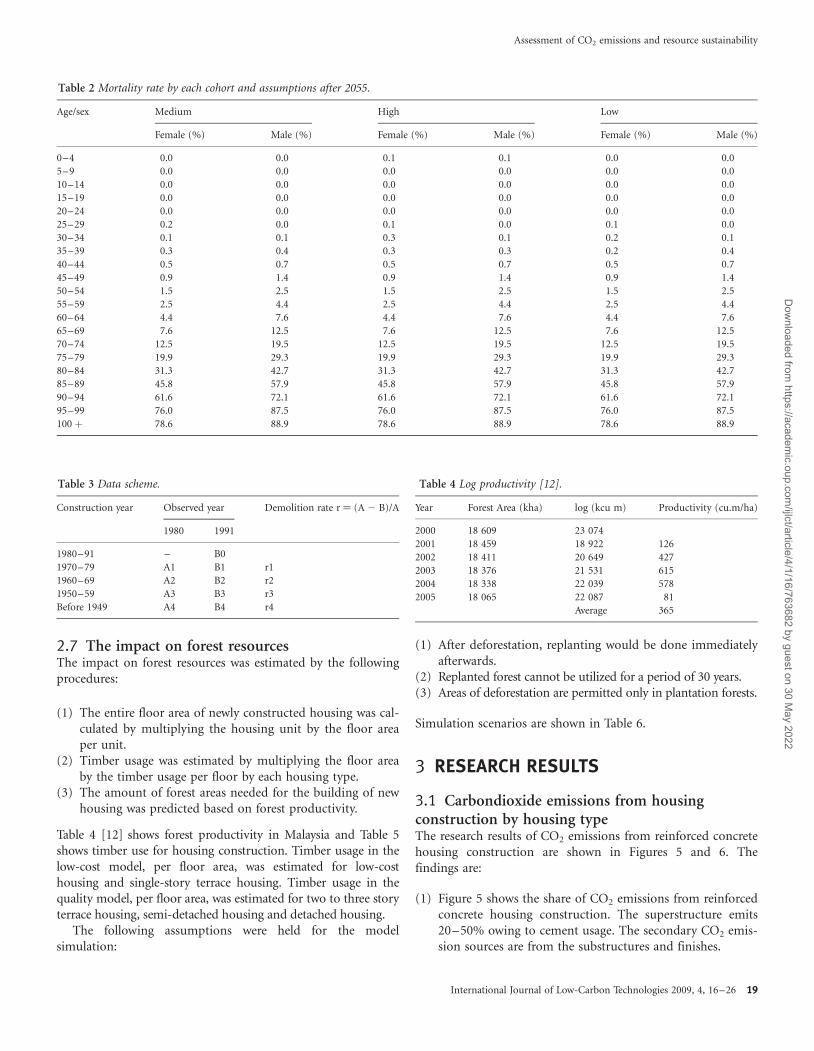
2.3 Environmental impact on forest resourcesIn this paper, the environmental impact on forest resource hasbeen viewed as the use of forest area in producing timber. Theenvironmental impact on forest resources from the effects ofchanging the structural materials was computed using a stat-istic model. This estimation was carried out with data from theyear 2000 to 2001, based on new housing construction andforest productivity. Figure 3 shows the statistical model for theestimation of future housing stock. This estimation for newhousing construction was calculated from both demolishedand new household formation, along with the existing housingstock as shown in Figure 4.
2.4 Estimation of a populationThe cohort survival method was used to estimate the popu-lation. The data for these predictions were quoted from theUnited Nation’s population division [9]. Population data pre-dicted by the United Nations up to the year 2050 was used.The population data after 2050 was predicted by the cohortsurvival method based on several parameters as shown inTables 1 and 2.
2.5 Estimation of the urbanization rateThe urbanization rate was estimated with a logistic curve asshown in Equation (4). The data for deciding a coefficient wasadopted from the United Nations’ population division [9] asshown below:
UrðtÞ ¼ K
1þ A expð�BtÞ ð3Þ
The variables used in the computation are as follows: A andB, coefficient; t, year; K, limit of the urbanization rate; Ur(t),urbanization rate
2.6 Estimation of the demolition rate of housingThe demolition rate was also estimated with a logistic curve.The data for the calculation was taken from the Housing Censusby Malaysian Statistics Bureau [10, 11]. In general, the demoli-tion rate should be estimated based on each construction year,housing type and structural material, however the authors hadto estimate the rate based on certain assumptions, owing to thelimitation of the data. The assumptions are as follows:
(1) All houses have similar durability regardless of the con-struction year, structural material or housing types.
(2) All houses eventually deteriorate after a long period oftime.
These assumptions are discussed in the subsequent section.The demolition rate of housing was estimated by the followingsteps and data scheme in Table 3:
(1) Calculate relative demolition rate (r).(2) Calculate cumulative demolition rate: R(t) ¼ Pri
(3) Estimate coefficients by linear regression.
Figure 3. Procedure for housing stock estimation.
Figure 4. Procedure for housing construction estimation.
Table 1 Total fertility rate after 2055.
Age/Parameters Medium High Low
15–19 0.04 0.05 0.03
20–24 0.43 0.54 0.31
25–29 0.75 0.95 0.54
30–34 0.45 0.57 0.33
35–39 0.16 0.20 0.12
40–44 0.03 0.04 0.02
45–49 0.00 0.00 0.00
TFR 1.85 2.35 1.35
Y. Fujita et al.
18 International Journal of Low-Carbon Technologies 2009, 4, 16–26
Dow
nloaded from https://academ
ic.oup.com/ijlct/article/4/1/16/763682 by guest on 30 M
ay 2022
2.7 The impact on forest resourcesThe impact on forest resources was estimated by the followingprocedures:
(1) The entire floor area of newly constructed housing was cal-culated by multiplying the housing unit by the floor areaper unit.
(2) Timber usage was estimated by multiplying the floor areaby the timber usage per floor by each housing type.
(3) The amount of forest areas needed for the building of newhousing was predicted based on forest productivity.
Table 4 [12] shows forest productivity in Malaysia and Table 5shows timber use for housing construction. Timber usage in thelow-cost model, per floor area, was estimated for low-costhousing and single-story terrace housing. Timber usage in thequality model, per floor area, was estimated for two to three storyterrace housing, semi-detached housing and detached housing.
The following assumptions were held for the modelsimulation:
(1) After deforestation, replanting would be done immediatelyafterwards.
(2) Replanted forest cannot be utilized for a period of 30 years.(3) Areas of deforestation are permitted only in plantation forests.
Simulation scenarios are shown in Table 6.
3 RESEARCH RESULTS
3.1 Carbondioxide emissions from housingconstruction by housing typeThe research results of CO2 emissions from reinforced concretehousing construction are shown in Figures 5 and 6. Thefindings are:
(1) Figure 5 shows the share of CO2 emissions from reinforcedconcrete housing construction. The superstructure emits20–50% owing to cement usage. The secondary CO2 emis-sion sources are from the substructures and finishes.
Table 4 Log productivity [12].
Year Forest Area (kha) log (kcu m) Productivity (cu.m/ha)
2000 18 609 23 074
2001 18 459 18 922 126
2002 18 411 20 649 427
2003 18 376 21 531 615
2004 18 338 22 039 578
2005 18 065 22 087 81
Average 365
Table 2 Mortality rate by each cohort and assumptions after 2055.
Age/sex Medium High Low
Female (%) Male (%) Female (%) Male (%) Female (%) Male (%)
0–4 0.0 0.0 0.1 0.1 0.0 0.0
5–9 0.0 0.0 0.0 0.0 0.0 0.0
10–14 0.0 0.0 0.0 0.0 0.0 0.0
15–19 0.0 0.0 0.0 0.0 0.0 0.0
20–24 0.0 0.0 0.0 0.0 0.0 0.0
25–29 0.2 0.0 0.1 0.0 0.1 0.0
30–34 0.1 0.1 0.3 0.1 0.2 0.1
35–39 0.3 0.4 0.3 0.3 0.2 0.4
40–44 0.5 0.7 0.5 0.7 0.5 0.7
45–49 0.9 1.4 0.9 1.4 0.9 1.4
50–54 1.5 2.5 1.5 2.5 1.5 2.5
55–59 2.5 4.4 2.5 4.4 2.5 4.4
60–64 4.4 7.6 4.4 7.6 4.4 7.6
65–69 7.6 12.5 7.6 12.5 7.6 12.5
70–74 12.5 19.5 12.5 19.5 12.5 19.5
75–79 19.9 29.3 19.9 29.3 19.9 29.3
80–84 31.3 42.7 31.3 42.7 31.3 42.7
85–89 45.8 57.9 45.8 57.9 45.8 57.9
90–94 61.6 72.1 61.6 72.1 61.6 72.1
95–99 76.0 87.5 76.0 87.5 76.0 87.5
100 þ 78.6 88.9 78.6 88.9 78.6 88.9
Table 3 Data scheme.
Construction year Observed year Demolition rate r ¼ (A 2 B)/A
1980 1991
1980–91 – B0
1970–79 A1 B1 r1
1960–69 A2 B2 r2
1950–59 A3 B3 r3
Before 1949 A4 B4 r4
Assessment of CO2 emissions and resource sustainability
International Journal of Low-Carbon Technologies 2009, 4, 16–26 19
Dow
nloaded from https://academ
ic.oup.com/ijlct/article/4/1/16/763682 by guest on 30 M
ay 2022
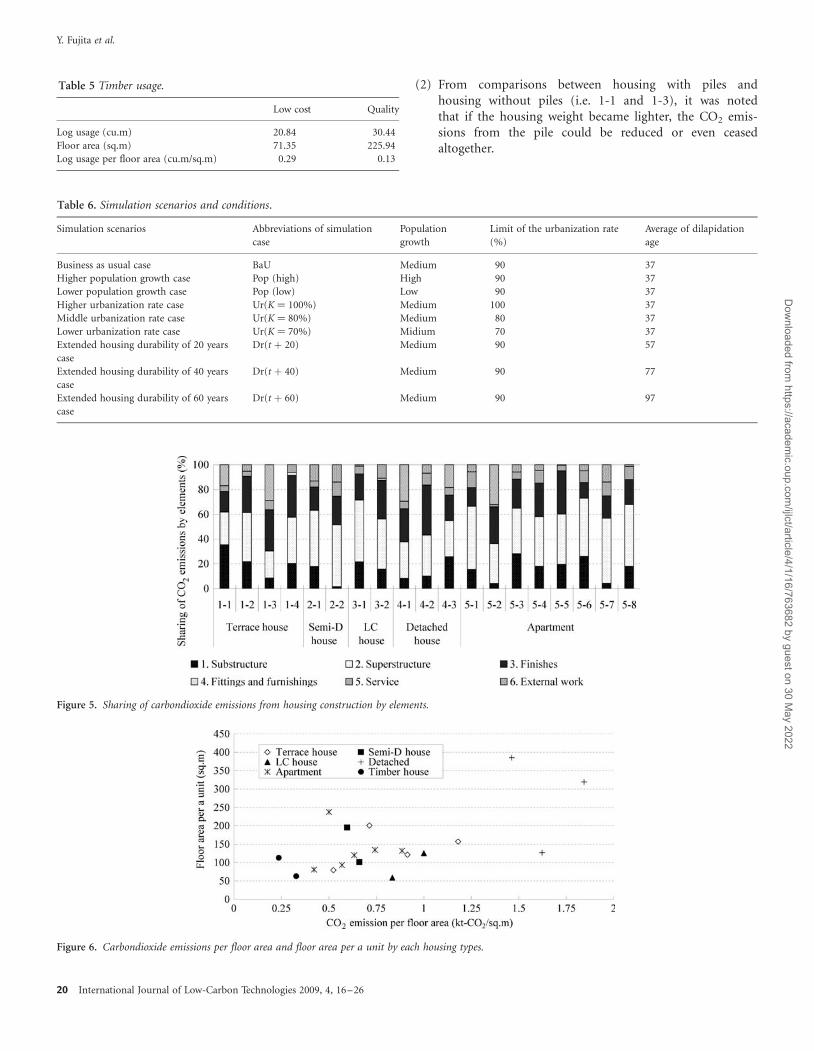
(2) From comparisons between housing with piles andhousing without piles (i.e. 1-1 and 1-3), it was notedthat if the housing weight became lighter, the CO2 emis-sions from the pile could be reduced or even ceasedaltogether.
Figure 5. Sharing of carbondioxide emissions from housing construction by elements.
Figure 6. Carbondioxide emissions per floor area and floor area per a unit by each housing types.
Table 6. Simulation scenarios and conditions.
Simulation scenarios Abbreviations of simulation
case
Population
growth
Limit of the urbanization rate
(%)
Average of dilapidation
age
Business as usual case BaU Medium 90 37
Higher population growth case Pop (high) High 90 37
Lower population growth case Pop (low) Low 90 37
Higher urbanization rate case Ur(K ¼ 100%) Medium 100 37
Middle urbanization rate case Ur(K ¼ 80%) Medium 80 37
Lower urbanization rate case Ur(K ¼ 70%) Midium 70 37
Extended housing durability of 20 years
case
Dr(t þ 20) Medium 90 57
Extended housing durability of 40 years
case
Dr(t þ 40) Medium 90 77
Extended housing durability of 60 years
case
Dr(t þ 60) Medium 90 97
Table 5 Timber usage.
Low cost Quality
Log usage (cu.m) 20.84 30.44
Floor area (sq.m) 71.35 225.94
Log usage per floor area (cu.m/sq.m) 0.29 0.13
Y. Fujita et al.
20 International Journal of Low-Carbon Technologies 2009, 4, 16–26
Dow
nloaded from https://academ
ic.oup.com/ijlct/article/4/1/16/763682 by guest on 30 M
ay 2022
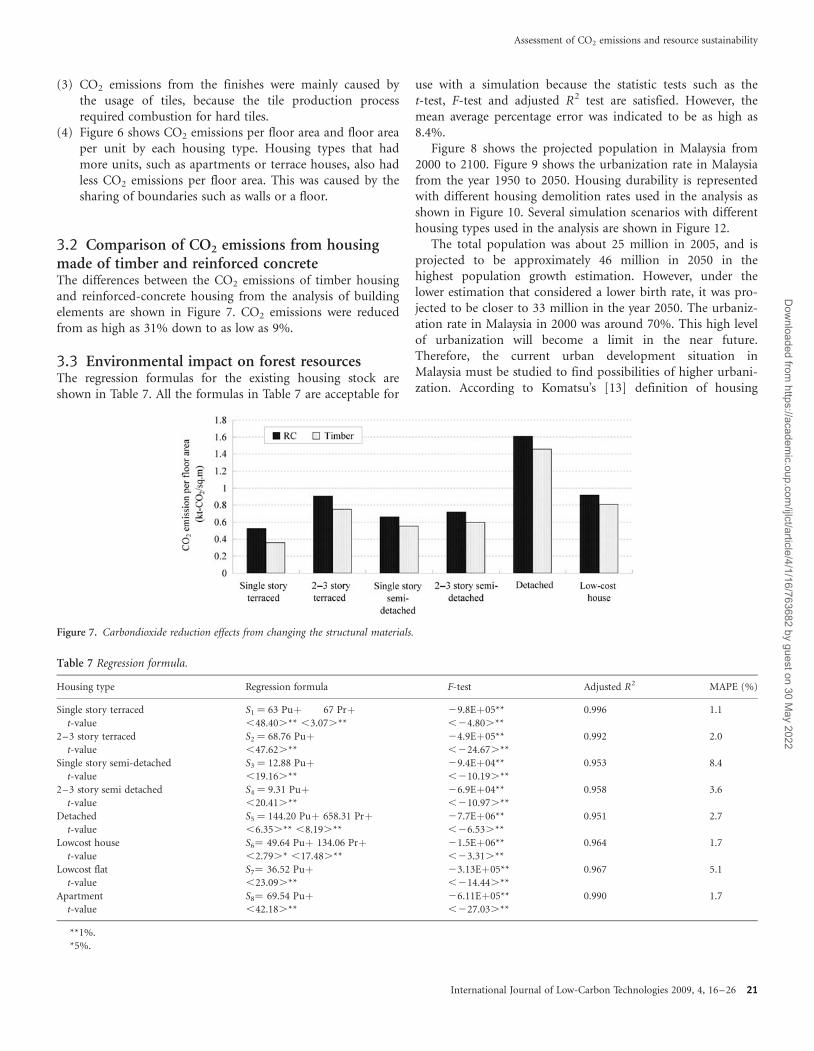
(3) CO2 emissions from the finishes were mainly caused bythe usage of tiles, because the tile production processrequired combustion for hard tiles.
(4) Figure 6 shows CO2 emissions per floor area and floor areaper unit by each housing type. Housing types that hadmore units, such as apartments or terrace houses, also hadless CO2 emissions per floor area. This was caused by thesharing of boundaries such as walls or a floor.
3.2 Comparison of CO2 emissions from housingmade of timber and reinforced concreteThe differences between the CO2 emissions of timber housingand reinforced-concrete housing from the analysis of buildingelements are shown in Figure 7. CO2 emissions were reducedfrom as high as 31% down to as low as 9%.
3.3 Environmental impact on forest resourcesThe regression formulas for the existing housing stock areshown in Table 7. All the formulas in Table 7 are acceptable for
use with a simulation because the statistic tests such as thet-test, F-test and adjusted R2 test are satisfied. However, themean average percentage error was indicated to be as high as8.4%.
Figure 8 shows the projected population in Malaysia from2000 to 2100. Figure 9 shows the urbanization rate in Malaysiafrom the year 1950 to 2050. Housing durability is representedwith different housing demolition rates used in the analysis asshown in Figure 10. Several simulation scenarios with differenthousing types used in the analysis are shown in Figure 12.
The total population was about 25 million in 2005, and isprojected to be approximately 46 million in 2050 in thehighest population growth estimation. However, under thelower estimation that considered a lower birth rate, it was pro-jected to be closer to 33 million in the year 2050. The urbaniz-ation rate in Malaysia in 2000 was around 70%. This high levelof urbanization will become a limit in the near future.Therefore, the current urban development situation inMalaysia must be studied to find possibilities of higher urbani-zation. According to Komatsu’s [13] definition of housing
Figure 7. Carbondioxide reduction effects from changing the structural materials.
Table 7 Regression formula.
Housing type Regression formula F-test Adjusted R2 MAPE (%)
Single story terraced S1 ¼ 63 Puþ 67 Prþ 29.8Eþ05** 0.996 1.1
t-value ,48.40.** ,3.07.** ,24.80.**
2–3 story terraced S2 ¼ 68.76 Puþ 24.9Eþ05** 0.992 2.0
t-value ,47.62.** ,224.67.**
Single story semi-detached S3 ¼ 12.88 Puþ 29.4Eþ04** 0.953 8.4
t-value ,19.16.** ,210.19.**
2–3 story semi detached S4 ¼ 9.31 Puþ 26.9Eþ04** 0.958 3.6
t-value ,20.41.** ,210.97.**
Detached S5 ¼ 144.20 Puþ 658.31 Prþ 27.7Eþ06** 0.951 2.7
t-value ,6.35.** ,8.19.** ,26.53.**
Lowcost house S6¼ 49.64 Puþ 134.06 Prþ 21.5Eþ06** 0.964 1.7
t-value ,2.79.* ,17.48.** ,23.31.**
Lowcost flat S7¼ 36.52 Puþ 23.13Eþ05** 0.967 5.1
t-value ,23.09.** ,214.44.**
Apartment S8¼ 69.54 Puþ 26.11Eþ05** 0.990 1.7
t-value ,42.18.** ,227.03.**
**1%.
*5%.
Assessment of CO2 emissions and resource sustainability
International Journal of Low-Carbon Technologies 2009, 4, 16–26 21
Dow
nloaded from https://academ
ic.oup.com/ijlct/article/4/1/16/763682 by guest on 30 M
ay 2022
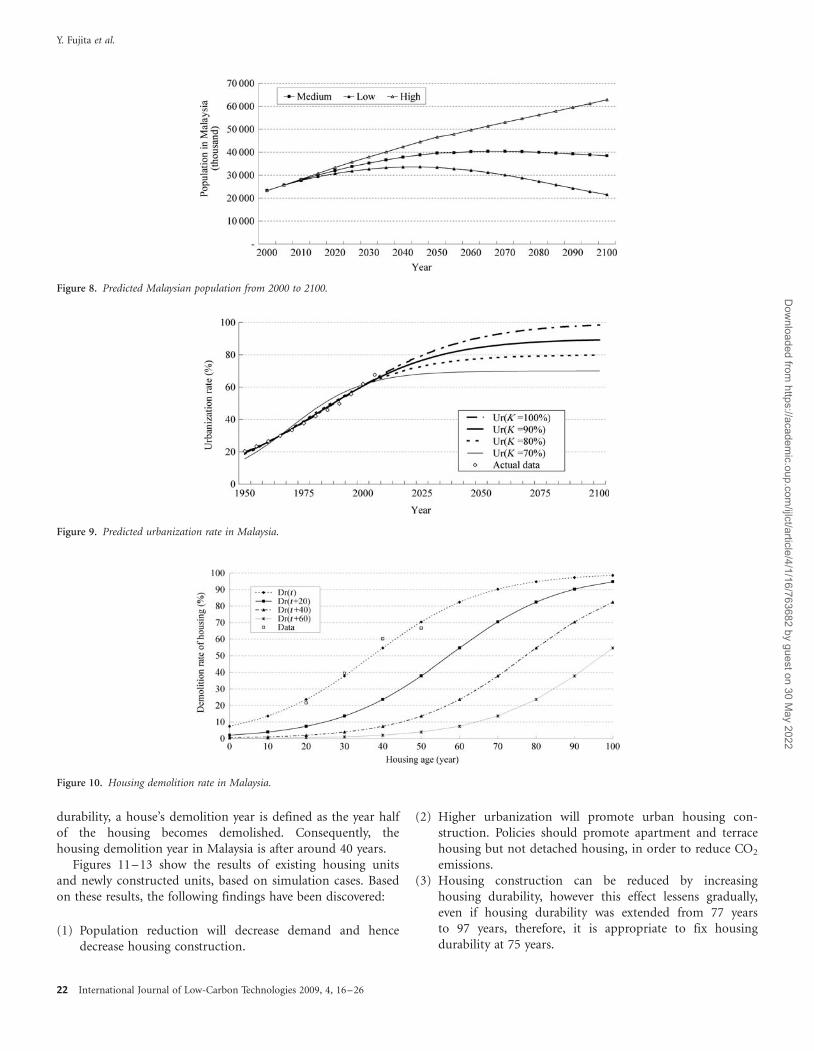
durability, a house’s demolition year is defined as the year halfof the housing becomes demolished. Consequently, thehousing demolition year in Malaysia is after around 40 years.
Figures 11–13 show the results of existing housing unitsand newly constructed units, based on simulation cases. Basedon these results, the following findings have been discovered:
(1) Population reduction will decrease demand and hencedecrease housing construction.
(2) Higher urbanization will promote urban housing con-struction. Policies should promote apartment and terracehousing but not detached housing, in order to reduce CO2
emissions.(3) Housing construction can be reduced by increasing
housing durability, however this effect lessens gradually,even if housing durability was extended from 77 yearsto 97 years, therefore, it is appropriate to fix housingdurability at 75 years.
Figure 8. Predicted Malaysian population from 2000 to 2100.
Figure 9. Predicted urbanization rate in Malaysia.
Figure 10. Housing demolition rate in Malaysia.
Y. Fujita et al.
22 International Journal of Low-Carbon Technologies 2009, 4, 16–26
Dow
nloaded from https://academ
ic.oup.com/ijlct/article/4/1/16/763682 by guest on 30 M
ay 2022
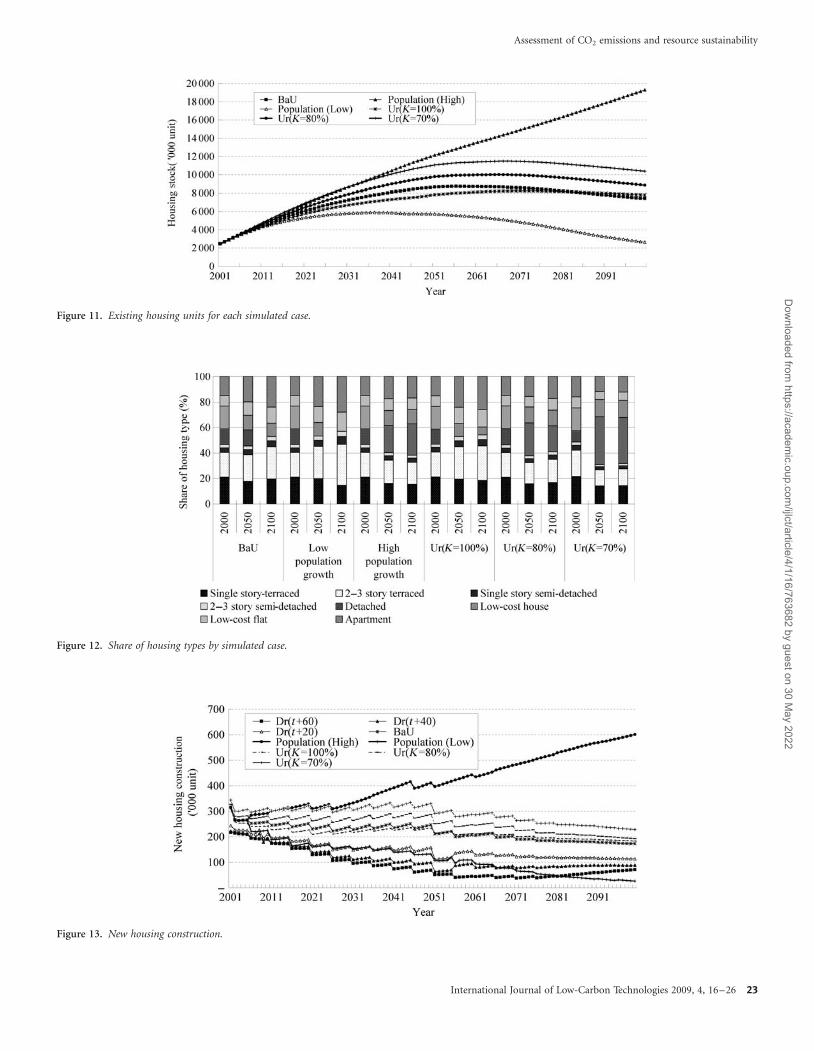
Figure 11. Existing housing units for each simulated case.
Figure 12. Share of housing types by simulated case.
Figure 13. New housing construction.
Assessment of CO2 emissions and resource sustainability
International Journal of Low-Carbon Technologies 2009, 4, 16–26 23
Dow
nloaded from https://academ
ic.oup.com/ijlct/article/4/1/16/763682 by guest on 30 M
ay 2022
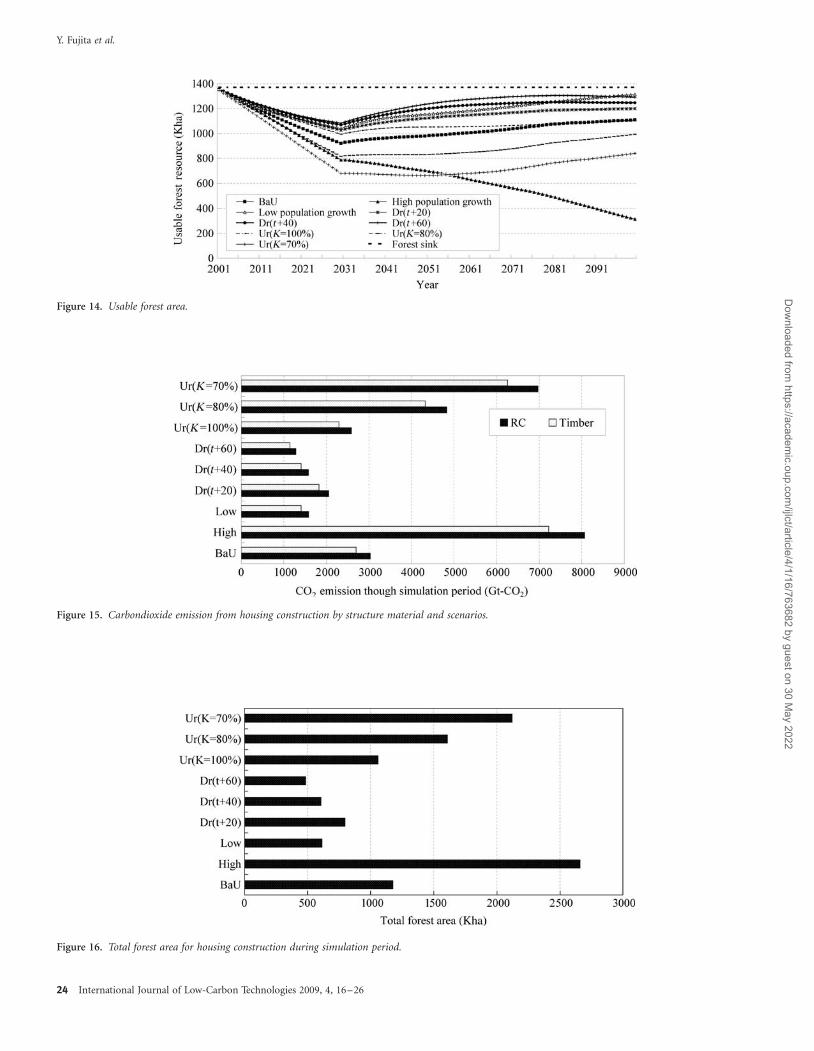
Figure 14. Usable forest area.
Figure 15. Carbondioxide emission from housing construction by structure material and scenarios.
Figure 16. Total forest area for housing construction during simulation period.
Y. Fujita et al.
24 International Journal of Low-Carbon Technologies 2009, 4, 16–26
Dow
nloaded from https://academ
ic.oup.com/ijlct/article/4/1/16/763682 by guest on 30 M
ay 2022
Usable forest areas for each simulation case are shownin Figure 14. The cumulative CO2 emissions during thesimulation period were compared in Figure 15. The require-ments of forest resources for 100 years are shown inFigure 16.
The following findings have been discovered from the simu-lation results.(1) Regarding rapid population growth cases, sustainable forest
resource use is impossible because of a greater demand onsuch resources which exceeded the productively.
(2) Cases for the increase of housing durability up to 60 yearsappears to have the lowest projected impact on forestresources, followed by extending housing durability up to40 years and low population growth.
(3) Extending housing durability 60 years has the lowest pro-jected CO2 emissions for 100 years among all the simu-lation cases, followed by the increase of housing durabilityup to 40 years and low population case.
4 DISCUSSION
4.1 CO2 emissions from housing constructionphaseThis section discusses countermeasures against CO2 emission.The countermeasures to reduce CO2 emissions are as follows:
(1) Building lower density housing such as terrace housing.Reducing structural weight by changing structural materialto timber, a reduction of emissions can be expected.
(2) Building should abstain from using tile for finishes.However, the relationship between housing durability andfinishing materials has not yet been studied in detail,hence this idea must be considered carefully.
(3) It is also important to improve housing durability. For thegoal of reducing CO2 emissions in the construction phase,it is adequate to set the housing demolition year at around75 years, from the perspective of reduction of CO2 emis-sion through construction phase.
This study did not show how to increase housing durability.According to Komatsu et al. [13], changing the Japanese life-style may be a main factor of housing durability in Japan. Inthe Malaysian case, this hypothesis also might be useful for theconsideration of housing durability. A study for determiningthe factors that affect housing durability in Malaysia must beconducted.
4.2 Carbondioxide reduction effect by changingthe structural materialThe results show that changing the structural material to timberhas a smaller CO2 reduction effect than population control, theextension of housing durability and urbanization. Therefore,these countermeasures must be adopted before structuralmaterials are changed. Furthermore, these measures are also
expected to reduce the impact of building on forest resources. Inparticular, we believe the extension of housing durability to bethe most effective countermeasure against CO2 emissions becausepopulation control has adverse effects on the economy and socialwelfare. In addition, a limit on the extent to which urbanizationcan be encouraged will soon be reached.
4.3 Carbondioxide emissions from housingconstruction and developmentFrom the findings, the following things are considered to beimportant in reducing CO2 emissions from housing construc-tion and making low carbon housing developments.
(1) Improvement of housing durability(2) Promotion of urbanization and compact city development.
In other words, the construction of housing which has ahigh occupant density in urban areas.
(3) Development of a control policy to prevent suburbansprawl.
(4) Promotion of low rise building construction (lower housing,i.e. terrace houses, row houses or semi-detached houses)using timber structures in suburban areas.
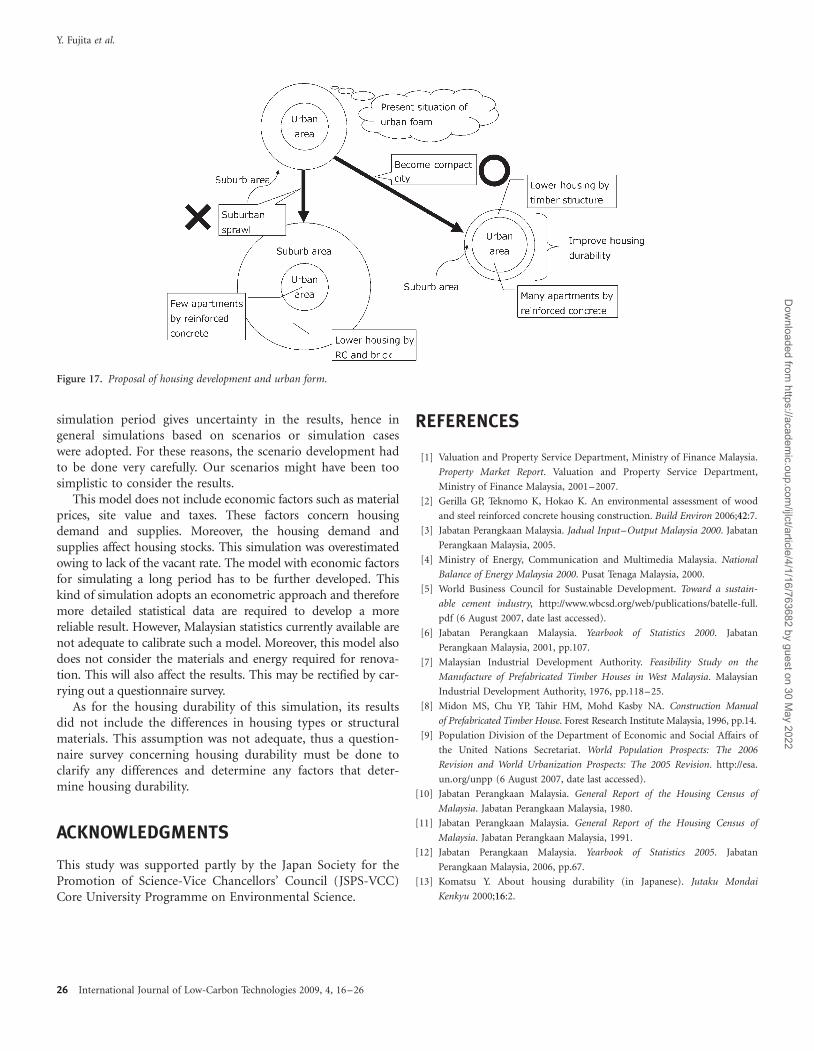
Figure 17 shows the idea of a compact city and the preventionof suburban sprawl as basic strategies of urban planning. Theseimportant findings can reinforce the idea of a ‘compact city’from the perspective of maintaining resource sustainability andCO2 reduction from housing development. However, there is alittle room for urbanization to contribute to CO2 reduction asit is already high, i.e. 70%. Therefore, the improvement ofhousing durability by using timber structures for lowerhousing is a possible option even though it is important toalso manage population growth to help maintain the sustain-ability of forest resources.
4.4 A limit of this simulation and some tasks forfuture researchIn this section, the authors discuss a limit of this simulationand some tasks. The following things were not consideredwhen the authors developed this model;
(1) The simulation period and uncertainty;(2) Economic factors such as energy price, site value and
taxes;(3) The vacant rate of housing and backlog;(4) The energy and materials required for renovations;(5) Other building types such as commercial and office
buildings;(6) The differences in housing durability among housing types
and structure materials.
The reason of why a long-term simulation period was usedwas to confirm the effect of extending housing durabilityagainst housing construction. It was also used to account forthe time necessary for trees to mature. In contrast, a long-term
Assessment of CO2 emissions and resource sustainability
International Journal of Low-Carbon Technologies 2009, 4, 16–26 25
Dow
nloaded from https://academ
ic.oup.com/ijlct/article/4/1/16/763682 by guest on 30 M
ay 2022
simulation period gives uncertainty in the results, hence ingeneral simulations based on scenarios or simulation caseswere adopted. For these reasons, the scenario development hadto be done very carefully. Our scenarios might have been toosimplistic to consider the results.
This model does not include economic factors such as materialprices, site value and taxes. These factors concern housingdemand and supplies. Moreover, the housing demand andsupplies affect housing stocks. This simulation was overestimatedowing to lack of the vacant rate. The model with economic factorsfor simulating a long period has to be further developed. Thiskind of simulation adopts an econometric approach and thereforemore detailed statistical data are required to develop a morereliable result. However, Malaysian statistics currently available arenot adequate to calibrate such a model. Moreover, this model alsodoes not consider the materials and energy required for renova-tion. This will also affect the results. This may be rectified by car-rying out a questionnaire survey.
As for the housing durability of this simulation, its resultsdid not include the differences in housing types or structuralmaterials. This assumption was not adequate, thus a question-naire survey concerning housing durability must be done toclarify any differences and determine any factors that deter-mine housing durability.
ACKNOWLEDGMENTS
This study was supported partly by the Japan Society for thePromotion of Science-Vice Chancellors’ Council (JSPS-VCC)Core University Programme on Environmental Science.
REFERENCES
[1] Valuation and Property Service Department, Ministry of Finance Malaysia.
Property Market Report. Valuation and Property Service Department,
Ministry of Finance Malaysia, 2001–2007.
[2] Gerilla GP, Teknomo K, Hokao K. An environmental assessment of wood
and steel reinforced concrete housing construction. Build Environ 2006;42:7.
[3] Jabatan Perangkaan Malaysia. Jadual Input–Output Malaysia 2000. Jabatan
Perangkaan Malaysia, 2005.
[4] Ministry of Energy, Communication and Multimedia Malaysia. National
Balance of Energy Malaysia 2000. Pusat Tenaga Malaysia, 2000.
[5] World Business Council for Sustainable Development. Toward a sustain-
able cement industry, http://www.wbcsd.org/web/publications/batelle-full.
pdf (6 August 2007, date last accessed).
[6] Jabatan Perangkaan Malaysia. Yearbook of Statistics 2000. Jabatan
Perangkaan Malaysia, 2001, pp.107.
[7] Malaysian Industrial Development Authority. Feasibility Study on the
Manufacture of Prefabricated Timber Houses in West Malaysia. Malaysian
Industrial Development Authority, 1976, pp.118–25.
[8] Midon MS, Chu YP, Tahir HM, Mohd Kasby NA. Construction Manual
of Prefabricated Timber House. Forest Research Institute Malaysia, 1996, pp.14.
[9] Population Division of the Department of Economic and Social Affairs of
the United Nations Secretariat. World Population Prospects: The 2006
Revision and World Urbanization Prospects: The 2005 Revision. http://esa.
un.org/unpp (6 August 2007, date last accessed).
[10] Jabatan Perangkaan Malaysia. General Report of the Housing Census of
Malaysia. Jabatan Perangkaan Malaysia, 1980.
[11] Jabatan Perangkaan Malaysia. General Report of the Housing Census of
Malaysia. Jabatan Perangkaan Malaysia, 1991.
[12] Jabatan Perangkaan Malaysia. Yearbook of Statistics 2005. Jabatan
Perangkaan Malaysia, 2006, pp.67.
[13] Komatsu Y. About housing durability (in Japanese). Jutaku Mondai
Kenkyu 2000;16:2.
Figure 17. Proposal of housing development and urban form.
Y. Fujita et al.
26 International Journal of Low-Carbon Technologies 2009, 4, 16–26
Dow
nloaded from https://academ
ic.oup.com/ijlct/article/4/1/16/763682 by guest on 30 M
ay 2022