The efficiency and equity of marketable permits for CO2 emissions
30
Resource and Enert ;’ Economics 15 (1993) 117-146. Nort Adam Rose Department oj Mineral Economics, The Pennsylvania State i~nircrsity, University Park, PA 16802, L’SA Brandt Stevens Fuels Planning Ofice. Cul$wr iu Enqg Commission. Sucramer;to, CA 95814, USA Final version received Decem!ber 1992 This Daper examines the eficiency and equity implications of alternative assignments of marketable permits for carbon dioxide. A no+linear programming model is used ?o estimate the net welfare changes of permit allocations based on Sovereignty and Rawlsian equity criteria for 8 countries/regions covering the spectrum of economic development levels. The net welfare gains associated with LT. overall 204, reduction in COz emissions are estimated to be nearly $20 billion, an increase of several billion dollars over a system of inflexible emission quotas requiring 200, abatement in each country. Also, although the welfare changes Implied by alternative permit assignments may vary greatly between countries before trading, the tr:!.fing process significantly reduces the disparities. This result stems from the Coase Theorem, which implies a uniquely ellicient outcome. That is, individual country abatement levels and. hence, costs. are the same under all permit assignments after trading, ;rld net welfare for J gven nation differs only by the amount of permit revenues/expenditures associated with the app!;cation of alternative equity criteria. For‘:most among the paper’s policy implications is that although equity criteria ma! differ significantly in principle. their welfare implica;ions in practice may be v:zry similar for various subsets of these criteria. This should reduce tensions at the bargaining table and facilitate the negotiation of greenhouse gas agreements. 1. Inlroduction Several policy instruments have been proposed to add-sss the acceleration of global warming caused by CO2 emissions [e.g., Flavin (1990), Grubb and Sebenius (1991)]. Although significant progress has been made in analyzing the theoretical aspects of these instruments [e.g., Poterba (1991) on taxes, and Task Force ( 1991) on marketable permits], there are still some Correspondence to: Professor Adam Rose. Department of ineral Economics, The Pennsylvania State IJniversity. 221 Eric A. Walker Building, University ‘Park. PA 16802. USA. *The views expressed in this paper are those of the authors and do not represent any ofkid i;&lion. 0928-7655,‘93,~506.00 (‘ 1993 -Elsevier Science Publishers B.V. All rights reserved
-
Upload
independent -
Category
Documents
-
view
0 -
download
0
Transcript of The efficiency and equity of marketable permits for CO2 emissions
Resource and Enert ;’ Economics 15 (1993) 117-146. Nort
Adam Rose
Department oj Mineral Economics, The Pennsylvania State i~nircrsity, University Park, PA 16802,
L’SA
Brandt Stevens
Fuels Planning Ofice. Cul$wr iu Enqg Commission. Sucramer;to, CA 95814, USA
Final version received Decem!ber 1992
This Daper examines the eficiency and equity implications of alternative assignments of marketable permits for carbon dioxide. A no+linear programming model is used ?o estimate the net welfare changes of permit allocations based on Sovereignty and Rawlsian equity criteria for 8 countries/regions covering the spectrum of economic development levels.
The net welfare gains associated with LT. overall 204, reduction in COz emissions are estimated to be nearly $20 billion, an increase of several billion dollars over a system of inflexible emission quotas requiring 200, abatement in each country. Also, although the welfare changes Implied by alternative permit assignments may vary greatly between countries before trading, the tr:!.fing process significantly reduces the disparities. This result stems from the Coase Theorem, which implies a uniquely ellicient outcome. That is, individual country abatement levels and. hence, costs. are the same under all permit assignments after trading, ;rld net welfare for J gven nation differs only by the amount of permit revenues/expenditures associated with the app!;cation of alternative equity criteria.
For‘:most among the paper’s policy implications is that although equity criteria ma! differ significantly in principle. their welfare implica;ions in practice may be v:zry similar for various subsets of these criteria. This should reduce tensions at the bargaining table and facilitate the negotiation of greenhouse gas agreements.
1. Inlroduction
Several policy instruments have been proposed to add-sss the acceleration of global warming caused by CO2 emissions [e.g., Flavin (1990), Grubb and Sebenius (1991)]. Although significant progress has been made in analyzing the theoretical aspects of these instruments [e.g., Poterba (1991) on taxes, and Task Force ( 1991) on marketable permits], there are still some
Correspondence to: Professor Adam Rose. Department of ineral Economics, The Pennsylvania State IJniversity. 221 Eric A. Walker Building, University ‘Park. PA 16802. USA.
*The views expressed in this paper are those of the authors and do not represent any ofkid i;&lion.
0928-7655,‘93,~506.00 (‘ 1993 -Elsevier Science Publishers B.V. All rights reserved
118 A. Rose and B. Stevens, Marketable permits jib* CO2 emissions
unresolved issues. These include the free-rider problem and the optimal distribution of tax revenues or permit assignments. Furthermore, empirical assessments of the performance of these instruments are needed for policy- makers to reach an informed decision on the control of greenhouse gases. Most analyses thus far have focused on the direct costs [e.g., Darmstadter and Plantinga (1991)] and some on macroeconomic impacts [e.g., Manne and Richels (1991)] of various policies, but few have examined both benefits and costs [Nordhaus (1991b) is a notable exception].
The purpose of this paper is to perform an economic analysis of a tradeable permits approach to global warming policy. Section 2 contains a theoretical analysis of efficiency implications of this instrument. Also pre- sented are alternative welfare measures, distinguished according to assump- tions regarding opportunity costs and free-riders. Because there is no consensus on a single best definition of equity, section 3 presents several international equity criteria for consideration. Each alternative is then translated into an operational rule for assigning permits among the nations of the world.
Section 4 presents the detaiis of a mathematical programming model we construct to perform our empirical analysis, including a discussion of cost and benefit data. In section 5, the model is used to estimate the weifare implications of utilizing various equity criteria for the initial assignment of permits. Pre- and post-trading outcomes are compared for eight countries/ regions: LTnited States, Canada, Western Europe, Commonwealth of Indepen- dent States, Brazil, Central Africa, Indonesia, and China.
Our empirical results indicate that permit trading can lower mitigation costs by tens of billions of dollars in the aggregate vis-a-vis an inflexible system of emission quotas. For the countries/regions examined, aggregate and individual net benefits of moderatt CO1 cutbacks are positive. At the same time, we found that the popular policy proposal of a 20% reduction in current CO2 emission levels (considered necessary to stabilize atmospheric concentrations) may be higher than the economically efficient level. Our ~natysis also chows that initial welfare changes vary considerably between assignments of permits according to various equity criteria, but that the trading process helps reduce * &hese disparities significantly. This result should be of great vaiue to policy-makers. It hejps natrov v the distinctions between equity criteria, thereby enabling policy-makers to focus on those most likely to bring about an agreement on CU3, emission reductions.
ionale for the marketable permits approach stems from the work of Coase ( : 960). hat has become known as the Coase Theorem states:
ahties can bc eh ctivcly through arket transactio
A. Rose and B. Stevens, Marketabk permitsfor CO2 emissioiis 119
C& Abatement
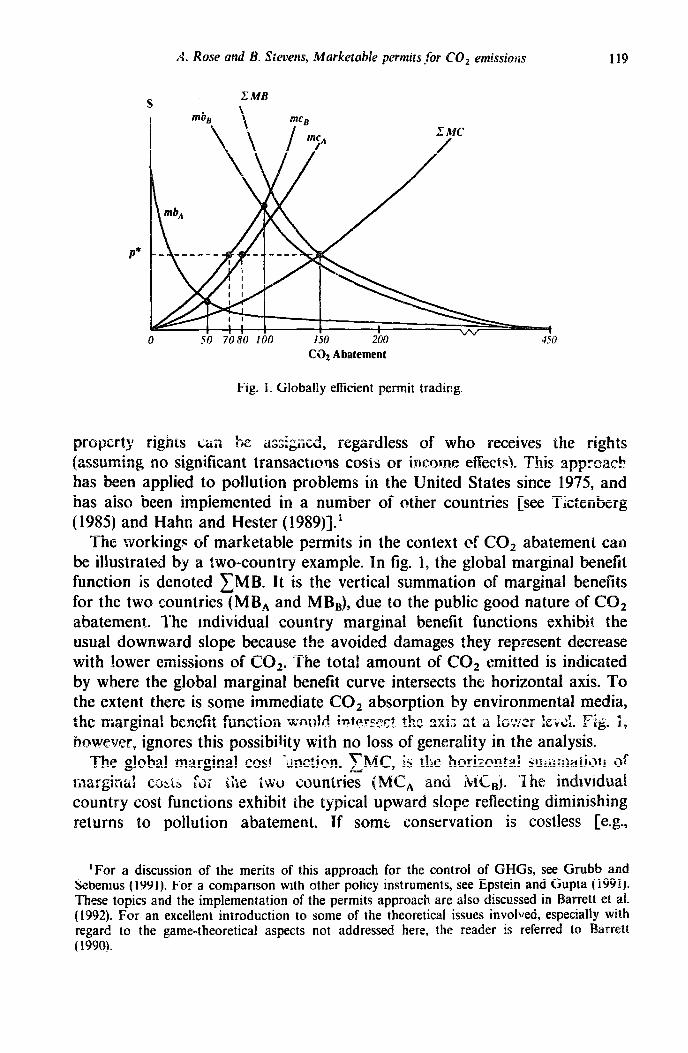
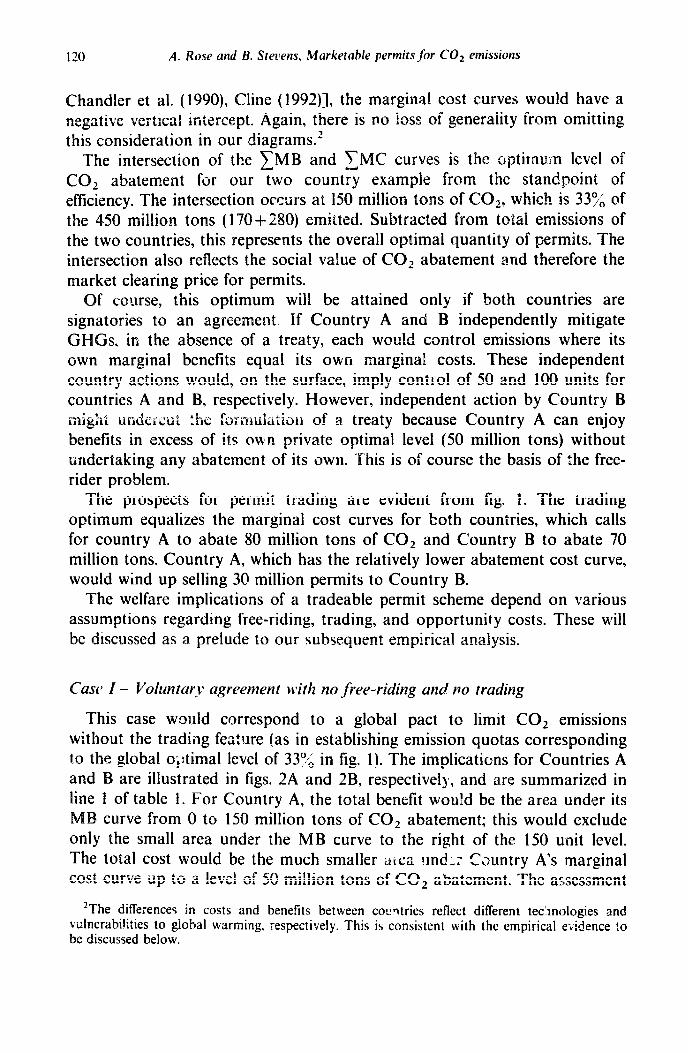
Fig. I. Globally efficient permit trading.
picq.wty rights Cal he astigiicd, regardless of who receives the rights (assuming no significant transactroas costs or income effects!. This apprsack has been applied to pollution problems in the United States since 1975, and has also been implemented in a number of other countries [see Tictenberg ( 1985) and Hahn and Hester (1989)-J.’
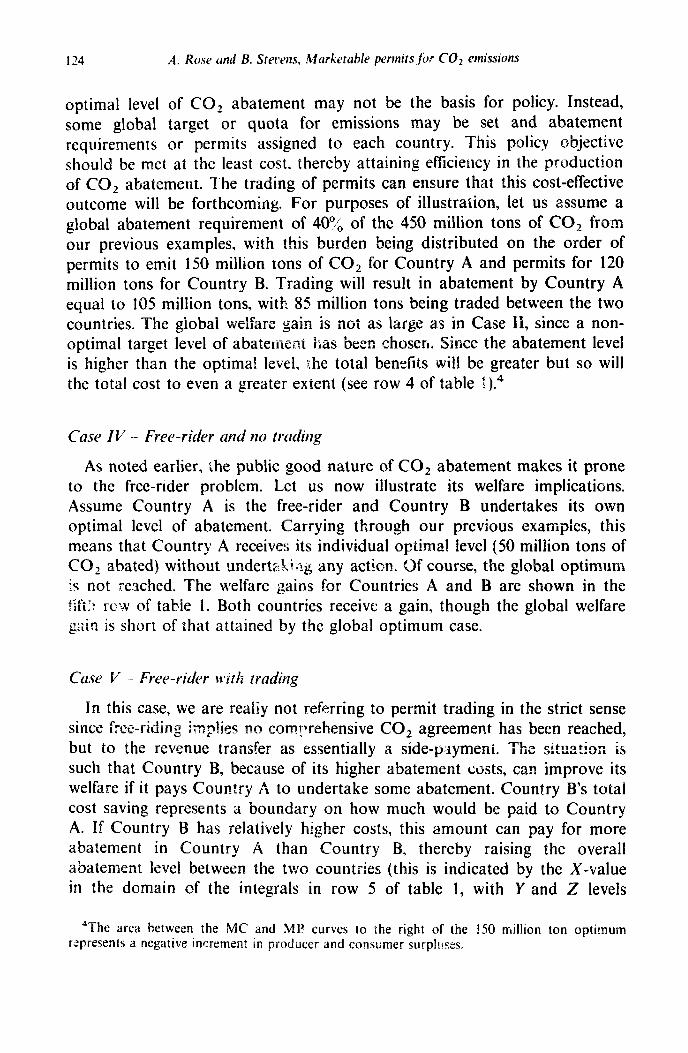
The workings of marketable permits in the context cf CO, abatement can be illustrated by a two-country example. In fig. 1, the global marginal benefit function is denoted CMB. It is the vertical summation of marginal benefits for the two countries (MBA and MBB), due to the public good nature of CO2 abatement. The individual country marginal benefit functions exhibit the usual downward slope because the avoided damages they represent decrease with lower @missions of COz. The total amount of CO2 emitted is indicated by where the global marginal benefit curve intersects the horizontal axis. To the extent there is some immediate CO, absorption by environmental media, the marginal benefit function would +e~c? thz axi;; at i; IGVX~ !e~l. Fig. i, however, ignores this possibility with no loss of generality in the analysis.
The global marginal cost ‘lanction, ~,MC, is the horizontal SUillUlalid)ti Of
margkGil c3CAB hr ;k ~WJ countries (MC, and k&j. ‘I he individual country cost functions exhibit the typical upward slope reflecting diminishing returns to pollution abatement. If some conservation is costless [e.g.,
‘For a discussion of the merits of this approach for the control of GHGs, see Grubb and Sebenius (1991). For a comparison with other policy instruments, see Epstein and Gupta (1991). These topics and the implementation of the permits approach are also discussed in Barrett et al. (1992). For an excellent introduction to some of the theoretical issues involved, especially with regard to the game-theoretical aspects not addressed here, the reader is referred to arrett (1990).
120 A. Rose and B. Stevens, Marketable permits for CO2 emissions
Chandler et al. (1990), Cline (1992)-J, the marginal cost curves would have a negative vcrtica! intercept. Again, there is no loss of generality from omitting this consideration in our diagrams.’
The intersection of the CMB and r_haC curves is the optimum level of CO2 abatement for our two country example from the standpoint of efficiency. The intersection occurs at 150 million tons of COZr which is 337: of the 450 million tons (170+280) emitted. Subtracted from total emissions of the two countries, this represents the overall optimal quantity of permits. The intersection also reflects the social value of CO2 abatement and therefore the market clearing price for permits.
Of course, this optimum will be attained only if both countries are signatories to an agreement. If Country A and B independently mitigate GHGs, in the absence of a treaty, each would control emissions where its own marginal benefits equal its own marginal costs. These independent country actions would, on the surface, imply control of 50 and 100 units for countries A and B, respectively. However, independent action by Country B m&$“L alad<ri.&t :hc form~&ti~~~ of a treaty because Country A can enjoy benefits in excess of its o&n private optimal level (50 million tons) without undertaking any abatement of its own. This is of course the basis of the free- rider problem.
The prospects for permit trading are evident from fig. 1. The trading optimum equalizes the marginal cost curves for both countries, which calls for country A to abate 80 million tons of CO2 and Country B to abate 70 million tons. Country A, which has the relatively lower abatement cost curve, would wind up selling 30 million permits to Country B.
The welfare implications of a tradeable permit scheme depend on various assumptions regarding free-riding, trading, and opportunity costs. These will be discussed as a prelude to our subsequent empirical analysis.
Case I - Voluntary agreement with no free-riding and no trading
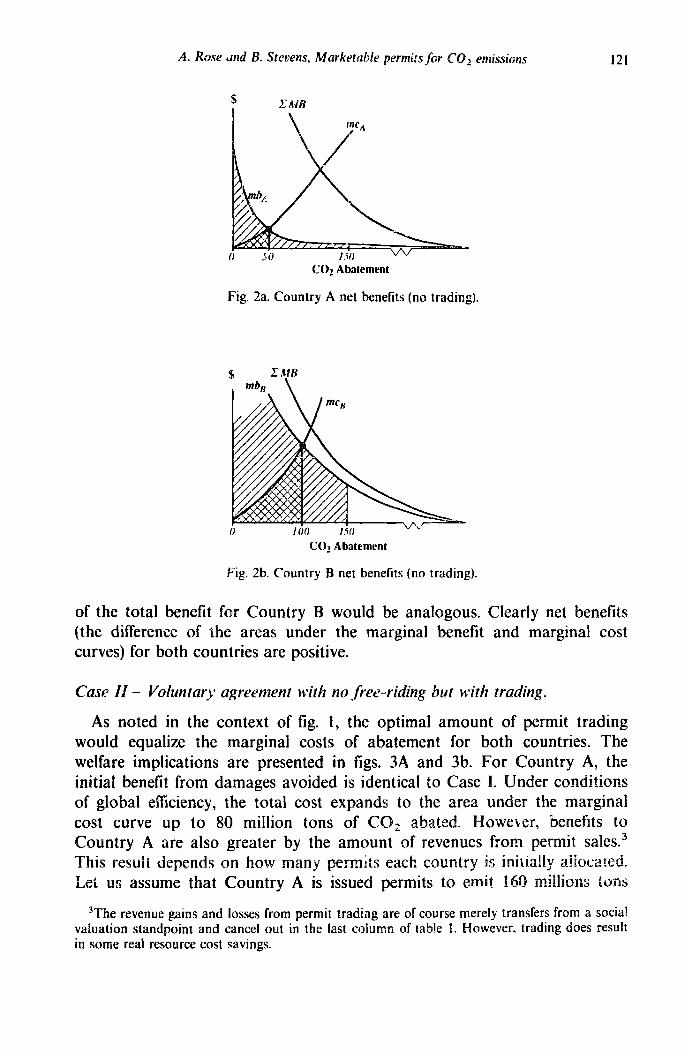
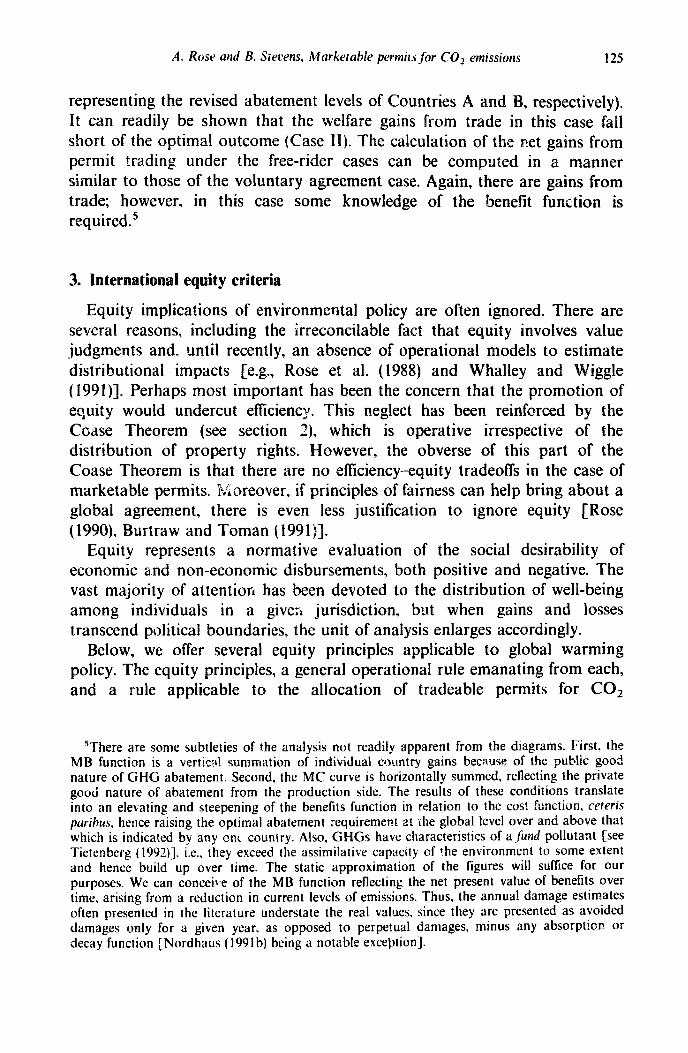
This case would correspond to a global pact to limit CO, emissions without the trading feature (as in establishing emission quotas corresponding to the global o;:timal level of 339d in fig. 1). The implications for Countries A and B are illustrated in figs. 28 and 2B, respectively, and are summarized in line 1 of table 1. For Country A, the total benefit would be the area under its
curve from 0 to 150 million tons of CO2 abatement; this would exclude only the small area under the MB curve to the right of the 150 unit level. The total cost would be the much smaller aica und:; Country A’s marginal
-:II:,, cost ciirve up to a Ievc: of 52 lLlllllulI tons of CG, auaLLlll~lll. I.,.c,,,,+ l-l., n.-0~.-..-.-a~* I lib asJLJJIIlbllI
*The differences in costs and benefits between cocytries reflect different tec:mologies and vulnerabitities to global warming, respectively. This is consistent with the empirical evidence to be discussed below.
A. Rose dnd B. Stcoens, Markrtnhle permi!s jar CO1 emissions 121
CO2 Abatement
Fig. 2a. Country A net benefits (no trading).
COz Abatement
Fig. 2b. Country B net benefits (no trading).
of the total benefit for Country B would be analogous. Clearly net benefits (the difference of the areas under the marginal benefit and marginal cost curves) for both countries are positive.
Case II - Voluntary agreement with no free-riding but with trading.
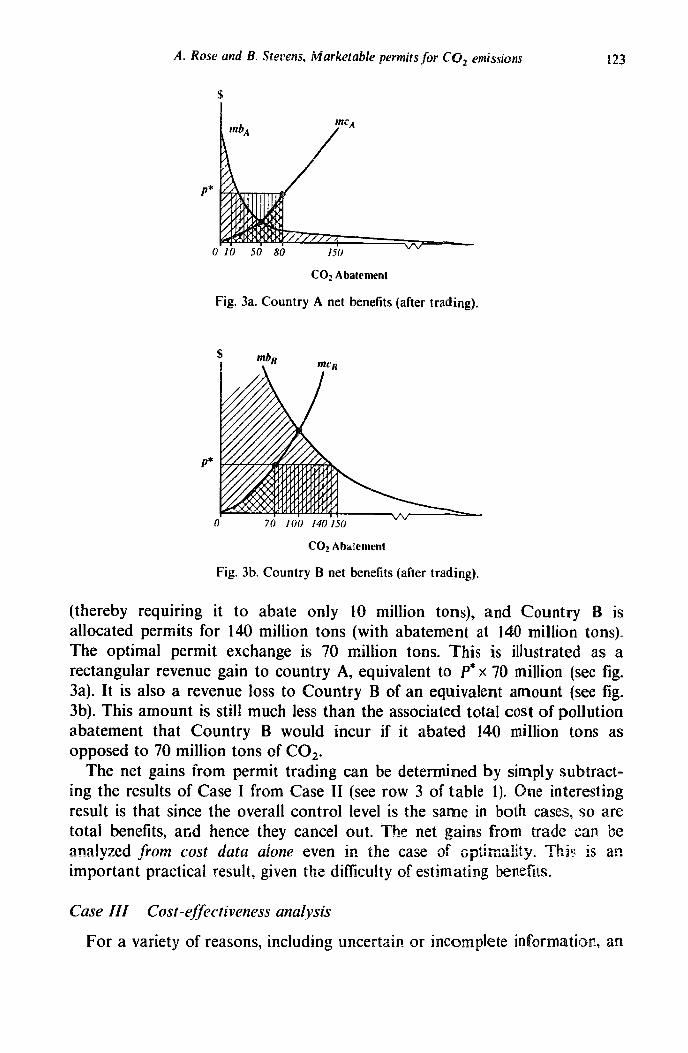
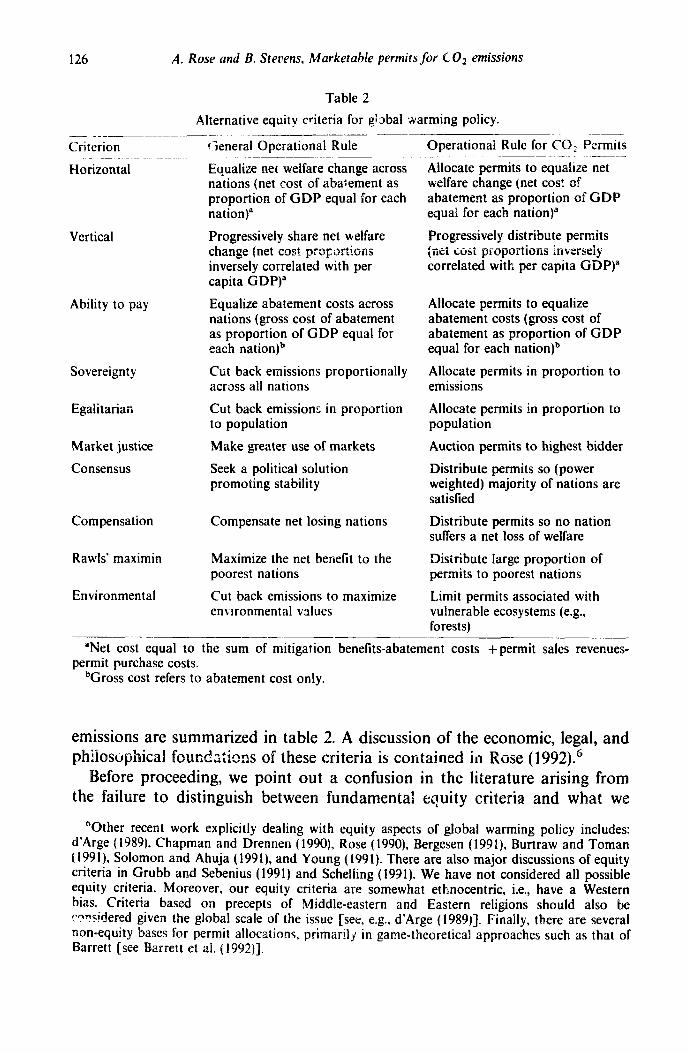
As noted in the context of fig. 1, the optimal amount of permit trading would equalize the marginal costs of abatement for both countries. The welfare implications are presented in figs. 3A and 3b. For Country A, the initial benefit from damages avoided is identical to Case I. Under conditions of global effkiency, the total cost expands to the area under the marginal cost curve up to 80 million tons of CO2 abated. However, benefits to Country A are also greater by the amount of revenues from permit sales.3 This result depends on how many permits each country is inillaily a!locaied. Let us assume that Country A is issued permits to emit 160 m!!lisns Lens
‘The revenue pains and losses from permit trading are of course merely transfers from a social valuation standpoint and cancel out in the last column of table I. However, trading does result in some real resource cost savings.
A. Rose and B. Stevens, Marketable permits/or CO, emissions
c .= 3
>
> I
>
A. Rose and B. S!ewsis, Marketable permitsjor CO, emissiorls 123
CO? Abatement
Fig. 3a. Country A net benefits (after trading).
CO2 Ahaiement
Fig. 3b. Country B net benefits (after trading).
(thereby requiring it to abate only 10 million tons), and Country B is allocated permits for 140 million tons (with abatement at 140 million tons). The optimal permit exchange is 70 million tons. This is illustrated as a rectangular revenue gain to country A, equivalent to P* x 70 million (see fig. 3a). It is also a revenue loss to Country B of an equivalent amount (see fig. 3b). This amount is still much less than the associated total cost of pollution abatement that Country B would incur if it abated 140 million tons as opposed to 70 million tons of C02.
The net gains from permit trading can be determined by simply subtract- ing the results of Case I from Case II (see row 3 of table 1). One interesting result is that since the overall control level is the same in both cases, so are total benefits, and hence they cancel out. The net gains from trade can be analyzed Jfrcm cost data alone even in the case of ~i;timality. Thir is an important practical result, given the diflkulty of estimating bene6ts.
Case III -
124 A. Rose and B. Stevens. Marketable permitsf‘or CO2 emissions
optimal level of CO2 abatement may not be the basis for policy. Instead, some global target or quota for emissions may be set and abatement requirements or permits assigned to each country. This policy objective should be met at the least cost, thereby attaining efficiency in the production of CO, abatement. The trading of permits can ensure that this cost-effective outcome will be forthcoming. For purposes of i’llustraiion, let us assume a global abatement requirement of 4O:i, of the 450 million tons of CO2 from our previous examples, with this burden being distributed on the order of permits to emit 150 million tons of CO2 for Country A and permits for 120 million tons for Country B. Trading will result in abatement by Country A equal to IO5 million tons, with 85 million tons being traded between the two countries. The global welfare gain is not as large as in Case II, since a non- optimal target level of abatement has be&.. .- on phosen. Since the abatement level is higher than the optimal level, :he total ben:lits will be greater but so will the total cost to even a greater extent (see row 4 of table r).4
Case IV -- Free-rider and no tradirzg
As noted earlier, the public good nature of CO2 abatement makes it prone to the free-rider problem. Let us now illustrate its welfare implications. Assume Country A is the free-rider and Country B undertakes its own optimal level of abatement. Carrying through our previous examples, this means that Country A receives its individual optimal level (50 million tons of CO1 abated) without underts::.4I?rg any action. 0f course, the global optimum is not reached. The welfare gains for Countries A and B are shown in the kifti: row of table 1. Both countries receive a gain, though the global welfare gain is short of that attained by the global optimum case.
Case V - Free-rider \t*r’th trading
In this case, we are realiy not referring to permit trading in the strict sense since free-riding implies no com!vrehensive CO, agreement has been reached, but to the revenue transfer as essentially a side-piymeni. The situation is such that Country B, because of its higher abatement costs, can improve its welfare if it pays Country A to undertake some abatement. Country B’s total cost saving represents a boundary on how much would be paid to Country A. If Country B has relatively higher costs, this amount can pay for more abatement in Country A than Country B, thereby raising the overall abatement level between the two countries (this is indicated by the X-value in the domain of the integrals in row 5 of table 1, with Y and 2 levels
The area between the MC and MC curves IO the right of the 150 million ton optimum rqresents a negative increment in producer and consumer surpl~~ses.
A. Rose and B. Stevens, Marketable permirsior CO2 emissiom 125
representing the revised abatement levels of Countries A and B, respectively). It can readily be shown that the welfare gains from trade in this case fall short of the optimal outcome (Case II). The calculation of the net gains from permit trading under the free-rider cases can be computed in a manner similar to those of the voluntary agreement case. Again, there are gains from trade; however, in this case some knowledge of the benefit function is required.’
3. lnternatisnal equity criteria
Equity implications of environmental policy are often ignored. There are several reasons, including the irreconcilable fact that equity involves value judgments and. until recently, an absence of operational models to estimate distributional impacts [e.g., Rose et al. (1988) and Whalley and Wiggle (1991)-J. Perhaps most important has been the concern that the promotion of equity would undercut efficiency. This neglect has been reinforced by the Cease Theorem (see section 3), which is operative irrespective of the distribution of property rights. However, the obverse of this part of the Coase Theorem is that there are no efficiency-equity tradeoffs in the case of marketable permits. Moreover, if principles of fairness can help bring about a global agreement, there is even less justification to ignore equity [Rose (1990), Burtraw and Toman (1991)-J.
Equity represents a normative evaluation of the social desirability of economic a.nd non-economic disbursements, both positive and negative. The vast majority of attention has been devoted to the distribution of well-being among individuals in a give:i jurisdiction, but when gains and losses transcend political boundaries, the unit of analysis enlarges accordingly.
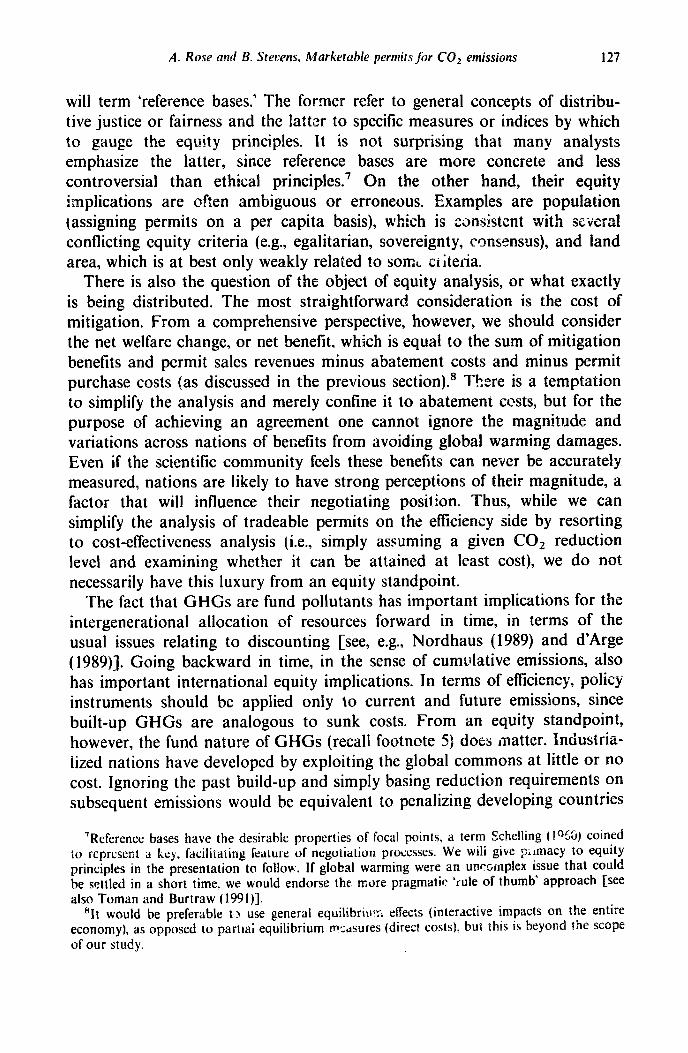
Below, we offer several equity principles applicable to global warming policy. The equity principles, a general operational rule emanating from each, and a rule applicable to the allocation of tradeable permits for CO2
5’There are some subtleties of the analysis not readily apparent from the diagrams. First, the MB function is a vertica! summation of individual country gains because of the public goo?. nature of GHG abatement. Second, the MC curve is horizontally summed, reflecting the private good nature of abatement from the production side. The results of these conditions translate into an elevating and steepening of the benefits function in relation to the cosf function. ceteris parihus, hence raising the optimal abatement :equirement zf Ihe global level over and above that which is indicated by any one country. Also. GHGs have characteristics of a.{ind pollutant [see Tietenberg (l!N2)]. i.e., they exceed the assimilative capacity of !he environment to some extent and hence build up over time. The static approximation of the figures will suffice for our purposes. We can concei1.e of the MB function reflecting Ihe net present value of benefits over time, arising from a reduction in current levels of emissions. Thus, the annual damage estimates often presented in the literature understate the real values, since they are presented as avoided damages only for a given year, as opposed to perpetual damages, minus any absorption or decay function [Nordhaus (199lb) being a notable exception].
126 A. Rose and B. Stecens, Marketable permits for CO2 emissions
Table 2
Alternative equity criteria for global warming policy. __- _~ ~___
Criterion
Horizontal
Vertical
Ability to pay
Sovereignty
Egditaiiaii
Market justice
Consensus
Compensation
Rawls’ maximin
Environmental
c;eneral Operational Rule
Equalize net welfare change across nations (net cost of abatement as proportion of GDP equal for each nation)
Progressively share net welfare change (net cost proportions inversely correlated with per capita GDP)a
Equalize abatement costs across nations (gross cost of abatement as proportion of GDP equal for each nation)b
Cut back emissions proportionally across all nations
Cut back emissions in proportion to population
Make greater use of markets
Seek a political solution promoting stability
Compensate net losing nations
Maximize the net benefit to the poorest nations
Cut back emissions to maximize en\ ironmental values
Operational Rule for CO, Permits ~____
Allocate permits to equalize net welfare change (net cost of abatement as proportion of GDP equal for each nation)
Progressively distribute (it&i iosi pioportions inversely correlated with per capita 6DP)’
Allocate permits to equalize abatement costs (gross cost of abatement as proportion of GDP equal for each nation)b
Allocate permits in proportion to emissions
Allocate permits in proportion to population
Auction permits to highest bidder
Distribute permits so (power weighted) majority of nations are satisfied
Distribute permits so no nation suffers a net loss of welfare
Distribute large proportion of permits to poorest nations
Limit permits associated with vulnerable ecosystems (e.g., forests)
____ “Net cost equal to the sum of mitigation benefits-abatement costs +permit sales revenues-
permit purchase costs. bGross cost refers to abatement cost only.
emissions are summarized in table 2. A discuss’ion of the economic, legal, and phliosirphical found rr;kns of these criteria is contained in Rose (1992).6
efore proceeding, we point out a confusion in the literature arising from the failure to distinguish between fundamental equity criteria and what we
60ther recent work explicitly dealing with equity aspects of global warming policy includes: d’Arge (1989), Chapman and Drennen (1990) Rose (1990), Bergesen (1991) Burtraw and Toman ( l991), Solomon and Ahuja ( 1991), and Young ( 1991). There are also major discussions of equity criteria in Grubb and Sebenius (1991) and Scheliing (1931). We have not considered all possible equity criteria. Moreover, our equity criteria are somewhat ethnocentric, i.e., have a Western bias. Criteria based on precepts of Middle-eastern and Eastern religions should also be considered given the global scale of the issue [see, e.g., d’Arge (1989)-J. Finally, tkere are several
n-equity bases for permit allocations, primarily in game-theoretical approaches suck as that of rrett [see Barrett et al. (1992)].
A. Rose and B. Sterens. Marketable permits for CO1 emissions 127
will term ‘reference bases.’ The former refer to general concepts of distribu- tive justice or fairness and the latter to specific measures or indices by which to gauge the equity principles. It is not surprising that many analysts emphasize the latter, since reference bases are more concrete and less controversial than ethical principles.’ On the other hand, their equity implications are often ambiguous or erroneous. Examples are population (assigning permits on a per capita basis), which is zonsistcnt with several conflicting equity criteria (e.g.. egalitarian, sovereignty, consensus), and land area, which is at best only weakly related to some ctiteria.
There is also the question of the object of equity analysis, or what exactly is being distributed. The most straightforward consideration is the cost of mitigation. From a comprehensive perspective, however, we should consider the net welfare change, or net benefit, which is equal to the sum of mitigation benefits and permit sales revenues minus abatement costs and minus permit purchase costs (as discussed in the previous section).8 There is a temptation to simplify the analysis and merely confine it to abatement costs, but for the purpose of achieving an agreement one cannot ignore the magnitude and variations across nations of benefits from avoiding global warming damages. Even if the scientific community feels these benefits can never be accurately measured, nations are likely to have strong perceptions of their magnitude, a factor that will influence their negotiating position. Thus, while we can simplify the analysis of tradeable permits on the efficiency side by resorting to cost-efrectiveness analysis (i.e., simply assuming a given CO, reduction level and examining whether it can be attained at least cost), we do not necessarily have this luxury from an equity standpoint.
The fact that GHGs are fund pollutants has important implications for the intergenerational allocation of resources forward in time, in terms of the usual issues relating to discounting [see, e.g., Nordhaus (1989) and d’Arge (1989)]. Going backward in time, in the sense of cumulative emissions, also has important international equity implications. In terms of eficiency, policy instruments should be applied only to current and future emissions, since built-up GHGs are analogous to sunk costs. From an equity standpoint, however, the fund nature of GHGs (recall footnote 5) does matter. Industria- iized nations have developed by exploiting the global commons at little or no cost. Ignoring the past build-up and simply basing reduction requirements on subsequent emissions would be equivalent to penalizing developing countries
‘Reference bases have the desirable properties of focal points, a term Schei!ing (lo%) coined to represent a key, facilitating featufe of negoliation processes. We wili give p;imacy to equity principles in the presentation to follow. If global warming were an unrsmplex issue that could be settled in a short time, we would endorse the. more pragmatic ‘rule of thumb’ approach [see also Toman and Burtraw (1991)].
“It would be preferable t 3 use general equilibriar..P *-- effects (interactive impacts on the entire economy), as opposed to parttai equilibrium r%dSUreS (direct costs), but this is beyond the scope of our study.
128 A. Rose and B. Stevens, Marketalrle permits for CO2 emissions
for their progress, when no such penalty was imposed on industrialized countries [see Agarwal and Narain (1991)]. Fortunately, since the efficiency and equity aspects of marketable permits are generally separable, the latter objective can be pursued in this context without misallocating resources.
The equity criteria in table 2 can be reinterpreted in terms of cumulative emissions. Cumulative emissions can, for example, be thought of as affecting a country’s GHG ‘rights’ or ‘responsibilities,’ where these are relevant. The consideration of rights arises in the context of sovereignty and the egalitarian ethic. Responsibility is not exp!icitly related to any of the criteria except sovereignty and the environmental ethic, and possibly rather weakly to consensus. Otherwise, it is simply compatible with all other criteria except market justice and one rigid form of egalitarianism.’
The effect of incorporating cumulative emission considerations into the reference base is to alter abatement requirements or permit allocations. Surprisingly, the cumulative emission- reference base would not change the distribution of the CO1 cost burden dramatically. Smith et al. (1991) estimate the contribution to cumulative emissions between industrialized and develop- ing nations as 6O:itO on a current oasis and X:30 on a cumulative one.
The fund nature of GHGs, as well as the potential for them to be emitted at significantly higher rates as population grows and economic development spreads, justifies special concern over future emissions. For example, the contribution of developing countries to CO, emissions is likely to rise from 30-4Oqd of the world total currently to 60+“/, in perhaps the next 3&40 years. As such, the pressure will mount to raise emission limits (reduce permits) for these countries. While there has been a big emphasis on the 13,~ cost of achieving emission reductions technologically in the Third World, other mitigation po icies might be costly. One example is a policy to discourage or ban the use of fossil fuels. In countries like China, these costs could be huge. Under these circumstances, it may be legitimate to include the opportunity cost of devalued indigenous resources. Their inclusion into the net WL fare calculus would place such countries in a position to receive extra permits under criteria like vertical equity and Rawls’ maximin principle.
In the ‘future reference’ case, it must be emphasized that currently undertaking CO2 abatement diverts resources from investment needed to stimulate economic development. The opportunity cost extends beyond the partial equilibrium aspects associated with fossil fuel reserves, and includes the general equilibrium losses from foregonk: ecqnomic growth and develop- ment. The result is problematic because ueveloping nations are especially
‘In addition, there are some equity criteria that are unly relevant in the context of historical emissions and very explicitly so. A good example is Young’s (1990) ‘status quo’ or ‘adverse possession’ criterion, which stipulates that the current rate of GHG emissions constitutes a ‘right’ legitimized by usage and custom. The latter has been proposed by Fujii (1990) in terms of
erson having an equal emissions quota regardless of his/her location or generation.

A. Rose and B. Srcwn.~, Markrtuhle pennirs,fiw CO2 emissions 129
needy and, according to some specifications of welfare functions and views of equity, suffer more from a comparable decrease in the rate of economic growth than industrialized nations. The effect of including future. dynamic elements would therefore shift the allocation of entitlements in favor of developing countries.
To assess the efficiency and equity implications of greenhouse gas controls, we constructed a non-linear programming mcdel that incorporates estimates of the costs of CO, control and the benefits of CO, reduction. The model is used to analyze individual and global net benefits before and after trading for eight countries or regions: the US, Canada, Western Europe, the Common- wealth of Independent States, Brazil, Central Africa, Indonesia, and China.
Sections 2 and 3 demonstrated that global net benefits and the equity consequences of greenhouse gas controls are sensitive to: the number of countries that are signatories to a greenhouse gas treaty or protocol, the extent that permit trading is allowed, and the initial distribution of emission control responsibilities between nations. If all countries are signatories and permit trading is allowed, the global efficiency version of the model, in accordance with Cases II and III of section 2, can be stated as:
where
TBi = the ith country’s total benefits (or avoided damages) from global control of greenhouse gases,
TC,= the ith country’s total emission control costs, TEi = the ith country’s total revenues or payments for permits, P* = the equilibrium permit price.
Given the public good nature of greenhouse gas controls, the benefit for each country is a function of global emission reductions, while costs are determined by each country’s abatement level. The third term of expression (I) represents the sum of individual country expenditures and revenues on permits, which cancel out.
The model’s static formulation has two important implicaticns. First, we assume that each nation can look forward in time and assess the implications of a greenhouse gas protocol on its own economic well-being, as well as how a protocol would improve or worsen its economic standing vis-Lvis other nations. There is considerable scientific uncertainty about the contribution of greenhouse gases to global warming, the rate of te perature increase, a
130 A. Rose and B. Stewu Marketable permits far CO2 emissions
ecosystem impacts, so negotiators are likely to have an imprecise estimate of the economic implications of an agreement. The model implicitly assumes risk-neutral behavior by each nation, though, clearly, attitudes towards risk will atfect negotiating positions. It would be inordinately difftcuh to charac- terize each nation’s risk attitude, but it is not necessary for our purposes because the model is designed to analyze efficiency and equity implications, not to predict the outcome of treatv negotiations.
A second limitation of the static model is it ignores issues regarding the rate of accumulation of greenhouse gases and the timing of emission reductions. Clearly, these issues are important, e.g., the timing of emission reductions will affect costs. We assume that a ‘crash’ program will not be implemented via a greenho::se protocol, and that in the absence of controls, a 3“C warming effect will occur near the middle of the next century. No other assumptions about the dynamics of global warming are made, partly because the dynamics are extremely complex and would rightly be the subject of another paper. In addition, there is little guidance in the literature on the rate and timing of emission controls. Our cost and benefit estimates are based on the assumption employed by Nordhaus (1991b) and others regarding the amount of warming and when it OCCL?~S.~~
4.a. Cost estinzates
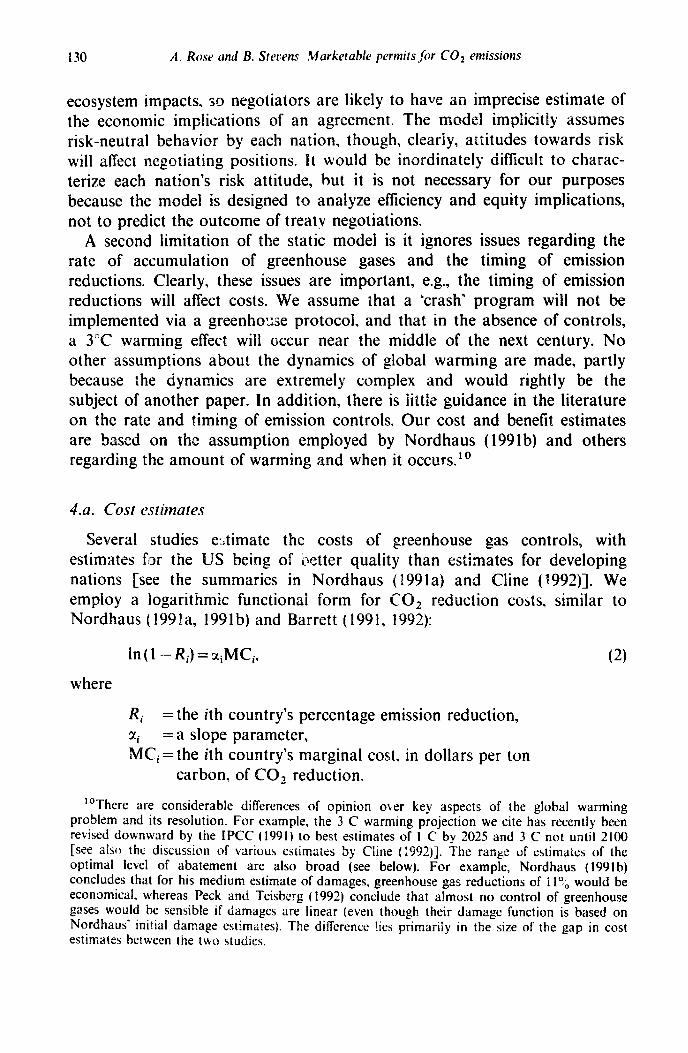
Several studies ebtimate the costs of greenhouse gas controls, with estimates for the US being of better quality than estimates for developing nations [see the summaries in Nordhaus ( 1991a) and Cline (1.992)]. We empioy a logarithmic functionai form for CO1 reduction costs, similar to Nordhaus (1991a, 1991b) and Barrett (1991, 1992):
in ( 1 - Ri) = xiMCi, (2)
where
Ri = the ith country’s percentage emission reduction,
xi =a slope parameter, MCi = the ith country’s marginal cost. in dollars per ton
carbon, of CO2 reduction.
“There are considerable differences of opinion over key aspects of the global warming problem and its resolution. For example, the 3 C warming projection we cite has recently been revised downward by the IPCC (1991) to best estimates of I C by 2025 and 3 C not until 2100 [see also the discussion of various estimates by Chne (:992)]. The range of estimates of the optimal level of abatement are also broad (see below). For example, Nordhaus ( 1991b) concludes that for his medium estimate of damages, greenhouse gas reductions of 11:~ would be economical, whereas Peck and Teisberg (1992) conclude that almost no control of greenhouse gases would be sensible if damages are linear (even though their damage function is based on Nordhaus’ initial damage estimates). The difference lies primarily in the size of the gap in cost estimates between the two studies.
cost
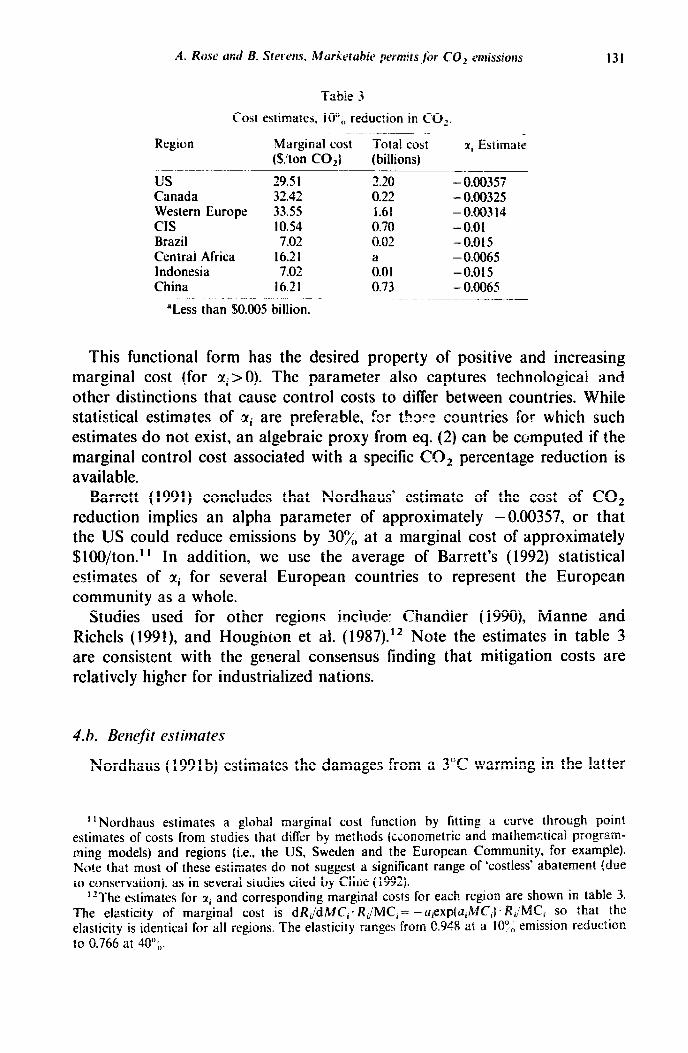
Tabie 3
estimates. lo”, reduction in CO?.
Region
us Canada Western Europe CIS Brazil Central Africa Indonesia China
Marginal cost Total cost (S/ton CO,) (billions)
..__ 29.51 2.20 32.42 0.22 33.55 1.61 10.54 0.70 7.02 0.02
16.21 7.02 i.01
16.21 0.73
xl Estimate
~_.____ - 0.00357 - 0.00325
-0.01 -0.015 - 0.0065 - 0.015 - 0.0065
131
‘Less than SO.005 billion.
This functional form has the desired property of positive and increasing marginal cost (for Xi>O). The parameter also captures technological and other distinctions that cause control costs to differ between countries. While statistical estimates of Zi are preferable, for those countries for which such estimates do not exist, an algebraic proxy from eq. (2) can be computed if the marginal control cost associated with a specific CO, percentage reduction is available.
Barrett (1991) concludes that Nordhaus’ estimate of the cost of CO2 reduction implies an alpha parameter of approximately -0.00357, or that the US could reduce emissions by 307; at a marginal cost of approximately $IOO/ton. “ In addition, we use the average of Barrett’s (1992) statistical estimates of bi for several European countries to represent the European community as a whole.
Studies used for other regions inc!ude: Chandler (1990), Manne and Richels (1991), and Hougnron et al. (1987).” Note the estimates in table 3 are consistent with the general consensus finding that mitigation costs are relatively higher for industrialized nations.
4.h. Benefit estimates
Nordhaus (1991 b) estimates the damages from a 3°C warming in the latter
t I Nordhaus estimates a global marginal cost function by fitting a curve through point
estimates of costs from studies that differ by methods (c;onometric and mathem;.tical program- ming models) and regions (i.e., the US, Sweden and the European Community, for example). Note that most of these eknates do not suggest a significant range of ‘costless’ abatement (due to conservation). as in several studies cited by Cline (1992).
“The estimates for xi and corresponding marginal costs for each region are shown in table 3. The elasticity of marginal cost is dR,jd MCi* RJMC, = -u,exp(a,MC’,) . RJ elasticity is identical for all regions. The elasticity ranges from 0.948 at a lb”,, to 0.766 at 40”,,.
132 A. Rose and B. Sterens, Marketable permits for COz emissions
part of the next century at approximately l”/ of global output.13 This estimate serves as the basis for constructing a global marginal benefit function, though it requires several modificatioils. First, the economic value of damag.es from global warming will differ between nations according to their vulnerability to crop losses, sea level rise, loss of amenities, etc. Utilizing a recent IPCC study (1991) that qualitatively assesses these differences, we assume that, relative to the US, each qaa’litative adjustment implies a 107; decrease or increase in damages from the 176 reference point. I4 Under the assumption that the 3°C global temperature increase wil’l occur in the middle of the next century, nations considering agreeing to a greenhouse protocol need to know their domestic output roughly 60 years hence and also need to know the present discounted value of damages. Using each nation’s current GDP, and assuming annual growth rates of 37; for the US, Canada, and Western Europe, 5:; fur China, 47; for Indonesia and Central Africa, and 3.5”, for Brazil and the CIS, as well as a 4‘5; real interest sate, and the adjusted percentage of output that represents damages, we compute the present discourbted value of damagesI (discounted from 2050 to 2000)16 for
13Nordhaus bases his estimate on an exami;;s!ion of various sectors of the WS economy in 1981 that would be airected by a change in global climate. As Nordhaus notes, his medium estimate of lo, of global output includes an ad hoc estimafe of damages to nonmarket sectors. Implicit in Nordhaus’ extension of this estimate to ,Le globe is that other naticms’ economies are structurally sin:ilar to the US. at lcast with respect to tho_.z sectors where damages occur and that the magnitude of damages in nonmarket sectors is similarI) ..~:I~n?d. For less-developed nations, agriculture is currently a much larger share of the economy, though m 40 or 50 years, that may no longer be true. In addition. the value oi nonmarket damages may be lower in lesr- de\,eloped cnuntries (consistent with the hypothesis that environmenral quality has an income elasticity greater than one). Thus, while this assumption may appear to be quite strong, the disparities between currently industrialized nations and ie;s-developed nations will not be as large in 50 ye;.rs, and, as damages to the market sector decline (i.e., agriculture), the value of damages in nonmarket sectors will increase. For a critical discussion of Nordhaus’ estimates, see “line (1992).
14The adiusiment factors results in damages as a percent of gross domestic product as follows: us, iok; C&da, 0.71.; Western Europe. 0.74,; CIS, 0.5”~; Brazil, 1%; Central Africa, 0.7:4; Indonesia, 0.9’ .,: and China. 1.3’!,,. Note also that the benelit estimates employed here differ significantly from those in Rose (199.?). because of greater reliance on Nordhaus’ estimates and those of the IPCC in this paper.
“The real output discount rate employed here is consistent with the assumption in Nordhaus ! !Wl b) that the global real output discount rate is in the range of 0:; to I”,,. In more recent work, NDrdhaus (1993) uses a global real output discount rate of 3”;,, arguing that this is in line with real outF#ut growth rates in industrialized economies over the last twenty years. However, such a real output discount rate may not be realistic over the next sixty years, and real output discount rater, may differ substantially between industrialized and developing economies. We acknowledge thy importance of the issue since higher growth rates would increase the optimal amount of greenhouse paq control, perhaps substantially. We do not explore the issue further, partially due LO the static nature of our model.
“‘We have chosen the year 2000 for our example for several reasons. First, it is reasonable to assume that it will take several years for an agreement tc be ratified and for an abatement program to be initiated. Second, choosing an earlier, ratner thx later, year for illustra:ive purposes is preferable l,ecause projections are less prone to errors thal c’&ld arise from changes in emission hates or nifts in benefit and cost functions (e.g., there is less of an opportuni:) for
A. Row and B. Stevens, Marketable permitsfor CO2 emissions 133
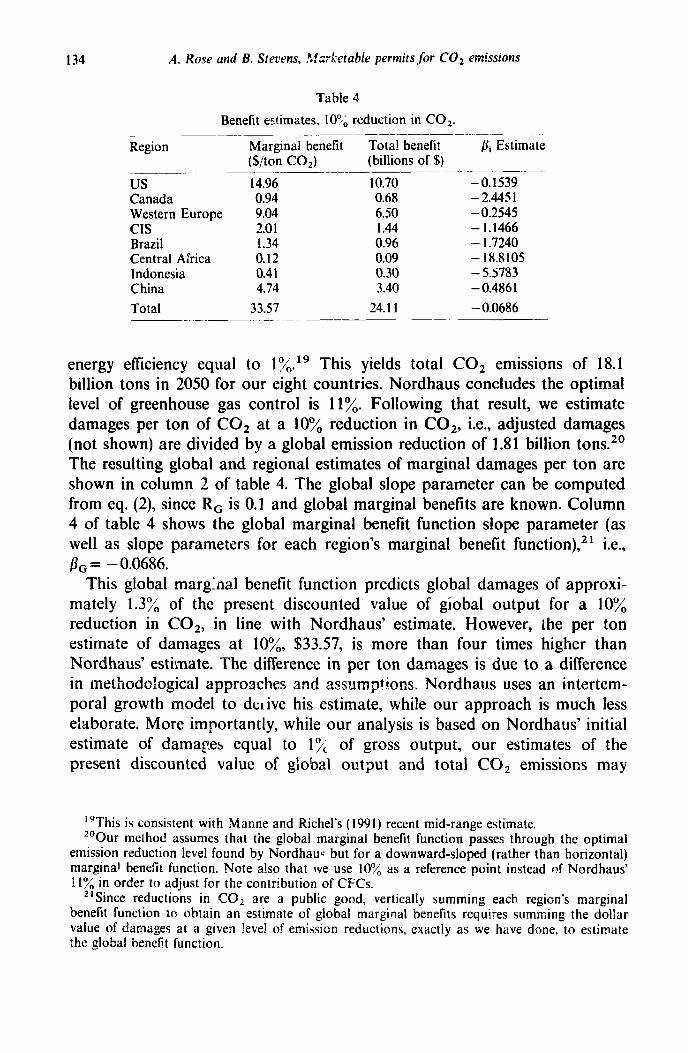
each region in table 4. 1 ’
Much of the empirical evidence from the benefit estimation literature shows that marginal benefits decline as environmental quality improves. We assume this principle applies to global climate change as well, i.e., marginal benefits from reduci:ng global temperature increases will be higher at higher levels of temperature change.’ 8 A negatively sloped marginal benefit function could be represented by several functional forms. We selected a logarithmic functional form to represent marginal benefits, using the adjusted 1% gross global output criterion to determine its parameters, thus:
In Ri = BiM Bi, (3)
though given the public good nature of the benefits (each nation benefits from CO2 abatement without detracting from the benefits received by other nations), we use the global, G, version of this function:
This functional form is similar to that we employed for marginal costs an6 is consistent with the:oretical expectations for lower marginal benefits as global emission reductions increase. Nordhaus assumes marginal damages per ton of CO, are constant, while we assume a logarithmic margina! damage function calibrated to his 10% optimal mitigation level.
Thus, an estim&e of the global marginal benefit slope parameter, PG, is possible if we have an estimate of marginal benefits for a given emission reduction. To estimate the global slope parameter, we convert our global damage estimate into damages per ton of carbon. For this purpose, we assume that without any controls on greenhouse gases, each country’s CO2 emissions would grow, over the 6%year time horizon, at thlz growth rate of tsn:,,?! .-r:+-;:t i .= :-=e ,~,.l,..l! ;??r,;;;. _>*= =,,,;.,! --;;cx~.~--__,~~ * - . . . _ _. . . . . ..__.. - ib~itiJ1nLL1 ““‘F’“’ \urr U”“.V, .n.A..U” ciii CiiiilLiLii iiiiiiiiiLvn..“..Y ..___ _._ _ ;F_m-_ _i.. .._... ,..ramant ;- y.,.Y**i. L-L I..
technological change to affect the results in the short run). If such factors arc stable ,Dver the policy horizon, then the year 2000 will be reasonably representative of all of the other years in any case. Note that the benefit function is such that the effects of warming still do not take place until the middle of the next century. These are simply discounted back to the year 2000 (though all figures are expressed in 1989 constant dollars).
“Note that the ‘totals’ in table 4 represent vertical (public good) summations of the individual country benefit functions (recall the discussion in section 2). No totals were presented for table 3 because of the private good nature 0: !he entries in that table (i.e., they are horizontally summed to yield an aggregate marginal cost curve). In the analysis below, eficiency is achieved by the equality of individual country marginal costs and aggregate marginal benefits.
‘*The total benefits function may be nonccnvex, due to the physical parameters governing global warming, Although further scientific inquiry would provide insights aboxi the shape O! the total benefits function, nonconvexity may lio: !Y troublesome. If the mar$nnl benefits function is initially positive!y sloped and then negatively sloped, the optimum emission reduction would occur where marginal CR,. ct intersects the negatively sloped portion of marginal benefits.
134 A. Kose and B. Sretlens, .\i;;;ketabie permits for CO2 emissions
Table 4
Region
Benefit estimates, LOO,; reduction in CO,. _____-____.. .._ _~~~_ _~
Marginal benefit Total benefit pi Estimate ($/ton CO,) (billions of $)
US Canada Western Europe CIS Brazil Central Africa Indonesia China
Total
14.96 0.94 9.04 2.01 1.34 0.12 0.41 4.74
33.57
10.70 -0.1539 0.68 -2.4451 6.50 - 0.2545 1.44 - 1.1466 0.96 - 1.7240 0.09 - 18.8105 0.30 - 5.5783 3.40 -0.4861
24.11 - 0.0686
energy efficiency equal to 1%. l9 This yields total CO, emissions of 18.1 billion tons in 2050 for our eight countries. Nordhaus concludes the optimal level of greenhouse gas control is 11%. Following that result, we estimate damages per ton of CO, at a 10% reduction in C02, i.e., adjusted damages (not shown) are divided by a global emission reduction of 1.81 billion tons.” The resulting global and regional estimates of marginal damages per ton are shown in column 2 of table 4. The global slope parameter can be computed from eq. (2), since R, is 0.1 and global marginal benefits are known. Column 4 of table 4 shows the global marginal benefit function slope parameter (as well as slope parameters for each region’s marginal benefit function),21 i.e., I-L= - 0.0686.
This global margIna benefit function predicts global damages of approxi- mately 1.3% of the present discounted value of giobal output for a 10% reduction in C02, in line with Nordhaus’ estimate. However, the per ton estimate of damages at lo%, $33.57, is more than four times higher than Nordhaus’ estimate. The difference in per ton damages is due to a difference in methodoZogica1 approaches and assumptions. Nordhaus uses an intertem- poral growth model to dt;live his estimate, while our approach is much less elaborate. More importantly, while our analysis is based on Nordhaus’ initial estimate of damages equal to l”/,. of gross output, our estimates of the present discounted value of global output and total COz emissions may
“This is consistent with Manne and Richel’s (1991) recent mid-range estimate. “Our method assumes that the global marginal benefit function passes through the optimal
emission reduction level found by Nordhauc but for a downward-sloped (rather than horizontal) marginal benefit function. Note also that we use 10% as a reference point instead of Nordhaus’ 1 I”/;; in order to adjust for the contribution of CFCs.
2’Since reductions in CO, are a public good, vertically summing each region’s marginal benefit function to obtain an estimate of global marginal benefits requires summing the dollar value of damages at a given level of emission reductions, exactly as we have done, to estimate the global benefit function.
A. Rose and B. Stevem. Marketable permirs for CO, emissions 135
differ from his beca.use we differentiate regions in terms of the likely global warming damages and the growth rate of output and CO, emissions.
5. elfare analysis
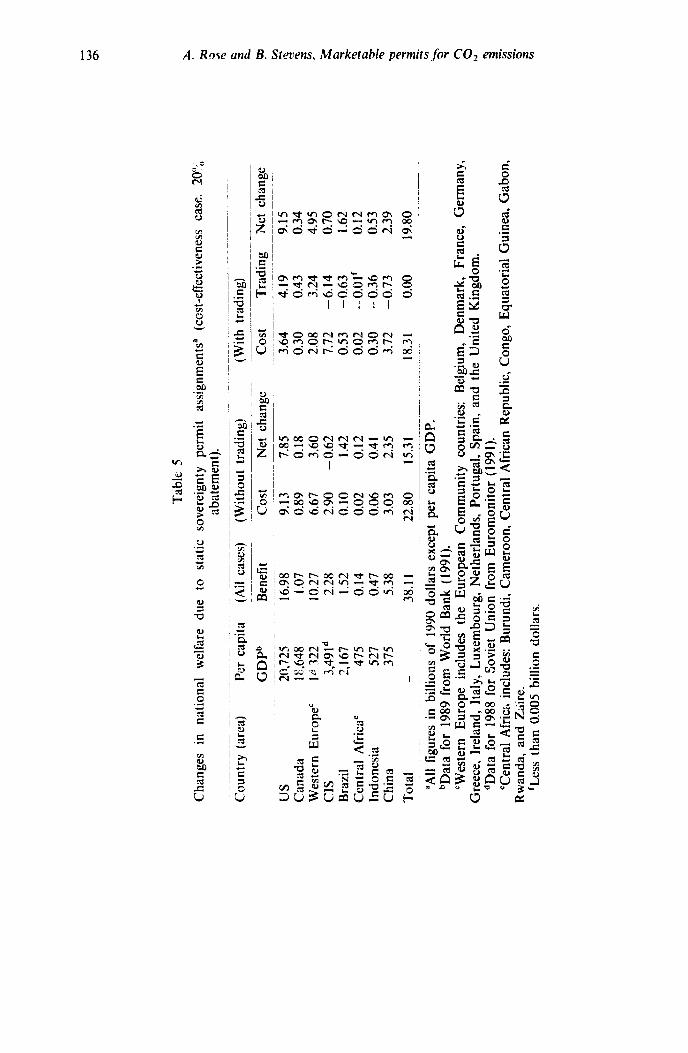
In this section, we use our empirical model to estimate the welfare effects of using two equity criteria - sovereignty and the Rawlsian maximin principle - to distribute marketable permits for CO, emissions. Both will be examined in terms of current and cumuiative reference bases. Also, we will examine both a cost-effectiveness policy relating to the oft-espoused 20% COZ reduction target” and a global efficiency policy determined by the intersection of aggregate marginal benefits and aggregate marginal costs. Insights to the utilization of other equity criteria for assigning permits will be noted as well.
5.a. Empiricd results
Our analysis is undertaken for eight countries or country groupings, listed in column
**A 20” reduction in baseline emissions has been estimated as necessary to avoid a doubling , II of CO, in the atmosphere by the middle of the 21st century (even taking into account atmospheric removal rates). Most serious policy pronouncements have not been so rigid as to require a 20’,,, redttction across the board; most policy-makers are cognizant of the status of LDCs, and simply require some capping of emissions or allowing for modest growth to avoid stifling development. This dichotomy is actually more consistent with vertical equity or the Rawlsian principle. Still, we choose to use the stylized version Ok r the actual policy pronounce-
ment in order to simplify the analysis and to begin with the depiction of the pure sovereignty case.
?“Note that the ~:~rhn dioxide emission estimates we used do not include those associated
with deforestation; thus, the relatively low cost estimates for Brazil.
Cha
nges
in
na
tiona
l w
elfa
re
due
to
stat
ic
Cou
ntry
(a
rea)
Pe
r ca
pita
us
Can
ada
Wes
tern
E
urop
ee
CIS
B
razi
l C
entr
al
Afr
ica’
In
done
sia
Chi
na
GD
Pb
Ben
efit
20,7
25
16.9
8 1 K
648
1.07
li’
722
10
.27
3,49
1d
2.28
2,
167
1.52
47
5 0.
14
527
0.47
37
5 5.
38
Tot
al
_
(Ail
case
s)
38.1
1
Tab
le
5
sove
reig
nty
perm
it as
sign
men
tsa
(ccs
t-ef
fect
iven
ess
case
. 20
”6
abat
emen
t).
- __
_ _
_ ~
~~
~
~ ~~
.___
___.
. - ~
~~
~~
(W
ithou
t tr
adin
g)
(With
tr
adin
g)
_-
cost
N
et
chan
ge
cost
T
radi
ng
Net
ch
ange
9.13
7.
85
3.64
4.
19
9.15
0.
89
0.18
0.
30
0.43
0.
34
6.67
3.
60
2.08
3.
24
4.95
2.
90
- 0.
62
7.72
-6
.14
0.70
0.
10
1.42
0.
53
-0.6
3 1.
62
0.02
0.
12
0.02
--
0.01
‘ 0.
12
0.06
0.
41
0.30
-
0.36
0.
53
3.03
2.
35
3.72
-0
.73
2.39
22.8
0 15
.31
18.3
1 0.
00
19.8
0
“All
figu
res
in
billi
ons
of
1990
dol
lars
ex
cept
pe
r ca
pita
G
DP.
bD
ata
for
1989
fro
m
Wor
ld
Ban
k co
untr
ies:
B
elgi
um,
Den
mar
k,
Fran
ce,
Ger
man
y,
Gre
ece,
Ir
elan
d,
Ital
y,
Lux
embo
urg,
E
urom
onito
r (1
991)
. eC
entr
al
Afr
ica
incl
udes
: B
urun
di,
Cam
eroo
n,
Cen
tral
A
fric
an
Rep
ublic
, C
ongo
, G
uine
a,
Gab
on,
Rw
anda
, an
d Z
a‘ir
e.
‘Les
s th
an
0.00
5 bi
llion
do
llars
.
A. Rose and B. Slerens, Markeraide pernlits.for CO, emissions 137
switching, for example, are ?he main reasons for its relatively high mitigation costs in relation to other deveioping countries.
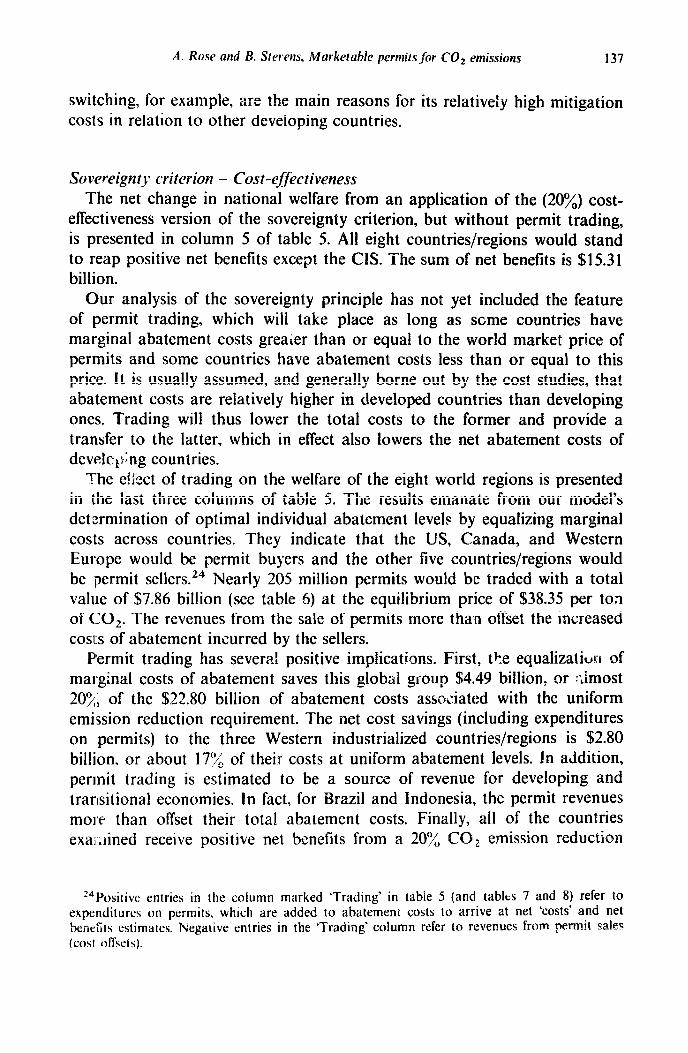
Sovereignty criterion - Cost-effectiveness The net change in national welfare from an application of the (20%) cost-
effectiveness version of the sovereignty criterion, but without permit trading, is presented in column 5 of table 5. All eight countries/regions would stand to reap positive net benefits except the CIS. The sum of net benefits is $15.31 billion.
Our analysis of the sovereignty principle has not yet included the feature of permit trading, which will take place as long as some countries have marginal abatement costs grealer than or equal to the world market price of permits and some countries have abatement costs less than or equal to this price. It is usually assumed, and generally borne out by the cost studies, that abatement costs are relatively higher in developed countries than developing ones. Trading will thus lower the total costs to the former and provide a transfer to the latter, which in effect also lowers the net abatement costs of dev&Qng countries.
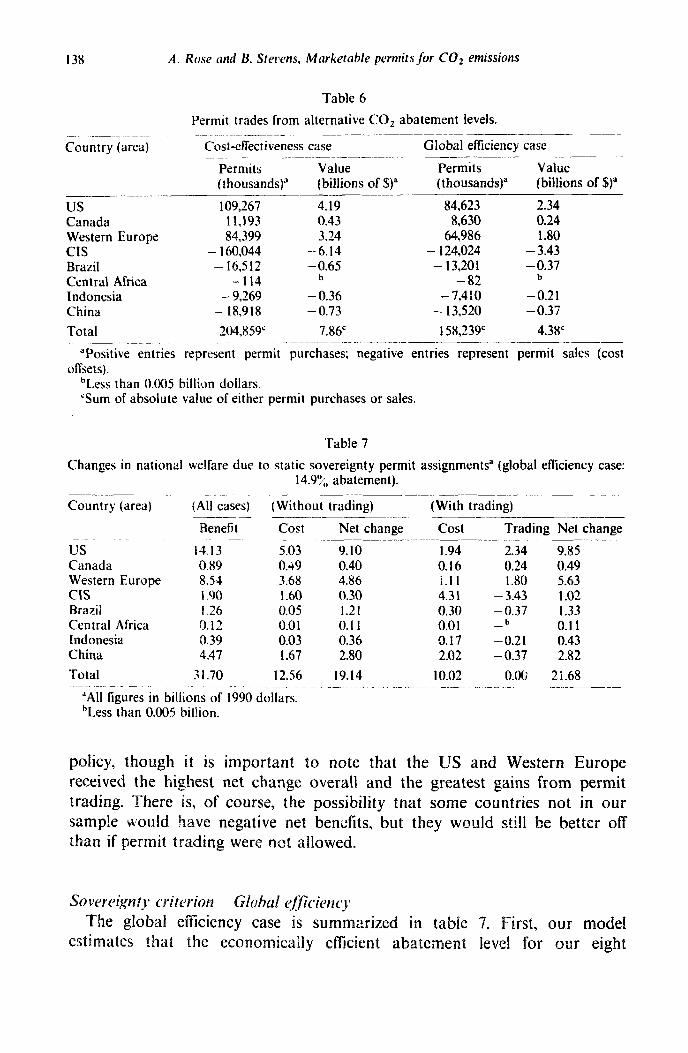
The e!;&t of trading on the welfare of the eight world regions is presented in the last three columns of table 5. The results emanate from our model’s determination of optimal individual abatement levels by equalizing marginal costs across countries. They indicate that the US, Canada, and Western Europe would be permit buyers and the other five countries/regions would be permit sellers.24 Nearly 205 million permits would ble traded with a total value of $7.86 billion (see table 5) at the equilibrium price of $38.35 per ton of CO,. The revenues from the sale of permits more than offset the increased COSIIS of abatement incurred by the sellers.
Permit trading has several positive implications. First, tFe equalization of marginal costs of abatement saves this global group $4.49 billion, or :-Jmost 20%; of the $22.80 billion of abatement costs associated with the uniform emission reduction requirement. The net cost savings (including expenditures on permits) to the three Western industrialized countries/regions is $2.80 bil!ion, or about 17:< of their costs at uniform abatement levels. In addition, permit trading is estimated to be a source of revenue for developing and transitional economies. In fact, for Brazil and Indonesia, the permit revenues more than offset their total abatement costs. Finally, all of the countries exa;-;iined receive positive net benefits from a 20”/, CO,, emission reduction
‘“Positive entries in the column marked ‘Trading’ in table 5 (and tables 7 and 8) refer to expenditures on permits. which are added to abatement costs to arrive at net ‘costs’ and net benefits estimates. Negative entries in the ‘Trading’ column refer to revenues from permit sales (cost offsets).
138 A. Rose nrld B. Stellens, Marketable permits for CQ2 emissions
Table 6
Permit trades from alternative CO1 abatement levels.
Country (area) Cost-effectiveness case Global efficiency case _.___~~__ .____ ~~~ _____.___~~~
Permits Value Permits Value (thousands)’ (billions of S)” (thousands) (billions of S)”
-- US 109,267 4.19 84,623 2.34 Canada 11,193 0.43 8,630 0.24 Western Europe 84,399 3.24 64,986 1.80 CIS - 160,044 -6.14 - 124,024 - 3.43 Brazil - 16,512 -0.65 - 13,201 -0.37 Central Africa -114 b -82 b
Indonesia -- 9,269 -0.36 - 7,4:0 -0.21 China - 18,918 - 0.73 - 13,520 -0.37
Total 204,859’ 7.86’ 158,239’ 4.38’ ~__
“Positive entries represent permit purchases; negative entries represent permit sales (cost offsets).
bLess than 0.005 billian dollars. “Sum of absolute value of either permit purchases or sales.
Table 7
Changes in national welfare due to static sovereignty permit assignments” (global efficiency case:
Country (area)
us Canada Western Europe CIS Brazil Central Africa Indonesia China
Total
14.9?,;, abatement).
(All cases, -- -
(Without trading) (With trading) __~.___ --___
cost Net change cost Trading Net change -~-__ .-__
14.13 5.03 9.10 1.94 2.34 9.85 0.89 0.49 0.40 0.16 0.24 0.49 8.5’4 3.68 4.86 i.11 1.80 5.63 1.90 1.60 0.30 4.31 - 3.43 1.02 1.26 0.05 1.21 0.30 -0.37 1.33 0.12 0.01 0.11 0.01 -b 0.11 0.39 0.03 0.36 0.17 -0.21 0.43 4.47 1.67 2.80 2.02 -0.37 2.82
31.70 12.56 19.14 10.02 0.00 211.68
“All figures in billions of 1990 dollars. bLess than 0.005 billion.
policy, though it is important to note that the US and Western Europe received the highest net change overall and the greatest gains from permit trading. There is, of course, the possibility that some countries not in our sample would have negative net benefits, but they would still be better off than if permit trading were not allowed.
Sowreignt_r critc7ion ~ Global i$%*itwq
The global efficiency case is summarized in table 7. First, 0u.r model at the econo ically efficient abate ent level for our eight
.4. Rose and B. Stevens, Marketable permits.for CO2 emissions 139
countries/regions is 14.9”/,; thereby implyJIg a 207; reduction target over- shoots the mark.25 Individual country benefits are itemized in column 2 of table 7 and the associated mitigation costs in column 3. The estimates in these columns are all srl;aller than their counterparts in table 5; however, the net benefits in column 4 are not. This is because the case presented in table 7 reflects the globally efficient abatement requirement. Note also that no country suffers negative net benefits, even before trading, though there are significant disparities between countries.
The effects of trading are depicted in the !ast three columns of table 7. Again the US, Canada, and Western Europe would be permit buyers and the other five countries/regions would be permit sellers. Over 158 million permits would be traded with a total value of $4.38 billion (see table 6) at the price of $27.67 per ton of C02. The lower permit price than in the 20% cost-effectiveness case reflects the lower ec,uilibrium abatement level. Again, permit trading lowers global abatement costs, in this case from $12.56 billion to $10.02 billion, or slightly more than 20%.
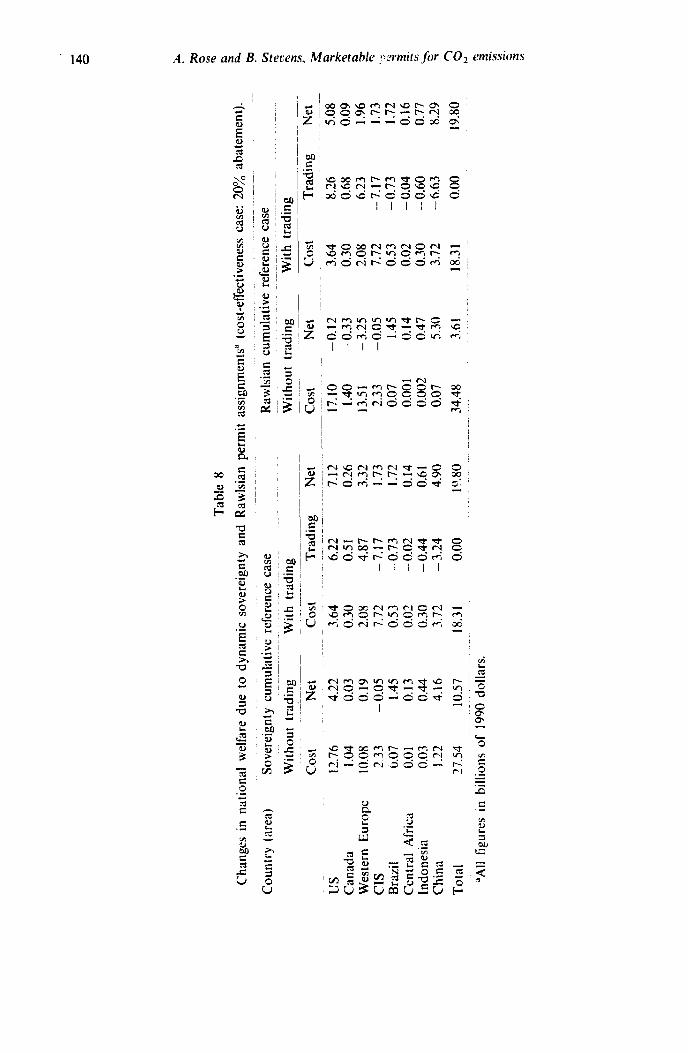
Sovereignty criterion - Cumulative reference base The zsults or an application of the sovereignty criterion under a cumulat-
ive reference basis are presented in the first part of table 8. Recall that this reference base corresponds to the accumulation of CO2 in the atmosphere, and thss the overall 2076 CO2 abatement requirement is apportioned according to each country’s/region’s contribution to the build-up over time.26 The higher abatement cost estimates in column 2 of table 8 for the US and Western Europe, relative to their costs in column 4 of table 5, reflect the increased abatement requirements for these two areas.
Overall, pre-trading CO, abatement costs are higher by almost $5 billion because of the exponential nature of the abatement cost functions. The associated net benefits for our eight region globe are thus also lower by almost $5 billion relative to the example in table 5.
However, individual and aggregate abstement costs following trading are identical for the two sovereignty cases, as are the aggregate net benefits. This
250ur benefit estimates rely on Nordhaus’ midrange estimate of damages equal to 1”; of global GDP. Nordhaus believes that the upper bound of damages is equal to 2’!;, of GDP. Sensitivity analysis of the global efliciency results when permit trading is allowed by the global warming protocol, using OS”,, and 29, of GDP as the raw damage estimates, yielded the following results: at 0.5”; of GDP, global net benefits would be equal to $7.7 billion, the eficient percentage reduction in CO, would be about 9.6”,, and permit prices would be $17.08 per ton; while at 29; of GDP, global net benefits would be $58.4 billion, rhe efficient percentage CO2 reduction would be 22.4’);, and permit prices would be $43.68 per ton.
2hEslimation of CO, emissions far back in time is tenuous at best, so we utilized the data series compi1.A by Smith et al. (1991). which covers the period 1950 to 1986, and then added our own projections to the year 2000.
140 A. Rose and B. Stevens, Markerahlc ,wmitsJor CO, emissions
is caused by the uniqueness of the et‘ficient trading outcome, despite a different number of permits traded - 306 million in the cumulative reference case vs. 205 million in the current reference case (see again table 6). This means that aggregate gains from trading are significantly higher in the cumulative case, amounting to more than 33% of the $27.54 billion initial level.
It is also important to look at the distribution of gross and net costs, permit revenues and expenditures, and net benefits between the current and cumulative reference cases. Before trading, the CIS suffers net losses, but trading helps it achieve positive net benefits. The CIS and China gain the most over the current reference case, through receipt of permit revenues, while the US and Europe have relatively lower net benefits because of higher permit expenditures.
Rawhim criterion - Cumulative rqkxwce base This case accentuates the shift of the initial abatement burden to industria-
lized nations by way of assigning more permits to developing countries, in this case the three lesser-developed countries (LDCs) in our sample. The Rawlsian rule favors the most disadvantaged group, in principle, though there is no specific guidance on exactly how much. Our approximation is to increase permit assignments from 80% of projected year 2000 emissions to 95% for LDCs. The permits assigned to the three Western industrialized nations decrease in number so as to still attain an exact 20% global reduction. We then make the same adjustment as in the previous case for cumulative emissions. Interestingly, the initial control requirements for industrialized countries do not increase much (they are: 23.87: for cumulative sovereignty, 25.8’4 for the current Rawlsian, and 27.4% for the cumulative Rawlsian). The initial control requirements for LDCs do drop sharply, however (13% to 5% to 3.2% for China for the three cases, respectively).
The initial results are presented in the second part of table 8. Control costs do go up dramatically to nearly $35 billion, with global net benefits less than $4 billion. Moreover, all four industrialized nations stand to incur negative net benefits.
As in the other cases we examined, trading improves the situation greatly. Permits for over 400 million tons of CO2 would be traded with a value of $15.2 billion. Post-trading abatement costs are the same as for the other two cost-effectiveness cases examined (and for current and cumulative emission reference bases for all ten equity criteria). Global net benefits increase dramatically to nearly $20 billion, and all countries receive positive net benefits. China is clearly the largest net winner in this case and the US and Western Europe do not fare as well as in the other cases examined. Note that the net benefits for Brazil and the ClS ars: the same in both cases an
142 A. Rose and B. Stecens, Marketahlr permitsj’r CO, emissions
table 8, since the Rawlsian adjustment to permit assignments does not apply to them.
S.h. Iirterpretation of the ressults
We have obtained several important findings. First, gains from permit trading are likely to be substantial, especially for the cost-effectiveness case. Abatement cost savings are on the order of 25”/0 for the current reference base case (the sovereignty criterion) and 3376 for its cumulative counterpart. They are nearly 50% ’ in the Rawlsian cumulative reference case. While there is sizable uncertainty in the data used, the results represent relative improve- ments and are therefore less susceptible to variations in the data than are absolute levels of cost savings. Our more tenuous estimates of these levels are that post-trading CO, abatement yields positive aggregate net benefits on the order of $20 billion for the cost-effectiveness case and $22 billion for the g1ob.71 efficiency case. Also, permit trading will result in transfers in the tens of billions of dollars per year to developing countries in the cost-effectiveness cases.
A definitive finding is that trading substantially erodes the differences in real world implications of various equity criteria. In a comparison of the four cases we examined (and several others we could not present for lack of space), there is a striking uniformity in the final outcomes of individual country abatement levels and a strong similarity in net welfare changes. This is due to the uniqueness of the Coase Theorem equilibrium. That is, no matter how permits are assigned there is rt single, least-cost mix of abatement levels between countries. Put anothsr way, this means that post-trading abatement costs for any country will aiways be the same for a given COZ reduction target no matter what the initial allocation of permits. Since these abatement costs will be a major proportion of the net costs (including permit transactions) this feature will significantly reduce the variance between nations. Only those countries engaging in large permit transactions will have noticeably varying net welfare changes. In addition, we have found that because the global efficiency and cost-effectiveness abatement levels are fairly similar. the welfare changes associated with these two options will be similar as well. All of this has very important policy implications. It, in effect, narrows the distinct number of equity criteria that may need to be examined, and hence could speed the negotiation process. Two countries may differ in their first choice of equity principles to apply to permit assignments, but if
the two principles have the s-a nlllr welfare implications, a deadlock can be avoided.
e emphasize that these resuhs do not mean that initial permit assign- ments do not matter or hat equity is not an actionable policy criterion. In our e e outcomes for some countries likely to engage in
A. Rose and B. Stevens, Marketable permits for CO2 emissions 143
permit trading on a large scale, such as the US and China, were significantly different across criteria and reference bases. Moreover, relatively high initial permit assignments may give some countries a greater sense of security about this policy instrument, thereby making their participation in an internationa! agreement more likely. What the results do mean are that marketable permits have some inherent !Imitations, if redistribution is a major policy objective. No matter how large a revenue gain is forthcoming from the sale of a sizable allocation of permits, there is a partially offsetting cost incurred in undertaking the abatement necessary to make the sale legal; moreover, this offset level is constant over all permit assignments.
There are several other important findings. None of the eight countries/ regions that we examined would appear to be a net loser. In fact, Brazil and Indonesia receive permit revenues in excess of their abatement costs. Even if we have grossly overestimated the benefits for these countries, there is no question that their welfare will be improved as a result of global warming policies like those we examined.
Our efficiency analysis identified 14.9% as the global optimum abatement level in our eight country/region world. Net welfare would be $2 billion, or lo%, higher than with a 207; target. Thus it could be that the oft-espoused 207; reduction target may be too high, though we caution that this result could change if all countries were considered.
Of course, some of our emprrical results might change significantly if we were to have explicitly addressed some other critical issues, such as the free- rider problem. We plan to investigate considerations such as this in future work.27
6. Conclusion
We have performed a conceptual and empirical analysis of a tradeable permits approach to global warming policy. We first derived some welfare measures associated with different policy cases and then laid out operational
“There are some other considerations briefly worth noting. First, we have assumed that the caveats to the Coase Theorem are not significant in the cases examined. The transactions costs associated with negotiating a greenhouse gas treaty alone will not undercut the efficacy of the marketable permit approach, and, although monitoring and enforcement portions of such costs are non-trivial, they would not affect our results either. Also, welfare changes of less than 3”/:, of GDP will not generate any significant income effects at the national level. At the same time, we acknowledge that the use of a monetary common denominator appears to give billion dollar welfare changes equal weight in, say, the US and China. We have, however, stated several of our equity criteria in terms of proportions (of GDP), though this still does not incorporate any considerations of differing marginal utilities of income between countries. Finally, we note that our results, which consistently show transfers from industrialized nations to transitional and developing countries, are highly dependent on the relative shapes of abatement cost curves. Although studies generally find marginal cost curves to be steeper in industrialized nations than in others, there may be some important exceptions outside the range of the 8 countries/regions we examined.
I44 A. Row and B. Sterem. Marketable permirs~for C 22 missions
rules for the assignment of permits under a diversity of equity criteria. Our empirical analysis involved the application of a non-linear programming model to analyze the costs and benefits before and after permit trading.
We found that net benefits are positive and on the order of $20 billion for the eight countries/regions we examined. Trading could involve transfers of tens of billions of dollars towards developing and transitional economies. Trading also helps arrive at a much more ef’ficient outcome.
Our most important finding is that the post-trading outcome is rather similar between different initial assignments of permits. The reason is the uniqueness of the efficient equilibrium. Post-t1 lding abatement levels and abatement costs are the same in each case, with only the level of transfers being different. This means that, although various equity criteria would appear to have significant philosophical and politka! diflerences, their implications for the welfare of nations may be very similar in many instances. This fact should facilitate negotiations by minimizing tensions over alterna- tive initial permit assignments.
eferences
Agarwai, A. and S. Narain. 1991, Global warming in an unequal wsrid: A case of environmental colonialism (Centre for Science and Environment, New Delhi).
Barrett, S.. 1990. The problem of global environmental protection, Oxford Review of Economic Policy 6, 68-79.
Barrett. S., 1991, Reaching a COz, emission limitation agreement for the community: Impli- cations for equity and cost-effectiveness, Report to OECD Environment Directorate (London Business School).
Barrett. S.. 1992. Acceptable allocations of tradeable carbon erxission entitlements in a global .:;.:i-mmg treaty. in: S. Barrett et al., Combating giob;ll warm;ng.
Barrett, S., M. Grubb, K. Roland, A. Rose, R. Sandor and-’ 7. Tietenberg, 1992, Combating global warming: A global system of tradeable carbon emission entitlements (UNCI AD, Geneva, Switzerland).
Bergesen. H.. 1991, A legitimate social order in a ‘greenhouse’ world: Some basic requirements, International Challenges 1 I, 2 i-30.
British Petroleum, 1988. BP statistical review of world energy (BP, London, UK). Burtraw, D. and M. Toman. 1991, Equity and international agreements for CO, containment,
Discussion Paper ENR 91-07 (Resources for the Future, Washington, DC). Chandler, W. (ed.), 1990, Carbon emissions control strategies (World Wildlife Fund and The
Conservation Foundation, Washington, DC). Chapman. D. and T. Drennen, 1990. Economic dimensions of CO2 treaty proposals, Contem-
porary Policy Issues 8. 16-28. Cline. W., 1992, The economics of global warming (Institute for International Economics,
Washington. DC). Coase. R.. 1960, The problem of social cost, Journal of Law and Economics 3, i-44. d’Arge, R., 1989, Ethical and economic systems for managing the global commons, in: I). Botkin
et al., eds.. Changing the world environment (Academic Press, New York, NY). Darmstadter, J. and A. Plantinga, 1991. The economics of CO2 mitigation: A review of estimates
for selected world regions, Discussion Paper ENR9i-06 (Resources for the Future, Wash- ington, DC).
Energy Information Administration. 1988, International energy annual (EIA. Washington, DC). Epstein, J. and R. Gupta, 1991, Con!rolling the greenhouse effect: Five global regimes compared
rookings Institution, Washington, DC),
A. Rose and B. Stecens, Marketable permiislbr CO2 emissions 145
Euromonitor, 1991, European marketing data and statis.rcs iY91 (Euromonitor Publicaticns, London).
European Community, 1990, Cost effectiveness analysis of COz reduction options: Repo*t for the commission of the European Community, Paper presented at a Workshcp on Ecouomic, Energy/Environmental Modeling for Climate Policy Analysis (Washington, DC).
Flavin, C., 1990, Slowing global warming: A worldwide strategy, Worldwatch Paper 91 (Worldwatch Institute, Washington, DC).
Fujii, Y., 1990, An assessment of the responsibility for +he increase in the CO2 conrentrations and inter-generational carbon accounts, HASA Working paper WP-05-55.
Grubb, M. and J. Sebenius, 1991, Participation, allocation and adaptability in international tradeable emission permit systems for greenhouse gas control, Paper prepared for OECD Workshop on Tradeable Greenhouse Gas Permits (Pari,, France;.
Hahn, R. and G. Hester, 1989, Marketable permits: Lessons for theory and n;actice, Ecology Law Quarterly 16, 361-406.
Hoeiler, P., A. Dean and J. Nico!dsen, 1990, t. survey of studies of the costs of reducing greenhouse gas emissions, Organization for Economic Cooperation and Development, Department of Economics and Statistics Working Paper No. 89.
Houghton, R., R. Boon, J. Fruci, J. Hobbie, J. Melillo, C. Palmer, B. Peterson. G. Shwer and G. Woodwell. 1987, The flux of carbon from terrestrial ecosystems to ti:e atmosphere in 1980 due to changes in land use: Geographic di: ttibution of the global flux, Telius 39B, 122-139.
Intergovernmental Panel on Climate Chart?,, 1991, Climate change: The iPCC scientific assessment (revised) (Cambridge University ?ress, New York, NY).
Kosobud, R. and T. Daly, 1984, Global conflict or cooperation over the CO2 climate impact, Kykios 37,638-659.
Manne, A. and R. Richels, 1991, Global CO, emission reductions: The impacts of rising energy costs, Energy Journal 12, 87-107.
Morris, S., B. Solomon, D. Hill, J. Lee and G. Goldstein, 1990, A least-cost energy analysis of U.S. CO, reduction options, in: J. Tester et al., eds., Energy and the environment in the 21st century (MIT Press, Cambridge, MA) .
Morrisette, P. and A. Plantinga, 1991, The global warming issue: Viewpoints of different countries, Resources 103, 2-6 (Resources for the Future, Washington, DC).
Nordhaus, W., 1989, The economics of the greenhous: effect, Paper presented for !he Workshop on Energy and Environmental Modeling and Pciicy Analysis, MIT Center for Energy Policy Research, July 31. August 1.
Nordhaus, W., 1991a. The cost of slowing climate, change: A survey, Energy Journal 12. 35-67. Nordhaus, W., 1991b, To slow or not to slow: The economics of the greenhouse effect,
Economic Journal 101,92&37. Nordhaus, W.. 1993. Rolling the DICE: Th(;_ optimal transition path for controlling greenhouse
gases, Resource and Energy Economics 15, 27-50. Parry, M., 1990, Climate change and world agriculture (Earthscan Publications, London, UK). Peck, S. and T. Teisberg, 1992. CETA: A model for carbon emissions trajectory zqseccment,
Energy Journal 13, 55-77. Poterba, J., 1991, Tax policy to combat global warming, in: R. Dorciusch and J. Poterba, eds.,
Global warming; Econotnic policy responses (MIT Press, Cambndgt, MA). Rose. A., 1990, Reducing conflict in global warming policy: Equity as a unifying principle,
Energy Policy 18,927-935. Rose, A., 1992, Equity considerations cf tradeable carbon enti!lements, in. S. Barrett et al.,
Combatting global warming. Rose, A. and D. Webber, 1993, Interregional equity and acid rain policy, Regional Studies
(forthcoming). Rose, A., B. Stevens and G. Davis, 1988, Natural resource poSicy and income distribution (Johns
Hopkins University Press, Baltimore, MD). Schelhng, T., 1991. Economic responses to global warming: Prospects for cooperative
approaches, in: R. Dornbusch and J. Poterba, eds.. Global warming: Economic policy responses (MIT Press, Cambridge, MA).
Smith, K., J. Swisher, R. Kanter and D. Ahuja, 1991, Greenhouse gas indices: Crucial link between science and policy (East-West Center,
146 A. Rose and B. Stevens, Marketable permits for COz emissions
Solomon, B. and D. Ahuja. 1991, An equitable approach to international reductions of greenhouse- gas emissions, Global Environment Change 1, 343-350.
Spash, C. and R. d’Arge, 1989, I‘he greenhouse etfect and intergenerational transfers, Energy Policy 17. 88-96.
Stevens, B. and H. Vaux, Jr., 1990, Assessing strategies for contol of irrigation-induced salinity in the upper CoTorado River Basin: Comment, American Journal of Agricultural Economics 72, 493-496.
Task Force on the Comprehensive Approach to Climate Change, 1991, A comprehensive approach to addressing potential climate change. (U.S. Department of Justice, Environment and Natural Resources Division, Washington, DC).
Tietenberg, T., 1985, Emissions trading: An exercise in reforming pollution policy (Resources for the Future, Washington, DC).
Tietenberg, T.. 1992, Environmental and natural resource economics, 3rd edition (Harper Collins, New York, NY).
U.S. EPA, 1990, Policy options for stabilizing global climate, Draft report to Congress, Ofice of Policy, Planning, and Evaluation (U.S. Environmental Protection Agency, Washington, DC).
Whalley, J. and R. Wiggle, 1991, Cutting CO2 emissions: The effects of alternative policy approaches, Energy Journal 12. 109-24.
World Bank. 1991, World development report 1991 (Oxford University I’:--- New York. NY). World Resources Institute. 1990, World resources 1990/91 (World Resources Inat!tulc, “?.‘--h-
ington, DC). Young, H., 1991, Sharing the burden of global warming, Equity and Global Climate Change
Project, School of Public Affairs, University of Maryland.